Embed Size (px)
Citation preview
Company website www.experianplc.com
Annual Report 2012 www.experianplc.com/annualreport
Annual R
eport 2012
Operational headquarters
ExperianLandmark HouseExperian WayNG2 Business ParkNottingham NG80 1ZZUnited Kingdom
T +44 (0) 115 941 0888F +44 (0) 115 828 6341
Experian 475 Anton BoulevardCosta MesaCA 92626United States
T +1 714 830 7000F +1 714 830 2449
Serasa Experian Alameda dos Quinimuras, 187 CEP 04068-900Planalto PaulistaSão PauloBrazil
T +55 11 3373 7272F +55 11 2847 9198
Corporate headquarters
Experian plcNewenham HouseNorthern CrossMalahide RoadDublin 17Ireland
T +353 (0) 1 846 9100F +353 (0) 1 846 9150
Corporate office
ExperianCardinal Place80 Victoria StreetLondonSW1E 5JLUnited Kingdom
T +44 (0) 20 304 24200F +44 (0) 20 304 24250
Corporate Responsibility Report 2012 www.experianplc.com/crreport
About Experian www.experianplc.com/aboutexperian
Annual Report 2012
Don RobertChief Executive Officer
We’ve delivered another strong financial performance
and continued to lay the foundations for sustaining growth into the future. I want to congratulate the men and women of Experian on these achievements and to thank them for their boundless energy,
creativity and commitment.

This annual report has been produced using ISO 14001 and FSC certified environmental print technology, together with vegetable-based inks and a single-site production facility that required no transport between processes. The report is printed on an environmentally responsible paper that uses 50% certified de-inked post consumer waste and 50% certified virgin fibre from sustainable sources.
Produced by Accrue* Printed by Royle Print Limited
Experian Annual Report 2012
Revenue US$4.5bnRevenue from continuing activities up 15% and organic revenue growth of 10%, at constant exchange rates.
Continuing activities only. 2011 restated to exclude comparison shopping and lead generation businesses in North America and UK and Ireland (now classified as discontinued operations).
Full year dividend US 32.0cDividends per share up 14%.
EBIT US$1.2bnEBIT margin from continuing activities up 50 basis points to 26.2%.
2011 restated to exclude comparison shopping and lead generation businesses in North America and UK and Ireland (now classified as discontinued operations).
We delivered good growth across all regions, with organic revenue growth of 23% in Latin America, 8% in the UK and Ireland, 7% in EMEA/Asia Pacific and 6% in North America.
We delivered good growth across our four global business lines, with organic revenue growth of 12% in Credit Services, 9% in Marketing Services, 8% in Decision Analytics and 7% in Interactive.
We met or exceeded each of our financial objectives, namely to deliver mid-high single digit organic revenue growth, maintain or improve margin and deliver cash flow conversion of over 90%.
We executed well on our global growth programme, positioning us strongly for the future.
12
11
10
4,485
3,859
3,803
12
11
10
1,175
991
935
12
11
10
32.0
28.0
23.0
Highlights
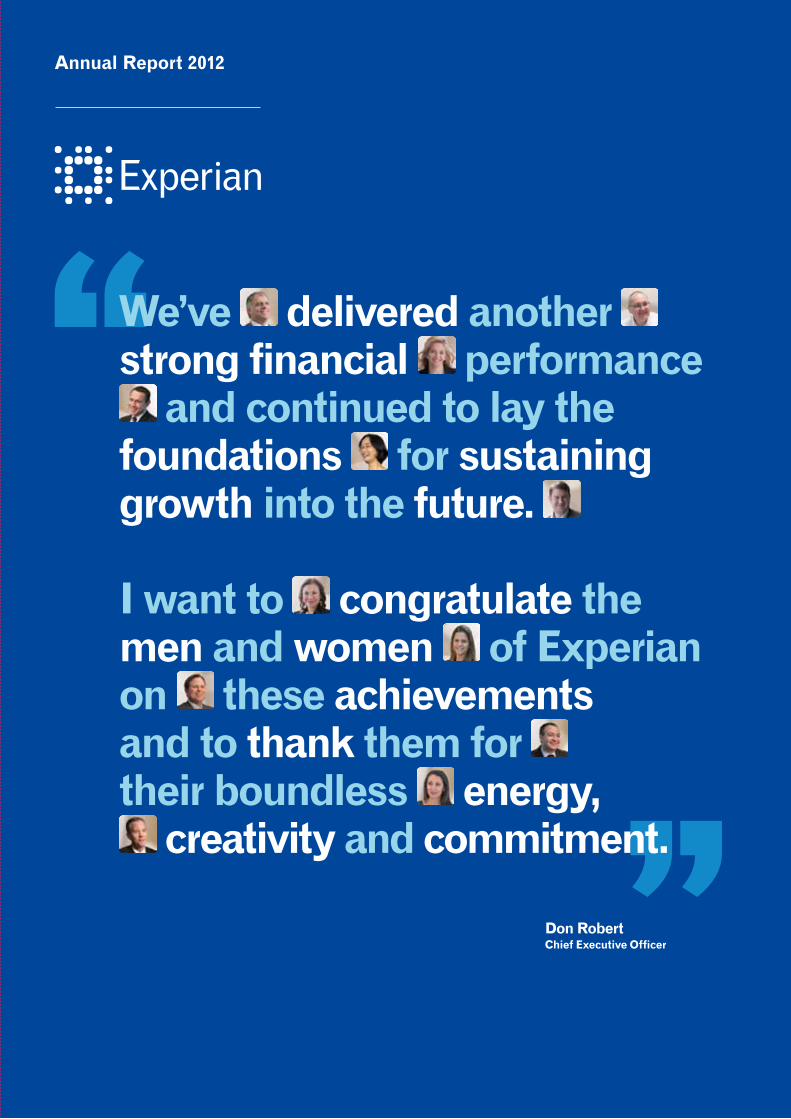
Business overview 2 Chairman’s statement 4 What we do 6 How we do it 8 How we’re getting there 10 Credit Services 12 Decision Analytics 14 Marketing Services 16 Interactive 18 Our people, our strength 22 Key performance indicators 24 Risks and uncertainties
Governance 51 Chairman’s introduction 52 Board of directors 54 Corporate governance statement 66 Report on directors’ remuneration 83 Directors’ report
Business review 28 Chief Executive’s review 32 North America review 34 Latin America review 36 UK and Ireland review 38 EMEA/Asia Pacific review 40 Financial review 47 Corporate responsibility
Financial statements 87 Group audit report 88 Group income statement 89 Group statement of
comprehensive income 90 Group balance sheet 91 Group statement of changes in total equity 92 Group cash flow statement 93 Notes to the Group financial statements 149 Parent company audit report 150 Parent company profit and loss account 151 Parent company balance sheet 152 Notes to the parent company financial statements
159 Shareholder information
To help you get the most from this report, we have used the following page reference symbol to indicate where additional information can be found.
Benchmark profit before tax US$1,128mProfit before tax from continuing operations of US$689m, up 5%, and Benchmark profit before tax of US$1,128m, up 23%.
See note 7 to the Group financial statements for definition of Benchmark profit before tax. 2011 restated to exclude comparison shopping and lead generation businesses in North America and UK and Ireland (now classified as discontinued operations).
1
Governance
Financial statements
Busin
ess reviewB
usiness overview
12
11
10
1,128
920
854
Basic EPS US 66.2c
Benchmark earnings per share up 18% to US 78.9c and basic EPS of US 66.2c, up 14%.
Benchmark earnings per share movement is based on 2011 restated to exclude comparison shopping and lead generation businesses in North America and UK and Ireland (now classified as discontinued operations).
12
11
10
66.2
57.9
59.0
Pxx
Highlights
Contents
2 Experian Annual Report 2012 Business overview2 Experian Annual Report 2012 Business overview
Sustained value creation remains Experian’s top priority and I believe we can be proud of our achievements in this respect. In the five years since demerger, notwithstanding the often challenging conditions in some of our biggest markets, Experian has provided shareholders with returns totalling more than 90%, which compares with an average of 16% for the FTSE 100.
Driving growth across the Group
Expanding our operations into major emerging consumer economies is one of several key drivers of growth for Experian, with over a third of our revenue now coming from fast developing markets outside of the US and UK. A particular highlight this year was the acquisition of Computec, which has expanded our credit bureau presence into Colombia, Peru and Venezuela. Latin America is a very attractive region economically for us and we are finding no shortage of further opportunities in Brazil, where we are continuing to extend the range of Experian products available and are now preparing our clients for the legalised sharing of positive credit data.
The Group has also continued its global diversification outside of financial services with other industry sectors now representing 68% of our revenue. We’re building substantial businesses in sectors such as
telecommunications where operators are focusing hard on building customer loyalty, in the utility market where the challenge is preventing fraud and energy theft, and in the public sector where there is a major drive for greater efficiency. In the US, we’re also helping physicians and hospitals to manage billings as patients become responsible for a larger proportion of their healthcare bills.
We made further strides during the year towards Experian’s goal of becoming the global leader in digital marketing services. In EMEA/Asia Pacific, for instance, this is now our single largest revenue contributor as marketers look for more cost-effective ways to reach their customers and develop more personalised communications. In Brazil, we accelerated our digital marketing development with the acquisition of Virid, the country’s leading email marketing business.
We continued to strengthen our position as a trusted consumer brand for helping individuals to manage their credit profile and protect against the threat of identity theft. In the UK, our CreditExpert product helped grow our Interactive revenues in the region by 30%. I am pleased to say that we also reached an agreement to dispose of our non-core businesses in comparison shopping and lead generation, maintaining the Group’s clear strategic focus on data and analytics.
Chairman’s statementThis has been another excellent year for Experian. Each of the Group’s four regions and four global business lines has delivered strong organic revenue growth. We have also continued to invest throughout the business and made a number of important strategic moves that will help secure our long-term growth.
Sir John PeaceChairman
3
Governance
Financial statements
Busin
ess reviewB
usiness overview
lasting legacy for Experian. Paul was always a generous mentor to his team and, in liaison with his family, we are establishing an employee scholarship award in his name. He is missed by everyone who knew him.
Strengthening our Board
Since the year-end, Brian Cassin has joined Experian as our new Chief Financial Officer. Brian was previously with Greenhill & Co, the global investment banking firm and has 20 years’ experience in the corporate financial advisory sector. Brian was already well known to us as a strategic advisor and I am confident that he will make a great contribution to Experian in the years ahead.
I am also pleased to tell you that the Board and its committees have been further strengthened by the appointment of Deirdre Mahlan and George Rose as non-executive directors from September 2012. Both have extensive boardroom experience and will bring a wealth of management and financial expertise to Experian. I believe they have the personal qualities and experience that are important to us in continuing to create value for our shareholders.
In order to provide continuity following Paul Brooks’ death, David Tyler has kindly agreed to remain on the Board until 31 December 2012, when he will retire. David played a key role in the successful demerger of Experian in 2006 as the finance director of our former parent company and we are very grateful to him for his wise counsel and support since then.
Recognising our responsibilities
With growth comes an even greater awareness of our wider social, ethical and environmental responsibilities and we have made good progress again on a number of fronts. The community programme continues to grow and all our regions now have employees engaged in raising funds and giving their time. Volunteering overall, including time outside of normal working hours spent on Experian projects, was up by
almost 3,500 hours. Environmentally we have exceeded our three-year target, reducing our energy from utilities (as a proportion of revenue) by 21%, while our ethical progress has been typified by achievements such as the successful roll out of our new global code of conduct.
Our employees continue to astound us by the strength of their commitment to volunteering and fundraising for all manner of good causes. And while we remain focused on financial education and support for new entrepreneurs, our people are also deeply connected to the issues of importance within their local communities.
We are especially mindful of the challenges that communities face in our emerging markets and this year our senior management conference takes place in Mumbai where our leaders will see and experience a range of local social issues. We want to use this to give them a greater awareness of the wider social context for our business and its continued growth.
Listening to and taking account of the views of stakeholders underpins all our actions and we have recently embarked upon a comprehensive stakeholder engagement project, involving shareholders, clients, suppliers, employees and our communities. You can read about this and about our broader progress in Experian’s latest corporate responsibility report at www.experianplc.com/crreport.
A business in excellent shape
Experian has come a long way in less than six years as a public company and this last year has again combined strong financial performance with real strategic progress. There’s no doubt that the business is in excellent shape today with a first class management team and a colossal sense of purpose. I want to thank everyone at Experian for all their hard work and to congratulate them on an outstanding achievement.
Constant product innovation underpins all our activities, with over 10% of our revenue generated from products developed in just the past five years. We’ve been investing in new data sources around the globe and in a major new Decision Analytics product suite, PowerCurve, which saw the successful launch of the first phase last September. Our new Business IQ product in North America is also transforming the way we deliver business information to clients and we’re now set to introduce it to the UK.
Engaging our workforce
Experian’s success owes a great deal to the outstanding efforts of a very committed workforce, which is why the Group’s ability to attract and inspire talented people has always been a priority for us. Since the introduction of our annual Global People Survey in 2007, Experian’s employee engagement scores have steadily improved and we are now intent on closing the remaining gap with global high-performing organisations.
A major Group-wide initiative is underway, led by our CEO, Don Robert, to unite our people around a common understanding of what makes Experian special and to ensure that these defining characteristics help shape every aspect of how we work together across the world. We’ve called it the Heart of Experian and are using it to strengthen the qualities that have made us who we are, while continuing to embrace the diversity that is the hallmark of any successful global business.
Paul Brooks
It was with the greatest sadness that we learnt of the death in January of Paul Brooks, our Chief Financial Officer. Paul was an immensely talented and inspirational leader, who played a central role in building the Group we are today. He was admired both inside and outside the Group as an exceptionally able CFO and leaves behind a very strong finance team that will be a
P18
P52
P47

4 Experian Annual Report 2012 Business overview
What we doExperian helps organisations to manage credit risk, prevent fraud, target marketing offers and automate decision making. We also provide credit monitoring and identity protection services to millions of consumers via the internet.
We are extending our global lead through geographic expansion, product innovation and entry into new market sectors
Revenue by region
North America 47%
Latin America 21%
UK and Ireland 18%
EMEA/ Asia Pacific 14%
47%*
Credit Services provides information to organisations to help them manage the risks associated with extending credit and preventing fraud.
Revenue by region
Credit Services
UK
and
Irel
and
EMEA
/Asi
a P
acifi
c
37%42%
11% 10%
Nor
th A
mer
ica
Latin
Am
eric
a
Revenue by industry
Financial services 32%
Direct-to-consumer 21%
Retail 14%
Automotive 5%
Telecoms and utilities 5%
Insurance 4%
Public sector and education 3%
Other 16%
Revenue by client
Top 10 clients 9%
Top 50 clients 21%
All other clients 79%
Data and Analytics
Our focus is on providing data and analytical tools across our
four core business lines.
*Proportion of Group revenue
5
Governance
Financial statements
Busin
ess reviewB
usiness overview
11%*
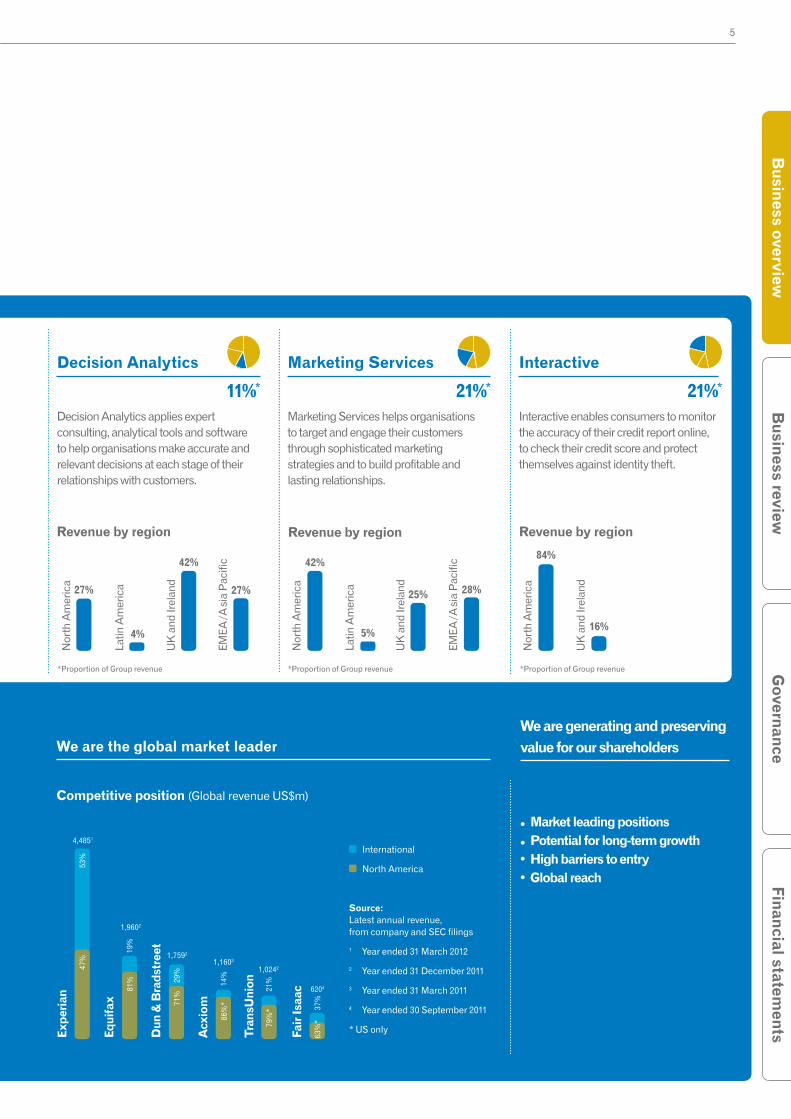
Decision Analytics applies expert consulting, analytical tools and software to help organisations make accurate and relevant decisions at each stage of their relationships with customers.
21%*
Marketing Services helps organisations to target and engage their customers through sophisticated marketing strategies and to build profitable and lasting relationships.
21%*
Interactive enables consumers to monitor the accuracy of their credit report online, to check their credit score and protect themselves against identity theft.
Decision Analytics Marketing Services Interactive
We are the global market leader
International
North America
Source: Latest annual revenue, from company and SEC filings
1 Year ended 31 March 2012
2 Year ended 31 December 2011
3 Year ended 31 March 2011
4 Year ended 30 September 2011
* US only
Competitive position (Global revenue US$m)
53%
47%
4,4851
1,9602
81%
19%
1,7592
29%
71%
1,1603
14%
86%
*
79%
*
1,0242
21%
63%
*
6204
37%
Exp
eria
n
Equi
fax
Dun
& B
rads
tree
t
Acx
iom
Tra
nsU
nion
Fair
Isaa
c
Revenue by region
84%
16%
Nor
th A
mer
ica
UK
and
Irel
and
Revenue by region
UK
and
Irel
and
EMEA
/Asi
a P
acifi
c
27%
4%
42%
27%
Nor
th A
mer
ica
Latin
Am
eric
a
Revenue by region
UK
and
Irel
and
EMEA
/Asi
a P
acifi
c42%
5%
25% 28%
Nor
th A
mer
ica
Latin
Am
eric
a
•Market leading positions
•Potential for long-term growth•Highbarrierstoentry•Globalreach
We are generating and preserving value for our shareholders
*Proportion of Group revenue *Proportion of Group revenue *Proportion of Group revenue
6 Experian Annual Report 2012 Business overview
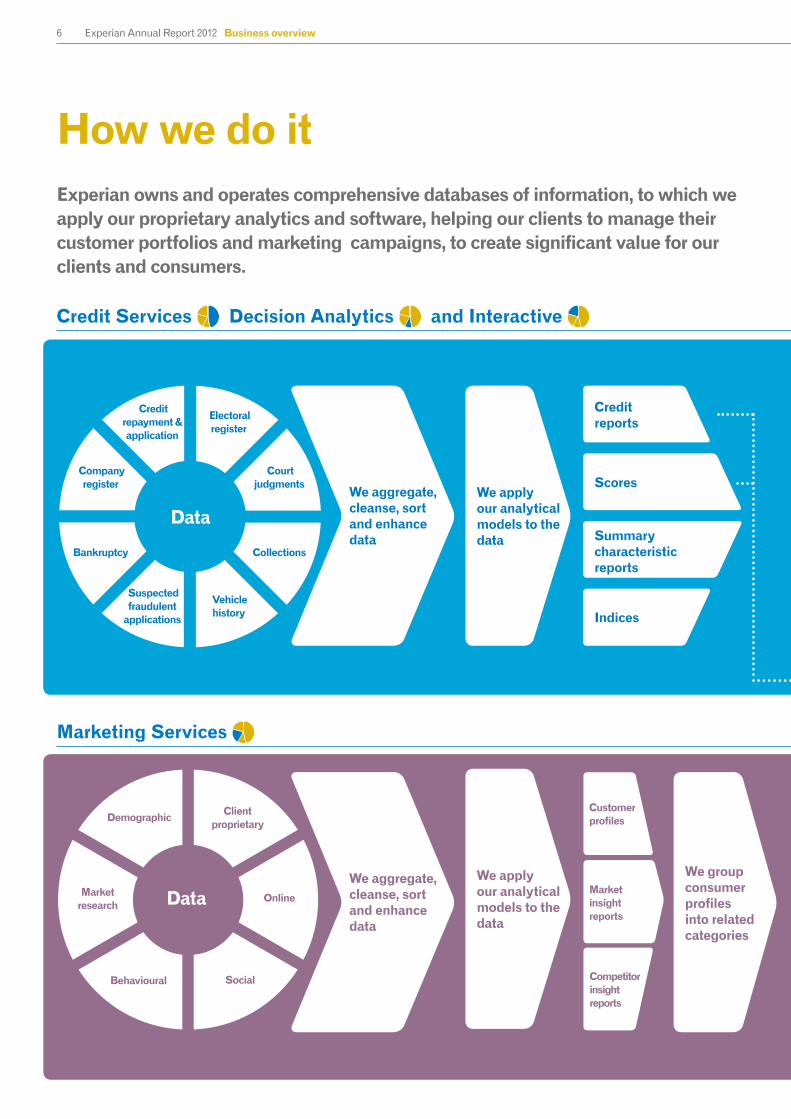
How we do itExperian owns and operates comprehensive databases of information, to which we apply our proprietary analytics and software, helping our clients to manage their customer portfolios and marketing campaigns, to create significant value for our clients and consumers.
Demographic Client proprietary
Online
SocialBehavioural
Market research Data
We aggregate, cleanse, sort and enhance data
We aggregate, cleanse, sort and enhance data
Data
Credit repayment & application
Suspected fraudulent
applications
Electoral register
Vehicle history
Court judgments
Company register
CollectionsBankruptcy
Credit reports
Scores
Summary characteristic reports
Indices
We group consumer profiles into related categories
We apply our analytical models to the data
We apply our analytical models to the data
Customer profiles
Competitorinsightreports
Market insightreports
Credit Services Decision Analytics and Interactive
Marketing Services

7
Governance
Financial statements
Busin
ess reviewB
usiness overview
Internet
Mobile
Social
TV
Clientsbenefitfromimproved business decisions
Consumers
Our clientsFinancial services Telecommunications Utilities Insurance Automotive Healthcare Public sector
Clients’ internal risk policies
Our decisioning tools help our clients to: manage their customer portfolios
Look for new customers
Process applications
Identify and prevent fraud and risk of default
Manage collections and debt recovery
Manage and develop existing customer relationships
Clients benefit from increased return on investment and improved customer engagement
Our clientsRetail Financial servicesMedia Public sectorTelecommunications
We help our clients to: plan, target and execute their marketing campaigns
Tar
gete
d of
fers
are
sen
t to
con
sum
ers
We measure the success of clients’ campaigns
Credit Services Decision Analytics and Interactive
Marketing Services
8 Experian Annual Report 2012 Business overview
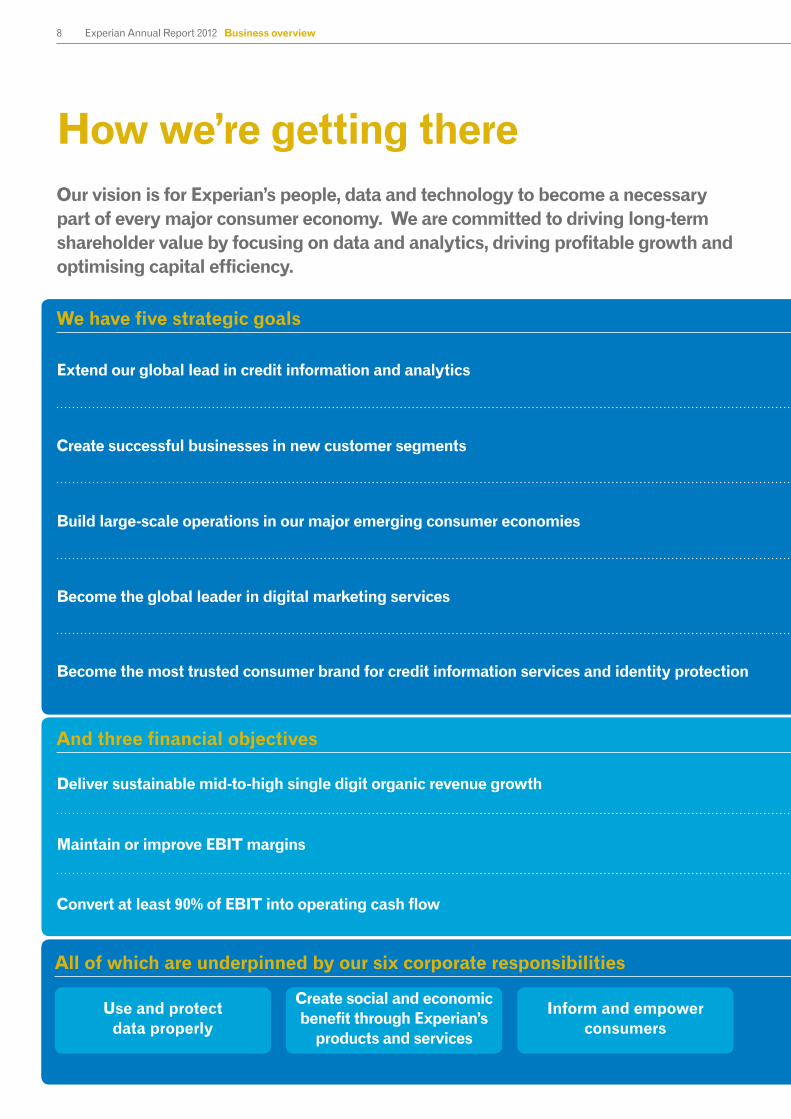
We have five strategic goals
And three financial objectives
How we’re getting thereOur vision is for Experian’s people, data and technology to become a necessary part of every major consumer economy. We are committed to driving long-term shareholder value by focusing on data and analytics, driving profitable growth and optimising capital efficiency.
Extend our global lead in credit information and analytics
We continue to extend and build data assets by investing in rental, income, payday loan, and utilities data, enabling us to develop new products for risk management and fraud prevention. In Brazil, Spain and Denmark, we are building positive data files. In Australia we are establishing new consumer and business credit bureaux, in partnership with the major banks.
Create successful businesses in new customer segments
We expanded our addressable market in US healthcare payments with the acquisition of Medical Present Value, and in the UK, we increased services we offer to small and medium enterprises in the credit reference sector with the acquisition of LM Group. We are helping telecommunication providers better manage their collections processes, and in the UK we are partnering with the public sector to assist government departments to authenticate benefit claimants and to prevent fraud.
Build large-scale operations in our major emerging consumer economies
The acquisition of Computec extended our geographic presence to Colombia, Peru and Venezuela. In Brazil we have invested in new sources of negative data in partnership with a major retail association. We have also launched credit risk and business information services in India and fraud prevention services in Russia.
Become the global leader in digital marketing services
With the acquisition of an email marketing business in Brazil, we now offer email marketing across ten of the largest advertising markets in the world. We have deepened our social media capabilities, with the launch of social research and media campaign platforms. And we have developed a sophisticated digital advertising platform that allows our clients to manage their online campaigns.
Become the most trusted consumer brand for credit information services and identity protection
We continue to enhance the services we provide to consumers. For example, in the UK we are offering greater value to subscribers of credit reference products by bundling vehicle history checks and property valuation reports. We have added new identity protection services including wider web monitoring and protection for children when online in the US. And we are the first credit reporting agency in the US to offer personalised, live telephone-based credit education.
Deliver sustainable mid-to-high single digit organic revenue growth Organic revenue growth KPI on page 22
Maintain or improve EBIT margins EBIT margin KPI on page 22
Convert at least 90% of EBIT into operating cash flow Cash flow conversion KPI on page 22
All of which are underpinned by our six corporate responsibilities
Use and protect data properly
Inform and empower consumers
Create social and economic benefit through Experian’s
products and services

9
Governance
Financial statements
Busin
ess reviewB
usiness overview
We have five strategic goals Progress
And three financial objectives Progress
Extend our global lead in credit information and analytics
We continue to extend and build data assets by investing in rental, income, payday loan, and utilities data, enabling us to develop new products for risk management and fraud prevention. In Brazil, Spain and Denmark, we are building positive data files. In Australia we are establishing new consumer and business credit bureaux, in partnership with the major banks.
Create successful businesses in new customer segments
We expanded our addressable market in US healthcare payments with the acquisition of Medical Present Value, and in the UK, we increased services we offer to small and medium enterprises in the credit reference sector with the acquisition of LM Group. We are helping telecommunication providers better manage their collections processes, and in the UK we are partnering with the public sector to assist government departments to authenticate benefit claimants and to prevent fraud.
Build large-scale operations in our major emerging consumer economies
The acquisition of Computec extended our geographic presence to Colombia, Peru and Venezuela. In Brazil we have invested in new sources of negative data in partnership with a major retail association. We have also launched credit risk and business information services in India and fraud prevention services in Russia.
Become the global leader in digital marketing services
With the acquisition of an email marketing business in Brazil, we now offer email marketing across ten of the largest advertising markets in the world. We have deepened our social media capabilities, with the launch of social research and media campaign platforms. And we have developed a sophisticated digital advertising platform that allows our clients to manage their online campaigns.
Become the most trusted consumer brand for credit information services and identity protection
We continue to enhance the services we provide to consumers. For example, in the UK we are offering greater value to subscribers of credit reference products by bundling vehicle history checks and property valuation reports. We have added new identity protection services including wider web monitoring and protection for children when online in the US. And we are the first credit reporting agency in the US to offer personalised, live telephone-based credit education.
Deliver sustainable mid-to-high single digit organic revenue growth Organic revenue growth KPI on page 22
Maintain or improve EBIT margins EBIT margin KPI on page 22
Convert at least 90% of EBIT into operating cash flow Cash flow conversion KPI on page 22
2012
2012
(+50 basis points)
2012
10%
26.2%
96%
All of which are underpinned by our six corporate responsibilities
Be a good employer to all
Play an active part in our communities
Minimise environmental impacts
CR section on page 47

10 Experian Annual Report 2012 Business overview
At the core of Credit Services are the comprehensive databases that Experian builds and manages, that hold the credit application and repayment histories of millions of consumers and businesses. Globally, Experian holds credit payment data on more than 740 million consumers and 70 million businesses, and historical data on 650 million vehicles. In total, Experian operates 19 consumer credit bureaux and 14 business credit bureaux around the world.
Consumer and business information
A credit bureau is a database that includes information supplied by lenders, and certain public records, such as liens, judgments and bankruptcies, by other third parties.
Lenders and other subscribing members provide us with credit application and repayment data on consumers and businesses.
Experian augments that data with publicly available information. It is then aggregated, cleansed and sorted to form a credit report on a consumer or a business which comprehensively shows how credit obligations have been managed in the past.
Credit reports vary by country, but typically include identification information, past and present credit obligations, court judgments, bankruptcy information, suspected fraudulent applications, collections data, previous addresses and, in the case of businesses, may include company registration and ownership.
In developed credit markets, such as the US and UK, a credit report includes information on credit obligations, both positive and negative. Positive data includes accounts that have been paid on time, forming a complete picture of indebtedness and credit payment behaviour, while negative information includes past-due payments, collection accounts and public records information such as bankruptcies. In less mature credit markets, bureaux often contain only negative data.
Consumer credit reports help lenders make better informed and faster credit decisions through access to detailed historical information about how consumers have managed their credit obligations.
Business credit reports are used by clients to set the credit terms for new accounts and to manage existing account relationships with their customers and suppliers.
Experian continually freshens and augments its bureau databases, adding new sources of data to further enhance the depth and quality of the credit reports.
To check the credit history of a consumer or business and store information with a credit bureau, a company must have a legitimate need for accessing the data and usually must notify the applicant of their intention to contact a credit bureau. The laws of each country vary in respect of the hosting of such data and access to it.
Experian maintains a comprehensive security programme to protect credit bureau data through its entire lifecycle, from collection, transformation and use, to storage and then destruction.
Experian does not make lending decisions or offer any comment or advice on particular applications, but simply provides factual information.
Clients then use that information, often in conjunction with other information such as that included in an application form or any previous agreements with the applicant, to help decide whether or not to lend.
Automotive information
Experian’s automotive business supplies vehicle history reports in the US, the UK, Ireland and Italy to help organisations and consumers understand the risk associated with used vehicles. Reports typically include data on title, registration, history and accidents, manufacturer recall and repair records. The information is sold to automotive dealers, auction houses,
automotive companies and direct-to-consumer to help establish the market value of a used vehicle, the accuracy of the odometer reading and whether or not the vehicle has changed owners, been damaged in an accident, or been imported.
Clients
Clients principally include organisations that are extending or offering credit. Examples include financial services, telecommunications, utilities, insurance companies, hospitals and automotive dealers.
Financial characteristics
Credit reports are sold on a transactional basis, priced per report delivered. Pricing is typically tiered, varying according to the volume of reports delivered to the client. Typically, revenue for Credit Services recurs habitually.
Competitive environment
Experian is the primary provider of consumer credit information to many financial institutions in the US; the other credit bureaux are Equifax and TransUnion. In Brazil and the UK, Experian is the clear market leader and has leading positions in many other countries.
In business information, Experian is the market-leading provider in Brazil, the UK and a number of other markets. In the US, Experian is second to Dun & Bradstreet, which is the only global competitor in this field.
Market influences
See page 12 for market influences on Credit Services and Decision Analytics.
Our four global business lines
Credit Services
Contribution to Group revenue
47%
P12

We’ve provided Oi with the opportunity to capitalize fully on the convergence of consumer telecom services.
Credit Services success story: Helping Oi Telecom in Brazil to maintain market leadership
Oi is the leading provider of telecommunication services in Brazil and a pioneer of convergent services that include fixed and mobile telephony, broadband and cable television.
In July 2011, we began discussions with Oi’s senior management about how Serasa Experian could improve their business performance by using our data and analytics to help guide decision making at each stage of their relationship with customers. Working closely with Oi, we undertook analytical studies to prove Experian’s capabilities. We then developed more than 50 business models as part of a comprehensive portfolio management solution that would embrace customer prospecting and acquisition, customer management and collections.
The project has provided Oi with the opportunity to capitalize fully on the convergence of consumer telecom services and to drive greater customer loyalty using its vast array of products and services to create unique competitive offerings that can strengthen its market position.
This is a long-term partnership and we’ll be working closely with Oi to support its key strategic objectives of expanding its subscriber base, driving higher average customer revenue and creating greater loyalty by targeting the right product bundles to the right consumer groups across Brazil. The Serasa Experian solution will also provide Oi with the added benefits of greater operational efficiencies and reduced bad debts, which will have a positive impact on its financial performance.
No other company could have put together a solution like this, with all the inherent advantages of a one-stop-shop. We’ve worked with Oi for over ten years and they trusted us to get it right.
Rosane Bensusan
Serasa Experian Latin America
Governance
Financial statements
Busin
ess reviewB
usiness overview

12 Experian Annual Report 2012 Business overview
Decision Analytics unlocks the value of Experian’s vast databases of credit and marketing information, as well as clients’ data, applying expert consulting, analytical tools, software and systems, to help clients solve complex problems and make valuable business decisions.
Description
Experian enables organisations to make accurate and relevant decisions at every stage of the customer relationship; helping to identify potentially profitable new customers, to segment their existing customers according to risk and opportunity, to manage loan portfolios and to undertake effective collections actions. Decision Analytics products are also used in the detection and prevention of fraud.
Experian has developed a comprehensive consultative-led approach for its clients, helping them identify issues, develop insights and to focus on solutions that add value to their business. Hundreds of statisticians, mathematicians and analysts are employed globally creating both bespoke and industry solutions.
Solutions developed by Experian include application processing, customer management, fraud solutions and collections software and systems.
• Application processing systems enable organisations to balance the requirement for speed and competitiveness with the need for careful risk assessment when considering an applicant for credit.
• Customer management systems are used to automate huge volumes of day-to-day decisions; helping clients make the right decision for each customer, in a consistent and cost-efficient manner.
• Fraud and identity solutions are used to authenticate that people are who they say they are and that the information being provided is correct.
• Collections analytics and software play an important part in helping organisations establish an accurate picture of a customer’s propensity to pay, and therefore the amount likely to be recovered.
Clients
Clients vary in size, from small to medium, to multinational. They come from a range of industries, including financial services, telecommunications, utilities, retailers, insurance, automotive and the public sector. Multinational clients often standardise their operations globally on Experian’s tools and software, helping to improve strategic control and operating effectiveness as well as helping to satisfy regulatory obligations.
Financial characteristics
Credit scores and fraud checks are sold on a transactional volume-tiered basis, whilst revenue from software and systems consists partly of implementation fees and partly of contractually recurring licence fees.
Competitive environment
Experian is a market leading provider of Decision Analytics in all its major geographies. Global competitors include Fair Isaac and SAS, and competition in individual markets consists typically of smaller, local players.
Market influences for Credit Services and Decision Analytics
There is a growing demand from governments, regulators and lenders for greater transparency. Governments want safety and soundness in the banking system, regulators want greater insight and control over the entities they are regulating and lenders want to grow whilst being more discerning about their customer acquisition.
Clients in newer customer segments, such as telecommunications and utilities, are becoming increasingly aware of the benefits of managing customer relationships, optimising collections and combating fraud.
These are all driving a need for more data, more segmentation, more consultancy and more execution support.
Our four global business lines
Decision Analytics11%
Contribution to Group revenue

13
Governance
Financial statements
Busin
ess reviewB
usiness overview
HMRC expects our partnership to save the Government at least £800 million.
These are testing times for the UK public sector as the Government reins back on spending and promotes an agenda of reform and efficiency savings. One of the most widely publicised initiatives has been the Prime Minister’s commitment to tackling fraud and error in the welfare system, using the expertise and information resources of credit reference agencies.
In July 2011, following a successful pilot, Experian was appointed by HM Revenue & Customs (HMRC) to help reduce losses due to fraud and error in the payment of tax credits. It’s estimated that the Government loses more than £3bn each year from incorrect payment of these tax benefits, which are designed to support people with low incomes or children.
Every month, Experian is applying an unrivalled view of consumers to some 65,000 tax credit claimants. Using information such as financial associations, changes of address and declarations of income, we’re highlighting claims where the circumstances of an individual have changed since the benefit was originally granted. We’re then applying sophisticated analytics to the records to prioritise those claims where we’ve found a potential issue. It means that HMRC can now focus their resources on those cases that are most likely to result in a saving.
We’re also looking to apply technology from our recent acquisition of Garlik, which provides web monitoring services that will enable us to find relationships between individuals in cyberspace that could indicate a citizen is no longer entitled to a benefit.
By revealing information such as an undisclosed partner or changes in income, Experian is enabling HMRC to mount a concerted campaign to challenge a large number of payments, which is proving very successful. During the life of this contract HMRC expects our partnership to save the Government at least £800 million.
Nick Mothershaw
Experian Identity and Fraud SolutionsUK and Ireland
Decision Analytics success story: Tackling fraud and error in the welfare systemG
overnanceFinancial statem
entsB
usiness review
Busin
ess overview
14 Experian Annual Report 2012 Business overview
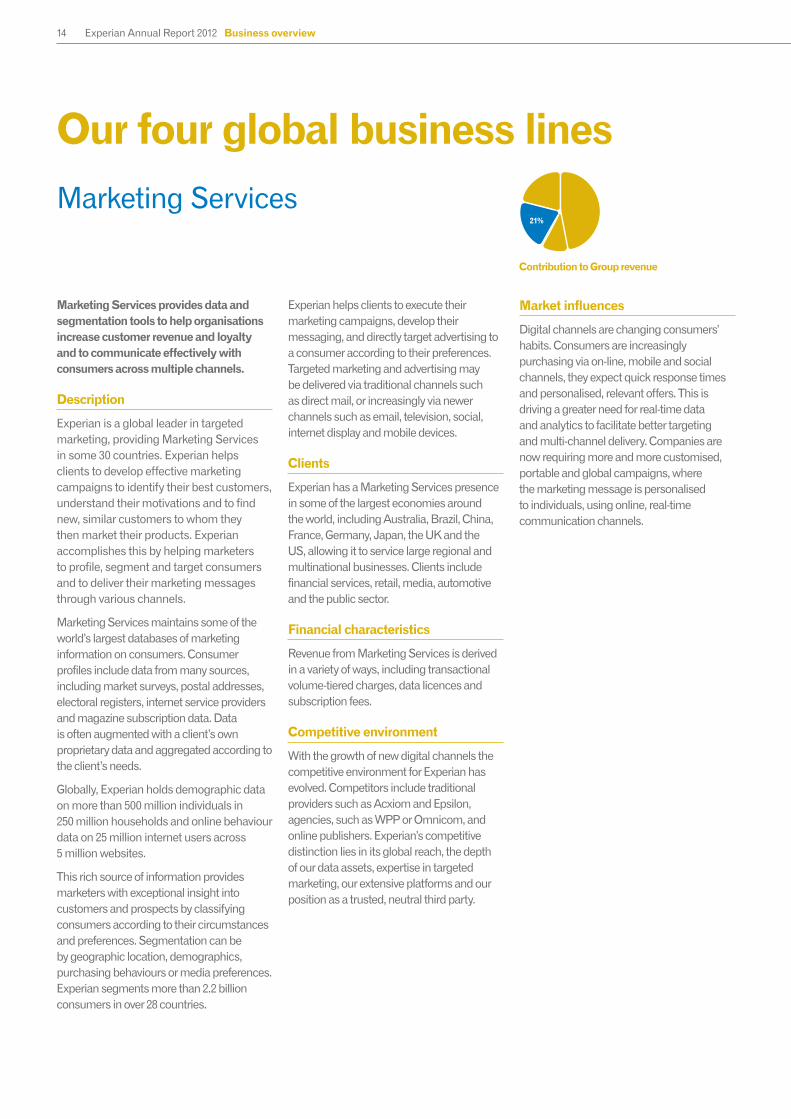
Marketing Services provides data and segmentation tools to help organisations increase customer revenue and loyalty and to communicate effectively with consumers across multiple channels.
Description
Experian is a global leader in targeted marketing, providing Marketing Services in some 30 countries. Experian helps clients to develop effective marketing campaigns to identify their best customers, understand their motivations and to find new, similar customers to whom they then market their products. Experian accomplishes this by helping marketers to profile, segment and target consumers and to deliver their marketing messages through various channels.
Marketing Services maintains some of the world’s largest databases of marketing information on consumers. Consumer profiles include data from many sources, including market surveys, postal addresses, electoral registers, internet service providers and magazine subscription data. Data is often augmented with a client’s own proprietary data and aggregated according to the client’s needs.
Globally, Experian holds demographic data on more than 500 million individuals in 250 million households and online behaviour data on 25 million internet users across 5 million websites.
This rich source of information provides marketers with exceptional insight into customers and prospects by classifying consumers according to their circumstances and preferences. Segmentation can be by geographic location, demographics, purchasing behaviours or media preferences. Experian segments more than 2.2 billion consumers in over 28 countries.
Experian helps clients to execute their marketing campaigns, develop their messaging, and directly target advertising to a consumer according to their preferences. Targeted marketing and advertising may be delivered via traditional channels such as direct mail, or increasingly via newer channels such as email, television, social, internet display and mobile devices.
Clients
Experian has a Marketing Services presence in some of the largest economies around the world, including Australia, Brazil, China, France, Germany, Japan, the UK and the US, allowing it to service large regional and multinational businesses. Clients include financial services, retail, media, automotive and the public sector.
Financial characteristics
Revenue from Marketing Services is derived in a variety of ways, including transactional volume-tiered charges, data licences and subscription fees.
Competitive environment
With the growth of new digital channels the competitive environment for Experian has evolved. Competitors include traditional providers such as Acxiom and Epsilon, agencies, such as WPP or Omnicom, and online publishers. Experian’s competitive distinction lies in its global reach, the depth of our data assets, expertise in targeted marketing, our extensive platforms and our position as a trusted, neutral third party.
Market influences
Digital channels are changing consumers’ habits. Consumers are increasingly purchasing via on-line, mobile and social channels, they expect quick response times and personalised, relevant offers. This is driving a greater need for real-time data and analytics to facilitate better targeting and multi-channel delivery. Companies are now requiring more and more customised, portable and global campaigns, where the marketing message is personalised to individuals, using online, real-time communication channels.
Our four global business lines
Marketing Services21%
Contribution to Group revenue

We’re helping ACE to better understand the individual behaviours and needs of customers.
We began talking to ACE, the global insurance organisation, in 2009 when we were approached by its Accident & Health business in Spain. ACE wanted to develop a better understanding of the individual behaviours and needs of its customers. That meant changing the way it looked at information; moving from a ‘policy view’ to a more customer-focused one.
Our solution was to develop a ‘datamart’ where ACE could bring together all of its customer and prospect information within one integrated system, hosted by Experian in Nottingham. Individual countries would view their own information through a centralised web application, from which they’d also have access to Experian tools for analysing customer information, making selections and running marketing campaigns. Prospect information and data quality would be managed by Experian locally to ensure compliance with local regulations.
Another vital aspect of the project was the participation of ACE sponsors, who are an important source of new business. These companies provide ACE with information about their own customers, who they believe may be interested in insurance products. In the past they would send files directly to ACE’s call centres, but with the introduction of the datamart they have separate contracts with Experian, allowing us to host their information and enabling ACE to make more refined selections on their behalf without compromising commercial confidentiality.
The new datamart went live in Spain during September 2011 and we’re now introducing Sweden and Finland to the project, to be followed by several other European countries this year. Jose Luiz Gomez, Accident & Health Director for ACE in Spain, described the implementation of the datamart as ‘impeccable’. He believes it’s giving real advantage to ACE by maximising opportunities with customers, partners and prospects.
Our relationship with ACE is very exciting, but we’re really only at the beginning of the journey. We’re now introducing ACE to potential new sponsors, to new lists of prospective customers and to the power of email marketing through Experian CheetahMail.
Olga Rodriguez-Piñero
Experian Marketing Services EMEA
Governance
Financial statements
Busin
ess reviewB
usiness overview
Marketing Services success story: Maximising opportunities with customers, partners and prospects

16 Experian Annual Report 2012 Business overview
Our Consumer Direct business provides credit monitoring and other information services directly to millions of consumers via the internet. It enables consumers to monitor the accuracy of their credit report, to check their credit score and to protect against identity theft.
Description
Experian provides consumers with secure, online, unlimited access to their complete credit history in return for a regular monthly subscription fee.
In the US, CreditReport.com and freecreditscore.com, and in the UK, CreditExpert.co.uk, allow consumers to see the same information available to lenders.
Typically a consumer will subscribe to Experian when they have a major life event, such as when obtaining a loan, and they want to feel more confident about their situation by looking at their credit report and score. Or when there is a life change, such as getting married or moving city and they need to take a more in-depth look at their financial situation through their credit report.
Email or text alerts keep consumers informed about any significant changes to their credit report. Subscribers also receive information that helps them manage their credit commitments.
Experian’s identity protection services in the US and the UK, ProtectMyID.com and ProtectMyID.co.uk, provide identity theft detection, protection and fraud resolution to consumers. In the event of fraud, Experian provides access to a dedicated fraud resolution service together with insurance against financial loss.
In the US, Safetyweb.com helps parents monitor their children’s online activity and mobile usage, and Garlik.com, in the UK, US, Germany and Italy, provides wider web and social network monitoring to help prevent identity fraud before it happens.
Financial characteristics
Consumer credit reports, scores and identity protection are provided to consumers for a monthly subscription fee.
Competitive environment
Experian’s direct-to-consumer, credit information business is the clear market leader in both the US and UK. In the US, competition is provided by Equifax, TransUnion, Fair Isaac and other smaller specialists, but Experian is more than four times the size of any of those competitors. In the UK, competition is provided by Equifax and smaller niche players.
Market influences
Consumers are becoming increasingly aware of the need to manage and control their financial circumstances, and protect their identity. They are more conscious of how personal information and credit history is employed by lenders, and are more focused on managing their credit relationships. Consumers want to protect their identities and to minimise the risk of identity theft, as well as protecting their children while they are on-line and using mobile devices.
Our four global business lines
Interactive 21%
Contribution to Group revenue
17 Experian Annual Report 2012 Business overview
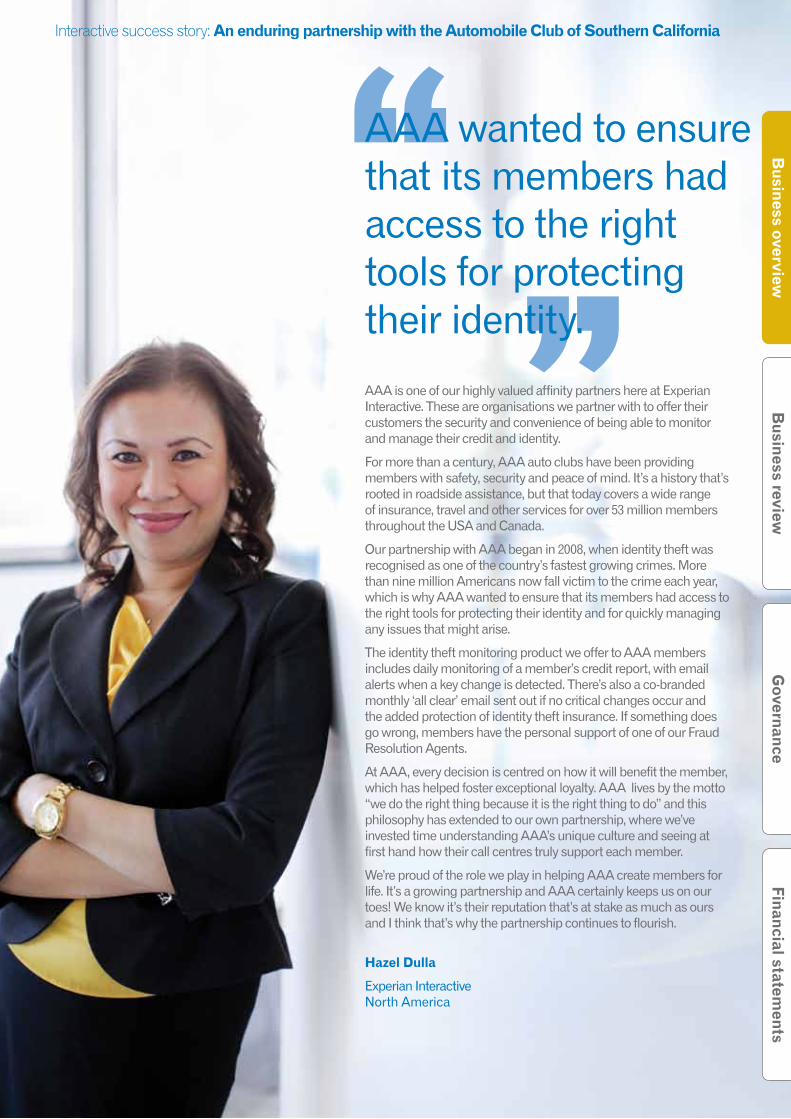
AAA wanted to ensure that its members had access to the right tools for protecting their identity.
Interactive success story: An enduring partnership with the Automobile Club of Southern California
AAA is one of our highly valued affinity partners here at Experian Interactive. These are organisations we partner with to offer their customers the security and convenience of being able to monitor and manage their credit and identity.
For more than a century, AAA auto clubs have been providing members with safety, security and peace of mind. It’s a history that’s rooted in roadside assistance, but that today covers a wide range of insurance, travel and other services for over 53 million members throughout the USA and Canada.
Our partnership with AAA began in 2008, when identity theft was recognised as one of the country’s fastest growing crimes. More than nine million Americans now fall victim to the crime each year, which is why AAA wanted to ensure that its members had access to the right tools for protecting their identity and for quickly managing any issues that might arise.
The identity theft monitoring product we offer to AAA members includes daily monitoring of a member’s credit report, with email alerts when a key change is detected. There’s also a co-branded monthly ‘all clear’ email sent out if no critical changes occur and the added protection of identity theft insurance. If something does go wrong, members have the personal support of one of our Fraud Resolution Agents.
At AAA, every decision is centred on how it will benefit the member, which has helped foster exceptional loyalty. AAA lives by the motto “we do the right thing because it is the right thing to do” and this philosophy has extended to our own partnership, where we’ve invested time understanding AAA’s unique culture and seeing at first hand how their call centres truly support each member.
We’re proud of the role we play in helping AAA create members for life. It’s a growing partnership and AAA certainly keeps us on our toes! We know it’s their reputation that’s at stake as much as ours and I think that’s why the partnership continues to flourish.
Hazel Dulla
Experian Interactive North America
Governance
Financial statements
Busin
ess reviewB
usiness overview

18 Experian Annual Report 2012 Business overview
Culture – generating a sense of pride
Building a strong cultural identity has become a top priority for us. In 2011, we initiated a project called the Heart of Experian, to enable us to further identify our purpose and a way to express the ties that bind our organisation together wherever we are in the world and whatever we do. We further set out to define three words that would express our convictions, how we behave and what we believe, in other words our ‘Core DNA’.
In April 2012, we introduced this new way of articulating what Experian stands for in the eyes of our employees, our clients, our investors, and the communities we serve. The three words we chose to represent our ‘Core DNA’ are: Connect, Protect and Create.
Connect, Protect and Create, symbolise the way we work, what we believe, and what we are about. In communicating our Core DNA we identified stories across all parts of Experian globally to bring these to life.
To further infuse our Core DNA into everything we do, we have instigated several global projects relating to people, processes and systems. One example is the Ambassador Programme, where employees from all levels and areas of Experian act as cultural ambassadors to generate energy and excitement right at the heart of Experian.
Our people, our strengthBuilding a strong culture and effectively managing and deploying the talents of employees on a global basis are essential to the successful execution of Experian’s growth strategy. Our objectives are to build a strong and sustainable talent pool so as to establish a dynamic and inspirational work environment that will attract and retain the best people.
Connect ‘Connect’ is about how our employees work together across the world to make a difference for our clients by helping them to connect successfully with their own customers. It’s also about how we combine many different items of data to drive millions of decisions each day and how we connect with the communities of which our business is a part.
Meet Project Tiger member and Business Consultant Suebie Wong, based in Hong Kong. Suebie takes us through the challenges and highlights of how 20 people from five different countries, speaking multiple languages recently connected to help high-profile Standard Chartered Bank implement a successful solution.
Find out more about the Heart of Experian and read Suebie’s story on Zoom.

19
Protect ‘Protect’ is about the way we care for personal and commercially sensitive information, safeguarding the financial interests of organisations and consumers. It relies on trust and integrity, which are two of the words most often used by our employees when asked what makes them proud to be part of Experian.
Not only is Nottingham’s Paul Dennis busy ensuring world class standards to protect our data as Technical Facilities Manager at Fairham House, he’s also working hard to protect the environment. Paul tells us how he met the challenge of lowering the data centre’s energy consumption, reducing Experian’s carbon footprint.
Find out more about the Heart of Experian and read Paul’s story on Zoom.
These posters form part of an internal campaign about the Heart of Experian, using employee stories to bring to life the three special qualities that unite our global organisation – Connect, Protect and Create.
Costa Mesa’s Senior Director of Marketing, Viviana M. Rueda, tells us how a staggering nine million Americans are victims of identity theft per year. Inspired by the flagship ProtectMyID® product, Viviana and her team are now creating the next generation of identity management tools and making a positive difference in people’s lives.
Find out more about the Heart of Experian and read Viviana’s story on Zoom.
Create ‘Create’ is about how all our employees’ ideas matter in finding new ways to help organisations and consumers use the power of information, and to advance the economies in which we operate. It’s also about creating opportunities for our employees to realise their own ambitions with us.
Governance
Financial statements
Busin
ess reviewB
usiness overview

20 Experian Annual Report 2012 Business overview
Diversity – expanding our talent pool
Our employees are drawn from as diverse a pool as possible. Where we can obtain employee diversity data, it can be shown that the Experian employee base broadly reflects that of the country in which it operates.
Approximately 45% of our employees are female and 55% male. Around 32% are classified as white and 20% as non-white, with the remainder choosing not to disclose this information or the information being unavailable.
The overall objective remains to drive diversity through the talent agenda to ensure that our future senior leadership team better reflects our client, investor and general employee base. The table below outlines the current picture and highlights the progress being made. You will find details of our Board diversity in the corporate governance statement later in the annual report.
The following are some of the initiatives designed to drive sustainable change:
Experian Business Network (EBN)This development forum for high potential and diverse emerging talent was successfully launched in October 2008 and now runs in all major geographies, making it a truly global forum. To date, approximately 320 employees have been or are currently part of the EBN, with analysis showing that approximately 30% of participants have gained a role promotion while part of the forum. This promotion rate is three times that of our employee population. Of the 320 participants, 55% are female and 30% offer ethnic or cultural diversity to the membership mix. Additionally, retention rates within the EBN are over twice that seen across the Group, indicating that the forum is achieving its objectives in terms of both the promotion and retention of diverse talent.
The EBN continues to demonstrate great strength in the promotion and retention of diverse talent. There are plans to extend the EBN concept through the development of feeder programmes.
CEO Forum This development forum is designed for senior talent, with a focus on creating opportunities for exposure to the CEO and other senior executives. Members are selected from the talent pool, with diversity being actively encouraged. Analysis shows that, since its creation in 2008, of the 60 participants to date, approximately 25% have received notable promotion.
A new Executive Success programme is targeted on our highest potential leaders who have participated in the CEO Forum events and have been identified as individuals we want to further develop. The programme is designed to enhance the leadership and business strategy skills that will help them prepare for future roles in the most senior levels of management.
FTSE 100 Cross-Company Mentoring Programme We continue to participate in this mentoring programme, which pairs high-potential female executives with CEO or Chairman mentors from other, non-competing, FTSE 100 companies.
Entry point hiringDuring 2012 a project will commence to review the level of diverse talent hired at entry point, with a particular focus on graduate hires. This will be done with a view to developing external partnerships to aid the attraction of ethnically diverse graduate hires so as to feed the future leadership talent base.
Our people, our strength continued
Diversity profile of the senior leadership team
September
2008
September
2009
September
2010
September
2011
External benchmark(FTSE 100)
Total population 87 87 90 85
Gender (number and % females) 11 (13%) 14 (16%) 16 (18%) 16 (19%) 17.2%
Ethnic origin (number and % non White Caucasian) 6 (7%) 4 (5%) 6 (7%) 8 (9%) 4.1%
21
Governance
Financial statements
Busin
ess reviewB
usiness overview
Employee engagement – listening to our people
Our global people survey is carried out every 18 months and provides valuable insights into the views of employees and their level of engagement with the business.
Experian’s fourth global people survey in November 2011 achieved 88% employee participation, the same level as the last survey. This response level is considered to be ‘high performing’ and our objective is to maintain such high levels.
The strongest results globally in 2011 were found in those areas that employees identified as a priority for improvement in the previous survey (particularly Teamwork, Communication and Respect and Integrity).These were the focus of action plans at a global and regional level.
Overall the results showed a positive trend since the first survey carried out in 2007, and improved over the scores of 2010 with 53% of items showing significant improvement (2010: 42%). Only 14% of survey items have shown significant decline against 25% in 2010.
Global and regional action plans relating to the 2011 survey have been completed and continue to demonstrate the strong commitment from executive and senior leadership to addressing issues raised by these surveys.
Plans are in place for a quarterly review of progress against the action plans, all set with consistent principles, communication processes and measurement.
The fifth global people survey will run in Spring 2013. The focus for this survey will be to continue closing the gap between Experian’s scores and those of global high performing organisations. In addition, there will again be a strong focus on whether action has been taken on areas identified for improvement in the last survey, indicating how well we addressed specific employee feedback.
More information on how we are progressing on closing the employee engagement gap with global high performing organisations can be found in the key performance indicators section.
Succession planning – building our base of talent
Succession planning ensures that appropriate senior leadership resources are in place to achieve our strategic objectives. The plans are regularly reviewed by the Board’s Nomination and Corporate Governance Committee.
For the broader leadership, plans are reviewed twice-yearly by our executive team. The most recent review highlighted the following:
• 71% of senior leadership appointments are internal promotions. This ratio is in line with FTSE 100 best practice.
• 11% of the senior leadership team are occupying developmental roles outside their home market and geography. This mobility of talent continues to be a key focus, especially across our biggest markets.
• Approximately 95% of senior leadership roles have successors ready to cover these roles in the short-term and emergency cover, and over 60% have one or more candidates identified in medium or longer term as permanent replacements. The key focus is on developing the strength of this talent base. We continue to cascade the talent review process to increasingly junior levels of emerging talent as one way of doing this.
Talent development – investing in high potential employees
We remain committed to checking and challenging our assessments of people, in order to ensure that we are investing in the development of the right individuals. We took many actions this year including expansion of the global talent forums for high-potential employees, a continued focus on career planning as part of performance review discussions and the active alignment of the global mobility and talent agendas to identify individuals who will develop personally and professionally from international experience.
In 2012, we further emphasised developing high potential employees with the new Executive Success Programme which is targeted to select highest potential leaders who have participated in the CEO Forum events, as referred to above.
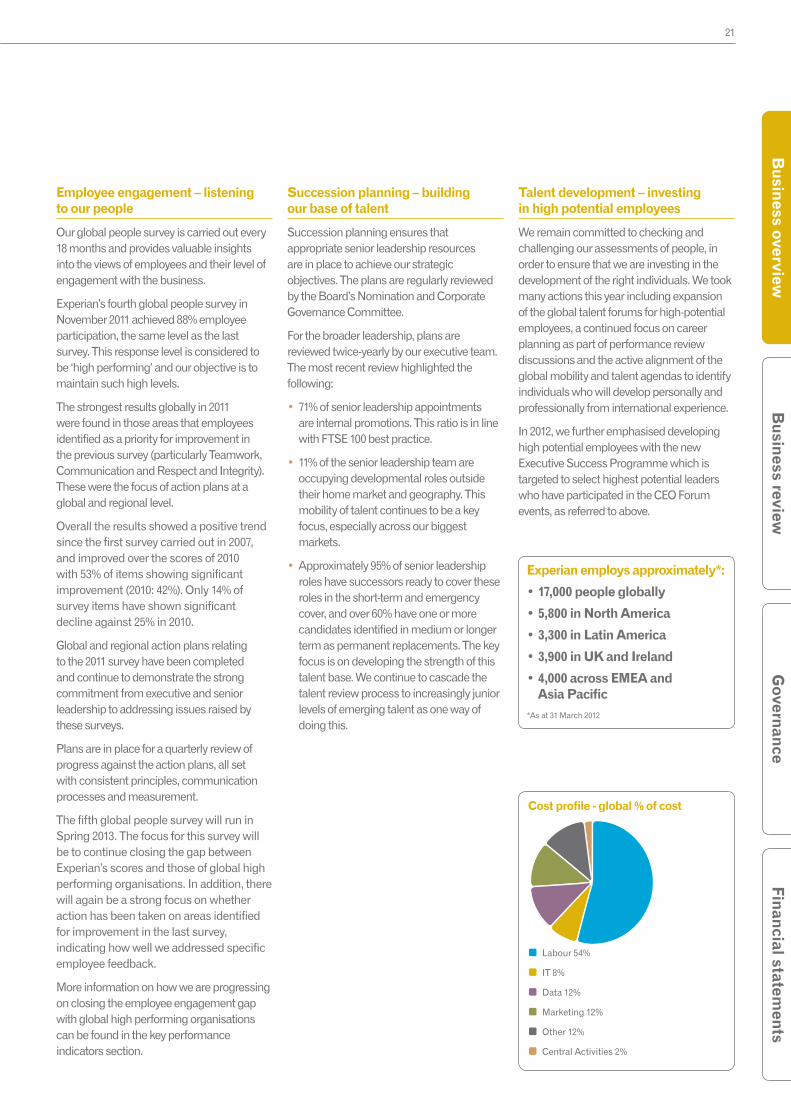
Experian employs approximately*:
•17,000peopleglobally
•5,800inNorthAmerica
•3,300inLatinAmerica
•3,900inUKandIreland
•4,000acrossEMEAand AsiaPacific*As at 31 March 2012
Cost profile - global % of cost
Labour 54%
IT 8%
Data 12%
Marketing 12%
Other 12%
Central Activities 2%
22 Experian Annual Report 2012 Business overview
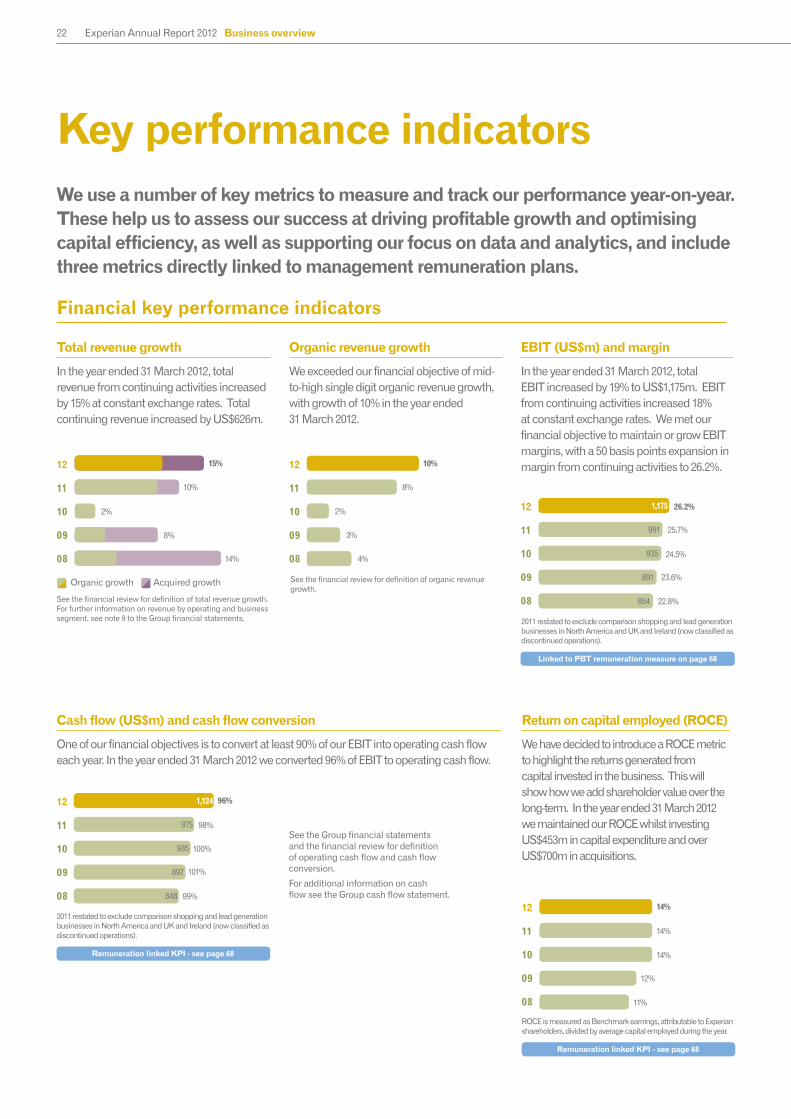
Organic revenue growth
We exceeded our financial objective of mid-to-high single digit organic revenue growth, with growth of 10% in the year ended 31 March 2012.
See the financial review for definition of organic revenue growth.
Key performance indicatorsWe use a number of key metrics to measure and track our performance year-on-year. These help us to assess our success at driving profitable growth and optimising capital efficiency, as well as supporting our focus on data and analytics, and include three metrics directly linked to management remuneration plans.
Total revenue growth
In the year ended 31 March 2012, total revenue from continuing activities increased by 15% at constant exchange rates. Total continuing revenue increased by US$626m.
See the financial review for definition of total revenue growth. For further information on revenue by operating and business segment, see note 9 to the Group financial statements.
Financial key performance indicators
Cash flow (US$m) and cash flow conversion
One of our financial objectives is to convert at least 90% of our EBIT into operating cash flow each year. In the year ended 31 March 2012 we converted 96% of EBIT to operating cash flow.
See the Group financial statements and the financial review for definition of operating cash flow and cash flow conversion.
For additional information on cash flow see the Group cash flow statement.
Remuneration linked KPI - see page 68
2011 restated to exclude comparison shopping and lead generation businesses in North America and UK and Ireland (now classified as discontinued operations).
Linked to PBT remuneration measure on page 68
EBIT (US$m) and margin
In the year ended 31 March 2012, total EBIT increased by 19% to US$1,175m. EBIT from continuing activities increased 18% at constant exchange rates. We met our financial objective to maintain or grow EBIT margins, with a 50 basis points expansion in margin from continuing activities to 26.2%.
2011 restated to exclude comparison shopping and lead generation businesses in North America and UK and Ireland (now classified as discontinued operations).
Return on capital employed (ROCE)
We have decided to introduce a ROCE metric to highlight the returns generated from capital invested in the business. This will show how we add shareholder value over the long-term. In the year ended 31 March 2012 we maintained our ROCE whilst investing US$453m in capital expenditure and over US$700m in acquisitions.
Remuneration linked KPI - see page 68
Organic growth Acquired growth
12
11
10
09
08
12
11
10
09
08 4%
3%
2%
8%
10%
22.8%
23.6%
24.5%
25.7%
26.2%12
11
10
09
08 854
891
935
991
1,175
99%
101%
100%
98%
96%12
11
10
09
08 848
897
935
975
1,124
12
11
10
09
08 11%
12%
14%
14%
14%
ROCE is measured as Benchmark earnings, attributable to Experian shareholders, divided by average capital employed during the year.
8%
2%
10%
15%
14%

23
Governance
Financial statements
Busin
ess reviewB
usiness overview
Countries with offices
Experian no longer reports ‘countries with offices’ as a key performance indicator as we do not use this metric to track our performance.
Employee engagement
Driving greater employee engagement is a key objective and our aim is for Experian to be ranked among the top performing companies in the world.
We conduct an all-employee global people survey every 18 months to gather feedback from employees and to measure their engagement with the business. The results are analysed in depth and used to develop action plans that deliver sustainable improvement.
This year, for the first time, we are reporting our employee engagement results against those of top performing companies. Our latest survey showed that employee engagement improved three percentage points in 2011 to nine percent below the Towers Watson Global High Performance Companies Norm1 benchmark.
Number of consumer credit bureaux
The consumer credit bureaux, which hold credit application and repayment histories on consumers, are the foundation of our consumer information credit-related activities in Credit Services. We own consumer credit bureaux in 18 countries and operate one further bureau.
Number of business credit bureaux
The business credit bureaux, which hold credit application and repayment histories on businesses, are the foundation of our business information activities in Credit Services. We own business credit bureaux in 13 countries and operate one further bureau.
Please refer to the Credit Services section for further information on credit bureaux.
1. The Towers Watson Global High Performance Companies Norm is based on over 500,000 employees’ survey results from a cross section of 28 companies. Companies qualifying for this norm meet two criteria: superior financial performance and superior human resources practices.
Please refer to the ‘Our people, our strength’ section, for further information.
The next survey will be conducted in May 2013.
Carbon footprint (000’s tonnes)
Experian’s environmental impact is largely the result of energy use in buildings, particularly its data centres, and employee travel. A policy and strategy are in place to ensure that we steadily reduce energy consumption, and hence cost, and increase the use of energy from renewable sources. Employee engagement in individually responsible behaviour is also a priority.
Data from 2009 onwards reflects increased coverage, improved measurement and estimation processes, and has been restated accordingly. The data relating to travel were previously reported as: 2009: 21,000 tonnes CO2, 2010: 18,000 tonnes CO2 and 2011: 20,000 tonnes CO2.
See the full corporate responsibility report for details, calculation methods and further information on how Experian is minimising its impact on the environment at www.experianplc.com/crreport.
Where emission factors have changed Experian has applied the most recent factors retrospectively.
Please refer to the Credit Services section for further information on credit bureaux.
Experian Group employee engagement
Towers Watson Global High Performance Companies Norm1
Other key performance indicators
10
11
84%
84%75%
72%
Revenue dependence on top 20 clients (percentage of total revenue)
We are reducing our reliance on any single client in order to increase the balance and diversity of our revenue base. In the year ended 31 March 2012, the Group made progress against this objective with further reduction in revenue dependency on our top 20 clients.
Percentage of revenue from customer segments other than financial services
Our revenue base continues to diversify beyond financial services as we expand into new customer segments including SME, healthcare payments, insurance, public sector, telecommunications and utilities. We now generate 68% of revenue from non-financial verticals.
2011 restated to exclude comparison shopping and lead generation businesses in North America and UK and Ireland (now classified as discontinued operations).
Percentage of revenue from Latin America, EMEA and Asia Pacific
We continue to diversify beyond our traditional markets of the US and UK by penetrating further into Latin America, EMEA and Asia Pacific. Revenue from those regions now accounts for 35% of global revenue.
2011 restated to exclude comparison shopping and lead generation businesses in North America and UK and Ireland (now classified as discontinued operations).
2011 restated to exclude comparison shopping and lead generation businesses in North America and UK and Ireland (now classified as discontinued operations).
48%
59%
64%
66%
68%12
11
10
09
08
12
11
10
09
08 19%
23%
27%
35%
32%
18%
18%
17%
16%
15%12
11
10
09
08
15
15
16
16
1912
11
10
09
08
12
11
10
09
08
Buildings Transport
Total CO2 emission by full time equivalent headcount (tonnes per full time equivalent)
5.2
5.4
5.4
5.4
5.1
56 26
57 23
61 19
59 20
65 16
6
12
12
12
1412
11
10
09
08
24 Experian Annual Report 2012 Business overview
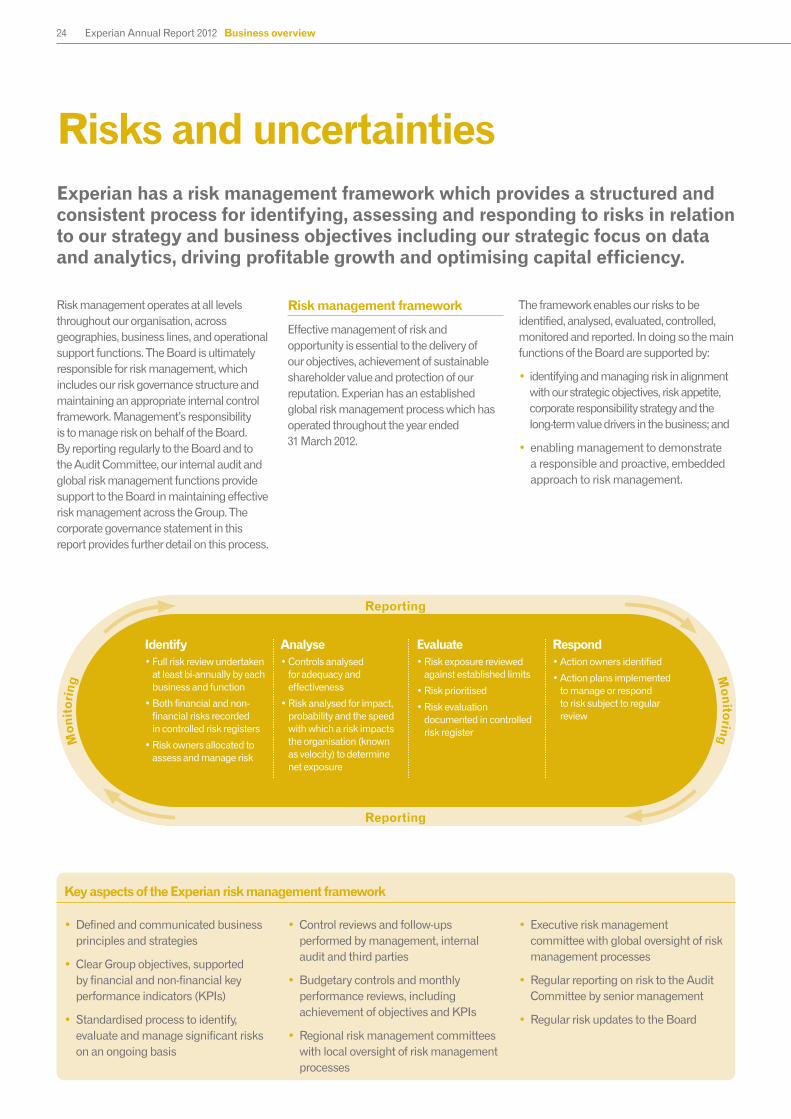
Risks and uncertainties Experian has a risk management framework which provides a structured and consistent process for identifying, assessing and responding to risks in relation to our strategy and business objectives including our strategic focus on data and analytics, driving profitable growth and optimising capital efficiency.
Risk management operates at all levels throughout our organisation, across geographies, business lines, and operational support functions. The Board is ultimately responsible for risk management, which includes our risk governance structure and maintaining an appropriate internal control framework. Management’s responsibility is to manage risk on behalf of the Board. By reporting regularly to the Board and to the Audit Committee, our internal audit and global risk management functions provide support to the Board in maintaining effective risk management across the Group. The corporate governance statement in this report provides further detail on this process.
Risk management framework
Effective management of risk and opportunity is essential to the delivery of our objectives, achievement of sustainable shareholder value and protection of our reputation. Experian has an established global risk management process which has operated throughout the year ended 31 March 2012.
The framework enables our risks to be identified, analysed, evaluated, controlled, monitored and reported. In doing so the main functions of the Board are supported by:
• identifying and managing risk in alignment with our strategic objectives, risk appetite, corporate responsibility strategy and the long-term value drivers in the business; and
• enabling management to demonstrate a responsible and proactive, embedded approach to risk management.
• Defined and communicated business principles and strategies
• Clear Group objectives, supported by financial and non-financial key performance indicators (KPIs)
• Standardised process to identify, evaluate and manage significant risks on an ongoing basis
• Control reviews and follow-ups performed by management, internal audit and third parties
• Budgetary controls and monthly performance reviews, including achievement of objectives and KPIs
• Regional risk management committees with local oversight of risk management processes
• Executive risk management committee with global oversight of risk management processes
• Regular reporting on risk to the Audit Committee by senior management
• Regular risk updates to the Board
Key aspects of the Experian risk management framework
Identify
• Full risk review undertaken at least bi-annually by each business and function
• Both financial and non-financial risks recorded in controlled risk registers
• Risk owners allocated to assess and manage risk
Analyse
• Controls analysed for adequacy and effectiveness
• Risk analysed for impact, probability and the speed with which a risk impacts the organisation (known as velocity) to determine net exposure
Evaluate
• Risk exposure reviewed and risks prioritised
• Risk evaluation documented in controlled risk register
Respond
• Risk owners identified
• Action plans implemented to manage or respond to risk subject to regular review
Mon
itor
ing
Monitoring
Reporting
Reporting
Identify • Full risk review undertaken
at least bi-annually by each business and function
• Both financial and non-financial risks recorded in controlled risk registers
• Risk owners allocated to assess and manage risk
Analyse
• Controls analysed for adequacy and effectiveness
• Risk analysed for impact, probability and the speed with which a risk impacts the organisation (known as velocity) to determine net exposure
Evaluate
• Risk exposure reviewed against established limits
• Risk prioritised
• Risk evaluation documented in controlled risk register
Respond
• Action owners identified
• Action plans implemented to manage or respond to risk subject to regular review
25
Governance
Financial statements
Busin
ess reviewB
usiness overview
Risk factors
The following information sets out the risk factors which we believe could cause our future results to differ materially from expected results. However, other factors could also adversely affect our results and so the risks discussed below should not
be considered to be a complete set of all potential risks and uncertainties.
Our approach to identifying, assessing, managing and reporting risks is formalised in the risk management framework described in this section. Risks that we face are critically evaluated throughout the
year and synthesised in the year’s report. Exposure to consolidation among clients and markets has been removed as a risk due to a stabilisation of the financial services industry and Experian’s reduced exposure to financial services as a percentage of global revenue.
Principal risks
Increasing risk _
No change>
Risk and impact Mitigation ChangeFrom 2011
Commentary
Loss or inappropriate usage of data
Our business requires the appropriate and secure utilisation of consumer and other sensitive information by its business units or its third party partners. Internet-based electronic commerce requires the secure transmission of confidential information over public networks, and several of our products are accessed through the internet. Security breaches in connection with maintaining data and the delivery of our products and services could harm our reputation, business and operating results.
We have established rigorous information security policies, standards, procedures, and recruitment and training schemes, which are embedded throughout our business operations. We also screen new third party partners carefully and conduct targeted audits on their operations. Continued investments are made in IT security infrastructure, including the significant use of data and communications encryption technology.
_We maintain an awareness of security breaches throughout our industry and enhance our risk strategies accordingly. The evolving risk landscape requires continual improvement and refinement of our information security operations to help ensure the safety and protection of our environment.
Related global strategy:• Focus on data and analytics
Further information:• Corporate responsibility section –
Use and protect data properly
Dependence upon third parties to provide data and certain operational services
Our business model is dependent upon third parties to provide data and certain operational services, the loss of which could significantly impact the quality of and demand for our products. Similarly, if one or more of our outsource providers, including third parties with whom we have strategic relationships, were to experience financial or operational difficulties, their services to us would suffer or they may no longer be able to provide services to us at all, significantly impacting delivery of our products or services.
Our legal, regulatory and government affairs functions work closely with senior management to adopt strategies to help secure and maintain access to public and private information. Our global strategic sourcing function works closely with senior management to select and negotiate agreements with strategic suppliers based on criteria such as delivery assurance and reliability. A diverse network of strategic suppliers and vendors is maintained in order to minimise potential disruptions.
_Related global strategy:• Focus on data and analytics• Optimise capital efficiency
Exposure to legislation or regulatory reforms
Legislative, regulatory and judicial systems in the countries in which we operate are responding to changing societal attitudes about how commercial entities collect, use and maintain consumer data. In particular, the growing ubiquity of the internet drives public concerns about how consumer information is collected and used for marketing, risk management and fraud detection purposes. These concerns may result in new laws, regulations and enforcement practices, or pressure upon industries to adopt new self-regulation. Some proposed changes may adversely affect our ability to undertake these activities in a cost-effective manner. Separately, we are subject to changes in specific countries’ tax laws. Our future effective tax rates may be adversely affected by changes in tax laws.
Our legal, regulatory and government affairs functions work closely with senior management to adopt strategies and educate lawmakers, regulators, consumer and privacy advocates, industry trade groups and other stakeholders in the public policy debate. This includes advocating for robust, responsible sharing of commercial consumer data. It also includes negotiating with lawmakers and policymakers, directly and through trade groups and external consultants, to ensure proposed legal requirements reflect standards that are both workable for us and responsive to consumers. Finally, it includes advocating and promoting new industry self-regulatory standards, when appropriate, to address consumer concerns about privacy and information sharing. We also retain internal and external tax professionals that monitor the likelihood of future tax changes. These risks are generally outside our control.
_We continue to monitor and engage key stakeholders on several topics including: understanding the priorities of the newly established US Consumer Financial Protection Agency, the proposed US data security standards, the proposed EU Data Protection Directive, and the potential adoption of positive credit data repositories in various European and Asian countries.
Related global strategy:• Focus on data and analytics
Further information:• Financial statement note 15 for a discussion of
tax charges and rates
Regulatory compliance
Our businesses must comply with federal, regional, provincial, state and other jurisdictional regulations and best practice. These include rules that authorise and prescribe credit reporting protocols, as well as general information privacy, anti-corruption and information security requirements. Non-compliance could lead to fines/penalties, increased prudential requirements, enforced suspension of operations or, in extreme cases, withdrawal of authorisations to operate.
To the best of Experian’s knowledge, we are in compliance with data protection requirements in each jurisdiction in which we operate. Our regulatory compliance departments work closely with the businesses to identify and adopt strategies to help ensure compliance with jurisdictional regulations and identified business ethics which include active monitoring of our collection and use of personal data. Adequate procedures have been implemented to address requirements under the UK Bribery Act 2010.
> Regulatory compliance risk continues to increase as a result of heightened oversight and enforcement of existing financial laws and new regulations, such as the Wall Street Reform and Consumer Protection Act of 2010 and the UK Bribery Act 2010. The regulatory compliance function has actively participated in the evaluation and integration of acquired businesses within our emerging Latin America and Asia Pacific markets to deploy the fundamentals of our compliance programme.
Related global strategy:• Focus on data and analytics
Further information:• Corporate responsibility section –
Use and protect data properly

26 Experian Annual Report 2012 Business overview
Other risks
Increasing risk _
No change>
Risk and impact Mitigation ChangeFrom 2011
Commentary
Product/service or technology obsolescence
Without the timely introduction of new or enhanced products and services our offerings will become technologically or commercially obsolete over time. In addition, without continued investment in our technology infrastructure, we may not be able to support changes in the way our businesses and customers use and purchase information. In either case, there can be no assurance that there would not be a material adverse effect on our business, results of operations and/or financial condition.
Product innovation is a key driver of growth for Experian in all our markets and we have continued to invest strongly in new data sources and new analytical products, together with the platforms that support their worldwide delivery. Over 10% of our revenues come from products developed during just the past five years. In addition, 20% of our global costs are in information technology and data. Detailed competitive and market analysis are performed which provide the foundation of a rigorous product and services investment identification and selection process.
_Related global strategy:• Optimise capital efficiency• Drive profitable growth
Further information:• Business overview section – examples of how
businesses are delivering innovative solutions• Group strategy and objectives – examples of
product innovation• Business overview section – discussion of how
we extend our global lead through product innovation
Interruptions in business processes or systems
Our ability to provide reliable services largely depends on the efficient and uninterrupted operation of our computer network systems, data and call centres, as well as maintaining sufficient staffing levels. System or network interruptions, or the significant reduction in key staff or management resulting from a pandemic outbreak, could delay and disrupt our ability to develop, deliver or maintain our products and services, causing harm to our business and reputation and resulting in loss of customers or revenue.
We have strict standards, procedures and training schemes for physical security. Comprehensive business continuity plans and incident management programmes are maintained to minimise business and operational disruptions including pandemic incidents. We maintain full duplication of all information contained in databases and run back-up data centres. Support arrangements, strict standards, procedures and training schemes for business continuity have been established with third party vendors. We also monitor potential pandemic threats and adjust action plans.
_Continuity of services is a core focus and built into the development of new and existing products. While we experienced limited disruptions during the fiscal year, events such as the Japan earthquake/ tsunami provided real time validation of established plans and processes. We continue to execute periodic exercises to ensure that documented procedures are accurate and suitable for each specific environment.
Related global strategy:• Optimise capital efficiency• Drive profitable growth
Dependence on recruitment and retention of highly skilled personnel
Our ability to meet the demands of the market and compete effectively with other IT suppliers is, to a large extent, dependent on the skills, experience and performance of our personnel. Demand is high for individuals with appropriate knowledge and experience in the IT and business services market. The inability to attract, motivate or retain key talent could have a serious consequence on our ability to service client commitments and grow our business.
Effective recruitment programmes are ongoing across all business areas, as well as personal and career development initiatives. Talent identification and development programmes have been implemented and are reviewed annually. Compensation and benefits programmes are competitive and also regularly reviewed.
_88% of our employees participated in the 2011 global people survey which is considered to be a ‘high performing’ response level. The results of the survey show consistent overall improvement in the degree of employee engagement, as well as to assess general levels of satisfaction and involvement at work. Separately, approximately 60% of our senior leadership roles have successors ready to cover these roles in the short, medium and long-term.
Related global strategy:• Focus on data and analytics• Optimise capital efficiency
Further information:• ‘Our people, our strength’ section• Key performance indicators• Corporate responsibility section –
Be a good employer to all
Risk and impact Mitigation ChangeFrom 2011
Commentary
Exposure to material adverse litigation
We are regularly involved in a number of pending and threatened litigation claims in the United States and Latin America, including a number of class actions in the United States. As is inherent in all legal proceedings, litigation outcomes cannot be predicted with certainty and there is a risk of outcomes unfavourable to us.
We vigorously defend all pending and threatened litigation claims. We employ internal counsel and engage external counsel to assist in the effective management and disposal of litigation proceedings. Insurance coverage is maintained against litigation risks where such coverage is feasible and appropriate.
_The exposure to material adverse litigation in the US remains generally consistent with prior years.
Related global strategy:• Focus on data and analytics• Drive profitable growth
Further information:• Corporate governance section associated with
the identification and monitoring of litigation.• Financial statement note 45 describing
contingencies for pending and threatened litigation claims
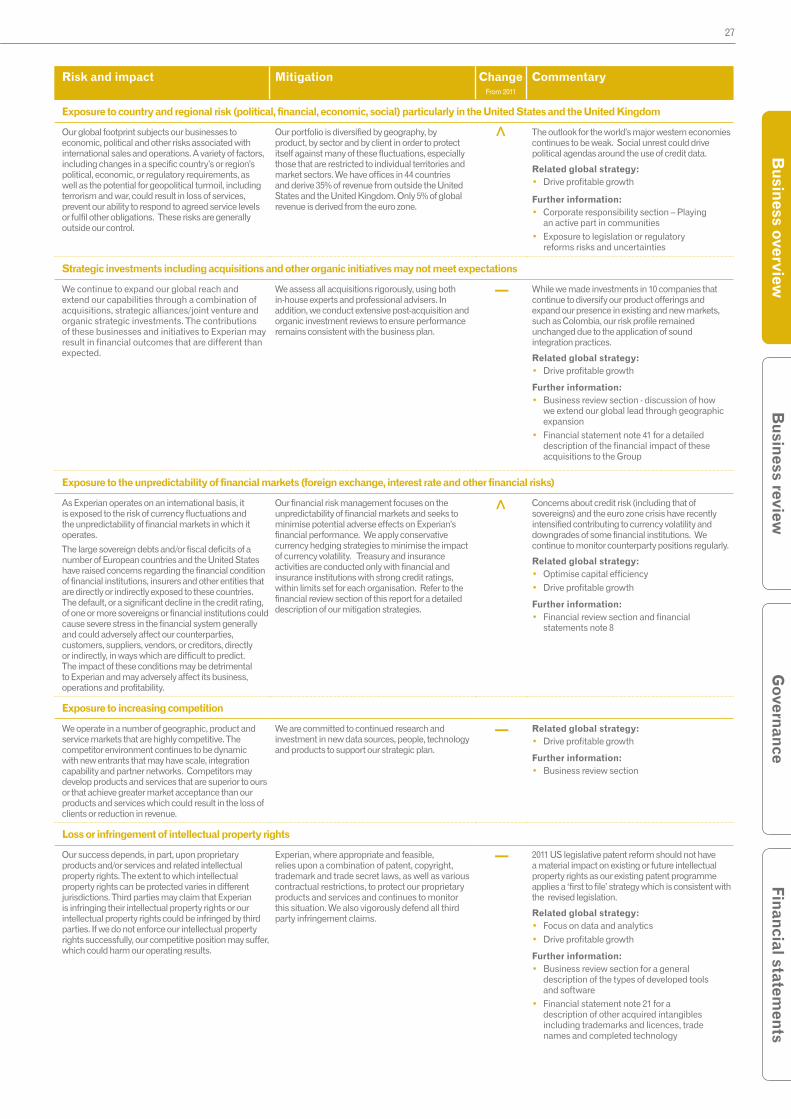
27
Governance
Financial statements
Busin
ess reviewB
usiness overview
Risk and impact Mitigation ChangeFrom 2011
Commentary
Exposure to country and regional risk (political, financial, economic, social) particularly in the United States and the United Kingdom
Our global footprint subjects our businesses to economic, political and other risks associated with international sales and operations. A variety of factors, including changes in a specific country’s or region’s political, economic, or regulatory requirements, as well as the potential for geopolitical turmoil, including terrorism and war, could result in loss of services, prevent our ability to respond to agreed service levels or fulfil other obligations. These risks are generally outside our control.
Our portfolio is diversified by geography, by product, by sector and by client in order to protect itself against many of these fluctuations, especially those that are restricted to individual territories and market sectors. We have offices in 44 countries and derive 35% of revenue from outside the United States and the United Kingdom. Only 5% of global revenue is derived from the euro zone.
> The outlook for the world’s major western economies continues to be weak. Social unrest could drive political agendas around the use of credit data.
Related global strategy:• Drive profitable growth
Further information:• Corporate responsibility section – Playing
an active part in communities • Exposure to legislation or regulatory
reforms risks and uncertainties
Strategic investments including acquisitions and other organic initiatives may not meet expectations
We continue to expand our global reach and extend our capabilities through a combination of acquisitions, strategic alliances/joint venture and organic strategic investments. The contributions of these businesses and initiatives to Experian may result in financial outcomes that are different than expected.
We assess all acquisitions rigorously, using both in-house experts and professional advisers. In addition, we conduct extensive post-acquisition and organic investment reviews to ensure performance remains consistent with the business plan.
_While we made investments in 10 companies that continue to diversify our product offerings and expand our presence in existing and new markets, such as Colombia, our risk profile remained unchanged due to the application of sound integration practices.
Related global strategy:• Drive profitable growth
Further information:• Business review section - discussion of how
we extend our global lead through geographic expansion
• Financial statement note 41 for a detailed description of the financial impact of these acquisitions to the Group
Exposure to the unpredictability of financial markets (foreign exchange, interest rate and other financial risks)
As Experian operates on an international basis, it is exposed to the risk of currency fluctuations and the unpredictability of financial markets in which it operates.
The large sovereign debts and/or fiscal deficits of a number of European countries and the United States have raised concerns regarding the financial condition of financial institutions, insurers and other entities that are directly or indirectly exposed to these countries. The default, or a significant decline in the credit rating, of one or more sovereigns or financial institutions could cause severe stress in the financial system generally and could adversely affect our counterparties, customers, suppliers, vendors, or creditors, directly or indirectly, in ways which are difficult to predict. The impact of these conditions may be detrimental to Experian and may adversely affect its business, operations and profitability.
Our financial risk management focuses on the unpredictability of financial markets and seeks to minimise potential adverse effects on Experian’s financial performance. We apply conservative currency hedging strategies to minimise the impact of currency volatility. Treasury and insurance activities are conducted only with financial and insurance institutions with strong credit ratings, within limits set for each organisation. Refer to the financial review section of this report for a detailed description of our mitigation strategies.
> Concerns about credit risk (including that of sovereigns) and the euro zone crisis have recently intensified contributing to currency volatility and downgrades of some financial institutions. We continue to monitor counterparty positions regularly.
Related global strategy:• Optimise capital efficiency• Drive profitable growth
Further information:• Financial review section and financial
statements note 8
Exposure to increasing competition
We operate in a number of geographic, product and service markets that are highly competitive. The competitor environment continues to be dynamic with new entrants that may have scale, integration capability and partner networks. Competitors may develop products and services that are superior to ours or that achieve greater market acceptance than our products and services which could result in the loss of clients or reduction in revenue.
We are committed to continued research and investment in new data sources, people, technology and products to support our strategic plan.
_Related global strategy:• Drive profitable growth
Further information:• Business review section
Loss or infringement of intellectual property rights
Our success depends, in part, upon proprietary products and/or services and related intellectual property rights. The extent to which intellectual property rights can be protected varies in different jurisdictions. Third parties may claim that Experian is infringing their intellectual property rights or our intellectual property rights could be infringed by third parties. If we do not enforce our intellectual property rights successfully, our competitive position may suffer, which could harm our operating results.
Experian, where appropriate and feasible, relies upon a combination of patent, copyright, trademark and trade secret laws, as well as various contractual restrictions, to protect our proprietary products and services and continues to monitor this situation. We also vigorously defend all third party infringement claims.
_2011 US legislative patent reform should not have a material impact on existing or future intellectual property rights as our existing patent programme applies a ‘first to file’ strategy which is consistent with the revised legislation.
Related global strategy:• Focus on data and analytics• Drive profitable growth
Further information:• Business review section for a general
description of the types of developed tools and software
• Financial statement note 21 for a description of other acquired intangibles including trademarks and licences, trade names and completed technology

28 Experian Annual Report 2012 Business review
Chief Executive’s reviewThis was a year of significant achievement for Experian. We delivered another year of strong financial performance and we took a series of strategic steps which will sustain growth into the future.
Don Robert Chief Executive Officerwith Sir John Peace
29
Governance
Financial statements
Busin
ess reviewB
usiness overview
Overview
Total revenue growth from continuing activities was 15%, at constant currency, and organic revenue growth was 10% (H1 9%, H2 10%). We delivered an increase in EBIT from continuing activities of 18% at constant currency, and further enhanced our EBIT margin, up 50 basis points to 26.2%. We delivered strong growth in Benchmark EPS, up 18% to 78.9 US cents per share and have raised the full-year dividend by 14% to 32.00 US cents per share.
• We delivered good growth across all regions, with organic revenue growth of 23% in Latin America, 8% in the UK and Ireland, 7% in EMEA/Asia Pacific and 6% in North America.
• We delivered good growth across our four global business lines, with organic revenue growth of 12% in Credit Services, 9% in Marketing Services, 8% in Decision Analytics and 7% in Interactive.
• We met or exceeded each of our financial objectives, namely to deliver mid-high single digit organic revenue growth, maintain or improve margin and deliver cash flow conversion of over 90%.
• We executed well on our global growth programme, positioning us strongly for the future.
I would like to thank the people of Experian whose inspiration, creativity and dedication make these achievements possible.
Impact of agreement to divest non-core activities
Over the past four years, our strategic focus has been on extending our global lead in credit information and analytics, digital marketing services and direct-to-consumer services. We have signed an agreement to divest our comparison shopping and North America lead generation businesses, which were non-core to Experian. We expect to complete the transaction within the first half of this fiscal year, subject to successful
completion of various conditions and events. For the purposes of these results, these businesses have been treated as discontinued operations. On a like-for-like basis, including these businesses, revenue was US$4.8bn, with organic revenue growth of 7% (H1 6%, H2 8%), EBIT was US$1,195m, up 14%, EBIT margin was 25.1% and Benchmark EPS was 80.0 US cents per share.
Our core Consumer Direct activities are not affected by the agreed divestment. In view of this, we will change the name of the Interactive business segment to Consumer Services, to more appropriately reflect the continuing operations of the business segment. We will adopt the new segment name in our financial reporting for the year ending 31 March 2013.
Financial and strategic highlights
In North America, we saw good performances in Credit Services and Decision Analytics. There was steady recovery in lending and we started to benefit from investments made in recent years. This is driving volume increases in consumer information, as well as demand for our new sources of data, analytics and software. We are also delighted by the progress that we are making across business information, automotive and healthcare payments, all of which delivered strong growth in the year and are well-positioned for future expansion. Medical Present Value, the acquisition which extends our presence in the US healthcare payments vertical, is performing strongly. While the external environment for Marketing Services was tepid, we have continued to benefit from extending our presence in the digital marketing space. Consumer Direct grew as we successfully migrate into our new brands. More recently, we have made good progress towards expanding the white label (affinity) channel, which will benefit our prospects in the latter part of FY13 and beyond.
We made excellent progress in Latin America during the year, with the region now accounting for over 20% of Group revenue. Our business in Brazil delivered very strong organic growth, as we invested in new sources of data, broadened our product range and further penetrated new customer segments. We continue to see significant prospects for growth in Brazil as we leverage our scale and the full extent of the Experian portfolio. We also made good strategic progress in Marketing Services, with the acquisition of the leading email marketing business in the country. This provides us with an important new platform for driving growth in targeted digital marketing in Brazil.
Also in Latin America, we were delighted to complete the acquisition of Computec in November, which has extended our credit bureau footprint to Colombia, Peru and Venezuela. Computec has performed strongly since acquisition, in line with the acquisition buy plan. On an underlying basis, revenue growth was approximately 20% for the year. We are in the process of integrating back office functions and we are developing plans to launch Experian’s full product range into these new markets.
We were pleased to deliver a good performance in the UK and Ireland. Credit Services returned to growth and Decision Analytics performed strongly. We have benefited from new client engagements in the financial services sector and have extended further into non-financial verticals. We also completed two bolt-on acquisitions, which extend our presence in the high growth fraud prevention sector and bolster our position in the small and medium enterprise market. Weak economic conditions had some impact on Marketing Services, where growth was fairly modest. Interactive by contrast performed very strongly, helped by a good reception for our bundled consumer product. We also took an important step to expand further into consumer identity protection with the acquisition of Garlik.
P32
P34
P36
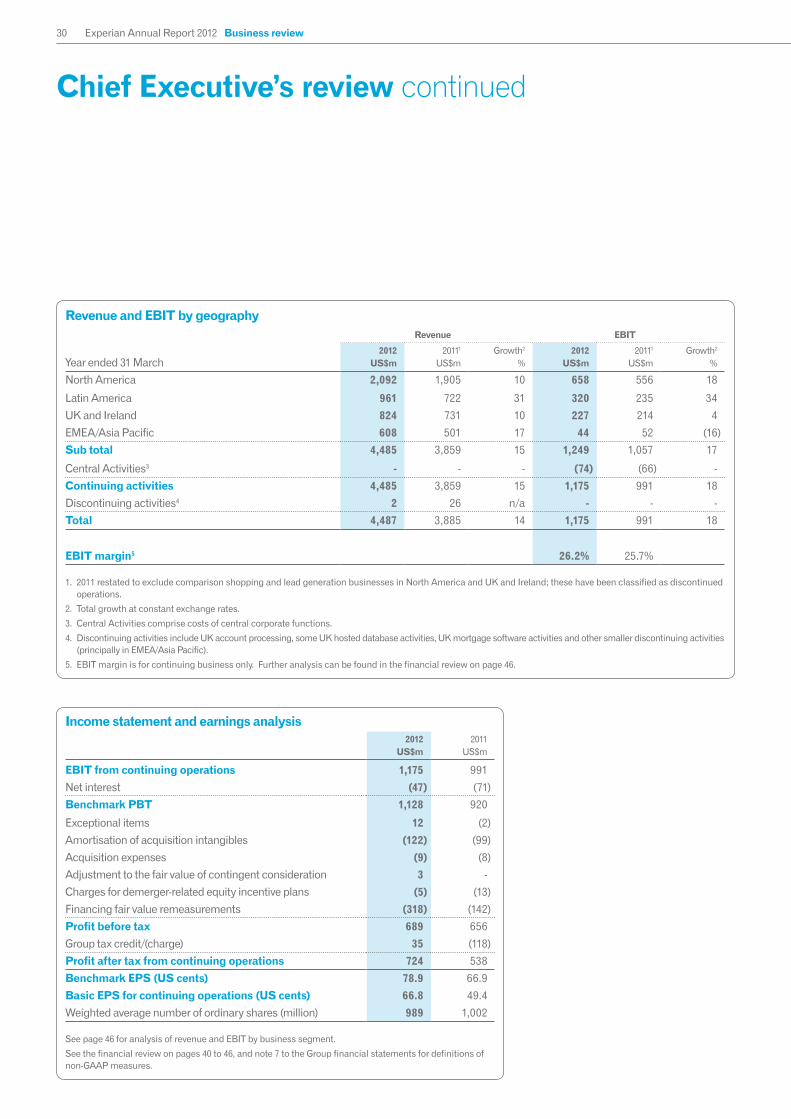
30 Experian Annual Report 2012 Business review
Chief Executive’s review continued
Revenue and EBIT by geographyRevenue EBIT
Year ended 31 March2012
US$m20111
US$mGrowth2
%2012
US$m20111
US$mGrowth2
%
North America 2,092 1,905 10 658 556 18
Latin America 961 722 31 320 235 34
UK and Ireland 824 731 10 227 214 4
EMEA/Asia Pacific 608 501 17 44 52 (16)
Sub total 4,485 3,859 15 1,249 1,057 17
Central Activities3 - - - (74) (66) -
Continuing activities 4,485 3,859 15 1,175 991 18
Discontinuing activities4 2 26 n/a - - -
Total 4,487 3,885 14 1,175 991 18
EBIT margin5 26.2% 25.7%
1. 2011 restated to exclude comparison shopping and lead generation businesses in North America and UK and Ireland; these have been classified as discontinued operations.
2. Total growth at constant exchange rates.
3. Central Activities comprise costs of central corporate functions.
4. Discontinuing activities include UK account processing, some UK hosted database activities, UK mortgage software activities and other smaller discontinuing activities (principally in EMEA/Asia Pacific).
5. EBIT margin is for continuing business only. Further analysis can be found in the financial review on page 46.
Income statement and earnings analysis2012
US$m2011
US$m
EBIT from continuing operations 1,175 991
Net interest (47) (71)
Benchmark PBT 1,128 920
Exceptional items 12 (2)
Amortisation of acquisition intangibles (122) (99)
Acquisition expenses (9) (8)
Adjustment to the fair value of contingent consideration 3 -
Charges for demerger-related equity incentive plans (5) (13)
Financing fair value remeasurements (318) (142)
Profit before tax 689 656
Group tax credit/(charge) 35 (118)
Profit after tax from continuing operations 724 538
Benchmark EPS (US cents) 78.9 66.9
Basic EPS for continuing operations (US cents) 66.8 49.4
Weighted average number of ordinary shares (million) 989 1,002
See page 46 for analysis of revenue and EBIT by business segment.
See the financial review on pages 40 to 46, and note 7 to the Group financial statements for definitions of non-GAAP measures.

31
Governance
Financial statements
Busin
ess reviewB
usiness overview
EMEA/Asia Pacific performed well despite difficult trading conditions in some European markets. A strong reception for digital marketing platforms drove exceptionally strong growth in Marketing Services, our largest revenue contributor within EMEA/Asia Pacific, with resilience in Credit Services. Decision Analytics was adversely affected by project deferrals in Continental Europe. We are in the process of realigning our regional sales structure for Decision Analytics in EMEA to improve operational efficiency and return that business to growth.
Strategy
We made further progress during the year against our five strategic goals to:
• Extend our global lead in credit information and analytics;
• Build successful businesses in new customer segments;
• Build large-scale operations in major emerging consumer economies;
• Become the global leader in digital marketing services; and
• Become the most trusted consumer brand for credit information and identity protection services.
During the year we continued to invest in our global growth programme, aimed at delivering these goals. We made good progress and, collectively, the programme contributed approximately 4% to organic revenue growth, ahead of our previous expectations.
Our growth programme has enabled us to further deliver against our strategic metrics, with 35% of Group revenue now arising from outside the US and UK (2011: 32%), 68% from non-financial verticals (2011: 66%) and, in line with last year, over 10% generated from product innovations in the past five years (2011: also greater than 10%).
Investment to support growth during FY12 included approximately 200 basis points of margin, net capital expenditure of US$453m and acquisition expenditure of US$787m. For FY13, we anticipate continued investment through the income statement, and capital expenditure in the range of US$470m to US$490m.
Cash flow and net debt
EBIT conversion into operating cash flow was 96%, exceeding our target of 90% conversion. Net debt increased by US$317m to US$1,818m at 31 March 2012, reflecting acquisitions made in the year. At 31 March 2012, the adjusted net debt to EBITDA gearing ratio was 2.0 times, including the current value of the Serasa put option of US$1,092m. This compares to our target net debt range of 1.75 to 2.0 times.
Experian seeks to diversify its sources of funding and to spread debt maturities. We have a £334m bond which matures at the end of calendar 2013 and in order to refinance this we expect to undertake a new bond issue during calendar year 2012. Including this item and an anticipated increase in average net interest rates, we expect the net interest expense will be in the range of US$50m to US$60m for the year ending 31 March 2013.
Capital strategy
In setting our capital strategy, we aim for an appropriate balance between investing in the business for growth while maintaining a prudent but efficient balance sheet. For the coming year, we have taken into account current leverage, anticipated free cash flow and the current acquisition pipeline, including the value of the Serasa put option and the opening up of the exercise window. In view of these items, we have decided not to initiate a further share buyback programme this year. We do, however, expect to repurchase shares in respect of employee share plans that vest, at an anticipated cost in the region of US$130m.
Dividend
For the year ended 31 March 2012, we are announcing a second interim dividend of 21.75 US cents per share. This gives a full-year dividend of 32.00 US cents per share, up 14%. The second interim dividend will be paid on 20 July 2012 to shareholders on the register at the close of business on 22 June 2012.
P38
P8
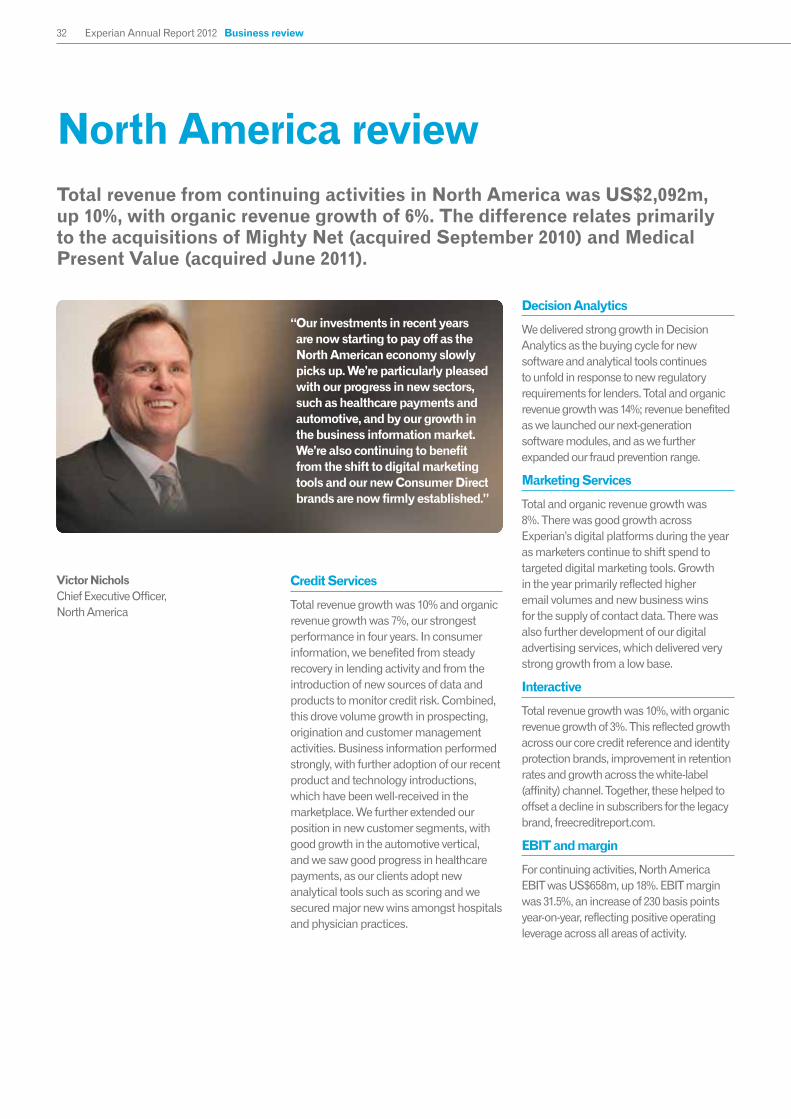
32 Experian Annual Report 2012 Business review
Credit Services
Total revenue growth was 10% and organic revenue growth was 7%, our strongest performance in four years. In consumer information, we benefited from steady recovery in lending activity and from the introduction of new sources of data and products to monitor credit risk. Combined, this drove volume growth in prospecting, origination and customer management activities. Business information performed strongly, with further adoption of our recent product and technology introductions, which have been well-received in the marketplace. We further extended our position in new customer segments, with good growth in the automotive vertical, and we saw good progress in healthcare payments, as our clients adopt new analytical tools such as scoring and we secured major new wins amongst hospitals and physician practices.
Decision Analytics
We delivered strong growth in Decision Analytics as the buying cycle for new software and analytical tools continues to unfold in response to new regulatory requirements for lenders. Total and organic revenue growth was 14%; revenue benefited as we launched our next-generation software modules, and as we further expanded our fraud prevention range.
Marketing Services
Total and organic revenue growth was 8%. There was good growth across Experian’s digital platforms during the year as marketers continue to shift spend to targeted digital marketing tools. Growth in the year primarily reflected higher email volumes and new business wins for the supply of contact data. There was also further development of our digital advertising services, which delivered very strong growth from a low base.
Interactive
Total revenue growth was 10%, with organic revenue growth of 3%. This reflected growth across our core credit reference and identity protection brands, improvement in retention rates and growth across the white-label (affinity) channel. Together, these helped to offset a decline in subscribers for the legacy brand, freecreditreport.com.
EBIT and margin
For continuing activities, North America EBIT was US$658m, up 18%. EBIT margin was 31.5%, an increase of 230 basis points year-on-year, reflecting positive operating leverage across all areas of activity.
North America reviewTotal revenue from continuing activities in North America was US$2,092m, up 10%, with organic revenue growth of 6%. The difference relates primarily to the acquisitions of Mighty Net (acquired September 2010) and Medical Present Value (acquired June 2011).
Victor Nichols Chief Executive Officer, North America
“Our investments in recent years are now starting to pay off as the North American economy slowly picks up. We’re particularly pleased with our progress in new sectors, such as healthcare payments and automotive, and by our growth in the business information market. We’re also continuing to benefit from the shift to digital marketing tools and our new Consumer Direct brands are now firmly established.”
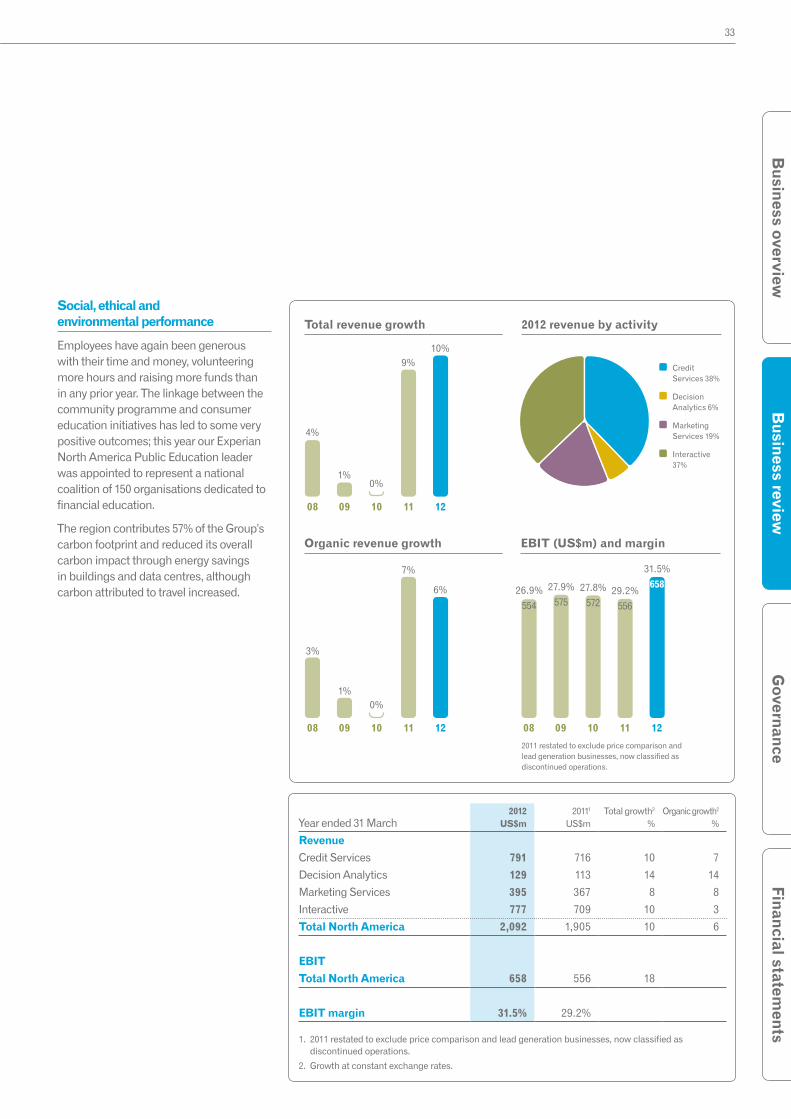
33
Governance
Busin
ess reviewB
usiness overview
Financial statements
Social, ethical and environmental performance
Employees have again been generous with their time and money, volunteering more hours and raising more funds than in any prior year. The linkage between the community programme and consumer education initiatives has led to some very positive outcomes; this year our Experian North America Public Education leader was appointed to represent a national coalition of 150 organisations dedicated to financial education.
The region contributes 57% of the Group’s carbon footprint and reduced its overall carbon impact through energy savings in buildings and data centres, although carbon attributed to travel increased.
Year ended 31 March2012
US$m20111
US$mTotal growth2
%Organic growth2
%
Revenue
Credit Services 791 716 10 7
Decision Analytics 129 113 14 14
Marketing Services 395 367 8 8
Interactive 777 709 10 3
Total North America 2,092 1,905 10 6
EBIT
Total North America 658 556 18
EBIT margin 31.5% 29.2%
1. 2011 restated to exclude price comparison and lead generation businesses, now classified as discontinued operations.
2. Growth at constant exchange rates.
08 09 10 11 12
08 09 10 11 12
08 09 10 11 12
Organic revenue growth EBIT (US$m) and margin
Total revenue growth 2012 revenue by activity
2011 restated to exclude price comparison and lead generation businesses, now classified as discontinued operations.
3%
1%0%
7%
6% 26.9%
554
27.9%
57527.8%
57229.2%
556
31.5%
658
4%
1%0%
9%10%
Credit Services 38%
Decision Analytics 6%
Marketing Services 19%
Interactive 37%

34 Experian Annual Report 2012 Business review
Credit Services
Total revenue growth was 28%, at constant exchange rates, while organic revenue growth was 23%. Both consumer information and business information activities in Brazil performed strongly, benefiting from new data supply agreements, take-up of new premium products, further penetration of the small and medium enterprise sector and good progress across new customer segments such as telecommunications. Authentication revenue grew exceptionally strongly in the year, as the Brazilian government extended its programme for businesses to use digital certificates to identify themselves in business-to-government interactions.
Decision Analytics
We delivered good progress at Decision Analytics with total and organic revenue growth of 70%. Our business is benefiting as we leverage our credit bureau footprint in Brazil, with new contract wins from major Brazilian banks during the year. We also saw good progress in other Latin American markets, including Argentina and Mexico.
Marketing Services
At Marketing Services, total revenue more than doubled, including first-time contributions from the acquisition of the Virid email marketing business and Computec’s marketing-related activities. Organic revenue growth was 8%.
EBIT and margin
For Latin America, EBIT grew 34% at constant exchange rates to US$320m. Margins increased by 80 basis points to 33.3%. Margins benefited from strong positive operating leverage in Credit Services in Brazil, offset by organic growth investments in other areas and adverse mix due to the first time contribution of Computec.
Latin America reviewPerformance in Latin America goes from strength to strength. Total revenue from continuing activities was US$961m, up 31% at constant exchange rates, with organic revenue growth of 23%. The difference relates to the acquisitions of Virid Interatividade Digital (Virid) (acquired July 2011) and Computec (completed November 2011).
Ricardo Loureiro Managing Director, Latin America
“We’re pleased with our region’s strong growth this year as we continued to broaden our product range, invest in new data sources and move into new customer segments. The acquisition of Computec has expanded our presence in Latin America and we can see many opportunities for further growth across the region.”
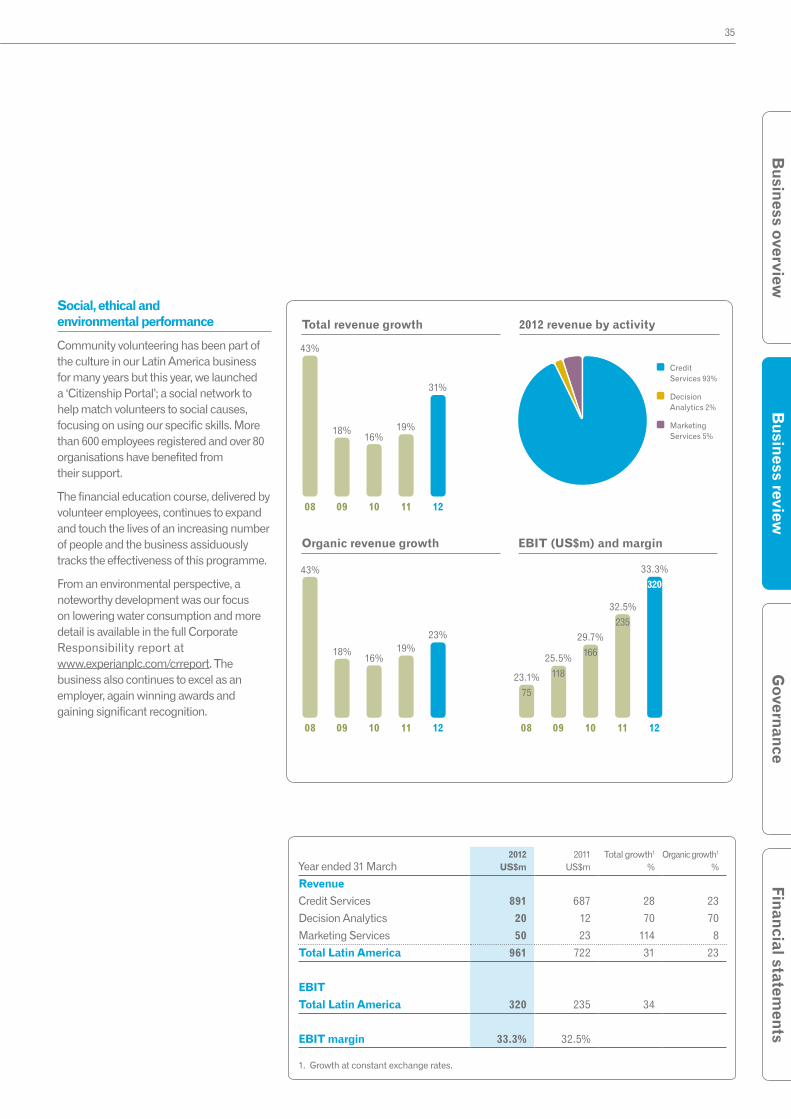
35
Governance
Busin
ess reviewB
usiness overview
Financial statements
Social, ethical and environmental performance
Community volunteering has been part of the culture in our Latin America business for many years but this year, we launched a ‘Citizenship Portal’; a social network to help match volunteers to social causes, focusing on using our specific skills. More than 600 employees registered and over 80 organisations have benefited from their support.
The financial education course, delivered by volunteer employees, continues to expand and touch the lives of an increasing number of people and the business assiduously tracks the effectiveness of this programme.
From an environmental perspective, a noteworthy development was our focus on lowering water consumption and more detail is available in the full Corporate Responsibility report at www.experianplc.com/crreport. The business also continues to excel as an employer, again winning awards and gaining significant recognition.
Year ended 31 March2012
US$m2011
US$mTotal growth1
%Organic growth1
%
Revenue
Credit Services 891 687 28 23
Decision Analytics 20 12 70 70
Marketing Services 50 23 114 8
Total Latin America 961 722 31 23
EBIT
Total Latin America 320 235 34
EBIT margin 33.3% 32.5%
1. Growth at constant exchange rates.
08 09 10 11 12
08 09 10 11 12
08 09 10 11 12
43%
18%16%
19%23%
23.1%
75
25.5%
118
29.7%
166
32.5%
235
33.3%
320
43%
18%16%
19%
31%
Credit Services 93%
Decision Analytics 2%
Marketing Services 5%
Organic revenue growth EBIT (US$m) and margin
Total revenue growth 2012 revenue by activity

Credit Services
Total revenue growth was 4% at constant exchange rates, while organic revenue growth was 1%. We were pleased to return to growth during the year, as we benefited from some stabilisation in lending activity, new client wins in the financial services sector and growth across non-financial verticals such as telecommunications and utilities.
Decision Analytics
Decision Analytics performed well, with total revenue growth at constant exchange rates of 11% and organic revenue growth of 10%. We benefited from the adoption of customer management tools by telecommunications and utilities clients, and further penetration of our authentication and fraud prevention tools within the public sector.
Marketing Services
Total revenue growth at constant exchange rates was 5%, while organic revenue growth was 1%. While there was good progress across digital marketing platforms such as email marketing, market conditions were fairly soft and demand for data services was relatively weak.
Interactive
We were delighted by growth at Interactive, where total revenue growth was 31% at constant exchange rates, with organic revenue growth of 30%. We benefited from a strong performance at CreditExpert, following strong market acceptance of our bundled product, which combines reports and scores. We also benefited from improved lifetime value, as we continue to focus on delivering more to the customer.
EBIT and margin
For the UK and Ireland, EBIT from continuing activities was US$227m, up 4% at constant exchange rates. The EBIT margin was 27.5% (2011: 29.3%), affected by the low revenue growth environment for Credit Services and Marketing Services and adverse acquisition mix.
UK and Ireland reviewIn the UK and Ireland, revenue from continuing activities was US$824m, up 10% at constant exchange rates. Organic revenue growth was 8%. The acquisition contribution relates to LM Group (acquired July 2011), 192Business (completed February 2012), and Garlik (acquired December 2011).
Craig Boundy Managing Director, UK and Ireland
“The UK and Ireland was Experian’s second fastest growing region despite little help from the economy. We won new contracts in financial services and in sectors such as telecommunications and utilities, where clients are increasingly looking for sophisticated customer management tools. Our direct-to-consumer business was the star performer, growing organically by 30%.”
36 Experian Annual Report 2012 Business review
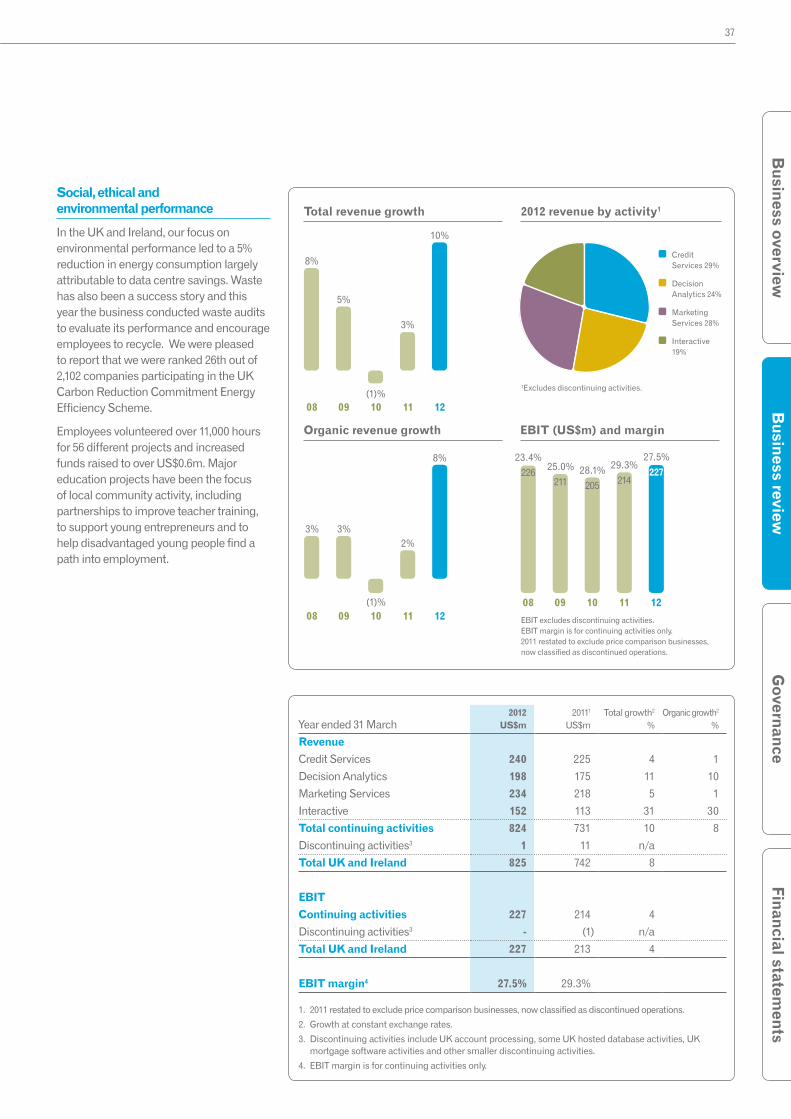
Social, ethical and environmental performance
In the UK and Ireland, our focus on environmental performance led to a 5% reduction in energy consumption largely attributable to data centre savings. Waste has also been a success story and this year the business conducted waste audits to evaluate its performance and encourage employees to recycle. We were pleased to report that we were ranked 26th out of 2,102 companies participating in the UK Carbon Reduction Commitment Energy Efficiency Scheme.
Employees volunteered over 11,000 hours for 56 different projects and increased funds raised to over US$0.6m. Major education projects have been the focus of local community activity, including partnerships to improve teacher training, to support young entrepreneurs and to help disadvantaged young people find a path into employment.
Year ended 31 March2012
US$m20111
US$mTotal growth2
%Organic growth2
%
Revenue
Credit Services 240 225 4 1
Decision Analytics 198 175 11 10
Marketing Services 234 218 5 1
Interactive 152 113 31 30
Total continuing activities 824 731 10 8
Discontinuing activities3 1 11 n/a
Total UK and Ireland 825 742 8
EBIT
Continuing activities 227 214 4
Discontinuing activities3 - (1) n/a
Total UK and Ireland 227 213 4
EBIT margin4 27.5% 29.3%
1. 2011 restated to exclude price comparison businesses, now classified as discontinued operations.
2. Growth at constant exchange rates.
3. Discontinuing activities include UK account processing, some UK hosted database activities, UK mortgage software activities and other smaller discontinuing activities.
4. EBIT margin is for continuing activities only.
08 09 10 11 12
08 09 10 11 12
Organic revenue growth EBIT (US$m) and margin
Total revenue growth 2012 revenue by activity1
EBIT excludes discontinuing activities. EBIT margin is for continuing activities only. 2011 restated to exclude price comparison businesses, now classified as discontinued operations.
08 09 10 11 12
3% 3%
(1)%
2%
8%
8%
5%
(1)%
3%
10%
¹Excludes discontinuing activities.
Credit Services 29%
Decision Analytics 24%
Marketing Services 28%
Interactive 19%
23.4%
226 25.0%
21128.1%
205
29.3%
214
27.5%
227
37
Governance
Financial statements
Busin
ess reviewB
usiness overview

38 Experian Annual Report 2012 Business review
Credit Services
Total revenue growth was 11%, at constant exchange rates, with organic revenue growth of 3%. There was a robust performance across our credit bureaux, despite difficult market conditions in the region. There were also strong contributions from our business information bureaux in China and Singapore.
Decision Analytics
Total and organic revenue, at constant exchange rates, was down 7% amid weak conditions across the Eurozone which led to some project deferrals. Growth across Asia Pacific and emerging European countries helped to offset challenging conditions elsewhere in Europe.
Marketing Services
We delivered strong growth in Marketing Services, with total revenue growth at constant exchange rates of 40%, and organic revenue growth of 22%. The strength of our performance reflected new client wins for targeted digital marketing products, and exceptionally strong growth in email marketing volumes during the year. Ken Sansom
Managing Director, Asia Pacific
Year ended 31 March2012
US$m2011
US$mTotal growth1
%Organic growth1
%
Revenue
Credit Services 211 184 11 3
Decision Analytics 129 134 (7) (7)
Marketing Services 268 183 40 22
Total continuing activities 608 501 17 7
Discontinuing activities2 1 15 n/a
Total EMEA/Asia Pacific 609 516 14
EBIT
Continuing activities 44 52 (16)
Discontinuing activities2 - 1 n/a
Total EMEA/Asia Pacific 44 53 (17)
EBIT margin3 7.2% 10.4%
1. Growth at constant exchange rates.
2. Discontinuing activities include a non-core business in Japan acquired as part of the email marketing acquisitions and other smaller discontinuing activities.
3. EBIT margin is for continuing activities only.
EMEA/Asia Pacific reviewTotal revenue from continuing activities in EMEA/Asia Pacific was US$608m, up 17% at constant exchange rates, with organic revenue growth of 7%. The difference in part relates to the move to a majority holding in DP Information in Singapore (April 2011).
“Asia Pacific saw strong growth across all markets and product lines. China has now become our largest market and digital marketing is our largest product line. We continue to seek new acquisitions and to invest for the future, including the launch of a consumer credit bureau in Australia next year.”
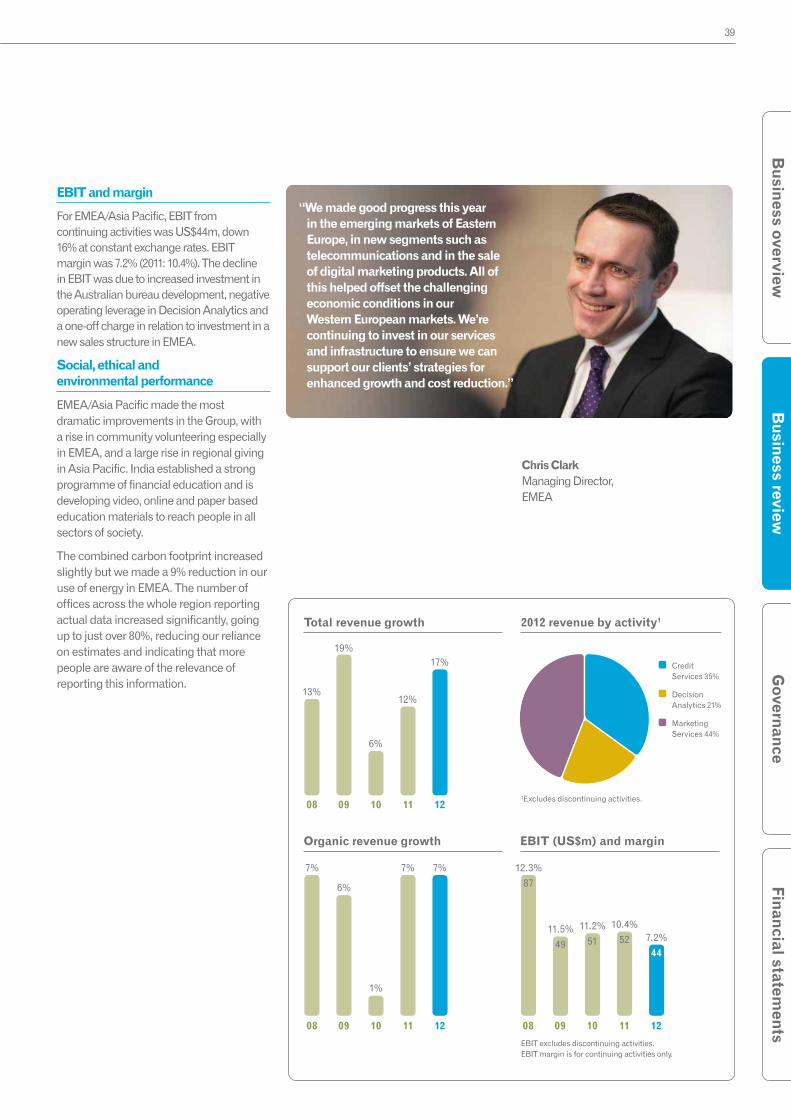
39
Governance
Busin
ess reviewB
usiness overview
Financial statements
EBIT and margin
For EMEA/Asia Pacific, EBIT from continuing activities was US$44m, down 16% at constant exchange rates. EBIT margin was 7.2% (2011: 10.4%). The decline in EBIT was due to increased investment in the Australian bureau development, negative operating leverage in Decision Analytics and a one-off charge in relation to investment in a new sales structure in EMEA.
Social, ethical and environmental performance
EMEA/Asia Pacific made the most dramatic improvements in the Group, with a rise in community volunteering especially in EMEA, and a large rise in regional giving in Asia Pacific. India established a strong programme of financial education and is developing video, online and paper based education materials to reach people in all sectors of society.
The combined carbon footprint increased slightly but we made a 9% reduction in our use of energy in EMEA. The number of offices across the whole region reporting actual data increased significantly, going up to just over 80%, reducing our reliance on estimates and indicating that more people are aware of the relevance of reporting this information.
Chris Clark Managing Director, EMEA
“We made good progress this year in the emerging markets of Eastern Europe, in new segments such as telecommunications and in the sale of digital marketing products. All of this helped offset the challenging economic conditions in our Western European markets. We’re continuing to invest in our services and infrastructure to ensure we can support our clients’ strategies for enhanced growth and cost reduction.”
08 09 10 11 12
08 09 10 11 12
08 09 10 11 12
Organic revenue growth EBIT (US$m) and margin
Total revenue growth 2012 revenue by activity1
EBIT excludes discontinuing activities. EBIT margin is for continuing activities only.
7%
6%
1%
7% 7% 12.3%
87
11.5%
49
11.2%
51
10.4%
52 7.2%
44
13%
19%
6%
12%
17%
¹Excludes discontinuing activities.
Credit Services 35%
Decision Analytics 21%
Marketing Services 44%
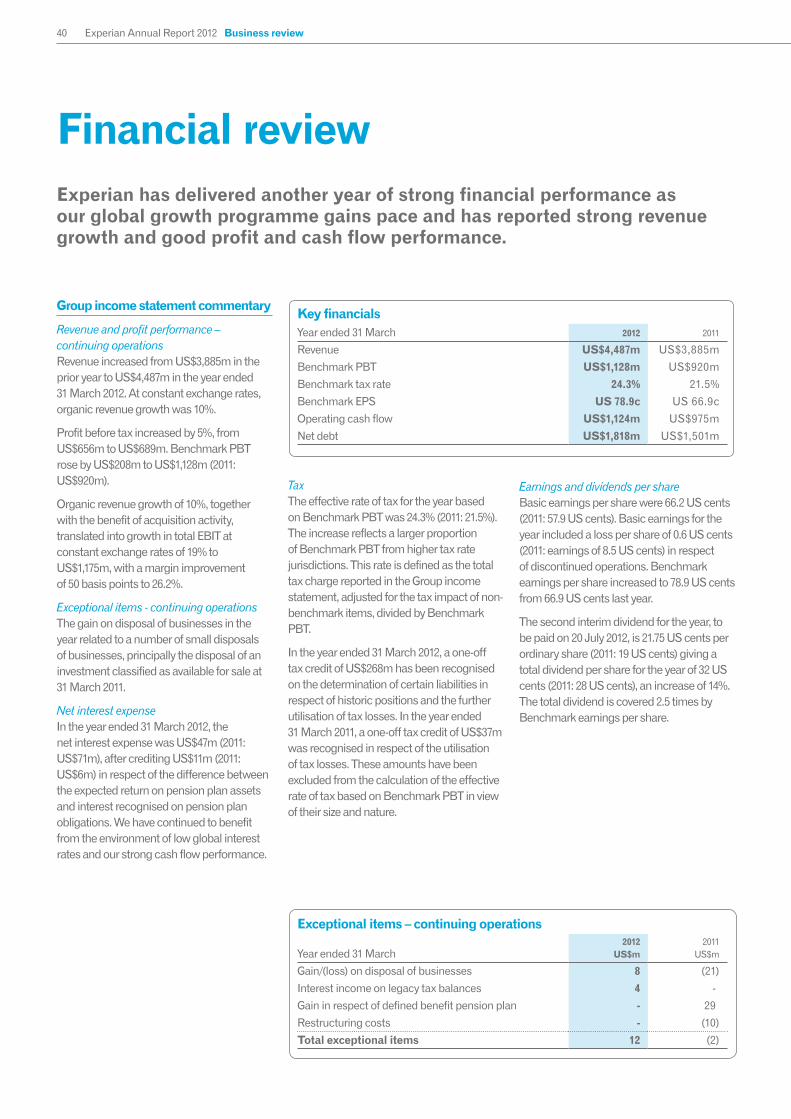
40 Experian Annual Report 2012 Business review
Group income statement commentary
Revenue and profit performance – continuing operations Revenue increased from US$3,885m in the prior year to US$4,487m in the year ended 31 March 2012. At constant exchange rates, organic revenue growth was 10%.
Profit before tax increased by 5%, from US$656m to US$689m. Benchmark PBT rose by US$208m to US$1,128m (2011: US$920m).
Organic revenue growth of 10%, together with the benefit of acquisition activity, translated into growth in total EBIT at constant exchange rates of 19% to US$1,175m, with a margin improvement of 50 basis points to 26.2%.
Exceptional items - continuing operationsThe gain on disposal of businesses in the year related to a number of small disposals of businesses, principally the disposal of an investment classified as available for sale at 31 March 2011.
Net interest expenseIn the year ended 31 March 2012, the net interest expense was US$47m (2011: US$71m), after crediting US$11m (2011: US$6m) in respect of the difference between the expected return on pension plan assets and interest recognised on pension plan obligations. We have continued to benefit from the environment of low global interest rates and our strong cash flow performance.
TaxThe effective rate of tax for the year based on Benchmark PBT was 24.3% (2011: 21.5%). The increase reflects a larger proportion of Benchmark PBT from higher tax rate jurisdictions. This rate is defined as the total tax charge reported in the Group income statement, adjusted for the tax impact of non-benchmark items, divided by Benchmark PBT.
In the year ended 31 March 2012, a one-off tax credit of US$268m has been recognised on the determination of certain liabilities in respect of historic positions and the further utilisation of tax losses. In the year ended 31 March 2011, a one-off tax credit of US$37m was recognised in respect of the utilisation of tax losses. These amounts have been excluded from the calculation of the effective rate of tax based on Benchmark PBT in view of their size and nature.
Earnings and dividends per shareBasic earnings per share were 66.2 US cents (2011: 57.9 US cents). Basic earnings for the year included a loss per share of 0.6 US cents (2011: earnings of 8.5 US cents) in respect of discontinued operations. Benchmark earnings per share increased to 78.9 US cents from 66.9 US cents last year.
The second interim dividend for the year, to be paid on 20 July 2012, is 21.75 US cents per ordinary share (2011: 19 US cents) giving a total dividend per share for the year of 32 US cents (2011: 28 US cents), an increase of 14%. The total dividend is covered 2.5 times by Benchmark earnings per share.
Financial reviewExperian has delivered another year of strong financial performance as our global growth programme gains pace and has reported strong revenue growth and good profit and cash flow performance.
Key financialsYear ended 31 March 2012 2011
Revenue US$4,487m US$3,885m
Benchmark PBT US$1,128m US$920m
Benchmark tax rate 24.3% 21.5%
Benchmark EPS US 78.9c US 66.9c
Operating cash flow US$1,124m US$975m
Net debt US$1,818m US$1,501m
Exceptional items – continuing operations
Year ended 31 March2012
US$m2011
US$m
Gain/(loss) on disposal of businesses 8 (21)
Interest income on legacy tax balances 4 -
Gain in respect of defined benefit pension plan - 29
Restructuring costs - (10)
Total exceptional items 12 (2)
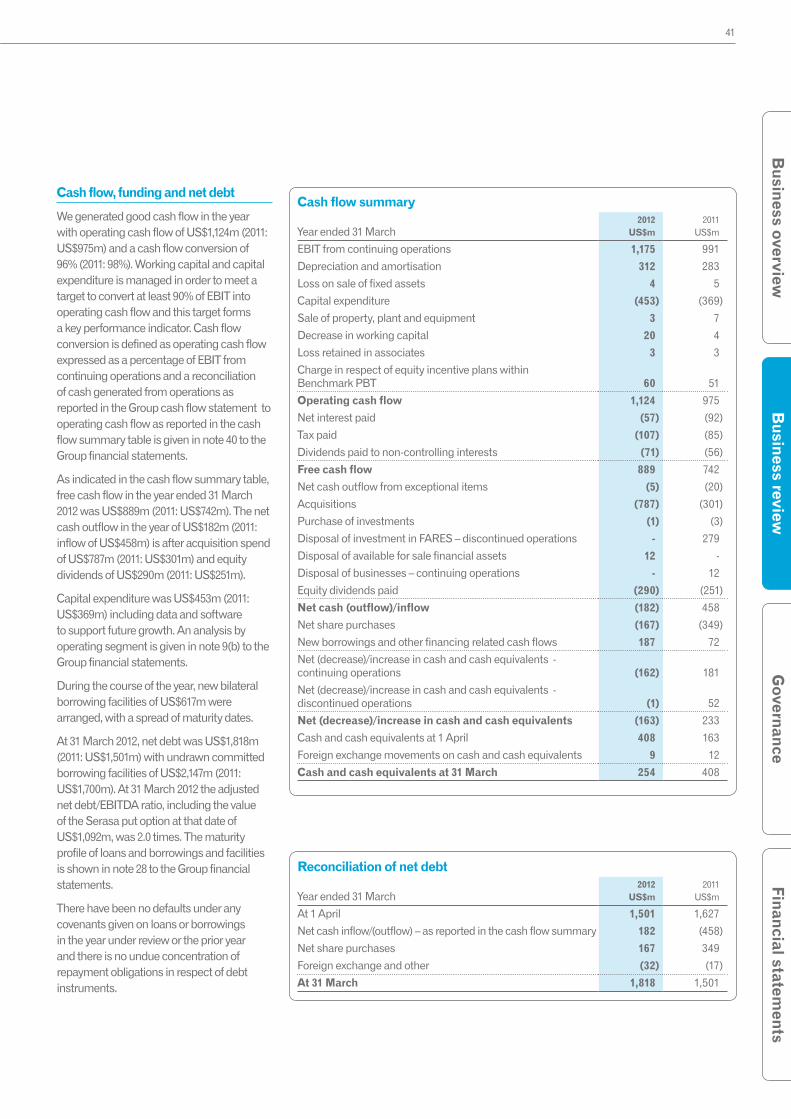
41
Governance
Busin
ess reviewB
usiness overview
Financial statements
Cash flow, funding and net debt
We generated good cash flow in the year with operating cash flow of US$1,124m (2011: US$975m) and a cash flow conversion of 96% (2011: 98%). Working capital and capital expenditure is managed in order to meet a target to convert at least 90% of EBIT into operating cash flow and this target forms a key performance indicator. Cash flow conversion is defined as operating cash flow expressed as a percentage of EBIT from continuing operations and a reconciliation of cash generated from operations as reported in the Group cash flow statement to operating cash flow as reported in the cash flow summary table is given in note 40 to the Group financial statements.
As indicated in the cash flow summary table, free cash flow in the year ended 31 March 2012 was US$889m (2011: US$742m). The net cash outflow in the year of US$182m (2011: inflow of US$458m) is after acquisition spend of US$787m (2011: US$301m) and equity dividends of US$290m (2011: US$251m).
Capital expenditure was US$453m (2011: US$369m) including data and software to support future growth. An analysis by operating segment is given in note 9(b) to the Group financial statements.
During the course of the year, new bilateral borrowing facilities of US$617m were arranged, with a spread of maturity dates.
At 31 March 2012, net debt was US$1,818m (2011: US$1,501m) with undrawn committed borrowing facilities of US$2,147m (2011: US$1,700m). At 31 March 2012 the adjusted net debt/EBITDA ratio, including the value of the Serasa put option at that date of US$1,092m, was 2.0 times. The maturity profile of loans and borrowings and facilities is shown in note 28 to the Group financial statements.
There have been no defaults under any covenants given on loans or borrowings in the year under review or the prior year and there is no undue concentration of repayment obligations in respect of debt instruments.
Cash flow summary
Year ended 31 March2012
US$m2011
US$m
EBIT from continuing operations 1,175 991
Depreciation and amortisation 312 283
Loss on sale of fixed assets 4 5
Capital expenditure (453) (369)
Sale of property, plant and equipment 3 7
Decrease in working capital 20 4
Loss retained in associates 3 3
Charge in respect of equity incentive plans within Benchmark PBT 60 51
Operating cash flow 1,124 975
Net interest paid (57) (92)
Tax paid (107) (85)
Dividends paid to non-controlling interests (71) (56)
Free cash flow 889 742
Net cash outflow from exceptional items (5) (20)
Acquisitions (787) (301)
Purchase of investments (1) (3)
Disposal of investment in FARES – discontinued operations - 279
Disposal of available for sale financial assets 12 -
Disposal of businesses – continuing operations - 12
Equity dividends paid (290) (251)
Net cash (outflow)/inflow (182) 458
Net share purchases (167) (349)
New borrowings and other financing related cash flows 187 72
Net (decrease)/increase in cash and cash equivalents - continuing operations (162) 181
Net (decrease)/increase in cash and cash equivalents - discontinued operations (1) 52
Net (decrease)/increase in cash and cash equivalents (163) 233
Cash and cash equivalents at 1 April 408 163
Foreign exchange movements on cash and cash equivalents 9 12
Cash and cash equivalents at 31 March 254 408
Reconciliation of net debt
Year ended 31 March2012
US$m2011
US$m
At 1 April 1,501 1,627
Net cash inflow/(outflow) – as reported in the cash flow summary 182 (458)
Net share purchases 167 349
Foreign exchange and other (32) (17)
At 31 March 1,818 1,501

42 Experian Annual Report 2012 Business review
Group balance sheet commentary
An analysis of net assets and capital employed is given in the net assets summary table. As part of the internal reporting process, capital employed is monitored by operating segment and further information by operating segment is given in note 9(b) to the Group financial statements. Capital employed includes net pension assets of US$77m (2011: US$55m) and net derivative financial assets of US$92m (2011: liabilities of US$13m).
The increase in Group total equity of US$224m for the year includes actuarial gains of US$7m in respect of defined benefit pension plans and is after currency translation losses of US$64m, mainly as a result of the weakening of the Brazilian real against the US dollar. These items are shown net of related tax in the Group statement of comprehensive income.
The share price of Experian ranged from a low of £6.65 to a high of £9.96 during the year. On 31 March 2012, the mid-market price was £9.75, giving a market capitalisation of US$15.4bn at that date (2011: US$12.7bn).
Financial review continued
2012 Net funding by interest rate
2011 Net funding by interest rate
Fixed Floating
Reconciliation of depreciation and amortisation
Year ended 31 March2012
US$m2011
US$m
As reported in the Group income statement 434 385
Less: amortisation of acquisition intangibles (122) (99)
Less: exceptional asset write-off - (3)
As reported in the cash flow summary 312 283
Net assets summary
At 31 March2012
US$m2011
US$m
Goodwill 4,163 3,761
Other intangible assets 1,582 1,374
Investment in associates 13 27
Other segment assets 1,426 1,318
Total segment assets 7,184 6,480
Segment liabilities (1,332) (1,267)
Operating segments - net assets 5,852 5,213
Central Activities - net assets 127 110
Capital employed 5,979 5,323
Net present value of put option in respect of Serasa non-controlling interest (1,092) (870)
Net debt (1,818) (1,501)
Tax (138) (245)
Net assets 2,931 2,707
US$ US$
Net assets per share 2.96 2.74
Accounting policies, estimates and assumptions
The principal accounting policies used are shown in note 5 to the Group financial statements. Details of critical accounting estimates and assumptions are shown in note 6(a) to those financial statements. The most significant of these relate to tax, pension benefits, goodwill and financial instruments and the key features can be summarised as follows:
• Estimates made in respect of tax assets and liabilities include the consideration of transactions in the ordinary course of business for which the ultimate tax determination is uncertain.
• The recognition of pension benefits involves the selection of appropriate actuarial assumptions. Changes to these may impact on the amounts disclosed in the Group financial statements.
• The assumptions used in the cash flow projections underpinning the impairment testing of goodwill include assumptions in respect of profitability and future growth, together with pre-tax discount rates specific to the Group’s operating segments.
• The contractual arrangements in respect of the put option associated with the remaining 30% stake of Serasa.

43
Governance
Busin
ess reviewB
usiness overview
Financial statements
Financial risk management
The risks and uncertainties that are specific to our business together with more general risks are set out in the risks and uncertainties section of this report. Our financial risk management focuses on the unpredictability of financial markets and seeks to minimise potentially adverse effects on our financial performance.
We seek to reduce exposures to foreign exchange, interest rate and other financial risks. Detailed disclosures in respect of such risks are included in the notes to the Group financial statements and the key features are summarised below.
Foreign exchange risk is managed by:
• Entering into forward foreign exchange contracts in the relevant currencies in respect of investments in entities with functional currencies other than US dollars, whose net assets are exposed to foreign exchange translation risk;
• Swapping the proceeds of certain bonds issued in sterling and euros into US dollars;
• Denominating internal loans in relevant currencies to match the currencies of assets and liabilities in entities with different functional currencies; and
• Use of forward foreign exchange contracts for certain future commercial transactions.
Interest rate risk is managed by:
• Use of both fixed and floating rate borrowings;
• Use of interest rate swaps to adjust the balance of fixed and floating rate liabilities; and
• Mix of duration of borrowings and interest rate swaps to smooth the impact of interest rate fluctuations.
Credit risk is managed by:
• Dealing only with banks and financial institutions with strong credit ratings, within limits set for each organisation; and
• Close control of dealing activity with counterparty positions monitored regularly.
Liquidity risk is managed by:
• Long-term committed facilities to ensure that sufficient funds are available for operations and planned expansion; and
• Monitoring of rolling forecasts of projected cash flows to ensure that adequate undrawn committed facilities are available.
2012 EBIT by currency
2011 EBIT by currency
US dollar Brazilian real Sterling Other
2012 Borrowings by currency
2011 Borrowings by currency
US dollar Sterling Other
Borrowings by currency are stated after the effect of forward foreign exchange contracts and cross currency swaps.

44 Experian Annual Report 2012 Business review
Capital risk management
Our objectives in managing capital are:
• To safeguard the ability to continue as a going concern in order to provide returns for shareholders and benefits for other stakeholders; and
• To maintain an optimal capital structure and cost of capital.
We remain committed to:
• A prudent but efficient balance sheet; and • A target gearing ratio of 1.75 to 2.0 times
EBITDA, consistent with a desire to retain a strong investment grade credit rating.
To maintain or adjust the capital structure, we may:
• Adjust the amount of dividends paid to shareholders;
• Return capital to shareholders;• Issue or purchase shares; or • Sell assets to reduce net debt.
Going concern
The Board formed a judgment at the time of approving the Group and the parent company financial statements that there was a reasonable expectation that the Group and the Company had adequate resources to continue in operational existence for the foreseeable future. In arriving at this conclusion the Board took account of:
• Current and anticipated trading performance which is the subject of detailed comment in the business review;
• Current and anticipated levels of borrowings and the availability of the committed borrowing facilities which are stated above; and
• Exposures to and management of financial risks which are summarised above and detailed in the notes to the Group financial statements.
For this reason, the going concern basis continues to be adopted in the preparation of the Group and the parent company financial statements.
Use of non-GAAP financial information
We have identified certain measures that we believe will assist understanding of the performance of the Group. As these measures are not defined under IFRS, they may not be directly comparable with other companies’ adjusted measures. The non-GAAP measures are not intended to be a substitute for, or superior to, any IFRS measures of performance but management has included them as these are considered to be important comparables and key measures used within the business for assessing performance. Such non-GAAP measures that are included within the Group financial statements are detailed in note 7 to those financial statements. Further non-GAAP measures and reconciliations of those measures are set out below.
Earnings before interest, tax, depreciation and amortisation (‘EBITDA’): EBITDA is defined as profit before amortisation of acquisition intangibles, acquisition expenses, goodwill impairments, adjustments to contingent consideration, charges in respect of the demerger-related equity incentive plans, exceptional items, net finance costs, tax, discontinued operations, depreciation and other amortisation. It includes the Group’s share of continuing associates’ pre-tax results.
Discontinuing activities: Experian defines discontinuing activities as businesses sold, closed or identified for closure during a financial year. These are treated as discontinuing activities for both revenue and EBIT purposes. The prior period, where shown, is restated to disclose separately the results of discontinuing activities. This financial measure differs from the definition of discontinued operations set out in IFRS 5, which defines a discontinued operation as a component of an entity that has either been disposed of, or is classified as held for sale, and is: (i) a separate major line of business or geographical area of operations; (ii) part of a single plan to dispose of a major line of business or geographical area of operations; or (iii) a subsidiary acquired exclusively with a view to resale.
Continuing activities: Businesses trading at 31 March 2012 that have not been disclosed as discontinuing activities are treated as continuing activities.
Total growth: This is the year-on-year change in the performance of Experian’s activities. Total growth at constant exchange rates removes the translational foreign exchange effects arising on the consolidation of Experian’s activities.
Organic growth: This is the year-on-year change in the revenue of continuing activities, at constant transactional and translation exchange rates, excluding acquisitions (other than affiliate credit bureaux) until the first anniversary date of consolidation.
Constant exchange rates: In order to illustrate its organic performance, Experian discusses its results in terms of constant exchange rate growth, unless otherwise stated. This represents growth calculated as if the exchange rates used to determine the results had remained unchanged from those used in the previous year.
Free cash flow: Free cash flow is derived from operating cash flow by excluding net interest and tax paid together with dividends paid to non-controlling interests. Operating cash flow is defined in note 7 to the Group financial statements.
Comparative financial information
The comparison shopping and lead generation businesses are now classified as discontinued operations and the comparative information in this report has been re-presented as appropriate.
Roundings
Certain financial data have been rounded within this report. As a result of this rounding, the totals of data presented may vary slightly from the actual arithmetic totals of such data.
Financial review continued

45
Governance
Busin
ess reviewB
usiness overview
Financial statements
Income statement analysis – continuing operations2012 2011
Year ended 31 March
Benchmark
US$m
Non-benchmark1
US$m
Total
US$m
Benchmark
US$m
Non-benchmark1
US$m
Total
US$m
Revenue 4,487 - 4,487 3,885 - 3,885
Labour costs (1,694) (5) (1,699) (1,486) 10 (1,476)
Data and information technology costs (400) - (400) (308) (1) (309)
Depreciation and amortisation (312) (122) (434) (283) (102) (385)
Marketing and customer acquisition costs (405) - (405) (369) - (369)
Other operating charges (499) 2 (497) (446) (29) (475)
Total operating expenses (3,310) (125) (3,435) (2,892) (122) (3,014)
Operating profit/(loss) 1,177 (125) 1,052 993 (122) 871
Share of losses of associates (2) - (2) (2) - (2)
EBIT from continuing operations 1,175 991
Non-benchmark items (125) (122)
Profit/(loss) before net finance costs and tax 1,175 (125) 1,050 991 (122) 869
Net finance costs (47) (314) (361) (71) (142) (213)
Profit/(loss) before tax 1,128 (439) 689 920 (264) 656
Tax credit/(charge) (274) 309 35 (198) 80 (118)
Profit/(loss) after tax from continuing operations 854 (130) 724 722 (184) 538
Attributable to:
Owners of Experian plc 780 (119) 661 670 (174) 496
Non-controlling interests 74 (11) 63 52 (10) 42
Profit/(loss) after tax from continuing operations 854 (130) 724 722 (184) 538
US cents US cents US cents US cents US cents US cents
Earnings/(loss) per share – basic 78.9 (12.1) 66.8 66.9 (17.5) 49.4
% % % % % %
Effective rate of tax 24.3 70.4 (5.1) 21.5 30.3 18.0
1. These include a credit for exceptional items of US$12m (2011: charge of US$2m) and charges of US$451m (2011: US$262m) for total adjustments made to derive Benchmark PBT, full details of which are included in note 13 to the Group financial statements.

46 Experian Annual Report 2012 Business review
Financial review continued
Revenue and EBIT by business segment
Year ended 31 March
2012
US$m
20111
US$m
Total growth2
%
Organic growth2
%
Revenue
Credit Services 2,133 1,812 16 12
Decision Analytics 476 434 8 8
Marketing Services 947 791 17 9
Interactive 929 822 13 7
Total – continuing activities 4,485 3,859 15 10
Discontinuing activities3 2 26 n/a
Total 4,487 3,885 14
EBIT
Credit Services 728 609 18
Decision Analytics 107 116 (10)
Marketing Services 146 126 15
Interactive 268 206 31
Total business segments 1,249 1,057 17
Central Activities (74) (66) n/a
Total – continuing activities 1,175 991 18
Discontinuing activities3 - - n/a
Total 1,175 991 18
EBIT margin4
Credit Services 34.1% 33.6%
Decision Analytics 22.5% 26.7%
Marketing Services 15.4% 15.9%
Interactive 28.8% 25.1%
Total EBIT margin 26.2% 25.7%
1. 2011 restated to exclude comparison shopping and lead generation businesses in Interactive; these have been classified as discontinued operations.
2. Growth at constant exchange rates.
3. Discontinuing activities include UK account processing, some UK hosted database activities, UK mortgage software activities and other smaller discontinuing activities (principally in EMEA/Asia Pacific).
4. EBIT margin is for continuing activities only.
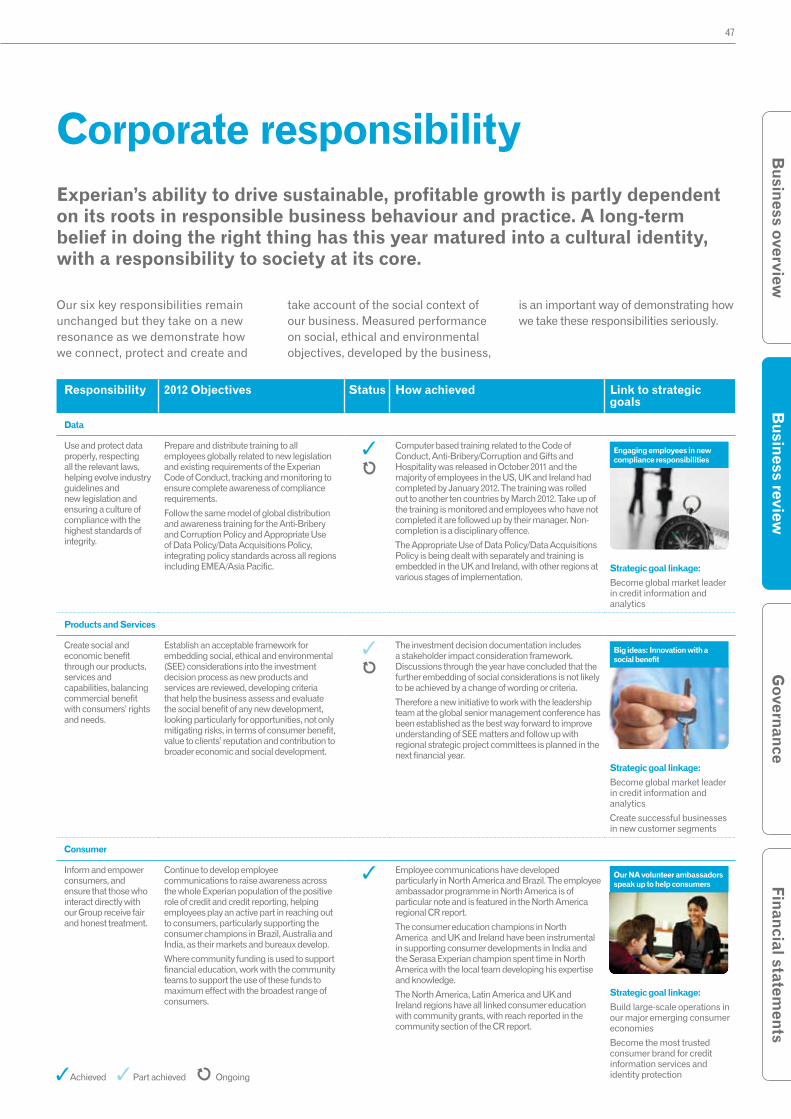
47
Governance
Busin
ess reviewB
usiness overview
Financial statements
Corporate responsibilityExperian’s ability to drive sustainable, profitable growth is partly dependent on its roots in responsible business behaviour and practice. A long-term belief in doing the right thing has this year matured into a cultural identity, with a responsibility to society at its core.
Our six key responsibilities remain unchanged but they take on a new resonance as we demonstrate how we connect, protect and create and
take account of the social context of our business. Measured performance on social, ethical and environmental objectives, developed by the business,
is an important way of demonstrating how we take these responsibilities seriously.
Responsibility 2012 Objectives Status How achieved Link to strategic goals
Data
Use and protect data properly, respecting all the relevant laws, helping evolve industry guidelines and new legislation and ensuring a culture of compliance with the highest standards of integrity.
Prepare and distribute training to all employees globally related to new legislation and existing requirements of the Experian Code of Conduct, tracking and monitoring to ensure complete awareness of compliance requirements.
Follow the same model of global distribution and awareness training for the Anti-Bribery and Corruption Policy and Appropriate Use of Data Policy/Data Acquisitions Policy, integrating policy standards across all regions including EMEA/Asia Pacific.
Computer based training related to the Code of Conduct, Anti-Bribery/Corruption and Gifts and Hospitality was released in October 2011 and the majority of employees in the US, UK and Ireland had completed by January 2012. The training was rolled out to another ten countries by March 2012. Take up of the training is monitored and employees who have not completed it are followed up by their manager. Non-completion is a disciplinary offence.
The Appropriate Use of Data Policy/Data Acquisitions Policy is being dealt with separately and training is embedded in the UK and Ireland, with other regions at various stages of implementation.
Engaging employees in new compliance responsibilities
Strategic goal linkage:
Become global market leader in credit information and analytics
Products and Services
Create social and economic benefit through our products, services and capabilities, balancing commercial benefit with consumers’ rights and needs.
Establish an acceptable framework for embedding social, ethical and environmental (SEE) considerations into the investment decision process as new products and services are reviewed, developing criteria that help the business assess and evaluate the social benefit of any new development, looking particularly for opportunities, not only mitigating risks, in terms of consumer benefit, value to clients’ reputation and contribution to broader economic and social development.
The investment decision documentation includes a stakeholder impact consideration framework. Discussions through the year have concluded that the further embedding of social considerations is not likely to be achieved by a change of wording or criteria.
Therefore a new initiative to work with the leadership team at the global senior management conference has been established as the best way forward to improve understanding of SEE matters and follow up with regional strategic project committees is planned in the next financial year.
Big ideas: Innovation with a social benefit
Strategic goal linkage:
Become global market leader in credit information and analytics
Create successful businesses in new customer segments
Consumer
Inform and empower consumers, and ensure that those who interact directly with our Group receive fair and honest treatment.
Continue to develop employee communications to raise awareness across the whole Experian population of the positive role of credit and credit reporting, helping employees play an active part in reaching out to consumers, particularly supporting the consumer champions in Brazil, Australia and India, as their markets and bureaux develop.
Where community funding is used to support financial education, work with the community teams to support the use of these funds to maximum effect with the broadest range of consumers.
Employee communications have developed particularly in North America and Brazil. The employee ambassador programme in North America is of particular note and is featured in the North America regional CR report.
The consumer education champions in North America and UK and Ireland have been instrumental in supporting consumer developments in India and the Serasa Experian champion spent time in North America with the local team developing his expertise and knowledge.
The North America, Latin America and UK and Ireland regions have all linked consumer education with community grants, with reach reported in the community section of the CR report.
Our NA volunteer ambassadors speak up to help consumers
Strategic goal linkage:
Build large-scale operations in our major emerging consumer economies
Become the most trusted consumer brand for credit information services and identity protection Achieved Part achieved Ongoing
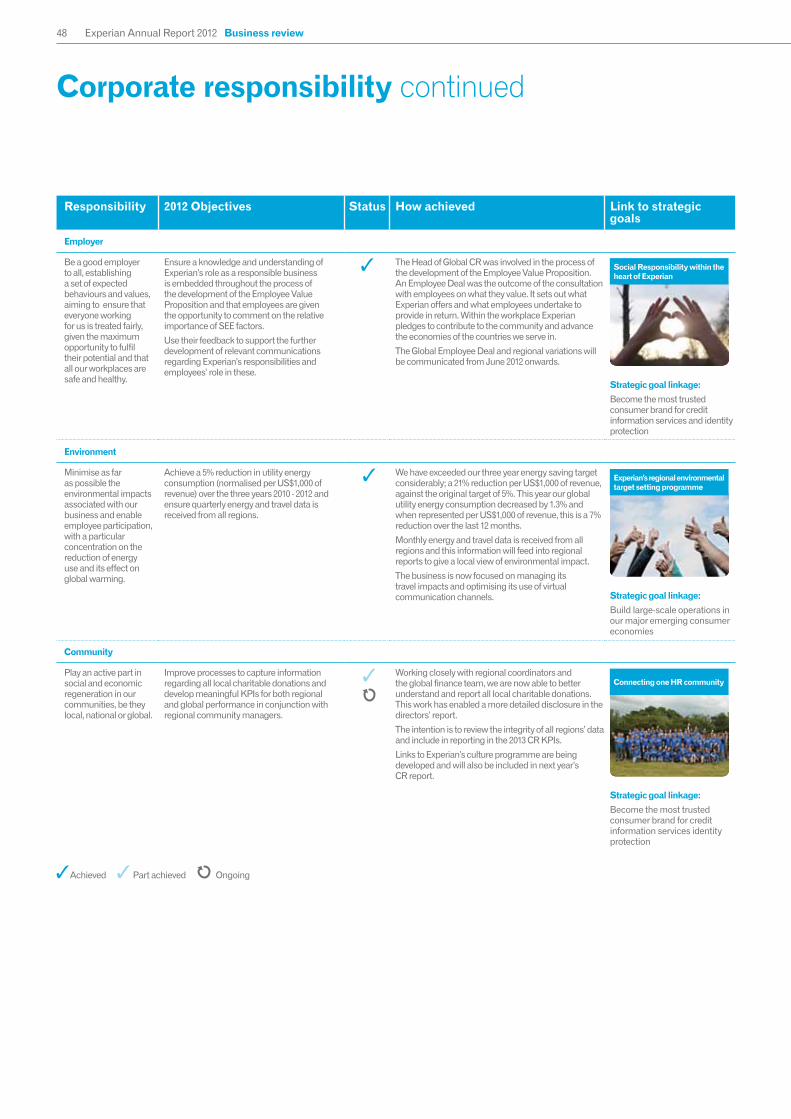
48 Experian Annual Report 2012 Business review
Responsibility 2012 Objectives Status How achieved Link to strategic goals
Employer
Be a good employer to all, establishing a set of expected behaviours and values, aiming to ensure that everyone working for us is treated fairly, given the maximum opportunity to fulfil their potential and that all our workplaces are safe and healthy.
Ensure a knowledge and understanding of Experian’s role as a responsible business is embedded throughout the process of the development of the Employee Value Proposition and that employees are given the opportunity to comment on the relative importance of SEE factors.
Use their feedback to support the further development of relevant communications regarding Experian’s responsibilities and employees’ role in these.
The Head of Global CR was involved in the process of the development of the Employee Value Proposition. An Employee Deal was the outcome of the consultation with employees on what they value. It sets out what Experian offers and what employees undertake to provide in return. Within the workplace Experian pledges to contribute to the community and advance the economies of the countries we serve in.
The Global Employee Deal and regional variations will be communicated from June 2012 onwards.
Social Responsibility within the heart of Experian
Strategic goal linkage:
Become the most trusted consumer brand for credit information services and identity protection
Environment
Minimise as far as possible the environmental impacts associated with our business and enable employee participation, with a particular concentration on the reduction of energy use and its effect on global warming.
Achieve a 5% reduction in utility energy consumption (normalised per US$1,000 of revenue) over the three years 2010 - 2012 and ensure quarterly energy and travel data is received from all regions.
We have exceeded our three year energy saving target considerably; a 21% reduction per US$1,000 of revenue, against the original target of 5%. This year our global utility energy consumption decreased by 1.3% and when represented per US$1,000 of revenue, this is a 7% reduction over the last 12 months.
Monthly energy and travel data is received from all regions and this information will feed into regional reports to give a local view of environmental impact.
The business is now focused on managing its travel impacts and optimising its use of virtual communication channels.
Experian’s regional environmental target setting programme
Strategic goal linkage:
Build large-scale operations in our major emerging consumer economies
Community
Play an active part in social and economic regeneration in our communities, be they local, national or global.
Improve processes to capture information regarding all local charitable donations and develop meaningful KPIs for both regional and global performance in conjunction with regional community managers.
Working closely with regional coordinators and the global finance team, we are now able to better understand and report all local charitable donations. This work has enabled a more detailed disclosure in the directors’ report.
The intention is to review the integrity of all regions’ data and include in reporting in the 2013 CR KPIs.
Links to Experian’s culture programme are being developed and will also be included in next year’s CR report.
Connecting one HR community
Strategic goal linkage:
Become the most trusted consumer brand for credit information services identity protection
Achieved Part achieved Ongoing
Corporate responsibility continued

49
Governance
Busin
ess reviewB
usiness overview
Financial statements
Making Corporate Responsibility our responsibility
The term Corporate Responsibility can be a barrier to individuals taking their own responsibility and so the focus at Experian is on:
• Embedding a concern for the social context of what we do and bringing this to the fore in business decisions;
• Focusing our community programme by giving it a business link; using our talent, skills and services to benefit society, as well as our funds;
• Innovating for social benefit, creating sustainable products that have a long term social payback; and
• Consulting with our stakeholders to ensure we are getting things right.
Embedding awareness of our social context
This year has seen a significant step forward in embedding a concern for the social context of our business. An illustration of this has been CR function involvement in preparations for the annual global senior management conference for leaders, which is taking place in Mumbai, India. In groups of ten, all 150 delegates are taking part in an experience to provide them with a taste of the social issues our Indian business faces. They will then be challenged to see how these translate into social issues in their own regions and discuss how Experian should, or could, address them. Partnering with Common Purpose, an NGO with a history of success in transformational business and third sector engagement, will give Experian’s leadership an opportunity to become agents for change in their own business areas.
A responsibility to society also infused the development of our Employee Deal, the shorthand term for the informal contract between employee and employer. Experian employees provided feedback that community engagement is an important part of what motivates them. The Head of Global CR was involved in this development work and it formed one of the six responsibility objectives.
The development of a cultural identity was a high priority for us in 2012 and the CR function also influenced this programme, called ‘Heart of Experian’. Consideration for the communities in which we’re based and serve comes through in all the communications and the six wider responsibilities relate directly to the three strands of our ‘Core DNA’, Connect, Protect and Create.
Using our skills, talents and services to benefit society
Our central funding to support regional community initiatives is primarily focused on projects addressing financial education and encouraging entrepreneurship, and creates projects that have a strong link to our business focus. This year 82% of our central funds allocated to the regions were spent on such projects.
Increasingly we are also looking at our community impacts: how many people do we reach through our financial education programmes, how do we measure how these projects change their lives. Our North America region has become expert at large scale interactions, using webinars to reach individuals, conferences to train teachers, partnerships with consumer groups to seek out the hard to reach. The CR report this year details some of this scale for the first time.
Meanwhile our Serasa Experian business is very focused on the numbers of people reached, but also measures how its smaller scale impacts are actually making a difference. Over the six months of their financial education course, they show how many people begin to make provision for themselves and save, and how many develop the means to pay off debts on a monthly basis.
Community investment20121
US$’000s20111
US$’000s
Funds from Experian plc 981 1,076
Financial donations from Experian subsidiaries 941 1,196
Employee time volunteered2 505 471
Gifts in kind 166 250
Management costs 274 217
Total from Experian 2,867 3,210
As % of Benchmark PBT 0.25% 0.34%
Employee fundraising 815 617
Total value of all giving 3,682 3,827
As % of Benchmark PBT 0.33% 0.39%
1. The community data has not been re-presented to take account of discontinued operations.
2. Excludes time volunteered outside normal working hours on Experian projects.
50 Experian Annual Report 2012 Business review
Experian’s community programme encourages employees to volunteer and this year saw us introduce measures to capture how much pro-bono work is done for charities, as well as the traditional type of support. This will have an increasing focus as we identify ways in which employees can support not for profit organisations using their skills and talents. Volunteering overall, including time outside normal working hours spent on Experian projects, was up by almost 3,500 hours, compared with the previous year. Regional and central business giving was down in 2012 but the available central funds have been increased for the next financial year to support the overall commitment to the community.
Innovating for social benefit
Developing products and services with a long-term benefit to society is one of the most sustainable ways in which we can have a positive impact. This year, Experian UK and Ireland developed a Rental Exchange service that will see landlords and tenants benefit from sharing information about rental payments. This new service will offer a safe and secure way to include a tenant’s rental payment history, with their permission, into their credit history.
At the core of this development was a relationship with Big Issue Invest (‘BII’), the investment arm of a major charity tackling homelessness in the UK. In partnership with BII, Experian is developing a social housing element of the Rental Exchange to provide benefit specifically for the most vulnerable in this sector, with funds from the business permanently channelled into providing financial education support.
Consulting with our stakeholders
We know that ‘taking account of society’ has to become a practically achievable objective and this year, we have undertaken a study of our relationships with our key stakeholders to help us understand whether we are getting things right in their eyes. We have looked at clients, consumers, suppliers, employees and investors from a CR perspective, interviewed a cross section of relationship owners from across the business and reviewed existing policies and initiatives. We will use the findings of the research to frame our strategy for engagement on sustainability issues going forward.
The full study can be read in the CR report and is a revealing picture showing how our employees’ dedication to the interests of these stakeholders has already put us in a good position.
Corporate responsibility continued
51
Governance
Financial statements
Busin
ess reviewB
usiness overview
Experian Annual Report 2012 Governance
Governance: Chairman’s introduction
context of an effective framework of controls and, as Chairman, it is my principal role to provide Board leadership that ensures Board effectiveness. To do this, I strive to create an open, energetic, productive and well-informed Boardroom culture and encourage our Board members to actively contribute, challenge and bring their considerable skills and experience to bear on Board discussions. Our committee chairmen hold themselves to the same high standards. You will read later about the key skills and experience of the Board members.
During the year, I led the annual evaluation process of the Board. Following last year’s external evaluation, this year’s process was internally facilitated and no major issues were identified. The evaluation did identify areas of focus for the Board, namely talent/succession management, familiarity with the business and executive talent and information technology and data security.
Last year, we reported to you that we had complied with the new UK Corporate Governance Code one year early, because the changes it contained reflected things we were already doing. This year, we are also reporting early on the changes to the UK Corporate Governance Code announced by the UK Financial Reporting Council in October 2011 relating to diversity, though they are not effective until October 2012. These changes are concerned with the implementation of the recommendations on diversity contained in the February 2011 report in the UK by Lord Davies, ‘Women on Boards’.
The main change you will see is the description in the governance statement of our new Board policy on diversity, including gender. When I spoke about diversity at our 2011 annual general meeting, I confirmed that we always take account of diversity in our recruitment, including when we consider Board appointments, and will continue to do so in the future.
Your Board is also fully aware of the need to effectively manage risks - this topic rightly comes up in many areas of the Board’s remit. It is a regular theme of annual Board evaluations, with Board members acknowledging the importance of the Board playing a leadership role in ensuring the effectiveness of controls and the evaluation of risk. The UK Corporate Governance Code places a strong emphasis on risk management, and that is consistent with our approach, both in satisfying ourselves that our risk management processes are effective, and in improving our disclosures so that investors and other stakeholders can understand our principal risks and our strategies to manage them.
You will have read in my Chairman’s statement about the various changes to our Board composition. I have no doubt that the new appointments will add further to the calibre and expertise of our Board, and I welcome Brian, Deirdre and George.
Experian has performed well in recent years, but there can be no room for complacency. Developing and implementing a clear strategy, within an appropriate risk framework, has worked well for us during recent challenging times. As a Board, we will continue to ensure that good governance is in place to support the business and to return enhanced value to our shareholders.
Our recent success has been underpinned by the clear strategy described at the start of the annual report. We believe we have the right governance framework in place to support that strategy, and to run the business in a manner which is responsible and consistent with our desire to conduct ourselves honestly, transparently and responsibly.
Our well-embedded governance structures help us to make what we believe to be the right decisions to ensure the continued long-term success of the business. We see this as a good way to think about governance, rather than simply as a compliance exercise for the Board, its committees and the management team. I believe that when good governance becomes second nature and is well managed, the Board can focus on the Group’s strategy and on delivering, creating and monitoring a performance culture that drives long-term value creation without exposing the Company to excessive risk of value destruction.
There has been much focus on governance in recent times but, for us, it has always been important to how we operate and will continue to be. Your Board takes governance issues seriously and debates them at the highest levels.
The UK Corporate Governance Code, under which we report on governance, tasks the Board with providing the entrepreneurial leadership necessary to promote the long-term success of the Company. This leadership must be provided within the
Sir John Peace Chairman
At Experian, we are committed to sustaining the results achieved in recent years.

52 Experian Annual Report 2012 Governance
Board of directorsSir John Peace (63)Chairman
Sir John Peace is also Chairman of Burberry Group plc and Standard Chartered PLC. From 2000 until 2006, he was Group Chief Executive of the former GUS plc, having been a director of GUS since 1997. John was appointed to the Board on 6 July 2006.
Sir Alan Rudge (74)Deputy Chairman
Sir Alan Rudge is Chairman of The ERA Foundation Limited and of the Board of Management of the Royal Commission for the Exhibition of 1851. He is Experian’s Senior Independent Director and Chairman of the Nomination and Corporate Governance Committee. Sir Alan was Pro Chancellor of Surrey University until December 2007, a non-executive director of the former GUS plc until October 2006, President of CELTEL International B.V. and a non-executive director of S.E.S.A. AG until March 2005, Special Advisor to General Atlantic Partners until 2004, Chairman of ERA Technology until October 2003, Chairman of WS Atkins until March 2001 and Deputy Chief Executive of BT until November 1997. He has a PhD in Electrical Engineering and is a fellow of the Royal Society and the Royal Academy of Engineering, a past chairman of the Engineering and Physical Sciences Research Council and a past president of the Institution of Electrical Engineers. Sir Alan was appointed to the Board on 6 September 2006.
Don Robert (52)Chief Executive Officer
Don Robert was appointed Chief Executive Officer in February 2005, with responsibility for Experian globally. He was previously Chief Executive Officer of Experian North America, having joined Experian from The First American Corporation in 2001. From 1995 to 2001, he held positions with First American and, before that, served as President at Credco, Inc., the largest specialist credit reporting company in the USA, which was acquired by The First American Corporation in 1995. Don began his career with US Bancorp, a multi-state bank holding company, where he held positions of increasing responsibility over 15 years. He graduated from Oregon State University with a degree in Business Administration. Don is a non-executive director of Compass Group PLC, a director and trustee of the National Education and Employer Partnership Taskforce, a trustee of Sage Hill School, California, a past director of the former GUS plc and a past chairman of the Consumer Data Industry Association. Don was appointed to the Board on 6 July 2006.
Chris Callero (60)President and Chief Operating Officer
Chris Callero was appointed President and Chief Operating Officer of Experian in April 2008. He previously served as Chief Executive Officer of Experian Americas, having joined Experian in 2002. Prior to joining Experian, Chris spent 27 years at Bank of America, where his roles included Group Executive Vice President in retail banking. He also served as Chief Operating Officer at Wink Communications, a leading interactive television company at the time. Chris is a member of the Chancellor’s Chief Executive Roundtable at the University of California, Irvine. He also serves in an advisory capacity for the Paul Merage School of Business, as well as the Bren School of Information and Computer Sciences, and also serves on the Board of Directors of the Segerstrom Center for the Arts. Chris was appointed to the Board on 1 April 2009.
Brian Cassin (44)Chief Financial Officer
Brian Cassin joined Experian in April 2012 as Chief Financial Officer, bringing 20 years of experience in the corporate financial advisory sector. He was previously at Greenhill & Co., which he joined in 1998 as a founding member of the European business, becoming Managing Director in 2002 and Co-Head of the European business in 2010. Prior to this, Brian worked with Baring Brothers International in London and in New York. He began his career at the London Stock Exchange, having graduated from the University of Dublin, Trinity College, with first class honours in Business Studies. Brian was appointed to the Board on 30 April 2012.
Fabiola Arredondo (45)Non-executive director
Fabiola Arredondo is the Managing Partner of Siempre Holdings, a private investment firm based in the USA, and a non-executive director of Rodale, Inc., the World Wildlife Fund and Sesame Workshop. Previously, she held senior operating positions at Yahoo!, the BBC and Bertelsmann AG and non-executive directorships of Bankinter S.A., BOC Group plc and Intelsat Corporation. Fabiola has a BA degree from Stanford University and an MBA from the Harvard Business School. Fabiola was appointed to the Board on 1 January 2007.

53
Governance
Financial statements
Busin
ess reviewB
usiness overview
Audit Committee Remuneration Committee Nomination and Corporate Governance Committee * from 1 September 2012Company Secretary: Charles Brown FCIS Independent auditors: PricewaterhouseCoopers LLP, Chartered Accountants and Recognized Auditor
Roger Davis (55)Non-executive director
Roger Davis is Chairman of Gem Diamonds Limited and Cabot Credit Management. He is Chairman of Experian’s Remuneration Committee. Roger previously spent some eight years at Barclays, latterly as the Chief Executive Officer of the 45,000 strong UK Banking operation and as a member of the Board of Barclays PLC. Prior to that, he was in investment banking for some ten years in London and in various positions in Asia for Flemings and BZW. Roger was appointed to the Board on 1 January 2007.
Alan Jebson (62)Non-executive director
Alan Jebson is a non-executive director of Vodafone Group plc. He is Chairman of Experian’s Audit Committee. Alan retired in May 2006 as Group Chief Operating Officer of HSBC Holdings plc, a position that included responsibility for IT and Global Resourcing. During a long career with HSBC, he held various positions in IT, including the position of Group Chief Information Officer. His roles included responsibility for HSBC’s international systems, including the consolidation of HSBC and Midland systems following HSBC’s acquisition of Midland Bank in 1993. Alan is a fellow of the Institute of Chartered Accountants in England and Wales. He was appointed to the Board on 1 January 2007.
Deirdre Mahlan (49)Non-executive director *
Deirdre Mahlan has been the Chief Financial Officer of Diageo plc since October 2010. At Diageo, her roles have included Deputy CFO and Head of Tax and Treasury for Diageo plc, Senior Vice President and Chief Financial Officer of Diageo North America and Vice President of Finance, Diageo Guinness USA. Deirdre joined Diageo in 2002, when it acquired Joseph Seagram and Sons, Inc., where she held various senior finance positions. Having graduated from New York University with a BS in accounting, Deirdre began her career at PricewaterhouseCoopers, and she holds an MBA from Columbia University. She has been appointed to the Board and its principal committees with effect from 1 September 2012.
George Rose (60)Non-executive director *
George Rose was Group Finance Director of BAE Systems plc from 1998 to 2011, having previously been Director of Finance and Treasury. He is a non-executive director, and chairs the Audit Committees of, National Grid plc, Genel Energy plc and Laing O’Rourke plc. George is a member of the Industrial Development Advisory Board, which provides advice to the UK’s Secretary of State for Business on applications for financial assistance. Prior to BAE Systems, George’s executive career included senior finance positions with Ford, Leyland DAF plc and the Rover Group, and previous non-executive directorships include SAAB AB and Orange plc. George has a degree in business studies from Thames Polytechnic and he is a fellow of the Chartered Institute of Management Accountants. He has been appointed to the Board and its principal committees with effect from 1 September 2012.
Judith Sprieser (58)Non-executive director
Judith Sprieser is the former President and Chief Executive Officer of Transora, a technology software and services company. She previously served as Executive Vice President, Food Operations and, before that, as Chief Financial Officer of Sara Lee Corporation. Judith is a non-executive director of Reckitt Benckiser Group plc, Allstate Corporation, InterContinental Exchange, Inc. and Royal Ahold N.V. She holds BA and MBA degrees from Northwestern University. Judith was appointed to the Board on 1 June 2010.
David Tyler (59)Non-executive director
David Tyler is Chairman of J Sainsbury plc and Logica plc and a non-executive director of Burberry Group plc (where he chairs the Remuneration Committee). He was Group Finance Director of the former GUS plc until it was demerged into Experian plc and Home Retail Group plc at the end of 2006. His executive career was in financial and general management with the former GUS plc, Christie’s International plc, County NatWest Limited and Unilever plc. David has a degree in economics from Cambridge University, is a fellow of the Chartered Institute of Management Accountants and a member of the Association of Corporate Treasurers. David was appointed to the Board on 6 July 2006.
Paul Walker (54)Non-executive director
Paul Walker is non-executive Chairman of Perform Group plc, Chair of the Newcastle Science City Partnership and a director of the Entrepreneurs’ Forum. He was Chief Executive of The Sage Group plc, a worldwide leader in business solutions for small and medium-sized enterprises, from 1994 to October 2010. He joined Sage in 1984 as Financial Controller and was appointed as Finance Director in 1987 prior to flotation on the London Stock Exchange. Paul qualified as a chartered accountant with Ernst & Young, having graduated from York University with an economics degree. Paul was appointed to the Board on 1 June 2010.
54 Experian Annual Report 2012 Governance
UK Corporate Governance Code
It is the Board’s view that the Company has been compliant with the provisions of the UK Corporate Governance Code, published by the UK Financial Reporting Council in 2010, throughout the year ended 31 March 2012. This statement, together with the report on directors’ remuneration, explains how the Company has applied the main principles and complied with the provisions of the UK Corporate Governance Code during the year. Additionally, the Company has chosen to comply voluntarily with the proposed changes to the UK Corporate Governance Code announced by the UK Financial Reporting Council in October 2011.
What is the role of the Board?
The Board is responsible for setting the strategic direction of Experian and for ensuring that the necessary financial and human resources are in place to achieve the goals. In January each year, senior management presents the proposed strategy to the Board for the following financial year. This provides an opportunity for the Board to critically review the proposed strategy with management and, at the January Board meeting, consider the strategy for approval. The budget discussions in March are essential for ensuring that the right resources are in place to deliver the agreed strategy, and include detailed focus on both regional and global business line budgets.
The Board also monitors management and financial performance against the Group’s goals. To enable them to do this, operational and financial updates are provided at every Board meeting. The Board also receives post-investment reviews on an agreed timeline for any acquisitions and/or investments it has previously approved.
It is not possible, or correct, for the Board to be involved with the day-to-day management of the Group’s activities, but it is accountable to shareholders for delivering financial performance and long-term shareholder value. To achieve this, the Board has put in place a framework of controls which enable risk to be appraised and managed effectively through clear and robust procedures and delegated authorities. In addition, there are certain key activities that it has reserved to itself for decision.
Examples include:
Strategy and management – approval and oversight of Experian’s long-term objectives and commercial strategy, ensuring that the necessary financial and human resources are in place to meet the objectives.
Management oversight – review of operating, financial and risk performance.
Regulatory/statutory activity – including approval of the Group’s results, key stakeholder documents and dividends.
Finance/treasury – approval of the framework for the Group’s finance, banking and capital structure arrangements.
Appointments – approval, upon the recommendation of the Nomination and Corporate Governance Committee, of the appointment of new directors.
Approval of Group policies – including, for example, an anti-corruption policy, a gifts and hospitality policy and a global code of conduct.
What did the Board do during the year?
The main areas of Board focus during the year included:
Corporate governance statement
Operational and financial performance, including monitoring•ReceivedoperationalandfinancialupdatesateachBoardmeeting.•ReceiveddetailsoftheexerciseofdelegatedauthoritiesbytheGroup’sprincipalsubsidiaries.•Reviewedmonthlyfinancereports,includingdetailsofperformanceagainstbudgetandtheGroup’sfinancialposition.•ApprovedtheGroup’sannualreport,fullandhalf-yearfinancialresultsandmaderecommendationsregardingdividendpayments.•ApprovedtheGroup’sbudgetfor2012/13.
Strategy•Receivedpresentationsfromleadersofthefourglobalbusinesslines:CreditServices,DecisionAnalytics,MarketingServicesandInteractive.Theseincludeddetailsonfinancialperformance,alignmenttoGroupstrategy,marketoutlook,productinnovationsandinvestmentneeds.•Receivedfurtherpresentationsoninitiativestogrowrevenue,currentchallengesandfurtherdevelopmentofExperian’sculture.
•ApprovedtheGroup’sstrategy.
Corporate development•ApprovedtheacquisitionofMedicalPresentValue,Inc.,aleadingproviderofdata,analyticsandsoftwareintheUShealthcarepaymentsmarket.•ApprovedtheformationofacreditbureauwithsixofAustralia’sleadingfinancialinstitutionstoprovideconsumerandbusinesscreditinformationinAustralia.•ApprovedtheacquisitionofComputecS.A.,aleadingLatinAmericancreditservicesinformationproviderbasedinColombia.
•Conductedpost-investmentreviewsonUnitedMailSolutionsinGermanyandA-CareSystemsinJapan.
Governance and risk•Reviewedreportsonriskandtheappropriatenessofthefinancialstatementsbeingpreparedonagoingconcernbasis.•ApprovedtheGroup’snewglobalanti-corruptionpolicyandgiftsandhospitalitypolicy,toensurecompliancewiththeUKBriberyAct2010.•ApprovedtheappointmentsofBrianCassinasChiefFinancialOfficer(‘CFO’)from30April2012,andDeirdreMahlanandGeorgeRoseasnon-executivedirectorsfrom1September2012.•Receivedregularupdatesoncorporatesocialresponsibilityissues,andtheannualhealthandsafetyupdate.•ApprovedrecommendationsonBoardandcommitteeevaluationprocesses,thecompositionoftheBoard,levelsofinductionandtheannualre-electionofallBoardmembers.•ReceiveddetailsofsharedealingsandexternalappointmentsofBoardmembers.
Investor relations•ReceivedaninvestorrelationsandmediaupdateateachBoardmeeting.•Revieweddraftanalysts’resultspresentations,whenreviewingtheGroup’sfullandhalf-yearfinancialresults.•ThroughtheRemunerationCommittee,engagedwithtopshareholdersonproposedremunerationarrangementsfor2011/12.
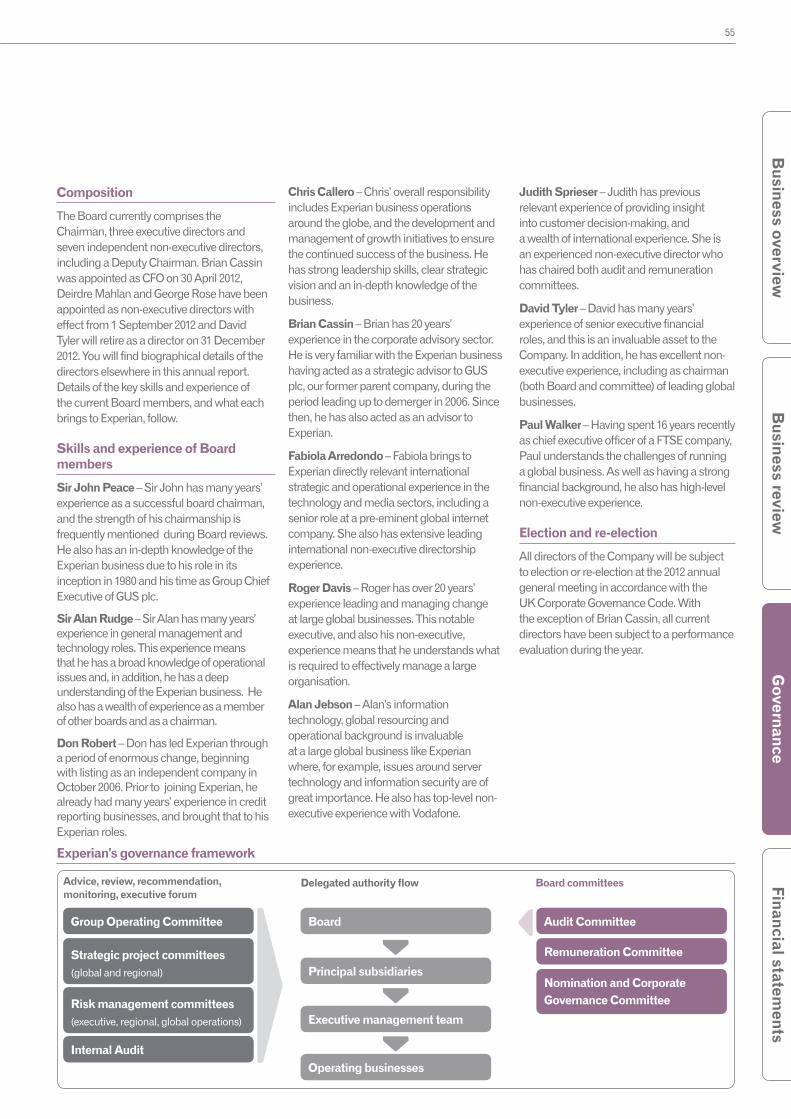
55
Governance
Financial statements
Busin
ess reviewB
usiness overview
Composition
The Board currently comprises the Chairman, three executive directors and seven independent non-executive directors, including a Deputy Chairman. Brian Cassin was appointed as CFO on 30 April 2012, Deirdre Mahlan and George Rose have been appointed as non-executive directors with effect from 1 September 2012 and David Tyler will retire as a director on 31 December 2012. You will find biographical details of the directors elsewhere in this annual report. Details of the key skills and experience of the current Board members, and what each brings to Experian, follow.
Skills and experience of Board members
Sir John Peace – Sir John has many years’ experience as a successful board chairman, and the strength of his chairmanship is frequently mentioned during Board reviews. He also has an in-depth knowledge of the Experian business due to his role in its inception in 1980 and his time as Group Chief Executive of GUS plc.
Sir Alan Rudge – Sir Alan has many years’ experience in general management and technology roles. This experience means that he has a broad knowledge of operational issues and, in addition, he has a deep understanding of the Experian business. He also has a wealth of experience as a member of other boards and as a chairman.
Don Robert – Don has led Experian through a period of enormous change, beginning with listing as an independent company in October 2006. Prior to joining Experian, he already had many years’ experience in credit reporting businesses, and brought that to his Experian roles.
Chris Callero – Chris’ overall responsibility includes Experian business operations around the globe, and the development and management of growth initiatives to ensure the continued success of the business. He has strong leadership skills, clear strategic vision and an in-depth knowledge of the business.
Brian Cassin – Brian has 20 years’ experience in the corporate advisory sector. He is very familiar with the Experian business having acted as a strategic advisor to GUS plc, our former parent company, during the period leading up to demerger in 2006. Since then, he has also acted as an advisor to Experian.
Fabiola Arredondo – Fabiola brings to Experian directly relevant international strategic and operational experience in the technology and media sectors, including a senior role at a pre-eminent global internet company. She also has extensive leading international non-executive directorship experience.
Roger Davis – Roger has over 20 years’ experience leading and managing change at large global businesses. This notable executive, and also his non-executive, experience means that he understands what is required to effectively manage a large organisation.
Alan Jebson – Alan’s information technology, global resourcing and operational background is invaluable at a large global business like Experian where, for example, issues around server technology and information security are of great importance. He also has top-level non-executive experience with Vodafone.
Judith Sprieser – Judith has previous relevant experience of providing insight into customer decision-making, and a wealth of international experience. She is an experienced non-executive director who has chaired both audit and remuneration committees.
David Tyler – David has many years’ experience of senior executive financial roles, and this is an invaluable asset to the Company. In addition, he has excellent non-executive experience, including as chairman (both Board and committee) of leading global businesses.
Paul Walker – Having spent 16 years recently as chief executive officer of a FTSE company, Paul understands the challenges of running a global business. As well as having a strong financial background, he also has high-level non-executive experience.
Election and re-election
All directors of the Company will be subject to election or re-election at the 2012 annual general meeting in accordance with the UK Corporate Governance Code. With the exception of Brian Cassin, all current directors have been subject to a performance evaluation during the year.
Advice, review, recommendation, monitoring, executive forum
Delegated authority flow Board committees
Board
Principal subsidiariesStrategic project committees (global and regional)
Risk management committees (executive, regional, global operations)
Internal AuditOperating businesses
Audit Committee
Remuneration Committee
Nomination and Corporate Governance Committee
Group Operating Committee
Executive management team
Experian’s governance framework
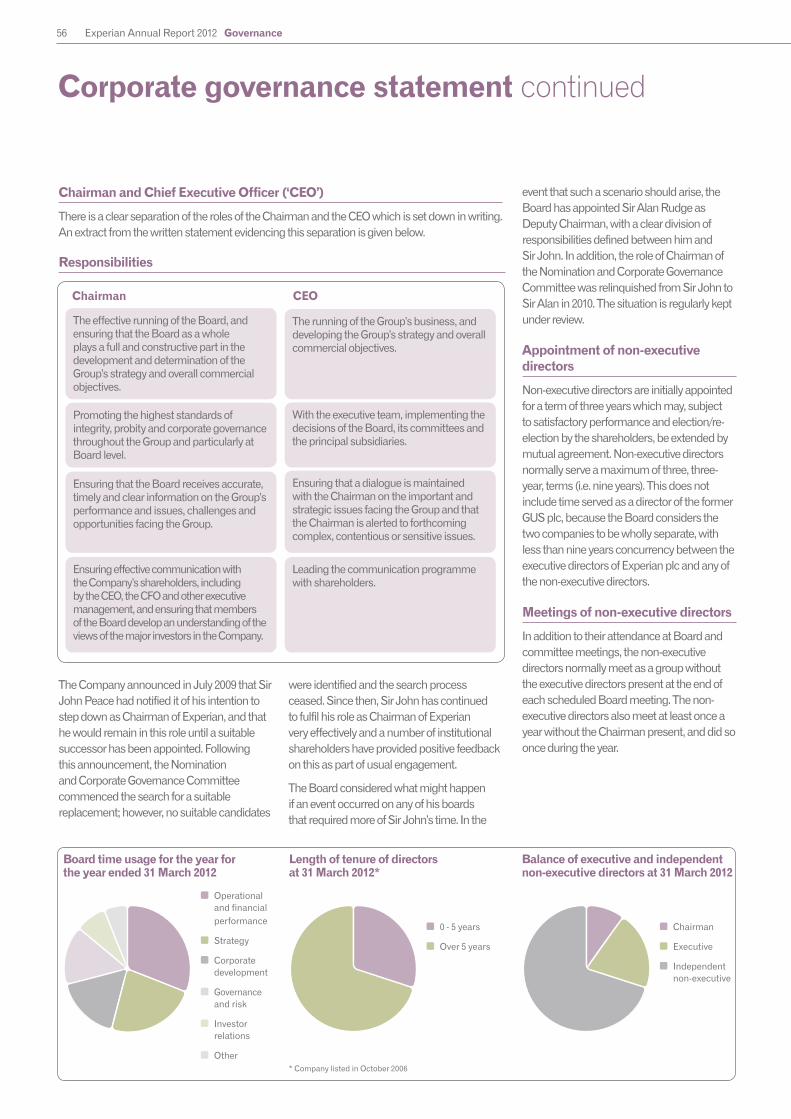
56 Experian Annual Report 2012 Governance
Corporate governance statement continued
The Company announced in July 2009 that Sir John Peace had notified it of his intention to step down as Chairman of Experian, and that he would remain in this role until a suitable successor has been appointed. Following this announcement, the Nomination and Corporate Governance Committee commenced the search for a suitable replacement; however, no suitable candidates
were identified and the search process ceased. Since then, Sir John has continued to fulfil his role as Chairman of Experian very effectively and a number of institutional shareholders have provided positive feedback on this as part of usual engagement.
The Board considered what might happen if an event occurred on any of his boards that required more of Sir John’s time. In the
event that such a scenario should arise, the Board has appointed Sir Alan Rudge as Deputy Chairman, with a clear division of responsibilities defined between him and Sir John. In addition, the role of Chairman of the Nomination and Corporate Governance Committee was relinquished from Sir John to Sir Alan in 2010. The situation is regularly kept under review.
Appointment of non-executive directors
Non-executive directors are initially appointed for a term of three years which may, subject to satisfactory performance and election/re-election by the shareholders, be extended by mutual agreement. Non-executive directors normally serve a maximum of three, three-year, terms (i.e. nine years). This does not include time served as a director of the former GUS plc, because the Board considers the two companies to be wholly separate, with less than nine years concurrency between the executive directors of Experian plc and any of the non-executive directors.
Meetings of non-executive directors
In addition to their attendance at Board and committee meetings, the non-executive directors normally meet as a group without the executive directors present at the end of each scheduled Board meeting. The non-executive directors also meet at least once a year without the Chairman present, and did so once during the year.
Responsibilities
Chairman CEO The effective running of the Board, and ensuring that the Board as a whole plays a full and constructive part in the development and determination of the Group’s strategy and overall commercial objectives.
The running of the Group’s business, and developing the Group’s strategy and overall commercial objectives.
Promoting the highest standards of integrity, probity and corporate governance throughout the Group and particularly at Board level.
With the executive team, implementing the decisions of the Board, its committees and the principal subsidiaries.
Ensuring that the Board receives accurate, timely and clear information on the Group’s performance and issues, challenges and opportunities facing the Group.
Ensuring that a dialogue is maintained with the Chairman on the important and strategic issues facing the Group and that the Chairman is alerted to forthcoming complex, contentious or sensitive issues.
Ensuring effective communication with the Company’s shareholders, including by the CEO, the CFO and other executive management, and ensuring that members of the Board develop an understanding of the views of the major investors in the Company.
Leading the communication programme with shareholders.
Chairman and Chief Executive Officer (‘CEO’)
There is a clear separation of the roles of the Chairman and the CEO which is set down in writing. An extract from the written statement evidencing this separation is given below.
Length of tenure of directors at 31 March 2012*
Balance of executive and independent non-executive directors at 31 March 2012
0 - 5 years
Over 5 years
Chairman
Executive
Independent non-executive
* Company listed in October 2006
Board time usage for the year for the year ended 31 March 2012
Operational and financial performance
Strategy
Corporate development
Governance and risk
Investor relations
Other

57
Governance
Financial statements
Busin
ess reviewB
usiness overview
The Board and committee meeting attendance record of each director is shown in the table. In addition to formal meetings, the Board received presentations on strategy from senior management.
Attendance at Board and principal committee meetings
Senior Independent Director
The Senior Independent Director is the Deputy Chairman, Sir Alan Rudge. In this role, Sir Alan is available to meet shareholders who have concerns that cannot be resolved through discussion with the Chairman, the CEO or the CFO, or where such contact is inappropriate.
Independence of non-executive directors
The Board considers each of the current non-executive directors to be independent in character and judgment and also that there are no relationships or circumstances which are likely to affect (or could appear to affect) each director’s judgment.
Board meetings
The Board meets regularly during the year and on an ad-hoc basis as required. For each scheduled meeting, the directors normally meet over a two or three day period and Board committee meetings are also held during the time the directors are together. Structuring the Board and committee meetings in this way enhances the effectiveness of the Board and its committees. At least one overseas Board meeting is held each year, which provides management across the Group with the opportunity to present to the Board and meet the directors informally.
Board evaluation
A comprehensive evaluation of the performance of the Board, its committees and each of the directors is carried out every year. For 2011, the internal evaluation process was led by the Chairman and supported by the Company Secretary. Using online evaluation software, the views of all directors were canvassed in respect of the performance of the Board and, separately, its committees. Among other things, the Board evaluation considered the following areas:
• providing direction to management and demonstrating ethical leadership;
• assessing the line of sight to the business for decision-making;
• contribution to the development and testing of the Group’s strategy;
• top operational issues facing the Group over the next three to five years;
Board visits
In July 2011, the Board visited the Techlightenment and QAS businesses, and received business reviews, presentations on the UK and Ireland digital strategy and product demonstrations. In March 2012, an overseas Board meeting was held in São Paulo, Brazil. The Board learnt more about the Latin American market, the financial position, prospects and risk management issues in the region, and sales and marketing strategy. On the same visit, the Board also met with senior management from the recently acquired Computec, giving them an early opportunity to learn more about the business.
Board*
Nomination and Corporate
Governance Committee*
Remuneration Committee*
Audit Committee
Sir John Peace 6/6 (1) 3/3 (1) n/a n/aDon Robert 6/6 (1) 3/3 (-) n/a n/aPaul Brooks 4/4 (1) n/a n/a n/aChris Callero 6/6 (1) n/a n/a n/aFabiola Arredondo 6/6 (1) 3/3 (-) 4/4 (1) 4/4
Roger Davis 6/6 (2) 3/3 (1) 4/4 (2) 4/4Alan Jebson 6/6 (2) 3/3 (1) 4/4 (1) 4/4Sir Alan Rudge 6/6 (-) 3/3 (-) 4/4 (-) 4/4Judith Sprieser 6/6 (2) 3/3 (1) 4/4 (1) n/aDavid Tyler 6/6 (-) 3/3 (-) 4/4 (-) 4/4Paul Walker 6/6 (1) 3/3 (1) 4/4 (1) 4/4
* Includes, in brackets, attendance at ad-hoc meetings held during the year – two Board meetings, one Nomination and Corporate Governance Committee meeting and two Remuneration Committee meetings.
Brian Cassin was appointed to the Board on 30 April 2012 – accordingly, his meeting attendance is not reflected above. Paul Brooks was a director until his death on 6 January 2012.
58 Experian Annual Report 2012 Governance
• performance assessment of the Board in its operation and decision-making; and
• oversight of risk and opportunities to improve Board performance in this area.
This process was complemented with separate meetings between each director and the Chairman. The evaluation of the Chairman himself was undertaken by the Deputy Chairman, through consultation with the other directors and the CEO.
The results of the Board evaluation were considered at the Board meeting held in January 2012. The directors have concluded that, following this review, the Board and its committees operate effectively and also consider that each director is contributing to the overall effectiveness and success of the Group. The Board also identified the following among its ‘top priorities’ for the coming year:
• talent/succession management, to ensure continuity in Board style/culture and executive talent;
• continued familiarisation with the business and executive talent, and continued close involvement with business issues, including corporate development, investment strategy and growth drivers; and
• information technology and data security.
Board support
The Group Corporate Secretariat, under the leadership of the Company Secretary, is responsible for providing administrative and logistical support to the Board. The Company Secretary also provides advice and support on governance and certain compliance and regulatory matters. All directors are provided with a regular supply of financial and operational information to assist them with the discharge of their duties. This information is provided on a monthly basis and Board papers are circulated in time to allow directors to be properly briefed in advance of meetings. During the year, the Group Corporate Secretariat implemented a process for circulating papers securely via tablet computer, which has resulted in time and cost efficiencies and has been very well received by the Board. It has also been implemented for use by other executive groups within the organisation.
Directors have access to independent professional advice at the Company’s expense, if considered appropriate. No director obtained any such advice during the year ended 31 March 2012.
Induction and training
There is an induction programme for all new non-executive directors which would normally include business presentations from senior management, site visits and receipt of information about operating procedures and activities of the Group, the governance structure of the Group, information on the duties and responsibilities of directors and information on dealing in the Company’s shares.
The Board received ongoing training and development to ensure that they can appropriately perform their duties. During the year, the Board received training sessions which included UK Bribery Act training, business presentations, legal and governance updates, product demonstrations and business updates from relevant leaders. As in previous years, next year’s induction and training for Board members is expected to include site visits, reviews of particular regions and global business lines and presentations from senior executives.
Conflicts of interest
The articles of association of the Company allow the Board to authorise conflicts, or potential conflicts, of interest. The authorisation procedure involves the issue of guidance and a questionnaire by the Group Corporate Secretariat each August, asking directors to identify any conflicts or potential conflicts, which are considered by the Board at its September meeting. In addition, directors are expected to advise the Company Secretary of any actual or potential conflicts as soon as they arise, so that they can be considered by the Board at the next available opportunity. It is the Board’s view that the procedure operated effectively during the year under review.
Other features of the governance framework
Global Delegated Authorities Matrix – this key document draws together the schedule of matters reserved to the Board, the terms of reference of the Board committees as well as the authority levels for the Group’s principal subsidiaries, directors and senior executives. For matters not reserved to the Board, the matrix prescribes the cascade of authorities delegated throughout the Group by respective Group companies, together with the monetary limits of such delegations. The matrix is reviewed and refreshed regularly and the Board monitors the exercise of delegations to the Group’s principal subsidiaries which are reported to it at each Board meeting. There are also regional matrices in place.
Strategic project committees (global and regional) – these committees are comprised of the most senior global and regional executives. The remit of the committees is to oversee a process to ensure that all strategic projects are appropriately resourced, risk assessed and commercially, financially and technically appraised. Depending on the outcome of the discussions, the conclusions of the committees are then considered by the relevant Group company.
Principal subsidiaries – these are Group companies to which the Board has delegated certain decision-making powers, for example, the implementation of decisions agreed in principle by the Board; executive management of the operations of the Group within the strategy and budget approved by the Board; acquisitions and disposals with a value up to US$20m, and capital expenditure projects.
Risk management committees (executive, regional and global operations) – the primary responsibility of the Executive Risk Management Committee (‘ERMC’), which is comprised of senior Group executives including the executive directors and the Company Secretary, is to oversee the management of global risks. The regional risk committees oversee the management of regional risks consistent with Experian’s risk appetite, strategies and objectives. Global operational related risks, including technology and project risks, are monitored by a global operations risk management
Corporate governance statement continued

59
Governance
Financial statements
Busin
ess reviewB
usiness overview
committee. This committee also oversees the management of operational related risks associated with the Group’s shared service and data centres as well as global product development and delivery activities. The regional and global operations risk committees review summary risk assessments and internal audit results, evaluate significant exposures, make mitigation decisions and enforce mitigation progress, monitor changes in the regional/operational risk profile and escalate significant risks and issues to the ERMC.
Group Operating Committee – the remit of this executive group includes identifying, debating and achieving consensus on issues involving strategy, growth, people and culture and operational efficiency. A further focus of this group, which is comprised of the most senior executives from the Group, is to ensure that there is strong communication and cooperative working relationships amongst the top team. The quarterly meetings tend to be issues-oriented and focus on selected important Group issues worthy of debate. Engagement with shareholders and others
The Company places considerable importance on communication and maintaining good relationships with shareholders, and makes every effort to ensure that shareholders are kept informed of significant Group developments.
To assist members of the Board to gain an understanding of the views of institutional shareholders, the Board receives an investor relations and media report at each of its meetings, which covers a wide range of matters including a commentary on the perception of the Company and views expressed by the investment community, media reports, share price performance and analysis. The views of shareholders are also assessed in detail via an investor survey, which is normally conducted at least every two years using a third party supplier. The results of the next survey are scheduled to be presented to the Board in September 2012. The Board consults with shareholders in connection with specific issues where it considers appropriate. For example in May 2011, the Chairman of the Remuneration Committee consulted with major institutional
shareholders and others regarding the proposed performance measures, targets and operation of the Company’s executive long-term incentive arrangements.
There is also an ongoing programme of dialogue and meetings between the executive team and institutional investors and analysts. At these meetings a wide range of relevant issues including strategy, performance, management and governance are discussed within the constraints of information already made public. The announcement of the annual and half-year results and interim management statements provide opportunities for the Company to answer questions from analysts covering a wide range of topics. After the annual results announcement for 2011 and half-year results announcement for 2012, several investor roadshows took place including ones in New York, Boston, London, Paris, Frankfurt and Edinburgh.
During the year, we also hosted a number of investor site visits. These half-day sessions included product demonstrations and focused presentations on, for example, our four global business lines, specific products and certain verticals. Investor seminars are generally held every two years, with the last one held in January 2011.
The Company’s website is a very important method of communication with shareholders and all material information reported to the regulatory news services, together with copies of annual results announcements, half-year results announcements and interim management statements, is published on the Company’s website so that all shareholders can have full access promptly to Company announcements. In January 2012, we launched an Experian Investor Relations application for tablet computer, which contains information on our financial performance, together with reports and presentations, and news of upcoming events.
The Board is also committed to ensuring that any concerns of private shareholders are dealt with and, on its behalf, the Company Secretary oversees communication with these shareholders. A ‘Shareholder Questions’ card is issued with the shareholder documentation for the annual general meeting and the Company receives numerous questions
from private shareholders using the card. The Company Secretary ensures that the Company responds to shareholders directly, as appropriate, at or following the annual general meeting.
The annual general meeting is an important event in Experian’s corporate calendar and provides a valuable opportunity for the Board to communicate with shareholders and meet with them on an informal basis before the main business of the meeting. All directors are expected to attend the annual general meeting.
Experian’s 2012 annual general meeting will take place on Wednesday 18 July 2012 and shareholders are encouraged to attend the meeting and use the opportunity to ask questions. However, given the size and geographical diversity of the Company’s shareholder base, attendance may not always be practical and shareholders are encouraged to use proxy voting on the resolutions put forward. Every vote cast, whether in person or by proxy, is counted, because votes on all matters except procedural issues are taken by a poll.
In accordance with the UK Corporate Governance Code, details of proxy voting by shareholders, including votes withheld, are made available on request and placed on the Company’s website following the meeting. In 2011, voting levels at the annual general meeting showed an increase to 68% of the issued share capital of the Company, compared with 66% in 2010.
Experian website
Additional information relevant to corporate governance at Experian can be found on the Experian website at www.experianplc.com.
There you will find:
• Terms of reference of the principal Board committees.
• The schedule of matters reserved to the Board.
• The memorandum and articles of association of the Company.
• Details of annual general meeting proxy voting by shareholders, including votes withheld.
• Contact details for any questions.

60 Experian Annual Report 2012 Governance
Corporate governance statement continued
Principal features of the risk management and internal control systems
Tone at the top• Sustaining a culture of integrity and ethical values supported by a global code of conduct, anti-corruption policies and a sustainable
corporate responsibility programme.
• Commitment to competency through our people selection, retention and talent management programmes. Further details on this process can be found in the ‘Our people, our strength’ section.
• Management’s commitment to maintaining a strong risk and control culture through support of a structured enterprise governance and risk management framework. Further details can be found in this section and the risks and uncertainties section.
How do we identify, manage and control risk? There is an ongoing process for identifying, assessing and managing the significant risks faced by the Group, including those risks relating to social, ethical and environmental matters. Further details on this process, which was in place throughout the year ended 31 March 2012 and up to the date of approval of the annual report, can be found in the risks and uncertainties section.
What does the control environment look like? •Terms of reference for the Board and
each of its committees, which are regularly reviewed.
•Clear organisational structure, with the global and regional delegated authorities matrices clearly outlining the delegation of authority, including from the Board to principal subsidiaries.
•Principles, policies and standards to be adhered to throughout the business. These include a global risk management policy, accounting policies, treasury policy,
information security policy and a policy on fraud and whistleblowing.
•Defined and well-understood review and approval procedures for major transactions, capital expenditure and revenue expenditure.
•The regional and global strategic project committees review and evaluate all significant business investments, developments and divestments, with risk assessment an integral component of the evaluation process.
•Appropriate strategies to deal with each significant risk that has been identified, including internal controls, insurance and specialised treasury instruments.
Information and communication•Monthly finance report to the Board,
which includes a Group financial summary, Group results, forecasts and sales trends, investor relations analysis and detailed business trading summaries.
•Detailed monthly performance reviews at a regional level.
•Regional and executive risk management committees receive quarterly reporting on the status of principal and emerging risks along with the status of significant projects that promote the Group’s strategic objectives.
•The Audit Committee receives global risk management reports during the year which are generated through the facilitated, quarterly contribution of managers in each area of Experian’s business; including facilitated contributions from key governance functions such as Information Security, Business Continuity, Legal, Government Affairs, Compliance, Finance, Group Corporate Secretariat, Internal Audit and Technology Services.
•Fraud and whistleblowing procedures are in place for employees to report suspected improprieties and the Audit Committee receives regular reports on this area from the Head of Global Internal Audit.
Risk management and internal control
The Board is responsible for establishing, maintaining and reviewing sound risk management and internal control systems. As such systems are designed to manage rather than eliminate the risk of failure to achieve business objectives, they can provide reasonable, but not absolute, assurance against material financial misstatement or loss. For certain joint arrangements, the Board places reliance upon the systems of internal control operating within the partners’ infrastructure and the obligations upon partners’ boards relating to the effectiveness of their own systems.
An annual review of the effectiveness of the risk management and control systems is required and this was performed by the Audit Committee in May 2012, under delegated authority from the Board. The review included senior executives being asked to confirm compliance with the Group’s system of internal control, Group policies, and corporate governance and corporate responsibility processes, i.e. to confirm compliance with the Turnbull Guidance ‘Internal Control Revised Guidance for Directors’ throughout the financial year. Unqualified confirmations were received from all regional finance directors and officers, senior Group functional heads and
the CEO. The Committee also reviewed, and confirmed its satisfaction with, the features of the risk management and control systems and the control framework, noting the level and quality of the various forms of assurance (both management and independent) that it received during the year. Following the review, it is the Board’s view that the information was sufficient to enable it to review the effectiveness of the Group’s system of internal control in accordance with the Turnbull Guidance, and that the system has no significant failings or weaknesses.
61
Governance
Financial statements
Busin
ess reviewB
usiness overview
What monitoring takes place?• Well-developed system of planning,
incorporating Board approval of Group strategy and budgets. Performance against the agreed plan is subsequently monitored and reported at each Board meeting.
• The achievement of business objectives, both financial and non-financial, is assessed on a monthly basis, using a range of key performance indicators.
• There is regular reporting to the Board in respect of the exercise of the delegations of authorities to the principal subsidiaries.
• The global risk management policy provides for the ongoing identification and escalation of accepted, new and emerging risks to management and the Board as appropriate.
• Each business unit is responsible for the day-to-day management of risk and for ensuring that risk exposure remains within established limits. The global risk management policy outlines, for business units, the expectations in relation to escalation of identified risks, control weaknesses or gaps.
• Certificates are provided annually by each business and key function leader to confirm compliance with the Group’s system of internal control, Group policies, and corporate governance and corporate responsibility processes.
• The Group’s internal audit function provides independent testing and verification of risk management policies, processes and practices across the Group and reports to the Audit Committee on the effectiveness of the system of internal control.
• The Audit Committee reviews a variety of reports on risk, including material risk reports, material litigation reports, information security reports and regulatory and compliance reports.
• The Audit Committee performs an annual review of the effectiveness of the Group’s systems of risk management and internal control and receives an annual report on the controls over relevant risks.
• The internal audit programme and methodology is aligned to the risk categories and makes use of risk assessment information at a business level in planning and conducting its audits.
Internal control over financial reporting Detailed policies and procedures are in place to ensure the accuracy and reliability of financial reporting and the preparation of consolidated financial statements. A comprehensive Group Accounting Manual (‘GAM’), including details of International Financial Reporting Standards (‘IFRS’) requirements, is in place. The document is owned by the Group’s finance team and has been rolled out across the Group. All Experian companies are obliged to follow the requirements of the GAM. The aims of the GAM are to:
• provide guidance on accounting issues;
• allow for consistent and well defined information for IFRS reporting requirements;
• provide uniform measures for quantitative and qualitative measures of Group performance; and
• increase the efficiency of the Group’s reporting process.
62 Experian Annual Report 2012 Governance
Corporate governance statement continued
Nomination and Corporate Governance Committee report
Sir Alan Rudge Chairman of Nomination and Corporate Governance Committee
Current members Sir Alan Rudge (Chairman) Sir John Peace Don Robert Fabiola Arredondo Roger Davis Alan Jebson Judith Sprieser David Tyler Paul Walker
Primary roles
To ensure that appropriate procedures are in place for the nomination, selection, training and evaluation of directors, and that adequate succession plans are in place.
To review the Board structure, size, composition and succession needs, at all times keeping under consideration the balance of membership and the required balance of skills, experience, independence and knowledge of the Board.
To identify and nominate, for the Board’s approval, suitable candidates to fill vacancies for non-executive and, with the assistance of the CEO, executive directors, such appointments to be made on merit and against objective criteria to ensure that the Board maintains its balance of skills, experience, independence and knowledge.
To review legislative, regulatory and corporate governance developments and make appropriate recommendations to the Board, and ensure that the standards and disclosures recommended by the UK Corporate Governance Code are observed.
Governance
The Committee was in place throughout the year ended 31 March 2012 and met four times, including one ad-hoc meeting. Seven members of the Committee are considered by the Board to be independent non-executive directors in accordance with provision B.2.1 of the UK Corporate Governance Code. The Group Human Resources Director and members of the Global Talent team attend certain meetings by invitation.
Activities
At its meetings during the year, the Committee: approved the process for the 2011 Board evaluation; received an ‘AGM Issues’ briefing from the Company Secretary; recommended to the Board that all directors retire at the 2012 annual general meeting, and reviewed its performance and terms of reference.
The Committee also discussed the overall structure, size and composition of the Board. The discussions included the desirable attributes of any proposed new non-executive director taking into account, among other things, diversity, including gender diversity.
In addition, the Committee reviewed progress with the talent agenda, received an insight into the impact of the talent framework and identified future actions on talent. The succession plans for the Chairman, CEO, non-executive directors and senior management were also reviewed. This planning ensures that appropriate leadership resources are in place to achieve Experian’s strategic objectives and includes strong development programmes and cross-regional development role changes.
The Committee also agreed the statement on diversity made by the Chairman at the 2011 annual general meeting and, in March 2012, as part of the early adoption by the Company of proposed changes to the UK Corporate Governance Code, approved the new Board diversity policy. The policy can be summarised as follows: We respect, value and welcome diversity, including gender diversity, and seek to reflect the diversity of our client, investor and general employee base in our Board.
Board committee reports
The principal Board committees are the Nomination and Corporate Governance Committee, the Remuneration Committee and the Audit Committee. The committees operate within defined terms of reference which cover the authority delegated to them by the Board. The terms of reference are available on the Experian website at www.experianplc.com or from the Company Secretary upon request. The Company Secretary is secretary to all three principal committees.
Throughout the year, the committee chairmen provided the Board with a report of the issues considered at committee meetings and the minutes of Audit Committee meetings were circulated to the Board. Reports of the activities of each of the principal Board committees follow.
63
Governance
Financial statements
Busin
ess reviewB
usiness overview
To this end, we recruit talented and diverse Board members who have the appropriate mix of skills, capabilities and market knowledge to ensure Board effectiveness. When recruiting, we look across all sectors and non-traditional talent pools and we require diversity of candidates on our shortlists.
The UK Corporate Governance Code recommends that we describe the process used in relation to Board appointments. In connection with the appointment of our new independent non-executive directors, Deirdre Mahlan and George Rose, the process commenced in September 2011. At that point, the Nomination and Corporate Governance Committee reviewed and approved an outline brief and role specification and appointed Lygon Group as the search agent for the assignment. (Lygon have also provided Board and committee evaluation services and market research for succession planning).
In discussing the desirable attributes of any new non-executive director, the Committee agreed that, if possible, candidates should possess, among other things, recent and relevant financial experience. The Committee also considers diversity when thinking about the composition of the Board.
Between September 2011 and March 2012, meetings were held with Lygon to discuss the specification and the search, an initial long list of candidates was prepared and interviews were held. A short list was then presented to the Committee in March 2012, and the Committee recommended to the Board the appointment of Deirdre and George as non-executive directors in May 2012. At its May 2012 meeting, the Board appointed both with effect from 1 September 2012. In due course, a tailored induction programme will be developed for the new non-executive directors.
Remuneration Committee report
Roger Davis Chairman of Remuneration Committee
Current members Roger Davis (Chairman) Fabiola Arredondo Alan Jebson Sir Alan Rudge Judith Sprieser David Tyler Paul Walker
Primary roles
To recommend to the Board senior management remuneration policy and the remuneration of the Chairman.
To determine individual remuneration packages for executive directors and certain senior executives.
To communicate with shareholders on remuneration policy.
To review and recommend to the Board the design of the Group’s short and long-term incentive plans.
To oversee the Group’s executive pension arrangements.
Governance
The Remuneration Committee was in place throughout the year ended 31 March 2012 and met six times, including two ad-hoc meetings. All of its members are considered by the Board to be independent non-executive directors in accordance with provision D.2.1 of the UK Corporate Governance Code. The Chairman and CEO attend meetings by invitation. They do not attend when their individual remuneration is discussed and no director is involved in deciding his or her own remuneration. Other regular attendees include the Group Human Resources Director and members of the Global Reward team. The Committee meets regularly with its independent advisers.
All members of the Committee were provided with an induction in the role of the Committee and the operation of its terms of reference on first appointment.
Activities
At its meetings during the year, the Committee:
• reviewed incentive arrangements related to the acquisition of Computec;
• initiated the invitation to employees to participate in the 2011 Sharesave scheme;
• reviewed the draft report on directors’ remuneration;
• initiated and reviewed feedback from a shareholder consultation exercise concerning the proposed performance measures, targets and operation of the Company’s long-term incentive plans;
• agreed the 2011 bonus outcome and the preliminary 2012 bonus targets and those for long-term incentive awards;
• received updates in respect of the long-term incentive plans of the Company;
• agreed the participants for certain long-term incentive plans;
• received an update on corporate governance issues relevant to remuneration; and
• agreed to make share plan awards.
The Committee also approved the proposed remuneration for three new senior appointments – the new CFO, the new Managing Director, EMEA and the new Managing Director, UK and Ireland; reviewed the fee of the Chairman and the salaries of the CEO, the COO, the Company Secretary and a number of senior executives, taking account of remuneration arrangements throughout Experian; received general and regional market overviews; received a summary of the Group’s global remuneration position and considerations for the next year, and reviewed its own performance and terms of reference.
The report on directors’ remuneration sets out the way in which the Company has applied corporate governance principles to directors’ remuneration.

64 Experian Annual Report 2012 Governance
Corporate governance statement continued
Audit Committee report
Alan Jebson Chairman of Audit Committee
Current members Alan Jebson (Chairman) Fabiola Arredondo Roger Davis Sir Alan Rudge David Tyler Paul Walker
Primary roles
To monitor the integrity of the financial statements.
To review the effectiveness of the system of internal control including the risk management system.
To review the effectiveness of the audit process and the independence and objectivity of the external auditors.
To monitor and review the effectiveness of the internal audit function.
To develop and monitor policy on non-audit services to be provided by the external auditors.
To approve the remuneration and terms of engagement of the external auditors and make recommendations in relation to their re-appointment.
Governance
The Audit Committee was in place throughout the year ended 31 March 2012, and met four times with meetings held to coincide with key dates in the financial reporting and audit cycle. All members of the Committee are considered by the Board to be independent non-executive directors in compliance with provision C.3.1 of the UK Corporate Governance Code.
The Chairman and the other directors attend meetings by invitation. Other regular attendees include the Global Executive Vice President Legal and Regulatory Risk and the Head of Global Internal Audit. The lead audit partner from PricewaterhouseCoopers LLP attends all meetings.
Other PricewaterhouseCoopers staff attend meetings where their particular expertise can be utilised. At each meeting, the Committee meets with the external auditors and the Head of Global Internal Audit without management present.
David Tyler, a Committee member, provides recent and relevant financial experience and also provides an in-depth knowledge of Experian’s business. The Board is confident that the collective international business experience of the Committee members enables them to act as an effective committee. The Committee has access to the financial expertise within the Group and the auditors and the Chairman of the Audit Committee is in regular contact with key members of senior management.
Activities
The key activities of the Audit Committee during the year ended 31 March 2012 included the following:
Reviewed the 2011 preliminary and 2012 half-year results announcements and the 2011 annual report and accounts, impairment papers as required by IAS 36 and papers supporting the preparation of relevant accounts on a going concern basis.
In September 2011, received a detailed briefing from senior management on important elements of the information security infrastructure, including an update on priorities, plans and progress on information security initiatives and related investment, to reflect a further increased focus on this area in the light of recent high profile breaches at other organisations. The Committee also received a briefing on the Company’s crisis communication plan in this context.
Received an update at each meeting on the roll-out of the programme designed to address the requirements of the UK Bribery Act 2010, including assessment of relevant guidance, the deployment of policies, noting that compliance, review of completed risk assessments and progress on the planned training programme would be included in future internal audits.
Took steps to assess the effectiveness of the audit process, receiving updates on the audit process from the auditors (including details of key matters and assessments of management judgements), reviewing the content of the management representation letter to the
auditors, assessing the annual audit plan presented to the Committee in September 2011 (noting the scope of the audit, potential risks outlined and materiality thresholds) and reviewing an assessment of the auditors which included feedback from the Committee and relevant senior management.
Reviewed a variety of reports on risk, as more fully described in the internal control and risk management section of this statement, received an internal audit update at every meeting and received a fraud and whistleblowing update.
Reviewed the effectiveness of the Group’s system of risk management and internal control, including financial, operational, compliance and risk management on an ongoing basis.
Made a recommendation to the Board (for shareholder approval) in relation to the re-appointment of the external auditors and considered their engagement terms.
Reviewed other services provided by the external auditors, evaluated their performance and monitored their independence, concluding that they had maintained their independence throughout the year ended 31 March 2012.
Reviewed and approved the Group’s treasury policy, approved the annual meeting schedule of the Committee and evaluated its own performance and concluded that its terms of reference remained appropriate.
65
Governance
Financial statements
Busin
ess reviewB
usiness overview
External auditors
PricewaterhouseCoopers LLP have been the Company’s auditors since the Group was demerged from the former GUS plc in October 2006. At its September 2011 meeting, the Audit Committee concluded that it remained satisfied with the work of the auditors in terms of its independence and level of challenge to management. The Committee also noted that there were no material issues around the quality of delivery of the audit, audit staff or the level of service provided. Overall, there were no significant recurring items to suggest that the auditors should change their approach and there was nothing to indicate that an effective audit had not been carried out in respect of the year ended 31 March 2011. The Committee concluded that the Group and the auditors had complied with the guidance set out in the
UK Financial Reporting Council’s December 2010 Guidance on Audit Committees. To date, the Committee has not considered it necessary to require the auditors to tender for the audit work. There are no contractual obligations restricting the Company’s choice of external auditor.
PricewaterhouseCoopers LLP provide a range of other services to Experian and, to ensure auditor objectivity and independence, a policy has been adopted by the Company in relation to the provision of such services. The policy includes financial limits above which the Chairman of the Audit Committee must pre-approve any proposed non-audit services.
The Committee receives half-yearly reports containing details of assignments carried out by the external auditors in addition to their normal work, together with details of related fees. The payment of non-audit fees to the Company’s auditors is capped at 100% of fees for audit and assurance services, except in exceptional circumstances, and an analysis of fees paid to the external auditors for the year ended 31 March 2012 is set out in note 11 to the Group financial statements.
In addition to the policy summarised below, the external auditors maintain safeguards to ensure the objectivity and independence of their service teams. The safeguards include the rotation of the lead audit engagement partner and the use of separate teams, where appropriate. There is also a policy in place for the employment of former employees of the external auditor.
Policy on the provision of non-audit services
This policy has not been changed during the year, and remains appropriate for the Group. Provided that the provision of such services does not conflict with the external auditors’ statutory responsibilities and ethical guidance, the following types of services may be assigned to the external auditors:
Further assurance services: where the external auditors’ deep knowledge of the Group’s affairs means that they may
be best placed to carry out such work. This may include, but is not restricted to, shareholder and other circulars, regulatory reports and work in connection with acquisitions and divestments.
Tax services: where the external auditors’ knowledge of the Group’s affairs may provide significant advantages which other parties would not have. Where this is not the case, the work is put out to tender.
General: in other circumstances, the external auditors may provide services provided that proposed assignments
are put out to tender and decisions to award work are taken on the basis of demonstrable competence and cost effectiveness. However, the external auditors are specifically prohibited from performing work related to accounting records and financial statements that will ultimately be subject to external audit; management of or significant involvement in internal audit services; any work that could compromise the independence of the external auditors; and any other work that is prohibited by UK ethical guidance.
66 Experian Annual Report 2012 Governance
Report on directors’ remuneration
Chairman’s introduction and highlights
The Committee, whose membership, remit and responsibilities are set out in the statement on corporate governance, continues to assess how best to support and encourage the executive directors to create shareholder value and ensure that the Group’s remuneration policy is aligned with shareholders’ interests. Our report sets out how we believe that we achieve this.
During the past year the salaries of the executive directors were increased by some 3% which was in line with the wider employee population. The Committee was mindful of the pay restraint which had been exercised across the Group and will ensure that future salary rises will continue to be positioned from this perspective.
Sadly during the year, Paul Brooks, Chief Financial Officer, died and he was succeeded by Brian Cassin who joined the Board on 30 April 2012. The Committee approved the remuneration arrangements for Brian Cassin and further details are set out in the relevant sections of this report.
Encouragingly, the Group has once again delivered a strong set of results for shareholders with Benchmark profit before tax of US$1,128m, up 23% on the prior year. As a result a full bonus was payable to the executive directors. The Committee had set stretching targets at the beginning of the year and required material outperformance for the payout that was earned.
This underlines our view that exceptional rewards are only paid for exceptional performance. Don Robert and Chris Callero have elected to defer 100% of their bonus into the Co-investment Plan, as they always have done, which the Committee welcomes as a strong signal of their confidence in the Company and further strengthening of their alignment of interests with those of shareholders.
Performance over the longer-term has also been strong, delivering average annual growth in benchmark profit before tax and earnings per share of 12% and 9.7% respectively over the last three years.
The relevant performance conditions for long-term incentive awards granted in June 2009 were measured at 31 March 2012 and, as a result, awards under the Performance Share Plan, Share Option Plan and Co-investment Plans will vest on 18 June 2012.
The Committee is of the opinion that the executive directors are rewarded appropriately and that their remuneration recognises their contribution to the ongoing success of the Group.
We continue to set performance targets that are robust but achievable and we are careful that they are of equivalent stretch from year to year whatever the change in the economic climate or trading conditions.
Above all, the Committee seeks to balance the interests of all stakeholders and is hopeful that shareholders will be able to endorse its activities by supporting the resolution to approve this report on directors’ remuneration which will be proposed at the annual general meeting on 18 July 2012.
“Experian’s remuneration philosophy is that reward should be used to drive long term, sustainable business performance.”
Roger Davis Chairman of the Remuneration Committee
The Remuneration Committee is pleased to present its annual report on directors’ remuneration.
P63
P30

67
Governance
Financial statements
Busin
ess reviewB
usiness overview
Remuneration in summary
This section provides a summary of key remuneration arrangements for our executive directors. More detail of how these were operated during the year ended 31 March 2012, and are intended to be operated in future, is provided later in this report.
Summary of proposed remuneration arrangements for the year ending 31 March 2013
The Committee reviews remuneration arrangements annually to ensure they remain suitable in the light of both internal and external factors. This year, the Committee concluded that the key elements of the existing arrangements remained aligned with the core principles of Experian’s remuneration policy and long-term business strategy and therefore no changes to the overall structure of the remuneration package were required. The Committee agreed the following key changes for the year ending 31 March 2013: • Salaries have been increased in line with salaries for the wider employee population; and• Performance targets have been reviewed by the Committee and as a result the cumulative cash flow target which applies to the
Co-investment Plan has increased. The Committee considered that the other long-term targets remain appropriate.
Summary of annual remuneration earned in 2012Salary‘000s
Annual bonus(1)
‘000sBenefits
‘000sTotal 2012
‘000s
Don Robert US$1,500 US$3,000 US$439 US$4,939
Paul Brooks(2) £408 £980 £24 £1,412
Chris Callero US$960 US$1,920 US$51 US$2,931
1. Don Robert and Chris Callero have deferred their entire annual bonus shown above and will be awarded invested shares under the Co-investment Plan in respect of this deferral. They will have the opportunity to earn matching shares on this deferral, subject to the achievement of performance conditions.
2. Paul Brooks died on 6 January 2012. The salary and benefits figures in the above table are those earned to 31 January 2012; annual bonus is that for the full year ended 31 March 2012.
Summary of long-term remuneration awarded in 2012Shares awarded under Shares awarded under Co-investment Plans
Performance Share Plan(1) Invested shares(2) Matching shares(1)
Don Robert 233,006 221,523 443,046
Paul Brooks 124,129 57,456 239,401
Chris Callero 149,124 142,080 284,160
1. Awards under the Performance Share Plan and matching shares awarded under the Co-investment Plans will only vest to the extent that stretching performance targets are met. These targets are described later in this report.
2. The directors deferred their entire annual bonus for 2011 and the invested shares shown above were awarded in respect of this deferral.

68 Experian Annual Report 2012 Governance
Elements Key features Purpose and link to strategy
Base salary Reflects the competitive market salary for the role
Reviewed annually against level of pay awards throughout the organisation, external market and in the light of Group and personal performance
Takes account of personal contribution and performance against Group strategy
Annual bonus Performance measure is growth in Benchmark profit before tax (‘PBT’)(1)
Maximum bonus for executive directors is 200% of salary
Rewards achievement against a stretching performance condition linked to Experian’s strategy to drive profitable growth
Experian Co-investment Plan
Participants are invited to invest some or all of their annual bonus in Experian shares with the opportunity to earn matching shares (at a maximum of two shares for every one invested) subject to the following performance measures, tested over a three-year period:
• Growth in PBT(1); and• Cumulative operating cash flow (‘cash flow’).
Performance measures directly link to Experian’s strategy to drive profitable growth and optimise capital efficiency
Aligns with shareholder interests through investment of bonus and delivery of shares
Encourages long-term commitment to the Group from participants
Experian Performance Share Plan
An award of shares of up to 200% of salary (in normal circumstances) may be made which vests subject to the following performance measures, tested over a three-year period:
• Growth in PBT(1); and• Total Shareholder Return (‘TSR’) out-
performance against the FTSE 100.
In addition, awards will be subject to the achievement of satisfactory Return on Capital Employed (‘ROCE’) performance
Performance measures directly link to Experian’s strategy to drive profitable growth and optimise capital efficiency
Aligns with shareholder interests through use of TSR performance criteria and delivery in shares
Benefits Defined benefit or defined contribution pension
Other benefits including car and private medical insurance
To provide market appropriate benefits
(1) All subsequent references in the report on director’s remuneration to PBT refer to Benchmark PBT
Summary of remuneration elements
The table below sets out the current structure of the remuneration package for the executive directors:
Report on directors’ remuneration continued

69
Governance
Financial statements
Busin
ess reviewB
usiness overview
Explanation of remuneration
Introduction
This report has been drawn up in line with the UK Corporate Governance Code, Schedule 8 of the Large and Medium-sized Companies and Groups (Accounts and Reports) Regulations 2008 and the UK Financial Services Authority Listing Rules.
The Remuneration Committee: members, role and frequency of meetings
Details of the Committee members, the scope of their role and frequency of meetings can be found in the corporate governance statement.
Working with advisers
In making its decisions, the Committee consults with the Chairman, the Chief Executive Officer and the Group HR Director. Other senior members of Experian’s reward function are also invited to attend meetings of the Committee as appropriate. The Chief Financial Officer is also normally consulted in respect of performance conditions applying to short and long-term incentive arrangements. No executives are present when their own remuneration arrangements are being discussed.
The Committee has access to independent consultants to ensure that it receives objective advice. In 2007, Deloitte LLP (‘Deloitte’) were appointed by the Committee as independent advisers and they continued to act in this role during the year ended 31 March 2012. Deloitte also provided unrelated advisory and tax services to the Group during the year. In addition, Kepler Associates (‘Kepler’) provided remuneration data, incentive plan award valuations and supporting data for the target calibration process. Kepler does not provide any other services to the Group. Linklaters LLP provided legal advice in respect of incentive plan design and interpretation in addition to other legal services to the Group during the year.
Remuneration philosophy and principles
Experian’s remuneration philosophy is that reward should be used to drive long-term, sustainable business performance. In this regard, the Committee aims to have in place remuneration principles for Experian which are consistent with its business objectives and are designed to:• drive accountability and transparency and align remuneration with the interests of shareholders;
• provide a balanced portfolio of incentives which align both short-term (one-year) and longer-term (three-year) performance such that sustainable growth and value are delivered for our shareholders;
• apply demanding performance conditions to deliver sustained profitable growth across the Group, thereby aligning incentives with shareholders’ interests, setting these conditions with due regard to actual and expected market conditions;
• pay base salaries that are market-competitive and appropriate in the context of the individual’s performance and experience as well as the remuneration arrangements throughout the Group;
• provide competitive performance-related compensation which influences performance and helps attract and retain executives by providing the opportunity to earn commensurate rewards for the achievement of outstanding performance, which leads to long-term shareholder value creation; and
• deliver competitive benefits to underpin the other components of the remuneration package.
Consistent with these principles, the Committee compares the Experian remuneration arrangements with those of other relevant organisations and companies of similar size and scope to Experian. The remuneration arrangements are also reviewed in light of changing market conditions, which continue to be challenging. Performance-related incentives are targeted at upper quartile levels for the achievement of stretching objectives. Experian is committed to performance-related pay at all levels within the organisation and the Committee takes into consideration the remuneration arrangements throughout Experian when determining those for the executive directors.
The performance measures used in Experian’s incentive plans are all financial, with growth in profit being the key measure used. This measure was selected as it reflects one of Experian’s key strategic objectives (driving profitable growth). The performance management process, which is used throughout Experian, assesses executives against both financial and non-financial performance objectives. Performance against these individual objectives ultimately supports growth in profit and so the Committee believes it is appropriate that this remains the key measure for the Group’s incentive plans. For the long-term incentive plans, external consultants are used to calculate whether, and the extent to which, the performance conditions have been met.
The management of the Group’s specific business risks is governed by its risk management framework and is inherent in the way in which Experian operates. As a result of this operational focus on risk management, the Committee is satisfied that the incentive arrangements do not encourage excessive risk taking and therefore it is not considered necessary to have a direct link to risk in the performance measures used.
P63
P24
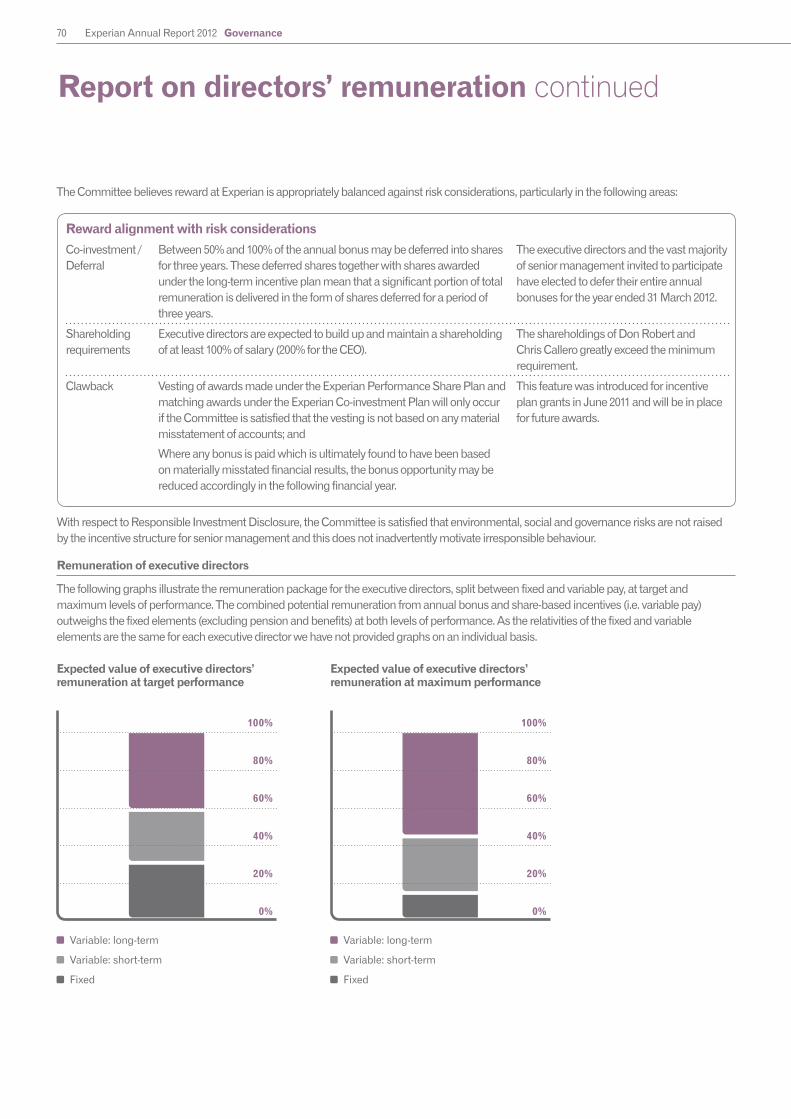
70 Experian Annual Report 2012 Governance
Report on directors’ remuneration continued
Reward alignment with risk considerations
Co-investment / Deferral
Between 50% and 100% of the annual bonus may be deferred into shares for three years. These deferred shares together with shares awarded under the long-term incentive plan mean that a significant portion of total remuneration is delivered in the form of shares deferred for a period of three years.
The executive directors and the vast majority of senior management invited to participate have elected to defer their entire annual bonuses for the year ended 31 March 2012.
Shareholding requirements
Executive directors are expected to build up and maintain a shareholding of at least 100% of salary (200% for the CEO).
The shareholdings of Don Robert and Chris Callero greatly exceed the minimum requirement.
Clawback Vesting of awards made under the Experian Performance Share Plan and matching awards under the Experian Co-investment Plan will only occur if the Committee is satisfied that the vesting is not based on any material misstatement of accounts; and
Where any bonus is paid which is ultimately found to have been based on materially misstated financial results, the bonus opportunity may be reduced accordingly in the following financial year.
This feature was introduced for incentive plan grants in June 2011 and will be in place for future awards.
Expected value of executive directors’ remuneration at target performance
Variable: long-term
Variable: short-term
Fixed
100%
80%
60%
40%
20%
0%
Expected value of executive directors’ remuneration at maximum performance
Variable: long-term
Variable: short-term
Fixed
100%
80%
60%
40%
20%
0%
With respect to Responsible Investment Disclosure, the Committee is satisfied that environmental, social and governance risks are not raised by the incentive structure for senior management and this does not inadvertently motivate irresponsible behaviour.
Remuneration of executive directors
The following graphs illustrate the remuneration package for the executive directors, split between fixed and variable pay, at target and maximum levels of performance. The combined potential remuneration from annual bonus and share-based incentives (i.e. variable pay) outweighs the fixed elements (excluding pension and benefits) at both levels of performance. As the relativities of the fixed and variable elements are the same for each executive director we have not provided graphs on an individual basis.
The Committee believes reward at Experian is appropriately balanced against risk considerations, particularly in the following areas:
71
Governance
Financial statements
Busin
ess reviewB
usiness overview
Salary to31 March 2012
Salary from1 April 2012
Percentageincrease
Don Robert US$1,500,000 US$1,550,000 3.3%
Chris Callero US$960,000 US$990,000 3.1%
Brian Cassin1 – £450,000 –1. Brian Cassin’s salary is from 30 April 2012 when he joined the Company.
Service contracts
Each executive director has a rolling service contract which can be terminated by the Group giving twelve months’ notice. In the event of termination of the director’s contract, any compensation payment is calculated in accordance with normal legal principles, including the application of mitigation to the extent appropriate in the circumstances of the case. Further details are provided in the section entitled ‘Executive directors’ service contracts’.
Fixed remuneration
Base salary and benefitsBefore making a final decision on individual salary awards, the Committee assesses each director’s individual performance and experience as well as average pay increases awarded to other employees in the Group. To assess the appropriate salary for a role, benchmark data, sourced from external remuneration consultants, is provided to the Committee. Executive directors’ salaries are benchmarked against those of executive directors from the companies in the FTSE 100 Index along with other global comparators, reflecting the markets from which Experian recruits talent. These include, but are not limited to, international companies of a similar size and geographic scope, companies in the financial services and related industries and companies with significant operations in the same markets as Experian.
The Committee reviewed salaries in early 2012 and, taking into account the factors described above, approved increases as detailed below. These increases are in line with those awarded to the wider employee population.
In addition to base salary, executive directors receive certain benefits-in-kind including a car or car allowance, private health cover and life assurance. These are set at market competitive levels for each role.
Pensions In the UK, a defined contribution plan is available for all employees, with an employer contribution rate (in normal circumstances) of up to 20% for the most senior executives. Retirement age is 65 but benefits can be taken from age 55 onwards.
The UK defined benefit arrangements are closed to new entrants, subject only to exceptions approved by the Committee on a case by case basis. There are no directors who are members of the UK defined benefit scheme.
In the US, Experian provides a Personal Investment Plan (401k) which all US employees, including directors, are eligible to join. This is a defined contribution arrangement to which participants are able to contribute up to 50% of salary, up to a maximum salary and participant contribution limit established by the IRS, each calendar year. A supplementary unfunded defined benefit arrangement is provided in the US for Don Robert.
Variable remuneration
Annual bonusAnnual bonuses are awarded for achieving profit growth targets. The Committee believes this is appropriate as it reflects one of Experian’s key strategic objectives (driving profitable growth). The maximum bonus opportunity for executive directors is 200% of base salary. However, this level of annual bonus is only payable if Experian’s financial performance surpasses stretching profit growth targets, designed to deliver exceptional results to shareholders. The calibration of these targets is based on benchmarks that reflect stretching internal and external expectations. The benchmarks considered include: broker earnings estimates, earnings estimates for competitors, latest projections for the current year, budget and strategic plan.
Annual bonus in respect of the year ended 31 March 2012The Committee set targets for the annual bonus in respect of the year ended 31 March 2012 which required stretching levels of performance (with reference to relevant external benchmarks) in order for maximum bonus to be earned. Experian delivered exceptional profit growth over the year in an economic environment which continued to be challenging in most of the markets in which we operate. The level of profit growth achieved exceeded the maximum target set by the Committee and so a bonus of 200% of salary was payable to the executive directors.
Co-investment PlanThe Experian Co-investment Plan (the ‘CIP’) provides the executive directors with the opportunity to defer between 50% and 100% of their annual bonus into Experian shares (‘invested shares’) that are matched with an additional award of shares (‘matching shares’) with the maximum match being calculated on the basis of two matching shares for each invested share (‘2:1 basis’). If no annual bonus is earned in the year there can be no participation in the CIP. The release of invested shares and matching shares is deferred for three years and the release of the matching shares is subject to performance conditions which are measured over that period.
P81

72 Experian Annual Report 2012 Governance
Report on directors’ remuneration continued
The operation of the CIP is described in the following schematic:
Performance conditions are determined by the Committee in advance of grant and dividend equivalents accrue on these awards. If a participant resigns during the three-year period they forfeit the right to the matching shares and the associated dividends, although they would be entitled to retain any invested shares. Matching awards under the CIP may vest early in the event of a change of control but will be pro-rated for time and performance.
Details of the awards granted in June 2011 are given in the table entitled ‘GUS and Experian Co-investment Plans and Experian Reinvestment Plans’.
CIP performance metricsFrom 2010 the vesting of awards under the CIP has been based 50% on the achievement of a growth in PBT performance condition, measured over three years, with the other 50% subject to the achievement of a three-year cash flow target. The Committee selected these two performance measures as they reflect two of Experian’s key strategic objectives (driving profitable growth and optimising capital efficiency).
The executive directors have elected to defer 100% of their bonus earned in respect of the year ended 31 March 2012 into the CIP. It is intended that the same performance measures will be used for the matching awards to be made in May 2012 as for the awards made in June 2011 (i.e. growth in PBT and cash flow). Economic conditions continue to be challenging and as a result the Committee believes that the PBT growth target set in 2011 continues to be appropriately calibrated. The cash flow target has been increased to reflect the Group’s increasing absolute profitability. Both performance conditions will be measured over a three-year period and the specific targets for the May 2012 awards are set out in the following tables along with the targets for the 2010 and 2011 awards:
* straight line vesting between points
In addition, vesting of any awards made in June 2011 and May 2012 will be subject to the Committee being satisfied that the vesting is not based on financial results which have been materially misstated.
Invested shares Invested shares released in full
Annual bonus, where earned, is deferred and invested in Experian shares
Matching shares (Up to 2 : 1 match on Invested shares). Committee sets performance targets
Matching shares released to the extent that performance conditions are satisfied
Three year deferral period
Three year performance period
PBT growth (50% of an award)
Vesting*0% 50% 100%
2010 Below 5% 5% 11%
2011 Below 7% 7% 14%
2012 Below 7% 7% 14%
Cash flow (50% of an award)
Vesting*0% 50% 100%
2010 Below $2.9bn $2.9bn $3.3bn
2011 Below $3.0bn $3.0bn $3.4bn
2012 Below $3.7bn $3.7bn $4.1bn
P79

73
Governance
Financial statements
Busin
ess reviewB
usiness overview
Annual bonus and CIP in respect of the year ending 31 March 2013It is intended that annual bonus arrangements and the operation of the CIP for executive directors will remain unchanged for the year ending 31 March 2013. For matching shares awarded under the CIP, the final performance measures and targets will be determined shortly before the awards are made in May 2012 and will be disclosed at the appropriate time. However, the Committee undertakes to ensure that any targets, whilst they must be seen as achievable to retain and motivate executives during the deferral period, are sufficiently stretching in order to deliver significant shareholder value.
Experian Performance Share Plan (the ‘PSP’)Under the PSP, shares are awarded to participants subject to the achievement of performance conditions, which are measured over a three-year period. The maximum award under the PSP is normally 200% of base salary, although up to 400% of salary may be awarded under exceptional circumstances. Any vesting occurs three years from the date of grant and dividend equivalents accrue on the vested shares. Awards under the PSP may vest early in the event of a change of control but will be pro-rated for time and performance.
Details of the awards granted in June 2011 are given in the table entitled ‘Performance Share Plan’.
The operation of the PSP is described in the following schematic:
PSP performance metricsThe vesting of awards under the PSP is based 75% on the achievement of a growth in PBT performance condition, measured over three years, with the other 25% subject to the achievement of a TSR target. The Committee has selected these two performance measures as they reflect a key strategic objective of Experian (driving profitable growth) and represent the value delivered to shareholders relative to Experian’s peers.
The performance targets for all outstanding PSP awards, and those expected to be granted in May 2012, are set out in the following tables:
* straight line vesting between points
The Committee has reviewed the calibration of the performance targets and considers that in the light of uncertain market conditions the targets set in 2011 continue to be appropriate for the awards to be made in 2012.
In addition, all outstanding awards are subject to a ROCE performance underpin. Additionally, a clawback feature was introduced in 2011 whereby the vesting of awards granted in June 2011, and in the future, is subject to the Committee being satisfied that the vesting is not based on financial results which have been materially misstated.
75% of the award is subject to growth in PBT
Shares subject to growth in PBT vest to the extent that the performance condition is satisfied
Awards granted to participants.Remuneration Committee sets performance targets
25% of the award is subject to TSR performance
Shares subject to TSR performance vest to the extent that the performance condition is satisfied
Three yearperformanceperiod
PBT growth (75% of an award)
Vesting*0% 25% 100%
2010 Below 5% 5% 11%
2011 Below 7% 7% 14%
2012 Below 7% 7% 14%
TSR vs. FTSE 100 - % outperformance (25% of an award)
Vesting*0% 25% 100%
2010 Below Index Equal to Index 25% Above Index
2011 Below Index Equal to Index 25% Above Index
2012 Below Index Equal to Index 25% Above Index
P80

74 Experian Annual Report 2012 Governance
Experian Share Option Plan (‘ESOP’)As has been the policy from 2010, no grants were made under this plan in 2011 and the Committee has agreed this will also be the case for 2012 (other than in exceptional circumstances). The maximum award under the ESOP is normally 200% of base salary, although up to 400% of salary may be awarded under exceptional circumstances. Use of the ESOP in the future will remain under review by the Committee. Details of outstanding awards under the ESOP and the associated performance conditions are set out in the table entitled ‘Share options’.
Experian Sharesave Plans All executive directors and employees of the Company, and any participating subsidiaries in which Sharesave or a local equivalent is operated, are eligible to participate if they are employed by the Group at a qualifying date. As an example of these plans, the UK Sharesave Plan provides an opportunity for employees to save a regular monthly amount, over either three or five years, and, at the end of that period, the savings may be used to purchase Experian shares at up to 20% below market value at the date of grant.
One-off share award to Brian Cassin
Brian Cassin joined the Board on 30 April 2012. In order to facilitate his recruitment, the Company has agreed to grant him a one-off share award to compensate him for the loss of incentives from his previous employer. The award will vest, subject to Brian Cassin’s continued employment, over a period of five years. The award is expected to be granted in May 2012 and will have a face value of approximately £1.3m. Full details of the award will be disclosed at the time it is granted and in next year’s remuneration report, as appropriate. The award is not pensionable and any amendments to the terms of the award which would be to Brian Cassin’s advantage (apart from certain minor amendments) are subject to shareholder approval.
Shares released to participants in the year ended 31 March 2012
Experian Reinvestment PlansAt demerger, outstanding awards under the GUS Co-investment Plans were reinvested in awards under the Experian Reinvestment Plans with matching awards available subject to further performance conditions, based on PBT growth and continued employment. Any vested matching shares were released in three tranches on the third, fourth and fifth anniversary of the date of grant. Following the end of the performance period in March 2009, the Committee determined that 92% of the awards subject to the PBT performance condition would vest and in the year ended 31 March 2012, the last tranche of the award was released to the executive directors. Details of these shares are set out in the table entitled ‘GUS and Experian Co-investment Plans and Experian Reinvestment Plans’.
Experian Performance Share PlanAt demerger, executive directors received share awards under the Experian PSP with a face value of two times salary that were subject to PBT and TSR performance conditions. When these were tested at the end of the performance period in October 2009, the Committee determined that 80.7% of the awards would vest. Whilst the measurement period was over the three years from the date of grant, the release of the awards was deferred for a further two years (i.e. until the 5th anniversary of the date of grant). These awards therefore vested in October 2011 and details of the shares released are set out in the table entitled ‘Performance Share Plan’.
Outcome of performance testing for performance periods ending on 31 March 2012
Experian Share Option PlanIn June 2009 participants were granted options subject to the achievement of a growth in benchmark earnings per share (‘EPS’) target measured over a three-year performance period that ended as at 31 March 2012. For EPS growth of at least 4% per annum on average 25% of an option would vest, rising on a straight-line basis to full vesting for EPS growth of at least 8% per annum on average. Vesting is also subject to the Committee confirming that ROCE performance has been satisfactory. The Committee tested the performance condition as at 31 March 2012 and determined that the average annual EPS growth over the period was 9.7% and that ROCE performance was satisfactory, as a result of which 100% of the awards will vest on 18 June 2012.
Experian Co-investment PlansFor awards granted under the Co-investment Plan and the North America Co-investment Plan in June 2009, the matching shares were subject to the achievement of growth in PBT of at least 3% per annum on average over the three-year performance period ending as at 31 March 2012. The Committee tested this performance condition as at 31 March 2012 and determined that the average annual PBT growth over the period was 12% and as a result, 100% of the awards will vest on 18 June 2012.
Experian Performance Share PlanPSP awards granted in June 2009 were subject to performance conditions measured over the three years ending as at 31 March 2012. 75% of an award would vest subject to the achievement of a growth in PBT target. For PBT growth of at least 4% per annum on average 25% of the award would vest, rising on a straight-line basis to full vesting for PBT growth of at least 8% per annum on average. The remaining 25% of an award would vest subject to the achievement of a TSR target with 25% of this part of an award vesting if the TSR of Experian was at least equal to that of the FTSE 100 Index, rising on a straight-line basis such that this part of the award would vest in full if Experian’s TSR exceeds that of the FTSE 100 Index by at least 25%. Vesting is also subject to the Committee confirming that ROCE performance has been satisfactory.
Report on directors’ remuneration continued
P78
P80
P79
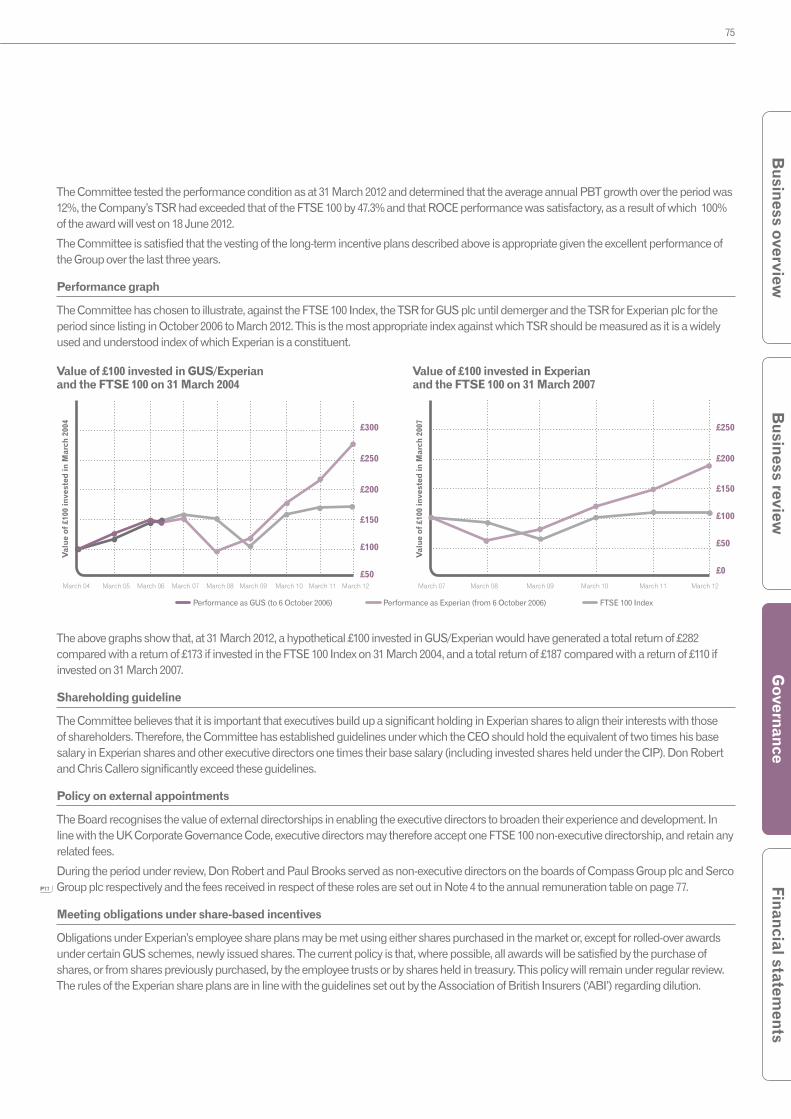
75
Governance
Financial statements
Busin
ess reviewB
usiness overview
The Committee tested the performance condition as at 31 March 2012 and determined that the average annual PBT growth over the period was 12%, the Company’s TSR had exceeded that of the FTSE 100 by 47.3% and that ROCE performance was satisfactory, as a result of which 100% of the award will vest on 18 June 2012.
The Committee is satisfied that the vesting of the long-term incentive plans described above is appropriate given the excellent performance of the Group over the last three years.
Performance graph
The Committee has chosen to illustrate, against the FTSE 100 Index, the TSR for GUS plc until demerger and the TSR for Experian plc for the period since listing in October 2006 to March 2012. This is the most appropriate index against which TSR should be measured as it is a widely used and understood index of which Experian is a constituent.
Val
ue
of £
100
inve
sted
in M
arch
200
4
Performance as GUS (to 6 October 2006) Performance as Experian (from 6 October 2006) FTSE 100 Index
Value of £100 invested in GUS/Experian and the FTSE 100 on 31 March 2004
£300
£250
£200
£150
£100
£50 March 04 March 05 March 06 March 07 March 08 March 09 March 10 March 11 March 12
Value of £100 invested in Experian and the FTSE 100 on 31 March 2007
£250
£200
£150
£100
£50
£0
March 07 March 08 March 09 March 10 March 11 March 12
Val
ue
of £
100
inve
sted
in M
arch
200
7
The above graphs show that, at 31 March 2012, a hypothetical £100 invested in GUS/Experian would have generated a total return of £282 compared with a return of £173 if invested in the FTSE 100 Index on 31 March 2004, and a total return of £187 compared with a return of £110 if invested on 31 March 2007.
Shareholding guideline
The Committee believes that it is important that executives build up a significant holding in Experian shares to align their interests with those of shareholders. Therefore, the Committee has established guidelines under which the CEO should hold the equivalent of two times his base salary in Experian shares and other executive directors one times their base salary (including invested shares held under the CIP). Don Robert and Chris Callero significantly exceed these guidelines.
Policy on external appointments
The Board recognises the value of external directorships in enabling the executive directors to broaden their experience and development. In line with the UK Corporate Governance Code, executive directors may therefore accept one FTSE 100 non-executive directorship, and retain any related fees.
During the period under review, Don Robert and Paul Brooks served as non-executive directors on the boards of Compass Group plc and Serco Group plc respectively and the fees received in respect of these roles are set out in Note 4 to the annual remuneration table on page 77.
Meeting obligations under share-based incentives
Obligations under Experian’s employee share plans may be met using either shares purchased in the market or, except for rolled-over awards under certain GUS schemes, newly issued shares. The current policy is that, where possible, all awards will be satisfied by the purchase of shares, or from shares previously purchased, by the employee trusts or by shares held in treasury. This policy will remain under regular review. The rules of the Experian share plans are in line with the guidelines set out by the Association of British Insurers (‘ABI’) regarding dilution.
P77

76 Experian Annual Report 2012 Governance
Remuneration of non-executive directors
The Board’s policy on the remuneration of non-executive directors is that:
• fees should reflect individual responsibilities and membership of Board committees;
• remuneration should be in line with recognised best practice and be sufficient to attract, motivate and retain high calibre non-executives; and
• remuneration should be a combination of cash fees (paid quarterly) and Experian shares (see below) to help align the interests of non- executive directors with those of shareholders.
Non-executive directors do not receive any benefits-in-kind with the exception of the Chairman who receives private healthcare and the use of a company car.
The fees of the non-executive directors were reviewed with effect from 1 October 2011, taking into account market practice in FTSE 100 companies, anticipated number of days worked, tasks and responsibilities. The current fees are shown in the table below and these will next be reviewed in October 2013.
The Chairman’s fee was reviewed by the Committee in early 2012 and increased by £25,000 to £375,000 with effect from 1 April 2012. This was the first fee review since April 2010 and the next review will be in April 2014.
Experian requires its non-executive directors to build up a holding in the Company’s shares equal to their annual fee. One quarter of their net annual fee is used to purchase Experian shares each year until they reach this holding and such shares are included in the table entitled ‘Directors’ interests’. Any tax liability arising from these arrangements is the responsibility of the individual director. Non-executive directors do not participate in any Experian share plans.
Non-executive directors do not have service contracts but each has a letter of appointment with no provision for any termination payment. Each appointment is for a renewable three-year term, subject to election/re-election by shareholders, but may be terminated by either party on one month’s written notice (six months’ notice in the case of the Chairman).
Report on directors’ remuneration continued
Non-executive directors’ fees from 1 October 2009
Non-executive directors’ fees from 1 October 2011
Base fee €120,000 €125,000
Plus additional fees for:
Senior Independent Director (to 15 September 2010) €22,000 -
Deputy Chairman/Senior Independent Director(1) (from 15 September 2010) - €80,000
Chairman of Audit Committee(2) €35,000 €35,000
Chairman of Remuneration Committee(2) €27,000 €27,000
Notes
1. Sir Alan Rudge, Senior Independent Director, was appointed Deputy Chairman with effect from 15 September 2010. As the level of his additional fee for the role was reviewed then, no further review was made in October 2011.
2. Fees for the Committee Chairmen were considered to remain competitive and were therefore unchanged in October 2011.
P82
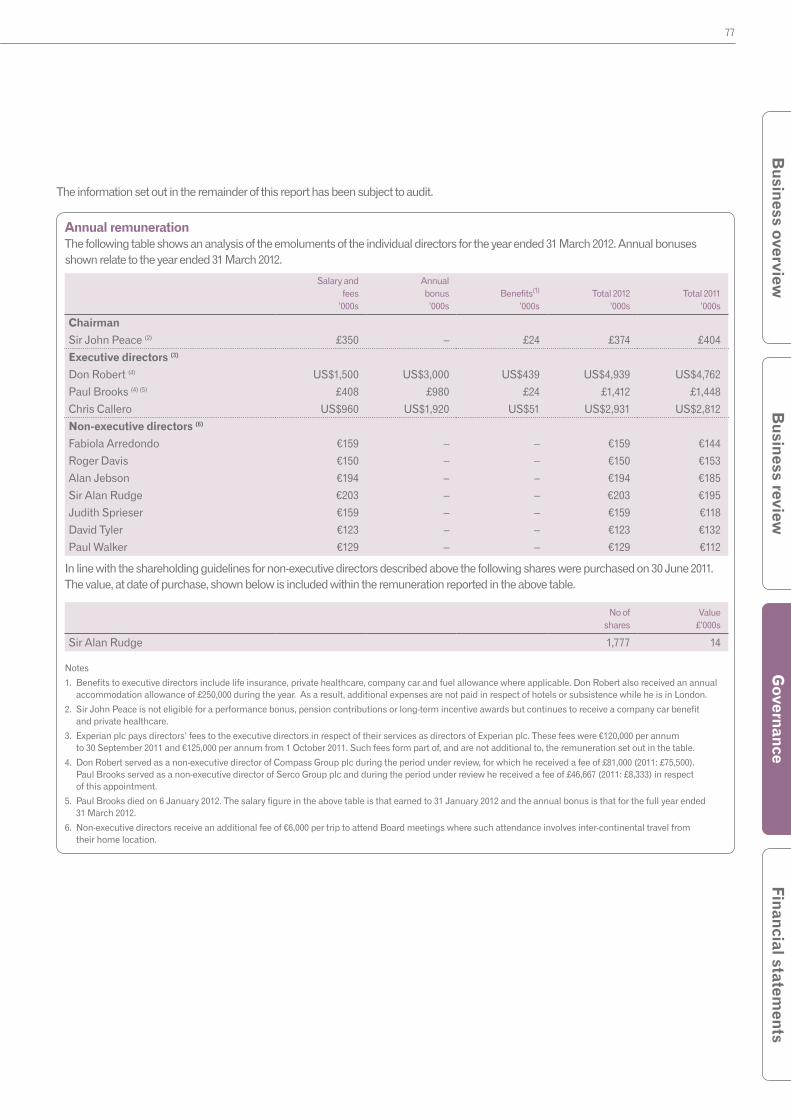
77
Governance
Financial statements
Busin
ess reviewB
usiness overview
The information set out in the remainder of this report has been subject to audit.
Annual remuneration The following table shows an analysis of the emoluments of the individual directors for the year ended 31 March 2012. Annual bonuses shown relate to the year ended 31 March 2012.
Salary and fees
’000s
Annual bonus
’000s Benefits(1)
’000sTotal 2012
’000sTotal 2011
’000s
Chairman
Sir John Peace (2) £350 – £24 £374 £404
Executive directors (3)
Don Robert (4) US$1,500 US$3,000 US$439 US$4,939 US$4,762
Paul Brooks (4) (5) £408 £980 £24 £1,412 £1,448
Chris Callero US$960 US$1,920 US$51 US$2,931 US$2,812
Non-executive directors (6)
Fabiola Arredondo €159 – – €159 €144
Roger Davis €150 – – €150 €153
Alan Jebson €194 – – €194 €185
Sir Alan Rudge €203 – – €203 €195
Judith Sprieser €159 – – €159 €118
David Tyler €123 – – €123 €132
Paul Walker €129 – – €129 €112
In line with the shareholding guidelines for non-executive directors described above the following shares were purchased on 30 June 2011. The value, at date of purchase, shown below is included within the remuneration reported in the above table.
No of shares
Value£’000s
Sir Alan Rudge 1,777 14
Notes
1. Benefits to executive directors include life insurance, private healthcare, company car and fuel allowance where applicable. Don Robert also received an annual accommodation allowance of £250,000 during the year. As a result, additional expenses are not paid in respect of hotels or subsistence while he is in London.
2. Sir John Peace is not eligible for a performance bonus, pension contributions or long-term incentive awards but continues to receive a company car benefit and private healthcare.
3. Experian plc pays directors’ fees to the executive directors in respect of their services as directors of Experian plc. These fees were €120,000 per annum to 30 September 2011 and €125,000 per annum from 1 October 2011. Such fees form part of, and are not additional to, the remuneration set out in the table.
4. Don Robert served as a non-executive director of Compass Group plc during the period under review, for which he received a fee of £81,000 (2011: £75,500). Paul Brooks served as a non-executive director of Serco Group plc and during the period under review he received a fee of £46,667 (2011: £8,333) in respect of this appointment.
5. Paul Brooks died on 6 January 2012. The salary figure in the above table is that earned to 31 January 2012 and the annual bonus is that for the full year ended 31 March 2012.
6. Non-executive directors receive an additional fee of €6,000 per trip to attend Board meetings where such attendance involves inter-continental travel from their home location.

78 Experian Annual Report 2012 Governance
Report on directors’ remuneration continued
Share options Details of options granted to directors under the Experian Share Option Plan and the GUS Executive Share Option Schemes are set out in the table below.
Date of grant
Number of shares
under option at
1 April 2011
Exerciseprice Granted Exercised
Experianshare price
on date of exercise Lapsed
Total number
of shares under
option at 31 March
2012
Date from which
exercisable/expiry date
Executive directors
Don Robert 31.05.05 132,091 483.1p – – – – 31.05.08 – 30.05.15
02.06.06 133,184 521.1p – – – – 02.06.09 – 01.06.16
18.06.09 552,453 464.0p – – – – 18.06.12 – 17.06.19
817,728
Paul Brooks 31.05.05 59,368 483.1p – – – – 31.05.08 – 06.01.13
02.06.06 54,883 521.1p – – – – 02.06.09 – 06.01.13
18.06.09 198,275 464.0p – – – – 06.01.12 – 06.01.13
312,526
Chris Callero 02.06.06 153,675 521.1p – 153,675 785.5p –
18.06.09 236,765 464.0p – – – – 18.06.12 – 17.06.19
236,765
Non-executive directors
David Tyler 02.06.06 104,585 521.1p – 104,585 785.0p – –
Notes:
1. Options granted in 2006 or earlier were originally granted under the GUS Executive Share Option Schemes and were exchanged for equivalent options over Experian plc shares on demerger.
2. Options granted to Chris Callero in 2006 were granted under The GUS plc North America Stock Option Plan. Vesting of these options was not subject to performance conditions. The 2005 and 2006 grants to Don Robert and Paul Brooks were made under the GUS Executive Share Option Scheme. These options vested subject to the achievement of performance conditions which were met in full.
3. Options were granted to David Tyler in respect of his role as an executive director of GUS plc. On demerger, he was eligible to exchange his options for equivalent options over Experian shares on the same basis as other participants. These options were exercised during the year.
4. The options granted in June 2009 are subject to the achievement of a growth in benchmark earnings per share (‘EPS’) target measured over a three-year performance period that ended on 31 March 2012. 25% of an option will vest if growth in EPS is at least 4% per annum on average. Vesting increases on a straight-line basis such that the option will be fully exercisable if growth in EPS over the performance period is at least 8% per annum on average. Vesting is also subject to satisfactory ROCE. The Company’s EPS growth was such that 100% of the awards will vest on 18 June 2012.
5. Paul Brooks died on 6 January 2012 and in line with the rules of the Share Option Plan unvested options vested at that date. All options will remain exercisable for a further 12 months.
6. The market price of Experian plc shares at 31 March 2012 was 975p; the highest and lowest prices during the financial year then ended were 996p and 665p respectively.
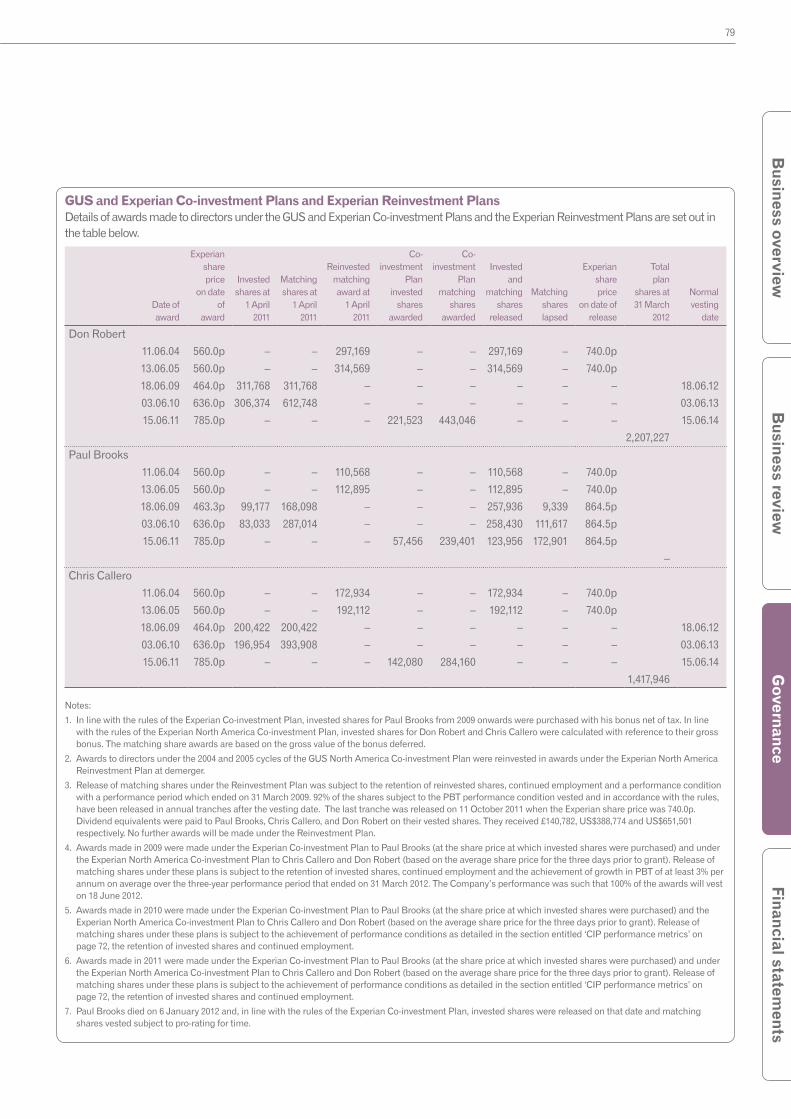
79
Governance
Financial statements
Busin
ess reviewB
usiness overview
GUS and Experian Co-investment Plans and Experian Reinvestment Plans Details of awards made to directors under the GUS and Experian Co-investment Plans and the Experian Reinvestment Plans are set out in the table below.
Date of award
Experianshareprice
on date of
award
Investedshares at
1 April 2011
Matchingshares at
1 April 2011
Reinvestedmatchingaward at
1 April 2011
Co-investment
Planinvested
sharesawarded
Co-investment
Planmatching
shares awarded
Investedand
matchingshares
released
Matchingshareslapsed
Experianshareprice
on date ofrelease
Totalplan
shares at31 March
2012
Normalvesting
date
Don Robert
11.06.04 560.0p – – 297,169 – – 297,169 – 740.0p
13.06.05 560.0p – – 314,569 – – 314,569 – 740.0p
18.06.09 464.0p 311,768 311,768 – – – – – – 18.06.12
03.06.10 636.0p 306,374 612,748 – – – – – – 03.06.13
15.06.11 785.0p – – – 221,523 443,046 – – – 15.06.14
2,207,227
Paul Brooks
11.06.04 560.0p – – 110,568 – – 110,568 – 740.0p
13.06.05 560.0p – – 112,895 – – 112,895 – 740.0p
18.06.09 463.3p 99,177 168,098 – – – 257,936 9,339 864.5p
03.06.10 636.0p 83,033 287,014 – – – 258,430 111,617 864.5p
15.06.11 785.0p – – – 57,456 239,401 123,956 172,901 864.5p
–
Chris Callero
11.06.04 560.0p – – 172,934 – – 172,934 – 740.0p
13.06.05 560.0p – – 192,112 – – 192,112 – 740.0p
18.06.09 464.0p 200,422 200,422 – – – – – – 18.06.12
03.06.10 636.0p 196,954 393,908 – – – – – – 03.06.13
15.06.11 785.0p – – – 142,080 284,160 – – – 15.06.14
1,417,946
Notes:
1. In line with the rules of the Experian Co-investment Plan, invested shares for Paul Brooks from 2009 onwards were purchased with his bonus net of tax. In line with the rules of the Experian North America Co-investment Plan, invested shares for Don Robert and Chris Callero were calculated with reference to their gross bonus. The matching share awards are based on the gross value of the bonus deferred.
2. Awards to directors under the 2004 and 2005 cycles of the GUS North America Co-investment Plan were reinvested in awards under the Experian North America Reinvestment Plan at demerger.
3. Release of matching shares under the Reinvestment Plan was subject to the retention of reinvested shares, continued employment and a performance condition with a performance period which ended on 31 March 2009. 92% of the shares subject to the PBT performance condition vested and in accordance with the rules, have been released in annual tranches after the vesting date. The last tranche was released on 11 October 2011 when the Experian share price was 740.0p. Dividend equivalents were paid to Paul Brooks, Chris Callero, and Don Robert on their vested shares. They received £140,782, US$388,774 and US$651,501 respectively. No further awards will be made under the Reinvestment Plan.
4. Awards made in 2009 were made under the Experian Co-investment Plan to Paul Brooks (at the share price at which invested shares were purchased) and under the Experian North America Co-investment Plan to Chris Callero and Don Robert (based on the average share price for the three days prior to grant). Release of matching shares under these plans is subject to the retention of invested shares, continued employment and the achievement of growth in PBT of at least 3% per annum on average over the three-year performance period that ended on 31 March 2012. The Company’s performance was such that 100% of the awards will vest on 18 June 2012.
5. Awards made in 2010 were made under the Experian Co-investment Plan to Paul Brooks (at the share price at which invested shares were purchased) and the Experian North America Co-investment Plan to Chris Callero and Don Robert (based on the average share price for the three days prior to grant). Release of matching shares under these plans is subject to the achievement of performance conditions as detailed in the section entitled ‘CIP performance metrics’ on page 72, the retention of invested shares and continued employment.
6. Awards made in 2011 were made under the Experian Co-investment Plan to Paul Brooks (at the share price at which invested shares were purchased) and under the Experian North America Co-investment Plan to Chris Callero and Don Robert (based on the average share price for the three days prior to grant). Release of matching shares under these plans is subject to the achievement of performance conditions as detailed in the section entitled ‘CIP performance metrics’ on page 72, the retention of invested shares and continued employment.
7. Paul Brooks died on 6 January 2012 and, in line with the rules of the Experian Co-investment Plan, invested shares were released on that date and matching shares vested subject to pro-rating for time.
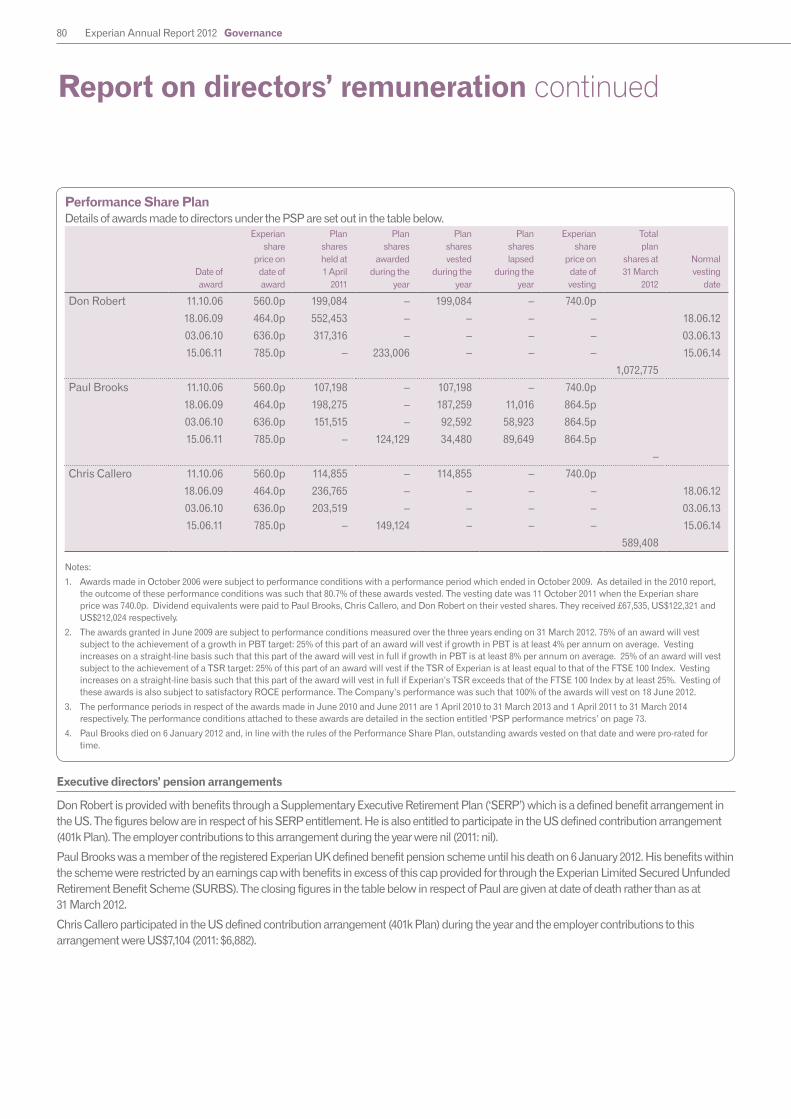
80 Experian Annual Report 2012 Governance
Report on directors’ remuneration continued
Performance Share Plan Details of awards made to directors under the PSP are set out in the table below.
Date ofaward
Experianshare
price ondate ofaward
Planshares held at 1 April
2011
Planshares
awardedduring the
year
Plansharesvested
during theyear
Planshareslapsed
during theyear
Experianshare
price ondate ofvesting
Totalplan
shares at31 March
2012
Normalvesting
date
Don Robert 11.10.06 560.0p 199,084 – 199,084 – 740.0p
18.06.09 464.0p 552,453 – – – – 18.06.12
03.06.10 636.0p 317,316 – – – – 03.06.13
15.06.11 785.0p – 233,006 – – – 15.06.14
1,072,775
Paul Brooks 11.10.06 560.0p 107,198 – 107,198 – 740.0p
18.06.09 464.0p 198,275 – 187,259 11,016 864.5p
03.06.10 636.0p 151,515 – 92,592 58,923 864.5p
15.06.11 785.0p – 124,129 34,480 89,649 864.5p
–
Chris Callero 11.10.06 560.0p 114,855 – 114,855 – 740.0p
18.06.09 464.0p 236,765 – – – – 18.06.12
03.06.10 636.0p 203,519 – – – – 03.06.13
15.06.11 785.0p – 149,124 – – – 15.06.14
589,408
Notes:
1. Awards made in October 2006 were subject to performance conditions with a performance period which ended in October 2009. As detailed in the 2010 report, the outcome of these performance conditions was such that 80.7% of these awards vested. The vesting date was 11 October 2011 when the Experian share price was 740.0p. Dividend equivalents were paid to Paul Brooks, Chris Callero, and Don Robert on their vested shares. They received £67,535, US$122,321 and US$212,024 respectively.
2. The awards granted in June 2009 are subject to performance conditions measured over the three years ending on 31 March 2012. 75% of an award will vest subject to the achievement of a growth in PBT target: 25% of this part of an award will vest if growth in PBT is at least 4% per annum on average. Vesting increases on a straight-line basis such that this part of the award will vest in full if growth in PBT is at least 8% per annum on average. 25% of an award will vest subject to the achievement of a TSR target: 25% of this part of an award will vest if the TSR of Experian is at least equal to that of the FTSE 100 Index. Vesting increases on a straight-line basis such that this part of the award will vest in full if Experian’s TSR exceeds that of the FTSE 100 Index by at least 25%. Vesting of these awards is also subject to satisfactory ROCE performance. The Company’s performance was such that 100% of the awards will vest on 18 June 2012.
3. The performance periods in respect of the awards made in June 2010 and June 2011 are 1 April 2010 to 31 March 2013 and 1 April 2011 to 31 March 2014 respectively. The performance conditions attached to these awards are detailed in the section entitled ‘PSP performance metrics’ on page 73.
4. Paul Brooks died on 6 January 2012 and, in line with the rules of the Performance Share Plan, outstanding awards vested on that date and were pro-rated for time.
Executive directors’ pension arrangements
Don Robert is provided with benefits through a Supplementary Executive Retirement Plan (‘SERP’) which is a defined benefit arrangement in the US. The figures below are in respect of his SERP entitlement. He is also entitled to participate in the US defined contribution arrangement (401k Plan). The employer contributions to this arrangement during the year were nil (2011: nil).
Paul Brooks was a member of the registered Experian UK defined benefit pension scheme until his death on 6 January 2012. His benefits within the scheme were restricted by an earnings cap with benefits in excess of this cap provided for through the Experian Limited Secured Unfunded Retirement Benefit Scheme (SURBS). The closing figures in the table below in respect of Paul are given at date of death rather than as at 31 March 2012.
Chris Callero participated in the US defined contribution arrangement (401k Plan) during the year and the employer contributions to this arrangement were US$7,104 (2011: $6,882).

81
Governance
Financial statements
Busin
ess reviewB
usiness overview
The directors’ pension entitlements in respect of benefits from registered and non-registered defined benefit schemes and arrangements are detailed in the table below.
Executive directors’ service contracts
Don Robert has a service agreement with Experian Services Corporation (‘ESC’) dated 7 August 2006. This provides that, if his employment is terminated by ESC without cause, he is entitled to the following severance payments: continued payment of monthly salary for 12 months from the termination date; 12 months’ participation in welfare benefit plans in which he participated during his employment; and an annual bonus based on 100% achievement of objectives payable in equal monthly instalments for 12 months. The same amounts are payable by ESC if Don Robert terminates the contract: (i) following material breach by ESC; or (ii) for Good Reason following a change of control of ESC. Good Reason means, during the six month period following a change of control, a material and substantial adverse reduction or change in Don Robert’s position. These terms are in line with US practice.
Don Robert’s service agreement also provides for the following payments to be made if the agreement terminates in the event of his death (in addition to payments due but unpaid before death): a pro rata annual bonus for the bonus year to the termination date based on ESC’s performance in that bonus year; and a lump sum equal to 12 months’ base salary to be paid no later than 90 days after the date of death. If the employment is terminated due to Don Robert’s disability, he is entitled to the bonus as described immediately above (in addition to payments due but unpaid before the termination). Any deferred compensation obligations will be governed in accordance with the relevant plan rules. This is consistent with US employment practice.
Paul Brooks was employed under a service agreement dated 2 April 2007. Following his death, his emoluments were paid to the end of January 2012. These emoluments are set out in the relevant tables contained within this report.
Chris Callero has a service agreement, dated 11 June 2009, with ESC which is terminable by 12 months’ notice either from ESC or from Chris Callero.
Brian Cassin has a service contract, dated 29 February 2012, with Experian Limited which is terminable by 12 months’ notice from Experian Limited and by 6 months’ notice from Brian Cassin.
Other than as described above, the service contract of each of the executive directors does not provide for any benefits on the termination of employment. Experian’s policy on service contracts for new executive directors is to follow the UK Corporate Governance Code guidelines and best practice.
Closing accrued pension
per annum(1)
US$’000s
Opening accrued pension
per annum(2)
US$’000s
Closing transfervalue
(3)US$’000s
Opening transfer value
(4)US$’000s
Change intransfer
value (lessdirector’s
contributions)(5)
US$’000s
Additional pension earned (net of inflation)
per annum(6)
US$’000s
Transfer valueof the increase(less director’scontributions)
(7)US$’000s
Don Robert 543 484 11,749 8,465 3,284 34 742
£’000s £’000s £’000s £’000s £’000s £’000s £’000s
Paul Brooks 201 186 4,720 4,065 647 15 340
Four former directors of Experian Finance plc (formerly GUS plc), received unfunded pensions from the Company during the year. Three of the former directors are paid under the SURBS. The total unfunded pensions paid to the former directors was £473,153 (2011: £508,547).
Notes:
Columns (1) and (2) represent the deferred pension to which the director would have been entitled had he left the Group at 31 March 2012 (or date of death in the case of Paul Brooks) and 31 March 2011 respectively. Following Paul's death, benefits were paid to his widow in line with the rules of the Experian Pension Scheme and the Experian Limited SURBS arrangement.
Column (3) is the transfer value of the pension in column (1) calculated as at 31 March 2012 (or date of death in the case of Paul) based on factors supplied by the actuary of the relevant Group pension scheme in accordance with version 8.1 of the UK actuarial guidance note GN11.
Column (4) is the equivalent transfer value, but calculated as at 31 March 2011 on the assumption that the director left service at that date.
Column (5) is the change in transfer value of accrued pension during the year net of contributions by the director. The change in transfer value for Paul includes the change due to the implementation of a new transfer value basis by the Trustee of the Experian Pension Scheme with effect from 1 November 2011.
Column (6) is the increase in pension built up during the year, recognising (i) the accrual rate for the additional service based on the pensionable salary in force at the end of the period, and (ii) where appropriate the effect of pay changes in “real” (inflation adjusted) terms on the pension already earned at the start of the year.
Column (7) represents the transfer value of the pension in column (6).
The disclosures in columns (1) to (5) are equivalent to those required by the large and medium-sized Companies and Groups (Accounts and Reports) Regulations 2008 and those in columns (6) and (7) are those required by the UK Financial Services Authority Listing Rules.
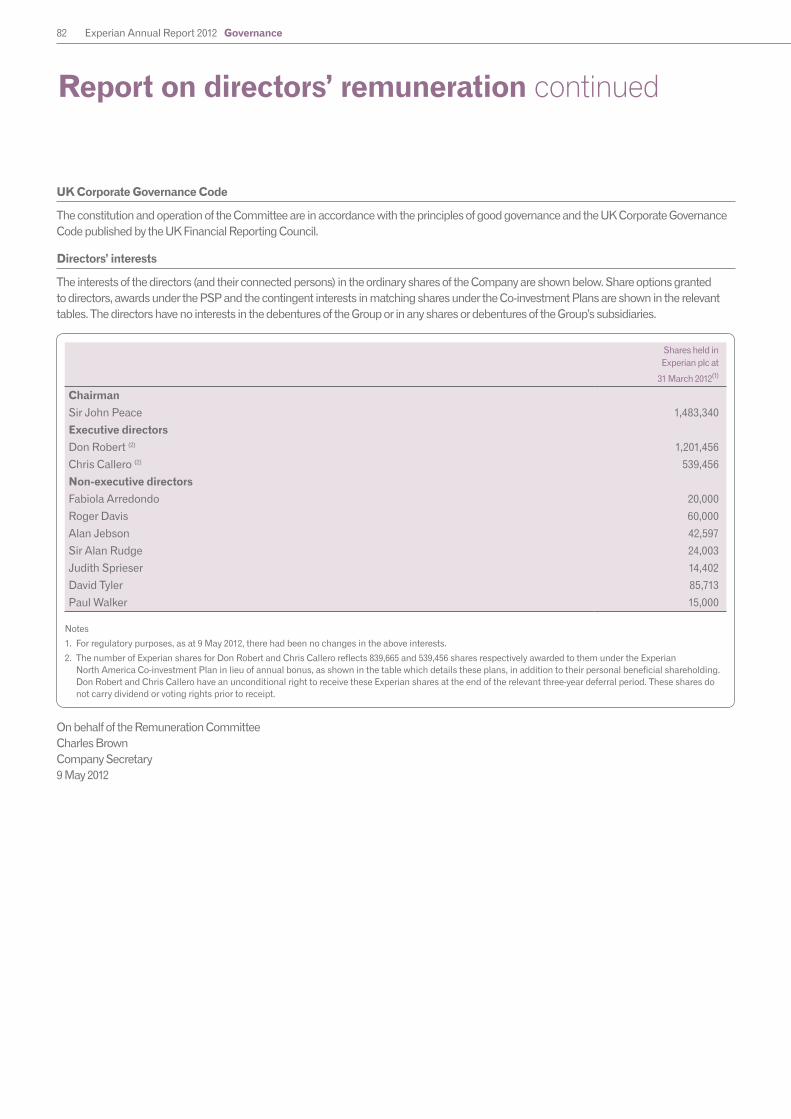
82 Experian Annual Report 2012 Governance
Report on directors’ remuneration continued
Shares held inExperian plc at
31 March 2012(1)
Chairman
Sir John Peace 1,483,340
Executive directors
Don Robert (2) 1,201,456
Chris Callero (2) 539,456
Non-executive directors
Fabiola Arredondo 20,000
Roger Davis 60,000
Alan Jebson 42,597
Sir Alan Rudge 24,003
Judith Sprieser 14,402
David Tyler 85,713
Paul Walker 15,000
Notes
1. For regulatory purposes, as at 9 May 2012, there had been no changes in the above interests.
2. The number of Experian shares for Don Robert and Chris Callero reflects 839,665 and 539,456 shares respectively awarded to them under the Experian North America Co-investment Plan in lieu of annual bonus, as shown in the table which details these plans, in addition to their personal beneficial shareholding. Don Robert and Chris Callero have an unconditional right to receive these Experian shares at the end of the relevant three-year deferral period. These shares do not carry dividend or voting rights prior to receipt.
UK Corporate Governance Code
The constitution and operation of the Committee are in accordance with the principles of good governance and the UK Corporate Governance Code published by the UK Financial Reporting Council.
Directors’ interests
The interests of the directors (and their connected persons) in the ordinary shares of the Company are shown below. Share options granted to directors, awards under the PSP and the contingent interests in matching shares under the Co-investment Plans are shown in the relevant tables. The directors have no interests in the debentures of the Group or in any shares or debentures of the Group’s subsidiaries.
On behalf of the Remuneration Committee Charles Brown Company Secretary 9 May 2012

83
Governance
Financial statements
Busin
ess reviewB
usiness overview
The directors present their report and the audited financial statements for the year ended 31 March 2012. The corporate governance statement forms part of this report.
Principal activities and business review
Experian provides data and analytical tools to organisations in North America, Latin America, UK and Ireland, EMEA and Asia Pacific. Clients use these to manage credit risk, prevent fraud, target marketing offers and automate decision-making. Experian also helps individuals to manage their credit relationships and protect against identity theft. Activities in the regions in which Experian operates are grouped into four global business lines: Credit Services, Decision Analytics, Marketing Services and Interactive.
The business overview and business review sections are incorporated into this directors’ report by reference. They contain details of the development and performance of the Group’s businesses during the year, an indication of the key performance indicators and information regarding principal risks and uncertainties, together with information equivalent to that required for a business review.
Research and development
Research and development plays a key role in supporting Experian’s activities. Details of such activities are given in the business review section.
Results and dividends
The Group income statement shows a profit for the financial year ended 31 March 2012 of US$718m (2011: US$623m). The directors have announced the payment of a second interim dividend in lieu of a final dividend of 21.75 US cents per ordinary share
(2011: 19 US cents) to be paid on 20 July 2012 to shareholders on the register of members on 22 June 2012. An interim dividend of 10.25 US cents per ordinary share was paid on 27 January 2012 giving a total dividend for the year of 32 US cents per ordinary share (2011: 28 US cents).
Directors
The names and biographical details of the directors are shown in the biographies section of the annual report. Paul Brooks served as a director of the Company until his death on 6 January 2012. Brian Cassin was appointed as a director of the Company on 30 April 2012. Deirdre Mahlan and George Rose have been appointed as directors of the Company with effect from 1 September 2012.
Particulars of directors’ remuneration, service contracts and interests in the ordinary shares of the Company are shown in the report on directors’ remuneration. There have been no changes in the directors’ interests in such ordinary shares between the end of the financial year and 9 May 2012.
In accordance with the UK Corporate Governance Code, all directors will retire at the annual general meeting in July 2012 and, being eligible, will offer themselves for election/re-election. An evaluation of Board performance and the performance of individual directors, as well as an evaluation of the performance of the principal Board committees, was carried out during the year ended 31 March 2012 and the Board is satisfied that all directors contribute effectively and demonstrate commitment to their roles. Further details regarding the evaluation process are contained in the corporate governance statement.
Insurance and third party indemnification
During the year and up to the date of approval of this annual report, the Company maintained liability insurance and third party indemnification provisions for its directors.
Acquisitions
Information in respect of acquisitions made during the year is contained in the business review and in note 41 to the Group financial statements.
Post balance sheet events
Details of events occurring after the end of the reporting period are contained in note 47 to the Group financial statements.
Share capital
Details of the authorised and issued share capital of the Company and changes to the Company’s share capital during the year ended 31 March 2012 are set out in note N to the parent company financial statements. The rights and obligations attaching to the ordinary and deferred shares are also set out in note N and the articles of association of the Company, a copy of which can be obtained from the Experian website which is www.experianplc.com.
Substantial shareholdings
Substantial shareholders are required to notify their interests in accordance with the Company’s articles of association, which obliges shareholders to comply with the notification obligations to the Company contained in the UK Disclosure and Transparency Rules. As at 9 May 2012, the Company had been notified of the interests below in its issued ordinary share capital or voting rights. No notifications have been received by the Company between 31 March 2012 and the date of approval of this annual report.
Directors’ report
Substantial shareholdings
Date of notification Shareholder Direct/indirect
interestNumber of ordinary shares/voting rights
Percentage of issuedshare capital/voting rights
14 October 2009 Legal & General Group plc Direct 40,756,800 3.97%
15 February 2011 Artisan Partners Limited Partnership Indirect 50,901,871 4.98%
25 October 2011 BlackRock, Inc. Indirect 55,911,695 5.57%

84 Experian Annual Report 2012 Governance
Directors’ report continued
ADR programme
The Company has a Level 1 American Depositary Receipt (‘ADR’) programme in the USA for which the Bank of New York Mellon acts as depositary. The ADRs are traded on the highest tier of the US over-the-counter market, OTCQX, where each ADR represents one Experian plc ordinary share. Further details are given in the shareholder information section.
Restrictions on transfers of shares and/or voting rights
The Company is not aware of any agreements between shareholders that may result in restrictions on the transfer of securities and/or voting rights and, apart from those matters described below, there are no restrictions on the transfer of ordinary shares in the capital of the Company and/or voting rights:
• Certain restrictions on transfers of shares may from time to time be imposed by, for example, insider dealing regulations. In accordance with the Listing Rules of the UK Financial Services Authority, directors and certain employees are required to seek the approval of the Company to deal in its shares.
• Some of Experian’s share-based employee incentive plans include restrictions on transfer of shares while the shares are subject to the plan.
• As described in the report on directors’ remuneration, non-executive directors receive a proportion of fees in shares until their shareholding reaches one times their annual fee. These shares may not normally be transferred during their period of office.
• Where, under a share-based employee incentive plan operated by Experian, participants are the beneficial owners of the shares but not the registered owner, the voting rights are normally exercised by the registered owner at the direction of the participants.
• Shares held in treasury carry no voting rights for as long as they are held as treasury shares.
• The deferred shares in the Company carry no voting rights.
• No member shall, unless the directors otherwise determine, be entitled in respect of any share held by him/her to vote either personally or by proxy at a shareholders’ meeting or to exercise any other right conferred by membership in relation to shareholders’ meetings if any call or other sum presently payable by him/her to the Company in respect of that share remains unpaid.
• No member shall, unless the directors otherwise determine, be entitled to vote either personally or by proxy at a shareholders’ meeting or to exercise any other right conferred by membership in relation to shareholders’ meetings if he/she fails within the prescribed period to provide the Company with information concerning interests in those shares required to be provided after being duly served with a notice pursuant to the articles of association of the Company.
• In accordance with the articles of association of the Company and save for certain limited circumstances, if the number of shares in the Company beneficially owned by residents of the USA exceeds a defined permitted maximum and the directors give notice to the holder(s) of such shares, such shares shall not confer on the holder(s) thereof the right to receive notice of, attend or vote at general meetings of the Company.
• Details of deadlines in respect of voting for the 2012 annual general meeting are contained in the notice of meeting that has been circulated to shareholders and which can also be viewed at the Company’s website.
Own shares
The existing authority for the Company to purchase its own shares, which expires at the end of this year’s annual general meeting, was given at the annual general meeting held on 20 July 2011 and permitted the Company to purchase, in the market, 99,713,610 of its own shares. The Company did not utilise this authority during the year under review, or up to the date of approval of this annual report. At the date of approval of this annual report, the Company holds 23,995,602 of its own shares as treasury shares.
Details of the new authority being requested at the 2012 annual general meeting are contained in the circular to shareholders, which accompanies this annual report or is available on the Company’s website at www.experianplc.com.
Details of the shares in the Company purchased by and held under The Experian plc Employee Share Trust and the Experian UK Approved All Employee Share Plan are set out in note O to the parent company’s financial statements.
Significant agreements – change of control
There are a number of agreements to which the Group is party that take effect, alter or terminate, or have the potential to do so, upon a change of control of the Company following a takeover bid. Details of the agreements of this nature are:
• The Group’s banking facilities contain provisions which, in the event of a change of control of the Company, could result in a renegotiation or withdrawal of such facilities.
• The £334m 5.625% Euronotes due 2013, the £400m 4.75% Euronotes due 2018 and the €500m 4.75% Euronotes due 2020, issued by the Group, provide that holders may require repayment of the notes in the event that a rating agency re-rates the notes to below investment grade following a change of control of the Company.
• All of Experian’s share-based employee incentive plans contain provisions relating to a change of control. Outstanding awards and options would normally vest and become exercisable on a change of control, subject to the satisfaction of any performance conditions at that time.
• The Group is party to a limited number of operational arrangements which can be terminated or altered upon a change of control of the Company, but these are not considered to be individually significant to the business of the Group as a whole or, in certain cases, it is considered that their disclosure would be seriously prejudicial to the Company.
• The provisions in directors’ service contracts relating to a change of control of the Company are described in the report on directors’ remuneration.

85
Governance
Financial statements
Busin
ess reviewB
usiness overview
Contractual arrangements
The licences granted to Group companies by governmental entities in respect of the operation of its credit bureaux in key jurisdictions are essential to the Group’s business. The Group also has several key agreements with its technology and data providers. Although the Group has numerous other third party contractual arrangements, none of these is considered essential to its business.
Appointment and removal of directors
Both the Company by ordinary resolution and the directors may elect any person to be a director, but the number of directors shall not exceed the maximum number fixed by the articles of association of the Company. Any person appointed by the directors shall only hold office until the next annual general meeting and shall then be eligible for election. The office of a director shall be vacated on the occurrence of any of the events listed in article 92 of the articles of association of the Company. The Company may, in accordance with its articles of association, remove any director from office and elect another person in place of a director so removed.
Articles of association
The articles of association of the Company may be amended by the passing of a special resolution.
Financial risk management, objectives and policies
Descriptions of the use of financial instruments and Experian’s treasury and risk management objectives and policies are set out in the financial review within the business review section and also in note 8 to the Group financial statements.
Charitable donations
Experian has continued to support community initiatives and charitable causes worldwide in line with our strategy, which focuses on financial education and entrepreneurship. The total commitment, including cash support and employee time, during the year was US$2.9m (2011: US$3.2m).
Of this, in 2012, the Group’s community investment in the UK totalled US$1.2m (2011: US$1.2m) and US$0.8m was made in financial donations and volunteering hours to charitable organisations. An amount of US$0.2m was given to fund significant partnership projects with The Princes Trust, Framework, The School of Artisan Food and Entrepreneur First. A further US$0.2m was donated to the ABF Soldiers Charity and Help For Heroes, the Experian UK’s charity of the year. In addition, small grants were made to a further 74 charities in support of employees’ suggestions and fundraising efforts.
Political donations
Experian did not make any EU political donations during the year ended 31 March 2012.
Employment of people with disabilities
People with disabilities have equal opportunities when applying for vacancies. In addition to complying with legislative requirements, procedures are in place to ensure that disabled employees are fairly treated and that their training and career development needs are carefully managed. The policies are considered to operate effectively. For those employees becoming disabled during the course of their employment, the Group is supportive, whether through re-training or re-deployment, so as to provide an opportunity for them to remain with the Group whenever possible.
Employee involvement
Experian is committed to employee involvement throughout the business and is intent on motivating and keeping staff informed on matters that concern them in the context of their employment and involving them through local consultative procedures. Where there are recognition agreements with trade unions, the consultation process is established through national and local trade union representatives and through joint consultation committees.
Employees are kept well informed on matters of concern and the financial and economic factors affecting the Group’s performance through management channels, conferences,
meetings, publications and intranet sites. More detail on employee engagement, together with information on diversity, succession planning and talent development, can be found in the ‘Our people, our strength’ section of the annual report.
Experian continues to support employee share ownership through the provision of save as you earn and other employee share plan arrangements which are intended to align the interests of employees with those of shareholders.
Creditor payment
For all trade creditors, it is Group policy to:
• Agree and confirm the terms of payment at the commencement of business with that supplier;
• Pay in accordance with any contract agreed with the supplier or as required by law; and
• Continually review payment procedures and liaise with suppliers as a means of eliminating difficulties and maintaining good working relationships.
Trade creditors of the Group at 31 March 2012 were 28 days based on the ratio of Group trade creditors at the end of the year to the amounts invoiced during the year by trade creditors. The Company has, and in respect of the year ended 31 March 2011, had, no trade creditors.
Going concern
Details of the adoption by the Group and the Company of the going concern basis in preparing the financial statements are set out in the financial review within the business review section and are incorporated into this report by reference.
Relevant audit information
As at 9 May 2012, so far as each director is aware, there is no relevant audit information, being information needed by the auditors in connection with preparing their report, of which the auditors are unaware and each director has taken all steps that he/she ought to have taken as a director in order to make himself/herself aware of any relevant audit information and to establish that the auditors are aware of that information.
86 Experian Annual Report 2012 Governance
Annual general meeting
The 2012 annual general meeting of the Company will be held at The Merrion Hotel, Upper Merrion Street, Dublin 2, Ireland at 9.30am on Wednesday 18 July 2012. Shareholders who are unable to attend in person may submit questions beforehand via email to [email protected] or on the prepaid card sent to shareholders with the notice of meeting. The questions will be addressed at the meeting, via the Company’s website at www.experianplc.com or individually as appropriate. The notice of meeting has been circulated to shareholders and can also be viewed on the Company’s website.
Independent auditors
The auditors, PricewaterhouseCoopers LLP, have indicated their willingness to continue in office and a resolution that they be re-appointed as auditors of the Company will be proposed at the annual general meeting.
Statements of directors’ responsibilities
The directors are responsible for:
• preparing the annual report, the Group and parent company financial statements and the report on director’s remuneration in accordance with applicable law and regulations;
• preparing financial statements which give a true and fair view of the state of affairs at the balance sheet date, and the profit or loss for the period then ended of (a) the Group (in accordance with IFRSs as adopted for use in the European Union), and (b) the Company (in accordance with UK Accounting Standards);
• keeping proper accounting records which disclose, with reasonable accuracy, at any time the financial position of the Group and the Company and enable them to ensure that the Group financial statements comply with applicable law and Article 4 of the International Accounting Standards Regulation;
• taking such steps as are reasonably open to them to safeguard the assets of the Company and the Group, and to prevent and detect fraud and other irregularities; and
• the maintenance and integrity of the statutory and audited information on the Company’s website (Jersey legislation and UK regulation governing the preparation and dissemination of financial statements may differ from requirements in other jurisdictions).
In addition, the directors consider that, in preparing the financial statements:
• suitable accounting policies have been selected and applied consistently;
• judgments and estimates made have been reasonable and prudent;
• the Group financial statements comply with IFRSs as adopted for use in the European Union;
• all accounting standards which they consider applicable have been followed in preparing the parent company financial statements; and
• it is appropriate that the Group and parent company financial statements have been prepared on a going concern basis.
The directors confirm that, to the best of their knowledge, the financial statements are prepared in accordance with the applicable set of accounting standards, give a true and fair view of the assets, liabilities, financial position and profit of the Company and the Group taken as a whole; and this directors’ report contains a fair review of the development and performance of the business and the position of the Company and the Group taken as a whole, together with a description of the principal risks and uncertainties that they face.
By order of the Board
Charles Brown Company Secretary 9 May 2012
Corporate headquarters: Newenham House Northern Cross Malahide Road Dublin 17 Ireland
Registered office: 22 Grenville Street St Helier Jersey JE4 8PX
Directors’ report continued
87
Governance
Financial statements
Busin
ess reviewB
usiness overview
Report of the auditors:Group financial statementsIndependent auditors’ report to the members of Experian plc
We have audited the Group financial statements of Experian plc for the year ended 31 March 2012 which comprise the Group income statement, the Group statement of comprehensive income, the Group balance sheet, the Group statement of changes in total equity, the Group cash flow statement and the related notes. The financial reporting framework that has been applied in their preparation is applicable law and International Financial Reporting Standards as adopted by the European Union.
Respective responsibilities of directors and auditors
As explained more fully in the Statements of directors’ responsibilities the directors are responsible for the preparation of the Group financial statements and for being satisfied that they give a true and fair view. Our responsibility is to audit and express an opinion on the Group financial statements in accordance with applicable law and International Standards on Auditing (UK and Ireland). Those standards require us to comply with the Auditing Practices Board’s Ethical Standards for Auditors.
This report, including the opinions, has been prepared for and only for the Company’s members as a body in accordance with Article 113A of the Companies (Jersey) Law 1991 and for no other purpose. We do not, in giving these opinions, accept or assume responsibility for any other purpose or to any other person to whom this report is shown or into whose hands it may come save where expressly agreed by our prior consent in writing.
Scope of the audit of the financial statements
An audit involves obtaining evidence about the amounts and disclosures in the financial statements sufficient to give reasonable assurance that the financial statements are free from material misstatement, whether caused by fraud or error. This includes an assessment of: whether the accounting policies are appropriate to the Group’s circumstances and have been consistently applied and adequately disclosed; the reasonableness of significant accounting estimates made by the directors; and the overall presentation of the financial statements. In addition, we read all the financial and non-financial information in the Annual report and accounts to identify material inconsistencies with the audited financial statements. If we become aware of any apparent material misstatements or inconsistencies we consider the implications for our report.
Opinion on financial statements
In our opinion the Group financial statements:
• give a true and fair view of the state of the Group’s affairs as at 31 March 2012 and of the Group’s profit and cash flows for the year then ended;• have been properly prepared in accordance with International Financial Reporting Standards as adopted by the European Union; and• have been properly prepared in accordance with the requirements of the Companies (Jersey) Law 1991 and Article 4 of the IAS Regulation.
Opinion on other matters
In our opinion:
• the information given in the Directors’ report for the financial year for which the Group financial statements are prepared is consistent with the Group financial statements; and
• the information given in the Corporate governance statement with respect to internal control and risk management systems and about share capital structures is consistent with the financial statements.
Matters on which we are required to report by exception
We have nothing to report in respect of the following:
Under the Companies (Jersey) Law 1991, we are required to report to you if, in our opinion we have not received all the information and explanations we require for our audit.
Under the UK Listing Rules we are required to review:
• the directors’ statement in relation to going concern as set out in the Directors’ report; • the part of the Corporate governance statement relating to the Company’s compliance with the nine provisions of the UK Corporate
Governance Code specified for our review; and • certain elements of the report to shareholders by the Board on directors’ remuneration.
Other matter
We have reported separately on the parent company financial statements of Experian plc for the year ended 31 March 2012.
Ranjan SriskandanFor and on behalf of PricewaterhouseCoopers LLP, Chartered Accountants and Recognized Auditor, London, United Kingdom9 May 2012
Experian Annual Report 2012 Financial statements

88 Experian Annual Report 2012 Financial statements
Group income statementfor the year ended 31 March 2012
Notes 2012
US$m
2011 (Re-presented)
(Note 3)US$m
Revenue 9 4,487 3,885
Labour costs 11(a) (1,699) (1,476)
Data and information technology costs (400) (309)
Depreciation and amortisation 11(b) (434) (385)
Marketing and customer acquisition costs (405) (369)
Other operating charges (497) (475)
Total operating expenses (3,435) (3,014)
Operating profit 1,052 871
Interest income 79 69
Finance expense (440) (282)
Net finance costs 14(a) (361) (213)
Share of post-tax losses of associates (2) (2)
Profit before tax 9 689 656
Group tax credit/(charge) 15 35 (118)
Profit after tax for the financial year from continuing operations 724 538
(Loss)/profit for the financial year from discontinued operations 17(a) (6) 85
Profit for the financial year 718 623
Attributable to:
Owners of Experian plc 655 581
Non-controlling interests 63 42
Profit for the financial year 718 623
US cents US cents
Earnings per share
Basic 18 66.2 57.9
Diluted 18 65.1 56.7
Earnings per share from continuing operations
Basic 18 66.8 49.4
Diluted 18 65.7 48.4
Full year dividend per share 19 32.0 28.0
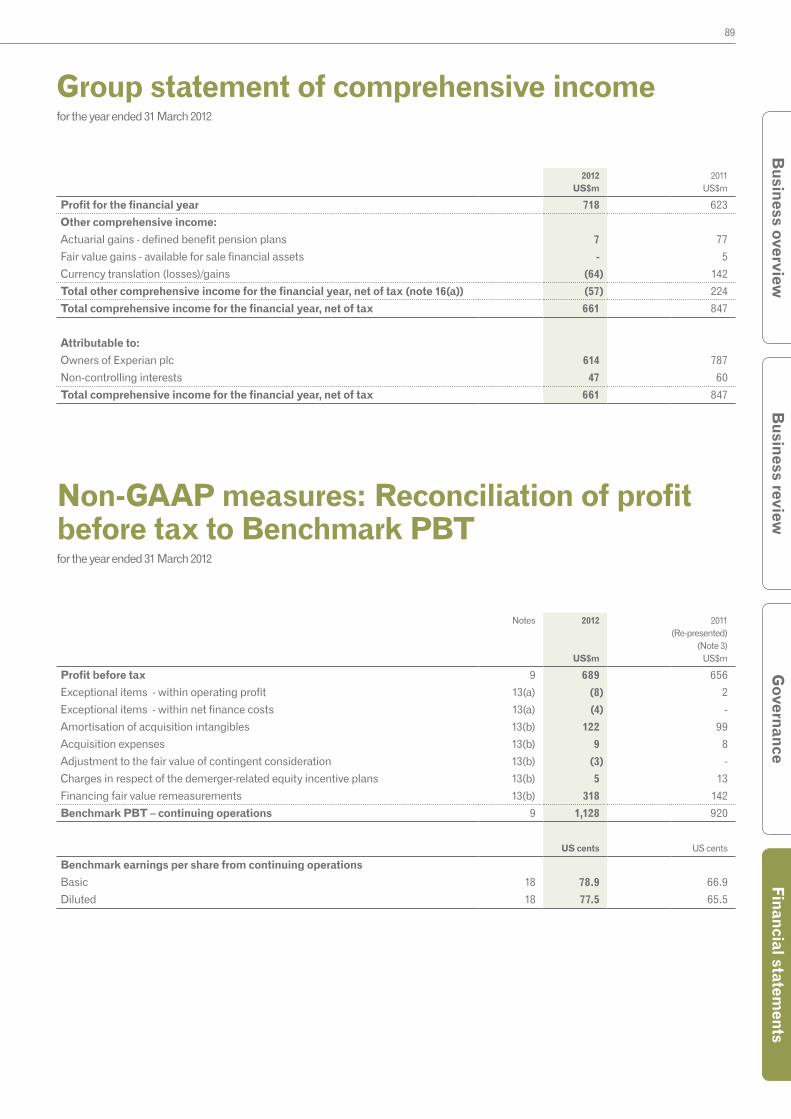
89
Governance
Financial statements
Busin
ess reviewB
usiness overview
Group statement of comprehensive incomefor the year ended 31 March 2012
2012US$m
2011US$m
Profit for the financial year 718 623
Other comprehensive income:
Actuarial gains - defined benefit pension plans 7 77
Fair value gains - available for sale financial assets - 5
Currency translation (losses)/gains (64) 142
Total other comprehensive income for the financial year, net of tax (note 16(a)) (57) 224
Total comprehensive income for the financial year, net of tax 661 847
Attributable to:
Owners of Experian plc 614 787
Non-controlling interests 47 60
Total comprehensive income for the financial year, net of tax 661 847
Notes 2012
US$m
2011 (Re-presented)
(Note 3)US$m
Profit before tax 9 689 656
Exceptional items - within operating profit 13(a) (8) 2
Exceptional items - within net finance costs 13(a) (4) -
Amortisation of acquisition intangibles 13(b) 122 99
Acquisition expenses 13(b) 9 8
Adjustment to the fair value of contingent consideration 13(b) (3) -
Charges in respect of the demerger-related equity incentive plans 13(b) 5 13
Financing fair value remeasurements 13(b) 318 142
Benchmark PBT – continuing operations 9 1,128 920
US cents US cents
Benchmark earnings per share from continuing operations
Basic 18 78.9 66.9
Diluted 18 77.5 65.5
Non-GAAP measures: Reconciliation of profit before tax to Benchmark PBTfor the year ended 31 March 2012
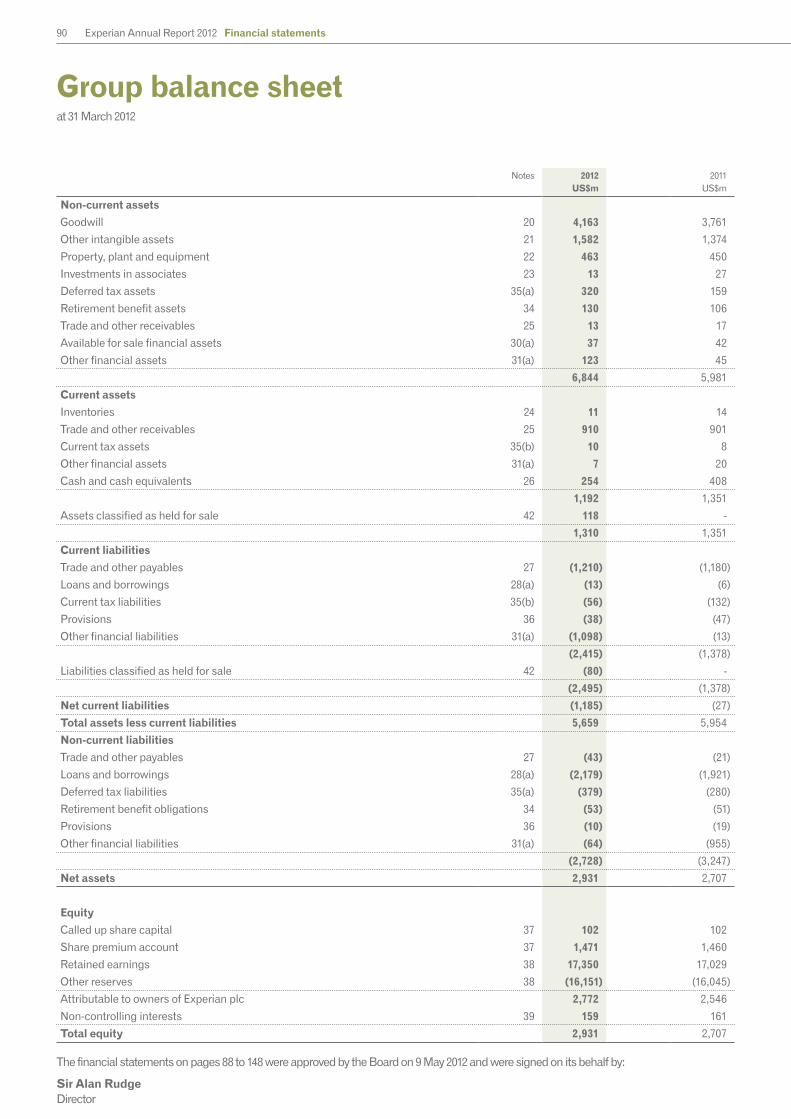
90 Experian Annual Report 2012 Financial statements
Group balance sheetat 31 March 2012
Notes 2012
US$m2011
US$m
Non-current assets
Goodwill 20 4,163 3,761
Other intangible assets 21 1,582 1,374
Property, plant and equipment 22 463 450
Investments in associates 23 13 27
Deferred tax assets 35(a) 320 159
Retirement benefit assets 34 130 106
Trade and other receivables 25 13 17
Available for sale financial assets 30(a) 37 42
Other financial assets 31(a) 123 45
6,844 5,981
Current assets
Inventories 24 11 14
Trade and other receivables 25 910 901
Current tax assets 35(b) 10 8
Other financial assets 31(a) 7 20
Cash and cash equivalents 26 254 408
1,192 1,351
Assets classified as held for sale 42 118 -
1,310 1,351
Current liabilities
Trade and other payables 27 (1,210) (1,180)
Loans and borrowings 28(a) (13) (6)
Current tax liabilities 35(b) (56) (132)
Provisions 36 (38) (47)
Other financial liabilities 31(a) (1,098) (13)
(2,415) (1,378)
Liabilities classified as held for sale 42 (80) -
(2,495) (1,378)
Net current liabilities (1,185) (27)
Total assets less current liabilities 5,659 5,954
Non-current liabilities
Trade and other payables 27 (43) (21)
Loans and borrowings 28(a) (2,179) (1,921)
Deferred tax liabilities 35(a) (379) (280)
Retirement benefit obligations 34 (53) (51)
Provisions 36 (10) (19)
Other financial liabilities 31(a) (64) (955)
(2,728) (3,247)
Net assets 2,931 2,707
Equity
Called up share capital 37 102 102
Share premium account 37 1,471 1,460
Retained earnings 38 17,350 17,029
Other reserves 38 (16,151) (16,045)
Attributable to owners of Experian plc 2,772 2,546
Non-controlling interests 39 159 161
Total equity 2,931 2,707
The financial statements on pages 88 to 148 were approved by the Board on 9 May 2012 and were signed on its behalf by:
Sir Alan RudgeDirector

91
Governance
Financial statements
Busin
ess reviewB
usiness overview
Group statement of changes in total equityfor the year ended 31 March 2012
Called upshare
capital(Note 37)
US$m
Sharepremiumaccount
(Note 37)US$m
Retainedearnings
(Note 38)US$m
Otherreserves
(Note 38)US$m
Attributableto owners of
Experianplc
US$m
Non-controlling
interests(Note 39)
US$m
Totalequity
US$m
At 1 April 2011 102 1,460 17,029 (16,045) 2,546 161 2,707
Comprehensive income:
Profit for the financial year - - 655 - 655 63 718
Total other comprehensive income - - 7 (48) (41) (16) (57)
Total comprehensive income - - 662 (48) 614 47 661
Transactions with owners:
Employee share incentive plans:
– value of employee services - - 65 - 65 - 65
– proceeds from shares issued on vesting - 11 - - 11 - 11
– other exercises of share options and awards - - (110) 166 56 - 56
– tax credit relating to employee share incentive plans - - 20 - 20 - 20
Purchase of own shares by employee trusts - for employee share incentive plans - - - (224) (224) - (224)
Other payments for employee share incentive plans - - (7) - (7) - (7)
Liability for put option over non-controlling interests - - (9) - (9) - (9)
Non-controlling interests arising on business combinations - - - - - 23 23
Transactions with non-controlling interests - - (10) - (10) (1) (11)
Dividends paid during the financial year - - (290) - (290) (71) (361)
Transactions with owners - 11 (341) (58) (388) (49) (437)
At 31 March 2012 102 1,471 17,350 (16,151) 2,772 159 2,931
Called upshare
capital(Note 37)
US$m
Sharepremiumaccount
(Note 37)US$m
Retainedearnings
(Note 38)US$m
Otherreserves
(Note 38)US$m
Attributableto owners of
Experianplc
US$m
Non-controlling
interests(Note 39)
US$m
Totalequity
US$m
At 1 April 2010 102 1,453 16,591 (15,860) 2,286 151 2,437
Comprehensive income:
Profit for the financial year - - 581 - 581 42 623
Total other comprehensive income - - 82 124 206 18 224
Total comprehensive income - - 663 124 787 60 847
Transactions with owners:
Employee share incentive plans:
– value of employee services - - 64 - 64 - 64
– proceeds from shares issued on vesting - 7 - - 7 - 7
– other exercises of share options and awards - - (37) 86 49 - 49
– tax credit relating to employee share incentive plans - - 20 - 20 - 20
Purchase of own shares held as treasury shares - - - (334) (334) - (334)
Purchase of own shares by employee trusts - for employee share incentive plans - - - (61) (61) - (61)
Liability for put option over non-controlling interests - - (21) - (21) - (21)
Non-controlling interests arising on business combinations - - - - - 6 6
Dividends paid during the financial year - - (251) - (251) (56) (307)
Transactions with owners - 7 (225) (309) (527) (50) (577)
At 31 March 2011 102 1,460 17,029 (16,045) 2,546 161 2,707
Financial statements

92 Experian Annual Report 2012 Financial statements
Group cash flow statementfor the year ended 31 March 2012
Notes 2012
US$m
2011 (Re-presented)
(Note 3)US$m
Cash flows from operating activities
Cash generated from operations 40(a) 1,539 1,311
Interest paid (79) (106)
Interest received 22 14
Dividends received from associates 1 1
Tax paid 40(d) (107) (85)
Net cash inflow from operating activities - continuing operations 1,376 1,135
Net cash inflow from operating activities - discontinued operations 17(b) 2 57
Net cash inflow from operating activities 1,378 1,192
Cash flows from investing activities
Purchase of property, plant and equipment (84) (69)
Purchase of other intangible assets 40(e) (369) (300)
Sale of property, plant and equipment 3 7
Purchase of available for sale financial assets (1) (3)
Disposal of investments in associates - discontinued operations 17(b) - 279
Disposal of available for sale financial assets 13(a) 12 -
Acquisition of subsidiaries, net of cash acquired 41 (746) (296)
Disposal of subsidiaries - continuing operations 13(a) - 12
Net cash flows used in investing activities - continuing operations (1,185) (370)
Net cash flows used in investing activities - discontinued operations 17(b) (3) (5)
Net cash flows used in investing activities (1,188) (375)
Cash flows from financing activities
Issue of ordinary shares 40(g) 11 7
Receipt of share option proceeds 40(g) 54 50
Purchase of own shares held as treasury shares 40(g) - (336)
Purchase of own shares by employee trusts - for employee share incentive plans 40(g) (232) (70)
Other payments for employee share incentive plans (7) -
Payments to acquire non-controlling interests (12) -
New borrowings 179 643
Repayment of borrowings - (593)
Capital element of finance lease rental payments (4) (5)
Net payments on derivative financial instruments held to manage currency profile - (15)
Net receipts from equity swaps 5 13
Receipt from bank deposit 14 29
Dividends paid (361) (307)
Net cash flows used in financing activities (353) (584)
Net (decrease)/increase in cash and cash equivalents (163) 233
Cash and cash equivalents at 1 April 408 163
Exchange and other movements on cash and cash equivalents 9 12
Cash and cash equivalents at 31 March 254 408
93
Governance
Financial statements
Busin
ess reviewB
usiness overview
Notes to the Group financial statementsfor the year ended 31 March 2012
1. Corporate information
Experian plc (the ‘Company’), which is the ultimate parent company of the Experian group of companies (‘Experian’ or the ‘Group’), is incorporated and registered in Jersey as a public company limited by shares and is resident in Ireland. The Company’s registered office is at 22 Grenville Street, St Helier, Jersey JE4 8PX. The Company’s ordinary shares are traded on the London Stock Exchange’s Regulated Market (Premium Listing). Experian is the leading global information services group.
2. Basis of preparation
These financial statements are:
• prepared in accordance with International Financial Reporting Standards (‘IFRS’ or ‘IFRSs’) as adopted for use in the European Union (the ‘EU’) and International Financial Reporting Interpretations Committee (‘IFRIC’) interpretations;
• prepared under the historical cost convention, as modified for the revaluation of available for sale financial assets and certain other financial assets and financial liabilities including derivatives;
• presented in US dollars, the most representative currency of the Group’s operations, and rounded to the nearest million;• prepared using the principal exchange rates set out in note 10; and• designed to include disclosures sufficient to comply with those parts of the UK Companies Act 2006 applicable to companies reporting under
IFRS even though the Company is incorporated and registered in Jersey.
In compliance with the requirements for companies whose shares are traded on the London Stock Exchange’s Regulated Market, the financial statements of the Company are included within the Group annual report and are set out on pages 150 to 158. Those financial statements are prepared under UK accounting standards.
3. Comparative information
Experian has agreed to divest the Group’s comparison shopping and lead generation businesses and it is anticipated that this transaction will be completed in the first half of the financial year ending 31 March 2013. In accordance with the requirements of IFRS 5, the assets and liabilities of these businesses at 31 March 2012 are classified as held for sale and the results and cash flows of the businesses for the year ended 31 March 2011 have been reclassified as discontinued. The results of the North America and the UK and Ireland operating segments (shown within note 9(b)) and the Interactive business segment (shown within note 9(c)) have been re-presented accordingly.
Except as indicated above, the Group financial statements have been prepared on a basis consistent with that reported for the year ended 31 March 2011.
4. Recent accounting developments
The following accounting standards, amendments and interpretations issued by the International Accounting Standards Board and the IFRIC are effective for the Group’s accounting periods beginning on or after 1 April 2011:
• Improvements to IFRSs (April 2010)• Amendment to IAS 24 (revised) ‘Related party disclosures’• Amendment to IFRIC 14 ‘Prepayment of a minimum funding requirement’• IFRIC 19 ‘Extinguishing financial liabilities with equity instruments’
These accounting standards, amendments and interpretations have had no material effect on the results or financial position of the Group disclosed within these financial statements.
Other new or revised accounting standards and interpretations issued by 31 March 2012 but not yet effective include those listed below. Their impact will be fully considered in due course. In the case of IAS 19 there will be a restriction on the expected return recognised on pension plan assets within interest income.
• Improvements to IFRSs (April 2011)• Amendments to IFRS 7 ‘Financial instruments: disclosures’• IFRS 9 ‘Financial instruments: classification and measurement’• IFRS 10 ‘Consolidated financial statements’• IFRS 11 ‘Joint arrangements’• IFRS 12 ‘Disclosure of interests in other entities’• IFRS 13 ‘Fair value remeasurements’• Amendments to IAS 1 ‘Financial statements presentation’, IAS 12 ‘Income taxes’ and IAS 19 (revised) ‘Employee benefits’• IAS 27 (revised) ‘Separate financial statements’• IAS 28 (revised) ‘Associate and joint ventures’• Amendment to IAS 32 ‘Financial instruments: presentation’, on offsetting financial assets and financial liabilities

94 Experian Annual Report 2012 Financial statements
Notes to the Group financial statements continued
5. Significant accounting policies
The principal accounting policies applied in the preparation of these financial statements are set out below. These policies have been consistently applied to both years presented.
(a) Basis of consolidationSubsidiaries Subsidiaries are fully consolidated from the date on which control is transferred to the Group. They cease to be consolidated from the date that the Group no longer has control. As required by IFRS 3, all business combinations are accounted for using the acquisition method.
Intra-group transactions, balances and unrealised gains on transactions between Group companies are eliminated on consolidation. Unrealised losses are also eliminated unless the transaction provides evidence of an impairment of the asset transferred.
Accounting policies of subsidiaries and segments are consistent with the policies adopted by the Group for the purposes of the Group’s consolidation. The Group financial statements incorporate the financial statements of the Company and its subsidiary undertakings for the financial year ended 31 March 2012. A list of the significant subsidiaries is given in note T to the parent company financial statements.
Non-controlling interestsThe non-controlling interests in the Group balance sheet represent the share of net assets of subsidiary undertakings held outside the Group. The movement in the year comprises the profit attributable to such interests together with any dividends paid, movements in respect of corporate transactions and related exchange differences.
In accordance with IAS 27, the Group applies a policy of treating transactions with non-controlling interests that do not result in a loss of control as transactions with equity owners of the Group. For purchases from non-controlling interests, the difference between any consideration paid and the relevant share acquired of the carrying value of the net assets of the subsidiary is recorded in equity. Gains or losses on disposals to non-controlling interests are also recorded in equity.
Where put/call option agreements are in place in respect of shares held by non-controlling shareholders, the put element of the liability is measured in accordance with the requirements of IAS 32 and IAS 39 and is stated at the net present value of the expected future payments. Such liabilities are shown as current or non-current financial liabilities in the Group balance sheet. The change in the net present value of such options in the year is recognised in the Group income statement within net finance costs, whilst any change in that value attributable to exchange rate movements is recognised directly in other comprehensive income.
Associates Associates are entities over which the Group has significant influence but not control, generally achieved by a shareholding of between 20% and 50% of the voting rights. The equity method is used to account for investments in associates and investments are initially recognised at cost.
The Group’s share of net assets of its associates and loans made to associates are included in the Group balance sheet. The Group’s share of post-acquisition profits or losses is recognised in the Group income statement. The Group’s share of post-acquisition movements in other comprehensive income is recognised in other comprehensive income. These cumulative post-acquisition movements are adjusted against the carrying amount of the investment. The carrying amount of an investment in an associate is tested for impairment by comparing its recoverable amount to its carrying amount whenever there is an indication that the investment may be impaired.
(b) Foreign currency translationTransactions and balancesTransactions in foreign currencies are recorded in the functional currency of the relevant Group undertaking at the exchange rate prevailing on the date of the transaction. At each balance sheet date, monetary assets and liabilities denominated in foreign currencies are retranslated at the exchange rate prevailing at the balance sheet date. Translation differences on monetary items are taken to the Group income statement except when recognised in other comprehensive income, as qualifying net investment hedges or cash flow hedges.
Translation differences on non-monetary available for sale financial assets are reported as part of the fair value gains or losses in other comprehensive income.
Group undertakingsThe results and financial position of Group undertakings whose functional currencies are not US dollars are translated into US dollars as follows:
• Income and expenses are translated at the average exchange rate for the year (unless this average is not a reasonable approximation of the cumulative effect of the rates prevailing on the transaction dates, in which case income and expenses are translated at the rates on the dates of the transactions);
• Assets and liabilities are translated at the closing exchange rate on the balance sheet date; and• All resulting exchange differences are recognised in other comprehensive income and as a separate component of equity.
95
Governance
Financial statements
Busin
ess reviewB
usiness overview
5. Significant accounting policies (continued)
On consolidation, exchange differences arising from the translation of the net investment in Group undertakings whose functional currencies are not US dollars, and of borrowings and other currency instruments designated as hedges of such investments, are recognised in other comprehensive income to the extent that such hedges are effective. Tax charges and credits attributable to those exchange differences are taken directly to other comprehensive income. When such undertakings are sold, these exchange differences are recognised in the Group income statement as part of the gain or loss on sale. Goodwill and fair value adjustments arising on the acquisition of such undertakings are treated as assets and liabilities of the entities and are translated into US dollars at the closing exchange rate.
(c) GoodwillGoodwill is stated at cost less any accumulated impairment, where cost is the excess of the fair value of the consideration payable for an acquisition over the fair value at the date of acquisition of the Group’s share of identifiable net assets of a subsidiary or associate acquired. Fair values are attributed to the identifiable assets, liabilities and contingent liabilities that existed at the date of acquisition, reflecting their condition at that date. Adjustments are made where necessary to align the accounting policies of acquired businesses with those of the Group. Goodwill is not amortised but is tested annually for impairment. An impairment charge is recognised for any amount by which the carrying value of goodwill exceeds its recoverable amount.
Goodwill on acquisitions of subsidiaries is separately recognised in the Group balance sheet. Goodwill on acquisitions of associates is included in the carrying amount of the investment. Goodwill is allocated to cash generating units (‘CGUs’) and monitored for internal management purposes by operating segment. The allocation is made to those CGUs or groups of CGUs that are expected to benefit from the business combination in which the goodwill arose. Where the recoverable amount of the CGU is less than its carrying amount, including goodwill, an impairment charge is recognised in the Group income statement.
Gains and losses on the disposal of an undertaking include the carrying amount of goodwill relating to the undertaking sold, allocated where necessary on the basis of relative fair value.
(d) Other intangible assetsIntangible assets acquired as part of a business combination are capitalised at fair value separately from goodwill, if those assets are identifiable, separable or arise from legal rights and their fair value can be measured reliably. Other intangible assets are capitalised at cost. Certain costs incurred in the developmental phase of an internal project are capitalised as intangible assets provided that a number of criteria are satisfied. These include the technical feasibility of completing the asset so that it is available for use or sale, the availability of adequate resources to complete the development and to use or sell the asset and how the asset will generate probable future economic benefit.
The cost of such intangible assets with finite useful economic or contractual lives is amortised over those lives. The carrying values of intangible assets are reviewed for impairment when events or changes in circumstances indicate that the carrying values may not be recoverable. If impaired, the carrying values are written down to the higher of fair value less costs to sell, and value-in-use which is determined by reference to projected future income streams using assumptions in respect of profitability and growth.
Research expenditure is charged in the Group income statement in the year in which it is incurred.
Acquisition intangiblesCustomer and advertiser relationshipsContractual and non-contractual customer and advertiser relationships acquired as part of a business combination are capitalised at fair value on acquisition and amortised on a straight line basis over three to eighteen years, based on management’s estimates of the average lives of such relationships. In view of the relative significance of such assets, customer and advertiser relationships are reported separately within note 21.
Trademarks and licencesTrademarks and licences acquired as part of a business combination are capitalised at fair value on acquisition and are amortised on a straight line basis over their contractual lives, up to a maximum period of twenty years.
Trade namesLegally protected or otherwise separable trade names acquired as part of a business combination are capitalised at fair value on acquisition and amortised on a straight line basis over three to fourteen years, based on management’s expectations to retain trade names within the business.
Completed technologyCompleted technology acquired as part of a business combination is capitalised at fair value on acquisition and amortised on a straight line basis over three to eight years, based on the expected life of the asset.
96 Experian Annual Report 2012 Financial statements
Notes to the Group financial statements continued
5. Significant accounting policies (continued)
Databases and computer softwareDatabasesCapitalised databases comprise the fair value of databases acquired as part of a business combination or the data purchase and data capture costs of internally developed databases. Databases are held at cost and are amortised on a straight line basis over three to seven years.
Computer softwareAcquired computer software licences for internal use are capitalised on the basis of the costs incurred to acquire and bring into use the specific software. These costs are amortised on a straight line basis over three to ten years.
Costs that are directly associated with the production of identifiable and unique software products controlled by the Group, and that will generate economic benefits beyond one year, are recognised as intangible assets. These internally generated software costs are amortised on a straight line basis over three to ten years.
Other costs associated with developing or maintaining computer software programmes are recognised as an expense as incurred.
(e) Property, plant and equipmentProperty, plant and equipment is held at cost less accumulated depreciation and any impairment in value. Cost includes the original purchase price of the asset and amounts attributable to bringing the asset to its working condition for its intended use.
Land is not depreciated and capitalised equipment on hire or lease is depreciated over the lower of the useful life of the equipment and period of the lease.
Depreciation is provided on other property, plant and equipment at rates calculated to depreciate the cost, less estimated residual value based on prices prevailing at the balance sheet date, of each asset evenly over its expected useful life as follows:
• Freehold properties - 50 years;• Short leasehold properties - the remaining period of the lease; and
• Plant and equipment - three to ten years according to the estimated life of the asset. Technology based assets are typically depreciated over three to five years with other infrastructure assets depreciated over five to ten years.
(f) LeasesFinance leasesLeases of property, plant and equipment where the Group has substantially all the risks and rewards of ownership are classified as finance leases. Such leases are capitalised at the lease’s inception at the lower of the fair value of the leased asset and the present value of the minimum lease payments. Each lease payment is allocated between the liability and finance charges. The rental obligations, net of finance charges, are included in loans and borrowings. The interest element of the lease payment is charged in the Group income statement over the lease period so as to produce a constant periodic rate of interest on the remaining balance of the liability.
Operating leasesLeases in which a significant portion of the risks and rewards of ownership are retained by the lessor are classified as operating leases and not capitalised. Payments made under operating leases are charged in the Group income statement on a straight line basis over the period of the lease. Incentives from lessors are recognised as a systematic reduction of the charge over the period of the lease.
(g) Financial assetsThe Group classifies its financial assets in four categories: loans and receivables, derivatives used for hedging, assets at fair value through profit and loss, and available for sale. The classification is determined at initial recognition and depends on the purpose for which the financial assets are acquired.
Loans and receivablesLoans and receivables are non-derivative financial assets with fixed or determinable payments that are not quoted in an active market. They are included in current assets, except for maturities more than one year after the balance sheet date which are classified as non-current assets. The Group’s loans and receivables comprise trade and other receivables and cash and cash equivalents.
Derivatives used for hedgingDerivative financial assets used for hedging are included in current assets, except for maturities more than one year after the balance sheet date which are classified as non-current assets. Derivatives utilised by the Group include interest rate swaps, cross currency swaps, foreign exchange contracts and equity swaps.
Assets at fair value through profit and lossAssets at fair value through profit and loss comprise non-hedging derivative financial instruments.

97
Governance
Financial statements
Busin
ess reviewB
usiness overview
5. Significant accounting policies (continued)
Available for sale financial assetsAvailable for sale financial assets are non-derivative financial assets that are either designated to this category or not classified in the other financial asset categories.
Available for sale financial assets are carried at fair value and are included in non-current assets unless management intends to dispose of the assets within one year of the balance sheet date. Purchases and disposals of such assets are accounted for at settlement date. Unrealised gains and losses on available for sale financial assets are recognised directly in other comprehensive income. On disposal or impairment of such assets, the gains and losses in equity are reclassified through the Group income statement. Gains and losses recognised on disposal exclude dividend and interest income.
At each balance sheet date, the Group assesses whether there is objective evidence to suggest that available for sale financial assets are impaired. In the case of equity securities, a significant or prolonged decline in the fair value of the security below its cost is considered in determining whether the security is impaired. If any such evidence exists, the cumulative loss is removed from equity and recognised in the Group income statement. Impairment losses recognised in the Group income statement on equity instruments are not subsequently reversed through the Group income statement.
(h) Trade receivablesTrade receivables are initially recognised at fair value and subsequently measured at this value less any provision for impairment. Where the time value of money is material, receivables are then carried at amortised cost using the effective interest rate method, less any provision for impairment.
A provision for impairment of trade receivables is established when there is objective evidence that the Group will not be able to collect all amounts due according to the original terms of receivables. Such evidence is based primarily on the pattern of cash received compared to the terms upon which the trade receivable is contracted. The amount of the provision is the difference between the carrying amount and the value of estimated future cash flows. Any charge or credit in respect of such provisions is recognised in the Group income statement within other operating charges. The cost of any irrecoverable trade receivables not included in the provision is recognised in the Group income statement immediately within other operating charges. Subsequent recoveries of amounts previously written off are credited in the Group income statement within other operating charges.
(i) Cash and cash equivalentsCash and cash equivalents include cash in hand, term and call deposits held with banks and other short-term highly liquid investments with original maturities of three months or less. Bank overdrafts are shown within borrowings in current liabilities on the Group balance sheet. For the purposes of the Group cash flow statement, cash and cash equivalents are reported net of bank overdrafts.
(j) Borrowings and borrowing costsBorrowings are recognised initially at fair value, net of any transaction costs incurred. Borrowings are subsequently stated at amortised cost except where they are hedged by an effective fair value hedge, in which case the carrying value is adjusted to reflect the fair value movements associated with the hedged risk.
Borrowings are classified as non-current to the extent that the Group has an unconditional right to defer settlement of the liability for at least one year after the balance sheet date.
Incremental transaction costs which are directly attributable to the issue of debt are capitalised and amortised over the expected life of the borrowing using the effective interest rate method. All other borrowing costs are expensed in the year in which they are incurred.
(k) Derivative financial instrumentsThe Group uses derivative financial instruments to manage its exposures to fluctuations in foreign exchange rates, interest rates and certain obligations, including social security obligations, relating to share-based payments. Derivative instruments utilised by the Group include interest rate swaps, cross currency swaps, foreign exchange contracts and equity swaps. These are recognised as assets or liabilities as appropriate.
Derivative financial instruments are initially recognised at their fair value at the date a contract is entered into, and are subsequently remeasured at their fair value at each reporting date. Depending on the type of the derivative financial instrument, fair value calculation techniques include, but are not limited to, quoted market value, present value of estimated future cash flows (of which the valuation of interest rate swaps is an example) and exchange rates at the balance sheet date (of which the valuation of foreign exchange contracts is an example). The method of recognising the resulting gain or loss depends on whether the derivative is designated as a hedging instrument and, if so, the nature of the hedge relationship. The Group designates certain derivatives as:
• Fair value hedges - hedges of the fair value of a recognised asset or liability or a firm commitment; or• Cash flow hedges - hedges of a particular risk associated with a recognised asset or liability or a highly probable forecast transaction; or• Net investment hedges - hedges of a net investment in an operation whose functional currency is not US dollars.

98 Experian Annual Report 2012 Financial statements
Notes to the Group financial statements continued
5. Significant accounting policies (continued)
The Group documents the relationship between hedging instruments and hedged items at the hedge inception, as well as its risk management objective and strategy for undertaking various hedge transactions. The Group also documents its assessment, both at hedge inception and on an ongoing basis, of whether the derivatives that are used in hedging transactions are highly effective in offsetting changes in fair values of hedged items. This effectiveness testing is performed at every reporting date throughout the life of the hedge to confirm that the hedge remains, and will continue to remain, highly effective.
Hedge accounting is discontinued when the hedging instrument expires or is sold, terminated or exercised or no longer qualifies for hedge accounting.
Derivative assets and liabilities are classified as non-current unless they mature within one year after the balance sheet date.
Amounts payable or receivable in respect of interest rate swaps are taken to net finance costs over the period of the contracts, together with the interest differentials reflected in foreign exchange contracts.
Fair value hedgesChanges in the fair value of derivatives that are designated and qualify as fair value hedging instruments are recorded in the Group income statement, together with any changes in the fair value of the hedged asset or liability that are attributable to the hedged risk. The ineffective portion of a fair value hedge is recognised in net finance costs in the Group income statement.
Cash flow hedgesThe effective portion of changes in the fair value of derivatives that are designated and qualify as cash flow hedges is recognised in other comprehensive income. The gain or loss relating to the ineffective portion is recognised immediately in total operating expenses in the Group income statement.
Amounts accumulated in equity are reclassified in the Group income statement in the period when the hedged item impacts the Group income statement. However, when the forecast transaction that is hedged results in the recognition of a non-financial asset or liability, the gains and losses previously deferred in equity are transferred from equity and included in the initial measurement of the cost of the asset or liability. When a hedging instrument expires or is sold, or when a hedge no longer meets the criteria for hedge accounting, any cumulative gain or loss included in equity at that time remains in equity and is recognised when the forecast transaction is ultimately recognised in the Group income statement. When a forecast transaction is no longer expected to occur, the cumulative gain or loss that was included in equity is transferred immediately to the Group income statement.
Net investment hedgesAny gain or loss on the hedging instrument relating to the effective portion of the hedge of a net investment in an undertaking whose functional currency is not US dollars is recognised in other comprehensive income; the gain or loss relating to the ineffective portion is recognised immediately in net finance costs in the Group income statement. Gains and losses accumulated in equity are included in the Group income statement when the undertaking is disposed of.
Non-hedging derivativesChanges in the fair value of such derivative instruments are recognised immediately in the Group income statement. Costs and income in respect of derivatives entered into in connection with social security obligations on employee share incentive plans, other than those of a financing nature, are charged or credited within labour costs; other costs and changes in fair value on such derivatives are charged or credited within financing fair value remeasurements in the Group income statement.
Derivatives embedded in other financial instruments or other host contracts are treated as separate derivatives when their risks and characteristics are not closely related to those of host contracts, and the host contracts are not carried at fair value with unrealised gains or losses reported in the Group income statement.
(l) Impairment of non-financial assetsAssets that are not subject to amortisation or depreciation are tested annually for impairment. Assets that are subject to amortisation or depreciation are reviewed for impairment whenever events or changes in circumstances indicate that the carrying amount may not be recoverable. An impairment charge is recognised for the amount by which the asset’s carrying amount exceeds its recoverable amount. The recoverable amount is the higher of an asset’s fair value less costs to sell, and value-in-use. For the purposes of assessing impairment, assets are grouped into CGUs, determined by the lowest levels for which there are separately identifiable cash flows.
(m) Trade payablesTrade payables are recognised initially at fair value. Where the time value of money is material, payables are then carried at amortised cost using the effective interest rate method.
99
Governance
Financial statements
Busin
ess reviewB
usiness overview
5. Significant accounting policies (continued)
(n) Contingent considerationThe cost of each acquisition initially recorded includes a reasonable estimate of the fair value of any contingent amounts expected to be payable in the future. In accordance with IFRS 3, any cost or benefit arising when revised estimates of such consideration are made is recognised in the Group income statement.
(o) Current and deferred taxThe tax charge or credit for the year for current and deferred tax is recognised in the Group income statement, except to the extent that it relates to items recognised in other comprehensive income or directly in equity. In such cases the tax is recognised in other comprehensive income or directly in equity as appropriate.
Current income tax is calculated on the basis of the tax laws enacted or substantively enacted at the balance sheet date in the countries where the Group operates.
Deferred tax is provided in full on temporary differences arising between the tax bases of assets and liabilities and their carrying amounts in the Group financial statements. Deferred tax is not recognised on taxable temporary differences arising on the initial recognition of goodwill. Deferred tax that arises from the initial recognition of an asset or liability in a transaction, other than a business combination, that at the time of the transaction affects neither accounting nor taxable profit or loss, is not accounted for. Deferred tax assets and liabilities are calculated at the tax rates that are expected to apply to the period when the asset is realised or the liability is settled, based on the tax rates and laws that have been enacted or substantively enacted by the balance sheet date.
Deferred tax assets are recognised to the extent that it is probable that future taxable profit will be available against which the temporary differences can be utilised.
Deferred tax is provided on temporary differences arising on investments in subsidiaries and associates, except where the timing of the reversal of the temporary difference is controlled by the Group and it is probable that the temporary difference will not reverse in the foreseeable future.
(p) ProvisionsWhere the effect of the time value of money is material, provisions are determined by discounting the expected future cash flows at a pre-tax rate that reflects current market assessments of the time value of money and, where appropriate, the risks specific to the liability. Where discounting is used, the increase in the provision due to the passage of time is recognised as an interest expense.
(q) Assets and liabilities classified as held for saleAssets and liabilities are classified as held for sale when their carrying amounts are to be recovered or settled principally through a sale transaction and a sale is considered highly probable. They are stated at the lower of the carrying amount and fair value less costs to sell.
(r) Own sharesShares in the Company purchased in connection with any share buyback programme, and held as treasury shares, are shown as a deduction from total equity at cost.
The Group has a number of equity settled, share-based employee incentive plans and, in connection with these plans, own shares are held by The Experian plc Employee Share Trust and the Experian UK Approved All-Employee Share Plan. The assets of the trusts mainly comprise shares in the Company and such shares are also shown as a deduction from total equity at cost.
Contractual obligations to purchase own shares are recognised at the net present value of expected future payments. Gains and losses in connection with such obligations are recognised in the Group income statement.
(s) Revenue recognitionRevenue represents the fair value of consideration receivable on the sale of goods and services to clients, net of value added tax and other sales taxes, rebates and discounts. Revenue includes the provision and processing of data, subscriptions to services, software and database customisation and development and the sale of software licences, maintenance and related consulting services.
Revenue in respect of the provision and processing of data is recognised in the year in which the service is provided. Subscription revenues, and revenues in respect of services to be provided by an indeterminate number of acts over a specified period of time, are recognised on a straight line basis over those periods. Customisation, development and consulting revenues are recognised by reference to the stage of completion of the work generally on the basis of costs incurred to date as a percentage of estimated total costs. Revenue from software licences is recognised upon delivery. Revenue from maintenance agreements is recognised on a straight line basis over the term of the maintenance period.
100 Experian Annual Report 2012 Financial statements
Notes to the Group financial statements continued
5. Significant accounting policies (continued)
Where a single arrangement comprises a number of individual elements which are capable of operating independently of one another, the total revenues are allocated amongst the individual elements based on an estimate of the fair value of each element. Where the elements are not capable of operating independently, or reasonable measures of fair value for each element are not available, total revenues are recognised on a straight line basis over the contract period to reflect the timing of services performed.
Sales are generally invoiced in the geographic area in which the customer is located and accordingly the geographic location of the invoicing undertaking is used as the basis for attributing revenue to individual countries.
(t) Employee benefitsPension and other post employment benefitsDefined benefit pension arrangements – funded plansThe retirement benefit assets and obligations recognised in the Group balance sheet in respect of funded plans comprise the fair value of plan assets of funded plans less the present value of the related defined benefit obligation at the balance sheet date, together with adjustments for past service costs. The defined benefit obligation is calculated annually by independent qualified actuaries using the projected unit credit method.
The present value of the defined benefit obligation is determined by discounting the estimated future cash outflows using market yields available at the assessment date on high-quality corporate bonds that are denominated in the currency in which the benefits will be paid, and that have terms to maturity consistent with the estimated average term of the related pension liability.
Actuarial gains and losses arising from experience adjustments, and changes in actuarial assumptions, are recognised immediately in the Group statement of comprehensive income.
Past service costs are recognised immediately in the Group income statement, unless the changes to the pension plan are conditional on the employees remaining in service for a specified period of time. In this case, the past service costs are amortised on a straight line basis over that period.
The pension cost recognised in the Group income statement comprises the cost of benefits accrued plus interest on the defined benefit obligation less the expected return on the plan assets over the year. Service and financing costs are recognised separately in the Group income statement.
Defined benefit pension arrangements – unfunded plansUnfunded pension obligations are determined and accounted for in accordance with the principles used in respect of the funded arrangements.
Defined contribution pension arrangementsThe assets of defined contribution plans are held separately from those of the Group in independently administered funds. The pension cost recognised in the Group income statement represents the contributions payable by the Group to these funds in respect of the year.
Post-retirement healthcare obligationsObligations in respect of post-retirement healthcare plans are calculated annually by independent qualified actuaries using an actuarial methodology similar to that for the funded defined benefit pension arrangements.
Actuarial gains and losses arising from experience adjustments, and changes in actuarial assumptions, are recognised in the Group statement of comprehensive income. The pension cost recognised in the Group income statement only comprises interest on the defined benefit obligation.
Share-based paymentsThe fair value of share options and share awards granted in connection with the Group’s equity settled, share-based employee incentive plans is recognised as an expense in the Group income statement on a straight line basis over the vesting period. Fair value is measured at the date of grant using whichever of the Black-Scholes model, Monte Carlo model and closing market price is most appropriate to value the award. The Group takes into account the best estimate of the number of options and awards expected to vest and such estimates are revised at each balance sheet date. Non-market performance conditions are included in the vesting estimates. Market-based performance conditions are included in the fair value measurement on grant date and are not revised for actual performance.
(u) Acquisition expensesAcquisition expenses are charged to the Group income statement. Related cash flows are reported within the net cash inflow from operating activities.
(v) Discontinued operationsA discontinued operation is a component of the Group’s business that represents a separate geographic area of operation or a separate major line of business. Classification as a discontinued operation occurs upon disposal or earlier, if the operation meets the criteria to be classified as held for sale under IFRS 5.

101
Governance
Financial statements
Busin
ess reviewB
usiness overview
6. Critical accounting estimates and judgments
(a) Critical accounting estimates and assumptionsIn preparing the Group financial statements, management is required to make estimates and assumptions that affect the reported amount of revenues, expenses, assets and liabilities and the disclosure of contingent liabilities. The resulting accounting estimates, which are based on management’s best judgment at the date of the Group financial statements, will, by definition, seldom equal the related actual results. The estimates and assumptions that have a significant risk of causing a material adjustment to the carrying amounts of assets and liabilities within the next financial year are discussed below.
Tax (note 15) The Group is subject to tax in numerous jurisdictions. Significant judgment is required in determining the related assets or provisions as there are transactions in the ordinary course of business and calculations for which the ultimate tax determination is uncertain. The Group recognises liabilities based on estimates of whether additional tax will be due. Where the final tax outcome of these matters is different from the amounts that were initially recognised, such differences will impact on the results for the year and the respective income tax and deferred tax assets or provisions in the year in which such determination is made.
Goodwill (note 20)Goodwill is allocated to CGUs and monitored for internal management purposes by operating segment. The allocation is made to those CGUs or groups of CGUs that are expected to benefit from the business combination in which the goodwill arose.
The Group tests goodwill for impairment annually or more frequently if events or changes in circumstances indicate that the goodwill may be impaired. The recoverable amount of each CGU is generally determined on the basis of value-in-use calculations which require the use of cash flow projections based on financial budgets approved by management, looking forward up to five years. Management determines budgeted gross margin based on past performance and its expectations for the market development. Cash flows are extrapolated using estimated growth rates beyond a five year period. The growth rates used do not exceed the long-term average growth rate for the markets in which the segment operates. The discount rates used reflect the segment’s pre-tax weighted average cost of capital (‘WACC’).
Fair value of derivatives and other financial instruments (note 31)The fair value of derivatives and other financial instruments that are not traded in an active market (for example, over-the-counter derivatives) is determined using valuation techniques. The Group uses its judgment to select a variety of methods and makes assumptions that are mainly based on market conditions existing at each balance sheet date.
The assumptions in respect of the valuation of the put option associated with the remaining 30% stake in Serasa are set out in note 8.
Share-based payments (note 33)The assumptions used in determining the amounts charged in the Group income statement include judgments in respect of performance conditions and length of service together with future share prices, dividend and interest yields and exercise patterns.
Pension benefits (note 34)The present value of the defined benefit assets and obligations depends on factors that are determined on an actuarial basis using a number of assumptions. The assumptions used in determining the defined benefit assets and obligations and net pension costs include the expected long-term rate of return on the plan assets and the discount rate. Any changes in these assumptions may impact on the amounts disclosed in the Group financial statements.
The expected return on plan assets is calculated by reference to the plan investments at the balance sheet date and is a weighted average of the expected returns on each main asset type based on market yields available on these asset types at the balance sheet date.
The Group determines the appropriate discount rate at the end of each year. This is the interest rate used to calculate the present value of estimated future cash outflows expected to be required to settle the defined benefit obligations. In determining the discount rate, the Group has considered the prevailing market yields of high-quality corporate bonds that are denominated in the currency in which the benefits will be paid, and that have terms to maturity consistent with the estimated average term of the related pension liability. In determining the discount rate, management has accordingly derived an appropriate discount rate by consideration of an AA rated corporate bond yield curve and the estimated future cash outflows.
Other key assumptions for defined benefit obligations and pension costs are based in part on market conditions at the relevant balance sheet dates and additional information is given in note 34.
(b) Critical judgmentsManagement has made certain judgments in the process of applying the Group’s accounting policies that have a significant effect on the amounts recognised in the Group financial statements. These judgments include the classification of transactions between the Group income statement and the Group balance sheet.

102 Experian Annual Report 2012 Financial statements
Notes to the Group financial statements continued
6. Critical accounting estimates and judgments (continued)
The most significant of these judgments is in respect of intangible assets where certain costs incurred in the developmental phase of an internal project are capitalised if a number of criteria are met. Management has made certain judgments and assumptions when assessing whether a project meets these criteria, and on measuring the costs and the economic life attributed to such projects. On acquisition, specific intangible assets are identified and recognised separately from goodwill and then amortised over their estimated useful lives. These include such items as brand names and customer lists, to which value is first attributed at the time of acquisition. The capitalisation of these assets and the related amortisation charges are based on judgments about the value and economic life of such items. The economic lives for intangible assets are estimated at between three and ten years for internal projects, which include databases, internal use software and internally generated software, and between two and twenty years for acquisition intangibles. Further details of the amounts of, and movements in, such assets are given in note 21.
7. Use of non-GAAP measures in the Group financial statements
The Group has identified certain measures that it believes will assist understanding of the performance of the business. The measures are not defined under IFRS and they may not be directly comparable with other companies’ adjusted measures. The non-GAAP measures are not intended to be a substitute for, or superior to, any IFRS measures of performance but management has included them as they consider them to be important comparables and key measures used within the business for assessing performance.
The following are the key non-GAAP measures identified by the Group and used in the Group financial statements:
Benchmark profit before tax (‘Benchmark PBT’) Benchmark PBT is defined as profit before amortisation of acquisition intangibles, acquisition expenses, goodwill impairments, adjustments to contingent consideration, charges in respect of the demerger-related equity incentive plans, exceptional items, financing fair value remeasurements, tax and discontinued operations. It includes the Group’s share of continuing associates’ pre-tax results.
Earnings before interest and tax (‘EBIT’)EBIT is defined as profit before amortisation of acquisition intangibles, acquisition expenses, goodwill impairments, adjustments to contingent consideration, charges in respect of the demerger-related equity incentive plans, exceptional items, net finance costs, tax and discontinued operations. It includes the Group’s share of continuing associates’ pre-tax results.
Benchmark earningsBenchmark earnings represents Benchmark PBT less attributable tax and non-controlling interests. Benchmark earnings attributable to non-controlling interests represents that portion of Benchmark earnings that relate to non-controlling interests. Benchmark PBT less attributable tax is designated as overall benchmark earnings. The attributable tax for the purposes of determining benchmark earnings excludes significant tax credits and charges arising in the year which, in view of their size or nature, are not comparable with previous periods together with tax arising on exceptional items and on total adjustments made to derive Benchmark PBT.
Benchmark earnings per share (‘Benchmark EPS’)Benchmark EPS represents Benchmark earnings divided by a weighted average number of shares, and is disclosed to indicate the underlying profitability of the Group.
Exceptional itemsThe separate reporting of non-recurring exceptional items gives an indication of the Group’s underlying performance. Exceptional items are those arising from the profit or loss on disposal of businesses, closure costs of major business units or costs of significant restructuring programmes. All other restructuring costs are charged against EBIT in the segments in which they are incurred.
Operating cash flowOperating cash flow is calculated as cash generated from operations adjusted for outflows in respect of acquisition expenses, the purchase and disposal of property, plant and equipment and other intangible assets, and adding dividends from continuing associates but excluding any cash inflows and outflows in respect of exceptional items. It is reconciled to cash generated from operations in note 40(h).
Operating cash flow is defined as EBIT from continuing operations, plus depreciation, amortisation and charges in respect of equity incentive plans within Benchmark PBT, less capital expenditure net of disposal proceeds and further adjusted for changes in working capital and profit or loss retained in continuing associates.
Net debtNet debt is calculated as total debt less cash and cash equivalents and other highly liquid bank deposits with original maturities greater than three months. Total debt includes loans and borrowings (and the fair value of derivatives hedging loans and borrowings), overdrafts and obligations under finance leases. Accrued interest is excluded from net debt.

103
Governance
Financial statements
Busin
ess reviewB
usiness overview
8. Financial risk management
(a) Financial risk factorsThe Group’s activities expose it to a variety of financial risks: market risk (including foreign exchange risk, interest rate risk and price risk), credit risk and liquidity risk. The Group’s financial risk management focuses on the unpredictability of financial markets and seeks to minimise potentially adverse effects on the Group’s financial performance. The Group seeks to reduce its exposure to financial risks and uses derivative financial instruments to hedge certain risk exposures. The Group also ensures surplus funds are managed and controlled in a prudent manner which will protect capital sums invested and ensure adequate short-term liquidity, whilst maximising returns. Financial risks represent part of the Group’s risks in relation to its strategy and business objectives and a full discussion of all such risks is contained within the separate risks and uncertainties section of the annual report.
Market riskForeign exchange riskThe Group operates internationally and is exposed to foreign exchange risk from future commercial transactions, recognised assets and liabilities and investments in, and loans between, undertakings with different functional currencies. The Group manages such risk, primarily within undertakings whose functional currencies are US dollars, by borrowing in the relevant currencies and using forward foreign exchange contracts. The principal transaction exposures are to sterling and the euro.
The following table quantifies the Group’s sensitivity to foreign exchange risk on the basis of the profile of foreign exchange transaction exposures, and an assessment of reasonably possible changes in such exposures. In making its assessment of reasonably possible changes, the Group has considered data on movements in relevant currencies.
Foreign exchange exposure 2012 2011
Sterling against US dollar:
Currency strengthening/weakening 9% 10%
Effect on profit for the financial year US$nil US$1m higher/lower
Effect on other comprehensive income and other components of equity US$nil US$nil
Euro against US dollar:
Currency strengthening/weakening 8% 10%
Effect on profit for the financial year US$1m higher/lower US$nil
Effect on other comprehensive income and other components of equity US$nil US$nil
The Group has investments in undertakings with other functional currencies, whose net assets are exposed to foreign exchange translation risk. In order to reduce the impact of currency fluctuations on the value of such entities, the Group has a policy of borrowing in sterling and euros, as well as in US dollars, and of entering into forward foreign exchange contracts in the relevant currencies. The sensitivity reported in respect of sterling against the US dollar is wholly attributable to such net exposures. Otherwise the above analysis excludes the impact of foreign exchange risk on the translation of the net assets of such undertakings.
Interest rate riskThe Group’s interest rate risk arises principally from its net debt and the portions thereof at variable rates which expose the Group to such risk.
The Group has a policy of normally maintaining between 30% and 70% of net funding at rates that are fixed for more than six months. The Group’s interest rate exposure is managed by the use of fixed and floating rate borrowings and by the use of interest rate swaps and cross currency interest rate swaps to adjust the balance of fixed and floating rate liabilities. The Group also mixes the duration of its borrowings to smooth the impact of interest rate fluctuations.

104 Experian Annual Report 2012 Financial statements
Notes to the Group financial statements continued
8. Financial risk management (continued)
The following table quantifies the Group’s sensitivity to interest rate risk on the basis of the profile of net debt at each balance sheet date and an assessment of reasonably possible changes in the principal interest rates, with all other variables held constant. In making its assessment of reasonably possible changes, the Group has considered data on movements in relevant interest rates over the most recent three-year period.
Interest rate exposure 2012 2011
On US dollar denominated net debt:
Interest rate movement 0.7% higher 1.6% higher
Effect on profit for the financial year1 US$14m higher US$16m higher
On sterling denominated net debt:
Interest rate movement 1.4% higher 1.7% higher
Effect on profit for the financial year2 US$1m lower US$9m lower
On Brazilian real denominated net debt:
Interest rate movement 2.3% higher 2.3% higher
Effect on profit for the financial year3 US$3m higher US$2m higher
On euro denominated net debt:
Interest rate movement 1.4% higher 1.5% higher
Effect on profit for the financial year2 US$7m lower US$8m lower
1. Primarily as a result of fair value gains on interest rate swaps offset by higher interest expense on floating rate borrowings.
2. Primarily as a result of the revaluation of borrowings and related derivatives.
3. Primarily as a result of higher interest income on cash and cash equivalents.
Price riskThe Group is exposed to price risk in connection with investments classified on the balance sheet as available for sale financial assets. Such investments are primarily held to provide security in connection with unfunded pension obligations and are managed by independent fund managers who seek to mitigate such risk by diversification of the portfolio.
At 31 March 2012, if the relevant stock market and other indices had been 10% higher/lower with all other variables held constant, no further significant gains/losses would have been recognised in the Group statement of comprehensive income. In making its assessment of reasonably possible changes, the Group has used the movements in relevant stock market and other indices for the year ended 31 March 2012.
Credit riskIn the case of derivative financial instruments, deposits and trade receivables, the Group is exposed to credit risk from the non-performance of contractual agreements by the contracted party.
This credit risk is minimised by a policy under which the Group only enters into such contracts with banks and financial institutions with strong credit ratings, within limits set for each organisation. Dealing activity is closely controlled and counterparty positions are monitored regularly. The general credit risk on derivative financial instruments utilised by the Group is therefore not considered to be significant. The Group does not anticipate that any losses will arise from non-performance by these counterparties.
At the balance sheet date trade receivables with financial institutions accounted for some 25% (2011: 26%) of total trade receivables in Brazil, some 28% (2011: 23%) in the UK and some 27% (2011: 22%) in the USA. The remaining balances are distributed across multiple industries and geographies. The Group has implemented policies that require appropriate credit checks on potential clients before granting credit. The maximum credit risk in respect of such financial assets is the carrying value of the assets.
Liquidity riskThe Group maintains long-term committed facilities to ensure it has sufficient funds available for operations and planned expansions. The Group monitors rolling forecasts of projected cash flows to ensure that it will have adequate undrawn committed facilities available.
Details of the facilities available to the Group and their utilisation at the balance sheet date are given in note 28. The maturity analysis of financial liabilities is given in note 32.
(b) Capital risk managementThe Group’s objectives in managing capital are to safeguard its ability to continue as a going concern in order to provide returns for shareholders and benefits for other stakeholders and to maintain an optimal capital structure and cost of capital.

105
Governance
Financial statements
Busin
ess reviewB
usiness overview
8. Financial risk management (continued)
In order to maintain or adjust the capital structure, the Group may adjust the amount of dividends paid to shareholders, return capital to shareholders, issue or purchase shares or sell assets to reduce net debt. As part of its internal reporting processes the Group monitors capital employed by operating segment. For this purpose, capital employed is defined as net assets excluding the net present value of the Serasa put option, net debt, and tax balances. At 31 March 2012 the Group’s capital employed was US$5,979m (2011: US$5,323m). The Group manages its working capital and capital expenditure in order to meet its target to convert at least 90% of EBIT into operating cash flow and the conversion percentage for the year ended 31 March 2012 was 96% (2011: 98%).
(c) Fair value estimationThe fair value of derivative financial instruments and other financial assets and liabilities is determined by using market data and established estimation techniques such as discounted cash flow and option valuation models. The fair value of foreign exchange contracts is based on a comparison of the contractual and year end exchange rates. The fair values of other derivative financial instruments are estimated by discounting the future cash flows to net present values using appropriate market rates prevailing at the year end.
The following table presents an analysis of the Group’s financial assets and financial liabilities that are measured at fair value by level, as required and defined by IFRS 7:
2012 2011
Level 1US$m
Level 2US$m
Level 3US$m
TotalUS$m
Level 1US$m
Level 2US$m
Level 3US$m
TotalUS$m
Financial assets:
Bank deposits - - - - - 14 - 14
Derivatives used for hedging - 113 - 113 - 37 - 37
Financial assets at fair value through profit and loss - 11 6 17 - 8 6 14
Available for sale 37 - - 37 42 - - 42
37 124 6 167 42 59 6 107
Financial liabilities:
Derivatives used for hedging - - - - - (31) - (31)
Financial liabilities at fair value through profit and loss - (38) (1,124) (1,162) - (33) (904) (937)
- (38) (1,124) (1,162) - (64) (904) (968)
Net financial assets/(liabilities) 37 86 (1,118) (995) 42 (5) (898) (861)
Assets and liabilities whose valuations are based on unadjusted quoted prices in active markets for identical assets and liabilities are classified as Level 1 in the above analysis. Assets and liabilities which are not traded in an active market and whose valuations are derived from available market data that is observable for the asset or liability are classified as Level 2. Assets and liabilities whose valuations are derived from inputs not based on observable market data are classified as Level 3.
The following table presents an analysis of the changes in financial assets and liabilities classified as Level 3 which comprise put and call options associated with corporate transactions:
Year ended 31 March 2012 Year ended 31 March 2011
Serasa put optionUS$m
Other
US$m
Total
US$m
Serasa put optionUS$m
Other
US$m
Total
US$m
At 1 April (870) (28) (898) (661) 1 (660)
Additions - (9) (9) - (21) (21)
Valuation (losses)/gains recognised in income statement (325) 11 (314) (142) (6) (148)
Currency translation gains and losses recognised in other comprehensive income 103 - 103 (67) (2) (69)
At 31 March (1,092) (26) (1,118) (870) (28) (898)
In view of the anticipated exercise of the put option associated with the remaining 30% stake in Serasa from June 2012, the option has been valued by the Company at 31 March 2012 at the higher of 95% of the equity value of Serasa and the value of Serasa based on assumptions such as the price/earnings ratio of Experian and the latest earnings of Serasa. This method is in accordance with the contractual arrangements on exercise. A further 10% increase in the equity value of Serasa would have resulted in an increase of US$109m in the value of the put obligation. A change of 10% in the Brazilian real exchange rate against the US dollar from that prevailing at the balance sheet date would result in a change of US$109m in the value of the obligation.
106 Experian Annual Report 2012 Financial statements
Notes to the Group financial statements continued
8. Financial risk management (continued)
In prior years a Monte Carlo simulation was used to calculate the liability. The key assumptions in arriving at such valuations were the equity value of Serasa, the future price/earnings ratio of Experian at the date of exercise, the respective volatilities of Experian and Serasa and the risk free rate in Brazil. It was assumed that the put may be exercised in June 2012.
Gains and losses in respect of the valuation of the put option since acquisition in June 2007 have been recorded as financing fair value remeasurements. Movements in the year ended 31 March 2012 and the year ended 31 March 2011 primarily relate to an increase in the equity value of Serasa.
9. Segment information
(a) Narrative disclosuresUnder IFRS 8, an operating segment is a component of an entity:
• that engages in business activities from which it may earn revenues and incur expenses (including revenues and expenses relating to transactions with other components);
• whose operating results are regularly reviewed by the chief operating decision maker to assess its performance and make decisions about resources to be allocated to the segment; and
• for which discrete financial information is available.
Experian is organised into, and managed on a worldwide basis over, the following five operating segments, based on geographic areas, supported by its central Group functions:
• North America;• Latin America;• UK and Ireland;• Europe, Middle East and Africa (‘EMEA’); and• Asia Pacific.
The chief operating decision maker assesses the performance of the above operating segments on the basis of EBIT, as defined in note 7.
The ‘All other segments’ category required to be disclosed under IFRS 8 has been captioned in these financial statements as EMEA/Asia Pacific. This combines information in respect of the EMEA and the Asia Pacific segments as, on the basis of their share of the Group’s results and net assets, neither of these operating segments is individually reportable under IFRS 8.
Experian separately presents information equivalent to segment disclosures in respect of the costs of its central Group functions under the caption of ‘Central Activities’, as management believes that the reporting of this information is helpful to users of the financial statements. Information disclosed under Central Activities includes costs arising from finance, treasury and other global functions.
Inter-segment transactions are entered into under the normal commercial terms and conditions that would also be available to unrelated third parties. There is no material impact from inter-segment transactions on the Group’s results.
Segment assets consist primarily of property, plant and equipment, intangible assets including goodwill, inventories, derivatives designated as hedges of future commercial transactions, and receivables. They exclude tax assets, cash and cash equivalents and derivatives designated as hedges of borrowings.
Segment liabilities comprise operating liabilities, including derivatives designated as hedges of future commercial transactions. They exclude tax liabilities, borrowings and related hedging derivatives.
Capital expenditure comprises additions to property, plant and equipment and intangible assets, excluding additions resulting from acquisitions through business combinations.
Information presented to meet the requirements of IFRS 8 additionally includes analysis of the Group’s revenues over groups of service lines. This is supplemented by voluntary disclosure of the profitability of those same groups of service lines and, for ease of reference, Experian continues to use the term ‘business segments’ when discussing the results of groups of service lines. The four business segments for Experian, details of which are given in the business overview section of this annual report, are:
• Credit Services;• Decision Analytics;• Marketing Services; and• Interactive.
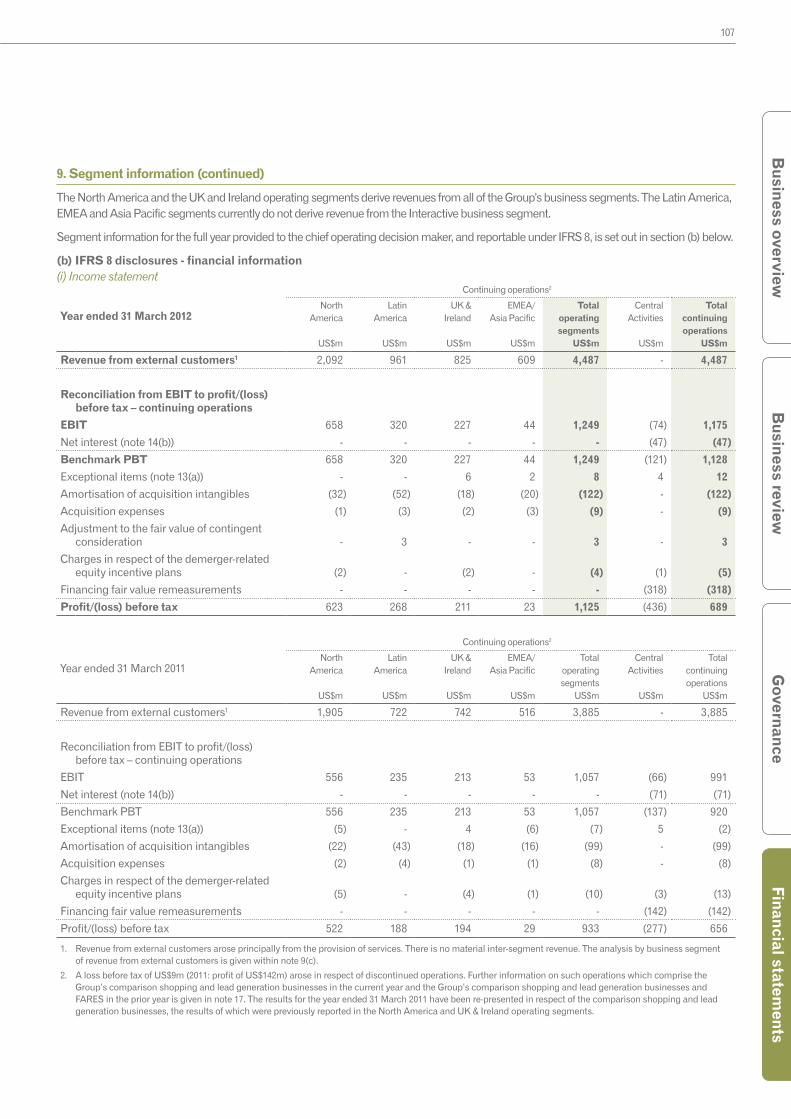
107
Governance
Financial statements
Busin
ess reviewB
usiness overview
9. Segment information (continued)
The North America and the UK and Ireland operating segments derive revenues from all of the Group’s business segments. The Latin America, EMEA and Asia Pacific segments currently do not derive revenue from the Interactive business segment.
Segment information for the full year provided to the chief operating decision maker, and reportable under IFRS 8, is set out in section (b) below.
(b) IFRS 8 disclosures - financial information(i) Income statement
Continuing operations2
Year ended 31 March 2012North
America
US$m
LatinAmerica
US$m
UK & Ireland
US$m
EMEA/Asia Pacific
US$m
Totaloperatingsegments
US$m
CentralActivities
US$m
Totalcontinuingoperations
US$m
Revenue from external customers1 2,092 961 825 609 4,487 - 4,487
Reconciliation from EBIT to profit/(loss) before tax – continuing operations
EBIT 658 320 227 44 1,249 (74) 1,175
Net interest (note 14(b)) - - - - - (47) (47)
Benchmark PBT 658 320 227 44 1,249 (121) 1,128
Exceptional items (note 13(a)) - - 6 2 8 4 12
Amortisation of acquisition intangibles (32) (52) (18) (20) (122) - (122)
Acquisition expenses (1) (3) (2) (3) (9) - (9)
Adjustment to the fair value of contingent consideration - 3 - - 3 - 3
Charges in respect of the demerger-related equity incentive plans (2) - (2) - (4) (1) (5)
Financing fair value remeasurements - - - - - (318) (318)
Profit/(loss) before tax 623 268 211 23 1,125 (436) 689
Continuing operations2
Year ended 31 March 2011North
America
US$m
LatinAmerica
US$m
UK & Ireland
US$m
EMEA/Asia Pacific
US$m
Totaloperatingsegments
US$m
CentralActivities
US$m
Totalcontinuingoperations
US$m
Revenue from external customers1 1,905 722 742 516 3,885 - 3,885
Reconciliation from EBIT to profit/(loss) before tax – continuing operations
EBIT 556 235 213 53 1,057 (66) 991
Net interest (note 14(b)) - - - - - (71) (71)
Benchmark PBT 556 235 213 53 1,057 (137) 920
Exceptional items (note 13(a)) (5) - 4 (6) (7) 5 (2)
Amortisation of acquisition intangibles (22) (43) (18) (16) (99) - (99)
Acquisition expenses (2) (4) (1) (1) (8) - (8)
Charges in respect of the demerger-related equity incentive plans (5) - (4) (1) (10) (3) (13)
Financing fair value remeasurements - - - - - (142) (142)
Profit/(loss) before tax 522 188 194 29 933 (277) 656
1. Revenue from external customers arose principally from the provision of services. There is no material inter-segment revenue. The analysis by business segment of revenue from external customers is given within note 9(c).
2. A loss before tax of US$9m (2011: profit of US$142m) arose in respect of discontinued operations. Further information on such operations which comprise the Group’s comparison shopping and lead generation businesses in the current year and the Group’s comparison shopping and lead generation businesses and FARES in the prior year is given in note 17. The results for the year ended 31 March 2011 have been re-presented in respect of the comparison shopping and lead generation businesses, the results of which were previously reported in the North America and UK & Ireland operating segments.

108 Experian Annual Report 2012 Financial statements
Notes to the Group financial statements continued
9. Segment information (continued)
(ii) Balance sheet
At 31 March 2012North
America
US$m
LatinAmerica
US$m
UK & Ireland
US$m
EMEA/Asia Pacific
US$m
Segmentassets and
liabilitiesUS$m
Central Activities
and other1
US$m
TotalGroup
US$m
Goodwill 1,778 1,322 686 377 4,163 - 4,163
Investments in associates 2 10 - 1 13 - 13
Other assets 1,061 895 600 452 3,008 970 3,978
Total assets 2,841 2,227 1,286 830 7,184 970 8,154
Total liabilities (485) (244) (328) (275) (1,332) (3,891) (5,223)
Net assets/(liabilities) 2,356 1,983 958 555 5,852 (2,921) 2,931
At 31 March 2011North
America
US$m
LatinAmerica
US$m
UK & Ireland
US$m
EMEA/Asia Pacific
US$m
Segmentassets and
liabilitiesUS$m
Central Activities
and other1
US$m
TotalGroup
US$m
Goodwill 1,675 1,116 611 359 3,761 - 3,761
Investments in associates 2 - - 25 27 - 27
Other assets 953 770 557 412 2,692 852 3,544
Total assets 2,630 1,886 1,168 796 6,480 852 7,332
Total liabilities (491) (191) (338) (247) (1,267) (3,358) (4,625)
Net assets/(liabilities) 2,139 1,695 830 549 5,213 (2,506) 2,707
2012 2011
Central Activities and other comprise:Assets
US$m
Liabilities
US$m
Net assets/ (liabilities)
US$m
Assets
US$m
Liabilities
US$m
Net assets/ (liabilities)
US$m
Central Activities1 277 (150) 127 230 (120) 110
Net present value of put option in respect of non-controlling interest in Serasa - (1,092) (1,092) - (870) (870)
Net debt 358 (2,176) (1,818) 455 (1,956) (1,501)
Tax 335 (473) (138) 167 (412) (245)
Central Activities and other 970 (3,891) (2,921) 852 (3,358) (2,506)
1. Net assets for Central Activities comprise corporate head office balances including retirement benefit assets and obligations and derivative assets and liabilities.
2. The tax liability at 31 March 2012 includes a net liability of US$33m classified as held for sale (note 42). Other assets and liabilities classified as held for sale at 31 March 2012 are principally reported in the North America operating segment.
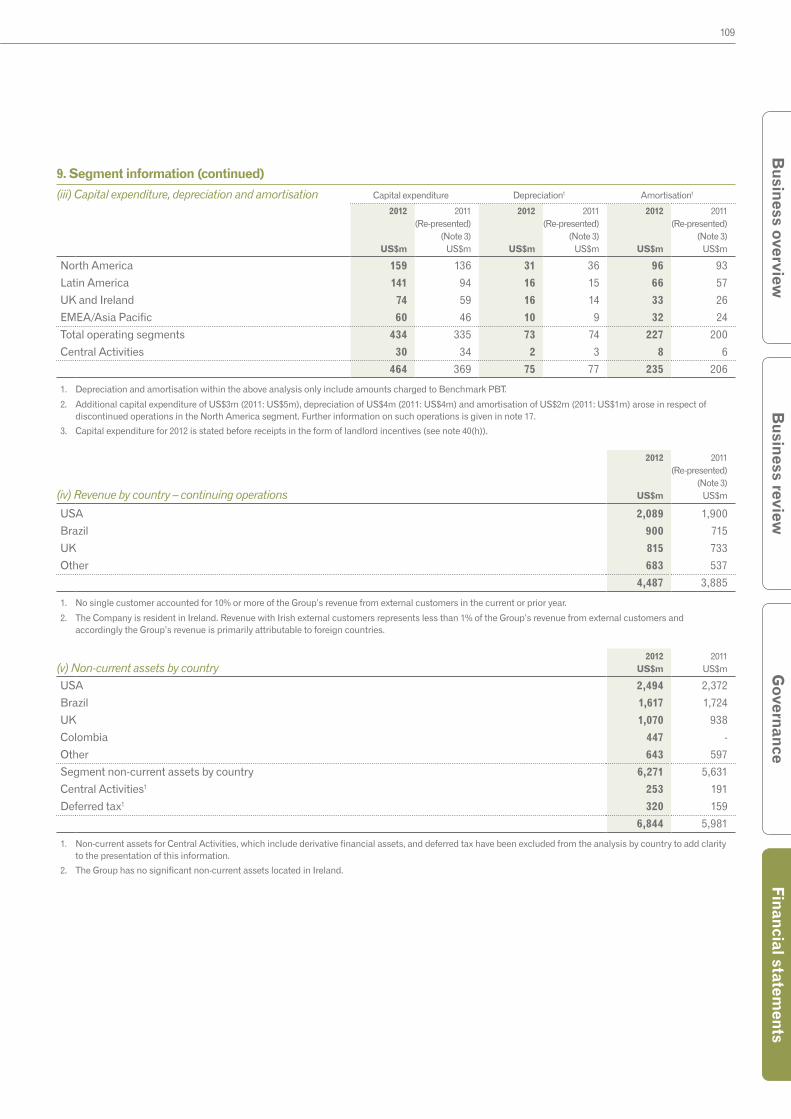
109
Governance
Financial statements
Busin
ess reviewB
usiness overview
9. Segment information (continued)
(iii) Capital expenditure, depreciation and amortisation Capital expenditure Depreciation1 Amortisation1
2012
US$m
2011 (Re-presented)
(Note 3)US$m
2012
US$m
2011 (Re-presented)
(Note 3)US$m
2012
US$m
2011 (Re-presented)
(Note 3)US$m
North America 159 136 31 36 96 93
Latin America 141 94 16 15 66 57
UK and Ireland 74 59 16 14 33 26
EMEA/Asia Pacific 60 46 10 9 32 24
Total operating segments 434 335 73 74 227 200
Central Activities 30 34 2 3 8 6
464 369 75 77 235 206
1. Depreciation and amortisation within the above analysis only include amounts charged to Benchmark PBT.
2. Additional capital expenditure of US$3m (2011: US$5m), depreciation of US$4m (2011: US$4m) and amortisation of US$2m (2011: US$1m) arose in respect of discontinued operations in the North America segment. Further information on such operations is given in note 17.
3. Capital expenditure for 2012 is stated before receipts in the form of landlord incentives (see note 40(h)).
(iv) Revenue by country – continuing operations
2012
US$m
2011 (Re-presented)
(Note 3)US$m
USA 2,089 1,900
Brazil 900 715
UK 815 733
Other 683 537
4,487 3,885
1. No single customer accounted for 10% or more of the Group’s revenue from external customers in the current or prior year.
2. The Company is resident in Ireland. Revenue with Irish external customers represents less than 1% of the Group’s revenue from external customers and accordingly the Group’s revenue is primarily attributable to foreign countries.
(v) Non-current assets by country2012
US$m2011
US$m
USA 2,494 2,372
Brazil 1,617 1,724
UK 1,070 938
Colombia 447 -
Other 643 597
Segment non-current assets by country 6,271 5,631
Central Activities1 253 191
Deferred tax1 320 159
6,844 5,981
1. Non-current assets for Central Activities, which include derivative financial assets, and deferred tax have been excluded from the analysis by country to add clarity to the presentation of this information.
2. The Group has no significant non-current assets located in Ireland.
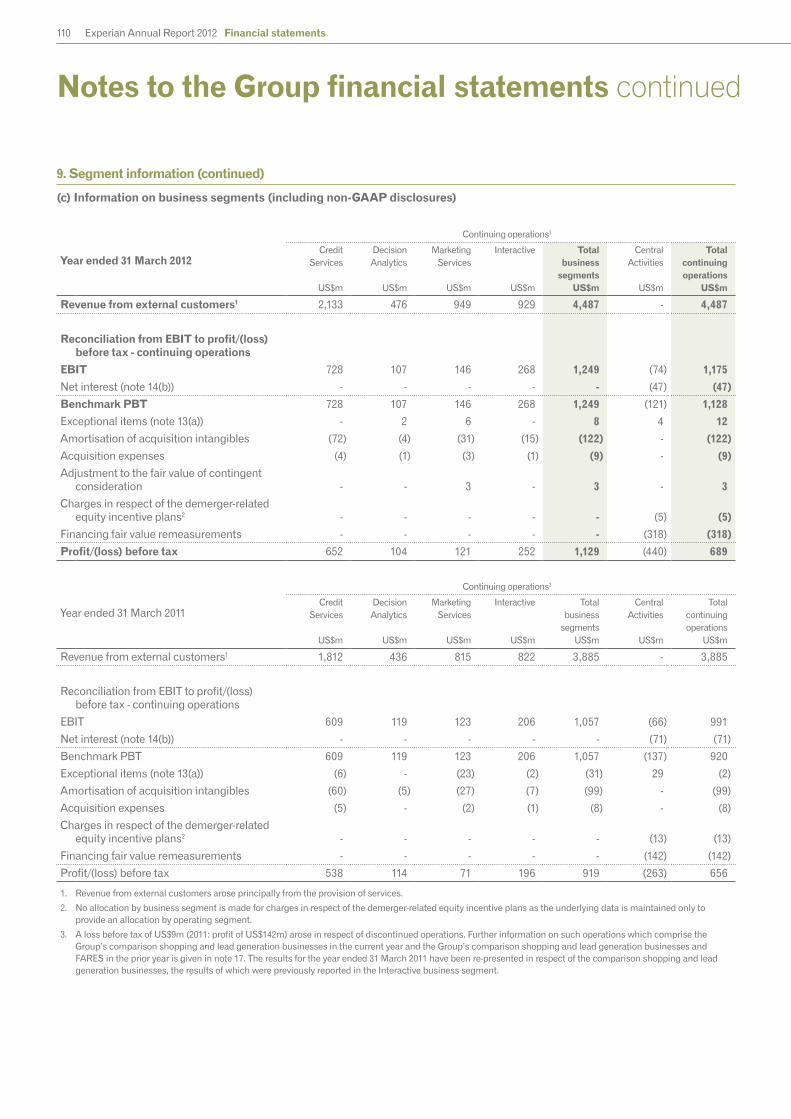
110 Experian Annual Report 2012 Financial statements
Notes to the Group financial statements continued
9. Segment information (continued)
(c) Information on business segments (including non-GAAP disclosures)
Continuing operations3
Year ended 31 March 2012Credit
Services
US$m
DecisionAnalytics
US$m
MarketingServices
US$m
Interactive
US$m
Totalbusiness
segmentsUS$m
CentralActivities
US$m
Totalcontinuingoperations
US$m
Revenue from external customers1 2,133 476 949 929 4,487 - 4,487
Reconciliation from EBIT to profit/(loss) before tax - continuing operations
EBIT 728 107 146 268 1,249 (74) 1,175
Net interest (note 14(b)) - - - - - (47) (47)
Benchmark PBT 728 107 146 268 1,249 (121) 1,128
Exceptional items (note 13(a)) - 2 6 - 8 4 12
Amortisation of acquisition intangibles (72) (4) (31) (15) (122) - (122)
Acquisition expenses (4) (1) (3) (1) (9) - (9)
Adjustment to the fair value of contingent consideration - - 3 - 3 - 3
Charges in respect of the demerger-related equity incentive plans2 - - - - - (5) (5)
Financing fair value remeasurements - - - - - (318) (318)
Profit/(loss) before tax 652 104 121 252 1,129 (440) 689
Continuing operations3
Year ended 31 March 2011
Credit Services
US$m
DecisionAnalytics
US$m
MarketingServices
US$m
Interactive
US$m
Totalbusiness
segmentsUS$m
CentralActivities
US$m
Totalcontinuingoperations
US$m
Revenue from external customers1 1,812 436 815 822 3,885 - 3,885
Reconciliation from EBIT to profit/(loss) before tax - continuing operations
EBIT 609 119 123 206 1,057 (66) 991
Net interest (note 14(b)) - - - - - (71) (71)
Benchmark PBT 609 119 123 206 1,057 (137) 920
Exceptional items (note 13(a)) (6) - (23) (2) (31) 29 (2)
Amortisation of acquisition intangibles (60) (5) (27) (7) (99) - (99)
Acquisition expenses (5) - (2) (1) (8) - (8)
Charges in respect of the demerger-related equity incentive plans2 - - - - - (13) (13)
Financing fair value remeasurements - - - - - (142) (142)
Profit/(loss) before tax 538 114 71 196 919 (263) 656
1. Revenue from external customers arose principally from the provision of services.
2. No allocation by business segment is made for charges in respect of the demerger-related equity incentive plans as the underlying data is maintained only to provide an allocation by operating segment.
3. A loss before tax of US$9m (2011: profit of US$142m) arose in respect of discontinued operations. Further information on such operations which comprise the Group’s comparison shopping and lead generation businesses in the current year and the Group’s comparison shopping and lead generation businesses and FARES in the prior year is given in note 17. The results for the year ended 31 March 2011 have been re-presented in respect of the comparison shopping and lead generation businesses, the results of which were previously reported in the Interactive business segment.

111
Governance
Financial statements
Busin
ess reviewB
usiness overview
10. Foreign currency
The principal exchange rates used in these financial statements are given below. An indication of the sensitivity of the Group’s results to foreign exchange risk is given in note 8.
Average Closing
2012 2011 2012 2011 2010
Sterling : US dollar 1.60 1.55 1.60 1.60 1.52
US dollar : Brazilian real 1.70 1.73 1.82 1.63 1.79
Euro : US dollar 1.38 1.32 1.33 1.42 1.35
11. Total operating expenses
(a) Labour costs - continuing operations
2012
US$m
2011 (Re-presented)
(Note 3)US$m
Wages and salaries 1,222 1,104
Social security costs 194 161
Share-based payments (note 33) 65 64
Pension costs/(income) - defined benefit plans (note 34) 9 (19)
Pension costs - defined contribution plans 45 36
Employee benefit costs 1,535 1,346
Other labour costs 164 130
1,699 1,476
Other labour costs include costs in respect of external contractors, outsourcing costs and costs relating to the recruitment, development and training of employees. The definition, and analysis of the remuneration, of key management personnel is given in note 46.
(b) Depreciation and amortisation - continuing operations
2012
US$m
2011 (Re-presented)
(Note 3)US$m
Depreciation of property, plant and equipment 75 76
Amortisation of intangible assets 359 306
Write down on disposal of intangibles - 3
434 385
(c) Fees payable to the Company’s auditor2012
US$m2011
US$m
Audit of the parent company and Group financial statements 0.5 0.5
Audit of the financial statements of the parent company’s subsidiaries 3.2 3.3
Tax compliance services 0.4 0.3
Tax advisory services 1.2 2.5
Other assurance services 1.6 0.8
Total fees payable to the Company’s auditor and its associates 6.9 7.4
Summary of fees by nature:
Fees for audit and assurance services 5.3 4.6
Fees for other services 1.6 2.8
Total fees payable to the Company’s auditor and its associates 6.9 7.4
The guidelines covering the use of the Company’s auditor for non-audit services are set out in the corporate governance statement and in the year ended 31 March 2012 fees payable for such services were 30% (2011: 61%) of fees payable for audit and assurance services. All such fees are included within other operating charges.

112 Experian Annual Report 2012 Financial statements
Notes to the Group financial statements continued
12. Average monthly number of employees (including executive directors) – continuing operations2012 2011
(Re-presented) (Note 3)
Full time Part time Full timeequivalent
Full time Part time Full timeequivalent
North America 5,493 86 5,536 5,123 90 5,168
Latin America 2,915 130 2,980 2,555 154 2,632
UK and Ireland 3,386 262 3,517 3,172 229 3,286
EMEA/Asia Pacific 3,838 88 3,882 3,229 75 3,267
Total operating segments 15,632 566 15,915 14,079 548 14,353
Central Activities 105 11 110 96 12 102
Total continuing operations 15,737 577 16,025 14,175 560 14,455
13. Exceptional items and total adjustments made to derive Benchmark PBT – continuing operations
(a) Exceptional items2012
US$m2011
US$m
(Gain)/loss on disposal of businesses (8) 21
Interest income arising on legacy tax balances (4) -
Gain in respect of defined benefit pension plan - (29)
Restructuring costs - 10
Total exceptional items (12) 2
Exceptional items by income statement caption:
Labour costs - (23)
Data and information technology costs - 1
Depreciation and amortisation - 3
Other operating charges (8) 21
Within operating profit (8) 2
Within net finance costs (4) -
Total exceptional items (12) 2
The gain on disposal of businesses in the year ended 31 March 2012 related to a number of small disposals of businesses, principally the disposal of an investment classified as available for sale at 31 March 2011. The loss on disposal of businesses in the year ended 31 March 2011 principally related to the completion of a number of small disposals of businesses whose assets and liabilities were classified as held for sale at 31 March 2010. There were related cash inflows of US$12m (2011: US$12m).
Interest income of US$4m arose on the determination of certain legacy tax balances in the year ended 31 March 2012.
The gain of US$29m in respect of the defined benefit pension plan in the year ended 31 March 2011 arose as a consequence of a change by the UK Government to the index required to be used in determining pension increases for benefits accrued in respect of past service (see note 34).
Expenditure of US$10m arose in the year ended 31 March 2011 in connection with the conclusion of the Group’s strategic programme of cost efficiency measures.
A reconciliation of total exceptional items to the cash outflow in respect of exceptional items is given in note 40(c).
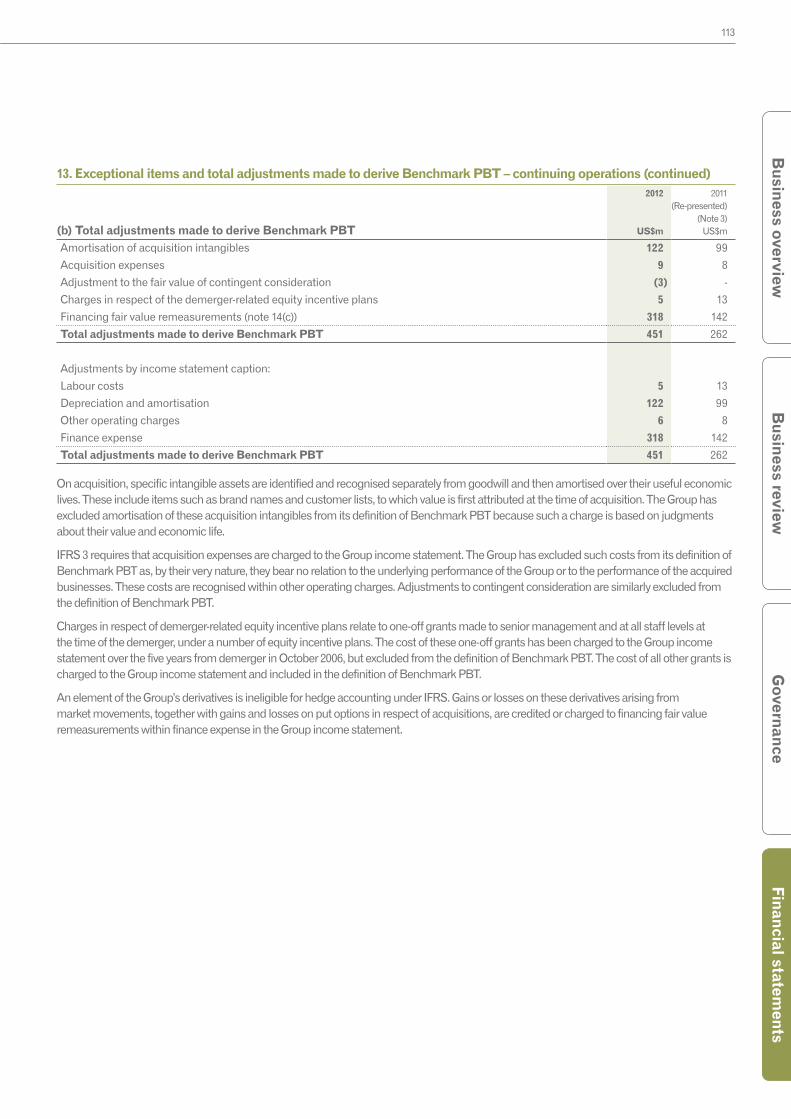
113
Governance
Financial statements
Busin
ess reviewB
usiness overview
13. Exceptional items and total adjustments made to derive Benchmark PBT – continuing operations (continued)
(b) Total adjustments made to derive Benchmark PBT
2012
US$m
2011 (Re-presented)
(Note 3)US$m
Amortisation of acquisition intangibles 122 99
Acquisition expenses 9 8
Adjustment to the fair value of contingent consideration (3) -
Charges in respect of the demerger-related equity incentive plans 5 13
Financing fair value remeasurements (note 14(c)) 318 142
Total adjustments made to derive Benchmark PBT 451 262
Adjustments by income statement caption:
Labour costs 5 13
Depreciation and amortisation 122 99
Other operating charges 6 8
Finance expense 318 142
Total adjustments made to derive Benchmark PBT 451 262
On acquisition, specific intangible assets are identified and recognised separately from goodwill and then amortised over their useful economic lives. These include items such as brand names and customer lists, to which value is first attributed at the time of acquisition. The Group has excluded amortisation of these acquisition intangibles from its definition of Benchmark PBT because such a charge is based on judgments about their value and economic life.
IFRS 3 requires that acquisition expenses are charged to the Group income statement. The Group has excluded such costs from its definition of Benchmark PBT as, by their very nature, they bear no relation to the underlying performance of the Group or to the performance of the acquired businesses. These costs are recognised within other operating charges. Adjustments to contingent consideration are similarly excluded from the definition of Benchmark PBT.
Charges in respect of demerger-related equity incentive plans relate to one-off grants made to senior management and at all staff levels at the time of the demerger, under a number of equity incentive plans. The cost of these one-off grants has been charged to the Group income statement over the five years from demerger in October 2006, but excluded from the definition of Benchmark PBT. The cost of all other grants is charged to the Group income statement and included in the definition of Benchmark PBT.
An element of the Group’s derivatives is ineligible for hedge accounting under IFRS. Gains or losses on these derivatives arising from market movements, together with gains and losses on put options in respect of acquisitions, are credited or charged to financing fair value remeasurements within finance expense in the Group income statement.

114 Experian Annual Report 2012 Financial statements
Notes to the Group financial statements continued
14. Net finance costs
(a) Net finance costs included in Profit before tax2012
US$m2011
US$m
Interest income:
Bank deposits and short-term investments (18) (13)
Expected return on pension plan assets (57) (56)
Interest income before interest on legacy tax balances (75) (69)
Interest income arising on legacy tax balances (4) -
Interest income (79) (69)
Finance expense:
Bank loans and overdrafts 3 6
Eurobonds and notes 95 66
Commitment and facility fees 8 6
Unwind of discounts 1 2
Interest differentials on derivatives (31) 9
Finance lease interest expense - 1
Interest expense on pension plan liabilities 46 50
Interest expense 122 140
Charge in respect of financing fair value remeasurements (note 14(c)) 318 142
Finance expense 440 282
Net finance costs included in Profit before tax 361 213
(b) Net interest expense included in Benchmark PBT 2012
US$m2011
US$m
Interest income before interest on legacy tax balances (75) (69)
Interest expense 122 140
Net interest expense included in Benchmark PBT 47 71
(c) Analysis of charge in respect of financing fair value remeasurements2012
US$m2011
US$m
Fair value losses/(gains) on borrowings - attributable to interest rate risk 135 (22)
Fair value (gains)/losses on borrowings - attributable to currency risk (53) 38
Losses on interest rate swaps - fair value hedges 3 9
Gains on cross currency swaps - fair value hedges (101) (6)
Fair value losses/(gains) on non-hedging derivatives 4 (26)
Losses in connection with commitments to purchase own shares - 2
Foreign exchange losses on financing activities 16 8
Increase in fair value of put options - principally Serasa 314 139
Charge in respect of financing fair value remeasurements 318 142
An indication of the sensitivity of the Group’s results to interest rate risk is given in note 8.

115
Governance
Financial statements
Busin
ess reviewB
usiness overview
15. Tax (credit)/charge in the Group income statement
(a) Analysis of Group tax (credit)/charge2012
US$m
2011 (Re-presented)
(Note 3)US$m
Current tax:
Tax on income for the year 120 91
Adjustments in respect of prior years (71) (35)
Total current tax charge 49 56
Deferred tax:
Origination and reversal of temporary differences (82) 49
Adjustments in respect of prior years (2) 13
Total deferred tax (credit)/charge (84) 62
Group tax (credit)/charge (35) 118
The Group tax (credit)/charge comprises:
UK tax (241) (23)
Non-UK tax 206 141
Group tax (credit)/charge (35) 118
(b) Tax reconciliations
(i) Reconciliation of the Group tax (credit)/charge
2012
US$m
2011 (Re-presented)
(Note 3)US$m
Profit before tax 689 656
Profit before tax multiplied by the standard rate of UK corporation tax of 26% (2011: 28%) 179 184
Effects of:
Adjustments in respect of prior years (73) (22)
Income not taxable (42) (23)
Expenses not deductible 139 72
Adjustment in respect of previously unrecognised tax losses (217) (58)
Reduction in future rate of UK corporation tax 9 10
Effect of different tax rates in non-UK businesses (30) (45)
Group tax (credit)/charge (35) 118
Effective rate of tax based on Profit before tax (5.1%) 18.0%
The effective tax rate for both years is lower than the standard rate of UK corporation tax and the differences are explained above.

116 Experian Annual Report 2012 Financial statements
Notes to the Group financial statements continued
15. Tax (credit)/charge in the Group income statement (continued)
(ii) Reconciliation of the Group tax (credit)/charge to the Benchmark tax charge
2012
US$m
2011 (Re-presented)
(Note 3)US$m
Group tax (credit)/charge (35) 118
One-off tax credit 268 37
Tax attributable to exceptional items (1) 4
Tax relief on total adjustments made to derive Benchmark PBT 42 39
Tax on Benchmark PBT 274 198
Benchmark PBT 1,128 920
Effective rate of tax based on Benchmark PBT 24.3% 21.5%
In the year ended 31 March 2012, a one-off tax credit of US$268m has been recognised on the determination of certain liabilities in respect of historic positions and the further utilisation of tax losses. In the year ended 31 March 2011, a one-off tax credit of US$37m was recognised in respect of the utilisation of tax losses. These amounts have been excluded from the calculation of the effective rate of tax based on Benchmark PBT in view of their size and nature.
(c) Factors that may affect future tax chargesIn the foreseeable future, the Group’s tax charge will continue to be influenced by the profile of profits earned in the different countries in which the Group’s businesses operate and could be affected by changes in tax law. In the UK, the main rate of corporation tax was reduced from 28% to 26% with effect from 1 April 2011 and to 24% with effect from 1 April 2012. Further proposed reductions to the main rate will reduce it by 1% per annum to 22% from 1 April 2014. Each of these further proposed reductions is expected to be separately enacted and has not yet been substantively enacted.
(d) Other information in respect of taxTax recognised in other comprehensive income and directly in equity is detailed in note 16. Details of the tax position in the Group balance sheet are given in note 35 and an analysis of the cash outflow in respect of tax is given in note 40(d).
16. Tax recognised in other comprehensive income and directly in equity
(a) Tax recognised in other comprehensive income
2012 2011
Before tax
US$m
Tax (charge)
US$m
After tax
US$m
Before tax
US$m
Tax (charge)/
creditUS$m
After tax
US$m
Actuarial gains - defined benefit pension plans 9 (2) 7 107 (30) 77
Fair value gains - available for sale financial assets - - - 4 1 5
Currency translation differences (64) - (64) 142 - 142
Other comprehensive income (55) (2) (57) 253 (29) 224
Current tax - 1
Deferred tax (2) (30)
Other comprehensive income (2) (29)
(b) Tax credit recognised directly in equity on transactions with owners2012
US$m2011
US$m
Current tax 15 5
Deferred tax 5 15
20 20
The tax credit recognised directly in equity relates to employee share incentive plans.

117
Governance
Financial statements
Busin
ess reviewB
usiness overview
17. Discontinued operations
Experian has agreed to divest the Group’s comparison shopping and lead generation businesses, and the results and cash flows of these businesses are accordingly classified as discontinued with comparative figures re-presented. The results and cash flows of First American Real Estate Solutions LLC (‘FARES’) were reported as discontinued in the year ended 31 March 2011.
(a) Results for discontinued operationsThe loss before tax in respect of discontinued operations of US$9m (2011: profit of US$142m) comprises a loss of US$9m (2011: profit of US$23m) in respect of the comparison shopping and lead generation businesses and US$nil (2011: profit of US$119m) in respect of FARES. The loss for the financial year in respect of discontinued operations of US$6m (2011: profit of US$85m) comprises US$6m (2011: profit of US$12m) in respect of the comparison shopping and lead generation businesses and US$nil (2011: profit of US$73m) in respect of FARES.
The results of the comparison shopping and lead generation businesses were:
2012US$m
2011US$m
Revenue 283 354
Labour costs (44) (49)
Data and information technology costs (7) (8)
Depreciation and amortisation (32) (35)
Marketing and customer acquisition costs (201) (225)
Other operating charges (8) (14)
Total operating expenses (292) (331)
(Loss)/profit before tax (9) 23
Tax credit/(charge) 3 (11)
(Loss)/profit for the financial year (6) 12
Depreciation and amortisation includes amortisation of acquisition intangibles of US$27m (2011: US$30m).
The results of FARES for the year ended 31 March 2011 were:
2011US$m
Share of profits 5
Gain arising in connection with disposal of interest 123
Finance expense - financing fair value reversal arising on FAC buy-out option (9)
Profit before tax 119
Tax charge (46)
Profit for the financial year 73
In the period to the date of the exercise by The First American Corporation (’FAC’) of its buy-out option over Experian’s 20% interest in FARES on 22 April 2010, Experian used the equity method to account for its shareholding in FARES. Experian’s share of FARES’ post-tax profits of US$5m was recognised and reported within results for discontinued operations.
The gain of US$123m which arose in connection with this disposal in the year ended 31 March 2011 represented the difference between the pre-tax amount of US$314m realised on the disposal of the interest in December 2010 and its book value of US$217m at the date of the exercise by FAC of its buy-out option, together with dividends of US$26m received after the exercise of the buy-out option.
In the period to 22 April 2010, the Group made net sales and recharges to FARES of US$2m. Such net sales and recharges were made under normal commercial terms and conditions that would be available to third parties.
(b) Cash flows for discontinued operationsCash flows for the comparison shopping and lead generation businesses comprise:
2012US$m
2011US$m
Cash inflow from operating activities 2 55
Cash flow used in investing activities (3) (5)
(1) 50
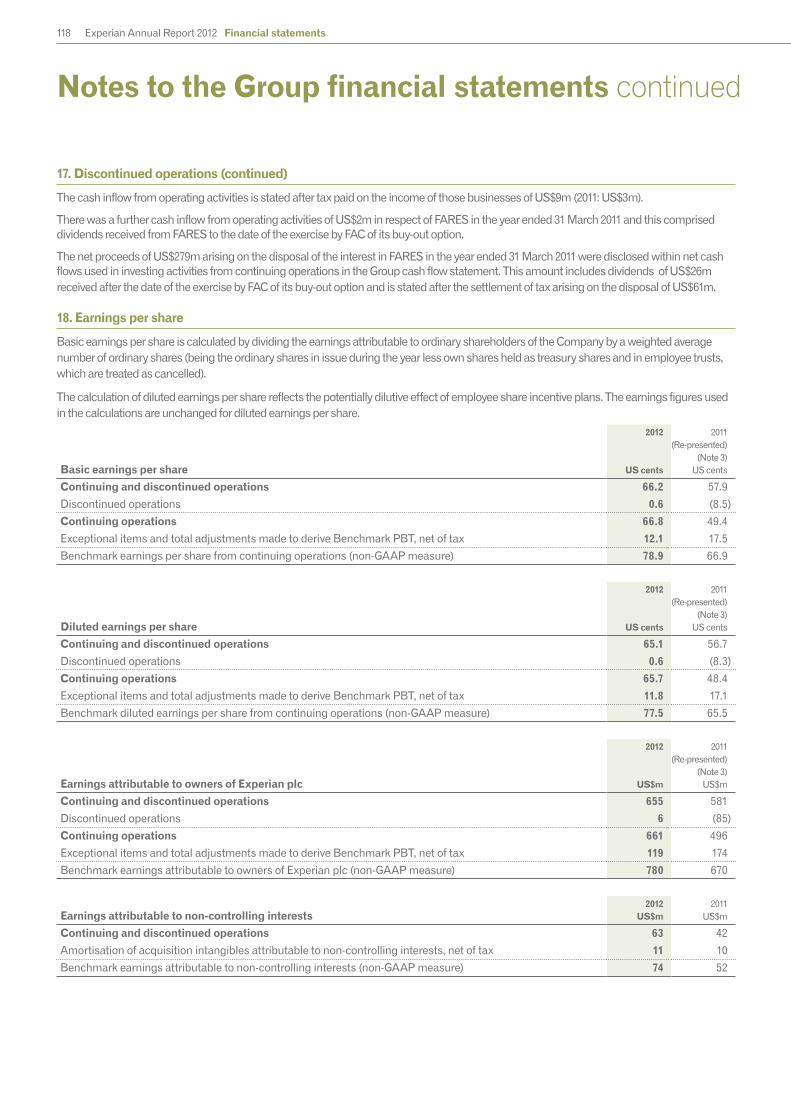
118 Experian Annual Report 2012 Financial statements
Notes to the Group financial statements continued
17. Discontinued operations (continued)
The cash inflow from operating activities is stated after tax paid on the income of those businesses of US$9m (2011: US$3m).
There was a further cash inflow from operating activities of US$2m in respect of FARES in the year ended 31 March 2011 and this comprised dividends received from FARES to the date of the exercise by FAC of its buy-out option.
The net proceeds of US$279m arising on the disposal of the interest in FARES in the year ended 31 March 2011 were disclosed within net cash flows used in investing activities from continuing operations in the Group cash flow statement. This amount includes dividends of US$26m received after the date of the exercise by FAC of its buy-out option and is stated after the settlement of tax arising on the disposal of US$61m.
18. Earnings per share
Basic earnings per share is calculated by dividing the earnings attributable to ordinary shareholders of the Company by a weighted average number of ordinary shares (being the ordinary shares in issue during the year less own shares held as treasury shares and in employee trusts, which are treated as cancelled).
The calculation of diluted earnings per share reflects the potentially dilutive effect of employee share incentive plans. The earnings figures used in the calculations are unchanged for diluted earnings per share.
Basic earnings per share
2012
US cents
2011 (Re-presented)
(Note 3)US cents
Continuing and discontinued operations 66.2 57.9
Discontinued operations 0.6 (8.5)
Continuing operations 66.8 49.4
Exceptional items and total adjustments made to derive Benchmark PBT, net of tax 12.1 17.5
Benchmark earnings per share from continuing operations (non-GAAP measure) 78.9 66.9
Diluted earnings per share
2012
US cents
2011 (Re-presented)
(Note 3)US cents
Continuing and discontinued operations 65.1 56.7
Discontinued operations 0.6 (8.3)
Continuing operations 65.7 48.4
Exceptional items and total adjustments made to derive Benchmark PBT, net of tax 11.8 17.1
Benchmark diluted earnings per share from continuing operations (non-GAAP measure) 77.5 65.5
Earnings attributable to owners of Experian plc
2012
US$m
2011 (Re-presented)
(Note 3)US$m
Continuing and discontinued operations 655 581
Discontinued operations 6 (85)
Continuing operations 661 496
Exceptional items and total adjustments made to derive Benchmark PBT, net of tax 119 174
Benchmark earnings attributable to owners of Experian plc (non-GAAP measure) 780 670
Earnings attributable to non-controlling interests2012
US$m2011
US$m
Continuing and discontinued operations 63 42
Amortisation of acquisition intangibles attributable to non-controlling interests, net of tax 11 10
Benchmark earnings attributable to non-controlling interests (non-GAAP measure) 74 52
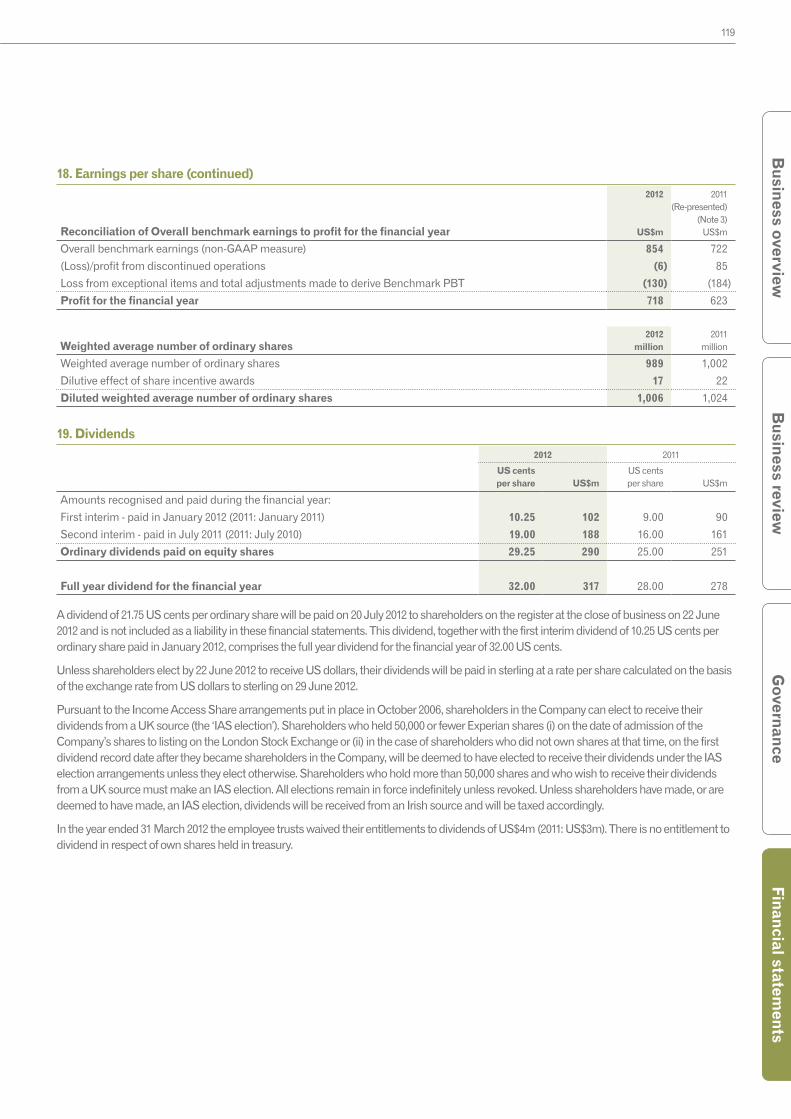
119
Governance
Financial statements
Busin
ess reviewB
usiness overview
18. Earnings per share (continued)
Reconciliation of Overall benchmark earnings to profit for the financial year
2012
US$m
2011 (Re-presented)
(Note 3)US$m
Overall benchmark earnings (non-GAAP measure) 854 722
(Loss)/profit from discontinued operations (6) 85
Loss from exceptional items and total adjustments made to derive Benchmark PBT (130) (184)
Profit for the financial year 718 623
Weighted average number of ordinary shares2012
million2011
million
Weighted average number of ordinary shares 989 1,002
Dilutive effect of share incentive awards 17 22
Diluted weighted average number of ordinary shares 1,006 1,024
19. Dividends2012 2011
US cents per share US$m
US cents per share US$m
Amounts recognised and paid during the financial year:
First interim - paid in January 2012 (2011: January 2011) 10.25 102 9.00 90
Second interim - paid in July 2011 (2011: July 2010) 19.00 188 16.00 161
Ordinary dividends paid on equity shares 29.25 290 25.00 251
Full year dividend for the financial year 32.00 317 28.00 278
A dividend of 21.75 US cents per ordinary share will be paid on 20 July 2012 to shareholders on the register at the close of business on 22 June 2012 and is not included as a liability in these financial statements. This dividend, together with the first interim dividend of 10.25 US cents per ordinary share paid in January 2012, comprises the full year dividend for the financial year of 32.00 US cents.
Unless shareholders elect by 22 June 2012 to receive US dollars, their dividends will be paid in sterling at a rate per share calculated on the basis of the exchange rate from US dollars to sterling on 29 June 2012.
Pursuant to the Income Access Share arrangements put in place in October 2006, shareholders in the Company can elect to receive their dividends from a UK source (the ‘IAS election’). Shareholders who held 50,000 or fewer Experian shares (i) on the date of admission of the Company’s shares to listing on the London Stock Exchange or (ii) in the case of shareholders who did not own shares at that time, on the first dividend record date after they became shareholders in the Company, will be deemed to have elected to receive their dividends under the IAS election arrangements unless they elect otherwise. Shareholders who hold more than 50,000 shares and who wish to receive their dividends from a UK source must make an IAS election. All elections remain in force indefinitely unless revoked. Unless shareholders have made, or are deemed to have made, an IAS election, dividends will be received from an Irish source and will be taxed accordingly.
In the year ended 31 March 2012 the employee trusts waived their entitlements to dividends of US$4m (2011: US$3m). There is no entitlement to dividend in respect of own shares held in treasury.

120 Experian Annual Report 2012 Financial statements
Notes to the Group financial statements continued
20. Goodwill
(a) Movements in goodwill2012
US$m 2011
US$m
At 1 April 3,761 3,412
Differences on exchange (115) 144
Additions through business combinations (note 41) 553 201
Adjustments to contingent consideration on prior year acquisitions (3) 4
Additions through business combinations - total 550 205
Transfer in respect of assets held for sale (note 42) (33) -
At 31 March 4,163 3,761
(b) Analysis of allocation of goodwill by CGU2012
US$m 2011
US$m
North America 1,778 1,675
Latin America 1,322 1,116
UK and Ireland 686 611
EMEA 262 270
Asia Pacific 115 89
At 31 March 4,163 3,761
(c) Key assumptions for value-in-use calculations by CGU2012 2011
Pre-tax WACC
%
Long-term growth rate
%
Pre-tax WACC
%
Long-term growth rate
%
North America 11.3 2.3 12.7 2.3
Latin America 14.8 7.0 16.4 6.7
UK and Ireland 9.1 2.3 10.4 2.3
EMEA 11.4 4.3 11.2 4.3
Asia Pacific 11.6 5.3 12.0 5.1
Further details of the principles used in determining the basis of allocation by CGU and annual impairment testing are given in note 6. There have been no impairments of goodwill in the current or prior years. At 31 March 2012, the recoverable amount of the Asia Pacific CGU exceeds the carrying value by approximately US$80m and an increase in the pre-tax WACC of 1.3% or a reduction in the long-term growth rate of 1.9% would reduce the value-in-use of its goodwill to an amount equal to its carrying value. The recoverable amount of the other CGUs exceed their carrying value on the basis of the above assumptions and any reasonably possible changes thereof.
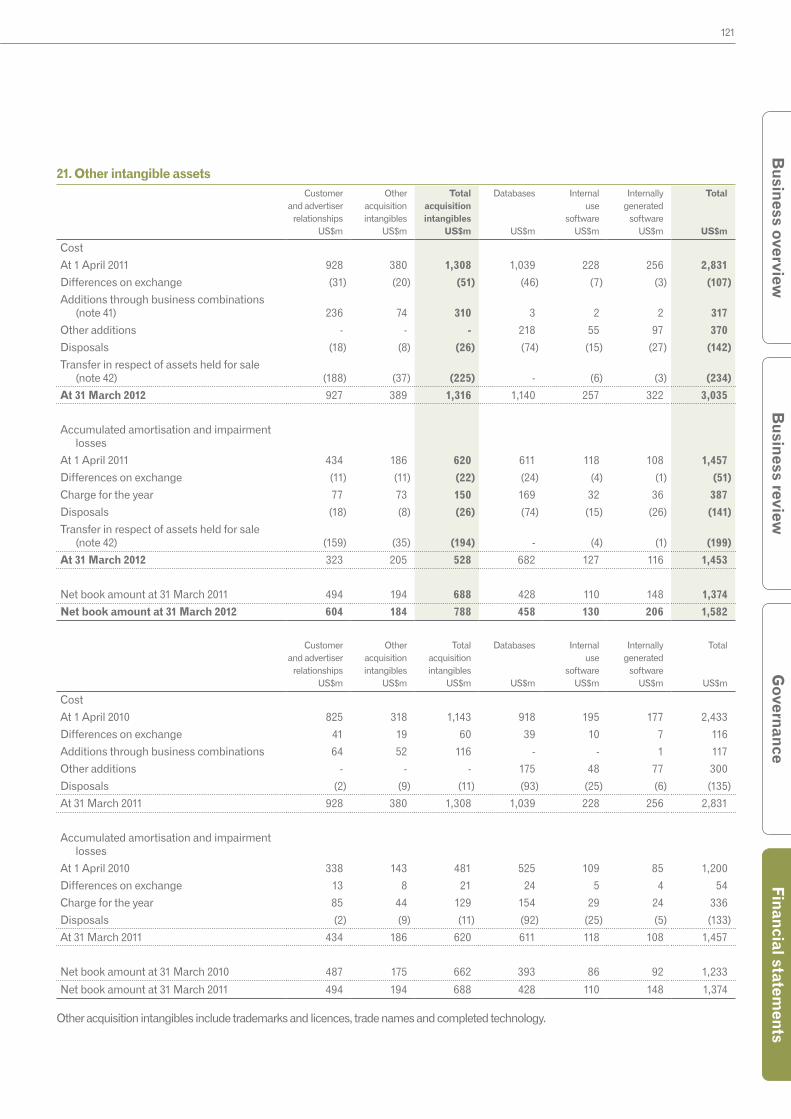
121
Governance
Financial statements
Busin
ess reviewB
usiness overview
21. Other intangible assetsCustomer
and advertiser relationships
US$m
Other acquisition intangibles
US$m
Total acquisition intangibles
US$m
Databases
US$m
Internal use
softwareUS$m
Internally generated
softwareUS$m
Total
US$m
Cost
At 1 April 2011 928 380 1,308 1,039 228 256 2,831
Differences on exchange (31) (20) (51) (46) (7) (3) (107)
Additions through business combinations (note 41) 236 74 310 3 2 2 317
Other additions - - - 218 55 97 370
Disposals (18) (8) (26) (74) (15) (27) (142)
Transfer in respect of assets held for sale (note 42) (188) (37) (225) - (6) (3) (234)
At 31 March 2012 927 389 1,316 1,140 257 322 3,035
Accumulated amortisation and impairment losses
At 1 April 2011 434 186 620 611 118 108 1,457
Differences on exchange (11) (11) (22) (24) (4) (1) (51)
Charge for the year 77 73 150 169 32 36 387
Disposals (18) (8) (26) (74) (15) (26) (141)
Transfer in respect of assets held for sale (note 42) (159) (35) (194) - (4) (1) (199)
At 31 March 2012 323 205 528 682 127 116 1,453
Net book amount at 31 March 2011 494 194 688 428 110 148 1,374
Net book amount at 31 March 2012 604 184 788 458 130 206 1,582
Customer and advertiser
relationshipsUS$m
Other acquisition intangibles
US$m
Total acquisition intangibles
US$m
Databases
US$m
Internal use
softwareUS$m
Internally generated
softwareUS$m
Total
US$m
Cost
At 1 April 2010 825 318 1,143 918 195 177 2,433
Differences on exchange 41 19 60 39 10 7 116
Additions through business combinations 64 52 116 - - 1 117
Other additions - - - 175 48 77 300
Disposals (2) (9) (11) (93) (25) (6) (135)
At 31 March 2011 928 380 1,308 1,039 228 256 2,831
Accumulated amortisation and impairment losses
At 1 April 2010 338 143 481 525 109 85 1,200
Differences on exchange 13 8 21 24 5 4 54
Charge for the year 85 44 129 154 29 24 336
Disposals (2) (9) (11) (92) (25) (5) (133)
At 31 March 2011 434 186 620 611 118 108 1,457
Net book amount at 31 March 2010 487 175 662 393 86 92 1,233
Net book amount at 31 March 2011 494 194 688 428 110 148 1,374
Other acquisition intangibles include trademarks and licences, trade names and completed technology.
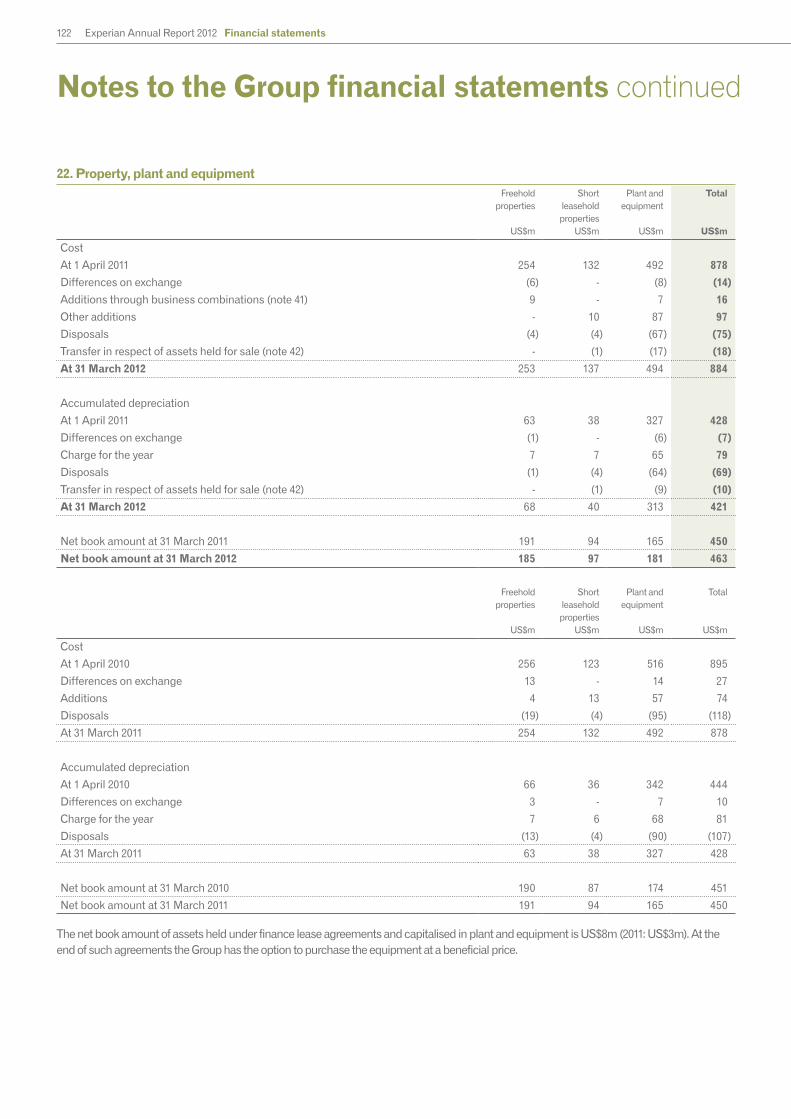
122 Experian Annual Report 2012 Financial statements
Notes to the Group financial statements continued
22. Property, plant and equipmentFreehold
properties
US$m
Shortleaseholdproperties
US$m
Plant andequipment
US$m
Total
US$m
Cost
At 1 April 2011 254 132 492 878
Differences on exchange (6) - (8) (14)
Additions through business combinations (note 41) 9 - 7 16
Other additions - 10 87 97
Disposals (4) (4) (67) (75)
Transfer in respect of assets held for sale (note 42) - (1) (17) (18)
At 31 March 2012 253 137 494 884
Accumulated depreciation
At 1 April 2011 63 38 327 428
Differences on exchange (1) - (6) (7)
Charge for the year 7 7 65 79
Disposals (1) (4) (64) (69)
Transfer in respect of assets held for sale (note 42) - (1) (9) (10)
At 31 March 2012 68 40 313 421
Net book amount at 31 March 2011 191 94 165 450
Net book amount at 31 March 2012 185 97 181 463
Freehold properties
US$m
Shortleaseholdproperties
US$m
Plant andequipment
US$m
Total
US$m
Cost
At 1 April 2010 256 123 516 895
Differences on exchange 13 - 14 27
Additions 4 13 57 74
Disposals (19) (4) (95) (118)
At 31 March 2011 254 132 492 878
Accumulated depreciation
At 1 April 2010 66 36 342 444
Differences on exchange 3 - 7 10
Charge for the year 7 6 68 81
Disposals (13) (4) (90) (107)
At 31 March 2011 63 38 327 428
Net book amount at 31 March 2010 190 87 174 451
Net book amount at 31 March 2011 191 94 165 450
The net book amount of assets held under finance lease agreements and capitalised in plant and equipment is US$8m (2011: US$3m). At the end of such agreements the Group has the option to purchase the equipment at a beneficial price.
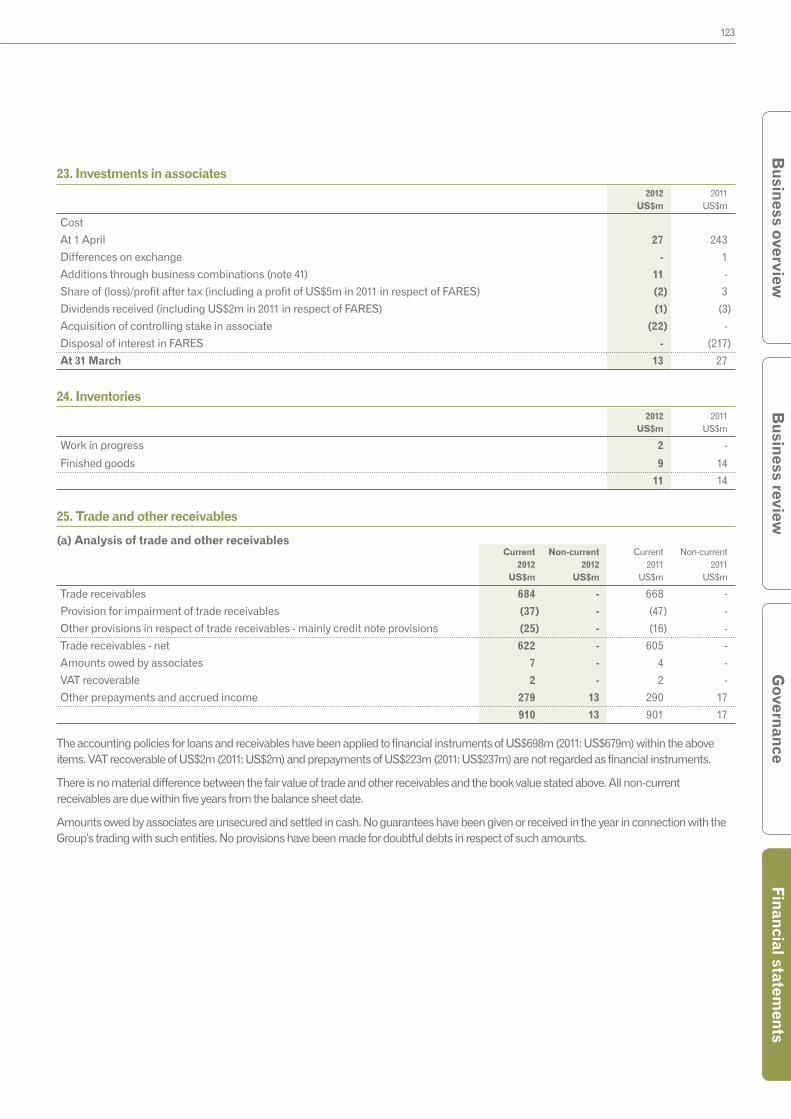
123
Governance
Financial statements
Busin
ess reviewB
usiness overview
23. Investments in associates2012
US$m2011
US$m
Cost
At 1 April 27 243
Differences on exchange - 1
Additions through business combinations (note 41) 11 -
Share of (loss)/profit after tax (including a profit of US$5m in 2011 in respect of FARES) (2) 3
Dividends received (including US$2m in 2011 in respect of FARES) (1) (3)
Acquisition of controlling stake in associate (22) -
Disposal of interest in FARES - (217)
At 31 March 13 27
24. Inventories2012
US$m2011
US$m
Work in progress 2 -
Finished goods 9 14
11 14
25. Trade and other receivables
(a) Analysis of trade and other receivablesCurrent
2012US$m
Non-current2012
US$m
Current2011
US$m
Non-current2011
US$m
Trade receivables 684 - 668 -
Provision for impairment of trade receivables (37) - (47) -
Other provisions in respect of trade receivables - mainly credit note provisions (25) - (16) -
Trade receivables - net 622 - 605 -
Amounts owed by associates 7 - 4 -
VAT recoverable 2 - 2 -
Other prepayments and accrued income 279 13 290 17
910 13 901 17
The accounting policies for loans and receivables have been applied to financial instruments of US$698m (2011: US$679m) within the above items. VAT recoverable of US$2m (2011: US$2m) and prepayments of US$223m (2011: US$237m) are not regarded as financial instruments.
There is no material difference between the fair value of trade and other receivables and the book value stated above. All non-current receivables are due within five years from the balance sheet date.
Amounts owed by associates are unsecured and settled in cash. No guarantees have been given or received in the year in connection with the Group’s trading with such entities. No provisions have been made for doubtful debts in respect of such amounts.

124 Experian Annual Report 2012 Financial statements
Notes to the Group financial statements continued
25. Trade and other receivables (continued)
(b) Trade and other receivables by denomination of currencyCurrent
2012US$m
Non-current2012
US$m
Current2011
US$m
Non-current2011
US$m
US dollar 310 6 294 13
Sterling 236 - 234 -
Brazilian real 135 3 152 -
Euro 101 - 114 1
Other 128 4 107 3
910 13 901 17
(c) Analysis of trade receivables neither past due nor impaired2012
US$m2011
US$m
New customers (of less than six months’ standing) 37 35
Existing customers (of more than six months’ standing) with no defaults in the past 373 370
410 405
None of these trade receivables has been renegotiated in the year (2011: US$nil). There is no evidence of impairment in respect of the above amounts.
(d) Analysis of trade receivables past due but not considered impaired2012
US$m2011
US$m
Up to three months past due 175 167
Three to six months past due 21 14
Over six months past due 12 13
208 194
Of the above amounts, trade receivables of US$nil (2011: US$2m) have been renegotiated in the year. There is no evidence of impairment in respect of the above amounts.
(e) Analysis of trade receivables considered partially impaired and provided for2012
US$m2011
US$m
Up to three months past due 7 7
Three to six months past due 3 8
Over six months past due 31 38
41 53
Impairment provision (37) (47)
4 6
The other classes within trade and other receivables at the balance sheet dates do not include any impaired assets.
(f) Movements in the impairment provision2012
US$m2011
US$m
At 1 April 47 38
Differences on exchange (4) 5
Provision for receivables impairment 24 34
Provision utilised in respect of debts written off (18) (20)
Unused amounts reversed (12) (10)
At 31 March 37 47
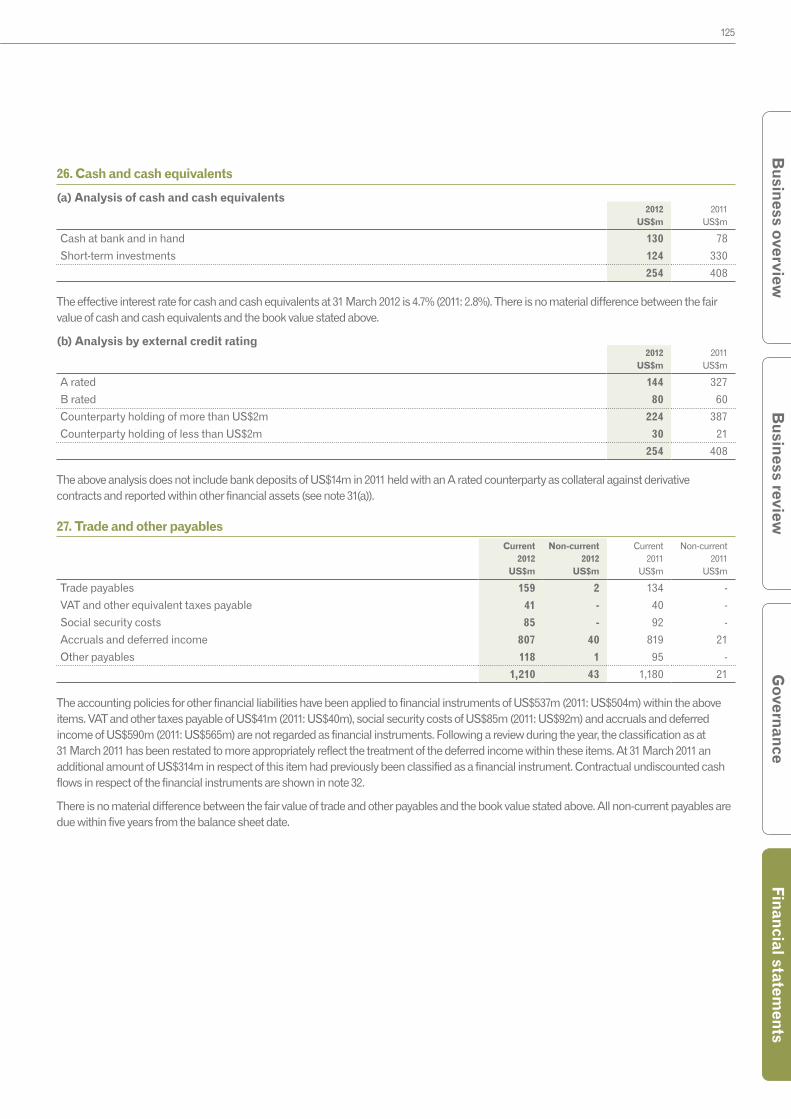
125
Governance
Financial statements
Busin
ess reviewB
usiness overview
26. Cash and cash equivalents
(a) Analysis of cash and cash equivalents2012
US$m2011
US$m
Cash at bank and in hand 130 78
Short-term investments 124 330
254 408
The effective interest rate for cash and cash equivalents at 31 March 2012 is 4.7% (2011: 2.8%). There is no material difference between the fair value of cash and cash equivalents and the book value stated above.
(b) Analysis by external credit rating2012
US$m2011
US$m
A rated 144 327
B rated 80 60
Counterparty holding of more than US$2m 224 387
Counterparty holding of less than US$2m 30 21
254 408
The above analysis does not include bank deposits of US$14m in 2011 held with an A rated counterparty as collateral against derivative contracts and reported within other financial assets (see note 31(a)).
27. Trade and other payablesCurrent
2012US$m
Non-current2012
US$m
Current2011
US$m
Non-current2011
US$m
Trade payables 159 2 134 -
VAT and other equivalent taxes payable 41 - 40 -
Social security costs 85 - 92 -
Accruals and deferred income 807 40 819 21
Other payables 118 1 95 -
1,210 43 1,180 21
The accounting policies for other financial liabilities have been applied to financial instruments of US$537m (2011: US$504m) within the above items. VAT and other taxes payable of US$41m (2011: US$40m), social security costs of US$85m (2011: US$92m) and accruals and deferred income of US$590m (2011: US$565m) are not regarded as financial instruments. Following a review during the year, the classification as at 31 March 2011 has been restated to more appropriately reflect the treatment of the deferred income within these items. At 31 March 2011 an additional amount of US$314m in respect of this item had previously been classified as a financial instrument. Contractual undiscounted cash flows in respect of the financial instruments are shown in note 32.
There is no material difference between the fair value of trade and other payables and the book value stated above. All non-current payables are due within five years from the balance sheet date.
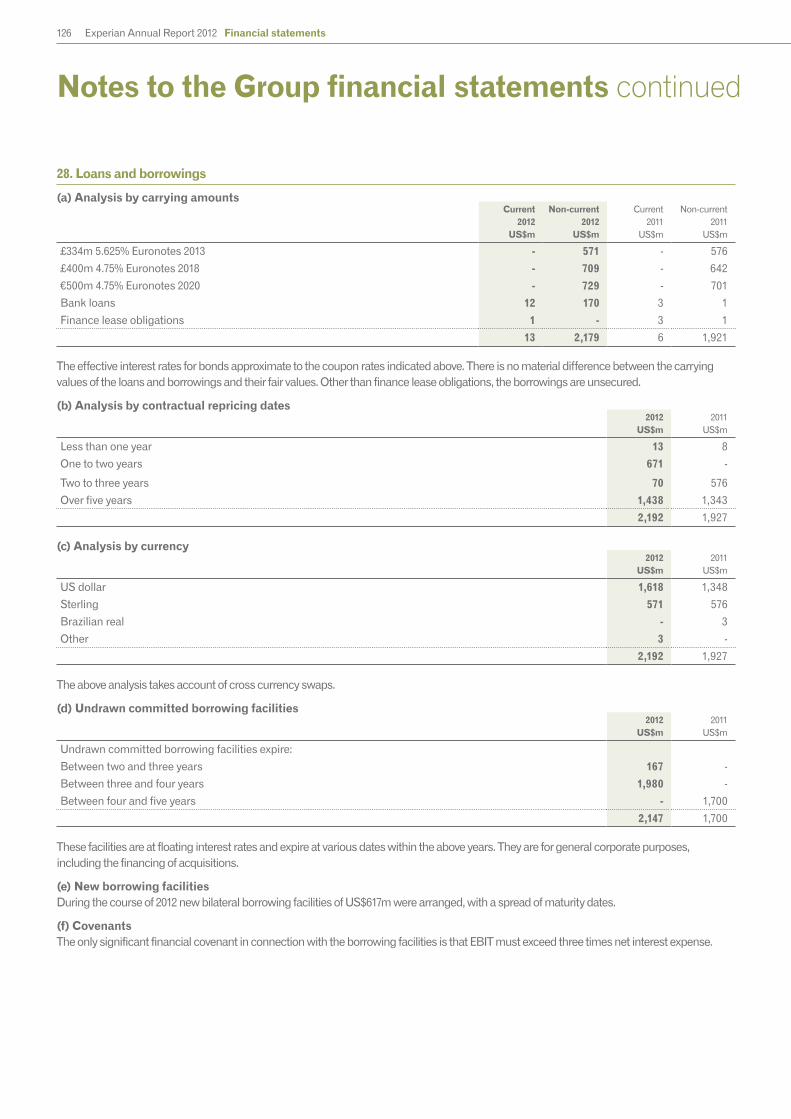
126 Experian Annual Report 2012 Financial statements
Notes to the Group financial statements continued
28. Loans and borrowings
(a) Analysis by carrying amountsCurrent
2012US$m
Non-current2012
US$m
Current2011
US$m
Non-current2011
US$m
£334m 5.625% Euronotes 2013 - 571 - 576
£400m 4.75% Euronotes 2018 - 709 - 642
€500m 4.75% Euronotes 2020 - 729 - 701
Bank loans 12 170 3 1
Finance lease obligations 1 - 3 1
13 2,179 6 1,921
The effective interest rates for bonds approximate to the coupon rates indicated above. There is no material difference between the carrying values of the loans and borrowings and their fair values. Other than finance lease obligations, the borrowings are unsecured.
(b) Analysis by contractual repricing dates 2012
US$m2011
US$m
Less than one year 13 8
One to two years 671 -
Two to three years 70 576
Over five years 1,438 1,343
2,192 1,927
(c) Analysis by currency2012
US$m2011
US$m
US dollar 1,618 1,348
Sterling 571 576
Brazilian real - 3
Other 3 -
2,192 1,927
The above analysis takes account of cross currency swaps.
(d) Undrawn committed borrowing facilities2012
US$m2011
US$m
Undrawn committed borrowing facilities expire:
Between two and three years 167 -
Between three and four years 1,980 -
Between four and five years - 1,700
2,147 1,700
These facilities are at floating interest rates and expire at various dates within the above years. They are for general corporate purposes, including the financing of acquisitions.
(e) New borrowing facilitiesDuring the course of 2012 new bilateral borrowing facilities of US$617m were arranged, with a spread of maturity dates.
(f) CovenantsThe only significant financial covenant in connection with the borrowing facilities is that EBIT must exceed three times net interest expense.
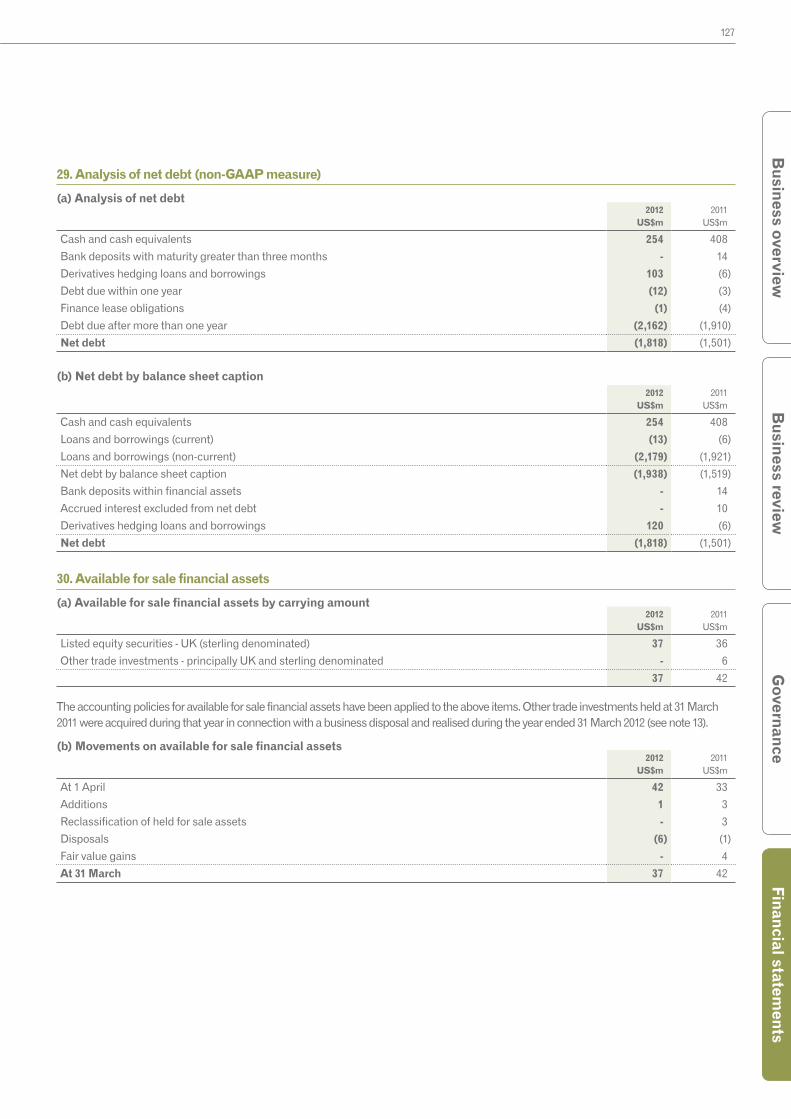
127
Governance
Financial statements
Busin
ess reviewB
usiness overview
29. Analysis of net debt (non-GAAP measure)
(a) Analysis of net debt2012
US$m2011
US$m
Cash and cash equivalents 254 408
Bank deposits with maturity greater than three months - 14
Derivatives hedging loans and borrowings 103 (6)
Debt due within one year (12) (3)
Finance lease obligations (1) (4)
Debt due after more than one year (2,162) (1,910)
Net debt (1,818) (1,501)
(b) Net debt by balance sheet caption2012
US$m2011
US$m
Cash and cash equivalents 254 408
Loans and borrowings (current) (13) (6)
Loans and borrowings (non-current) (2,179) (1,921)
Net debt by balance sheet caption (1,938) (1,519)
Bank deposits within financial assets - 14
Accrued interest excluded from net debt - 10
Derivatives hedging loans and borrowings 120 (6)
Net debt (1,818) (1,501)
30. Available for sale financial assets
(a) Available for sale financial assets by carrying amount2012
US$m2011
US$m
Listed equity securities - UK (sterling denominated) 37 36
Other trade investments - principally UK and sterling denominated - 6
37 42
The accounting policies for available for sale financial assets have been applied to the above items. Other trade investments held at 31 March 2011 were acquired during that year in connection with a business disposal and realised during the year ended 31 March 2012 (see note 13).
(b) Movements on available for sale financial assets2012
US$m2011
US$m
At 1 April 42 33
Additions 1 3
Reclassification of held for sale assets - 3
Disposals (6) (1)
Fair value gains - 4
At 31 March 37 42

128 Experian Annual Report 2012 Financial statements
Notes to the Group financial statements continued
31. Other financial assets and liabilities
(a) Analysis of other financial assets and liabilities
Assets
Current2012
US$m
Non-current2012
US$m
Current2011
US$m
Non-current2011
US$m
Bank deposits - - 14 -
Derivative financial instruments:
Fair value hedge of borrowings (interest rate swaps) - 33 - 37
Fair value hedge of borrowings (cross currency swaps) - 80 - -
Derivatives used for hedging - 113 - 37
Non-hedging derivatives (equity swaps) - 4 5 -
Non-hedging derivatives (foreign exchange contracts) 7 - 1 -
Non-hedging derivatives (interest rate swaps) - - - 2
Assets at fair value through profit and loss 7 4 6 2
Derivative financial instruments 7 117 6 39
Other derivatives - 6 - 6
Total other financial assets 7 123 20 45
Bank deposits at 31 March 2011 comprised amounts held with an A rated counterparty as collateral against derivative contracts.
Liabilities
Current2012
US$m
Non-current2012
US$m
Current2011
US$m
Non-current2011
US$m
Derivative financial instruments:
Derivatives used for hedging - fair value hedge of borrowings (cross currency swaps) - - - 31
Non-hedging derivatives (foreign exchange contracts) 3 - 5 -
Non-hedging derivatives (interest rate swaps) 3 32 8 20
Liabilities at fair value through profit and loss 6 32 13 20
Derivative financial instruments 6 32 13 51
Put option in respect of Serasa non-controlling interest 1,092 - - 870
Put options in respect of other non-controlling interests - 32 - 34
Total other financial liabilities 1,098 64 13 955
The accounting policies for financial instruments have been applied as appropriate to the above items. Amounts recognised in the Group income statement in connection with the Group’s hedging instruments are disclosed in note 14.
The net present value of the put option in respect of the Serasa non-controlling interest is reported within current liabilities, rather than non-current liabilities, at 31 March 2012 as the put may be exercised from June 2012. The change in value during the year ended 31 March 2012 comprised a financing fair value loss of US$325m reported in the Group income statement and a currency translation gain of US$103m taken directly to the statement of comprehensive income.
There is no material difference between the fair values of these assets and liabilities and the book values stated above.

129
Governance
Financial statements
Busin
ess reviewB
usiness overview
31. Other financial assets and liabilities (continued)
(b) Fair value and notional principal amounts of derivative financial instruments
2012 2011
Assets Liabilities Assets Liabilities
Fair valueUS$m
NotionalUS$m
Fair valueUS$m
NotionalUS$m
Fair valueUS$m
NotionalUS$m
Fair valueUS$m
NotionalUS$m
Cross currency swaps 80 1,347 - - - - 31 1,347
Interest rate swaps 33 759 35 1,315 39 646 28 864
Equity swaps 4 21 - - 5 14 - 10
Foreign exchange contracts 7 497 3 256 1 272 5 407
124 2,624 38 1,571 45 932 64 2,628
(c) Maturity of derivative financial liabilities - contractual undiscounted cash flows
At 31 March 2012Less than
1 yearUS$m
1 to 2years
US$m
2 to 3years
US$m
3 to 4years
US$m
4 to 5years
US$m
Over 5years
US$m
Total
US$m
Settled on a net basis - interest rate swaps 16 12 9 6 2 1 46
Settled on a gross basis:
Outflows for foreign exchange contracts 281 - - - - - 281
Inflows for foreign exchange contracts (279) - - - - - (279)
Settled on a gross basis 2 - - - - - 2
Cash outflows 18 12 9 6 2 1 48
At 31 March 2011Less than
1 yearUS$m
1 to 2years
US$m
2 to 3years
US$m
3 to 4years
US$m
4 to 5years
US$m
Over 5years
US$m
Total
US$m
Settled on a net basis - interest rate swaps 6 (4) (9) 6 3 - 2
Settled on a gross basis:
Outflows for cross currency swaps 25 24 24 24 24 1,428 1,549
Inflows for cross currency swaps (58) (64) (64) (64) (64) (1,578) (1,892)
Outflows for foreign exchange contracts 682 - - - - - 682
Inflows for foreign exchange contracts (679) - - - - - (679)
Settled on a gross basis (30) (40) (40) (40) (40) (150) (340)
Cash inflows (24) (44) (49) (34) (37) (150) (338)
The table above analyses the derivative financial liabilities into maturity groupings based on the period from the balance sheet date to the contractual maturity date. As the amounts disclosed are the contractual undiscounted cash flows, they differ from the carrying values and fair values.
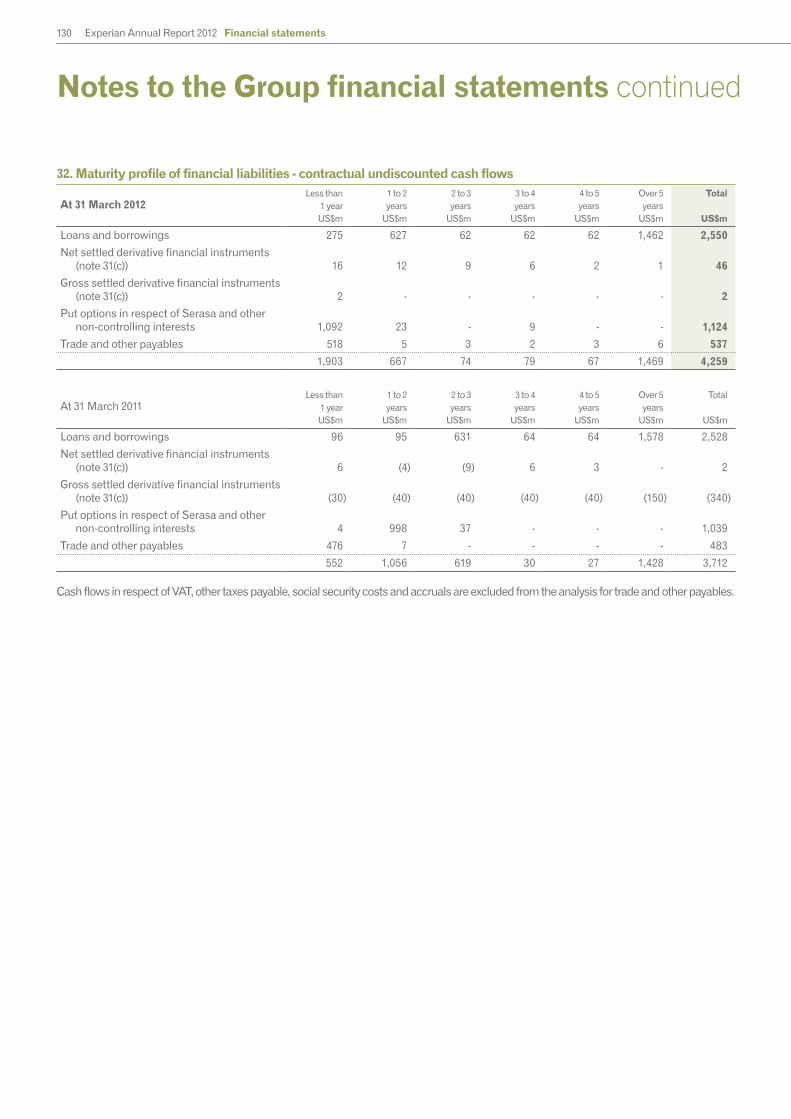
130 Experian Annual Report 2012 Financial statements
Notes to the Group financial statements continued
32. Maturity profile of financial liabilities - contractual undiscounted cash flows
At 31 March 2012Less than
1 yearUS$m
1 to 2years
US$m
2 to 3years
US$m
3 to 4years
US$m
4 to 5years
US$m
Over 5years
US$m
Total
US$m
Loans and borrowings 275 627 62 62 62 1,462 2,550
Net settled derivative financial instruments (note 31(c)) 16 12 9 6 2 1 46
Gross settled derivative financial instruments (note 31(c)) 2 - - - - - 2
Put options in respect of Serasa and other non-controlling interests 1,092 23 - 9 - - 1,124
Trade and other payables 518 5 3 2 3 6 537
1,903 667 74 79 67 1,469 4,259
At 31 March 2011Less than
1 yearUS$m
1 to 2years
US$m
2 to 3years
US$m
3 to 4years
US$m
4 to 5years
US$m
Over 5years
US$m
Total
US$m
Loans and borrowings 96 95 631 64 64 1,578 2,528
Net settled derivative financial instruments (note 31(c)) 6 (4) (9) 6 3 - 2
Gross settled derivative financial instruments (note 31(c)) (30) (40) (40) (40) (40) (150) (340)
Put options in respect of Serasa and other non-controlling interests 4 998 37 - - - 1,039
Trade and other payables 476 7 - - - - 483
552 1,056 619 30 27 1,428 3,712
Cash flows in respect of VAT, other taxes payable, social security costs and accruals are excluded from the analysis for trade and other payables.

131
Governance
Financial statements
Busin
ess reviewB
usiness overview
33. Share-based payments
The Group has a number of equity settled, share-based employee incentive plans. Details of the arrangements under which options are granted and awards made are given below, together with information on their valuation and cost. The price of the Company’s ordinary shares is quoted in sterling and accordingly option, award and share prices are disclosed in sterling.
(a) Share options(i) Summary of arrangements and valuationsOptions have only been granted in the current and prior year in respect of Experian Sharesave Plans and the amounts involved are not significant. Accordingly disclosures relating to the application of valuation techniques, inputs into valuation models and fair values of options granted have been omitted. Information in respect of options granted in prior years has been previously provided in the relevant annual reports.
There were no grants of options under the Experian Share Option Plan in the year ended 31 March 2012 and the year ended 31 March 2011 but options remain outstanding under this plan. Fully vested options also exist under The GUS plc North America Executive Stock Option Plan, a former GUS share option plan, and these options had a maximum term of six years from the date of grant.
(ii) Movement in number of options and weighted average exercise price
Number2012
million
Price2012
£
Number2011
million
Price 2011
£
Options outstanding at 1 April 24.8 4.27 35.3 4.42
Grant of options 1.1 6.16 0.7 4.85
Forfeiture and cancellation of options1 (0.9) 4.74 (1.8) 4.01
Exercise of options2 (9.9) 3.87 (8.9) 4.94
Expiry of options (0.1) 4.85 (0.5) 4.91
Options outstanding at 31 March 15.0 4.63 24.8 4.27
Options exercisable at 31 March 3.8 4.54 5.9 5.16
1. For plans of a ‘save as you earn’ nature, forfeitures include non-leavers who have not completed the savings requirement.
2. The weighted average share price of options exercised during the year was £7.84 (2011: £6.90).
3. Options exercisable at 31 March 2012 include 0.1 million shares (2011: 0.1 million shares) in respect of the Experian Share Option Plan and 3.7 million shares (2011: 5.8 million shares) in respect of Experian Sharesave Plans.
(iii) Details of options outstanding
At 31 March 2012 At 31 March 2011
Range of exercise prices
£
Number
million
Weighted average
exercise price £
Weighted average remaining lives Number
million
Weighted average
exercise price £
Weighted average remaining lives
Expected years
Contractual years
Expected years
Contractual years
2-3 0.7 2.91 1.3 1.7 2.1 2.91 1.1 1.5
3-4 1.6 3.36 0.4 6.3 6.5 3.23 1.2 6.9
4-5 9.8 4.66 1.1 9.1 12.0 4.65 1.9 7.1
5-6 1.9 5.39 0.1 6.6 4.0 5.41 0.2 4.4
6-7 1.0 6.18 2.7 3.3 0.2 6.13 0.3 6.1
15.0 4.63 24.8 4.27
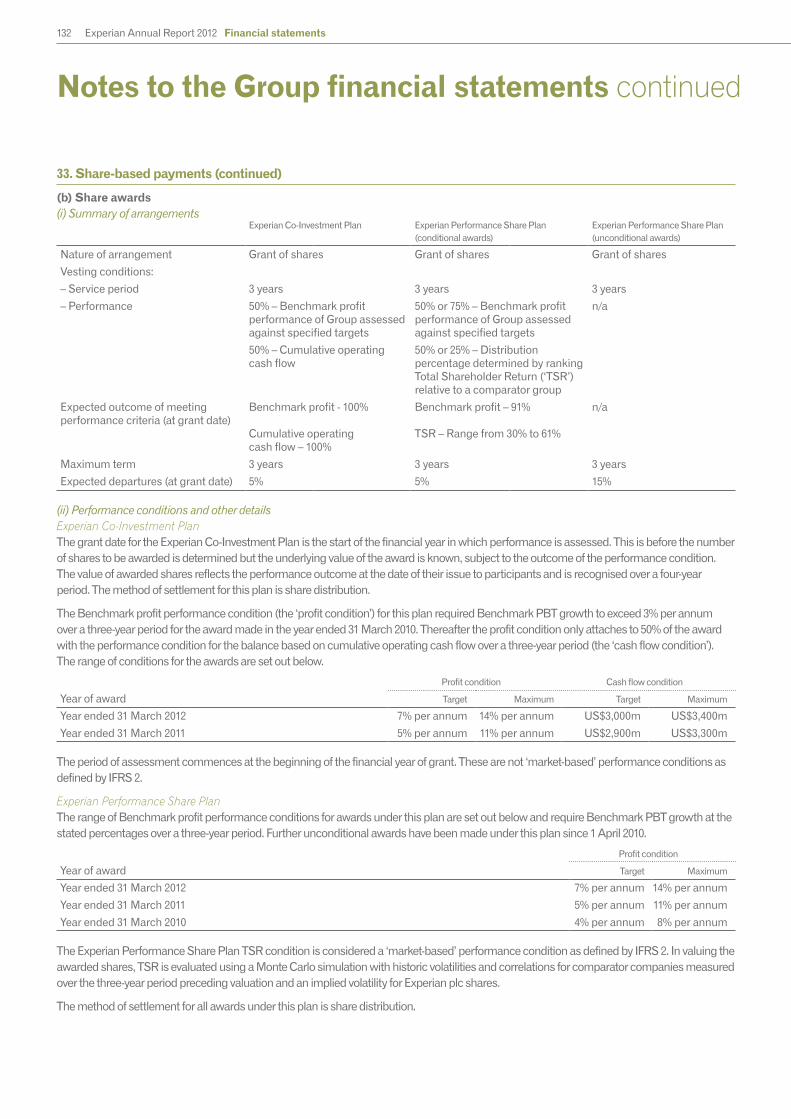
132 Experian Annual Report 2012 Financial statements
Notes to the Group financial statements continued
33. Share-based payments (continued)
(b) Share awards (i) Summary of arrangements
Experian Co-Investment Plan Experian Performance Share Plan (conditional awards)
Experian Performance Share Plan (unconditional awards)
Nature of arrangement Grant of shares Grant of shares Grant of shares
Vesting conditions:
– Service period 3 years 3 years 3 years
– Performance 50% – Benchmark profit performance of Group assessed against specified targets
50% or 75% – Benchmark profit performance of Group assessed against specified targets
n/a
50% – Cumulative operating cash flow
50% or 25% – Distribution percentage determined by ranking Total Shareholder Return (‘TSR’) relative to a comparator group
Expected outcome of meeting performance criteria (at grant date)
Benchmark profit - 100%
Cumulative operating cash flow – 100%
Benchmark profit – 91%
TSR – Range from 30% to 61%
n/a
Maximum term 3 years 3 years 3 years
Expected departures (at grant date) 5% 5% 15%
(ii) Performance conditions and other detailsExperian Co-Investment Plan The grant date for the Experian Co-Investment Plan is the start of the financial year in which performance is assessed. This is before the number of shares to be awarded is determined but the underlying value of the award is known, subject to the outcome of the performance condition. The value of awarded shares reflects the performance outcome at the date of their issue to participants and is recognised over a four-year period. The method of settlement for this plan is share distribution.
The Benchmark profit performance condition (the ‘profit condition’) for this plan required Benchmark PBT growth to exceed 3% per annum over a three-year period for the award made in the year ended 31 March 2010. Thereafter the profit condition only attaches to 50% of the award with the performance condition for the balance based on cumulative operating cash flow over a three-year period (the ‘cash flow condition’). The range of conditions for the awards are set out below.
Profit condition Cash flow condition
Year of award Target Maximum Target Maximum
Year ended 31 March 2012 7% per annum 14% per annum US$3,000m US$3,400m
Year ended 31 March 2011 5% per annum 11% per annum US$2,900m US$3,300m
The period of assessment commences at the beginning of the financial year of grant. These are not ‘market-based’ performance conditions as defined by IFRS 2.
Experian Performance Share PlanThe range of Benchmark profit performance conditions for awards under this plan are set out below and require Benchmark PBT growth at the stated percentages over a three-year period. Further unconditional awards have been made under this plan since 1 April 2010.
Profit condition
Year of award Target Maximum
Year ended 31 March 2012 7% per annum 14% per annum
Year ended 31 March 2011 5% per annum 11% per annum
Year ended 31 March 2010 4% per annum 8% per annum
The Experian Performance Share Plan TSR condition is considered a ‘market-based’ performance condition as defined by IFRS 2. In valuing the awarded shares, TSR is evaluated using a Monte Carlo simulation with historic volatilities and correlations for comparator companies measured over the three-year period preceding valuation and an implied volatility for Experian plc shares.
The method of settlement for all awards under this plan is share distribution.
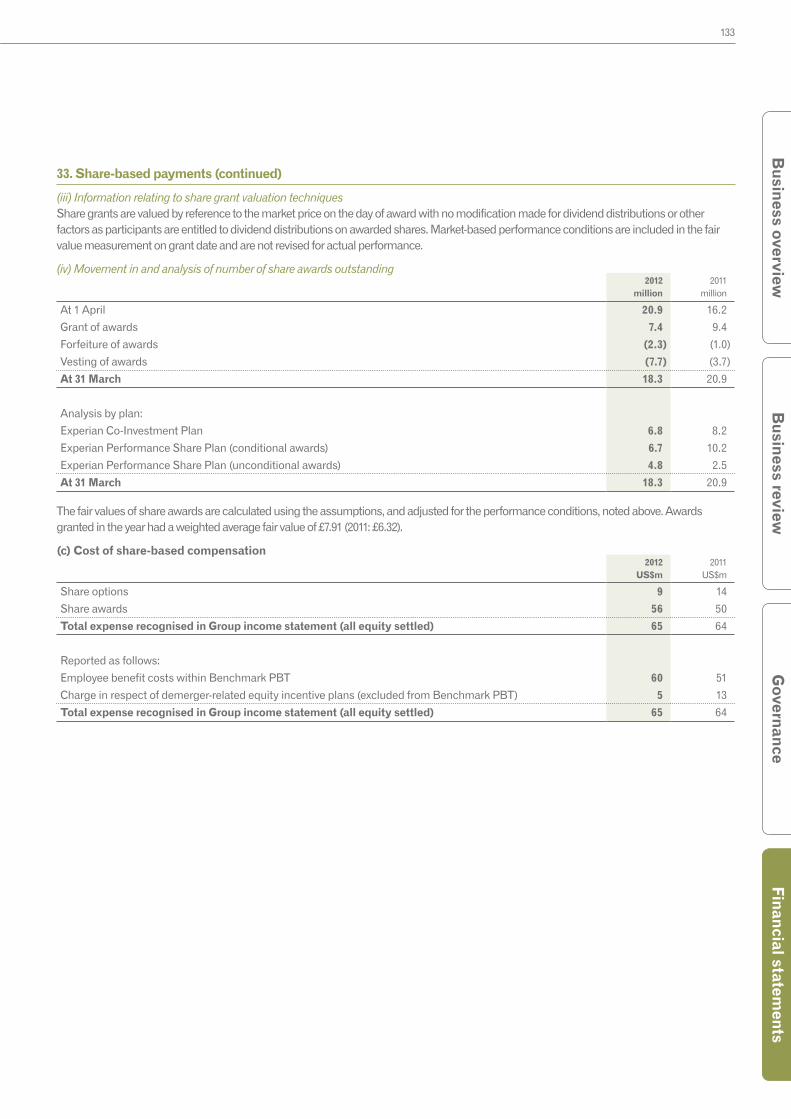
133
Governance
Financial statements
Busin
ess reviewB
usiness overview
33. Share-based payments (continued)
(iii) Information relating to share grant valuation techniquesShare grants are valued by reference to the market price on the day of award with no modification made for dividend distributions or other factors as participants are entitled to dividend distributions on awarded shares. Market-based performance conditions are included in the fair value measurement on grant date and are not revised for actual performance.
(iv) Movement in and analysis of number of share awards outstanding2012
million2011
million
At 1 April 20.9 16.2
Grant of awards 7.4 9.4
Forfeiture of awards (2.3) (1.0)
Vesting of awards (7.7) (3.7)
At 31 March 18.3 20.9
Analysis by plan:
Experian Co-Investment Plan 6.8 8.2
Experian Performance Share Plan (conditional awards) 6.7 10.2
Experian Performance Share Plan (unconditional awards) 4.8 2.5
At 31 March 18.3 20.9
The fair values of share awards are calculated using the assumptions, and adjusted for the performance conditions, noted above. Awards granted in the year had a weighted average fair value of £7.91 (2011: £6.32).
(c) Cost of share-based compensation2012
US$m2011
US$m
Share options 9 14
Share awards 56 50
Total expense recognised in Group income statement (all equity settled) 65 64
Reported as follows:
Employee benefit costs within Benchmark PBT 60 51
Charge in respect of demerger-related equity incentive plans (excluded from Benchmark PBT) 5 13
Total expense recognised in Group income statement (all equity settled) 65 64
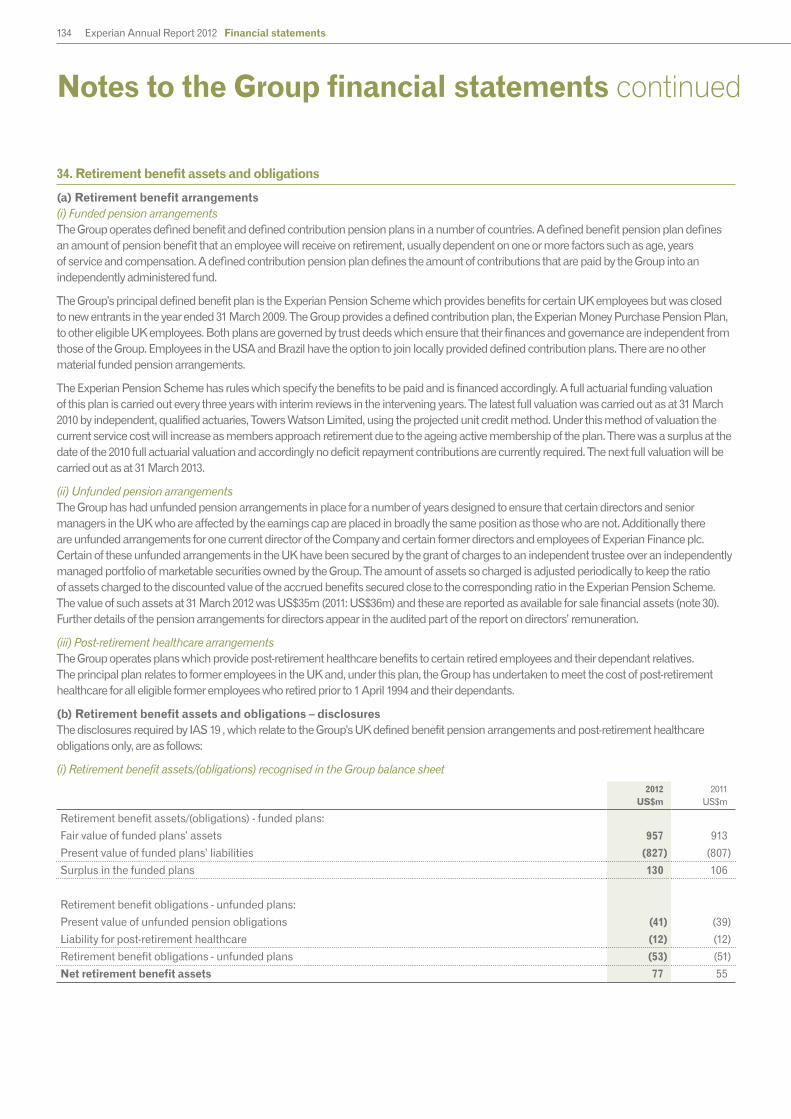
134 Experian Annual Report 2012 Financial statements
Notes to the Group financial statements continued
34. Retirement benefit assets and obligations
(a) Retirement benefit arrangements(i) Funded pension arrangementsThe Group operates defined benefit and defined contribution pension plans in a number of countries. A defined benefit pension plan defines an amount of pension benefit that an employee will receive on retirement, usually dependent on one or more factors such as age, years of service and compensation. A defined contribution pension plan defines the amount of contributions that are paid by the Group into an independently administered fund.
The Group’s principal defined benefit plan is the Experian Pension Scheme which provides benefits for certain UK employees but was closed to new entrants in the year ended 31 March 2009. The Group provides a defined contribution plan, the Experian Money Purchase Pension Plan, to other eligible UK employees. Both plans are governed by trust deeds which ensure that their finances and governance are independent from those of the Group. Employees in the USA and Brazil have the option to join locally provided defined contribution plans. There are no other material funded pension arrangements.
The Experian Pension Scheme has rules which specify the benefits to be paid and is financed accordingly. A full actuarial funding valuation of this plan is carried out every three years with interim reviews in the intervening years. The latest full valuation was carried out as at 31 March 2010 by independent, qualified actuaries, Towers Watson Limited, using the projected unit credit method. Under this method of valuation the current service cost will increase as members approach retirement due to the ageing active membership of the plan. There was a surplus at the date of the 2010 full actuarial valuation and accordingly no deficit repayment contributions are currently required. The next full valuation will be carried out as at 31 March 2013.
(ii) Unfunded pension arrangementsThe Group has had unfunded pension arrangements in place for a number of years designed to ensure that certain directors and senior managers in the UK who are affected by the earnings cap are placed in broadly the same position as those who are not. Additionally there are unfunded arrangements for one current director of the Company and certain former directors and employees of Experian Finance plc. Certain of these unfunded arrangements in the UK have been secured by the grant of charges to an independent trustee over an independently managed portfolio of marketable securities owned by the Group. The amount of assets so charged is adjusted periodically to keep the ratio of assets charged to the discounted value of the accrued benefits secured close to the corresponding ratio in the Experian Pension Scheme. The value of such assets at 31 March 2012 was US$35m (2011: US$36m) and these are reported as available for sale financial assets (note 30). Further details of the pension arrangements for directors appear in the audited part of the report on directors’ remuneration.
(iii) Post-retirement healthcare arrangementsThe Group operates plans which provide post-retirement healthcare benefits to certain retired employees and their dependant relatives. The principal plan relates to former employees in the UK and, under this plan, the Group has undertaken to meet the cost of post-retirement healthcare for all eligible former employees who retired prior to 1 April 1994 and their dependants.
(b) Retirement benefit assets and obligations – disclosuresThe disclosures required by IAS 19 , which relate to the Group’s UK defined benefit pension arrangements and post-retirement healthcare obligations only, are as follows:
(i) Retirement benefit assets/(obligations) recognised in the Group balance sheet
2012US$m
2011US$m
Retirement benefit assets/(obligations) - funded plans:
Fair value of funded plans’ assets 957 913
Present value of funded plans’ liabilities (827) (807)
Surplus in the funded plans 130 106
Retirement benefit obligations - unfunded plans:
Present value of unfunded pension obligations (41) (39)
Liability for post-retirement healthcare (12) (12)
Retirement benefit obligations - unfunded plans (53) (51)
Net retirement benefit assets 77 55
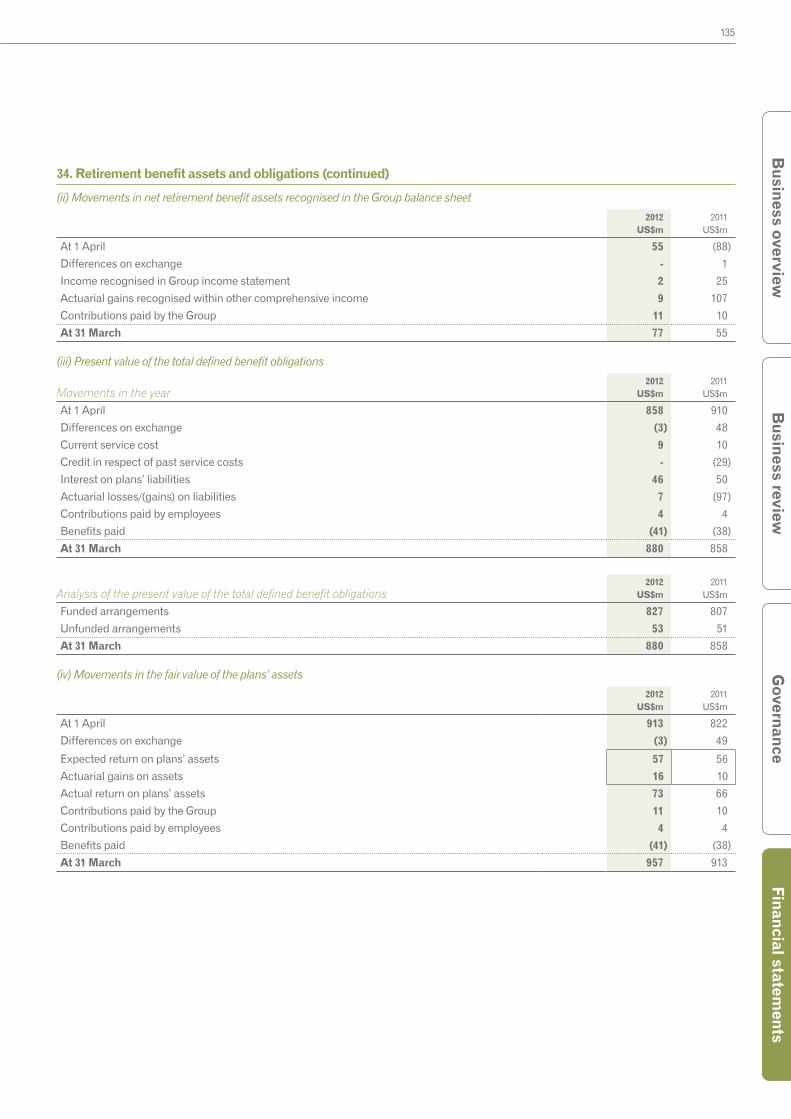
135
Governance
Financial statements
Busin
ess reviewB
usiness overview
34. Retirement benefit assets and obligations (continued)
(ii) Movements in net retirement benefit assets recognised in the Group balance sheet
2012US$m
2011US$m
At 1 April 55 (88)
Differences on exchange - 1
Income recognised in Group income statement 2 25
Actuarial gains recognised within other comprehensive income 9 107
Contributions paid by the Group 11 10
At 31 March 77 55
(iii) Present value of the total defined benefit obligations
Movements in the year2012
US$m2011
US$m
At 1 April 858 910
Differences on exchange (3) 48
Current service cost 9 10
Credit in respect of past service costs - (29)
Interest on plans’ liabilities 46 50
Actuarial losses/(gains) on liabilities 7 (97)
Contributions paid by employees 4 4
Benefits paid (41) (38)
At 31 March 880 858
Analysis of the present value of the total defined benefit obligations2012
US$m2011
US$m
Funded arrangements 827 807
Unfunded arrangements 53 51
At 31 March 880 858
(iv) Movements in the fair value of the plans’ assets
2012US$m
2011US$m
At 1 April 913 822
Differences on exchange (3) 49
Expected return on plans’ assets 57 56
Actuarial gains on assets 16 10
Actual return on plans’ assets 73 66
Contributions paid by the Group 11 10
Contributions paid by employees 4 4
Benefits paid (41) (38)
At 31 March 957 913
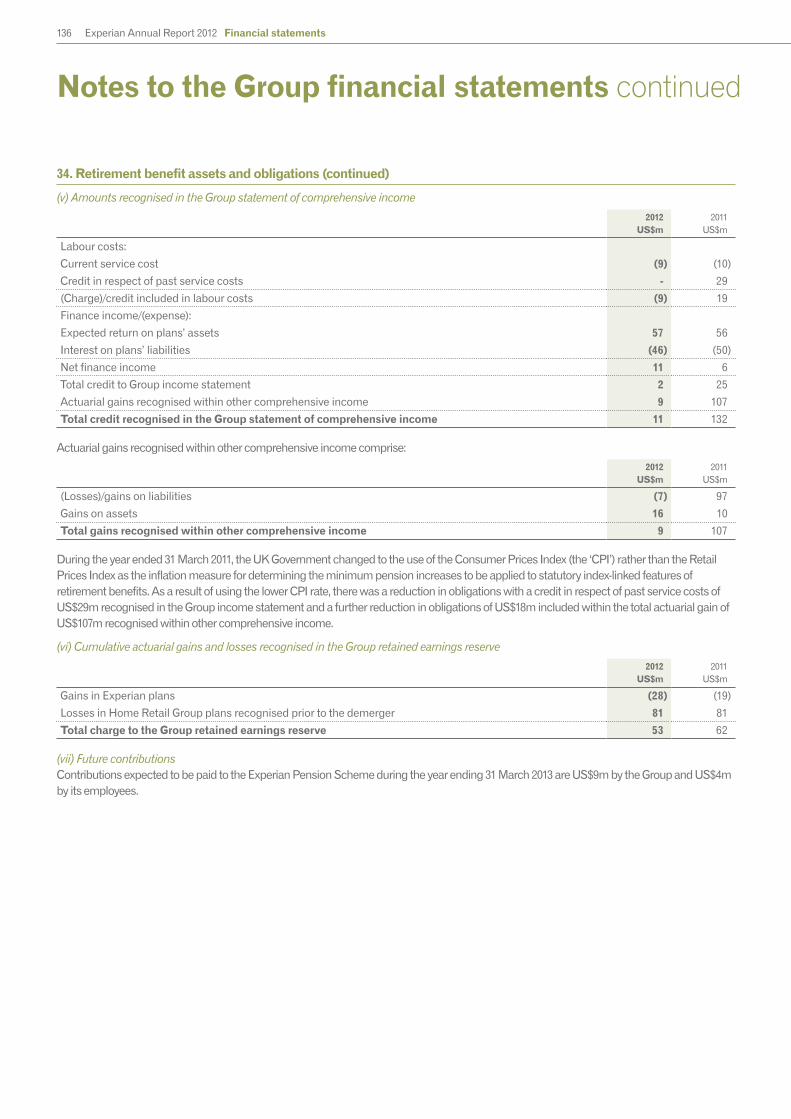
136 Experian Annual Report 2012 Financial statements
Notes to the Group financial statements continued
34. Retirement benefit assets and obligations (continued)
(v) Amounts recognised in the Group statement of comprehensive income
2012US$m
2011US$m
Labour costs:
Current service cost (9) (10)
Credit in respect of past service costs - 29
(Charge)/credit included in labour costs (9) 19
Finance income/(expense):
Expected return on plans’ assets 57 56
Interest on plans’ liabilities (46) (50)
Net finance income 11 6
Total credit to Group income statement 2 25
Actuarial gains recognised within other comprehensive income 9 107
Total credit recognised in the Group statement of comprehensive income 11 132
Actuarial gains recognised within other comprehensive income comprise:
2012US$m
2011US$m
(Losses)/gains on liabilities (7) 97
Gains on assets 16 10
Total gains recognised within other comprehensive income 9 107
During the year ended 31 March 2011, the UK Government changed to the use of the Consumer Prices Index (the ‘CPI’) rather than the Retail Prices Index as the inflation measure for determining the minimum pension increases to be applied to statutory index-linked features of retirement benefits. As a result of using the lower CPI rate, there was a reduction in obligations with a credit in respect of past service costs of US$29m recognised in the Group income statement and a further reduction in obligations of US$18m included within the total actuarial gain of US$107m recognised within other comprehensive income.
(vi) Cumulative actuarial gains and losses recognised in the Group retained earnings reserve
2012US$m
2011US$m
Gains in Experian plans (28) (19)
Losses in Home Retail Group plans recognised prior to the demerger 81 81
Total charge to the Group retained earnings reserve 53 62
(vii) Future contributionsContributions expected to be paid to the Experian Pension Scheme during the year ending 31 March 2013 are US$9m by the Group and US$4m by its employees.
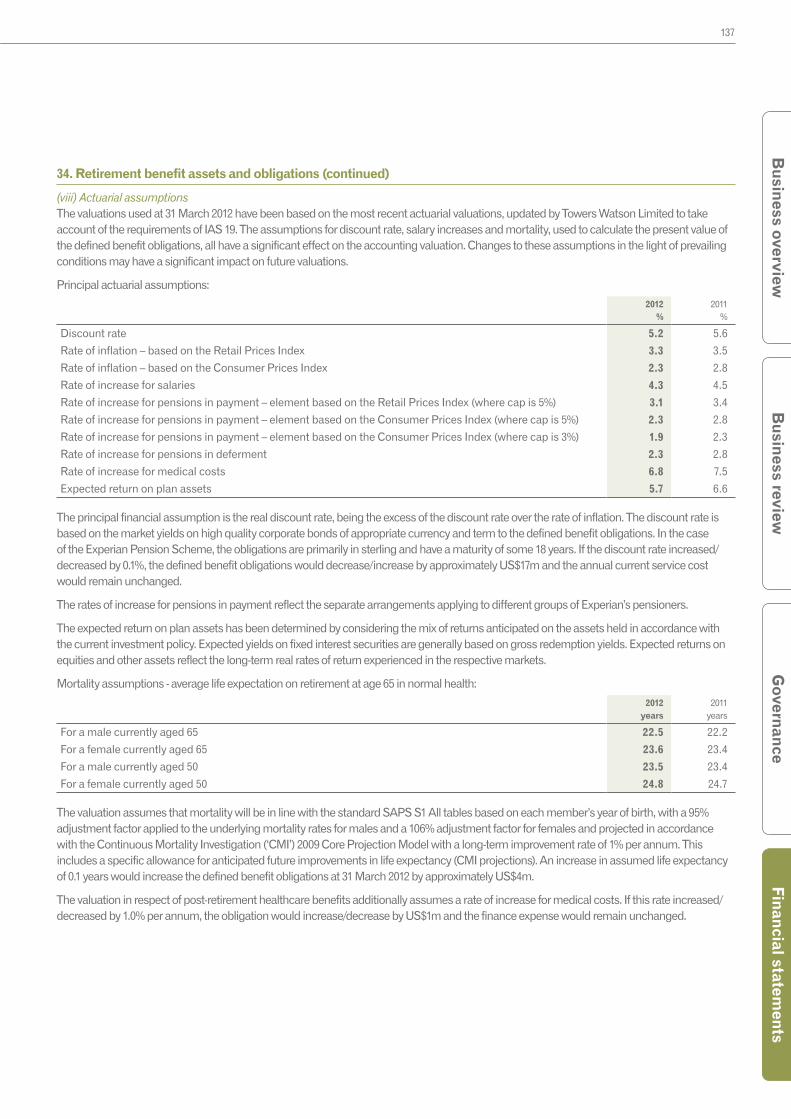
137
Governance
Financial statements
Busin
ess reviewB
usiness overview
34. Retirement benefit assets and obligations (continued)
(viii) Actuarial assumptionsThe valuations used at 31 March 2012 have been based on the most recent actuarial valuations, updated by Towers Watson Limited to take account of the requirements of IAS 19. The assumptions for discount rate, salary increases and mortality, used to calculate the present value of the defined benefit obligations, all have a significant effect on the accounting valuation. Changes to these assumptions in the light of prevailing conditions may have a significant impact on future valuations.
Principal actuarial assumptions:
2012%
2011%
Discount rate 5.2 5.6
Rate of inflation – based on the Retail Prices Index 3.3 3.5
Rate of inflation – based on the Consumer Prices Index 2.3 2.8
Rate of increase for salaries 4.3 4.5
Rate of increase for pensions in payment – element based on the Retail Prices Index (where cap is 5%) 3.1 3.4
Rate of increase for pensions in payment – element based on the Consumer Prices Index (where cap is 5%) 2.3 2.8
Rate of increase for pensions in payment – element based on the Consumer Prices Index (where cap is 3%) 1.9 2.3
Rate of increase for pensions in deferment 2.3 2.8
Rate of increase for medical costs 6.8 7.5
Expected return on plan assets 5.7 6.6
The principal financial assumption is the real discount rate, being the excess of the discount rate over the rate of inflation. The discount rate is based on the market yields on high quality corporate bonds of appropriate currency and term to the defined benefit obligations. In the case of the Experian Pension Scheme, the obligations are primarily in sterling and have a maturity of some 18 years. If the discount rate increased/decreased by 0.1%, the defined benefit obligations would decrease/increase by approximately US$17m and the annual current service cost would remain unchanged.
The rates of increase for pensions in payment reflect the separate arrangements applying to different groups of Experian’s pensioners.
The expected return on plan assets has been determined by considering the mix of returns anticipated on the assets held in accordance with the current investment policy. Expected yields on fixed interest securities are generally based on gross redemption yields. Expected returns on equities and other assets reflect the long-term real rates of return experienced in the respective markets.
Mortality assumptions - average life expectation on retirement at age 65 in normal health:
2012years
2011years
For a male currently aged 65 22.5 22.2
For a female currently aged 65 23.6 23.4
For a male currently aged 50 23.5 23.4
For a female currently aged 50 24.8 24.7
The valuation assumes that mortality will be in line with the standard SAPS S1 All tables based on each member’s year of birth, with a 95% adjustment factor applied to the underlying mortality rates for males and a 106% adjustment factor for females and projected in accordance with the Continuous Mortality Investigation (‘CMI’) 2009 Core Projection Model with a long-term improvement rate of 1% per annum. This includes a specific allowance for anticipated future improvements in life expectancy (CMI projections). An increase in assumed life expectancy of 0.1 years would increase the defined benefit obligations at 31 March 2012 by approximately US$4m.
The valuation in respect of post-retirement healthcare benefits additionally assumes a rate of increase for medical costs. If this rate increased/decreased by 1.0% per annum, the obligation would increase/decrease by US$1m and the finance expense would remain unchanged.
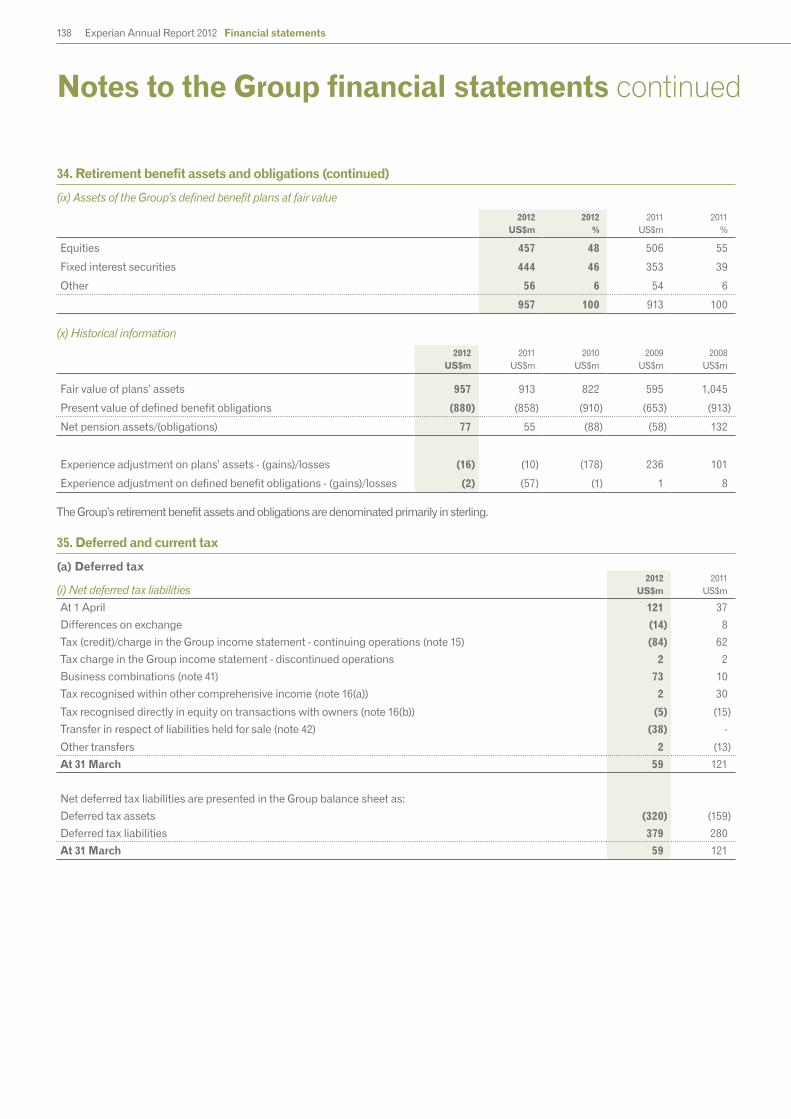
138 Experian Annual Report 2012 Financial statements
Notes to the Group financial statements continued
34. Retirement benefit assets and obligations (continued)
(ix) Assets of the Group’s defined benefit plans at fair value
2012US$m
2012%
2011US$m
2011%
Equities 457 48 506 55
Fixed interest securities 444 46 353 39
Other 56 6 54 6
957 100 913 100
(x) Historical information
2012US$m
2011US$m
2010US$m
2009US$m
2008US$m
Fair value of plans’ assets 957 913 822 595 1,045
Present value of defined benefit obligations (880) (858) (910) (653) (913)
Net pension assets/(obligations) 77 55 (88) (58) 132
Experience adjustment on plans’ assets - (gains)/losses (16) (10) (178) 236 101
Experience adjustment on defined benefit obligations - (gains)/losses (2) (57) (1) 1 8
The Group’s retirement benefit assets and obligations are denominated primarily in sterling.
35. Deferred and current tax
(a) Deferred tax
(i) Net deferred tax liabilities2012
US$m2011
US$m
At 1 April 121 37
Differences on exchange (14) 8
Tax (credit)/charge in the Group income statement - continuing operations (note 15) (84) 62
Tax charge in the Group income statement - discontinued operations 2 2
Business combinations (note 41) 73 10
Tax recognised within other comprehensive income (note 16(a)) 2 30
Tax recognised directly in equity on transactions with owners (note 16(b)) (5) (15)
Transfer in respect of liabilities held for sale (note 42) (38) -
Other transfers 2 (13)
At 31 March 59 121
Net deferred tax liabilities are presented in the Group balance sheet as:
Deferred tax assets (320) (159)
Deferred tax liabilities 379 280
At 31 March 59 121

139
Governance
Financial statements
Busin
ess reviewB
usiness overview
35. Deferred and current tax (continued)
(ii) Gross deferred tax assetsMovements in gross deferred tax assets, without taking into consideration the offsetting of assets and liabilities within the same tax jurisdiction, comprise:
Accelerated depreciation
US$m
Intangibles
US$m
Share incentive
plansUS$m
Tax losses
US$m
Other temporary
differencesUS$m
Total
US$m
At 1 April 2011 8 26 56 117 161 368
Differences on exchange - - - - 22 22
Tax credit/(charge) in the Group income statement 16 (2) (3) 183 (64) 130
Business combinations (note 41) - - - - 26 26
Tax recognised directly in equity on transactions with owners - - 5 - - 5
Other transfers - - - - (5) (5)
At 31 March 2012 24 24 58 300 140 546
Accelerated depreciation
US$m
Intangibles
US$m
Share incentive
plansUS$m
Tax losses
US$m
Other temporary
differencesUS$m
Total
US$m
At 1 April 2010 20 62 39 118 158 397
Differences on exchange 1 - - - 8 9
Tax credit/(charge) in the Group income statement (13) (36) 2 8 15 (24)
Tax recognised within other comprehensive income - - - - (30) (30)
Tax recognised directly in equity on transactions with owners - - 15 - - 15
Other transfers - - - (9) 10 1
At 31 March 2011 8 26 56 117 161 368
Deferred tax assets are recognised in respect of tax losses carried forward and other temporary differences to the extent that the realisation of the related tax benefit through future taxable profits is probable.
The Group has not recognised deferred tax assets of US$123m (2011: US$289m) in respect of losses that can be carried forward against future taxable income and deferred tax assets of US$15m (2011: US$17m) in respect of capital losses that can be carried forward against future taxable gains. These losses are available indefinitely.
At the balance sheet date there were deferred tax assets expected to reverse within the next year of US$90m (2011: US$71m).
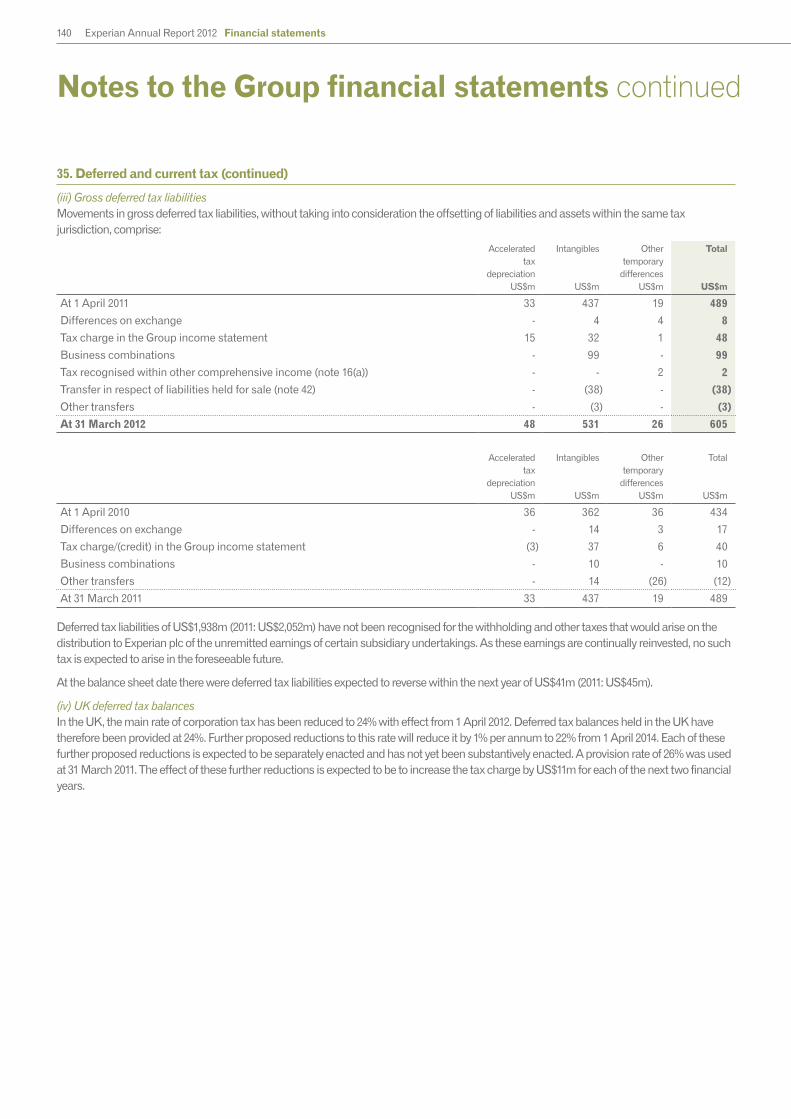
140 Experian Annual Report 2012 Financial statements
Notes to the Group financial statements continued
35. Deferred and current tax (continued)
(iii) Gross deferred tax liabilitiesMovements in gross deferred tax liabilities, without taking into consideration the offsetting of liabilities and assets within the same tax jurisdiction, comprise:
Accelerated tax
depreciationUS$m
Intangibles
US$m
Other temporary
differencesUS$m
Total
US$m
At 1 April 2011 33 437 19 489
Differences on exchange - 4 4 8
Tax charge in the Group income statement 15 32 1 48
Business combinations - 99 - 99
Tax recognised within other comprehensive income (note 16(a)) - - 2 2
Transfer in respect of liabilities held for sale (note 42) - (38) - (38)
Other transfers - (3) - (3)
At 31 March 2012 48 531 26 605
Accelerated tax
depreciationUS$m
Intangibles
US$m
Other temporary
differencesUS$m
Total
US$m
At 1 April 2010 36 362 36 434
Differences on exchange - 14 3 17
Tax charge/(credit) in the Group income statement (3) 37 6 40
Business combinations - 10 - 10
Other transfers - 14 (26) (12)
At 31 March 2011 33 437 19 489
Deferred tax liabilities of US$1,938m (2011: US$2,052m) have not been recognised for the withholding and other taxes that would arise on the distribution to Experian plc of the unremitted earnings of certain subsidiary undertakings. As these earnings are continually reinvested, no such tax is expected to arise in the foreseeable future.
At the balance sheet date there were deferred tax liabilities expected to reverse within the next year of US$41m (2011: US$45m).
(iv) UK deferred tax balancesIn the UK, the main rate of corporation tax has been reduced to 24% with effect from 1 April 2012. Deferred tax balances held in the UK have therefore been provided at 24%. Further proposed reductions to this rate will reduce it by 1% per annum to 22% from 1 April 2014. Each of these further proposed reductions is expected to be separately enacted and has not yet been substantively enacted. A provision rate of 26% was used at 31 March 2011. The effect of these further reductions is expected to be to increase the tax charge by US$11m for each of the next two financial years.
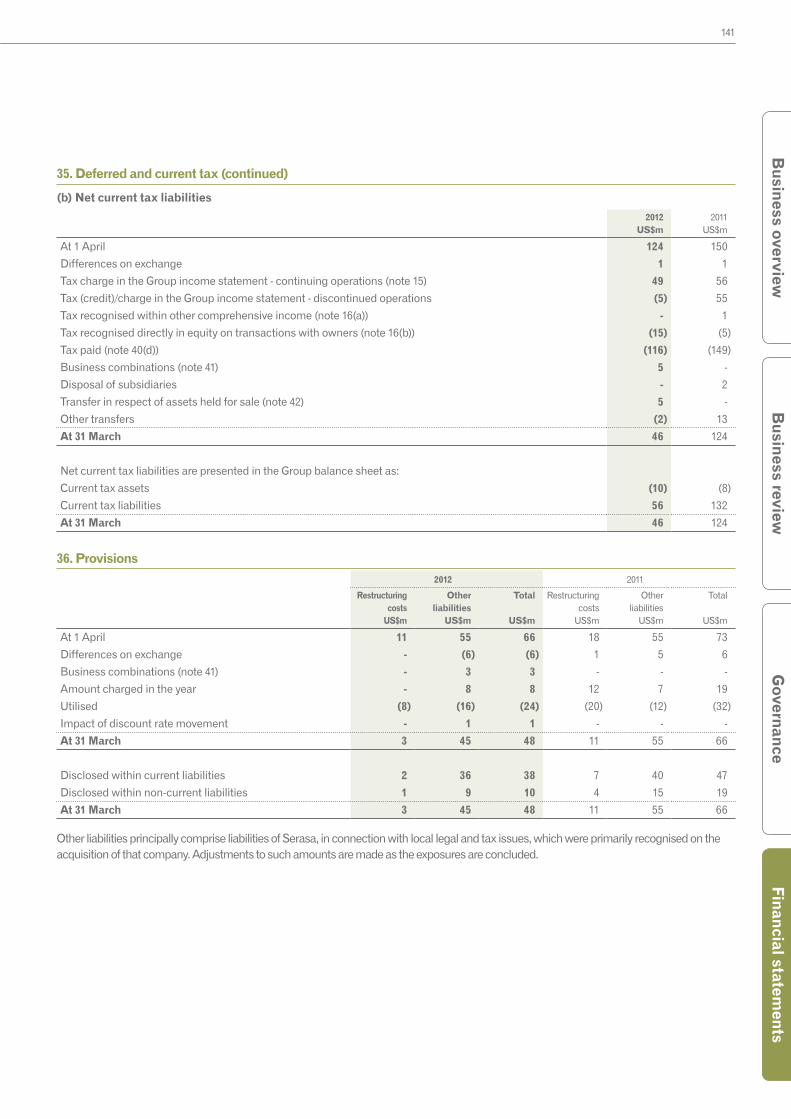
141
Governance
Financial statements
Busin
ess reviewB
usiness overview
35. Deferred and current tax (continued)
(b) Net current tax liabilities
2012US$m
2011US$m
At 1 April 124 150
Differences on exchange 1 1
Tax charge in the Group income statement - continuing operations (note 15) 49 56
Tax (credit)/charge in the Group income statement - discontinued operations (5) 55
Tax recognised within other comprehensive income (note 16(a)) - 1
Tax recognised directly in equity on transactions with owners (note 16(b)) (15) (5)
Tax paid (note 40(d)) (116) (149)
Business combinations (note 41) 5 -
Disposal of subsidiaries - 2
Transfer in respect of assets held for sale (note 42) 5 -
Other transfers (2) 13
At 31 March 46 124
Net current tax liabilities are presented in the Group balance sheet as:
Current tax assets (10) (8)
Current tax liabilities 56 132
At 31 March 46 124
36. Provisions2012 2011
Restructuring costs
US$m
Other liabilities
US$m
Total
US$m
Restructuring costs
US$m
Other liabilities
US$m
Total
US$m
At 1 April 11 55 66 18 55 73
Differences on exchange - (6) (6) 1 5 6
Business combinations (note 41) - 3 3 - - -
Amount charged in the year - 8 8 12 7 19
Utilised (8) (16) (24) (20) (12) (32)
Impact of discount rate movement - 1 1 - - -
At 31 March 3 45 48 11 55 66
Disclosed within current liabilities 2 36 38 7 40 47
Disclosed within non-current liabilities 1 9 10 4 15 19
At 31 March 3 45 48 11 55 66
Other liabilities principally comprise liabilities of Serasa, in connection with local legal and tax issues, which were primarily recognised on the acquisition of that company. Adjustments to such amounts are made as the exposures are concluded.

142 Experian Annual Report 2012 Financial statements
Notes to the Group financial statements continued
37. Called up share capital and share premium account
Called up share capital of US$102m (2011: US$102m) comprises the nominal value of the Company’s issued share capital. Movements in the current and prior year are summarised in the Group statement of changes in total equity. Further details relating to the share capital at the balance sheet dates, together with details of ordinary shares issued during the year and since 31 March 2012, are contained in note N to the parent company financial statements.
The share premium account of US$1,471m (2011: US$1,460m) comprises the amount received in excess of the nominal value of the shares issued by way of (i) the share offer in October 2006, net of expenses, and (ii) the subsequent issue of ordinary shares in connection with employee share incentive plans. Movements in the current and prior year are summarised in the Group statement of changes in total equity.
The difference between the amounts shown in the Group and parent company financial statements in respect of called up share capital and the share premium account arose due to the translation of the sterling amounts into US dollars at the different exchange rates on the different translation dates. The differences for share capital and the share premium account, with the higher numbers being reported in the Group financial statements, are US$23m and US$329m respectively at both balance sheet dates.
38. Retained earnings and other reserves
Retained earnings comprise net profits retained in the Group after the payment of equity dividends. In the Group’s statement of changes in total equity, the movements in retained earnings in the year ended 31 March 2012 include US$7m (2011: US$82m) in respect of fair value and actuarial gains recognised directly as other comprehensive income.
The composition of, and movements in, other reserves are set out below and the movements in the year ended 31 March 2012 include currency translation losses of US$48m (2011: gains of US$124m) recognised directly in other comprehensive income. There are no significant statutory, contractual or exchange control restrictions on distributions by Group undertakings.
Year ended 31 March 2012
Mergerreserve
US$m
Hedgingreserve
US$m
Translationreserve
US$m
Ownshares
reserveUS$m
Totalother
reservesUS$m
At 1 April 2011 (15,682) 11 60 (434) (16,045)
Purchase of own shares by employee trusts - for employee share incentive plans - - - (224) (224)
Exercise of share options and awards - - - 166 166
Currency translation gains recognised directly in other comprehensive income - - (48) - (48)
At 31 March 2012 (15,682) 11 12 (492) (16,151)
Year ended 31 March 2011
Mergerreserve
US$m
Hedgingreserve
US$m
Translationreserve
US$m
Ownshares
reserveUS$m
Totalother
reservesUS$m
At 1 April 2010 (15,682) 11 (64) (125) (15,860)
Purchase of own shares held as treasury shares - - - (334) (334)
Purchase of own shares by employee trusts - for employee share incentive plans - - - (61) (61)
Exercise of share options and awards - - - 86 86
Currency translation gains recognised directly in other comprehensive income - - 124 - 124
At 31 March 2011 (15,682) 11 60 (434) (16,045)

143
Governance
Financial statements
Busin
ess reviewB
usiness overview
38. Retained earnings and other reserves (continued)
The merger reserve arose on the demerger in October 2006 and represents the difference between the share capital and share premium of GUS plc and the nominal value of the share capital of the Company before the share offer in October 2006 and subsequent share issues.
Movements on the hedging reserve and the position at the balance sheet date reflect hedging transactions which are not charged or credited to the Group income statement, net of related tax.
Movements on the translation reserve and the position at the balance sheet date reflect foreign currency translations since 1 April 2004 which are not charged or credited to the Group income statement, net of related tax.
The balance on the own shares reserve represents the cost of ordinary shares in the Company and further details of movements are given below. The difference between the amounts shown in the Group and parent company financial statements in respect of the own shares reserve arose due to the translation of the sterling amounts into US dollars at the different exchange rates on the different translation dates. The difference is US$32m at both balance sheet dates, with the larger number being reported in the Group financial statements.
Number of own shares held Cost of own shares held
Year ended 31 March 2012 Treasurymillion
Trusts million
Totalmillion
TreasuryUS$m
TrustsUS$m
TotalUS$m
At 1 April 2011 30 8 38 334 100 434
Purchase of own shares - 18 18 - 224 224
Exercise of share options and awards - (16) (16) - (166) (166)
Transfers (6) 6 - (60) 60 -
At 31 March 2012 24 16 40 274 218 492
Number of own shares held Cost of own shares held
Year ended 31 March 2011 Treasurymillion
Trusts million
Totalmillion
Treasury US$m
Trusts US$m
TotalUS$m
At 1 April 2010 - 11 11 - 125 125
Purchase of own shares 30 6 36 334 61 395
Exercise of share options and awards - (9) (9) - (86) (86)
At 31 March 2011 30 8 38 334 100 434
39. Non-controlling interests
Non-controlling interests of US$159m (2011: US$161m) represents the share of net assets of subsidiary undertakings held outside the Group and principally relates to the 30% stake in Serasa. Movements in the current and prior year are summarised in the Group statement of changes in total equity and include currency translation losses of US$16m (2011: gains of US$18m) recognised directly in other comprehensive income.
Obligations for put options in respect of Serasa and other non-controlling interests are reported within other financial liabilities (note 31(a)). The put and call options associated with the shares held by non-controlling shareholders in Serasa are exercisable for a period of five years from June 2012 and further details in respect of the valuation of the put option are given in note 8.
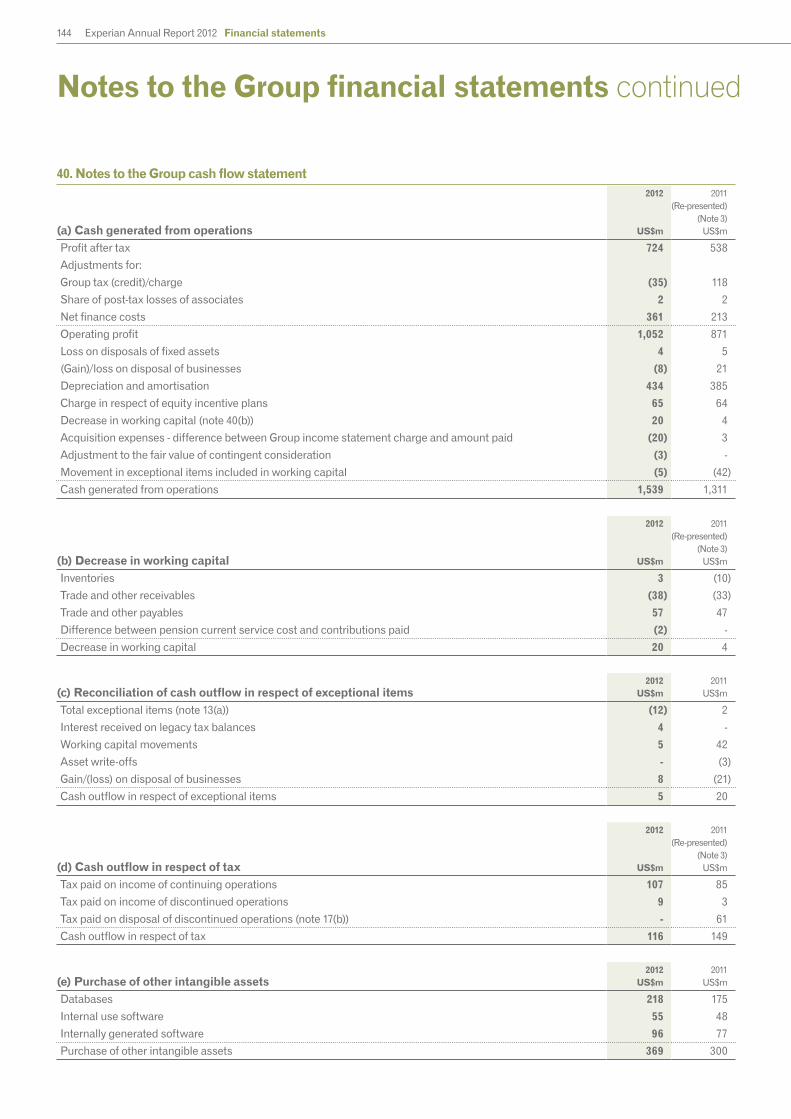
144 Experian Annual Report 2012 Financial statements
Notes to the Group financial statements continued
40. Notes to the Group cash flow statement
(a) Cash generated from operations
2012
US$m
2011 (Re-presented)
(Note 3)US$m
Profit after tax 724 538
Adjustments for:
Group tax (credit)/charge (35) 118
Share of post-tax losses of associates 2 2
Net finance costs 361 213
Operating profit 1,052 871
Loss on disposals of fixed assets 4 5
(Gain)/loss on disposal of businesses (8) 21
Depreciation and amortisation 434 385
Charge in respect of equity incentive plans 65 64
Decrease in working capital (note 40(b)) 20 4
Acquisition expenses - difference between Group income statement charge and amount paid (20) 3
Adjustment to the fair value of contingent consideration (3) -
Movement in exceptional items included in working capital (5) (42)
Cash generated from operations 1,539 1,311
(b) Decrease in working capital
2012
US$m
2011 (Re-presented)
(Note 3)US$m
Inventories 3 (10)
Trade and other receivables (38) (33)
Trade and other payables 57 47
Difference between pension current service cost and contributions paid (2) -
Decrease in working capital 20 4
(c) Reconciliation of cash outflow in respect of exceptional items2012
US$m2011
US$m
Total exceptional items (note 13(a)) (12) 2
Interest received on legacy tax balances 4 -
Working capital movements 5 42
Asset write-offs - (3)
Gain/(loss) on disposal of businesses 8 (21)
Cash outflow in respect of exceptional items 5 20
(d) Cash outflow in respect of tax
2012
US$m
2011 (Re-presented)
(Note 3)US$m
Tax paid on income of continuing operations 107 85
Tax paid on income of discontinued operations 9 3
Tax paid on disposal of discontinued operations (note 17(b)) - 61
Cash outflow in respect of tax 116 149
(e) Purchase of other intangible assets2012
US$m2011
US$m
Databases 218 175
Internal use software 55 48
Internally generated software 96 77
Purchase of other intangible assets 369 300

145
Governance
Financial statements
Busin
ess reviewB
usiness overview
40. Notes to the Group cash flow statement (continued)
(f) Cash flows on acquisition of subsidiaries (non-GAAP measure)2012
US$m2011
US$m
Purchase of subsidiaries (note 41) 785 277
Net cash acquired with subsidiaries (note 41) (53) (6)
Acquisition expenses - transaction expenses paid on behalf of vendors 18 -
Acquisition expenses - other amounts paid 11 5
Payments to acquire non-controlling interests 12 -
Deferred consideration settled on acquisitions 14 25
Net cash outflow for acquisition of subsidiaries 787 301
(g) Cash outflow in respect of net share purchases2012
US$m2011
US$m
Issue of ordinary shares (11) (7)
Receipt of share option proceeds (54) (50)
Purchase of own shares held as treasury shares - 336
Purchase of own shares by employee trusts - for employee share incentive plans 232 70
Cash outflow in respect of net share purchases 167 349
(h) Reconciliation of Cash generated from operations to Operating cash flow (non-GAAP measure)
2012
US$m
2011 (Re-presented)
(Note 3)US$m
Cash generated from operations (note 40(a)) 1,539 1,311
Acquisition expenses paid 29 5
Purchase of property, plant and equipment (84) (69)
Purchase of other intangible assets (note 40(e)) (369) (300)
Sale of property, plant and equipment 3 7
Dividends received from continuing associates 1 1
Cash outflow in respect of exceptional items (note 40(c)) 5 20
Operating cash flow 1,124 975
There were cash flows of US$84m (2011: US$69m) for the purchase of property, plant and equipment after receipts of US$11m (2011: US$nil) in the form of landlord incentives.
41. Acquisitions
The Group made ten acquisitions during the year, in connection with which provisional goodwill of US$553m has been recognised based on the fair value of the net assets acquired of US$282m. The cash outflow of US$746m in respect of these acquisitions is stated net of cash acquired of US$53m and includes deferred consideration settled in the year of US$14m.
These transactions included:
– the acquisition of substantially the whole of the issued share capital of Computec S.A. (‘Computec’), a leading Latin American credit services information provider, based in Colombia. The purchase involved a delisting tender offer and cash consideration for the equivalent of US$380m which was settled in October and November 2011. This acquisition extends Experian’s global leadership in credit information.
– the acquisition of the whole of the issued share capital of Medical Present Value, Inc (‘Medical Present Value’) on 1 July 2011 for a consideration of US$192m. This acquisition broadens Experian’s presence in the healthcare payments sector in North America.
– eight other acquisitions, none of which is individually material.

146 Experian Annual Report 2012 Financial statements
Notes to the Group financial statements continued
41. Acquisitions (continued)
Details of the net assets acquired at provisional fair values and the consideration and goodwill arising are given below.
Computec
US$m
Medical Present
ValueUS$m
Other acquisitions
US$m
Total
US$m
Intangible assets:
Customer and advertiser relationships 118 63 55 236
Other 25 12 44 81
Intangible assets 143 75 99 317
Property, plant and equipment 14 1 1 16
Investments in associates 10 - 1 11
Deferred tax assets 2 24 - 26
Trade and other receivables 17 2 18 37
Cash and cash equivalents 22 9 22 53
Trade and other payables (40) (4) (27) (71)
Current tax liability (2) - (3) (5)
Provisions - - (3) (3)
Deferred tax liabilities (46) (30) (23) (99)
Total identifiable net assets 120 77 85 282
Goodwill 262 115 176 553
Total 382 192 261 835
Satisfied by:
Cash 380 192 213 785
Deferred consideration - - 19 19
Fair value of existing stake in associate - - 22 22
Recognition of non-controlling interest 2 - 7 9
Total 382 192 261 835
The provisional fair values above contain certain amounts which will be finalised no later than one year after the date of acquisition. Provisional amounts have been included at 31 March 2012 as a consequence of the timing and complexity of the acquisitions. Goodwill represents the synergies, assembled workforce and future growth potential of the businesses acquired. None of the goodwill arising in the year of US$553m is currently deductible for tax purposes. As indicated in note 5, acquisition expenses have been charged to the Group income statement.
Additional information in respect of these acquisitions is given below.
Computec
US$m
Medical Present
ValueUS$m
Other acquisitions
US$m
Total
US$m
Increase in book value from fair value adjustments:
Intangible assets 140 74 96 310
Other assets and liabilities (30) (30) (23) (83)
Increase in book value from fair value adjustments 110 44 73 227
Gross contractual amounts receivable in respect of trade and other receivables1 17 2 18 37
Revenue from 1 April 2011 to dates of acquisition 54 11 30 95
Revenue from dates of acquisition to 31 March 2012 53 27 30 110
Profit before tax from dates of acquisition to 31 March 20122 4 - (5) (1)
1. At the dates of acquisition, the gross contractual amounts receivable in respect of trade and other receivables were expected to be collected in full.
2. It has been impracticable to estimate the impact on Group profit after tax had the acquired entities been owned from 1 April 2011, as their accounting policies and period end dates did not accord with those of the Group prior to their acquisition.
There have been no material gains, losses, error corrections or other adjustments recognised in the year ended 31 March 2012 that relate to acquisitions in the current or previous years. The cash outflow of US$296m in 2011 was principally attributable to the acquisition of Mighty Net, Inc, and is stated net of total cash acquired in that year of US$6m, and included deferred consideration settled in that year of US$25m.
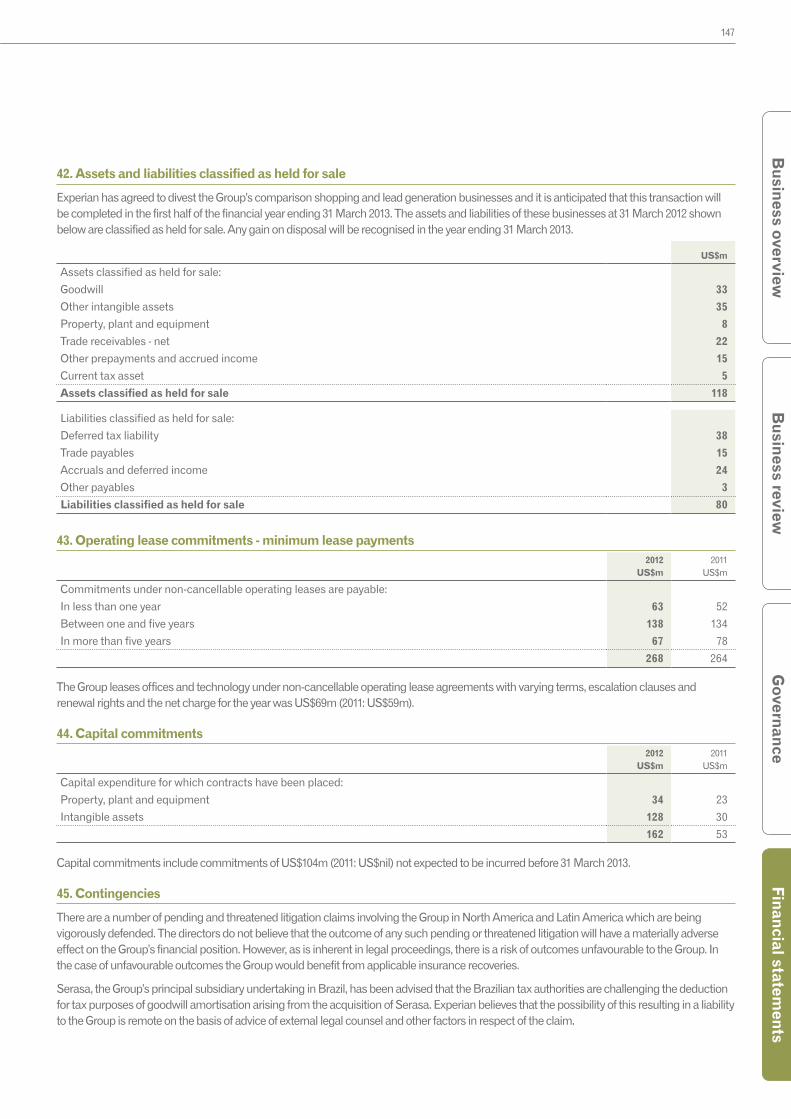
147
Governance
Financial statements
Busin
ess reviewB
usiness overview
42. Assets and liabilities classified as held for sale
Experian has agreed to divest the Group’s comparison shopping and lead generation businesses and it is anticipated that this transaction will be completed in the first half of the financial year ending 31 March 2013. The assets and liabilities of these businesses at 31 March 2012 shown below are classified as held for sale. Any gain on disposal will be recognised in the year ending 31 March 2013.
US$m
Assets classified as held for sale:
Goodwill 33
Other intangible assets 35
Property, plant and equipment 8
Trade receivables - net 22
Other prepayments and accrued income 15
Current tax asset 5
Assets classified as held for sale 118
Liabilities classified as held for sale:
Deferred tax liability 38
Trade payables 15
Accruals and deferred income 24
Other payables 3
Liabilities classified as held for sale 80
43. Operating lease commitments - minimum lease payments2012
US$m2011
US$m
Commitments under non-cancellable operating leases are payable:
In less than one year 63 52
Between one and five years 138 134
In more than five years 67 78
268 264
The Group leases offices and technology under non-cancellable operating lease agreements with varying terms, escalation clauses and renewal rights and the net charge for the year was US$69m (2011: US$59m).
44. Capital commitments2012
US$m2011
US$m
Capital expenditure for which contracts have been placed:
Property, plant and equipment 34 23
Intangible assets 128 30
162 53
Capital commitments include commitments of US$104m (2011: US$nil) not expected to be incurred before 31 March 2013.
45. Contingencies
There are a number of pending and threatened litigation claims involving the Group in North America and Latin America which are being vigorously defended. The directors do not believe that the outcome of any such pending or threatened litigation will have a materially adverse effect on the Group’s financial position. However, as is inherent in legal proceedings, there is a risk of outcomes unfavourable to the Group. In the case of unfavourable outcomes the Group would benefit from applicable insurance recoveries.
Serasa, the Group’s principal subsidiary undertaking in Brazil, has been advised that the Brazilian tax authorities are challenging the deduction for tax purposes of goodwill amortisation arising from the acquisition of Serasa. Experian believes that the possibility of this resulting in a liability to the Group is remote on the basis of advice of external legal counsel and other factors in respect of the claim.
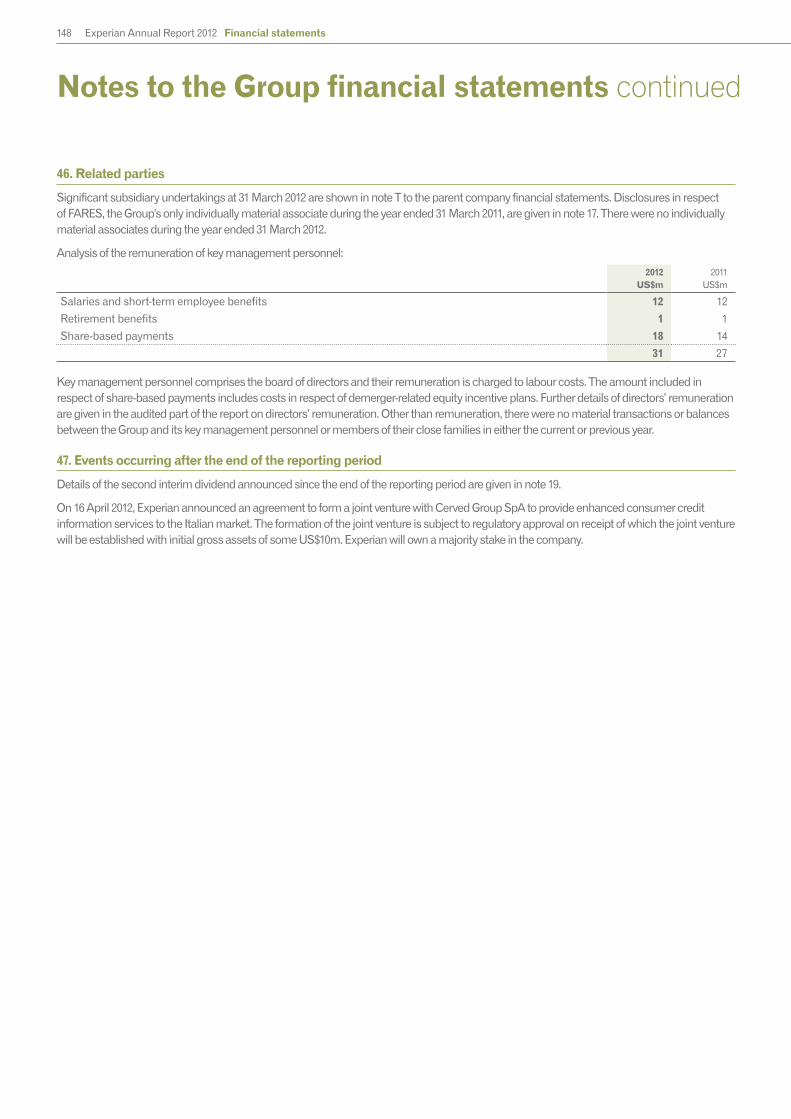
148 Experian Annual Report 2012 Financial statements
Notes to the Group financial statements continued
46. Related parties
Significant subsidiary undertakings at 31 March 2012 are shown in note T to the parent company financial statements. Disclosures in respect of FARES, the Group’s only individually material associate during the year ended 31 March 2011, are given in note 17. There were no individually material associates during the year ended 31 March 2012.
Analysis of the remuneration of key management personnel:
2012US$m
2011US$m
Salaries and short-term employee benefits 12 12
Retirement benefits 1 1
Share-based payments 18 14
31 27
Key management personnel comprises the board of directors and their remuneration is charged to labour costs. The amount included in respect of share-based payments includes costs in respect of demerger-related equity incentive plans. Further details of directors’ remuneration are given in the audited part of the report on directors’ remuneration. Other than remuneration, there were no material transactions or balances between the Group and its key management personnel or members of their close families in either the current or previous year.
47. Events occurring after the end of the reporting period
Details of the second interim dividend announced since the end of the reporting period are given in note 19.
On 16 April 2012, Experian announced an agreement to form a joint venture with Cerved Group SpA to provide enhanced consumer credit information services to the Italian market. The formation of the joint venture is subject to regulatory approval on receipt of which the joint venture will be established with initial gross assets of some US$10m. Experian will own a majority stake in the company.

149
Governance
Financial statements
Busin
ess reviewB
usiness overview
Report of the auditors:parent company financial statementsIndependent auditors' report to the members of Experian plc
We have audited the parent company financial statements of Experian plc for the year ended 31 March 2012 which comprise the parent company profit and loss account, the parent company balance sheet and the related notes. The financial reporting framework that has been applied in their preparation is United Kingdom Accounting Standards.
Respective responsibilities of directors and auditors
As explained more fully in the Statements of directors' responsibilities the directors are responsible for the preparation of the parent company financial statements and for being satisfied that they give a true and fair view. Our responsibility is to audit and express an opinion on the parent company financial statements in accordance with applicable law and International Standards on Auditing (UK and Ireland). Those standards require us to comply with the Auditing Practices Board’s Ethical Standards for Auditors.
This report, including the opinions, has been prepared for and only for the company’s members as a body in accordance with the terms of our engagement and for no other purpose. We do not, in giving these opinions, accept or assume responsibility for any other purpose or to any other person to whom this report is shown or into whose hands it may come save where expressly agreed by our prior consent in writing.
Scope of the audit of the financial statements
An audit involves obtaining evidence about the amounts and disclosures in the financial statements sufficient to give reasonable assurance that the financial statements are free from material misstatement, whether caused by fraud or error. This includes an assessment of: whether the accounting policies are appropriate to the Company’s circumstances and have been consistently applied and adequately disclosed; the reasonableness of significant accounting estimates made by the directors; and the overall presentation of the financial statements. In addition, we read all the financial and non-financial information in the Annual report and accounts to identify material inconsistencies with the audited financial statements. If we become aware of any apparent material misstatements or inconsistencies we consider the implications for our report.
Opinion on financial statements
In our opinion the parent company financial statements:
• give a true and fair view of the state of the Company’s affairs as at 31 March 2012 and of its loss for the year then ended; and• have been properly prepared in accordance with United Kingdom Accounting Standards.
Opinion on other matter
In our opinion the information given in the Directors’ report for the financial year for which the parent company’s financial statements are prepared is consistent with the parent company financial statements.
Ranjan SriskandanFor and on behalf of PricewaterhouseCoopers LLP Chartered Accountants London, United Kingdom 9 May 2012

150 Experian Annual Report 2012 Financial statements
Parent company profit and loss accountfor the year ended 31 March 2012
Notes 2012US$m
2011US$m
Staff costs D (3.6) (3.3)
Depreciation (0.2) (0.3)
Other operating charges E (32.2) (26.7)
Operating loss (36.0) (30.3)
Interest receivable and similar income F - 12.0
Interest payable and similar charges G (16.6) (2.6)
Loss on ordinary activities before tax (52.6) (20.9)
Tax on loss on ordinary activities H - -
Loss for the financial year O (52.6) (20.9)
All amounts relate to continuing operations.
There is no material difference between the loss on ordinary activities before tax and the loss for the financial year stated above and their historical cost equivalents.
The Company has no recognised gains and losses other than those included in the profit and loss account, and therefore no separate statement of total recognised gains and losses has been presented.
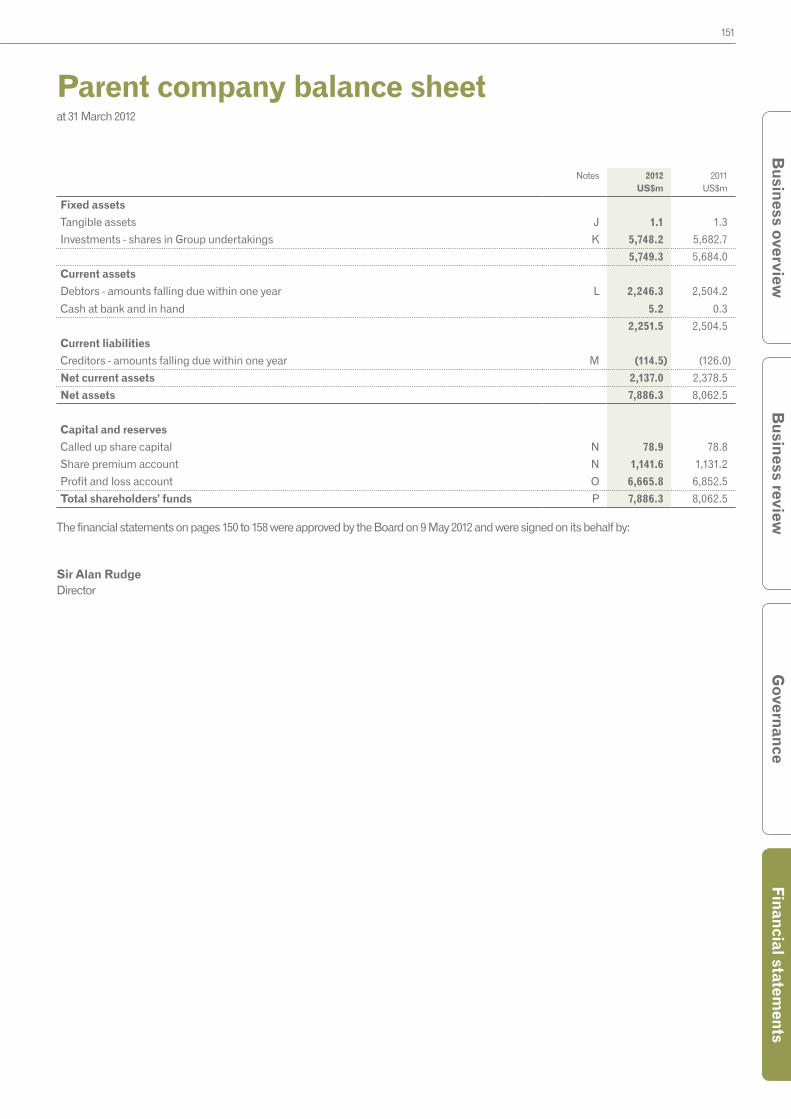
151
Governance
Financial statements
Busin
ess reviewB
usiness overview
Parent company balance sheetat 31 March 2012
Notes 2012US$m
2011US$m
Fixed assets
Tangible assets J 1.1 1.3
Investments - shares in Group undertakings K 5,748.2 5,682.7
5,749.3 5,684.0
Current assets
Debtors - amounts falling due within one year L 2,246.3 2,504.2
Cash at bank and in hand 5.2 0.3
2,251.5 2,504.5
Current liabilities
Creditors - amounts falling due within one year M (114.5) (126.0)
Net current assets 2,137.0 2,378.5
Net assets 7,886.3 8,062.5
Capital and reserves
Called up share capital N 78.9 78.8
Share premium account N 1,141.6 1,131.2
Profit and loss account O 6,665.8 6,852.5
Total shareholders’ funds P 7,886.3 8,062.5
The financial statements on pages 150 to 158 were approved by the Board on 9 May 2012 and were signed on its behalf by:
Sir Alan RudgeDirector

152 Experian Annual Report 2012 Financial statements
Notes to the parent company financial statementsfor the year ended 31 March 2012
A. Corporate information
Experian plc (the ‘Company’) is incorporated and registered in Jersey as a public company limited by shares and is resident in Ireland. The principal legislation under which the Company operates is the Companies (Jersey) Law 1991, as amended, and regulations made thereunder. The Company’s registered office is at 22 Grenville Street, St Helier, Jersey JE4 8PX.
The Company is the ultimate holding company of the Experian group of companies (the ‘Group’) and its ordinary shares are traded on the London Stock Exchange’s Regulated Market (Premium Listing). Experian is the leading global information services group.
B. Basis of preparation
The separate financial statements of the Company are:
• presented in compliance with the requirements for companies whose shares are traded on the London Stock Exchange’s Regulated Market;
• prepared on a going concern basis and under the historical cost convention, modified by the revaluation of certain financial instruments, and in accordance with UK accounting standards;
• presented in US dollars, the Company’s functional currency; and
• designed to include disclosures sufficient to comply with those parts of the UK Companies Act 2006 applicable to companies reporting under UK accounting standards even though the Company is incorporated and registered in Jersey.
The Experian plc Group financial statements for the year ended 31 March 2012 contain financial instrument disclosures required by IFRS 7 and these would also comply with the disclosures required by FRS 29. Accordingly, the Company has taken advantage of the exemption in FRS 29 and has not presented separate financial instrument disclosures. Under the terms of FRS 8 , the Company is exempt from disclosing transactions with its wholly-owned subsidiary undertakings.
C. Significant accounting policies
The principal accounting policies applied in the preparation of these financial statements are set out below. These policies have been consistently applied to both years presented.
Tangible fixed assetsLeasehold improvements are held at cost less accumulated depreciation. Cost includes the original purchase price and amounts attributable to bringing the asset to its working condition for its intended use. Depreciation is charged so as to write off such assets on a straight line basis over ten years, being the shorter of their estimated life and the remaining period of the lease.
Operating leasesLeases in which a significant portion of the risks and rewards of ownership are retained by the lessor are classified as operating leases and not capitalised. Payments made under operating leases are charged in the profit and loss account on a straight line basis over the period of the lease.
Investments - shares in Group undertakingsInvestments in Group undertakings are stated at cost less any provisions necessary for impairment.
The fair value of share incentives issued by the Company to employees of subsidiary undertakings is accounted for as a capital contribution and recognised as an increase in the Company’s investment in Group undertakings with a corresponding increase in total shareholders’ funds.
Impairment of fixed assetsWhere there is an indication of impairment, fixed assets are subject to review for impairment in accordance with FRS 11. Any impairment is recognised in the year in which it occurs.
Debtors and creditorsDebtors are initially recognised at fair value and subsequently measured at this value. Where the time value of money is material, they are then carried at amortised cost using the effective interest rate method. Creditors are initially recognised at fair value. Where the time value of money is material, they are then carried at amortised cost using the effective interest rate method.
Cash at bank and in handCash at bank includes deposits held at call with banks and other short-term highly liquid investments.
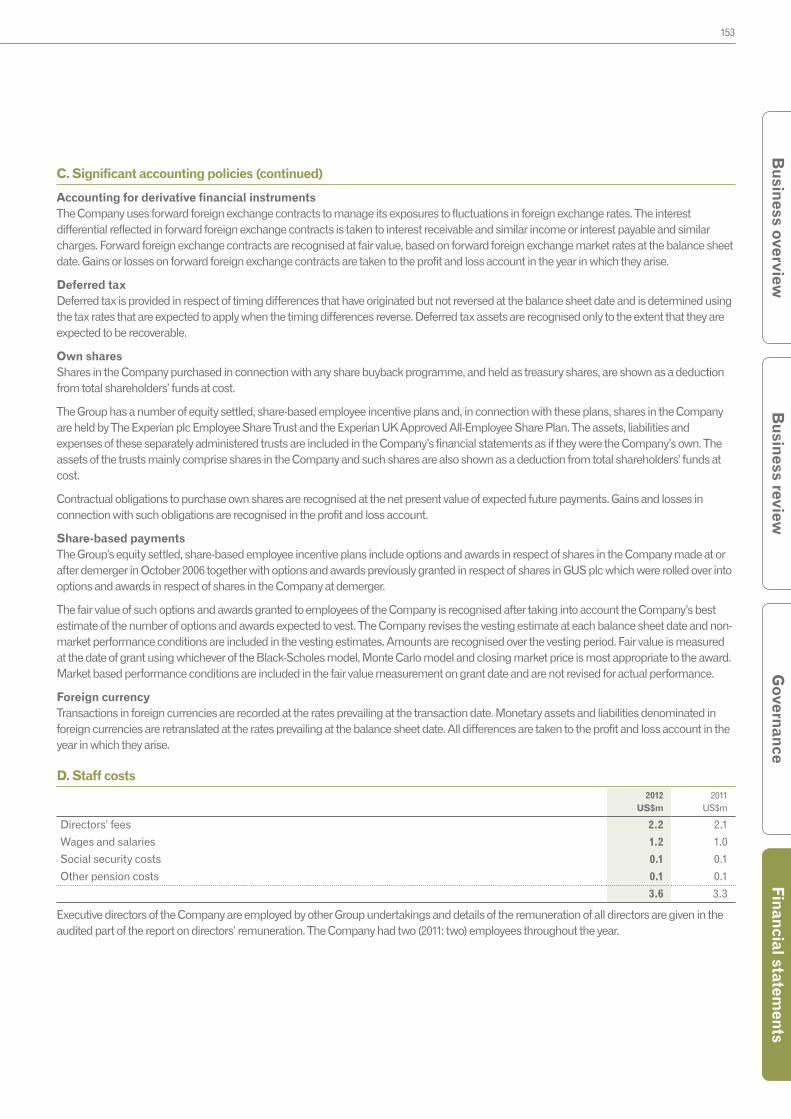
153
Governance
Financial statements
Busin
ess reviewB
usiness overview
C. Significant accounting policies (continued)
Accounting for derivative financial instrumentsThe Company uses forward foreign exchange contracts to manage its exposures to fluctuations in foreign exchange rates. The interest differential reflected in forward foreign exchange contracts is taken to interest receivable and similar income or interest payable and similar charges. Forward foreign exchange contracts are recognised at fair value, based on forward foreign exchange market rates at the balance sheet date. Gains or losses on forward foreign exchange contracts are taken to the profit and loss account in the year in which they arise.
Deferred taxDeferred tax is provided in respect of timing differences that have originated but not reversed at the balance sheet date and is determined using the tax rates that are expected to apply when the timing differences reverse. Deferred tax assets are recognised only to the extent that they are expected to be recoverable.
Own sharesShares in the Company purchased in connection with any share buyback programme, and held as treasury shares, are shown as a deduction from total shareholders’ funds at cost.
The Group has a number of equity settled, share-based employee incentive plans and, in connection with these plans, shares in the Company are held by The Experian plc Employee Share Trust and the Experian UK Approved All-Employee Share Plan. The assets, liabilities and expenses of these separately administered trusts are included in the Company’s financial statements as if they were the Company’s own. The assets of the trusts mainly comprise shares in the Company and such shares are also shown as a deduction from total shareholders’ funds at cost.
Contractual obligations to purchase own shares are recognised at the net present value of expected future payments. Gains and losses in connection with such obligations are recognised in the profit and loss account.
Share-based paymentsThe Group’s equity settled, share-based employee incentive plans include options and awards in respect of shares in the Company made at or after demerger in October 2006 together with options and awards previously granted in respect of shares in GUS plc which were rolled over into options and awards in respect of shares in the Company at demerger.
The fair value of such options and awards granted to employees of the Company is recognised after taking into account the Company’s best estimate of the number of options and awards expected to vest. The Company revises the vesting estimate at each balance sheet date and non-market performance conditions are included in the vesting estimates. Amounts are recognised over the vesting period. Fair value is measured at the date of grant using whichever of the Black-Scholes model, Monte Carlo model and closing market price is most appropriate to the award. Market based performance conditions are included in the fair value measurement on grant date and are not revised for actual performance.
Foreign currencyTransactions in foreign currencies are recorded at the rates prevailing at the transaction date. Monetary assets and liabilities denominated in foreign currencies are retranslated at the rates prevailing at the balance sheet date. All differences are taken to the profit and loss account in the year in which they arise.
D. Staff costs2012
US$m2011
US$m
Directors’ fees 2.2 2.1
Wages and salaries 1.2 1.0
Social security costs 0.1 0.1
Other pension costs 0.1 0.1
3.6 3.3
Executive directors of the Company are employed by other Group undertakings and details of the remuneration of all directors are given in the audited part of the report on directors’ remuneration. The Company had two (2011: two) employees throughout the year.

154 Experian Annual Report 2012 Financial statements
Notes to the parent company financial statements continued
E. Other operating charges
(i) Nature of chargesOther operating charges principally comprise charges from other Group undertakings in respect of services provided to the Company during the year.
(ii) Fees payable to the Company’s auditor and its associates2012
US$m2011
US$m
Audit of the Group financial statements 0.4 0.4
Audit of the Company financial statements 0.1 0.1
0.5 0.5
F. Interest receivable and similar income 2012
US$m2011
US$m
Foreign exchange gains - 12.0
G. Interest payable and similar charges2012
US$m2011
US$m
Interest on amounts owed to Group undertakings 0.8 0.5
Foreign exchange losses 15.8 -
Losses in connection with commitments to purchase own shares - 2.1
16.6 2.6
H. Tax on loss on ordinary activities
(i) Reconciliation of tax charge for the year2012
US$m2011
US$m
Loss on ordinary activities before tax (52.6) (20.9)
Loss on ordinary activities multiplied by the applicable rate of tax of 25% (2011: 25%) (13.2) (5.2)
Effects of:
Income not taxable - (2.3)
Expenses not deductible 4.4 -
Tax losses not utilised 8.8 7.5
Current tax charge for the year - -
(ii) Factors that may affect future tax chargesIn the foreseeable future, the Company’s tax charge will continue to be influenced by the nature of its income and expenditure and could be affected by changes in Irish and Jersey tax law.
The Company has no recognised deferred tax (2011: US$nil) and has not recognised deferred tax of US$37m (2011: US$28m) in respect of tax losses.
I. Dividends
The Company paid interim dividends of US$21.2m (2011: US$30.5m) to those shareholders who did not elect to receive dividends under the Income Access Share (‘IAS’) arrangements. Total dividends of US$289.9m (2011: US$251.1m) were paid to Experian shareholders during the year with the balance of US$268.7m (2011: US$220.6m) paid by subsidiary undertakings under the IAS arrangements.
Since the balance sheet date, the directors have announced a second interim dividend of 21.75 US cents per ordinary share for the year ended 31 March 2012. No part of this dividend is included as a liability in these financial statements.
Further details of Experian dividends and payment arrangements are given in note 19 to the Group financial statements.
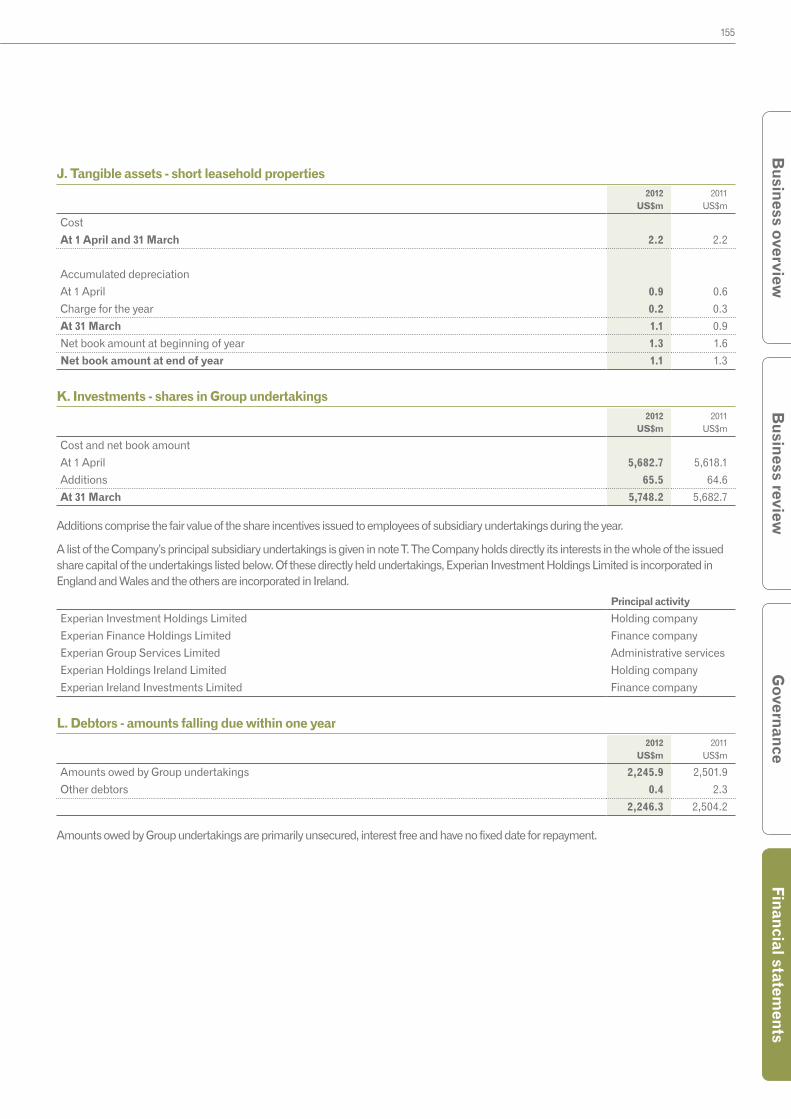
155
Governance
Financial statements
Busin
ess reviewB
usiness overview
J. Tangible assets - short leasehold properties2012
US$m2011
US$m
Cost
At 1 April and 31 March 2.2 2.2
Accumulated depreciation
At 1 April 0.9 0.6
Charge for the year 0.2 0.3
At 31 March 1.1 0.9
Net book amount at beginning of year 1.3 1.6
Net book amount at end of year 1.1 1.3
K. Investments - shares in Group undertakings2012
US$m2011
US$m
Cost and net book amount
At 1 April 5,682.7 5,618.1
Additions 65.5 64.6
At 31 March 5,748.2 5,682.7
Additions comprise the fair value of the share incentives issued to employees of subsidiary undertakings during the year.
A list of the Company’s principal subsidiary undertakings is given in note T. The Company holds directly its interests in the whole of the issued share capital of the undertakings listed below. Of these directly held undertakings, Experian Investment Holdings Limited is incorporated in England and Wales and the others are incorporated in Ireland.
Principal activity
Experian Investment Holdings Limited Holding company
Experian Finance Holdings Limited Finance company
Experian Group Services Limited Administrative services
Experian Holdings Ireland Limited Holding company
Experian Ireland Investments Limited Finance company
L. Debtors - amounts falling due within one year2012
US$m2011
US$m
Amounts owed by Group undertakings 2,245.9 2,501.9
Other debtors 0.4 2.3
2,246.3 2,504.2
Amounts owed by Group undertakings are primarily unsecured, interest free and have no fixed date for repayment.
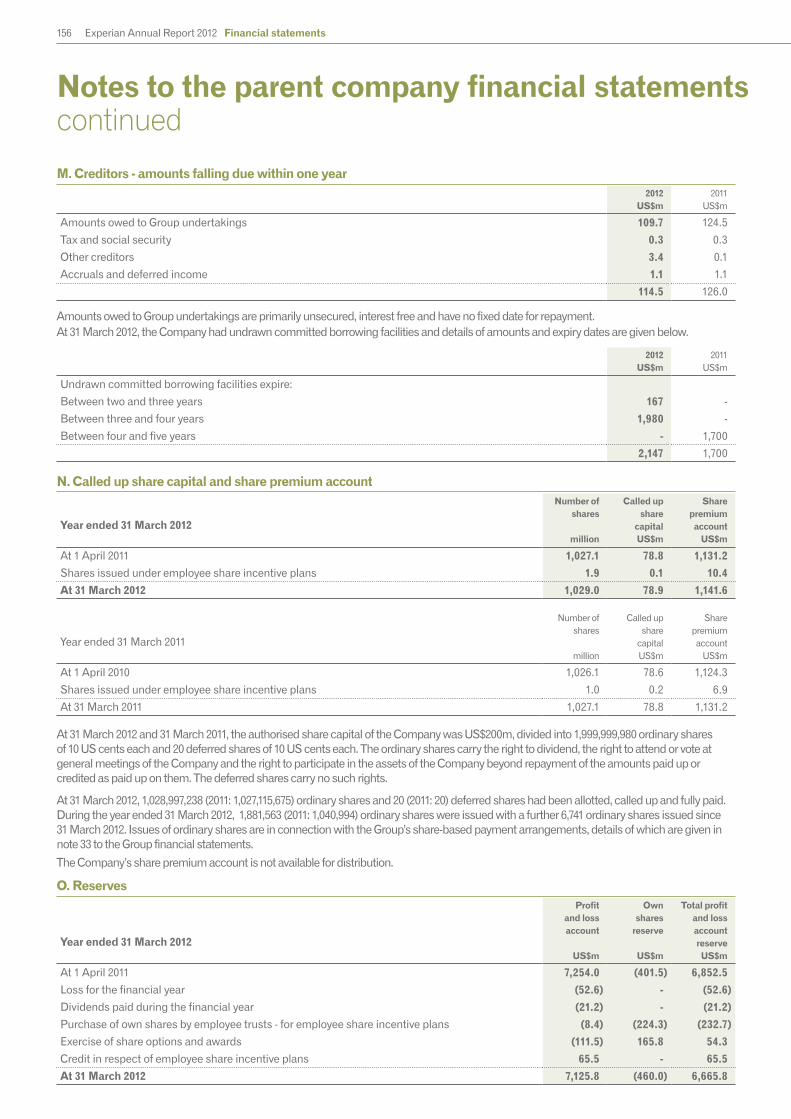
156 Experian Annual Report 2012 Financial statements
Notes to the parent company financial statements continued
M. Creditors - amounts falling due within one year2012
US$m2011
US$m
Amounts owed to Group undertakings 109.7 124.5
Tax and social security 0.3 0.3
Other creditors 3.4 0.1
Accruals and deferred income 1.1 1.1
114.5 126.0
Amounts owed to Group undertakings are primarily unsecured, interest free and have no fixed date for repayment.At 31 March 2012, the Company had undrawn committed borrowing facilities and details of amounts and expiry dates are given below.
2012US$m
2011US$m
Undrawn committed borrowing facilities expire:
Between two and three years 167 -
Between three and four years 1,980 -
Between four and five years - 1,700
2,147 1,700
N. Called up share capital and share premium account
Year ended 31 March 2012
Number of shares
million
Called up share
capitalUS$m
Share premium account
US$m
At 1 April 2011 1,027.1 78.8 1,131.2
Shares issued under employee share incentive plans 1.9 0.1 10.4
At 31 March 2012 1,029.0 78.9 1,141.6
Year ended 31 March 2011
Number of shares
million
Called up share
capitalUS$m
Share premium account
US$m
At 1 April 2010 1,026.1 78.6 1,124.3
Shares issued under employee share incentive plans 1.0 0.2 6.9
At 31 March 2011 1,027.1 78.8 1,131.2
At 31 March 2012 and 31 March 2011, the authorised share capital of the Company was US$200m, divided into 1,999,999,980 ordinary shares of 10 US cents each and 20 deferred shares of 10 US cents each. The ordinary shares carry the right to dividend, the right to attend or vote at general meetings of the Company and the right to participate in the assets of the Company beyond repayment of the amounts paid up or credited as paid up on them. The deferred shares carry no such rights.
At 31 March 2012, 1,028,997,238 (2011: 1,027,115,675) ordinary shares and 20 (2011: 20) deferred shares had been allotted, called up and fully paid. During the year ended 31 March 2012, 1,881,563 (2011: 1,040,994) ordinary shares were issued with a further 6,741 ordinary shares issued since 31 March 2012. Issues of ordinary shares are in connection with the Group’s share-based payment arrangements, details of which are given in note 33 to the Group financial statements.
The Company’s share premium account is not available for distribution.
O. Reserves
Year ended 31 March 2012
Profitand lossaccount
US$m
Ownshares
reserve
US$m
Total profitand lossaccountreserveUS$m
At 1 April 2011 7,254.0 (401.5) 6,852.5
Loss for the financial year (52.6) - (52.6)
Dividends paid during the financial year (21.2) - (21.2)
Purchase of own shares by employee trusts - for employee share incentive plans (8.4) (224.3) (232.7)
Exercise of share options and awards (111.5) 165.8 54.3
Credit in respect of employee share incentive plans 65.5 - 65.5
At 31 March 2012 7,125.8 (460.0) 6,665.8

157
Governance
Financial statements
Busin
ess reviewB
usiness overview
O. Reserves (continued)
Year ended 31 March 2011
Profitand lossaccount
US$m
Ownshares
reserve
US$m
Total profitand lossaccountreserveUS$m
At 1 April 2010 7,275.9 (92.2) 7,183.7
Loss for the financial year (20.9) - (20.9)
Dividends paid during the financial year (30.5) - (30.5)
Purchase of own shares - (334.4) (334.4)
Purchase of own shares by employee trusts - for employee share incentive plans 0.5 (60.6) (60.1)
Exercise of share options and awards (35.6) 85.7 50.1
Credit in respect of employee share incentive plans 64.6 - 64.6
At 31 March 2011 7,254.0 (401.5) 6,852.5
The balance on the profit and loss account comprises charges and credits taken directly to the profit and loss account in respect of employee share incentive plans and other net profits retained by the Company after the payment of dividends.
The balance on the own shares reserve represents the cost of ordinary shares in the Company and movements comprise:
Number of own shares held Cost of own shares held
Year ended 31 March 2012 Treasurymillion
Trusts million
Totalmillion
TreasuryUS$m
Trusts US$m
TotalUS$m
At 1 April 2011 30.0 8.3 38.3 334.4 67.1 401.5
Purchase of own shares - 17.9 17.9 - 224.3 224.3
Exercise of share options and awards - (15.9) (15.9) - (165.8) (165.8)
Transfers (6.0) 6.0 - (60.8) 60.8 -
At 31 March 2012 24.0 16.3 40.3 273.6 186.4 460.0
Number of own shares held Cost of own shares held
Year ended 31 March 2011 Treasurymillion
Trusts million
Totalmillion
TreasuryUS$m
Trusts US$m
TotalUS$m
At 1 April 2010 - 10.8 10.8 - 92.2 92.2
Purchase of own shares 30.0 6.8 36.8 334.4 60.6 395.0
Exercise of share options and awards - (9.3) (9.3) - (85.7) (85.7)
At 31 March 2011 30.0 8.3 38.3 334.4 67.1 401.5
P. Reconciliation of movements in total shareholders’ funds2012
US$m2011
US$m
Loss for the financial year (52.6) (20.9)
Dividends paid during the financial year (21.2) (30.5)
Purchase of own shares held in treasury - (334.4)
Purchase of own shares by employee trusts and in respect of employee share incentive plans (232.7) (60.1)
Shares issued under share incentive plans 64.8 57.2
Credit in respect of employee share incentive plans 65.5 64.6
Net decrease in total shareholders’ funds (176.2) (324.1)
Opening total shareholders’ funds 8,062.5 8,386.6
Closing total shareholders’ funds 7,886.3 8,062.5

158 Experian Annual Report 2012 Financial statements
Notes to the parent company financial statements continued
Q. Commitments
The Company has an annual operating lease commitment and related annual cost of US$0.6m (2011: US$0.5m) in respect of the corporate headquarters in Dublin and this commitment expires in more than five years. There are no significant capital commitments relating to the Company.
R. Contingencies
The Company has guaranteed borrowings of Group undertakings of US$1,531m (2011: US$1,351m) together with the liabilities of The Experian plc Employee Share Trust and the Experian UK Approved All-Employee Share Plan.
The Company has guaranteed the retirement benefit obligations of Group undertakings that participate in the Experian Pension Scheme together with the retirement benefit obligations of a Group undertaking that participates in the Pension and Life Assurance Plan of Sanderson Systems Limited, a small defined benefit pension plan.
The Company has issued a small number of other guarantees in connection with the performance of operational business contracts by Group undertakings.
S. Share options and awards
Details of options and awards in respect of the ordinary shares of the Company are given in note 33 to the Group financial statements together with a summary of the total cost of share-based compensation in respect of such plans. Details of such options and awards and the cost of share-based compensation in respect of the two employees of the Company are not separately disclosed within the Company’s financial statements as the amounts involved are not material. Details of such options and awards in respect of directors of the Company are given in the audited part of the report on directors’ remuneration.
T. Principal subsidiary undertakings at 31 March 2012
Principal activityCountry of incorporation
Experian Finance plc Holding company and administrative services
England and Wales
Experian Holdings Limited Holding company England and Wales
Experian Limited Information services England and Wales
Motorfile Limited Information services England and Wales
QAS Limited Marketing services England and Wales
Hitwise Pty Ltd Marketing services Australia
Serasa SA Information services Brazil
Computec S.A. Information services Colombia
Experian A/S Information services Denmark
Experian Holdings Ireland Limited Holding company Ireland
Experian Ireland Investments Limited Finance company Ireland
Experian South Africa (Pty) Limited Information services South Africa
ConsumerInfo.com Inc. Interactive business USA
Experian Holdings, Inc. Holding company USA
Experian Information Solutions Inc. Information services USA
Experian Marketing Solutions Inc. Marketing services USA
Experian Services Corporation Administrative services USA
LIM Holdings Inc. Interactive business USA
LMB Mortgage Services Inc. Interactive business USA
PriceGrabber.com, Inc. Interactive business USA
The results of the above undertakings are included in the Group financial statements. It is anticipated that the operations of three of the above undertakings (LIM Holdings Inc., LMB Mortgage Services Inc. and PriceGrabber.com, Inc.) will be disposed of in connection with the divestment of the Group’s comparison shopping and lead generation businesses.
The Company holds direct or indirect interests in the whole of the issued ordinary shares of these undertakings apart from Serasa SA, in which its interest is 70%, and Experian South Africa (Pty) Limited, in which its interest is 75%. The only undertakings listed that are held directly by the Company are Experian Holdings Ireland Limited and Experian Ireland Investments Limited.
The Company had no transactions in 2012 or 2011 with Group undertakings which are not wholly-owned and which require disclosure under FRS 8.
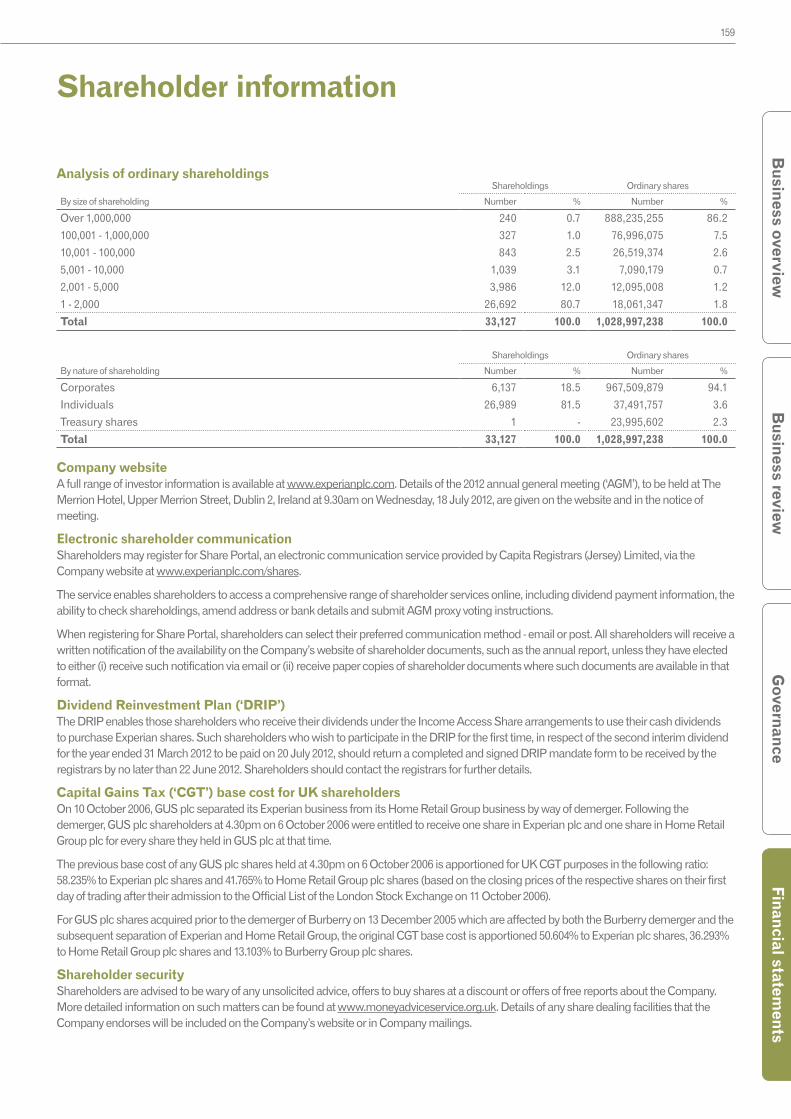
159
Governance
Financial statements
Busin
ess reviewB
usiness overview
Shareholder information
Analysis of ordinary shareholdingsShareholdings Ordinary shares
By size of shareholding Number % Number %
Over 1,000,000 240 0.7 888,235,255 86.2
100,001 - 1,000,000 327 1.0 76,996,075 7.5
10,001 - 100,000 843 2.5 26,519,374 2.6
5,001 - 10,000 1,039 3.1 7,090,179 0.7
2,001 - 5,000 3,986 12.0 12,095,008 1.2
1 - 2,000 26,692 80.7 18,061,347 1.8
Total 33,127 100.0 1,028,997,238 100.0
Shareholdings Ordinary shares
By nature of shareholding Number % Number %
Corporates 6,137 18.5 967,509,879 94.1
Individuals 26,989 81.5 37,491,757 3.6
Treasury shares 1 - 23,995,602 2.3
Total 33,127 100.0 1,028,997,238 100.0
Company websiteA full range of investor information is available at www.experianplc.com. Details of the 2012 annual general meeting (‘AGM’), to be held at The Merrion Hotel, Upper Merrion Street, Dublin 2, Ireland at 9.30am on Wednesday, 18 July 2012, are given on the website and in the notice of meeting.
Electronic shareholder communication Shareholders may register for Share Portal, an electronic communication service provided by Capita Registrars (Jersey) Limited, via the Company website at www.experianplc.com/shares.
The service enables shareholders to access a comprehensive range of shareholder services online, including dividend payment information, the ability to check shareholdings, amend address or bank details and submit AGM proxy voting instructions.
When registering for Share Portal, shareholders can select their preferred communication method - email or post. All shareholders will receive a written notification of the availability on the Company’s website of shareholder documents, such as the annual report, unless they have elected to either (i) receive such notification via email or (ii) receive paper copies of shareholder documents where such documents are available in that format.
Dividend Reinvestment Plan (‘DRIP’) The DRIP enables those shareholders who receive their dividends under the Income Access Share arrangements to use their cash dividends to purchase Experian shares. Such shareholders who wish to participate in the DRIP for the first time, in respect of the second interim dividend for the year ended 31 March 2012 to be paid on 20 July 2012, should return a completed and signed DRIP mandate form to be received by the registrars by no later than 22 June 2012. Shareholders should contact the registrars for further details.
Capital Gains Tax (‘CGT’) base cost for UK shareholdersOn 10 October 2006, GUS plc separated its Experian business from its Home Retail Group business by way of demerger. Following the demerger, GUS plc shareholders at 4.30pm on 6 October 2006 were entitled to receive one share in Experian plc and one share in Home Retail Group plc for every share they held in GUS plc at that time.
The previous base cost of any GUS plc shares held at 4.30pm on 6 October 2006 is apportioned for UK CGT purposes in the following ratio: 58.235% to Experian plc shares and 41.765% to Home Retail Group plc shares (based on the closing prices of the respective shares on their first day of trading after their admission to the Official List of the London Stock Exchange on 11 October 2006).
For GUS plc shares acquired prior to the demerger of Burberry on 13 December 2005 which are affected by both the Burberry demerger and the subsequent separation of Experian and Home Retail Group, the original CGT base cost is apportioned 50.604% to Experian plc shares, 36.293% to Home Retail Group plc shares and 13.103% to Burberry Group plc shares.
Shareholder securityShareholders are advised to be wary of any unsolicited advice, offers to buy shares at a discount or offers of free reports about the Company. More detailed information on such matters can be found at www.moneyadviceservice.org.uk. Details of any share dealing facilities that the Company endorses will be included on the Company’s website or in Company mailings.
160 Experian Annual Report 2012
The Unclaimed Assets RegisterExperian owns and participates in The Unclaimed Assets Register, which provides a search facility for shareholdings and other financial assets that may have been forgotten. For further information, please contact The Unclaimed Assets Register, PO Box 9501, Nottingham, NG80 1WD, United Kingdom (T +44 (0) 844 481 8180, E [email protected]) or visit www.uar.co.uk.
American Depositary Receipts (‘ADR’)Experian has a sponsored Level 1 ADR programme, for which Bank of New York Mellon acts as Depositary. The Level 1 ADR programme is not listed on a stock exchange in the USA and trades in the over-the-counter market on the OTCQX platform under the symbol EXPGY. Each ADR represents one Experian plc ordinary share. Further information can be obtained by contacting:
Shareholder Relations Bank of New York Mellon PO Box 358516 Pittsburgh PA 15252 - 8516 United States
T +1 201 680 6825 (from the USA 1-888-BNY-ADRS)
Financial calendarSecond interim dividend record date 22 June 2012Interim management statement, first quarter 13 July 2012Annual general meeting 18 July 2012Second interim dividend to be paid 20 July 2012Half-yearly financial report 8 November 2012Interim management statement, third quarter January 2013Preliminary announcement of results May 2013
ContactsCorporate headquarters:Newenham House Northern Cross Malahide Road Dublin 17 Ireland
T +353 (0) 1 846 9100 F +353 (0) 1 846 9150
Registered office:22 Grenville Street St Helier Jersey JE4 8PX
Registered number 93905
Registrars:Experian Shareholder Services Capita Registrars (Jersey) Limited PO Box 532 St Helier Jersey JE4 5UW
T +44 (0) 800 141 2952* (or 0871 664 9245* from the UK) E [email protected] Text phone facility +44 (0) 203 639 2062 (or 0871 664 0532 from the UK)
* Call charges apply on these numbers. Lines are open from 9.00am to 5.30pm (UK time), Monday to Friday.
Shareholder information continued

This annual report has been produced using ISO 14001 and FSC certified environmental print technology, together with vegetable-based inks and a single-site production facility that required no transport between processes. The report is printed on an environmentally responsible paper that uses 50% certified de-inked post consumer waste and 50% certified virgin fibre from sustainable sources.
Produced by Accrue* Printed by Royle Print Limited
Experian Annual Report 2012
Revenue US$4.5bnRevenue from continuing activities up 15% and organic revenue growth of 10%, at constant exchange rates.
Continuing activities only. 2011 restated to exclude comparison shopping and lead generation businesses in North America and UK and Ireland (now classified as discontinued operations).
Full year dividend US 32.0cDividends per share up 14%.
EBIT US$1.2bnEBIT margin from continuing activities up 50 basis points to 26.2%.
2011 restated to exclude comparison shopping and lead generation businesses in North America and UK and Ireland (now classified as discontinued operations).
We delivered good growth across all regions, with organic revenue growth of 23% in Latin America, 8% in the UK and Ireland, 7% in EMEA/Asia Pacific and 6% in North America.
We delivered good growth across our four global business lines, with organic revenue growth of 12% in Credit Services, 9% in Marketing Services, 8% in Decision Analytics and 7% in Interactive.
We met or exceeded each of our financial objectives, namely to deliver mid-high single digit organic revenue growth, maintain or improve margin and deliver cash flow conversion of over 90%.
We executed well on our global growth programme, positioning us strongly for the future.
12
11
10
4,485
3,859
3,803
12
11
10
1,175
991
935
12
11
10
32.0
28.0
23.0
Highlights
Company website www.experianplc.com
Annual Report 2012 www.experianplc.com/annualreport
Annual R
eport 2012
Operational headquarters
ExperianLandmark HouseExperian WayNG2 Business ParkNottingham NG80 1ZZUnited Kingdom
T +44 (0) 115 941 0888F +44 (0) 115 828 6341
Experian 475 Anton BoulevardCosta MesaCA 92626United States
T +1 714 830 7000F +1 714 830 2449
Serasa Experian Alameda dos Quinimuras, 187 CEP 04068-900Planalto PaulistaSão PauloBrazil
T +55 11 3373 7272F +55 11 2847 9198
Corporate headquarters
Experian plcNewenham HouseNorthern CrossMalahide RoadDublin 17Ireland
T +353 (0) 1 846 9100F +353 (0) 1 846 9150
Corporate office
ExperianCardinal Place80 Victoria StreetLondonSW1E 5JLUnited Kingdom
T +44 (0) 20 304 24200F +44 (0) 20 304 24250
Corporate Responsibility Report 2012 www.experianplc.com/crreport
About Experian www.experianplc.com/aboutexperian
Annual Report 2012
Don RobertChief Executive Officer
We’ve delivered another strong financial performance
and continued to lay the foundations for sustaining growth into the future. I want to congratulate the men and women of Experian on these achievements and to thank them for their boundless energy,
creativity and commitment.