Embed Size (px)
Citation preview
J. Electroanal. Chem., 150 (1983) 217-228 Elsevier Sequoia S.A., Lausanne - Printed in The Netherlands
217
A N O D I C O X I D A T I O N OF U O 2
PART II. ELECTROCHEMICAL AND X-RAY P H O T O E L E C T R O N SPECTROS C OPI C S TU D I ES IN ALKALINE S O L U T I O N S *
S. SUNDER, D.W. SHOESMITH, M.G. BAILEY and G.J. WALLACE
Research Chemistry Branch, Atomic Energy of Canada Limited, Whiteshell Nuclear Research Establishment, Pinawa, Manitoba ROE 1LO (Canada)
(Received 26th July 1982)
ABSTRACT
The anodic oxidation of polycrystalline UO 2 has been studied in alkaline Na2SO 4 solution (10 < pH _< 12) using potentiostatic and cyclic voltammetric techniques. The nature of the surface films formed has been determined by X-ray photoelectron spectroscopy. At low potentials (E < 0.000 V vs. SCE) two stages of oxidation are observed: the first appears to be of monolayer dimensions; the second a thin film of UO2+ x (x _< 0.25). This film achieves a constant thickness at constant potential, which increases at higher potentials in the range -0.500 < E < 0.000 V. At higher potentials (0.000 < E < +0.200 V) a sequence of oxide films is observed. For times ( t ) < 1 min (at +0.100 V) the surface composition changes with time. For 1 < t < 10 min a film of I320 s is formed, and for t > 10 min it transforms to U30 ~. Dissolution as UO22+ starts once a layer of U205 is formed. At pH = 12.0 an anodic voltammetric peak is observed corresponding to the formation of a partially passivating UO 3 layer.
INTRODUCTION
In the nuclear industry, sintered UO 2 pellets are used as reactor fuel. If used nuclear fuel should be disposed of in stable geologic formations (salt, hard rock), a knowledge of the dissolution of UO e under a variety of redox conditions would be needed to understand the release mechanisms of radionuclides contained within the fuel.
Electrochemical methods appear to be the most useful in controlling redox conditions, and we have presented a mechanism for the oxidative dissolution of UO 2 in neutral sulphate solutions (6 < p H < 10.5) based on combined electrochemical and X-ray photoelectron spectroscopic (XPS) experiments [1,2]. In this paper we present the results of our electrochemical and XPS studies in alkaline solutions (10 < pH _< 12). Most of the work discussed is for p H = 12.0 solutions.
* Issued as AECL - 7852.
0022-0728/83/$03.00 1983 Elsevier Sequoia S.A.
218
EXPERIMENTAL
Deta i ls of the equ ipment and exper imenta l p rocedure have been descr ibed prev ious ly [1-3]. G o o d reproduc ib i l i ty was ob ta ined for exper iments pe r fo rmed on the same electrode, but some var ia t ion was observed be tween dif ferent electrodes.
Al l potent ia l s ( E ) were measured , and are quoted, agains t the sa tu ra ted ca lomel e lec t rode (SCE). Al l exper iments were pe r fo rmed in a base e lect rolyte of 0.5 tool d m -3 N a z S O 4.
RESULTS
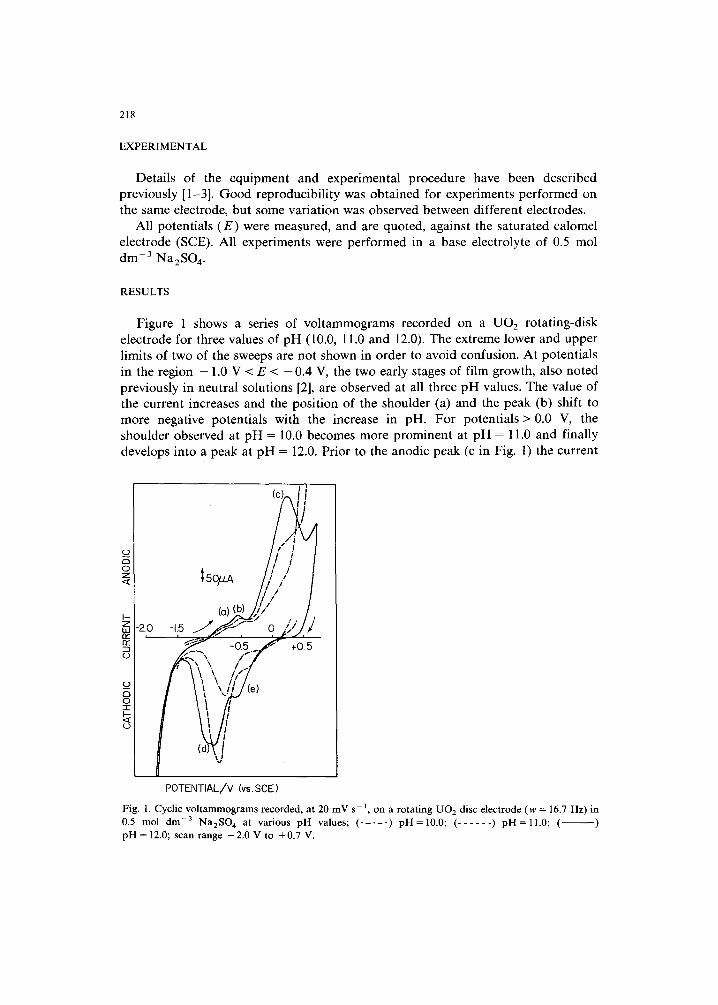
Figure 1 shows a series of vo l t ammogra ms recorded on a UO2 ro ta t ing-d i sk e lec t rode for three values of p H (10.0, 11.0 and 12.0). The ext reme lower and uppe r l imits of two of the sweeps are no t shown in o rder to avoid confusion. A t po ten t ia l s in the region - 1.0 V < E < - 0.4 V, the two ear ly stages of f i lm growth, also no ted previous ly in neut ra l solut ions [2], are observed at all three p H values. The value of the current increases and the pos i t ion of the shoulder (a) and the peak (b) shift to more negat ive poten t ia l s with the increase in pH. F o r po ten t ia l s > 0.0 V, the shoulder observed at p H -- 10.0 becomes more p rominen t at p H = 11.0 and f inal ly develops into a peak at p H = 12.0. Pr ior to the anodic peak (c in Fig. l ) the current
POTENTIAL /V i (vs. SCE )
Fig. 1. Cyclic voltammograms recorded, at 20 mV s -1 , on a rotating U O 2 disc electrode (w = 16.7 Hz) in 0.5 mol drn -3 NazSO 4 at various pH values; ( . . . . . ) pH=10.0; ( . . . . . . ) pH=l l .0 ; ( ) pH = 12.0; scan range -2.0 V to +0.7 V.
219
is increased by the increase in pH, whereas for potentials more positive than + 0.200 V, the current is decreased by an increase in pH. On the reverse negative sweep the size of the peaks for film reduction increases with increasing pH. Peak (d) was also observed in neutral solutions [2] but peak (e) first forms as a shoulder at pH = 11.0 and finally a peak at pH = 12.0. Voltammograms to varying upper limits show that reduction peak (e) develops as a consequence of the formation of anodic peak (c).
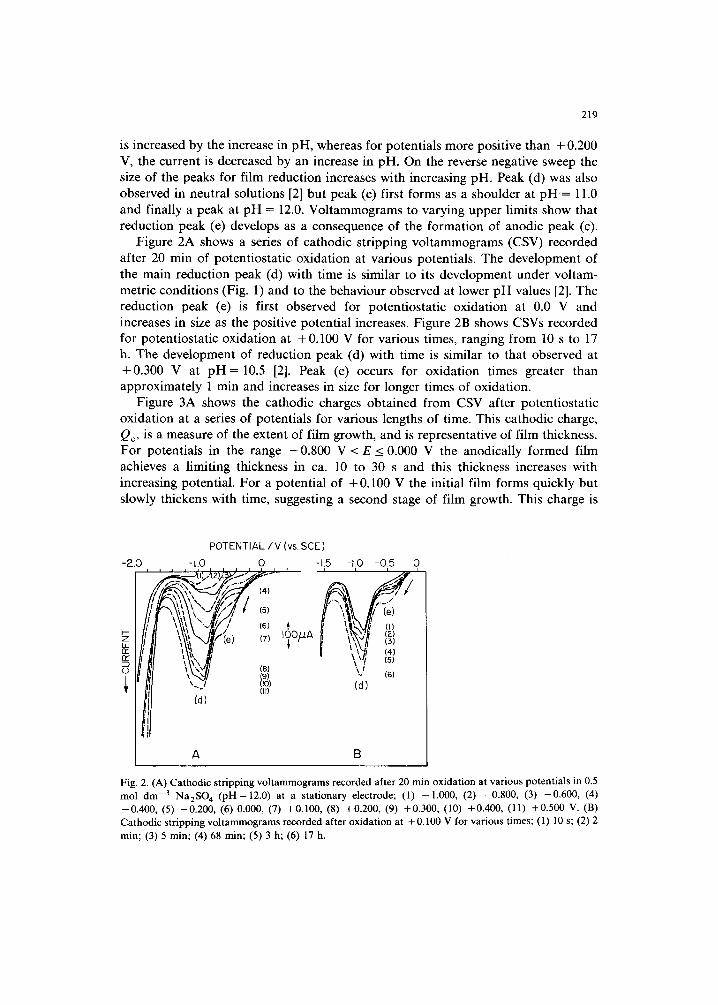
Figure 2A shows a series of cathodic stripping voltammograms (CSV) recorded after 20 min of potentiostatic oxidation at various potentials. The development of the main reduction peak (d) with time is similar to its development under voltam- metric conditions (Fig. 1) and to the behaviour observed at lower pH values [2]. The reduction peak (e) is first observed for potentiostatic oxidation at 0.0 V and increases in size as the positive potential increases. Figure 2B shows CSVs recorded for potentiostatic oxidation at +0.100 V for various times, ranging from 10 s to 17 h. The development of reduction peak (d) with time is similar to that observed at +0.300 V at pH = 10.5 [2]. Peak (e) occurs for oxidation times greater than approximately 1 min and increases in size for longer times of oxidation.
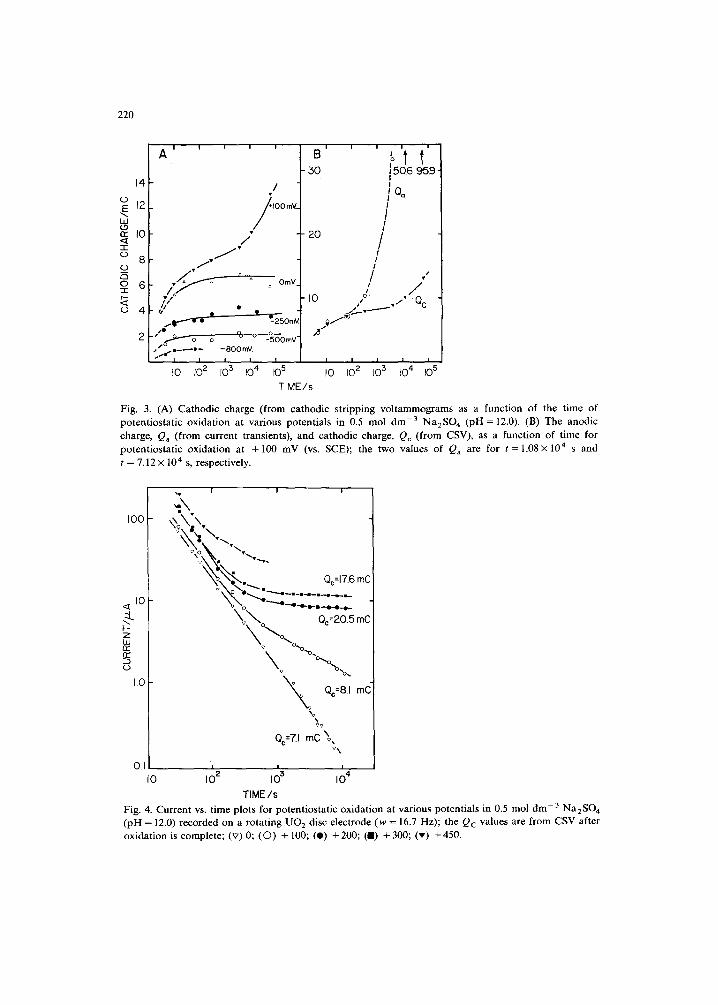
Figure 3A shows the cathodic charges obtained from CSV after potentiostatic oxidation at a series of potentials for various lengths of time. This cathodic charge, Qc, is a measure of the extent of film growth, and is representative of film thickness. For potentials in the range -0 .800 V < E < 0.000 V the anodically formed film achieves a limiting thickness in ca. 10 to 30 s and this thickness increases with increasing potential. For a potential of + 0.100 V the initial film forms quickly but slowly thickens with time, suggesting a second stage of film growth. This charge is
- 2 . 0 I
:D I .~ q)
P O T E N T I A L / V (vs. S C E )
-1 .0 I I I ¢/, ~. .
',~!,. \ \vi
(d)
0 - 1 5 -I 0 - 0 . 5 0
tTl / ~,.( , ._ t (e) [7) liO~A
I \ ¢!J (4)
(8) '~! (9) - (6) 00) ( d ) (ll)
A B
Fig. 2. (A) Cathodic stripping voltammograms recorded after 20 min oxidation at various potentials in 0.5 mol dm -3 Na2SO 4 (pH=12.0) at a stationary electrode; (1) -1.000, (2) -0.800, (3) -0.600, (4) --0.400, (5) --0.200, (6) 0.000, (7) +0.100, (8) +0.200, (9) +0.300, (10) +0.400, ( l l ) +0.500 V. (B) Cathodic stripping voltammograms recorded after oxidation at + 0.100 V for various times; (1) 10 s; (2) 2 min; (3) 5 min; (4) 68 min; (5) 3 h; (6) 17 h.
220
14
~ 12
b..l (.9 a: l0 "I- (D
8
~ 6 -1-
c~ 4
i i' i ! A '
/ lOOmV
/ / "
/ " e / ; ~ ~ ~ ~ ~ OrnV
.,. r . ~ . _ e ~ • o_250mV
" / x . , ~ "~o ~ o ~ -500row ~.=---=-- -800 rnV.
I I I I I
I0 I0 2 10 3 10 4 10 5
I I I | I '
B o l I
- 30 15°6 .9- I
IQo !
I l
- 2 0 / I !
I I
/ I
10 o' /
I I I I I
I0 I0 2 10 3 10 4 10 5
TIME/s
Fig. 3. (A) Cathodic charge (from cathodic stripping vol tammograms as a function of the time of potentiostatic oxidation at various potentials in 0.5 mol dm -3 Na2SO 4 (pH = 12.0). (B) The anodic charge, Q, (from current transients), and cathodic charge, Qc (from CSV), as a function of time for potentiostatic oxidation at + 100 mV (vs. SCE); the two values of Qa are for t = 1.08× 10⁴ s and t = 7.12 x 10⁴ s, respectively.
I I I
.. ',
~ ' . ~ . ~ Qc=17.6 m( ~ ' , , . -..... . . . . . . . . . . .
< I0 \ . N ° -----, . . . ,_,_,., ._,_,.,_ .
~" \ ; ~ o Qc=205 mC
w z X ~O,~o.o,.o n~
o ~ X v °'~'°~%
1.0 X Oc=8.1 mC"
~v
Q0--zl mc ~, v \
0.I i , i lO 10 2 10 3 10 4
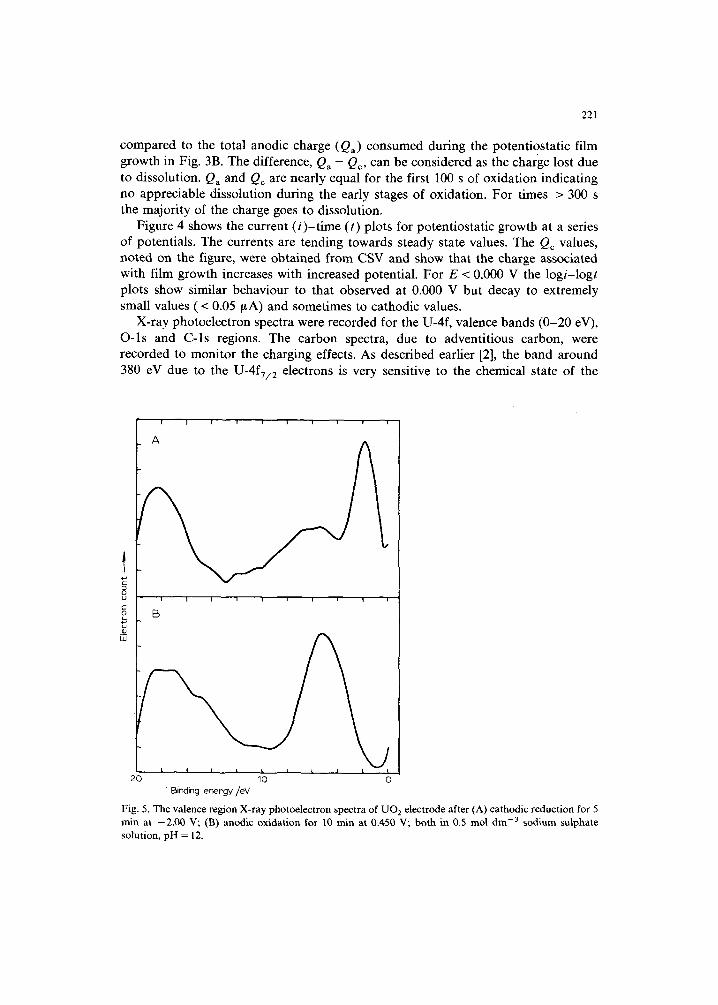
TIME/s Fig. 4. Current vs. time plots for potentiostatic oxidation at various potentials in 0.5 mol d m - 3 Na2SO4 (pH = 12.0) recorded on a rotating UO 2 disc electrode (w = 16.7 Hz); the Qc values are from CSV after oxidation is complete; ( v )0 ; (©) + 100; (O) +200; (E) +300; (v) +450.
221
compared to the total anodic charge ( Q a ) consumed during the potentiostatic film growth in Fig. 3B. The difference, Qa - Qc, can be considered as the charge lost due to dissolution. Qa and Qc are nearly equal for the first 100 s of oxidation indicating no appreciable dissolution during the early stages of oxidation. For times > 300 s the majority of the charge goes to dissolution.
Figure 4 shows the current (/)-time (t) plots for potentiostatic growth at a series of potentials. The currents are tending towards steady state values. The Qc values, noted on the figure, were obtained from CSV and show that the charge associated with film growth increases with increased potential. For E < 0.000 V the logi-logt plots show similar behaviour to that observed at 0.000 V but decay to extremely small values (< 0.05/~A) and sometimes to cathodic values.
X-ray photoelectron spectra were recorded for the U-4f, valence bands (0-20 eV), O-Is and C-Is regions. The carbon spectra, due to adventitious carbon, were recorded to monitor the charging effects. As described earlier [2], the band around 380 eV due to the U-4fT/2 electrons is very sensitive to the chemical state of the
I I '1 r I I I I I
I
E~
1 I I I I I 1 I I
( I I t . . . .
20 10 0 ' Binding energy/eV
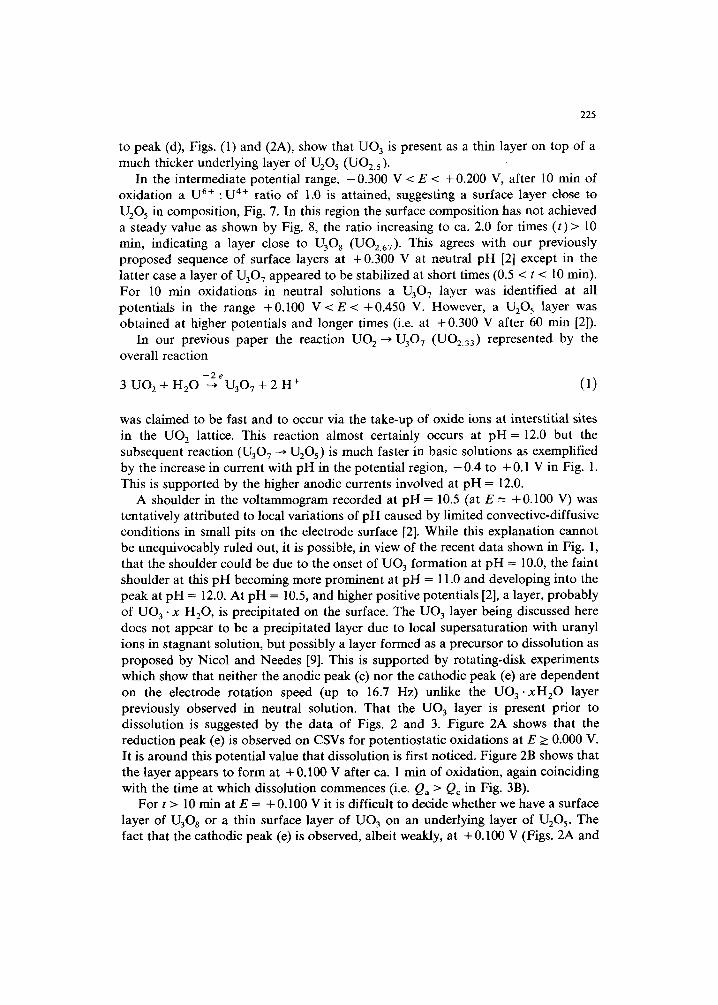
Fig. 5. The valence region X-ray photoelectron spectra of UO 2 electrode after (A) cathodic reduction for 5 rain at - 2 . 0 0 V; (B) anodic oxidation for 10 rain at 0.450 V; both in 0.5 tool dm -3 sodium sulphate solution, pH = 12.
222
i i i i ! i i i i
o
Z
O O U
Z O n~
o i i [
0 ~ 4 ~ , - , , ~ _ _ - ~ - . . . , - ~ - ~ - ~ _ 386 3a4 382 38o 37B
BINDING ENERGY/eV
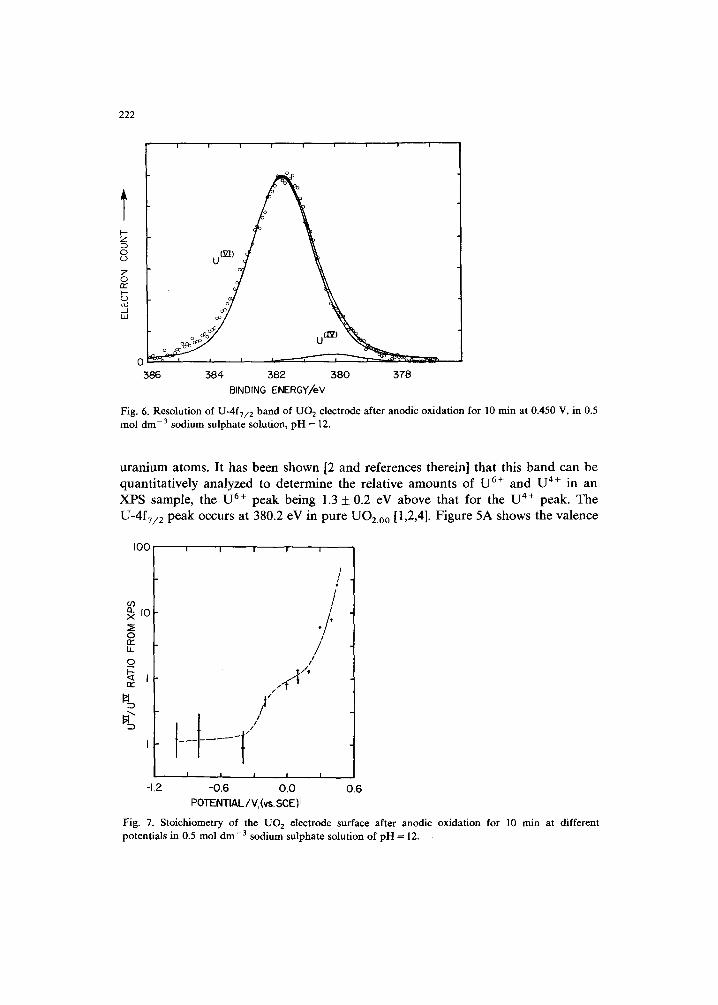
Fig. 6. Resolution of U-4fT/2 band of UO 2 electrode after anodic oxidation for 10 rain at 0.450 V, in 0.5 tool dm -3 sodium sulphate solution, pH = 12.
uranium atoms. It has been shown [2 and references therein] that this band can be quantitatively analyzed to determine the relative amounts of U 6÷ and U 4÷ in an XPS sample, the U 6+ peak being 1.3 + 0.2 eV above that for the U 4÷ peak. The U-4fT/2 peak occurs at 380.2 eV in pure UO2.00 [1,2,4]. Figure 5A shows the valence
I 0 0 I I I i i
¢/)
x ~ io
o t r la_
o
t ~
/
I I I I
A /
/ / /
/
I I I I
- 0 . 6 0 . 0
POTENTIAL/V, (vs. SCE) i
I
- 12 0 .6
Fig. 7. Stoichiometry of the UO 2 electrode surface after anodic oxidation for 10 rain at different potentials in 0.5 mol dm -3 sodium sulphate solution of pH = 12.
223
2.0 O3 13- X
o rv- it_ o_ 1.0
tV"
" 3
0 . 0
I I I
t t t I
t t
t
I I I I I
0.1 I I0 I 0 0 I 0 0 0
TIMF_/MIN
I
!
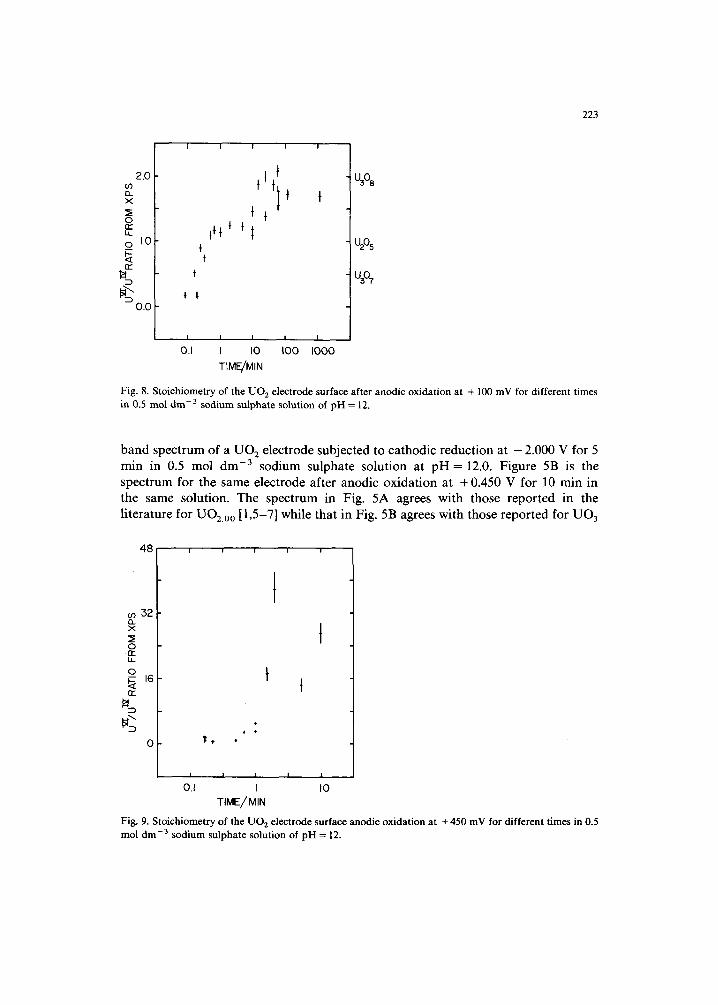
Fig. 8. S to ich iomet ry of the U O 2 e lect rode surface after anodic ox ida t ion at + 100 mV for di f ferent t imes in 0.5 mol d m -3 sod ium su lpha te so lu t ion of p H = 12.
band spectrum of a UO 2 electrode subjected to cathodic reduction at - 2.000 V for 5 min in 0.5 mol dm -3 sodium sulphate solution at pH = 12.0. Figure 5B is the spectrum for the same electrode after anodic oxidation at + 0.450 V for 10 rain in the same solution. The spectrum in Fig. 5A agrees with those reported in the literature for UO2.00 [1,5-7] while that in Fig. 5B agrees with those reported for UO 3
4 8 , , ,
o3 3 2 13_ X
o .cz i.t_ o
rr"
%
0
t t
t t
I I i I I
OJ I I0 TIME/MIN
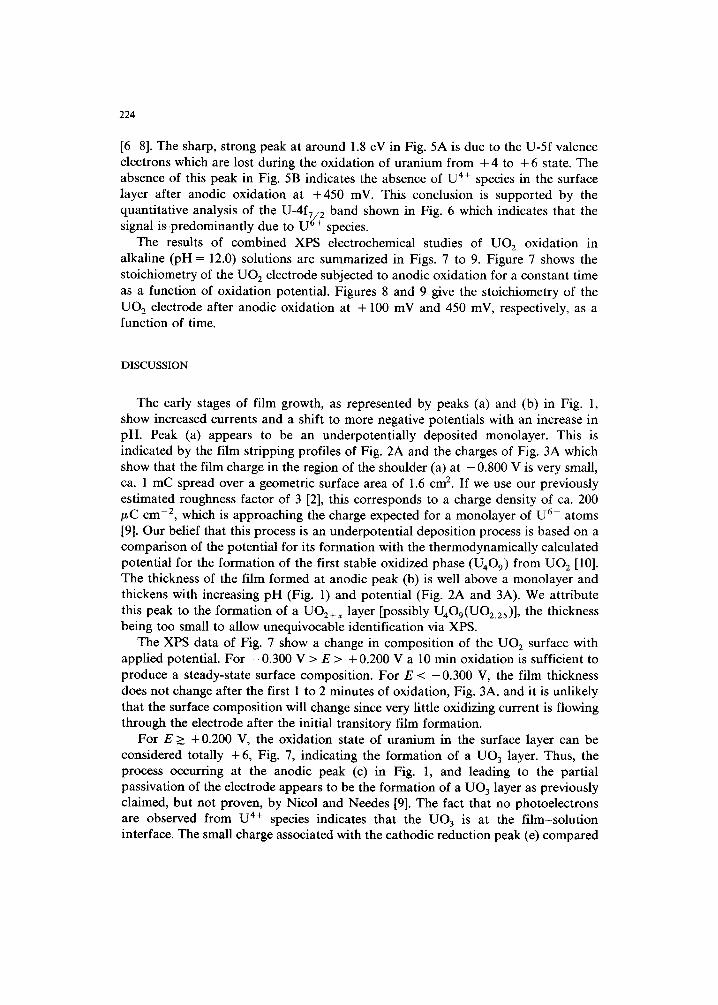
Fig. 9. S to ich iomet ry of the U O 2 electrode surface anodic ox ida t ion at + 450 mV for di f ferent t imes in 0.5 mol d m -3 sod ium su lpha te so lu t ion of pH = 12.
224
[6-8]. The sharp, strong peak at around 1.8 eV in Fig. 5A is due to the U-5f valence electrons which are lost during the oxidation of uranium from + 4 to + 6 state. The absence of this peak in Fig. 5B indicates the absence of U 4÷ species in the surface layer after anodic oxidation at +450 mV. This conclusion is supported by the quantitative analysis of the U-4f 7 2 band shown in Fig. 6 which indicates that the signal is predominantly due to U ~/~ species.
The results of combined XPS-electrochemical studies of UO 2 oxidation in alkaline (pH = 12.0) solutions are summarized in Figs. 7 to 9. Figure 7 shows the stoichiometry of the UO 2 electrode subjected to anodic oxidation for a constant time as a function of oxidation potential. Figures 8 and 9 give the stoichiometry of the UO 2 electrode after anodic oxidation at + 100 mV and 450 mV, respectively, as a function of time.
DISCUSSION
The early stages of film growth, as represented by peaks (a) and (b) in Fig. 1, show increased currents and a shift to more negative potentials with an increase in pH. Peak (a) appears to be an underpotentially deposited monolayer. This is indicated by the film stripping profiles of Fig. 2A and the charges of Fig. 3A which show that the film charge in the region of the shoulder (a) at - 0.800 V is very small, ca. 1 mC spread over a geometric surface area of 1.6 cm 2. If we use our previously estimated roughness factor of 3 [2], this corresponds to a charge density of ca. 200 /~C cm -2, which is approaching the charge expected for a monolayer of U 6+ atoms [9]. Our belief that this process is an underpotential deposition process is based on a comparison of the potential for its formation with the thermodynamically calculated potential for the formation of the first stable oxidized phase (U409) from UO 2 [10]. The thickness of the film formed at anodic peak (b) is well above a monolayer and thickens with increasing pH (Fig. 1) and potential (Fig. 2A and 3A). We attribute this peak to the formation of a UO2+ x layer [possibly U409(UO2.25)] , the thickness being too small to allow unequivocable identification via XPS.
The XPS data of Fig. 7 show a change in composition of the UO 2 surface with applied potential. For -0 .300 V > E > + 0.200 V a 10 min oxidation is sufficient to produce a steady-state surface composition. For E < -0 .300 V, the film thickness does not change after the first 1 to 2 minutes of oxidation, Fig. 3A, and it is unlikely that the surface composition will change since very little oxidizing current is flowing through the electrode after the initial transitory film formation.
For E > + 0.200 V, the oxidation state of uranium in the surface layer can be considered totally + 6, Fig. 7, indicating the formation of a UO 3 layer. Thus, the process occurring at the anodic peak (c) in Fig. 1, and leading to the partial passivation of the electrode appears to be the formation of a UO 3 layer as previously claimed, but not proven, by Nicol and Needes [9]. The fact that no photoelectrons are observed from U 4+ species indicates that the UO 3 is at the film-solution interface. The small charge associated with the cathodic reduction peak (e) compared
225
to peak (d), Figs. (1) and (2A), show that U O 3 is present as a thin layer on top of a much thicker underlying layer of U205 (UO2. 5).
In the intermediate potential range, - 0.300 V < E < + 0.200 V, after 10 min of oxidation a U 6+ : U 4+ ratio of 1.0 is attained, suggesting a surface layer close to U205 in composition, Fig. 7. In this region the surface composition has not achieved a steady value as shown by Fig. 8, the ratio increasing to ca. 2.0 for times ( t) > 10 min, indicating a layer close to 12308 (UO2.67). This agrees with our previously proposed sequence of surface layers at +0.300 V at neutral p H [2] except in the latter case a layer of 1230 7 appeared to be stabilized at short times (0.5 < t < 10 min). For 10 rain oxidations in neutral solutions a U30 7 layer was identified at all potentials in the range +0.100 V < E < +0.450 V. However, a U205 layer was obtained at higher potentials and longer times (i.e. at + 0.300 V after 60 min [2]).
In our previous paper the reaction UO 2 ~ U30 7 (UO2.33) represented by the overall reaction
- 2 e 3 UO 2 + H 2 0 ~ U307 + 2 H + (1)
was claimed to be fast and to occur via the take-up of oxide ions at interstitial sites in the UO 2 lattice. This reaction almost certainly occurs at p H = 12.0 but the subsequent reaction (U30 7 ~ UzOs) is much faster in basic solutions as exemplified by the increase in current with p H in the potential region, - 0.4 to + 0.1 V in Fig. 1. This is supported by the higher anodic currents involved at pH = 12.0.
A shoulder in the vol tammogram recorded at pH = 10.5 (at E - +0.100 V) was tentatively attributed to local variations of pH caused by limited convective-diffusive conditions in small pits on the electrode surface [2]. While this explanation cannot be unequivocably ruled out, it is possible, in view of the recent data shown in Fig. 1, that the shoulder could be due to the onset of UO 3 formation at p H = 10.0, the faint shoulder at this p H becoming more prominent at pH = 11.0 and developing into the peak at p H --- 12.0. At p H = 10.5, and higher positive potentials [2], a layer, probably of UO 3 • x H20, is precipitated on the surface. The UO 3 layer being discussed here does not appear to be a precipitated layer due to local supersaturation with uranyl ions in stagnant solution, but possibly a layer formed as a precursor to dissolution as proposed by Nicol and Needes [9]. This is supported by rotating-disk experiments which show that neither the anodic peak (c) nor the cathodic peak (e) are dependent on the electrode rotation speed (up to 16.7 Hz) unlike the UO 3 . x H 2 0 layer previously observed in neutral solution. That the UO 3 layer is present prior to dissolution is suggested by the data of Figs. 2 and 3. Figure 2A shows that the reduction peak (e) is observed on CSVs for potentiostatic oxidations at E >_ 0.000 V. It is around this potential value that dissolution is first noticed. Figure 2B shows that the layer appears to form at +0.100 V after ca. 1 rain of oxidation, again coinciding with the time at which dissolution commences (i.e. Qa > Qc in Fig. 3B).
For t > 10 rain at E = +0.100 V it is difficult to decide whether we have a surface layer of U308 or a thin surface layer of UO 3 on an underlying layer of 12205. The fact that the cathodic peak (e) is observed, albeit weakly, at + 0.100 V (Figs. 2A and
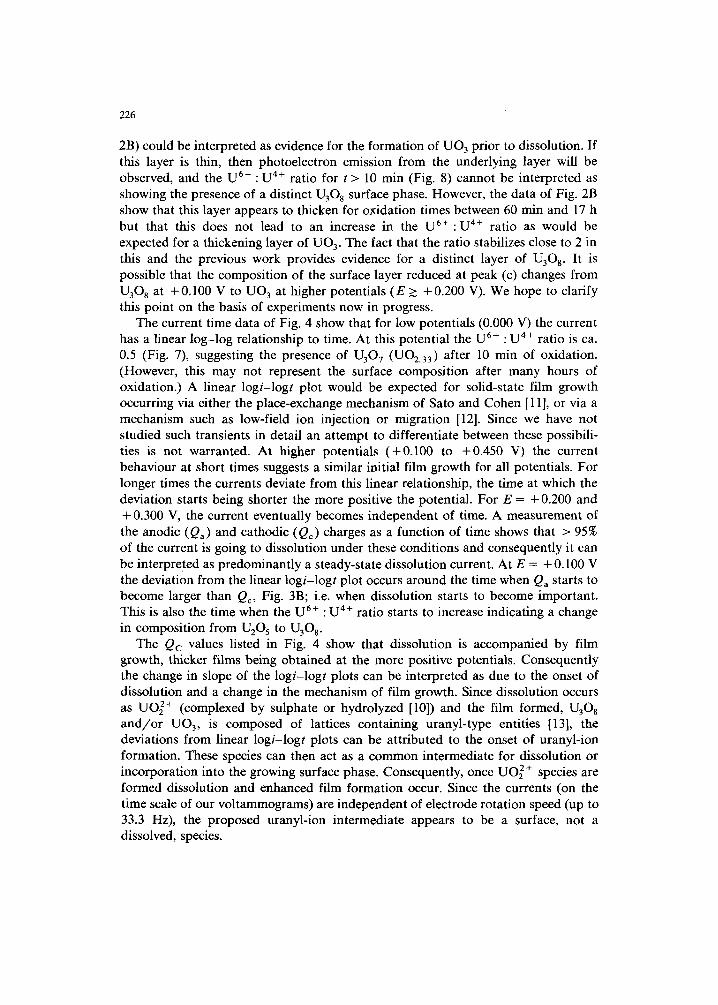
226
2B) could be interpreted as evidence for the formation of UO 3 prior to dissolution. If this layer is thin, then photoelectron emission from the underlying layer will be observed, and the U 6÷ :U 4÷ ratio for t > 10 min (Fig. 8) cannot be interpreted as showing the presence of a distinct U308 surface phase. However, the data of Fig. 2B show that this layer appears to thicken for oxidation times between 60 rain and 17 h but that this does not lead to an increase in the U 6 + : U 4÷ ratio as would be expected for a thickening layer of UO 3. The fact that the ratio stabilizes close to 2 in this and the previous work provides evidence for a distinct layer of U308. It is possible that the composition of the surface layer reduced at peak (e) changes from U308 at +0.100 V to UO 3 at higher potentials (E > +0.200 V). We hope to clarify this point on the basis of experiments now in progress.
The current time data of Fig. 4 show that for low potentials (0.000 V) the current has a linear log-log relationship to time. At this potential the U 6÷ : U 4÷ ratio is ca. 0.5 (Fig. 7), suggesting the presence of U307 (UO2.33) after 10 min of oxidation. (However, this may not represent the surface composition after many hours of oxidation.) A linear logi-logt plot would be expected for solid-state film growth occurring via either the place-exchange mechanism of Sato and Cohen [11], or via a mechanism such as low-field ion injection or migration [12]. Since we have not studied such transients in detail an attempt to differentiate between these possibili- ties is not warranted. At higher potentials (+0.100 to +0.450 V) the current behaviour at short times suggests a similar initial film growth for all potentials. For longer times the currents deviate from this linear relationship, the time at which the deviation starts being shorter the more positive the potential. For E = + 0.200 and + 0.300 V, the current eventually becomes independent of time. A measurement of the anodic (Qa) and cathodic (Q¢) charges as a function of time shows that > 95% of the current is going to dissolution under these conditions and consequently it can be interpreted as predominantly a steady-state dissolution current. At E = + 0.100 V the deviation from the linear logi-logt plot occurs around the time when Qa starts to become larger than Qc, Fig. 3B; i.e. when dissolution starts to become important. This is also the time when the U 6+ : U 4+ ratio starts to increase indicating a change in composition from U205 to U308.
The Qc values listed in Fig. 4 show that dissolution is accompanied by film growth, thicker films being obtained at the more positive potentials. Consequently the change in slope of the logi-logt plots can be interpreted as due to the onset of dissolution and a change in the mechanism of film growth. Since dissolution occurs as UO22+ (complexed by sulphate or hydrolyzed [10]) and the film formed, U308 a n d / o r UO 3, is composed of lattices containing uranyl-type entities [13], the deviations from linear logi-logt plots can be attributed to the onset of uranyl-ion formation. These species can then act as a common intermediate for dissolution or incorporation into the growing surface phase. Consequently, once UO 2+ species are formed dissolution and enhanced film formation occur. Since the currents (on the time scale of our voltammograms) are independent of electrode rotation speed (up to 33.3 Hz), the proposed uranyl-ion intermediate appears to be a surface, not a dissolved, species.
227
These observations can be summarized in terms of the following mechanism:
U O 2 --~2 e ( u o Z + ] k 2 Jads (2)
UO233 + (UO~ +)ads+ 2H20 ~ 2 UO2 5 + 4H+ (3)
2 UO2. 5 + (UO22+)aas + H20 --* 3 UO2.67 + 2 H + (4)
3 UO2.67 + (UOz2+)aas + 2 H 2 0 - 4 UO3 + 4 H + (5)
( UOz+)~a~ " ( UO2 + )~ot', (6)
In neutral solutions steps (3) and (4) do not occur at low potentials (< + 0.300 V) since the rate of formation of 2 + (UO2)aas is slow compared to the rate of desorption (dissolution), step (6). At pH = 12.0 the rate of step (2) is much higher leading to a higher surface coverage with (UO2+)ads and a faster formation of the phases U205 (UO2.5) and U3Os (UO267), steps (3) and (4), at much lower potentials (>__ +0.100 V). An increase in stability of oxidized surface phases is to be expected on the basis of thermodynamic data and calculations [10], although the actual phases formed are not the stable phases predicted thermodynamically.
Step (5) represents the formation of the partially passivating UO 3 layer, substan- tial steady-state dissolution currents being sustained in the presence of this film. The fact that dissolution is so extensive may mean that the U308/UO3 films are porous due to recrystallization processes during their formation. This is consistent with the conclusions of Taylor et al. [14]. The conversion, 1530 7 to U30 s, involves a major change in crystal structure, and when oxidation occurs in air, leads to the physical destruction of a U307 pellet. The formation of a porous layer of individual U30 s crystallites would allow both potential-dependent dissolution and further film-thick- ening via a combination of steps (4) to (6). The deviations from linearity of the logi-logt plots (Fig. 4), appear to mark the onset of such a process.
ACKNOWLEDGEMENT
We thank Mr. F.W. Stanchell for his help in the operation of the X-ray photoelectron spectrometer.
REFERENCES
1 N.S. Mclntyre, S. Sunder, D.W. Shoesmith and F.W. Stanchell, J. Vac. Sci. Tech., 18 (1981) 714. 2 S. Sunder, D.W. Shoesmith, M.G. Bailey, F.W. Stanchell and N.S. Mclntyre, J. Electroanal. Chem.
130 (1981) 163. 3 L.H. Johnson, D.W. Shoesmith, G.E. Lunansky, M.G. Bailey and P.R. Tremaine, Nucl. Technol., 56
(1982) 238. 4 G.C. Allen, I.R. Tickle and P.M. Tucker, Philos. Mag., 43 (1981) 689. 5 B.W. Veal and D.J. Lain, Phys. Rev., BI0 (1974) 4902. 6 B.W. Veal and D.J. Lain, Phys. Lett. 49A (1974) 468. 7 J. Verbist, J. Riga, J.J. Pireaux and R. Caudano, J. Electron Spectrosc. Relat. Phenom., 5 (1974) 193. 8 J. Verbist, J. Riga, C. Tenret-Noel, J.J. Pireaux, G. D'Ursel, R. Caudano and E.G. Derouane in H.
228
Blank and R. Lindner (Eds.), Plutonium and Other Actinides, North Holland, Amsterdam, 1976, p. 409.
9 M.J. Nicol and C.R.S. Needes, Electrochim. Acta, 20 (1975) 585. 10 J. Paquette and R.J. Lemire, Nucl. Sci. Eng., 79 (1981) 26. 1t N. Sato and M. Cohen, J. Electrochem. Soc., 111 (1964) 512, 519. 12 D.D. MacDonald and B. Roberts, Electrochim. Acta, 23 (1978) 557. 13 E.H.R. Cordfunke, The Chemistry of Uranium, Elsevier, London, 1969, p. 63. 14 P. Taylor, E.A. Burgess and D.G. Owen, J. Nucl. Mater., 88 (1980) 153.