Embed Size (px)
Citation preview
® MutualFunds
Merk Hard Currency FundInvestor Shares (MERKX)Institutional Shares (MHCIX)
Merk Absolute ReturnCurrency FundInvestor Shares (MABFX)Institutional Shares (MAAIX)
Annual Report March 31, 201

A MESSAGE TO OUR SHAREHOLDERS (Unaudited) MARCH 31, 2016
1
Dear Shareholder, We present the annual report for the Merk Hard Currency Fund®, and Merk Absolute Return Currency Fund® (individually a �“Fund�” and collectively the �“Funds�”) with respect to the period April 1, 2015 through March 31, 2016 (the �“Period�”).
The Merk Hard Currency Fund seeks to profit from a rise in hard currencies relative to the U.S. dollar. The Merk Absolute Return Currency Fund seeks to generate positive absolute returns by investing in securities and instruments that create
exposure to currencies.
Merk Hard Currency Fund Investor Shares posted a return of +3.37% for the 12-month period ended March 31, 2016. In comparison, the JPMorgan 3-Month Global Cash Index (�“reference basket�”) posted a return of +4.08% during the Period. As of March 31, 2016, the Investor Shares of the Fund had a five-year annualized return of -3.47% and an annualized return of +1.91% since inception on May 10, 2005; this compares to a five-year annualized return of -3.47% and an annualized return of +1.02% since May 10, 2005 for the reference basket. The Fund�’s performance data represents past performance and is no guarantee of future results. Current performance may be lower or higher than the performance data quoted. Investment return and principal value will fluctuate so that an investor�’s shares, when redeemed, may be worth more or less than original cost. Please visit www.merkfunds.com for most recent month end performance. The Fund�’s expense ratio for the Investor Shares is 1.30%. The Fund�’s performance is foremost influenced by changes in exchange rates of currencies to which the Fund has exposure. Over the Period the Japanese yen returned +6.72%, the Swedish krona returned +6.33%, the Euro returned +6.05%, the Singapore dollar returned +1.77%, the Swiss franc returned +1.13%, the Australian dollar returned +0.66%, the Canadian dollar returned -2.45%, the Norwegian krone returned -2.51%, the British pound returned -3.09%, and the New Zealand dollar returned -7.51%. Gold returned +4.16% during the Period, as measured by the spot price of gold per troy ounce. We adapt currency allocations as our analysis of monetary policies and economic environments evolves. In the second quarter of 2015, the U.S. dollar had a broad pullback from the prior year�’s rally. In Q3 2015, the Japanese yen was the best performer along with the euro in a risk-off environment. Both currencies likely had been used as �“funding�” currencies for long positions in so-called �“risk assets,�” such as global equities (one refers to a funding currency when investors borrow in a currency with low interest rates to buy higher yielding assets; this process equates to a shorting of the currency, exerting downward pressure). The Q3 rally in the euro was likely related to position unwinding in light of the global correction in risk assets. In Q4 gold and the currencies of two oil producing countries in which the Fund invests, the Canadian dollar and the Norwegian krone, underperformed as the Federal Reserve ("Fed") hiked rates and oil made new lows. The Fund closed its three-year strategic short position in the Japanese yen and entered a tactical long position. In Q1 2016 the U.S. dollar weakened broadly, falling versus all G10 currencies with the exception of the British pound. The dollar fell most notably against gold and the Japanese yen, where the Fund benefited given its strategic gold position and new long Japanese yen position. The Canadian dollar and the Norwegian krone were strong in the quarter likely because of the contemporaneous rebound in oil prices. British pound weakness was likely driven by concerns over a potential British exit from the European Union. The Fund was well positioned on the British pound as its long exposure was closed in late Q4 2015. The dollar decline accelerated following the March Fed meeting, when the Fed lowered rate guidance. Merk Absolute Return Currency Fund Investor Shares posted a return of +1.72% for the 12-month period ending March 31, 2016. In comparison, the Citigroup 3-Month U.S. T-Bill Index (�“reference basket�”) increased +0.08% during the Period. As of March 31, 2016, the Investor Shares had a five-year annualized return of -1.88% and an annualized return of -0.84% since inception on September 9, 2009; this compares to a five-year annualized return of +0.06% and an annualized return of +0.07% since August 31, 2009 for the reference basket.1 The Fund�’s performance data represents past performance and is no guarantee of future results. Current performance may be lower or higher than the performance data quoted. Investment return and principal value will fluctuate so that an investor�’s shares, when redeemed, may be worth more or less than original cost. Please visit www.merkfunds.com for most recent month end performance. The Fund�’s expense ratio for the Investor Shares is 1.30%. The Fund�’s performance is foremost influenced by changes in exchange rates of currencies to which the Fund has exposure. The Fund employs a periodic currency allocation process based on strategic and tactical considerations. We consider factors that lead to gradual allocation changes to be �“strategic,�” in contrast we consider factors that lead to allocation changes over shorter periods �“tactical.�” As such, currency exposures can change significantly from one holding period to the next and the Fund may have a net long or net short U.S. dollar currency exposure at any time. The Fund can take offsetting positions in otherwise highly correlated2 currencies, on a short-term view that such currency positioning may yield profitable returns. Indeed, during the Period, the Fund held both long and short positions at various points in time in the majority of currencies the Fund invests in. Such allocations may generate returns that are unlikely to be correlated to traditional asset classes. Holding offsetting positions in otherwise correlated currencies may also help contain the volatility of the Fund. 1 Note that data is not available for the reference basket on the inception date of the Merk Absolute Return Currency Fund (September 9, 2009). As such, performance for the reference basket is calculated for the time period August 31, 2009 through March 31, 2016, whereas performance for the Fund is calculated for the period since inception through March 31, 2016. 2 A statistical measure of how two variables move in relation to each other.
2
The Fund's investment process integrates the Merk hard currency strategy investment process to the underlying quantitative model and employs frequent currency rebalancing to be able to swiftly react to changing market sentiment. The result is a hybrid quantitative and systematic macro discretionary approach. The quantitative model provides a rules-based discipline while the tactical allocation includes a systematic discretionary macro overlay seeking to manage risk and capture upside potential based on more qualitative judgments. The enhanced investment process provides for a more active management that incorporates a holistic approach to risk management in response to increased policy intervention risk globally.
Outlook In last year�’s outlook we suggested that the Fed�’s attempt to exit ultra-accommodative monetary policy might not go entirely smoothly. Over the past year we have seen two sharp declines in the U.S. equity markets around attempted Fed hikes, with the Fed actually following through on a rate hike at their December 2015 meeting. Our view continues to be that the Fed will have difficulty raising rates without destabilizing global economies, particularly China and emerging markets, both tied closely to the U.S. dollar as the world�’s reserve currency. Negative effects to China would likely spill back to the U.S. economy, therefore we view it as unlikely that the Fed will pursue even the gradual rate path currently projected in the Federal Open Market Committee's ("FOMC") Summary of Economic Projections. In our view, the Fed�’s March 2016 meeting marked a significant, and likely lasting, shift in stance from the Fed. Notably, Chair Yellen backed away from her view that as the unemployment rate falls inflationary pressures will build. In our view, the message from the Fed was that deflationary pressures are more significant than previously thought and with concerns about global growth, particularly with respect to China, the risks are asymmetric to the downside. We think that going forward, the Fed will be guided by the outlook for global growth and by incoming inflation readings. It may be that the Fed will be �“behind the curve,�” meaning that the rate hikes will only come as inflation ticks up. As a result, interest rates net of inflation, i.e. real rates of return, may be near zero or even negative for the foreseeable future. The dollar could remain weak throughout 2016 if expectations about Fed rate hikes continue to adjust lower. Dollar weakness may be exacerbated by the fact that the European Central Bank (ECB) indicated at its March press conference that interest rates may not go any lower. While it may be premature to reach conclusions, market perception may be sinking in that the U.S. is nearing the top of its interest rate cycle just as other major economies may be near the lower bound on interest rates. We continue to see long term value in gold with a Fed that promises to be gradual with interest rate increases and a lower for longer approach to interest rates globally. If you know of friends who might benefit from the Merk Funds, please ask them to call us or visit merkfunds.com to learn more about the Funds. Sincerely,
Axel G. Merk President & Chief Investment Officer
The views in this Report were those of the Fund Manager as of March 31, 2016 and may not reflect the views of the Manager on the date this Report is first published or anytime thereafter. These views are intended to assist shareholders of the Fund in understanding their investments in a Fund and do not constitute investment advice. Since the Funds primarily invest in foreign currencies, changes in currency exchange rates will affect the value of what the respective Fund owns and the price of the Fund�’s shares. Investing in foreign instruments bears a greater risk than investing in domestic instruments for reasons such as volatility of currency exchange rates and, in some cases, limited geographic focus, political and economic instability, and relatively illiquid markets. The Funds are subject to interest rate risk, which is the risk that debt securities in a Fund�’s portfolio will decline in value because of increases in market interest rates. As a non-diversified fund, the Merk Hard Currency Fund will be subject to more investment risk and potential for volatility than a diversified fund because its portfolio may, at times, focus on a limited number of issuers. The Funds may also invest in derivative securities, which can be volatile and involve various types and degrees of risk. The Citigroup 3-Month U.S. T-Bill Index is an unmanaged index representing monthly return equivalents of yield averages of the last 3-month Treasury Bill issues. It is not possible to invest directly in an unmanaged index. The JPMorgan 3-Month Global Cash Index tracks total returns of three-month constant maturity euro-currency deposits. The euro-currency deposits are the only short-term securities consistent across all markets in terms of liquidity, maturity and credit quality. The index is unmanaged and includes reinvested distributions. One cannot invest directly in an index, nor is an index representative of the Fund's portfolio. JPMorgan does not sponsor, endorse or promote the Merk Hard Currency Fund in connection with any reference to the JPMorgan 3-Month Global Cash Index. JPMorgan makes no representation or warranty, express or implied regarding the advisability of investing in securities generally or in any product particularly or the ability of the JPMorgan 3-Month Global Cash Index to track general bond market performance.
MERK HARD CURRENCY FUND MARCH 31, 2016 PERFORMANCE CHART AND ANALYSIS (UNAUDITED)
3
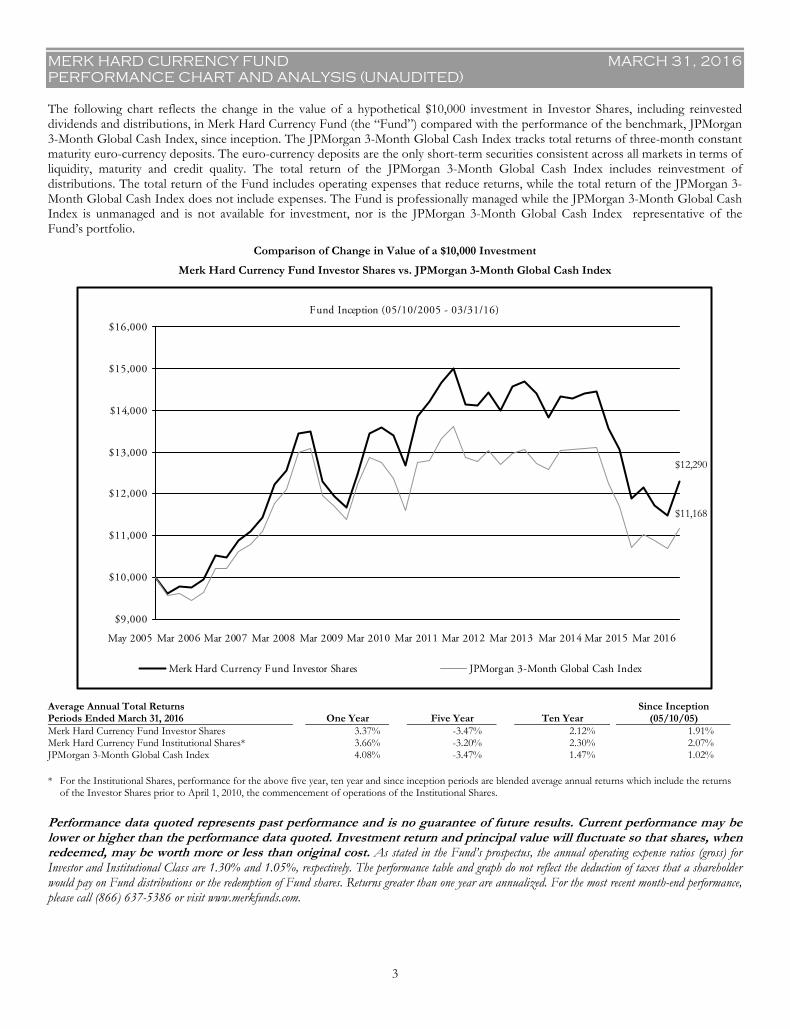
The following chart reflects the change in the value of a hypothetical $10,000 investment in Investor Shares, including reinvested dividends and distributions, in Merk Hard Currency Fund (the �“Fund�”) compared with the performance of the benchmark, JPMorgan 3-Month Global Cash Index, since inception. The JPMorgan 3-Month Global Cash Index tracks total returns of three-month constant maturity euro-currency deposits. The euro-currency deposits are the only short-term securities consistent across all markets in terms of liquidity, maturity and credit quality. The total return of the JPMorgan 3-Month Global Cash Index includes reinvestment of distributions. The total return of the Fund includes operating expenses that reduce returns, while the total return of the JPMorgan 3-Month Global Cash Index does not include expenses. The Fund is professionally managed while the JPMorgan 3-Month Global Cash Index is unmanaged and is not available for investment, nor is the JPMorgan 3-Month Global Cash Index representative of the Fund�’s portfolio.
Comparison of Change in Value of a $10,000 Investment
Merk Hard Currency Fund Investor Shares vs. JPMorgan 3-Month Global Cash Index
Fund Inception (05/10/2005 - 03/31/16)
$12,290
$11,168
$9,000
$10,000
$11,000
$12,000
$13,000
$14,000
$15,000
$16,000
May 2005 Mar 2006 Mar 2007 Mar 2008 Mar 2009 Mar 2010 Mar 2011 Mar 2012 Mar 2013 Mar 2014 Mar 2015 Mar 2016
Merk Hard Currency Fund Investor Shares JPMorgan 3-Month Global Cash Index
Performance data quoted represents past performance and is no guarantee of future results. Current performance may be lower or higher than the performance data quoted. Investment return and principal value will fluctuate so that shares, when redeemed, may be worth more or less than original cost. As stated in the Fund�’s prospectus, the annual operating expense ratios (gross) for Investor and Institutional Class are 1.30% and 1.05%, respectively. The performance table and graph do not reflect the deduction of taxes that a shareholder would pay on Fund distributions or the redemption of Fund shares. Returns greater than one year are annualized. For the most recent month-end performance, please call (866) 637-5386 or visit www.merkfunds.com.
Average Annual Total Returns Since InceptionPeriods Ended March 31, 2016 One Year Five Year Ten Year (05/10/05) Merk Hard Currency Fund Investor Shares 3.37% -3.47% 2.12% 1.91% Merk Hard Currency Fund Institutional Shares* 3.66% -3.20% 2.30% 2.07% JPMorgan 3-Month Global Cash Index 4.08% -3.47% 1.47% 1.02% * For the Institutional Shares, performance for the above five year, ten year and since inception periods are blended average annual returns which include the returns
of the Investor Shares prior to April 1, 2010, the commencement of operations of the Institutional Shares.
MERK ABSOLUTE RETURN CURRENCY FUND MARCH 31, 2016 PERFORMANCE CHART AND ANALYSIS (UNAUDITED)
4
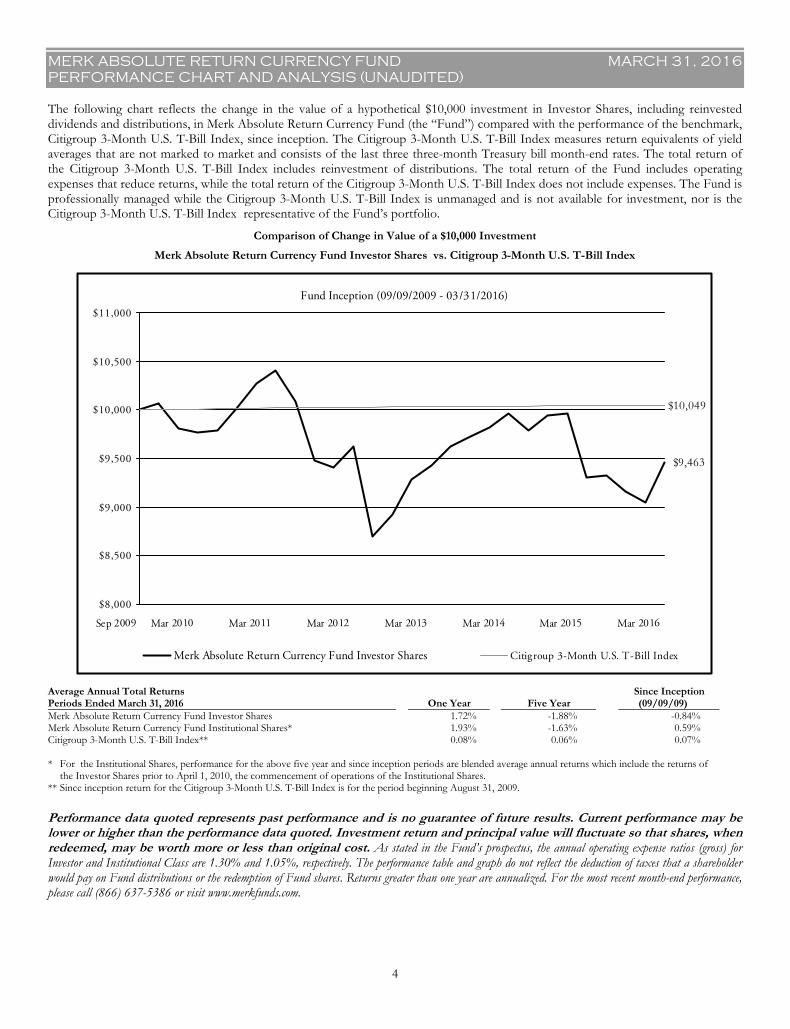
The following chart reflects the change in the value of a hypothetical $10,000 investment in Investor Shares, including reinvested dividends and distributions, in Merk Absolute Return Currency Fund (the �“Fund�”) compared with the performance of the benchmark, Citigroup 3-Month U.S. T-Bill Index, since inception. The Citigroup 3-Month U.S. T-Bill Index measures return equivalents of yield averages that are not marked to market and consists of the last three three-month Treasury bill month-end rates. The total return of the Citigroup 3-Month U.S. T-Bill Index includes reinvestment of distributions. The total return of the Fund includes operating expenses that reduce returns, while the total return of the Citigroup 3-Month U.S. T-Bill Index does not include expenses. The Fund is professionally managed while the Citigroup 3-Month U.S. T-Bill Index is unmanaged and is not available for investment, nor is the Citigroup 3-Month U.S. T-Bill Index representative of the Fund�’s portfolio.
Comparison of Change in Value of a $10,000 Investment
Merk Absolute Return Currency Fund Investor Shares vs. Citigroup 3-Month U.S. T-Bill Index
Fund Inception (09/09/2009 - 03/31/2016)
$9,463
$10,049
$8,000
$8,500
$9,000
$9,500
$10,000
$10,500
$11,000
Sep 2009 Mar 2010 Mar 2011 Mar 2012 Mar 2013 Mar 2014 Mar 2015 Mar 2016
Merk Absolute Return Currency Fund Investor Shares Citigroup 3-Month U.S. T-Bill Index
Performance data quoted represents past performance and is no guarantee of future results. Current performance may be lower or higher than the performance data quoted. Investment return and principal value will fluctuate so that shares, when redeemed, may be worth more or less than original cost. As stated in the Fund�’s prospectus, the annual operating expense ratios (gross) for Investor and Institutional Class are 1.30% and 1.05%, respectively. The performance table and graph do not reflect the deduction of taxes that a shareholder would pay on Fund distributions or the redemption of Fund shares. Returns greater than one year are annualized. For the most recent month-end performance, please call (866) 637-5386 or visit www.merkfunds.com.
Average Annual Total Returns Since InceptionPeriods Ended March 31, 2016 One Year Five Year (09/09/09) Merk Absolute Return Currency Fund Investor Shares 1.72% -1.88% -0.84% Merk Absolute Return Currency Fund Institutional Shares* 1.93% -1.63% 0.59% Citigroup 3-Month U.S. T-Bill Index** 0.08% 0.06% 0.07% * For the Institutional Shares, performance for the above five year and since inception periods are blended average annual returns which include the returns of
the Investor Shares prior to April 1, 2010, the commencement of operations of the Institutional Shares. ** Since inception return for the Citigroup 3-Month U.S. T-Bill Index is for the period beginning August 31, 2009.
MERK HARD CURRENCY FUND MARCH 31, 2016 SCHEDULE OF INVESTMENTS
See Notes to Financial Statements. 5
Principal Security Description Currency Rate Maturity Value in USD
Foreign Bonds(a) - 48.7% Non-U.S. Government - Australia - 1.4%
2,200,000 Australia Government Bond, Series 130 (b) AUD 4.750% 06/15/16 $ 1,695,832
Non-U.S. Government - Austria - 2.0% 2,000,000 Austria Government Bond (b) EUR 1.950 06/18/19 2,446,992
Non-U.S. Government - New Zealand - 0.3% 500,000 New Zealand Government Bond, Series 1217 (b) NZD 6.000 12/15/17 368,837
Non-U.S. Government Agency - Germany - 4.7% 5,000,000 KFW EUR 1.375 02/21/17 5,777,305
Non-U.S. Government Agency - Norway - 1.3% 13,000,000 Kommunalbanken AS, EMTN (b) NOK 3.000 09/02/16 1,582,677
Non-U.S. Government Agency - Sweden - 15.6% 155,000,000 Kommuninvest I Sverige AB, Series 1610, MTN SEK 2.000 10/12/16 19,350,442
Regional Authority - Australia - 2.5% 4,000,000 New South Wales Treasury Corp., Series 16 AUD 6.000 04/01/16 3,066,520
Regional Authority - Canada - 3.6% 1,700,000 Province of Alberta Canada CAD 1.850 09/01/16 1,315,3124,000,000 Province of Saskatchewan Canada CAD 4.500 08/23/16 3,125,775
4,441,087Regional Authority - Norway - 0.4%
4,000,000 City of Oslo Norway NOK 4.650 11/10/16 492,451
Regional Authority - Sweden - 2.1% 14,000,000 City of Gothenburg Sweden, EMTN SEK 1.630 12/05/16 1,746,6717,000,000 City of Gothenburg Sweden, EMTN SEK 4.325 04/10/17 902,727
2,649,398Supranational - Europe - 14.8%
4,850,000 European Financial Stability Facility, EMTN (b) EUR 2.750 12/05/16 5,634,1134,100,000 European Investment Bank, EMTN EUR 3.125 03/03/17 4,814,2435,000,000 European Stability Mechanism, EMTN (b)(c) EUR 0.000 10/28/16 5,701,009
18,530,000 Nordic Investment Bank, EMTN NOK 3.000 09/01/16 2,257,018 18,406,383
Total Foreign Bonds (Cost $58,295,535) 60,277,924
Foreign Treasury Securities(a) - 14.9% Non-U.S. Government - Belgium - 4.1%
4,497,000 Belgium Treasury Bill, Series 12M (c) EUR 0.000 04/14/16 5,117,841
Non-U.S. Government - Canada - 1.4% 2,200,000 Canadian Treasury Bill (c) CAD 0.440 04/21/16 1,693,513
Non-U.S. Government - France - 4.6% 5,000,000 France Treasury Bill BTF (b)(c) EUR 0.000 06/22/16 5,695,257
Non-U.S. Government - Norway - 1.4% 14,500,000 Norway Treasury Bill, Series 31 (b)(c) NOK 0.582 06/15/16 1,750,975
Non-U.S. Government - Sweden - 3.4% 19,000,000 Sweden Treasury Bill (c) SEK 0.000 06/15/16 2,343,84214,500,000 Sweden Treasury Bill, Series 194D (c) SEK 0.000 06/15/16 1,788,721
4,132,563
Total Foreign Treasury Securities(Cost $17,933,744) 18,390,149
See Notes to Financial Statements. 6
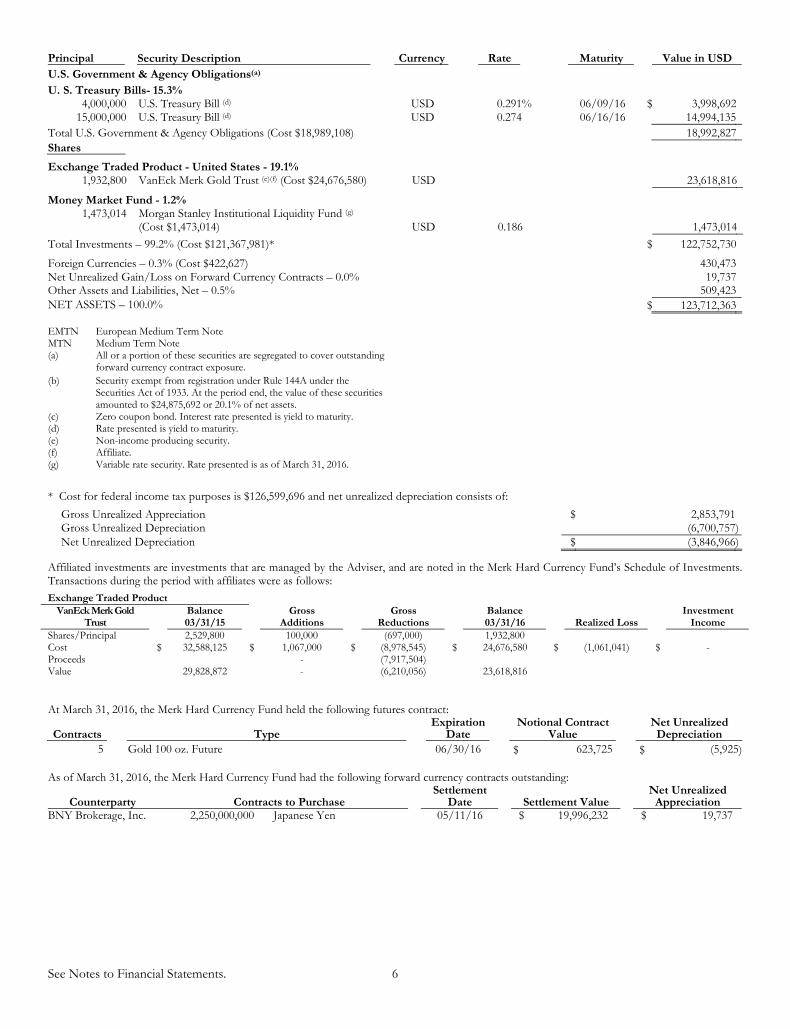
Principal Security Description Currency Rate Maturity Value in USD U.S. Government & Agency Obligations(a) U. S. Treasury Bills- 15.3%
4,000,000 U.S. Treasury Bill (d) USD 0.291% 06/09/16 $ 3,998,69215,000,000 U.S. Treasury Bill (d) USD 0.274 06/16/16 14,994,135
Total U.S. Government & Agency Obligations (Cost $18,989,108) 18,992,827
Shares
Exchange Traded Product - United States - 19.1% 1,932,800 VanEck Merk Gold Trust (e)(f) (Cost $24,676,580) USD 23,618,816
Money Market Fund - 1.2% 1,473,014 Morgan Stanley Institutional Liquidity Fund (g)
(Cost $1,473,014) USD 0.186 1,473,014
Total Investments �– 99.2% (Cost $121,367,981)* $ 122,752,730
Foreign Currencies �– 0.3% (Cost $422,627) 430,473Net Unrealized Gain/Loss on Forward Currency Contracts �– 0.0% 19,737Other Assets and Liabilities, Net �– 0.5% 509,423NET ASSETS �– 100.0% $ 123,712,363 EMTN European Medium Term Note
MTN Medium Term Note (a) All or a portion of these securities are segregated to cover outstanding
forward currency contract exposure.
(b) Security exempt from registration under Rule 144A under the Securities Act of 1933. At the period end, the value of these securities amounted to $24,875,692 or 20.1% of net assets.
(c) Zero coupon bond. Interest rate presented is yield to maturity. (d) Rate presented is yield to maturity.
(e) Non-income producing security.
(f) Affiliate. (g) Variable rate security. Rate presented is as of March 31, 2016.
* Cost for federal income tax purposes is $126,599,696 and net unrealized depreciation consists of:
Gross Unrealized Appreciation $ 2,853,791Gross Unrealized Depreciation (6,700,757)Net Unrealized Depreciation $ (3,846,966)
Affiliated investments are investments that are managed by the Adviser, and are noted in the Merk Hard Currency Fund�’s Schedule of Investments. Transactions during the period with affiliates were as follows: Exchange Traded Product
VanEck Merk Gold Trust
Balance 03/31/15
Gross Additions
Gross Reductions
Balance 03/31/16 Realized Loss
Investment Income
Shares/Principal 2,529,800 100,000 (697,000) 1,932,800 Cost $ 32,588,125 $ 1,067,000 $ (8,978,545) $ 24,676,580 $ (1,061,041) $ - Proceeds - (7,917,504) Value 29,828,872 - (6,210,056) 23,618,816 AFA
At March 31, 2016, the Merk Hard Currency Fund held the following futures contract:
Contracts
Type Expiration
Date Notional Contract
Value Net Unrealized Depreciation
5 Gold 100 oz. Future 06/30/16 $ 623,725 $ (5,925)
AFA As of March 31, 2016, the Merk Hard Currency Fund had the following forward currency contracts outstanding:
Counterparty Contracts to Purchase Settlement
Date Settlement Value Net Unrealized
Appreciation BNY Brokerage, Inc. 2,250,000,000 Japanese Yen 05/11/16 $ 19,996,232 $ 19,737
See Notes to Financial Statements. 7
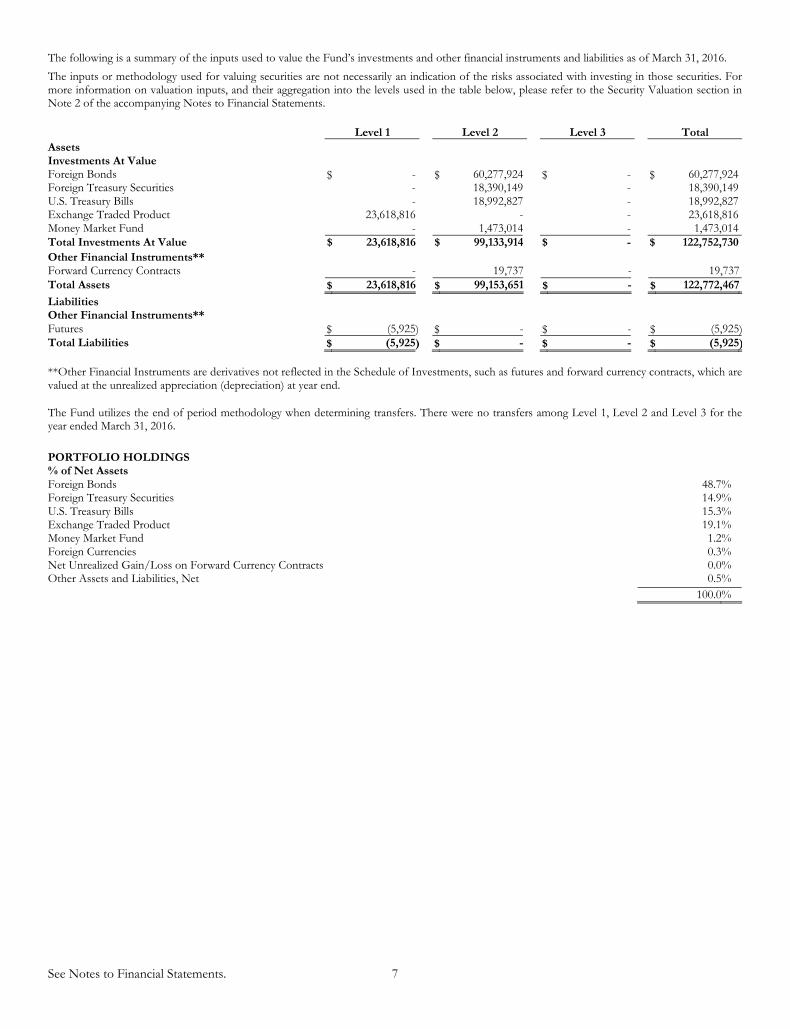
The following is a summary of the inputs used to value the Fund�’s investments and other financial instruments and liabilities as of March 31, 2016. The inputs or methodology used for valuing securities are not necessarily an indication of the risks associated with investing in those securities. For more information on valuation inputs, and their aggregation into the levels used in the table below, please refer to the Security Valuation section in Note 2 of the accompanying Notes to Financial Statements.
Level 1 Level 2 Level 3 Total
Assets Investments At Value Foreign Bonds $ - $ 60,277,924 $ - $ 60,277,924Foreign Treasury Securities - 18,390,149 - 18,390,149U.S. Treasury Bills - 18,992,827 - 18,992,827Exchange Traded Product 23,618,816 - - 23,618,816Money Market Fund - 1,473,014 - 1,473,014Total Investments At Value $ 23,618,816 $ 99,133,914 $ - $ 122,752,730
Other Financial Instruments** Forward Currency Contracts - 19,737 - 19,737Total Assets $ 23,618,816 $ 99,153,651 $ - $ 122,772,467
Liabilities Other Financial Instruments** Futures $ (5,925) $ - $ - $ (5,925)Total Liabilities $ (5,925) $ - $ - $ (5,925) **Other Financial Instruments are derivatives not reflected in the Schedule of Investments, such as futures and forward currency contracts, which are valued at the unrealized appreciation (depreciation) at year end. The Fund utilizes the end of period methodology when determining transfers. There were no transfers among Level 1, Level 2 and Level 3 for the year ended March 31, 2016. AFA PORTFOLIO HOLDINGS % of Net Assets Foreign Bonds 48.7% Foreign Treasury Securities 14.9% U.S. Treasury Bills 15.3% Exchange Traded Product 19.1% Money Market Fund 1.2% Foreign Currencies 0.3% Net Unrealized Gain/Loss on Forward Currency Contracts 0.0% Other Assets and Liabilities, Net 0.5% 100.0% AFA
MERK ABSOLUTE RETURN CURRENCY FUND MARCH 31, 2016 SCHEDULE OF INVESTMENTS
See Notes to Financial Statements. 8
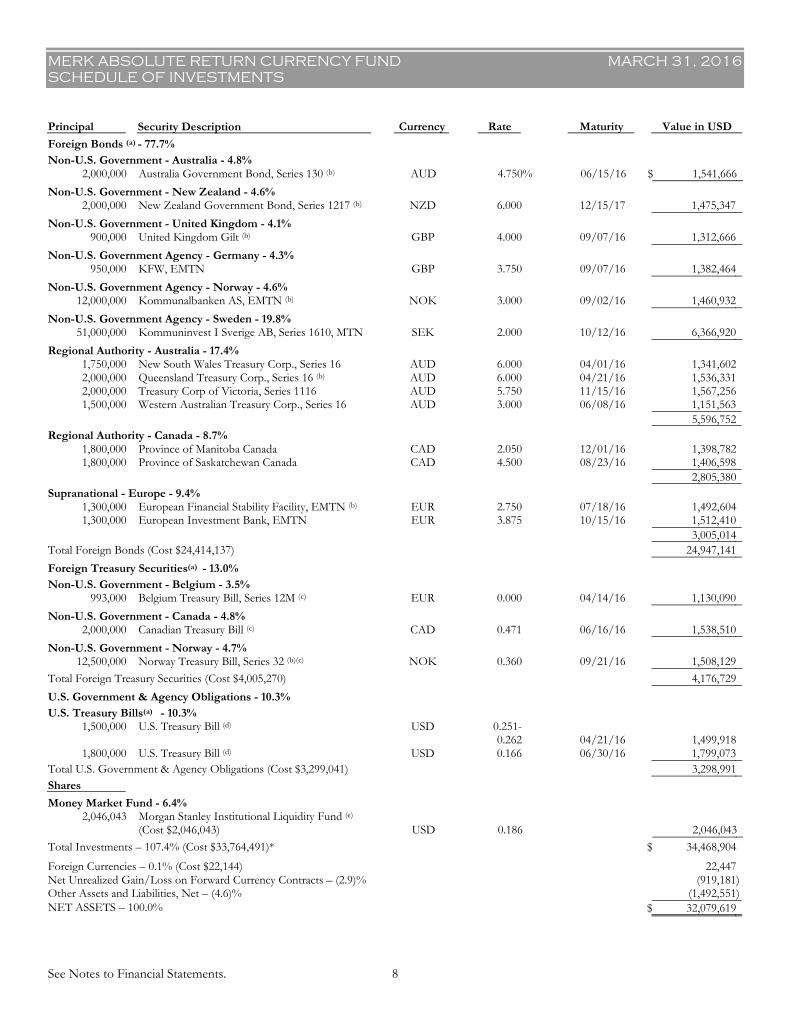
Principal Security Description Currency Rate Maturity Value in USD
Foreign Bonds (a) - 77.7% Non-U.S. Government - Australia - 4.8%
2,000,000 Australia Government Bond, Series 130 (b) AUD 4.750% 06/15/16 $ 1,541,666
Non-U.S. Government - New Zealand - 4.6% 2,000,000 New Zealand Government Bond, Series 1217 (b) NZD 6.000 12/15/17 1,475,347
Non-U.S. Government - United Kingdom - 4.1% 900,000 United Kingdom Gilt (b) GBP 4.000 09/07/16 1,312,666
Non-U.S. Government Agency - Germany - 4.3% 950,000 KFW, EMTN GBP 3.750 09/07/16 1,382,464
Non-U.S. Government Agency - Norway - 4.6% 12,000,000 Kommunalbanken AS, EMTN (b) NOK 3.000 09/02/16 1,460,932
Non-U.S. Government Agency - Sweden - 19.8% 51,000,000 Kommuninvest I Sverige AB, Series 1610, MTN SEK 2.000 10/12/16 6,366,920
Regional Authority - Australia - 17.4% 1,750,000 New South Wales Treasury Corp., Series 16 AUD 6.000 04/01/16 1,341,6022,000,000 Queensland Treasury Corp., Series 16 (b) AUD 6.000 04/21/16 1,536,3312,000,000 Treasury Corp of Victoria, Series 1116 AUD 5.750 11/15/16 1,567,2561,500,000 Western Australian Treasury Corp., Series 16 AUD 3.000 06/08/16 1,151,563
5,596,752Regional Authority - Canada - 8.7%
1,800,000 Province of Manitoba Canada CAD 2.050 12/01/16 1,398,7821,800,000 Province of Saskatchewan Canada CAD 4.500 08/23/16 1,406,598
2,805,380Supranational - Europe - 9.4%
1,300,000 European Financial Stability Facility, EMTN (b) EUR 2.750 07/18/16 1,492,6041,300,000 European Investment Bank, EMTN EUR 3.875 10/15/16 1,512,410
3,005,014
Total Foreign Bonds (Cost $24,414,137) 24,947,141
Foreign Treasury Securities(a) - 13.0% Non-U.S. Government - Belgium - 3.5%
993,000 Belgium Treasury Bill, Series 12M (c) EUR 0.000 04/14/16 1,130,090
Non-U.S. Government - Canada - 4.8% 2,000,000 Canadian Treasury Bill (c) CAD 0.471 06/16/16 1,538,510
Non-U.S. Government - Norway - 4.7% 12,500,000 Norway Treasury Bill, Series 32 (b)(c) NOK 0.360 09/21/16 1,508,129
Total Foreign Treasury Securities (Cost $4,005,270) 4,176,729
U.S. Government & Agency Obligations - 10.3% U.S. Treasury Bills(a) - 10.3%
1,500,000 U.S. Treasury Bill (d) USD 0.251-0.262 04/21/16 1,499,918
1,800,000 U.S. Treasury Bill (d) USD 0.166 06/30/16 1,799,073
Total U.S. Government & Agency Obligations (Cost $3,299,041) 3,298,991
Shares
Money Market Fund - 6.4% 2,046,043 Morgan Stanley Institutional Liquidity Fund (e)
(Cost $2,046,043) USD 0.186 2,046,043
Total Investments �– 107.4% (Cost $33,764,491)* $ 34,468,904
Foreign Currencies �– 0.1% (Cost $22,144) 22,447Net Unrealized Gain/Loss on Forward Currency Contracts �– (2.9)% (919,181)Other Assets and Liabilities, Net �– (4.6)% (1,492,551)NET ASSETS �– 100.0% $ 32,079,619
See Notes to Financial Statements. 9
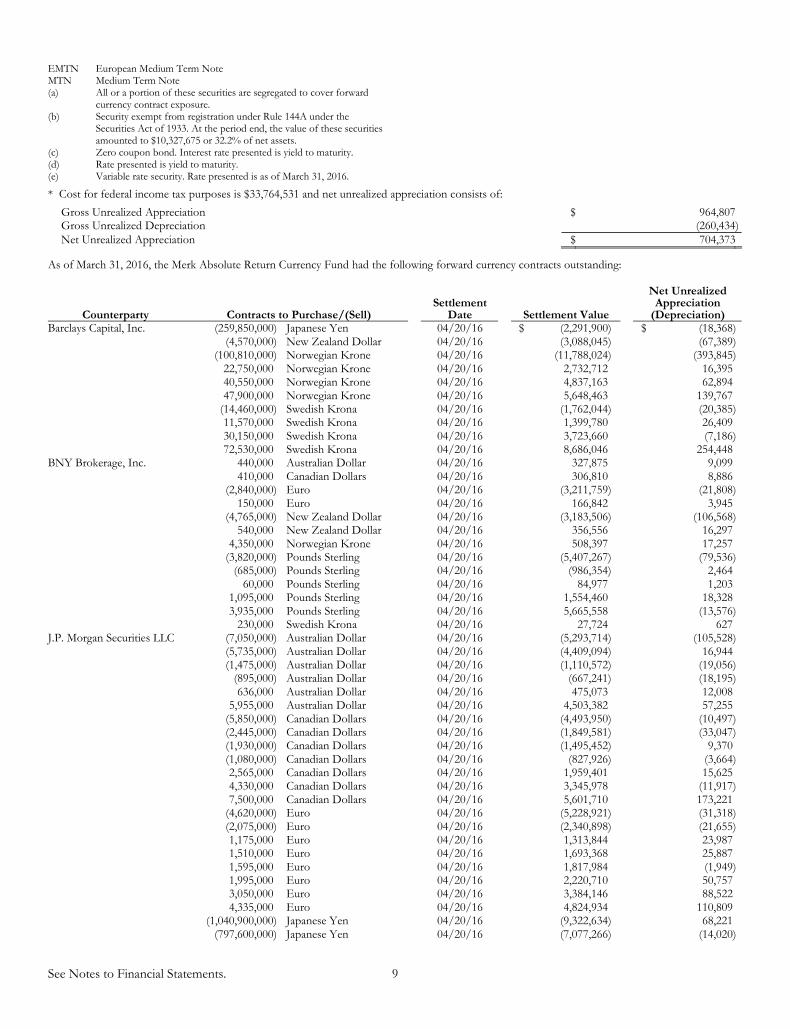
EMTN European Medium Term Note
MTN Medium Term Note (a) All or a portion of these securities are segregated to cover forward
currency contract exposure.
(b) Security exempt from registration under Rule 144A under the Securities Act of 1933. At the period end, the value of these securities amounted to $10,327,675 or 32.2% of net assets.
(c) Zero coupon bond. Interest rate presented is yield to maturity.
(d) Rate presented is yield to maturity. (e) Variable rate security. Rate presented is as of March 31, 2016.
* Cost for federal income tax purposes is $33,764,531 and net unrealized appreciation consists of:
Gross Unrealized Appreciation $ 964,807Gross Unrealized Depreciation (260,434)Net Unrealized Appreciation $ 704,373
As of March 31, 2016, the Merk Absolute Return Currency Fund had the following forward currency contracts outstanding:
Counterparty Contracts to Purchase/(Sell) Settlement
Date Settlement Value
Net Unrealized Appreciation
(Depreciation) Barclays Capital, Inc. (259,850,000) Japanese Yen 04/20/16 $ (2,291,900) $ (18,368) (4,570,000) New Zealand Dollar 04/20/16 (3,088,045) (67,389) (100,810,000) Norwegian Krone 04/20/16 (11,788,024) (393,845) 22,750,000 Norwegian Krone 04/20/16 2,732,712 16,395 40,550,000 Norwegian Krone 04/20/16 4,837,163 62,894 47,900,000 Norwegian Krone 04/20/16 5,648,463 139,767 (14,460,000) Swedish Krona 04/20/16 (1,762,044) (20,385) 11,570,000 Swedish Krona 04/20/16 1,399,780 26,409 30,150,000 Swedish Krona 04/20/16 3,723,660 (7,186) 72,530,000 Swedish Krona 04/20/16 8,686,046 254,448 BNY Brokerage, Inc. 440,000 Australian Dollar 04/20/16 327,875 9,099 410,000 Canadian Dollars 04/20/16 306,810 8,886 (2,840,000) Euro 04/20/16 (3,211,759) (21,808) 150,000 Euro 04/20/16 166,842 3,945 (4,765,000) New Zealand Dollar 04/20/16 (3,183,506) (106,568) 540,000 New Zealand Dollar 04/20/16 356,556 16,297 4,350,000 Norwegian Krone 04/20/16 508,397 17,257 (3,820,000) Pounds Sterling 04/20/16 (5,407,267) (79,536) (685,000) Pounds Sterling 04/20/16 (986,354) 2,464 60,000 Pounds Sterling 04/20/16 84,977 1,203 1,095,000 Pounds Sterling 04/20/16 1,554,460 18,328 3,935,000 Pounds Sterling 04/20/16 5,665,558 (13,576) 230,000 Swedish Krona 04/20/16 27,724 627 J.P. Morgan Securities LLC (7,050,000) Australian Dollar 04/20/16 (5,293,714) (105,528) (5,735,000) Australian Dollar 04/20/16 (4,409,094) 16,944 (1,475,000) Australian Dollar 04/20/16 (1,110,572) (19,056) (895,000) Australian Dollar 04/20/16 (667,241) (18,195) 636,000 Australian Dollar 04/20/16 475,073 12,008 5,955,000 Australian Dollar 04/20/16 4,503,382 57,255 (5,850,000) Canadian Dollars 04/20/16 (4,493,950) (10,497) (2,445,000) Canadian Dollars 04/20/16 (1,849,581) (33,047) (1,930,000) Canadian Dollars 04/20/16 (1,495,452) 9,370 (1,080,000) Canadian Dollars 04/20/16 (827,926) (3,664) 2,565,000 Canadian Dollars 04/20/16 1,959,401 15,625 4,330,000 Canadian Dollars 04/20/16 3,345,978 (11,917) 7,500,000 Canadian Dollars 04/20/16 5,601,710 173,221 (4,620,000) Euro 04/20/16 (5,228,921) (31,318) (2,075,000) Euro 04/20/16 (2,340,898) (21,655) 1,175,000 Euro 04/20/16 1,313,844 23,987 1,510,000 Euro 04/20/16 1,693,368 25,887 1,595,000 Euro 04/20/16 1,817,984 (1,949) 1,995,000 Euro 04/20/16 2,220,710 50,757 3,050,000 Euro 04/20/16 3,384,146 88,522 4,335,000 Euro 04/20/16 4,824,934 110,809 (1,040,900,000) Japanese Yen 04/20/16 (9,322,634) 68,221 (797,600,000) Japanese Yen 04/20/16 (7,077,266) (14,020)
See Notes to Financial Statements. 10
Counterparty Contracts to Purchase/(Sell) Settlement
Date Settlement Value
Net Unrealized Appreciation
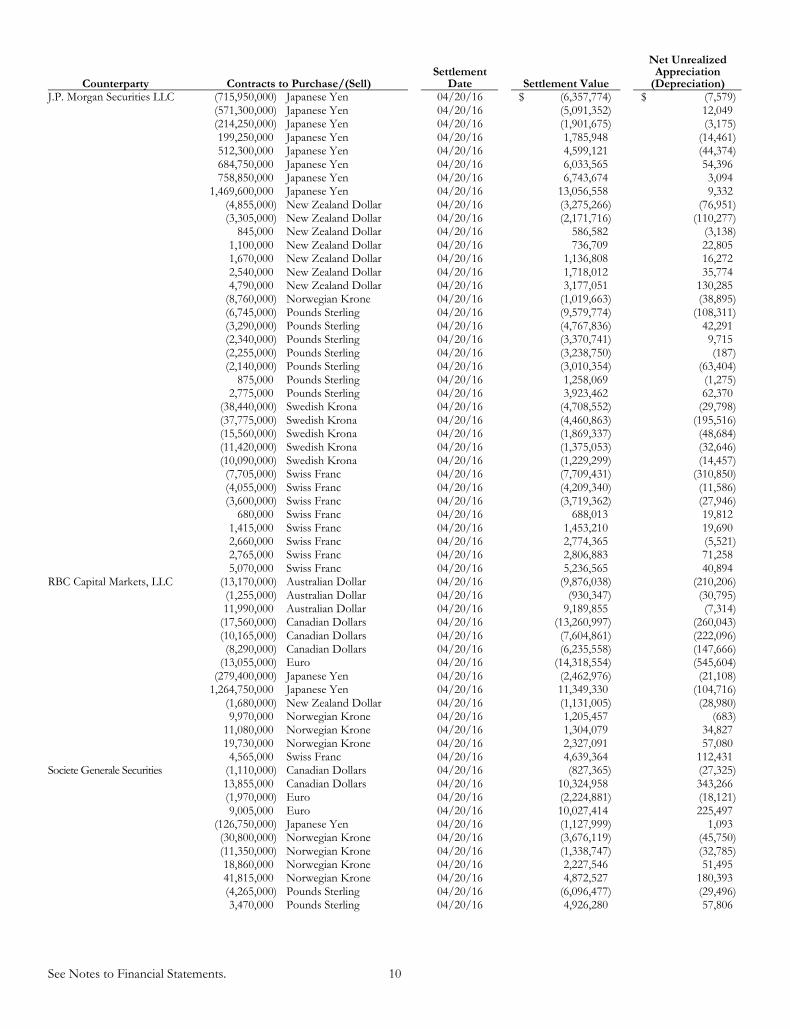
(Depreciation) J.P. Morgan Securities LLC (715,950,000) Japanese Yen 04/20/16 $ (6,357,774) $ (7,579) (571,300,000) Japanese Yen 04/20/16 (5,091,352) 12,049 (214,250,000) Japanese Yen 04/20/16 (1,901,675) (3,175) 199,250,000 Japanese Yen 04/20/16 1,785,948 (14,461) 512,300,000 Japanese Yen 04/20/16 4,599,121 (44,374) 684,750,000 Japanese Yen 04/20/16 6,033,565 54,396 758,850,000 Japanese Yen 04/20/16 6,743,674 3,094 1,469,600,000 Japanese Yen 04/20/16 13,056,558 9,332 (4,855,000) New Zealand Dollar 04/20/16 (3,275,266) (76,951) (3,305,000) New Zealand Dollar 04/20/16 (2,171,716) (110,277) 845,000 New Zealand Dollar 04/20/16 586,582 (3,138) 1,100,000 New Zealand Dollar 04/20/16 736,709 22,805 1,670,000 New Zealand Dollar 04/20/16 1,136,808 16,272 2,540,000 New Zealand Dollar 04/20/16 1,718,012 35,774 4,790,000 New Zealand Dollar 04/20/16 3,177,051 130,285 (8,760,000) Norwegian Krone 04/20/16 (1,019,663) (38,895) (6,745,000) Pounds Sterling 04/20/16 (9,579,774) (108,311) (3,290,000) Pounds Sterling 04/20/16 (4,767,836) 42,291 (2,340,000) Pounds Sterling 04/20/16 (3,370,741) 9,715 (2,255,000) Pounds Sterling 04/20/16 (3,238,750) (187) (2,140,000) Pounds Sterling 04/20/16 (3,010,354) (63,404) 875,000 Pounds Sterling 04/20/16 1,258,069 (1,275) 2,775,000 Pounds Sterling 04/20/16 3,923,462 62,370 (38,440,000) Swedish Krona 04/20/16 (4,708,552) (29,798) (37,775,000) Swedish Krona 04/20/16 (4,460,863) (195,516) (15,560,000) Swedish Krona 04/20/16 (1,869,337) (48,684) (11,420,000) Swedish Krona 04/20/16 (1,375,053) (32,646) (10,090,000) Swedish Krona 04/20/16 (1,229,299) (14,457) (7,705,000) Swiss Franc 04/20/16 (7,709,431) (310,850) (4,055,000) Swiss Franc 04/20/16 (4,209,340) (11,586) (3,600,000) Swiss Franc 04/20/16 (3,719,362) (27,946) 680,000 Swiss Franc 04/20/16 688,013 19,812 1,415,000 Swiss Franc 04/20/16 1,453,210 19,690 2,660,000 Swiss Franc 04/20/16 2,774,365 (5,521) 2,765,000 Swiss Franc 04/20/16 2,806,883 71,258 5,070,000 Swiss Franc 04/20/16 5,236,565 40,894 RBC Capital Markets, LLC (13,170,000) Australian Dollar 04/20/16 (9,876,038) (210,206) (1,255,000) Australian Dollar 04/20/16 (930,347) (30,795) 11,990,000 Australian Dollar 04/20/16 9,189,855 (7,314) (17,560,000) Canadian Dollars 04/20/16 (13,260,997) (260,043) (10,165,000) Canadian Dollars 04/20/16 (7,604,861) (222,096) (8,290,000) Canadian Dollars 04/20/16 (6,235,558) (147,666) (13,055,000) Euro 04/20/16 (14,318,554) (545,604) (279,400,000) Japanese Yen 04/20/16 (2,462,976) (21,108) 1,264,750,000 Japanese Yen 04/20/16 11,349,330 (104,716) (1,680,000) New Zealand Dollar 04/20/16 (1,131,005) (28,980) 9,970,000 Norwegian Krone 04/20/16 1,205,457 (683) 11,080,000 Norwegian Krone 04/20/16 1,304,079 34,827 19,730,000 Norwegian Krone 04/20/16 2,327,091 57,080 4,565,000 Swiss Franc 04/20/16 4,639,364 112,431 Societe Generale Securities (1,110,000) Canadian Dollars 04/20/16 (827,365) (27,325) 13,855,000 Canadian Dollars 04/20/16 10,324,958 343,266 (1,970,000) Euro 04/20/16 (2,224,881) (18,121) 9,005,000 Euro 04/20/16 10,027,414 225,497 (126,750,000) Japanese Yen 04/20/16 (1,127,999) 1,093 (30,800,000) Norwegian Krone 04/20/16 (3,676,119) (45,750) (11,350,000) Norwegian Krone 04/20/16 (1,338,747) (32,785) 18,860,000 Norwegian Krone 04/20/16 2,227,546 51,495 41,815,000 Norwegian Krone 04/20/16 4,872,527 180,393 (4,265,000) Pounds Sterling 04/20/16 (6,096,477) (29,496) 3,470,000 Pounds Sterling 04/20/16 4,926,280 57,806
See Notes to Financial Statements. 11
Counterparty Contracts to Purchase/(Sell) Settlement
Date Settlement Value
Net Unrealized Appreciation
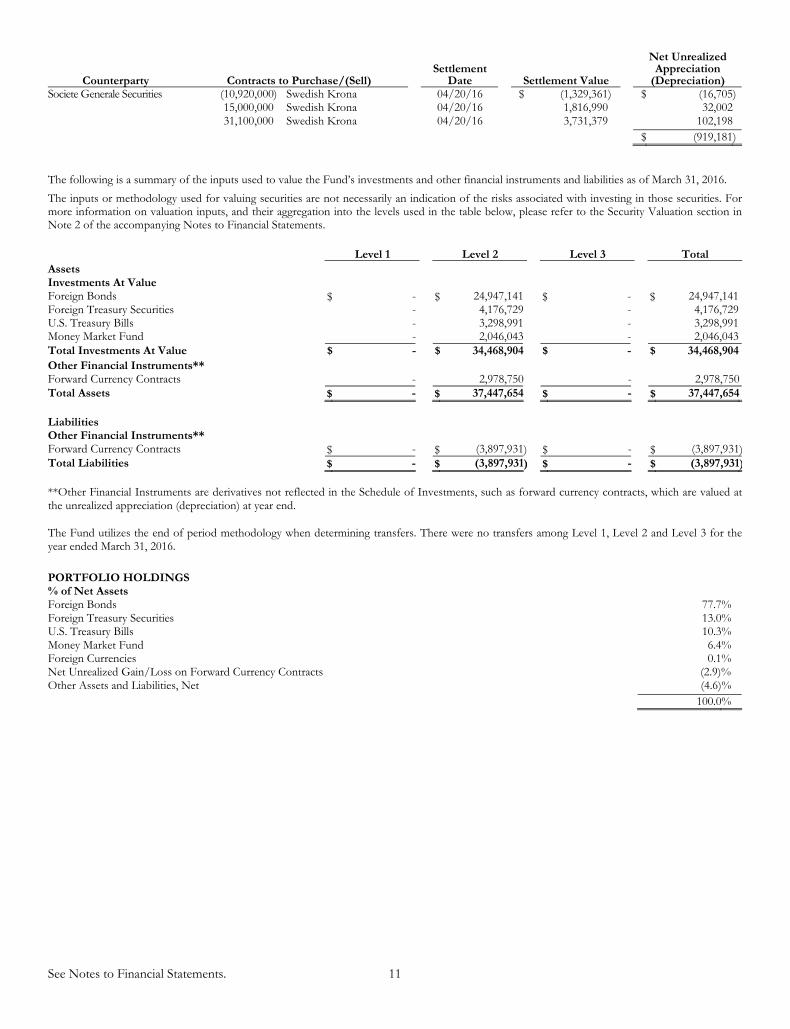
(Depreciation) Societe Generale Securities (10,920,000) Swedish Krona 04/20/16 $ (1,329,361) $ (16,705) 15,000,000 Swedish Krona 04/20/16 1,816,990 32,002 31,100,000 Swedish Krona 04/20/16 3,731,379 102,198
$ (919,181) The following is a summary of the inputs used to value the Fund�’s investments and other financial instruments and liabilities as of March 31, 2016. The inputs or methodology used for valuing securities are not necessarily an indication of the risks associated with investing in those securities. For more information on valuation inputs, and their aggregation into the levels used in the table below, please refer to the Security Valuation section in Note 2 of the accompanying Notes to Financial Statements.
Level 1 Level 2 Level 3 Total
Assets Investments At Value Foreign Bonds $ - $ 24,947,141 $ - $ 24,947,141Foreign Treasury Securities - 4,176,729 - 4,176,729U.S. Treasury Bills - 3,298,991 - 3,298,991Money Market Fund - 2,046,043 - 2,046,043Total Investments At Value $ - $ 34,468,904 $ - $ 34,468,904
Other Financial Instruments** Forward Currency Contracts - 2,978,750 - 2,978,750Total Assets $ - $ 37,447,654 $ - $ 37,447,654 Liabilities Other Financial Instruments** Forward Currency Contracts $ - $ (3,897,931) $ - $ (3,897,931)Total Liabilities $ - $ (3,897,931) $ - $ (3,897,931) **Other Financial Instruments are derivatives not reflected in the Schedule of Investments, such as forward currency contracts, which are valued at the unrealized appreciation (depreciation) at year end. The Fund utilizes the end of period methodology when determining transfers. There were no transfers among Level 1, Level 2 and Level 3 for the year ended March 31, 2016. AFA PORTFOLIO HOLDINGS % of Net Assets Foreign Bonds 77.7% Foreign Treasury Securities 13.0% U.S. Treasury Bills 10.3% Money Market Fund 6.4% Foreign Currencies 0.1% Net Unrealized Gain/Loss on Forward Currency Contracts (2.9)% Other Assets and Liabilities, Net (4.6)% 100.0% AFA
STATEMENTS OF ASSETS AND LIABILITIES MARCH 31, 2016
See Notes to Financial Statements. 12
MERK HARD CURRENCY
FUND MERK ABSOLUTE RETURN
CURRENCY FUND
ASSETS
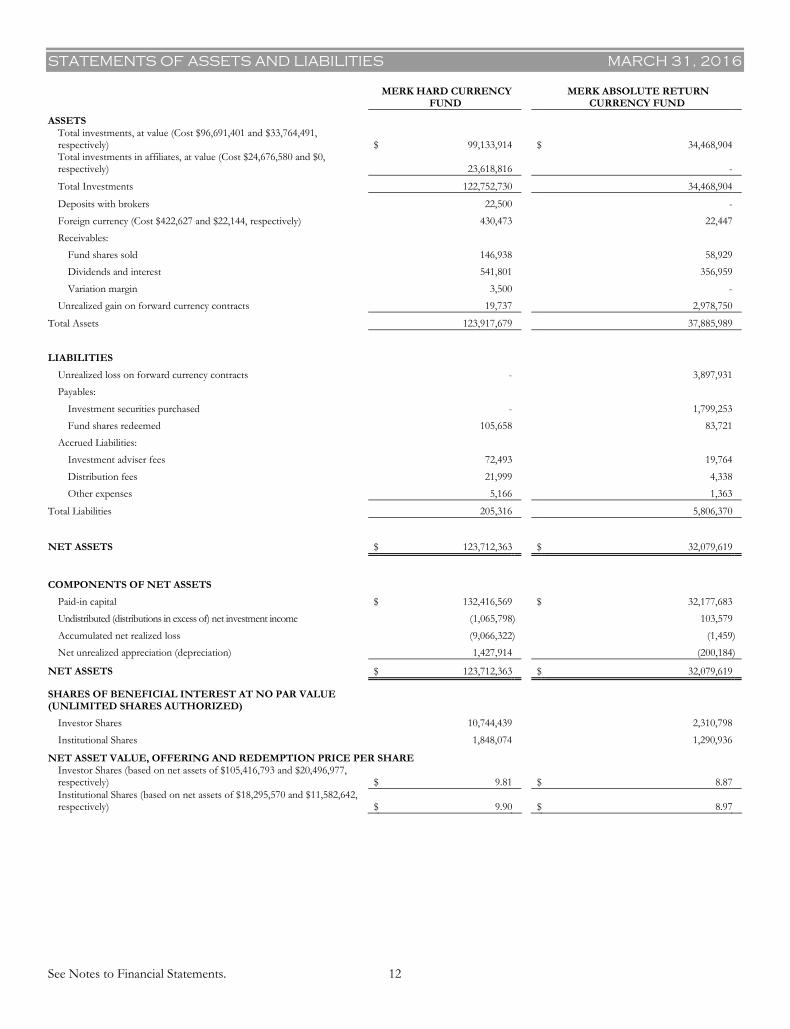
. Total investments, at value (Cost $96,691,401 and $33,764,491, respectively) $ 99,133,914 $ 34,468,904
Total investments in affiliates, at value (Cost $24,676,580 and $0, respectively) 23,618,816 -
Total Investments 122,752,730 34,468,904
Deposits with brokers 22,500 - Foreign currency (Cost $422,627 and $22,144, respectively) 430,473 22,447 Receivables: Fund shares sold 146,938 58,929 Dividends and interest 541,801 356,959 Variation margin 3,500 - Unrealized gain on forward currency contracts 19,737 2,978,750
Total Assets 123,917,679 37,885,989
LIABILITIES Unrealized loss on forward currency contracts - 3,897,931 Payables: Investment securities purchased - 1,799,253 Fund shares redeemed 105,658 83,721 Accrued Liabilities: Investment adviser fees 72,493 19,764 Distribution fees 21,999 4,338 Other expenses 5,166 1,363
Total Liabilities 205,316 5,806,370
NET ASSETS $ 123,712,363 $ 32,079,619
COMPONENTS OF NET ASSETS Paid-in capital $ 132,416,569 $ 32,177,683 Undistributed (distributions in excess of) net investment income (1,065,798) 103,579 Accumulated net realized loss (9,066,322) (1,459) Net unrealized appreciation (depreciation) 1,427,914 (200,184)
NET ASSETS $ 123,712,363 $ 32,079,619
SHARES OF BENEFICIAL INTEREST AT NO PAR VALUE (UNLIMITED SHARES AUTHORIZED) Investor Shares 10,744,439 2,310,798 Institutional Shares 1,848,074 1,290,936
NET ASSET VALUE, OFFERING AND REDEMPTION PRICE PER SHARE
Investor Shares (based on net assets of $105,416,793 and $20,496,977, respectively) $ 9.81 $ 8.87
Institutional Shares (based on net assets of $18,295,570 and $11,582,642, respectively) $ 9.90 $ 8.97
STATEMENTS OF OPERATIONS YEAR ENDED MARCH 31, 2016
See Notes to Financial Statements. 13
MERK HARD CURRENCY
FUND
MERK ABSOLUTE RETURN
CURRENCY FUND
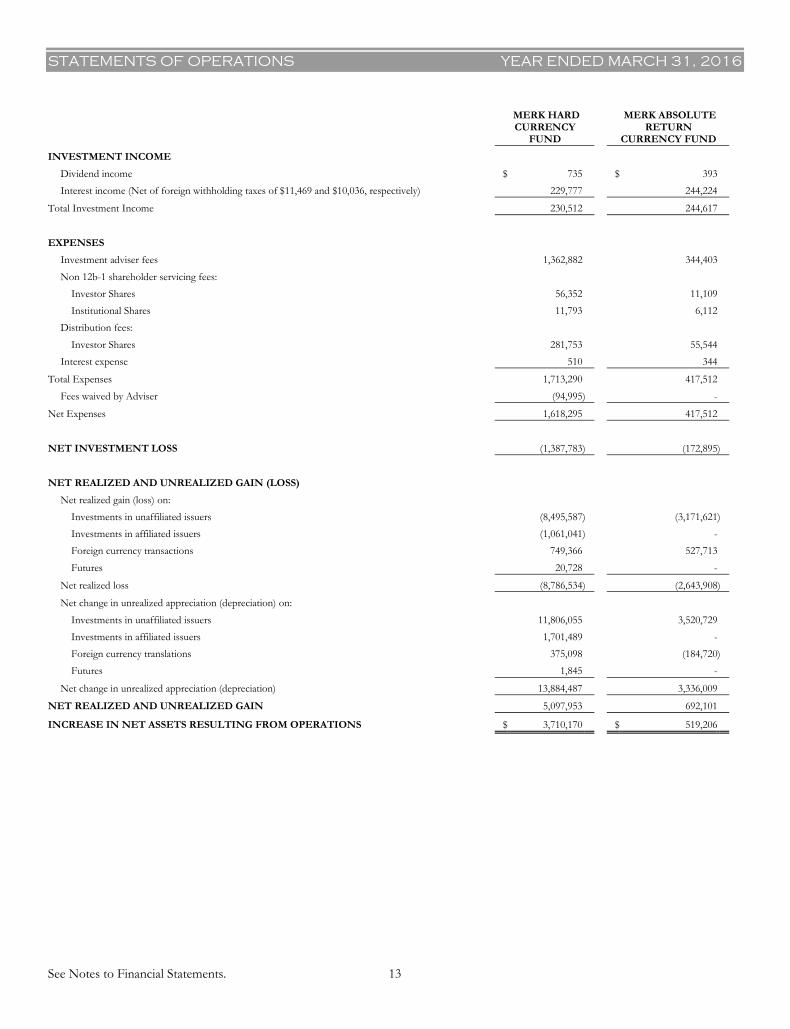
INVESTMENT INCOME Dividend income . $ 735 $ 393 Interest income (Net of foreign withholding taxes of $11,469 and $10,036, respectively) 229,777 244,224
Total Investment Income 230,512 244,617
Adviser EXPENSES Investment adviser fees 1,362,882 344,403 Non 12b-1 shareholder servicing fees: Investor Shares 56,352 11,109 Institutional Shares 11,793 6,112 Distribution fees: Investor Shares 281,753 55,544 Interest expense 5100 3440
Total Expenses 1,713,290 417,512 Fees waived by Adviser (94,995) -
Net Expenses 1,618,295 417,512
NET INVESTMENT LOSS (1,387,783) (172,895)
NET REALIZED AND UNREALIZED GAIN (LOSS) Net realized gain (loss) on: Investments in unaffiliated issuers (8,495,587) (3,171,621) Investments in affiliated issuers (1,061,041) - Foreign currency transactions 749,366 527,713 Futures 20,728 -
Net realized loss (8,786,534) (2,643,908)
Net change in unrealized appreciation (depreciation) on: Investments in unaffiliated issuers 11,806,055 3,520,729 Investments in affiliated issuers 1,701,489 - Foreign currency translations 375,098 (184,720) Futures 1,845 -
Net change in unrealized appreciation (depreciation) 13,884,487 3,336,009
NET REALIZED AND UNREALIZED GAIN 5,097,953 692,101
INCREASE IN NET ASSETS RESULTING FROM OPERATIONS $ 3,710,170 $ 519,206
STATEMENTS OF CHANGES IN NET ASSETS
See Notes to Financial Statements. 14
MERK HARD CURRENCY FUND MERK ABSOLUTE RETURN
CURRENCY FUND
For the Year Ended
March 31, 2016 For the Year Ended
March 31, 2015 For the Year Ended
March 31, 2016 For the Year Ended
March 31, 2015
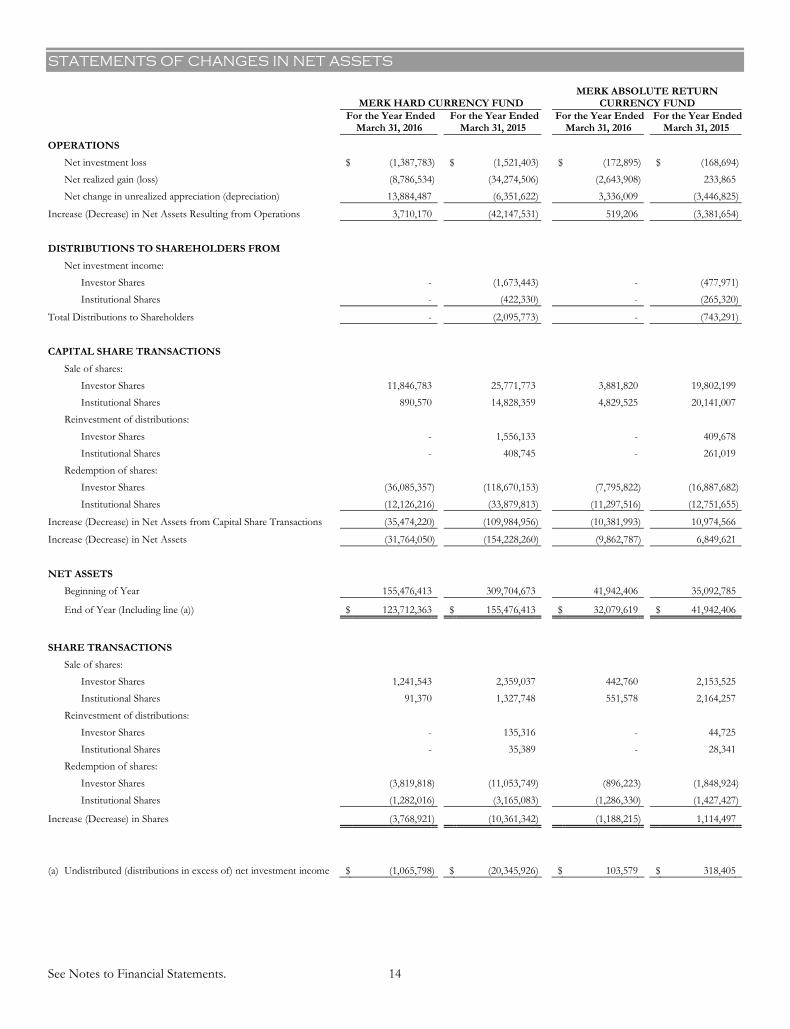
OPERATIONS Net investment loss $ (1,387,783) $ (1,521,403) $ (172,895) $ (168,694) Net realized gain (loss) (8,786,534) (34,274,506) (2,643,908) 233,865 Net change in unrealized appreciation (depreciation) 13,884,487 (6,351,622) 3,336,009 (3,446,825)
Increase (Decrease) in Net Assets Resulting from Operations 3,710,170 (42,147,531) 519,206 (3,381,654)
DISTRIBUTIONS TO SHAREHOLDERS FROM Net investment income: Investor Shares - (1,673,443) - (477,971) Institutional Shares - (422,330) - (265,320)
Total Distributions to Shareholders - (2,095,773) - (743,291)
CAPITAL SHARE TRANSACTIONS Sale of shares: Investor Shares 11,846,783 25,771,773 3,881,820 19,802,199 Institutional Shares 890,570 14,828,359 4,829,525 20,141,007 Reinvestment of distributions: Investor Shares - 1,556,133 - 409,678 Institutional Shares - 408,745 - 261,019 Redemption of shares: 2 Investor Shares (36,085,357) (118,670,153) (7,795,822) (16,887,682) 4 Institutional Shares (12,126,216) (33,879,813) (11,297,516) (12,751,655)
Increase (Decrease) in Net Assets from Capital Share Transactions (35,474,220) (109,984,956) (10,381,993) 10,974,566
Increase (Decrease) in Net Assets (31,764,050) (154,228,260) (9,862,787) 6,849,621
NET ASSETS Beginning of Year 155,476,413 309,704,673 41,942,406 35,092,785
End of Year (Including line (a)) $ 123,712,363 $ 155,476,413 $ 32,079,619 $ 41,942,406
SHARE TRANSACTIONS Sale of shares: Investor Shares 1,241,543 2,359,037 442,760 2,153,525 Institutional Shares 91,370 1,327,748 551,578 2,164,257 Reinvestment of distributions: Investor Shares - 135,316 - 44,725 Institutional Shares - 35,389 - 28,341 Redemption of shares: Investor Shares (3,819,818) (11,053,749) (896,223) (1,848,924) Institutional Shares (1,282,016) (3,165,083) (1,286,330) (1,427,427)
Increase (Decrease) in Shares (3,768,921) (10,361,342) (1,188,215) 1,114,497
(a) Undistributed (distributions in excess of) net investment income $ (1,065,798) $ (20,345,926) $ 103,579 $ 318,405
FINANCIAL HIGHLIGHTS
See Notes to Financial Statements. 15
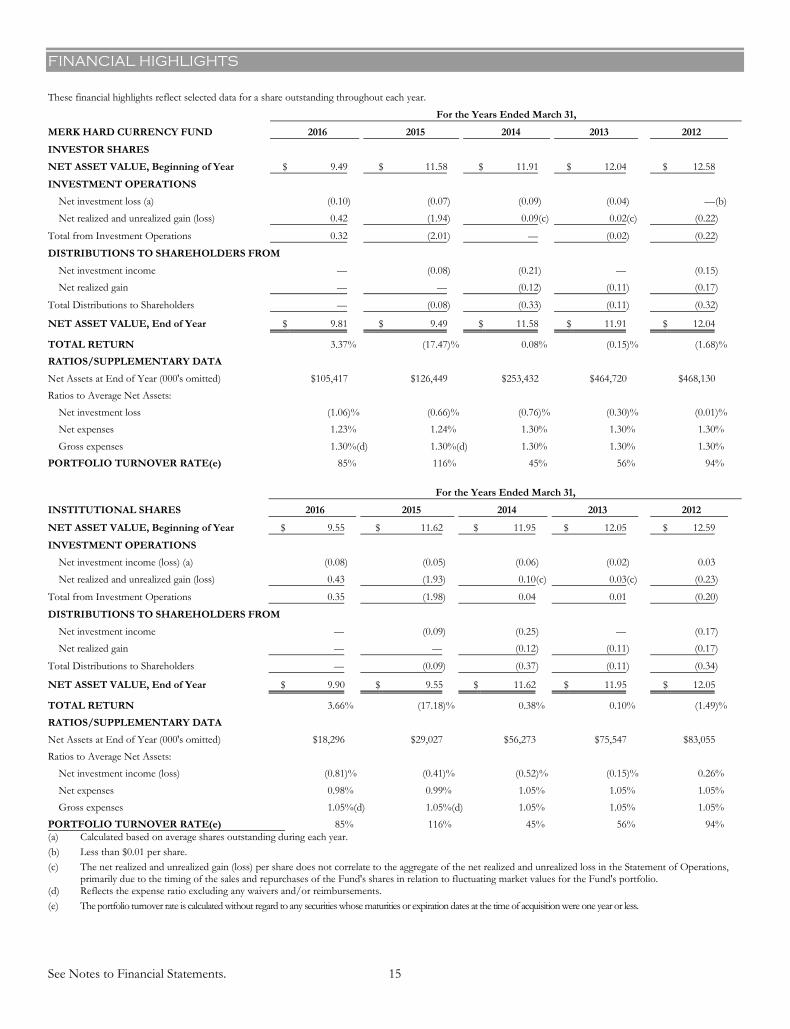
These financial highlights reflect selected data for a share outstanding throughout each year. For the Years Ended March 31,
MERK HARD CURRENCY FUND 2016 2015 2014 2013 2012
INVESTOR SHARES NET ASSET VALUE, Beginning of Year $ 9.49 $ 11.58 $ 11.91 $ 12.04 $ 12.58
INVESTMENT OPERATIONS Net investment loss (a) (0.10) (0.07) (0.09) (0.04) �—(b) Net realized and unrealized gain (loss) 0.42 (1.94) 0.09(c) 0.02(c) (0.22)
Total from Investment Operations 0.32 (2.01) �— (0.02) (0.22)
DISTRIBUTIONS TO SHAREHOLDERS FROM Net investment income �— (0.08) (0.21) �— (0.15) Net realized gain �— �— (0.12) (0.11) (0.17)
Total Distributions to Shareholders �— (0.08) (0.33) (0.11) (0.32)
NET ASSET VALUE, End of Year $ 9.81 $ 9.49 $ 11.58 $ 11.91 $ 12.04
TOTAL RETURN 3.37% (17.47)% 0.08% (0.15)% (1.68)% RATIOS/SUPPLEMENTARY DATA Net Assets at End of Year (000's omitted) $105,417 $126,449 $253,432 $464,720 $468,130 Ratios to Average Net Assets:
Net investment loss (1.06)% (0.66)% (0.76)% (0.30)% (0.01)% Net expenses 1.23% 1.24% 1.30% 1.30% 1.30% Gross expenses 1.30%(d) 1.30%(d) 1.30% 1.30% 1.30%
PORTFOLIO TURNOVER RATE(e) 85% 116% 45% 56% 94%
For the Years Ended March 31,
INSTITUTIONAL SHARES 2016 2015 2014 2013 2012
NET ASSET VALUE, Beginning of Year $ 9.55 $ 11.62 $ 11.95 $ 12.05 $ 12.59
INVESTMENT OPERATIONS Net investment income (loss) (a) (0.08) (0.05) (0.06) (0.02) 0.03 Net realized and unrealized gain (loss) 0.43 (1.93) 0.10(c) 0.03(c) (0.23)
Total from Investment Operations 0.35 (1.98) 0.04 0.01 (0.20)
DISTRIBUTIONS TO SHAREHOLDERS FROM Net investment income �— (0.09) (0.25) �— (0.17) Net realized gain �— �— (0.12) (0.11) (0.17)
Total Distributions to Shareholders �— (0.09) (0.37) (0.11) (0.34)
NET ASSET VALUE, End of Year $ 9.90 $ 9.55 $ 11.62 $ 11.95 $ 12.05
TOTAL RETURN 3.66% (17.18)% 0.38% 0.10% (1.49)% RATIOS/SUPPLEMENTARY DATA Net Assets at End of Year (000's omitted) $18,296 $29,027 $56,273 $75,547 $83,055 Ratios to Average Net Assets:
Net investment income (loss) (0.81)% (0.41)% (0.52)% (0.15)% 0.26% Net expenses 0.98% 0.99% 1.05% 1.05% 1.05% Gross expenses 1.05%(d) 1.05%(d) 1.05% 1.05% 1.05%
PORTFOLIO TURNOVER RATE(e) 85% 116% 45% 56% 94% (a) Calculated based on average shares outstanding during each year. (b) Less than $0.01 per share. (c) The net realized and unrealized gain (loss) per share does not correlate to the aggregate of the net realized and unrealized loss in the Statement of Operations,
primarily due to the timing of the sales and repurchases of the Fund's shares in relation to fluctuating market values for the Fund's portfolio. (d) Reflects the expense ratio excluding any waivers and/or reimbursements. (e) The portfolio turnover rate is calculated without regard to any securities whose maturities or expiration dates at the time of acquisition were one year or less.
FINANCIAL HIGHLIGHTS
See Notes to Financial Statements. 16
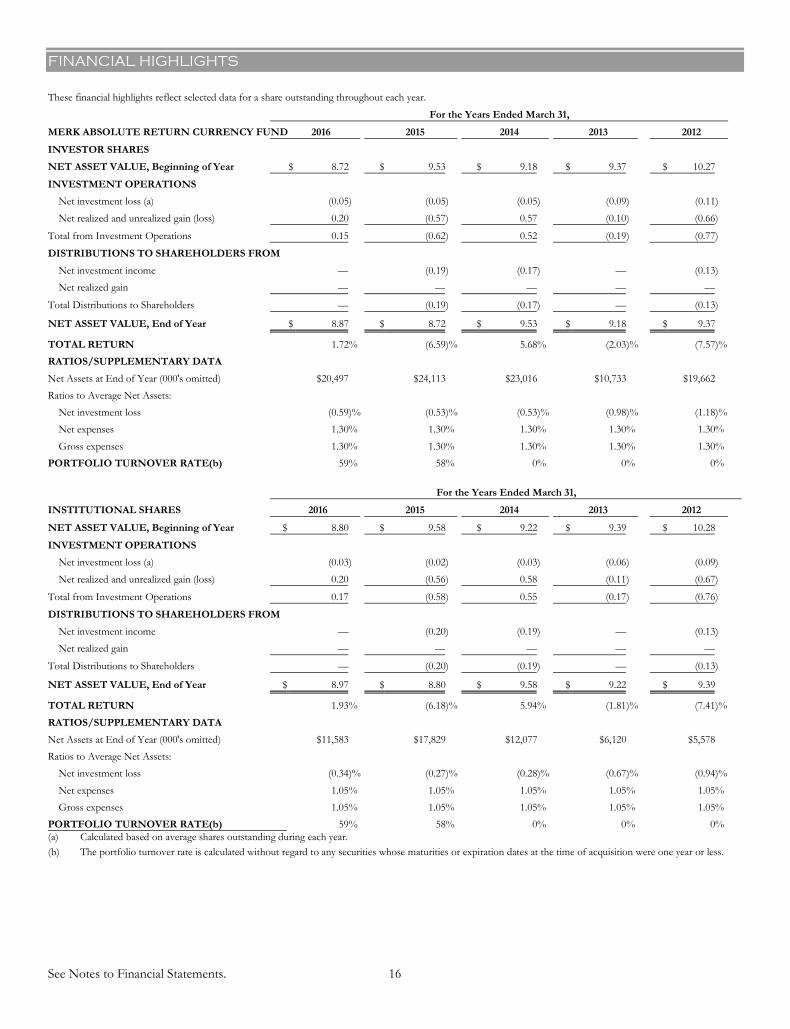
These financial highlights reflect selected data for a share outstanding throughout each year. For the Years Ended March 31,
MERK ABSOLUTE RETURN CURRENCY FUND 2016 2015 2014 2013 2012
INVESTOR SHARES NET ASSET VALUE, Beginning of Year $ 8.72 $ 9.53 $ 9.18 $ 9.37 $ 10.27
INVESTMENT OPERATIONS Net investment loss (a) (0.05) (0.05) (0.05) (0.09 ) (0.11) Net realized and unrealized gain (loss) 0.20 (0.57) 0.57 (0.10 ) (0.66)
Total from Investment Operations 0.15 (0.62) 0.52 (0.19 ) (0.77)
DISTRIBUTIONS TO SHAREHOLDERS FROM Net investment income �— (0.19) (0.17) �— (0.13) Net realized gain �— �— �— �— �—
Total Distributions to Shareholders �— (0.19) (0.17) �— (0.13)
NET ASSET VALUE, End of Year $ 8.87 $ 8.72 $ 9.53 $ 9.18 $ 9.37
TOTAL RETURN 1.72% (6.59)% 5.68% (2.03 )% (7.57)% RATIOS/SUPPLEMENTARY DATA Net Assets at End of Year (000's omitted) $20,497 $24,113 $23,016 $10,733 $19,662 Ratios to Average Net Assets:
Net investment loss (0.59)% (0.53)% (0.53)% (0.98 )% (1.18)% Net expenses 1.30% 1.30% 1.30% 1.30 % 1.30% Gross expenses 1.30% 1.30% 1.30% 1.30 % 1.30%
PORTFOLIO TURNOVER RATE(b) 59% 58% 0% 0 % 0%
For the Years Ended March 31,
INSTITUTIONAL SHARES 2016 2015 2014 2013 2012
NET ASSET VALUE, Beginning of Year $ 8.80 $ 9.58 $ 9.22 $ 9.39 $ 10.28
INVESTMENT OPERATIONS Net investment loss (a) (0.03) (0.02) (0.03) (0.06 ) (0.09) Net realized and unrealized gain (loss) 0.20 (0.56) 0.58 (0.11 ) (0.67)
Total from Investment Operations 0.17 (0.58) 0.55 (0.17 ) (0.76)
DISTRIBUTIONS TO SHAREHOLDERS FROM Net investment income �— (0.20) (0.19) �— (0.13) Net realized gain �— �— �— �— �—
Total Distributions to Shareholders �— (0.20) (0.19) �— (0.13)
NET ASSET VALUE, End of Year $ 8.97 $ 8.80 $ 9.58 $ 9.22 $ 9.39
TOTAL RETURN 1.93% (6.18)% 5.94% (1.81 )% (7.41)% RATIOS/SUPPLEMENTARY DATA Net Assets at End of Year (000's omitted) $11,583 $17,829 $12,077 $6,120 $5,578 Ratios to Average Net Assets:
Net investment loss (0.34)% (0.27)% (0.28)% (0.67 )% (0.94)% Net expenses 1.05% 1.05% 1.05% 1.05 % 1.05% Gross expenses 1.05% 1.05% 1.05% 1.05 % 1.05%
PORTFOLIO TURNOVER RATE(b) 59% 58% 0% 0 % 0% (a) Calculated based on average shares outstanding during each year. (b) The portfolio turnover rate is calculated without regard to any securities whose maturities or expiration dates at the time of acquisition were one year or less.
NOTES TO FINANCIAL STATEMENTS MARCH 31, 2016
17
Note 1. Organization
The Merk Hard Currency Fund and the Merk Absolute Return Currency Fund (individually included in the defined term, �“Fund�” and, collectively included in the defined term, �“Funds�”) are a non-diversified portfolio and a diversified portfolio of Forum Funds (the �“Trust�”), respectively. The Trust is a Delaware statutory trust that is registered as an open-end, management investment company under the Investment Company Act of 1940 (the �“Act�”), as amended. Under its Trust Instrument, the Trust is authorized to issue an unlimited number of each Fund�’s shares of beneficial interest without par value. Each Fund currently offers two classes of shares: Investor Shares and Institutional Shares. The Merk Hard Currency Fund seeks to profit from a rise in hard currencies relative to the U.S. dollar. The Merk Absolute Return Currency Fund seeks to generate positive absolute returns by investing in securities and instruments that create exposure to currencies. The Merk Hard Currency Fund Investor Shares and Institutional Shares commenced operations on May 10, 2005 and April 1, 2010, respectively. The Merk Absolute Return Currency Fund Investor Shares and Institutional Shares commenced operations on September 9, 2009 and April 1, 2010, respectively.
Note 2. Summary of Significant Accounting Policies
These financial statements are prepared in accordance with accounting principles generally accepted in the United States of America (�“GAAP�”), which require management to make estimates and assumptions that affect the reported amounts of assets and liabilities, the disclosure of contingent liabilities at the date of the financial statements, and the reported amounts of increases and decreases in net assets from operations during the fiscal period. Actual amounts could differ from those estimates. The following summarizes the significant accounting policies of each Fund:
Security Valuation �– Exchange-traded securities and over-the-counter securities are valued using the last quoted trade or official closing price, provided by independent pricing services as of the close of trading on the market or exchange for which they are primarily traded, on each Fund business day. In the absence of a sale, such securities are valued at the mean of the last bid and ask price provided by independent pricing services. Non-exchange-traded securities for which quotations are available are valued using the last quoted sales price, or in the absence of a sale, at the mean of the last bid and ask prices provided by independent pricing services. Debt securities may be valued at prices supplied by a fund�’s pricing agent based on broker or dealer supplied valuations or matrix pricing, a method of valuing securities by reference to the value of other securities with similar characteristics such as rating, interest rate and maturity. Shares of open-end mutual funds are valued at net asset value (�“NAV�”). Futures contracts listed for trading on a securities exchange or board of trade shall be valued at the last quoted sales price or in the absence of a sale at the mean of the last bid and asked prices. Forward currency contracts are generally valued at the mean of bid and ask prices for the time period interpolated from rates reported by an independent pricing service for proximate time periods. Short-term investments that mature in 60 days or less may be valued at amortized cost.
Each Fund values its investments at fair value pursuant to procedures adopted by the Trust's Board of Trustees (the "Board") if (1) market quotations are insufficient or not readily available or (2) the adviser believes that the values available are unreliable. The Trust�’s Valuation Committee, as defined in each Fund�’s registration statement, performs certain functions as they relate to the administration and oversight of each Fund�’s valuation procedures. Under these procedures, the Valuation Committee convenes on a regular and ad-hoc basis to review such investments and considers a number of factors, including valuation methodologies and significant unobservable inputs, when arriving at fair value.
The Valuation Committee may work with the adviser to provide valuation inputs. In determining fair valuations, inputs may include market-based analytics which may consider related or comparable assets or liabilities, recent transactions, market multiples, book values and other relevant investment information. Adviser inputs may include an income-based approach in which the anticipated future cash flows of the investment are discounted in determining fair value. Discounts may also be applied based on the nature or duration of any restrictions on the disposition of the investments. The Valuation Committee performs regular reviews of valuation methodologies, key inputs and assumptions, disposition analysis and market activity.
Fair valuation is based on subjective factors and, as a result, the fair value price of an investment may differ from the security�’s market price and may not be the price at which the asset may be sold. Fair valuation could result in a different Net Asset Value ("NAV") than a NAV determined by using market quotes.
Each Fund has a three-tier fair value hierarchy. The basis of the tiers is dependent upon the various �“inputs�” used to determine the value of each Fund�’s investments. These inputs are summarized in the three broad levels listed below:
Level 1 �— quoted prices in active markets for identical assets and liabilities
Level 2 �— other significant observable inputs (including quoted prices of similar securities, interest rates, prepayment speeds, credit risk, etc.)
Level 3 �— significant unobservable inputs (including each Fund�’s own assumptions in determining the fair value of investments)
The aggregate value by input level, as of March 31, 2016, for each Fund�’s investments is included at the end of each Fund�’s Schedule
18
of Investments.
Security Transactions, Investment Income and Realized Gain and Loss �– Investment transactions are accounted for on the trade date. Income and capital gains on some foreign securities may be subject to foreign withholding taxes, which are accrued as applicable. Interest income is recorded on an accrual basis. Premium is amortized and discount is accreted using the effective interest method. Identified cost of investments sold is used to determine the gain and loss for both financial statement and federal income tax purposes.
Foreign Currency Translations �– Foreign currency amounts are translated into U.S. dollars as follows: (1) assets and liabilities at the rate of exchange at the end of the respective period; and (2) purchases and sales of securities and income and expenses at the rate of exchange prevailing on the dates of such transactions. The portion of the results of operations arising from changes in the exchange rates and the portion due to fluctuations arising from changes in the market prices of securities are not isolated. Such fluctuations are included with the net realized and unrealized gain or loss on investments.
Foreign Currency Transactions �– Each Fund may enter into transactions to purchase or sell foreign currency contracts and options on foreign currency. Forward currency contracts are agreements to exchange one currency for another at a future date and at a specified price. A fund may use forward currency contracts to facilitate transactions in foreign securities, to manage a fund�’s foreign currency exposure and to protect the U.S. dollar value of its underlying portfolio securities against the effect of possible adverse movements in foreign exchange rates. These contracts are intrinsically valued daily based on forward rates, and a fund�’s net equity therein, representing unrealized gain or loss on the contracts as measured by the difference between the forward foreign exchange rates at the dates of entry into the contracts and the forward rates at the reporting date, is recorded as a component of net asset value. These instruments involve market risk, credit risk, or both kinds of risks, in excess of the amount recognized in the Statements of Assets and Liabilities. Risks arise from the possible inability of counterparties to meet the terms of their contracts and from movement in currency and securities values and interest rates. Due to the risks associated with these transactions, a fund could incur losses up to the entire contract amount, which may exceed the net unrealized value included in its net asset value.
The values of each individual forward currency contract outstanding as of March 31, 2016, are disclosed in each Fund�’s Schedule of Investments.
Futures Contracts �– Each Fund may purchase futures contracts to gain exposure to market changes, which may be more efficient or cost effective than actually buying the securities. A futures contract is an agreement between parties to buy or sell a security at a set price on a future date. Upon entering into such a contract, a fund is required to pledge to the broker an amount of cash, U.S. Government obligations or other high-quality debt securities equal to the minimum �“initial margin�” requirements of the exchange on which the futures contract is traded. Pursuant to the contract, the fund agrees to receive from or pay to the broker an amount of cash equal to the daily fluctuation in the value of the contract. Such receipts or payments are known as �“variation margin�” and are recorded by the fund as unrealized gains or losses. When the contract is closed, the fund records a realized gain or loss equal to the difference between the value of the contract at the time it was opened and value at the time it was closed. Risks of entering into futures contracts include the possibility that there may be an illiquid market and that a change in the value of the contract may not correlate with changes in the value of the underlying securities.
Distributions to Shareholders �– Distributions to shareholders of net investment income, if any, are declared and paid at least quarterly. Distributions to shareholders of net capital gains, if any, are declared and paid at least annually. Distributions to shareholders are recorded on the ex-dividend date. Distributions are based on amounts calculated in accordance with applicable federal income tax regulations, which may differ from GAAP. These differences are due primarily to differing treatments of income and gain on various investment securities held by each Fund, timing differences and differing characterizations of distributions made by each Fund.
Federal Taxes �– Each Fund intends to qualify each year as a regulated investment company under Subchapter M of the Internal Revenue Code of 1986, as amended (�“Code�”) and to distribute all of its taxable income to shareholders. In addition, by distributing in each calendar year substantially all of its net investment income and capital gains, if any, the Funds will not be subject to a federal excise tax. Therefore, no federal income or excise tax provision is required. Each Fund files a U.S. federal income and excise tax return as required. A fund�’s federal income tax returns are subject to examination by the Internal Revenue Service for a period of three fiscal years after they are filed. As of March 31, 2016, there are no uncertain tax positions that would require financial statement recognition, de-recognition, or disclosure.
Income and Expense Allocation �– The Trust accounts separately for the assets, liabilities and operations of each of its investment portfolios. Expenses that are directly attributable to more than one investment portfolio are allocated among the respective investment portfolios in an equitable manner.
The Funds�’ class-specific expenses are charged to the operations of that class of shares. Income and expenses (other than expenses attributable to a specific class) and realized and unrealized gains or losses on investments are allocated to each class of shares based on the class�’ respective net assets to the total net assets of each Fund.
Commitments and Contingencies �– In the normal course of business, each Fund enters into contracts that provide general indemnifications by each Fund to the counterparty to the contract. Each Fund�’s maximum exposure under these arrangements is
19
dependent on future claims that may be made against each Fund and, therefore, cannot be estimated; however, based on experience, the risk of loss from such claims is considered remote.
Note 3. Fees and Expenses
Investment Adviser �– Merk Investments LLC (the �“Adviser�”) is the investment adviser to each Fund. Pursuant to an investment advisory agreement, the Adviser receives an advisory fee from the Funds at an annual rate of 1.00% of each Fund�’s average daily net assets.
Under the terms of the Investment Advisory Agreement for the Funds the Adviser is obligated to pay all expenses of each Fund except any expenses it is authorized to pay under Rule 12b-1, brokerage costs, commissions, borrowing costs, taxes, the non 12b-1 shareholder servicing fees, acquired fund fees and expenses and extraordinary and non-recurring expenses.
Distribution �– Foreside Fund Services, LLC serves as each Fund�’s distributor (the �“Distributor�”). The Distributor is not affiliated with the Adviser or Atlantic Fund Administration, LLC (d/b/a Atlantic Fund Services) (�“Atlantic�”) or their affiliates. The Trust, on behalf of the Funds, has adopted a Distribution Plan (the �“Plan�”) for Investor Shares of the Funds in accordance with Rule 12b-1 of the Act. Under the Plan, the Funds pay the Distributor and/or any other entity as authorized by the Board a fee of up to 0.25% of the average daily net assets of each Fund�’s Investor Shares for the marketing of fund shares and for services provided to shareholders.
Other Service Providers �– Atlantic provides fund accounting, fund administration, compliance and transfer agency services to each Fund. Atlantic also provides certain shareholder report production, and EDGAR conversion and filing services. Atlantic provides a Principal Executive Officer, a Principal Financial Officer, a Chief Compliance Officer, and an Anti-Money Laundering Officer to each Fund, as well as certain additional compliance support functions.
Note 4. Fees Waived
During this period, Merk Hard Currency Fund invested in VanEck Merk Gold Trust, an Exchange Traded Product sponsored by the Adviser. As of March 31, 2016, Merk Hard Currency Fund owned approximately 24.0% of VanEck Merk Gold Trust. The Adviser has agreed to waive fees in an amount equal to the fee it receives from VanEck Merk Gold Trust based on Merk Hard Currency Fund�’s investment in VanEck Merk Gold Trust (NYSE:OUNZ). For the year ended March 31, 2016, the Adviser waived fees of $94,995 for Merk Hard Currency Fund.
Note 5. Security Transactions
The cost of purchases and proceeds from sales of investment securities (including maturities), other than short-term investments during the year ended March 31, 2016, were as follows:
Purchases Sales
Merk Hard Currency Fund $ 49,589,022 $ 58,604,193 Merk Absolute Return Currency Fund 8,929,305 4,119,784
Note 6. Summary of Derivative Activity
The volume of open derivative positions may vary on a daily basis as each Fund transacts derivative contracts in order to achieve the exposure desired by the Adviser. The notional value of activity for the year ended March 31, 2016 for any derivative type that was held during the year is as follows:
Merk Hard Currency Fund Merk Absolute Return Currency FundForward Currency Contracts $ 248,630,812 $ 6,361,654,068 Futures 6,862,264 -
Each Fund�’s use of derivatives during the year ended March 31, 2016, was limited to futures and forward currency contracts.
20
Following is a summary of the effect of derivatives on the Statements of Assets and Liabilities for each Fund as of March 31, 2016: Merk Hard Currency Fund
Location: Currency
Contracts Commodity Contracts
Asset derivatives: Receivable �– variation margin $ - $ 3,500Unrealized gain on forward currency contracts 19,737 -Total Asset derivatives $ 19,737 $ 3,500 Merk Absolute Return Currency Fund
Location: Currency
Contracts Asset derivatives: Unrealized gain on forward currency contracts $ 2,978,750
Liability derivatives: Unrealized loss on forward currency contracts $ (3,897,931) Realized and unrealized gains and losses on derivatives contracts during the year ended March 31, 2016, by each Fund are recorded in the following locations on the Statements of Operations:
Merk Hard Currency Fund
Location: Currency Contracts
Commodity Contracts
Net realized gain (loss) on: Futures $ - $ 20,728 Foreign currency transactions 1,162,380 - Total net realized gain (loss) $ 1,162,380 $ 20,728 Net change in unrealized appreciation (depreciation) on: Futures $ - $ 1,845 Foreign currency translations 186,134 - Total net change in unrealized appreciation (depreciation) $ 186,134 $ 1,845 Merk Absolute Return Currency Fund
Location: Currency Contracts
Net realized gain (loss) on: Foreign currency transactions $ 704,841 Net change in unrealized appreciation (depreciation) on: Foreign currency translations $ (224,574)
Asset (Liability) amounts shown in the table below represent amounts for derivative related investments for each Fund at March 31, 2016. These amounts may be collateralized by cash or financial instruments.
Gross Asset (Liability) as Presented in the Statements
of Assets and Liabilities Financial Instruments (Received) Pledged**
Cash Collateral (Received) Pledged** Net Amount
Merk Hard Currency Fund Assets: Over-the-counter derivatives* $ 23,237 $ - $ - $ 23,237 Merk Absolute Return Currency Fund Assets: Over-the-counter derivatives* $ 2,987,750 $ - $ - $ 2,987,750 Liabilities: Over-the-counter derivatives* (3,897,931) 3,897,931 - - * Over-the-counter derivatives may consist of forward currency contracts and futures contracts. The amounts disclosed above represent the exposure to one or more
counterparties. For further detail on individual derivative contracts and the corresponding unrealized appreciation (depreciation), see the Schedule of Investments. ** The actual financial instruments and cash collateral (received) pledged may be in excess of the amounts shown in the table. The table only reflects collateral amounts
up to the amount of the financial instrument disclosed on the Statements of Assets and Liabilities.
21
Note 7. Federal Income Tax
There were no distributions paid during the fiscal year ended March 31, 2016 for either Fund. Distributions paid during the fiscal year ended March 31, 2015 were characterized for tax purposes as follows:
Ordinary Income
Merk Hard Currency Fund $ 2,095,773
Merk Absolute Return Currency Fund $ 743,291
As of March 31, 2016, distributable earnings (accumulated loss) on a tax basis were as follows:
Capital and Other
Losses
Unrealized Appreciation
(Depreciation) Total
Merk Hard Currency Fund $ (4,886,593) $ (3,817,613) $ (8,704,206)
Merk Absolute Return Currency Fund (817,021) 718,957 (98,064)
The difference between components of distributable earnings on a tax basis and the amounts reflected in the Statements of Assets and Liabilities are primarily due to grantor trust adjustments, futures contracts, forward contracts and wash sales.
For tax purposes, the current year post-October loss was $1,095,099 for Merk Hard Currency Fund, and the current deferred late year ordinary loss was $1,046,061 and $815,602 for Merk Hard Currency Fund and Merk Absolute Return Currency Fund, respectively (realized during the period November 1, 2015 through March 31, 2016). These losses will be recognized for tax purposes on the first business day of each Fund�’s next fiscal year, April 1, 2016.
As of March 31, 2016, the Funds had the following available short term and long term capital loss carry forwards that have no expiration date:
Short Term Long Term Merk Hard Currency Fund $ 495,245 $ 2,250,188Merk Absolute Return Currency Fund 1,419 - On the Statements of Assets and Liabilities, as a result of permanent book to tax differences, certain amounts have been reclassified for the year ended March 31, 2016. The following reclassifications were the result of currency gain/loss reclassification, grantor trust adjustments and net operating losses and have no impact on the net assets of each Fund.
Undistributed Net Investment Income (Loss)
Accumulated Net Realized Gain (Loss)
Paid-in-Capital
Merk Hard Currency Fund $ 20,667,911 $ 7,851,590 $ (28,519,501)Merk Absolute Return Currency Fund (41,931) 2,643,684 (2,601,753)
Note 8. Underlying Investments in Other Pooled Investment Vehicles
The Merk Hard Currency Fund currently invests a portion of its assets in the VanEck Merk Gold Trust. The Merk Hard Currency Fund may eliminate its investments at any time if the Adviser determines that it is in the best interest of the Fund and its shareholders.
The performance of the Merk Hard Currency Fund may be directly affected by the performance of the VanEck Merk Gold Trust. The financial statements of the VanEck Merk Gold Trust, including the portfolio of investments, can be found at the Merk Funds website www.merkfunds.com, or the Securities and Exchange Commission�’s website www.sec.gov and should be read in conjunction with the Merk Hard Currency Fund�’s financial statements. As of March 31, 2016 the percentage of the Merk Hard Currency Fund�’s net assets invested in the VanEck Merk Gold Trust was 19.1%.
Note 9. Subsequent Events
Subsequent events occurring after the date of this report through the date these financial statements were issued have been evaluated for potential impact and each Fund has had no such events.
REPORT OF INDEPENDENT REGISTERED MARCH 31, 2016 PUBLIC ACCOUNTING FIRM
22
To the Shareholders of Merk Hard Currency Fund and Merk Absolute Return Currency Fund and the Board of Trustees of Forum Funds We have audited the accompanying statements of assets and liabilities of the Merk Hard Currency Fund and Mark Absolute Return Currency Fund (the "Funds"), each a series of shares of beneficial interest in the Forum Funds, including the schedules of investments, as of March 31, 2016, and the related statements of operations for the year then ended, the statements of changes in net assets for each of the years in the two-year period then ended and the financial highlights for each of the years in the five-year period then ended. These financial statements and financial highlights are the responsibility of the Funds' management. Our responsibility is to express an opinion on these financial statements and financial highlights based on our audits. We conducted our audits in accordance with the standards of the Public Company Accounting Oversight Board (United States). Those standards require that we plan and perform the audits to obtain reasonable assurance about whether the financial statements and financial highlights are free of material misstatement. An audit includes examining, on a test basis, evidence supporting the amounts and disclosures in the financial statements. Our procedures included confirmation of securities owned as of March 31, 2016 by correspondence with the custodian and brokers. An audit also includes assessing the accounting principles used and significant estimates made by management, as well as evaluating the overall financial statement presentation. We believe that our audits provide a reasonable basis for our opinion. In our opinion, the financial statements and financial highlights referred to above present fairly, in all material respects, the financial position of the Merk Hard Currency Fund and Merk Absolute Return Currency Fund as of March 31, 2016, and the results of their operations for the year then ended, the changes in their net assets for each of the years in the two-year period then ended and their financial highlights for each of the years in the five-year period then ended, in conformity with accounting principles generally accepted in the United States of America.
BBD, LLP Philadelphia, Pennsylvania May 24, 2016
ADDITIONAL INFORMATION (UNAUDITED) MARCH 31, 2016
23
Proxy Voting Information
A description of the policies and procedures that each Fund uses to determine how to vote proxies relating to securities held in each Fund�’s portfolio is available, without charge and upon request, by calling (866) 637-5386 and on the U.S. Securities and Exchange Commission�’s (the �“SEC�”) website at www.sec.gov. Each Fund�’s proxy voting record for the most recent twelve-month period ended June 30 is available, without charge and upon request, by calling (866) 637-5386 and on the SEC�’s website at www.sec.gov.
Availability of Quarterly Portfolio Schedules
Each Fund files its complete schedule of portfolio holdings with the SEC for the first and third quarters of each fiscal year on Form N-Q. These filings are available, without charge and upon request on the SEC�’s website at www.sec.gov or may be reviewed and copied at the SEC�’s Public Reference Room in Washington, DC. Information on the operation of the Public Reference Room may be obtained by calling (800) SEC-0330.
Shareholder Expense Example
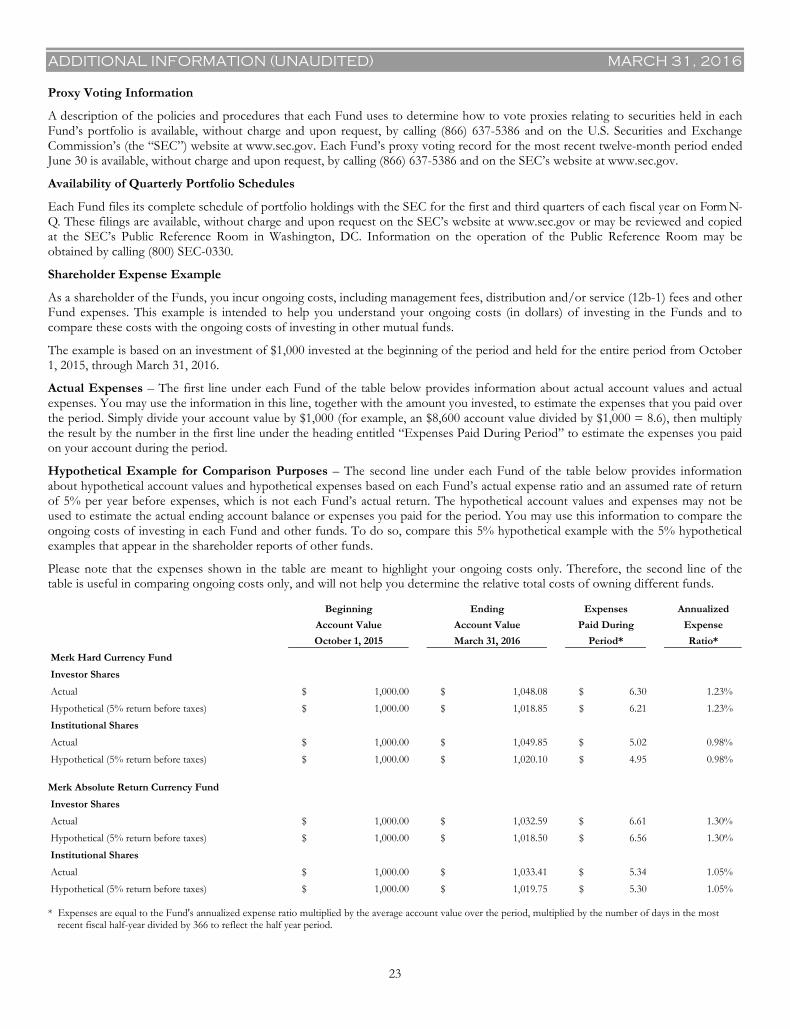
As a shareholder of the Funds, you incur ongoing costs, including management fees, distribution and/or service (12b-1) fees and other Fund expenses. This example is intended to help you understand your ongoing costs (in dollars) of investing in the Funds and to compare these costs with the ongoing costs of investing in other mutual funds.
The example is based on an investment of $1,000 invested at the beginning of the period and held for the entire period from October 1, 2015, through March 31, 2016.
Actual Expenses �– The first line under each Fund of the table below provides information about actual account values and actual expenses. You may use the information in this line, together with the amount you invested, to estimate the expenses that you paid over the period. Simply divide your account value by $1,000 (for example, an $8,600 account value divided by $1,000 = 8.6), then multiply the result by the number in the first line under the heading entitled �“Expenses Paid During Period�” to estimate the expenses you paid on your account during the period.
Hypothetical Example for Comparison Purposes �– The second line under each Fund of the table below provides information about hypothetical account values and hypothetical expenses based on each Fund�’s actual expense ratio and an assumed rate of return of 5% per year before expenses, which is not each Fund�’s actual return. The hypothetical account values and expenses may not be used to estimate the actual ending account balance or expenses you paid for the period. You may use this information to compare the ongoing costs of investing in each Fund and other funds. To do so, compare this 5% hypothetical example with the 5% hypothetical examples that appear in the shareholder reports of other funds.
Please note that the expenses shown in the table are meant to highlight your ongoing costs only. Therefore, the second line of the table is useful in comparing ongoing costs only, and will not help you determine the relative total costs of owning different funds.
Beginning Ending Expenses Annualized Account Value Account Value Paid During Expense October 1, 2015 March 31, 2016 Period* Ratio* Merk Hard Currency Fund Investor Shares Actual $ 1,000.00 $ 1,048.08 $ 6.30 1.23% Hypothetical (5% return before taxes) $ 1,000.00 $ 1,018.85 $ 6.21 1.23% Institutional Shares Actual $ 1,000.00 $ 1,049.85 $ 5.02 0.98% Hypothetical (5% return before taxes) $ 1,000.00 $ 1,020.10 $ 4.95 0.98% Merk Absolute Return Currency Fund Investor Shares Actual $ 1,000.00 $ 1,032.59 $ 6.61 1.30% Hypothetical (5% return before taxes) $ 1,000.00 $ 1,018.50 $ 6.56 1.30% Institutional Shares Actual $ 1,000.00 $ 1,033.41 $ 5.34 1.05% Hypothetical (5% return before taxes) $ 1,000.00 $ 1,019.75 $ 5.30 1.05% * Expenses are equal to the Fund's annualized expense ratio multiplied by the average account value over the period, multiplied by the number of days in the most
recent fiscal half-year divided by 366 to reflect the half year period.
24
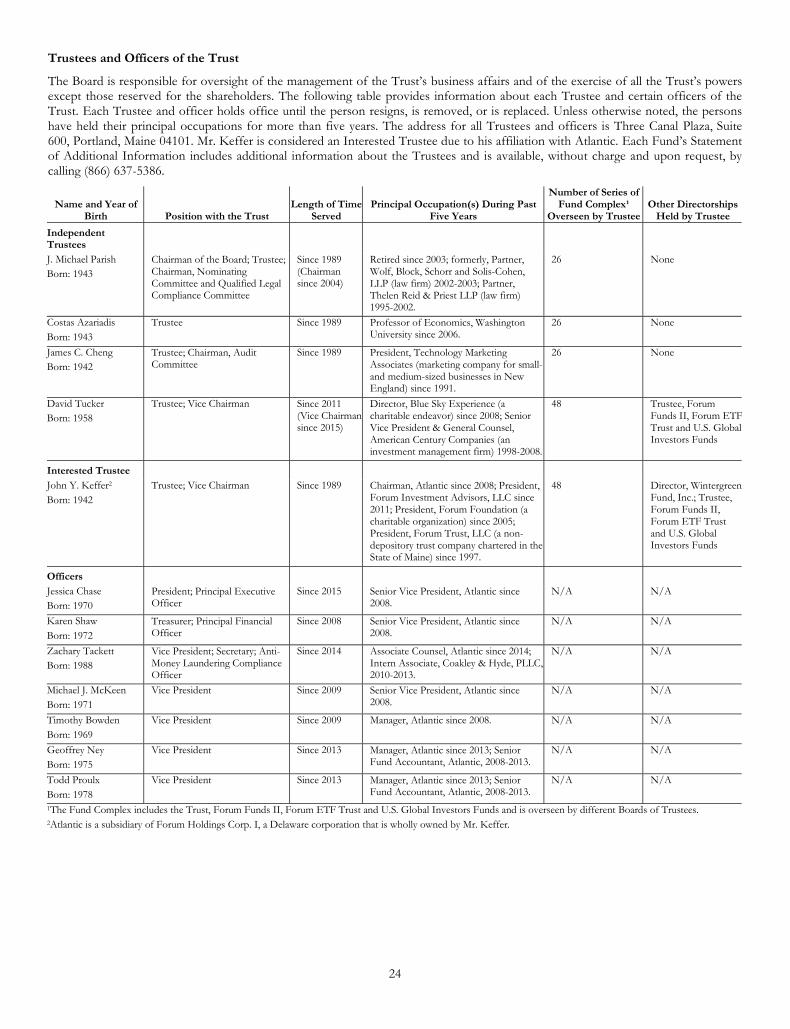
Trustees and Officers of the Trust
The Board is responsible for oversight of the management of the Trust�’s business affairs and of the exercise of all the Trust�’s powers except those reserved for the shareholders. The following table provides information about each Trustee and certain officers of the Trust. Each Trustee and officer holds office until the person resigns, is removed, or is replaced. Unless otherwise noted, the persons have held their principal occupations for more than five years. The address for all Trustees and officers is Three Canal Plaza, Suite 600, Portland, Maine 04101. Mr. Keffer is considered an Interested Trustee due to his affiliation with Atlantic. Each Fund�’s Statement of Additional Information includes additional information about the Trustees and is available, without charge and upon request, by calling (866) 637-5386.
Name and Year of Birth Position with the Trust
Length of Time Served
Principal Occupation(s) During Past Five Years
Number of Series of Fund Complex¹
Overseen by Trustee Other Directorships
Held by Trustee Independent Trustees
J. Michael Parish Born: 1943
Chairman of the Board; Trustee; Chairman, Nominating Committee and Qualified Legal Compliance Committee
Since 1989 (Chairman since 2004)
Retired since 2003; formerly, Partner, Wolf, Block, Schorr and Solis-Cohen, LLP (law firm) 2002-2003; Partner, Thelen Reid & Priest LLP (law firm) 1995-2002.
26 None
Costas Azariadis Born: 1943
Trustee Since 1989 Professor of Economics, Washington University since 2006.
26 None
James C. Cheng Born: 1942
Trustee; Chairman, Audit Committee
Since 1989 President, Technology Marketing Associates (marketing company for small-and medium-sized businesses in New England) since 1991.
26 None
David Tucker Born: 1958
Trustee; Vice Chairman Since 2011 (Vice Chairman since 2015)
Director, Blue Sky Experience (a charitable endeavor) since 2008; Senior Vice President & General Counsel, American Century Companies (an investment management firm) 1998-2008.
48 Trustee, Forum Funds II, Forum ETF Trust and U.S. Global Investors Funds
Interested Trustee
John Y. Keffer2 Born: 1942
Trustee; Vice Chairman Since 1989 Chairman, Atlantic since 2008; President, Forum Investment Advisors, LLC since 2011; President, Forum Foundation (a charitable organization) since 2005; President, Forum Trust, LLC (a non-depository trust company chartered in the State of Maine) since 1997.
48 Director, Wintergreen Fund, Inc.; Trustee, Forum Funds II, Forum ETF Trust and U.S. Global Investors Funds
Officers
Jessica Chase Born: 1970
President; Principal Executive Officer
Since 2015 Senior Vice President, Atlantic since 2008.
N/A N/A
Karen Shaw Born: 1972
Treasurer; Principal Financial Officer
Since 2008 Senior Vice President, Atlantic since 2008.
N/A N/A
Zachary Tackett Born: 1988
Vice President; Secretary; Anti-Money Laundering Compliance Officer
Since 2014 Associate Counsel, Atlantic since 2014; Intern Associate, Coakley & Hyde, PLLC, 2010-2013.
N/A N/A
Michael J. McKeen Born: 1971
Vice President Since 2009 Senior Vice President, Atlantic since 2008.
N/A N/A
Timothy Bowden Born: 1969
Vice President Since 2009 Manager, Atlantic since 2008. N/A N/A
Geoffrey Ney Born: 1975
Vice President Since 2013 Manager, Atlantic since 2013; Senior Fund Accountant, Atlantic, 2008-2013.
N/A N/A
Todd Proulx Born: 1978
Vice President Since 2013 Manager, Atlantic since 2013; Senior Fund Accountant, Atlantic, 2008-2013.
N/A N/A
1The Fund Complex includes the Trust, Forum Funds II, Forum ETF Trust and U.S. Global Investors Funds and is overseen by different Boards of Trustees. 2Atlantic is a subsidiary of Forum Holdings Corp. I, a Delaware corporation that is wholly owned by Mr. Keffer.

® MutualFunds
Merk Hard Currency Fund
Merk Absolute ReturnCurrency Fund
P.O. BOX 588PORTLAND, ME 04112
208-ANR-031
INVESTMENT ADVISERMerk Investments LLC
Palo Alto, CA 9430www.merkfunds.com
TRANSFER AGENTAtlantic Fund Services
P.O. Box 588Portland, ME 04112
DISTRIBUTORForeside Fund Services, LLCThree Canal Plaza, Suite 100
Portland, ME 04101www.foreside.com
This report is submitted for the general information of the shareholdersof each Fund. It is not authorized for distribution to prospective
investors unless preceded or accompanied by an effective prospectus,which includes information regarding each Fund’s risks, objectives, fees
and expenses, experience of its management and other information.
FOR MORE INFORMATION