Embed Size (px)
Citation preview

The annual cycle of water vapor on Mars as observed by the
Thermal Emission Spectrometer
Michael D. SmithNASA Goddard Space Flight Center, Greenbelt, Maryland, USA
Received 31 May 2001; revised 30 October 2001; accepted 19 November 2001; published 27 November 2002.
[1] Spectra taken by theMars Global Surveyor Thermal Emission Spectrometer (TES) havebeen used to monitor the latitude, longitude, and seasonal dependence of water vapor forover one full Martian year (March 1999 to March 2001). A maximum in water vaporabundance is observed at high latitudes during midsummer in both hemispheres, reaching amaximum value of �100 pr-mm in the north and �50 pr-mm in the south. Low water vaporabundance (<5 pr-mm) is observed at middle and high latitudes in the fall and winter of bothhemispheres. There are large differences in the hemispheric (north versus south) andseasonal (perihelion versus aphelion) behavior of water vapor. The latitudinal and seasonaldependence of the decay of the northern summer water vapor maximum implies cross-equatorial transport of water to the southern hemisphere, while there is little or nocorresponding transport during the decay of the southern hemisphere summer maximum.The latitude-longitude dependence of annually averaged water vapor (corrected fortopography) has a significant positive correlation with albedo and significant negativecorrelations with thermal inertia and surface pressure. Comparison of TES results with thoseretrieved from theVikingOrbiterMars AtmosphericWater Detectors (MAWD) experiments[Jakosky and Farmer, 1982] shows some similar features but also many significantdifferences. The southern hemisphere maximum observed by TES was not observed byMAWD, and the large latitudinal gradient in annually averaged water vapor observed byMAWD does not appear in the TES results. INDEX TERMS: 6225 Planetology: Solar System
Objects: Mars; 5409 Planetology: Solid Surface Planets: Atmospheres—structure and dynamics; 5464
Planetology: Solid Surface Planets: Remote sensing; KEYWORDS: Mars, Mars atmosphere, water vapor, Mars
Global Surveyor, Thermal Emission Spectrometer
Citation: Smith, M. D., The annual cycle of water vapor on Mars as observed by the Thermal Emission Spectrometer, J. Geophys.
Res., 107(E11), 5115, doi:10.1029/2001JE001522, 2002.
1. Introduction
[2] Although water vapor is a minor constituent in theatmosphere of Mars, it still plays an important role. Alongwith the annual cycles of CO2 and dust, the annual watercycle is one of the three main cycles that define the presentMars climate. Since the first detection of water vapor onMarsby Spinrad et al. [1963] there have been many additionalobservations, both from ground-based observers and fromspacecraft. Jakosky [1985] and Jakosky and Haberle [1992]give good reviews of water vapor measurements.[3] Since the time of the Viking mission, the definitive
description of the seasonal and latitudinal dependence ofwater vapor has been that derived from the Viking OrbiterMars Atmospheric Water Detectors (MAWD) [Farmer etal., 1977; Jakosky and Farmer, 1982]. That data set shows aglobal annual average of about 10 pr-mm of water withhigher values over the northern hemisphere in the northernsummer reaching a maximum of �90 pr-mm near the northpole at about Ls = 120�. Although interannual variability has
been noted [e.g., Clancy et al., 1992; Sprague et al., 1996],most ground-based observations of water vapor have beenmore-or-less consistent with the general pattern observed byMAWD. Notable exceptions to the MAWD trend were theobservation by Barker et al. [1970] of a maximum in watervapor abundance (reaching 30–40 pr-mm) in the southernsummer season compared to the very weak maximum in theMAWD data of 10–15 pr-mm at that season, and theobservation by Barker of a somewhat higher water vaporcolumn (15–20 pr-mm) at all seasons during the two Marsyears 1972–1976 [Jakosky and Barker, 1984].[4] The Thermal Emission Spectrometer (TES) on board
the Mars Global Surveyor (MGS) has been in mapping orbitaround Mars since March 1999, and now provides anexcellent opportunity to examine the column abundance ofwater vapor over an entire Mars year in great detail. Previousresults of atmospheric thermal structure and aerosol distri-bution from TES are given by Smith et al. [2001], Pearl et al.[2001], Conrath et al. [2000], Smith et al. [2000a, 2000c],and Christensen et al. [1998]. In this paper we report theresults of one Mars year of TES monitoring of water vapor.[5] In section 2 we give a brief description of the TES
instrument and the data taken during the mapping orbit.
JOURNAL OF GEOPHYSICAL RESEARCH, VOL. 107, NO. E11, 5115, doi:10.1029/2001JE001522, 2002
Copyright 2002 by the American Geophysical Union.0148-0227/02/2001JE001522$09.00
25 - 1

More detailed information is given by Christensen et al.[1992, 2001]. In section 3 we describe the algorithm usedfor the retrieval of water vapor column abundance. Insection 4 we present our results and compare them withViking MAWD and ground-based observations. We discussour findings in section 5, and summarize in section 6.
2. Data Set
[6] The Mars Global Surveyor mapping orbit gives onenarrow strip of observations running roughly north-south.One day of data gives two sets of twelve such strips spacedroughly 30� apart in longitude, with one set taken near a localtime of 0200 and the other near 1400. For this work, we useonly the nadir-geometry daytime (1400 hours) data. We donot use nighttime data because they have lower signal-to-noise and the atmospheric temperature profiles retrievedfrom nighttime TES data potentially have relatively largeuncertainties near the surface where water vapor is oftenconcentrated. This is because the km-scale vertical structureof the near-surface boundary layer nighttime temperatureinversion observed in the MGS radio occultation profiles[Hinson et al., 1999] cannot be resolved by TES.[7] To obtain a global- and seasonal-scale view of water
vapor abundance we average the long wavelength portion ofdaytime nadir-geometry TES spectra into bins that are 2�wide in latitude and 2� wide in season (Ls). All longitudesare binned together, so these represent zonal averages. Thisresults in �11000 bins. Spectra are averaged separately forthe two spectral resolutions (6.25 and 12.5 cm�1) that are
used by TES. The results presented below were retrievedusing data starting with the beginning of the mappingportion of the MGS mission at Ls = 104� (1 March 1999)and extending for just over one full Mars year to Ls = 137�(28 March 2001). The TES operated nearly continuallyduring this entire period with only minor exceptions.Several million spectra were used in this analysis.
3. Water Vapor Retrieval Algorithm
[8] Figure 1 shows a line-by-line synthetic water vaporspectrum convolved to the TES resolution of 6.25 cm�1. Atthis spectral resolution, TES has a sampling interval ofabout 5.3 cm�1. To retrieve water vapor abundance, we usethe rotation bands in the region 240–360 cm�1 (28–42mm). At 6.25 cm�1 resolution the hundreds of individualwater vapor lines that lie in this spectral region are com-bined into five main bands spaced roughly 20–30 cm�1
apart. This spectral region is a favorable place to perform aretrieval because at these wavelengths the TES signal-to-noise is relatively high (�500), the opacity from dust andwater-ice is relatively low [Smith et al., 2000a, 2000b], andthe distinctive, ‘‘picket-fence’’ spectral dependence of thewater vapor bands allows the contribution from water vaporto the spectrum to be easily separated from the contributionsfrom dust, water ice, and the surface.[9] The TES contains a 2 � 3 array of detectors. Because
optical path lengths in the instrument are slightly differentfor each detector, the wave numbers sampled by eachdetector for a given TES sample number are slightly offset
Figure 1. A synthetic line-by-line spectrum of water vapor convolved to the TES resolution of 6.25cm�1 for the wavelengths used in this analysis for typical conditions (solid line). The spectrum is shownin terms of opacity. The filled boxes show the best-fit wavenumber locations for the TES samples in the6.25 cm�1 resolution mode. The numbers refer to TES sample numbers. The five water vapor band peaksused in this analysis (centered near TES samples 20, 26, 30, 35, and 40) are separated by roughly 5 TESsamples or 25 cm�1.
25 - 2 SMITH: MARS WATER VAPOR

(by as much as a couple of cm�1). Water vapor rotationbands have sufficient spectral structure (see Figure 1) thatspectra from different detectors cannot be averaged togetherwithout significantly ‘‘smearing out’’ the bands. Therefore,we only use spectra from TES detector 2, which has theadvantage of being one of the two detectors nearest thecentral ray of the instrument. We have calibrated the wavenumber scale by shifting the grid of wave numbers as afunction of TES sample number until the shape and ampli-tude of water vapor lines observed in the TES spectra bestmatch the synthetic spectrum. This wave number calibrationis quite sensitive. A variation of one-tenth of the TESsampling (or about 0.5 cm�1) results in a noticeably worsefit. The resulting sampling of the water vapor spectrum isshown as points on the synthetic spectrum in Figure 1.
3.1. Model Atmosphere
[10] For each Ls/latitude bin, the thermal structure of theatmosphere is taken to be the average of all atmospherictemperature profiles available for that bin. Atmospherictemperatures are retrieved from each TES observation (eachfootprint of 2 � 3 detectors) as part of the standard opera-tional TES processing using a constrained linear inversionof observed radiance in the 15-mm CO2 band [Conrath etal., 2000]. The surface temperature for each bin is taken tobe the average brightness temperature in the relativelytransparent spectral window between 1285 and 1315cm�1 for all available spectra in that bin.[11] Water vapor absorption is computed using the corre-
lated-k method [for example, Goody et al., 1989]. Corre-lated-k coefficients for an array of different temperatures andpressures are computed using a line-by-line computation ofwater vapor transmittance. Water vapor line parameters areobtained from the GEISA-97 database [Husson et al., 1992].For the water vapor lines of interest, the line parameters fromGEISA-97 are essentially identical to those of the HITRAN-2000 database. An approximate correction is made to the linewidths to account for CO2-broadening of water vapor (seesection 3.5). The vertical distribution of water vapor isapproximated as being well-mixed with the CO2 gas up tothe water vapor condensation level and then zero above that.The condensation level is a function of both the atmospherictemperature profile and the water vapor column abundance.Therefore, an initial guess for the water vapor columnabundance is used to compute an initial condensation leveland then the entire retrieval is iterated until a self-consistentsolution is obtained. Typically no more than two or threeiterations are required for convergence.
3.2. Equivalent Opacity and Band Depth Index
[12] The first step in the water vapor retrieval algorithm isto convert the averaged observed radiance spectrum, Iobs(n),in each Ls/latitude bin to an equivalent opacity spectrum,t0(n), through numerical solution of the radiative transferequation:
Iobs nð Þ ¼ � nð ÞB Tsurf ; n½ � e�t0 nð Þ=m þZ t0 nð Þ
0
B T tð Þ; n½ �e�t=mdt; ð1Þ
where n is frequency, m is the cosine of the emission angle,B[T, n] is the Planck function, Tsurf is the surfacetemperature, T(t) is the atmospheric temperature, and theintegral is performed from the spacecraft (at t = 0) to thesurface (at t = t0).
[13] The above equation neglects scattering and the solarbeam, and assumes a plane-parallel geometry. These areexcellent approximations for the observation of water vaporin the TES nadir-geometry mode at 240–360 cm�1. Theintegral in opacity is evaluated by assuming that the opacitysource is well-mixed up to the water vapor condensationlevel and then zero above that.[14] The opacity spectrum obtained from solution of (1)
contains opacity from water vapor, dust aerosol, water iceaerosol, and the effect of a non-unit surface emissivity. Thecontribution from water vapor is estimated by removing acontinuum opacity from each of the five main water vaporbands. The underlying assumption is that the spectralsignatures of dust, water ice, and surface emissivity areapproximately linear over the narrow spectral range (about20 cm�1) of each individual water vapor band [Smith et al.,2000a, 2000b; Bandfield et al., 2000a]. An overall watervapor band depth index for the 6.25 cm�1 resolution data,t6.25, is then formed by averaging the continuum-removedopacities for the five bands as follows:
t6:25 ¼ ½�t0 18ð Þ þ 2
3t0 19ð Þ þ t0 20ð Þ þ t0 21ð Þ½ � � t0 22ð Þ
� t0 24ð Þ þ 2t0 26ð Þ � t0 28ð Þ � t0 29ð Þþ 2t0 30ð Þ � t0 31ð Þ � t0 33ð Þ þ 2t0 35ð Þ� t0 37ð Þ � t0 38ð Þ þ 2t0 40ð Þ � t0 42ð Þ�=12; ð2Þ
where the numbers in parentheses indicate the TES samplenumber (see Figure 1). Similarly, an overall water vaporband depth index can be formed for the 12.5 cm�1 resolutiondata, t12.5, by averaging the continuum-removed opacity forthe bands observed in 12.5 cm�1 data.
3.3. Cross-Calibration of 6.25 and 12.5 cm-1 Data
[15] Most of the spectra taken by TES before �Ls = 90�(December 2000) were taken in the 12.5 cm�1 spectralresolution mode, while most of the spectra taken after Ls =90� were taken in the 6.25 cm�1 spectral resolution mode.Figure 2 shows a comparison of TES observations of watervapor at 6.25 cm�1 and 12.5 cm�1 taken at nearly the sametime (Ls = 307�) and location (79�S latitude). Although it ispossible to perform the water vapor retrieval separately foreach spectral resolution, we have found it more convenientto convert the strength of the water vapor bands observed inthe 12.5 cm�1 mode to an equivalent strength as observed inthe 6.25 cm�1 mode, and then to perform a single retrievalusing the equivalent 6.25 cm�1 value of the water vaporband depth index. We have chosen to convert to 6.25 cm�1
resolution because the water vapor bands are much moreclearly defined at 6.25 cm�1 than they are at 12.5 cm�1 andso a more accurate retrieval can be performed.[16] Most of the Ls/latitude bins contain only one
spectral resolution or the other, but there are still over1800 bins that contain at least 10 spectra from eachresolution. These bins are used to find how the observedwater vapor band depth at 12.5 cm�1 relates to thatobserved at 6.25 cm�1. Figure 3 shows the relationbetween the 6.25 and 12.5 cm�1 water vapor band depthindices. The data are well-described by the empirical linearrelation
t6:25 ¼ 1:45 t12:5 � 0:0035ð Þ: ð3Þ
SMITH: MARS WATER VAPOR 25 - 3

For each Ls/latitude bin, the 6.25 and 12.5 cm�1 water vapor
band depth indices are computed, and the band depth for the12.5 cm�1 resolution data is converted to an equivalent 6.25cm�1 resolution value using (3). The final band depth indexfor each bin is then given by the average of the band depthindex from the 6.25 cm�1 data and the equivalent banddepth index inferred from the 12.5 cm�1 weighted by thenumber of spectra at each resolution.
3.4. Water Vapor Column Abundance From BandDepth Index
[17] The conversion from a water vapor band depth indexto a column abundance is performed for each Ls/latitude binby computing a suite of synthetic water vapor spectra at arange of different column abundances. The synthetic spectraare computed at 6.25 cm�1 spectral resolution and at thewave numbers sampled by TES. The synthetic spectrum isconverted first to opacity spectra using (1) and then next towater vapor band depth index using (2). Water vapor columnabundance is solved numerically by variation of the columnabundance until the band depth index from the synthetic datamatches the observed band depth. At this point a new watervapor condensation level is computed using the new estimateof water vapor column abundance and the entire retrievalprocess is iterated until convergence is obtained.[18] Figure 4 shows the resulting fit for one Ls/latitude bin
(centered at 43�N latitude, Ls = 85�) shown in terms ofopacity. A continuum has been removed from the TESopacity spectrum. The fit is excellent over the five bandsthat are used in the retrieval (between 240 and 360 cm�1)and still remains good for the strong band centered at 225
cm�1 and the weaker bands at 370–400 cm�1 which are notused in the retrieval. Both the relative amplitudes andspectral dependence (or shape) of the bands are well-reproduced. The retrieved water vapor column abundancefor this case is 25 pr-mm.
3.5. Water Vapor Line Broadening by Carbon Dioxide
[19] Synthetic water vapor spectra are computed using thecorrelated-k formulation. The correlated-k coefficients arederived from a very high resolution line-by-line computa-tion of the water vapor spectrum using water vapor linestrengths and widths from the GEISA-97 database. How-ever, the line widths given in the GEISA-97 database are forwater vapor broadened by terrestrial air, not by CO2 asappropriate for Mars. For water vapor abundances andatmospheric pressures typical for Mars, the net result atTES spectral resolution of an increase in line width is adecrease in water vapor transmittance (or an increase inwater vapor opacity). It is important to carefully considerthe effect of CO2 broadening and to make this correction tothe line widths because the effect on the retrieved watervapor column abundance is substantial. The value for CO2
broadening chosen below for this retrieval results in areduction of �40% in water vapor abundance.[20] We will call the ratio of the CO2-broadening coef-
ficient for water vapor to the air-broadening coefficient forwater vapor, the ‘‘broadening ratio’’. A value of the broad-ening ratio greater than unity indicates that water vaporlines are broader in a certain partial pressure of CO2 thanthey are in the same partial pressure of air (as given by theGEISA-97 database). There is little experimental data on the
Figure 2. A comparison of averaged TES spectra at 6.25 cm�1 (solid line, filled boxes) and 12.5 cm�1
(dotted line, open boxes) spectral resolution taken at the same season and latitude (Ls = 306�–308� and78�–80�S latitude). Spectra are shown in terms of opacity. Water vapor bands are much better defined at6.25 cm�1.
25 - 4 SMITH: MARS WATER VAPOR

broadening ratio. Laboratory measurements of CO2 broad-ening in the near-infrared by Gamache et al. [1995] indicatea broadening ratio between about 0.9 and 1.8 depending onthe particular transition. However, none of the lines forwhich line widths measured were in the wave number rangeused in this retrieval. In modeling Venus near-infraredspectra, Pollack et al. [1993] and Crisp et al. [1991] haveestimated CO2 broadening of water vapor by using aconstant broadening ratio of 1.3 based on work by Howardet al. [1956]. In modeling Mars microwave spectra, Clancyet al. [1992] have used a constant broadening ratio of 1.6based on work by Liebe and Dillon [1969]. None of theseestimates for the broadening ratio is for the water vaporlines used in our retrieval. Given this lack of informationand consensus, we choose to adopt a constant value for thebroadening ratio of 1.5 that is roughly consistent with all ofthe above. We note (as elaborated below in section 3.6) thatuncertainty in this parameter leads to an uncertainty in theoverall scaling of our water vapor column abundanceestimates.
3.6. Estimation of Uncertainties
[21] The algorithm used to retrieve water vapor columnabundance has a number of steps, and there are at least
seven main sources for uncertainty in the final retrievedvalue: 1) instrument noise and calibration, 2) the retrieval ofsurface and atmospheric temperatures, 3) the assumedvertical distributions of dust and water vapor, 4) the removalof a continuum opacity from sources other than water vapor,5) the cross-calibration of 6.25 and 12.5 cm�1 resolutiondata, 6) the calculation of synthetic water vapor opacity, and7) the estimation of the effect of CO2 broadening on watervapor.[22] The uncertainty introduced by instrument noise and
calibration is relatively small. For daytime conditions, thetypical instrument noise of 3 � 10�8 W cm�2 sr�1/cm�1
[Christensen et al., 1992, 1998, 2001; Christensen, 1999]gives an opacity error of about 0.02 for any one particularTES spectral sample. However, since we use 17 TESspectral samples (in the 6.25 cm�1 mode) the error in theobserved band depth index is much smaller. The absoluteTES calibration is quite good, and errors that do occur tendto have little spectral structure (for example, a nearlyconstant offset). This type of error is effectively removedwhen we compute the band depth index and subtract thecontinuum opacity. Uncertainties contributed by theretrieved surface and atmospheric temperatures can be oforder 0.03 for a particular TES spectral sample [Smith et al.,2000a], but this is a systematic error that tends to be nearlyan offset in the opacity and is therefore removed in thecontinuum when the band depth index is computed.[23] There is not sufficient information in a TES nadir-
geometry spectrum to retrieve the vertical distribution ofdust or water vapor independently. TES limb-geometryspectra can potentially provide information on the verticalprofile of dust and water vapor above a height of 10 km[Smith et al., 2000c], but that retrieval is not yet operational,and is beyond the scope of this work. We have taken thevertical distribution of dust to be well-mixed, which hasbeen found to be a good approximation for dust in Viking[Pollack et al., 1977], Pathfinder [Smith et al., 1997], andTES data [Smith et al., 2000a]. We have taken the watervapor vertical dependence to be that of a well-mixed profilebelow the water condensation level and zero above it.Analysis of the vertical distribution of water vapor by Rodinet al. [1997], Burgdorf et al. [2000], and Gurwell et al.[2000] are all consistent with this assumption. The watervapor profile could be made to follow the saturation con-densation curve above the condensation level, but that valuedrops off very quickly with height and its contribution to thetotal column abundance is negligible. For the dust loadingsobserved by TES during the period considered here, weestimate the uncertainty introduced by the assumed verticaldistributions of dust and water vapor to be �5% or less.[24] The computation of a water vapor band depth index
by removal of a continuum opacity level contains theimplicit assumption that the spectral dependence of thecontribution to the effective opacity from all other sources(dust and water ice aerosols and a non-unit surface emis-sivity) varies smoothly over the spectral width of one watervapor band (20–30 cm�1) in the spectral range considered(240–360 cm�1). The spectral dependence of dust andwater ice aerosol do indeed have much less spectral struc-ture on that scale than does water vapor [Smith et al., 2000a,2000b; Bandfield et al., 2000a]. On a global scale, the twomajor surface emissivity spectral shapes (a basaltic and a
Figure 3. The relationship between water vapor banddepth computed using TES data taken in the 12.5 cm�1
resolution mode (t12.5) and that taken in the 6.25 cm�1
resolution mode (t6.25). A nearly linear relation existsallowing band depth at 12.5 cm�1 resolution to be convertedto an equivalent band depth at 6.25 cm�1 resolution. Thelinear fit is given by t6.25 = 1.45 (t12.5 � 0.0035).
SMITH: MARS WATER VAPOR 25 - 5

basaltic-andesite composition) also have much less spectralstructure in this spectral region than water vapor [Bandfieldet al., 2000b]. Hematite has some significant spectralstructure at the frequencies of interest, but it is at the 50–100 cm�1 scale [Christensen et al., 2000]. Hematite featuresare observed over only a very limited portion of the surfaceand we expect the features to be mostly removed by thecontinuum removal process. Therefore, the total uncertaintyin the water vapor band depth index caused by the con-tinuum removal is small.[25] The above four sources of uncertainty occur in the
process of finding the water vapor band depth index. Allfour are relatively small and we estimate that the totaluncertainty in the index for 6.25 cm�1 resolution data tobe no more than 0.003 (with typical values of the indexranging from 0.03 to 0.10, see Figure 3). The uncertainty inthe index for 12.5 cm�1 resolution data may be somewhathigher because of the fewer number of points used informing the index. The largest uncertainty in obtaining afinal averaged band depth index for a particular Ls/latitudebin is likely caused by uncertainty in the calibration of 12.5cm�1 resolution index values relative to those at 6.25 cm�1.Figure 3 shows the relation between the two, and the spreadof points around the given linear relation gives an indicationof the uncertainty which appears to be roughly 0.005–0.010(i.e. �10–20%) in a root-mean square sense.[26] The final two sources of uncertainty come from the
process of calibrating the water vapor band depth index to acolumn abundance in precipitable microns. The computa-tion of a water vapor band depth index based on a syntheticwater vapor spectrum involves a different set of uncertain-
ties than that described above for computation of theobserved band depth. There is no longer a contributionfrom instrument noise and calibration or from removal of acontinuum opacity from other sources. However, there arenew uncertainties not present when using the observed data,such as uncertainty in the H2O line strengths, positions, andshapes (line widths will be discussed separately, below) anderror caused by use of the correlated-k approximation. Thefirst three uncertainties are very difficult to estimate, butbased on the excellent fits we get to the observed data (seeFigure 4), we believe this is not a dominant source ofuncertainty. Results from the correlated-k method can bedirectly compared with ‘‘exact’’ line-by-line calculations toevaluate the error involved with using the correlated-kapproximation. With the 20 correlated-k integration pointsthat we use, errors are typically 1–2%.[27] The largest source of uncertainty in the end-to-end
retrieval algorithm is in our assumption of a value for thebroadening ratio, defined above as the amount of watervapor line-broadening by CO2 compared to that by terres-trial air (as tabulated in the GEISA and HITRAN data-bases). This uncertainty enters as a systematic erroressentially multiplying all results by a nearly constantfactor. The value of 1.5 assumed here leads to an increasein the water vapor band depth index of about 20% over thatfor terrestrial air-broadening. The individual water vaporlines being observed are highly saturated and are thereforein the regime where opacity goes as the square-root ofabundance. Thus, abundance goes as opacity (or the banddepth index which is based on opacity) squared and ournominal value for the broadening ratio gives an abundance
Figure 4. An example of the fit between the observed averaged TES spectrum (open boxes and solidline) and the best-fit synthetic spectrum (stars and dotted line) for one particular Ls/latitude bin (centeredat 43�N latitude, Ls = 85�) shown in terms of opacity. An opacity continuum has been removed from theobserved spectrum. A water vapor column abundance of 25 pr-mm is indicated.
25 - 6 SMITH: MARS WATER VAPOR

�40% lower than would be obtained with terrestrial air-broadening. The likely value for the true broadening ratio(averaged over the important lines) is between 1.2 and 1.8(see Section 3.5) meaning that there could be an error inretrieved water vapor column abundance of order ±25%.Note that this error would affect all retrieved water vaporamounts by a similar factor and would have very little effecton the dependence of water vapor as a function of Ls andlatitude.[28] In summary, the largest source of random error is the
cross-calibration of 6.25 and 12.5 cm�1 data. The totalestimated random error is 0.005–0.010, which correspondsto an uncertainty in water vapor column abundance of about3–5 pr-mm. A significant systematic error of as much as25% is possible through uncertainty in the broadening ratio.This would result in a nearly constant multiplicative factorbeing applied to all water vapor column abundances andwould not affect the distribution of water vapor as afunction of season and latitude.
4. Results
[29] The top panel of Figure 5 shows the column abun-dance of water vapor observed by TES as a function ofseason (Ls) and latitude. Water vapor abundance is shownfor the MGS mapping period between Ls = 104�, 1 March1999 and Ls = 137�, 28 March 2001. Results include onlydaytime data (local time �1400) where the surface temper-ature is >220 K. Results have been zonally averaged intobins that are 2� wide in latitude and 2� wide in Ls. The total
integrated water column integrated perpendicularly from thesurface to infinity is shown. No attempt has been made hereto correct for topography or to scale to an equivalentpressure surface.
4.1. Overview
[30] The TES water vapor results (top panel of Figure 5)show a strong maximum in the northern hemisphere sum-mer. A peak water column of �100 pr-mm was attained ineach of the two Martian years observed poleward of 80�Nlatitude at Ls = 110�–120�. At Ls = 120�, water vaporabundance dropped off monotonically from north to southwith an abundance of 50 pr-mm at 60�N latitude, 20 pr-mmat 15�N latitude, and less than 5 pr-mm of water vapor southof 20�S latitude. After Ls = 130�, water vapor abundancedeclined rapidly at high northerly latitudes falling below10 pr-mm by Ls = 170�. However, the water vapor abun-dance at low northerly latitudes continued to increase duringthis time forming a tongue of high water vapor abundanceextending equatorward and to later season from middlenortherly latitudes. For any particular latitude in the north-ern hemisphere, the peak water vapor column abundanceoccurred progressively later in the season for lower northernlatitudes. At 80�N latitude, water vapor column abundancereached a maximum value at Ls = 115�, as compared to Ls =135� for 45�N latitude and Ls = 150� for 30�N latitude. Theequatorial water vapor column exhibited a broad maximumbetween Ls = 180� and 210�. By Ls = 170� a well-developedmaximum in water vapor appeared between the equator and30�N latitude. This maximum in water vapor as a function
Figure 5. The column abundance of water vapor as a function of Ls and latitude: (top) as observed byTES. Contours show a smoothed representation of the results, and (bottom) as observed by VikingMAWD [Jakosky and Farmer, 1982].
SMITH: MARS WATER VAPOR 25 - 7

of latitude at 0�–30�N latitudes persisted throughout north-ern fall and winter until Ls = 40� in the following year, whenwater vapor abundance rapidly increased throughout thenorthern hemisphere.[31] In the southern hemisphere there was a gradual rise
in water vapor abundance throughout southern winter andspring as water vapor appeared to be transported southwardfrom the northern hemisphere. In late southern spring (Ls =220�), water vapor at low southerly latitudes decreasedsomewhat, while water vapor at middle and high southerlylatitudes increased. A maximum in southern hemispherewater vapor was reached at Ls = 290� with a columnabundance of �40 pr-mm poleward of 75�S latitude. At thistime there was a local minimum in the latitudinal depend-ence of water vapor at 10�–30�S latitude and a small localmaximum at 0�and 30�N latitude, which may be caused bytransport of water vapor from the southern hemisphere tothe north via the Hadley circulation. The latitudinal depend-ence of water vapor in the southern summer at Ls = 290�was very different than that in the northern summer at Ls =110�. While there was significant water vapor at highlatitudes near the summer pole in both seasons, the northernhemisphere summer maximum was stronger and did notshow a secondary low-latitude maximum in the winterhemisphere.[32] Water vapor abundance decreased from the southern
summer polar maximum after Ls = 300�, and decreasedplanetwide after Ls = 330�. The period between Ls = 330�and 40� exhibited minimum water vapor abundance withthe average global abundance of 7–8 pr-mm. Water vaporabundance began to increase significantly in the northernhemisphere after Ls = 40�, steadily climbing to its peakvalue Ls = 120� while the southern hemisphere water vaporremained relatively unchanged at a very low level.
4.2. Comparison With Viking MAWD
[33] The bottom panel of Figure 5 shows water vaporcolumn abundance retrieved from the Viking Orbiter Mars
Atmospheric Water Detectors (MAWD) [Farmer et al.,1977; Jakosky and Farmer, 1982]. There are some broadsimilarities between the MAWD and TES results. The mostobvious similarity is the magnitude and timing of the northpolar summertime maximum in water vapor abundance.Both MAWD and TES show >75 pr-mm water vapor pole-ward of 75�N latitude from Ls = 100�–125�. In fact, thegeneral dependence of water vapor on Ls and latitudebetween about Ls = 75� and 140� is fairly similar, althoughTES water vapor abundance is somewhat higher at lowlatitudes. Both data sets also indicate that the timing of thenorthern hemisphere maximum occurs later in season withdecreasing latitude. Another similarity between the MAWDand TES results is the existence of a generally low amountof water vapor in middle and high latitudes in the winterhemisphere (in both the north and the south).[34] Although the above features of the MAWD and TES
water vapor Ls/latitude maps are similar, there are also anumber of very significant differences. Figure 6 shows theratio of TES to MAWD water vapor abundance as afunction of Ls and season. The largest distinction arisesfrom the appearance of a strong maximum in water vapor atsouth polar latitudes just after summer solstice in the TESresults. No such maximum appears in the MAWD results.Interannual variability likely accounts for some of thisdifference, but some of the difference is associated withan observational bias in the MAWD data caused by twoglobal, or ‘‘planet-encircling’’ dust storms which began nearLs = 205� and 274�. As indicated in the MAWD papers[Farmer et al., 1977; Davies, 1979; Jakosky and Farmer,1982], scattering of the solar radiation by dust and water icebiases the MAWD water vapor abundance to lower valuesbecause the observed radiation does not sample the entirecolumn of water vapor. Davies [1979] estimated that avisible dust opacity of 0.5 would result in a derived watervapor abundance 10% lower than actual. Jakosky andFarmer [1982] estimated that a visible dust opacity of 1.0would result in a derived water vapor abundance 20% lower
Figure 6. Contour map of the ratio of water vapor abundance derived from TES spectra to the watervapor abundance derived from MAWD data [Jakosky and Farmer, 1982] as a function of Ls and latitude.The shading represents Ls and latitudes where Viking IRTM measurements showed 9-mm dust opacity>0.4 [Martin and Richardson, 1993]. The solid lines bounding the contours on the top and bottomrepresent the latitude extent of where both TES and MAWD results exist. Planet-encircling dust stormsoccurred at Ls = 205� and 270�. The times and locations of high dust opacity (shaded areas) correspond tothe times and locations of high TES/MAWD water vapor ratio.
25 - 8 SMITH: MARS WATER VAPOR
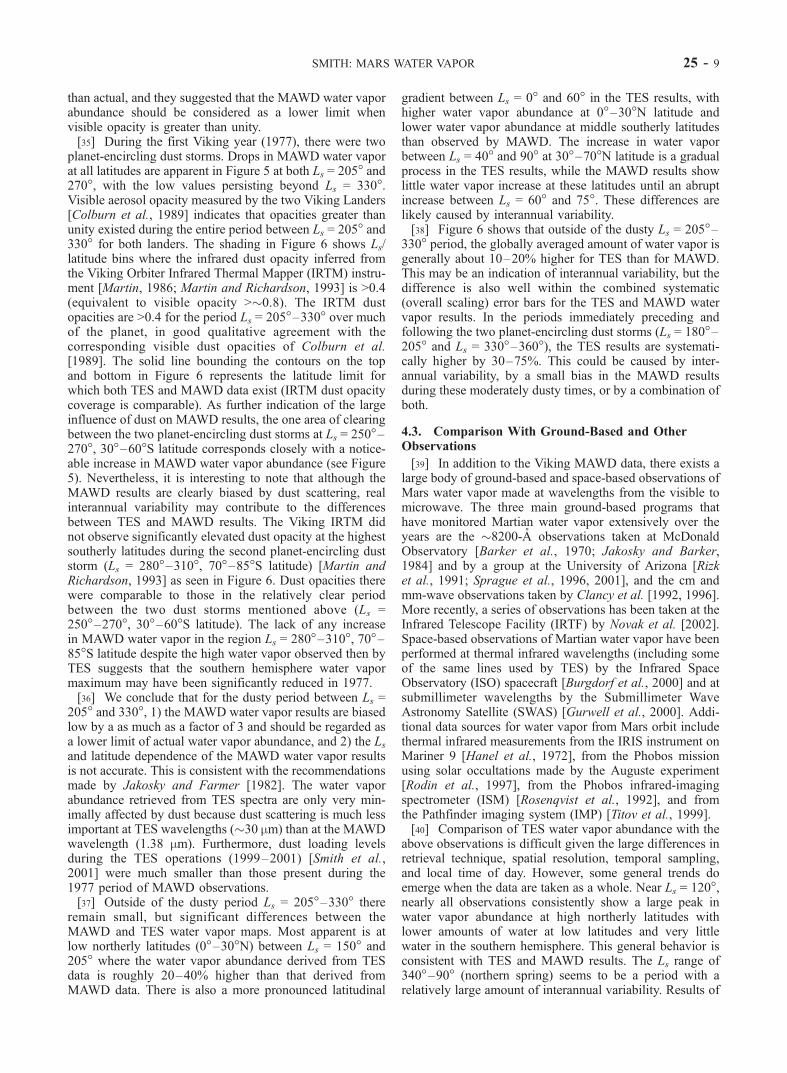
than actual, and they suggested that the MAWD water vaporabundance should be considered as a lower limit whenvisible opacity is greater than unity.[35] During the first Viking year (1977), there were two
planet-encircling dust storms. Drops in MAWD water vaporat all latitudes are apparent in Figure 5 at both Ls = 205� and270�, with the low values persisting beyond Ls = 330�.Visible aerosol opacity measured by the two Viking Landers[Colburn et al., 1989] indicates that opacities greater thanunity existed during the entire period between Ls = 205� and330� for both landers. The shading in Figure 6 shows Ls/latitude bins where the infrared dust opacity inferred fromthe Viking Orbiter Infrared Thermal Mapper (IRTM) instru-ment [Martin, 1986; Martin and Richardson, 1993] is >0.4(equivalent to visible opacity >�0.8). The IRTM dustopacities are >0.4 for the period Ls = 205�–330� over muchof the planet, in good qualitative agreement with thecorresponding visible dust opacities of Colburn et al.[1989]. The solid line bounding the contours on the topand bottom in Figure 6 represents the latitude limit forwhich both TES and MAWD data exist (IRTM dust opacitycoverage is comparable). As further indication of the largeinfluence of dust on MAWD results, the one area of clearingbetween the two planet-encircling dust storms at Ls = 250�–270�, 30�–60�S latitude corresponds closely with a notice-able increase in MAWD water vapor abundance (see Figure5). Nevertheless, it is interesting to note that although theMAWD results are clearly biased by dust scattering, realinterannual variability may contribute to the differencesbetween TES and MAWD results. The Viking IRTM didnot observe significantly elevated dust opacity at the highestsoutherly latitudes during the second planet-encircling duststorm (Ls = 280�–310�, 70�–85�S latitude) [Martin andRichardson, 1993] as seen in Figure 6. Dust opacities therewere comparable to those in the relatively clear periodbetween the two dust storms mentioned above (Ls =250�–270�, 30�–60�S latitude). The lack of any increasein MAWD water vapor in the region Ls = 280�–310�, 70�–85�S latitude despite the high water vapor observed then byTES suggests that the southern hemisphere water vapormaximum may have been significantly reduced in 1977.[36] We conclude that for the dusty period between Ls =
205� and 330�, 1) the MAWD water vapor results are biasedlow by a as much as a factor of 3 and should be regarded asa lower limit of actual water vapor abundance, and 2) the Lsand latitude dependence of the MAWD water vapor resultsis not accurate. This is consistent with the recommendationsmade by Jakosky and Farmer [1982]. The water vaporabundance retrieved from TES spectra are only very min-imally affected by dust because dust scattering is much lessimportant at TES wavelengths (�30 mm) than at the MAWDwavelength (1.38 mm). Furthermore, dust loading levelsduring the TES operations (1999–2001) [Smith et al.,2001] were much smaller than those present during the1977 period of MAWD observations.[37] Outside of the dusty period Ls = 205�–330� there
remain small, but significant differences between theMAWD and TES water vapor maps. Most apparent is atlow northerly latitudes (0�–30�N) between Ls = 150� and205� where the water vapor abundance derived from TESdata is roughly 20–40% higher than that derived fromMAWD data. There is also a more pronounced latitudinal
gradient between Ls = 0� and 60� in the TES results, withhigher water vapor abundance at 0�–30�N latitude andlower water vapor abundance at middle southerly latitudesthan observed by MAWD. The increase in water vaporbetween Ls = 40� and 90� at 30�–70�N latitude is a gradualprocess in the TES results, while the MAWD results showlittle water vapor increase at these latitudes until an abruptincrease between Ls = 60� and 75�. These differences arelikely caused by interannual variability.[38] Figure 6 shows that outside of the dusty Ls = 205�–
330� period, the globally averaged amount of water vapor isgenerally about 10–20% higher for TES than for MAWD.This may be an indication of interannual variability, but thedifference is also well within the combined systematic(overall scaling) error bars for the TES and MAWD watervapor results. In the periods immediately preceding andfollowing the two planet-encircling dust storms (Ls = 180�–205� and Ls = 330�–360�), the TES results are systemati-cally higher by 30–75%. This could be caused by inter-annual variability, by a small bias in the MAWD resultsduring these moderately dusty times, or by a combination ofboth.
4.3. Comparison With Ground-Based and OtherObservations
[39] In addition to the Viking MAWD data, there exists alarge body of ground-based and space-based observations ofMars water vapor made at wavelengths from the visible tomicrowave. The three main ground-based programs thathave monitored Martian water vapor extensively over theyears are the �8200-A observations taken at McDonaldObservatory [Barker et al., 1970; Jakosky and Barker,1984] and by a group at the University of Arizona [Rizket al., 1991; Sprague et al., 1996, 2001], and the cm andmm-wave observations taken by Clancy et al. [1992, 1996].More recently, a series of observations has been taken at theInfrared Telescope Facility (IRTF) by Novak et al. [2002].Space-based observations of Martian water vapor have beenperformed at thermal infrared wavelengths (including someof the same lines used by TES) by the Infrared SpaceObservatory (ISO) spacecraft [Burgdorf et al., 2000] and atsubmillimeter wavelengths by the Submillimeter WaveAstronomy Satellite (SWAS) [Gurwell et al., 2000]. Addi-tional data sources for water vapor from Mars orbit includethermal infrared measurements from the IRIS instrument onMariner 9 [Hanel et al., 1972], from the Phobos missionusing solar occultations made by the Auguste experiment[Rodin et al., 1997], from the Phobos infrared-imagingspectrometer (ISM) [Rosenqvist et al., 1992], and fromthe Pathfinder imaging system (IMP) [Titov et al., 1999].[40] Comparison of TES water vapor abundance with the
above observations is difficult given the large differences inretrieval technique, spatial resolution, temporal sampling,and local time of day. However, some general trends doemerge when the data are taken as a whole. Near Ls = 120�,nearly all observations consistently show a large peak inwater vapor abundance at high northerly latitudes withlower amounts of water at low latitudes and very littlewater in the southern hemisphere. This general behavior isconsistent with TES and MAWD results. The Ls range of340�–90� (northern spring) seems to be a period with arelatively large amount of interannual variability. Results of
SMITH: MARS WATER VAPOR 25 - 9
Rizk et al. [1991], Clancy et al. [1992], and Sprague et al.[1996] vary by as much as a factor of three during thisperiod. TES water vapor abundance tends to fall near theupper limit of this range of variation for the northernhemisphere, and near the middle or lower limit for thesouthern hemisphere. Near-infrared ground-based data fromthe IRTF taken by Novak et al. [2002] at Ls = 67� (January1997) is consistent with TES data taken two Mars yearslater southward of 30�N latitude, but is significantly lowerat middle and high northerly latitudes. Data from thePhobos/ISM instrument [Rosenqvist et al., 1992] takenduring this season (9 pr-mm for 0�–20�S latitude, and�12 pr-mm for 0�–20�N latitude at Ls = 2�–18�) are ingood agreement with TES data.[41] At Ls = 150�–160�, both the Pathfinder [Titov et al.,
1999] and the SWAS [Gurwell et al., 2000] find very lowwater vapor abundances of 6 and 8 pr-mm, respectively. TESobserved 24 pr-mm water vapor at the time and latitude ofthe Pathfinder observation (Ls = 150�, 19�N latitude), and adisk-integrated value of about 20 pr-mm at the time of theSWAS observation (Ls = 160�). It is not clear why these twoobservations are so low compared to TES (and to MAWD).[42] There are relatively few additional observations that
can be used to determine the degree to which the southernsummer maximum observed by TES at Ls = 260�–320�repeats each Martian year. Barker et al. [1970] and Jakoskyand Barker [1984] present disk-integrated water vapor fromMcDonald Observatory taken during this season. FollowingJakosky and Barker [1984], we estimate a disk-integratedTES value of 18 pr-mm water vapor at Ls = 220� increasingto 23 pr-mm at 280�–300� and falling to 16 pr-mm by Ls =330�. The McDonald Observatory data from 1969, oftencited as an unusually wet year are roughly consistent withthe TES values through Ls = 300�. However, the very highvalues of 30–45 pr-mm observed at Ls = 320�–350� are atleast twice as high as those observed by TES at that season.The extensive McDonald Observatory measurements madeduring 1972–1973 are consistently somewhat higher thanMAWD, but agree better with the TES data, especially forLs = 150�–300�. Hanel et al. [1972] report 10–20 pr-mmwater vapor from Mariner 9 IRIS spectra at Ls = 297� and321� in the region around the south polar cap, and obser-vations by Rizk et al. [1991] made in December 1988 at Ls =320� show a water vapor abundance of 15–20 pr-mm at highsoutherly latitudes. These values are lower than thoseobserved by TES (30–40 pr-mm at Ls = 297� and 20–25 pr-mm at Ls = 320�), but substantially higher than the5 pr-mm observed by MAWD.[43] The best ground-based measurements for compari-
son are those taken since 1 March 1999 so that a directcomparison can be made with the TES water vapor retriev-als. We know of three groups that have observations ofMartian water vapor during this time. The program atMcDonald Observatory to monitor Mars water vapor ledby E. Barker (personal communication, 2001) has observa-tions from 1999 and 2000 but these data have not yet beenreduced and calibrated. Sprague et al. [2001] report onobservations taken at 70�–80�N latitude between at Ls =105�–115� and at 150� in 1999 which can be directlycompared with TES observations taken from the beginningof mapping. TES water vapor abundance at 70�–80�Nlatitude and Ls = 105�–115� cover the range �50–100
pr-mm and so are roughly consistent, though perhaps some-what higher than the 43–76 pr-mm reported by Sprague etal. [2001]. At 70�–80�N latitude and Ls = 150�, TESobservations give 20–30 pr-mm water vapor which issignificantly higher than the 9–17 pr-mm reported bySprague et al. [2001]. Preliminary results are available fromrecent observations by R. Novak, M. Mumma, and M.DiSanti (personal communication, 2001) taken in the near-infrared (3.6 mm) at the IRTF on 22 March 1999 (Ls = 113�)and 16 January 2001 (Ls = 104�). The IRTF water vaporresults are comparable to those of TES from the same dateand latitude near the equator, but are significantly lower (by afactor of 2 or 3) than TES at middle and high northerlylatitudes. This is the season where TES (and others) haveconsistently observed the northern hemisphere summertimemaximum of water vapor.
5. Discussion
5.1. Condensation Level
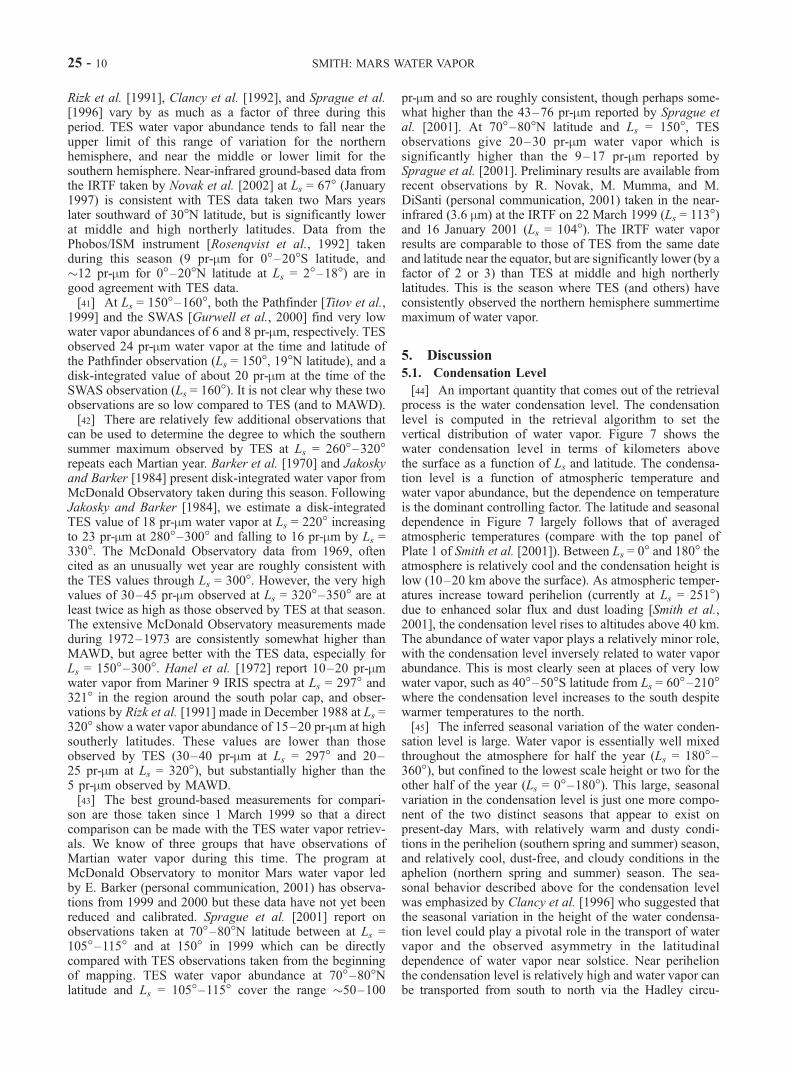
[44] An important quantity that comes out of the retrievalprocess is the water condensation level. The condensationlevel is computed in the retrieval algorithm to set thevertical distribution of water vapor. Figure 7 shows thewater condensation level in terms of kilometers abovethe surface as a function of Ls and latitude. The condensa-tion level is a function of atmospheric temperature andwater vapor abundance, but the dependence on temperatureis the dominant controlling factor. The latitude and seasonaldependence in Figure 7 largely follows that of averagedatmospheric temperatures (compare with the top panel ofPlate 1 of Smith et al. [2001]). Between Ls = 0� and 180� theatmosphere is relatively cool and the condensation height islow (10–20 km above the surface). As atmospheric temper-atures increase toward perihelion (currently at Ls = 251�)due to enhanced solar flux and dust loading [Smith et al.,2001], the condensation level rises to altitudes above 40 km.The abundance of water vapor plays a relatively minor role,with the condensation level inversely related to water vaporabundance. This is most clearly seen at places of very lowwater vapor, such as 40�–50�S latitude from Ls = 60�–210�where the condensation level increases to the south despitewarmer temperatures to the north.[45] The inferred seasonal variation of the water conden-
sation level is large. Water vapor is essentially well mixedthroughout the atmosphere for half the year (Ls = 180�–360�), but confined to the lowest scale height or two for theother half of the year (Ls = 0�–180�). This large, seasonalvariation in the condensation level is just one more compo-nent of the two distinct seasons that appear to exist onpresent-day Mars, with relatively warm and dusty condi-tions in the perihelion (southern spring and summer) season,and relatively cool, dust-free, and cloudy conditions in theaphelion (northern spring and summer) season. The sea-sonal behavior described above for the condensation levelwas emphasized by Clancy et al. [1996] who suggested thatthe seasonal variation in the height of the water condensa-tion level could play a pivotal role in the transport of watervapor and the observed asymmetry in the latitudinaldependence of water vapor near solstice. Near perihelionthe condensation level is relatively high and water vapor canbe transported from south to north via the Hadley circu-
25 - 10 SMITH: MARS WATER VAPOR

lation without condensing. Near aphelion the condensationlevel is relatively low and water vapor cannot be transportedvia the Hadley circulation without condensing. This mech-anism could explain the relative maximum observed at lownortherly latitudes during the fall and winter, and the muchlarger latitudinal gradient in water vapor in the northernsummer as compared to the southern summer.
5.2. Globally Averaged Trends
[46] The top panel of Figure 8 shows the total amount ofatmospheric water vapor as a function of season integratedover the northern and southern hemispheres and over theentire globe. Condensed water is not included in the totalintegrated amount of water because its contribution isinsignificant. To perform the integration over an entirehemisphere, an estimate was made for water vapor abun-dance in the high-latitude regions where no results areavailable because of insufficient thermal contrast betweenthe surface and the atmosphere. In the fall and winterseasons in each hemisphere (Ls = 180�–360� in the northernhemisphere and 0�–180� in the southern hemisphere), a lownominal value of 3 pr-mm water vapor was used to beconsistent with the low values retrieved at the highestlatitudes where good results were obtained during thoseseasons (see Figure 5). In the spring and summer seasons, aconstant water vapor abundance was extrapolated to thepole from the most poleward retrieved results. Theseextrapolations have little effect on the hemispherically andglobally averaged water vapor amounts for two reasons.First, the surface area where water vapor is extrapolated(which is near the pole) is a small fraction of the totalsurface area over a hemisphere. Second, the water vaporvalues being extrapolated are generally small (except duringearly summer) and contribute little to the total.[47] The total global amount of water vapor varies from
�1.0–2.5 � 1015 g (equivalent to 14–35 pr-mm or 1.1–2.7km3 ice) during the year. The major seasonal feature in theglobal amount of water vapor is a �50% drop from Ls =310�–360� and a corresponding recovery from Ls = 50�–120�. Both the northern and southern hemispheric totalsshow maxima in the spring and summer seasons andminima in the fall and winter. The annually averaged total
amount of water vapor is 1.2 � 1015, 0.7 � 1015, and 1.9 �1015 g (equivalent to 17, 9.5, and 13 pr-mm) for the northernhemisphere, southern hemisphere, and the entire globe,respectively.[48] As expected, the total water vapor amounts shown in
Figure 8 are slightly higher from Ls = 330�–205� than thosecomputed by Jakosky and Farmer [1982] and by Haberleand Jakosky [1990] using MAWD results, and significantlyhigher during the dusty Ls = 205�–330� season. Unlike thenearly constant level observed by TES, MAWD results showa significant decrease in the global amount of water vaporbetween Ls = 170� and 320� because of the two planet-encircling dust storms that occurred during 1977 at that time.[49] The changes in total atmospheric water vapor as a
function of season give clues to the important large-scalesources, sinks, and transport processes for water vapor.Between Ls = 50� and 120�, northern hemisphere watervapor increases dramatically while southern hemispherewater vapor remains at a nearly constant low level. Theincrease in northern hemisphere water vapor occurs primar-ily at middle and high latitudes (see Figures 5 and 9) and sothe likely sources for the water vapor are the recedingseasonal ice cap and the release of water adsorbed intothe regolith. The north residual polar cap can also contributeto the increase in northern hemisphere water toward the endof this period after �Ls = 80� when it is exposed. Therelative importance of the seasonal and residual ice capsversus the regolith as a source (or as a sink) cannot bedetermined from this analysis alone.[50] The northern hemisphere peak in water vapor abun-
dance lasts for only a short time. During the period Ls =140�–240�, the amount of northern hemisphere water vapordecreases rapidly to a value less than half of its peak valueat Ls = 120�. Although global water vapor shows a small(�20%) decline from Ls = 140�–170�, it is essentiallyconstant from Ls = 170�–320� because of an increase insouthern hemisphere water vapor which largely offsets thedecrease in northern hemisphere water vapor. This suggeststhat both non-atmospheric sinks and transport contribute tothe loss of northern hemisphere water vapor. During the firstportion of this period (before Ls = 180�), the loss isdominated by incorporation of water back into the residual
Figure 7. The height in km above the surface of the water condensation level as a function of Ls andlatitude. Contour levels higher than 40 km above the surface are not shown. The solid lines bounding thecontours on the top and bottom represent the latitude extent of where results exist.
SMITH: MARS WATER VAPOR 25 - 11

and seasonal ice caps and by adsorption of water into theregolith. Later, there also appears to be a net transport ofwater vapor from the northern to the southern hemispherethat is most active between Ls = 150� and 230�.
[51] The amount of northern hemisphere water vaporstops declining near Ls = 230�, but the amount of southernhemisphere water vapor continues to increase somewhatuntil reaching a peak at Ls = 290�. During this period, water
Figure 8. The top panel shows total amount of atmospheric water vapor as a function of season for thenorthern hemisphere (dashed line), the southern hemisphere (dotted line), and the entire globe (solid line).The bottom panel shows the hemispheric data in the top panel replotted to allow direct seasonalcomparison of the two hemispheres. Season is expressed as �Ls from spring equinox (Ls = 0� for thenorthern hemisphere and Ls = 180� for the southern hemisphere). Equivalent values are 1 km3 of ice is0.917 � 1015 g, and 10 pr-mm over a hemisphere is 0.723 � 1015 g.
25 - 12 SMITH: MARS WATER VAPOR

vapor equatorward of 40�S latitude slowly decreases whilewater vapor poleward of 40�S latitude rapidly increases.The latitudes where water vapor increases are clear ofseasonal CO2 frost by this time of the year [Christensenet al., 2001], so the source for this increase seems to beprimarily from the release of water adsorbed into theregolith and possibly from transport. Beginning at Ls =310�, southern hemisphere water vapor declines rapidlywithout a compensating increase in the northern hemispherewater vapor, such that the northern spring season presents asignificant minimum in the annual variation of Mars globalatmospheric water. This contrast in global water abundancebetween the northern and southern spring seasons is a majoraspect of the north-south asymmetry in atmospheric waterbehavior, as described in section 5.3. There appears to belittle, if any, transport from the southern hemisphere to thenorthern hemisphere during the decay of the southernsummer water vapor maximum. The decline in southernhemisphere water vapor appears to be dominated by lossesto the seasonal cap, water vapor being cold-trapped onto theresidual CO2 polar cap, and adsorption into the regolith.
5.3. Hemispheric Asymmetry
[52] The bottom panel of Figure 8 shows the totalamounts of water vapor in the northern and southern hemi-spheres as a function of season in terms of �Ls after springequinox so that the behavior of the two hemispheres can bedirectly compared. There are significant asymmetries. Theoverall level of water vapor throughout the year is higher inthe northern hemisphere. The amount of northern hemi-
sphere water vapor never reaches the very low levels thatsouthern hemisphere water vapor does in the fall because amoderate amount of water vapor (at least 10 pr-mm) ismaintained at low northerly latitudes during the entire year(see Figure 5 and further discussion in section 5.4). Bothhemispheres exhibit very similarly timed early summermaxima in water vapor and then large decreases in watervapor in late summer and early fall. However, the amplitudeof the northern hemisphere maximum is larger, and thetime-dependence of the increase in water vapor leading upto the summer maxima are very different for the twohemispheres. In the north, the increase begins ratherabruptly at about �Ls = 40� and the entire increase occursbetween �Ls = 40� and 120�. In the south, there is asimilarly timed increase in water vapor (�Ls = 40�–120�)but it is much smaller. The majority of the increase insouthern hemisphere water vapor occurs earlier during thewinter and early spring and appears to be caused by trans-port of water vapor from the northern to the southernhemisphere. Because of these differences, in the earlynorthern summer (�Ls = 100�–140�), the northern hemi-sphere holds �85% of the total global atmospheric water,while in the early southern summer (Ls = 280�–320�) thesouthern hemisphere holds only �60% of the total globalatmospheric water.[53] Significant asymmetry also currently exists in the
seasonal and latitudinal distribution of water vapor betweenthe northern and southern hemispheres. This asymmetry isshown in Figure 9. The water vapor abundances shown inFigure 9 are the same as those shown in the top panel of
Figure 9. The distribution of water vapor as a function of season and latitude for the (top) northern and(bottom) southern hemispheres. Season is expressed as �Ls from spring equinox (Ls = 0� for the northernhemisphere and Ls = 180� for the southern hemisphere). Both hemispheres are shown with the pole at thetop and the equator at the bottom for direct comparison. Contours show a smoothed representation of theresults.
SMITH: MARS WATER VAPOR 25 - 13

Figure 5 except that the southern hemisphere data have been‘‘flipped’’ in latitude (so that south pole is at the top and theequator is at the bottom) and shifted by 180� of Ls relative tothe northern hemisphere data so that a direct comparisonbetween the two hemispheres can be made. There areseveral key differences. As mentioned above, the summer-time maximum that is apparent at high latitudes in bothhemispheres is about twice as strong in terms of maximumwater vapor column abundance in the north as it is in thesouth. A second key difference is the existence of a deepminimum in water vapor covering the entire southernhemisphere during the fall and early winter. No suchminimum exists in the northern hemisphere. In fact, thereis more water vapor at low northerly latitudes during the falland winter than there is in the spring. The third and perhapsmost striking difference between the two hemispheres is thecompletely different behavior of the decay of the summer-time maximum between mid-summer and mid-fall. In thenorthern hemisphere, an area of relatively high water vaporextends increasingly equatorward as the season progresses.Near northern fall equinox the water vapor appears to crossthe equator and continue southward eventually contributingto the formation of the summertime maximum in watervapor at high southerly latitudes. In stark contrast, thesouthern hemisphere maximum rather abruptly decays inmiddle to late summer with no indication at all of an area ofrelatively high water vapor extending equatorward, andlittle indication of northward transport of water vapor.
5.4. Latitude and Longitude Dependence of WaterVapor
[54] In all of the above analysis we have always averagedover longitude to view the dependence of water vapor withLs and latitude. However, retrieved water vapor columnabundance values can also be binned in latitude and longi-tude (averaging over time) to produce time-averaged lati-tude-longitude maps. The top panel of Figure 10 shows sucha map where the time average is taken over the entire annualcycle. Immediately apparent is an inverse correlation withtopography. Hellas shows relatively large water vapor col-umns while Tharsis shows relatively low water vapor. Thiskind of inverse correlation implies that the water vapormixing ratio is constant or a relatively weak function ofaltitude in the lowest scale height or two where most of themass of the atmosphere lies. Thus the retrieved results areconsistent with our algorithm assumption that water vapor iswell-mixed up to the condensation level which is typically1–1.5 scale heights for Ls = 20�–150� and higher for the restof the year.[55] The effect of topography can be removed by dividing
retrieved water vapor abundance by a quantity proportionalto surface pressure. The bottom panel of Figure 10 showsannually averaged water vapor divided by the quantity( psurf/6.1), where psurf is the annually averaged surfacepressure in mbar. Surface pressures are computed usingthe topographic map produced by the MGS Mars OrbiterLaser Altimeter (MOLA) team [Smith et al., 1999] alongwith the annual variation of surface pressure [Hess et al.,1980; Tillman et al., 1993]. A map of annually averagedsurface pressure is shown in Figure 11. We will use the term‘‘scaled water vapor’’ for the average annual water vaporabundance divided by (psurf/6.1). With this correction, the
dependence of water vapor with latitude and longitude thatis independent of topography is now apparent.[56] Figure 12 shows the latitudinal dependence of the
scaled water vapor obtained by taking a zonal average of theresults shown in Figure 10. The hemispheric asymmetry atmiddle and high latitudes is caused by hemispheric asym-metry in altitude. When the lower northern hemispherealtitudes are taken account of, the northern and southernhemispheres poleward of 45� latitude are nearly identical.This is a markedly different result than that obtained byJakosky and Farmer [1982] using the MAWD data whofound a large gradient in annually averaged water vaporwith twice as much water vapor at high northerly latitudesthan at high southerly latitudes (even after correcting for thehemispheric topographic difference).[57] The most obvious feature in the latitude dependence
of scaled water vapor (Figure 12) is a pronounced maximumbetween 10�S and 40�N with roughly 50% more watervapor in this latitude band than outside it. The annuallyaveraged water vapor abundance is high in this latitudeband because water vapor is maintained year-round at theselatitudes (see Figure 5). Water vapor may be maintained atlow northerly latitudes during late northern fall and winterby transport from the southern hemisphere via the Hadleycirculation. The northern boundary of the band of highwater vapor (�40�N latitude) is likely defined by thesouthernmost extent of the north seasonal polar cap. Equa-torward of that latitude the sinks for water vapor are muchreduced and water vapor can remain at a moderate levelyear-round.[58] The bottom panel of Figure 10 shows that there are
large longitude variations in annually averaged scaled watervapor equatorward of �50�N and S latitude. The maximumseen in Figure 12 (and Figure 5) at 10�S–40�N latitude isprimarily caused by two large regions of high water vaporabundance from 60�–150�W longitude (Tharsis) and 300�–10�W longitude (Arabia Terra). Although the highlandsaround Olympus Mons and the Tharsis volcanoes have ahigh scaled water vapor, the volcanoes themselves do not.Large longitude variations exist outside of the latitude bandof high annually averaged water vapor as well. At 25�Slatitude, scaled water vapor varies from its global minimumof 7.5 pr-mm at 35�W longitude (just south of MargaritiferSinus) to a value twice as high just 90� of longitude to boththe east and west.[59] The top panel of Figure 13 shows the albedo of Mars
derived from TES visible bolometric observations [Chris-tensen et al., 2001]. The low latitude longitude dependencein scaled water vapor shows a strong positive correlationwith albedo (high water vapor in high albedo regions). Thissame correlation with albedo was also noted by Jakosky andFarmer [1982] using MAWD results and by Rosenqvist etal. [1992] using results from the ISM instrument on thePhobos spacecraft. At low latitudes water vapor is also anti-correlated with surface pressure [Smith et al., 1999] (Figure11), and with thermal inertia [Mellon et al., 2000] (bottompanel of Figure 13). All three of these quantities (albedo,surface pressure, and thermal inertia) have moderate corre-lations (or anti-correlations) between them and so it isdifficult to sort out the cause and effect. Albedo, thermalinertia, and surface pressure (topography) have direct rela-tions to the average and diurnal variation of surface and
25 - 14 SMITH: MARS WATER VAPOR

subsurface temperatures, the pore space size and grain sizeof the regolith, and to the circulation patterns of theatmosphere. These can in turn influence the transport ofwater vapor and its adsorption and desorption into theregolith. It is likely that a combination of albedo, thermalinertia, and topography contribute to the longitude depend-ence of annually averaged water vapor. Poleward of 40�Nlatitude the correlation of scaled water vapor with albedo,and the anti-correlation with thermal inertia and surfacepressure, abruptly vanishes, and perhaps even changes sign.In the southern hemisphere, the correlation of scaled watervapor with albedo persists to at least 60�S latitude. Pole-ward of that there is little longitude dependence in thescaled water vapor.[60] Scaled water vapor might still be anti-correlated with
surface pressure even after the topography has been‘‘removed’’ because water vapor is not completely well-mixed through the entire atmosphere. Therefore, dividingby ( psurf/6.1) can actually be a slight overcompensation for
topography. Supporting this idea is the fact that the corre-lation between scaled water vapor and surface pressure islower in the southern hemisphere than in the northernhemisphere. For example, Hellas and Argyre do not showup at all in the bottom panel of Figure 10 (scaled watervapor) although Hellas is very prominent in the top panel ofFigure 10 (unscaled). In the southern spring and summerwhen southern hemisphere water vapor abundance is high(and the most contribution to the annual average is made),the condensation level is high and water vapor is morenearly well-mixed throughout the atmosphere. In the north-ern spring and summer when northern hemisphere watervapor is high the condensation level is lower and watervapor is not as completely well-mixed.
6. Summary
[61] We have developed an algorithm to retrieve watervapor column abundance from TES nadir-geometry spectra
Figure 10. Maps of (top) seasonally averaged water vapor column abundance and (bottom) seasonallyaveraged water vapor column abundance divided by ( psurf/6.1) to remove the effect of topography.Contours show a smoothed representation of the maps.
SMITH: MARS WATER VAPOR 25 - 15

using rotational lines from 240–360 cm�1. Observations ofwater vapor by TES during the Mars Global Surveyormapping mission now cover over one full Martian yearand allow an analysis of the dependence of water vapor onlatitude, longitude, and season (Ls) in unprecedented detail.[62] The TES results show a maximum in water vapor
abundance at high latitudes during mid-summer in bothhemispheres. The southern hemisphere maximum was not
observed by Viking MAWD. Results from MAWD takenbetween Ls = 205� and 330� appear to be greatly affected bytwo planet-encircling dust storms. Scattering by dust andwater ice biases the MAWD water vapors to lower valuessince the observed radiation does not sample the entirecolumn of water vapor. As stated by Jakosky and Farmer[1982], we believe that MAWD water vapor results fromthis period must be regarded as lower limits. The TES-
Figure 11. Map of the annual average value of surface pressure in mbar based on MOLA data [Smith etal., 1999]. In this map, quantities have been smoothed by the same amount as the contours shown inFigure 10.
Figure 12. The latitudinal behavior of the annually averaged water vapor abundance, and the latitudinalbehavior of the annually averaged water vapor abundance divided by (psurf/6.1) to remove the effect oftopography.
25 - 16 SMITH: MARS WATER VAPOR

derived water vapor results are only very minimally affectedby dust scattering because scattering is much less importantat TES wavelengths (�30 mm) than at the MAWD wave-length (1.38 mm), and no planet-encircling dust storm wasobserved during the TES year (1999–2000). Outside of thedusty Ls = 205�–330� season, TES and MAWD are gen-erally comparable, although TES results are systematically10–50% higher than MAWD results, and significant differ-ences are apparent in the details of the dependence on Lsand latitude.[63] There are large differences in the hemispheric (north
versus south) and seasonal (perihelion versus aphelion)behavior of water vapor. The summertime peak in watervapor abundance is roughly twice as high in the north as inthe south. The decay of the northern hemispheres summer-time maximum leads to a relative maximum in water vaporthat extends further southward with time, eventually cross-ing the equator to the southern hemisphere. The decay of thesouthern hemisphere summertime maximum has no corre-sponding northward transport. Water vapor abundancedeclines monotonically at all latitudes at the end of southernsummer.
[64] Primarily because of the seasonal dependence ofatmospheric temperatures, there is a strong seasonaldependence on the water condensation level. The conden-sation level is typically 10–15 km (1–1.5 scale heights)above the surface during the aphelion season (Ls = 0�–180�), but greater than 30 km (>3 scale heights) during theperihelion season (Ls = 180�–360�). This means that watervapor is confined to lower altitudes in the aphelion season,and transport between the two hemispheres seems to beinfluenced by this. A very steep latitudinal gradient in watervapor abundance forms during the aphelion season (high inthe north), while water vapor is spread more uniformly inlatitude during the perihelion season.[65] The annually averaged amount of water vapor is 17
pr-mm in the northern hemisphere and 9.5 pr-mm in thesouthern hemisphere. However, when the effect of top-ography is removed, the annually averaged amount of watervapor becomes 17 pr-mm (referenced to a 6.1 mbar pressuresurface) in the latitude band from 10�S–40�N, and 12 pr-mm everywhere else. Northerly and southerly high latitudeshave the same scaled water vapor abundance. This latitudi-nal dependence is very different than the analysis of
Figure 13. Maps of (top) broadband visual albedo, and (bottom) thermal inertia in J/m2 K s1/2. In thesemaps, quantities have been smoothed by the same amount as the contours shown in Figure 10. Thealbedo [Christensen et al., 2001] and the thermal inertia [Mellon et al., 2000] maps are from TESmeasurements.
SMITH: MARS WATER VAPOR 25 - 17

MAWD results by Jakosky and Farmer [1982] whichshowed a large gradient from north to south in annuallyaveraged water vapor abundance even after correction fortopography. The latitude and longitude dependence ofannually averaged water vapor retrieved by TES (correctedfor topography) has a significant positive correlation withalbedo and significant negative correlations with thermalinertia and surface pressure.[66] Additional analysis and observations promise to
make the TES data set an even more useful and compre-hensive tool for the study of the Martian water cycle.Continued observations by TES during the Mars GlobalSurveyor extended mission will provide the amount ofinterannual variability between two consecutive Martianyears, and further analysis of the existing TES spectra takenin the limb-geometry will provide crucial information aboutthe vertical structure and diurnal (�0200 versus �1400local time) dependence of water vapor.
[67] Acknowledgments. We thank Todd Clancy, John Pearl, andBarney Conrath for numerous suggestions and for providing detailed earlyreviews of this paper. We thank Bruce Jakosky for providing the VikingMAWD results in tabular form, and Terry Martin for providing the VikingIRTM dust opacity results in digital form. We thank Monte Kaelberer andEver Guandique for providing software development and data-handlingexpertise at Goddard Space Flight Center, and Bill Maguire for advice onspectroscopic issues. We thank Mike Wolff for help with constructing theline-by-line code used to compute synthetic water vapor transmittances. Wealso thank the TES operations team at Arizona State University, includingKelly Bender, Noel Gorelick, Greg Mehall, and Kim Murray, and the entirespacecraft and mission operations teams at the Jet Propulsion Lab andLockheed Martin. Finally, we thank Phil Christensen, PI of the TESinstrument, for all the work he has done to provide this spectacular data set.
ReferencesBandfield, J. L., V. E. Hamilton, and P. R. Christensen, A global view ofMartian surface composition from MGS-TES, Science, 287, 1626–1630,2000a.
Bandfield, J. L., P. R. Christensen, and M. D. Smith, Spectral data set factoranalysis and end-member recovery: Application to analysis of Martianatmospheric particulates, J. Geophys. Res., 105, 9573–9588, 2000b.
Barker, E. S., R. A. Schorn, A. Woszczyk, R. G. Tull, and S. J. Little, Mars:Detection of atmospheric water vapor during the southern hemispherespring and summer seasons, Science, 170, 1308–1310, 1970.
Burgdorf, M. J., et al., ISO observations of Mars: An estimate of the watervapor vertical distribution and the surface emissivity, Icarus, 145, 79–90,2000.
Christensen, P. R., Calibration report for the Thermal Emission Spectro-meter (TES) for the Mars Global Surveyor Mission, Mars Global Sur-veyor Project, Jet Propul. Lab., Pasadena, Calif., 1999.
Christensen, P. R., et al., Thermal Emission Spectrometer Experiment: MarsObserver Mission, J. Geophys. Res., 97, 7719–7734, 1992.
Christensen, P. R., et al., Results from the Mars Global Surveyor ThermalEmission Spectrometer, Science, 279, 1692–1698, 1998.
Christensen, P. R., et al., Detection of crystalline hematite mineralization onMars by the Thermal Emission Spectrometer: Evidence for near-surfacewater, J. Geophys. Res., 105, 9623–9642, 2000.
Christensen, P. R., et al., The Mars Global Surveyor Thermal EmissionSpectrometer experiment: Investigation description and surface scienceresults, J. Geophys. Res., 106, 23,823–23,871, 2001.
Clancy, R. T., A. W. Grossman, and D. O. Muhleman, Mapping Mars watervapor with the Very Large Array, Icarus, 100, 48–59, 1992.
Clancy, R. T., A. W. Grossman, M. J. Wolff, P. B. James, Y. N. Billawalla,B. J. Sandor, S. W. Lee, and D. J. Rudy, Water vapor saturation at lowaltitudes around Mars aphelion: A key to Mars climate?, Icarus, 122,36–62, 1996.
Colburn, D. S., J. B. Pollack, and R. M. Haberle, Diurnal variations inoptical depth at Mars, Icarus, 79, 159–189, 1989.
Conrath, B. J., J. C. Pearl, M. D. Smith, W. C. Maguire, S. Dason, M. S.Kaelberer, and P. R. Christensen, Mars Global Surveyor Thermal Emis-sion Spectrometer (TES) observations: Atmospheric temperatures duringaerobraking and science phasing, J. Geophys. Res., 105, 9509–9520,2000.
Crisp, D., D. A. Allen, D. H. Grinspoon, and J. B. Pollack, The dark side of
Venus: Near-infrared images and spectra from the Anglo-Australian Ob-servatory, Science, 253, 1263–1266, 1991.
Davies, D. W., The vertical distribution of Mars water vapor, J. Geophys.Res., 84, 2875–2880, 1979.
Farmer, C. B., D. W. Davies, A. L. Holland, D. P. La Porte, and P. E. Doms,Mars: Water vapor observations from the Viking orbiters, J. Geophys.Res., 82, 4225–4248, 1977.
Gamache, R. R., S. P. Neshyba, J. J. Plateaux, A. Barbe, L. Regalia, andJ. B. Pollack, CO2-broadening of water-vapor lines, J. Molec. Spectrosc.,170, 131–151, 1995.
Goody, R., R. West, L. Chen, and D. Crisp, The correlated-k method forradiation calculations in nonhomogeneous atmospheres, J. Quant. Spec-trosc. Radiat. Transfer, 42, 539–550, 1989.
Gurwell, M. A., et al., Submillimeter Wave Astronomy Satellite observa-tions of the Martian atmosphere: Temperature and vertical distribution ofwater vapor, Astrophys. J., 539, L143–L146, 2000.
Haberle, R. M., and B. M. Jakosky, Sublimation and transport of waterfrom the north residual polar cap on Mars, J. Geophys. Res., 95, 1423–1437, 1990.
Hanel, R. A., et al., Investigation of the Martian environment by infraredspectroscopy on Mariner 9, Icarus, 17, 423–442, 1972.
Hess, S. L., J. A. Ryan, J. E. Tillman, R. M. Henry, and C. B. Leovy, Theannual cycle of pressure on Mars measured by Viking Landers 1 and 2,Geophys. Res. Lett., 7, 197–200, 1980.
Hinson, D. P., R. A. Simpson, J. D. Twicken, G. L. Tyler, and F. M. Flasar,Initial results from radio occultation measurements with Mars GlobalSurveyor, J. Geophys. Res., 104, 26,997–27,012, 1999.
Howard, T. N., D. E. Burch, and D. Williams, Infrared transmission ofsynthetic atmospheres, J. Opt. Soc. Am., 46, 186 – 190, 237 –245,334–338, 452–455, 1956.
Husson, N., B. Bonnet, N. A. Scott, and A. Chedin, Management and studyof spectroscopic information-The GEISA program, J. Quant. Spectrosc.Radiat. Transfer, 48, 509–518, 1992.
Jakosky, B. M., The seasonal cycle of water on Mars, Space Sci. Rev., 41,131–200, 1985.
Jakosky, B. M., and E. S. Barker, Comparison of ground-based and VikingOrbiter measurements of Martian water vapor: Variability of the seasonalcycle, Icarus, 57, 322–334, 1984.
Jakosky, B. M., and C. B. Farmer, The seasonal and global behavior ofwater vapor in the Mars atmosphere: Complete global results of theViking Atmospheric Water Detector Experiment, J. Geophys. Res., 87,2999–3019, 1982.
Jakosky, B. M. and R. M. Haberle, The seasonal behavior of water on Mars,in Mars, edited by H. H. Kieffer et al., pp. 969–1016, Univ. of Ariz.Press, Tucson, 1992.
Liebe, H. J., and T. A. Dillon, Accurate foreign-gas-broadening parametersof the 22-GHz H2O line from refraction spectroscopy, J. Chem. Phys., 50,727–732, 1969.
Martin, T. Z., Thermal infrared opacity of the Martian atmosphere, Icarus,66, 2–21, 1986.
Martin, T. Z., and M. I. Richardson, New dust opacity mapping fromViking infrared thermal mapper data, J. Geophys. Res., 98, 10,941–10,949, 1993.
Mellon, M. T., B. M. Jakosky, H. H. Kieffer, and P. R. Christensen, High-resolution thermal inertia mapping from the Mars Global Surveyor Ther-mal Emission Spectrometer, Icarus, 148, 437–455, 2000.
Novak, R. E., M. J. Mumma, M. A. DiSanti, and N. Dello Russo, Mappingof ozone and water in the atmosphere of Mars near the 1997 aphelion,Icarus, 158, 14–23, 2002.
Pearl, J. C., M. D. Smith, B. J. Conrath, J. L. Bandfield, and P. R. Chris-tensen, Observations of Martian ice clouds by the Mars Global SurveyorThermal Emission Spectrometer: The first Martian year, J. Geophys. Res.,106, 12,325–12,338, 2001.
Pollack, J. B., D. S. Colburn, R. Kahn, J. Hunter, W. Van Camp, C. E.Carlston, and M. R. Wolf, Properties of aerosols in the Martian atmo-sphere, as inferred from Viking lander imaging data, J. Geophys. Res., 82,4479–4496, 1977.
Pollack, J. B., et al., Near-infrared light from Venus’ nightside: A spectro-scopic analysis, Icarus, 103, 1–42, 1993.
Rizk, B., W. K. Wells, and D. M. Hunten, Meridional Martian water abun-dance profiles during the 1988–1989 season, Icarus, 90, 205–213, 1991.
Rodin, A. V., O. I. Korablev, and V. I. Moroz, Vertical distribution of waterin the near-equatorial troposphere of Mars: Water vapor and clouds,Icarus, 125, 212–229, 1997.
Rosenqvist, J., P. Drossart, M. Combes, T. Encrenaz, E. Lellouch, J. P.Bibring, S. Erard, Y. Langevin, and E. Chassefiere, Minor constituentsin the Martian atmosphere from the ISM/Phobos experiment, Icarus, 98,254–270, 1992.
Smith, D. E., et al., The global topography of Mars and implications forsurface evolution, Science, 284, 1495–1503, 1999.
25 - 18 SMITH: MARS WATER VAPOR

Smith, M. D., J. C. Pearl, B. J. Conrath, and P. R. Christensen, Mars GlobalSurveyor Thermal Emission Spectrometer (TES) observations of dustopacity during aerobraking and science phasing, J. Geophys. Res., 105,9539–9552, 2000a.
Smith, M. D., J. L. Bandfield, and P. R. Christensen, Separation of atmo-spheric and surface spectral features in Mars Global Surveyor ThermalEmission Spectrometer (TES) spectra, J. Geophys. Res., 105, 9589–9608, 2000b.
Smith, M. D., J. C. Pearl, B. J. Conrath, and P. R. Christensen, Recent TESresults: Mars water vapor abundance and the vertical distribution ofaerosols, Bull. Am. Astron. Soc., 32, 1094, 2000c.
Smith, M. D., J. C. Pearl, B. J. Conrath, and P. R. Christensen, ThermalEmission Spectrometer results: Mars atmospheric thermal structure andaerosol distribution, J. Geophys. Res., 106, 23,929–23,945, 2001.
Smith, P. H., et al., Results from the Mars Pathfinder Camera, Science, 278,1758–1765, 1997.
Spinrad, H., G. Munch, and L. D. Kaplan, The detection of water vapor onMars, Astrophys. J., 137, 1319–1321, 1963.
Sprague, A. L., D. M. Hunten, and R. E. Hill, Martian water vapor, 1988–1995, J. Geophys. Res., 101, 23,229–23,241, 1996.
Sprague, A. L., D. M. Hunten, R. E. Hill, L. R. Doose, and B. Rizk, Watervapor abundances over Mars north high latitude regions: 1996–1999,Icarus, 154, 183–189, 2001.
Tillman, J. E., N. C. Johnson, P. Guttorp, and D. B. Percival, The Martianannual atmospheric pressure cycle-Years without great dust storms,J. Geophys. Res., 98, 10,963–10,971, 1993.
Titov, D. V., M. J. Markiewicz, N. Thomas, H. U. Keller, R. M. Sablotny,M. G. Tomasko, M. T. Lemmon, and P. H. Smith, Measurements of theatmospheric water vapor on Mars by the Imager for Mars Pathfinder,J. Geophys. Res., 104, 9019–9026, 1999.
�����������������������M. D. Smith, NASA Goddard Space Flight Center, Code 693, Greenbelt,
MD 20771, USA. ([email protected])
SMITH: MARS WATER VAPOR 25 - 19