Embed Size (px)
Citation preview

2019
CITY OF PRINCE GEORGE ANNUAL WATER SYSTEM REPORT
eDoc #565514
1 | P a g e
City of Prince George
(Image source: https://en.wikipedia.org/wiki/Prince_George,_British_Columbia)
Prepared by:
Cory Smith Supervisor, Utilities Division
1100 Patricia Blvd.
Prince George, B.C.
V2L 3V9
Released: November 2020
Reviewed by:
Wil Wedel Jon Lafontaine
Manager, Utilities Division Supervisor, Utilities Division

eDoc #565514
2 | P a g e
Contents 1.0 Introduction .................................................................................................................................... 4
2.0 Northern Health Authority Operating Permit .................................................................................. 4
3.0 Drinking Water System ................................................................................................................... 4
3.1 Distribution System Overview .................................................................................................................... 5
3.1.1 System Management ............................................................................................................... 7
3.1.2 Supply Wells ............................................................................................................................... 8
3.1.3 Booster Stations ...................................................................................................................... 10
3.1.4 Reservoirs .................................................................................................................................. 11
3.1.5 Pressure Reducing Valves ................................................................................................... 12
3.1.6 Distribution System ............................................................................................................... 13
3.2 Water Production ........................................................................................................................................... 15
3.3 Water Conservation Program ................................................................................................................... 16
3.4 Water Meter Program .................................................................................................................................. 18
3.4.1 Program Overview ................................................................................................................. 18
3.4.2 Program Updates .................................................................................................................... 18
4.0 Water Quality ............................................................................................................................... 19
4.1 Overview ............................................................................................................................................................ 19
4.2 Water Quality Sampling ............................................................................................................................... 19
4.2.1 Bacteriological Samples ....................................................................................................... 19
4.2.2 Boil Water Advisories ........................................................................................................... 22
4.2.3 Raw Water Samples ............................................................................................................... 22
4.2.4 Sentinel Well Samples ........................................................................................................... 23
4.2.5 Distribution System Samples ............................................................................................. 23
4.2.6 PW621/PW624 Additional Samples............................................................................... 23
4.2.7 Turbidity ..................................................................................................................................... 23
4.3 Disinfection ....................................................................................................................................................... 24
4.4 Cross-Connection Control (CCC) Program ........................................................................................... 24
4.4.1 Program Overview .................................................................................................................. 24
4.4.2 Program Updates ...................................................................................................................... 27

eDoc #565514
3 | P a g e
4.5 Wellhead/Aquifer Protection Program ................................................................................................. 28
4.6 Water Quality Concerns ............................................................................................................................... 29
5.0 Emergency Response Plan .......................................................................................................... 29
6.0 Environmental Operators Certification Program (EOCP) ............................................................. 30
6.1 Classification .................................................................................................................................................... 30
6.2 Certified Operators ........................................................................................................................................ 30
6.3 Training .............................................................................................................................................................. 30
7.0 Conclusion ................................................................................................................................... 31

eDoc #565514
4 | P a g e
1.0 Introduction
The City of Prince George has prepared this Annual Water System Report (Report) for 2019 in
compliance with the British Columbia Drinking Water Protection Act and the Northern Health
Authority Operating Permit Requirements. The Report is intended to provide information to the
public and government agencies regarding the quality of the drinking water and operation of the
water system.
The City takes great pride in their drinking water, and strives to provide the highest quality of water
to the residents of Prince George. Experienced, knowledgeable staff oversee the collection,
pumping, distribution and protection of the City of Prince George Water Distribution System.
The City provides this report to the Northern Health Authority (NHA) and posts it on the City’s
website, www.princegeorge.ca
2.0 Northern Health Authority Operating Permit The Drinking Water Protection Regulation requires that the City obtain an Operating Permit from the
local health authority before water can be provided to users. Northern Health Authority (NHA)
provides the City with the conditions of their Operating Permits.
In 2019, the City had five operating permits. The conditions of the operating permits are as follows:
Maintain ongoing water bacteriology sampling as per schedule.
Complete Level 4 staff training and certification at your earliest opportunity as specified by
the EOCP.
Develop and maintain a cross-connection control program.
Develop and implement a wellhead/aquifer protection program.
Maintain a minimum free chlorine residual of 0.2 ppm throughout the distribution system.
The City was compliant with all conditions of the permits.
3.0 Drinking Water System Prince George is a city of 74,003 people, as per the 2016 census, located in central British
Columbia. Being at the intersection of two major highways as well a major junction for rail traffic,
Prince George services the majority of the northern portion of the province. Two major rivers,
Nechako and Fraser, provide historic trade routes to the city. The groundwater aquifers from which
the City provides majority of their water are under direct influence from these waterways.

eDoc #565514
5 | P a g e
The main water system for the city covers over 90% of the developed area. Three major
groundwater wells along the Nechako River provide water into this system. Two groundwater wells
along the western bank of the Fraser River provide additional flow to a portion of the main system
during summer months. Two groundwater wells on the eastern bank of the Fraser River have
transitioned into backup supply for the BCR Industrial area. One groundwater well provides water to
a separate system on the Southwest corner of the city.
3.1 Distribution System Overview
The City supplied 12,242,170,000 litres of water in 2019, through more than 800 kilometres of
distribution pipes. The City provided potable drinking water to 25,644 residential and 2,815 other
(industrial, commercial, institutional) service connections.
Seven (7) groundwater well locations draw from underground aquifers to provide the City of Prince
George with water. The City relies on nine (9) booster pump stations to transport the water
throughout the distribution system. There are fifteen (15) water reservoirs throughout the City. The
reservoirs provide storage capacity for potable water use, as well as fire protection. The City’s total
storage capacity of all the reservoirs combined in 2019 was 63,190,000 liters of water. Figure 1
identifies a typical groundwater, gravity supplied Water Distribution System.
Throughout the City’s water distribution system; there are twenty-four (24) pressure reducing valve
(PRV) locations. The pressure reducing valves, along with the reservoirs, allow the City to provide
sustained pressure throughout the City’s twenty-three (23) pressure zones. Figure 2 identifies the
pressure zones throughout the City of Prince George. The City has 7,138 system valves. These
valves allow the City to isolate areas for operations and maintenance purposes. The City of Prince
George has 2,143 hydrants connected to the water distribution system. Hydrants are used primarily
for firefighting, but can be a source of water for operational and maintenance purposes.
The City uses a Supervisory Control and Data Acquisition (SCADA) system to monitor and control
equipment. The SCADA system will send an alarm notification to staff when equipment is not
operating as required. One of the main functions of the SCADA system is water level monitoring.
Water levels in the reservoirs are monitored with sensors, and instruct the pumps when to start and
stop. Figure 1: Water Distribution System
(Image source: www.princegeorge.ca)

eDoc #565514
6 | P a g e
Figure 2: City of Prince George Pressure Zone Boundary Map

eDoc #565514
7 | P a g e
The following subcategories identify the operational, maintenance and upgrades of note, completed
within the highlighted areas of the City of Prince George Water Distribution System in 2017, 2018
and 2019. City staff perform routine maintenance and operational work to maintain the City’s
infrastructure, some of which is not contained in this report.
3.1.1 System Management
The City utilizes an asset management strategy to govern decision making for future upgrades, as
well as operational and maintenance efficiencies. Insufficient fire flow, deteriorating infrastructure,
water quality, and availability to customers are examples of the criteria considered. The City is one
of over fifty municipalities that participates in the National Water and Wastewater Benchmarking
Initiative (NWWBI). Benchmarking can help utility managers to achieve continuous performance
improvement towards the utility’s goals. The Utilities Division utilizes a Computer Maintenance
Management System (CMMS) called Cityworks to schedule and document operational,
maintenance and capital works performed. 2019 marked the role out of Cityworks to all work
groups within the Utilities Division. Utilities strives to continuously improve the use of Cityworks to
ensure efficient and effective operations.
In August 2019, the City started an upgrade project on their SCADA system. Some of the goals of
the upgrade are reduced communication failures, consistent monitoring throughout stations,
improved human machine interface and a decrease in unnecessary alarm notifications. Progress
on this project continued throughout 2019 with an anticipated completion in 2020.
In September 2019, the City received a Water Stations Condition Assessment for all supply wells,
booster stations, reservoirs and PRV locations. The City obtained a consultant to assess the
mechanical, electrical and structural conditions of these sites. The Water Stations Condition
Assessment identified risks, repair/replacement priority, along with a maintenance and inspection
plan.
Throughout 2018 and 2019, the City underwent an overhaul on their Confined Space Entry
Program. The City worked to develop Confined Space Entry Hazard Assessments and Confined
Space Entry Procedures for all of the known confined spaces. This included many PRV locations,
booster station basements and underground valve chambers. In conjunction with this, the City
developed a Modified Double Block and Bleed Isolation Safe Work Procedure for the PRV’s.

eDoc #565514
8 | P a g e
3.1.2 Supply Wells
Figure 3: City of Prince George Well Location Details
NAME Source (Area
of Influence)
Type of Well % of Total Service
Connections
Supplied
% of Total
Water Supplied
to City
PW601 Groundwater
(Nechako River)
Radial
Collector
22%
30.4%
PW605 Groundwater
(Nechako River)
Radial
Collector
Oct. to March 55%
April to Sept. 45%
51%
PW621/624 Groundwater
(Fraser River)
Standard x2 April to Sept. 10%
Oct. to March 0%
2.4%
PW625 Groundwater Standard x1 0.1% 0.2%
PW627 Groundwater
(Fraser River)
Standard x2 1.4 0.3%
PW660 Groundwater
(Nechako River)
Radial
Collector
21.5% 15.7%
Operational
In 2018, the City completed a Groundwater at Risk of Containing Pathogens (GARP) Risk
Assessment for PW601, PW605 and PW660. The NHA Drinking Water Officer suggested the City
obtain a GARP determination for these wells. The City acquired a Hydrogeologist to conduct the
GARP Risk Assessment. A Level 2 GARP Investigation, following the Ministry of Health’s GARP
Guideline, was completed. The consulting Hydrogeologist provided a final report in January 2019.
The report indicated a Level 3 GARP Investigation be conducted, as well as an increase in chlorine
residuals from PW605. The City followed the advice, conducted a yearlong sampling routine
throughout 2019, and increased disinfection levels at PW605. Figure 4 identifies the parameters of
the sampling routine. The City provided the GARP Risk Assessment to the NHA. This project is
ongoing into 2020.

eDoc #565514
9 | P a g e
Figure 4: 2019 GARP Sampling Routine
Frequency Analytes Locations
At least every 4 hours (or
continuously)
Turbidity and water levels Production well (PW601,
PW605, PW660)
Weekly Field: pH, temperature,
conductivity, turbidity, water
levels in selected sentinel
wells.
Lab: E. Coli, total coliforms,
aerobic spore forming bacteria
Production well (PW601,
PW605, PW660)
Nechako River
Sentinel Wells 5A & 5B
Bi-monthly Giardia, Cryptosporidium,
modified Microscopic
Particulate Analysis (MPA)
Production well (PW601,
PW605, PW660)
Nechako River
In 2019, the City installed a new water main connecting two major groundwater wells, PW605 and
PW660. This provides the City with added redundancy, allowing either groundwater well to service
each other’s pressure zones. This also provides a new roadway to PW605, improving safety for City
staff.
In September 2019, the City placed PW627 into a backup role, providing water from a new water
main installed along Boundary Rd. PW601 now provides water to the BCR Industrial site through a
booster station and pressure-reducing valves.
Construction initiated on a new groundwater well pump station in the Western Acres Subdivision,
with completion anticipated in 2020.

eDoc #565514
10 | P a g e
Maintenance/Upgrades
PW601 PW605
Building storm water drainage repaired and on-
site storm water recharge chamber upgraded.
Water pump #2 rebuilt and replaced.
Variable frequency drive # 2 replaced.
Exterior of building painted.
Sodium hypochlorite generation cell replaced.
Sodium hypochlorite pump room floor
resurfaced.
Domestic water line in station replaced.
Surge relief tank rehabilitation.
Water-cooled A/C units removed and replaced
with exterior roof exhaust fans and fresh air
grilles.
Sodium Hypochlorite Generation System
upgraded from 75 lb/day to 100 lb/day system
(replaced with used system from PW660).
Three (3) water pump air-relief valves installed.
PW621 PW624
Pump control valve rebuilt.
Ventilation equipment installed in sodium
hypochlorite pump room.
Emergency eyewash & shower replaced.
New hot water tank, sufficient for emergency
shower demands installed.
PW625 PW627
Water heater replaced. Water pump #2 replaced.
Water pump room exhaust fan replaced.
PW652 PW660
Initiated construction of a new well, and pump
station for pressure zone 25.
Sodium Hypochlorite Generation System
upgraded from 100 lb/day to 200 lb/day
system.
Sanitary sewer main repaired.
Water pump room floor painted.
High-pressure relief valve rebuilt.
Water pump motor #1 and #2 replaced as part
of PW660 Upgrade Project.
Water Pump Station Decommission
In 2018, the City decommissioned unused wells
at PW603, PW607, PW608 and PW632.
PW603, PW604 and PW608 buildings were
demolished, as they were deemed unusable in
the future.
3.1.3 Booster Stations
Operational
In March of 2019, the City commissioned Booster Station PW653 on Stauble Rd. to replace the
existing booster station PW615. PW653 allows the City to provide fire flow demands to pressure
zone 12. PW615 was decommissioned as it was past its life expectancy and did not provide the
ability to upgrade to meet current standards.

eDoc #565514
11 | P a g e
Maintenance/Upgrades
PW602 PW614
Ultrasonic transducer replaced inside caisson.
Direct-drive emergency backup pump removed
from service.
Surge relief tank rehabilitation.
Three (3) water pump air-relief valves installed.
Replaced failed water pump discharge piping.
Installed an isolation valve on water supply inlet
inside station.
Ventilation system upgraded.
PW623 PW628
New backup diesel powered generator and
building installed (2017).
SCADA system hardware upgrade.
Water pump #1 and #2 rebuilt and replaced.
Water pump motor #2 rebuilt and replaced.
New emergency safety eyewash and shower
installed.
New hot water tank, sufficient for emergency
shower demands installed.
Ventilation system upgraded.
Chlorine vapour monitoring equipment installed.
PW630
Free Chlorine Analyzer Installation.
Water pump # 2 control valve rebuild.
Replaced natural gas unit heater.
3.1.4 Reservoirs
Operational
Construction initiated on a new 1.4 million litre, dual-cell reservoir in the Western Acres Subdivision,
with completion anticipated in 2020.
Maintenance/Upgrades
In 2017, the City started an inspection and cleaning schedule for the potable water reservoirs.
Inspection involved the use of a remote operated vehicle (ROV) inside the reservoir while it is full of
water. Cleaning consists of removing the sediment from the interior floor. All equipment entering the
potable water reservoir was thoroughly cleaned and disinfected prior to entry. Figure 5 identifies the
work accomplished at the completion of 2019.
Figure 5: Reservoir Inspection & Cleaning Completed
2017 2018 2019
Inspected PW803
PW805
PW810
PW827
PW828
PW806
PW810
PW817
PW823
PW824
PW803
PW806
PW827

eDoc #565514
12 | P a g e
PW830
PW860
PW832
Cleaned PW860
PW810
PW817
PW824
PW832
PW803
PW806
PW827
PW803 PW806
SCADA Communication Shelter Installed.
Overflow pipe repaired.
Roadway rehabilitation.
PW824 PW828
Roof vents replaced. SCADA Communication Shelter Installed.
PW832 PW852
SCADA Communication Shelter Installed. Construction commenced on a new dual-cell
reservoir for pressure zone 25 to replace
PW825.
PW860
Isolation valves installed on inlet and outlet
piping.
Check valve’s inside valve chamber to reservoir
repaired.
Future Projects
The City plans to complete the inspection and cleaning schedule developed in 2017, and re-inspect
each reservoir five (5) years post cleaning, to determine the required cleaning schedule thereafter.
3.1.5 Pressure Reducing Valves
Operational
In 2017 and 2018, the City converted PW629 from a booster pump station into a PRV location,
allowing water to be delivered from the PW823 reservoir through the watermain on Boundary Rd.
and Sintich Rd. The building exterior was unchanged, but an extensive amount of mechanical and
electrical work was completed. This allows reservoir PW827 to receive water from the major
groundwater well PW601.
In 2019, the City placed PRV PW651 near the PG Playhouse on Rec Drive into operation. This
provides the City with additional interconnectivity between pressure zones 1 and 2, creating added
redundancy.
eDoc #565514
13 | P a g e
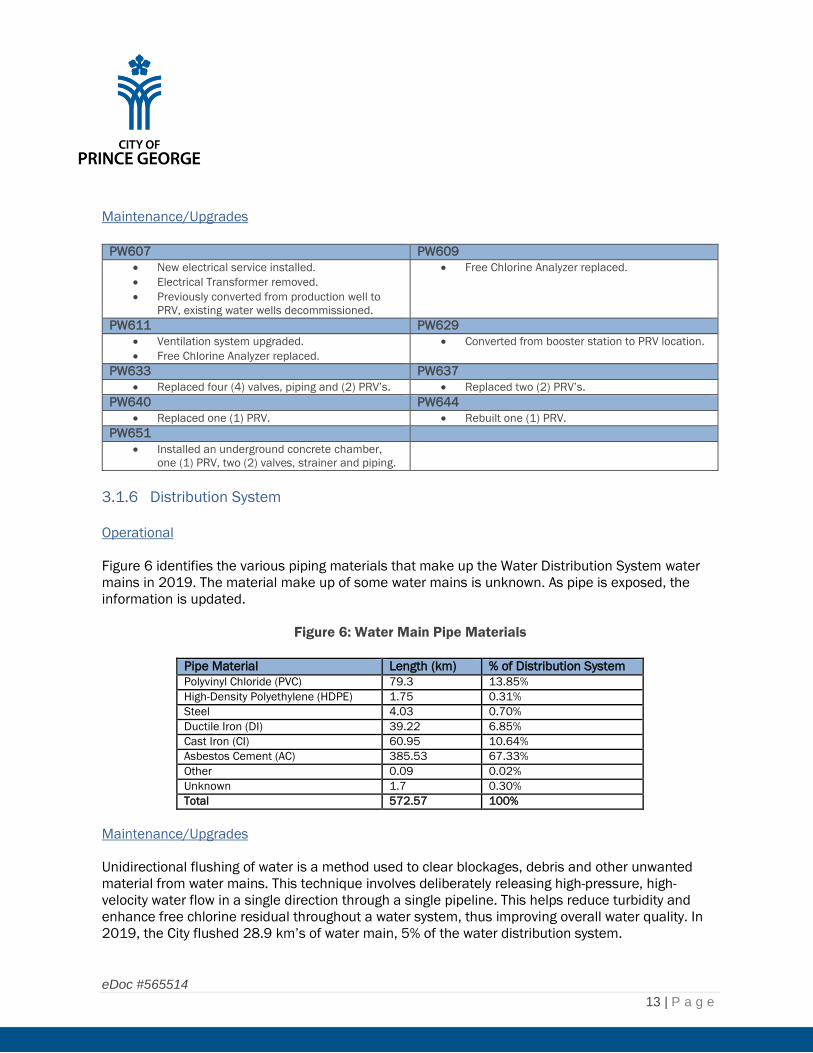
Maintenance/Upgrades
PW607 PW609
New electrical service installed.
Electrical Transformer removed.
Previously converted from production well to
PRV, existing water wells decommissioned.
Free Chlorine Analyzer replaced.
PW611 PW629
Ventilation system upgraded.
Free Chlorine Analyzer replaced.
Converted from booster station to PRV location.
PW633 PW637
Replaced four (4) valves, piping and (2) PRV’s. Replaced two (2) PRV’s.
PW640 PW644
Replaced one (1) PRV. Rebuilt one (1) PRV.
PW651
Installed an underground concrete chamber,
one (1) PRV, two (2) valves, strainer and piping.
3.1.6 Distribution System
Operational
Figure 6 identifies the various piping materials that make up the Water Distribution System water
mains in 2019. The material make up of some water mains is unknown. As pipe is exposed, the
information is updated.
Figure 6: Water Main Pipe Materials
Pipe Material Length (km) % of Distribution System
Polyvinyl Chloride (PVC) 79.3 13.85%
High-Density Polyethylene (HDPE) 1.75 0.31%
Steel 4.03 0.70%
Ductile Iron (DI) 39.22 6.85%
Cast Iron (CI) 60.95 10.64%
Asbestos Cement (AC) 385.53 67.33%
Other 0.09 0.02%
Unknown 1.7 0.30%
Total 572.57 100%
Maintenance/Upgrades
Unidirectional flushing of water is a method used to clear blockages, debris and other unwanted
material from water mains. This technique involves deliberately releasing high-pressure, high-
velocity water flow in a single direction through a single pipeline. This helps reduce turbidity and
enhance free chlorine residual throughout a water system, thus improving overall water quality. In
2019, the City flushed 28.9 km’s of water main, 5% of the water distribution system.

eDoc #565514
14 | P a g e
The City performs valve maintenance throughout the year. City staff operate or “exercise” the valve
to determine its condition and confirm if they will work when needed. The City has 8 valves reported
as exercised in 2019. The process for obtaining the data will be reviewed in 2020, to ensure
accurate numbers are obtained, as the City performed more than was accounted for through
activities such as during watermain breaks and flushing activities. 17 valves within the underground
piping network were replaced in 2019 due to leakage or inoperability.
Hydrants play a critical role in providing local areas with fire protection services. The City performed
624 hydrant inspections in 2019. The City is required to perform an inspection on hydrants annually
and after each operation as per National Fire Protection Association (NFPA). The City replaced 10
hydrants in 2019.
A break in a water main or service connection may cause negative effects within a water distribution
system. A water service connection is a direct connection from the water main to the property. The
City repaired/replaced 118 water service connections in 2019 due to immediate or anticipated
failure. The City also experienced 15 water main breaks, requiring repair. Due to the geographical
location of Prince George, water pipes are required to be buried to a depth that will prevent them
from freezing. This means the City typically has to excavate up to ten (10) feet, sometimes deeper,
below ground level to perform the work. The water from a pipe break may take time come to the
surface, due to the depth of bury. The City uses various methods to check for leaks in our water
system such as sounding technology. This technology allows workers to locate a problem before it
becomes a major issue.
In 2018/2019 the City replaced several water services in the Baker Rd. area. The area has plastic
water service connections installed in the late 1970’s. The type of plastic pipe used is prone to
breaking prematurely, causing pavement deterioration, and water quality concerns. Given the
geography of this area, replacement of the services is difficult, as there are steep elevations, ground
water build-up, and local traffic challenges.
The following chart identifies the capital projects completed or slated for completion from 2017 to
2019.
Mobile Equipment Replacement - Water Baker/Davis Water Services
Money allocated annually for the replacement of
excavators, dump trucks, crane trucks, etc.
within the Utilities Division.
$400,000 allocated for the replacement of
plastic water service pipes in the Baker/Davis
subdivision.
Water Main Replacements (Design) New Water Mains Installed
Lower Patricia Blvd.
3rd Ave.
7th Ave.
12th Ave.
Recreation Pl. to Massey.
Recreation Pl. to PW803.
PW650 to PW817.
14th Ave. Upgrades Construction Tools and Equipment Replacing water mains along 14th Ave. between
Irwin St. and Freeman St. $50,000 annually for the replacement or
purchase of tools and equipment in the Utilities
Division for the water system.

eDoc #565514
15 | P a g e
3.2 Water Production
The City reports water production totals to the Ministry of Forests, Lands, Natural Resource
Operations and Rural Development Water Management Branch annually. Figure 7 identifies the
reported monthly volumes of water produced in 2019. Figure 8 highlights the typical trend of water
production throughout the year. This is reported in cubic metres as volumes are substantial. One (1)
cubic metre is equal to one thousand (1000) litres.
Figure 7: City of Prince George 2019 Monthly Water Production Totals
Month Cubic Metres
January 913,558
February 839,127
March 889,323
April 1,016,385
May 1,319,795
June 1,345,764
July 1,293,463
August 1,061,993
September 998,297
October 864,755
November 808,662
December 891,048
Total: 12,242,170

eDoc #565514
16 | P a g e
Figure 8: City of Prince George 2019 Monthly Water Production
As you can see, water production increased in April and did not reduce below that amount until
September. This is a consistent trend in Prince George for water consumption, as water use peaks
in the summer months primarily due to outdoor water use. Irrigation demands in the summer
months is the most significant contributor to increased water production between April and
September. In 2019, May and June were unseasonably warm and dry while August experienced
higher rainfall, which likely contributed to the higher water use in May and June compared to
August.
3.3 Water Conservation Program
The City has seen a decrease in total water production from its well locations over the past five (5)
years. In 2019, the City saw its lowest water production numbers since the year 2000. The City of
Prince George Water Conservation Plan was implemented in 2016 and since then total water
production has decreased by approximately 16%. Figure 9 identifies the total production volume
from 2009 to 2019, which demonstrates water production peak in 2014 and decrease to 2019.
0
200000
400000
600000
800000
1000000
1200000
1400000
1600000
Cu
bic
Met
res
of
Wat
er
Month
2019 Monthly Water Production

eDoc #565514
17 | P a g e
Figure 9: City of Prince George Yearly Water Production
The decrease in water production from 2014 may be attributed to several factors such as updates
to the Plumbing Code and plumbing technology resulting in more efficient appliances and fixtures,
plus the requirement for water meters in all new builds and large renovations. Climatic factors have
also attributed to water use reduction including a city-wide water ban in 2015 during the hottest
part of the summer, and a wetter than normal summer in 2019.
Efforts implemented under the 2016 Water Conservation Plan have also contributed to a reduction
of water use, including the:
Transition of Bulk Water Users from fire hydrants to public water filling stations;
Calibration of water meters at all City wells and booster stations;
Continuation of leak detection and repair program;
Expansion of the City Sentinel automated irrigation system;
Increased uptake of the Volunteer Water Meter program; and,
Increased public education on sprinkling restrictions through summer events and door-to-door
information sharing.
In 2019, the average daily residential per capita demand was 388 litres per person per day (L/c/d),
with the average household of 2.5 persons using 970 litres per day. Residential water use accounts
for 78% of the total system demand, while the remaining 22% is associated with industrial,
commercial and institutional water use. Prince George’s residential per capita water demand is
approximately 20% higher than the Provincial average of 312 L/c/d. Prince George’s water use is
0
2000000
4000000
6000000
8000000
10000000
12000000
14000000
16000000
18000000
20000000
2009 2010 2011 2012 2013 2014 2015 2016 2017 2018 2019
Cu
bic
Met
res
of
Wat
er
Year
2019 Monthly Water Production

eDoc #565514
18 | P a g e
likely higher than the Provincial average due to larger lot sizes and irrigation demands, and the
majority of residential water users are unmetered and less incentivized to be more water conscious.
3.4 Water Meter Program
3.4.1 Program Overview
A water meter is a device that measures the amount of water that passes through it. The City
utilizes water meters, inside the groundwater well stations to record how much water the wells
produce. Within the distribution system, there are sub-meters, located inside the booster stations. A
water meter identifies pump flow volumes, which assists with maintenance planning. Further
downstream, water meters are located on some individual water service connections. Having water
meters at varying locations throughout the distribution system allows a Utility to identify area
demands and locations where leakage may be occurring. As of September 2020 the City has 3,285
consumer water meters located on water service connections.
A water meter is required on the water service connection when any new building is constructed
(including a carriage house), mobile home placed on a lot, or when a plumbing permit is obtained
for three (3) or more fixtures. All Industrial, Commercial or Institutional buildings require a water
meter as well. Meter sizing is determined by the amount of flow that is required to meet the needs
of the property.
3.4.2 Program Updates
In 2016, the City introduced a Volunteer Water Meter Program. The incentive behind this program is
that a customer will receive a water meter and plumbing permit at no charge. The customer is
required to pay for the installation of the water meter. A certified plumber is required to obtain the
plumbing permit to obtain the water meter and to complete the installation of the water meter. This
allows a customer to understand their water use habits and adjust their usage to see cost savings
on their Utilities bill. The City also sees benefits of additional water meters by having more water
usage information in the system for trouble shooting purposes. This program is ongoing and
correlates with the City’s Water Conservation Program.
January 2018, the City altered their process for new construction water meter installations. Prior to
the alteration, the City would obtain payment for a new water meter from the contractor, purchase
the meter and supply to site. The alteration sees contractors providing a water meter that fits the
City’s Water Meter Installation Specification, and acceptance upon final plumbing inspection. To
communicate the message the City held an Open House in December 2017, and issued notice on
all plumbing permits obtained from October 2017 to February 2018.
April 2018, the City instituted a Water Systems Technician position within the Utilities Division. One
of the responsibilities of this position is to provide technical oversight and ensure effective
administration of the Water Meter Program. Prior to this, administrative and trades staff shared the

eDoc #565514
19 | P a g e
duties. The upgrade provides the Utilities Division with consistent, knowledgeable supervision from
start to finish of the Water Meter Program.
In 2018 and 2019, the City replaced one (1) Bulk Water Filling Station, located at Fire Hall No. 2 (5th
Ave. & Ospika Blvd.) and installed a new one at the Elksentre (4833 Heather Rd.). The intention of
the Bulk Water Filling Stations is to increase bulk water supply availability throughout the City of
Prince George, reducing the number of hydrants used for this purpose, along with better tracking of
water used and generate revenue for the utility. The City hopes to expand the Bulk Water Filling
Station locations and reduce the hydrant use to construction or fire emergencies only. Hydrant
Water Meter Carts were purchased to install on hydrants used for construction purposes to obtain
water use data.
4.0 Water Quality
4.1 Overview The use of underground aquifers allows the City to utilize the gravel bed layer between the surface
water and the pump intakes as a natural filtration system. The City has no additional filtration
systems. The City ensures the water is potable through water sampling protocols, disinfection, and a
cross-connection control program. The Guidelines for Canadian Drinking Water Quality (Guideline),
set by Health Canada, determine the maximum acceptable concentration (MAC) and aesthetic
objective (AO) for various parameters within Canadian drinking water systems. The City strictly
adheres to these guidelines.
4.2 Water Quality Sampling 4.2.1 Bacteriological Samples
The City obtains bacteriological samples on a weekly basis from various locations throughout the
distribution system. The City is required to provide 74 samples from the distribution system per
month. The City provided an average of 30 samples per week (120 samples per month) in 2019, as
per the NHA’s request. The City achieved their required sampling frequency in 2019.
The drinking water samples were sent to the British Columbia Centre for Disease Control (BCCDC) to
confirm the absence of E. coli and total coliforms. The results were provided to the Environmental
Health Officer within the NHA and to City staff.
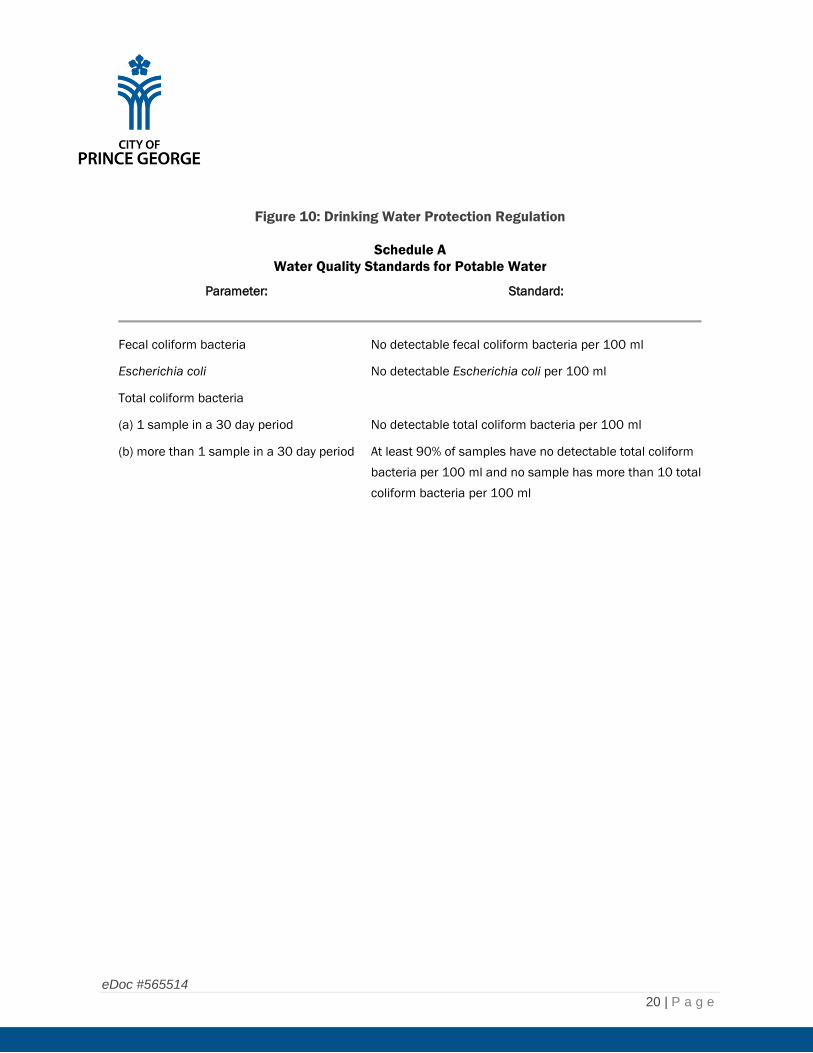
The City met the Drinking Water Protection Regulation standards in 2019, as outlined below in
Figure 10. Figure 11 identifies the bacteriological sample sites within the Water Distribution
System.
eDoc #565514
20 | P a g e
Figure 10: Drinking Water Protection Regulation
Schedule A
Water Quality Standards for Potable Water
Parameter: Standard:
Fecal coliform bacteria No detectable fecal coliform bacteria per 100 ml
Escherichia coli No detectable Escherichia coli per 100 ml
Total coliform bacteria
(a) 1 sample in a 30 day period No detectable total coliform bacteria per 100 ml
(b) more than 1 sample in a 30 day period
At least 90% of samples have no detectable total coliform
bacteria per 100 ml and no sample has more than 10 total
coliform bacteria per 100 ml

eDoc #565514
21 | P a g e
Figure 11: City of Prince George 2019 Bacteriological Sample Locations

eDoc #565514
22 | P a g e
4.2.2 Boil Water Advisories
The regulating health authority of a water distribution system will impose a boil water advisory when
there is a concern for the public’s health. The associated water purveyor would implement the boil
water advisory within their system. The City was not required to implement any boil water advisories
in 2019.
4.2.3 Raw Water Samples
The City obtains raw (non-disinfected) water samples from each well site on a semi-annual basis
and tests them for organic, inorganic, microorganisms, radionuclides and physical parameters. The
testing laboratory uploads sample results directly to Watertrax, an electronic documenting system
used by the City, then City staff posts the results on the City’s website for the residents to view.
The City met all the set parameters within the Guidelines for Canadian Drinking Water Quality in
2019, except for the following:
Parameter Sample Date Location Result MAC AO
Manganese April 16, 2019 PW624 0.077 mg/l 0.12 mg/l 0.02 mg/l
Manganese October 4, 2019 PW624 0.085 mg/l 0.12 mg/l 0.02 mg/l
Iron October 4, 2019 PW627 0.40 mg/l n/a 0.30 mg/l
Manganese October 4, 2019 PW627 0.084 mg/l 0.12 mg/l 0.20 mg/l
Manganese
Manganese is a dissolution of naturally occurring minerals commonly found in soil and rock. On
March 10, 2019 the guideline was updated to include a new Maximum Acceptable Concentration
(MAC) of 0.12 mg/l and reduced aesthetic objective (AO) from 0.05 to 0.02 mg/l. The MAC
adjustment was introduced as new research has shown that levels above the MAC can pose effects
on neurological development and behaviour, deficits in memory, attention, and motor skills,
especially in formula-fed infants where water containing levels above the MAC was used. The AO
was reduced to minimize the occurrence of discoloured water, consumer complaints and staining of
laundry.
Iron
Iron is commonly found in groundwater due to erosion and weathering of rocks and minerals. There
is no evidence of dietary iron toxicity in the general population, thus there being no MAC. An AO is
provided as levels above this may cause concerns of taste, or staining of laundry and plumbing
fixtures.

eDoc #565514
23 | P a g e
PW624 Manganese
The City is continuing to monitor the levels of manganese in PW624 well. A meeting was held with
NHA representatives to inform of the exceedance. No action has been applied to correct the
exceedance at this time.
PW627 Iron and Manganese
In September 2019, the City placed PW627 into a backup role. The increase in iron and manganese
was likely due to the sedentary state of the well prior to the sampling date. PW627 will be operated
in emergencies only, following NHA notification and guidance prior to activation.
4.2.4 Sentinel Well Samples
The City obtained groundwater samples from six (6) sentinel (monitoring) wells around PW660 three
(3) times in 2019. The intent of the sentinel wells is to aid in the protection of the water quality from
potential landward spills or existing areas of contamination. The City samples for physical
parameters, dissolved cations, nutrients, anions, microbiological, organics, and radionuclides. This
information is available upon request.
4.2.5 Distribution System Samples
The City gathered monthly drinking water samples from each pressure zone and tested them for pH,
iron, alkalinity, and hardness. The City’s internal laboratory performed the testing, and recorded the
results in Watertrax. This information is available upon request.
4.2.6 PW621/PW624 Additional Samples
The City of Prince George Wastewater Treatment Centre requires a permit to operate from the
Ministry of Environment. The permit identifies the following requirements:
“The Permittee must analyze the unchlorinated water from the College Heights water pumping
station three times per week (Monday, Wednesday and Friday) for Faecal Coliform CFU per mL or
MPN per 100 mL. Any positive result must be immediately reported to the Director and the Medical
Health Officer for the Northern Interior Health Unit. If a positive result is encountered, daily
monitoring (Monday to Friday inclusive) must be carried out until three successive monitoring
results show no Faecal Coliforms. All samples results must be submitted together with the monthly
sewage analyses and the flow measurement report.”
The City met these permit requirements and received zero positive results.
4.2.7 Turbidity
Turbidity is the measure of relative clarity of a liquid. It is measured by analyzing the amount of light
that is scattered by material in the water. The higher the intensity of scattered light, the higher the

eDoc #565514
24 | P a g e
turbidity, or particles in the water. Particles in the water can harbor microorganisms, protecting
them from disinfection. The Guidelines recommend that water entering the distribution system have
turbidity levels of 1.0 Nephelometric Turbidity Unit (NTU) or less to ensure effectiveness of
disinfection and for good operation of a distribution system.
The City has in-line turbidity monitors located at each supply well. The monitors provide continuous
monitoring of the well turbidity levels. City staff perform quality assurance checks and calibrations
on the turbidity monitors by comparing the results to hand-held monitors on a monthly basis.
Turbidity levels leaving each supply well were under 1.0 NTU in 2019, ranging from 0.01 NTU to
0.20 NTU.
4.3 Disinfection
The City is required to maintain a minimum free chlorine residual of 0.2 ppm throughout the
distribution system, as per the NHA Operating Permit. The City accomplishes this by adding sodium
hypochlorite to the water. The sodium hypochlorite is generated on-site at the major groundwater
wells (PW601, PW605, and PW660), and transported to the smaller groundwater wells (PW621,
PW624, PW625, PW627). The free chlorine residuals leaving each well site vary, depending on
system demands, from 0.5 ppm to 1.0 ppm. The City uses five (5) booster stations as monitoring
and re-injection sites.
City staff utilize continuous free chlorine monitoring equipment throughout the system, and
performs quality assurance checks by comparing the results to hand-held monitors on a weekly
basis. The free chlorine monitoring equipment is connected to the City’s SCADA system. The SCADA
system will notify City staff when free chlorine residuals drop below or above the desired amount.
Free chlorine residual information is recorded in Watertrax for historical reference. The City tests the
free chlorine residual throughout each pressure zone at over 30 locations two times per week to
ensure consistency.
The City requires that all new water main installations over four (4) inch in size undertake
disinfection in accordance with the American Water Works Association (AWWA) Standard B300 or
C651. The City administers this through the Subdivision & Development Servicing Bylaw No. 8618,
2014.
4.4 Cross-Connection Control (CCC) Program
4.4.1 Program Overview
The NHA requires the City to develop and maintain a CCC program. A cross-connection is any actual
or potential connection between a potable water supply and any pipe, vessel, tank, plumbing fixture,
equipment or device through which it is possible for used, polluted or contaminated water or any
other substance to enter the potable water system. A CCC program is a program designed to
administer and regulate the selection, installation, testing and maintenance of backflow preventers.

eDoc #565514
25 | P a g e
Backflow preventers are devices designed to prevent backflow. Figure 12 identifies different types
of backflow preventers.
Figure 12: Backflow Preventers
(Image source: http://safewatercommission.com/index.php/property-owners/backflow-survey)
The type of backflow preventer selected is dependent on the hazard level. If a substance is
connected to the potable water system, and can cause illness or death if swallowed, the level of
backflow preventer is increased. The highest form of protection is a not a backflow preventer, but
an actual air gap.
Air gap is a physical space between a fixtures outlet and the flood level rim of the fixture. This
ensures water cannot physically enter through the fixture outlet. Figure 13 shows what an air gap
looks like.
Figure 13: Air Gap
(Image source: British Columbia Plumbing Code 2018)

eDoc #565514
26 | P a g e
Backflow is the undesirable reversal of flow in a potable water system. When this occurs, other
liquids, moistures, gases, or substances can enter the potable water piping through a cross-
connection. Under the right hydraulic conditions, backflow can result in contamination of the water
supply when a cross-connection exists. These hydraulic conditions are called back-siphonage and
back-pressure.
Back-siphonage is caused by reduced pressure in a supply line to the point where it becomes a
partial vacuum. Common causes are fire hydrants being used to fight a fire, or a water main
breaking. The large demand of water from the hydrants, or water main break, may cause water
downstream to be siphoned upstream. Figure 14 illustrates how contaminated water may enter into
the potable water system through back-siphonage.
Figure 14: Back-siphonage
(Image Source: https://hydrocorpinc.com/municipal-services/homeowner-information/)
Back-pressure is caused by a source of pressure that exceeds the supply pressure. Figure 15
identifies what this looks like inside the water pipes. Some of the systems that may cause back-
pressure are boilers, elevated tanks, pressure washers. The City maintains various pressures
throughout the water distribution system, and interruptions in pressure may occur. This is why the
City relies on backflow preventers to prevent pressurized systems from contaminating the water
distribution system.

eDoc #565514
27 | P a g e
Figure 15: Back-pressure
(Original Image Source: https://hydrocorpinc.com/municipal-services/homeowner-information/)
The City administers its CCC program through the following City of Prince George Bylaws:
Water Regulation and Rates Bylaw No. 7479, 2003
Building Bylaw No. 8922, 2018
Comprehensive Fees & Charges Bylaw No. 9080, 2019
The City requires that a Plumbing Permit be obtained for all backflow preventer installations. The
device must be installed by a certified Plumber and tested by a certified Backflow Preventer Tester.
The backflow preventer is input into the City’s backflow preventer database. Annual tests are
required on each backflow preventer. The City will notify the property owner one (1) month prior to
their re-certification date via mail. If a test report is not received before the re-certification date, two
(2) follow-up letters are mailed; one (1) month post, and two (2) months post re-certification date.
Penalties for non-compliance of the CCC Program can lead to fines and/or disconnection of the
water service. The City backflow preventer database currently (October 2020) houses 1,667
backflow preventers.
4.4.2 Program Updates
April 2018, the City instituted a Water Systems Technician position within the Utilities Division.
Some of the responsibilities of this position are to provide technical oversight and ensure effective
administration of the Cross-Connection Control Program. Prior to this, administrative and trades
staff shared the duties. The upgrade provides the Utilities Division with consistent, knowledgeable
supervision from start to finish of the Cross-Connection Control Program.
July 2018, the City provided the following training sessions for staff, to increase education regarding
cross-connections.
Cross-Connection Control Inspector Certification
eDoc #565514
28 | P a g e
o Three (3) staff within the Utilities Division and three (3) staff within the Civic
Facilities Maintenance work group obtained certification.
o Increased the knowledge of workers that regularly worked on non-potable water
systems within City of Prince George buildings.
Cross-Connection Control Awareness
o Ten (10) staff within the Utilities Division attended this training session.
o Increased the knowledge of workers that regularly work on hydrants, and water
mains in correlation with backflow events.
In 2018 and 2019, the City replaced one (1) Bulk Water Filling Station, located at Fire Hall No. 2 (5th
Ave. & Ospika Blvd.) and installed a new one at the Elksentre (4833 Heather Rd.). These upgrades
enhance the CCC Program, as backflow preventers are installed inside the buildings. This allows the
City to ensure a backflow preventer is in place, and functioning properly for water use by private
haulers. Some trucks that hook up to the distribution system for bulk water use may have been
used to haul fluids other than potable water within their tanks. Where bulk water use is supplied at
a location other than at a bulk filling station, the City requires a backflow preventer be used when
hooking up to a hydrant, and an air gap to be maintained between the tank and fill pipe. The City
intends to expand the Bulk Water Filling Station locations and reduce the hydrant use to
construction or fire emergencies only. Hydrant Water Meter Carts with backflow preventers were
purchased to install on hydrants used for construction purposes.
In 2019 the City reviewed the Comprehensive Fees and Charges Bylaw. Changes regarding the CCC
Program will be the ability for the City to administer fees for processing backflow testing
documentation, as well as failing to provide test results prior to expiry date. These are not in effect
until January 1, 2021 at the earliest.
2019 also launched the development of software that will allow backflow testers to submit
documentation electronically.
4.5 Wellhead/Aquifer Protection Program
The City has established a Wellhead/Aquifer Protection Program through the development of
several reports, and assessments throughout the Water Distribution System’s history.
Some include:
1993, City of Prince George Wilson Park Collector Well No. 3 (PW601) Construction and
Testing Report;
2002, Capture Zone Analysis and Preliminary Delineation of Well Protection Areas for Wells
PW605, PW601, and Fishtrap Island: City of Prince George, BC;
2005, Installation Report: Fishtrap Island Collector Well Design and Construction Project;
2010, Sentinel Well Construction and Sampling PW660;
2010, Flood Risk Evaluation and Flood Control Solutions;
2015, City of Prince George Wells Protection Plan: For CN Related Risks;
2019, City of Prince George Groundwater at Risk of Containing Pathogens Risk Assessment

eDoc #565514
29 | P a g e
As the City obtains new information about the wellhead and aquifer protection areas, the
Wellhead/Aquifer Protection Program is updated.
Currently, the City performs the sentinel well, raw water and PW621/PW624 additional sampling,
noted in Section 4.2 Water Quality Sampling, as part of this Program. Additionally, there are specific
requirements around developing land within the wellhead and aquifer protection areas. City staff
monitor the wells on a routine basis to ensure the immediate area is safe.
Future plans include; identify the wellhead/aquifer protection areas with signage, and implement
recommendations from the City of Prince George GARP Risk Assessment.
4.6 Water Quality Concerns
In 2019, the City received thirty-six (36) concerns from the public regarding the drinking water
quality. The City receives water quality concerns through phone, email and app inquiries to the City’s
Service Centre. Service Centre staff create a Service Request in Cityworks, and dispatch the
requests to the Utilities Division. Utilities staff investigate each concern and determine the
appropriate path to correct the water quality. The concern and resolution are documented within
the Service Request for the associated address. The calls received are typically for dirty water, or
undesirable taste and odour. The common causes are water main construction, water main breaks,
unidirectional flushing, higher flow output from pumps than normal and undesirable chlorine
residual taste.
5.0 Emergency Response Plan
The City has prepared an Emergency Response Plan (Plan) for the City of Prince George Water
Distribution System. City staff review the Plan on an annual basis, and update when required. The
City updated the Plan in 2017. City staff and the NHA receive the Plan, as it pertains to the
operation of the system.
The City communicates emergency response situations through the City of Prince George website.

eDoc #565514
30 | P a g e
6.0 Environmental Operators Certification Program (EOCP)
6.1 Classification
The City of Prince George Water Distribution System is classed as a Level IV system. The
classification system is from Level I to Level IV, with Level IV being the highest level of classification.
This is due to the systems complexity and size.
6.2 Certified Operators
In 2019, the City had the following numbers of certified Water Distribution staff:.
Level IV – 1
Level III – 2
Level II – 6
Level I – 8
Operator in Training – 13
Additionally, the City relies on specialists in their field, such as technology, engineering, electrical
and mechanical trades, environmental and administrative staff to ensure a safe and efficient
drinking water system.
6.3 Training
The City ensures staff receive training in all health and safety related areas that pertain to their
work environment. This includes, but not limited to the following:
Confined Space Entry
Fall Protection
Aerial Work Platform
Traffic Control
Arc Flash
H2S Alive
Excavation Safety
Electrical Safety
Hoisting, Lifting & Rigging
Forklift
Skid Steer
Bullying & Harassment
First Aid
WHMIS
Due Diligence for Supervisors
Lockout & Tag Out
From 2017 to 2019, the City provided training courses that directly relate to the Water Distribution
System, such as:
Water Quality & Sampling
Sodium Hypochlorite Generation System Operations and Maintenance

eDoc #565514
31 | P a g e
Water Distribution 1, 2 & 3
Cross-Connection Control Awareness
Cross Connection Control Inspector
BCWWA Annual Conference attendance
Control Valve Operations & Maintenance
7.0 Conclusion The City of Prince George remains committed to safeguarding the highest quality of water to their
residents. Staff are continuously monitoring the system, updating infrastructure and advancing
their knowledge of any changes in regulations, or technology that pertain to the operations and
maintenance of the Water Distribution System. The City will continue to be transparent and work
with the government agencies, health authority, and citizens to ensure their satisfaction.
For questions or comments regarding the Report, please contact the aforementioned Utilities
Division staff on Page 1.


![PRINCE GEORGE GYMNASTICS CLUB PRESENTATION [Read-Only]princegeorge.ca/cityhall/mayorcouncil... · 2019. 1. 3. · PG GYMNASTICS CLUB • WHO WE ARE • OUR HISTORY • MEMBERSHIP](https://img.pdfslide.us/doc/110x75/609c57149224e94d1015588c/prince-george-gymnastics-club-presentation-read-only-2019-1-3-pg-gymnastics.jpg)