Embed Size (px)
Citation preview
Annual Variation of Daily Energy Expenditure
by the Black-billed Magpie: A Study of Thermal and Behavioral Energetics
JOHN N. MUGAAS and JAMES R. KING
DEPARTMENT OF ZOOLOGY WASHINGTON STATE UNIVERSITY
PULLMAN. WASHINGTON
Studies in Avian Biology No. 5 A PUBLICATION OF THE COOPER ORNITHOLOGICAL SOCIETY
Cover Design: Black-billed Magpie by Eleanor Mchtire, Department of Biomedical Communications, West Virginia School of Osteopathic Medicine.
STUDIES IN AVIAN BIOLOGY
Edited by
RALPH J. RAITT
with assistance of
JEAN P. THOMPSON and THOMAS G. MARR
at the
Department of Biology New Mexico State University
Las Cruces, New Mexico 88003
EDITORIAL ADVISORY BOARD
Joseph R. Jehl, Jr. Frank A. Pitelka Dennis M. Power
Studies in Avian Biology, as successor to Paci3c Coast Avifuunu, is a series of works too long for Thr Condor, published at irregular intervals by the Cooper Ornithological Society. Manuscripts for consideration should be submitted to the Editor at the above address. Style and format should follow those of previous issues.
Price: $8.00 including postage and handling. All orders cash in advance; make checks payable to Cooper Ornithological Society. Send orders to Allen Press, Inc., P.O. Box 368, Lawrence, Kansas 66044. For information on other publi- cations of the Society, see recent issues of The Condor.
Current address of John N. Mugaas: Department of Physiology, West Virginia School of Osteopathic Medicine, Lewisburg, WV 24901.
Library of Congress Catalog Card Number 8 I-66956 Printed by the Allen Press, Inc., Lawrence, Kansas 66044
Issued May 6, 1981 Copyright by Cooper Ornithological Society, 198 1
ii
CONTENTS
LISTOF SYMBOLS .................................................. INTRODUCTION ....................................................
POPULATION AND STUDY AREA ..................................... RATIONALE AND MET.HODS OF THERMAL ANALYSIS ...................
Nonmeteorological Variables ...................................... Meteorological Variables ..........................................
RATIONAI.E AND METHODS OF TIME-ACTIVITY AND ENERGY BUDGET ANAL- YSIS ..........................................................
Behavioral Categories ............................................ Methods of Observation .......................................... Energy Equivalents .............................................. Calculation of Daily Energy Expenditure ........................... Statistical Treatment .............................................
THE THERMAL ENVIRONMENT AND ITS INFLUENCE ON THE BIOLOGY OF THE MAGPIE ...................................................
Meteorological Measurements and the Microclimatic Set ............. Calculation of Equivalent Blackbody Temperature and Its Variability . . Annual Cycle of Equivalent Blackbody Temperature in Specific Thermal
Environments ............................................... TIME-ACTIVITY AND ENERGY BUDGETING IN THE ANNUAL CYCLE ......
Chronology of Events in the Annual Cycle .......................... Daily Time-Activity Budget ....................................... Metabolic Cost of Activity ........................................
Total Daily Energy Expenditure ...................................
DISCUSSION ....................................................... Thermal Tolerance and Geographic Distribution ..................... The Bout as an Index of Behavior .................................
Annual Cycle of Energy Expenditure ...............................
Minimizing H,,, Through Adaptive Use of Time and Energy .......... Comparisons of Time Budgets of Black-billed and Yellow-billed Mag-
pies ........................................................ Comparisons of Daily Energy Expenditure for Several Species ........
SUMMARY ......................................................... ACKNOWLEDGMENT s ............................................... LITERATURE CITED ...............................................
APPENDIX .........................................................
vi 1 2 3 5 6
7 7 8 9
14 14
15 15 18
22 27 27 31 33 37 40 41 42 45 58
59 60 67 69 69 76
. 111
TABLES
Table I.
Table 2.
Table 3. Table 4.
Table 5. Table 6. Table 7. T-able 8.
Table 9. Table IO. Table I I. Table 12. Table 13.
Table 14.
Table 15.
Table 16.
Table 17.
Table 18. Table A-l
Table A-2
Behavioral categories used in quantifying daily activity patterns and energy expendi- ture of Black-billed Magpies _. _. Categories and conversions used in estimating daily energy expenditure of Black- billed Magpies . .._...........____..........__............._................ Seasonal and daily variation observed in six meteorological variables Body weight, body dimensions, total surface area, and ratio of body diameter to body length of female and male Black-billed Magpies Absorptivity of Black-billed Magpie plumage to shortwave radiation A,,/A, ratios for bodies and heads of female and male Black-billed Magpies Relationship of 7,. of Black-billed Magpies to 7,, in response to clear or cloudy skies Phenological events, months, and dates of behavioral observation of Black-billed Magp,ies together with average length of active periods, hours of visual contact. and percent of the active period in visual contact for each composite day Daily time budget of Black-billed Magpies during nonreproductive months Daily time budget of Black-billed Magpies during various reproductive stages Daily energy expenditure of Black-billed Magpies during nonreproductive months Daily energy expenditure of Black-billed Magpies during various reproductive stages Estimated number of hours per composite day during which Black-billed Magpies had a thermoregulatory requirement Maximum and minimum energy costs possible for Black-billed Magpies during each Bout, and actual calculated costs of the Bouts during the annual cycle expressed as a multiple ofH,, . . . . . ..___..............__.............___.........._.....
Consequences of variation in intra- and interbout activity on metabolic costs of activity of Black-billed Magpies _. _. Metabolic rates predicted for six Black-billed Magpie nestlings at about day 21 of the nestling stage ___....................................................... Distribution, abundance, and size of Black-billed Magpie food items in relation to behavioral characteristics used in exploiting them Selected H,,,values........................................................ Mean value, sample size, and standard deviation of the hourly metabolic cost of activ- ity of Black-billed Magpies for periods of visual contact during each composite day Paired f-tests between composite days of the hourly metabolic cost of activity of
8
9 I5
18 I9 20 24
30 31 32 36 37
41
44
45
51
56 62
76
Black-billed Magpies _....................._............__,.......__........ 77
iv
FIGURES
Figure 1. Figure 2.
Figure 3.
Figure 4.
Figure 5.
Figure 6.
Figure 7.
Figure 8. Figure 9.
Figure 10.
Figure I I.
Figure 12. Figure 13.
Figure 14.
Air temperature, and windspeed profiles for selected months _. Percentage of days each month (June 1973-June 1974) having cloudy, partly cloudy, and clear skies _...........,....,..,....____..............._............... Range of effect of different orientations to sun and wind on 7, of the Black-billed Magpies . . . . . . . . . . . . . . ..__.___..............._._____...................... Equivalent blackbody and ambient air temperatures for Black-billed Magpies as a function of time during a composite day in July Equivalent blackbody and ambient air temperatures for Black-billed Magpies as a function of time during a composite day in January Summary of thermal steps available to Black-billed Magpies, and variables used in calculating 7,. and H,,, for magpies A. Effect of windspeed on metbolic requirements of Black-billed Magpies at various air temperatures. B. Boundary-layer resistance for Black-billed Magpies as a func- tionofwindspeed . . . . . . . . . . . . ..__._____................................... Annual cycle of Black-billed Magpies _. Diurnal activity pattern of Black-billed Magpies for composite days of each repro- ductive stage and nonreproductive month _. Change by months in the ratio of hourly metabolic cost of activity to hourly cost of basal metabolism of Black-billed Magpies _. Ratio of total daily energy expenditure to daily basal metabolic requirement of Black- billed Magpies for composite days of each reproductive stage and nonreproductive month . . . . . . . . . . . . . .._..............__._.................................. Variation by month in thermoregulatory requirements of Black-billed Magpies A. Required foraging efficiency of Black-billed Magpies during each composite day. B. Required foraging efficiency of Black-billed Magpies as a function of time spent foraging, and H,,, ofeach composite day . . . . .._._._.........._....__........ Cumulative energy expenditure for Black-billed Magpies during various reproduc- tive stages as a function of days during which these expenditures were incurred
I6
17
21
22
23
25
26 28
33
34
38 40
46
52
V
h
PU P CT
7
coat thermal resistance (s m-l) equivalent resistance (s m-l) radiative resistance (s m-l) tissue resistance (s m-l) direct shortwave irradiance (W m-‘) reflected direct and scattered shortwave irradiance (W m-‘) scattered shortwave irradiance (W rne2) global radiation (W m-‘) air temperature (“C) body temperature (“C) equivalent blackbody temperature (“C) lower critical temperature (“C) thermoneutral zone (“C) upper critical temperature (“C) time (h) time spent active perching (h) time spent on flights > 3 sec. duration (h) time spent on flights s 3 sec. duration (h) time spent foraging (h) time spent hopping (h) time spent incubating (h) time spent in nest attendance (h) the time interval for estimating the cost of molt (h) the time interval for estimating the cost of ovogenesis (h) time spent running (h) time spent roosting (h) time spent rest perching (h) time spent standing (h) time during which thermoregulation is required (h) time spent walking (h) wind velocity (m s-l) ratio of the prolate spheroids minor to major axis absorptivity of surfaces to longwave radiation absorptivity of surfaces to shortwave radiation latitude of the study area (degrees) solar declination (degrees) emmissivity of the animal’s surface achieved foraging efficiency exploitation efficiency required foraging efficiency the angle between the direct solar beam and the major axis of the prolate spheroid (degrees) heat of vaporation (2.43 MJ kg-‘) density of air at 20°C (1.2 kg m-“) reflectance (radiation) Stephan Boltzmann constant (5.67 x IOPx W me2 “KP4) transmittance (radiation)
vii
INTRODUCTION
The imperatives that mold organismal life histories consist of self-maintenance and reproduction. Both of these processes require expenditures of two basic and pervasive resources-time and energy (King 1974). While the requirements for energy (and other nutrients) are obvious, those for time are more obscure. As a resource, time is required in the performance of such essential functions as for- aging, courtship, vigilance against predators, or the completion of vital productive processes, to name but a few, and under certain circumstances may be limiting. If daylength or the seasonality of other resources is too brief to allow the com- pletion of essential functions, or if environmental pressures (e.g., thermal stress, daylength, pressure from predators) combine to reduce the availability of time for still other essential functions (e.g., courtship and mating, care of the young, etc.), then the time required to meet these demands may be reduced below an effective minimum. Since the cumulative expenditure of energy is also a function of time, and time spent in obtaining energy (foraging) is subtracted from time allocated to other functions, it is apparent that these resources are intricately interrelated (Orians 1961). Indeed, energy acquisition (requiring time) and time spent in other vital activities cannot simultaneously be maximized (Wolf and Hainsworth 1971), a situation that poses fitness-related problems to organisms in time-limited and/or energy-limited environments.
It is a reasonable assumption that the observed diversity of life-history patterns strongly reflects the wide variety of evolutionary solutions taken in exploiting resources of time and energy. Current theory (e.g., Emlen 1966, MacArthur and Pianka 1966, Schoener 1971, Pyke et al. 1977, and others) maintains that these varied life-history patterns are compromises that tend to optimize the acquisition and allocation of resources, and thus tend to maximize fitness in varied ways.
The organismal traits on which selection can act are legion, but can be segre- gated broadly into morphological, physiological, and behavioral characters, each of which may impose constraints on the adaptive plasticity of another. For in- stance, body size in homeotherms determines their minimal energy requirements, their relative thermostatic expenditure, their access to shelter, whether they are arboreal or terrestrial, volant or nonvolant, and so on. Physiological functions are, in general, much less plastic in the evolutionary sense than are behavioral characteristics, and while we can predict many physiological rates or processes principally by body size (Calder 1974), we know of no similar generalization for behavioral traits.
It follows that selection has affected primarily the activity budgets, or time budgets, of organisms, and has thus influenced energy budgets secondarily through the effects of various activities on energy budgets. Because allocations of time and energy resources are so intimately interrelated with each other and other resources, it is clearly necessary to examine energy budgets concurrently with time budgets if we are to understand how and why life-history patterns have diversified in response to various environments.
Beginning with the insights of Pearson (1954), Orians (1961), Verbeek (1964), and Verner (1965), there has been an acceleration through the 1970s in studies of time and energy budgets (for review, see King 1974, and later references sum- marized in the Discussion section). These have been valuable in adding to the
I
2 STUDIES IN AVIAN BIOLOGY NO. 5
comparative matrix that will eventually permit the recognition of generalizations concerning the role of time and energy in forming life-history patterns, but most of them have concerned only a part of the annual cycle (usually the breeding season). Thus, it is still impossible to discern what part of the annual cycle constitutes a bottleneck of energy or time that limits an animal’s distribution or abundance, or jeopardizes its survival. Furthermore, all but a few of these in- vestigations have neglected to distinguish obligatory energy expenditure (basal and thermostatic requirements), over which an animal has only minor volitional control, from expenditures in volitional or facultative activities. This results in a serious loss of information if, as we believe, volitional (behavioral) character- istics are more sensitive to selection than are obligatory physiological processes.
As an effort to augment the fund of information about annual variation in energy and time budgets, and to provide a format that is more responsive to ecological questions, we undertook a year-long investigation of free-living Black-billed Mag- pies (Picu pica hudsonia) in southeastern Washington. To facilitate separating and estimating obligatory and facultative energy expenditure, our methods fea- tured a detailed month by month quantification of the magpie’s microclimates and its activity budgets. The activity budgets were converted to components of the energy budget by methods to be detailed later, but in general depended on known relationships between timed activities in the field and the energy con- sumption of such activities measured in the laboratory. We abbreviate this and similar techniques using “time-activity-laboratory” data as the “TAL” method.
The Black-billed Magpie is a medium-sized ground-foraging bird whose behav- ior can be readily observed. It is a permanent resident throughout most of its range, where it may be subjected to harsh weather in both summer and winter. Its general biology (e.g., Linsdale 1937, Evenden 1947, Brown 19.57, Jones 1960, O’Halloran 1961, Erpino 1968, Bock and Lepthien 1975) and its thermal physi- ology (Stevenson 1971) are fairly well known. These characteristics make the Black-billed Magpie very well suited to investigation by TAL methods.
POPULATION AND STUDY AREA
The population studied occupied a 646-ha area on the west end of the Wash- ington State University campus, an area of gently rolling hills dissected by nu- merous small drainages that coalesce in its eastern half and eventually empty into Paradise Creek. The difference in valley bottom elevations between the south and north end is about 61 m. The western edge of the study area extended to the main campus, while the other three sides were bordered mainly by farmland (predominantly wheat). The study area is in the Frstucu-Symphoricurpos and Festucu-Rosa vegetation zones of the steppe region of Washington (Daubenmire 1970) which when undisturbed is characterized by a mosaic of habitat types. The two types important to the magpie are the Crutuegus douglussii-Symphoricur- pos ulhus and Crutuegus douglussii-Heruculrum lunutum types where Crutue- gus bushes afford nesting and roosting sites. The study area, however, is very disturbed and is a mixture of fields, poultry yards, pastures, farm buildings, pine plantations, fir plantations, groves of introduced exotics (honeysuckle, corrigana, lilac, apple, cherry), as well as some remnant groves of native brush (black haw- thorne, Crutuegus douglussii, predominantly, but mixed with snowberry, Sym-
ENERGY EXPENDITURE BY THE BLACK-BILLED MAGPIE 3
phoricarpos albus, spirea, Spirea hetulifoliu , and service berry, Amelanchier alnifolifl).
About 36 adult magpies occpied this area during the investigation. Six of them, previously marked with colored bibs bearing an identifying number, had been used by Johnson (1972) in an earlier investigation. When Johnson marked these birds (1970-1971), juvenals (birds yet to complete their first molt) received red bibs, and adults yellow bibs. Therefore, when field observations first started (April 1973) the three birds with red bibs were two to three years old, and the three with yellow bibs were more than three years old. Johnson had also marked mapgie populations in adjacent drainages, and during the winter when these joined with ours in a communal roosting flock, several other birds with bibs were seen. In the spring of 1974, only two red-bibbed and one yellow-bibbed birds were breeding in the study area. The other three either had been assimilated into another population during the winter flocking, had lost their bibs, or had been eliminated entirely. Therefore, it appears that the adult individuals in the observed population were resident not only to the Pullman area in general, but perhaps specifically to the study area. This population remained within a home range area as a loose flock, except during the reproductive season, when the adults dispersed over that same area as pairs on nesting territories.
RATIONALE AND METHODS OF THERMAL ANALYSIS
The thermal environment is the milieu in which all activity takes place. It is therefore one of the major selective forces in an organism’s environment, and while there are many laboratory investigations describing physiological, morpho- logical, and behavioral adjustments of birds to various thermal regimes (see Daw- son and Hudson (1970) and Calder and King (1974) for recent reviews), few describe the set of thermal conditions available to an animal in its natural envi- ronment or the extent to which an animal may utilize a set of microclimatic differences to extend the full range of variation identified in the laboratory. For an animal as mobile as a bird there are several different thermal conditions avail- able to it at any time, and it is important in evaluating time-activity and energy budgets not only to determine the character of these on a temporal basis but also to determine which of them are actively sought and occupied at certain times of the day or year. The ability to accept or reject various thermal environments may allow an animal to “assemble the environmental conditions necessary for survival and reproduction out of remarkably unlikely arrays of environmental factors” (Bartholomew 1958). It is in this context that the analysis of thermal energy exchange between organisms and their environment becomes important and makes it possible to quantify the relative roles of physiological, morphological, and behavioral adaptations in determining an animal’s temporal spacing of activ- ities (daily and seasonal), daily energy requirements, distribution within its hab- itat, and perhaps geographic distribution.
Winslow et al. (1936a, 1936b, 1937) made fundamental pioneering studies of “partitional calorimetry” in a controlled laboratory environment and estimated the radiative, evaporative, and convective heat transfer terms separately for men under a wide variety of thermal conditions. They (Winslow et al. 1937) described their controlled laboratory environment in terms of a single “operational tem-
4 STUDIES IN AVIAN BIOLOGY NO. 5
perature” which took into account the combined contributions of radiation and air temperature in creating a specific thermal environment. Since then, methods have been developed for describing the thermal energy budgets of plants and animals under uncontrolled field conditions (Gates 1962, Geiger 1965, Birkebak 1966, Monteith 1973, Campbell 1977) with concomitant efforts to bridge the gap between field and laboratory studies of thermal balance. A seminal step in bridg- ing this gap was the development of the “climate space” concept by Porter and Gates (1969). From its location on a climate space diagram, a particular set of microclimatic conditions can be reduced from real expressions of radiation, wind, and air temperature to a single “lumped” variable, the equivalent blackbody temperature (T,), which can be directly equated to a blackbody cavity (Morhardt 1971, Morhardt and Gates 1974). Laboratory data describing thermoregulatory responses of animals are usually gathered in controlled thermal environments that also approximate blackbody cavities. Therefore, by comparing thermal environ- ments in terms of equivalent blackbody cavities, it is possible to completely bridge the gap between the field and the laboratory, and to predict appropriate thermoregulatory responses for animals in the field from estimates of T,,. This assumes that thermoregulatory responses are the same to equivalent thermal environments even though the relative contributions of the physical variables may differ between the two.
The equivalent blackbody temperature, used as an index of the thermal envi- ronment in this investigation, is given by Eq. 1,
“T, = T, + (&,s - E~&“)lP,,Cr,( l/r,, + I/r,) (1)
where T, is the equivalent blackbody temperature (“C), T,, is air temperature (“C), K,, is air temperature in degrees Kelvin, RIlhs is the flux density of absorbed radiation (W mp2), E is the emissivity of the animal’s surface (0.98), (T is the Stephan-Boltzmann constant (5.67 x 10px W rn-’ ‘Kp4), pn is the density of air at 20°C (1.2 kg me3), c,, is the specific heat of air (10” J kg-’ ‘C-l), Y, is boundary- layer thermal resistance [s m-l; r, = K(d/u)“.“; where u is wind velocity (m s-l); d is the characteristic dimension of the bird; and K is a constant (3 10) for laminar flow over a flat plate; Robinson et al. 19761, and r,. is the radiative resistance (s m-l; r, = P,,c~,I~E(TT~,~; Monteith 1973). Derivation of Eq. 1 comes from the cli- mate space of Porter and Gates (1969) and is given in detail by Robinson et al. (1976) and Campbell (1977).
The equivalent blackbody temperature describes one end of the thermal gra- dient for heat gain or heat loss between the animal and the environment. It is used in Eq. 4 of Robinson et al. (1976) to describe the physiological response of an animal to its thermal environment through an energy budget,
a,,, - AE = ]p,,c,,I(r,, + r,Jl(Ttj - T,J (2)
where fi,,, is the flux density of metabolic heat at the skin surface (W m-Z), hE is latent heat flux density (W mm’; h = heat of vaporization = 2.43 MJ kg-‘; E =
total evaporative water loss = g m-’ s-l), r,, is whole body thermal resistance [s m-l; equal to tissue resistance (rt) plus coat resistance (r,.)], T,) is body temper- ature (“C), and the other terms are as defined above.
* See p. vi for IISI of symbols.
ENERGY EXPENDITURE BY THE BLACK-BILLED MAGPIE 5 ,
The validity of this approach in describing thermal environments and predicting physiological responses to them is supported by the investigations of both Rob- inson et al. (1976) and Mahoney and King (1977), who demonstrate good con- cordance between theoretical and empirical estimates of fi,,, using T,, as a measure of the environmental end of the thermal gradient.
NONMETEOROLOGICAL VARIABLES
Values for the various nonmeteorological variables associated with Eqs. 1 and 2 were estimated as extrapolations from literature values, measured on live mag- pies and study skins, or evaluated from an appropriate equation.
Surface area.-If the tail, head, and legs are excluded, the silhouette of a bird’s body has the shape of a prolate spheroid, while the head minus the beak can be considered a hemisphere. Therefore, the area of the external surface involved in radiative exchange with the physical environment can be estimated from the sum of the areas of these two solids as given in Eq. 3,
A, = [2rrb” + (2nable) sin’e] + 6.285 r2
where u, b, and e are the major axis, minor axis, and eccentric, respectively, for a prolate spheroid, and r is the radius of the hemispherical head. Measurements were made at the feather surface of head circumference, body circumference at its widest point, and body length from the middle of the neck to the base of the tail on six live male and four live female magpies. These measurements were then used in calculating the external surface areas for these birds. Walsberg and King (1978~) have subsequently demonstrated with empirical measurement that the external feather surface is on the average 23% less than the skin surface area beneath the plumage and point out the necessity of using the former for estimates of heat transfer in birds. Their allometric equation for external surface area
(S = 8 11 mO.fifi7. where S es/ . 2 6’S, is the external surface area in cm’, and m is body mass in grams) predicts values for female (242 cm”) and male (261 cm’) magpies that conform closely (-8.0 and + 0.7% difference for females and males, re- spectively) to those calculated geometrically (Table 4).
The projected surface area normal to the direct solar beam (A,,) is the area of a shadow cast by the bird on a surface that is normal to the solar beam. Eq. 4 gives the AJA, ratio for a prolate spheroid (Campbell 1977, pers. comm.)
(A,,IA,) = [1 + (.? - l)cosz0]*
2x + (2 sin-‘J1 - x2 lJI- x’)
where x is the ratio of the minor to major axis of the spheroid (b/a, representing the bird’s body), and 0 is the angle between the solar beam and the major axis.
Absorptivity.-Through the courtesy of Dr. Warren Porter, Department of Zo- ology, University of Wisconsin, reflectance measurements were made of the black back, black chest, and white belly plumage of three magpie study skins. Reflec- tance was measured at 5 to 60 nm intervals over the spectral range from 295 to 2500 nm. Each reading was corrected to correspond to the reflectance of the energy present in that wavelength of the solar spectrum as seen on a clear day at 12:00 hours on 1 July at 46”N. These values were then integrated over the corresponding solar spectrum to give an average reflectance for each of these
STUDIES IN AVIAN BIOLOGY NO. 5
plumage areas. The corresponding average absorptivity was calculated from the equation 1 = u + T + p, where a is the absorptivity, 7 is the transmissivity (as- sumed to be zero), and p is the reflectivity.
Physiological vuriables.-The physiological variables required in energy bud- get analysis are body temperature, metabolic rate, rate of latent heat loss, lower critical temperature (T,,.), upper critical temperature (T,,,.), and whole body resis- tance. These variables were not measured directly during this investigation but were taken from the literature or estimated from accepted equations. Values for T,, were taken from Stevenson (1971) who found that Black-billed Magpies show a diurnal variation in T,, of about 3.5”C, ranging from 39°C while roosting to 425°C while active. Basal metabolic rate (A,,; 70 W rn-‘), Tl, (5”C), and T,,, (35°C) were also taken from Stevenson (1971). The proportion of metabolic heat lost via evaporative cooling at various air temperatures under laboratory conditions was estimated from Eq. 56 in Calder and King (1974). Whole-body thermal resistance was calculated by solving Eq. 2 for r,,. The maximum and minimum values for r,, bounding the thermoneutral zone (T,,) were then obtained by substituting the T,,,. and T,,. for T,, in the equation.
Characteristic dimrnsions.-The characteristic dimension d used in estima- tions of r,, refers to the orientation of the bird with respect to the direction of the wind. For a bird whose long axis is parallel to the wind, d is the straight line length from the base of the beak to the base of the tail, and for a bird whose long axis is normal to the wind, d is the body diameter at the widest point. These measurements were obtained from six male and four female magpies and averaged separately for the sexes to estimate d.
METEOROLOGICAL VARIABLES
The required meteorological variables were measured in the field at localities occupied by the birds. During any period of measurements (except at night) a transect was established so that several (3 to 5) localities could be sampled. A typical transect would sample the shade of a grove of trees, an open bottom area, and a hillside or hill crest, or a north-facing slope and south-facing slope. Each locality was then sampled once each hour during the entire measurement period. A complete diurnal record was generally not made on any one day, but a com- posite day was constructed for each month. Measurements were made for at least four hours at different times on two to four different days, so that by the end of the time required to complete the series, a complete dawn-to-dark record was available for each position along the transect. The location of the transect varied from season to season as the birds changed their pattern of distribution over the study area. Nighttime measurements were made within the roost sites of the population, which changed with season. Portable, battery-operated meteorolog- ical instruments were mounted on a pack frame and carried along the transects, or placed within the roost site for these measurements.
Radiution measurements.-Shortwave radiation was measured with a Moll- Gorczynski solarimeter (Kipp and Zonen, Delft, Holland, manufacturer). The sensor was mounted on the end of a 60-cm-long tube and held 80 cm above the ground with a tripod. A 4-cm-diameter aluminum disk, suspended 12 cm above the sensing surface on a thin wire, was used to shade the sensor surface in order to measure scattered shortwave radiation. The surface of the disk facing the
ENERGY EXPENDITURE BY THE BLACK-BILLED MAGPIE 7
sensor was painted with flat black Krylon. All measurements were made with the radiation sensor in a horizontal position, facing upward for global and scattered radiation, and downward for reflected radiation. The value for the direct beam was calculated from Eq. 5,
S, = (ST,, - S,y)/(cos p cos 6 cos h + sin p sin 6) (5)
where S7’,, is global radiation, S, is scattered radiation, ,8 is the latitude of the study area (46”37.5’), 6 is the solar declination taken from the ephemeris for the day in question, and h is the hour angle of the sun (List 1971).
Longwave sky radiation was estimated in three ways. On clear days or days with scattered clouds, longwave sky radiation was estimated from the Idso-Jack- son (1969) equation for atmospheric radiation and corrected for cloud cover (Monteith 1973). On some days, sky temperatures were measured with a Wahl Heat Spy radiation thermometer (Model HSA-120, William Wahl Corporation, Los Angeles, California, U.S.A.) and converted to u-radiance using E = 1.0 for sky emmisivity. On completely overcast days, or within a shady canopy, or within the roosting grove at night, longwave ground and sky radiation were estimated from measurements of total incoming radiation (Q) made with a modified Moll- Gorczynski solarimeter fitted with a polyethylene dome and a thermocouple ther- mometer on the cold junction of the sensor’s thermopile (Mugaas 1976, Campbell et al. 1978). The longwave component was then estimated by subtracting the total shortwave reading (S,,,,) from Q.
Air and ground temperatures.-Air temperature was measured with a 26 ga copper-constantan thermocouple shaded from sky radiation with an aluminum foil shield. Measurements were made at 9 cm (mid-height on a bird standing on the ground) and 160 cm (fence-post height) above the ground. Ground tempera- tures were measured with this same thermocouple by pulling the aluminum shield back from the junction and laying the junction on the ground. In all cases of air and ground temperature, the maximum and minimum temperatures observed for a one-minute period were recorded and the average of these used in data presen- tation. Ground temperature was also used to calculate longwave terrestrial ra- diation.
Windspeed.-A Hastings model RB- 1 anemometer with an omnidirectional probe was used to measure windspeed. Measurements were made at 9 cm and 160 cm above the ground for a period of one minute at each height and the maximum and minimum values recorded for that interval. The average of these was used as the mean windspeed.
RATIONALE AND METHODS OF TIME-ACTIVITY AND ENERGY BUDGET ANALYSIS
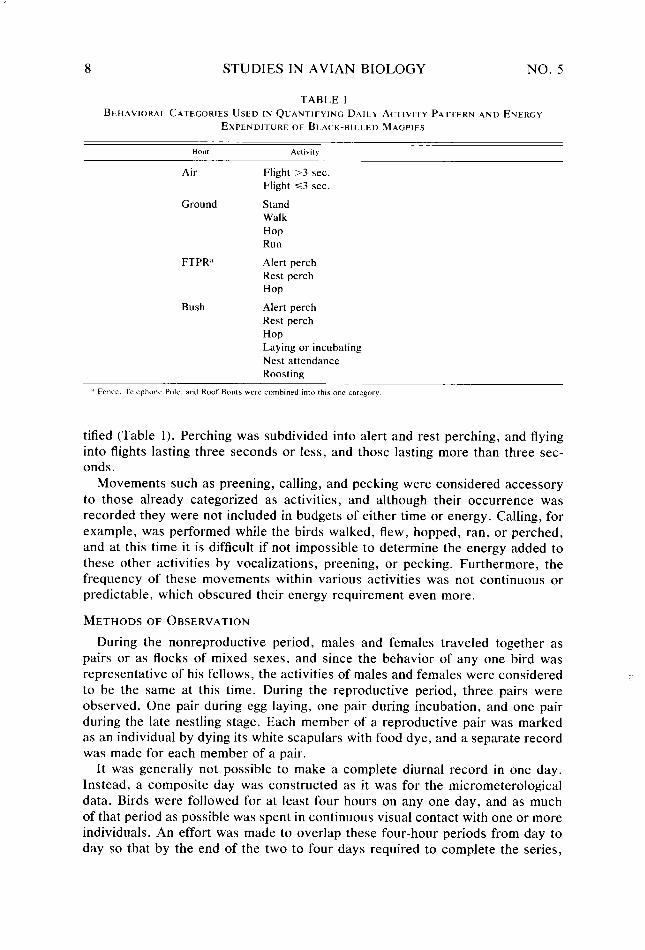
BEHAVIORAL CATEGORIES
Behavior was described in units called Bouts. Bouts (Table 1) defined an in- dividual’s position within the habitat, and the length of a Bout was determined by the amount of time spent in that position. For example, a Ground Bout started when a bird landed on the ground and ended when it left it. Fence, Telephone Pole, and Roof Bouts were combined into a single Bout abbreviated FTPR. Within each Bout, the basic energy-requiring movements, called activities, were quan-
8 STUDIES IN AVIAN BIOLOGY NO. 5
TABLE 1 BEHAVIORAL CATEGORIES USED IN QUANTIFYING DAILY ACTIVITY PATTERN AND ENERGY
EXPENDITURE OF BLACK-BILLED MAGPIES
BON
Air
Ground
Activity
Flight 23 sec. Flight ~3 sec.
Stand Walk
Hop Run
FTPR;’ Alert perch Rest perch
Hop
Bush Alert perch Rest perch
Hop Laying or incubating Nest attendance Roosting
A Fence. Telephone Pale. and Roof Bouts were combined mf~ this one category.
tified (Table 1). Perching was subdivided into alert and rest perching, and flying into flights lasting three seconds or less, and those lasting more than three sec- ends.
Movements such as preening, calling, and pecking were considered accessory to those already categorized as activities, and although their occurrence was recorded they were not included in budgets of either time or energy. Calling, for example, was performed while the birds walked, flew, hopped, ran, or perched, and at this time it is difficult if not impossible to determine the energy added to these other activities by vocalizations, preening, or pecking. Furthermore, the frequency of these movements within various activities was not continuous or predictable, which obscured their energy requirement even more.
METHODS OF OBSERVATION
During the nonreproductive period, males and females traveled together as pairs or as flocks of mixed sexes, and since the behavior of any one bird was representative of his fellows, the activities of males and females were considered to be the same at this time. During the reproductive period, three pairs were observed. One pair during egg laying, one pair during incubation, and one pair during the late nestling stage. Each member of a reproductive pair was marked as an individual by dying its white scapulars with food dye, and a separate record was made for each member of a pair.
It was generally not possible to make a complete diurnal record in one day. Instead, a composite day was constructed as it was for the micrometerological data. Birds were followed for at least four hours on any one day, and as much of that period as possible was spent in continuous visual contact with one or more individuals. An effort was made to overlap these four-hour periods from day to day so that by the end of the two to four days required to complete the series,
ENERGY EXPENDITURE BY THE BLACK-BILLED MAGPIE 9
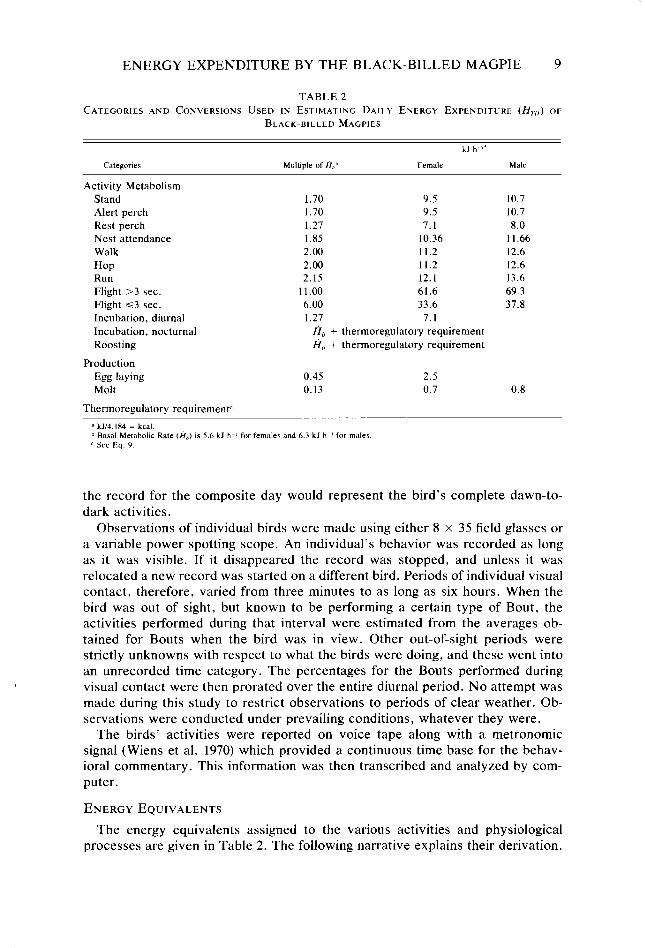
TABLE 2 CATEGORIES AND CONVERSONS USED IN ESTIMATING DAILY ENERGY EXPENDITURE (Hrr,) OF
BLACK-BILLED MAGPIES
kJ h “’
Categoriec Multiple of H,,” Female Male
Activity Metabolism Stand Alert perch Rest perch Nest attendance Walk Hop Run Flight >3 sec. Flight ~3 sec. Incubation, diurnal Incubation, nocturnal Roosting
Production Egg laying Molt
Thermoregulatory requirementC
1.70 9.5 1.70 9.5 1.27 7.1 1.85 10.36 2.00 11.2 2.00 11.2 2.15 12.1
11.00 61.6 6.00 33.6 1.27 7.1
A,, + thermoregulatory requirement A,, + thermoregulatory requirement
0.45 2.5 0.13 0.7
10.7 10.7 8.0
11.66 12.6 12.6 13.6 69.3 37.8
0.8
d kJN. 184 = kcal. ‘I Basal Metabolic Rate (A,) is 5.6 k.l h-’ for females and 6.3 kJ h I for males c See Ea. 9
the record for the composite day would represent the bird’s complete dawn-to- dark activities.
Observations of individual birds were made using either 8 x 35 field glasses or a variable power spotting scope. An individual’s behavior was recorded as long as it was visible. If it disappeared the record was stopped, and unless it was relocated a new record was started on a different bird. Periods of individual visual contact, therefore, varied from three minutes to as long as six hours. When the bird was out of sight, but known to be performing a certain type of Bout, the activities performed during that interval were estimated from the averages ob- tained for Bouts when the bird was in view. Other out-of-sight periods were strictly unknowns with respect to what the birds were doing, and these went into an unrecorded time category. The percentages for the Bouts performed during visual contact were then prorated over the entire diurnal period. No attempt was made during this study to restrict observations to periods of clear weather. Ob- servations were conducted under prevailing conditions, whatever they were.
The birds’ activities were reported on voice tape along with a metronomic signal (Wiens et al. 1970) which provided a continuous time base for the behav- ioral commentary. This information was then transcribed and analyzed by com- puter.
ENERGY EQUIVALENTS
The energy equivalents assigned to the various activities and physiological processes are given in Table 2. The following narrative explains their derivation.
10 STUDIES IN AVIAN BIOLOGY NO. 5
Size dimorphism between sexes.-Male magpies weighed 182.9 g (n = 6, SD
= 9.0) and females weighed 162.4 g (n = 4, SD = 8.4). Because of this size dimorphism, separate energy requirements were estimated for each sex. From Stevenson’s (1971) measurements of basal metabolic rate for a mixed population, the basal metabolic rates were estimated to be 6.3 and 5.6 kJ h-l for adult males and females, respectively.
Thermoregulatory requirements.-The metabolic requirements for T,,‘s below the T,,. were estimated as follows. Evaporative water loss may be expressed as a function of fi,,, ,
LIZ = fi,,,x (6)
where X = Elfi,,, , and other symbols are as described above. Substituting Eq. 6 for AE in Eq. 2 gives
fi,,, - fi,,,X = [p,,c,,I(r,, + r,)lUi, - T,J (7)
and solving for fi,, ,
fi,,, = b,,c,Arl, + r,Xl - -JGI(Tb - T,) (8)
Metabolism predicted by this equation includes both basal and thermoregulatory requirements. The predicted thermoregulatory requirement (total metabolic re- quirement minus basal metabolic requirement) below the T,,. forms a straight line described by
8, = (0.736 - 0.145 T,,) (9)
where 8, is the thermoregulatory requirement (kJ h-l), and T, is as described above.
Standing und perching.-Standing (hi,) and alert perching (a,,,) were assigned an energy requirement of 1.7 x ri,, , and rest perching (Ej,,) an energy requirement of 1.27 x 8, (King 1974).
Incubation.-The energy requirement of incubation (fij) seems to be predict- able (West 1960, Kendeigh 1963, Drent 1970, Ricklefs 1974) but there is disagree- ment as to how this requirement is satisfied. King (1973) maintains that until shown otherwise, it is reasonable to assume that the residual heat from the resting metabolism of a bird can “supply a large fraction, if not all, of the heat required for incubation.” In opposition to this view (West 1960: Kendeigh 1963: El-Wailly 1966: Drent 1970, 1972; Ricklefs 1974) is the opinion that the major fraction of this requirement is additive to the bird’s metabolic requirement at rest and as such is derived from its “productive energy” resources.
White and Kinney (1974) have demonstrated that egg temperature during in- cubation is regulated by either adjusting the tightness of sit on the eggs or the degree of attentiveness and not by increasing thermogenesis except when needed at T,, < T,,. . Walsberg and King (1978a, 1978b) used formal heat budget modeling to assess the total energy requirement of incubating Mountain White-crowned Sparrows (Zonotrichia leucophrys oriantha), Red-winged Blackbirds (Agelaius phoeniceus), and Willow Flycatchers (Empidonax trail/ii), and demonstrated it to be 1.5-18% lower than that of a bird perched outside the nest but exposed to the same microclimate. This supports the contention that, at least for these species and perhaps for any species that builds a well-insulated nest, incubation
ENERGY EXPENDITURE BY THE BLACK-BILLED MAGPIE I1
will substantially reduce rather than increase total parental energy expenditure. King’s (1973) viewpoint was therefore chosen for this investigation.
Several features of incubation in the Black-billed Magpie prompted this deci- sion: (1) the nest of the magpie is large and appears to be well insulated (from outside in it is composed of an outer woven tangle of sticks that completely surrounds and usually forms a dome over a thick-walled nest cup that is composed of mud and small sticks and lined with such materials as fine roots, horse hair, grass, soft twigs, and shreaded bark), (2) the female alone incubates, is more than 90% attentive (Table lo), and is fed periodically on the nest by the male, and (3) when she does leave the nest it is for short periods during the warmer part of the day when T, is usually well above her T,,.. With this pattern of incubation, the cumulative heat needed to rewarm the eggs is minimized and egg temperature during the remainder of the day could be maintained primarily by adjusting tight- ness of sit on the eggs. It was assumed, therefore, that during the day this activity, plus the occasional changing of position in the nest, and the task of periodically turning the eggs would make incubating equivalent in cost to rest perching (1.27 x fi,,). At night the metabolic output was assumed to be the same as for a roosting bird (Ej, plus any thermoregulatory requirement), which is probably an overestimate since no effort was made to assess the insulative value of the nest and its possible role in reducing the thermoregulatory requirement.
Nest uttcJndance.-Whenever a male was attending an incubating female, or the male and female were attending nestlings, they performed a combination of activities which included occasional hopping, alert standing, and manipulating objects with the beak. It was not possible to observe all of these activities in the enclosed nest, and so it was assumed that nest attendance (a,,,,) was energetically less costly than walking but more costly than perching, and it was assigned an intermediate value of 1.85 x ci,,.
W&king, hopping, and running.-Energy equivalents for these activities were estimated from the relationship between running speed and oxygen consumption for the Bobwhite Quail, Colinus virginicrms (Fedak et al. 1974). This quail is in the same bodyweight range as the magpie (165-208 g), and since the magpie is well adapted to terrestrial locomotion it was assumed that the costs of walking and running (A,,. and tj,(, respectively) would be comparable in these two species.
Data for the costs of walking and running in man (Margaria et al. 1963) dem- onstrate that at a certain speed, running becomes less costly (per km) than walk- ing, and at that speed there is a shift from walking to running. It was assumed for the quail that the shift from walking to running represented its slowest running speed on the treadmill (1.0 km h-l; Fedak et al. 1974). Whereas fi, at various speeds is a linear relationship, data for man demonstrate that fi,,- at various speeds is curvilinear (Margaria et al. 1963). Immediately following the onset of walking, Hi,,. increases rapidly as walking speed increases. This is followed by a range of speeds over which the increase in fi,, with increasing walking speed is more moderate than the initial rate. Following this there is a range of walking speeds over which fi,, increases very sharply until it intersects the line describing the relationship between fi,< and speed of running. This second very sharp in- crease in fi,,. occurs at a speed that is approximately three-fourths that of the
12 STUDIES IN AVIAN BIOLOGY NO. 5
slowest running speed. A second assumption, therefore, was that a similar sharp rise in the cost of walking would occur for the quail at a speed about three-fourths that of its slowest running speed (0.75 x 1.0 km h-l = 0.75 km h-l). In the field, walking speed for the magpie was unpredictable. It depended on what the bird was doing, and whether it was moving uphill, downhill, or on the level. Conse- quently, it was arbitrarily decided that on the average magpies walked at a speed of 0.75 km h-l. Fedak et al. (1974) present no data for Ij,, in the quail, and it was impossible to fit this assumed curvilinear relationship onto their graph relating oxygen consumption and the speed of running. Therefore, the line relating oxygen consumption and running speed for the Bobwhite was extrapolated to 0.0 km h-l, and the oxygen consumption at a speed of 0.75 km h-’ was read directly off the extrapolated line. This yielded an energy equivalent of 2.0 x I&, and while this is undoubtedly an overestimate, it is the value used in this report to estimate the cost of walking for the magpie. Magpies rarely hopped, and when they did it was only for a few hops at a time; therefore, for simplicity, the cost of hopping (Ej,,) was considered to be equivalent to a,,..
Magpies ran infrequently, and when they did it was only for a few seconds as they dashed at a food item. It was assumed that under these conditions the birds would probably be moving at a speed very close to that at which Ei, becomes less than fi,,., and that this is equivalent to the slowest running speed for the quail on a treadmill. From these assumptions we estimated an energy equivalent of 2.15 x &, for the cost of running.
F&ht.-Bernstein et al. (1973) measured oxygen consumption during flapping flight in the Fish Crow, Corvus ossifragus. Depending on air speed, power output for level flight varied from 23 to 24.5 Watts. Basal metabolic rate for the Fish Crow, estimated from the Aschoff-Pohl (1970) equation for passerine birds at night, is 2.17 Watts. This indicates that level flight costs between 10.6 and 11.3 x
fit, for the Fish Crow. An average value of 11 .O x fib was used in estimating the cost of magpie flights lasting longer than three seconds (tip,). This is in agreement with a value of 11.1 x 8, as calculated using Kokshaysky’s (1970) equation for predicting the power output of flight (P = 84.5m’~“‘“, where P is power output in cal h-l, and m is body weight in grams), but is greater than the value of 8.3 x fi,, as calculated using Berger and Hart’s (1974) equation (P = 0.29m0.7z, where P is power output in kcal h-l).
The metabolic cost for perching in the Fish Crow is 3.85 Watts (Bernstein et al. 1973). This is 1.65 times the Aschoff-Pohl estimate for fi, , which agrees well with the estimate made above for the cost of active perching and standing (1.7 x fi,).
The cost of predominantly gliding flight has been estimated for the Purple Martin, Progne subis (6.0 x fiti; Utter and LeFebvre 1970), and the House Mar- tin, Delichon urbica (4.8 x fi,; Hails 1979). Since flights less than or equal to three seconds in duration by the magpie are primarily gliding flights, the value measured for the Purple Martin was used in estimating the cost of this type of flight (fip,). This agrees well with the 6.34 x fib cost measured for the Fish Crow flying at a 6” descent angle (Bernstein et al. 1973).
Thermoregulatory requirements.-Rubner (1910, from Ricklefs 1974) suggested that heat generated by specific dynamic action (SDA), production, and activity
ENERGY EXPENDITURE BY THE BLACK-BILLED MAGPIE 13
could be used for temperature regulation. Available evidence would indicate that for muscular activity this is not always the case. Investigations of both birds (West and Hart 1966, Kontogiannis 1968, Pohl 1969, Pohl and West 1973) and small mammals (Hart 1952, 1957; Hart and Heroux 1955; Jansky 1959; Hart and Jansky 1963; Wunder 1970), indicate that work metabolism at low levels of ac- tivity is additive to resting metabolism over a very broad range of ambient tem- peratures. Partial substitution of heat from activity to cold-stimulated thermo- genesis occurred in rats (Hart and Jansky 1963), white mice (Mount and Willmott 1967), and in Clethrionomys glareolus (Jansky 1959) acclimated to thermoneutral conditions. Hart (1960) and Jansky (1966) account for this by the assumption that the same muscle cannot be involved in two different activities: exercise replaces the shivering but not the nonshivering component of cold-stimulated thermo- genesis. Mount and Willmott’s (1967, from Hart 1971) data, however, suggest that their mice were using the same muscles for both locomotor activity and shivering; Pohl (1969) found partial substitution in Chaffinches, Fringilla coelehs, but its extent depended on the degree of cold stress and/or exercise level. Pohl and West (1973) found the heat of exercise almost totally substitutive for cold induced thermogenesis (-45°C) in the Common Redpoll, Acanthisjlammea, dur- ing the fall, spring, and summer, but not winter. Wunder (1970) found partial substitution at low ambient temperatures during high but not low velocity tread- mill running in the chipmunk Eutamias merriami. Pohl and West (1973) report on the basis of a personal communication with Berger and Hart that there is a total substitution of the heat of exercise for cold-induced thermogenesis in hov- ering hummingbirds. Nielsen (1938), and Nielsen and Nielsen (1962) report total substitution of exercise for thermoregulatory thermogenesis in man while Le- Fevre and Auguet (1933, 1934) report a partial substitution for man.
These various reports indicate that the relationship of activity to thermoregu- latory thermogenesis depends on the species, its state of temperature acclimation, the season of the year, and the level of activity being performed. In this inves- tigation, moderate activities such as standing, active perching, rest perching, walking, hopping, and running, were considered additive to thermoregulation, while flight was considered substitutive. Therefore, those hours during the day spent in flight when T,, was below the T,,. , were not included in calculations of diurnal thermoregulatory requirements.
Nocturnal energy requirements (fi,.) at T,, below the T,,. were estimated from Eq. 8, which includes the thermoregulatory requirement. When T,> was above the T,,. , Ej,) alone was used in estimating the cost of roosting.
The specific dynamic action (SDA) of food can substitute for thermoregulatory requirements and the compensatory heat increment is greater for proteins than for carbohydrates and fats. Its effect, however, is influenced by the nutritional status and history of the animal (King and Farner 1961, Kleiber 1961, Whittow 1965, Romijn and Vreugdenhil 1969, Calder and King 1974, King 1974) and even where it has been measured in domestic animals, the substitution may be present, partial, or absent (Hart 1963). Calder and King (1974) caution, therefore, that while SDA is of ecological interest as a potential substitute for regulatory calo- rigensis in wild birds “general statements about the ecological significance of the heat increment of feeding in birds are not yet appropriate.” Because nothing is
14 STUDIES IN AVIAN BIOLOGY NO. 5
known of the SDA for the magpie, and because of the apparent nonuniformity of response between species, no attempt was made to include its possible contri- bution in estimates of thermoregulatory requirements.
Production costs.-Molt and egg laying were the two kinds of production con- sidered in this investigation. During molt, production goes into the formation of new feathers, and during egg laying into the formation of the clutch of eggs. Various studies have shown that the total daily intake of food during the molt may be the same as in nonmolting birds (Davis 195.5) or only slightly increased (West 1960, 1968; Blackmore 1969; Chilgren 1975), suggesting a compensatory shift in the partitioning of energy expenditure, perhaps between activity and pro- duction. Within the thermoneutral zone molting increases oxygen consumption over the entire molt period by an average of 13% fi,, (King 1974). Since T,.‘s during the magpie’s molt were well within their thermoneutral zone, the cost of molt (a,,,,) was estimated at 13% of their daily a,,. More recently, King (In press) compared the cost of molt as estimated by several investigators using three dif- ferent techniques (of which oxygen consumption was one) and found them to be in close agreement. From the average of these data, he (King, In press) estimated molt to account for about 15% of a caged sparrow’s daily energy expenditure; this is in close agreement with the 13% ci,, used in this investigation.
Reviews by King (1973) and Ricklefs (1974) provide information concerning the cost of production during the reproductive period for both males and females. In males, the cost of gonadal recrudescence and maintenance is negligible, being less than 1% of the daily fi, , but in females it may require about 10% of the daily fi,, during the period of maximum enlargement (King 1973). Sperm production by males may require about 0.8% of the daily fi,, and is, therefore, negligible (Ricklefs 1974). King (1973) estimated the cost of ovogenesis for three species with altricial young at 45 to 58% fi,, , while Ricklefs (1974) estimated it at 45 to 50% Ej,,. This indicates that the only significant production cost during the re- productive period is ovogenesis (ti,,,) and it was assigned an energy requirement of 45% of B,,.
CALCULATION OF DAILY ENERGY EXPENDITURE
Daily energy expenditure (HTIj) was calculated from Eq. 10,
H,,, = t ,,>a.,, + t,,& + tp.,yif~.s + t,,tj,, + fH& + f,Jl,{, f t.&(y + tH.fi~l. + tiEji + t,{,,Ej,((, + t,.IGZi,. + tfl?jt + tp\fEjl’.)J + tp()tjJ’() (10)
where t’s are time and fi’s are the energy equivalents as described above. The subscript for each t defines the time associated with the energy equivalents for various activities (Tables 9 and IO), periods of thermoregulation (Table 13), and production costs (taken to be 24 hours).
STATISTICAL TREATMENT
The methods used in this study provided a single H,.,, value for one composite day for each month. Statistical comparisons of H.r,, between the days of different months were, therefore, not possible. However, it was possible to compare the intensity of daytime activity between composite days of different months.
During each period of visual contact, time spent on each activity was recorded, and the energy expended due to the various activities standardized to the period
ENERGY EXPENDITURE BY THE BLACK-BILLED MAGPIE 15
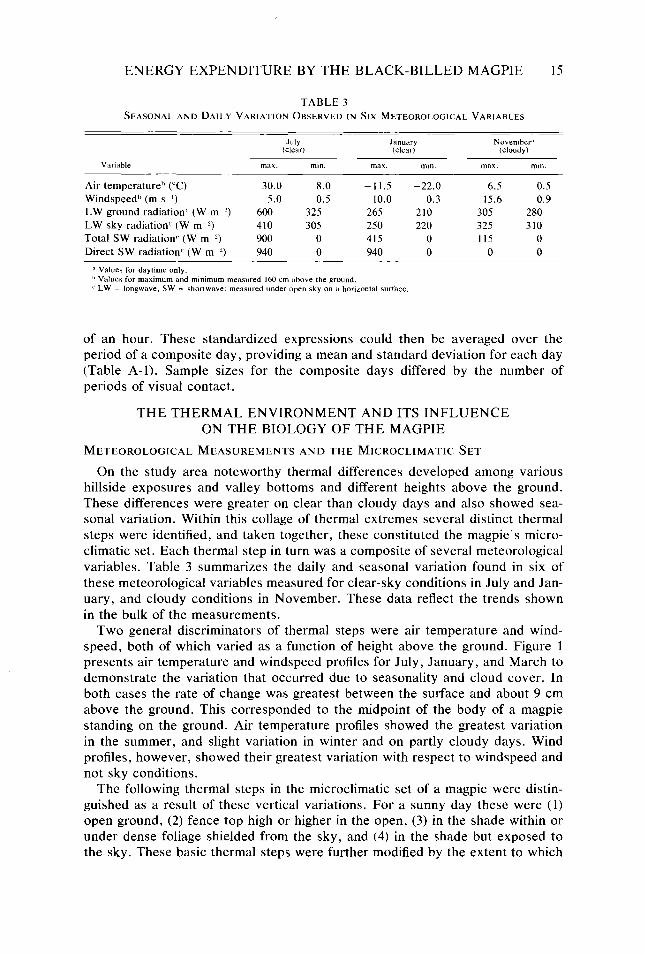
TABLE 3 SEASONAL AND DAILY VARIATION OBSERVED IN SIX METEOROLOGICAL VARIABLES
Variable
July January November” (clear) (clear) (cloudy)
max. min. max. min. max. Ill,“.
Air temperature” (“C) 30.0 8.0 -11.5 -22.0 6.5 0.5 Windspeed” (m SK’) 5.0 0.5 10.0 0.3 15.6 0.9 LW ground radiation” (W mm’) 600 325 265 210 305 280 LW sky radiation” (W m “) 410 305 250 220 325 310 Total SW radiation” (W m ‘) 900 0 415 0 115 0 Direct SW radiation’ (W m ‘) 940 0 940 0 0 0
d Values for daytime only. h Values for maximum and minimum measured 160 cm above the ground. C LW = longwave, SW = shortwave: measured under open sky on a honzontal surface.
of an hour. These standardized expressions could then be averaged over the period of a composite day, providing a mean and standard deviation for each day (Table A-l). Sample sizes for the composite days differed by the number of periods of visual contact.
THE THERMAL ENVIRONMENT AND ITS INFLUENCE ON THE BIOLOGY OF THE MAGPIE
METEOROLOGICAL MEASUREMENTS AND THE MICROCLIMATIC SET
On the study area noteworthy thermal differences developed among various hillside exposures and valley bottoms and different heights above the ground. These differences were greater on clear than cloudy days and also showed sea- sonal variation. Within this collage of thermal extremes several distinct thermal steps were identified, and taken together, these constituted the magpie’s micro- climatic set. Each thermal step in turn was a composite of several meteorological variables. Table 3 summarizes the daily and seasonal variation found in six of these meteorological variables measured for clear-sky conditions in July and Jan- uary, and cloudy conditions in November. These data reflect the trends shown in the bulk of the measurements.
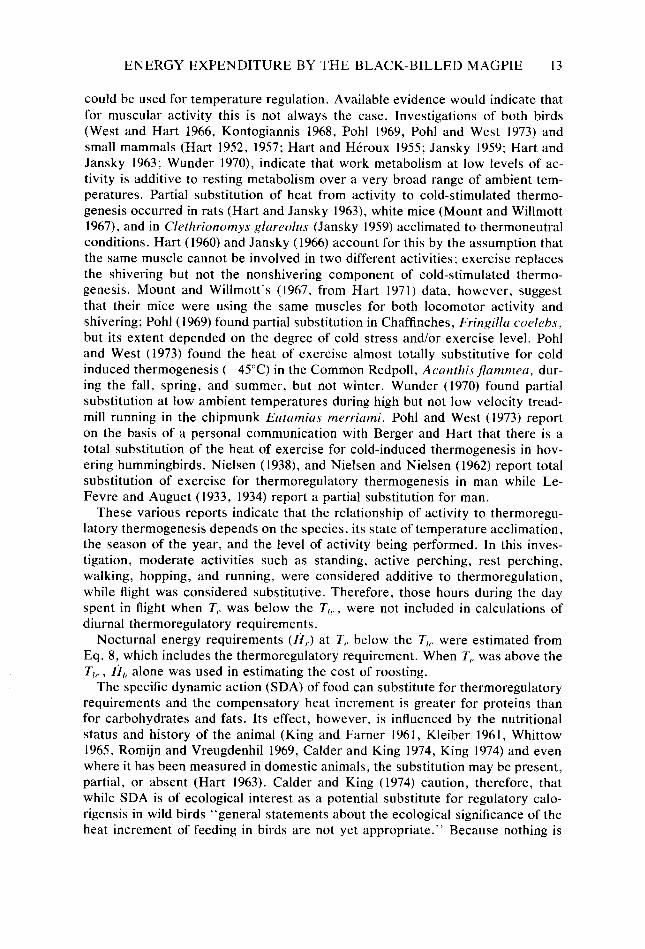
Two general discriminators of thermal steps were air temperature and wind- speed, both of which varied as a function of height above the ground. Figure 1 presents air temperature and windspeed profiles for July, January, and March to demonstrate the variation that occurred due to seasonality and cloud cover. In both cases the rate of change was greatest between the surface and about 9 cm above the ground. This corresponded to the midpoint of the body of a magpie standing on the ground. Air temperature profiles showed the greatest variation in the summer, and slight variation in winter and on partly cloudy days. Wind profiles, however, showed their greatest variation with respect to windspeed and not sky conditions.
The following thermal steps in the microclimatic set of a magpie were distin- guished as a result of these vertical variations. For a sunny day these were (1) open ground, (2) fence top high or higher in the open, (3) in the shade within or under dense foliage shielded from the sky, and (4) in the shade but exposed to the sky. These basic thermal steps were further modified by the extent to which
100
C
IOC
C
STUDIES IN AVIAN BIOLOGY NO. 5
JANUARY MARCH JULY
88 . . . . *0 o-
! -20
%s 8888 8 EC%? . . . . . . . . . . . . N-4. OQDln co -- --- - t5&gs
-10 0 IO 20 30 40 50
AIR TEMPERATURE (“C)
JULY JANUARY MARCH
8 0” 8 g
88 --
ii8
g_ 0 ii, - g
$ InnI 5% ii
llKk!r 2 4 0 2 o 2 4 6
WINDSPEED (m i’l
Air temperature (“C), and windspeed (m s-*) profiles for selected months. Upper panel describes temperature protiles for a clear January day, a partly cloudy March day, and a clear July day. Lower panel describes windspeed profiles for the same months. Numbers associated with each profile line represent time of the day measurements were made.
they were sheltered from wind. On cloudy days, or at night, the shaded/unshaded aspect disappeared and the slope of the vertical temperature profile diminished. But because the wind profile was still present, differences in the potential for thermal exchange still occurred stepwise between ground, and fence-post high or higher above ground, and between sheltered and unsheltered places.
On clear days, extremes within and between these thermal steps were domi- nated and maintained by shortwave solar radiation, but modified by windspeed. On cloudy days extremes between these steps were less, and wind became the major contributor to differences between them.
Figure 2 indicates the percentages of clear, partly cloudy, and cloudy days that occurred monthly from June 1973 to June 1974 at the airport in Lewiston, Idaho,
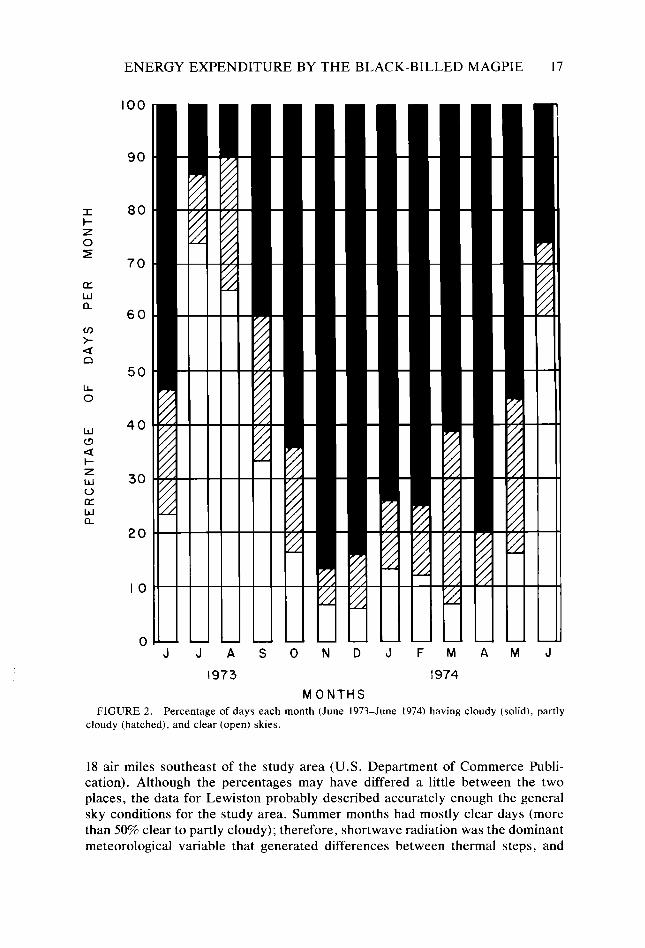
ENERGY EXPENDITURE BY THE BLACK-BILLED MAGPIE
1973
0 A
17
J
MONTHS FIGURE 2. Percentage of days each month (June 1973-June 1974) having cloudy (solid), partly
cloudy (hatched), and clear (open) skies.
18 air miles southeast of the study area (U.S. Department of Commerce Publi- cation). Although the percentages may have differed a little between the two places, the data for Lewiston probably described accurately enough the general sky conditions for the study area. Summer months had mostly clear days (more than 50% clear to partly cloudy); therefore, shortwave radiation was the dominant meteorological variable that generated differences between thermal steps, and
18 STUDIES IN AVIAN BIOLOGY NO. 5
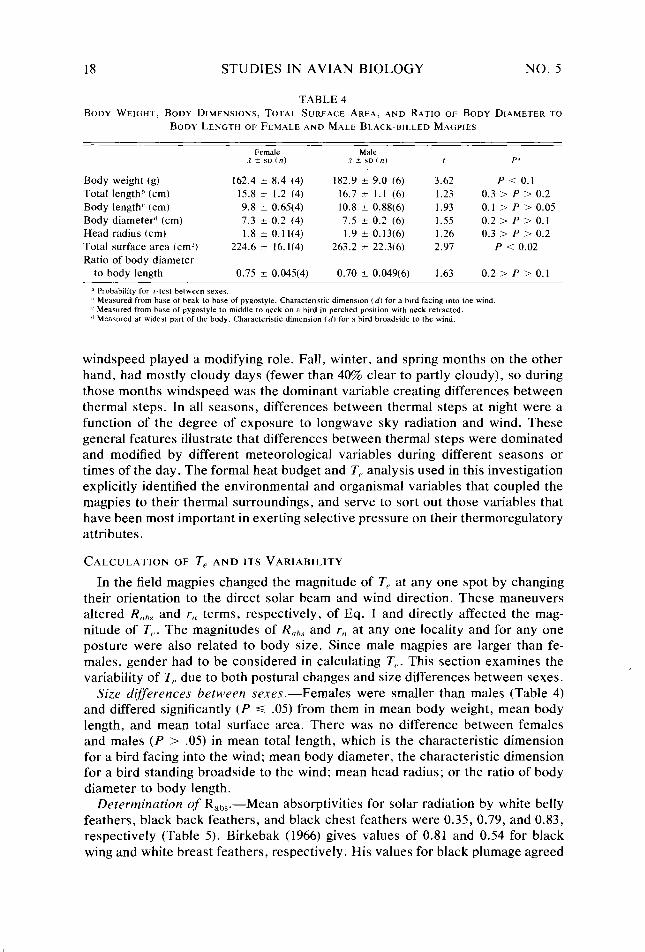
TABLE 4 BODY WEIGHT, BODY DIMENSIONS, TOTAL SURFACE AREA, AND RATIO OF BODY DIAMETER TO
BODY LENGTH OF FEMALE AND MALE BLACK-BILLED MAGPIES
Female Male iiso(n) i 2 SD(n) , P"
Body weight (g) 162.4 i- 8.4 (4) 182.9 + 9.0 (6) 3.62 P i 0.1 Total length” (cm) 15.8 5 1.2 (4) 16.7 t 1.1 (6) 1.23 0.3 > P > 0.2 Body length” (cm) 9.8 k 0.65(4) 10.8 k 0.88(6) 1.93 0.1 > P > 0.05 Body diameter” (cm) 7.3 + 0.2 (4) 7.5 5 0.2 (6) 1.55 0.2 > P > 0.1 Head radius (cm) 1.8 2 0.11(4) 1.9 k 0.13(6) 1.26 0.3 > P > 0.2 Total surface area (cm’) 224.6 t 16.1(4) 263.2 t 22.3(6) 2.97 P < 0.02 Ratio of body diameter
to body length 0.75 + 0.045(4) 0.70 2 0.049(6) 1.63 0.2 > P > 0.1
” Probability for r-test between sexes. I’ Measured from bae of beak to base of pygostyle. Characteristic dimenslon Cd) for a burd facing nnto the wind.
( Measured from base of pygostyle to middle to neck on a bird in perched position with neck retracted.
” Measured at wdest pan of the body. Characteristic dimension Cd) for a bird broadside to the wind.
windspeed played a modifying role. Fall, winter, and spring months on the other hand, had mostly cloudy days (fewer than 40% clear to partly cloudy), so during those months windspeed was the dominant variable creating differences between thermal steps. In all seasons, differences between thermal steps at night were a function of the degree of exposure to longwave sky radiation and wind. These general features illustrate that differences between thermal steps were dominated and modified by different meteorological variables during different seasons or times of the day. The formal heat budget and T,, analysis used in this investigation explicitly identified the environmental and organismal variables that coupled the magpies to their thermal surroundings, and serve to sort out those variables that have been most important in exerting selective pressure on their thermoregulatory attributes.
CALCULATION OF T, AND ITS VARIABILITY
In the field magpies changed the magnitude of T, at any one spot by changing their orientation to the direct solar beam and wind direction. These maneuvers altered Rlrhs and r,I terms, respectively, of Eq. I and directly affected the mag- nitude of T,,. The magnitudes of Rlrbs and r,, at any one locality and for any one posture were also related to body size. Since male magpies are larger than fe- males, gender had to be considered in calculating T,,. This section examines the variability of T, due to both postural changes and size differences between sexes.
Size differences between sexes.-Females were smaller than males (Table 4) and differed significantly (P < .05) from them in mean body weight, mean body length, and mean total surface area. There was no difference between females and males (P > .05) in mean total length, which is the characteristic dimension for a bird facing into the wind; mean body diameter, the characteristic dimension for a bird standing broadside to the wind; mean head radius; or the ratio of body diameter to body length.
Determination of Rahs.-Mean absorptivities for solar radiation by white belly feathers, black back feathers, and black chest feathers were 0.35, 0.79, and 0.83, respectively (Table 5). Birkebak (1966) gives values of 0.81 and 0.54 for black wing and white breast feathers, respectively. His values for black plumage agreed
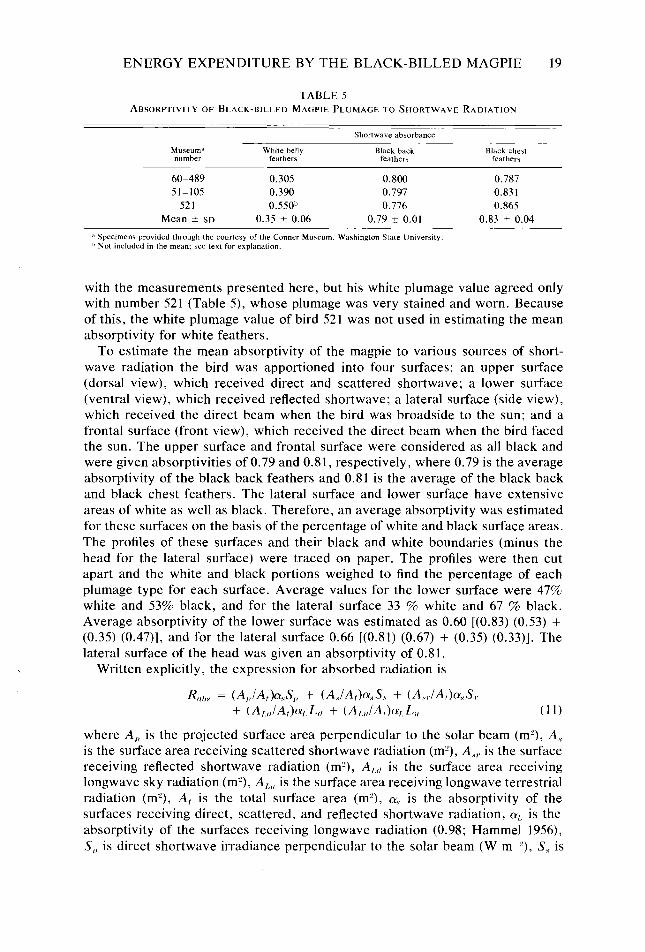
ENERGY EXPENDITURE BY THE BLACK-BILLED MAGPIE 19
TABLE 5 ABSORPTIVITY OF BLACK-BILLED MAGPIE PLUMAGE TO SHORTWAVE RADIATION
Shortwave absorbance
Museum,’ White belly Black back number feather\ featherr
60-489 0.305 0.800 51-105 0.390 0.797
521 0.550” 0.776 Mean k SD 0.35 + 0.06 0.79 + 0.01
i3 Specimens prowded through the courtesy of the Conner MuTeurn. Washington State Umversity. ” Not included in the mean: see text for explanation.
Black chest feathers
0.787 0.831 0.865
0.83 2 0.04
with the measurements presented here, but his white plumage value agreed only with number 521 (Table 5), whose plumage was very stained and worn. Because of this, the white plumage value of bird 521 was not used in estimating the mean absorptivity for white feathers.
To estimate the mean absorptivity of the magpie to various sources of short- wave radiation the bird was apportioned into four surfaces: an upper surface (dorsal view), which received direct and scattered shortwave; a lower surface (ventral view), which received reflected shortwave; a lateral surface (side view), which received the direct beam when the bird was broadside to the sun; and a frontal surface (front view), which received the direct beam when the bird faced the sun. The upper surface and frontal surface were considered as all black and were given absorptivities of 0.79 and 0.81, respectively, where 0.79 is the average absorptivity of the black back feathers and 0.81 is the average of the black back and black chest feathers. The lateral surface and lower surface have extensive areas of white as well as black. Therefore, an average absorptivity was estimated for these surfaces on the basis of the percentage of white and black surface areas. The profiles of these surfaces and their black and white boundaries (minus the head for the lateral surface) were traced on paper. The profiles were then cut apart and the white and black portions weighed to find the percentage of each plumage type for each surface. Average values for the lower surface were 47% white and 53% black, and for the lateral surface 33 % white and 67 % black. Average absorptivity of the lower surface was estimated as 0.60 [(0.83) (0.53) + (0.35) (0.47)], and for the lateral surface 0.66 [(0.81) (0.67) + (0.35) (0.33)]. The lateral surface of the head was given an absorptivity of 0.81.
Written explicitly, the expression for absorbed radiation is
R ,,,,s = (A,,iA,hS,, + (A.JA,hS, + CAs,.IA,hS, + (A ,,r, IA,h.L + (A,,,,iA,h,L, (11)
where A,, is the projected surface area perpendicular to the solar beam (m”), A,s is the surface area receiving scattered shortwave radiation (mr), A,s, is the surface receiving reflected shortwave radiation (m’), A ,,,, is the surface area receiving longwave sky radiation (m”), AI,,, is the surface area receiving longwave terrestrial radiation (m”), A, is the total surface area (m’), CY, is the absorptivity of the surfaces receiving direct, scattered, and reflected shortwave radiation, q, is the absorptivity of the surfaces receiving longwave radiation (0.98; Hammel 1956), S,, is direct shortwave irradiance perpendicular to the solar beam (W m +), S,y is
20 STUDIES IN AVIAN BIOLOGY NO. 5
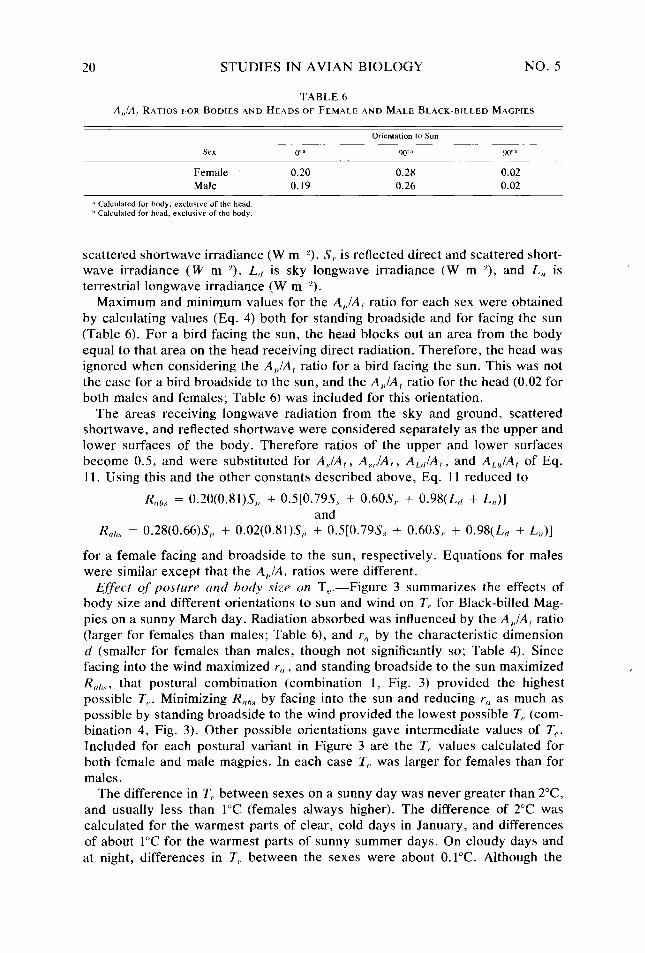
TABLE 6 AJA, RATIOS FOR BODIES AND HEADS OF FEMALE AND MALE BLACK-BILLED MAGPIES
Orientation to Sun
S.3 0”” 90”” 90””
Female 0.20 0.28 0.02 Male 0.19 0.26 0.02
* Calculated for body, exclusive of the head. ” Calculated for head. exclusive of the body.
scattered shortwave irradiance (W rn-“), S,. is reflected direct and scattered short- wave irradiance ( W m-3, L,, is sky longwave irradiance (W mPe), and L,l is terrestrial longwave irradiance (W mm”).
Maximum and minimum values for the AJA, ratio for each sex were obtained by calculating values (Eq. 4) both for standing broadside and for facing the sun (Table 6). For a bird facing the sun, the head blocks out an area from the body equal to that area on the head receiving direct radiation. Therefore, the head was ignored when considering the AJA, ratio for a bird facing the sun. This was not the case for a bird broadside to the sun, and the AJA, ratio for the head (0.02 for both males and females; Table 6) was included for this orientation.
The areas receiving longwave radiation from the sky and ground, scattered shortwave, and reflected shortwave were considered separately as the upper and lower surfaces of the body. Therefore ratios of the upper and lower surfaces become 0.5, and were substituted for A,Y/A,, A,JA,, A,,,/A,, and ALU/A, of Eq. 11. Using this and the other constants described above, Eq. 11 reduced to
Rnbs = 0.20(0.81)S,, + 0.5[0.79& + 0.6OS,. + 0.98(L,l + L,,)] and
Rnhs = 0.28(0.66)s,, + 0.02(0.81)S,, + 0.5[0.79& + 0.6OS,. + 0.98(L,, + L,,)]
for a female facing and broadside to the sun, respectively. Equations for males were similar except that the AJA, ratios were different.
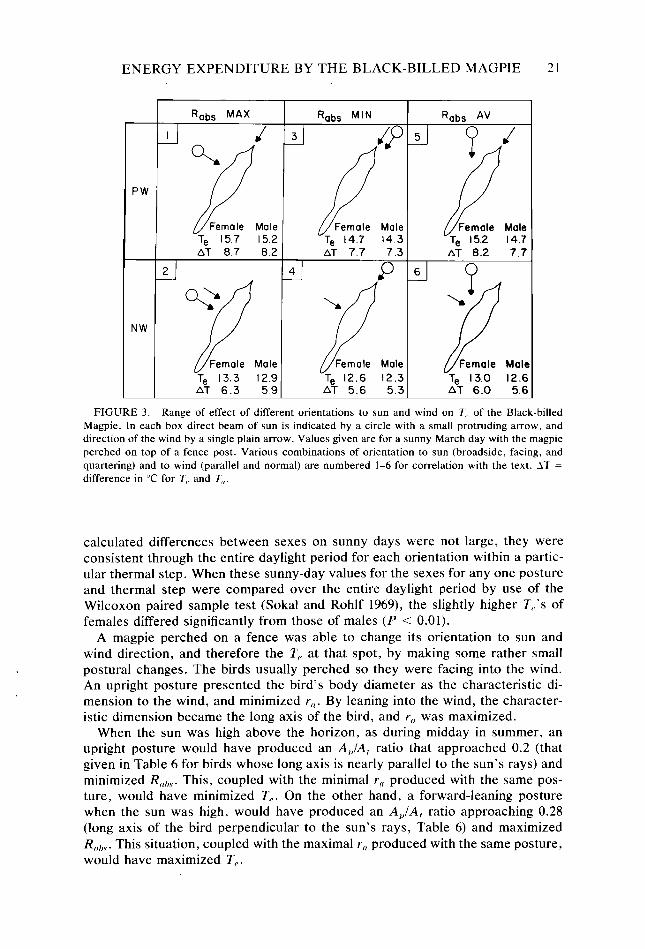
Effect of posture and body size on T,.-Figure 3 summarizes the effects of body size and different orientations to sun and wind on T,, for Black-billed Mag- pies on a sunny March day. Radiation absorbed was influenced by the A&,/A, ratio (larger for females than males: Table 6), and Y, by the characteristic dimension d (smaller for females than males, though not significantly so; Table 4). Since facing into the wind maximized Y,, , and standing broadside to the sun maximized R,,,,,?, that postural combination (combination 1, Fig. 3) provided the highest possible T,,. Minimizing Rrrhs by facing into the sun and reducing r,, as much as possible by standing broadside to the wind provided the lowest possible T, (com- bination 4, Fig. 3). Other possible orientations gave intermediate values of T,. Included for each postural variant in Figure 3 are the T, values calculated for both female and male magpies. In each case T, was larger for females than for males.
The difference in T,, between sexes on a sunny day was never greater than 2°C and usually less than 1°C (females always higher). The difference of 2°C was calculated for the warmest parts of clear, cold days in January, and differences of about 1°C for the warmest parts of sunny summer days. On cloudy days and at night, differences in T,, between the sexes were about O.l”C. Although the
ENERGY EXPENDITURE BY THE BLACK-BILLED MAGPIE 21
PW
NW
R nhe MAX ““I
I J 9, fl v Female Male
T, 15.7 15.2 AT 8.7 8.2
T, 13.3 12.9 AT 6.3 5.9
‘
Rabs MlN
3
Female Male
T, 12.6 12.3 AT 5.6 5.3
Rabs AV
P J
P Female Male T, 15.2 14.7 AT 8.2 7.7
6
T, 13.0 12.6 AT 6.0 5.6
FIGURE 3. Range of effect of different orientations to sun and wind on Z’? of the Black-billed Magpie. In each box direct beam of sun is indicated by a circle with a small protruding arrow, and direction of the wind by a single plain arrow. Values given are for a sunny March day with the magpie perched on top of a fence post. Various combinations of orientation to sun (broadside, facing, and quartering) and to wind (parallel and normal) are numbered l-6 for correlation with the text. AT = difference in “C for T,, and T,,.
calculated differences between sexes on sunny days were not large, they were consistent through the entire daylight period for each orientation within a partic- ular thermal step. When these sunny-day values for the sexes for any one posture and thermal step were compared over the entire daylight period by use of the Wilcoxon paired sample test (Sokal and Rohlf 1969), the slightly higher T,.‘s of females differed significantly from those of males (P < 0.01).
A magpie perched on a fence was able to change its orientation to sun and wind direction, and therefore the T, at that spot, by making some rather small postural changes. The birds usually perched so they were facing into the wind. An upright posture presented the bird’s body diameter as the characteristic di- mension to the wind, and minimized Y,. By leaning into the wind, the character- istic dimension became the long axis of the bird, and r,[ was maximized.
When the sun was high above the horizon, as during midday in summer, an upright posture would have produced an AJA, ratio that approached 0.2 (that given in Table 6 for birds whose long axis is nearly parallel to the sun’s rays) and minimized Rnhs. This, coupled with the minimal Y, produced with the same pos- ture, would have minimized T,. On the other hand, a forward-leaning posture when the sun was high, would have produced an APIA, ratio approaching 0.28 (long axis of the bird perpendicular to the sun’s rays, Table 6) and maximized Rmbs. This situation, coupled with the maximal r, produced with the same posture, would have maximized T,.
STUDIES IN AVIAN BIOLOGY NO. 5
EST EXPOSURE
12 JULY 1973
- 14 JULY 1973
0 2 4 6 8 IO 12 14 16 I8 20 22
TIME OF DAY (h)
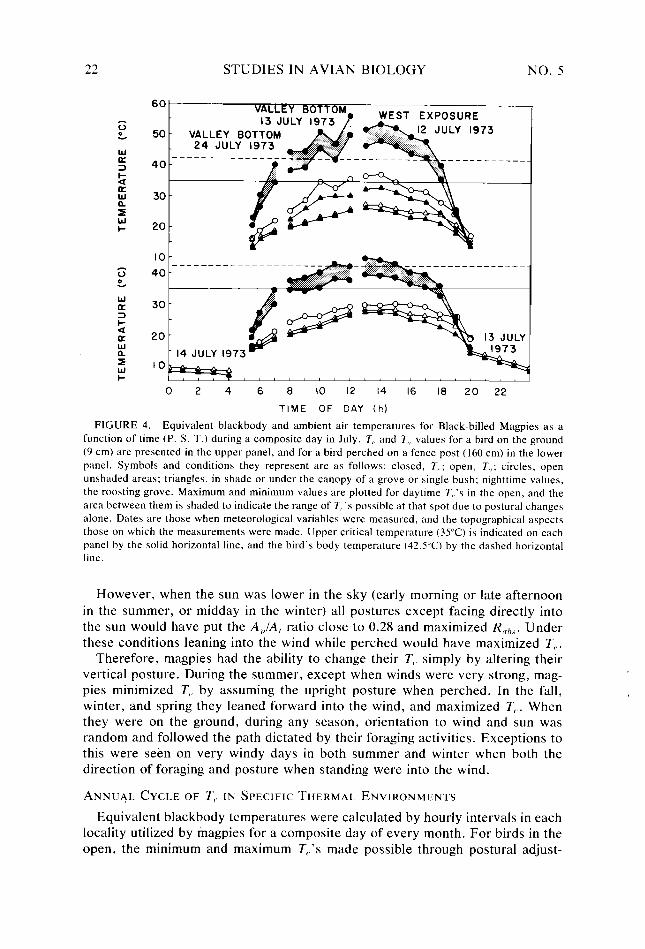
FIGURE 4. Equivalent blackbody and ambient air temperatures for Black-billed Magpies as a function of time (P. S. T.) during a composite day in July. 7, and 7;, values for a bird on the ground (9 cm) are presented in the upper panel, and for a bird perched on a fence post (160 cm) in the lower panel. Symbols and conditions they represent are as follows: closed, 7,.; open, T,,; circles, open unshaded areas: triangles, in shade or under the canopy of a grove or single bush: nighttime values, the roosting grove. Maximum and minimum values are plotted for daytime T,.‘s in the open, and the area between them is shaded to indicate the range of 7,:s possible at that spot due to postural changes
alone. Dates are those when meteorological variables were measured, and the topographical aspects those on which the measurements were made. Upper critical temperature (35°C) is indicated on each panel by the solid horizontal line, and the bird’s body temperature (42.5”C) by the dashed horizontal line.
However, when the sun was lower in the sky (early morning or late afternoon in the summer, or midday in the winter) all postures except facing directly into the sun would have put the AJA, ratio close to 0.28 and maximized Rnbs. Under these conditions leaning into the wind while perched would have maximized T,,.
Therefore, magpies had the ability to change their T,. simply by altering their vertical posture. During the summer, except when winds were very strong, mag- pies minimized T,, by assuming the upright posture when perched. In the fall, winter, and spring they leaned forward into the wind, and maximized T,,. When they were on the ground, during any season, orientation to wind and sun was random and followed the path dictated by their foraging activities. Exceptions to this were seen on very windy days in both summer and winter when both the direction of foraging and posture when standing were into the wind.
ANNUAL CYCLE OF T,, IN SPECIFIC THERMAL ENVIRONMENTS
Equivalent blackbody temperatures were calculated by hourly intervals in each locality utilized by magpies for a composite day of every month. For birds in the open, the minimum and maximum T,,‘s made possible through postural adjust-
ENERGY EXPENDITURE BY THE BLACK-BILLED MAGPIE 23
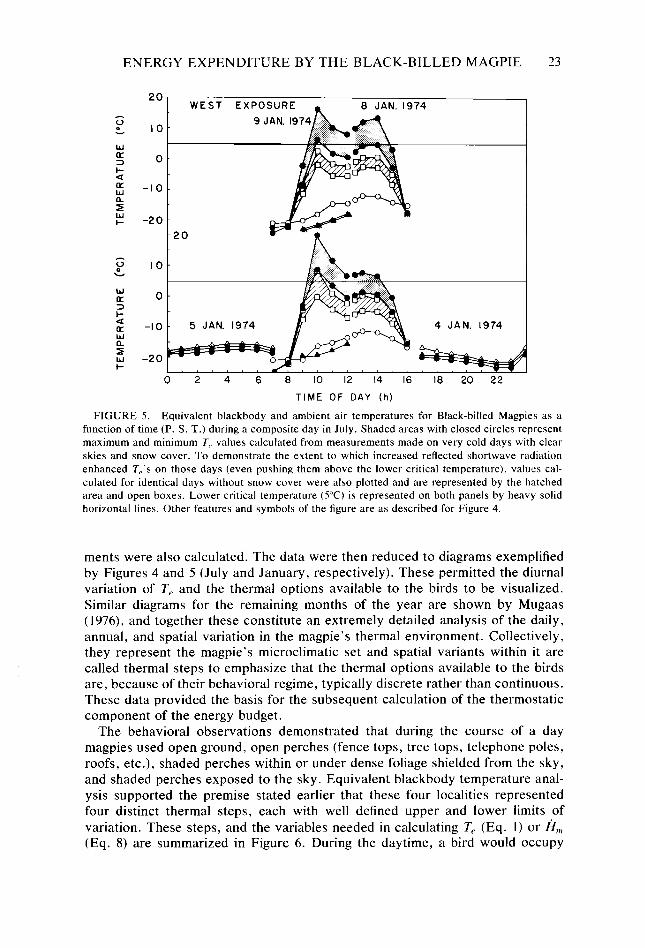
20
G L
IO
” a 0
ci ; -10
4 ? -20
WEST EXPOSURE 8 JAN. 1974
9
5 JAN. 1974 4 JAN. 1974
0 2 4 6 8 IO 12 14 16 18 20 22
TIME OF DAY (h)
FIGURE 5. Equivalent blackbody and ambient air temperatures for Black-billed Magpies as a function of time (P. S. T.) during a composite day in July. Shaded areas with closed circles represent maximum and minimum T,, values calculated from measurements made on very cold days with clear skies and snow cover. To demonstrate the extent to which increased reflected shortwave radiation enhanced T,,‘s on those days (even pushing them above the lower critical temperature), values cal- culated for identical days without snow cover were also plotted and are represented by the hatched area and open boxes. Lower critical temperature (5°C) is represented on both panels by heavy solid horizontal lines. Other features and symbols of the figure are as described for Figure 4.
ments were also calculated. The data were then reduced to diagrams exemplified by Figures 4 and 5 (July and January, respectively). These permitted the diurnal variation of T, and the thermal options available to the birds to be visualized. Similar diagrams for the remaining months of the year are shown by Mugaas (1976), and together these constitute an extremely detailed analysis of the daily, annual, and spatial variation in the magpie’s thermal environment. Collectively, they represent the magpie’s microclimatic set and spatial variants within it are called thermal steps to emphasize that the thermal options available to the birds are, because of their behavioral regime, typically discrete rather than continuous. These data provided the basis for the subsequent calculation of the thermostatic component of the energy budget.
The behavioral observations demonstrated that during the course of a day magpies used open ground, open perches (fence tops, tree tops, telephone poles, roofs, etc.), shaded perches within or under dense foliage shielded from the sky, and shaded perches exposed to the sky. Equivalent blackbody temperature anal- ysis supported the premise stated earlier that these four localities represented four distinct thermal steps, each with well defined upper and lower limits of variation. These steps, and the variables needed in calculating T, (Eq. 1) or firr, (Eq. 8) are summarized in Figure 6. During the daytime, a bird would occupy
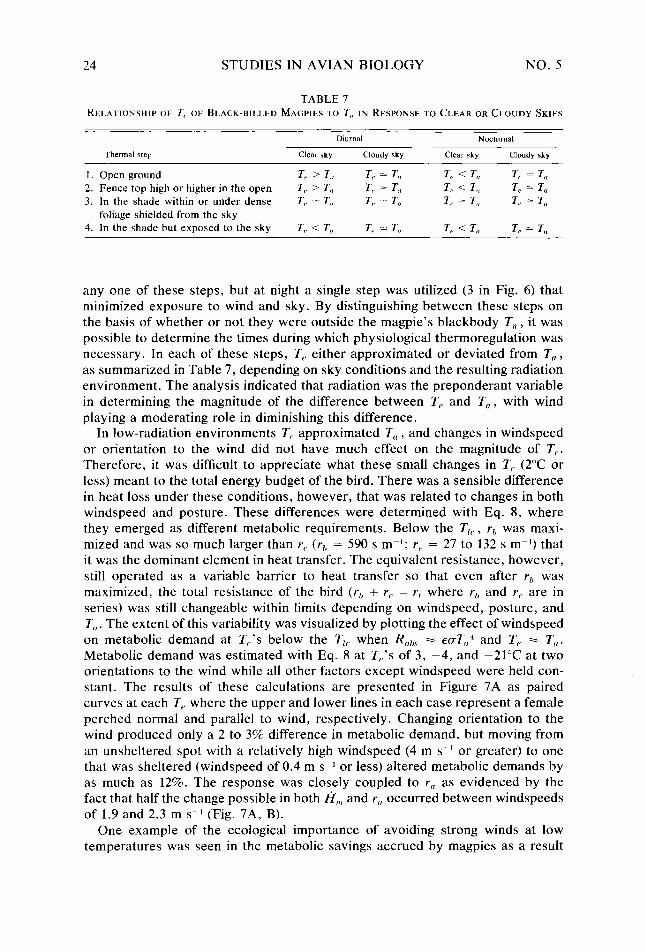
24 STUDIES IN AVIAN BIOLOGY NO. 5
TABLE 7 RELATIONSHIP OF TV OF BLACK-BILLED MAGPIES TO T,, IN RESPONSE TO CLEAR OR CLOUDY SKIES
Thermal step
Diurnal Nocturnal
Clear sky Cloudy sky Clear sky Cloudy sky
1. Open ground 2. Fence top high or higher in the open 3. In the shade within or under dense
foliage shielded from the sky 4. In the shade but exposed to the sky
Tc > T,, TV = T, T,, < To T,, = T,,
T,, > T, T,, = T,, Te < Tu T,, = T,, T,, = T,, T,, = T,, T, = T,, T, = T,,
T,. < T, T, = T,, T,, < T, T,, = T,z
any one of these steps, but at night a single step was utilized (3 in Fig. 6) that minimized exposure to wind and sky. By distinguishing between these steps on the basis of whether or not they were outside the magpie’s blackbody T, , it was possible to determine the times during which physiological thermoregulation was necessary. In each of these steps, T, either approximated or deviated from T, , as summarized in Table 7, depending on sky conditions and the resulting radiation environment. The analysis indicated that radiation was the preponderant variable in determining the magnitude of the difference between T, and T,t, with wind playing a moderating role in diminishing this difference.
In low-radiation environments T,, approximated T, , and changes in windspeed or orientation to the wind did not have much effect on the magnitude of T,. Therefore, it was difficult to appreciate what these small changes in T, (2°C or less) meant to the total energy budget of the bird. There was a sensible difference in heat loss under these conditions, however, that was related to changes in both windspeed and posture. These differences were determined with Eq. 8, where they emerged as different metabolic requirements. Below the T,, , Y,, was maxi- mized and was so much larger than Y,. (Y?, = 590 s m-l; r, = 27 to 132 s m-l) that it was the dominant element in heat transfer. The equivalent resistance, however, still operated as a variable barrier to heat transfer so that even after Y() was maximized, the total resistance of the bird (Y!, + r, = r, where rh and r, are in series) was still changeable within limits depending on windspeed, posture, and T,, . The extent of this variability was visualized by plotting the effect of windspeed on metabolic demand at T,‘s below the T,,. when Rnbs = ECTT,,” and T, = T,l. Metabolic demand was estimated with Eq. 8 at T,‘s of 3, -4, and -21°C at two orientations to the wind while all other factors except windspeed were held con- stant. The results of these calculations are presented in Figure 7A as paired curves at each T,, where the upper and lower lines in each case represent a female perched normal and parallel to wind, respectively. Changing orientation to the wind produced only a 2 to 3% difference in metabolic demand, but moving from an unsheltered spot with a relatively high windspeed (4 m s-l or greater) to one that was sheltered (windspeed of 0.4 m SK’ or less) altered metabolic demands by as much as 12%. The response was closely coupled to r, as evidenced by the fact that half the change possible in both A,,, and r, occurred between windspeeds of 1.9 and 2.3 m s-’ (Fig. 7A, B).
One example of the ecological importance of avoiding strong winds at low temperatures was seen in the metabolic savings accrued by magpies as a result
ENERGY EXPENDITURE BY THE BLACK-BILLED MAGPIE 25
n \ S scattered
FIGURE 6. Summary of thermal steps (1, 2, 3, and 4) available to Black-billed Magpies, and variables used in calculating T,, and I?,,, for magpies. All symbols are as described in text.
of having selected a dense fir grove on the lee side of a hill for their winter roost. When a magpie roosted at low temperatures, its shape approximated a sphere (beak in scapular feathers and body feathers erected), so its charateristic dimen- sion approached body diameter at its widest point. Assuming that a magpie was in the roosting posture on a cold (-20°C) cloudy night when windspeeds outside and inside the grove averaged 4.0 and 0.4 m ss’, respectively (as measured in January), its potential metabolic demand was reduced by 8.3% when it elected to roost in the shelter of the grove (121.0 W mm” as compared with 132 W mpS). On a clear night, with other conditions remaining constant, the metabolic differ- ence in and out of the grove would have been even greater since the foliage
26 STUDIES IN AVIAN BIOLOGY NO. 5
WINDSPEED (m s-l)
80
GO_ cj 2 4 6 8 IO I2 I4 16 I8 20
WINDSPEED (m s-‘1
J FIGURE 7. A. Effect of windspeed on metabolic requirements of Black-billed Magpies at various
air temperatures, described by plotting metabolic rate (W m-‘) as a function of windspeed (m s I). Each pair of lines represents the effect at the air temperature (“C) indicated. Upper lines of each pair represent a female perched normal to the wind, and lower lines, parallel to the wind. B. Boundary- layer resistance (s m ‘) for Black-billed Magpies as a function of windspeed (m s ‘). Upper line is for a female parallel to the wind: lower line, normal to the wind. Solid vertical lines in both figures describe the windspeed at which one-half the change in both A,,, and Y,, occurs.
sheltered the birds from the sky as well as the wind. Kelty and Lustick (1977) calculated that Starlings, Stuvnus vu/gut-is, reduced metabolic costs by 12% on cold winter nights when they avoided high windspeeds by roosting in the shelter of a pine woods, and Balda et al. (1977) reported similar wind avoidance habits in the winter roosting behavior of Pinon Jays, Gymnorhinus cyanocephalus. Wind avoidance and orientation to maximize r,, has also been shown to be a major behavioral pattern for deer, Odocoileus virginianus (Verme 1968), and pronghorn antelope, Antilocupra americana (Bruns 1977) when resting during cold winter months.
T,~ = T,, was arbitrarily picked as the point where physical activity and its associated higher metabolic heat production could be a detriment to the heat-loss capacities of evaporative cooling and could represent a point on the T,, diagrams above which thermal heat stress could occur. Owing to intense shortwave radia- tion and low windspeed, T, exceeded TtJ at 9 cm above the ground for substantial parts of clear days from May through September, even though T, was rarely above 35°C. These high T,.‘s limited the time a bird could spend on open ground
ENERGY EXPENDITURE BY THE BLACK-BILLED MAGPIE 27
before experiencing heat stress, and could therefore have limited foraging time. During these months, fence tops represented a more moderate step, and T,,‘s exceeded T,, only when windspeed was very low. But, unlike the winter situation, in which the birds minimized but could not escape the cold, these places of potential heat stress were avoided and the birds simply moved into the shade.
Behavioral observations showed that magpies, when active during the hot part of a day, shuttled between the top of a fence and the ground, or between the open ground and the shade of a fence post. In fence-top shuttling, a typical sequence was as follows. A bird perched on the fence would fly to the ground and begin foraging. Soon its beak would open, indicating enhanced evaporative cooling. After some time on the ground, the bird would return to the top of the fence and perch in an upright posture, facing into the wind with wings drooped and beak open. Sometimes the breast and back feathers would be drooped open as well. Soon the beak would close, the wings would be retracted, the body feathers sleeked, and shortly thereafter the bird would return to the ground and the cycle would resume. Another typical pattern involved standing in the shade of a fence post and making occasional short forays out into the open sun after grasshoppers, then returning to the shade of another fence post. In addition, the magpies often retreated into dense shade for long periods of time and completely avoided foraging when it was very hot on the ground. Brown-headed Cowbirds, Molothrus atrr, and European Starlings in the same pastures remained active during hot times of the day by foraging in the shade of grazing cows.
In October, T,,‘s still sporadically exceeded the T,,,. at ground level, but from October through early April, they usually fluctuated around the T,,.. During this time of the year, on sunny days and even some cloudy days, T,.‘s exceeded the T,,. even when T,, did not. This indicated that, in general, the ground offered comfortable thermal conditions for the magpie during the daytime, even during very cold days in January (Fig. 5).
TIME-ACTIVITY AND ENERGY BUDGETING IN THE ANNUAL CYCLE
CHRONOLOGY OF EVENTS IN THE ANNUAL CYCLE
A summary of the annual cycle is presented in Figure 8. Daylength and length of civil twilight for the first day of each month at the latitude of Pullman (46”37.5’N) were taken from List (1971). Daylength was distributed equally around true solar noon for this longitude ( 117”08’W), with civil twilight added at dawn and dusk. Times of entering and leaving the roost were noted periodically throughout the year, corrected to true solar time, and plotted on Figure 8.
Reproduction 1974.-The chronology of reproductive events is superimposed on Figure 8. The horizontal bars represent the timing of the various reproductive stages for the 1974 season and were constructed from semi-weekly inventories of the nests within the study area. The construction of a simple stick platform signaled the onset of nest building and usually involved one or more false starts before the final nest site was selected. This activity was first noted during the last few days of January. By the end of February all pairs on the study area were engaged in nest building, which continued to just past mid-April, at which time there were 18 completed nests.
28 STUDIES IN AVIAN BIOLOGY NO. 5
22
20
18
16
6
4
2
0- J
- N.B.
--
Kzi NC.
f JESl -LDC 3. N.
q .
M A M J A S 0 N D
MONTHS
FIGURE 8. Annual cycle of Black-billed Magpies. Lengths of diurnal and nocturnal periods are plotted as a function of the time of year, with heavy solid lines representing daylength, and thin solid lines, civil twilight. Times of entering and leaving the roost are indicated by squares and rectangles during the nonreproductive period, and by open (for males) and closed (for females) circles and ovals during the reproductive period. Rectangles and ovals indicate times of extended activity within the roosting grove. The dashed line connecting these points at each end of the day describes the diurnal activity pattern over the annual cycle. Horizontal bars describe timing of various reproductive stages for both 1973 and 1974, duration of the molt, pattern of evening flocking, and intermittent flocking. N. B. = nest building; E. L. = egg-laying stage; INC. = incubation stage; NEST. = nestling stage; FLDG. = fledgling stage; R. N. = renesting (the pattern in this bar describes the chronology of the events from egg laying to fledging for the renesting effort): M. = molt: F. = evening flocking: I. F. = intermittent flocking.
ENERGY EXPENDITURE BY THE BLACK-BILLED MAGPIE 29
The first eggs in the study area were found on 22 March, and the last new egg was discovered on 27 April. The length of the egg-laying period for a given bird depended on the size of the clutch. The hen usually laid an egg per day (in the morning) but sometimes (especially where large clutches were produced) skipped a day. The average clutch size (&SD) was 6.17 ? 1.29 (n = IS), with a range of 3-8. The female did not incubate the eggs during the day until the clutch was complete but she did roost within the nest dome, and so presumably incubated them at night during the laying period.
With the exception of the pair involved in renesting, the last adult-fledgling interactions, for any of the other pairs, were seen during the last week in June, and this signaled the end of five months of reproductive activity. The pair that renested after their first clutch was destroyed started their second clutch on 13 May, and the last interaction between fledglings and adults at this nest was ob- served on 14 July.
Rrpvoduction 1973.-During May and June of 1973, nestlings from 16 of the 17 nests on the study area were weighed and banded. The ages of these nestlings at the time of banding were estimated, using nestling growth curves from the 1974 season. From this information and the average length of the various stages during the 1974 season, the history of each of these nests was reconstructed and the chronology of the 1973 reproductive period plotted on Figure 8. Using this tech- nique it was determined that egg laying in 1973 started 6 April and ended 4 May.
According to this reconstruction, egg laying started 15 days earlier in 1974, but the end of the fledgling period was about the same for each year. This may indicate that, rather than 1974 being an earlier season, there was more synchrony in the reproductive effort of the population in 1973 than in 1974.
Because the ground has such potential as a source of thermal stress, it is not surprising that this primarily ground-foraging species has an early reproductive season. Linsdale (1937) reports for both the Yellow-billed Magpie, Pica nuttalli, and the Black-billed Magpie that the nesting season is completed by the time the daily average air temperature reaches 28°C. On this study area, egg laying began as early as 22 March, and in most nests feeding of the incubating female by the male, and nestlings by both sexes occurred during that part of the year when a large percentage of the days were cloudy to partly cloudy (Fig. 2). This minimized the period of the breeding season during which ground level T(,‘s would be high enough, at least during part of the day, to interfere with foraging and feeding of nestlings.
M&.-Records of molt were kept on all free-living birds captured during 1973 and 1974, as well as on five captive birds during the summer and fall of 1974. Molt was first detected in the middle of June and was completed by the middle of September (Fig. 8). In the field the onset of molt closely followed the termi- nation of the fledgling period, and since it involved the loss of the middle rectri- ties, it was first recognizable in unrestrained birds as a gap which gave them a V-shaped tail. Later, as middle rectrices were replaced and the outer retricies lost, adults had a short-tailed appearance. Since young of the year do not molt their rectricies, and have long tail feathers, they were easily distinguishable from adults at this time. Body molt was heaviest during the end of July, and the first part of August, and even in free-living birds it was common to see individuals with patches of bare skin on the head and neck. Flight feather and tail feather
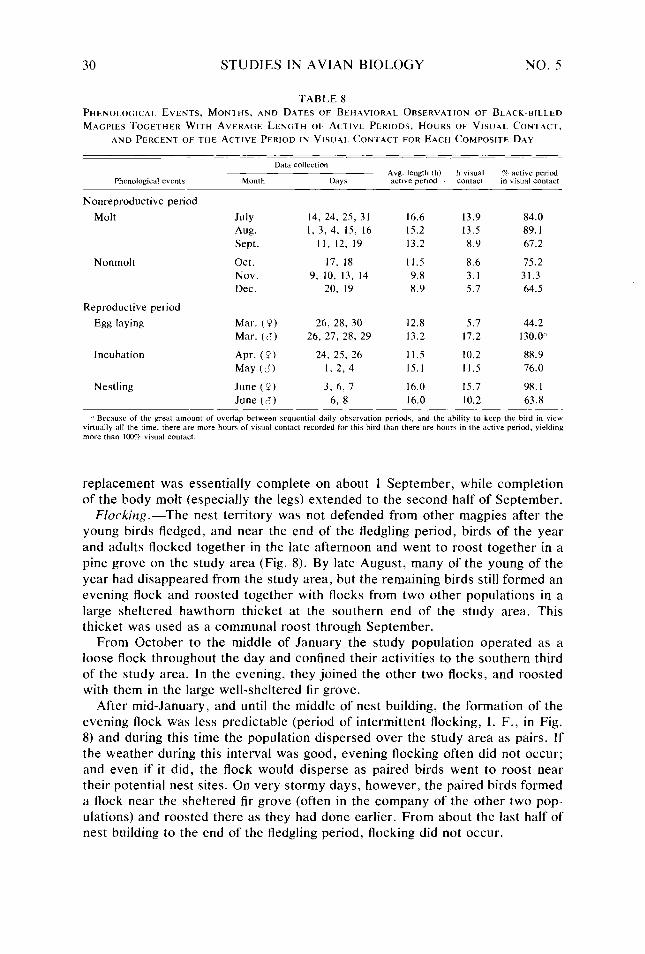
30 STUDIES IN AVIAN BIOLOGY NO. 5
TABLE 8 PHENOLOCICAL EVENTS, MONTHS, AND DATES OF BEHAVIORAL ORSERVATION OF BLACK-BILLED
MAGPIES TOGETHER WITH AVERAGE LENGTH OF ACTIVE PERIODS, HOURS OF VISUAL CONTACT,
AND PERCENT OF THE ACTIVE PERIOD IN VISUAL CONTACT FOR EACH COMPOSITE DAY
Phenologiczd events
Nonreproductive period
Molt
Nonmolt
Reproductive period
Egg laying
Incubation
Nestling
Data collect,on Avg. length (h) h visual 96 active penod
Month Days active penod contact I” viwal contact
July 14, 24, 25, 31 16.6 13.9 84.0 Aug. I, 3, 4, IS, 16 15.2 13.5 89.1 Sept. 11, 12, 19 13.2 8.9 67.2
Oct. 17, 18 11.5 8.6 75.2 Nov. 9, 10, 13, 14 9.8 3.1 31.3 Dec. 20, 19 8.9 5.7 64.5
Mar. (9) 26, 28, 30 12.8 5.7 44.2 Mar. (6) 26, 27, 28, 29 13.2 17.2 130.0”
Apr. (9) 24, 25, 26 11.5 10.2 88.9 May ($1 1, 2, 4 15.1 11.5 76.0
June (9) 3, 6, 7 16.0 15.7 98.1 June (6) 6, 8 16.0 10.2 63.8
4 Because of the great amount of overlap between sequent~d daily obserwtion periods, and the ability to keep the bird in view virtually all the time, there are more hour\ of viwal contact recorded for this bird than there are hours I” the active period, yielding more than 100% visuzd contact.
replacement was essentially complete on about 1 September, while completion of the body molt (especially the legs) extended to the second half of September.
Flocking.-The nest territory was not defended from other magpies after the young birds fledged, and near the end of the fledgling period, birds of the year and adults flocked together in the late afternoon and went to roost together in a pine grove on the study area (Fig. 8). By late August, many of the young of the year had disappeared from the study area, but the remaining birds still formed an evening flock and roosted together with flocks from two other populations in a large sheltered hawthorn thicket at the southern end of the study area. This thicket was used as a communal roost through September.
From October to the middle of January the study population operated as a loose flock throughout the day and confined their activities to the southern third of the study area. In the evening, they joined the other two flocks, and roosted with them in the large well-sheltered fir grove.
After mid-January, and until the middle of nest building, the formation of the evening flock was less predictable (period of intermittent flocking, I. F., in Fig. 8) and during this time the population dispersed over the study area as pairs. If the weather during this interval was good, evening flocking often did not occur; and even if it did, the flock would disperse as paired birds went to roost near their potential nest sites. On very stormy days, however, the paired birds formed a flock near the sheltered fir grove (often in the company of the other two pop- ulations) and roosted there as they had done earlier. From about the last half of nest building to the end of the fledgling period, flocking did not occur.
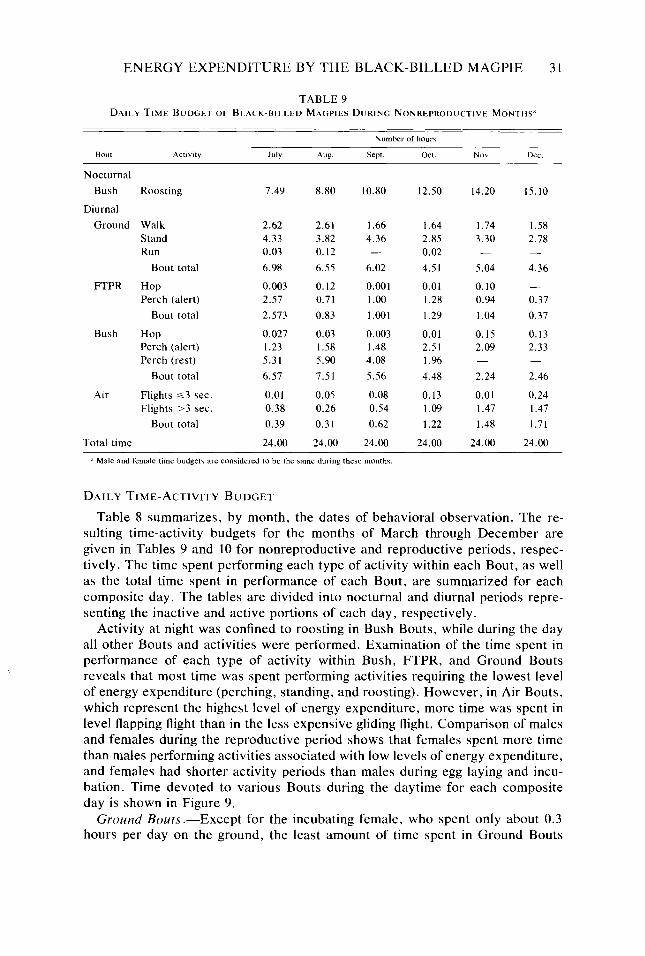
ENERGY EXPENDITURE BY THE BLACK-BILLED MAGPIE 3 I
TABLE 9 DAILY TIME BUDGET OF Br ACK-BII.I.ED MAGPIES DURING NONREPRODUCTIVE MONTHS”
Number of hours
BOUl Activity July Aug. Sept.
Nocturnal
Bush Roosting 7.49 8.80 10.80
Diurnal
Ground Walk 2.62 2.61 1.66 Stand 4.33 3.82 4.36 Run 0.03 0.12 -
Bout total 6.98 6.55 6.02
FTPR Hop 0.003 0.12 0.001 Perch (alert) 2.57 0.7 1 1 .oo
Bout total 2.573 0.83 1.001
Bush Hop 0.027 0.03 0.003 Perch (alert) 1.23 1.58 1.48 Perch (rest) 5.31 5.90 4.08
Bout total 6.57 7.51 5.56
Air Flights ~3 sec. 0.01 0.05 0.08 Flights >3 sec. 0.38 0.26 0.54
Bout total 0.39 0.31 0.62
Total time 24.00 24.00 24.00
rl Male and female time budgets are considered to be the same during these months
DAILY TIME-ACTIVITY BUDGET
Oct. NOV. Dec.
12.50 14.20 15.10
1.64 1.74 1.58 2.85 3.30 2.78 0.02 - -
4.51 5.04 4.36
0.01 0.10 - 1.28 0.94 0.37
1.29 1.04 0.37
0.01 0.15 0.13 2.51 2.09 2.33 1.96 -
4.48 2.24 2.46
0.13 0.01 0.24 1.09 1.47 1.47
1.22 1.48 1.71
24.00 24.00 24.00
Table 8 summarizes, by month, the dates of behavioral observation. The re- sulting time-activity budgets for the months of March through December are given in Tables 9 and 10 for nonreproductive and reproductive periods, respec- tively. The time spent performing each type of activity within each Bout, as well as the total time spent in performance of each Bout, are summarized for each composite day. The tables are divided into nocturnal and diurnal periods repre- senting the inactive and active portions of each day, respectively.
Activity at night was confined to roosting in Bush Bouts, while during the day all other Bouts and activities were performed. Examination of the time spent in performance of each type of activity within Bush, FTPR, and Ground Bouts reveals that most time was spent performing activities requiring the lowest level of energy expenditure (perching, standing, and roosting). However, in Air Bouts, which represent the highest level of energy expenditure, more time was spent in level flapping flight than in the less expensive gliding flight. Comparison of males and females during the reproductive period shows that females spent more time than males performing activities associated with low levels of energy expenditure, and females had shorter activity periods than males during egg laying and incu- bation. Time devoted to various Bouts during the daytime for each composite day is shown in Figure 9.
Ground Bouts.-Except for the incubating female, who spent only about 0.3 hours per day on the ground, the least amount of time spent in Ground Bouts
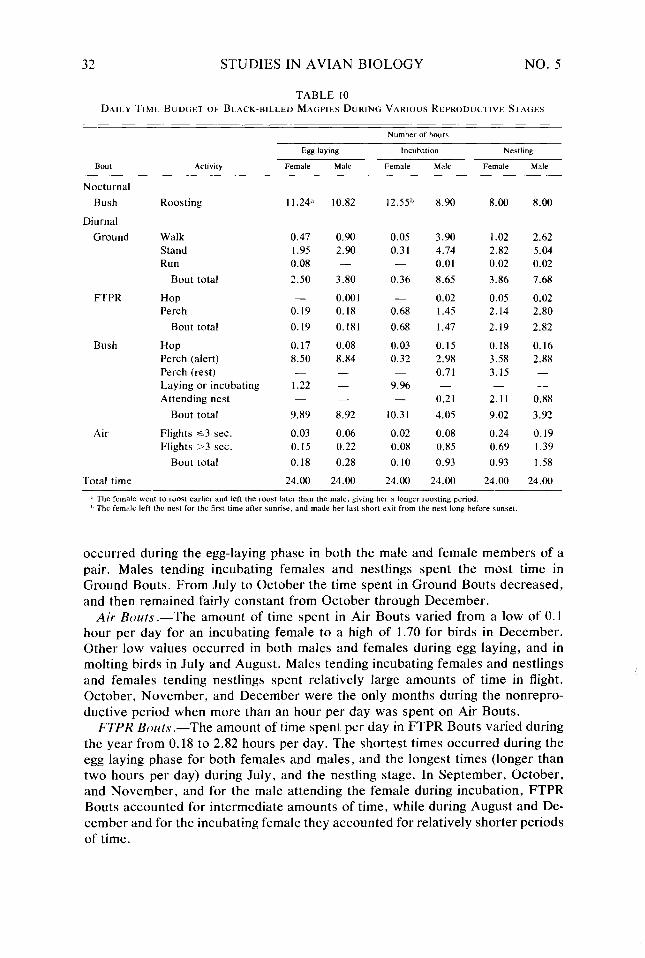
32 STUDIES IN AVIAN BIOLOGY NO. 5
TABLE 10 DAILY TIME BUDGET OF BLACK-BILL-ED MAGPIES DURING VARIOUS REPRODUCTIVE STAGES
Number of hours
BOUt Activity
Egg laying Incubation Nestling
Female Male Female Male Female Male
Nocturnal
Bush
Diurnal
Ground
FTPR
Bush
Air
Roosting 11.24” 10.82 12.55” 8.90 8.00 8.00
Walk Stand Run
Bout total
Hop Perch
Bout total
Hop Perch (alert) Perch (rest) Laying or incubating Attending nest
Bout total
Flights ~3 sec. Flights >3 sec.
Bout total
Total time
0.47 0.90 1.95 2.90 0.08 -
2.50 3.80
- 0.001 0.19 0.18
0.19 0.181
0.17 0.08 8.50 8.84 - -
1.22 - - -
9.89 8.92
0.03 0.06 0.15 0.22
0.18 0.28
24.00 24.00
0.05 3.90 1.02 0.31 4.74 2.82 - 0.01 0.02
0.36 8.65 3.86
- 0.02 0.05 0.68 1.45 2.14
0.68 1.47 2.19
0.03 0.15 0.18 0.32 2.98 3.58
0.71 3.15 9.96 - -
- 0.21 2.11
10.31 4.05 9.02
0.02 0.08 0.24 0.08 0.85 0.69
0.10 0.93 0.93
24.00 24.00 24.00
2.62 5.04 0.02 7.68 0.02 2.80 2.82 0.16 2.88 - - 0.88 3.92 0.19 1.39 1.58
24.00 ‘* The female went to roo9t earlier and left the roost later than the male, giving her a longer roosting period. I’ The female left the ne\t for the first time after sunrise, and made her last Fhort exit from the nest long before sunset.
occurred during the egg-laying phase in both the male and female members of a pair. Males tending incubating females and nestlings spent the most time in Ground Bouts. From July to October the time spent in Ground Bouts decreased, and then remained fairly constant from October through December.
Air- Bouts.-The amount of time spent in Air Bouts varied from a low of 0.1 hour per day for an incubating female to a high of 1.70 for birds in December. Other low values occurred in both males and females during egg laying, and in molting birds in July and August. Males tending incubating females and nestlings and females tending nestlings spent relatively large amounts of time in flight. October, November, and December were the only months during the nonrepro- ductive period when more than an hour per day was spent on Air Bouts.
FTPR Bouts .-The amount of time spent per day in FTPR Bouts varied during the year from 0.18 to 2.82 hours per day. The shortest times occurred during the egg laying phase for both females and males, and the longest times (longer than two hours per day) during July, and the nestling stage. In September, October, and November, and for the male attending the female during incubation, FTPR Bouts accounted for intermediate amounts of time, while during August and De- cember and for the incubating female they accounted for relatively shorter periods of time.
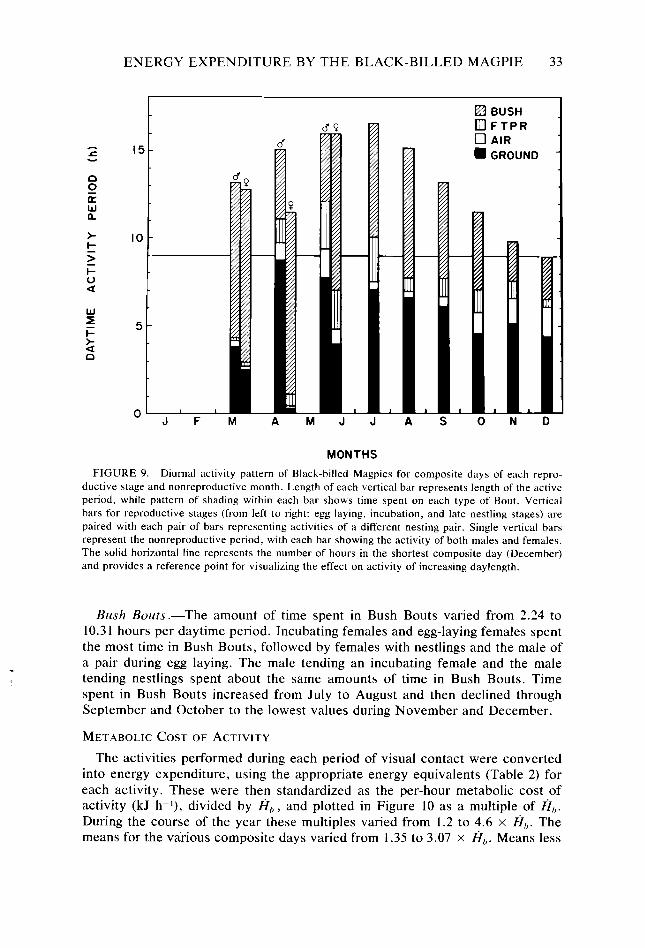
ENERGY EXPENDITURE BY THE BLACK-BILLED MAGPIE 33
I= i- ”
IO
5
0 J F M A M
-
El BUSH
E n
FTPR AIR GROUND
N D
MONTHS
FIGURE 9. Diurnal activity pattern of Black-billed Magpies for composite days of each repro- ductive stage and nonreproductive month. Length of each vertical bar represents length of the active period, while pattern of shading within each bar shows time spent on each type of Bout. Vertical bars for reproductive stages (from left to right: egg laying, incubation, and late nestling stages) are paired with each pair of bars representing activities of a different nesting pair. Single vertical bars represent the nonreproductive period, with each bar showing the activity of both males and females. The solid horizontal line represents the number of hours in the shortest composite day (December) and provides a reference point for visualizing the effect on activity of increasing daylength.
Bush Bouts.-The amount of time spent in Bush Bouts varied from 2.24 to 10.3 1 hours per daytime period. Incubating females and egg-laying females spent the most time in Bush Bouts, followed by females with nestlings and the male of a pair during egg laying. The male tending an incubating female and the male tending nestlings spent about the same amounts of time in Bush Bouts. Time spent in Bush Bouts increased from July to August and then declined through September and October to the lowest values during November and December.
METABOLIC COST OF ACTIVITY
The activities performed during each period of visual contact were converted into energy expenditure, using the appropriate energy equivalents (Table 2) for each activity. These were then standardized as the per-hour metabolic cost of activity (kJ h-l), divided by Eil,, and plotted in Figure 10 as a multiple of fit). During the course of the year these multiples varied from 1.2 to 4.6 x fi,. The means for the various composite days varied from 1.35 to 3.07 x fi,. Means less
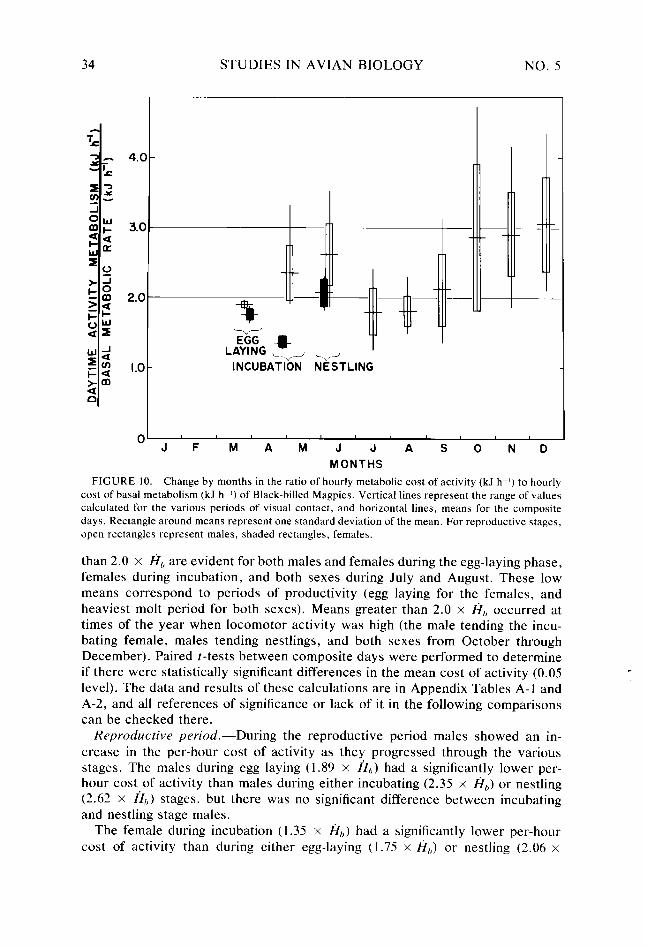
34 STUDIES IN AVIAN BIOLOGY NO. 5
I I 1 I I 1
JFMAMJJASOND
MONTHS
FIGURE 10. Change by months in the ratio of hourly metabolic cost of activity (kJ h-l) to hourly cost of basal metabolism (kJ h ‘) of Black-billed Magpies. Vertical lines represent the range of values calculated for the various periods of visual contact, and horizontal lines, means for the composite days. Rectangle around means represent one standard deviation of the mean. For reproductive stages, open rectangles represent males, shaded rectangles, females.
than 2.0 x fi,, are evident for both males and females during the egg-laying phase, females during incubation, and both sexes during July and August. These low means correspond to periods of productivity (egg laying for the females, and heaviest molt period for both sexes). Means greater than 2.0 x I-i, occurred at times of the year when locomotor activity was high (the male tending the incu- bating female, males tending nestlings, and both sexes from October through December). Paired f-tests between composite days were performed to determine if there were statistically significant differences in the mean cost of activity (0.05 level). The data and results of these calculations are in Appendix Tables A-l and A-2, and all references of significance or lack of it in the following comparisons can be checked there.
Reproductive period.-During the reproductive period males showed an in- crease in the per-hour cost of activity as they progressed through the various stages. The males during egg laying (1.89 x fib) had a significantly lower per- hour cost of activity than males during either incubating (2.35 x Ej,) or nestling (2.62 x fi,,) stages, but there was no significant difference between incubating and nestling stage males.
The female during incubation (1.35 x fib) had a significantly lower per-hour cost of activity than during either egg-laying (1.75 x hi,) or nestling (2.06 x
ENERGY EXPENDITURE BY THE BLACK-BILLED MAGPIE 3.5
fi,)) stages, and the egg-laying stage was significantly lower than the nestling stage.
At all stages of reproduction, males expended significantly more energy per hour on activity than females.
Nonreproductive period.-Males and females were assumed to have performed the same bouts and activities from July through December, but because males are significantly heavier than females (Table 4), they will expend more total en- ergy than females. Paired t-tests of the weight-specific metabolic cost of activity for both males and females during each month of this period showed that with the exception of August (.02 > P), the values for males were not significantly greater than those for females. In addition, the ratio of activity metabolism to Eil, was the same for both sexes during these months, and comparisons between ratios should therefore hold for either sex. The means of the ratios for these months formed two distinct groups: July, August, and September (JAS); and October, November, and December (OND).
The metabolic cost of activity during July (1.79 x fi,), August (1.79 x I?,),
and September (2.11 x fi,,) was low. The per-hour cost of activity for September was significantly higher than for July and August, but there was no difference between the means for July and August. There was no significant difference between the high means for October (2.86 x fi,,), November (2.90 x Ej,), or December (3.07 x fi,,) birds. The OND birds all expended significantly more energy per hour on activity than JAS birds.
Reproductive stage mules compared with JAS and OND males.-The nestling stage male had a significantly higher per-hour cost of activity than males in July, August, and September. The incubating stage male had a significantly higher per- hour cost of activity than July and August but not September males. There was no significant difference between the male during egg laying and the JAS males. There is for males, therefore, a significant increase in the per-hour expenditure of energy on activity after the eggs are laid, followed by a significant drop after the nestling stage. It remained low through July and August, and then increased during September to levels comparable to the nestling and incubating stages.
The nestling stage male had a significantly lower cost of activity than did the December male but not October or November males. The incubating stage male had a significantly lower cost of activity than November and December but not October males, and the egg-laying-stage male was significantly lower than OND males. The greatest expenditure of energy by males for activity occurred during the incubating and nestling stages of the reproductive period and during October, November, and December of the nonreproductive period.
Reproductive stuge females compared ttith JAS and OND females.-The nest- ling stage female had a significantly higher per-hour cost of activity than August females, but not July or September females. The incubating female had a signif- icantly lower per hour cost of activity than any JAS female, but no difference was seen between egg-laying females and JAS females. With the exception of incubation, therefore, there was little change in the expenditure of energy by females for activity from the time egg laying started through September. This contrasted sharply with the pattern seen in the male during that same period.
With the exception of the nestling stage and October females, OND females expended significantly more energy on activity than females at any other time.
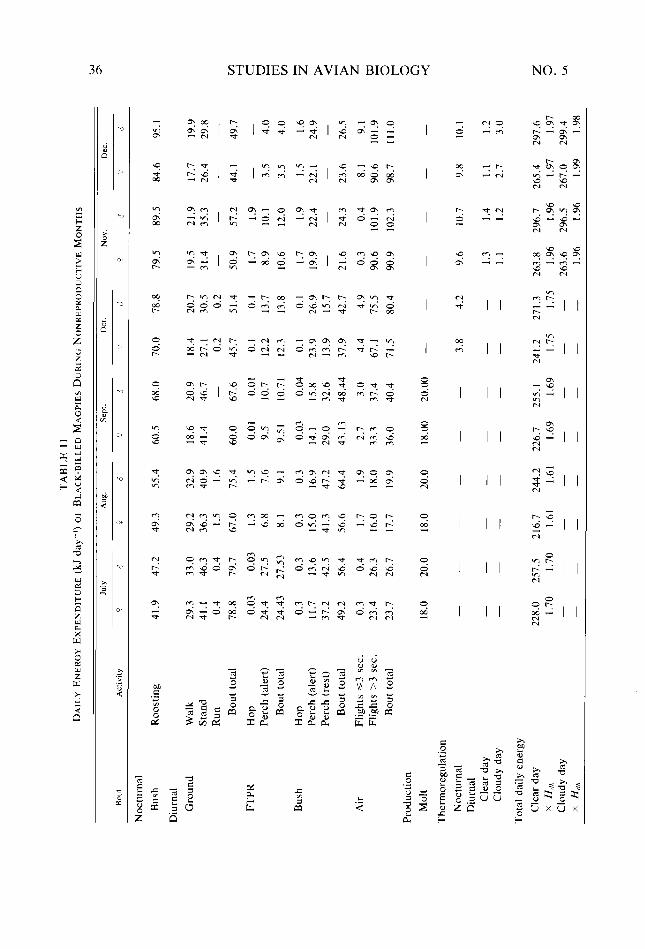
ENERGY EXPENDITURE BY THE BLACK-BILLED MAGPIE 37
TABLE 12 DAILY ENERGY EXPENDITURE (jK day-‘) OF BLACK-BILLED MAGPIES DURING VARIOUS
REPRODUCTIVE STAGES
Egg laying& Incubation” Ne\tling’
Bout Activity Y d 9 ‘3 d
Nocturnal
Bush
Diurnal
Ground
FTPR
Bush
Air
Production
Egg laying
Thermoregulation
Nocturnal Diurnal
Clear day Cloudy day
Total daily energy
Clear day
x H,,,, Cloudy day
x H,,,, _ ” Late March. ” Late April, early May. ’ Early June.
Roosting 62.9 68.2 70.2 56.1 44.8 50.4
Walk 5.3 Stand 18.5 Run 1.0
Bout total 24.8
Hop Perch (alert)
Bout total
Hop Perch (alert) Perch (rest) Laying or incubating Attending nest
Bout total
1.8
1.8
1.9 80.8
8.5
Flights ~3 sec. Flights >3 sec.
Bout total
91.2
1.0 9.2
10.2
11.3 31.0
42.3
0.01 1.9
1.91
1.0 94.6
0.6 3.0 -
3.6
-
6.5
6.5
0.3 3.0 -
69.7
49.1 11.4 33.0 47.8 26.8 53.9
0.01 0.2 0.3
96.91 38.4 87.2
0.3 0.6 0.3 15.5 20.3 30.0
15.8 20.9 30.3
1.9 2.0 2.0 30.9 34.0 30.8
5.7 22.4 -
-
95.6
2.3 15.3
17.6
73.0
0.7 4.9
5.6
2.5 21.9 10.3
41.0 80.3 43.1
3.0 8.1 7.2 58.9 42.5 96.3
61.9 50.6 103.5
60.0 - - -
6.5 6.9 2.9 3.3
0.3 3.4
0.3 3.7 -
257.7 232.8 1.91 1.54
260.8 236.2 1.94 1.56
-
161.6 1.20
-
275.0 235.0 1.82 1.75
-
-
-
3 14.5 2.08
The per-hour expenditure of energy on activity by females was, therefore, great- est during the winter months.
TOTAL DAILY ENERGY EXPENDITURE
The estimated energy budgets are given for each composite day in Tables 11 and 12 for nonreproductive and reproductive months, respectively. From July through December, activity was assumed to be the same for both sexes. The separation of males and females in Table 11, therefore, was on the basis of males
38 STUDIES IN AVIAN BIOLOGY NO. 5
MONTHS
FIGURE Il. Ratio of total daily energy expenditure to daily basal metabolic requirement of Black- billed Magpies for composite days of each reproductive stage and nonreproductive month. The length of each bar represents total daily energy expenditure. Bars for reproductive stages (from left to right: egg laying, incubation, and nestling stages) are paired, with each pair of bars representing the activities of a different nesting pair. The pattern of shading within each bar delineates various major energy demands making up the total daily energy expenditure. Production (ovogenesis and molt) is repre- sented by right-handed hatching, thermoregulation by vertical hatching, activity by the solid-open- solid segment (lower solid segment, Air Bouts: open segment, Bush + FTPR Bouts; upper solid segment, Ground Bouts), and daily basal metabolic requirement by crosshatching.
being heavier and having a higher total basal metabolic requirement than females. During the reproductive period (Table 12), however, the separation of males and females was based on the observed differences in activity between sexes. With the exception of the costs of individual activities the daily energy values were summarized, for ease of comparison, as a multiple of total daily basal metabolism (I?,, x 24 hours = H ,,,,) in Figure 11.
H.,,,, was not constant through the year but varied in response to behavioral and seasonal demands. Figure 11 emphasizes the point that, with the exception of the cost of egg production, most of the annual variation (1.20 to 2.08 x H,,(,) in H,.,, was due to variation in energy expended in diurnal activity. The lowest H,,,, occurred in the incubating female (1.2 x H,,,,). Levels of energy expenditure around 1.5 x H,,,, occurred in the male during egg laying, and birds during the period of molt. The highest levels of energy expenditure (1.75 to 2.08 x H,,,,) were estimated for the egg-laying female, the male tending the incubating female, the male and female tending nestlings, and birds during the OND period. Within that portion of the HT,, related to diurnal activity, the cost of Air Bouts fluctuated
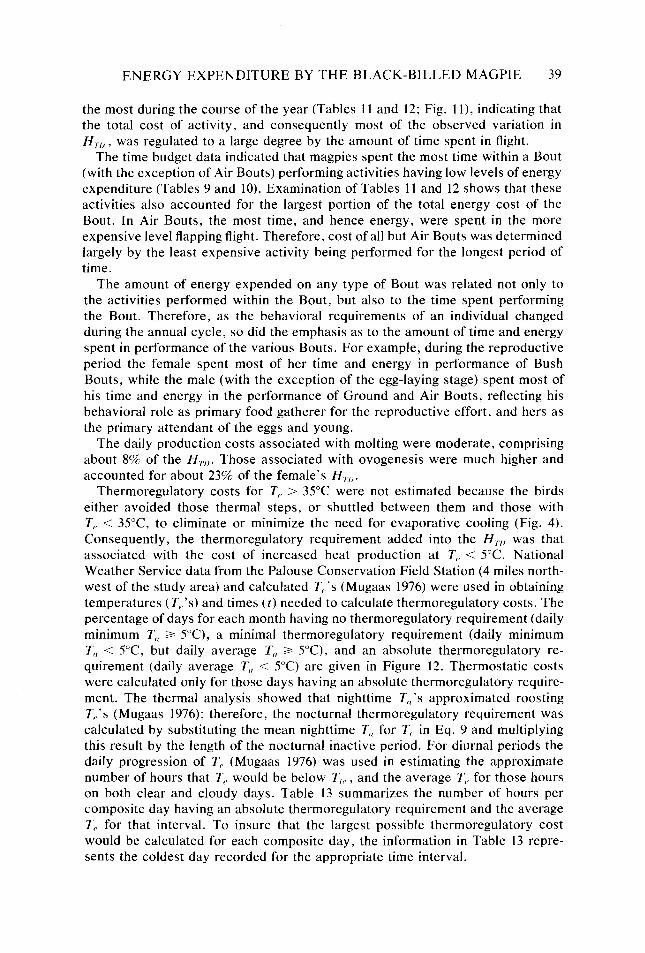
ENERGY EXPENDITURE BY THE BLACK-BILLED MAGPIE 39
the most during the course of the year (Tables 11 and 12; Fig. 1 l), indicating that the total cost of activity, and consequently most of the observed variation in NT,, , was regulated to a large degree by the amount of time spent in flight.
The time budget data indicated that magpies spent the most time within a Bout (with the exception of Air Bouts) performing activities having low levels of energy expenditure (Tables 9 and 10). Examination of Tables 11 and 12 shows that these activities also accounted for the largest portion of the total energy cost of the Bout. In Air Bouts, the most time, and hence energy, were spent in the more expensive level flapping flight. Therefore, cost of all but Air Bouts was determined largely by the least expensive activity being performed for the longest period of time.
The amount of energy expended on any type of Bout was related not only to the activities performed within the Bout, but also to the time spent performing the Bout. Therefore, as the behavioral requirements of an individual changed during the annual cycle, so did the emphasis as to the amount of time and energy spent in performance of the various Bouts. For example, during the reproductive period the female spent most of her time and energy in performance of Bush Bouts, while the male (with the exception of the egg-laying stage) spent most of his time and energy in the performance of Ground and Air Bouts, reflecting his behavioral role as primary food gatherer for the reproductive effort, and hers as the primary attendant of the eggs and young.
The daily production costs associated with molting were moderate, comprising about 8% of the H7.,,. Those associated with ovogenesis were much higher and accounted for about 23% of the female’s Hr,,.
Thermoregulatory costs for T,, > 35°C were not estimated because the birds either avoided those thermal steps, or shuttled between them and those with T,, < 35”C, to eliminate or minimize the need for evaporative cooling (Fig. 4). Consequently, the thermoregulatory requirement added into the H,.,, was that associated with the cost of increased heat production at T,, < 5°C. National Weather Service data from the Palouse Conservation Field Station (4 miles north- west of the study area) and calculated T,.‘s (Mugaas 1976) were used in obtaining temperatures (T<,‘s) and times (t) needed to calculate thermoregulatory costs. The percentage of days for each month having no thermoregulatory requirement (daily minimum T,{ b YC), a minimal thermoregulatory requirement (daily minimum T,, < 5”C, but daily average T,, 2 5”C), and an absolute thermoregulatory re- quirement (daily average T,, < S°C) are given in Figure 12. Thermostatic costs were calculated only for those days having an absolute thermoregulatory require- ment. The thermal analysis showed that nighttime T,‘s approximated roosting T,,‘s (Mugaas 1976); therefore, the nocturnal thermoregulatory requirement was calculated by substituting the mean nighttime T, for T,, in Eq. 9 and multiplying this result by the length of the nocturnal inactive period. For diurnal periods the daily progression of T,, (Mugaas 1976) was used in estimating the approximate number of hours that T,, would be below T,,. , and the average T,, for those hours on both clear and cloudy days. Table 13 summarizes the number of hours per composite day having an absolute thermoregulatory requirement and the average T, for that interval. To insure that the largest possible thermoregulatory cost would be calculated for each composite day, the information in Table 13 repre- sents the coldest day recorded for the appropriate time interval.
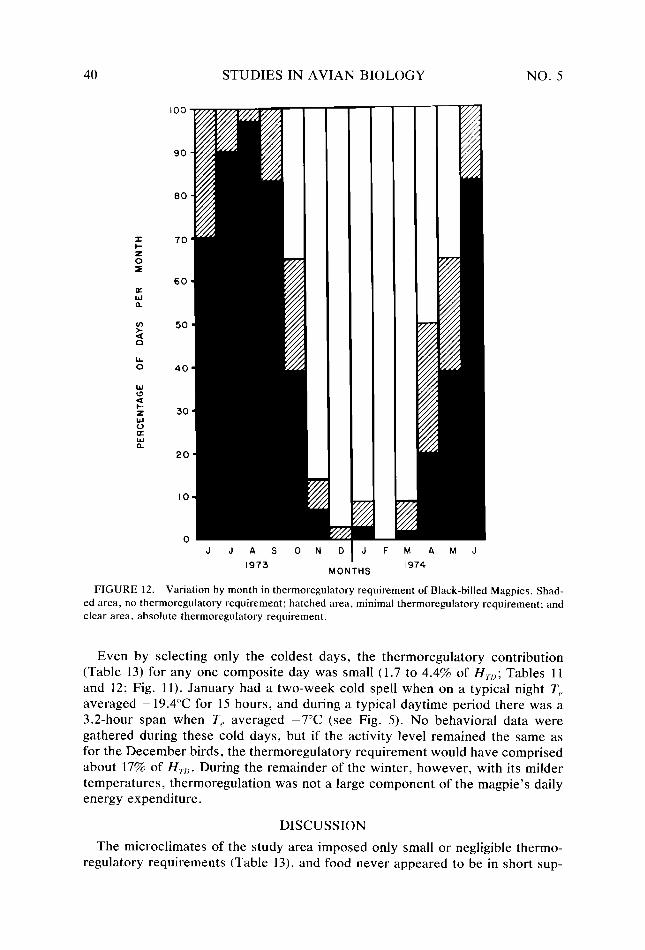
40 STUDIES IN AVIAN BIOLOGY NO. 5
70
60
JJASONC
1973
JFMAMJ
FIGURE 12 Variation by month in thermoregulatory requirement of Black-billed Magpies. Shad- ed area, no thermoregulatory requirement: hatched area, minimal thermoregulatory requirement; and clear area, absolute thermoregulatory requirement.
Even by selecting only the coldest days, the thermoregulatory contribution (Table 13) for any one composite day was small (1.7 to 4.4% of H,,; Tables 11 and 12; Fig. 11). January had a two-week cold spell when on a typical night T, averaged - 19.4”C for 15 hours, and during a typical daytime period there was a 3.2-hour span when T, averaged -7°C (see Fig. 5). No behavioral data were gathered during these cold days, but if the activity level remained the same as for the December birds, the thermoregulatory requirement would have comprised about 17% of H,,. During the remainder of the winter, however, with its milder temperatures, thermoregulation was not a large component of the magpie’s daily energy expenditure.
DISCUSSION
The microclimates of the study area imposed only small or negligible thermo- regulatory requirements (Table 13), and food never appeared to be in short sup-
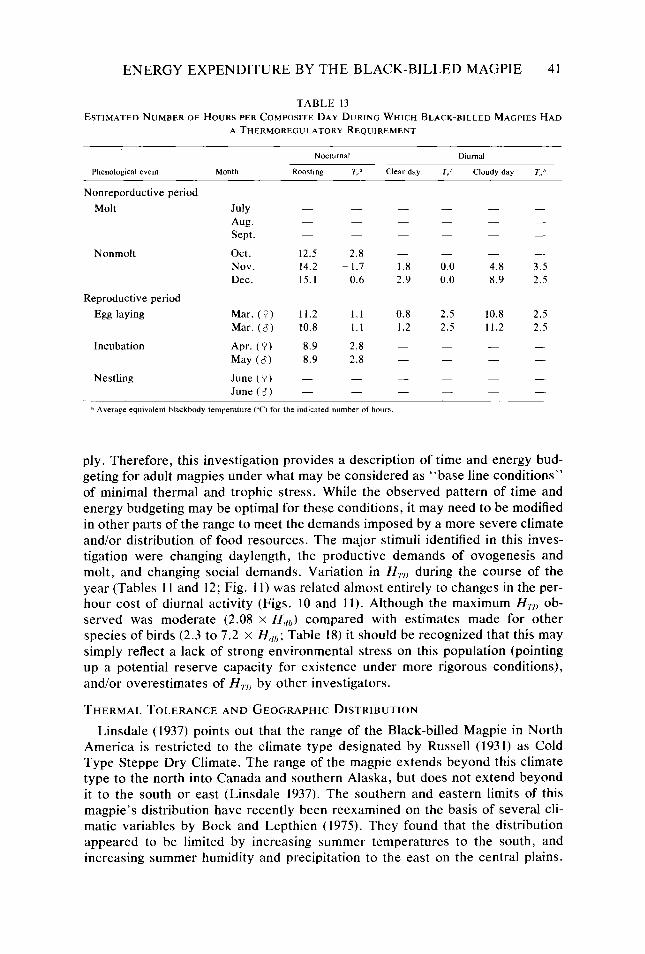
ENERGY EXPENDITURE BY THE BLACK-BILLED MAGPIE 41
TABLE 13 ESTIMATED NUMBER OF HOURS PER COMPOSITE DAY DURING WHICH BLACK-BILLED MAGPIES HAD
A THERMOREGULATORY REQUIREMENT
Phenological event Month
Nocturnal Diurnal
RLXW,ng 7,; Clear day Z,.” Cloudy day Z,”
Nonreporductive period
Molt
Nonmolt
July Aug. Sept.
Oct. Nov. Dec.
Reproductive period
Egg laying
Incubation
Nestling
Mar. (0) Mar. (d)
Apr. (P) May (6)
June (9) June (8)
- - - - -
12.5 2.8 - - - - 14.2 - 1.7 1.8 0.0 4.8 3.5 15.1 0.6 2.9 0.0 8.9 2.5
11.2 1.1 0.8 2.5 10.8 2.5 10.8 1.1 1.2 2.5 11.2 2.5
8.9 2.8 - - -
8.9 2.8 - - - -
d Average equivalent blackbody temperature K) for the indicated numher of hours
ply. Therefore, this investigation provides a description of time and energy bud- geting for adult magpies under what may be considered as “base line conditions” of minimal thermal and trophic stress. While the observed pattern of time and energy budgeting may be optimal for these conditions, it may need to be modified in other parts of the range to meet the demands imposed by a more severe climate and/or distribution of food resources. The major stimuli identified in this inves- tigation were changing daylength, the productive demands of ovogenesis and molt, and changing social demands. Variation in H,, during the course of the year (Tables 11 and 12; Fig. 11) was related almost entirely to changes in the per- hour cost of diurnal activity (Figs. 10 and 11). Although the maximum H,,, ob- served was moderate (2.08 x Hdh) compared with estimates made for other species of birds (2.3 to 7.2 x H,,; Table 18) it should be recognized that this may simply reflect a lack of strong environmental stress on this population (pointing up a potential reserve capacity for existence under more rigorous conditions), and/or overestimates of H,,, by other investigators.
THERMAL TOLERANCE AND GEOGRAPHIC DISTRIBUTION
Linsdale (1937) points out that the range of the Black-billed Magpie in North America is restricted to the climate type designated by Russell (1931) as Cold Type Steppe Dry Climate. The range of the magpie extends beyond this climate type to the north into Canada and southern Alaska, but does not extend beyond it to the south or east (Linsdale 1937). The southern and eastern limits of this magpie’s distribution have recently been reexamined on the basis of several cli- matic variables by Bock and Lepthien (1975). They found that the distribution appeared to be limited by increasing summer temperatures to the south, and increasing summer humidity and precipitation to the east on the central plains.
42 STUDIES IN AVIAN BIOLOGY NO. 5
Therefore, it seems that cool-to-cold, dry macroclimates are a major selective factor in the geographic distribution and thermal adaptation of this species.
Macroclimatic categories, however, provide only a gross and undiscriminating index of the potential limits to avian distribution. Within any macroclimatic cat- egory, microclimatic sets are a source of environmental variation that can be exploited behaviorally by a species to minimize thermoregulatory stress. In terms of thermal tolerance alone, the geographic range of a species will be fixed ulti- mately by its physiological capacities and behavioral options in relation to the available array of thermal steps within its own microclimatic set (Brown 1968, Porter and Gates 1969, Gates 1970, Calder 1973, Smith 1974). Black-billed Mag- pies in southeastern Washington completely avoid, or at least minimize, thermal stress by both obvious and subtle exploitation of their climatic set as well as by an adaptive partitioning of the annual cycle that minimizes the overlap of thermal and trophic stresses.
Habitat use, therefore, can be viewed as a series of movements between distinct thermal steps. Within a step, smaller adjustments by posture or position allow the bird to sample a smaller sliding scale of conditions. Thermal stress within a step may be minimized or even avoided by these postural adjustments, but once the bird can no longer do this, the only way stress can be further reduced or avoided is by moving to a new thermal step. If it is occupying the most favorable thermal step available at that time, then the animal has maximized its behavioral options, and if that step is thermally stressful it must activate physiological mech- anisms to maintain heat balance.
The microclimatic analysis demonstrated that during warm months in the north- western segment of the Black-billed Magpie’s range, T,,‘s > Tt, occurred in the open at ground level for several hours on each clear day, but that on even the hottest days, T,,‘s in the shade were always lower than T,,. (Fig. 4; Mugaas 1976). To avoid the danger of heat stress, birds limited foraging and other activities on open ground during those hours, and either retreated into the shade for long periods or limited their exposure to open ground by shuttling between it and cooler thermal steps (shade or fence tops). During the winter months, when T,‘s were below T,,. (YC), the cold could not be avoided and metabolic heat production had to increase to offset increased heat loss. It seems reasonable to assume, therefore, that for this magpie, selective pressures have favored physiological adaptation to cold. Contrary to n pviovi expectations, therefore, it is evident that hot days hold greater potential for thermal stress and are more limiting to behavior than cold days. While it is misleading to consider an organism’s distribution as being fixed by a single variable, this analysis does reveal that high ground-level temperatures could be limiting to this magpie, particularly when coupled with other unfavorable abiotic and biotic variables. But, in terms of thermal conditions alone, if the macroclimate does not contain microclimates suitable for retreat from high temperatures, or if retreat is possible but necessary for such long periods that it significantly interferes with foraging or other ground level activities (particularly during reproductive or molt periods), then overall fitness in that area would be reduced and the distribution limited.
THE BOUT ASANINDEXOF BEHAVIOR
The description of behavior used in this investigation is unlike that of most others (Greenlaw 1969, Utter and LeFebvre 1970, Schartz and Zimmerman 1971,
ENERGY EXPENDITURE BY THE BLACK-BILLED MAGPIE 43
Stiles 1971, Utter 1971, Wolf and Hainsworth 1971, Custer and Pitelka 1972, Verbeek 1972a, Wiens and Innis 1973, Wolf 1975, Wolf et al. 1975), and it may be argued the “traditional” behavioral categories used in these other investiga- tions (foraging, flying, preening, bathing, courtship, territorial defense, nest build- ing, resting, laying, incubating, brooding, storing food, drinking, sunbathing, etc.) provide an ecologically more relevant description of a bird’s behavior. However, there were several overwhelming advantages associated with describing the mag- pie’s behavior in terms of Bouts and activities.
Some “traditional” behaviors are composed of both postural and locomotor components, while others are mostly postural changes that occur while the bird is standing or perched, making it impossible to assign to them a realistic energy equivalent. In addition, there is often considerable overlap between the perfor- mance of one of these behaviors and another, making it difficult to resolve their separate time and energy requirements. The description used in this investigation did not require the observer to interpret behavior and resolve the time and energy overlaps of complex social events. The activities performed in each Bout are the basic energy-requiring movements, and because they were continuously recorded during each period of visual contact, there was no confusion involved in making a realistic estimate of the cost of activity at any level of resolution (the activities themselves, Bouts, or an entire day). It was also possible to distinguish between energetically expensive and inexpensive behavior and resolve the energetically important from unimportant shifts in the allocation of time and energy. In addi- tion, the use of Bouts as major categories of behavior greatly facilitated the analysis of the spatial and microclimatic context of behavioral events.
By describing behavior in terms of activities (Table 1) it was possible to esti- mate a maximum and a minimum energy cost for each Bout. For example, the activities associated with Ground Bouts are standing, walking, hopping, and run- ning, which have estimated energy equivalents of 1.7, 2.0, 2.0, and 2.1 x 8,, , respectively. If a magpie spent all of its time running when performing Ground Bouts, it would incur an expense of 2.15 x 8,) and if it spent all of its time standing the cost would be 1.7 x fit,. But since the bird spent time performing all four types of activities (regardless of the “traditional” behaviors being performed) and the most time and energy on the least expensive activity, the actual cost of the Bout for each composite day was closer to the minimum than the maximum (1.77 to 1.83 x fi,,; Table 14). With the exception of Air Bouts, Table 14 shows a similar pattern of cost for each of the other Bouts on each composite day. Air Bouts are quantitatively different from other Bouts because of their high energetic cost, and qualitatively different in that more time and energy were spent on the most expensive of the two types of flight, so their actual cost ap- proximated the maximum. In addition, Air Bouts are essentially single-purpose in function (moving the bird from place to place over various distances), while the other bouts are multipurpose and represent the places where most of the business of life is conducted.
If the Bout, as defined in this investigation, was considered the most basic unit of resolution in describing the allocation of time and energy, then behavioral modifications to accommodate changing energy requirements would involve both inter- and intrabout variations. While the goal of a bird’s behavior may be altered significantly by changes in activities within Ground, FTPR, and Bush Bouts, the energetic cost of these will be small because the total variation possible is small
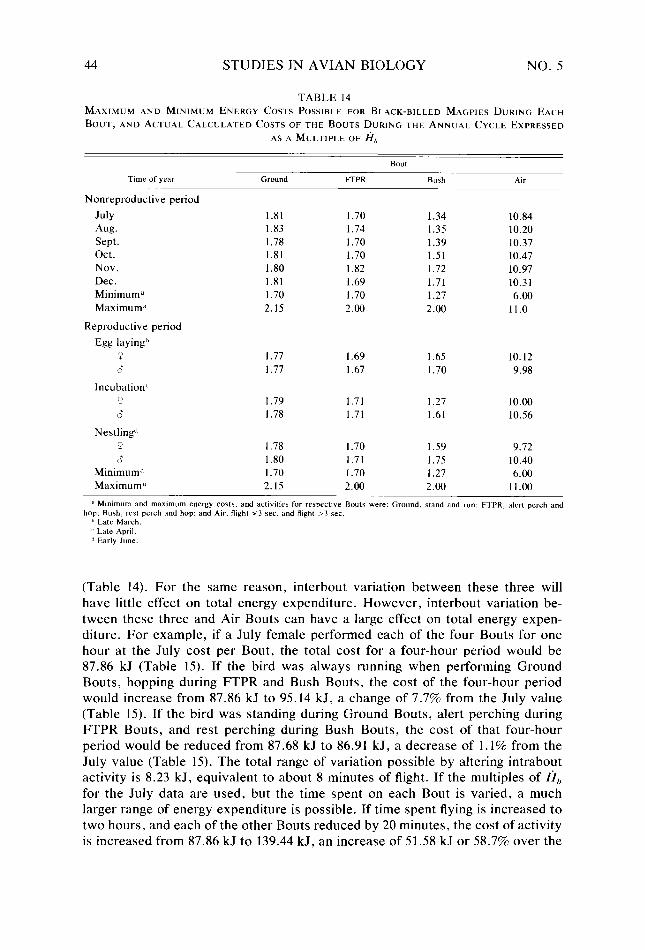
44 STUDIES IN AVIAN BIOLOGY NO. 5
TABLE 14 MAXIMUM AND MINIMUM ENERGY COSTS POSSIBLE FOR BLACK-BILLED MAGPIES DURING EACH
BOUT, AND ACTUAL CALCULATED COSTS OF THE BOUTS DURING THE ANNUAL CYCLE EXPRESSED
AS A MULTIPLE OF a,,
Time of year Ground FTPR Bush Air
Nonreproductive period
July Aug. Sept. Oct. Nov. Dec. Minimuma Maximum”
1.81 1.70 1.34 10.84 1.83 1.74 1.35 10.20 1.78 1.70 1.39 10.37 1.81 1.70 1.51 10.47 1.80 1.82 1.72 10.97 1.81 1.69 1.71 10.31 1.70 1.70 1.27 6.00 2.15 2.00 2.00 11.0
Reproductive period
Egg laying’]
P 1.77 1.69 1.65 10.12
d 1.77 1.67 1.70 9.98
Incubation’
P 1.79 1.71 1.27 10.00
d 1.78 1.71 1.61 10.56
Nestling”
Y 1.78 1.70 1.59 9.72
IS 1.80 1.71 1.75 10.40
Minimum” 1.70 1.70 1.27 6.00
Maximum” 2.15 2.00 2.00 11.00
” Minimum and maximum energy CO%% and activitie? for respective Bouts were: Ground, stand and nrn: FTPR, alert perch and hop: Bush, rest perch and hop; and Air, flight s3 sec. and Right >3 sec.
‘I Late March. ’ Late Apnl. ” Early June.
(Table 14). For the same reason, interbout variation between these three will have little effect on total energy expenditure. However, interbout variation be- tween these three and Air Bouts can have a large effect on total energy expen- diture. For example, if a July female performed each of the four Bouts for one hour at the July cost per Bout, the total cost for a four-hour period would be 87.86 kJ (Table 15). If the bird was always running when performing Ground Bouts, hopping during FTPR and Bush Bouts, the cost of the four-hour period would increase from 87.86 kJ to 95.14 kJ, a change of 7.7% from the July value (Table 15). If the bird was standing during Ground Bouts, alert perching during FTPR Bouts, and rest perching during Bush Bouts, the cost of that four-hour period would be reduced from 87.68 kJ to 86.91 kJ, a decrease of 1.1% from the July value (Table 15). The total range of variation possible by altering intrabout activity is 8.23 kJ, equivalent to about 8 minutes of flight. If the multiples of ci,, for the July data are used, but the time spent on each Bout is varied, a much larger range of energy expenditure is possible. If time spent flying is increased to two hours, and each of the other Bouts reduced by 20 minutes, the cost of activity is increased from 87.86 kJ to 139.44 kJ, an increase of 51.58 kJ or 58.7% over the
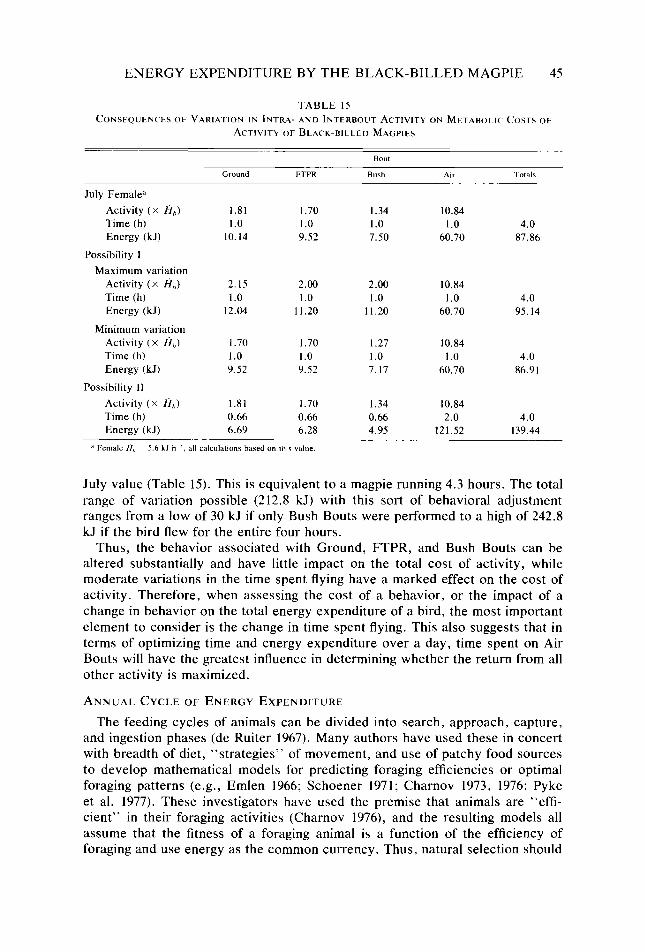
ENERGY EXPENDITURE BY THE BLACK-BILLED MAGPIE 45
TABLE 15 CONSEQUENCES OF VARIATION IN INTRA- AND INTERBOUT ACTIVITY ON METABOLIC COSTS OF
ACTIVITY OF BLACK-BILLED MAGPIES
Bout
Ground FTPR Bush Air TOtalS
July Female”
Activity (x a,,) 1.81 1.70 Time (h) 1.0 1.0 Energy (kJ) 10.14 9.52
Possibility I
Maximum variation Activity (x ci,,) 2.15 2.00 Time (h) 1.0 1.0 Energy (kJ) 12.04 11.20
Minimum variation Activity (x A,,) 1.70 1.70 Time (h) 1 .o 1.0 Energy (kJ) 9.52 9.52
Possibility II
Activity (x fi,,) 1.81 1.70 Time (h) 0.66 0.66 Energy (kJ) 6.69 6.28
n Female H,, = 5.6 kJ h I, all calculations based on this value.
1.34 10.84 1.0 1.0 4.0 7.50 60.70 87.86
2.00 10.84 1.0 1.0 4.0
11.20 60.70 95.14
1.27 10.84 1 .o 1.0 4.0 7.17 60.70 86.91
1.34 10.84 0.66 2.0 4.0 4.95 121.52 139.44
July value (Table 15). This is equivalent to a magpie running 4.3 hours. The total range of variation possible (212.8 kJ) with this sort of behavioral adjustment ranges from a low of 30 kJ if only Bush Bouts were performed to a high of 242.8 kJ if the bird flew for the entire four hours.
Thus, the behavior associated with Ground, FTPR, and Bush Bouts can be altered substantially and have little impact on the total cost of activity, while moderate variations in the time spent flying have a marked effect on the cost of activity. Therefore, when assessing the cost of a behavior, or the impact of a change in behavior on the total energy expenditure of a bird, the most important element to consider is the change in time spent flying. This also suggests that in terms of optimizing time and energy expenditure over a day, time spent on Air Bouts will have the greatest influence in determining whether the return from all other activity is maximized.
ANNUAL CYCLE OF ENERGY EXPENDITURE
The feeding cycles of animals can be divided into search, approach, capture, and ingestion phases (de Ruiter 1967). Many authors have used these in concert with breadth of diet, “strategies” of movement, and use of patchy food sources to develop mathematical models for predicting foraging efficiencies or optimal foraging patterns (e.g., Emlen 1966; Schoener 1971; Charnov 1973, 1976; Pyke et al. 1977). These investigators have used the premise that animals are “effi- cient” in their foraging activities (Charnov 1976), and the resulting models all assume that the fitness of a foraging animal is a function of the efficiency of foraging and use energy as the common currency. Thus, natural selection should
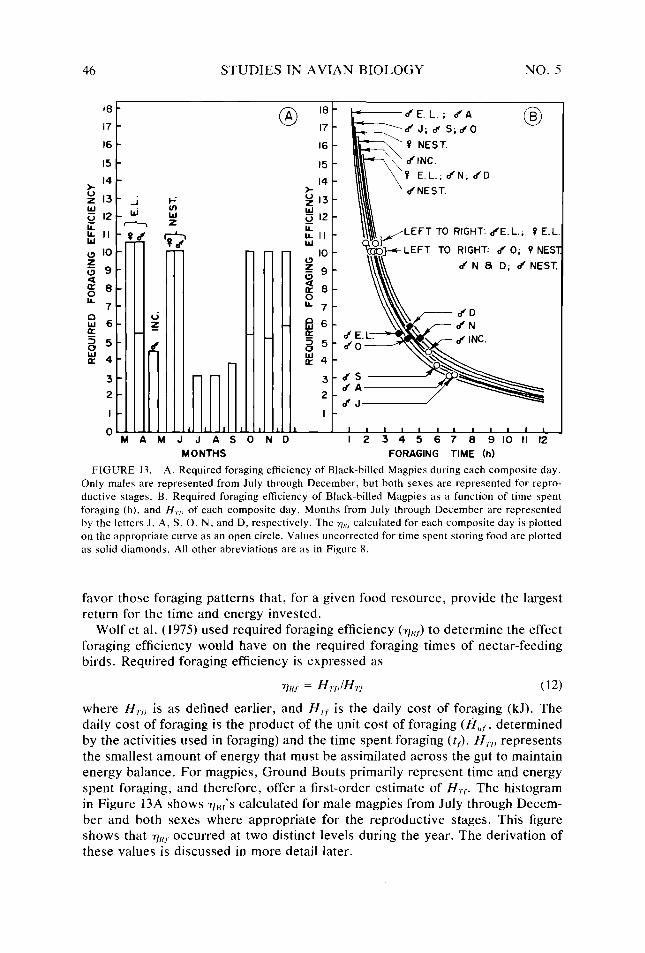
46 STUDIES IN AVIAN BIOLOGY NO. 5
18
17
16
15
0 IO- + c3 g-
2 i?
8-
?-
: 6- oz 5 s 5-
LL 4-
3-
2-
I -
O I JAS MONTHS
I6 -
I4 -
g z 13-
g l2- E s II -
IO - P _ G9 2 8-
2 7-
? E.L.; bN; bD
LEFT TO RIGHT: ej’E. L.; Q E.L
FT TO RIGHT: d 0; Q NES
d N 8 D; d NEST
11 1 I I I, I I I, I
I 2 3 4 5 6 7 8 9 IO II I2
FORAGING TIME (h)
r:
FIGURE 13. A. Required foraging efficiency of Black-billed Magpies during each composite day. Only males are represented from July through December, but both sexes are represented for repro- ductive stages. B. Required foraging efficiency of Black-billed Magpies as a function of time spent foragmg (h). and H,,, of each composite day. Months from July through December are represented by the letters J, A, S, 0, N, and D, respectively. The T,,, calculated for each composite day is plotted on the appropriate curve as an open circle. Values uncorrected for time spent storing food are plotted as solid diamonds. All other abreviations are as in Figure 8.
favor those foraging patterns that, for a given food resource, provide the largest return for the time and energy invested.
Wolf et al. (1975) used required foraging efficiency (Q~) to determine the effect foraging efficiency would have on the required foraging times of nectar-feeding birds. Required foraging efficiency is expressed as
rl/fr = H,,,IHr/ (12)
where HT,, is as defined earlier, and Hrf is the daily cost of foraging (kJ). The daily cost of foraging is the product of the unit cost of foraging (h,,,, determined by the activities used in foraging) and the time spent foraging (tf). H,,,, represents the smallest amount of energy that must be assimilated across the gut to maintain energy balance. For magpies, Ground Bouts primarily represent time and energy spent foraging, and therefore, offer a first-order estimate of HTf. The histogram in Figure 13A shows vHf’ s calculated for male magpies from July through Decem- ber and both sexes where appropriate for the reproductive stages. This figure shows that qnf occurred at two distinct levels during the year. The derivation of these values is discussed in more detail later.
ENERGY EXPENDITURE BY THE BLACK-BILLED MAGPIE 47
Achieved foraging efficiency (T,~) which is the ratio of the quantity of energy actually swallowed to cost (Wolf et al. 1975) could not be estimated for the magpie because (1) energy content of individual food items was not known, (2) not all food items swallowed were identifiable, and (3) not all food items handled were swallowed (some were partially eaten, then hidden; others were hidden intact shortly after initial discovery).
The relationship between Q~ and the time spent foraging approximates a hy- perbolic curve. Curves relating qKf. to the time required for foraging are presented in Figure 13B for the H7.,,‘s peculiar to composite days for males from July through December, and for both sexes where appropriate for the reproductive stages. At any particular Hr,, , vR, increases, as time spent foraging decreases, and as H,.,, increases at any particular foraging time so does vrrt. The Q,‘S for the composite days are plotted as open symbols on the appropriate curves in Figure 13B. The low values (3.2 to 4.5) fall on that region of the curves where a small change in Q~ produces a large change in foraging time while the large values (10.1 to 10.5) fall where a large change in Q, produces little change in foraging time. Thus, the extent to which foraging time will be decreased or increased will depend on the foraging efficiency a bird can achieve, which in turn is a function of the characteristics of the food supply. The very short foraging times associated with Q~‘S of about 10.1 to 10.5 occurred when food items were large and the rate of energy intake was rapid. Longer foraging times and lower Q~‘S (3.2 to 4.5) oc- curred when small food items were being utilized and the rate of energy intake was low.
Since the fi,,, varied little during the year (1.77 to 1.83 x fib; Table 14), the major factors determining H,:, were the characteristics of the food being utilized and the time required to exploit it. Coupled with these are the temporal variation in T,s at ground level that will have some influence on when foraging will occur, and what will be available. These factors will be the focal point in the following discussion, which examines the adaptive features of changing activity patterns during various periods of the magpie’s annual cycle.
Reproductive period.-The largest productive demand during reproduction is ovogenesis (King 1973, Ricklefs 1974), and combined with all other costs of ex- istence during egg laying, it accounted for 23% of each day’s H.r,, (Fig. 11). This was the only time during the annual cycle when the influence of productivity was nearly as great as that of activity. During this time the female spent little time on Air Bouts (Table 12) so that even with the increased productive demand, her total H,,, was less than 2.0 x H,,,,. This implies that there may have been a compen- sation of the energy of activity for the energy of production. The female also reduced the time spent on Ground Bouts to about 2.5 hours a day, yielding an vRr of 10.5 (Fig. 13A). This drastic change in behavior occurred at a time when freezing and near-freezing temperatures accompanied by snow or rain squalls were not uncommon (Mugaas 1976) and there was no flush of insect prey available to support increased energy demands. The food resources at this time, however, consisted of large earthworms, Lumhricus terrestris, and large pieces of carrion, or commercial dog and cat food (from nearby Veterinary School kennels) that the birds found on the ground near and within the nesting territory. Many of these were so large (including the earthworms) that when they were uncovered, they were only partially consumed and then cached. This food resource represented
48 STUDIES IN AVIAN BIOLOGY NO. 5
a concentrated assemblage of large food items that satisfied the energy require- ments of egg production with a minimum of ground activity. How much of the carrion and pet food was stored on and near the nesting territory prior to egg laying is not known, but should be investigated since it suggests a way in which these birds could artifically develop a high quality readily accessible food source to be utilized during the egg-laying period. Nor is it known to what extent storing food on or near the territory may influence the onset of egg laying. Late winter breeding of nutcrackers (Nucifraga spp.) and perhaps other corvids in snow- covered regions is possible as a result of prior caching of food (Turcek and Kelso 1968, Balda and Bock 1971).
During the egg-laying phase the male was also very sedentary, with an HTI, only slightly over 1.5 x Hllb (Fig. 11). The male’s low level of activity during this period may have both an energetic and behavioral function. After the eggs are laid, the male is involved in about 40 days of intense activity transporting food to the incubating and brooding female, as well as the nestlings. His inactivity during egg laying may provide a period during which his own energy reserves can be increased in preparation for the oncoming period of increased activity. Cop- ulation and courtship feeding were observed during egg laying, and both appeared to be solicited by the female. By staying relatively sedentary and near the nest, the male not only “saved” energy, but was readily available to the female, who consequently had to spend little of her time or energy in locating him for these activities. Furthermore, courtship feeding may, as Verbeek (1973) predicts for the Yellow-billed Magpie, provide the priming stimulus to ensure that the male will continue feeding her during incubation. The male spent 1.3 hours more than the female on Ground Bouts. The foraging activity of the male at this time in- volved not only finding and swallowing the necessary quantity of food, but also finding and storing additional food items and in some cases what appeared to be checking items previously stored (perhaps as reinforcement to recollection of their locality). The female also engaged in some of these activities but did so less than the male. The female often flew to the male after he had uncovered a food item, and after displacing him from it, fed on it herself. If she did not entirely consume it she would hide what remained at a different spot before retiring to a tree or bush. This behavior undoubtedly played a role in exposing stored food and making it available to the female, but it is not known what fraction of her total energy requirement was supplied in this way. Calculating qRf for the male by assuming that total ground time represented his Hyy yielded a value of 5.5. However, since both birds were feeding on the same food items, and the female’s feeding time mostly involved finding and swallowing what was needed, it is rea- sonable to assume the rlKf for the male, exclusive of time spent storing food, was also about 10.5. Solving Eq. 12 for tf and using an rlrcf of 10.5 for the male, [tf = 232.3 kJ/(11.15 kJ h-’ x lO.S)], yields 1.98 hours as the time he would require, given the existing food supply, simply to find and swallow what he needed to balance his energy demands. This leaves 1.82 hours, or almost half the time spent on the ground available for food storing activities. By spending the additional time on the ground in augmenting stored food supplies the male insures the con- tinuation of a high rate of energy intake and a reduction in the cost of activity for both himself and the female. The behavior also produces no obvious penalty to the male’s allocation of either time or energy to other activities because (1) the
ENERGY EXPENDITURE BY THE BLACK-BILLED MAGPIE 49
Ej,, is low so the difference in H.,.,, produced by foraging beyond the time required to simply find and swallow what was needed is slight, and (2) the activity was performed on or very near the nest territory so the male was still readily available to the female; consequently the time involved did not detract from that required for reproductive behavior.
During egg laying, the female roosted out of sight within the nest. She presum- ably sat on the eggs at this time, so nocturnal incubation actually started as the eggs were being laid. Once the clutch was complete, diurnal incubation also started and the male began feeding the female on the nest. This undoubtedly contributed to her high degree (~93%) of diurnal nest attentiveness. The observed male spent more time (8.65 hours; Tables 9 and 10) and energy (96.91 kJ; Tables 11 and 12) on Ground Bouts than was observed for this group of magpies at any other time. He usually transported food directly to the female in the nest, although she occasionally emerged from it as he approached and received the food some distance away from the nest. His flying time (0.93 hours; Table 10) was more than three times that for the male observed during egg laying and the calculated H, for this male was 1.82 x H,,* (Fig. 11). Since he was also feeding the female, the total energy requirement of this stage is represented by the sum of the H7.,,‘s for both the male and the female. The cost of foraging, however, is represented only by the Ground Bout activity of the male. Using these assumptions, qHf for the incubating stage as a unit is 4.5 [r),, = (161.6 kJ + 275 kJ)/(l1.21 kJ h-l x 8.65 h)]. The simplest assumption leading from this is that he has two qIKf’s; one for feeding himself and one for feeding his mate, and since he probably fed her the same things he ate, the Ijlcl (11.21 kJ h-‘) and qHf (4.5) should be the same for both efforts. The details of this male’s foraging were harder to follow because he foraged further from the nest territory, but it appeared that he was much less involved in either finding previously stored food or storing new food. The nKf of 4.5, therefore, may be close to what the bird was actually experiencing and may be a reasonable value to use in calculating the time he had to spend foraging to satisfy the energy requirement of both himself and his mate. The calculation predicts that the male would have had to devote 3.2 hours [t = 161.6 kJ/( 11.21 kJ h-l x 4.5)] of his foraging time gathering food for the female, and 5.4 hours [t = 275 kJ/(11.21 kJ h-l x 4.5)] gathering food for himself. This result indicates that under the given foraging conditions he spent 2.2 more hours per day satisfying his energy requirement than hers. Any improvement in food abundance or dis- tribution that would increase his rate of energy intake would raise the vHf and shorten the required foraging times. Any factor that minimizes the female’s H,,,, will reduce the time the male must spend foraging for her. For example, in harsher climates, the thick, well-insulated nest characteristic of these magpies would reduce the female’s thermoregulatory costs, and her high degree of nest atten- tiveness would reduce the cost of her activity. Both factors minimize her Hr,, and the time required to find the food to feed her. In this study, both thermoreg- ulatory and activity costs were negligible for the female, and her H,.,, was about as low as could be expected (1.2 x H,,,; Table 12; Fig. 11). Therefore, the foraging time imposed on her mate represents an absolute minimum for the given char- acteristics of the food supply.
In addition to some unidentifiable items picked off the ground, the incubation- stage male also captured small flies by nabbing them out of the air with his beak.
50 STUDIES IN AVIAN BIOLOGY NO. 5
When this male, and one other who was also feeding an incubating female, were captured during this interval, they both had a bolus of small flies in the gular area under their tongues. The bolus, when removed from the mouth, was wet with saliva and very compact. This suggests that Black-billed Magpies may use saliva, as Dow (1965) has reported for the Gray Jay (Pevisorrus c~unmdensis), to produce large energy-rich pellets from small individual items. When the bolus reached a suitable size, it could be taken to the female (thus increasing the efficiency of transporting food to her, or later on to the chicks), or stored for later use.
No quantitative observations were made during the brooding phase of the nest- ling period, but it was qualitatively noted that brooding females were very atten- tive to new hatchlings and spent much time at the nest. Erpino (1968) also re- ported this for female magpies near Laramie, Wyoming. Consequently, the female’s H,.,, is probably increased only slightly by the transition from incubating to brooding, while the male’s should remain high and perhaps even increase, since he may feed the female as well as the nestlings at this time.
The female of the pair observed during the late nestling period fed herself, and appeared to take an active role in transporting food to the young. However, she still spent most of the daytime in the nest tree (9.02 hours; Table 10). Most of the increase in her Hy.,, , over that of the incubating female, therefore, was due to increased flight time associated with transporting food to the nestlings. During this time the male foraged farther from the nest than the female and accumulated the bulk of the nestlings’ food requirement. Although insects were abundant (qualitative observation) and were obviously being utilized, the male also often brought large food items back and deposited them on the ground near the nest tree (scraps from hawk kills, unidentified material from animal pens, and some commercial dog and cat food). He and the female then alternated in tearing up these large scraps and transporting them to the nest. Data from Johnson (1972) indicate that the diet of late nestling magpies near Pullman was composed by volume of 31.9% arthropods (29.0% insects), 20.8% earthworms, 28.1% carrion, 14.3% chordates, 3.9% commercial dog and cat food, 0.5% molluscs, 0.4% plant material, and 0.1% unknown objects. A similar variety of foods was found for nestling Black-billed Magpies in other regions of the United States (Kalmbach 1927, Owen 1956, Jones 1958). This variety indicates that during the late nestling stage, at least, parent Black-billed Magpies are opportunistic in foraging for their nestlings and take both large and the most abundant items as encountered.
The T),,~ of the nestling stage as a unit is represented by the total energy re- quirement (H,.,, of the male + H,.,, of the female + the combined HT,,‘s of the six nestlings) divided by the combined foraging costs of the male and female. Daily energy expenditures of the male and female (314.5 kJ and 235.0 kJ, respectively) are given in Table 12, as are their respective foraging costs (87.2 kJ and 38.4 kJ). Even though it is an underestimate, H,.,, of each nestling during the observation period was assumed to be equivalent to its weight-dependent Ej, as calculated from Aschoff and Pohl’s (1970) equation for passerines. Since these nestlings were about to fledge, a cost increment was not estimated for growth requirements. The values for the six chicks are given in Table 16, and total 715 kJ for the nest. The qRI. calculated for the nestling stage is (314.5 kJ + 235 kJ + 715 kJ)/(87.2 kJ + 38.4 kJ) = 10.1, which is very close to that calculated for the female during egg laying. If we assume that the diet was the same for the male, female, and
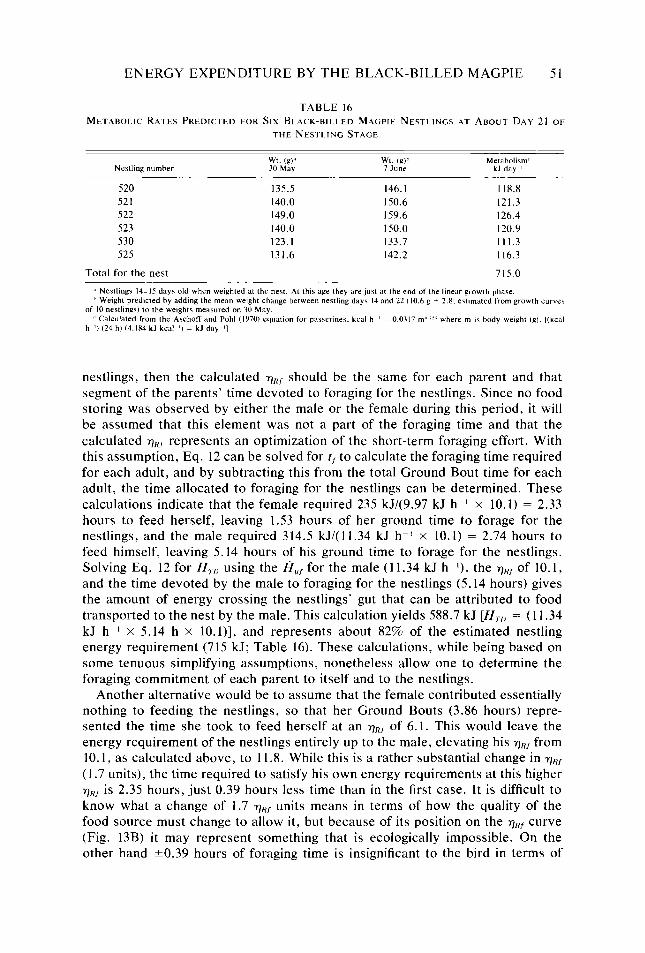
ENERGY EXPENDITURE BY THE BLACK-BILLED MAGPIE 51
TABLE 16 METABOLIC RATES PREDICTED FOR SIX BLACK-BILLED MAGPIE NESTI INGS AT ABOUT DAY 21 OF
THE NESTI.ING STAGE
Nestling number wt. (g),’ wt. Q)” 30 May 7 June
Metabolism’ kJ day ’
520 135.5 146.1 118.8 521 140.0 150.6 121.3 522 149.0 159.6 126.4 523 140.0 150.0 120.9 530 123.1 133.7 111.3 525 131.6 142.2 116.3
Total for the nest 715.0
d Nestlings 14-15 day\ old when weighted at the newt. At this age they are~u~t at the end of the linear growth phase. ” Weight predicted by adding the mean weight change between nettling day\ I4 and 22 (IO.6 g z 2.8: estimated from growth curve?
of 10 nestlings) to the weights measured on 30 May. ’ Calculated from the Aschoff and Pohl (1970) equation for pa?senne\. kcal h ’ = 0.0317 m”‘?“ where m i\ body waght ,g,. [(kcal
h ‘) (24 h) (4.184 kJ kcal ‘1 = kJ day ‘1
nestlings, then the calculated n,?, should be the same for each parent and that segment of the parents’ time devoted to foraging for the nestlings. Since no food storing was observed by either the male or the female during this period, it will be assumed that this element was not a part of the foraging time and that the calculated ~~~ represents an optimization of the short-term foraging effort. With this assumption, Eq. 12 can be solved for t, to calculate the foraging time required for each adult, and by subtracting this from the total Ground Bout time for each adult, the time allocated to foraging for the nestlings can be determined. These calculations indicate that the female required 235 kJ/(9.97 kJ h-’ x 10.1) = 2.33 hours to feed herself, leaving 1.53 hours of her ground time to forage for the nestlings, and the male required 314.5 kJ/( 11.34 kJ h-’ x 10.1) = 2.74 hours to feed himself, leaving 5.14 hours of his ground time to forage for the nestlings. Solving Eq. 12 for H,,,, using the fi,,, for the male (11.34 kJ h-l), the qHf of 10.1, and the time devoted by the male to foraging for the nestlings (5.14 hours) gives the amount of energy crossing the nestlings’ gut that can be attributed to food transported to the nest by the male. This calculation yields 588.7 kJ [H.r,, = (11.34 kJ h-’ x 5.14 h x lO.l)], and represents about 82% of the estimated nestling energy requirement (715 kJ; Table 16). These calculations, while being based on some tenuous simplifying assumptions, nonetheless allow one to determine the foraging commitment of each parent to itself and to the nestlings.
Another alternative would be to assume that the female contributed essentially nothing to feeding the nestlings, so that her Ground Bouts (3.86 hours) repre- sented the time she took to feed herself at an Q, of 6.1. This would leave the energy requirement of the nestlings entirely up to the male, elevating his q),, from 10.1, as calculated above, to 11.8. While this is a rather substantial change in nHf (1.7 units), the time required to satisfy his own energy requirements at this higher nKf is 2.35 hours, just 0.39 hours less time than in the first case. It is difficult to know what a change of 1.7 qRf units means in terms of how the quality of the food source must change to allow it, but because of its position on the nHf curve (Fig. 13B) it may represent something that is ecologically impossible. On the other hand kO.39 hours of foraging time is insignificant to the bird in terms of
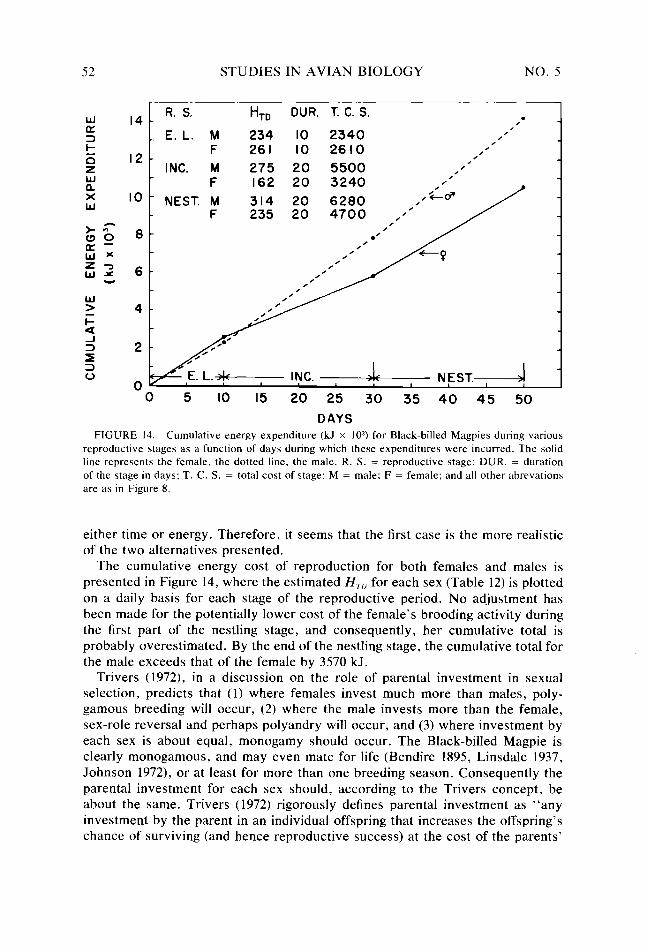
52 STUDIES IN AVIAN BIOLOGY NO. 5
z 14 -
R. S. H TD DUR. T. C. S. ,.
_ E. L. M 234 IO 2340 /’
2 /
F 261 IO 2610 /’ i5 I2 - /’ I
;
INC. M 275 20 5500 / I
X w
y
5
5 I
s ,E. L.w IYC. 6
0 5 IO I5 20 25 30 35 40 45 50
DAYS FIGURE 14. Cumulative energy expenditure (kJ x 10”) for Black-billed Magpies during various
reproductive stages as a function of days during which these expenditures were incurred. The solid line represents the female, the dotted line, the male. R. S. = reproductive stage; DUR. = duration of the stage in days: T. C. S. = total cost of stage: M = male; F = female: and all other abrevations are as in Figure 8.
either time or energy. Therefore, it seems that the first case is the more realistic of the two alternatives presented.
The cumulative energy cost of reproduction for both females and males is presented in Figure 14, where the estimated H,.,, for each sex (Table 12) is plotted on a daily basis for each stage of the reproductive period. No adjustment has been made for the potentially lower cost of the female’s brooding activity during the first part of the nestling stage, and consequently, her cumulative total is probably overestimated. By the end of the nestling stage, the cumulative total for the male exceeds that of the female by 3570 kJ.
Trivers (1972), in a discussion on the role of parental investment in sexual selection, predicts that (I) where females invest much more than males, poly- gamous breeding will occur, (2) where the male invests more than the female, sex-role reversal and perhaps polyandry will occur, and (3) where investment by each sex is about equal, monogamy should occur. The Black-billed Magpie is clearly monogamous, and may even mate for life (Bendire 1895, Linsdale 1937, Johnson 1972), or at least for more than one breeding season. Consequently the parental investment for each sex should, according to the Trivers concept, be about the same. Trivers (1972) rigorously defines parental investment as “any investment by the parent in an individual offspring that increases the offspring’s chance of surviving (and hence reproductive success) at the cost of the parents’
ENERGY EXPENDITURE BY THE BLACK-BILLED MAGPIE 53
ability to invest in other offspring.” He places further limits on the definition by stating that parental investment can include metabolic investment in the primary sex cells, and any investment that benefits the young (feeding, guarding, etc.), but not in finding a member of the opposite sex, or subduing a member of one’s own sex to obtain a member of the opposite sex. And he concludes, “Energy investment may be a good approximation of parental investment, but it is clearly sometimes a poor one. An individual defending its brood from a predator may expend little energy in the process, but suffers a high chance of mortality; such behavior should be measured as a large investment, not a small one as suggested by the energy involved.”
In the case of the Black-billed Magpie, while the male expends more energy in raising the young, the female cares for and incubates the eggs, broods, and gives other forms of attention to the young, and is the more aggressive and the leader of the pair in defense of the nest from both predators and other magpies. So even though the total energetic cost of the female’s activities is lower than the male’s, they require considerable fidelity in their execution; therefore, their importance in terms of parental investment must be measured, as Trivers (1972) suggests, in other than energetic terms. From this point of view, the relative investments of the two sexes may not be so different, but cannot be rigorously compared until all investment costs have been expressed in a common set of units.
M&.-Molt in the magpie is sequential through the flight feathers, and requires about 77 days. By extending the molt over a long period of time, each day’s energy increment is much less than if it were performed simultaneously over a shorter time (King 1974, Ricklefs 1974, Chilgren 1975). Various investigations have shown that the total daily intake of food during the molt may be the same as in a nonmolting bird (Davis 1955), or only slightly increased (West 1960, 1968; Blackmore 1969; Chilgren 1975). Thus, even if each day’s increment of cost is small, the fact that food intake increases only slightly, if at all, suggests a com- pensatory shift in the partitioning of energy expenditure (King 1974).
Energy for growing new feathers appeared to come primarily from feeding on the abundance of grasshoppers present during the molt. Flight times were very low (indicating that the grasshoppers were ubiquitous and could be exploited with a minimum of flying) and the greatest expenditures of time and energy were on Ground Bouts, followed closely by rest perching during Bush Bouts (Tables 9 and 11; Figs. 9 and 11). The Q,.‘s calculated for these months (3.23 to 3.77; Fig. 13A) were the lowest for the year. Food-storing behavior was not observed, so the times associated with Ground Bouts must represent time required to exploit the grasshoppers. The low qHf s and long foraging times also indicate that the rate of energy intake was low as a result either of the low energy content of each grasshopper and/or of the low rate of capture.
July and August had mostly clear days (Fig. 2) with ground level T,,‘s exceeding T,, during midday (Fig. 4; Mugaas 1976). Foraging, therefore, was mostly restrict- ed to the cooler morning and late afternoon periods, with rest perching occupying most of the midday. Molt of the body feathers, with its accompanying exposure of patches of skin, probably reduced the insulative value of the plumage, but the warm temperatures, particularly in July and August when body molt was heaviest,
54 STUDIES IN AVIAN BIOLOGY NO. 5
would have eliminated or at least minimized any thermoregulatory demand. Thus, it was estimated that molt was accomplished with H7.,,‘s of only 1.70, 1.61, and 1.69 x H,,!, for July, August, and September, respectively (Table 11).
The August H,.,, is a composite of data gathered during the first half of that month, which corresponds to the period of heaviest body molt. It was at this time that energy expended on activity was lowest (Fig. 11). This suggests that there was a steady decrease in activity from the onset to the heaviest phase of the body molt, followed by a steady increase in activity to the end. This is similar to the activity pattern observed during the postnuptial molt in captive White-crowned Sparrows, Zonotrichirc leucophrys gcrmhelii (Chilgren 1975). The eastern White- crowned Sparrow, Zonotrichim leucophrys leucophrys, the White-throated Spar- row, Zonotrichirr crlhicollis, and the Slate-colored Junco, Junco hyemalis hye- malis, have also shown a decrease in locomotor activity in cages during molt (Eyster 1954). Field data from several other species indicate that inactivity during molt is not uncommon (Blanchard 1941, Davis 1945, F. S. L. Williamson 1956, K. Williamson 1957, Zimmerman 1965, Newton 1966, Dolnik and Blyumenthal 1967, Penny 1967, Mewaldt et al. 1968, Haukioja 1971) but this is the first study that describes the behavior associated with this inactivity in more than a quali- tative way.
Since the caloric value of typical food items, and the rate of capture and intake were not measured, it is not possible to determine whether or not the total daily food intake of these magpies was increased during the molt. The decrease in activity, however, indicates that the total energy intake could have remained the same throughout the molt and still allowed the bird to maintain its energy balance.
Nonproductive period.-During October, November, and December there were no productive demands on the birds, but the length of the diurnal period was progressively shortening (Figs. 8 and 9), constraining the time available for obtaining energy. As daylength decreased, flight time increased and the tempo of the birds’ diurnal activity showed a steady increase from October through De- cember (Figs. 10 and 11). The diurnal activity pattern at this time included flying relatively long distances from place to place, and then spending a short period of time on the ground before flying again. Flying, therefore, became the most ex- pensive diurnal activity (Table ll), but it allowed the birds to exploit widely scattered patchy food sources. Under these conditions the intensity of activity increased as less and less time was available each day for either visiting known food patches or exploring the wintering area for new ones.
This pattern of activity was energetically expensive (Fig. 10) and produced high H7.,,‘s (Fig. 11) but the food patches obviously held large, high-quality food items that supported this energy demand with a minimum of foraging time. The birds were often observed finding large food items, feeding on them awhile, and then storing whatever remained before moving on. The source of all these large items is not known, but at least some of them came from carrion (hawk or owl kills, road kills, and butchering activities around the animal pens), commercial dog and cat food, and vegetable matter left in gardens (potatoes, pumpkins, squash, to- matoes, and mushrooms softened after the first frosts appeared to be favorites) that the birds themselves stored around the area. Food hiding by European Mag- pies, Pica pica, has been described by Hayman (1958), Butlin (1971), and Henty (1975) and is a trait also common to other corvids. (For a review, see Turcek and
ENERGY EXPENDITURE BY THE BLACK-BILLED MAGPIE 5.5
Kelso 1968; also more recently Salfeld 1969, Balda and Bock 1971.) But for the Black-billed Magpie, it would be interesting to know (1) how much time each day was spent checking foods already hidden, (2) how much stored as opposed to newly found food was eaten each day, (3) how much of the food stored by an individual was actually reclaimed by that individual, and (4) how much of the food stored by one individual was found by others. This aspect of the magpie’s winter behavior and ecology merits further study.
Since some of the foraging time (Ground Bouts) involved food storing, qKf’s calculated using the total time spent on Ground Bouts to estimate H,, (5.28, 5.19, and 5.99; Fig. 13B) are lower than if only the time involved in finding and swal- lowing food were used in making the calculations. The very short amounts of time (4-5 hours; Fig. 9) spent on Grount Bouts indicates that the food items being swallowed allowed for a rapid rate of energy intake. Consequently, it may not be far wrong to assume that the -Q~, exclusive of food storage time, was about the same as that calculated for the egg-laying female, or the nestling-stage adults (10. I and 10.5; Fig. 13A). Using this assumption, and the lower of the two possible vRs’s (10.1) in solving Eq. 12 for rf, it is possible to estimate that finding and swallowing required 2.36, 2.59, and 2.58 hours, while finding and storing occupied 2.15, 2.45, and 1.78 hours of the total Ground Bout time for October, November, and December, respectively.
During this three-month interval the time devoted to Ground Bouts remained fairly constant (4-5 hours), while time allocated to flight increased and that de- voted to Bush and FTPR Bouts decreased. This behavior preserved ground for- aging time in the face of a steadily decreasing number of daylight hours. The allocation of more time to Air Bouts, even though time spent on Ground Bouts was stable could imply: (1) the frequency of visits to each food patch was in- creased, (2) less time was spent on old patches and more on searching new areas (perhaps looking for new food items to store on known food patches), or (3) the number of food patches utilized increased. Since the time spent on Bush and FTPR Bouts did decrease directly with the decrease in the number of daylight hours (Fig. 9) it may be fair to speculate that they represent a reserve of time that could be allocated to additional flying and/or foraging if needed, as predicted by the “principle of stringency” (Wilson 1975).
Recapitulations.-An organism’s food and feeding habits have a primary influ- ence on the type of activity it will perform (Linsdale 1937). The foraging behavior of the Black-billed Magpie appeared to be regulated by the size and distribution of the food items being utilized. A general qualitative summary of these obser- vations is given in Table 17. Ground time in the table refers specifically to that required by an individual to satisfy its own energy requirement, and is related to the size of the items being utilized. Large food items provided for a high rate of energy intake and a rapid satisfaction of individual energy demands, while use of small items yielded a low rate of energy intake and required a prolonged foraging time to balance the energy equation. Table 17 shows that the time spent on flight is related to the pattern of food distribution (ubiquitous, concentrated in a single patch, or concentrated in several widespread patches) and to behavioral demands (incubation and nestling stages in particular). Except in the case of egg-laying females, the annual variation in H,.,, (Fig. 11) was due primarily to small changes in the time spent in flight (total variation observed was less than two hours),
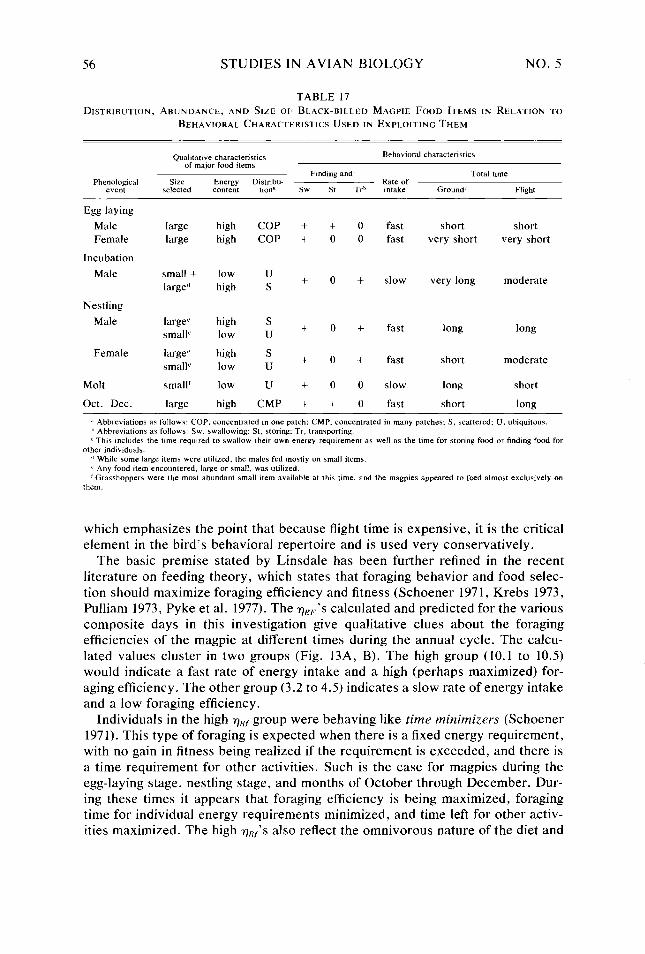
56 STUDIES IN AVIAN BIOLOGY NO. 5
TABLE 17 DISTRIBUTION, ABUNDANCE, AND SIZE OF BLACK-BILLED MAGPIE FOOD ITEMS IN RELATION TO
BEHAVIORAL CHARACTERISTICS USED IN EXPLOITING THEM
Phenological event
Qualitative characteristics of mayor food items
~ FInding and: Size Energy Distribu-
selected content tion” SW St Tr”
Behavioral characteristics
Total t,me Rate of intake Ground’ Flight
Egg laying
Male Female
Incubation
Male
Nestling
Male
Female
Molt
Oct.-Dec.
large large
small + large”
large’ small*’
large” small”
small’
large
high high
low high
high low
high low
low
high
COP + COP +
U s +
S u + S u + u +
CMP +
0 fast short short 0 fast very short very short
+ slow very long moderate
+ fast long long
+ fast short moderate
0 slow long short
0 fast short long
i Abbreviations as follows. COP, concentrated m one patch: CMP, concentrated in many patches: S. scattered: U, ubiquitous.
D Abbrewations as follows, SW. swallowing: St, storing: Tr, transporting.
c This mcludes the time required to swallow their own energy requirement as well as the time for storing food or tindmg food for
other individuals.
‘I While some large items were utilized, the males fed mostly on wnall items.
c Any food item encountered, large or small. was utillred.
f Grasshoppers were the most abundant small item available at this lime, and the magpies appeared to feed almost exclusively on
them.
which emphasizes the point that because flight time is expensive, it is the critical element in the bird’s behavioral repertoire and is used very conservatively.
The basic premise stated by Linsdale has been further refined in the recent literature on feeding theory, which states that foraging behavior and food selec- tion should maximize foraging efficiency and fitness (Schoener 1971, Krebs 1973, Pulliam 1973, Pyke et al. 1977). The Q~‘S calculated and predicted for the various composite days in this investigation give qualitative clues about the foraging efficiencies of the magpie at different times during the annual cycle. The calcu- lated values cluster in two groups (Fig. 13A, B). The high group (10.1 to 10.5) would indicate a fast rate of energy intake and a high (perhaps maximized) for- aging efficiency. The other group (3.2 to 4.5) indicates a slow rate of energy intake and a low foraging efficiency.
Individuals in the high nKr group were behaving like time minimizers (Schoener 1971). This type of foraging is expected when there is a fixed energy requirement, with no gain in fitness being realized if the requirement is exceeded, and there is a time requirement for other activities. Such is the case for magpies during the egg-laying stage, nestling stage, and months of October through December. Dur- ing these times it appears that foraging efficiency is being maximized, foraging time for individual energy requirements minimized, and time left for other activ- ities maximized. The high qnf’s also reflect the omnivorous nature of the diet and
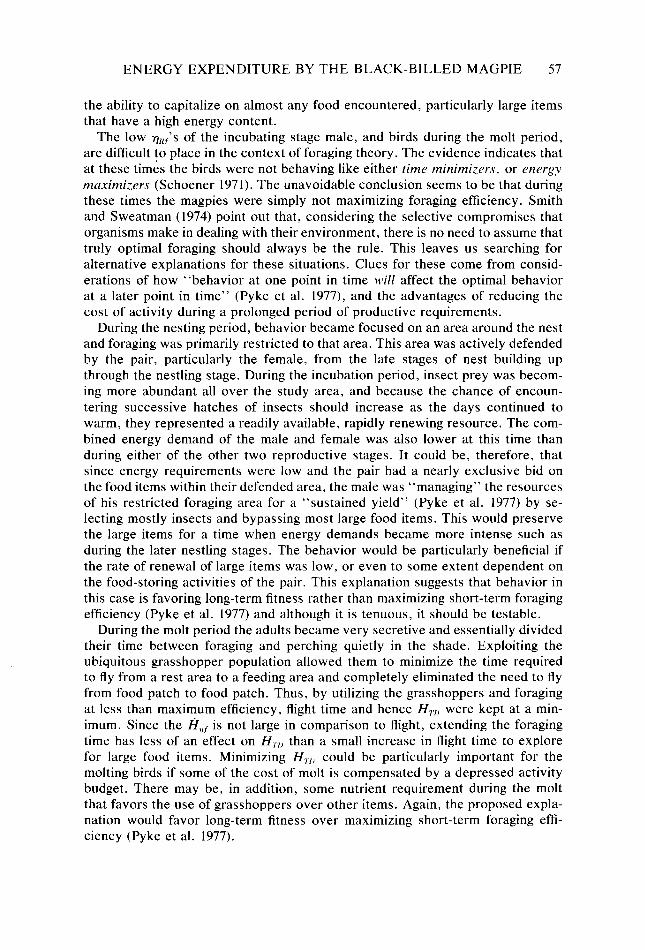
ENERGY EXPENDITURE BY THE BLACK-BILLED MAGPIE 57
the ability to capitalize on almost any food encountered, particularly large items that have a high energy content.
The low qKf’s of the incubating stage male, and birds during the molt period, are difficult to place in the context of foraging theory. The evidence indicates that at these times the birds were not behaving like either time minimizers, or energy
maximizers (Schoener 1971). The unavoidable conclusion seems to be that during these times the magpies were simply not maximizing foraging efficiency. Smith and Sweatman (1974) point out that, considering the selective compromises that organisms make in dealing with their environment, there is no need to assume that truly optimal foraging should always be the rule. This leaves us searching for alternative explanations for these situations. Clues for these come from consid- erations of how “behavior at one point in time will affect the optimal behavior at a later point in time” (Pyke et al. 1977), and the advantages of reducing the cost of activity during a prolonged period of productive requirements.
During the nesting period, behavior became focused on an area around the nest and foraging was primarily restricted to that area. This area was actively defended by the pair, particularly the female, from the late stages of nest building up through the nestling stage. During the incubation period, insect prey was becom- ing more abundant all over the study area, and because the chance of encoun- tering successive hatches of insects should increase as the days continued to warm, they represented a readily available, rapidly renewing resource. The com- bined energy demand of the male and female was also lower at this time than during either of the other two reproductive stages. It could be, therefore, that since energy requirements were low and the pair had a nearly exclusive bid on the food items within their defended area, the male was “managing” the resources of his restricted foraging area for a “sustained yield” (Pyke et al. 1977) by se- lecting mostly insects and bypassing most large food items. This would preserve the large items for a time when energy demands became more intense such as during the later nestling stages. The behavior would be particularly beneficial if the rate of renewal of large items was low, or even to some extent dependent on the food-storing activities of the pair. This explanation suggests that behavior in this case is favoring long-term fitness rather than maximizing short-term foraging efficiency (Pyke et al. 1977) and although it is tenuous, it should be testable.
During the molt period the adults became very secretive and essentially divided their time between foraging and perching quietly in the shade. Exploiting the ubiquitous grasshopper population allowed them to minimize the time required to fly from a rest area to a feeding area and completely eliminated the need to fly from food patch to food patch. Thus, by utilizing the grasshoppers and foraging at less than maximum efficiency, flight time and hence HT,, were kept at a min- imum. Since the filLf is not large in comparison to flight, extending the foraging time has less of an effect on H,,.,, than a small increase in flight time to explore for large food items. Minimizing H,,,, could be particularly important for the molting birds if some of the cost of molt is compensated by a depressed activity budget. There may be, in addition, some nutrient requirement during the molt that favors the use of grasshoppers over other items. Again, the proposed expla- nation would favor long-term fitness over maximizing short-term foraging effi- ciency (Pyke et al. 1977).
58 STUDIES IN AVIAN BIOLOGY NO. 5
MINIMIZING H7,,, THROUGH ADAPTIVE USE OF TIME AND ENERGY
Many variables contribute to H,.,, (Table 2) but they can all be placed into one of two adaptive sets. Variables such as basal metabolism, thermoregulation, and production represent physiological adaptations, that when viewed collectively comprise one set. Because an individual cannot directly control the time and energy requirements of the variables within this set, it may be regarded as the obligatory component of H,,,,. Behavioral adaptations comprise the second set. The time and energy requirements associated with this set can be manipulated behaviorally by the individual. Therefore, the set may be regarded as the facul- tative component of H,.,,. In their simplest form, the variables that make up this set can be reduced to the activities performed within each Bout, and their energy requirement amounts to the per-hour cost of behavior.
Since some form of behavior is ultimately involved in obtaining the energy required by the variables in the physiological set, it exerts a driving force on the behavioral set. The degree of flexibility in the behavioral manipulation of time and energy resources, and hence the energetic cost of the behavior, will depend on (I) how stereotyped the behavior pattern may be, and (2) the availability of suitable environmental resources. Therefore, H,,,, has some fixed minimal re- quirement associated with it that will be determined by the variables in the phys- iological set, and a realized value whose magnitude will be determined by the per- hour cost of activity. The adaptive use of time and energy should allow the animal to integrate its physiological capabilities behaviorally with the biotic and abiotic components of the environment in such a way that, given a particular phenological circumstance, H,.,, will be kept as low as possible.
Data for the magpie support this concept. As demands on the resources of time and energy changed during the year so did the cost of activity and the thrust of the birds’ behavior (Fig. 1 I). The data for any one composite day imply that these demands were met with the lowest possible H,.,, and that behavioral adjustments were primarily responsible for accomplishing this. These adjustments are sum- marized below, and their effectiveness was undoubtedly enhanced by the tem- poral separation of reproduction and molt. (1) Magpies demonstrated the tenden- cy to minimize energy expenditure via the conservation of movement (a habit that is probably common to the entire animal kingdom). Hence, with the excep- tion of Air Bouts, the most time and energy within the various Bouts was allocated to the least expensive activities (Tables 9, 10, and 12). (2) We estimated that the activity having the greatest impact on H.,.,, was flight. Regardless of changes occurring within or between other Bouts, it was the small amounts of time added to or subtracted from Air Bouts that markedly influenced the per-hour cost of activity and H7.,,. By restricting flight time to that which just accomplished the required behavior, H,.,, was held to a minimum. (3) During productive periods (egg laying and molt), nonproductive costs were minimized, primarily by keeping the rate of activity down. (4) The Ij,,, was low and fairly stable throughout the year so that any one day’s HTf was a function of the time spent on the ground finding and swallowing food. The time required to find and swallow the required food in turn was determined by the characteristics of the food resource being utilized. Consequently, Q(~ varied during the year, but always in such a way that long-term fitness seemed to be enhanced. The role that food-storing plays in the overall foraging effort needs to be clarified. (5) Maintaining a territory only during
ENERGY EXPENDITURE BY THE BLACK-BILLED MAGPIE 59
the reproductive period minimized that responsibility. In addition, territorial dis- putes were infrequent and brief when they did occur. Pursuit flights were kept to a minimum and much of the disagreement was settled by posturing and calling. (6) Selecting a winter roost that minimized convective and radiative heat loss, and avoiding long exposure to T,, > T,,,. during the summer, both operated to minimize thermoregulatory demands.
It is, therefore, our prediction that, in general, selection should operate to minimize H,,, by minimizing the time-related cost of the variables associated with each adaptive set (integrating the magnitude of the daily energy cost and gross efficiency as it relates to the duration of a process), and that those individuals (or populations) that can realize a given benefit with an H,.,, that is lower than that of their competitors will have a selective advantage. Theoretically this view is supported by the concept of exploitation efficiency (Fisher 1930, Emlen 1978) which as a generalized expression can be written as
qs = BJC, (13)
where Q is exploitation efficiency, B,. is the total of all the possible benefits attained in a given time interval, and C,. is the total of all the costs incurred in that same interval. Some of the benefits and some of the costs can be compared directly using energy as a common currency (energy gains:production::cost of activity:cost of production) but others cannot because their value cannot be gauged only in terms of energy (reproductive success, social position, predator defense, mineral and fluid balance, etc.). Since H,.,, includes all the costs that can be evaluated using energy as a currency, it represents a prominent component in the denominator of Eq. 13, and should exert considerable influence on qe. The relationship between Q,. and HT,) is inverse so that one can predict that for any given phenological event vE will be enhanced if H,,.,, can be kept at a minimum.
COMPARISON OF TIME-BUDGETS OF BLACK-BILLED AND
YELLOW-BILLED MAGPIES
Mating systems. territoriality (defined for both species of magpie as an area around the nest defended against conspecifics), courtship and copulation, nest structure and location, clutch size, incubation, fledging success, flocking, and roosting have been described for the Black-billed Magpie in North America by several authors (Dice 1917; Kalmbach 1927; Linsdale 1937, 1946a: Evenden 1947; Owen 1956; Brown 1957; Jones 1960; O’Halloran 1961; Erpino 1968; Johnson 1972) and for the Yellow-billed Magpie by Linsdale (1937, 1946b), and Verbeek (1970, 1972a, 1972b, 1973). Linsdale (1937, 1946a, 1946b), and, to a greater extent, Verbeek (1970, 1973) have compared the natural histories of these species, and now it is possible also to compare their time budgets. Verbeek (1972a) described the Yellow-billed Magpie’s behavior in terms of traditional categories (feeding, resting, preening, bathing, building, flying, incubating, egg laying, brooding, ter- ritory defense, drinking, and storing acorns), and presented the data as the per- cent of the daylight period spent on each behavior in central California. Conse- quently, the data are not quantitatively comparable with those of this investigation, but some qualitatively important differences and similarities are itemized below.
By mid-September, molt was essentially completed in both species, and it is at this time that Yellow-billed Magpies, but not Black-billed Magpies, increase
60 STUDIES IN AVIAN BIOLOGY NO. 5
the time spent defending their nesting territories (Verbeek 1972a, 1973). The Yellow-billed Magpie defends a breeding territory throughout the year, but most intensely during the fall, winter, and spring. The Black-billed Magpie defends a similar territory but only from about mid-nestbuilding through the nestling stage.
Verbeek (1972a, 1973) reports that the female Yellow-billed Magpie spends most of her time in feeding activity during egg laying (68% of the daylight period) and that the increased food intake supported the cost of egg production. The female Black-billed Magpie spends most of her time during egg laying in Bush Bouts and little on the ground feeding (Table IO). The difference in female patterns between these species is probably related to the type of food being utilized in each place. The Black-billed Magpie’s food resources at this time are large items while the Yellow-billed Magpie’s food, by contrast, is an invertebrate fauna (pri- marily insects) that just starts to increase at the onset of egg production (Verbeek 1973). Although this must represent an abundant, ubiquitous food source, each item would be small and contain less energy than the large items used by the Black-billed Magpie. Consequently, the Yellow-billed Magpie would have to spend more time feeding to acquire the extra energy needed for egg production.
Females of both species devoted little time to flying during egg laying (Verbeek 1972a; Table lo), indicating that there is a common behavioral mechanism op- erating to decrease the cost of activity during egg production. Even though the female Yellow-billed Magpie spent a larger amount of time on the ground feeding, and may have expended more energy in this activity than the female Black-billed Magpie, it is still reasonable to assume that, unless she ran or walked continuously while on the ground, her overall cost of activity and H,.,, should still have been reduced.
During the late nestling stage, the female Black-billed Magpie observed in this study spent most of her time in the nest bush perched near the nest (Table IO), while the male was more wide ranging in his activities and often flew off the nesting territory in search of food. In contrast to this, Verbeek (1973) reports that it is the female Yellow-billed Magpie that is more far ranging and forages off the territory during the nestling stage.
Verbeek’s (1970) investigation indicates that his study population of Yellow- billed Magpies fed primarily on ground-dwelling invertebrates and had a much more restricted diet than we qualitatively observed for the Black-billed Magpie. The milder climate associated with the Yellow-billed Magpie’s distribution would make invertebrates, especially insects, abundant over longer periods of time, and the birds in California obviously take advantage of this. Kalmbach (1927) also reported a greater use of invertebrates (especially insects) by the Yellow-billed than the Black-billed Magpie. While the above comparisons suggest the Yellow- billed Magpie may be more of a food specialist than the Black-billed Magpie, the data are too limited to establish this point. More comparative work needs to be done on the food habits of these two species, particularly with respect to how they may be responsible for interspecific differences in time and energy budgeting.
COMPARISONS OF H,.,, FOR SEVERAL SPECIES OF BIRDS AND THE TECHNIQUES USED IN ESTIMATING THEM
The cost of existence has been estimated for a number of species of birds by a variety of techniques, and these have been reviewed by Utter (1971), Gessaman
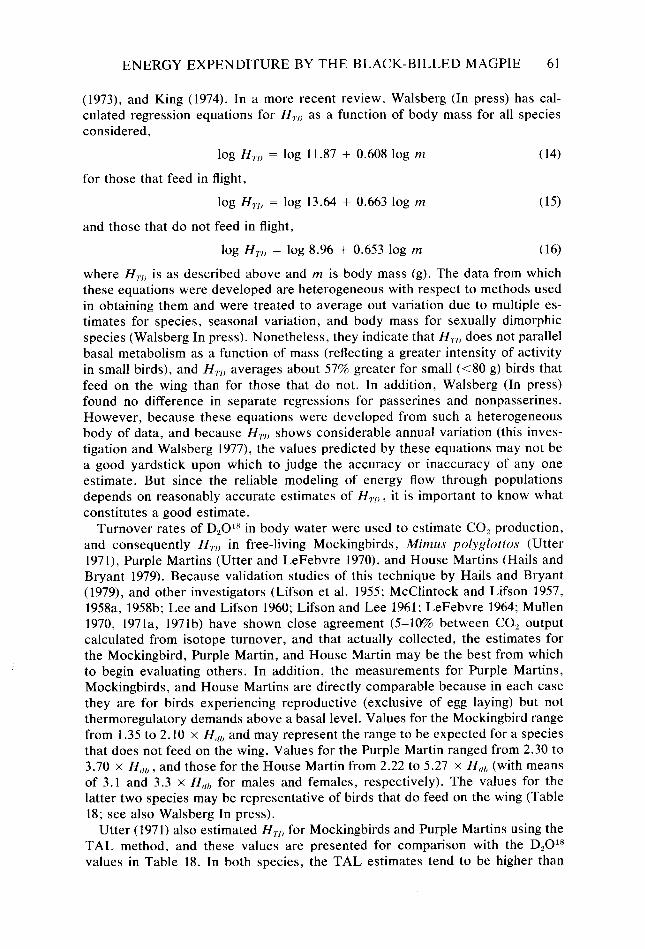
ENERGY EXPENDITURE BY THE BLACK-BILLED MAGPIE 61
(1973), and King (1974). In a more recent review, Walsberg (In press) has cal- culated regression equations for HT,) as a function of body mass for all species considered,
log Hr,, = log 11.87 + 0.608 log m
for those that feed in flight,
(14)
log H,,, = log 13.64 + 0.663 log m
and those that do not feed in flight,
(13
log HT,, = log 8.96 + 0.653 log m (16)
where HT,, is as described above and m is body mass (g). The data from which these equations were developed are heterogeneous with respect to methods used in obtaining them and were treated to average out variation due to multiple es- timates for species, seasonal variation, and body mass for sexually dimorphic species (Walsberg In press). Nonetheless, they indicate that H,,,, does not parallel basal metabolism as a function of mass (reflecting a greater intensity of activity in small birds), and HT,) averages about 57% greater for small (~80 g) birds that feed on the wing than for those that do not. In addition, Walsberg (In press) found no difference in separate regressions for passerines and nonpasserines. However, because these equations were developed from such a heterogeneous body of data, and because HT,, shows considerable annual variation (this inves- tigation and Walsberg 1977), the values predicted by these equations may not be a good yardstick upon which to judge the accuracy or inaccuracy of any one estimate. But since the reliable modeling of energy flow through populations depends on reasonably accurate estimates of H,.,, , it is important to know what constitutes a good estimate.
Turnover rates of D,OIX in body water were used to estimate CO, production, and consequently HT,, in free-living Mockingbirds, Mimus polyglottos (Utter 1971), Purple Martins (Utter and LeFebvre 1970), and House Martins (Hails and Bryant 1979). Because validation studies of this technique by Hails and Bryant (1979), and other investigators (Lifson et al. 1955; McClintock and Lifson 1957, 1958a, 1958b; Lee and Lifson 1960; Lifson and Lee 1961; LeFebvre 1964; Mullen 1970, 1971a, 1971b) have shown close agreement (5-10% between CO, output calculated from isotope turnover, and that actually collected, the estimates for the Mockingbird, Purple Martin, and House Martin may be the best from which to begin evaluating others. In addition, the measurements for Purple Martins, Mockingbirds, and House Martins are directly comparable because in each case they are for birds experiencing reproductive (exclusive of egg laying) but not thermoregulatory demands above a basal level. Values for the Mockingbird range from 1.35 to 2.10 x H,,?, and may represent the range to be expected for a species that does not feed on the wing. Values for the Purple Martin ranged from 2.30 to 3.70 x H,,,, , and those for the House Martin from 2.22 to 5.27 x HIlh (with means of 3.1 and 3.3 x H,,,, for males and females, respectively). The values for the latter two species may be representative of birds that do feed on the wing (Table 18; see also Walsberg In press).
Utter (1971) also estimated H,, for Mockingbirds and Purple Martins using the TAL method, and these values are presented for comparison with the D,Ol* values in Table 18. In both species, the TAL estimates tend to be higher than
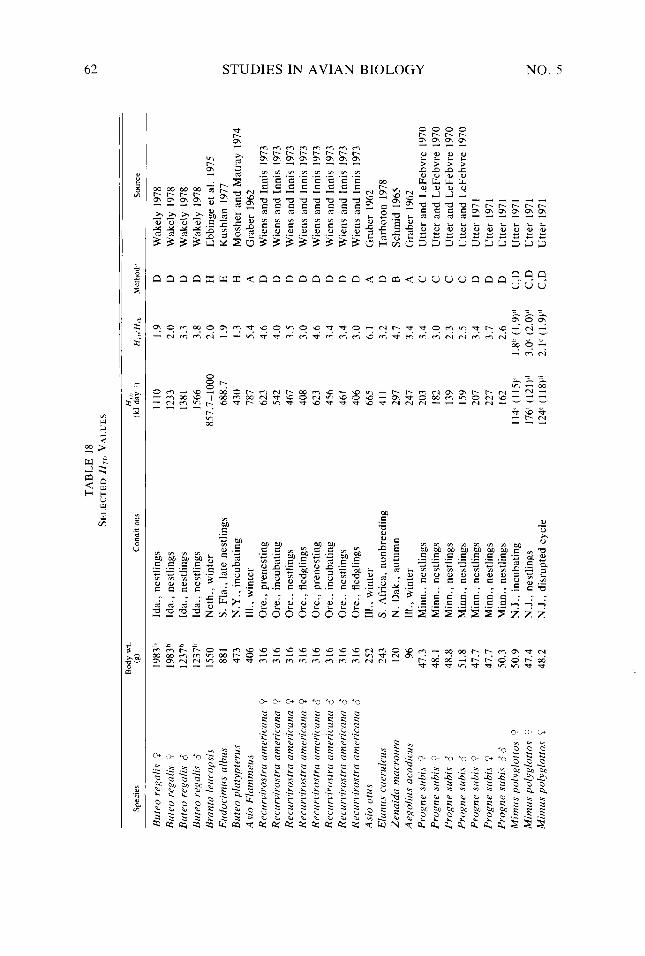
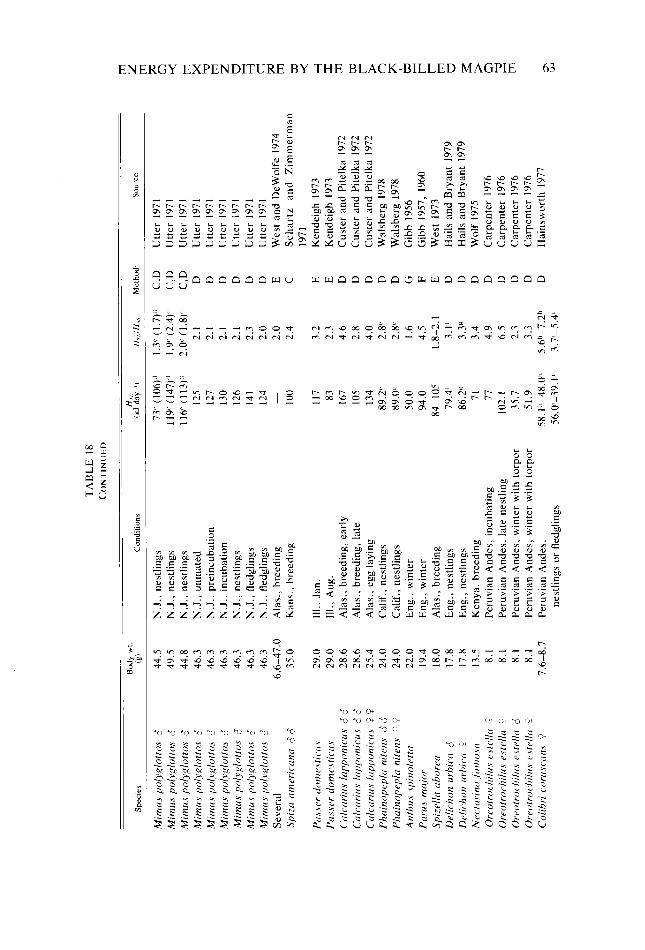
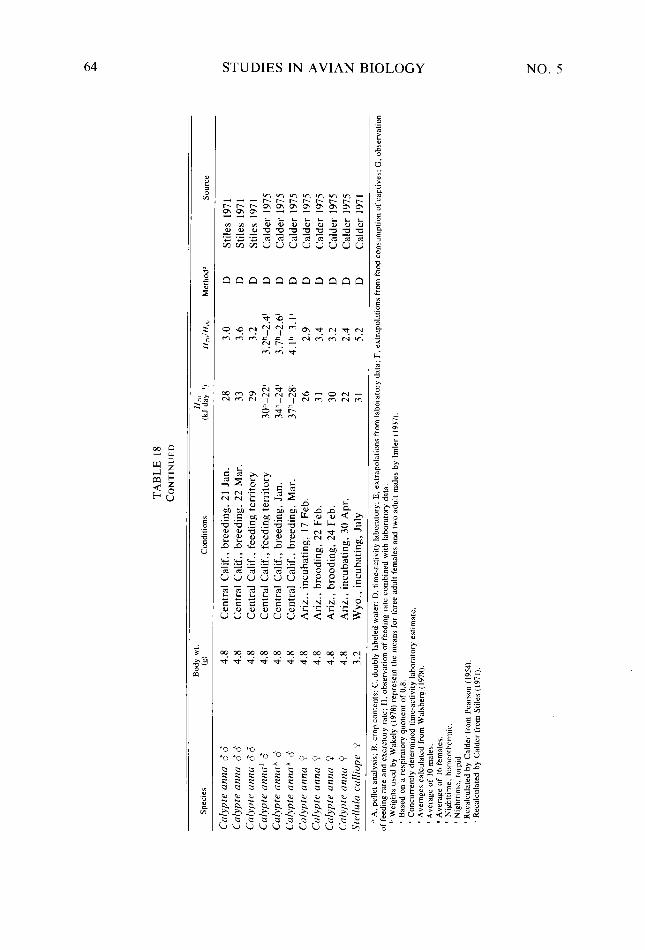
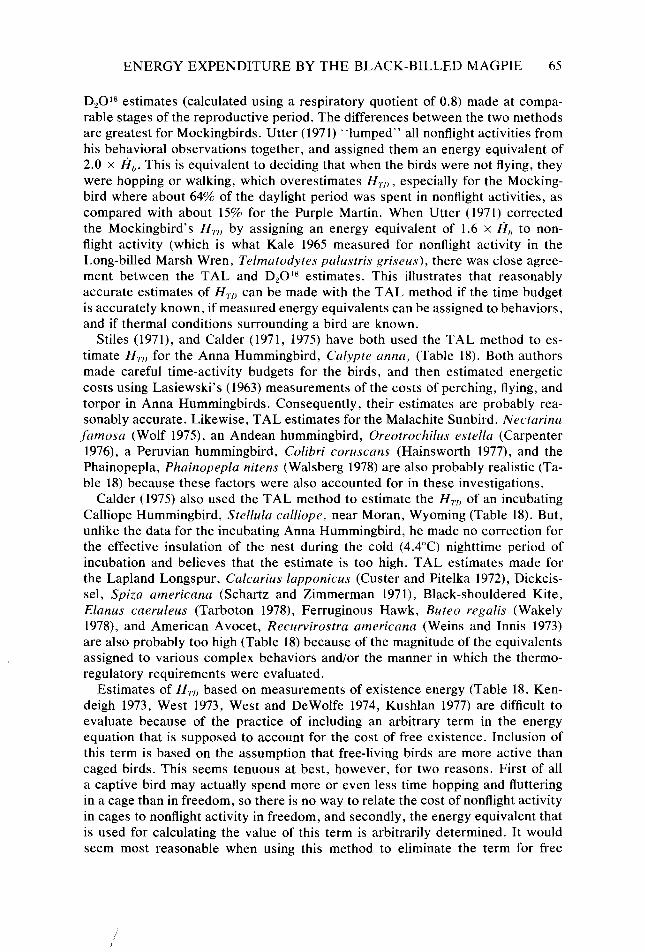
ENERGY EXPENDITURE BY THE BLACK-BILLED MAGPIE 65
D,018 estimates (calculated using a respiratory quotient of 0.8) made at compa- rable stages of the reproductive period. The differences between the two methods are greatest for Mockingbirds. Utter (1971) “lumped” all nonflight activities from his behavioral observations together, and assigned them an energy equivalent of 2.0 x 8,. This is equivalent to deciding that when the birds were not flying, they were hopping or walking, which overestimates H r,), especially for the Mocking- bird where about 64% of the daylight period was spent in nonflight activities, as compared with about 15% for the Purple Martin. When Utter (1971) corrected the Mockingbird’s H,,.,, by assigning an energy equivalent of 1.6 x fi, to non- flight activity (which is what Kale 1965 measured for nonflight activity in the Long-billed Marsh Wren, Telmatodytes palustris griseus), there was close agree- ment between the TAL and D,018 estimates. This illustrates that reasonably accurate estimates of HYl, can be made with the TAL method if the time budget is accurately known, if measured energy equivalents can be assigned to behaviors, and if thermal conditions surrounding a bird are known.
Stiles (1971), and Calder (1971, 1975) have both used the TAL method to es- timate Hr,, for the Anna Hummingbird, Calypte anna, (Table 18). Both authors made careful time-activity budgets for the birds, and then estimated energetic costs using Lasiewski’s (1963) measurements of the costs of perching, flying, and torpor in Anna Hummingbirds. Consequently, their estimates are probably rea- sonably accurate. Likewise, TAL estimates for the Malachite Sunbird, Nectarina
famosa (Wolf 1975), an Andean hummingbird, Oreotrochifus estefla (Carpenter 1976), a Peruvian hummingbird, Colibri coruscans (Hainsworth 1977), and the Phainopepla, Phainopepla nitens (Walsberg 1978) are also probably realistic (Ta- ble 18) because these factors were also accounted for in these investigations.
Calder (1975) also used the TAL method to estimate the HT,, of an incubating Calliope Hummingbird, Stellula calliope, near Moran, Wyoming (Table 18). But, unlike the data for the incubating Anna Hummingbird, he made no correction for the effective insulation of the nest during the cold (4.4”C) nighttime period of incubation and believes that the estimate is too high. TAL estimates made for the Lapland Longspur, Calcurius lapponicus (Custer and Pitelka 1972), Dickcis- sel, Spiza americana (Schartz and Zimmerman 1971), Black-shouldered Kite, Elanus caeruleus (Tarboton 1978), Ferruginous Hawk, Buteo regalis (Wakely 1978), and American Avocet, Recurvirostra americana (Weins and Innis 1973) are also probably too high (Table 18) because of the magnitude of the equivalents assigned to various complex behaviors and/or the manner in which the thermo- regulatory requirements were evaluated.
Estimates of HT,, based on measurements of existence energy (Table 18, Ken- deigh 1973, West 1973, West and DeWolfe 1974, Kushlan 1977) are difficult to evaluate because of the practice of including an arbitrary term in the energy equation that is supposed to account for the cost of free existence. Inclusion of this term is based on the assumption that free-living birds are more active than caged birds. This seems tenuous at best, however, for two reasons. First of all a captive bird may actually spend more or even less time hopping and fluttering in a cage than in freedom, so there is no way to relate the cost of nonflight activity in cages to nonflight activity in freedom, and secondly, the energy equivalent that is used for calculating the value of this term is arbitrarily determined. It would seem most reasonable when using this method to eliminate the term for free
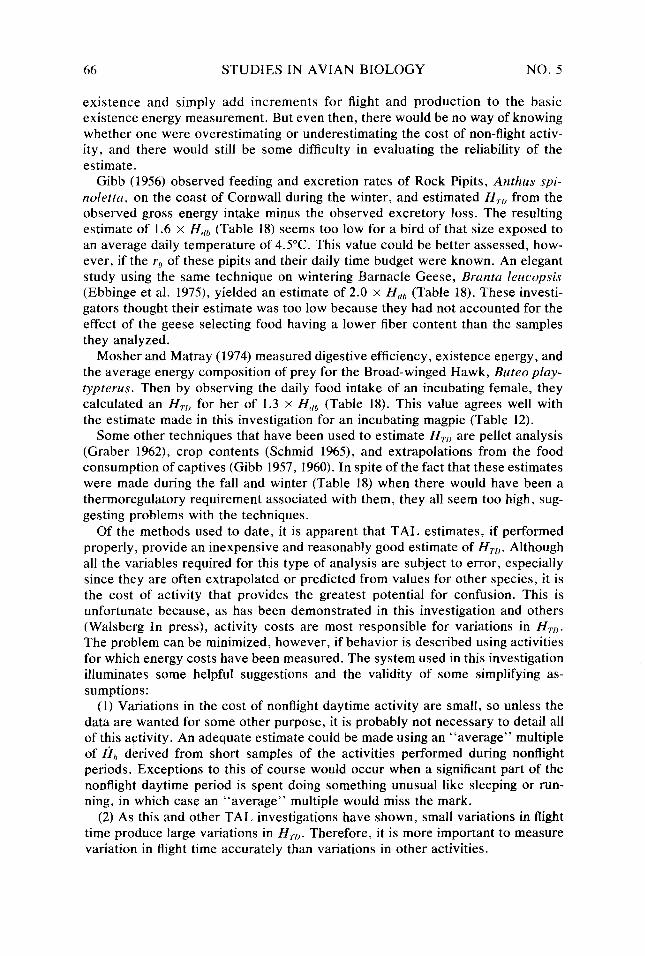
66 STUDIES IN AVIAN BIOLOGY NO. 5
existence and simply add increments for flight and production to the basic existence energy measurement. But even then, there would be no way of knowing whether one were overestimating or underestimating the cost of non-flight activ- ity, and there would still be some difficulty in evaluating the reliability of the estimate.
Gibb (1956) observed feeding and excretion rates of Rock Pipits, Anthus spi- noletta, on the coast of Cornwall during the winter, and estimated H,,) from the observed gross energy intake minus the observed excretory loss. The resulting estimate of 1.6 x H,lb (Table 18) seems too low for a bird of that size exposed to an average daily temperature of 4.5”C. This value could be better assessed, how- ever, if the T?, of these pipits and their daily time budget were known. An elegant study using the same technique on wintering Barnacle Geese, Branta leucopsis (Ebbinge et al. 1975), yielded an estimate of 2.0 x H,l, (Table 18). These investi- gators thought their estimate was too low because they had not accounted for the effect of the geese selecting food having a lower fiber content than the samples they analyzed.
Mosher and Matray (1974) measured digestive efficiency, existence energy, and the average energy composition of prey for the Broad-winged Hawk, Buteo play- typterus. Then by observing the daily food intake of an incubating female, they calculated an H,, for her of 1.3 x H,,* (Table 18). This value agrees well with the estimate made in this investigation for an incubating magpie (Table 12).
Some other techniques that have been used to estimate HTIj are pellet analysis (Graber 1962), crop contents (Schmid 1965), and extrapolations from the food consumption of captives (Gibb 1957, 1960). In spite of the fact that these estimates were made during the fall and winter (Table 18) when there would have been a thermoregulatory requirement associated with them, they all seem too high, sug- gesting problems with the techniques.
Of the methods used to date, it is apparent that TAL estimates, if performed properly, provide an inexpensive and reasonably good estimate of H,. Although all the variables required for this type of analysis are subject to error, especially since they are often extrapolated or predicted from values for other species, it is the cost of activity that provides the greatest potential for confusion. This is unfortunate because, as has been demonstrated in this investigation and others (Walsberg In press), activity costs are most responsible for variations in HTu. The problem can be minimized, however, if behavior is described using activities for which energy costs have been measured. The system used in this investigation illuminates some helpful suggestions and the validity of some simplifying as- sumptions:
(1) Variations in the cost of nonflight daytime activity are small, so unless the data are wanted for some other purpose, it is probably not necessary to detail all of this activity. An adequate estimate could be made using an “average” multiple of fib derived from short samples of the activities performed during nonflight periods. Exceptions to this of course would occur when a significant part of the nonflight daytime period is spent doing something unusual like sleeping or run- ning, in which case an “average” multiple would miss the mark.
(2) As this and other TAL investigations have shown, small variations in flight time produce large variations in HT,,. Therefore, it is more important to measure variation in flight time accurately than variations in other activities.
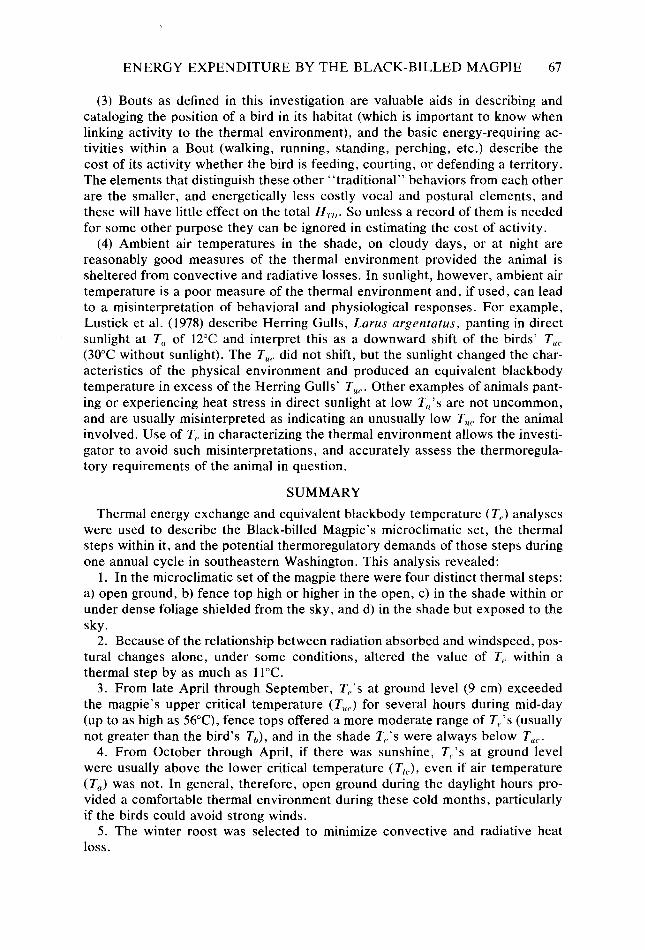
ENERGY EXPENDITURE BY THE BLACK-BILLED MAGPIE 67
(3) Bouts as defined in this investigation are valuable aids in describing and cataloging the position of a bird in its habitat (which is important to know when linking activity to the thermal environment), and the basic energy-requiring ac- tivities within a Bout (walking, running, standing, perching, etc.) describe the cost of its activity whether the bird is feeding, courting, or defending a territory. The elements that distinguish these other “traditional” behaviors from each other are the smaller, and energetically less costly vocal and postural elements, and these will have little effect on the total H,,,. So unless a record of them is needed for some other purpose they can be ignored in estimating the cost of activity.
(4) Ambient air temperatures in the shade, on cloudy days, or at night are reasonably good measures of the thermal environment provided the animal is sheltered from convective and radiative losses. In sunlight, however, ambient air temperature is a poor measure of the thermal environment and, if used, can lead to a misinterpretation of behavioral and physiological responses. For example, Lustick et al. (1978) describe Herring Gulls, Lams argentatus, panting in direct sunlight at T, of 12°C and interpret this as a downward shift of the birds’ T,, (30°C without sunlight). The T,,. did not shift, but the sunlight changed the char- acteristics of the physical environment and produced an equivalent blackbody temperature in excess of the Herring Gulls’ T,,.. Other examples of animals pant- ing or experiencing heat stress in direct sunlight at low T,l’s are not uncommon, and are usually misinterpreted as indicating an unusually low T,, for the animal involved. Use of T, in characterizing the thermal environment allows the investi- gator to avoid such misinterpretations, and accurately assess the thermoregula- tory requirements of the animal in question.
SUMMARY
Thermal energy exchange and equivalent blackbody temperature (T,,) analyses were used to describe the Black-billed Magpie’s microclimatic set, the thermal steps within it, and the potential thermoregulatory demands of those steps during one annual cycle in southeastern Washington. This analysis revealed:
1. In the microclimatic set of the magpie there were four distinct thermal steps: a) open ground, b) fence top high or higher in the open, c) in the shade within or under dense foliage shielded from the sky, and d) in the shade but exposed to the sky.
2. Because of the relationship between radiation absorbed and windspeed, pos- tural changes alone, under some conditions, altered the value of T,, within a thermal step by as much as 11°C.
3. From late April through September, T,‘s at ground level (9 cm) exceeded the magpie’s upper critical temperature (T,,.) for several hours during mid-day (up to as high as 56”C), fence tops offered a more moderate range of T,‘s (usually not greater than the bird’s TJ, and in the shade T,‘s were always below T,,..
4. From October through April, if there was sunshine, T,‘s at ground level were usually above the lower critical temperature (T,,.), even if air temperature (T,) was not. In general, therefore, open ground during the daylight hours pro- vided a comfortable thermal environment during these cold months, particularly if the birds could avoid strong winds.
5. The winter roost was selected to minimize convective and radiative heat loss.
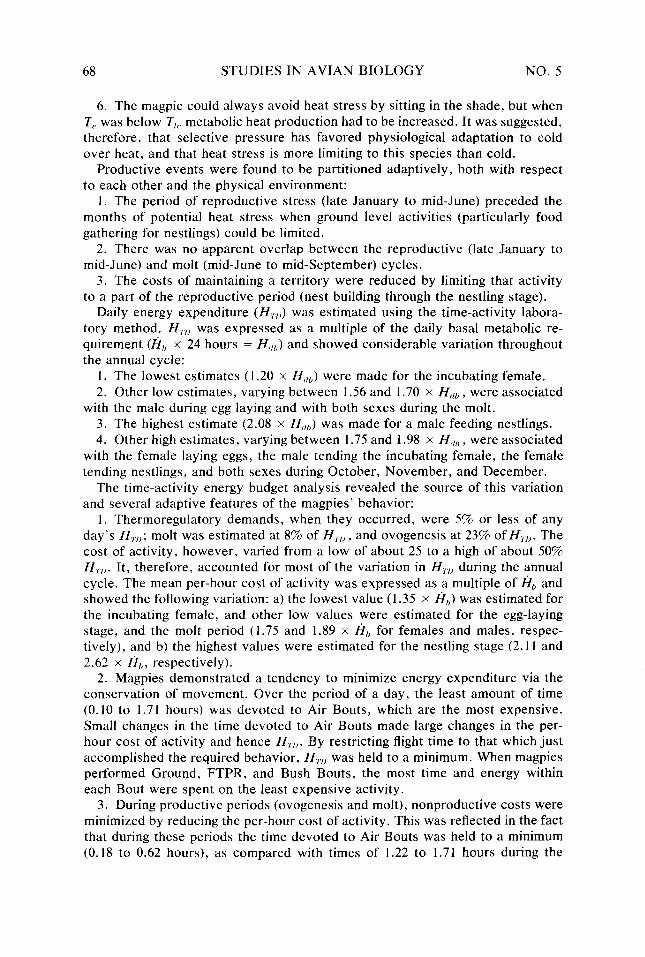
68 STUDIES IN AVIAN BIOLOGY NO. 5
6. The magpie could always avoid heat stress by sitting in the shade, but when T, was below T,,. metabolic heat production had to be increased. It was suggested, therefore, that selective pressure has favored physiological adaptation to cold over heat, and that heat stress is more limiting to this species than cold.
Productive events were found to be partitioned adaptively, both with respect to each other and the physical environment:
1. The period of reproductive stress (late January to mid-June) preceded the months of potential heat stress when ground level activities (particularly food gathering for nestlings) could be limited.
2. There was no apparent overlap between the reproductive (late January to mid-June) and molt (mid-June to mid-September) cycles.
3. The costs of maintaining a territory were reduced by limiting that activity to a part of the reproductive period (nest building through the nestling stage).
Daily energy expenditure (H,.,,) was estimated using the time-activity labora- tory method. HT,, was expressed as a multiple of the daily basal metabolic re- quirement (l-i,, x 24 hours = H,,!,) and showed considerable variation throughout the annual cycle:
1. The lowest estimates (1.20 x H,,,) were made for the incubating female. 2. Other low estimates, varying between 1.56 and 1.70 x H,,[, , were associated
with the male during egg laying and with both sexes during the molt. 3. The highest estimate (2.08 x H,,,) was made for a male feeding nestlings. 4. Other high estimates, varying between 1.75 and 1.98 x Hrlh , were associated
with the female laying eggs, the male tending the incubating female, the female tending nestlings, and both sexes during October, November, and December.
The time-activity energy budget analysis revealed the source of this variation and several adaptive features of the magpies’ behavior:
1. Thermoregulatory demands, when they occurred, were 5% or less of any day’s HT,,; molt was estimated at 8% of H.,.,, , and ovogenesis at 23% of H,,,,. The cost of activity, however, varied from a low of about 25 to a high of about 50% H,.,,. It, therefore, accounted for most of the variation in H,.,, during the annual cycle. The mean per-hour cost of activity was expressed as a multiple of fib and showed the following variation: a) the lowest value (1.35 x f?,,) was estimated for the incubating female, and other low values were estimated for the egg-laying stage, and the molt period (1.75 and 1.89 x Eil, for females and males, respec- tively), and b) the highest values were estimated for the nestling stage (2. I1 and 2.62 x ti,,, respectively).
2. Magpies demonstrated a tendency to minimize energy expenditure via the conservation of movement. Over the period of a day, the least amount of time (0.10 to 1.71 hours) was devoted to Air Bouts, which are the most expensive. Small changes in the time devoted to Air Bouts made large changes in the per- hour cost of activity and hence H,,,,. By restricting flight time to that which just accomplished the required behavior, H?,, was held to a minimum. When magpies performed Ground, FTPR, and Bush Bouts, the most time and energy within each Bout were spent on the least expensive activity.
3. During productive periods (ovogenesis and molt), nonproductive costs were minimized by reducing the per-hour cost of activity. This was reflected in the fact that during these periods the time devoted to Air Bouts was held to a minimum (0.18 to 0.62 hours), as compared with times of 1.22 to 1.71 hours during the
ENERGY EXPENDITURE BY THE BLACK-BILLED MAGPIE 69
October to December interval or 0.93 to 1.58 hours for a male tending his incu- bating female and, later, his nestlings.
4. This led to the hypothesis that selection should operate to minimize H,,.,, , and since changes in behavior are the greatest source of variation in H,.,, , selec- tion should favor those behaviors that maximize the return on the investment of time and energy in activity.
The cost of foraging, and the required foraging efficiency (vHf) for any one day depended on the characteristics of the food resource being utilized. Consequently qnf varied during the year, but always in such a way that long-term fitness seemed to be enhanced when 1) individual food items were large, finding and swallowing time was short, rate of energy intake high, and qHf. was high (10.1 to 10.5) and 2) individual food items were small, finding and swallowing took longer, the rate of energy intake was low, and qHf was low (3.2 to 4.5).
The time-activity laboratory method used in this investigation was evaluated and shown to provide inexpensive, reasonably accurate estimates of HT,, , pro- vided that measured energy equivalents can be assigned to the behaviors being described and that thermoregulatory demands are adequately determined.
ACKNOWLEDGMENTS
This investigation was completed by the principal author in partial fulfillment of the Ph. D. degree at Washington State University. The work reported was supported by the National Institutes of Health (Predoctoral Training Grant, GM 01276.13). and the National Science Foundation (Predoctoral Dissertation Award, GB 35638, to John N. Mugaas: and grant BMS 75-20338 to James R. King). Awards from the West Virginia School of Osteopathic Medicine Foundation, Inc., and the Graduate School Research and Development Fund of Washington State University helped defray part of the cost of printing.
Thanks are due to many individuals whose help and cooperation were felt throughout this inves- tigation. G. S. Campbell provided many hours of technical advice and assistance on meteorological instrumentation, and A. R. Koch provided help and advice in writing programs for data reduction and analysis. Access to the relatively undisturbed magpie population used in this study was made possible by a number of people who granted permission to use their property, or property under their jurisdiction: D. Coonrad, Beef Cattle Center; D. Caldwell, Farm Shop; M. Russell, Sheep Center: E. St. Pierre, Poultry Plant: R. K. Farrell, Animal Disease Field Laboratory, Animal Disease Research Fur Farm, and his private property; R. W. Dingle. Stephan Center: F. Webb, Plant Materials Center: and M. J. Poppie, her private property. Without the goodwill and support of these people the field work would have been impossible.
LITERATURE CITED
ASCHOFF, J., AND H. POHL. 1970. Rhythmic variations in energy metabolism. Fed. Proc. 29: 1541- 1552.
BAI.DA, R. P., AND W. J. BOCK. 1971. Ecology and morphology of food storage in the Clark’s Nutcracker. Abstr. 89th Stated Meeting, A. 0. U. Seattle, Washington.
BALDA. R. P., M. L. MORRISON, AND T. R. BEMENT. 1977. Roosting behavior of the Piiion Jay in autumn and winter. Auk 94:494-504.
BARTHOLOMEW, G. A. 1958. The role of physiology in the distribution of terrestrial vertebrates. Pp. 81-95 in C. L. Hubbs (ed.), Zoogeography. Publ. No. 51, Amer. Assoc. Advan. Sci., Wash- ington, D. C.
BENDIRE, C. H. 1895. Life histories of North American birds. U.S. Natl. Mus., Spec. Bull. 3: I-518. BERGER, M., AND J. S. HART. 1974. Physiology and energetics of flight. Pp. 415-477 in D. S. Famer
and J. R. King (eds.), Avian biology. Vol. IV. Academic Press, New York.
BERNSTEIN, M. H., S. P. THOMAS, AND K. SCHMIDT-NIELSEN. 1973. Power input during flight of the Fish Crow, Corvus ossifrugus. J. Exper. Biol. 58:401-410.
70 STUDIES IN AVIAN BIOLOGY NO. 5
BIRKEBAK, R. C. 1966. Heat transfer in biological systems. Int. Rev. Gen. and Exper. Zool. 2:269-
344. BLACKMORE, F. H., JR. 1969. The effect of temperature, photoperiod and molt on the energy re-
quirements of the House Sparrow, Passer domesticus. Comp. Biochem. Physiol. 30:433-444. BLANCHARD, B. D. 1941. The White-crowned Sparrows (Zonotrichia leucophrys) of the Pacific
seaboard: environment and annual cycle. Univ. Calif. Publ. Zool. 46: I-178. BOCK, C. E., AND L. W. LEPTHIEN. 1975. Distribution and abundance of the Black-billed Magpie
(Picu pica) in North America. Great Basin Natur. 35:269-272. BROWN, J. H. 1968. Adaptation to environmental temperature in two species of woodrats, Neotomn
cinrrecr and N. ~/h;gu/o. Misc. Publ. Mus. Zool., Univ. Mich. 135:1-48. BROWN, R. L. 1957. The population ecology of the magpie in western Montana. Unpubl. M. S.
thesis, Univ. Montana, Missoula. BRUNS, E. H. 1977. Winter behavior of pronghorns in relation to habitat. J. Wildl. Mgmt. 41:560-
571. BUTLIN, S. M. 1971. Food-hiding by Magpie. Brit. Birds 64:422. CALDER, W. A. 1971. Temperature relationships and nesting of the Calliope Hummingbird. Condor
73:314-321. CALDER, W. A. 1973. Microhabitat selection during nesting of hummingbirds in the Rocky Moun-
tains. Ecology 54: 127-134. CALDER, W. A. 1974. Consequences of body size for avian energetics. Pp. 86-151 in R. A. Paynter
(ed.), Avian energetics. Publ. Nuttall Omithol. Club 15:1-334. CALDER, W. A. 1975. Daylength and the hummingbirds’ use of time. Auk 92:81-97. CALDER, W. A., AND J. R. KING. 1974. Thermal and caloric relations of birds. Pp. 259-413 in D.
S. Farner and J. R. King (eds.), Avian biology. Vol. IV. Academic Press, New York. CAMPBELL, G. S. 1977. Introduction to environmental biophysics. Springer-Verlag, New York. CAMPBELL, G. S.. J. N. MUGAAS, AND J. R. KING. 1978. Measurement of long-wave radiant flux
in animal energy budgets: a comparison of three methods. Ecology 59: 1277-1281. CARPENTER, F. L. 1976. Ecology and evolution of an Andean hummingbird (Oreotrochilus estella).
Univ. Calif. Publ. Zool. 106:1-74. CHARNOV, E. L. 1973. Optimal foraging: some theoretical explorations. Unpubl. Ph.D. thesis, Univ.
Washington, Seattle. CHARNOV, E. L. 1976. Optimal foraging: attack strategy of a mantid. Amer. Natur. I10:141-151. CHILCREN, J. D. 1975. Dynamics and bioenergetics of post-nuptial molt in captive White-crowned
Sparrows (Zonotrichia lrucophrys gcrmhelii). Unpubl. Ph.D. thesis, Washington State Univ., Pullman.
CUSTER, T. W., AND F. A. PITELKA. 1972. Time-activity patterns and energy budget of nesting Lapland Longspurs near Barrow, Alaska. Tundra Biome Symposium, Lake Wilderness Center, Univ. Washington, pp. 160-164.
DALJBENMIRE, R. F. 1970. Steppe vegetation of Washington. Wash. Agr. Exper. Sta. Bull. 62:1-131.
DAVIS, E. A., JR. 1955. Seasonal changes in the energy balance of the English Sparrow. Auk 72:385- 411.
DAVIS, M. 1945. The molt of the Emperor Penguin. Auk 62: 144.
DAWSON, W. R., AND J. W. HUDSON. 1970. Birds. Pp. 223-310 in G. C. Whittow (ed.), Comparative physiology of thermoregulation. Vol. I, Invertebrates and nonmammalian vertebrates. Aca- demic Press, New York.
DICE, L. R. 1917. Habits of the magpie in southeastern Washington. Condor 19:121-124.
DOLNIK, V. R., AND T. I. BLYUMENTHAL. 1967. Autumnal premigratory and migratory periods in the Chaffinch (Fri’ngillu coelehs coelehs) and some other temperate zone passerine birds. Condor 69:435-468.
Dow, D. D. 1965. The role of saliva in food storage by the Gray Jay. Auk 82: 139-154.
DRENT, R. H. 1970. Functional aspects of incubation in the Herring Gull (Laws crrgentatus Pont.). Behaviour Suppl. 17: I-132.
DRENT, R. H. 1972. Adaptive aspects of the physiology of incubation. Proc. XVth Int. Omithol. Congr. (The Hague), pp. 255-280.
EBBINGE, B., K. CANTERS, AND R. DRENT. 1975. Foraging routines and estimated daily food intake in Barnacle Geese wintering in northern Netherlands. Wildfowl 26:5-19.
ENERGY EXPENDITURE BY THE BLACK-BILLED MAGPIE 71
EL-WAILLY, A. J. 1966. Energy requirements for egg-laying and incubation in the Zebra Finch, Taeniopygia castanotis. Condor 68:582-594.
EMLEN, J. M. 1966. The role of time and energy in food preference. Amer. Natur. 100:611-617. EMLEN, J. T. 1978. Density anomalies and regulatory mechanisms in land bird populations on the
Florida Penisula. Amer. Natur. 112:265-286. ERPINO, M. J. 1968. Nest-related activities of Black-billed Magpies. Condor 70: 154-165. EVENDEN, F. G. 1947. Nesting studies of the Black-billed Magpie in southern Idaho. Auk 64:260-
266. EYSTER, M. B. 1954. Quantitative measurement of the influence of photoperiod, temperature, and
season on the activity of captive songbirds. Ecol. Monogr. 24: l-28. FEDAK, M. A., B. PINSHOW, AND K. SCHMIDT-NIELSEN. 1974. Energy cost of bipedal running.
Amer. J. Physiol. 277: 1038-1044. FISHER, R. A. 1930. The genetical theory of natural selection. Dover Reprint 1958, Oxford Univ.
Press, London. GATES, D. M. 1962. Energy exchange in the biosphere. Harper and Row Publ., New York. GATES, D. M. 1970. Animal climates (where animals must live). Environ. Res. 3: 132-144. GEIGER, R. 1965. The climate near the ground. Harvard Univ. Press, Cambridge. GESSAMAN, J. A. 1973. Methods of estimating the energy costs of free existence. Pp. 3-31 in J. A.
Gessaman (ed.), Ecological energetics of homeotherms. Utah State Univ. Monogr. Series 20: l- 155.
GIBB, J. 1956. Food, feeding habits, and territory of the Rock Pipit Anthus .spino/ettcr. Ibis 98:506- 530.
GIBB, J. 1957. Food requirements and other observations on captive tits. Bird Study 4:207-215. GIBB, J. 1960. Populations of tits and goldcrests and their food supply in pine plantations. Ibis
102:163-208. GRABBER, R. R. 1962. Food and oxygen consumption in three species of owls (Strigidae). Condor
641473-487. GREENLAW, J. S. 1969. The importance of food in the breeding system of the Rufous-sided Towhee,
Pipilo erythrophthaimus (L.). Unpubl. Ph.D. thesis, Rutgers Univ., New Brunswick, N. J. HAILS, C. J. 1979. A comparison of flight energetics in hirundines and other birds. Comp. Biochem.
Physiol. 63A:581-585. HAILS, C. J., AND D. M. BRYANT. 1979. Reproductive energetics of a free-living bird. J. Anim.
Ecol. 48:471-482. HAINSWORTH, F. R. 1977. Foraging efficiency and parental care in Colihri coruscans. Condor 79:69-
75. HAMMEL, H. I. 1956. Infrared emissivities of some arctic fauna. J. Mammal. 37:375-378. HART, J. S. 1952. Effects of temperature and work on metabolism, body temperature, and insulation:
results with mice. Can. J. Zoo]. 30:90-98. HART, J. S. 1957. Climatic and temperature induced changes in the energetics of homeotherms. Rev.
Can. Biol. 16:133-174. HART, J. S. 1960. The role of equivalence of specific dynamic action: exercise thermogenesis and
cold thermogenesis. Pp. 271-302 in S. M. Horvath (ed.), Cold injury transactions. Sixth Conf. Joseiah Macy Jr. Found., New York.
HART, J. S. 1963. Physiological responses to cold in nonhibernating homeotherms. Pp. 373-406 in
J. D. Hardy (ed.), Temperature: Its measurement and control in science and industry. Vol. III, Pt. 3. VanNostrand-Reinhold, Princeton.
HART, J. S. 1971. Rodents. Pp. l-149 in G. C. Whittow (ed.), Comparative physiology of thermo- regulation. Vol. II, Mammals. Academic Press, New York.
HART, J. S., AND 0. HEROUX. 1955. Exercise and temperature regulation in lemmings and rabbits. Can. J. Biochem. Physiol. 33:428%435.
HART, J. S., AND L. JANSKY. 1963. Thermogenesis due to exercise and cold in warm-and-cold- acclimated rats. Can. J. Biochem. Physiol. 41:629-643.
HAUKIOJA, E. 1971. Flightlessness in some moulting passerines in northern Europe. Ornis Fenn. 48:101-l 16.
HAYMAN, R. R. 1958. Magpie burying and recovering food. Brit. Birds 51:275. HENTY, C. J. 1975. Feeding and food-hiding responses of Jackdaws and Magpies. Brit. Birds 68:463-
466.
72 STUDIES IN AVIAN BIOLOGY NO. 5
HOLMES, R. T., AND F. W. SPURGES. 1973. Annual energy expenditure by the avifauna of a northern hardwoods ecosystem. Okios 24:24-29.
IDSO, S. B., AND R. D. JACKSON. 1969. Thermal radiation from the atmosphere. J. Geophysical Res. 7415397-5403.
IMLER, R. H. 1937. Weights of some birds of prey of western Kansas. Bird-Banding 8:166-169. JANSKY, L. 1959. Oxygen consumption in white mice during physical exercise. Physiol. Bohemoslov.
8:464-471. JANSKY, L. 1966. Body organ thermogenesis of the rat during exposure to cold at maximal metabolic
rate. Fed. Proc. 2.5:1297-1302. JOHNSON, R. L. 1972. Ecology of the Black-billed Magpie in southeastern Washington. Unpubl. M.
S. thesis, Washington State Univ., Pullman. JONES, R. E. 1958. The effect of magpie predation on pheasant and waterfowl populations in southern
Idaho. Unpubl. M. S. thesis, Univ. Idaho, Moscow. JONES, R. E. 1960. Activities of the magpie during the breeding period in southern Idaho. Northwest
Sci. 34: 18-24. KALE, H. W. II. 1965. Ecology and bioenergetics of the Long-billed Marsh Wren, Telmatodytes
pa/~~.stri.s gri.seus (Brewster) in Georgia salt marshes. Publ. Nuttall Ornithol. Club 5: l-142. KALMBACH, E. R. 1927. The magpie in relation to agriculture. U.S. Dept. Agr. Tech. Bull. 24:1-29. KELTY, M. P., AND S. I. LUSTICK. 1977. Energetics of the Starling (Sturnus vulgaris) in a pine
woods. Ecology 58:1181-1185. KENDEIGH, S. C. 1963. Thermodynamics of incubation in the House Wren, Troglodytes aedon.
Proc. XIIIth Int. Ornithol. Congr. (Ithaca), pp. 884-904. KENDEIGH, S. C. 1973. Monthly variation in the energy budget of the House Sparrow throughout
the year. Pp. 17-44 in S. C. Kendeigh and J. Pinowski (eds.), Productivity, population dynam- ics, and systematics of granivorous birds. Polish Scientific Publ., Warsaw.
KING, J. R. 1973. Energetics of reproduction in birds. Pp. 78-107 in D. S. Farner (ed.), Breeding biology of birds. Nat. Acad. Sci., Washington, D.C.
KING, J. R. 1974. Seasonal allocation of time and energy resources in birds. Pp. 4-85 in R. A. Paynter (ed.), Avian energetics. Publ. Nuttall Ornithol. Club 15: l-334.
KING, J. R. In press. Energetics of avian moult. Proc. XVIIth Int. Omithol. Congr. (Berlin), 1978.
KING, J. R., AND D. S. FARNER. 1961. Energy metabolism, thermoregulation, and body temperature. Pp. 215-288 in A. J. Marshall (ed.), Biology and comparative physiology of birds. Vol. II. Academic Press, New York.
KLEIBER, M. 1961. The fire of life. John Wiley and Sons, New York. KOKSHAYSKY, N. V. 1970. Flight energetics of insects and birds. Zh. Obshch. Biol. 31, No. 5, pp.
525-549 (in Russian). KONTOCIANNIS, J. E. 1968. Effect of temperature and exercise on energy intake and body weight
of the White-throated Sparrow, Zonotrichicr rrlhicollis. Physiol. Zool. 41:.5-64. KREBS, J. R. 1973. Behavioral aspects of predation. Pp. 73-111 in P. P. G. Bateson and P. H.
Klopfer (eds.), Perspectives in ethology. Plenum, New York. KUSHI.AN, J. A. 1977. Population energetics of the American White Ibis. Auk 94: 114-122. LASIEWSKI, R. C. 1963. Oxygen consumption of torpid, resting, active and flying hummingbirds.
Physiol. Zool. 37:212-223. LEE, J. S., AND N. LIFSON. 1960. Measurement of total energy and material balance in rats by
means of doubly labeled water. Amer. J. Physiol. 199:238-242. LEFEBVRE, E. A. 1964. The use of DIO’” for measuring energy metabolism in Columhn livin at rest
and in flight. Auk 81:403-416. LEFEVRE, J., AND A. AUGUET. 1933. La thermoregulation du travail. Rapports de ses courbes avec
celles du repos. Ann. Physiol. Physicochim. Biol. 9: 1103-l 121. LEFEVRE, J., AND A. AUGUE~. 1934. Le courbes thermoregulatrices et les rendements de la machine
vivante dans les grandes puissances de travail. Ann. Physiol. Physiocochim. Biol. 10: 1116- 1134.
LIFSON, N., AND J. S. LEE. 1961. Estimation of material balance of totally fasted rats by doubly labeled water. Amer. J. Physiol. 200:85-88.
LIFSON, N., G. B. GORDON, AND R. M. MCCLINTOCK. 1955. Measurement of total carbon dioxide production by means of D,O*“. J. Appl. Physiol. 7:704-710.
LINSDALE, J. M. 1937. The natural history of magpies. Pacific Coast Avifauna 25: l-234.
ENERGY EXPENDITURE BY THE BLACK-BILLED MAGPIE 73
LINSDALE, J. M. 1946a. American Magpie. Pp. 133-155 in A. C. Bent, Life histories of North American jays, crows, and titmice. Dover Reprint, 1964, U.S. Natl. Mus. Bull. 191:1-495.
LINSDALE, J. M. 1946b. Yellow-billed Magpie. Pp. 155-183 in A. C. Bent, Life histories of North American jays, crows, and titmice. Dover Reprint, 1964, U.S. Natl. Mus. Bull. 191: l-495.
LIST, R. J. 1971. Smithsonian meteorological tables. Smithsonian Misc. Coll. 114: l-527. LUSTICK, S., B. BATTERSBY, AND M. KELTY. 1978. Behavioral thermoregulation: orientation toward
the sun in Herring Gulls. Science 200:81-83. MACARTHUR, R. H., AND E. R. PIANKA. 1966. On optimal use of a patchy environment. Amer.
Natur. 100:603-609. MAHONEY, S. A., AND J. R. KING. 1977. The use of the equivalent black-body temperature in the
thermal energetics of small birds. J. Thermal Biol. 1977: 115-120. MARGARIA, R., P. CERRETELLI, P. AGHEMO, AND G. SASSI. 1963. Energy cost of running. J. Appl.
Physiol. 18:367-370. MCCLINTOCK, R., AND N. LIFSON. 1957. Applicability of the D,O’” method to the measurement of
the total carbon dioxide output of obese mice. J. Biol. Chem. 226: 153-156. MCCLINTOCK, R., AND N. LIFSON. 1958a. Determination of the total carbon dioxide outputs of rats
by the D,OIR method. Amer. J. Physiol. 192:76-78. MCCLINTOCK, R., AND N. LIFSON. 1958b. CO, output of mice measured by D,O’” under conditions
of isotope re-entry into the body. Amer. J. Physiol. 195:721-725.
MEWALDT, L. R., S. S. KIBBY, AND M. L. MORTON. 1968. Comparative biology of Pacific costal White-crowned Sparrows. Condor 70: 14-30.
MONTEITH, J. L. 1973. Principles of environmental physics. Amer. Elsevier Publ. Co., New York. MORHARDT, S. S. 1971. Energy exchange properties, physiology, and general ecology of the belding
ground squirrel. Unpubl. Ph.D. thesis, Washington Univ., St. Louis, MO. MORHARDT, S. S., AND D. M. GATES. 1974. Energy exchange analysis of the belding ground squirrel
and its habitat. Ecol. Monogr. 44: 17-44. MOSHER, J. A., AND P. F. MATRAY. 1974. Size dimorphism: a factor in energy savings for Broad-
winged Hawks. Auk 91:325-341. MOUNT, L. E., AND J. V. WILLMONT. 1967. The relation between spontaneous activity, metabolic
rate and the 24 hour cycle in mice at different environmental temperatures. J. Physiol., Lond. 190:371-380.
MUGAAS, J. N. 1976. Thermal energy exchange, microclimate analysis, and behavioral energetics of Black-billed Magpies, Pica pica hudsonin. Unpubl. Ph.D. thesis, Washington State Univ., Pullman.
MULLEN, R. K. 1970. Respiratory metabolism and body water turnover rates of Perognathu.s for- rnosu~ in its natural environment. Comp. Biochem. Physiol. 32:259-265.
MULLEN, R. K. 1971a. Energy metabolism and body water turnover rates of two species of free- living kangaroo rats, Dipodomys merriami and Dipodomys microps. Comp. Biochem. Physiol. 39A:379-380.
MULLEN, R. K. 1971b. Note on the energy metabolism of Peromyscrts crinifrts in its natural envi- ronment. J. Mammal. 52:633-635.
NEWTON, I. 1966. The molt of the Bullfinch, Pyrrhulo pyrrhula. Ibis 108:41-67. NIELSEN, M. 1938. Die Regulation der Korpertemperatur bei Muskelarbeit. Skand. Arch. Physiol.
79: 193-230.
NIELSEN, B., AND M. NIELSEN. 1962. Body temperature during work at different environmental temperatures. Acta Physiol. Stand. 56: 120-129.
O’HALLORAN, P. L. 1961. Dynamics of a reduced magpie population. Unpubl. M. S. thesis, Univ. Montana, Missoula.
ORIANS, G. H. 1961. The ecology of blackbird (Ag~elnirts) social systems. Ecol. Monogr. 31:285-312.
OWEN, D. F. 1956. The food of nestling jays and magpies. Bird Study 3:257-265.
PEARSON, 0. P. 1954. The daily energy requirements of a wild Anna Hummingbird. Condor 56:317- 322.
PENNEY, R. L. 1967. Molt in the Adelie Penquin. Auk 84:61-71.
POHL, H. 1969. Some factors influencing the metabolic response to cold in birds. Fed. Proc. 28: 1059- 1064.
POHL, H., AND G. C. WEST. 1973. Daily and seasonal variation in metabolic response to cold during rest and forced exercise in the Common Redpoll. Comp. Biochem. Physiol. 45A:851-867.
74 STUDIES IN AVIAN BIOLOGY NO. 5
PORTER, W. P., AND D. M. GATES. 1969. Thermodynamic equilibria of animals with environment. Ecol. Monogr. 39:227-244.
PULLIAM, H. R. 1974. On the theory of optimal diets. Amer. Natur. 108:59-74. PYKE, G. H., H. R. PULLIAM, AND E. L. CHARNOV. 1977. Optimal foraging: a selective review of
theory and tests. Quart. Rev. Biol. 52:137-154. RICKLEFS, R. E. 1974. Energetic-s of reproduction in birds. Pp. 152-297 in R. A. Paynter (ed.), Avian
energetics. Publ. Nuttall Omithol. Club 15: l-334. ROBINSON, D. E., G. S. CAMPBELL, AND J. R. KING. 1976. An evaluation of heat exchange in small
birds. J. Comp. Physiol. 105:153-166. ROMIJN, C., AND E. L. VREUGDENHIL. 1969. Energy balance and heat regulation in the white leghorn
fowl. Neth. J. Vet. Sci. 2:32-58. RUBNER, M. 1910. Uber Kompensation und Summation von funktionellen leistungen des Korpers.
Sitziingber Koniglich preussichen Akad. Wiss. 1910:316-324. RUITER, L. DE. 1967. Feeding behavior of vertebrates in their natural environment. Pp. 97-l 16 in
C. F. Cody (ed.), Handbook of physiology, Sec. 6: Alimentary canal, Vol. 1, Food and water intake. Amer. Physiol. Sot., Washington, D.C.
RUSSELL, R. J. 1931. Dry climates of the United States. I. Climatic map. Univ. Calif. Publ. Geog. 4:l-41.
SALFELD, D. 1969. Jays recovering buried food from under snow. Brit. Birds 62:238-240. SCHARTZ, R. L., AND J. L. ZIMMERMAN. 1971. The time and energy budget of the male Dickcissel
(S&a americuna). Condor 73:65-76. SCHMID, W. D. 1965. Energy intake of the Mourning Dove Zenaidura macroura marginella. Science
150:1171-1172. SCHOENER, T. W. 1971. Theory of feeding strategies. Ann. Rev. Ecol. Syst. 2:369-404. SMITH, A. T. 1974. The distribution and dispersal of pikas: influences of behavior and climate.
Ecology 55: 1368-1376. SMITH, J. N. M., AND H. P. A. SWEATMAN. 1974. Food-searching behavior of titmice in patchy
environments. Ecology 55:1216-1232. SOKAL, R. R., AND F. J. ROHLF. 1969. Biometry. W. H. Freeman and Co., San Francisco. STEVENSON, R. E. 1971. Temperature acclimatiziation in the Black-billed Magpie (Pica pica hud-
sonia, Sabine). Unpubl. Ph.D. thesis, Montana State Univ., Bozeman. STILES, F. G. 1971. Time, energy, and territoriality of the Anna Hummingbird (Culypte anna).
Science 173:818-821. TARBOTON, W. R. 1978. Hunting and the energy budget of the Black-shouldered Kite. Condor 80:88-
91. TRIVERS, R. L. 1972. Parental investment and sexual selection. Pp. 136-149 in B. Campbell (ed.),
Sexual selection and the descent of man, 1871-1971. Aldine Publ. Co., Chicago. TURCEK, F. J., AND L. KELSO. 1968. Ecological aspects of food transportation and storage in the
Corvidae. Comm. Behav. Biol. 1:277-297. UTTER, J. M. 1971. Daily energy expenditure of free-living Purple Martins (Progne suhis) and
Mockingbirds (Mimus polyglottos) with comparison of two northern populations of Mocking- birds. Unpubl. Ph.D. thesis, Rutgers Univ., New Brunswick, N. J.
UTTER, J. M., AND E. A. LEFEBVRE. 1970. Energy expenditure for free flight by the Purple Martin (Progne suhis). Comp. Biochem. Physiol. 35:713-719.
VERBEEK, N. A. M. 1964. A time and energy budget of the Brewer Blackbird. Condor 66:70-74. VERBEEK, N. A. M. 1970. The exploitation system of the Yellow-billed Magpie (Pica nutalli). Un-
publ. Ph.D. thesis, Univ. Calif., Berkeley. VERBEEK, N. A. M. 1972a. Daily and annual time budget of the Yellow-billed Magpie. Auk 89:567-
582. VERBEEK, N. A. M. 1972b. Comparison of displays of the Yellow-billed Magpie (Pica nutalli) and
other corvids. J. fiir Omithol. 113:297-314. VERBEEK, N. A. M. 1973. The exploitation system of the Yellow-billed Magpie. Univ. Calif. Publ.
2001. 99: l-58. VERME, L. J. 1968. An index of winter weather severity for northern deer. J. Wildl. Mgmt. 32:566-
574. VERNER, J. 1965. Time budget of the male Long-billed Marsh Wren during the breeding season.
Condor 67:125-139.
ENERGY EXPENDITURE BY THE BLACK-BILLED MAGPIE 75
WAKELY, J. S. 1978. Activity budgets, energy expenditures, and energy intakes of nesting Ferru- ginous Hawks. Auk 95:667-676.
WALSBERG, G. E. 1977. Ecology and energetics of contrasting social systems in Phainopepla nitens (Aves: Ptilogonatidae). Univ. Calif. Pub]. Zool. 108: l-63.
WALSBERG, G. E. 1978. Brood size and the use of time and energy by the Phainopepla. Ecology 59: 147-1.53.
WALSBERG, G. E. In press. Energy expenditure in free-living birds: patterns and diversity. Proc. XVIIth Intern. Omithol. Congr. (Berlin), 1978.
WALSBERG, G. E., AND J. R. KING. 1978a. The heat budget of incubating Mountain White-crowned Sparrows (Zonotrichia leucophrys oriantha) in Oregon. Physiol. Zool. 51:92-103.
WALSBERG, G. E., AND J. R. KING. 1978b. The energetic consequences of incubation for two passerine species. Auk 95:64&655.
WALSBERG, G. E., AND J. R. KING. 1978~. The relationship of the external surface area of birds to skin surface area and body mass. J. Exper. Biol. 76:185-189.
WEST, G. C. 1960. Seasonal variation in energy balance of the Tree Sparrow in relation to migration. Auk 771306-329.
WEST, G. C. 1968. Bioenergetics of captive Willow Ptarmigan under natural conditions. Ecology 49:1035-1045.
WEST, G. C. 1973. Foods eaten by Tree Sparrows in relation to availability during summer in northern Manitoba. Arctic 26:7-2 1.
WEST, G. C., AND J. S. HART. 1966. Metabolic responses of Evening Grosbeaks to constant and fluctuating temperatures. Physiol. Zool. 39: 171-184.
WEST, G. C., AND B. B. DEWOLFE. 1974. Populations and energetics of taiga birds near Fairbanks, Alaska. Auk 91~757-775.
WHITE, F. N., AND J. L. KINNEY. 1974. Avian incubation. Science 186:107-115. WHITTOW, G. C. 1965. Energy metabolism. Pp. 239-271 in P. D. Sturkie (ed.), Avian physiology.
Second ed. Cornell Univ. Press, Ithaca, N.Y. WIENS, J. A., AND G. S. INNIS. 1973. Estimation of energy flow in bird communities. II. A simulation
model of activity budgets and population bioenergetics. Proc. Summer Computer Simulation Conf., Montreal, Canada, pp. 739-752.
WIENS, J. A., S. G. MARTIN, W. R. HOLTHAUS, AND F. A. IWEN. 1970. Metronome timing in behavioral ecology studies. Ecology 51:350-352.
WILLIAMSON, F. S. L. 1956. The molt and testis cycles of the Anna Hummingbird. Condor 58:342- 366.
WILLIAMSON, K. 1957. The annual post-nuptial moult in the Wheatear (Oenanrhe oenanthe). Bird- Banding 28:129-135.
WILSON, E. 0. 1975. Sociobiology, the new synthesis. Belknap Press, Harvard Univ. Press, Cam- bridge.
WINSLOW, C. E. A., L. P. HERRINGTON, AND A. P. GAGGE. 1936a. A new method of partitional calorimetry. Amer. J. Physiol. 116:64-655.
WINSLOW, C. E. A., L. P. HERRINGTON, AND A. P. GAGGE. 1936b. The determination of radiation and convection exchanges by partitional calorimetry. Amer. J. Physiol. 116:669-684.
WINSLOW, C. E. A., L. P. HERRINGTON, AND A. P. GAGGE. 1937. Physiological reactions of the human body to varying environmental temperatures. Amer. J. Physiol. 120: l-22.
WOLF, L. L. 1975. Energy intake and expenditure in a nectar-feeding sunbird. Ecology 56:92-104. WOLF, L. L., AND F. R. HAINSWORTH. 1971. Time and energy budgets of territorial hummingbirds.
Ecology 52:980-988. WOLF, L. L., F. R. HAINSWORTH, AND F. B. GII.L. 1975. Foraging efficiencies and time budgets in
nectar-feeding birds. Ecology 56: 117-128. WUNDER, B. A. 1970. Energetics of running activity in Merriam’s chipmunk, Euramias merriami.
Comp. Biochem. Physiol. 33:821-836. ZIMMERMAN, J. L. 1965. Carcass analysis of wild and thermal-stressed Dickcissels. Wilson Bull.
77:55-70.

76 STUDIES IN AVIAN BIOLOGY NO. 5
APPENDIX
TABLE A-l MEAN VALUE, SAMPLE SIZE, AND STANDARD DEVIATION OF THE HOURLY METABOLIC COST OF
ACTIVITY” OF BLACK-BILLED MAGPIES FOR PERIODS OF VISUAL CONTACT DURING EACH COMPOSITE
DAY
Phenological events Month ‘; n SD
Nonreproductive period
Molt
Nonmolt
July Aug. Sept.
Oct. Nov. Dec.
Reproductive period
Egg laying
Incubating
Nestling
Mar. P 1.75 5 0.08 Mar. d 1.89 12 0.07
Apr. P I.35 3 0.08
May 6 2.35 9 0.44
June P 2.06 6 0.22 June d 2.62 20 0.44
1.79 17 0.34 1.79 14 0.22 2.11 17 0.52
2.86 29 1.07 2.90 17 0.61 3.07 18 0.68
d Expressed as a multiple of the hourly cost of basal metabolism.
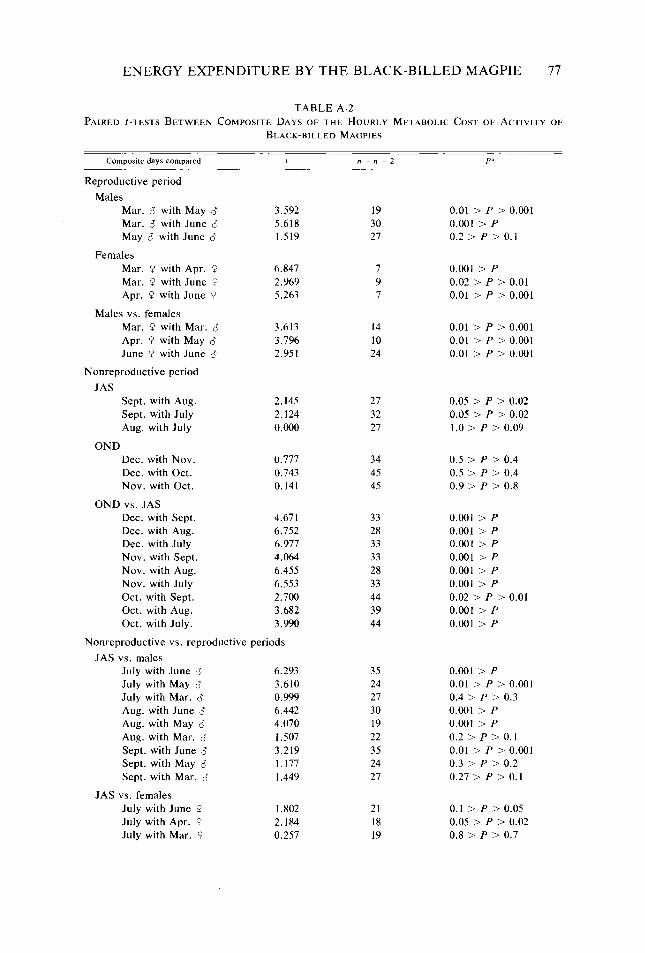
ENERGY EXPENDITURE BY THE BLACK-BILLED MAGPIE 77
TABLE A-2 PAIRED ~-TESTS BETWEEN COMPOSITE DAYS OF THE HOURLY METABOLIC COST OF ACTIVITY OF
BLACK-BILLED MAGPIES
Composite days compared f n+n-2 P”
Reproductive period
Males Mar. $ with May $ 3.592 Mar. 6 with June d 5.618 May 6 with June 6 1.519
Females Mar. 0 with Apr. 0 6.847 Mar. P with June P 2.969 Apr. P with June P 5.263
Males vs. females Mar. Y with Mar. 6 3.613 Apr. P with May $ 3.796 June P with June $ 2.951
Nonreproductive period
JAS Sept. with Aug. 2.145 Sept. with July 2.124 Aug. with July 0.000
OND Dec. with Nov. 0.777 Dec. with Oct. 0.743 Nov. with Oct. 0.141
OND vs. JAS Dec. with Sept. 4.671 Dec. with Aug. 6.752 Dec. with July 6.977 Nov. with Sept. 4.064 Nov. with Aug. 6.455 Nov. with July 6.553 Oct. with Sept. 2.700 Oct. with Aug. 3.682 Oct. with July. 3.990
Nonreproductive vs. reproductive periods
JAS vs. males July with June d 6.293 July with May $ 3.610 July with Mar. $ 0.999 Aug. with June d 6.442 Aug. with May d 4.070 Aug. with Mar. d 1.507 Sept. with June 8 3.219 Sept. with May C? 1.177 Sept. with Mar. d 1.449
JAS vs. females July with June P 1.802 July with Apr. P 2.184 July with Mar. P 0.257
19 0.01 > P > 0.001 30 0.001 > P 27 0.2 > P > 0.1
7 9 7
0.001 > P 0.02 > P > 0.01 0.01 > P > 0.001
14 0.01 > P > 0.001 10 0.01 > P > 0.001 24 0.01 > P > 0.001
27 0.05 > P > 0.02 32 0.05 > P > 0.02 27 1.0 > P > 0.09
34 45 45
0.5 > P > 0.4 0.5 > P > 0.4 0.9 > P > 0.8
33 28 33 33 28 33 44 39 44
0.001 > P 0.001 > P 0.001 > P 0.001 > P 0.001 > P 0.001 > P 0.02 > P > 0.01 0.001 > P 0.001 > P
35 0.001 > P 24 0.01 > P > 0.001 27 0.4 > P > 0.3 30 0.001 > P 19 0.001 > P 22 0.2 > P > 0.1 35 0.01 > P > 0.001 24 0.3 > P > 0.2 27 0.27 > P > 0.1
21 0.1 > P > 0.05 18 0.05 > P > 0.02 19 0.8 > P > 0.7
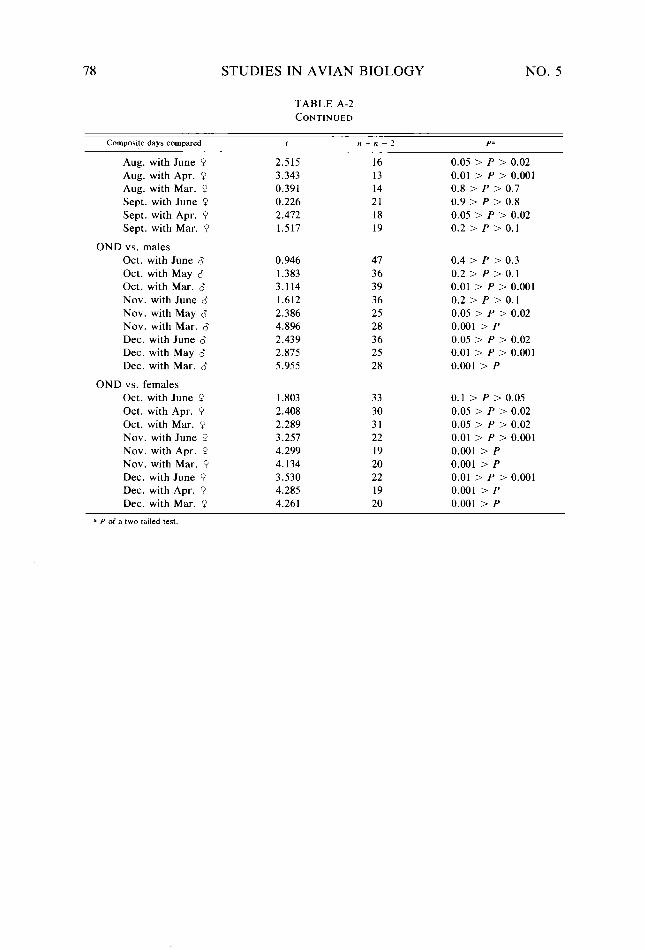
78 STUDIES IN AVIAN BIOLOGY NO. 5
TABLE A-2 CONTINUED
Composite days compared f n+n-2 P*
Aug. with June P 2.515 Aug. with Apr. P 3.343 Aug. with Mar. 0 0.391 Sept. with June P 0.226 Sept. with Apr. P 2.472 Sept. with Mar. P 1.517
OND vs. males Oct. with June 6 Oct. with May d Oct. with Mar. d Nov. with June 6 Nov. with May 6 Nov. with Mar. $ Dec. with June d Dec. with May 6 Dec. with Mar. $
0.946 47 0.4 > P > 0.3 1.383 36 0.2 > P > 0.1 3.114 39 0.01 > P > 0.001 1.612 36 0.2 > P > 0.1 2.386 25 0.05 > P 1 0.02 4.8% 28 0.001 > P 2.439 36 0.05 > P > 0.02 2.875 25 0.01 > P > 0.001 5.955 28 0.001 > P
OND vs. females Oct. with June P Oct. with Apr. P Oct. with Mar. P Nov. with June P Nov. with Apr. 0 Nov. with Mar. P Dec. with June P Dec. with Apr. P Dec. with Mar. P
1.803 33 0.1 > P > 0.05 2.408 30 0.05 > P > 0.02 2.289 31 0.05 > P > 0.02 3.257 22 0.01 > P > 0.001 4.299 19 0.001 > P 4.134 20 0.001 > P 3.530 22 0.01 > P > 0.001 4.285 19 0.001 > P 4.261 20 0.001 > P
16 0.05 > P > 0.02 13 0.01 > P > 0.001 14 0.8 > P > 0.7 21 0.9 > P > 0.8 18 0.05 > P > 0.02 19 0.2 > P > 0.1
a P of a tw’O tailed test.