Embed Size (px)
Citation preview
© Transamerica Institute®, 2016TCRS 1335-1216
17th Annual Transamerica Retirement SurveyA Compendium of Findings About American Workers
December 2016TCRS 1335-1216
• Welcome to the 17th Annual Transamerica Retirement Survey Page 3
– About the Transamerica Center for Retirement Studies® Page 4
– About the Survey Page 5
– Methodology Page 6
– Terminology Page 7
• The American Worker – An Overview Page 8
• Influences of Demographics on Retirement Preparations
– Company size Page 77
– Generation Page 114
– Gender Page 151
– Household Income Page 187
– Education Page 225
– Ethnicity Page 263
• Appendix: Respondent Profiles by Full/Part-Time Status Page 298
Table of Contents
2
Welcome to this compendium of insights and findings from the 17th Annual Transamerica Retirement Survey of
Workers from the Transamerica Center for Retirement Studies® (TCRS).
This report is an exploration of retirement preparedness of American workers that offers perspectives on
retirement confidence, access to employer-sponsored retirement benefits, savings rates, and planning-related
activities. It is comprised of these chapters:
• The American Worker – An Overview. This chapter contains a comprehensive set of more than 50 key
measures of retirement preparedness and 5-year trend analysis looking at overall survey findings among
workers of for-profit companies of 10 or more employees.
• Influences of Demographics on Retirement Preparations. These chapters are demographic segmentation
analyses by employer size, generation, gender, household income, level of education, and ethnicity. Each
chapter presents a concise set of approximately 30 key measures for each demographic segment.
We hope that you find this compendium to be a helpful source of retirement-related research and survey data.
If you are seeking survey data that you do not find in this report, please contact TCRS at
[email protected] and we will do our best to assist you.
Thank you.
Welcome to the 17th Annual Transamerica Retirement Survey
3
• The Transamerica Center for Retirement Studies® (TCRS) is a division of Transamerica Institute® (The
Institute), a nonprofit, private foundation. TCRS is dedicated to educating the public on emerging trends
surrounding retirement security in the United States. Its research emphasizes employer-sponsored
retirement plans, including companies and their employees, unemployed and underemployed workers, and
the implications of legislative and regulatory changes. For more information about TCRS, please refer to
www.transamericacenter.org.
• The Institute is funded by contributions from Transamerica Life Insurance Company and its affiliates and
may receive funds from unaffiliated third parties.
• TCRS and its representatives cannot give ERISA, tax, investment or legal advice. This material is provided
for informational purposes only and should not be construed as ERISA, tax, investment or legal advice.
Interested parties must consult and rely solely upon their own independent advisors regarding their
particular situation and the concepts presented here.
• Although care has been taken in preparing this material and presenting it accurately, TCRS disclaims any
express or implied warranty as to the accuracy of any material contained herein and any liability with
respect to it.
About the Transamerica Center for Retirement Studies®
4

• Since 1998, the Transamerica Center for Retirement Studies® has conducted national surveys of U.S.
business employers and workers regarding their attitudes toward retirement. The overall goals for the
study are to illuminate emerging trends, promote awareness, and help educate the public.
• Nielsen and the Harris Poll were commissioned to conduct the 17th Annual Retirement Survey for
Transamerica Center for Retirement Studies. Transamerica Center for Retirement Studies is not affiliated
with Nielsen.
• Over the last five decades, Harris Polls have become media staples around the world. With comprehensive
experience and precise technique in public opinion polling, along with a proven track record of uncovering
consumers’ motivations and behaviors, The Harris Poll has gained strong brand recognition around the
world. For more information, contact: [email protected].
About the Survey
5
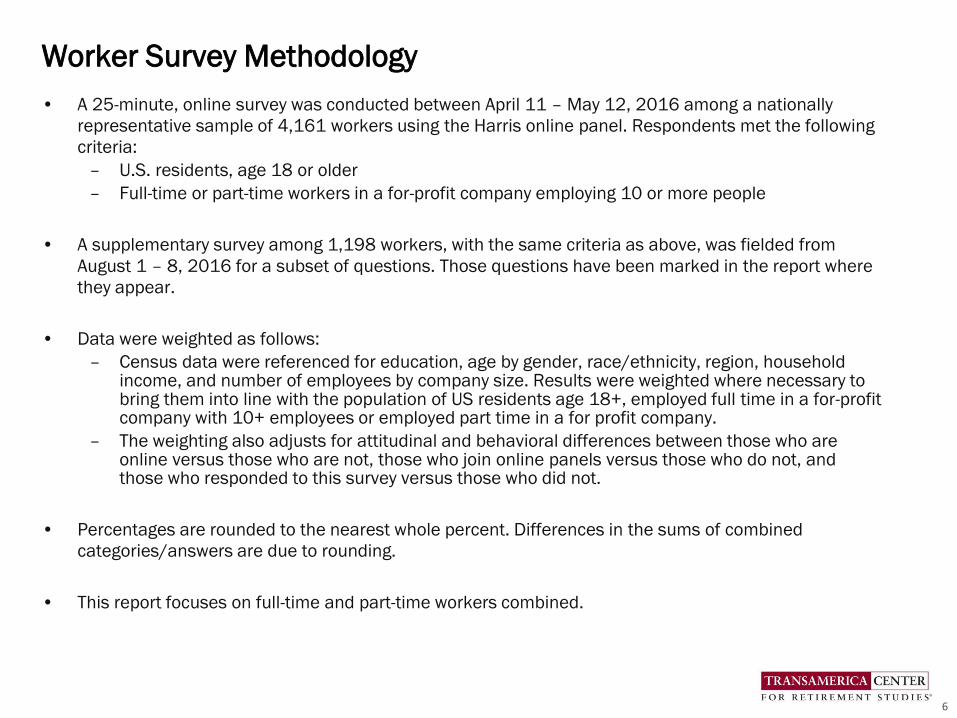
• A 25-minute, online survey was conducted between April 11 – May 12, 2016 among a nationally
representative sample of 4,161 workers using the Harris online panel. Respondents met the following
criteria:
– U.S. residents, age 18 or older
– Full-time or part-time workers in a for-profit company employing 10 or more people
• A supplementary survey among 1,198 workers, with the same criteria as above, was fielded from
August 1 – 8, 2016 for a subset of questions. Those questions have been marked in the report where
they appear.
• Data were weighted as follows:
– Census data were referenced for education, age by gender, race/ethnicity, region, household income, and number of employees by company size. Results were weighted where necessary to bring them into line with the population of US residents age 18+, employed full time in a for-profit company with 10+ employees or employed part time in a for profit company.
– The weighting also adjusts for attitudinal and behavioral differences between those who are online versus those who are not, those who join online panels versus those who do not, and those who responded to this survey versus those who did not.
• Percentages are rounded to the nearest whole percent. Differences in the sums of combined
categories/answers are due to rounding.
• This report focuses on full-time and part-time workers combined.
Worker Survey Methodology
6

This report uses the following terminology:
Generation
• Millennial: Born 1979 - 2000
• Generation X: Born 1965 - 1978
• Baby Boomer: Born 1946 - 1964
Company Size
• Small Company: 10 to 499 employees
• Large Company: 500 or more employees
All Workers
• Refers to all workers age 18 and older
Terminology
7

The American Worker – An Overview
Detailed Findings
8
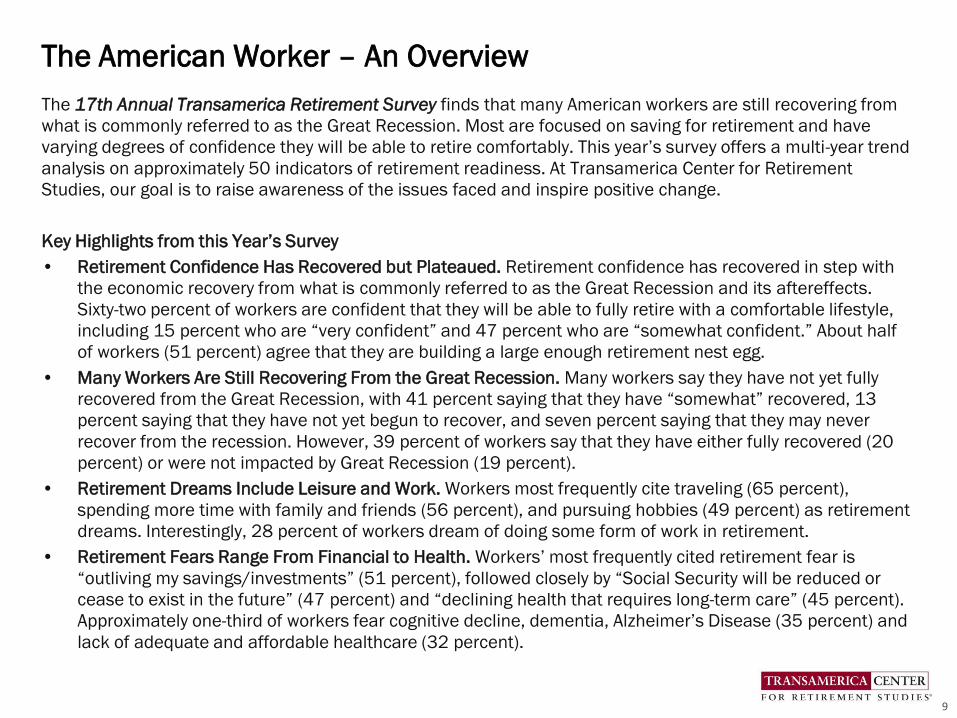
The 17th Annual Transamerica Retirement Survey finds that many American workers are still recovering from
what is commonly referred to as the Great Recession. Most are focused on saving for retirement and have
varying degrees of confidence they will be able to retire comfortably. This year’s survey offers a multi-year trend
analysis on approximately 50 indicators of retirement readiness. At Transamerica Center for Retirement
Studies, our goal is to raise awareness of the issues faced and inspire positive change.
Key Highlights from this Year’s Survey
• Retirement Confidence Has Recovered but Plateaued. Retirement confidence has recovered in step with
the economic recovery from what is commonly referred to as the Great Recession and its aftereffects.
Sixty-two percent of workers are confident that they will be able to fully retire with a comfortable lifestyle,
including 15 percent who are “very confident” and 47 percent who are “somewhat confident.” About half
of workers (51 percent) agree that they are building a large enough retirement nest egg.
• Many Workers Are Still Recovering From the Great Recession. Many workers say they have not yet fully
recovered from the Great Recession, with 41 percent saying that they have “somewhat” recovered, 13
percent saying that they have not yet begun to recover, and seven percent saying that they may never
recover from the recession. However, 39 percent of workers say that they have either fully recovered (20
percent) or were not impacted by Great Recession (19 percent).
• Retirement Dreams Include Leisure and Work. Workers most frequently cite traveling (65 percent),
spending more time with family and friends (56 percent), and pursuing hobbies (49 percent) as retirement
dreams. Interestingly, 28 percent of workers dream of doing some form of work in retirement.
• Retirement Fears Range From Financial to Health. Workers’ most frequently cited retirement fear is
“outliving my savings/investments” (51 percent), followed closely by “Social Security will be reduced or
cease to exist in the future” (47 percent) and “declining health that requires long-term care” (45 percent).
Approximately one-third of workers fear cognitive decline, dementia, Alzheimer’s Disease (35 percent) and
lack of adequate and affordable healthcare (32 percent).
The American Worker – An Overview
9

• Age Planning to Live to. Workers are planning to live to age 86 (median). Most (68 percent) are planning to
live to age 80 or older. Thirty-nine percent are planning to live to age 90 or older. Sixteen percent are
planning to 100 or older. And 15 percent say that they are “not sure.”
• Retirement Beliefs, Preparations, and Involvement. Most workers have concerns about their life in
retirement — the majority (82 percent) say their generation will have a much harder time achieving
financial security compared to their parents’ generation, and three-quarters (77 percent) are concerned
that Social Security won’t be there for them when they are ready to retire. The survey findings also present
an opportunity for education: two-thirds of workers admitting they don’t know as much as they should
about retirement investing, and two-thirds looking to their company for more information and advice on
how to reach their goals.
• Expected Standard of Living in Retirement. Fifty-nine percent of workers expect that their standard of living
will stay the same or increase while in retirement. However, 30 percent expect that they will see a decrease
in their standard of living during retirement.
• Current Financial Priorities. Saving for retirement is the most frequently cited current financial priority
among workers (57 percent). Forty-four percent of workers say that “just getting by – covering basic living
expenses” is a current priority. Thirty-nine percent cite paying off credit card debt. Other priorities include
paying off mortgage (36 percent), paying healthcare expenses (26 percent), and supporting children (25
percent).
• Greatest Financial Priority. Saving for retirement (26 percent) is the most frequently cited top financial
priority among workers. Other top priorities are “just getting by – covering basic living expenses” (21
percent) and paying off credit card or consumer debt (17 percent).
• Percentage Saving For Retirement and Age Started Saving. Seventy-seven percent of workers are saving
for retirement through an employer-sponsored retirement plan and/or outside of work.
The American Worker – An Overview
10

• Expected Sources of Retirement Income. Today’s workers are expecting diverse sources of income. Self-
funded savings including retirement accounts (e.g., 401(k)s, 403(b)s, IRAs) and other savings and
investment are the most frequently cited sources of retirement income expected by workers (78 percent
NET, 69 percent 401(k)s et al., 47 percent other savings and investments)), followed by Social Security (70
percent). Interestingly, 38 percent cite “working” as an expected source of retirement income. Company-
funded plans (25 percent), home equity (14 percent), and inheritance (11 percent) are less frequently
cited among workers.
• Primary Source of Retirement Income. Many workers expect to self-fund their retirement, either through
401(k)s or similar accounts and/or IRAs (36 percent), or other savings and investments (11 percent).
Twenty-five percent of workers plan to rely on Social Security as their primary source of income in
retirement. Notably, 15 percent of workers expect that income from “working” will be their primary source
of income to cover living expenses when they retire.
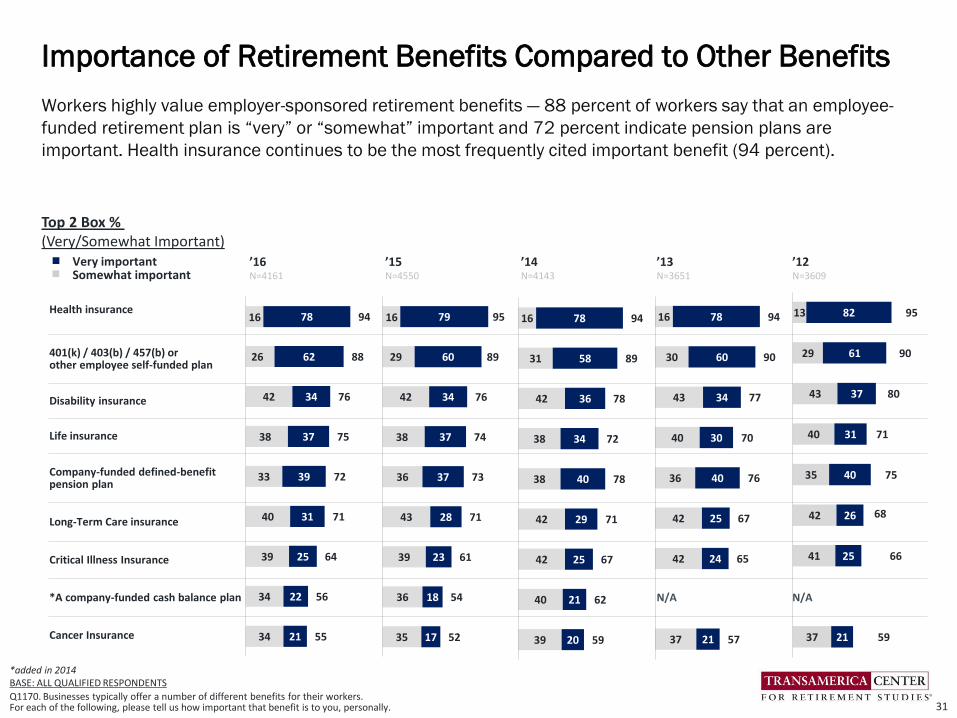
• Importance of Retirement Benefits Compared to Other Benefits. Workers highly value employer-sponsored
retirement benefits — 88 percent say that an employee-funded retirement plan is “very” or “somewhat”
important and 72 percent indicate pension plans are important. Health insurance continues to be the most
frequently cited important benefit (94 percent).
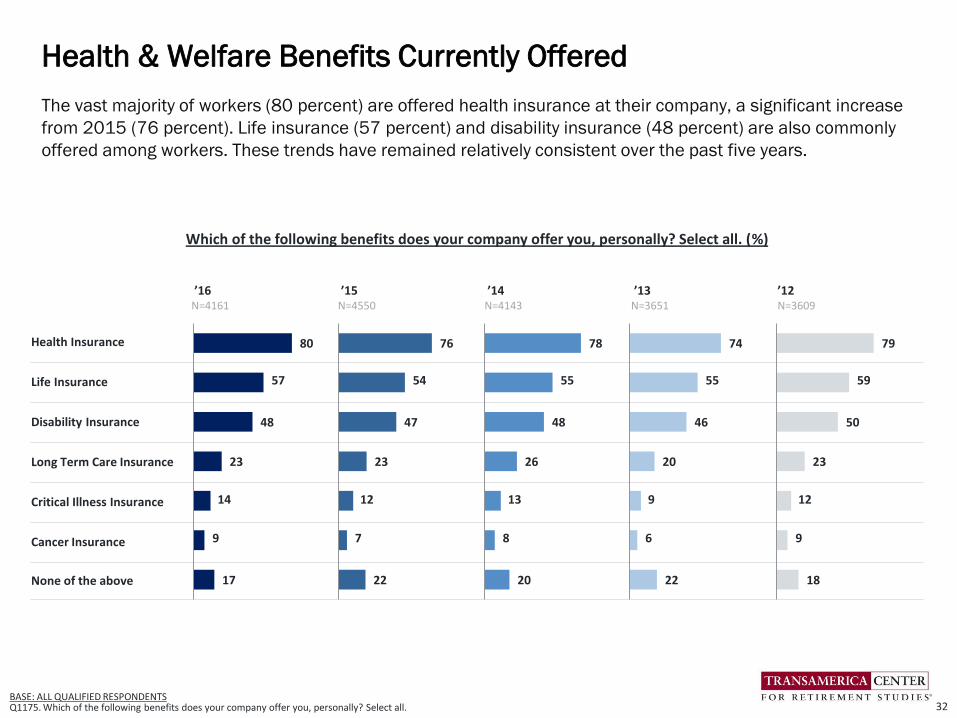
• Health & Welfare Benefits Currently Offered. The vast majority of workers (80 percent) are offered health
insurance at their company, a significant increase from 2015 (76 percent). Life insurance (57 percent)
and disability insurance (48 percent) are also commonly offered among workers. These trends have
remained relatively consistent over the past five years.
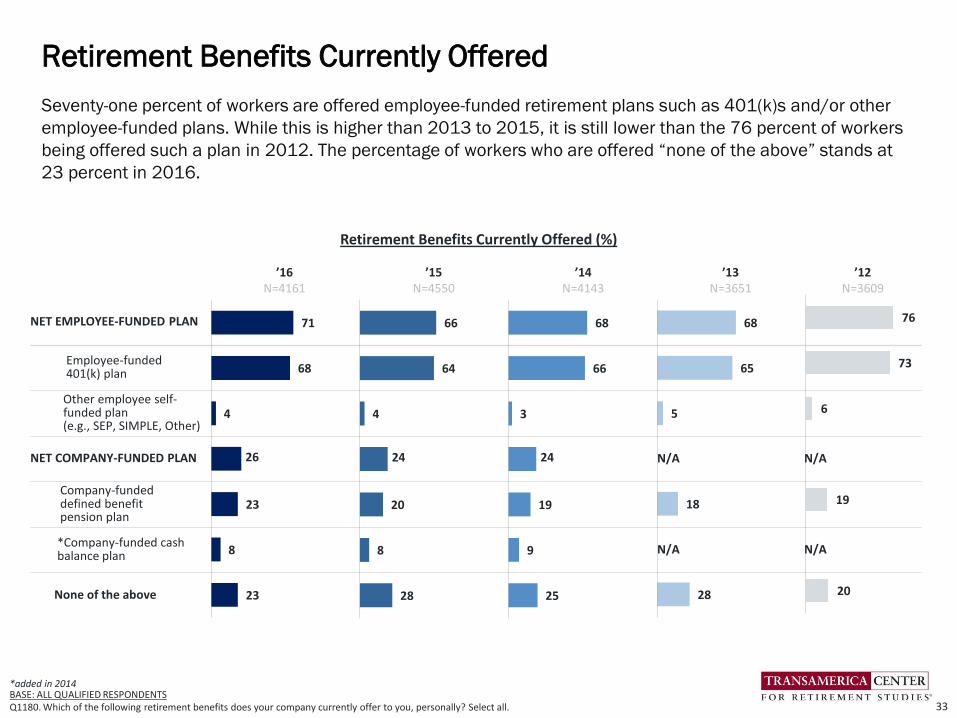
• Retirement Benefits Currently Offered. Seventy-one percent of workers are offered employee-funded
retirement plans such as 401(k)s and/or other employee-funded plans. However, 23 percent of workers
are offered “none of the above."
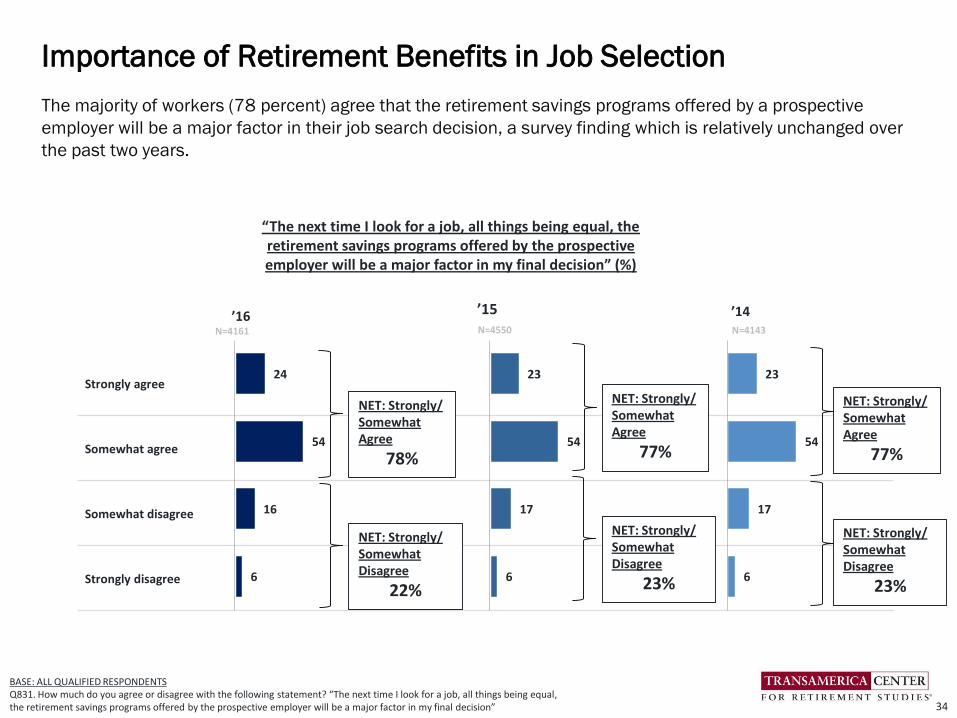
• Importance of Retirement Benefits in Job Selection. The majority of workers (78 percent) agree that the
retirement savings programs offered by a prospective employer will be a major factor in their job search
decision.
The American Worker – An Overview
11
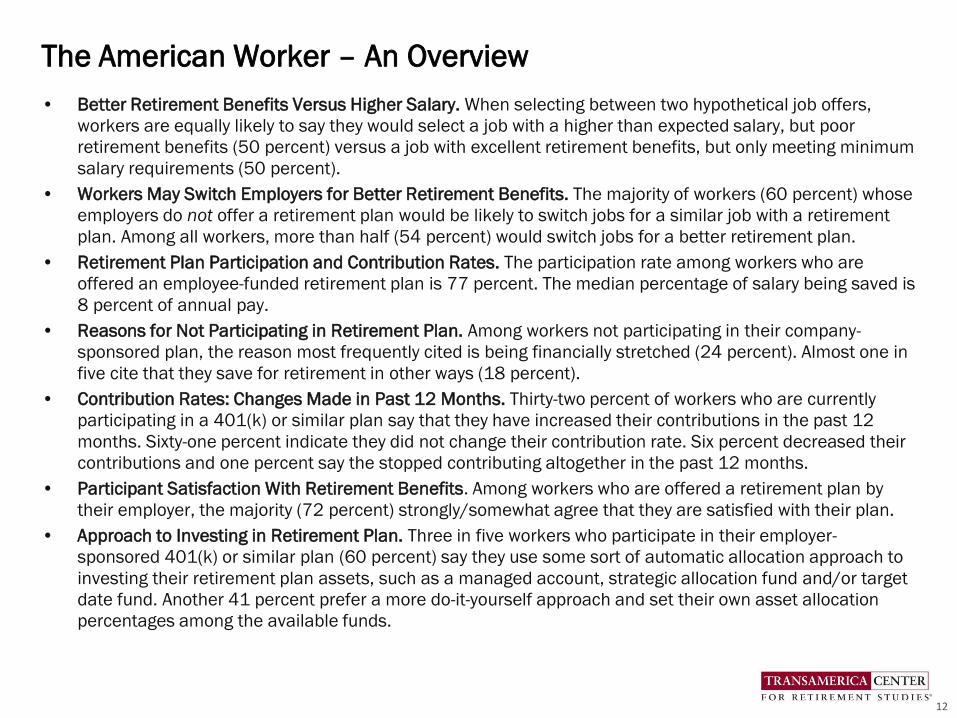
• Better Retirement Benefits Versus Higher Salary. When selecting between two hypothetical job offers,
workers are equally likely to say they would select a job with a higher than expected salary, but poor
retirement benefits (50 percent) versus a job with excellent retirement benefits, but only meeting minimum
salary requirements (50 percent).
• Workers May Switch Employers for Better Retirement Benefits. The majority of workers (60 percent) whose
employers do not offer a retirement plan would be likely to switch jobs for a similar job with a retirement
plan. Among all workers, more than half (54 percent) would switch jobs for a better retirement plan.
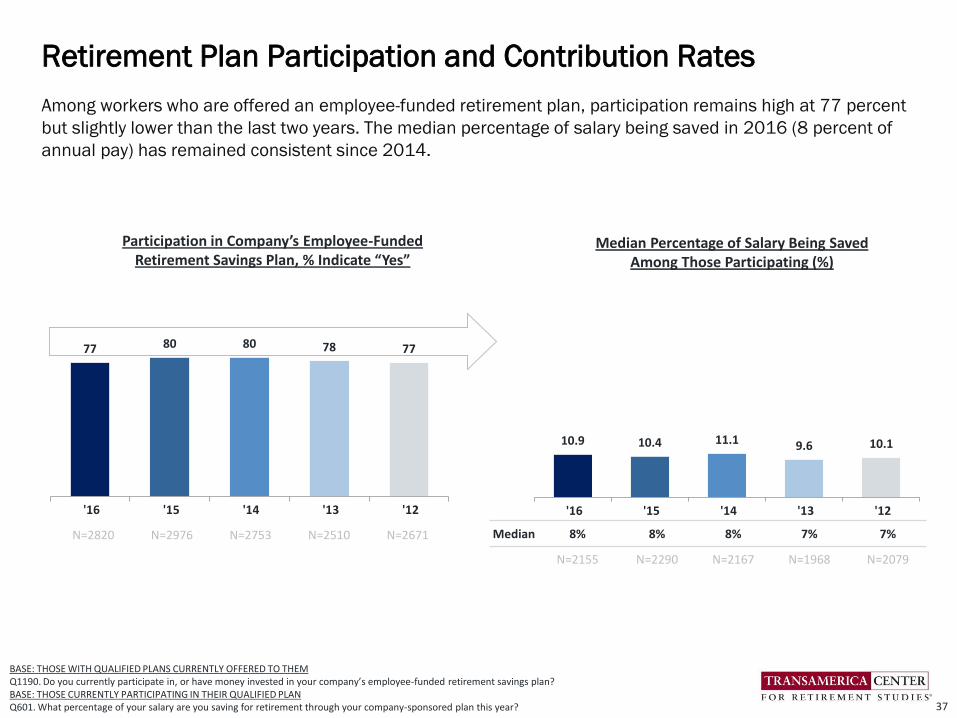
• Retirement Plan Participation and Contribution Rates. The participation rate among workers who are
offered an employee-funded retirement plan is 77 percent. The median percentage of salary being saved is
8 percent of annual pay.
• Reasons for Not Participating in Retirement Plan. Among workers not participating in their company-
sponsored plan, the reason most frequently cited is being financially stretched (24 percent). Almost one in
five cite that they save for retirement in other ways (18 percent).
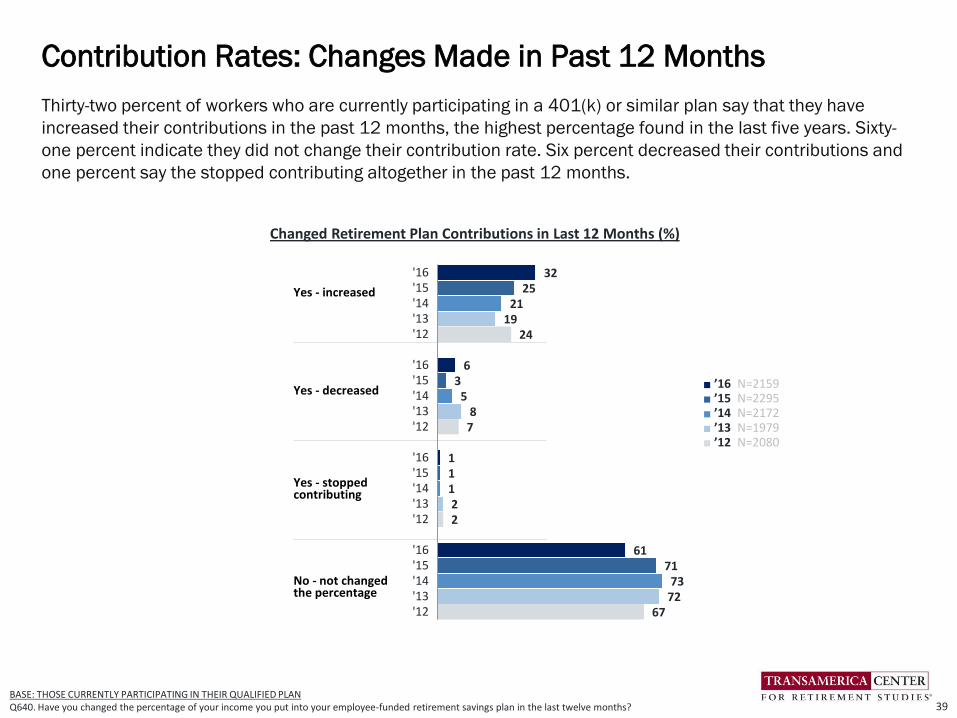
• Contribution Rates: Changes Made in Past 12 Months. Thirty-two percent of workers who are currently
participating in a 401(k) or similar plan say that they have increased their contributions in the past 12
months. Sixty-one percent indicate they did not change their contribution rate. Six percent decreased their
contributions and one percent say the stopped contributing altogether in the past 12 months.
• Participant Satisfaction With Retirement Benefits. Among workers who are offered a retirement plan by
their employer, the majority (72 percent) strongly/somewhat agree that they are satisfied with their plan.
• Approach to Investing in Retirement Plan. Three in five workers who participate in their employer-
sponsored 401(k) or similar plan (60 percent) say they use some sort of automatic allocation approach to
investing their retirement plan assets, such as a managed account, strategic allocation fund and/or target
date fund. Another 41 percent prefer a more do-it-yourself approach and set their own asset allocation
percentages among the available funds.
The American Worker – An Overview
12
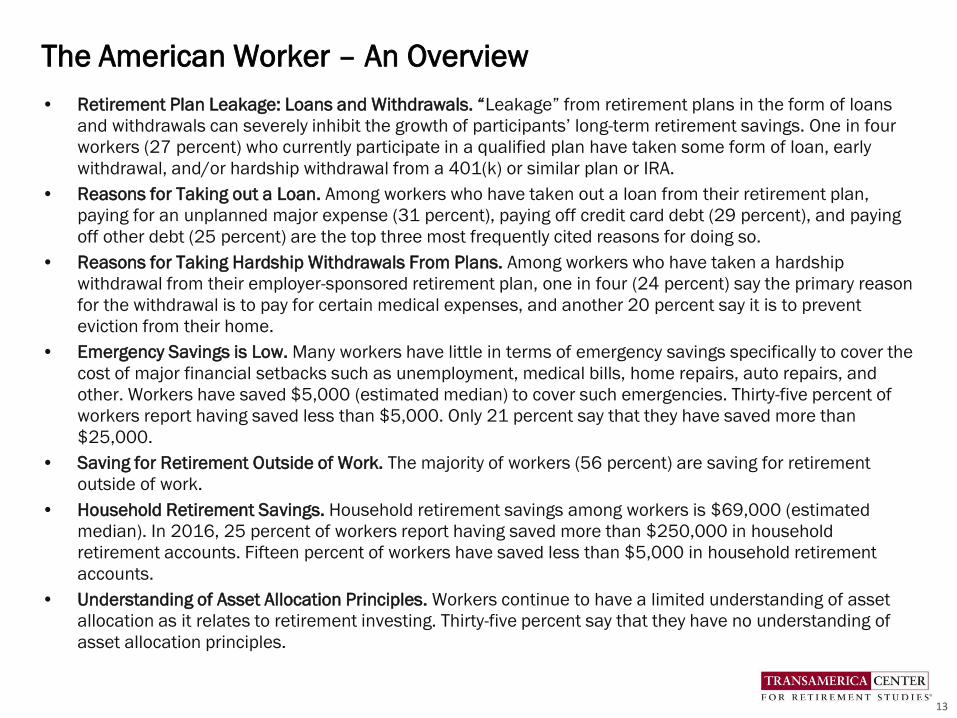
• Retirement Plan Leakage: Loans and Withdrawals. “Leakage” from retirement plans in the form of loans
and withdrawals can severely inhibit the growth of participants’ long-term retirement savings. One in four
workers (27 percent) who currently participate in a qualified plan have taken some form of loan, early
withdrawal, and/or hardship withdrawal from a 401(k) or similar plan or IRA.
• Reasons for Taking out a Loan. Among workers who have taken out a loan from their retirement plan,
paying for an unplanned major expense (31 percent), paying off credit card debt (29 percent), and paying
off other debt (25 percent) are the top three most frequently cited reasons for doing so.
• Reasons for Taking Hardship Withdrawals From Plans. Among workers who have taken a hardship
withdrawal from their employer-sponsored retirement plan, one in four (24 percent) say the primary reason
for the withdrawal is to pay for certain medical expenses, and another 20 percent say it is to prevent
eviction from their home.
• Emergency Savings is Low. Many workers have little in terms of emergency savings specifically to cover the
cost of major financial setbacks such as unemployment, medical bills, home repairs, auto repairs, and
other. Workers have saved $5,000 (estimated median) to cover such emergencies. Thirty-five percent of
workers report having saved less than $5,000. Only 21 percent say that they have saved more than
$25,000.
• Saving for Retirement Outside of Work. The majority of workers (56 percent) are saving for retirement
outside of work.
• Household Retirement Savings. Household retirement savings among workers is $69,000 (estimated
median). In 2016, 25 percent of workers report having saved more than $250,000 in household
retirement accounts. Fifteen percent of workers have saved less than $5,000 in household retirement
accounts.
• Understanding of Asset Allocation Principles. Workers continue to have a limited understanding of asset
allocation as it relates to retirement investing. Thirty-five percent say that they have no understanding of
asset allocation principles.
The American Worker – An Overview
13
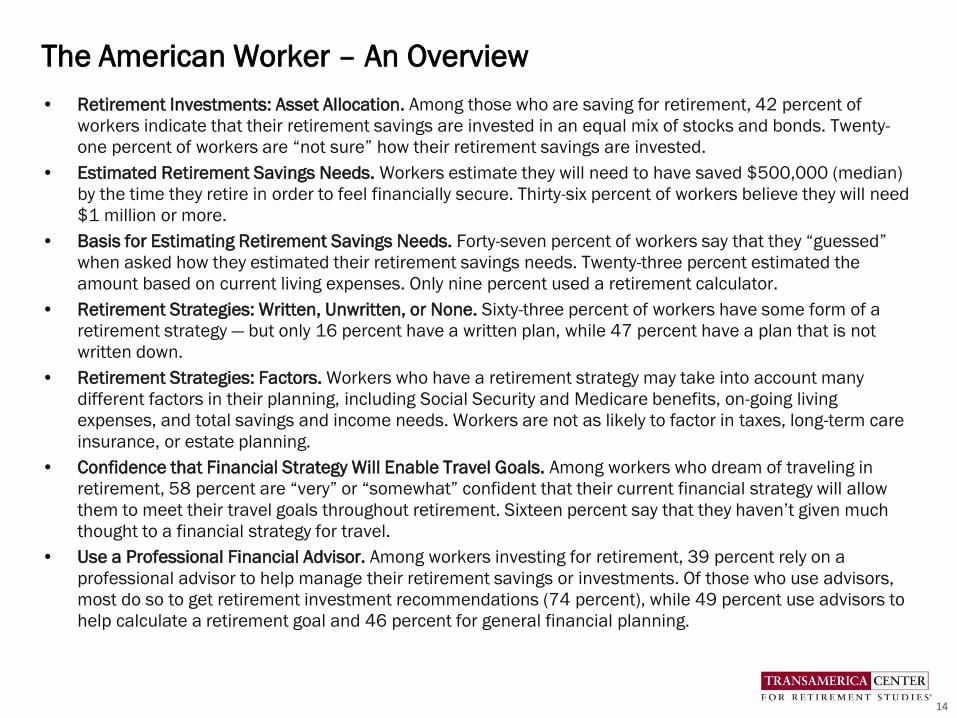
• Retirement Investments: Asset Allocation. Among those who are saving for retirement, 42 percent of
workers indicate that their retirement savings are invested in an equal mix of stocks and bonds. Twenty-
one percent of workers are “not sure” how their retirement savings are invested.
• Estimated Retirement Savings Needs. Workers estimate they will need to have saved $500,000 (median)
by the time they retire in order to feel financially secure. Thirty-six percent of workers believe they will need
$1 million or more.
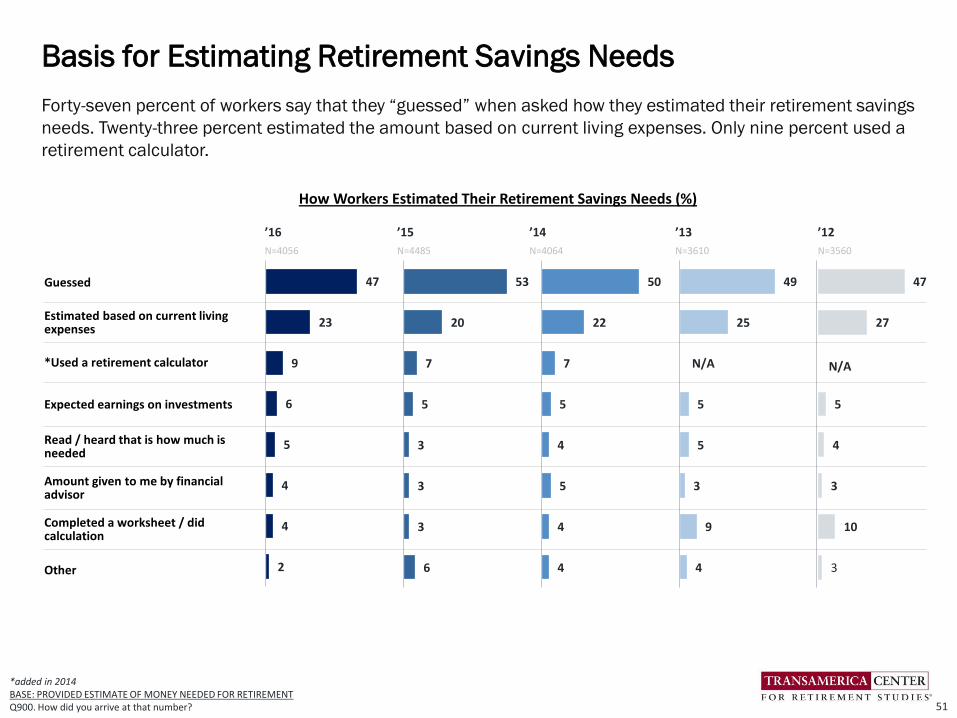
• Basis for Estimating Retirement Savings Needs. Forty-seven percent of workers say that they “guessed”
when asked how they estimated their retirement savings needs. Twenty-three percent estimated the
amount based on current living expenses. Only nine percent used a retirement calculator.
• Retirement Strategies: Written, Unwritten, or None. Sixty-three percent of workers have some form of a
retirement strategy — but only 16 percent have a written plan, while 47 percent have a plan that is not
written down.
• Retirement Strategies: Factors. Workers who have a retirement strategy may take into account many
different factors in their planning, including Social Security and Medicare benefits, on-going living
expenses, and total savings and income needs. Workers are not as likely to factor in taxes, long-term care
insurance, or estate planning.
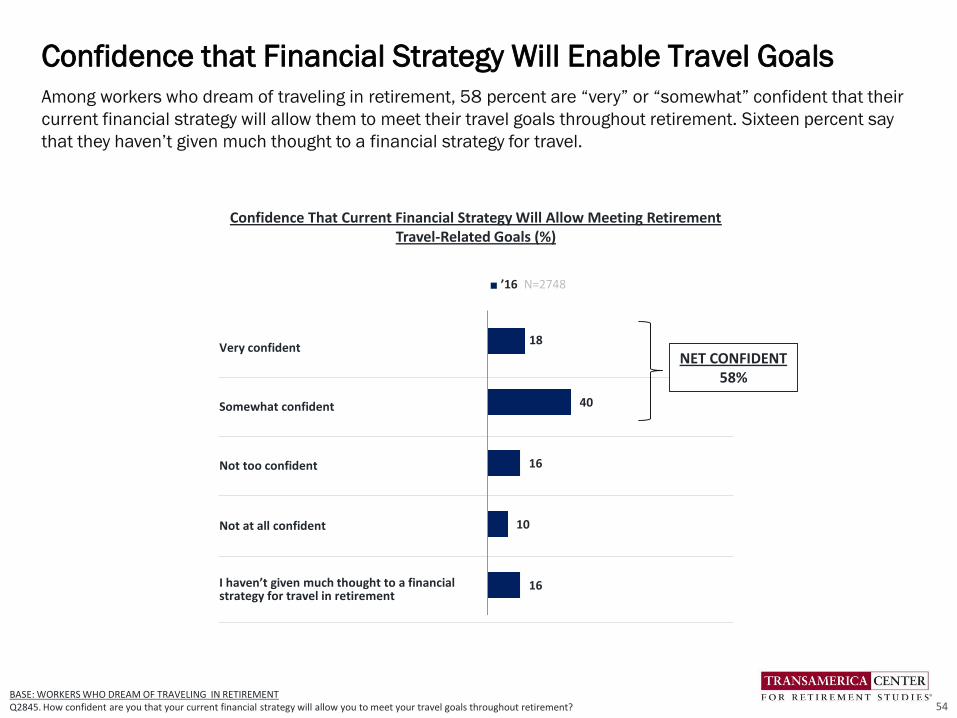
• Confidence that Financial Strategy Will Enable Travel Goals. Among workers who dream of traveling in
retirement, 58 percent are “very” or “somewhat” confident that their current financial strategy will allow
them to meet their travel goals throughout retirement. Sixteen percent say that they haven’t given much
thought to a financial strategy for travel.
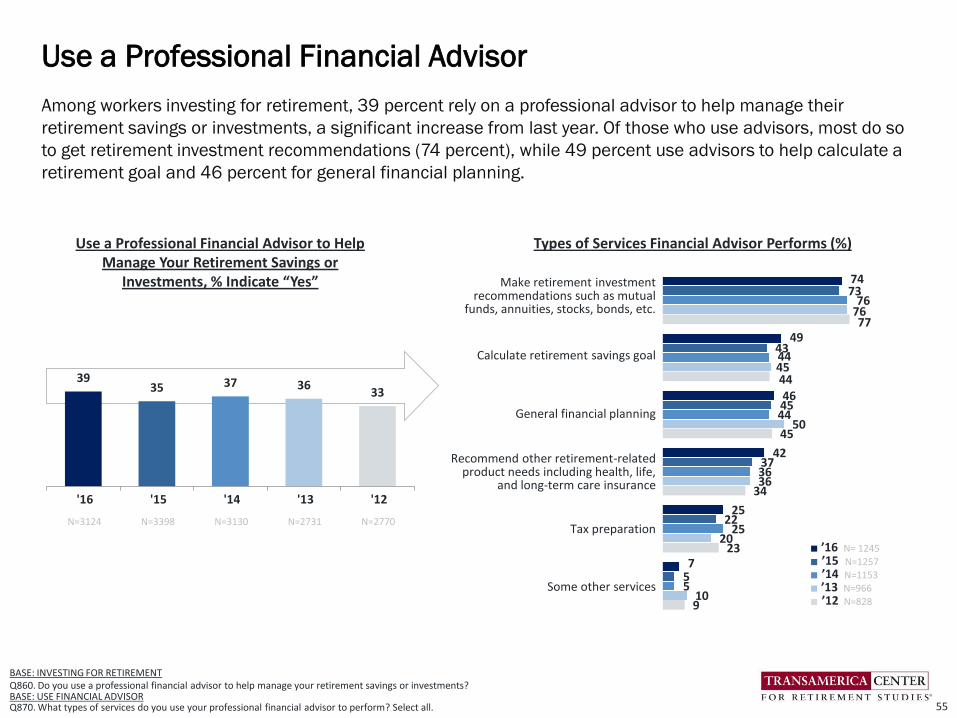
• Use a Professional Financial Advisor. Among workers investing for retirement, 39 percent rely on a
professional advisor to help manage their retirement savings or investments. Of those who use advisors,
most do so to get retirement investment recommendations (74 percent), while 49 percent use advisors to
help calculate a retirement goal and 46 percent for general financial planning.
The American Worker – An Overview
14
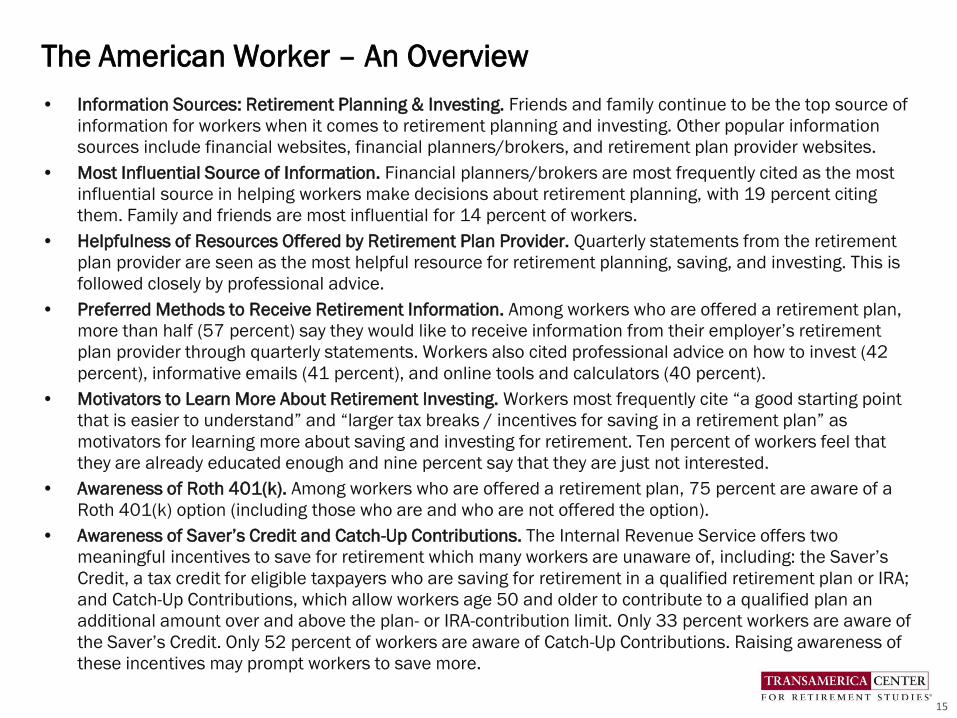
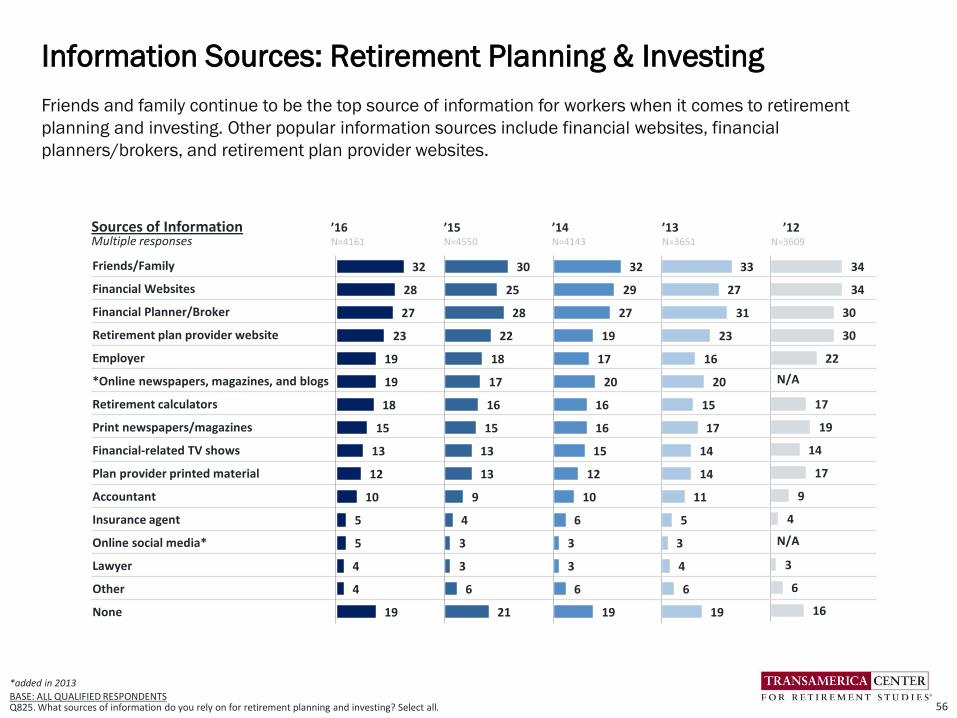
• Information Sources: Retirement Planning & Investing. Friends and family continue to be the top source of
information for workers when it comes to retirement planning and investing. Other popular information
sources include financial websites, financial planners/brokers, and retirement plan provider websites.
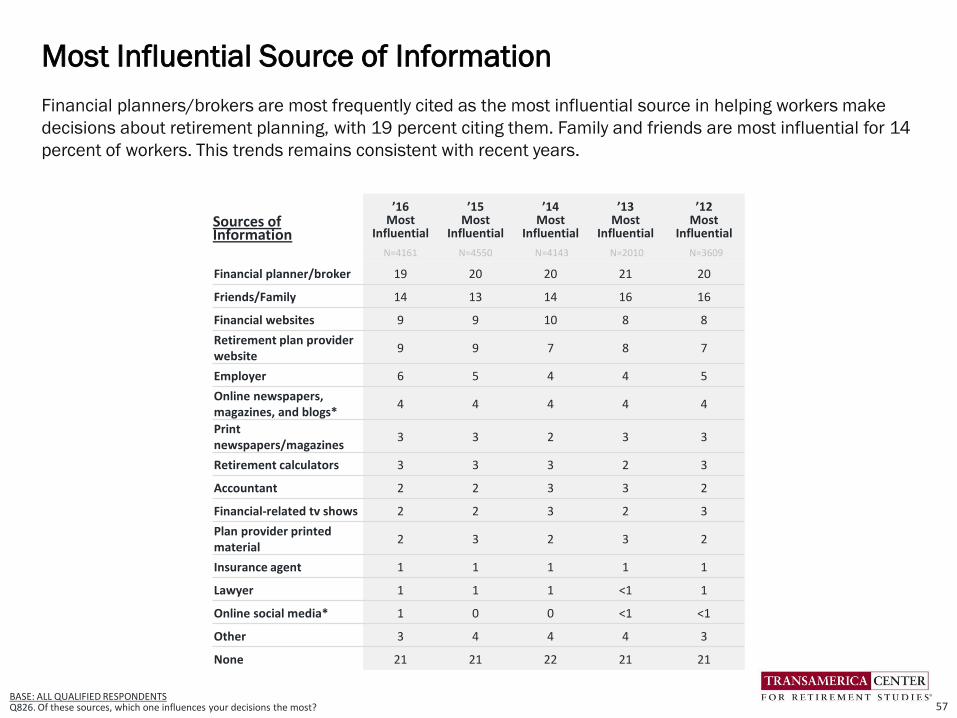
• Most Influential Source of Information. Financial planners/brokers are most frequently cited as the most
influential source in helping workers make decisions about retirement planning, with 19 percent citing
them. Family and friends are most influential for 14 percent of workers.
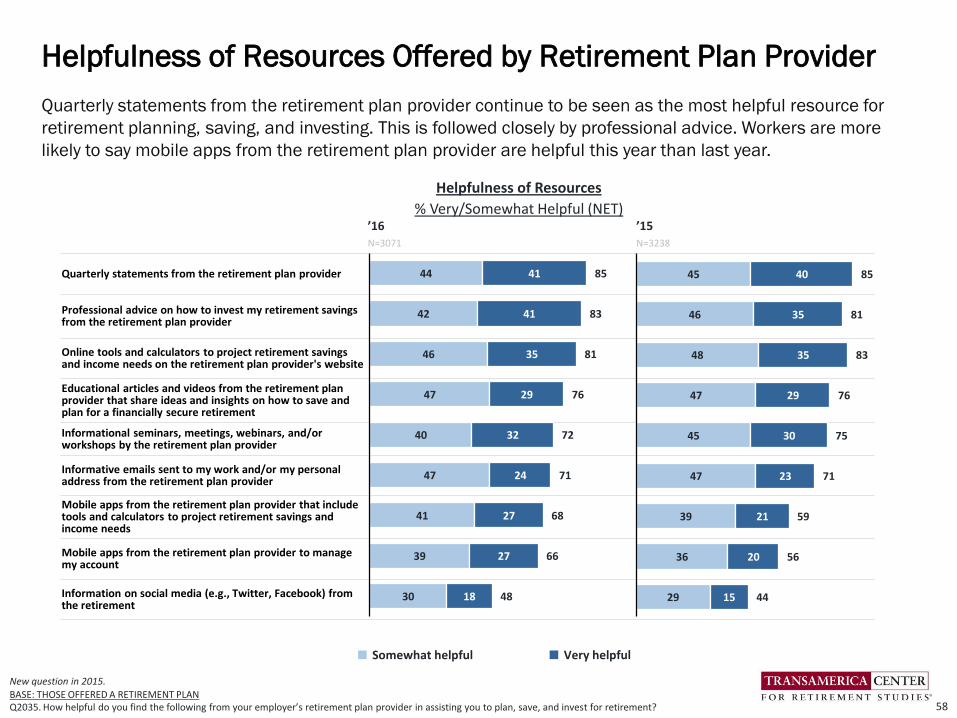
• Helpfulness of Resources Offered by Retirement Plan Provider. Quarterly statements from the retirement
plan provider are seen as the most helpful resource for retirement planning, saving, and investing. This is
followed closely by professional advice.
• Preferred Methods to Receive Retirement Information. Among workers who are offered a retirement plan,
more than half (57 percent) say they would like to receive information from their employer’s retirement
plan provider through quarterly statements. Workers also cited professional advice on how to invest (42
percent), informative emails (41 percent), and online tools and calculators (40 percent).
• Motivators to Learn More About Retirement Investing. Workers most frequently cite “a good starting point
that is easier to understand” and “larger tax breaks / incentives for saving in a retirement plan” as
motivators for learning more about saving and investing for retirement. Ten percent of workers feel that
they are already educated enough and nine percent say that they are just not interested.
• Awareness of Roth 401(k). Among workers who are offered a retirement plan, 75 percent are aware of a
Roth 401(k) option (including those who are and who are not offered the option).
• Awareness of Saver’s Credit and Catch-Up Contributions. The Internal Revenue Service offers two
meaningful incentives to save for retirement which many workers are unaware of, including: the Saver’s
Credit, a tax credit for eligible taxpayers who are saving for retirement in a qualified retirement plan or IRA;
and Catch-Up Contributions, which allow workers age 50 and older to contribute to a qualified plan an
additional amount over and above the plan- or IRA-contribution limit. Only 33 percent workers are aware of
the Saver’s Credit. Only 52 percent of workers are aware of Catch-Up Contributions. Raising awareness of
these incentives may prompt workers to save more.
The American Worker – An Overview
15

• Awareness of myRA. Introduced in 2015, myRA is a starter retirement savings account that is offered by
the U.S. Department of Treasury. It is a convenient way to save for retirement, especially workers who are
not offered a 401(k) or similar plan by their employer. Just one in five workers (21 percent) are aware of
myRA, according to the survey findings.
• Understanding of Government Benefits. Most workers continue to have limited understanding of
government benefits that can be utilized in retirement. Only 18 percent workers know “a great deal” about
Social Security benefits and even fewer know a great deal about Medicare and Medicaid.
• Talk About Retirement. Most workers (71 percent) discuss saving, investing and planning for retirement
with family and friends. However, only 14 percent do so frequently. Twenty-nine percent of workers say that
they never discuss it.
• Age Expecting to Retire. Workers’ expectations regarding when and how they will retire represent a
dramatic change from long-held societal notions about fully retiring at age 65. The majority of workers (54
percent) plan to work past age 65 (41 percent) or do not plan to retire (13 percent).
• Working In Retirement. Fifty-one percent of workers plan to continue working in retirement, either part-time
(38 percent) or full-time (13 percent). Twenty-seven percent do not plan to work in retirement and 22
percent are “not sure.”
• Reasons for Working in Retirement and Backup Plans. One-third of workers who plan on retiring after 65 or
working after retirement plan to work for enjoyment (33 percent) while slightly more than that are planning
to work because they need to for financial or health benefit reasons. The majority of workers (60 percent)
do not have a backup plan if they are unable to work, and only one-quarter (25 percent) cite that they have
a backup plan.
• Retirement Transitions: Phased Versus Immediate. Only 23 percent of workers plan to immediately stop
working at a specific point in time. Many are planning to transition into retirement by either shifting from
full-time to part-time (28 percent) or moving into a less demanding or more personally satisfying role (14
percent). Another 22 percent plan to continue working as long as possible in their current or similar
position until they cannot work any longer, and 13 percent are “not sure” about their transition.
The American Worker – An Overview
16
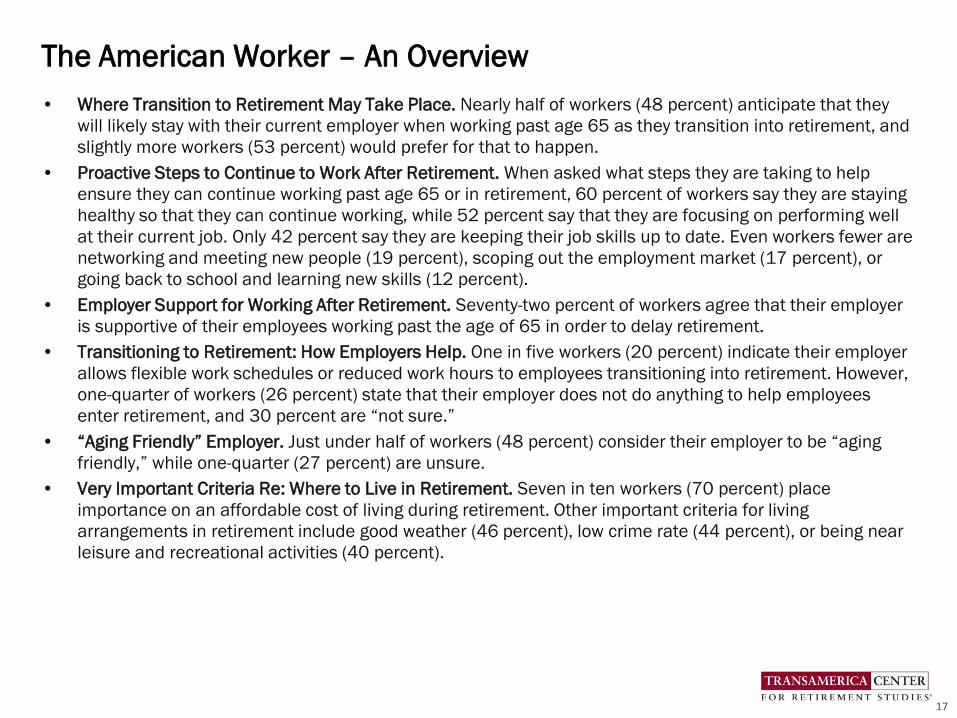
• Where Transition to Retirement May Take Place. Nearly half of workers (48 percent) anticipate that they
will likely stay with their current employer when working past age 65 as they transition into retirement, and
slightly more workers (53 percent) would prefer for that to happen.
• Proactive Steps to Continue to Work After Retirement. When asked what steps they are taking to help
ensure they can continue working past age 65 or in retirement, 60 percent of workers say they are staying
healthy so that they can continue working, while 52 percent say that they are focusing on performing well
at their current job. Only 42 percent say they are keeping their job skills up to date. Even workers fewer are
networking and meeting new people (19 percent), scoping out the employment market (17 percent), or
going back to school and learning new skills (12 percent).
• Employer Support for Working After Retirement. Seventy-two percent of workers agree that their employer
is supportive of their employees working past the age of 65 in order to delay retirement.
• Transitioning to Retirement: How Employers Help. One in five workers (20 percent) indicate their employer
allows flexible work schedules or reduced work hours to employees transitioning into retirement. However,
one-quarter of workers (26 percent) state that their employer does not do anything to help employees
enter retirement, and 30 percent are “not sure.”
• “Aging Friendly” Employer. Just under half of workers (48 percent) consider their employer to be “aging
friendly,” while one-quarter (27 percent) are unsure.
• Very Important Criteria Re: Where to Live in Retirement. Seven in ten workers (70 percent) place
importance on an affordable cost of living during retirement. Other important criteria for living
arrangements in retirement include good weather (46 percent), low crime rate (44 percent), or being near
leisure and recreational activities (40 percent).
The American Worker – An Overview
17
• Retirement Security Priorities for the New President and Congress. With the November 2016 election in
mind, workers most frequently cite fully funding Social Security (58 percent) as a priority for the new
President and Congress to help Americans prepare for a financially secure retirement. Other top cited
responses include “encouraging 401(k) plans to offer the option to pay retirement benefits in a form that
guarantees retirees a set monthly income for life” (46 percent), and “encouraging employers with a 401(k)
or similar plan to enable their part-time workers to participate in the plan” (38 percent).
The American Worker – An Overview
18
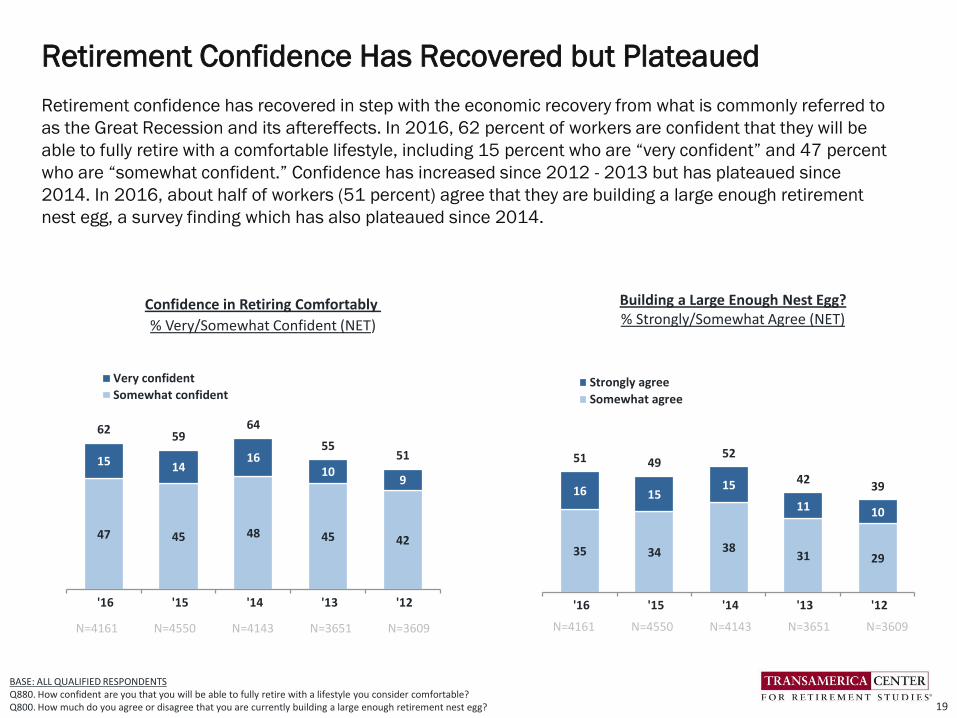
Retirement confidence has recovered in step with the economic recovery from what is commonly referred to
as the Great Recession and its aftereffects. In 2016, 62 percent of workers are confident that they will be
able to fully retire with a comfortable lifestyle, including 15 percent who are “very confident” and 47 percent
who are “somewhat confident.” Confidence has increased since 2012 - 2013 but has plateaued since
2014. In 2016, about half of workers (51 percent) agree that they are building a large enough retirement
nest egg, a survey finding which has also plateaued since 2014.
Retirement Confidence Has Recovered but Plateaued
19
47 45 48 45 42
15 1416
109
6259
64
5551
'16 '15 '14 '13 '12
Very confident
Somewhat confident
N=4161 N=4550 N=4143 N=3651 N=3609
BASE: ALL QUALIFIED RESPONDENTSQ880. How confident are you that you will be able to fully retire with a lifestyle you consider comfortable?Q800. How much do you agree or disagree that you are currently building a large enough retirement nest egg?
35 34 3831 29
16 1515
11 10
51 4952
4239
'16 '15 '14 '13 '12
Strongly agree
Somewhat agree
N=4161 N=4550 N=4143 N=3651 N=3609
Confidence in Retiring Comfortably
% Very/Somewhat Confident (NET)
Building a Large Enough Nest Egg?% Strongly/Somewhat Agree (NET)
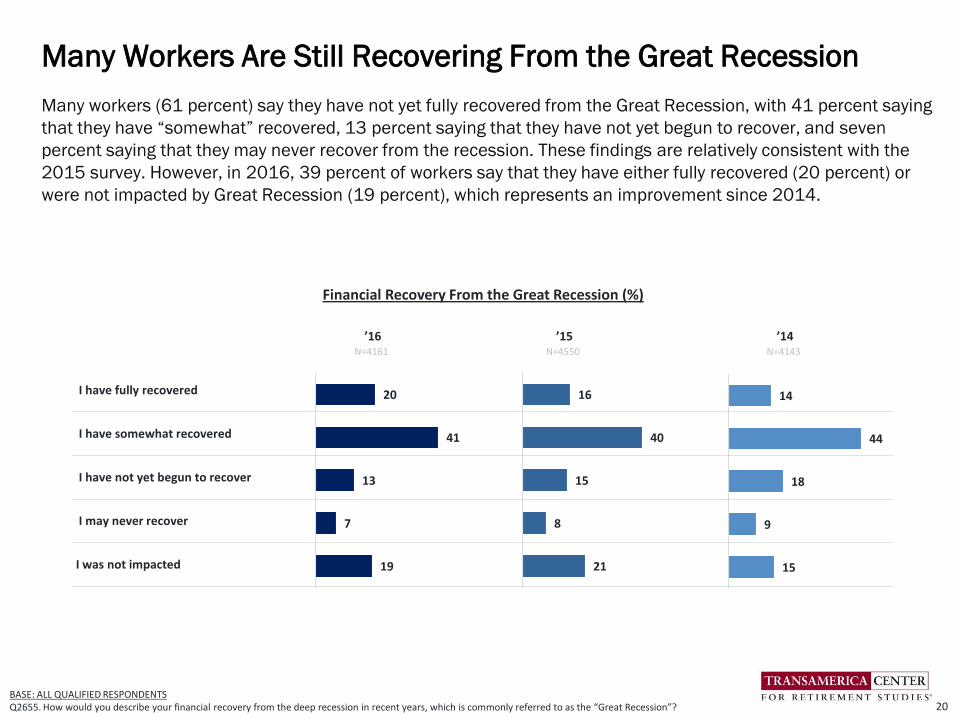
Many workers (61 percent) say they have not yet fully recovered from the Great Recession, with 41 percent saying
that they have “somewhat” recovered, 13 percent saying that they have not yet begun to recover, and seven
percent saying that they may never recover from the recession. These findings are relatively consistent with the
2015 survey. However, in 2016, 39 percent of workers say that they have either fully recovered (20 percent) or
were not impacted by Great Recession (19 percent), which represents an improvement since 2014.
Many Workers Are Still Recovering From the Great Recession
20BASE: ALL QUALIFIED RESPONDENTSQ2655. How would you describe your financial recovery from the deep recession in recent years, which is commonly referred to as the “Great Recession”?
’16 ’15 ’14N=4161 N=4550 N=4143
I have fully recovered
I have somewhat recovered
I have not yet begun to recover
I may never recover
I was not impacted
16
40
15
8
21
Financial Recovery From the Great Recession (%)
20
41
13
7
19
14
44
18
9
15

Workers most frequently cite traveling (65 percent), spending more time with family and friends (56 percent),
and pursuing hobbies (49 percent) as retirement dreams. Interestingly, 28 percent of workers dream of doing
some form of work in retirement.
Retirement Dreams Include Leisure and Work
21
New question added in 2016BASE: ALL QUALIFIED RESPONDENTS Q1418. How do you dream of spending your retirement? Select all.
How do you dream of spending your retirement? Please select all that apply. (%)
’16N=4161
Traveling
Spending more time with family and friends
Pursuing hobbies
Doing volunteer work
Pursuing an encore career (pursuing a new role, work, activity, or career)
Continue working in the same field
Starting a business
Other
None of the above
65
56
49
27
13
12
11
7
4
NET: Working
28%

’16 ’15N= 4161 N= 4550
Outliving my savings and investments
Social Security will be reduced or cease to exist in the future
Declining health that requires long-term care
Not being able to meet the basic financial needs of my family
Cognitive decline, dementia, Alzheimer’s Disease
Lack of access to adequate and affordable healthcare
Being laid off - not being able to retire on my own terms
Feeling isolated and alone
Finding meaningful ways to spend time and stay involved
None of the above
BASE: ALL QUALIFIED RESPONDENTSQ1422. What are your greatest fears about retirement? Select all.
44
36
36
33
26
25
14
13
13
8
Workers’ most frequently cited retirement fear is “outliving my savings/investments” (51 percent), followed
closely by “Social Security will be reduced or cease to exist in the future” (47 percent) and “declining health that
requires long-term care” (45 percent). Approximately one-third of workers fear cognitive decline, dementia,
Alzheimer’s Disease (35 percent) and lack of adequate and affordable healthcare (32 percent).
Retirement Fears Range From Financial to Health
22
Workers’ Greatest Retirement Fears (%)
51
47
45
42
35
32
19
19
19
7
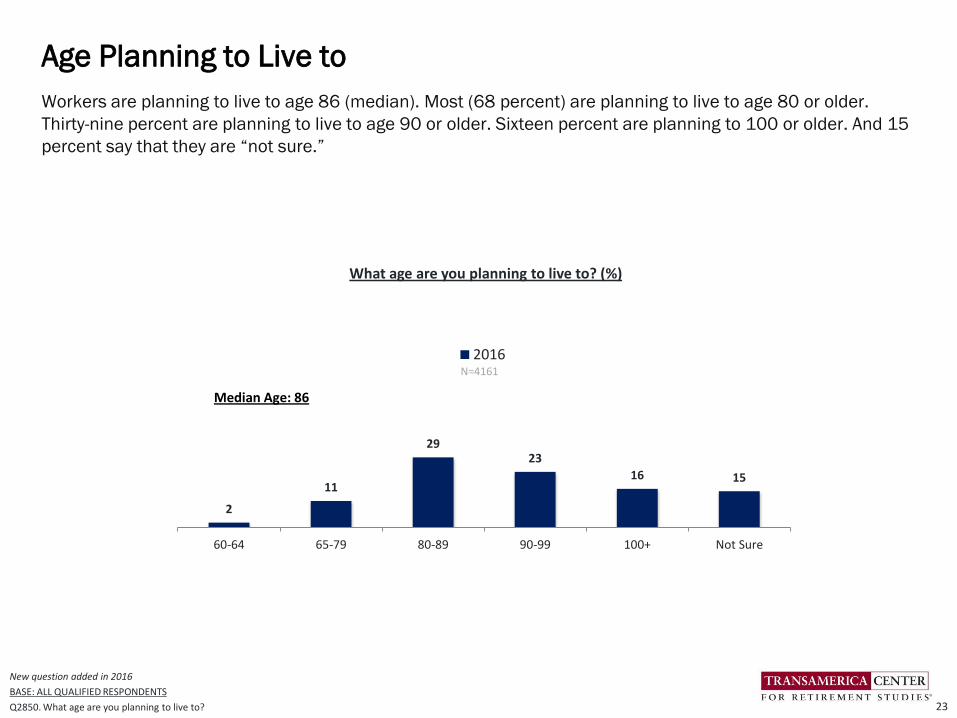
Workers are planning to live to age 86 (median). Most (68 percent) are planning to live to age 80 or older.
Thirty-nine percent are planning to live to age 90 or older. Sixteen percent are planning to 100 or older. And 15
percent say that they are “not sure.”
Age Planning to Live to
23
New question added in 2016
BASE: ALL QUALIFIED RESPONDENTS
Q2850. What age are you planning to live to?
2
11
2923
16 15
60-64 65-79 80-89 90-99 100+ Not Sure
N=4161
2016
Median Age: 86
What age are you planning to live to? (%)
’16 ’15 ’14 ’13 ’12
N=4161 N=4550 N=4143 N=3651 N=3609
**Compared to my parent's generation, people in my generation will have a much harder time in achieving financial security
N/A N/A
**Concerned that when I am ready to retire, Social Security will not be there for me
N/A N/A
*My current employer is supportive of its employees working past 65 N/A N/A N/A N/A
Do not know as much as I should about retirement investing
Like more info and advice from my company on how to reach my goals
Could work until age 65 and still not have enough money saved
Very involved in monitoring and managing my retirement savings
*Satisfied with the retirement plan my company offers N/A N/A N/A N/A
Prefer to rely on outside experts to monitor and manage my plan
Prefer not to think about or concern myself with it until closer to retirement
24
80
76
67
61
66
63
53
39
82
76
67
63
66
69
56
38
70
62
69
60
54
35
69
60
68
61
51
35
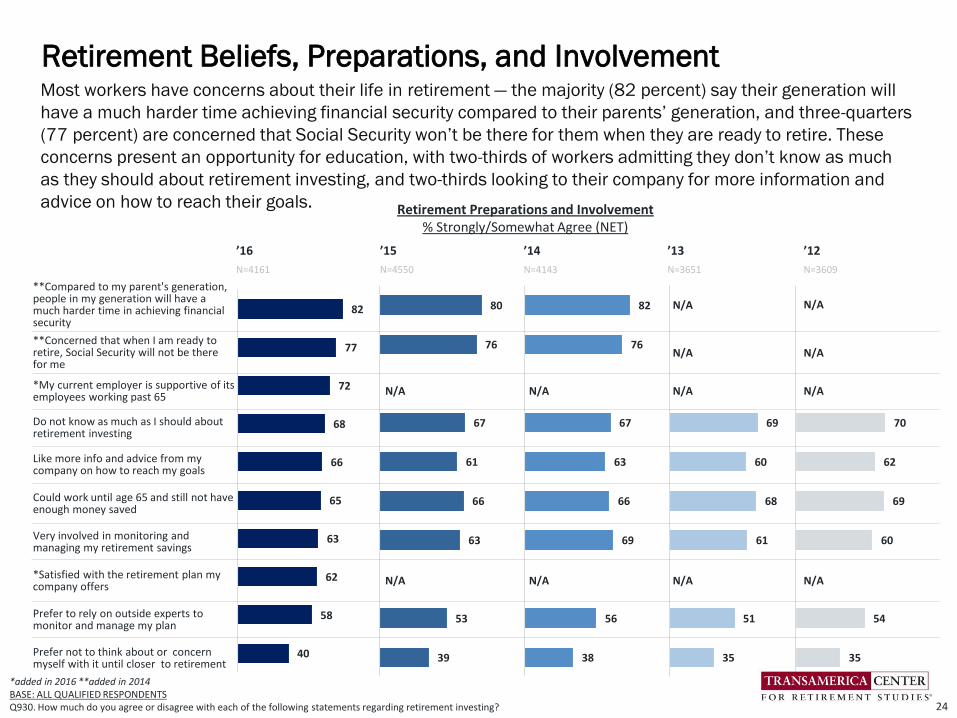
Most workers have concerns about their life in retirement — the majority (82 percent) say their generation will
have a much harder time achieving financial security compared to their parents’ generation, and three-quarters
(77 percent) are concerned that Social Security won’t be there for them when they are ready to retire. These
concerns present an opportunity for education, with two-thirds of workers admitting they don’t know as much
as they should about retirement investing, and two-thirds looking to their company for more information and
advice on how to reach their goals.
Retirement Beliefs, Preparations, and Involvement
*added in 2016 **added in 2014BASE: ALL QUALIFIED RESPONDENTSQ930. How much do you agree or disagree with each of the following statements regarding retirement investing?
Retirement Preparations and Involvement% Strongly/Somewhat Agree (NET)
82
77
72
68
66
65
63
62
58
40
Not Sure
’16
N=416111
’15
N=455010
’14
N=41439
’13
N=365110
’12
N=36099
41
42
41
38
36
30
33
32
41
43
18
15
17
12
12
■ Decrease ■ Stay the Same ■ Increase
BASE: ALL QUALIFIED RESPONDENTSQ1500. Do you expect your standard of living to increase, decrease, or stay the same when you retire?
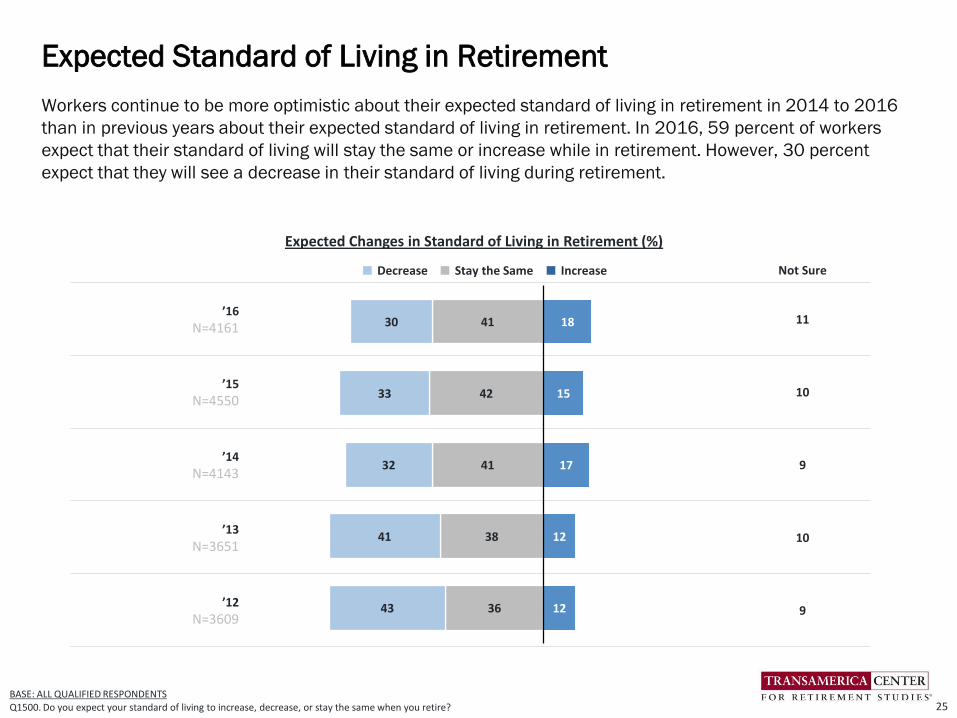
Workers continue to be more optimistic about their expected standard of living in retirement in 2014 to 2016
than in previous years about their expected standard of living in retirement. In 2016, 59 percent of workers
expect that their standard of living will stay the same or increase while in retirement. However, 30 percent
expect that they will see a decrease in their standard of living during retirement.
Expected Standard of Living in Retirement
25
Expected Changes in Standard of Living in Retirement (%)

Saving for retirement is the most frequently cited current financial priority among workers (57 percent). Forty-
four percent of workers say that “just getting by – covering basic living expenses” is a current priority. Thirty-
nine percent cite paying off credit card debt. Other priorities include paying off mortgage (36 percent), paying
healthcare expenses (26 percent), and supporting children (25 percent).
Current Financial Priorities
26
***Note: This question is based on a supplementary survey. See methodology for more information. BASE: ALL QUALIFIED RESPONDENTSQ2639. Which of the following are your financial priorities right now? Select all.
■ ’16 (N=1198)***
Saving for retirement
Just getting by - covering basic living expenses
Paying off credit card or consumer debt
Paying off mortgage
Paying healthcare expenses
Supporting children
Contributing to an education fund (for my children, grandchildren, or other)
Paying off student loans
Creating an inheritance or financial legacy
Supporting parents
Other
57
44
39
36
26
25
16
12
11
7
7
Current Financial Priorities (%)
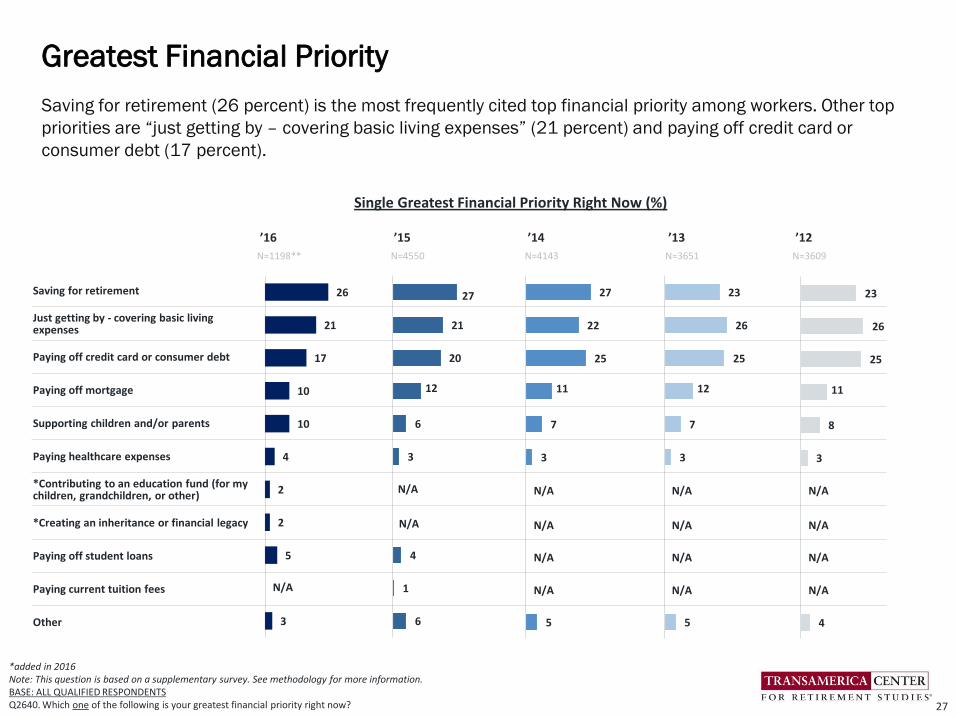
Saving for retirement (26 percent) is the most frequently cited top financial priority among workers. Other top
priorities are “just getting by – covering basic living expenses” (21 percent) and paying off credit card or
consumer debt (17 percent).
Greatest Financial Priority
27
’16 ’15 ’14 ’13 ’12
N=1198** N=4550 N=4143 N=3651 N=3609
Saving for retirement
Just getting by - covering basic living expenses
Paying off credit card or consumer debt
Paying off mortgage
Supporting children and/or parents
Paying healthcare expenses
*Contributing to an education fund (for my children, grandchildren, or other)
*Creating an inheritance or financial legacy
Paying off student loans
Paying current tuition fees
Other
23
26
25
12
7
3
5
23
26
25
11
8
3
4
27
21
20
12
6
3
4
1
6
26
21
17
10
10
4
2
2
5
3
Single Greatest Financial Priority Right Now (%)
N/A
*added in 2016 Note: This question is based on a supplementary survey. See methodology for more information. BASE: ALL QUALIFIED RESPONDENTS Q2640. Which one of the following is your greatest financial priority right now?
N/A
N/A
N/A
N/A
N/A
N/A
N/A
N/A
N/A
N/A
N/A
N/A
N/A
N/A
27
22
25
11
7
3
5
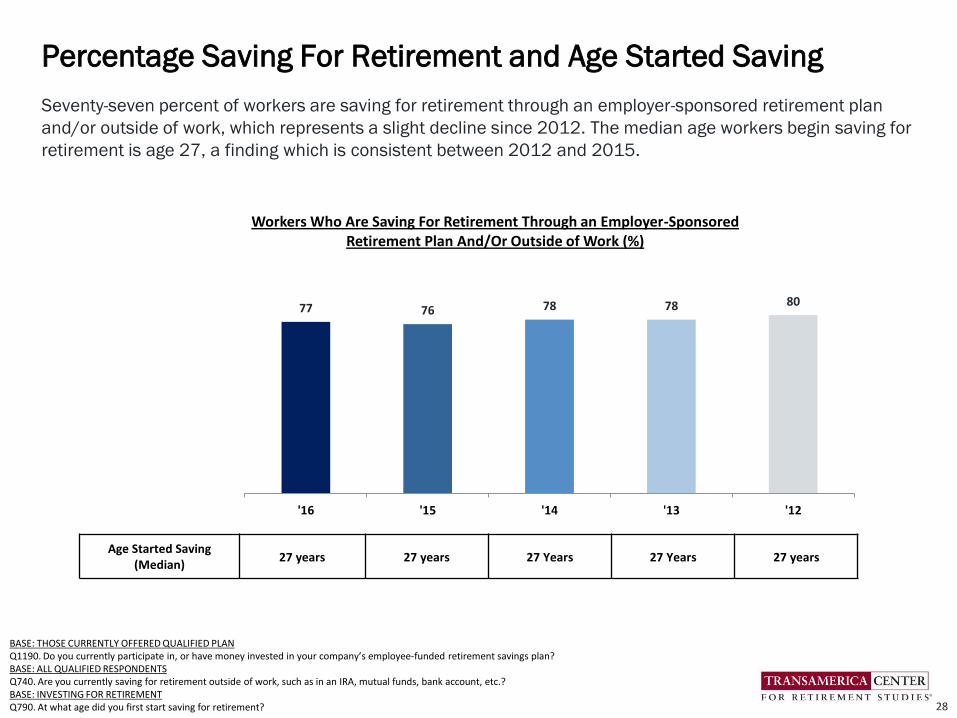
Seventy-seven percent of workers are saving for retirement through an employer-sponsored retirement plan
and/or outside of work, which represents a slight decline since 2012. The median age workers begin saving for
retirement is age 27, a finding which is consistent between 2012 and 2015.
Percentage Saving For Retirement and Age Started Saving
28
77 76 78 78 80
'16 '15 '14 '13 '12
Workers Who Are Saving For Retirement Through an Employer-Sponsored Retirement Plan And/Or Outside of Work (%)
Age Started Saving (Median)
27 years 27 years 27 Years 27 Years 27 years
BASE: THOSE CURRENTLY OFFERED QUALIFIED PLANQ1190. Do you currently participate in, or have money invested in your company’s employee-funded retirement savings plan?BASE: ALL QUALIFIED RESPONDENTSQ740. Are you currently saving for retirement outside of work, such as in an IRA, mutual funds, bank account, etc.?BASE: INVESTING FOR RETIREMENTQ790. At what age did you first start saving for retirement?

New question in 2015BASE: ALL QUALIFIED RESPONDENTS Q1145. Which one of the following do you expect to be sources of income to cover your living expenses after you retire? Select all.
Expected Sources of Income During Retirement (%)
Self-funded savings including retirement accounts (e.g., 401(k)s, 403(b)s, IRAs) and other savings and
investment are the most frequently cited sources of retirement income expected by workers (78 percent),
followed by Social Security (70 percent). Today’s workers are expecting diverse sources of income, including
38 percent who cite “working” to be a source of retirement income. Company-funded plans (25 percent),
home equity (14 percent), and inheritance (11 percent) are less frequently cited among workers.
Expected Sources of Retirement Income
29
’16 ’15N=4161 N=4550
NET – Self-Funded Savings
401(k) / 403(b) Accounts / IRAs
Other savings and investments
Social security
Working
Company-funded pension plan
Home equity
Inheritance
Other
78
69
47
70
38
25
14
11
4
77
68
45
69
37
23
13
11
5

44
26
15
8
3
1
4
41
27
16
8
2
1
5
43
26
15
7
2
2
5
37
26
13
12
6
2
1
3
36
25
15
11
7
2
1
3
*added in 2015BASE: ALL QUALIFIED RESPONDENTS Q1150. Which one of the following do you expect to be your primary source of income to cover your living expenses after you retire?
Expected Primary Source of Income During Retirement (%)
Many workers expect to self-fund their retirement, either through 401(k)s or similar accounts and/or IRAs (36
percent), or other savings and investments (11 percent). Twenty-five percent of workers plan to rely on Social
Security as their primary source of income in retirement. This year’s survey found that 15 percent expect that
income from “working” will be their primary source of income to cover living expenses when they retire. (Note:
Working was added as a possible response to the survey question in 2015, thereby affecting any trend
analysis.)
Primary Source of Retirement Income
30
’16 ’15 ’14 ’13 ’12N=4161 N=4549 N=4143 N=3651 N=3609
401(k) / 403(b) Accounts / IRAs
Social security
*Working N/A N/A N/A
Other savings and investments
Company-funded pension plan
Inheritance
Home equity
Other
Workers highly value employer-sponsored retirement benefits — 88 percent of workers say that an employee-
funded retirement plan is “very” or “somewhat” important and 72 percent indicate pension plans are
important. Health insurance continues to be the most frequently cited important benefit (94 percent).
Importance of Retirement Benefits Compared to Other Benefits
31
*added in 2014BASE: ALL QUALIFIED RESPONDENTS
Q1170. Businesses typically offer a number of different benefits for their workers. For each of the following, please tell us how important that benefit is to you, personally.
’16N=4161
’15N=4550
’14N=4143
’13N=3651
’12N=3609
Health insurance
401(k) / 403(b) / 457(b) or other employee self-funded plan
Disability insurance
Life insurance
Company-funded defined-benefit pension plan
Long-Term Care insurance
Critical Illness Insurance
*A company-funded cash balance plan N/A N/A
Cancer Insurance
16
31
42
38
38
42
42
40
39
78
58
36
34
40
29
25
21
20
94
89
78
72
78
71
67
62
59
16
30
43
40
36
42
42
37
78
60
34
30
40
25
24
21
94
90
77
70
76
67
65
57
16
26
42
38
33
40
39
34
34
78
62
34
37
39
31
25
22
21
94
88
76
75
72
71
64
56
55
13
29
43
40
35
42
41
37
82
61
37
31
40
26
25
21
95
90
80
71
75
68
66
59
Top 2 Box % (Very/Somewhat Important)
Very importantSomewhat important
16
29
42
38
36
43
39
36
35
79
60
34
37
37
28
23
18
17
95
89
76
74
73
71
61
54
52
The vast majority of workers (80 percent) are offered health insurance at their company, a significant increase
from 2015 (76 percent). Life insurance (57 percent) and disability insurance (48 percent) are also commonly
offered among workers. These trends have remained relatively consistent over the past five years.
Health & Welfare Benefits Currently Offered
32BASE: ALL QUALIFIED RESPONDENTS Q1175. Which of the following benefits does your company offer you, personally? Select all.
’16 ’15 ’14 ’13 ’12N=4161 N=4550 N=4143 N=3651 N=3609
Health Insurance
Life Insurance
Disability Insurance
Long Term Care Insurance
Critical Illness Insurance
Cancer Insurance
None of the above
80
57
48
23
14
9
17
76
54
47
23
12
7
22
78
55
48
26
13
8
20
74
55
46
20
9
6
22
79
59
50
23
12
9
18
Which of the following benefits does your company offer you, personally? Select all. (%)
’16 ’15 ’14 ’13 ’12N=4161 N=4550 N=4143 N=3651 N=3609
NET EMPLOYEE-FUNDED PLAN
Employee-funded 401(k) plan
Other employee self-funded plan (e.g., SEP, SIMPLE, Other)
NET COMPANY-FUNDED PLAN N/A N/A
Company-fundeddefined benefit pension plan
*Company-funded cash balance plan N/A N/A
None of the above
66
64
4
24
20
8
28
Seventy-one percent of workers are offered employee-funded retirement plans such as 401(k)s and/or other
employee-funded plans. While this is higher than 2013 to 2015, it is still lower than the 76 percent of workers
being offered such a plan in 2012. The percentage of workers who are offered “none of the above” stands at
23 percent in 2016.
Retirement Benefits Currently Offered
33
*added in 2014BASE: ALL QUALIFIED RESPONDENTSQ1180. Which of the following retirement benefits does your company currently offer to you, personally? Select all.
68
65
5
18
28
76
73
6
19
20
68
66
3
24
19
9
25
Retirement Benefits Currently Offered (%)
71
68
4
26
23
8
23
The majority of workers (78 percent) agree that the retirement savings programs offered by a prospective
employer will be a major factor in their job search decision, a survey finding which is relatively unchanged over
the past two years.
Importance of Retirement Benefits in Job Selection
34
’16N=4161
’15N=4550
’14N=4143
Strongly agree
Somewhat agree
Somewhat disagree
Strongly disagree
24
54
16
6
BASE: ALL QUALIFIED RESPONDENTSQ831. How much do you agree or disagree with the following statement? “The next time I look for a job, all things being equal, the retirement savings programs offered by the prospective employer will be a major factor in my final decision”
“The next time I look for a job, all things being equal, the retirement savings programs offered by the prospective employer will be a major factor in my final decision” (%)
NET: Strongly/Somewhat Agree
78%
NET: Strongly/Somewhat Disagree
22%
23
54
17
6
NET: Strongly/Somewhat Agree
77%
NET: Strongly/Somewhat Disagree
23%
23
54
17
6
NET: Strongly/Somewhat Agree
77%
NET: Strongly/Somewhat Disagree
23%
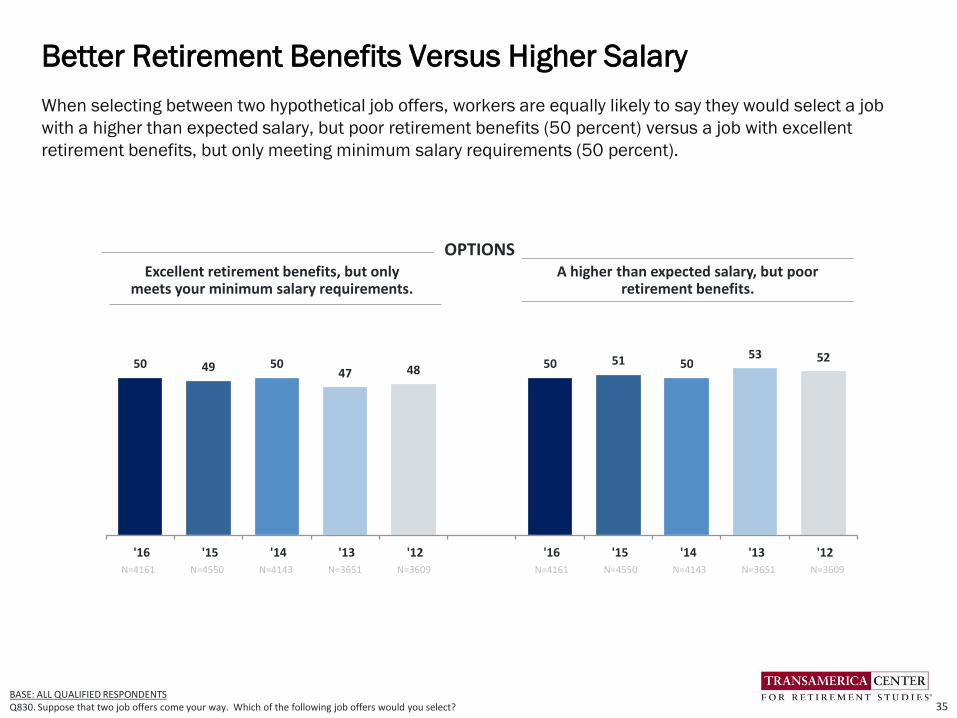
When selecting between two hypothetical job offers, workers are equally likely to say they would select a job
with a higher than expected salary, but poor retirement benefits (50 percent) versus a job with excellent
retirement benefits, but only meeting minimum salary requirements (50 percent).
Better Retirement Benefits Versus Higher Salary
35
50 49 5047 48 50 51 50
53 52
'16 '15 '14 '13 '12 '16 '15 '14 '13 '12
BASE: ALL QUALIFIED RESPONDENTS Q830. Suppose that two job offers come your way. Which of the following job offers would you select?
Excellent retirement benefits, but only meets your minimum salary requirements.
A higher than expected salary, but poor retirement benefits.
N=4161 N=4550 N=4143 N=3651 N=3609 N=4161 N=4550 N=4143 N=3651 N=3609
OPTIONS

◄ NOT LIKELY LIKELY ► ◄ NOT LIKELY LIKELY ►
’16 N=1048 ’16 N=4161
’15 N=1242 ’15 N=4550
’14 N=1118 ’14 N=4143
’13 N=1014 ’13 N=3651
’12 N=815 ’12 N=3609
21
23
24
22
27
19
17
17
13
12
40
40
42
34
38
33
35
33
37
36
27
25
26
29
26
60
60
58
66
62
Not likely at all Not too likely Somewhat likely Very likely
27
31
29
30
31
19
19
19
15
15
46
50
48
45
46
35
34
35
37
34
19
17
17
18
20
54
50
52
55
53
Not likely at all Not too likely Somewhat likely Very likely
BASE: ALL QUALIFIED RESPONDENTS
Q730. How likely would you be to leave your current employer to take a nearly identical job, with a similar employer, if that employer offered you [a retirement plan/a better retirement plan than that offered by your current employer]?
The majority of workers (60 percent) whose employers do not offer a retirement plan would be likely to switch
jobs for a similar job with a retirement plan, a survey finding which has remained unchanged since 2015.
Among all workers, more than half (54 percent) would switch jobs for a better retirement plan, representing an
increase since last year.
Workers May Switch Employers for Better Retirement Benefits
36
Among Those Whose EmployerDoesn’t Offer Retirement Plan (%)
Among All Workers (%)
10.9 10.4 11.1 9.6 10.1
'16 '15 '14 '13 '12
Among workers who are offered an employee-funded retirement plan, participation remains high at 77 percent
but slightly lower than the last two years. The median percentage of salary being saved in 2016 (8 percent of
annual pay) has remained consistent since 2014.
Retirement Plan Participation and Contribution Rates
37
BASE: THOSE WITH QUALIFIED PLANS CURRENTLY OFFERED TO THEMQ1190. Do you currently participate in, or have money invested in your company’s employee-funded retirement savings plan?BASE: THOSE CURRENTLY PARTICIPATING IN THEIR QUALIFIED PLAN Q601. What percentage of your salary are you saving for retirement through your company-sponsored plan this year?
N=2820 N=2976 N=2753 N=2510 N=2671
77 80 80 78 77
'16 '15 '14 '13 '12
Median 8% 8% 8% 7% 7%
N=2155 N=2290 N=2167 N=1968 N=2079
Participation in Company’s Employee-Funded Retirement Savings Plan, % Indicate “Yes”
Median Percentage of Salary Being SavedAmong Those Participating (%)

’16 ’15 ’14 ’13 ’12N=683 N=708 N=606 N=561 N=634
Financially stretched with other financial priorities
*I save for retirement in other ways N/A
Just started with company
Do not plan to stay at current employer much longer
Not eligible to join
Have been intending to sign up - just haven't taken the time to do so yet
Apprehensive about the plan and its investments
*My spouse/partner already contributes to their retirement funds N/A
*I don’t understand the process for signing up N/A
Some other reason
26
14
9
9
6
7
3
3
5
17
31
14
10
8
9
5
5
2
2
14
Among workers not participating in their company-sponsored plan, the reason most frequently cited is being
financially stretched (24 percent), which has decreased slightly since last year. Almost one in five cite that they
save for retirement in other ways (18 percent), a significant increase since last year.
Reasons for Not Participating in Retirement Plan
38
*added in 2013BASE: THOSE NOT CURRENTLY CONTRIBUTING TO PLANQ670. Which of the following is the main reason you are not currently participating in your company’s retirement plan?
31
9
10
12
10
8
21
28
10
9
8
9
6
6
5
4
16
24
18
11
10
8
7
5
4
2
11
Reasons for Not Participating in Retirement Plan (%)
Yes - increased
Yes - decreased
Yes - stopped contributing
No - not changed the percentage
32
6
1
61
25
3
1
71
21
5
1
73
19
8
2
72
24
7
2
67
'16 '15 '14 '13 '12
'16 '15 '14 '13 '12
'16 '15 '14 '13 '12
'16 '15 '14 '13 '12
Thirty-two percent of workers who are currently participating in a 401(k) or similar plan say that they have
increased their contributions in the past 12 months, the highest percentage found in the last five years. Sixty-
one percent indicate they did not change their contribution rate. Six percent decreased their contributions and
one percent say the stopped contributing altogether in the past 12 months.
Contribution Rates: Changes Made in Past 12 Months
39BASE: THOSE CURRENTLY PARTICIPATING IN THEIR QUALIFIED PLAN Q640. Have you changed the percentage of your income you put into your employee-funded retirement savings plan in the last twelve months?
Changed Retirement Plan Contributions in Last 12 Months (%)
■ ’16 N=2159■ ’15 N=2295■ ’14 N=2172■ ’13 N=1979■ ’12 N=2080
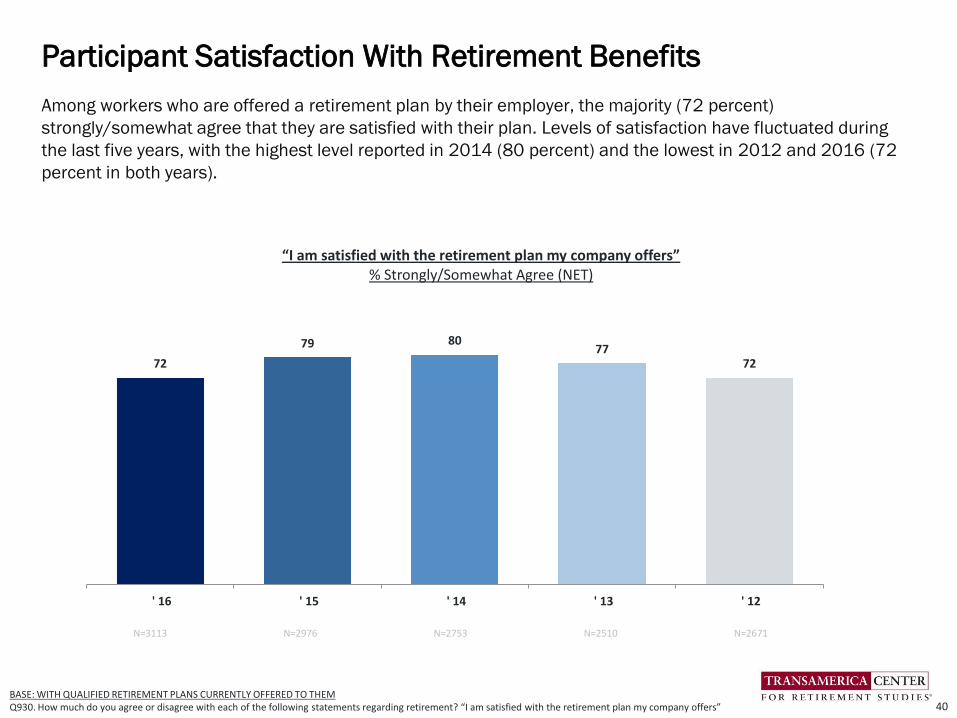
Among workers who are offered a retirement plan by their employer, the majority (72 percent)
strongly/somewhat agree that they are satisfied with their plan. Levels of satisfaction have fluctuated during
the last five years, with the highest level reported in 2014 (80 percent) and the lowest in 2012 and 2016 (72
percent in both years).
Participant Satisfaction With Retirement Benefits
40BASE: WITH QUALIFIED RETIREMENT PLANS CURRENTLY OFFERED TO THEMQ930. How much do you agree or disagree with each of the following statements regarding retirement? “I am satisfied with the retirement plan my company offers”
N=3113 N=2976 N=2753 N=2510 N=2671
72
79 8077
72
' 16 ' 15 ' 14 ' 13 ' 12
“I am satisfied with the retirement plan my company offers”% Strongly/Somewhat Agree (NET)

Three in five workers who participate in their employer-sponsored 401(k) or similar plan (60 percent) say they
use some sort of automatic allocation approach to investing their retirement plan assets, such as a managed
account, strategic allocation fund and/or target date fund, significantly more than in previous years. Another 41
percent prefer a more do-it-yourself approach and set their own asset allocation percentages among the
available funds.
Approach to Investing in Retirement Plan
41BASE: THOSE PARTICIPATING IN QUALIFIED PLANQ1466. What is your current approach to investing in your employer-sponsored retirement plan? Select all.
’16N=2159
’15N=2295
’14N=2172
I set my own asset allocation percentages among the available funds
I invest in an account (or service) that is managed by a professional investment advisor and I do not have to make investment or allocation decisions
I invest in a strategic allocation fund that is designed to address my specific risk tolerance profile
I invest in a target date fund that is designed to change allocation percentages as I approach my target retirement year
Not sure
44
23
20
19
16
Investments in Employer-Sponsored Retirement Plan (%)
NET –Professionally Managed
= 51%
45
24
24
20
12
NET –Professionally Managed
= 54%
41
28
22
23
11
NET –Professionally Managed
= 60%
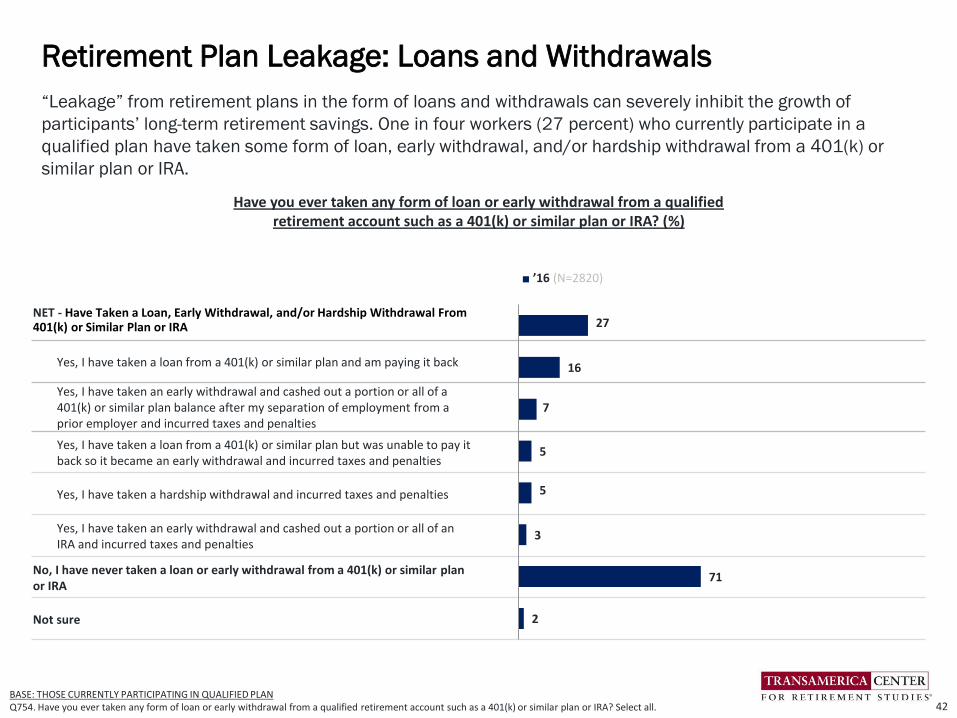
“Leakage” from retirement plans in the form of loans and withdrawals can severely inhibit the growth of
participants’ long-term retirement savings. One in four workers (27 percent) who currently participate in a
qualified plan have taken some form of loan, early withdrawal, and/or hardship withdrawal from a 401(k) or
similar plan or IRA.
Retirement Plan Leakage: Loans and Withdrawals
42BASE: THOSE CURRENTLY PARTICIPATING IN QUALIFIED PLANQ754. Have you ever taken any form of loan or early withdrawal from a qualified retirement account such as a 401(k) or similar plan or IRA? Select all.
■ ’16 (N=2820)
NET - Have Taken a Loan, Early Withdrawal, and/or Hardship Withdrawal From 401(k) or Similar Plan or IRA
Yes, I have taken a loan from a 401(k) or similar plan and am paying it back
Yes, I have taken an early withdrawal and cashed out a portion or all of a 401(k) or similar plan balance after my separation of employment from a prior employer and incurred taxes and penalties
Yes, I have taken a loan from a 401(k) or similar plan but was unable to pay it back so it became an early withdrawal and incurred taxes and penalties
Yes, I have taken a hardship withdrawal and incurred taxes and penalties
Yes, I have taken an early withdrawal and cashed out a portion or all of an IRA and incurred taxes and penalties
No, I have never taken a loan or early withdrawal from a 401(k) or similar plan or IRA
Not sure
27
16
7
5
5
3
71
2
Have you ever taken any form of loan or early withdrawal from a qualified retirement account such as a 401(k) or similar plan or IRA? (%)
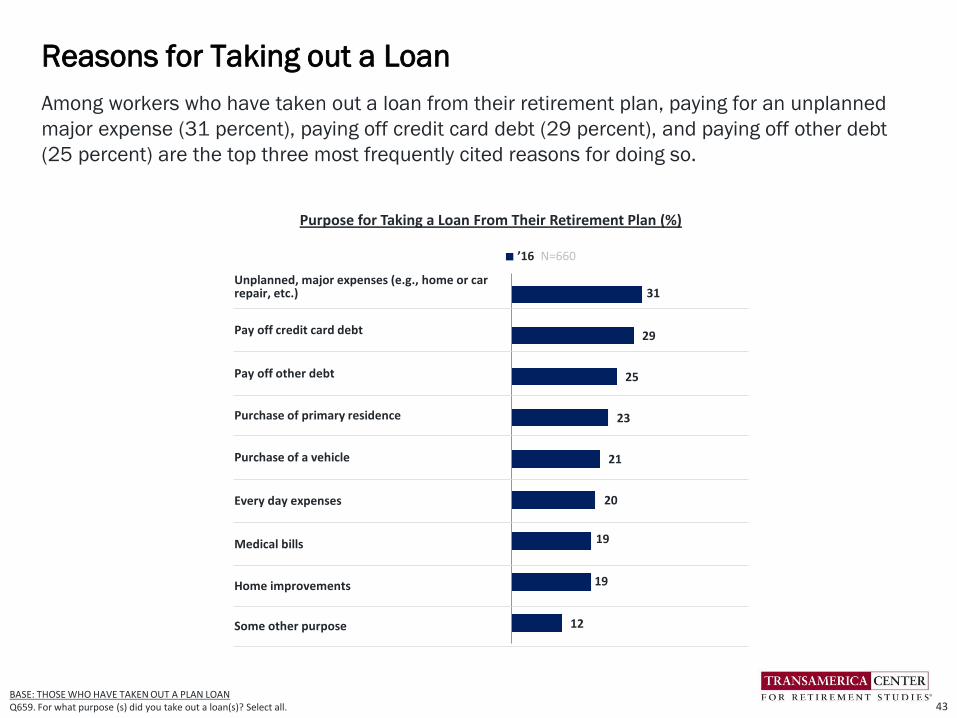
Among workers who have taken out a loan from their retirement plan, paying for an unplanned
major expense (31 percent), paying off credit card debt (29 percent), and paying off other debt
(25 percent) are the top three most frequently cited reasons for doing so.
Reasons for Taking out a Loan
43
31
29
25
23
21
20
19
19
12
BASE: THOSE WHO HAVE TAKEN OUT A PLAN LOANQ659. For what purpose (s) did you take out a loan(s)? Select all.
Purpose for Taking a Loan From Their Retirement Plan (%)
■ ’16 N=660
Unplanned, major expenses (e.g., home or car repair, etc.)
Pay off credit card debt
Pay off other debt
Purchase of primary residence
Purchase of a vehicle
Every day expenses
Medical bills
Home improvements
Some other purpose
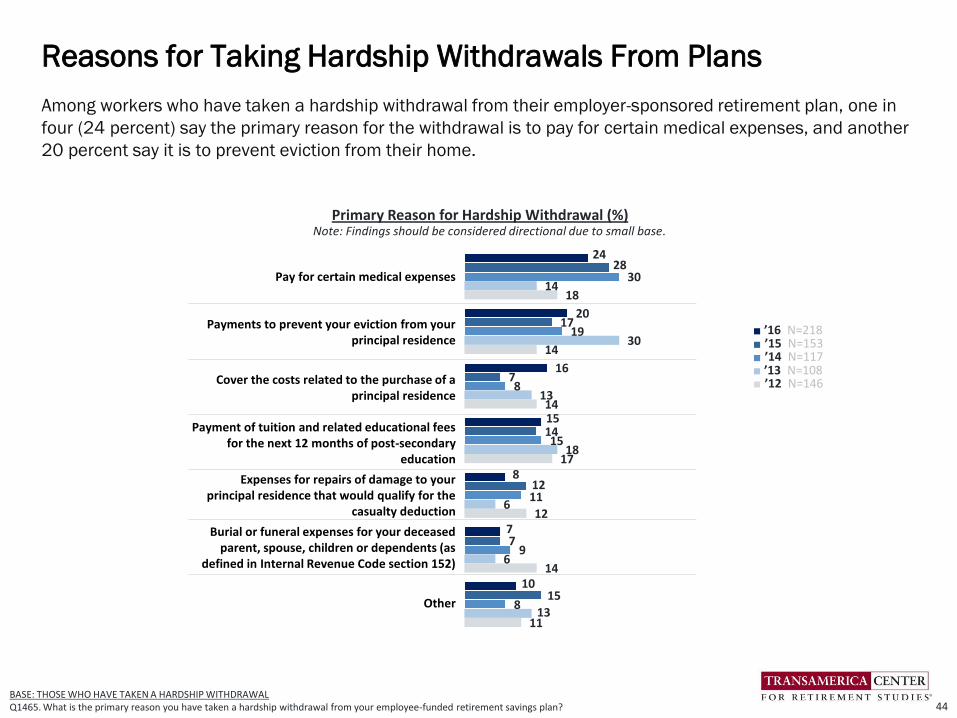
Pay for certain medical expenses
Payments to prevent your eviction from your principal residence
Cover the costs related to the purchase of a principal residence
Payment of tuition and related educational fees for the next 12 months of post-secondary
education
Expenses for repairs of damage to your principal residence that would qualify for the
casualty deduction
Burial or funeral expenses for your deceased parent, spouse, children or dependents (as
defined in Internal Revenue Code section 152)
Other
BASE: THOSE WHO HAVE TAKEN A HARDSHIP WITHDRAWALQ1465. What is the primary reason you have taken a hardship withdrawal from your employee-funded retirement savings plan?
■ ’16 N=218■ ’15 N=153■ ’14 N=117■ ’13 N=108■ ’12 N=146
24
20
16
15
8
7
10
28
17
7
14
12
7
15
30
19
8
15
11
9
8
14
30
13
18
6
6
13
18
14
14
17
12
14
11
Among workers who have taken a hardship withdrawal from their employer-sponsored retirement plan, one in
four (24 percent) say the primary reason for the withdrawal is to pay for certain medical expenses, and another
20 percent say it is to prevent eviction from their home.
Reasons for Taking Hardship Withdrawals From Plans
44
Note: Findings should be considered directional due to small base.Primary Reason for Hardship Withdrawal (%)
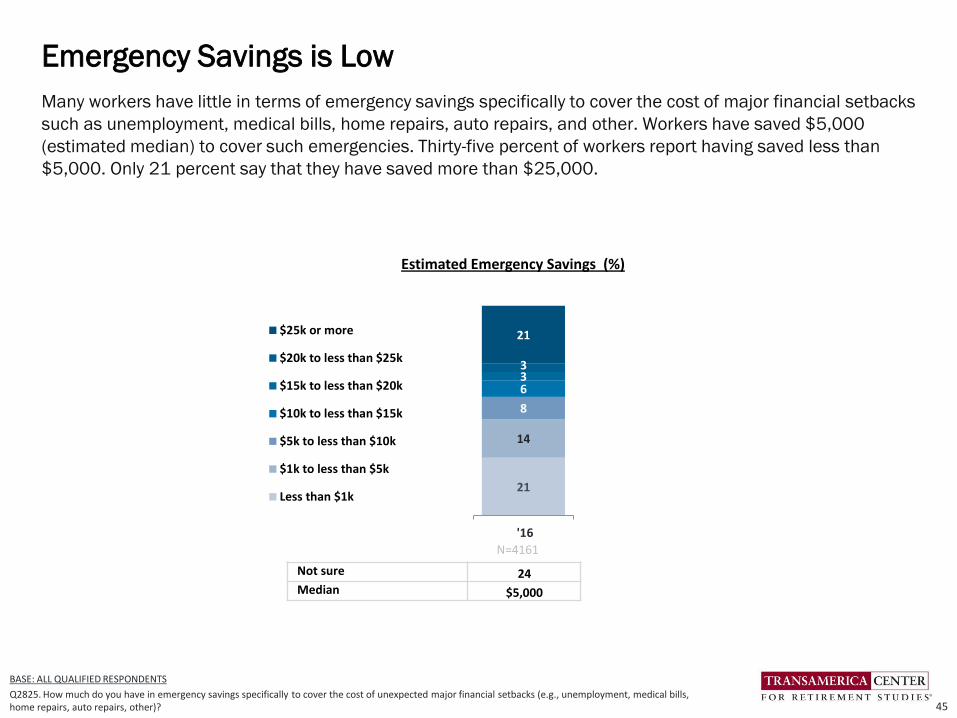
Many workers have little in terms of emergency savings specifically to cover the cost of major financial setbacks
such as unemployment, medical bills, home repairs, auto repairs, and other. Workers have saved $5,000
(estimated median) to cover such emergencies. Thirty-five percent of workers report having saved less than
$5,000. Only 21 percent say that they have saved more than $25,000.
Emergency Savings is Low
45
21
14
8
633
21
'16
$25k or more
$20k to less than $25k
$15k to less than $20k
$10k to less than $15k
$5k to less than $10k
$1k to less than $5k
Less than $1k
Not sure 24Median $5,000
Estimated Emergency Savings (%)
BASE: ALL QUALIFIED RESPONDENTS
Q2825. How much do you have in emergency savings specifically to cover the cost of unexpected major financial setbacks (e.g., unemployment, medical bills, home repairs, auto repairs, other)?
N=4161
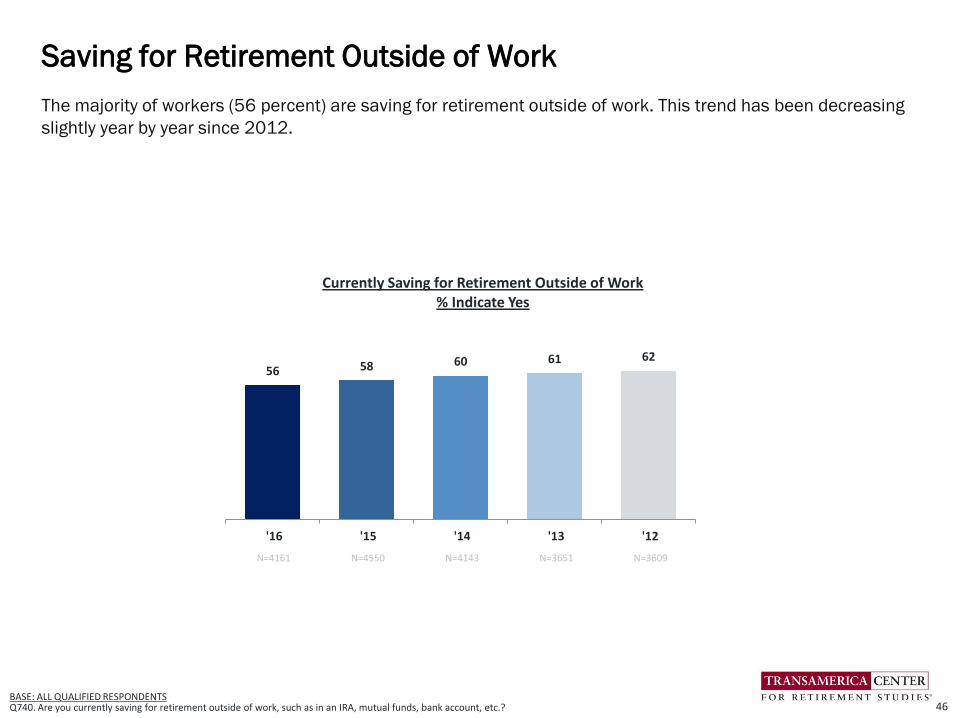
56 58 60 61 62
'16 '15 '14 '13 '12
Currently Saving for Retirement Outside of Work% Indicate Yes
BASE: ALL QUALIFIED RESPONDENTS Q740. Are you currently saving for retirement outside of work, such as in an IRA, mutual funds, bank account, etc.?
N=4161 N=4550 N=4143 N=3651 N=3609
The majority of workers (56 percent) are saving for retirement outside of work. This trend has been decreasing
slightly year by year since 2012.
Saving for Retirement Outside of Work
46
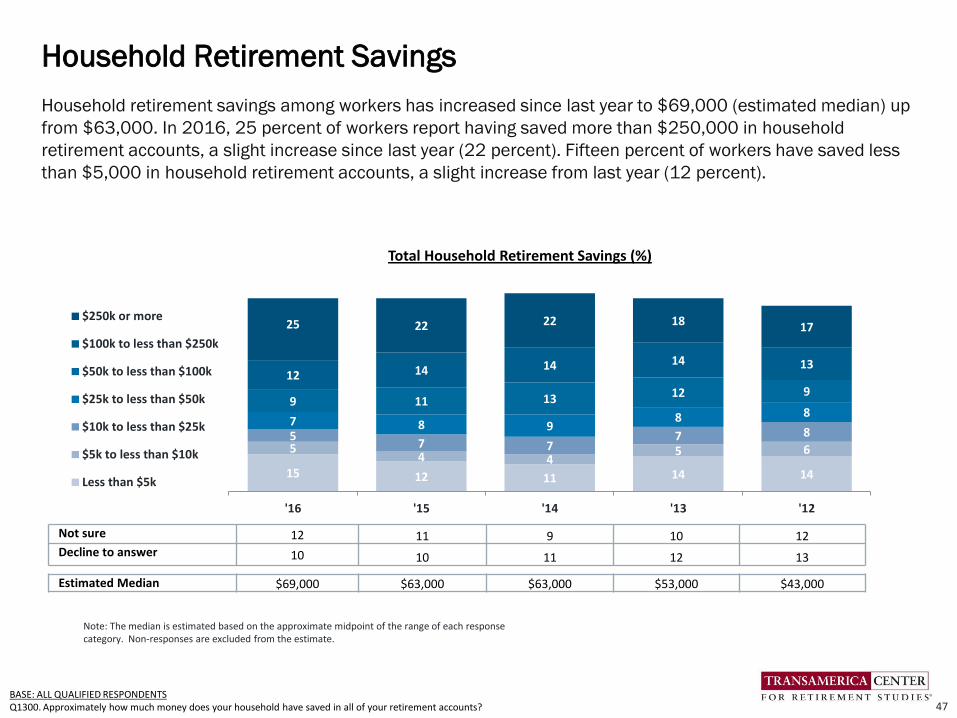
Household retirement savings among workers has increased since last year to $69,000 (estimated median) up
from $63,000. In 2016, 25 percent of workers report having saved more than $250,000 in household
retirement accounts, a slight increase since last year (22 percent). Fifteen percent of workers have saved less
than $5,000 in household retirement accounts, a slight increase from last year (12 percent).
Household Retirement Savings
47BASE: ALL QUALIFIED RESPONDENTSQ1300. Approximately how much money does your household have saved in all of your retirement accounts?
15 12 11 14 14
54 4
5 65
7 77 8
7 8 98 8
9 11 13 12 912 14 14 14 13
25 22 22 18 17
'16 '15 '14 '13 '12
$250k or more
$100k to less than $250k
$50k to less than $100k
$25k to less than $50k
$10k to less than $25k
$5k to less than $10k
Less than $5k
Not sure 12 11 9 10 12Decline to answer 10 10 11 12 13
Estimated Median $69,000 $63,000 $63,000 $53,000 $43,000
Note: The median is estimated based on the approximate midpoint of the range of each response category. Non-responses are excluded from the estimate.
Total Household Retirement Savings (%)
32
31
30
30
35
45
45
45
44
41
17
18
18
18
16
6
6
8
8
8
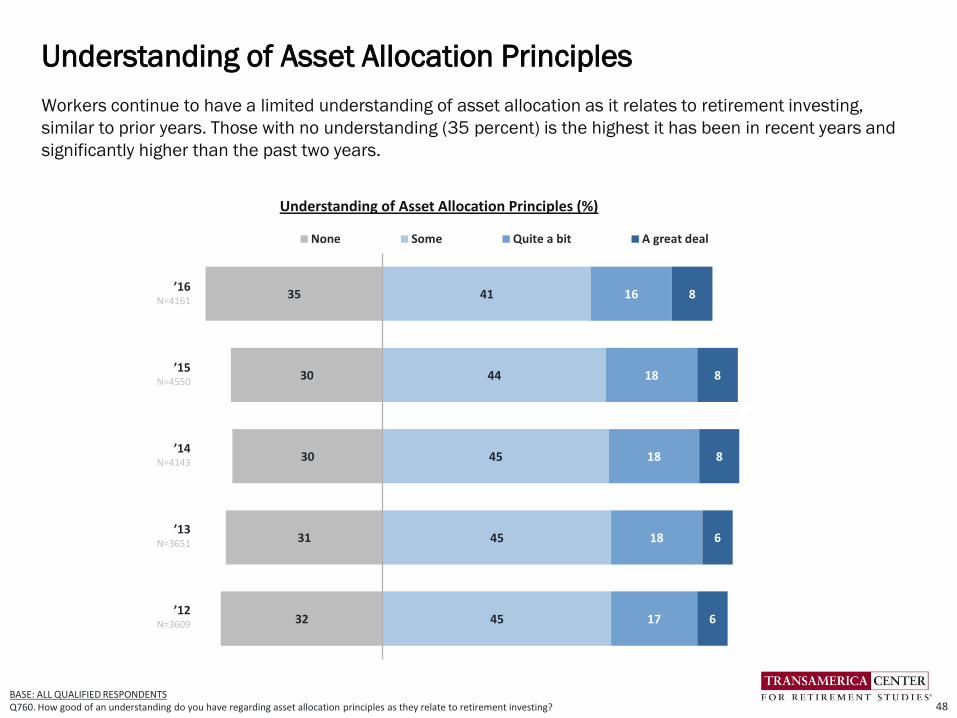
None Some Quite a bit A great deal
’16N=4161
’15N=4550
’14N=4143
’13N=3651
’12N=3609
BASE: ALL QUALIFIED RESPONDENTSQ760. How good of an understanding do you have regarding asset allocation principles as they relate to retirement investing?
Workers continue to have a limited understanding of asset allocation as it relates to retirement investing,
similar to prior years. Those with no understanding (35 percent) is the highest it has been in recent years and
significantly higher than the past two years.
Understanding of Asset Allocation Principles
48
Understanding of Asset Allocation Principles (%)

21 20 20 19 17
19 21 20 20 21
42 42 44 44 43
18 17 16 17 19
'16 '15 '14 '13 '12
Mostly in bonds, money marketfunds, cash and other stableinvestments
Relatively equal mix of stocks andinvestments such as bonds, moneymarket funds, and cash
Mostly in stocks with little or nomoney in investments such as bonds,money market funds, and cash
Not sure
BASE: INVESTING FOR RETIREMENTQ770. How are your retirement savings invested?
N=3124 N=3398 N=3130 N=2731 N=2770
Among those who are saving for retirement, 42 percent of workers indicate that their retirement savings are
invested in an equal mix of stocks and bonds, a survey finding which is consistent with previous years. Twenty-
one percent of workers are “not sure” how their retirement savings are invested.
Retirement Investments: Asset Allocation
49
How Retirement Savings Are Invested (%)
50
209 10 14 12
23
17 19
26 26
21
1920
23 22
21
25 22
21 23
15
30 28
16 17
'16 '15 '14 '13 '12
$2m or more
$1m to less than $2m
$500k to less than $1m
$100k to less than $500k
Less than $100k
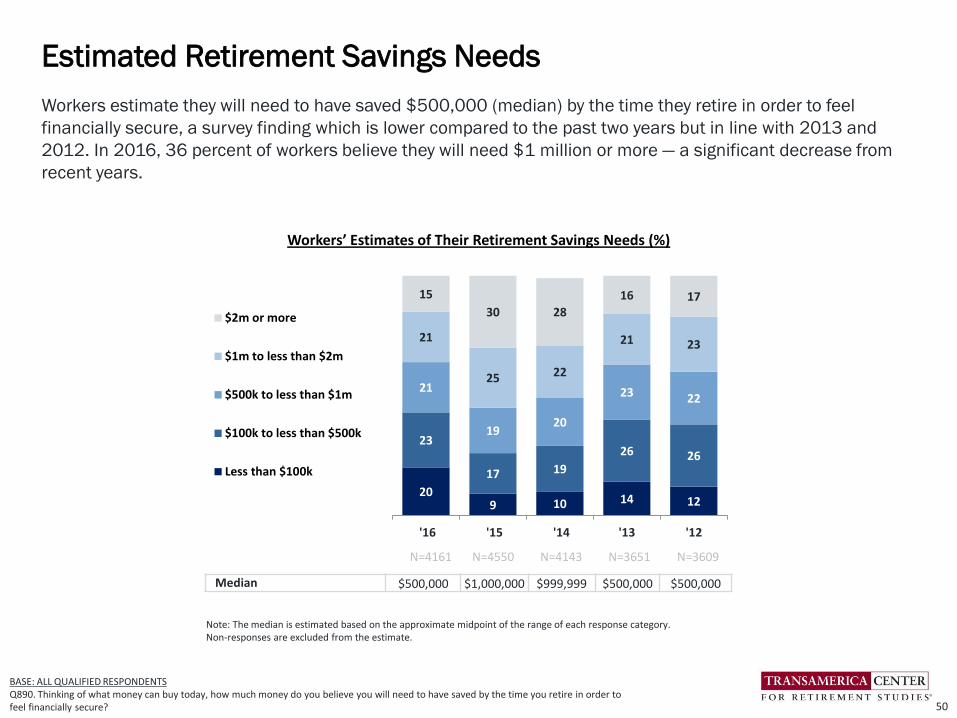
Median $500,000 $1,000,000 $999,999 $500,000 $500,000
Note: The median is estimated based on the approximate midpoint of the range of each response category. Non-responses are excluded from the estimate.
BASE: ALL QUALIFIED RESPONDENTSQ890. Thinking of what money can buy today, how much money do you believe you will need to have saved by the time you retire in order to feel financially secure?
Workers estimate they will need to have saved $500,000 (median) by the time they retire in order to feel
financially secure, a survey finding which is lower compared to the past two years but in line with 2013 and
2012. In 2016, 36 percent of workers believe they will need $1 million or more — a significant decrease from
recent years.
Estimated Retirement Savings Needs
Workers’ Estimates of Their Retirement Savings Needs (%)
N=4161 N=4550 N=4143 N=3651 N=3609
’16 ’15 ’14 ’13 ’12
N=4056 N=4485 N=4064 N=3610 N=3560
Guessed
Estimated based on current living expenses
*Used a retirement calculator
Expected earnings on investments
Read / heard that is how much is needed
Amount given to me by financial advisor
Completed a worksheet / did calculation
Other
47
27
5
4
3
10
3
49
25
5
5
3
9
4
53
20
7
5
3
3
3
6
*added in 2014BASE: PROVIDED ESTIMATE OF MONEY NEEDED FOR RETIREMENTQ900. How did you arrive at that number?
50
22
7
5
4
5
4
4
47
23
9
6
5
4
4
2
Forty-seven percent of workers say that they “guessed” when asked how they estimated their retirement savings
needs. Twenty-three percent estimated the amount based on current living expenses. Only nine percent used a
retirement calculator.
Basis for Estimating Retirement Savings Needs
51
N/A N/A
How Workers Estimated Their Retirement Savings Needs (%)

◄ Do not have a plan Have a plan ►
’16N=4161
’15N=4550
’14N= 4143
’13N= 3651
’12N= 3609 43
42
39
42
37
45
46
47
44
47
12
12
14
14
16
57
58
61
58
63
Do not have a plan Have a plan, butnot written down
Have a written plan
BASE: ALL QUALIFIED RESPONDENTSQ1155. Which of the following best describes your retirement strategy?
Sixty-three percent of workers have some form of a retirement strategy — but only 16 percent have a written
plan, while 47 percent have a plan that is not written down. This finding is consistent with prior years.
Retirement Strategies: Written, Unwritten, or None
52
Workers’ Retirement Strategies (%)

55
52
49
48
46
40
37
31
27
27
21
19
14
3
7
57
57
54
52
50
41
33
22
29
22
19
15
4
8
*added in 2016** added in 2014BASE: HAS RETIREMENT STRATEGYQ1510. Which of the following have you factored into your retirement strategy? Select all.
Workers who have a retirement strategy take into account many different factors in their planning, including
Social Security and Medicare benefits, on-going living expenses, and total savings and income needs. Workers
are not as likely to factor in taxes, long-term care insurance, or estate planning.
Retirement Strategies: Factors
56
62
60
51
46
42
25
25
22
15
4
9
59
65
60
49
48
39
22
27
20
15
6
8
56
58
57
53
52
42
33
25
29
25
20
17
4
6
’16 ’15 ’14 ’13 ’12N=2479 N=2591 N=2382 N=1957 N=1922
Social Security and Medicare benefits
On-going living expenses
Total retirement savings and income needs
**A retirement budget that includes basic living expenses N/A N/A
Healthcare costs
*A plan to help ensure my savings last throughout my retirement N/A N/A N/A N/A
Investment returns
Inflation
Long-term care needs
**Pursuing retirement dreams N/A N/A
Tax planning
Estate planning
Contingency plans for retiring sooner than expected and/or savings shortfalls
Other
Not sure
53
Among workers who dream of traveling in retirement, 58 percent are “very” or “somewhat” confident that their
current financial strategy will allow them to meet their travel goals throughout retirement. Sixteen percent say
that they haven’t given much thought to a financial strategy for travel.
Confidence that Financial Strategy Will Enable Travel Goals
54
Confidence That Current Financial Strategy Will Allow Meeting Retirement Travel-Related Goals (%)
■ ’16 N=2748
Very confident
Somewhat confident
Not too confident
Not at all confident
I haven’t given much thought to a financial strategy for travel in retirement
18
40
16
10
16
BASE: WORKERS WHO DREAM OF TRAVELING IN RETIREMENTQ2845. How confident are you that your current financial strategy will allow you to meet your travel goals throughout retirement?
NET CONFIDENT58%
3935 37 36
33
'16 '15 '14 '13 '12
74
49
46
42
25
7
73
43
45
37
22
5
76
44
44
36
25
5
76
45
50
36
20
10
77
44
45
34
23
9
BASE: INVESTING FOR RETIREMENTQ860. Do you use a professional financial advisor to help manage your retirement savings or investments?BASE: USE FINANCIAL ADVISOR Q870. What types of services do you use your professional financial advisor to perform? Select all.
N=3124 N=3398 N=3130 N=2731 N=2770
■ ’16 N= 1245
■ ’15 N=1257■ ’14 N=1153■ ’13 N=966
■ ’12 N=828
Make retirement investment recommendations such as mutual
funds, annuities, stocks, bonds, etc.
Calculate retirement savings goal
General financial planning
Recommend other retirement-related product needs including health, life,
and long-term care insurance
Tax preparation
Some other services
Among workers investing for retirement, 39 percent rely on a professional advisor to help manage their
retirement savings or investments, a significant increase from last year. Of those who use advisors, most do so
to get retirement investment recommendations (74 percent), while 49 percent use advisors to help calculate a
retirement goal and 46 percent for general financial planning.
Use a Professional Financial Advisor
55
Use a Professional Financial Advisor to Help Manage Your Retirement Savings or
Investments, % Indicate “Yes”
Types of Services Financial Advisor Performs (%)
33
27
31
23
16
20
15
17
14
14
11
5
3
4
6
19
34
34
30
30
22
17
19
14
17
9
4
3
6
16
Sources of Information ’16 ’15 ’14 ’13 ’12Multiple responses N=4161 N=4550 N=4143 N=3651 N=3609
Friends/Family
Financial Websites
Financial Planner/Broker
Retirement plan provider website
Employer
*Online newspapers, magazines, and blogs N/A
Retirement calculators
Print newspapers/magazines
Financial-related TV shows
Plan provider printed material
Accountant
Insurance agent
Online social media* N/A
Lawyer
Other
None
32
29
27
19
17
20
16
16
15
12
10
6
3
3
6
19
32
28
27
23
19
19
18
15
13
12
10
5
5
4
4
19
*added in 2013
BASE: ALL QUALIFIED RESPONDENTSQ825. What sources of information do you rely on for retirement planning and investing? Select all.
Friends and family continue to be the top source of information for workers when it comes to retirement
planning and investing. Other popular information sources include financial websites, financial
planners/brokers, and retirement plan provider websites.
Information Sources: Retirement Planning & Investing
56
30
25
28
22
18
17
16
15
13
13
9
4
3
3
6
21
BASE: ALL QUALIFIED RESPONDENTS Q826. Of these sources, which one influences your decisions the most?
Sources of Information
’16Most
Influential
’15Most
Influential
’14Most
Influential
’13Most
Influential
’12Most
Influential
N=4161 N=4550 N=4143 N=2010 N=3609
Financial planner/broker 19 20 20 21 20
Friends/Family 14 13 14 16 16
Financial websites 9 9 10 8 8
Retirement plan provider website
9 9 7 8 7
Employer 6 5 4 4 5
Online newspapers, magazines, and blogs*
4 4 4 4 4
Print newspapers/magazines
3 3 2 3 3
Retirement calculators 3 3 3 2 3
Accountant 2 2 3 3 2
Financial-related tv shows 2 2 3 2 3
Plan provider printed material
2 3 2 3 2
Insurance agent 1 1 1 1 1
Lawyer 1 1 1 <1 1
Online social media* 1 0 0 <1 <1
Other 3 4 4 4 3
None 21 21 22 21 21
Financial planners/brokers are most frequently cited as the most influential source in helping workers make
decisions about retirement planning, with 19 percent citing them. Family and friends are most influential for 14
percent of workers. This trends remains consistent with recent years.
Most Influential Source of Information
57
’16 ’15N=3071 N=3238
Quarterly statements from the retirement plan provider
Professional advice on how to invest my retirement savings from the retirement plan provider
Online tools and calculators to project retirement savings and income needs on the retirement plan provider's website
Educational articles and videos from the retirement plan provider that share ideas and insights on how to save and plan for a financially secure retirement
Informational seminars, meetings, webinars, and/or workshops by the retirement plan provider
Informative emails sent to my work and/or my personal address from the retirement plan provider
Mobile apps from the retirement plan provider that include tools and calculators to project retirement savings and income needs
Mobile apps from the retirement plan provider to manage my account
Information on social media (e.g., Twitter, Facebook) from the retirement
44
42
46
47
40
47
41
39
30
41
41
35
29
32
24
27
27
18
85
83
81
76
72
71
68
66
48
Quarterly statements from the retirement plan provider continue to be seen as the most helpful resource for
retirement planning, saving, and investing. This is followed closely by professional advice. Workers are more
likely to say mobile apps from the retirement plan provider are helpful this year than last year.
Helpfulness of Resources Offered by Retirement Plan Provider
58
45
46
48
47
45
47
39
36
29
40
35
35
29
30
23
21
20
15
85
81
83
76
75
71
59
56
44
New question in 2015.BASE: THOSE OFFERED A RETIREMENT PLANQ2035. How helpful do you find the following from your employer’s retirement plan provider in assisting you to plan, save, and invest for retirement?
■ Somewhat helpful ■ Very helpful
Helpfulness of Resources
% Very/Somewhat Helpful (NET)
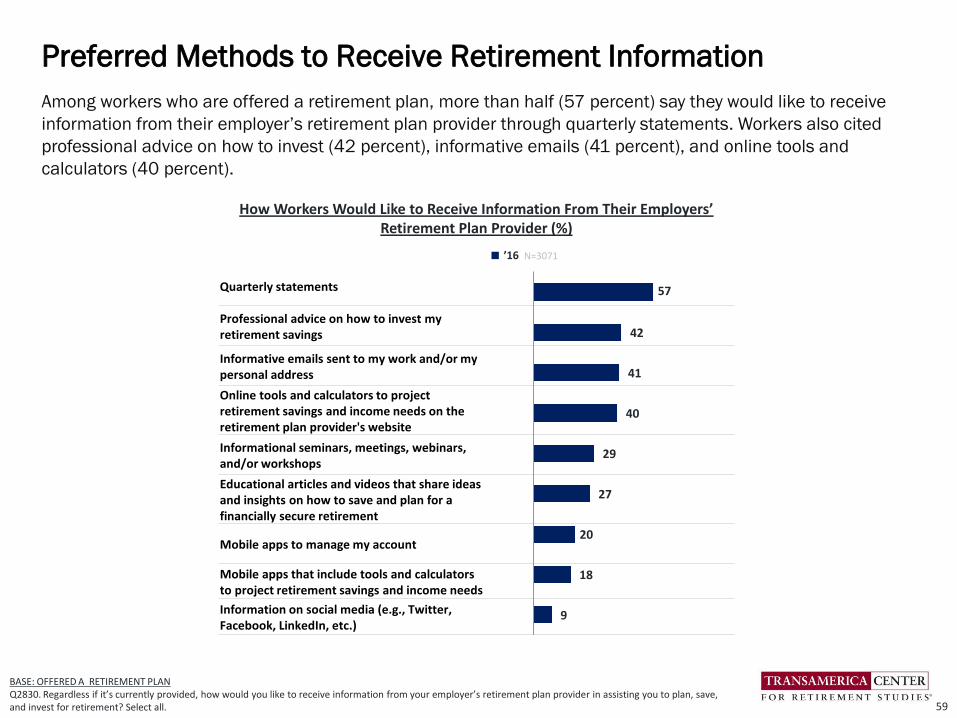
Among workers who are offered a retirement plan, more than half (57 percent) say they would like to receive
information from their employer’s retirement plan provider through quarterly statements. Workers also cited
professional advice on how to invest (42 percent), informative emails (41 percent), and online tools and
calculators (40 percent).
Preferred Methods to Receive Retirement Information
59
How Workers Would Like to Receive Information From Their Employers’ Retirement Plan Provider (%)
■ ’16 N=3071
Quarterly statements
Professional advice on how to invest my retirement savings
Informative emails sent to my work and/or my personal address
Online tools and calculators to project retirement savings and income needs on the retirement plan provider's website
Informational seminars, meetings, webinars, and/or workshops
Educational articles and videos that share ideas and insights on how to save and plan for a financially secure retirement
Mobile apps to manage my account
Mobile apps that include tools and calculatorsto project retirement savings and income needs
Information on social media (e.g., Twitter, Facebook, LinkedIn, etc.)
57
42
41
40
29
27
20
18
9
BASE: OFFERED A RETIREMENT PLANQ2830. Regardless if it’s currently provided, how would you like to receive information from your employer’s retirement plan provider in assisting you to plan, save, and invest for retirement? Select all.

’16N=4161
’15N=4550
’14N=4143
’13N=3651
’12N=3609
A good starting point that is easy to understand
Larger tax breaks/incentives for saving in a retirement plan
Educational materials that are easier to understand
A financial advisor
A greater sense of urgency(or fear) that I need to save
Other
Nothing - I am already educated enough
Nothing - I'm just not interested
38
38
35
34
23
4
10
9
34
37
34
29
22
5
12
10
35
40
34
30
25
5
10
9
33
40
34
27
24
5
13
9
35
41
39
27
23
4
13
8
BASE: ALL QUALIFIED RESPONDENTSQ2040. What would motivate you to learn more about saving and investing for retirement? Select all.
Workers most frequently cite “a good starting point that is easier to understand” and “larger tax breaks /
incentives for saving in a retirement plan” as motivators for learning more about saving and investing for
retirement. Ten percent of workers feel that they are already educated enough and nine percent say that they
are just not interested. These findings are relatively consistent for the past five years.
Motivators to Learn More About Retirement Investing
60
Motivators to Learn More About Saving and Investing For Retirement (%)

BASE: THOSE WITH QUALIFIED PLANS CURRENTLY OFFERED TO THEM Q605. Are you aware of the Roth 401(k)/403(b) option? (Allows you to make post-tax contributions to your 401(k)/403(b).)
75 73 7268 68
'16 '15 '14 '13 '12
Workers Aware of the Roth 401(k)/403(b) Option% Indicate Yes
N=2820 N=2976 N=2753 N=2510 N=2671
Among workers who are offered a retirement plan, 75 percent are aware of a Roth 401(k) option (including
those who are and who are not offered the option).
Awareness of Roth 401(k)
61
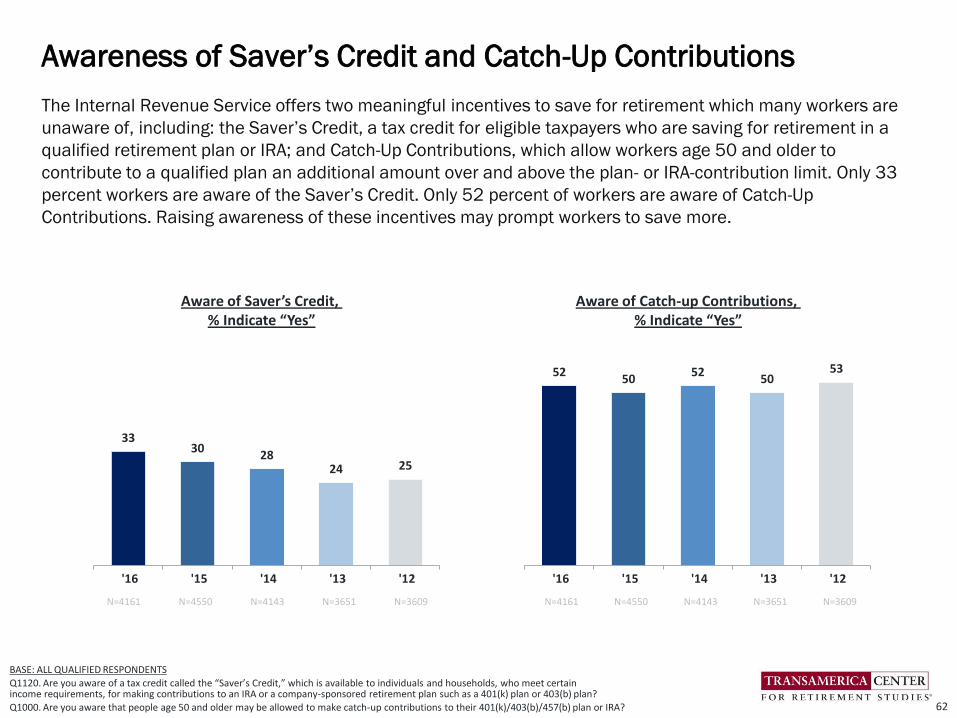
3330
2824 25
'16 '15 '14 '13 '12
BASE: ALL QUALIFIED RESPONDENTS
Q1120. Are you aware of a tax credit called the “Saver’s Credit,” which is available to individuals and households, who meet certainincome requirements, for making contributions to an IRA or a company-sponsored retirement plan such as a 401(k) plan or 403(b) plan?
Q1000. Are you aware that people age 50 and older may be allowed to make catch-up contributions to their 401(k)/403(b)/457(b) plan or IRA?
N=4161 N=4550 N=4143 N=3651 N=3609
5250
5250
53
'16 '15 '14 '13 '12
N=4161 N=4550 N=4143 N=3651 N=3609
The Internal Revenue Service offers two meaningful incentives to save for retirement which many workers are
unaware of, including: the Saver’s Credit, a tax credit for eligible taxpayers who are saving for retirement in a
qualified retirement plan or IRA; and Catch-Up Contributions, which allow workers age 50 and older to
contribute to a qualified plan an additional amount over and above the plan- or IRA-contribution limit. Only 33
percent workers are aware of the Saver’s Credit. Only 52 percent of workers are aware of Catch-Up
Contributions. Raising awareness of these incentives may prompt workers to save more.
Awareness of Saver’s Credit and Catch-Up Contributions
62
Aware of Saver’s Credit, % Indicate “Yes”
Aware of Catch-up Contributions, % Indicate “Yes”

myRA (my Retirement Account) is a new way to start saving for your future developed by the United States
Department of the Treasury and launched in 2015. myRA is a Roth IRA that invests in a new United States
Treasury retirement savings bond, which will not lose money. myRA was designed for people without access to
employer-sponsored retirement savings plans and for people looking for a simple, safe, and affordable way to
start saving for retirement. myRA accounts cost nothing to open, have no fees, and don’t require a minimum
amount of savings.* Just one in five workers (21 percent) are aware of myRA, according to the survey findings.
Awareness of myRA
63
21
'16
New question added in 2016.
*Source: www.myra.gov
BASE: ALL QUALIFIED RESPONDENTSQ2820. Are you aware of myRA, the retirement savings account that was developed by the U.S. Department of the Treasury to help people start saving for retirement in a simple, safe, and affordable way?
N=4161
Workers Aware of the myRA OptionYes (%)
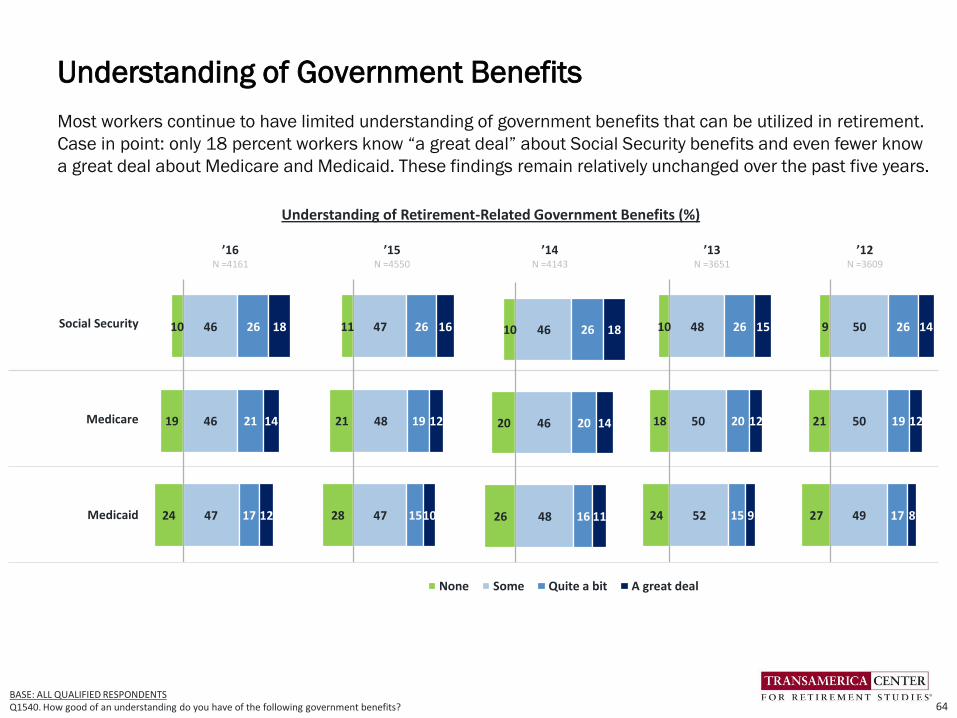
’16N =4161
’15N =4550
’14N =4143
’13N =3651
’12N =3609
Social Security
Medicare
Medicaid
Most workers continue to have limited understanding of government benefits that can be utilized in retirement.
Case in point: only 18 percent workers know “a great deal” about Social Security benefits and even fewer know
a great deal about Medicare and Medicaid. These findings remain relatively unchanged over the past five years.
BASE: ALL QUALIFIED RESPONDENTSQ1540. How good of an understanding do you have of the following government benefits?
27
21
9
49
50
50
17
19
26
8
12
14
64
Understanding of Government Benefits
26
20
10
48
46
46
16
20
26
11
14
18
None Some Quite a bit A great deal
24
19
10
47
46
46
17
21
26
12
14
18
28
21
11
47
48
47
15
19
26
10
12
16
24
18
10
52
50
48
15
20
26
9
12
15
Understanding of Retirement-Related Government Benefits (%)
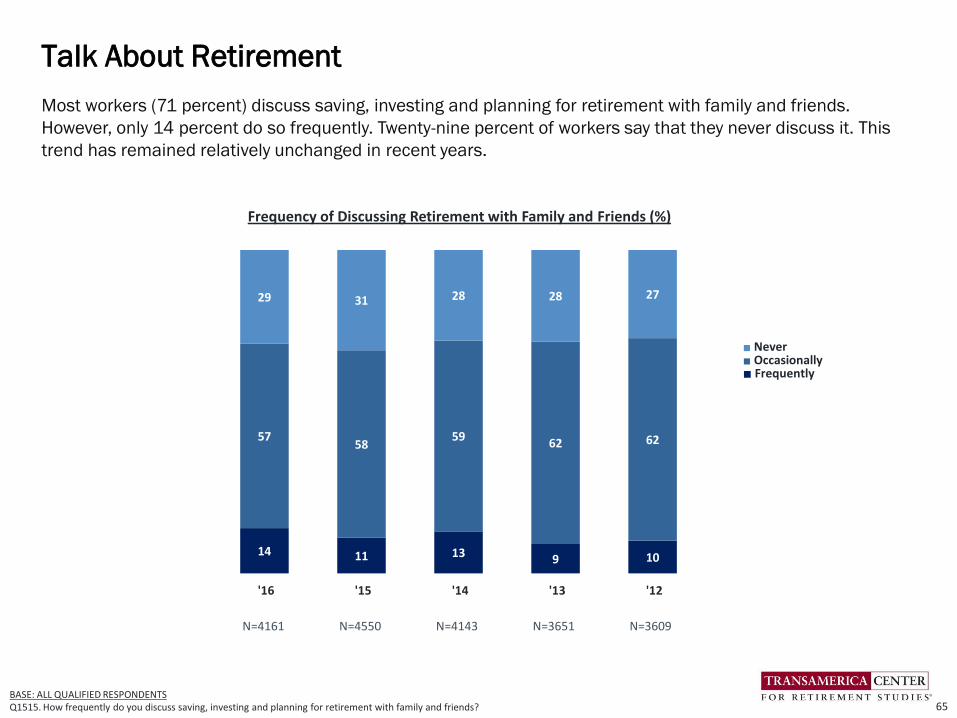
Most workers (71 percent) discuss saving, investing and planning for retirement with family and friends.
However, only 14 percent do so frequently. Twenty-nine percent of workers say that they never discuss it. This
trend has remained relatively unchanged in recent years.
Talk About Retirement
65
109131114
626259
5857
2728283129
'12 '13 '14 '15 '16
BASE: ALL QUALIFIED RESPONDENTSQ1515. How frequently do you discuss saving, investing and planning for retirement with family and friends?
Frequency of Discussing Retirement with Family and Friends (%)
■ Never■ Occasionally■ Frequently
N=4161 N=4550 N=4143 N=3651 N=3609
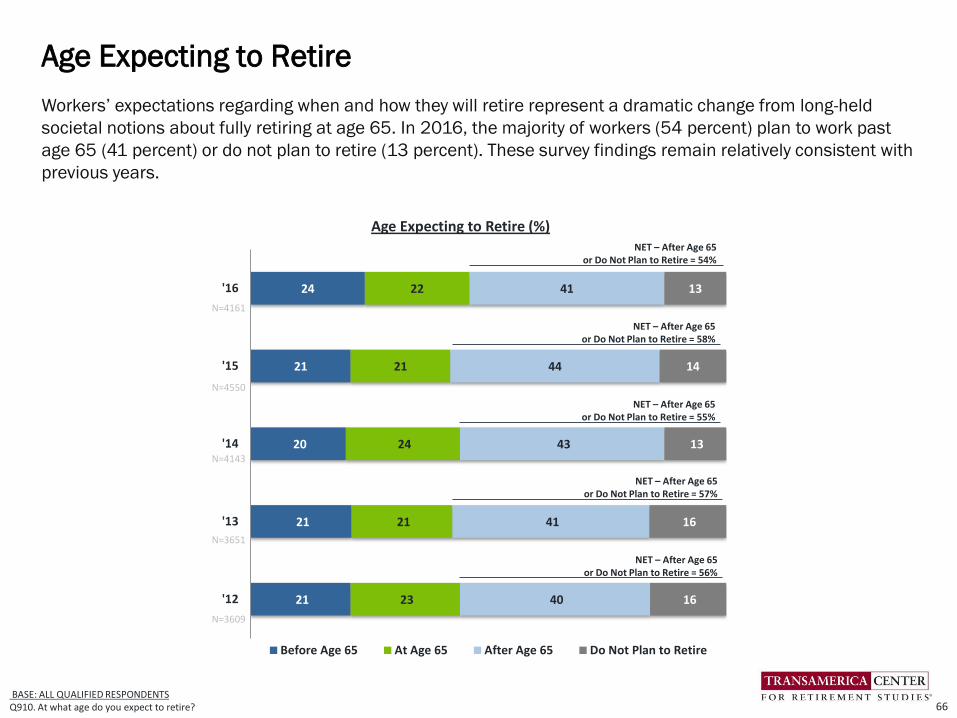
N=4161
N=4143
N=4550
N=3651
N=3609
BASE: ALL QUALIFIED RESPONDENTSQ910. At what age do you expect to retire?
Workers’ expectations regarding when and how they will retire represent a dramatic change from long-held
societal notions about fully retiring at age 65. In 2016, the majority of workers (54 percent) plan to work past
age 65 (41 percent) or do not plan to retire (13 percent). These survey findings remain relatively consistent with
previous years.
Age Expecting to Retire
66
21
21
20
21
24
23
21
24
21
22
40
41
43
44
41
16
16
13
14
13
'12
'13
'14
'15
'16
Before Age 65 At Age 65 After Age 65 Do Not Plan to Retire
NET – After Age 65 or Do Not Plan to Retire = 56%
NET – After Age 65 or Do Not Plan to Retire = 57%
NET – After Age 65 or Do Not Plan to Retire = 55%
NET – After Age 65 or Do Not Plan to Retire = 58%
NET – After Age 65 or Do Not Plan to Retire = 54%
Age Expecting to Retire (%)

NET Yes:
Fifty-one percent of workers plan to continue working in retirement, either part-time (38 percent) or full-time (13
percent). Twenty-seven percent do not plan to work in retirement and 22 percent are “not sure.” These findings
are relatively consistent since 2014.
Working In Retirement
67BASE: ALL QUALIFIED RESPONDENTSQ1525. Do you plan to work after you retire?
Plan to Work in Retirement (%)
38 39 40 44 43
13 12 1210 11
27 25 2719 19
22 24 2127 27
Yes, I plan to work full-timeYes, I plan to work part-timeNo, I do not plan to workNot sure
N=4550
’15
N=3651 N=3609N=4143N= 4161
’16 ’14 ’13 ’12
51 52 54 5451
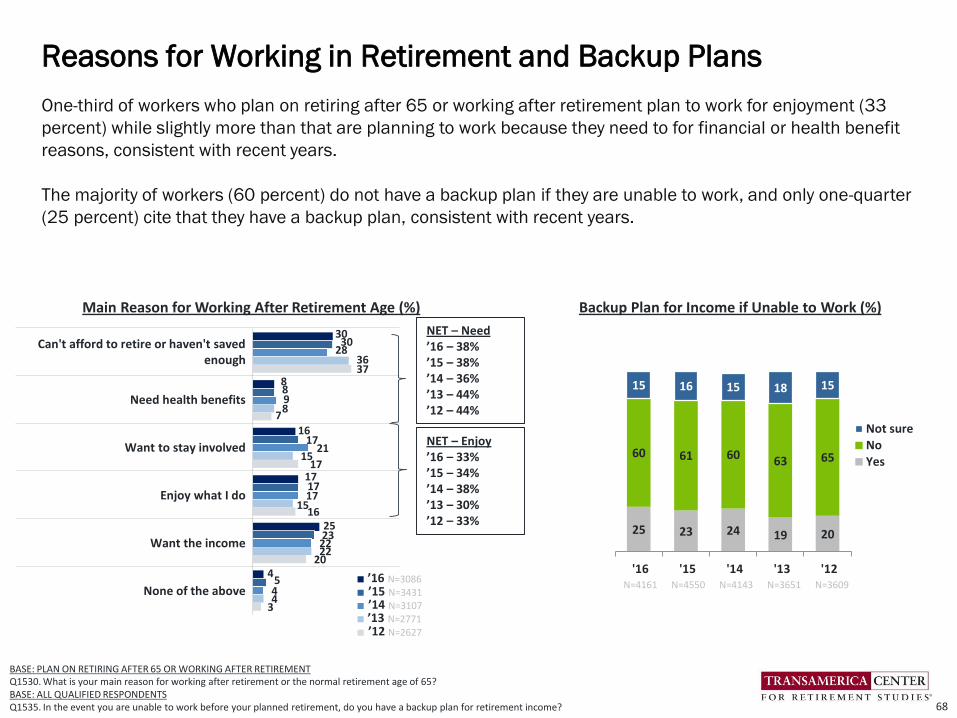
BASE: PLAN ON RETIRING AFTER 65 OR WORKING AFTER RETIREMENTQ1530. What is your main reason for working after retirement or the normal retirement age of 65? BASE: ALL QUALIFIED RESPONDENTSQ1535. In the event you are unable to work before your planned retirement, do you have a backup plan for retirement income?
25 23 24 19 20
60 61 60 63 65
15 16 15 18 15
'16 '15 '14 '13 '12
Not sureNoYes
Can't afford to retire or haven't saved enough
Need health benefits
Want to stay involved
Enjoy what I do
Want the income
None of the above
30
8
16
17
25
4
30
8
17
17
23
5
28
9
21
17
22
4
36
8
15
15
22
4
37
7
17
16
20
3
N=4161 N=4550 N=4143 N=3651 N=3609
One-third of workers who plan on retiring after 65 or working after retirement plan to work for enjoyment (33
percent) while slightly more than that are planning to work because they need to for financial or health benefit
reasons, consistent with recent years.
The majority of workers (60 percent) do not have a backup plan if they are unable to work, and only one-quarter
(25 percent) cite that they have a backup plan, consistent with recent years.
Reasons for Working in Retirement and Backup Plans
68
■ ’16 N=3086
■ ’15 N=3431■ ’14 N=3107■ ’13 N=2771
■ ’12 N=2627
Backup Plan for Income if Unable to Work (%)Main Reason for Working After Retirement Age (%)
NET – Need’16 – 38%’15 – 38%’14 – 36%’13 – 44%’12 – 44%
NET – Enjoy’16 – 33%’15 – 34%’14 – 38%’13 – 30%’12 – 33%

Only 23 percent of workers plan to immediately stop working at a specific point in time. Many are planning to
transition into retirement by either shifting from full-time to part-time (28 percent) or moving into a less
demanding or more personally satisfying role (14 percent). Another 22 percent plan to continue working as long
as possible in their current or similar position until they cannot work any longer, and 13 percent are “not sure”
about their transition.
Retirement Transitions: Phased Versus Immediate
69
18
20
22
29
26
28
17
15
14
14
14
14
8
7
9
14
18
13
'14
'15
'16
How do you envision transitioning into retirement? (%) Continue working as long as possiblein current or similar position until Icannot work any more
Transition into retirement byreducing work hours with moreleisure time to enjoy life
Transition into retirement by workingin a difference capacity that is eitherless demanding and/or brings greaterpersonal satisfaction
Immediately stop working once Ireach a specific age and beginpursuing my retirement dreams
Immediately stop working once I savea specific amount of money andbegin pursuing my retirementdreams
Not sure
New question in 2014.
BASE: ALL QUALIFIED RESPONDENTSQ1545. How do you envision transitioning into retirement?
NET – Transition = 42%
NET – Transition = 41%
NET – Planned Stop = 23%
NET – Planned Stop = 21%
NET – Transition = 46% NET – Planned Stop = 22%
N=4161
N=4550
N=4143
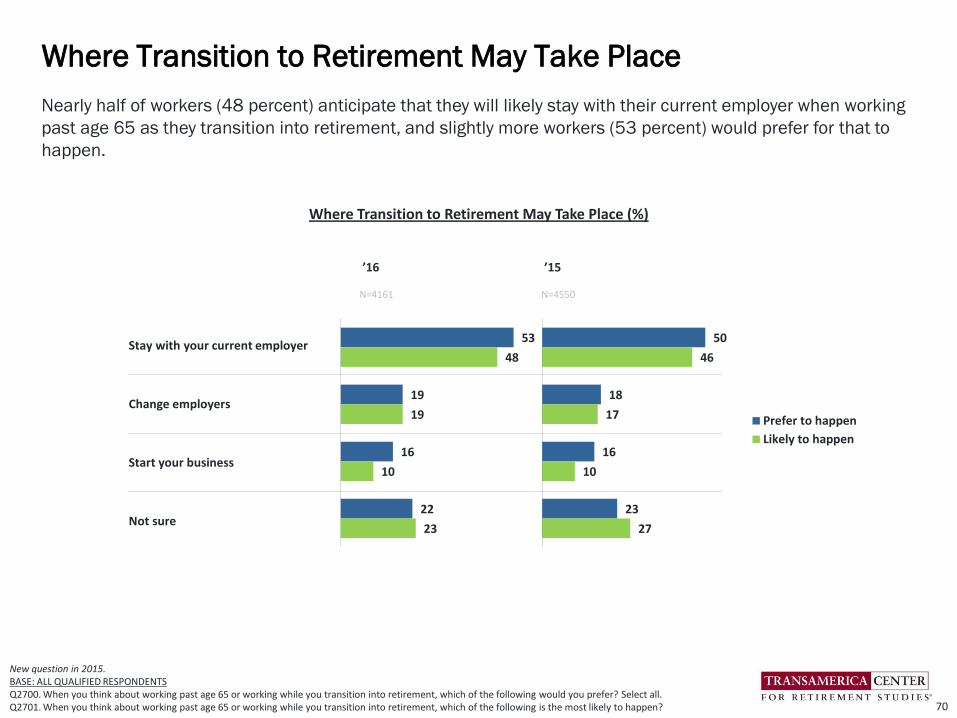
Nearly half of workers (48 percent) anticipate that they will likely stay with their current employer when working
past age 65 as they transition into retirement, and slightly more workers (53 percent) would prefer for that to
happen.
Where Transition to Retirement May Take Place
70
New question in 2015.BASE: ALL QUALIFIED RESPONDENTSQ2700. When you think about working past age 65 or working while you transition into retirement, which of the following would you prefer? Select all.Q2701. When you think about working past age 65 or working while you transition into retirement, which of the following is the most likely to happen?
’16 ’15
N=4161 N=4550
Stay with your current employer
Change employers
Start your business
Not sure
50
18
16
23
46
17
10
27
Prefer to happen
Likely to happen
Where Transition to Retirement May Take Place (%)
53
19
16
22
48
19
10
23

When asked what steps they are taking to help ensure they can continue working past age 65 or in retirement,
60 percent of workers say they are staying healthy so that they can continue working, while 52 percent say that
they are focusing on performing well at their current job. Only 42 percent say they are keeping their job skills up
to date. Even workers fewer are networking and meeting new people (19 percent), scoping out the employment
market (17 percent), or going back to school and learning new skills (12 percent). These findings are relatively
consistent since 2014.
Proactive Steps to Continue to Work After Retirement
71
New question in 2014.BASE: ALL QUALIFIED RESPONDENTSQ1531. Have you taken any steps to help ensure that you'll be able to continue working past age 65 or in retirement, if needed? Select all.
’16N=4161
’15N=4550
’14N=4143
Staying healthy so I can continue working
Performing well at my current job
Keeping my job skills up to date
Networking and meeting new people
Scoping out the employment market and opportunities available
Going back to school and learning new skills
Other
59
47
40
18
15
9
13
Steps to Continue to Work After Retirement (%)
60
50
41
19
15
11
12
60
52
42
19
17
12
9
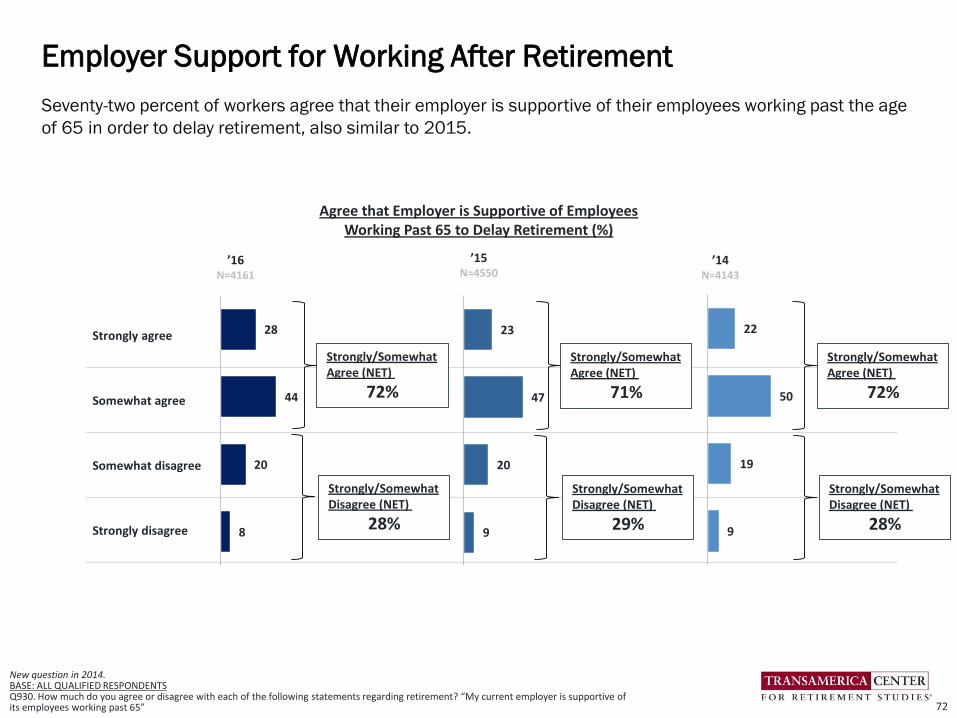
Strongly agree
Somewhat agree
Somewhat disagree
Strongly disagree
Seventy-two percent of workers agree that their employer is supportive of their employees working past the age
of 65 in order to delay retirement, also similar to 2015.
Employer Support for Working After Retirement
72
23
47
20
9
New question in 2014.BASE: ALL QUALIFIED RESPONDENTSQ930. How much do you agree or disagree with each of the following statements regarding retirement? “My current employer is supportive of its employees working past 65”
22
50
19
9
Strongly/SomewhatAgree (NET)
71%
Strongly/SomewhatDisagree (NET)
29%
Strongly/SomewhatAgree (NET)
72%
Strongly/SomewhatDisagree (NET)
28%
’14N=4143
Agree that Employer is Supportive of Employees Working Past 65 to Delay Retirement (%)
’16N=4161
’15N=4550
28
44
20
8
Strongly/SomewhatAgree (NET)
72%
Strongly/SomewhatDisagree (NET)
28%
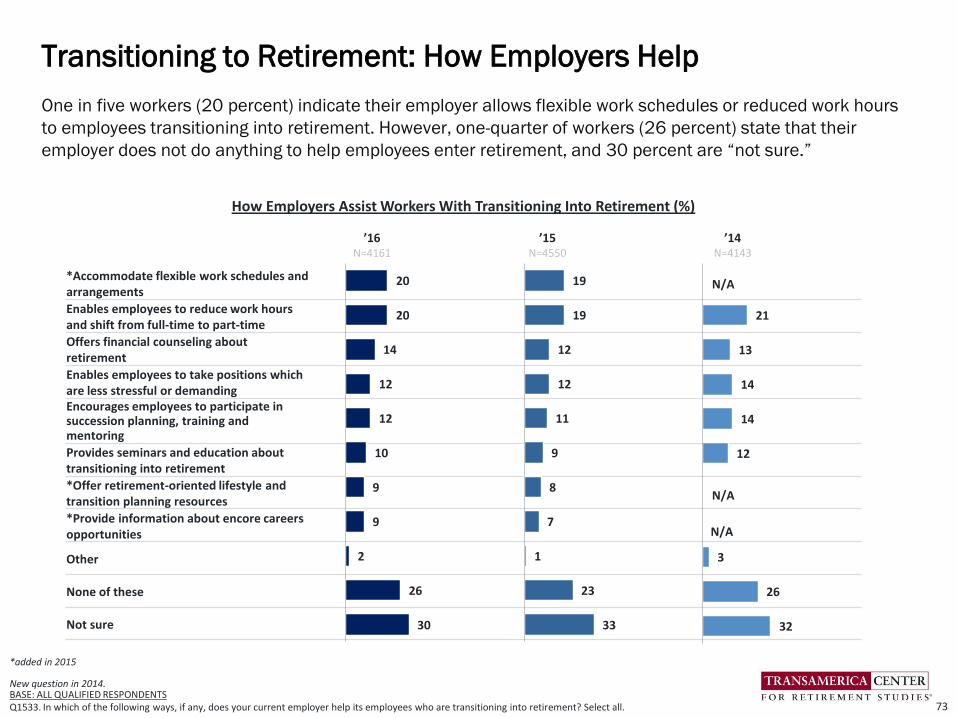
One in five workers (20 percent) indicate their employer allows flexible work schedules or reduced work hours
to employees transitioning into retirement. However, one-quarter of workers (26 percent) state that their
employer does not do anything to help employees enter retirement, and 30 percent are “not sure.”
Transitioning to Retirement: How Employers Help
73
*added in 2015
New question in 2014.BASE: ALL QUALIFIED RESPONDENTSQ1533. In which of the following ways, if any, does your current employer help its employees who are transitioning into retirement? Select all.
*Accommodate flexible work schedules and arrangements
Enables employees to reduce work hours and shift from full-time to part-time
Offers financial counseling about retirement
Enables employees to take positions which are less stressful or demandingEncourages employees to participate in succession planning, training and mentoring
Provides seminars and education about transitioning into retirement
*Offer retirement-oriented lifestyle and transition planning resources
*Provide information about encore careers opportunities
Other
None of these
Not sure
19
19
12
12
11
9
8
7
1
23
33
How Employers Assist Workers With Transitioning Into Retirement (%)
21
13
14
14
12
3
26
32
N/A
N/A
N/A
’14N=4143
’15N=4550
’16N=4161
20
20
14
12
12
10
9
9
2
26
30
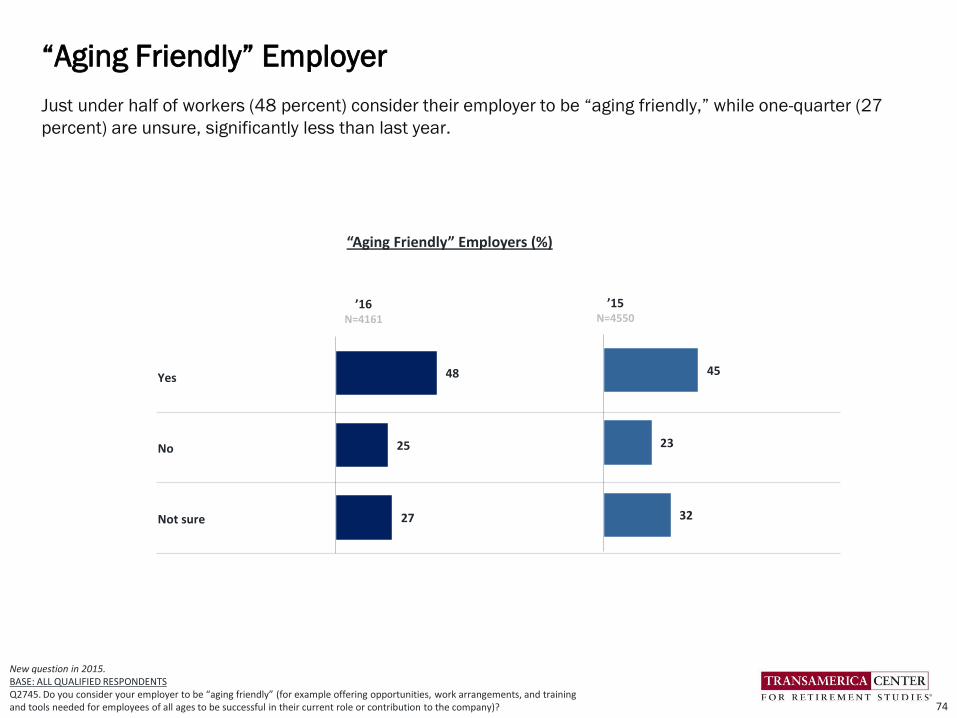
Just under half of workers (48 percent) consider their employer to be “aging friendly,” while one-quarter (27
percent) are unsure, significantly less than last year.
“Aging Friendly” Employer
74
New question in 2015.BASE: ALL QUALIFIED RESPONDENTS Q2745. Do you consider your employer to be “aging friendly” (for example offering opportunities, work arrangements, and training and tools needed for employees of all ages to be successful in their current role or contribution to the company)?
“Aging Friendly” Employers (%)
Yes
No
Not sure
’15N=4550
’16N=4161
48
25
27
45
23
32
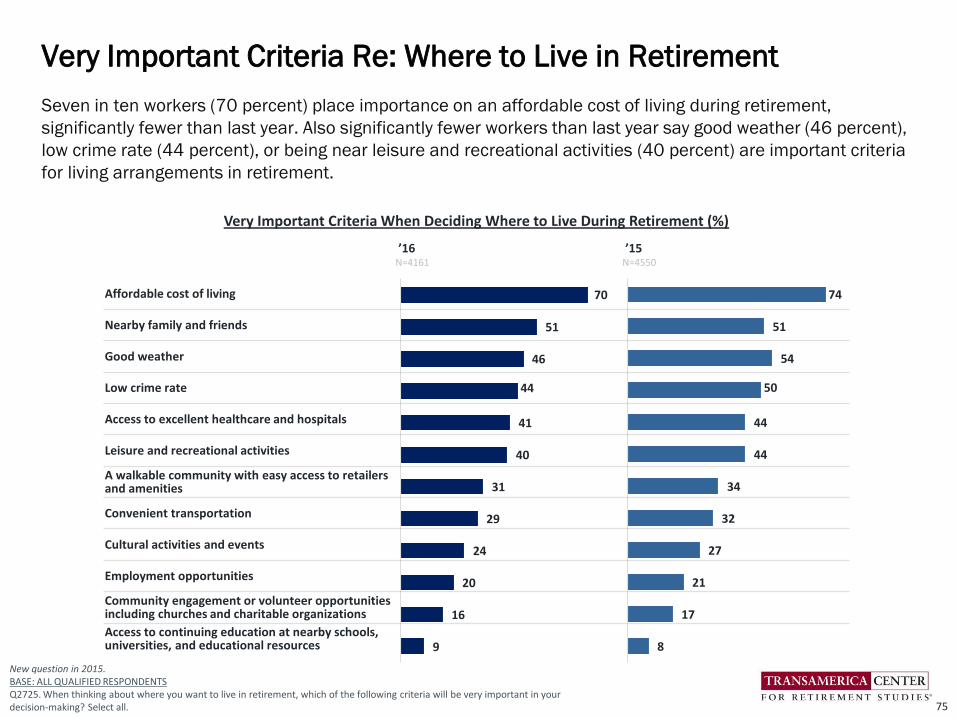
’16 ’15N=4161 N=4550
Affordable cost of living
Nearby family and friends
Good weather
Low crime rate
Access to excellent healthcare and hospitals
Leisure and recreational activities
A walkable community with easy access to retailers and amenities
Convenient transportation
Cultural activities and events
Employment opportunities
Community engagement or volunteer opportunities including churches and charitable organizations
Access to continuing education at nearby schools, universities, and educational resources
Seven in ten workers (70 percent) place importance on an affordable cost of living during retirement,
significantly fewer than last year. Also significantly fewer workers than last year say good weather (46 percent),
low crime rate (44 percent), or being near leisure and recreational activities (40 percent) are important criteria
for living arrangements in retirement.
Very Important Criteria Re: Where to Live in Retirement
75
New question in 2015.BASE: ALL QUALIFIED RESPONDENTSQ2725. When thinking about where you want to live in retirement, which of the following criteria will be very important in your decision-making? Select all.
70
51
46
44
41
40
31
29
24
20
16
9
Very Important Criteria When Deciding Where to Live During Retirement (%)
74
51
54
50
44
44
34
32
27
21
17
8
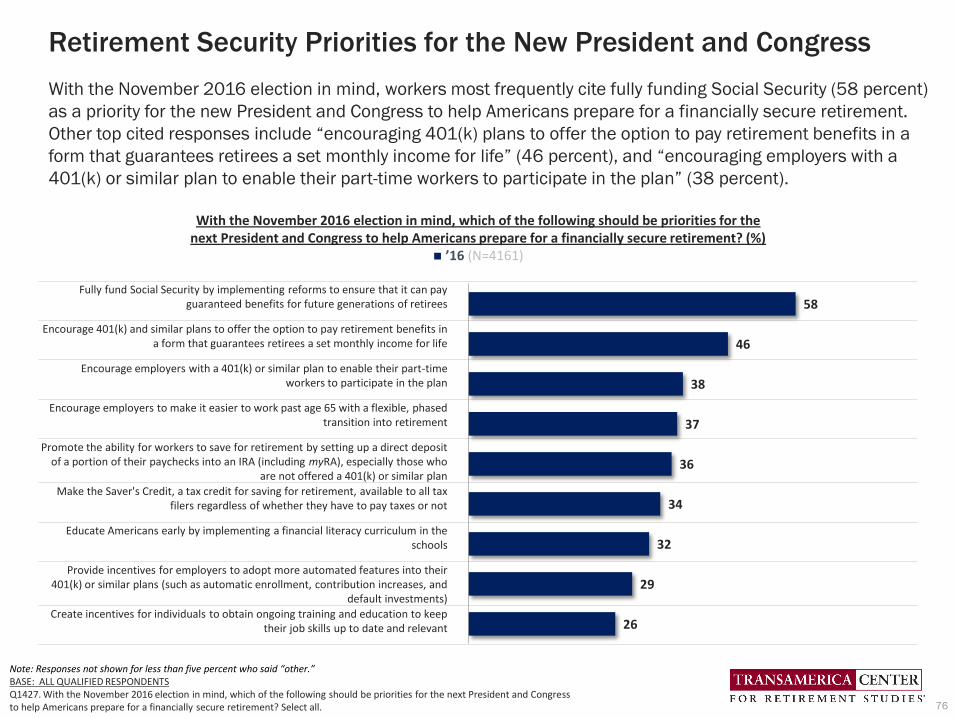
Retirement Security Priorities for the New President and Congress
With the November 2016 election in mind, workers most frequently cite fully funding Social Security (58 percent)
as a priority for the new President and Congress to help Americans prepare for a financially secure retirement.
Other top cited responses include “encouraging 401(k) plans to offer the option to pay retirement benefits in a
form that guarantees retirees a set monthly income for life” (46 percent), and “encouraging employers with a
401(k) or similar plan to enable their part-time workers to participate in the plan” (38 percent).
76
Note: Responses not shown for less than five percent who said “other.”BASE: ALL QUALIFIED RESPONDENTSQ1427. With the November 2016 election in mind, which of the following should be priorities for the next President and Congress to help Americans prepare for a financially secure retirement? Select all.
With the November 2016 election in mind, which of the following should be priorities for the next President and Congress to help Americans prepare for a financially secure retirement? (%)
■ ’16 (N=4161)
Fully fund Social Security by implementing reforms to ensure that it can pay guaranteed benefits for future generations of retirees
Encourage 401(k) and similar plans to offer the option to pay retirement benefits in a form that guarantees retirees a set monthly income for life
Encourage employers with a 401(k) or similar plan to enable their part-time workers to participate in the plan
Encourage employers to make it easier to work past age 65 with a flexible, phased transition into retirement
Promote the ability for workers to save for retirement by setting up a direct deposit of a portion of their paychecks into an IRA (including myRA), especially those who
are not offered a 401(k) or similar plan
Make the Saver's Credit, a tax credit for saving for retirement, available to all tax filers regardless of whether they have to pay taxes or not
Educate Americans early by implementing a financial literacy curriculum in the schools
Provide incentives for employers to adopt more automated features into their 401(k) or similar plans (such as automatic enrollment, contribution increases, and
default investments)
Create incentives for individuals to obtain ongoing training and education to keep their job skills up to date and relevant
58
46
38
37
36
34
32
29
26

Influences of Company Size on Retirement Readiness
Detailed Findings
77
Access to retirement benefits can improve the long-term financial health and wealth of workers. Large
companies (500+ employees) typically offer more robust benefits, including retirement benefits, to their
employees than small companies (10 to 499 employees). Increasing access to retirement benefits among all
workers, especially those in small companies, can help them achieve higher levels of retirement readiness.
Thirty Indicators of Retirement Readiness
• Recovery From the Great Recession. Workers of small and large companies report similar stages of
financial recovery from the Great Recession. Nearly four in ten workers in small companies (37 percent)
and in large companies (40 percent) say they were either were “not impacted” or have “fully recovered.”
One in five workers of both company sizes say they have “not yet begun to recover” or feel they may
“never recover.”
• Confidence in Retiring Comfortably. Retirement confidence is relatively consistent between workers of
small and large companies, with 62 percent being “somewhat” or “very” confident.
• Building a Large Enough Nest Egg? About half of workers in small companies (52 percent) and large
companies (51 percent) agree they are building a large enough nest egg.
• Retirement Dreams Include Leisure and Work. Workers of both small companies (63 percent) and large
companies (66 percent) most frequently cite traveling as a retirement dream. Other frequently cited
dreams include spending more time with family and friends (57 percent small companies, 56 percent
large companies), and pursuing hobbies (46 percent small companies, 51 percent large companies).
Interestingly, 30 percent of workers in small companies and 27 percent in large companies dream of
doing some sort of work in retirement.
• Age Planning to Live to. Both small and large company workers share similar expectations regarding age
they are planning to live to. Large company workers are planning to live to an older age of 89 (median) —
and 18 percent of them are planning to become centenarian. Small company workers are planning to
live to age 85 (median) with 14 percent planning to live to 100+.
Influences of Company Size on Retirement Readiness
78
• Retirement Beliefs. Most workers in small companies (80 percent) and large companies (83 percent)
agree that people in their generation will have a much harder time in achieving financial security compared
to their parent’s generation. Most workers in small companies (76 percent) and large companies (78
percent) are concerned that Social Security will not be there when they retire.
• Current Financial Priorities. Most workers in both small (61 percent) and large (53 percent) companies
indicate that saving for retirement is a current financial priority. More than 40 percent say “just getting by -
covering basic living expenses” is a priority. Approximately two in five workers of both small and large
companies cite paying off credit card or consumer debt as a priority.
• Greatest Financial Priority Right Now. Financial priorities among workers of small and large companies are
similarly shared. The top three most frequently cited priorities among workers are “saving for retirement”
(25 percent small, 27 percent large), “just getting by” (20 percent small, 23 percent large), and “paying off
debt” (15 percent small, 19 percent large).
• Expected Sources of Retirement Income. Self-funded savings including retirement accounts (e.g., 401(k)s,
403(b)s, IRAs) and other savings and investments are the most frequently cited source of retirement
income expected by workers of both company sizes: 75 percent of small company workers and 81 percent
of large company workers. This is closely followed by Social Security as an expected source of retirement
income for 68 percent of small company workers and 72 percent of large company workers.
• Expected Primary Source of Income in Retirement. Workers of large companies (37 percent) are more
likely to expect to rely on retirement accounts (e.g., 401(k)s, 403(b)s, IRAs) as their primary source of
income in retirement compared to workers of small companies (33 percent). Expectations that “working”
will be their primary source of income is similarly shared among workers of small and large companies (16
and 14 percent, respectively).
• Percentage Saving for Retirement / Age They Started to Save. More large company workers (80 percent)
than small company workers (73 percent) are saving for retirement at work through their employer and/or
outside of work. The median age at which workers started saving is relatively consistent between small
(age 27) and large (age 26) company workers.
Influences of Company Size on Retirement Readiness
79
• Importance of Retirement Benefits Compared to Other Benefits. Most workers of small and large
companies believe that retirement benefits are important. Large company workers (90 percent) are
somewhat more likely than those of small companies (86 percent) to value a 401(k) or similar plan as an
important benefit.
• Retirement Benefits Currently Offered. Most workers are offered a 401(k) or other self-funded plan by their
employers; however, access is greater among workers of large companies (80 percent) compared to those
of small companies (60 percent). Relatively few workers are offered a traditional company-funded defined
benefit plan.
• Retirement Plan Participation. Among workers who are offered a 401(k) or similar plan, the participation
rate is similar among large company workers (78 percent) and small company workers (77 percent).
• Retirement Plan Contribution Rate. Among workers who participate in a 401(k) or similar plan, the median
contribution rate is directionally lower among large company workers (8 percent) than small company
workers (9 percent).
• Approach to Investing in Retirement Plan. “Professionally managed” accounts refers to a managed
account service, strategic allocation funds, and/or target date funds. Many plan participants in both small
(62 percent) and large companies (58 percent) are using some form of professionally managed offering in
their 401(k) or similar plans. Small business workers (42 percent) are slightly more likely to set their own
asset allocation among the available funds compared to large company workers (40 percent).
• Retirement Plan Leakage: Loans and Withdrawals. “Leakage” from retirement plans in the form of loans
and withdrawals can severely inhibit the growth of participants’ long-term retirement savings. Among those
who are currently participating in a plan, 25 percent of small company and 28 percent of large company
workers have taken some form of loan, early withdrawal, and/or hardship withdrawal from a 401(k).
Influences of Company Size on Retirement Readiness
80
• Estimated Emergency Savings. Workers of both small and large companies lack emergency savings that
could help cover the cost of a major financial setback (e.g., unemployment, medical bills, home repairs,
auto repairs, other). Both groups reported having saved just $5,000 (median) for such emergencies. More
than one-third of small company (34 percent) and large company workers (35 percent) have saved less
than $5,000. Of concern, one in five workers are unsure how much they have saved in emergency savings:
25 percent of small company workers and 22 percent of large company workers.
• Estimated Retirement Savings Needs. Workers of both large and small companies believe that they will
need to save $500,000 (median) to feel financially secure when they retire.
• Basis for Estimating Retirement Savings Needs. Among those who provided an estimate of their retirement
savings needs, almost half of workers of both small (45 percent) and large companies (48 percent) say
that they “guessed” how much they need to save. Approximately one in five estimated the amount based
on current living expenses, and fewer than 10 percent used a retirement calculator.
• Asset Allocation of Retirement Investments. Workers of both large and small companies (40 and 43
percent, respectively) most frequently indicate that their retirement savings are invested in relatively equal
mix of stocks and investments such as bonds, money market funds and cash. A concerning one in five say
that they are “not sure” how their savings are invested.
• Retirement Strategy: Written, Unwritten, or None. Most workers of both small and large companies (63
percent) say that they have some form of retirement strategy, either written or unwritten. However, only 18
percent of small company workers and 16 percent of large company workers have a written plan.
• Confidence that Financial Strategy Will Enable Travel Goals. Among workers who dream of traveling in
retirement, most are confident their current financial strategy will allow them to meet their retirement
travel goals including 60 percent of small company workers and 57 percent of large company workers.
However, relatively few workers are “very” confident (17 percent small companies, 18 percent large
companies). Interestingly, some workers haven’t given much thought to it (15 percent small companies, 17
percent large companies).
Influences of Company Size on Retirement Readiness
81
• Professional Financial Advisor Usage. Small company workers (41 percent) are more likely to use a
professional financial advisor to help manage their retirement savings or investments compared to large
company workers (37 percent).
• Total Household Retirement Savings. Workers of large companies report higher levels of total household
savings in retirement accounts compared to those of small companies. Large company works have saved
$87,000 (estimated median), while small company workers have saved $56,000 (estimated median).
Large company workers (28 percent) are also more likely than small company workers (24 percent) to say
that they have saved $250,000 or more.
• Expected Retirement Age. The majority of both small company workers (57 percent) and large company
workers (52 percent) plan to work past age 65 or do not plan to retire. Large company workers (27
percent) are more likely than small company workers (20 percent) to expect to retire before age 65. A
similar percentage of small company workers (23 percent) and large company workers (21 percent) expect
to retire at age 65.
• Expectations of Working in Retirement. More than half (54 percent) of workers in small companies plan to
work full- or part-time in retirement, while just under half (49 percent) of large company employees plan to
do so.
• Retirement Transitions: Phased Versus Immediate. Many workers are planning to either transition into
retirement by changing work patterns (e.g., shifting from full- to part-time or working in a different capacity)
or planning to continue working until they cannot work any longer, with workers of small companies being
somewhat more likely to be planning for both of these scenarios. More large company workers (26
percent) than small company workers (20 percent) plan to immediately stop working and retire once they
reach a specific age or amount of money.
Influences of Company Size on Retirement Readiness
82

• Awareness of the Saver’s Credit. The IRS Saver’s Credit is a tax credit available to eligible taxpayers who
are saving for retirement in a qualified retirement plan or IRA. Workers in small companies (35 percent)
are somewhat more likely to be aware of the credit, compared to workers in large companies (31 percent).
• Retirement Security Priorities for the New President and Congress. With the November 2016 election in
mind, workers across company size most frequently cite fully funding Social Security as a priority for the
new President and Congress to help Americans prepare for a financially secure retirement: 55 percent of
small company workers and 61 percent of large company workers. Other top cited responses include
“encouraging 401(k) plans to offer the option to pay retirement benefits in a form that guarantees retirees
a set monthly income for life,” and “encouraging employers with a 401(k) or similar plan to enable their
part-time workers to participate in the plan.”
Influences of Company Size on Retirement Readiness
83
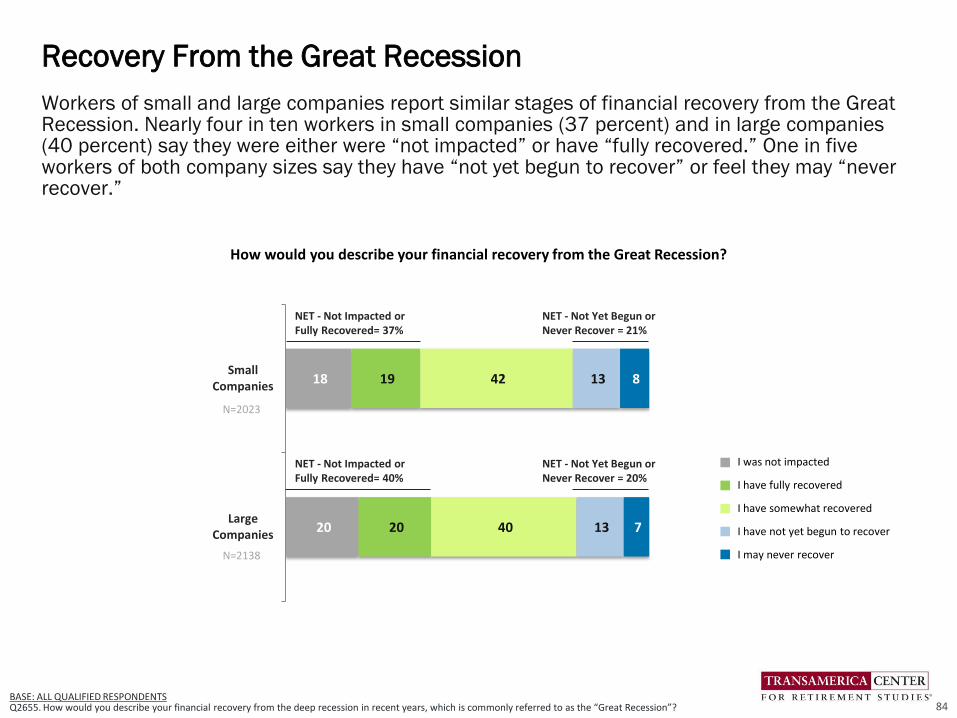
Workers of small and large companies report similar stages of financial recovery from the Great Recession. Nearly four in ten workers in small companies (37 percent) and in large companies (40 percent) say they were either were “not impacted” or have “fully recovered.” One in five workers of both company sizes say they have “not yet begun to recover” or feel they may “never recover.”
Recovery From the Great Recession
84BASE: ALL QUALIFIED RESPONDENTS Q2655. How would you describe your financial recovery from the deep recession in recent years, which is commonly referred to as the “Great Recession”?
18
20
19
20
42
40
13
13
8
7
SmallCompanies
LargeCompanies
I was not impacted
I have fully recovered
I have somewhat recovered
I have not yet begun to recover
I may never recover
NET - Not Impacted or Fully Recovered= 37%
NET - Not Impacted or Fully Recovered= 40%
How would you describe your financial recovery from the Great Recession?
NET - Not Yet Begun or Never Recover = 21%
NET - Not Yet Begun or Never Recover = 20%
N=2023
N=2138
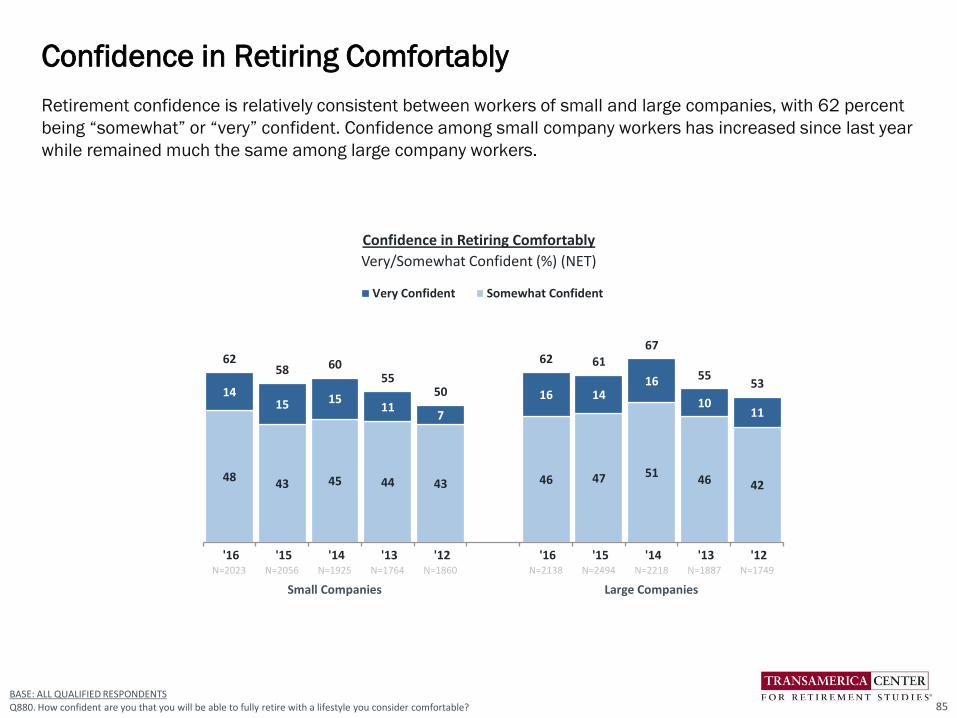
4843 45 44 43 46 47 51
46 42
1415 15
117
16 1416
1011
6258 60
5550
62 6167
5553
'16 '15 '14 '13 '12 '16 '15 '14 '13 '12
Very Confident Somewhat Confident
BASE: ALL QUALIFIED RESPONDENTSQ880. How confident are you that you will be able to fully retire with a lifestyle you consider comfortable?
N=2023 N=2056 N=1925 N=1764 N=1860 N=2138 N=2494 N=2218 N=1887 N=1749
Small Companies Large Companies
Confidence in Retiring Comfortably
Very/Somewhat Confident (%) (NET)
85
Retirement confidence is relatively consistent between workers of small and large companies, with 62 percent
being “somewhat” or “very” confident. Confidence among small company workers has increased since last year
while remained much the same among large company workers.
Confidence in Retiring Comfortably

3630
3530 30
35 37 4032 29
1616
14
9 9
16 1516
1211
5245
49
39 38
51 5256
4440
'16 '15 '14 '13 '12 '16 '15 '14 '13 '12
Strongly Agree Somewhat Agree
N=2023 N=2056 N=1925 N=1764 N=1860 N=2138 N=2494 N=2218 N=1887 N=1749
Small Companies Large Companies
BASE: ALL QUALIFIED RESPONDENTSQ800. How much do you agree or disagree that you are currently building a large enough retirement nest egg?
About half of workers in small companies (52 percent) and large companies (51 percent) agree they are
building a large enough nest egg. The percentage of workers who agree they are building a large enough nest
egg has increased since 2012. Among small company workers, it has increased significantly since last year.
Building a Large Enough Nest Egg?
86
Building a Large Enough Nest Egg
Strongly/Somewhat Agree (%) (NET)

Workers of both small companies (63 percent) and large companies (66 percent) most frequently cite traveling
as a retirement dream. Other frequently cited dreams include spending more time with family and friends (57
percent small companies, 56 percent large companies), and pursuing hobbies (46 percent small companies,
51 percent large companies). Interestingly, 30 percent of workers in small companies and 27 percent in large
companies dream of doing some sort of work in retirement.
Retirement Dreams Include Leisure and Work
87BASE: ALL QUALIFIED RESPONDENTS Q1418. How do you dream of spending your retirement? Select all.
How do you dream of spending your retirement? Please select all that apply. (%)
Small Companies Large Companies
■ ’16 (N=2023) ■ ’16 (N=2138)
Traveling
Spending more time with family and friends
Pursuing hobbies
Doing volunteer work
Pursuing an encore career (pursuing a new role, work, activity, or career)
Continue working in the same field
Starting a business
Other
None of the above
63
57
46
24
13
14
11
5
4
NET: Working
30%
66
56
51
30
12
10
11
8
4
NET: Working
27%
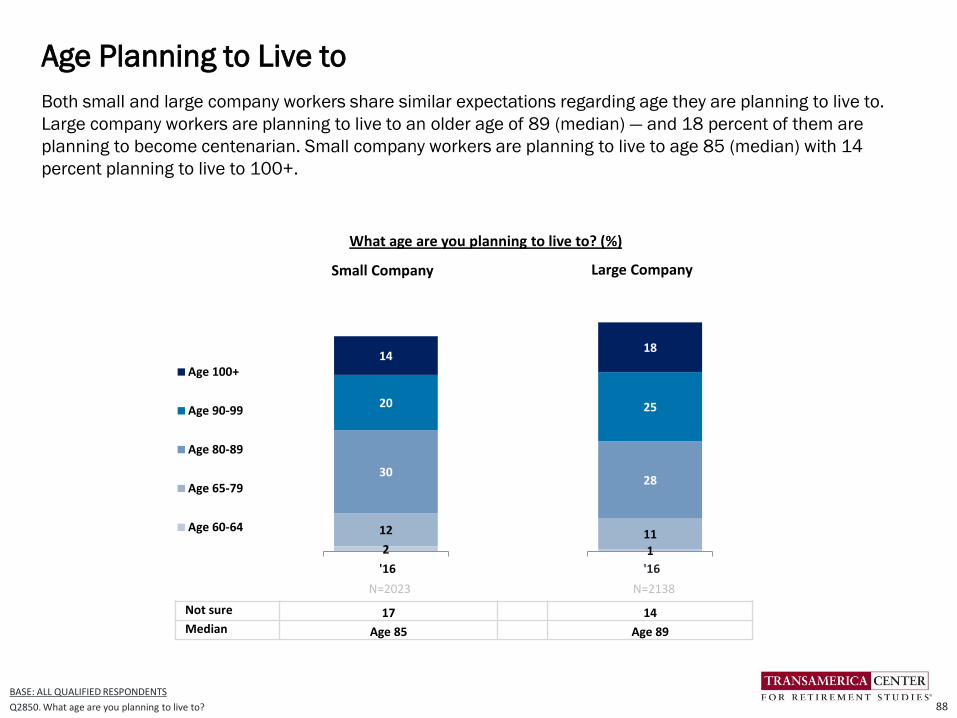
1
11
28
25
18
'16
Both small and large company workers share similar expectations regarding age they are planning to live to.
Large company workers are planning to live to an older age of 89 (median) — and 18 percent of them are
planning to become centenarian. Small company workers are planning to live to age 85 (median) with 14
percent planning to live to 100+.
Age Planning to Live to
88
BASE: ALL QUALIFIED RESPONDENTS
Q2850. What age are you planning to live to?
Small Company Large Company
2
12
30
20
14
'16
Age 100+
Age 90-99
Age 80-89
Age 65-79
Age 60-64
N=2023 N=2138
Not sure 17 14Median Age 85 Age 89
What age are you planning to live to? (%)
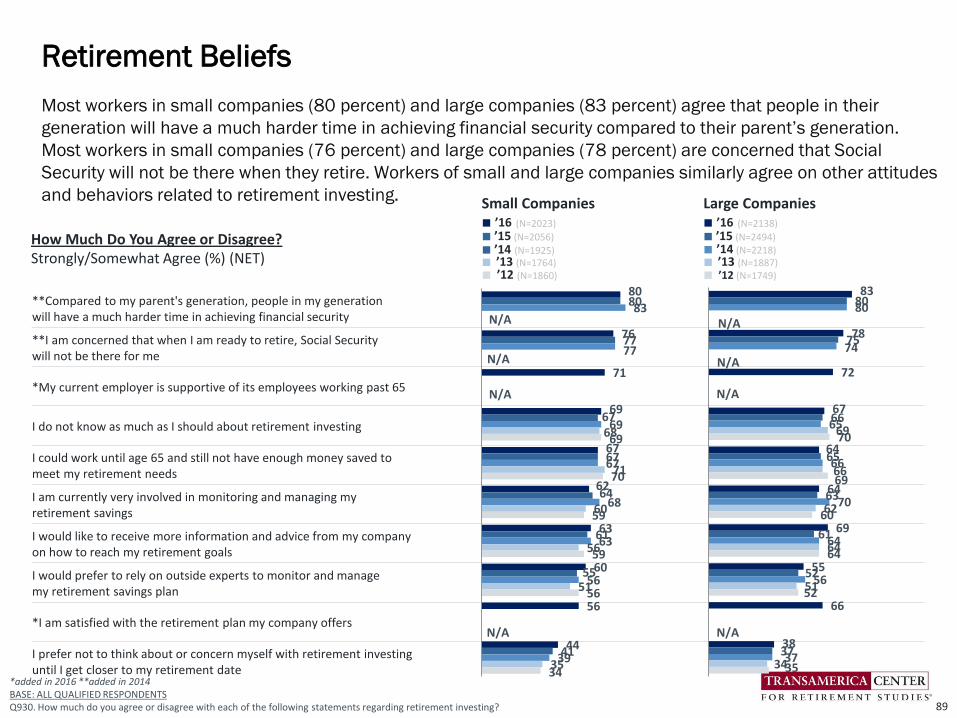
*added in 2016 **added in 2014BASE: ALL QUALIFIED RESPONDENTSQ930. How much do you agree or disagree with each of the following statements regarding retirement investing?
Small Companies Large Companies
How Much Do You Agree or Disagree?Strongly/Somewhat Agree (%) (NET)
■ ’16 (N=2023)
■ ’15 (N=2056)■ ’14 (N=1925)■ ’13 (N=1764)■ ’12 (N=1860)
■ ’16 (N=2138)
■ ’15 (N=2494)■ ’14 (N=2218)■ ’13 (N=1887)■ ’12 (N=1749)
**Compared to my parent's generation, people in my generation will have a much harder time in achieving financial security
**I am concerned that when I am ready to retire, Social Security will not be there for me
*My current employer is supportive of its employees working past 65
I do not know as much as I should about retirement investing
I could work until age 65 and still not have enough money saved to meet my retirement needs
I am currently very involved in monitoring and managing my retirement savings
I would like to receive more information and advice from my company on how to reach my retirement goals
I would prefer to rely on outside experts to monitor and manage my retirement savings plan
*I am satisfied with the retirement plan my company offers
I prefer not to think about or concern myself with retirement investing until I get closer to my retirement date
Most workers in small companies (80 percent) and large companies (83 percent) agree that people in their
generation will have a much harder time in achieving financial security compared to their parent’s generation.
Most workers in small companies (76 percent) and large companies (78 percent) are concerned that Social
Security will not be there when they retire. Workers of small and large companies similarly agree on other attitudes
and behaviors related to retirement investing.
Retirement Beliefs
89
80
76
71
69
67
62
63
60
56
44
80
77
67
67
64
61
55
41
83
77
69
67
68
63
56
39
68
71
60
56
51
35
69
70
59
59
56
34
83
78
72
67
64
64
69
55
66
38
80
75
66
65
63
61
52
37
80
74
65
66
70
64
56
37
69
66
62
64
51
34
70
69
60
64
52
35
N/A N/A
N/A N/A
N/A N/A
N/A N/A

Current Financial Priorities
90
***Note: This question is based on a supplementary survey. See methodology for more information. BASE: ALL QUALIFIED RESPONDENTSQ2639. Which of the following are your financial priorities right now? Select all.
Small Companies Large Companies
■ ’16 (N=778) *** ■ ’16 (N=420) ***
Saving for retirement
Just getting by - covering basic living expenses
Paying off credit card or consumer debt
Paying off mortgage
Paying healthcare expenses
Supporting children
Contributing to an education fund (for my children, grandchildren, or other)
Paying off student loans
Creating an inheritance or financial legacy
Supporting parents
Other
61
42
40
39
30
31
19
14
13
6
7
53
46
38
33
22
19
13
10
9
7
8
Most workers in both small (61 percent) and large (53 percent) companies indicate that saving for retirement is
a current financial priority. More than 40 percent say “just getting by - covering basic living expenses” is a
priority. Approximately two in five workers of both small and large companies cite paying off credit card or
consumer debt as a priority. Current Financial Priorities (%)

Financial priorities among workers of small and large companies are similarly shared. The top three most
frequently cited priorities among workers are “saving for retirement” (25 percent small, 27 percent large), “just
getting by” (20 percent small, 23 percent large), and “paying off debt” (15 percent small, 19 percent large).
Greatest Financial Priority Right Now
91
Small Companies Large Companies
■ ’16 (N=778)***
■ ’15 (N=2056)
■ ’14 (N=1925)■ ’13 (N=1764)
■ ’12 (N=1860)
■ ’16 (N=420)***■ ’15 (N=2494)
■ ’14 (N=2218)
■ ’13 (N=1887)■ ’12 (N=1749)
Saving for retirement
Just getting by - covering basic living expenses
Paying off credit card or consumer debt
Paying off mortgage
**Supporting children and/or parents
Paying healthcare expenses
Contributing to an education fund (for my children, grandchildren, or other)
Creating an inheritance or financial legacy
*Paying off student loans
*Paying current tuition fees
Other
N/A N/A
*added in 2015 **shown as two separate answers in 2016*** Note: This question is based on a supplementary survey. See methodology for more information.BASE: ALL QUALIFIED RESPONDENTSQ2640. Which one of the following is your greatest financial priority right now?
252725
2422
20222426
2715
1924
2424
1013
1091113
6868
33343
3
2
64
1
3556
4
2727
28222423
2021
252519
202526269
12121411
755
775332
2
2
1
45
2
36544
N/A N/A
N/A N/A
N/A N/A
N/A N/A
Greatest Financial Priority Right Now (%)
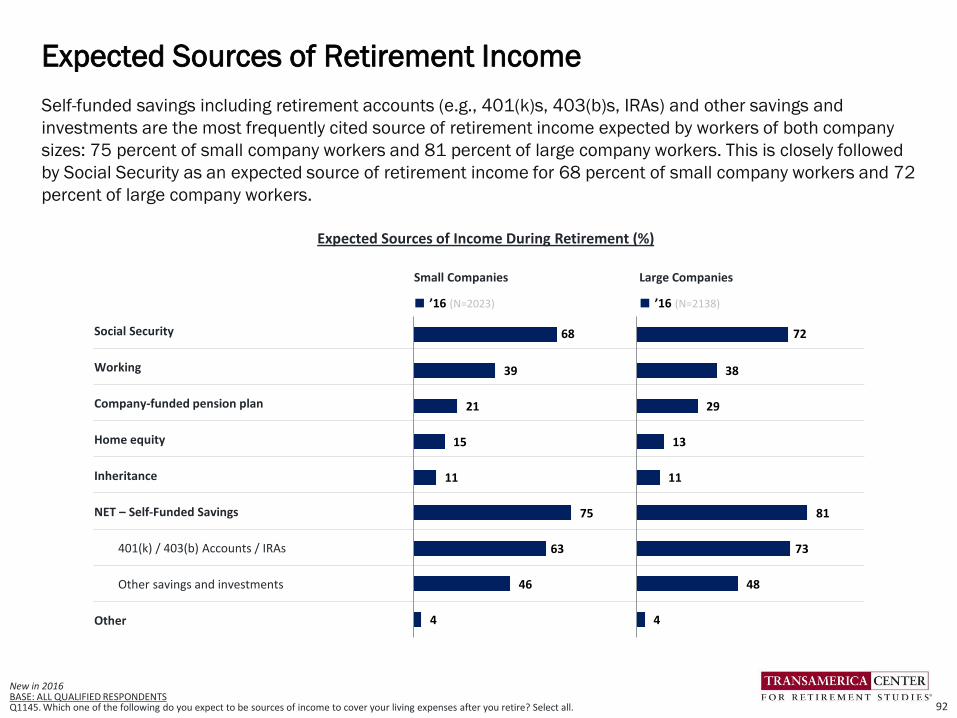
Small Companies Large Companies
■ ’16 (N=2023) ■ ’16 (N=2138)
Social Security
Working
Company-funded pension plan
Home equity
Inheritance
NET – Self-Funded Savings
401(k) / 403(b) Accounts / IRAs
Other savings and investments
Other
68
39
21
15
11
75
63
46
4
72
38
29
13
11
81
73
48
4
New in 2016BASE: ALL QUALIFIED RESPONDENTS Q1145. Which one of the following do you expect to be sources of income to cover your living expenses after you retire? Select all.
Self-funded savings including retirement accounts (e.g., 401(k)s, 403(b)s, IRAs) and other savings and
investments are the most frequently cited source of retirement income expected by workers of both company
sizes: 75 percent of small company workers and 81 percent of large company workers. This is closely followed
by Social Security as an expected source of retirement income for 68 percent of small company workers and 72
percent of large company workers.
Expected Sources of Retirement Income
92
Expected Sources of Income During Retirement (%)
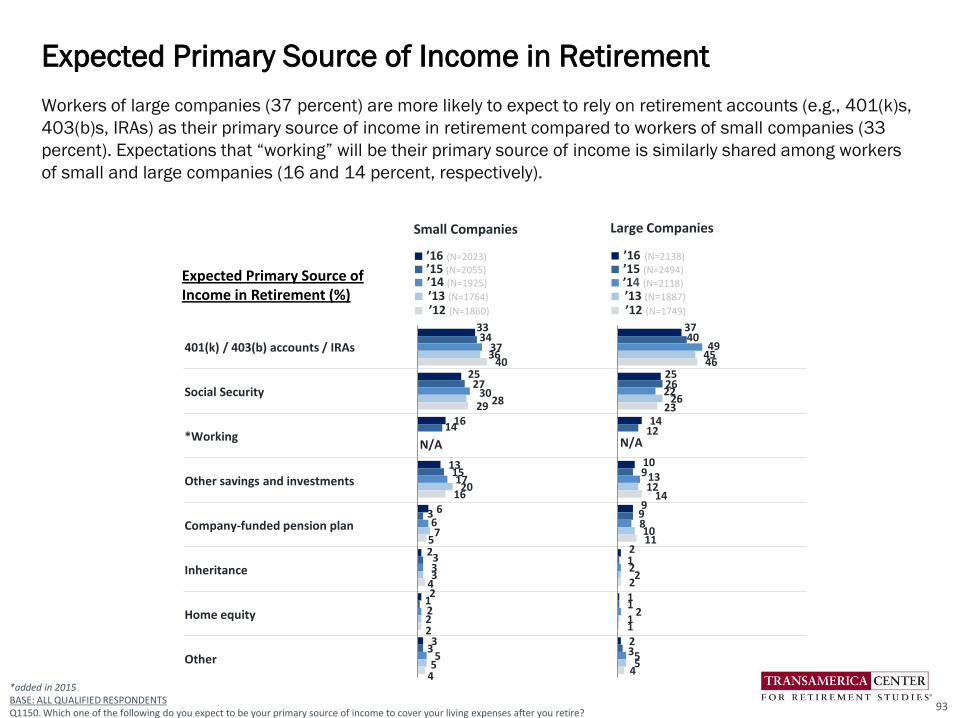
Workers of large companies (37 percent) are more likely to expect to rely on retirement accounts (e.g., 401(k)s,
403(b)s, IRAs) as their primary source of income in retirement compared to workers of small companies (33
percent). Expectations that “working” will be their primary source of income is similarly shared among workers
of small and large companies (16 and 14 percent, respectively).
*added in 2015BASE: ALL QUALIFIED RESPONDENTS Q1150. Which one of the following do you expect to be your primary source of income to cover your living expenses after you retire?
Small Companies Large Companies
■ ’16 (N=2023)■ ’15 (N=2055)■ ’14 (N=1925)
■ ’13 (N=1764)
■ ’12 (N=1860)
■ ’16 (N=2138)
■ ’15 (N=2494)■ ’14 (N=2118)
■ ’13 (N=1887)
■ ’12 (N=1749)
401(k) / 403(b) accounts / IRAs
Social Security
*Working
Other savings and investments
Company-funded pension plan
Inheritance
Home equity
Other
33
25
16
13
6
2
2
3
34
27
14
15
3
3
1
3
37
30
17
6
3
2
5
36
28
20
7
3
2
5
40
29
16
5
4
2
4
37
25
14
10
9
2
1
2
40
26
12
9
9
1
1
3
49
22
13
8
2
2
5
45
26
12
10
2
1
5
46
23
14
11
2
1
4
Expected Primary Source of Income in Retirement
N/A N/A
Expected Primary Source of Income in Retirement (%)
93
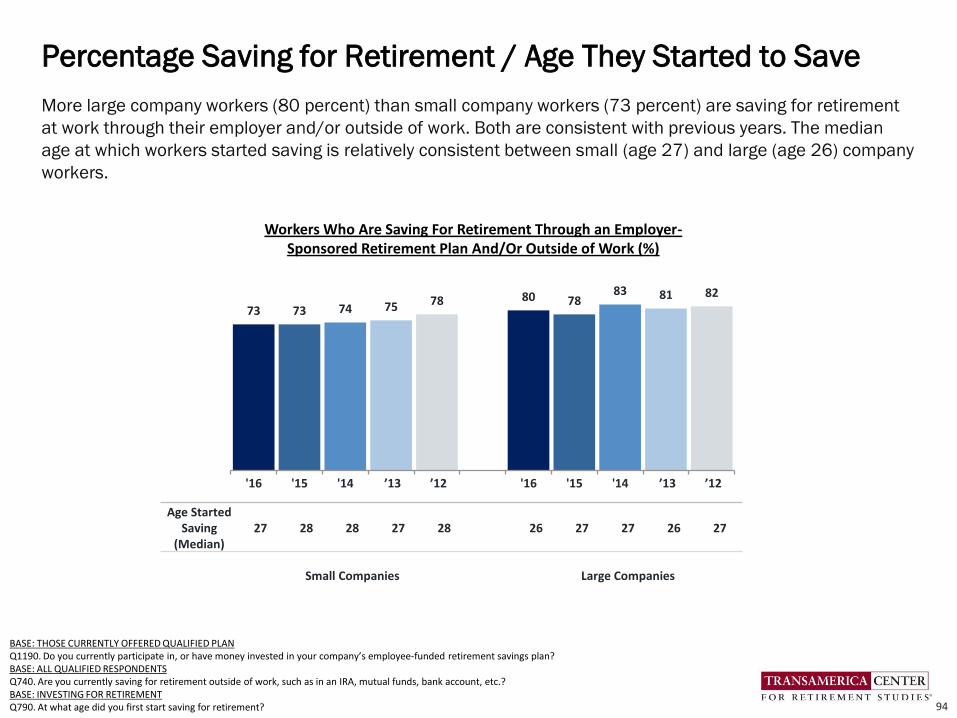
BASE: THOSE CURRENTLY OFFERED QUALIFIED PLANQ1190. Do you currently participate in, or have money invested in your company’s employee-funded retirement savings plan?BASE: ALL QUALIFIED RESPONDENTSQ740. Are you currently saving for retirement outside of work, such as in an IRA, mutual funds, bank account, etc.?BASE: INVESTING FOR RETIREMENTQ790. At what age did you first start saving for retirement?
More large company workers (80 percent) than small company workers (73 percent) are saving for retirement
at work through their employer and/or outside of work. Both are consistent with previous years. The median
age at which workers started saving is relatively consistent between small (age 27) and large (age 26) company
workers.
Percentage Saving for Retirement / Age They Started to Save
94
73 73 74 75 78 80 7883 81 82
'16 '15 '14 ’13 ’12 '16 '15 '14 ’13 ’12
Workers Who Are Saving For Retirement Through an Employer-Sponsored Retirement Plan And/Or Outside of Work (%)
Age Started Saving
(Median)27 28 28 27 28 26 27 27 26 27
Small Companies Large Companies

Small Companies Large Companies
■ ’16 (N=2023)■ ’15 (N=2056)■ ’14 (N=1925)
■ ’13 (N=1764)
■ ’12 (N=1860)
■ ’16 (N=2138)
■ ’15 (N=2494)■ ’14(N=2218)
■ ’13 (N=1887)
■ ’12 (N=1749)
Health insurance
A 401(k)/403(b)/457(b) or other employee self-funded plan
Disability insurance
Life insurance
Company-funded defined-benefit pension plan
Long-Term Care insurance
Critical Illness Insurance
*A company-funded cash balance plan
Cancer Insurance
*added in 2014BASE: ALL QUALIFIED RESPONDENTS
Q1171. Businesses typically offer a number of different benefits for their workers. For each of the following, please tell us how important that benefit is to you, personally.
Most workers of small and large companies believe that retirement benefits are important. Large company
workers (90 percent) are somewhat more likely than those of small companies (86 percent) to value a 401(k)
or similar plan as an important benefit. This trend has remained consistent over the past five years.
Importance of Retirement Benefits Compared to Other Benefits
95
95
86
76
75
71
70
63
56
55
94
86
74
72
69
69
59
52
50
93
86
75
69
76
70
66
60
59
92
88
76
65
71
66
63
56
95
89
78
71
72
67
64
57
95
90
77
74
73
72
64
55
55
95
91
77
76
76
73
63
56
54
95
92
80
74
80
72
68
63
59
95
92
78
74
80
69
68
59
95
92
81
72
77
69
69
60
Very/Somewhat Important(%) (NET)
N/A N/A
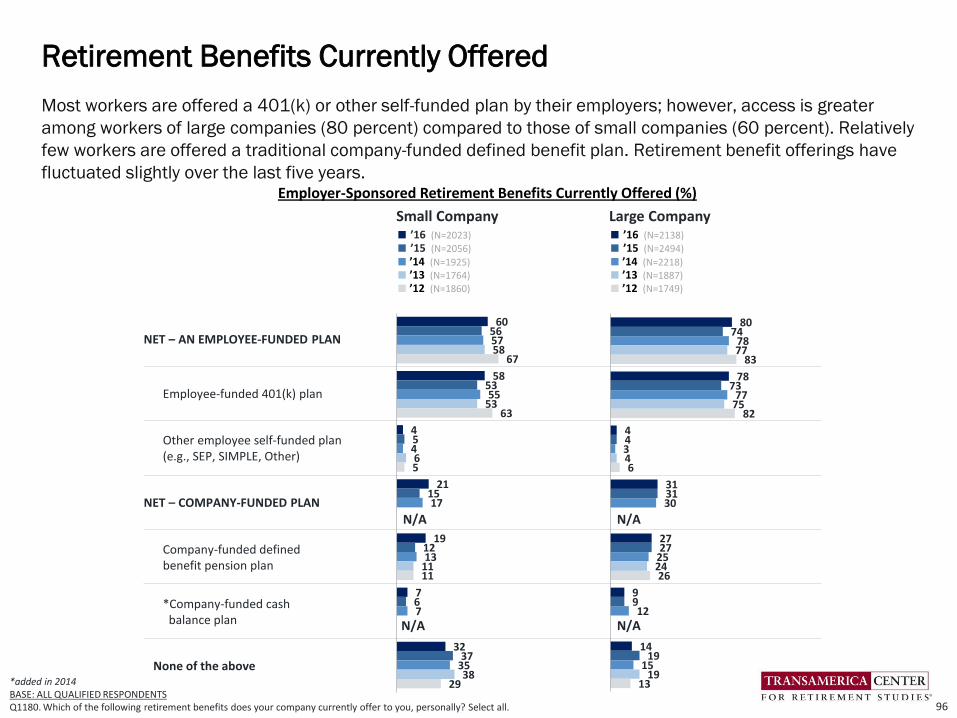
Small Company Large Company■ ’16 (N=2023) ■ ’15 (N=2056)
■ ’14 (N=1925)■ ’13 (N=1764)■ ’12 (N=1860)
■ ’16 (N=2138) ■ ’15 (N=2494)
■ ’14 (N=2218)■ ’13 (N=1887)■ ’12 (N=1749)
NET – AN EMPLOYEE-FUNDED PLAN
Employee-funded 401(k) plan
Other employee self-funded plan(e.g., SEP, SIMPLE, Other)
NET – COMPANY-FUNDED PLAN
Company-funded defined benefit pension plan
*Company-funded cash balance plan
None of the above
60
58
4
21
19
7
32
56
53
5
15
12
6
37
57
55
4
17
13
7
35
58
53
6
11
38
67
63
5
11
29
Most workers are offered a 401(k) or other self-funded plan by their employers; however, access is greater
among workers of large companies (80 percent) compared to those of small companies (60 percent). Relatively
few workers are offered a traditional company-funded defined benefit plan. Retirement benefit offerings have
fluctuated slightly over the last five years.
Retirement Benefits Currently Offered
96
*added in 2014BASE: ALL QUALIFIED RESPONDENTSQ1180. Which of the following retirement benefits does your company currently offer to you, personally? Select all.
80
78
4
31
27
9
14
74
73
4
31
27
9
19
78
77
3
30
25
12
15
77
75
4
24
19
83
82
6
26
13
N/AN/A
N/AN/A
Employer-Sponsored Retirement Benefits Currently Offered (%)
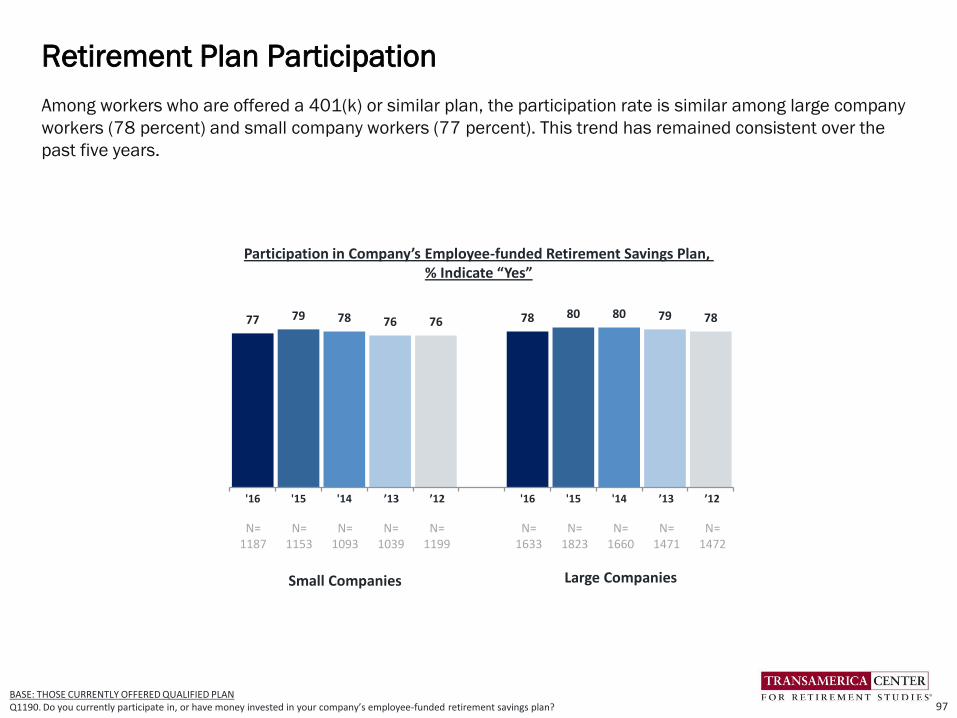
BASE: THOSE CURRENTLY OFFERED QUALIFIED PLANQ1190. Do you currently participate in, or have money invested in your company’s employee-funded retirement savings plan?
Among workers who are offered a 401(k) or similar plan, the participation rate is similar among large company
workers (78 percent) and small company workers (77 percent). This trend has remained consistent over the
past five years.
Retirement Plan Participation
97
Participation in Company’s Employee-funded Retirement Savings Plan, % Indicate “Yes”
77 79 78 76 76 78 80 80 79 78
'16 '15 '14 ’13 ’12 '16 '15 '14 ’13 ’12
N=1187
N=1153
N=1093
N=1039
N=1199
N=1633
N=1823
N=1660
N=1471
N=1472
Small Companies Large Companies
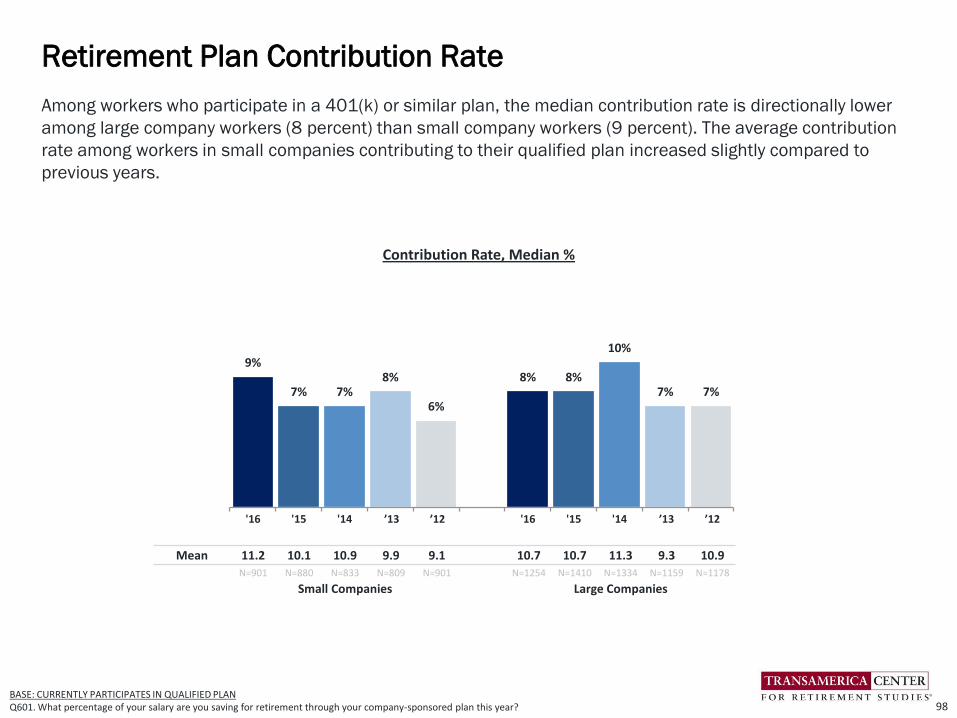
BASE: CURRENTLY PARTICIPATES IN QUALIFIED PLAN Q601. What percentage of your salary are you saving for retirement through your company-sponsored plan this year?
Among workers who participate in a 401(k) or similar plan, the median contribution rate is directionally lower
among large company workers (8 percent) than small company workers (9 percent). The average contribution
rate among workers in small companies contributing to their qualified plan increased slightly compared to
previous years.
Retirement Plan Contribution Rate
98
Contribution Rate, Median %
9%
7% 7%8%
6%
8% 8%
10%
7% 7%
'16 '15 '14 ’13 ’12 '16 '15 '14 ’13 ’12
Mean 11.2 10.1 10.9 9.9 9.1 10.7 10.7 11.3 9.3 10.9
N=901 N=880 N=833 N=809 N=901 N=1254 N=1410 N=1334 N=1159 N=1178
Small Companies Large Companies
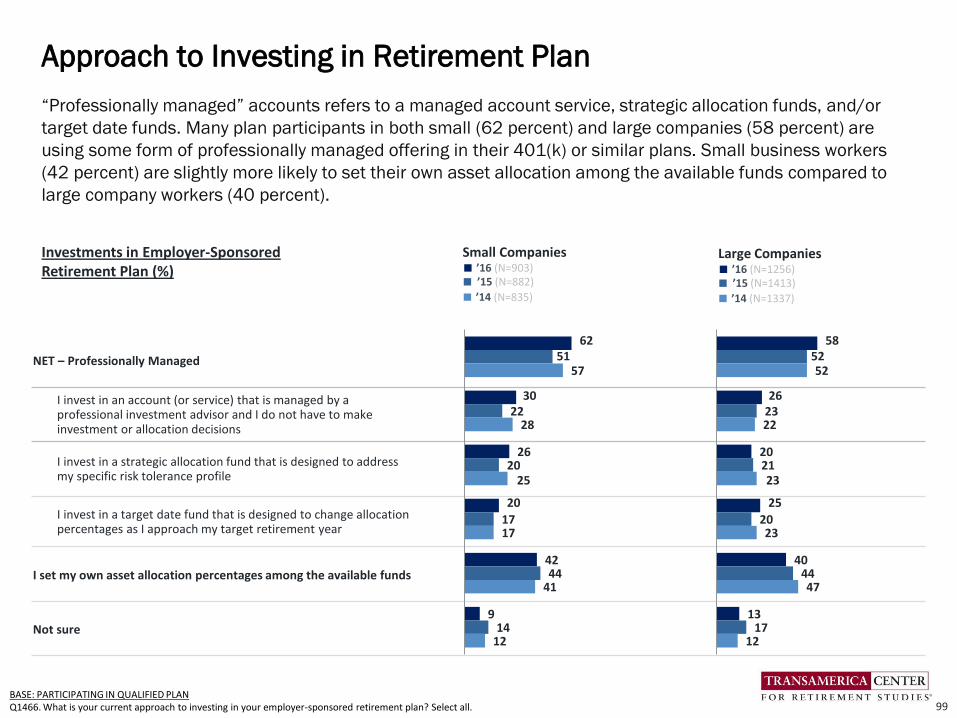
“Professionally managed” accounts refers to a managed account service, strategic allocation funds, and/or
target date funds. Many plan participants in both small (62 percent) and large companies (58 percent) are
using some form of professionally managed offering in their 401(k) or similar plans. Small business workers
(42 percent) are slightly more likely to set their own asset allocation among the available funds compared to
large company workers (40 percent).
Approach to Investing in Retirement Plan
99BASE: PARTICIPATING IN QUALIFIED PLANQ1466. What is your current approach to investing in your employer-sponsored retirement plan? Select all.
Small Companies■ ’16 (N=903)■ ’15 (N=882)
■ ’14 (N=835)
Large Companies■ ’16 (N=1256)■ ’15 (N=1413)
■ ’14 (N=1337)
NET – Professionally Managed
I invest in an account (or service) that is managed by a professional investment advisor and I do not have to make investment or allocation decisions
I invest in a strategic allocation fund that is designed to address my specific risk tolerance profile
I invest in a target date fund that is designed to change allocation percentages as I approach my target retirement year
I set my own asset allocation percentages among the available funds
Not sure
Investments in Employer-Sponsored Retirement Plan (%)
62
30
26
20
42
9
51
22
20
17
44
14
57
28
25
17
41
12
58
26
20
25
40
13
52
23
21
20
44
17
52
22
23
23
47
12
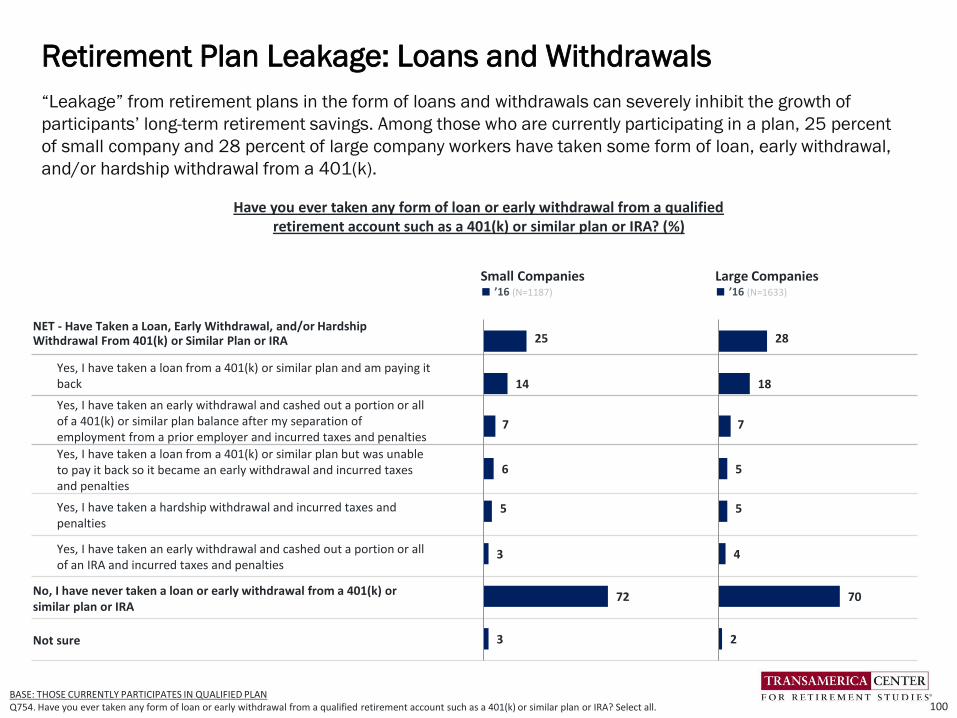
“Leakage” from retirement plans in the form of loans and withdrawals can severely inhibit the growth of
participants’ long-term retirement savings. Among those who are currently participating in a plan, 25 percent
of small company and 28 percent of large company workers have taken some form of loan, early withdrawal,
and/or hardship withdrawal from a 401(k).
Retirement Plan Leakage: Loans and Withdrawals
100BASE: THOSE CURRENTLY PARTICIPATES IN QUALIFIED PLANQ754. Have you ever taken any form of loan or early withdrawal from a qualified retirement account such as a 401(k) or similar plan or IRA? Select all.
Small Companies■ ’16 (N=1187)
Large Companies■ ’16 (N=1633)
NET - Have Taken a Loan, Early Withdrawal, and/or Hardship Withdrawal From 401(k) or Similar Plan or IRA
Yes, I have taken a loan from a 401(k) or similar plan and am paying it back
Yes, I have taken an early withdrawal and cashed out a portion or all of a 401(k) or similar plan balance after my separation of employment from a prior employer and incurred taxes and penalties
Yes, I have taken a loan from a 401(k) or similar plan but was unable to pay it back so it became an early withdrawal and incurred taxes and penalties
Yes, I have taken a hardship withdrawal and incurred taxes and penalties
Yes, I have taken an early withdrawal and cashed out a portion or all of an IRA and incurred taxes and penalties
No, I have never taken a loan or early withdrawal from a 401(k) or similar plan or IRA
Not sure
25
14
7
6
5
3
72
3
28
18
7
5
5
4
70
2
Have you ever taken any form of loan or early withdrawal from a qualified retirement account such as a 401(k) or similar plan or IRA? (%)

Workers of both small and large companies lack emergency savings that could help cover the cost of a major
financial setback (e.g., unemployment, medical bills, home repairs, auto repairs, other). Both groups reported
having saved just $5,000 (median) for such emergencies. More than one-third of small company (34 percent)
and large company workers (35 percent) have saved less than $5,000. Of concern, one in five workers are
unsure how much they have saved in emergency savings: 25 percent of small company workers and 22
percent of large company workers.
Estimated Emergency Savings
101
BASE: ALL QUALIFIED RESPONDENTS
Q2825. How much do you have in emergency savings specifically to cover the cost of unexpected major financial setbacks (e.g., unemployment, medical bills, home repairs, auto repairs, other)?
N=2023 N=2138
Not sure 25 22Median $5,000 $5,000
22
13
7
733
17
6
'16
20
14
10
623
16
4
'16
$100k or more
$25k to less than $100k
$20k to less than $25k
$15k to less than $20k
$10k to less than $15k
$5k to less than $10k
$1k to less than $5k
Less than $1k
Small Company Large Company
How much do you have in emergency savings to cover the cost of unexpected major financial setbacks? (%)

Workers of both large and small companies believe that they will need to save $500,000 (median) to feel
financially secure when they retire. This year’s survey finding represents a major decrease in estimated savings
needs since last year when workers indicated they would need to save $1,000,000 (median).
Estimated Retirement Savings Needs
102
228 12 14 14
22
2022
27 27
22
18
21
23 24
19
24
21
22 20
1530 24
14 15
'16 '15 '14 '13 '12
$2m or more
$1m to less than $2m
$500k to less than $1m
$100k to less than $500k
Less than $100k
Median $500,000 $1,000,000 $750,000 $500,000 $500,000 $500,000 $1,000,000 $1,000,000 $500,000 $700,000
Note: The median is estimated based on the approximate midpoint of the range of each response category.
Small Company
BASE: ALL QUALIFIED RESPONDENTSQ890. Thinking of what money can buy today, how much money do you believe you will need to have saved by the time you retire in order to feel financially secure?
Large Company
1810 9 14 10
22
15 17
2525
21
19 20
2221
23
26 23
20 25
1630 31
18 18
'16 '15 '14 '13 '12
N=2023 N=2056 N=1925 N=1764 N=1860 N=2138 N=2494 N=2218 N=1887 N=1749

Small Companies Large Companies
■ ’16 (N=1966)■ ’15 (N=2024)■ ’14 (N=1873)
■ ’13 (N=1745)
■ ’12 (N=1836)
■ ’16 (N=2090)
■ ’15 (N=2461)■ ’14(N=2191)
■ ’13 (N=1865)
■ ’12 (N=1724)
Guessed
Estimated based on current living expenses
*Used a retirement calculator
Expected earnings on investments
Completed a worksheet
Read/heard that is how much is needed
Amount given to me by financial advisor
Other
48
23
9
5
4
5
3
3
52
20
8
6
3
4
4
5
48
23
7
5
4
3
5
4
49
25
5
10
5
3
3
48
27
5
10
4
3
3
45
22
8
6
5
5
5
4
55
21
7
5
3
3
3
3
52
21
6
6
4
4
5
3
50
25
5
8
5
3
5
47
27
4
10
4
4
4
*added in 2014BASE: PROVIDED AN ESTIMATE OF SAVINGS NEEDEDQ900. How did you arrive at that number?
Among those who provided an estimate of their retirement savings needs, almost half of workers of both small
(45 percent) and large companies (48 percent) say that they “guessed” how much they need to save.
Approximately one in five estimated the amount based on current living expenses, and fewer than 10 percent
used a retirement calculator.
Basis for Estimating Retirement Savings Needs
103
N/AN/A
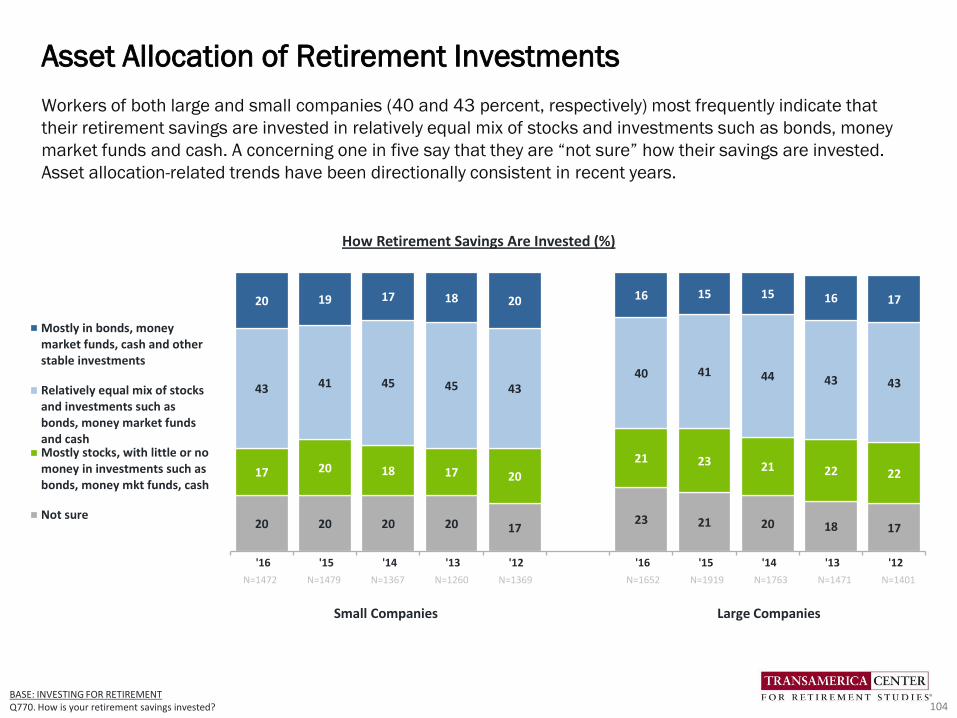
BASE: INVESTING FOR RETIREMENTQ770. How is your retirement savings invested?
Workers of both large and small companies (40 and 43 percent, respectively) most frequently indicate that
their retirement savings are invested in relatively equal mix of stocks and investments such as bonds, money
market funds and cash. A concerning one in five say that they are “not sure” how their savings are invested.
Asset allocation-related trends have been directionally consistent in recent years.
Asset Allocation of Retirement Investments
104
20 20 20 20 1723 21 20 18 17
17 20 18 17 20
21 23 21 22 22
43 41 45 45 4340 41 44 43 43
20 19 17 18 20 16 15 15 16 17
'16 '15 '14 '13 '12 '16 '15 '14 '13 '12
Mostly in bonds, moneymarket funds, cash and otherstable investments
Relatively equal mix of stocksand investments such asbonds, money market fundsand cashMostly stocks, with little or nomoney in investments such asbonds, money mkt funds, cash
Not sure
N=1472 N=1479 N=1367 N=1260 N=1369 N=1652 N=1919 N=1763 N=1471 N=1401
Small Companies Large Companies
How Retirement Savings Are Invested (%)
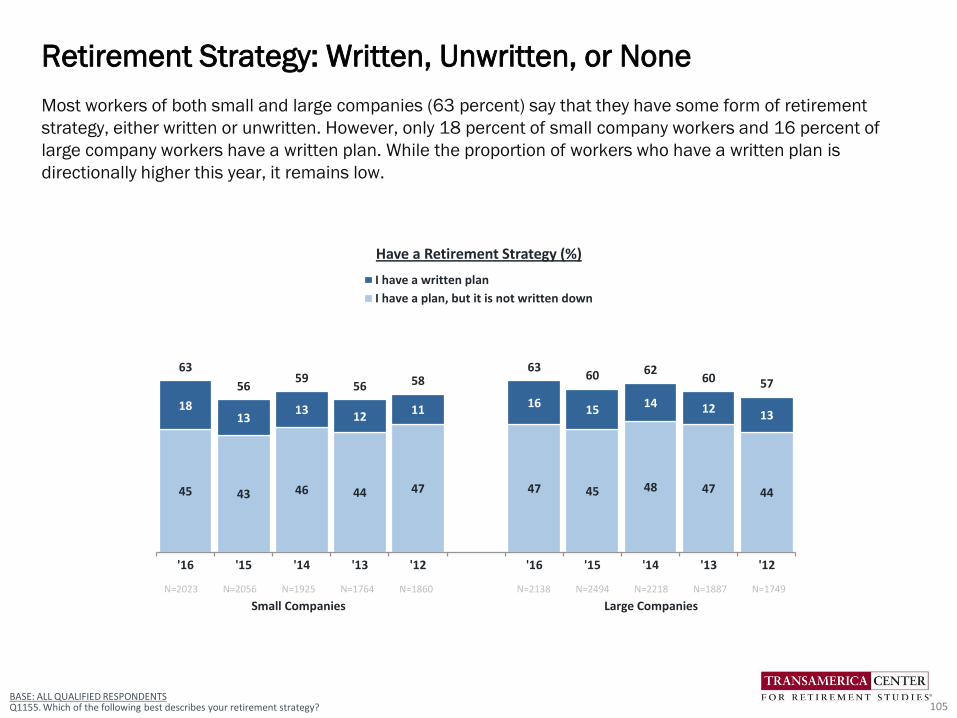
Most workers of both small and large companies (63 percent) say that they have some form of retirement
strategy, either written or unwritten. However, only 18 percent of small company workers and 16 percent of
large company workers have a written plan. While the proportion of workers who have a written plan is
directionally higher this year, it remains low.
Retirement Strategy: Written, Unwritten, or None
105BASE: ALL QUALIFIED RESPONDENTSQ1155. Which of the following best describes your retirement strategy?
45 43 46 44 47 47 45 48 47 44
1813
1312
1116
1514 12
13
63
5659
56 5863
60 6260 57
'16 '15 '14 '13 '12 '16 '15 '14 '13 '12
I have a written plan
I have a plan, but it is not written down
N=2023 N=2056 N=1925 N=1764 N=1860 N=2138 N=2494 N=2218 N=1887 N=1749
Small Companies Large Companies
Have a Retirement Strategy (%)
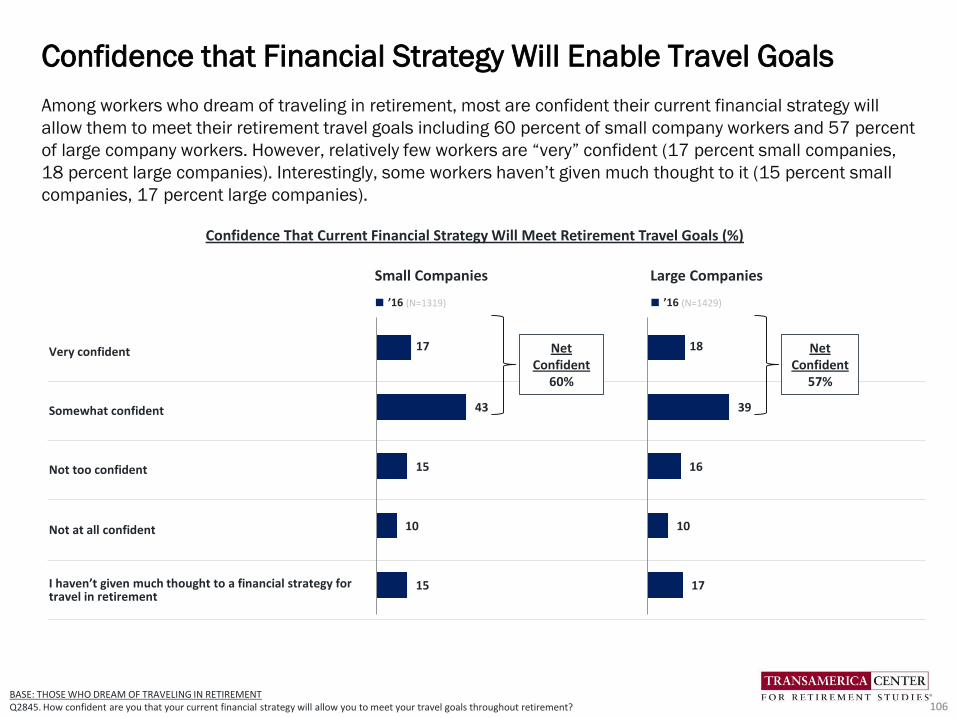
Among workers who dream of traveling in retirement, most are confident their current financial strategy will
allow them to meet their retirement travel goals including 60 percent of small company workers and 57 percent
of large company workers. However, relatively few workers are “very” confident (17 percent small companies,
18 percent large companies). Interestingly, some workers haven’t given much thought to it (15 percent small
companies, 17 percent large companies).
Confidence that Financial Strategy Will Enable Travel Goals
BASE: THOSE WHO DREAM OF TRAVELING IN RETIREMENTQ2845. How confident are you that your current financial strategy will allow you to meet your travel goals throughout retirement?
Confidence That Current Financial Strategy Will Meet Retirement Travel Goals (%)
Small Companies Large Companies
■ ’16 (N=1319) ■ ’16 (N=1429)
Very confident
Somewhat confident
Not too confident
Not at all confident
I haven’t given much thought to a financial strategy for travel in retirement
106
17
43
15
10
15
18
39
16
10
17
Net Confident
57%
Net Confident
60%
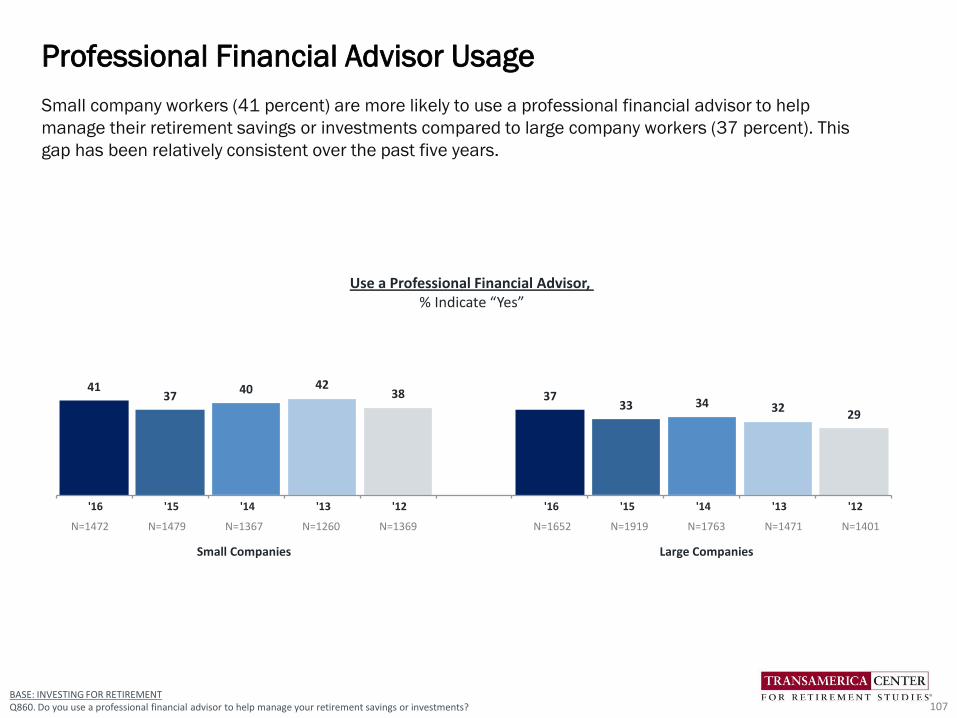
Small company workers (41 percent) are more likely to use a professional financial advisor to help
manage their retirement savings or investments compared to large company workers (37 percent). This
gap has been relatively consistent over the past five years.
Professional Financial Advisor Usage
107BASE: INVESTING FOR RETIREMENTQ860. Do you use a professional financial advisor to help manage your retirement savings or investments?
4137
40 4238 37
33 34 3229
'16 '15 '14 '13 '12 '16 '15 '14 '13 '12
N=1472 N=1479 N=1367 N=1260 N=1369 N=1652 N=1919 N=1763 N=1471 N=1401
Small Companies Large Companies
Use a Professional Financial Advisor, % Indicate “Yes”

16 14 14 16 15 14 11 9 13 14
65 5 5 8
44 4
5 5
5 8 7 78
56 6
7 8
7 9 10 88
6 8 8
8 8
1012 13 12 10
8 9 1411 8
1113 13 15 13
13 1415
14 13
24 19 19 1613
28 2624 20
19
'16 '15 '14 '13 '12 '16 '15 '14 '13 '12
$250k or more
$100k to less than $250k
$50k to less than $100k
$25k to less than $50k
$10k to less than $25k
$5k to less than $10k
Less than $5k
Small Companies Large Companies
Workers of large companies report higher levels of total household savings in retirement accounts compared to
those of small companies. Large company works have saved $87,000 (estimated median), while small
company workers have saved $56,000 (estimated median). Large company workers (28 percent) are also more
likely than small company workers (24 percent) to say that they have saved $250,000 or more. Retirement
savings have increased among small and large company workers since 2012.
Total Household Retirement Savings
108BASE: ALL QUALIFIED RESPONDENTSQ1300. Approximately how much money does your household have saved in all of your retirement accounts?
Note: The median is estimated based on the approximate midpoint of the range of each response category. Non-responses are excluded from the estimate.
Total Household Retirement Savings (%)
Not sure 12 10 8 9 12 12 12 10 11 12
Decline to answer 9 10 11 12 13 10 10 10 11 13
Estimated Median $56,000 $50,000 $51,000 $47,000 $35,000 $87,000 $79,000 $73,000 $58,000 $53,000
N=2023
N=2056
N=1925
N=1764
N=1860
N=2138
N=2494
N=2218
N=1887
N=1749
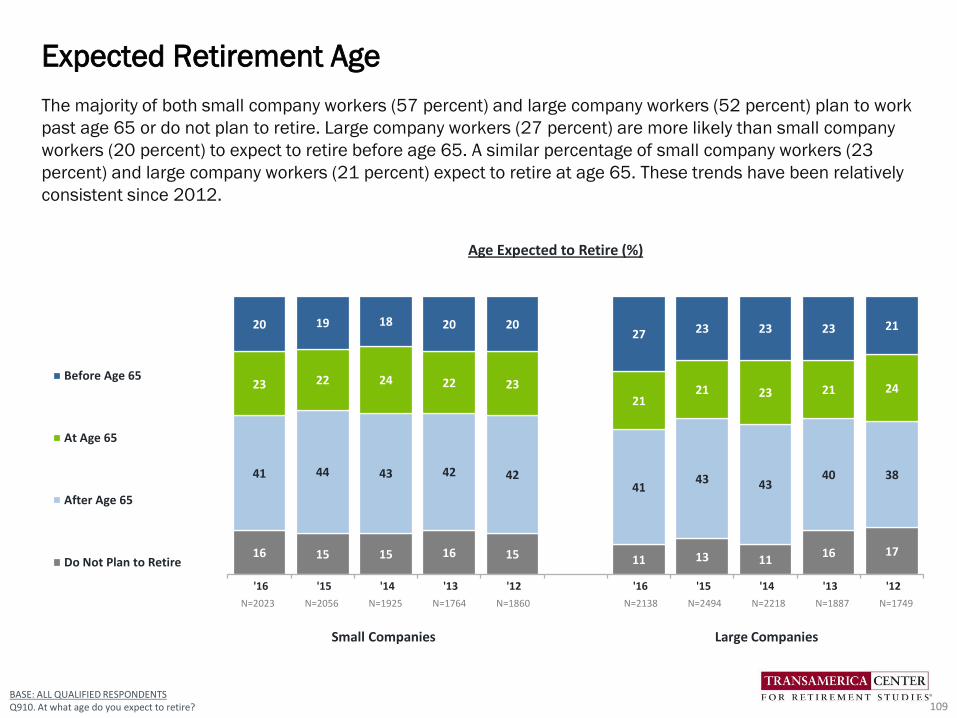
BASE: ALL QUALIFIED RESPONDENTSQ910. At what age do you expect to retire?
The majority of both small company workers (57 percent) and large company workers (52 percent) plan to work
past age 65 or do not plan to retire. Large company workers (27 percent) are more likely than small company
workers (20 percent) to expect to retire before age 65. A similar percentage of small company workers (23
percent) and large company workers (21 percent) expect to retire at age 65. These trends have been relatively
consistent since 2012.
Expected Retirement Age
109
16 15 15 16 15 11 13 1116 17
41 44 43 42 4241
43 4340 38
23 22 24 22 23
2121 23 21 24
20 19 18 20 2027 23 23 23 21
'16 '15 '14 '13 '12 '16 '15 '14 '13 '12
Before Age 65
At Age 65
After Age 65
Do Not Plan to Retire
N=2023 N=2056 N=1925 N=1764 N=1860 N=2138 N=2494 N=2218 N=1887 N=1749
Small Companies Large Companies
Age Expected to Retire (%)

38 42 41 46 4838 37 40 43 41
16 13 1310 9
11 11 11 9 12
24 23 24 19 1730 27 29
19 20
22 22 2225 26
21 25 2029 27
54Net Yes: 54 56 57
More than half (54 percent) of workers in small companies plan to work full- or part-time in retirement, while
just under half (49 percent) of large company employees plan to do so. Over the past five years, small company
workers have been consistently more likely to say they plan to work in retirement, although this gap is slightly
smaller this year.
Expectations of Working in Retirement
110BASE: ALL QUALIFIED RESPONDENTSQ1525. Do you plan to work after you retire?
Working After Retirement (%)
Yes, I plan to work full-timeYes, I plan to work part-timeNo, I do not plan to workNot sure
55
’16 ’15 ’14 ’13 ’12 ’16 ’15 ’14 ’13 ’12
N=2023
N=2056
N=1925
N=1764
N=1860
N=2138
N=2494
N=2218
N=1887
N=1749
Small Companies Large Companies
4951 52 5348

Many workers are planning to either transition into retirement by changing work patterns (e.g., shifting from full-
to part-time or working in a different capacity) or planning to continue working until they cannot work any
longer, with workers of small companies being somewhat more likely to be planning for both of these scenarios.
More large company workers (26 percent) than small company workers (20 percent) plan to immediately stop
working and retire once they reach a specific age or amount of money.
Retirement Transitions: Phased Versus Immediate
111
Small Companies Large Companies
■ ’16 (N=2023)
■ ’15 (N=2056)■ ’14 (N=1925)
■ ’16 (N=2138)■ ’15 (N=2494)■ ’14 (N=2218)
Continue working as long as possible in current or similar position until I cannot work anymore
TRANSITION (NET)
Transition into retirement by reducing work hours
Transition into retirement by working in a different capacity
PLAN TO STOP (NET)
Immediately stop working once I reach a specific age
Immediately stop working once I save a specific amount of money
Not sure
New in 2014.
BASE: ALL QUALIFIED RESPONDENTSQ1545. How do you envision transitioning into retirement?
20
39
24
15
26
16
10
15
20
38
23
15
25
17
8
17
18
46
28
18
23
16
7
13
23
45
32
13
20
12
8
12
21
45
29
16
17
11
6
17
18
47
31
16
20
11
9
15
How do you envision transitioning into retirement? (%)
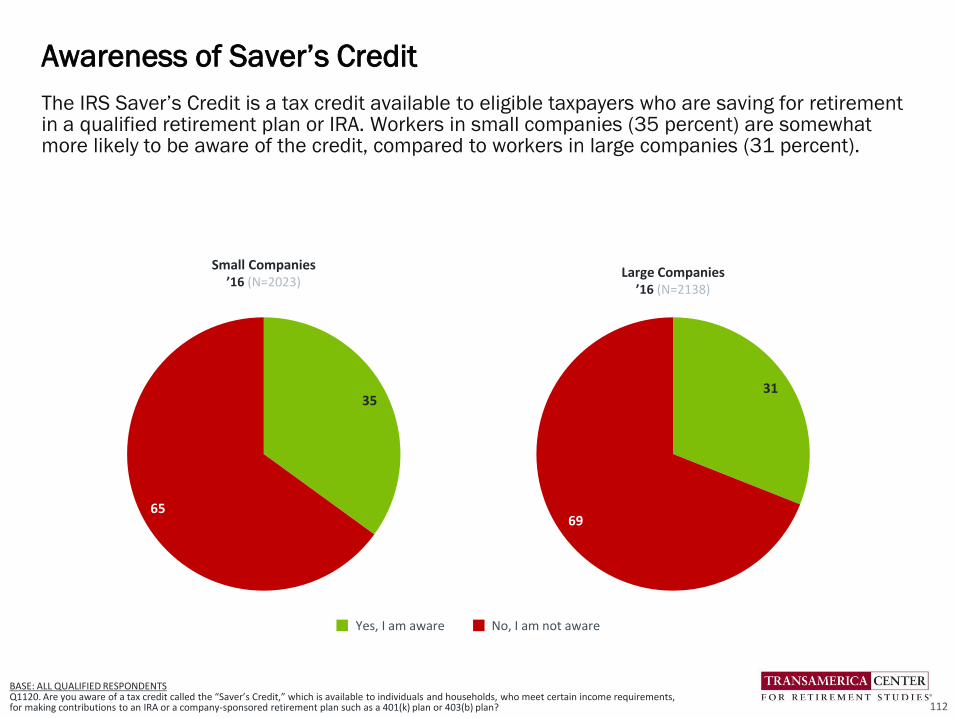
The IRS Saver’s Credit is a tax credit available to eligible taxpayers who are saving for retirement in a qualified retirement plan or IRA. Workers in small companies (35 percent) are somewhat more likely to be aware of the credit, compared to workers in large companies (31 percent).
Awareness of Saver’s Credit
112
BASE: ALL QUALIFIED RESPONDENTS Q1120. Are you aware of a tax credit called the “Saver’s Credit,” which is available to individuals and households, who meet certain income requirements, for making contributions to an IRA or a company-sponsored retirement plan such as a 401(k) plan or 403(b) plan?
31
69
Yes, I am aware No, I am not aware
35
65
Small Companies’16 (N=2023)
Large Companies’16 (N=2138)
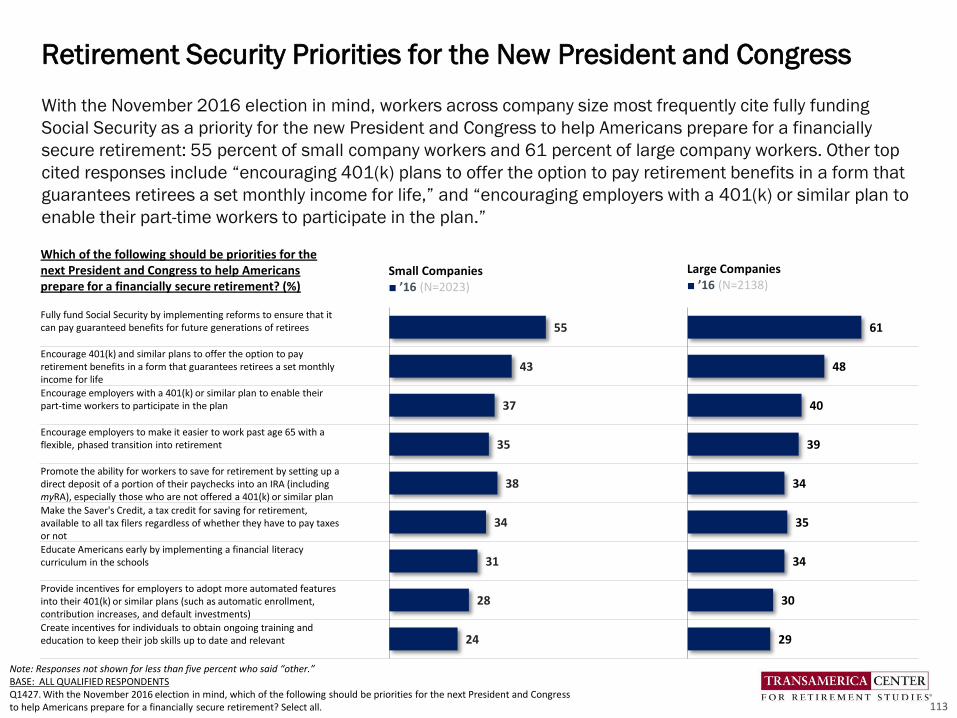
With the November 2016 election in mind, workers across company size most frequently cite fully funding
Social Security as a priority for the new President and Congress to help Americans prepare for a financially
secure retirement: 55 percent of small company workers and 61 percent of large company workers. Other top
cited responses include “encouraging 401(k) plans to offer the option to pay retirement benefits in a form that
guarantees retirees a set monthly income for life,” and “encouraging employers with a 401(k) or similar plan to
enable their part-time workers to participate in the plan.”
Retirement Security Priorities for the New President and Congress
113
Note: Responses not shown for less than five percent who said “other.”BASE: ALL QUALIFIED RESPONDENTSQ1427. With the November 2016 election in mind, which of the following should be priorities for the next President and Congress to help Americans prepare for a financially secure retirement? Select all.
Which of the following should be priorities for the next President and Congress to help Americans prepare for a financially secure retirement? (%)
Small Companies■ ’16 (N=2023)
Large Companies■ ’16 (N=2138)
Fully fund Social Security by implementing reforms to ensure that it can pay guaranteed benefits for future generations of retirees
Encourage 401(k) and similar plans to offer the option to pay retirement benefits in a form that guarantees retirees a set monthly income for life
Encourage employers with a 401(k) or similar plan to enable their part-time workers to participate in the plan
Encourage employers to make it easier to work past age 65 with a flexible, phased transition into retirement
Promote the ability for workers to save for retirement by setting up a direct deposit of a portion of their paychecks into an IRA (including myRA), especially those who are not offered a 401(k) or similar plan
Make the Saver's Credit, a tax credit for saving for retirement, available to all tax filers regardless of whether they have to pay taxes or not
Educate Americans early by implementing a financial literacy curriculum in the schools
Provide incentives for employers to adopt more automated features into their 401(k) or similar plans (such as automatic enrollment, contribution increases, and default investments)
Create incentives for individuals to obtain ongoing training and education to keep their job skills up to date and relevant
55
43
37
35
38
34
31
28
24
61
48
40
39
34
35
34
30
29
Influences of Generation on Retirement Readiness
Detailed Findings
114

Baby Boomers, Generation X, and Millennials face unique circumstances as well as common challenges in
achieving long-term financial security. Baby Boomers (born 1946 to 1964) have re-written societal rules at
every stage of their life — and are now trailblazing a new brand of retirement. Generation X (born 1965 and
1978) entered the workforce in the late 1980s and were making their first appearance and defined benefit
plans were beginning to disappear. Millennials (born 1979 to 2000) are a digital do-it-yourself generation of
retirement savers that will be self-funding a greater portion of their future retirement income compared to older
generations. All three generations face risks and opportunities for improving their long-term retirement outlook.
Thirty Indicators of Retirement Readiness
• Recovery From the Great Recession. Financial recovery from the Great Recession varies across
generations. Millennial workers (27 percent) are most likely to say they were not impacted,” followed by
Generation X (17 percent) and Baby Boomers (12 percent). All three generations are similarly likely to say
they have fully recovered, including Millennials (19 percent), Generation X (20 percent), and Baby Boomers
(18 percent). Baby Boomers (25 percent) are more likely than Generation X (22 percent) and Millennials
(16 percent) to say they have not yet begun to recover or may never recover.
• Confidence in Retiring Comfortably. More than half of workers are “somewhat” or “very” confident that they
will be able to retire comfortably; confidence is highest among Millennials (68 percent) and Baby Boomers
(62 percent) and notably lower among Generation X (56 percent). Relatively few workers of all three
generations are “very” confident, including 18 percent of Millennials, 12 percent of Generation X, and 15
percent of Baby Boomers.
• Building a Large Enough Nest Egg? About half of Generation X (47 percent) and Baby Boomers (51
percent) either “somewhat” or “strongly” agree that they are building a large enough retirement nest egg,
and slightly more Millennials (56 percent) agree. Among all three generations, fewer than one in five
“strongly” agree.
Influences of Generation on Retirement Readiness
115
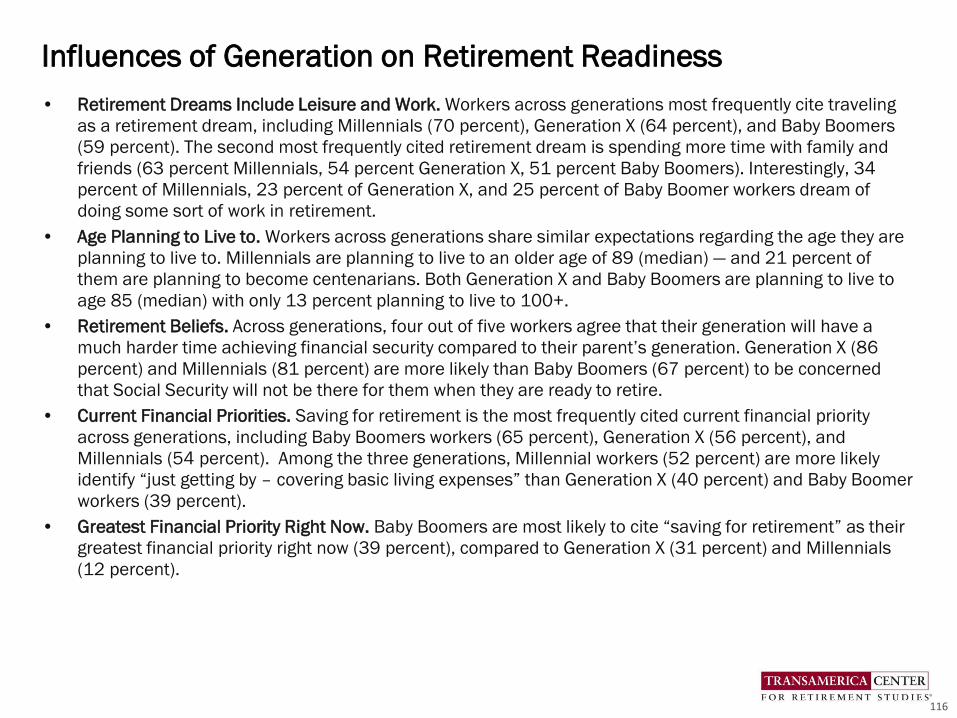
• Retirement Dreams Include Leisure and Work. Workers across generations most frequently cite traveling
as a retirement dream, including Millennials (70 percent), Generation X (64 percent), and Baby Boomers
(59 percent). The second most frequently cited retirement dream is spending more time with family and
friends (63 percent Millennials, 54 percent Generation X, 51 percent Baby Boomers). Interestingly, 34
percent of Millennials, 23 percent of Generation X, and 25 percent of Baby Boomer workers dream of
doing some sort of work in retirement.
• Age Planning to Live to. Workers across generations share similar expectations regarding the age they are
planning to live to. Millennials are planning to live to an older age of 89 (median) — and 21 percent of
them are planning to become centenarians. Both Generation X and Baby Boomers are planning to live to
age 85 (median) with only 13 percent planning to live to 100+.
• Retirement Beliefs. Across generations, four out of five workers agree that their generation will have a
much harder time achieving financial security compared to their parent’s generation. Generation X (86
percent) and Millennials (81 percent) are more likely than Baby Boomers (67 percent) to be concerned
that Social Security will not be there for them when they are ready to retire.
• Current Financial Priorities. Saving for retirement is the most frequently cited current financial priority
across generations, including Baby Boomers workers (65 percent), Generation X (56 percent), and
Millennials (54 percent). Among the three generations, Millennial workers (52 percent) are more likely
identify “just getting by – covering basic living expenses” than Generation X (40 percent) and Baby Boomer
workers (39 percent).
• Greatest Financial Priority Right Now. Baby Boomers are most likely to cite “saving for retirement” as their
greatest financial priority right now (39 percent), compared to Generation X (31 percent) and Millennials
(12 percent).
Influences of Generation on Retirement Readiness
116

• Expected Sources of Retirement Income. Self-funded savings including retirement accounts (e.g., 401(k)s,
403(b)s, IRAs) and other savings and investments are the most frequently cited source of retirement
income expected by Millennials (79 percent) and Generation X (76 percent), while Baby Boomers are most
likely to expect to rely on Social Security (87 percent).
• Expected Primary Source of Income in Retirement. Millennial (43 percent) and Generation X (38 percent)
workers most frequently cite 401(k)s, 403(b)s, or IRAs to be their expected primary source of retirement
income, while Baby Boomers (34 percent) are more likely to expect to rely on Social Security during
retirement. Approximately one in seven Millennials (16 percent) and Generation X (17 percent) expect
“working” to be their primary source of retirement income.
• Percentage Saving for Retirement/ Age They Started to Save. The majority of workers across all three
generations are saving for retirement through an employer-sponsored plan and/or outside of work. Baby
Boomers (83 percent) are most likely to be saving, followed by Generation X (77 percent) and Millennials
(72 percent). In terms of the median age that they started saving, Millennials started at a younger age (age
22) compared to Generation X (age 28) and Baby Boomers (age 35).
• Importance of Retirement Benefits Compared to Other Benefits. The vast majority of workers — including
91 percent of Millennials, 91 percent of Generation X, and 84 percent of Baby Boomers — believe that a
401(k) or similar plan is a “somewhat” or “very” important employee benefit.
• Retirement Benefits Currently Offered. Most workers are offered a 401(k) or similar plan by their
employers. Baby Boomers (73 percent) and Generation X (76 percent) are more likely to be offered such
benefits compared to Millennials (66 percent). Few workers are offered a company-funded defined benefit
plan.
• Retirement Plan Participation. Among workers who are offered a 401(k) or similar plan, the participation
rate increases with age. Seventy-two percent of Millennial workers participate in their employer’s plan,
compared to 80 percent of Generation X and 80 percent of Baby Boomers.
Influences of Generation on Retirement Readiness
117
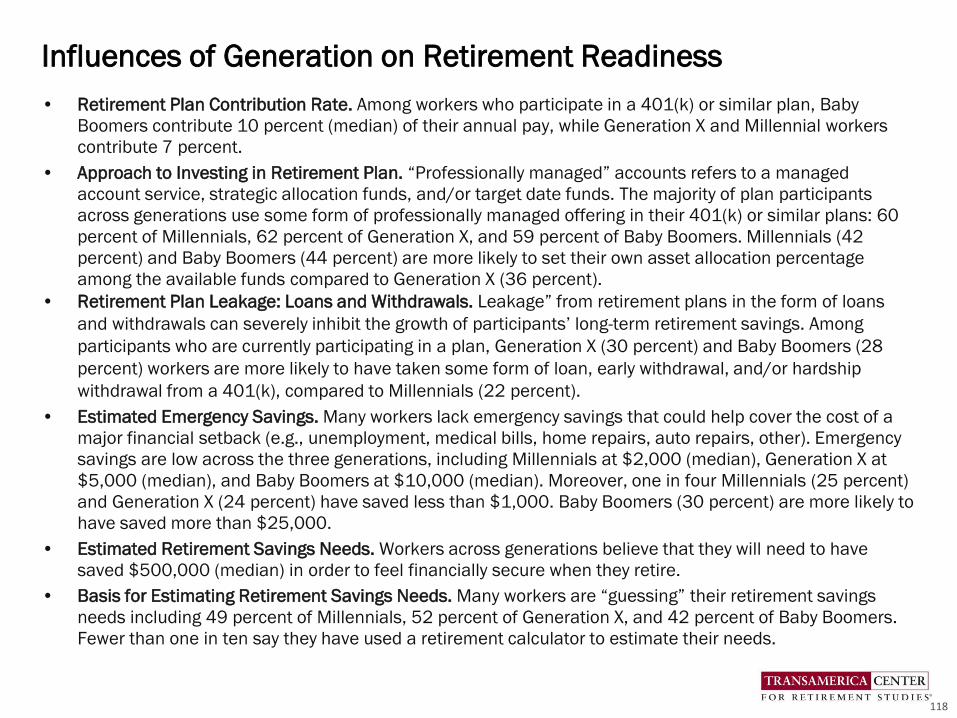
• Retirement Plan Contribution Rate. Among workers who participate in a 401(k) or similar plan, Baby
Boomers contribute 10 percent (median) of their annual pay, while Generation X and Millennial workers
contribute 7 percent.
• Approach to Investing in Retirement Plan. “Professionally managed” accounts refers to a managed
account service, strategic allocation funds, and/or target date funds. The majority of plan participants
across generations use some form of professionally managed offering in their 401(k) or similar plans: 60
percent of Millennials, 62 percent of Generation X, and 59 percent of Baby Boomers. Millennials (42
percent) and Baby Boomers (44 percent) are more likely to set their own asset allocation percentage
among the available funds compared to Generation X (36 percent).
• Retirement Plan Leakage: Loans and Withdrawals. Leakage” from retirement plans in the form of loans
and withdrawals can severely inhibit the growth of participants’ long-term retirement savings. Among
participants who are currently participating in a plan, Generation X (30 percent) and Baby Boomers (28
percent) workers are more likely to have taken some form of loan, early withdrawal, and/or hardship
withdrawal from a 401(k), compared to Millennials (22 percent).
• Estimated Emergency Savings. Many workers lack emergency savings that could help cover the cost of a
major financial setback (e.g., unemployment, medical bills, home repairs, auto repairs, other). Emergency
savings are low across the three generations, including Millennials at $2,000 (median), Generation X at
$5,000 (median), and Baby Boomers at $10,000 (median). Moreover, one in four Millennials (25 percent)
and Generation X (24 percent) have saved less than $1,000. Baby Boomers (30 percent) are more likely to
have saved more than $25,000.
• Estimated Retirement Savings Needs. Workers across generations believe that they will need to have
saved $500,000 (median) in order to feel financially secure when they retire.
• Basis for Estimating Retirement Savings Needs. Many workers are “guessing” their retirement savings
needs including 49 percent of Millennials, 52 percent of Generation X, and 42 percent of Baby Boomers.
Fewer than one in ten say they have used a retirement calculator to estimate their needs.
Influences of Generation on Retirement Readiness
118

• Asset Allocation of Retirement Investments. Workers across generations most frequently cite that their
retirement savings are invested in a relatively equal mix of stocks and investments such as bonds, money
market funds and cash; however, the response rate is higher among Baby Boomers (49 percent) and
Generation X (44 percent) compared to Millennials (32 percent). A concerning 25 percent of Millennials
are “not sure” how their savings are invested.
• Retirement Strategy: Written, Unwritten, or None. The majority of workers across all generations has a
retirement strategy including 64 percent of Baby Boomers, 60 percent of Generation X and 65 percent of
Millennials. Workers in all generations are far less likely to have a written strategy.
• Confidence that Financial Strategy Will Enable Travel Goals. Among workers who dream of traveling in
retirement, most are confident their current financial strategy will allow them to meet their travel goals,
including 58 percent of Millennials, 54 percent of Generation X, and 63 percent of Baby Boomer workers.
However, relatively few across generations are “very” confident (19 percent Millennials, 13 percent
Generation X, 20 percent Baby Boomers). Interestingly, some workers say that they haven’t given it much
thought: 20 percent Millennials, 17 percent Generation X, 10 percent Baby Boomers.
• Professional Financial Advisor Usage. Baby Boomers (40 percent) and Generation X (39 percent) workers
are somewhat more likely than Millennials (36 percent) to use a financial advisor to help manage
retirement savings and investments.
• Total Household Retirement Savings. Baby Boomer workers have the highest reported total household
retirement savings at $147,000 (estimated median) compared to Generation X ($69,000) and Millennials
($31,000).Thirteen percent of Millennials are not sure what their total household retirement savings are.
• Expected Retirement Age. Sixty-six percent of Baby Boomers expect to either work past age 65 (51
percent) or do not plan to retire (15 percent). Fifty-five percent of Generation X share these expectations
including 41 percent who plan to work past age 65 and 14 percent who do not plan to retire. In contrast,
the majority of Millennials (60 percent) expect to either retire at age 65 (25 percent) or sooner (35
percent).
Influences of Generation on Retirement Readiness
119

• Expectations of Working in Retirement. Many workers plan to continue working after they retire, including
50 percent of Baby Boomers, 51 percent of Generation X, and 52 percent of Millennials. Among those
planning to work, most plan to do so on a part-time basis.
• Retirement Transitions: Phased Versus Immediate. Many workers across the three generations are
planning either transition into retirement changing work patterns (e.g., shifting from full-time to part-time or
working in a different capacity) or planning to continue working until they cannot work any longer. Baby
Boomers (26 percent) are more likely to be planning to immediately stop working when they reach a
certain age or savings goal compared to Generation X (22 percent) and Millennials (22 percent).
• Awareness of the Saver’s Credit. The IRS Saver’s Credit is a tax credit available to eligible taxpayers who
are saving for retirement in a qualified retirement plan or IRA. Level of awareness about the credit is
highest among Millennials (38 percent), followed by Generation X (30 percent) and Baby Boomers (29
percent).
• Retirement Security Priorities for the New President and Congress. Workers across generations most
frequently cite fully funding Social Security as a priority for the new President and Congress to help
Americans prepare for a financially secure retirement. However, there are differences of opinion among
generations about other priorities. Baby Boomers (73 percent) are more likely to cite fully funding Social
Security compared to other generations. Millennials (39 percent) are more likely to cite “educating
Americans early by implementing a financial literacy curriculum in schools.” Generation X (48 percent) is
slightly more likely to cite “encouraging 401(k) plans to offer the option to pay retirement benefits in a form
that guarantees retirees a set monthly income for life.”
Influences of Generation on Retirement Readiness
120

Financial recovery from the Great Recession varies across generations. Millennial workers (27 percent) are most likely to say they were not impacted,” followed by Generation X (17 percent) and Baby Boomers (12 percent). All three generations are similarly likely to say they have fully recovered, including Millennials (19 percent), Generation X (20 percent), and Baby Boomers (18 percent). Baby Boomers (25 percent) are more likely than Generation X (22 percent) and Millennials (16 percent) to say they have not yet begun to recover or may never recover.
Recovery From the Great Recession
121BASE: ALL QUALIFIED RESPONDENTS Q2655. How would you describe your financial recovery from the deep recession in recent years, which is commonly referred to as the “Great Recession”?
27
17
12
19
20
18
38
41
45
13
14
13
3
8
12
Millennials
GenerationX
BabyBoomers
I was not impacted
I have fully recovered
I have somewhat recovered
I have not yet begun to recover
I may never recover
NET - Not Impacted or Fully Recovered= 46%
How would you describe your financial recovery from the Great Recession?
NET - Not Yet Begun or Never Recover = 16%
N=1353
N=1462
N=1232
NET - Not Impacted or Fully Recovered= 37%
NET - Not Yet Begun or Never Recover = 22%
NET - Not Impacted or Fully Recovered= 30%
NET - Not Yet Begun or Never Recover = 25%

50 46 49 4941 44 44 47
41 4247 46 49 45 42
1817
1911
15 12 1114
9 7
15 15 13
87
6863
68
5956 56 54
61
50 49
62 61 62
5349
'16 '15 '14 '13 '12 '16 '15 '14 '13 '12 '16 '15 '14 '13 '12
Very confident Somewhat confident
N=1353 N=1135 N=1021 N=523 N=895 N=1232 N=1224 N=1120 N=801 N=1113 N=1462 N=2026 N=1805 N=1929 N=1282
Millennial Generation X Baby Boomer
More than half of workers are “somewhat” or “very” confident that they will be able to retire comfortably;
confidence is highest among Millennials (68 percent) and Baby Boomers (62 percent) and notably lower among
Generation X (56 percent). Relatively few workers of all three generations are “very” confident, including 18
percent of Millennials, 12 percent of Generation X, and 15 percent of Baby Boomers.
Confidence in Retiring Comfortably
122BASE: ALL QUALIFIED RESPONDENTSQ880. How confident are you that you will be able to fully retire with a lifestyle you consider comfortable?
Confidence in Retiring Comfortably
Very/Somewhat Confident (%) (NET)

37 3440
31 31 35 34 36 32 3035 33
3831 29
1918
16
13 1512 12
15
98
1615
13
9 9
5651
56
44 46 47 4750
4137
5148
51
40 37
'16 '15 '14 '13 '12 '16 '15 '14 '13 '12 '16 '15 '14 '13 '12
Strongly agree Somewhat agree
About half of Generation X (47 percent) and Baby Boomers (51 percent) either “somewhat” or “strongly” agree
that they are building a large enough retirement nest egg, and slightly more Millennials (56 percent) agree.
Among all three generations, fewer than one in five “strongly” agree. Level of agreement rose between 2011
and 2014 and then dropped in the past year.
Building a Large Enough Nest Egg?
123
Building a Large Enough Nest Egg
Strongly/Somewhat Agree (%) (NET)
N=1353 N=1135 N=1021 N=523 N=895 N=1232 N=1224 N=1120 N=801 N=1113 N=1462 N=2026 N=1805 N=1929 N=1282
Millennial Generation X Baby Boomer
BASE: ALL QUALIFIED RESPONDENTSQ800. How much do you agree or disagree that you are currently building a large enough retirement nest egg?
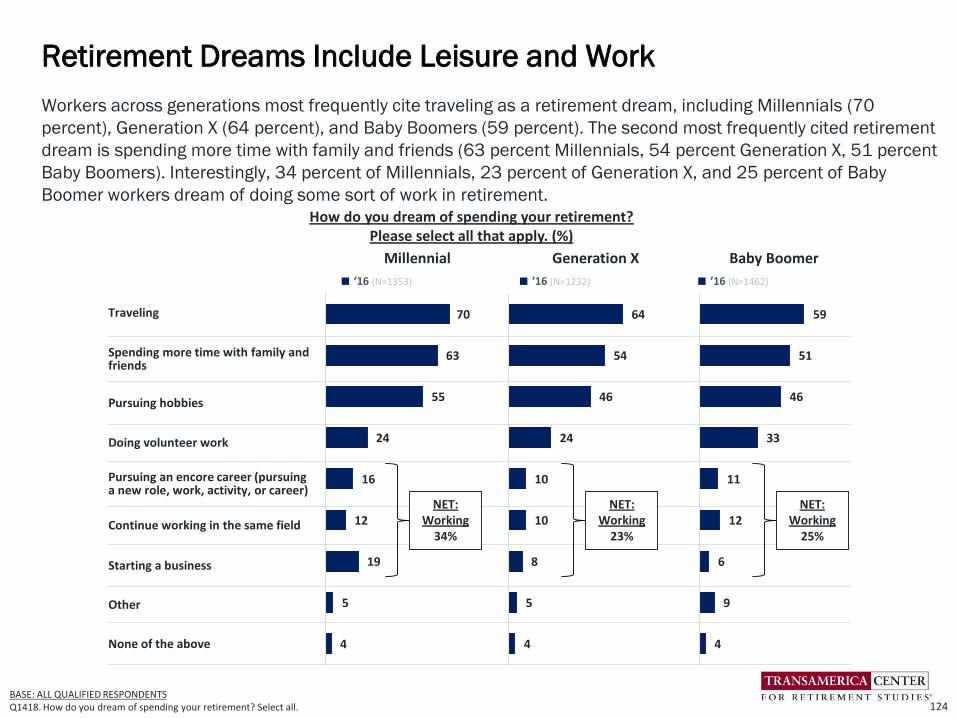
Workers across generations most frequently cite traveling as a retirement dream, including Millennials (70
percent), Generation X (64 percent), and Baby Boomers (59 percent). The second most frequently cited retirement
dream is spending more time with family and friends (63 percent Millennials, 54 percent Generation X, 51 percent
Baby Boomers). Interestingly, 34 percent of Millennials, 23 percent of Generation X, and 25 percent of Baby
Boomer workers dream of doing some sort of work in retirement.
Retirement Dreams Include Leisure and Work
124BASE: ALL QUALIFIED RESPONDENTS Q1418. How do you dream of spending your retirement? Select all.
How do you dream of spending your retirement? Please select all that apply. (%)
Millennial Generation X Baby Boomer
■ ’16 (N=1353) ■ ’16 (N=1232) ■ ’16 (N=1462)
Traveling
Spending more time with family and friends
Pursuing hobbies
Doing volunteer work
Pursuing an encore career (pursuing a new role, work, activity, or career)
Continue working in the same field
Starting a business
Other
None of the above
70
63
55
24
16
12
19
5
4
NET: Working
34%
64
54
46
24
10
10
8
5
4
NET: Working
23%
59
51
46
33
11
12
6
9
4
NET: Working
25%

2
10
24
20
21
'16
Age 100+
Age 90-99
Age 80-89
Age 65-79
Age 60-64
1
12
33
24
13
'16
1
12
30
24
13
'16
Workers across generations share similar expectations regarding the age they are planning to live to.
Millennials are planning to live to an older age of 89 (median) — and 21 percent of them are planning to
become centenarians. Both Generation X and Baby Boomers are planning to live to age 85 (median) with only
13 percent planning to live to 100+.
Age Planning to Live to
125
BASE: ALL QUALIFIED RESPONDENTS
Q2850. What age are you planning to live to?
Not sure 16 15 14Median Age 89 Age 85 Age 85
Millennial Generation X Baby Boomer
N=1353 N=1232 N=1462
What age are you planning to live to? (%)

How Much Do You Agree or Disagree?
Strongly/Somewhat Agree (%) (NET)
Millennial Generation X Baby Boomer
■ ’16 (N=1353)
■ ’15 (N=1135)
■ ’14 (N=1021)
■ ’13(N=523)
■ ’12 (N=895)
■ ’16(N=1232)
■ ’15 (N=1224)
■ ’14 (N=1120)
■ ’13 (N=801)
■ ’12 (N=1113)
■ ’16 (N=1462)
■ ’15 (N=2026)
■ ’14 (N=1805)
■ ’13 (N=1929)
■ ’12 (N=1282)
**Compared to my parent's generation, people in my generation will have a much harder time in achieving financial security
**I am concerned that when I am ready to retire, Social Security will not be there for me
*My current employer is supportive of its employees working past 65
I do not know as much as I should about retirement investing
I could work until age 65 and still not have enough money saved to meet my retirement needs
I am currently very involved in monitoring and managing my retirement savings
I would like to receive more information and advice from my company on how to reach my retirement goals
I would prefer to rely on outside experts to monitor and manage my retirement savings plan
*I am satisfied with the retirement plan my company offers
I prefer not to think about or concern myself with retirement investing until I get closer to my retirement date
Across generations, four out of five workers agree that their generation will have a much harder time achieving financial security
compared to their parent’s generation. Generation X (86 percent) and Millennials (81 percent) are more likely than Baby Boomers
(67 percent) to be concerned that Social Security will not be there for them when they are ready to retire. With regards to their
retirement-related preparations, Millennials tend to lag behind the older generations.
Retirement Beliefs
126
82
81
71
72
67
59
75
61
62
52
81
83
73
69
59
71
57
51
82
81
72
67
66
73
62
52
77
72
55
72
56
46
76
69
54
74
62
50
83
86
69
69
70
63
68
61
64
40
83
85
66
69
63
64
54
45
85
83
65
69
69
65
56
39
70
73
59
61
50
37
71
75
56
62
58
34
80
67
73
63
60
67
55
52
61
28
79
65
63
61
66
51
50
24
80
67
65
65
72
57
51
26
67
66
66
56
50
25
68
67
65
57
47
25
*added in 2016 **added in 2014BASE: ALL QUALIFIED RESPONDENTSQ930. How much do you agree or disagree with each of the following statements regarding retirement investing?
N/A N/A N/A
N/A N/A N/A
N/A
N/A
N/A
N/A
N/A
N/A
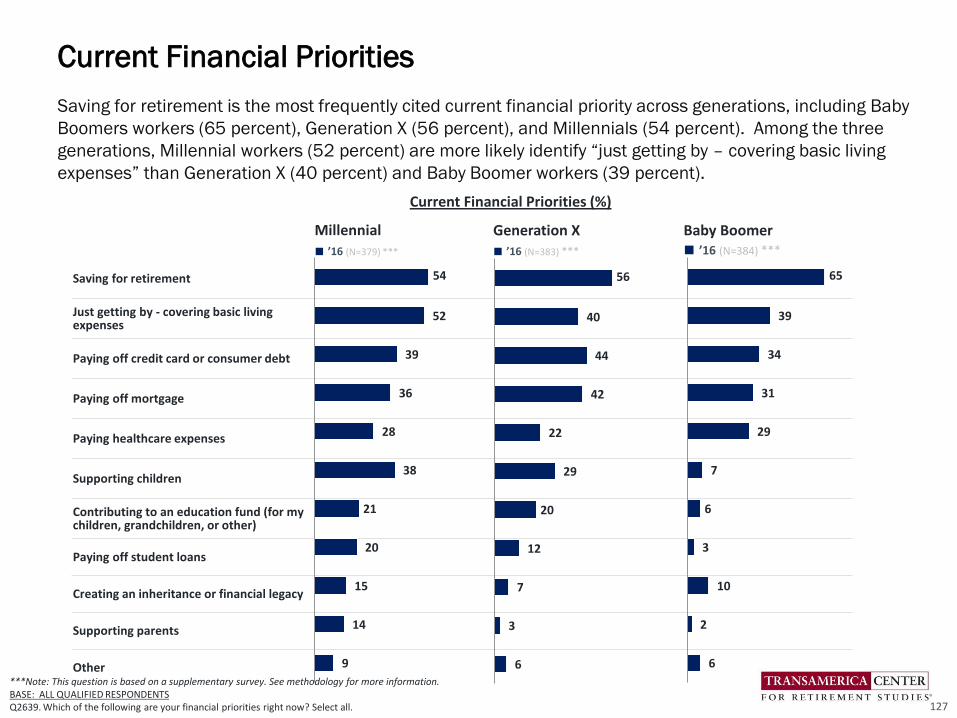
127
***Note: This question is based on a supplementary survey. See methodology for more information.BASE: ALL QUALIFIED RESPONDENTSQ2639. Which of the following are your financial priorities right now? Select all.
Millennial Generation X Baby Boomer■ ’16 (N=379) *** ■ ’16 (N=383) *** ■ ’16 (N=384) ***
Saving for retirement
Just getting by - covering basic living expenses
Paying off credit card or consumer debt
Paying off mortgage
Paying healthcare expenses
Supporting children
Contributing to an education fund (for my children, grandchildren, or other)
Paying off student loans
Creating an inheritance or financial legacy
Supporting parents
Other
54
52
39
36
28
38
21
20
15
14
9
56
40
44
42
22
29
20
12
7
3
6
65
39
34
31
29
7
6
3
10
2
6
Saving for retirement is the most frequently cited current financial priority across generations, including Baby
Boomers workers (65 percent), Generation X (56 percent), and Millennials (54 percent). Among the three
generations, Millennial workers (52 percent) are more likely identify “just getting by – covering basic living
expenses” than Generation X (40 percent) and Baby Boomer workers (39 percent).
Current Financial Priorities
Current Financial Priorities (%)
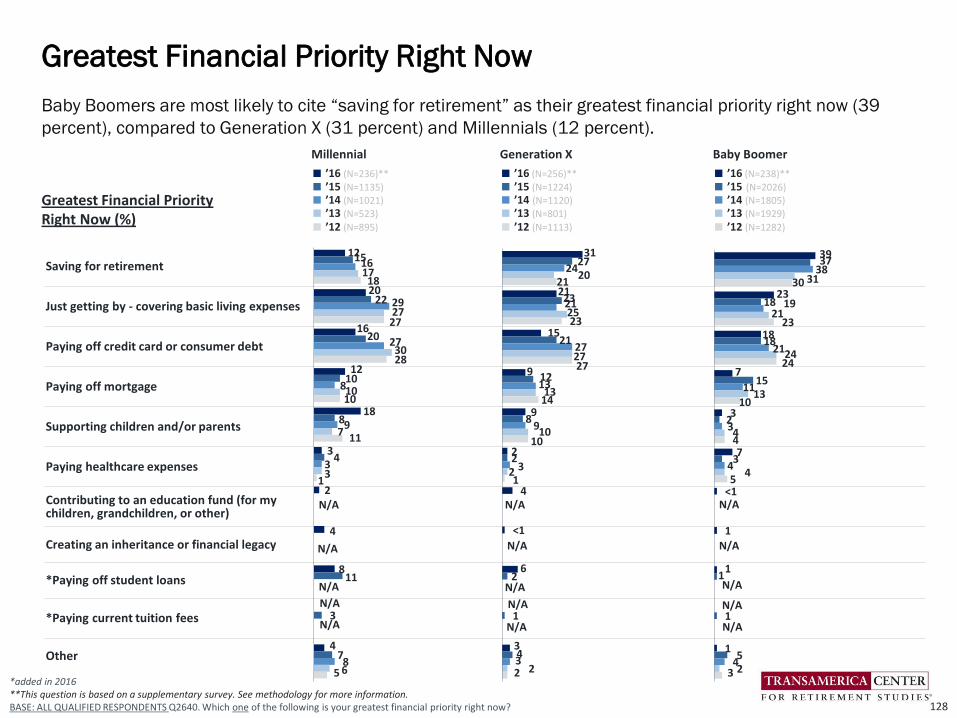
Millennial Generation X Baby Boomer
■ ’16 (N=236)** ■ ’15 (N=1135) ■ ’14 (N=1021)■ ’13 (N=523)
■ ’12 (N=895)
■ ’16 (N=256)**■ ’15 (N=1224) ■ ’14 (N=1120)■ ’13 (N=801)
■ ’12 (N=1113)
■ ’16 (N=238)** ■ ’15 (N=2026)■ ’14 (N=1805)■ ’13 (N=1929)
■ ’12 (N=1282)
Saving for retirement
Just getting by - covering basic living expenses
Paying off credit card or consumer debt
Paying off mortgage
Supporting children and/or parents
Paying healthcare expenses
Contributing to an education fund (for my children, grandchildren, or other)
Creating an inheritance or financial legacy
*Paying off student loans
*Paying current tuition fees
Other
*added in 2016 **This question is based on a supplementary survey. See methodology for more information.BASE: ALL QUALIFIED RESPONDENTS Q2640. Which one of the following is your greatest financial priority right now?
12
20
16
12
18
3
2
4
8
4
15
22
20
10
8
4
11
3
7
16
29
27
8
9
3
8
17
27
30
10
7
3
6
18
27
28
10
11
1
5
31
21
15
9
9
2
4
<1
6
3
27
23
21
12
8
2
2
1
4
24
21
27
13
9
3
3
20
25
27
13
10
2
2
21
23
27
14
10
1
2
39
23
18
7
3
7
<1
1
1
1
37
18
18
15
2
3
1
1
5
38
19
21
11
3
4
4
31
21
24
13
4
4
2
30
23
24
10
4
5
3
Baby Boomers are most likely to cite “saving for retirement” as their greatest financial priority right now (39
percent), compared to Generation X (31 percent) and Millennials (12 percent).
Greatest Financial Priority Right Now
128
N/A
N/A N/A
N/A N/A
N/A
N/A
N/A N/A N/A
N/A N/A
N/A N/A N/A
Greatest Financial Priority Right Now (%)
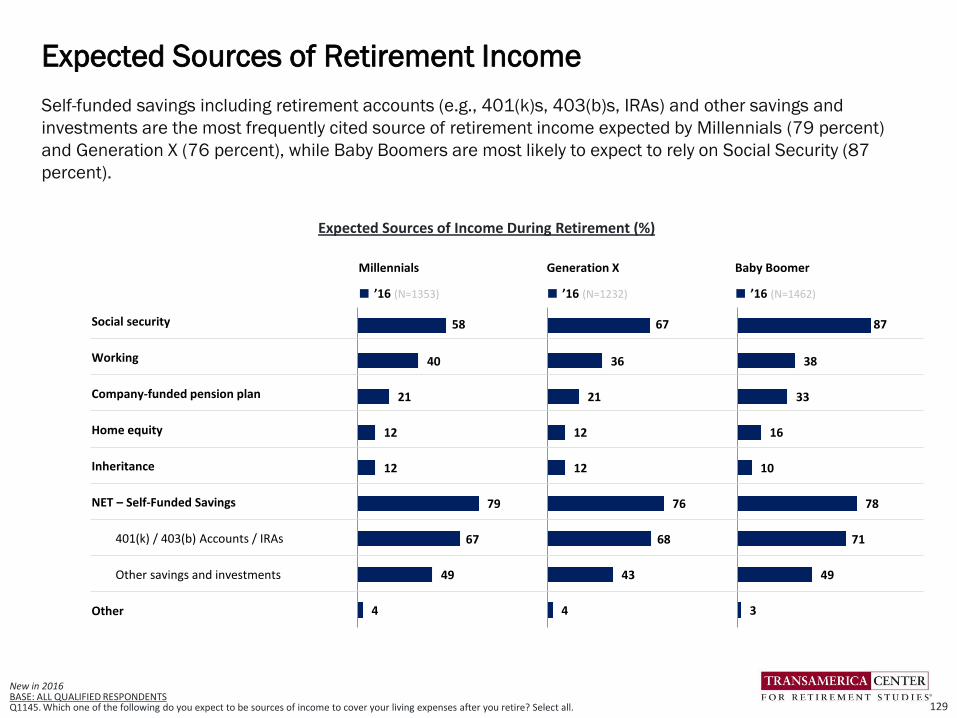
58
40
21
12
12
79
67
49
4
67
36
21
12
12
76
68
43
4
87
38
33
16
10
78
71
49
3
Millennials Generation X Baby Boomer
■ ’16 (N=1353) ■ ’16 (N=1232) ■ ’16 (N=1462)
Social security
Working
Company-funded pension plan
Home equity
Inheritance
NET – Self-Funded Savings
401(k) / 403(b) Accounts / IRAs
Other savings and investments
Other
New in 2016BASE: ALL QUALIFIED RESPONDENTS Q1145. Which one of the following do you expect to be sources of income to cover your living expenses after you retire? Select all.
Self-funded savings including retirement accounts (e.g., 401(k)s, 403(b)s, IRAs) and other savings and
investments are the most frequently cited source of retirement income expected by Millennials (79 percent)
and Generation X (76 percent), while Baby Boomers are most likely to expect to rely on Social Security (87
percent).
Expected Sources of Retirement Income
129
Expected Sources of Income During Retirement (%)

Millennial Generation X Baby Boomer
■ ’16 (N=1353)■ ’15 (N=1134) ■ ’14 (N=1021)■ ’13 (N=523)
■ ’12 (N=895)
■ ’16 (N=1232)■ ’15 (N=1224) ■ ’14 (N=1120)■ ’13 (N=801)
■ ’12 (N=1113)
■ ’16 (N=1462) ■ ’15 (N=2026)■ ’14 (N=1805)■ ’13 (N=1929)
■ ’12 (N=1282)
401(k) / 403(b) accounts / IRAs
Social Security
*Working
Other savings and investments
Company-funded pension plan
Inheritance
Home equity
Other
*added in 2015BASE: ALL QUALIFIED RESPONDENTS Q1150. Which one of the following do you expect to be your primary source of income to cover your living expenses after you retire?
43
17
16
12
5
2
2
3
48
14
14
15
2
2
1
4
48
18
18
4
3
2
7
51
17
19
4
3
2
5
50
21
17
5
2
1
3
38
24
17
10
5
2
1
3
40
24
14
11
4
3
1
3
52
20
14
5
2
3
5
50
22
16
4
2
1
5
50
21
15
5
3
1
4
28
34
11
11
11
2
1
2
26
35
12
10
12
2
1
2
34
36
12
13
2
0
4
30
37
11
14
2
1
4
39
32
11
11
2
1
5
Millennial (43 percent) and Generation X (38 percent) workers most frequently cite 401(k)s, 403(b)s, or IRAs to
be their expected primary source of retirement income, while Baby Boomers (34 percent) are more likely to
expect to rely on Social Security during retirement. Approximately one in seven Millennials (16 percent) and
Generation X (17 percent) expect “working” to be their primary source of retirement income.
Expected Primary Source of Income in Retirement
130
N/AN/A N/A
Expected Primary Source of Income in Retirement (%)

BASE: THOSE CURRENTLY OFFERED QUALIFIED PLANQ1190. Do you currently participate in, or have money invested in your company’s employee-funded retirement savings plan?BASE: ALL QUALIFIED RESPONDENTSQ740. Are you currently saving for retirement outside of work, such as in an IRA, mutual funds, bank account, etc.?BASE: INVESTING FOR RETIREMENTQ790. At what age did you first start saving for retirement?
The majority of workers across all three generations are saving for retirement through an employer-sponsored
plan and/or outside of work. Baby Boomers (83 percent) are most likely to be saving, followed by Generation X
(77 percent) and Millennials (72 percent). In terms of the median age that they started saving, Millennials
started at a younger age (age 22) compared to Generation X (age 28) and Baby Boomers (age 35).
Percentage Saving for Retirement/ Age They Started to Save
131
Age Started Saving
(Median)22 23 22 22 22 28 28 27 25 26 35 34 35 35 32
Millennial Generation X Baby Boomer
Workers Who Are Saving For Retirement Through an Employer-Sponsored Retirement Plan And/Or Outside of Work (%)
7268 70 68 70
77 7783 82 83 83 81 81 81
85
'16 '15 '14 ’13 ’12 '16 '15 '14 ’13 ’12 '16 '15 '14 ’13 ’12
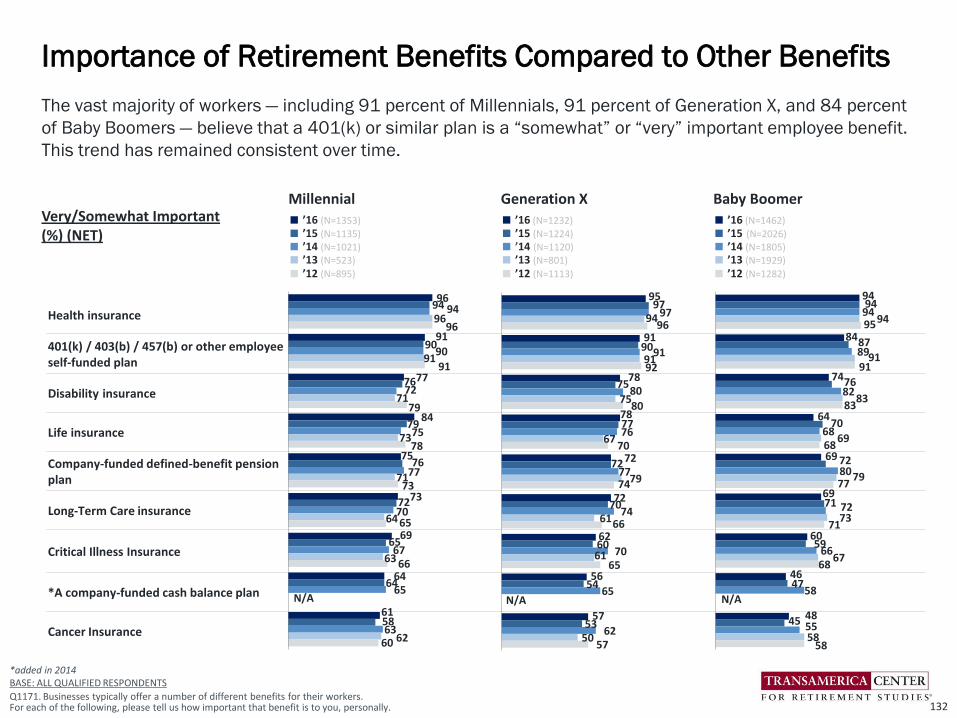
*added in 2014BASE: ALL QUALIFIED RESPONDENTS
Q1171. Businesses typically offer a number of different benefits for their workers. For each of the following, please tell us how important that benefit is to you, personally.
Millennial Generation X Baby Boomer■ ’16 (N=1353) ■ ’15 (N=1135) ■ ’14 (N=1021)■ ’13 (N=523)
■ ’12 (N=895)
■ ’16 (N=1232)■ ’15 (N=1224) ■ ’14 (N=1120)■ ’13 (N=801)
■ ’12 (N=1113)
■ ’16 (N=1462) ■ ’15 (N=2026)■ ’14 (N=1805)■ ’13 (N=1929)
■ ’12 (N=1282)
Health insurance
401(k) / 403(b) / 457(b) or other employee self-funded plan
Disability insurance
Life insurance
Company-funded defined-benefit pension plan
Long-Term Care insurance
Critical Illness Insurance
*A company-funded cash balance plan
Cancer Insurance
96
91
77
84
75
73
69
64
61
94
90
76
79
76
72
65
64
58
94
90
72
75
77
70
67
65
63
96
91
71
73
71
64
63
62
96
91
79
78
73
65
66
60
95
91
78
78
72
72
62
56
57
97
90
75
77
72
70
60
54
53
97
91
80
76
77
74
70
65
62
94
91
75
67
79
61
61
50
96
92
80
70
74
66
65
57
94
84
74
64
69
69
60
46
48
94
87
76
70
72
71
59
47
45
94
89
82
68
80
72
66
58
55
94
91
83
69
79
73
67
58
95
91
83
68
77
71
68
58
N/A N/A
The vast majority of workers — including 91 percent of Millennials, 91 percent of Generation X, and 84 percent
of Baby Boomers — believe that a 401(k) or similar plan is a “somewhat” or “very” important employee benefit.
This trend has remained consistent over time.
Importance of Retirement Benefits Compared to Other Benefits
132
N/A
Very/Somewhat Important(%) (NET)

Millennial Generation X Baby Boomer
■ ’16 (N=1353) ■ ’15 (N=1135) ■ ’14 (N=1021)■ ’13 (N=523)
■ ’12 (N=895)
■ ’16 (N=1232)■ ’15 (N=1224) ■ ’14 (N=1120)■ ’13 (N=801)
■ ’12 (N=1113)
■ ’16 (N=1462) ■ ’15 (N=2026)■ ’14 (N=1805)■ ’13 (N=1929)
■ ’12 (N=1282)
NET – AN EMPLOYEE-FUNDED PLAN
Employee-funded 401(k) plan
Other employee self-funded plan(e.g., SEP, SIMPLE, Other)
NET – COMPANY-FUNDED PLAN
Company-funded defined benefit pension plan
*Company-funded cash balance plan
None of the above
66
65
4
29
25
13
24
59
56
5
26
20
11
30
62
59
3
27
21
14
27
67
63
8
18
29
76
74
9
25
20
Most workers are offered a 401(k) or similar plan by their employers. Baby Boomers (73 percent) and
Generation X (76 percent) are more likely to be offered such benefits compared to Millennials (66 percent).
Few workers are offered a company-funded defined benefit plan.
Retirement Benefits Currently Offered
133
*added in 2014BASE: ALL QUALIFIED RESPONDENTSQ1180. Which of the following retirement benefits does your company currently offer to you, personally? Select all.
76
74
3
24
21
6
19
69
68
3
21
18
7
25
74
72
3
21
16
9
21
75
72
4
15
22
82
79
5
18
15
73
70
4
26
23
6
23
69
67
4
25
21
6
26
71
69
3
25
20
6
24
69
67
4
22
26
77
76
4
19
19
N/A N/AN/A
N/A N/AN/A
Employer-Sponsored Retirement Benefits Currently Offered (%)

Among workers who are offered a 401(k) or similar plan, the participation rate increases with age. Seventy-two
percent of Millennial workers participate in their employer’s plan, compared to 80 percent of Generation X and
80 percent of Baby Boomers. This trend has remained relatively consistent over the past five years.
Retirement Plan Participation
134
Participation in Company’s Employee-funded Retirement Savings Plan, % Indicate “Yes”
BASE: THOSE CURRENTLY OFFERED QUALIFIED PLANQ1190. Do you currently participate in, or have money invested in your company’s employee-funded retirement savings plan?
72 74 71 68 70
80 81 8480 82 80 83 81 82 79
'16 '15 '14 ’13 ’12 '16 '15 '14 ’13 ’12 '16 '15 '14 ’13 ’12
N=711
N=689
N=637
N=431
N=764
N=783
N=831
N=591
N=876
N=918
N=751
N=1374
N=1368
N=968
N=1495
Millennial Generation X Baby Boomer
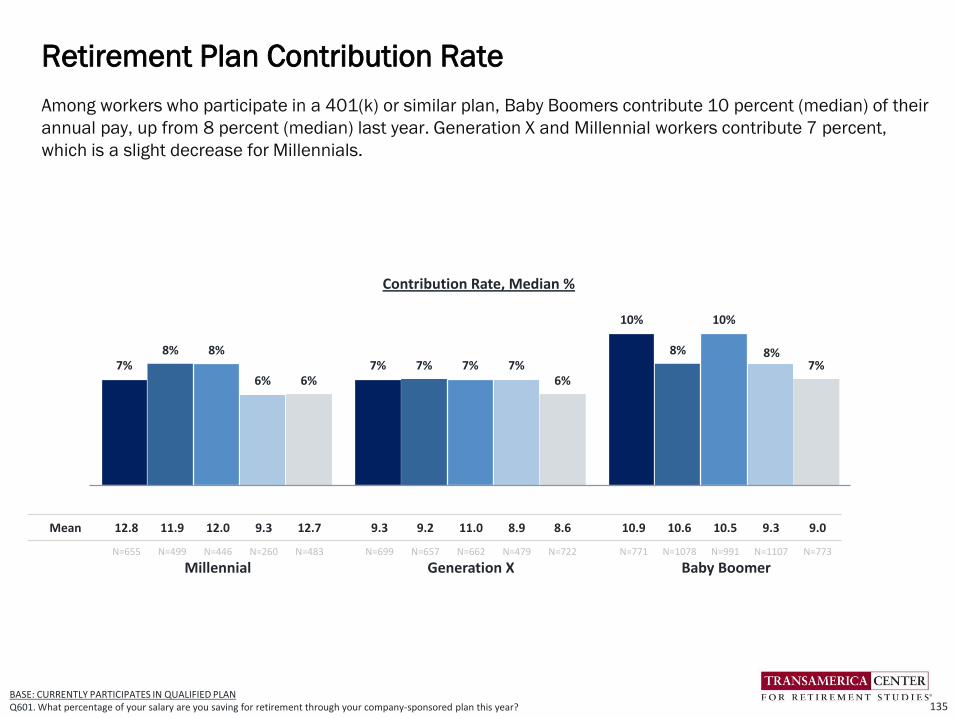
7% 7%
10%
8%7%
8%8%7%
10%
6%7%
8%
6% 6%7%
BASE: CURRENTLY PARTICIPATES IN QUALIFIED PLAN Q601. What percentage of your salary are you saving for retirement through your company-sponsored plan this year?
Among workers who participate in a 401(k) or similar plan, Baby Boomers contribute 10 percent (median) of their
annual pay, up from 8 percent (median) last year. Generation X and Millennial workers contribute 7 percent,
which is a slight decrease for Millennials.
Retirement Plan Contribution Rate
135
Mean 12.8 11.9 12.0 9.3 12.7 9.3 9.2 11.0 8.9 8.6 10.9 10.6 10.5 9.3 9.0
N=655 N=499 N=446 N=260 N=483 N=699 N=657 N=662 N=479 N=722 N=771 N=1078 N=991 N=1107 N=773
Millennial Generation X Baby Boomer
Contribution Rate, Median %

“Professionally managed” accounts refers to a managed account service, strategic allocation funds, and/or
target date funds. The majority of plan participants across generations use some form of professionally managed
offering in their 401(k) or similar plans: 60 percent of Millennials, 62 percent of Generation X, and 59 percent of
Baby Boomers. Millennials (42 percent) and Baby Boomers (44 percent) are more likely to set their own asset
allocation percentage among the available funds compared to Generation X (36 percent).
Approach to Investing in Retirement Plan
136BASE: PARTICIPATING IN QUALIFIED PLANQ1466. What is your current approach to investing in your employer-sponsored retirement plan? Select all.
Millennials■ ’16 (N=655)■ ’15 (N=500)
■ ’14 (N=448)
Generation X■ ’16 (N=699)■ ’15 (N=658)
■ ’14 (N=665)
Baby Boomer■ ’16 (N=775)■ ’15 (N=1081)
■ ’14 (N=991)
NET – Professionally Managed
I invest in an account (or service) that is managed by a professional investment advisor and I do not have to make investment or allocation decisions
I invest in a strategic allocation fund that is designed to address my specific risk tolerance profile
I invest in a target date fund that is designed to change allocation percentages as I approach my target retirement year
I set my own asset allocation percentages among the available funds
Not sure
Investments in Employer-Sponsored Retirement Plan (%)
60
27
25
27
42
15
56
25
23
25
38
17
62
25
29
30
40
14
62
29
24
22
36
12
50
20
22
21
44
19
56
24
26
23
44
12
59
26
18
21
44
7
49
23
18
14
47
13
47
22
18
12
50
11
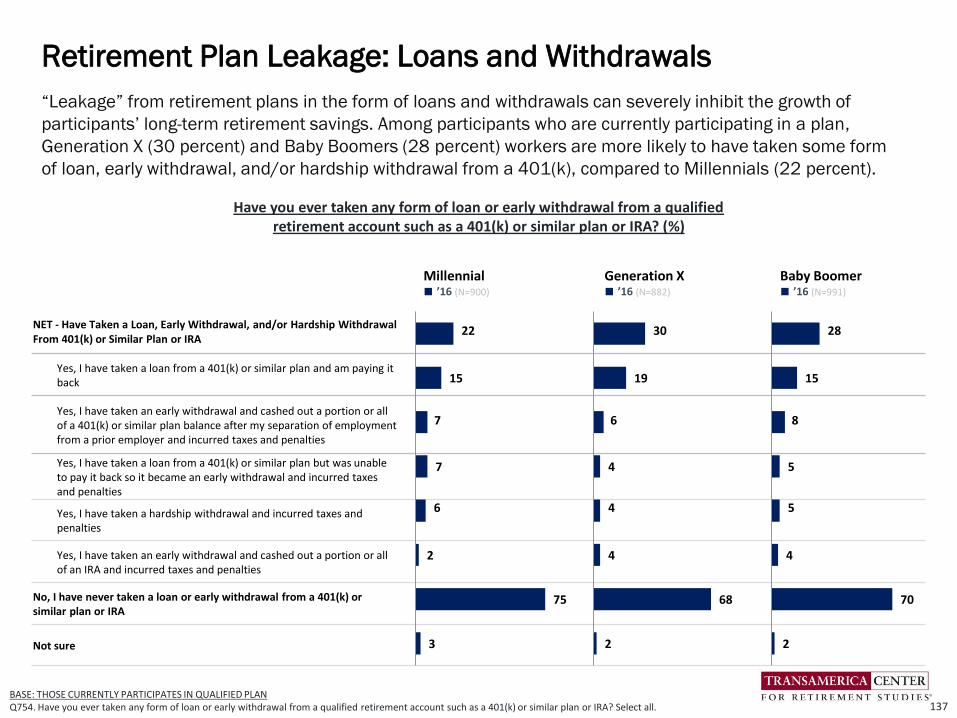
“Leakage” from retirement plans in the form of loans and withdrawals can severely inhibit the growth of
participants’ long-term retirement savings. Among participants who are currently participating in a plan,
Generation X (30 percent) and Baby Boomers (28 percent) workers are more likely to have taken some form
of loan, early withdrawal, and/or hardship withdrawal from a 401(k), compared to Millennials (22 percent).
Retirement Plan Leakage: Loans and Withdrawals
137BASE: THOSE CURRENTLY PARTICIPATES IN QUALIFIED PLANQ754. Have you ever taken any form of loan or early withdrawal from a qualified retirement account such as a 401(k) or similar plan or IRA? Select all.
Millennial■ ’16 (N=900)
Generation X■ ’16 (N=882)
Baby Boomer■ ’16 (N=991)
NET - Have Taken a Loan, Early Withdrawal, and/or Hardship Withdrawal From 401(k) or Similar Plan or IRA
Yes, I have taken a loan from a 401(k) or similar plan and am paying it back
Yes, I have taken an early withdrawal and cashed out a portion or all of a 401(k) or similar plan balance after my separation of employment from a prior employer and incurred taxes and penalties
Yes, I have taken a loan from a 401(k) or similar plan but was unable to pay it back so it became an early withdrawal and incurred taxes and penalties
Yes, I have taken a hardship withdrawal and incurred taxes and penalties
Yes, I have taken an early withdrawal and cashed out a portion or all of an IRA and incurred taxes and penalties
No, I have never taken a loan or early withdrawal from a 401(k) or similar plan or IRA
Not sure
Have you ever taken any form of loan or early withdrawal from a qualified retirement account such as a 401(k) or similar plan or IRA? (%)
22
15
7
7
6
2
75
3
30
19
6
4
4
4
68
2
28
15
8
5
5
4
70
2
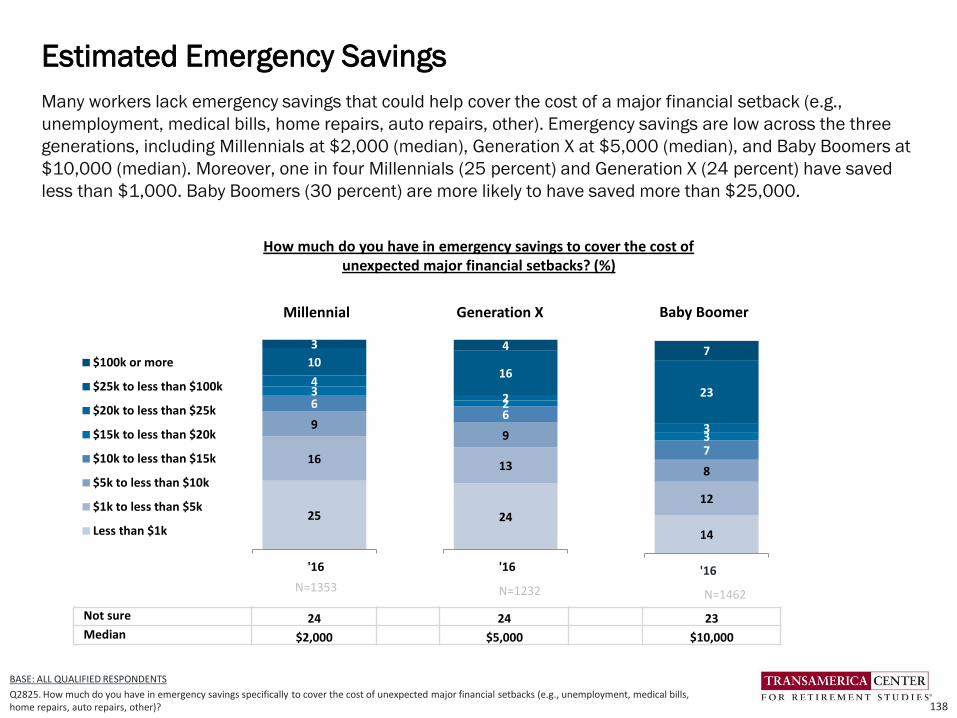
14
12
8
733
23
7
'16
25
16
9
634
10
3
'16
$100k or more
$25k to less than $100k
$20k to less than $25k
$15k to less than $20k
$10k to less than $15k
$5k to less than $10k
$1k to less than $5k
Less than $1k24
13
9
622
16
4
'16
Many workers lack emergency savings that could help cover the cost of a major financial setback (e.g.,
unemployment, medical bills, home repairs, auto repairs, other). Emergency savings are low across the three
generations, including Millennials at $2,000 (median), Generation X at $5,000 (median), and Baby Boomers at
$10,000 (median). Moreover, one in four Millennials (25 percent) and Generation X (24 percent) have saved
less than $1,000. Baby Boomers (30 percent) are more likely to have saved more than $25,000.
Estimated Emergency Savings
138
BASE: ALL QUALIFIED RESPONDENTS
Q2825. How much do you have in emergency savings specifically to cover the cost of unexpected major financial setbacks (e.g., unemployment, medical bills, home repairs, auto repairs, other)?
Not sure 24 24 23Median $2,000 $5,000 $10,000
Millennial Generation X Baby Boomer
N=1232N=1353N=1462
How much do you have in emergency savings to cover the cost of unexpected major financial setbacks? (%)
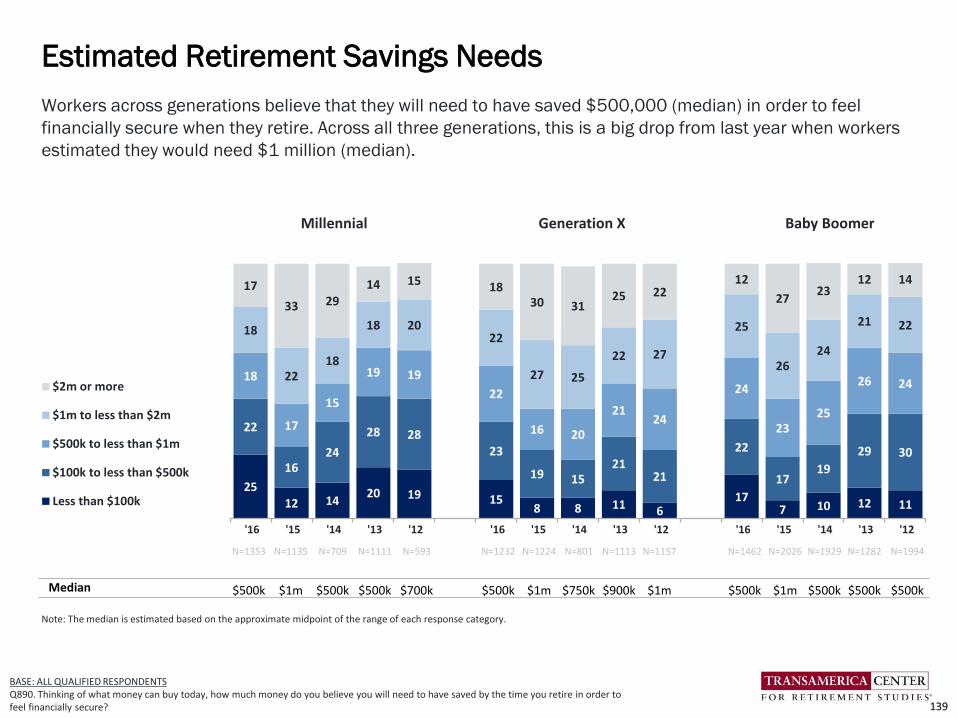
Workers across generations believe that they will need to have saved $500,000 (median) in order to feel
financially secure when they retire. Across all three generations, this is a big drop from last year when workers
estimated they would need $1 million (median).
Estimated Retirement Savings Needs
139139
2512 14
20 19 158 8 11 6
177 10 12 11
22
1624
28 2823
19 1521
21
22
1719
29 30
18
17
15
19 19
22
16 20
2124
24
2325
26 24
18
2218
18 2022
27 25
22 27
25
2624
21 22
17
33 2914 15 18
30 3125 22
12
2723
12 14
'16 '15 '14 '13 '12 '16 '15 '14 '13 '12 '16 '15 '14 '13 '12
$2m or more
$1m to less than $2m
$500k to less than $1m
$100k to less than $500k
Less than $100k
N=1353 N=1135 N=709 N=1111 N=593 N=1232 N=1224 N=801 N=1113 N=1157 N=1462 N=2026 N=1929 N=1282 N=1994
Median $500k $1m $500k $500k $700k $500k $1m $750k $900k $1m $500k $1m $500k $500k $500k
Note: The median is estimated based on the approximate midpoint of the range of each response category.
BASE: ALL QUALIFIED RESPONDENTSQ890. Thinking of what money can buy today, how much money do you believe you will need to have saved by the time you retire in order to feel financially secure?
Millennial Generation X Baby Boomer
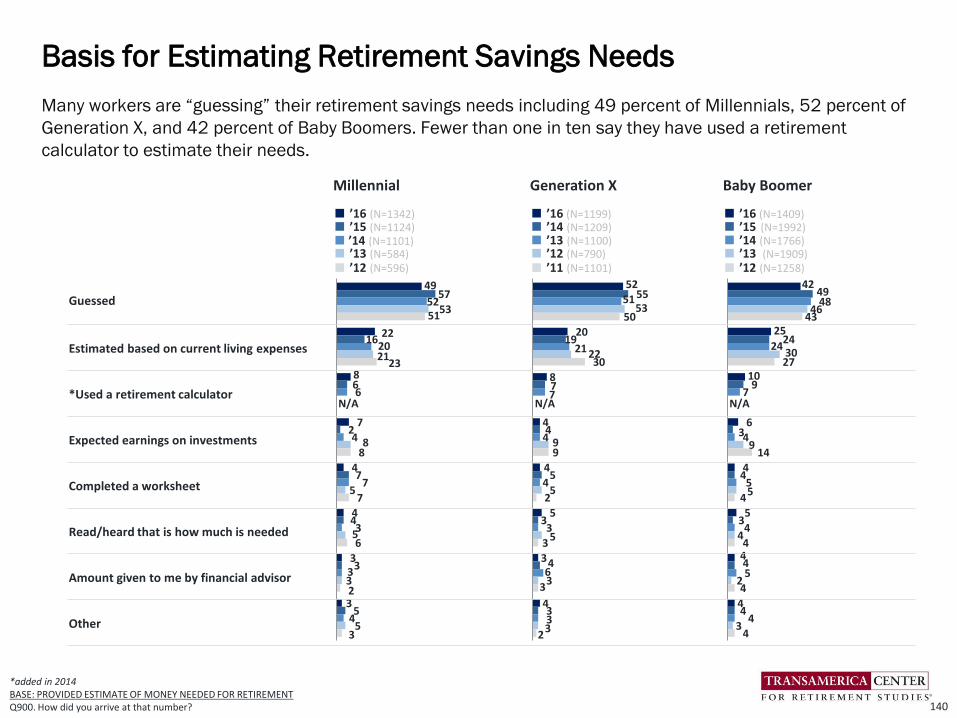
Many workers are “guessing” their retirement savings needs including 49 percent of Millennials, 52 percent of
Generation X, and 42 percent of Baby Boomers. Fewer than one in ten say they have used a retirement
calculator to estimate their needs.
Basis for Estimating Retirement Savings Needs
140
*added in 2014BASE: PROVIDED ESTIMATE OF MONEY NEEDED FOR RETIREMENT Q900. How did you arrive at that number?
49
22
8
7
4
4
3
3
57
16
6
2
7
4
3
5
52
20
6
4
7
3
3
4
53
21
8
5
5
3
5
51
23
8
7
6
2
3
52
20
8
4
4
5
3
4
55
19
7
4
5
3
4
3
51
21
7
4
4
3
6
3
53
22
9
5
5
3
3
50
30
9
2
3
3
2
42
25
10
6
4
5
4
4
49
24
9
3
4
3
4
4
48
24
7
4
5
4
5
4
46
30
9
5
4
2
3
43
27
14
4
4
4
4
N/A N/A N/A
Millennial Generation X Baby Boomer
■ ’16 (N=1342) ■ ’15 (N=1124) ■ ’14 (N=1101)■ ’13 (N=584)■ ’12 (N=596)
■ ’16 (N=1199)■ ’14 (N=1209) ■ ’13 (N=1100)■ ’12 (N=790)■ ’11 (N=1101)
■ ’16 (N=1409) ■ ’15 (N=1992)■ ’14 (N=1766)■ ’13 (N=1909)■ ’12 (N=1258)
Guessed
Estimated based on current living expenses
*Used a retirement calculator
Expected earnings on investments
Completed a worksheet
Read/heard that is how much is needed
Amount given to me by financial advisor
Other

BASE: INVESTING FOR RETIREMENTQ770. How is your retirement savings invested?
Workers across generations most frequently cite that their retirement savings are invested in a relatively
equal mix of stocks and investments such as bonds, money market funds and cash; however, the
response rate is higher among Baby Boomers (49 percent) and Generation X (44 percent) compared to
Millennials (32 percent). A concerning 25 percent of Millennials are “not sure” how their savings are
invested. Asset allocation-related trends have been directionally consistent in recent years.
Asset Allocation of Retirement Investments
141
25 26 24 2722 22 21 19 19 16 19 17 18 15 16
21 21 2223
25 21 2322 25
2615 19 16
17 16
32 33 36 3132 44 43 45
4644
49 48 50 50 49
22 20 18 18 2213 13 13
1113 17 16 15 17
19
'16 '15 '14 '13 '12 '16 '15 '14 '13 '12 '16 '15 '14 '13 '12
Mostly in bonds, money marketfunds, cash and other stableinvestments
Relatively equal mix of stocks andinvestments such as bonds,money market funds and cash
Mostly stocks, with little or nomoney in investments such asbonds, money mkt funds, cash
Not sure
N=962 N=781 N=687 N=364 N=653 N=937 N=921 N=871 N=607 N=881 N=1150 N=1577 N=1429 N=1509 N=1040
Millennial Generation X Baby Boomer
How Retirement Savings Are Invested (%)

The majority of workers across all generations has a retirement strategy including 64 percent of Baby Boomers,
60 percent of Generation X and 65 percent of Millennials. The proportion of Generation X and Millennial
workers with a strategy have both increased considerably since last year. Workers in all generations are far less
likely to have a written strategy.
Retirement Strategy: Written, Unwritten, or None
142
Have a Retirement Strategy (%)
BASE: ALL QUALIFIED RESPONDENTSQ1155. Which of the following best describes your retirement strategy?
45 41 46 40 44 44 4047 45 42
51 51 48 50 48
2015
1310
16 1612
1411
10
13 14 14 12 12
65
56 59
50
60 60
52
6156
52
64 64 61 62 60
'16 '15 '14 '13 '12 '16 '15 '14 '13 '12 '16 '15 '14 '13 '12
I have a written plan
I have a plan, but it is not written down
N=1353 N=1135 N=1021 N=523 N=895 N=1232 N=1224 N=1120 N=801 N=1113 N=1462 N=2026 N=1805 N=1929 N=1282
Millennial Generation X Baby Boomer
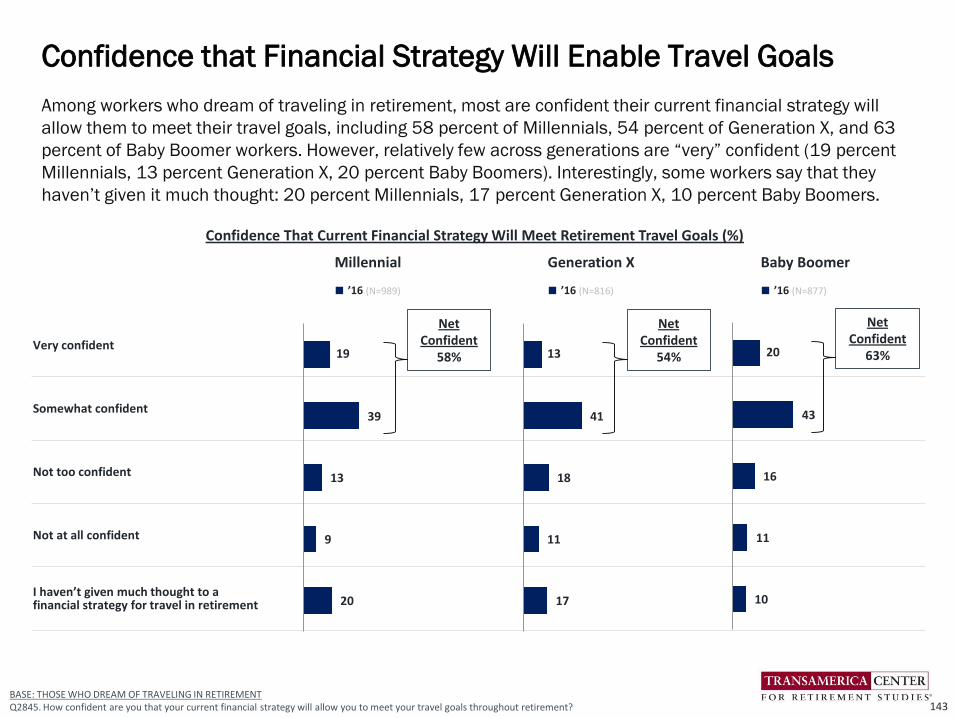
Among workers who dream of traveling in retirement, most are confident their current financial strategy will
allow them to meet their travel goals, including 58 percent of Millennials, 54 percent of Generation X, and 63
percent of Baby Boomer workers. However, relatively few across generations are “very” confident (19 percent
Millennials, 13 percent Generation X, 20 percent Baby Boomers). Interestingly, some workers say that they
haven’t given it much thought: 20 percent Millennials, 17 percent Generation X, 10 percent Baby Boomers.
Confidence that Financial Strategy Will Enable Travel Goals
143
Millennial Generation X Baby Boomer
■ ’16 (N=989) ■ ’16 (N=816) ■ ’16 (N=877)
Very confident
Somewhat confident
Not too confident
Not at all confident
I haven’t given much thought to a financial strategy for travel in retirement
19
39
13
9
20
BASE: THOSE WHO DREAM OF TRAVELING IN RETIREMENTQ2845. How confident are you that your current financial strategy will allow you to meet your travel goals throughout retirement?
Net Confident
58% 13
41
18
11
17
Net Confident
54% 20
43
16
11
10
Net Confident
63%
Confidence That Current Financial Strategy Will Meet Retirement Travel Goals (%)
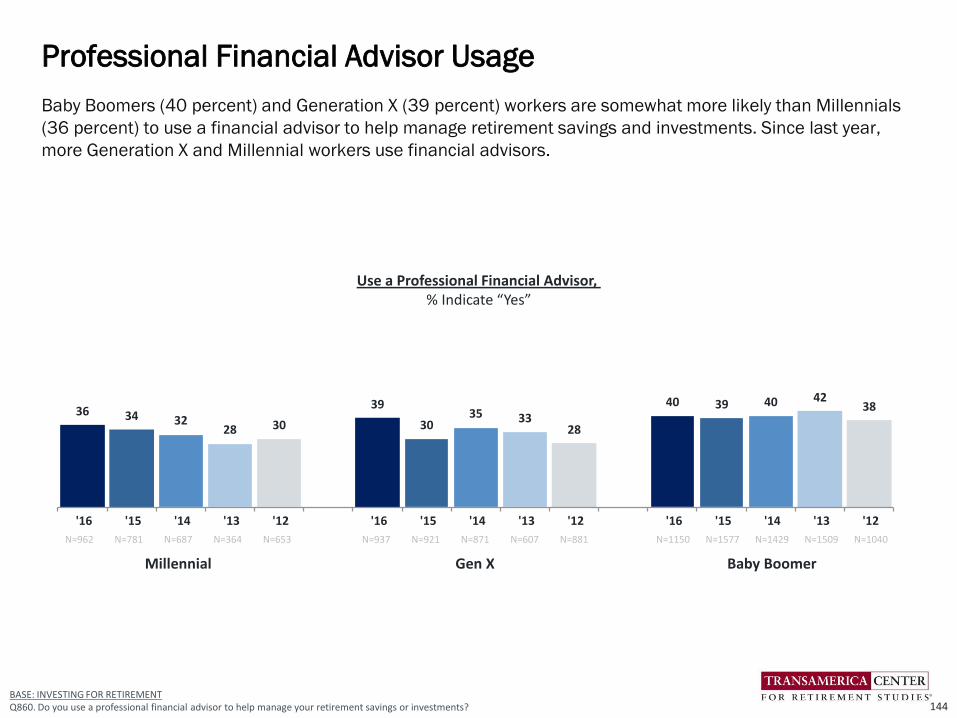
Baby Boomers (40 percent) and Generation X (39 percent) workers are somewhat more likely than Millennials
(36 percent) to use a financial advisor to help manage retirement savings and investments. Since last year,
more Generation X and Millennial workers use financial advisors.
Professional Financial Advisor Usage
144BASE: INVESTING FOR RETIREMENTQ860. Do you use a professional financial advisor to help manage your retirement savings or investments?
36 34 3228 30
39
3035 33
28
40 39 40 4238
'16 '15 '14 '13 '12 '16 '15 '14 '13 '12 '16 '15 '14 '13 '12
N=962 N=781 N=687 N=364 N=653 N=937 N=921 N=871 N=607 N=881 N=1150 N=1577 N=1429 N=1509 N=1040
Millennial Gen X Baby Boomer
Use a Professional Financial Advisor, % Indicate “Yes”

2015 15 17 18 14 13 9
16 14 11 10 10 11 11
77 6
8 10
5 45
5 7
2 3 3 4 4
711 9
1010
6 67
7 8
4 5 5 5 6
9 1112
1010
7 8 9
10 9
5 7 7 6 6
10 1019 13 10
10 13 14
14 11
910 9 10 8
11 11
99 6
1216 20
1617
1314 13
17 15
1510
75 7 26 17
19 13 13
3633 34
2825
'16 '15 '14 '13 '12 '16 '15 '14 '13 '12 '16 '15 '14 '13 '12
$250k or more
$100k to less than $250k
$50k to less than $100k
$25k to less than $50k
$10k to less than $25k
$5k to less than $10k
Less than $5k
Baby Boomer workers have the highest reported total household retirement savings at $147,000 (estimated
median) compared to Generation X ($69,000) and Millennials ($31,000). Among Baby Boomers, their reported
retirement savings is the highest it has been in the past five years. Thirteen percent of Millennials are not sure
what their total household retirement savings are.
Total Household Retirement Savings
145BASE: ALL QUALIFIED RESPONDENTSQ1300. Approximately how much money does your household have saved in all of your retirement accounts?
Not sure 13 17 14 19 18 10 11 8 8 10 8 7 7 6 9
Decline to answer
8 8 9 9 11 10 12 9 11 11 12 11 12 13 16
Estimated Median
$31,000 $25,000 $32,000 $19,000 $14,000 $69,000 $61,000 $70,000 $45,000 $42,000 $147,000 $132,000 $127,000 $103,000 $99,000
Note: The median is estimated based on the approximate midpoint of the range of each response category. Non-responses are excluded from the estimate.
Total Household Retirement Savings (%)
N=1353 N=1135 N=1021 N=709 N=1111 N=1232 N=1224 N=1120 N=801 N=1113 N=1462 N=2026 N=1805 N=1929 N=1282
Millennial Generation X Baby Boomer
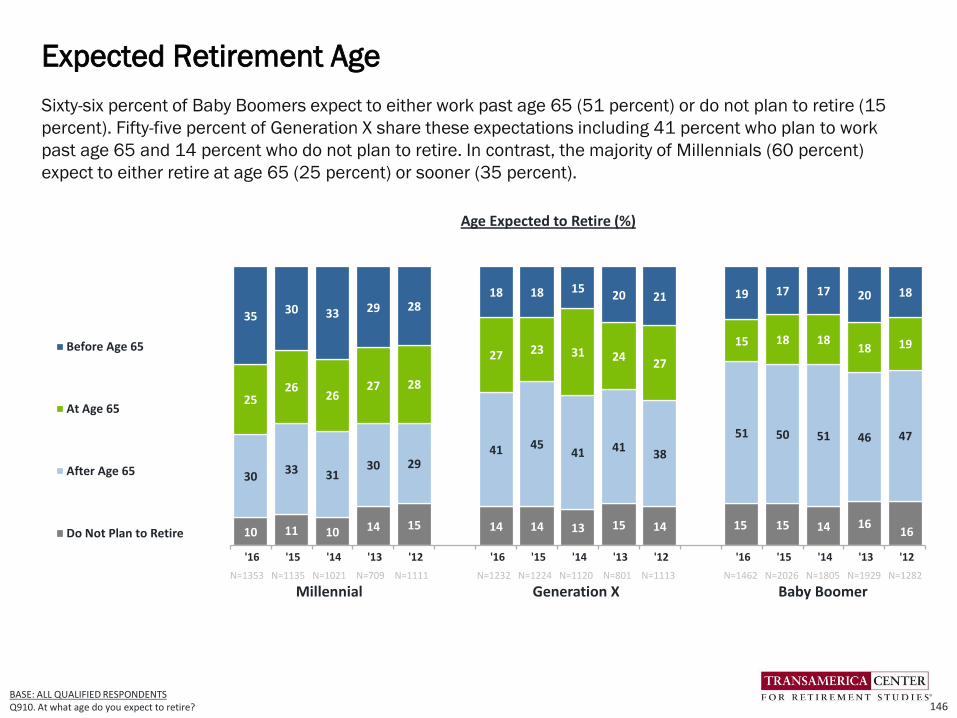
BASE: ALL QUALIFIED RESPONDENTSQ910. At what age do you expect to retire?
Sixty-six percent of Baby Boomers expect to either work past age 65 (51 percent) or do not plan to retire (15
percent). Fifty-five percent of Generation X share these expectations including 41 percent who plan to work
past age 65 and 14 percent who do not plan to retire. In contrast, the majority of Millennials (60 percent)
expect to either retire at age 65 (25 percent) or sooner (35 percent).
Expected Retirement Age
146
10 11 10 14 15 14 14 13 15 14 15 15 14 1616
3033 31
30 2941 45
41 4138
51 50 51 46 47
2526
2627 28
27 23 31 2427
15 18 1818 19
3530 33 29 28
18 18 1520 21 19 17 17 20 18
'16 '15 '14 '13 '12 '16 '15 '14 '13 '12 '16 '15 '14 '13 '12
Before Age 65
At Age 65
After Age 65
Do Not Plan to Retire
N=1353 N=1135 N=1021 N=709 N=1111 N=1232 N=1224 N=1120 N=801 N=1113 N=1462 N=2026 N=1805 N=1929 N=1282
Millennial Generation X Baby Boomer
Age Expected to Retire (%)
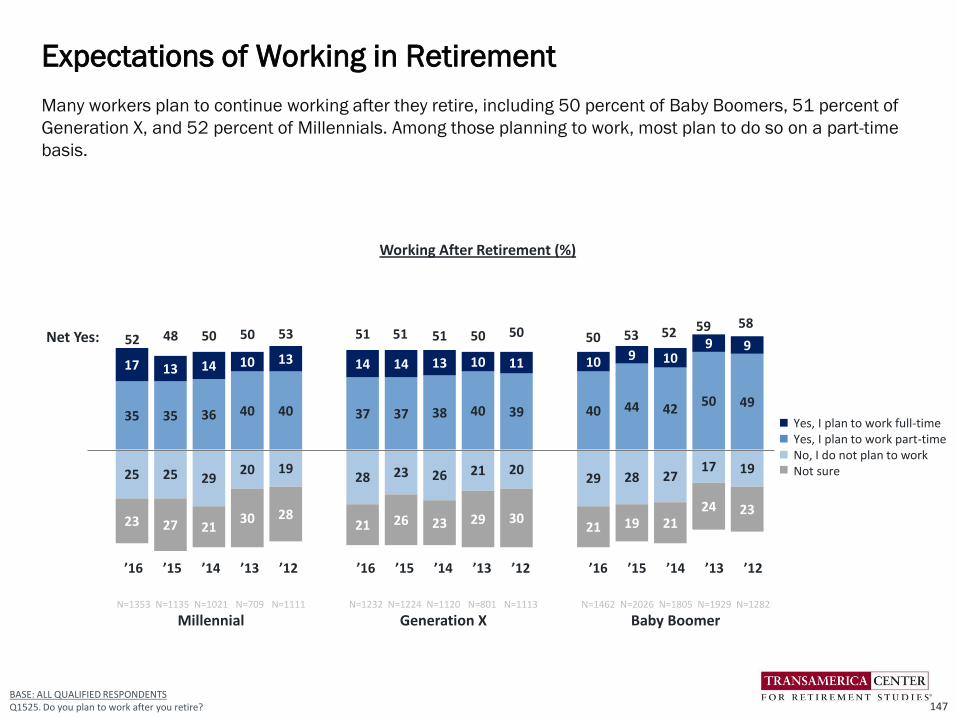
35 35 36 40 40 37 37 38 40 39 40 44 4250 49
17 13 14 10 13 14 14 13 10 11 10 9 109 9
25 25 2920 19
28 23 26 21 2029 28 27
17 19
23 27 2130 28
21 26 23 29 3021 19 21
24 23
52Net Yes:
Many workers plan to continue working after they retire, including 50 percent of Baby Boomers, 51 percent of
Generation X, and 52 percent of Millennials. Among those planning to work, most plan to do so on a part-time
basis.
Expectations of Working in Retirement
147BASE: ALL QUALIFIED RESPONDENTSQ1525. Do you plan to work after you retire?
Working After Retirement (%)
Yes, I plan to work full-timeYes, I plan to work part-timeNo, I do not plan to workNot sure
’16 ’15 ’14 ’13 ’12 ’16 ’15 ’14 ’13 ’12 ’16 ’15 ’14 ’13 ’12
N=1353 N=1135 N=1021 N=709 N=1111 N=1232 N=1224 N=1120 N=801 N=1113 N=1462 N=2026 N=1805 N=1929 N=1282
Millennial Generation X Baby Boomer
48 50 50 53 51 51 51 50 50 50 53 52 59 58
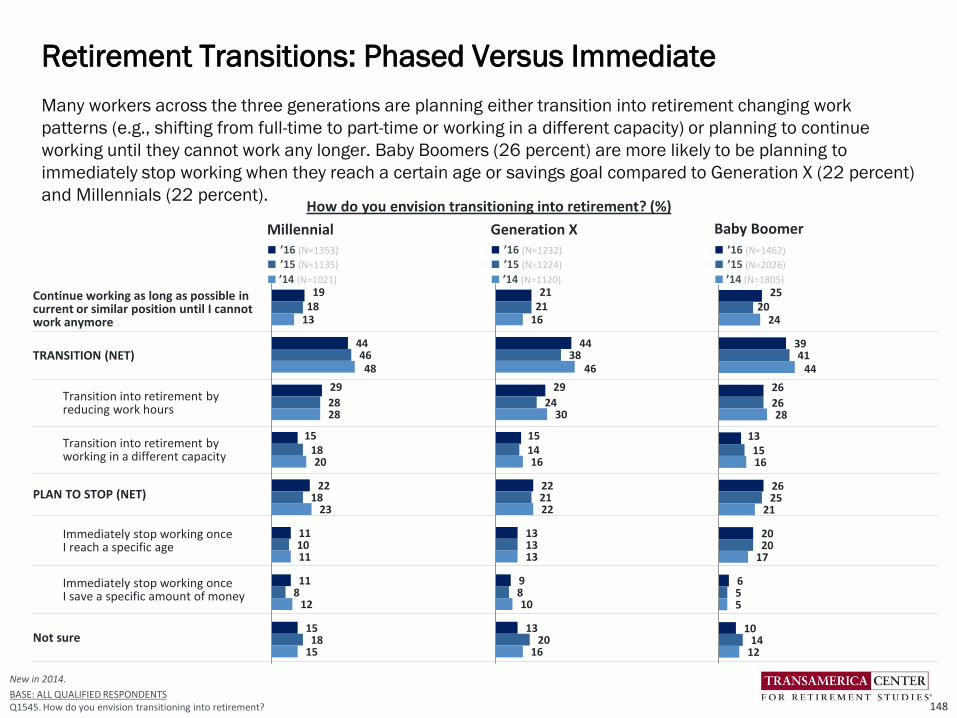
Many workers across the three generations are planning either transition into retirement changing work
patterns (e.g., shifting from full-time to part-time or working in a different capacity) or planning to continue
working until they cannot work any longer. Baby Boomers (26 percent) are more likely to be planning to
immediately stop working when they reach a certain age or savings goal compared to Generation X (22 percent)
and Millennials (22 percent).
Retirement Transitions: Phased Versus Immediate
148
Millennial Generation X Baby Boomer■ ’16 (N=1353)
■ ’15 (N=1135)
■ ’14 (N=1021)
■ ’16 (N=1232)
■ ’15 (N=1224)
■ ’14 (N=1120)
■ ’16 (N=1462)
■ ’15 (N=2026)
■ ’14 (N=1805)
Continue working as long as possible in current or similar position until I cannot work anymore
TRANSITION (NET)
Transition into retirement by reducing work hours
Transition into retirement by working in a different capacity
PLAN TO STOP (NET)
Immediately stop working once I reach a specific age
Immediately stop working once I save a specific amount of money
Not sure
New in 2014.
BASE: ALL QUALIFIED RESPONDENTSQ1545. How do you envision transitioning into retirement?
19
44
29
15
22
11
11
15
18
46
28
18
18
10
8
18
13
48
28
20
23
11
12
15
21
44
29
15
22
13
9
13
21
38
24
14
21
13
8
20
16
46
30
16
22
13
10
16
25
39
26
13
26
20
6
10
20
41
26
15
25
20
5
14
24
44
28
16
21
17
5
12
How do you envision transitioning into retirement? (%)
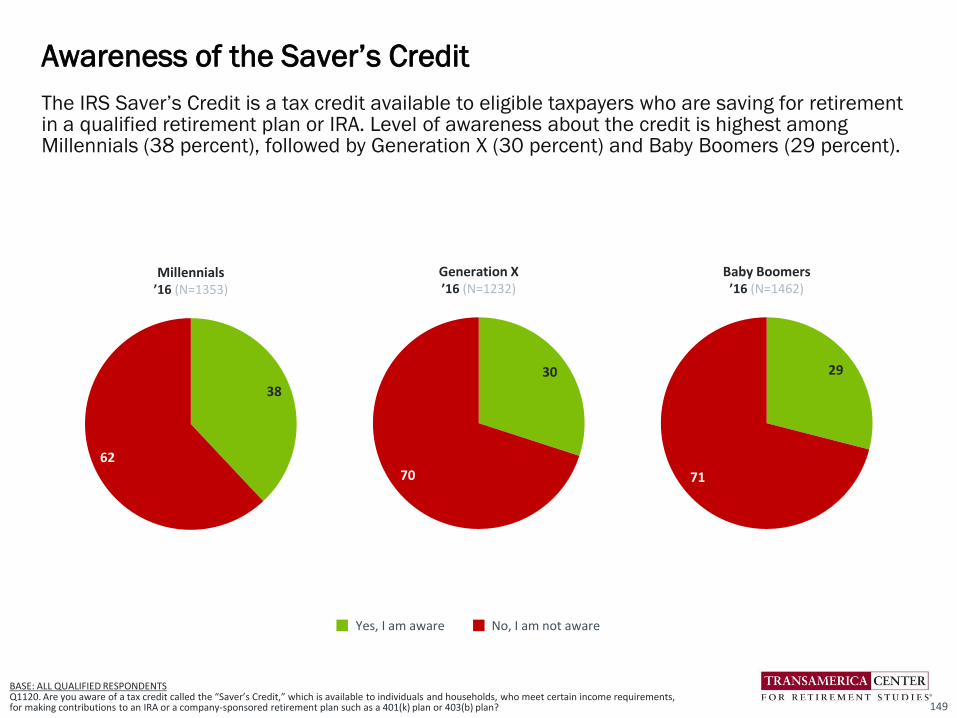
The IRS Saver’s Credit is a tax credit available to eligible taxpayers who are saving for retirement in a qualified retirement plan or IRA. Level of awareness about the credit is highest among Millennials (38 percent), followed by Generation X (30 percent) and Baby Boomers (29 percent).
Awareness of the Saver’s Credit
149
Yes, I am aware No, I am not aware
38
62
Millennials’16 (N=1353)
30
70
Generation X’16 (N=1232)
29
71
Baby Boomers’16 (N=1462)
BASE: ALL QUALIFIED RESPONDENTS Q1120. Are you aware of a tax credit called the “Saver’s Credit,” which is available to individuals and households, who meet certain income requirements, for making contributions to an IRA or a company-sponsored retirement plan such as a 401(k) plan or 403(b) plan?

Workers across generations most frequently cite fully funding Social Security as a priority for the new President and Congress to help
Americans prepare for a financially secure retirement. However, there are differences of opinion among generations about other
priorities. Baby Boomers (73 percent) are more likely to cite fully funding Social Security compared to other generations. Millennials
(39 percent) are more likely to cite “educating Americans early by implementing a financial literacy curriculum in schools.”
Generation X (48 percent) is slightly more likely to cite “encouraging 401(k) plans to offer the option to pay retirement benefits in a
form that guarantees retirees a set monthly income for life.”
Retirement Security Priorities for the New President and Congress
150
Note: Responses not shown for less than five percent who said “other.”BASE: ALL QUALIFIED RESPONDENTSQ1427. With the November 2016 election in mind, which of the following should be priorities for the next President and Congress to help Americans prepare for a financially secure retirement? Select all.
Which of the following should be priorities for the next President and Congress to help Americans prepare for a financially secure retirement? (%)
Millennials■ ’16 (N=1353)
Generation X■ ’16 (N=1232)
Baby Boomers■ ’16 (N=1462)
Fully fund Social Security by implementing reforms to ensure that it can pay guaranteed benefits for future generations of retirees
Encourage 401(k) and similar plans to offer the option to pay retirement benefits in a form that guarantees retirees a set monthly income for life
Encourage employers with a 401(k) or similar plan to enable their part-time workers to participate in the plan
Encourage employers to make it easier to work past age 65 with a flexible, phased transition into retirement
Promote the ability for workers to save for retirement by setting up a direct deposit of a portion of their paychecks into an IRA (including myRA), especially those who are not offered a 401(k) or similar plan
Make the Saver's Credit, a tax credit for saving for retirement, available to all tax filers regardless of whether they have to pay taxes or not
Educate Americans early by implementing a financial literacy curriculum in the schools
Provide incentives for employers to adopt more automated features into their 401(k) or similar plans (such as automatic enrollment, contribution increases, and default investments)
Create incentives for individuals to obtain ongoing training and education to keep their job skills up to date and relevant
45
42
37
34
32
28
39
29
30
57
48
38
35
36
37
28
30
27
73
47
39
42
40
38
29
28
21
Influences of Gender on Retirement Readiness
Detailed Findings
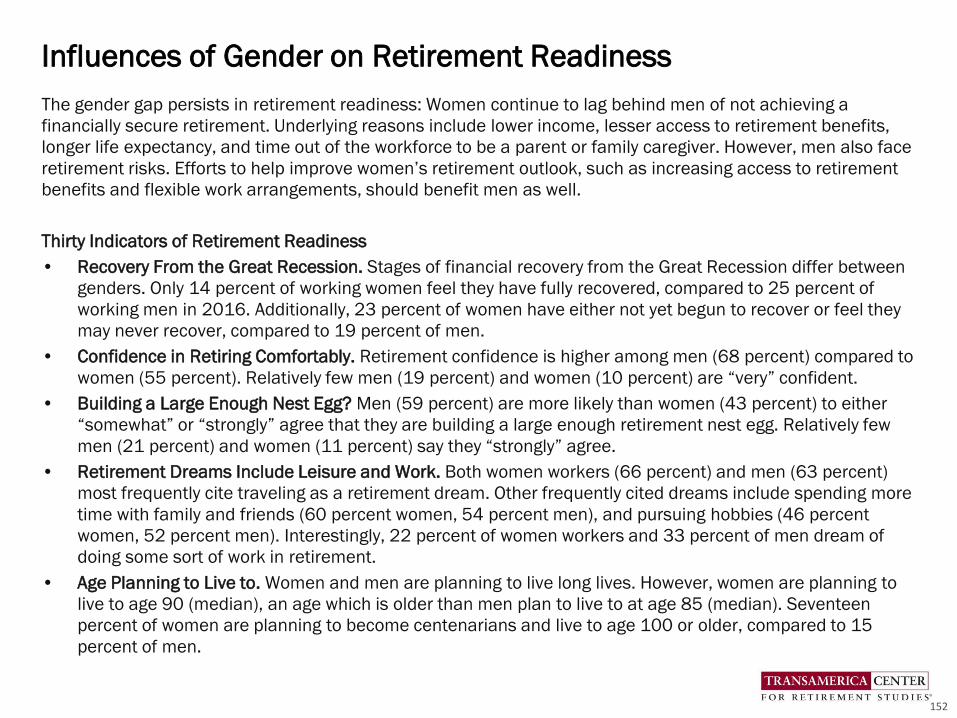
The gender gap persists in retirement readiness: Women continue to lag behind men of not achieving a
financially secure retirement. Underlying reasons include lower income, lesser access to retirement benefits,
longer life expectancy, and time out of the workforce to be a parent or family caregiver. However, men also face
retirement risks. Efforts to help improve women’s retirement outlook, such as increasing access to retirement
benefits and flexible work arrangements, should benefit men as well.
Thirty Indicators of Retirement Readiness
• Recovery From the Great Recession. Stages of financial recovery from the Great Recession differ between
genders. Only 14 percent of working women feel they have fully recovered, compared to 25 percent of
working men in 2016. Additionally, 23 percent of women have either not yet begun to recover or feel they
may never recover, compared to 19 percent of men.
• Confidence in Retiring Comfortably. Retirement confidence is higher among men (68 percent) compared to
women (55 percent). Relatively few men (19 percent) and women (10 percent) are “very” confident.
• Building a Large Enough Nest Egg? Men (59 percent) are more likely than women (43 percent) to either
“somewhat” or “strongly” agree that they are building a large enough retirement nest egg. Relatively few
men (21 percent) and women (11 percent) say they “strongly” agree.
• Retirement Dreams Include Leisure and Work. Both women workers (66 percent) and men (63 percent)
most frequently cite traveling as a retirement dream. Other frequently cited dreams include spending more
time with family and friends (60 percent women, 54 percent men), and pursuing hobbies (46 percent
women, 52 percent men). Interestingly, 22 percent of women workers and 33 percent of men dream of
doing some sort of work in retirement.
• Age Planning to Live to. Women and men are planning to live long lives. However, women are planning to
live to age 90 (median), an age which is older than men plan to live to at age 85 (median). Seventeen
percent of women are planning to become centenarians and live to age 100 or older, compared to 15
percent of men.
Influences of Gender on Retirement Readiness
152
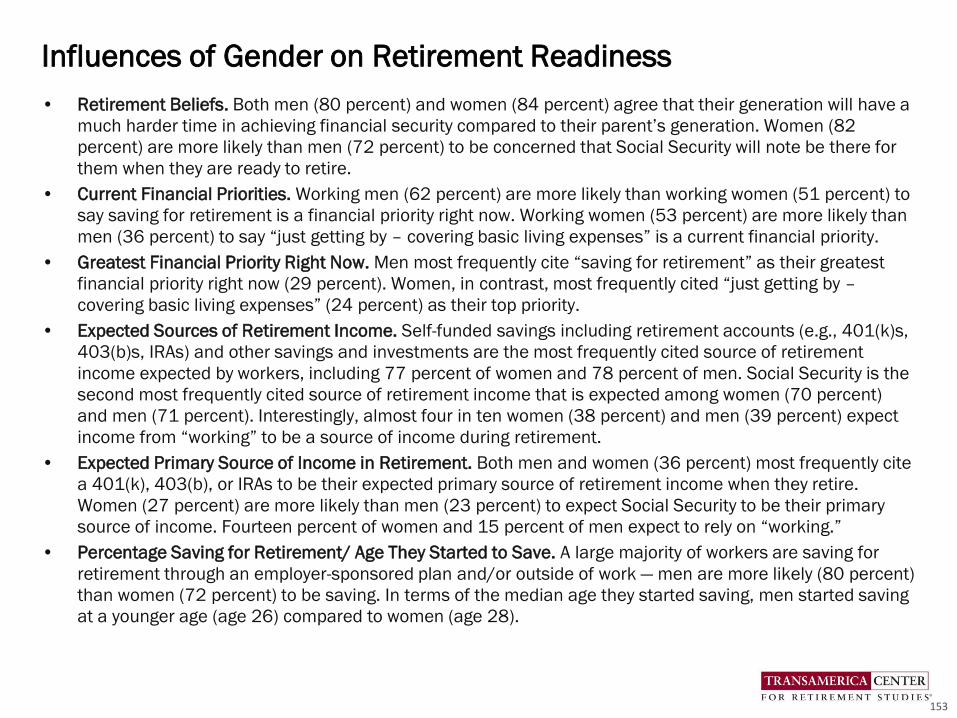
• Retirement Beliefs. Both men (80 percent) and women (84 percent) agree that their generation will have a
much harder time in achieving financial security compared to their parent’s generation. Women (82
percent) are more likely than men (72 percent) to be concerned that Social Security will note be there for
them when they are ready to retire.
• Current Financial Priorities. Working men (62 percent) are more likely than working women (51 percent) to
say saving for retirement is a financial priority right now. Working women (53 percent) are more likely than
men (36 percent) to say “just getting by – covering basic living expenses” is a current financial priority.
• Greatest Financial Priority Right Now. Men most frequently cite “saving for retirement” as their greatest
financial priority right now (29 percent). Women, in contrast, most frequently cited “just getting by –
covering basic living expenses” (24 percent) as their top priority.
• Expected Sources of Retirement Income. Self-funded savings including retirement accounts (e.g., 401(k)s,
403(b)s, IRAs) and other savings and investments are the most frequently cited source of retirement
income expected by workers, including 77 percent of women and 78 percent of men. Social Security is the
second most frequently cited source of retirement income that is expected among women (70 percent)
and men (71 percent). Interestingly, almost four in ten women (38 percent) and men (39 percent) expect
income from “working” to be a source of income during retirement.
• Expected Primary Source of Income in Retirement. Both men and women (36 percent) most frequently cite
a 401(k), 403(b), or IRAs to be their expected primary source of retirement income when they retire.
Women (27 percent) are more likely than men (23 percent) to expect Social Security to be their primary
source of income. Fourteen percent of women and 15 percent of men expect to rely on “working.”
• Percentage Saving for Retirement/ Age They Started to Save. A large majority of workers are saving for
retirement through an employer-sponsored plan and/or outside of work — men are more likely (80 percent)
than women (72 percent) to be saving. In terms of the median age they started saving, men started saving
at a younger age (age 26) compared to women (age 28).
Influences of Gender on Retirement Readiness
153
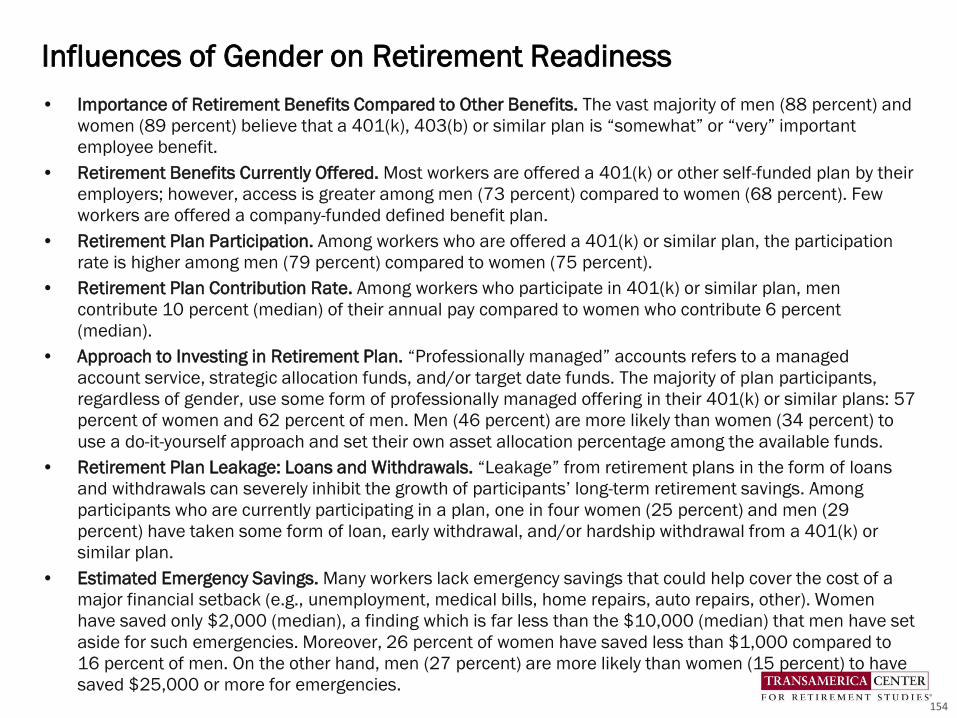
• Importance of Retirement Benefits Compared to Other Benefits. The vast majority of men (88 percent) and
women (89 percent) believe that a 401(k), 403(b) or similar plan is “somewhat” or “very” important
employee benefit.
• Retirement Benefits Currently Offered. Most workers are offered a 401(k) or other self-funded plan by their
employers; however, access is greater among men (73 percent) compared to women (68 percent). Few
workers are offered a company-funded defined benefit plan.
• Retirement Plan Participation. Among workers who are offered a 401(k) or similar plan, the participation
rate is higher among men (79 percent) compared to women (75 percent).
• Retirement Plan Contribution Rate. Among workers who participate in 401(k) or similar plan, men
contribute 10 percent (median) of their annual pay compared to women who contribute 6 percent
(median).
• Approach to Investing in Retirement Plan. “Professionally managed” accounts refers to a managed
account service, strategic allocation funds, and/or target date funds. The majority of plan participants,
regardless of gender, use some form of professionally managed offering in their 401(k) or similar plans: 57
percent of women and 62 percent of men. Men (46 percent) are more likely than women (34 percent) to
use a do-it-yourself approach and set their own asset allocation percentage among the available funds.
• Retirement Plan Leakage: Loans and Withdrawals. “Leakage” from retirement plans in the form of loans
and withdrawals can severely inhibit the growth of participants’ long-term retirement savings. Among
participants who are currently participating in a plan, one in four women (25 percent) and men (29
percent) have taken some form of loan, early withdrawal, and/or hardship withdrawal from a 401(k) or
similar plan.
• Estimated Emergency Savings. Many workers lack emergency savings that could help cover the cost of a
major financial setback (e.g., unemployment, medical bills, home repairs, auto repairs, other). Women
have saved only $2,000 (median), a finding which is far less than the $10,000 (median) that men have set
aside for such emergencies. Moreover, 26 percent of women have saved less than $1,000 compared to
16 percent of men. On the other hand, men (27 percent) are more likely than women (15 percent) to have
saved $25,000 or more for emergencies.
Influences of Gender on Retirement Readiness
154
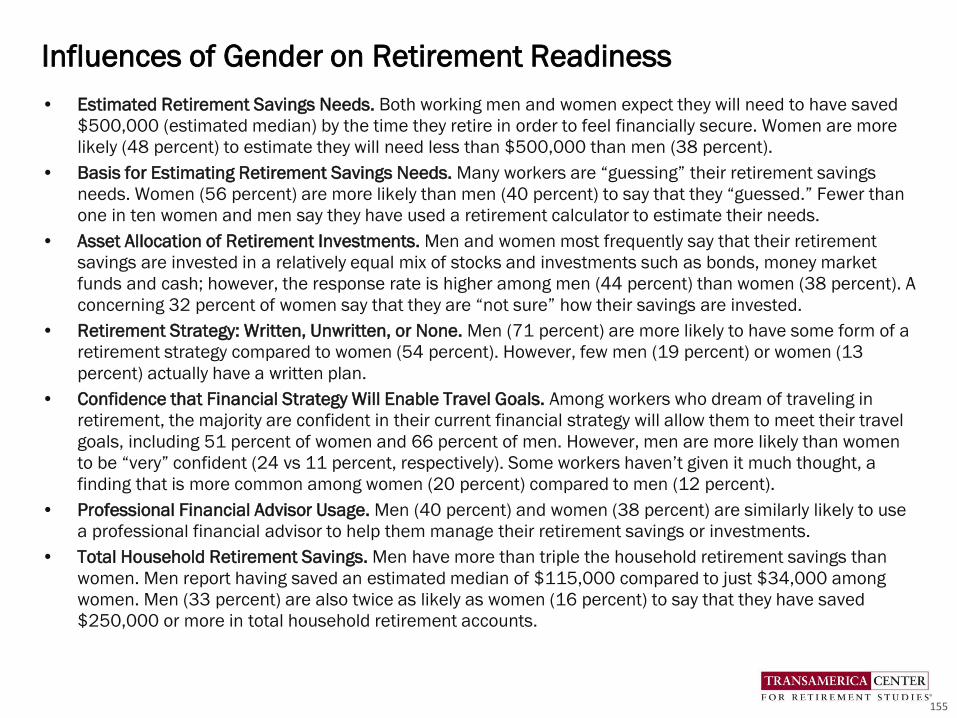
• Estimated Retirement Savings Needs. Both working men and women expect they will need to have saved
$500,000 (estimated median) by the time they retire in order to feel financially secure. Women are more
likely (48 percent) to estimate they will need less than $500,000 than men (38 percent).
• Basis for Estimating Retirement Savings Needs. Many workers are “guessing” their retirement savings
needs. Women (56 percent) are more likely than men (40 percent) to say that they “guessed.” Fewer than
one in ten women and men say they have used a retirement calculator to estimate their needs.
• Asset Allocation of Retirement Investments. Men and women most frequently say that their retirement
savings are invested in a relatively equal mix of stocks and investments such as bonds, money market
funds and cash; however, the response rate is higher among men (44 percent) than women (38 percent). A
concerning 32 percent of women say that they are “not sure” how their savings are invested.
• Retirement Strategy: Written, Unwritten, or None. Men (71 percent) are more likely to have some form of a
retirement strategy compared to women (54 percent). However, few men (19 percent) or women (13
percent) actually have a written plan.
• Confidence that Financial Strategy Will Enable Travel Goals. Among workers who dream of traveling in
retirement, the majority are confident in their current financial strategy will allow them to meet their travel
goals, including 51 percent of women and 66 percent of men. However, men are more likely than women
to be “very” confident (24 vs 11 percent, respectively). Some workers haven’t given it much thought, a
finding that is more common among women (20 percent) compared to men (12 percent).
• Professional Financial Advisor Usage. Men (40 percent) and women (38 percent) are similarly likely to use
a professional financial advisor to help them manage their retirement savings or investments.
• Total Household Retirement Savings. Men have more than triple the household retirement savings than
women. Men report having saved an estimated median of $115,000 compared to just $34,000 among
women. Men (33 percent) are also twice as likely as women (16 percent) to say that they have saved
$250,000 or more in total household retirement accounts.
Influences of Gender on Retirement Readiness
155
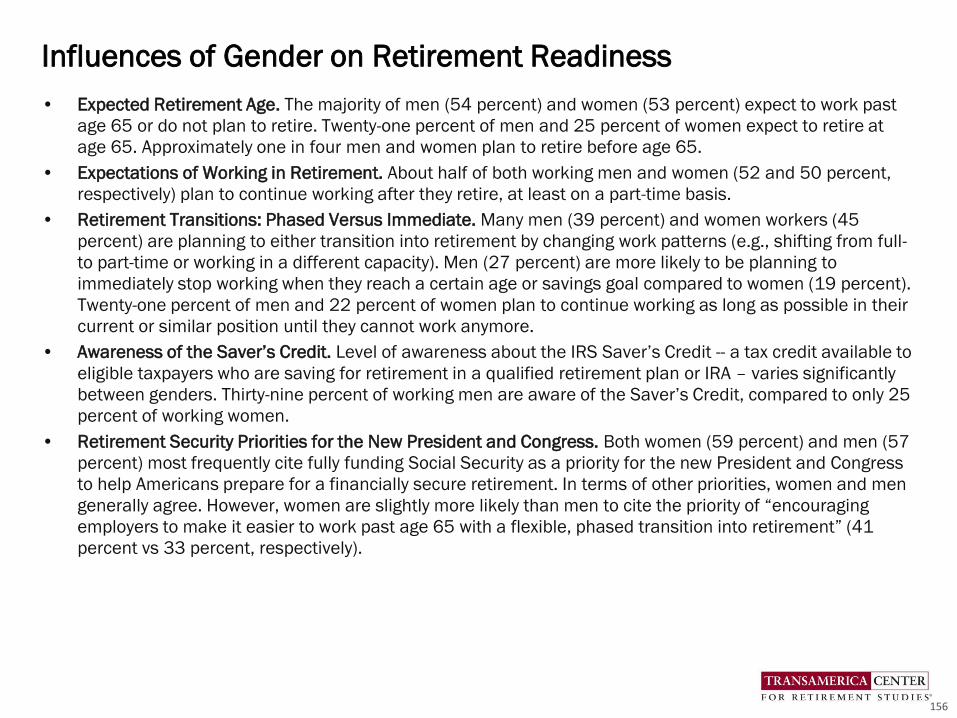
• Expected Retirement Age. The majority of men (54 percent) and women (53 percent) expect to work past
age 65 or do not plan to retire. Twenty-one percent of men and 25 percent of women expect to retire at
age 65. Approximately one in four men and women plan to retire before age 65.
• Expectations of Working in Retirement. About half of both working men and women (52 and 50 percent,
respectively) plan to continue working after they retire, at least on a part-time basis.
• Retirement Transitions: Phased Versus Immediate. Many men (39 percent) and women workers (45
percent) are planning to either transition into retirement by changing work patterns (e.g., shifting from full-
to part-time or working in a different capacity). Men (27 percent) are more likely to be planning to
immediately stop working when they reach a certain age or savings goal compared to women (19 percent).
Twenty-one percent of men and 22 percent of women plan to continue working as long as possible in their
current or similar position until they cannot work anymore.
• Awareness of the Saver’s Credit. Level of awareness about the IRS Saver’s Credit -- a tax credit available to
eligible taxpayers who are saving for retirement in a qualified retirement plan or IRA – varies significantly
between genders. Thirty-nine percent of working men are aware of the Saver’s Credit, compared to only 25
percent of working women.
• Retirement Security Priorities for the New President and Congress. Both women (59 percent) and men (57
percent) most frequently cite fully funding Social Security as a priority for the new President and Congress
to help Americans prepare for a financially secure retirement. In terms of other priorities, women and men
generally agree. However, women are slightly more likely than men to cite the priority of “encouraging
employers to make it easier to work past age 65 with a flexible, phased transition into retirement” (41
percent vs 33 percent, respectively).
Influences of Gender on Retirement Readiness
156
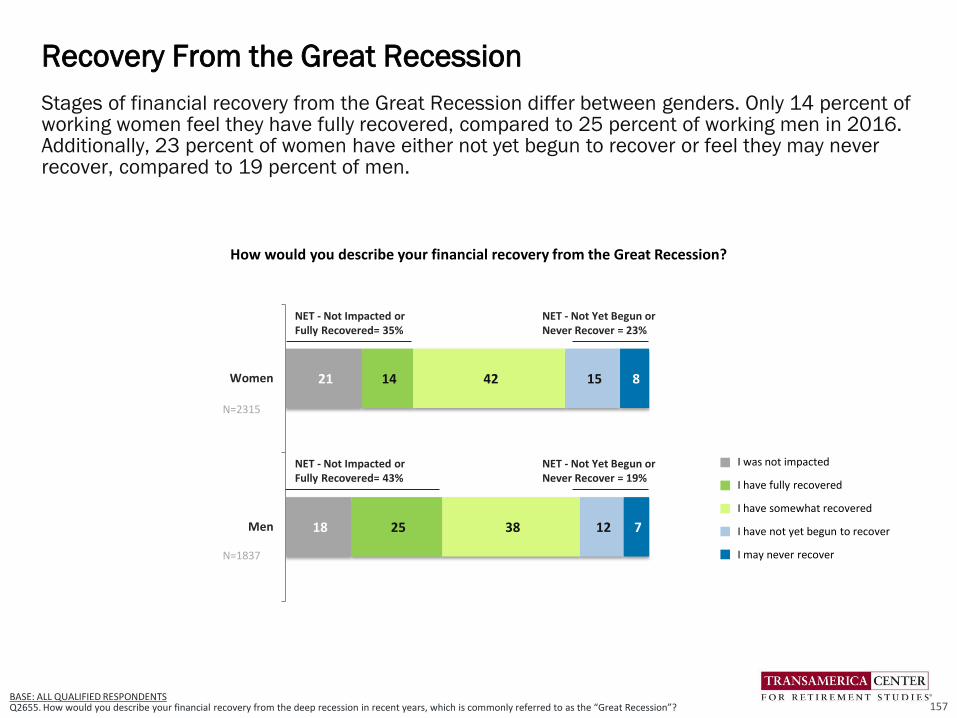
Stages of financial recovery from the Great Recession differ between genders. Only 14 percent of working women feel they have fully recovered, compared to 25 percent of working men in 2016. Additionally, 23 percent of women have either not yet begun to recover or feel they may never recover, compared to 19 percent of men.
Recovery From the Great Recession
157BASE: ALL QUALIFIED RESPONDENTS Q2655. How would you describe your financial recovery from the deep recession in recent years, which is commonly referred to as the “Great Recession”?
21
18
14
25
42
38
15
12
8
7
Women
Men
I was not impacted
I have fully recovered
I have somewhat recovered
I have not yet begun to recover
I may never recover
NET - Not Impacted or Fully Recovered= 35%
NET - Not Impacted or Fully Recovered= 43%
How would you describe your financial recovery from the Great Recession?
NET - Not Yet Begun or Never Recover = 23%
NET - Not Yet Begun or Never Recover = 19%
N=2315
N=1837
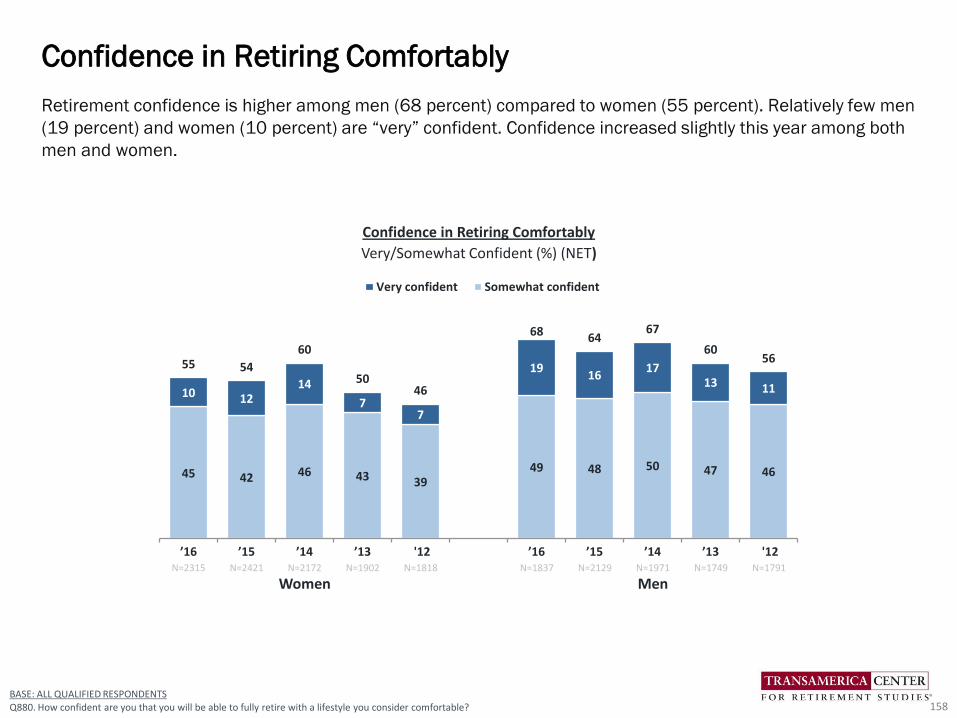
45 42 46 43 3949 48 50 47 46
10 1214
77
1916
1713 11
55 54
60
5046
68 6467
6056
’16 ’15 ’14 ’13 '12 ’16 ’15 ’14 ’13 '12
Very confident Somewhat confident
BASE: ALL QUALIFIED RESPONDENTSQ880. How confident are you that you will be able to fully retire with a lifestyle you consider comfortable?
Retirement confidence is higher among men (68 percent) compared to women (55 percent). Relatively few men
(19 percent) and women (10 percent) are “very” confident. Confidence increased slightly this year among both
men and women.
Confidence in Retiring Comfortably
158
N=2315 N=2421 N=2172 N=1902 N=1818 N=1837 N=2129 N=1971 N=1749 N=1791
Women Men
Confidence in Retiring Comfortably
Very/Somewhat Confident (%) (NET)
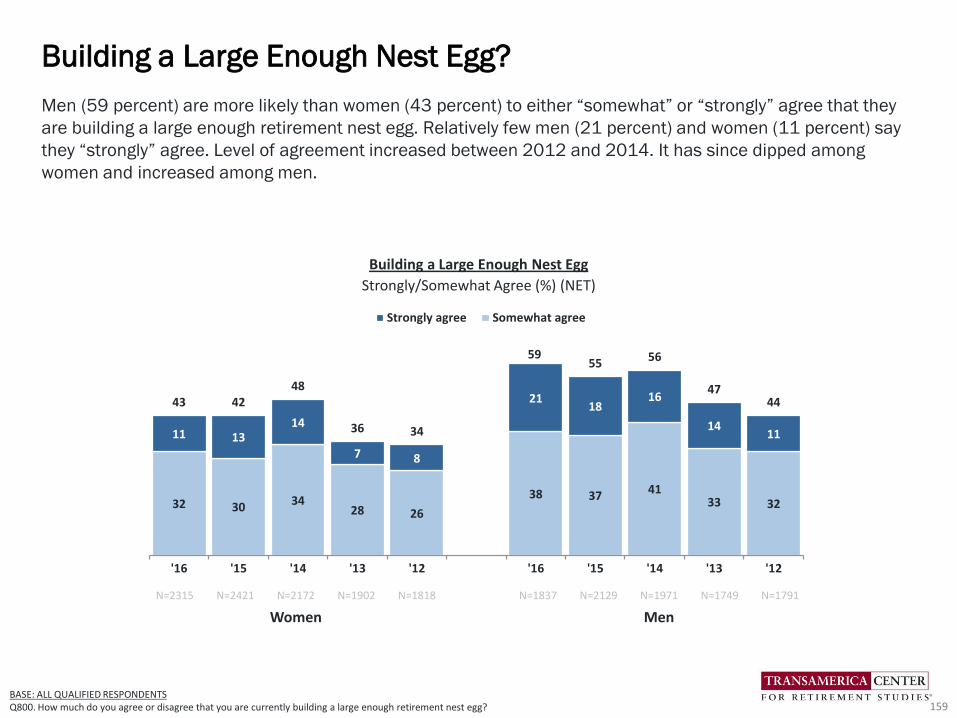
BASE: ALL QUALIFIED RESPONDENTSQ800. How much do you agree or disagree that you are currently building a large enough retirement nest egg?
Men (59 percent) are more likely than women (43 percent) to either “somewhat” or “strongly” agree that they
are building a large enough retirement nest egg. Relatively few men (21 percent) and women (11 percent) say
they “strongly” agree. Level of agreement increased between 2012 and 2014. It has since dipped among
women and increased among men.
Building a Large Enough Nest Egg?
159
32 30 3428 26
38 37 4133 32
11 1314
7 8
2118
16
1411
43 4248
36 34
5955 56
4744
'16 '15 '14 '13 '12 '16 '15 '14 '13 '12
Strongly agree Somewhat agree
N=2315 N=2421 N=2172 N=1902 N=1818 N=1837 N=2129 N=1971 N=1749 N=1791
Women Men
Building a Large Enough Nest Egg
Strongly/Somewhat Agree (%) (NET)
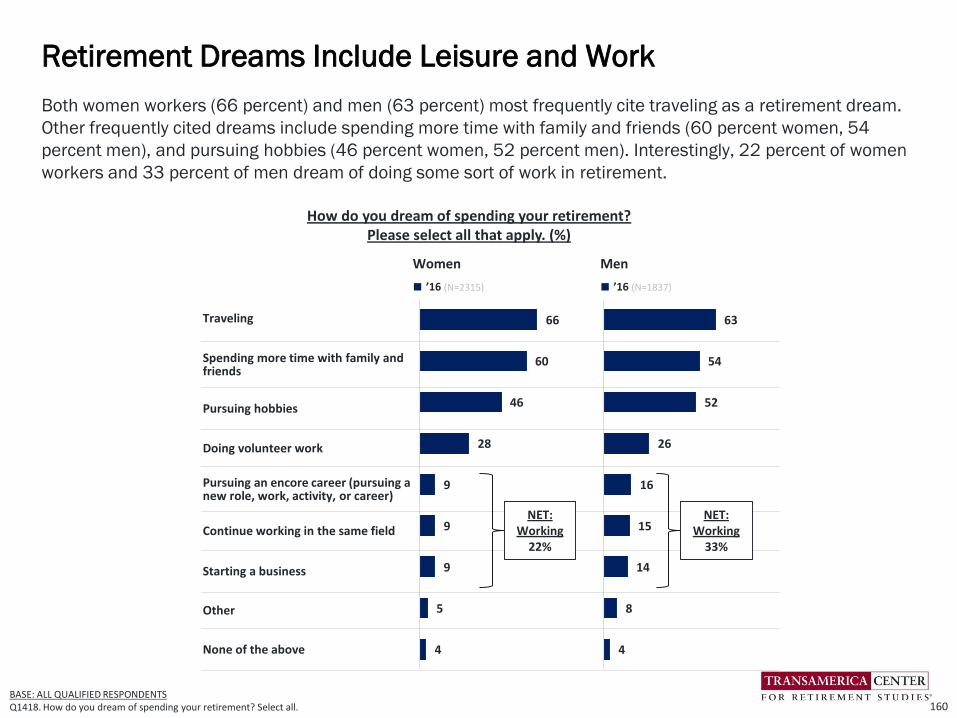
Both women workers (66 percent) and men (63 percent) most frequently cite traveling as a retirement dream.
Other frequently cited dreams include spending more time with family and friends (60 percent women, 54
percent men), and pursuing hobbies (46 percent women, 52 percent men). Interestingly, 22 percent of women
workers and 33 percent of men dream of doing some sort of work in retirement.
Retirement Dreams Include Leisure and Work
160BASE: ALL QUALIFIED RESPONDENTS Q1418. How do you dream of spending your retirement? Select all.
How do you dream of spending your retirement? Please select all that apply. (%)
Women Men
■ ’16 (N=2315) ■ ’16 (N=1837)
Traveling
Spending more time with family and friends
Pursuing hobbies
Doing volunteer work
Pursuing an encore career (pursuing a new role, work, activity, or career)
Continue working in the same field
Starting a business
Other
None of the above
66
60
46
28
9
9
9
5
4
NET: Working
22%
63
54
52
26
16
15
14
8
4
NET: Working
33%
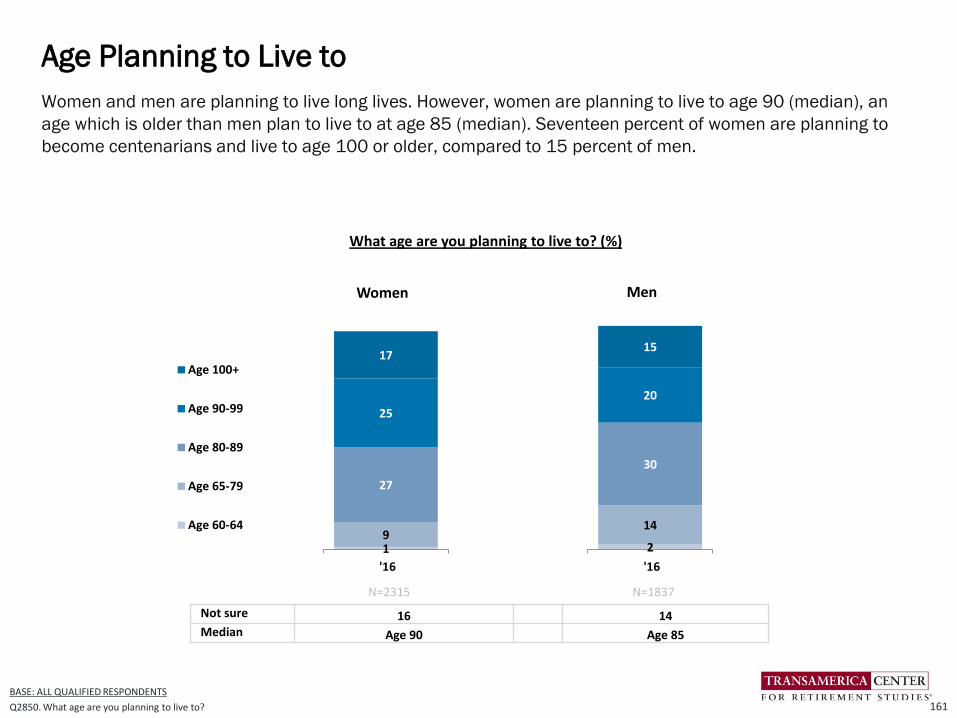
2
14
30
20
15
'16
Women and men are planning to live long lives. However, women are planning to live to age 90 (median), an
age which is older than men plan to live to at age 85 (median). Seventeen percent of women are planning to
become centenarians and live to age 100 or older, compared to 15 percent of men.
Age Planning to Live to
161
BASE: ALL QUALIFIED RESPONDENTS
Q2850. What age are you planning to live to?
Women Men
19
27
25
17
'16
Age 100+
Age 90-99
Age 80-89
Age 65-79
Age 60-64
N=2315 N=1837
Not sure 16 14Median Age 90 Age 85
What age are you planning to live to? (%)
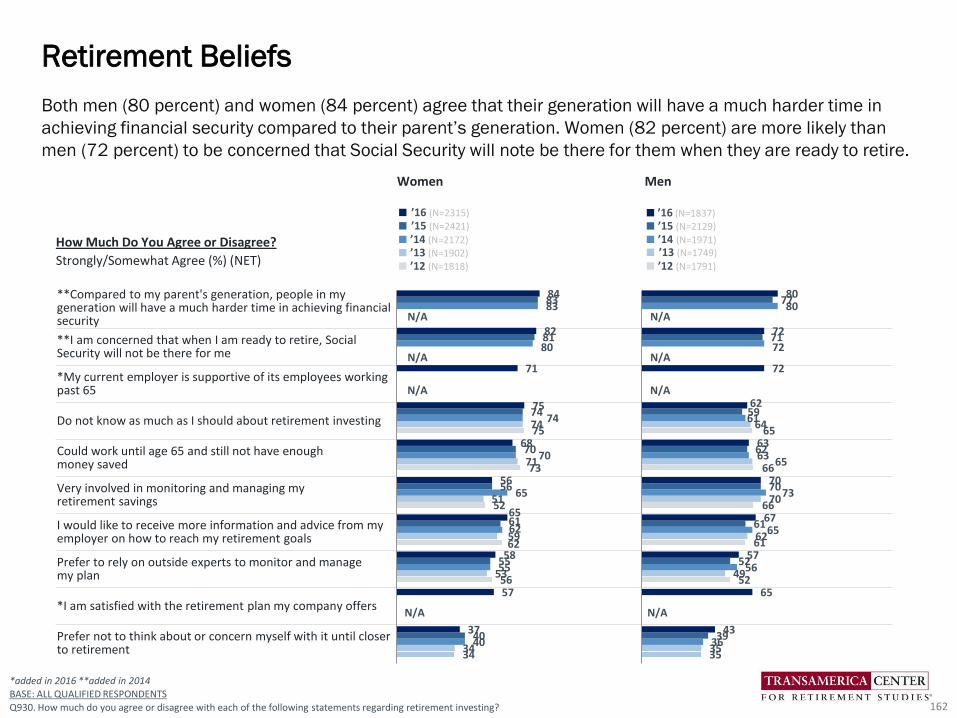
How Much Do You Agree or Disagree?
Strongly/Somewhat Agree (%) (NET)
Women Men
■ ’16 (N=2315) ■ ’15 (N=2421)
■ ’14 (N=2172)■ ’13 (N=1902)■ ’12 (N=1818)
■ ’16 (N=1837) ■ ’15 (N=2129) ■ ’14 (N=1971)■ ’13 (N=1749)
■ ’12 (N=1791)
**Compared to my parent's generation, people in my generation will have a much harder time in achieving financial security
**I am concerned that when I am ready to retire, Social Security will not be there for me
*My current employer is supportive of its employees working past 65
Do not know as much as I should about retirement investing
Could work until age 65 and still not have enough money saved
Very involved in monitoring and managing my retirement savings
I would like to receive more information and advice from my employer on how to reach my retirement goals
Prefer to rely on outside experts to monitor and manage my plan
*I am satisfied with the retirement plan my company offers
Prefer not to think about or concern myself with it until closer to retirement
*added in 2016 **added in 2014BASE: ALL QUALIFIED RESPONDENTS
Q930. How much do you agree or disagree with each of the following statements regarding retirement investing?
Both men (80 percent) and women (84 percent) agree that their generation will have a much harder time in
achieving financial security compared to their parent’s generation. Women (82 percent) are more likely than
men (72 percent) to be concerned that Social Security will note be there for them when they are ready to retire.
Retirement Beliefs
162
75
73
52
62
56
34
74
71
51
59
53
34
83
80
74
70
65
62
55
40
83
81
74
70
56
61
55
40
84
82
71
75
68
56
65
58
57
37
65
66
66
61
52
35
64
65
70
62
49
35
80
72
61
63
73
65
56
36
77
71
59
62
70
61
52
39
80
72
72
62
63
70
67
57
65
43
N/A
N/A
N/A
N/A
N/A
N/A
N/AN/A
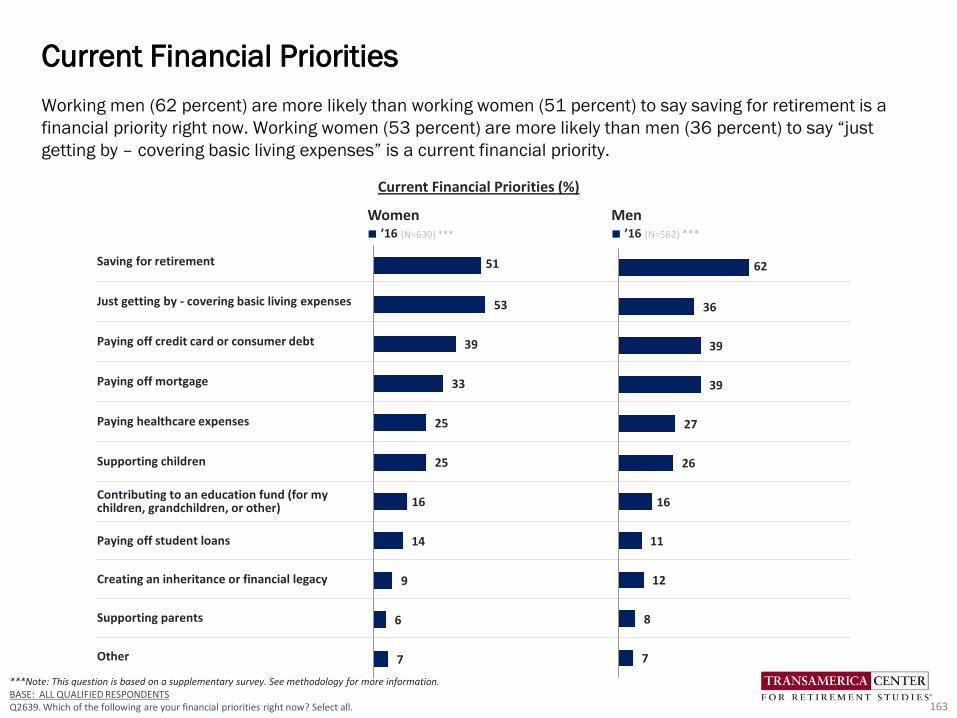
Working men (62 percent) are more likely than working women (51 percent) to say saving for retirement is a
financial priority right now. Working women (53 percent) are more likely than men (36 percent) to say “just
getting by – covering basic living expenses” is a current financial priority.
Current Financial Priorities
163
***Note: This question is based on a supplementary survey. See methodology for more information. BASE: ALL QUALIFIED RESPONDENTSQ2639. Which of the following are your financial priorities right now? Select all.
Women Men■ ’16 (N=630) *** ■ ’16 (N=562) ***
Saving for retirement
Just getting by - covering basic living expenses
Paying off credit card or consumer debt
Paying off mortgage
Paying healthcare expenses
Supporting children
Contributing to an education fund (for my children, grandchildren, or other)
Paying off student loans
Creating an inheritance or financial legacy
Supporting parents
Other
51
53
39
33
25
25
16
14
9
6
7
62
36
39
39
27
26
16
11
12
8
7
Current Financial Priorities (%)

www.transamericacenter.org
*added in 2015**shown as two separate answers in 2016***This question is based on a supplementary survey. See methodology for more information
BASE: ALL QUALIFIED RESPONDENTS Q2640. Which one of the following is your greatest financial priority right now?
Men most frequently cite “saving for retirement” as their greatest financial priority right now (29 percent).
Women, in contrast, most frequently cited “just getting by – covering basic living expenses” (24 percent) as
their top priority.
Greatest Financial Priority Right Now
164
222225
1920
242524
2927
2020
262728
9111010910
6789
334432
1
65
2
36544
293129
2626
19182122
2515
20232423
1013121413
105667
5333321
2
44
1
35654
N/A N/A
N/AN/A
N/A N/A
N/A N/A
N/A N/A
Women Men
■ ’16 (N=630)***
■ ’15(N=2421)
■ ’14 (N=2172)■ ’13 (N=1902)
■ ’12 (N=1818)
■ ’16 (N=562)***
■ ’15 (N=2129)
■ ’14 (N=1971)■ ’13 (N=1749)■ ’12 (N=1791)
Saving for retirement
Just getting by - covering basic living expenses
Paying off credit card or consumer debt
Paying off mortgage
**Supporting children and/or parents
Paying healthcare expenses
Contributing to an education fund (for my children, grandchildren, or other)
Creating an inheritance or financial legacy
*Paying off student loans
*Paying current tuition fees
Other
Greatest Financial Priority Right Now (%)
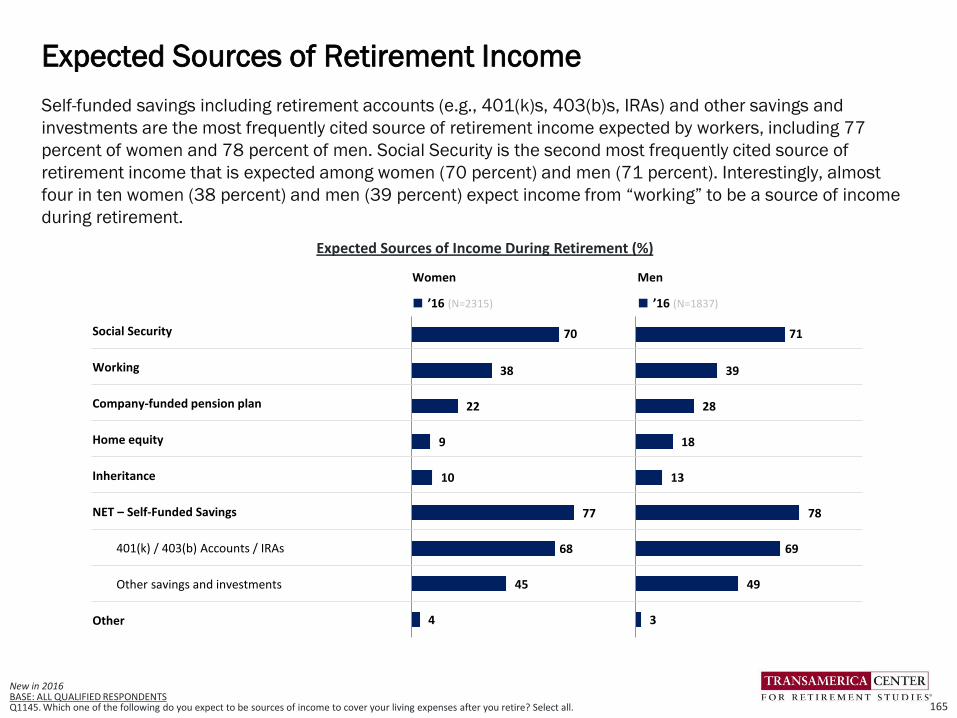
New in 2016BASE: ALL QUALIFIED RESPONDENTS Q1145. Which one of the following do you expect to be sources of income to cover your living expenses after you retire? Select all.
Self-funded savings including retirement accounts (e.g., 401(k)s, 403(b)s, IRAs) and other savings and
investments are the most frequently cited source of retirement income expected by workers, including 77
percent of women and 78 percent of men. Social Security is the second most frequently cited source of
retirement income that is expected among women (70 percent) and men (71 percent). Interestingly, almost
four in ten women (38 percent) and men (39 percent) expect income from “working” to be a source of income
during retirement.
Expected Sources of Retirement Income
165
70
38
22
9
10
77
68
45
4
71
39
28
18
13
78
69
49
3
Expected Sources of Income During Retirement (%)
Women Men
■ ’16 (N=2315) ■ ’16 (N=1837)
Social Security
Working
Company-funded pension plan
Home equity
Inheritance
NET – Self-Funded Savings
401(k) / 403(b) Accounts / IRAs
Other savings and investments
Other
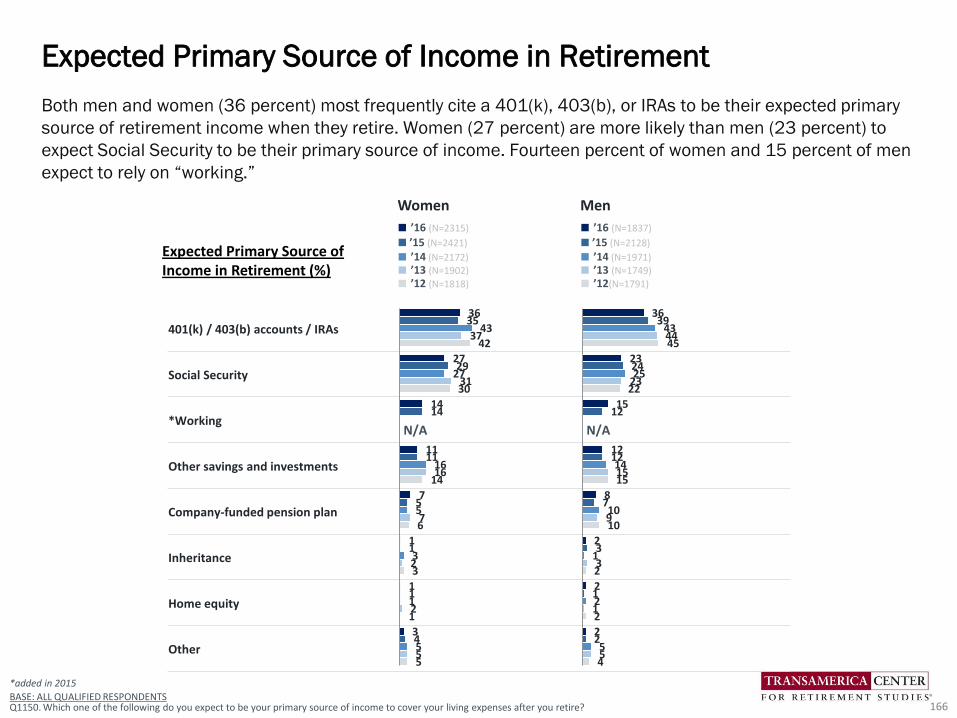
Women Men
■ ’16 (N=2315)
■ ’15 (N=2421)
■ ’14 (N=2172)■ ’13 (N=1902)■ ’12 (N=1818)
■ ’16 (N=1837)
■ ’15 (N=2128)
■ ’14 (N=1971)■ ’13 (N=1749)■ ’12(N=1791)
401(k) / 403(b) accounts / IRAs
Social Security
*Working
Other savings and investments
Company-funded pension plan
Inheritance
Home equity
Other
*added in 2015
BASE: ALL QUALIFIED RESPONDENTSQ1150. Which one of the following do you expect to be your primary source of income to cover your living expenses after you retire?
Both men and women (36 percent) most frequently cite a 401(k), 403(b), or IRAs to be their expected primary
source of retirement income when they retire. Women (27 percent) are more likely than men (23 percent) to
expect Social Security to be their primary source of income. Fourteen percent of women and 15 percent of men
expect to rely on “working.”
Expected Primary Source of Income in Retirement
166
3639
434445
232425
2322
1512
1212141515
8710910
23
132
21212
22554
3635
4337
42
2729
273130
1414
1111
1616
14
75576
11323
11121
34555
N/A N/A
Expected Primary Source of Income in Retirement (%)
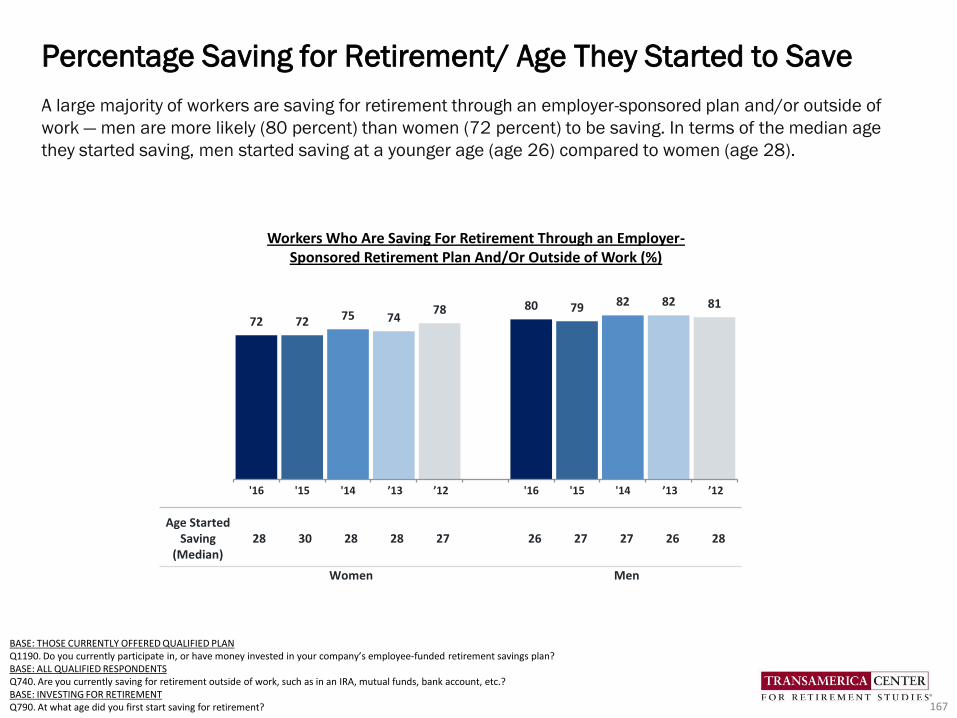
BASE: THOSE CURRENTLY OFFERED QUALIFIED PLANQ1190. Do you currently participate in, or have money invested in your company’s employee-funded retirement savings plan?BASE: ALL QUALIFIED RESPONDENTSQ740. Are you currently saving for retirement outside of work, such as in an IRA, mutual funds, bank account, etc.?BASE: INVESTING FOR RETIREMENTQ790. At what age did you first start saving for retirement?
A large majority of workers are saving for retirement through an employer-sponsored plan and/or outside of
work — men are more likely (80 percent) than women (72 percent) to be saving. In terms of the median age
they started saving, men started saving at a younger age (age 26) compared to women (age 28).
Percentage Saving for Retirement/ Age They Started to Save
167
72 72 75 7478 80 79 82 82 81
'16 '15 '14 ’13 ’12 '16 '15 '14 ’13 ’12
Workers Who Are Saving For Retirement Through an Employer-Sponsored Retirement Plan And/Or Outside of Work (%)
Age Started Saving
(Median)28 30 28 28 27 26 27 27 26 28
Women Men
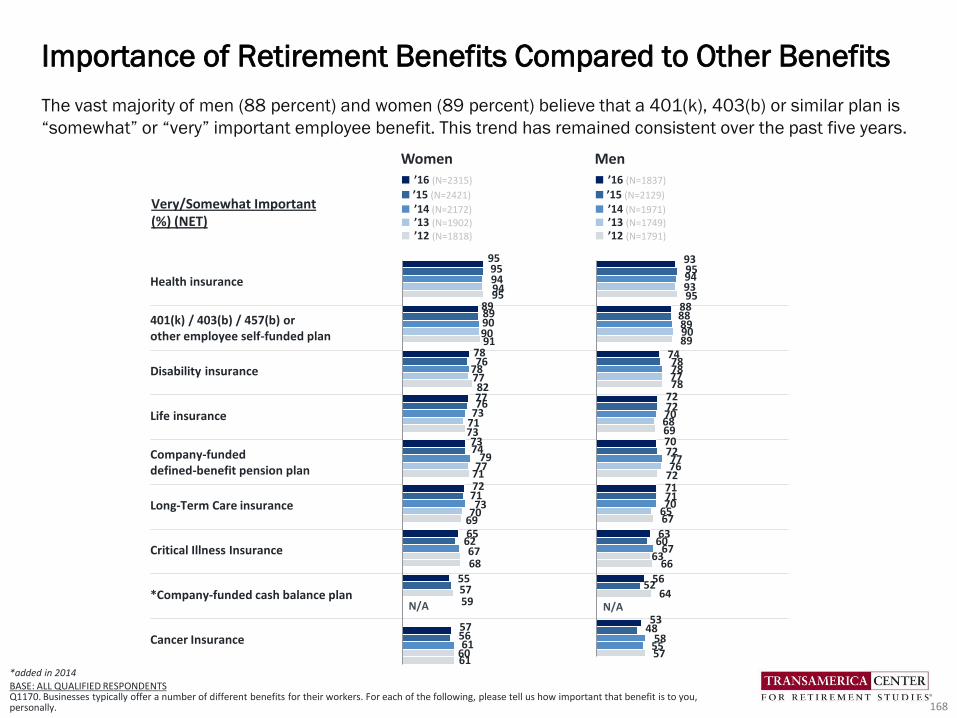
Women Men■ ’16 (N=2315)
■ ’15 (N=2421)
■ ’14 (N=2172)■ ’13 (N=1902)■ ’12 (N=1818)
■ ’16 (N=1837)
■ ’15 (N=2129)
■ ’14 (N=1971)■ ’13 (N=1749)■ ’12 (N=1791)
Health insurance
401(k) / 403(b) / 457(b) or other employee self-funded plan
Disability insurance
Life insurance
Company-funded defined-benefit pension plan
Long-Term Care insurance
Critical Illness Insurance
*Company-funded cash balance plan
Cancer Insurance
9395949395
8888899089
7478787778
727270686970727776
72717170
6567
6360
6763
66
5652
64
5348
585557
*added in 2014BASE: ALL QUALIFIED RESPONDENTSQ1170. Businesses typically offer a number of different benefits for their workers. For each of the following, please tell us how important that benefit is to you, personally.
The vast majority of men (88 percent) and women (89 percent) believe that a 401(k), 403(b) or similar plan is
“somewhat” or “very” important employee benefit. This trend has remained consistent over the past five years.
Importance of Retirement Benefits Compared to Other Benefits
168
N/A N/A
Very/Somewhat Important(%) (NET)
9595949495
8989909091
7876
7877827776
7371737374
7977
71727173
706965626768
555759
575661
6061
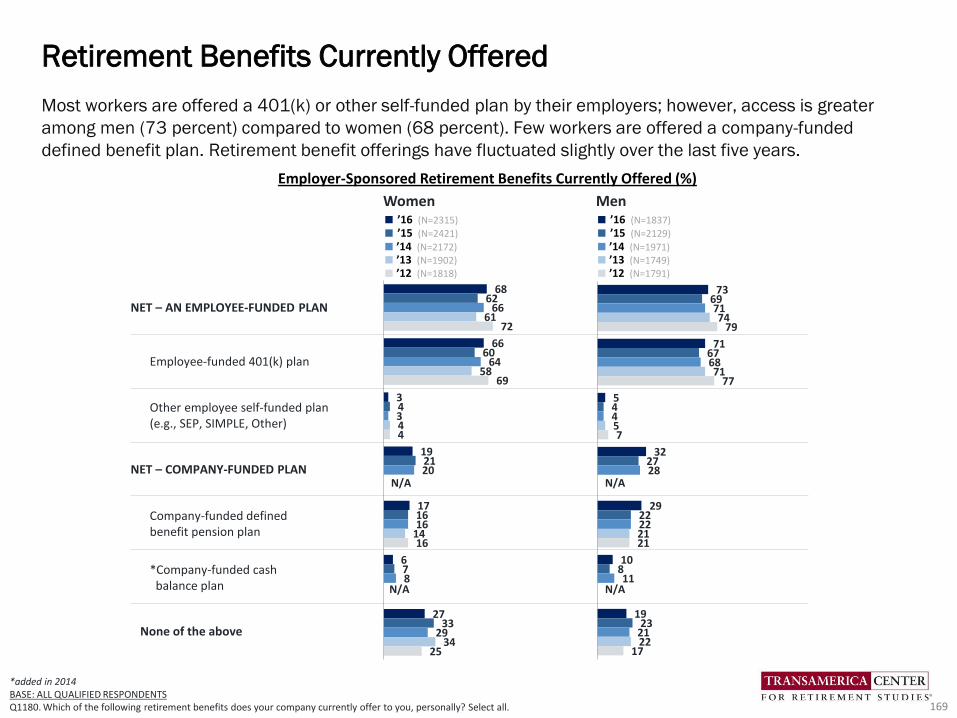
Most workers are offered a 401(k) or other self-funded plan by their employers; however, access is greater
among men (73 percent) compared to women (68 percent). Few workers are offered a company-funded
defined benefit plan. Retirement benefit offerings have fluctuated slightly over the last five years.
Retirement Benefits Currently Offered
169
Women Men■ ’16 (N=2315) ■ ’15 (N=2421)
■ ’14 (N=2172)■ ’13 (N=1902)■ ’12 (N=1818)
■ ’16 (N=1837) ■ ’15 (N=2129)
■ ’14 (N=1971)■ ’13 (N=1749)■ ’12 (N=1791)
NET – AN EMPLOYEE-FUNDED PLAN
Employee-funded 401(k) plan
Other employee self-funded plan(e.g., SEP, SIMPLE, Other)
NET – COMPANY-FUNDED PLAN
Company-funded defined benefit pension plan
*Company-funded cash balance plan
None of the above
*added in 2014BASE: ALL QUALIFIED RESPONDENTSQ1180. Which of the following retirement benefits does your company currently offer to you, personally? Select all.
68
66
3
19
17
6
27
62
60
4
21
16
7
33
66
64
3
20
16
8
29
61
58
4
14
34
72
69
4
16
25
73
71
5
32
29
10
19
69
67
4
27
22
8
23
71
68
4
28
22
11
21
74
71
5
21
22
79
77
7
21
17
N/AN/A
N/AN/A
Employer-Sponsored Retirement Benefits Currently Offered (%)
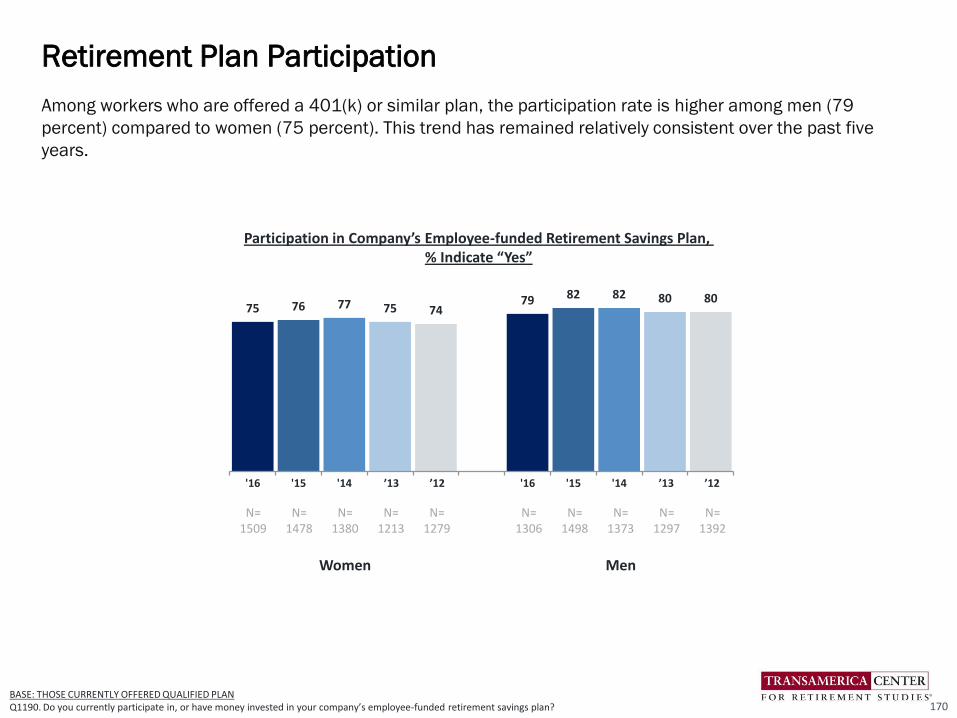
Among workers who are offered a 401(k) or similar plan, the participation rate is higher among men (79
percent) compared to women (75 percent). This trend has remained relatively consistent over the past five
years.
Retirement Plan Participation
170BASE: THOSE CURRENTLY OFFERED QUALIFIED PLANQ1190. Do you currently participate in, or have money invested in your company’s employee-funded retirement savings plan?
Participation in Company’s Employee-funded Retirement Savings Plan, % Indicate “Yes”
75 76 77 75 7479 82 82 80 80
'16 '15 '14 ’13 ’12 '16 '15 '14 ’13 ’12
N=1509
N=1478
N=1380
N=1213
N=1279
N=1306
N=1498
N=1373
N=1297
N=1392
Women Men

6%
7% 7%
6% 6%
10%
8%
10%
8% 8%
'16 '15 '14 ’13 ’12 '16 '15 '14 ’13 ’12
BASE: CURRENTLY PARTICIPATES IN QUALIFIED PLAN Q601. What percentage of your salary are you saving for retirement through your company-sponsored plan this year?
Among workers who participate in 401(k) or similar plan, men contribute 10 percent (median) of their annual
pay compared to women who contribute 6 percent (median). The contribution rate for men increased since last
year, while the contribution rate for women decreased slightly. Over the past five years, the medium median
contribution rate has been consistently higher among men than women.
Retirement Plan Contribution Rate
171
Mean 9.7 10.1 10.8 9.3 9.1 11.9 10.7 11.4 9.8 10.9N=1102 N=1100 N=1059 N=929 N=972 N=1049 N=1190 N=1108 N=1039 N=1107
Women Men
Contribution Rate, Median %

“Professionally managed” accounts refers to a managed account service, strategic allocation funds, and/or
target date funds. The majority of plan participants, regardless of gender, use some form of professionally
managed offering in their 401(k) or similar plans: 57 percent of women and 62 percent of men. Men (46
percent) are more likely than women (34 percent) to use a do-it-yourself approach and set their own asset
allocation percentage among the available funds.
Approach to Investing in Retirement Plan
172BASE: PARTICIPATING IN QUALIFIED PLANQ1466. What is your current approach to investing in your employer-sponsored retirement plan? Select all.
Women■ ’16 (N=1104)■ ’15 (N=1104)
■ ’14 (N=1063)
Men■ ’16 (N=1051)■ ’15 (N=1191)
■ ’14 (N=1109)
NET – Professionally Managed
I invest in an account (or service) that is managed by a professional investment advisor and I do not have to make investment or allocation decisions
I invest in a strategic allocation fund that is designed to address my specific risk tolerance profile
I invest in a target date fund that is designed to change allocation percentages as I approach my target retirement year
I set my own asset allocation percentages among the available funds
Not sure
Investments in Employer-Sponsored Retirement Plan (%)
57
28
19
19
34
15
51
24
18
18
35
22
50
23
23
19
43
16
62
27
25
26
46
8
51
22
22
20
50
11
57
25
24
22
47
9
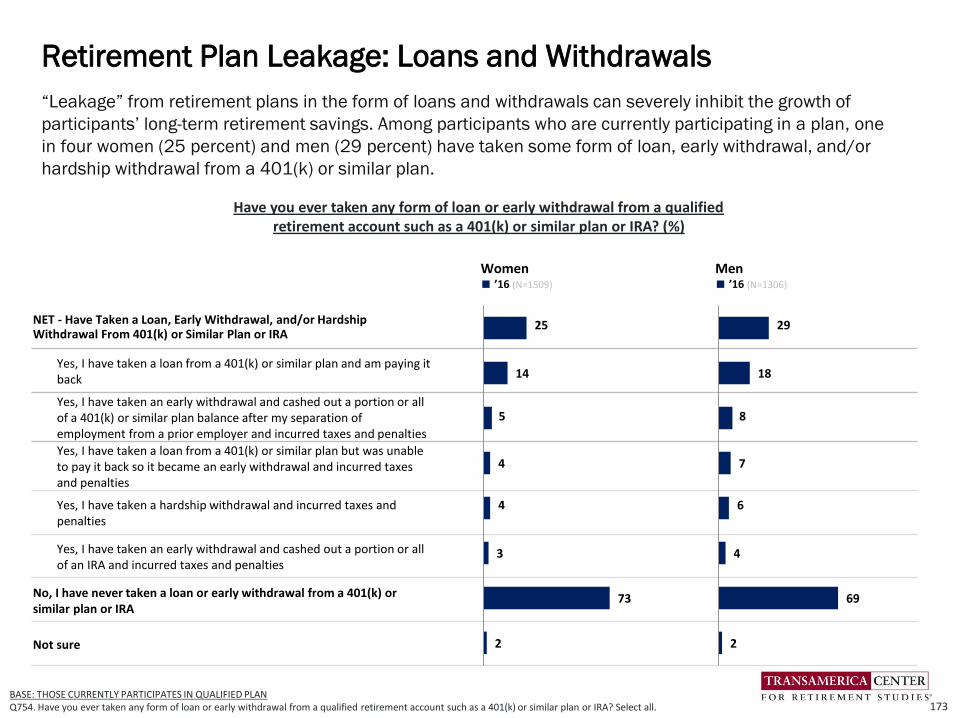
“Leakage” from retirement plans in the form of loans and withdrawals can severely inhibit the growth of
participants’ long-term retirement savings. Among participants who are currently participating in a plan, one
in four women (25 percent) and men (29 percent) have taken some form of loan, early withdrawal, and/or
hardship withdrawal from a 401(k) or similar plan.
Retirement Plan Leakage: Loans and Withdrawals
173BASE: THOSE CURRENTLY PARTICIPATES IN QUALIFIED PLANQ754. Have you ever taken any form of loan or early withdrawal from a qualified retirement account such as a 401(k) or similar plan or IRA? Select all.
Women■ ’16 (N=1509)
Men■ ’16 (N=1306)
NET - Have Taken a Loan, Early Withdrawal, and/or Hardship Withdrawal From 401(k) or Similar Plan or IRA
Yes, I have taken a loan from a 401(k) or similar plan and am paying it back
Yes, I have taken an early withdrawal and cashed out a portion or all of a 401(k) or similar plan balance after my separation of employment from a prior employer and incurred taxes and penalties
Yes, I have taken a loan from a 401(k) or similar plan but was unable to pay it back so it became an early withdrawal and incurred taxes and penalties
Yes, I have taken a hardship withdrawal and incurred taxes and penalties
Yes, I have taken an early withdrawal and cashed out a portion or all of an IRA and incurred taxes and penalties
No, I have never taken a loan or early withdrawal from a 401(k) or similar plan or IRA
Not sure
25
14
5
4
4
3
73
2
29
18
8
7
6
4
69
2
Have you ever taken any form of loan or early withdrawal from a qualified retirement account such as a 401(k) or similar plan or IRA? (%)

Many workers lack emergency savings that could help cover the cost of a major financial setback (e.g.,
unemployment, medical bills, home repairs, auto repairs, other). Women have saved only $2,000 (median), a
finding which is far less than the $10,000 (median) that men have set aside for such emergencies. Moreover,
26 percent of women have saved less than $1,000 compared to 16 percent of men. On the other hand, men
(27 percent) are more likely than women (15 percent) to have saved $25,000 or more for emergencies.
Estimated Emergency Savings
174
BASE: ALL QUALIFIED RESPONDENTS
Q2825. How much do you have in emergency savings specifically to cover the cost of unexpected major financial setbacks (e.g., unemployment, medical bills, home repairs, auto repairs, other)?
16
12
9
734
21
6
'16
26
16
8
622
12
3
'16
$100k or more
$25k to less than $100k
$20k to less than $25k
$15k to less than $20k
$10k to less than $15k
$5k to less than $10k
$1k to less than $5k
Less than $1k
Women Men
N=2315 N=1837
Not sure 25 22Median $2,000 $10,000
How much do you have in emergency savings to cover the cost of unexpected major financial setbacks? (%)
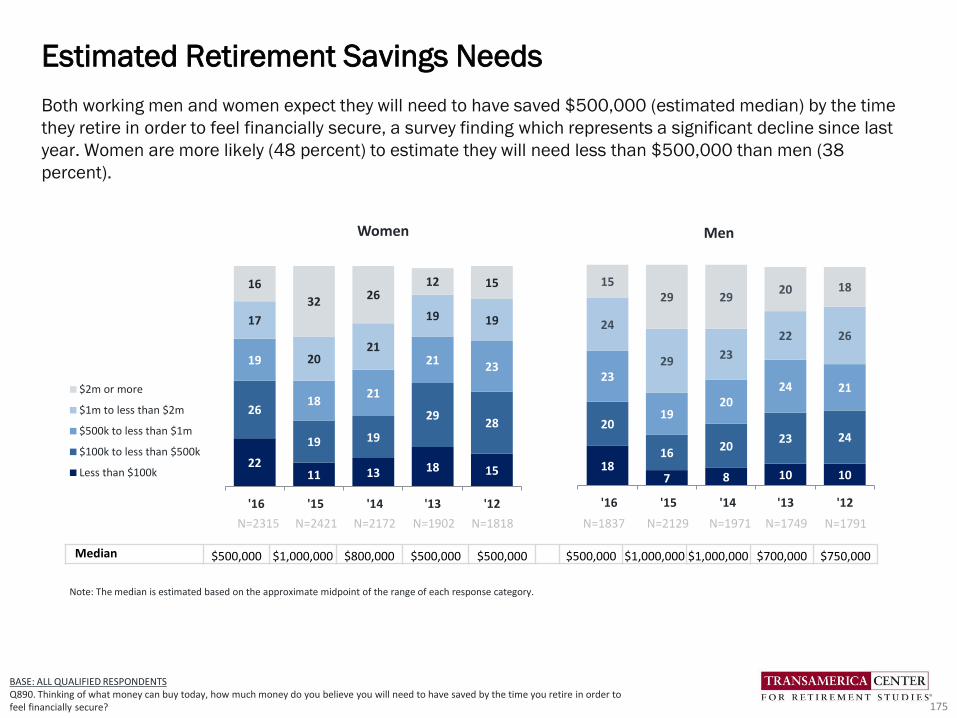
Both working men and women expect they will need to have saved $500,000 (estimated median) by the time
they retire in order to feel financially secure, a survey finding which represents a significant decline since last
year. Women are more likely (48 percent) to estimate they will need less than $500,000 than men (38
percent).
Estimated Retirement Savings Needs
175
2211 13 18 15
26
19 19
2928
19
1821
21 23
17
2021
19 19
16
3226
12 15
'16 '15 '14 '13 '12
$2m or more
$1m to less than $2m
$500k to less than $1m
$100k to less than $500k
Less than $100k
Median $500,000 $1,000,000 $800,000 $500,000 $500,000 $500,000 $1,000,000 $1,000,000 $700,000 $750,000
Note: The median is estimated based on the approximate midpoint of the range of each response category.
Women
BASE: ALL QUALIFIED RESPONDENTSQ890. Thinking of what money can buy today, how much money do you believe you will need to have saved by the time you retire in order to feel financially secure?
Men
187 8 10 10
20
1620
23 24
23
1920
24 21
24
2923
22 26
1529 29
20 18
'16 '15 '14 '13 '12
N=2421 N=2172 N=1902 N=1818 N=2129 N=1971 N=1749 N=1791N=2315 N=1837
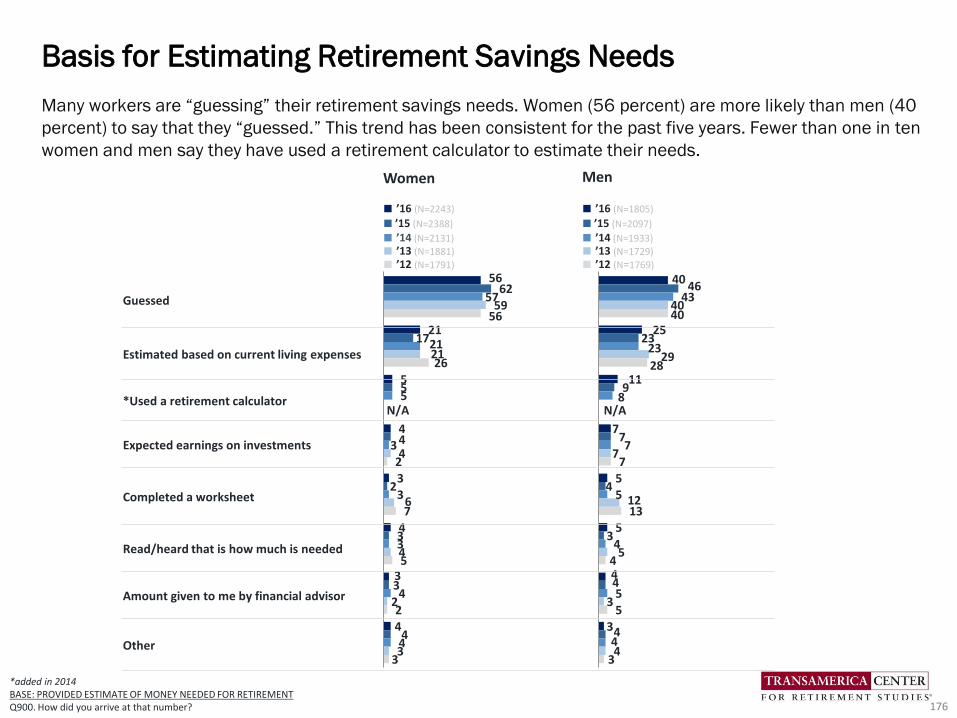
Many workers are “guessing” their retirement savings needs. Women (56 percent) are more likely than men (40
percent) to say that they “guessed.” This trend has been consistent for the past five years. Fewer than one in ten
women and men say they have used a retirement calculator to estimate their needs.
*added in 2014BASE: PROVIDED ESTIMATE OF MONEY NEEDED FOR RETIREMENT Q900. How did you arrive at that number?
Basis for Estimating Retirement Savings Needs
176
56
21
5
4
3
4
3
4
62
17
5
4
2
3
3
4
57
21
5
3
3
3
4
4
59
21
4
6
4
2
3
56
26
2
7
5
2
3
40
25
11
7
5
5
4
3
46
23
9
7
4
3
4
4
43
23
8
7
5
4
5
4
40
29
7
12
5
3
4
40
28
7
13
4
5
3
N/A N/A
Women Men
■ ’16 (N=2243)
■ ’15 (N=2388)
■ ’14 (N=2131)■ ’13 (N=1881)■ ’12 (N=1791)
■ ’16 (N=1805)
■ ’15 (N=2097)
■ ’14 (N=1933)■ ’13 (N=1729)■ ’12 (N=1769)
Guessed
Estimated based on current living expenses
*Used a retirement calculator
Expected earnings on investments
Completed a worksheet
Read/heard that is how much is needed
Amount given to me by financial advisor
Other
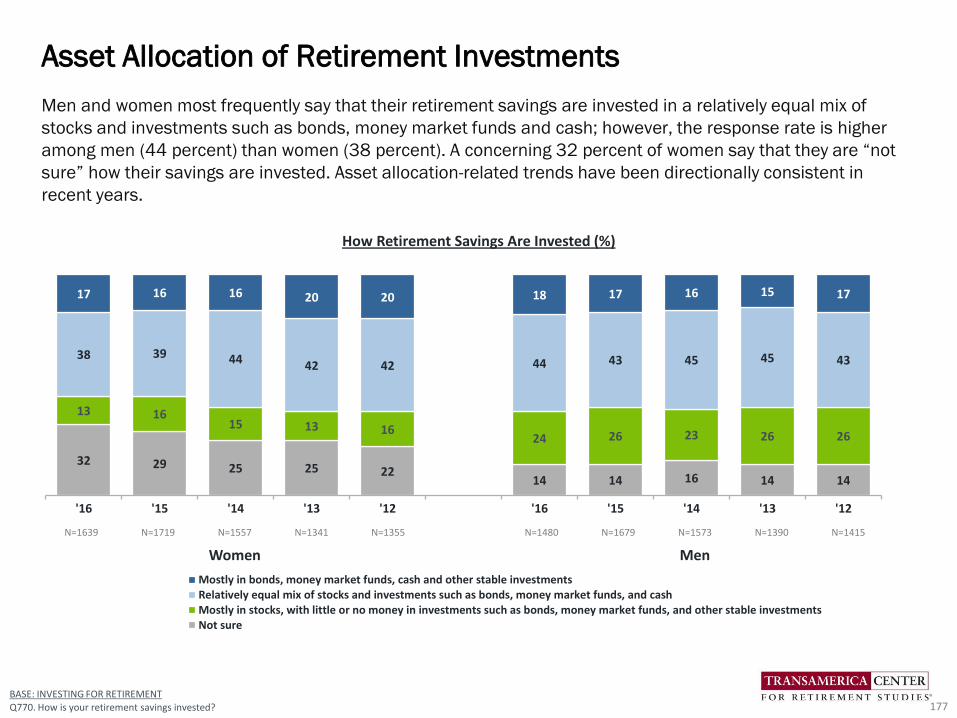
32 29 25 25 2214 14 16 14 14
13 1615 13 16
24 26 23 26 26
38 39 44 42 42 44 43 45 45 43
17 16 16 20 20 18 17 16 15 17
'16 '15 '14 '13 '12 '16 '15 '14 '13 '12
Mostly in bonds, money market funds, cash and other stable investmentsRelatively equal mix of stocks and investments such as bonds, money market funds, and cashMostly in stocks, with little or no money in investments such as bonds, money market funds, and other stable investmentsNot sure
BASE: INVESTING FOR RETIREMENTQ770. How is your retirement savings invested?
Men and women most frequently say that their retirement savings are invested in a relatively equal mix of
stocks and investments such as bonds, money market funds and cash; however, the response rate is higher
among men (44 percent) than women (38 percent). A concerning 32 percent of women say that they are “not
sure” how their savings are invested. Asset allocation-related trends have been directionally consistent in
recent years.
Asset Allocation of Retirement Investments
177
N=1639 N=1719 N=1557 N=1341 N=1355 N=1480 N=1679 N=1573 N=1390 N=1415
Women Men
How Retirement Savings Are Invested (%)
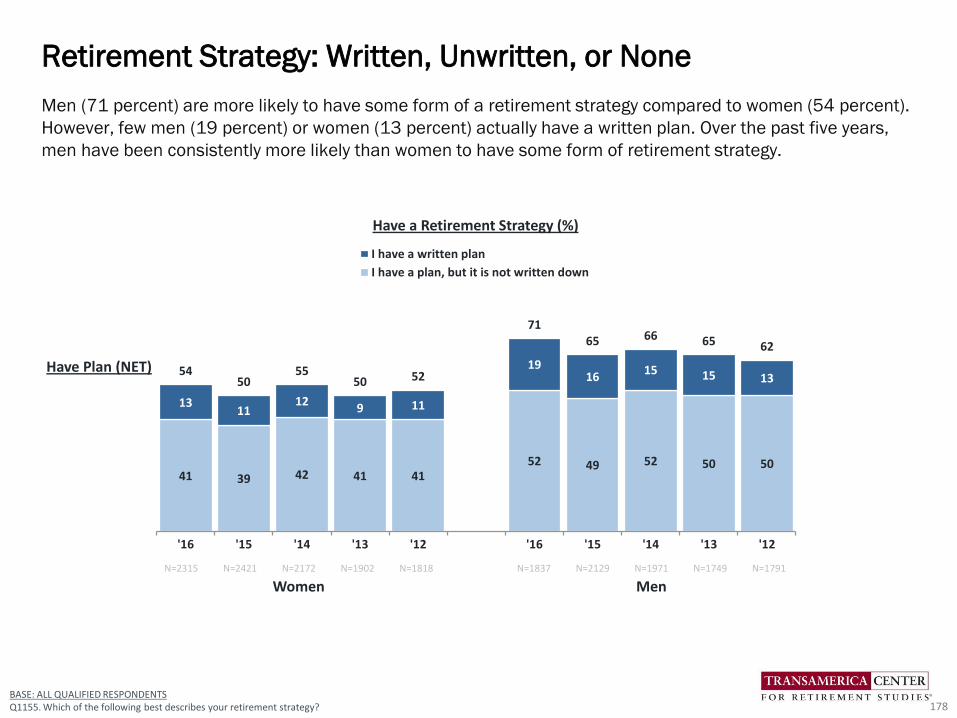
Have a Retirement Strategy (%)
41 39 42 41 4152 49 52 50 50
1311
129 11
1916
15 15 1354
5055
50 52
7165 66 65 62
'16 '15 '14 '13 '12 '16 '15 '14 '13 '12
I have a written plan
I have a plan, but it is not written down
BASE: ALL QUALIFIED RESPONDENTSQ1155. Which of the following best describes your retirement strategy?
Men (71 percent) are more likely to have some form of a retirement strategy compared to women (54 percent).
However, few men (19 percent) or women (13 percent) actually have a written plan. Over the past five years,
men have been consistently more likely than women to have some form of retirement strategy.
Retirement Strategy: Written, Unwritten, or None
178
N=2315 N=2421 N=2172 N=1902 N=1818 N=1837 N=2129 N=1971 N=1749 N=1791
Women Men
Have Plan (NET)
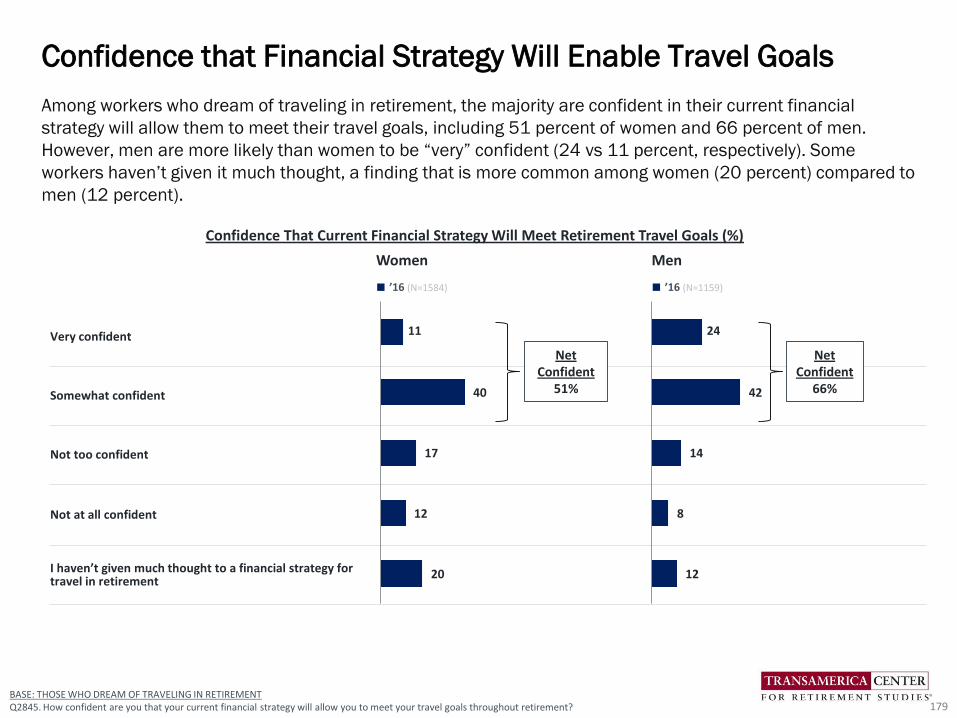
Among workers who dream of traveling in retirement, the majority are confident in their current financial
strategy will allow them to meet their travel goals, including 51 percent of women and 66 percent of men.
However, men are more likely than women to be “very” confident (24 vs 11 percent, respectively). Some
workers haven’t given it much thought, a finding that is more common among women (20 percent) compared to
men (12 percent).
Confidence that Financial Strategy Will Enable Travel Goals
179
Women Men
■ ’16 (N=1584) ■ ’16 (N=1159)
Very confident
Somewhat confident
Not too confident
Not at all confident
I haven’t given much thought to a financial strategy for travel in retirement
11
40
17
12
20
BASE: THOSE WHO DREAM OF TRAVELING IN RETIREMENTQ2845. How confident are you that your current financial strategy will allow you to meet your travel goals throughout retirement?
24
42
14
8
12
Net Confident
66%
Net Confident
51%
Confidence That Current Financial Strategy Will Meet Retirement Travel Goals (%)
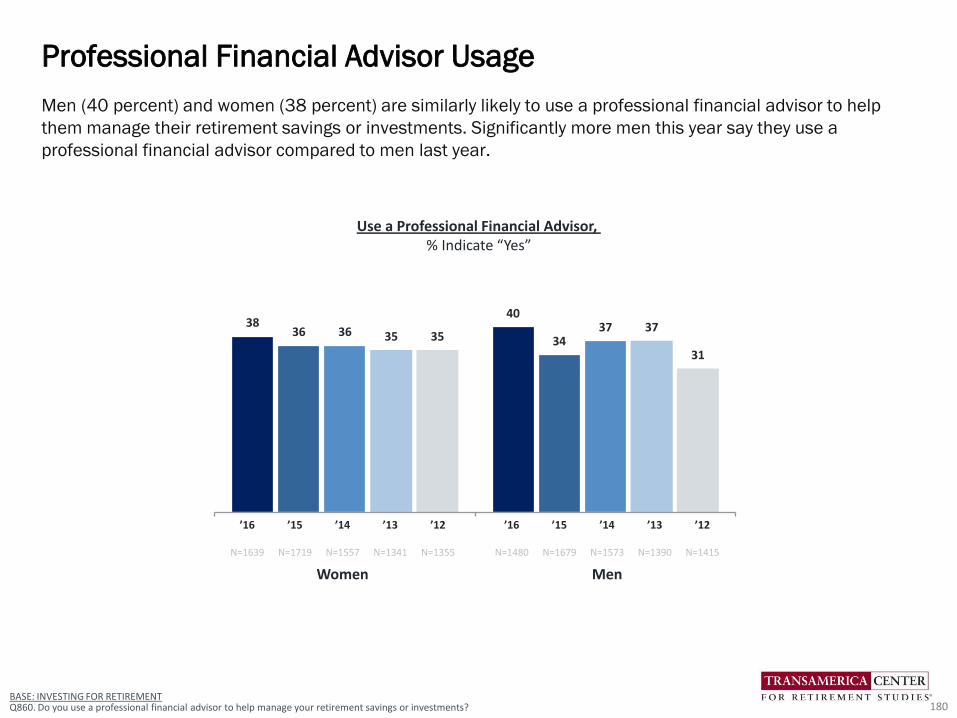
BASE: INVESTING FOR RETIREMENTQ860. Do you use a professional financial advisor to help manage your retirement savings or investments?
3840
3634
36 3735
3735
31
Men (40 percent) and women (38 percent) are similarly likely to use a professional financial advisor to help
them manage their retirement savings or investments. Significantly more men this year say they use a
professional financial advisor compared to men last year.
Professional Financial Advisor Usage
180
’16 ’15 ’14 ’13 ’12 ’16 ’15 ’14 ’13 ’12
N=1639 N=1719 N=1557 N=1341 N=1355 N=1480 N=1679 N=1573 N=1390 N=1415
Women Men
Use a Professional Financial Advisor, % Indicate “Yes”
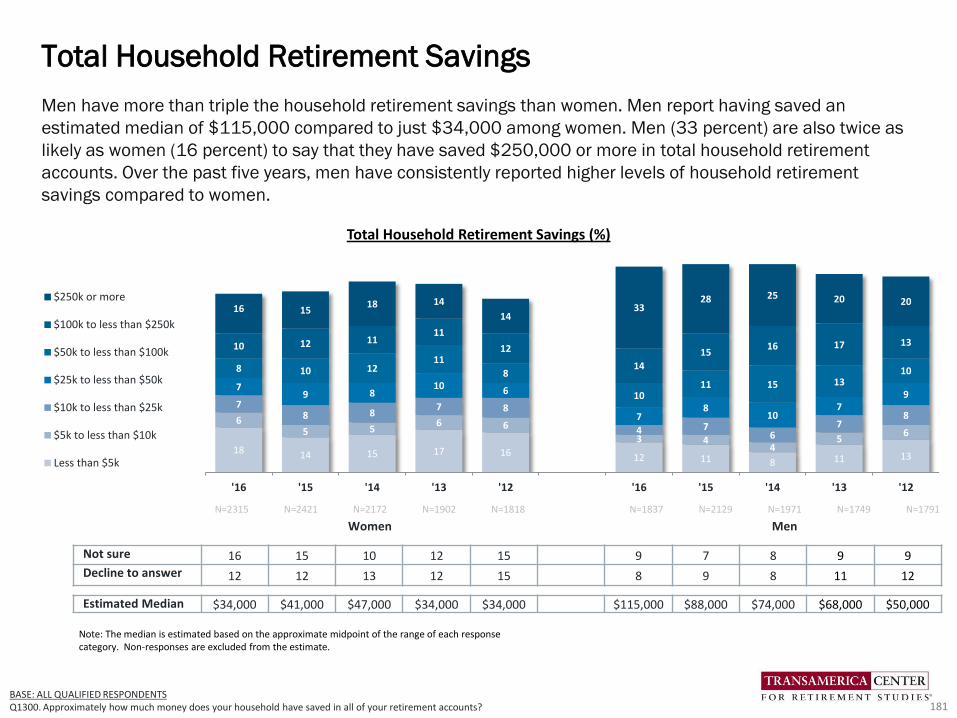
18 14 15 17 16 12 11 8 11 13
65 5
6 6
3 44
56
78 8
7 8
4 76
78
79 8
10 6
78
107
9
8 10 1211
8
1011 15 13
10
10 12 1111
12
14
1516 17 13
16 1518 14
1433
28 25 20 20
'16 '15 '14 '13 '12 '16 '15 '14 '13 '12
$250k or more
$100k to less than $250k
$50k to less than $100k
$25k to less than $50k
$10k to less than $25k
$5k to less than $10k
Less than $5k
Men have more than triple the household retirement savings than women. Men report having saved an
estimated median of $115,000 compared to just $34,000 among women. Men (33 percent) are also twice as
likely as women (16 percent) to say that they have saved $250,000 or more in total household retirement
accounts. Over the past five years, men have consistently reported higher levels of household retirement
savings compared to women.
Total Household Retirement Savings
181BASE: ALL QUALIFIED RESPONDENTSQ1300. Approximately how much money does your household have saved in all of your retirement accounts?
Not sure 16 15 10 12 15 9 7 8 9 9
Decline to answer 12 12 13 12 15 8 9 8 11 12
Estimated Median $34,000 $41,000 $47,000 $34,000 $34,000 $115,000 $88,000 $74,000 $68,000 $50,000
Note: The median is estimated based on the approximate midpoint of the range of each response category. Non-responses are excluded from the estimate.
Total Household Retirement Savings (%)
N=2315 N=2421 N=2172 N=1902 N=1818 N=1837 N=2129 N=1971 N=1749 N=1791
Women Men
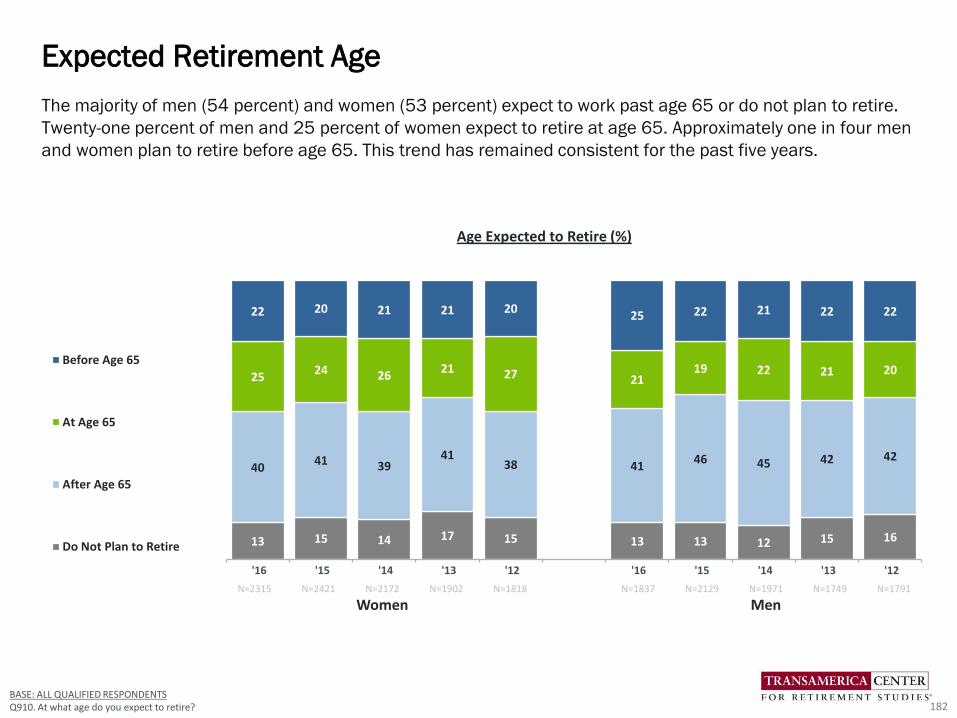
BASE: ALL QUALIFIED RESPONDENTSQ910. At what age do you expect to retire?
The majority of men (54 percent) and women (53 percent) expect to work past age 65 or do not plan to retire.
Twenty-one percent of men and 25 percent of women expect to retire at age 65. Approximately one in four men
and women plan to retire before age 65. This trend has remained consistent for the past five years.
Expected Retirement Age
182
13 15 14 17 15 13 13 12 15 16
4041 39
4138 41
46 45 42 42
2524 26
21 27 2119 22 21 20
22 20 21 21 2025 22 21 22 22
'16 '15 '14 '13 '12 '16 '15 '14 '13 '12
Before Age 65
At Age 65
After Age 65
Do Not Plan to Retire
N=2315 N=2421 N=2172 N=1902 N=1818 N=1837 N=2129 N=1971 N=1749 N=1791
Women Men
Age Expected to Retire (%)

39 40 3845 46
37 39 42 44 42
11 11 117 8
15 13 13 12 13
25 23 2717 18
29 27 27 21 20
25 27 2431 28
19 21 1823 25
50Yes (NET)
About half of both working men and women (52 and 50 percent, respectively) plan to continue working after
they retire, at least on a part-time basis. Over the past five years, men have become less likely to plan to work in
retirement, while women’s plans have remained relatively consistent.
Expectations of Working in Retirement
183BASE: ALL QUALIFIED RESPONDENTSQ1525. Do you plan to work after you retire?
Working After Retirement (%)
Yes, I plan to work full-timeYes, I plan to work part-timeNo, I do not plan to workNot sure
’16 ’15 ’14 ’13 ’12 ’16 ’15 ’14 ’13 ’12
N=2315 N=2421 N=2172 N=1902 N=1818 N=1837 N=2129 N=1971 N=1749 N=1791
Women Men
51 49 52 54 52 52 5556 55
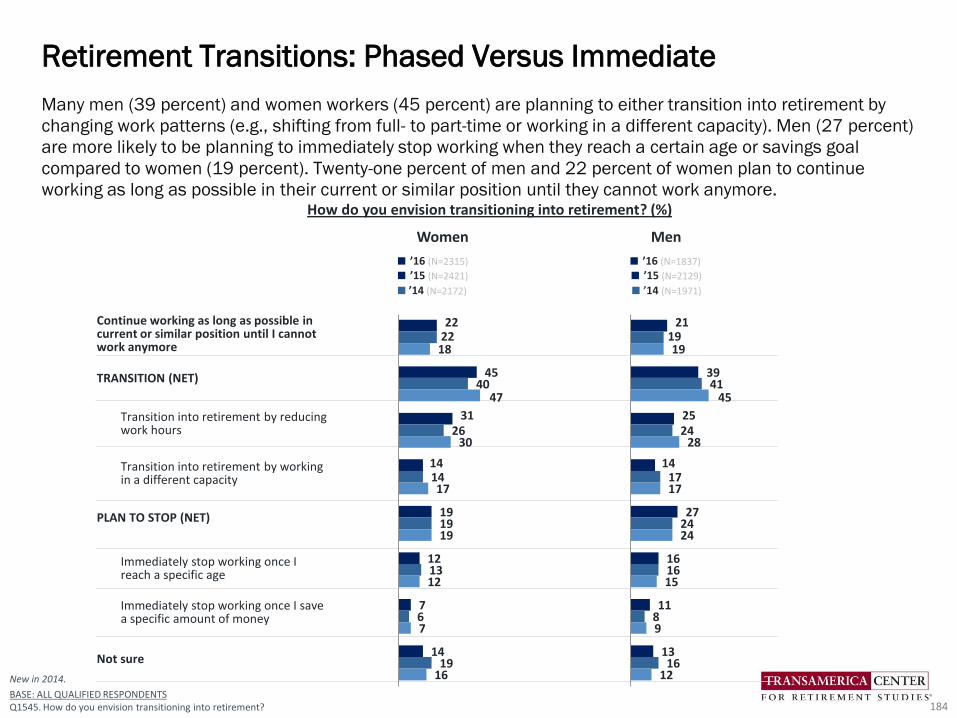
Many men (39 percent) and women workers (45 percent) are planning to either transition into retirement by
changing work patterns (e.g., shifting from full- to part-time or working in a different capacity). Men (27 percent)
are more likely to be planning to immediately stop working when they reach a certain age or savings goal
compared to women (19 percent). Twenty-one percent of men and 22 percent of women plan to continue
working as long as possible in their current or similar position until they cannot work anymore.
Retirement Transitions: Phased Versus Immediate
184
Women Men
■ ’16 (N=2315)
■ ’15 (N=2421)
■ ’14 (N=2172)
■ ’16 (N=1837)
■ ’15 (N=2129)
■ ’14 (N=1971)
Continue working as long as possible in current or similar position until I cannot work anymore
TRANSITION (NET)
Transition into retirement by reducing work hours
Transition into retirement by working in a different capacity
PLAN TO STOP (NET)
Immediately stop working once I reach a specific age
Immediately stop working once I save a specific amount of money
Not sure
New in 2014.
BASE: ALL QUALIFIED RESPONDENTSQ1545. How do you envision transitioning into retirement?
22
45
31
14
19
12
7
14
22
40
26
14
19
13
6
19
18
47
30
17
19
12
7
16
21
39
25
14
27
16
11
13
19
41
24
17
24
16
8
16
19
45
28
17
24
15
9
12
How do you envision transitioning into retirement? (%)
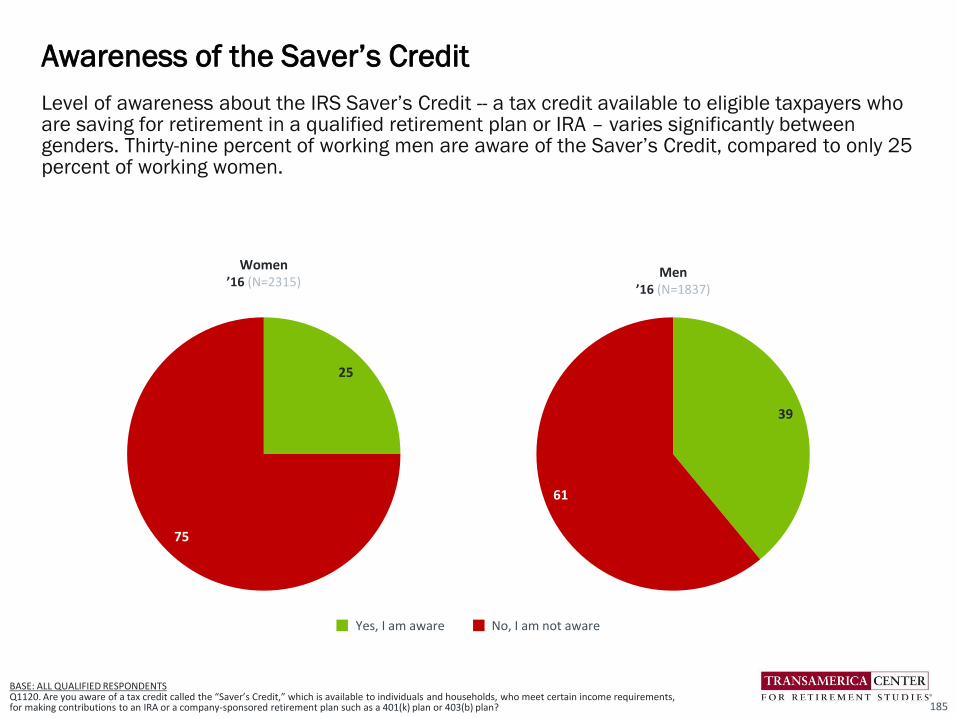
Level of awareness about the IRS Saver’s Credit -- a tax credit available to eligible taxpayers who are saving for retirement in a qualified retirement plan or IRA – varies significantly between genders. Thirty-nine percent of working men are aware of the Saver’s Credit, compared to only 25 percent of working women.
Awareness of the Saver’s Credit
185
BASE: ALL QUALIFIED RESPONDENTS Q1120. Are you aware of a tax credit called the “Saver’s Credit,” which is available to individuals and households, who meet certain income requirements, for making contributions to an IRA or a company-sponsored retirement plan such as a 401(k) plan or 403(b) plan?
39
61
Yes, I am aware No, I am not aware
25
75
Women’16 (N=2315)
Men’16 (N=1837)
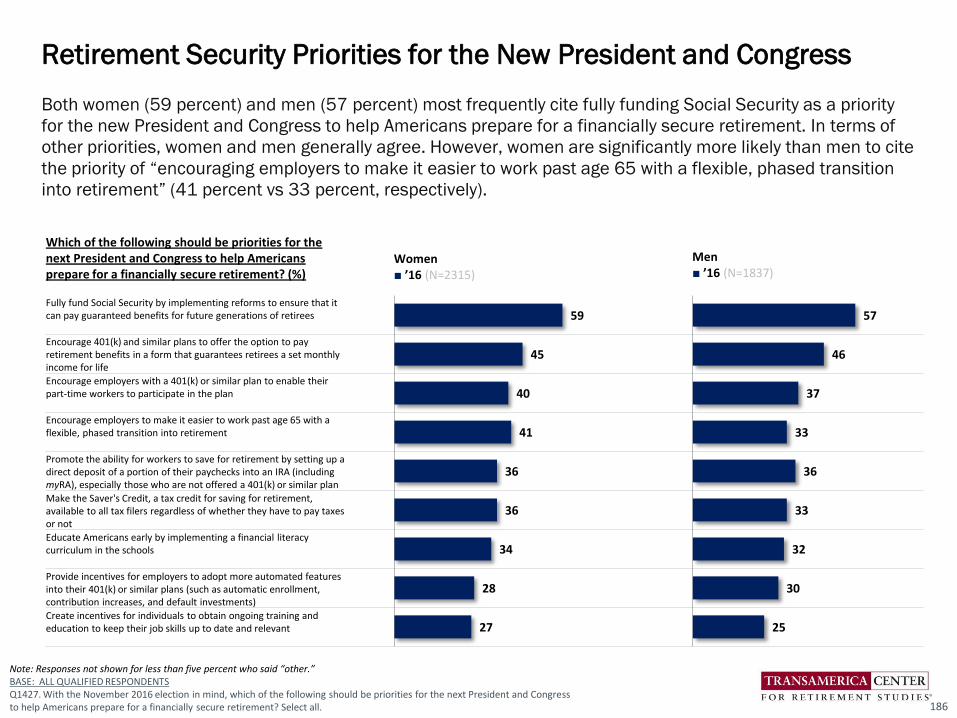
Both women (59 percent) and men (57 percent) most frequently cite fully funding Social Security as a priority
for the new President and Congress to help Americans prepare for a financially secure retirement. In terms of
other priorities, women and men generally agree. However, women are significantly more likely than men to cite
the priority of “encouraging employers to make it easier to work past age 65 with a flexible, phased transition
into retirement” (41 percent vs 33 percent, respectively).
Retirement Security Priorities for the New President and Congress
186
Note: Responses not shown for less than five percent who said “other.”BASE: ALL QUALIFIED RESPONDENTSQ1427. With the November 2016 election in mind, which of the following should be priorities for the next President and Congress to help Americans prepare for a financially secure retirement? Select all.
Which of the following should be priorities for the next President and Congress to help Americans prepare for a financially secure retirement? (%)
Women■ ’16 (N=2315)
Men■ ’16 (N=1837)
Fully fund Social Security by implementing reforms to ensure that it can pay guaranteed benefits for future generations of retirees
Encourage 401(k) and similar plans to offer the option to pay retirement benefits in a form that guarantees retirees a set monthly income for life
Encourage employers with a 401(k) or similar plan to enable their part-time workers to participate in the plan
Encourage employers to make it easier to work past age 65 with a flexible, phased transition into retirement
Promote the ability for workers to save for retirement by setting up a direct deposit of a portion of their paychecks into an IRA (including myRA), especially those who are not offered a 401(k) or similar plan
Make the Saver's Credit, a tax credit for saving for retirement, available to all tax filers regardless of whether they have to pay taxes or not
Educate Americans early by implementing a financial literacy curriculum in the schools
Provide incentives for employers to adopt more automated features into their 401(k) or similar plans (such as automatic enrollment, contribution increases, and default investments)
Create incentives for individuals to obtain ongoing training and education to keep their job skills up to date and relevant
59
45
40
41
36
36
34
28
27
57
46
37
33
36
33
32
30
25
Influences of Household Income on
Retirement Readiness
Detailed Findings
Retirement readiness increases with higher levels of workers’ household income (HHI). Lower income workers
have less access to benefits and they are more likely to depend on Social Security as their primary source of
income during retirement. Higher income workers also face long-term retirement risks including potentially
inadequate savings. Workers across levels of HHI share concerns that their generation will have a more difficult
time achieving financial security compared to their parent’s generation.
Thirty Indicators of Retirement Readiness
• Recovery From the Great Recession. Financial recovery from the Great Recession improves with higher
levels of household income (HHI). In 2016, workers with HHI of $100k+ are more likely to say they have
fully recovered (29 percent), compared to workers with HHI of $50k to $99k (18 percent) and those with
HHI of less than $50k (12 percent). Twenty-eight percent of workers with HHI of less than $50k have “not
yet begun to recover” or feel they may “never recover,” compared to 21 percent of workers with HHI of
$50k to $99 and 14 percent of those with HHI of $100k+.
• Confidence in Retiring Comfortably. Retirement confidence varies dramatically by workers’ household
income (HHI). Seventy-five percent of workers with HHI of $100k+ are confident that they will be able to
fully retire with a comfortable lifestyle, compared to 62 percent of workers with HHI of $50k to 99k and
just 47 percent of workers with HHI of less than $50k. Relatively few workers of all income levels are
“very” confident.
• Building a Large Enough Nest Egg? Workers’ level of agreement that they are building a large enough
retirement nest egg rises with higher levels of household income (HHI). Sixty-five percent of workers with
HHI of $100k+ either “somewhat” or “strongly” agree that they are building a large enough retirement nest
egg, compared to 52 percent of workers with HHI of $50k to $99k and just 36 percent of workers with a
HHI of less than $50k. Relatively few workers of all income levels “strongly” agree.
Influences of Household Income on Retirement Readiness
188
• Retirement Dreams Include Leisure and Work. Traveling is a most frequently cited retirement dream
among workers across levels of household income, including workers with HHI less than $50k (54
percent), workers with HHI $50k to $99k (65 percent), and workers with HHI of $100k or more (73
percent). Most workers dream of spending more time with family and friends (54 percent of HHI less than
$50k, 57 percent of HHI $50k to $99k, and 60 percent of HHI of $100k or more). Interestingly, many
workers also dream of some form of continued work in retirement.
• Age Planning to Live to. Workers across levels of household income (HHI) share similar expectations
regarding the age they are planning to live to. Workers with HHI of $100k+ are planning to live to an older
age of 88 (median) — and 13 percent of them are planning to become centenarians. Workers with HHI of
less than $50k are planning to live to age 87 (compared to age 85 for those with HHI of $50k to $99k),
with one in five of them (21 percent) planning to live to age 100+ (compared to 15 percent of those with
HHI of $50k to $99k).
• Retirement Beliefs. Across levels of household income (HHI), four out of five workers agree that their
generation will have a much harder time achieving financial security compared to their parent’s generation.
Workers with HHI of less than $50k (80 percent) and those with HHI of $50k to $99k (78 percent) are
more likely to be concerned that Social Security will not be there for them when they are ready to retire,
compared to workers with HHI of $100k+. With regards to their retirement-related preparations, workers
with HHI of less than $50k tend to lag behind workers with higher-HHI.
• Current Financial Priorities. Workers’ financial priorities differ by level of household income (HHI). Workers
with HHI of $100k+ (71 percent) and those with $50k to $99k (57 percent) most frequently cite “saving
for retirement” as a financial priority right now, compared to workers with HHI of less than $50k (41
percent). In contrast, workers with HHI of less than $50k are most likely to say their financial priority is
“just getting by – covering basic living expenses.”
• Greatest Financial Priority Right Now. Workers with HHIs of less than $50k (40 percent) most frequently
cite “just getting by” as their top financial priority, while those with HHIs of $50k to $99k (25 percent) cite
“paying off debt,” and those with HHIs of $100k or more (42 percent) cite “saving for retirement.”
Influences of Household Income on Retirement Readiness
189

• Expected Sources of Retirement Income. Across levels of household income (HHI), the majority of workers
expect retirement income from self-funded savings including retirement accounts (e.g., 401(k)s, 403(b)s,
IRAs) and other savings and investments: 89 percent of workers with HHI of $100k+, 80 percent of those
with HHI of $50k to $99k, and 64 percent of those with HHI of less than $50k. Nearly half of workers with
HHI of less than $50k (47 percent) expect income from working, compared to those with HHI of $50k to
$99k (39 percent) and those with HHI of $100k+ (30 percent).
• Expected Primary Source of Income in Retirement. Workers with higher household incomes are more likely
to expect to rely on retirement accounts — such as 401(k), 401(b), or IRA — as their expected primary
source of income in retirement, including 44 percent of workers with HHI of $100k+ and 38 percent of
those with HHI of $50k to $99k. Workers with HHI of less than $50k are likely to cite Social Security (33
percent) or working (24 percent) as their expected primary source of retirement income.
• Percentage Saving for Retirement/ Age They Started to Save. Most workers are saving for retirement
through an employer-sponsored retirement plan and/or outside of work; however, retirement savings rates
vary dramatically by household income (HHI). Eighty-nine percent of workers with HHI of $100k+ are saving
for retirement, compared to 79 percent of workers with HHI of $50k to $99k and 60 percent of those with
HHI of less than $50k. Workers across levels of HHI started saving for retirement in their mid- to late-
twenties.
• Importance of Retirement Benefits Compared to Other Benefits. More than 80 percent of workers across
all levels of household income value a 401(k), 401(b), 457(b) or similar plan as an important employee
benefit. Workers with higher household incomes are more likely to believe such benefits are important.
• Retirement Benefits Currently Offered. Most workers are offered a 401(k) or other self-funded plan by their
employers; however, access to a plan increases with higher levels of household income (HHI). Only 58
percent of workers with HHI of less than $50k are offered retirement benefits, compared to 70 percent of
those earning $50k to $99k and 81 percent earning $100k+.
Influences of Household Income on Retirement Readiness
190
• Retirement Plan Participation. Among workers who are offered a 401(k) or similar plan, the participation
rate increases with higher levels of household income (HHI). Sixty-four percent of workers with HHI of less
than $50k participate in their employer’s plan, compared to 81 percent with HHI of $50k to $99k and 82
percent earning $100k+.
• Retirement Plan Contribution Rate. Among workers who participate in a 401(k) or similar plan, those with
higher household incomes (HHI) contribute more. Workers with HHI of $100+ contribute 10 percent
(median) of their annual pay, while those with HHI of less than $100k contribute 6 percent (median).
• Approach to Investing in Retirement Plan. “Professionally managed” accounts refers to a managed
account service, strategic allocation funds, and/or target date funds. The majority of plan participants,
across levels of household income (HHI), use some form of professionally managed offering in their 401(k)
or similar plans: 55 percent of workers with HHI of less than $50k, 61 percent of those with HHI of $50k to
$99k, and 62 percent of those with HHI of $100k+. Workers with HHI of $100k+ (45 percent) are more
likely to set their own asset allocation percentage among the available funds compared to those with HHI
of less than $50k (35 percent) and those with HHI of $50k to $99k (38 percent).
• Retirement Plan Leakage: Loans and Withdrawals. “Leakage” from retirement plans in the form of loans
and withdrawals can severely inhibit the growth of participants’ long-term retirement savings. Among
participants who are currently participating in a plan, one in four workers across levels of household
income (HHI) have taken some form of loan, early withdrawal, and/or hardship withdrawal from a 401(k) or
similar plan — 24 percent of workers with HHI of less than $50k, 29 percent of those with HHI of $50k to
$99k, and 27 percent of those with HHI of $100k+.
• Estimated Emergency Savings. Workers across levels of household income (HHI) lack emergency savings
that could help cover the cost of a major financial setback (e.g., unemployment, medical bills, home
repairs, auto repairs, other). Workers with HHIs of less than $50k have saved just $1,000 (median) and 37
percent have saved less than $1,000. Workers with HHIs of $50k to $99k have saved $5,000 (median)
and 20 percent have saved less than $1,000. Workers with HHIs of $100k or more have saved $20,000
(median) and 10 percent have saved less than $1,000 for such emergencies.
Influences of Household Income on Retirement Readiness
191
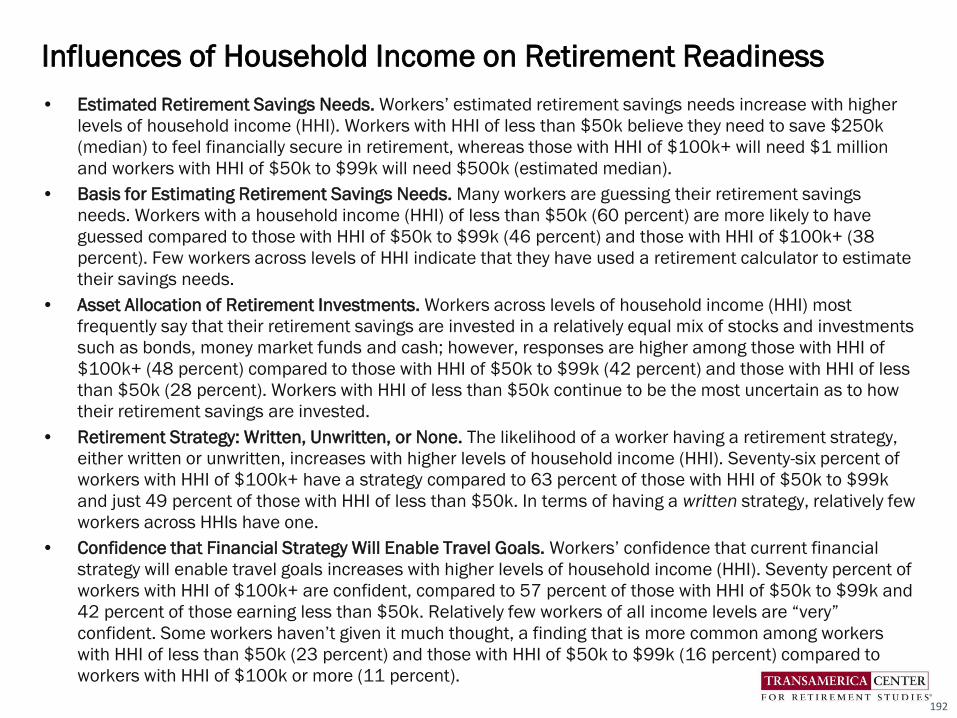
• Estimated Retirement Savings Needs. Workers’ estimated retirement savings needs increase with higher
levels of household income (HHI). Workers with HHI of less than $50k believe they need to save $250k
(median) to feel financially secure in retirement, whereas those with HHI of $100k+ will need $1 million
and workers with HHI of $50k to $99k will need $500k (estimated median).
• Basis for Estimating Retirement Savings Needs. Many workers are guessing their retirement savings
needs. Workers with a household income (HHI) of less than $50k (60 percent) are more likely to have
guessed compared to those with HHI of $50k to $99k (46 percent) and those with HHI of $100k+ (38
percent). Few workers across levels of HHI indicate that they have used a retirement calculator to estimate
their savings needs.
• Asset Allocation of Retirement Investments. Workers across levels of household income (HHI) most
frequently say that their retirement savings are invested in a relatively equal mix of stocks and investments
such as bonds, money market funds and cash; however, responses are higher among those with HHI of
$100k+ (48 percent) compared to those with HHI of $50k to $99k (42 percent) and those with HHI of less
than $50k (28 percent). Workers with HHI of less than $50k continue to be the most uncertain as to how
their retirement savings are invested.
• Retirement Strategy: Written, Unwritten, or None. The likelihood of a worker having a retirement strategy,
either written or unwritten, increases with higher levels of household income (HHI). Seventy-six percent of
workers with HHI of $100k+ have a strategy compared to 63 percent of those with HHI of $50k to $99k
and just 49 percent of those with HHI of less than $50k. In terms of having a written strategy, relatively few
workers across HHIs have one.
• Confidence that Financial Strategy Will Enable Travel Goals. Workers’ confidence that current financial
strategy will enable travel goals increases with higher levels of household income (HHI). Seventy percent of
workers with HHI of $100k+ are confident, compared to 57 percent of those with HHI of $50k to $99k and
42 percent of those earning less than $50k. Relatively few workers of all income levels are “very”
confident. Some workers haven’t given it much thought, a finding that is more common among workers
with HHI of less than $50k (23 percent) and those with HHI of $50k to $99k (16 percent) compared to
workers with HHI of $100k or more (11 percent).
Influences of Household Income on Retirement Readiness
192

• Professional Financial Advisor Usage. Use of a professional financial advisor increases with higher levels of
household income (HHI). Forty five percent of workers with HHI of $100K+ are most likely to use an
advisor, compared to 37 percent of those with HHI of $50k to $99k and 30 percent of earning less than
$50k.
• Total Household Retirement Savings. Workers with a household income (HHI) of $100k+ have saved
$210,000 (estimated median), compared to $62,000 for those with HHI of $50k to $99k and $4,000 for
those with HHI of less than $50k (estimated medians). In other words, workers with HHI of $100k+ have
saved more than 52 times the amount of those with a HHI of less than $50k. A concerning 36 percent of
workers with HHI of less than $50k have saved less than $5,000 in household retirement savings.
• Expected Retirement Age. Regardless of their household income (HHI), most workers are expecting to work
past age 65 or do not plan to retire. Sixty-one percent of workers with HHI of less than $50k are most likely
to expect to do so, followed by 54 percent of workers with HHI of $50k to $99k and 49 percent of those
earning $100k+.
• Expectations of Working in Retirement. Approximately half of workers plan to continue working in
retirement, a finding which is surprisingly consistent across levels of household income (HHI), including
workers with HHI less than $50k (54 percent), $50k to $99k (53 percent), and $100k or more (48
percent). Most workers who are planning to work in retirement say that they will do so on a part-time basis.
• Retirement Transitions: Phased Versus Immediate. Across levels of household income (HHI), most workers
envision a phased transition into retirement by changing work patterns (e.g., shifting from full-time to part-
time or working in a different capacity): 43 percent of workers with HHI of $100k+, 43 percent of those
with HHI of $50k to $99k, and 41 percent of those earning less than $50k.
Influences of Household Income on Retirement Readiness
193
• Awareness of the Saver’s Credit. The IRS Saver’s Credit is a tax credit available to eligible taxpayers who
are saving for retirement in a qualified retirement plan or IRA; however, few workers who are potentially
eligible to claim the credit are aware of it. Only 26 percent of workers with HHI of less than $50k are aware
of the Saver’s Credit, compared to 35 percent of those with HHI of $50k to $99k and 38 percent of those
with HHI of $100k+.
• Retirement Security Priorities for the New President and Congress. Workers across levels of household
income (HHI) most frequently cite fully funding Social Security as a priority for the new President and
Congress to help Americans prepare for a financially secure retirement: 55 percent with HHI of less than
$50k, 56 percent of those with HHI of $50k to $99k, and 62 percent of those with $100k+. Other top
cited responses include “encouraging 401(k) plans to offer the option to pay retirement benefits in a form
that guarantees retirees a set monthly income for life,” and “encouraging employers with a 401(k) or
similar plan to enable their part-time workers to participate in the plan.”
Influences of Household Income on Retirement Readiness
194
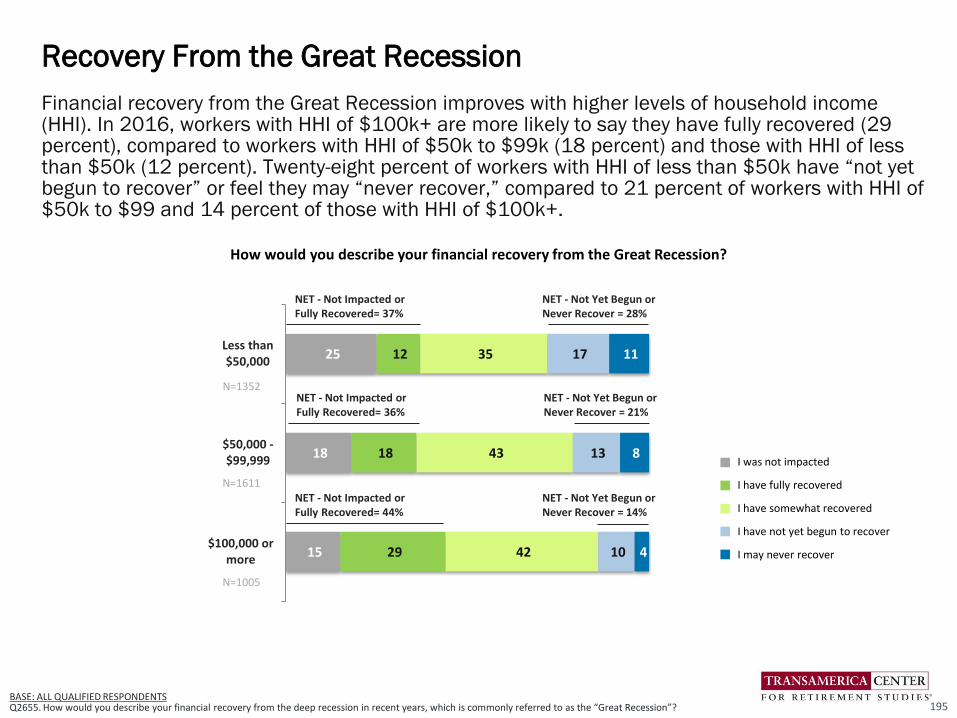
Financial recovery from the Great Recession improves with higher levels of household income (HHI). In 2016, workers with HHI of $100k+ are more likely to say they have fully recovered (29 percent), compared to workers with HHI of $50k to $99k (18 percent) and those with HHI of less than $50k (12 percent). Twenty-eight percent of workers with HHI of less than $50k have “not yet begun to recover” or feel they may “never recover,” compared to 21 percent of workers with HHI of $50k to $99 and 14 percent of those with HHI of $100k+.
Recovery From the Great Recession
195BASE: ALL QUALIFIED RESPONDENTS Q2655. How would you describe your financial recovery from the deep recession in recent years, which is commonly referred to as the “Great Recession”?
25
18
15
12
18
29
35
43
42
17
13
10
11
8
4
Less than$50,000
$50,000 -$99,999
$100,000 ormore
I was not impacted
I have fully recovered
I have somewhat recovered
I have not yet begun to recover
I may never recover
NET - Not Impacted or Fully Recovered= 37%
How would you describe your financial recovery from the Great Recession?
NET - Not Yet Begun or Never Recover = 28%
N=1352
N=1005
N=1611
NET - Not Impacted or Fully Recovered= 36%
NET - Not Yet Begun or Never Recover = 21%
NET - Not Impacted or Fully Recovered= 44%
NET - Not Yet Begun or Never Recover = 14%

40 36 37 35 31
4843 47 45 44
52 56 5954 52
7 11 137
4
1413
158 7
2320
19
15 16
47 4750
42
36
6256
61
53 50
75 76 78
69 69
'16 '15 '14 '13 '12 '16 '15 '14 '13 '12 '16 '15 '14 '13 '12
Very confident Somewhat confident
BASE: ALL QUALIFIED RESPONDENTSQ880. How confident are you that you will be able to fully retire with a lifestyle you consider comfortable?
Retirement confidence varies dramatically by workers’ household income (HHI). Seventy-five percent of workers
with HHI of $100k+ are confident that they will be able to fully retire with a comfortable lifestyle, compared to
62 percent of workers with HHI of $50k to 99k and just 47 percent of workers with HHI of less than $50k.
Relatively few workers of all income levels are “very” confident. Over the past five years, workers with higher
HHI have reported consistently greater levels of retirement confidence.
Confidence in Retiring Comfortably
196
N=1352 N=1450 N=1427 N=1302 N=1144 N=1611 N=1786 N=1566 N=1324 N=1285 N=1005 N=1042 N=958 N=791 N=836
Less than $50,000 $50,000 - $99,999 $100,000 or more
Confidence in Retiring Comfortably
Very/Somewhat Confident (%) (NET)
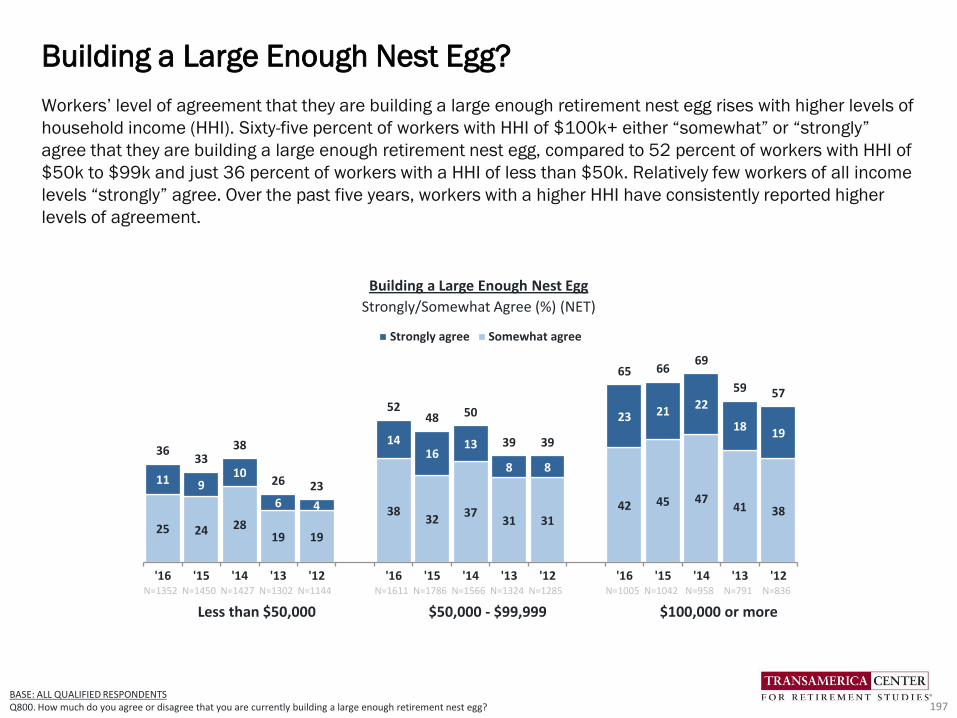
25 24 2819 19
3832
3731 31
42 45 4741 38
11 910
6 4
1416
13
8 8
23 2122
1819
3633
38
26 23
5248 50
39 39
65 6669
59 57
'16 '15 '14 '13 '12 '16 '15 '14 '13 '12 '16 '15 '14 '13 '12
Strongly agree Somewhat agree
BASE: ALL QUALIFIED RESPONDENTSQ800. How much do you agree or disagree that you are currently building a large enough retirement nest egg?
Workers’ level of agreement that they are building a large enough retirement nest egg rises with higher levels of
household income (HHI). Sixty-five percent of workers with HHI of $100k+ either “somewhat” or “strongly”
agree that they are building a large enough retirement nest egg, compared to 52 percent of workers with HHI of
$50k to $99k and just 36 percent of workers with a HHI of less than $50k. Relatively few workers of all income
levels “strongly” agree. Over the past five years, workers with a higher HHI have consistently reported higher
levels of agreement.
Building a Large Enough Nest Egg?
197
N=1352 N=1450 N=1427 N=1302 N=1144 N=1611 N=1786 N=1566 N=1324 N=1285 N=1005 N=1042 N=958 N=791 N=836
Less than $50,000 $50,000 - $99,999 $100,000 or more
Building a Large Enough Nest Egg
Strongly/Somewhat Agree (%) (NET)
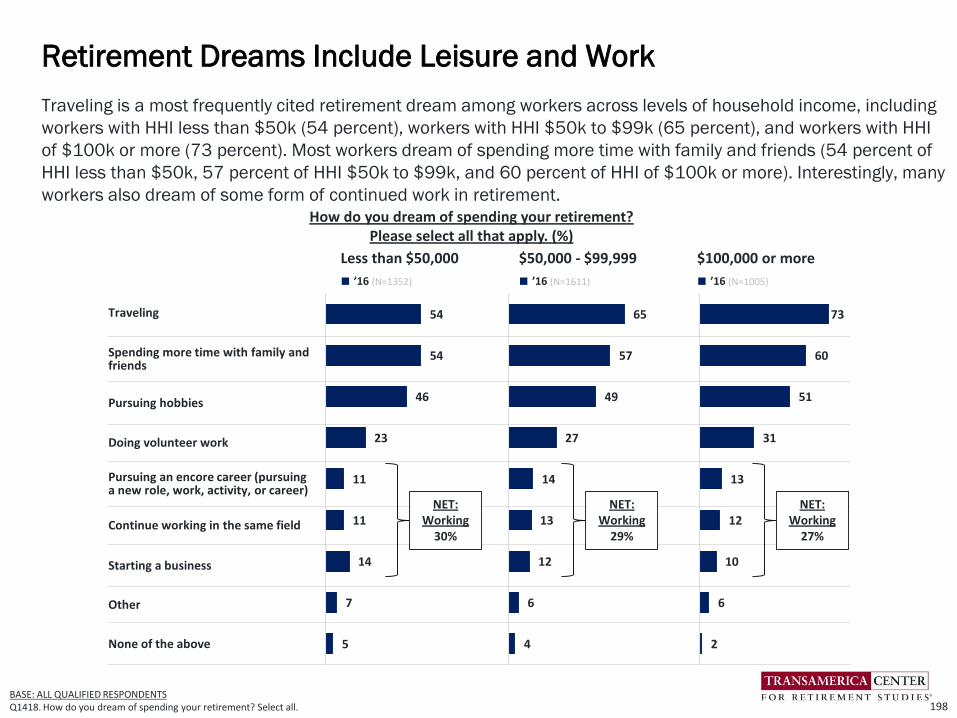
Traveling is a most frequently cited retirement dream among workers across levels of household income, including
workers with HHI less than $50k (54 percent), workers with HHI $50k to $99k (65 percent), and workers with HHI
of $100k or more (73 percent). Most workers dream of spending more time with family and friends (54 percent of
HHI less than $50k, 57 percent of HHI $50k to $99k, and 60 percent of HHI of $100k or more). Interestingly, many
workers also dream of some form of continued work in retirement.
Retirement Dreams Include Leisure and Work
198BASE: ALL QUALIFIED RESPONDENTS Q1418. How do you dream of spending your retirement? Select all.
How do you dream of spending your retirement? Please select all that apply. (%)
Less than $50,000 $50,000 - $99,999 $100,000 or more
■ ’16 (N=1352) ■ ’16 (N=1611) ■ ’16 (N=1005)
Traveling
Spending more time with family and friends
Pursuing hobbies
Doing volunteer work
Pursuing an encore career (pursuing a new role, work, activity, or career)
Continue working in the same field
Starting a business
Other
None of the above
54
54
46
23
11
11
14
7
5
NET: Working
30%
65
57
49
27
14
13
12
6
4
NET: Working
29%
73
60
51
31
13
12
10
6
2
NET: Working
27%
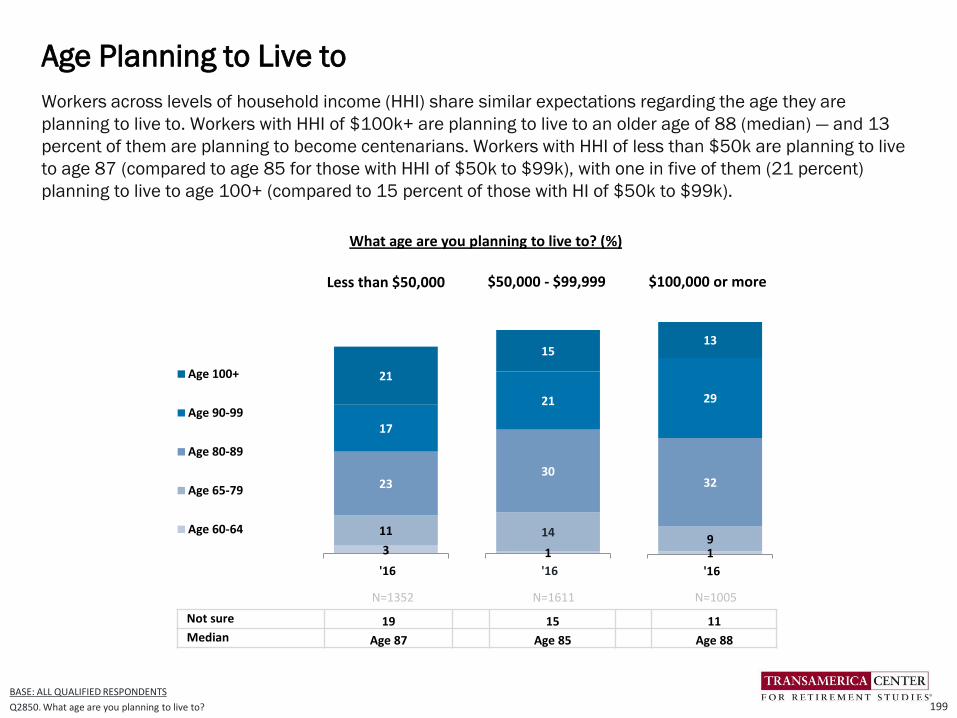
3
11
23
17
21
'16
Age 100+
Age 90-99
Age 80-89
Age 65-79
Age 60-64
19
32
29
13
'16
1
14
30
21
15
'16
Workers across levels of household income (HHI) share similar expectations regarding the age they are
planning to live to. Workers with HHI of $100k+ are planning to live to an older age of 88 (median) — and 13
percent of them are planning to become centenarians. Workers with HHI of less than $50k are planning to live
to age 87 (compared to age 85 for those with HHI of $50k to $99k), with one in five of them (21 percent)
planning to live to age 100+ (compared to 15 percent of those with HI of $50k to $99k).
Age Planning to Live to
199
BASE: ALL QUALIFIED RESPONDENTS
Q2850. What age are you planning to live to?
Not sure 19 15 11Median Age 87 Age 85 Age 88
Less than $50,000 $50,000 - $99,999 $100,000 or more
N=1352 N=1611 N=1005
What age are you planning to live to? (%)
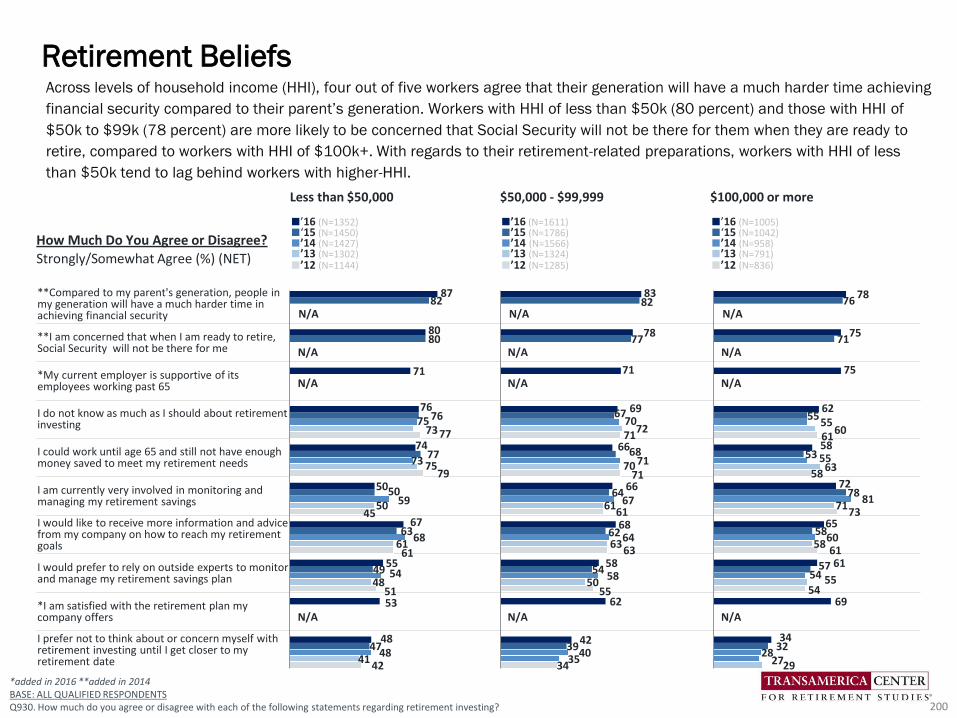
How Much Do You Agree or Disagree?
Strongly/Somewhat Agree (%) (NET)
Less than $50,000 $50,000 - $99,999 $100,000 or more
■’16 (N=1352) ■‘15 (N=1450) ■’14 (N=1427)■’13 (N=1302)■’12 (N=1144)
■’16 (N=1611) ■’15 (N=1786) ■’14 (N=1566)■’13 (N=1324)■’12 (N=1285)
■’16 (N=1005) ■‘15 (N=1042) ■’14 (N=958)■’13 (N=791)■’12 (N=836)
**Compared to my parent's generation, people in my generation will have a much harder time in achieving financial security
**I am concerned that when I am ready to retire, Social Security will not be there for me
*My current employer is supportive of its employees working past 65
I do not know as much as I should about retirement investing
I could work until age 65 and still not have enough money saved to meet my retirement needs
I am currently very involved in monitoring and managing my retirement savings
I would like to receive more information and advice from my company on how to reach my retirement goals
I would prefer to rely on outside experts to monitor and manage my retirement savings plan
*I am satisfied with the retirement plan my company offers
I prefer not to think about or concern myself with retirement investing until I get closer to my retirement date
*added in 2016 **added in 2014BASE: ALL QUALIFIED RESPONDENTSQ930. How much do you agree or disagree with each of the following statements regarding retirement investing?
Across levels of household income (HHI), four out of five workers agree that their generation will have a much harder time achieving
financial security compared to their parent’s generation. Workers with HHI of less than $50k (80 percent) and those with HHI of
$50k to $99k (78 percent) are more likely to be concerned that Social Security will not be there for them when they are ready to
retire, compared to workers with HHI of $100k+. With regards to their retirement-related preparations, workers with HHI of less
than $50k tend to lag behind workers with higher-HHI.
Retirement Beliefs
200
77
79
45
61
51
42
73
75
50
61
48
41
75
73
59
68
54
48
82
80
76
77
50
63
49
47
87
80
71
76
74
50
67
55
53
48
71
71
61
63
55
34
72
70
61
63
50
35
70
71
67
64
58
40
82
77
67
68
64
62
54
39
83
78
71
69
66
66
68
58
62
42
61
58
73
61
54
29
60
63
71
58
55
27
55
55
81
60
54
28
76
71
55
53
78
58
57
32
78
75
75
62
58
72
65
61
69
34
N/A
N/A N/A
N/A
N/A
N/A
N/A N/A N/A
N/A N/A N/A
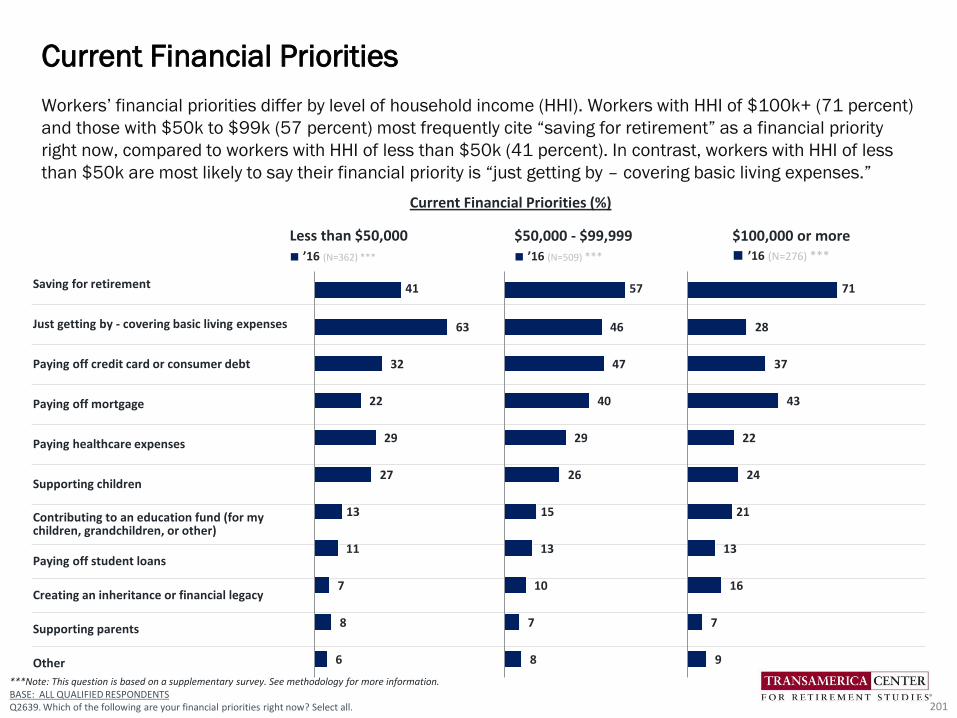
Workers’ financial priorities differ by level of household income (HHI). Workers with HHI of $100k+ (71 percent)
and those with $50k to $99k (57 percent) most frequently cite “saving for retirement” as a financial priority
right now, compared to workers with HHI of less than $50k (41 percent). In contrast, workers with HHI of less
than $50k are most likely to say their financial priority is “just getting by – covering basic living expenses.”
Current Financial Priorities
201
***Note: This question is based on a supplementary survey. See methodology for more information. BASE: ALL QUALIFIED RESPONDENTSQ2639. Which of the following are your financial priorities right now? Select all.
Less than $50,000 $50,000 - $99,999 $100,000 or more■ ’16 (N=362) *** ■ ’16 (N=509) *** ■ ’16 (N=276) ***
Saving for retirement
Just getting by - covering basic living expenses
Paying off credit card or consumer debt
Paying off mortgage
Paying healthcare expenses
Supporting children
Contributing to an education fund (for my children, grandchildren, or other)
Paying off student loans
Creating an inheritance or financial legacy
Supporting parents
Other
Current Financial Priorities (%)
41
63
32
22
29
27
13
11
7
8
6
57
46
47
40
29
26
15
13
10
7
8
71
28
37
43
22
24
21
13
16
7
9

*added in 2015 **shown as two separate answers in 2016***This question is based on a supplementary survey. See methodology for more information BASE: ALL QUALIFIED RESPONDENTS Q2640. Which one of the following is your greatest financial priority right now?
Workers with HHIs of less than $50k (40 percent) most frequently cite “just getting by” as their top financial priority, while those
with HHIs of $50k to $99k (25 percent) cite “paying off debt,” and those with HHIs of $100k or more (42 percent) cite “saving for
retirement.”
Greatest Financial Priority Right Now
202
14
40
10
7
13
4
1
3
4
4
16
36
17
8
7
4
5
1
6
12
40
27
6
7
3
4
10
49
20
5
6
4
5
9
49
24
5
7
1
5
18
21
25
11
8
5
3
1
6
2
24
22
23
13
5
3
4
2
4
24
23
26
11
7
4
5
22
25
28
13
5
3
5
19
24
29
13
8
4
3
42
9
13
9
10
3
2
2
5
5
41
6
19
16
5
2
4
1
6
42
6
20
16
6
3
7
35
5
26
17
10
3
4
40
9
24
13
9
2
4
N/A N/A N/A
N/A N/A N/A
N/A N/A N/A
N/A N/A N/A
Greatest Financial Priority Right Now (%)
Less than $50,000 $50,000 - $99,999 $100,000 or more■’16 (N=362)***■’15 (N=1450) ■’14 (N=1427) ■’13 (N=1302)■’12 (N=1144)
■’16 (N=509)*** ■’15 (N=1786)■’14 (N=1566) ■’13 (N=1324)■’12 (N=1285)
■’16 (N=276)***■’15 (N=1042) ■’14 (N=958) ■’13 (N=791)■’12 (N=836)
Saving for retirement
Just getting by – covering basic living expenses
Paying off debt
Paying off mortgage
**Supporting children and/or parents
Paying healthcare expenses
Contributing to an education fund (for my children, grandchildren, or other)
Creating an inheritance or financial legacy
*Paying off student loans
*Paying current tuition fees
Other
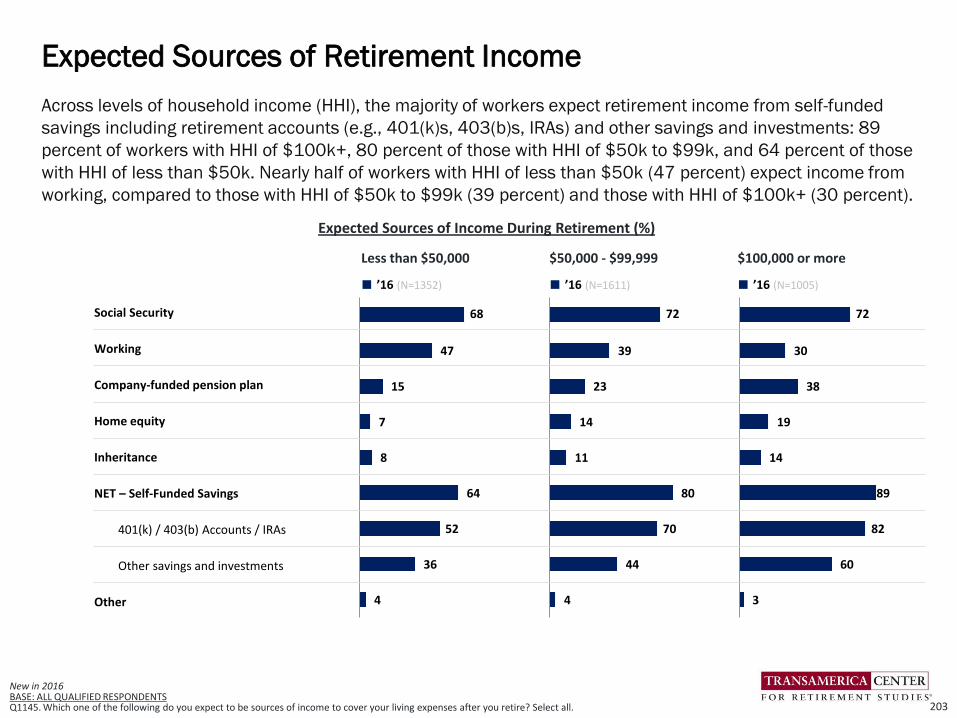
68
47
15
7
8
64
52
36
4
72
39
23
14
11
80
70
44
4
72
30
38
19
14
89
82
60
3
Less than $50,000 $50,000 - $99,999 $100,000 or more
■ ’16 (N=1352) ■ ’16 (N=1611) ■ ’16 (N=1005)
Social Security
Working
Company-funded pension plan
Home equity
Inheritance
NET – Self-Funded Savings
401(k) / 403(b) Accounts / IRAs
Other savings and investments
Other
New in 2016BASE: ALL QUALIFIED RESPONDENTS Q1145. Which one of the following do you expect to be sources of income to cover your living expenses after you retire? Select all.
Across levels of household income (HHI), the majority of workers expect retirement income from self-funded
savings including retirement accounts (e.g., 401(k)s, 403(b)s, IRAs) and other savings and investments: 89
percent of workers with HHI of $100k+, 80 percent of those with HHI of $50k to $99k, and 64 percent of those
with HHI of less than $50k. Nearly half of workers with HHI of less than $50k (47 percent) expect income from
working, compared to those with HHI of $50k to $99k (39 percent) and those with HHI of $100k+ (30 percent).
Expected Sources of Retirement Income
203
Expected Sources of Income During Retirement (%)
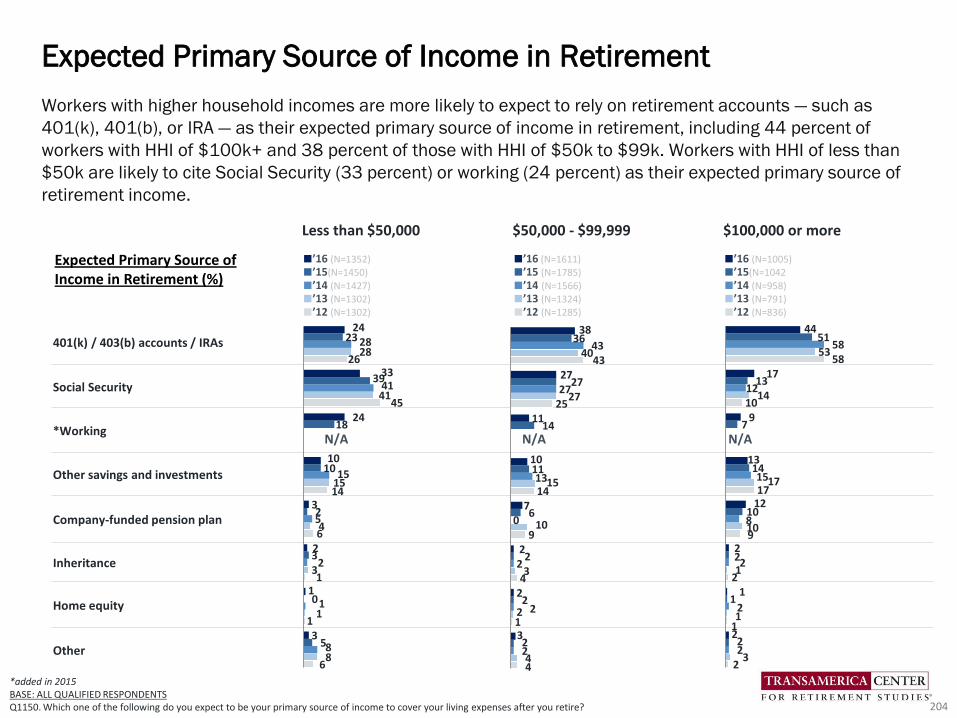
Less than $50,000 $50,000 - $99,999 $100,000 or more
■’16 (N=1352) ■’15(N=1450)■’14 (N=1427)■’13 (N=1302)■’12 (N=1302)
■’16 (N=1611) ■’15 (N=1785) ■’14 (N=1566)■’13 (N=1324)■’12 (N=1285)
■’16 (N=1005) ■’15(N=1042 ■’14 (N=958)■’13 (N=791)■’12 (N=836)
401(k) / 403(b) accounts / IRAs
Social Security
*Working
Other savings and investments
Company-funded pension plan
Inheritance
Home equity
Other
*added in 2015BASE: ALL QUALIFIED RESPONDENTS Q1150. Which one of the following do you expect to be your primary source of income to cover your living expenses after you retire?
Workers with higher household incomes are more likely to expect to rely on retirement accounts — such as
401(k), 401(b), or IRA — as their expected primary source of income in retirement, including 44 percent of
workers with HHI of $100k+ and 38 percent of those with HHI of $50k to $99k. Workers with HHI of less than
$50k are likely to cite Social Security (33 percent) or working (24 percent) as their expected primary source of
retirement income.
Expected Primary Source of Income in Retirement
204
26
45
14
6
1
1
6
28
41
15
4
3
1
8
28
41
15
5
2
1
8
23
39
18
10
2
3
0
5
24
33
24
10
3
2
1
3
43
25
14
9
4
1
4
40
27
15
10
3
2
4
43
27
13
0
2
2
2
36
27
14
11
6
2
2
2
38
27
11
10
7
2
2
3
58
10
17
9
2
1
2
53
14
17
10
1
1
3
58
12
15
8
2
2
2
51
13
7
14
10
2
1
2
44
17
9
13
12
2
1
2
N/A N/A N/A
Expected Primary Source of Income in Retirement (%)

BASE: THOSE CURRENTLY OFFERED QUALIFIED PLANQ1190. Do you currently participate in, or have money invested in your company’s employee-funded retirement savings plan?BASE: ALL QUALIFIED RESPONDENTSQ740. Are you currently saving for retirement outside of work, such as in an IRA, mutual funds, bank account, etc.?BASE: INVESTING FOR RETIREMENTQ790. At what age did you first start saving for retirement?
Most workers are saving for retirement through an employer-sponsored retirement plan and/or outside of work;
however, retirement savings rates vary dramatically by household income (HHI). Eighty-nine percent of workers
with HHI of $100k+ are saving for retirement, compared to 79 percent of workers with HHI of $50k to $99k
and 60 percent of those with HHI of less than $50k. Retirement savings rates have remained relatively
consistent over the past five years with the exception of workers with HHI of less than $50k who have shown an
incline. Workers across levels of HHI started saving for retirement in their mid- to late-twenties.
Percentage Saving for Retirement/ Age They Started to Save
205
Age Started Saving
(Median)27 28 28 28 30 27 28 28 29 27 25 28 27 25 26
Less than $50,000 $50,000 - $99,999 $100,000 or more
Workers Who Are Saving For Retirement Through an Employer-Sponsored Retirement Plan And/Or Outside of Work (%)
6056
60 60 60
79 80 80 82 8389 91 93 90
94
'16 '15 '14 ’13 ’12 '16 '15 '14 ’13 ’12 '16 '15 '14 ’13 ’12
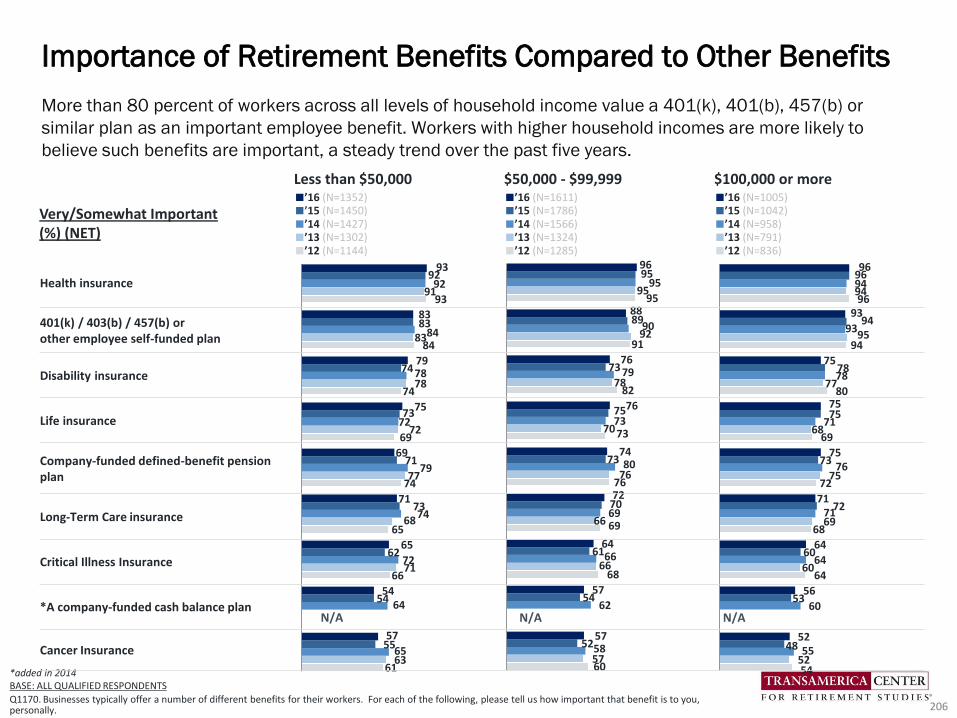
*added in 2014BASE: ALL QUALIFIED RESPONDENTS
Q1170. Businesses typically offer a number of different benefits for their workers. For each of the following, please tell us how important that benefit is to you, personally.
N/A N/A N/A
More than 80 percent of workers across all levels of household income value a 401(k), 401(b), 457(b) or
similar plan as an important employee benefit. Workers with higher household incomes are more likely to
believe such benefits are important, a steady trend over the past five years.
Importance of Retirement Benefits Compared to Other Benefits
206
Very/Somewhat Important(%) (NET)
93
84
74
69
74
65
66
61
91
83
78
72
77
68
71
63
92
84
78
72
79
74
72
64
65
92
83
74
73
71
73
62
54
55
93
83
79
75
69
71
65
54
57
95
91
82
73
76
69
68
60
95
92
78
70
76
66
66
57
95
90
79
73
80
69
66
62
58
95
89
73
75
73
70
61
54
52
96
88
76
76
74
72
64
57
57
96
94
80
69
72
68
64
54
94
95
77
68
75
69
60
52
94
93
78
71
76
71
64
60
55
96
94
78
75
73
72
60
53
48
96
93
75
75
75
71
64
56
52
Less than $50,000 $50,000 - $99,999 $100,000 or more■’16 (N=1352)■’15 (N=1450)■’14 (N=1427)■’13 (N=1302)■’12 (N=1144)
■’16 (N=1611)■’15 (N=1786)■’14 (N=1566) ■’13 (N=1324)■’12 (N=1285)
■’16 (N=1005)■’15 (N=1042) ■’14 (N=958)■’13 (N=791)■’12 (N=836)
Health insurance
401(k) / 403(b) / 457(b) or other employee self-funded plan
Disability insurance
Life insurance
Company-funded defined-benefit pension plan
Long-Term Care insurance
Critical Illness Insurance
*A company-funded cash balance plan
Cancer Insurance

*added in 2014BASE: ALL QUALIFIED RESPONDENTSQ1180. Which of the following retirement benefits does your company currently offer to you, personally? Select all.
Most workers are offered a 401(k) or other self-funded plan by their employers; however, access to a plan
increases with higher levels of household income (HHI). Only 58 percent of workers with HHI of less than $50k
are offered retirement benefits, compared to 70 percent of those earning $50k to $99k and 81 percent
earning $100k+. Retirement benefit offerings have decreased slightly across levels of HHI over the past five
years.
Retirement Benefits Currently Offered
207
62
59
4
11
34
55
51
6
11
40
55
54
2
18
14
7
37
53
51
3
17
13
5
40
58
56
4
15
13
4
37
71
74
4
20
18
71
68
5
17
26
69
67
4
26
22
9
22
67
65
5
25
21
7
25
70
68
5
27
24
8
21
88
85
10
27
10
77
75
4
25
18
80
78
4
28
21
12
15
78
76
4
30
25
11
17
81
80
4
35
31
13
12
N/A N/A
N/A N/A N/A
N/A
Less than $50,000 $50,000 - $99,999 $100,000 or more■ ’16 (N=1352) ■ ’15 (N=1450) ■ ’14 (N=1427)■ ’13 (N=1302)
■ ’12 (N=1144)
■ ’16 (N=1611) ■ ’15 (N=1786) ■ ’14 (N=1566)■ ’13 (N=1324)
■ ’12 (N=1285)
■ ’16 (N=1005) ■ ’15 (N=1042)
■ ’14 (N=958)■ ’13 (N=791)■ ’12 (N=836)
NET – AN EMPLOYEE-FUNDED PLAN
Employee-funded 401(k) plan
Other employee self-funded plan(e.g., SEP, SIMPLE, Other)
NET – COMPANY-FUNDED PLAN
Company-funded defined benefit pension plan
*A company-fundedcash balance plan
None of the above
Employer-Sponsored Retirement Benefits Currently Offered (%)
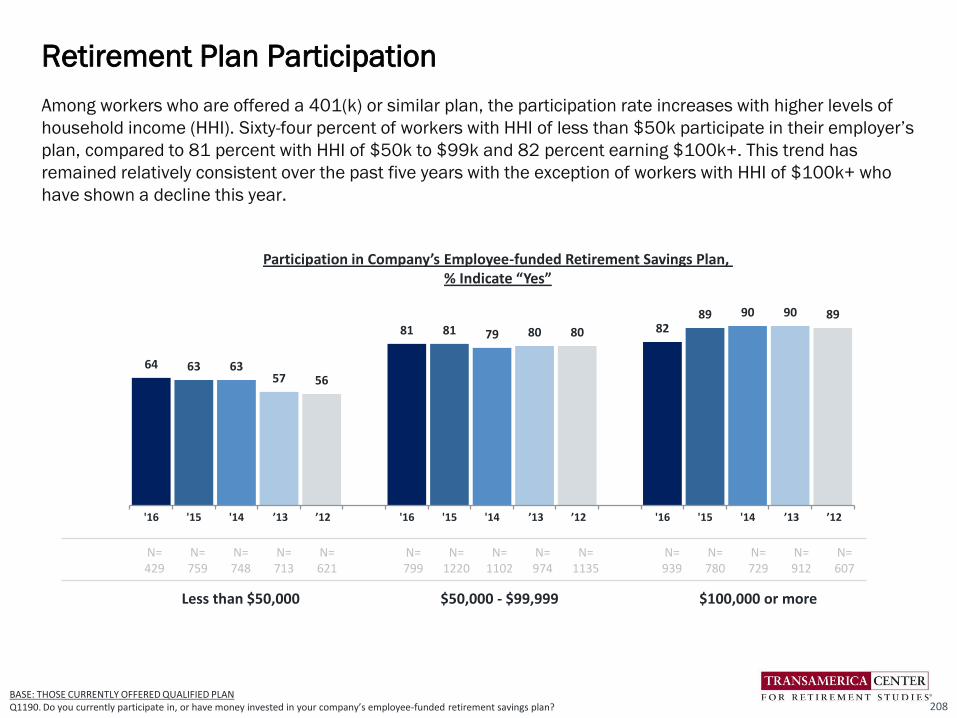
Among workers who are offered a 401(k) or similar plan, the participation rate increases with higher levels of
household income (HHI). Sixty-four percent of workers with HHI of less than $50k participate in their employer’s
plan, compared to 81 percent with HHI of $50k to $99k and 82 percent earning $100k+. This trend has
remained relatively consistent over the past five years with the exception of workers with HHI of $100k+ who
have shown a decline this year.
Retirement Plan Participation
208BASE: THOSE CURRENTLY OFFERED QUALIFIED PLANQ1190. Do you currently participate in, or have money invested in your company’s employee-funded retirement savings plan?
Participation in Company’s Employee-funded Retirement Savings Plan, % Indicate “Yes”
64 63 6357 56
81 81 79 80 80 8289 90 90 89
'16 '15 '14 ’13 ’12 '16 '15 '14 ’13 ’12 '16 '15 '14 ’13 ’12
N=429
N=759
N=748
N=713
N=621
N=799
N=1220
N=1102
N=974
N=1135
N=939
N=780
N=729
N=912
N=607
Less than $50,000 $50,000 - $99,999 $100,000 or more
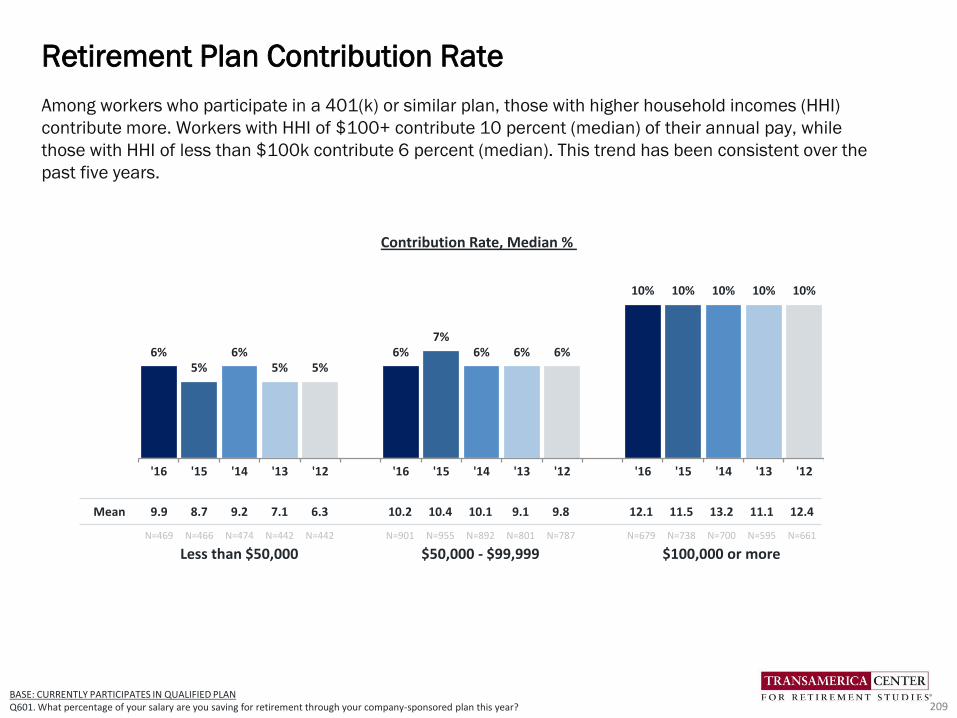
6%5%
6%5% 5%
6%7%
6% 6% 6%
10% 10% 10% 10% 10%
'16 '15 '14 '13 '12 '16 '15 '14 '13 '12 '16 '15 '14 '13 '12
BASE: CURRENTLY PARTICIPATES IN QUALIFIED PLAN Q601. What percentage of your salary are you saving for retirement through your company-sponsored plan this year?
Among workers who participate in a 401(k) or similar plan, those with higher household incomes (HHI)
contribute more. Workers with HHI of $100+ contribute 10 percent (median) of their annual pay, while
those with HHI of less than $100k contribute 6 percent (median). This trend has been consistent over the
past five years.
Retirement Plan Contribution Rate
209
Mean 9.9 8.7 9.2 7.1 6.3 10.2 10.4 10.1 9.1 9.8 12.1 11.5 13.2 11.1 12.4
N=469 N=466 N=474 N=442 N=442 N=901 N=955 N=892 N=801 N=787 N=679 N=738 N=700 N=595 N=661
Less than $50,000 $50,000 - $99,999 $100,000 or more
Contribution Rate, Median %
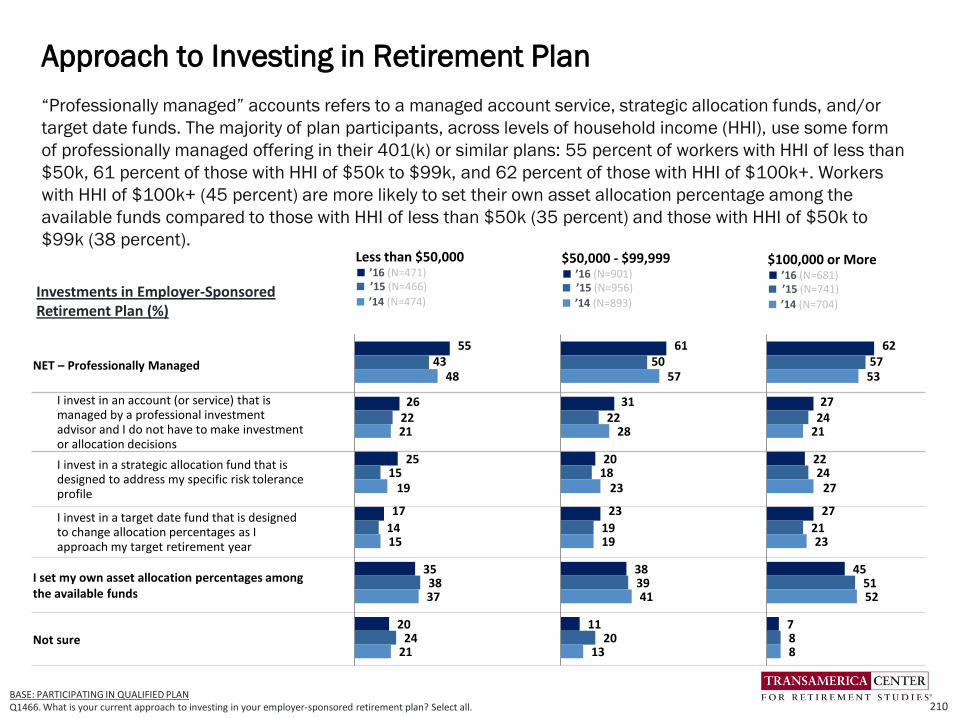
“Professionally managed” accounts refers to a managed account service, strategic allocation funds, and/or
target date funds. The majority of plan participants, across levels of household income (HHI), use some form
of professionally managed offering in their 401(k) or similar plans: 55 percent of workers with HHI of less than
$50k, 61 percent of those with HHI of $50k to $99k, and 62 percent of those with HHI of $100k+. Workers
with HHI of $100k+ (45 percent) are more likely to set their own asset allocation percentage among the
available funds compared to those with HHI of less than $50k (35 percent) and those with HHI of $50k to
$99k (38 percent).
Approach to Investing in Retirement Plan
210BASE: PARTICIPATING IN QUALIFIED PLANQ1466. What is your current approach to investing in your employer-sponsored retirement plan? Select all.
Less than $50,000■ ’16 (N=471)■ ’15 (N=466)
■ ’14 (N=474)
$50,000 - $99,999■ ’16 (N=901)■ ’15 (N=956)
■ ’14 (N=893)
$100,000 or More■ ’16 (N=681)■ ’15 (N=741)
■ ’14 (N=704)
NET – Professionally Managed
I invest in an account (or service) that is managed by a professional investment advisor and I do not have to make investment or allocation decisions
I invest in a strategic allocation fund that is designed to address my specific risk tolerance profile
I invest in a target date fund that is designed to change allocation percentages as I approach my target retirement year
I set my own asset allocation percentages among the available funds
Not sure
Investments in Employer-Sponsored Retirement Plan (%)
55
26
25
17
35
20
43
22
15
14
38
24
48
21
19
15
37
21
61
31
20
23
38
11
50
22
18
19
39
20
57
28
23
19
41
13
62
27
22
27
45
7
57
24
24
21
51
8
53
21
27
23
52
8

“Leakage” from retirement plans in the form of loans and withdrawals can severely inhibit the growth of
participants’ long-term retirement savings. Among participants who are currently participating in a plan, one
in four workers across levels of household income (HHI) have taken some form of loan, early withdrawal,
and/or hardship withdrawal from a 401(k) or similar plan — 24 percent of workers with HHI of less than
$50k, 29 percent of those with HHI of $50k to $99k, and 27 percent of those with HHI of $100k+.
Retirement Plan Leakage: Loans and Withdrawals
211BASE: THOSE CURRENTLY PARTICIPATES IN QUALIFIED PLANQ754. Have you ever taken any form of loan or early withdrawal from a qualified retirement account such as a 401(k) or similar plan or IRA? Select all.
Less than $50,000■ ’16 (N=758)
$50,000 - $99,999■ ’16 (N=1128)
$100,000 or more■ ’16 (N=805)
NET - Have Taken a Loan, Early Withdrawal, and/or Hardship Withdrawal From 401(k) or Similar Plan or IRA
Yes, I have taken a loan from a 401(k) or similar plan and am paying it back
Yes, I have taken an early withdrawal and cashed out a portion or all of a 401(k) or similar plan balance after my separation of employment from a prior employer and incurred taxes and penalties
Yes, I have taken a loan from a 401(k) or similar plan but was unable to pay it back so it became an early withdrawal and incurred taxes and penalties
Yes, I have taken a hardship withdrawal and incurred taxes and penalties
Yes, I have taken an early withdrawal and cashed out a portion or all of an IRA and incurred taxes and penalties
No, I have never taken a loan or early withdrawal from a 401(k) or similar plan or IRA
Not sure
24
11
8
4
5
3
72
4
29
17
6
6
5
4
69
3
27
19
7
6
6
3
72
1
Have you ever taken any form of loan or early withdrawal from a qualified retirement account such as a 401(k) or similar plan or IRA? (%)
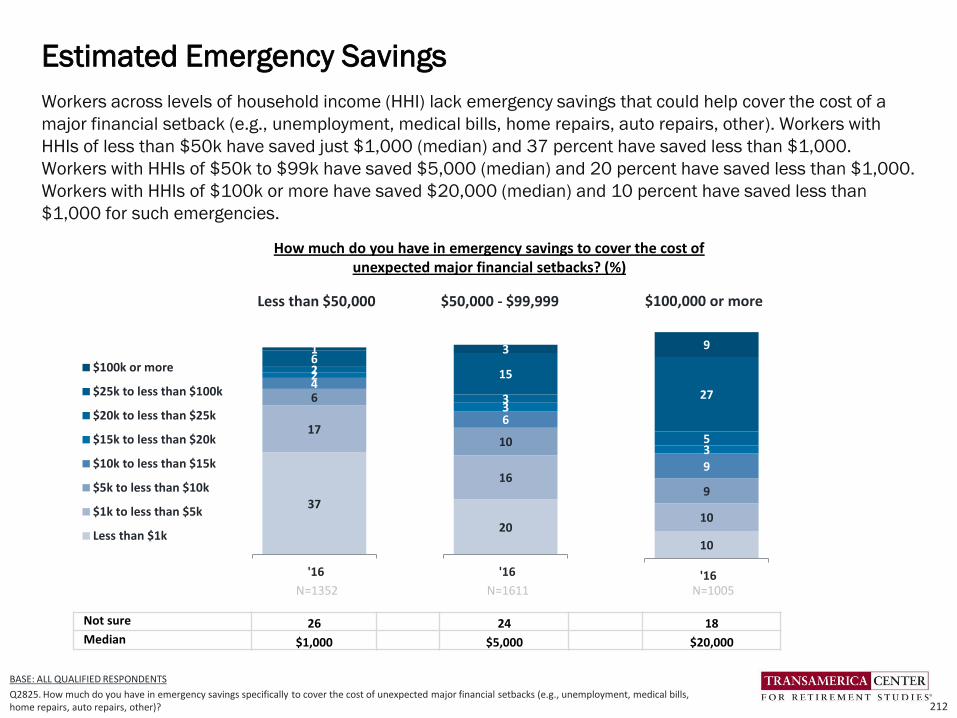
Workers across levels of household income (HHI) lack emergency savings that could help cover the cost of a
major financial setback (e.g., unemployment, medical bills, home repairs, auto repairs, other). Workers with
HHIs of less than $50k have saved just $1,000 (median) and 37 percent have saved less than $1,000.
Workers with HHIs of $50k to $99k have saved $5,000 (median) and 20 percent have saved less than $1,000.
Workers with HHIs of $100k or more have saved $20,000 (median) and 10 percent have saved less than
$1,000 for such emergencies.
Estimated Emergency Savings
212
BASE: ALL QUALIFIED RESPONDENTS
Q2825. How much do you have in emergency savings specifically to cover the cost of unexpected major financial setbacks (e.g., unemployment, medical bills, home repairs, auto repairs, other)?
Not sure 26 24 18Median $1,000 $5,000 $20,000
37
17
642261
'16
$100k or more
$25k to less than $100k
$20k to less than $25k
$15k to less than $20k
$10k to less than $15k
$5k to less than $10k
$1k to less than $5k
Less than $1k20
16
10
633
15
3
'16
10
10
9
9
35
27
9
'16
Less than $50,000 $50,000 - $99,999 $100,000 or more
N=1611N=1352 N=1005
How much do you have in emergency savings to cover the cost of unexpected major financial setbacks? (%)
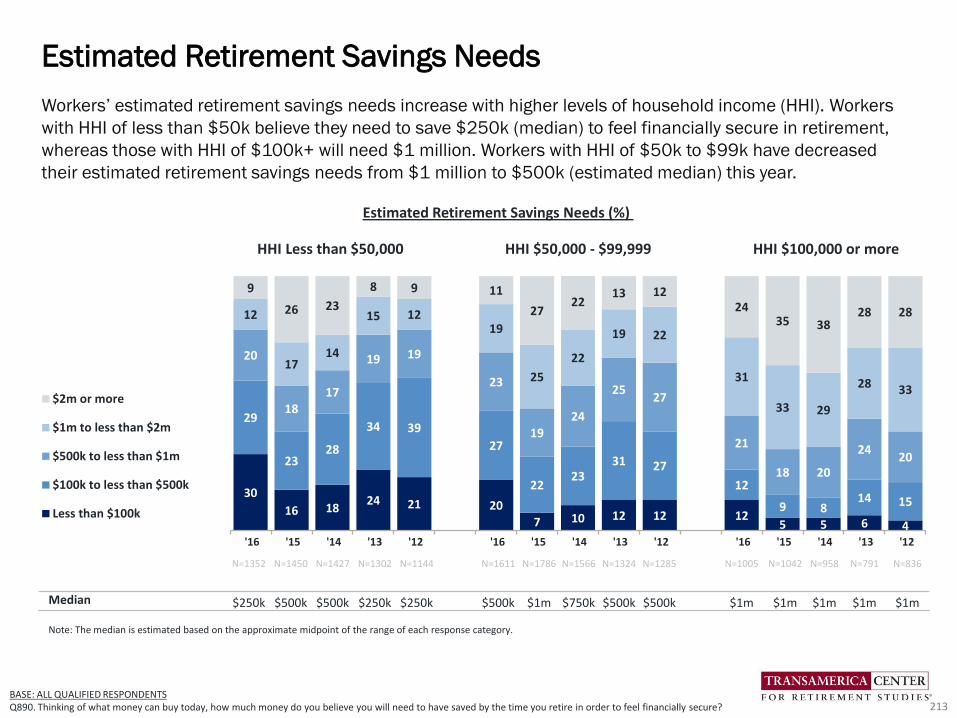
213
30
16 1824 21 20
7 10 12 12 125 5 6 4
29
2328
34 39
27
2223
31 27
12
9 814 15
20
1817
19 19
23
1924
2527
21
18 20
2420
12
1714
15 1219
25
22
19 22
31
33 29
28 33
9
26 23
8 9 11
2722
13 1224
35 3828 28
'16 '15 '14 '13 '12 '16 '15 '14 '13 '12 '16 '15 '14 '13 '12
$2m or more
$1m to less than $2m
$500k to less than $1m
$100k to less than $500k
Less than $100k
N=1352 N=1450 N=1427 N=1302 N=1144 N=1611 N=1786 N=1566 N=1324 N=1285 N=1005 N=1042 N=958 N=791 N=836
Median $250k $500k $500k $250k $250k $500k $1m $750k $500k $500k $1m $1m $1m $1m $1m
Note: The median is estimated based on the approximate midpoint of the range of each response category.
BASE: ALL QUALIFIED RESPONDENTSQ890. Thinking of what money can buy today, how much money do you believe you will need to have saved by the time you retire in order to feel financially secure?
HHI Less than $50,000 HHI $50,000 - $99,999 HHI $100,000 or more
Workers’ estimated retirement savings needs increase with higher levels of household income (HHI). Workers
with HHI of less than $50k believe they need to save $250k (median) to feel financially secure in retirement,
whereas those with HHI of $100k+ will need $1 million. Workers with HHI of $50k to $99k have decreased
their estimated retirement savings needs from $1 million to $500k (estimated median) this year.
Estimated Retirement Savings Needs
Estimated Retirement Savings Needs (%)
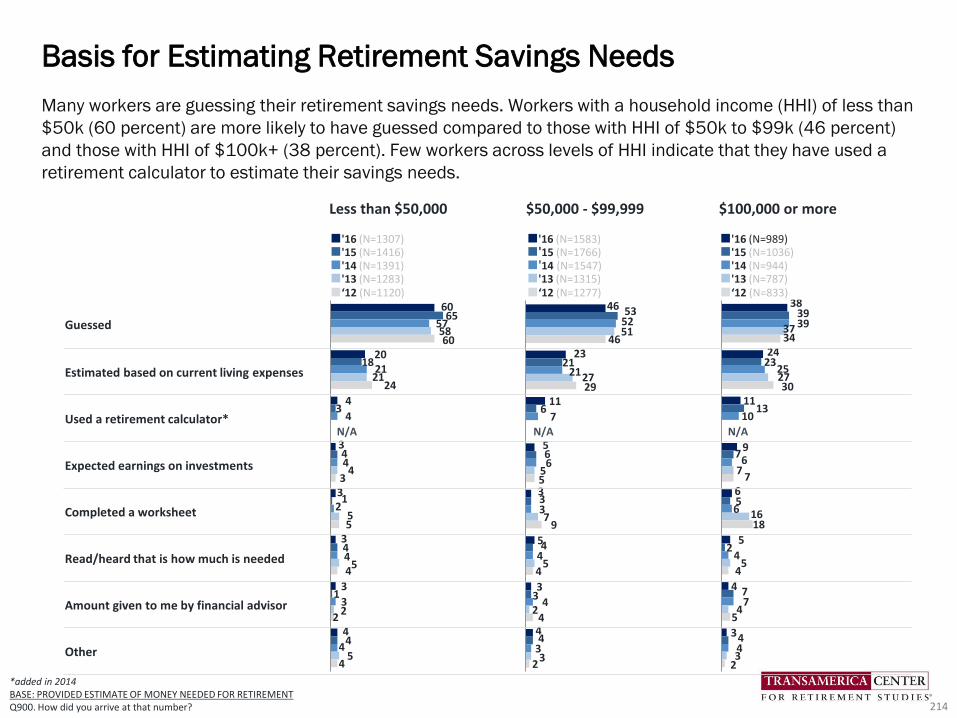
46
23
11
5
3
5
3
4
53
21
6
6
3
4
3
4
52
21
7
6
3
4
4
3
51
27
5
7
5
2
3
46
29
5
9
4
4
2
Many workers are guessing their retirement savings needs. Workers with a household income (HHI) of less than
$50k (60 percent) are more likely to have guessed compared to those with HHI of $50k to $99k (46 percent)
and those with HHI of $100k+ (38 percent). Few workers across levels of HHI indicate that they have used a
retirement calculator to estimate their savings needs.
Basis for Estimating Retirement Savings Needs
214
*added in 2014BASE: PROVIDED ESTIMATE OF MONEY NEEDED FOR RETIREMENT Q900. How did you arrive at that number?
60
20
4
3
3
3
3
4
65
18
3
4
1
4
1
4
57
21
4
4
2
4
3
4
58
21
4
5
5
2
5
60
24
3
5
4
2
4
38
24
11
9
6
5
4
3
39
23
13
7
5
2
7
4
39
25
10
6
6
4
7
4
37
27
7
16
5
4
3
34
30
7
18
4
5
2
N/A N/A N/A
Less than $50,000 $50,000 - $99,999 $100,000 or more
■'16 (N=1307) ■'15 (N=1416) ■'14 (N=1391)■'13 (N=1283)■‘12 (N=1120)
■'16 (N=1583)■'15 (N=1766) ■'14 (N=1547)■'13 (N=1315)■‘12 (N=1277)
■'16 (N=989) ■'15 (N=1036)■'14 (N=944)■'13 (N=787)■‘12 (N=833)
Guessed
Estimated based on current living expenses
Used a retirement calculator*
Expected earnings on investments
Completed a worksheet
Read/heard that is how much is needed
Amount given to me by financial advisor
Other

38 3730 30 30
20 21 22 19 15 13 10 12 11 9
1714
17 1318
1821 17 21
21 22 26 24 24 25
2831
3335
3142
39 45 4345 48
51 50 50 51
17 18 21 22 22 20 19 16 17 20 17 13 14 15 15
'16 '15 '14 '13 '12 '16 '15 '14 '13 '12 '16 '15 '14 '13 '12
Mostly in bonds, moneymarket funds, cash and otherstable investments
Relatively equal mix of stocksand investments such asbonds, money market fundsand cash
Mostly stocks, with little or nomoney in investments such asbonds, money mkt funds, cash
Not sure
BASE: INVESTING FOR RETIREMENTQ770. How is your retirement savings invested?
Workers across levels of household income (HHI) most frequently say that their retirement savings are invested
in a relatively equal mix of stocks and investments such as bonds, money market funds and cash; however,
responses are higher among those with HHI of $100k+ (48 percent) compared to those with HHI of $50k to
$99k (42 percent) and those with HHI of less than $50k (28 percent). Workers with HHI of less than $50k
continue to be the most uncertain as to how their retirement savings are invested. Asset allocation-related
trends have consistent over the past five years.
Asset Allocation of Retirement Investments
215
N=796 N=829 N=824 N=733 N=668 N=1289 N=1406 N=1272 N=1091 N=1043 N=895 N=959 N=889 N=729 N=782
Less than $50,000 $50,000 - $99,999 $100,000 or more
How Retirement Savings Are Invested (%)
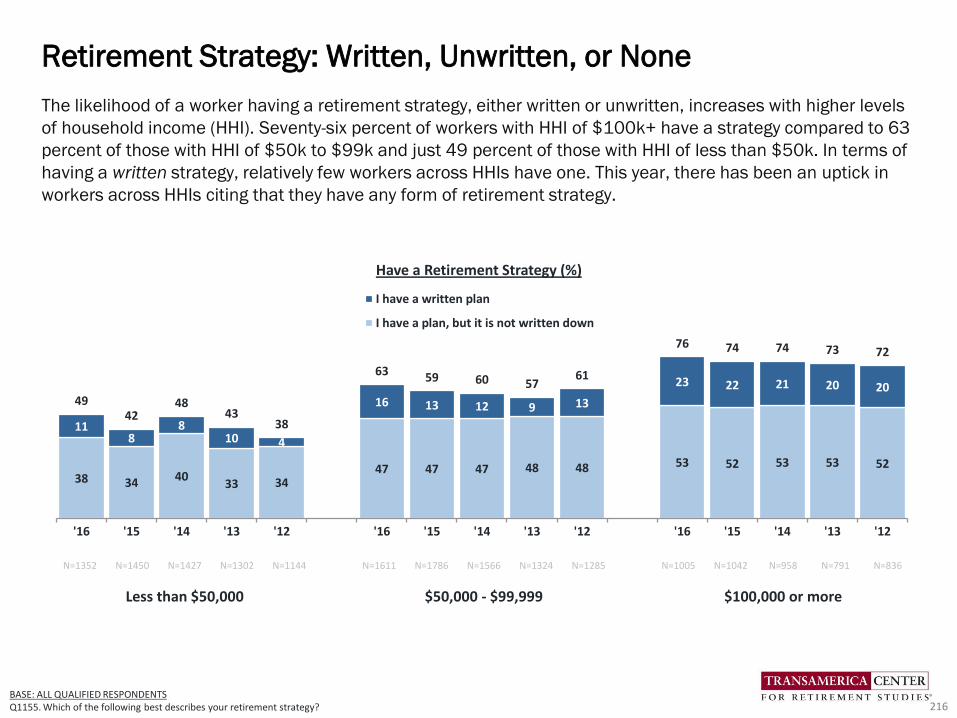
The likelihood of a worker having a retirement strategy, either written or unwritten, increases with higher levels
of household income (HHI). Seventy-six percent of workers with HHI of $100k+ have a strategy compared to 63
percent of those with HHI of $50k to $99k and just 49 percent of those with HHI of less than $50k. In terms of
having a written strategy, relatively few workers across HHIs have one. This year, there has been an uptick in
workers across HHIs citing that they have any form of retirement strategy.
Retirement Strategy: Written, Unwritten, or None
216
38 34 4033 34
47 47 47 48 48 53 52 53 53 52
118
810 4
16 13 12 9 13
23 22 21 20 2049
4248
4338
63 59 60 5761
76 74 74 73 72
'16 '15 '14 '13 '12 '16 '15 '14 '13 '12 '16 '15 '14 '13 '12
I have a written plan
I have a plan, but it is not written down
Have a Retirement Strategy (%)
BASE: ALL QUALIFIED RESPONDENTSQ1155. Which of the following best describes your retirement strategy?
N=1352 N=1450 N=1427 N=1302 N=1144 N=1611 N=1786 N=1566 N=1324 N=1285 N=1005 N=1042 N=958 N=791 N=836
Less than $50,000 $50,000 - $99,999 $100,000 or more
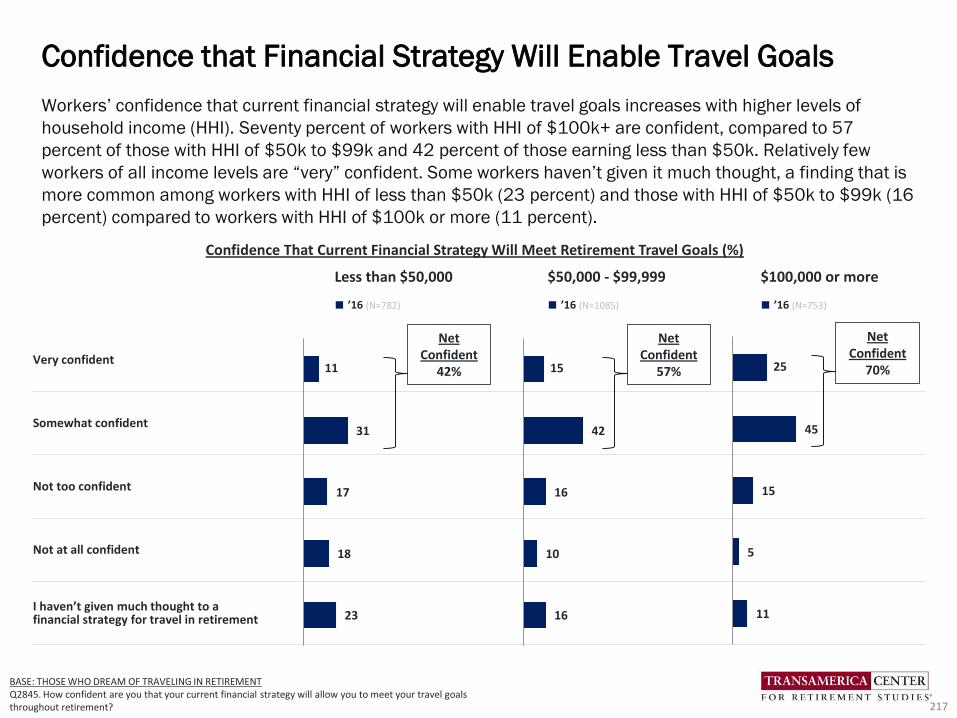
Less than $50,000 $50,000 - $99,999 $100,000 or more
■ ’16 (N=782) ■ ’16 (N=1085) ■ ’16 (N=753)
Very confident
Somewhat confident
Not too confident
Not at all confident
I haven’t given much thought to a financial strategy for travel in retirement
Workers’ confidence that current financial strategy will enable travel goals increases with higher levels of
household income (HHI). Seventy percent of workers with HHI of $100k+ are confident, compared to 57
percent of those with HHI of $50k to $99k and 42 percent of those earning less than $50k. Relatively few
workers of all income levels are “very” confident. Some workers haven’t given it much thought, a finding that is
more common among workers with HHI of less than $50k (23 percent) and those with HHI of $50k to $99k (16
percent) compared to workers with HHI of $100k or more (11 percent).
Confidence that Financial Strategy Will Enable Travel Goals
217
11
31
17
18
23
BASE: THOSE WHO DREAM OF TRAVELING IN RETIREMENTQ2845. How confident are you that your current financial strategy will allow you to meet your travel goals throughout retirement?
Net Confident
42% 15
42
16
10
16
Net Confident
57% 25
45
15
5
11
Net Confident
70%
Confidence That Current Financial Strategy Will Meet Retirement Travel Goals (%)
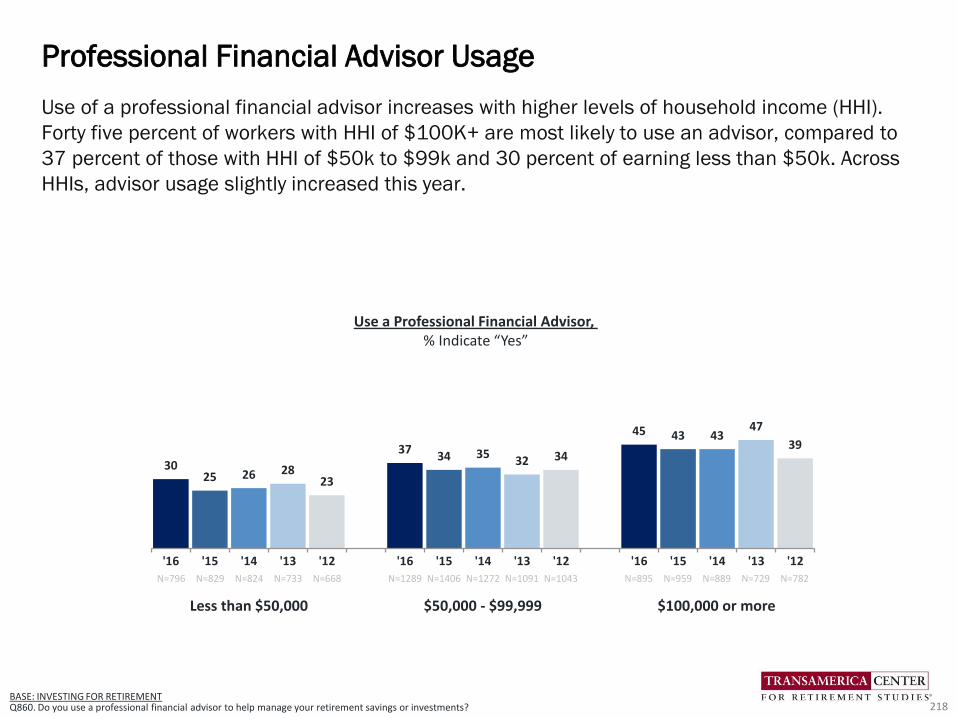
BASE: INVESTING FOR RETIREMENTQ860. Do you use a professional financial advisor to help manage your retirement savings or investments?
3025 26 28
23
3734 35
32 34
45 43 4347
39
'16 '15 '14 '13 '12 '16 '15 '14 '13 '12 '16 '15 '14 '13 '12
Use of a professional financial advisor increases with higher levels of household income (HHI).
Forty five percent of workers with HHI of $100K+ are most likely to use an advisor, compared to
37 percent of those with HHI of $50k to $99k and 30 percent of earning less than $50k. Across
HHIs, advisor usage slightly increased this year.
Professional Financial Advisor Usage
218
N=796 N=829 N=824 N=733 N=668 N=1289 N=1406 N=1272 N=1091 N=1043 N=895 N=959 N=889 N=729 N=782
Less than $50,000 $50,000 - $99,999 $100,000 or more
Use a Professional Financial Advisor, % Indicate “Yes”

3626 26
33 37
11 11 10 11 93 2 2 4 3
7
9 8
8
12
6 4 5 6 8
2 1 12 2
712 12
12
12
6 8 67 9
42 4
4 5
11 17 1511
7
8 8 1011
12
33 3
4 6
57 9
85
14 17 21 17 15
98
912 8
55 5 5 3
1616
17 16 16
15 2120
2420
63
2 2 1
1817
1613 11
50 49 49
4044
'16 '15 '14 '13 '12 '16 '15 '14 '13 '12 '16 '15 '14 '13 '12
$250k or more
$100k to less than $250k
$50k to less than $100k
$25k to less than $50k
$10k to less than $25k
$5k to less than $10k
Less than $5k
Workers with a household income (HHI) of $100k+ have saved $210,000 (estimated median), compared to
$62,000 for those with HHI of $50k to $99k and $4,000 for those with HHI of less than $50k (estimated
medians). In other words, workers with HHI of $100k+ have saved more than 52 times the amount of those
with a HHI of less than $50k. A concerning 36 percent of workers with HHI of less than $50k have saved less
than $5,000 in household retirement savings.
Total Household Retirement Savings
219BASE: ALL QUALIFIED RESPONDENTSQ1300. Approximately how much money does your household have saved in all of your retirement accounts?
Not sure 14 14 13 13 15 13 11 9 12 12 9 7 6 5 7
Decline to answer
9 7 10 8 8 8 8 6 7 8 5 7 6 5 5
Estimated Median
$4,000 $11,000 $12,000 $6,000 $3,000 $62,000 $58,000 $57,000 $51,000 $42,000 $210,00 $183,000 $184,000 $157,000 $171,000
Note: The median is estimated based on the approximate midpoint of the range of each response category. Non-responses are excluded from the estimate.
Total Household Retirement Savings (%)
N=1352 N=1450 N=1427 N=1302 N=1144 N=1611 N=1786 N=1566 N=1324 N=1285 N=1005 N=1042 N=958 N=791 N=836
Less than $50,000 $50,000 - $99,999 $100,000 or more

BASE: ALL QUALIFIED RESPONDENTSQ910. At what age do you expect to retire?
Regardless of their household income (HHI), most workers are expecting to work past age 65 or do not plan to
retire. Sixty-one percent of workers with HHI of less than $50k are most likely to expect to do so, followed by 54
percent of workers with HHI of $50k to $99k and 49 percent of those earning $100k+.
Expected Retirement Age
220
20 17 19 23 2211 14 11 15 12 9 9 9 8
13
4141 38
39 40
4347
4644
4540 43 41 42 36
2020 25
21 22
23
21 25 21 24
2223 23 22 23
19 22 18 17 1623
18 18 20 1929 25 27 28 28
'16 '15 '14 '13 '12 '16 '15 '14 '13 '12 '16 '15 '14 '13 '12
Before Age 65
At Age 65
After Age 65
Do Not Plan to Retire
N=1352 N=1450 N=1427 N=1302 N=1144 N=1611 N=1786 N=1566 N=1324 N=1285 N=1005 N=1042 N=958 N=791 N=836
Less than $50,000 $50,000 - $99,999 $100,000 or more
Age Expected to Retire (%)

% Yes (NET):
37 38 41 44 47 41 41 40 44 4635 40 40 45 42
17 14 1315 11
12 12 13 8 10
13 9 11 7 13
21 23 21 17 1426 24 26
17 2034 29 33
25 22
25 25 2524 28
21 23 2131 24
18 22 1623 23
54
Approximately half of workers plan to continue working in retirement, a finding which is surprisingly consistent
across levels of household income (HHI), including workers with HHI less than $50k (54 percent), $50k to
$99k (53 percent), and $100k or more (48 percent). Most workers who are planning to work in retirement say
that they will do so on a part-time basis. This trend has been relatively consistent over the past five years.
Expectations of Working in Retirement
221BASE: ALL QUALIFIED RESPONDENTSQ1525. Do you plan to work after you retire?
Working After Retirement (%)
Yes, I plan to work full-timeYes, I plan to work part-timeNo, I do not plan to workNot sure
’16 ’15 ’14 ’13 ’12 ’16 ’15 ’14 ’13 ’12 ’16 ’15 ’14 ’13 ’12
N=1352 N=1450 N=1427 N=1302 N=1144 N=1611 N=1786 N=1566 N=1324 N=1285 N=1005 N=1042 N=958 N=791 N=836
Less than $50,000 $50,000 - $99,999 $100,000 or more
52 5459 58
53 53 53 5256
48 49 51 52 55
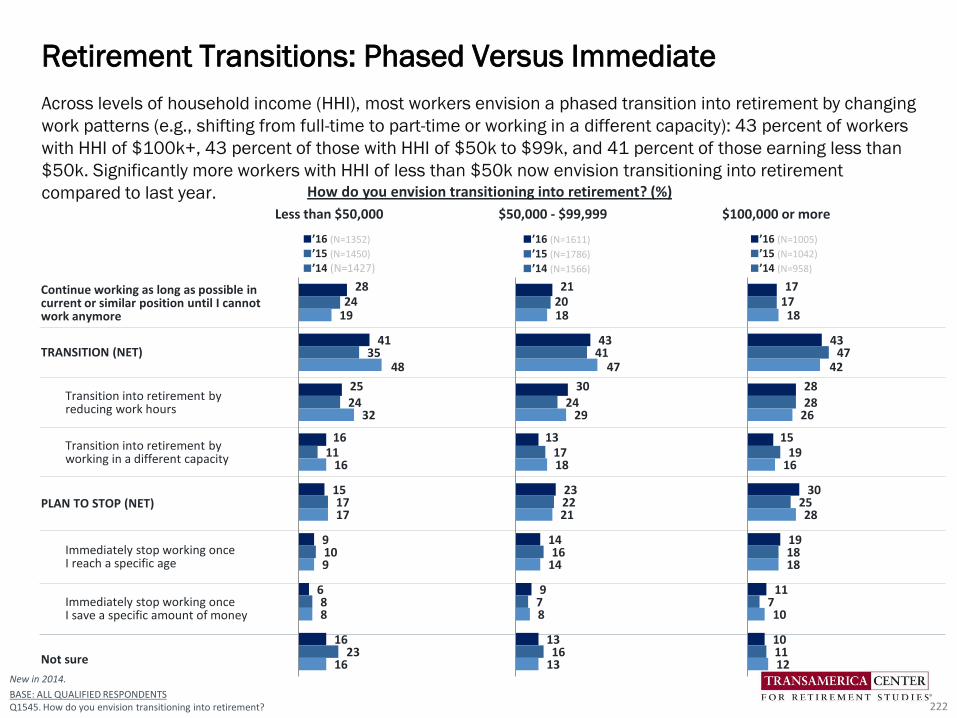
Less than $50,000 $50,000 - $99,999 $100,000 or more
■’16 (N=1352)
■’15 (N=1450)
■’14 (N=1427)
■’16 (N=1611)
■’15 (N=1786)
■’14 (N=1566)
■’16 (N=1005)
■’15 (N=1042)
■’14 (N=958)
Continue working as long as possible in current or similar position until I cannot work anymore
TRANSITION (NET)
Transition into retirement by reducing work hours
Transition into retirement by working in a different capacity
PLAN TO STOP (NET)
Immediately stop working once I reach a specific age
Immediately stop working once I save a specific amount of money
Not sure
Across levels of household income (HHI), most workers envision a phased transition into retirement by changing
work patterns (e.g., shifting from full-time to part-time or working in a different capacity): 43 percent of workers
with HHI of $100k+, 43 percent of those with HHI of $50k to $99k, and 41 percent of those earning less than
$50k. Significantly more workers with HHI of less than $50k now envision transitioning into retirement
compared to last year.
Retirement Transitions: Phased Versus Immediate
222
New in 2014.
BASE: ALL QUALIFIED RESPONDENTSQ1545. How do you envision transitioning into retirement?
28
41
25
16
15
9
6
16
24
35
24
11
17
10
8
23
19
48
32
16
17
9
8
16
21
43
30
13
23
14
9
13
20
41
24
17
22
16
7
16
18
47
29
18
21
14
8
13
17
43
28
15
30
19
11
10
17
47
28
19
25
18
7
11
18
42
26
16
28
18
10
12
How do you envision transitioning into retirement? (%)

The IRS Saver’s Credit is a tax credit available to eligible taxpayers who are saving for retirement in a qualified retirement plan or IRA; however, few workers who are potentially eligible to claim the credit are aware of it. Only 26 percent of workers with HHI of less than $50k are aware of the Saver’s Credit, compared to 35 percent of those with HHI of $50k to $99k and 38 percent of those with HHI of $100k+.
Awareness of the Saver’s Credit
223
Yes, I am aware No, I am not aware
26
74
Less Than $50,000’16 (N=1352)
35
65
$50,000 - $99,999’16 (N=1611)
38
62
$100,000 or more’16 (N=1005)
BASE: ALL QUALIFIED RESPONDENTS Q1120. Are you aware of a tax credit called the “Saver’s Credit,” which is available to individuals and households, who meet certain income requirements, for making contributions to an IRA or a company-sponsored retirement plan such as a 401(k) plan or 403(b) plan?
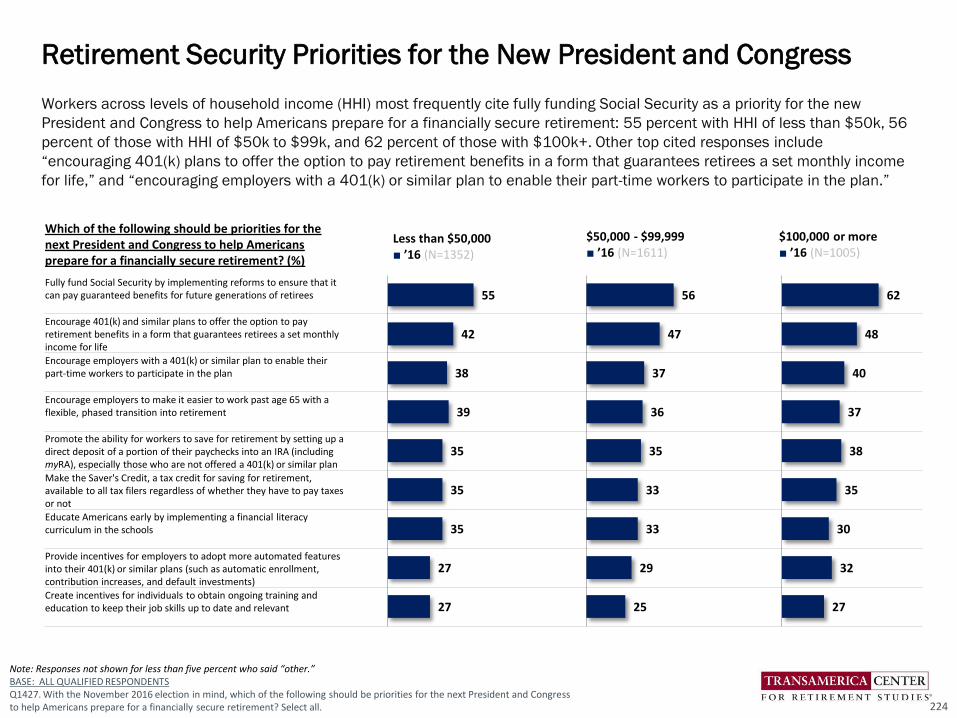
Workers across levels of household income (HHI) most frequently cite fully funding Social Security as a priority for the new
President and Congress to help Americans prepare for a financially secure retirement: 55 percent with HHI of less than $50k, 56
percent of those with HHI of $50k to $99k, and 62 percent of those with $100k+. Other top cited responses include
“encouraging 401(k) plans to offer the option to pay retirement benefits in a form that guarantees retirees a set monthly income
for life,” and “encouraging employers with a 401(k) or similar plan to enable their part-time workers to participate in the plan.”
Retirement Security Priorities for the New President and Congress
224
Note: Responses not shown for less than five percent who said “other.”BASE: ALL QUALIFIED RESPONDENTSQ1427. With the November 2016 election in mind, which of the following should be priorities for the next President and Congress to help Americans prepare for a financially secure retirement? Select all.
Which of the following should be priorities for the next President and Congress to help Americans prepare for a financially secure retirement? (%)
Less than $50,000■ ’16 (N=1352)
$50,000 - $99,999■ ’16 (N=1611)
$100,000 or more■ ’16 (N=1005)
Fully fund Social Security by implementing reforms to ensure that it can pay guaranteed benefits for future generations of retirees
Encourage 401(k) and similar plans to offer the option to pay retirement benefits in a form that guarantees retirees a set monthly income for life
Encourage employers with a 401(k) or similar plan to enable their part-time workers to participate in the plan
Encourage employers to make it easier to work past age 65 with a flexible, phased transition into retirement
Promote the ability for workers to save for retirement by setting up a direct deposit of a portion of their paychecks into an IRA (including myRA), especially those who are not offered a 401(k) or similar plan
Make the Saver's Credit, a tax credit for saving for retirement, available to all tax filers regardless of whether they have to pay taxes or not
Educate Americans early by implementing a financial literacy curriculum in the schools
Provide incentives for employers to adopt more automated features into their 401(k) or similar plans (such as automatic enrollment, contribution increases, and default investments)
Create incentives for individuals to obtain ongoing training and education to keep their job skills up to date and relevant
55
42
38
39
35
35
35
27
27
56
47
37
36
35
33
33
29
25
62
48
40
37
38
35
30
32
27
Influences of Educational Attainment on
Retirement Readiness
Detailed Findings
Retirement readiness increases with higher educational attainment. College graduates are more likely to have
access to retirement benefits, have higher plan participation rates, and contribute more than non-college
graduates — which leads to higher lifetime savings at retirement. While workers across levels of educational
attainment are at risk, non-college graduates are at much greater risk of not achieving a financially secure
retirement.
Thirty Indicators of Retirement Readiness
• Recovery From the Great Recession. Financial recovery from the Great Recession increases with
educational attainment. Workers with a high school education or less (23 percent) and those with some
college or trade school (26 percent) are more likely to say they have not yet begun to recover or they may
never recover, compared to workers with higher levels of educational attainment. Workers with a college or
post-graduate degree (both 45 percent) are more likely to say that they were not impacted or have fully
recovered than those with lower levels of educational attainment.
• Confidence in Retiring Comfortably. Retirement confidence increases with workers’ level of education.
College graduates (71 percent) and those with some graduate or advanced degree (73 percent) are more
likely to be confident about their future retirement compared to workers with only some college or trade
school education (60 percent) and those with high school diploma or less (51 percent).
• Building a Large Enough Nest Egg? Workers’ confidence in building a large enough nest egg increases with
educational attainment, and workers with a college degree are more confident than those without.
• Retirement Dreams Include Leisure and Work. Traveling is the most frequently cited retirement dream
among workers with some higher education, including those with some college or trade school (65
percent), college graduates (73 percent), and those with some graduate school or post-graduate degree
(73 percent). Workers with a high school education or less (57 percent) most frequently cited spending
more time with family and friends as a retirement dream. Interestingly, many workers dream of working in
retirement.
Influences of Educational Attainment on Retirement Readiness
226

• Age Planning to Live to. The age that workers are planning to live to increases with educational attainment.
Workers with a high school diploma or less are planning to live to age 85 (median), while those with some
college and college graduates are planning to live to 87 (median), and those with some graduate school or
a post-graduate degree are planning to live to an older age of 90 (median). Approximately one in seven
workers across levels of educational attainment are planning to live to 100 or older.
• Retirement Beliefs. Involvement in retirement investing increases across education levels; however,
regardless of their level of education, strong majorities feel that their generation will have a tough time
achieving financial security and that Social Security will not be there when they are ready to retire.
• Current Financial Priorities. “Saving for retirement” is the most frequently cited priority among workers with
higher levels of education, including college graduates (74 percent) and those with a post-graduate degree
(67 percent). In contrast “just getting by – covering basic living expenses” is most frequently cited among
those with a high school diploma or less (60 percent) and those with some college or trade school (50
percent).
• Greatest Financial Priority Right Now. “Saving for retirement” is the most frequently cited top financial
priority among those with a college or post-graduate degree. In contrast, those with some college (or less)
or a trade school education are more likely to cite “just getting by” or “paying off debt.”
• Expected Sources of Retirement Income. Across levels of educational attainment, the majority of workers
expect retirement income from self-funded savings including retirement accounts (e.g., 401(k)s, 403(b)s,
IRAs) and other savings and investments: 88 percent of post-graduates, 87 percent of college graduates,
78 percent of those with some college or trade school, and 65 percent of those with a high school diploma
or less. More than one-third of workers across levels of educational attainment are expecting income from
working to be a source of retirement income.
Influences of Educational Attainment on Retirement Readiness
227

• Expected Primary Source of Income in Retirement. Workers with higher levels of educational attainment
are more likely to expect to rely on retirement accounts (e.g., 401(k)s, 403(b)s, or IRAs) as their expected
primary source of income in retirement, including 47 percent of college graduates and 44 percent of those
with a post-graduate degree. Non-college graduates tend to expect to rely on Social Security, including 30
percent of those with some college or trade school and 29 percent of those with a high school education or
less. Non-college graduates are also more likely to expect to rely on income from “working.”
• Percentage Saving for Retirement/ Age They Started to Save. Savings rates increase with higher
educational attainment. College graduates (86 percent) and those with a post-graduate degree (91
percent) are more likely to be saving compared to those with some college or trade school (72 percent)
and those with a high school diploma or less (67 percent). Aligning with this trend, college graduates
started saving at an earlier age (25 median), compared to those with some college or trade school (28
median) and those with a high school diploma or less (30 median).
• Importance of Retirement Benefits Compared to Other Benefits. More than 83 percent of workers across
all levels of educational attainment value a 401(k), 403(b), 457(b) or similar plan as an important
employee benefit. Workers with higher levels of educational attainment are slightly more likely to value
such benefits.
• Retirement Benefits Currently Offered. While most workers have access to employer-sponsored retirement
benefits, those with higher educational attainment are more likely to be offered a plan compared to those
with lower educational levels. An alarming 33 percent of workers with a high school education or less and
26 percent of those with some college or trade school are not offered retirement benefits.
• Retirement Plan Participation. Among workers who are offered a 401(k) or similar plan, the participation
rate increases with level of educational attainment. Eighty-four percent of workers with a post-graduate
degree participate in their employer’s plan, compared to 77 percent of those with a high school education
or less.
Influences of Educational Attainment on Retirement Readiness
228
• Retirement Plan Contribution Rate. Among workers who participate in a 401(k) or similar plan, those with
higher educational attainment continue to contribute more compared to those in lower educational levels.
College graduates contribute 8 percent and those with a post-graduate degree contribute 10 percent
(median); in contrast, workers with some college or trade school contribute 7 percent and those with a high
school education or less contribute 6 percent (median).
• Approach to Investing in Retirement Plan. “Professionally managed” accounts refers to a managed
account service, strategic allocation funds, and/or target date funds. Regardless of level of educational
attainment, the majority of plan participants use some form of professionally managed offering in their
401(k) or similar plans: 57 percent of workers with a high school diploma or less, 61 percent of those with
some college or trade school, 63 percent of college graduates, and 57 percent of those with some
graduate school or a post-graduate degree. Workers with higher educational attainment are more likely to
set their own asset allocation percentage among the available funds.
• Retirement Plan Leakage: Loans and Withdrawals. “Leakage” from retirement plans in the form of loans
and withdrawals can severely inhibit the growth of participants’ long-term retirement savings. Among
participants who are currently participating in a plan, more than one in five workers across levels of
educational attainment have taken some form of loan, early withdrawal, and/or hardship withdrawal from
a 401(k) or similar plan. Workers with a high school diploma or less are more likely to have done so
compared to those with higher levels of educational attainment.
• Estimated Emergency Savings. Emergency savings can help cover the cost of a major financial setback
(e.g., unemployment, medical bills, home repairs, auto repairs, other); however, many workers have saved
little. Workers with a high school education or less have saved just $1,000 (median). Those with some
college or trade school have saved $4,000 (median). College graduates have saved $10,000 (median. And
workers with some graduate school or a graduate degree have saved $25,000 (median) for such
emergencies.
Influences of Educational Attainment on Retirement Readiness
229

• Estimated Retirement Savings Needs. Workers’ estimated retirement savings needs increase with higher
educational attainment. College graduates estimate that they will need $900k and workers with a post-
graduate degree estimate $1 million (estimated medians). In contrast, those with some college or trade
school estimate that they will need $500k and those with a high school education or less estimate $250k
(estimated medians).
• Basis for Estimating Retirement Savings Needs. The percentage of workers guessing their retirement
savings needs decreases with educational attainment. Those with a high school education or less (56
percent) are most likely to have guess compared to those with a post-graduate degree (33 percent). Few
workers across education levels have used a retirement calculator.
• Asset Allocation of Retirement Investments. Across educational levels, workers most frequently say their
retirement savings are invested in a relatively equal mix of stocks and investments such as bonds, money
market funds and cash. The response rate is higher among those with a college education (46 percent) or
those with a post-graduate degree (48 percent), compared to those with some college or trade school (37
percent) and those with a high school education or less (39 percent). Nearly one-third (32 percent) of
workers with a high school education or less are unsure about how their savings are invested.
• Retirement Strategy: Written, Unwritten, or None. The likelihood of workers having a retirement strategy
increases with higher educational attainment − with more educated workers being more likely to have a
strategy. Seventy-two percent of college graduates and 75 percent of workers with a post-graduate degree
have a strategy, compared to only 52 percent of those with a high school diploma or less and 61 percent of
those with some college or trade school. However, relatively few workers have yet to put their plans down
in writing.
Influences of Educational Attainment on Retirement Readiness
230

• Confidence that Financial Strategy Will Enable Travel Goals. Among those who dream of traveling in
retirement, workers’ confidence that their current financial strategy will enable travel goals varies
dramatically by level of educational attainment. The majority of workers with college degree or more are
confident compared to just half of workers with high school to some college education. Relatively few
workers across educational levels are “very” confident. Some workers haven’t given it much thought, a
finding that is more common among workers with high school diploma or less (23 percent).
• Professional Financial Advisor Usage. Use of a professional financial advisor increases with higher
educational attainment. College graduates (43 percent) and workers with a post-graduate degree (48
percent) are more likely to use a financial advisor, compared to workers with only some college or trade
school (34 percent) or those with a high school education or less (35 percent).
• Total Household Retirement Savings. Household retirement savings increase with higher educational
attainment. College graduates have saved $143,000 and workers with a post-graduate degree have saved
$176,000 (estimated medians). In contrast, workers with some college or trade school have saved
$47,000 and those with a high school education or less have saved $23,000 (estimated medians). Forty-
one percent of workers with a post-graduate degree have saved $250,000 or more compared to just 14
percent of those with a high school education or less.
• Expected Retirement Age. Most workers across levels of educational attainment expect to retire after age
65 or do not plan to retire, including 58 percent of those with a high school education or less, 55 percent
of those with some college or trade school, 51 percent of college graduates, and 51 percent of those with
a post-graduate degree. Additionally, 20 percent of workers with a high school education or less do not
plan to retire — an expectation that decreases with higher levels of education.
• Expectations of Working in Retirement. Approximately half of workers plan to continue working in
retirement, which is relatively consistent across levels of educational attainment. Workers with a graduate
level of education (56 percent) are most likely to plan to work in retirement and those with high school
education or less (51 percent) are least likely. Among workers planning to work in retirement, most plan to
do so on a part-time basis.
Influences of Educational Attainment on Retirement Readiness
231
• Retirement Transitions: Phased Versus Immediate. Workers with a post-graduate degree (48 percent) are
most likely to expect a phased transition into retirement by changing work patterns (e.g., shifting from full-
to part-time or working in a different capacity) — while workers with a high school education or less are
more likely to say they plan to continue working until they can’t work any longer (31 percent) or “not sure”
(16 percent).
• Awareness of the Saver’s Credit. Level of awareness about the IRS Saver’s Credit -- a tax credit available to
eligible taxpayers who are saving for retirement in a qualified retirement plan or IRA – increases with
higher educational attainment. College graduates (39 percent) and workers with some graduate school or
a post-graduate degree (43 percent) are more likely to be aware of the Saver’s Credit, compared to
workers with some college or trade school (32 percent) and those with a high school education or less (24
percent).
• Retirement Security Priorities for the New President and Congress. Workers across levels of educational
attainment most frequently cite fully funding Social Security as a priority for the new President and
Congress to help Americans prepare for a financially secure retirement: 56 percent of those with high
school diploma or less, 64 percent of those with some college or trade school, 55 percent of college
graduates, and 53 percent of post-graduates. Other top cited responses include “encouraging 401(k)
plans to offer the option to pay retirement benefits in a form that guarantees retirees a set monthly income
for life,” and “encouraging employers with a 401(k) or similar plan to enable their part-time workers to
participate in the plan.”
Influences of Educational Attainment on Retirement Readiness
232
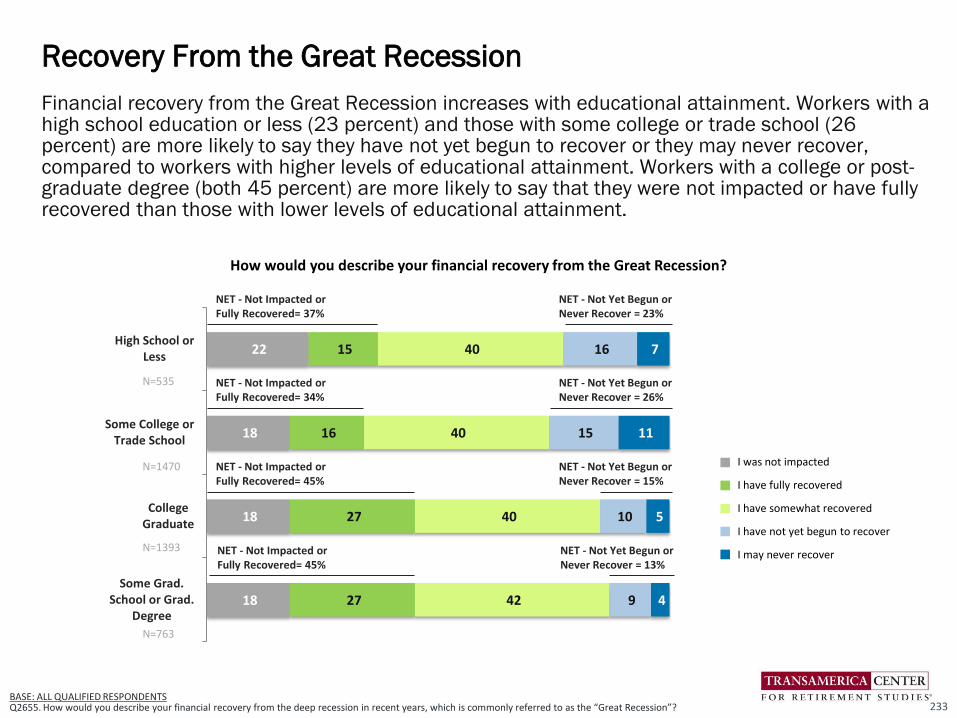
Financial recovery from the Great Recession increases with educational attainment. Workers with a high school education or less (23 percent) and those with some college or trade school (26 percent) are more likely to say they have not yet begun to recover or they may never recover, compared to workers with higher levels of educational attainment. Workers with a college or post-graduate degree (both 45 percent) are more likely to say that they were not impacted or have fully recovered than those with lower levels of educational attainment.
Recovery From the Great Recession
233BASE: ALL QUALIFIED RESPONDENTS Q2655. How would you describe your financial recovery from the deep recession in recent years, which is commonly referred to as the “Great Recession”?
22
18
18
18
15
16
27
27
40
40
40
42
16
15
10
9
7
11
5
4
High School orLess
Some College orTrade School
CollegeGraduate
Some Grad.School or Grad.
Degree
I was not impacted
I have fully recovered
I have somewhat recovered
I have not yet begun to recover
I may never recover
NET - Not Impacted or Fully Recovered= 37%
How would you describe your financial recovery from the Great Recession?
NET - Not Yet Begun or Never Recover = 23%
N=535
N=1470
N=1393
N=763
NET - Not Impacted or Fully Recovered= 34%
NET - Not Yet Begun or Never Recover = 26%
NET - Not Impacted or Fully Recovered= 45%
NET - Not Yet Begun or Never Recover = 15%
NET - Not Impacted or Fully Recovered= 45%
NET - Not Yet Begun or Never Recover = 13%
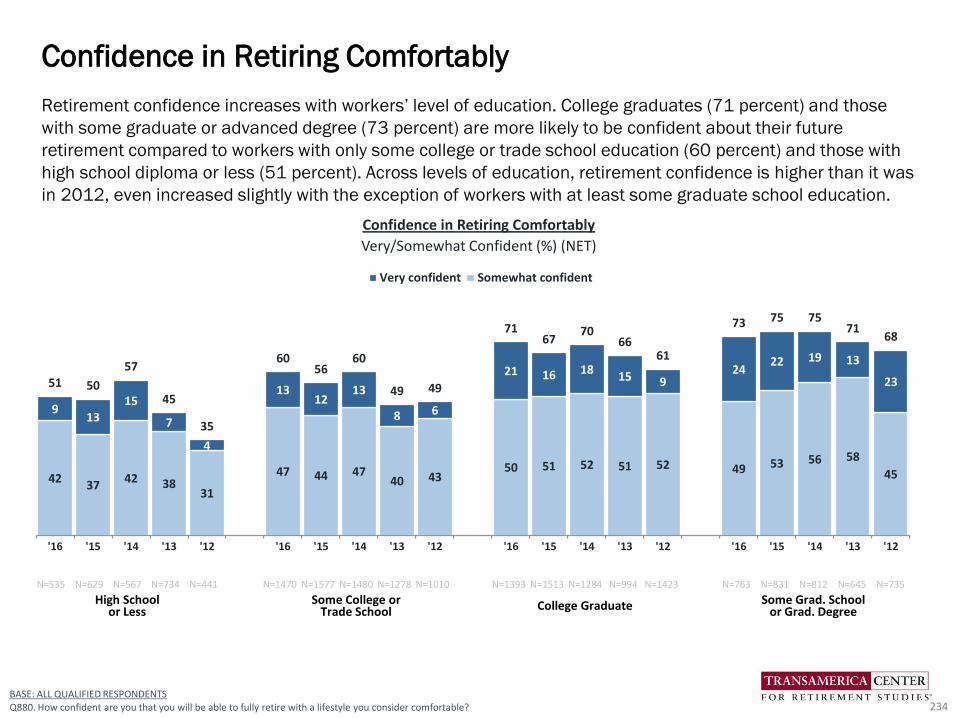
4237
42 3831
47 44 4740 43
50 51 52 51 52 49 53 56 58
45
913
15
7
4
1312
13
8 6
21 16 1815 9
2422 19 13
2351 50
57
45
35
6056
60
49 49
7167
7066
61
73 75 7571
68
'16 '15 '14 '13 '12 '16 '15 '14 '13 '12 '16 '15 '14 '13 '12 '16 '15 '14 '13 '12
Very confident Somewhat confident
BASE: ALL QUALIFIED RESPONDENTSQ880. How confident are you that you will be able to fully retire with a lifestyle you consider comfortable?
Retirement confidence increases with workers’ level of education. College graduates (71 percent) and those
with some graduate or advanced degree (73 percent) are more likely to be confident about their future
retirement compared to workers with only some college or trade school education (60 percent) and those with
high school diploma or less (51 percent). Across levels of education, retirement confidence is higher than it was
in 2012, even increased slightly with the exception of workers with at least some graduate school education.
Confidence in Retiring Comfortably
234
N=535 N=629 N=567 N=734 N=441 N=1470 N=1577 N=1480 N=1278 N=1010 N=1393 N=1513 N=1284 N=994 N=1423 N=763 N=831 N=812 N=645 N=735
High School or Less
Some College or Trade School College Graduate Some Grad. School
or Grad. Degree
Confidence in Retiring Comfortably
Very/Somewhat Confident (%) (NET)
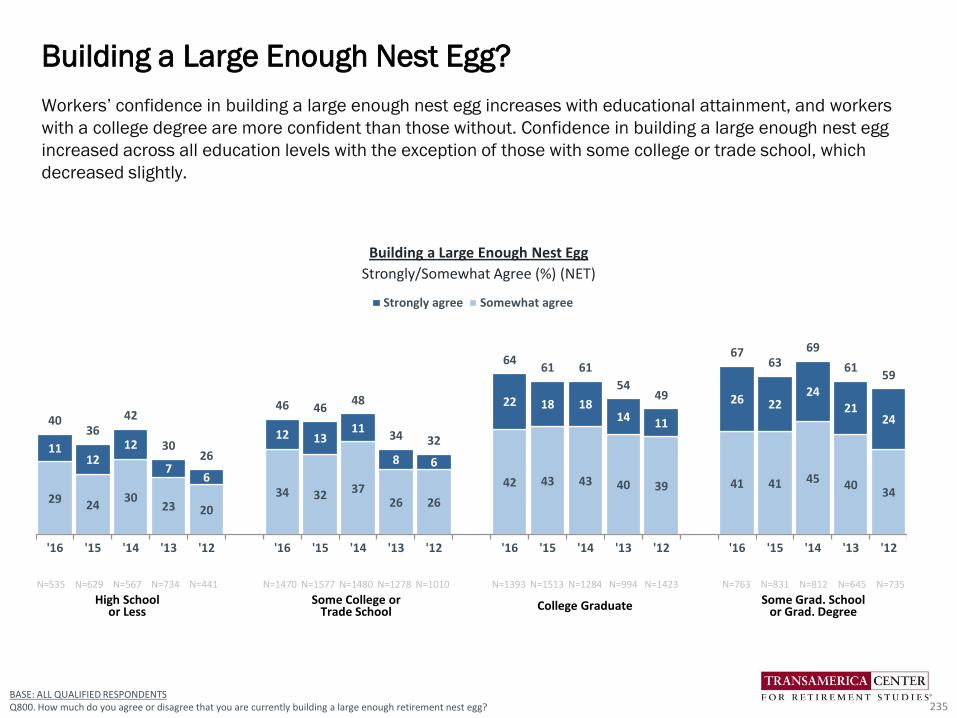
29 2430
23 20
34 32 3726 26
42 43 43 40 39 41 41 45 4034
1112
12
76
12 1311
8 6
22 18 1814 11
26 2224
212440
3642
3026
46 4648
34 32
6461 61
5449
6763
69
6159
'16 '15 '14 '13 '12 '16 '15 '14 '13 '12 '16 '15 '14 '13 '12 '16 '15 '14 '13 '12
Strongly agree Somewhat agree
BASE: ALL QUALIFIED RESPONDENTSQ800. How much do you agree or disagree that you are currently building a large enough retirement nest egg?
Workers’ confidence in building a large enough nest egg increases with educational attainment, and workers
with a college degree are more confident than those without. Confidence in building a large enough nest egg
increased across all education levels with the exception of those with some college or trade school, which
decreased slightly.
Building a Large Enough Nest Egg?
235
N=535 N=629 N=567 N=734 N=441 N=1470 N=1577 N=1480 N=1278 N=1010 N=1393 N=1513 N=1284 N=994 N=1423 N=763 N=831 N=812 N=645 N=735
High School or Less
Some College or Trade School College Graduate Some Grad. School
or Grad. Degree
Building a Large Enough Nest Egg
Strongly/Somewhat Agree (%) (NET)

Traveling is the most frequently cited retirement dream among workers with some higher education, including those
with some college or trade school (65 percent), college graduates (73 percent), and those with some graduate
school or post-graduate degree (73 percent). Workers with a high school education or less (57 percent) most
frequently cited spending more time with family and friends as a retirement dream. Interestingly, many workers
dream of working in retirement.
Retirement Dreams Include Leisure and Work
236BASE: ALL QUALIFIED RESPONDENTS Q1418. How do you dream of spending your retirement? Select all.
How do you dream of spending your retirement? Please select all that apply. (%)
High School or Less Some College or
Trade School College Graduate
Some Grad. School or Grad. Degree
■ ’16 (N=535) ■ ’16 (N=1470) ■ ’16 (N=1393) ■ ’16 (N=763)
Traveling
Spending more time with family and friends
Pursuing hobbies
Doing volunteer work
Pursuing an encore career (pursuing a new role, work, activity, or career)
Continue working in the same field
Starting a business
Other
None of the above
53
57
43
18
10
12
12
7
5
NET: Working
28%
65
53
48
26
11
8
9
8
4
NET: Working
24%
73
60
55
34
17
13
13
6
2
NET: Working
31%
73
58
54
36
14
18
13
4
4
NET: Working
36%
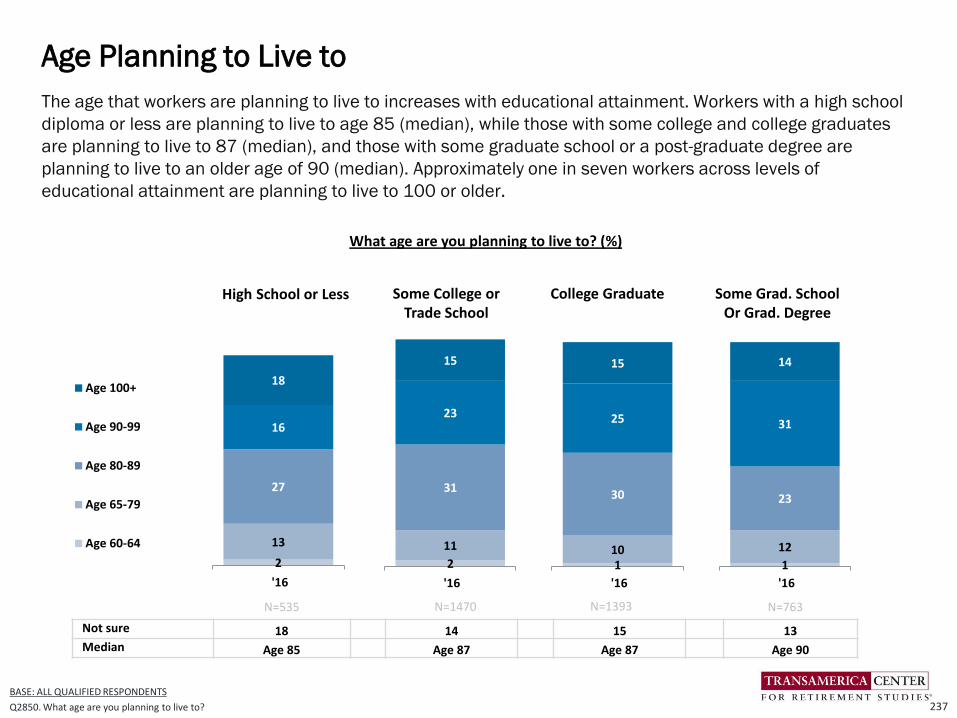
The age that workers are planning to live to increases with educational attainment. Workers with a high school
diploma or less are planning to live to age 85 (median), while those with some college and college graduates
are planning to live to 87 (median), and those with some graduate school or a post-graduate degree are
planning to live to an older age of 90 (median). Approximately one in seven workers across levels of
educational attainment are planning to live to 100 or older.
Age Planning to Live to
237
BASE: ALL QUALIFIED RESPONDENTS
Q2850. What age are you planning to live to?
Not sure 18 14 15 13Median Age 85 Age 87 Age 87 Age 90
High School or Less Some College orTrade School
College Graduate
2
13
27
16
18
'16
Age 100+
Age 90-99
Age 80-89
Age 65-79
Age 60-64
Some Grad. SchoolOr Grad. Degree
1
12
23
31
14
'16
N=535 N=763
2
11
31
23
15
'16
110
30
25
15
'16
N=1470 N=1393
What age are you planning to live to? (%)
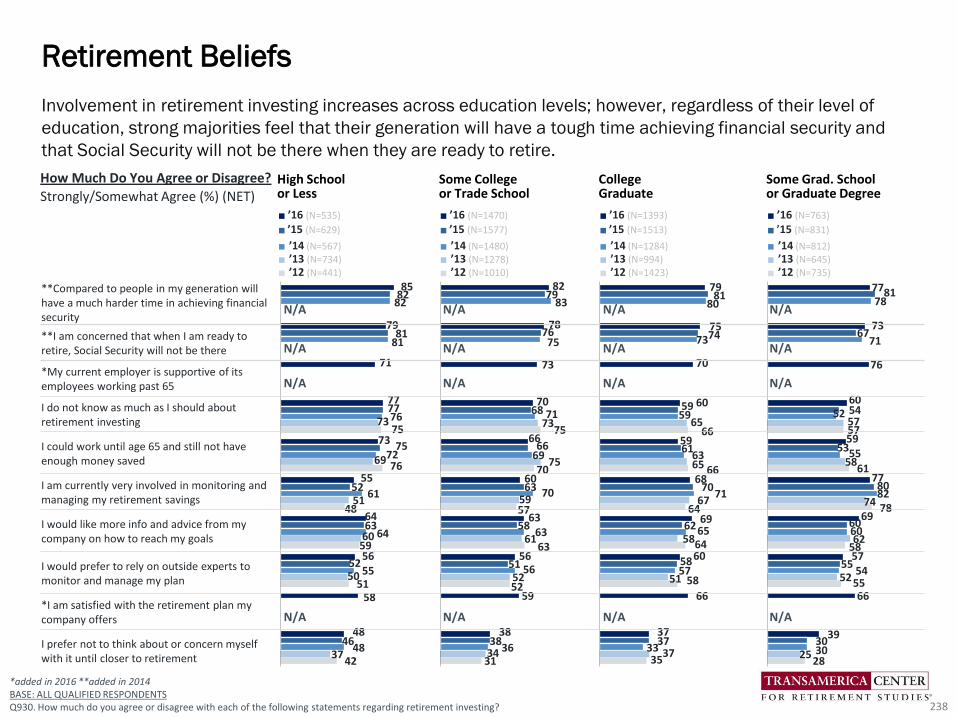
77
73
76
60
59
77
69
57
66
39
81
67
54
53
80
60
55
30
78
71
52
55
82
60
54
30
57
58
74
62
52
25
57
61
78
58
55
28
79
75
70
60
59
68
69
60
66
37
81
74
59
61
70
62
58
37
80
73
59
63
71
65
57
33
65
65
67
58
51
37
66
66
64
64
58
35
82
78
73
70
66
60
63
56
59
38
79
76
68
66
63
58
51
38
83
75
71
69
70
63
56
36
73
75
59
61
52
34
75
70
57
63
52
31
85
79
71
77
73
55
64
56
58
48
82
81
77
75
52
63
52
46
82
81
76
72
61
64
55
48
73
69
51
60
50
37
75
76
48
59
51
42
*added in 2016 **added in 2014BASE: ALL QUALIFIED RESPONDENTSQ930. How much do you agree or disagree with each of the following statements regarding retirement investing?
Involvement in retirement investing increases across education levels; however, regardless of their level of
education, strong majorities feel that their generation will have a tough time achieving financial security and
that Social Security will not be there when they are ready to retire.
Retirement Beliefs
238
N/A
N/A N/A
N/A N/A
N/A
N/A
N/A
N/A
N/A
N/A
N/A
N/A
N/A
N/A
N/A
How Much Do You Agree or Disagree?
Strongly/Somewhat Agree (%) (NET)High School or Less
Some College or Trade School
College Graduate
Some Grad. School or Graduate Degree
■ ’16 (N=535)
■ ’15 (N=629)
■ ’14 (N=567)
■ ’13 (N=734)
■ ’12 (N=441)
■ ’16 (N=1470)
■ ’15 (N=1577)
■ ’14 (N=1480)
■ ’13 (N=1278)
■ ’12 (N=1010)
■ ’16 (N=1393)
■ ’15 (N=1513)
■ ’14 (N=1284)
■ ’13 (N=994)
■ ’12 (N=1423)
■ ’16 (N=763)
■ ’15 (N=831)
■ ’14 (N=812)
■ ’13 (N=645)
■ ’12 (N=735)
**Compared to people in my generation will have a much harder time in achieving financial security
**I am concerned that when I am ready to retire, Social Security will not be there
*My current employer is supportive of its employees working past 65
I do not know as much as I should about retirement investing
I could work until age 65 and still not have enough money saved
I am currently very involved in monitoring and managing my retirement savings
I would like more info and advice from my company on how to reach my goals
I would prefer to rely on outside experts to monitor and manage my plan
*I am satisfied with the retirement plan my company offers
I prefer not to think about or concern myself with it until closer to retirement

“Saving for retirement” is the most frequently cited priority among workers with higher levels of education,
including college graduates (74 percent) and those with a post-graduate degree (67 percent). In contrast “just
getting by – covering basic living expenses” is most frequently cited among those with a high school diploma or
less (60 percent) and those with some college or trade school (50 percent).
Current Financial Priorities
239
***Note: This question is based on a supplementary survey. See methodology for more information. BASE: ALL QUALIFIED RESPONDENTSQ2639. Which of the following are your financial priorities right now? Select all.
42
60
35
31
25
20
7
5
6
5
9
53
50
43
33
27
28
15
12
11
5
8
74
31
38
41
23
23
21
18
11
7
6
67
19
38
44
32
31
27
16
18
17
5
Current Financial Priorities (%)
High School or Less Some College or Trade School
College Graduate
Some Grad. School or Graduate Degree
■ ’16 (N=150) *** ■ ’16 (N=397) *** ■ ’16 (N=417) *** ■ ’16 (N=234) ***
Saving for retirement
Just getting by - covering basic living expenses
Paying off credit card or consumer debt
Paying off mortgage
Paying healthcare expenses
Supporting children
Contributing to an education fund (for my children, grandchildren, or other)
Paying off student loans
Creating an inheritance or financial legacy
Supporting parents
Other

High School or Less
Some College or Trade School
College Graduate
Some Grad. School or Graduate Degree
■’16 (N=150)***■’15 (N=629)■’14 (N=567)■’13 (N=734)■’12 (N=441)
■’16 (N=397)***■’14 (N=1577)■’13 (N=1480)■’12 (N=1278)■’12 (N=1010)
■’16 (N=417)***■’15 (N=1513)■’14 (N=1284)■’13 (N=994)■’12 (N=1423)
■’16 (N=234)***■’15 (N=831)■’14 (N=812)■’13 (N=645)■’12 (N=735)
Saving for retirement
Just getting by - covering basic living expenses
Paying off debt (consumer debt, i.e. credit card)
Paying off mortgage
**Supporting children and/or parents
Paying healthcare expenses
Contributing to an education fund (for my children, grandchildren, or other)
Creating an inheritance or financial legacy
*Paying off student loans
*Paying current tuition fees
Other
“Saving for retirement” is the most frequently cited top financial priority among those with a college or post-
graduate degree. In contrast, those with some college (or less) or a trade school education are more likely to
cite “just getting by” or “paying off debt.”
Greatest Financial Priority Right Now
240
19
32
28
8
6
3
4
17
28
28
11
6
4
6
21
25
28
9
6
5
6
28
22
23
11
4
3
3
2
4
24
25
15
6
13
4
3
1
4
5
30
16
26
13
8
2
4
30
19
27
12
7
2
3
36
12
24
13
8
2
5
32
12
18
13
6
3
9
1
6
36
13
17
11
9
2
2
1
6
3
41
11
20
12
9
3
5
34
11
25
16
8
2
4
43
10
18
14
7
4
4
35
10
12
14
9
2
9
1
8
31
6
13
14
7
9
4
6
6
4
11
38
24
11
8
4
4
18
36
20
11
7
4
6
18
34
24
10
7
2
5
18
33
20
12
6
4
1
1
5
17
32
21
11
7
4
1
1
4
2
N/A N/A N/A N/A
N/A N/A N/A N/A
N/A N/A N/A N/A
N/A N/A N/A N/A
N/A N/A N/A N/A
*added in 2015, **shown as two separate answers in 2016, ***This question is based on a supplementary survey. See methodology for more information BASE: ALL QUALIFIED RESPONDENTS Q2640. Which one of the following is your greatest financial priority right now?
Greatest Financial Priority Right Now (%)
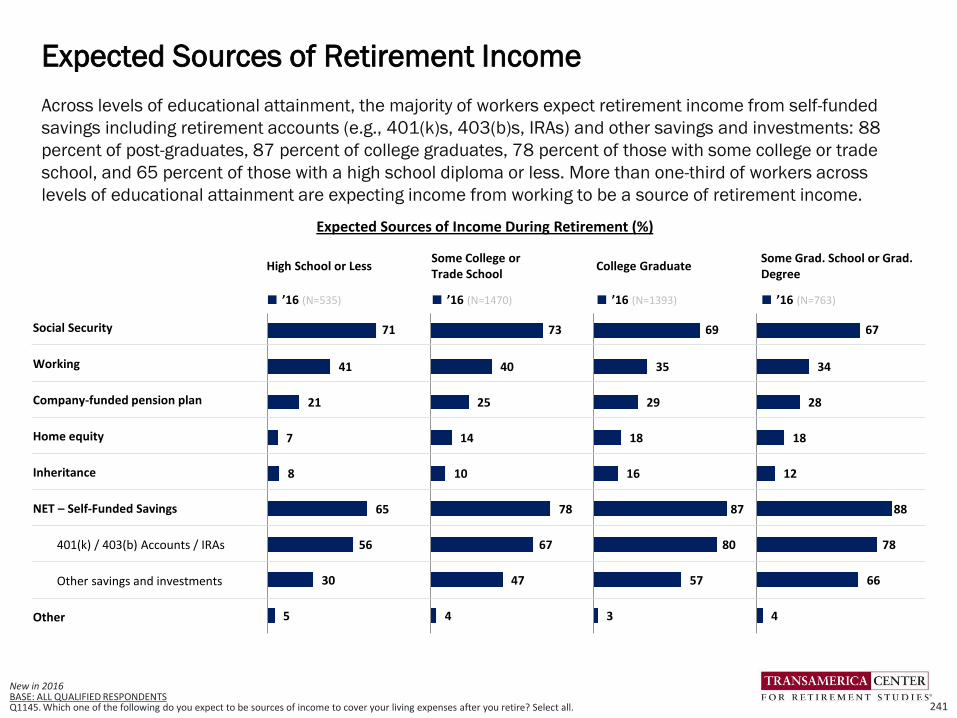
New in 2016BASE: ALL QUALIFIED RESPONDENTS Q1145. Which one of the following do you expect to be sources of income to cover your living expenses after you retire? Select all.
Across levels of educational attainment, the majority of workers expect retirement income from self-funded
savings including retirement accounts (e.g., 401(k)s, 403(b)s, IRAs) and other savings and investments: 88
percent of post-graduates, 87 percent of college graduates, 78 percent of those with some college or trade
school, and 65 percent of those with a high school diploma or less. More than one-third of workers across
levels of educational attainment are expecting income from working to be a source of retirement income.
Expected Sources of Retirement Income
241
71
41
21
7
8
65
56
30
5
73
40
25
14
10
78
67
47
4
69
35
29
18
16
87
80
57
3
67
34
28
18
12
88
78
66
4
Expected Sources of Income During Retirement (%)
High School or LessSome College or Trade School
College GraduateSome Grad. School or Grad. Degree
■ ’16 (N=535) ■ ’16 (N=1470) ■ ’16 (N=1393) ■ ’16 (N=763)
Social Security
Working
Company-funded pension plan
Home equity
Inheritance
NET – Self-Funded Savings
401(k) / 403(b) Accounts / IRAs
Other savings and investments
Other
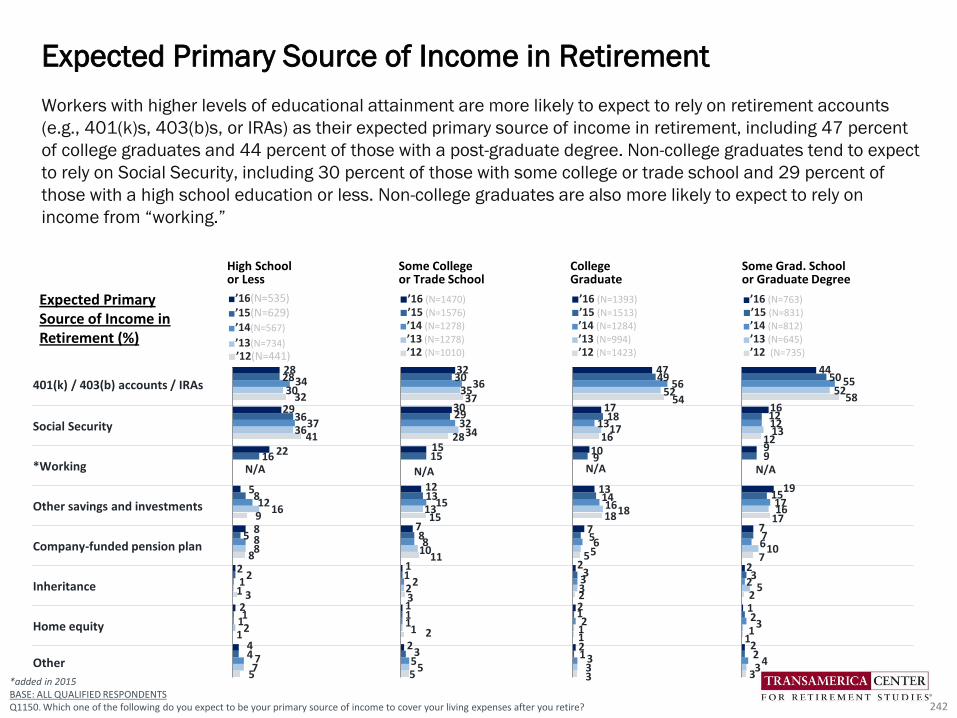
High School or Less
Some College or Trade School
College Graduate
Some Grad. School or Graduate Degree
■’16(N=535)■’15(N=629)
■’14(N=567)
■’13(N=734)■’12(N=441)
■’16 (N=1470)
■’15 (N=1576)
■’14 (N=1278)
■’13 (N=1278)
■’12 (N=1010)
■’16 (N=1393)
■’15 (N=1513)
■’14 (N=1284)
■’13 (N=994)
■’12 (N=1423)
■’16 (N=763)■’15 (N=831)
■’14 (N=812)
■’13 (N=645)
■’12 (N=735)
401(k) / 403(b) accounts / IRAs
Social Security
*Working
Other savings and investments
Company-funded pension plan
Inheritance
Home equity
Other
32
41
9
8
3
1
5
30
36
16
8
1
2
7
34
37
12
8
1
1
7
28
36
16
8
5
2
1
4
28
29
22
5
8
2
2
4
*added in 2015BASE: ALL QUALIFIED RESPONDENTS Q1150. Which one of the following do you expect to be your primary source of income to cover your living expenses after you retire?
Workers with higher levels of educational attainment are more likely to expect to rely on retirement accounts
(e.g., 401(k)s, 403(b)s, or IRAs) as their expected primary source of income in retirement, including 47 percent
of college graduates and 44 percent of those with a post-graduate degree. Non-college graduates tend to expect
to rely on Social Security, including 30 percent of those with some college or trade school and 29 percent of
those with a high school education or less. Non-college graduates are also more likely to expect to rely on
income from “working.”
Expected Primary Source of Income in Retirement
242
37
28
15
11
3
2
5
35
34
13
10
2
1
5
36
32
15
8
2
1
5
30
29
15
13
8
1
1
3
32
30
15
12
7
1
1
2
54
16
18
5
2
1
3
52
17
18
5
3
1
3
56
13
16
6
3
2
3
49
18
9
14
5
3
1
1
47
17
10
13
7
2
2
2
58
12
17
7
2
1
3
52
13
16
10
5
1
3
55
12
17
6
2
3
4
50
12
9
15
7
3
2
2
44
16
9
19
7
2
1
2
N/A N/A N/A N/A
Expected Primary Source of Income in Retirement (%)
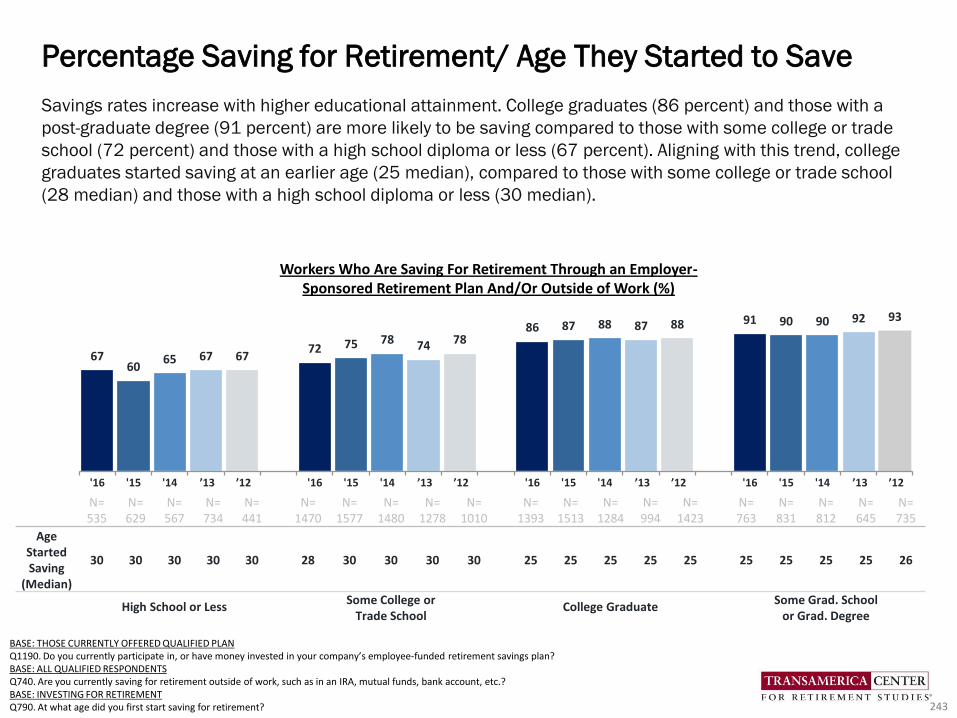
BASE: THOSE CURRENTLY OFFERED QUALIFIED PLANQ1190. Do you currently participate in, or have money invested in your company’s employee-funded retirement savings plan?BASE: ALL QUALIFIED RESPONDENTSQ740. Are you currently saving for retirement outside of work, such as in an IRA, mutual funds, bank account, etc.?BASE: INVESTING FOR RETIREMENTQ790. At what age did you first start saving for retirement?
Savings rates increase with higher educational attainment. College graduates (86 percent) and those with a
post-graduate degree (91 percent) are more likely to be saving compared to those with some college or trade
school (72 percent) and those with a high school diploma or less (67 percent). Aligning with this trend, college
graduates started saving at an earlier age (25 median), compared to those with some college or trade school
(28 median) and those with a high school diploma or less (30 median).
Percentage Saving for Retirement/ Age They Started to Save
243
6760
65 67 6772 75 78 74 78
86 87 88 87 88 91 90 90 92 93
'16 '15 '14 ’13 ’12 '16 '15 '14 ’13 ’12 '16 '15 '14 ’13 ’12 '16 '15 '14 ’13 ’12
N=535
N=629
N=567
N=734
N=441
N=1470
N=1577
N=1480
N=1278
N=1010
N=1393
N=1513
N=1284
N=994
N=1423
N=763
N=831
N=812
N=645
N=735
Age Started Saving
(Median)
30 30 30 30 30 28 30 30 30 30 25 25 25 25 25 25 25 25 25 26
High School or LessSome College or
Trade School College Graduate
Some Grad. School or Grad. Degree
Workers Who Are Saving For Retirement Through an Employer-Sponsored Retirement Plan And/Or Outside of Work (%)
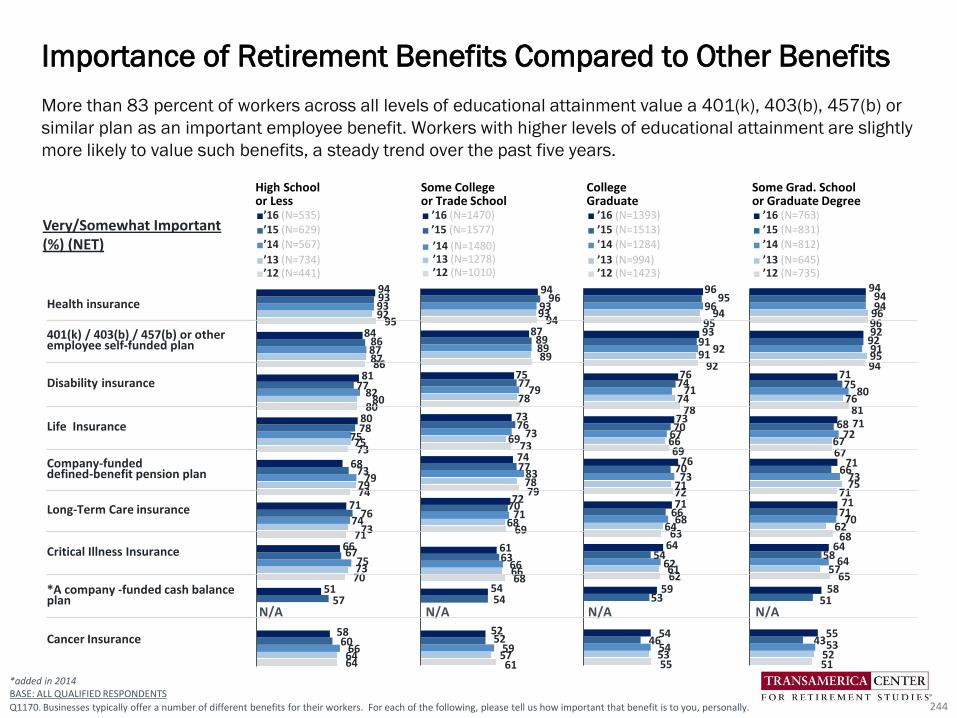
More than 83 percent of workers across all levels of educational attainment value a 401(k), 403(b), 457(b) or
similar plan as an important employee benefit. Workers with higher levels of educational attainment are slightly
more likely to value such benefits, a steady trend over the past five years.
96
94
81
67
71
68
65
51
96
95
76
67
75
62
57
52
94
91
80
72
73
70
64
53
94
92
75
68
66
71
58
51
43
94
92
71
71
71
71
64
58
55
95
92
78
69
72
63
62
55
94
91
74
66
71
64
61
53
96
92
71
67
73
68
62
54
95
91
74
70
70
66
54
53
46
96
93
76
73
76
71
64
59
54
94
73
79
69
68
61
93
89
78
69
78
68
66
57
93
89
79
73
83
71
66
59
96
89
77
76
77
70
63
54
52
94
87
75
73
74
72
61
54
52
95
86
80
73
74
71
70
64
92
87
80
75
79
73
73
64
93
87
82
75
79
74
75
66
93
86
77
78
73
76
67
57
60
94
84
81
80
68
71
66
51
58
*added in 2014BASE: ALL QUALIFIED RESPONDENTS
Q1170. Businesses typically offer a number of different benefits for their workers. For each of the following, please tell us how important that benefit is to you, personally.
Importance of Retirement Benefits Compared to Other Benefits
244
Very/Somewhat Important(%) (NET)
N/A N/A N/A N/A
High School or Less
Some College or Trade School
College Graduate
Some Grad. School or Graduate Degree
■’16 (N=535)■’15 (N=629)
■’14 (N=567)
■’13 (N=734)■’12 (N=441)
■ ’16 (N=1470)■ ’15 (N=1577)
■ ’14 (N=1480)■ ’13 (N=1278)■ ’12 (N=1010)
■ ’16 (N=1393)■ ’15 (N=1513)
■ ’14 (N=1284)
■ ’13 (N=994)■ ’12 (N=1423)
■ ’16 (N=763)
■ ’15 (N=831)
■ ’14 (N=812)
■ ’13 (N=645)■ ’12 (N=735)
Health insurance
401(k) / 403(b) / 457(b) or other employee self-funded plan
Disability insurance
Life Insurance
Company-funded defined-benefit pension plan
Long-Term Care insurance
Critical Illness Insurance
*A company -funded cash balance plan
Cancer Insurance

High School or Less
Some College or Trade School
College Graduate
Some Grad. School or Graduate Degree
■ ’16 (N=535)■ ’15 (N=629)
■ ’14 (N=567)
■ ’13 (N=734)■ ’12 (N=441)
■ ’16 (N=1470)■ ’15 (N=1577)■ ’14 (N=1480)■ ’13 (N=1278)■ ’12 (N=1010)
■ ’16 (N=1393)■ ’15 (N=1513)■ ’14 (N=1284)■ ’13 (N=994)■ ’12 (N=1423)
■ ’16 (N=763)■ ’15 (N=831)■ ’14 (N=812)■ ’13 (N=645)■ ’12 (N=735)
NET – AN EMPLOYEE-FUNDED PLAN
Employee-funded 401(k) plan
Other employee self-funded plan(e.g., SEP, SIMPLE, Other)
NET – COMPANY-FUNDED PLAN
Company-funded defined benefit pension plan
*A company-fundedcash balance plan
None of the above
76
73
4
15
22
65
63
4
15
31
64
62
3
23
17
8
29
65
62
5
22
19
6
29
69
67
4
23
20
6
26
82
79
5
21
15
79
75
6
21
18
77
75
4
24
19
10
17
73
73
4
28
23
10
19
79
77
4
31
25
12
13
*added in 2014BASE: ALL QUALIFIED RESPONDENTSQ1180. Which of the following retirement benefits does your company currently offer to you, personally? Select all.
While most workers have access to employer-sponsored retirement benefits, those with higher educational
attainment are more likely to be offered a plan compared to those with lower educational levels. An alarming
33 percent of workers with a high school education or less and 26 percent of those with some college or trade
school are not offered retirement benefits.
Retirement Benefits Currently Offered
245
64
61
4
16
30
55
51
6
15
39
61
60
2
23
19
8
30
56
53
3
19
15
6
38
61
59
4
22
21
6
33
N/A N/A N/A
N/A N/A N/A
86
85
11
29
11
80
79
4
25
16
78
75
5
29
23
12
16
77
76
5
30
26
10
15
77
75
5
35
31
11
13
N/A
N/A
Employer-Sponsored Retirement Benefits Currently Offered (%)
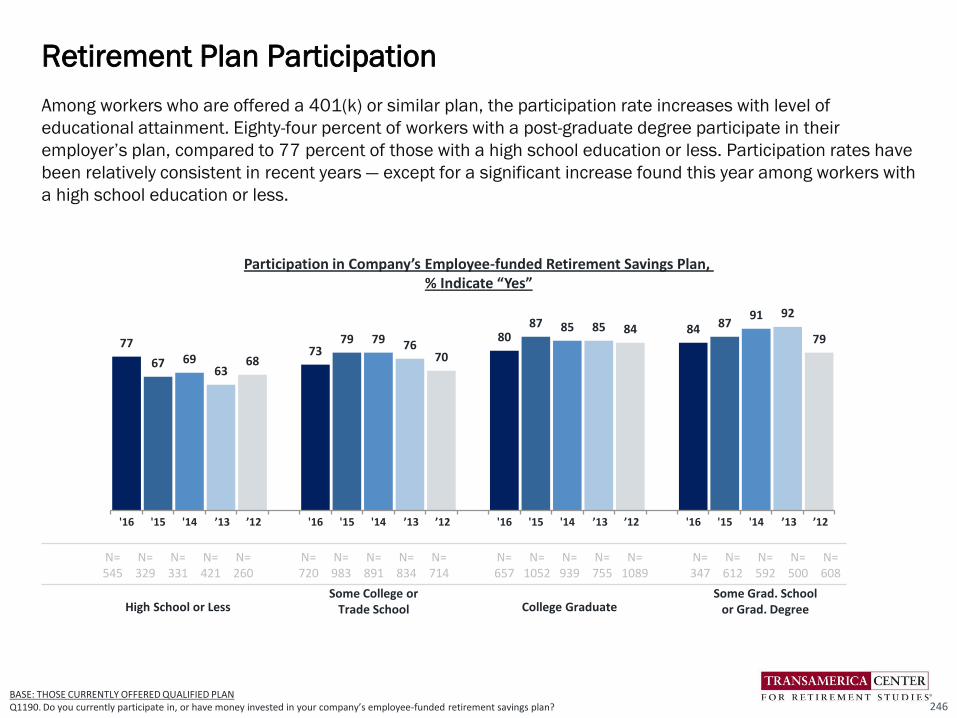
Among workers who are offered a 401(k) or similar plan, the participation rate increases with level of
educational attainment. Eighty-four percent of workers with a post-graduate degree participate in their
employer’s plan, compared to 77 percent of those with a high school education or less. Participation rates have
been relatively consistent in recent years — except for a significant increase found this year among workers with
a high school education or less.
Retirement Plan Participation
246BASE: THOSE CURRENTLY OFFERED QUALIFIED PLANQ1190. Do you currently participate in, or have money invested in your company’s employee-funded retirement savings plan?
Participation in Company’s Employee-funded Retirement Savings Plan, % Indicate “Yes”
77
67 6963
6873
79 79 7670
8087 85 85 84 84 87
91 92
79
'16 '15 '14 ’13 ’12 '16 '15 '14 ’13 ’12 '16 '15 '14 ’13 ’12 '16 '15 '14 ’13 ’12
N=545
N=329
N=331
N=421
N=260
N=720
N=983
N=891
N=834
N=714
N=657
N=1052
N=939
N=755
N=1089
N=347
N=612
N=592
N=500
N=608
High School or LessSome College or
Trade School College Graduate Some Grad. School
or Grad. Degree
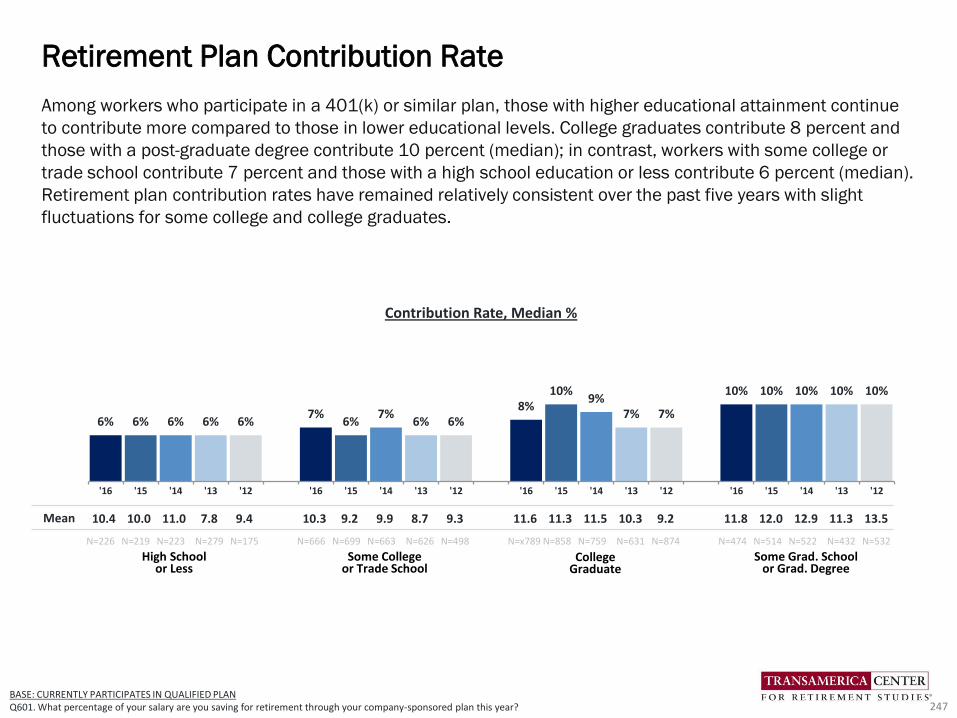
6% 6% 6% 6% 6%7%
6%7%
6% 6%8%
10%9%
7% 7%
10% 10% 10% 10% 10%
'16 '15 '14 '13 '12 '16 '15 '14 '13 '12 '16 '15 '14 '13 '12 '16 '15 '14 '13 '12
BASE: CURRENTLY PARTICIPATES IN QUALIFIED PLAN Q601. What percentage of your salary are you saving for retirement through your company-sponsored plan this year?
Contribution Rate, Median %
Among workers who participate in a 401(k) or similar plan, those with higher educational attainment continue
to contribute more compared to those in lower educational levels. College graduates contribute 8 percent and
those with a post-graduate degree contribute 10 percent (median); in contrast, workers with some college or
trade school contribute 7 percent and those with a high school education or less contribute 6 percent (median).
Retirement plan contribution rates have remained relatively consistent over the past five years with slight
fluctuations for some college and college graduates.
Retirement Plan Contribution Rate
247
Mean 10.4 10.0 11.0 7.8 9.4 10.3 9.2 9.9 8.7 9.3 11.6 11.3 11.5 10.3 9.2 11.8 12.0 12.9 11.3 13.5
N=226 N=219 N=223 N=279 N=175 N=666 N=699 N=663 N=626 N=498 N=x789 N=858 N=759 N=631 N=874 N=474 N=514 N=522 N=432 N=532
High School or Less
Some College or Trade School
College Graduate
Some Grad. School or Grad. Degree
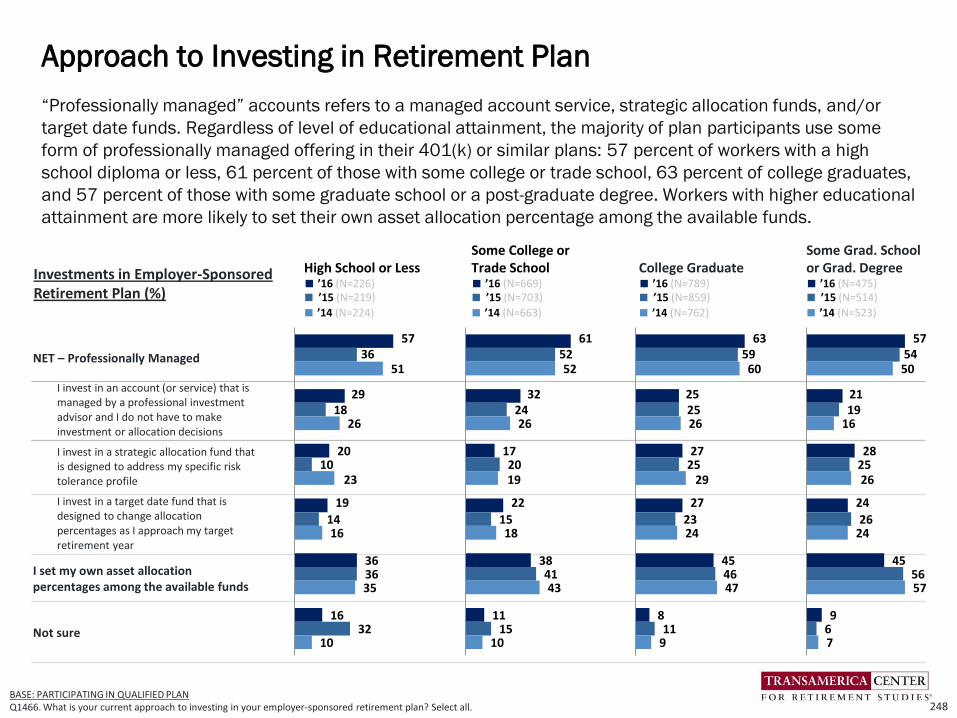
“Professionally managed” accounts refers to a managed account service, strategic allocation funds, and/or
target date funds. Regardless of level of educational attainment, the majority of plan participants use some
form of professionally managed offering in their 401(k) or similar plans: 57 percent of workers with a high
school diploma or less, 61 percent of those with some college or trade school, 63 percent of college graduates,
and 57 percent of those with some graduate school or a post-graduate degree. Workers with higher educational
attainment are more likely to set their own asset allocation percentage among the available funds.
Approach to Investing in Retirement Plan
248BASE: PARTICIPATING IN QUALIFIED PLANQ1466. What is your current approach to investing in your employer-sponsored retirement plan? Select all.
High School or Less■ ’16 (N=226)■ ’15 (N=219)
■ ’14 (N=224)
Some College or Trade School■ ’16 (N=669)■ ’15 (N=703)
■ ’14 (N=663)
College Graduate■ ’16 (N=789)■ ’15 (N=859)
■ ’14 (N=762)
Some Grad. School or Grad. Degree■ ’16 (N=475)■ ’15 (N=514)
■ ’14 (N=523)
NET – Professionally Managed
I invest in an account (or service) that is managed by a professional investment advisor and I do not have to make investment or allocation decisions
I invest in a strategic allocation fund that is designed to address my specific risk tolerance profile
I invest in a target date fund that is designed to change allocation percentages as I approach my target retirement year
I set my own asset allocation percentages among the available funds
Not sure
Investments in Employer-Sponsored Retirement Plan (%)
57
29
20
19
36
16
36
18
10
14
36
32
51
26
23
16
35
10
61
32
17
22
38
11
52
24
20
15
41
15
52
26
19
18
43
10
63
25
27
27
45
8
59
25
25
23
46
11
60
26
29
24
47
9
57
21
28
24
45
9
54
19
25
26
56
6
50
16
26
24
57
7

“Leakage” from retirement plans in the form of loans and withdrawals can severely inhibit the growth of
participants’ long-term retirement savings. Among participants who are currently participating in a plan, more
than one in five workers across levels of educational attainment have taken some form of loan, early
withdrawal, and/or hardship withdrawal from a 401(k) or similar plan. Workers with a high school diploma or
less are more likely to have done so compared to those with higher levels of educational attainment.
Retirement Plan Leakage: Loans and Withdrawals
249BASE: THOSE CURRENTLY PARTICIPATES IN QUALIFIED PLANQ754. Have you ever taken any form of loan or early withdrawal from a qualified retirement account such as a 401(k) or similar plan or IRA? Select all.
High School or Less■ ’16 (N=309)
Some College or Trade School■ ’16 (N=936)
College Graduate■ ’16 (N=1015)
Some Grad. School or Grad. Degree■ ’16 (N=560)
NET - Have Taken a Loan, Early Withdrawal, and/or Hardship Withdrawal From 401(k) or Similar Plan or IRA
Yes, I have taken a loan from a 401(k) or similar plan and am paying it back
Yes, I have taken an early withdrawal and cashed out a portion or all of a 401(k) or similar plan balance after my separation of employment from a prior employer and incurred taxes and penalties
Yes, I have taken a loan from a 401(k) or similar plan but was unable to pay it back so it became an early withdrawal and incurred taxes and penalties
Yes, I have taken a hardship withdrawal and incurred taxes and penalties
Yes, I have taken an early withdrawal and cashed out a portion or all of an IRA and incurred taxes and penalties
No, I have never taken a loan or early with-drawal from a 401(k) or similar plan or IRA
Not sure
32
20
8
5
8
4
64
4
28
16
6
5
4
4
70
2
23
14
7
6
5
2
76
1
23
15
7
5
5
3
77
1
Have you ever taken any form of loan or early withdrawal from a qualified retirement account such as a 401(k) or similar plan or IRA? (%)
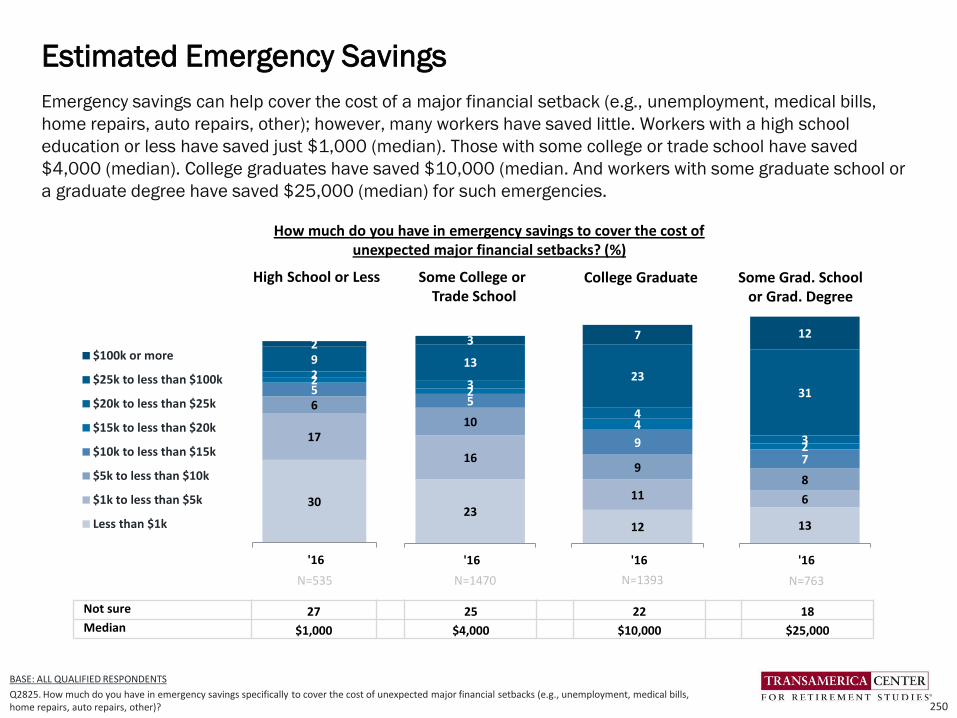
Emergency savings can help cover the cost of a major financial setback (e.g., unemployment, medical bills,
home repairs, auto repairs, other); however, many workers have saved little. Workers with a high school
education or less have saved just $1,000 (median). Those with some college or trade school have saved
$4,000 (median). College graduates have saved $10,000 (median. And workers with some graduate school or
a graduate degree have saved $25,000 (median) for such emergencies.
Estimated Emergency Savings
250
BASE: ALL QUALIFIED RESPONDENTS
Q2825. How much do you have in emergency savings specifically to cover the cost of unexpected major financial setbacks (e.g., unemployment, medical bills, home repairs, auto repairs, other)?
Not sure 27 25 22 18Median $1,000 $4,000 $10,000 $25,000
30
17
652292
'16
$100k or more
$25k to less than $100k
$20k to less than $25k
$15k to less than $20k
$10k to less than $15k
$5k to less than $10k
$1k to less than $5k
Less than $1k
High School or Less Some College or Trade School
College Graduate
N=535
Some Grad. Schoolor Grad. Degree
13
6
8
723
31
12
'16
23
16
10
523
13
3
'16
12
11
9
9
44
23
7
'16
N=1470 N=1393 N=763
How much do you have in emergency savings to cover the cost of unexpected major financial setbacks? (%)

251
Note: The median is estimated based on the approximate midpoint of the range of each response category.
BASE: ALL QUALIFIED RESPONDENTSQ890. Thinking of what money can buy today, how much money do you believe you will need to have saved by the time you retire in order to feel financially secure?
Workers’ estimated retirement savings needs increase with higher educational attainment. College graduates
estimate that they will need $900k and workers with a post-graduate degree estimate $1 million (estimated
medians). In contrast, those with some college or trade school estimate that they will need $500k and those
with a high school education or less estimate $250k (estimated medians).
Estimated Retirement Savings Needs
High School or Less Some College or Trade School College Graduate Some Grad. School or Grad. Degree
’16 ‘15 '14 '13 '12 ’16 ‘15 '14 '13 '12 ’16 ‘15 '14 '13 '12 ’16 ‘15 '14 '13 '12
N=535 N=629 N=567 N=734 N=441 N=1470 N=1577 N=1480 N=1278 N=1010 N=1393 N=1513 N=1284 N=994 N=1423 N=763 N=831 N=812 N=645 N=735
$2m or more 11 27 23 7 8 10 26 23 12 13 21 34 35 25 20 29 42 37 29 32
$1m to less than $2m 13 18 16 16 14 19 23 21 18 22 28 32 27 25 29 28 31 29 29 31
$500k to less than $1m 21 17 21 19 22 24 21 23 26 25 20 18 19 24 22 17 16 16 21 18
$100k to less than $500k 25 25 26 37 36 29 20 21 29 30 17 11 14 18 20 12 7 13 14 13
Less than $100k 30 13 15 21 20 18 10 12 15 11 14 5 5 9 9 14 4 5 7 6
Median $250k $600k $500k $250k $250k $500k $888k $750k $500k $500k $900k $1m $1m $900k $800k $1m $1.4m $1m $1m $1m
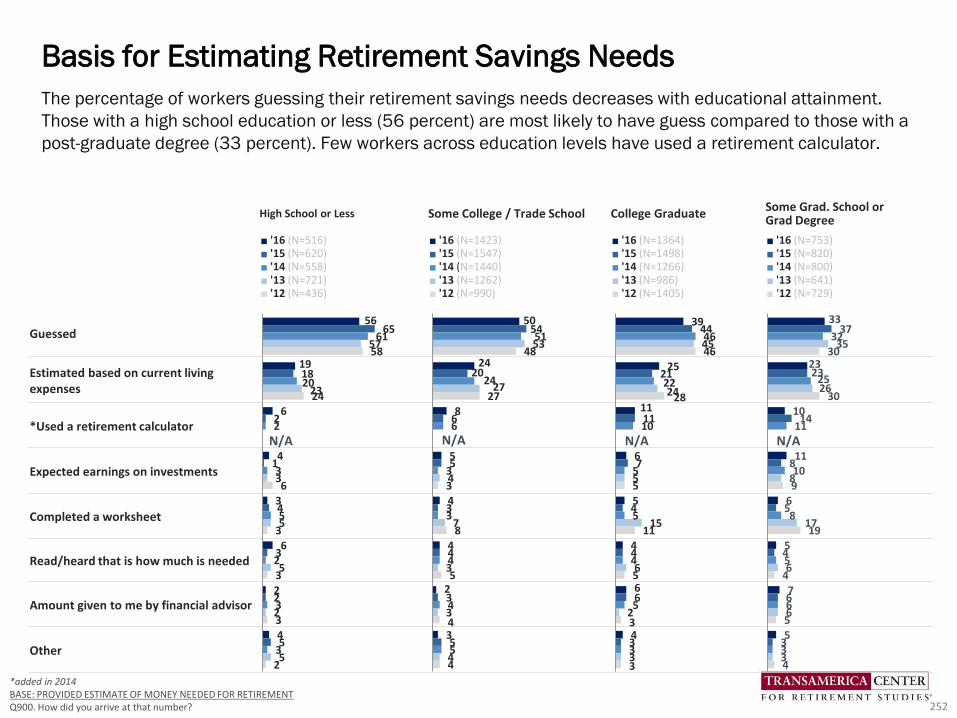
High School or Less Some College / Trade School College GraduateSome Grad. School or Grad Degree
■ '16 (N=516)■ '15 (N=620)■ '14 (N=558)■ '13 (N=721)■ '12 (N=436)
■ '16 (N=1423)■ '15 (N=1547)■ '14 (N=1440)■ '13 (N=1262)■ '12 (N=990)
■ '16 (N=1364)■ '15 (N=1498)■ '14 (N=1266) ■ '13 (N=986)■ '12 (N=1405)
■ '16 (N=753)■ '15 (N=820) ■ '14 (N=800)■ '13 (N=641)■ '12 (N=729)
Guessed
Estimated based on current living expenses
*Used a retirement calculator
Expected earnings on investments
Completed a worksheet
Read/heard that is how much is needed
Amount given to me by financial advisor
Other
The percentage of workers guessing their retirement savings needs decreases with educational attainment.
Those with a high school education or less (56 percent) are most likely to have guess compared to those with a
post-graduate degree (33 percent). Few workers across education levels have used a retirement calculator.
Basis for Estimating Retirement Savings Needs
252
*added in 2014BASE: PROVIDED ESTIMATE OF MONEY NEEDED FOR RETIREMENT Q900. How did you arrive at that number?
56
19
6
4
3
6
2
4
65
18
2
1
4
3
2
5
61
20
2
3
5
2
3
3
57
23
3
5
5
2
5
58
24
6
3
3
3
2
N/A
50
24
8
5
4
4
2
3
54
20
6
5
3
4
3
5
51
24
6
3
3
4
4
5
53
27
4
7
3
3
4
48
27
3
8
5
4
4
N/A
39
25
11
6
5
4
6
4
44
21
11
7
4
4
6
3
46
22
10
5
5
4
5
3
45
24
5
15
6
2
3
46
28
5
11
5
3
3
N/A
33
23
10
11
6
5
7
5
37
23
14
8
5
4
6
3
32
25
11
10
8
5
6
3
35
26
8
17
6
6
3
30
30
9
19
4
5
4
N/A

32 35 31 30 27 27 23 23 21 2013 12 13 13 13 9 6 10 8 9
1315
12 12 19 1716 16 16 17
23 27 26 28 2325 32 26 26 27
39 34 4338 35 37 42 42 42 43 46
47 4647
46 4847 48 51 45
16 16 1420 19 19 19 18 21 20 18 14 15 11
17 18 15 16 15 18
'16 '15 '14 '13 '12 '16 '15 '14 '13 '12 '16 '15 '14 '13 '12 '16 '15 '14 '13 '12
Mostly in bonds, moneymarket funds, cash andother stable investments
Relatively equal mix ofstocks and investmentssuch as bonds, moneymarket funds and cash
Mostly stocks, with littleor no money ininvestments such asbonds, money mkt funds,cashNot sure
N=336
N=362
N=339
N=469
N=260
N=979
N=1078
N=1029
N=871
N=695
N=1149
N=1243
N=1066
N=823
N=1158
N=660
N=715
N=696
N=568
N=657
High School or Less
Some College or Trade School
College Graduate Some Grad. School or Grad. Degree
BASE: INVESTING FOR RETIREMENTQ770. How is your retirement savings invested?
Across educational levels, workers most frequently say their retirement savings are invested in a relatively
equal mix of stocks and investments such as bonds, money market funds and cash. The response rate is higher
among those with a college education (46 percent) or those with a post-graduate degree (48 percent),
compared to those with some college or trade school (37 percent) and those with a high school education or
less (39 percent). Nearly one-third (32 percent) of workers with a high school education or less are unsure
about how their savings are invested. Asset allocation-related trends have been relatively consistent over the
past five years.
Asset Allocation of Retirement Investments
253
How Retirement Savings Are Invested (%)
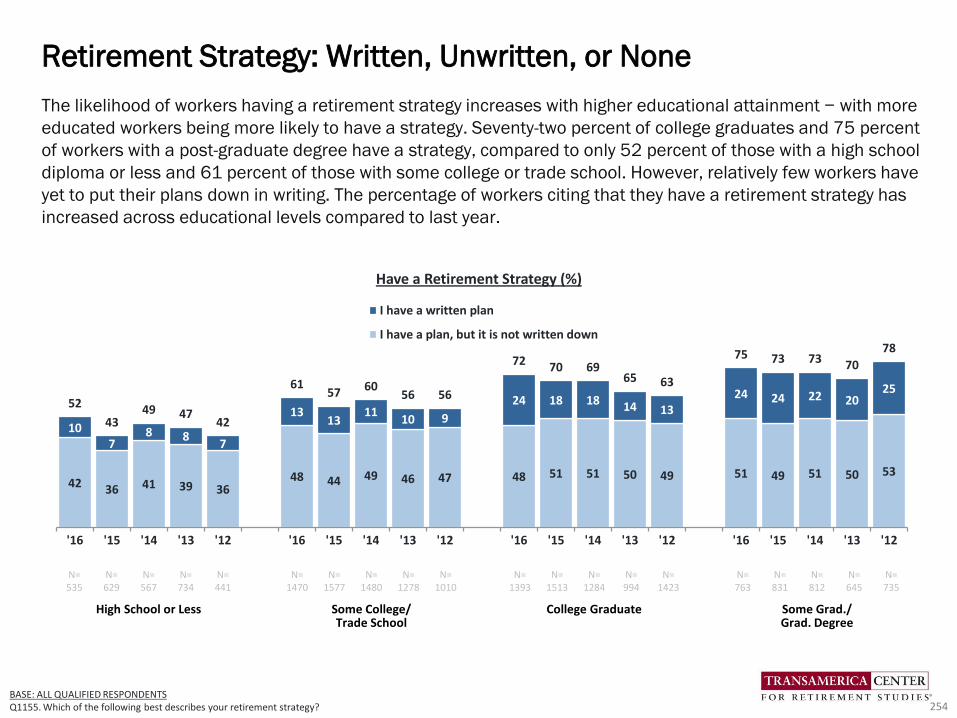
42 36 41 39 3648 44 49 46 47 48 51 51 50 49 51 49 51 50 53
107
8 87
1313
1110 9
24 18 18 14 1324 24 22 20
2552
4349 47
42
6157 60
56 56
72 70 6965 63
75 73 73 70
78
'16 '15 '14 '13 '12 '16 '15 '14 '13 '12 '16 '15 '14 '13 '12 '16 '15 '14 '13 '12
I have a written plan
I have a plan, but it is not written down
Have a Retirement Strategy (%)
BASE: ALL QUALIFIED RESPONDENTSQ1155. Which of the following best describes your retirement strategy?
N=535
N=629
N=567
N=734
N=441
N=1470
N=1577
N=1480
N=1278
N=1010
N=1393
N=1513
N=1284
N=994
N=1423
N=763
N=831
N=812
N=645
N=735
High School or Less Some College/Trade School
College Graduate Some Grad./ Grad. Degree
The likelihood of workers having a retirement strategy increases with higher educational attainment − with more
educated workers being more likely to have a strategy. Seventy-two percent of college graduates and 75 percent
of workers with a post-graduate degree have a strategy, compared to only 52 percent of those with a high school
diploma or less and 61 percent of those with some college or trade school. However, relatively few workers have
yet to put their plans down in writing. The percentage of workers citing that they have a retirement strategy has
increased across educational levels compared to last year.
Retirement Strategy: Written, Unwritten, or None
254

Among those who dream of traveling in retirement, workers’ confidence that their current financial strategy will
enable travel goals varies dramatically by level of educational attainment. The majority of workers with college
degree or more are confident compared to just half of workers with high school to some college education.
Relatively few workers across educational levels are “very” confident. Some workers haven’t given it much
thought, a finding that is more common among workers with high school diploma or less (23 percent).
Confidence that Financial Strategy Will Enable Travel Goals
255
High School or Less
Some College or Trade School
College Graduate Some Grad. School or Grad. Degree
■ ’16 (N=279) ■ ’16 (N=932) ■ ’16 (N=998) ■ ’16 (N=539)
Very confident
Somewhat confident
Not too confident
Not at all confident
I haven’t given much thought to a financial strategy for travel in retirement
12
35
15
14
23
BASE: THOSE WHO DREAM OF TRAVELING IN RETIREMENTQ2845. How confident are you that your current financial strategy will allow you to meet your travel goals throughout retirement?
Net Confident
48% 13
39
18
13
18
Net Confident
52% 23
45
15
6
11
Net Confident
68% 27
44
12
5
11
Net Confident
71%
Confidence That Current Financial Strategy Will Meet Retirement Travel Goals (%)
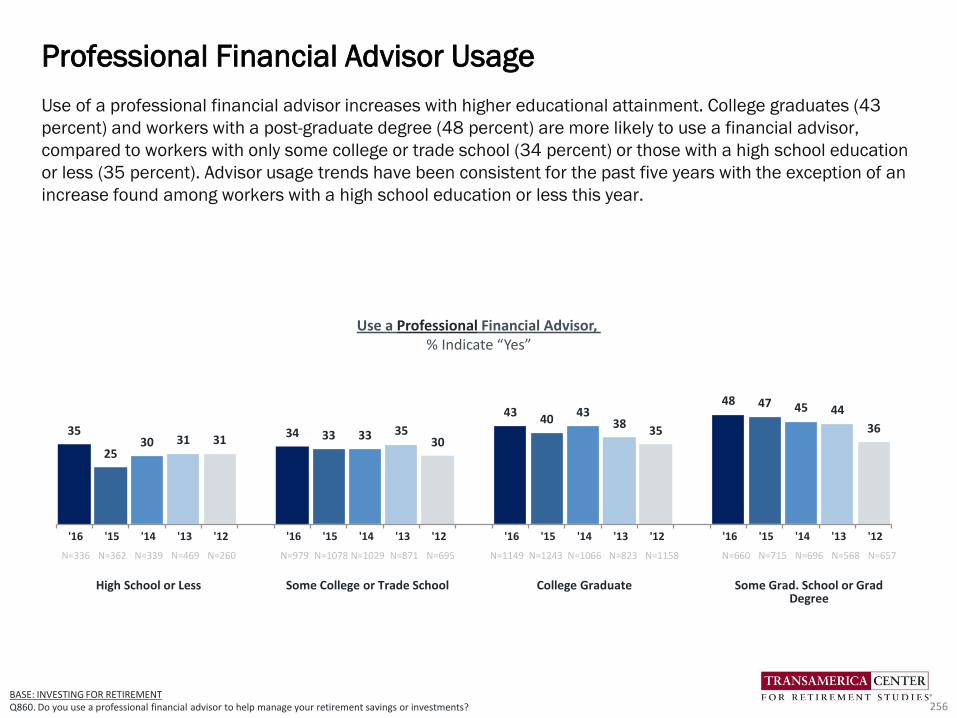
Use of a professional financial advisor increases with higher educational attainment. College graduates (43
percent) and workers with a post-graduate degree (48 percent) are more likely to use a financial advisor,
compared to workers with only some college or trade school (34 percent) or those with a high school education
or less (35 percent). Advisor usage trends have been consistent for the past five years with the exception of an
increase found among workers with a high school education or less this year.
Professional Financial Advisor Usage
256BASE: INVESTING FOR RETIREMENTQ860. Do you use a professional financial advisor to help manage your retirement savings or investments?
35
2530 31 31
34 33 33 3530
4340
4338
35
48 47 45 44
36
'16 '15 '14 '13 '12 '16 '15 '14 '13 '12 '16 '15 '14 '13 '12 '16 '15 '14 '13 '12
N=336 N=362 N=339 N=469 N=260 N=979 N=1078 N=1029 N=871 N=695 N=1149 N=1243 N=1066 N=823 N=1158 N=660 N=715 N=696 N=568 N=657
High School or Less Some College or Trade School College Graduate Some Grad. School or Grad Degree
Use a Professional Financial Advisor, % Indicate “Yes”

Household retirement savings increase with higher educational attainment. College graduates have saved
$143,000 and workers with a post-graduate degree have saved $176,000 (estimated medians). In contrast,
workers with some college or trade school have saved $47,000 and those with a high school education or less
have saved $23,000 (estimated medians). Forty-one percent of workers with a post-graduate degree have
saved $250,000 or more compared to just 14 percent of those with a high school education or less.
Total Household Retirement Savings
257BASE: ALL QUALIFIED RESPONDENTSQ1300. Approximately how much money does your household have saved in all of your retirement accounts?
Not sure 13 16 12 13 18 15 11 11 11 13 10 8 7 10 9 10 5 4 5 4
Decline to answer 11 13 13 14 13 8 11 10 11 14 10 9 8 12 13 9 6 8 7 13
Estimated Median $23k $27k $31k $28k $14k $47k $51k $47k $33k $25k $143k $117k $114k $79k $66k $176k $178k $169k $157k $176k
Note: The median is estimated based on the approximate midpoint of the range of each response category. Non-responses are excluded from the estimate.
2518 15 18 21
16 14 14 17 167 7 6 10 9 5 7 5 4 4
6
45
88
5 6 56 8
4 3 44 6
2 2 2 2 3
5
8 85
9
7 8 810 9
4 5 55
8
35
4 7 4
812 12 10
9
8 7 9
8 7
5 7 79
8
34
45 6
8 11 15 137
8 1114
1310
1011 13
1111
128 10 8 10
10 911 11 10
1113
1011
11
1518
1918
17
15 16 20 2114
149
9 85 22
19 19 1312
3532
31 21 19
4147 43 41
42
'16 '15 '14 '13 '12 '16 '15 '14 '13 '12 '16 '15 '14 '13 '12 '16 '15 '14 '13 '12
$250k or more
$100k to less than $250k
$50k to less than $100k
$25k to less than $50k
$10k to less than $25k
$5k to less than $10k
Less than $5k
Total Household Retirement Savings (%)
N=535 N=629 N=567 N=734 N=441 N=1470 N=1577 N=1480 N=1278 N=1010 N=1393 N=1513 N=1284 N=994 N=1423 N=763 N=831 N=812 N=645 N=735
High School or Less
Some College or Trade School
College Graduate Some Grad. School or Grad. Degree
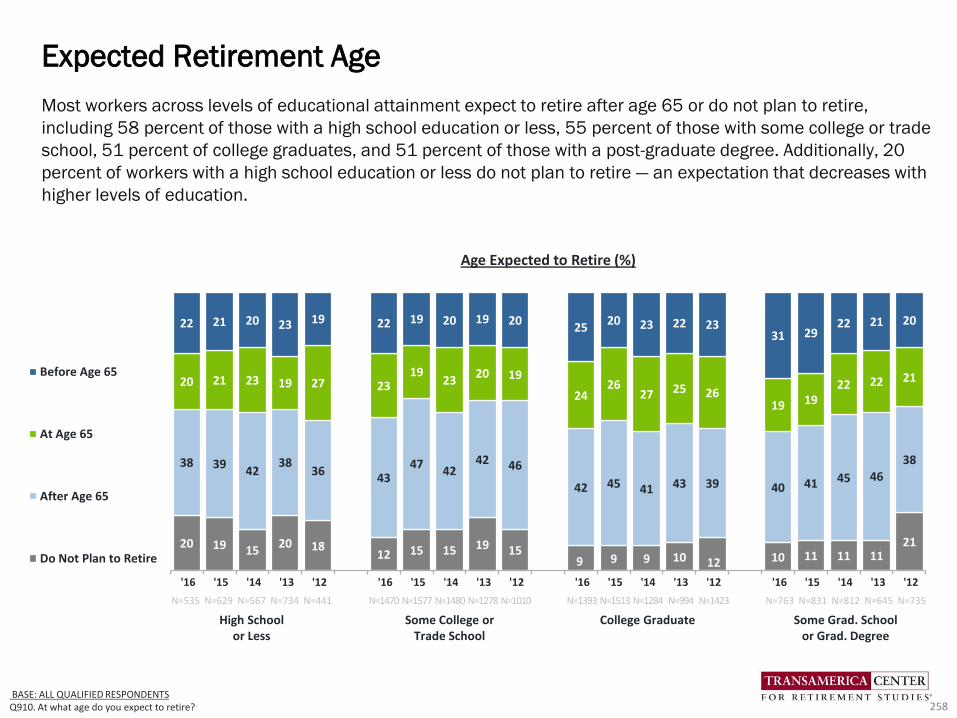
Most workers across levels of educational attainment expect to retire after age 65 or do not plan to retire,
including 58 percent of those with a high school education or less, 55 percent of those with some college or trade
school, 51 percent of college graduates, and 51 percent of those with a post-graduate degree. Additionally, 20
percent of workers with a high school education or less do not plan to retire — an expectation that decreases with
higher levels of education.
Expected Retirement Age
258
20 19 1520 18
12 15 15 19 159 9 9 10 12 10 11 11 11
21
38 3942
3836
4347
4242 46
42 45 41 43 39 40 41 45 46
38
20 21 23 19 27 2319
2320 19
2426
27 25 2619 19
22 22 21
22 21 20 23 19 22 19 20 19 2025
20 23 22 2331 29
22 21 20
'16 '15 '14 '13 '12 '16 '15 '14 '13 '12 '16 '15 '14 '13 '12 '16 '15 '14 '13 '12
Before Age 65
At Age 65
After Age 65
Do Not Plan to Retire
BASE: ALL QUALIFIED RESPONDENTSQ910. At what age do you expect to retire?
N=535 N=629 N=567 N=734 N=441 N=1470 N=1577 N=1480 N=1278 N=1010 N=1393 N=1513 N=1284 N=994 N=1423 N=763 N=831 N=812 N=645 N=735
High School or Less
Some College or Trade School
College Graduate Some Grad. School or Grad. Degree
Age Expected to Retire (%)
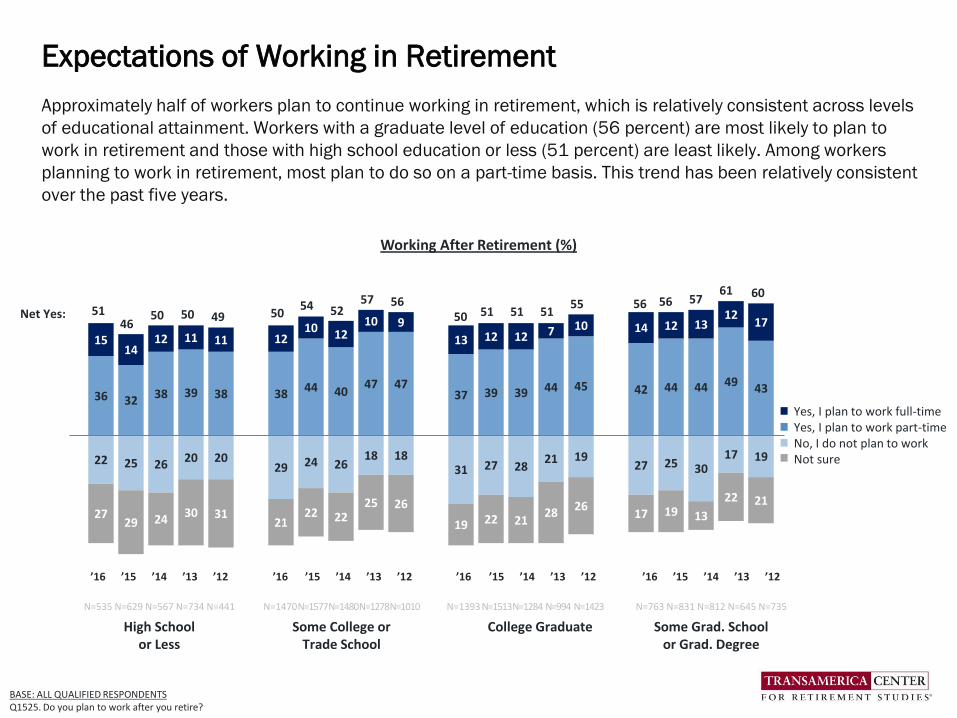
Approximately half of workers plan to continue working in retirement, which is relatively consistent across levels
of educational attainment. Workers with a graduate level of education (56 percent) are most likely to plan to
work in retirement and those with high school education or less (51 percent) are least likely. Among workers
planning to work in retirement, most plan to do so on a part-time basis. This trend has been relatively consistent
over the past five years.
Expectations of Working in Retirement
259
BASE: ALL QUALIFIED RESPONDENTSQ1525. Do you plan to work after you retire?
Working After Retirement (%)
Yes, I plan to work full-timeYes, I plan to work part-timeNo, I do not plan to workNot sure
’16 ’15 ’14 ’13 ’12 ’16 ’15 ’14 ’13 ’12 ’16 ’15 ’14 ’13 ’12 ’16 ’15 ’14 ’13 ’12
N=535 N=629 N=567 N=734 N=441 N=1470N=1577N=1480N=1278N=1010 N=1393N=1513N=1284 N=994 N=1423 N=763 N=831 N=812 N=645 N=735
High School or Less
Some College or Trade School
College Graduate Some Grad. School or Grad. Degree
36 32 38 39 38 38 44 4047 47
37 39 39 44 45 42 44 44 49 43
1514
12 11 11 1210 12
10 9
13 12 12 7 10 14 12 1312
17
22 25 26 20 2029 24 26
18 1831 27 28
21 1927 25 30
17 19
2729 24 30 31
2122 22
25 26
19 22 2128 26
17 19 13
22 21
Net Yes:46
50 50 4954 52
57 5651 51 51
55 56 5761 60
56505051
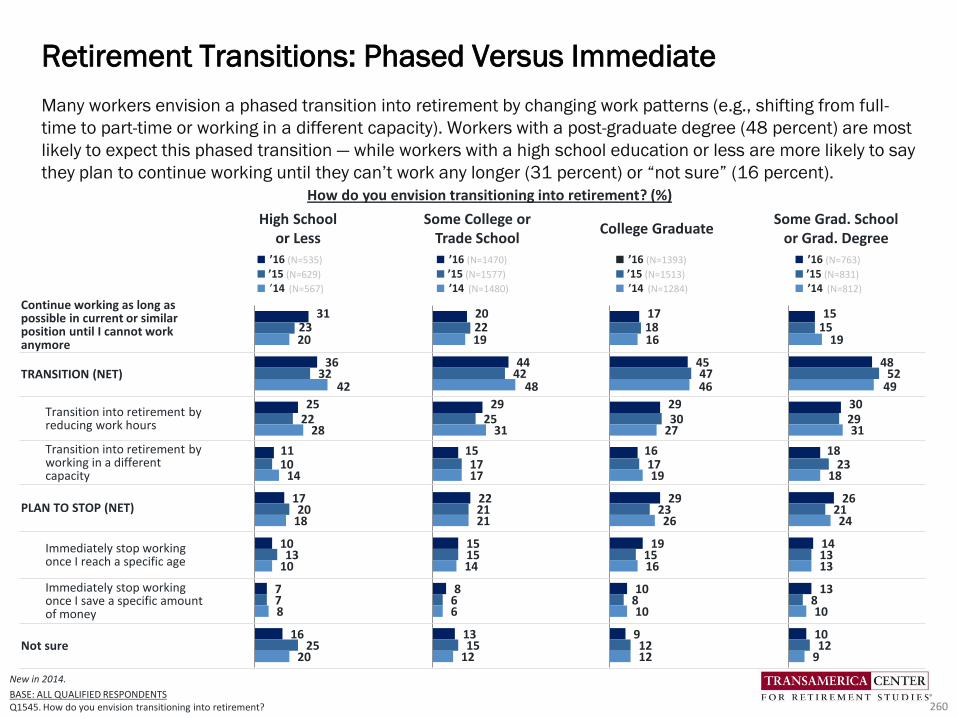
Many workers envision a phased transition into retirement by changing work patterns (e.g., shifting from full-
time to part-time or working in a different capacity). Workers with a post-graduate degree (48 percent) are most
likely to expect this phased transition — while workers with a high school education or less are more likely to say
they plan to continue working until they can’t work any longer (31 percent) or “not sure” (16 percent).
Retirement Transitions: Phased Versus Immediate
260
New in 2014.
BASE: ALL QUALIFIED RESPONDENTSQ1545. How do you envision transitioning into retirement?
31
36
25
11
17
10
7
16
23
32
22
10
20
13
7
25
20
42
28
14
18
10
8
20
20
44
29
15
22
15
8
13
22
42
25
17
21
15
6
15
19
48
31
17
21
14
6
12
17
45
29
16
29
19
10
9
18
47
30
17
23
15
8
12
16
46
27
19
26
16
10
12
15
48
30
18
26
14
13
10
15
52
29
23
21
13
8
12
19
49
31
18
24
13
10
9
High School or Less
Some College or Trade School
College Graduate Some Grad. School
or Grad. Degree ■ ’16 (N=535)
■ ’15 (N=629)
■ ’14 (N=567)
■ ’16 (N=1470)
■ ’15 (N=1577)
■ ’14 (N=1480)
■ ’16 (N=1393)
■ ’15 (N=1513)
■ ’14 (N=1284)
■ ’16 (N=763)
■ ’15 (N=831)
■ ’14 (N=812)
Continue working as long as possible in current or similar position until I cannot work anymore
TRANSITION (NET)
Transition into retirement by reducing work hours
Transition into retirement by working in a different capacity
PLAN TO STOP (NET)
Immediately stop working once I reach a specific age
Immediately stop working once I save a specific amount of money
Not sure
How do you envision transitioning into retirement? (%)
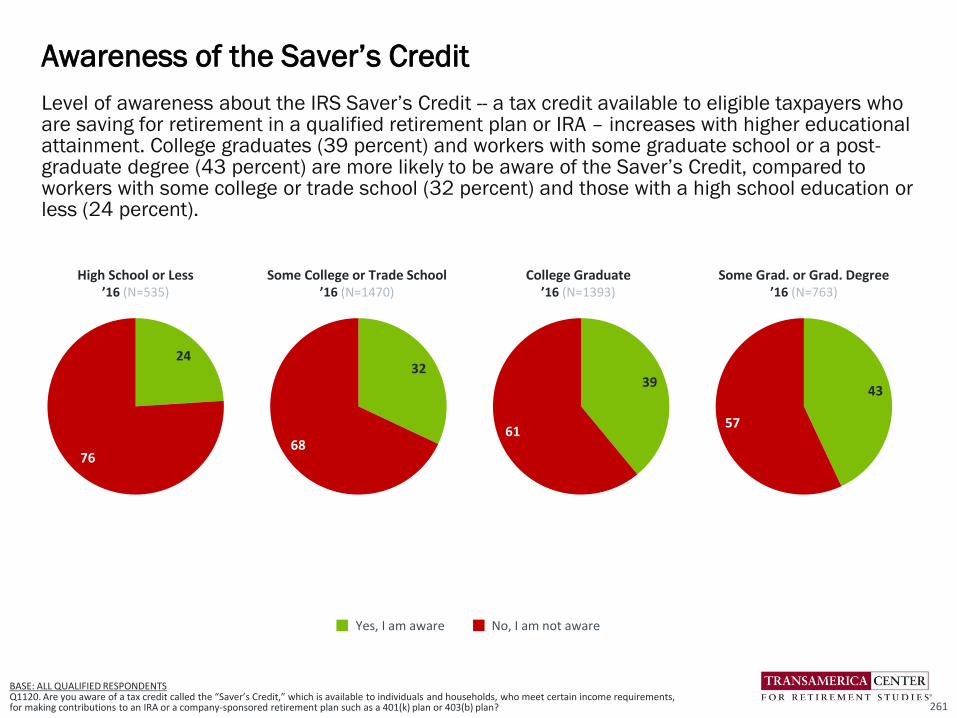
Level of awareness about the IRS Saver’s Credit -- a tax credit available to eligible taxpayers who are saving for retirement in a qualified retirement plan or IRA – increases with higher educational attainment. College graduates (39 percent) and workers with some graduate school or a post-graduate degree (43 percent) are more likely to be aware of the Saver’s Credit, compared to workers with some college or trade school (32 percent) and those with a high school education or less (24 percent).
Awareness of the Saver’s Credit
261
Yes, I am aware No, I am not aware
24
76
High School or Less’16 (N=535)
32
68
Some College or Trade School’16 (N=1470)
39
61
College Graduate’16 (N=1393)
43
57
Some Grad. or Grad. Degree’16 (N=763)
BASE: ALL QUALIFIED RESPONDENTS Q1120. Are you aware of a tax credit called the “Saver’s Credit,” which is available to individuals and households, who meet certain income requirements, for making contributions to an IRA or a company-sponsored retirement plan such as a 401(k) plan or 403(b) plan?

Workers across levels of educational attainment most frequently cite fully funding Social Security as a priority
for the new President and Congress to help Americans prepare for a financially secure retirement: 56 percent
of those with high school diploma or less, 64 percent of those with some college or trade school, 55 percent of
college graduates, and 53 percent of post-graduates. Other top cited responses include “encouraging 401(k)
plans to offer the option to pay retirement benefits in a form that guarantees retirees a set monthly income for
life,” and “encouraging employers with a 401(k) or similar plan to enable their part-time workers to participate
in the plan.”
Retirement Security Priorities for the New President and Congress
262
Which of the following should be priorities for the next President and Congress to help Americans prepare for a financially secure retirement? (%)
High School or Less■ ’16 (N=535)
Some College or Trade School■ ’16 (N=1470)
College Graduate■ ’16 (N=1393)
Some Grad. School or Grad. Degree■ ’16 (N=763)
Fully fund Social Security by implementing reforms to ensure that it can pay guaranteed benefits for future generations of retirees
Encourage 401(k) and similar plans to offer the option to pay retirement benefits in a form that guarantees retirees a set monthly income for life
Encourage employers with a 401(k) or similar plan to enable their part-time workers to participate in the plan
Encourage employers to make it easier to work past age 65 with a flexible, phased transition into retirement
Promote the ability for workers to save for retirement by setting up a direct deposit of a portion of their paychecks into an IRA (including myRA), especially those who are not offered a 401(k) or similar plan
Make the Saver's Credit, a tax credit for saving for retirement, available to all tax filers regardless of whether they have to pay taxes or not
Educate Americans early by implementing a financial literacy curriculum in the schools
Provide incentives for employers to adopt more automated features into their 401(k) or similar plans (such as automatic enrollment, contribution increases, and default investments)
Create incentives for individuals to obtain ongoing training and education to keep their job skills up to date and relevant
56
41
35
35
34
31
28
27
23
64
48
40
39
38
37
35
29
27
55
47
41
37
36
36
33
30
25
53
47
39
37
35
31
34
33
34
Note: Responses not shown for less than five percent who said “other.”BASE: ALL QUALIFIED RESPONDENTSQ1427. With the November 2016 election in mind, which of the following should be priorities for the next President and Congress to help Americans prepare for a financially secure retirement? Select all.
Influences of Ethnicity on Retirement Readiness
Detailed Findings

Retirement expectations are generally similar across ethnicities. Workers of different ethnicities envision a
phased transition into retirement and are planning to live well into their eighties. However, there are some
disparities by ethnicity. Hispanic and African American workers are less likely to be saving for retirement and to
have emergency savings in the event of a major financial setback, compared to White and Asian workers.
However, White and Asian workers also face retirement risks. Efforts to improve the retirement outlook of
Hispanic and African American workers, such as improving retirement plan participation, should benefit other
ethnicities as well
Twenty-Eight Indicators of Retirement Readiness
• Recovery From the Great Recession. In 2016, nearly four in ten workers across ethnicities say were either
not impacted or have fully recovered from the Great Recession, including 41 percent of African Americans,
39 percent of Whites, and 38 percent of both Hispanics and Asians. However, there are some differences
across ethnicities of those who have not yet begun to recover or may never recover: Whites (19 percent),
Asians (21 percent), African Americans (22 percent) and Hispanics (24 percent).
• Confidence in Retiring Comfortably. The majority of workers across ethnicities are confident that they will
be able to fully retire with a comfortable lifestyle: 61 percent of White, 63 percent of Hispanic, 65 percent
of African American, and 63 percent of Asian workers. Relatively few workers of all four ethnic groups are
“very” confident, including 15 percent of White, 13 percent of Hispanic, 18 percent of African American,
and 17 percent of Asian workers.
• Building a Large Enough Nest Egg? Workers’ confidence in whether they are building a large enough
retirement nest egg varies by ethnicity. Asian workers (57 percent) are most likely to agree that they are
building a large enough nest egg, followed by Hispanic (54 percent), White (51 percent), and African
American workers (49 percent).
Influences of Ethnicity on Retirement Readiness
264
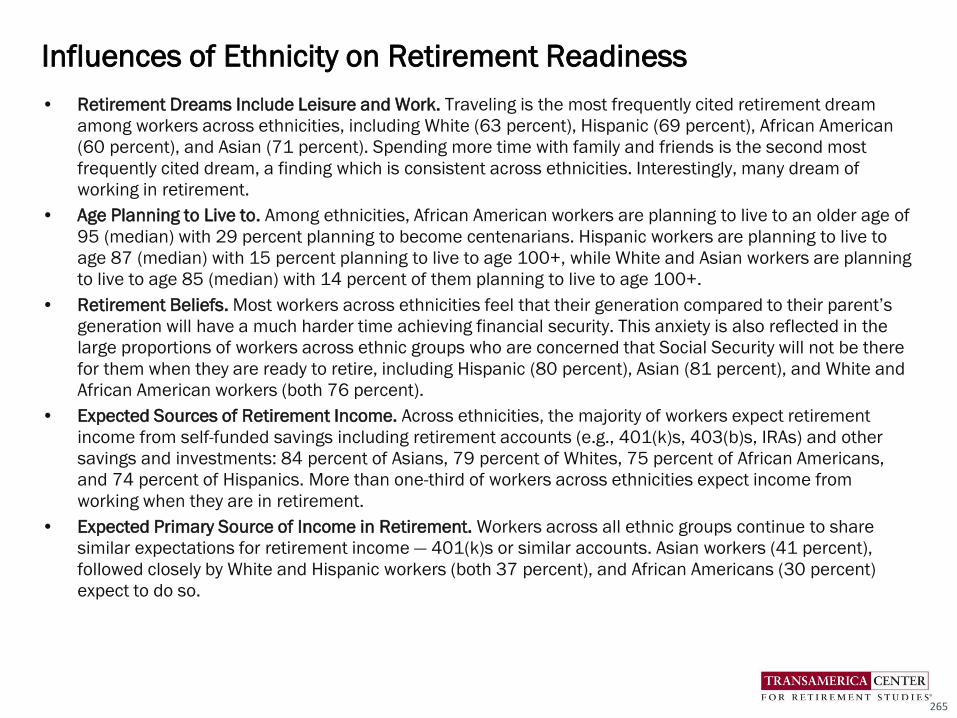
• Retirement Dreams Include Leisure and Work. Traveling is the most frequently cited retirement dream
among workers across ethnicities, including White (63 percent), Hispanic (69 percent), African American
(60 percent), and Asian (71 percent). Spending more time with family and friends is the second most
frequently cited dream, a finding which is consistent across ethnicities. Interestingly, many dream of
working in retirement.
• Age Planning to Live to. Among ethnicities, African American workers are planning to live to an older age of
95 (median) with 29 percent planning to become centenarians. Hispanic workers are planning to live to
age 87 (median) with 15 percent planning to live to age 100+, while White and Asian workers are planning
to live to age 85 (median) with 14 percent of them planning to live to age 100+.
• Retirement Beliefs. Most workers across ethnicities feel that their generation compared to their parent’s
generation will have a much harder time achieving financial security. This anxiety is also reflected in the
large proportions of workers across ethnic groups who are concerned that Social Security will not be there
for them when they are ready to retire, including Hispanic (80 percent), Asian (81 percent), and White and
African American workers (both 76 percent).
• Expected Sources of Retirement Income. Across ethnicities, the majority of workers expect retirement
income from self-funded savings including retirement accounts (e.g., 401(k)s, 403(b)s, IRAs) and other
savings and investments: 84 percent of Asians, 79 percent of Whites, 75 percent of African Americans,
and 74 percent of Hispanics. More than one-third of workers across ethnicities expect income from
working when they are in retirement.
• Expected Primary Source of Income in Retirement. Workers across all ethnic groups continue to share
similar expectations for retirement income — 401(k)s or similar accounts. Asian workers (41 percent),
followed closely by White and Hispanic workers (both 37 percent), and African Americans (30 percent)
expect to do so.
Influences of Ethnicity on Retirement Readiness
265
• Percentage Saving for Retirement/ Age They Started to Save. Asian workers (86 percent) are most likely to
be saving for retirement through an employer-sponsored retirement plan and/or outside of work, followed
by White (78 percent), African American (73 percent), and Hispanic workers (70 percent). In terms of the
median age that they started saving, African American and Asian workers started at a relatively younger
age (age 25), compared to White (age 28) and Hispanic (age 26) workers.
• Importance of Retirement Benefits Compared to Other Benefits. Approximately nine in ten workers across
ethnicities value a 401(k) or similar employee-funded retirement as an important benefit. They value
retirement plans second only to health insurance.
• Retirement Benefits Currently Offered. Most workers across ethnic groups are offered a 401(k) or other
self-funded plan by their employers. Such access is greatest among Asian workers (79 percent) and least
among Hispanic workers (66 percent), and similar among White (71 percent) and African American
workers (73 percent).
• Retirement Plan Participation. Among workers who are offered a 401(k) or similar plan, the participation
rate varies across ethnic groups. White (81 percent) and Asian workers (78 percent) are more likely to be
participating in their employer’s plan, compared to Hispanic (67 percent) and African American workers
(71 percent).
• Retirement Plan Contribution Rate. Of workers who participate in a 401(k) or similar plan, the median
contribution rate is highest among Asian workers (10 percent), followed by Hispanic and African American
(both 8 percent) and White workers (7 percent).
• Approach to Investing in Retirement Plan. “Professionally managed” accounts refers to a managed
account service, strategic allocation funds, and/or target date funds. Across ethnicities, the majority of
plan participants use some form of professionally managed offering in their 401(k) or similar plans: 59
percent Whites, 62 percent of Hispanics, 62 percent of Asians, and 63 percent of African Americans. White
(43 percent) and Hispanic workers (40 percent) are slightly more likely to set their own asset allocation
percentage among the available funds, compared to African American (34 percent) and Asian workers (36
percent).
Influences of Ethnicity on Retirement Readiness
266
• Retirement Plan Leakage: Loans and Withdrawals. “Leakage” from retirement plans in the form of loans
and withdrawals can severely inhibit the growth of participants’ long-term retirement savings. Among
participants who are currently participating in a plan, some workers across ethnicities have taken some
form of loan, early withdrawal, and/or hardship withdrawal from a 401(k) or similar plan, including African
American workers (31 percent) who are most likely to have done so, followed by Hispanic workers (29
percent), White workers (27 percent), and Asian workers (18 percent).
• Estimated Emergency Savings. Emergency savings can help cover the cost of a major financial setback
(e.g., unemployment, medical bills, home repairs, auto repairs, other); however, workers report having
saved relatively little in this regards. White workers have saved $5,000 (median), Hispanics have saved
$3,000 (median), African Americans have saved $1,000 (median), and Asian workers have saved
$20,000 (median). More than one in five White, Hispanic, and African American workers have saved less
than $1,000 for such emergencies.
• Estimated Retirement Savings Needs. Asian workers estimate that they will need to have saved $1 million
by the time they retire in order to feel financially secure. White and Hispanic workers estimate they will
need $500k (estimated median), and African American workers estimate $250k.
• Basis for Estimating Retirement Savings Needs. Many workers are “guessing their retirement savings
needs. African American workers (52 percent) are most likely to have guessed while Asian workers (39
percent) are least likely to have done so. Few workers across ethnic groups indicate that they have used a
retirement calculator to estimate their savings needs.
• Asset Allocation of Retirement Investments. Workers across ethnicities most frequently indicate that their
retirement savings are invested in a relatively equal mix of stocks and investments such as bonds, money
market funds and cash; however, the response rate is lower among African American workers (32 percent)
compared to White (43 percent), Hispanic (40 percent), and Asian workers (43 percent). More than one in
five White, Hispanic, and African American workers are unsure how their savings are invested.
Influences of Ethnicity on Retirement Readiness
267
• Retirement Strategy: Written, Unwritten, or None. The majority of workers across ethnicities have some
form of retirement strategy (either written or unwritten), including 63 percent of Whites and Hispanics, 64
percent of African Americans, and 67 percent of Asians. However, few workers across ethnicities have a
written strategy, including Whites and Hispanics (both 17 percent), African Americans (18 percent), and
Asians (15 percent).
• Confidence that Financial Strategy Will Enable Travel Goals. Among workers who dream of traveling in
retirement, the majority are confident their current financial strategy will allow them to meet their travel
goals: 59 percent of Whites, 59 percent of Hispanics, and 60 percent of both African Americans and
Asians. However, relatively few across ethnic groups are “very” confident and some haven’t given it much
thought.
• Professional Financial Advisor Usage. Hispanic workers (46 percent) are most likely to use a professional
financial advisor to help manage their retirement savings or investments while Asian workers (29 percent)
are least likely. Forty-percent of White and 36 percent of African American workers use a financial adviser.
• Total Household Retirement Savings. White and Asian workers have the highest reported household
retirement savings (estimated medians of $89k and $134k, respectively). They are also most likely to say
that they have saved $25k or more (29 percent of Whites and 33 percent of Asians). In contrast, Hispanic
workers have saved $48k and African American workers have saved $22k.
• Expected Retirement Age. The majority of White (58 percent) and Asian workers (51 percent) expect to
work past age 65 or do not plan to retire. In contrast, the majority of African American (59 percent) and
Hispanic workers (52 percent) expect to retire at age 65 or sooner.
• Expectations of Working in Retirement. Across ethnicities, approximately half of workers plan to work full-
or part-time in retirement, including 51 percent of Whites, 50 percent of Hispanics, 49 percent of African
Americans, and 50 percent of Asian workers.
Influences of Ethnicity on Retirement Readiness
268
• Retirement Transitions: Phased Versus Immediate. Many workers across ethnicities envision a phased
transition into retirement by changing work patterns (e.g., shifting from full-time to part-time or working in a
different capacity), including 40 percent of Whites, 45 percent of Hispanics, 44 percent of African
Americans, and 48 percent of Asians. Approximately one in five workers across ethnicities plan to
immediately stop working when they reach a specific age or savings goal.
• Awareness of the Saver’s Credit. The IRS offers a tax credit to eligible taxpayers who are saving for
retirement in a qualified retirement plan or IRA, called the Saver’s Credit – yet only about one-third of
workers across ethnicities are aware of it. Hispanic (36 percent) and Asian workers (35 percent) are more
likely to be aware of the Saver’s Credit, compared to White (32 percent) and African American workers (30
percent).
• Retirement Security Priorities for the New President and Congress. Workers across ethnicities most
frequently cite fully funding Social Security as a priority for the new President and Congress to help
Americans prepare for a financially secure retirement. However, there are noteworthy differences by
ethnicity. White workers (63 percent) are more likely to cite fully funding Social Security compared to other
ethnicities. Hispanic workers (38 percent) are slightly more likely to cite “educating Americans early by
implementing a financial literacy curriculum in school.” African American workers (36 percent) are more
likely to cite “creating incentives for individuals to obtain ongoing training and education to keep their job
skills up to date and relevant.”
In this section, please note that data is unavailable for two indicators — Current Financial Priorities (Q2639)
and Greatest Financial Priority Right Now (Q2640) — due to very small base sizes.
Influences of Ethnicity on Retirement Readiness
269
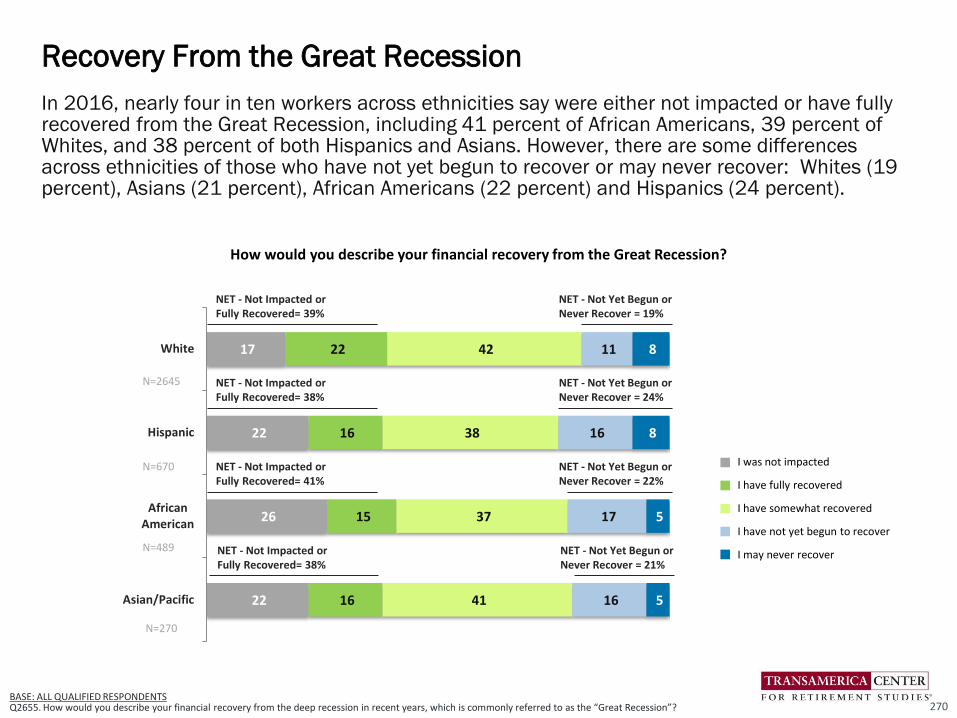
In 2016, nearly four in ten workers across ethnicities say were either not impacted or have fully recovered from the Great Recession, including 41 percent of African Americans, 39 percent of Whites, and 38 percent of both Hispanics and Asians. However, there are some differences across ethnicities of those who have not yet begun to recover or may never recover: Whites (19 percent), Asians (21 percent), African Americans (22 percent) and Hispanics (24 percent).
Recovery From the Great Recession
270BASE: ALL QUALIFIED RESPONDENTS Q2655. How would you describe your financial recovery from the deep recession in recent years, which is commonly referred to as the “Great Recession”?
17
22
26
22
22
16
15
16
42
38
37
41
11
16
17
16
8
8
5
5
White
Hispanic
AfricanAmerican
Asian/Pacific
I was not impacted
I have fully recovered
I have somewhat recovered
I have not yet begun to recover
I may never recover
NET - Not Impacted or Fully Recovered= 39%
How would you describe your financial recovery from the Great Recession?
NET - Not Yet Begun or Never Recover = 19%
N=2645
N=670
N=489
N=270
NET - Not Impacted or Fully Recovered= 38%
NET - Not Yet Begun or Never Recover = 24%
NET - Not Impacted or Fully Recovered= 41%
NET - Not Yet Begun or Never Recover = 22%
NET - Not Impacted or Fully Recovered= 38%
NET - Not Yet Begun or Never Recover = 21%
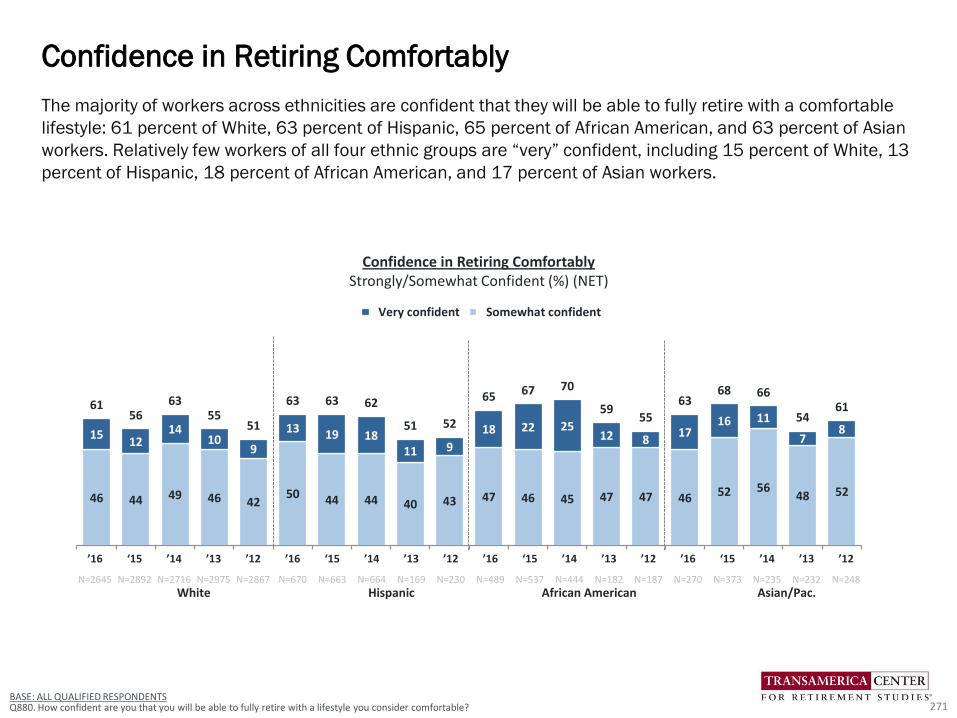
46 44 49 46 4250 44 44 40 43 47 46 45 47 47 46 52 56
48 52
1512
1410
9
13 19 1811 9
18 22 2512 8
1716 11
78
6156
6355
51
63 63 62
51 52
65 67 70
5955
6368 66
5461
Very confident Somewhat confident
The majority of workers across ethnicities are confident that they will be able to fully retire with a comfortable
lifestyle: 61 percent of White, 63 percent of Hispanic, 65 percent of African American, and 63 percent of Asian
workers. Relatively few workers of all four ethnic groups are “very” confident, including 15 percent of White, 13
percent of Hispanic, 18 percent of African American, and 17 percent of Asian workers.
Confidence in Retiring Comfortably
271BASE: ALL QUALIFIED RESPONDENTSQ880. How confident are you that you will be able to fully retire with a lifestyle you consider comfortable?
Confidence in Retiring ComfortablyStrongly/Somewhat Confident (%) (NET)
’16 ‘15 ’14 ’13 ’12 ’16 ‘15 ’14 ’13 ’12 ’16 ‘15 ’14 ’13 ’12 ’16 ‘15 ’14 ’13 ’12
N=2645 N=2892 N=2716 N=2975 N=2867 N=670 N=663 N=664 N=169 N=230 N=489 N=537 N=444 N=182 N=187 N=270 N=373 N=235 N=232 N=248
White Hispanic African American Asian/Pac.

35 33 38 31 2836 33 35 29 35 32 32 35 29 27
44 42 4635
44
16 1314
11 10
18 18 1612
10 17 21 18
10 7
13 18 17
16
1651
4652
4238
54 51 51
4145
4953 53
3934
57 61 64
51
60
Strongly agree Somewhat agree
’16 ’15 ’14 ’13 ’12 ’16 ’15 ’14 ’13 ’12 ’16 ’15 ’14 ’13 ’12 ’16 ’15 ’14 ’13 ’12
N=2645 N=2892 N=2716 N=2975 N=2867 N=670 N=663 N=664 N=169 N=230 N=489 N=537 N=444 N=182 N=187 N=270 N=373 N=235 N=232 N=248
White Hispanic African American Asian/Pacific
Workers’ confidence in whether they are building a large enough retirement nest egg varies by ethnicity. Asian
workers (57 percent) are most likely to agree that they are building a large enough nest egg, followed by
Hispanic (54 percent), White (51 percent), and African American workers (49 percent). Among White, Hispanic,
and African American workers, confidence has increased in the past five years, while among Asians it has
remained relatively consistent.
Building a Large Enough Nest Egg?
272BASE: ALL QUALIFIED RESPONDENTSQ800. How much do you agree or disagree that you are currently building a large enough retirement nest egg?
Building a Large Enough Retirement Nest EggStrongly/Somewhat Agree (%) (NET)
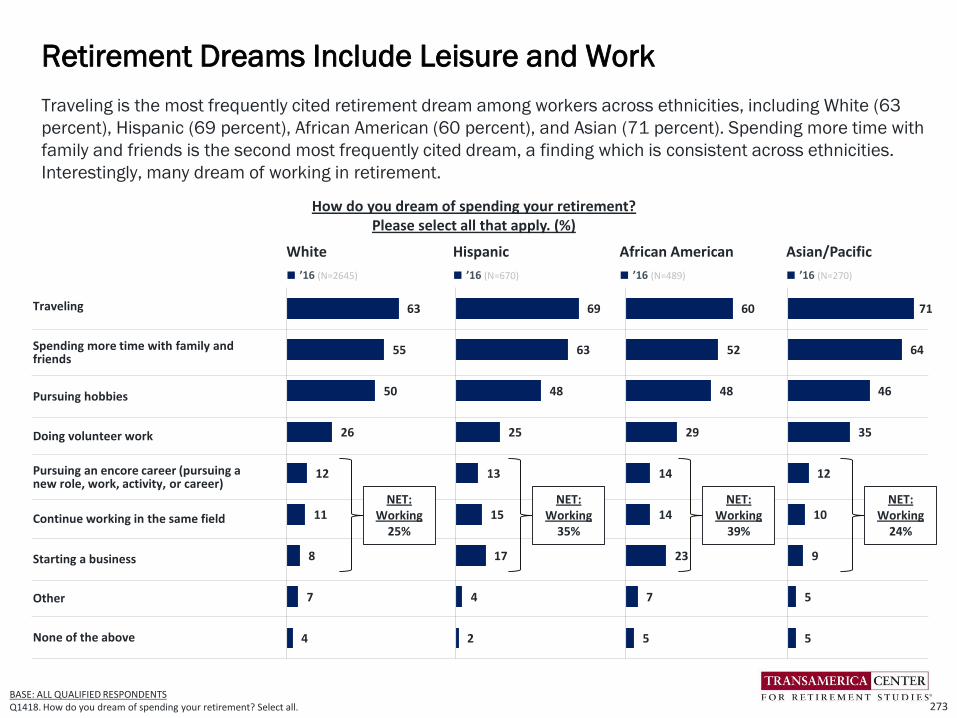
Traveling is the most frequently cited retirement dream among workers across ethnicities, including White (63
percent), Hispanic (69 percent), African American (60 percent), and Asian (71 percent). Spending more time with
family and friends is the second most frequently cited dream, a finding which is consistent across ethnicities.
Interestingly, many dream of working in retirement.
Retirement Dreams Include Leisure and Work
273BASE: ALL QUALIFIED RESPONDENTS Q1418. How do you dream of spending your retirement? Select all.
How do you dream of spending your retirement? Please select all that apply. (%)
White Hispanic African American Asian/Pacific
■ ’16 (N=2645) ■ ’16 (N=670) ■ ’16 (N=489) ■ ’16 (N=270)
Traveling
Spending more time with family and friends
Pursuing hobbies
Doing volunteer work
Pursuing an encore career (pursuing a new role, work, activity, or career)
Continue working in the same field
Starting a business
Other
None of the above
63
55
50
26
12
11
8
7
4
NET: Working
25%
69
63
48
25
13
15
17
4
2
NET: Working
35%
60
52
48
29
14
14
23
7
5
NET: Working
39%
71
64
46
35
12
10
9
5
5
NET: Working
24%

Among ethnicities, African American workers are planning to live to an older age of 95 (median) with 29 percent
planning to become centenarians. Hispanic workers are planning to live to age 87 (median) with 15 percent
planning to live to age 100+, while White and Asian workers are planning to live to age 85 (median) with 14
percent of them planning to live to age 100+.
Age Planning to Live to
274
BASE: ALL QUALIFIED RESPONDENTS
Q2850. What age are you planning to live to?
Not sure 10 25 28 19Median Age 85 Age 87 Age 95 Age 85
White Hispanic African American
2
13
34
24
14
'16
Age 100+
Age 90-99
Age 80-89
Age 65-79
Age 60-64
Asian/Pacific
110
24
25
14
'16
N=2645 N=270
110
25
19
15
'16
25
11
19
29
'16
N=670 N=489
What age are you planning to live to? (%)
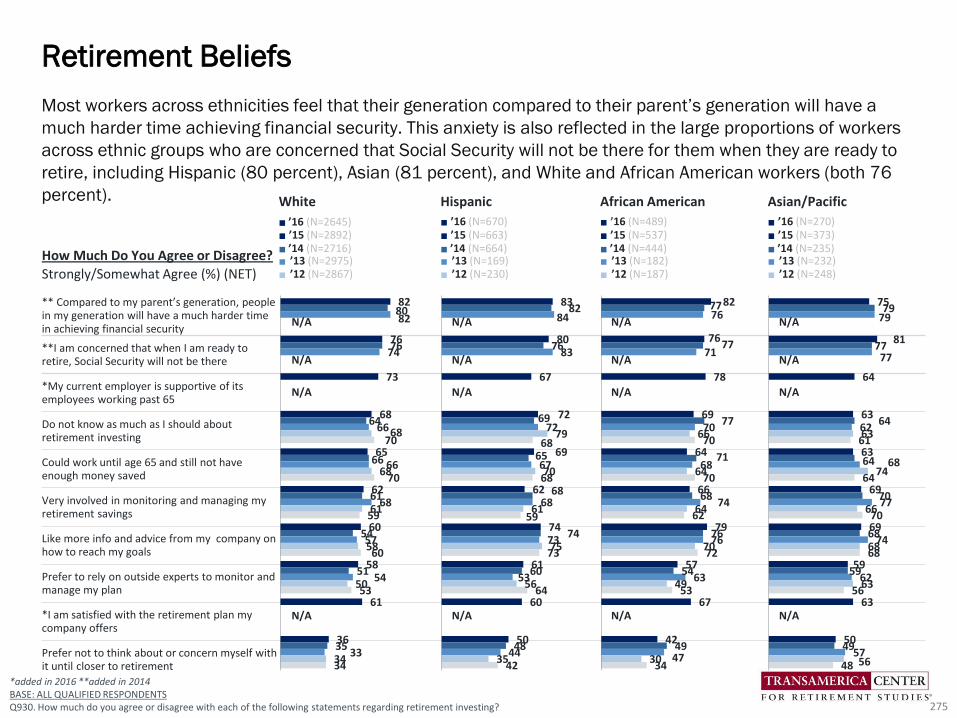
*added in 2016 **added in 2014BASE: ALL QUALIFIED RESPONDENTSQ930. How much do you agree or disagree with each of the following statements regarding retirement investing?
Most workers across ethnicities feel that their generation compared to their parent’s generation will have a
much harder time achieving financial security. This anxiety is also reflected in the large proportions of workers
across ethnic groups who are concerned that Social Security will not be there for them when they are ready to
retire, including Hispanic (80 percent), Asian (81 percent), and White and African American workers (both 76
percent).
Retirement Beliefs
275
How Much Do You Agree or Disagree?
Strongly/Somewhat Agree (%) (NET)
White Hispanic African American Asian/Pacific
■ ’16 (N=2645)■ ’15 (N=2892)■ ’14 (N=2716)■ ’13 (N=2975)■ ’12 (N=2867)
■ ’16 (N=670)■ ’15 (N=663)■ ’14 (N=664)■ ’13 (N=169)■ ’12 (N=230)
■ ’16 (N=489)■ ’15 (N=537)■ ’14 (N=444)■ ’13 (N=182)■ ’12 (N=187)
■ ’16 (N=270)■ ’15 (N=373)■ ’14 (N=235)■ ’13 (N=232)■ ’12 (N=248)
** Compared to my parent’s generation, people in my generation will have a much harder time in achieving financial security
**I am concerned that when I am ready to retire, Social Security will not be there
*My current employer is supportive of its employees working past 65
Do not know as much as I should about retirement investing
Could work until age 65 and still not have enough money saved
Very involved in monitoring and managing my retirement savings
Like more info and advice from my company on how to reach my goals
Prefer to rely on outside experts to monitor and manage my plan
*I am satisfied with the retirement plan my company offers
Prefer not to think about or concern myself with it until closer to retirement
75
81
64
63
63
69
69
59
63
50
79
77
64
64
70
68
59
49
79
77
62
68
77
74
62
57
63
74
66
68
63
56
61
64
70
68
56
48
82
77
78
69
64
66
79
57
67
42
77
76
77
71
68
76
54
49
76
71
70
68
74
76
63
47
66
64
64
70
49
30
70
70
62
72
53
34
83
80
67
72
69
62
74
61
60
50
82
76
69
65
68
74
60
48
84
83
72
67
68
73
53
44
79
70
61
75
56
35
68
68
59
73
64
42
82
76
73
68
65
62
60
58
61
36
80
76
64
66
61
54
51
35
82
74
66
66
68
57
54
33
68
68
61
58
50
34
70
70
59
60
53
34
N/A
N/A
N/A
N/A
N/A
N/A
N/A
N/A
N/AN/AN/AN/A
N/AN/AN/AN/A

New in 2016BASE: ALL QUALIFIED RESPONDENTS Q1145. Which one of the following do you expect to be sources of income to cover your living expenses after you retire? Select all.
Across ethnicities, the majority of workers expect retirement income from self-funded savings including
retirement accounts (e.g., 401(k)s, 403(b)s, IRAs) and other savings and investments: 84 percent of Asians,
79 percent of Whites, 75 percent of African Americans, and 74 percent of Hispanics. More than one-third of
workers across ethnicities expect income from working when they are in retirement.
Expected Sources of Retirement Income
276
73
39
26
14
12
79
70
48
3
64
37
20
14
10
74
62
44
4
70
39
29
8
9
75
65
43
6
66
34
26
19
10
84
77
52
3
Expected Sources of Income During Retirement (%)
White Hispanic African American Asian/Pacific
■ ’16 (N=2645) ■ ’16 (N=670) ■ ’16 (N=489) ■ ’16 (N=270)
Social Security
Working
Company-funded pension plan
Home equity
Inheritance
NET – Self-Funded Savings
401(k) / 403(b) Accounts / IRAs
Other savings and investments
Other
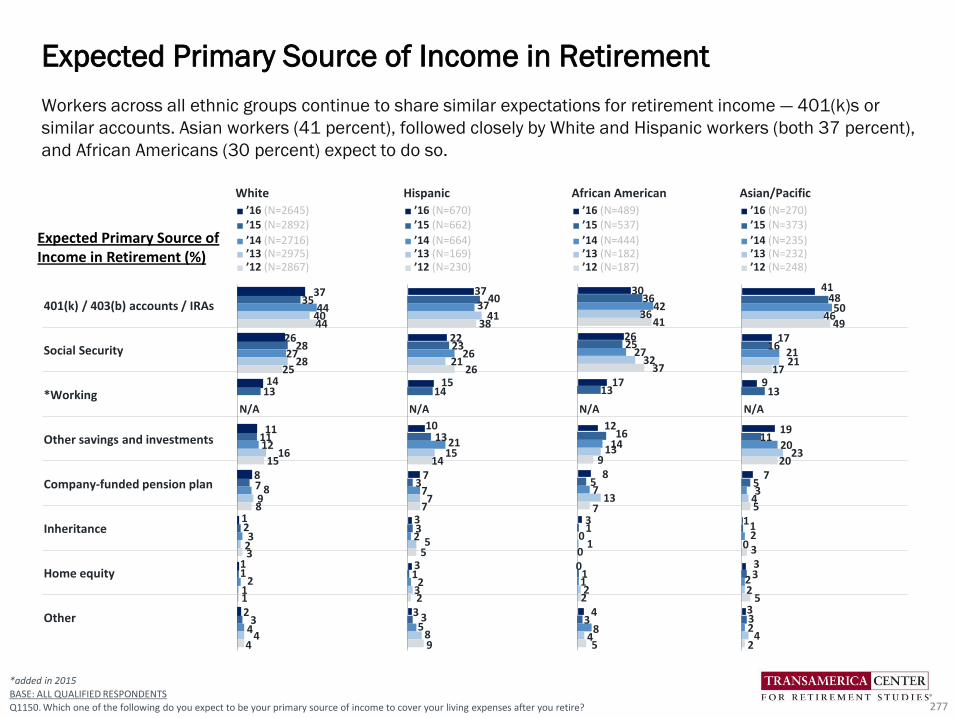
Workers across all ethnic groups continue to share similar expectations for retirement income — 401(k)s or
similar accounts. Asian workers (41 percent), followed closely by White and Hispanic workers (both 37 percent),
and African Americans (30 percent) expect to do so.
Expected Primary Source of Income in Retirement
277
*added in 2015
BASE: ALL QUALIFIED RESPONDENTS
Q1150. Which one of the following do you expect to be your primary source of income to cover your living expenses after you retire?
White Hispanic African American Asian/Pacific
■ ’16 (N=2645)■ ’15 (N=2892)
■ ’14 (N=2716)■ ’13 (N=2975)■ ’12 (N=2867)
■ ’16 (N=670)■ ’15 (N=662)
■ ’14 (N=664)■ ’13 (N=169)■ ’12 (N=230)
■ ’16 (N=489)■ ’15 (N=537)
■ ’14 (N=444)■ ’13 (N=182)■ ’12 (N=187)
■ ’16 (N=270)■ ’15 (N=373)
■ ’14 (N=235)■ ’13 (N=232)■ ’12 (N=248)
401(k) / 403(b) accounts / IRAs
Social Security
*Working
Other savings and investments
Company-funded pension plan
Inheritance
Home equity
Other
37
22
15
10
7
3
3
3
40
23
14
13
3
3
1
3
37
26
21
7
2
2
5
41
21
15
7
5
3
8
38
26
14
7
5
2
9
30
26
17
12
8
3
0
4
36
25
13
16
5
1
1
3
42
27
14
7
0
1
8
36
32
13
13
1
2
4
41
37
9
7
0
2
5
41
17
9
19
7
1
3
3
48
16
13
11
5
1
3
3
50
21
20
3
2
2
2
46
21
23
4
0
2
4
49
17
20
5
3
5
2
37
26
14
11
8
1
1
2
35
28
13
11
7
2
1
3
44
27
12
8
3
2
4
40
28
16
9
2
1
4
44
25
15
8
3
1
4
N/A N/A N/A N/A
Expected Primary Source of Income in Retirement (%)
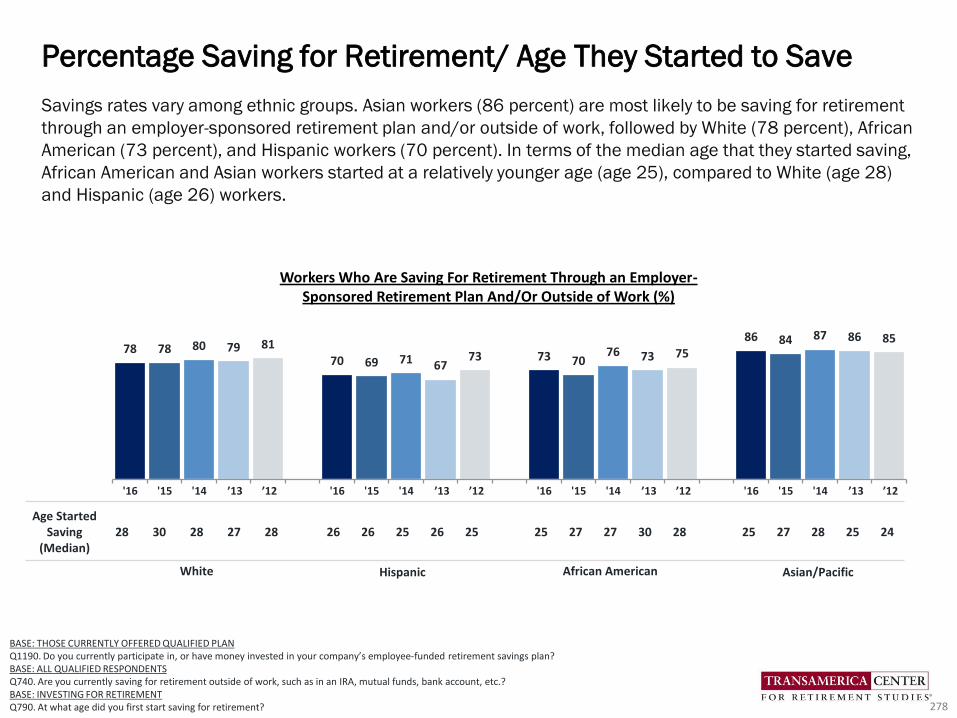
78 78 80 79 8170 69 71 67
73 73 7076 73 75
86 84 87 86 85
'16 '15 '14 ’13 ’12 '16 '15 '14 ’13 ’12 '16 '15 '14 ’13 ’12 '16 '15 '14 ’13 ’12
BASE: THOSE CURRENTLY OFFERED QUALIFIED PLANQ1190. Do you currently participate in, or have money invested in your company’s employee-funded retirement savings plan?BASE: ALL QUALIFIED RESPONDENTSQ740. Are you currently saving for retirement outside of work, such as in an IRA, mutual funds, bank account, etc.?BASE: INVESTING FOR RETIREMENTQ790. At what age did you first start saving for retirement?
Savings rates vary among ethnic groups. Asian workers (86 percent) are most likely to be saving for retirement
through an employer-sponsored retirement plan and/or outside of work, followed by White (78 percent), African
American (73 percent), and Hispanic workers (70 percent). In terms of the median age that they started saving,
African American and Asian workers started at a relatively younger age (age 25), compared to White (age 28)
and Hispanic (age 26) workers.
Percentage Saving for Retirement/ Age They Started to Save
278
Age Started Saving
(Median)28 30 28 27 28 26 26 25 26 25 25 27 27 30 28 25 27 28 25 24
White Hispanic African American Asian/Pacific
Workers Who Are Saving For Retirement Through an Employer-Sponsored Retirement Plan And/Or Outside of Work (%)

Approximately nine in ten workers across ethnicities value a 401(k) or similar employee-funded retirement as
an important benefit. They value retirement plans second only to health insurance.
*added in 2014BASE: ALL QUALIFIED RESPONDENTS
Q1170. Businesses typically offer a number of different benefits for their workers. For each of the following, please tell us how important that benefit is to you,
personally.
White Hispanic African American Asian/Pacific
■’16 (N=2645)
■’15 (N=2892)
■’14 (N=2716)
■’13 (N=2975)
■’12 (N=2867)
■’16 (N=670)
■’15 (N=663)
■’14 (N=664)
■’13 (N=169)
■’12 (N=230)
■’16 (N=489)
■’15 (N=537)
■’14 (N=444)
■’13 (N=182)
■’12 (N=187)
■’16 (N=270)
■’15 (N=373)
■’14 (N=235)
■’13 (N=232)
■’12 (N=248)
Health insurance
401(k) / 403(b) / 457(b) or other employee self-funded plan
Disability insurance
Life insurance
Company-funded defined-benefit pension plan
Long-Term Care insurance
Critical Illness Insurance
*A company-funded cash balance plan
Cancer Insurance
9494
9393
9588888989
907574757679
7170
6867
706969
747473
6666
676567
60556263
655048
55
5046
5455 58
Importance of Retirement Benefits Compared to Other Benefits
279
9691949797
8990919494
7172
8177797573
747478
7177
838085
7975
827678
6065
777174
6064
77
5065676862
9594959697
8990
8895
9181
7983
8286
8182
7780
71
79808489
7480
7976
76717372
7671
7268
6671
6564
656366
989898
9498
939293
91888485
87868687
839283
85
83898886
828389868275
7575
8077
76
6670
78
7167
7362 68
Very/Somewhat Important(%) (NET)
N/A N/A N/A N/A
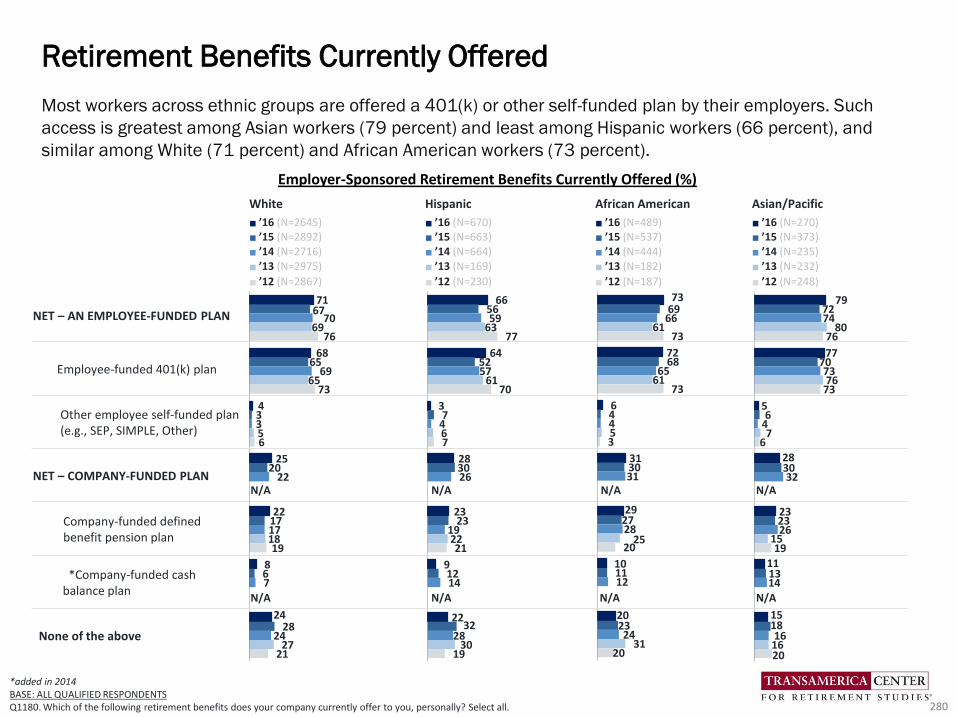
79
77
5
28
23
11
15
72
70
6
30
23
13
18
74
73
4
32
26
14
16
80
76
7
15
16
76
73
6
19
20
73
72
6
31
29
10
20
69
68
4
30
27
11
23
66
65
4
31
28
12
24
61
61
5
25
31
73
73
3
20
20
71
68
4
25
22
8
24
67
65
3
20
17
6
28
70
69
3
22
17
7
24
69
65
5
18
27
76
73
6
19
21
Most workers across ethnic groups are offered a 401(k) or other self-funded plan by their employers. Such
access is greatest among Asian workers (79 percent) and least among Hispanic workers (66 percent), and
similar among White (71 percent) and African American workers (73 percent).
Retirement Benefits Currently Offered
280
*added in 2014BASE: ALL QUALIFIED RESPONDENTSQ1180. Which of the following retirement benefits does your company currently offer to you, personally? Select all.
66
64
3
28
23
9
22
56
52
7
30
23
12
32
59
57
4
26
19
14
28
63
61
6
22
30
77
70
7
21
19
N/A N/A N/AN/A
N/A N/A N/AN/A
White Hispanic African American Asian/Pacific
■ ’16 (N=2645)■ ’15 (N=2892)
■ ’14 (N=2716)
■ ’13 (N=2975)
■ ’12 (N=2867)
■ ’16 (N=670)■ ’15 (N=663)
■ ’14 (N=664)
■ ’13 (N=169)
■ ’12 (N=230)
■ ’16 (N=489)■ ’15 (N=537)
■ ’14 (N=444)
■ ’13 (N=182)
■ ’12 (N=187)
■ ’16 (N=270)■ ’15 (N=373)
■ ’14 (N=235)
■ ’13 (N=232)
■ ’12 (N=248)
NET – AN EMPLOYEE-FUNDED PLAN
Employee-funded 401(k) plan
Other employee self-funded plan(e.g., SEP, SIMPLE, Other)
NET – COMPANY-FUNDED PLAN
Company-funded defined benefit pension plan
*Company-funded cash balance plan
None of the above
Employer-Sponsored Retirement Benefits Currently Offered (%)
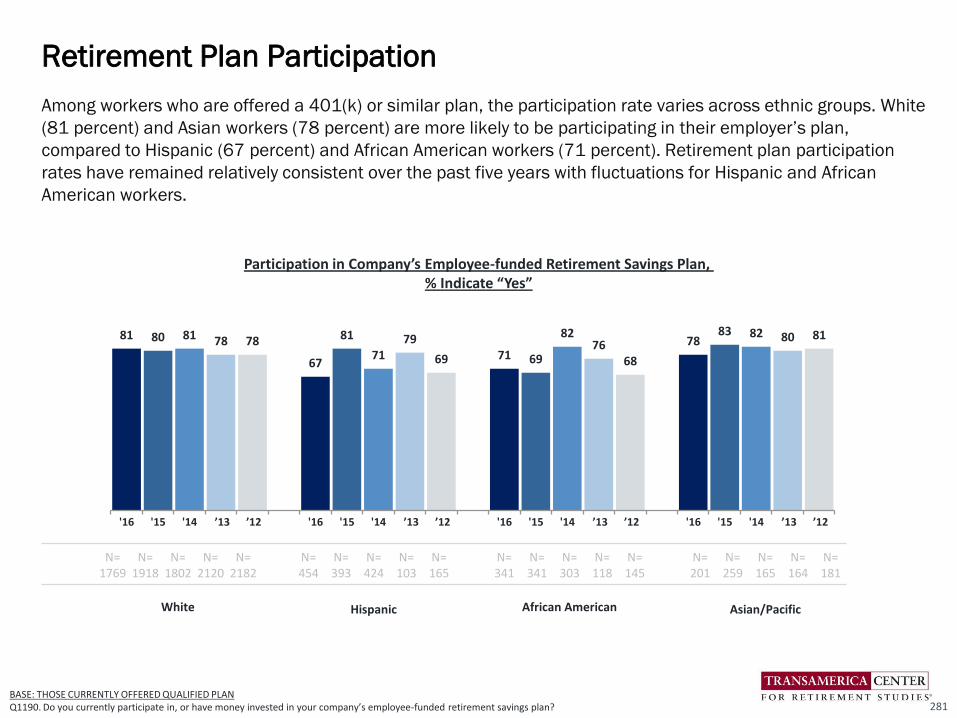
Among workers who are offered a 401(k) or similar plan, the participation rate varies across ethnic groups. White
(81 percent) and Asian workers (78 percent) are more likely to be participating in their employer’s plan,
compared to Hispanic (67 percent) and African American workers (71 percent). Retirement plan participation
rates have remained relatively consistent over the past five years with fluctuations for Hispanic and African
American workers.
Retirement Plan Participation
281BASE: THOSE CURRENTLY OFFERED QUALIFIED PLANQ1190. Do you currently participate in, or have money invested in your company’s employee-funded retirement savings plan?
Participation in Company’s Employee-funded Retirement Savings Plan, % Indicate “Yes”
81 80 81 78 78
67
81
7179
69 71 69
8276
68
7883 82 80 81
'16 '15 '14 ’13 ’12 '16 '15 '14 ’13 ’12 '16 '15 '14 ’13 ’12 '16 '15 '14 ’13 ’12
N=1769
N=1918
N=1802
N=2120
N=2182
N=454
N=393
N=424
N=103
N=165
N=341
N=341
N=303
N=118
N=145
N=201
N=259
N=165
N=164
N=181
White Hispanic African American Asian/Pacific
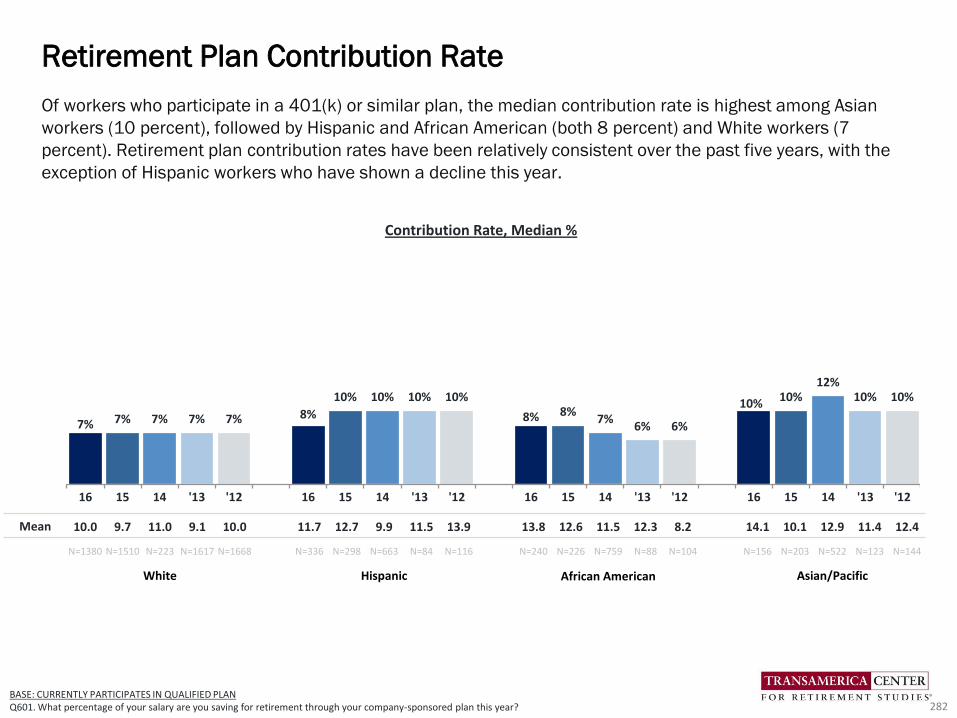
Of workers who participate in a 401(k) or similar plan, the median contribution rate is highest among Asian
workers (10 percent), followed by Hispanic and African American (both 8 percent) and White workers (7
percent). Retirement plan contribution rates have been relatively consistent over the past five years, with the
exception of Hispanic workers who have shown a decline this year.
Retirement Plan Contribution Rate
282BASE: CURRENTLY PARTICIPATES IN QUALIFIED PLAN Q601. What percentage of your salary are you saving for retirement through your company-sponsored plan this year?
7% 7% 7% 7% 7% 8%
10% 10% 10% 10%
8% 8%7%
6% 6%
10%10%
12%10% 10%
16 15 14 '13 '12 16 15 14 '13 '12 16 15 14 '13 '12 16 15 14 '13 '12
Mean 10.0 9.7 11.0 9.1 10.0 11.7 12.7 9.9 11.5 13.9 13.8 12.6 11.5 12.3 8.2 14.1 10.1 12.9 11.4 12.4
N=1380 N=1510 N=223 N=1617 N=1668 N=336 N=298 N=663 N=84 N=116 N=240 N=226 N=759 N=88 N=104 N=156 N=203 N=522 N=123 N=144
White Hispanic African American Asian/Pacific
Contribution Rate, Median %
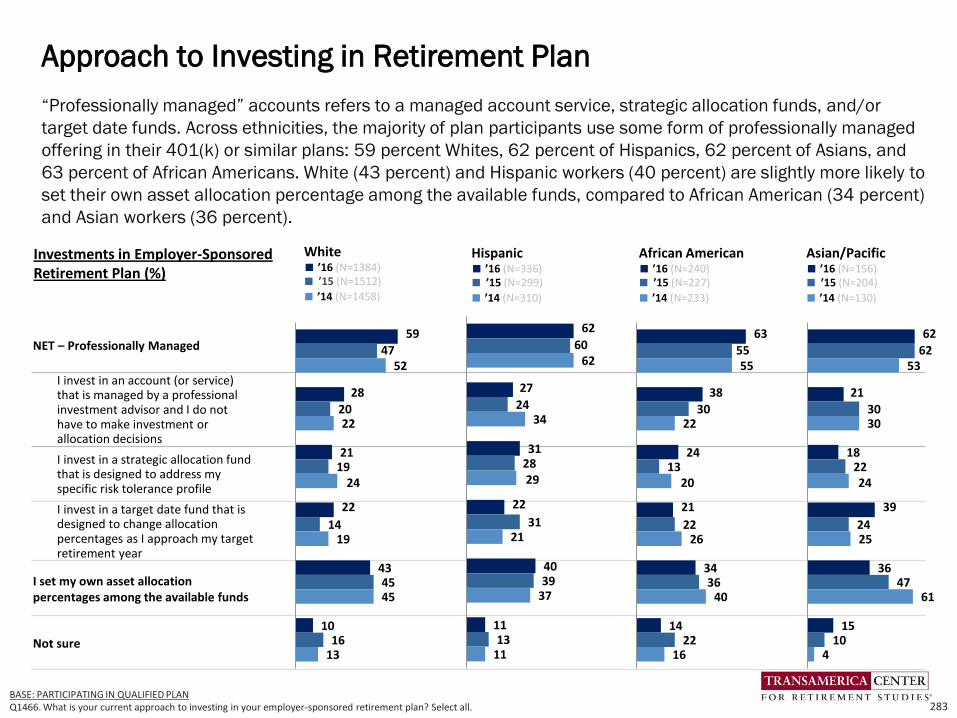
“Professionally managed” accounts refers to a managed account service, strategic allocation funds, and/or
target date funds. Across ethnicities, the majority of plan participants use some form of professionally managed
offering in their 401(k) or similar plans: 59 percent Whites, 62 percent of Hispanics, 62 percent of Asians, and
63 percent of African Americans. White (43 percent) and Hispanic workers (40 percent) are slightly more likely to
set their own asset allocation percentage among the available funds, compared to African American (34 percent)
and Asian workers (36 percent).
Approach to Investing in Retirement Plan
283BASE: PARTICIPATING IN QUALIFIED PLANQ1466. What is your current approach to investing in your employer-sponsored retirement plan? Select all.
White■ ’16 (N=1384)■ ’15 (N=1512)
■ ’14 (N=1458)
Hispanic■ ’16 (N=336)■ ’15 (N=299)
■ ’14 (N=310)
African American■ ’16 (N=240)■ ’15 (N=227)
■ ’14 (N=233)
Asian/Pacific■ ’16 (N=156)■ ’15 (N=204)
■ ’14 (N=130)
NET – Professionally Managed
I invest in an account (or service) that is managed by a professional investment advisor and I do not have to make investment or allocation decisions
I invest in a strategic allocation fund that is designed to address my specific risk tolerance profile
I invest in a target date fund that is designed to change allocation percentages as I approach my target retirement year
I set my own asset allocation percentages among the available funds
Not sure
Investments in Employer-Sponsored Retirement Plan (%)
59
28
21
22
43
10
47
20
19
14
45
16
52
22
24
19
45
13
62
27
31
22
40
11
60
24
28
31
39
13
62
34
29
21
37
11
63
38
24
21
34
14
55
30
13
22
36
22
55
22
20
26
40
16
62
21
18
39
36
15
62
30
22
24
47
10
53
30
24
25
61
4
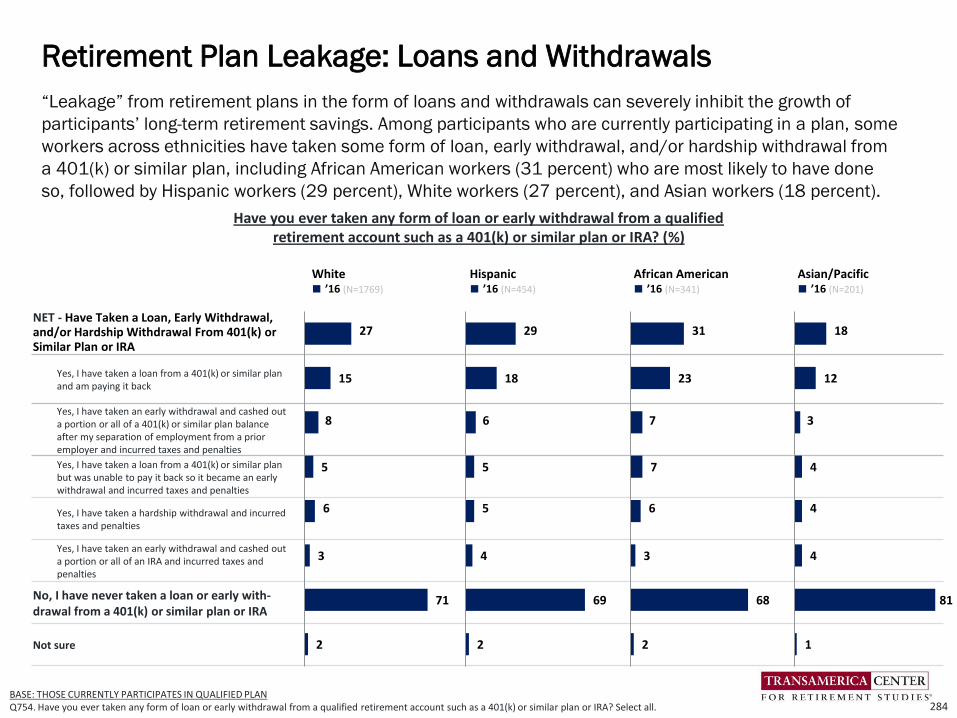
“Leakage” from retirement plans in the form of loans and withdrawals can severely inhibit the growth of
participants’ long-term retirement savings. Among participants who are currently participating in a plan, some
workers across ethnicities have taken some form of loan, early withdrawal, and/or hardship withdrawal from
a 401(k) or similar plan, including African American workers (31 percent) who are most likely to have done
so, followed by Hispanic workers (29 percent), White workers (27 percent), and Asian workers (18 percent).
Retirement Plan Leakage: Loans and Withdrawals
284BASE: THOSE CURRENTLY PARTICIPATES IN QUALIFIED PLANQ754. Have you ever taken any form of loan or early withdrawal from a qualified retirement account such as a 401(k) or similar plan or IRA? Select all.
White■ ’16 (N=1769)
Hispanic■ ’16 (N=454)
African American■ ’16 (N=341)
Asian/Pacific■ ’16 (N=201)
NET - Have Taken a Loan, Early Withdrawal, and/or Hardship Withdrawal From 401(k) or Similar Plan or IRA
Yes, I have taken a loan from a 401(k) or similar plan and am paying it back
Yes, I have taken an early withdrawal and cashed out a portion or all of a 401(k) or similar plan balance after my separation of employment from a prior employer and incurred taxes and penalties
Yes, I have taken a loan from a 401(k) or similar plan but was unable to pay it back so it became an early withdrawal and incurred taxes and penalties
Yes, I have taken a hardship withdrawal and incurred taxes and penalties
Yes, I have taken an early withdrawal and cashed out a portion or all of an IRA and incurred taxes and penalties
No, I have never taken a loan or early with-drawal from a 401(k) or similar plan or IRA
Not sure
27
15
8
5
6
3
71
2
29
18
6
5
5
4
69
2
31
23
7
7
6
3
68
2
18
12
3
4
4
4
81
1
Have you ever taken any form of loan or early withdrawal from a qualified retirement account such as a 401(k) or similar plan or IRA? (%)
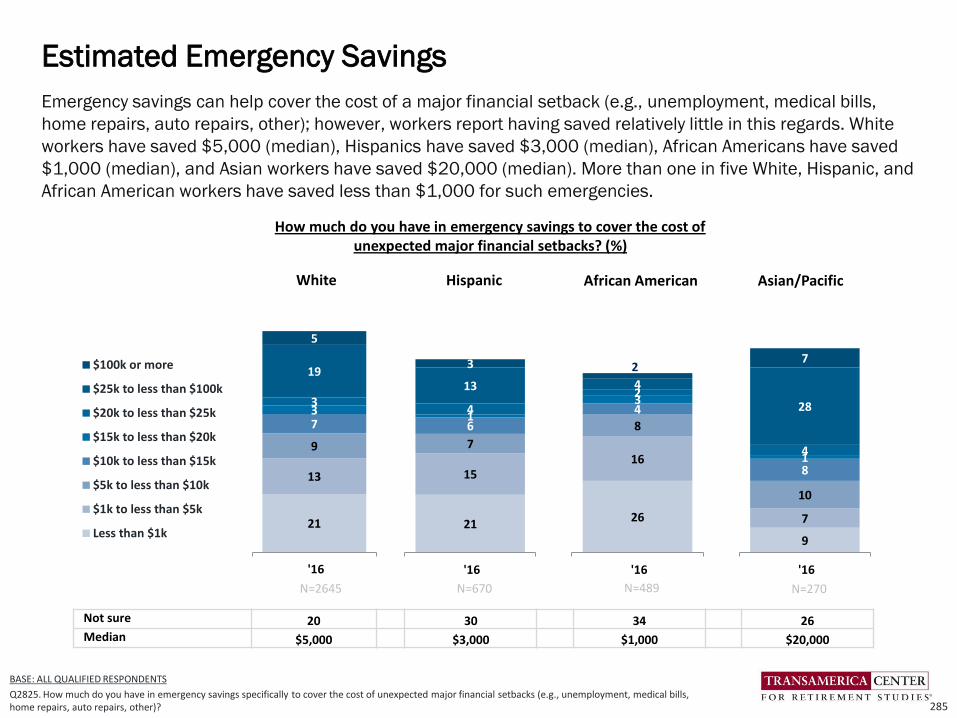
Emergency savings can help cover the cost of a major financial setback (e.g., unemployment, medical bills,
home repairs, auto repairs, other); however, workers report having saved relatively little in this regards. White
workers have saved $5,000 (median), Hispanics have saved $3,000 (median), African Americans have saved
$1,000 (median), and Asian workers have saved $20,000 (median). More than one in five White, Hispanic, and
African American workers have saved less than $1,000 for such emergencies.
Estimated Emergency Savings
285
BASE: ALL QUALIFIED RESPONDENTS
Q2825. How much do you have in emergency savings specifically to cover the cost of unexpected major financial setbacks (e.g., unemployment, medical bills, home repairs, auto repairs, other)?
Not sure 20 30 34 26Median $5,000 $3,000 $1,000 $20,000
21
13
9
733
19
5
'16
$100k or more
$25k to less than $100k
$20k to less than $25k
$15k to less than $20k
$10k to less than $15k
$5k to less than $10k
$1k to less than $5k
Less than $1k
White Hispanic African American
N=2645
Asian/Pacific
N=670 N=489 N=270
9
7
10
814
28
7
'16
21
15
7
614
13
3
'16
26
16
8
4324
2
'16
How much do you have in emergency savings to cover the cost of unexpected major financial setbacks? (%)
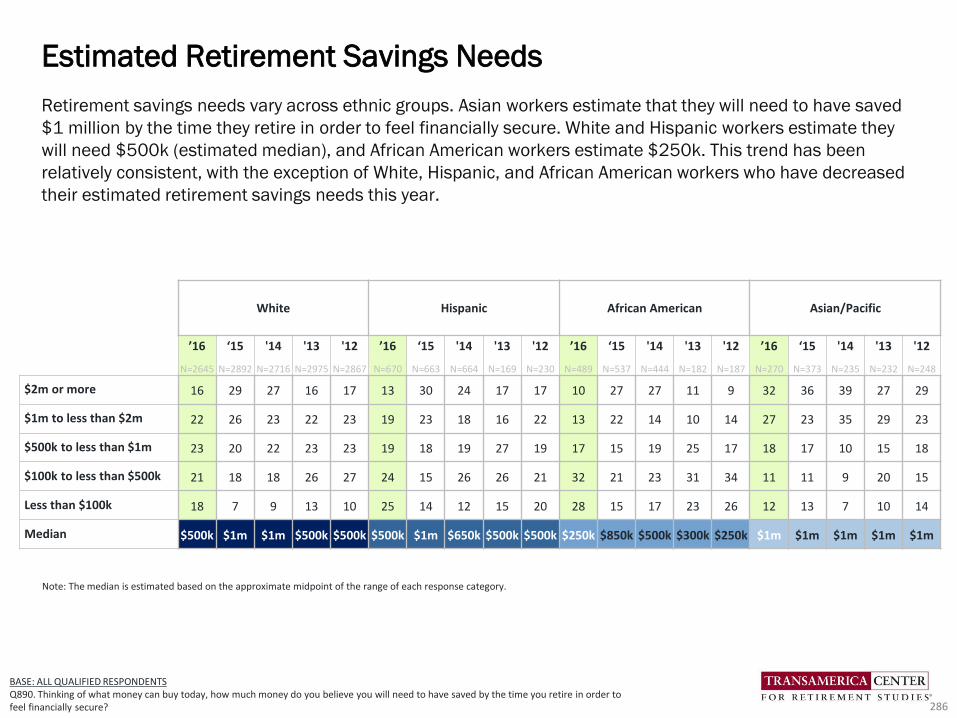
286
Note: The median is estimated based on the approximate midpoint of the range of each response category.
BASE: ALL QUALIFIED RESPONDENTSQ890. Thinking of what money can buy today, how much money do you believe you will need to have saved by the time you retire in order to feel financially secure?
White Hispanic African American Asian/Pacific
’16 ‘15 '14 '13 '12 ’16 ‘15 '14 '13 '12 ’16 ‘15 '14 '13 '12 ’16 ‘15 '14 '13 '12
N=2645 N=2892 N=2716 N=2975 N=2867 N=670 N=663 N=664 N=169 N=230 N=489 N=537 N=444 N=182 N=187 N=270 N=373 N=235 N=232 N=248
$2m or more 16 29 27 16 17 13 30 24 17 17 10 27 27 11 9 32 36 39 27 29
$1m to less than $2m 22 26 23 22 23 19 23 18 16 22 13 22 14 10 14 27 23 35 29 23
$500k to less than $1m 23 20 22 23 23 19 18 19 27 19 17 15 19 25 17 18 17 10 15 18
$100k to less than $500k 21 18 18 26 27 24 15 26 26 21 32 21 23 31 34 11 11 9 20 15
Less than $100k 18 7 9 13 10 25 14 12 15 20 28 15 17 23 26 12 13 7 10 14
Median $500k $1m $1m $500k $500k $500k $1m $650k $500k $500k $250k $850k $500k $300k $250k $1m $1m $1m $1m $1m
Estimated Retirement Savings Needs
Retirement savings needs vary across ethnic groups. Asian workers estimate that they will need to have saved
$1 million by the time they retire in order to feel financially secure. White and Hispanic workers estimate they
will need $500k (estimated median), and African American workers estimate $250k. This trend has been
relatively consistent, with the exception of White, Hispanic, and African American workers who have decreased
their estimated retirement savings needs this year.

Many workers are “guessing their retirement savings needs. African American workers (52 percent) are most
likely to have guessed while Asian workers (39 percent) are least likely to have done so. Few workers across
ethnic groups indicate that they have used a retirement calculator to estimate their savings needs.
Basis for Estimating Retirement Savings Needs
287
*added in 2014BASE: PROVIDED ESTIMATE OF MONEY NEEDED FOR RETIREMENTQ900. How did you arrive at that number?
N/A
46
21
6
8
5
6
6
2
49
20
7
10
2
6
3
3
46
24
9
6
3
5
4
3
52
28
3
9
2
3
2
43
27
6
8
7
5
3
N/A
52
21
6
6
4
5
3
3
60
18
8
4
2
2
2
4
54
21
4
8
3
3
2
4
45
29
7
11
3
3
2
46
27
3
11
6
6
1
N/A
39
34
7
13
2
2
2
1
43
24
5
9
6
6
1
6
43
18
6
9
8
7
8
2
46
23
5
10
9
5
2
44
29
5
9
5
6
4
N/A
48
22
10
4
4
5
3
4
56
20
7
4
3
2
4
4
51
22
6
4
4
3
5
4
49
25
6
9
5
3
4
48
27
5
10
4
3
3
White Hispanic African American Asian/Pacific
■ '16 (N=2571) ■ '15 (N=2844) ■ '14 (N=2657)■ '13 (N=2943)■ '12 (N=2827)
■ '16 (N=657)■ '15 (N=657) ■ '14 (N=659)■ '13 (N=168)■ '12 (N=226)
■ '16 (N=478) ■ '15 (N=530)■ '14 (N=433)■ '13 (N=182)■ '12 (N=186)
■ '16 (267) ■ '15 (N=370)■ '14 (N=233)■ '13 (N=228)■ '12 (N=247)
Guessed
Estimated based on current living expenses
Used a retirement calculator*
Expected earnings on investments
Completed a worksheet
Read/heard that is how much is needed
Amount given to me by financial advisor
Other

Workers across ethnicities most frequently indicate that their retirement savings are invested in a relatively
equal mix of stocks and investments such as bonds, money market funds and cash; however, the response rate
is lower among African American workers (32 percent) compared to White (43 percent), Hispanic (40 percent),
and Asian workers (43 percent). More than one in five White, Hispanic, and African American workers are
unsure how their savings are invested. Asset allocation-related trends have been relatively consistent in recent
years, with slight increases in workers are “not sure” found among Hispanic, African American, and Asian
workers this year.
Asset Allocation of Retirement Investments
288BASE: INVESTING FOR RETIREMENTQ770. How is your retirement savings invested?
*Note: Small base size; interpret with caution
21 21 20 19 1723 20 23
14 16
2924 22 26 24
14 10 14 16 12
19 21 21 21 2117 20 16
11
24
1918
1617
1224 30 25 24
36
43 43 46 44 44 40 4239
41
3732
34 4238
34
43 43 4348 31
17 15 14 16 18 20 18 2334
22 20 24 20 1931
19 17 1813
20Mostly in bonds, money marketfunds, cash and other stableinvestments
Relatively equal mix of stocksand investments such as bonds,money market funds and cash
Mostly in stocks, with little or nomoney in investments such asbonds, money market funds andcashNot sure
’16
N=
2002
’15
N=
2177
’14
N=
2072
’13
N=
2246
’12
N=
2212
’16
N=
505
’15
N=
485
’14
N=
481
’13
N=
115
’12
N=
160
’16
N=
336
’15
N=
366
’14
N=
323
’13
N=
124
’12
N=
131
‘16
N=
222
‘15
N=
303
‘14
N=
190
‘13
N=
176
‘12
N=
205
White Hispanic African American Asian/Pacific
How Retirement Savings Are Invested (%)
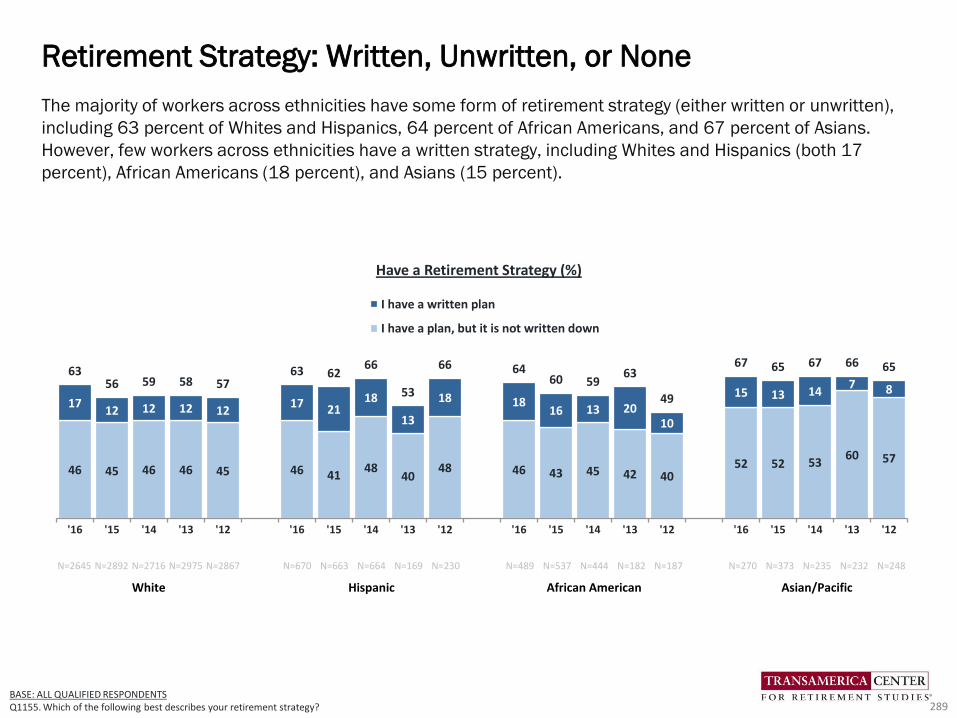
Have a Retirement Strategy (%)
BASE: ALL QUALIFIED RESPONDENTSQ1155. Which of the following best describes your retirement strategy?
N=2645 N=2892 N=2716 N=2975 N=2867 N=670 N=663 N=664 N=169 N=230 N=489 N=537 N=444 N=182 N=187 N=270 N=373 N=235 N=232 N=248
White Hispanic African American Asian/Pacific
The majority of workers across ethnicities have some form of retirement strategy (either written or unwritten),
including 63 percent of Whites and Hispanics, 64 percent of African Americans, and 67 percent of Asians.
However, few workers across ethnicities have a written strategy, including Whites and Hispanics (both 17
percent), African Americans (18 percent), and Asians (15 percent).
Retirement Strategy: Written, Unwritten, or None
289
46 45 46 46 45 46 4148
4048 46 43 45 42 40
52 52 5360 57
1712 12 12 12
17 2118
13
18 1816 13 20
10
15 13 147 8
6356 59 58 57
63 6266
53
66 6460 59
63
49
67 65 67 66 65
'16 '15 '14 '13 '12 '16 '15 '14 '13 '12 '16 '15 '14 '13 '12 '16 '15 '14 '13 '12
I have a written plan
I have a plan, but it is not written down
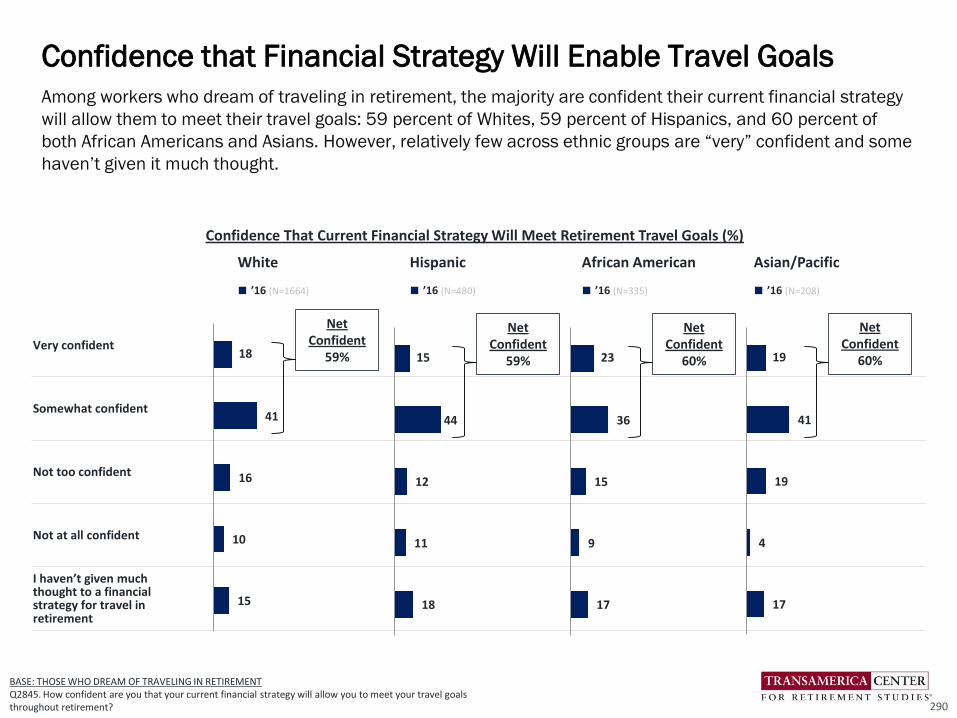
Among workers who dream of traveling in retirement, the majority are confident their current financial strategy
will allow them to meet their travel goals: 59 percent of Whites, 59 percent of Hispanics, and 60 percent of
both African Americans and Asians. However, relatively few across ethnic groups are “very” confident and some
haven’t given it much thought.
Confidence that Financial Strategy Will Enable Travel Goals
290
BASE: THOSE WHO DREAM OF TRAVELING IN RETIREMENTQ2845. How confident are you that your current financial strategy will allow you to meet your travel goals throughout retirement?
White Hispanic African American Asian/Pacific
■ ’16 (N=1664) ■ ’16 (N=480) ■ ’16 (N=335) ■ ’16 (N=208)
Very confident
Somewhat confident
Not too confident
Not at all confident
I haven’t given much thought to a financial strategy for travel in retirement
18
41
16
10
15
Net Confident
59% 15
44
12
11
18
Net Confident
59% 23
36
15
9
17
Net Confident
60% 19
41
19
4
17
Net Confident
60%
Confidence That Current Financial Strategy Will Meet Retirement Travel Goals (%)

Hispanic workers (46 percent) are most likely to use a professional financial advisor to help manage their
retirement savings or investments while Asian workers (29 percent) are least likely. Forty-percent of White and
36 percent of African American workers use a financial adviser. White, Hispanic and African American workers
saw slightly increased levels of professional financial advisor use from last year.
Professional Financial Advisor Usage
291BASE: INVESTING FOR RETIREMENTQ860. Do you use a professional financial advisor to help manage your retirement savings or investments?
4036 37 38
34
4642
37
26
3936
3033 34
28 29 29
3733
22
'16 '15 '14 '13 '12 '16 '15 '14 '13 '12 '16 '15 '14 '13 '12 '16 '15 '14 '13 '12
N=2002 N=2177 N=2072 N=2246 N=2212 N=505 N=485 N=481 N=115 N=160 N=336 N=366 N=323 N=124 N=131 N=222 N=303 N=190 N=176 N=205
White Hispanic African American Asian/Pacific
Use a Professional Financial Advisor, % Indicate “Yes”
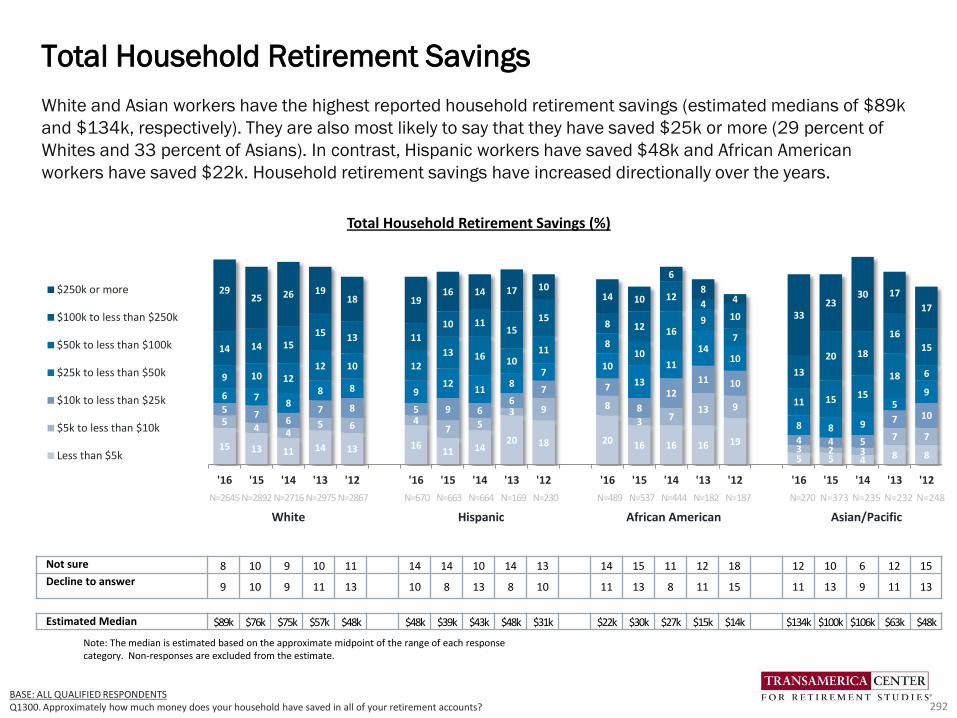
White and Asian workers have the highest reported household retirement savings (estimated medians of $89k
and $134k, respectively). They are also most likely to say that they have saved $25k or more (29 percent of
Whites and 33 percent of Asians). In contrast, Hispanic workers have saved $48k and African American
workers have saved $22k. Household retirement savings have increased directionally over the years.
Total Household Retirement Savings
292BASE: ALL QUALIFIED RESPONDENTSQ1300. Approximately how much money does your household have saved in all of your retirement accounts?
Note: The median is estimated based on the approximate midpoint of the range of each response category. Non-responses are excluded from the estimate.
Not sure 8 10 9 10 11 14 14 10 14 13 14 15 11 12 18 12 10 6 12 15
Decline to answer 9 10 9 11 13 10 8 13 8 10 11 13 8 11 15 11 13 9 11 13
Estimated Median $89k $76k $75k $57k $48k $48k $39k $43k $48k $31k $22k $30k $27k $15k $14k $134k $100k $106k $63k $48k
Total Household Retirement Savings (%)
N=2645 N=2892 N=2716 N=2975 N=2867 N=670 N=663 N=664 N=169 N=230 N=489 N=537 N=444 N=182 N=187 N=270 N=373 N=235 N=232 N=248
White Hispanic African American Asian/Pacific
15 13 11 14 13 1611 14
20 18 20 16 16 16 19
5 5 4 8 8
54 4
5 6 47 5
3 9 8
3 713 9
3 2 3
7 7
5 76
7 8 5 9 66
7 7
8
12
11 10
4 4 5
7 10
6 78
8 8 912
118
710
13
11
1410
8 8 9
59
9 10 1212 10 12
13 16 1011
810
169
7
11 15 15
18 6
14 14 1515 13 11
10 1115
158 12
124
10
13
20 18
16
15
2925 26 19
18 1916 14 17 10
14 10
6
84
3323
30 17
17
'16 '15 '14 '13 '12 '16 '15 '14 '13 '12 '16 '15 '14 '13 '12 '16 '15 '14 '13 '12
$250k or more
$100k to less than $250k
$50k to less than $100k
$25k to less than $50k
$10k to less than $25k
$5k to less than $10k
Less than $5k
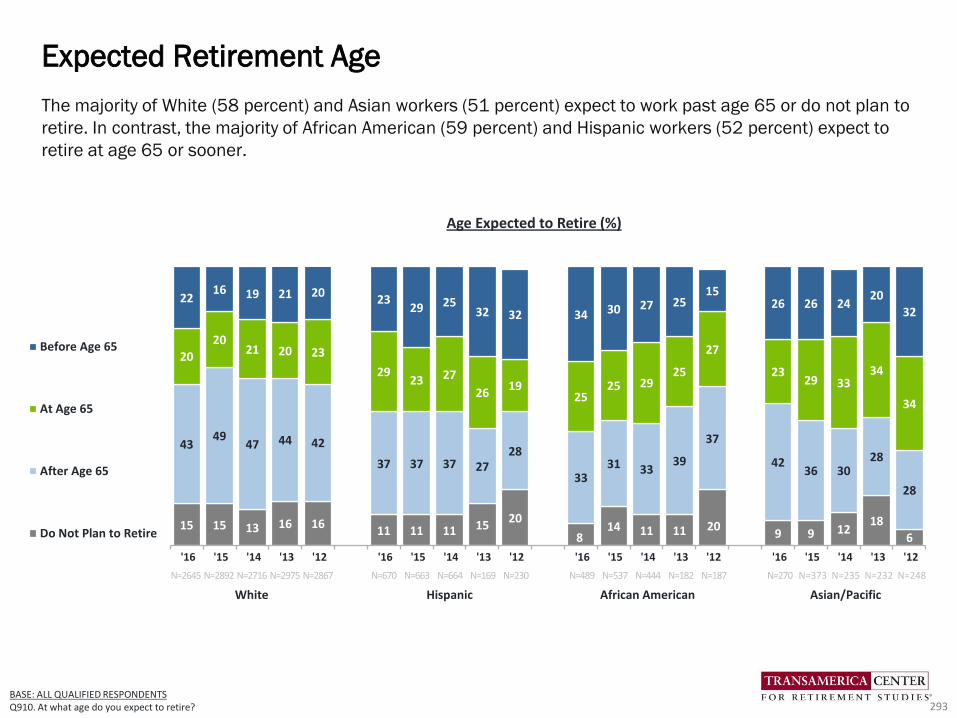
BASE: ALL QUALIFIED RESPONDENTSQ910. At what age do you expect to retire?
The majority of White (58 percent) and Asian workers (51 percent) expect to work past age 65 or do not plan to
retire. In contrast, the majority of African American (59 percent) and Hispanic workers (52 percent) expect to
retire at age 65 or sooner.
Expected Retirement Age
293
15 15 13 16 1611 11 11 15
20
814 11 11 20
9 9 1218
6
4349
47 44 42
37 37 37 2728
3331 33
39
37
4236 30
28
28
20
2021 20 23
2923 27
2619
2525 29
25
27
2329 33
34
34
2216 19 21 20
2329 25
32 32 34 30 27 2515
26 26 2420
32
'16 '15 '14 '13 '12 '16 '15 '14 '13 '12 '16 '15 '14 '13 '12 '16 '15 '14 '13 '12
Before Age 65
At Age 65
After Age 65
Do Not Plan to Retire
N=2645 N=2892 N=2716 N=2975 N=2867 N=670 N=663 N=664 N=169 N=230 N=489 N=537 N=444 N=182 N=187 N=270 N=373 N=235 N=232 N=248
White Hispanic African American Asian/Pacific
Age Expected to Retire (%)

Across ethnicities, approximately half of workers plan to work full- or part-time in retirement, including 51
percent of Whites, 50 percent of Hispanics, 49 percent of African Americans, and 50 percent of Asian workers.
Expectations of working in retirement have for the most part decreased over the past five years.
Expectations of Working in Retirement
294BASE: ALL QUALIFIED RESPONDENTSQ1525. Do you plan to work after you retire?
38 41 40 44 4436 35
43 39 4436 36 37
5142
35 36 3341
51
13 10 11 9 1114 16
14 1815
13 12 13
12
5 15 18 2117
11
28 25 2720 20 23 28 23 18 14
30 26 2815 20 26 24
3119 14
21 24 2227 26
27 2119 25 27
21 26 22
22
33 24 2215
2224
% Yes (NET)
Working After Retirement (%)
Yes, I plan to work full-timeYes, I plan to work part-timeNo, I do not plan to workNot sure
’16 ’15 ’14 ’13 ’12 ’16 ’15 ’14 ’13 ’12 ’16 ’15 ’14 ’13 ’12 ’16 ’15 ’14 ’13 ’12
N=2645N=2892N=2716N=2975N=2867 N=670 N=663 N=664 N=169 N=230 N=489 N=537 N=444 N=182 N=187 N=270 N=373 N=235 N=232 N=248
White Hispanic African American Asian/Pacific
51 51 53 55 5157 57 59
48 50
63
4754 54
5862
51 50 49 50
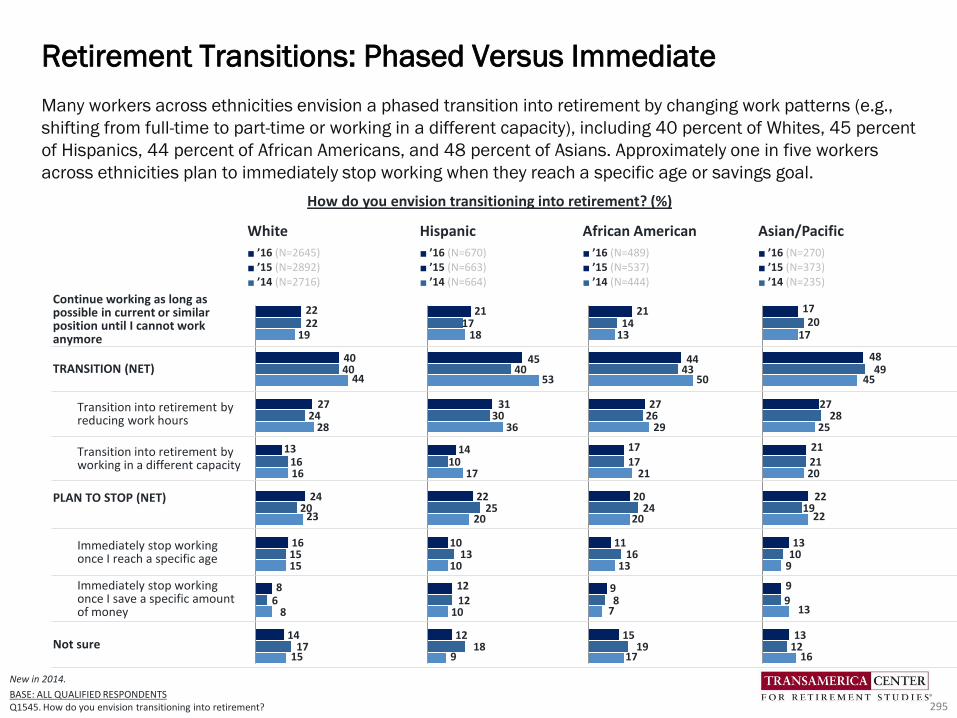
Many workers across ethnicities envision a phased transition into retirement by changing work patterns (e.g.,
shifting from full-time to part-time or working in a different capacity), including 40 percent of Whites, 45 percent
of Hispanics, 44 percent of African Americans, and 48 percent of Asians. Approximately one in five workers
across ethnicities plan to immediately stop working when they reach a specific age or savings goal.
Retirement Transitions: Phased Versus Immediate
295
New in 2014.
BASE: ALL QUALIFIED RESPONDENTSQ1545. How do you envision transitioning into retirement?
2222
19
4040
44
2724
28
131616
2420
23
161515
86
8
1417
15
2117
18
4540
53
3130
36
1410
17
2225
20
1013
10
1212
10
1218
9
2114
13
4443
50
2726
29
1717
21
2024
20
1116
13
98
7
1519
17
1720
17
4849
45
2728
25
212120
2219
22
1310
9
99
13
1312
16
White Hispanic African American Asian/Pacific
■ ’16 (N=2645)■ ’15 (N=2892)
■ ’14 (N=2716)
■ ’16 (N=670)■ ’15 (N=663)
■ ’14 (N=664)
■ ’16 (N=489)■ ’15 (N=537)
■ ’14 (N=444)
■ ’16 (N=270)■ ’15 (N=373)
■ ’14 (N=235)
Continue working as long as possible in current or similar position until I cannot work anymore
TRANSITION (NET)
Transition into retirement by reducing work hours
Transition into retirement by working in a different capacity
PLAN TO STOP (NET)
Immediately stop working once I reach a specific age
Immediately stop working once I save a specific amount of money
Not sure
How do you envision transitioning into retirement? (%)
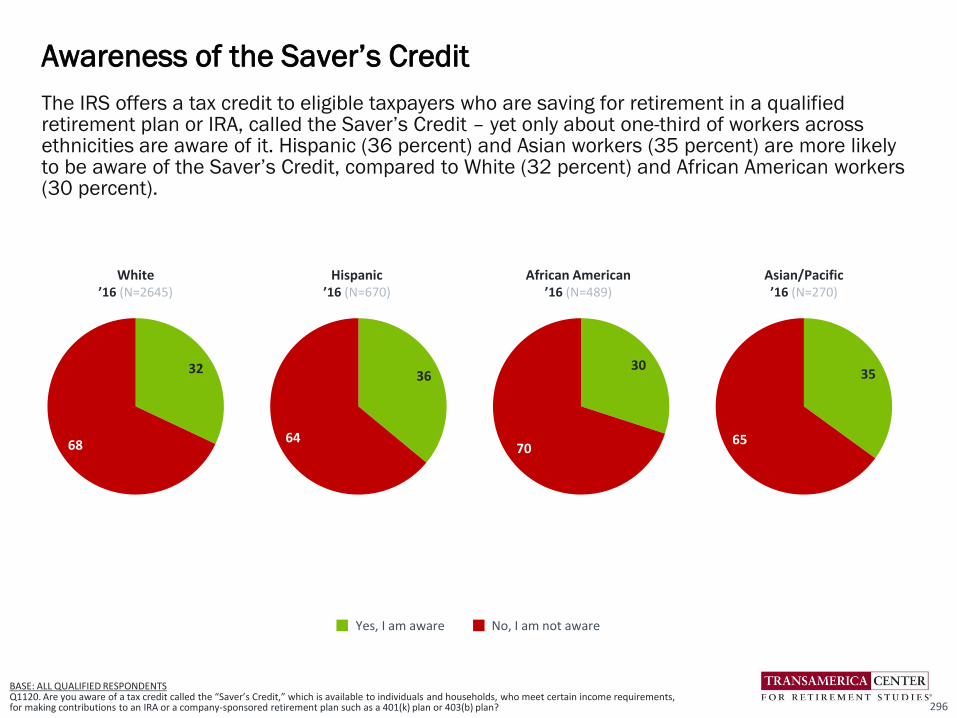
The IRS offers a tax credit to eligible taxpayers who are saving for retirement in a qualified retirement plan or IRA, called the Saver’s Credit – yet only about one-third of workers across ethnicities are aware of it. Hispanic (36 percent) and Asian workers (35 percent) are more likely to be aware of the Saver’s Credit, compared to White (32 percent) and African American workers (30 percent).
Awareness of the Saver’s Credit
296
Yes, I am aware No, I am not aware
32
68
White’16 (N=2645)
36
64
Hispanic’16 (N=670)
30
70
African American’16 (N=489)
35
65
Asian/Pacific’16 (N=270)
BASE: ALL QUALIFIED RESPONDENTS Q1120. Are you aware of a tax credit called the “Saver’s Credit,” which is available to individuals and households, who meet certain income requirements, for making contributions to an IRA or a company-sponsored retirement plan such as a 401(k) plan or 403(b) plan?
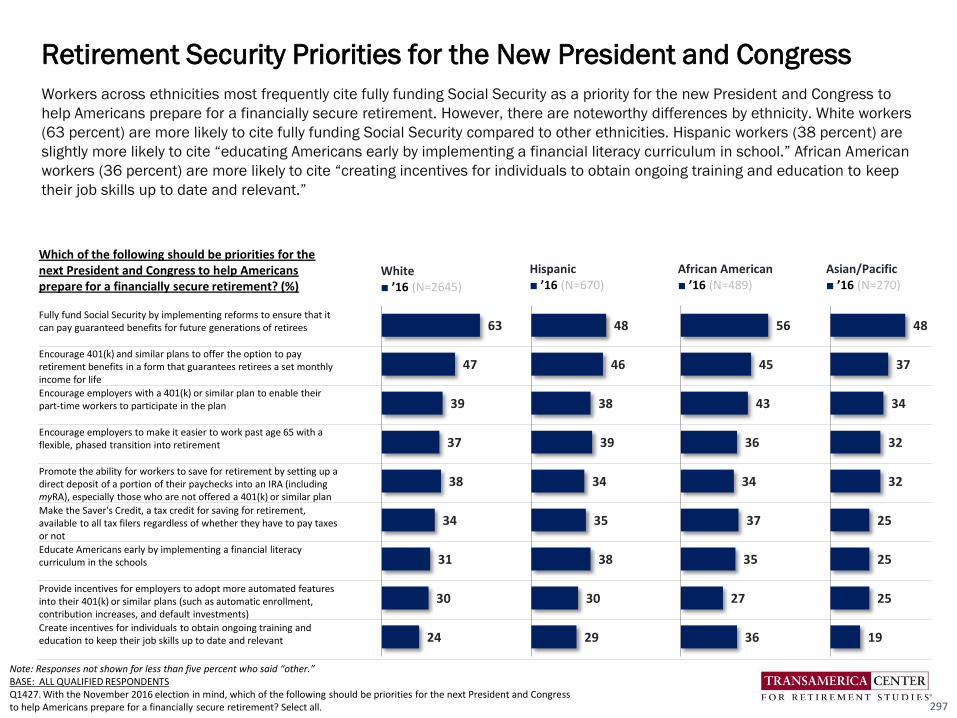
Workers across ethnicities most frequently cite fully funding Social Security as a priority for the new President and Congress to
help Americans prepare for a financially secure retirement. However, there are noteworthy differences by ethnicity. White workers
(63 percent) are more likely to cite fully funding Social Security compared to other ethnicities. Hispanic workers (38 percent) are
slightly more likely to cite “educating Americans early by implementing a financial literacy curriculum in school.” African American
workers (36 percent) are more likely to cite “creating incentives for individuals to obtain ongoing training and education to keep
their job skills up to date and relevant.”
Retirement Security Priorities for the New President and Congress
297
Which of the following should be priorities for the next President and Congress to help Americans prepare for a financially secure retirement? (%)
White■ ’16 (N=2645)
Hispanic■ ’16 (N=670)
African American■ ’16 (N=489)
Asian/Pacific■ ’16 (N=270)
Fully fund Social Security by implementing reforms to ensure that it can pay guaranteed benefits for future generations of retirees
Encourage 401(k) and similar plans to offer the option to pay retirement benefits in a form that guarantees retirees a set monthly income for life
Encourage employers with a 401(k) or similar plan to enable their part-time workers to participate in the plan
Encourage employers to make it easier to work past age 65 with a flexible, phased transition into retirement
Promote the ability for workers to save for retirement by setting up a direct deposit of a portion of their paychecks into an IRA (including myRA), especially those who are not offered a 401(k) or similar plan
Make the Saver's Credit, a tax credit for saving for retirement, available to all tax filers regardless of whether they have to pay taxes or not
Educate Americans early by implementing a financial literacy curriculum in the schools
Provide incentives for employers to adopt more automated features into their 401(k) or similar plans (such as automatic enrollment, contribution increases, and default investments)
Create incentives for individuals to obtain ongoing training and education to keep their job skills up to date and relevant
63
47
39
37
38
34
31
30
24
48
46
38
39
34
35
38
30
29
56
45
43
36
34
37
35
27
36
48
37
34
32
32
25
25
25
19
Note: Responses not shown for less than five percent who said “other.”BASE: ALL QUALIFIED RESPONDENTSQ1427. With the November 2016 election in mind, which of the following should be priorities for the next President and Congress to help Americans prepare for a financially secure retirement? Select all.
Respondent Profiles
Comparison of Full- and Part-Time
Workers
Appendix
298
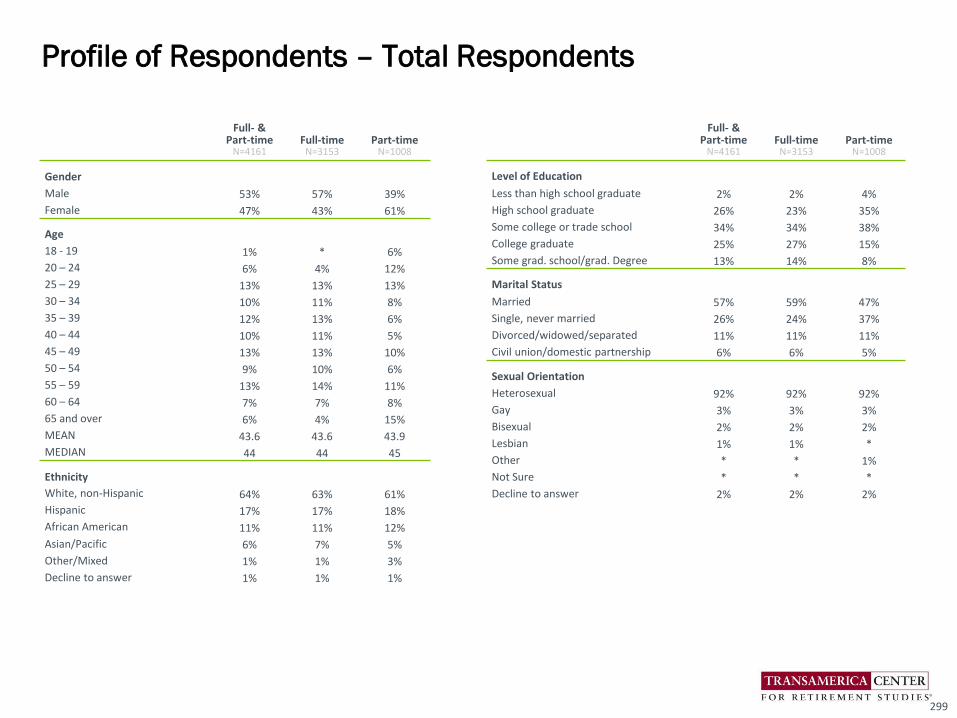
Profile of Respondents – Total Respondents
299
Full- & Part-time
N=4161Full-time
N=3153Part-time
N=1008
Gender
Male 53% 57% 39%
Female 47% 43% 61%
Age
18 - 19 1% * 6%
20 – 24 6% 4% 12%
25 – 29 13% 13% 13%
30 – 34 10% 11% 8%
35 – 39 12% 13% 6%
40 – 44 10% 11% 5%
45 – 49 13% 13% 10%
50 – 54 9% 10% 6%
55 – 59 13% 14% 11%
60 – 64 7% 7% 8%
65 and over 6% 4% 15%
MEAN 43.6 43.6 43.9
MEDIAN 44 44 45
Ethnicity
White, non-Hispanic 64% 63% 61%
Hispanic 17% 17% 18%
African American 11% 11% 12%
Asian/Pacific 6% 7% 5%
Other/Mixed 1% 1% 3%
Decline to answer 1% 1% 1%
Full- & Part-time
N=4161Full-time
N=3153Part-time
N=1008
Level of Education
Less than high school graduate 2% 2% 4%
High school graduate 26% 23% 35%
Some college or trade school 34% 34% 38%
College graduate 25% 27% 15%
Some grad. school/grad. Degree 13% 14% 8%
Marital Status
Married 57% 59% 47%
Single, never married 26% 24% 37%
Divorced/widowed/separated 11% 11% 11%
Civil union/domestic partnership 6% 6% 5%
Sexual Orientation
Heterosexual 92% 92% 92%
Gay 3% 3% 3%
Bisexual 2% 2% 2%
Lesbian 1% 1% *
Other * * 1%
Not Sure * * *
Decline to answer 2% 2% 2%
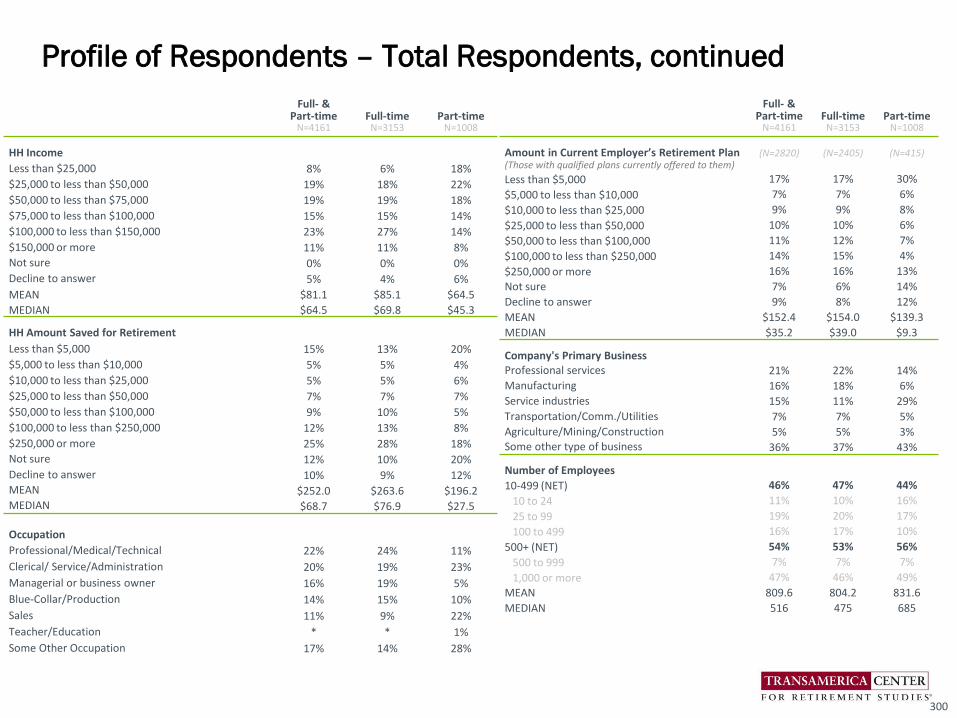
Profile of Respondents – Total Respondents, continued
300
Full- & Part-time
N=4161Full-time
N=3153Part-time
N=1008
Amount in Current Employer’s Retirement Plan(Those with qualified plans currently offered to them)
(N=2820) (N=2405) (N=415)
Less than $5,000 17% 17% 30%
$5,000 to less than $10,000 7% 7% 6%
$10,000 to less than $25,000 9% 9% 8%
$25,000 to less than $50,000 10% 10% 6%
$50,000 to less than $100,000 11% 12% 7%
$100,000 to less than $250,000 14% 15% 4%
$250,000 or more 16% 16% 13%
Not sure 7% 6% 14%
Decline to answer 9% 8% 12%
MEAN $152.4 $154.0 $139.3
MEDIAN $35.2 $39.0 $9.3
Company's Primary BusinessProfessional services 21% 22% 14%
Manufacturing 16% 18% 6%
Service industries 15% 11% 29%
Transportation/Comm./Utilities 7% 7% 5%
Agriculture/Mining/Construction 5% 5% 3%Some other type of business 36% 37% 43%
Number of Employees
10-499 (NET) 46% 47% 44%
10 to 24 11% 10% 16%
25 to 99 19% 20% 17%
100 to 499 16% 17% 10%
500+ (NET) 54% 53% 56%
500 to 999 7% 7% 7%
1,000 or more 47% 46% 49%
MEAN 809.6 804.2 831.6
MEDIAN 516 475 685
Full- & Part-time
N=4161Full-time
N=3153Part-time
N=1008
HH Income
Less than $25,000 8% 6% 18%
$25,000 to less than $50,000 19% 18% 22%
$50,000 to less than $75,000 19% 19% 18%
$75,000 to less than $100,000 15% 15% 14%
$100,000 to less than $150,000 23% 27% 14%
$150,000 or more 11% 11% 8%
Not sure 0% 0% 0%
Decline to answer 5% 4% 6%
MEAN $81.1 $85.1 $64.5
MEDIAN $64.5 $69.8 $45.3
HH Amount Saved for Retirement
Less than $5,000 15% 13% 20%
$5,000 to less than $10,000 5% 5% 4%
$10,000 to less than $25,000 5% 5% 6%
$25,000 to less than $50,000 7% 7% 7%
$50,000 to less than $100,000 9% 10% 5%
$100,000 to less than $250,000 12% 13% 8%
$250,000 or more 25% 28% 18%
Not sure 12% 10% 20%
Decline to answer 10% 9% 12%MEAN $252.0 $263.6 $196.2MEDIAN $68.7 $76.9 $27.5
Occupation
Professional/Medical/Technical 22% 24% 11%
Clerical/ Service/Administration 20% 19% 23%
Managerial or business owner 16% 19% 5%
Blue-Collar/Production 14% 15% 10%
Sales 11% 9% 22%
Teacher/Education * * 1%
Some Other Occupation 17% 14% 28%