Embed Size (px)
Citation preview

ANNUAL SURVEY
OF
INDUSTRIES
2016-17
Directorate of Economics & Statistics
Government of Andhra Pradesh,
ANNUAL SURVEY
OF
INDUSTRIES
2016-17
Directorate of Economics and Statistics
Govt. of A. P.

FOREWORD
The Central Statistics Office (CSO) conducts Annual Survey of Industries
every year. The Survey covers all units registered under sections 2m(i) and
2m(ii) of Factories Act, 1948 i.e. those employing 10 or more workers with
power and 20 or more workers without power respectively.
The National Sample Survey Office (NSSO) conducts field work for
Census and Sample units. CSO (IS Wing) is processing and tabulating the data.
The Directorate of Economics and Statistics(DES) conducts field work for
Sample units allotted to State to get reliable estimates at District level. The CSO
(IS Wing) provides the soft copy of the validated state-wise unit level data to
the Directorate of Economics and Statistics, which will in turn process along
with State surveyed data to get a combined estimate at the sub-state level and
analyses the data by industry group wise and brings out results in the form of
publication. The present publication on “Report on Annual Survey of
Industries, Andhra Pradesh 2016-17” is the 6th in the series with pooled
data after Re-organisation of A.P.
This publication provides the comprehensive data relating to number of
factories, employment, emoluments, capital structure, loans, output and value
added by manufacture etc., in the State. Estimates of selected characteristics are
provided at NIC 2 & 3 digit level classification of industries for State and NIC 2
digit level classification of industries for districts.
I hope this publication will be useful to Researchers, Administrators &
others monitoring the industrial progress of the State. Any suggestions towards
improvement in scope and content of this publication are welcome.
I appreciate the sincere efforts of all the District and State level Officers
and Staff involved in bringing out this publication.
Sd/- V. Prathima
Dt : 11.12.2019 DIRECTOR
1
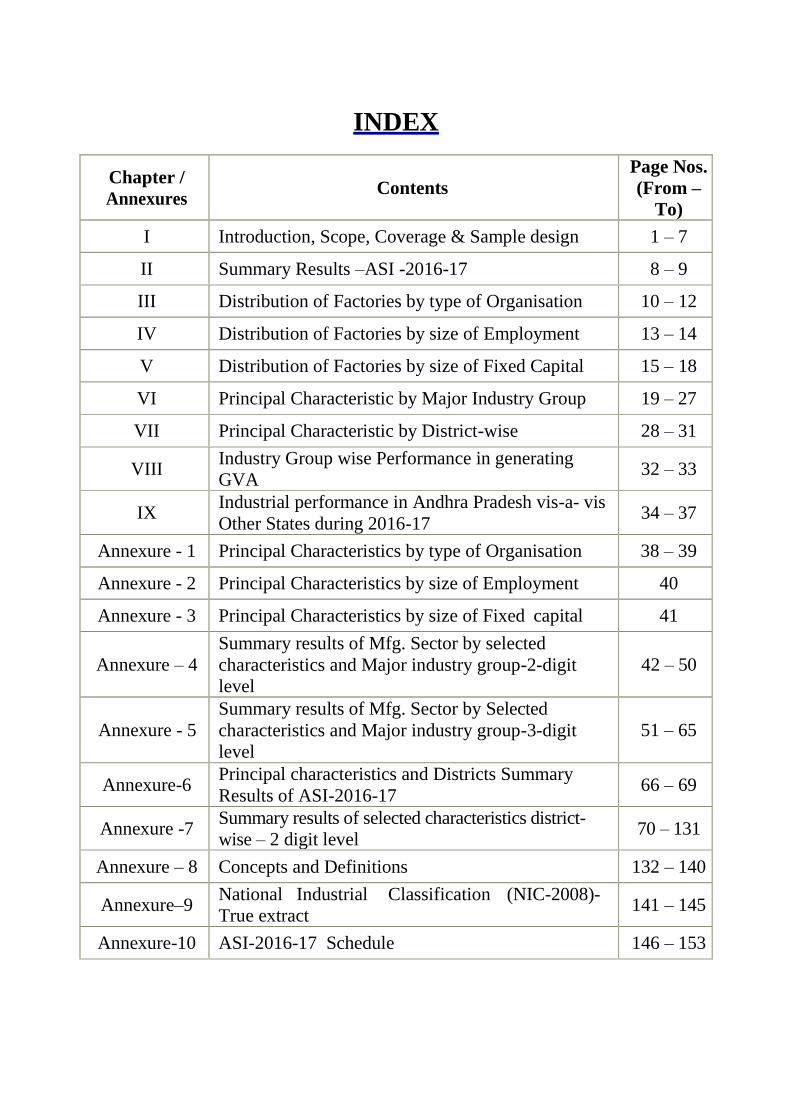
INDEX
Chapter /
Annexures Contents
Page Nos.
(From –
To)
I Introduction, Scope, Coverage & Sample design 1 – 7
II Summary Results –ASI -2016-17 8 – 9
III Distribution of Factories by type of Organisation 10 – 12
IV Distribution of Factories by size of Employment 13 – 14
V Distribution of Factories by size of Fixed Capital 15 – 18
VI Principal Characteristic by Major Industry Group 19 – 27
VII Principal Characteristic by District-wise 28 – 31
VIII Industry Group wise Performance in generating
GVA 32 – 33
IX Industrial performance in Andhra Pradesh vis-a- vis
Other States during 2016-17 34 – 37
Annexure - 1 Principal Characteristics by type of Organisation 38 – 39
Annexure - 2 Principal Characteristics by size of Employment 40
Annexure - 3 Principal Characteristics by size of Fixed capital 41
Annexure – 4
Summary results of Mfg. Sector by selected
characteristics and Major industry group-2-digit
level
42 – 50
Annexure - 5
Summary results of Mfg. Sector by Selected
characteristics and Major industry group-3-digit
level
51 – 65
Annexure-6 Principal characteristics and Districts Summary
Results of ASI-2016-17 66 – 69
Annexure -7 Summary results of selected characteristics district-
wise – 2 digit level 70 – 131
Annexure – 8 Concepts and Definitions 132 – 140
Annexure–9 National Industrial Classification (NIC-2008)-
True extract 141 – 145
Annexure-10 ASI-2016-17 Schedule 146 – 153

2
Salient features of ASI-2016-17
Factories:
Total number of factories in operation is estimated at 12,696 an increase of
7.72% in number over previous year.
Guntur district occupies first place in respect of number of factories with
2,443 (19.24%) followed by Prakasam 1,317 (10.37%), East Godavari 1,193
(9.40%), Chittoor 1,057(8.33%) and Krishna 978(7.70%). These five districts
accounted for 6,988 (55.04 %) factories of the state.
Vizianagaram district occupies last place in the State with only 276 (2.17%)
factories.
Large No. of factories are concentrated in Food products group 4,375 with
34.46% share in number of factories followed by Other Non-metallic Mineral
Products group (25.93%), Cotton ginning (4.32%), Rubber and Plastic
products group (4.30%), Tobacco Products (3.05%) and Textile group
(3.03%). The contribution of the above mentioned 5 groups is 72.06% of total
operating factories in the state.
Total Gross Value Added (GVA) from Manufacturing sector is estimated at
Rs. 37,279.66 Crores and it is decreased by -6.01% over previous year.
Employment: Total No. of persons employed in the industrial sector (Manufacturing, Bidi, &
Electricity) are 5,67,345.
Visakhapatnam provides highest employment to 1,20,169(21.18%) persons.
The other districts which provides significant employment are Guntur 77,773
(13.41%), East Godavari 55,714 (9.82%), Chittoor 48,844(8.61%) and West
Godavari 43,049(7.59%). These districts provide employment to 60.61% of
the state.
Food products group provides employment to 1,42,909 (25.19%), Non-
metallic Minerals 80,519 (14.19%), Textiles 57,360 (10.11%),
Pharmaceuticals 45,261 (7.98%). The above 4 groups exclusively provide
employment to 57.47% out of total employment of the state.
Gross Value Added (GVA) GVA of the State for the year 2016-17 is Rs.37,279.66 Crores for all
industrial groups and GVA for Manufacturing sector (i.e., 10 to 32 group) is
Rs.35,832.82 Crores. Food Products Group tops the GVA with Rs. 17049.95 (45.74%) Crores
followed by Chemical & Chemical products group Rs. 4118.59 (11.05 %) Crores, Coke & Petroleum products 3319.21 (8.90%) , Textiles 2568.67 (6.89%). These groups have accounted for Rs. 27056.41 (72.58%) Crores of State GVA.
Visakhapatnam is the major contributing district in respect of GVA i.e., Rs. 9611.10 (25.78%) Crores, followed by East Godavari Rs. 6156.74 (16.52%) Crores, Guntur Rs. 5216.42 (13.99%) Crores, SPS Nellore Rs.3553.74 (9.00%) Crores and Anantapuramu Rs. 2292.78 (6.15%) Crores totaling to Rs.26630.78 (71.44%) crores.
Prakasam is in last place with Rs.229.02 (0.61%)Crores GVA.

1
CHAPTER– I
INTRODUCTION, SCOPE, COVERAGE AND SAMPLE DESIGN
Annual Survey of Industries (ASI) is the principal source of Industrial Statistics
of the registered/ organized manufacturing sector in India. It provides statistical
information to assess and evaluate objectively and realistically the changes in growth,
composition and structure of organized manufacturing processes, repair, services, gas,
water supply and cold storage. The Survey has been conducted since 1959 under the
authority of the Collection of Statistics Act, 1953. From ASI 2010-11, the survey is
being conducted under the authority of the Collection of Statistics Act, 2008. In
accordance with the provisions of Collection of Statistics (Central) Rules, 2011 framed
under the Act, ASI has been designed to obtain comprehensive and detailed data for
the following objectives, viz.,
Estimation of the contribution of manufacturing industries as a whole and of
each type of industry to the "State Income"
Systematic study of the structure of the industry as a whole and of each type of
industry
To analyze the various factors influencing the industries in the State
construction of comprehensive, factual and systematic base for formulation of
policy.
ASI Schedule
ASI schedule is the basic tool to collect required data for the factories registered
under Sections 2m (i) and 2m (ii) of the Factories Act, 1948. The schedule for ASI, at
present, has two parts. Part-I of ASI schedule aims to collect data on assets and
liabilities, employment and labour cost, receipts, expenses, input items (indigenous
and imported), products and by- products, distributive expenses, etc. Part-II of ASI
schedule, processed by the Labour Bureau, aims to collect data on different aspects of
labour statistics, viz., working days, man-days worked, absentism, labour turnover,
man-hours worked etc.
Scope and Coverage
The Geographical coverage of the ASI extends to the entire country. The
reference period for the collection of ASI data is the financial year (April-March) for
all the items. The actual survey period is generally September to April of every year.
Coverage of the Annual Survey of Industries extends to the entire Factory Sector
comprising industrial units (called factories) registered under the section 2m (i) and
2m (ii) of the Factories Act, 1948, wherein a "Factory", which is the primary statistical
unit of enumeration for the ASI, is defined as
2
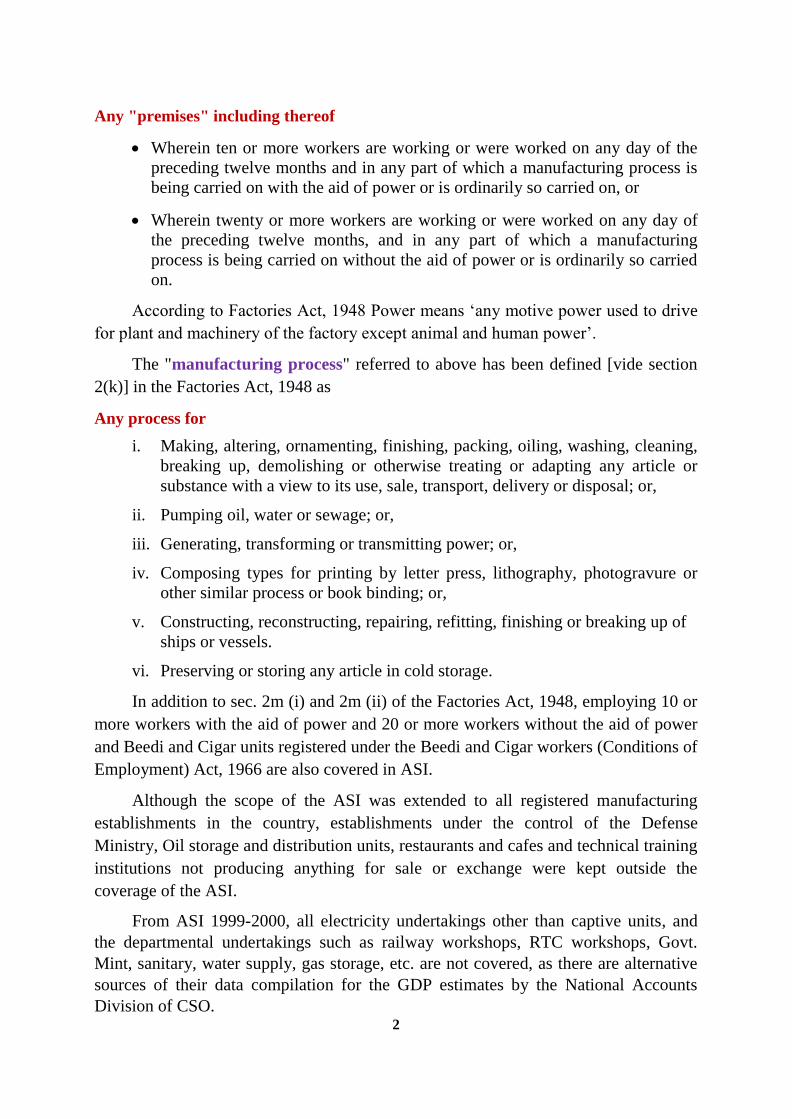
Any "premises" including thereof
Wherein ten or more workers are working or were worked on any day of the
preceding twelve months and in any part of which a manufacturing process is
being carried on with the aid of power or is ordinarily so carried on, or
Wherein twenty or more workers are working or were worked on any day of
the preceding twelve months, and in any part of which a manufacturing
process is being carried on without the aid of power or is ordinarily so carried
on.
According to Factories Act, 1948 Power means ‘any motive power used to drive
for plant and machinery of the factory except animal and human power’.
The "manufacturing process" referred to above has been defined [vide section
2(k)] in the Factories Act, 1948 as
Any process for
i. Making, altering, ornamenting, finishing, packing, oiling, washing, cleaning,
breaking up, demolishing or otherwise treating or adapting any article or
substance with a view to its use, sale, transport, delivery or disposal; or,
ii. Pumping oil, water or sewage; or,
iii. Generating, transforming or transmitting power; or,
iv. Composing types for printing by letter press, lithography, photogravure or
other similar process or book binding; or,
v. Constructing, reconstructing, repairing, refitting, finishing or breaking up of
ships or vessels.
vi. Preserving or storing any article in cold storage.
In addition to sec. 2m (i) and 2m (ii) of the Factories Act, 1948, employing 10 or
more workers with the aid of power and 20 or more workers without the aid of power
and Beedi and Cigar units registered under the Beedi and Cigar workers (Conditions of
Employment) Act, 1966 are also covered in ASI.
Although the scope of the ASI was extended to all registered manufacturing
establishments in the country, establishments under the control of the Defense
Ministry, Oil storage and distribution units, restaurants and cafes and technical training
institutions not producing anything for sale or exchange were kept outside the
coverage of the ASI.
From ASI 1999-2000, all electricity undertakings other than captive units, and
the departmental undertakings such as railway workshops, RTC workshops, Govt.
Mint, sanitary, water supply, gas storage, etc. are not covered, as there are alternative
sources of their data compilation for the GDP estimates by the National Accounts
Division of CSO.
3
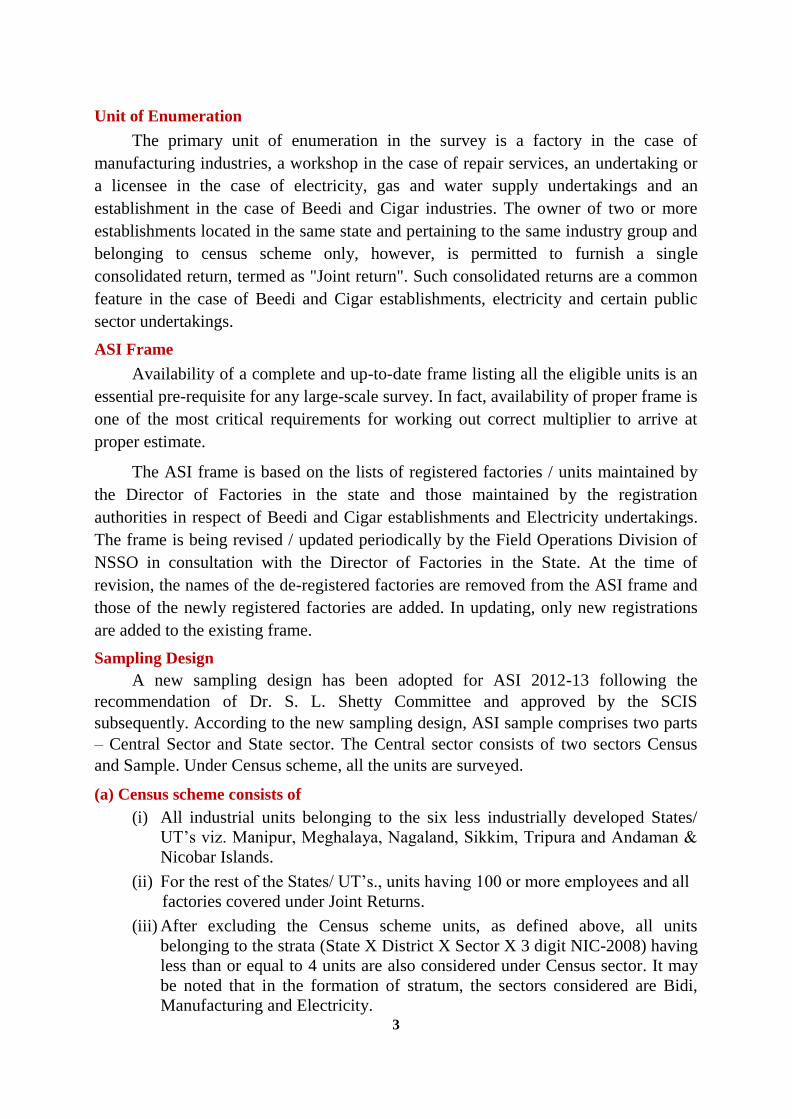
Unit of Enumeration
The primary unit of enumeration in the survey is a factory in the case of
manufacturing industries, a workshop in the case of repair services, an undertaking or
a licensee in the case of electricity, gas and water supply undertakings and an
establishment in the case of Beedi and Cigar industries. The owner of two or more
establishments located in the same state and pertaining to the same industry group and
belonging to census scheme only, however, is permitted to furnish a single
consolidated return, termed as "Joint return". Such consolidated returns are a common
feature in the case of Beedi and Cigar establishments, electricity and certain public
sector undertakings.
ASI Frame
Availability of a complete and up-to-date frame listing all the eligible units is an
essential pre-requisite for any large-scale survey. In fact, availability of proper frame is
one of the most critical requirements for working out correct multiplier to arrive at
proper estimate.
The ASI frame is based on the lists of registered factories / units maintained by
the Director of Factories in the state and those maintained by the registration
authorities in respect of Beedi and Cigar establishments and Electricity undertakings.
The frame is being revised / updated periodically by the Field Operations Division of
NSSO in consultation with the Director of Factories in the State. At the time of
revision, the names of the de-registered factories are removed from the ASI frame and
those of the newly registered factories are added. In updating, only new registrations
are added to the existing frame.
Sampling Design
A new sampling design has been adopted for ASI 2012-13 following the
recommendation of Dr. S. L. Shetty Committee and approved by the SCIS
subsequently. According to the new sampling design, ASI sample comprises two parts
– Central Sector and State sector. The Central sector consists of two sectors Census
and Sample. Under Census scheme, all the units are surveyed.
(a) Census scheme consists of
(i) All industrial units belonging to the six less industrially developed States/
UT’s viz. Manipur, Meghalaya, Nagaland, Sikkim, Tripura and Andaman &
Nicobar Islands.
(ii) For the rest of the States/ UT’s., units having 100 or more employees and all
factories covered under Joint Returns.
(iii) After excluding the Census scheme units, as defined above, all units
belonging to the strata (State X District X Sector X 3 digit NIC-2008) having
less than or equal to 4 units are also considered under Census sector. It may
be noted that in the formation of stratum, the sectors considered are Bidi,
Manufacturing and Electricity.
4
(b) Sample Sector
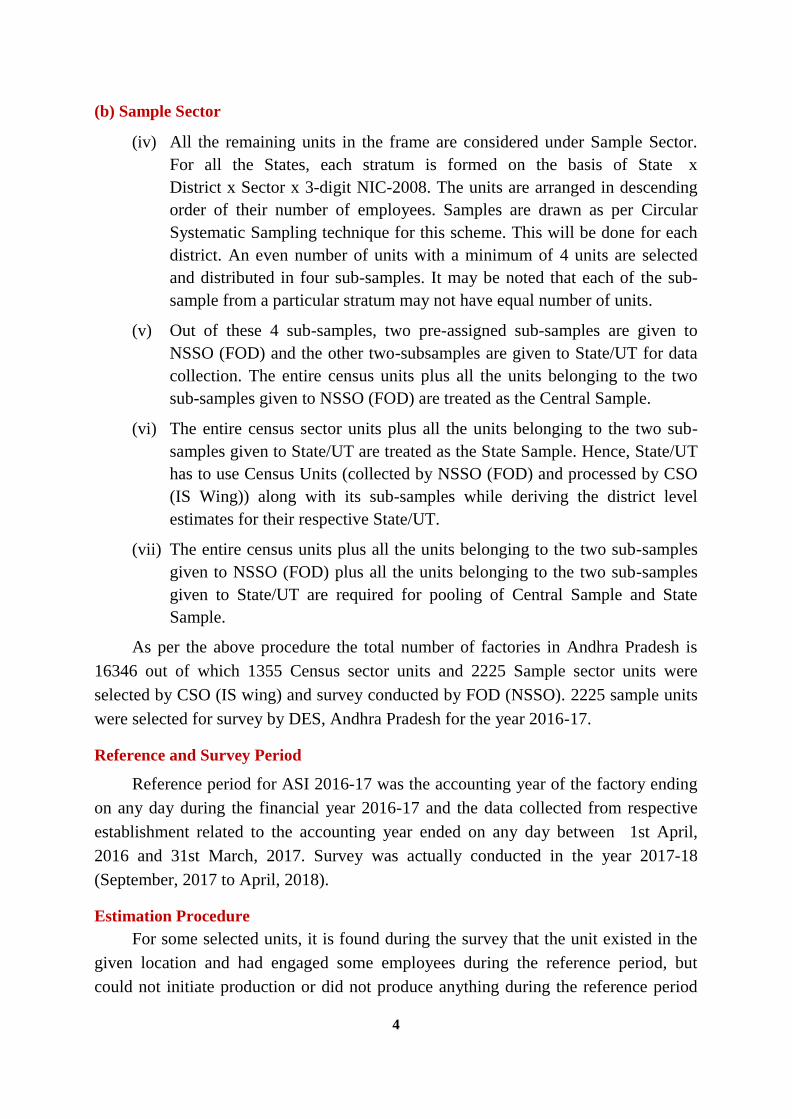
(iv) All the remaining units in the frame are considered under Sample Sector.
For all the States, each stratum is formed on the basis of State x
District x Sector x 3-digit NIC-2008. The units are arranged in descending
order of their number of employees. Samples are drawn as per Circular
Systematic Sampling technique for this scheme. This will be done for each
district. An even number of units with a minimum of 4 units are selected
and distributed in four sub-samples. It may be noted that each of the sub-
sample from a particular stratum may not have equal number of units.
(v) Out of these 4 sub-samples, two pre-assigned sub-samples are given to
NSSO (FOD) and the other two-subsamples are given to State/UT for data
collection. The entire census units plus all the units belonging to the two
sub-samples given to NSSO (FOD) are treated as the Central Sample.
(vi) The entire census sector units plus all the units belonging to the two sub-
samples given to State/UT are treated as the State Sample. Hence, State/UT
has to use Census Units (collected by NSSO (FOD) and processed by CSO
(IS Wing)) along with its sub-samples while deriving the district level
estimates for their respective State/UT.
(vii) The entire census units plus all the units belonging to the two sub-samples
given to NSSO (FOD) plus all the units belonging to the two sub-samples
given to State/UT are required for pooling of Central Sample and State
Sample.
As per the above procedure the total number of factories in Andhra Pradesh is
16346 out of which 1355 Census sector units and 2225 Sample sector units were
selected by CSO (IS wing) and survey conducted by FOD (NSSO). 2225 sample units
were selected for survey by DES, Andhra Pradesh for the year 2016-17.
Reference and Survey Period
Reference period for ASI 2016-17 was the accounting year of the factory ending
on any day during the financial year 2016-17 and the data collected from respective
establishment related to the accounting year ended on any day between 1st April,
2016 and 31st March, 2017. Survey was actually conducted in the year 2017-18
(September, 2017 to April, 2018).
Estimation Procedure
For some selected units, it is found during the survey that the unit existed in the
given location and had engaged some employees during the reference period, but
could not initiate production or did not produce anything during the reference period

5
due to various reasons, and can take up production any moment once the problems are
sorted out. These units, for the purpose of the survey, are considered as closed units
and similarly placed with other surveyed units (i.e., units for which the relevant
information could be collected) in respect of all parameters, such as, assets,
employment, etc. There are some other units which existed in the given location, but
did not engage any employee during the reference period, and also, did not initiate
production or produce anything during the reference period. These units, for the
purpose of ASI, are considered as non-operative units and termed as NOP cases,
during the reference period. Moreover, as a matter of practice, these units are
maintained in the frame for consecutive three years and are meant for selection for
survey with the consideration that these units might start production any time
employing some workers.
The results presented in the publication are based on the central sample data
collected by the FOD, NSSO and processed by the CSO (IS Wing) and sample data
collected by DE&S, Andhra Pradesh.
Classification of Industries
The NIC-1970 was followed to classify economic activities of the factories from
ASI 1973-74 to ASI 1988-89. NIC-1987 had then been introduced and followed till
ASI 1997-98. NIC-1998 was then followed from ASI 1998-99 to ASI 2003-04. From
ASI 2004-05, the new series of classification, i.e., NIC-2004 has been introduced and
the same has been used till ASI 2007-08. From ASI 2008-09, NIC- 2008 has been
introduced. It classifies all the factories in the ASI frame in their appropriate industry
groups on the basis of the principal product manufactured. This way a unit gets
classified in one and only one industry group even though it might be manufacturing
products belonging to different industries.
Objectives in analyzing data at disaggregate level (District level)
The estimates at disaggregate level with respect to industrial development in
Andhra Pradesh is viewed importance on various vital aspects is hereunder.
1) Principal Characteristics by districts and also with two digit industry
groups.
2) Share of districts in fixed capital, employment, Gross Value of Output, Net
Value Added.
Limitations
The fieldwork of Annual Survey of Industries is conducted by National Sample
Survey Organisation, Field Operations Division (NSSO, FOD) and DE&S., A.P. The
unit level data entry, validation etc., of Central sample is done by Central Statistical
6
Organisation (CSO) and State Sample by DE&S. The analysis given in this report is
based on Pooled data unit level data supplied by CSO, Kolkata and unit level data of
DE&S.
The Collection of Statistics Act prohibits disclosure of data relating to individual
factories. Therefore, if the number of factories under any industry (2‐digit/3‐digit level
of NIC‐2008) is less than three, the data have been combined to a similar industry in
order to conceal the identity of all such units belonging to the concerned stratum.
All the estimates, especially for quantity and value figures for any particular item
consumed and produced, are subject to Statistical Error as these are estimated on the
basis of a selected sample.
It may be noted that these results are not comparable over years because in
certain cases, there may be abnormal growth/decline in some characteristics compared
to the previous year. The possible reasons for the same may be as follows:
a) Inclusion of new units in the frame, particularly in the Census Sector.
b) Selection/non-selection of some Sample units, having considerable value of
multiplier.
c) Closure/Non-Operation of units, which had the significant effect on the
economy in the previous year.
d) Movement of Sample units in the previous year to Census units in the current
year, depending either on the size of employment or due to the sampling
strategy or both, and vice-versa.
e) High/low performance of the units in the current year, as compared to
low/high performance in the previous year.
f) Increase in the number of Census units (having multiplier 1) as compared to
the previous years (where many such units were covered under Sample sector
with multiplier higher than 1) with considerable reduction in the growth rates
of Total Output, Gross Value Added (GVA), Fixed Capital and other
important parameters in certain cases.
Processing and Tabulation of Data
For all the fourteen (14) blocks of filled-in schedules of all States/Union
Territories, data transcription, scrutiny and processing was done at the CSO (IS Wing),
Kolkata. All the items of information contained in the schedule were transferred
on to computer media according to specified formats. Tabulation was undertaken at
All India level after validation of census and sample unit level data. The processing of
ASI data is also taken up in the State, by using the same data supplied by CSO and
State Sample data by pooling for the purpose of arriving estimates for important
industrial characteristics at district level i.e. to get a combined estimate at the sub-state
level.

7
Presentation of Data
The results presented in this report relate to the factory sector i.e. factories
covered under the census and sample sectors of ASI 2016-17. The total for any
characteristic was obtained by adding the figures of the census sector and estimates of
sample sector, as per estimation procedure.
This report presents ASI summary results in respect of 27 selected
characteristics at various levels of aggregation.
The report also contains chapters covering overall structure of Industries for
the last five years, distribution of industries by type of organization, type of ownership,
size of employment and size of fixed capital etc. This report also covers district level
estimates and estimates of certain important characteristics for major states and All
India.

8
CHAPTER – II
SUMMARY RESULTS – ASI 2016-17
The distribution of the important economic aggregates and their percentage
contribution by the manufacturing and other sector of industrial activity in Andhra
Pradesh State covered by the Annual survey of Industries for the period from 2012-13
to 2016-17 is detailed below.
Sl.
No Characteristic Unit 2012-13 2013-14 2014-15 2015-16 2016-17
1 Factories (Working) No. 12549 12658 12940 11786 12696
(12.09) (0.87) (2.23) (-8.91) (7.72)
2 Fixed Capital Rs.
Crores
135942.23 144996.95 150435.37 168968.43 187770.52
(-26.84) (6.66) (3.75) (12.32) (11.13)
3 Working Capital Rs.
Crores
16383.94 28782.04 8910.88 16708.42 2891.12
(1.90) (75.67) -(69.04) (87.51) (-82.7)
4 Productive Capital Rs.
Crores
152326.17 173778.99 159346.25 185676.85 190661.64
(-24.55) (14.08) (-8.31) (16.52) (2.68)
5 Workers No. 405564 414747 433116 421850 460467
(9.74) (2.26) (4.42) (-2.60) (9.15)
6
Employees
(incl: workers)
500799 515736 530063 519530 567345
No. (10.06) (2.98) (2.78) (-1.99) (9.20)
7 Emoluments Rs.
Crores
7629.16 9617.09 11570.25 11163.71 12186.01
(13.94) (26.06) (20.31) (-3.51) (9.16)
8 Total Input Rs.
Crores
183526.99 231604.66 215286.31 203028.63 235897.45
(9.33) (26.19) (-7.05) (-5.69) (16.19)
9 Total Output Rs.
Crores
215029.62 258539.18 251261.05 242692.46 273177.12
(4.32) (20.23) (-2.82) (-3.41) (12.56)
10 Gross Value Added Rs.
Crores
31502.63 26934.52 35974.74 39663.83 37279.66
(-17.67) (-14.50) (33.56) (10.25) (-6.01)
11 Depreciation Rs.
Crores
7893.05 8193.69 7035.24 7594.36 9112.83
(18.20) (3.81) (-14.14) (7.95) (19.99)
12 Net Value Added Rs.
Crores
23609.58 18740.83 28939.51 32069.47 28166.83
(-25.25) (-20.62) (54.42) (10.82) (-12.17)
Note:Figures in brackets indicate percentage of increase / decrease over the previous
year.
Important Economic Aggregates during 2012-13 to 2016-17
455
00
7

9
The summary results reveal that there are 12,696 working factories in
Andhra Pradesh state and providing employment to 5,67,345 persons by the end of
2016-17. These factories with a productive capital of Rs. 1,90,661.64 Crores in the
State produced goods value worth of Rs. 2,73,177.12 Crores and contributed Rs.
37,279.66 Crores of Gross Value Added in the Manufacturing sector.
12
,54
9
12
,65
8
12
,94
0
11
,78
6
12
,69
6
11,200
11,400
11,600
11,800
12,000
12,200
12,400
12,600
12,800
13,000
13,200 2
01
2-1
3
20
13
-14
20
14
-15
20
15
-16
20
16
-17
Factories (Working-No.)
5,0
0,7
99
5,1
5,7
36
5,3
0,0
63
5,1
9,5
30
5,6
7,3
45
4,60,000
4,80,000
5,00,000
5,20,000
5,40,000
5,60,000
5,80,000
2012-13 2013-14 2014-15 2015-16 2016-17
Employees (incl. Workers-No.)
2012-13 2013-14 2014-15 2015-16 2016-17
31
,50
3
26
,93
5
35
,97
5
39
,66
4
37
,28
0
Gross Value Added (in Crores)
258
53
9.1
8
315
02
.63 2
,15
,030
2,5
8,5
39
2,5
1,2
61
2,4
2,6
92
2,7
3,1
77
0
50,000
1,00,000
1,50,000
2,00,000
2,50,000
3,00,000
2012-13 2013-14 2014-15 2015-16 2016-17
Output (in Crores)

10
CHAPTER – III Table – 3.1
DISTRIBUTION OF FACTORIES - BY TYPE OF
ORGANISATION– 2016-17
(Rs. in Crores)
Sl.
No
Organi-
sation
Facto-
ries
(No.)
Employ
ees (No.)
Fixed
Capital
Work ing
Capital
Total
Output
Gross
Value
Added
Net Value
Added
Gross
Fixed
Capital
Formation
1
Individual
Proprietor-
ship
6867 93194 10066.80 3353.47 23801.89 3043.92 2490.45 964.07
(54.09) (16.43) (5.36) (115.99) (8.71) (8.17) (8.84) (3.93)
2 Partner-
ship
3130 73201 4683.26 3003.85 24315.73 1318.00 805.62 940.19
(24.65) (12.90) (2.49) (103.90) (8.90) (3.54) (2.86) (3.84)
3
Limited
Liability
Partnership
167 5234 496.07 361.30 2147.68 341.29 289.37 70.31
(1.32) (0.92) (0.26) (12.500 (0.790 (0.920 (1.030 (0.29)
Non-
Corporate
Sector
10164 171629 15246.13 6718.62 50265.30 4703.21 3585.44 1974.57
(80.06) (30.25) (8.11) (232.39) (18.40) (12.62) (12.73) (8.06)
4
Govt.
Company-
Public
45 22077 41965.20 -
12823.49 41780.62 5101.51 3825.69 15381.24
(0.35) (3.89) (22.35) (-443.55) (15.29) (13.68) (13.58) (62.77)
5
Govt.
Company-
Private
59 5457 350.14 -68.54 1444.70 -77.75 -122.83 15.22
(0.46) (0.96) (0.19) (-2.37) (0.53) (-0.21) (-0.44) (0.06)
6
Non-Govt.
Company-
Public
320 100406 77691.68 837.56 58468.45 9829.83 7074.27 3046.99
(2.52) (17.70) (41.38) (28.97) (21.40) (26.37) (25.12) (12.43)
7
Non-Govt.
Company-
Private
2035 262560 52395.18 8018.65 119431.39 17166.92 13257.34 4103.85
(16.04) (46.28) (27.90) (277.36) (43.73) (46.05) (47.07) (16.75)
Corporate
Sector
2459 390500 172402.20 -4035.82 221125.16 32020.51 24034.47 22547.30
(19.37) (68.83) (91.82) (-139.59) (80.95) (85.89) (85.33) (92.01)
8
Co-
Operative
Societies
36 4228 105.29 158.76 1658.54 533.68 526.64 -17.67
(0.28) (0.75) (0.06) (5.49) (0.61) (1.43) (1.87) (-0.07)
9 Others 37 988 16.92 49.56 128.12 22.27 20.28 0.61
(0.29) (0.17) (0.01) (1.71) (0.04) (0.06) (0.07) (0.00)
Other Sector 73 5216 122.21 208.32 1786.66 555.95 546.92 -17.06
(0.57) (0.92) (0.07) (7.20) (0.65) (1.49) (1.94) (-0.07)
TOTAL 12696 567345 187770.52 2891.12 273177.12 37279.66 28166.83 24504.81
Note : Figures in brackets indicate percentage to total.

11
Type of Organisation-wise Distribution of Selected Characteristics
Non-
Corporate
Sector,
10164,
80%
Corporate
Sector,
2459, 19%
Other
Sector, 73,
1%
Factories (No.)
Non-
Corporat
e Sector,
171629,
30%
Corporat
e Sector,
390500,
69%
Other
Sector,
5216, 1%
Employees (No.)
Non-
Corporat
e Sector,
50,265
Corporat
e Sector,
2,21,125
Other
Sector,
1,787
Total Output (Crores)
Non-
Corporate
Sector,
4703.21,
13%
Corporate
Sector,
32020.51,
86%
Other
Sector,
555.95,
1%
Gross Value Added(Crores)

12
Table - 3.2
Structural Ratios of Industries by Type of Organisation - 2016-17
Sl.
No Organisation
Per Employee (Rs.)
Fixed
Capital
Working
Capital
Productive
Capital
Net
Value
Added
Gross
Fixed
Capital
Forma-
tion
1 Individual
Proprietorship 10,80,198 3,59,838 14,40,036 2,67,233 103448
2 Partnership 6,39,781 4,10,356 10,50,137 1,10,056 128440
3 Limited Liability
Partnership 9,47,784 6,90,294 16,38,078 5,52,866 134333
Non-Corp. Sector 8,88,319 3,91,462 12,79,781 2,08,906 115049
4 Govt. Company-
Public 1,90,08,561 -58,08,529 1,32,00,032 17,32,885 69,67,088
5 Govt. Company-
Private 6,41,635 -1,25,600 5,16,035 -2,25,087 27,891
6
Non-Govt.
Company-
Public
77,37,753 83,417 78,21,170 7,04,566 3,03,467
7 Non-Govt.
Company- Private 19,95,551 3,05,403 23,00,954 5,04,926 1,56,301
Corporate Sector 44,14,909 -1,03,350 43,11,559 6,15,479 5,77,396
8 Co- Operative
Societies 2,49,030 3,75,497 6,24,527 12,45,601 -41,793
9 Others 1,71,255 5,01,619 6,72,874 2,05,263 6,174
Other Sector 2,34,298 3,99,387 6,33,685 10,48,543 -32,707
All Sectors 33,09,636 50,959 33,60,594 4,96,467 4,31,921
The per employee Fixed Capital (Rs.44,14,909) and Productive capital (Rs.
43,11,559) is higher in Corporate Sector than in Non Corporate sector and whereas
Net Value Added (Rs. 10,48,543) is higher in other Sector. Within the Non-Corporate
Sector Limited Liability Partnership Companies are having higher Productive Capital.

13
CHAPTER –IV
DISTRIBUTION OF FACTORIES BY SIZE OF EMPLOYMENT – 2016-17
The distribution of factories by size of employment in the state during 2016-17
is as below.
Table - 4 (Rs. in Crores)
Sl.
No
Employ-
ment size
(No.)
Facto-
ries
Fixed
Capital
Working
Capital
Emp-
loyees
Total
Output
Gross
Value
Added
Net
Value
Added
Gross Fixed
Capital
Formation
1 0 - 49 10818 12395.91 4507.39 117531 40278.07 4475.79 3350.00 1952.12
(85.20) (6.60) (155.90) (20.72) (14.73) (12.01) (11.78) (7.97)
2 50 - 99 863 11709.43 -2158.02 60638 24199.01 2364.28 1414.13 1351.50
(6.80) (6.24) (-74.64) (10.69) (8.85) (6.34) (4.97) (5.52)
3 100 -
199 500 25190.94 1271.21 69436 29046.97 3885.92 2888.98 14180.29
(3.93) (13.42) (43.97) (12.24) (10.62) (10.42) (10.16) (57.87)
4 200 -
499 341 27880.50 1344.63 108710 62395.25 7835.70 6272.64 1944.40
(2.69) (14.85) (46.51) (19.16) (22.82) (21.02) (22.05) (7.93)
5 500 -999
113 24104.82 739.40 76681 33519.90 6776.34 5208.67 873.46
(0.89) (12.84) (25.57) (13.52) (12.26) (18.18) (18.31) (3.56)
6 1000-
1999 40 44710.41 5007.48 53915 21138.84 1867.00 1105.29 566.01
(0.31) (23.81) (173.20) (9.49) (7.73) (5.01) (3.89) (2.31)
7 2000-
4999
20 19257.87 -2519.04 52638 46226.24 7184.16 5863.16 732.45
(0.16) (10.26) (-87.13) (9.28) (16.90) (19.27) (20.61) (2.99)
8 5000
&Above
3 22520.66 -5301.93 27897 16372.86 2890.48 2063.98 2904.60
(0.02) (11.98) (-183.39) (4.90) (6.00) (7.75) (7.33) (11.85)
Total 12696 187770.52 2891.12 567345 273177.12 37279.66 28166.83 24504.81
Note : Figures in brackets indicate percentage to total.
The share of No. of factories 10818 (85.20%) is higher in size class 0-49 and No.
of factories 3 (0.02%) is lower in size class 5000 & above in the state. The share of
Total Output 22.82% is higher in size class 200-499 and 6.00% is lower in size class
5000& above. The share of Gross Fixed Capital Formation 57.87% is higher in size
class 100-199 and 2.31 % is lower in size class 1000-1999.

14
Table – 4.1
Structural Ratios and Technical Parameters of Factories by Employment Size
Employment
Size (No.)
Per Employee Fixed
Capital(Rs.)
Working
Capital (Rs.)
Productive
Capital (Rs.)
Net Value Added
(Rs.) GFCF (Rs.)
0 – 49 1054692 383506 1438198 285031 166094
50 – 99 1931038 -355885 1575153 233208 222879
100–199 3627936 183076 3811012 416063 2042209
200–499 2564667 123690 2688357 577007 178861
500–999 3143539 96226 3239965 679269 113908
1000-1999 8308168 930499 9238667 205387 105177
2000-4999 3658549 -478559 3179990 1113865 139149
5000 & Above 8072789 -1900538 6172251 739857 1041187
Total 3309633 50959 3360592 496467 431921
It is observed that the per employee Fixed capital and Productive capital are
higher in factories with 1000 - 1999 employment size. Further per employee Net Value
Added is higher in 2000-4999 employment size and GFCF is higher in 100-199.
40
,27
8
24
,19
9
29
,04
7
62
,39
5
33
,52
0
21
,13
9
46
,22
6
16
,37
3
0
10000
20000
30000
40000
50000
60000
70000
0 - 49 50 - 99
100 - 199
200 - 499
500 - 999
1000 - 1999
2000 -
4999
5000 &
Above
Gross Output (In Crores)
10
81
8
86
3
50
0
34
1
11
3
40
20
3
0
2000
4000
6000
8000
10000
12000
0 - 49 100 - 199 500 - 999 2000 - 4999
Factories
40
,27
8
24
,19
9
29
,04
7
62
,39
5
33
,52
0
21
,13
9 4
6,2
26
16
,37
3
0
10000
20000
30000
40000
50000
60000
70000
Gross Output (In Crores)
1,1
7,5
31
60
,63
8
69
,43
6 1,0
8,7
10
76
,68
1
53
,81
5
52
,63
8
27
,89
7
0
20000
40000
60000
80000
100000
120000
140000
0 - 49 50 - 99
100 - 199
200 - 499
500 - 999
1000 - 1999
2000 -
4999
5000 &
Above
Employees (No)

15
CHAPTER – V DISTRIBUTION OF FACTORIES BY SIZE OF FIXED CAPITAL
The distribution of factories by size of Fixed Capital in the State during 2016-17
is as below.
Table – 5 (Rs. in Crores)
Sl.
No
Fixed
Capital
Range
(Rs. in
Lakhs)
Facto-
ries
(No.)
Fixed
Capital
Work ing
Capital
Employ
ees (No.)
Total
Output
Gross
Value
Added
Net
Value
Added
Gross
Fixed Cap.
Formation
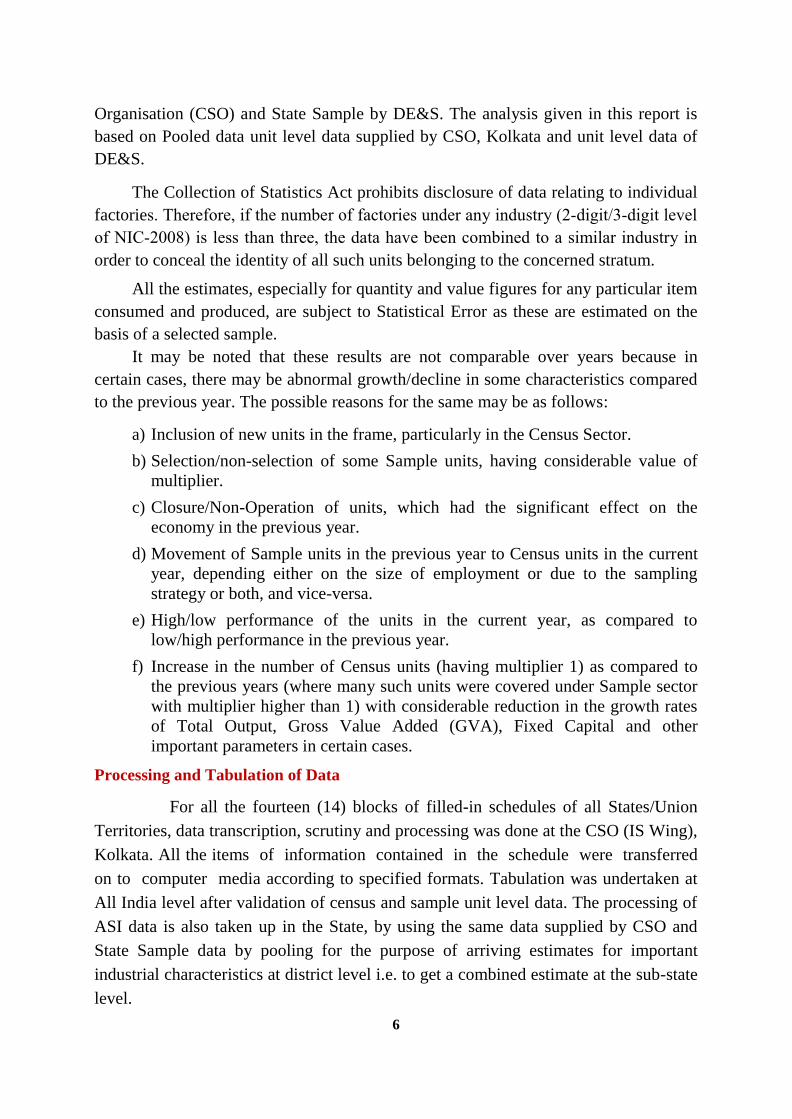
1 Up to -
2.49
2482 13250.57 826.01 22792 3344.51 934.35 918.10 13302.91
(19.55) (7.06) (28.57) (4.02) (1.22) (2.51) (3.26) (54.29)
2 2.50 -
4.99
574 24.20 114.19 4366 811.52 245.73 243.15 5.40
(4.52) (0.01) (3.95) (0.77) (0.30) (0.66) (0.86) (0.02)
3 5.00 -
7.49
711 44.10 108.83 6182 576.91 75.60 69.81 7.48
(5.60) (0.02) (3.76) (1.09) (0.21) (0.20) (0.25) (0.03)
4 7.50 -
19.99
1817 228.34 -511.07 20511 4682.00 746.64 721.43 20.44
(14.31) (0.12) (-17.68) (3.62) (1.71) (2.00) (2.56) (0.08)
5 20.00 -
49.99
2182 826.68 755.58 35515 6187.69 820.56 738.19 185.17
(17.19) (0.44) (26.13) (6.26) (2.27) (2.20) (2.62) (0.76)
6 50.00 -
99.99
1582 1114.06 833.27 33701 8364.62 1266.38 1132.55 126.77
(12.46) (0.59) (28.82) (5.94) (3.06) (3.40) (4.02) (0.52)
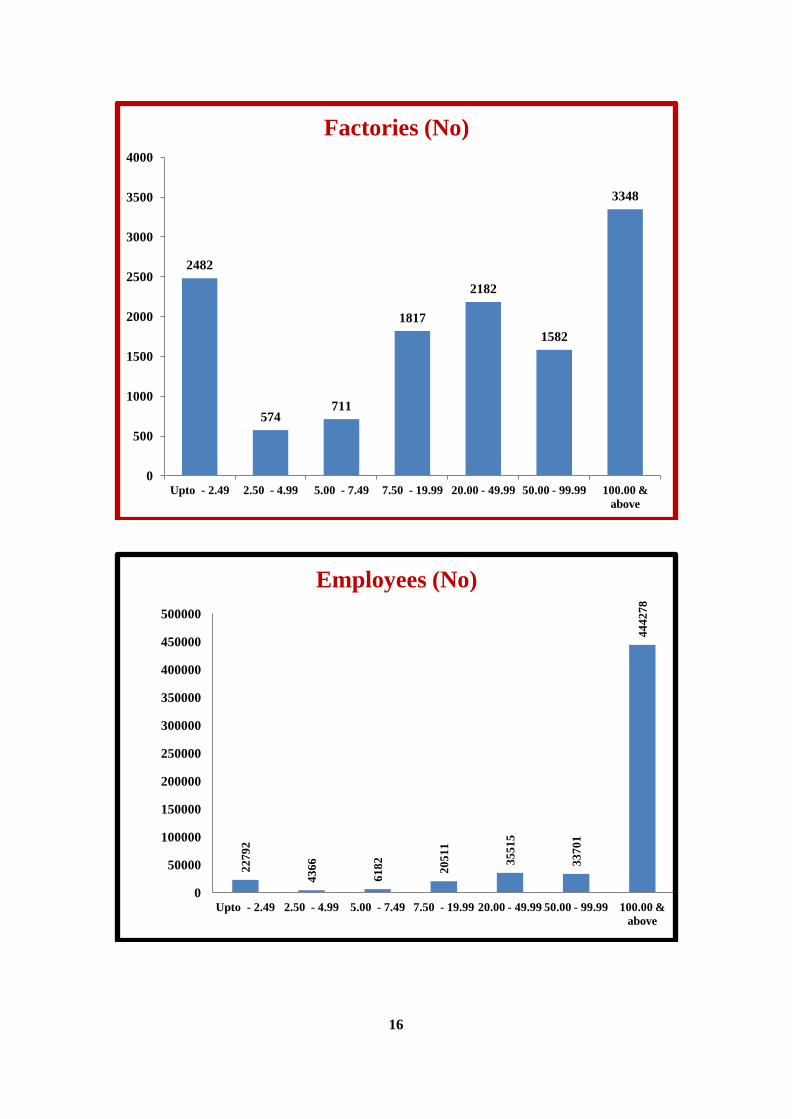
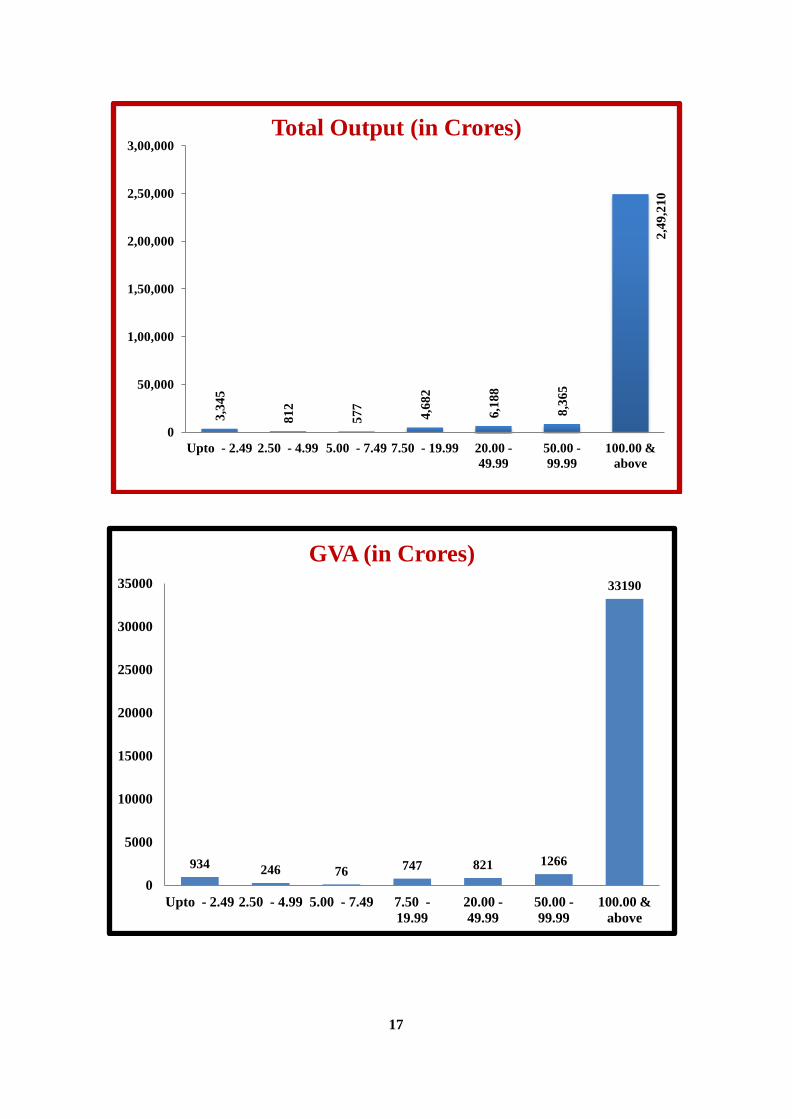
7 100.00 & above
3348 172282.57 764.31 444278 249209.87 33190.41 24343.60 10856.64 (26.37) (91.76) (26.45) (78.30) (91.23) (89.03) (86.43) (44.30)
Total 12696 187770.52 2891.12 567345 273177.12 37279.66 28166.83 24504.81
Note : Figures in brackets indicate Percentage to total.
It is observed that 3348 (26.37%) factories are in above one Crore of fixed
capital and 2482(19.55%) factories are in the category of below 2.5 lakh fixed capital
out of 12696 working factories.
The major portion 73.63% of factories in the State fall in size group of fixed
capital below one Crore and just capturing 8.24% of fixed capital, 73.55% of working
capital. Further their contribution is also simultaneously low in respect of total Output
with a share of 8.77%, Net Value Added with 13.57%, Gross Fixed Capital Formation
with 55.7% and employment share of 21.7%. On the other hand, factories with one
Crore and above of fixed capital are just 26.37% in the State total has contributed
91.76% of total fixed capital, 26.45% of total working capital and which generates
91.23% of total output and contributing 86.43% of Net Value Added and 44.30% of
Gross Fixed Capital Formation in the State.
16
2482
574 711
1817
2182
1582
3348
0
500
1000
1500
2000
2500
3000
3500
4000
Upto - 2.49 2.50 - 4.99 5.00 - 7.49 7.50 - 19.99 20.00 - 49.99 50.00 - 99.99 100.00 &
above
Factories (No)
22
79
2
43
66
61
82
20
51
1
35
51
5
33
70
1
44
42
78
0
50000
100000
150000
200000
250000
300000
350000
400000
450000
500000
Upto - 2.49 2.50 - 4.99 5.00 - 7.49 7.50 - 19.99 20.00 - 49.99 50.00 - 99.99 100.00 &
above
Employees (No)
17
3,3
45
81
2
57
7
4,6
82
6,1
88
8,3
65
2,4
9,2
10
0
50,000
1,00,000
1,50,000
2,00,000
2,50,000
3,00,000
Upto - 2.49 2.50 - 4.99 5.00 - 7.49 7.50 - 19.99 20.00 -
49.99
50.00 -
99.99
100.00 &
above
Total Output (in Crores)
934 246 76 747 821 1266
33190
0
5000
10000
15000
20000
25000
30000
35000
Upto - 2.49 2.50 - 4.99 5.00 - 7.49 7.50 -
19.99
20.00 -
49.99
50.00 -
99.99
100.00 &
above
GVA (in Crores)

18
Table – 5.1
The Structural Ratios and Technical Parameters of Factories
according to Size of Fixed Capital
Sl.
No.
Fixed Capital
Range
(Rs.in lakhs)
Per Employee (Rs.)
Fixed
Capital
Working
Capital
Productive
Capital
Net
Value
Added
Gross
Fixed
Capital
Formation
1 0 -2.49 5813693 362412 6176105 402817 5836658
2 2.50 - 4.99 55428 261544 316972 556917 12368
3 5.00 - 7.49 71336 176043 247379 112925 12100
4 7.50 - 19.99 111326 -249169 -137843 351728 9965
5 20.00 - 49.99 232769 212750 445519 207853 52139
6 50.00 - 99.99 330572 247254 577826 336058 37616
7 100.00 & Above 3877810 17203 3895013 547936 244366
Total 3309636 50959 3360595 496467 431921
It is observed that per employee Fixed Capital, Working Capital, Productive
capital, and GFCF are more in the factories in Fixed Capital Size group of 0-2.49
whereas NVA is more in 2.50 -4.99 in Fixed Capital Size group.
19
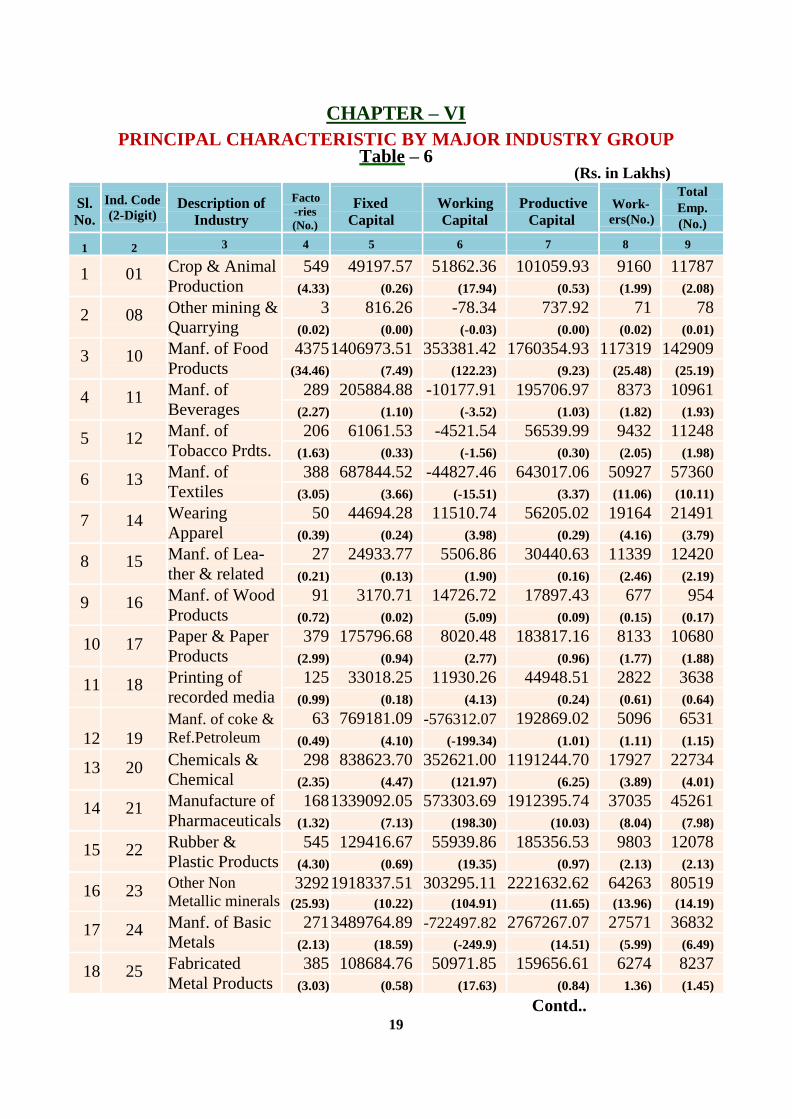
CHAPTER – VI
PRINCIPAL CHARACTERISTIC BY MAJOR INDUSTRY GROUP Table – 6
(Rs. in Lakhs)
Sl.
No.
Ind. Code
(2-Digit) Description of
Industry
Facto
-ries
(No.)
Fixed
Capital
Working
Capital
Productive
Capital
Work-
ers(No.)
Total
Emp.
(No.)
1 2 3 4 5 6 7 8 9
1 01 Crop & Animal
Production
549 49197.57 51862.36 101059.93 9160 11787
(4.33) (0.26) (17.94) (0.53) (1.99) (2.08)
2 08 Other mining &
Quarrying
3 816.26 -78.34 737.92 71 78
(0.02) (0.00) (-0.03) (0.00) (0.02) (0.01)
3 10 Manf. of Food
Products
4375 1406973.51 353381.42 1760354.93 117319 142909
(34.46) (7.49) (122.23) (9.23) (25.48) (25.19)
4 11 Manf. of
Beverages
289 205884.88 -10177.91 195706.97 8373 10961
(2.27) (1.10) (-3.52) (1.03) (1.82) (1.93)
5 12 Manf. of
Tobacco Prdts.
206 61061.53 -4521.54 56539.99 9432 11248
(1.63) (0.33) (-1.56) (0.30) (2.05) (1.98)
6 13 Manf. of
Textiles
388 687844.52 -44827.46 643017.06 50927 57360
(3.05) (3.66) (-15.51) (3.37) (11.06) (10.11)
7 14 Wearing
Apparel
50 44694.28 11510.74 56205.02 19164 21491
(0.39) (0.24) (3.98) (0.29) (4.16) (3.79)
8 15 Manf. of Lea-
ther & related
27 24933.77 5506.86 30440.63 11339 12420
(0.21) (0.13) (1.90) (0.16) (2.46) (2.19)
9 16 Manf. of Wood
Products
91 3170.71 14726.72 17897.43 677 954
(0.72) (0.02) (5.09) (0.09) (0.15) (0.17)
10 17 Paper & Paper
Products
379 175796.68 8020.48 183817.16 8133 10680
(2.99) (0.94) (2.77) (0.96) (1.77) (1.88)
11 18 Printing of
recorded media
125 33018.25 11930.26 44948.51 2822 3638
(0.99) (0.18) (4.13) (0.24) (0.61) (0.64)
12
19
Manf. of coke &
Ref.Petroleum
63 769181.09 -576312.07 192869.02 5096 6531
(0.49) (4.10) (-199.34) (1.01) (1.11) (1.15)
13 20 Chemicals &
Chemical
298 838623.70 352621.00 1191244.70 17927 22734
(2.35) (4.47) (121.97) (6.25) (3.89) (4.01)
14 21 Manufacture of
Pharmaceuticals
168 1339092.05 573303.69 1912395.74 37035 45261
(1.32) (7.13) (198.30) (10.03) (8.04) (7.98)
15 22 Rubber &
Plastic Products
545 129416.67 55939.86 185356.53 9803 12078
(4.30) (0.69) (19.35) (0.97) (2.13) (2.13)
16 23 Other Non
Metallic minerals 3292 1918337.51 303295.11 2221632.62 64263 80519
(25.93) (10.22) (104.91) (11.65) (13.96) (14.19)
17 24 Manf. of Basic
Metals
271 3489764.89 -722497.82 2767267.07 27571 36832
(2.13) (18.59) (-249.9) (14.51) (5.99) (6.49)
18 25 Fabricated
Metal Products
385 108684.76 50971.85 159656.61 6274 8237
(3.03) (0.58) (17.63) (0.84) 1.36) (1.45)
Contd..

20
PRINCIPAL CHARACTERISTIC BY MAJOR INDUSTRY GROUP
(Rs. in Lakhs)
Sl. No.
Indu-
stry
Code (2-
digit)
Description
of Industry
Emolu-
ments
Total
Input
Total
Output
Gross Value Added
Net Value Added
Gross Fixed Cap.
Forma- tion
1 2 3 10 11 12 13 14 15
1 01 Crop & Animal
Production 10118.27 304965.06 408335.33 103370.27 97446.35 8148.93
(0.83) (1.29) (1.49) (2.77) (3.46) (0.33)
2 08 Other mining &
Quarrying 98.13 177.45 347.08 169.63 146.49 13.62
(0.01) (0.00) (0.00) (0.00) (0.01) (0.00)
3 10 Manf. of Food
Products 211655.73 6766457.20 8471451.97 1704994.77 1584833.95 66561.79
(17.37) (28.68) (31.01) (45.74) (56.27) (2.72)
4 11 Manf. of
Beverages 19497.00 371324.72 447579.16 76254.44 60461.44 46541.73
(1.60) (1.57) (1.64) (2.05) (2.15) (1.90)
5 12 Manf. of
Tobacco Prdts. 12864.02 244134.08 303240.25 59106.17 53763.80 3865.89
(1.06) (1.03) (1.11) (1.59) (1.91) (0.16)
6 13 Manf. of
Textiles 78245.91 1139373.56 1396240.15 256866.59 206254.07 28194.96
(6.42) (4.83) (5.11) (6.89) (7.32) (1.15)
7 14 Wearing
Apparel
30024.50 62707.77 117097.45 54389.68 48517.42 8858.29 (2.46) (0.27) (0.43) (1.46) (1.72) (0.36)
8 15 Manf. of Lea-
ther & related 15928.83 78814.92 102021.21 23206.29 19246.29 4539.73
(1.31) (0.33) (0.37) (0.62) (0.68) (0.19)
9 16 Manf. of Wood
Products 842.25 31972.75 36554.80 4582.05 4226.79 242.18
(0.07) (0.14) (0.13) (0.12) (0.15) (0.01)
10 17 Paper & Paper
Products
21358.61 301712.86 418698.22 116985.36 102774.44 7659.47 (1.75) (1.28) (1.53) (3.14) (3.65) (0.31)
11 18 Printing of
recorded media 6674.00 66765.07 88808.71 22043.64 19224.02 13145.44
(0.55) (0.28) (0.33) (0.59) (0.68) (0.54)
12
19
Manf. of coke
&
Ref.Petroleum
30363.22 2641687.53 2973608.49 331920.96 278342.26 -13954.42
(2.49) (11.20) (10.89) (8.90) (9.88) (-0.57)
13 20 Chemicals &
Chemical
64639.09 1543987.41 1955846.05 411858.64 357978.46 59216.31 (5.30) (6.55) (7.16) (11.05) (12.71( (2.42)
14 21 Manufacture of
Pharmaceuticals 146686.76 1455732.31 1698086.88 242354.57 138364.12 194389.34
(12.04) (6.17) (6.22) (6.50) (4.91) (7.93)
15 22 Rubber &
Plastic Products
17013.11 209598.74 165834.60 -43764.14 -52979.37 21653.23 (1.40) (0.89) (0.61) (-1.17) (-1.88) (0.88)
16 23 Other Non
Metallic
minerals
130593.26 1700374.44 1875598.98 175224.54 40184.75 178995.58
(10.72) (7.21) (6.87) (4.70) (1.43) (7.30)
17 24 Manf. of Basic
Metals 229417.79 2848877.56 2794884.89 -53992.67 -204360.90 292673.14
(18.83) (12.08) (10.23) (-1.45) (-7.26) (11.94)
18 25 Fabricated
Metal Products
20035.41 251799.40 163734.61 -88064.79 -97367.21 23854.83
(1.64) (1.07) (0.60) (-2.36) (-3.46) (0.97)

21
PRINCIPAL CHARACTERISTIC BY MAJOR INDUSTRY GROUP (Rs. in Lakhs)
Sl.
No.
Ind
Code
(2-
Digit)
Description of
Industry
Facto
-ries
(No.)
Fixed
Capital
Workin
g
Capital
Productive
Capital
Workers
(No.)
Total Employees
(No.)
1 2 3 4 5 6 7 8 9
19 26 Computer,
Electronics 13 21633.33 -113999.65 -92366.32 1571 1802
(0.10) (0.12) (-39.43) (-0.48) (0.34) (0.32)
20 27 Electrical
Equipment 98 258742.95 147496.54 406239.49 9694 12137
(0.77) (1.38) (51.02) (2.13) (2.11) (2.14)
21 28 Machinery &
Equipment 122 134811.53 57689.48 192501.01 6649 8341 (0.96) (0.72) (19.95) (1.01) (1.44) (1.47)
22 29 Motor Vehicles,
trailers 45 72398.07 32076.53 104474.60 5079 5953
(0.35) (0.39) (11.09) (0.55) (1.10) (1.05)
23 30 Other Transport
Equipment 9 12233.65 10116.47 22350.12 3226 3984
(0.07) (0.07) (3.50) (0.12) (0.70) (0.70)
24 31 Manufacture of
furniture 28 13712.38 13224.46 26936.84 232 325
(0.22) (0.07) (4.57) (0.14) (0.05) (0.06)
25 32 Other
Manufacturing 55 32657.94 -187.68 32470.26 3790 4269
(0.44) (0.17) (-0.06) (0.17) (0.82) (0.75)
26 33 Repair of
Machinery 46 90946.47 -3790.37 87156.10 2010 3573
(0.36) (0.48) (-1.31) (0.46) (0.44) (0.63)
27 35 Electricity, gas,
steam supply 100 6674393.70 -373925.78 6300467.92 7139 8504 (0.79) (35.53) (-129.34) (33.05) (1.55) (1.50)
28 36 Water Colle-ction,
treatment 3 3639.37 9613.14 13252.51 109 146
(0.02) (0.02) (3.33) (0.07) (0.02) (0.03)
29 37 Sewerage 2 20626.16 -51.99 20574.17 23 69
(0.02) (0.11) (-0.02) (0.11) (0.00) (0.01)
30 38 Waste Collection 57 4118.44 1529.61 5648.05 615 802
(0.45) (0.02) (0.53) (0.03) (0.13) (0.14)
31 45 Repair & Main. of
Motor Vehicles 327 79616.61 67708.51 147325.12 11198 15713 (2.58) (0.42) (23.42) (0.77) (2.43) (2.77)
32 52 Cold Storages 238 41558.91 7639.84 49198.75 1679 2979 (1.87) (0.22) (2.64) (0.26) (0.36) (0.53)
33 58 Publishing
Activities 38 28338.45 -1727.21 26611.24 1448 2305
(0.30) (0.15) (-0.60) (0.14) (0.33) (0.41)
34 74 Other profe-
ssional 1 42.53 110.06 152.59 12 21
(0.01) (0.00) (0.04( (0.00( (0.00) (0.00)
35 82 Office admini-
strative, office 6 739.60 889.36 1628.96 486 548
(0.05) (0.00) (0.32) (0.01) (0.11) (0.10)
36 95 Repair of
computers 1 16.75 2.77 19.52 16 19
(0.01) (0.00) (0.00) (0.00) (0.00) (0.00)
37 96 Other personal
services 4 332.91 43.11 376.02 106 139
(0.02) (0.00) (0.01) (0.00) (0.02) (0.02)
Total 12696 18777052.38 289112.41 19066164.79 460467 567345

22
PRINCIPAL CHARACTERISTIC BY MAJOR INDUSTRY GROUP (Rs. in Lakhs)
Sl. No.
Industry
Code (2-digit)
Description of
Industry
Emolu-
ments
Total
Input
Total
Output
Gross Value Added
Net Value Added
Gross Fixed
Cap.
Forma- tion
1 2 3 10 11 12 13 14 15
19 26 Computer,
Electronics 3480.12 1125151.52 1161356.16 36204.64 33174.88 10142.28
(0.29) (4.77) (4.25) (0.97) (1.18) (0.41)
20 27 Electrical
Equipment 40309.52 720147.11 907252.87 187105.76 160267.39 56898.75
(3.31) (3.05) (3.32) (5.02) (5.69) (2.32)
21 28 Machinery &
Equipment 31991.97 285310.56 315848.83 30538.27 17194.30 9709.21
(2.63) (1.21) (1.16) (0.82) (0.61) (0.40)
22 29 Motor Vehi-cles,
trailers 10041.73 79732.28 106114.27 26381.99 19649.76 11915.18
(0.82) (0.34) (0.39) (0.71) (0.70) (0.49)
23 30 Other Transport
Equipment 11968.86 53174.76 72714.50 19539.74 18552.95 1136.77
(0.98) (0.23) (0.27) (0.52) (0.66) (0.05)
24 31 Manufacture of
furniture 308.04 14416.53 2431.40 -11985.13 -13809.89 489.55
(0.03) (0.06) (0.01) (-0.32) (-0.49) (0.02)
25 32 Other
Manufacturing 5319.72 54702.89 56233.73 1530.84 -352.62 448.81
(0.44) (0.23) (0.21) (0.04) (-0.01) (0.02)
26 33 Repair of
Machinery 4297.26 49332.23 66074.67 16742.44 13467.57 1301.12
(0.35) (0.21) (0.24) (0.45) (0.48) (0.05)
27 35 Electricity, gas,
steam supply 26099.62 510678.17 529034.93 18356.76 -76367.34 1395953.13
(2.14) (2.16) (1.94) (0.49) (-2.71) (56.97)
28 36 Water Colle-
ction, treatment 280.68 4143.25 5007.46 864.21 651.48 198.31
(0.02) (0.02) (0.02) (0.02) (0.02) (0.01)
29 37 Sewerage 455.02 1896.22 3478.50 1582.28 39.90 57.55
(0.04) (0.01) (0.01) (0.04) (0.00) (0.00)
30 38 Waste Collection 953.99 16603.82 21893.24 5289.42 4084.39 299.62
(0.08) (0.07) (0.08) (0.14) (0.15) (0.01)
31 45 Repair & Main.
of Motor
Vehicles
25009.78 576863.85 574839.91 -2023.94 -8896.61 6675.89
(2.04) (2.45) (2.10) (-0.05) (-0.32) (0.27)
32 52 Cold Storages 3664.30 35591.19 31069.43 -4521.76 -9327.30 2502.56
(0.30) (0.15) (0.11) (-0.12) (-0.33) (0.10)
33 58 Publishing
Activities 7352.12 31415.46 34718.10 3302.64 -68.37 8097.93
(0.60) (0.13) (0.12) (0.09) (0.00) (0.34)
34 74 Other profe-
ssional 24.36 120.76 146.57 25.81 18.12 0.00
(0.00) (0.00) (0.00) (0.00) (0.00) (0.00)
35 82 Office admini-
strative, office 823.49 9836.41 11188.33 1351.92 1236.01 13.73
(0.07) (0.04) (0.04) (0.04) (0.04) (0.00)
36 95 Repair of
computers 21.74 19.40 47.00 27.60 26.60 1.01
(0.00) (0.00) (0.00) (0.00) (0.00) (0.00)
37 96 Other personal
services 142.84 146.09 292.78 146.69 84.67 39.29
(0.01) (0.00) (0.00) (0.00) (0.00) (0.00)
Total 1218601.05 23589745.33 27317711.51 3727966.18 2816683.06 2450480.73
Note: Figures in brackets indicate percentage to total.

23
54
9
3
4375
28
9
206 38
8
50
27
91
37
9
125
63
29
8
168
54
5
3292
27
1
38
5
13
98
12
2
45
9 28
55
46
10
0
3
2 57
32
7
23
8
38
1
6
1
4
0
500
1000
1500
2000
2500
3000
3500
4000
4500
5000
01 08 10 11 12 13 14 15 16 17 18 19 20 21 22 23 24 25 26 27 28 29 30 31 32 33 35 36 37 38 45 52 58 74 82 95 96
No
of
Fa
cto
ries
Industry Group
No. of Factories (No.)

24
0
20
40
60
80
100
120
140
160
01 08 10 11 12 13 14 15 16 17 18 19 20 21 22 23 24 25 26 27 28 29 30 31 32 33 35 36 37 38 45 52 58 74 82 95 96
11
.79
0.0
8
142.9
1
10
.96
11
.25
57
.36
21
.49
12
.42
0.9
5 1
0.6
8
3.6
4
6.5
3
22
.73
45
.26
12
.08
80.5
2
36
.83
8.2
4
1.8
0 1
2.1
4
8.3
4
5.9
5
3.9
8
0.3
2
4.2
7
3.5
7
8.5
0
0.1
5
0.0
7
0.8
0
15
.71
2.9
8
2.3
1
0.0
2
0.5
5
0.0
2
0.1
4
Th
ou
san
ds
Employees ('000 Nos.)

25
0
10000
20000
30000
40000
50000
60000
70000
80000
90000
01 08 10 11 12 13 14 15 16 17 18 19 20 21 22 23 24 25 26 27 28 29 30 31 32 33 35 36 37 38 45 52 58 74 82 95 96
4083
3
84715
4476
3032
13962
1171
1020
366 4187
888
29736
19558
16981
1658
18756
27949
1637
11614
9073
3158
1061
727
24
562
661 5
290
50
35
219
5748
311
347
1
112
0
3
Ou
t p
ut
(in
Cro
res)
Industry Group

26
1033.7
0
1.7
0
17049.9
5
762.5
4
591.0
6 2
568.6
7
543.9
0
232.0
6
45.8
2
1169.8
5
220.4
4
3319.2
1
4118.5
9
2423.5
5
-437.6
4
1752.2
5
-539.9
3
-880.6
5
362.0
5
1871.0
6
305.3
8
263.8
2
195.4
0
-119.8
5
15.3
1
167.4
2
183.5
7
8.6
4
15.8
2
52.8
9
-20.2
4
-45.2
2
33.0
3
0.2
6
13.5
2
0.2
8
1.4
7
-2,000
0
2,000
4,000
6,000
8,000
10,000
12,000
14,000
16,000
18,000
01 08 10 11 12 13 14 15 16 17 18 19 20 21 22 23 24 25 26 27 28 29 30 31 32 33 35 36 37 38 45 52 58 74 82 95 96
GV
A (C
rore
s)
Gross Value Added (in Crores)
Total Output (in Crores)

27
Analysis of important Economic Aggregates by Major Economic Activity
The agriculture oriented factories engaged in manufacture of Agriculture,
Hunting & related service activities, Food Products, Beverages and manufacture of
Tobacco products making a total of 5419 units which account for 42.71% to the total
number of factories. The remaining are covered under non-agricultural activities.
Large number of factories is in the Food products Group numbering 4,375
(34.46%) units. The other larger number of industries in the state are Other Non-
Metallic Mineral Products 3,292 (25.93%) followed by Crop & Animal production,
Hunting & related activities 549 (4.33%), Rubber & Plastic products group
545(4.30%), Textile group 388 (3.05%), Fabricated metal products except Machinery
and Equipment group 385(3.03%), Paper& Paper products group 379 (2.99%). All the
above Industrial group occupies 78.09% of total industries in the state. Further these
factories with 23.84% of total fixed capital have provided 269.32% of working capital
whereas 57.03% of employment, products towards 47.22% of output and contributed
66.79% of Net Value Added, 59.71% of GVA and 13.68% is Gross Fixed Capital
Formation in the State. The contribution of Coke & Refined Petroleum Products and
Electricity, Gas, Steam & Air Conditioning supply Industry Groups towards Fixed
Capital (39.65%) provided employment to 2.65% Total Output (12.83%), Net Value
Added (7.17%) and GFCF (63.57%) is very significant even though the working
industries in these groups are just 1.28% of total industries.
On the other hand, the remaining 30 Industrial groups that constitutes 21.91% in
number with an employment to the extent of 42.97%. Their share of total output and
Net Value Added is 40.29% and 33.21% respectively are very significant though
others are small in number.
In respect of employment, Food products group provides employment of
1,42,909 (25.19%), Non Metallic Minerals 80,519 (14.19%), Textiles 57,360
(10.11%), Pharmaceuticals 45,261 (7.98%) and Basic Metals 36,832 (6.49%). The
above 5 groups alone provided employment to 63.96% of total employment provided
by the registered manufacturing sector.
In case of Gross Value Added, Food Products Group tops the list with 17,049.95
Crores (45.74%) followed by Chemical & Chemical Products 4,118.58 Crores (
11.05%) , Coke & refined Petroleum Products 3,319.21 Crores (8.90%), Textiles
2,568.67 Crores (6.89%) and Pharmaceuticals 2,423.55 Crores (6.05%) out of
37,279.66Crores GVA of the Industries sector.
In the case of Gross Fixed Capital Formation of 4 groups viz., Manufacturing of
Electricity, gas, steam & air-conditioning supply (56.97%), Manufacturing and Basic
Metals (11.94%), Pharmaceuticals (7.93%), Non-Metallic Minerals (7.30)%, groups
put together are contributing 84.14% of the Gross Fixed Capital Formation in the
State. (20,620.11 Crores out of 24,504.80 Crores).

28
CHAPTER – VII
PRINCIPAL CHARACTERISTIC BY DISTRICT WISE
The District-wise distribution of factories and their related important parameters
in the state during 2016-17 are as follows.
Table – 7 (Rs. in Crores)
Sl.
No District
Facto-
ries
(No)
Fixed
Capital
Work-
ing
Capital
Produ-
ctive
Capital
Emp-
loyees
(No)
Total
Input
Total
Output
Gross
Value
Added
Net
Value
Added
GFCF
1
Srika-
kulam
735 3488.90 1787.27 5276.17 22615 5305.29 6574.99 1269.70 885.52 526.10
(5.79) (1.86) (61.82) (2.77) (3.99) (2.25) (2.41) (3.41) (3.14) (2.15)
2
Vizia-
nagaram
276 3183.63 612.94 3796.57 16869 6596.64 7744.30 1147.66 934.11 180.72
(2.17) (1.70) (21.20) (1.99) (2.97) (2.80) (2.83) (3.08) (3.32) (0.74)
3
Visakha-
patnam
943 53183.68 -6534.25 46649.43 120169 69061.91 78673.01 9611.10 6827.42 4704.75
(7.43) (28.32) (-226.01) (24.47) (21.18) (29.28) (28.80) (25.78) (24.24) (19.20)
4
East
Godavai
1193 67102.35 -2784.93 64317.42 55714 36550.44 37983.40 1432.96 246.04 13971.69
(9.40) (35.74) (-96.32) (33.73) (9.82) (15.48) (13.90) (3.84) (0.87) (57.02)
5
West
Godavari
899 4003.13 1220.45 5223.58 43049 13230.94 15200.62 1969.68 1644.90 412.09
(7.08) (2.13) (42.21) (2.74) (7.59) (5.61) (5.58) (5.28) (5.84) (1.68)
6 Krishna 978 5401.25 2525.39 7926.64 41974 12228.65 14145.95 1917.30 1537.45 663.97
(7.70) (2.88) (87.35) (4.16) (7.40) (5.18) (5.18) (5.14) (5.46) (2.71)
7 Guntur 2443 7184.17 2094.47 9278.64 77773 21437.55 26653.98 5216.42 4690.31 625.49
(19.24) (3.83) (72.44) (4.87) (13.71) (9.09) (9.76) (13.99) (16.65) (2.55)
8 Prakasam 1317 3341.27 812.59 4153.86 39240 9165.61 9394.64 229.03 -97.20 261.48
(10.37) (1.78) (28.11) (2.18) (6.92) (3.89) (3.44) (0.61) (-0.35) (1.07)
9
SPS
Nellore
631 9318.50 440.83 9759.33 36596 15014.39 18368.13 3353.74 2644.25 632.61
(4.97) (4.95) (15.25) (5.12) (6.45) (6.36) (6.72) (9.02) (9.39) (2.58)
10 Kadapa 749 6103.29 1475.25 7578.54 14592 5274.73 6431.24 1156.51 754.23 599.09
(5.90) (3.25) (51.03) (3.97) (2.57) (2.24) (2.35) (3.10) (2.68) (2.44)
11 Kurnool 938 5677.79 661.61 6339.40 18116 4876.15 6402.19 1526.04 1190.10 1188.97
(7.39) (3.02) (22.88) (3.32) (3.19) (2.07) (2.34) (4.09) (4.23) (4.85)
12
Anantha-
puramu
537 8373.47 733.56 9107.03 31793 8314.61 10607.39 2292.78 1712.93 298.70
(4.23) (4.46) (25.37) (4.78) (5.60) (3.52) (3.88) (6.15) (6.08) (1.22)
13 Chittoor 1057 11409.09 -154.06 11255.03 48844 28840.54 34997.27 6156.73 5196.77 439.15
(8.33) (6.08) (-5.330 (5.90) (8.61) (12.23) (12.81) (16.51) (18.45) (1.79)
Total 12696 187770.52 2891.12 190661.64 567345 235897.45 273177.11 37279.66 28166.83 24504.81
Note : Figures in brackets indicate percentage to total

29
73
5
27
6
94
3 11
93
89
9
97
8
24
43
13
17
63
1
74
9
93
8
53
7
10
57
0
500
1000
1500
2000
2500
3000
Srik
ak
ula
m
Vizia
na
ga
ram
Visa
kh
ap
atn
am
Ea
st Go
da
va
ri
West G
od
av
ari
Krish
na
Gu
ntu
r
Pra
ka
sam
Nello
re
Cu
dd
ap
ah
Ku
rno
ol
AN
AN
TH
AP
UR
CH
ITT
OO
R
No
of
Fa
ctori
es
Districts
Factories (No)
0.00
20.00
40.00
60.00
80.00
100.00
120.00
140.00
Srik
ak
ula
m
Vizia
na
ga
ram
Visa
kh
ap
atn
am
Ea
st Go
da
va
ri
West G
od
av
ari
Krish
na
Gu
ntu
r
Pra
ka
sam
Nello
re
Cu
dd
ap
ah
Ku
rno
ol
AN
AN
TH
AP
UR
CH
ITT
OO
R
23
17
120.1
7
56
43
42
78
39
37
15
18
32
49
No o
f E
mp
loyee
s (i
n '
000s)
Employees (No.)

30
6,5
75
7,7
44
78
,67
3
37
,98
3
15
,20
1
14
,14
6
26
,65
4
9,3
95
18
,36
8
6,4
31
6,4
02
10
,60
7
34
,99
7
0
10000
20000
30000
40000
50000
60000
70000
80000
90000
Srik
ak
ula
m
Vizia
na
ga
ram
Visa
kh
ap
atn
am
Ea
st Go
da
va
ri
West G
od
av
ari
Krish
na
Gu
ntu
r
Pra
ka
sam
Nello
re
Cu
dd
ap
ah
Ku
rno
ol
AN
AN
TH
AP
UR
CH
ITT
OO
R
Ou
tpu
t (C
rore
s)
Districts
1,2
70
1,1
48
9,6
11
1,4
33
1,9
70
1,9
17
5,2
16
22
9
3,3
54
1,1
57
1,5
26
2,2
93
6,1
57
0
2000
4000
6000
8000
10000
12000
Srik
ak
ula
m
Vizia
na
ga
ram
Visa
kh
ap
atn
am
Ea
st Go
da
va
ri
West G
od
av
ari
Krish
na
Gu
ntu
r
Pra
ka
sam
Nello
re
Cu
dd
ap
ah
Ku
rno
ol
AN
AN
TH
AP
UR
CH
ITT
OO
R
GVA (Crores)
Total Output

31
From the Table-7 it is observed that, Guntur district occupies highest place in
number of (2,443) factories, accounts for 19.24% followed by Prakasam district with
1,317 factories which accounts for 10.37 %. The other districts which accounted for a
significant number of factories in the State are East Godavari (1,193), Chittoor(1057)
Krishna (978), Visakhapatnam(943), and Kurnool(938). These 7 districts account for
(8,869) 69.86% of total factories in the State. The less concentration of factories are
found in Vizianagaram district with (2.76%) units.
With regard to Fixed Capital size, East Godavari district ranks first with a Fixed
Capital of Rs.67,102.35Crores(35.74%) followed by Visakhapatnam district with
Rs.53,183.68 Crores (28.32%). These two districts account for 64.06% of the total
State Fixed Capital. Vizianagarm district stands at the lowest rank with Rs.3183.63
Crores (1.7%) of Fixed Capital.
The number of persons employed in the industrial sector in the State was
5,67,345. The highest concentration is noticed in the Visakhapatnam District which
employed 1,20,169 persons (21.18%). The other districts, which provide substantial
employment in the State are Guntur 77,773 (13.71%), East Godavari 55,714; Chittoor
48,844; West Godavari 43049; Krishna 41,974; and Prakasam 39,239 persons. Least
number of persons employed in the district Y.S.R. Kadapa is 14,592.
The value of total output generated in the entire State was Rs. 2,73,177.12
Crores. The Visakhapatnam district occupies highest position of Output valued at
Rs.78,673.01 Crores (28.8%) of the State Output generated in this district. The other
districts with substantial contribution of Output are East Godavari Rs.37,983.40
Crores(13.9%) & Chittoor Rs.34,997.27 Crores (12.81%).
Visakhapatnam district ranks first place in terms of Net value added by
Rs.6,827.42 Crores (24.24%) followed by Chittoor Rs. 5,196.78 Crores (18.45%),
Guntur Rs. 4,690.30 Crores (16.65%), SPS Nellore Rs.2,644.25 (9.39%) &
Ananthapuramu Rs. 1,712.94 Crores (6.08%).
Visakhapatnam district is the highest contributor towards Gross value Added in
the State with Rs. 9,611.10 Crores (25.78%) followed by Chittoor Rs. 6,156.73 Crores
(16.52%) and Guntur Rs. 5,216.42 Crores (13.99%). These three districts Gross Value
Added is Rs.20,984.26 Crores (56.29%).
The highest Gross Fixed Capital Formation of Rs. 13,971.68 Crores (57.02%) is
observed in East Godavari followed by Visakhapatnam Rs. 4,704.75 Crores (19.2%).
30
2

32
CHAPTER – VIII
INDUSTRY GROUP WISE PERFORMANCE OF GVA FOR THE YEAR- 2016-17
Gross State Domestic Product measures the value of all goods and services
produced during a given period of time within the geographical boundaries of the
State. The following table shows the industry wise performance in generating GVA /
NVA during 2016-17. Table – 8
(Rs. in Crores)
Sl
No
Industry
Code
(NIC-2) Description GVA DEP NVA
1 01 Crop & Animal Production, Hunting &
related activities 1033.70 59.24 974.46
2 08 Other mining & Quarrying 1.70 0.24 1.46
3 10 Manufacture of Food Products 17049.95 1201.61 15848.34
4 11 Manufacture of Beverages 762.54 157.93 604.61
5 12 Manufacture of Tobacco products 591.06 53.42 537.64
6 13 Manufacture of Textiles 2568.67 506.13 2062.54
7 14 Manufacture of Wearing Apparel 543.90 58.73 485.17
8 15 Manufacture of Leather & related
products 232.06 39.60 192.46
9 16 Manufacture of Wood Products 45.82 3.55 42.27
10 17 Paper& Paper Products 1169.85 142.11 1027.74
11 18 Printing & reproduction of recorded
media 220.44 28.20 192.24
12 19 Manufacture of coke & Refined
Petroleum Products 3319.21 535.79 2783.42
13 20 Manufacture of Chemicals & Chemical
Products 4118.59 538.81 3579.78
14 21 Manufacture of Pharmaceuticals 2423.55 1039.91 1383.64
15 22 Manufacture of Rubber & Plastic
products -437.64 92.15 -529.79
16 23 Manufacture of other Non Metallic
Mineral products 1752.25 1350.40 401.85
17 24 Manufacture of Basic Metals -539.93 1503.68 -2043.61
18 25 Manufacture of Fabricated Metal
Products except machinery & equipment -880.65 93.02 -973.67
19 26 Manufacture of Computer, Electronic &
Optical Products 362.05 30.30 331.75
20 27 Manufacture of Electrical Equipment 1871.06 268.39 1602.67
21 28 Manufacture of Machinery &
Equipment n.e.c. 305.38 133.44 171.94
22 29 Manufacture of Motor Vehicles, trailers
& semi trailers 263.82 67.32 196.50

33
Sl
No
Industry
Code
(NIC-2)
Description GVA DEP NVA
23 30 Manufacture of Other Transport
Equipment 195.40 9.87 185.53
24 31 Manufacture of furniture -119.85 18.25 -138.10
25 32 Other Manufacturing 15.31 18.84 -3.53
26 33 Repair & Installation of Machinery &
equipment 167.42 32.74 134.68
27 35 Electricity, gas, steam & air-
conditioning supply 183.57 947.24 -763.67
28 36 Water Collection, treatment & supply 8.64 2.13 6.51
29 37 Sewerage 15.82 15.42 0.40
30 38 Waste Collection 52.89 12.05 40.84
31 45 Repair & Main. of Motor Vehicles &
motor cycles -20.24 68.73 -88.97
32 52 Cold Storages -45.22 48.05 -93.27
33 58 Publishing Activities 33.03 33.71 -0.68
34 74 Other professional, scientific &
technical activities 0.26 0.08 0.18
35 82 Office administrative, office support &
other business support activities 13.52 1.16 12.36
36 95 Repair of computers& personal &
household goods 0.28 0.01 0.27
37 96 Other personal services (Washing &
Dry Cleaning ) 1.47 0.62 0.85
Total 37279.66 9112.83 28166.83
The above table reveals that the economic activities covered by 12696 factories
generated Rs. 28166.83 Crores of Net Value Added and Rs. 37279.66 Crores of Gross
Value Added in the state at current prices during the year 2016-17. It is further
observed that Food Products Group (10) generated highest portion in Gross Value
Added worth Rs. 17049.95 Crores followed by Manufacture of Chemicals & Chemical
Products Rs. 4118.59 Crores, Manufacture of coke & Refined Petroleum Products Rs.
3319.21 Crores, Manufacture of Textiles Rs.2568.67 Crores and Manufacture of
Pharma-ceuticals Rs. 2423.55 Crores.
During the year i.e., 2016-17 Gross value added of Manufacturing sector Groups
(10 to 32) is Rs.35832.84 Crores ( 96.12 %) and remaining other Groups is Rs.
1446.82 Crores (3.88%).

34
CHAPTER – IX
Industrial performance in Andhra Pradesh vis-a-vis
Other Major Industrially Developed States during 2016-17
Table – 9 (Value Rs. in lakhs & others in Nos.)
Sl.
No State Factories Fixed
Capital
Working
Capital
Invested
Capital
Gross
value of
Plant &
Machinery
Total
employees
1 Maharashtra 21095 33798216 20255727 50280256 35179526 1926154 (10.85) (10.59) (30.55) (11.70) (12.12) (12.92)
2 Gujarat 18980 63304138 2662562 81454084 56966667 1634566
(9.76) (19.84) (4.02) (18.96) (19.63) (10.96)
3 Tamilnadu 31614 28244128 8028146 40255907 25367027 2408282 (16.26) (8.85) (12.11) (9.37) (8.74) (16.15)
4 Uttar
Pradesh
12894 13270699 4064610 20813332 13114427 1012882 (6.63) (4.16) (6.13) (4.84) (4.52) (6.79)
5 Karnataka 10748 18122114 5900889 25187858 18065113 1065021
(5.53) (5.68) (8.90) (5.86) (6.23) (7.14)
6 Haryana 6854 11632485 3151042 18035144 10736515 826994 (3.53) (3.65) (4.75) (4.20) (3.70) (5.55)
7 Uttrakhand 2556 5870612 1788076 8123750 5623468 425616 (1.31) (1.84) (2.70) (1.89) (1.94) (2.85)
8 Rajasthan 8263 10080805 3612465 14013500 10150889 533019 (4.25) (3.16) (5.45) (3.26) (3.50) (3.57)
9 Telangana 12725 6931972 3535477 10774282 6164683 724612
(6.55) (2.17) (5.33) (2.51) (2.12) (4.86)
10 Madhya
Pradesh
3975 14932012 778730 17976081 14250890 372587 (2.04) (4.68) (1.17) (4.18) (4.91) (2.50)
11 West
Bengal
8604 11383728 2540119 15946367 10998452 640678 (4.43) (3.57) (3.83) (3.71) (3.79) (4.30)
12 Andhra
Pradesh
13084 18632079 -198423 23844352 15449799 564017 (6.73) (5.84) (-0.30) (5.55) (5.32) (3.78)
13 Himachal
Pradesh
2233 4304421 711070 5552878 4288044 197826 (1.15) (1.35) (1.07) (1.29) (1.48) (1.33)
14 Odisha 2694 33800626 -2300922 36978340 26868857 272508 (1.39) (10.59) (-3.47) (8.61) (9.26) (1.83)
15 Punjab 10705 4128112 3384773 7823137 4445803 656255
(5.51) (1.29) (5.10) (1.82) (1.53) (4.40)
16 Jharkhand 2449 10328969 428760 12729831 9657436 189116 (1.26) (3.24) (0.65) (2.96) (3.33) (1.27)
N.B.: Figures in brackets indicate percentage to totals
Source: ASI-2016-17 All India publication published by CSO, Kolkata.

35
Industrial performance in Andhra Pradesh vis-a-vis
other States during 2016-17
(Value Rs. in lakhs & others in Nos.)
Sl.
No State
Emolu-
ments
Total
Input
Total
Output GVA NVA
% share
in
Aggregate
GVA
1 Maharashtra 6608311 83281871 107497036 24215165 20880019
17.70 (17.61) (14.12) (14.80) (17.70) (18.22)
2 Gujarat 4321111 102299006 122220075 19921069 16543326
14.56 (11.52) (17.35) (16.82) (14.56) (14.44)
3 Tamilnadu 5275843 62248020 76552431 14304411 11788606
10.46 (14.06) (10.56) (10.54) (10.46) (10.29)
4 Uttar Pradesh 2439831 39451590 49552268 10100678 9049549
7.38 (6.50) (6.69) (6.82) (7.38) (7.90)
5 Karnataka 3119727 40435530 50164690 9729160 8276614
7.11 (8.32) (6.86) (6.90) (7.11) (7.22)
6 Haryana 2268231 42142682 50038700 7896018 6690746
5.77 (6.05) (7.15) (6.89) (5.77) (5.84)
7 Utthrakhand 930382 15548193 21013696 5465503 4951666
4.00 (2.48) (2.64) (2.89) (4.00) (4.32)
8 Rajasthan 1311771 22032111 27054565 5022453 4166552
3.67 (3.50) (3.74) (3.72) (3.67) (3.64)
9 Telangana 1349789 16161720 20381796 4220077 3551504
3.08 (3.60) (2.74) (2.81) (3.08) (3.10)
10 Madhya
Pradesh
907865 16499661 20467293 3967632 3050925 2.90
(2.42) (2.80) (2.82) (2.90) (2.66)
11 West Bengal 1374274 25114224 28823593 3709369 2904543
2.71 (3.66) (4.26) (3.97) (2.71) (2.53)
12 Andhra
Pradesh
1253334 23042788 26583434 3540646 2611022 2.59
(3.34) (3.91) (3.66) (2.59) (2.28)
13 Himachal
Pradesh
556690 7647226 10859355 3212129 2832143 2.35
(1.48) (1.30) (1.49) (2.35) (2.47)
14 Odhisha 793763 12025645 15109219 3083574 1847663
2.25 (2.12) (2.04) (2.08) (2.25) (1.61)
15 Punjab 1106470 16007202 18921535 2914334 2489373
2.13 (2.95) (2.71) (2.60) (2.13) (2.17)
16 Jharkhand 705670 9628571 12322755 2694184 2120637
1.97 (1.88) (1.63) (1.70) (1.97) (1.85)
N.B.: Figures in brackets indicate percentage to totals
Source: ASI-2016-17 All India publication published by CSO, Kolkata.

36
Industrial performance in Andhra Pradesh vis-a-vis other states during 2016-17
(Value Rs. in lakhs & others in Nos.)
Sl.
No State Factories
Fixed
Capital
Working
Capital
Invested
Capital
Gross value
of Plant &
Machinery
Total
employees
17 Kerala 6748 4548354 1268404 6258249 2617241 319568
(3.47) (1.43) (1.91) (1.46) (0.90) (2.14)
18 Chattisgarh 2874 12513740 997278 14293149 10141146 187374
(1.48) (3.92) (1.50) (3.33) (3.49) (1.26)
19 Goa 626 996946 1112027 1605942 1053279 64324
(0.32) (0.31) (1.68) (0.37) (0.36) (0.43)
20 Assam 4024 2802255 761596 3736145 1535394 218002
(2.07) (0.88) (1.15) (0.87) (0.53) (1.46)
21 Dadra and Nagarhaveli
971 3003602 772494 4206543 2903147 123227
(0.50) (0.94) (1.17) (0.98) (1.00) (0.83)
22 Sikkim 69 710069 137840 868943 198909 17232
(0.04) (0.22) (0.21) (0.20) (0.07) (0.12)
23 Daman and Diu
1118 1197057 954533 1767329 882930 113925
(0.58) (0.38) (1.44) (0.41) (0.30) (0.76)
24 Jammu and Kashmir
938 1003913 515759 1391867 905116 75307
(0.48) (0.31) (0.78) (0.32) (0.31) (0.51)
25 Delhi 2699 602994 890604 1733603 342376 111370
(1.39) (0.19) (1.34) (0.40) (0.12) (0.75)
26 Bihar 2908 1804252 207878 2372084 1087513 116232
(1.50) (0.57) (0.31) (0.55) (0.37) (0.78)
27 Puducherry 545 479119 267007 737296 612889 46728
(0.28) (0.15) (0.40) (0.17) (0.21) (0.31)
28 Chandigarh 200 129447 37008 223392 98809 10348
(0.10) (0.04) (0.06) (0.05) (0.03) (0.07)
29 Meghalaya 117 377159 -17161 480468 418165 12367
(0.06) (0.12) (-0.03) (0.11) (0.14) (0.08)
30 Tripura 573 46357 7980 69609 41501 27258
(0.29) (0.01) (0.01) (0.02) (0.01) (0.18)
31 Arunachal Pradesh
118 19982 31014 35726 15028 3347
(0.06) (0.01) (0.05) (0.01) (0.01) (0.02)
32 Nagaland 182 21422 18316 33164 10534 5895
(0.09) (0.01) (0.03) (0.01) (0.00) (0.04)
33 Manipur 181 15327 4271 20218 3693 8133
(0.09) (0.00) (0.01) (0.00) (0.00) (0.05)
34 A&N Islands
16 1536 -1664 2666 6338 421
(0.01) (0.00) (0.00) (0.00) (0.00) (0.00)
All India 194380 319038649 66308287 429625490 290201604 14911189
N.B : Figures in brackets indicate percentage to totals.
Source: ASI-2016-17 All India publication published by CSO, Kolkata.

37
Industrial performance in Andhra Pradesh vis-a-vis other states during 2016-17
(Value Rs. in lakhs & others in Nos.)
Sl.
No Name of
the State
Emolu-
ments
Total
Input
Total
Output GVA NVA % share in
Aggregate
GVA
17 Kerala 689059 12082529 14318717 2236189 1991866
1.63 (1.84) (2.05) (1.97) (1.63) (1.74)
18 Chattisgarh 577798 9159242 10866893 1707652 1138267
1.25 (1.54) (1.55) (1.50) (1.25) (0.99)
19 Goa 245818 2893197 4401225 1508029 1367219
1.10 (0.66) (0.49) (0.61) (1.10) (1.19)
20 Assam 266420 4806942 6293606 1486663 1282165
1.09 (0.71) (0.82) (0.87) (1.09) (1.12)
21 Dadra and
Nagarhaveli
308201 7723773 8845212 1121439 870751 0.82
(0.82) (1.31) (1.22) (0.82) (0.76)
22 Sikkim 72684 649298 1677216 1027918 965582
0.75 (0.19) (0.11) (0.23) (0.75) (0.84)
23 Daman and
Diu
264022 3651458 4464842 813383 694636 0.59
(0.70) (0.62) (0.61) (0.59) (0.61)
24 Jammu and
Kashmir
134412 2252020 3034727 782707 695502 0.57
(0.36) (0.38) (0.42) (0.57) (0.61)
25 Delhi 284497 6030969 6715380 684411 620589
0.50 (0.76) (1.02) (0.92) (0.50) (0.54)
26 Bihar 148320 4127896 4769275 641380 536902
0.47 (0.40) (0.70) (0.66) (0.47) (0.47)
27 Puducherry 115122 1717641 2264375 546734 496782
0.40 (0.31) (0.29) (0.31) (0.40) (0.43)
28 Chandigarh 36167 504297 588511 84214 73922
0.06 (0.10) (0.09) (0.08) (0.06) (0.06)
29 Meghalaya 24182 312606 395194 82588 28578
0.06 (0.06) (0.05) (0.05) (0.06) (0.02)
30 Tripura 13129 98994 137953 38959 33840
0.03 (0.03) (0.02) (0.02) (0.03) (0.03)
31 Arunachal
Pradesh
3864 91688 114492 22804 20203 0.02
(0.01) (0.02) (0.02) (0.02) (0.02)
32 Nagaland 3437 37749 51746 13997 12540
0.01 (0.01) (0.01) (0.01) (0.01) (0.01)
33 Manipur 5462 27305 36295 8990 7383
0.01 (0.01) (0.00) (0.00) (0.01) (0.01)
34 A&N
Islands
731 12730 13322 592 296 0.00
(0.00) (0.00) (0.00) (0.00) (0.00)
All India 37516385 589746374 726551423 136805049 114591911 100.00
N.B : Figures in brackets indicate percentage to totals
Source: ASI-2016-17 All India publication published by CSO, Kolkata.

38
ANNEXURE -1
PRINCIPAL CHARACTERSTICS BY TYPE OF ORGANISATION 2016-17
(Values are Rs. in Crores, Man days in '000s & others in
No.)
Sl.
No Organization Factories Fixed
Capital
Working
Capital
Employ-
ees
1 2 3 4 5 6
1 Individual Proprietorship 6867 10066.80 3353.47 93194
2 Partnership 3130 4683.26 3003.85 73201
3 Limited Liability Partnership 167 496.07 361.30 5234
Non-Corporate Sector (1+2+3) 10164 15246.12 6718.62 171629
4 Govt. Company-Public 45 41965.20 -12823.49 22077
5 Govt. Company-Private 59 350.14 -68.54 5457
6 Non-Govt. Company-Public 320 77691.68 837.56 100406
7 Non-Govt. Company-Private 2035 52395.18 8018.65 262560
Corporate Sector (4+5+6+7) 2459 172402.20 -4035.82 390500
8 Co-Operative Societies 36 105.29 158.76 4228
9 Others 37 16.92 49.56 988
10 Other Sector (8+9) 73 122.21 208.32 5216
TOTAL 12696 187770.52 2891.12 567345
Sl.
No
Organization
Total
Emolu-
ments
Total
Input
Gross
Output Net Value
Added
1 2 7 8 9 10
1 Individual Proprietorship 851.82 20757.96 23801.89 2490.45
2 Partnership 832.81 22997.73 24315.73 805.62
3 Limited Liability Partnership 66.98 1806.39 2147.68 289.37
Non-Corporate Sector (1+2+3) 1751.60 45562.08 50265.30 3585.44
4 Govt. Company-Public 2290.99 36679.11 41780.62 3825.69
5 Govt. Company-Private 154.86 1522.45 1444.70 -122.83
6 Non-Govt. Company-Public 2894.36 48638.62 58468.45 7074.27
7 Non-Govt. Company-Private 4990.27 102264.47 119431.39 13257.34
Corporate Sector (4+5+6+7) 10330.47 189104.64 221125.16 24034.47
8 Co-Operative Societies 72.67 1124.86 1658.54 526.64
9 Others 31.29 105.85 128.12 20.28
10 Other Sector (8+9) 103.95 1230.71 1786.66 546.92
TOTAL 12186.01 235897.45 273177.12 28166.83
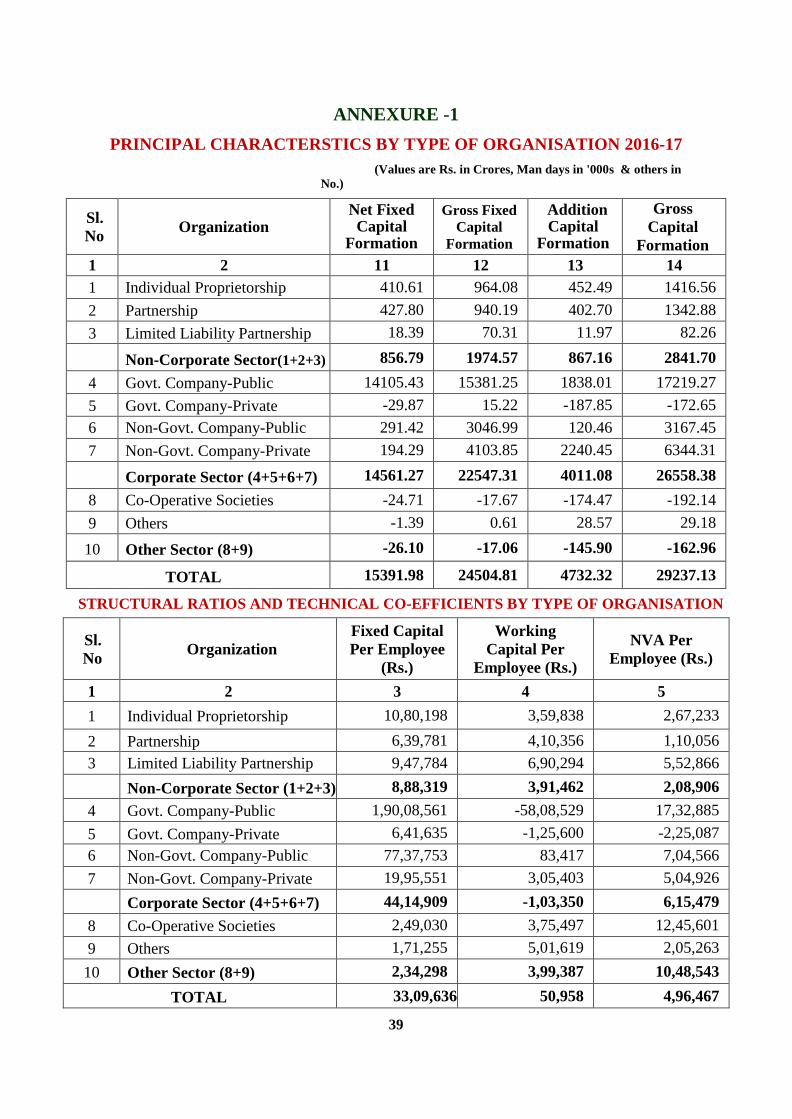
39
ANNEXURE -1
PRINCIPAL CHARACTERSTICS BY TYPE OF ORGANISATION 2016-17
(Values are Rs. in Crores, Man days in '000s & others in
No.)
Sl.
No Organization
Net Fixed Capital
Formation
Gross Fixed
Capital
Formation
Addition Capital
Formation
Gross
Capital
Formation
1 2 11 12 13 14
1 Individual Proprietorship 410.61 964.08 452.49 1416.56
2 Partnership 427.80 940.19 402.70 1342.88
3 Limited Liability Partnership 18.39 70.31 11.97 82.26
Non-Corporate Sector(1+2+3) 856.79 1974.57 867.16 2841.70
4 Govt. Company-Public 14105.43 15381.25 1838.01 17219.27
5 Govt. Company-Private -29.87 15.22 -187.85 -172.65
6 Non-Govt. Company-Public 291.42 3046.99 120.46 3167.45
7 Non-Govt. Company-Private 194.29 4103.85 2240.45 6344.31
Corporate Sector (4+5+6+7) 14561.27 22547.31 4011.08 26558.38
8 Co-Operative Societies -24.71 -17.67 -174.47 -192.14
9 Others -1.39 0.61 28.57 29.18
10 Other Sector (8+9) -26.10 -17.06 -145.90 -162.96
TOTAL 15391.98 24504.81 4732.32 29237.13
STRUCTURAL RATIOS AND TECHNICAL CO-EFFICIENTS BY TYPE OF ORGANISATION
Sl.
No Organization
Fixed Capital
Per Employee
(Rs.)
Working
Capital Per
Employee (Rs.)
NVA Per
Employee (Rs.)
1 2 3 4 5
1 Individual Proprietorship 10,80,198 3,59,838 2,67,233
2 Partnership 6,39,781 4,10,356 1,10,056
3 Limited Liability Partnership 9,47,784 6,90,294 5,52,866
Non-Corporate Sector (1+2+3) 8,88,319 3,91,462 2,08,906
4 Govt. Company-Public 1,90,08,561 -58,08,529 17,32,885
5 Govt. Company-Private 6,41,635 -1,25,600 -2,25,087
6 Non-Govt. Company-Public 77,37,753 83,417 7,04,566
7 Non-Govt. Company-Private 19,95,551 3,05,403 5,04,926
Corporate Sector (4+5+6+7) 44,14,909 -1,03,350 6,15,479
8 Co-Operative Societies 2,49,030 3,75,497 12,45,601
9 Others 1,71,255 5,01,619 2,05,263
10 Other Sector (8+9) 2,34,298 3,99,387 10,48,543
TOTAL 33,09,636 50,958 4,96,467

40
ANNEXURE - 2
PRINCIPAL CHARACTERSTICS BY TYPE OF EMPLOYMENT SIZE 2016-17
(Values are Rs. in Crores, Man days in '000s & Others in No.)
Sl.
No
Employment
Size (No.) Factories Fixed Capital
Working
Capital Employees
1 2 3 4 5 6
1 0 – 49 10818 12395.91 4507.39 117531
2 50 – 99 863 11709.43 -2158.02 60638
3 100 – 199 500 25190.94 1271.21 69436
4 200 – 499 341 27880.50 1344.63 108710
5 500 – 999 113 24104.82 739.40 76681
6 1000 – 1999 40 44710.41 5007.48 53815
7 2000 – 4999 20 19257.87 -2519.04 52638
8 5000 & Above 3 22520.66 -5301.93 27897
Total 12696 187770.52 2891.12 567345
Sl.
No
Employment
Size (No.)
Total
Emolu-
ments
Total
Input
Gross
Output
Net Value
Added
1 2 7 8 9 10
1 0 – 49 1187.43 35802.28 40278.07 3350.00
2 50 – 99 997.64 21834.73 24199.01 1414.13
3 100 – 199 1219.16 25161.06 29046.97 2888.98
4 200 – 499 2042.78 54559.55 62395.25 6272.64
5 500 – 999 1711.18 26743.56 33519.90 5208.67
6 1000 – 1999 1326.44 19271.84 21138.84 1105.29
7 2000 – 4999 1542.03 39042.08 46226.24 5863.16
8 5000 & Above 2159.35 13482.38 16372.86 2063.98
Total 12186.00 235897.45 273177.12 28166.83
Sl.
No
Employment
Size (No.) NFCF GFCF
Addition
Capital
Formation
Gross
Capital
Formation
1 2 11 12 13 14
1 0 – 49 826.34 1952.12 421.28 2373.39
2 50 - 99 401.33 1351.50 559.00 1910.49
3 100 - 199 13183.34 14180.29 214.97 14395.25
4 200 - 499 381.34 1944.40 1271.07 3215.47
5 500 - 999 -694.22 873.46 445.37 1318.81
6 1000 - 1999 -195.70 566.01 -203.88 362.13
7 2000 - 4999 -588.54 732.45 1156.18 1888.63
8 5000 & Above 2078.10 2904.60 868.36 3772.96
Total 15391.98 24504.81 4732.32 29237.13

41
ANNEXURE - 3
PRINCIPAL CHARACTERISTICS BY TYPE OF FIXED CAPITAL SIZE
(Values are Rs. in Crores , Mandays in '000s & Others in No.)
Sl.
No
Fixed Capital
Size (Rs. in Lakhs)
Factories Fixed Capital Working
Capital Employees
1 2 3 4 5 6
1 Upto - 2.49 2482 13250.57 826.01 22792
2 2.50 - 4.99 574 24.20 114.19 4366
3 5.00 - 7.49 711 44.10 108.83 6182
4 7.50 - 19.99 1817 228.34 -511.07 20511
5 20.00 - 49.99 2182 826.68 755.58 35515
6 50.00 - 99.99 1582 1114.06 833.27 33701
7 100.00 & above 3349 172282.57 764.27 444278
Total 12696 187770.52 2891.12 567345
Sl.
No
Fixed Capital
Size (Rs. in Lakhs)
Total Emolu-
ments
Total
Input
Gross
Output
Net Value
Added
1 2 7 8 9 10
1 Upto - 2.49 181.72 2410.16 3344.51 918.10
2 2.50 - 4.99 34.81 565.79 811.52 243.15
3 5.00 - 7.49 49.43 501.31 576.91 69.81
4 7.50 - 19.99 170.02 3935.36 4682.00 721.43
5 20.00 - 49.99 325.17 5367.13 6187.69 738.19
6 50.00 - 99.99 318.51 7098.24 8364.62 1132.55
7 100.00 & above 11106.36 216019.48 249209.87 24343.60
Total 12186.01 235897.45 273177.12 28166.83
Sl.
No
Fixed Capital
Size (Rs. in Lakhs)
Net Fixed
Capital
Formation
Gross
Fixed
Capital
Formation
Addition
Capital
Formation
Gross
Capital
Formation
1 2 11 12 13 14
1 Upto - 2.49 13286.65 13302.91 60.84 13363.76
2 2.50 - 4.99 2.82 5.40 -2.31 3.10
3 5.00 - 7.49 1.69 7.48 -2.68 4.80
4 7.50 - 19.99 -4.77 20.44 67.89 88.32
5 20.00 - 49.99 102.81 185.17 178.64 363.82
6 50.00 - 99.99 -7.06 126.77 58.98 185.76
7 100.00 & above 2009.86 10856.64 4370.94 15227.57
Total 15391.98 24504.81 4732.32 29237.13

42
ANNEXURE - 4
Summary results of manufacturing sector by selected characteristics
and major industry group NIC-2 digit level
(Values are Rs. in Crores , Mandays in '000s & Others in No.)
Sl.
No
CHARECTERSTIC GROUP
INDUSTRY GROUP
Cotton
Ginning
01
Salt
Extraction
Food
Products Beverages
08 10 11
1 Number of Factories 549 3 4375 289
2 Fixed Capital 49197.6 816.26 1406973.51 205884.88
3 Physical Working Capital 85701.4 1.6 1278614.68 42119.91
4 Working Capital 51862.4 -78.34 353381.42 -10177.91
5 Invested Capital 134900 817.85 2685589.52 248005.54
6 Outstanding loans 37651.8 0 876322.84 55818.53
7 Man days- Workers 1906.65 21.44 35999.57 2637.21
8 Number of Workers 9160 71 117319 8373
9 Man days-Employees 2378.88 23.23 43023.43 3423.24
10 Total Employees 11787 78 142909 10961
11 Wages to Workers 7208.56 70.81 135115.51 11954.79
12 Total Emoluments 10118.3 98.13 211655.73 19497
13 Fuels Consumed 5138.79 49.72 161231.89 23179.05
14 Materials Consumed 145975 3.59 5625690.41 234384.22
15 Total Inputs 304965 177.45 6766457.2 371324.72
16 Products 215938 269.49 7352161.06 360750.3
17 Value of Output 408335 347.08 8471451.97 447579.16
18 GVA 103370 169.63 1704994.77 76254.44
19 Depreciation 5923.92 23.14 120160.82 15793
20 Net Value Added 97446.3 146.49 1584833.95 60461.44
21 Net Fixed Capital Formation 2225.01 -9.52 -53599.03 30748.73
22 Gross Fixed Capital Formation 8148.93 13.62 66561.79 46541.73
23 Materials, Fuels etc 5114.05 -0.13 102586.45 3388.15
24 Semi Fin. Goods 67.6 0 6504.89 -35.54
25 Finished Goods 4680.72 0 28642.29 5669.57
26 Total (20+21+22) 9862.37 -0.13 137733.63 9022.18
27 Gross Cap Form 18011.3 13.49 204295.42 55563.91

43
ANNEXURE - 4
Summary results of manufacturing sector by selected characteristics
and major industry group NIC-2 digit level
(Values are Rs. in Crores , Mandays in '000s & Others in No.)
Sl.
No INDUSTRY GROUP
Tobacco Textiles Wearing
Apparel Leather
12 13 14 15
1 Number of Factories 206 388 50 27
2 Fixed Capital 61061.53 687844.52 44694.28 24934
3 Physical Working Capital 82954.57 310059.61 9655.08 17465
4 Working Capital -4521.54 -44827.46 11510.74 5506.9
5 Invested Capital 144016.5 997903.8 54349.65 42398
6 Outstanding loans 14039.78 425399.16 10299.76 4832.7
7 Man days- Workers 2671.98 17071.4 6374.88 3512.6
8 Number of Workers 9432 50927 19164 11339
9 Man days-Employees 3131.22 19147.55 7141.54 3843.6
10 Total Employees 11248 57360 21491 12420
11 Wages to Workers 9597.72 59022.15 24222.37 13588
12 Total Emoluments 12864.02 78245.91 30024.5 15929
13 Fuels Consumed 5516.64 126821.35 3870.13 2997.2
14 Materials Consumed 200700.63 841078.87 44757.39 67155
15 Total Inputs 244134.08 1139373.56 62707.77 78815
16 Products 264940.3 1240939.14 71680.49 96745
17 Value of Output 303240.25 1396240.15 117097.5 102021
18 GVA 59106.17 256866.59 54389.68 23206
19 Depreciation 5342.37 50612.52 5872.26 3960
20 Net Value Added 53763.8 206254.07 48517.42 19246
21 Net Fixed Capital Formation -1476.48 -22417.56 2986.03 579.73
22 Gross Fixed Capital Formation 3865.89 28194.96 8858.29 4539.7
23 Materials, Fuels etc 3999.99 36219.37 -1730.3 -1560
24 Semi Fin. Goods -27.08 865.39 309.05 -692.1
25 Finished Goods 10108.22 3742.4 -1421.93 -4231
26 Total (20+21+22) 14081.13 40827.16 -2843.18 -6482
27 Gross Cap Form 17947.02 69022.12 6015.11 -1943

44
ANNEXURE - 4
Summary results of manufacturing sector by selected characteristics
and major industry group NIC-2 digit level
(Values are Rs. in Crores , Mandays in '000s & Others in No.)
Sl.
No INDUSTRY GROUP
Wood
Products
Paper & Paper
Products Printing
Ref. Petroleum Products
16 17 18 19
1 Number of Factories 91 379 125 63
2 Fixed Capital 3170.71 175797 33018.25 769181.09
3 Physical Working Capital 5737.57 66084 16737.59 436331.7
4 Working Capital 14726.72 8020.5 11930.26 -576312.07
5 Invested Capital 8908.19 241879 49755.66 1205512.8
6 Outstanding loans 4619.59 52523 13100.01 21650.85
7 Man days- Workers 192.65 2635 878.06 1726.27
8 Number of Workers 677 8133 2822 5096
9 Man days-Employees 247.26 3452.4 1096.83 2211.51
10 Total Employees 954 10680 3638 6531
11 Wages to Workers 559.95 12122 4613.03 12135.61
12 Total Emoluments 842.25 21359 6674 30363.22
13 Fuels Consumed 596.73 39439 1903.12 8831.91
14 Materials Consumed 11253.69 245043 44061.89 2450310.3
15 Total Inputs 31972.75 301713 66765.07 2641687.5
16 Products 15955.01 413259 61262.93 2857251.3
17 Value of Output 36554.8 418698 88808.71 2973608.5
18 GVA 4582.05 116985 22043.64 331920.96
19 Depreciation 355.26 14211 2819.62 53578.7
20 Net Value Added 4226.79 102774 19224.02 278342.26
21 Net Fixed Capital Formation -113.08 -6551 10325.82 -67533.12
22 Gross Fixed Capital Formation 242.18 7659.5 13145.44 -13954.42
23 Materials, Fuels etc -1097.93 -3048 2940.21 54255.72
24 Semi Fin. Goods -339.95 606.21 14.3 15073.65
25 Finished Goods 55.69 -3088 4464.06 40615.55
26 Total (20+21+22) -1382.19 -5530 7418.57 109944.92
27 Gross Cap Form -1140.01 2129.4 20564.01 95990.5

45
ANNEXURE - 4
Summary results of manufacturing sector by selected characteristics
and major industry group NIC-2 digit level
(Values are Rs. in Crores , Mandays in '000s & Others in No.)
Sl.
No
INDUSTRY GROUP Chemical
Products
Pharma-
ceuticals
Rubber &
Plastics
Non- Metallic Minerals
20 21 22 23
1 Number of Factories 298 168 545 3292
2 Fixed Capital 838623.7 1339092.05 129416.67 1918337.51
3 Physical Working Capital 304557.59 612213.69 47689.53 363836.06
4 Working Capital 352621 573303.69 55939.86 303295.11
5 Invested Capital 1143181 1951305.15 177105.8 2282172.97
6 Outstanding loans 184808.55 149294.74 37208.87 653919.55
7 Man days- Workers 6142.44 13074.66 3001.77 19906.59
8 Number of Workers 17927 37035 9803 64263
9 Man days-Employees 7684.54 15880.48 3505.74 24333.55
10 Total Employees 22734 45261 12078 80519
11 Wages to Workers 34422.59 91654.27 11565.2 81668.96
12 Total Emoluments 64639.09 146686.76 17013.11 130593.26
13 Fuels Consumed 196162 96038.86 14503.29 340647.22
14 Materials Consumed 1161664.3 1078874.34 174599.39 975957.38
15 Total Inputs 1543987.4 1455732.31 209598.74 1700374.44
16 Products 1826703.5 1588001.81 147915.3 1618699.6
17 Value of Output 1955846.1 1698086.88 165834.6 1875598.98
18 GVA 411858.64 242354.57 -43764.14 175224.54
19 Depreciation 53880.18 103990.45 9215.23 135039.79
20 Net Value Added 357978.46 138364.12 -52979.37 40184.75
21 Net Fixed Capital Formation 5336.13 90398.89 12438 43955.79
22 Gross Fixed Capital Formation 59216.31 194389.34 21653.23 178995.58
23 Materials, Fuels etc -6181.13 11149.45 6741.91 16439.3
24 Semi Fin. Goods -6885.77 -16378.98 -1355.64 6186.29
25 Finished Goods -2028.18 37504.35 2542.74 26300.89
26 Total (20+21+22) -15095.08 32274.82 7929.01 48926.48
27 Gross Cap Form 44121.23 226664.16 29582.24 227922.06

46
ANNEXURE - 4
Summary results of manufacturing sector by selected characteristics
and major industry group NIC-2 digit level
(Values are Rs. in Crores , Mandays in '000s & Others in No.)
Sl.
No
INDUSTRY GROUP Basic Metals
Fabricated Metal
Products
Electronic
Products
Electrical
Equipment.
24 25 26 27
1 Number of Factories 271 385 13 98
2 Fixed Capital 3489764.89 108684.76 21633.33 258742.95
3 Physical Working Capital 834090.57 58223.54 98146.65 136083.58
4 Working Capital -722497.82 50971.85 -113999.7 147496.54
5 Invested Capital 4323855.55 166907.72 119779.98 394826.55
6 Outstanding loans 1327754.84 38662.76 6335.81 37767.63
7 Man days- Workers 9244.12 1893.15 475.67 3019.17
8 Number of Workers 27571 6274 1571 9694
9 Man days-Employees 12307.33 2365.68 544.74 3758.33
10 Total Employees 36832 8237 1802 12137
11 Wages to Workers 119969.19 10231.77 2015.77 19568.22
12 Total Emoluments 229417.79 20035.41 3480.12 40309.52
13 Fuels Consumed 365293.65 4295.28 1219.82 21571.24
14 Materials Consumed 1994501.19 189296.59 1095277.7 570737.13
15 Total Inputs 2848877.56 251799.4 1125151.5 720147.11
16 Products 2423838.84 95854.34 1145982.4 804860.61
17 Value of Output 2794884.89 163734.61 1161356.2 907252.87
18 GVA -53992.67 -88064.79 36204.64 187105.76
19 Depreciation 150368.23 9302.42 3029.76 26838.37
20 Net Value Added -204360.9 -97367.21 33174.88 160267.39
21 Net Fixed Capital Formation 142304.91 14552.41 7112.52 30060.38
22 Gross Fixed Capital
Formation 292673.14 23854.83 10142.28 56898.75
23 Materials, Fuels etc 7916.19 7392.99 29669.92 8262.71
24 Semi Fin. Goods 4870.24 32.16 -899.94 10308.35
25 Finished Goods 36034.89 936.73 -5216.72 11763.47
26 Total (20+21+22) 48821.32 8361.88 23553.26 30334.53
27 Gross Cap Form 341494.46 32216.71 33695.54 87233.28

47
ANNEXURE - 4
Summary results of manufacturing sector by selected characteristics
and major industry group NIC-2 digit level
(Values are Rs. in Crores , Mandays in '000s & Others in No.)
Sl.
No
INDUSTRY GROUP
Machinery
Equipment
Motor
Vehicles
Other Transport Equipment
Wood & Metal
Furniture
28 29 30 31
1 Number of Factories 122 45 9 28
2 Fixed Capital 134811.53 72398.07 12233.65 13712.38
3 Physical Working Capital 84468.53 30716.05 10141.11 4604.57
4 Working Capital 57689.48 32076.53 10116.47 13224.46
5 Invested Capital 219279.94 103114.14 22375.14 18316.85
6 Outstanding loans 43157.41 31144.17 40024.09 1015.09
7 Man days- Workers 2138.6 1586.35 1136.28 59.1
8 Number of Workers 6649 5079 3226 232
9 Man days-Employees 2638.91 1855.75 1407.56 74.77
10 Total Employees 8341 5953 3984 325
11 Wages to Workers 14639.87 7405.91 6861.88 215.56
12 Total Emoluments 31991.97 10041.73 11968.86 308.04
13 Fuels Consumed 7060.94 10411.47 1603.91 226.95
14 Materials Consumed 202376.65 52916.17 41053.06 12436.01
15 Total Inputs 285310.56 79732.28 53174.76 14416.53
16 Products 205832.75 84078.8 9779.71 1918.19
17 Value of Output 315848.83 106114.27 72714.5 2431.4
18 GVA 30538.27 26381.99 19539.74 -11985.13
19 Depreciation 13343.97 6732.23 986.79 1824.76
20 Net Value Added 17194.3 19649.76 18552.95 -13809.89
21 Net Fixed Capital Formation -3634.76 5182.95 149.98 -1335.21
22 Gross Fixed Capital Formation 9709.21 11915.18 1136.77 489.55
23 Materials, Fuels etc -6465.89 923.51 -20688.48 -231.74
24 Semi Fin. Goods -8195.79 -971.61 361.15 -52.17
25 Finished Goods 1548.96 4289.68 3.4 831.71
26 Total (20+21+22) -13112.72 4241.58 -20323.93 547.8
27 Gross Cap Form -3403.51 16156.76 -19187.16 1037.35
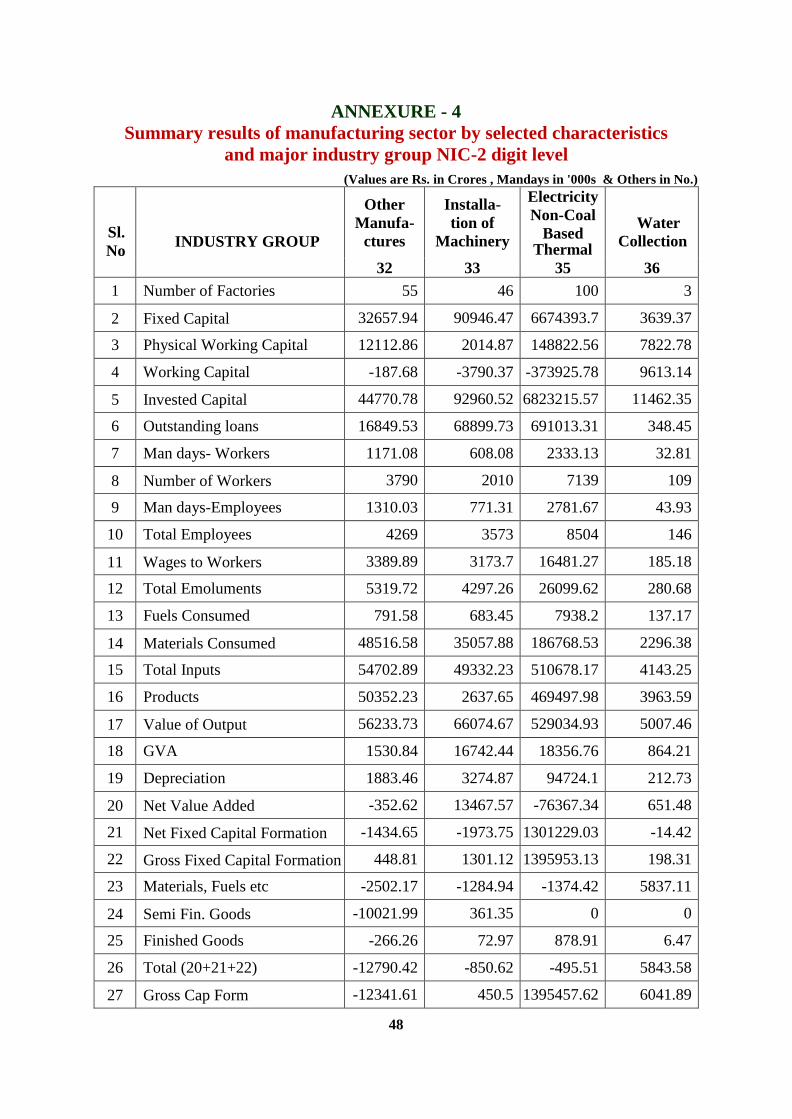
48
ANNEXURE - 4
Summary results of manufacturing sector by selected characteristics
and major industry group NIC-2 digit level
(Values are Rs. in Crores , Mandays in '000s & Others in No.)
Sl.
No
INDUSTRY GROUP
Other
Manufa-
ctures
Installa-
tion of
Machinery
Electricity
Non-Coal
Based Thermal
Water
Collection
32 33 35 36
1 Number of Factories 55 46 100 3
2 Fixed Capital 32657.94 90946.47 6674393.7 3639.37
3 Physical Working Capital 12112.86 2014.87 148822.56 7822.78
4 Working Capital -187.68 -3790.37 -373925.78 9613.14
5 Invested Capital 44770.78 92960.52 6823215.57 11462.35
6 Outstanding loans 16849.53 68899.73 691013.31 348.45
7 Man days- Workers 1171.08 608.08 2333.13 32.81
8 Number of Workers 3790 2010 7139 109
9 Man days-Employees 1310.03 771.31 2781.67 43.93
10 Total Employees 4269 3573 8504 146
11 Wages to Workers 3389.89 3173.7 16481.27 185.18
12 Total Emoluments 5319.72 4297.26 26099.62 280.68
13 Fuels Consumed 791.58 683.45 7938.2 137.17
14 Materials Consumed 48516.58 35057.88 186768.53 2296.38
15 Total Inputs 54702.89 49332.23 510678.17 4143.25
16 Products 50352.23 2637.65 469497.98 3963.59
17 Value of Output 56233.73 66074.67 529034.93 5007.46
18 GVA 1530.84 16742.44 18356.76 864.21
19 Depreciation 1883.46 3274.87 94724.1 212.73
20 Net Value Added -352.62 13467.57 -76367.34 651.48
21 Net Fixed Capital Formation -1434.65 -1973.75 1301229.03 -14.42
22 Gross Fixed Capital Formation 448.81 1301.12 1395953.13 198.31
23 Materials, Fuels etc -2502.17 -1284.94 -1374.42 5837.11
24 Semi Fin. Goods -10021.99 361.35 0 0
25 Finished Goods -266.26 72.97 878.91 6.47
26 Total (20+21+22) -12790.42 -850.62 -495.51 5843.58
27 Gross Cap Form -12341.61 450.5 1395457.62 6041.89

49
ANNEXURE - 4
Summary results of manufacturing sector by selected characteristics
and major industry group NIC-2 digit level
(Values are Rs. in Crores , Mandays in '000s & Others in No.)
Sl.
No
INDUSTRY GROUP
Sewe-
rage
Waste
Colle-
ction
Repair &
Maint. of
Motor Vehicles
Cold
Storage
Publishing
Activities
37 38 45 52 58
1 Number of Factories 2 57 327 238 38
2 Fixed Capital 20626.16 4118.44 79616.61 41558.91 28338.45
3 Physical Working Capital 0 1531.65 82655.94 3940.33 9776.87
4 Working Capital -51.99 1529.61 67708.51 7639.84 -1727.21
5 Invested Capital 20626.16 5649.57 162274.5 45499.52 38115.52
6 Outstanding loans 4585.94 1945.75 39626.53 21685.37 17340.44
7 Man days- Workers 6.94 180.41 3441.24 581.65 526.89
8 Number of Workers 23 615 11198 1679 1448
9 Man days-Employees 20.59 225.82 4765.73 951.04 838.86
10 Total Employees 69 802 15713 2979 2305
11 Wages to Workers 43.8 597.72 15970.89 1784.03 3509.87
12 Total Emoluments 455.02 953.99 25009.78 3664.3 7352.12
13 Fuels Consumed 198.25 409.64 7547.55 4877.95 1831.54
14 Materials Consumed 402.08 14544.18 69995.81 26408.66 20391.91
15 Total Inputs 1896.22 16603.82 576863.9 35591.19 31415.46
16 Products 0 15309.37 37566.42 21.88 29901.88
17 Value of Output 3478.5 21893.24 574839.9 31069.43 34718.1
18 GVA 1582.28 5289.42 -2023.94 -4521.76 3302.64
19 Depreciation 1542.38 1205.03 6872.67 4805.54 3371.01
20 Net Value Added 39.9 4084.39 -8896.61 -9327.3 -68.37
21 Net Fixed Capital Formation -1484.83 -905.41 -196.78 -2302.98 4726.92
22 Gross Fixed Capital Formation 57.55 299.62 6675.89 2502.56 8097.93
23 Materials, Fuels etc 0 -17.22 8928.93 900.01 2905.73
24 Semi Fin. Goods 0 0 43.54 0 -3.79
25 Finished Goods 0 41.66 -1221.83 994.55 1.61
26 Total (20+21+22) 0 24.44 7750.64 1894.56 2903.55
27 Gross Cap Form 57.55 324.06 14426.53 4397.12 11001.48

50
ANNEXURE - 4
Summary results of manufacturing sector by selected characteristics
and major industry group NIC-2 digit level
(Values are Rs. in Crores , Mandays in '000s & Others in No.)
Sl.
No INDUSTRY GROUP
Specia-
lized
design
active- ties
Office
Admini-
strative
and
Support
Activities
Repair of
Comp. of
personal
household
goods
Wash-
ing &
Dry
Clean- ing
TOTAL
74 82 95 96
1 Number of Factories 1 6 1 4 12696
2 Fixed Capital 42.53 739.6 16.75 332.91 18777052.38
3 Physical Working Capital 11.91 496.33 0.01 3.13 5205422.49
4 Working Capital 110.06 889.36 2.77 43.11 289112.41
5 Invested Capital 54.44 1235.78 17.2 335.53 23982474.31
6 Outstanding loans 90.55 477.19 0 230.01 4930444.64
7 Man days- Workers 3.53 163.46 4.8 31.97 146391.59
8 Number of Workers 12 486 16 106 460467
9 Man days-Employees 6.38 183.49 5.08 42.16 177424.17
10 Total Employees 21 548 19 139 567345
11 Wages to Workers 12.85 654.46 20.9 102.6 736357.13
12 Total Emoluments 24.36 823.49 21.74 142.84 1218601.05
13 Fuels Consumed 9.27 39.8 1.75 37.92 1463114.48
14 Materials Consumed 37.12 3590.43 14.78 40.64 17868168.74
15 Total Inputs 120.76 9836.41 19.4 146.09 23589745.33
16 Products 0 3778.93 0 0 23517648.03
17 Value of Output 146.57 11188.33 47 292.78 27317711.51
18 GVA 25.81 1351.92 27.6 146.69 3727966.18
19 Depreciation 7.69 115.91 1 62.02 911283.12
20 Net Value Added 18.12 1236.01 26.6 84.67 2816683.06
21 Net Fixed Capital Formation -7.69 -102.18 0.01 -22.73 1539197.61
22 Gross Fixed Capital Formation 0 13.73 1.01 39.29 2450480.73
23 Materials, Fuels etc -22.79 -135.49 -0.54 -0.18 269230.39
24 Semi Fin. Goods 0 0 0 0 -256.15
25 Finished Goods 0 0 0 0 204257.95
26 Total (20+21+22) -22.79 -135.49 -0.54 -0.18 473232.19
27 Gross Cap Form -22.79 -121.76 0.47 39.11 2923712.92

51
ANNEXURE -5
Summary results of manufacturing sector by selected characteristics
and major industry group NIC- 3 digit level
(Values are Rs. in Crores , Mandays in '000s & Others in No.)
No. INDUSTRY GROUP 016 089 101 102 103
1 Number of Factories 549.15 3.00 10.00 81.25 156.04
2 Fixed Capital 49197.57 816.26 18896.02 129457.04 58800.34
3 Physical Working Capital 85701.38 1.60 4028.25 122868.93 48354.35
4 Working Capital 51862.36 -78.34 2907.28 75210.94 -15343.38
5 Invested Capital 134899.53 817.85 22924.27 252325.97 107155.20
6 Outstanding loans 37651.76 0.00 3702.44 105208.33 88118.55
7 Man days- Workers 1906.65 21.44 185.15 8873.40 2512.29
8 Number of Workers 9159.61 71.00 619.00 25466.50 11040.80
9 Man days-Employees 2378.88 23.23 219.14 9847.62 2817.17
10 Total Employees 11786.83 78.00 735.00 28316.50 12326.55
11 Wages to Workers 7208.56 70.81 801.63 28617.81 8272.46
12 Total Emoluments 10118.27 98.13 1117.38 40372.37 11593.54
13 Fuels Consumed 5138.79 49.72 1305.99 22375.07 6506.65
14 Materials Consumed 145975.42 3.59 30349.88 1027304.74 162845.39
15 Total Inputs 304965.06 177.45 34122.06 1142914.66 196667.03
16 Products 215938.25 269.49 34896.59 1164423.62 250406.37
17 Value of Output 408335.33 347.08 35264.27 1251285.55 307878.85
18 GVA 5.73 22.56 0.00 6334.76 567.74
19 Depreciation 5923.92 23.14 1116.06 12474.95 7458.89
20 Net Value Added -98.47 0.58 -643.64 -2444.42 -317.45
21 Net Fixed Capital Formation 2225.01 -9.52 1239.39 21186.65 1185.34
22 Gross Fixed Capital
Formation 547.80 3.00 10.00 81.25 148.76
23 Materials, Fuels etc 5114.05 -0.13 217.23 12981.10 -2476.48
24 Semi Fin. Goods 67.60 0.00 -4.10 1273.66 635.11
25 Finished Goods 4680.72 0.00 861.52 20069.86 7092.43
26 Total (20+21+22) 5203.61 49.72 1305.99 22375.07 7692.77
27 Gross Cap Form 145975.4 3.6 30349.9 1027304.7 162845.4

52
ANNEXURE -5
Summary results of manufacturing sector by selected characteristics
and major industry group NIC- 3 digit level
(Values are Rs. in Crores , Mandays in '000s & Others in No.)
Sl.
No INDUSTRY GROUP 104 105 106 107 108
1 Number of Factories 273.04 333.36 2693.14 745.42 83.00
2 Fixed Capital 250527.16 99632.96 303151.96 369903.42 176604.61
3 Physical Working Capital 234362.25 68980.95 362647.05 297418.66 139954.24
4 Working Capital 94230.35 50995.59 188650.41 -65157.06 21887.29
5 Invested Capital 484889.41 168613.91 665799.00 667322.11 316559.65
6 Outstanding loans 151598.03 56343.01 254166.48 128013.20 89172.80
7 Man days- Workers 3088.93 3095.80 8353.39 8150.61 1740.00
8 Number of Workers 9455.18 8866.64 29487.74 27299.14 5084.25
9 Man days-Employees 4022.59 4156.03 10127.17 9583.12 2250.59
10 Total Employees 12412.95 11943.08 37798.27 32719.99 6656.42
11 Wages to Workers 14218.97 12671.93 30087.28 32395.98 8049.45
12 Total Emoluments 25538.84 24100.15 44318.89 48713.39 15901.17
13 Fuels Consumed 31191.68 14519.92 45627.25 21800.32 17905.01
14 Materials Consumed 1471804.08 603980.99 1208145.74 581610.41 539649.18
15 Total Inputs 1651351.30 670193.42 1776759.37 701785.16 592664.20
16 Products 1752678.03 898728.07 1722163.45 860750.51 668114.42
17 Value of Output 1965783.12 942651.09 2307237.21 948509.18 712842.70
18 GVA 3076.02 -1298.81 -3877.59 2842.91 4522.19
19 Depreciation 24351.16 9964.41 28355.76 23280.19 13159.40
20 Net Value Added -10936.66 -1750.60 -10511.28 -4851.55 -4904.88
21 Net Fixed Capital Formation -131.26 2675.92 5814.52 -96014.25 10444.66
22 Gross Fixed Capital
Formation 342.27 444.57 2769.35 748.72 83.00
23 Materials, Fuels etc 6320.87 6087.33 -282.65 29204.79 50534.26
24 Semi Fin. Goods 5216.19 -249.51 1150.17 -1705.57 188.94
25 Finished Goods 6291.90 5839.50 16273.25 -32577.10 4790.93
26 Total (20+21+22) 31500.19 15232.17 49780.31 16077.39 19658.19
27 Gross Cap Form 1471804.08 603985.92 1208502.55 582151.68 539220.18

53
ANNEXURE -5
Summary results of manufacturing sector by selected characteristics
and major industry group NIC- 3 digit level
(Values are Rs. in Crores , Mandays in '000s & Others in No.)
Sl.
No. INDUSTRY GROUP 110 120 131 139 141
1 Number of Factories 289 206 247 141 46
2 Fixed Capital 205884.88 61061.53 621038.10 66806.42 34496.47
3 Physical Working Capital 42119.91 82954.57 281321.47 28738.14 3930.56
4 Working Capital -10177.91 -4521.54 66224.95 -
111052.50 8493.68
5 Invested Capital 248005.54 144016.50 902359.55 95544.25 38427.32
6 Outstanding loans 55818.53 14039.78 407098.70 18300.46 4775.61
7 Man days- Workers 2637 2672 14018 3054 6010
8 Number of Workers 8373 9432 41240 9687 18085
9 Man days-Employees 3423 3131 15799 3349 6711
10 Total Employees 10961 11248 46574 10786 20222
11 Wages to Workers 11954.79 9597.72 46957.43 12064.72 22434.45
12 Total Emoluments 19497.00 12864.02 63823.66 14422.25 27627.04
13 Fuels Consumed 23179.05 5516.64 120826.07 5995.28 2074.17
14 Materials Consumed 234384.22 200700.63 777537.66 63541.21 20720.82
15 Total Inputs 371324.72 244134.08 1049978.55 89395.01 32394.30
16 Products 360750.30 264940.30 1128309.36 112629.78 35056.37
17 Value of Output 447579.16 303240.25 1269013.86 127226.29 79974.18
18 GVA 1164.96 -3.29 814.17 -1974.56 -722.93
19 Depreciation 15793.00 5342.37 41529.59 9082.93 4654.13
20 Net Value Added -5022.35 -427.15 -4368.03 -386.79 7.65
21 Net Fixed Capital Formation 30748.73 -1476.48 -15752.45 -6665.11 807.55
22 Gross Fixed Capital
Formation 288.80 206.45 -466.47 140.80 52.73
23 Materials, Fuels etc 3388.15 3999.99 40519.83 -4300.46 -2056.13
24 Semi Fin. Goods -35.54 -27.08 1629.41 -764.02 15.39
25 Finished Goods 5669.57 10108.22 3016.13 726.27 -1642.80
26 Total (20+21+22) 23225.21 5610.86 124164.43 5757.78 3071.19
27 Gross Cap Form 234384.22 200700.63 777537.66 63526.24 20720.82

54
ANNEXURE -5
Summary results of manufacturing sector by selected characteristics
and major industry group NIC- 3 digit level
(Values are Rs. in Crores , Mandays in '000s & Others in No.)
Sl.
No. INDUSTRY GROUP 143 151 152 161 162
1 Number of Factories 4 10 17 46 46
2 Fixed Capital 10197.81 5695.13 19238.64 269.03 2901.68
3 Physical Working Capital 5724.52 473.14 16991.41 377.37 5360.20
4 Working Capital 3017.06 252.38 5254.48 931.30 13795.42
5 Invested Capital 15922.33 6168.27 36229.44 646.99 8261.20
6 Outstanding loans 5524.15 3400.98 1431.69 128.53 4491.06
7 Man days- Workers 365 409 3104 62 131
8 Number of Workers 1079 1347 9992 211 466
9 Man days-Employees 431 430 3414 71 176
10 Total Employees 1269 1422 10998 296 658
11 Wages to Workers 1787.92 1366.24 12221.97 155.10 404.85
12 Total Emoluments 2397.46 1486.36 14442.47 187.64 654.61
13 Fuels Consumed 1795.96 311.21 2685.99 43.48 553.25
14 Materials Consumed 24036.57 3161.39 63993.23 2416.43 8837.26
15 Total Inputs 30313.47 4151.06 74663.86 2614.64 29358.11
16 Products 36624.12 3647.01 93097.81 2483.37 13471.64
17 Value of Output 37123.27 5209.47 96811.74 2868.90 33685.90
18 GVA 2226.97 45.98 0.00 106.85 1.78
19 Depreciation 1218.13 337.51 3622.49 15.47 339.79
20 Net Value Added -36.28 -53.55 12.03 0.55 31.21
21 Net Fixed Capital Formation 2178.48 897.72 -317.99 -15.47 -97.61
22 Gross Fixed Capital
Formation 4.00 10.00 17.20 45.50 44.56
23 Materials, Fuels etc 325.83 47.57 -1607.18 119.92 -1217.85
24 Semi Fin. Goods 293.66 44.33 -736.40 0.00 -339.95
25 Finished Goods 220.87 -34.17 -4196.55 32.33 23.36
26 Total (20+21+22) 1795.96 311.21 2695.77 44.56 504.31
27 Gross Cap Form 24036.57 3161.39 63993.23 2416.43 8837.26

55
ANNEXURE -5
Summary results of manufacturing sector by selected characteristics
and major industry group NIC- 3 digit level
(Values are Rs. in Crores , Mandays in '000s & Others in No.)
Sl.
No INDUSTRY GROUP 170 181 191 192 201
1 Number of Factories 379 125 8 54 179
2 Fixed Capital 175796.68 33018.25 15201.28 753979.81 644833.55
3 Physical Working Capital 66083.54 16737.59 6000.13 430331.57 239976.47
4 Working Capital 8020.48 11930.26 6789.04 -583101.11 365545.06
5 Invested Capital 241879.30 49755.66 21201.41 1184311.39 884810.01
6 Outstanding loans 52523.38 13100.01 18003.43 3647.42 112783.54
7 Man days- Workers 2635 878 152 1574 4249
8 Number of Workers 8133 2822 513 4583 12339
9 Man days-Employees 3452 1097 184 2028 5357
10 Total Employees 10680 3638 622 5910 15735
11 Wages to Workers 12122.07 4613.03 586.71 11548.90 25745.05
12 Total Emoluments 21358.61 6674.00 877.60 29485.62 46414.96
13 Fuels Consumed 39439.25 1903.12 324.18 8507.73 159397.27
14 Materials Consumed 245042.81 44061.89 13084.65 2437225.61 942634.96
15 Total Inputs 301712.86 66765.07 14739.44 2626948.09 1262770.36
16 Products 413259.15 61262.93 17099.43 2840151.84 1490589.28
17 Value of Output 418698.22 88808.71 17563.53 2956044.96 1607664.70
18 GVA 782.22 -96.62 -829.81 -65006.80 9874.67
19 Depreciation 14210.92 2819.62 1537.97 52040.73 37008.26
20 Net Value Added -9604.23 -4238.69 0.00 -577.37 -12537.31
21 Net Fixed Capital Formation -6551.45 10325.82 -1244.53 -66288.59 -2664.50
22 Gross Fixed Capital Formation 451.83 125.06 8.25 60.37 86.10
23 Materials, Fuels etc -3048.35 2940.21 -932.15 55187.87 -11403.87
24 Semi Fin. Goods 606.21 14.30 52.52 15021.13 -7523.74
25 Finished Goods -3087.90 4464.06 211.30 40404.25 -10803.52
26 Total (20+21+22) 38822.72 1769.51 412.36 10153.50 147366.32
27 Gross Cap Form 245042.81 44061.89 13084.65 2437225.61 942634.96

56
ANNEXURE -5
Summary results of manufacturing sector by selected characteristics
and major industry group NIC- 3 digit level
(Values are Rs. in Crores , Mandays in '000s & Others in No.)
Sl.
No. INDUSTRY GROUP 202 210 221 222 231
1 Number of Factories 119 168 50 495 19
2 Fixed Capital 193790.15 1339092.05 32748.22 96668.45 96243.96
3 Physical Working Capital 64581.12 612213.69 6045.22 41644.31 16326.42
4 Working Capital -12924.06 573303.69 16293.64 39646.22 -3019.97
5 Invested Capital 258370.98 1951305.15 38793.44 138312.36 112570.37
6 Outstanding loans 72025.01 149294.74 2325.62 34883.25 27844.21
7 Man days- Workers 1894 13075 423 2579 483
8 Number of Workers 5588 37035 1375 8428 1528
9 Man days-Employees 2328 15880 522 2983 553
10 Total Employees 6999 45261 1827 10251 1762
11 Wages to Workers 8677.54 91654.27 2445.24 9119.96 2207.86
12 Total Emoluments 18224.13 146686.76 4810.78 12202.33 3147.54
13 Fuels Consumed 36764.73 96038.86 2598.66 11904.63 10448.29
14 Materials Consumed 219029.38 1078874.34 11135.85 163463.54 33481.25
15 Total Inputs 281217.05 1455732.31 17838.76 191759.98 48539.63
16 Products 336114.22 1588001.81 11353.36 136561.94 62385.19
17 Value of Output 348181.35 1698086.88 19167.94 146666.66 64480.79
18 GVA 10743.26 81871.17 -750.33 598.21 -506.94
19 Depreciation 16871.92 103990.45 2658.00 6557.23 6522.36
20 Net Value Added -1365.34 -711.86 -168.43 -3530.38 45.92
21 Net Fixed Capital Formation 8000.63 90398.89 -996.50 13434.50 -5592.87
22 Gross Fixed Capital Formation 1013.67 430.85 102.41 632.36 19.00
23 Materials, Fuels etc 5222.74 11149.45 1249.28 5492.63 641.92
24 Semi Fin. Goods 637.97 -16378.98 -753.70 -601.94 64.14
25 Finished Goods 8775.34 37504.35 386.12 2156.62 -273.79
26 Total (20+21+22) 43948.83 89767.54 1818.47 12685.83 11679.09
27 Gross Cap Form 219029.38 1083866.09 11135.85 163463.54 33481.25

57
ANNEXURE -5
Summary results of manufacturing sector by selected characteristics
and major industry group NIC- 3 digit level
(Values are Rs. in Crores , Mandays in '000s & Others in No.)
Sl.
No. INDUSTRY GROUP 239 241 242 243 251
1 Number of Factories 3273 138 51 82 159
2 Fixed Capital 1822093.55 2972827.62 403158.01 113779.26 92845.71
3 Physical Working Capital 347509.64 752945.69 30949.21 50195.67 48319.38
4 Working Capital 306315.08 -632464.18 -115637.43 25603.79 43070.03
5 Invested Capital 2169602.60 3725773.70 434106.61 163975.24 141165.10
6 Outstanding loans 626075.34 1013505.63 287335.98 26913.23 23271.68
7 Man days- Workers 19424 7422 827 995 1204
8 Number of Workers 62735 21803 2576 3192 4018
9 Man days-Employees 23781 10081 965 1261 1547
10 Total Employees 78757 29693 3060 4079 5285
11 Wages to Workers 79461.10 110926.29 3740.15 5302.75 7297.51
12 Total Emoluments 127445.72 213305.58 7490.69 8621.52 16238.90
13 Fuels Consumed 330198.93 309860.99 19699.44 35733.22 2376.77
14 Materials Consumed 942476.13 1782085.39 93496.90 118918.90 149128.54
15 Total Inputs 1651834.81 2538126.78 133997.05 176753.73 202460.57
16 Products 1556314.41 2106925.05 120593.99 196319.80 54984.83
17 Value of Output 1811118.19 2441826.15 143443.71 209615.03 116030.56
18 GVA 33208.90 156033.08 5260.61 1118.72 248.81
19 Depreciation 128517.43 129018.75 8822.32 12527.16 7695.09
20 Net Value Added -12339.17 155.32 -447.80 373.27 -2856.00
21 Net Fixed Capital Formation 49548.66 141657.67 4408.34 -3761.10 13806.30
22 Gross Fixed Capital
Formation 5269.45 -269.51 204.92 82.00 158.78
23 Materials, Fuels etc 15797.38 10986.00 -2228.33 -841.48 6504.59
24 Semi Fin. Goods 6122.15 3240.85 666.84 962.55 -289.84
25 Finished Goods 26574.68 33235.90 1693.98 1105.01 380.63
26 Total (20+21+22) 392831.08 245017.94 20366.11 35733.86 2499.92
27 Gross Cap Form 942265.67 1780867.75 92935.54 118918.90 149128.54

58
ANNEXURE -5
Summary results of manufacturing sector by selected characteristics
and major industry group NIC- 3 digit level
(Values are Rs. in Crores , Mandays in '000s & Others in No.)
Sl.
No. INDUSTRY GROUP 259 261 263 266 267 268
1 Number of Factories 226 7 2 2 1 1
2 Fixed Capital 15839.05 15388.33 1933.40 4120.27 102.79 88.54
3 Physical Working Capital 9904.16 90854.57 1072.12 5982.54 14.11 223.31
4 Working Capital 7901.82 41112.52 3973.75 -159706.98 161.06 460.00
5 Invested Capital 25742.62 106242.91 3005.52 10102.81 116.89 311.85
6 Outstanding loans 15391.08 697.05 141.00 4991.62 0.00 506.14
7 Man days- Workers 689 348 90 28 7 2
8 Number of Workers 2256 1150 298 93 23 7
9 Man days-Employees 818 386 108 38 9 4
10 Total Employees 2952 1277 358 126 29 12
11 Wages to Workers 2934.26 1399.22 398.51 174.00 26.80 17.24
12 Total Emoluments 3796.51 2298.28 701.33 399.62 38.08 42.81
13 Fuels Consumed 1918.51 1069.75 90.44 44.15 8.51 6.97
14 Materials Consumed 40168.05 1088490.07 5430.96 1004.74 68.67 283.27
15 Total Inputs 49338.83 1116688.61 6418.38 1507.76 174.70 362.07
16 Products 40869.51 1135693.70 6877.13 2744.29 171.29 496.03
17 Value of Output 47704.05 1150419.14 7388.67 2753.29 287.23 507.83
18 GVA 163.17 -68.47 -8.94 -392.53 0.00 -37.71
19 Depreciation 1607.33 2052.40 461.51 467.82 8.21 39.82
20 Net Value Added -88.55 -285.41 0.00 0.00 -10.64 0.00
21 Net Fixed Capital Formation 746.11 7420.91 111.21 -392.53 10.64 -37.71
22 Gross Fixed Capital
Formation 251.59 7.00 2.00 2.00 1.00 1.00
23 Materials, Fuels etc 888.40 39025.68 -4.10 -9309.64 2.15 -44.17
24 Semi Fin. Goods 322.00 -566.63 -476.58 143.27 0.00 0.00
25 Finished Goods 556.10 -5193.20 0.00 -15.20 -8.32 0.00
26 Total (20+21+22) 1926.56 1069.75 90.44 44.15 8.51 6.97
27 Gross Cap Form 40168.05 1088490.07 5430.96 1004.74 68.67 283.27
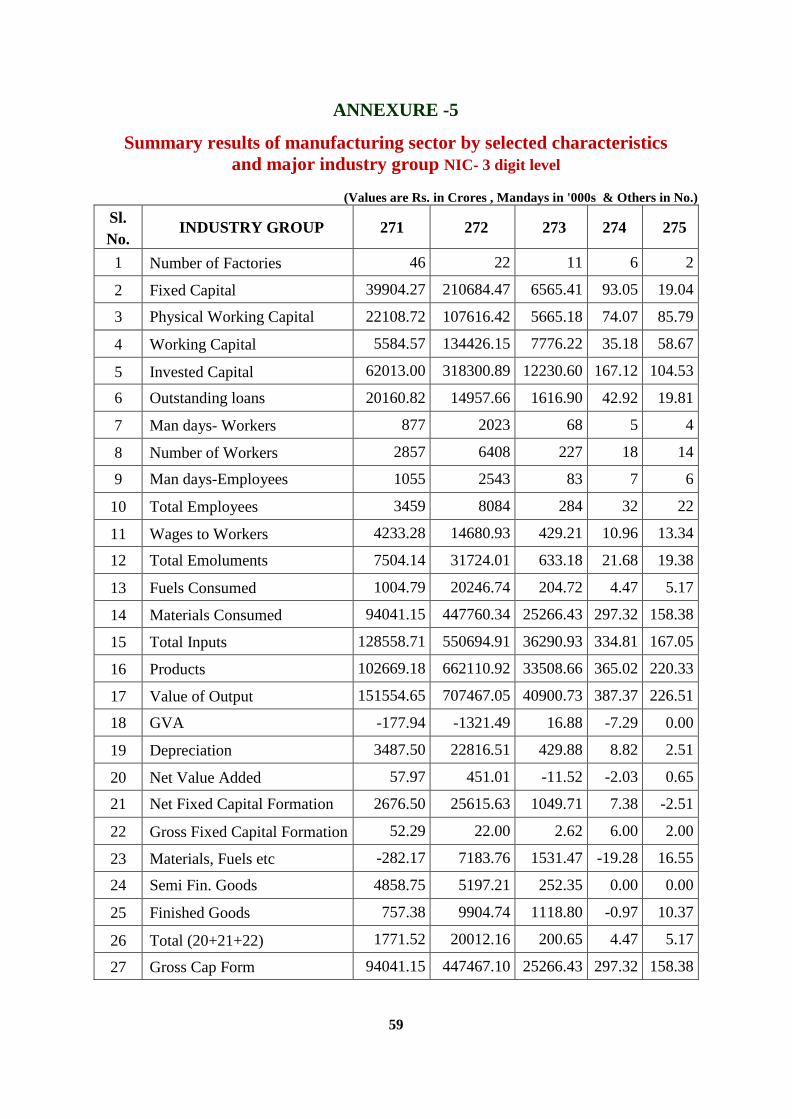
59
ANNEXURE -5
Summary results of manufacturing sector by selected characteristics
and major industry group NIC- 3 digit level
(Values are Rs. in Crores , Mandays in '000s & Others in No.)
Sl.
No. INDUSTRY GROUP 271 272 273 274 275
1 Number of Factories 46 22 11 6 2
2 Fixed Capital 39904.27 210684.47 6565.41 93.05 19.04
3 Physical Working Capital 22108.72 107616.42 5665.18 74.07 85.79
4 Working Capital 5584.57 134426.15 7776.22 35.18 58.67
5 Invested Capital 62013.00 318300.89 12230.60 167.12 104.53
6 Outstanding loans 20160.82 14957.66 1616.90 42.92 19.81
7 Man days- Workers 877 2023 68 5 4
8 Number of Workers 2857 6408 227 18 14
9 Man days-Employees 1055 2543 83 7 6
10 Total Employees 3459 8084 284 32 22
11 Wages to Workers 4233.28 14680.93 429.21 10.96 13.34
12 Total Emoluments 7504.14 31724.01 633.18 21.68 19.38
13 Fuels Consumed 1004.79 20246.74 204.72 4.47 5.17
14 Materials Consumed 94041.15 447760.34 25266.43 297.32 158.38
15 Total Inputs 128558.71 550694.91 36290.93 334.81 167.05
16 Products 102669.18 662110.92 33508.66 365.02 220.33
17 Value of Output 151554.65 707467.05 40900.73 387.37 226.51
18 GVA -177.94 -1321.49 16.88 -7.29 0.00
19 Depreciation 3487.50 22816.51 429.88 8.82 2.51
20 Net Value Added 57.97 451.01 -11.52 -2.03 0.65
21 Net Fixed Capital Formation 2676.50 25615.63 1049.71 7.38 -2.51
22 Gross Fixed Capital Formation 52.29 22.00 2.62 6.00 2.00
23 Materials, Fuels etc -282.17 7183.76 1531.47 -19.28 16.55
24 Semi Fin. Goods 4858.75 5197.21 252.35 0.00 0.00
25 Finished Goods 757.38 9904.74 1118.80 -0.97 10.37
26 Total (20+21+22) 1771.52 20012.16 200.65 4.47 5.17
27 Gross Cap Form 94041.15 447467.10 25266.43 297.32 158.38

60
ANNEXURE -5
Summary results of manufacturing sector by selected characteristics
and major industry group NIC- 3 digit level
(Values are Rs. in Crores , Mandays in '000s & Others in No.)
Sl.
No. INDUSTRY GROUP 279 281 282 291 292
1 Number of Factories 11 52 70 13 7
2 Fixed Capital 1476.71 71777.28 63034.25 32968.70 4524.41
3 Physical Working Capital 533.40 39140.44 45328.09 7714.70 1109.93
4 Working Capital -384.25 17261.57 40427.91 21462.68 870.77
5 Invested Capital 2010.41 110917.91 108362.03 40683.40 5634.34
6 Outstanding loans 969.52 27631.30 15526.11 7456.60 4221.18
7 Man days- Workers 43 1385 753 508 27
8 Number of Workers 170 4195 2454 1661 92
9 Man days-Employees 64 1703 936 607 37
10 Total Employees 255 5200 3142 1984 132
11 Wages to Workers 200.50 7832.20 6807.67 2302.48 161.97
12 Total Emoluments 407.13 15549.51 16442.46 2934.73 512.33
13 Fuels Consumed 105.35 5461.69 1599.25 3956.89 67.78
14 Materials Consumed 3213.51 68405.58 133971.07 11026.58 1985.72
15 Total Inputs 4100.70 106981.01 178329.55 19879.55 2463.07
16 Products 5986.50 93593.51 112239.24 17940.18 2069.28
17 Value of Output 6716.56 122162.12 193686.71 35265.69 2219.68
18 GVA 701.95 684.01 -90.90 0.00 -105.04
19 Depreciation 93.15 7538.59 5805.38 3172.84 325.92
20 Net Value Added -18.01 44.42 -68.60 -113.95 4.60
21 Net Fixed Capital Formation 713.67 -811.58 -2823.18 1475.49 -301.77
22 Gross Fixed Capital
Formation 11.00 285.64 63.97 12.50 6.75
23 Materials, Fuels etc -167.62 -4214.99 -2250.90 5.10 -93.85
24 Semi Fin. Goods 0.04 -6513.53 -1682.26 -352.59 67.21
25 Finished Goods -26.85 318.53 1230.43 547.24 41.48
26 Total (20+21+22) 105.35 3022.47 1616.65 4016.83 67.78
27 Gross Cap Form 3213.51 68405.58 133971.07 11026.58 1985.72

61
ANNEXURE -5
Summary results of manufacturing sector by selected characteristics
and major industry group NIC- 3 digit level
(Values are Rs. in Crores , Mandays in '000s & Others in No.)
Sl.
No. INDUSTRY GROUP 293 301 302 303 309
1 Number of Factories 26 3 2 1 3
2 Fixed Capital 34904.96 5815.09 53.14 1991.63 4373.79
3 Physical Working Capital 21891.42 8827.93 59.69 691.83 561.66
4 Working Capital 9743.08 4384.74 68.29 5563.42 100.02
5 Invested Capital 56796.40 14643.02 113.22 2683.45 4935.45
6 Outstanding loans 19466.39 37244.11 71.87 44.33 2663.78
7 Man days- Workers 1051 972 22 66 76
8 Number of Workers 3326 2682 72 216 256
9 Man days-Employees 1212 1228 25 71 83
10 Total Employees 3837 3386 84 232 282
11 Wages to Workers 4941.46 6134.58 90.59 346.58 290.13
12 Total Emoluments 6594.67 10982.23 126.88 388.55 471.20
13 Fuels Consumed 6386.80 839.41 48.58 107.47 608.45
14 Materials Consumed 39903.87 37039.20 863.18 1272.95 1877.73
15 Total Inputs 57389.66 47477.10 961.93 1920.89 2814.84
16 Products 64069.34 992.80 1095.30 4903.42 2788.19
17 Value of Output 68628.90 63632.23 1138.61 4903.42 3040.24
18 GVA 4241.28 -627.31 0.00 234.76 0.00
19 Depreciation 3233.47 641.34 14.52 160.09 170.84
20 Net Value Added -137.79 0.00 0.00 14.14 0.41
21 Net Fixed Capital Formation 4009.23 -627.31 -5.26 -14.14 796.69
22 Gross Fixed Capital
Formation 25.67 3.00 2.00 1.00 3.00
23 Materials, Fuels etc 1012.26 -21270.92 30.82 323.08 228.54
24 Semi Fin. Goods -686.23 -11.36 6.40 234.76 131.35
25 Finished Goods 3700.96 0.00 0.00 0.00 3.40
26 Total (20+21+22) 6363.50 839.41 32.80 107.47 608.45
27 Gross Cap Form 39916.63 37039.20 863.18 1272.95 1877.73
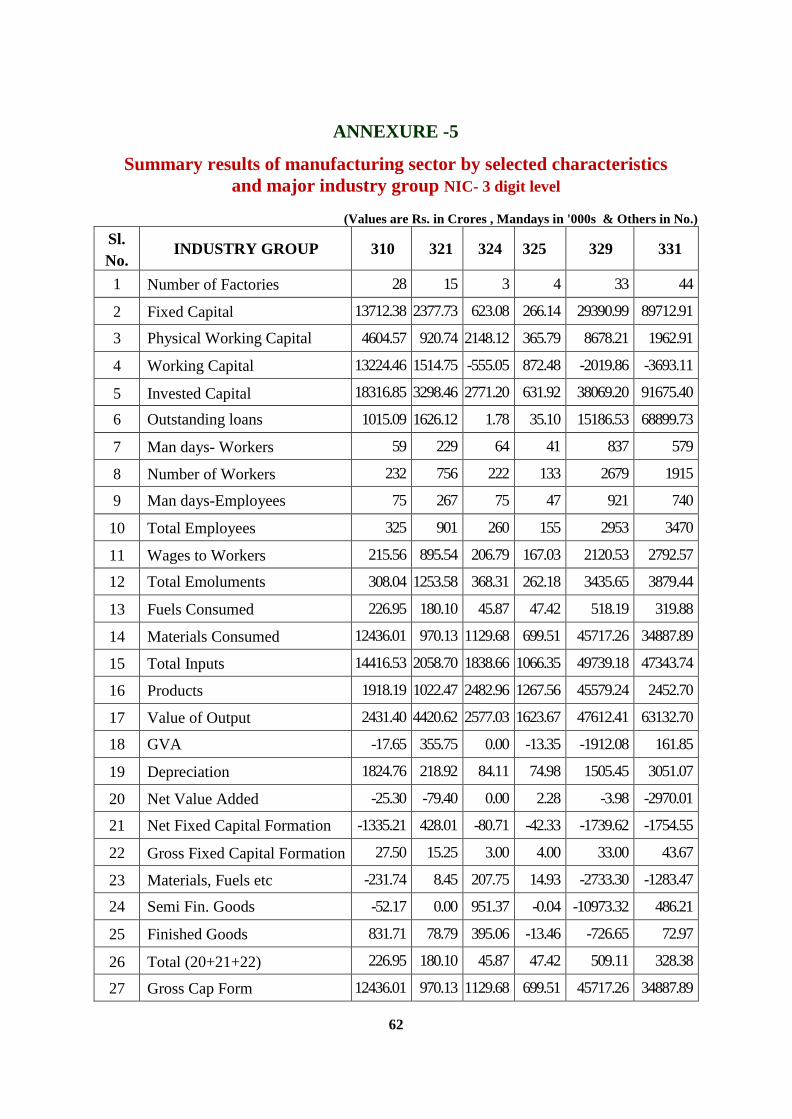
62
ANNEXURE -5
Summary results of manufacturing sector by selected characteristics
and major industry group NIC- 3 digit level
(Values are Rs. in Crores , Mandays in '000s & Others in No.)
Sl.
No. INDUSTRY GROUP 310 321 324 325 329 331
1 Number of Factories 28 15 3 4 33 44
2 Fixed Capital 13712.38 2377.73 623.08 266.14 29390.99 89712.91
3 Physical Working Capital 4604.57 920.74 2148.12 365.79 8678.21 1962.91
4 Working Capital 13224.46 1514.75 -555.05 872.48 -2019.86 -3693.11
5 Invested Capital 18316.85 3298.46 2771.20 631.92 38069.20 91675.40
6 Outstanding loans 1015.09 1626.12 1.78 35.10 15186.53 68899.73
7 Man days- Workers 59 229 64 41 837 579
8 Number of Workers 232 756 222 133 2679 1915
9 Man days-Employees 75 267 75 47 921 740
10 Total Employees 325 901 260 155 2953 3470
11 Wages to Workers 215.56 895.54 206.79 167.03 2120.53 2792.57
12 Total Emoluments 308.04 1253.58 368.31 262.18 3435.65 3879.44
13 Fuels Consumed 226.95 180.10 45.87 47.42 518.19 319.88
14 Materials Consumed 12436.01 970.13 1129.68 699.51 45717.26 34887.89
15 Total Inputs 14416.53 2058.70 1838.66 1066.35 49739.18 47343.74
16 Products 1918.19 1022.47 2482.96 1267.56 45579.24 2452.70
17 Value of Output 2431.40 4420.62 2577.03 1623.67 47612.41 63132.70
18 GVA -17.65 355.75 0.00 -13.35 -1912.08 161.85
19 Depreciation 1824.76 218.92 84.11 74.98 1505.45 3051.07
20 Net Value Added -25.30 -79.40 0.00 2.28 -3.98 -2970.01
21 Net Fixed Capital Formation -1335.21 428.01 -80.71 -42.33 -1739.62 -1754.55
22 Gross Fixed Capital Formation 27.50 15.25 3.00 4.00 33.00 43.67
23 Materials, Fuels etc -231.74 8.45 207.75 14.93 -2733.30 -1283.47
24 Semi Fin. Goods -52.17 0.00 951.37 -0.04 -10973.32 486.21
25 Finished Goods 831.71 78.79 395.06 -13.46 -726.65 72.97
26 Total (20+21+22) 226.95 180.10 45.87 47.42 509.11 328.38
27 Gross Cap Form 12436.01 970.13 1129.68 699.51 45717.26 34887.89
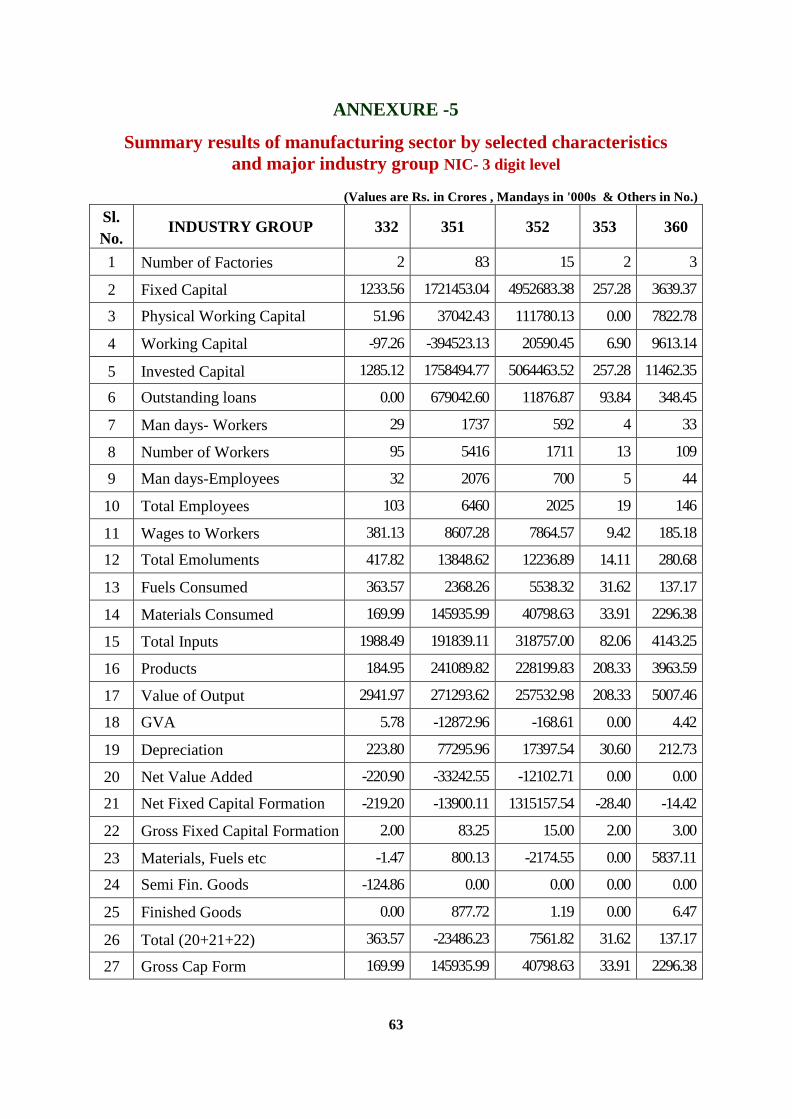
63
ANNEXURE -5
Summary results of manufacturing sector by selected characteristics
and major industry group NIC- 3 digit level
(Values are Rs. in Crores , Mandays in '000s & Others in No.)
Sl.
No. INDUSTRY GROUP 332 351 352 353 360
1 Number of Factories 2 83 15 2 3
2 Fixed Capital 1233.56 1721453.04 4952683.38 257.28 3639.37
3 Physical Working Capital 51.96 37042.43 111780.13 0.00 7822.78
4 Working Capital -97.26 -394523.13 20590.45 6.90 9613.14
5 Invested Capital 1285.12 1758494.77 5064463.52 257.28 11462.35
6 Outstanding loans 0.00 679042.60 11876.87 93.84 348.45
7 Man days- Workers 29 1737 592 4 33
8 Number of Workers 95 5416 1711 13 109
9 Man days-Employees 32 2076 700 5 44
10 Total Employees 103 6460 2025 19 146
11 Wages to Workers 381.13 8607.28 7864.57 9.42 185.18
12 Total Emoluments 417.82 13848.62 12236.89 14.11 280.68
13 Fuels Consumed 363.57 2368.26 5538.32 31.62 137.17
14 Materials Consumed 169.99 145935.99 40798.63 33.91 2296.38
15 Total Inputs 1988.49 191839.11 318757.00 82.06 4143.25
16 Products 184.95 241089.82 228199.83 208.33 3963.59
17 Value of Output 2941.97 271293.62 257532.98 208.33 5007.46
18 GVA 5.78 -12872.96 -168.61 0.00 4.42
19 Depreciation 223.80 77295.96 17397.54 30.60 212.73
20 Net Value Added -220.90 -33242.55 -12102.71 0.00 0.00
21 Net Fixed Capital Formation -219.20 -13900.11 1315157.54 -28.40 -14.42
22 Gross Fixed Capital Formation 2.00 83.25 15.00 2.00 3.00
23 Materials, Fuels etc -1.47 800.13 -2174.55 0.00 5837.11
24 Semi Fin. Goods -124.86 0.00 0.00 0.00 0.00
25 Finished Goods 0.00 877.72 1.19 0.00 6.47
26 Total (20+21+22) 363.57 -23486.23 7561.82 31.62 137.17
27 Gross Cap Form 169.99 145935.99 40798.63 33.91 2296.38
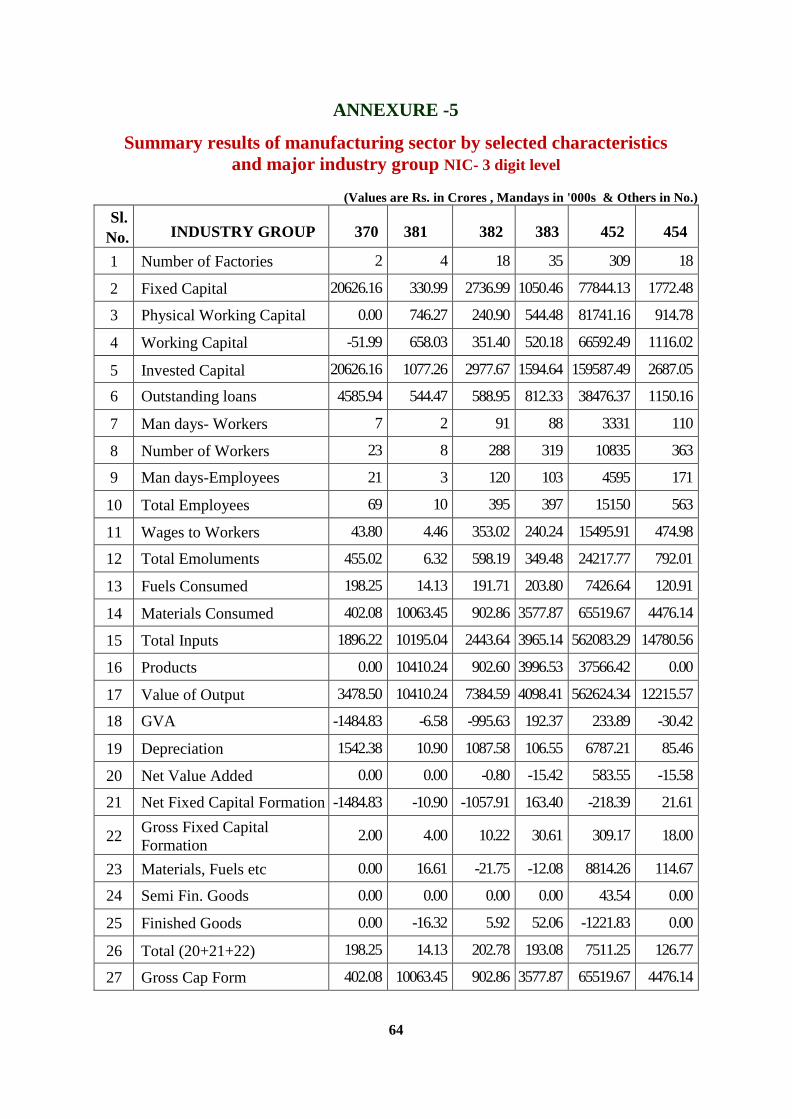
64
ANNEXURE -5
Summary results of manufacturing sector by selected characteristics
and major industry group NIC- 3 digit level
(Values are Rs. in Crores , Mandays in '000s & Others in No.)
Sl.
No. INDUSTRY GROUP 370 381 382 383 452 454
1 Number of Factories 2 4 18 35 309 18
2 Fixed Capital 20626.16 330.99 2736.99 1050.46 77844.13 1772.48
3 Physical Working Capital 0.00 746.27 240.90 544.48 81741.16 914.78
4 Working Capital -51.99 658.03 351.40 520.18 66592.49 1116.02
5 Invested Capital 20626.16 1077.26 2977.67 1594.64 159587.49 2687.05
6 Outstanding loans 4585.94 544.47 588.95 812.33 38476.37 1150.16
7 Man days- Workers 7 2 91 88 3331 110
8 Number of Workers 23 8 288 319 10835 363
9 Man days-Employees 21 3 120 103 4595 171
10 Total Employees 69 10 395 397 15150 563
11 Wages to Workers 43.80 4.46 353.02 240.24 15495.91 474.98
12 Total Emoluments 455.02 6.32 598.19 349.48 24217.77 792.01
13 Fuels Consumed 198.25 14.13 191.71 203.80 7426.64 120.91
14 Materials Consumed 402.08 10063.45 902.86 3577.87 65519.67 4476.14
15 Total Inputs 1896.22 10195.04 2443.64 3965.14 562083.29 14780.56
16 Products 0.00 10410.24 902.60 3996.53 37566.42 0.00
17 Value of Output 3478.50 10410.24 7384.59 4098.41 562624.34 12215.57
18 GVA -1484.83 -6.58 -995.63 192.37 233.89 -30.42
19 Depreciation 1542.38 10.90 1087.58 106.55 6787.21 85.46
20 Net Value Added 0.00 0.00 -0.80 -15.42 583.55 -15.58
21 Net Fixed Capital Formation -1484.83 -10.90 -1057.91 163.40 -218.39 21.61
22 Gross Fixed Capital
Formation 2.00 4.00 10.22 30.61 309.17 18.00
23 Materials, Fuels etc 0.00 16.61 -21.75 -12.08 8814.26 114.67
24 Semi Fin. Goods 0.00 0.00 0.00 0.00 43.54 0.00
25 Finished Goods 0.00 -16.32 5.92 52.06 -1221.83 0.00
26 Total (20+21+22) 198.25 14.13 202.78 193.08 7511.25 126.77
27 Gross Cap Form 402.08 10063.45 902.86 3577.87 65519.67 4476.14

65
ANNEXURE -5
Summary results of manufacturing sector by selected characteristics
and major industry group NIC- 3 digit level
(Values are Rs. in Crores , Mandays in '000s & Others in No.)
Sl.
No. INDUSTRY GROUP 521 581 742 829 952 960 TOTAL
1 Number of Factories 238 38 1 6 1 4 12696
2 Fixed Capital 41558.91 28338.45 42.53 739.60 16.75 332.91 18777052.38
3 Physical Working Capital 3940.33 9776.87 11.91 496.33 0.01 3.13 5205422.49
4 Working Capital 7639.84 -1727.21 110.06 889.36 2.77 43.11 289112.41
5 Invested Capital 45499.52 38115.52 54.44 1235.78 17.20 335.53 23982474.31
6 Outstanding loans 21685.37 17340.44 90.55 477.19 0.00 230.01 4930444.64
7 Man days- Workers 582 527 4 163 5 32 146392
8 Number of Workers 1679 1448 12 486 16 106 460467
9 Man days-Employees 951 839 6 183 5 42 177424
10 Total Employees 2979 2305 21 548 19 139 567345
11 Wages to Workers 1784.03 3509.87 12.85 654.46 20.90 102.60 736357.13
12 Total Emoluments 3664.30 7352.12 24.36 823.49 21.74 142.84 1218601.05
13 Fuels Consumed 4877.95 1831.54 9.27 39.80 1.75 37.92 1463114.48
14 Materials Consumed 26408.66 20391.91 37.12 3590.43 14.78 40.64 17868168.74
15 Total Inputs 35591.19 31415.46 120.76 9836.41 19.40 146.09 23589745.33
16 Products 21.88 29901.88 0.00 3778.93 0.00 0.00 23517648.03
17 Value of Output 31069.43 34718.10 146.57 11188.33 47.00 292.78 27317711.51
GVA 569.01 -232.17 0.00 0.00 0.01 -19.87 233377.95
19 Depreciation 4805.54 3371.01 7.69 115.91 1.00 62.02 911283.12
20 Net Value Added 171.43 -4446.59 0.00 -71.02 0.00 0.30 -147103.15
21 Net Fixed Capital Formation -2302.98 4726.92 -7.69 -102.18 0.01 -22.73 1539197.61
22 Gross Fixed Capital
Formation 237.68 38.00 1.00 6.00 1.00 4.00 15555.21
23 Materials, Fuels etc 900.01 2905.73 -22.79 -135.49 -0.54 -0.18 269230.39
24 Semi Fin. Goods 0.00 -3.79 0.00 0.00 0.00 0.00 -256.15
25 Finished Goods 994.55 1.61 0.00 0.00 0.00 0.00 204257.95
26 Total (20+21+22) 4676.08 1831.54 9.27 39.80 1.75 37.92 1433639.23
27 Gross Cap Form 26408.66 20391.91 37.12 3590.43 14.78 40.64 17871349.59

66
ANNEXURE - 6
Summary results of manufacturing sector by selected characteristics
and major industry group NIC- 3 digit level
(Values are Rs. in Crores , Mandays in '000s & Others in No.)
Sl.
No DISTRICT NAME Srikakulam Vizianagaram Visakhapatnam
1 Number of Factories 735 276 943
2 Fixed Capital 348889.55 318363.06 5318367.52
3 Physical Working Capital 183207.2 223694.7 1758542.55
4 Working Capital 178727.4 61293.61 -653425.45
5 Invested Capital 532096.2 542057.5 7076909.98
6 Outstanding loans 53205.65 306559.7 1305601.37
7 Man days- Workers 6123.12 4480.51 31938.98
8 Number of Workers 18487 14356 94050
9 Man days-Employees 7217.77 5218.77 40099.46
10 Total Employees 22615 16869 120169
11 Wages to Workers 34831.53 21958.71 248737.36
12 Total Emoluments 48099.53 31744.89 449750.65
13 Fuels Consumed 40956.42 50822.17 319403.97
14 Materials Consumed 411459 415503.4 5623554.24
15 Total Inputs 530529.3 659664.1 6906191.2
16 Products 608171.5 532872 7105471.37
17 Value of Output 657498.7 774430.2 7867301.29
18 GVA 126969.4 114766.1 961110.09
19 Depreciation 38417.94 21354.53 278368.1
20 Net Value Added 88551.47 93411.57 682741.99
21 Net Fixed Capital Formation 14191.52 -3282.69 192107.31
22 Gross Fixed Capital Formation 52609.46 18071.84 470475.41
23 Materials, Fuels etc -725.81 -5818.96 83260.26
24 Semi Fin. Goods -11260.37 3180.85 -14988.95
25 Finished Goods -12802.12 -1532.17 139287.04
26 Total (20+21+22) -24788.3 -4170.28 207558.35
27 Gross Cap Form 27821.16 13901.56 678033.76

67
ANNEXURE - 6
Summary results of manufacturing sector by selected characteristics
and major industry group NIC- 3 digit level
(Values are Rs. in Crores , Mandays in '000s & Others in No.)
Sl.
No DISTRICT NAME East Godavari West Godavari Krishna
1 Number of Factories 1193 899 978
2 Fixed Capital 6710234.64 400313.58 540125.52
3 Physical Working Capital 707999.51 261978.6 292540.5
4 Working Capital -278492.59 122045.5 252539.3
5 Invested Capital 7418232.1 662293.3 832664.9
6 Outstanding loans 558370.9 228392.6 269065.8
7 Man days- Workers 14934.06 11391.33 10744.83
8 Number of Workers 46800 36564 32991
9 Man days-Employees 17742.9 13295.69 13372.46
10 Total Employees 55714 43049 41974
11 Wages to Workers 71295.86 45775.69 48860.96
12 Total Emoluments 117224.5 66177.57 82164.52
13 Fuels Consumed 169988.58 87069.51 92601.35
14 Materials Consumed 2664759 1116861 874109.8
15 Total Inputs 3655043.7 1323094 1222865
16 Products 3230099.9 1401503 1164893
17 Value of Output 3798340.5 1520062 1414595
18 GVA 143296.76 196968.4 191729.9
19 Depreciation 118691.52 32477.5 37984.51
20 Net Value Added 24605.24 164490.9 153745.4
21 Net Fixed Capital Formation 1278476.9 8731.24 28411.63
22 Gross Fixed Capital Formation 1397168.4 41208.74 66396.14
23 Materials, Fuels etc 6538.19 3475.92 25280.41
24 Semi Fin. Goods 2789.05 2211.85 -623.22
25 Finished Goods 5854.98 -6116.87 -2225.52
26 Total (20+21+22) 15182.22 -429.1 22431.67
27 Gross Cap Form 1412350.7 40779.64 88827.81
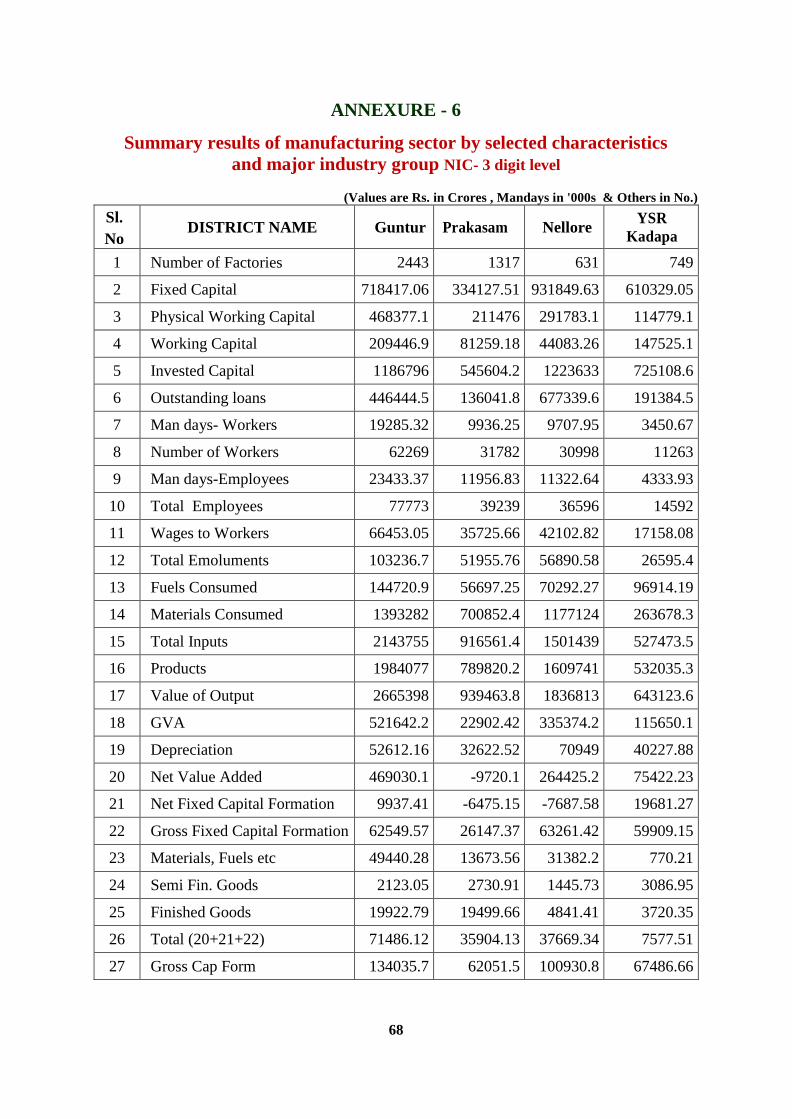
68
ANNEXURE - 6
Summary results of manufacturing sector by selected characteristics
and major industry group NIC- 3 digit level
(Values are Rs. in Crores , Mandays in '000s & Others in No.)
Sl.
No DISTRICT NAME Guntur Prakasam Nellore
YSR
Kadapa
1 Number of Factories 2443 1317 631 749
2 Fixed Capital 718417.06 334127.51 931849.63 610329.05
3 Physical Working Capital 468377.1 211476 291783.1 114779.1
4 Working Capital 209446.9 81259.18 44083.26 147525.1
5 Invested Capital 1186796 545604.2 1223633 725108.6
6 Outstanding loans 446444.5 136041.8 677339.6 191384.5
7 Man days- Workers 19285.32 9936.25 9707.95 3450.67
8 Number of Workers 62269 31782 30998 11263
9 Man days-Employees 23433.37 11956.83 11322.64 4333.93
10 Total Employees 77773 39239 36596 14592
11 Wages to Workers 66453.05 35725.66 42102.82 17158.08
12 Total Emoluments 103236.7 51955.76 56890.58 26595.4
13 Fuels Consumed 144720.9 56697.25 70292.27 96914.19
14 Materials Consumed 1393282 700852.4 1177124 263678.3
15 Total Inputs 2143755 916561.4 1501439 527473.5
16 Products 1984077 789820.2 1609741 532035.3
17 Value of Output 2665398 939463.8 1836813 643123.6
18 GVA 521642.2 22902.42 335374.2 115650.1
19 Depreciation 52612.16 32622.52 70949 40227.88
20 Net Value Added 469030.1 -9720.1 264425.2 75422.23
21 Net Fixed Capital Formation 9937.41 -6475.15 -7687.58 19681.27
22 Gross Fixed Capital Formation 62549.57 26147.37 63261.42 59909.15
23 Materials, Fuels etc 49440.28 13673.56 31382.2 770.21
24 Semi Fin. Goods 2123.05 2730.91 1445.73 3086.95
25 Finished Goods 19922.79 19499.66 4841.41 3720.35
26 Total (20+21+22) 71486.12 35904.13 37669.34 7577.51
27 Gross Cap Form 134035.7 62051.5 100930.8 67486.66
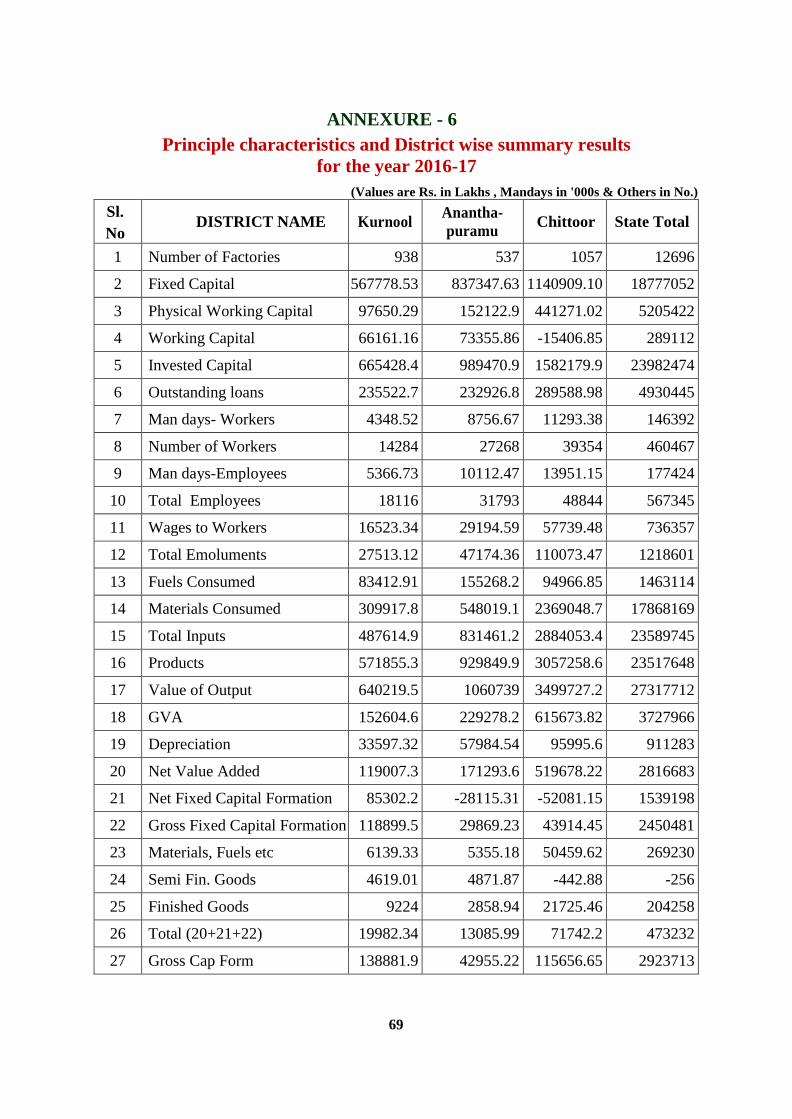
69
ANNEXURE - 6
Principle characteristics and District wise summary results
for the year 2016-17
(Values are Rs. in Lakhs , Mandays in '000s & Others in No.)
Sl.
No DISTRICT NAME Kurnool
Anantha-
puramu Chittoor State Total
1 Number of Factories 938 537 1057 12696
2 Fixed Capital 567778.53 837347.63 1140909.10 18777052
3 Physical Working Capital 97650.29 152122.9 441271.02 5205422
4 Working Capital 66161.16 73355.86 -15406.85 289112
5 Invested Capital 665428.4 989470.9 1582179.9 23982474
6 Outstanding loans 235522.7 232926.8 289588.98 4930445
7 Man days- Workers 4348.52 8756.67 11293.38 146392
8 Number of Workers 14284 27268 39354 460467
9 Man days-Employees 5366.73 10112.47 13951.15 177424
10 Total Employees 18116 31793 48844 567345
11 Wages to Workers 16523.34 29194.59 57739.48 736357
12 Total Emoluments 27513.12 47174.36 110073.47 1218601
13 Fuels Consumed 83412.91 155268.2 94966.85 1463114
14 Materials Consumed 309917.8 548019.1 2369048.7 17868169
15 Total Inputs 487614.9 831461.2 2884053.4 23589745
16 Products 571855.3 929849.9 3057258.6 23517648
17 Value of Output 640219.5 1060739 3499727.2 27317712
18 GVA 152604.6 229278.2 615673.82 3727966
19 Depreciation 33597.32 57984.54 95995.6 911283
20 Net Value Added 119007.3 171293.6 519678.22 2816683
21 Net Fixed Capital Formation 85302.2 -28115.31 -52081.15 1539198
22 Gross Fixed Capital Formation 118899.5 29869.23 43914.45 2450481
23 Materials, Fuels etc 6139.33 5355.18 50459.62 269230
24 Semi Fin. Goods 4619.01 4871.87 -442.88 -256
25 Finished Goods 9224 2858.94 21725.46 204258
26 Total (20+21+22) 19982.34 13085.99 71742.2 473232
27 Gross Cap Form 138881.9 42955.22 115656.65 2923713

70
ANNEXURE - 7
Summary results of mfg. Sector by selected characteristics
and major industry group NIC-2 digit level
DISTRICT : Srikakulam (Value Figures in lakhs, Mandays are in ‘000s and Others in No.)
Sl.
No CHARACTERISTIC
INDUSTRY GROUP
08 10 11 13 15 16
1 Number of Factories 2 489 14 32 0 0
2 Fixed Capital 813.12 24325.45 11463.56 5577.02 0.00 0.00
3 Physical Working Capital 1.60 29601.66 2018.20 3935.80 0.00 0.00
4 Working Capital -51.94 22678.17 3653.20 -4411.59 0.00 0.00
5 Invested Capital 814.71 53927.11 13481.77 9512.82 0.00 0.00
6 Outstanding loans 0.00 15404.77 18.96 10611.72 0.00 0.00
7 Man days- Workers 21 1238 170 727 0 0
8 Number of Workers 71 4325 474 2251 0 0
9 Man days-Employees 23 1523 191 853 0 0
10 Total Employees 77 5770 551 2683 0 0
11 Wages to Workers 70.81 3174.32 857.47 1988.47 0.00 0.00
12 Total Emoluments 96.93 4483.65 1145.62 2491.48 0.00 0.00
13 Fuels Consumed 49.49 1991.08 5869.77 867.71 0.00 0.00
14 Materials Consumed 3.59 75961.37 13211.31 13810.71 0.00 0.00
15 Total Inputs 175.55 99383.62 24691.53 17934.73 0.00 0.00
16 Products 269.49 123306.88 24915.83 13943.14 0.00 0.00
17 Value of Output 347.08 146066.77 25389.35 22576.69 0.00 0.00
18 GVA 171.53 46683.15 697.82 4641.96 0.00 0.00
19 Depreciation 22.56 2440.52 1248.56 970.08 0.00 0.00
20 Net Value Added 148.97 44242.63 -550.74 3671.88 0.00 0.00
21 Net Fixed Capital Formation -8.94 -599.66 1891.23 -7.23 0.00 0.00
22 Gross Fixed Capital Formation 13.62 1840.86 3139.79 962.85 0.00 0.00
23 Materials, Fuels etc -0.13 1275.83 130.80 -535.51 0.00 0.00
24 Semi Fin. Goods 0.00 -491.68 -45.40 -143.95 0.00 0.00
25 Finished Goods 0.00 -2136.48 580.77 250.85 0.00 0.00
26 Total (20+21+22) -0.13 -1352.33 666.17 -428.61 0.00 0.00
27 Gross Cap Form 13.49 488.53 3805.96 534.24 0.00 0.00

71
ANNEXURE – 7
Summary results of mfg. Sector by selected characteristics
and major industry group NIC-2 digit level
DISTRICT : Srikakulam (Value Figures in lakhs, Mandays are in ‘000s and Others in No.) Sl.
No CHARACTERISTIC
INDUSTRY GROUP
17 18 20 21 22
1 Number of Factories 13 1 5 8 11
2 Fixed Capital 4838.11 550.03 80073.16 185366.96 802.83
3 Physical Working Capital 4134.38 68.82 35838.26 92985.12 1295.32
4 Working Capital 820.02 -1125.75 37468.52 104182.27 1109.88
5 Invested Capital 8972.49 618.85 115911.42 278352.08 2098.15
6 Outstanding loans 4283.91 0.00 3500.12 10751.98 2926.89
7 Man days- Workers 95 13 588 2204 50
8 Number of Workers 268 37 1612 6037 152
9 Man days-Employees 136 21 717 2495 64
10 Total Employees 387 57 1965 6837 207
11 Wages to Workers 315.96 186.60 3830.37 19286.82 143.67
12 Total Emoluments 563.45 310.11 7263.68 25011.65 210.86
13 Fuels Consumed 2317.45 43.36 7393.32 18832.59 194.45
14 Materials Consumed 15133.93 1375.65 59031.70 199963.76 2223.30
15 Total Inputs 17999.53 1533.60 75820.71 244859.95 2496.16
16 Products 18555.48 1195.02 85699.81 294140.19 2711.98
17 Value of Output 18742.68 1195.53 91162.00 298547.55 2761.80
18 GVA 743.15 -338.07 15341.29 53687.60 265.64
19 Depreciation 404.33 119.08 7925.01 20343.95 129.81
20 Net Value Added 338.82 -457.15 7416.28 33343.65 135.83
21 Net Fixed Capital Formation 295.61 -66.06 4844.90 10260.56 -75.80
22 Gross Fixed Capital Formation 699.94 53.02 12769.91 30604.51 54.01
23 Materials, Fuels etc -381.79 -14.34 5521.54 -647.73 5.14
24 Semi Fin. Goods 18.51 0.21 -6401.87 -3857.66 0.00
25 Finished Goods -66.26 2.65 4455.02 -2102.06 149.24
26 Total (20+21+22) -429.54 -11.48 3574.69 -6607.45 154.38
27 Gross Cap Form 270.40 41.54 16344.60 23997.06 208.39

72
ANNEXURE - 7
Summary results of mfg. Sector by selected characteristics
and major industry group NIC-2 digit level
DISTRICT : Srikakulam (Value Figures in lakhs, Mandays are in ‘000s and Others in No.)
Sl.
No CHARACTERISTIC
INDUSTRY GROUP
23 24 25 27 28 29
1 Number of Factories 123 4 10 1 3 1
2 Fixed Capital 7699.57 15904.39 676.65 1456.13 6748.44 6.19
3 Physical Working Capital 2708.39 6384.82 937.97 1197.66 1665.95 2.97
4 Working Capital 2319.01 6397.02 1066.71 2594.49 492.56 22.42
5 Invested Capital 10407.97 22289.21 1614.61 2653.80 8414.39 9.16
6 Outstanding loans 4508.86 5.67 505.77 84.99 7.03 13.72
7 Man days- Workers 352 40 26 7 484 1
8 Number of Workers 1366 134 85 25 1327 2
9 Man days-Employees 416 61 33 10 538 1
10 Total Employees 1824 205 121 33 1474 3
11 Wages to Workers 1222.47 145.20 62.17 28.83 3121.18 2.20
12 Total Emoluments 1559.41 229.53 86.28 43.23 3965.68 4.60
13 Fuels Consumed 1899.40 279.04 43.95 34.24 984.34 0.88
14 Materials Consumed 5856.02 18.17 1584.52 15160.51 3983.18 30.84
15 Total Inputs 9613.60 818.51 1691.47 21915.27 5797.18 32.96
16 Products 8590.03 -318.15 377.46 17340.52 11785.95 39.11
17 Value of Output 9051.54 -293.63 485.80 22302.11 11790.13 40.18
18 GVA -562.06 -1112.14 -1205.67 386.84 5992.95 7.22
19 Depreciation 935.90 2765.74 84.98 12.90 711.89 0.33
20 Net Value Added -1497.96 -3877.88 -1290.65 373.94 5281.06 6.89
21 Net Fixed Capital Formation 528.83 -2425.49 -81.42 1.20 -196.63 -0.33
22 Gross Fixed Capital Formation 1464.73 340.25 3.56 14.10 515.26 0.00
23 Materials, Fuels etc 44.47 -5950.99 -28.41 -1.84 -88.13 1.44
24 Semi Fin. Goods 21.95 -318.15 0.00 -5.32 -37.01 0.00
25 Finished Goods 1178.49 -16352.63 513.11 330.23 378.12 -0.37
26 Total (20+21+22) 1244.91 -22621.77 484.70 323.07 252.98 1.07
27 Gross Cap Form 2709.64 -22281.52 488.26 337.17 768.24 1.07

73
ANNEXURE - 7
Summary results of mfg. Sector by selected characteristics
and major industry group NIC-2 digit level
DISTRICT : Srikakulam (Value Figures in lakhs, Mandays are in ‘000s and Others in No.)
No CHARACTERISTIC INDUSTRY GROUP
31 32 35 36 38
1 Number of Factories 1 1 1 0 2
2 Fixed Capital 257.79 384.36 1487.21 0.00 70.42
3 Physical Working Capital 0.00 86.02 178.28 0.00 31.40
4 Working Capital 2.20 -104.80 1341.23 0.00 13.26
5 Invested Capital 257.79 470.37 1665.50 0.00 101.81
6 Outstanding loans 0.00 3.12 314.83 0.00 70.55
7 Man days- Workers 0 16 54 0 3
8 Number of Workers 0 53 148 0 11
9 Man days-Employees 0 19 63 0 6
10 Total Employees 1 64 174 0 20
11 Wages to Workers 0.00 57.39 162.80 0.00 9.66
12 Total Emoluments 0.60 81.33 286.56 0.00 19.37
13 Fuels Consumed 0.17 43.84 50.40 0.00 25.63
14 Materials Consumed 0.00 2455.72 1387.11 0.00 223.95
15 Total Inputs 1.32 2702.65 1660.58 0.00 261.02
16 Products 0.00 2842.83 2531.56 0.00 244.37
17 Value of Output 0.00 2975.83 2538.71 0.00 302.66
18 GVA -1.32 273.18 878.13 0.00 41.64
19 Depreciation 38.64 45.69 171.66 0.00 10.45
20 Net Value Added -39.96 227.49 706.47 0.00 31.19
21 Net Fixed Capital Formation -38.64 -46.15 -84.50 0.00 -10.01
22 Gross Fixed Capital Formation 0.00 -0.46 87.16 0.00 0.44
23 Materials, Fuels etc 0.00 3.57 -24.43 0.00 0.00
24 Semi Fin. Goods 0.00 0.00 0.00 0.00 0.00
25 Finished Goods 0.00 14.58 0.00 0.00 21.61
26 Total (20+21+22) 0.00 18.15 -24.43 0.00 21.61
27 Gross Cap Form 0.00 17.69 62.73 0.00 22.05

74
ANNEXURE - 7
Summary results of mfg. Sector by selected characteristics
and major industry group NIC-2 digit level
DISTRICT : Srikakulam (Value Figures in lakhs, Mandays are in ‘000s and Others in No.)
Sl.
No CHARACTERISTIC
INDUSTRY GROUP Total
45 52 58 95
1 Number of Factories 12 1 0 0 735
2 Fixed Capital 179.71 208.45 0.00 0.00 348889.55
3 Physical Working Capital 134.62 0.00 0.00 0.00 183207.24
4 Working Capital 227.14 33.38 0.00 0.00 178727.40
5 Invested Capital 313.92 208.25 0.00 0.00 532096.18
6 Outstanding loans 126.59 66.17 0.00 0.00 53205.65
7 Man days- Workers 33 1 0 0 6123
8 Number of Workers 106 2 0 0 18487
9 Man days-Employees 47 1 0 0 7218
10 Total Employees 159 4 0 0 22615
11 Wages to Workers 162.93 2.21 0.00 0.00 34831.53
12 Total Emoluments 233.40 12.11 0.00 0.00 48099.53
13 Fuels Consumed 24.21 11.10 0.00 0.00 40956.42
14 Materials Consumed 38.25 5.43 0.00 0.00 411459.02
15 Total Inputs 1112.97 26.35 0.00 0.00 530529.26
16 Products 0.00 0.00 0.00 0.00 608171.50
17 Value of Output 1446.57 69.32 0.00 0.00 657498.67
18 GVA 333.60 42.97 0.00 0.00 126969.41
19 Depreciation 12.60 23.26 0.00 0.00 38417.94
20 Net Value Added 321.00 19.71 0.00 0.00 88551.47
21 Net Fixed Capital Formation -12.01 22.06 0.00 0.00 14191.52
22 Gross Fixed Capital Formation 0.59 45.32 0.00 0.00 52609.46
23 Materials, Fuels etc -35.30 0.00 0.00 0.00 -725.81
24 Semi Fin. Goods 0.00 0.00 0.00 0.00 -11260.37
25 Finished Goods -18.99 0.00 0.00 0.00 -12802.12
26 Total (20+21+22) -54.29 0.00 0.00 0.00 -24788.30
27 Gross Cap Form -53.70 45.32 0.00 0.00 27821.16

75
ANNEXURE - 7
Summary results of mfg. Sector by selected characteristics
and major industry group NIC-2 digit level
DISTRICT : Vizianagaram (Value Figures in lakhs, Mandays are in ‘000s and Others in No.)
Sl.
No CHARACTERISTIC
INDUSTRY GROUP
08 10 11 13 15 16
1 Number of Factories 2 489 14 32 0 0
2 Fixed Capital 813.12 24325.45 11463.56 5577.02 0.00 0.00
3 Physical Working Capital 1.60 29601.66 2018.20 3935.80 0.00 0.00
4 Working Capital -51.94 22678.17 3653.20 -4411.59 0.00 0.00
5 Invested Capital 814.71 53927.11 13481.77 9512.82 0.00 0.00
6 Outstanding loans 0.00 15404.77 18.96 10611.72 0.00 0.00
7 Man days- Workers 21 1238 170 727 0 0
8 Number of Workers 71 4325 474 2251 0 0
9 Man days-Employees 23 1523 191 853 0 0
10 Total Employees 77 5770 551 2683 0 0
11 Wages to Workers 70.81 3174.32 857.47 1988.47 0.00 0.00
12 Total Emoluments 96.93 4483.65 1145.62 2491.48 0.00 0.00
13 Fuels Consumed 49.49 1991.08 5869.77 867.71 0.00 0.00
14 Materials Consumed 3.59 75961.37 13211.31 13810.71 0.00 0.00
15 Total Inputs 175.55 99383.62 24691.53 17934.73 0.00 0.00
16 Products 269.49 123306.88 24915.83 13943.14 0.00 0.00
17 Value of Output 347.08 146066.77 25389.35 22576.69 0.00 0.00
18 GVA 171.53 46683.15 697.82 4641.96 0.00 0.00
19 Depreciation 22.56 2440.52 1248.56 970.08 0.00 0.00
20 Net Value Added 148.97 44242.63 -550.74 3671.88 0.00 0.00
21 Net Fixed Capital Formation -8.94 -599.66 1891.23 -7.23 0.00 0.00
22 Gross Fixed Capital Formation 13.62 1840.86 3139.79 962.85 0.00 0.00
23 Materials, Fuels etc -0.13 1275.83 130.80 -535.51 0.00 0.00
24 Semi Fin. Goods 0.00 -491.68 -45.40 -143.95 0.00 0.00
25 Finished Goods 0.00 -2136.48 580.77 250.85 0.00 0.00
26 Total (20+21+22) -0.13 -1352.33 666.17 -428.61 0.00 0.00
27 Gross Cap Form 13.49 488.53 3805.96 534.24 0.00 0.00

76
ANNEXURE - 7
Summary results of mfg. Sector by selected characteristics
and major industry group NIC-2 digit level
DISTRICT : Vizianagaram (Value Figures in lakhs, Mandays are in ‘000s and Others in
No.)
Sl.
No CHARACTERISTIC
INDUSTRY GROUP
10 11 13 15 16 17
1 Number of Factories 125 13 6 0 4 8
2 Fixed Capital 55822.69 477.77 2197.44 0 343.86 379.89
3 Physical Working Capital 36627.46 129.18 2858.70 0 43.60 654.12
4 Working Capital 4704.80 141.71 -2994.08 0 -298.88 -79.31
5 Invested Capital 92450.15 606.96 5056.12 0 387.47 1034.01
6 Outstanding loans 65524.48 160.43 2245.38 0 206.78 379.02
7 Man days- Workers 1176 9 701 0 2 6
8 Number of Workers 3942 33 2526 0 7 53
9 Man days-Employees 1353 16 742 0 5 7
10 Total Employees 4641 55 2735 0 17 60
11 Wages to Workers 5287.90 25.30 2488.81 0 6.48 14.58
12 Total Emoluments 7340.73 45.78 2682.96 0 26.40 15.42
13 Fuels Consumed 5825.48 88.38 690.09 0 38.38 12.42
14 Materials Consumed 116392.24 162.31 13696.32 0 262.08 102.00
15 Total Inputs 139675.74 287.75 14900.74 0 1032.32 124.85
16 Products 157024.28 441.66 18294.93 0 339.55 144.08
17 Value of Output 170851.36 473.02 18350.19 0 1101.94 181.52
18 GVA 31175.62 185.27 3449.45 0 69.62 56.67
19 Depreciation 5115.19 63.02 243.65 0 30.76 22.22
20 Net Value Added 26060.43 122.25 3205.80 0 38.86 34.45
21 Net Fixed Capital Formation -6182.98 -63.02 -196.40 0 -22.44 -22.22
22 Gross Fixed Capital Formation -1067.79 0.00 47.25 0 8.32 0.00
23 Materials, Fuels etc 8675.02 28.93 505.70 0 -286.70 -2224.83
24 Semi Fin. Goods 474.01 0.00 -14.97 0 0.00 0.00
25 Finished Goods -75.81 13.33 162.34 0 -19.07 0.00
26 Total (20+21+22) 9073.22 42.26 653.07 0 -305.77 -2224.83
27 Gross Cap Form 8005.43 42.26 700.32 0 -297.45 -2224.83

77
ANNEXURE - 7
Summary results of mfg. Sector by selected characteristics
and major industry group NIC-2 digit level
DISTRICT : Vizianagaram (Value Figures in lakhs, Mandays are in ‘000s and Others in No.)
Sl.
No CHARACTERISTIC
INDUSTRY GROUP
18 19 20 21 22 23
1 Number of Factories 2 4 10 4 7 37
2 Fixed Capital 15.55 780.83 2086.03 57736.97 156.05 3307.17
3 Physical Working Capital 7.77 327.92 88.62 68276.64 829.15 681.50
4 Working Capital 9.77 434.33 -2327.06 75728.85 940.28 -1269.54
5 Invested Capital 23.33 1108.75 2174.65 126013.61 985.20 3988.67
6 Outstanding loans 0.00 215.72 1094.54 8892.04 111.56 1378.21
7 Man days- Workers 4 18 34 726 16 103
8 Number of Workers 13 62 98 1991 55 388
9 Man days-Employees 4 22 42 866 22 128
10 Total Employees 17 74 127 2377 77 497
11 Wages to Workers 15.71 65.70 170.54 6015.21 61.63 280.31
12 Total Emoluments 15.71 231.05 217.21 9322.20 88.71 389.50
13 Fuels Consumed 4.25 56.57 3709.89 6001.88 31.92 431.40
14 Materials Consumed 31.64 3137.51 4792.38 40307.68 331.25 2885.77
15 Total Inputs 37.51 3828.65 9592.78 58554.31 522.29 3827.72
16 Products 71.54 4435.61 416.20 89869.90 154.47 1170.30
17 Value of Output 71.70 4443.95 10654.56 94196.55 506.63 1689.91
18 GVA 34.19 615.30 1061.78 35642.24 -15.66 -2137.81
19 Depreciation 3.02 48.47 193.43 3729.28 28.64 304.70
20 Net Value Added 31.17 566.83 868.35 31912.96 -44.30 -2442.51
21 Net Fixed Capital Formation 0.02 213.14 -51.08 -1068.61 -28.58 129.78
22 Gross Fixed Capital Formation 3.04 261.61 142.35 2660.67 0.06 434.48
23 Materials, Fuels etc 2.41 82.69 23.02 -8788.37 227.01 151.16
24 Semi Fin. Goods 0 0 0 4991.75 0 -210.46
25 Finished Goods 0.00 36.76 1.61 -488.98 -1.19 10.01
26 Total (20+21+22) 2.41 119.45 24.63 -4285.60 225.82 -49.29
27 Gross Cap Form 5.45 381.06 166.98 -1624.93 225.88 385.19

78
ANNEXURE - 7
Summary results of mfg. Sector by selected characteristics
and major industry group NIC-2 digit level
DISTRICT : Vizianagaram (Value Figures in lakhs, Mandays are in ‘000s and Others in No.)
Sl.
No CHARACTERISTIC
INDUSTRY GROUP
24 25 27 28 29 32 33
1 Number of Factories 33 4 2 2 1 1 1
2 Fixed Capital 159520.96 5.05 7574.04 36.54 6.21 41.25 18.04
3 Physical Working Capital 101018.35 0.00 11251.56 153.19 41.31 3.67 0.02
4 Working Capital -20376.47 -5.51 11379.59 46.28 102.04 27.67 0.05
5 Invested Capital 260539.31 5.05 18825.61 189.73 47.52 44.92 18.05
6 Outstanding loans 207556.70 0.48 568.02 0.00 0.00 32.29 0.00
7 Man days- Workers 1164 3 398 3 1 2 0
8 Number of Workers 3722 11 1092 11 2 5 4
9 Man days-Employees 1414 4 443 5 1 2 0
10 Total Employees 4489 14 1218 20 4 8 5
11 Wages to Workers 4923.13 5.42 2033.60 14.11 1.87 4.97 0.68
12 Total Emoluments 7940.10 6.02 2570.21 24.45 2.77 5.04 0.92
13 Fuels Consumed 31322.81 7.54 2250.30 5.13 1.13 14.06 0.13
14 Materials Consumed 180573.42 21.49 41258.29 153.89 44.45 56.99 0.02
15 Total Inputs 361470.84 69.39 44445.60 560.41 48.41 74.92 0.36
16 Products 194324.35 0.00 60167.27 220.11 51.79 98.19 0.00
17 Value of Output 384273.49 95.52 60252.01 629.90 55.74 98.19 1.84
18 GVA 22802.65 26.13 15806.41 69.49 7.33 23.27 1.48
19 Depreciation 9380.83 0.12 1079.70 3.41 0.70 6.80 1.06
20 Net Value Added 13421.82 26.01 14726.71 66.08 6.63 16.47 0.42
21 Net Fixed Capital Formation 5347.39 -0.12 -245.15 -3.21 -0.70 -4.77 -1.06
22 Gross Fixed Capital Formation 14728.22 0.00 834.55 0.20 0.00 2.03 0.00
23 Materials, Fuels etc -4305.84 -0.32 -18.61 111.89 2.74 -4.33 0.00
24 Semi Fin. Goods -1779.00 0.00 -293.24 0.00 12.76 0.00 0.00
25 Finished Goods -1049.07 0.00 -117.29 11.49 -11.65 -4.65 0.00
26 Total (20+21+22) -7133.91 -0.32 -429.14 123.38 3.85 -8.98 0.00
27 Gross Cap Form 7594.31 -0.32 405.41 123.58 3.85 -6.95 0.00

79
ANNEXURE - 7
Summary results of mfg. Sector by selected characteristics
and major industry group NIC-2 digit level
DISTRICT : Vizianagaram (Value Figures in lakhs, Mandays are in ‘000s and Others in No.)
Sl.
No CHARECTERSTIC
INDUSTRY GROUP Total
35 38 45 52 74
1 Number of Factories 2 0 6 5 1 276
2 Fixed Capital 27216.01 0.00 215.69 382.49 42.53 318363.06
3 Physical Working Capital 649.36 0.00 40.63 0.00 11.91 223694.66
4 Working Capital -5282.04 0.00 232.59 68.48 110.06 61293.61
5 Invested Capital 27865.17 0.00 256.32 382.49 54.44 542057.53
6 Outstanding loans 17849.58 0.00 48.07 205.83 90.55 306559.68
7 Man days- Workers 37 0 62 11 4 4481
8 Number of Workers 101 0 182 50 12 14356
9 Man days-Employees 51 0 70 17 6 5219
10 Total Employees 141 0 207 66 21 16869
11 Wages to Workers 204.18 0.00 297.11 28.62 12.85 21958.71
12 Total Emoluments 393.94 0.00 331.32 70.09 24.36 31744.89
13 Fuels Consumed 188.44 0.00 28.63 104.07 9.27 50822.17
14 Materials Consumed 11250.94 0.00 0.32 5.33 37.12 415503.44
15 Total Inputs 12150.20 0.00 8089.73 248.81 120.76 659664.09
16 Products 5647.72 0.00 0.00 0.00 0.00 532871.95
17 Value of Output 14133.78 0.00 11832.76 389.06 146.57 774430.19
18 GVA 1983.58 0.00 3743.03 140.25 25.81 114766.10
19 Depreciation 1029.05 0.00 34.22 28.57 7.69 21354.53
20 Net Value Added 954.53 0.00 3708.81 111.68 18.12 93411.57
21 Net Fixed Capital Formation -1023.62 0.00 -23.25 -28.12 -7.69 -3282.69
22 Gross Fixed Capital Formation 5.43 0.00 10.97 0.45 0.00 18071.84
23 Materials, Fuels etc -0.90 0.00 23.16 0.00 -22.79 -5818.96
24 Semi Fin. Goods 0.00 0.00 0.00 0.00 0.00 3180.85
25 Finished Goods 0.00 0.00 0.00 0.00 0.00 -1532.17
26 Total (20+21+22) -0.90 0.00 23.16 0.00 -22.79 -4170.28
27 Gross Cap Form 4.53 0.00 34.13 0.45 -22.79 13901.56
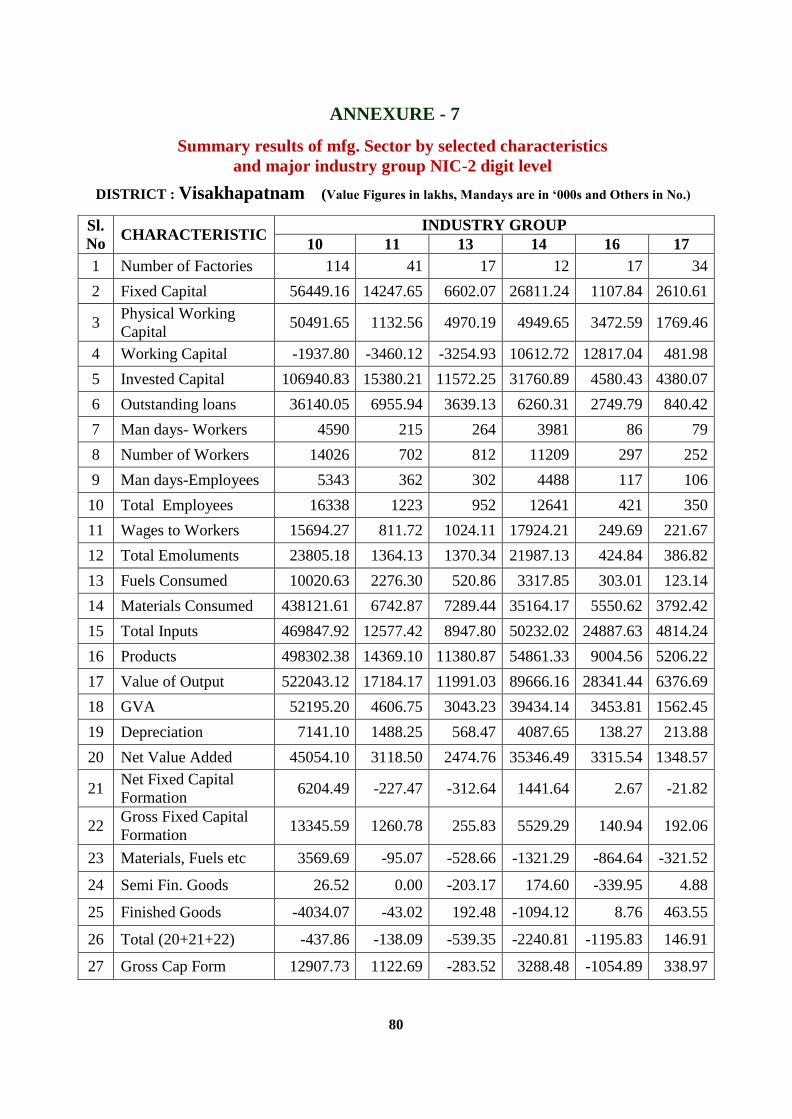
80
ANNEXURE - 7
Summary results of mfg. Sector by selected characteristics
and major industry group NIC-2 digit level
DISTRICT : Visakhapatnam (Value Figures in lakhs, Mandays are in ‘000s and Others in No.)
Sl.
No CHARACTERISTIC
INDUSTRY GROUP
10 11 13 14 16 17
1 Number of Factories 114 41 17 12 17 34
2 Fixed Capital 56449.16 14247.65 6602.07 26811.24 1107.84 2610.61
3 Physical Working
Capital 50491.65 1132.56 4970.19 4949.65 3472.59 1769.46
4 Working Capital -1937.80 -3460.12 -3254.93 10612.72 12817.04 481.98
5 Invested Capital 106940.83 15380.21 11572.25 31760.89 4580.43 4380.07
6 Outstanding loans 36140.05 6955.94 3639.13 6260.31 2749.79 840.42
7 Man days- Workers 4590 215 264 3981 86 79
8 Number of Workers 14026 702 812 11209 297 252
9 Man days-Employees 5343 362 302 4488 117 106
10 Total Employees 16338 1223 952 12641 421 350
11 Wages to Workers 15694.27 811.72 1024.11 17924.21 249.69 221.67
12 Total Emoluments 23805.18 1364.13 1370.34 21987.13 424.84 386.82
13 Fuels Consumed 10020.63 2276.30 520.86 3317.85 303.01 123.14
14 Materials Consumed 438121.61 6742.87 7289.44 35164.17 5550.62 3792.42
15 Total Inputs 469847.92 12577.42 8947.80 50232.02 24887.63 4814.24
16 Products 498302.38 14369.10 11380.87 54861.33 9004.56 5206.22
17 Value of Output 522043.12 17184.17 11991.03 89666.16 28341.44 6376.69
18 GVA 52195.20 4606.75 3043.23 39434.14 3453.81 1562.45
19 Depreciation 7141.10 1488.25 568.47 4087.65 138.27 213.88
20 Net Value Added 45054.10 3118.50 2474.76 35346.49 3315.54 1348.57
21 Net Fixed Capital
Formation 6204.49 -227.47 -312.64 1441.64 2.67 -21.82
22 Gross Fixed Capital
Formation 13345.59 1260.78 255.83 5529.29 140.94 192.06
23 Materials, Fuels etc 3569.69 -95.07 -528.66 -1321.29 -864.64 -321.52
24 Semi Fin. Goods 26.52 0.00 -203.17 174.60 -339.95 4.88
25 Finished Goods -4034.07 -43.02 192.48 -1094.12 8.76 463.55
26 Total (20+21+22) -437.86 -138.09 -539.35 -2240.81 -1195.83 146.91
27 Gross Cap Form 12907.73 1122.69 -283.52 3288.48 -1054.89 338.97
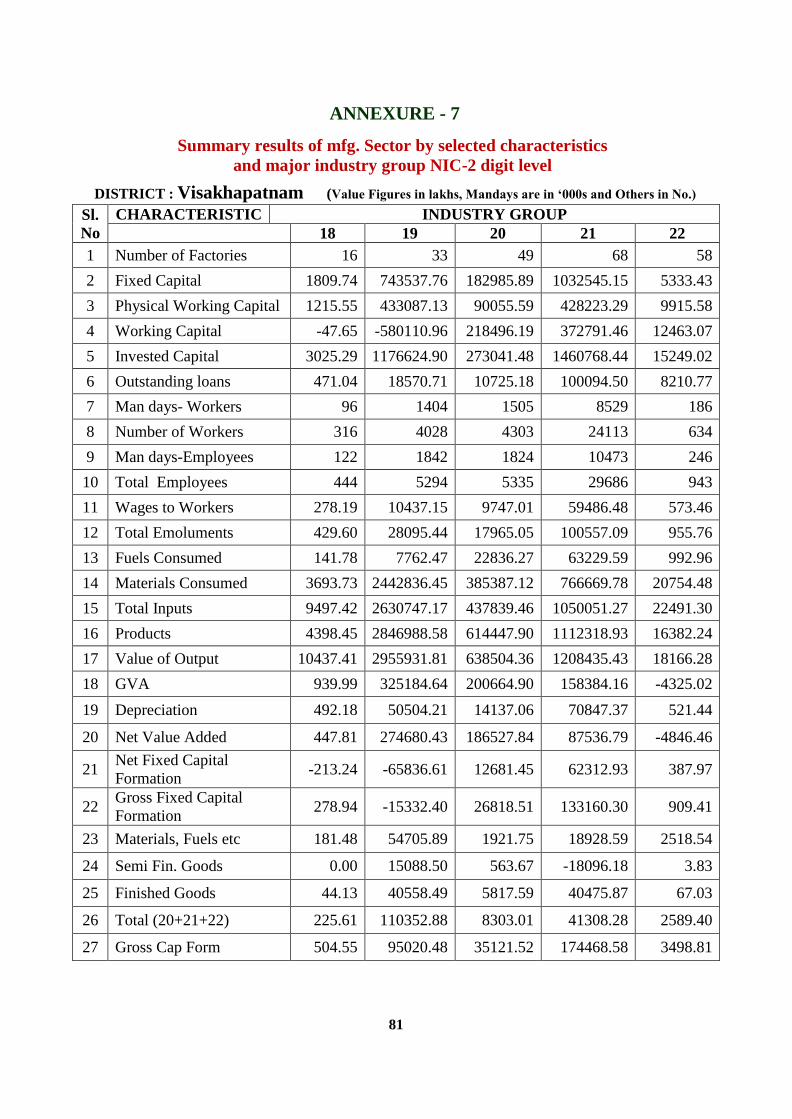
81
ANNEXURE - 7
Summary results of mfg. Sector by selected characteristics
and major industry group NIC-2 digit level
DISTRICT : Visakhapatnam (Value Figures in lakhs, Mandays are in ‘000s and Others in No.)
Sl.
No
CHARACTERISTIC INDUSTRY GROUP
18 19 20 21 22
1 Number of Factories 16 33 49 68 58
2 Fixed Capital 1809.74 743537.76 182985.89 1032545.15 5333.43
3 Physical Working Capital 1215.55 433087.13 90055.59 428223.29 9915.58
4 Working Capital -47.65 -580110.96 218496.19 372791.46 12463.07
5 Invested Capital 3025.29 1176624.90 273041.48 1460768.44 15249.02
6 Outstanding loans 471.04 18570.71 10725.18 100094.50 8210.77
7 Man days- Workers 96 1404 1505 8529 186
8 Number of Workers 316 4028 4303 24113 634
9 Man days-Employees 122 1842 1824 10473 246
10 Total Employees 444 5294 5335 29686 943
11 Wages to Workers 278.19 10437.15 9747.01 59486.48 573.46
12 Total Emoluments 429.60 28095.44 17965.05 100557.09 955.76
13 Fuels Consumed 141.78 7762.47 22836.27 63229.59 992.96
14 Materials Consumed 3693.73 2442836.45 385387.12 766669.78 20754.48
15 Total Inputs 9497.42 2630747.17 437839.46 1050051.27 22491.30
16 Products 4398.45 2846988.58 614447.90 1112318.93 16382.24
17 Value of Output 10437.41 2955931.81 638504.36 1208435.43 18166.28
18 GVA 939.99 325184.64 200664.90 158384.16 -4325.02
19 Depreciation 492.18 50504.21 14137.06 70847.37 521.44
20 Net Value Added 447.81 274680.43 186527.84 87536.79 -4846.46
21 Net Fixed Capital
Formation -213.24 -65836.61 12681.45 62312.93 387.97
22 Gross Fixed Capital
Formation 278.94 -15332.40 26818.51 133160.30 909.41
23 Materials, Fuels etc 181.48 54705.89 1921.75 18928.59 2518.54
24 Semi Fin. Goods 0.00 15088.50 563.67 -18096.18 3.83
25 Finished Goods 44.13 40558.49 5817.59 40475.87 67.03
26 Total (20+21+22) 225.61 110352.88 8303.01 41308.28 2589.40
27 Gross Cap Form 504.55 95020.48 35121.52 174468.58 3498.81

82
ANNEXURE - 7
Summary results of mfg. Sector by selected characteristics
and major industry group NIC-2 digit level
DISTRICT : Visakhapatnam (Value Figures in lakhs, Mandays are in ‘000s and Others in No.)
Sl.
No CHARACTERISTIC
INDUSTRY GROUP
23 24 25 26 27
1 Number of Factories 108 61 136 4 11
2 Fixed Capital 195677.80 2888976.62 29182.60 5538.97 5082.25
3 Physical Working Capital 39393.68 572932.76 27984.13 6975.64 4196.13
4 Working Capital 69396.30 -715569.55 16535.11 -158454.98 5580.12
5 Invested Capital 235071.48 3461909.38 57166.74 12514.61 9278.40
6 Outstanding loans 34350.82 939751.37 11874.23 5638.76 1149.64
7 Man days- Workers 1275 4551 1019 115 142
8 Number of Workers 4015 12867 3365 378 495
9 Man days-Employees 1632 6655 1298 142 198
10 Total Employees 5196 19061 4522 467 701
11 Wages to Workers 5999.58 99890.23 6479.12 558.53 606.48
12 Total Emoluments 9525.65 196061.86 14504.28 1064.50 1066.06
13 Fuels Consumed 12658.97 185613.39 1832.37 88.63 323.57
14 Materials Consumed 118337.91 1229719.11 23260.59 2303.29 8414.12
15 Total Inputs 160890.43 1689566.54 42014.50 3642.51 13199.33
16 Products 175836.40 1608905.80 34991.36 5562.22 16037.05
17 Value of Output 201973.96 1744182.64 57473.57 6094.52 21112.88
18 GVA 41083.53 54616.10 15459.07 2452.01 7913.55
19 Depreciation 11065.14 102589.20 3080.89 686.97 424.20
20 Net Value Added 30018.39 -47973.10 12378.18 1765.04 7489.35
21 Net Fixed Capital Formation 30480.58 158567.99 237.77 -439.18 372.14
22 Gross Fixed Capital Formation 41545.72 261157.19 3318.66 247.79 796.34
23 Materials, Fuels etc 5629.52 14736.02 5350.74 -9351.74 -246.85
24 Semi Fin. Goods 627.25 -341.99 -227.71 -333.31 168.50
25 Finished Goods 3594.62 49684.57 956.88 -15.20 417.60
26 Total (20+21+22) 9851.39 64078.60 6079.91 -9700.25 339.25
27 Gross Cap Form 51397.11 325235.79 9398.57 -9452.46 1135.59
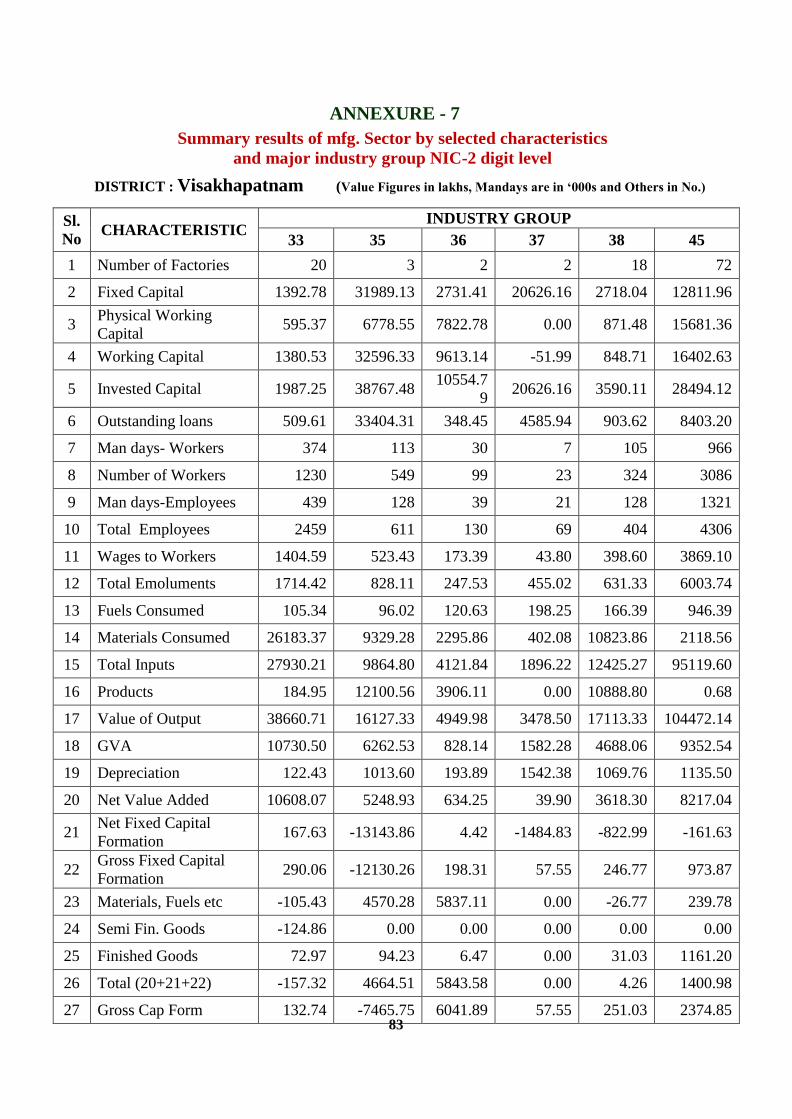
83
ANNEXURE - 7
Summary results of mfg. Sector by selected characteristics
and major industry group NIC-2 digit level
DISTRICT : Visakhapatnam (Value Figures in lakhs, Mandays are in ‘000s and Others in No.)
Sl.
No CHARACTERISTIC
INDUSTRY GROUP
33 35 36 37 38 45
1 Number of Factories 20 3 2 2 18 72
2 Fixed Capital 1392.78 31989.13 2731.41 20626.16 2718.04 12811.96
3 Physical Working
Capital 595.37 6778.55 7822.78 0.00 871.48 15681.36
4 Working Capital 1380.53 32596.33 9613.14 -51.99 848.71 16402.63
5 Invested Capital 1987.25 38767.48 10554.7
9 20626.16 3590.11 28494.12
6 Outstanding loans 509.61 33404.31 348.45 4585.94 903.62 8403.20
7 Man days- Workers 374 113 30 7 105 966
8 Number of Workers 1230 549 99 23 324 3086
9 Man days-Employees 439 128 39 21 128 1321
10 Total Employees 2459 611 130 69 404 4306
11 Wages to Workers 1404.59 523.43 173.39 43.80 398.60 3869.10
12 Total Emoluments 1714.42 828.11 247.53 455.02 631.33 6003.74
13 Fuels Consumed 105.34 96.02 120.63 198.25 166.39 946.39
14 Materials Consumed 26183.37 9329.28 2295.86 402.08 10823.86 2118.56
15 Total Inputs 27930.21 9864.80 4121.84 1896.22 12425.27 95119.60
16 Products 184.95 12100.56 3906.11 0.00 10888.80 0.68
17 Value of Output 38660.71 16127.33 4949.98 3478.50 17113.33 104472.14
18 GVA 10730.50 6262.53 828.14 1582.28 4688.06 9352.54
19 Depreciation 122.43 1013.60 193.89 1542.38 1069.76 1135.50
20 Net Value Added 10608.07 5248.93 634.25 39.90 3618.30 8217.04
21 Net Fixed Capital
Formation 167.63 -13143.86 4.42 -1484.83 -822.99 -161.63
22 Gross Fixed Capital
Formation 290.06 -12130.26 198.31 57.55 246.77 973.87
23 Materials, Fuels etc -105.43 4570.28 5837.11 0.00 -26.77 239.78
24 Semi Fin. Goods -124.86 0.00 0.00 0.00 0.00 0.00
25 Finished Goods 72.97 94.23 6.47 0.00 31.03 1161.20
26 Total (20+21+22) -157.32 4664.51 5843.58 0.00 4.26 1400.98
27 Gross Cap Form 132.74 -7465.75 6041.89 57.55 251.03 2374.85

84
ANNEXURE - 7
Summary results of mfg. Sector by selected characteristics
and major industry group NIC-2 digit level
DISTRICT : Visakhapatnam (Value Figures in lakhs, Mandays are in ‘000s and Others in No.)
Sl.
No CHARACTERISTIC
INDUSTRY GROUP
Total 52 58 74 95 96
1 Number of Factories 7 3 0 1 1 943
2 Fixed Capital 5013.38 4514.78 0.00 16.75 317.75 5318367.52
3 Physical Working Capital 0.00 1069.55 0.00 0.01 3.13 1758542.55
4 Working Capital 164.08 901.26 0.00 2.77 22.99 -653425.45
5 Invested Capital 5013.38 5584.64 0.00 17.20 319.07 7076909.98
6 Outstanding loans 1550.33 7007.07 0.00 0.00 230.01 1305601.37
7 Man days- Workers 34 39 0 5 28 31939
8 Number of Workers 113 107 0 16 94 94050
9 Man days-Employees 42 65 0 5 37 40099
10 Total Employees 155 179 0 19 121 120169
11 Wages to Workers 130.77 329.46 0.00 20.90 92.50 248737.36
12 Total Emoluments 169.25 624.54 0.00 21.74 126.74 449750.65
13 Fuels Consumed 128.13 165.06 0.00 1.75 35.14 319403.97
14 Materials Consumed 0.53 2986.32 0.00 14.78 36.71 5623554.24
15 Total Inputs 1259.10 3449.71 0.00 19.40 132.25 6906191.20
16 Products 0.00 2265.55 0.00 0.00 0.00 7105471.37
17 Value of Output 1950.76 2448.97 0.00 47.00 254.55 7867301.29
18 GVA 691.66 -1000.74 0.00 27.60 122.30 961110.09
19 Depreciation 457.22 686.00 0.00 1.00 59.16 278368.10
20 Net Value Added 234.44 -1686.74 0.00 26.60 63.14 682741.99
21 Net Fixed Capital Formation -423.24 -273.63 0.00 0.01 -19.87 192107.31
22 Gross Fixed Capital Formation 33.98 412.37 0.00 1.01 39.29 470475.41
23 Materials, Fuels etc 0.00 434.85 0.00 -0.54 -0.18 83260.26
24 Semi Fin. Goods 0.00 0.00 0.00 0.00 0.00 -14988.95
25 Finished Goods 0.00 1.64 0.00 0.00 0.00 139287.04
26 Total (20+21+22) 0.00 436.49 0.00 -0.54 -0.18 207558.35
27 Gross Cap Form 33.98 848.86 0.00 0.47 39.11 678033.76

85
ANNEXURE – 7
Summary results of mfg. Sector by selected characteristics
and major industry group NIC-2 digit level
DISTRICT : East Godavari (Value Figures in lakhs, Mandays are in ‘000s and Others in No.)
Sl.
No Characteristic
INDUSTRY GROUP
01 10 11 12 13 14
1 Number of Factories 1 536 62 2 55 2
2 Fixed Capital 1537.38 337888.01 32327.42 4074.71 7660.01 54.40
3 Physical Working
Capital 2358.66 395005.27 3942.26 476.93 2487.16 0.00
4 Working Capital 495.44 87385.40 8287.66 -6649.92 -2409.86 0.00
5 Invested Capital 3896.04 732893.26 36269.69 4551.64 10147.17 54.40
6 Outstanding loans 1401.32 303533.74 12443.10 0.00 8403.96 0.00
7 Man days- Workers 7 7427 461 279 195 0
8 Number of Workers 33 23776 1500 773 611 0
9 Man days-Employees 9 8635 599 308 226 0
10 Total Employees 43 27706 1959 854 719 0
11 Wages to Workers 23.58 29033.47 1832.13 1387.56 512.21 0.00
12 Total Emoluments 100.69 44208.58 3090.20 1552.90 665.17 0.00
13 Fuels Consumed 82.89 34683.56 2356.84 228.03 1009.69 0.00
14 Materials Consumed 6375.04 1630473.39 23923.91 796.65 5896.18 0.00
15 Total Inputs 6533.72 1972146.85 36459.70 2507.69 11478.28 0.00
16 Products 7094.24 1959971.55 44427.51 908.28 8263.73 0.00
17 Value of Output 7094.24 2317599.00 51621.26 1008.97 12744.63 0.00
18 GVA 560.52 345452.15 15161.56 -1498.72 1266.35 0.00
19 Depreciation 158.16 29162.49 3440.55 432.46 464.30 0.81
20 Net Value Added 402.36 316289.66 11721.01 -1931.18 802.05 -0.81
21 Net Fixed Capital
Formation 402.10 14169.21 1053.23 -288.73 -396.37 -0.81
22 Gross Fixed Capital
Formation 560.26 43331.70 4493.78 143.73 67.93 0.00
23 Materials, Fuels etc 1809.33 30343.97 -712.76 100.32 151.16 0.00
24 Semi Fin. Goods 0.00 2967.16 -57.81 -31.54 -30.58 0.00
25 Finished Goods 0.00 19107.37 865.12 1.00 -297.86 0.00
26 Total (20+21+22) 1809.33 52418.50 94.55 69.78 -177.28 0.00
27 Gross Cap Form 2369.59 95750.20 4588.33 213.51 -109.35 0.00
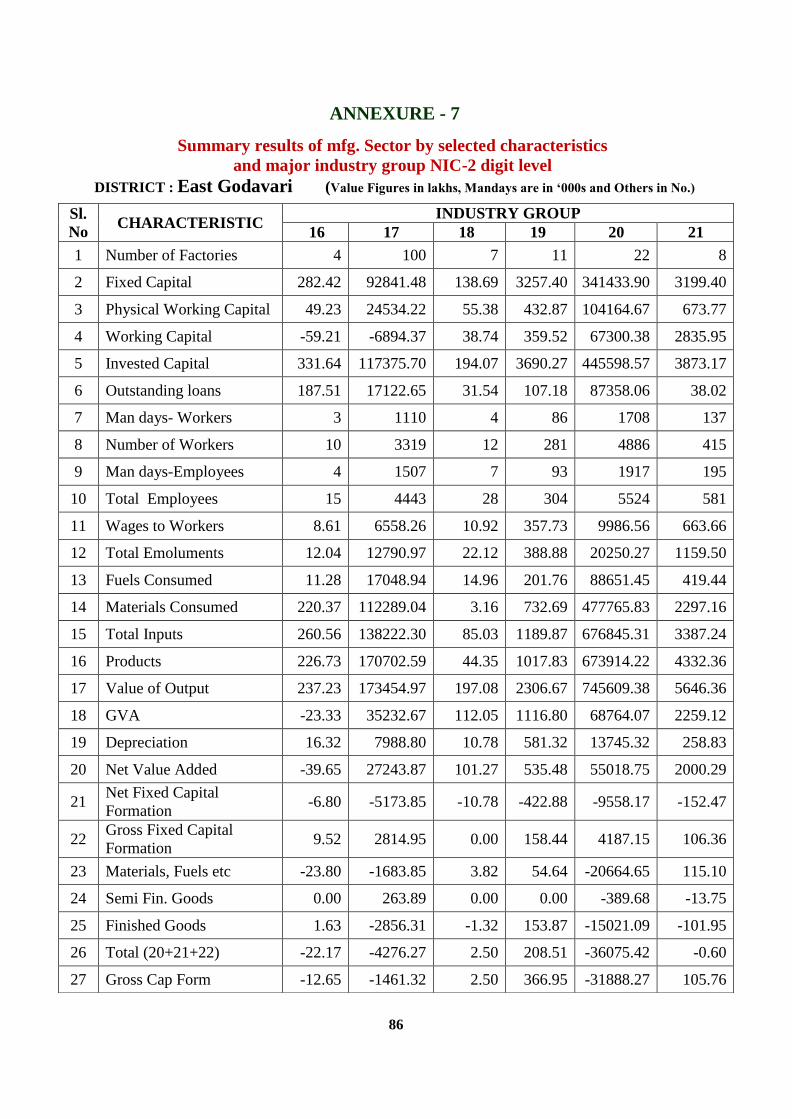
86
ANNEXURE - 7
Summary results of mfg. Sector by selected characteristics
and major industry group NIC-2 digit level
DISTRICT : East Godavari (Value Figures in lakhs, Mandays are in ‘000s and Others in No.)
Sl.
No CHARACTERISTIC
INDUSTRY GROUP
16 17 18 19 20 21
1 Number of Factories 4 100 7 11 22 8
2 Fixed Capital 282.42 92841.48 138.69 3257.40 341433.90 3199.40
3 Physical Working Capital 49.23 24534.22 55.38 432.87 104164.67 673.77
4 Working Capital -59.21 -6894.37 38.74 359.52 67300.38 2835.95
5 Invested Capital 331.64 117375.70 194.07 3690.27 445598.57 3873.17
6 Outstanding loans 187.51 17122.65 31.54 107.18 87358.06 38.02
7 Man days- Workers 3 1110 4 86 1708 137
8 Number of Workers 10 3319 12 281 4886 415
9 Man days-Employees 4 1507 7 93 1917 195
10 Total Employees 15 4443 28 304 5524 581
11 Wages to Workers 8.61 6558.26 10.92 357.73 9986.56 663.66
12 Total Emoluments 12.04 12790.97 22.12 388.88 20250.27 1159.50
13 Fuels Consumed 11.28 17048.94 14.96 201.76 88651.45 419.44
14 Materials Consumed 220.37 112289.04 3.16 732.69 477765.83 2297.16
15 Total Inputs 260.56 138222.30 85.03 1189.87 676845.31 3387.24
16 Products 226.73 170702.59 44.35 1017.83 673914.22 4332.36
17 Value of Output 237.23 173454.97 197.08 2306.67 745609.38 5646.36
18 GVA -23.33 35232.67 112.05 1116.80 68764.07 2259.12
19 Depreciation 16.32 7988.80 10.78 581.32 13745.32 258.83
20 Net Value Added -39.65 27243.87 101.27 535.48 55018.75 2000.29
21 Net Fixed Capital
Formation -6.80 -5173.85 -10.78 -422.88 -9558.17 -152.47
22 Gross Fixed Capital
Formation 9.52 2814.95 0.00 158.44 4187.15 106.36
23 Materials, Fuels etc -23.80 -1683.85 3.82 54.64 -20664.65 115.10
24 Semi Fin. Goods 0.00 263.89 0.00 0.00 -389.68 -13.75
25 Finished Goods 1.63 -2856.31 -1.32 153.87 -15021.09 -101.95
26 Total (20+21+22) -22.17 -4276.27 2.50 208.51 -36075.42 -0.60
27 Gross Cap Form -12.65 -1461.32 2.50 366.95 -31888.27 105.76

87
ANNEXURE - 7
Summary results of mfg. Sector by selected characteristics
and major industry group NIC-2 digit level
DISTRICT : East Godavari (Value Figures in lakhs, Mandays are in ‘000s and Others in No.)
Sl.
No CHARACTERISTIC
INDUSTRY GROUP
22 23 24 25 26 27
1 Number of Factories 70 133 21 32 1 3
2 Fixed Capital 6799.04 46764.70 1654.17 49806.84 476.49 114.55
3 Physical Working Capital 5169.74 30499.85 1648.68 61.51 300.72 594.46
4 Working Capital 3578.83 10155.74 896.78 10876.63 573.74 2189.22
5 Invested Capital 11968.78 77264.55 3302.85 49868.35 777.21 709.01
6 Outstanding loans 2923.00 13631.99 607.74 128.63 151.05 1121.64
7 Man days- Workers 257 1180 145 58 17 15
8 Number of Workers 882 3948 482 203 55 50
9 Man days-Employees 314 1432 169 67 23 18
10 Total Employees 1097 4752 569 237 77 63
11 Wages to Workers 1124.93 4731.52 557.63 186.00 77.21 45.61
12 Total Emoluments 1258.49 8540.34 763.09 232.97 199.94 79.79
13 Fuels Consumed 1442.06 15443.40 192.27 157.67 36.38 31.78
14 Materials Consumed 25802.40 143033.90 1719.29 106644.68 337.40 1434.55
15 Total Inputs 28207.73 189107.01 3918.13 107337.59 446.65 1576.39
16 Products 8086.00 48991.82 4206.32 1354.12 812.66 1516.35
17 Value of Output 11308.57 72675.52 5412.57 1509.79 812.66 1576.15
18 GVA -
16899.16
-
116431.49 1494.44 -105827.80 366.01 -0.24
19 Depreciation 615.75 6424.79 427.70 3295.70 58.09 5.87
20 Net Value Added -
17514.91
-
122856.28 1066.74 -109123.50 307.92 -6.11
21 Net Fixed Capital
Formation -200.75 -4648.58 212.60 14629.74 13.63 0.29
22 Gross Fixed Capital
Formation 415.00 1776.21 640.30 17925.44 71.72 6.16
23 Materials, Fuels etc 173.67 -1550.92 -6.38 -31.27 -9.60 199.37
24 Semi Fin. Goods -787.38 -129.39 634.16 0.00 24.09 29.03
25 Finished Goods -72.84 3371.82 -8.98 -4.88 9.65 136.68
26 Total (20+21+22) -686.55 1691.51 618.80 -36.15 24.14 365.08
27 Gross Cap Form -271.55 3467.72 1259.10 17889.29 95.86 371.24

88
ANNEXURE - 7
Summary results of mfg. Sector by selected characteristics
and major industry group NIC-2 digit level
DISTRICT : East Godavari (Value Figures in lakhs, Mandays are in ‘000s and Others in No.)
Sl.
No CHARACTERISTIC
INDUSTRY GROUP
28 29 30 31 32 33
1 Number of Factories 21 18 0 3 2 13
2 Fixed Capital 1148.96 5769.64 0.00 154.14 34.64 89303.13
3 Physical Working Capital 1605.17 5520.53 0.00 111.83 217.18 1231.28
4 Working Capital 1763.80 2442.00 0.00 141.93 225.61 -5692.69
5 Invested Capital 2754.12 11290.17 0.00 265.97 251.82 90534.41
6 Outstanding loans 836.78 2228.10 0.00 137.83 203.69 68142.75
7 Man days- Workers 72 270 0 8 12 190
8 Number of Workers 239 855 0 27 41 634
9 Man days-Employees 99 315 0 13 15 272
10 Total Employees 327 998 0 43 53 906
11 Wages to Workers 220.81 1140.49 0.00 22.99 22.68 1576.60
12 Total Emoluments 376.09 1441.21 0.00 50.00 36.02 2276.41
13 Fuels Consumed 214.79 801.75 0.00 6.12 16.52 541.58
14 Materials Consumed 17027.64 12851.69 0.00 487.51 859.09 8536.60
15 Total Inputs 18489.06 14925.07 0.00 641.89 942.94 20161.49
16 Products 3242.07 10083.29 0.00 676.69 1002.11 2414.14
17 Value of Output 4464.67 27135.94 0.00 770.16 1027.72 25584.80
18 GVA -14024.39 12210.87 0.00 128.27 84.78 5423.31
19 Depreciation 147.84 416.53 0.00 21.29 9.66 3132.79
20 Net Value Added -14172.23 11794.34 0.00 106.98 75.12 2290.52
21 Net Fixed Capital Formation -9.90 1720.72 0.00 -18.63 -7.03 -2187.67
22 Gross Fixed Capital Formation 137.94 2137.25 0.00 2.66 2.63 945.12
23 Materials, Fuels etc -39.82 -181.78 0.00 13.60 0.00 -1150.38
24 Semi Fin. Goods -63.29 -93.40 0.00 0.00 0.00 471.35
25 Finished Goods -159.31 948.62 0.00 -12.52 -78.00 0.00
26 Total (20+21+22) -262.42 673.44 0.00 1.08 -78.00 -679.03
27 Gross Cap Form -124.48 2810.69 0.00 3.74 -75.37 266.09
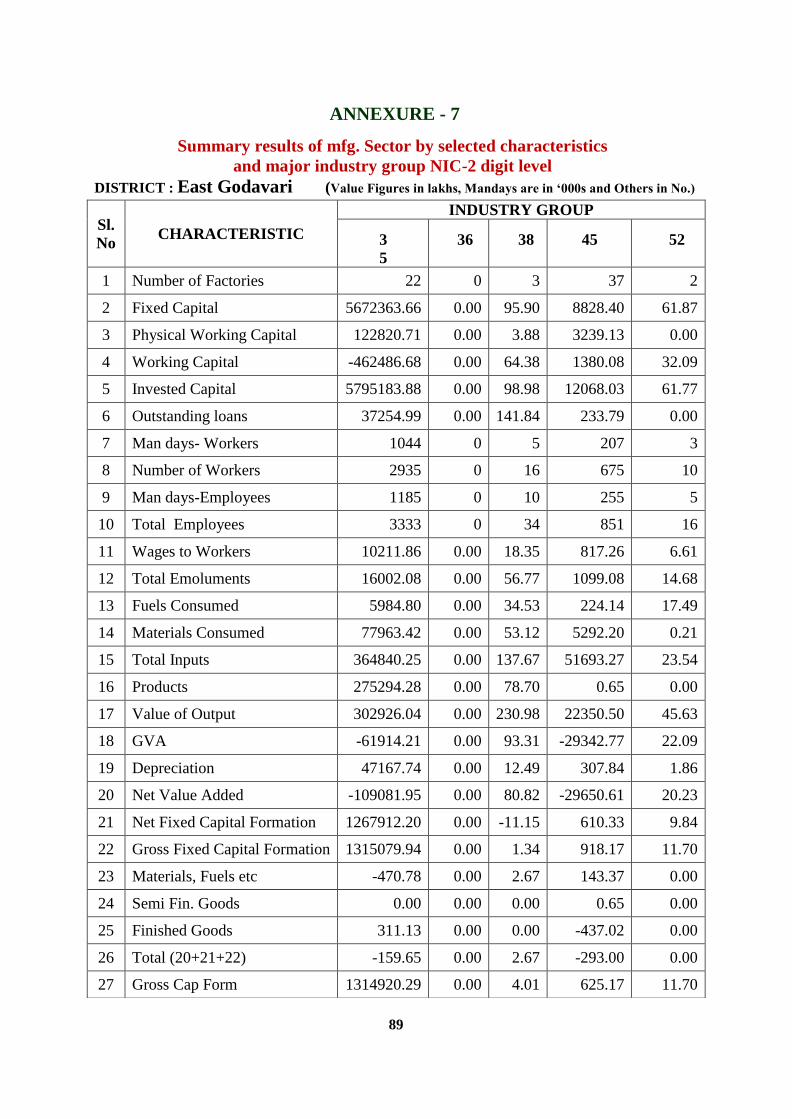
89
ANNEXURE - 7
Summary results of mfg. Sector by selected characteristics
and major industry group NIC-2 digit level
DISTRICT : East Godavari (Value Figures in lakhs, Mandays are in ‘000s and Others in No.)
Sl.
No CHARACTERISTIC
INDUSTRY GROUP
3
5
36 38 45 52
1 Number of Factories 22 0 3 37 2
2 Fixed Capital 5672363.66 0.00 95.90 8828.40 61.87
3 Physical Working Capital 122820.71 0.00 3.88 3239.13 0.00
4 Working Capital -462486.68 0.00 64.38 1380.08 32.09
5 Invested Capital 5795183.88 0.00 98.98 12068.03 61.77
6 Outstanding loans 37254.99 0.00 141.84 233.79 0.00
7 Man days- Workers 1044 0 5 207 3
8 Number of Workers 2935 0 16 675 10
9 Man days-Employees 1185 0 10 255 5
10 Total Employees 3333 0 34 851 16
11 Wages to Workers 10211.86 0.00 18.35 817.26 6.61
12 Total Emoluments 16002.08 0.00 56.77 1099.08 14.68
13 Fuels Consumed 5984.80 0.00 34.53 224.14 17.49
14 Materials Consumed 77963.42 0.00 53.12 5292.20 0.21
15 Total Inputs 364840.25 0.00 137.67 51693.27 23.54
16 Products 275294.28 0.00 78.70 0.65 0.00
17 Value of Output 302926.04 0.00 230.98 22350.50 45.63
18 GVA -61914.21 0.00 93.31 -29342.77 22.09
19 Depreciation 47167.74 0.00 12.49 307.84 1.86
20 Net Value Added -109081.95 0.00 80.82 -29650.61 20.23
21 Net Fixed Capital Formation 1267912.20 0.00 -11.15 610.33 9.84
22 Gross Fixed Capital Formation 1315079.94 0.00 1.34 918.17 11.70
23 Materials, Fuels etc -470.78 0.00 2.67 143.37 0.00
24 Semi Fin. Goods 0.00 0.00 0.00 0.65 0.00
25 Finished Goods 311.13 0.00 0.00 -437.02 0.00
26 Total (20+21+22) -159.65 0.00 2.67 -293.00 0.00
27 Gross Cap Form 1314920.29 0.00 4.01 625.17 11.70

90
ANNEXURE - 7
Summary results of mfg. Sector by selected characteristics
and major industry group NIC-2 digit level
DISTRICT : East Godavari (Value Figures in lakhs, Mandays are in ‘000s and Others in No.)
Sl.
No CHARACTERISTIC
INDUSTRY GROUP
58 82 96 Total
1 Number of Factories 1 2 2 1193
2 Fixed Capital 1712.94 443.50 6.85 6710234.64
3 Physical Working Capital 794.42 0.00 0.00 707999.51
4 Working Capital 4177.78 492.42 6.02 -278492.59
5 Invested Capital 2506.56 442.60 7.45 7418232.13
6 Outstanding loans 0.00 0.00 0.00 558370.90
7 Man days- Workers 23 10 3 14934
8 Number of Workers 63 60 10 46800
9 Man days-Employees 36 11 4 17743
10 Total Employees 101 66 15 55714
11 Wages to Workers 92.60 60.11 7.91 71295.86
12 Total Emoluments 438.20 105.73 12.29 117224.50
13 Fuels Consumed 125.06 7.38 2.02 169988.58
14 Materials Consumed 1901.04 38.95 1.88 2664758.99
15 Total Inputs 2273.22 1194.77 10.50 3655043.72
16 Products 1437.35 0.00 0.00 3230099.94
17 Value of Output 1491.15 1468.88 28.96 3798340.48
18 GVA -782.07 274.11 18.46 143296.76
19 Depreciation 313.14 71.02 1.28 118691.52
20 Net Value Added -1095.21 203.09 17.18 24605.24
21 Net Fixed Capital Formation 920.69 -81.82 -1.28 1278476.91
22 Gross Fixed Capital Formation 1233.83 -10.80 0.00 1397168.43
23 Materials, Fuels etc -46.84 0.00 0.00 6538.19
24 Semi Fin. Goods -4.46 0.00 0.00 2789.05
25 Finished Goods 0.17 0.00 0.00 5854.98
26 Total (20+21+22) -51.13 0.00 0.00 15182.22
27 Gross Cap Form 1182.70 -10.80 0.00 1412350.65

91
ANNEXURE - 7
Summary results of mfg. Sector by selected characteristics
and major industry group NIC-2 digit level
DISTRICT : West Godavari (Value Figures, Mandays are in ‘000s and others in No.)
Sl.
No CHARACTERISTIC
INDUSTRY GROUP
01 10 11 12 13 14
1 Number of Factories 13 448 49 7 50 1
2 Fixed Capital 2989.56 149979.01 7415.91 200.59 50666.03 0.00
3 Physical Working Capital 122.62 157847.97 1225.07 58.52 27974.39 0.00
4 Working Capital -98.12 102696.69 -63.50 77.13 6894.86 15.77
5 Invested Capital 3112.17 307827.08 8641.28 259.12 78640.41 0.00
6 Outstanding loans 2056.04 130797.10 8239.12 57.25 22909.44 0.00
7 Man days- Workers 50 5805 287 12 2058 0
8 Number of Workers 530 18432 857 46 6864 0
9 Man days-Employees 58 6810 318 13 2239 0
10 Total Employees 609 21836 986 55 7529 2
11 Wages to Workers 188.64 22003.59 1329.36 47.00 9538.99 0.00
12 Total Emoluments 243.34 32777.48 1730.35 48.95 12244.04 0.72
13 Fuels Consumed 425.27 27916.99 2178.49 43.93 13618.31 0.05
14 Materials Consumed 484.70 797036.72 4583.69 153.94 75962.40 0.00
15 Total Inputs 1441.46 897321.77 9046.47 213.09 96600.36 53.35
16 Products 565.74 940458.57 8851.93 291.43 117596.54 0.00
17 Value of Output 2223.05 1019672.86 11730.43 291.43 122097.66 72.76
18 GVA 781.59 122351.09 2683.96 78.34 25497.30 19.41
19 Depreciation 522.07 12999.11 965.35 0.49 3955.26 0.00
20 Net Value Added 259.52 109351.98 1718.61 77.85 21542.04 19.41
21 Net Fixed Capital
Formation -65.52 2965.96 -681.93 28.82 -2682.65 -22.37
22 Gross Fixed Capital
Formation 456.55 15965.07 283.42 29.31 1272.61 -22.37
23 Materials, Fuels etc 5.73 3748.92 -0.10 -3.29 -2031.49 -24.82
24 Semi Fin. Goods 0.00 976.56 21.85 0.00 29.06 0.00
25 Finished Goods 0.00 -8134.39 846.57 -2.04 1043.96 -17.07
26 Total (20+21+22) 5.73 -3408.91 868.32 -5.33 -958.47 -41.89
27 Gross Cap Form 462.28 12556.16 1151.74 23.98 314.14 -64.26

92
ANNEXURE - 7
Summary results of mfg. Sector by selected characteristics
and major industry group NIC-2 digit level
DISTRICT : West Godavari (Value Figures, Mandays are in ‘000s and others in No.)
Sl.
No CHARACTERISTIC
INDUSTRY GROUP
16 17 18 19 20 21
1 Number of Factories 16 100 5 0 35 10
2 Fixed Capital 366.45 27474.53 94.31 0.00 43233.21 12264.86
3 Physical Working Capital 208.35 24974.67 77.46 0.00 14836.97 2806.62
4 Working Capital 840.68 9340.25 103.06 0.00 2359.44 2503.83
5 Invested Capital 574.80 52449.19 171.77 0.00 58070.18 15071.48
6 Outstanding loans 301.48 9950.25 61.48 0.00 9680.07 35.00
7 Man days- Workers 25 691 9 0 319 313
8 Number of Workers 95 2089 33 0 950 874
9 Man days-Employees 27 882 10 0 451 365
10 Total Employees 122 2688 44 0 1343 1017
11 Wages to Workers 62.68 2783.56 24.96 0.00 2017.37 1639.86
12 Total Emoluments 69.70 4204.48 26.16 0.00 3613.15 2446.88
13 Fuels Consumed 33.86 11334.95 18.91 0.00 19405.65 2258.77
14 Materials Consumed 2167.99 49300.12 99.62 0.00 59336.98 21319.91
15 Total Inputs 2229.56 64076.70 120.35 0.00 86714.54 26516.62
16 Products 2454.98 75795.64 147.79 0.00 144601.89 22610.42
17 Value of Output 2468.79 76325.20 187.04 0.00 149084.96 22804.56
18 GVA 239.23 12248.50 66.69 0.00 62370.42 -3712.06
19 Depreciation 11.07 1926.28 16.61 0.00 2547.15 760.74
20 Net Value Added 228.16 10322.22 50.08 0.00 59823.27 -4472.80
21 Net Fixed Capital
Formation 24.73 -962.87 -18.25 0.00 -875.62 902.96
22 Gross Fixed Capital
Formation 35.80 963.41 -1.64 0.00 1671.53 1663.70
23 Materials, Fuels etc 105.96 399.71 -1.39 0.00 101.91 -629.49
24 Semi Fin. Goods 0.00 734.36 0.00 0.00 -194.06 -166.74
25 Finished Goods 0.94 -781.97 1.13 0.00 1084.64 -374.75
26 Total (20+21+22) 106.90 352.10 -0.26 0.00 992.49 -1170.98
27 Gross Cap Form 142.70 1315.51 -1.90 0.00 2664.02 492.72

93
ANNEXURE - 7
Summary results of mfg. Sector by selected characteristics
and major industry group NIC-2 digit level
DISTRICT : West Godavari (Value Figures, Mandays are in ‘000s and others in No.)
Sl.
No CHARACTERISTIC
INDUSTRY GROUP
22 23 24 25 27 28
1 Number of Factories 36 41 5 26 8 4
2 Fixed Capital 4833.13 33781.58 489.82 1309.21 32.97 107.99
3 Physical Working Capital 1404.59 11070.89 186.73 6829.86 123.98 82.37
4 Working Capital 67.02 -1389.18 259.18 4790.77 20.09 -24.82
5 Invested Capital 6237.73 44852.48 676.55 8139.07 156.95 190.36
6 Outstanding loans 790.90 26315.39 411.22 798.49 45.33 27.97
7 Man days- Workers 185 745 7 47 45 30
8 Number of Workers 589 2327 23 156 134 85
9 Man days-Employees 211 909 8 58 51 41
10 Total Employees 699 2858 30 209 158 123
11 Wages to Workers 571.86 3234.93 24.22 155.90 140.30 134.03
12 Total Emoluments 754.56 4003.01 28.87 221.01 191.38 205.20
13 Fuels Consumed 1088.40 7838.47 101.58 73.30 8.27 26.30
14 Materials Consumed 10944.82 23555.97 171.45 4852.17 1858.26 755.46
15 Total Inputs 12606.39 38265.06 362.91 5410.43 1909.63 876.98
16 Products 10709.15 26552.23 333.36 4258.84 883.74 838.99
17 Value of Output 10787.01 30128.34 369.59 5158.43 936.33 1137.76
18 GVA -1819.38 -8136.72 6.68 -252.00 -973.30 260.78
19 Depreciation 287.06 2331.30 26.64 145.62 5.25 19.62
20 Net Value Added -2106.44 -10468.02 -19.96 -397.62 -978.55 241.16
21 Net Fixed Capital
Formation 77.79 150.73 91.24 -82.68 -1.99 7.07
22 Gross Fixed Capital
Formation 364.85 2482.03 117.88 62.94 3.26 26.69
23 Materials, Fuels etc 124.99 1049.98 -25.20 104.98 -43.86 -2.07
24 Semi Fin. Goods 8.23 833.57 0.00 -35.93 0.00 0.00
25 Finished Goods -213.70 -182.46 9.32 47.67 30.29 12.33
26 Total (20+21+22) -80.48 1701.09 -15.88 116.72 -13.57 10.26
27 Gross Cap Form 284.37 4183.12 102.00 179.66 -10.31 36.95
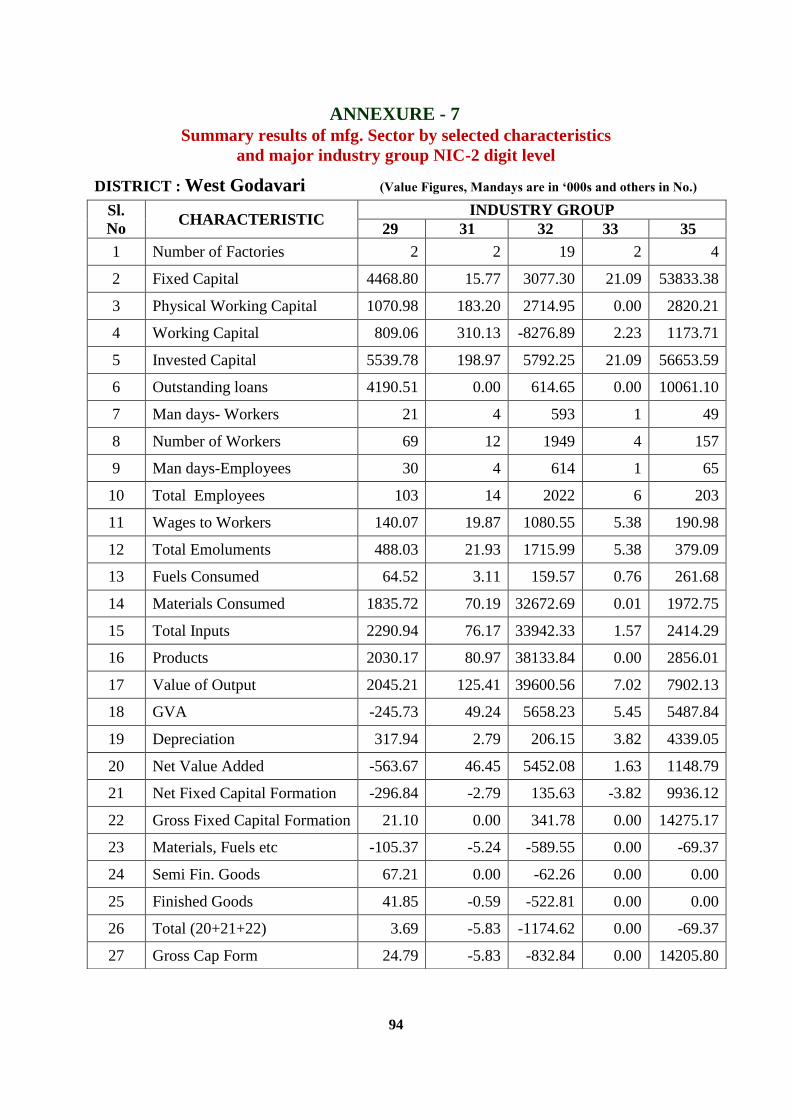
94
ANNEXURE - 7
Summary results of mfg. Sector by selected characteristics
and major industry group NIC-2 digit level
DISTRICT : West Godavari (Value Figures, Mandays are in ‘000s and others in No.)
Sl.
No CHARACTERISTIC
INDUSTRY GROUP
29 31 32 33 35
1 Number of Factories 2 2 19 2 4
2 Fixed Capital 4468.80 15.77 3077.30 21.09 53833.38
3 Physical Working Capital 1070.98 183.20 2714.95 0.00 2820.21
4 Working Capital 809.06 310.13 -8276.89 2.23 1173.71
5 Invested Capital 5539.78 198.97 5792.25 21.09 56653.59
6 Outstanding loans 4190.51 0.00 614.65 0.00 10061.10
7 Man days- Workers 21 4 593 1 49
8 Number of Workers 69 12 1949 4 157
9 Man days-Employees 30 4 614 1 65
10 Total Employees 103 14 2022 6 203
11 Wages to Workers 140.07 19.87 1080.55 5.38 190.98
12 Total Emoluments 488.03 21.93 1715.99 5.38 379.09
13 Fuels Consumed 64.52 3.11 159.57 0.76 261.68
14 Materials Consumed 1835.72 70.19 32672.69 0.01 1972.75
15 Total Inputs 2290.94 76.17 33942.33 1.57 2414.29
16 Products 2030.17 80.97 38133.84 0.00 2856.01
17 Value of Output 2045.21 125.41 39600.56 7.02 7902.13
18 GVA -245.73 49.24 5658.23 5.45 5487.84
19 Depreciation 317.94 2.79 206.15 3.82 4339.05
20 Net Value Added -563.67 46.45 5452.08 1.63 1148.79
21 Net Fixed Capital Formation -296.84 -2.79 135.63 -3.82 9936.12
22 Gross Fixed Capital Formation 21.10 0.00 341.78 0.00 14275.17
23 Materials, Fuels etc -105.37 -5.24 -589.55 0.00 -69.37
24 Semi Fin. Goods 67.21 0.00 -62.26 0.00 0.00
25 Finished Goods 41.85 -0.59 -522.81 0.00 0.00
26 Total (20+21+22) 3.69 -5.83 -1174.62 0.00 -69.37
27 Gross Cap Form 24.79 -5.83 -832.84 0.00 14205.80
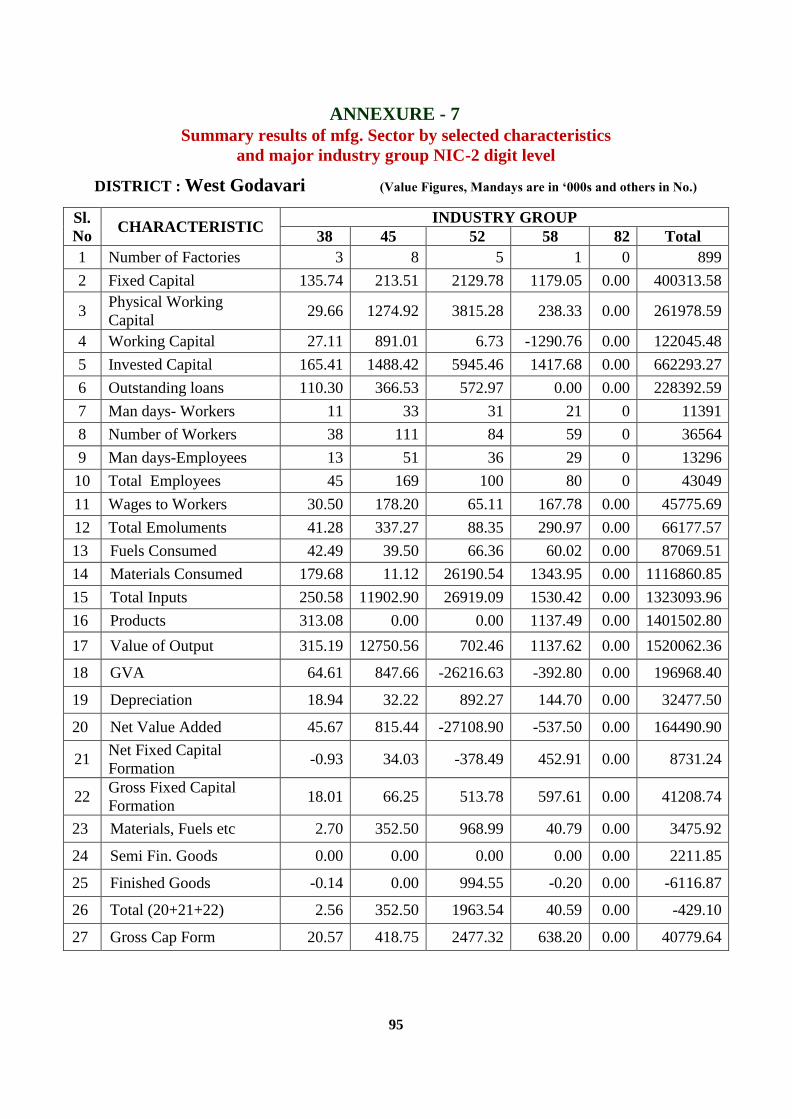
95
ANNEXURE - 7
Summary results of mfg. Sector by selected characteristics
and major industry group NIC-2 digit level
DISTRICT : West Godavari (Value Figures, Mandays are in ‘000s and others in No.)
Sl.
No CHARACTERISTIC
INDUSTRY GROUP
38 45 52 58 82 Total
1 Number of Factories 3 8 5 1 0 899
2 Fixed Capital 135.74 213.51 2129.78 1179.05 0.00 400313.58
3 Physical Working
Capital 29.66 1274.92 3815.28 238.33 0.00 261978.59
4 Working Capital 27.11 891.01 6.73 -1290.76 0.00 122045.48
5 Invested Capital 165.41 1488.42 5945.46 1417.68 0.00 662293.27
6 Outstanding loans 110.30 366.53 572.97 0.00 0.00 228392.59
7 Man days- Workers 11 33 31 21 0 11391
8 Number of Workers 38 111 84 59 0 36564
9 Man days-Employees 13 51 36 29 0 13296
10 Total Employees 45 169 100 80 0 43049
11 Wages to Workers 30.50 178.20 65.11 167.78 0.00 45775.69
12 Total Emoluments 41.28 337.27 88.35 290.97 0.00 66177.57
13 Fuels Consumed 42.49 39.50 66.36 60.02 0.00 87069.51
14 Materials Consumed 179.68 11.12 26190.54 1343.95 0.00 1116860.85
15 Total Inputs 250.58 11902.90 26919.09 1530.42 0.00 1323093.96
16 Products 313.08 0.00 0.00 1137.49 0.00 1401502.80
17 Value of Output 315.19 12750.56 702.46 1137.62 0.00 1520062.36
18 GVA 64.61 847.66 -26216.63 -392.80 0.00 196968.40
19 Depreciation 18.94 32.22 892.27 144.70 0.00 32477.50
20 Net Value Added 45.67 815.44 -27108.90 -537.50 0.00 164490.90
21 Net Fixed Capital
Formation -0.93 34.03 -378.49 452.91 0.00 8731.24
22 Gross Fixed Capital
Formation 18.01 66.25 513.78 597.61 0.00 41208.74
23 Materials, Fuels etc 2.70 352.50 968.99 40.79 0.00 3475.92
24 Semi Fin. Goods 0.00 0.00 0.00 0.00 0.00 2211.85
25 Finished Goods -0.14 0.00 994.55 -0.20 0.00 -6116.87
26 Total (20+21+22) 2.56 352.50 1963.54 40.59 0.00 -429.10
27 Gross Cap Form 20.57 418.75 2477.32 638.20 0.00 40779.64

96
ANNEXURE - 7
Summary results of mfg. Sector by selected characteristics
and major industry group NIC-2 digit level
DISTRICT : Krishna (Value Figures, Mandays are in ‘000s and others in No.)
Sl.
No CHARACTERISTIC
INDUSTRY GROUP
01 08 10 11 12
1 Number of Factories 3 1 298 31 3
2 Fixed Capital 385.38 3.14 106409.50 29625.79 62.32
3 Physical Working Capital 680.38 0.00 124684.96 3664.10 14.94
4 Working Capital 414.88 -26.40 55530.52 -3399.98 20.62
5 Invested Capital 1066.35 3.14 231094.45 33289.89 77.26
6 Outstanding loans 249.10 0.00 49928.12 6786.88 0.00
7 Man days- Workers 9 0 3128 295 6
8 Number of Workers 48 0 9553 886 22
9 Man days-Employees 12 0 4070 368 6
10 Total Employees 77 1 12718 1117 26
11 Wages to Workers 31.94 0.00 14441.56 1163.88 11.66
12 Total Emoluments 78.27 1.20 27616.81 2045.63 11.66
13 Fuels Consumed 23.47 0.23 20143.62 4545.09 0.52
14 Materials Consumed 2120.99 0.00 455490.16 29923.17 69.17
15 Total Inputs 2204.64 1.90 557914.99 38712.48 71.36
16 Products 2364.04 0.00 609633.76 42495.21 88.25
17 Value of Output 2412.87 0.00 680763.35 44790.35 88.25
18 GVA 208.23 -1.90 122848.36 6077.87 16.89
19 Depreciation 33.32 0.58 9881.07 1193.89 5.31
20 Net Value Added 174.91 -2.48 112967.29 4883.98 11.58
21 Net Fixed Capital
Formation -59.69 -0.58 7197.99 1581.80 -5.31
22 Gross Fixed Capital
Formation -26.37 0.00 17079.06 2775.69 0.00
23 Materials, Fuels etc 10.24 0.00 1488.76 609.42 0.08
24 Semi Fin. Goods 0.00 0.00 -226.71 143.97 0.00
25 Finished Goods 348.08 0.00 -3272.84 89.58 1.61
26 Total (20+21+22) 358.32 0.00 -2010.79 842.97 1.69
27 Gross Cap Form 331.95 0.00 15068.27 3618.66 1.69

97
ANNEXURE - 7 Summary results of mfg. Sector by selected characteristics
and major industry group NIC-2 digit level
DISTRICT : Krishna (Value Figures, Mandays are in ‘000s and others in No.)
Sl.
No CHARACTERISTIC
INDUSTRY GROUP
13 14 15 16 17 18
1 Number of Factories 30 5 9 10 30 46
2 Fixed Capital 100268.54 1210.32 865.94 472.61 3226.96 13964.21
3 Physical Working Capital 41807.38 2793.59 762.47 793.93 1373.89 5742.68
4 Working Capital 24923.95 1390.23 745.66 710.64 183.89 5480.92
5 Invested Capital 142075.92 4003.91 1627.81 1267.15 4600.85 19706.89
6 Outstanding loans 85786.54 3129.87 1272.80 699.66 1375.73 7077.94
7 Man days- Workers 1752 177 148 18 120 385
8 Number of Workers 4991 577 486 59 396 1214
9 Man days-Employees 2017 192 159 22 134 443
10 Total Employees 5755 630 530 85 458 1423
11 Wages to Workers 6444.06 519.46 548.76 66.47 674.85 1909.49
12 Total Emoluments 8738.60 645.00 627.19 86.03 832.85 2452.13
13 Fuels Consumed 15554.43 77.47 45.62 70.48 366.82 939.73
14 Materials Consumed 107111.90 2989.39 2974.83 2249.09 12385.06 20746.15
15 Total Inputs 136226.75 3914.19 3195.69 2379.64 14142.96 25407.36
16 Products 163211.97 5231.75 3919.10 2669.89 16087.20 24426.77
17 Value of Output 172341.37 5641.08 3977.46 2756.89 16628.73 32841.37
18 GVA 36114.62 1726.89 781.77 377.25 2485.77 7434.01
19 Depreciation 6149.05 114.25 72.78 77.24 279.52 751.57
20 Net Value Added 29965.57 1612.64 708.99 300.01 2206.25 6682.44
21 Net Fixed Capital Formation 4290.52 27.82 41.52 -48.08 1615.43 4227.91
22 Gross Fixed Capital Formation 10439.57 142.07 114.30 29.16 1894.95 4979.48
23 Materials, Fuels etc 10116.32 127.51 -60.75 -95.12 457.07 2351.73
24 Semi Fin. Goods 213.66 87.22 45.98 0.00 0.00 -1.07
25 Finished Goods 812.31 308.24 -3.29 30.55 0.14 14.06
26 Total (20+21+22) 11142.29 522.97 -18.06 -64.57 457.21 2364.72
27 Gross Cap Form 21581.86 665.04 96.24 -35.41 2352.16 7344.20

98
ANNEXURE - 7
Summary results of mfg. Sector by selected characteristics
and major industry group NIC-2 digit level
DISTRICT : Krishna (Value Figures, Mandays are in ‘000s and others in No.)
Sl.
No CHARACTERISTIC
INDUSTRY GROUP
19 20 21 22 23
1 Number of Factories 3 29 22 52 93
2 Fixed Capital 30.52 22715.18 10635.27 16855.50 143969.65
3 Physical Working Capital 0.45 6107.28 5828.02 7092.78 23396.22
4 Working Capital 67.91 4324.35 7488.82 12957.12 4497.41
5 Invested Capital 30.97 28822.46 16463.29 23948.27 167365.25
6 Outstanding loans 59.16 21912.88 1936.77 8418.82 22479.81
7 Man days- Workers 2 184 419 210 1164
8 Number of Workers 6 620 1329 729 3419
9 Man days-Employees 3 262 533 259 1438
10 Total Employees 14 915 1767 1038 4263
11 Wages to Workers 7.03 1093.63 1791.51 977.89 5625.02
12 Total Emoluments 12.90 1563.21 3079.71 2014.27 10639.08
13 Fuels Consumed 1.21 1148.89 2175.52 1523.12 36049.17
14 Materials Consumed 102.98 5976.48 19830.77 15414.09 63573.73
15 Total Inputs 107.11 8368.77 25127.69 19307.55 161817.68
16 Products 123.81 19912.21 22030.03 12081.75 111518.60
17 Value of Output 123.81 19931.02 22363.14 12549.62 177888.15
18 GVA 16.70 11562.25 -2764.55 -6757.93 16070.47
19 Depreciation 3.95 1490.24 877.82 1195.65 9246.40
20 Net Value Added 12.75 10072.01 -3642.37 -7953.58 6824.07
21 Net Fixed Capital
Formation -3.95 157.33 453.03 3083.06 5868.46
22 Gross Fixed Capital
Formation 0.00 1647.57 1330.85 4278.71 15114.86
23 Materials, Fuels etc -2.73 940.38 460.06 1987.15 2748.97
24 Semi Fin. Goods 0.00 -90.44 -156.22 -794.89 235.50
25 Finished Goods 0.00 131.17 -457.86 181.27 381.22
26 Total (20+21+22) -2.73 981.11 -154.02 1373.53 3365.69
27 Gross Cap Form -2.73 2628.68 1176.83 5652.24 18480.55

99
ANNEXURE - 7
Summary results of mfg. Sector by selected characteristics
and major industry group NIC-2 digit level
DISTRICT : Krishna (Value Figures, Mandays are in ‘000s and others in No.)
Sl.
No CHARACTERISTIC
INDUSTRY GROUP
24 25 26 27 28 29
1 Number of Factories 39 89 3 24 34 13
2 Fixed Capital 9344.07 7328.50 1165.53 6812.72 4251.60 6517.85
3 Physical Working Capital 13351.20 15074.74 1124.87 2463.16 4672.58 4027.03
4 Working Capital 17850.19 14537.12 2352.94 -129.41 8902.71 1623.33
5 Invested Capital 22695.27 22403.24 2290.40 9275.58 8923.87 10544.89
6 Outstanding loans 10314.15 9738.78 195.79 5719.61 3679.68 7581.77
7 Man days- Workers 464 187 193 177 569 160
8 Number of Workers 1477 655 638 575 1706 443
9 Man days-Employees 592 245 223 231 708 175
10 Total Employees 1918 930 737 756 2139 490
11 Wages to Workers 1871.57 689.29 948.63 814.46 3565.07 765.55
12 Total Emoluments 2998.35 1120.35 1693.84 1529.61 5522.23 884.38
13 Fuels Consumed 2875.90 564.71 120.64 619.70 1902.82 1006.31
14 Materials Consumed 57015.45 22028.88 3320.53 8652.56 18748.91 3391.09
15 Total Inputs 66980.60 52943.45 6160.38 11568.11 23487.38 5565.44
16 Products 31024.79 18760.09 5923.70 10109.27 26602.40 6069.21
17 Value of Output 36335.37 50868.08 9912.72 11764.65 28139.20 6256.91
18 GVA -30645.23 -2075.37 3752.34 196.54 4651.82 691.47
19 Depreciation 1205.42 548.95 118.17 757.91 508.09 556.01
20 Net Value Added -31850.65 -2624.32 3634.17 -561.37 4143.73 135.46
21 Net Fixed Capital
Formation -508.49 -351.15 237.96 -483.94 -123.66 -169.39
22 Gross Fixed Capital
Formation 696.93 197.80 356.13 273.97 384.43 386.62
23 Materials, Fuels etc -405.97 1811.37 98.91 69.49 -768.53 -129.54
24 Semi Fin. Goods 1103.88 -15.75 -68.47 -1129.07 -264.64 58.40
25 Finished Goods 204.62 -403.62 -55.20 101.38 -33.65 -285.03
26 Total (20+21+22) 902.53 1392.00 -24.76 -958.20 -1066.82 -356.17
27 Gross Cap Form 1599.46 1589.80 331.37 -684.23 -682.39 30.45
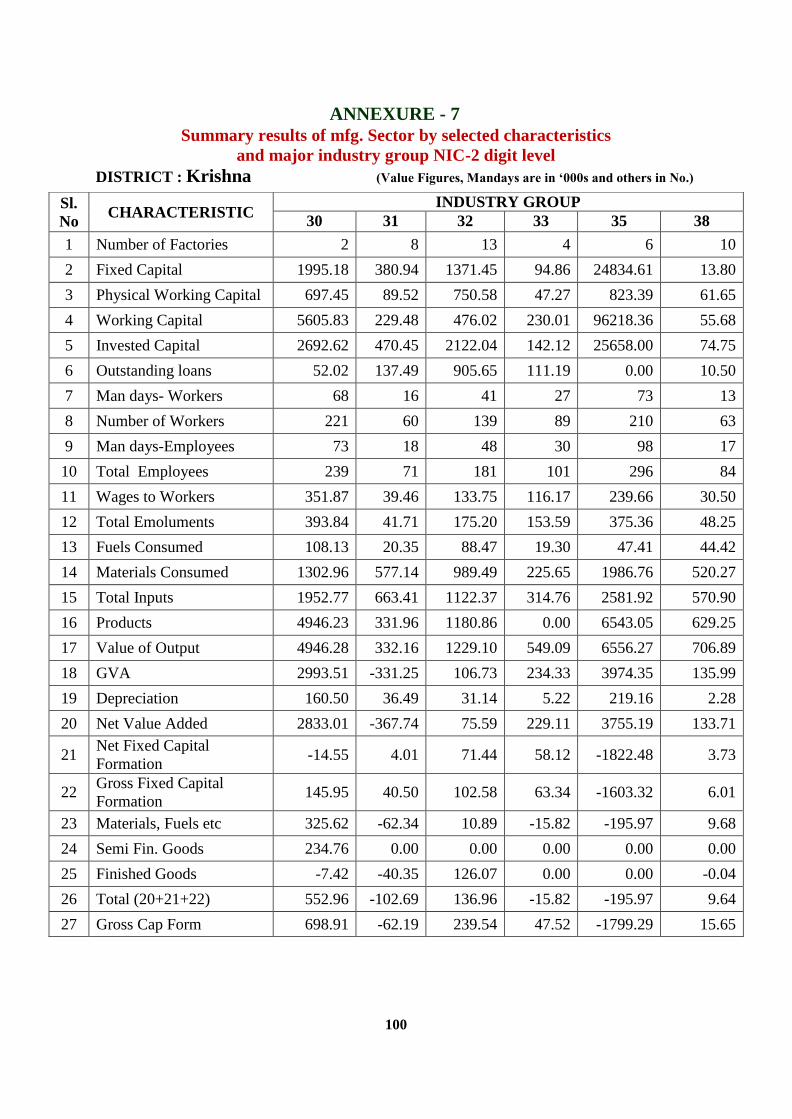
100
ANNEXURE - 7
Summary results of mfg. Sector by selected characteristics
and major industry group NIC-2 digit level
DISTRICT : Krishna (Value Figures, Mandays are in ‘000s and others in No.)
Sl.
No CHARACTERISTIC
INDUSTRY GROUP
30 31 32 33 35 38
1 Number of Factories 2 8 13 4 6 10
2 Fixed Capital 1995.18 380.94 1371.45 94.86 24834.61 13.80
3 Physical Working Capital 697.45 89.52 750.58 47.27 823.39 61.65
4 Working Capital 5605.83 229.48 476.02 230.01 96218.36 55.68
5 Invested Capital 2692.62 470.45 2122.04 142.12 25658.00 74.75
6 Outstanding loans 52.02 137.49 905.65 111.19 0.00 10.50
7 Man days- Workers 68 16 41 27 73 13
8 Number of Workers 221 60 139 89 210 63
9 Man days-Employees 73 18 48 30 98 17
10 Total Employees 239 71 181 101 296 84
11 Wages to Workers 351.87 39.46 133.75 116.17 239.66 30.50
12 Total Emoluments 393.84 41.71 175.20 153.59 375.36 48.25
13 Fuels Consumed 108.13 20.35 88.47 19.30 47.41 44.42
14 Materials Consumed 1302.96 577.14 989.49 225.65 1986.76 520.27
15 Total Inputs 1952.77 663.41 1122.37 314.76 2581.92 570.90
16 Products 4946.23 331.96 1180.86 0.00 6543.05 629.25
17 Value of Output 4946.28 332.16 1229.10 549.09 6556.27 706.89
18 GVA 2993.51 -331.25 106.73 234.33 3974.35 135.99
19 Depreciation 160.50 36.49 31.14 5.22 219.16 2.28
20 Net Value Added 2833.01 -367.74 75.59 229.11 3755.19 133.71
21 Net Fixed Capital
Formation -14.55 4.01 71.44 58.12 -1822.48 3.73
22 Gross Fixed Capital
Formation 145.95 40.50 102.58 63.34 -1603.32 6.01
23 Materials, Fuels etc 325.62 -62.34 10.89 -15.82 -195.97 9.68
24 Semi Fin. Goods 234.76 0.00 0.00 0.00 0.00 0.00
25 Finished Goods -7.42 -40.35 126.07 0.00 0.00 -0.04
26 Total (20+21+22) 552.96 -102.69 136.96 -15.82 -195.97 9.64
27 Gross Cap Form 698.91 -62.19 239.54 47.52 -1799.29 15.65

101
ANNEXURE - 7
Summary results of mfg. Sector by selected characteristics
and major industry group NIC-2 digit level
DISTRICT : Krishna (Value Figures, Mandays are in ‘000s and others in No.)
Sl.
No CHARACTERISTIC
INDUSTRY GROUP
45 52 58 96 Total
1 Number of Factories 42 15 11 1 978
2 Fixed Capital 12516.56 1415.51 11373.20 8.31 540125.52
3 Physical Working Capital 21214.47 0.00 3399.51 0.00 292540.49
4 Working Capital 15406.93 12.10 -26156.59 14.10 252539.34
5 Invested Capital 33730.53 1415.51 14772.71 9.01 832664.85
6 Outstanding loans 8938.08 277.03 10289.94 0.00 269065.76
7 Man days- Workers 588 15 135 1 10745
8 Number of Workers 1963 42 372 2 32991
9 Man days-Employees 732 23 240 1 13372
10 Total Employees 2478 72 662 3 41974
11 Wages to Workers 2840.63 47.73 1097.22 2.19 48860.96
12 Total Emoluments 3882.28 92.13 2805.05 3.81 82164.52
13 Fuels Consumed 1965.03 174.09 377.92 0.76 92601.35
14 Materials Consumed 9633.73 0.64 4755.69 2.05 874109.76
15 Total Inputs 39372.93 312.19 10364.02 3.34 1222864.73
16 Products 9278.98 0.00 7698.70 0.00 1164892.83
17 Value of Output 51201.56 887.65 9801.98 9.27 1414594.64
18 GVA 11828.63 575.46 -562.04 5.93 191729.91
19 Depreciation 1365.10 173.29 922.56 1.58 37984.51
20 Net Value Added 10463.53 402.17 -1484.60 4.35 153745.40
21 Net Fixed Capital
Formation -875.81 -173.29 4133.45 -1.58 28411.63
22 Gross Fixed Capital
Formation 489.29 0.00 5056.01 0.00 66396.14
23 Materials, Fuels etc 1823.21 0.00 1570.32 0.00 25280.41
24 Semi Fin. Goods 0.00 0.00 0.67 0.00 -623.22
25 Finished Goods -396.52 0.00 0.00 0.00 -2225.52
26 Total (20+21+22) 1426.69 0.00 1570.99 0.00 22431.67
27 Gross Cap Form 1915.98 0.00 6627.00 0.00 88827.81

102
ANNEXURE - 7
Summary results of mfg. Sector by selected characteristics
and major industry group NIC - 2 digit level
DISTRICT : Guntur (Value Figures, Mandays are in ‘000s and Others in No.)
Sl.
No CHARACTERISTIC
INDUSTRY GROUP
01 10 11 12 13
1 Number of Factories 384 867 15 70 85
2 Fixed Capital 28831.12 79330.45 39622.16 28201.94 290218.08
3 Physical Working Capital 65741.54 109641.75 16431.89 55494.13 156083.03
4 Working Capital 36714.35 59856.44 -9860.97 -1020.32 32063.67
5 Invested Capital 94572.66 188972.18 56054.45 83696.87 446301.11
6 Outstanding loans 23024.77 24450.83 3878.48 7275.61 236945.99
7 Man days- Workers 1186 4888 426 1046 7211
8 Number of Workers 5952 16795 1170 3606 20107
9 Man days-Employees 1535 5763 692 1305 8042
10 Total Employees 7903 20587 1919 4504 22415
11 Wages to Workers 4949.09 15422.79 2194.34 2943.10 23379.44
12 Total Emoluments 7133.04 24500.18 4267.17 5014.99 31816.36
13 Fuels Consumed 3559.44 13797.54 2552.68 2703.88 61553.96
14 Materials Consumed 89653.18 479276.43 39646.70 136533.39 469725.27
15 Total Inputs 227834.92 621865.66 85047.35 170921.54 647503.05
16 Products 123258.34 687779.59 75839.48 169334.93 608498.04
17 Value of Output 294409.49 844066.28 103863.23 201152.91 723124.80
18 GVA 66574.57 222200.62 18815.88 30231.37 75621.75
19 Depreciation 3705.07 6107.66 3220.49 2472.33 18220.46
20 Net Value Added 62869.50 216092.96 15595.39 27759.04 57401.29
21 Net Fixed Capital
Formation 232.91 -142.38 13568.28 206.38 -9986.17
22 Gross Fixed Capital
Formation 3937.98 5965.28 16788.77 2678.71 8234.29
23 Materials, Fuels etc 2051.60 9746.76 4007.23 2407.44 27546.69
24 Semi Fin. Goods 20.19 509.06 10.29 4.34 -342.48
25 Finished Goods -1040.12 8664.61 534.66 4916.98 4939.27
26 Total (20+21+22) 1031.67 18920.43 4552.18 7328.76 32143.48
27 Gross Cap Form 4969.65 24885.71 21340.95 10007.47 40377.77
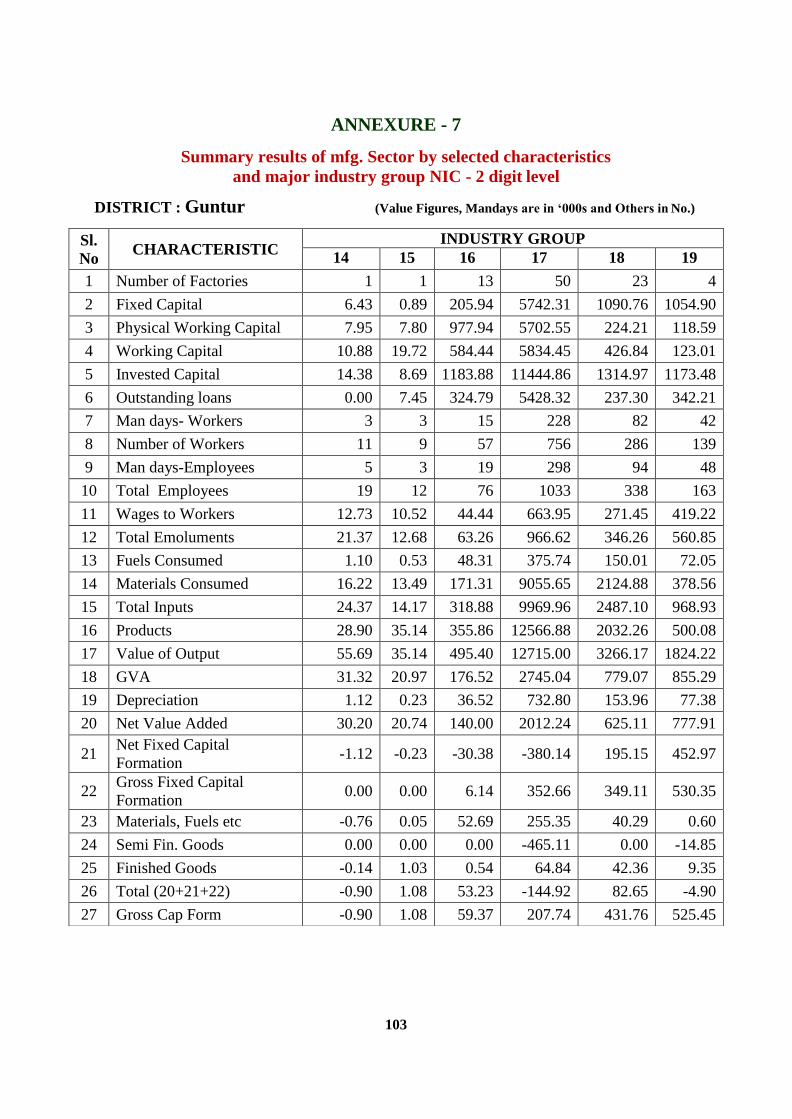
103
ANNEXURE - 7
Summary results of mfg. Sector by selected characteristics
and major industry group NIC - 2 digit level
DISTRICT : Guntur (Value Figures, Mandays are in ‘000s and Others in No.)
Sl.
No CHARACTERISTIC
INDUSTRY GROUP
14 15 16 17 18 19
1 Number of Factories 1 1 13 50 23 4
2 Fixed Capital 6.43 0.89 205.94 5742.31 1090.76 1054.90
3 Physical Working Capital 7.95 7.80 977.94 5702.55 224.21 118.59
4 Working Capital 10.88 19.72 584.44 5834.45 426.84 123.01
5 Invested Capital 14.38 8.69 1183.88 11444.86 1314.97 1173.48
6 Outstanding loans 0.00 7.45 324.79 5428.32 237.30 342.21
7 Man days- Workers 3 3 15 228 82 42
8 Number of Workers 11 9 57 756 286 139
9 Man days-Employees 5 3 19 298 94 48
10 Total Employees 19 12 76 1033 338 163
11 Wages to Workers 12.73 10.52 44.44 663.95 271.45 419.22
12 Total Emoluments 21.37 12.68 63.26 966.62 346.26 560.85
13 Fuels Consumed 1.10 0.53 48.31 375.74 150.01 72.05
14 Materials Consumed 16.22 13.49 171.31 9055.65 2124.88 378.56
15 Total Inputs 24.37 14.17 318.88 9969.96 2487.10 968.93
16 Products 28.90 35.14 355.86 12566.88 2032.26 500.08
17 Value of Output 55.69 35.14 495.40 12715.00 3266.17 1824.22
18 GVA 31.32 20.97 176.52 2745.04 779.07 855.29
19 Depreciation 1.12 0.23 36.52 732.80 153.96 77.38
20 Net Value Added 30.20 20.74 140.00 2012.24 625.11 777.91
21 Net Fixed Capital
Formation -1.12 -0.23 -30.38 -380.14 195.15 452.97
22 Gross Fixed Capital
Formation 0.00 0.00 6.14 352.66 349.11 530.35
23 Materials, Fuels etc -0.76 0.05 52.69 255.35 40.29 0.60
24 Semi Fin. Goods 0.00 0.00 0.00 -465.11 0.00 -14.85
25 Finished Goods -0.14 1.03 0.54 64.84 42.36 9.35
26 Total (20+21+22) -0.90 1.08 53.23 -144.92 82.65 -4.90
27 Gross Cap Form -0.90 1.08 59.37 207.74 431.76 525.45

104
ANNEXURE - 7
Summary results of mfg. Sector by selected characteristics
and major industry group NIC - 2 digit level
DISTRICT : Guntur (Value Figures, Mandays are in ‘000s and Others in No.)
Sl.
No CHARACTERISTIC
INDUSTRY GROUP
20 21 22 23 24 25
1 Number of Factories 39 15 90 509 16 35
2 Fixed Capital 10702.49 7507.42 3375.35 177818.23 524.94 356.03
3 Physical Working Capital 7173.98 1035.18 2530.29 30100.61 835.05 1026.22
4 Working Capital 12800.78 -1199.77 1765.56 35440.36 536.06 1010.53
5 Invested Capital 17876.47 8542.60 5905.64 207918.84 1359.98 1382.25
6 Outstanding loans 961.60 5451.40 1774.01 113011.48 384.81 266.61
7 Man days- Workers 499 79 113 2085 14 46
8 Number of Workers 1493 265 449 6865 60 164
9 Man days-Employees 599 125 145 2742 20 57
10 Total Employees 1836 498 697 9190 93 218
11 Wages to Workers 1809.32 236.45 238.75 8268.74 42.51 146.91
12 Total Emoluments 2725.34 437.94 362.62 14614.47 85.24 197.53
13 Fuels Consumed 3383.75 179.16 428.16 50449.24 163.46 104.13
14 Materials Consumed 42549.47 2208.95 8028.93 82333.64 6849.30 1407.49
15 Total Inputs 47701.23 8972.17 9689.36 150304.81 7162.34 4108.50
16 Products 54355.01 9535.29 9882.33 177828.71 7739.37 1952.91
17 Value of Output 56185.57 9834.68 11131.62 214217.30 7814.29 4633.55
18 GVA 8484.34 862.51 1442.26 63912.49 651.95 525.05
19 Depreciation 1244.65 172.44 369.42 11714.86 49.05 53.53
20 Net Value Added 7239.69 690.07 1072.84 52197.63 602.90 471.52
21 Net Fixed Capital Formation 257.17 6369.99 588.12 922.05 -4.13 -45.95
22 Gross Fixed Capital
Formation 1501.82 6542.43 957.54 12636.91 44.92 7.58
23 Materials, Fuels etc 424.98 521.15 34.39 743.12 145.42 99.88
24 Semi Fin. Goods 395.68 -120.99 109.20 2891.66 98.26 -0.23
25 Finished Goods -33.11 -140.80 -104.87 2509.26 171.67 86.57
26 Total (20+21+22) 787.55 259.36 38.72 6144.04 415.35 186.22
27 Gross Cap Form 2289.37 6801.79 996.26 18780.95 460.27 193.80
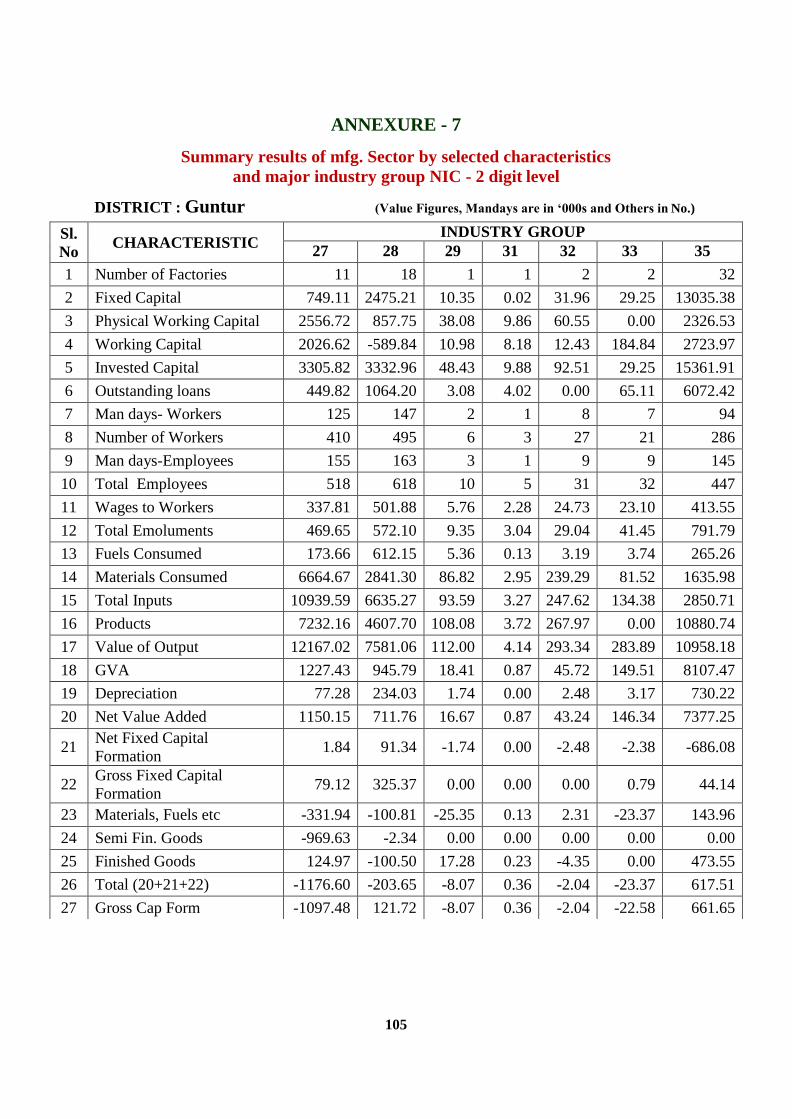
105
ANNEXURE - 7
Summary results of mfg. Sector by selected characteristics
and major industry group NIC - 2 digit level
DISTRICT : Guntur (Value Figures, Mandays are in ‘000s and Others in No.)
Sl.
No CHARACTERISTIC
INDUSTRY GROUP
27 28 29 31 32 33 35
1 Number of Factories 11 18 1 1 2 2 32
2 Fixed Capital 749.11 2475.21 10.35 0.02 31.96 29.25 13035.38
3 Physical Working Capital 2556.72 857.75 38.08 9.86 60.55 0.00 2326.53
4 Working Capital 2026.62 -589.84 10.98 8.18 12.43 184.84 2723.97
5 Invested Capital 3305.82 3332.96 48.43 9.88 92.51 29.25 15361.91
6 Outstanding loans 449.82 1064.20 3.08 4.02 0.00 65.11 6072.42
7 Man days- Workers 125 147 2 1 8 7 94
8 Number of Workers 410 495 6 3 27 21 286
9 Man days-Employees 155 163 3 1 9 9 145
10 Total Employees 518 618 10 5 31 32 447
11 Wages to Workers 337.81 501.88 5.76 2.28 24.73 23.10 413.55
12 Total Emoluments 469.65 572.10 9.35 3.04 29.04 41.45 791.79
13 Fuels Consumed 173.66 612.15 5.36 0.13 3.19 3.74 265.26
14 Materials Consumed 6664.67 2841.30 86.82 2.95 239.29 81.52 1635.98
15 Total Inputs 10939.59 6635.27 93.59 3.27 247.62 134.38 2850.71
16 Products 7232.16 4607.70 108.08 3.72 267.97 0.00 10880.74
17 Value of Output 12167.02 7581.06 112.00 4.14 293.34 283.89 10958.18
18 GVA 1227.43 945.79 18.41 0.87 45.72 149.51 8107.47
19 Depreciation 77.28 234.03 1.74 0.00 2.48 3.17 730.22
20 Net Value Added 1150.15 711.76 16.67 0.87 43.24 146.34 7377.25
21 Net Fixed Capital
Formation 1.84 91.34 -1.74 0.00 -2.48 -2.38 -686.08
22 Gross Fixed Capital
Formation 79.12 325.37 0.00 0.00 0.00 0.79 44.14
23 Materials, Fuels etc -331.94 -100.81 -25.35 0.13 2.31 -23.37 143.96
24 Semi Fin. Goods -969.63 -2.34 0.00 0.00 0.00 0.00 0.00
25 Finished Goods 124.97 -100.50 17.28 0.23 -4.35 0.00 473.55
26 Total (20+21+22) -1176.60 -203.65 -8.07 0.36 -2.04 -23.37 617.51
27 Gross Cap Form -1097.48 121.72 -8.07 0.36 -2.04 -22.58 661.65

106
ANNEXURE - 7
Summary results of mfg. Sector by selected characteristics
and major industry group NIC - 2 digit level
DISTRICT : Guntur (Value Figures, Mandays are in ‘000s and Others in No.)
Sl.
No CHARACTERISTIC
INDUSTRY GROUP
38 45 52 58 82 TOTAL
1 Number of Factories 1 15 122 22 1 2443
2 Fixed Capital 0.21 1548.31 16219.18 9558.48 170.16 718417.06
3 Physical Working Capital 1.82 4998.22 119.77 4275.06 0.00 468377.07
4 Working Capital 2.08 6152.16 2989.38 20641.10 179.01 209446.94
5 Invested Capital 2.03 6546.54 16338.94 13833.93 170.16 1186795.67
6 Outstanding loans 0.00 3623.04 11122.75 43.43 230.93 446444.46
7 Man days- Workers 1 224 257 309 146 19285
8 Number of Workers 3 873 718 847 400 62269
9 Man days-Employees 1 342 483 468 162 23433
10 Total Employees 4 1327 1551 1283 447 77773
11 Wages to Workers 3.24 870.16 821.73 1822.81 572.25 66453.05
12 Total Emoluments 3.24 2260.21 2055.47 3193.36 682.08 103236.70
13 Fuels Consumed 0.35 165.31 2850.00 1103.48 15.09 144720.86
14 Materials Consumed 0.58 2184.67 163.93 9404.91 2.40 1393281.88
15 Total Inputs 0.96 108327.76 3955.23 13798.09 1874.52 2143755.33
16 Products 6.92 2077.25 6.82 17362.79 0.00 1984077.27
17 Value of Output 6.92 112997.81 9544.34 19838.38 2785.13 2665397.55
18 GVA 5.96 4670.05 5589.11 6040.29 910.61 521642.22
19 Depreciation 0.04 152.83 1743.72 1304.61 30.07 52612.16
20 Net Value Added 5.92 4517.22 3845.39 4735.68 880.54 469030.06
21 Net Fixed Capital
Formation -0.04 -47.65 -1079.30 -506.50 -32.12 9937.41
22 Gross Fixed Capital
Formation 0.00 105.18 664.42 798.11 -2.05 62549.57
23 Materials, Fuels etc 0.27 862.73 -71.14 906.61 0.00 49440.28
24 Semi Fin. Goods 0.00 0.00 0.00 0.00 0.00 2123.05
25 Finished Goods 0.92 -1211.41 0.00 0.00 0.00 19922.79
26 Total (20+21+22) 1.19 -348.68 -71.14 906.61 0.00 71486.12
27 Gross Cap Form 1.19 -243.50 593.28 1704.72 -2.05 134035.69

107
ANNEXURE - 7
Summary results of mfg. Sector by selected characteristics
and major industry group NIC - 2 digit level
DISTRICT : Prakasam (Value Figures, Mandays are in ‘000s and Others in No.)
Sl.
No CHARACTERISTIC
INDUSTRY GROUP
01 08 10 11 12 13
1 Number of Factories 6 0 274 6 56 26
2 Fixed Capital 310.75 0.00 44722.17 9389.77 28169.74 78805.90
3 Physical Working Capital 419.04 0.00 69154.18 5777.12 26556.07 22408.61
4 Working Capital 510.21 0.00 50494.55 5496.93 2991.71 -11350.40
5 Invested Capital 729.79 0.00 113876.35 15166.89 54725.80 101214.22
6 Outstanding loans 8.22 0.00 11528.21 7621.28 6678.23 38007.18
7 Man days- Workers 8 0 1541 209 1159 1296
8 Number of Workers 27 0 4613 682 4238 3760
9 Man days-Employees 11 0 1844 240 1310 1467
10 Total Employees 36 0 5753 787 4873 4256
11 Wages to Workers 11.15 0.00 4754.33 1337.93 4823.06 3469.62
12 Total Emoluments 13.27 0.00 7938.28 1760.53 5762.84 4376.55
13 Fuels Consumed 24.56 0.00 6214.79 1192.45 2512.43 13235.55
14 Materials Consumed 1489.60 0.00 260271.61 47496.60 59873.30 66762.07
15 Total Inputs 1540.68 0.00 287614.15 58627.05 66661.27 88167.62
16 Products 1951.15 0.00 334474.85 61696.84 87658.02 103678.56
17 Value of Output 1951.85 0.00 358185.79 64702.09 93891.77 109826.56
18 GVA 411.17 0.00 70571.64 6075.04 27230.50 21658.94
19 Depreciation 30.50 0.00 4780.10 1043.61 2363.89 4386.66
20 Net Value Added 380.67 0.00 65791.54 5031.43 24866.61 17272.28
21 Net Fixed Capital Formation -30.50 0.00 1875.91 1517.63 -1370.08 -2125.61
22 Gross Fixed Capital
Formation 0.00 0.00 6656.01 2561.24 993.81 2261.05
23 Materials, Fuels etc 11.93 0.00 1830.46 -235.64 1479.54 -1774.63
24 Semi Fin. Goods 47.41 0.00 2478.79 -110.89 0.00 1025.01
25 Finished Goods 160.14 0.00 8308.62 1484.70 5193.49 -1747.35
26 Total (20+21+22) 219.48 0.00 12617.87 1138.17 6673.03 -2496.97
27 Gross Cap Form 219.48 0.00 19273.88 3699.41 7666.84 -235.92
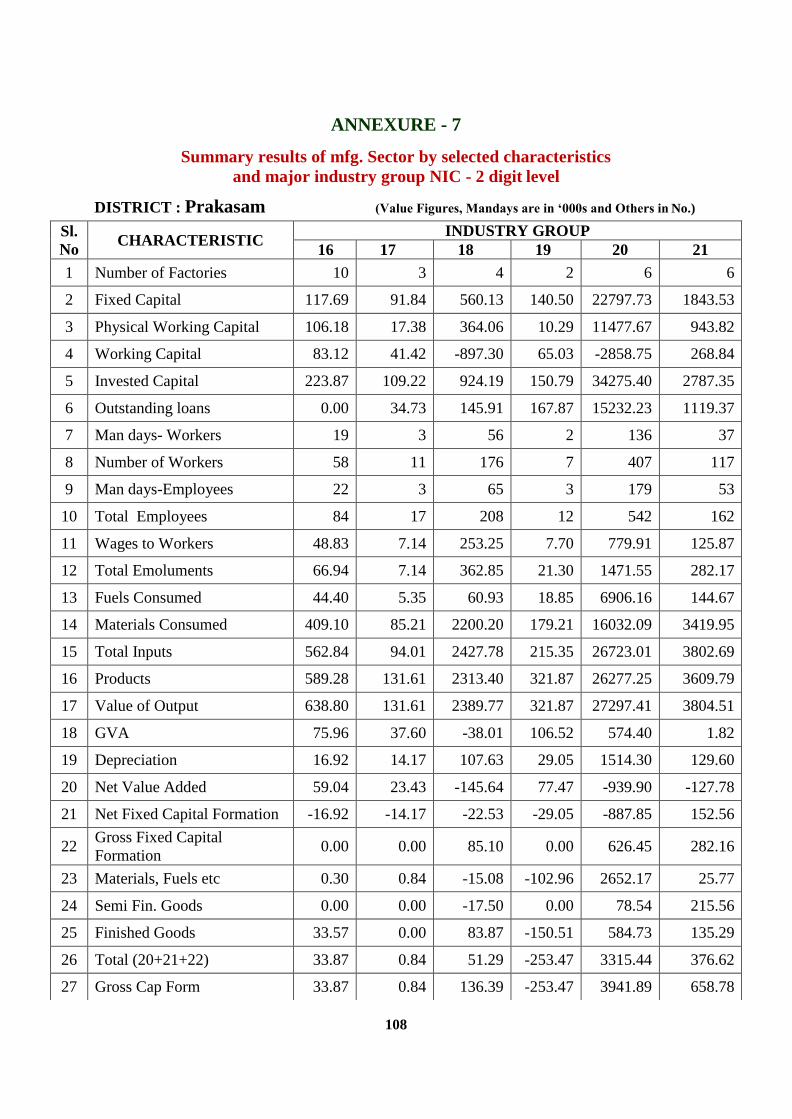
108
ANNEXURE - 7
Summary results of mfg. Sector by selected characteristics
and major industry group NIC - 2 digit level
DISTRICT : Prakasam (Value Figures, Mandays are in ‘000s and Others in No.)
Sl.
No CHARACTERISTIC
INDUSTRY GROUP
16 17 18 19 20 21
1 Number of Factories 10 3 4 2 6 6
2 Fixed Capital 117.69 91.84 560.13 140.50 22797.73 1843.53
3 Physical Working Capital 106.18 17.38 364.06 10.29 11477.67 943.82
4 Working Capital 83.12 41.42 -897.30 65.03 -2858.75 268.84
5 Invested Capital 223.87 109.22 924.19 150.79 34275.40 2787.35
6 Outstanding loans 0.00 34.73 145.91 167.87 15232.23 1119.37
7 Man days- Workers 19 3 56 2 136 37
8 Number of Workers 58 11 176 7 407 117
9 Man days-Employees 22 3 65 3 179 53
10 Total Employees 84 17 208 12 542 162
11 Wages to Workers 48.83 7.14 253.25 7.70 779.91 125.87
12 Total Emoluments 66.94 7.14 362.85 21.30 1471.55 282.17
13 Fuels Consumed 44.40 5.35 60.93 18.85 6906.16 144.67
14 Materials Consumed 409.10 85.21 2200.20 179.21 16032.09 3419.95
15 Total Inputs 562.84 94.01 2427.78 215.35 26723.01 3802.69
16 Products 589.28 131.61 2313.40 321.87 26277.25 3609.79
17 Value of Output 638.80 131.61 2389.77 321.87 27297.41 3804.51
18 GVA 75.96 37.60 -38.01 106.52 574.40 1.82
19 Depreciation 16.92 14.17 107.63 29.05 1514.30 129.60
20 Net Value Added 59.04 23.43 -145.64 77.47 -939.90 -127.78
21 Net Fixed Capital Formation -16.92 -14.17 -22.53 -29.05 -887.85 152.56
22 Gross Fixed Capital
Formation 0.00 0.00 85.10 0.00 626.45 282.16
23 Materials, Fuels etc 0.30 0.84 -15.08 -102.96 2652.17 25.77
24 Semi Fin. Goods 0.00 0.00 -17.50 0.00 78.54 215.56
25 Finished Goods 33.57 0.00 83.87 -150.51 584.73 135.29
26 Total (20+21+22) 33.87 0.84 51.29 -253.47 3315.44 376.62
27 Gross Cap Form 33.87 0.84 136.39 -253.47 3941.89 658.78

109
ANNEXURE - 7
Summary results of Mfg. Sector by selected characteristics
and major industry group NIC - 2 digit level
DISTRICT : Prakasam (Value Figures, Mandays are in ‘000s and Others in No.)
Sl.
No CHARACTERISTIC
INDUSTRY GROUP
22 23 24 25 28
1 Number of Factories 20 818 6 5 3
2 Fixed Capital 2400.86 124159.59 5685.04 1314.20 1032.68
3 Physical Working Capital 1436.88 55305.03 1119.54 525.01 311.63
4 Working Capital 1181.63 29968.65 -2584.81 -14.29 1306.44
5 Invested Capital 3837.73 179464.61 6804.58 1839.22 1344.51
6 Outstanding loans 2126.52 41642.22 2069.12 953.48 1537.54
7 Man days- Workers 178 4935 28 38 18
8 Number of Workers 529 16084 93 124 59
9 Man days-Employees 215 5933 38 45 22
10 Total Employees 650 19953 127 149 71
11 Wages to Workers 672.01 18276.15 83.47 103.66 72.84
12 Total Emoluments 859.23 26833.39 147.50 119.47 110.58
13 Fuels Consumed 494.54 23526.39 972.12 95.29 16.30
14 Materials Consumed 9411.39 195741.00 6547.80 4823.36 2688.73
15 Total Inputs 10532.19 278248.97 7632.10 5976.32 4013.73
16 Products 6609.72 149418.85 4471.62 4405.24 400.57
17 Value of Output 6742.02 188900.00 4472.18 6696.06 4902.56
18 GVA -3790.17 -89348.97 -3159.92 719.74 888.83
19 Depreciation 323.90 15781.10 590.20 180.67 73.31
20 Net Value Added -4114.07 -105130.07 -3750.12 539.07 815.52
21 Net Fixed Capital
Formation -85.77 -5811.54 -657.87 3.30 17.96
22 Gross Fixed Capital
Formation 238.13 9969.56 -67.67 183.97 91.27
23 Materials, Fuels etc -60.00 5129.06 -1442.67 229.18 -23.59
24 Semi Fin. Goods -16.46 -998.09 0.00 0.00 28.11
25 Finished Goods -122.29 5957.10 -420.95 0.00 -2.63
26 Total (20+21+22) -198.75 10088.07 -1863.62 229.18 1.89
27 Gross Cap Form 39.38 20057.63 -1931.29 413.15 93.16

110
ANNEXURE - 7
Summary results of mfg. Sector by selected characteristics
and major industry group NIC - 2 digit level
DISTRICT : Prakasam (Value Figures, Mandays are in ‘000s and Others in No.)
Sl.
No CHARACTERISTIC
INDUSTRY GROUP
32 35 45 52 82 Total
1 Number of Factories 1 2 16 46 1 1317
2 Fixed Capital 47.07 102.54 4562.54 7808.34 64.90 334127.51
3 Physical Working Capital 18.9 1.89 15306.70 0.00 216.01 211476.01
4 Working Capital -1 -24.06 4057.39 2357.10 166.77 81259.18
5 Invested Capital 65.96 104.44 19869.25 7808.34 281.66 545604.17
6 Outstanding loans 20.97 75.17 2750.20 4100.31 223.01 136041.77
7 Man days- Workers 1.48 1 156 112 1 9936
8 Number of Workers 5 5 472 311 4 31782
9 Man days-Employees 2.08 3 331 172 2 11957
10 Total Employees 7 10 1028 511 5 39239
11 Wages to Workers 4.36 4.36 523.56 363.58 2.88 35725.66
12 Total Emoluments 7.24 7.60 1148.21 655.22 3.90 51955.76
13 Fuels Consumed 1.11 6.20 233.55 983.33 8.28 56697.25
14 Materials Consumed 34.59 17.62 21734.24 15.45 1619.23 700852.35
15 Total Inputs 39.44 27.93 70414.18 1570.13 1669.92 916561.36
16 Products 49.17 46.05 0.00 0.00 1716.31 789820.15
17 Value of Output 59.14 49.37 50085.27 12695.46 1719.69 939463.78
18 GVA 19.7
21.44 -
20328.91 11125.33 49.77 22902.42
19 Depreciation 5.41 10.64 484.24 750.28 6.34 32622.52
20 Net Value Added 14.29
10.80 -
20813.15 10375.05 43.43 -9720.10
21 Net Fixed Capital
Formation -5.27 7.68 512.88 473.85 20.24 -6475.15
22 Gross Fixed Capital
Formation 0.14 18.32 997.12 1224.13 26.58 26147.37
23 Materials, Fuels etc 2.09 0.00 5900.84 0.00 65.95 13673.56
24 Semi Fin. Goods 0.43 0.00 0.00 0.00 0.00 2730.91
25 Finished Goods 1.88 0.00 0.00 0.00 0.00 19499.66
26 Total (20+21+22) 4.4 0.00 5900.84 0.00 65.95 35904.13
27 Gross Cap Form 4.54 18.32 6897.96 1224.13 92.53 62051.50

111
ANNEXURE - 7
Summary results of mfg. Sector by selected characteristics
and major industry group NIC - 2 digit level
DISTRICT : Nellore (Value Figures, Mandays are in ‘000s and Others in No.)
Sl.
No CHARACTERISTIC
INDUSTRY GROUP
10 11 12 13 14
1 Number of Factories 342 17 1 13 4
2 Fixed Capital 152577.02 499.67 65.57 16493.04 1066.13
3 Physical Working Capital 181888.97 3.04 302.40 3744.22 1110.09
4 Working Capital 53098.39 81.33 426.52 3807.74 -339.36
5 Invested Capital 334465.99 502.71 367.67 20237.26 2176.51
6 Outstanding loans 77847.88 86.32 13.85 3468.62 428.42
7 Man days- Workers 2444 19 17 379 189
8 Number of Workers 7482 57 55 1237 619
9 Man days-Employees 2913 23 28 438 213
10 Total Employees 9275 88 90 1438 700
11 Wages to Workers 11472.09 61.57 77.08 1433.74 541.20
12 Total Emoluments 15852.98 77.32 140.14 1777.05 922.88
13 Fuels Consumed 21296.31 143.82 11.50 2613.24 86.72
14 Materials Consumed 853362.54 150.13 1667.22 10816.73 5787.39
15 Total Inputs 1006026.09 368.47 1715.96 14840.27 6198.42
16 Products 1071937.55 550.22 2071.95 29022.34 7668.32
17 Value of Output 1213326.95 607.84 2071.95 29452.96 7741.03
18 GVA 207300.86 239.37 355.99 14612.69 1542.61
19 Depreciation 15115.10 65.50 10.21 3637.60 228.95
20 Net Value Added 192185.76 173.87 345.78 10975.09 1313.66
21 Net Fixed Capital Formation 9188.89 -65.50 10.12 -2597.56 -11.99
22 Gross Fixed Capital
Formation 24303.99 0.00 20.33 1040.04 216.96
23 Materials, Fuels etc 39357.97 1.95 45.95 438.66 -7.47
24 Semi Fin. Goods 1161.19 0.00 0.00 -52.22 47.23
25 Finished Goods 4701.92 0.00 -6.83 20.02 236.21
26 Total (20+21+22) 45221.08 1.95 39.12 406.46 275.97
27 Gross Cap Form 69525.07 1.95 59.45 1446.50 492.93

112
ANNEXURE - 7
Summary results of mfg. Sector by selected characteristics
and major industry group NIC - 2 digit level
DISTRICT : Nellore (Value Figures, Mandays are in ‘000s and Others in No.)
Sl.
No CHARACTERISTIC
INDUSTRY GROUP
15 16 17 18 19 20
1 Number of Factories 9 13 1 4 1 12
2 Fixed Capital 21966.66 220.64 1678.54 614.13 1959.96 3505.18
3 Physical Working Capital 16568.52 22.32 255.30 121.73 44.99 2471.63
4 Working Capital 4613.33 -1.90 711.73 -1177.85 419.99 1848.05
5 Invested Capital 38535.18 242.97 1933.84 735.86 2004.95 5976.82
6 Outstanding loans 2586.61 101.29 266.42 145.17 2117.65 263.37
7 Man days- Workers 3238 21 67 22 10 121
8 Number of Workers 10429 78 218 66 32 403
9 Man days-Employees 3546 26 79 32 12 142
10 Total Employees 11418 110 257 99 41 474
11 Wages to Workers 12554.06 59.55 242.90 219.76 24.61 489.59
12 Total Emoluments 14762.26 72.99 303.62 352.11 44.74 711.63
13 Fuels Consumed 2826.66 22.22 218.39 57.41 189.26 253.46
14 Materials Consumed 63929.32 42.28 6803.81 1060.81 100.90 6305.03
15 Total Inputs 75111.90 84.69 7244.77 1422.07 411.58 8350.99
16 Products 92587.81 86.24 8253.49 1031.37 108.45 10290.69
17 Value of Output 96948.70 249.92 8255.10 10846.65 842.94 10896.05
18 GVA 21836.80 165.23 1010.33 9424.58 431.36 2545.06
19 Depreciation 3758.86 20.45 240.37 144.38 103.63 607.89
20 Net Value Added 18077.94 144.78 769.96 9280.20 327.73 1937.17
21 Net Fixed Capital Formation 552.70 -11.45 -21.47 -148.83 -59.67 560.68
22 Gross Fixed Capital
Formation 4311.56 9.00 218.90 -4.45 43.96 1168.57
23 Materials, Fuels etc -1498.46 -0.48 0.00 -9.12 -13.09 -296.19
24 Semi Fin. Goods -736.40 0.00 0.00 0.00 0.00 -264.69
25 Finished Goods -4231.39 -0.04 19.03 0.00 1.47 198.85
26 Total (20+21+22) -6466.25 -0.52 19.03 -9.12 -11.62 -362.03
27 Gross Cap Form -2154.69 8.48 237.93 -13.57 32.34 806.54

113
ANNEXURE - 7
Summary results of mfg. Sector by selected characteristics
and major industry group NIC - 2 digit level
DISTRICT : Nellore (Value Figures, Mandays are in ‘000s and Others in No.)
Sl.
No CHARACTERISTIC
INDUSTRY GROUP
21 22 23 24 25
1 Number of Factories 10 25 80 24 12
2 Fixed Capital 17217.99 4724.05 79528.66 27854.57 1597.48
3 Physical Working Capital 2610.28 1875.08 15058.41 31697.37 219.15
4 Working Capital -612.01 475.25 9726.72 12404.34 495.64
5 Invested Capital 19827.68 6599.13 94587.07 59551.94 1816.63
6 Outstanding loans 13752.64 730.80 3627.01 9573.38 970.15
7 Man days- Workers 241 139 506 350 19
8 Number of Workers 730 454 1678 1111 63
9 Man days-Employees 334 154 603 462 29
10 Total Employees 1010 511 2039 1460 99
11 Wages to Workers 923.72 437.40 1964.80 1443.38 79.69
12 Total Emoluments 2082.24 543.54 2852.04 2144.14 145.50
13 Fuels Consumed 1149.20 726.98 9872.98 24600.62 254.74
14 Materials Consumed 10986.14 6900.82 27539.26 67340.00 1793.42
15 Total Inputs 16446.50 8084.16 40913.55 102477.39 3212.81
16 Products 12859.99 6360.73 53757.13 131860.15 1983.94
17 Value of Output 13603.64 6595.70 54281.91 134251.36 3836.85
18 GVA -2842.86 -1488.46 13368.36 31773.97 624.04
19 Depreciation 5538.73 598.98 5171.68 2752.25 154.56
20 Net Value Added -8381.59 -2087.44 8196.68 29021.72 469.48
21 Net Fixed Capital
Formation 10521.77 -477.49 2531.88 -1628.53 4.69
22 Gross Fixed Capital
Formation 16060.50 121.49 7703.56 1123.72 159.25
23 Materials, Fuels etc -17.35 -45.32 1494.49 -331.96 0.74
24 Semi Fin. Goods -4.67 19.27 258.92 -10.63 0.00
25 Finished Goods 216.34 559.58 1330.90 1593.29 -34.35
26 Total (20+21+22) 194.32 533.53 3084.31 1250.70 -33.61
27 Gross Cap Form 16254.82 655.02 10787.87 2374.42 125.64

114
ANNEXURE - 7
Summary results of mfg. Sector by selected characteristics
and major industry group NIC - 2 digit level
DISTRICT : Nellore (Value Figures, Mandays are in ‘000s and Others in No.)
Sl.
No CHARACTERISTIC
INDUSTRY GROUP
27 28 29 31 32
1 Number of Factories 12 1 1 1 2
2 Fixed Capital 36761.31 610.48 29813.32 156.67 242.17
3 Physical Working Capital 11593.97 49.23 4814.58 30.13 134.42
4 Working Capital 6047.91 -294.97 21884.96 -22.20 304.84
5 Invested Capital 48355.28 659.71 34627.90 186.81 376.58
6 Outstanding loans 15109.87 0.00 7456.60 68.15 105.71
7 Man days- Workers 579 14 387 3 19
8 Number of Workers 1898 45 1263 11 64
9 Man days-Employees 672 14 466 3 20
10 Total Employees 2202 48 1524 12 69
11 Wages to Workers 3197.13 66.94 1828.82 12.02 57.66
12 Total Emoluments 4305.63 71.96 2344.65 12.02 61.86
13 Fuels Consumed 933.99 16.17 3929.53 1.38 16.66
14 Materials Consumed 27793.75 1079.05 4524.53 83.79 319.02
15 Total Inputs 55314.28 1107.42 12424.39 91.02 369.04
16 Products 50779.77 1281.15 17940.18 114.66 502.90
17 Value of Output 70373.96 1281.15 18132.15 126.64 507.00
18 GVA 15059.68 173.73 5707.76 35.62 137.96
19 Depreciation 3230.73 63.69 3028.92 3.28 51.51
20 Net Value Added 11828.95 110.04 2678.84 32.34 86.45
21 Net Fixed Capital Formation -706.53 41.04 -785.34 -3.28 -46.43
22 Gross Fixed Capital
Formation 2524.20 104.73 2243.58 0.00 5.08
23 Materials, Fuels etc -333.61 -1.48 -66.34 1.07 9.60
24 Semi Fin. Goods 1376.96 -0.48 -352.59 0.00 -11.02
25 Finished Goods 358.76 0.00 -59.00 0.42 6.80
26 Total (20+21+22) 1402.11 -1.96 -477.93 1.49 5.38
27 Gross Cap Form 3926.31 102.77 1765.65 1.49 10.46

115
ANNEXURE - 7
Summary results of mfg. Sector by selected characteristics
and major industry group NIC - 2 digit level
DISTRICT : Nellore (Value Figures, Mandays are in ‘000s and Others in No.)
Sl.
No CHARACTERISTIC
INDUSTRY GROUP
35 45 52 82 Total
1 Number of Factories 7 33 2 2 631
2 Fixed Capital 527716.38 4804.28 50.40 61.04 931849.63
3 Physical Working Capital 11156.71 5715.37 0.00 280.32 291783.09
4 Working Capital -71177.23 1280.40 -3.66 51.16 44083.26
5 Invested Capital 538873.09 10520.45 50.10 341.36 1223632.74
6 Outstanding loans 533119.50 5444.49 32.42 23.25 677339.57
7 Man days- Workers 719 195 1 7 9708
8 Number of Workers 2324 640 3 22 30998
9 Man days-Employees 815 282 3 9 11323
10 Total Employees 2638 935 9 30 36596
11 Wages to Workers 3859.15 1012.98 3.41 19.22 42102.82
12 Total Emoluments 5588.20 1659.30 7.85 31.78 56890.58
13 Fuels Consumed 829.75 220.09 8.44 9.05 70292.27
14 Materials Consumed 73697.45 3078.86 7.41 1929.85 1177124.40
15 Total Inputs 95053.86 38992.21 22.56 5097.20 1501438.77
16 Products 106589.94 0.00 1.00 2062.62 1609741.15
17 Value of Output 107600.64 39620.69 40.22 5214.63 1836812.94
18 GVA 12546.78 628.48 17.66 117.43 335374.17
19 Depreciation 25704.84 699.49 7.06 8.48 70949.00
20 Net Value Added -13158.06 -71.01 10.60 108.95 264425.17
21 Net Fixed Capital Formation -23973.22 -547.02 -4.70 -8.48 -7687.58
22 Gross Fixed Capital
Formation 1731.62 152.47 2.36 0.00 63261.42
23 Materials, Fuels etc -6281.71 -861.77 0.00 -201.44 31382.20
24 Semi Fin. Goods 0.00 0.00 0.00 0.00 1445.73
25 Finished Goods 0.00 -70.57 0.00 0.00 4841.41
26 Total (20+21+22) -6281.71 -932.34 0.00 -201.44 37669.34
27 Gross Cap Form -4550.09 -779.87 2.36 -201.44 100930.76
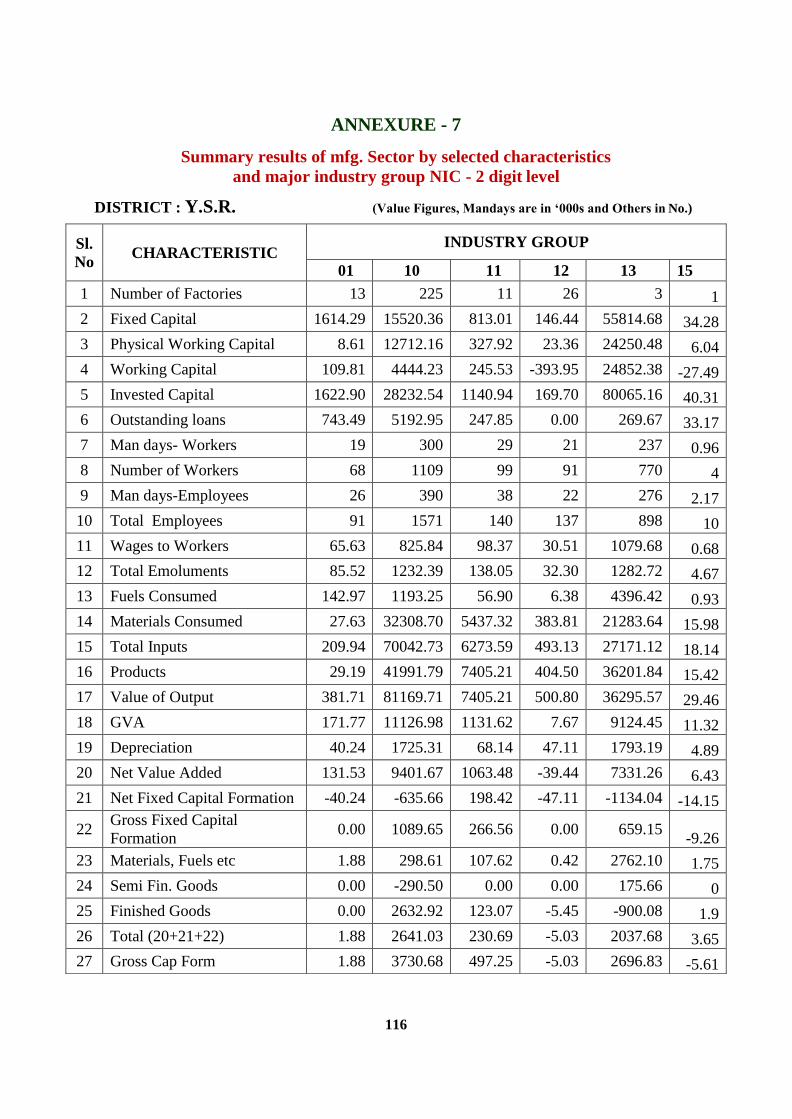
116
ANNEXURE - 7
Summary results of mfg. Sector by selected characteristics
and major industry group NIC - 2 digit level
DISTRICT : Y.S.R. (Value Figures, Mandays are in ‘000s and Others in No.)
Sl.
No CHARACTERISTIC
INDUSTRY GROUP
01 10 11 12 13 15
1 Number of Factories 13 225 11 26 3 1
2 Fixed Capital 1614.29 15520.36 813.01 146.44 55814.68 34.28
3 Physical Working Capital 8.61 12712.16 327.92 23.36 24250.48 6.04
4 Working Capital 109.81 4444.23 245.53 -393.95 24852.38 -27.49
5 Invested Capital 1622.90 28232.54 1140.94 169.70 80065.16 40.31
6 Outstanding loans 743.49 5192.95 247.85 0.00 269.67 33.17
7 Man days- Workers 19 300 29 21 237 0.96
8 Number of Workers 68 1109 99 91 770 4
9 Man days-Employees 26 390 38 22 276 2.17
10 Total Employees 91 1571 140 137 898 10
11 Wages to Workers 65.63 825.84 98.37 30.51 1079.68 0.68
12 Total Emoluments 85.52 1232.39 138.05 32.30 1282.72 4.67
13 Fuels Consumed 142.97 1193.25 56.90 6.38 4396.42 0.93
14 Materials Consumed 27.63 32308.70 5437.32 383.81 21283.64 15.98
15 Total Inputs 209.94 70042.73 6273.59 493.13 27171.12 18.14
16 Products 29.19 41991.79 7405.21 404.50 36201.84 15.42
17 Value of Output 381.71 81169.71 7405.21 500.80 36295.57 29.46
18 GVA 171.77 11126.98 1131.62 7.67 9124.45 11.32
19 Depreciation 40.24 1725.31 68.14 47.11 1793.19 4.89
20 Net Value Added 131.53 9401.67 1063.48 -39.44 7331.26 6.43
21 Net Fixed Capital Formation -40.24 -635.66 198.42 -47.11 -1134.04 -14.15
22 Gross Fixed Capital
Formation 0.00 1089.65 266.56 0.00 659.15
-9.26
23 Materials, Fuels etc 1.88 298.61 107.62 0.42 2762.10 1.75
24 Semi Fin. Goods 0.00 -290.50 0.00 0.00 175.66 0
25 Finished Goods 0.00 2632.92 123.07 -5.45 -900.08 1.9
26 Total (20+21+22) 1.88 2641.03 230.69 -5.03 2037.68 3.65
27 Gross Cap Form 1.88 3730.68 497.25 -5.03 2696.83 -5.61
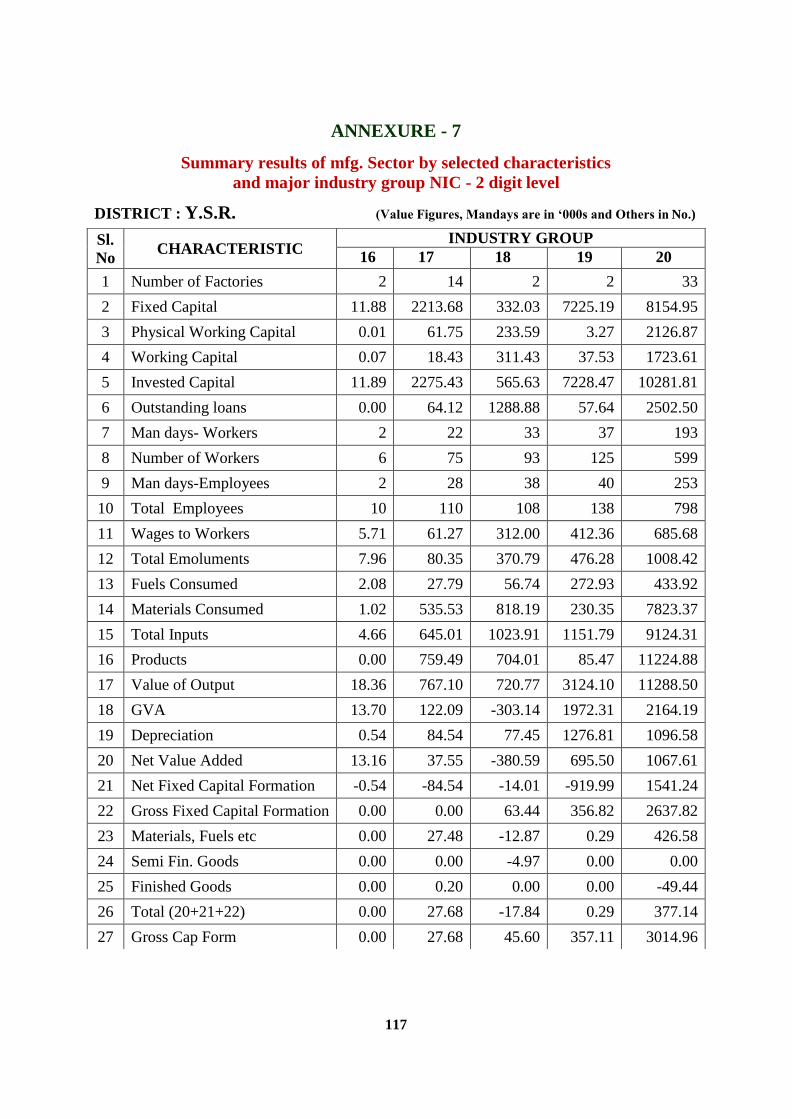
117
ANNEXURE - 7
Summary results of mfg. Sector by selected characteristics
and major industry group NIC - 2 digit level
DISTRICT : Y.S.R. (Value Figures, Mandays are in ‘000s and Others in No.)
Sl.
No CHARACTERISTIC
INDUSTRY GROUP
16 17 18 19 20
1 Number of Factories 2 14 2 2 33
2 Fixed Capital 11.88 2213.68 332.03 7225.19 8154.95
3 Physical Working Capital 0.01 61.75 233.59 3.27 2126.87
4 Working Capital 0.07 18.43 311.43 37.53 1723.61
5 Invested Capital 11.89 2275.43 565.63 7228.47 10281.81
6 Outstanding loans 0.00 64.12 1288.88 57.64 2502.50
7 Man days- Workers 2 22 33 37 193
8 Number of Workers 6 75 93 125 599
9 Man days-Employees 2 28 38 40 253
10 Total Employees 10 110 108 138 798
11 Wages to Workers 5.71 61.27 312.00 412.36 685.68
12 Total Emoluments 7.96 80.35 370.79 476.28 1008.42
13 Fuels Consumed 2.08 27.79 56.74 272.93 433.92
14 Materials Consumed 1.02 535.53 818.19 230.35 7823.37
15 Total Inputs 4.66 645.01 1023.91 1151.79 9124.31
16 Products 0.00 759.49 704.01 85.47 11224.88
17 Value of Output 18.36 767.10 720.77 3124.10 11288.50
18 GVA 13.70 122.09 -303.14 1972.31 2164.19
19 Depreciation 0.54 84.54 77.45 1276.81 1096.58
20 Net Value Added 13.16 37.55 -380.59 695.50 1067.61
21 Net Fixed Capital Formation -0.54 -84.54 -14.01 -919.99 1541.24
22 Gross Fixed Capital Formation 0.00 0.00 63.44 356.82 2637.82
23 Materials, Fuels etc 0.00 27.48 -12.87 0.29 426.58
24 Semi Fin. Goods 0.00 0.00 -4.97 0.00 0.00
25 Finished Goods 0.00 0.20 0.00 0.00 -49.44
26 Total (20+21+22) 0.00 27.68 -17.84 0.29 377.14
27 Gross Cap Form 0.00 27.68 45.60 357.11 3014.96

118
ANNEXURE - 7
Summary results of mfg. Sector by selected characteristics
and major industry group NIC - 2 digit level
DISTRICT : Y.S.R. (Value Figures, Mandays are in ‘000s and Others in No.)
Sl.
No CHARACTERISTIC
INDUSTRY GROUP
22 23 24 25 28
1 Number of Factories 42 329 3 3 4
2 Fixed Capital 5946.14 473812.60 199.32 296.73 8127.73
3 Physical Working Capital 1688.96 59480.61 1296.92 9.81 10140.69
4 Working Capital 4949.72 89044.55 1123.11 9.54 14320.54
5 Invested Capital 7635.10 533293.21 1496.23 306.54 18268.42
6 Outstanding loans 2422.98 170363.08 0.00 27.32 2105.09
7 Man days- Workers 142 2175 1 8 88
8 Number of Workers 493 6975 2 27 257
9 Man days-Employees 158 2729 1 11 115
10 Total Employees 587 8930 4 36 334
11 Wages to Workers 313.97 12306.54 1.62 62.22 398.24
12 Total Emoluments 465.96 18251.52 1.62 70.08 2211.35
13 Fuels Consumed 795.16 88758.90 3.99 0.52 561.23
14 Materials Consumed 7371.10 113562.37 8.78 0.03 69293.53
15 Total Inputs 8559.59 298085.70 13.70 39.43 81269.84
16 Products 8085.47 350380.19 17.33 0.00 66519.59
17 Value of Output 8407.96 368751.91 17.91 103.71 95367.15
18 GVA -151.63 70666.21 4.21 64.28 14097.31
19 Depreciation 704.28 31644.74 27.43 43.37 389.74
20 Net Value Added -855.91 39021.47 -23.22 20.91 13707.57
21 Net Fixed Capital Formation -626.70 17291.61 -27.44 -43.37 5050.23
22 Gross Fixed Capital
Formation 77.58 48936.35 -0.01 0.00 5439.97
23 Materials, Fuels etc -181.21 -3506.98 0.14 0.00 273.64
24 Semi Fin. Goods 16.72 -1235.40 -0.28 0.00 4425.72
25 Finished Goods -184.47 1790.30 -3.34 0.22 288.69
26 Total (20+21+22) -348.96 -2952.08 -3.48 0.22 4988.05
27 Gross Cap Form -271.38 45984.27 -3.49 0.22 10428.02

119
ANNEXURE - 7
Summary results of mfg. Sector by selected characteristics
and major industry group NIC - 2 digit level
DISTRICT : Y.S.R. (Value Figures, Mandays are in ‘000s and Others in No.)
Sl.
No
CHARACTERIST
IC
INDUSTRY GROUP
33 35 36 38 45 52 Total
1 Number of Factories 1 1 3 9 16 4 749
2 Fixed Capital 6.68 22.53 27425.66 563.84 310.04 1222.7
9 610329.05
3 Physical Working
Capital 42.36 126.05 212.71 241.09 1700.86 0.01 114779.10
4 Working Capital 51.71 70.47 3125.19 269.98 3009.36 213.10 147525.07
5 Invested Capital 49.04 148.58 27638.37 805.33 2010.90 1222.9
0 725108.57
6 Outstanding loans 40.85 71.07 2071.07 429.46 3062.15 374.45 191384.46
7 Man days- Workers 1 1 32 18 69 8 3451
8 Number of Workers 4 3 91 74 231 22 11263
9 Man days-
Employees 2 10 39 23 94 12 4334
10 Total Employees 9 33 113 100 317 35 14592
11 Wages to Workers 3.87 4.07 167.86 47.35 185.35 19.22 17158.08
12 Total Emoluments 6.11 55.30 227.92 79.19 324.42 37.70 26595.40
13 Fuels Consumed 2.03 7.17 21.28 27.41 61.62 67.73 96914.19
14 Materials Consumed 83.58 5.28 2097.98 2299.14 23.05 2.84 263678.26
15 Total Inputs 124.24 726.63 2321.07 2356.57 17556.7
4 79.01 527473.45
16 Products 98.94 0.00 5601.21 2438.13 0.00 0.00 532035.32
17 Value of Output 144.18 842.93 5601.21 2452.62 19303.4
8 226.70 643123.56
18 GVA 19.94 116.30 3280.14 96.05 1746.74 147.69 115650.11
19 Depreciation 0.11 4.25 1070.38 21.55 33.91 42.00 40227.88
20 Net Value Added 19.83 112.05 2209.76 74.50 1712.83 105.69 75422.23
21 Net Fixed Capital
Formation -0.11 -2.44 -1051.08 6.23 -9.60 -42.37 19681.27
22 Gross Fixed Capital
Formation 0.00 1.81 19.30 27.78 24.31 -0.37 59909.15
23 Materials, Fuels etc 6.08 12.51 22.66 -15.18 481.12 0.00 770.21
24 Semi Fin. Goods 0.00 0.00 0.00 0.00 0.00 0.00 3086.95
25 Finished Goods 1.70 0.00 0.00 24.13 0.00 0.00 3720.35
26 Total (20+21+22) 7.78 12.51 22.66 8.95 481.12 0.00 7577.51
27 Gross Cap Form 7.78 14.32 41.96 36.73 505.43 -0.37 67486.66

120
ANNEXURE - 7
Summary results of mfg. Sector by selected characteristics
and major industry group NIC - 2 digit level
DISTRICT : Kurnool (Value Figures, Mandays are in ‘000s and Others in No.)
Sl.
No CHARACTERISTIC
INDUSTRY GROUP
01 10 11 12 13
1 Number of Factories 125 185 16 4 2
2 Fixed Capital 13370.33 17148.04 7962.78 22.66 497.57
3 Physical Working Capital 16304.09 19380.35 804.98 0.00 420.18
4 Working Capital 13699.67 13412.32 2042.54 -62.96 396.91
5 Invested Capital 29674.42 36528.41 8767.76 22.66 917.75
6 Outstanding loans 10122.03 11582.80 2422.15 4.17 9.06
7 Man days- Workers 618 557 93 6 30
8 Number of Workers 2470 1837 514 19 86
9 Man days-Employees 718 726 97 9 56
10 Total Employees 2991 2506 548 33 168
11 Wages to Workers 1915.36 1982.84 204.31 18.39 116.00
12 Total Emoluments 2439.72 2791.71 219.58 26.89 213.73
13 Fuels Consumed 871.18 3205.22 55.54 5.08 52.58
14 Materials Consumed 45563.59 70988.01 7002.80 176.78 389.06
15 Total Inputs 64876.74 84419.04 8279.11 288.26 600.38
16 Products 80387.39 91303.25 8354.51 317.20 718.51
17 Value of Output 99497.74 101183.67 8825.91 317.20 845.34
18 GVA 34621.00 16764.63 546.80 28.94 244.96
19 Depreciation 1419.20 2445.28 143.24 0.51 16.28
20 Net Value Added 33201.80 14319.35 403.56 28.43 228.68
21 Net Fixed Capital Formation 1791.17 1951.28 7913.44 -0.51 -16.28
22 Gross Fixed Capital
Formation 3210.37 4396.56 8056.68 0.00 0.00
23 Materials, Fuels etc 1219.51 1141.13 141.82 -20.40 -2.10
24 Semi Fin. Goods 0.00 -88.10 0.00 0.00 3.13
25 Finished Goods 5213.97 1292.68 657.45 0.00 -5.21
26 Total (20+21+22) 6433.48 2345.71 799.27 -20.40 -4.18
27 Gross Cap Form 9643.85 6742.27 8855.95 -20.40 -4.18

121
ANNEXURE - 7
Summary results of mfg. Sector by selected characteristics
and major industry group NIC - 2 digit level
DISTRICT : Kurnool (Value Figures, Mandays are in ‘000s and Others in No.)
Sl.
No CHARACTERISTIC
INDUSTRY GROUP
15 17 18 20 22
1 Number of Factories 1 5 4 14 49
2 Fixed Capital 8.88 51.56 366.42 96162.44 7168.58
3 Physical Working Capital 4.89 133.57 156.74 14682.44 1353.28
4 Working Capital 17.54 28.59 236.28 6247.16 8186.20
5 Invested Capital 13.77 184.73 522.96 110844.58 8521.76
6 Outstanding loans 0.00 22.96 942.17 26253.68 482.89
7 Man days- Workers 5 27 14 413 537
8 Number of Workers 18 122 40 1152 1599
9 Man days-Employees 6 28 19 711 566
10 Total Employees 21 134 56 1978 1728
11 Wages to Workers 12.14 56.29 138.95 2123.38 1533.15
12 Total Emoluments 14.35 60.60 288.19 5162.18 1766.77
13 Fuels Consumed 19.24 3.14 41.20 39031.62 634.08
14 Materials Consumed 27.27 287.35 1315.15 64144.15 13550.84
15 Total Inputs 49.68 309.54 1458.42 117142.27 20066.04
16 Products 70.35 406.37 1180.51 138239.04 8695.46
17 Value of Output 70.35 407.51 1270.85 146063.00 11051.28
18 GVA 20.67 97.97 -187.57 28920.73 -9014.76
19 Depreciation 0.74 4.13 74.85 7731.82 356.67
20 Net Value Added 19.93 93.84 -262.42 21188.91 -9371.43
21 Net Fixed Capital Formation -0.74 -4.13 -44.55 -4923.40 -347.56
22 Gross Fixed Capital Formation 0.00 0.00 30.30 2808.42 9.11
23 Materials, Fuels etc 1.18 -2.69 -36.92 1494.63 -147.50
24 Semi Fin. Goods 0.00 0.00 0.00 -115.50 -136.44
25 Finished Goods 0.46 12.50 -10.69 -337.47 -18.38
26 Total (20+21+22) 1.64 9.81 -47.61 1041.66 -302.32
27 Gross Cap Form 1.64 9.81 -17.31 3850.08 -293.21

122
ANNEXURE - 7
Summary results of mfg. Sector by selected characteristics
and major industry group NIC - 2 digit level
DISTRICT : Kurnool (Value Figures, Mandays are in ‘000s and Others in No.)
Sl.
No CHARACTERISTIC
INDUSTRY GROUP
23 24 25 27 28
1 Number of Factories 482 7 4 2 1
2 Fixed Capital 259497.37 16576.02 33.92 1266.71 2.59
3 Physical Working Capital 34434.82 6821.59 165.68 456.13 0.00
4 Working Capital 26015.72 -7858.09 193.65 141.95 0.00
5 Invested Capital 293932.20 23398.01 199.00 1722.84 2.59
6 Outstanding loans 117462.47 12518.94 37.11 1183.41 0.00
7 Man days- Workers 1656 54 4 24 0
8 Number of Workers 5025 293 15 82 0
9 Man days-Employees 1924 67 7 28 0
10 Total Employees 6126 376 26 96 0
11 Wages to Workers 7007.21 184.18 8.55 81.52 0.00
12 Total Emoluments 12220.92 282.03 15.30 104.86 0.00
13 Fuels Consumed 37687.23 1418.67 6.78 13.91 0.00
14 Materials Consumed 76578.69 14975.72 383.53 763.27 0.00
15 Total Inputs 147371.62 16588.25 397.65 895.49 0.00
16 Products 227820.01 2033.01 429.83 1051.34 0.00
17 Value of Output 233746.12 2042.42 454.94 1106.18 0.00
18 GVA 86374.50 -14545.83 57.29 210.69 0.00
19 Depreciation 16175.09 793.61 4.40 96.03 0.10
20 Net Value Added 70199.41 -15339.44 52.89 114.66 -0.10
21 Net Fixed Capital Formation -2949.99 7965.81 -4.40 82.55 -0.10
22 Gross Fixed Capital Formation 13225.10 8759.42 0.00 178.58 0.00
23 Materials, Fuels etc 1093.15 156.90 37.08 177.15 0.00
24 Semi Fin. Goods 4894.04 51.66 0.00 10.22 0.00
25 Finished Goods 163.99 2319.12 15.89 10.07 0.00
26 Total (20+21+22) 6151.18 2527.68 52.97 197.44 0.00
27 Gross Cap Form 19376.28 11287.10 52.97 376.02 0.00

123
ANNEXURE - 7
Summary results of mfg. Sector by selected characteristics
and major industry group NIC - 2 digit level
DISTRICT : Kurnool (Value Figures, Mandays are in ‘000s and Others in No.)
Sl.
No CHARACTERISTIC
INDUSTRY GROUP
33 35 38 45 52 Total
1 Number of Factories 1 9 5 13 11 938
2 Fixed Capital 0.50 137454.44 262.45 5916.01 4009.26 567778.53
3 Physical Working Capital 0.02 944.75 93.51 1488.00 5.27 97650.29
4 Working Capital 0.05 1078.08 124.67 2093.91 166.97 66161.16
5 Invested Capital 0.52 138399.18 355.95 7404.81 4014.52 665428.42
6 Outstanding loans 0.00 47205.53 224.14 2150.95 2898.24 235522.70
7 Man days- Workers 4 30 15 246 15 4349
8 Number of Workers 10 92 54 818 41 14284
9 Man days-Employees 4 46 16 312 24 5367
10 Total Employees 12 141 67 1043 69 18116
11 Wages to Workers 22.76 149.00 36.40 898.13 34.78 16523.34
12 Total Emoluments 27.64 452.35 40.41 1324.89 61.00 27513.12
13 Fuels Consumed 1.73 28.05 21.43 102.62 213.61 83412.91
14 Materials Consumed 0.54 4781.29 218.63 8770.23 0.91 309917.81
15 Total Inputs 5.66 9237.57 271.73 15076.28 281.14 487614.87
16 Products 0.00 10493.43 355.06 0.00 0.00 571855.27
17 Value of Output 38.08 15237.48 358.08 17039.90 663.41 640219.46
18 GVA 32.42 5999.91 86.35 1963.62 382.27 152604.59
19 Depreciation 0.27 3588.17 37.64 243.27 466.02 33597.32
20 Net Value Added 32.15 2411.74 48.71 1720.35 -83.75 119007.27
21 Net Fixed Capital Formation -0.27 74457.58 -55.71 -47.55 -464.44 85302.20
22 Gross Fixed Capital
Formation 0.00 78045.75 -18.07 195.72 1.58 118899.52
23 Materials, Fuels etc -0.01 944.75 -18.04 -42.47 2.16 6139.33
24 Semi Fin. Goods 0.00 0.00 0.00 0.00 0.00 4619.01
25 Finished Goods 0.00 0.00 -23.28 -67.10 0.00 9224.00
26 Total (20+21+22) -0.01 944.75 -41.32 -109.57 2.16 19982.34
27 Gross Cap Form -0.01 78990.50 -59.39 86.15 3.74 138881.86

124
ANNEXURE - 7
Summary results of mfg. Sector by selected characteristics
and major industry group NIC - 2 digit level
DISTRICT : Ananthapuramu (Value Figures, Mandays are in ‘000s and Others in No.)
Sl.
No CHARACTERISTIC
INDUSTRY GROUP
01 10 11 13 14 16
1 Number of Factories 4 173 4 44 15 1
2 Fixed Capital 158.76 4821.53 79.63 11114.59 10272.49 39.83
3 Physical Working Capital 66.44 5514.79 10.70 6009.86 164.67 61.31
4 Working Capital 16.12 2049.24 8.24 -1689.63 219.13 42.76
5 Invested Capital 225.20 10337.53 90.33 17124.45 10437.16 100.43
6 Outstanding loans 46.79 2715.17 10.03 477.02 478.16 48.29
7 Man days- Workers 10 291 5 1466 1824 2
8 Number of Workers 31 981 16 4356 6057 7
9 Man days-Employees 9 352 7 1606 2018 3
10 Total Employees 37 1295 25 4822 6712 9
11 Wages to Workers 23.17 729.13 9.38 4642.07 4648.26 5.48
12 Total Emoluments 24.42 1200.73 12.42 6412.67 5683.64 9.96
13 Fuels Consumed 9.01 960.61 16.91 7079.75 299.37 19.06
14 Materials Consumed 260.69 41690.83 23.23 30064.71 431.30 177.30
15 Total Inputs 322.96 77252.74 47.41 40987.14 1461.94 204.27
16 Products 288.16 180426.41 60.60 85864.55 2881.46 227.92
17 Value of Output 364.38 221187.16 84.13 88885.45 12108.54 232.30
18 GVA 41.42 143934.42 36.72 47898.31 10646.60 28.03
19 Depreciation 15.36 430.16 8.66 1488.15 1139.70 6.90
20 Net Value Added 26.06 143504.26 28.06 46410.16 9506.90 21.13
21 Net Fixed Capital Formation -5.22 24.85 -8.66 -174.10 332.34 -3.60
22 Gross Fixed Capital Formation 10.14 455.01 0.00 1314.05 1472.04 3.30
23 Materials, Fuels etc 3.83 537.27 -4.27 -2.62 43.88 13.74
24 Semi Fin. Goods 0.00 25.96 0.00 272.34 0.00 0.00
25 Finished Goods -1.35 252.67 -0.03 -713.34 6.98 -1.19
26 Total (20+21+22) 2.48 815.90 -4.30 -443.62 50.86 12.55
27 Gross Cap Form 12.62 1270.91 -4.30 870.43 1522.90 15.85

125
ANNEXURE - 7
Summary results of mfg. Sector by selected characteristics
and major industry group NIC - 2 digit level
DISTRICT : Ananthapuramu (Value Figures, Mandays are in ‘000s and Others in No.)
Sl.
No CHARACTERISTIC
INDUSTRY GROUP
17 18 19 20 21 22
1 Number of Factories 6152.87 475.50 6301.72 18218.71 6037.59 3393.19
2 Fixed Capital 1203.60 137.14 53.71 10426.41 3606.67 3106.18
3 Physical Working Capital -1571.76 56.39 39.09 4023.75 2236.87 1162.96
4 Working Capital 7355.96 612.64 6355.43 28645.12 9644.26 6499.37
5 Invested Capital 420.48 1219.47 12.71 520.84 5145.82 709.24
6 Outstanding loans 25 8 60 150 110 378
7 Man days- Workers 76 23 198 484 349 1253
8 Number of Workers 30 14 63 189 147 431
9 Man days-Employees 92 38 209 622 463 1492
10 Total Employees 66.96 140.56 230.45 669.87 392.31 1186.47
11 Wages to Workers 91.54 290.03 307.31 1107.58 1057.10 1557.92
12 Total Emoluments 1461.16 48.01 143.83 1134.68 553.27 2888.37
13 Fuels Consumed 7771.75 1162.93 52.21 19852.92 6425.80 26234.11
14 Materials Consumed 9844.05 1299.37 382.51 22847.34 8117.67 30778.13
15 Total Inputs 25229.59 1078.67 46.87 29347.51 7114.52 10017.20
16 Products 25244.68 1078.72 1066.42 30523.66 8005.70 15149.78
17 Value of Output 15400.63 -220.65 683.91 7676.32 -111.97 -
15628.35
18 GVA 438.23 145.18 324.53 793.75 771.66 647.75
19 Depreciation 14962.40 -365.83 359.38 6882.57 -883.63 -
16276.10
20 Net Value Added -274.21 -96.31 -297.73 1920.17 807.32 -468.39
21 Net Fixed Capital Formation 164.02 48.87 26.80 2713.92 1578.98 179.36
22 Gross Fixed Capital Formation 20.22 137.14 44.43 1434.00 277.50 940.61
23 Materials, Fuels etc 43.66 0.00 0.00 -593.21 603.81 -35.99
24 Semi Fin. Goods 72.45 0.00 6.12 802.04 262.92 189.46
25 Finished Goods 136.33 137.14 50.55 1642.83 1144.23 1094.08
26 Total (20+21+22) 300.35 186.01 77.35 4356.75 2723.21 1273.44
27 Gross Cap Form 6152.87 475.50 6301.72 18218.71 6037.59 3393.19

126
ANNEXURE - 7
Summary results of mfg. Sector by selected characteristics
and major industry group NIC - 2 digit level
DISTRICT : Ananthapuramu (Value Figures, Mandays are in ‘000s and Others in No.)
Sl.
No CHARACTERISTIC
INDUSTRY GROUP
23 24 25 27 28 30
1 Number of Factories 126 39 13 7 6 2
2 Fixed Capital 331812.79 262712.49 1260.81 85.64 20340.46 53.14
3 Physical Working Capital 42749.76 68835.72 1152.29 232.03 8229.42 59.69
4 Working Capital 30239.30 -2054.97 1078.58 207.59 10546.73 68.29
5 Invested Capital 374562.56 331547.62 2413.11 317.67 28569.87 113.2
6 Outstanding loans 91232.41 122735.76 1378.19 134.23 1543.02 71.87
7 Man days- Workers 1948 1780 137 28 218 21.92
8 Number of Workers 6045 5200 448 97 724 72
9 Man days-Employees 2289 2069 159 35 264 25.31
10 Total Employees 7170 6041 524 122 877 84
11 Wages to Workers 6845.55 7089.44 364.95 80.03 949.17 90.59
12 Total Emoluments 13262.59 11691.46 535.94 147.32 1918.74 126.9
13 Fuels Consumed 41803.31 96820.20 192.25 18.02 1388.37 48.58
14 Materials Consumed 78333.82 309549.17 3075.02 1296.68 19898.57 863.2
15 Total Inputs 152758.88 436416.26 4103.54 1478.59 25782.54 961.9
16 Products 241464.60 279901.74 4446.88 1284.63 27815.69 1095
17 Value of Output 268875.42 299356.99 5520.23 1468.09 28100.75 1139
18 GVA 116116.54 -137059.27 1416.69 -10.50 2318.21 176.7
19 Depreciation 19260.79 19842.19 155.65 8.18 3086.02 14.52
20 Net Value Added 96855.75 -156901.46 1261.04 -18.68 -767.81 162.2
21 Net Fixed Capital Formation 169.85 -20498.72 14.82 -2.06 -791.16 -5.26
22 Gross Fixed Capital Formation 19430.64 -656.53 170.47 6.12 2294.86 9.26
23 Materials, Fuels etc 1329.36 -443.11 -6.21 45.44 914.19 30.82
24 Semi Fin. Goods -948.59 5050.31 158.94 2.80 285.44 6.4
25 Finished Goods 1996.78 -253.63 25.61 -1.84 227.86 0
26 Total (20+21+22) 2377.55 4353.57 178.34 46.40 1427.49 37.22
27 Gross Cap Form 21808.19 3697.04 348.81 52.52 3722.35 46.48

127
ANNEXURE - 7
Summary results of mfg. Sector by selected characteristics
and major industry group NIC - 2 digit level
DISTRICT : Ananthapuramu (Value Figures, Mandays are in ‘000s and Others in No.)
Sl.
N
o
CHARACTERISTIC
INDUSTRY GROUP
33 35 38 4
5
52 Tota
l
1 Number of Factories 126 39 13 7 6 2
2 Fixed Capital 331812.79 262712.49 1260.81 85.64 20340.46 53.14
3 Physical Working Capital 42749.76 68835.72 1152.29 232.03 8229.42 59.69
4 Working Capital 30239.30 -2054.97 1078.58 207.59 10546.73 68.29
5 Invested Capital 374562.56 331547.62 2413.11 317.67 28569.87 113.2
6 Outstanding loans 91232.41 122735.76 1378.19 134.23 1543.02 71.87
7 Man days- Workers 1948 1780 137 28 218 21.92
8 Number of Workers 6045 5200 448 97 724 72
9 Man days-Employees 2289 2069 159 35 264 25.31
10 Total Employees 7170 6041 524 122 877 84
11 Wages to Workers 6845.55 7089.44 364.95 80.03 949.17 90.59
12 Total Emoluments 13262.59 11691.46 535.94 147.32 1918.74 126.9
13 Fuels Consumed 41803.31 96820.20 192.25 18.02 1388.37 48.58
14 Materials Consumed 78333.82 309549.17 3075.02 1296.68 19898.57 863.2
15 Total Inputs 152758.88 436416.26 4103.54 1478.59 25782.54 961.9
16 Products 241464.60 279901.74 4446.88 1284.63 27815.69 1095
17 Value of Output 268875.42 299356.99 5520.23 1468.09 28100.75 1139
18 GVA 116116.54 -137059.27 1416.69 -10.50 2318.21 176.7
19 Depreciation 19260.79 19842.19 155.65 8.18 3086.02 14.52
20 Net Value Added 96855.75 -156901.46 1261.04 -18.68 -767.81 162.2
21 Net Fixed Capital Formation 169.85 -20498.72 14.82 -2.06 -791.16 -5.26
22 Gross Fixed Capital
Formation 19430.64 -656.53 170.47 6.12 2294.86 9.26
23 Materials, Fuels etc 1329.36 -443.11 -6.21 45.44 914.19 30.82
24 Semi Fin. Goods -948.59 5050.31 158.94 2.80 285.44 6.4
25 Finished Goods 1996.78 -253.63 25.61 -1.84 227.86 0
26 Total (20+21+22) 2377.55 4353.57 178.34 46.40 1427.49 37.22
27 Gross Cap Form 21808.19 3697.04 348.81 52.52 3722.35 46.48
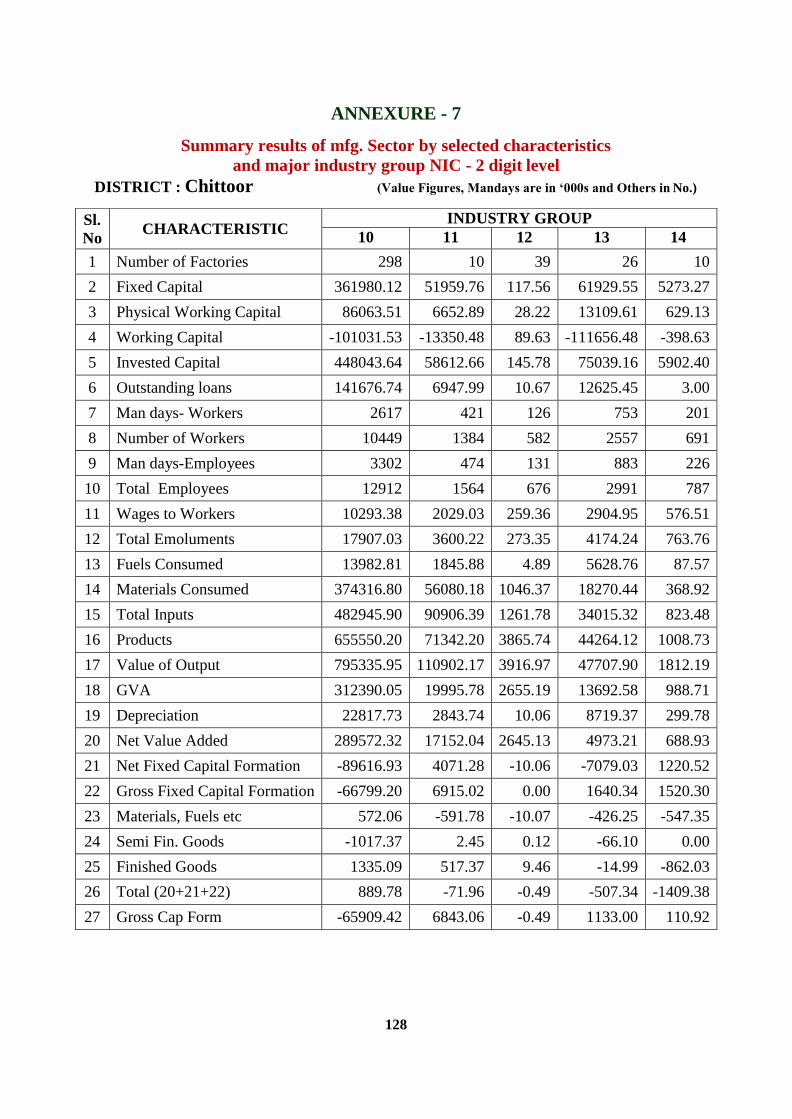
128
ANNEXURE - 7
Summary results of mfg. Sector by selected characteristics
and major industry group NIC - 2 digit level
DISTRICT : Chittoor (Value Figures, Mandays are in ‘000s and Others in No.)
Sl.
No CHARACTERISTIC
INDUSTRY GROUP
10 11 12 13 14
1 Number of Factories 298 10 39 26 10
2 Fixed Capital 361980.12 51959.76 117.56 61929.55 5273.27
3 Physical Working Capital 86063.51 6652.89 28.22 13109.61 629.13
4 Working Capital -101031.53 -13350.48 89.63 -111656.48 -398.63
5 Invested Capital 448043.64 58612.66 145.78 75039.16 5902.40
6 Outstanding loans 141676.74 6947.99 10.67 12625.45 3.00
7 Man days- Workers 2617 421 126 753 201
8 Number of Workers 10449 1384 582 2557 691
9 Man days-Employees 3302 474 131 883 226
10 Total Employees 12912 1564 676 2991 787
11 Wages to Workers 10293.38 2029.03 259.36 2904.95 576.51
12 Total Emoluments 17907.03 3600.22 273.35 4174.24 763.76
13 Fuels Consumed 13982.81 1845.88 4.89 5628.76 87.57
14 Materials Consumed 374316.80 56080.18 1046.37 18270.44 368.92
15 Total Inputs 482945.90 90906.39 1261.78 34015.32 823.48
16 Products 655550.20 71342.20 3865.74 44264.12 1008.73
17 Value of Output 795335.95 110902.17 3916.97 47707.90 1812.19
18 GVA 312390.05 19995.78 2655.19 13692.58 988.71
19 Depreciation 22817.73 2843.74 10.06 8719.37 299.78
20 Net Value Added 289572.32 17152.04 2645.13 4973.21 688.93
21 Net Fixed Capital Formation -89616.93 4071.28 -10.06 -7079.03 1220.52
22 Gross Fixed Capital Formation -66799.20 6915.02 0.00 1640.34 1520.30
23 Materials, Fuels etc 572.06 -591.78 -10.07 -426.25 -547.35
24 Semi Fin. Goods -1017.37 2.45 0.12 -66.10 0.00
25 Finished Goods 1335.09 517.37 9.46 -14.99 -862.03
26 Total (20+21+22) 889.78 -71.96 -0.49 -507.34 -1409.38
27 Gross Cap Form -65909.42 6843.06 -0.49 1133.00 110.92

129
ANNEXURE - 7
Summary results of mfg. Sector by selected characteristics
and major industry group NIC - 2 digit level
DISTRICT : Chittoor (Value Figures, Mandays are in ‘000s and Others in No.)
Sl.
No CHARACTERISTIC
INDUSTRY GROUP
15 16 17 18 19 20
1 Number of Factories 6 2 18 10 1 29
2 Fixed Capital 2057.12 1.55 28494.30 13006.75 4892.31 6554.83
3 Physical Working Capital 114.83 2.11 1268.65 8332.46 2252.48 5107.20
4 Working Capital 138.10 7.96 -894.84 8515.38 2252.48 1214.58
5 Invested Capital 2171.95 3.66 29762.95 21339.21 7144.79 11662.03
6 Outstanding loans 932.64 0.00 12334.37 1479.11 0.00 4803.48
7 Man days- Workers 117 1 163 152 66 293
8 Number of Workers 393 3 501 513 218 922
9 Man days-Employees 127 1 213 229 85 399
10 Total Employees 429 6 651 778 282 1277
11 Wages to Workers 462.05 2.01 454.68 851.19 173.66 1019.36
12 Total Emoluments 507.68 2.13 1054.75 1407.94 224.47 1579.82
13 Fuels Consumed 104.22 3.65 6143.96 325.83 112.98 1872.94
14 Materials Consumed 193.73 2.53 27500.94 9429.78 2559.40 12666.82
15 Total Inputs 425.34 7.70 34224.94 19965.15 2684.57 16916.69
16 Products 117.00 0.00 79420.51 22638.79 3622.70 17976.89
17 Value of Output 960.10 13.73 79467.43 24305.65 3622.70 18645.58
18 GVA 534.76 6.03 45242.49 4340.50 938.13 1728.89
19 Depreciation 122.50 0.27 1861.65 722.93 629.35 852.98
20 Net Value Added 412.26 5.76 43380.84 3617.57 308.78 875.91
21 Net Fixed Capital Formation 0.63 -0.27 -1503.07 6537.30 -629.35 -330.69
22 Gross Fixed Capital Formation 123.13 0.00 358.58 7260.23 0.00 522.29
23 Materials, Fuels etc -3.38 0.12 405.66 313.06 -514.04 -161.25
24 Semi Fin. Goods -1.65 0.00 6.02 37.63 0.00 125.79
25 Finished Goods 0.57 0.00 -16.07 4287.87 0.00 337.28
26 Total (20+21+22) -4.46 0.12 395.61 4638.56 -514.04 301.82
27 Gross Cap Form 118.67 0.12 754.19 11898.79 -514.04 824.11

130
ANNEXURE - 7
Summary results of mfg. Sector by selected characteristics
and major industry group NIC - 2 digit level
DISTRICT : Chittoor (Value Figures, Mandays are in ‘000s and Others in No.)
Sl.
No CHARACTERISTIC
INDUSTRY GROUP
27 28 29 30 31 32
1 Number of Factories 13 13 3 2 6 5
2 Fixed Capital 190679.79 91136.63 18321.54 4370.2 12244.8 9891.8
3 Physical Working Capital 91277.09 45878.11 5889.65 556.04 3390.17 2936.4
4 Working Capital 103117.83 22556.15 454.29 57.61 12101.7 1274
5 Invested Capital 281957.17 137014.74 24211.19 4926.3 15634.8 12828
6 Outstanding loans 10095.98 27923.58 7265.14 2656.1 514.58 9.75
7 Man days- Workers 1391.5 394.94 108.19 74.73 12.65 72.05
8 Number of Workers 4580 1367 369 251 71 250
9 Man days-Employees 1802.81 514.96 118.29 81.57 17.7 90.97
10 Total Employees 5936 1795 403 275 111 318
11 Wages to Workers 11804.21 4630.05 955.18 284.84 80.07 264.18
12 Total Emoluments 27590.43 16678.01 1556.39 465.91 122.26 588.6
13 Fuels Consumed 16602.57 1395.49 914.23 607.79 175.24 76.91
14 Materials Consumed 388146.94 127597.55 9185.4 1847.7 10662 5575.6
15 Total Inputs 475634.99 167293.81 13163.94 2783 12057.1 7042.7
16 Products 571938.92 116821.25 12008.73 2745.4 279.76 8359.8
17 Value of Output 608826.34 191620.24 14710.47 2997.4 283.22 8462.6
18 GVA 133191.35 24326.43 1546.53 214.42 -11774 1419.9
19 Depreciation 20750.58 7414.23 1241.69 170.43 1670.18 335.85
20 Net Value Added 112440.77 16912.2 304.84 43.99 -13444 1084
21 Net Fixed Capital Formation 25991.8 -2814.09 245.41 797.1 -1224.8 -503.7
22 Gross Fixed Capital Formation 46742.38 4600.14 1487.1 967.53 445.35 -167.8
23 Materials, Fuels etc 8474.33 -6752.4 994.69 226 -277.12 40.01
24 Semi Fin. Goods 6692.38 -7969.54 251.55 131.35 -72.09 951.37
25 Finished Goods 10083.93 1236.28 2702.11 10.82 836.78 330.76
26 Total (20+21+22) 25250.64 -13485.66 3948.35 368.17 487.57 1322.1
27 Gross Cap Form 71993.02 -8885.52 5435.45 1335.7 932.92 1154.3

131
ANNEXURE - 7
Summary results of mfg. Sector by selected characteristics
and major industry group NIC - 2 digit level
DISTRICT : Chittoor (Value Figures, Mandays are in ‘000s and Others in No.)
Sl.
No CHARACTERISTIC
INDUSTRY GROUP
35 36 38 45 52 Total
1 Number of Factories 3 1 2 36 9 1057
2 Fixed Capital 7086.76 907.96 143.74 24982.82 1711.19 1140909.10
3 Physical Working Capital 5.13 0.00 96.58 11564.10 0.00 441271.02
4 Working Capital 13.49 0.00 64.75 16726.94 1603.74 -15406.85
5 Invested Capital 7091.88 907.56 240.32 36546.92 1711.19 1582179.91
6 Outstanding loans 0.00 0.00 0.00 4158.71 418.50 289588.98
7 Man days- Workers 0 3 1 493 68 11293
8 Number of Workers 0 10 3 1535 209 39354
9 Man days-Employees 1 5 2 718 95 13951
10 Total Employees 5 16 7 2267 288 48844
11 Wages to Workers 0.00 11.79 2.49 3727.04 193.02 57739.48
12 Total Emoluments 7.66 33.15 7.72 5577.70 277.69 110073.47
13 Fuels Consumed 0.35 16.54 19.28 3446.57 146.37 94966.85
14 Materials Consumed 0.00 0.52 59.86 17083.13 1.07 2369048.66
15 Total Inputs 0.45 21.41 88.73 110868.25 732.04 2884053.36
16 Products 0.00 57.48 98.72 26135.09 0.00 3057258.58
17 Value of Output 0.00 57.48 101.00 120234.83 2719.22 3499727.18
18 GVA -0.45 36.07 12.27 9366.58 1987.18 615673.82
19 Depreciation 642.46 18.84 16.46 2113.01 123.82 95995.60
20 Net Value Added -642.91 17.23 -4.19 7253.57 1863.36 519678.22
21 Net Fixed Capital
Formation -642.46 -18.84 -0.29 362.95 -119.49 -52081.15
22 Gross Fixed Capital
Formation 0.00 0.00 16.17 2475.96 4.33 43914.45
23 Materials, Fuels etc 0.00 0.00 42.32 -24.98 0.00 50459.62
24 Semi Fin. Goods 0.00 0.00 0.00 42.89 0.00 -442.88
25 Finished Goods 0.00 0.00 0.00 -181.42 0.00 21725.46
26 Total (20+21+22) 0.00 0.00 42.32 -163.51 0.00 71742.20
27 Gross Cap Form 0.00 0.00 58.49 2312.45 4.33 115656.65

132
ANNEXURE – 8
CONCEPTS AND DEFINITIONS
Various terms relating to a accounting and economic aspects related to the
factories are used in conduct of Annual Survey of Industries. For proper compilation /
verification of ASI return, it is essential that the staff engaged in the conduct of ASI
properly understands the terminology used in ASI. In this context, the concepts and
definitions of some of the important terms are given below.
Accounting Year
For the purpose of ASI, the accounting year is the period for which the factory
closes its books of account. With the enactment of Income Tax Act, by and large, the
accounting year of all factories is from April to March.
Reference Period
For ASI 2016-17 the financial year commencing from 1st April, 2016 and ending
on 31st March, 2017.
Survey Period
Survey period is a period during which work of any Annual Survey of Industries
is undertaken. The survey period for ASI 2016-17 is from September, 2017 to April,
2018.
Factory
Factory is one, which is registered under sections 2m (i) and 2m (ii) of the
Factory Act, 1948. The sections 2m (i) and 2m (ii) refer to any premises including the
precincts thereof (i) whereon ten or more workers are working, or were working on
any day of the preceding twelve months, and in any part of which a manufacturing
process is being carried on with the aid of power, or is ordinarily so carried on or (ii)
wherein twenty or more workers are working or were working on any day of the
preceding twelve months and in any part of which a manufacturing process is being
carried on without the aid of power , or is ordinarily so carried on. Closed Non
operating factories with fixed assets on site are also considered as registered factories
till they are de-registered and removed from the live-register maintained by the
Director of Factories in the State.

133
Fixed Capital
Fixed Capital represents the depreciated value of fixed assets owned by the
factory as on the closing day of the accounting year. Fixed assets are those, which
have normal productive life of more than one year. Fixed capital covers all type of
assets, new or used or own constructed, deployed for production, transportation, living
or recreational facilities, hospitals, schools, etc. for factory personnel. It would include
land, building, plant and machinery, furniture and fixtures, transport equipment etc. It
includes the fixed assets of the head office allocable to the factory and also the full
value of assets taken on hire-purchase basis (whether fully paid or not) excluding
interest element. It excludes intangible assets and assets solely used for post
manufacturing activities such as, sale, storage, distribution, etc.
Depreciation
Depreciation is consumption of fixed capital by the factory due to wear and tear
and obsolescence during the accounting year and is taken as provided by the factory
owner or if not provided by the factory this is estimated on the basis of cost of
installation and working life of the fixed assets
Physical Working Capital
This is defined to include all physical inventories owned, held or controlled by
the factory as on the closing day of the accounting year such as the materials, fuels and
lubricants, stores etc. that enter into products manufactured by the factory itself or
supplied by the factory to others for processing. Physical working capital also includes
the value of stock of materials, fuels and stores etc., purchased expressing for re-sale,
semi-finished goods and goods-in-process on account of others and goods made by
the factory which are ready for sale at the end of the accounting year. However, it does
not include the stock of the materials, fuels, stores etc. supplied by others to the factory
for processing. Finished goods processed by others from raw materials supplied by the
factory and held by them are included and finished goods processed by the factory
from raw materials supplied by others are excluded.
Working Capital is the sum total of the physical working capital as already
defined above and the cash deposits in hand and at bank and the net balance
receivable over amounts payable at the end of the accounting year. Amounts
receivable include value of credit items on revenue account, such as sums due to the
factory for goods sold, amounts advanced in connection with normal factory work,
bills of exchange payable to the factory, payments made in advance such as for fire
insurance, telephone charges, rates and taxes, call deposits and security deposits
having a normal life of less than one year, etc. Working capital, however, excludes
unused overdraft facility, fixed deposits irrespective of duration, advances for
acquisition of fixed assets, long-term loans including interest thereon and investments.

134
Invested Capital
Invested Capital is the total of fixed capital and physical working capital.
Productive Capital
This is the total of fixed capital and working capital.
Gross Value of Plant and Machinery
Gross Value of Plant and Machinery represents the total original (un-depreciated)
value of installed plant and machinery at the end of the accounting year. It includes the
book value of own constructed plant and machinery, if installed, and the approximate
value of rented-in plant & machinery as at the time of renting in but excludes the value
of rented-out plant & machinery. Total value of all the plant and machinery acquired
on hire-purchase basis is also included. Thus it represents the gross value of plant and
machinery engaged in production process.
Outstanding Loans
Outstanding Loans represent all loans, whether short-term or long-term, whether
interest bearing or not, outstanding according to the books of the factory as on the
closing day of the accounting year.
Rent paid
Rent paid represents the amount of royalty paid in the nature of rent for the use of
the fixed assets in the factory.
Interest paid
Interest paid includes all interest paid on factory account on loans whether short
term or long term, irrespective of the duration and the nature of agency from which the
loan was taken. Interest paid to partners and proprietors on capital or loan are
excluded.
Rent received
Rent received represents the amount of royalty received in the nature of rent for
the use of the fixed assets in the factory.
Interest received
Interest received includes all interest received on factory account on loans,
whether short term or long term, irrespective of the duration and the nature of agency
to which the loan was given. Interest received from partners and proprietors on capital
or loan are excluded.

135
Workers
Workers are defined to include all persons employed directly or through any
agency whether for wages or not and engaged in any manufacturing process or in
cleaning any part of the machinery or premises used for manufacturing process or in
any other kind of work incidental to or connected with the manufacturing process or
the subject of the manufacturing process. Labour engaged in the repair and
maintenance or production of fixed assets for factory's own use or labour employed for
generating electricity or producing coal, gas etc. are included.
Contract Worker
All persons who are not employed directly by an employer but through the third
agency, i.e., contractor, are termed as contract workers. Those workers may be
employed with or without the knowledge of the principal employer.
Employees
Employees relate to all persons engaged by the factory whether for wages or not,
in work connected directly or indirectly with the manufacturing process and include all
administrative, technical and clerical staff as also labour in production of capital assets
for factory’s own use. This is inclusive of persons holding position of supervision or
management or engaged in administrative office, store keeping section and welfare
section, watch and ward staff, sales department as also those engaged in purchase of
raw materials etc. and purchase of fixed assets for the factory. It also includes all
working proprietors and their family members who are actively engaged in the work of
the factory even without any pay and the unpaid members of the co- operative
societies who work in or for the factory in any direct and productive capacity. Persons
in the head office connected with the manufacturing activity of the factory are also
included in this item.
Labour Turnover
Labour Turnover measures the extent of change in the working force due to
accession and separation during a given period. The term ‘accession’ was defined as
the total number of workers added to employment during the period, whether new or
re-employed or transferred from other establishments or units under the same
management. Inter-departmental transfers within the same establishments are, however
ignored. The term ’separation’ implies termination of employment at the instance of
worker or employers. It includes termination of services due to death or retirement. As
in the case of accession, transfers to other establishments are included but transfers
within the same establishment are ignored. Retrenchment as a result of rationalization
or modernization or any other cause, is also treated as separation

136
Wages and Salaries
Wages and Salaries are defined to include all remuneration in monetary terms
and also payable more or less regularly in each pay period to workers as compensation
for work done during the accounting year. It includes (a) direct wages and salary (i.e.,
basic wages/salaries, payment of overtime, dearness, compensatory, house rent and
other allowances) (b) remuneration for the period not worked (i.e., basic wages,
salaries and allowances payable for leave period, paid holiday, lay- off payments and
compensation for unemployment, if not paid from sources other than employers) (c)
bonus and ex-gratia payment paid both at regular and less frequent intervals (i.e.,
incentive bonuses, good attendance bonuses, productive bonuses, profit sharing
bonuses, festival or year-end bonuses etc). It excludes layoff payments and
compensation for employment except where such payments are made from trust or
other special funds set up exclusively for this purpose i.e., payments not made by the
employer. It excludes employer's contribution to old age benefits and other social
security charges, direct expenditure on maternity benefits and crèches and other group
benefits in kind and traveling and other expenditure incurred for business purposes and
reimbursed by the employer. The wages are expressed in terms of gross value i.e.,
before deduction for fines, damages, taxes, provident fund, employee's state insurance
contribution etc. But benefits in kind (perquisites) of individual nature are only
included.
Bonus
Profit sharing bonus, festival bonus, year-end bonus and all other bonuses and
ex-gratia payments paid at less frequent intervals are covered by this term.
Workmen and Staff welfare Expenses
These include expenditure incurred by the employer on the maternity benefits
and crèches and other benefits such as supply of food, beverages, tobacco, clothing
and group lodging at concession rates and educational, cultural recreational facilities
and services and grants to trade unions, co-operative stores etc. meant for employees.
All group benefits are included.
Contribution to Provident Fund and Other Funds
Includes old age benefits like provident fund pension, gratuity etc. and
employer’s contribution towards other social security charges such as employee’s state
insurance, compensation for work injuries and occupational diseases, provident fund-
linked insurance, retrenchment and lay off benefits.
137
Emoluments
These are defined as the same way as wages but paid to all employees plus
imputed value of benefits in kind i.e. the net cost to the employers on those goods and
services provided to employees free of charge or at markedly reduced cost which are
clearly and primarily of benefit to the employees as consumers. It includes profit
sharing festival and other bonuses and ex-gratia payments paid at less frequent
intervals (i.e. other than bonus paid more or less regularly for each period). Benefits in
kind include supplies or services rendered such as housing, medical, education and
recreation facilities. Personal insurance, income tax, house rent allowance, conveyance
etc. for payment by the factory also is included in the emoluments.
Supplements to Emoluments
These include:
(i) Employer’s contribution to old age benefits, i.e., provident fund, pension,
gratuity, etc.,
(ii) Employer’s contribution towards other social security charges such as
Employee’s State Insurance, compensation for work injuries, occupational
diseases, maternity benefits retrenchment and lay-off benefits etc.; and
(iii) Group benefits like direct expenditure on maternity, crèches, canteen facilities,
educational, cultural and recreational facilities and grant to trade unions, co-
operative stores etc, meant for employees.
Mandays paid for
The number of man days paid for is arrived at by summing up the number of
employees paid for in each shift. This also includes man days on weekly schedule
holidays if paid for and those absences with pay as also man days lost through lay off /
strike for which compensation was payable.
Working Day:
Working Day means the days on which a manufacturing process and / or repair
or maintenance work was carried on.
Non Working Day
Apart from manufacturing day and repair and maintenance days there may be
some non-working days, are those days on which the workers give their attendance but
due to non-availability of raw materials, power etc., no effective work is done. As the
workers are paid for these days such days are also taken into account for the purpose
of labour statistics.
138
Basic Materials
Basic materials are the materials which are important and of key nature to the
industry on which the manufacturing process is based, e.g., metal for machine, leather
for shoe. Such material is not lost through the process of production but only changes
its forms.
Consumable Stores
All such materials which assist the manufacturing process and lose their identity
without entering the products are called consumable stores, e.g., cotton waste.
Fuel consumed
Fuel consumed represent total purchase value of all items of fuels, lubricants,
electricity, water (purchased to make steam) etc. consumed by the factory during the
accounting year except those which directly enter into products as materials consumed.
It excludes that part of fuels, which is produced and consumed by the factory in
manufacturing i.e., all intermediate products and also fuels consumed by employees as
part of amenities. It includes quantities acquired and consumed from allied concerns,
their book value being taken as their purchase value and also the quantities consumed
in production of machinery or other capital items for factory’s own use.
Materials Consumed
Materials consumed represent the total delivered value of all items of raw
materials, components, chemicals, packing materials and stores which actually enter
into the production process of the factory during the accounting year. It also includes
the cost of all materials used in the production of fixed assets, including construction
work for factory's own use. Components and accessories fitted as purchased with the
finished product during the accounting year are also to be included. It excludes
intermediate products. Intermediate products in above context means all those
products which are produced by the factory and consumed for further manufacturing
process.
Total Input
This comprises gross value of fuel, materials etc., consumed as well (as defined
above) and also other inputs viz. (a) cost of non-industrial services received from
others (b) cost of materials consumed for repair and maintenance of factory's fixed
assets including cost of work done by others to the factory’s fixed assets (c) cost of
contract and commission work done by others on materials supplied by the factory
(d) Cost of office supplies and products reported for sale during last year & used for
further manufacture during the accounting year.

139
Intermediate Product
Intermediate product is a product which is obtained during a manufacturing
process, which may or may not be saleable and is not the intended final product.
Net Value of Semi-finished Goods
It represents the excess / deficit of value of semi-finished goods and / or goods-
in-process at the end of the accounting year over that at the beginning of year.
Products
These are defined to include the ex-factory value (i.e. exclusive of taxes duties
etc. on sale and inclusive of subsidies etc., if any) of all products and by products,
excluding intermediate products, that have been completed during the accounting year
for sale whether actually sold during the accounting year or entered into books. Also
include fixed assets produced by the factory for its own use.
Gross Output
Gross Output is defined to include the ex-factory value, (i.e., exclusive of
taxes, duties, etc. on sale and inclusive of subsidies etc., if any) of products and by-
products manufactured during the accounting year, and the net value of the semi-
finished goods, work-in-progress (represents the excess / deficit of value of semi-
finished goods or work-in-progress at the end of the accounting year over that of the
beginning of the year plus net balance of semi-finished fixed assets on factory’s capital
account) and also the receipts for industrial and non-industrial services rendered to
others, value of semi-finished goods of last year sold in the current year and sale value
of goods sold in the same condition as purchased. Value of gross output and total
output has been used in the text inter-changeable to mean the same thing.
Semi-finished goods
It refers to the imputed value of all materials which have been partially processed
by the factory but which are not usually sold without further processing. It includes the
work in progress for materials supplied by others, but excludes the value of semi-
finished fixed assets produced for factory's own use.

140
Finished goods
Finished goods are those which are manufactured by the factory for sale. It does
not require further processing but includes packaging and labeling etc.
Imported Materials consumed on actual use
Comprise the portion of materials consumed and which are imported from other
countries. It may be raw materials or fuel or components and accessories of the input
basket.
Industrial Services
Any services taken or rendered from one to another unit resulting in increase in
the value of material during the manufacturing process are industrial services.
Non-Industrial Services
All such services which do not have a direct bearing on the manufacturing
process but are needed by any manufacturing unit are called non-industrial services,
say and transport.
Net Value Added
This is the increment to the value of goods and services that contributed by the
factory and is obtained by deducting the value of total inputs and depreciation from
gross value of output.

141
ANNEXURE - 9
NATIONAL INDUSTRIAL CLASSFICATION (NIC) 2008
Divisions: Classification at two digit, three digit and four digit level
Industry
Code (2-Digit)
Group
(3-Digit)
Class
(4-Digit) Description
01 016
0163
0164
Crop & Animal Production, Hunting & related activities
Support activities to Agriculture & Post Harvest Crop Activities
Post Harvest Crop Activities (Cotton Ginning, Cleaning & Bailing)
Seed Processing for Propagation
02 022
0220
Forestry and Logging.
Production of Charcoal in the forest(Using traditional Methods)
08 089
0893
Other mining and quarrying.
Mining and quarrying.
(Salt Production by evaporation of sea water or other saline water)
10
101
102
103
104
105
106
107
108
1010
1020
1030
1040
1050
1061
1062
1071
1072
1073
1074
1075
1079
1080
Manufacture of Food Products
Processing and preservation of meat
Processing and preserving of fish and fish products
Processing and preserving of fruits and vegetables
Manufacture of vegetable and animal oils and fats.
Manufacture of dairy products
Manufacture of Grain mill products (This class excludes potato floor
see 1030, vet corn milling 1062)
Manufacture of starches and starch products,
Manufacture of other Food Products
Manufacture of Sugar.
Manufacture of Cocoa, Chocolate and Sugar Confectionery.
Manufacture of macaroni, noodles, couscous and similar farinaceous
products.
Manufacture of prepared meals & Dishes
Manufacture of other food products n.e.c.(not elsewhere classified)
Manufacture of prepared animal feeds
11 110
1101
1102
1103
1104
Manufacture of beverages
Manufacture of beverages
Distilling, rectifying and blending of spirits; ethyl alcohol production
from fermented materials
Manufacture of wines
Manufacture of malt liquors and malt
Manufacture of soft drinks, production of mineral water & other bottled
waters
12 120
1200
Manufacture of Tobacco Products
Manufacture of tobacco products (Tobacco related products are also
included while preliminary processing of tobacco leaves is classified in
class 01633)
13
131
139
1311
1312
1313
1391
1392
1393
1394 1399
Manufacture of Textiles
Spinning, weaving, and finishing of textiles
Preparation and spinning of textile fibers
Weaving of Textiles
Finishing of textile (by the operations such as bleaching, dying,
calendaring, napping, shrinking or printing. No distinction is to be
made between these activities carried out on fee or contract basis or by
purchasing the material and selling the finished products.) Manufacture
of other textiles
Manufacture of knitted and crocheted fabrics
Manufacture of made up textile articles, except apparel.
Manufacture of carpets and rugs (manufacture of linoleum and other
hard surface floor coverings is classified in Class1629 ) Manufacture
of cordage, rope, twine and netting. Manufacture of other textiles n.e.c.

142
Industry
Code
(2-Digit)
Group
(3-Digit)
Class
(4-Digit)
Description
14 141
142
143
1410
1420
1430
Manufacture of wearing apparel;
Manufacture of wearing apparel, except fur
skins Manufacturing of articles of fur.
Manufacture of knitted and crocheted apparel
15 151
152
1511
1512
1520
Manufacture of Leather and related products
Tanning and dressing of leather; Manufacture of Luggage, Handbags
saddlers, Harness and dyeing of fur
Tanning and dressing of leather; dressing and dyeing of fur
Manufacture of luggage,handbags, and the like, Saddlery and harness
Manufacture of footwear
16
161
162
1610
1621
1622
1623
1629
Manufacture of wood and products of wood and cork, except furniture,
manufacture of articles of straw and plating materials
Saw milling and planning of wood.
Saw milling and planning of wood.
Manufacture of Products of wood, cork, straw and plaiting materials.
Manufacture of veneer sheets; manufacture of plywood, laminated board,
particle board and other panels and boards
Manufacture of builder’s carpentry and joinery.
Manufacture of wooden containers.
Manufacture of other products of wood, Manufacture of articles of cork,
straw and plaiting materials
17 170 1701
1702
1709
Manufacture of Paper and paper products.
Manufacture of Pulp, Paper and paper board.
Manufacture of corrugated Paper and paper board and containers of Paper
and paper board.
Manufacture of other articles of Paper and paper board
18
181
182
1811
1812
1820
Printing and reproduction of recorded media. (This division excludes
publishing activities, see section J for publishing activities)
Printing and service activities related to
printing. Printing
Service activities related to printing.
Reproduction of recorded media
19 191
192
1910
1920
Manufacture of Coke, Refined Petroleum Products
Manufacture of Coke oven products Manufacture of
refined petroleum products
20
201
202
203
2011
2012
2013
2021
2022
2023
2029
2030
Manufacture of Chemicals and Chemical Products
Manufacture of basic chemicals, fertilizer and nitrogen compounds, plastics
and synthetic rubber in primary forms.
Manufacture of basic chemicals
Manufacture fertilizers and nitrogen compounds.
Manufacture of plastics and synthetic rubber in primary forms
Manufacture of other Chemical products.
Manufacture of pesticides and other agrochemical products.
Manufacture of Paints, Varnishes and Similar coatings, printing ink and
mastics.
Manufacture of Soap and detergents, cleaning and polishing preparations,
perfumes and toilet preparations.
Manufacture of other chemical products n.e.c.
Manufacture of man-made fibers
21
210
2100
Manufacture of Pharmaceuticals, Medicinal chemical and Botanical
Products
Manufacture of Pharmaceuticals, Medicinal chemical and Botanical
Products

143
Industry
Code (2-Digit)
Group
(3-Digit)
Class (4-Digit)
Description
22 221
222
2211
2219
2220
Manufacture of rubber and Plastic products
Manufacture of rubber products.
Manufacture of rubber tyres and tubes, retreading and rebuilding of rubber tyres.
Manufacture of other rubber products.
Manufacture of Plastic Products.
Manufacture of Plastic Products
23 231
2310
2391
2392
2393
2394
2395
2396
2399
Manufacture of other Non-Metallic Mineral Products.
Manufacture of glass and glass products.
Manufacture of glass and glass products.
Manufacture of refractory products.
Manufacture of clay building materials.
Manufacture of other porcelain and ceramic products’
Manufacture of cement, lime and plaster.
Manufacture of articles of concrete, Cement and plaster.
Cutting, shaping and finishing of stone.
Manufacture of other non-metallic mineral products n.e.c.
24 241
242
243
2410
2420
2431
2432
Manufacture of Basic Metals
Manufacture of basic Iron and steel
Manufacture of basic Iron and steel
Manufacture of basic precious and non-ferrous metals.
Manufacture of basic precious and non-ferrous metals
Casting of metals
Casting of Iron and Steel Casting
of non-ferrous metals.
25
251
252
259
2511
2512
2513
2520
2591
2592
2593
2599
Manufacture of Fabricated metal products, except machinery and
equipments
Manufacture of structural metal products, tanks, reservoirs and steam generators.
Manufacture of structural metal products.
Manufacture of tanks, reservoirs and containers of metal
Manufacture of steam generators, except central heating hot water boilers.
Manufacture of weapons and ammunition
Manufacture of other fabricated metal products, metal working service activities.
Forging, pressing, stamping and roll-forming of metal, powder metallurgy.
Mechining,Treatment and coating of metals.
Manufacture of cutlery, hand tools and general hardware.
Manufacture of other fabricated metal products n.e.c.
26 261
262
263
264
265
266
267
268
2610
2620
2630
2640
2651
2652
2660
2670
2680
Manufacture of Computer, Electronic and Optical Products.
Manufacture of Electronic components.
Manufacture of Computers and peripheral equipment.
Manufacture of Communication of equipment.
Manufacture of Consumer Electronics.
Manufacture of measuring, testing, navigating and control equipment; watches
and clocks.
Manufacture of measuring, testing, navigating and control equipment.
Manufacture of watches and clocks.
Manufacture of irradiation, electro medical and electrotherapeutic equipment.
Manufacture of Optical instruments and equipment.
Manufacture of magnetic and optical media.

144
Industry
Code
(2-Digit)
Group
(3-Digit)
Class
(4-Digit)
Description
27 271
272
273
274
275
279
2710
2720
2730
2740
2750
2790
Manufacture of electrical equipment.
Manufacture of electric motors, generators, transformers and electricity
distribution and control apparatus.
Manufacture of batteries and accumulators.
Manufacture of wiring and wiring devices.
Manufacture of fibre optic cables for data transmission or live transmission
of images.
Manufacture of electric lighting equipment.
Manufacture of domestic appliances.
Manufacture of other electrical equipment.
28 281
282
2811
2812
2813
2814
2815
2816
2817
2818
2819
2821
2822
2823
2824
2825
2826
2829
Manufacture of machinery and equipment n.e.c.
Manufacture of General purpose machinery.
Manufacture of engines and turbines, except aircraft, vehicle and cycle
engines.
Manufacture of fluid power equipment.
Manufacture of other pumps, compressors, taps and valves,
Manufacture of bearings, gears, gearing and driving elements.
Manufacture of ovens, furnaces and furnace burners.
Manufacture of lifting and handling equipment.
Manufacture of office machinery and equipment
Manufacture of power-driven hand tools.
Manufacture of other general-purpose machinery.
Manufacture of special purpose machinery.
Manufacture of agricultural and forestry machinery.
Manufacture of metal-forming machinery and machine tools.
Manufacture of machinery for metallurgy.
Manufacture of machinery for mining, quarrying and construction.
Manufacture of machinery for food, beverages and tobacco processing.
Manufacture of machinery for textile, apparel and leather production.
Manufacture of other special purpose machinery.
29 291
292
293
2910
2920
2930
Manufacture of Motor Vehicles, Trailers, and Semi Trailers.
Manufacture of Motor Vehicles.
Manufacture of bodies (Coach work) for Motor Vehicles, Manufacture of
trailers and semi Trailers.
Manufacture of parts and accessories for motor vehicles.
30 301
302
303
304
309
3011
3012
3020
3030
3040
3091
3092
3099
Manufacture of other Transport equipment.
Building of ships and boats.
Building of ships and floating structures.
Building of pleasure and sporting boats.
Manufacture of railway locomotives and rolling stock.
Manufacture of aircraft and spacecraft and related machinery
Manufacture of weapon and ammunition.
Manufacture of transport equipment n.e.c.
Manufacture of Motor cycles
Manufacture of Bicycles, and invalid carriage.
Manufacture of other transport equipment n.e.c.
31 310
3100
Manufacture of furniture
Manufacture of furniture.
Manufacture of furniture
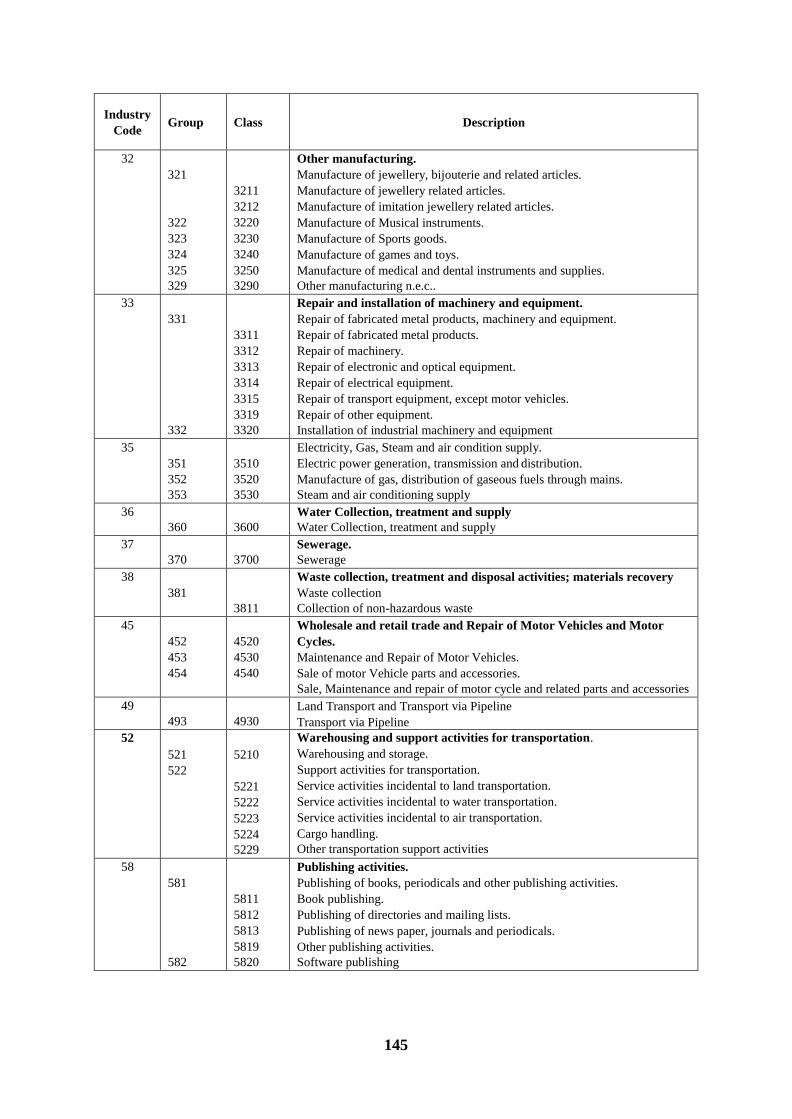
145
Industry
Code
Group
Class
Description
32 321
322
323
324
325
329
3211
3212
3220
3230
3240
3250
3290
Other manufacturing.
Manufacture of jewellery, bijouterie and related articles.
Manufacture of jewellery related articles.
Manufacture of imitation jewellery related articles.
Manufacture of Musical instruments.
Manufacture of Sports goods.
Manufacture of games and toys.
Manufacture of medical and dental instruments and supplies.
Other manufacturing n.e.c..
33 331
332
3311
3312
3313
3314
3315
3319
3320
Repair and installation of machinery and equipment.
Repair of fabricated metal products, machinery and equipment.
Repair of fabricated metal products.
Repair of machinery.
Repair of electronic and optical equipment.
Repair of electrical equipment.
Repair of transport equipment, except motor vehicles.
Repair of other equipment.
Installation of industrial machinery and equipment
35 351
352
353
3510
3520
3530
Electricity, Gas, Steam and air condition supply.
Electric power generation, transmission and distribution.
Manufacture of gas, distribution of gaseous fuels through mains.
Steam and air conditioning supply
36 360
3600
Water Collection, treatment and supply
Water Collection, treatment and supply
37 370
3700
Sewerage.
Sewerage
38 381
3811
Waste collection, treatment and disposal activities; materials recovery
Waste collection
Collection of non-hazardous waste
45 452
453
454
4520
4530
4540
Wholesale and retail trade and Repair of Motor Vehicles and Motor
Cycles.
Maintenance and Repair of Motor Vehicles.
Sale of motor Vehicle parts and accessories.
Sale, Maintenance and repair of motor cycle and related parts and accessories
49 493
4930
Land Transport and Transport via Pipeline
Transport via Pipeline
52 521
522
5210
5221
5222
5223
5224
5229
Warehousing and support activities for transportation.
Warehousing and storage.
Support activities for transportation.
Service activities incidental to land transportation.
Service activities incidental to water transportation.
Service activities incidental to air transportation.
Cargo handling.
Other transportation support activities
58 581
582
5811
5812
5813
5819
5820
Publishing activities.
Publishing of books, periodicals and other publishing activities.
Book publishing.
Publishing of directories and mailing lists.
Publishing of news paper, journals and periodicals.
Other publishing activities.
Software publishing

146
CONFIDENTIAL Government of India
Ministry of Statistics and Programme Implementation Return under Collection of Statistics Act, 2008 and rules framed there under in 2011 Annual Survey of Industries 2015-2016 (Part –I)
(Please read the instructions before filling the return)
Block A: Identification particulars (for official use)
1. Schedule Despatch (DSL) No.
2. PSL No.
3. Scheme code (Census-1, Sample-2)
4. Industry code as per frame (4-digit level of NIC-2008)
5. Industry code as per return (5-digit level of NIC-2008)
6. Description of Industry:
7. State Code
8. District Code
9. Sector (Rural-1, Urban-2)
10. RO /SRO code
11. No. of Units
12. Status of Unit (Code)
Block B: Particulars of the factory (to be filled by owner of the factory)
1. Name and address of the Industrial undertaking: 1.1 Vill./Town:
1.2 District name:
1.3 State name:
1.4 PIN Code
2. Type of organisation (code)
3. Company Identification Number (CIN)
4. Whether the unit has ISO Certification, 14000 Series (yes-1, no-2)
5. Year of initial production
6. Accounting year (........... to ............ ) to
7. Number of months of operation
8. Whether the share capital of the company includes share of foreign entities (yes-1, no-2)
9. Any R&D unit in your factory?
(yes & registered with DST/DBT-1, yes & registered with others-
2, no-3)
10. Details of contact
person
i) Name & designation:
ii) Tele (with STD code)
iii) FAX no.
iv) E-mail
DECLARATION I hereby declare that information furnished in this return is correct and complete to the best of my knowledge and belief.
Date :
Place : (Name and Signature of owner with stamp)

147
Block C: FIXED ASSETS
Sl.
No. Type of Assets Gross value
(Rs.) Depreciation (Rs.) Net value (Rs.)
Opening
as on
- - - -
Addition during the year Deduction
&
adjustment
during the
year
Closing
as on
- - - - (cols.
3+4+5-6)
Up to year
beginning
Provi-
ded
during
the
year
Adjustment
for sold/
discarded
during the
year
Up to
year end
(cols.
8+9 -10)
Opening
as on
- - - - - (cols. 3-
8)
Closing
as on
- - - - - - (cols. 7-
11)
Due
to
revalu
ation
Actual
additions
(1) (2) (3) (4) (5) (6) (7) (8) (9) (10) (11) (12) (13)
1. Land
2. Building
3. Plant & Machinery
4. Transport equipment
5. Computer
equipment
including software
6. Pollution control
equipment/
Environment
improvement
equipment
7. Others
8. Sub-total (items 2
to7)
9. Capital work in progress
10. Total
(items 1+8+9)

148
DSL No PSL No
Block D: WORKING CAPITAL AND LOANS
Sl. No. Items Opening (Rs.) Closing (Rs.)
(1) (2) (3) (4)
1. Raw Materials & Components and Packing materials
2. Fuels & Lubricants
3. Spares, Stores & others
4. Sub-total (items 1 to 3)
5. Semi-finished goods/work in progress
6. Finished goods
7. Total inventory ( items 4 to 6)
8. Cash in Hand & at Bank
9. Sundry Debtors
10. Other current assets
11. Total current assets (items 7 to 10)
12. Sundry Creditors
13. Over draft, cash credit, other short term loan from banks & other financial institutions
14. Other current liabilities
15. Total current liabilities (items 12 to 14)
16. Working Capital (item 11-item 15)*
17. Outstanding loans (excluding interest but including deposits)**
Note: * Give reasons in the footnote for negative values and abnormal verification in opening and closing values.
** If outstanding loans include interest, a footnote may be given

149
Block E: EMPLOYMENT AND LABOUR COST
Sl. No.
Category of staff
Man-days worked Average
number of persons worked
No. of
mandays paid for
Wages/
salaries (in Rs.)
Manu- facturing
Non Manufacturing
Total
1 2 3 4 5 6 7 8
Part A: Details for each category of staff
1. Male workers employed directly
2. Female workers employed directly
3. Sub-total (items 1 + 2)
4. Workers employed through contractors
5. Total workers (items 3 + 4)
6. Supervisory & managerial staff
7. Other employees
8. Unpaid family members/ proprietor/ coop. members
9. Total employees
(items 5+6+7+8)
Part B: Some details for all categories of staff combined
10. Bonus (in Rs.)
11. Contribution to provident & other funds (in Rs.)
12. Workmen & staff welfare expenses (in Rs.)
13.
Number of working days
(i) Manufacturing days
(ii) Non-manufacturing days
(iii) Total ( i+ ii)
14.
Total cost of production (in Rs.)
[entry in col. 8 of item 9, 10, 11, and 12, block E + entry in col. 3 of item 1, 2(i), 2(ii), 3, 4, 5, 6, 7, 8, 9 & 10, block
F + entry in col. 6 of item 23 of block H + entry in col. 6 of item 7, block I]
DSL No PSL No

150
Block F : OTHER EXPENSES
Sl. No. Items Expenditure (in Rs.)
(1) (2) (3)
O
T
H
E
R
I
N
P
U
T
1. Work done by others on materials supplied by the industrial undertaking
2. Repair & maintenance of
(i) Buildings and other construction
(ii) Other fixed assets
3. Operating expenses
4. Expenses on raw materials and other components for own construction
5. Insurance charges
6. Rent paid for plant & machinery and other fixed assets
7. Expenses on Research & Development (R&D)
8. Rent paid for buildings
9. Rent paid for land on lease or royalties on mines, quarries and similar assets
10. Interest paid
11. Purchase value of goods sold in the same condition as purchased
Block G: OTHER OUTPUT/RECEIPTS
Sl. No. Items Receipts (in Rs.)
(1) (2) (3)
O
T
H
E
R
O
U
T
P
U
T
1. Receipts from manufacturing services (including
work done for others on materials supplied by
them and sale value of waste left by the party)
2. Receipts from non-manufacturing services (including non-industrial services)
3. Value of electricity generated and sold
4. Value of own construction
5. Net balance of goods sold in the same condition
as purchased. (item 11 of block G minus item 11 of block F)
6. Rent received for plant & machinery and other fixed assets
7. Variation in stock of semi-finished goods (col.4 minus col 3 against item 5 in block D)
8. Rent received for buildings
9. Rent received for land on lease or royalties on mines, quarries and similar assets
10. Interest received
11. Sale value of goods sold in the same condition as purchased
12. Other production subsidies
DSL No PSL No

151
DSL No PSL No
Block H: Indigenous input items consumed (if needed, additional sheets may be used for recording input items with serial nos. starting from 25)
Sl. No.
Item description Item code (NPC-MS)
Unit of quantity
Quantity consumed Purchase value ( in Rs.)
Rate per unit (in Rs.)
(1) (2) (3) (4) (5) (6) (7) Major ten basic items (indigenous)
1.
2.
3.
4.
5.
6.
7.
8.
9.
10.
11. Other basic items (indigenous)* 9920100
12. Total basic items (items 1 to 11) 9990100
13. Non-basic chemicals all kinds 9920300
14. Packing items 9990800
15. Electricity own generated 9990400 KWH
16. Electricity purchased & consumed 9990500 KWH
17. Petrol,diesel,oil,lubricants consumed 9990600
18. Coal consumed 9990700 Tonne
19 Gas consumed 9990900 KG
20. Other fuel consumed 9920400
21. Consumable store 9922000
22. Total non-basic items (items 13 to 21) 9992000
23. Total inputs (items 12+ 22) 9993000
24. Any additional requirement of electricity (unmet demand)
9999999 KWH
Full description of items not in NPC-MS 2011 (Revised):

152
Block I: Imported input items consumed - directly only (if needed, additional sheets may be used for recording input items with serial nos. starting from 8)
Sl. No.
Item description (Major five imported items)
Item code
(NPC-MS)
Unit of quantity Quantity consumed Purchase value (in Rs.) Rate per unit (in Rs.)
(1) (2) (3) (4) (5) (6) (7)
1.
2.
3.
4.
5.
6. Other imported items 9922100
7. Total imports
(consumed) (items 1 to 6)
9994000
DSL No PSL No
Block J: Products and by-products manufactured by the unit (if needed, additional sheets may be used for recording output items with serial nos. starting from 14)
Sl. No.
Products/By-
products description
(First ten major
items as per value -
no brand name)
Item code
(NPC-
MS)
Unit of
quantity
Quantity
manu-
factured
Quantity
sold
Gross sale
value (Rs)
Distributive expenses (Rs.) Per unit net sale
value (Rs. 0.00)
(col. 7-[col.
8+col. 9+col.10-
col.11]) ÷ col. 6
Ex-factory value
of quantity
manufactured
(Rs.) (col.12×
col.5)
Excise
duty
Sales
tax/
VAT
Others Subsidy
(-)
(1) (2) (3) (4) (5) (6) (7) (8) (9) (10) (11) (12) (13)
1.
2.
3.
4.
5.
6.
7.
8.
9.
10.
11. Other products/ by-products*
9921100
12. Total ( items 1 to 11) 9995000
13. Share (%) of products/by-products directly exported
* Full description of items not in NPC-MS 2011 (Revised):

153
Block K: Information and Communication technology (ICT)
usage Sl. No. ICT indicator yes-1, no-2
1. Did the factory use computer/s during FY
2015-16?
2. Did the factory use the internet during FY 2015-16?
3. Did the factory have a website as on the date of survey?
4. Did the factory receive orders via the internet during FY 2015-16?
5. Did the factory place orders for business purpose via the internet during FY 2015-16?
6. Did the factory connect to the internet either
by a. Narrowband or b. Fixed broadband or c. Mobile broadband during FY 2015-16?
7. Does the factory have a local area network (LAN) as on the date of survey?
Block L: Energy Conservation (EC) measures
Sl. No. EC indicator yes-1, no-2
Have any measures been taken during
last financial year with regard to:
1. Electrical saving?
2. Coal saving?
3. Oil saving?
4. Gas saving?
DSL No PSL No
FOR OFFICIAL USE ONLY: Block M: Particulars of field operations
1. Name of Superintending Officer 5. Date of receipt from factory
2. Signature of Superintending Officer 6. Date of verification/compilation
3. Name & Designation of Scrutinising Officer
7. Date(s) of scrutiny
4. Signature of Scrutinising Officer 8. Date of despatch
Block N: Comments of Superintending Officer/Scrutinising Officer
Note: Reasons for negative working capital and for any abnormal values or entries (high or low) in respect to important characteristics (Such as GVA,
working capital, wage rate, number of workers, distributive expenses, depreciation etc.) should be given invariably. For instance the reasons for high GVA
could be increased demand/production, profit, govt. subsidy; or for low GVA, the reasons could be decreased demand/production, capacity under-utilization,
high input cost etc. similarly reasons for any abnormal values of certain important ratios eg. Ratio of output to input, ratio of depreciation/distributive
expenses to output etc should be given. Please refer to detailed instructions also for further guidance.

154
Directorate of Economics & Statistics
Government of Andhra Pradesh,