Embed Size (px)
Citation preview

Annual Surveillance Report 2018

Acknowledgements The Public Health Agency Northern Ireland gratefully acknowledges all those who
contributed to this report, including; physicians, nurses, microbiologists, laboratory staff, and
administrative staff who provide or contribute information on the surveillance of
tuberculosis.
Authors M. G. O’Doherty, E.Dickson, E. Walker and M. Devine
Public Health Agency 12-22 Linenhall Street Belfast BT2 8BS Tel: 0300 555 0114 www.publichealth.hscni.net

Epidemiology of Tuberculosis in Northern Ireland, Annual Surveillance Report 2018
2
Contents
Acknowledgements ..................................................................................................... 1
Authors ........................................................................................................................ 1
Contents ...................................................................................................................... 2
Key Points ................................................................................................................... 3
Introduction .................................................................................................................. 4
Definitions .................................................................................................................... 5
Methodology ................................................................................................................ 6
Results ........................................................................................................................ 7
Demographic characteristics ....................................................................................... 9
Clinical characteristics ............................................................................................... 12
Microbiology .............................................................................................................. 22
Drug resistance ......................................................................................................... 23
Treatment outcomes.................................................................................................. 24
Discussion ................................................................................................................. 26
References ................................................................................................................ 28

Epidemiology of Tuberculosis in Northern Ireland, Annual Surveillance Report 2018
3
Key Points
There were 56 cases of tuberculosis (TB) notified in Northern Ireland in 2018 giving
the lowest recorded rate of TB in Northern Ireland of 3.0 cases per 100,000
population.
The average rate of TB was 3.8 cases per 100,000 population in 2016-2018.
The average rates of TB were highest in the Southern Health and Social Care Trust
at 7.5 cases per 100,000 population in 2016-2018.
Demographic characteristic
The highest average rates of TB were observed in those aged 65 years and over at
5.8 cases per 100,000 population in 2016-2018.
The proportion of TB cases born outside the UK/Ireland was 57% (n=32/56) in 2018.
The average rate was highest in this population at 42.4 cases per 100,000
population in 2016-2018.
Clinical characteristics
The average rate of pulmonary TB in Northern Ireland was 2.4 cases per 100,000
population in 2016-2018.
The average rate of non-pulmonary TB in Northern Ireland was 1.4 cases per
100,000 population in 2016-2018.
Microbiology
64% (n=36/56) of TB cases were culture confirmed in 2018.
Drug resistance
In 2018, <5 culture confirmed TB cases were recorded as resistant to first line
treatment.
Treatment outcome
The proportion of drug sensitive TB cases that completed treatment by 12 months,
an indicator of the quality of the TB service, was 78% (n=50/64) in 2017.

Epidemiology of Tuberculosis in Northern Ireland, Annual Surveillance Report 2018
4
Introduction This report presents the epidemiological data for tuberculosis (TB) cases reported in
Northern Ireland from 1 January 2018 to 31 December 2018. This report also presents data
from previous years for comparative purposes and to give indications of trends in TB
epidemiology.
The outcome of TB treatments are collected annually and reported in retrospect. The
treatment outcomes reported in this report are for those individuals notified to the Public
Health Agency (PHA) from 1 January 2017 to 31 December 2017.
There may be slight differences in numbers of TB cases quoted in the UK National TB
report compared with this regional report, principally due to differences in time of data
extraction and analysis between the two reports. This regional report takes account of late
notifications that may have been reported after the national data extraction process has
taken place.

Epidemiology of Tuberculosis in Northern Ireland, Annual Surveillance Report 2018
5
Definitions Notified case: Refers to clinically active disease caused, or thought to be caused, by
infection with organisms of the Mycobacterium tuberculosis complex (Mycobacterium
tuberculosis, Mycobacterium bovis, Mycobacterium africanum).
Culture confirmed cases: Where the diagnosis has been confirmed by culture as M.
tuberculosis, M. bovis or M. africanum.
Other than culture confirmed cases: In the absence of culture confirmation, a case with a
clinician’s judgement that the patient’s clinical and/or radiological signs and/or symptoms
are compatible with TB and a clinician’s decision to treat the patient with a full course of
anti-tuberculosis treatment1.
Pulmonary tuberculosis: A disease involving the lung parenchyma and/or
tracheobronchial tree, with or without extra-pulmonary tuberculosis diagnosis1.
Sputum smear result: Sputum smear positive TB is defined as a positive microscopy
result on spontaneously produced or induced sputum.
Multi-drug resistance (MDR): Resistance to at least isoniazid and rifampicin1.
Extensively-drug resistant (XDR): MDR case with additional resistance to any
fluoroquinolone and at least one of the second-line drugs (capreomycin, karamycin,
amikacin)1.
Health and Social Care Trusts (HSCTs) in Northern Ireland: There are five HSCTs in
Northern Ireland; Belfast (BHSCT), South Eastern (SEHSCT), Northern (NHSCT), Southern
(SHSCT) and Western (WHSCT).
Treatment outcome: A patient is defined as having completed treatment if; a) the case
was reported, b) the patient completed a full course of treatment and c) was officially
discharged by the attending physician.

Epidemiology of Tuberculosis in Northern Ireland, Annual Surveillance Report 2018
6
Methodology Data collection
Completed TB notification forms are forwarded to PHA in Northern Ireland where the
information is entered onto a secure database. Treatment outcome forms are generated
and forwarded, approximately 12 months after initial notification, to the patient’s clinician,
who then returns them to the PHA. This information is then appended to the initial
notification details.
Information on M. tuberculosis complex isolates is obtained from local hospital diagnostic
laboratories and the mycobacterial reference laboratory. Collected data include species (M.
tuberculosis, M. bovis and M. africanum), specimen type, strain type and drug susceptibility.
Data on cause of death, including TB, are also collected from the Northern Ireland Statistics
and Research Agency (NISRA).
Datasets are validated (using laboratory reports and anti-microbial susceptibility
information), updated and analysed.
Data analysis
Data are entered onto the PHE National Enhanced TB Surveillance database and
analysed. TB rates per 100,000 population, stratified by age, sex and HSCT in Northern
Ireland, are calculated using the mid-year estimates of the Northern Ireland population from
NISRA. Three-year moving averages are calculated, where possible, as relatively small
differences in the number of cases each year can give rise to substantial percentage
changes due to small numbers and considerable year to year variation. Summary
information on cases is reported only if the numbers do not risk data confidentiality.

Epidemiology of Tuberculosis in Northern Ireland, Annual Surveillance Report 2018
7
0.0
1.0
2.0
3.0
4.0
5.0
6.0
0
10
20
30
40
50
60
70
80
90
100
Ra
te p
er
100
,00
0 p
op
ula
tio
n
Nu
mb
er
of
cas
es
Average number of cases Average rate per 100,000 Average mean rate
Results Overall number of cases and rates of infection
Northern Ireland is a low incidence region for TB averaging 4 cases per 100,000 population.
In 2018, a total of 56 cases of TB were reported giving a rate of 3.0 cases per 100,000
population, which is the lowest recorded rate in Northern Ireland. The three-year moving
average numbers and rates of notified TB cases between 2008 and 2018 are shown in
Figure 1. The average rate in 2016-2018 was similar to that in 2015-2017, 3.8 TB cases per
100,000 compared to 3.9 per 100,000. The average number of TB cases was also similar,
71 cases for the period 2016-2018 compared to 73 for 2015-2017.
Figure 1: Three-year moving average numbers and rates of TB cases, Northern Ireland, 2008-2018
In 2016-2018, the average TB rate was highest in SHSCT at 7.5 cases per 100,000, similar
to the previous period (2015-2017) when the rate in SHSCT was also highest at 7.4 per
100,000. The average number of TB cases in SHSCT was 29 in 2016-2018 (28 cases in
2015-2017). The average TB rates and average number of cases decreased in BHSCT and
SEHSCT between 2015-2017 and 2016-2018, whilst remaining relatively stable in the
NHSCT and WHSCT (Figures 2 and 3).

Epidemiology of Tuberculosis in Northern Ireland, Annual Surveillance Report 2018
8
0.0
1.0
2.0
3.0
4.0
5.0
6.0
7.0
8.0
9.0
0
5
10
15
20
25
30
Ra
te p
er
10
0,0
00
po
pu
lati
on
Nu
mb
er
of
ca
se
s
BHSCT
Average number of cases
Average rate per 100,000
0.0
1.0
2.0
3.0
4.0
5.0
6.0
7.0
8.0
9.0
10.0
0
5
10
15
20
25
30
35
Ra
te p
er
10
0,0
00
po
pu
lati
on
Nu
mb
er
of
ca
se
s
NHSCT
Average number of cases
Average rate per 100,000
0.01.02.03.04.05.06.07.08.09.010.0
0
5
10
15
20
25
30
35
Rate
pe
r 1
00
,00
0 p
op
ula
tio
n
Nu
mb
er
of
ca
se
s
SEHSCT
Average number of cases
Average rate per 100,000
0.01.02.03.04.05.06.07.08.09.010.0
0
5
10
15
20
25
30
35
Rate
pe
r 1
00
,00
0 p
op
ula
tio
n
Nu
mb
er
of
ca
se
s
SHSCT
Average number of cases
Average rate per 100,000
0.0
1.0
2.0
3.0
4.0
5.0
6.0
7.0
8.0
9.0
10.0
0
5
10
15
20
25
30
35
Rate
pe
r 1
00
,00
0 p
op
ula
tio
n
Nu
mb
er
of
ca
se
s
WHSCT
Average number of cases
Average rate per 100,000
Figure 2: Three-year moving average numbers and rates of TB cases by HSCT, Northern Ireland, 2008-2018

Epidemiology of Tuberculosis in Northern Ireland, Annual Surveillance Report 2018
9
Figure 3: Three-year moving average rates of TB cases by HSCT, Northern Ireland, 2008-2018
Demographic characteristics Age and gender
Of the 56 notified cases of TB in 2018, 70% (n=39/56) were male and 30% (n=17/56) were
female. The ages ranged from 12 years to 90 years, with a median age of 49 years and a
mean age of 50 years.
Patients aged 15-44 years accounted for the majority of cases reported in 2018, 41%
(n=23/56), a decrease from 2017 when this group accounted for 49% of cases.
However, the average rate of TB remained highest in those aged 65 years and over at 5.8
cases per 100,000 population in 2016-2018, which was a slight increase from 5.5 cases per
100,000 in 2015-2017. The average TB rate remained relatively stable in those aged 0-14
years in 2016-2018, whilst the rate decreased slightly in those aged 15-44 years. The
0.0
1.0
2.0
3.0
4.0
5.0
6.0
7.0
8.0
9.0
Ra
te p
er
100
,00
0 p
op
ula
tio
n
BHSCT NHSCT SEHSCT SHSCT WHSCT

Epidemiology of Tuberculosis in Northern Ireland, Annual Surveillance Report 2018
10
average TB rate increased from 3.9 cases per 100,000 in 2015-2017 to 4.2 per 100,000 in
2016-2018 in those aged 45-64 years (Figure 4).
Figure 4: Three-year moving average age-specific disease rates of TB cases, Northern Ireland, 2008-2018
Place of birth
In 2018, 57% (n=32/56) of TB cases were born outside the UK/Ireland, an increase
compared with 2017 when the proportion was 51%. The highest average rates of TB
remained in those born outside the UK/Ireland at 42.4 per 100,000 in 2016-2018 (40.6 per
100,000 in 2015-2017). The average rate of TB in the UK-born population remained
relatively stable at 2.0 cases per 100,000 population in 2016-2018 compared with 2.2 per
100,000 in 2015-2017 (Figure 5).
In 2018, the highest proportion of UK-born TB cases occurred in those aged 65 years and
over (50%, n=12/24). In comparison, the highest proportion of non-UK born TB cases were
in those aged 15-44 years (56%, n=18/32).
0.0
1.0
2.0
3.0
4.0
5.0
6.0
7.0
8.0
9.0
10.0
Ra
te p
er
100
,00
0 p
op
ula
tio
n
0-14 15-44 45-64 65+

Epidemiology of Tuberculosis in Northern Ireland, Annual Surveillance Report 2018
11
Figure 5: Three-year moving average numbers and rate of UK-born and non-UK born TB cases, Northern Ireland, 2008-2018
Time from entry to UK to diagnosis
Time from entry into Northern Ireland until TB diagnosis in 2018 was known for 81%
(n=26/32) of cases born outside the UK/Ireland. Of these, the majority were diagnosed
between three and nine years of entry (54%, n=14/26).
Social risk factors
In 2018, 18% (n=10/56) of TB cases were reported as having at least one social risk factor.
The risk factors associated with the cases were reported as being homeless and/or a
history of alcohol misuse/abuse and/or a history of drug misuse/abuse and/or were in prison
in the last five years. However, non-reporting of risk factors may not be indicative of there
being no risk factors existing; therefore it is difficult to ascertain the true incidence.
Deprivation
The rates of TB are falling among those in the most deprived areas but they remain almost
twice that of those living in the least deprived areas. In 2016-2018 the average rate of TB in
0.0
10.0
20.0
30.0
40.0
50.0
60.0
0
5
10
15
20
25
30
35
40
45
50
Ra
te p
er
100
,00
0 p
op
ula
tio
n
Nu
mb
er
of
cas
es
Average number of UK born cases Average number of non-UK born cases
Average UK born rate per 100,000 Average non-UK born rate per 100,000

Epidemiology of Tuberculosis in Northern Ireland, Annual Surveillance Report 2018
12
the most deprived areas of Northern Ireland was 4.8 cases per 100,000 population
compared with 2.4 per 100,000 in the least deprived areas (Figure 6).
Figure 6: Three-year moving average rate of TB cases by deprivation, Northern Ireland 2008-2018 The Northern Ireland Multiple Deprivation Measure (NIMDM) 2017 is an overall measure of multiple deprivation experienced by people living in an area and is measured at Super Output Area (SOA) level. Commissioned output is based on Small Area Population Estimates for 890 Super Output Areas in Northern Ireland. NISRA – Deprivation Statistics branch.
Clinical characteristics The average rate of pulmonary and non-pulmonary TB cases in Northern Ireland remained
relatively stable between 2016-2018 and 2015-2017 (2.4 vs. 2.3 cases and 1.4 vs. 1.6
cases per 100,000 population, respectively) (Figure 7).
0.0
1.0
2.0
3.0
4.0
5.0
6.0
7.0
8.0
9.0
10.0
Ra
te p
er
100
,00
0 p
op
ula
tio
n
Quintile 1 (most deprived) Quintile 2 Quintile 3 Quintile 4 Quintile 5 (least deprived)

Epidemiology of Tuberculosis in Northern Ireland, Annual Surveillance Report 2018
13
Figure 7: Three-year moving average numbers and rates of pulmonary and non-pulmonary TB cases, Northern Ireland, 2008-2018
Site of disease
Pulmonary involvement was reported as a site of disease in 71% (n=40/56) of cases in
2018. Extra-thoracic and intra-thoracic lymph nodes were reported as a site of disease in
30% (n=17/56) of cases in 2018. Other reported sites of disease included extra pulmonary,
pleural, miliary, CNS meningitis and other, gastrointestinal/peritoneal, bone joint space and
other, and genitourinary. The total percentage exceeds 100% due to infections at more than
one site.
Site of disease - pulmonary
In 2018, 75% (n=18/24) of UK-born cases had pulmonary TB, which is higher compared to
the proportion of cases in 2017 (69%). The proportion of pulmonary disease in those born
outside the UK/Ireland also increased, from 61% in 2017 to 69% (n=22/32) in 2018 (Figure
8).
0.0
0.5
1.0
1.5
2.0
2.5
3.0
0
10
20
30
40
50
60
Ra
te p
er
100
,00
0 p
op
ula
tio
n
Nu
mb
er
of
cas
es
Average number of pulmonary cases Average number of non-pulmonary cases
Average pulmonary rate per 100,000 Average non-pulmonary rate per 100,000

Epidemiology of Tuberculosis in Northern Ireland, Annual Surveillance Report 2018
14
Figure 8: Proportion of UK and non-UK born pulmonary TB cases, Northern Ireland 2009-2018
The average rates of pulmonary TB remained similar in those aged 0-14 years (0.5 cases
per 100,000 population) and 15-44 years (2.4 per 100,000) in 2016-2018, compared to the
rates in 2015-2017 (0.7 and 2.5 per 100,000, respectively). The average pulmonary TB rate
increased in those aged 45-64 years from 2.7 cases per 100,000 in 2015-2017 to 3.1 per
100,000 in 2016-2018. The average rate of pulmonary TB also increased in those aged 65
years and older in 2016-2018, 3.9 cases per 100,000 compared to 3.1 per 100,000 in 2015-
2017.
Average pulmonary disease rates were lower in all age groups in females compared to
males in 2016-2018, with the exception of those aged 0-14 years. The highest average rate
of pulmonary TB in both males and females occurred in those aged 65 years and older in
2016-2018; 5.6 cases per 100,000 population in males and 2.4 per 100,000 in females
(Figures 9, 10 and 11).
0%
10%
20%
30%
40%
50%
60%
70%
80%
90%
100%P
rop
ort
ion
of
UK
an
d N
on
-UK
bo
rn c
ases
Proportion pulmonary UK born Proportion pulmonary non-UK born

Epidemiology of Tuberculosis in Northern Ireland, Annual Surveillance Report 2018
15
Figure 9: Three-year moving average age-specific disease rates of pulmonary TB cases, Northern Ireland, 2008-2018
Figure 10: Three-year moving average age-specific disease rates of pulmonary TB cases in males, Northern Ireland, 2008-2018
0.0
1.0
2.0
3.0
4.0
5.0
6.0
7.0
8.0
Ra
te p
er
100
,00
0 p
op
ula
tio
n
0-14 15-44 45-64 65+
0.0
1.0
2.0
3.0
4.0
5.0
6.0
7.0
8.0
Rate
per
100,0
00 m
ale
po
pu
lati
on
Average male rate per 100,000 (all ages) Average male rate per 100,000 (ages 0-14)
Average male rate per 100,000 (ages 15-44) Average male rate per 100,000 (45-64)
Average male rate per 100,000 (age 65+)

Epidemiology of Tuberculosis in Northern Ireland, Annual Surveillance Report 2018
16
Figure 11: Three-year moving average age-specific disease rates of pulmonary TB cases in females, Northern Ireland, 2008-2018
SHSCT had the highest rate of TB with a pulmonary component at 5.5 cases per 100,000
population and accounted for 75% (n=21/28) of all TB cases reported in SHSCT in 2018.
SEHSCT had the highest proportion of pulmonary TB cases (80%) in 2018 with a rate of 1.1
pulmonary TB cases per 100,000 (Figure 12).
0.0
1.0
2.0
3.0
4.0
5.0
6.0
7.0
8.0
Ra
te p
er
100
,00
0 f
em
ale
po
pu
lati
on
Average female rate per 100,000 (all ages) Average female rate per 100,000 (ages 0-14)
Average female rate per 100,000 (ages 15-44) Average female rate per 100,000 (ages 45-64)
Average female rate per 100,000 (age 65+)

Epidemiology of Tuberculosis in Northern Ireland, Annual Surveillance Report 2018
17
Figure 12: Proportion of TB cases in HSCTs with pulmonary infection, Northern Ireland, 2009-2018
Site of disease - non-pulmonary
The proportion of non-pulmonary TB continued to decrease in both UK-born and non-UK
born cases in 2018 compared to previous years. In 2018, 25% (n=6/24) of cases born in the
UK were diagnosed with non-pulmonary TB, compared to 31% in 2017. The proportion of
cases born outside the UK/Ireland who presented with non-pulmonary TB decreased from
39% in 2017 to 31% (n=10/32) in 2018 (Figure 13).
0%
10%
20%
30%
40%
50%
60%
70%
80%
90%
100%
2009 2010 2011 2012 2013 2014 2015 2016 2017 2018
Pro
po
rtio
n o
f p
ulm
on
ary
TB
cas
es
BHSCT NHSCT SEHSCT SHSCT WHSCT

Epidemiology of Tuberculosis in Northern Ireland, Annual Surveillance Report 2018
18
Figure 13: Proportion of UK and non-UK non-pulmonary TB cases, Northern Ireland, 2009-2018
The average rates of non-pulmonary TB remained similar in those aged 0-14 years (0.1
cases per 100,000 population) and 45-64 years (1.1 per 100,000) in 2016-2018, compared
to the rates in 2015-2017 (0 and 1.1 per 100,000, respectively). The average non-
pulmonary TB rate decreased slightly in those aged 15-44 years from 2.4 cases per
100,000 in 2015-2017 to 2.0 per 100,000 in 2016-2018. The average rate of non-pulmonary
TB also decreased slightly in those aged 65 years and older in 2016-2018, 2.0 cases per
100,000 compared to 2.3 per 100,000 in 2015-2017.
Average non-pulmonary disease rates were lower in all age groups in females compared to
males in 2016-2018, with the exception of those aged 65 years and older. The highest
average rate of non-pulmonary TB in males occurred in those aged 15-44 years in 2016-
2018 at 2.0 cases per 100,000 population. The highest average rate in females occurred in
those aged 65 years and older at 2.0 cases per 100,000 population (Figures 14, 15 and
16).
0%
10%
20%
30%
40%
50%
60%
70%P
rop
ort
ion
of
UK
an
d N
on
-UK
bo
rn c
ases
Proportion non-pulmonary UK born Proportion non-pulmonary non-UK born

Epidemiology of Tuberculosis in Northern Ireland, Annual Surveillance Report 2018
19
Figure 14: Three-year moving average age-specific disease rates of non-pulmonary TB cases, Northern Ireland, 2008-2018
Figure 15: Three-year moving average age-specific disease rates of non-pulmonary TB in males, Northern Ireland, 2008-2018
0.0
0.5
1.0
1.5
2.0
2.5
3.0
3.5
4.0
Ra
te p
er
100
,00
0 p
op
ula
tio
n
0-14 15-44 45-64 65+
0.0
0.5
1.0
1.5
2.0
2.5
3.0
3.5
4.0
Ra
te p
er
100
,00
0 m
ale
po
pu
lati
on
Average male rate per 100,000 (all ages) Average male rate per 100,000 (ages 0-14)
Average male rate per 100,000 (ages 15-44) Average male rate per 100,000 (45-64)
Average male rate per 100,000 (age 65+)

Epidemiology of Tuberculosis in Northern Ireland, Annual Surveillance Report 2018
20
Figure 16: Three-year moving average age-specific disease rates of non-pulmonary TB in females, Northern Ireland, 2008-2018
SHSCT had the highest rate of non-pulmonary TB at 1.8 cases per 100,000 population and
accounted for 25% (n=7/28) of all TB cases reported in this Trust in 2018. BHSCT had the
highest proportion of non-pulmonary TB cases (45%) in 2018 with a rate of 1.4 non-
pulmonary TB cases per 100,000 (Figure 17).
0.0
0.5
1.0
1.5
2.0
2.5
3.0
3.5
4.0
Ra
te p
er
100
,00
0 f
em
ale
po
pu
lati
on
Average female rate per 100,000 (all ages) Average female rate per 100,000 (ages 0-14)
Average female rate per 100,000 (ages 15-44) Average female rate per 100,000 (ages 45-64)
Average female rate per 100,000 (age 65+)

Epidemiology of Tuberculosis in Northern Ireland, Annual Surveillance Report 2018
21
Figure 17: Proportion of TB cases in HSCTs with non-pulmonary infection, Northern Ireland, 2009-2018
Time symptomatic
The time between onset of symptoms and starting treatment was known for 84% (n=47/56)
of TB cases in 2018. Of the 47 cases: 23% (n=11/47) were treated within two months of
onset of symptoms with a median time frame of 40 days (IQR 21-46); an additional 28%
(n=13/47) of cases were treated within two to four months of onset with a median time
period of 77 days (IQR 66-89); and the remaining 49% (n=23/47) of cases reported a
treatment period from onset of symptoms greater than four months with a median time
period of 218 days (IQR 151-320).
The time between onset of symptoms and starting treatment was known for 83% (n=33/40)
of pulmonary cases in 2018. The overall median time period from onset of symptoms to
treatment was 108 days (IQR 52-212). This period was lower than for non-pulmonary cases
where the median time period from onset to treatment was 113 days (IQR 73-264) (Table
2).
0%
10%
20%
30%
40%
50%
60%
70%
80%
90%
100%
2009 2010 2011 2012 2013 2014 2015 2016 2017 2018
Pro
po
rtio
n o
f n
on
-pu
lmo
nary
TB
cas
es
BHSCT NHSCT SEHSCT SHSCT WHSCT

Epidemiology of Tuberculosis in Northern Ireland, Annual Surveillance Report 2018
22
Table 2: Time between onset of symptoms and start of treatment (days)
All TB cases Number Median IQR
0-2 months 11 40 21-46
2-4 months 13 77 66-89
>4 months 23 218 151-320
All 47 108 61-215
Pulmonary cases*
All pulmonary 33 108 52-212
Non-pulmonary cases*
All non-pulmonary 14 113 73-264
*Summary information on pulmonary and non-pulmonary cases is reported only if the numbers do not risk data confidentiality.
Microbiology In 2018, 64% (n=36/56) of TB cases were culture confirmed, similar to the proportion in
2017 (65%). Of the 36 isolates culture confirmed, 32 were identified as having M.
tuberculosis infection, two as M.tuberculosis complex and two as M. bovis. The additional
20 cases were notified on the basis of clinical or non-culture diagnosis and response to
anti-tuberculosis therapy.
Of the 40 pulmonary cases in 2018, 65% (n=26/40) were culture positive. Sputum smear
results were known for 73% (n=29/40) of pulmonary infection cases. 40% (n=16/40) of
pulmonary cases were sputum smear positive at notification, of which 75% (n=12/16) were
confirmed by culture. An additional 33% (n=13/40) of pulmonary infection cases were
sputum smear negative of which eight were later confirmed by culture as M. tuberculosis
and <5 as M. bovis. Of the 11 pulmonary cases where sputum smear status was not known
or not done, five were culture confirmed (Table 3).
Of the 16 non-pulmonary cases in 2018, 63% (n=10/16) were culture positive and the
remaining six cases were not cultured or culture status was unknown (Table 4).

Epidemiology of Tuberculosis in Northern Ireland, Annual Surveillance Report 2018
23
Table 3: Culture positive and sputum smear positive pulmonary TB cases, Northern Ireland, 2009-2018
Year Pulmonary Cases Culture Positive (%) Culture and Sputum
Smear Positive (%)
2009 42 86% 31%
2010 34 97% 59%
2011 47 81% 40%
2012 47 77% 36%
2013 42 67% 29%
2014 63 68% 35%
2015 35 83% 37%
2016 49 78% 35%
2017 46 67% 41%
2018 40 65% 30%
Total 481 77% 37%
Table 4: Culture positive non-pulmonary TB cases, Northern Ireland, 2009-2018
Year Non-Pulmonary Cases Culture Positive (%)
2009 17 76%
2010 32 69%
2011 15 67%
2012 40 45%
2013 32 53%
2014 32 66%
2015 27 41%
2016 37 46%
2017 25 60%
2018 16 63%
Total 273 56%
Drug resistance Isoniazid, rifampicin, ethambutol and pyrazinamide are first-line drugs for treatment of TB in
the UK. Drug susceptibility test results were available for all 36 culture confirmed cases of
TB in Northern Ireland in 2018.
In 2018, there were <5 TB cases recorded as resistant to first line drug treatment. There
were no multi-drug resistant TB cases recorded in 2018.
Epidemiology of Tuberculosis in Northern Ireland, Annual Surveillance Report 2018
24
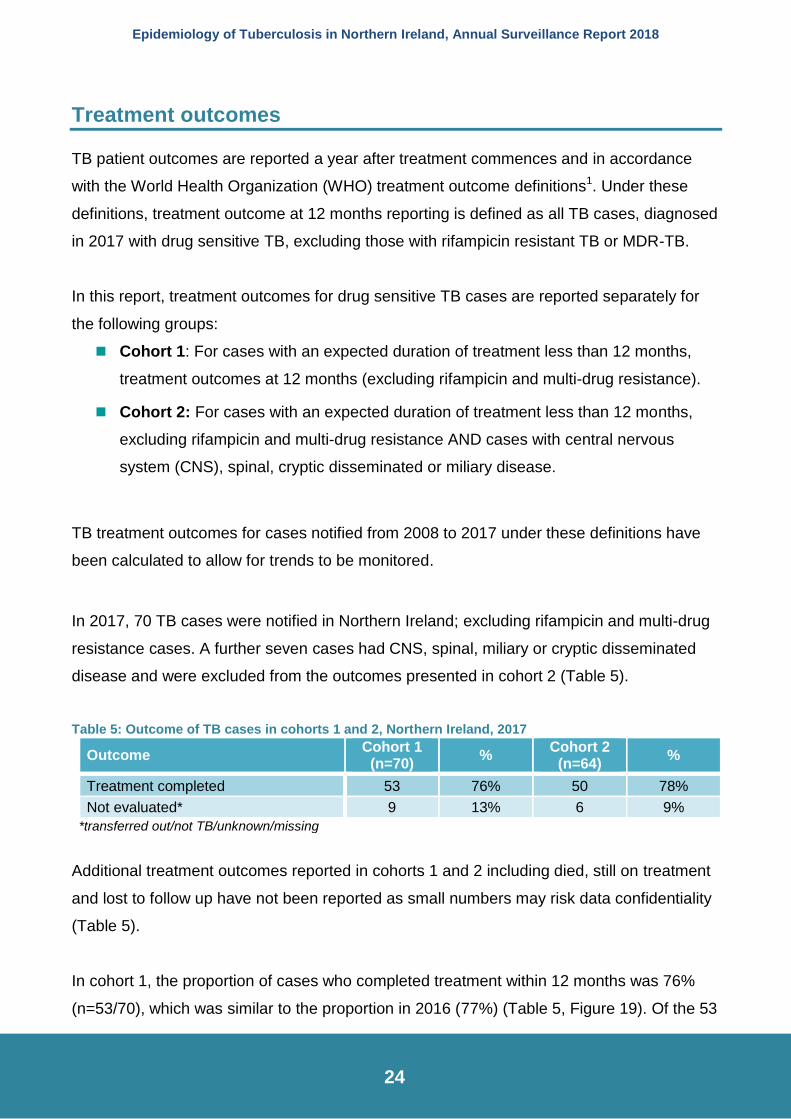
Treatment outcomes TB patient outcomes are reported a year after treatment commences and in accordance
with the World Health Organization (WHO) treatment outcome definitions1. Under these
definitions, treatment outcome at 12 months reporting is defined as all TB cases, diagnosed
in 2017 with drug sensitive TB, excluding those with rifampicin resistant TB or MDR-TB.
In this report, treatment outcomes for drug sensitive TB cases are reported separately for
the following groups:
Cohort 1: For cases with an expected duration of treatment less than 12 months,
treatment outcomes at 12 months (excluding rifampicin and multi-drug resistance).
Cohort 2: For cases with an expected duration of treatment less than 12 months,
excluding rifampicin and multi-drug resistance AND cases with central nervous
system (CNS), spinal, cryptic disseminated or miliary disease.
TB treatment outcomes for cases notified from 2008 to 2017 under these definitions have
been calculated to allow for trends to be monitored.
In 2017, 70 TB cases were notified in Northern Ireland; excluding rifampicin and multi-drug
resistance cases. A further seven cases had CNS, spinal, miliary or cryptic disseminated
disease and were excluded from the outcomes presented in cohort 2 (Table 5).
Table 5: Outcome of TB cases in cohorts 1 and 2, Northern Ireland, 2017
Outcome Cohort 1
(n=70) %
Cohort 2 (n=64)
%
Treatment completed 53 76% 50 78%
Not evaluated* 9 13% 6 9%
*transferred out/not TB/unknown/missing
Additional treatment outcomes reported in cohorts 1 and 2 including died, still on treatment
and lost to follow up have not been reported as small numbers may risk data confidentiality
(Table 5).
In cohort 1, the proportion of cases who completed treatment within 12 months was 76%
(n=53/70), which was similar to the proportion in 2016 (77%) (Table 5, Figure 19). Of the 53

Epidemiology of Tuberculosis in Northern Ireland, Annual Surveillance Report 2018
25
cases who completed treatment within 12 months, 51% (n=27/53) were born in the
UK/Ireland and the remaining were non-UK born (49%, n=26/53). The proportion of males
completing at 12 months was slightly higher than the number of females (28 males, 53%
and 25 females, 47%).
In cohort 2, the proportion of cases who completed treatment within 12 months was 78%
(n=50/64), the same proportion as in 2016 (Table 5, Figure 19). Of the 50 cases who
completed treatment within 12 months, 54% (n=27/50) were born in the UK/Ireland and the
remaining were non-UK born (46%, n=23/50). The proportion of males completing at 12
months was slightly higher than the number of females (27 males, 54% and 23 females,
46%).
Figure 18: Treatment completed within 12 months for drug sensitive TB cases with expected treatment
less than 12 months (in accordance with WHO treatment outcome definitions), 2008-2017
0%
10%
20%
30%
40%
50%
60%
70%
80%
90%
100%
2008 2009 2010 2011 2012 2013 2014 2015 2016 2017
Pro
po
rtio
n o
f ca
ses
(%)
Cohort 1 Cohort 2

Epidemiology of Tuberculosis in Northern Ireland, Annual Surveillance Report 2018
26
Discussion The incidence of TB in Northern Ireland remains relatively low with an average rate of 3.8
cases per 100,000 population in 2016-2018. The average rate of the disease was similar to
that of the previous period (3.9 per 100,000 in 2015-2017). Three-year moving averages
have been used were possible as relatively small differences in the number of cases can
give rise to substantial percentage changes due to small numbers and considerable year to
year variation. The rate of TB in Northern Ireland in 2018 was 3.0 cases per 100,000
population. This rate was the lowest recorded in Northern Ireland and was lower than
England (8.3 per 100,000), Scotland (5.0 per 100,000), Wales (3.1 per 100,000) and the
Republic of Ireland (6.6 per 100,000) in 20182,3,4,5.
In 2016-2018, the average rate of TB remains highest in the SHSCT area at 7.5 cases per
100,000 population (7.4 per 100,000 in 2015-2017). The average number of TB cases was
also highest in SHSCT, 29 cases in 2016-2018 (28 cases in 2015-2017).
Patients aged 15-44 years accounted for the majority of cases (41%, n=23/56) in 2016-
2018, while the average rate of TB remains highest in those aged 65 years and over at 5.8
cases per 100,000 in 2016-2018 (5.5 cases per 100,000 in 2015-2017).
TB rates in the UK-born population remain low and relatively stable at 2.0 cases per
100,000 population in 2016-2018. The highest rates of TB continue to be reported in those
born outside the UK/Ireland at 42.4 per 100,000 population in 2016-2018. In 2018, 57%
(n=32/56) of TB cases occurred in individuals born outside the UK/Ireland.
In 2018, 71% (n=40/56) of TB cases had a pulmonary component. The average rate of
pulmonary TB in 2016-2018 (2.4 cases per 100,000 population) remains similar to that in
2015-2017, whilst the rate of non-pulmonary TB has decreased slightly from 1.6 per
100,000 in 2015-2017 to 1.4 per 100,000 in 2016-2018.
European Centre for Disease Prevention and Control (ECDC) targets6 recommend that at
least 80% of pulmonary TB cases be culture confirmed in order to have optimal detection of
infectivity and drug resistance. In 2018, 64% (n=36/56) of pulmonary cases were culture
confirmed in Northern Ireland.

Epidemiology of Tuberculosis in Northern Ireland, Annual Surveillance Report 2018
27
There were <5 TB cases recorded as resistant to first line drug treatment in 2018. There
were no multi-drug resistant TB cases recorded in 2018. The proportion of drug sensitive
TB cases expected to complete treatment by 12 months is an indicator of the quality of TB
services. In 2017, 78% (cohort 2, n=50/64) of drug sensitive cases completed treatment in
this time frame.
The overall median time period from onset of symptoms to starting treatment for pulmonary
cases was 108 days (33 cases, IQR 52-215). This suggests a significant number of
pulmonary cases still have a substantial delay before treatment, increasing the likelihood of
infectivity. While we do not know the reasons behind the delay it highlights the need to
continue raising awareness of TB.

Epidemiology of Tuberculosis in Northern Ireland, Annual Surveillance Report 2018
28
References
1. Definitions and reporting framework for tuberculosis- 2013 revision. WHO; updated
December 2014.
https://www.who.int/tb/publications/definitions/en/
2. Tuberculosis in England: 2019 report, August 2019.
https://www.gov.uk/government/publications/tuberculosis-in-england-annual-report
3. Enhanced Surveillance of Mycobacterial Infections in Scotland: 2019 Tuberculosis
Annual Report for Scotland. October 2019.
https://www.hps.scot.nhs.uk/web-resources-container/enhanced-surveillance-of-
mycobacterial-infections-in-scotland-2019-tuberculosis-annual-report-for-scotland/
4. Tuberculosis in Wales Annual report 2019. Public Health Wales, September 2019.
http://www.wales.nhs.uk/sitesplus/888/page/91231
5. Annual Epidemiological Report; National TB surveillance in Ireland, 2018. Health
Protection Surveillance Centre Ireland. February 2019.
https://www.hpsc.ie/a-z/vaccinepreventable/tuberculosistb/tbdataandreports/
6. European Centre for Disease Prevention and Control. Progressing towards TB
elimination. Stockholm: ECDC; 2010.
https://www.ecdc.europa.eu/en/publications-data/progressing-towards-tb-elimination


![walkeronline.files.wordpress.com · Web viewQuestion 26] 2011 HSC. Question 27) 2009 HSC. Question 26 OR 27 – 2008 HSC. Question 22c – 2007 HSC. Question 25 – 2007 HSC . Question](https://img.pdfslide.us/doc/110x75/5f729fa6ab3ff2103b11719e/web-view-question-26-2011-hsc-question-27-2009-hsc-question-26-or-27-a-2008.jpg)