Embed Size (px)
Citation preview

Copyright © 2014 Oracle and/or its affiliates. All rights reserved. | Oracle Confidential – Internal/Restricted/Highly Restricted
Annual Stockholder Meeting
Jeff Henley Oracle Vice Chairman November 5, 2014

Copyright © 2014, Oracle and/or its affiliates. All rights reserved. 2
"Safe Harbor" Statement: Statements in this presentation relating to Oracle's future plans, expectations, beliefs, intentions and prospects are "forward-looking statements" and are subject to material risks and uncertainties. Many factors could affect our current expectations and our actual results, and could cause actual results to differ materially. We presently consider the following to be among the important factors that could cause actual results to differ materially from expectations: (1) Economic, geopolitical and market conditions, including the continued slow economic recovery in the U.S. and other parts of the world, can adversely affect our business, results of operations and financial condition, including our revenue growth and profitability, which in turn could adversely affect our stock price. (2) We may fail to achieve our financial forecasts due to such factors as delays or size reductions in transactions, fewer large transactions in a particular quarter, unanticipated fluctuations in currency exchange rates, delays in delivery of new products or releases or a decline in our renewal rates for support contracts. (3) Our cloud computing strategy, including our Oracle Cloud Software-as-a-Service, Platform-as-a-Service, Infrastructure-as-a-Service and Database-as-a-Service offerings, may not be successful. (4) If we are unable to develop new or sufficiently differentiated products and services, or to enhance and improve our products and support services in a timely manner or to position and/or price our products and services to meet market demand, customers may not buy new software licenses, cloud software subscriptions or hardware systems products or purchase or renew support contracts. (5) Our international sales and operations subject us to additional risks that can adversely affect our operating results, including risks relating to foreign currency gains and losses. (6) If the security measures for our software, hardware, services or Oracle Cloud offerings are compromised or if such offerings contain significant coding, manufacturing or configuration errors, we may experience reputational harm, legal claims and financial exposure. (7) We have an active acquisition program and our acquisitions may not be successful, may involve unanticipated costs or other integration issues or may disrupt our existing operations. A detailed discussion of these factors and other risks that affect our business is contained in our SEC filings, including our most recent reports on Form 10-K and Form 10-Q, particularly under the heading "Risk Factors." Copies of these filings are available online from the SEC or by contacting Oracle Corporation's Investor Relations Department at (650) 506-4073 or by clicking on SEC Filings on Oracle’s Investor Relations website at http://www.oracle.com/investor. All information set forth in this presentation is current as of November 5, 2014. Oracle undertakes no duty to update any statement in light of new information or future events.
Safe Harbor Statement
Copyright © 2014 Oracle and/or its affiliates. All rights reserved. | Oracle Confidential – Internal/Restricted/Highly Restricted 3
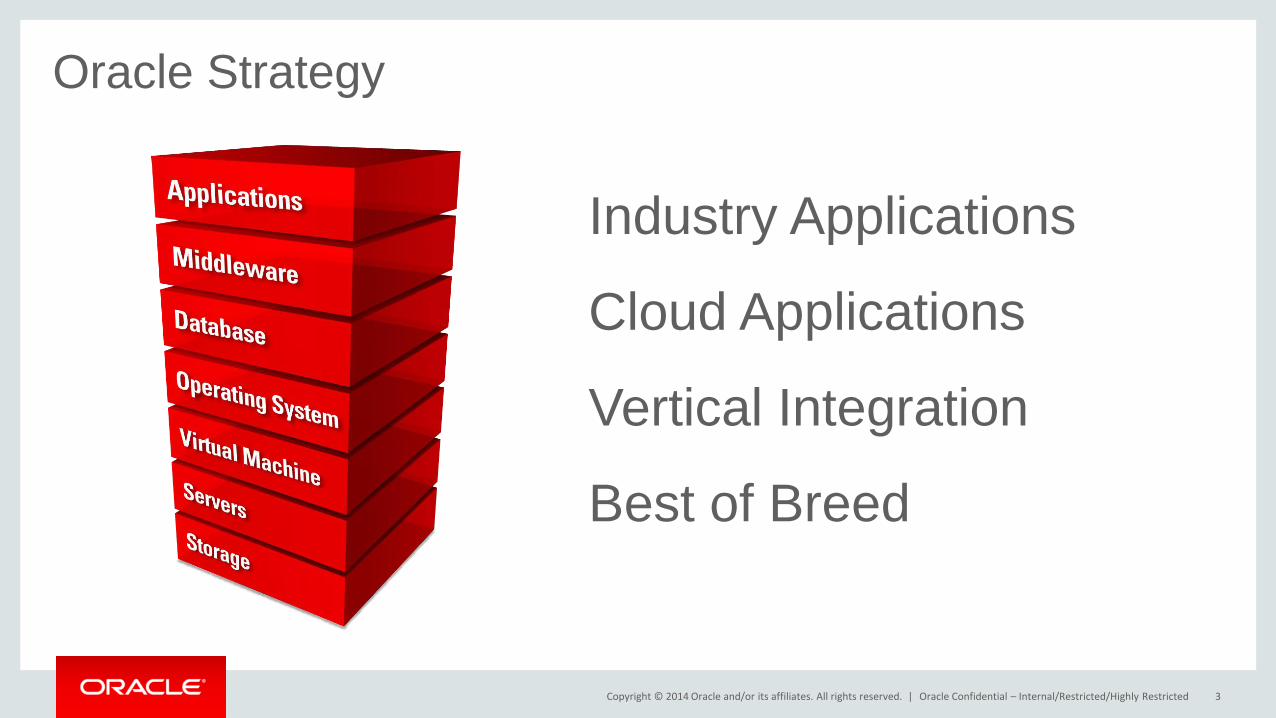
Industry Applications
Cloud Applications
Vertical Integration
Best of Breed
Oracle Strategy

Technology
• Application Server
• Database
• Database on Linux
• Database on Unix
• Data Warehouse
• Embedded Database
• Engineered Systems
• Identity and Access Management
• Middleware
• UNIX Server Shipments
Applications
• Business Analytics
• Enterprise Performance Management
• Lead Management
• Marketing Automation
• Supply Chain Execution
• Supply Chain Planning
• Talent Management
• Talent Recruiting
Leader in Key Segments
Copyright © 2014, Oracle and/or its affiliates. All rights reserved. 4

Copyright © 2014, Oracle and/or its affiliates. All rights reserved. 5
Scale • $38B revenue in FY14
• #1 in 50 product or industry categories
• 400,000 customers in 145+ countries
• More than 25,000 partners
• 123,000 employees
• 15 million developers in Oracle on-line communities
Innovation and Investment • 36,000 developers and engineers
• 18,000 customer support specialists, speaking 29 languages
• 17,000 implementation consultants
• 2.2 million students supported annually
Headcount current as of Q1 FY2015.
Company Profile
Copyright © 2014, Oracle and/or its affiliates. All rights reserved. 6
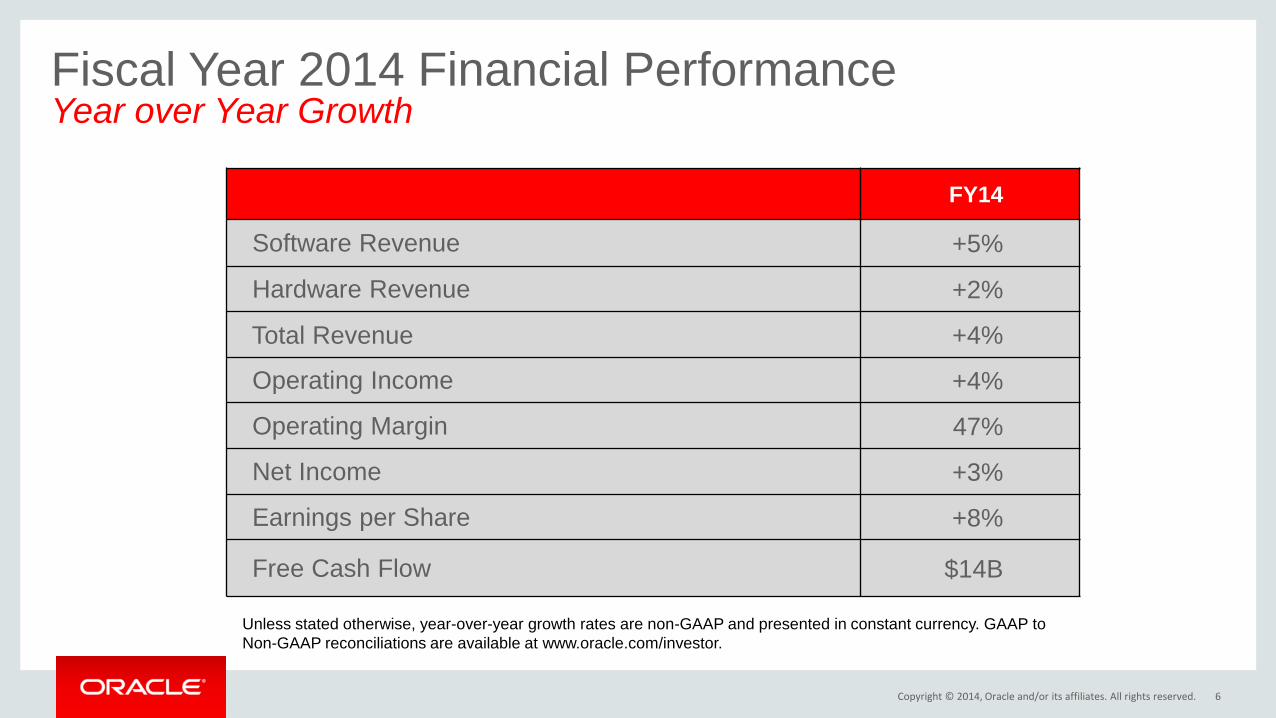
FY14
Software Revenue +5%
Hardware Revenue +2%
Total Revenue +4%
Operating Income +4%
Operating Margin 47%
Net Income +3%
Earnings per Share +8%
Free Cash Flow $14B
Unless stated otherwise, year-over-year growth rates are non-GAAP and presented in constant currency. GAAP to
Non-GAAP reconciliations are available at www.oracle.com/investor.
Fiscal Year 2014 Financial Performance Year over Year Growth
Copyright © 2014, Oracle and/or its affiliates. All rights reserved. 7
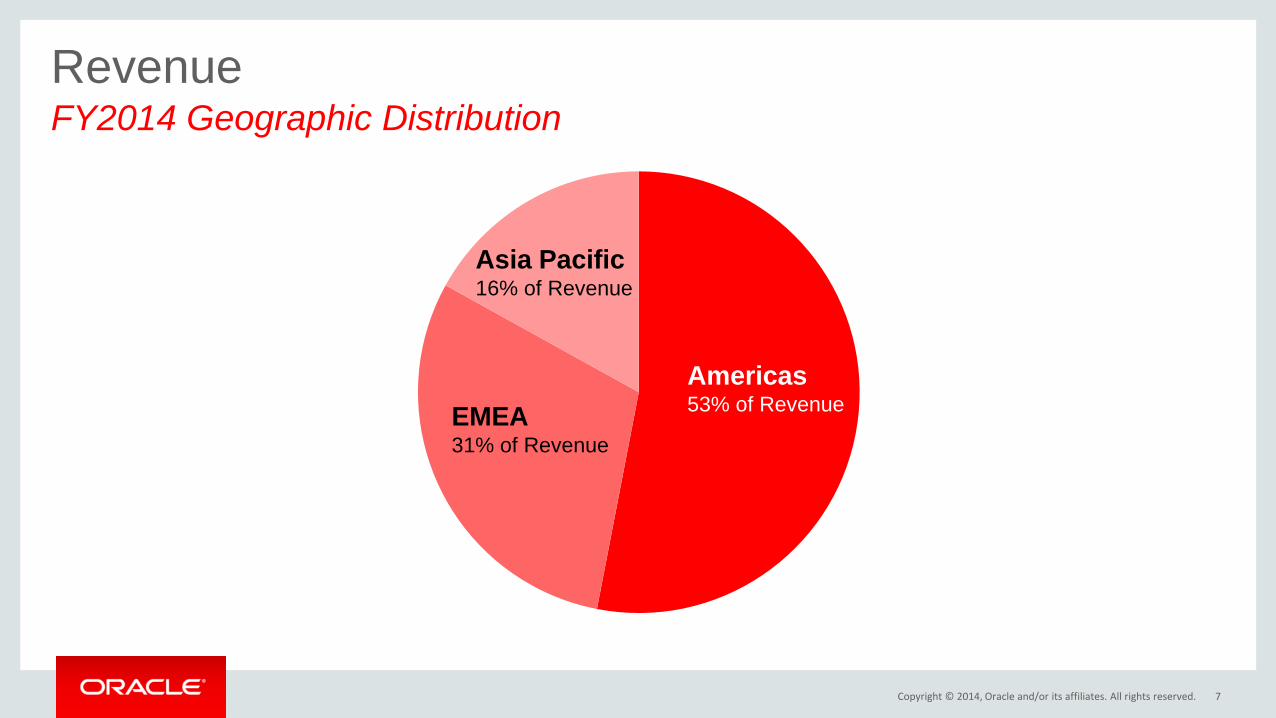
Revenue FY2014 Geographic Distribution
Asia Pacific 16% of Revenue
EMEA 31% of Revenue
Americas 53% of Revenue
Copyright © 2014, Oracle and/or its affiliates. All rights reserved. 8
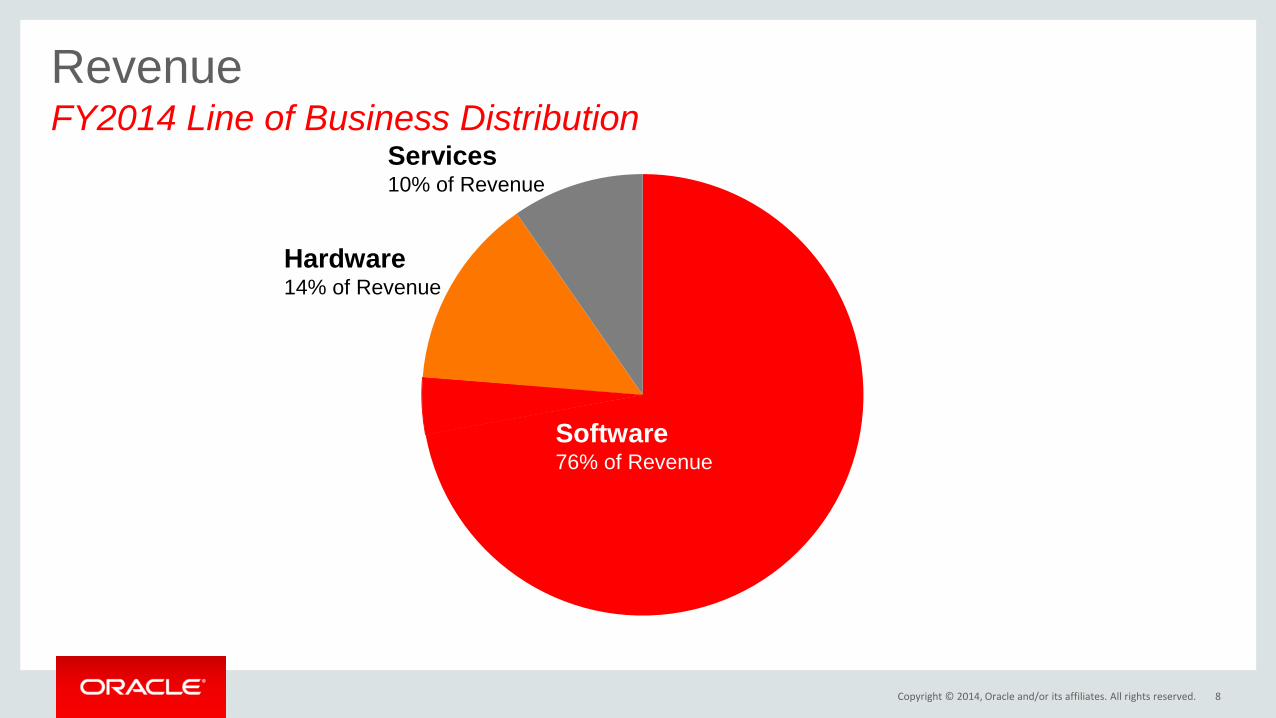
Revenue FY2014 Line of Business Distribution
Services 10% of Revenue
Software 76% of Revenue
Hardware 14% of Revenue

Copyright © 2014, Oracle and/or its affiliates. All rights reserved. 9
Revenue FY2014 Line of Business Distribution
Services 10% of Revenue
On-Premise Software 72% of Revenue
Cloud 4% of Revenue
Hardware 14% of Revenue
Copyright © 2014, Oracle and/or its affiliates. All rights reserved. 10
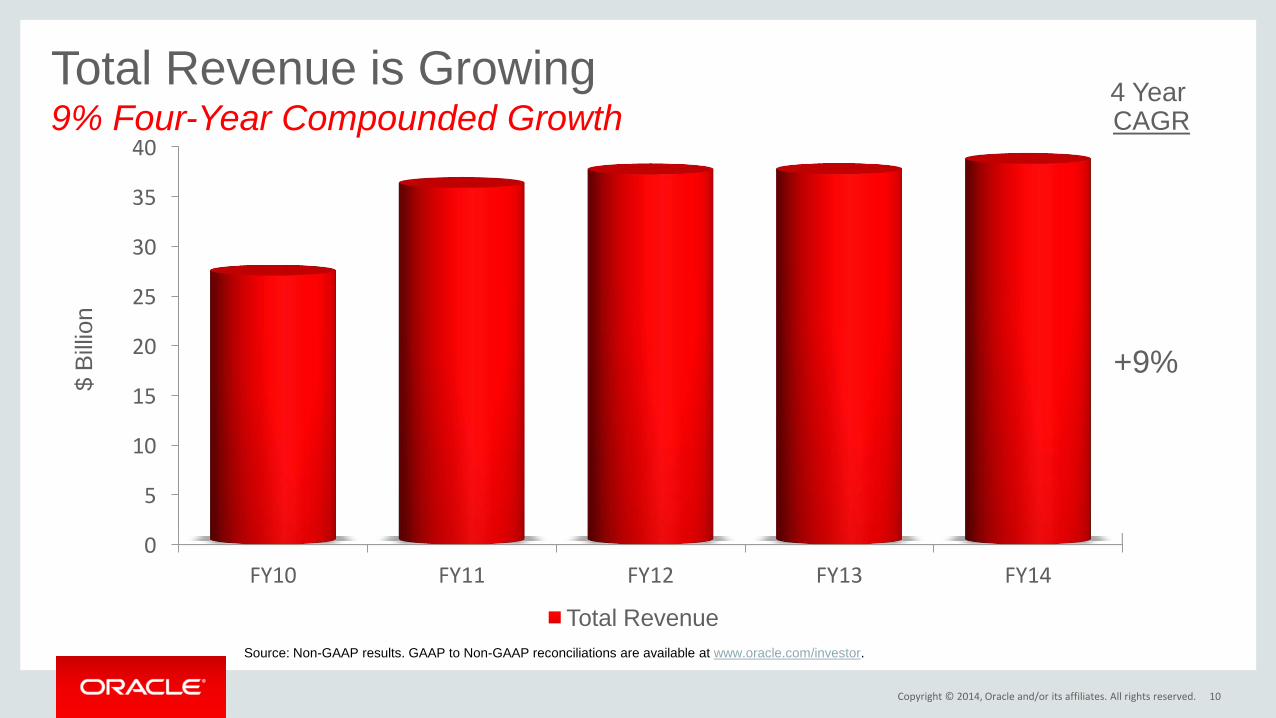
Total Revenue is Growing 9% Four-Year Compounded Growth
0
5
10
15
20
25
30
35
40
FY10 FY11 FY12 FY13 FY14
Total Revenue
+9%
$ B
illio
n
Source: Non-GAAP results. GAAP to Non-GAAP reconciliations are available at www.oracle.com/investor.
4 Year CAGR

Copyright © 2014, Oracle and/or its affiliates. All rights reserved. 11
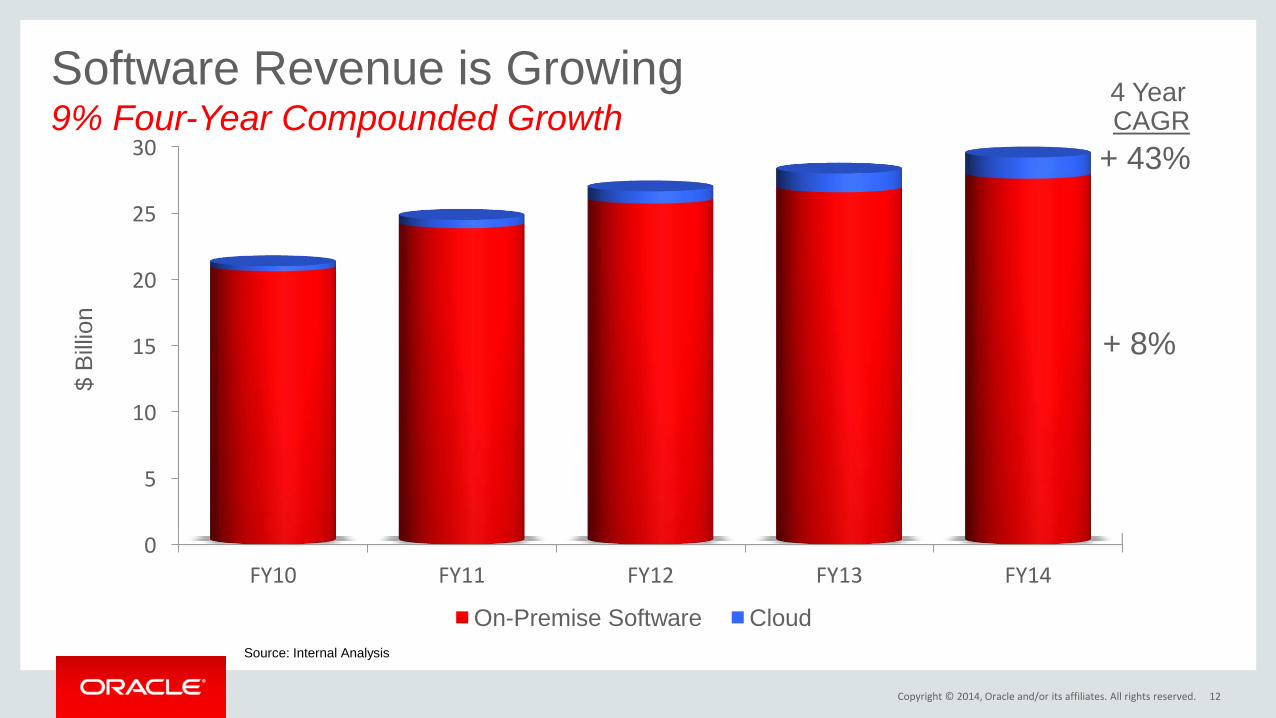
Software Revenue is Growing 9% Four-Year Compounded Growth
0
5
10
15
20
25
30
FY10 FY11 FY12 FY13 FY14
Software & Cloud
$ B
illio
n
Source: Internal Analysis
+9%
4 Year CAGR
Copyright © 2014, Oracle and/or its affiliates. All rights reserved. 12
Software Revenue is Growing 9% Four-Year Compounded Growth
0
5
10
15
20
25
30
FY10 FY11 FY12 FY13 FY14
On-Premise Software Cloud
4 Year CAGR
+ 8%
$ B
illio
n
Source: Internal Analysis
+ 43%

Copyright © 2014, Oracle and/or its affiliates. All rights reserved. 13
Cloud Revenue is Growing Rapidly 43% Four-Year Compounded Growth
FY10 FY11 FY12 FY13 FY14
IaaS SaaS/PaaS
4 Year CAGR
+88%
Source: Internal Analysis
+12%
Copyright © 2014, Oracle and/or its affiliates. All rights reserved. 14
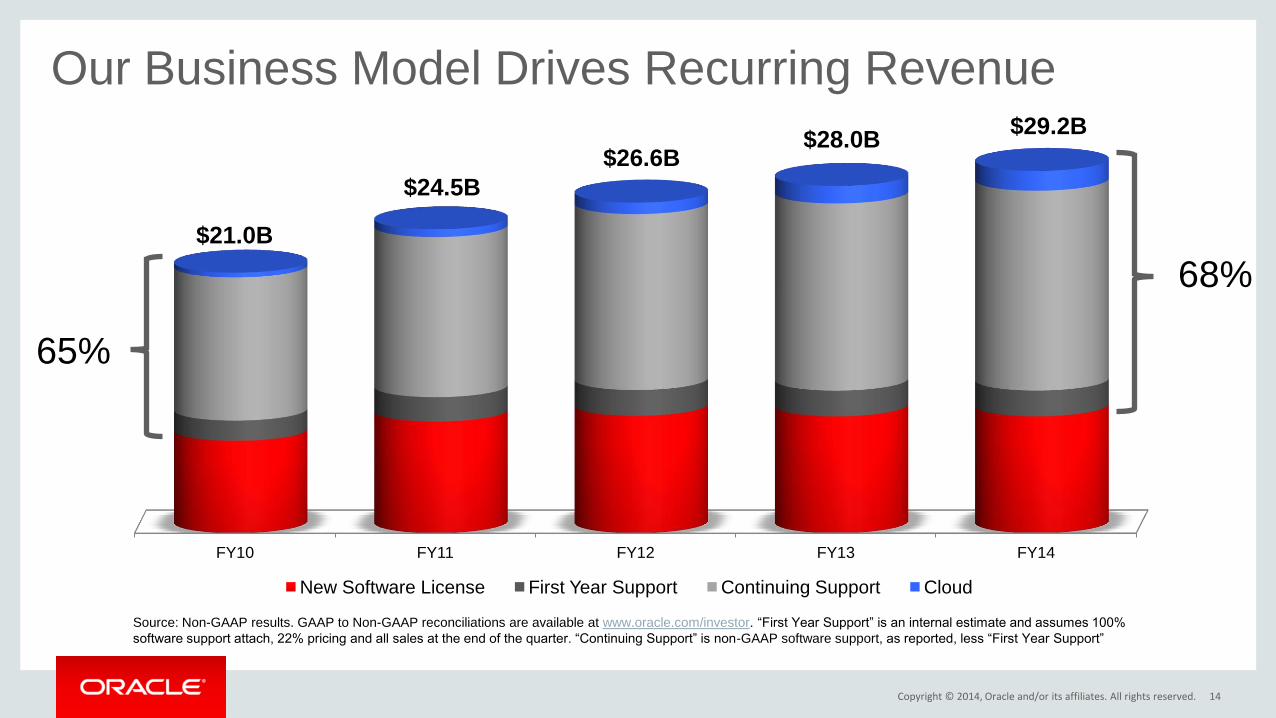
Our Business Model Drives Recurring Revenue
FY10 FY11 FY12 FY13 FY14
New Software License First Year Support Continuing Support Cloud
Source: Non-GAAP results. GAAP to Non-GAAP reconciliations are available at www.oracle.com/investor. “First Year Support” is an internal estimate and assumes 100%
software support attach, 22% pricing and all sales at the end of the quarter. “Continuing Support” is non-GAAP software support, as reported, less “First Year Support”
$28.0B $26.6B
$24.5B
$21.0B
68%
65%
$29.2B

Copyright © 2014, Oracle and/or its affiliates. All rights reserved. 15
Free Cash Flow 14% Four-Year Compounded Growth
Source: GAAP Results
0
2
4
6
8
10
12
14
16
FY10 FY11 FY12 FY13 FY14
Free Cash Flow
$ B
illio
n
+14%
4 Year CAGR
Copyright © 2014, Oracle and/or its affiliates. All rights reserved. 16
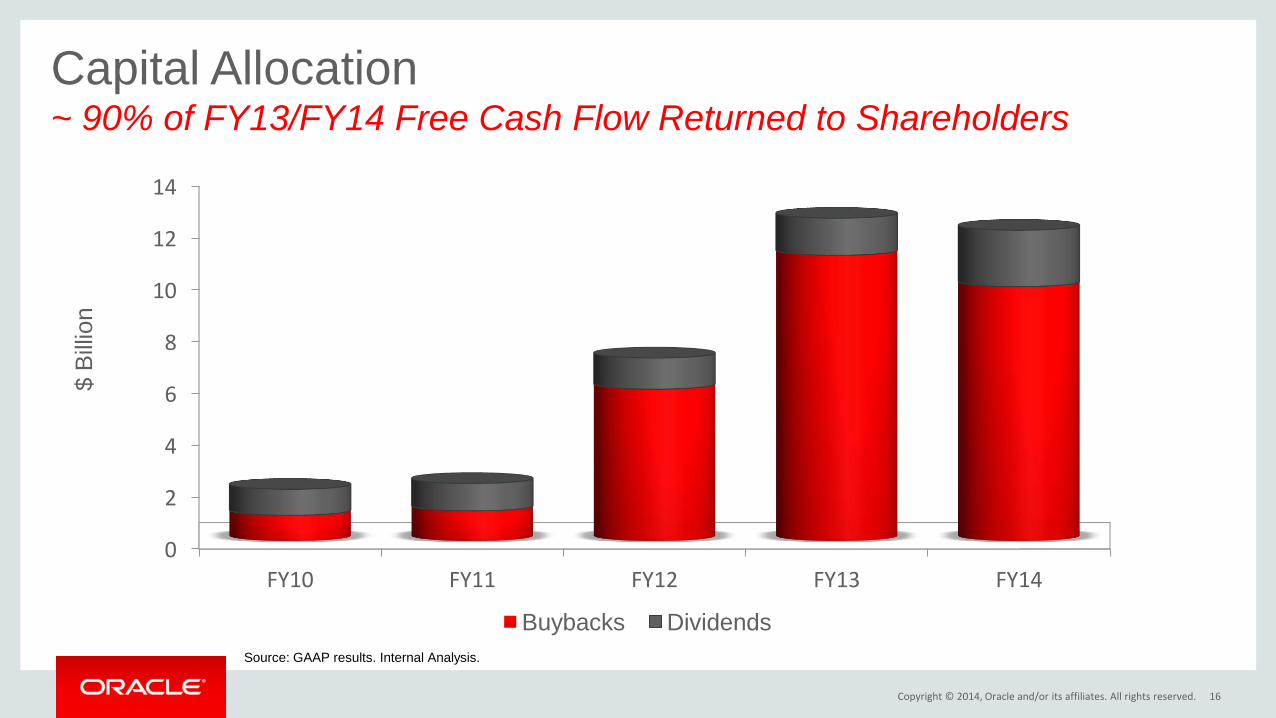
Capital Allocation ~ 90% of FY13/FY14 Free Cash Flow Returned to Shareholders
0
2
4
6
8
10
12
14
FY10 FY11 FY12 FY13 FY14
Buybacks Dividends
Source: GAAP results. Internal Analysis.
$ B
illio
n

Copyright © 2014, Oracle and/or its affiliates. All rights reserved. 17
• Return on Equity (TTM) 24%
• Return on Assets (TTM) 12%
• Cash & Investment (MRQ) $52B
• Debt to Equity (MRQ) 1.08x
• Net Cash (MRQ) $19B
Above figures are based on GAAP results for the four most recent quarters including Q1 FY2015. TTM – Trailing Twelve Months; MRQ – Q1 FY2015
A Very Healthy Balance Sheet
Copyright © 2014, Oracle and/or its affiliates. All rights reserved. 18
Comparative Performance
Copyright © 2014, Oracle and/or its affiliates. All rights reserved. 19
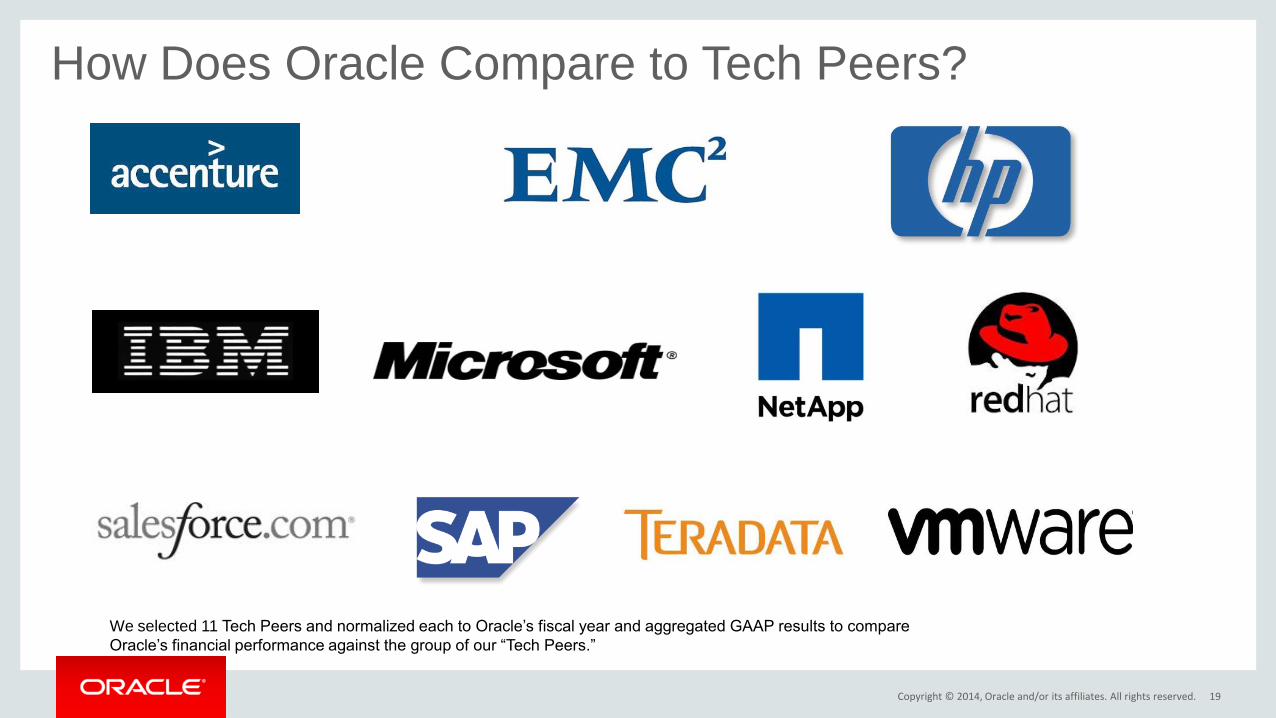
We selected 11 Tech Peers and normalized each to Oracle’s fiscal year and aggregated GAAP results to compare
Oracle’s financial performance against the group of our “Tech Peers.”
How Does Oracle Compare to Tech Peers?
Copyright © 2014, Oracle and/or its affiliates. All rights reserved. 20
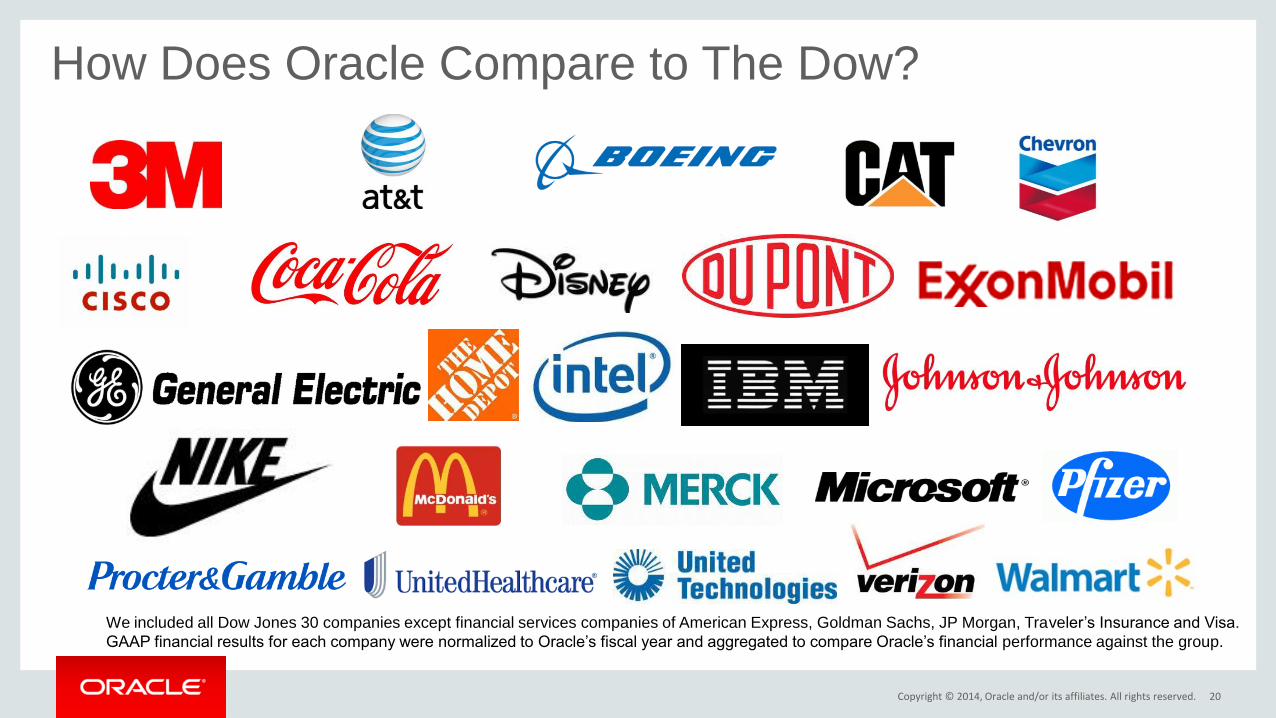
How Does Oracle Compare to The Dow?
We included all Dow Jones 30 companies except financial services companies of American Express, Goldman Sachs, JP Morgan, Traveler’s Insurance and Visa.
GAAP financial results for each company were normalized to Oracle’s fiscal year and aggregated to compare Oracle’s financial performance against the group.
Copyright © 2014, Oracle and/or its affiliates. All rights reserved. 21
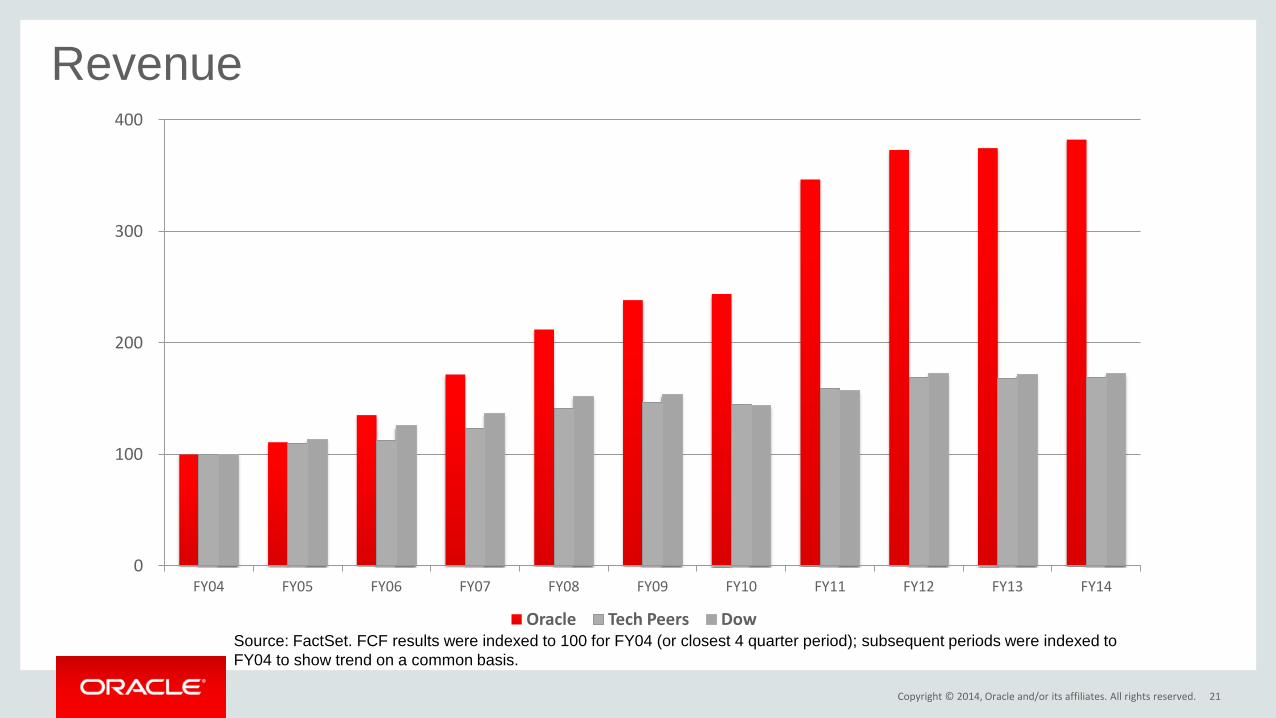
Revenue
0
100
200
300
400
FY04 FY05 FY06 FY07 FY08 FY09 FY10 FY11 FY12 FY13 FY14
Oracle Tech Peers Dow Source: FactSet. FCF results were indexed to 100 for FY04 (or closest 4 quarter period); subsequent periods were indexed to
FY04 to show trend on a common basis.

Copyright © 2014, Oracle and/or its affiliates. All rights reserved. 22
Operating Income
0
100
200
300
400
FY04 FY05 FY06 FY07 FY08 FY09 FY10 FY11 FY12 FY13 FY14
Oracle Tech Peers Dow Source: FactSet. FCF results were indexed to 100 for FY04 (or closest 4 quarter period); subsequent periods were indexed to
FY04 to show trend on a common basis
Copyright © 2014, Oracle and/or its affiliates. All rights reserved. 23
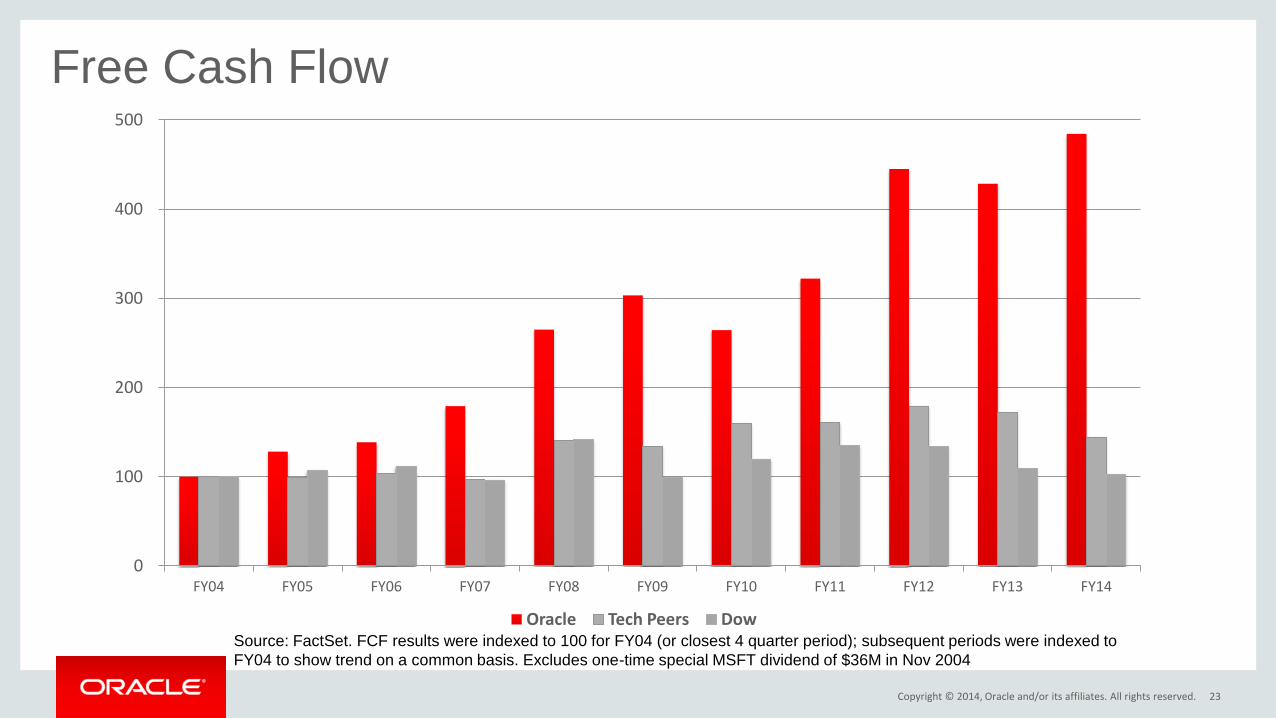
Free Cash Flow
0
100
200
300
400
500
FY04 FY05 FY06 FY07 FY08 FY09 FY10 FY11 FY12 FY13 FY14
Oracle Tech Peers Dow Source: FactSet. FCF results were indexed to 100 for FY04 (or closest 4 quarter period); subsequent periods were indexed to
FY04 to show trend on a common basis. Excludes one-time special MSFT dividend of $36M in Nov 2004
Copyright © 2014, Oracle and/or its affiliates. All rights reserved. 24
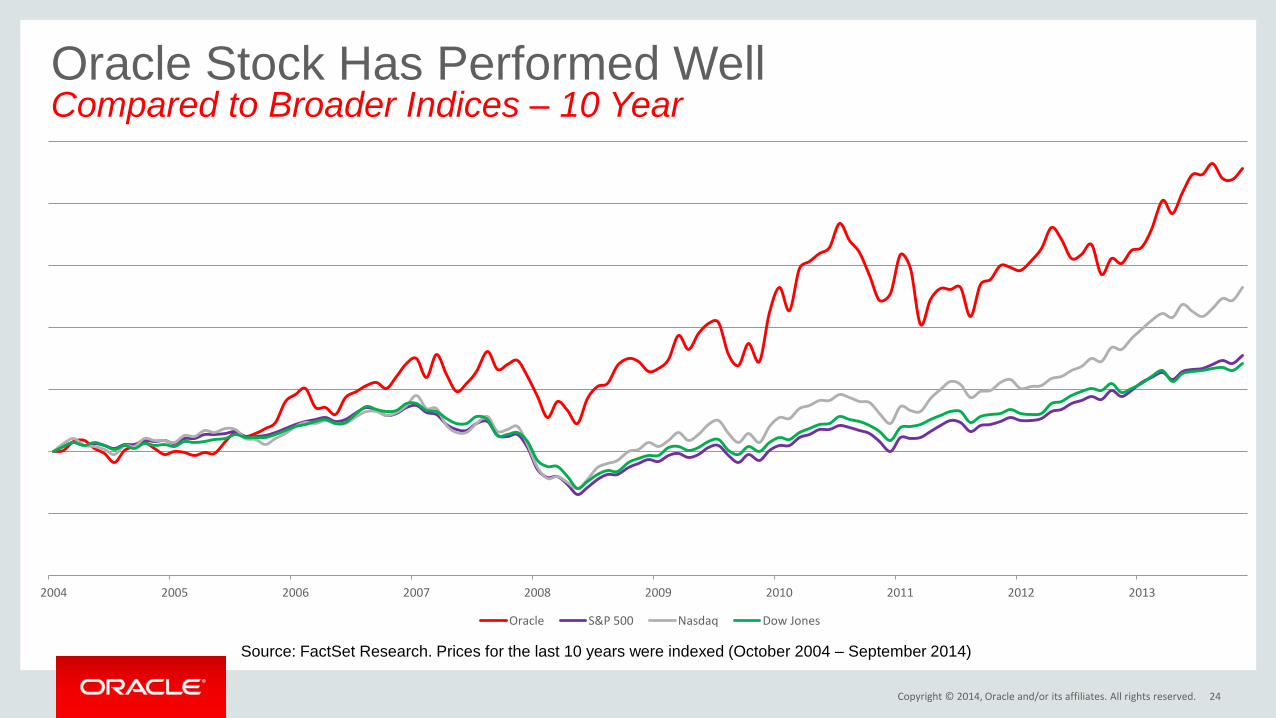
Source: FactSet Research. Prices for the last 10 years were indexed (October 2004 – September 2014)
Oracle Stock Has Performed Well Compared to Broader Indices – 10 Year
2004 2005 2006 2007 2008 2009 2010 2011 2012 2013
Oracle S&P 500 Nasdaq Dow Jones

Copyright © 2014, Oracle and/or its affiliates. All rights reserved. 25