Embed Size (px)
Citation preview
ANNUAL STATEMENT
STUDIES
2017
2018
FINANCIAL RATIO BENCHMARKS
Volume I

iii
RMA Annual Statement Studies
Copyright, Ordering, Licensing, and Use of Data Information All of the information contained herein is obtained from sources believed to be accurate and reliable. ALL REPRESENTATIONS CONTAINED HEREIN ARE BELIEVED BY RMA TO BE AS ACCURATE AS THE DATA AND METHODOLOGIES WILL ALLOW. HOWEVER, BECAUSE OF THE POSSIBILITIES OF HUMAN AND MECHANICAL ERROR, AS WELL AS UNFORESEEN FACTORS BEYOND RMA’S CONTROL, THE INFORMATION IN THIS BOOK IS PROVIDED “AS IS” WITHOUT WARRANTY OF ANY KIND. RMA MAKES NO REPRESENTATIONS OR WARRANTIES EXPRESS OR IMPLIED TO A SUBSCRIBER OR LICENSEE OR ANY OTHER PERSON OR ENTITY AS TO THE ACCURACY, TIMELINESS, COMPLETENESS, MERCHANTABILITY OR FITNESS FOR ANY PARTICULAR PURPOSE OF ANY OF THE INFORMATION CONTAINED IN THIS BOOK. MOREOVER, INFORMATION IS SUPPLIED WITHOUT WARRANTY ON THE UNDERSTANDING THAT ANY PERSON WHO ACTS UPON IT OR OTHERWISE CHANGES POSITION IN RELIANCE THEREON DOES SO ENTIRELY AT SUCH PERSON’S OWN RISK. This Annual Statement Studies book and information is not intended to provide loan advice or recommendations of any kind. The information contained herein is intended for educational, informational, and research purposes only. Accordingly, RMA does not offer any advice regarding the suitability of any loan, of any debtor or of any other business determination related to the information contained in this Annual Statement Studies book. You use this book and information at your own risk, and RMA assumes no responsibility or liability for any advice or other guidance that you may take from this book or the information contained therein. Prior to making any business decisions, you should conduct all necessary due diligence as may be appropriate under the circumstances, and RMA assumes no responsibility or liability for any business decisions, including but not limited to loan decisions, or other services rendered by you based upon the Statement Studies data or results obtained therefrom.
The Annual Statement Studies : Financial Ratio Benchmarks, 2017-2018
is a copyrighted product of RMA. All rights reserved.
No part of this product may be copied, reproduced, replicated, disseminated, or distributed in any form or by any means, electronic or mechanical, without the express written permission of RMA.
To obtain permission to copy, quote, reproduce, replicate, disseminate, or distribute the Statement Studies data/material please fax or email a brief letter stating who you are and how you intend to use the Statement Studies data to: Statement Studies Information Products at fax number 215-446-4101 or via email to [email protected]. Depending on the requested use, RMA may require a license agreement and royalty fee. A License Agreement is required if you wish to use or incorporate any portion of the data, in whole or in part in other products that will in turn be sold to others, such as in software oriented or derived products, scholarly publications, or training materials. To purchase a copy, or additional copies, of the Statement Studies data in book or online format, contact RMA’s Customer Relations at 1-800-677-7621. Regional data presented in the same fashion as you see in this book is only available in eStatement Studies. If you have a question regarding the data please reference the detailed explanatory notes provided in the Introduction section of the enclosed product. If you are unable to find the answer to your question please contact us by e-mail at: [email protected]. Be sure to include your detailed question along with your telephone number, fax number, and email address.
The Risk Management Association 1801 Market Street, Suite 300
Philadelphia, PA 19103 © 2017 by RMA
ISBN# 978-1-57070-347-8
iv
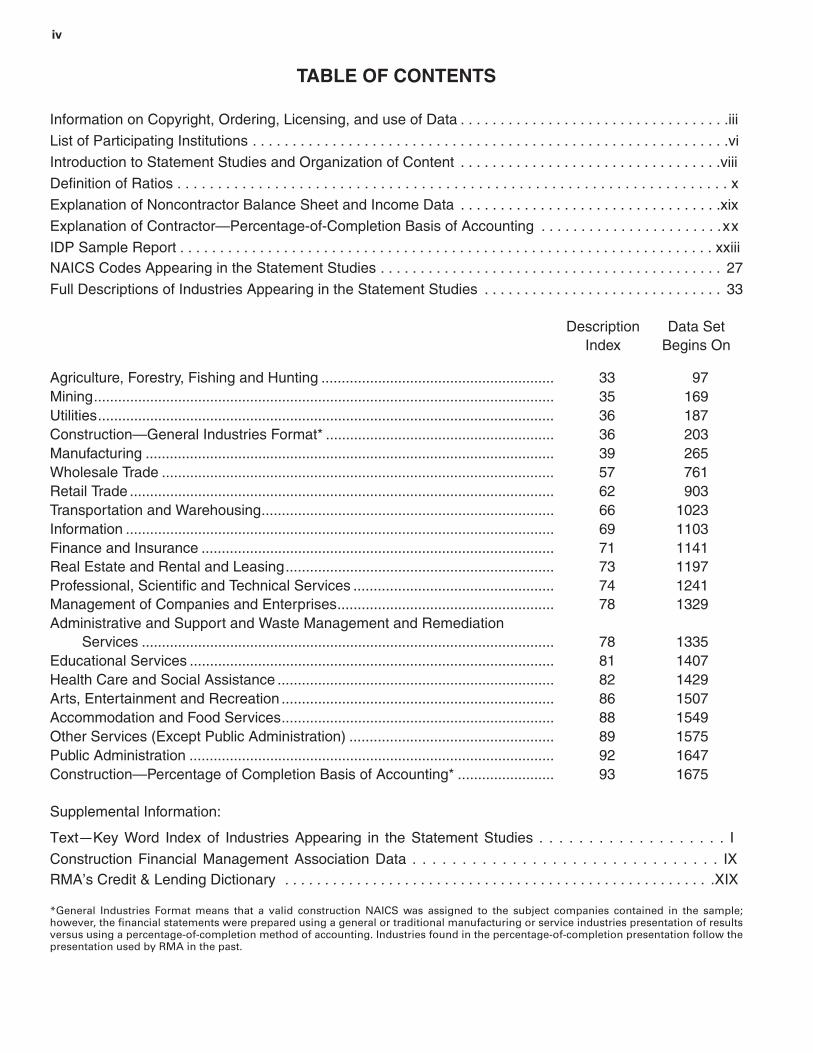
TABLE OF CONTENTS
Information on Copyright, Ordering, Licensing, and use of Data . . . . . . . . . . . . . . . . . . . . . . . . . . . . . . . . . .
List of Participating Institutions . . . . . . . . . . . . . . . . . . . . . . . . . . . . . . . . . . . . . . . . . . . . . . . . . . . . . . . . . . . .
Introduction to Statement Studies and Organization of Content . . . . . . . . . . . . . . . . . . . . . . . . . . . . . . . . .
Definition of Ratios . . . . . . . . . . . . . . . . . . . . . . . . . . . . . . . . . . . . . . . . . . . . . . . . . . . . . . . . . . . . . . . . . . . .
Explanation of Noncontractor Balance Sheet and Income Data . . . . . . . . . . . . . . . . . . . . . . . . . . . . . . . . .
Explanation of Contractor—Percentage-of-Completion Basis of Accounting . . . . . . . . . . . . . . . . . . . . . . .
IDP Sample Report . . . . . . . . . . . . . . . . . . . . . . . . . . . . . . . . . . . . . . . . . . . . . . . . . . . . . . . . . . . . . . . . . . .NAICS Codes Appearing in the Statement Studies . . . . . . . . . . . . . . . . . . . . . . . . . . . . . . . . . . . . . . . . . . . 27
Full Descriptions of Industries Appearing in the Statement Studies . . . . . . . . . . . . . . . . . . . . . . . . . . . . . . 33
DescriptionIndex
Data SetBegins On
Agriculture, Forestry, Fishing and Hunting .......................................................... 33 97Mining................................................................................................................... 35 169Utilities.................................................................................................................. 36 187Construction—General Industries Format* ......................................................... 36 203Manufacturing ...................................................................................................... 39 265Wholesale Trade .................................................................................................. 57 761Retail Trade .......................................................................................................... 62 903Transportation and Warehousing......................................................................... 66 1023Information ........................................................................................................... 69 1103Finance and Insurance ........................................................................................ 71 1141Real Estate and Rental and Leasing................................................................... 73 1197Professional, Scientific and Technical Services .................................................. 74 1241Management of Companies and Enterprises...................................................... 78 1329Administrative and Support and Waste Management and Remediation
Services ....................................................................................................... 78 1335Educational Services ........................................................................................... 81 1407Health Care and Social Assistance ..................................................................... 82 1429Arts, Entertainment and Recreation .................................................................... 86 1507Accommodation and Food Services.................................................................... 88 1549Other Services (Except Public Administration) ................................................... 89 1575Public Administration ........................................................................................... 92 1647Construction—Percentage of Completion Basis of Accounting* ........................ 93 1675
Supplemental Information:
RMA’s Credit & Lending Dictionary . . . . . . . . . . . . . . . . . . . . . . . . . . . . . . . . . . . . . . . . . . . . . . . . . . . . .
*General Industries Format means that a valid construction NAICS was assigned to the subject companies contained in the sample;however, the financial statements were prepared using a general or traditional manufacturing or service industries presentation of resultsversus using a percentage-of-completion method of accounting. Industries found in the percentage-of-completion presentation follow thepresentation used by RMA in the past.
v
About RMA
Founded in 1914, The Risk Management Association is a not-for-profit, member-driven professional association whose sole purpose is to advance the use of sound risk principlesin the financial services industry. RMA promotes an enterprise approach to risk managementthat focuses on credit risk, market risk, and operational risk.
Headquartered in Philadelphia, Pennsylvania, RMA has 2,500 institutional members thatinclude banks of all sizes as well as nonbank financial institutions. They are represented inthe association by 1 ,000 risk management professionals who are chapter members infinancial centers throughout North America, Europe, and Asia/Pacific. Visit RMA on the Webat www.rmahq.org.
vi
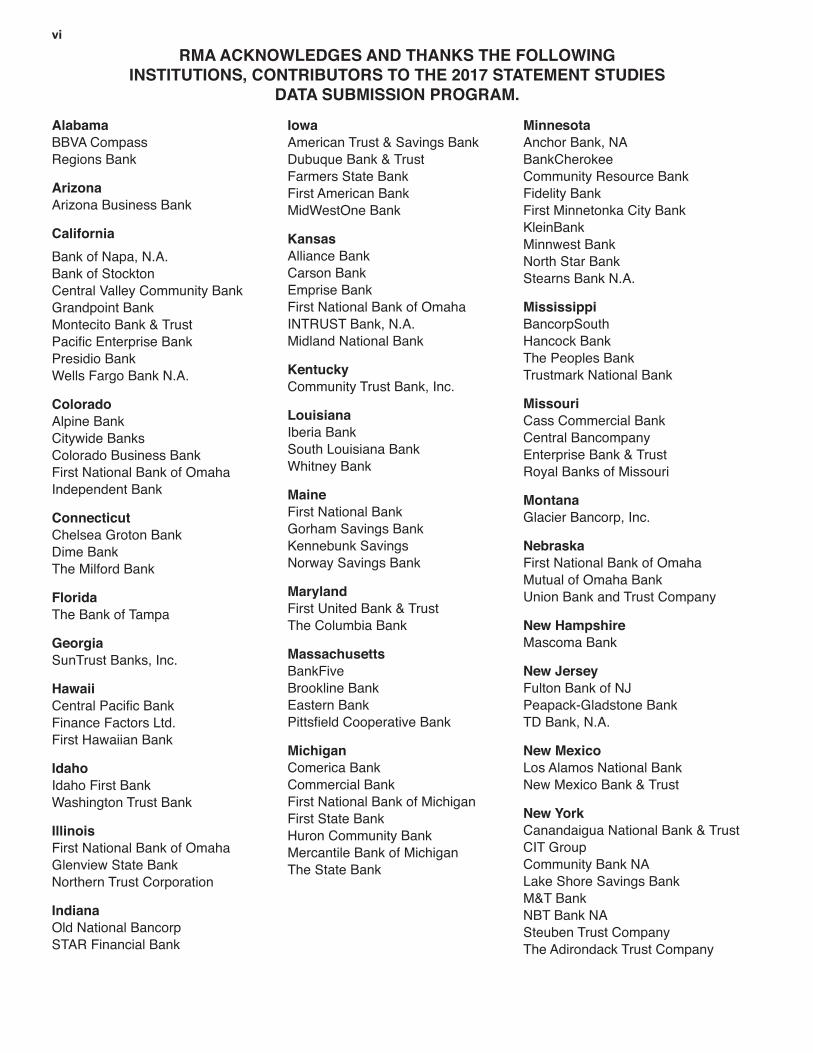
AlabamaBBVA CompassRegions Bank
ArizonaArizona Business Bank
California
Bank of Napa, N.A.Bank of StocktonCentral Valley Community BankGrandpoint BankMontecito Bank & Trust
Presidio BankWells Fargo Bank N.A.
ColoradoAlpine BankCitywide BanksColorado Business BankFirst National Bank of OmahaIndependent Bank
ConnecticutChelsea Groton BankDime BankThe Milford Bank
FloridaThe Bank of Tampa
GeorgiaSunTrust Banks, Inc.
Hawaii
Finance Factors Ltd.First Hawaiian Bank
IdahoIdaho First BankWashington Trust Bank
IllinoisFirst National Bank of OmahaGlenview State BankNorthern Trust Corporation
IndianaOld National BancorpSTAR Financial Bank
IowaAmerican Trust & Savings BankDubuque Bank & TrustFarmers State BankFirst American BankMidWestOne Bank
KansasAlliance BankCarson Bank
First National Bank of OmahaINTRUST Bank, N.A.Midland National Bank
KentuckyCommunity Trust Bank, Inc.
LouisianaIberia BankSouth Louisiana BankWhitney Bank
MaineFirst National BankGorham Savings BankKennebunk SavingsNorway Savings Bank
MarylandFirst United Bank & TrustThe Columbia Bank
MassachusettsBankFiveBrookline Bank
MichiganComerica BankCommercial BankFirst National Bank of MichiganFirst State BankHuron Community BankMercantile Bank of MichiganThe State Bank
MinnesotaAnchor Bank, NABankCherokeeCommunity Resource BankFidelity BankFirst Minnetonka City BankKleinBankMinnwest BankNorth Star BankStearns Bank N.A.
MississippiBancorpSouthHancock BankThe Peoples BankTrustmark National Bank
MissouriCass Commercial BankCentral Bancompany
Royal Banks of Missouri
MontanaGlacier Bancorp, Inc.
NebraskaFirst National Bank of OmahaMutual of Omaha BankUnion Bank and Trust Company
New HampshireMascoma Bank
New JerseyFulton Bank of NJPeapack-Gladstone BankTD Bank, N.A.
New MexicoLos Alamos National BankNew Mexico Bank & Trust
New YorkCanandaigua National Bank & TrustCIT GroupCommunity Bank NALake Shore Savings BankM&T BankNBT Bank NASteuben Trust CompanyThe Adirondack Trust Company
RMA ACKNOWLEDGES AND THANKS THE FOLLOWING INSTITUTIONS, CONTRIBUTORS TO THE 2017 STATEMENT STUDIES
DATA SUBMISSION PROGRAM.

vii
North CarolinaBB&TFirst Citizens BankHomeTrust Bank
OhioFifth Third BankFirst Financial BankThe Huntington National Bank
OklahomaFirst Fidelity BankFirst United Bank & Trust Co
Oregon
Umpqua BankWashington Trust Bank
PennsylvaniaCommunity BankDollar Bank, Federal Savings BankFirst Columbia Bank & Trust Co.First Commonwealth BankFirstrust BankFNB BankFulton BankGemino Healthcare Finance, LLCKish BankLafayette AmbassadorNorthwest BankOrrstown BankPeoplesBank, a Codorus Valley CompanyQNB BankRepublic BankSNB BankSomerset Trust CompanyUnivest Bank & Trust CoWashington Financial BankYork Traditions Bank
Rhode IslandCitizens BankCoastway Community Bank
South Dakota
The First National Bank in Sioux Falls
TennesseeCivic Bank & TrustFirst Farmers and Merchants BankFirst Tennessee Bank, N.A.Pinnacle Bank
Texas
First United Bank & Trust CoFrost BankIndependent BankSouthwest BankTexas Capital BankThe Bank of San Antonio
UtahFirst Utah BankZions Bancorporation
VermontNational Bank of MiddleburyThe Bank of BenningtonUnion Bank
VirginiaAccess National Bank
First Community BankVirginia National Bank
Washington
Northwest Farm Credit ServicesWashington Trust Bank
West VirginiaWesBanco
WisconsinAssociated Bank N.A.Bank of Sun PrairieFirst Bank Financial CentreFirst National Bank and Trust CompanyHoricon BankJohnson BankState Bank FinancialWisconsin Bank & Trust
viii
Introduction to Annual Statement Studies: Financial Ratio Benchmarks, 2017-2018 and General Organization of Content
The notes below will explain the presentation of Annual Statement Studies: Financial Ratio Benchmarks, describe how the book is organized, and answer most of your questions.
The Quality You Expect from RMA: RMA is the most respected source of objective, unbiased information on Annual Statement Studies® has been
Annual Statement Studies was Federal Reserve Bulletin. In the days before computers, the Annual
Statement Studies data was recorded in pencil on yellow ledger paper! Today, it features data for over 787 industries derived directly
• Data That Comes Straight from Original Sources: The more than 260,000 statements used to produce the
commercial customers and prospects. RMA does not know the names of the individual entities. In fact, to ensure
each composite is not available to any third party.
• Data Presented in Common Size: Annual Statement Studies: Financial Ratio Benchmarks contains composite
a percentage of total assets and sales. RMA computes common size statements for each individual statement in
value indicates credits and losses.
• Includes the Most Widely Used Ratios:industry accompany the balance sheet information, including various types of liquidity, coverage, leverage, and operating ratios.
• Organized by the NAICS for Ease of Use:
s/www/naics/ • Twenty Sections Outline Major Types of Businesses: To provide further delineation, the book is divided
into 20 sections outlining major lines of businesses. If you know the NAICS number you are looking for, use the NAICS-page guide provided in the front of this book. In general, the book is arranged in ascending NAICS numerical order. For your convenience, full descriptions of each NAICS are presented in this book. In addition,
• If You Do Not Know the NAICS Code You Are Looking for… If you do not know the precise industry NAICS
the establishment for which you need an industry code and you will receive a reply. Another source to help you
• looking for
Annual Statement Studies: Financial Ratio Benchmarkshave the data. Generally, most of what we receive is published.
• size category, the composite data is not shown because a sample this small is not considered representative and could be misleading. However, all the data for that industry is shown in the All Sizes column. The total number of statements for each size category is shown in bold print at the top of each column. In addition, the number of statements used in a ratio array will differ from the number of statements in a sample because certain elements
in parentheses to the left of the array.
ix
• Presentation of the Data on Each Page-Spread: For all non-contracting spread statements, the data for a particular industry appears on both the left and right pages. The heading Current Data Sorted by Assets is in
Comparable data from past editions of the Annual Statement Studies: Financial Ratio Benchmarks also appears
• Companies with Less than $250 Million in Total Assets: In our presentation, we used companies having
method of accounting. The section for contractors using the percentage-of-completion method of accounting contains data only sorted by revenue. There is no upper limit placed on revenue size for any industry. Its information is found on only one page.
• Page Headers:
• Page Footers:
statements into dollar amounts. To do this, divide the number at the bottom of the page by the number of statements in that size category. Then multiply the result by the percentages in the common size statement. Please note: The dollar amounts will be an approximation because RMA computes the balance sheet and income statement percentages for each individual statement in an industry group, then aggregates and averages all the
• Our Thanks to CFMA: RMA appreciates the cooperation of the Construction Financial Management Association in permitting us to reproduce excerpts from its Construction Industry Annual Financial Survey. This data complements the RMA contractor industry data. For more details on this data, please visit www.cfma.org.
• Recommended for Use as General Guidelines: RMA recommends you use Annual Statement Studies: Financial Ratio Benchmarks data only as general guidelines and not as absolute industry norms. There are several reasons why the data may not be fully representative of a given industry:
Data Not Random — Annual Statement Studies: Financial Ratio Benchmarks are not selected by any random or statistically reliable method. RMA member banks voluntarily submit the raw data they have available each year with no limitation on company size.
2. Categorized by Primary Product Only — Many companies have varied product lines; however, the Annual Statement Studies: Financial Ratio Benchmarks categorizes them by their primary product NAICS number only.
3. Small Samples —industry. A relatively small sample can increase the chances that some composites do not fully represent an industry.
4. Extreme Statements — An extreme or outlier statement can occasionally be present in a sample, causing
Operational Differences — Companies within the same industry may differ in their method of operations,
6. Additional Considerations — There are other considerations that can result in variations among different companies engaged in the same general line of business. These include different labor markets, geographical
terms of sale.
For these reasons, RMA does not recommend using the Annual Statement Studies: Financial Ratio Benchmarks
x
DEFINITION OF RATIOS
Introduction
“strongest” or “best” value is not always the largest numerical value, nor is the “weakest” always the lowest
3. The array of values is divided into four groups of equal size. The description of each ratio appearing in the Statement Studies provides details regarding the arraying of the values.
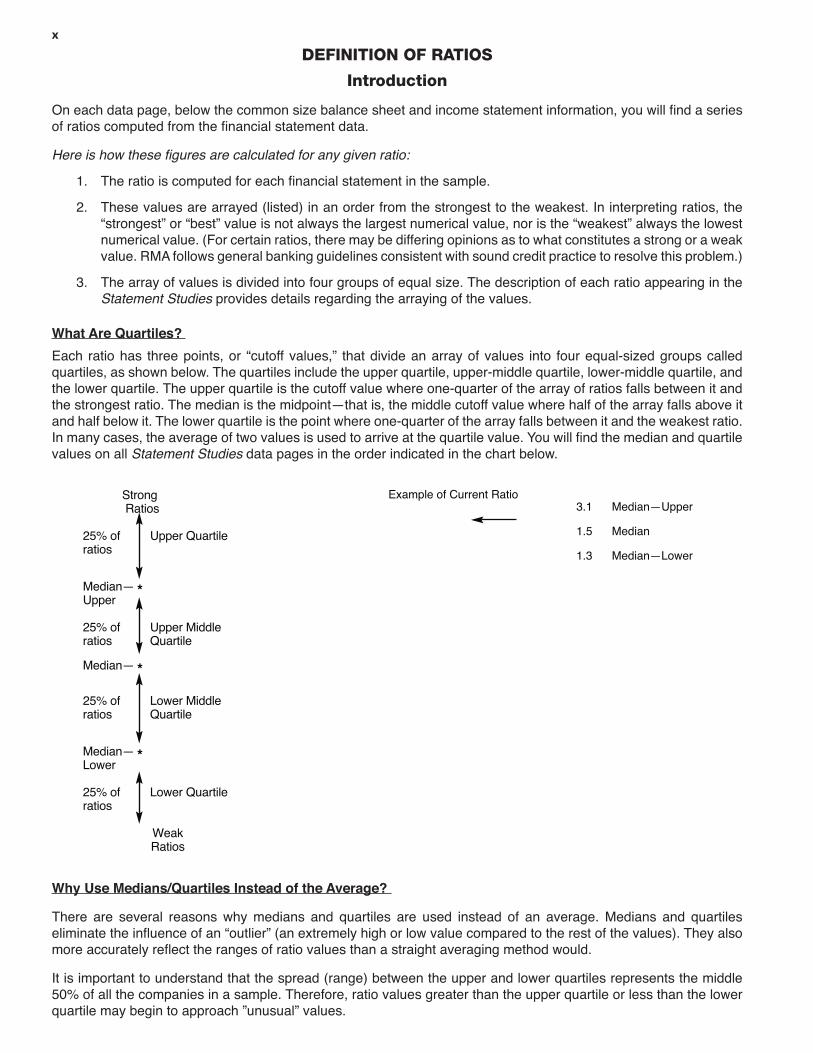
quartiles, as shown below. The quartiles include the upper quartile, upper-middle quartile, lower-middle quartile, and the lower quartile. The upper quartile is the cutoff value where one-quarter of the array of ratios falls between it and
and half below it. The lower quartile is the point where one-quarter of the array falls between it and the weakest ratio.
values on all Statement Studies data pages in the order indicated in the chart below.
StrongRatios
25% of Upper Quartileratios
Median— *Upper
25% of Upper Middleratios Quartile
Median— *
25% of Lower Middleratios Quartile
Median— *Lower
25% of Lower Quartileratios
WeakRatios
Example of Current Ratio3.1 Median—Upper
1.5 Median
1.3 Median—Lower
There are several reasons why medians and quartiles are used instead of an average. Medians and quartiles
more acc
the companies in a sample. Therefore, ratio values greater than the upper quartile or less than the lower quartile may begin to approach ”unusual” values.
xi
Nonconventional Values:
For some ratio values, you will occasionally see an entry that is other than a conventional number. These entries are
UND
NM
999.8designation. This is considered to be a close enough approximation to the actual unusually large value.
Linear versus Nonlinear Ratios:
An array that is ordered in ascending sequence or in descending sequence is linear. An array that deviates from true
Working Capital ratio is positive, then the top quartile would be represented by the lowest positive ratio. However, if the ratio is negative, the top quartile will be represented by the highest negative ratio! In a nonlinear array such as this, the median could be either positive or negative because it is whatever the middle value is in the particular array of numbers.
Nonlinear Ratios
Linear RatiosCurrent RatioQuick Ratio
Sales Receivables
Important Notes on Ratios:
Turnover Ratiostwo numbers, one in BOLD and one in regular type. These ratios are generally called turnover ratios. The number in BOLD represents the number of days and the number in regular type is the number of times. Please see the
and what each means.
Inventory Presentations Inventory presentations
The following ratios contained in the Statement Studies
xii
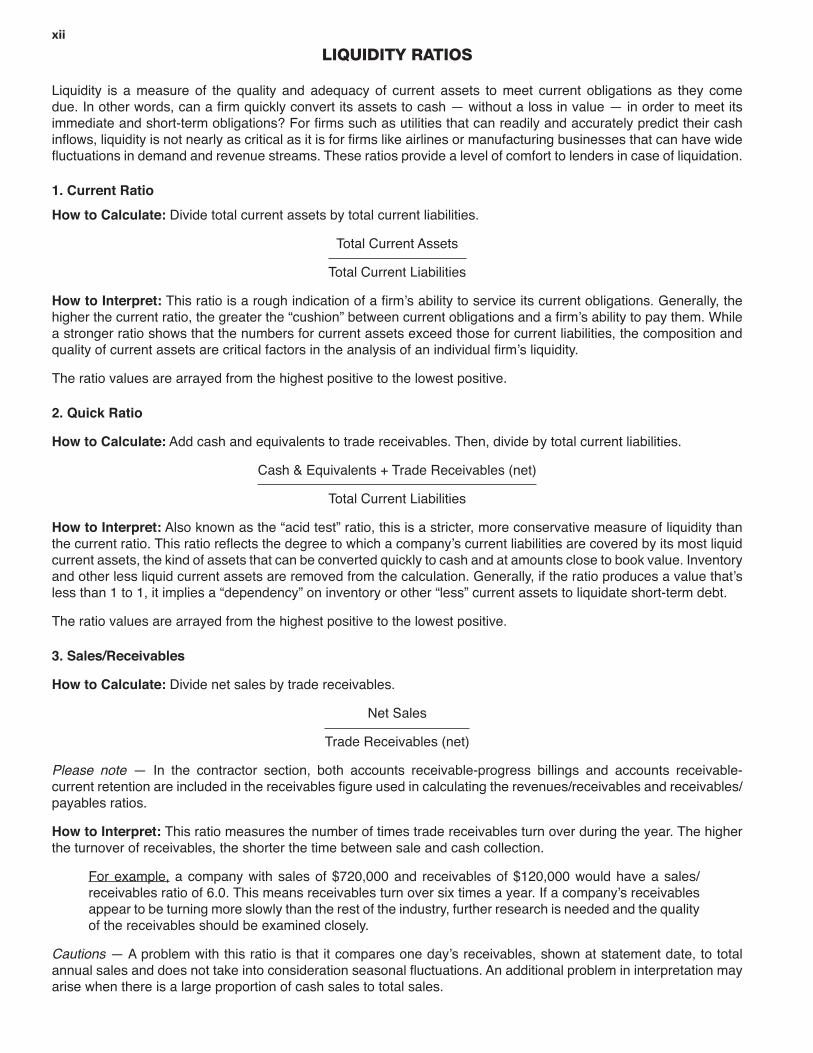
LIQUIDITY RATIOS
Liquidity is a measure of the quality and adequacy of current assets to meet current obligations as they come
1. Current Ratio
How to Calculate: Divide total current assets by total current liabilities.
Total Current Assets
Total Current Liabilities
How to Interpret:
a stronger ratio shows that the numbers for current assets exceed those for current liabilities, the composition and
The ratio values are arrayed from the highest positive to the lowest positive.
2. Quick Ratio
How to Calculate: Add cash and equivalents to trade receivables. Then, divide by total current liabilities.
Total Current Liabilities
How to Interpret: Also known as the “acid test” ratio, this is a stricter, more conservative measure of liquidity than
current assets, the kind of assets that can be converted quickly to cash and at amounts close to book value. Inventory
The ratio values are arrayed from the highest positive to the lowest positive.
3. Sales/Receivables
How to Calculate: Divide net sales by trade receivables.
Net Sales
Please note
payables ratios.
How to Interpret: This ratio measures the number of times trade receivables turn over during the year. The higher the turnover of receivables, the shorter the time between sale and cash collection.
For example,
appear to be turning more slowly than the rest of the industry, further research is needed and the quality of the receivables should be examined closely.
Cautions
arise when there is a large proportion of cash sales to total sales.
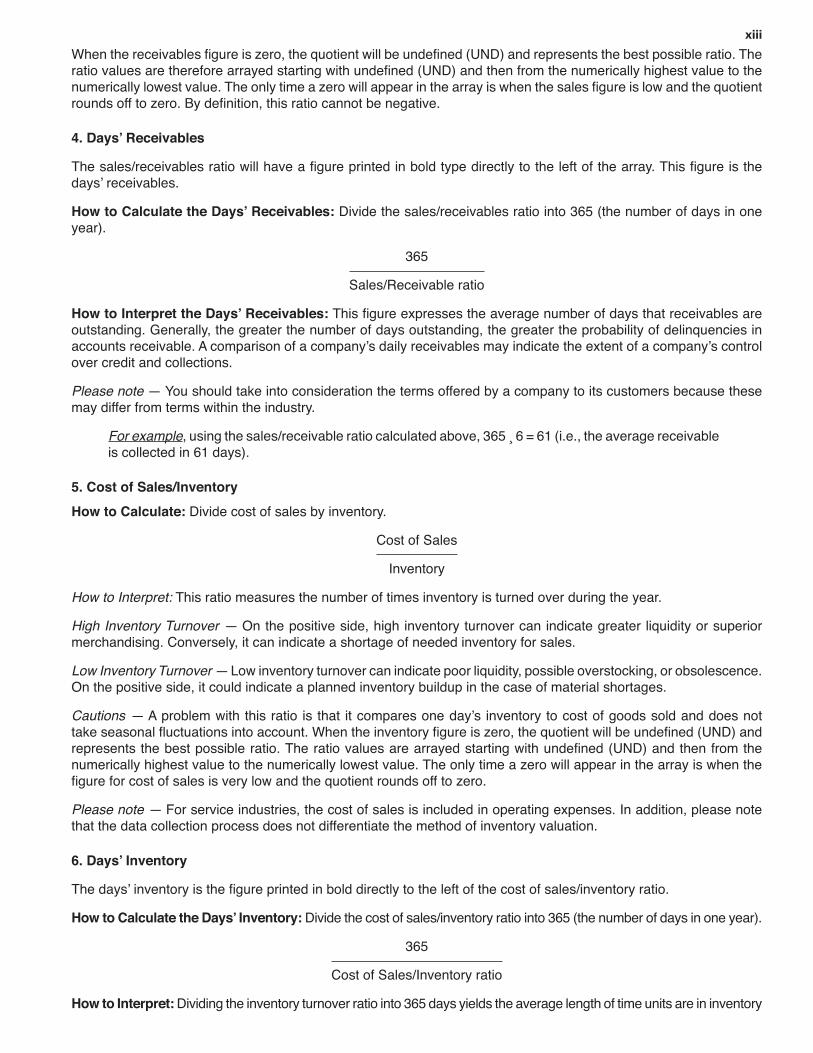
xiii
outstanding. Generally, the greater the number of days outstanding, the greater the probability of delinquencies in
over credit and collections.
Please notemay differ from terms within the industry.
For example
5. Cost of Sales/Inventory
How to Calculate: Divide cost of sales by inventory.
Cost of Sales
Inventory
How to Interpret: This ratio measures the number of times inventory is turned over during the year.
High Inventory Turnover — On the positive side, high inventory turnover can indicate greater liquidity or superior merchandising. Conversely, it can indicate a shortage of needed inventory for sales.
Low Inventory Turnover — Low inventory turnover can indicate poor liquidity, possible overstocking, or obsolescence. On the positive side, it could indicate a planned inventory buildup in the case of material shortages.
Cautions —
numerically highest value to the numerically lowest value. The only time a zero will appear in the array is when the
Please note — For service industries, the cost of sales is included in operating expenses. In addition, please note that the data collection process does not differentiate the method of inventory valuation.
How to Interpret:
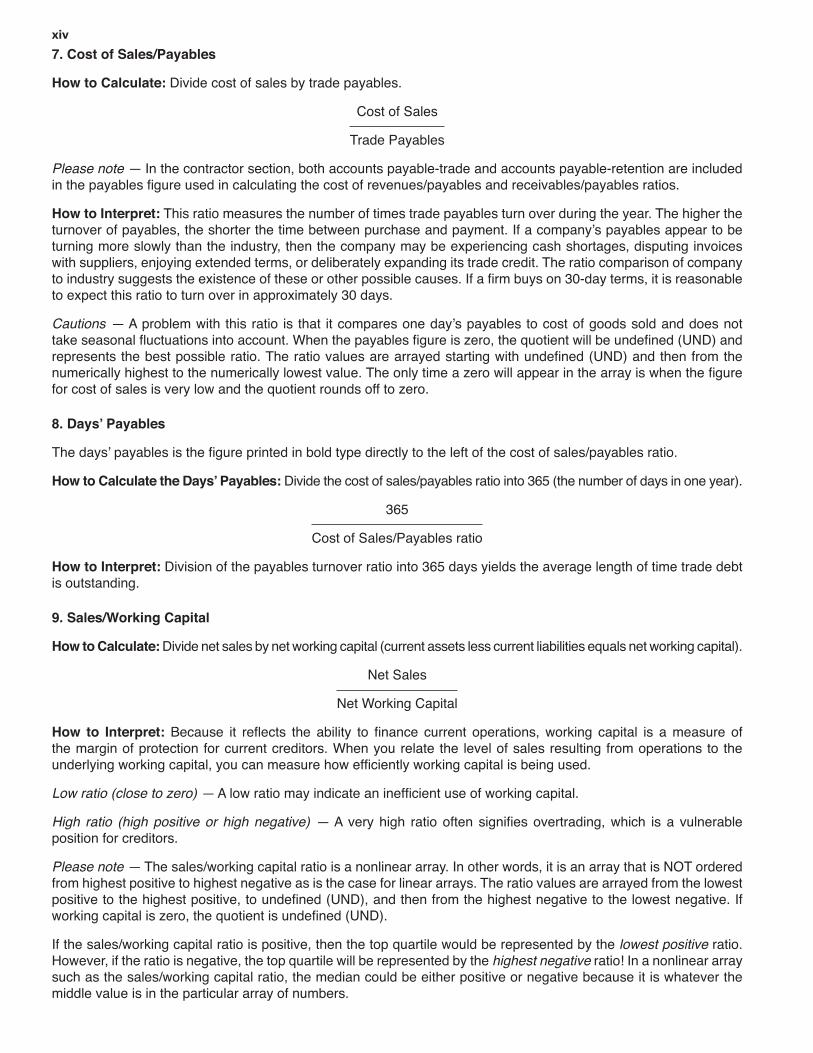
xiv
7. Cost of Sales/Payables
How to Calculate: Divide cost of sales by trade payables.
Cost of Sales
Trade Payables
Please note — In the contractor section, both accounts payable-trade and accounts payable-retention are included
How to Interpret: This ratio measures the number of times trade payables turn over during the year. The higher the
turning more slowly than the industry, then the company may be experiencing cash shortages, disputing invoices with suppliers, enjoying extended terms, or deliberately expanding its trade credit. The ratio comparison of company
to expect this ratio to turn over in approximately 30 days.
Cautions —
for cost of sales is very low and the quotient rounds off to zero.
How to Interpret:is outstanding.
9. Sales/Working Capital
How to Calculate:
Net Sales
Net Working Capital
How to Interpret:the margin of protection for current creditors. When you relate the level of sales resulting from operations to the
Low ratio (close to zero) —
High ratio (high positive or high negative) —position for creditors.
Please note —from highest positive to highest negative as is the case for linear arrays. The ratio values are arrayed from the lowest
lowest positive ratio. However, if the ratio is negative, the top quartile will be represented by the highest negative ratio! In a nonlinear array
middle value is in the particular array of numbers.
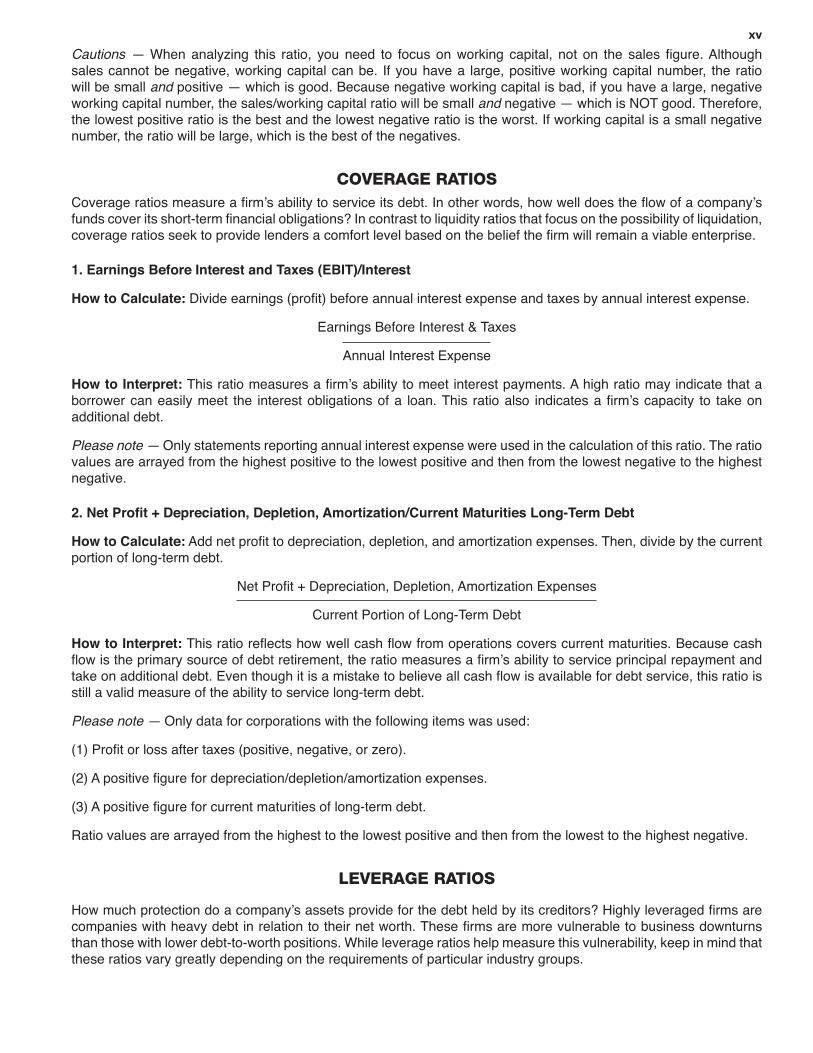
xv
Cautions —sales cannot be negative, working capital can be. If you have a large, positive working capital number, the ratio will be small and
andthe lowest positive ratio is the best and the lowest negative ratio is the worst. If working capital is a small negative number, the ratio will be large, which is the best of the negatives.
COVERAGE RATIOS
1. Earnings Before Interest and Taxes (EBIT)/Interest
How to Calculate:
How to Interpret:
additional debt.
Please note — Only statements reporting annual interest expense were used in the calculation of this ratio. The ratio values are arrayed from the highest positive to the lowest positive and then from the lowest negative to the highest negative.
How to Calculate:portion of long-term debt.
Current Portion of Long-Term Debt
How to Interpret:
still a valid measure of the ability to service long-term debt.
Please note — Only data for corporations with the following items was used:
Ratio values are arrayed from the highest to the lowest positive and then from the lowest to the highest negative.
LEVERAGE RATIOS
than those with lower debt-to-worth positions. While leverage ratios help measure this vulnerability, keep in mind that these ratios vary greatly depending on the requirements of particular industry groups.
xvi
1. Fixed/Worth
How to Calculate:
Net Fixed Assets
Tangible Net Worth
How to Interpret:
worth and a better “cushion” for creditors in case of liquidation. Similarly, a higher ratio would indicate the opposite
Please note —other words, it is an array that is NOT ordered from highest positive to highest negative as a linear array would be.
highest negative to the lowest negative.
lowest positive ratio. However, if the ratio is negative, the top quartile will be represented by the highest negative ratio! In a nonlinear array such as this, the median could be either positive or negative because it is whatever the middle value is in the particular array of numbers.
2. Debt/WorthHow to Calculate: Divide total liabilities by tangible net worth.
Total Liabilities
Tangible Net Worth
How to Interpret: This ratio expresses the relationship between capital contributed by creditors and that contributed by owners. Basically, it shows how much protection the owners are providing creditors. The higher the ratio, the
which results in the quotient being negative. The ratio values are arrayed from the lowest to highest positive, to
Please note —other words, it is an array that is NOT ordered from highest positive to highest negative as a linear array would be.
highest negative to the lowest negative.
lowest positive ratio. However, if the ratio is negative, the top quartile will be represented by the highest negative ratio! In a nonlinear array such as this, the median could be either positive or negative because it is whatever the middle value is in the particular array of numbers.
OPERATING RATIOSOperating ratios are designed to assist in the evaluation of management performance.
How to Calculate:
Tangible Net Worth
xvii
How to Interpret: This ratio expresses the rate of return on tangible capital employed. While it can serve as an indicator of management performance, you should always use it in conjunction with other ratios. Normally associated
conservatively operated business.
negative quotients. Firms with negative tangible net worth have been omitted from the ratio arrays. Negative ratios
lowest to the highest negative values.
How to Calculate:
Total Assets
How to Interpret: This ratio expresses the pre-tax return on total assets and measures the effectiveness of
A heavily depreciated plant and a large amount of intangible assets or unusual income or expense items will cause distortions of this ratio.
lowest positive and then from the lowest to the highest negative.
3. Sales/Net Fixed Assets
How to Calculate:
Net Sales
Net Fixed Assets
How to Interpret:assets or a labor-intensive operation may cause a distortion of this ratio.
4. Sales/Total Assets
How to Calculate: Divide net sales by total assets.
Net Sales
Total Assets
How to Interpret:
to determine the effective employment of assets.
zero. The ratio values cannot be negative. They are arrayed from the highest to the lowest positive values.
xviii
EXPENSE TO SALES RATIOS
Comparisons are convenient because the item, net sales, is used as a constant. Variations in these ratios are most pronounced between capital- and labor-intensive industries.
1. % Depreciation, Depletion, Amortization/Sales
How to Calculate:
Net Sales
How to Calculate:
Net Sales
are arrayed from the lowest to highest positive values.
xix
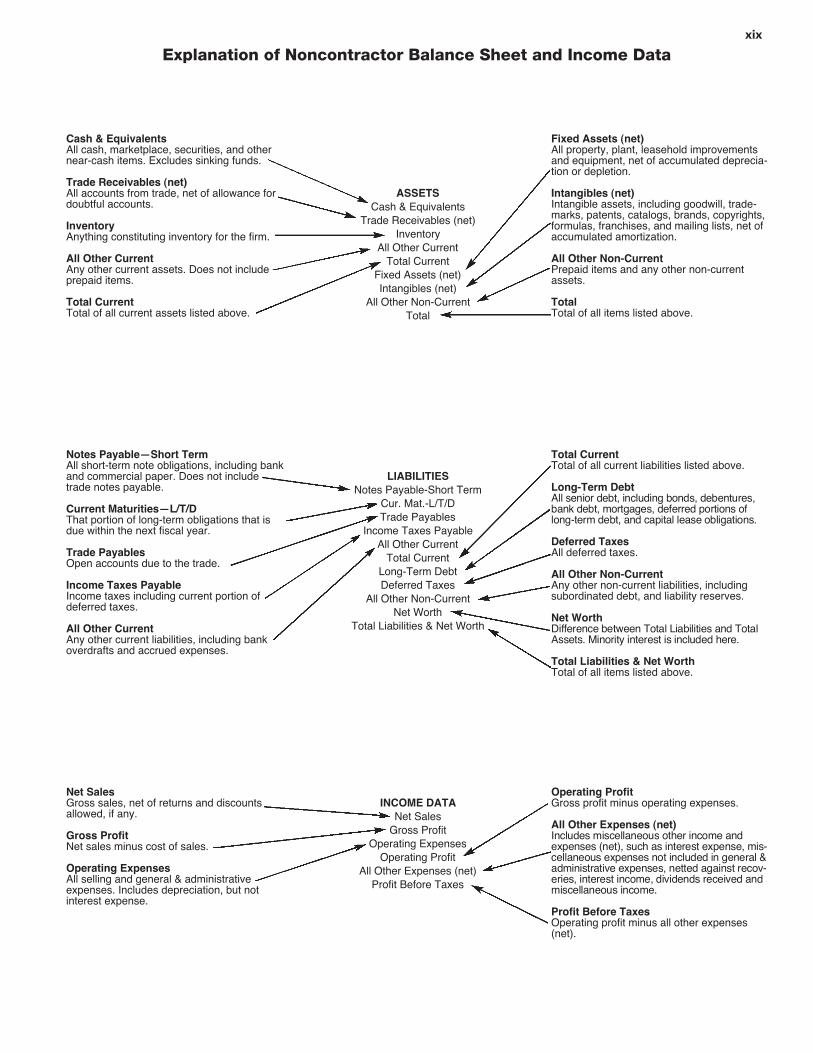
Cash & EquivalentsAll cash, marketplace, securities, and other near-cash items. Excludes sinking funds.
Trade Receivables (net)All accounts from trade, net of allowance fordoubtful accounts.
InventoryAnything constituting inventory for the firm.
All Other CurrentAny other current assets. Does not includeprepaid items.
Total CurrentTotal of all current assets listed above.
Notes Payable—Short TermAll short-term note obligations, including bankand commercial paper. Does not includetrade notes payable.
Current Maturities—L/T/DThat portion of long-term obligations that isdue within the next fiscal year.
Trade PayablesOpen accounts due to the trade.
Income Taxes PayableIncome taxes including current portion ofdeferred taxes.
All Other CurrentAny other current liabilities, including bankoverdrafts and accrued expenses.
Net SalesGross sales, net of returns and discountsallowed, if any.
Gross ProfitNet sales minus cost of sales.
Operating ExpensesAll selling and general & administrativeexpenses. Includes depreciation, but notinterest expense.
ASSETS
Cash & EquivalentsTrade Receivables (net)
InventoryAll Other Current
Total CurrentFixed Assets (net)Intangibles (net)
All Other Non-CurrentTotal
LIABILITIES
Notes Payable-Short TermCur. Mat.-L/T/DTrade Payables
Income Taxes PayableAll Other Current
Total CurrentLong-Term DebtDeferred Taxes
All Other Non-CurrentNet Worth
Total Liabilities & Net Worth
INCOME DATA
Net SalesGross Profit
Operating ExpensesOperating Profit
All Other Expenses (net)Profit Before Taxes
Fixed Assets (net)All property, plant, leasehold improvementsand equipment, net of accumulated deprecia-tion or depletion.
Intangibles (net)Intangible assets, including goodwill, trade-marks, patents, catalogs, brands, copyrights,formulas, franchises, and mailing lists, net ofaccumulated amortization.
All Other Non-CurrentPrepaid items and any other non-currentassets.
TotalTotal of all items listed above.
Total CurrentTotal of all current liabilities listed above.
Long-Term DebtAll senior debt, including bonds, debentures,bank debt, mortgages, deferred portions oflong-term debt, and capital lease obligations.
Deferred TaxesAll deferred taxes.
All Other Non-CurrentAny other non-current liabilities, includingsubordinated debt, and liability reserves.
Net WorthDifference between Total Liabilities and TotalAssets. Minority interest is included here.
Total Liabilities & Net WorthTotal of all items listed above.
Operating ProfitGross profit minus operating expenses.
All Other Expenses (net)Includes miscellaneous other income andexpenses (net), such as interest expense, mis-cellaneous expenses not included in general &administrative expenses, netted against recov-eries, interest income, dividends received andmiscellaneous income.
Profit Before TaxesOperating profit minus all other expenses(net).
Explanation of Noncontractor Balance Sheet and Income Data
xx
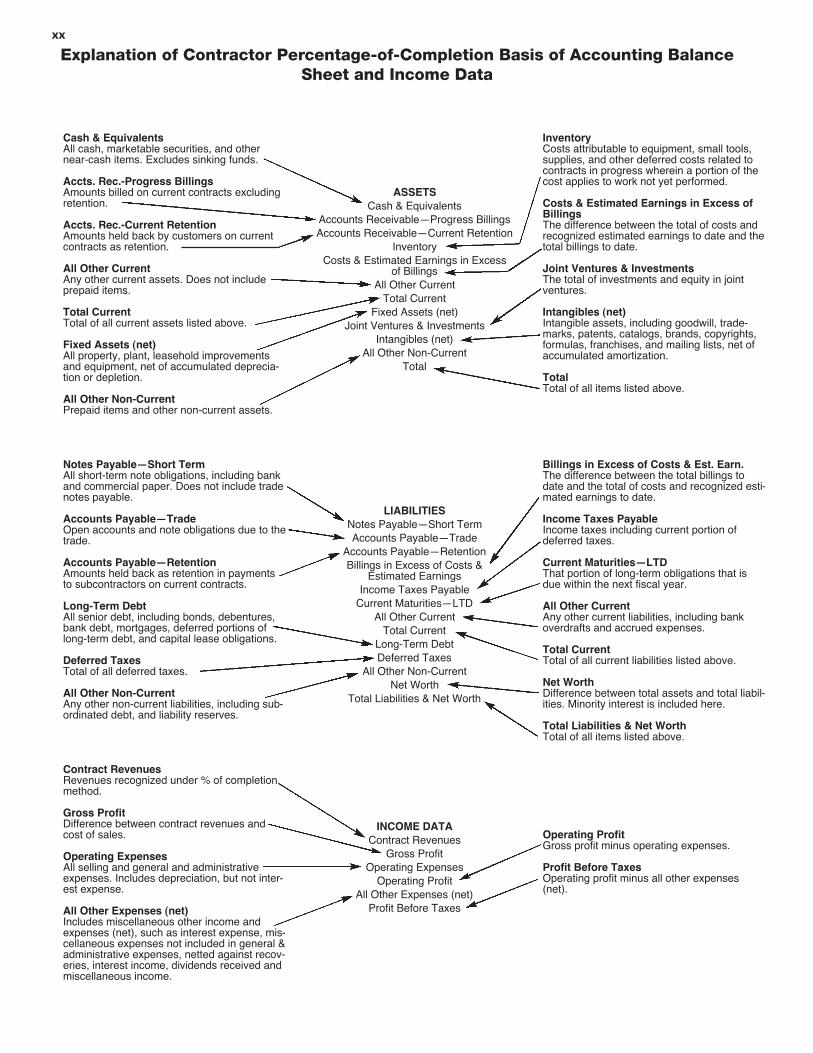
Cash & EquivalentsAll cash, marketable securities, and othernear-cash items. Excludes sinking funds.
Accts. Rec.-Progress BillingsAmounts billed on current contracts excludingretention.
Accts. Rec.-Current RetentionAmounts held back by customers on currentcontracts as retention.
All Other CurrentAny other current assets. Does not includeprepaid items.
Total CurrentTotal of all current assets listed above.
Fixed Assets (net)All property, plant, leasehold improvementsand equipment, net of accumulated deprecia-tion or depletion.
All Other Non-CurrentPrepaid items and other non-current assets.
Notes Payable—Short TermAll short-term note obligations, including bankand commercial paper. Does not include tradenotes payable.
Accounts Payable—TradeOpen accounts and note obligations due to thetrade.
Accounts Payable—RetentionAmounts held back as retention in paymentsto subcontractors on current contracts.
Long-Term DebtAll senior debt, including bonds, debentures,bank debt, mortgages, deferred portions oflong-term debt, and capital lease obligations.
Deferred TaxesTotal of all deferred taxes.
All Other Non-CurrentAny other non-current liabilities, including sub-ordinated debt, and liability reserves.
Contract RevenuesRevenues recognized under % of completionmethod.
Gross ProfitDifference between contract revenues andcost of sales.
Operating ExpensesAll selling and general and administrativeexpenses. Includes depreciation, but not inter-est expense.
All Other Expenses (net)Includes miscellaneous other income andexpenses (net), such as interest expense, mis-cellaneous expenses not included in general &administrative expenses, netted against recov-eries, interest income, dividends received andmiscellaneous income.
ASSETS
Cash & EquivalentsAccounts Receivable—Progress BillingsAccounts Receivable—Current Retention
InventoryCosts & Estimated Earnings in Excess
of BillingsAll Other Current
Total CurrentFixed Assets (net)
Joint Ventures & InvestmentsIntangibles (net)
All Other Non-CurrentTotal
LIABILITIES
Notes Payable—Short TermAccounts Payable—Trade
Accounts Payable—RetentionBillings in Excess of Costs &
Estimated EarningsIncome Taxes Payable
Current Maturities—LTDAll Other Current
Total CurrentLong-Term DebtDeferred Taxes
All Other Non-CurrentNet Worth
Total Liabilities & Net Worth
INCOME DATA
Contract RevenuesGross Profit
Operating ExpensesOperating Profit
All Other Expenses (net)Profit Before Taxes
InventoryCosts attributable to equipment, small tools,supplies, and other deferred costs related tocontracts in progress wherein a portion of thecost applies to work not yet performed.
Costs & Estimated Earnings in Excess ofBillingsThe difference between the total of costs andrecognized estimated earnings to date and thetotal billings to date.
Joint Ventures & InvestmentsThe total of investments and equity in jointventures.
Intangibles (net)Intangible assets, including goodwill, trade-marks, patents, catalogs, brands, copyrights,formulas, franchises, and mailing lists, net ofaccumulated amortization.
TotalTotal of all items listed above.
Billings in Excess of Costs & Est. Earn.The difference between the total billings todate and the total of costs and recognized esti-mated earnings to date.
Income Taxes PayableIncome taxes including current portion ofdeferred taxes.
Current Maturities—LTDThat portion of long-term obligations that isdue within the next fiscal year.
All Other CurrentAny other current liabilities, including bankoverdrafts and accrued expenses.
Total CurrentTotal of all current liabilities listed above.
Net WorthDifference between total assets and total liabil-ities. Minority interest is included here.
Total Liabilities & Net WorthTotal of all items listed above.
Operating ProfitGross profit minus operating expenses.
Profit Before TaxesOperating profit minus all other expenses(net).
Explanation of Contractor Percentage-of-Completion Basis of Accounting Balance Sheet and Income Data
xxi
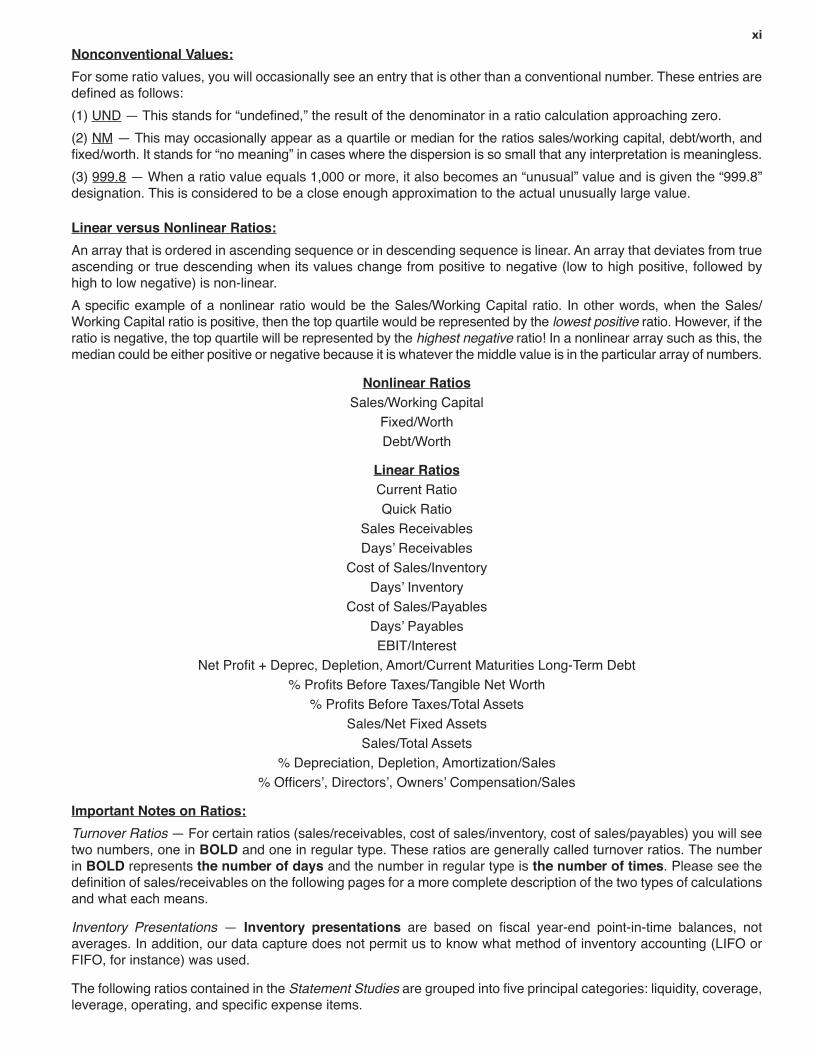
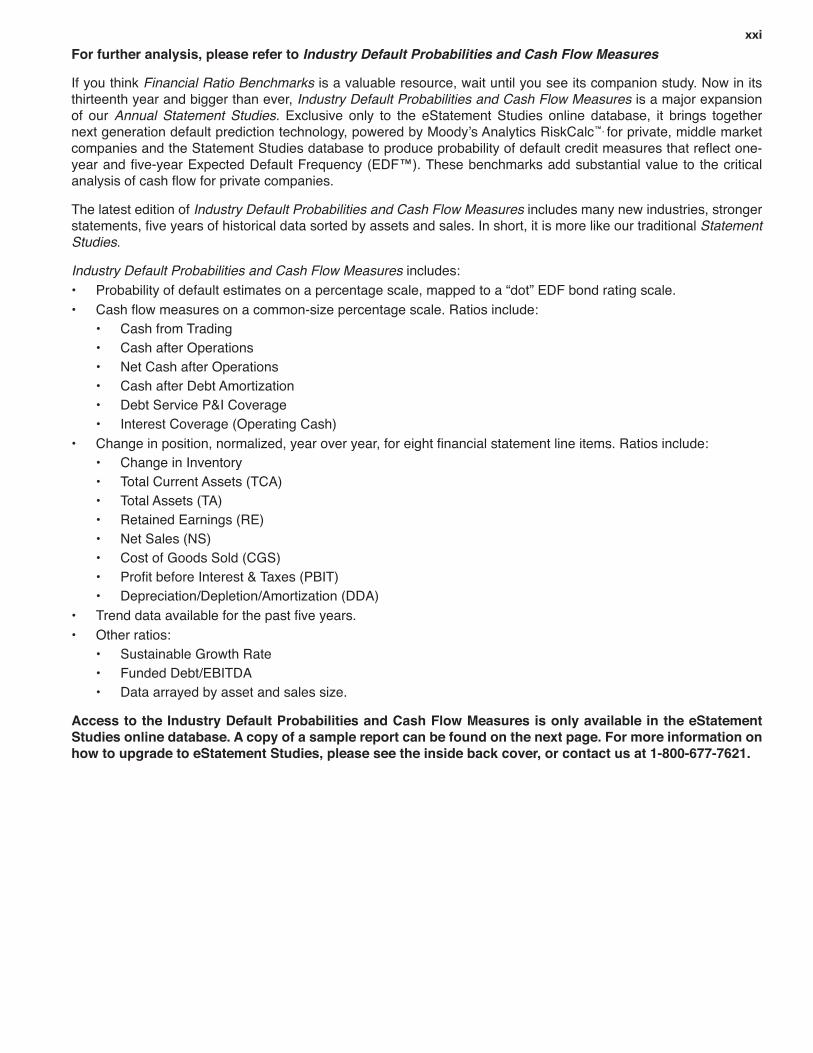
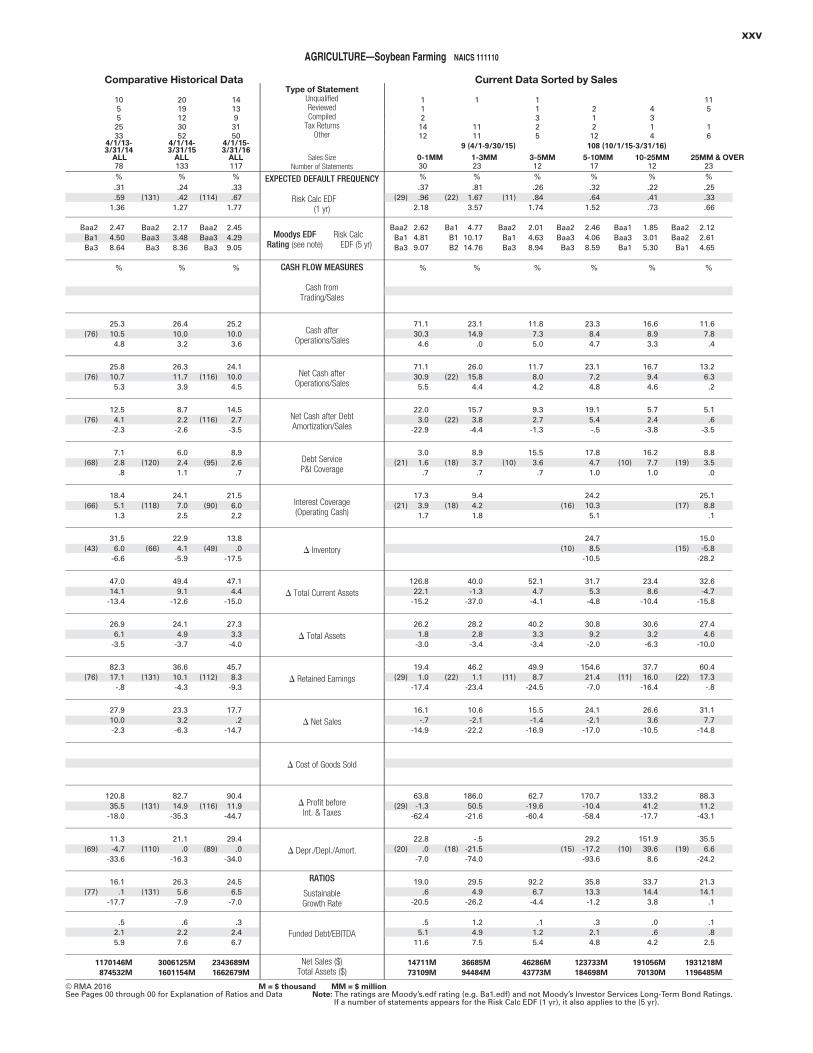
For further analysis, please refer to Industry Default Probabilities and Cash Flow Measures
If you think Financial Ratio Benchmarks is a valuable resource, wait until you see its companion study. Now in its thirteenth year and bigger than ever, Industry Default Probabilities and Cash Flow Measures is a major expansion of our Annual Statement Studies.
™, for private, middle market
The latest edition of Industry Default Probabilities and Cash Flow Measures includes many new industries, stronger Statement
Studies.
Industry Default Probabilities and Cash Flow Measures includes:• •
• Cash from Trading• Cash after Operations• Net Cash after Operations• Cash after Debt Amortization• Debt Service P&I Coverage•
• • Change in Inventory• • • • • • •
• • Other ratios:
• Sustainable Growth Rate• • Data arrayed by asset and sales size.
Access to the Industry Default Probabilities and Cash Flow Measures is only available in the eStatement Studies online database. A copy of a sample report can be found on the next page. For more information on how to upgrade to eStatement Studies, please see the inside back cover, or contact us at 1-800-677-7621.

xxiii
INDUSTRY DEFAULT PROBABILITIES
AND CASH FLOW MEASURES
SAMPLE REPORT
xxiv
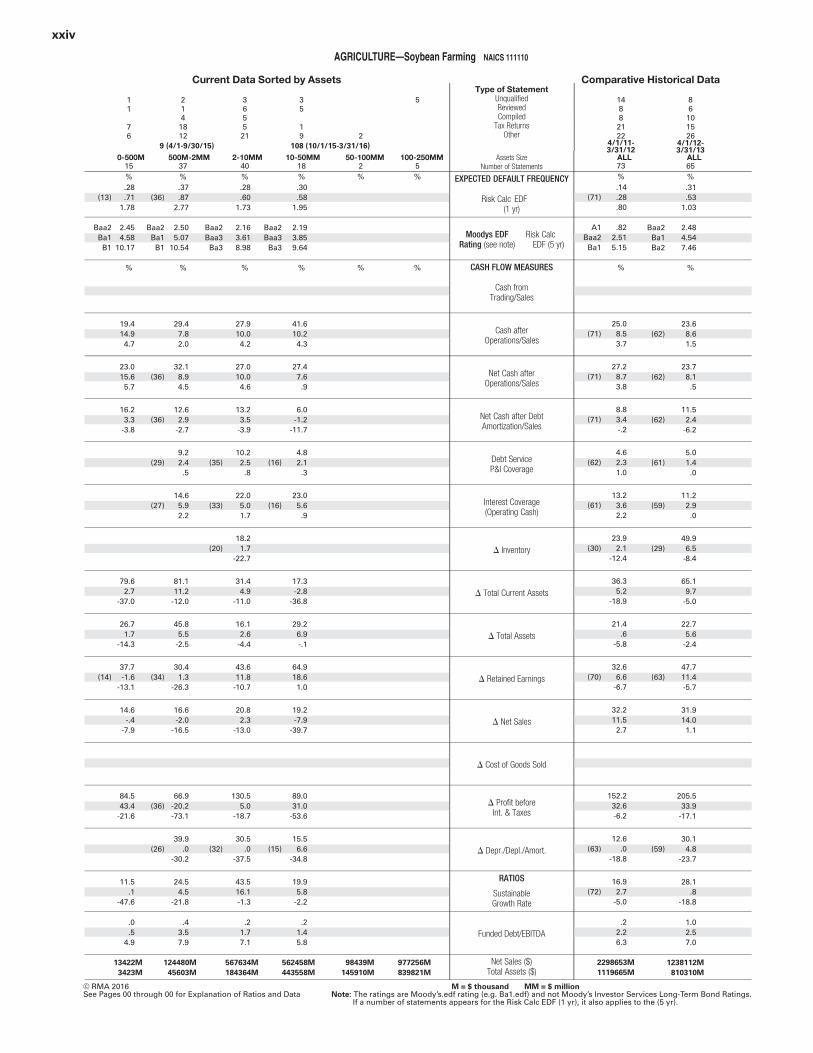
AGRICULTURE—Soybean Farming NAICS 111110
9 (4/1-9/30/15) 108 (10/1/15-3/31/16)
Current Data Sorted by Assets Comparative Historical DataType of Statement
UnqualifiedReviewedCompiled
Tax ReturnsOther
0-500M 500M-2MM 2-10MM 10-50MM 50-100MM 100-250MM Assets Size ALL ALLNumber of Statements
EXPECTED DEFAULT FREQUENCY
Risk Calc EDF(1 yr)
Moodys EDF Risk CalcRating (see note) EDF (5 yr)
CASH FLOW MEASURES
Cash fromTrading/Sales
Cash afterOperations/Sales
Net Cash afterOperations/Sales
Net Cash after DebtAmortization/Sales
Debt ServiceP&I Coverage
Interest Coverage(Operating Cash)
� Inventory
� Total Current Assets
� Total Assets
� Retained Earnings
� Net Sales
� Cost of Goods Sold
� Profit beforeInt. & Taxes
� Depr./Depl./Amort.
RATIOS
SustainableGrowth Rate
Funded Debt/EBITDA
Net Sales ($)Total Assets ($)
11
76
15%.28
(13) .711.78
Baa2 2.45Ba1 4.58B1 10.17
%
19.414.94.7
23.015.65.7
16.23.3
-3.8
79.62.7
-37.0
26.71.7
-14.3
37.7(14) -1.6
-13.1
14.6-.4
-7.9
84.543.4
-21.6
11.5.1
-47.6
.0
.54.9
13422M
3423M
2141812
37%.37
(36) .872.77
Baa2 2.50Ba1 5.07B1 10.54
%
29.47.82.0
32.1(36) 8.9
4.5
12.6(36) 2.9
-2.7
9.2(29) 2.4
.5
14.6(27) 5.9
2.2
81.111.2
-12.0
45.85.5
-2.5
30.4(34) 1.3
-26.3
16.6-2.0
-16.5
66.9(36) -20.2
-73.1
39.9(26) .0
-30.2
24.54.5
-21.8
.43.57.9
124480M
45603M
365521
40%.28.60
1.73
Baa2 2.16Baa3 3.61Ba3 8.98
%
27.910.04.2
27.010.04.6
13.23.5
-3.9
10.2(35) 2.5
.8
22.0(33) 5.0
1.7
18.2(20) 1.7
-22.7
31.44.9
-11.0
16.12.6
-4.4
43.611.8
-10.7
20.82.3
-13.0
130.55.0
-18.7
30.5(32) .0
-37.5
43.516.1-1.3
.21.77.1
567634M
184364M
35
19
18%.30.58
1.95
Baa2 2.19Baa3 3.85Ba3 9.64
%
41.610.24.3
27.47.6.9
6.0-1.2
-11.7
4.8(16) 2.1
.3
23.0(16) 5.6
.9
17.3-2.8
-36.8
29.26.9-.1
64.918.61.0
19.2-7.9
-39.7
89.031.0
-53.6
15.5(15) 6.6
-34.8
19.95.8
-2.2
.21.45.8
562458M
443558M
2
2%
%
98439M
145910M
5
5%
%
977256M
839821M
1488
2122
4/1/11-3/31/12
73%.14
(71) .28.80
A1 .82Baa2 2.51Ba1 5.15
%
25.0(71) 8.5
3.7
27.2(71) 8.7
3.8
8.8(71) 3.4
-.2
4.6(62) 2.3
1.0
13.2(61) 3.6
2.2
23.9(30) 2.1
-12.4
36.35.2
-18.9
21.4.6
-5.8
32.6(70) 6.6
-6.7
32.211.52.7
152.232.6-6.2
12.6(63) .0
-18.8
16.9(72) 2.7
-5.0
.22.26.3
2298653M
1119665M
86
101526
4/1/12-3/31/13
65%.31.53
1.03
Baa2 2.48Ba1 4.54Ba2 7.46
%
23.6(62) 8.6
1.5
23.7(62) 8.1
.5
11.5(62) 2.4
-6.2
5.0(61) 1.4
.0
11.2(59) 2.9
.0
49.9(29) 6.5
-8.4
65.19.7
-5.0
22.75.6
-2.4
47.7(63) 11.4
-5.7
31.914.01.1
205.533.9
-17.1
30.1(59) 4.8
-23.7
28.1.8
-18.8
1.02.57.0
1238112M
810310M
© RMA 2016 M = $ thousand MM = $ millionSee Pages 00 through 00 for Explanation of Ratios and Data Note: The ratings are Moody’s.edf rating (e.g. Ba1.edf) and not Moody’s Investor Services Long-Term Bond Ratings.
If a number of statements appears for the Risk Calc EDF (1 yr), it also applies to the (5 yr).
xxv
AGRICULTURE—Soybean Farming NAICS 111110
9 (4/1-9/30/15) 108 (10/1/15-3/31/16)
Comparative Historical Data Current Data Sorted by SalesType of Statement
UnqualifiedReviewedCompiled
Tax ReturnsOther
ALL ALL ALL Sales Size 0-1MM 1-3MM 3-5MM 5-10MM 10-25MM 25MM & OVERNumber of Statements
EXPECTED DEFAULT FREQUENCY
Risk Calc EDF(1 yr)
Moodys EDF Risk CalcRating (see note) EDF (5 yr)
CASH FLOW MEASURES
Cash fromTrading/Sales
Cash afterOperations/Sales
Net Cash afterOperations/Sales
Net Cash after DebtAmortization/Sales
Debt ServiceP&I Coverage
Interest Coverage(Operating Cash)
� Inventory
� Total Current Assets
� Total Assets
� Retained Earnings
� Net Sales
� Cost of Goods Sold
� Profit beforeInt. & Taxes
� Depr./Depl./Amort.
RATIOS
SustainableGrowth Rate
Funded Debt/EBITDA
Net Sales ($)Total Assets ($)
10552533
4/1/13-3/31/14
78%.31.59
1.36
Baa2 2.47Ba1 4.50Ba3 8.64
%
25.3(76) 10.5
4.8
25.8(76) 10.7
5.3
12.5(76) 4.1
-2.3
7.1(68) 2.8
.8
18.4(66) 5.1
1.3
31.5(43) 6.0
-6.6
47.014.1
-13.4
26.96.1
-3.5
82.3(76) 17.1
-.8
27.910.0-2.3
120.835.5
-18.0
11.3(69) -4.7
-33.6
16.1(77) .1
-17.7
.52.15.9
1170146M
874532M
2019123052
4/1/14-3/31/15
133%.24
(131) .421.27
Baa2 2.17Baa3 3.48Ba3 8.36
%
26.410.03.2
26.311.73.9
8.72.2
-2.6
6.0(120) 2.4
1.1
24.1(118) 7.0
2.5
22.9(66) 4.1
-5.9
49.49.1
-12.6
24.14.9
-3.7
36.6(131) 10.1
-4.3
23.33.2
-6.3
82.7(131) 14.9
-35.3
21.1(110) .0
-16.3
26.3(131) 5.6
-7.9
.62.27.6
3006125M
1601154M
14139
3150
4/1/15-3/31/16
117%.33
(114) .671.77
Baa2 2.45Baa3 4.29Ba3 9.05
%
25.210.03.6
24.1(116) 10.0
4.5
14.5(116) 2.7
-3.5
8.9(95) 2.6
.7
21.5(90) 6.0
2.2
13.8(49) .0
-17.5
47.14.4
-15.0
27.33.3
-4.0
45.7(112) 8.3
-9.3
17.7.2
-14.7
90.4(116) 11.9
-44.7
29.4(89) .0
-34.0
24.56.5
-7.0
.32.46.7
2343689M
1662679M
112
1412
30%.37
(29) .962.18
Baa2 2.62Ba1 4.81Ba3 9.07
%
71.130.34.6
71.130.95.5
22.03.0
-22.9
3.0(21) 1.6
.7
17.3(21) 3.9
1.7
126.822.1
-15.2
26.21.8
-3.0
19.4(29) 1.0
-17.4
16.1-.7
-14.9
63.8(29) -1.3
-62.4
22.8(20) .0
-7.0
19.0.6
-20.5
.55.1
11.6
14711M
73109M
1
1111
23%.81
(22) 1.673.57
Ba1 4.77B1 10.17B2 14.76
%
23.114.9
.0
26.0(22) 15.8
4.4
15.7(22) 3.8
-4.4
8.9(18) 3.7
.7
9.4(18) 4.2
1.8
40.0-1.3
-37.0
28.22.8
-3.4
46.2(22) 1.1
-23.4
10.6-2.1
-22.2
186.050.5
-21.6
-.5(18) -21.5
-74.0
29.54.9
-26.2
1.24.97.5
36685M
94484M
11325
12%.26
(11) .841.74
Baa2 2.01Ba1 4.63Ba3 8.94
%
11.87.35.0
11.78.04.2
9.32.7
-1.3
15.5(10) 3.6
.7
52.14.7
-4.1
40.23.3
-3.4
49.9(11) 8.7
-24.5
15.5-1.4
-16.9
62.7-19.6-60.4
92.26.7
-4.4
.11.25.4
46286M
43773M
21212
17%.32.64
1.52
Baa2 2.46Baa3 4.06Ba3 8.59
%
23.38.44.7
23.17.24.8
19.15.4-.5
17.84.71.0
24.2(16) 10.3
5.1
24.7(10) 8.5
-10.5
31.75.3
-4.8
30.89.2
-2.0
154.621.4-7.0
24.1-2.1
-17.0
170.7-10.4-58.4
29.2(15) -17.2
-93.6
35.813.3-1.2
.32.14.8
123733M
184698M
4314
12%.22.41.73
Baa1 1.85Baa3 3.01Ba1 5.30
%
16.68.93.3
16.79.44.6
5.72.4
-3.8
16.2(10) 7.7
1.0
23.48.6
-10.4
30.63.2
-6.3
37.7(11) 16.0
-16.4
26.63.6
-10.5
133.241.2
-17.7
151.9(10) 39.6
8.6
33.714.43.8
.0
.64.2
191056M
70130M
115
16
23%.25.33.66
Baa2 2.12Baa2 2.61Ba1 4.65
%
11.67.8.4
13.26.3.2
5.1.6
-3.5
8.8(19) 3.5
.0
25.1(17) 8.8
.1
15.0(15) -5.8
-28.2
32.6-4.7
-15.8
27.44.6
-10.0
60.4(22) 17.3
-.8
31.17.7
-14.8
88.311.2
-43.1
35.5(19) 6.6
-24.2
21.314.1
.1
.1
.82.5
1931218M
1196485M
© RMA 2016 M = $ thousand MM = $ millionSee Pages 00 through 00 for Explanation of Ratios and Data Note: The ratings are Moody’s.edf rating (e.g. Ba1.edf) and not Moody’s Investor Services Long-Term Bond Ratings.
If a number of statements appears for the Risk Calc EDF (1 yr), it also applies to the (5 yr).