Embed Size (px)
Citation preview
ANNUAL NGO SECTORREPORT 2018/19
Non-Governmental OrganizationsCo-ordination Board
Empowered lives.Resilient nations.

3ANNUAL NGO SECTOR REPORT2018/19
Published 2019
© NGOs Co-Ordination Board
Co-operative Bank House, 15th floor,
Haile Selassie Avenue
P.O. Box 44617-00100, NAIROBI, KENYA
Tel: +254 (20) 2214044, 2214887 Fax: +254 (20) 2214801
Email: [email protected]
Website: www.ngobureau.or.ke
Twitter: @ngoboardkenya
ISBN: 978-9966-137-24-1
All Rights Reserved Copyright©2019
4 ANNUAL NGO SECTOR REPORT 2018/19
Contents
List of Tables .............................................................................................................. 6
List of Figures ............................................................................................................ 7
NGOs Co-ordination Board in Brief ....................................................................... 8
Foreword .................................................................................................................... 9
Preface ........................................................................................................................ 11
Acknowledgments ................................................................................................... 13
Abbreviations and Acronyms ................................................................................. 14
Executive Summary ................................................................................................. 15
CHAPTER ONE ............................................................................. 181. INTRODUCTION........................................................................... 181.1 Scope .............................................................................................................. 19
1.2 Objectives ....................................................................................................... 19
1.3 Limitations ..................................................................................................... 10
CHAPTER TWO ............................................................................ 202. SECTOR GROWTH AND CONTRIBUTION TO DEVELOPMENT .......... 202.1 Sector Growth ............................................................................................... 20
2.1.1 Registered NGOs in 2018/19 .............................................................. 20
2.1.2 Deregistration ...................................................................................... 21
2.1.3 Reinstatement ..................................................................................... 21
2.1.4 Dissolution ............................................................................................ 22
2.1.5 Active NGOs .......................................................................................... 22
2.1.6 Funds received ..................................................................................... 22
2.2 Contribution to Development .................................................................... 23
2.2.1 Utilization of funds on projects ........................................................ 23
2.2.2 Leading NGOs in utilization of funds on projects.......................... 26
2.2.3 Project implementation: Counties of operation .......................... 28
2.2.4 Newly registered NGOs: Preferred counties of operation .......... 29
2.2.5 Newly registered NGOs: Preferred sectors of operation ............. 31
5ANNUAL NGO SECTOR REPORT2018/19
2.2.6 Leading sector players ...................................................................... 31
2.2.7 Contribution of NGOs to the “Big Four” agenda ........................... 33
2.2.8 Employment ......................................................................................... 33
2.2.9 Collaborations and networking ....................................................... 36
CHAPTER THREE ......................................................................... 383 NGO FUNDING AND SECTOR SUSTAINABILITY ............................... 383.1 NGO Funding .................................................................................................. 38
3.1.1 Amount of funds received.................................................................. 383.1.2 Description on sources of funds ....................................................... 383.1.3 Funds raised within and outside Kenya .......................................... 413.1.4 Continental distribution of sources of funds ................................. 423.1.5 Leading NGOs by funding .................................................................. 423.1.6 NGO Utilization of Funds ................................................................... 433.1.7 Expenditure within and outside Kenya ........................................... 443.1.8 Expenditure Breakdown .................................................................... 44
3.2 Sector Sustainability .................................................................................... 463.2.1 Background .......................................................................................... 463.2.2 Sustainability Index: Methodology .................................................. 463.3.3 Overall Sustainability Index ............................................................... 473.3.4 Organization capacity ........................................................................ 483.3.5 Financial viability ................................................................................ 493.3.6 Collaboration and networking ......................................................... 51
3.3. Annual Reports ............................................................................................. 513.3.1 Submission of annual returns .......................................................... 513.3.2 Audited accounts ................................................................................ 52
CHAPTER FOUR ........................................................................... 534. CONCLUSIONS AND RECOMMENDATIONS .................................... 53
4.1 Conclusions ............................................................................................ 53
4.2 Recommendations ................................................................................ 55
References ...................................................................................................... 58
6 ANNUAL NGO SECTOR REPORT 2018/19
List of Tables
Table 2.1: Cumulative registration change, 2009/10–2018/19 ................... 21
Table 2.2: Summary of the register .................................................................. 22
Table 2.3: Utilization of funds on projects per sector .................................. 24
Table 2.4: Comparative percentage change in utilizationof funds per sector ........................................................................... 25
Table 2.5: Leading NGOs in utilization of funds on projects ....................... 27
Table 2.6: NGOs that implemented projects per county ............................. 29
Table 2.7: Preferred counties of operation for newly registered NGOs .... 30
Table 2.8: Leading sector players ..................................................................... 32
Table 2.9: NGO sector sta� establishment ..................................................... 35
Table 3.1: NGO funding by source types ......................................................... 39
Table 3.2: Percentage change in funds source type2017/18 and 2018/19 ....................................................................... 40
Table 3.3: NGO funding countries .................................................................... 41
Table 3.4: Continental distribution of funds received .................................. 42
Table 3.5: Leading NGOs by funds received ................................................... 43
Table 3.6: Expenditure by NGOs ....................................................................... 45
7ANNUAL NGO SECTOR REPORT2018/19
List of Figures
Figure 2.1: Cumulative registrations, 2009/10–2018/19 .............................. 20
Figure 2.2: NGO funding..................................................................................... 23
Figure 2.3: Preferred sectors of operation for newly registered NGOs ..... 31
Figure 2.4: Trend on salaried employees ....................................................... 34
Figure 2.5: Trend on volunteers and interns .................................................. 35
Figure 2.6: NGO collaborations and networking trends in percentage.... 36
Figure 2.7: Networking and collaborations ................................................... 36
Figure 2.8: Nature of collaborations ............................................................... 37
Figure 2.9: Expenditure within and outside Kenya ...................................... 44
Figure 3.2: Expenditure by NGOs ..................................................................... 45
Figure 3.3: Overall sustainability index ........................................................... 47
Figure 3.4: Trend of submission of annual reports ...................................... 52
8 ANNUAL NGO SECTOR REPORT 2018/19
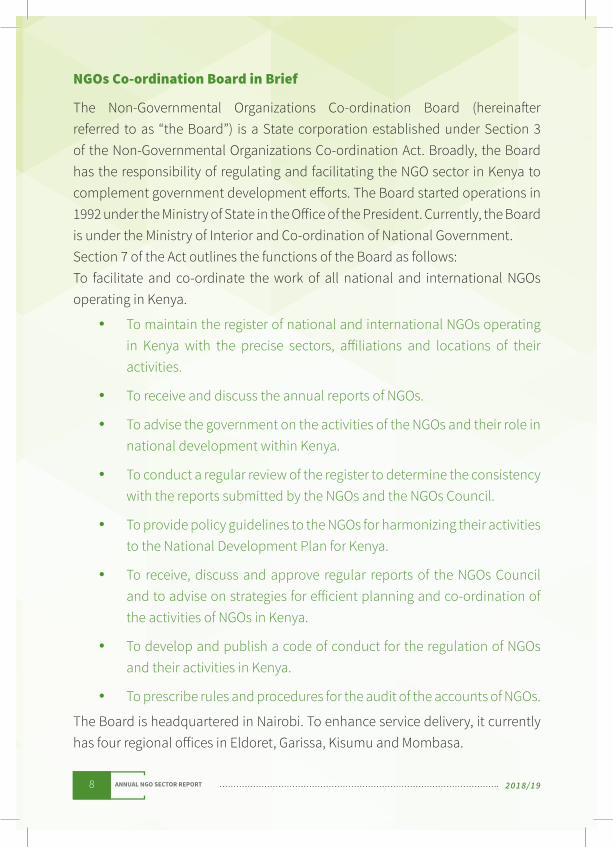
NGOs Co-ordination Board in Brief
The Non-Governmental Organizations Co-ordination Board (hereina� er referred to as “the Board”) is a State corporation established under Section 3 of the Non-Governmental Organizations Co-ordination Act. Broadly, the Board has the responsibility of regulating and facilitating the NGO sector in Kenya to complement government development e� orts. The Board started operations in 1992 under the Ministry of State in the O� ice of the President. Currently, the Board is under the Ministry of Interior and Co-ordination of National Government.Section 7 of the Act outlines the functions of the Board as follows: To facilitate and co-ordinate the work of all national and international NGOs operating in Kenya.
• To maintain the register of national and international NGOs operating in Kenya with the precise sectors, a� iliations and locations of their activities.
• To receive and discuss the annual reports of NGOs.
• To advise the government on the activities of the NGOs and their role in national development within Kenya.
• To conduct a regular review of the register to determine the consistency with the reports submitted by the NGOs and the NGOs Council.
• To provide policy guidelines to the NGOs for harmonizing their activities to the National Development Plan for Kenya.
• To receive, discuss and approve regular reports of the NGOs Council and to advise on strategies for e� icient planning and co-ordination of the activities of NGOs in Kenya.
• To develop and publish a code of conduct for the regulation of NGOs and their activities in Kenya.
• To prescribe rules and procedures for the audit of the accounts of NGOs.
The Board is headquartered in Nairobi. To enhance service delivery, it currently has four regional o� ices in Eldoret, Garissa, Kisumu and Mombasa.
9ANNUAL NGO SECTOR REPORT2018/19
Foreword
It is now appreciated that the Non-Governmental Organisations (NGO) sector is an important development pillar in Kenya.While some sector players complement Government e� orts as providers of basic and relief services, others check whether the State is delivering on its obligations and commitments to the citizens. There are those that mobilize citizens to participate in governance.
It is for this reason that there have been calls to expand the space in which the sector players operate, with Government facilitation and enhanced self-regulation gaining prominence.
I am a staunch proponent of this approach to regulation of non-profit organizations.I believe, however, that there is need to provide empirical data to support this argument. Credible data and statistics on the sector is what is needed for all, including the sceptics, to acknowledge NGOs as potent agents of development.I, therefore, welcome studies such as the one that culminated to the development of this Annual NGO Sector Report for 2018/19. I am happy that this report provides useful data, which include growth of the NGO sector in terms of numbers and finances, and programmes that have transformed the lives of the needy in Kenya.I am impressed that the NGO sector is employing thousands of Kenyans and foreign nationals whose unique skills are utilised for e� ectiveness and sustainability of the sector.
In my view, the report provides a reflection of the state of the NGO sector in the financial year 2018/19. It has confirmed the significant contribution of the NGO sector to socio-economic development of the country.The report now forms a basis for a national discourse on the place of the civil society organizations (CSOs) in Kenya, including enabling regulatory regime and sustainability of charities.
10 ANNUAL NGO SECTOR REPORT 2018/19
One of the downsides, however, is that about a third of all registered NGOs filed their annual reports in 2017/18. This trend should be reversed, as all NGOs and CSOs should abide by the laws of the country.
On our part, I will work with my colleagues in the Board to provide a conducive regulatory and policy environment for NGOs to thrive. This will include working with stakeholders to continue with the dialogue aimed at operationalization of the Public Benefit Organisations Act, 2013.
I wish to thank my Board colleagues for the support they provided in this study and the management for conducting the study under constrained resource base and developing this important report.
Mr Gichira Kibara, CBSChairmanNGOs Co-ordination Board
11ANNUAL NGO SECTOR REPORT2018/19
Preface
The NGOs Co-ordination Board is obligated by law to advise the Government on the work of NGOs and to guide NGOs to align their activities to the country’s development priorities. To fulfil these mandates, the Board prepares and disseminates NGO sector reports every year. The report analyses the role the sector plays in complementing Government development e� orts.
The 2018/19 report addresses the general need for quality data on NGO activities in Kenya. It provides information on the activities of NGOs and their contribution to socio-economic development. The report documents NGO sector support to the Government in implementing the “Big Four” agenda, namely: food security, a� ordable housing, manufacturing and universal health coverage.
The Government recognizes the role of NGOs in complementing its development e� orts. As stated in the Third Medium Term Plan (MTP III) 2018-2022, strong partnerships with charitable organizations will strengthen the implementation of the MTP and enhance socio-economic development of the country. During this plan period, the Government has committed to improve co-ordination of non-State actors and align their activities and resources towards implementation of MTP III by operationalizing the Public Benefit Organizations (PBO) Act, 2013. The Act aims at facilitating the formation and growth of PBOs; promoting their compliance with legal and statutory requirements and high standards of governance, transparency and accountability; and enhancing co-operation between PBOs, government, private sector and development partners.
In 2018/19, the report projects a bright future of the NGO sector. It indicates that the 3,028 reported NGOs received Ksh 165.97 billion, an amount higher than one reported in 2017/18. While the number of new registrations has gone up in the last ten years, compliance with submission of annual reports is relatively low. Monitoring, evaluation and research activities are, therefore, critical in promoting transparency and accountability in the sector, and conclusively capturing the contribution of the sector in national development. In addition, the Board’s compliance and enforcement functions will be strengthened to improve NGOs’ response in filing annual reports as required by law.
12 ANNUAL NGO SECTOR REPORT 2018/19
To meet the service demands of the expanding NGO sector, the Board will continue to invest in strengthening its capacity. Specifically, more resources will be required to automate the functions and activities of the Board. There will also be focus on outreach programmes to sensitize NGOs on compliance and other regulatory requirements.
Mr Mutuma NkanataExecutive DirectorNGOs Co-ordination Board
13ANNUAL NGO SECTOR REPORT2018/19
Acknowledgments
The NGOs Co-ordination Board is grateful to all the individuals who participated in the conceptualization, development and publication of the Annual NGO Sector Report 2018/19.
We acknowledge the Board of Directors led by the Chairman, Mr Gichira Kibara, CBS; the Executive Director Mr Mutuma Nkanata; and the Deputy Executive Director Mr Andrew Ogombe for providing leadership and oversight in the preparation of the report.
We acknowledge the immense contribution of the technical team that developed the report, including data collection, analysis and report writing. Team members included: Jemimah Muraya, Zilpah Angwenyi, Josephine Wanjala, Lindon Otieno, Bernard Bwoma, Richard Chesos, Isaiah Sang, Stephen Monyoncho, Amina Matheka and Yvonne Isichi.
To data entry sta� Lorna Antat and Fauziya Mohamed, we thank you. We are also grateful to the various heads of departments and other Board sta� for providing invaluable support to ensure timely submission of datasets for completion of the report.
The Board also wishes to thank and appreciate NGOs that availed the data used in writing this report. We also acknowledge the contribution of sector stakeholders who provided vital insights especially during the validation workshop of this report.
Special thanks go to Richard Chesos for editing and proofreading the report. The preparation of the report was made possible through support to the Board by the Government of Kenya, the United Nations Development Programme (UNDP) Amkeni Wakenya CSO facility and the Embassy of the Kingdom of the Netherlands. We are profoundly grateful for this support.
Mr Mutuma NkanataExecutive DirectorNGOs Co-ordination Board
Mr Mutuma NkanataExecutive DirectorNGOs Co-ordination Board
14 ANNUAL NGO SECTOR REPORT 2018/19
Abbreviations and Acronyms
AGMs Annual General Meetings
CBOs Community-Based Organizations
CSO Civil Society Organization
FBOs Faith-Based Organizations
HDI Human Development Index
HIV/AIDS Human Immunodeficiency Virus/Acquired Immunodeficiency
Syndrome
ICPAK Institute of Certified Public Accountants of Kenya
ICT Information and Communications Technology
IFRS International Financial Reporting Standards
INGOs International Non-Governmental Organizations
ISBN International Standard Book Number
Ksh Kenya Shillings
MDGs Millennium Development Goals
M&E Monitoring and Evaluation
MTP III Medium Term Plan III
NGO Non-Governmental Organization
PBO Public Benefit Organization
SDGs Sustainable Development Goals
SPSS Statistical Package for Social Sciences
UHC Universal Health Coverage
UNDP United Nations Development Programme
USAID United States Agency for International Development
15ANNUAL NGO SECTOR REPORT2018/19
Executive Summary
The Annual NGO Sector Report 2018/19 details information on the NGO sector, including sector growth, funding, expenditure and sustainability of the sector.It is, however, important to note that this report largely contains data on NGOs that submitted their Annual Reports in the Financial Year 2018/19 in line with the NGOs Co-ordination Act.
There has been a significant growth in the number of organizations registering under the Non-Governmental Organizations Co-ordination Act since 2001. During the period under review, a total of 98 NGOs were registered, bringing the cumulative number of NGOs to 11,262 by 30th June 2019. Most of the newly registered NGOs were operating in education, relief and health sectors.
In 2018/19, NGOs received a total of Ksh 165.97 billion, a 8 per cent increase from the previous year. It is noteworthy, however, that 88 per cent of these funds were raised from sources outside Kenya. The total expenditure was Ksh 172.1 billion, representing a 15 per cent increase from 2017/18.
The extra amount spent by the NGOs over and above the revenue for the year had been deferred from the previous period.
On project implementation, the report indicates that NGOs spent Ksh 78.8 billion on projects in various parts of the country. The bulk of the project expenditure was on health, HIV/AIDS, education and relief/disaster management at Ksh 13.0 billion, Ksh 10.6 billion, Ksh 9.4 billion and Ksh 8.8 billion, respectively. Most charities implemented projects in areas with good infrastructure, such as Nairobi, Kiambu, Kisumu, Nakuru and other urban centres.
Data gathered indicates that the NGO sector is making significant contributions in complementing government’s development e� orts as the country strives to achieve the Sustainable Development Goals (SDGs), Kenya Vision 2030 and
16 ANNUAL NGO SECTOR REPORT 2018/19
other development priorities. A total of 1,026 NGOs reported spending a total of Ksh 34.9 billion implementing projects related to the “Big Four” government agenda. NGOs spent a total of Ksh 30.8 billion on health-related projects, Ksh 3.8 billion on food security and nutrition, Ksh 352.6 million (manufacturing) and Ksh 19.6 million on housing and settlement.
In addition, NGOs are providing employment opportunities to many Kenyans. During the period under review, 39,109 Kenyans were salaried NGO employees, with 32,868 of them based in Kenya and 6,241 stationed in other countries. NGOs engaged a total of 37,401 Kenyan volunteers and interns. The sector had 1,591 salaried expatriate sta� and 1,507 foreign volunteers and interns in the same period.
However, the sector faces some challenges. The report highlights some of the challenges NGOs faced, potentially inhibiting their ability to e� ectively serve the needy.
Based on the sustainability index used in analyzing the data, it was noted that NGOs in Kenya are in the evolving stage, implying that significant e� ort is required to ensure the sector’s sustainability. The report established that the overall NGO sustainability index stood at 66 per cent.
Many NGOs in Kenya depend on foreign donor funding, making them susceptible to external factors, thus threatening their sustainability. In the year under review, 88 per cent of funds received by NGOs were from sources outside Kenya compared to 11 per cent received from local sources.
On governance, the report established that most NGOs are yet to establish strong management structures. Consequently, the charities have poor accountability mechanisms, which are necessary for their growth and sustainability.
17ANNUAL NGO SECTOR REPORT2018/19
While boards of directors of various NGOs are expected to exercise e� ective oversight for their respective charitable organizations in their fiduciary role, it is evident that most boards are faced with the challenge of playing this important role.
The report notes low compliance levels in submission of annual reports. Out of the 8,893 expected to be active, only 3,028 NGOs (34%) filed their reports during the year.
The report makes recommendations for consideration with a view to strengthening the NGO sector in Kenya. They include: adequate investment on legislative and regulatory environment, including operationalization of the Public Benefit Organisations Act, 2013; the need to enhance capacity building among NGOs to improve resource mobilization; a national census of NGOs to determine the actual number of active ones; enforcement mechanism to improve compliance among NGOs; and policies aimed at e� ective regulation and enablement of the sector.
Others are incentives to ensure more NGOs move from urban centres; the need to encourage NGOs to align their programmes and projects to government development plans; encouraging local philanthropy and income generating projects for sustainability; strengthening the Board’s monitoring and evaluation system to minimize risks NGOs are exposed to; and the need to encourage NGOs to spend more of their income on projects.
18 ANNUAL NGO SECTOR REPORT 2018/19
CHAPTER ONE
1. INTRODUCTION
Quality statistics and information on the Non-Governmental Organizations (NGOs) sector is important for policy and decision making. In the recent past, there has been evident demand for credible data and statistics on the sector. This demand has emanated from stakeholders, including government, NGOs, development partners, research institutions, the private sector and the media.
The Act mandates the Board to advise the Government on the activities of the NGOs and their role in national development. The Board is also required under the law to provide policy guidelines to all national and international NGOs (INGOs) to harmonize their activities to conform to the national development plans (Kenya Vision 2030 and Medium-Term Plans).
The introduction by the Government of the “Big Four” agenda of Universal Health Coverage (UHC), food security, a� ordable housing, and manufacturing has even made the need for up-to-date information on the NGO sector more urgent.
In line with Article 35 of the Constitution of Kenya and Access to Information Act, and the NGOs Co-ordination Act, the Board is required to develop, publish and disseminate annual sector reports on the activities of the charitable organizations. The report, therefore, quantifies the contribution of NGOs in national development and identifies opportunities for improved facilitation of the NGO sector, thereby forming the basis for policy guidelines.
The Annual NGO Sector Report 2018/19 provides an important basis for the Government and NGOs to determine the key issues facing the important prerogatives of self-regulation, transparency and accountability and how these can be enhanced. This will no doubt lead to improved performance of the charitable sector in complimenting Government development e� orts.
19ANNUAL NGO SECTOR REPORT2018/19
1.1 Scope
The Annual NGO Sector Report 2018/19 details information on the NGO sector, including growth in funding, expenditure and sustainability of the sector in the year under review. The information contained in the report was derived from data provided by 3,028 NGOs which filed their annual reports with the Board from 1st July 2018 to 30th June 2019 (financial year 2018/2019) and data from newly registered NGOs. The data were contained in Form 14 (annual reports form), audited accounts and Form 3 (registration form).
1.2 Objectives
The study of state of the sector report was undertaken to provide credible statistics and information necessary for policy and decision-making on the NGO sector. Specifically, the study was designed to generate data towards meeting various objectives, including:1. To fulfil the Board’s statutory mandate of advising the Government and
documenting the contribution of NGOs in national development.2. To advise NGOs to align their programmes to national development
plans.3. To address the demand for quality data on activities of NGOs in Kenya
and to improve access to that information.4. To ascertain the sustainability level of the NGO sector in Kenya.
1.3 Limitations
The report only covers the 3,028 NGOs that filed their annual reports for 2018/2019. The report also contains information limited to what the newly registered NGOs voluntarily provided during the year under review. Some charitable institutions are registered with other legal regimes, making it di� icult to capture credible data on their contribution.
20 ANNUAL NGO SECTOR REPORT 2018/19
CHAPTER TWO
2. SECTOR GROWTH AND CONTRIBUTION TO DEVELOPMENT
This chapter focuses on the growth and contribution of the NGO sector during the year 2018/2019. For the purpose of this report, sector growth refers to the overall change in the number of NGOs in the Board’s register, NGO funding and utilization of monies received and their contribution in the year under review.
2.1 Sector Growth
Growth of the NGO sector is determined by changes in the register and money received. Changes in the register include new registrations, deregistration, dissolutions and reinstatements.
2.1.1 Registered NGOs in 2018/19
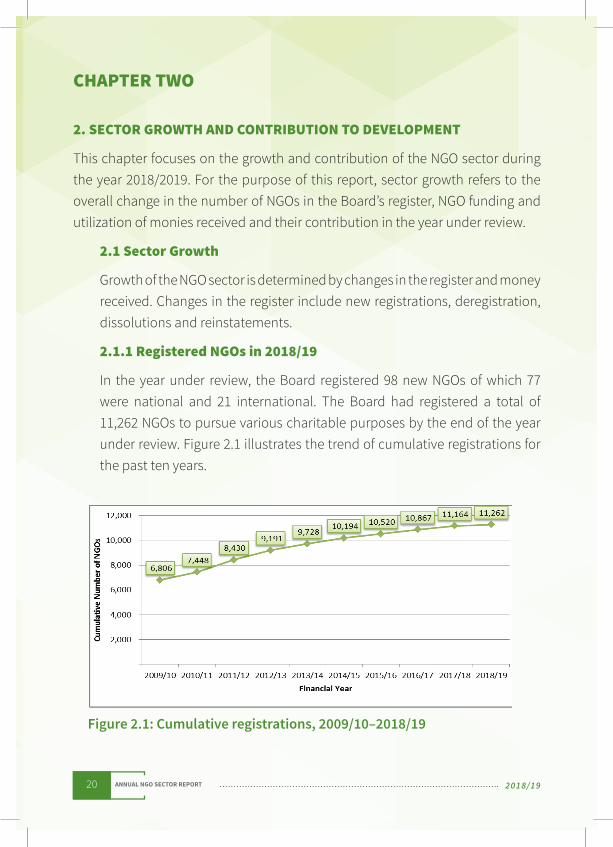
In the year under review, the Board registered 98 new NGOs of which 77 were national and 21 international. The Board had registered a total of 11,262 NGOs to pursue various charitable purposes by the end of the year under review. Figure 2.1 illustrates the trend of cumulative registrations for the past ten years.
Figure 2.1: Cumulative registrations, 2009/10–2018/19
21ANNUAL NGO SECTOR REPORT2018/19
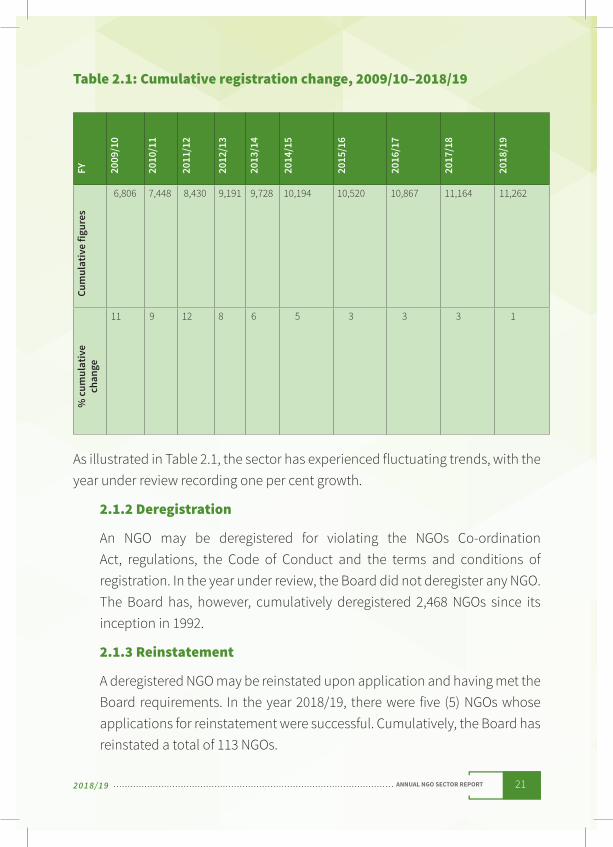
Table 2.1: Cumulative registration change, 2009/10–2018/19FY 20
09/1
0
2010
/11
2011
/12
2012
/13
2013
/14
2014
/15
2015
/16
2016
/17
2017
/18
2018
/19
Cum
ulat
ive
figur
es
6,806 7,448 8,430 9,191 9,728 10,194 10,520 10,867 11,164 11,262
% c
umul
ativ
e
ch
ange
11 9 12 8 6 5 3 3 3 1
As illustrated in Table 2.1, the sector has experienced fluctuating trends, with the year under review recording one per cent growth.
2.1.2 Deregistration
An NGO may be deregistered for violating the NGOs Co-ordination Act, regulations, the Code of Conduct and the terms and conditions of registration. In the year under review, the Board did not deregister any NGO. The Board has, however, cumulatively deregistered 2,468 NGOs since its inception in 1992.
2.1.3 Reinstatement
A deregistered NGO may be reinstated upon application and having met the Board requirements. In the year 2018/19, there were five (5) NGOs whose applications for reinstatement were successful. Cumulatively, the Board has reinstated a total of 113 NGOs.
22 ANNUAL NGO SECTOR REPORT 2018/19
2.1.4 Dissolution
An NGO may voluntarily wind up its operations in what is referred to as dissolution. The organization must meet the regulatory requirements in line with Regulation 21 for its dissolution application to be approved. In year 2018/19, some 24 organizations applied for dissolution, but no organization was dissolved. Cumulatively, the Board has dissolved a total of 14 NGOs since it started operations in1992.
2.1.5 Active NGOs
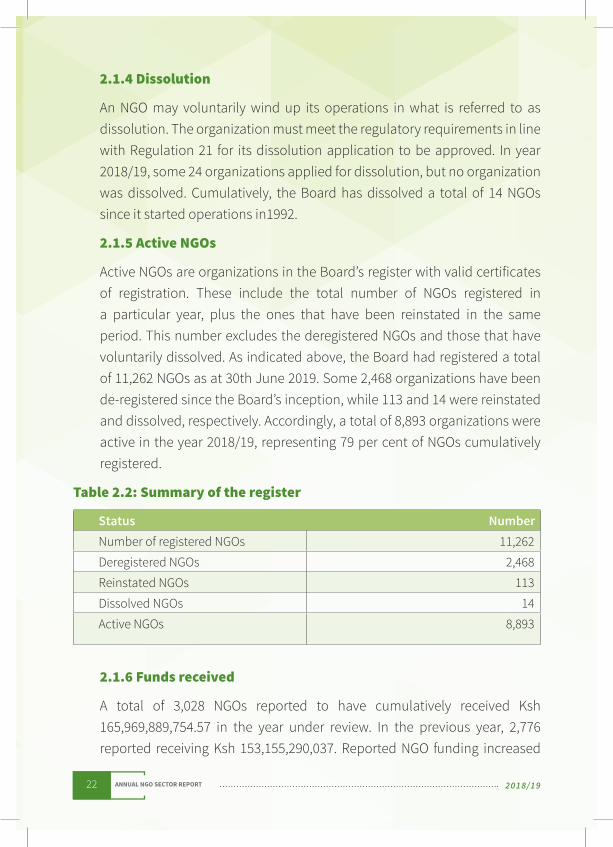
Active NGOs are organizations in the Board’s register with valid certificates of registration. These include the total number of NGOs registered in a particular year, plus the ones that have been reinstated in the same period. This number excludes the deregistered NGOs and those that have voluntarily dissolved. As indicated above, the Board had registered a total of 11,262 NGOs as at 30th June 2019. Some 2,468 organizations have been de-registered since the Board’s inception, while 113 and 14 were reinstated and dissolved, respectively. Accordingly, a total of 8,893 organizations were active in the year 2018/19, representing 79 per cent of NGOs cumulatively registered.
Table 2.2: Summary of the register
Status NumberNumber of registered NGOs 11,262
Deregistered NGOs 2,468
Reinstated NGOs 113
Dissolved NGOs 14
Active NGOs 8,893
2.1.6 Funds received
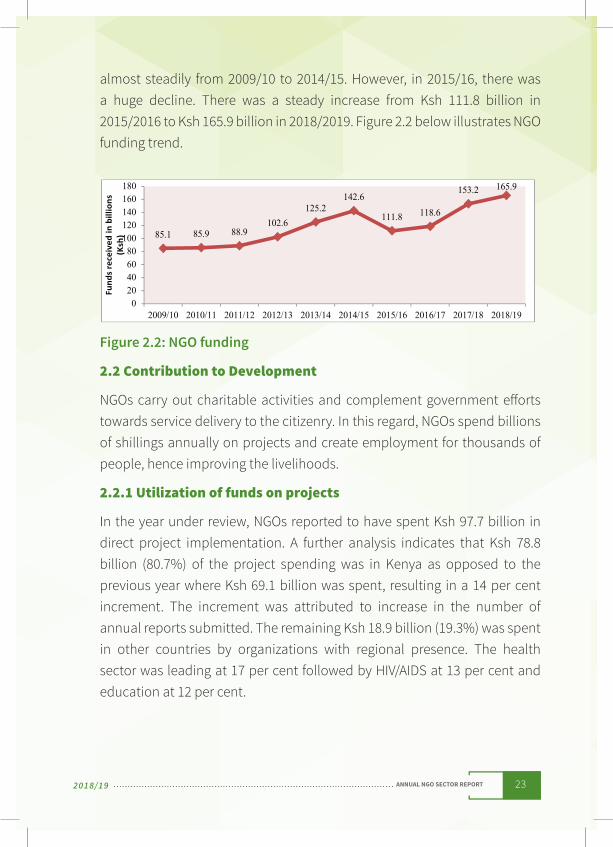
A total of 3,028 NGOs reported to have cumulatively received Ksh 165,969,889,754.57 in the year under review. In the previous year, 2,776 reported receiving Ksh 153,155,290,037. Reported NGO funding increased
23ANNUAL NGO SECTOR REPORT2018/19
almost steadily from 2009/10 to 2014/15. However, in 2015/16, there was a huge decline. There was a steady increase from Ksh 111.8 billion in 2015/2016 to Ksh 165.9 billion in 2018/2019. Figure 2.2 below illustrates NGO funding trend.
Figure 2.2: NGO funding
2.2 Contribution to Development
NGOs carry out charitable activities and complement government e� orts towards service delivery to the citizenry. In this regard, NGOs spend billions of shillings annually on projects and create employment for thousands of people, hence improving the livelihoods.
2.2.1 Utilization of funds on projects
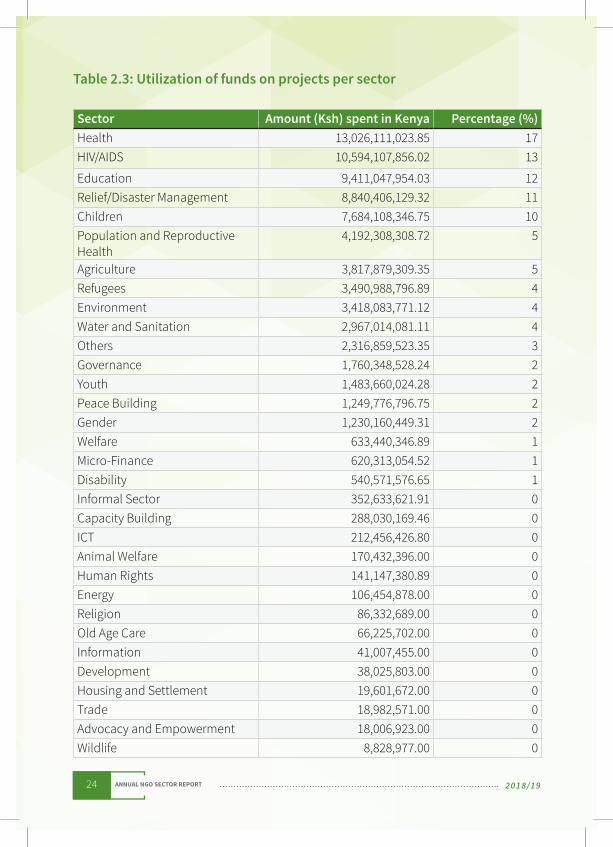
In the year under review, NGOs reported to have spent Ksh 97.7 billion in direct project implementation. A further analysis indicates that Ksh 78.8 billion (80.7%) of the project spending was in Kenya as opposed to the previous year where Ksh 69.1 billion was spent, resulting in a 14 per cent increment. The increment was attributed to increase in the number of annual reports submitted. The remaining Ksh 18.9 billion (19.3%) was spent in other countries by organizations with regional presence. The health sector was leading at 17 per cent followed by HIV/AIDS at 13 per cent and education at 12 per cent.
24 ANNUAL NGO SECTOR REPORT 2018/19
Table 2.3: Utilization of funds on projects per sector
Sector Amount (Ksh) spent in Kenya Percentage (%)Health 13,026,111,023.85 17HIV/AIDS 10,594,107,856.02 13
Education 9,411,047,954.03 12Relief/Disaster Management 8,840,406,129.32 11Children 7,684,108,346.75 10Population and Reproductive Health
4,192,308,308.72 5
Agriculture 3,817,879,309.35 5Refugees 3,490,988,796.89 4Environment 3,418,083,771.12 4Water and Sanitation 2,967,014,081.11 4Others 2,316,859,523.35 3Governance 1,760,348,528.24 2Youth 1,483,660,024.28 2Peace Building 1,249,776,796.75 2Gender 1,230,160,449.31 2Welfare 633,440,346.89 1Micro-Finance 620,313,054.52 1Disability 540,571,576.65 1Informal Sector 352,633,621.91 0Capacity Building 288,030,169.46 0ICT 212,456,426.80 0Animal Welfare 170,432,396.00 0Human Rights 141,147,380.89 0Energy 106,454,878.00 0Religion 86,332,689.00 0Old Age Care 66,225,702.00 0Information 41,007,455.00 0Development 38,025,803.00 0Housing and Settlement 19,601,672.00 0Trade 18,982,571.00 0Advocacy and Empowerment 18,006,923.00 0Wildlife 8,828,977.00 0
25ANNUAL NGO SECTOR REPORT2018/19
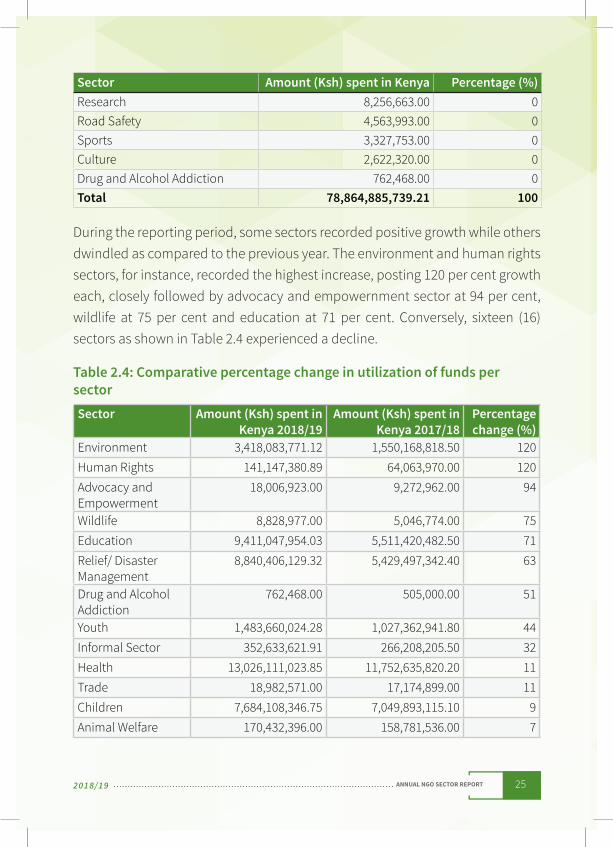
Sector Amount (Ksh) spent in Kenya Percentage (%)Research 8,256,663.00 0Road Safety 4,563,993.00 0Sports 3,327,753.00 0Culture 2,622,320.00 0Drug and Alcohol Addiction 762,468.00 0Total 78,864,885,739.21 100
During the reporting period, some sectors recorded positive growth while others dwindled as compared to the previous year. The environment and human rights sectors, for instance, recorded the highest increase, posting 120 per cent growth each, closely followed by advocacy and empowernment sector at 94 per cent, wildlife at 75 per cent and education at 71 per cent. Conversely, sixteen (16) sectors as shown in Table 2.4 experienced a decline.
Table 2.4: Comparative percentage change in utilization of funds per sectorSector Amount (Ksh) spent in
Kenya 2018/19Amount (Ksh) spent in
Kenya 2017/18Percentage change (%)
Environment 3,418,083,771.12 1,550,168,818.50 120Human Rights 141,147,380.89 64,063,970.00 120Advocacy and Empowerment
18,006,923.00 9,272,962.00 94
Wildlife 8,828,977.00 5,046,774.00 75Education 9,411,047,954.03 5,511,420,482.50 71Relief/ Disaster Management
8,840,406,129.32 5,429,497,342.40 63
Drug and Alcohol Addiction
762,468.00 505,000.00 51
Youth 1,483,660,024.28 1,027,362,941.80 44Informal Sector 352,633,621.91 266,208,205.50 32Health 13,026,111,023.85 11,752,635,820.20 11Trade 18,982,571.00 17,174,899.00 11Children 7,684,108,346.75 7,049,893,115.10 9Animal Welfare 170,432,396.00 158,781,536.00 7
26 ANNUAL NGO SECTOR REPORT 2018/19
Sector Amount (Ksh) spent in Kenya 2018/19
Amount (Ksh) spent in Kenya 2017/18
Percentage change (%)
Water and Sanitation
2,967,014,081.11 2,791,495,266.40 6
Population and Reproductive Health
4,192,308,308.72 4,098,896,803.70 2
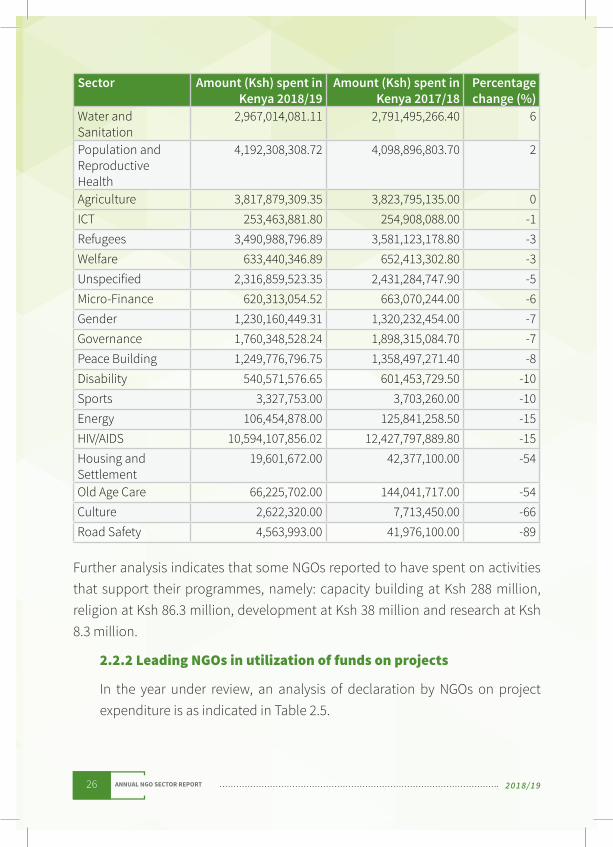
Agriculture 3,817,879,309.35 3,823,795,135.00 0ICT 253,463,881.80 254,908,088.00 -1Refugees 3,490,988,796.89 3,581,123,178.80 -3Welfare 633,440,346.89 652,413,302.80 -3Unspecified 2,316,859,523.35 2,431,284,747.90 -5Micro-Finance 620,313,054.52 663,070,244.00 -6Gender 1,230,160,449.31 1,320,232,454.00 -7Governance 1,760,348,528.24 1,898,315,084.70 -7Peace Building 1,249,776,796.75 1,358,497,271.40 -8Disability 540,571,576.65 601,453,729.50 -10Sports 3,327,753.00 3,703,260.00 -10Energy 106,454,878.00 125,841,258.50 -15HIV/AIDS 10,594,107,856.02 12,427,797,889.80 -15Housing and Settlement
19,601,672.00 42,377,100.00 -54
Old Age Care 66,225,702.00 144,041,717.00 -54Culture 2,622,320.00 7,713,450.00 -66Road Safety 4,563,993.00 41,976,100.00 -89
Further analysis indicates that some NGOs reported to have spent on activities that support their programmes, namely: capacity building at Ksh 288 million, religion at Ksh 86.3 million, development at Ksh 38 million and research at Ksh 8.3 million.
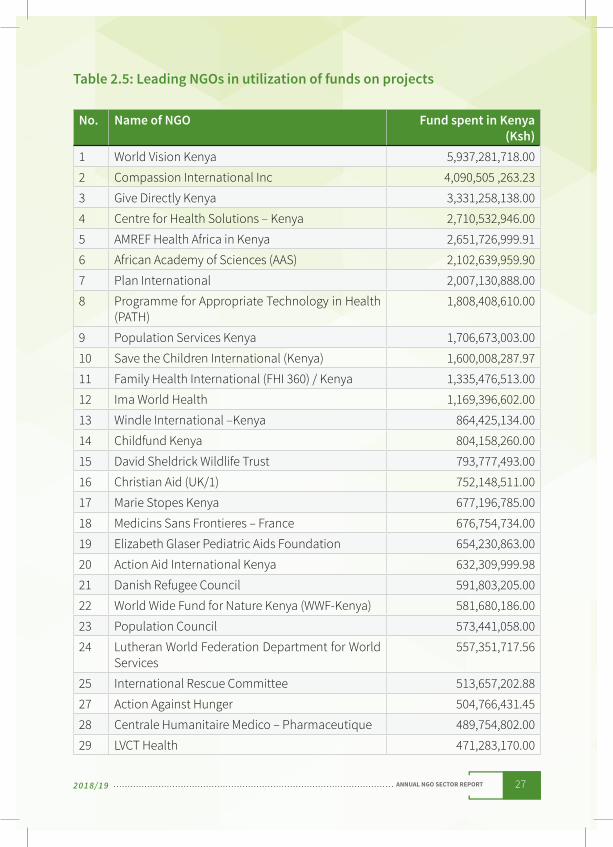
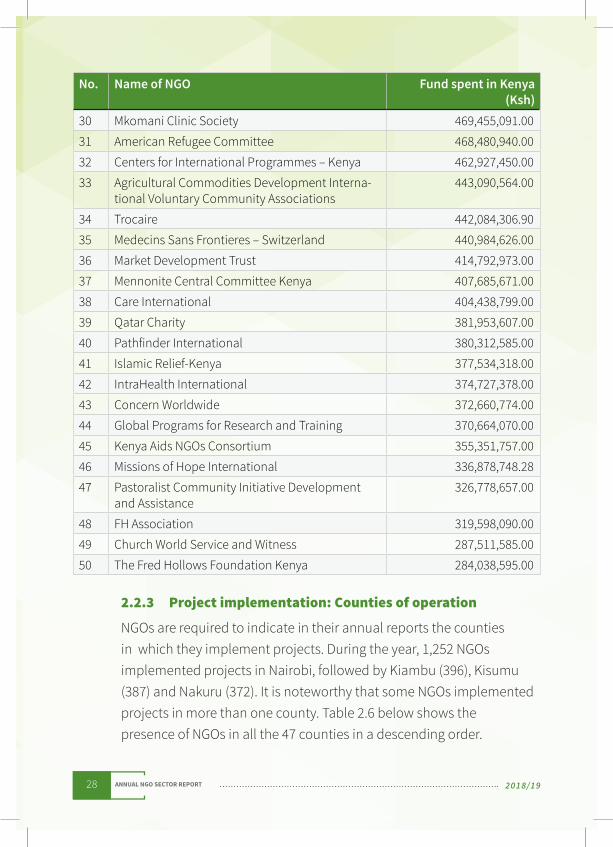
2.2.2 Leading NGOs in utilization of funds on projects
In the year under review, an analysis of declaration by NGOs on project expenditure is as indicated in Table 2.5.
27ANNUAL NGO SECTOR REPORT2018/19
Table 2.5: Leading NGOs in utilization of funds on projects
No. Name of NGO Fund spent in Kenya (Ksh)
1 World Vision Kenya 5,937,281,718.00
2 Compassion International Inc 4,090,505 ,263.23
3 Give Directly Kenya 3,331,258,138.00
4 Centre for Health Solutions – Kenya 2,710,532,946.00
5 AMREF Health Africa in Kenya 2,651,726,999.91
6 African Academy of Sciences (AAS) 2,102,639,959.90
7 Plan International 2,007,130,888.00
8 Programme for Appropriate Technology in Health (PATH)
1,808,408,610.00
9 Population Services Kenya 1,706,673,003.00
10 Save the Children International (Kenya) 1,600,008,287.97
11 Family Health International (FHI 360) / Kenya 1,335,476,513.00
12 Ima World Health 1,169,396,602.00
13 Windle International –Kenya 864,425,134.00
14 Childfund Kenya 804,158,260.00
15 David Sheldrick Wildlife Trust 793,777,493.00
16 Christian Aid (UK/1) 752,148,511.00
17 Marie Stopes Kenya 677,196,785.00
18 Medicins Sans Frontieres – France 676,754,734.00
19 Elizabeth Glaser Pediatric Aids Foundation 654,230,863.00
20 Action Aid International Kenya 632,309,999.98
21 Danish Refugee Council 591,803,205.00
22 World Wide Fund for Nature Kenya (WWF-Kenya) 581,680,186.00
23 Population Council 573,441,058.00
24 Lutheran World Federation Department for World Services
557,351,717.56
25 International Rescue Committee 513,657,202.88
27 Action Against Hunger 504,766,431.45
28 Centrale Humanitaire Medico – Pharmaceutique 489,754,802.00
29 LVCT Health 471,283,170.00
28 ANNUAL NGO SECTOR REPORT 2018/19
No. Name of NGO Fund spent in Kenya (Ksh)
30 Mkomani Clinic Society 469,455,091.00
31 American Refugee Committee 468,480,940.00
32 Centers for International Programmes – Kenya 462,927,450.00
33 Agricultural Commodities Development Interna-tional Voluntary Community Associations
443,090,564.00
34 Trocaire 442,084,306.90
35 Medecins Sans Frontieres – Switzerland 440,984,626.00
36 Market Development Trust 414,792,973.00
37 Mennonite Central Committee Kenya 407,685,671.00
38 Care International 404,438,799.00
39 Qatar Charity 381,953,607.00
40 Pathfinder International 380,312,585.00
41 Islamic Relief-Kenya 377,534,318.00
42 IntraHealth International 374,727,378.00
43 Concern Worldwide 372,660,774.00
44 Global Programs for Research and Training 370,664,070.00
45 Kenya Aids NGOs Consortium 355,351,757.00
46 Missions of Hope International 336,878,748.28
47 Pastoralist Community Initiative Development and Assistance
326,778,657.00
48 FH Association 319,598,090.00
49 Church World Service and Witness 287,511,585.00
50 The Fred Hollows Foundation Kenya 284,038,595.00
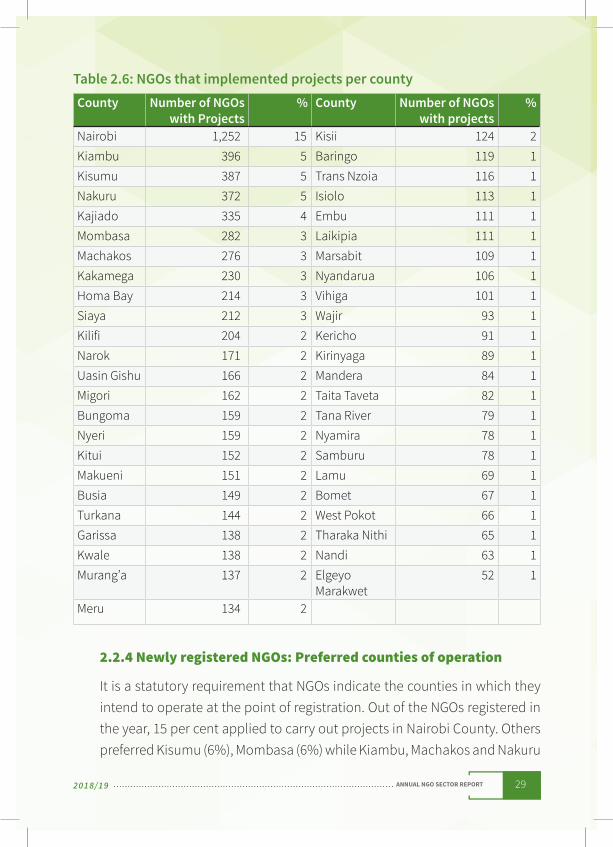
2.2.3 Project implementation: Counties of operation
NGOs are required to indicate in their annual reports the counties in which they implement projects. During the year, 1,252 NGOs implemented projects in Nairobi, followed by Kiambu (396), Kisumu (387) and Nakuru (372). It is noteworthy that some NGOs implemented projects in more than one county. Table 2.6 below shows the presence of NGOs in all the 47 counties in a descending order.
29ANNUAL NGO SECTOR REPORT2018/19
Table 2.6: NGOs that implemented projects per countyCounty Number of NGOs
with Projects% County Number of NGOs
with projects%
Nairobi 1,252 15 Kisii 124 2Kiambu 396 5 Baringo 119 1Kisumu 387 5 Trans Nzoia 116 1Nakuru 372 5 Isiolo 113 1Kajiado 335 4 Embu 111 1Mombasa 282 3 Laikipia 111 1Machakos 276 3 Marsabit 109 1Kakamega 230 3 Nyandarua 106 1Homa Bay 214 3 Vihiga 101 1Siaya 212 3 Wajir 93 1Kilifi 204 2 Kericho 91 1Narok 171 2 Kirinyaga 89 1Uasin Gishu 166 2 Mandera 84 1Migori 162 2 Taita Taveta 82 1Bungoma 159 2 Tana River 79 1Nyeri 159 2 Nyamira 78 1Kitui 152 2 Samburu 78 1Makueni 151 2 Lamu 69 1Busia 149 2 Bomet 67 1Turkana 144 2 West Pokot 66 1Garissa 138 2 Tharaka Nithi 65 1Kwale 138 2 Nandi 63 1Murang’a 137 2 Elgeyo
Marakwet52 1
Meru 134 2
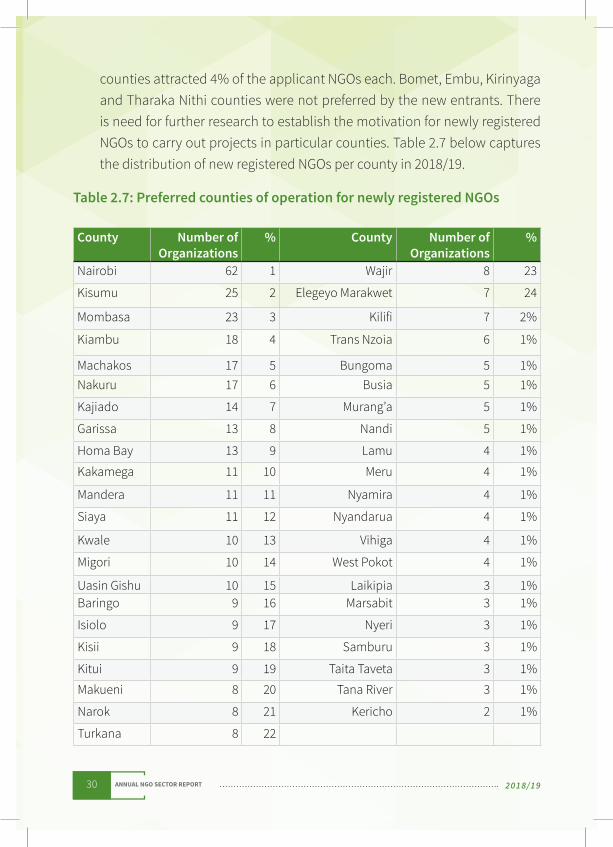
2.2.4 Newly registered NGOs: Preferred counties of operation
It is a statutory requirement that NGOs indicate the counties in which they intend to operate at the point of registration. Out of the NGOs registered in the year, 15 per cent applied to carry out projects in Nairobi County. Others preferred Kisumu (6%), Mombasa (6%) while Kiambu, Machakos and Nakuru
30 ANNUAL NGO SECTOR REPORT 2018/19
counties attracted 4% of the applicant NGOs each. Bomet, Embu, Kirinyaga and Tharaka Nithi counties were not preferred by the new entrants. There is need for further research to establish the motivation for newly registered NGOs to carry out projects in particular counties. Table 2.7 below captures the distribution of new registered NGOs per county in 2018/19.
Table 2.7: Preferred counties of operation for newly registered NGOs
County Number of Organizations
% County Number of Organizations
%
Nairobi 62 1 Wajir 8 23
Kisumu 25 2 Elegeyo Marakwet 7 24
Mombasa 23 3 Kilifi 7 2%
Kiambu 18 4 Trans Nzoia 6 1%
Machakos 17 5 Bungoma 5 1%Nakuru 17 6 Busia 5 1%
Kajiado 14 7 Murang’a 5 1%
Garissa 13 8 Nandi 5 1%
Homa Bay 13 9 Lamu 4 1%
Kakamega 11 10 Meru 4 1%
Mandera 11 11 Nyamira 4 1%
Siaya 11 12 Nyandarua 4 1%
Kwale 10 13 Vihiga 4 1%
Migori 10 14 West Pokot 4 1%
Uasin Gishu 10 15 Laikipia 3 1%Baringo 9 16 Marsabit 3 1%
Isiolo 9 17 Nyeri 3 1%
Kisii 9 18 Samburu 3 1%
Kitui 9 19 Taita Taveta 3 1%
Makueni 8 20 Tana River 3 1%
Narok 8 21 Kericho 2 1%
Turkana 8 22
31ANNUAL NGO SECTOR REPORT2018/19
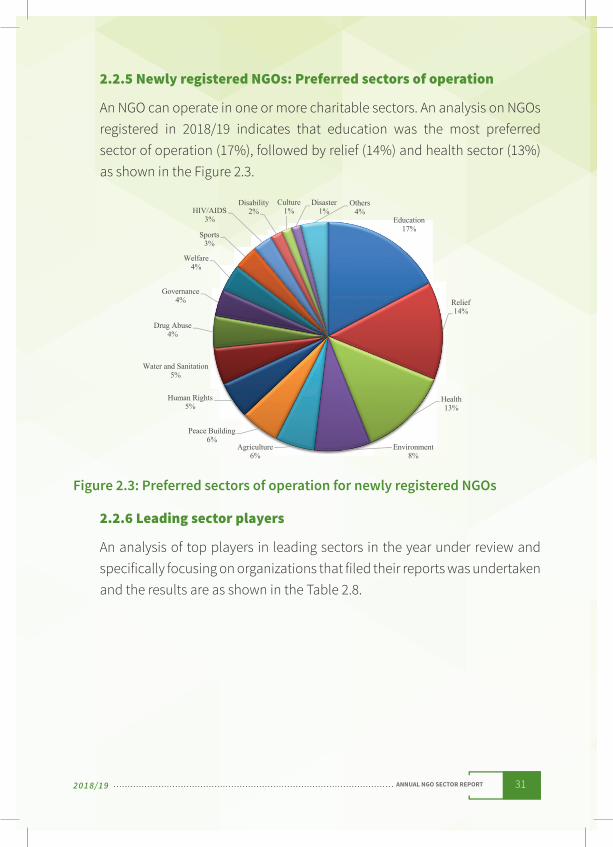
2.2.5 Newly registered NGOs: Preferred sectors of operation
An NGO can operate in one or more charitable sectors. An analysis on NGOs registered in 2018/19 indicates that education was the most preferred sector of operation (17%), followed by relief (14%) and health sector (13%) as shown in the Figure 2.3.
Figure 2.3: Preferred sectors of operation for newly registered NGOs
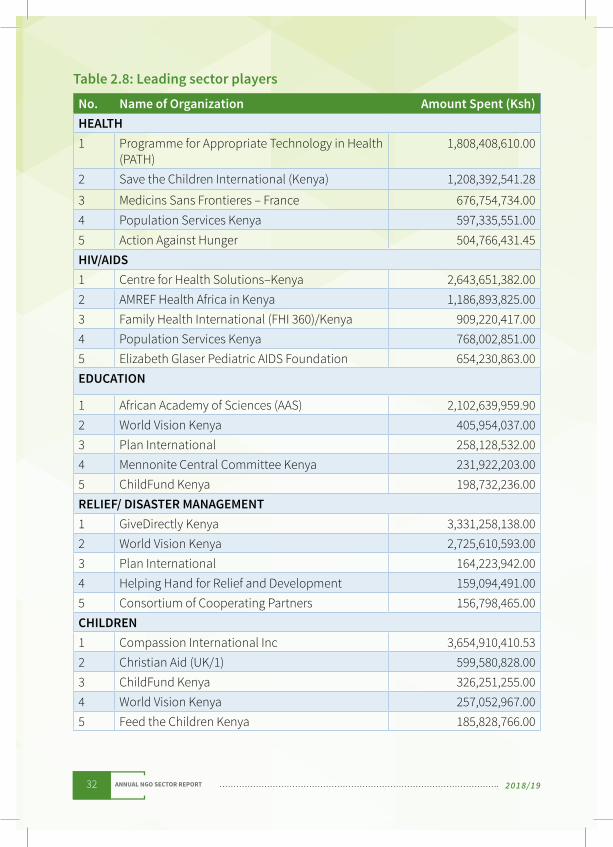
2.2.6 Leading sector players
An analysis of top players in leading sectors in the year under review and specifically focusing on organizations that filed their reports was undertaken and the results are as shown in the Table 2.8.
32 ANNUAL NGO SECTOR REPORT 2018/19
Table 2.8: Leading sector players
No. Name of Organization Amount Spent (Ksh)HEALTH1 Programme for Appropriate Technology in Health
(PATH)1,808,408,610.00
2 Save the Children International (Kenya) 1,208,392,541.28
3 Medicins Sans Frontieres – France 676,754,734.00 4 Population Services Kenya 597,335,551.00 5 Action Against Hunger 504,766,431.45 HIV/AIDS1 Centre for Health Solutions–Kenya 2,643,651,382.00 2 AMREF Health Africa in Kenya 1,186,893,825.00 3 Family Health International (FHI 360)/Kenya 909,220,417.00 4 Population Services Kenya 768,002,851.00 5 Elizabeth Glaser Pediatric AIDS Foundation 654,230,863.00 EDUCATION
1 African Academy of Sciences (AAS) 2,102,639,959.90 2 World Vision Kenya 405,954,037.00 3 Plan International 258,128,532.00 4 Mennonite Central Committee Kenya 231,922,203.00 5 ChildFund Kenya 198,732,236.00 RELIEF/ DISASTER MANAGEMENT1 GiveDirectly Kenya 3,331,258,138.002 World Vision Kenya 2,725,610,593.003 Plan International 164,223,942.004 Helping Hand for Relief and Development 159,094,491.005 Consortium of Cooperating Partners 156,798,465.00CHILDREN1 Compassion International Inc 3,654,910,410.532 Christian Aid (UK/1) 599,580,828.003 ChildFund Kenya 326,251,255.004 World Vision Kenya 257,052,967.005 Feed the Children Kenya 185,828,766.00
33ANNUAL NGO SECTOR REPORT2018/19
2.2.7 Contribution of NGOs to the “Big Four” agenda
The Government identified four development priority areas popularly known as the “Big Four” agenda in mid-2017/18 financial year. They are food and nutrition security, universal health coverage (UHC), a� ordable housing, and manufacturing.
Data collated at the end of the year under review indicates that a total 1,026 of NGOs reported spending a total of Ksh 34,970,418,340.96 implementing projects related to the “Big Four” areas.
A total of 838 NGOs reported spending Ksh 30,780,303,737 implementing various health-related projects, including: health education; training community health workers, addressing HIV/AIDS, mobilizing communities to register for health coverage, equipping health facilities, providing pharmaceutical and non-pharmaceutical resources, and responding to health emergencies.
In the area of food and nutrition security, 374 NGOs spent a total of Ksh 3,817,879, 309.35 to implement various interventions, including agricultural research, financing, irrigation agriculture, provision of farm inputs and equipment, livestock breeding, training of farmers, nutrition sensitization and distribution of food supplements.Some 62 organizations spent a total of Ksh 352,633,621.91 in supporting programmes related to manufacturing, including establishing small-scale agro-processing plants for farmers while four NGOs reported spending a total of Ksh 19,601,672.00 on housing and settlement for the needy in the year under review.
2.2.8 Employment
NGOs engaged a total of 79,608 employees in the year under review. Of those employed, 70,921 were stationed in Kenya while the rest were stationed outside Kenya. There were 40,700 (51%) reported as salaried while 38,908 (49%) were hired as volunteers/interns.
34 ANNUAL NGO SECTOR REPORT 2018/19
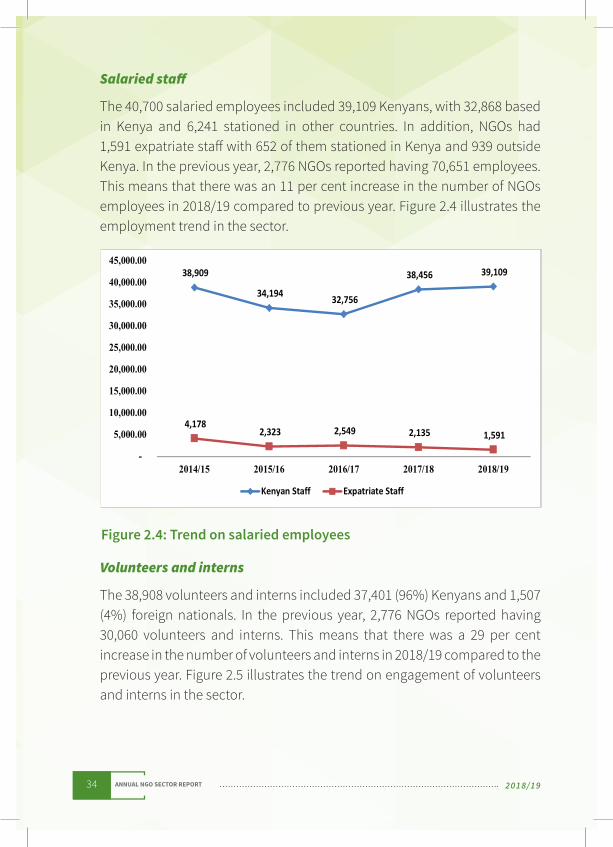
Salaried sta�
The 40,700 salaried employees included 39,109 Kenyans, with 32,868 based in Kenya and 6,241 stationed in other countries. In addition, NGOs had 1,591 expatriate sta� with 652 of them stationed in Kenya and 939 outside Kenya. In the previous year, 2,776 NGOs reported having 70,651 employees. This means that there was an 11 per cent increase in the number of NGOs employees in 2018/19 compared to previous year. Figure 2.4 illustrates the employment trend in the sector.
Figure 2.4: Trend on salaried employees
Volunteers and interns
The 38,908 volunteers and interns included 37,401 (96%) Kenyans and 1,507 (4%) foreign nationals. In the previous year, 2,776 NGOs reported having 30,060 volunteers and interns. This means that there was a 29 per cent increase in the number of volunteers and interns in 2018/19 compared to the previous year. Figure 2.5 illustrates the trend on engagement of volunteers and interns in the sector.
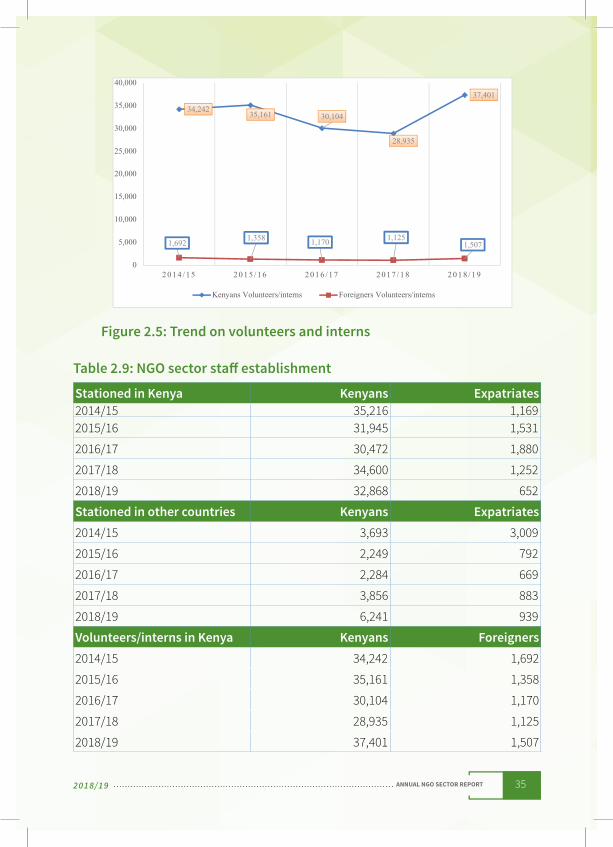
35ANNUAL NGO SECTOR REPORT2018/19
Figure 2.5: Trend on volunteers and interns
Table 2.9: NGO sector sta� establishment
Stationed in Kenya Kenyans Expatriates2014/15 35,216 1,1692015/16 31,945 1,531
2016/17 30,472 1,880
2017/18 34,600 1,252
2018/19 32,868 652
Stationed in other countries Kenyans Expatriates2014/15 3,693 3,009
2015/16 2,249 792
2016/17 2,284 669
2017/18 3,856 883
2018/19 6,241 939
Volunteers/interns in Kenya Kenyans Foreigners2014/15 34,242 1,692
2015/16 35,161 1,358
2016/17 30,104 1,170
2017/18 28,935 1,125
2018/19 37,401 1,507
36 ANNUAL NGO SECTOR REPORT 2018/19
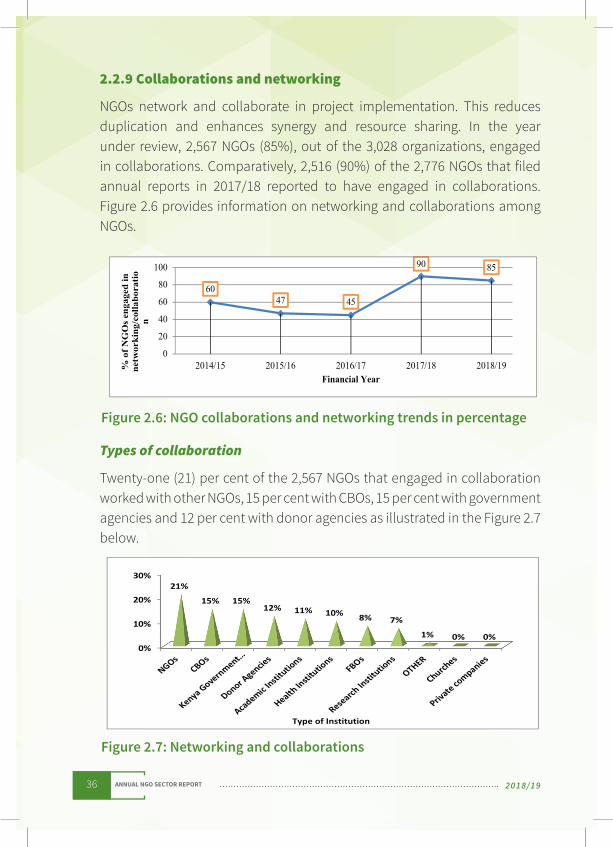
2.2.9 Collaborations and networking
NGOs network and collaborate in project implementation. This reduces duplication and enhances synergy and resource sharing. In the year under review, 2,567 NGOs (85%), out of the 3,028 organizations, engaged in collaborations. Comparatively, 2,516 (90%) of the 2,776 NGOs that filed annual reports in 2017/18 reported to have engaged in collaborations. Figure 2.6 provides information on networking and collaborations among NGOs.
Figure 2.6: NGO collaborations and networking trends in percentage
Types of collaboration
Twenty-one (21) per cent of the 2,567 NGOs that engaged in collaboration worked with other NGOs, 15 per cent with CBOs, 15 per cent with government agencies and 12 per cent with donor agencies as illustrated in the Figure 2.7 below.
Figure 2.7: Networking and collaborations
37ANNUAL NGO SECTOR REPORT2018/19
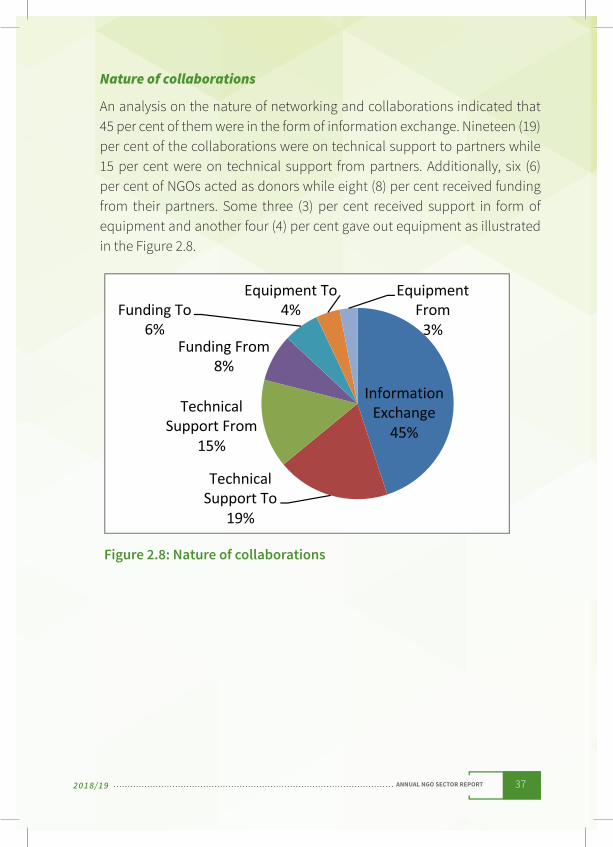
Nature of collaborations
An analysis on the nature of networking and collaborations indicated that 45 per cent of them were in the form of information exchange. Nineteen (19) per cent of the collaborations were on technical support to partners while 15 per cent were on technical support from partners. Additionally, six (6) per cent of NGOs acted as donors while eight (8) per cent received funding from their partners. Some three (3) per cent received support in form of equipment and another four (4) per cent gave out equipment as illustrated in the Figure 2.8.
Figure 2.8: Nature of collaborations
38 ANNUAL NGO SECTOR REPORT 2018/19
CHAPTER THREE
3. NGO FUNDING AND SECTOR SUSTAINABILITY
This chapter contains information on NGO funding, including sources of funds and expenditure for the year 2018/19. It also focuses on the sector’s sustainability. A sector is considered as sustainable if it continues to fulfil its mission over time, hence meeting the needs of its stakeholders, particularly the beneficiaries.
3.1 NGO Funding
NGOs receive funding from various donors based in or outside Kenya. They spend these funds on programmes, including in remunerating sta� . At the end of each financial year, an NGO may retain funds that could be injected in programme implementation the following year.
3.1.1 Amount of funds received
During the reporting period, 3,028 NGOs that filed reports indicated to have received a total of Ksh 165,989,889,754.57. This represents 8 per cent increase from Ksh 153,155,290,037 reported by 2,776 NGOs in the previous year.
3.1.2 Description on sources of funds
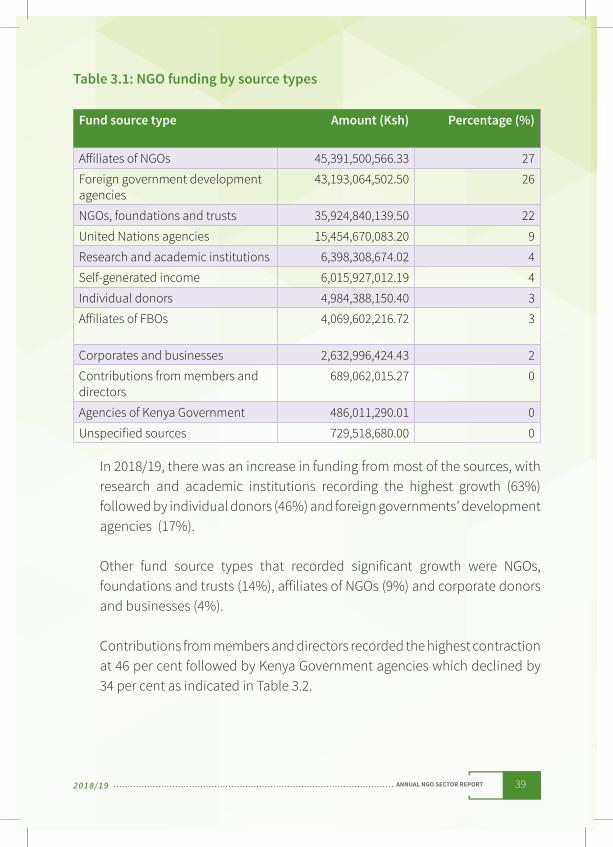
In 2018/19, the main sources of funds were a� iliates of NGOs at 27 per cent followed by foreign government development agencies at 26 per cent and other international NGOs, foundations and trusts at 22 per cent. Funds donated by United Nations agencies accounted for nine (9) per cent of the total funding to NGOs while research and academic institutions contributed four (4) per cent. Support from individual donors and a� iliates of faith-based organizations was each at 3 per cent. NGOs engaged in income generating activities that raised four (4) per cent of the total revenue during the year. Table 3.1 details information on NGO funding and sources of funds.
39ANNUAL NGO SECTOR REPORT2018/19
Table 3.1: NGO funding by source types
Fund source type Amount (Ksh) Percentage (%)
A� iliates of NGOs 45,391,500,566.33 27
Foreign government development agencies
43,193,064,502.50 26
NGOs, foundations and trusts 35,924,840,139.50 22
United Nations agencies 15,454,670,083.20 9
Research and academic institutions 6,398,308,674.02 4
Self-generated income 6,015,927,012.19 4
Individual donors 4,984,388,150.40 3
A� iliates of FBOs 4,069,602,216.72 3
Corporates and businesses 2,632,996,424.43 2
Contributions from members and directors
689,062,015.27 0
Agencies of Kenya Government 486,011,290.01 0
Unspecified sources 729,518,680.00 0
In 2018/19, there was an increase in funding from most of the sources, with research and academic institutions recording the highest growth (63%) followed by individual donors (46%) and foreign governments’ development agencies (17%).
Other fund source types that recorded significant growth were NGOs, foundations and trusts (14%), a� iliates of NGOs (9%) and corporate donors and businesses (4%).
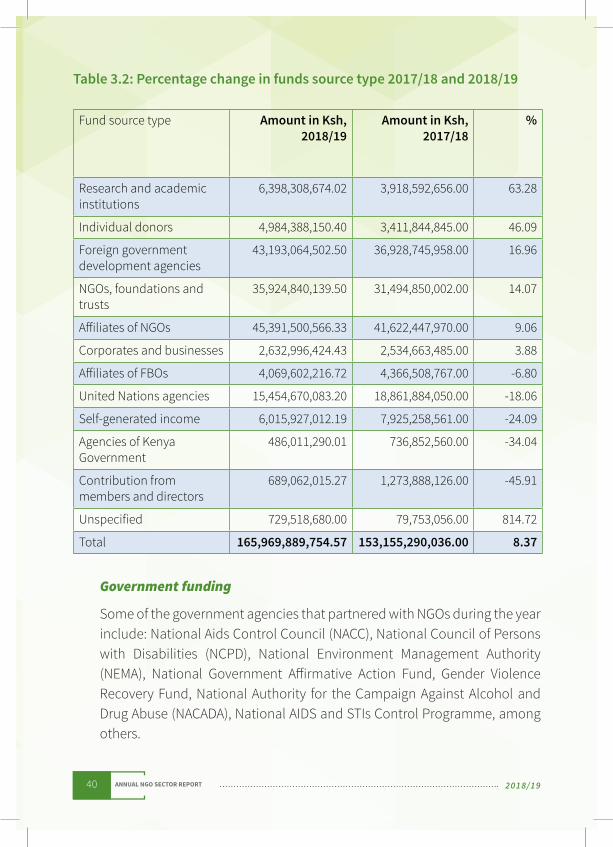
Contributions from members and directors recorded the highest contraction at 46 per cent followed by Kenya Government agencies which declined by 34 per cent as indicated in Table 3.2.
40 ANNUAL NGO SECTOR REPORT 2018/19
Table 3.2: Percentage change in funds source type 2017/18 and 2018/19
Fund source type Amount in Ksh, 2018/19
Amount in Ksh, 2017/18
%
Research and academic institutions
6,398,308,674.02 3,918,592,656.00 63.28
Individual donors 4,984,388,150.40 3,411,844,845.00 46.09
Foreign government development agencies
43,193,064,502.50 36,928,745,958.00 16.96
NGOs, foundations and trusts
35,924,840,139.50 31,494,850,002.00 14.07
A� iliates of NGOs 45,391,500,566.33 41,622,447,970.00 9.06
Corporates and businesses 2,632,996,424.43 2,534,663,485.00 3.88
A� iliates of FBOs 4,069,602,216.72 4,366,508,767.00 -6.80
United Nations agencies 15,454,670,083.20 18,861,884,050.00 -18.06
Self-generated income 6,015,927,012.19 7,925,258,561.00 -24.09
Agencies of Kenya Government
486,011,290.01 736,852,560.00 -34.04
Contribution from members and directors
689,062,015.27 1,273,888,126.00 -45.91
Unspecified 729,518,680.00 79,753,056.00 814.72
Total 165,969,889,754.57 153,155,290,036.00 8.37
Government funding
Some of the government agencies that partnered with NGOs during the year include: National Aids Control Council (NACC), National Council of Persons with Disabilities (NCPD), National Environment Management Authority (NEMA), National Government A� irmative Action Fund, Gender Violence Recovery Fund, National Authority for the Campaign Against Alcohol and Drug Abuse (NACADA), National AIDS and STIs Control Programme, among others.
41ANNUAL NGO SECTOR REPORT2018/19
Support from County Governments
County governments also partnered with NGOs especially in projects related to devolved functions. The counties include County governments of Kajiado, Isiolo, Marsabit, Kisumu, Nairobi, Baringo, Siaya and Murang’a.
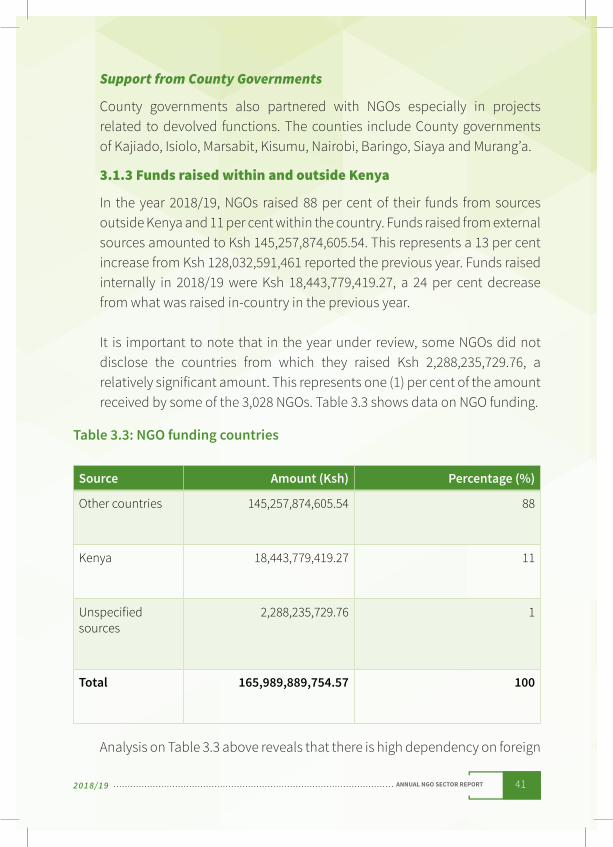
3.1.3 Funds raised within and outside Kenya
In the year 2018/19, NGOs raised 88 per cent of their funds from sources outside Kenya and 11 per cent within the country. Funds raised from external sources amounted to Ksh 145,257,874,605.54. This represents a 13 per cent increase from Ksh 128,032,591,461 reported the previous year. Funds raised internally in 2018/19 were Ksh 18,443,779,419.27, a 24 per cent decrease from what was raised in-country in the previous year.
It is important to note that in the year under review, some NGOs did not disclose the countries from which they raised Ksh 2,288,235,729.76, a relatively significant amount. This represents one (1) per cent of the amount received by some of the 3,028 NGOs. Table 3.3 shows data on NGO funding.
Table 3.3: NGO funding countries
Source Amount (Ksh) Percentage (%)
Other countries 145,257,874,605.54 88
Kenya 18,443,779,419.27 11
Unspecified sources
2,288,235,729.76 1
Total 165,989,889,754.57 100
Analysis on Table 3.3 above reveals that there is high dependency on foreign
42 ANNUAL NGO SECTOR REPORT 2018/19
funding by NGOs, and this does not augur well for the long-term sustainability of the sector. It is evident that internal sources of funds remain largely unexploited. Therefore, NGOs need to enhance their resource mobilization e� orts targeting internal (in country) sources such as local philanthropists, and further explore opportunities for generating their own income.
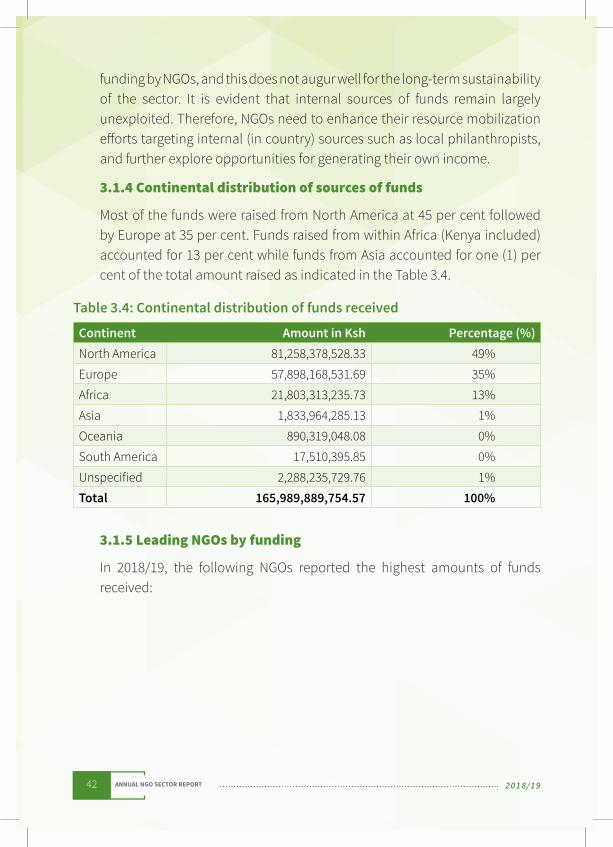
3.1.4 Continental distribution of sources of funds
Most of the funds were raised from North America at 45 per cent followed by Europe at 35 per cent. Funds raised from within Africa (Kenya included) accounted for 13 per cent while funds from Asia accounted for one (1) per cent of the total amount raised as indicated in the Table 3.4.
Table 3.4: Continental distribution of funds received
Continent Amount in Ksh Percentage (%)North America 81,258,378,528.33 49%
Europe 57,898,168,531.69 35%
Africa 21,803,313,235.73 13%
Asia 1,833,964,285.13 1%
Oceania 890,319,048.08 0%
South America 17,510,395.85 0%
Unspecified 2,288,235,729.76 1%
Total 165,989,889,754.57 100%
3.1.5 Leading NGOs by funding
In 2018/19, the following NGOs reported the highest amounts of funds received:
43ANNUAL NGO SECTOR REPORT2018/19
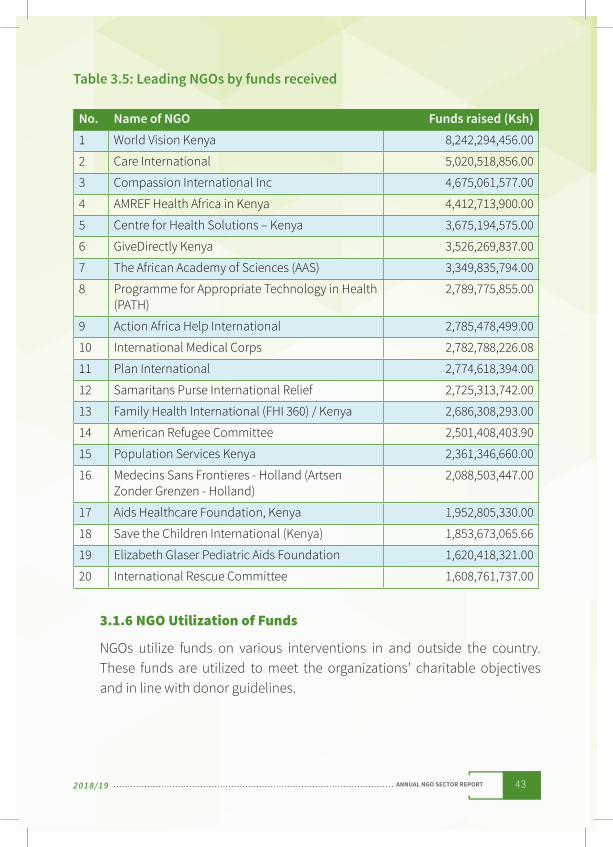
Table 3.5: Leading NGOs by funds received
No. Name of NGO Funds raised (Ksh) 1 World Vision Kenya 8,242,294,456.00
2 Care International 5,020,518,856.00
3 Compassion International Inc 4,675,061,577.00
4 AMREF Health Africa in Kenya 4,412,713,900.00
5 Centre for Health Solutions – Kenya 3,675,194,575.00
6 GiveDirectly Kenya 3,526,269,837.00
7 The African Academy of Sciences (AAS) 3,349,835,794.00
8 Programme for Appropriate Technology in Health (PATH)
2,789,775,855.00
9 Action Africa Help International 2,785,478,499.00
10 International Medical Corps 2,782,788,226.08
11 Plan International 2,774,618,394.00
12 Samaritans Purse International Relief 2,725,313,742.00
13 Family Health International (FHI 360) / Kenya 2,686,308,293.00
14 American Refugee Committee 2,501,408,403.90
15 Population Services Kenya 2,361,346,660.00
16 Medecins Sans Frontieres - Holland (Artsen Zonder Grenzen - Holland)
2,088,503,447.00
17 Aids Healthcare Foundation, Kenya 1,952,805,330.00
18 Save the Children International (Kenya) 1,853,673,065.66
19 Elizabeth Glaser Pediatric Aids Foundation 1,620,418,321.00
20 International Rescue Committee 1,608,761,737.00
3.1.6 NGO Utilization of Funds
NGOs utilize funds on various interventions in and outside the country. These funds are utilized to meet the organizations’ charitable objectives and in line with donor guidelines.
44 ANNUAL NGO SECTOR REPORT 2018/19
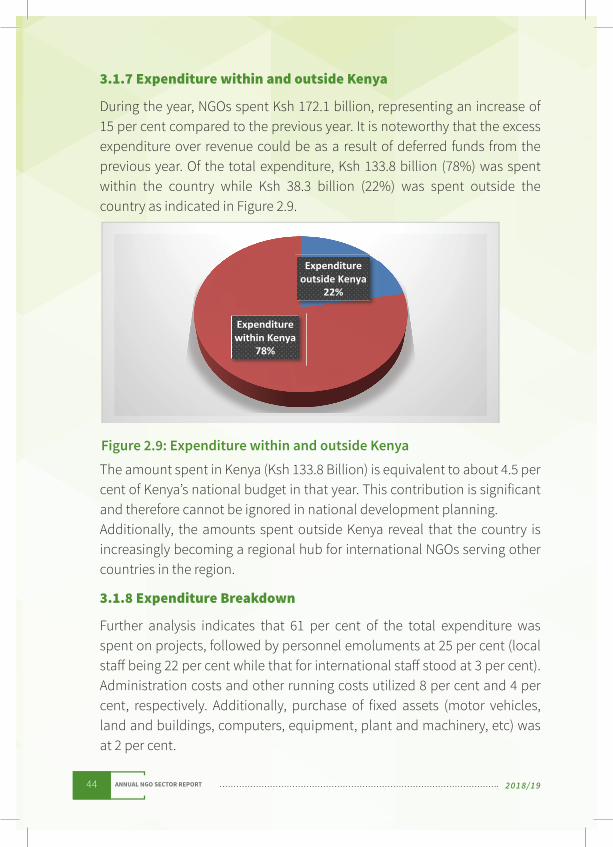
3.1.7 Expenditure within and outside Kenya
During the year, NGOs spent Ksh 172.1 billion, representing an increase of 15 per cent compared to the previous year. It is noteworthy that the excess expenditure over revenue could be as a result of deferred funds from the previous year. Of the total expenditure, Ksh 133.8 billion (78%) was spent within the country while Ksh 38.3 billion (22%) was spent outside the country as indicated in Figure 2.9.
Figure 2.9: Expenditure within and outside KenyaThe amount spent in Kenya (Ksh 133.8 Billion) is equivalent to about 4.5 per cent of Kenya’s national budget in that year. This contribution is significant and therefore cannot be ignored in national development planning. Additionally, the amounts spent outside Kenya reveal that the country is increasingly becoming a regional hub for international NGOs serving other countries in the region.
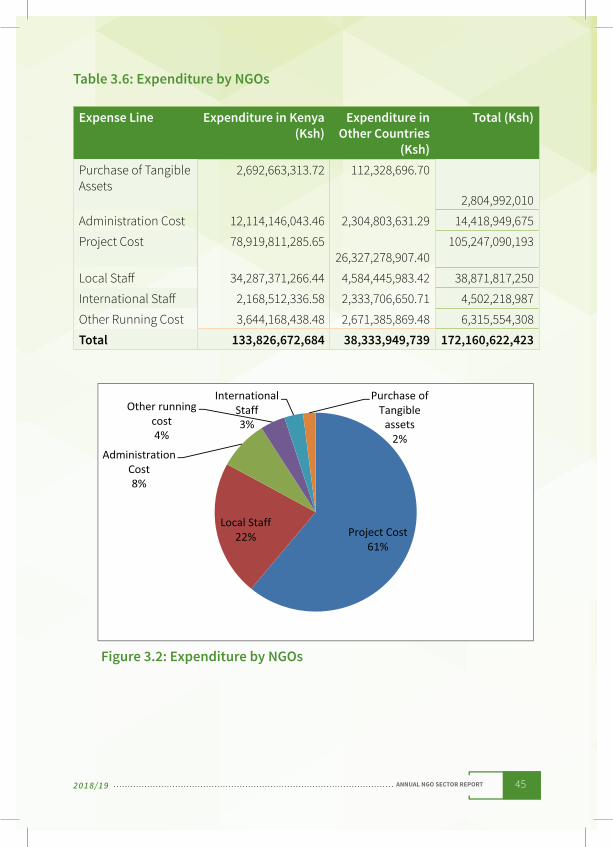
3.1.8 Expenditure Breakdown
Further analysis indicates that 61 per cent of the total expenditure was spent on projects, followed by personnel emoluments at 25 per cent (local sta� being 22 per cent while that for international sta� stood at 3 per cent). Administration costs and other running costs utilized 8 per cent and 4 per cent, respectively. Additionally, purchase of fixed assets (motor vehicles, land and buildings, computers, equipment, plant and machinery, etc) was at 2 per cent.
45ANNUAL NGO SECTOR REPORT2018/19
Table 3.6: Expenditure by NGOs
Expense Line Expenditure in Kenya (Ksh)
Expenditure in Other Countries
(Ksh)
Total (Ksh)
Purchase of Tangible Assets
2,692,663,313.72 112,328,696.70
2,804,992,010
Administration Cost 12,114,146,043.46 2,304,803,631.29 14,418,949,675
Project Cost 78,919,811,285.65 26,327,278,907.40
105,247,090,193
Local Sta� 34,287,371,266.44 4,584,445,983.42 38,871,817,250
International Sta� 2,168,512,336.58 2,333,706,650.71 4,502,218,987
Other Running Cost 3,644,168,438.48 2,671,385,869.48 6,315,554,308
Total 133,826,672,684 38,333,949,739 172,160,622,423
Figure 3.2: Expenditure by NGOs
46 ANNUAL NGO SECTOR REPORT 2018/19
3.2 Sector Sustainability
3.2.1 Background
NGOs sector sustainability is the ability of the sector to improve its overall institutional capacity to continue its activities among target population over an extended period of time, minimize financial vulnerability, develop diversified sources of institutional and financial support, and maximize impact by providing quality interventions (USAID, 2012). The index as a tool allows users to assess the political and economic developments over time that influence the viability of the NGO sector in a country. Various dimensions of the NGO sector are normally analyzed in coming up with the overall Sustainability Index. In assessing the sector sustainability in Kenya, this report adopted a CSO Sustainability Index developed by USAID. The index herein was based on three dimensions: financial viability, organization capacity, collaborations and networking with the aim of measuring overall viability in the sector.
3.2.2 Sustainability Index: Methodology
The adoption of the index was based on three interrelated dimensions: organizational capacity, financial viability, and collaboration and networking, with various indicators for each dimension. This assessment involves scoring each indicator of a dimension and averaging these together for a preliminary dimension score. Since the dimensions had di� erent indicators, scores for each indicator were averaged together to come up with the overall NGO sustainability index.
Further, the sustainability dimension scores were clustered into three stages: Sustainability Enhanced, Sustainability Evolving and Sustainability Impended. The Sustainability Enhanced stage is the highest level of sustainability, corresponding to a score between 70 and 100 per cent; the Sustainability Evolving stage corresponding to a score between 40 and 69.9 per cent; and the lowest level of development, the Sustainability Impeded,
47ANNUAL NGO SECTOR REPORT2018/19
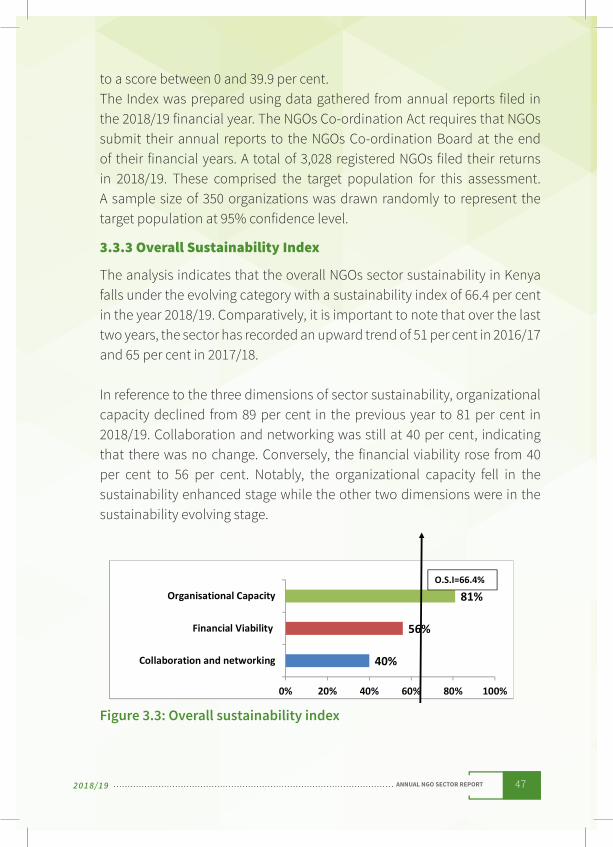
to a score between 0 and 39.9 per cent.The Index was prepared using data gathered from annual reports filed in the 2018/19 financial year. The NGOs Co-ordination Act requires that NGOs submit their annual reports to the NGOs Co-ordination Board at the end of their financial years. A total of 3,028 registered NGOs filed their returns in 2018/19. These comprised the target population for this assessment. A sample size of 350 organizations was drawn randomly to represent the target population at 95% confidence level.
3.3.3 Overall Sustainability Index
The analysis indicates that the overall NGOs sector sustainability in Kenya falls under the evolving category with a sustainability index of 66.4 per cent in the year 2018/19. Comparatively, it is important to note that over the last two years, the sector has recorded an upward trend of 51 per cent in 2016/17 and 65 per cent in 2017/18.
In reference to the three dimensions of sector sustainability, organizational capacity declined from 89 per cent in the previous year to 81 per cent in 2018/19. Collaboration and networking was still at 40 per cent, indicating that there was no change. Conversely, the financial viability rose from 40 per cent to 56 per cent. Notably, the organizational capacity fell in the sustainability enhanced stage while the other two dimensions were in the sustainability evolving stage.
Figure 3.3: Overall sustainability index
48 ANNUAL NGO SECTOR REPORT 2018/19
3.3.4 Organization capacity
A sustainable NGOs sector will have a significant number of NGOs that are transparently governed, well managed, and that demonstrate essential organizational skills. In assessing the organizational capacity dimension, the report addressed organizations’ governance structures in terms of existence of a substantive board, separation between the governance and management and annual general meetings. The report also considered sta� ing, with a focus on sta� training and sta� turnover, and volunteers engaged in the sector. Lastly, the report considered the ICT resources that were available to the NGOs.
(a) NGO governance
All the sampled organizations had an established board of management in place. However, based on the NGO Board’s experiences on compliance among NGOs, it is evident that some of these boards play a perfunctory role to fulfil either statutory or donor requirements and are not actually involved in the governance of the organizations. Despite this, 33.4 per cent of NGOs have not separated their governance from management. Lack of separation of governance and management bodies tends to lead to weak governance, lack of accountability and in the long run a� ect the long term health of the organization. It is a statutory requirement for NGOs to hold Annual General Meetings (AGMs). AGMs provide an opportunity for board of directors to review past performance and plan for the future; present annual programme and financial reports; appoint auditors and subject themselves to elections. From the study, it emerged that 94 per cent of the sampled organizations had conducted AGMs in the financial year under study.
(b) NGO sta� ing
In Kenya, NGO funding is largely project-based and short-term in nature. Employees in the sector are consequently hired on short term contracts, resulting in high sta� turnover. Undoubtedly, this turnover can destabilize NGO capacity, which further impacts negatively on the organization, resulting in lower sustainability levels. In the year under review, 31 per cent of the sampled organizations experienced sta� turnover.
49ANNUAL NGO SECTOR REPORT2018/19
Some 56 per cent of the sampled NGOs invested in building capacity of their sta� by equipping them with relevant skills through in-house trainings, seminars and workshops. Training of sta� is vital in the sense that it helps in improving organizational internal management, networking and project implementation skills. Of the NGOs that invested in building the capacity of their sta� , only 31.4 per cent reported o� ering professional training to the workers. Further analysis reveals that majority of the organizations - 68% - had engaged volunteers in their activities, of which 87% were locals and 13% foreign nationals.
(c) ICT capacity
Majority of the organizations sampled in the study reported to have had access to modern communication equipment, which eases interaction with various stakeholders resulting to quality interventions. In this respect, 81% of the NGOs had computers while 52% had printers and 97% of them reported having access to internet.
3.3.5 Financial viability
There are many factors that influence financial viability, such as financial diversification, financial management systems, among others. For the purpose of this assessment, financial viability dimension addresses the organizations’ diverse sources of funding, local support, self-generated income, ownership of assets such as land and biological assets (animals and plants), and investments in financial instruments such as bonds and treasury bills. NGOs financial viability may be equally dependent upon their ability to compete for donor support.
(a) Diversity of income sources
It is noteworthy that majority of NGOs (60%) reported having more than one source of funds, although the reliability of these sources was not guaranteed. In the short term, this thins out their financial risk but in the long-term, they may be exposed financially. Some NGOs reported that they either relied on a single donor or depended on their directors’ and/or members’ contributions. The lack of diversity in sources of funds by NGOs could be attributed to lack of a fundraising strategy, compounded by inadequate capacity by NGOs in
50 ANNUAL NGO SECTOR REPORT 2018/19
resource mobilization and/or inertia to embrace non-traditional resource mobilization strategies. It is important to note that smaller national NGOs, which are the majority of registered NGOs, rarely have full time and qualified fundraisers or even fund-raising budget.
(b) Local support
Local community support is vital in organizations’ sustainability. Community participation and project ownership are key to the success of projects. Community support could be both financial and/or in-kind donations. A modest number of NGOs (31%) reported to have received support from the local community. Some 43 per cent of the support received was financial, amounting to Ksh 70.7 million. In-kind contributions were in form of labour (30%) and materials (26%) valued at Ksh 49.7 million and Ksh 43.1 million, respectively. In conclusion, the total value of local community support was Ksh 163.6 million. This finding indicates acceptance by the local community.
(c) Self-generated income
In this assessment, 1.7 per cent of the organizations reported to have generated their own income from diverse activities such as renting out buildings, providing consultancy services in the area of training and research services, farming, running schools and hospital, etc.
As earlier indicated, NGOs that filed annual reports in 2018/19 reported to have raised a total of Ksh 1 billion from income generating activities. This portrays the potential of NGOs to exploit available opportunities and creatively design income generating activities that could supplement their funding sources.
(d) Ownership of non-current assets
Owning non-current assets is evidence that organizations that have invested in such assets may generate income, thereby reducing dependency on non-reliable donor funding. Investment in securing productive assets, however, depends on access to non-designated or non-restricted funds.
51ANNUAL NGO SECTOR REPORT2018/19
In 2018/19, some 20 per cent of the sampled organizations owned land, 1.4 per cent owned biological assets and 2.3 per cent had invested in bonds. It was noted that the reported assets were owned by larger organizations, which are mainly INGOs.
3.3.6 Collaboration and networking
In this assessment, collaboration and networking sustainability dimension was defined in terms of existence of information exchange, access to technical and equipment support.
Some 68 per cent of the sampled organizations were involved in information exchange mostly with other NGOs, CBOs, government agencies and academic institutions. Further analysis shows that 39 per cent of the NGOs sampled received technical support from partners while 12 per cent had received equipment support from their partners.
3.3 Annual Reports
The submission of annual reports in the statutory Form 14 is provided for in Regulations 24 of the NGOs Co-ordination Regulations, 1992. NGOs are required to submit their reports within three months a� er the end of their financial year.
3.3.1 Submission of annual returns
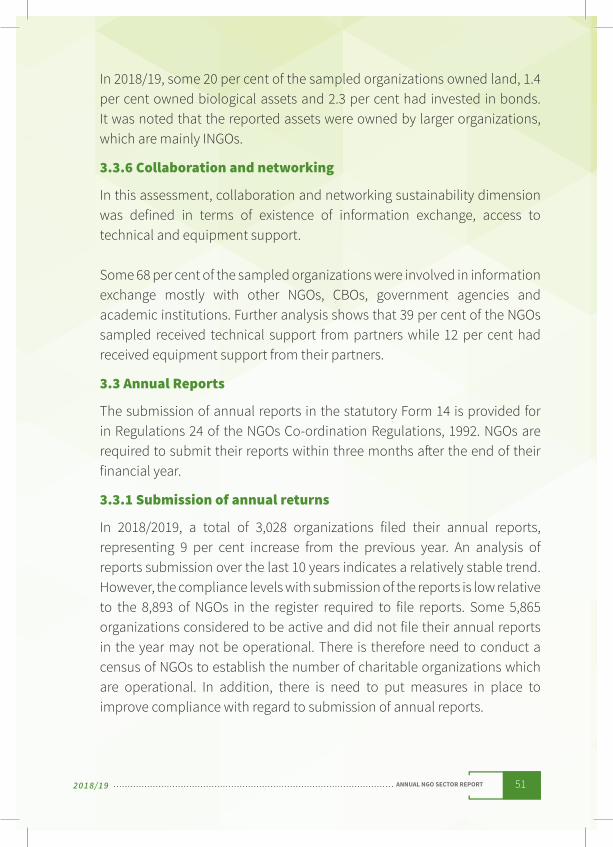
In 2018/2019, a total of 3,028 organizations filed their annual reports, representing 9 per cent increase from the previous year. An analysis of reports submission over the last 10 years indicates a relatively stable trend. However, the compliance levels with submission of the reports is low relative to the 8,893 of NGOs in the register required to file reports. Some 5,865 organizations considered to be active and did not file their annual reports in the year may not be operational. There is therefore need to conduct a census of NGOs to establish the number of charitable organizations which are operational. In addition, there is need to put measures in place to improve compliance with regard to submission of annual reports.
52 ANNUAL NGO SECTOR REPORT 2018/19
Figure 3.4: Trend of submission of annual reports
3.3.2 Audited accounts
NGOs which receive income/funding or spend more than Ksh 1 million during a financial year are required to file, together with their annual reports (Form 14), an audit report from an ICPAK recognized auditor. The audited accounts must comply with the International Financial Reporting Standards (IFRS). During the year under review, a total of 1,520 organizations received/spent more than Ksh 1 million and were expected to file audited accounts alongside Form 14. However, only 1,258 organizations complied with this requirement. This means that 262 organizations submitted Form 14 without accompanying it with the audited accounts. This translated to a compliance level with respect to submission of audited accounts of 83 per cent, up from 80 per cent in the previous financial year.
53ANNUAL NGO SECTOR REPORT2018/19
CHAPTER FOUR
4. CONCLUSIONS AND RECOMMENDATIONS
4.1 Conclusions
Sector growth: The NGO sector in Kenya has grown tremendously since the enactment of the Act. Cumulatively, 11,262 NGOs have been registered since inception of the Board. However, the report indicates that the total number of active NGOs is 8,893. Most of the 98 NGOs registered in 2018/19 preferred to operate in Nairobi County while education, relief and health remained the most preferred sectors. The NGO sector has also experienced increased growth in funding over the years. There is still potential, however, for NGOs to engage in self-generated income activities.
Contribution to national development: NGOs are making immense contribution to national development, with the 3,028 NGOs spending a total of Ksh 133.8 billion in the country. This includes Ksh 78.8 billion spent on projects mainly in the areas of health, HIV/AIDS, children, agriculture, water and sanitation, and education. These are important components of the Kenya Vision 2030 and by extension the realization of the “Big Four” government agenda. Further, the report has indicated that NGOs employed 39,109 Kenyans and also engaged 37,401 Kenyans on internship programmes.
Collaboration: Collaborations between NGOs and other stakeholders are important in reducing duplication and enhancing synergies and resource sharing thus contributing to e� iciency and e� ectiveness. The report has shown that among the NGOs that filed annual reports, 85 per cent reported having engaged in collaborations. Further analysis has revealed relatively low levels of collaboration between NGOs and Government. This does not augur well for the attainment of SDGs and the Kenya Vision 2030, especially the social pillar which requires joint e� orts by government and the CSO sector.
54 ANNUAL NGO SECTOR REPORT 2018/19
Funding: It was established that NGOs that filed annual reports in 2018/19 received a total of Ksh 165.97 billion meant for a wide range of public benefit interventions. Most of these funds (88%) were raised from external sources, which indicates over-reliance of NGOs on donor funding. The over-dependence on foreign donors, for instance, means that NGOs operating in Kenya are subject to the vagaries of donor priorities.
Expenditure: There is indication that NGOs are allocating substantial amount of resources in complementing governments services. The fact that huge amounts of resources are received in Kenya but utilized outside the country means that Kenya is increasingly becoming a regional hub for charities operating in the region.
Sustainability: NGO sustainability continues to be a challenge. Based on a sustainability index, it was noted that NGOs in Kenya are in the evolving level of sustainability. This is demonstrated by the ability of NGOs to raise 4 per cent of the total funding through income generating projects. NGOs can also avoid over-reliance on donor funding from countries outside Kenya by exploring more avenues to fundraise locally, since 11 per cent of the donations raised in 2018/19 were from in-country sources. Governance is a key aspect of organizational capacity as a dimension of sector sustainability. It was noted that many NGOs experience governance challenges regarding separation of boards from managements, a situation that can adversely a� ect the sustainability of the sector in the long run. It has also been noted that some NGOs engaged in income generating activities, a good indication of a huge potential in raising funds internally. Collaborations between NGOs and other stakeholders are very important in enhancing sustainability of the sector. Although networking and collaborations were reported by most NGOs, collaboration and networking indicators showed that this dimension scored slightly below average. This does not augur well in the future sustainability of the sector. Compliance: Submission of annual reports has gone up over time from 67 in 2002/2003 to 3,028 in 2018/19. This is due to the cumulative number of NGOs registered. However, the level of compliance is still very low considering the number of active NGOs in the Board’s register.
55ANNUAL NGO SECTOR REPORT2018/19
4.2 Recommendations
In view of the findings and conclusions of this report, the following are the recommendations for consideration with a view to strengthening the NGO sector in Kenya:
Legal and regulatory framework: The NGO sector needs to be e� ectively regulated and enabled to thrive. The Act, as it is, does not provide for adequate regulatory and legal provisions for the enablement and regulation of the sector. It is, therefore, imperative that adequate investment be made in ensuring an appropriate legislative and regulatory environment. The proposed legislative and regulatory framework needs to recognize that there are many charitable organizations registered under di� erent regimes. It should also take into consideration the facilitation of NGOs to undertake commercial activities as they move towards self-sustainability. It is recommended that the Government operationalizes the Public Benefit Organizations Act as committed to in Medium Term Plan III.
NGO sustainability and collaborations: The over-dependency on external funding by NGOs and the fact that few NGOs have established income generating activities could imply that the sector is largely unsustainable. This is further confirmed by the overall sustainability index. There is need for the Board to build the capacity of the NGOs in resource mobilization and engage stakeholders to come up with innovative ways of promoting local philanthropy. In addition, there is need to upscale collaboration between NGOs and other stakeholders, including the Government. It is recommended that capacity building for NGOs be enhanced to improve the capacity of the organizations to generate funds internally and from local sources.Additionally, a lot of capacity building should be done so that NGOs are aware of the 70 to 30 good practice resource utilization rule. Therefore, a study should be conducted to establish the impediments to Government-NGO partnerships to inform formulation of policies that enhance collaboration between the two partners.
Annual reports: Compliance levels regarding submission of annual reports
56 ANNUAL NGO SECTOR REPORT 2018/19
by NGOs are still low. The Board will put in place mechanisms to improve compliance with regard to submission of annual reports. The Board will conduct a census of NGOs to establish the number of charitable organizations which are operational.
The Board will continue to enforce compliance with the Act, Regulations and policies aimed at e� ective regulation and enablement of the sector.
Service delivery: The Board’s capacity to provide e� icient and e� ective services will be strengthened through:
• Automation of Board processes;
• Strengthening sta� ing levels; and
• Decentralization to the county level for improved monitoring and evaluation of NGO programmes.
Decentralization of services: Most NGOs prefer to operate from Nairobi and other urban areas. This could be due to the fact that urban centres have established infrastructure, secure working environment and improved access to communication services such as the internet, which are useful in resource mobilization. The Board will strengthen its regional o� ices and open new ones to enhance compliance levels and improve monitoring. Measures will also be put in place to encourage more NGOs to engage local communities where their services are mostly required for ownership and acceptance of the projects.
Monitoring and evaluation: The Board will strengthen its monitoring and evaluation system to promote transparency and accountability in the sector, and conclusively capture the contribution of the sector in national development.
The Board will develop a policy framework that will encourage all NGOs registered and regulated by the Board to disclose important information, including on funding and project implementation, and the impact of the programmes
57ANNUAL NGO SECTOR REPORT2018/19
Proactive disclosure of information: The Board will put in place mechanisms to ensure that relevant information about the NGO sector is proactively disseminated to the public. This includes review of data collection tools and undertaking sectoral research studies, among others.
This will be done through automation of Board processes and revamping the website to ensure that reports are uploaded. Further, the NGOs Week will be reintroduced and more sensitization and capacity building workshops held. The resource mobilization function will be strengthened to improve collaboration and partnership with entities that would ultimately fund studies about the sector.
58 ANNUAL NGO SECTOR REPORT 2018/19
References
NGOs Co-ordination Board (2009), National Validation Survey of NGOs. Nairobi: NGOs Coordination Board.
Government of Kenya (2007), Kenya Vision 2030, Nairobi: Ministry of Planning, National Development and Vision 2030.
Government of Kenya (2010), Constitution of Kenya 2010, Nairobi.
Government of Kenya (2006), Sessional Paper No. 1 of 2006 on Non-Governmental Organizations. Nairobi: Government Printer.
United States Agency for International Development (2012). CSO Sustainability Index for Sub-Sahara Africa. USAD.
59ANNUAL NGO SECTOR REPORT2018/19
60 ANNUAL NGO SECTOR REPORT 2018/19
61ANNUAL NGO SECTOR REPORT2018/19
62 ANNUAL NGO SECTOR REPORT 2018/19
63ANNUAL NGO SECTOR REPORT2018/19
64 ANNUAL NGO SECTOR REPORT 2018/19
65ANNUAL NGO SECTOR REPORT2018/19
66 ANNUAL NGO SECTOR REPORT 2018/19


Published 2019© NGOs Co-Ordination Board
Co-operative Bank House, 15th floor, Haile Selassie AvenueP.O. Box 44617-00100, NAIROBI, KENYA
Tel: +254 (20) 2214044, 2214887 Fax: +254 (20) 2214801Email: [email protected] Website: www.ngobureau.or.ke
Twitter: @ngoboardkenya
All Rights Reserved
ISBN: 978-9966-137-24-1