Embed Size (px)
Citation preview
1
Annual results to 31 March 2010
13 May 2010
2
Baroness HoggChairman
2
3
Sir Adrian Montague
3
4
Agenda
• Introduction and progress Michael Queen
• Strategy Michael Queen
• Results for year to 31 March 2010 Stephen Halliwell
• Closing remarks Michael Queen

5
Michael QueenChief Executive
5

6
Key themes
Improved performance
Transformed financial position
Focused business model with a platform for growth
7
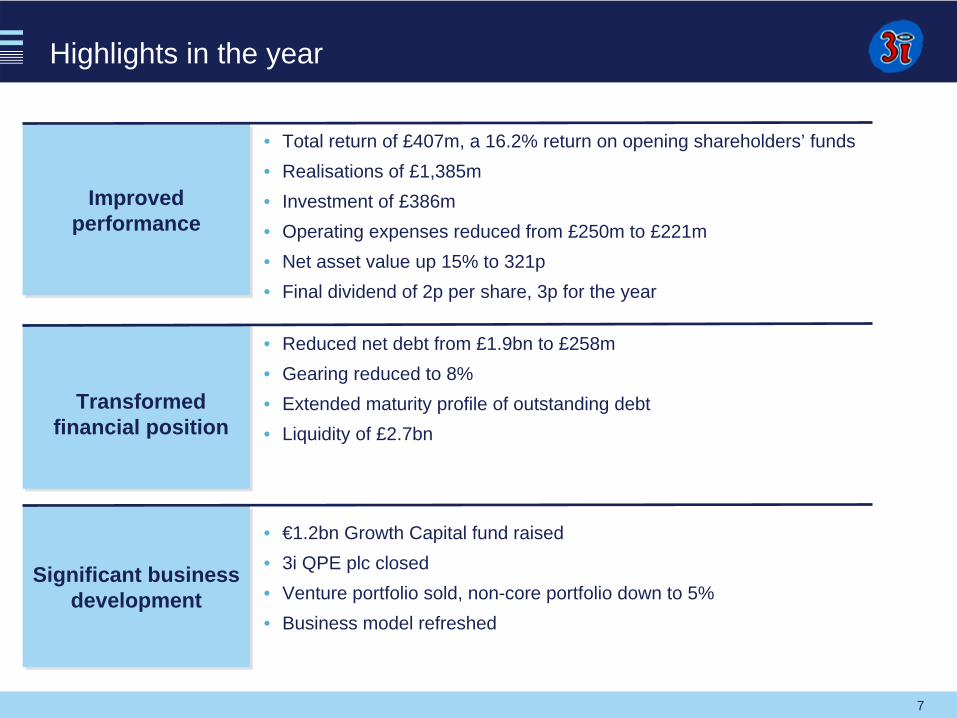
Highlights in the year
Improved performance
Improved performance
Transformed financial position
Transformed financial position
Significant business development
Significant business development
• Reduced net debt from £1.9bn to £258m• Gearing reduced to 8% • Extended maturity profile of outstanding debt• Liquidity of £2.7bn
• €1.2bn Growth Capital fund raised• 3i QPE plc closed• Venture portfolio sold, non-core portfolio down to 5%• Business model refreshed
• Total return of £407m, a 16.2% return on opening shareholders’ funds• Realisations of £1,385m• Investment of £386m• Operating expenses reduced from £250m to £221m• Net asset value up 15% to 321p• Final dividend of 2p per share, 3p for the year
8
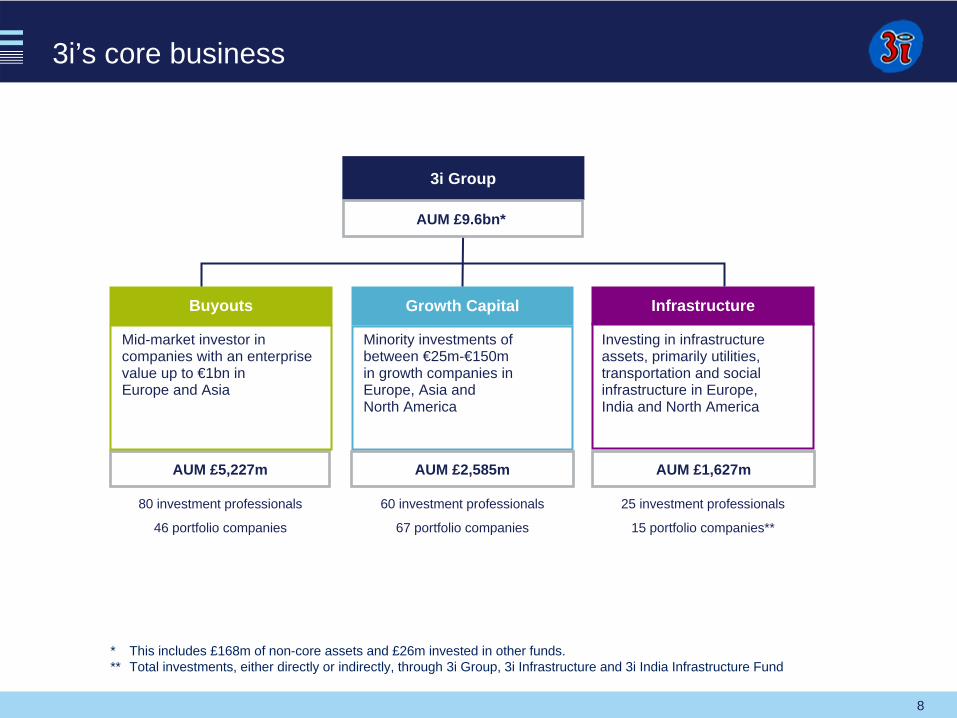
3i’s core business
3i Group
AUM £5,227m
Growth Capital InfrastructureBuyouts
Mid-market investor in companies with an enterprise value up to €1bn in Europe and Asia
Investing in infrastructure assets, primarily utilities, transportation and social infrastructure in Europe, India and North America
Minority investments of between €25m-€150m in growth companies in Europe, Asia and North America
AUM £9.6bn*
AUM £2,585m AUM £1,627m
80 investment professionals
46 portfolio companies
25 investment professionals
15 portfolio companies**
60 investment professionals
67 portfolio companies
* This includes £168m of non-core assets and £26m invested in other funds. ** Total investments, either directly or indirectly, through 3i Group, 3i Infrastructure and 3i India Infrastructure Fund
9
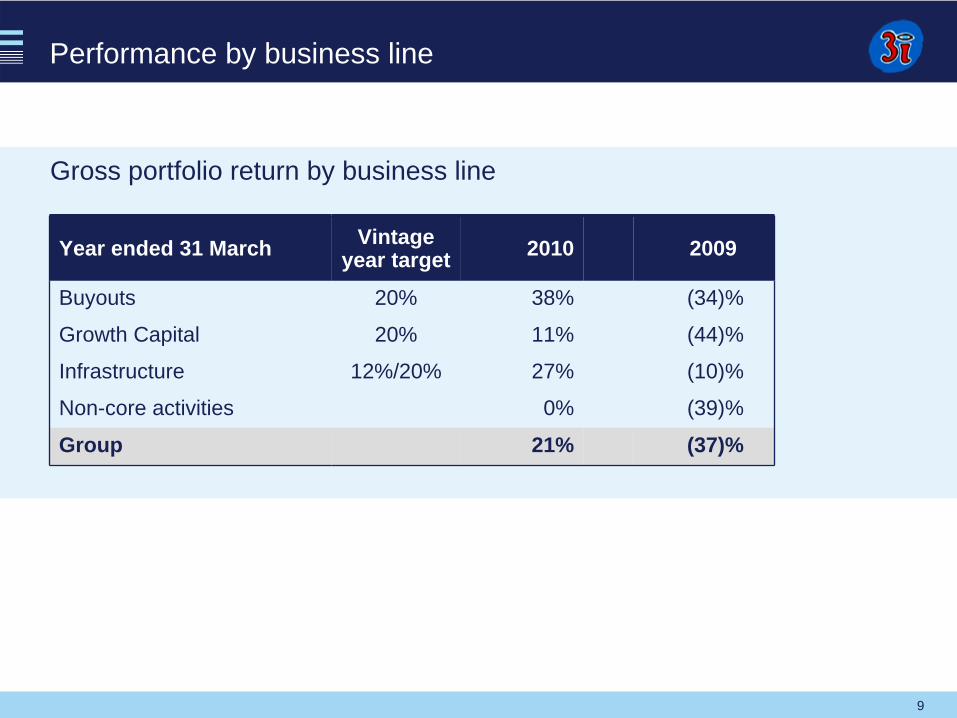
Performance by business line
Year ended 31 March Vintage year target 2010 2009
Buyouts 20% 38% (34)%
Growth Capital 20% 11% (44)%
Infrastructure 12%/20% 27% (10)%
Non-core activities 0% (39)%
Group 21% (37)%
Gross portfolio return by business line
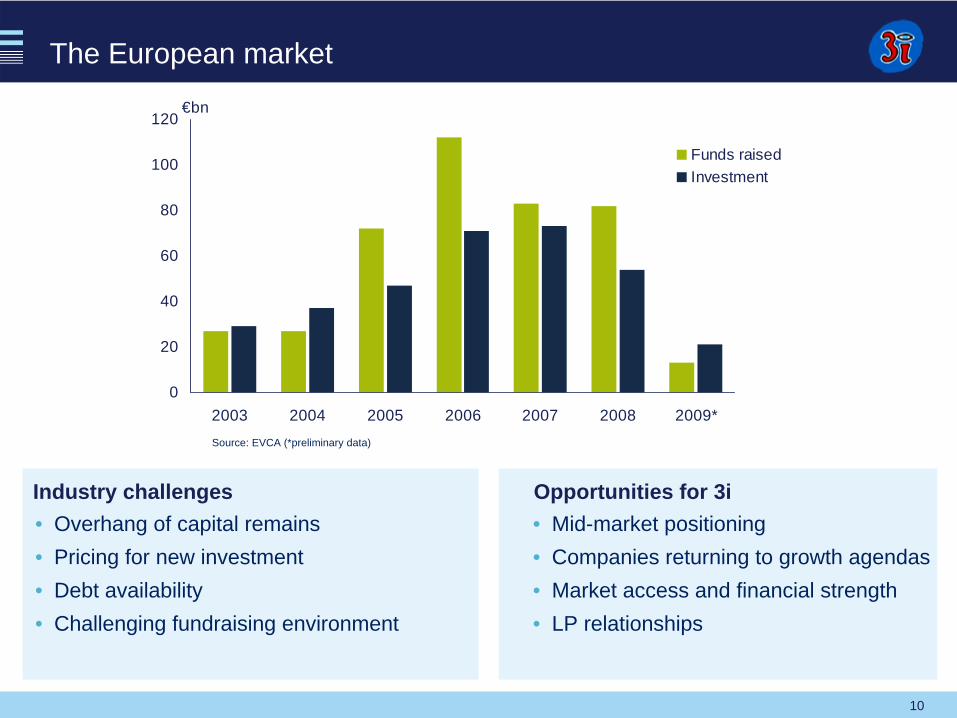
10
€bn
0
20
40
60
80
100
120
2003 2004 2005 2006 2007 2008 2009*
Funds raisedInvestment
The European market
• Overhang of capital remains• Pricing for new investment• Debt availability• Challenging fundraising environment
• Mid-market positioning• Companies returning to growth agendas• Market access and financial strength• LP relationships
Industry challenges Opportunities for 3i
Source: EVCA (*preliminary data)
11
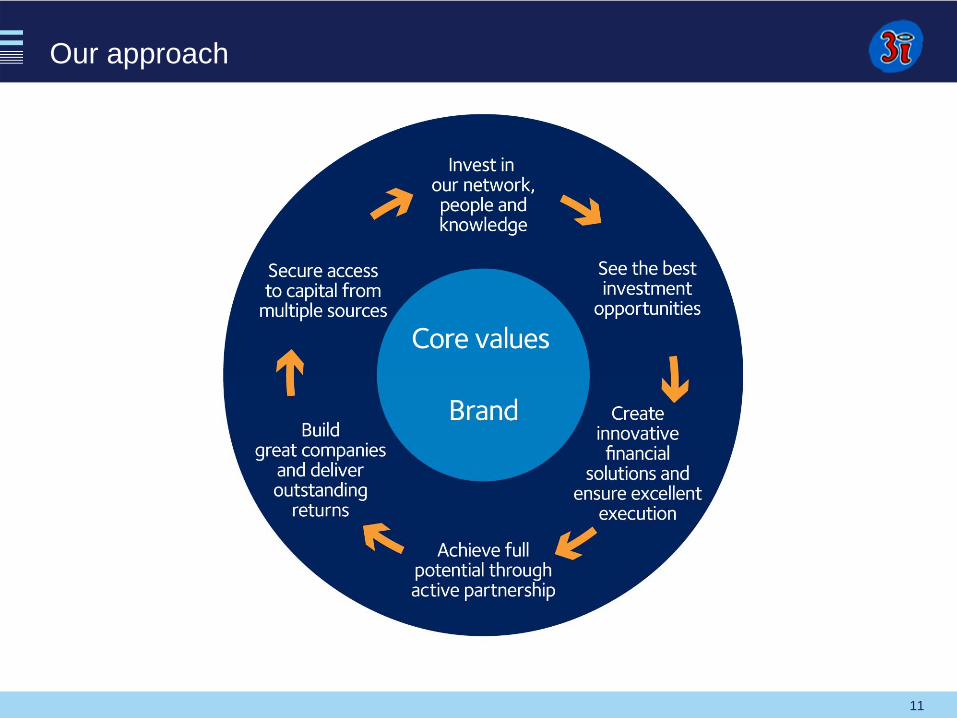
Our approach
12
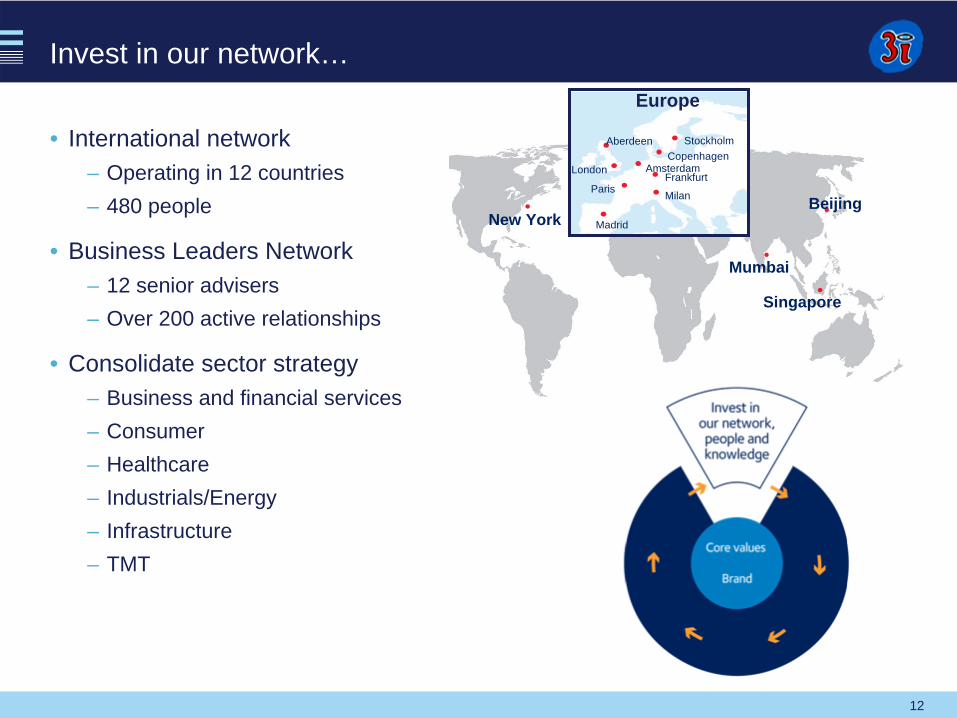
Invest in our network…
• International network– Operating in 12 countries– 480 people
• Business Leaders Network– 12 senior advisers– Over 200 active relationships
• Consolidate sector strategy– Business and financial services– Consumer– Healthcare– Industrials/Energy– Infrastructure– TMT
Singapore
New YorkBeijing
Mumbai
London
Aberdeen StockholmCopenhagen
AmsterdamFrankfurt
Milan
Madrid
Paris
Europe
13
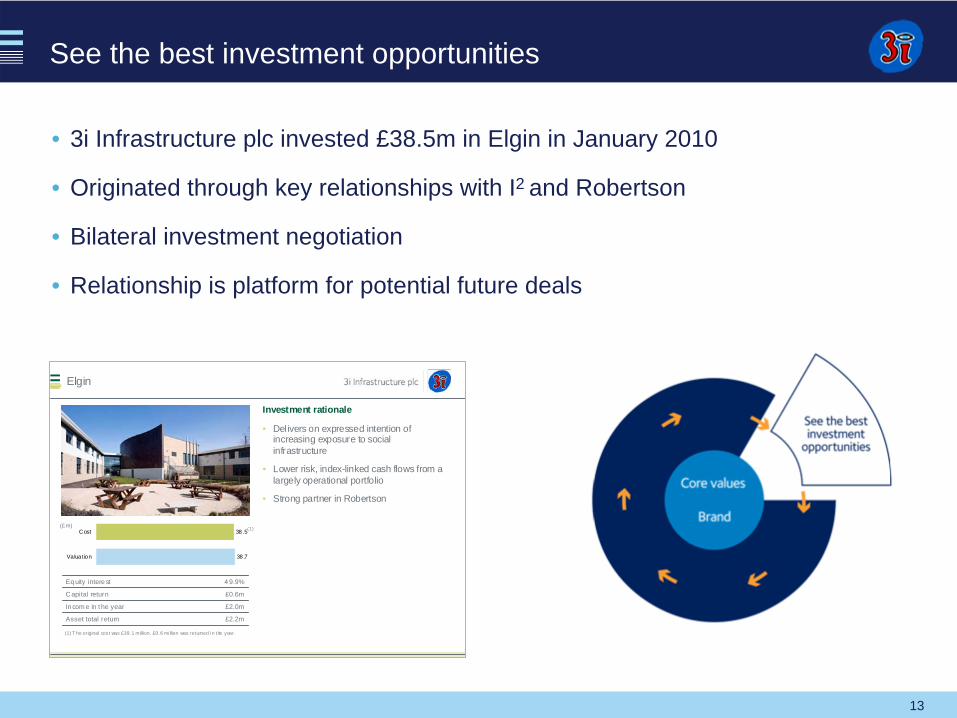
See the best investment opportunities
• 3i Infrastructure plc invested £38.5m in Elgin in January 2010
• Originated through key relationships with I2 and Robertson
• Bilateral investment negotiation
• Relationship is platform for potential future deals
38.5
38.7
Cost
Valuation
Elgin
Investment rationale
• Delivers on expressed intention of increasing exposure to social infrastructure
• Lower risk, index-linked cash flows from a largely operational portfolio
• Strong partner in Robertson
£2.2mAsset total return
£2.0mIn com e in t he year
£0.6mCapital return
4 9.9%Eq uity intere st
(£m) (1)
(1) T he original cost was £39.1 m illion. £0.6 mi llion was returned i n the year.
14
Create innovative solutions…
• Committed €84m of investment to Refresco in March 2010
• First investment from the new Growth Capital fund
• Second investment in Refresco having led a buyout in 2003
• Investment will support successful “buy and build strategy”
15
Achieve full potential…
Active partnership• 90 Active partnership initiatives implemented across the portfolio
• Focus: strategic, commercial, operational, functional performance improvements
Banking team• Covenants under review – down from 16 to 7• Buyout leverage 5.0x• Growth leverage 2.2x• Over 80% matures 2013 or later
Business Leaders Network• 30 chairmen appointed in past three years
16
Achieve full potential…
45% increase in EBITDA further €15m identified
• Result of organic growth and acquisitions (12 acquisitions)
• Improved EBITDA margins
• New divisional CEOs, FDs and operations directors appointed
17
Achieve full potential…
Active partnership
• Full working capital review
• Pricing efficiencies achieved across largest operational divisions
• Cost efficiencies identified
• Continued review of sales force effectiveness and procurement processes
18
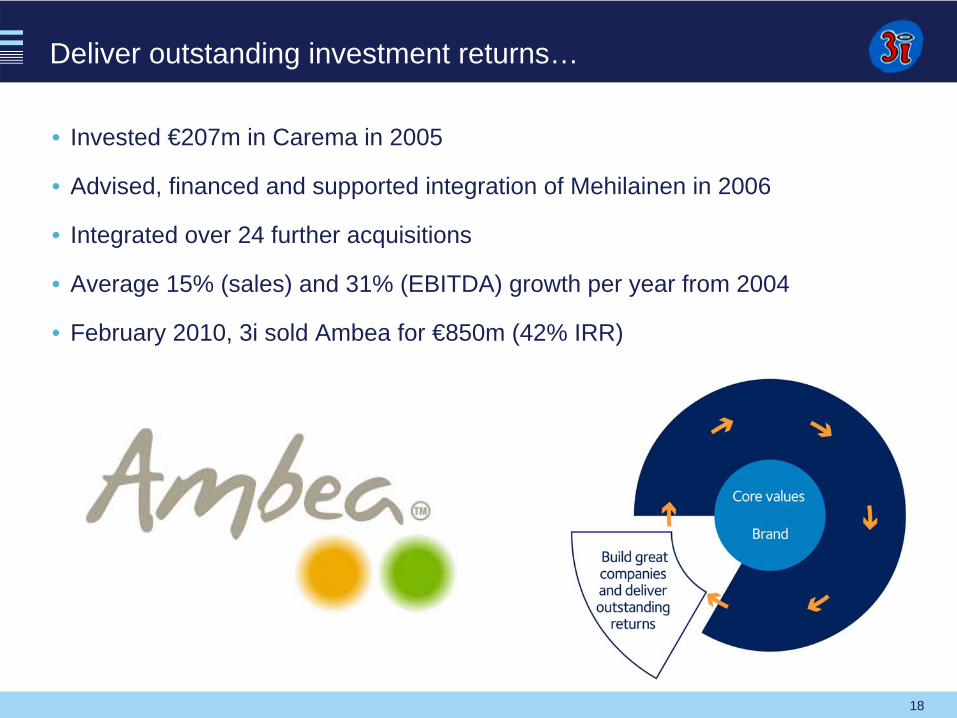
Deliver outstanding investment returns…
• Invested €207m in Carema in 2005
• Advised, financed and supported integration of Mehilainen in 2006
• Integrated over 24 further acquisitions
• Average 15% (sales) and 31% (EBITDA) growth per year from 2004
• February 2010, 3i sold Ambea for €850m (42% IRR)
19
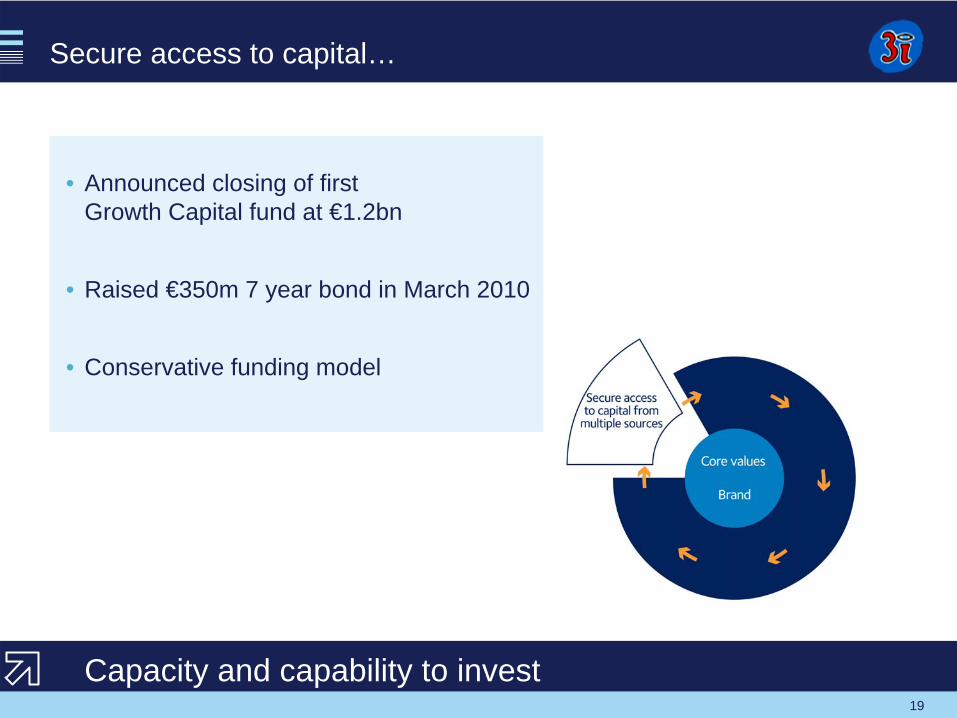
Secure access to capital…
• Announced closing of first Growth Capital fund at €1.2bn
• Raised €350m 7 year bond in March 2010
• Conservative funding model
Capacity and capability to invest
20
Stephen Halliwell
20
21
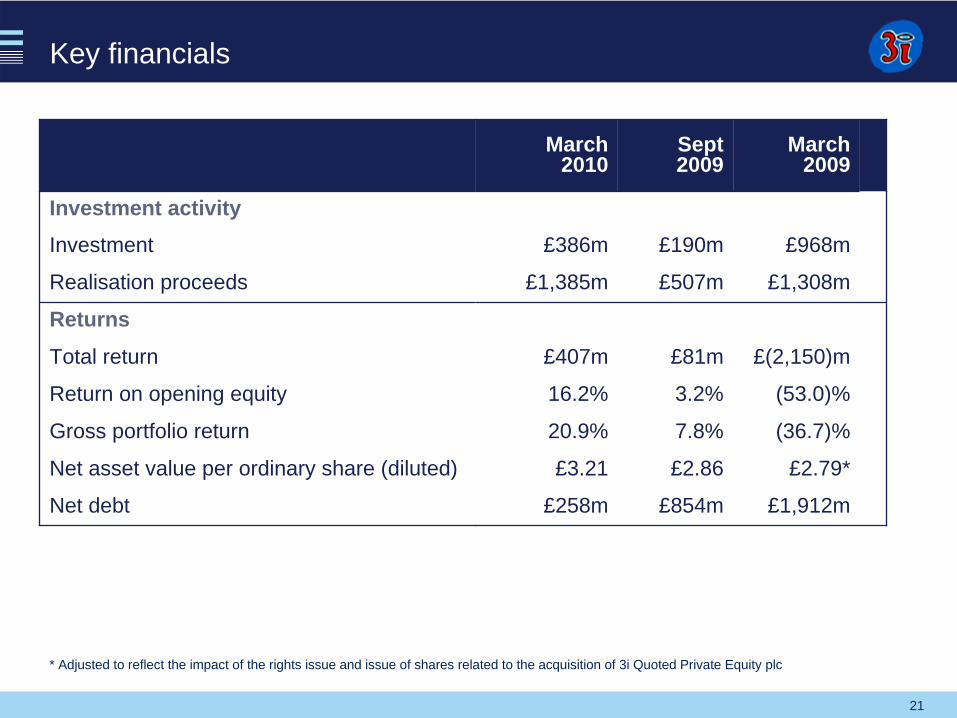
Key financials
March 2010
Sept 2009
March 2009
Investment activityInvestment £386m £190m £968m
Realisation proceeds £1,385m £507m £1,308m
Returns
Total return £407m £81m £(2,150)m
Return on opening equity 16.2% 3.2% (53.0)%
Gross portfolio return 20.9% 7.8% (36.7)%
Net asset value per ordinary share (diluted) £3.21 £2.86 £2.79*
Net debt £258m £854m £1,912m
* Adjusted to reflect the impact of the rights issue and issue of shares related to the acquisition of 3i Quoted Private Equity plc
22
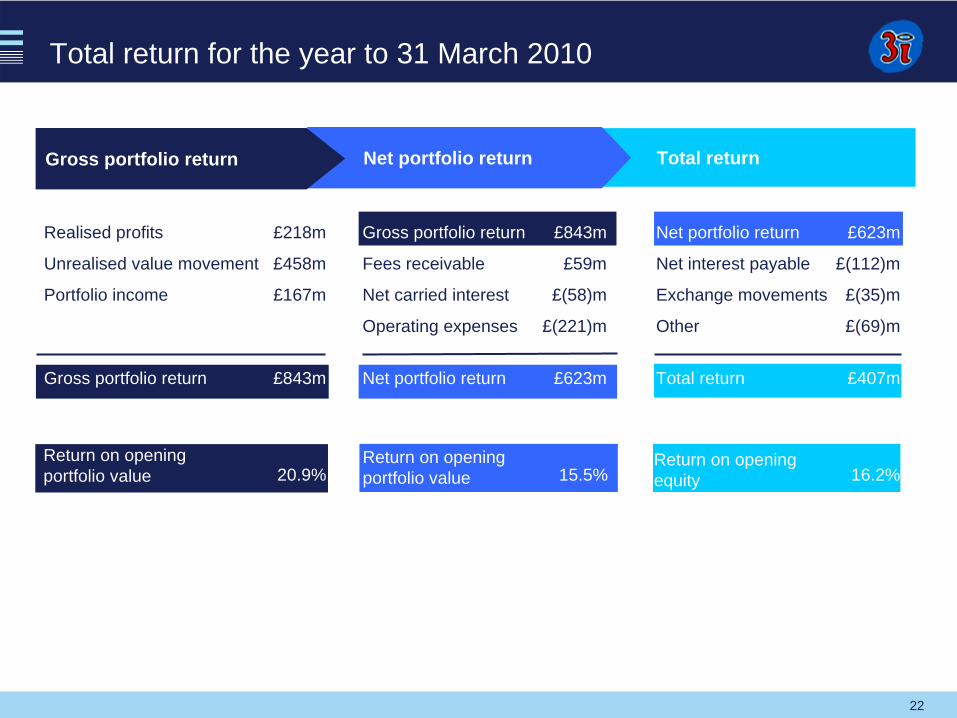
Gross portfolio return £843m
Fees receivable £59m
Net carried interest £(58)m
Operating expenses £(221)m
Net portfolio return £623m
Net portfolio return £623m
Net interest payable £(112)m
Exchange movements £(35)m
Other £(69)m
Total return £407m
Return on opening portfolio value
Realised profits £218m
Unrealised value movement £458m
Portfolio income £167m
Gross portfolio return £843m
Total returnNet portfolio return
Total return for the year to 31 March 2010
20.9% 15.5% 16.2%Return on opening equity
Return on opening portfolio value
Gross portfolio return
23
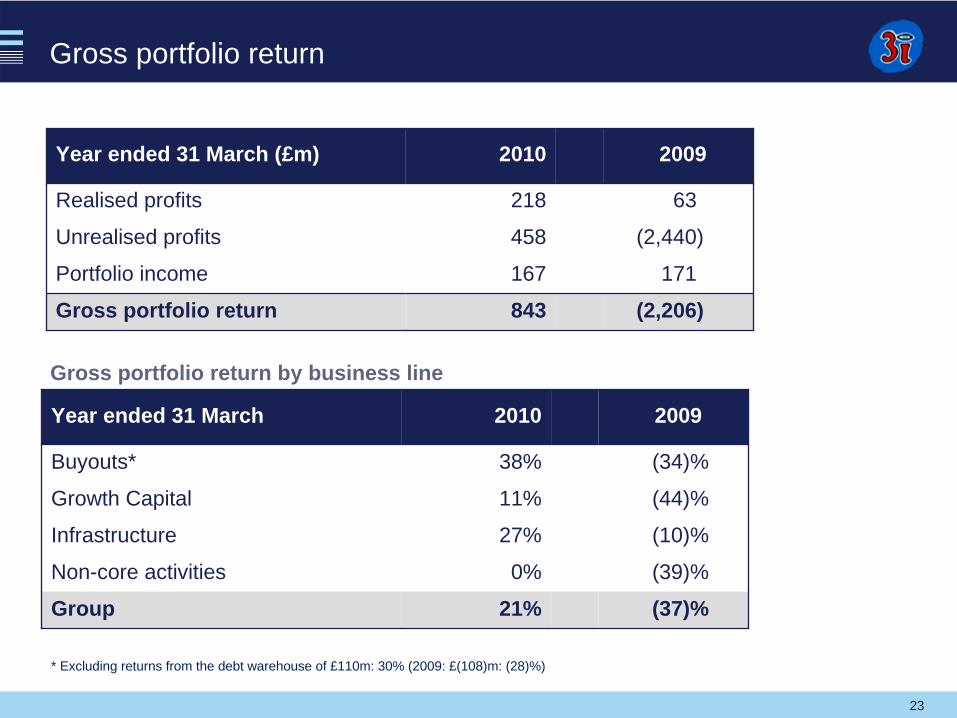
Gross portfolio return
Year ended 31 March (£m) 2010 2009
Realised profits 218 63
Unrealised profits 458 (2,440)
Portfolio income 167 171
Gross portfolio return 843 (2,206)
Year ended 31 March 2010 2009
Buyouts* 38% (34)%
Growth Capital 11% (44)%
Infrastructure 27% (10)%
Non-core activities 0% (39)%
Group 21% (37)%
Gross portfolio return by business line
* Excluding returns from the debt warehouse of £110m: 30% (2009: £(108)m: (28)%)
24
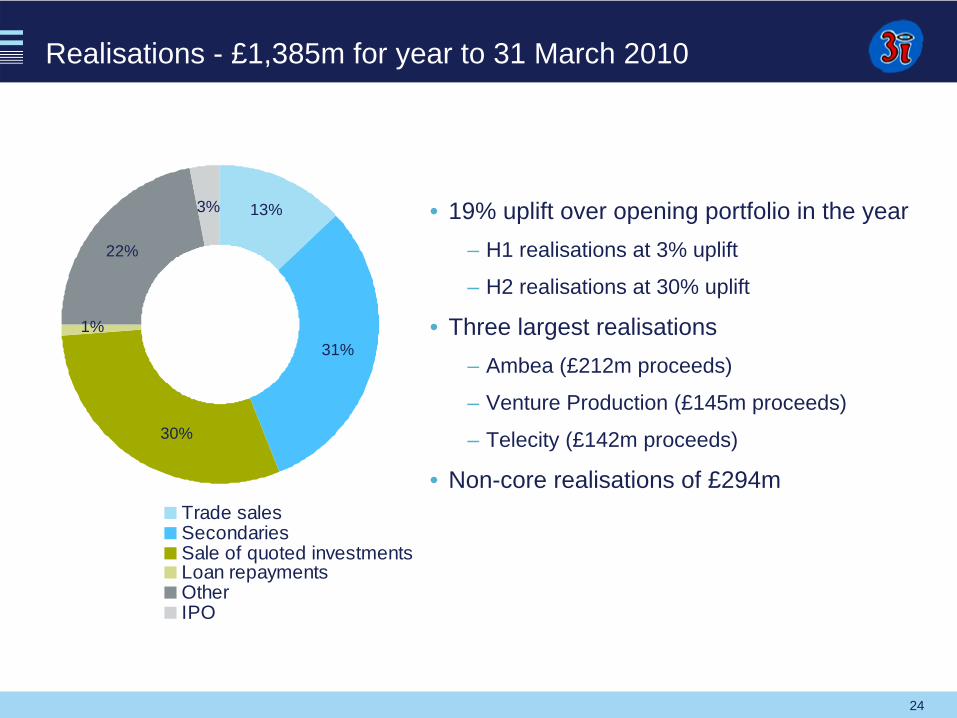
Realisations - £1,385m for year to 31 March 2010
• 19% uplift over opening portfolio in the year– H1 realisations at 3% uplift
– H2 realisations at 30% uplift
• Three largest realisations – Ambea (£212m proceeds)
– Venture Production (£145m proceeds)
– Telecity (£142m proceeds)
• Non-core realisations of £294m
13%
30%
31%
3%
22%
1%
Trade salesSecondariesSale of quoted investmentsLoan repaymentsOtherIPO
25
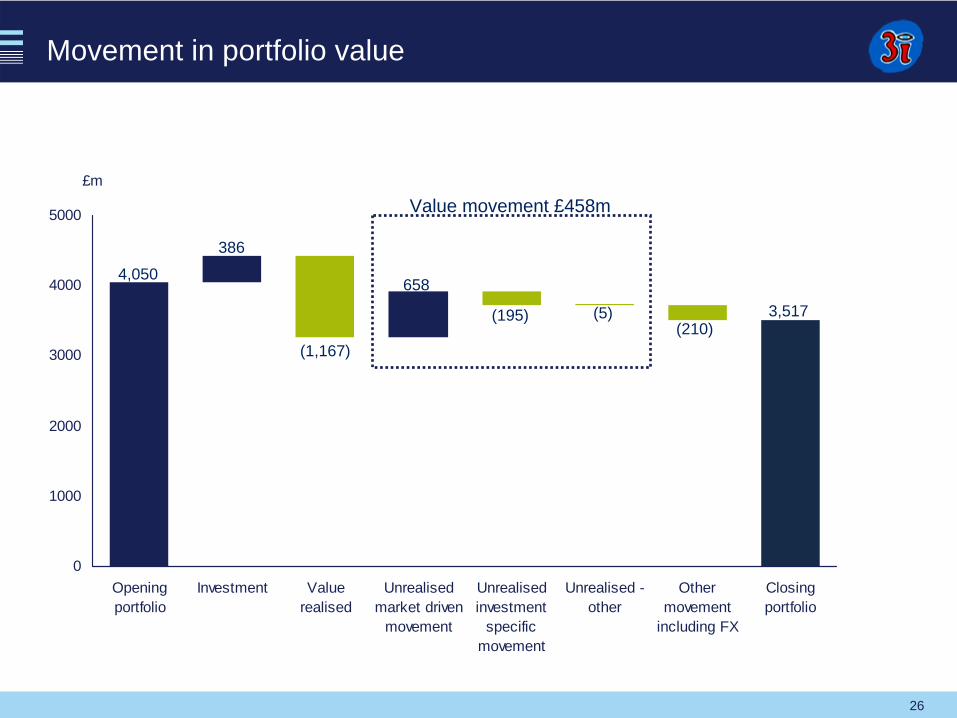
Unrealised value movement summary - £458m
• Earnings recovery in the second half of the year
• Earnings multiples improved
• Incorporated new IPEV valuation guidelines
26
Movement in portfolio value
£m
0
1000
2000
3000
4000
5000
Openingportfolio
Investment Valuerealised
Unrealisedmarket driven
movement
Unrealisedinvestment
specificmovement
Unrealised -other
Othermovement
including FX
Closingportfolio
4,050
386
(1,167)
658
(195) (5)(210)
3,517
Value movement £458m
27
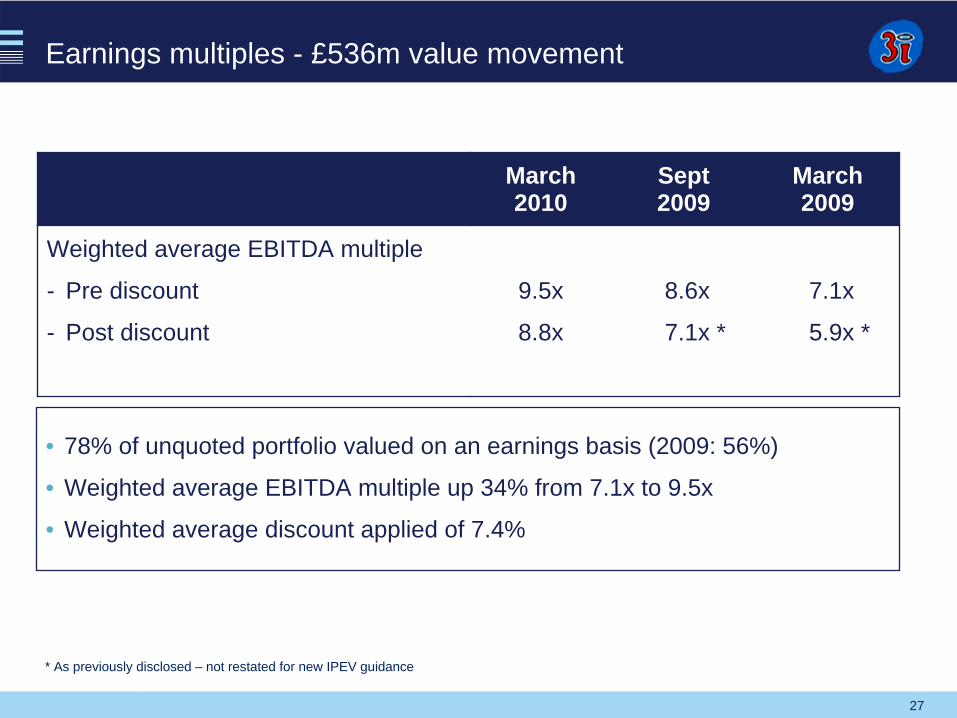
Earnings multiples - £536m value movement
• 78% of unquoted portfolio valued on an earnings basis (2009: 56%)
• Weighted average EBITDA multiple up 34% from 7.1x to 9.5x
• Weighted average discount applied of 7.4%
March 2010
Sept 2009
March 2009
Weighted average EBITDA multiple
- Pre discount
- Post discount
9.5x
8.8x
8.6x
7.1x *
7.1x
5.9x *
* As previously disclosed – not restated for new IPEV guidance
28
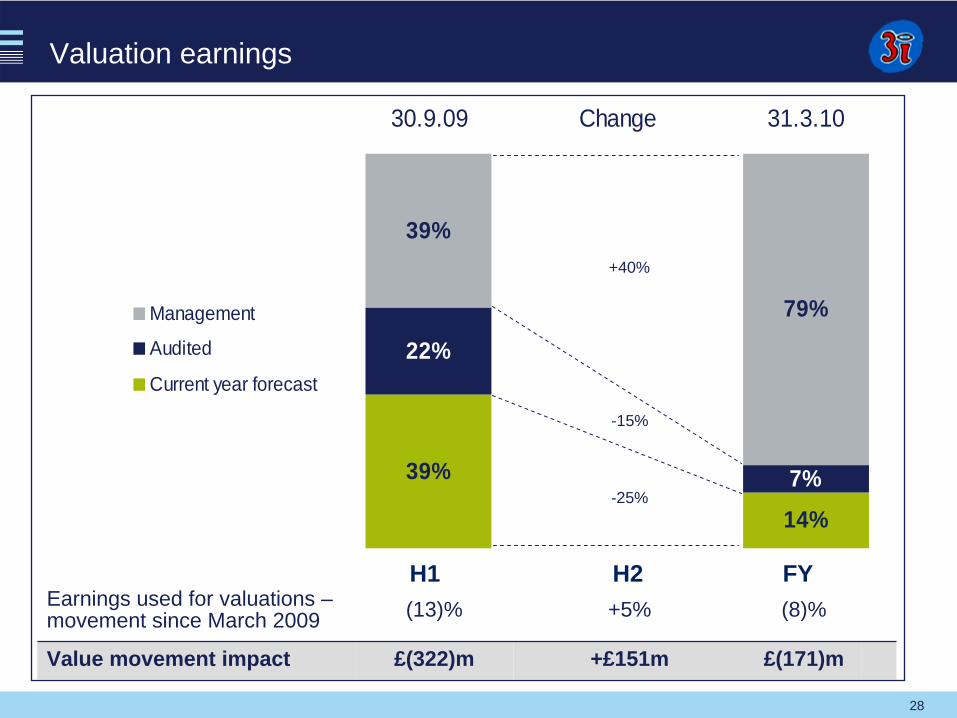
Valuation earnings
14%
39%
22%
7%
39%
79%
30.9.09 Change 31.3.10
Management
Audited
Current year forecast
Earnings used for valuations – movement since March 2009 (13)% +5% (8)%
Value movement impact £(322)m +£151m £(171)m
-25%
+40%
-15%
H1 FYH2
29
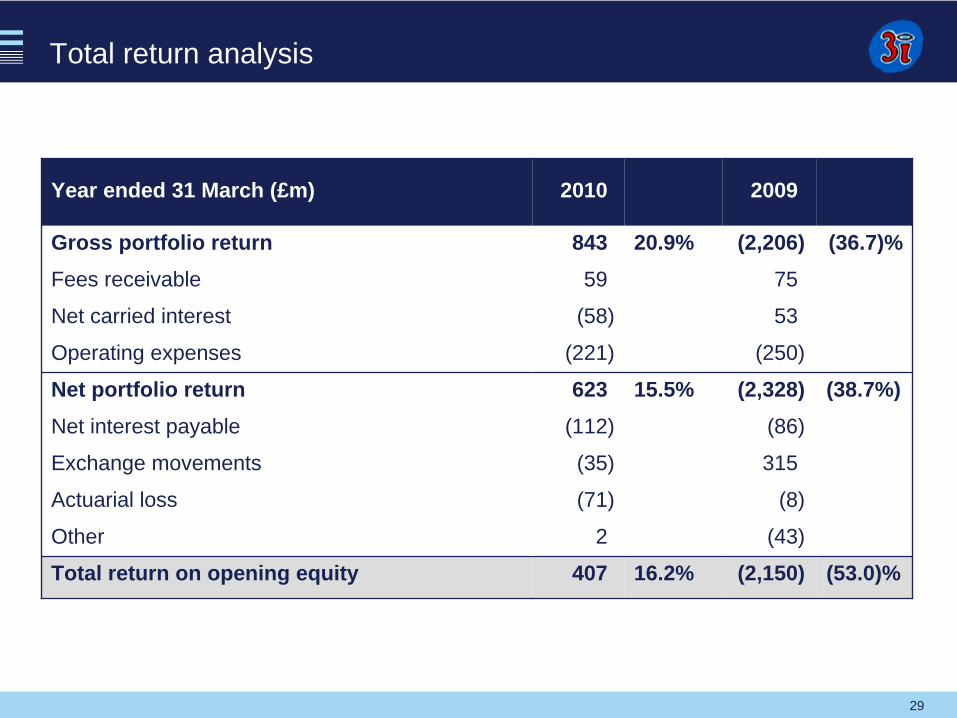
Total return analysis
Year ended 31 March (£m) 2010 2009
Gross portfolio return 843 20.9% (2,206) (36.7)%Fees receivable 59 75
Net carried interest (58) 53
Operating expenses (221) (250)
Net portfolio return 623 15.5% (2,328) (38.7%)Net interest payable (112) (86)
Exchange movements (35) 315
Actuarial loss (71) (8)
Other 2 (43)
Total return on opening equity 407 16.2% (2,150) (53.0)%
30
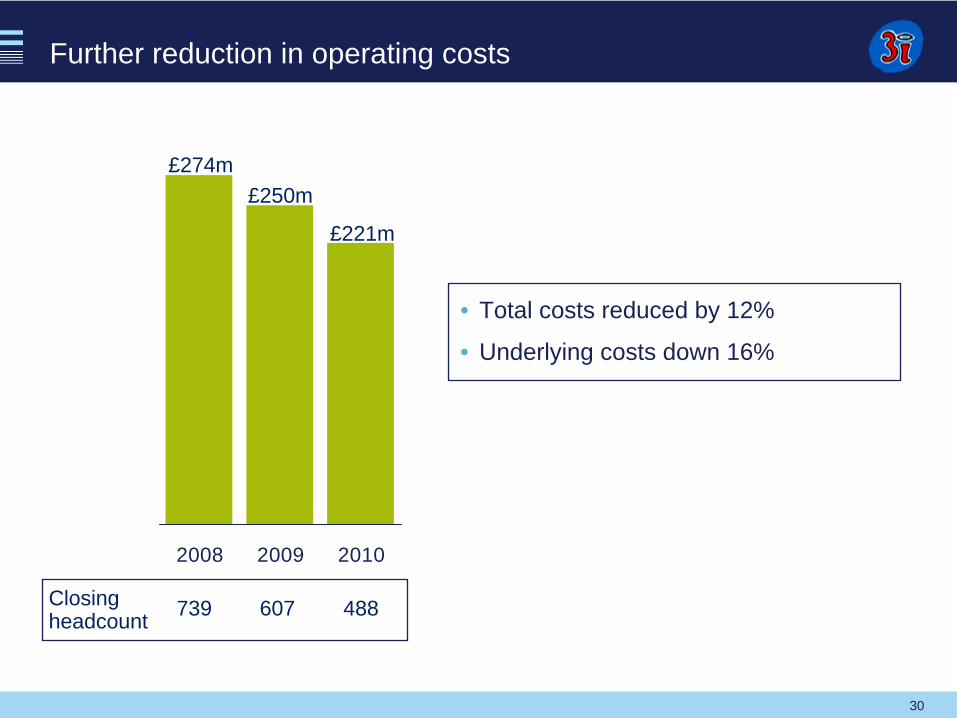
Further reduction in operating costs
2008 2009 2010
£250m
488
• Total costs reduced by 12%
• Underlying costs down 16%
£221m
607739Closing headcount
£274m
31
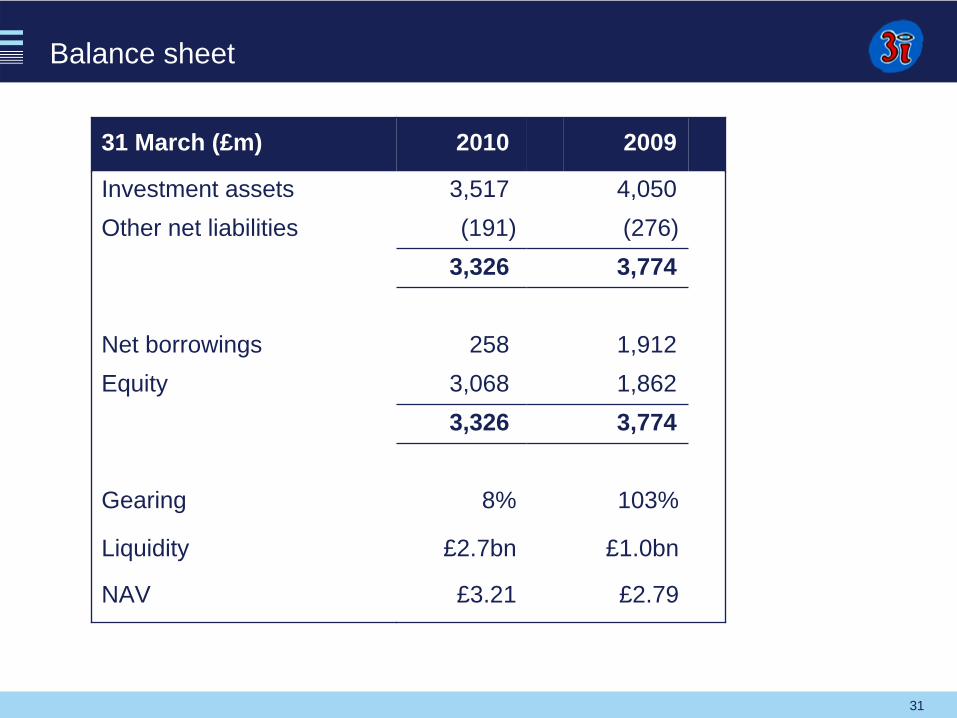
Balance sheet
31 March (£m) 2010 2009
Investment assets 3,517 4,050Other net liabilities (191) (276)
3,326 3,774
Net borrowings 258 1,912Equity 3,068 1,862
3,326 3,774
Gearing 8% 103%
Liquidity £2.7bn £1.0bn
NAV £3.21 £2.79
32
Michael QueenChief Executive
32
33
Key themes
Improved performance
Transformed financial position
Focused business model with a platform for growth
34
Looking forward – our priorities
Invest
Grow our business
Grow our reputation
One 3i
35
36
Appendix
36
37
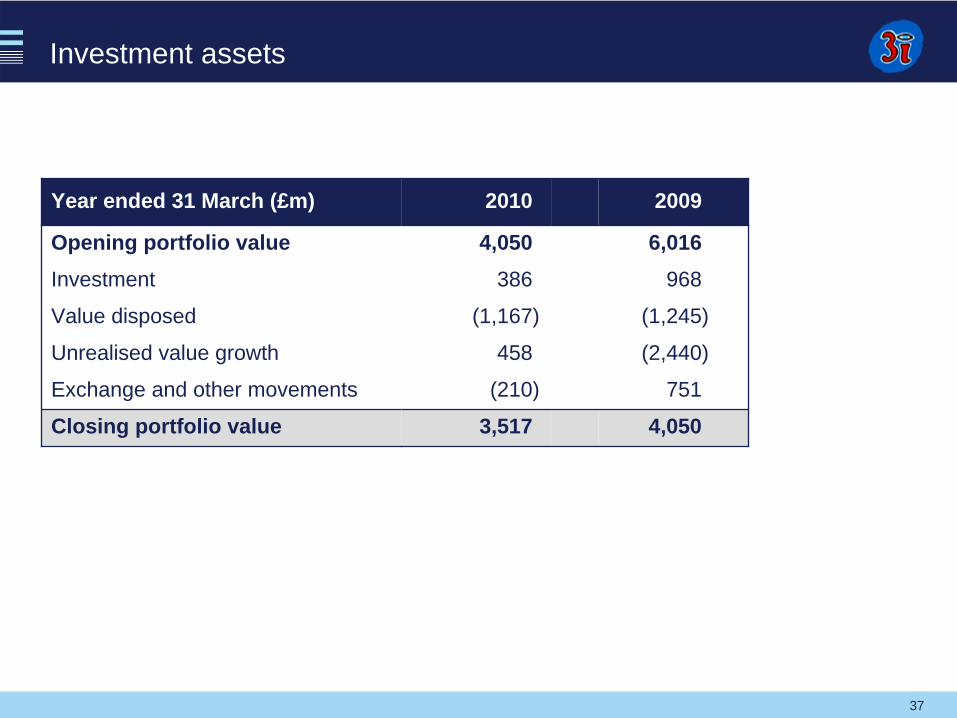
Investment assets
Year ended 31 March (£m) 2010 2009
Opening portfolio value 4,050 6,016Investment 386 968
Value disposed (1,167) (1,245)
Unrealised value growth 458 (2,440)
Exchange and other movements (210) 751
Closing portfolio value 3,517 4,050
38
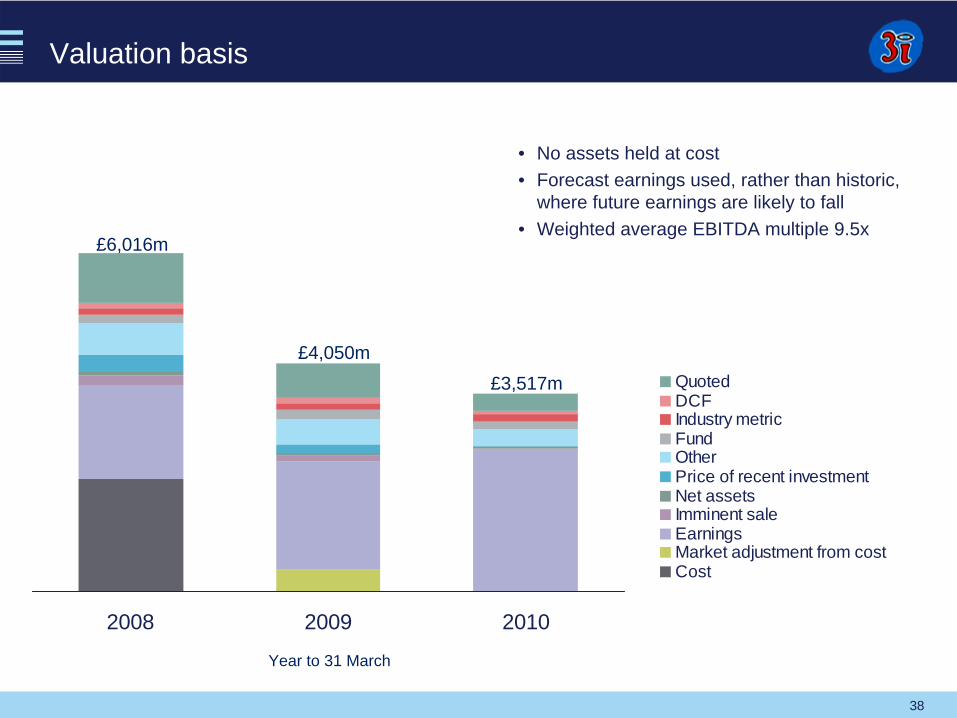
Valuation basis
2008 2009 2010
QuotedDCFIndustry metricFundOtherPrice of recent investmentNet assets Imminent saleEarningsMarket adjustment from costCost
Year to 31 March
£6,016m
£4,050m
• No assets held at cost• Forecast earnings used, rather than historic,
where future earnings are likely to fall• Weighted average EBITDA multiple 9.5x
£3,517m
39
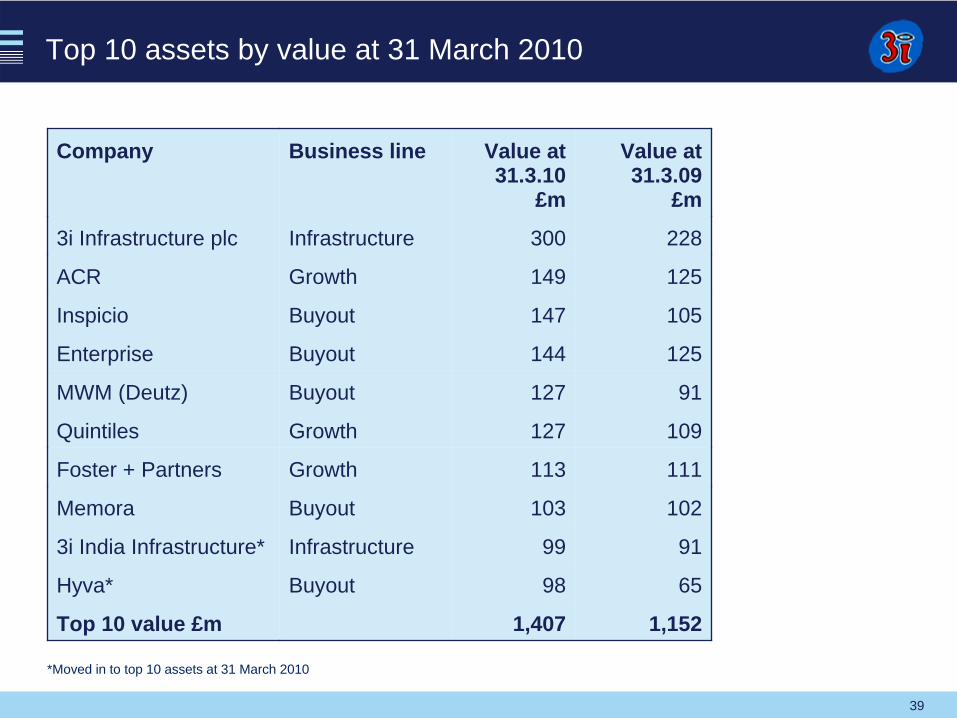
Top 10 assets by value at 31 March 2010
Company Business line Value at 31.3.10
£m
Value at 31.3.09
£m
3i Infrastructure plc Infrastructure 300 228
ACR Growth 149 125
Inspicio Buyout 147 105
Enterprise Buyout 144 125
MWM (Deutz) Buyout 127 91
Quintiles Growth 127 109
Foster + Partners Growth 113 111
Memora Buyout 103 102
3i India Infrastructure* Infrastructure 99 91
Hyva* Buyout 98 65
Top 10 value £m 1,407 1,152
*Moved in to top 10 assets at 31 March 2010
40
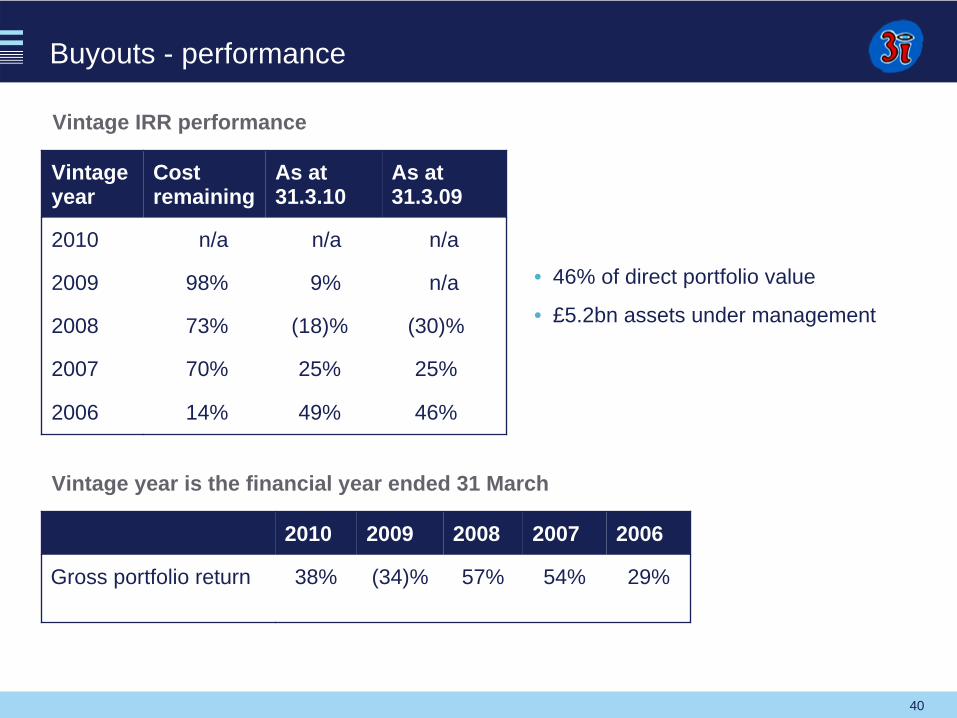
Vintage IRR performance
Vintage year is the financial year ended 31 March
• 46% of direct portfolio value
• £5.2bn assets under management
Buyouts - performance
Vintage year
Cost remaining
As at 31.3.10
As at 31.3.09
2010 n/a n/a n/a
2009 98% 9% n/a
2008 73% (18)% (30)%
2007 70% 25% 25%
2006 14% 49% 46%
2010 2009 2008 2007 2006
Gross portfolio return 38% (34)% 57% 54% 29%
41
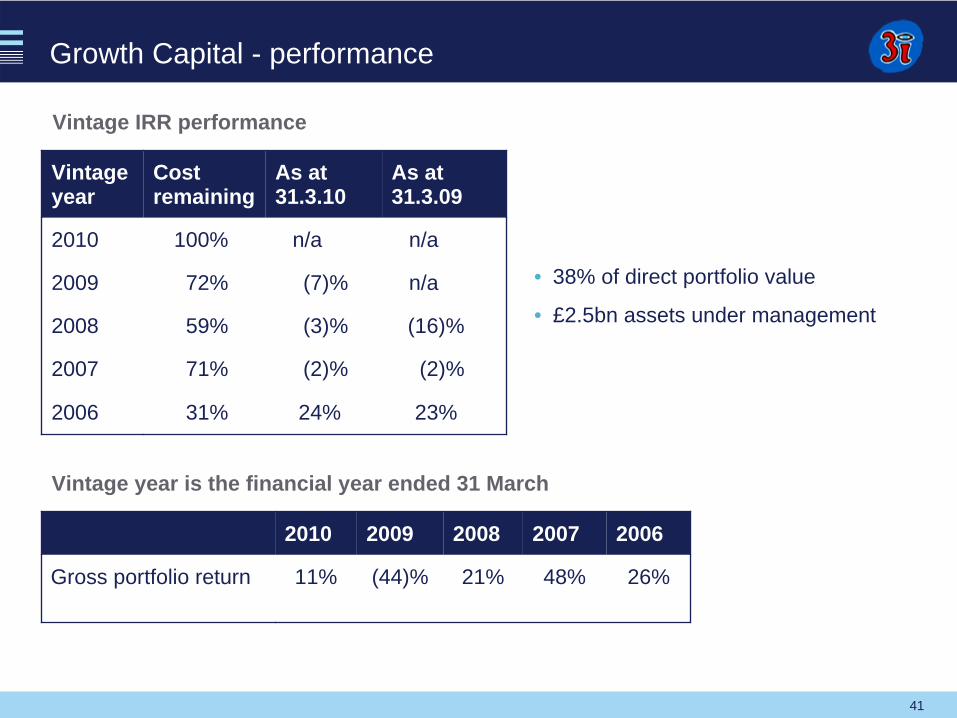
Vintage IRR performance
Vintage year is the financial year ended 31 March
• 38% of direct portfolio value
• £2.5bn assets under management
Growth Capital - performance
Vintage year
Cost remaining
As at 31.3.10
As at 31.3.09
2010 100% n/a n/a
2009 72% (7)% n/a
2008 59% (3)% (16)%
2007 71% (2)% (2)%
2006 31% 24% 23%
2010 2009 2008 2007 2006
Gross portfolio return 11% (44)% 21% 48% 26%
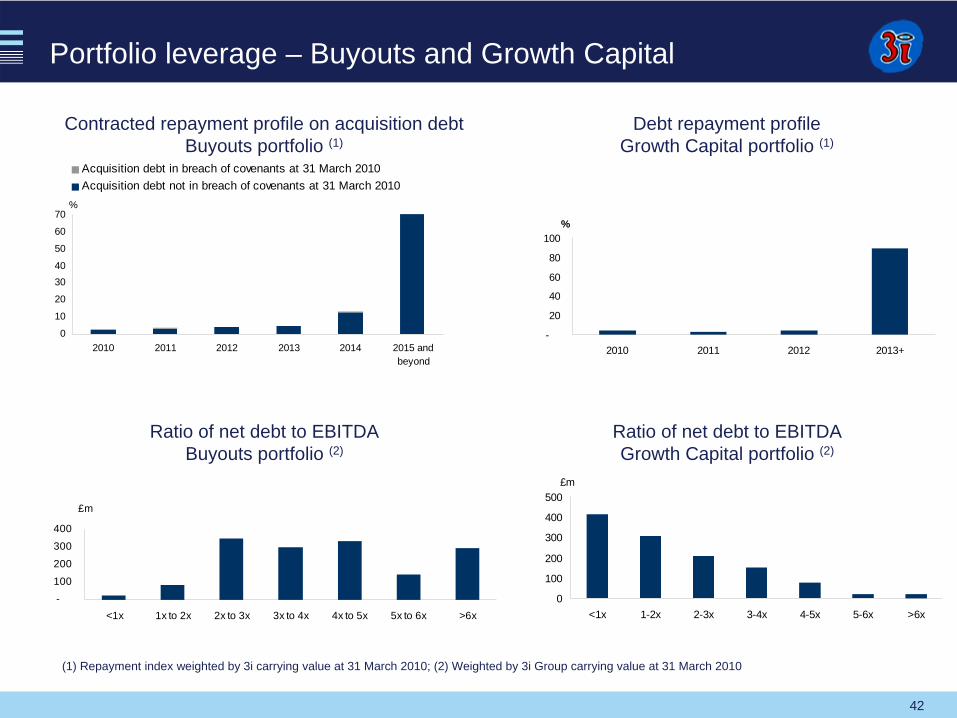
42
0
10
20
3040
50
60
70
2010 2011 2012 2013 2014 2015 andbeyond
%
Acquisition debt in breach of covenants at 31 March 2010Acquisition debt not in breach of covenants at 31 March 2010
-
100
200
300
400
<1x 1x to 2x 2x to 3x 3x to 4x 4x to 5x 5x to 6x >6x
£m
Portfolio leverage – Buyouts and Growth Capital
-
20
40
60
80
100
2010 2011 2012 2013+
%
Debt repayment profile Growth Capital portfolio (1)
(1) Repayment index weighted by 3i carrying value at 31 March 2010; (2) Weighted by 3i Group carrying value at 31 March 2010
Contracted repayment profile on acquisition debt Buyouts portfolio (1)
0
100
200
300
400
500
<1x 1-2x 2-3x 3-4x 4-5x 5-6x >6x
£m
Ratio of net debt to EBITDA Growth Capital portfolio (2)
Ratio of net debt to EBITDA Buyouts portfolio (2)
43
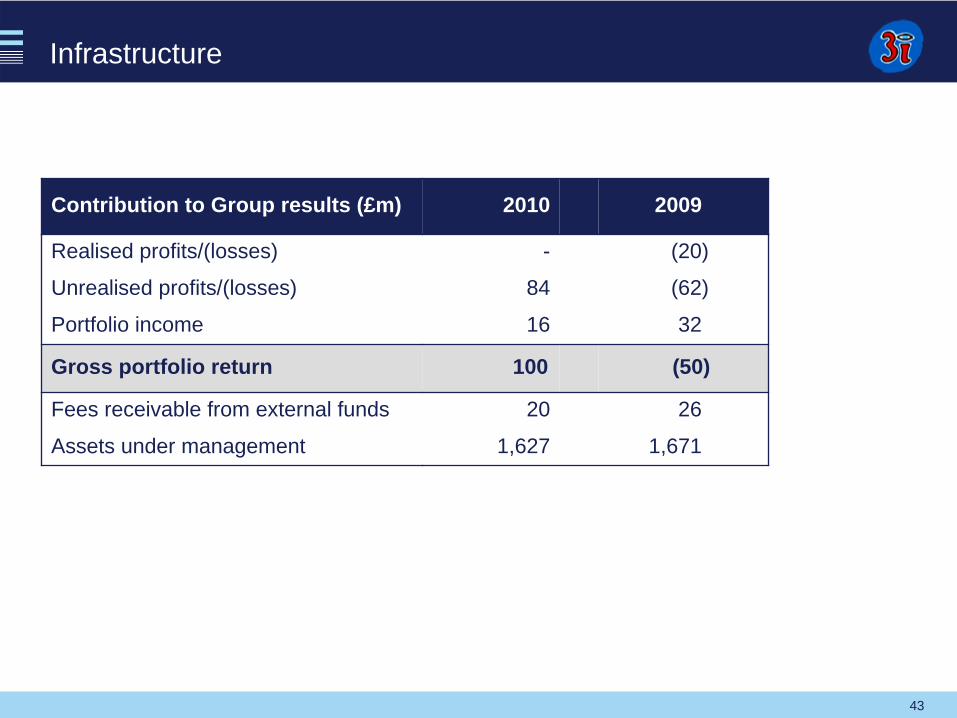
Infrastructure
Contribution to Group results (£m) 2010 2009
Realised profits/(losses) - (20)
Unrealised profits/(losses) 84 (62)
Portfolio income 16 32
Gross portfolio return 100 (50)
Fees receivable from external funds 20 26
Assets under management 1,627 1,671
44
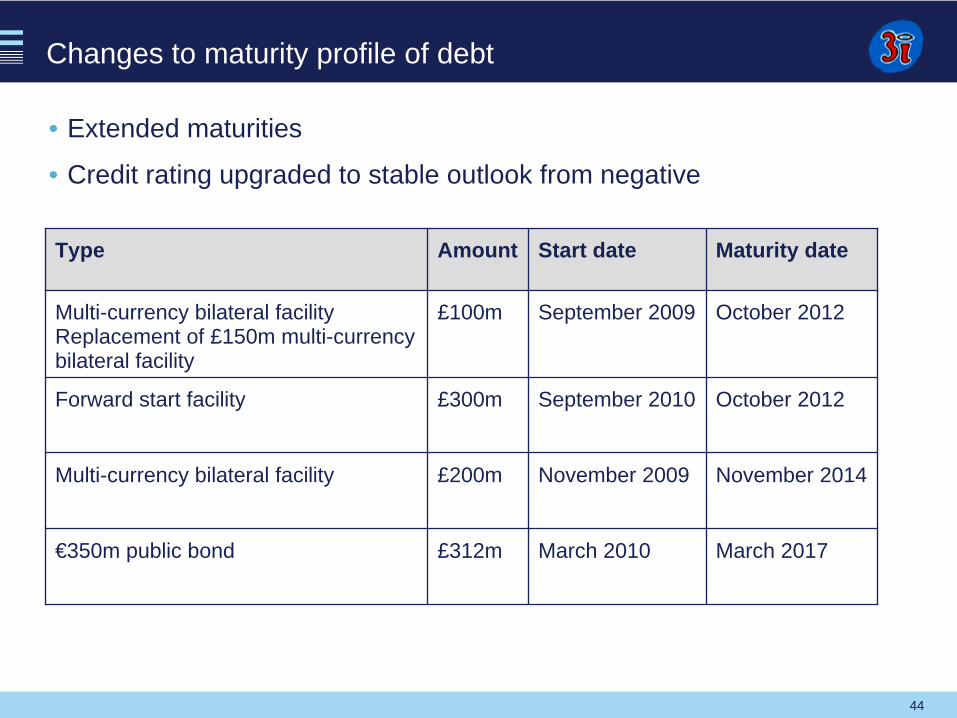
Changes to maturity profile of debt
Type Amount Start date Maturity date
Multi-currency bilateral facility Replacement of £150m multi-currency bilateral facility
£100m September 2009 October 2012
Forward start facility £300m September 2010 October 2012
Multi-currency bilateral facility £200m November 2009 November 2014
€350m public bond £312m March 2010 March 2017
• Extended maturities
• Credit rating upgraded to stable outlook from negative