Embed Size (px)
Citation preview

Annual ResultsFY 2009
Depa United GroupDubai UAEDubai, UAE
DISCLAIMER
This material contains certain statements that are “forward-looking” including management’s expectations and analysis These statements are based onmanagement s expectations and analysis. These statements are based on management’s current expectations and are naturally subject to uncertainty and changes in circumstances. Actual results may vary materially from the expectations contained herein and readers and listeners are cautioned not to place undue reliance on any forward-looking comments. Depa Ltd undertakes no obligation toreliance on any forward looking comments. Depa Ltd undertakes no obligation to update or alter its forward-looking statements, whether as a result of new information, future events, or otherwise.
1

CONTENTS
2009 Performance
Backlog
Financials, Risk Management and Investments
Nasdaq Dubai and DFM Merger
2010 and Beyond
2

2009 SUMMARYTop and bottom line growth reinforce the company’s strength and meet expectations
2,689 +36%
RevenuesRevenue
Grew in line with market expectations and guidance.
1,420 1,972 Full year revenue growth of over 36% vs. FY 2008.
Revenues increased to AED 2.69 billion (vs. 2008: AED 1.97 billion).
AED MillionFY 07 FY 08 FY 09
Net Profit
+23%
Net Profit
23% Net Profit growth before provisions and contingencies.
Recognized growth of 23% after provisions and contingencies.
Net profit reached AED 234.0 million (vs. 2008: AED 195 million) after expenses.161 195
234 +23%
Backlog
AED MillionFY 07 FY 08 FY 09
Year End BacklogBacklog
Year end contracted backlog stood at AED 2.1 billion (vs. 2008: AED 2.7 billion).
Backlog consists only of contracts/projects that the company has signed and is currently on site.
1,619
2,700 2,100
Year End Backlog
3
on site.
AED MillionFY 07 FY 08 FY 09
Unaudited financials, * Includes Impairments yet to be determined
CONTENTS
2009 Performance
Backlog
Financials, Risk Management and Investments
Nasdaq Dubai and DFM Merger
2010 and Beyond
4

BACKLOG – KEY PROJECT LISTBacklog includes iconic projects such as the Ferrari Theme Park and the Metro Green Line
All projects are in the advanced stage ofconstruction .
Depa continues to have healthy contractedbacklog which stood at AED 2.1 billion.
B kl i t f 202 j t hBacklog consists of 202 projects where we arealready working on site and does not includeprojects where we have yet to begin interior works.
N li t j t t f th 11% fNo client or project accounts for more than 11% ofbacklog as an annual expectation of backlogcompletion.
Key projects represent 90% of our backlog valueand are worth AED 1.9 billion.
The remaining 10% of backlog consists of 165g gprojects with an average value of AED 1.2 millionper project.
5

BACKLOG – GEOGRAPHICAL DISTRIBUTIONThe total remaining value of contracts where Depa is currently on site
E ti t d B klBahrain
Q t
AED 100 - 150 M
>AED 150 M
<AED 100 M
Estimated BacklogQatar
Singapore
EUROPE & AFRICA GCC & LEVANT ASIA
Mazagan VillasMorocco
Ferrari ExperienceAbu Dhabi
Sentosa Island Resort, Singapore
Intercon 22Mövenpick S Saadiyat Island Development
On-going /Recent Projects
El Nile KempinskiCairo Egypt
Mazagan Resort Morocco
Talatona Conv.Luanda, Angola
ArcapitaBahrain
Defence & Aviation, S.A.
Conrad HotelDubai
Al Wahda Sports City, Abu Dhabi
Dubai Metro Green Line
Leela KempinskiGrugoan, India
Louis VuittonNew Delhi, India
Marina Bay Sands Singapore
VIP Suites MBSSingapore
Meritus Mandarin Singapore
Mövenpick (3 new hotels in pipeline) El Ad Group South Beach Hotel
6
Intercon – 22 new hotels plannedCarlson Hotel–50 hotels in pipeline
Mövenpick S. Arabia – 4 new hotelsHilton – 13 new hotels in S. Arabia
Saadiyat Island DevelopmentAbu Dhabi Airport ExtentsionMarriott plans 17 new propertiesCleveland Clinic Abu DhabiTaj Exotica & Resort – DubaiDubai World Central Airport
PotentialPipeline
Mövenpick (3 new hotels in pipeline) in EgyptMövenpick , Tripoli, LibyaInterContinental - Resort which includes Holiday Inn Tripoli (2011)
El Ad Group – South Beach Hotel Singapore (2010)Accor Group – 8 new hotels in ThailandIntercon, Crowne Plaza & Holiday Inn – 9 hotels in Vietnam
Various news releases
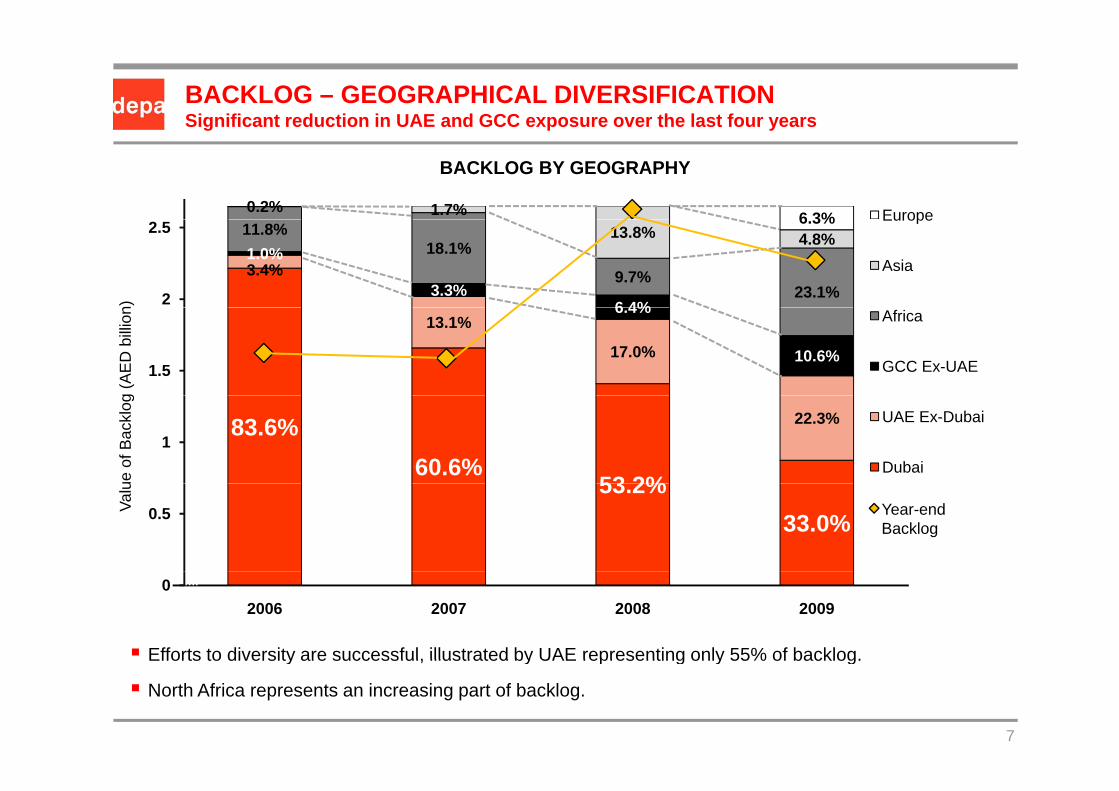
BACKLOG – GEOGRAPHICAL DIVERSIFICATIONSignificant reduction in UAE and GCC exposure over the last four years
0.2% 1.7% 6 3% Europe
BACKLOG BY GEOGRAPHY
3.4%1.0%
3.3%6 4%
11.8%18.1%
9.7%23.1%
13.8% 4.8%6.3% Europe
Asia
2
2.5
n)
13.1%
17.0%
6.4%
10.6%
Africa
GCC Ex-UAE1.5
g (A
ED b
illion
83.6%60.6%
53 2%
22.3% UAE Ex-Dubai
Dubai1
ue o
f Bac
klog
53.2%33.0%0.5Va
lu
Year-end Backlog
2006 2007 2008 2009
Efforts to diversity are successful, illustrated by UAE representing only 55% of backlog.
0
7
Efforts to diversity are successful, illustrated by UAE representing only 55% of backlog.
North Africa represents an increasing part of backlog.

BACKLOG – SECTOR DIVERSIFICATIONThe backlog is diversified across many market segments
BACKLOG BY SECTOR
Other(Joinery Work & small
projects)11 0%Theming
Yacht1.4%
Other(Joinery Work & small
projects)7%
FY 2009FY 2008
Theming
Yacht7.5%
11.0%
Shops, Malls & Offices
5.2%
Theming1.3%
7%
Hospitality56.6%Shops, Malls &
Offices1.7%
g6.2%
Hospitality63 4%
Infrastructure14.8%
Residential
Infrastructure15.5%
63.4%Residential
7.2%
1.5%
8

COUNTER CYCLICAL – REFURBISHMENTRefurbishment is a counter-cyclical part of the hospitality industry
Refurbishment work in the region has picked up over the last 12 months.
R f bi h t j t t li l i h t l t i l
Completed Refurbishment Projects by Depa
Al Bustan Rotana, Dubai – 1997Refurbishment projects are counter-cyclical since hotels typical renovate when occupancy rates and chargeable rates per room drop.
In the past, we have worked on numerous refurbishment
Hyatt Regency Madeleine, Paris – 1997
Intercontinental, Amman – 1998
Hotel Kamp, Helsinki – 1999projects and given the current economic conditions, we expect to continue our growth in this sector as the market segment booms.
Sheraton, Bahrain – 2000
Ledra Marriott, Athens – 2001
Renaissance, Dubai – 2001Ledra Marriott, Athens Renaissance Hotel, Dubai Al Bustan Rotana, Dubai ,
Sheraton Hotel & Resorts, Abu Dhabi – 2003
Sheraton Al Montazah, Alexandria – 2003
Hyatt Regency Casablanca – 2005
By purely focusing on refurbishment needs of our past and current projects, we can potentially generate refurbishment
Hyatt Regency, Casablanca 2005
Meritus Mandarin, Singapore – 2009
Kempinski Hotel, Egypt – 2009p j , p y g
work worth AED 622 million annually for the period 2010-2018*.
Most of potential refurbishment work for the period 2010-2018 comes from UAE market followed by Egypt, Qatar and
9
comes from UAE market followed by Egypt, Qatar and Morocco.
* Shuaa Capital
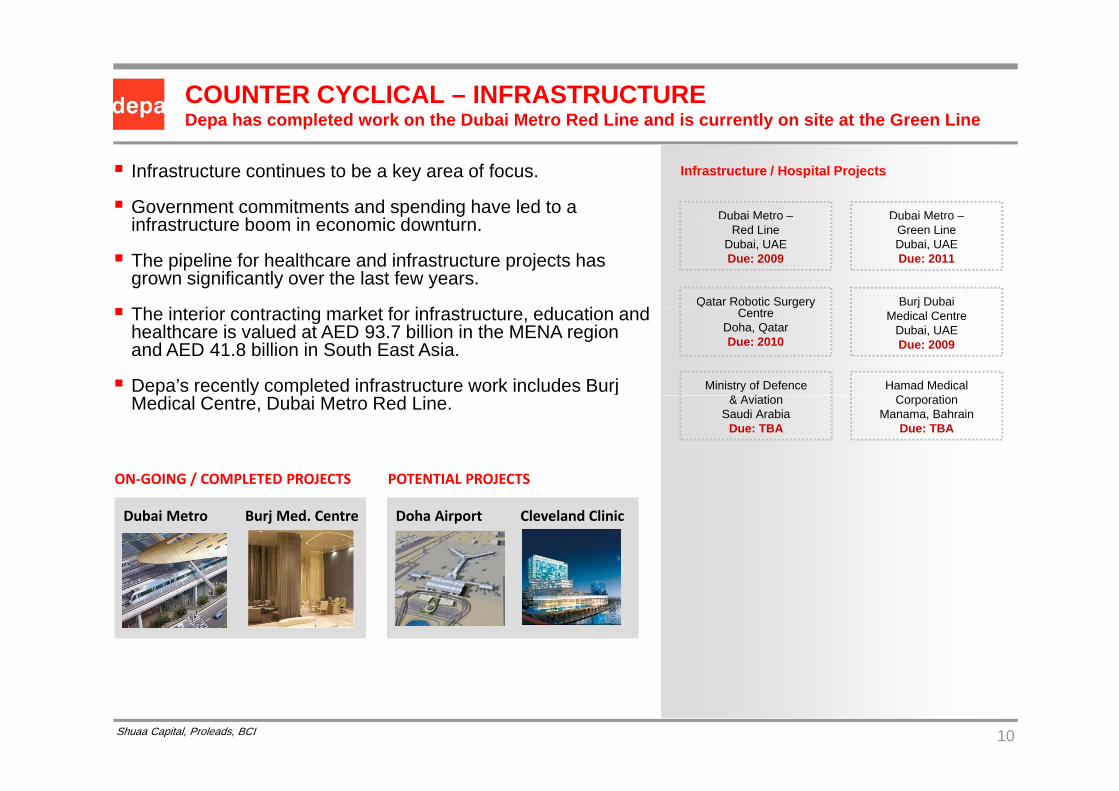
COUNTER CYCLICAL – INFRASTRUCTUREDepa has completed work on the Dubai Metro Red Line and is currently on site at the Green Line
Infrastructure continues to be a key area of focus.
Government commitments and spending have led to a i f t t b i i d t
Infrastructure / Hospital Projects
Dubai Metro – Dubai Metro –infrastructure boom in economic downturn.
The pipeline for healthcare and infrastructure projects has grown significantly over the last few years.
Th i t i t ti k t f i f t t d ti dQatar Robotic Surgery Burj Dubai
uba et oRed Line
Dubai, UAEDue: 2009
uba et oGreen LineDubai, UAEDue: 2011
The interior contracting market for infrastructure, education and healthcare is valued at AED 93.7 billion in the MENA region and AED 41.8 billion in South East Asia.
Depa’s recently completed infrastructure work includes Burj
g yCentre
Doha, QatarDue: 2010
jMedical Centre
Dubai, UAEDue: 2009
Hamad MedicalC ti
Ministry of Defence& A i ti
y jMedical Centre, Dubai Metro Red Line.
ON‐GOING / COMPLETED PROJECTS POTENTIAL PROJECTS
CorporationManama, Bahrain
Due: TBA
& AviationSaudi Arabia
Due: TBA
ON GOING / COMPLETED PROJECTS
Dubai Metro Burj Med. Centre Doha Airport Cleveland Clinic
POTENTIAL PROJECTS
10Shuaa Capital, Proleads, BCI

CONTENTS
2009 Performance
Backlog
Financials, Risk Management and Investments
Nasdaq Dubai and DFM Merger
2010 and Beyond
11
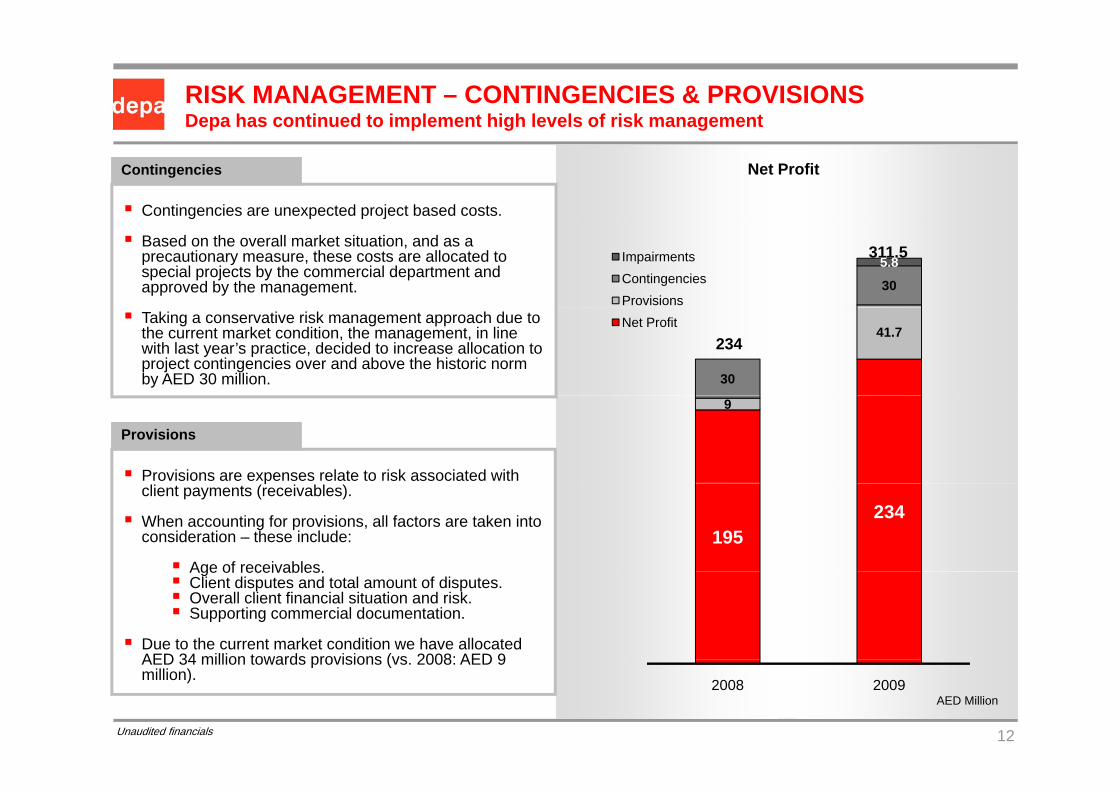
RISK MANAGEMENT – CONTINGENCIES & PROVISIONSDepa has continued to implement high levels of risk management
Contingencies
Contingencies are unexpected project based costs.
Net Profit
Based on the overall market situation, and as a precautionary measure, these costs are allocated to special projects by the commercial department and approved by the management. 30
5.8ImpairmentsContingenciesProvisions
311.5
Taking a conservative risk management approach due to the current market condition, the management, in line with last year’s practice, decided to increase allocation to project contingencies over and above the historic norm by AED 30 million.
41.7
30
Net Profit
234
Provisions
Provisions are expenses relate to risk associated with
9
pclient payments (receivables).
When accounting for provisions, all factors are taken into consideration – these include:
Age of receivables.
195234
Age of receivables.Client disputes and total amount of disputes.Overall client financial situation and risk.Supporting commercial documentation.
Due to the current market condition we have allocated AED 34 million towards provisions (vs 2008: AED 9
12
AED 34 million towards provisions (vs. 2008: AED 9 million).
2008 2009AED Million
Unaudited financials

SELECTED INCOME STATEMENT FIGURES
AED M’s Actual DUG2007
Actual2008
Actual2009
Revenue 1,420 1,972 2,689
Revenue Growth 35.5% 38.9% 36.3%
Contract Profit 281 389 430
Contract Profit Margin 19.8% 19.7% 16.0%
G&A 116 192 192
G&A M i 8 2% 9 7% 7 1%G&A Margin 8.2% 9.7% 7.1%
Amortization & Impairment loss 18 8 32
% Turnover 1.2% 0.4% 1.2%
Profit from Associates 8 17 23
Net Profit before MI 181 225 284
Net Profit Margin (Before MI) 12 7% 11 4% 10 6%Net Profit Margin (Before MI) 12.7% 11.4% 10.6%
Net Profit (After MI) 161 195 234
Net Profit Growth (After MI) 72.2% 21.1% 20.3%
Net Profit Margin (After MI) 11.3% 9.9% 8.7%
13

SELECTED BALANCE SHEET FIGURES
AED M’s Actual DUG2007
Actual 2008
Actual2009
Cash in Hand 69 739 543
Unbilled Revenue Balance 437 862 910
Total Current Assets 1 127 2 350 2 272Total Current Assets 1,127 2,350 2,272
Total Assets 1,872 3,295 3,372
Total Current Liabilities 997 1,265 1,261
Total Liabilities 1,152 1,477 1,398
Total Bank Debt 399 395 220
Total Equity 720 1,818 1,974
W ki C it l 130 1 085 1 011Working Capital 130 1,085 1,011
Liquidity Ratio 1.1 1.9 1.8
Total Debt to Equity Ratio 1 6 0 8 0 7Total Debt to Equity Ratio 1.6 0.8 0.7
14

SELECTED CASH FLOW FIGURES
AED M’s Actual DUG2007
Actual2008
Actual2009
N t C h ( d i )/ t d f ti ( )Net Cash (used in )/generated from operating activities
(43) 47 100
Net Cash used in investing activities* Includes short term deposits of AED 117.3 Million as a new IS accounting requirement
(120) (254) (132)*
IS accounting requirement.
Net Cash (used in) / generated from financing activities **Includes Issuance of share capital AED 953M
*** Includes shares acquired and cancelled of AED (36) Million
184 946** (281)***
q ( )*** Includes Dividends paid ,net of AED (68.3 )million
AR days (including unbilled revenue) 159 days 176 days 171days
AR days (excluding unbilled revenue) 61 days 56 days 51 days
AP days 80 days 79 days 54 days
CAPEX 71 156 32
Acquisitions & Investments (net of cash) 64 23 28
15
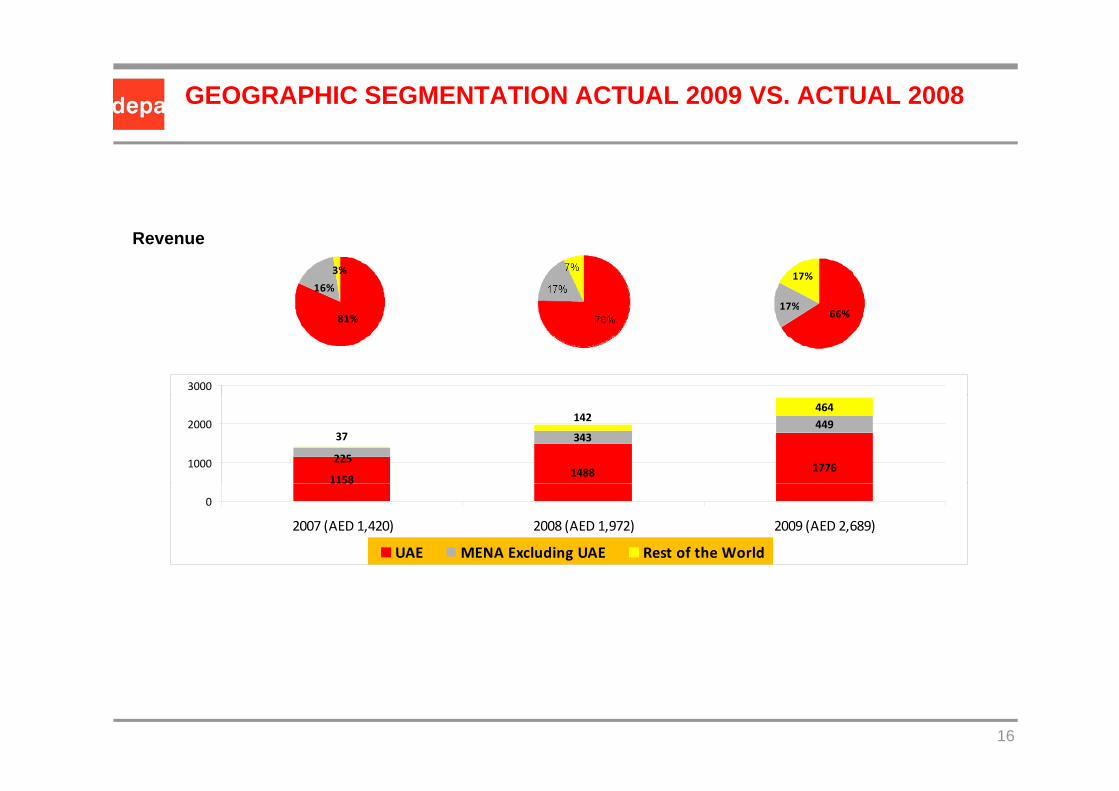
GEOGRAPHIC SEGMENTATION ACTUAL 2009 VS. ACTUAL 2008
16%
3% 17%
17%
Revenue
81%17%
66%
3000
11581488 1776
343449464
225
37
142
1000
2000
1158
0
2007 (AED 1,420) 2008 (AED 1,972) 2009 (AED 2,689)
UAE MENA Excluding UAE Rest of the World
16

ACTIVITY SEGMENTATION ACTUAL 2009 VS. ACTUAL 2008
2% 1%
Revenue
3%
83%
15% 13%
86%
18%
79%
1176 15612308214
359346
3052
35
1000
2000
3000
1176 15610
2007 (AED 1,420) 2008 (AED 1,972) 2009 (AED 2,689)
Procurement Manufacturing Contracting
17

COMPLETED ACQUISITIONS & JOINT VENTURESFrom Q4-2007 to Q1-2010
AED Million
450
AED Million
AcquisitionsJoint Ventures
18
27
Jwico
Decolight
~450 companies identified
~80 1
11
64
Paragon Creative
Design Studio (round#1)
Parker
~80companies contacted
+ high-level analysis 5
28
7
Lindner Depa
Jwico Capital Increase
DDS
g
~28companies deep-level analysis 15
1
37
5
Design Studio (round#2)
Depa Jordan JV
Futtaim Fund
Lindner Depa
analysis& negotiations
13 companies 3
30
53
15
Polypod
Thrislington
Vedder
Design Studio (round#2)
13 companies 17 transactions
2 3% highly 41
15
1
3
Carrara
Design Studio (round#3)
Parker Asia
Polypod
18
2-3% highly selective rate
35654
41
308Total
Carrara

CONTENTS
2009 Performance
Backlog
Financials, Risk Management and Investments
Nasdaq Dubai and DFM Merger
2010 and Beyond
19

NASDAQ DUBAI AND DFM MERGERMerger to increase liquidity and unify platforms
The merger of the DFM and the Nasdaq Dubai (ND) willhelp drive cost efficiency and improve liquidity.
DFM & Nasdaq Dubai Merger Depa Implications
Improved liquidity.
ND plans to outsource its Trading, Clearing, Settlementand Custody functions to DFM.
Issuers’ securities will continue to be listed on ND, buttraded on DFM’s operational platform.
Exposure to local market and investors.
Listing in local currency.
Outsourcing will increase liquidity for ND equities by:
Providing a seamless and familiar tradingexperience for brokers.
All i l l / i l i t t th i
Continue to be regulated by the DubaiFinancial Services Authority (DFSA),ensuring international standards ofcorporate governance.
Allowing local / regional investors to use theirInvestor Number accounts to trade and hold NDstock.
Providing one consolidated Statement of HoldingsReport showing stocks from both exchange.p g g
20Nasdaq Dubai

SHAREHOLDER STRUCTUREInstitutional Investors accounts for approx. 55 % of total shareholdings
Shareholder Composition Institutional Investors by Region
5.0% 0% 14%
35.%
4%
55.0%54%
28%
3.0%2.0%
Institutional InvestorsTrading, Lending and MiscellaneousRetail InvestorsCompany-Related HoldersUnidentified
Middle EastNorth AmericaContinental EuropeUK & IrelandNon-disclosures (minus retail, proprietary holdings & misc.)
21Source: Deutsche Bank

CONTENTS
2009 Performance
Backlog
Financials, Risk Management and Investments
Nasdaq Dubai and DFM Merger
2010 and Beyond
22

2010 AND BEYOND
We expect revenue and profit levels in 2010 to be similar to those of 2009.
In 2011 and 2012, we expect 20% growth annually (including acquisitions).
We continue to grow in new geographies and increase our market presence in Africa, Far East A i d I diAsia and India.
We see short term growth in Saudi Arabia and Qatar, medium term growth in South East and Central Asia, and long term growth in the African Continent.g g
Depa continues to win prestigious contracts due to its clear market leading position and unparallel experience in hotel fit out in the UAE and worldwide.
23