Embed Size (px)
Citation preview

THE a2 MILK COMPANY LIMITED
ANNUAL RESULTS26 AUGUST 2021

2
Disclaimer
This presentation dated 26 August 2021 provides additional comment on the Annual Report for the 12 months ended 30 June 2021 of The a2 Milk Company Limited (the “Company” or “a2MC”) and accompanying information released to the market on the same date. As such, it should be read in conjunction with the explanations and views in those documents.
This presentation is provided for general information purposes only. The information contained in this presentation is not intended to be relied upon as advice to investors and does not take into account the investment objectives, financial situation or needs of any particular investor. Investors should assess their own individual financial circumstances and consider talking to a financial adviser or consultant before making any investment decision.
This presentation is not a prospectus, investment statement or disclosure document, or an offer of shares for subscription, or sale, in any jurisdiction.
Certain statements in this presentation constitute forward looking statements. Such forward looking statements involve known and unknown risks, uncertainties, assumptions and other important factors, many of which are beyond the control of the Company and which may cause actual results, performance or achievements to differ materially from those expressed or implied by such statements.
While all reasonable care has been taken in relation to the preparation of this presentation, none of the Company, its subsidiaries, or their respective directors, officers, employees, contractors or agents accepts responsibility for any loss or damage resulting from the use of or reliance on this presentation by any person.
Past performance is not indicative of future performance and no guarantee of future returns is implied or given.
Some of the information in this presentation is based on unaudited financial data which may be subject to change.
All values are expressed in New Zealand currency unless otherwise stated.
All intellectual property, proprietary and other rights and interests in this presentation are owned by the Company.
20
21
A
NN
UA
L
RE
SU
LT
S

3
Results overview 4
Financial overview 7
Regional performance 11
Group updates 24
Outlook 31
Questions 33
Appendix 34
•A
GE
ND
A
3
20
21
A
NN
UA
L
RE
SU
LT
S

4
Challenging year impacted by COVID-19
• Unprecedented levels of uncertainty and volatility due to the prolonged
impact of COVID-19 and a rapidly changing China infant nutrition
market
• China market growth has reduced significantly from globally high rates
to be flat, and cross-border trade has been disrupted significantly which
has had a profound impact on the Company’s results
• Certain areas of the business performed well with market share gains
in China label infant nutrition and Australian fresh milk
• In response to the dramatic change in circumstances, significant
actions were taken from 4Q21 to address excess inventory issues,
rebuild the management team, increase brand investment and
commence a growth strategy review
• Confident in the underlying fundamentals of the business and that the
growth opportunity remains strong supported by a healthy brand and
strong balance sheet
• While the long-term outlook is positive, FY22 outlook remains
challenging and uncertain and it will take time to recover
20
21
A
NN
UA
L
RE
SU
LT
S

5
FY21 result overview and additional updates1
• Revenue and EBITDA2 margin was within the guidance range provided in May
‒ Revenue down 30.3% to $1.21b
‒ EBITDA down 77.6% to $123m including stock write-down and MVM acquisition costs
‒ EBITDA margin of 10.2% or 11.1% excluding MVM acquisition costs
• Net profit after tax down 79.1% to $80.7 million (including discontinued operations)
• Actions taken from 4Q21 to address excess inventory are proving effective
• Executive Leadership Team appointments and Asia Pacific division reorganisation to build
capability and provide a more dedicated management focus has been completed
• Brand health metrics overall remain strong with some improvements in recent tracking
research following a significant 4Q21 marketing campaign in China
• MVM acquisition and strategic partnership with China Animal Husbandry Group completed
• Growth strategy review underway to respond to rapidly changing China market dynamics
• The Board has carefully considered capital management initiatives and has decided not to
return capital to shareholders at this point in time
20
21
A
NN
UA
L
RE
SU
LT
S
1 All figures are in New Zealand Dollars (NZ$) and based on continuing operations of the Group, unless otherwise stated.2 Earnings before interest, tax, depreciation and amortisation (EBITDA) is a non-GAAP measure. However, the Company
believes that it assists in providing investors with a comprehensive understanding of the underlying performance of the
business. A reconciliation of EBITDA to net profit after tax is shown at the end of this document.

6
Actions taken from 4Q21 are improving channel inventory dynamics
a2MC inventory
• Inventory of $112.2 million at year-end, reflecting the impact of stock write-downs
• Improvement in age of stock being sold to customers (China label and English label)
Channel inventory (customers / distributors)
• China label: inventory approaching target levels with rebalancing to continue through 1Q22
• English label: inventory across CBEC and Daigou has improved and is now at targeted levels
Product freshness
• Exchanged stock with first tier customers / distributors has significantly improved
aging profile
• China label: in-store dating is improving as a result of the efforts to freshen stock in trade
• English label: aging profile of stock in trade has improved significantly and is starting to flow
through to consumers
Visible market pricing (CBEC / online platforms)
• Market pricing for English label product sold in CBEC platforms is improving
• However, aged stock is still being sold by certain wholesale traders and online platforms,
expected to clear in 1H22
20
21
A
NN
UA
L
RE
SU
LT
S

7
F I N A N C I A LO V E R V I E W
20
21
A
NN
UA
L
RE
SU
LT
S

8
Key financials
• Revenue impacted by unprecedented levels of uncertainty and volatility due to COVID-19, challenges experienced in the English label infant nutrition channels, and actions required in the second half to rebalance channel inventory
• Gross margin percentage of 42.3%3 reflects stock write-downs, higher COGS, adverse mix impact due to higher proportion of liquid milk, relative increase in China label infant nutrition sales and adverse foreign currency impact particularly in the second half. Excluding stock write-downs, the gross margin percentage is 51.3%
• Distribution costs higher due to increased warehousing costs, higher percentage of liquid milk sales and impact of COVID-19 which has increased shipping rates and USA freight
• Marketing investment in China and Australia broadly in-line with prior corresponding period; lower marketing investment in USA reflects the higher trade spend to support execution of new pricing strategy
• Employee costs reflect investment in capability, particularly in China, offset by a reduction in employee incentive benefits
• Admin & other reflects reduced professional services fees and a reduction in discretionary spend, offset by ERP implementation costs
• EBITDA further reduced by MVM acquisition costs
• NPAT also reflects a higher effective tax rate than FY20
20
21
A
NN
UA
L
RE
SU
LT
S
1 All figures quoted in New Zealand Dollars (NZ$) and all comparisons are with the 12 months ended 30 June 2020 (FY20)
unless otherwise stated. Numbers may not add down due to rounding. 2 EBITDA is a non-GAAP measure and represents earnings before interest, tax, depreciation and amortisation.3 Gross margin percentage is calculated by dividing gross margin by net revenue
NZ$ million (continuing operations)1 FY21 FY20 % change
Revenue 1,206.7 1,731.1 (30.3%)
Gross margin 509.7 968.6 (47.4%)
Distribution (45.2) (42.6) +6.1%
Marketing (168.7) (194.3) (13.2%)
Employee costs (62.3) (74.2) (16.0%)
Admin & other (99.7) (105.5) (5.5%)
EBITDA(2) (excl. MVM transaction costs) 133.8 552.0 (75.8%)
MVM transaction costs (10.4) - nm
EBITDA(2) 123.4 552.0 (77.6%)
EBIT 116.0 547.7 (78.8%)
Profit from continuing operations 80.7 388.2 (79.2%)
Loss from discontinued operation - (2.3) nm
NPAT 80.7 385.8 (79.1%)

9
Gross margin decreased to 42.3% largely driven by English-label disruption
• Stock write-down of $108.6m
• Higher cost of goods sold driven by an
increase in raw milk prices
• Higher proportion of liquid milk to
infant nutrition sales
• Relative increase in China label sales
as a proportion of overall infant
nutrition sales
• Adverse foreign currency movements,
particularly in 2H21
• Gross margin of 51.3% excluding
stock write-down
20
21
A
NN
UA
L
RE
SU
LT
S
FY21 gross margin drivers FY21 higher proportion of China-label infant nutritionFY21 higher proportion liquid milk
82% 82% 82%78%
73%
13% 13% 13% 18%22%
5% 5% 5% 4% 5%
Jun-19 Dec-19 Jun-20 Dec-20 Jun-21
Infant nutrition Liquid milk Other
6%12%
16%24%
39%
20%18%
22%23%
24%
18%
78% 76%66%
61%52%
43%
FY16 FY17 FY18 FY19 FY20 FY21
China label CBEC & other labels ANZ daigou/reseller, retail

10
Robust balance sheet, investment in strategic assets
• Closing cash balance of $875.2 million
• Improvement in working capital reflects reductions in inventory and prepayments, partially offset by reduced payables
• Investment in PPE & Intangibles includes $17.2m acquisition of Kyvalley milk processing facility and post acquisition capital expenditure
• Participation in Synlait Milk capital raising (Nov-20), to maintain shareholding of 19.8%
• Non-cash items includes a $25.8m increase in deferred tax, largely driven by the timing of deductions for stock write-down
• MVM acquisition funded from cash reserves post year end (Jul-21)
• Balance sheet strength provides capacity to invest in growth opportunities
20
21
A
NN
UA
L
RE
SU
LT
S
$854.2 $875.2
$80.7 $21.4
Group NPATCash on hand (Jun-20)
Investments in PPE & Intangibles
Working capital Depreciation, amortisation & other non-cash items
Investment in Synlait Financing activities & FX on cash holdings
Cash on hand(Jun-21)
($24.5)($39.8) ($12.7) ($4.1)
+$21.0

11
R E G I O N A LP E R F O R M A N C E
20
21
A
NN
UA
L
RE
SU
LT
S

12
China infant nutrition market structure is changing rapidly
• Overall infant nutrition market in China decreased in volume1 during
FY21 driven by a significant reduction in birth rates, particularly
impacting early stage products, partially offset by increased product
penetration
• Value growth was flat1 as the impact of premiumisation (which included
consumers trading-up and new product innovation) was partially offset
by increased promotional activity resulting from heightened competitive
intensity
• There is an overall mix shift from cross-border to domestic China
channels
• Local players continued to gain share against the traditional
multinational brands
• Rapidly evolving market dynamics re-iterates the importance of the
Company’s current growth strategy review
INFANT NUTRITION
20
21
A
NN
UA
L
RE
SU
LT
S
1 Kantar Worldpanel 0-6 years old Baby & Kids panel: National IMF market tracking (Key & A + BCD cities) for the 52 weeks ending 18 June 2021.

13
China label infant nutrition growth in FY21
Performance
• Sales of a2 至初® China label infant nutrition of $389.9 million, up 15.4%
• Reduced rate of growth in 2H21 reflective of substantial uplift in the prior
period due to COVID-19 related pantry stocking, reduced birth rates, and
increased competition from domestic brands
• Adverse foreign currency movements and some inventory rebalancing in 2H21
• MBS value share increased to 2.5%1 and DOL value value share increased to
2.0%2, as measured by Nielsen and Smartpath respectively
Key activities
• Increased investment behind in-store activation, promotional people, mama
classes, roadshows and point of sales materials
• Significant 4Q21 integrated marketing campaign
• Investment in China-based team to support growth and execution plans
INFANT NUTRITION – CHINA LABEL
20
21
A
NN
UA
L
RE
SU
LT
S
China-label revenue growth
NZ$ millions
4073
147
213
44
95
191
177
84
168
338
390
FY18 FY19 FY20 FY21
1H 2H
1 Nielsen MBS retail measurement service: mother and baby stores only retail sales (by value). FY21 versus FY20 and 2H21 versus 2H20.2 Smart Path China IMF online market tracking: domestic online platform sales (by value). FY21 versus FY20 and 2H21 versus 2H20.

14
Continuing to invest in our brand and engage with consumers in China
20
21
A
NN
UA
L
RE
SU
LT
S
INFANT NUTRITION – CHINA LABEL
Targeted advertising across
various digital channels
Investment in mama classes
and in-store promotional people
Roadshows and in-store activations to engage
and build brand connection with consumers

15
Continued investment in the brand driving increases in footprint and share in MBS
INFANT NUTRITION – CHINA LABEL
20
21
A
NN
UA
L
RE
SU
LT
S
Expanding store footprint Market share increasing
1.3%
1.7%
2.0%
2.4%2.5%
Jun-19 Dec-19 Jun-20 Dec-20 Jun-21
MBS value share (%)2
18.2
21.8
22.8
Jun-20 Dec-20 Jun-21
China distribution (store count ‘000)1
FY19 FY20 FY21
APAC Group
137 169195
APAC marketing a higher proportion of
overall group marketing spend
APAC and Group marketing ($mil)
1 Source: a2MC internal data tracking of stores with active sales in the past 6 months. Restated store numbers for December 2020 and June 2020
reflecting enhanced data capture and updated internal tracking methodology.2 Nielsen MBS retail measurement service: mother and baby stores only retail sales (by value). FY21 versus FY20 and 2H21 versus 2H20.
169
16
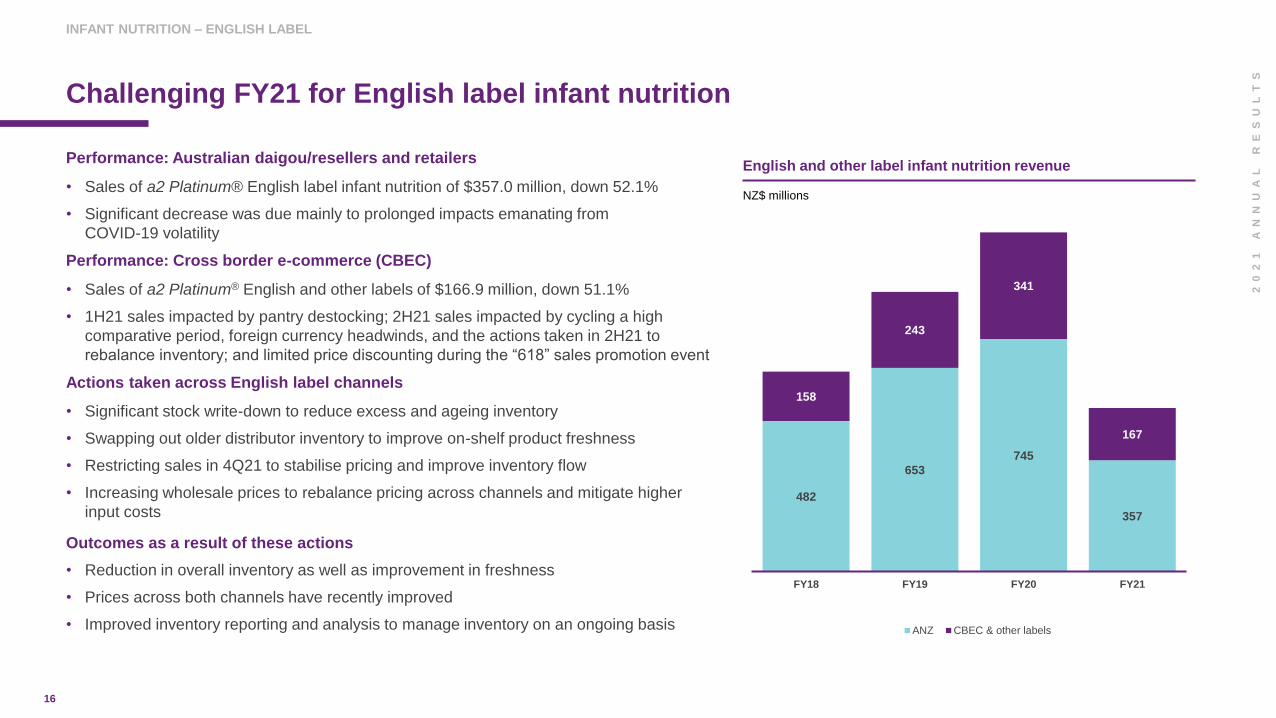
482
653
745
357
158
243
341
167
FY18 FY19 FY20 FY21
ANZ CBEC & other labels
Challenging FY21 for English label infant nutrition
Performance: Australian daigou/resellers and retailers
• Sales of a2 Platinum® English label infant nutrition of $357.0 million, down 52.1%
• Significant decrease was due mainly to prolonged impacts emanating from
COVID-19 volatility
Performance: Cross border e-commerce (CBEC)
• Sales of a2 Platinum® English and other labels of $166.9 million, down 51.1%
• 1H21 sales impacted by pantry destocking; 2H21 sales impacted by cycling a high
comparative period, foreign currency headwinds, and the actions taken in 2H21 to
rebalance inventory; and limited price discounting during the “618” sales promotion event
Actions taken across English label channels
• Significant stock write-down to reduce excess and ageing inventory
• Swapping out older distributor inventory to improve on-shelf product freshness
• Restricting sales in 4Q21 to stabilise pricing and improve inventory flow
• Increasing wholesale prices to rebalance pricing across channels and mitigate higher
input costs
Outcomes as a result of these actions
• Reduction in overall inventory as well as improvement in freshness
• Prices across both channels have recently improved
• Improved inventory reporting and analysis to manage inventory on an ongoing basis
INFANT NUTRITION – ENGLISH LABEL
20
21
A
NN
UA
L
RE
SU
LT
S
English and other label infant nutrition revenue
NZ$ millions
17
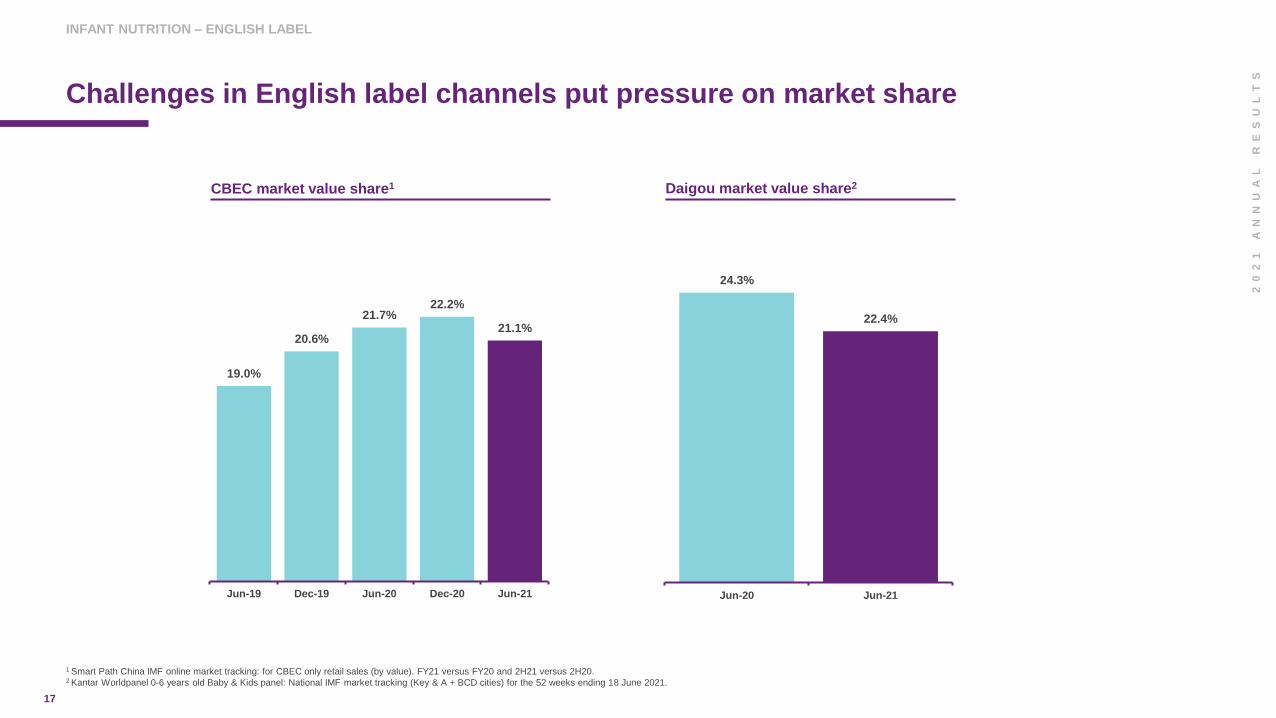
Challenges in English label channels put pressure on market share
INFANT NUTRITION – ENGLISH LABEL
1 Smart Path China IMF online market tracking: for CBEC only retail sales (by value). FY21 versus FY20 and 2H21 versus 2H20.2 Kantar Worldpanel 0-6 years old Baby & Kids panel: National IMF market tracking (Key & A + BCD cities) for the 52 weeks ending 18 June 2021.
20
21
A
NN
UA
L
RE
SU
LT
S
19.0%
20.6%
21.7%22.2%
21.1%
Jun-19 Dec-19 Jun-20 Dec-20 Jun-21
CBEC market value share1 Daigou market value share2
24.3%
22.4%
10.0%
12.0%
14.0%
16.0%
18.0%
20.0%
22.0%
24.0%
Jun-20 Jun-21

18
ANZ liquid milk growing strongly
Performance
• Australia liquid milk revenue up 10.8% to $169.0 million
• Australia achieved a record market share of 12.2%1
• Increased levels of in-home consumption during 1H21
lockdowns which moderated in 2H21
Investment in brand and strong presence
• The a2 Milk™ brand continues to be the only fresh milk brand
ranged in all major Australian supermarket chains
• Largest brand advertiser in the fresh milk category in Australia
Kyvalley
• Purchase and upgrade of Kyvalley Dairy Group (Kyvalley)
• Strategic investment to ensure quality of products and
processing capacity
ANZ LIQUID MILK
20
21
A
NN
UA
L
RE
SU
LT
S
Liquid milk revenue (Australia)
Australian milk market value share1
NZ$ millions
11.2% 11.3% 11.3%
11.7%
12.2%
Jun-19 Dec-19 Jun-20 Dec-20 Jun-21
1 IRI Australian Grocery Weighted Scan 12-months ending 30 June 2021.
67 75 87
67 78
82
134 153
169
FY19 FY20 FY21
1H 2H
1 IRI Australian Grocery Weighted Scan 12-months ending 30 June 2021.

19
Consistent brand investment has led to strong brand loyalty
20
21
A
NN
UA
L
RE
SU
LT
S
ANZ LIQUID MILK
Build brand equity with investment in major TV
partnerships and ‘always on’ media campaignFoster connections with community and
reinforce relevance to consumer
Continuous physical availability powered by
team excellence at store level

20
Other nutritional segment also impacted by challenges in daigou/reseller channel
Performance
• Overall revenue decline of 38.5% to $52.4 million
• Significantly impacted by challenges in daigou/reseller channel
Growth potential
• Further growth potential across new channels, particularly
in offline China retail channels
OTHER NUTRITION
20
21
A
NN
UA
L
RE
SU
LT
S

21
USA result driven by change in execution approach
Performance
• Revenue decreased 3.7% to $63.6 million
• 2H21 decline in net revenue reflected higher planned trade spend in the period, reduced distribution in a club channel customer, and unfavourable foreign exchange
• EBITDA loss of $33.5 million, $17.0 million improvement on prior year
• Underlying volume growth for the year was 13%, or 26% excluding the major club channel customer
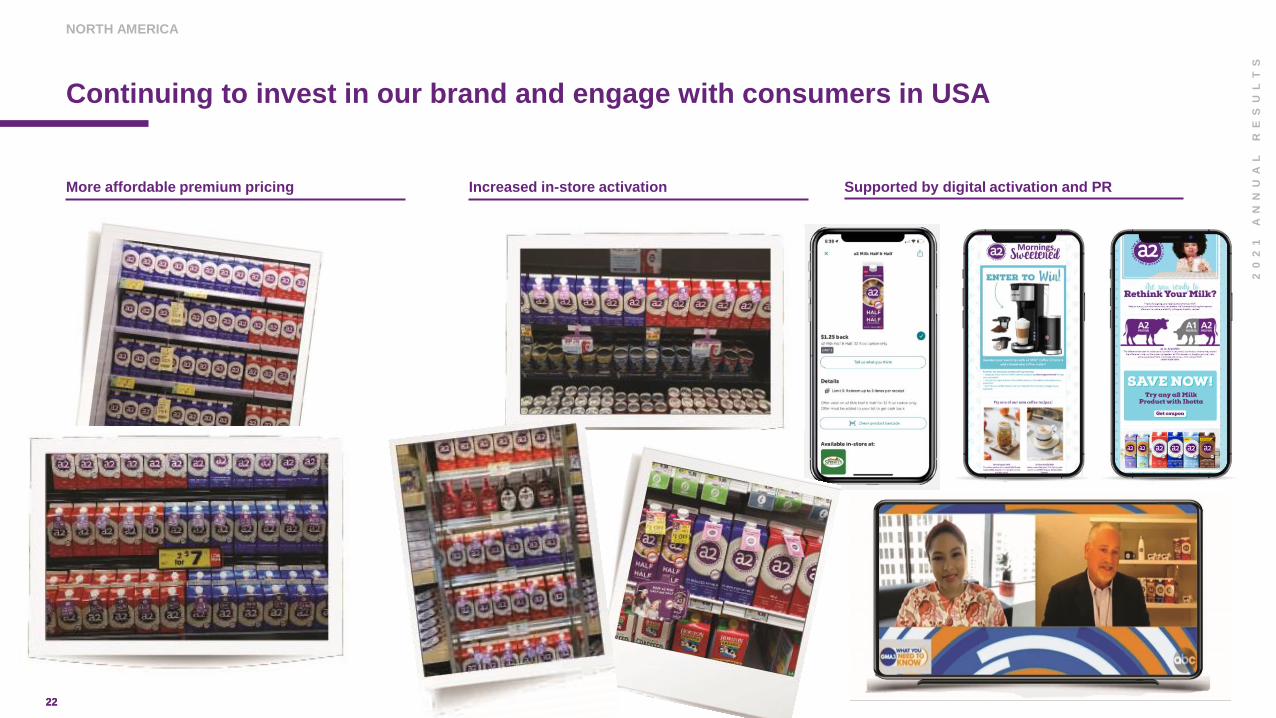
Results driven by change in execution approach
• Leveraged trade investment to bring price to an affordable premium
• Objective to increase conversion and household penetration
• Increasing range, facings and improving overall shelf positioning
• Improvements in brand health metrics
USA is an important market
• Largest global milk market with significant and growing premium segment
• Growth in awareness to create a platform for future product innovation
Launched in Canada via a licensing agreement with Agrifoods
NORTH AMERICA
20
21
A
NN
UA
L
RE
SU
LT
S
Significantly improved EBITDA
35.0
66.1 63.6
(44.0)(50.5)
(33.5)
FY19 FY20 FY21
Chart Title
Revenue EBITDA
2222
Continuing to invest in our brand and engage with consumers in USA
20
21
A
NN
UA
L
RE
SU
LT
S
NORTH AMERICA
More affordable premium pricing Increased in-store activation Supported by digital activation and PR

23
Broad national distribution in over 26k stores in USA
NORTH AMERICA
20
21
A
NN
UA
L
RE
SU
LT
S
USA distribution over time (store count*)
5.4
8.2
12.4
21.0 22.0
24.0
25.9 26.8
Dec-17 Jun-18 Dec-18 Jun-19 Dec-19 Jun-20 Dec-20 Jun-21
*Restated store count metrics based on expanded data set from external data provider.

24
U P D A T E S
20
21
A
NN
UA
L
RE
SU
LT
S
G R O U P
25
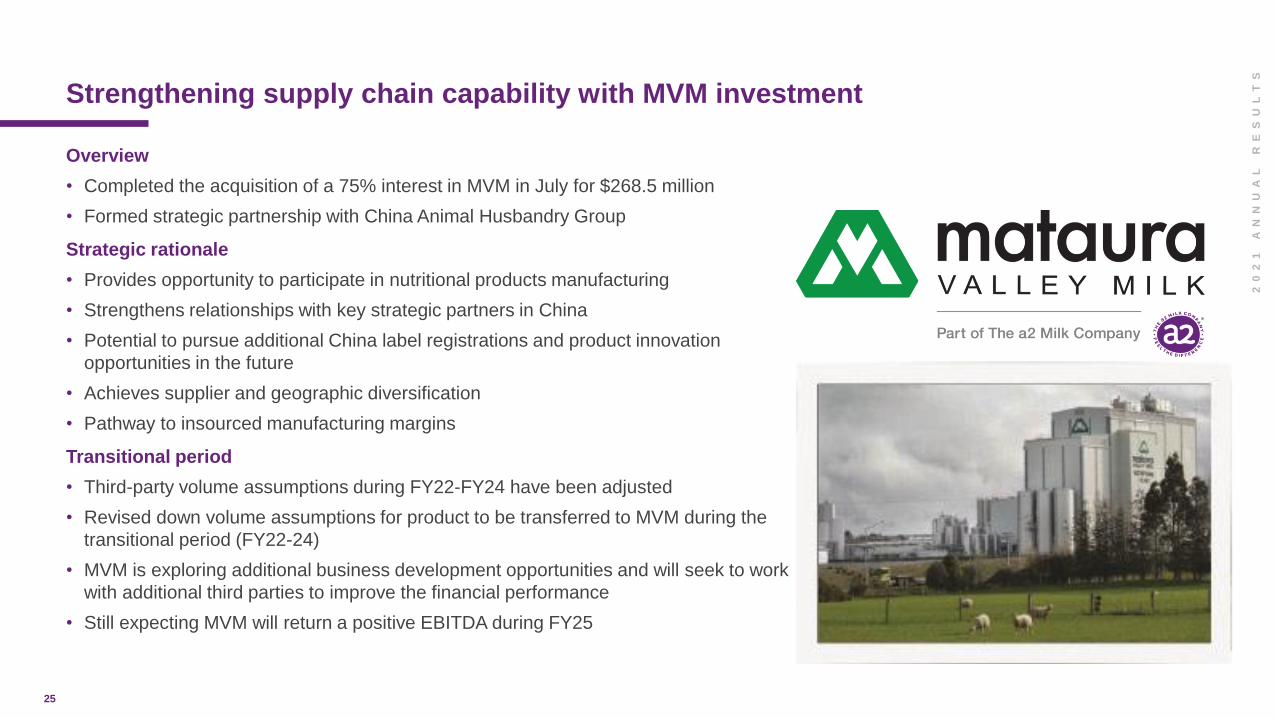
Strengthening supply chain capability with MVM investment
Overview
• Completed the acquisition of a 75% interest in MVM in July for $268.5 million
• Formed strategic partnership with China Animal Husbandry Group
Strategic rationale
• Provides opportunity to participate in nutritional products manufacturing
• Strengthens relationships with key strategic partners in China
• Potential to pursue additional China label registrations and product innovation
opportunities in the future
• Achieves supplier and geographic diversification
• Pathway to insourced manufacturing margins
Transitional period
• Third-party volume assumptions during FY22-FY24 have been adjusted
• Revised down volume assumptions for product to be transferred to MVM during the
transitional period (FY22-24)
• MVM is exploring additional business development opportunities and will seek to work
with additional third parties to improve the financial performance
• Still expecting MVM will return a positive EBITDA during FY25
20
21
A
NN
UA
L
RE
SU
LT
S

26
Capital allocation framework prioritises investment in growth initiatives ahead of returning capital to shareholders
20
21
A
NN
UA
L
RE
SU
LT
S
Operating cash flow generation
Capital funding
Excess cash flow
Shareholder returns
Grow the core business in existing markets Expand the boundaries Balance sheet strength and flexibility
• Investment in building core business
• Participate in infant nutrition manufacturing
• Enabling investment in systems, infrastructure, quality, safety and expertise
• Organic growth – existing and new products/new retail channels
• Adjacent new product categories in existing markets
• Geographic expansion of existing products into new markets
• Assess complementary M&A to drive further growth within core markets
• Capacity to support business growth and risk management initiatives
• Maintain a conservative cash reserve to manage in an uncertain environment

27
Capital planning is an ongoing activity guided by the overall strategy and capital allocation framework
20
21
A
NN
UA
L
RE
SU
LT
S
Overview
• Capital planning is an ongoing activity of the Board
• Guided by the Company’s strategy and capital allocation framework
• Framework prioritises investment in growth initiatives ahead of returning capital to shareholders
Current process
• Current capital planning process considering how to maximise the value of the
strong capital position through:
‒ further investment to strengthen the business
‒ reviewing potential acquisition opportunities to complement existing operations
• Also considered prudent to maintain a conservative cash reserve in uncertain times (particularly
relevant given volatile consumer markets and COVID-19)
• Several mechanisms are available when considering the return of excess capital to shareholders
• The effectiveness of these options is impacted by the Group’s ownership structure and taxation profile
• The Board is currently of the view that there is greater opportunity to create value by investing in the
business and through potential acquisition than by returning capital to shareholders or by introducing
a dividend at this stage
28
Growth strategy review underway with market update planned for late October
Growth strategy review
• Driving infant nutrition growth in China label
• Evolving English label distribution channels
• Advancing infant nutrition product portfolio and innovation
• Developing plan for adjacent growth opportunities
• Enhancing brand positioning to ensure continued resonance and
distinctiveness amongst an evolving consumer base
Investor strategy day
• Virtual event scheduled for 27 October 2021
• Executive Leadership Team presentations with Q&A
20
21
A
NN
UA
L
RE
SU
LT
S
29
Significant progress in sustainability
• Significant progress made in several focus areas including:
‒ Enhancing approach to animal welfare and farm environmental plans
‒ Continuing to invest, engage and support local communities
‒ Advancing several initiatives under the people strategy, responsible
sourcing and ethical supply chain
• Committed to investing in tangible climate-related programmes that will
create a positive impact on the planet
‒ Synlait boiler conversion contribution
‒ Commitment to MVM boiler replacement
• Packaging is a greater focus in FY22
• Further information regarding sustainability goals and strategy to be
provided at the upcoming investor strategy day in late October
20
21
A
NN
UA
L
RE
SU
LT
S

30
20
21
A
NN
UA
L
RE
SU
LT
SExecutive Leadership Team appointments and Asia Pacific division reorganisation to build capability and provide more dedicated management focus completed
Kevin BushExecutive General
Manager – ANZ
Xiao LiChief Executive –
Greater China
Yohan SenaratneExecutive General
Manager – International
Blake WaltripChief Executive –
USA
Janelle TongChief Marketing
Officer (Interim)
Shareef KhanChief Operations Officer
Eleanor KhorChief Strategy Officer
Amanda Hart Chief People &
Culture Officer*
(Commencing September)
Bernard MayChief Executive –
Mataura Valley Milk
Jaron McVicarChief Legal and
Sustainability Officer &
Company Secretary
David BortolussiManaging Director and
Chief Executive Officer
Race StraussChief Financial Officer

31
O U T L O O K
20
21
A
NN
UA
L
RE
SU
LT
S

32
Outlook
See full commentary in results announcement
• The Company is confident in the underlying fundamentals of the business and the
growth opportunity remains strong with a positive long-term outlook
• However, given the continuing uncertainty and volatility in a2MC’s consumer
markets resulting from issues related to COVID-19 and the rapidly changing market
dynamics in China, the Company has determined not to provide specific guidance
• Current observations on key drivers and important issues that may impact FY22
results is provided in the results announcement, covering:
‒ China infant nutrition market
‒ Category and business divisions
‒ Marketing and capability investment
‒ Key financials
20
21
A
NN
UA
L
RE
SU
LT
S

33
Q U E S T I O N S
20
21
A
NN
UA
L
RE
SU
LT
S

34
A P P E N D I X
20
21
A
NN
UA
L
RE
SU
LT
S

35
Reconciliation of non-GAAP measures
NZ$ million FY21 FY20
Australia & New Zealand EBITDA 148.8 465.6
China & Other Asia segment EBITDA 75.6 224.9
USA segment EBITDA (33.5) (50.5)
Corporate EBITDA (57.1) (88.0)
UK EBITDA - (2.3)
MVM transaction cost (10.4) -
EBITDA1 123.4 549.7
Depreciation/amortisation (7.5) (4.4)
EBIT1 115.9 545.3
Net interest income 3.3 5.7
Income tax expense (38.6) (165.2)
Net profit for the period 80.7 385.8
1EBITDA and EBIT are non-GAAP measures. However, the Company believes they assist in providing investors with a comprehensive understanding of the
underlying performance of the business. EBITDA is shown after non-recurring items. This includes MVM acquisition costs in FY21 of $10.4 million.
20
21
A
NN
UA
L
RE
SU
LT
S

36
Geographic and product segment revenue performance
Revenue
(NZ$ million)ANZ China & Other Asia USA
Total
Group
UK
(discontinued ops)
FY21
Infant nutrition 357.0 556.8 - 913.8 -
Liquid milk 169.0 8.3 63.3 240.5 -
Other nutritionals1 33.7 18.4 0.3 52.4 -
TOTAL 559.7 583.5 63.6 1,206.7 -
FY20
Infant nutrition 745.1 678.8 - 1,423.9 -
Liquid milk 152.5 3.4 66.1 222.0 1.4
Other nutritionals1 68.1 17.2 - 85.2 -
TOTAL 965.7 699.4 66.1 1,731.1 1.4
% Change
Infant nutrition (52.1%) (18.0%) - (35.8%) nm
Liquid milk +10.8% +142.7% (4.2%) +8.3% nm
Other nutritionals1 (50.5%) +7.3% - (38.5%) nm
TOTAL (42.0%) (16.6%) (3.7%) (30.3%) nm
20
21
A
NN
UA
L
RE
SU
LT
S
1Includes other income

37
Geographic and product segment revenue performance
Geographic segment revenue & EBITDA
NZ$ million ANZChina & Other
AsiaUSA
UK(Discontinued ops)
CorporateTotal
Group
FY21
Revenue 559.7 583.4 63.6 - - 1,206.7
EBITDA 148.8 75.6 (33.5) - (67.5) 123.4
EBITDA % 26.6% 13.0% nm nm - 10.2%
FY20
Revenue 965.7 699.4 66.1 1.4 - 1,732.5
EBITDA 465.6 224.9 (50.5) (2.3) (87.9) 549.7
EBITDA % 48.2% 32.2% nm nm Nm 31.7%
%
change
Revenue (42.0%) (16.6%) (3.7%) nm - (30.3%)
EBITDA (68.0%) (66.4%) +33.6% nm +23.3% (77.5%)
Product segment revenue1
Infant
nutrition
Liquid
milk
Other
nutritional
913.8 240.5 52.4
1,423.9 222.0 85.2
(35.8%) 8.3% (38.5%)
1 Product segment revenue excludes discontinued operation (UK) in FY20.
20
21
A
NN
UA
L
RE
SU
LT
S

www.thea2milkcompany.com