Embed Size (px)
Citation preview

Interim Results 2016
Annual Results 2016 For the Twelve Months Ended 31 December 2016
2016 Annual Results
This document contains certain forward-looking statements with respect to certain of the Permanent TSB Group Holdings plc’s Group’s (the ‘Group’) intentions, beliefs, current goals and expectations concerning, among other things, the Group’s results of operations, financial condition, performance, liquidity, prospects, growth, strategies, the banking industry and future capital requirements . The words “expect”, “anticipate”, “intend”, “plan”, “estimate”, “aim”, “forecast”, “project”, “target”, “goal”, “believe”, “may”, “could”, “will”, “seek”, “would”, “should”, “continue”, “assume” and similar expressions (or their negative) identify certain of these forward-looking statements but their absence does not mean that a statement is not forward looking. The forward-looking statements in this document are based on numerous assumptions regarding the Group’s present and future business strategies and the environment in which the Group will operate in the future. Forward-looking statements involve inherent known and unknown risks, uncertainties and contingencies because they relate to events and depend on circumstances that may or may not occur in the future and may cause the actual results, performance or achievements of the Group to be materially different from those expressed or implied by such forward looking statements. Many of these risks and uncertainties relate to factors that are beyond the Group’s ability to control or estimate precisely, such as future global, national and regional economic conditions, levels of market interest rates, credit or other risks of lending and investment activities, competition and the behaviour of other market participants, the actions of regulators and other factors such as changes in the political, social and regulatory framework in which the Group operates or in economic or technological trends or conditions. Past performance should not be taken as an indication or guarantee of future results, and no representation or warranty, express or implied, is made regarding future performance. Nothing in this document should be considered to be a forecast of future profitability or financial position and none of the information in this document is intended to be a profit forecast or profit estimate. The Group expressly disclaims any obligation or undertaking to release any updates or revisions to these forward-looking statements to reflect any change in the Group’s expectations with regard thereto or any change in events, assumptions, conditions or circumstances on which any statement is based after the date of this document or to update or to keep current any other information contained in this document. Accordingly, undue reliance should not be placed on the forward-looking statements, which speak only as of the date of this document. www.permanenttsbgroup.ie/investor-relations
Forward Looking Statements
1
2016 Annual Results
2016 Review and Strategic Outlook Jeremy Masding Group CEO
3
Detailed Financial Performance Patricia Carroll Interim Group CFO
14
Agenda
2

2016 Annual Results
Jeremy Masding Group CEO
2016 Review and Strategic Outlook
3

2016 Annual Results
Key Points
o Underlying Profit of €159m*; an improvement of over €130m
o 30,000 New Customers; 14% Growth in New Lending
o NPLs down by €700m or 11%
o Non-Core Deleveraging Programme now complete
o Robust Capital Position at 14.9% (Fully Loaded); well above SREP Demand of 11.45%**
* Excluding Gain from Visa Europe Share Sale of €29m ** Includes a Pillar 2 Guidance of 2.25% 4
2016 Annual Results
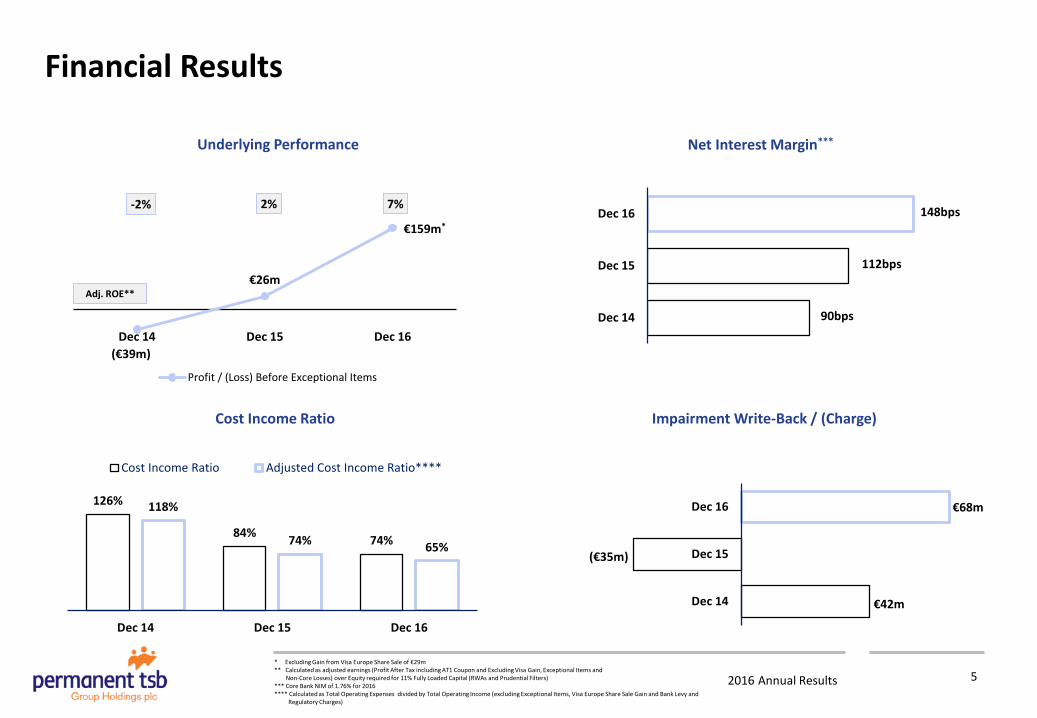
Financial Results
-2% 2% 7%
(€39m)
€26m
€159m*
Dec 14 Dec 15 Dec 16
Profit / (Loss) Before Exceptional Items
Adj. ROE**
126%
84% 74%
118%
74% 65%
Dec 14 Dec 15 Dec 16
Cost Income Ratio Adjusted Cost Income Ratio****
€42m
(€35m)
€68m
Dec 14
Dec 15
Dec 16
* Excluding Gain from Visa Europe Share Sale of €29m ** Calculated as adjusted earnings (Profit After Tax including AT1 Coupon and Excluding Visa Gain, Exceptional Items and Non-Core Losses) over Equity required for 11% Fully Loaded Capital (RWAs and Prudential Filters) *** Core Bank NIM of 1.76% for 2016 **** Calculated as Total Operating Expenses divided by Total Operating Income (excluding Exceptional Items, Visa Europe Share Sale Gain and Bank Levy and Regulatory Charges)
Underlying Performance Net Interest Margin***
Cost Income Ratio Impairment Write-Back / (Charge)
90bps
112bps
148bps
Dec 14
Dec 15
Dec 16
5
2016 Annual Results
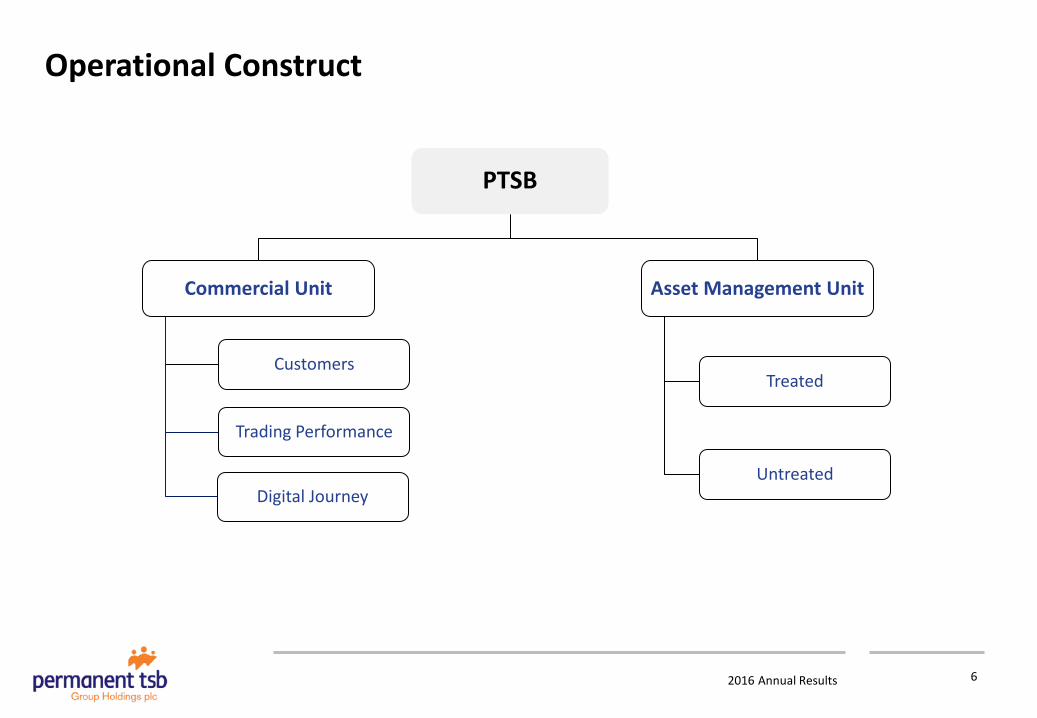
Operational Construct
PTSB
Commercial Unit
Digital Journey
Trading Performance
Customers
Asset Management Unit
Treated
Untreated
6
2016 Annual Results
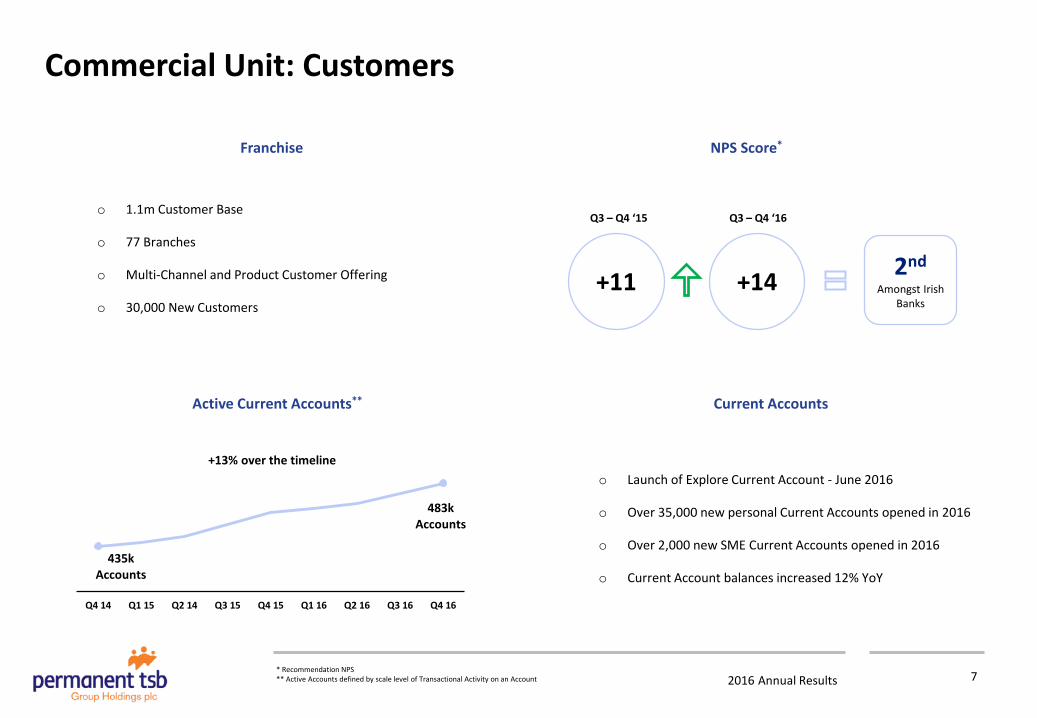
Commercial Unit: Customers
NPS Score*
+11 2nd Amongst Irish
Banks
o 1.1m Customer Base
o 77 Branches
o Multi-Channel and Product Customer Offering
o 30,000 New Customers
* Recommendation NPS ** Active Accounts defined by scale level of Transactional Activity on an Account
o Launch of Explore Current Account - June 2016
o Over 35,000 new personal Current Accounts opened in 2016
o Over 2,000 new SME Current Accounts opened in 2016
o Current Account balances increased 12% YoY
Current Accounts
Q3 – Q4 ‘15 Q3 – Q4 ‘16
Franchise
Active Current Accounts**
435k Accounts
483k Accounts
Q4 14 Q1 15 Q2 14 Q3 15 Q4 15 Q1 16 Q2 16 Q3 16 Q4 16
+13% over the timeline
+14
7
2016 Annual Results
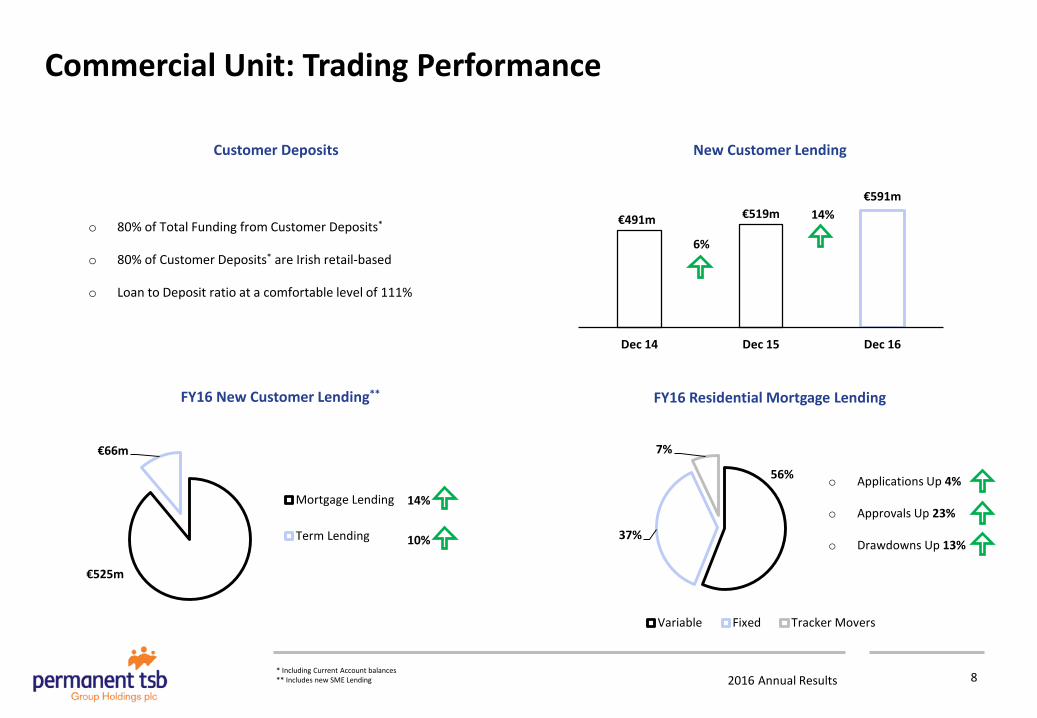
Commercial Unit: Trading Performance
o 80% of Total Funding from Customer Deposits*
o 80% of Customer Deposits* are Irish retail-based
o Loan to Deposit ratio at a comfortable level of 111%
€491m €519m €591m
Dec 14 Dec 15 Dec 16
€525m
€66m
Mortgage Lending
Term Lending
14%
6%
14%
56%
37%
7%
Variable Fixed Tracker Movers
New Customer Lending
FY16 New Customer Lending** FY16 Residential Mortgage Lending
Customer Deposits
10%
o Applications Up 4%
o Approvals Up 23%
o Drawdowns Up 13%
* Including Current Account balances ** Includes new SME Lending 8
2016 Annual Results
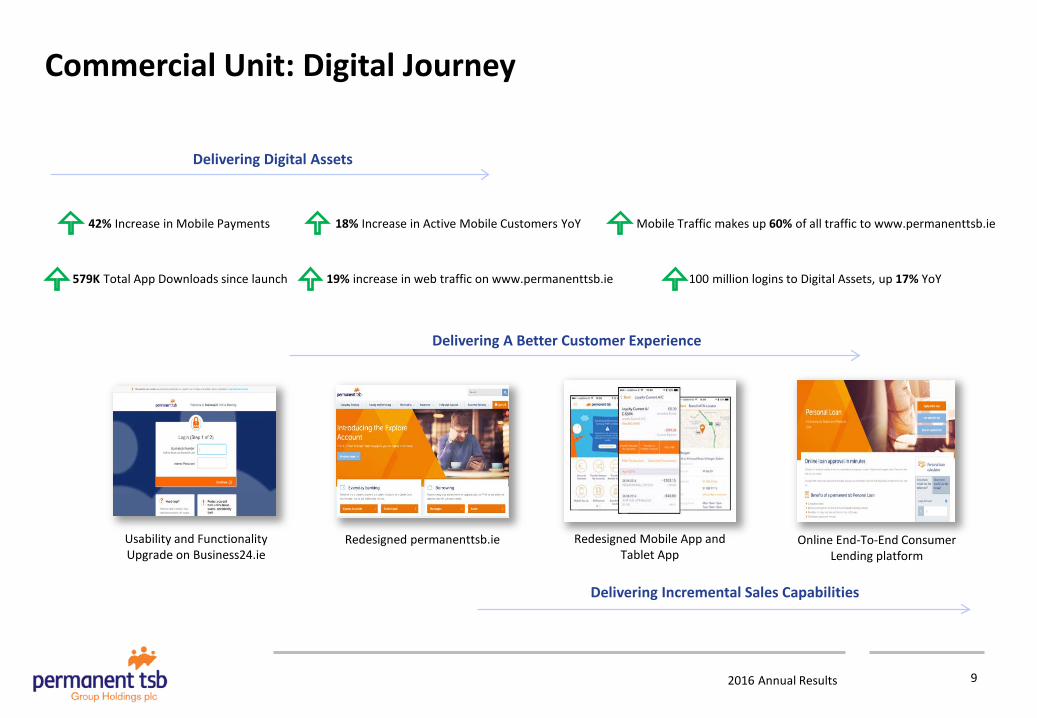
579K Total App Downloads since launch
Commercial Unit: Digital Journey
Delivering Incremental Sales Capabilities
Delivering A Better Customer Experience
Delivering Digital Assets
9
Usability and Functionality Upgrade on Business24.ie
Redesigned permanenttsb.ie Redesigned Mobile App and Tablet App
Online End-To-End Consumer Lending platform
42% Increase in Mobile Payments 18% Increase in Active Mobile Customers YoY Mobile Traffic makes up 60% of all traffic to www.permanenttsb.ie
19% increase in web traffic on www.permanenttsb.ie 100 million logins to Digital Assets, up 17% YoY
2016 Annual Results
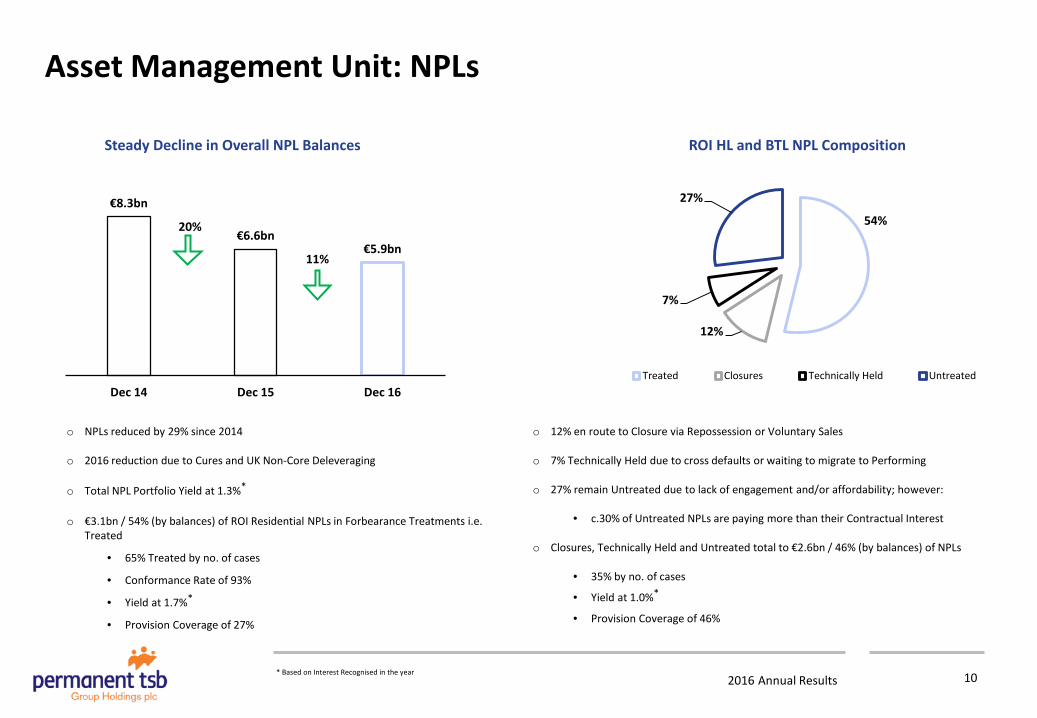
Asset Management Unit: NPLs
Steady Decline in Overall NPL Balances
€8.3bn
€6.6bn €5.9bn
Dec 14 Dec 15 Dec 16
10
54%
12%
7%
27%
Treated Closures Technically Held Untreated
20%
11%
ROI HL and BTL NPL Composition
o NPLs reduced by 29% since 2014
o 2016 reduction due to Cures and UK Non-Core Deleveraging
o Total NPL Portfolio Yield at 1.3%*
o €3.1bn / 54% (by balances) of ROI Residential NPLs in Forbearance Treatments i.e. Treated
• 65% Treated by no. of cases
• Conformance Rate of 93%
• Yield at 1.7%*
• Provision Coverage of 27%
o 12% en route to Closure via Repossession or Voluntary Sales
o 7% Technically Held due to cross defaults or waiting to migrate to Performing
o 27% remain Untreated due to lack of engagement and/or affordability; however:
• c.30% of Untreated NPLs are paying more than their Contractual Interest
o Closures, Technically Held and Untreated total to €2.6bn / 46% (by balances) of NPLs
• 35% by no. of cases
• Yield at 1.0%*
• Provision Coverage of 46%
* Based on Interest Recognised in the year
2016 Annual Results
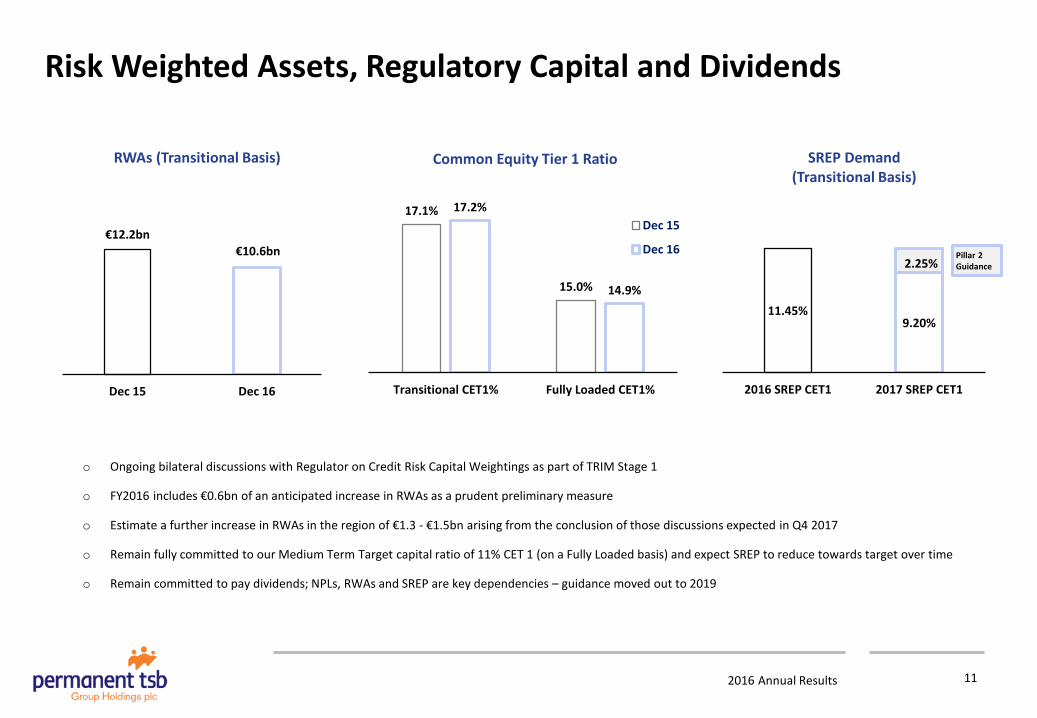
Risk Weighted Assets, Regulatory Capital and Dividends
o Ongoing bilateral discussions with Regulator on Credit Risk Capital Weightings as part of TRIM Stage 1
o FY2016 includes €0.6bn of an anticipated increase in RWAs as a prudent preliminary measure
o Estimate a further increase in RWAs in the region of €1.3 - €1.5bn arising from the conclusion of those discussions expected in Q4 2017
o Remain fully committed to our Medium Term Target capital ratio of 11% CET 1 (on a Fully Loaded basis) and expect SREP to reduce towards target over time
o Remain committed to pay dividends; NPLs, RWAs and SREP are key dependencies – guidance moved out to 2019
11.45% 9.20%
2.25%
2016 SREP CET1 2017 SREP CET1
SREP Demand (Transitional Basis)
11
€12.2bn €10.6bn
Dec 15 Dec 16
RWAs (Transitional Basis)
17.1%
15.0%
17.2%
14.9%
Transitional CET1% Fully Loaded CET1%
Common Equity Tier 1 Ratio
Dec 15
Dec 16 Pillar 2 Guidance
2016 Annual Results
Start Of The Beginning
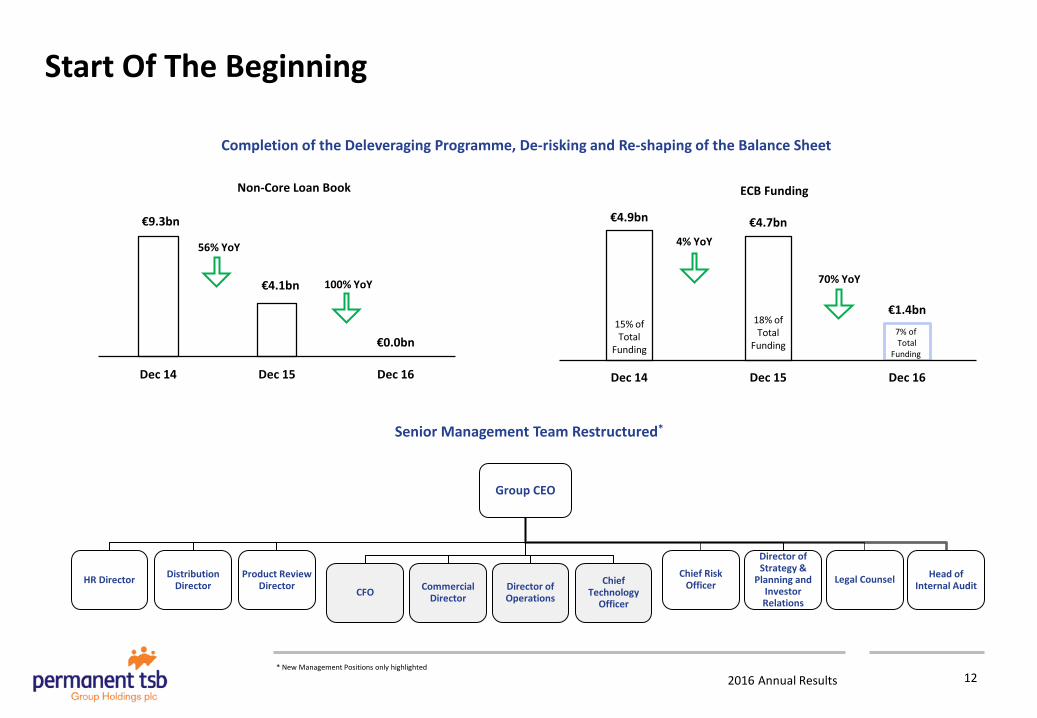
€9.3bn
€4.1bn
€0.0bn
Dec 14 Dec 15 Dec 16
Non-Core Loan Book
* New Management Positions only highlighted
Group CEO
HR Director Distribution Director
Product Review Director CFO Commercial
Director Director of Operations
Chief Technology
Officer
Chief Risk Officer
Director of Strategy &
Planning and Investor Relations
Legal Counsel Head of Internal Audit
Completion of the Deleveraging Programme, De-risking and Re-shaping of the Balance Sheet
Senior Management Team Restructured*
12
56% YoY
100% YoY
€4.9bn €4.7bn
€1.4bn
Dec 14 Dec 15 Dec 16
ECB Funding
4% YoY
70% YoY
15% of Total
Funding
18% of Total
Funding 7% of Total
Funding
2016 Annual Results
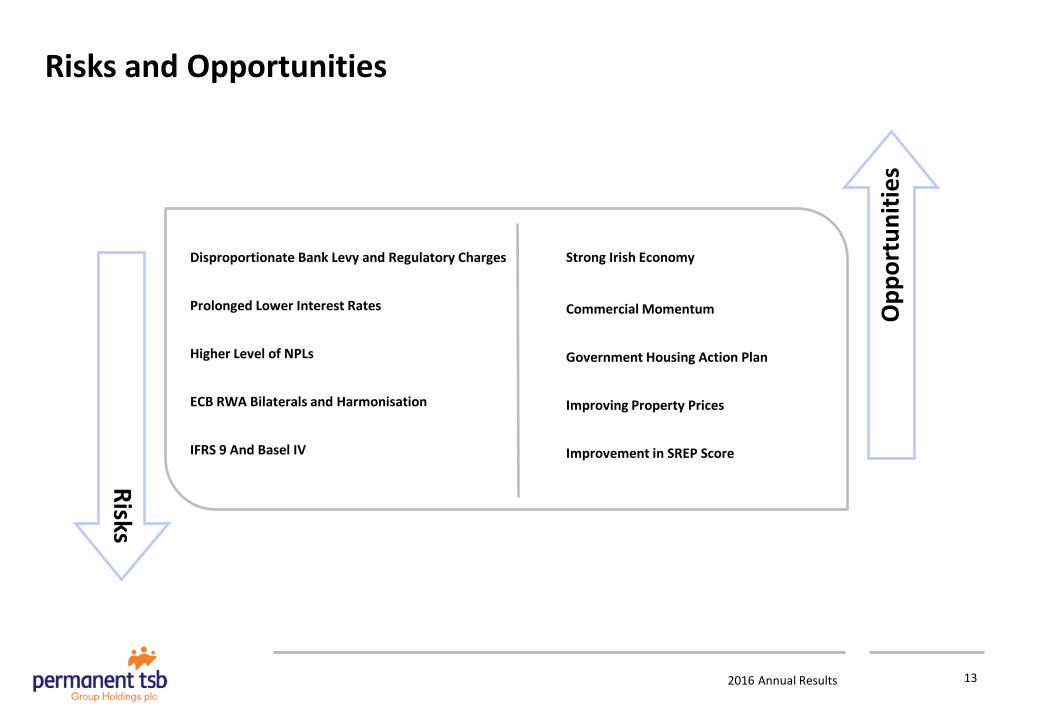
Risks and Opportunities
Disproportionate Bank Levy and Regulatory Charges
Prolonged Lower Interest Rates
Higher Level of NPLs
ECB RWA Bilaterals and Harmonisation
IFRS 9 And Basel IV
Strong Irish Economy
Commercial Momentum
Government Housing Action Plan
Improving Property Prices
Improvement in SREP Score
Opp
ortu
nitie
s Risks
13
2016 Annual Results 14
Patricia Carroll Interim Group CFO
Financial Performance
2016 Annual Results
Income Statement
* Calculated excluding Visa Europe Share sale gain of €29m, Bank Levy and Regulatory Charges, and Exceptional Items ** Calculated excluding HPI-linked Write-Backs *** Excluding Gain from Visa Europe Share Sale of €29m
15
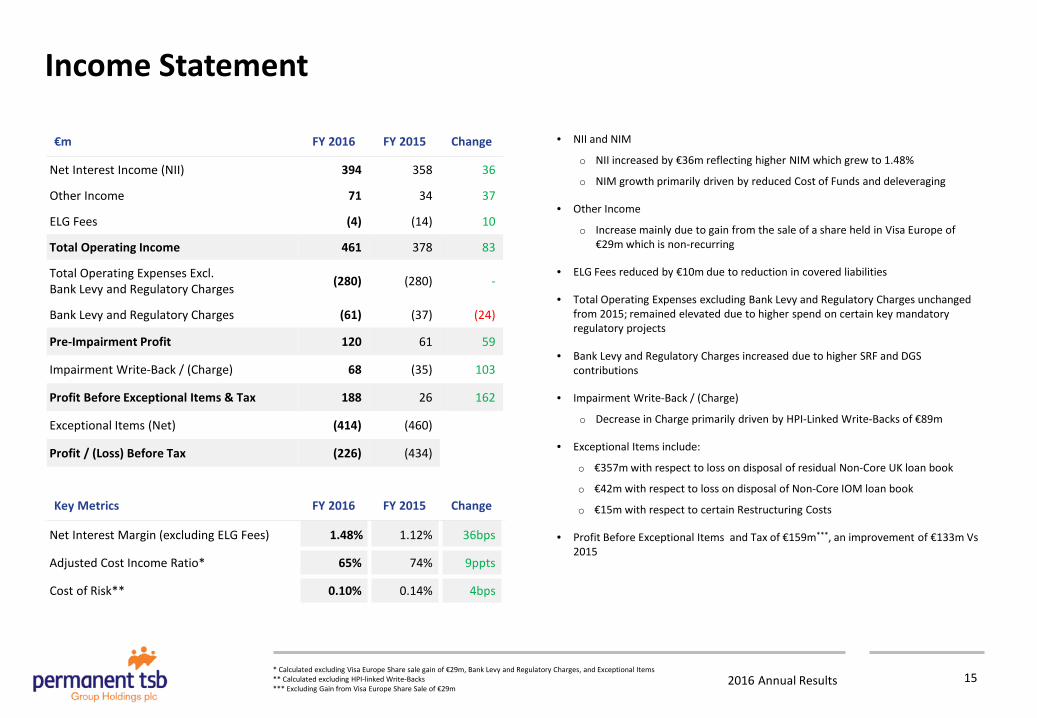
• NII and NIM
o NII increased by €36m reflecting higher NIM which grew to 1.48%
o NIM growth primarily driven by reduced Cost of Funds and deleveraging
• Other Income
o Increase mainly due to gain from the sale of a share held in Visa Europe of €29m which is non-recurring
• ELG Fees reduced by €10m due to reduction in covered liabilities
• Total Operating Expenses excluding Bank Levy and Regulatory Charges unchanged from 2015; remained elevated due to higher spend on certain key mandatory regulatory projects
• Bank Levy and Regulatory Charges increased due to higher SRF and DGS contributions
• Impairment Write-Back / (Charge)
o Decrease in Charge primarily driven by HPI-Linked Write-Backs of €89m
• Exceptional Items include:
o €357m with respect to loss on disposal of residual Non-Core UK loan book
o €42m with respect to loss on disposal of Non-Core IOM loan book
o €15m with respect to certain Restructuring Costs
• Profit Before Exceptional Items and Tax of €159m***, an improvement of €133m Vs 2015
€m FY 2016 FY 2015 Change
Net Interest Income (NII) 394 358 36
Other Income 71 34 37
ELG Fees (4) (14) 10
Total Operating Income 461 378 83
Total Operating Expenses Excl. Bank Levy and Regulatory Charges (280) (280) -
Bank Levy and Regulatory Charges (61) (37) (24)
Pre-Impairment Profit 120 61 59
Impairment Write-Back / (Charge) 68 (35) 103
Profit Before Exceptional Items & Tax 188 26 162
Exceptional Items (Net) (414) (460)
Profit / (Loss) Before Tax (226) (434)
Key Metrics FY 2016 FY 2015 Change
Net Interest Margin (excluding ELG Fees) 1.48% 1.12% 36bps
Adjusted Cost Income Ratio* 65% 74% 9ppts
Cost of Risk** 0.10% 0.14% 4bps
2016 Annual Results
Net Interest Margin
* CBI Data as of end November 2016 ** Treasury Assets include Debt Securities and, Loans and Advances to Banks *** Loan balances presented are net of Provisions
2.53 2.32 2.25
2.11 2.14 2.11
0.88 0.9 1.0
1.28 1.43 1.52
1.72 1.44
1.3
0.88 0.75 0.69
0
0.5
1
1.5
2
2.5
3
H1-14 H2-14 H1-15 H2-15 H1-16 H2-16
Asset Yield %
NIM %
Cost Of Funds %
16
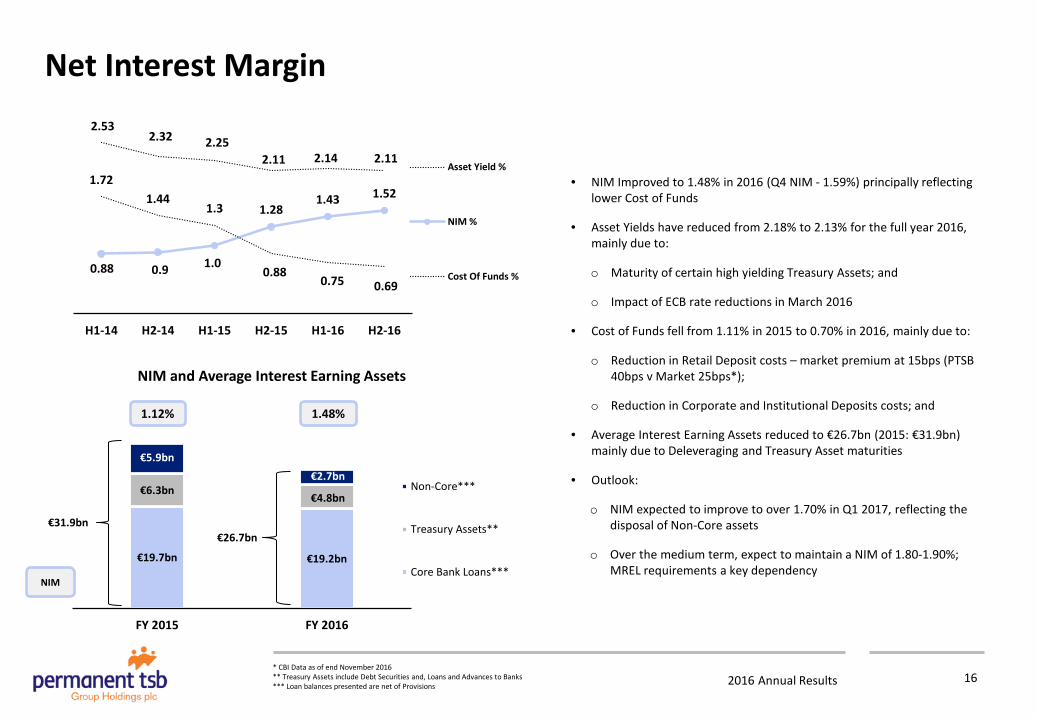
• NIM Improved to 1.48% in 2016 (Q4 NIM - 1.59%) principally reflecting lower Cost of Funds
• Asset Yields have reduced from 2.18% to 2.13% for the full year 2016, mainly due to:
o Maturity of certain high yielding Treasury Assets; and
o Impact of ECB rate reductions in March 2016
• Cost of Funds fell from 1.11% in 2015 to 0.70% in 2016, mainly due to:
o Reduction in Retail Deposit costs – market premium at 15bps (PTSB 40bps v Market 25bps*);
o Reduction in Corporate and Institutional Deposits costs; and
• Average Interest Earning Assets reduced to €26.7bn (2015: €31.9bn) mainly due to Deleveraging and Treasury Asset maturities
• Outlook:
o NIM expected to improve to over 1.70% in Q1 2017, reflecting the disposal of Non-Core assets
o Over the medium term, expect to maintain a NIM of 1.80-1.90%; MREL requirements a key dependency
€19.7bn €19.2bn
€6.3bn €4.8bn
€5.9bn €2.7bn
FY 2015 FY 2016
NIM and Average Interest Earning Assets
Non-Core***
Treasury Assets**
Core Bank Loans***
1.12% 1.48%
€31.9bn €26.7bn
NIM
2016 Annual Results
Total Operating Expenses
* Calculated excluding Visa Europe Share sale gain, Bank Levy and Regulatory Charges and Exceptional Items 17
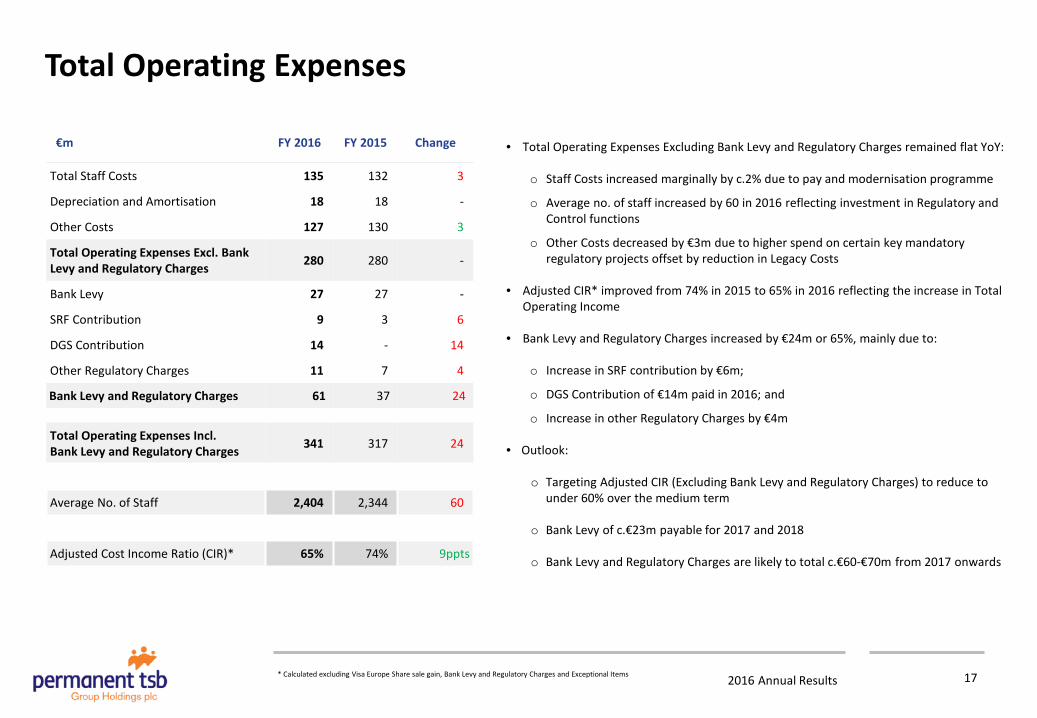
• Total Operating Expenses Excluding Bank Levy and Regulatory Charges remained flat YoY:
o Staff Costs increased marginally by c.2% due to pay and modernisation programme
o Average no. of staff increased by 60 in 2016 reflecting investment in Regulatory and Control functions
o Other Costs decreased by €3m due to higher spend on certain key mandatory regulatory projects offset by reduction in Legacy Costs
• Adjusted CIR* improved from 74% in 2015 to 65% in 2016 reflecting the increase in Total Operating Income
• Bank Levy and Regulatory Charges increased by €24m or 65%, mainly due to:
o Increase in SRF contribution by €6m;
o DGS Contribution of €14m paid in 2016; and
o Increase in other Regulatory Charges by €4m
• Outlook:
o Targeting Adjusted CIR (Excluding Bank Levy and Regulatory Charges) to reduce to under 60% over the medium term
o Bank Levy of c.€23m payable for 2017 and 2018
o Bank Levy and Regulatory Charges are likely to total c.€60-€70m from 2017 onwards
€m FY 2016 FY 2015 Change
Total Staff Costs 135 132 3
Depreciation and Amortisation 18 18 -
Other Costs 127 130 3
Total Operating Expenses Excl. Bank Levy and Regulatory Charges 280 280 -
Bank Levy 27 27 -
SRF Contribution 9 3 6
DGS Contribution 14 - 14
Other Regulatory Charges 11 7 4
Bank Levy and Regulatory Charges 61 37 24
Total Operating Expenses Incl. Bank Levy and Regulatory Charges 341 317 24
Average No. of Staff 2,404 2,344 60
Adjusted Cost Income Ratio (CIR)* 65% 74% 9ppts
2016 Annual Results
Impairment Write-Back / (Charge)
Breakdown by Portfolio (€m) FY 2016 FY 2015 Change
ROI Home Loans 66 12 54
ROI BTLs (14) (66) 52
Total ROI Residential Mortgages 52 (54) 106
Consumer Finance 9 (2) 11
CRE 4 27 23
UK Residential Mortgages - (6) 6
Repossessed Assets 3 (1) 4
Debt Securities - 1 1
Other Portfolios 16 19 3
Total Write-Back / (Charge) 68 (35) 103
Underlying Cost of Risk* 10bps 14bps 4bps
* Calculated excluding HPI-linked Write-Backs 18
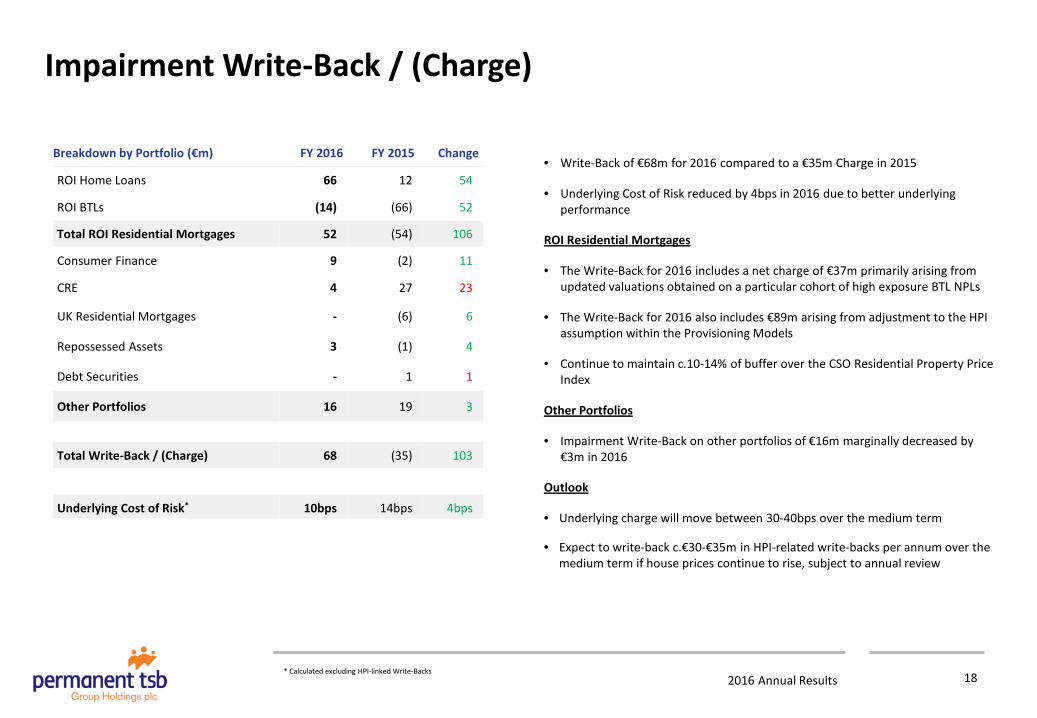
• Write-Back of €68m for 2016 compared to a €35m Charge in 2015
• Underlying Cost of Risk reduced by 4bps in 2016 due to better underlying performance
ROI Residential Mortgages
• The Write-Back for 2016 includes a net charge of €37m primarily arising from updated valuations obtained on a particular cohort of high exposure BTL NPLs
• The Write-Back for 2016 also includes €89m arising from adjustment to the HPI assumption within the Provisioning Models
• Continue to maintain c.10-14% of buffer over the CSO Residential Property Price Index
Other Portfolios
• Impairment Write-Back on other portfolios of €16m marginally decreased by €3m in 2016
Outlook
• Underlying charge will move between 30-40bps over the medium term
• Expect to write-back c.€30-€35m in HPI-related write-backs per annum over the medium term if house prices continue to rise, subject to annual review
2016 Annual Results 19
€bn Dec 2016 Dec 2015
Trackers 13.6 14.2
Variable 7.3 7.5
Fixed 0.5 0.5
Total ROI Loan Book (Gross) 21.4 22.2
Impairment Provisions (2.5) (2.7)
Total ROI Loan Book (net) 18.9 19.5
Non-Core Loan Book (net) - 3.5
Total Loans (Net) 18.9 23.0
Treasury Assets 4.0 5.5
Other Assets 0.7 0.8
Total Assets 23.6 29.3
ROI Retail Deposits (Incl. Current Accounts) 13.6 14.0
Isle of Man Deposits 0.4 0.5
Corporate & Institutional 3.0 4.0
Total Customer Deposits 17.0 18.5
Wholesale Funding 2.8 3.1
ECB Funding 1.4 4.7
Other Liabilities 0.3 0.6
Total Liabilities 21.5 26.9
Total Equity (incl. AT1) 2.1 2.4
Total Equity and Liabilities 23.6 29.3
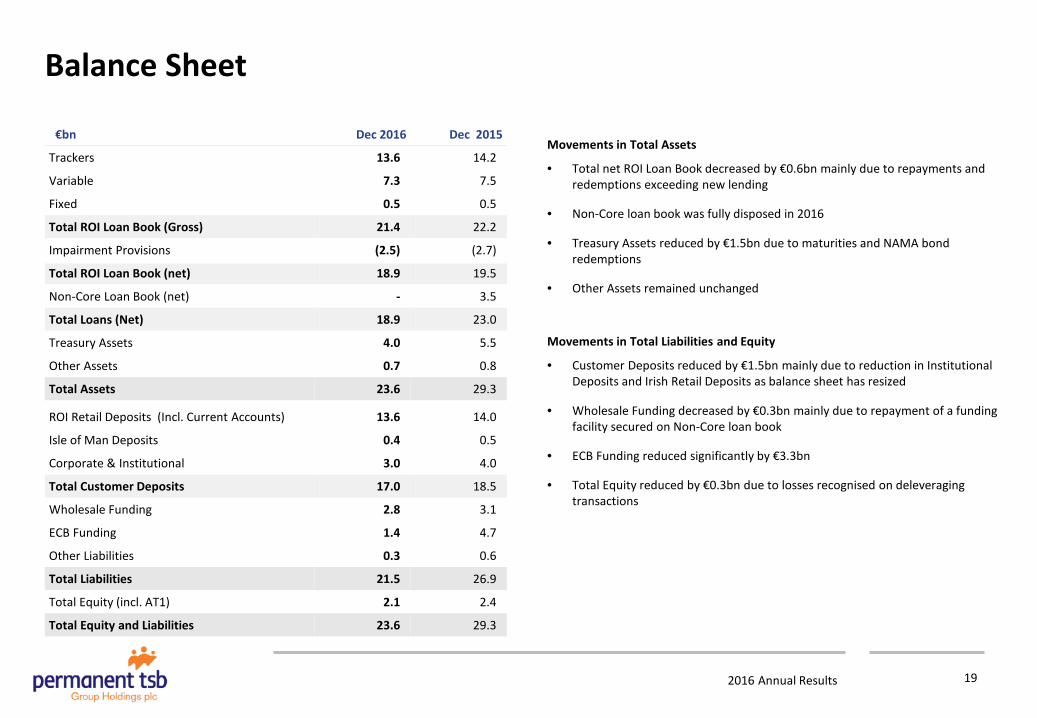
Movements in Total Assets
• Total net ROI Loan Book decreased by €0.6bn mainly due to repayments and redemptions exceeding new lending
• Non-Core loan book was fully disposed in 2016
• Treasury Assets reduced by €1.5bn due to maturities and NAMA bond redemptions
• Other Assets remained unchanged
Movements in Total Liabilities and Equity
• Customer Deposits reduced by €1.5bn mainly due to reduction in Institutional Deposits and Irish Retail Deposits as balance sheet has resized
• Wholesale Funding decreased by €0.3bn mainly due to repayment of a funding facility secured on Non-Core loan book
• ECB Funding reduced significantly by €3.3bn
• Total Equity reduced by €0.3bn due to losses recognised on deleveraging transactions
Balance Sheet
2016 Annual Results
NPLs
20
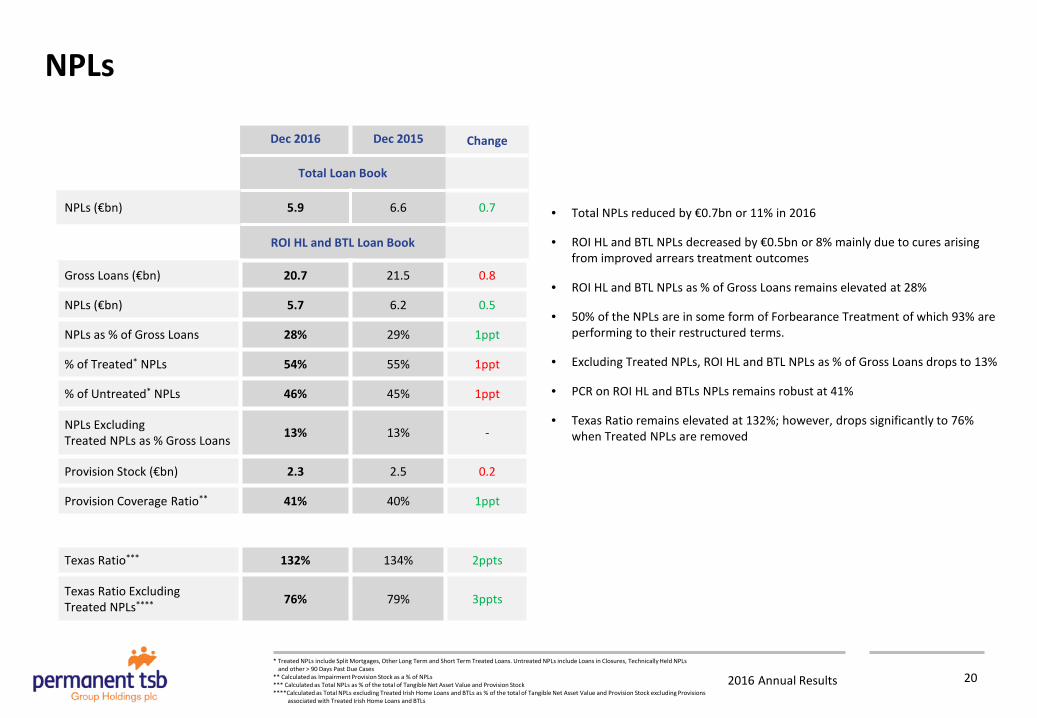
• Total NPLs reduced by €0.7bn or 11% in 2016
• ROI HL and BTL NPLs decreased by €0.5bn or 8% mainly due to cures arising from improved arrears treatment outcomes
• ROI HL and BTL NPLs as % of Gross Loans remains elevated at 28%
• 50% of the NPLs are in some form of Forbearance Treatment of which 93% are performing to their restructured terms.
• Excluding Treated NPLs, ROI HL and BTL NPLs as % of Gross Loans drops to 13%
• PCR on ROI HL and BTLs NPLs remains robust at 41%
• Texas Ratio remains elevated at 132%; however, drops significantly to 76% when Treated NPLs are removed
* Treated NPLs include Split Mortgages, Other Long Term and Short Term Treated Loans. Untreated NPLs include Loans in Closures, Technically Held NPLs and other > 90 Days Past Due Cases ** Calculated as Impairment Provision Stock as a % of NPLs *** Calculated as Total NPLs as % of the total of Tangible Net Asset Value and Provision Stock ****Calculated as Total NPLs excluding Treated Irish Home Loans and BTLs as % of the total of Tangible Net Asset Value and Provision Stock excluding Provisions associated with Treated Irish Home Loans and BTLs
Dec 2016 Dec 2015 Change
Total Loan Book
NPLs (€bn) 5.9 6.6 0.7
ROI HL and BTL Loan Book
Gross Loans (€bn) 20.7 21.5 0.8
NPLs (€bn) 5.7 6.2 0.5
NPLs as % of Gross Loans 28% 29% 1ppt
% of Treated* NPLs 54% 55% 1ppt
% of Untreated* NPLs 46% 45% 1ppt
NPLs Excluding Treated NPLs as % Gross Loans 13% 13% -
Provision Stock (€bn) 2.3 2.5 0.2
Provision Coverage Ratio** 41% 40% 1ppt
Texas Ratio*** 132% 134% 2ppts
Texas Ratio Excluding Treated NPLs**** 76% 79% 3ppts
2016 Annual Results
Funding Profile
70% 80%
12%
13% 18%
7%
Dec 15 Dec 16
Customer Deposits Wholesale ECB Funding
21
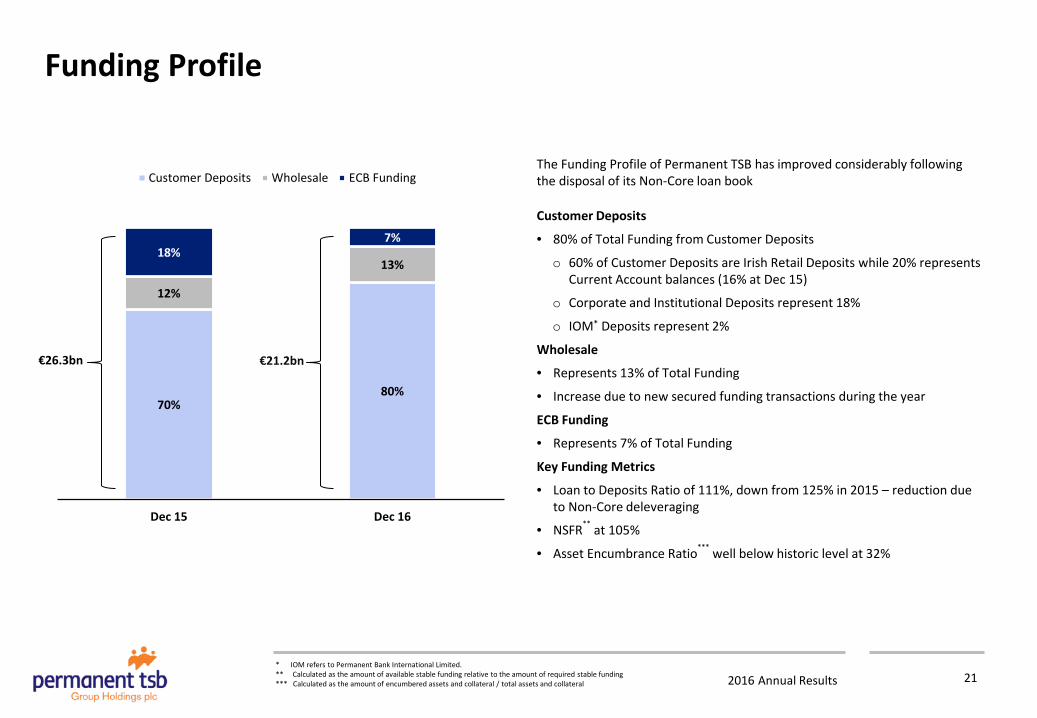
The Funding Profile of Permanent TSB has improved considerably following the disposal of its Non-Core loan book
Customer Deposits
• 80% of Total Funding from Customer Deposits
o 60% of Customer Deposits are Irish Retail Deposits while 20% represents Current Account balances (16% at Dec 15)
o Corporate and Institutional Deposits represent 18%
o IOM* Deposits represent 2%
Wholesale
• Represents 13% of Total Funding
• Increase due to new secured funding transactions during the year
ECB Funding
• Represents 7% of Total Funding
Key Funding Metrics
• Loan to Deposits Ratio of 111%, down from 125% in 2015 – reduction due to Non-Core deleveraging
• NSFR** at 105%
• Asset Encumbrance Ratio*** well below historic level at 32%
€26.3bn €21.2bn
* IOM refers to Permanent Bank International Limited. ** Calculated as the amount of available stable funding relative to the amount of required stable funding *** Calculated as the amount of encumbered assets and collateral / total assets and collateral
2016 Annual Results 22 * This relates to a preliminary prudential adjustment based on anticipated increase in the Credit Risk weighting arising out of bilateral discussions with SSM in advance of TRIM **Other includes movements in Prudential Filters and Reserves
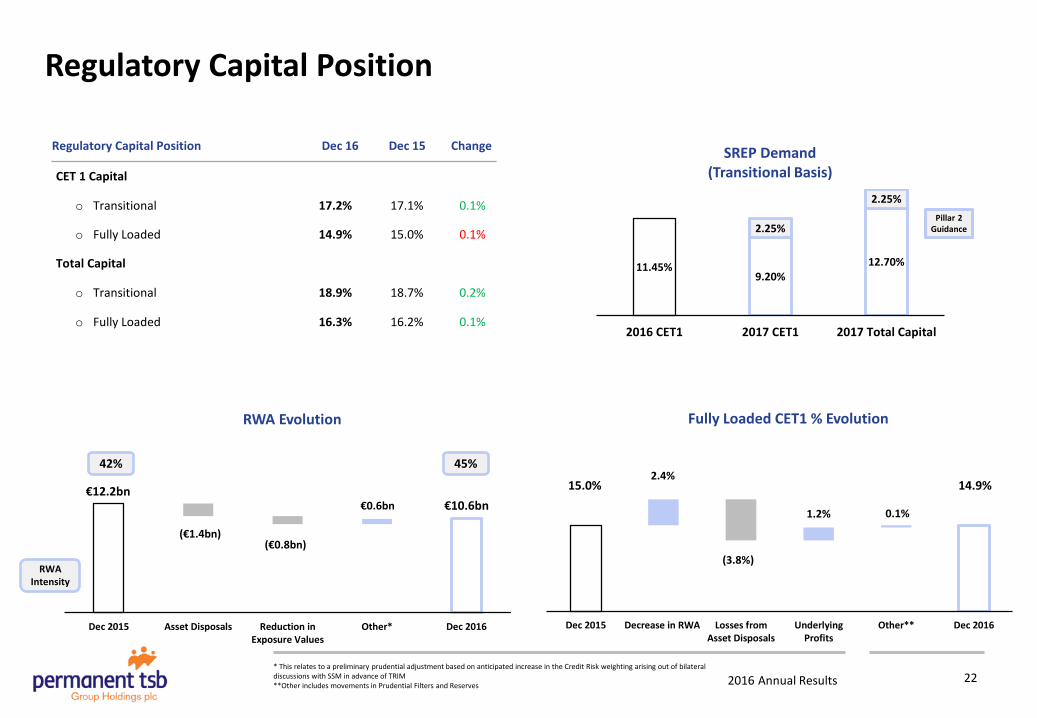
€12.2bn €10.6bn
(€1.4bn) (€0.8bn)
€0.6bn
Dec 2015 Asset Disposals Reduction inExposure Values
Other* Dec 2016
RWA Evolution
42% 45%
RWA Intensity
15.0% 14.9% 2.4%
(3.8%)
1.2% 0.1%
Dec 2015 Decrease in RWA Losses fromAsset Disposals
UnderlyingProfits
Other** Dec 2016
Fully Loaded CET1 % Evolution
Regulatory Capital Position Dec 16 Dec 15 Change
CET 1 Capital
o Transitional 17.2% 17.1% 0.1%
o Fully Loaded 14.9% 15.0% 0.1%
Total Capital
o Transitional 18.9% 18.7% 0.2%
o Fully Loaded 16.3% 16.2% 0.1%
11.45% 9.20%
12.70%
2.25%
2.25%
2016 CET1 2017 CET1 2017 Total Capital
SREP Demand (Transitional Basis)
Regulatory Capital Position
Pillar 2 Guidance
2016 Annual Results
Summary
23
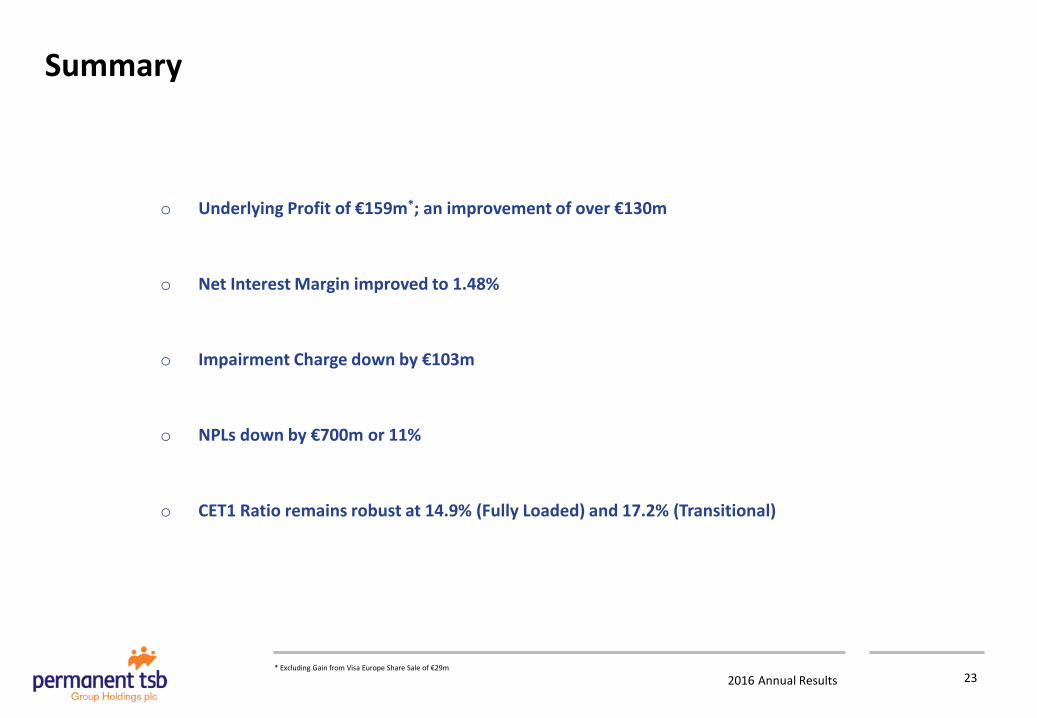
o Underlying Profit of €159m*; an improvement of over €130m
o Net Interest Margin improved to 1.48%
o Impairment Charge down by €103m
o NPLs down by €700m or 11%
o CET1 Ratio remains robust at 14.9% (Fully Loaded) and 17.2% (Transitional)
* Excluding Gain from Visa Europe Share Sale of €29m
2016 Annual Results
Appendices
24
Trading Conditions 25
Permanent TSB Overview 26
Historical Financial Results 27
Segmental Income Statement 28
Interest Income Analysis 29
Interest Expenses Analysis 30
Tracker Book and Margin 31
Other Income Analysis 32
Loan Book Profile 33
Asset Quality: Arrears Performance 34
NPL Composition 35
Asset Quality: Forbearance Treatments 36
Treasury Portfolio Overview 37
RWAs 38
Regulatory Capital 39
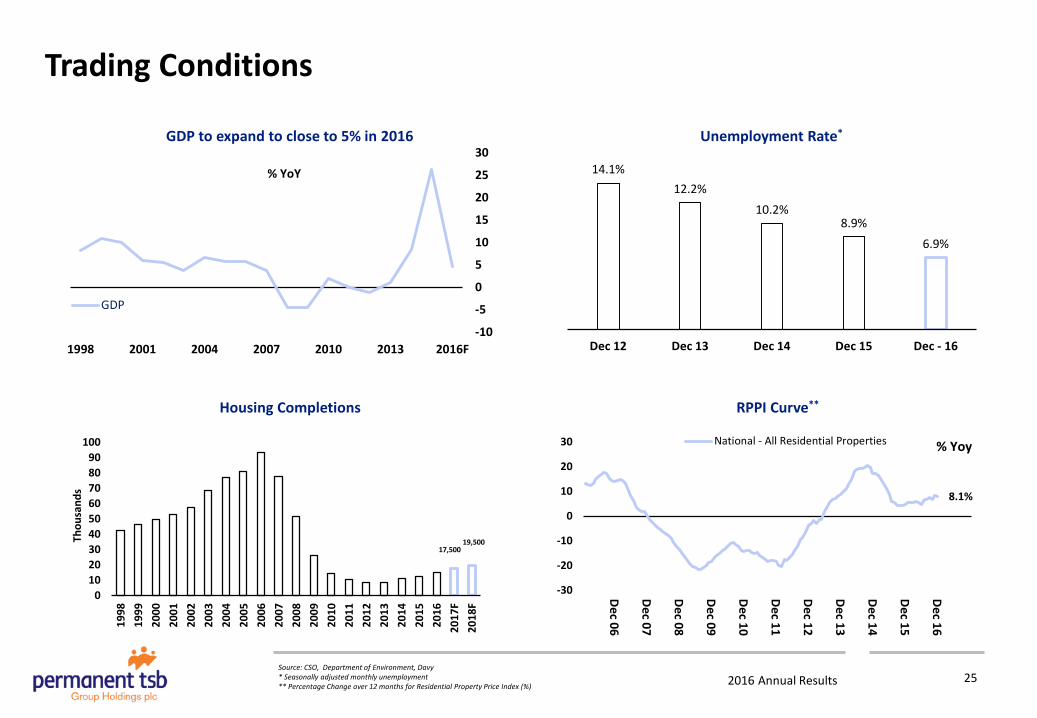
2016 Annual Results Source: CSO, Department of Environment, Davy * Seasonally adjusted monthly unemployment ** Percentage Change over 12 months for Residential Property Price Index (%)
Trading Conditions
-10
-5
0
5
10
15
20
25
30
1998 2001 2004 2007 2010 2013 2016F
GDP
% YoY 14.1% 12.2%
10.2% 8.9%
6.9%
Dec 12 Dec 13 Dec 14 Dec 15 Dec - 16
GDP to expand to close to 5% in 2016
25
Unemployment Rate*
Housing Completions RPPI Curve**
8.1%
-30
-20
-10
0
10
20
30D
ec 06
Dec 07
Dec 08
Dec 09
Dec 10
Dec 11
Dec 12
Dec 13
Dec 14
Dec 15
Dec 16
% Yoy National - All Residential Properties
0102030405060708090
100
1998
1999
2000
2001
2002
2003
2004
2005
2006
2007
2008
2009
2010
2011
2012
2013
2014
2015
2016
2017
F20
18F
Thou
sand
s
17,500 19,500
2016 Annual Results
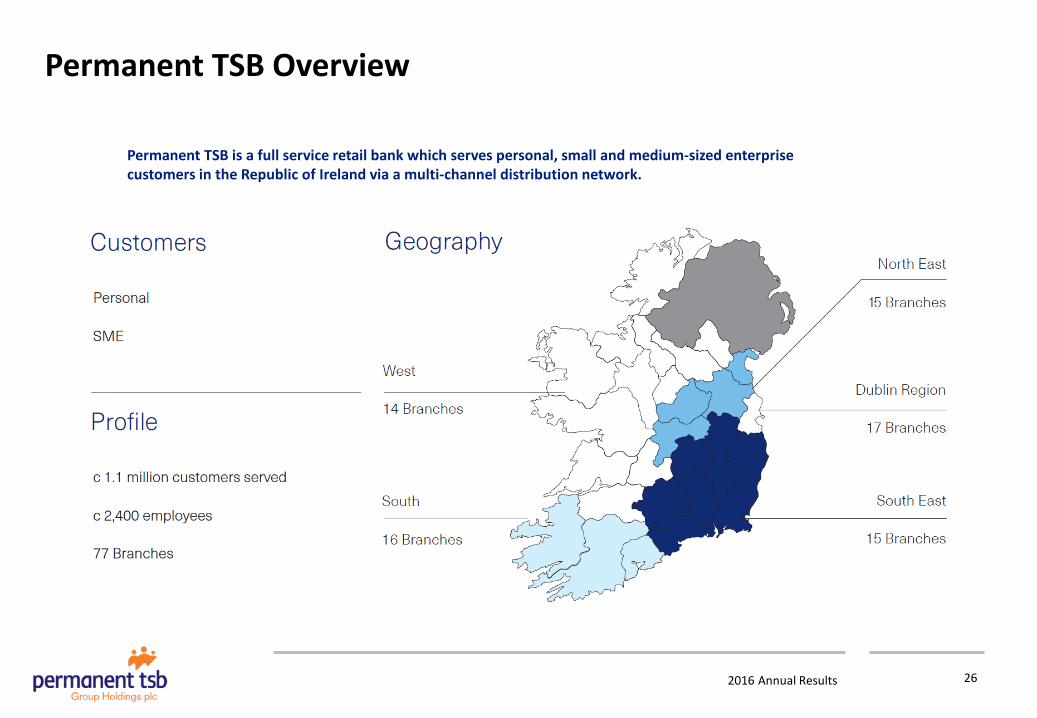
Permanent TSB Overview
26
Permanent TSB is a full service retail bank which serves personal, small and medium-sized enterprise customers in the Republic of Ireland via a multi-channel distribution network.
2016 Annual Results
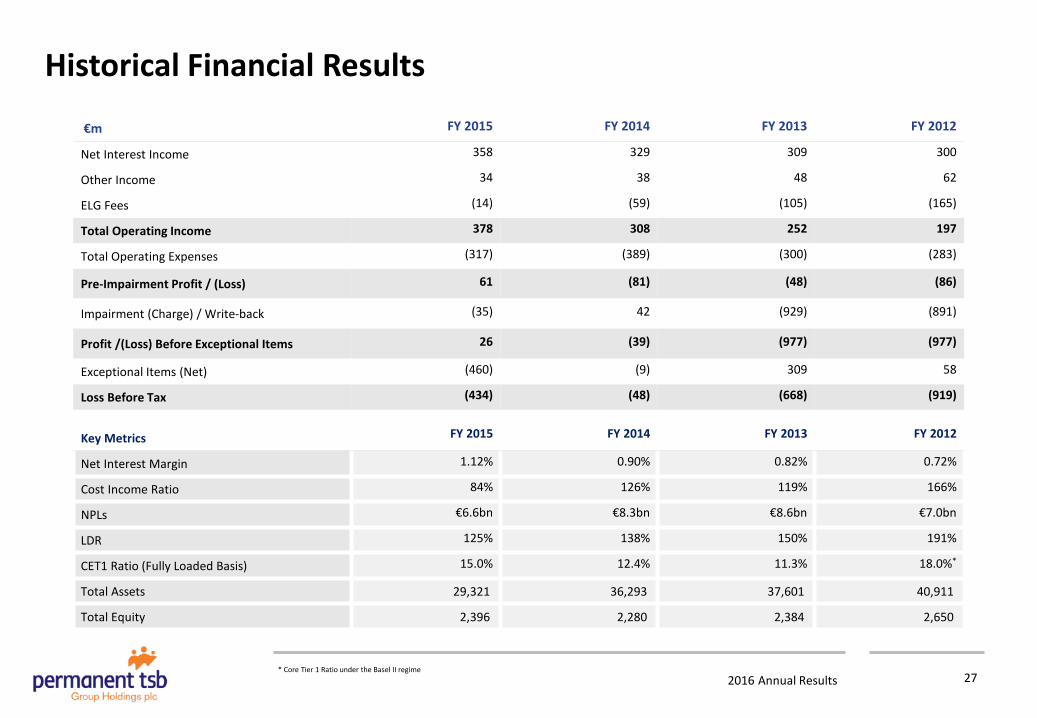
Historical Financial Results
€m FY 2015 FY 2014 FY 2013 FY 2012
Net Interest Income 358 329 309 300
Other Income 34 38 48 62
ELG Fees (14) (59) (105) (165)
Total Operating Income 378 308 252 197
Total Operating Expenses (317) (389) (300) (283)
Pre-Impairment Profit / (Loss) 61 (81) (48) (86)
Impairment (Charge) / Write-back (35) 42 (929) (891)
Profit /(Loss) Before Exceptional Items 26 (39) (977) (977)
Exceptional Items (Net) (460) (9) 309 58
Loss Before Tax (434) (48) (668) (919)
Key Metrics FY 2015 FY 2014 FY 2013 FY 2012
Net Interest Margin 1.12% 0.90% 0.82% 0.72%
Cost Income Ratio 84% 126% 119% 166%
NPLs €6.6bn €8.3bn €8.6bn €7.0bn
LDR 125% 138% 150% 191%
CET1 Ratio (Fully Loaded Basis) 15.0% 12.4% 11.3% 18.0%*
Total Assets 29,321 36,293 37,601 40,911
Total Equity 2,396 2,280 2,384 2,650
* Core Tier 1 Ratio under the Basel II regime 27
2016 Annual Results
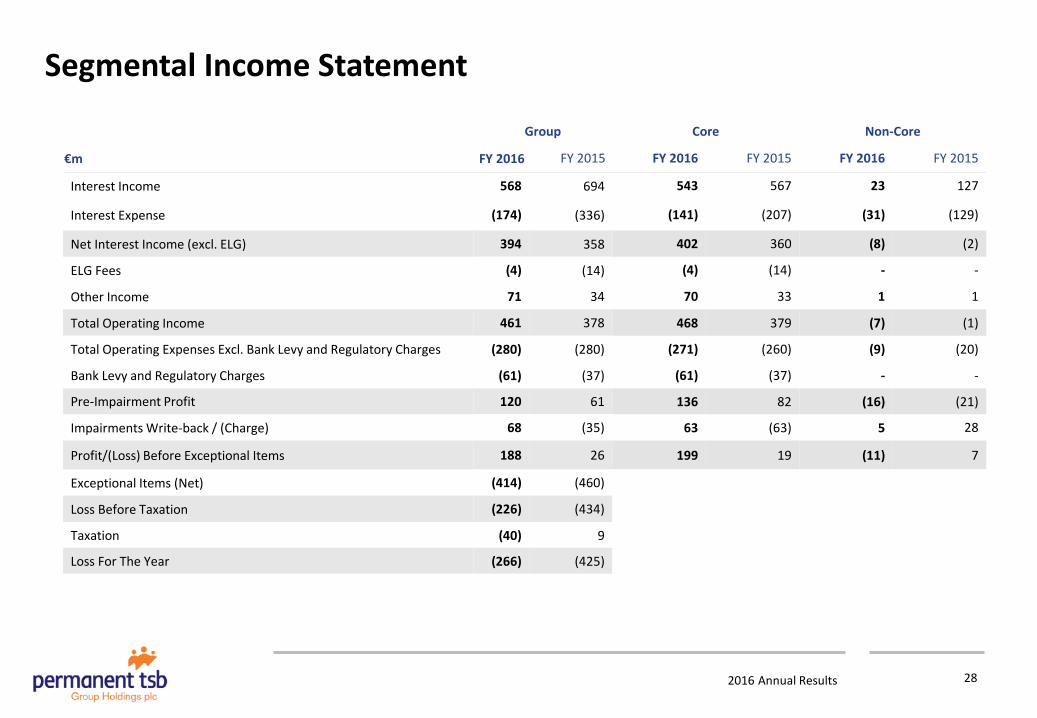
Group Core Non-Core
€m FY 2016 FY 2015 FY 2016 FY 2015 FY 2016 FY 2015
Interest Income 568 694 543 567 23 127
Interest Expense (174) (336) (141) (207) (31) (129)
Net Interest Income (excl. ELG) 394 358 402 360 (8) (2)
ELG Fees (4) (14) (4) (14) - -
Other Income 71 34 70 33 1 1
Total Operating Income 461 378 468 379 (7) (1)
Total Operating Expenses Excl. Bank Levy and Regulatory Charges (280) (280) (271) (260) (9) (20)
Bank Levy and Regulatory Charges (61) (37) (61) (37) - -
Pre-Impairment Profit 120 61 136 82 (16) (21)
Impairments Write-back / (Charge) 68 (35) 63 (63) 5 28
Profit/(Loss) Before Exceptional Items 188 26 199 19 (11) 7
Exceptional Items (Net) (414) (460)
Loss Before Taxation (226) (434)
Taxation (40) 9
Loss For The Year (266) (425)
Segmental Income Statement
28
2016 Annual Results
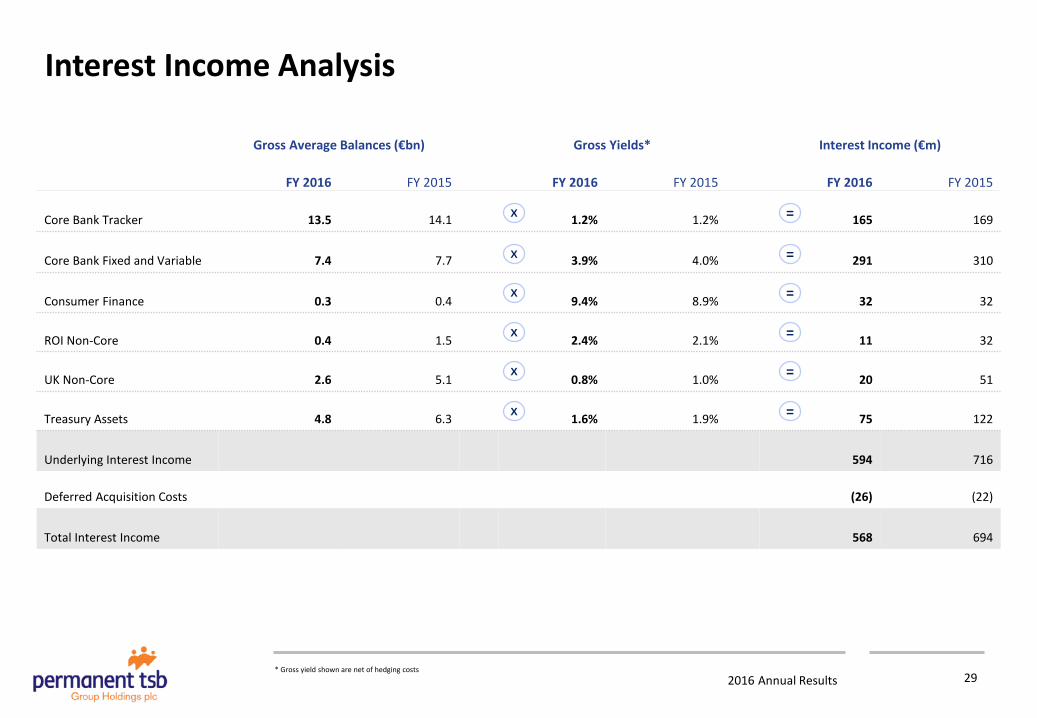
Gross Average Balances (€bn) Gross Yields* Interest Income (€m)
FY 2016 FY 2015 FY 2016 FY 2015 FY 2016 FY 2015
Core Bank Tracker 13.5 14.1 1.2% 1.2% 165 169
Core Bank Fixed and Variable 7.4 7.7 3.9% 4.0% 291 310
Consumer Finance 0.3 0.4 9.4% 8.9% 32 32
ROI Non-Core 0.4 1.5 2.4% 2.1% 11 32
UK Non-Core 2.6 5.1 0.8% 1.0% 20 51
Treasury Assets 4.8 6.3 1.6% 1.9% 75 122
Underlying Interest Income 594 716
Deferred Acquisition Costs (26) (22)
Total Interest Income 568 694
* Gross yield shown are net of hedging costs
X
X
X
X
X
X
=
=
=
=
=
=
Interest Income Analysis
29
2016 Annual Results
Interest Expenses Analysis
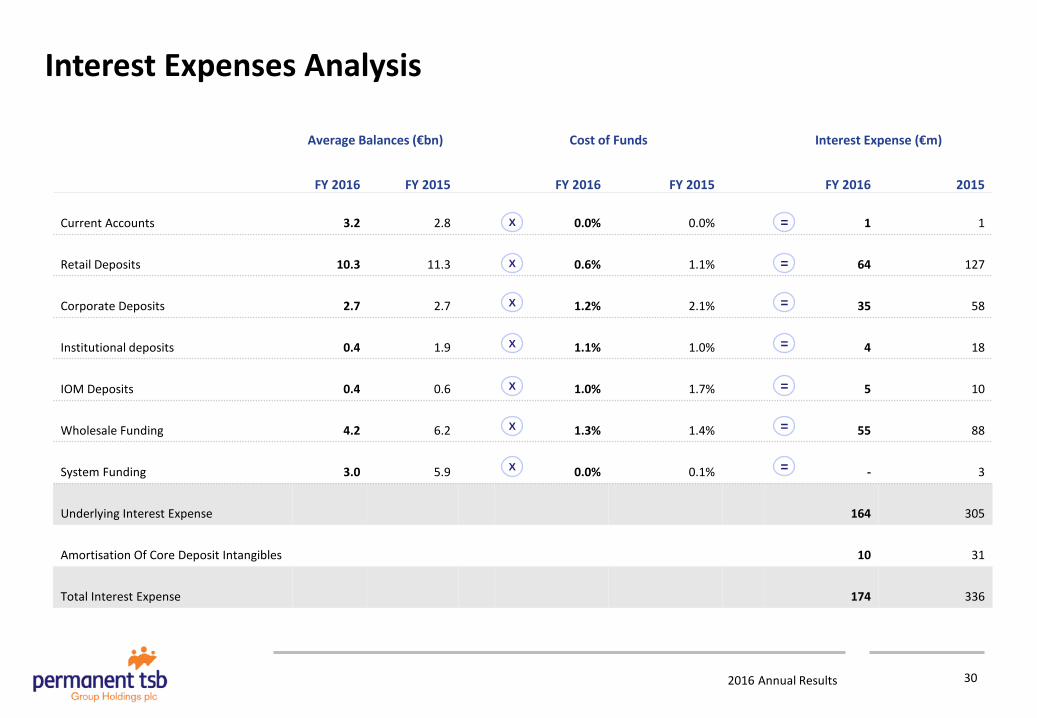
Average Balances (€bn) Cost of Funds Interest Expense (€m)
FY 2016 FY 2015 FY 2016 FY 2015 FY 2016 2015
Current Accounts 3.2 2.8 0.0% 0.0% 1 1
Retail Deposits 10.3 11.3 0.6% 1.1% 64 127
Corporate Deposits 2.7 2.7 1.2% 2.1% 35 58
Institutional deposits 0.4 1.9 1.1% 1.0% 4 18
IOM Deposits 0.4 0.6 1.0% 1.7% 5 10
Wholesale Funding 4.2 6.2 1.3% 1.4% 55 88
System Funding 3.0 5.9 0.0% 0.1% - 3
Underlying Interest Expense 164 305
Amortisation Of Core Deposit Intangibles 10 31
Total Interest Expense 174 336
X =
X =
X =
X =
X =
X =
X =
30
2016 Annual Results
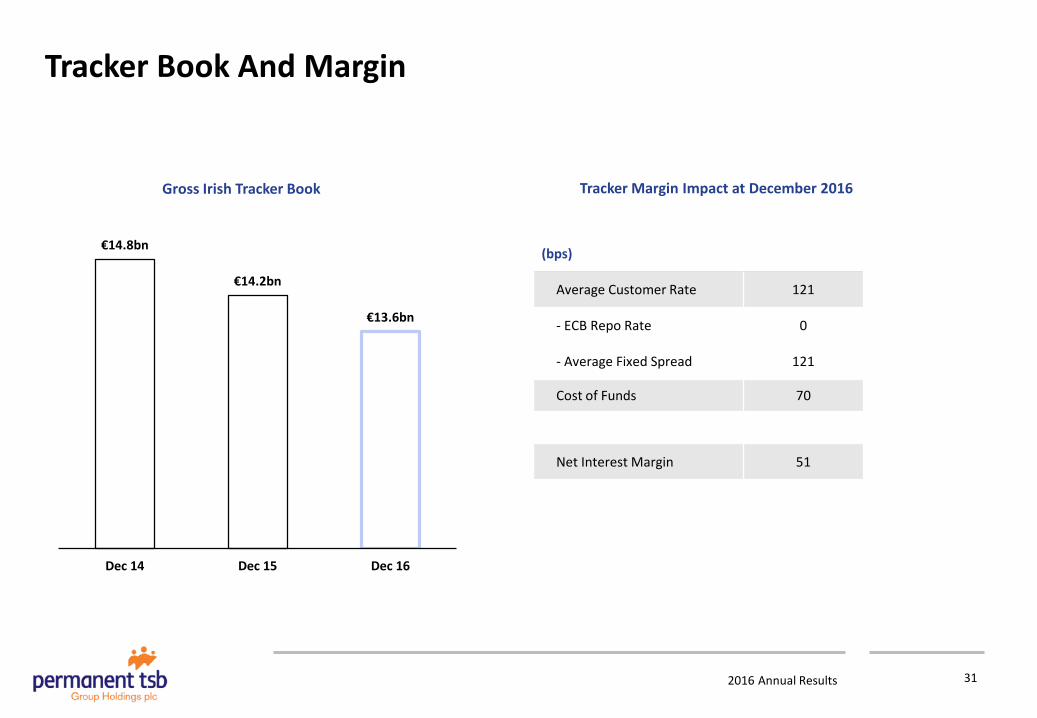
Tracker Margin Impact at December 2016
€14.8bn
€14.2bn
€13.6bn
Dec 14 Dec 15 Dec 16
Gross Irish Tracker Book
(bps)
Average Customer Rate 121
- ECB Repo Rate 0
- Average Fixed Spread 121
Cost of Funds 70
Net Interest Margin 51
Tracker Book And Margin
31
2016 Annual Results
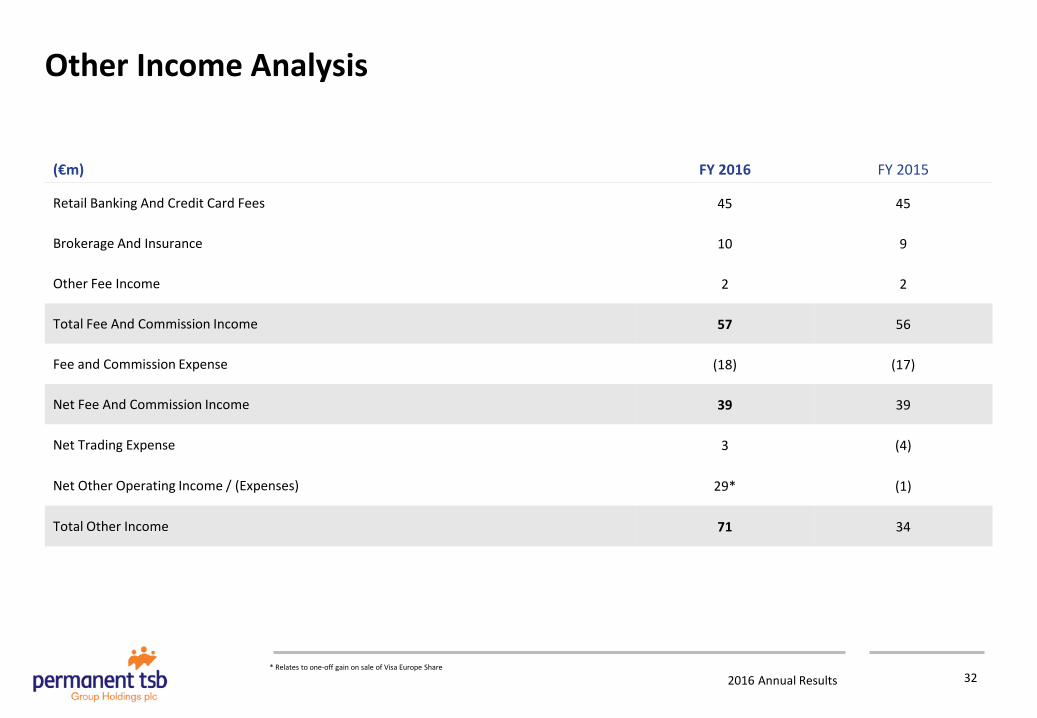
(€m) FY 2016 FY 2015
Retail Banking And Credit Card Fees 45 45
Brokerage And Insurance 10 9
Other Fee Income 2 2
Total Fee And Commission Income 57 56
Fee and Commission Expense (18) (17)
Net Fee And Commission Income 39 39
Net Trading Expense 3 (4)
Net Other Operating Income / (Expenses) 29*
(1)
Total Other Income 71 34
Other Income Analysis
* Relates to one-off gain on sale of Visa Europe Share 32
2016 Annual Results
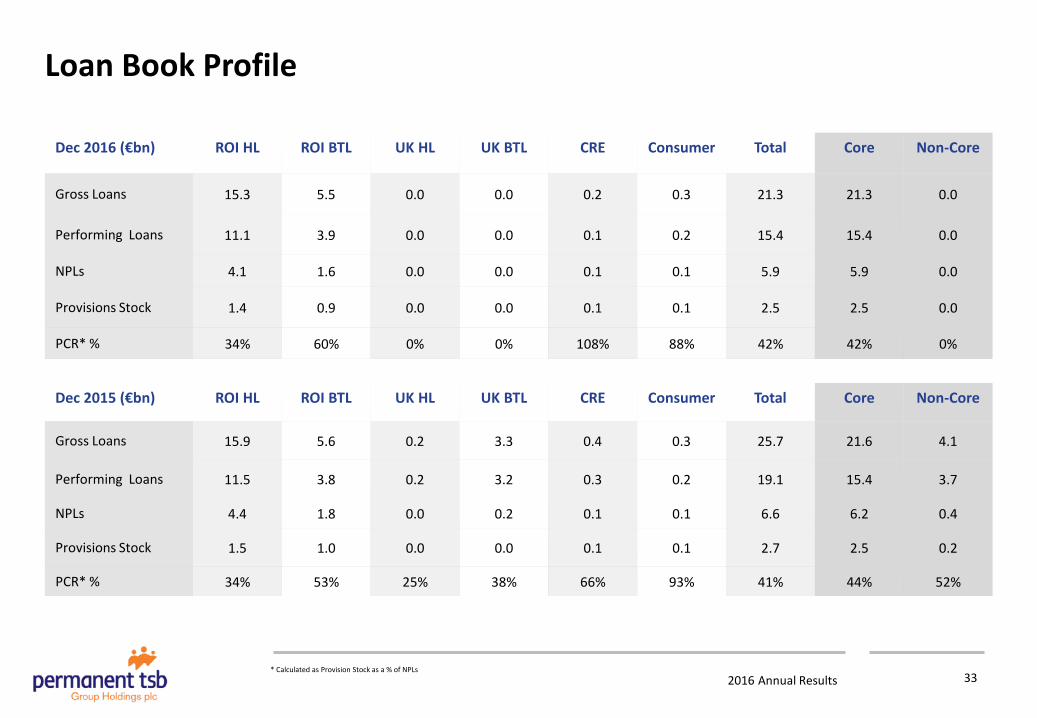
Dec 2015 (€bn) ROI HL ROI BTL UK HL UK BTL CRE Consumer Total Core Non-Core
Gross Loans 15.9 5.6 0.2 3.3 0.4 0.3 25.7 21.6 4.1
Performing Loans 11.5 3.8 0.2 3.2 0.3 0.2 19.1 15.4 3.7
NPLs 4.4 1.8 0.0 0.2 0.1 0.1 6.6 6.2 0.4
Provisions Stock 1.5 1.0 0.0 0.0 0.1 0.1 2.7 2.5 0.2
PCR* % 34% 53% 25% 38% 66% 93% 41% 44% 52%
Dec 2016 (€bn) ROI HL ROI BTL UK HL UK BTL CRE Consumer Total Core Non-Core
Gross Loans 15.3 5.5 0.0 0.0 0.2 0.3 21.3 21.3 0.0
Performing Loans 11.1 3.9 0.0 0.0 0.1 0.2 15.4 15.4 0.0
NPLs 4.1 1.6 0.0 0.0 0.1 0.1 5.9 5.9 0.0
Provisions Stock 1.4 0.9 0.0 0.0 0.1 0.1 2.5 2.5 0.0
PCR* % 34% 60% 0% 0% 108% 88% 42% 42% 0%
* Calculated as Provision Stock as a % of NPLs
Loan Book Profile
33
2016 Annual Results
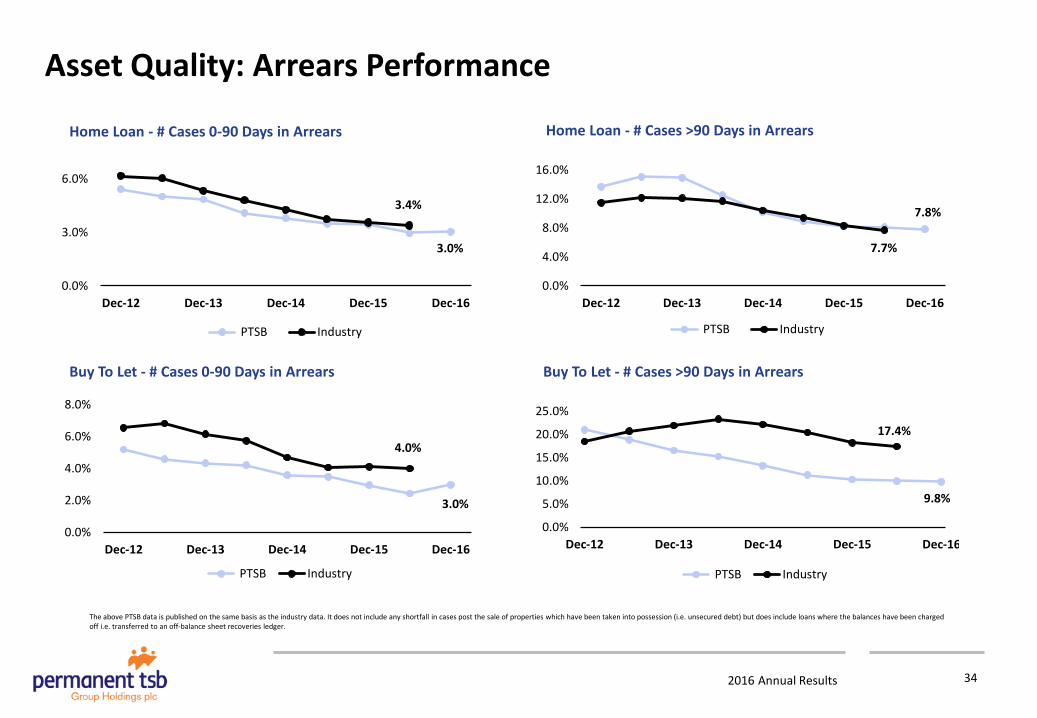
Asset Quality: Arrears Performance
Home Loan - # Cases 0-90 Days in Arrears
3.0%
3.4%
0.0%
3.0%
6.0%
Dec-12 Dec-13 Dec-14 Dec-15 Dec-16
PTSB Industry
Home Loan - # Cases >90 Days in Arrears
Buy To Let - # Cases 0-90 Days in Arrears
Buy To Let - # Cases >90 Days in Arrears
3.0%
4.0%
0.0%
2.0%
4.0%
6.0%
8.0%
Dec-12 Dec-13 Dec-14 Dec-15 Dec-16
PTSB Industry
9.8%
17.4%
0.0%
5.0%
10.0%
15.0%
20.0%
25.0%
Dec-12 Dec-13 Dec-14 Dec-15 Dec-16
PTSB Industry
7.8%
7.7%
0.0%
4.0%
8.0%
12.0%
16.0%
Dec-12 Dec-13 Dec-14 Dec-15 Dec-16
PTSB Industry
The above PTSB data is published on the same basis as the industry data. It does not include any shortfall in cases post the sale of properties which have been taken into possession (i.e. unsecured debt) but does include loans where the balances have been charged off i.e. transferred to an off-balance sheet recoveries ledger.
34
2016 Annual Results
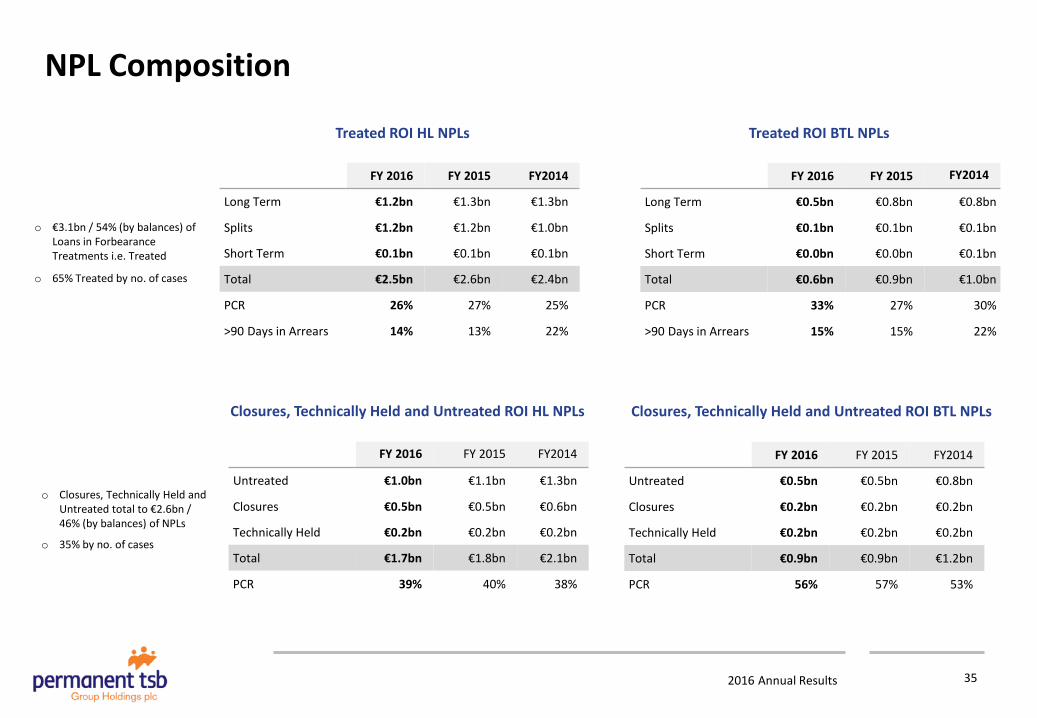
FY 2016 FY 2015 FY2014
Long Term €1.2bn €1.3bn €1.3bn
Splits €1.2bn €1.2bn €1.0bn
Short Term €0.1bn €0.1bn €0.1bn
Total €2.5bn €2.6bn €2.4bn
PCR 26% 27% 25%
>90 Days in Arrears 14% 13% 22%
o €3.1bn / 54% (by balances) of Loans in Forbearance Treatments i.e. Treated
o 65% Treated by no. of cases
o Closures, Technically Held and Untreated total to €2.6bn / 46% (by balances) of NPLs
o 35% by no. of cases
Treated ROI HL NPLs Treated ROI BTL NPLs
Closures, Technically Held and Untreated ROI HL NPLs
FY 2016 FY 2015 FY2014
Long Term €0.5bn €0.8bn €0.8bn
Splits €0.1bn €0.1bn €0.1bn
Short Term €0.0bn €0.0bn €0.1bn
Total €0.6bn €0.9bn €1.0bn
PCR 33% 27% 30%
>90 Days in Arrears 15% 15% 22%
FY 2016 FY 2015 FY2014
Untreated €1.0bn €1.1bn €1.3bn
Closures €0.5bn €0.5bn €0.6bn
Technically Held €0.2bn €0.2bn €0.2bn
Total €1.7bn €1.8bn €2.1bn
PCR 39% 40% 38%
FY 2016 FY 2015 FY2014
Untreated €0.5bn €0.5bn €0.8bn
Closures €0.2bn €0.2bn €0.2bn
Technically Held €0.2bn €0.2bn €0.2bn
Total €0.9bn €0.9bn €1.2bn
PCR 56% 57% 53%
NPL Composition
Closures, Technically Held and Untreated ROI BTL NPLs
35
2016 Annual Results
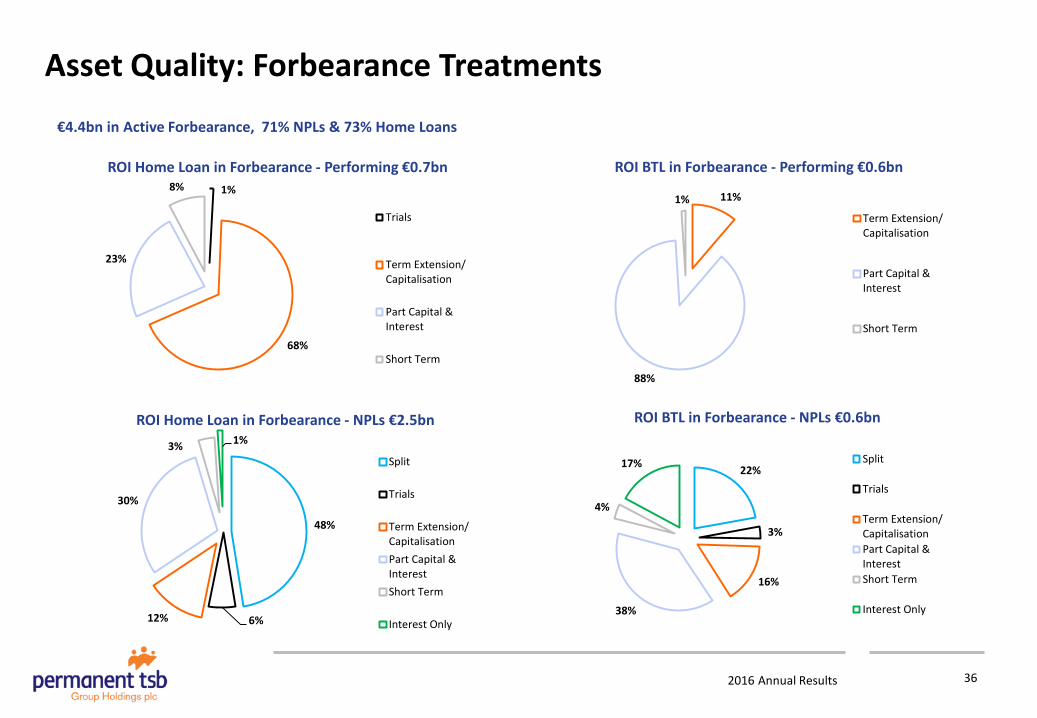
48%
6% 12%
30%
3% 1% ROI Home Loan in Forbearance - NPLs €2.5bn
Split
Trials
Term Extension/CapitalisationPart Capital &InterestShort Term
Interest Only
22%
3%
16%
38%
4%
17%
ROI BTL in Forbearance - NPLs €0.6bn
Split
Trials
Term Extension/CapitalisationPart Capital &InterestShort Term
Interest Only
1%
68%
23%
8% ROI Home Loan in Forbearance - Performing €0.7bn
Trials
Term Extension/Capitalisation
Part Capital &Interest
Short Term
11%
88%
1%
ROI BTL in Forbearance - Performing €0.6bn
Term Extension/Capitalisation
Part Capital &Interest
Short Term
€4.4bn in Active Forbearance, 71% NPLs & 73% Home Loans
36
Asset Quality: Forbearance Treatments
2016 Annual Results
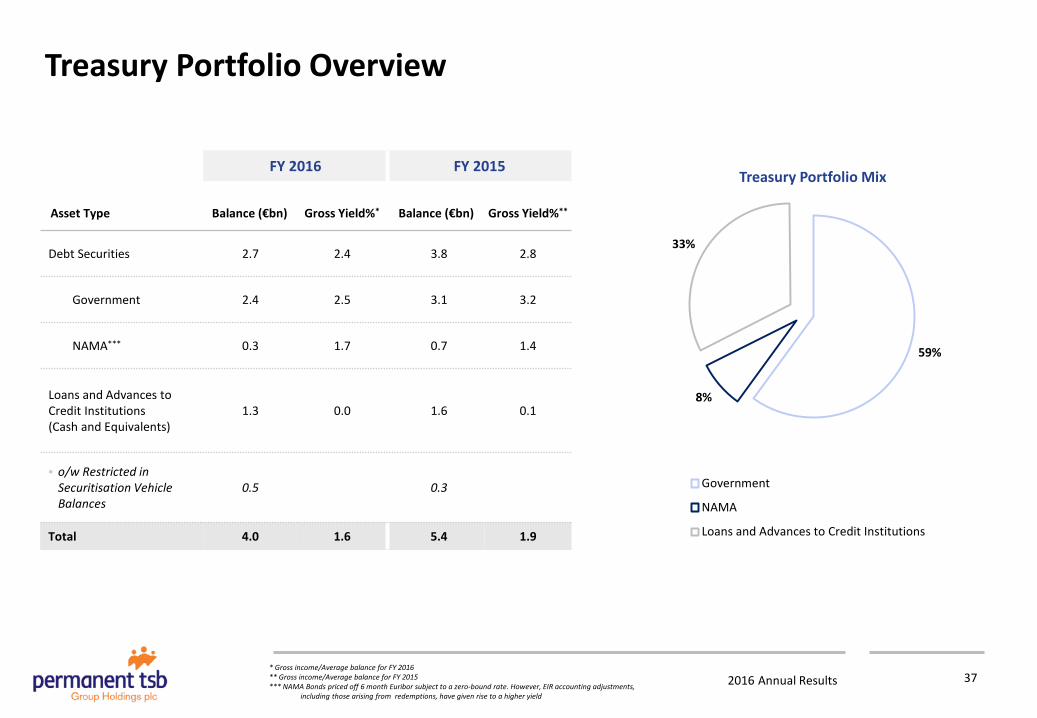
FY 2016 FY 2015
Asset Type Balance (€bn) Gross Yield%* Balance (€bn) Gross Yield%**
Debt Securities 2.7 2.4 3.8 2.8
Government 2.4 2.5 3.1 3.2
NAMA*** 0.3 1.7 0.7 1.4
Loans and Advances to Credit Institutions (Cash and Equivalents)
1.3 0.0 1.6 0.1
• o/w Restricted in Securitisation Vehicle Balances
0.5 0.3
Total 4.0 1.6 5.4 1.9
* Gross income/Average balance for FY 2016 ** Gross income/Average balance for FY 2015 *** NAMA Bonds priced off 6 month Euribor subject to a zero-bound rate. However, EIR accounting adjustments, including those arising from redemptions, have given rise to a higher yield
59%
8%
33%
Government
NAMA
Loans and Advances to Credit Institutions
Treasury Portfolio Mix
Treasury Portfolio Overview
37
2016 Annual Results
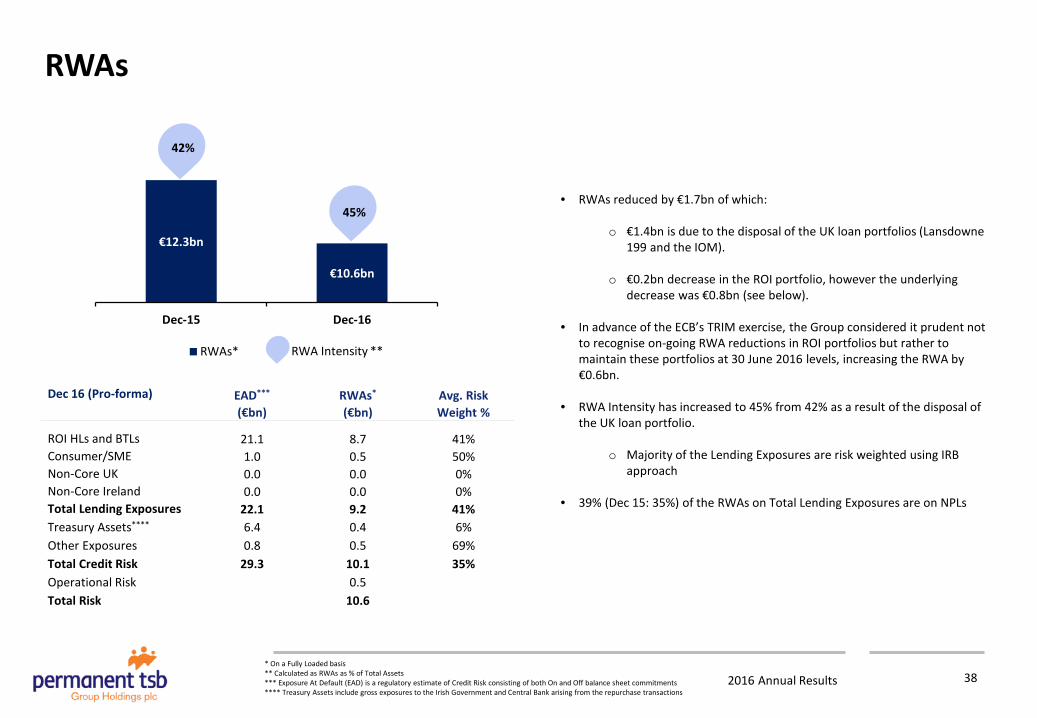
• RWAs reduced by €1.7bn of which:
o €1.4bn is due to the disposal of the UK loan portfolios (Lansdowne 199 and the IOM).
o €0.2bn decrease in the ROI portfolio, however the underlying decrease was €0.8bn (see below).
• In advance of the ECB’s TRIM exercise, the Group considered it prudent not to recognise on-going RWA reductions in ROI portfolios but rather to maintain these portfolios at 30 June 2016 levels, increasing the RWA by €0.6bn.
• RWA Intensity has increased to 45% from 42% as a result of the disposal of the UK loan portfolio.
o Majority of the Lending Exposures are risk weighted using IRB approach
• 39% (Dec 15: 35%) of the RWAs on Total Lending Exposures are on NPLs
Dec 16 (Pro-forma) EAD*** (€bn)
RWAs* (€bn)
Avg. Risk Weight %
ROI HLs and BTLs 21.1 8.7 41% Consumer/SME 1.0 0.5 50% Non-Core UK 0.0 0.0 0% Non-Core Ireland 0.0 0.0 0% Total Lending Exposures 22.1 9.2 41% Treasury Assets**** 6.4 0.4 6% Other Exposures 0.8 0.5 69% Total Credit Risk 29.3 10.1 35% Operational Risk 0.5 Total Risk 10.6
€10.6bn
€12.3bn
Dec-16Dec-15
RWAs* RWA Intensity **
45%
42%
* On a Fully Loaded basis ** Calculated as RWAs as % of Total Assets *** Exposure At Default (EAD) is a regulatory estimate of Credit Risk consisting of both On and Off balance sheet commitments **** Treasury Assets include gross exposures to the Irish Government and Central Bank arising from the repurchase transactions
RWAs
38
2016 Annual Results
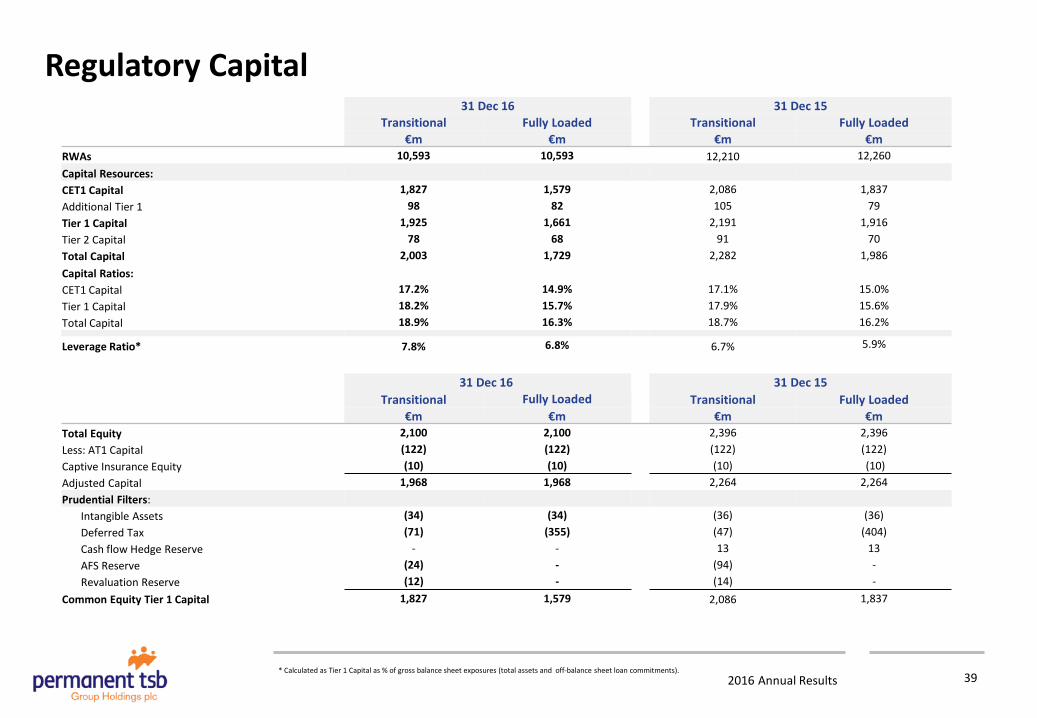
31 Dec 16 31 Dec 15 Transitional Fully Loaded Transitional Fully Loaded
€m €m €m €m RWAs 10,593 10,593 12,210 12,260 Capital Resources: CET1 Capital 1,827 1,579 2,086 1,837 Additional Tier 1 98 82 105 79 Tier 1 Capital 1,925 1,661 2,191 1,916 Tier 2 Capital 78 68 91 70 Total Capital 2,003 1,729 2,282 1,986 Capital Ratios: CET1 Capital 17.2% 14.9% 17.1% 15.0% Tier 1 Capital 18.2% 15.7% 17.9% 15.6% Total Capital 18.9% 16.3% 18.7% 16.2%
Leverage Ratio* 7.8% 6.8% 6.7% 5.9%
31 Dec 16 31 Dec 15 Transitional Fully Loaded Transitional Fully Loaded
€m €m €m €m Total Equity 2,100 2,100 2,396 2,396 Less: AT1 Capital (122) (122) (122) (122) Captive Insurance Equity (10) (10) (10) (10) Adjusted Capital 1,968 1,968 2,264 2,264 Prudential Filters:
Intangible Assets (34) (34) (36) (36) Deferred Tax (71) (355) (47) (404) Cash flow Hedge Reserve - - 13 13 AFS Reserve (24) - (94) - Revaluation Reserve (12) - (14) -
Common Equity Tier 1 Capital 1,827 1,579 2,086 1,837
* Calculated as Tier 1 Capital as % of gross balance sheet exposures (total assets and off-balance sheet loan commitments).
Regulatory Capital
39