Embed Size (px)
Citation preview
2015 ANNUAL REPORTS AND ACCOUNTS
Africa’s global bank www.ubagroup.com
Nigeria Ghana Cameroon Côte d’Ivoire Burkina Faso Uganda Liberia Sierra Leone Benin Senegal Chad Kenya Tanzania Gabon Zambia Guinea Mozambique Congo DR Congo Brazzaville USA Uk France
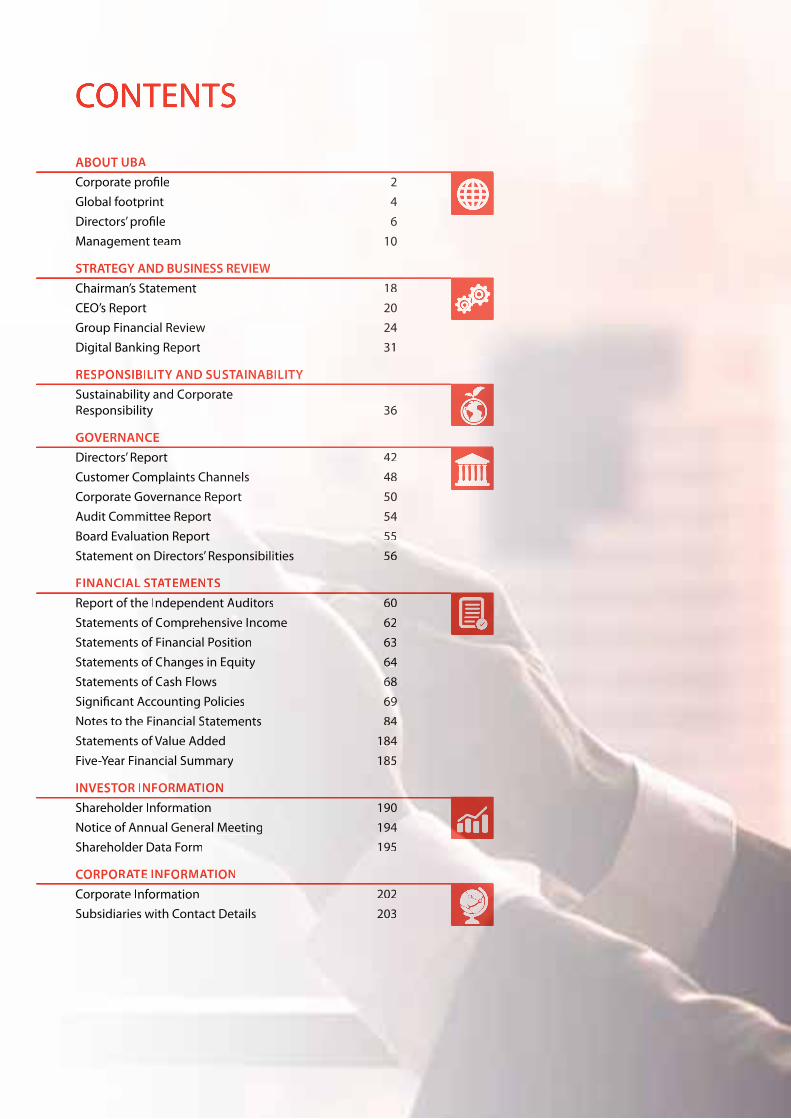
CONTENTS
ABOUT UBA
Corporate profile 2
Global footprint 4
Directors’ profile 6
Management team 10
STRATEGY AND BUSINESS REVIEW
Chairman’s Statement 18
CEO’s Report 20
Group Financial Review 24
Digital Banking Report 31
RESPONSIBILITY AND SUSTAINABILITY
Sustainability and Corporate
Responsibility 36
GOVERNANCE
Directors’ Report 42
Customer Complaints Channels 48
Corporate Governance Report 50
Audit Committee Report 54
Board Evaluation Report 55
Statement on Directors’ Responsibilities 56
FINANCIAL STATEMENTS
Report of the Independent Auditors 60
Statements of Comprehensive Income 62
Statements of Financial Position 63
Statements of Changes in Equity 64
Statements of Cash Flows 68
Significant Accounting Policies 69
Notes to the Financial Statements 84
Statements of Value Added 184
Five-Year Financial Summary 185
INVESTOR INFORMATION
Shareholder Information 190
Notice of Annual General Meeting 194
Shareholder Data Form 195
CORPORATE INFORMATION
Corporate Information 202
Subsidiaries with Contact Details 203
ABOUT UBA
Corporate profilee 2
Global footprint 4
Directors’ profilee 6
Management teaamm m 10
SSTTRARATAA EGY AND BUSSINESSS REVIEW
Chairman’s Stateememeem nt 181
CEO’s Report 200
Group Financial Reevvieiew 2442
Digital Banking RReepoortrt 31
RESPONSSIBBILITY AANDD SUUSTAAINATT BILITY
Sustainability annd Corpoorate
Responsibility 36
GOVERNANCCEE
Directors’ Report 442
Customer Complaiiiintn s Channels 48484
Corporate Governancncncncee e ReR port 50
Audit Committee Reportrt 54
Board Evaluation Report 5555555555
Statement on Directors’ Responsisibibibibiilililiililil tititttt eses 5656656
FINANCIAL L STATT TAA EEMENNNTTSS
Report of the Independent Auditors 6066
Statements of Comprehensiveveveve Income 626262
Statements of Financial Position 63
Statements of Changes in Equity 64
Statements of Cash Flows 66686868666866
Significant Accounting Policies 69669696996999699
Notes to the Financial Statements 848484448444
Statements of Value Added 1888844
Five-Year Financial Summary 1888888855555
INVESTOR INFORRRRMMMATAA ION
Shareholder Informamaatitt on 199000
Notice of Annual GGennererrralalaa Meeting 19991944444
Shareholder Data Fororm 1919555
CORPORATAA E INFORMATAA ION
Corporate Information 202022
Subsidiaries with Contact Detat ils 202033
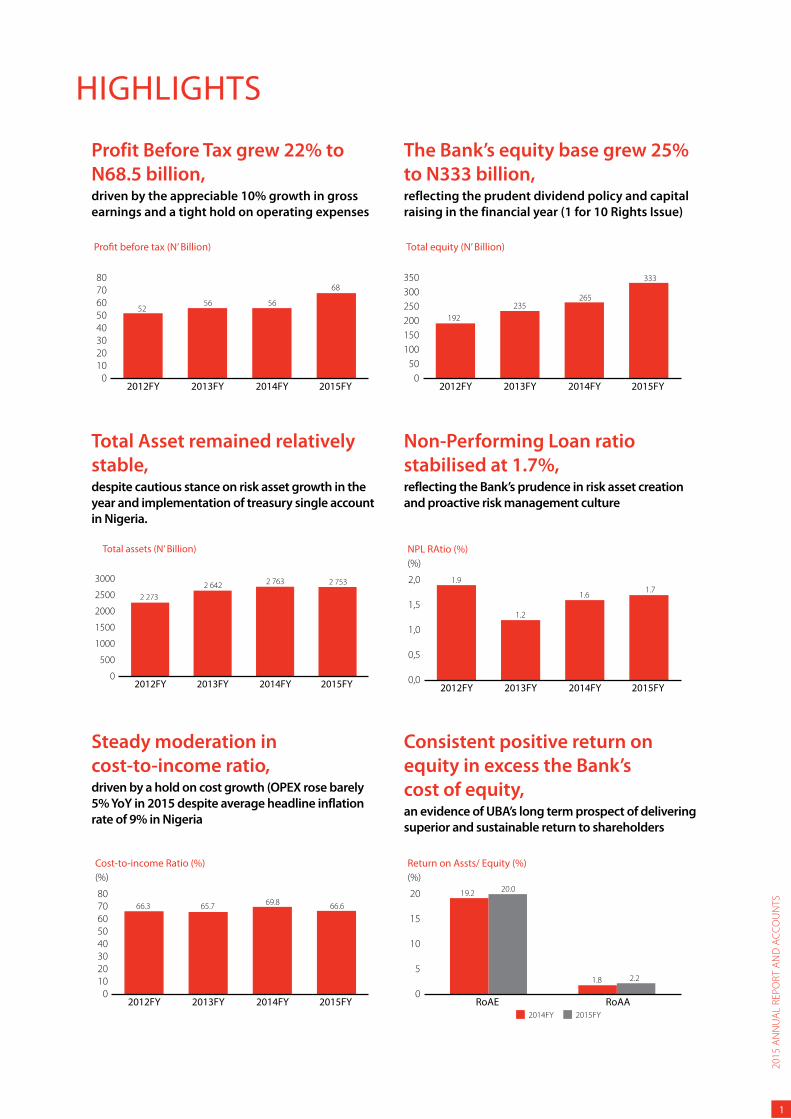
HIGHLIGHTS
Profit before tax (N’ Billion)
01020304050607080
2012FY 2013FY 2014FY 2015FY
5256 56
68
Profit Before Tax grew 22% to
N68.5 billion, driven by the appreciable 10% growth in gross
earnings and a tight hold on operating expenses
Total assets (N’ Billion)
0
500
1000
1500
2000
2500
3000
2012FY 2013FY 2014FY 2015FY
2 273
2 642 2 763 2 753
Total Asset remained relatively
stable, despite cautious stance on risk asset growth in the
year and implementation of treasury single account
in Nigeria.
Cost-to-income Ratio (%)(%)
01020304050607080
2012FY 2013FY 2014FY 2015FY
66.3 65.7 69.8 66.6
Steady moderation in
cost-to-income ratio,
driven by a hold on cost growth (OPEX rose barely
5% YoY in 2015 despite average headline inflation
rate of 9% in Nigeria
Total equity (N’ Billion)
0
50
100
150
200
250
300
350
2012FY 2013FY 2014FY 2015FY
192
235265
333
The Bank’s equity base grew 25%
to N333 billion,reflecting the prudent dividend policy and capital
raising in the financial year (1 for 10 Rights Issue)
NPL RAtio (%)(%)
0,0
0,5
1,0
1,5
2,0
2012FY 2013FY 2014FY 2015FY
1.9
1.2
1.61.7
Non-Performing Loan ratio
stabilised at 1.7%, reflecting the Bank’s prudence in risk asset creation
and proactive risk management culture
Return on Assts/ Equity (%)(%)
0
5
10
15
20
2014FY 2015FY
RoAE RoAA
19.220.0
1.8 2.2
Consistent positive return on
equity in excess the Bank’s
cost of equity,
an evidence of UBA’s long term prospect of delivering
superior and sustainable return to shareholders
1
20
15
AN
NU
AL
RE
PO
RT
AN
D A
CC
OU
NT
S
2
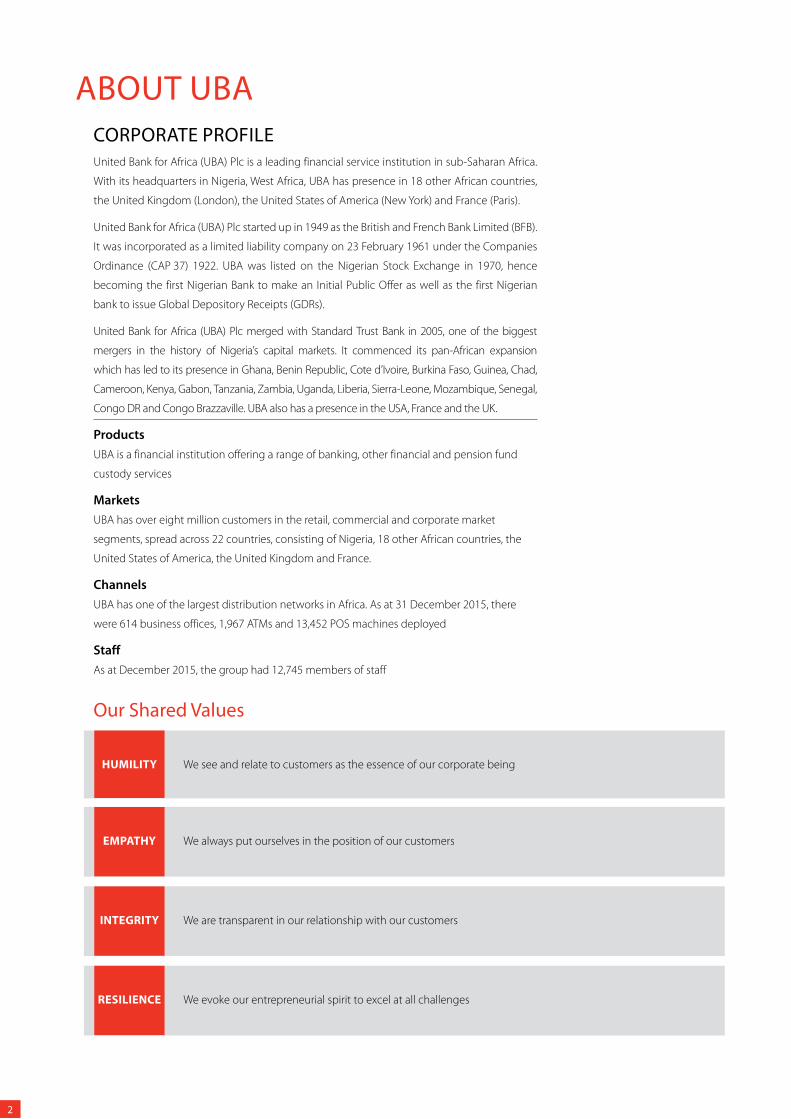
United Bank for Africa (UBA) Plc is a leading financial service institution in sub-Saharan Africa.
With its headquarters in Nigeria, West Africa, UBA has presence in 18 other African countries,
the United Kingdom (London), the United States of America (New York) and France (Paris).
United Bank for Africa (UBA) Plc started up in 1949 as the British and French Bank Limited (BFB).
It was incorporated as a limited liability company on 23 February 1961 under the Companies
Ordinance (CAP 37) 1922. UBA was listed on the Nigerian Stock Exchange in 1970, hence
becoming the first Nigerian Bank to make an Initial Public Offer as well as the first Nigerian
bank to issue Global Depository Receipts (GDRs).
United Bank for Africa (UBA) Plc merged with Standard Trust Bank in 2005, one of the biggest
mergers in the history of Nigeria’s capital markets. It commenced its pan-African expansion
which has led to its presence in Ghana, Benin Republic, Cote d’Ivoire, Burkina Faso, Guinea, Chad,
Cameroon, Kenya, Gabon, Tanzania, Zambia, Uganda, Liberia, Sierra-Leone, Mozambique, Senegal,
Congo DR and Congo Brazzaville. UBA also has a presence in the USA, France and the UK.
Products
UBA is a financial institution offering a range of banking, other financial and pension fund
custody services
Markets
UBA has over eight million customers in the retail, commercial and corporate market
segments, spread across 22 countries, consisting of Nigeria, 18 other African countries, the
United States of America, the United Kingdom and France.
Channels
UBA has one of the largest distribution networks in Africa. As at 31 December 2015, there
were 614 business offices, 1,967 ATMs and 13,452 POS machines deployed
Staff
As at December 2015, the group had 12,745 members of staff
ABOUT UBA
CORPORATE PROFILE
Our Shared Values
HUMILITY We see and relate to customers as the essence of our corporate being
EMPATHY We always put ourselves in the position of our customers
INTEGRITY We are transparent in our relationship with our customers
RESILIENCE We evoke our entrepreneurial spirit to excel at all challenges
2

20
15
AN
NU
AL
RE
PO
RT
AN
D A
CC
OU
NT
S
3
MissionTo be a role model for African businesses
by creating superior value for all our
stakeholders, abiding by the utmost
professional and ethical standards, and
building an enduring institution.
VisionTo be the undisputed leading
and dominant Financial Services
Institution in Africa.
We are one of the largest financial services
groups on the African continent. We provide
corporate, commercial, SME, consumer finance
and personal (retail) banking services to more
than eight million customers, served through
diverse channels: branches and digital platforms
(ATMs, online banking, mobile banking, social
media etc). Also, UBA offers pension custody and
related services.
WHO WE ARE
3
20
15
AN
NU
AL
RE
PO
RT
AN
D A
CC
OU
NT
S
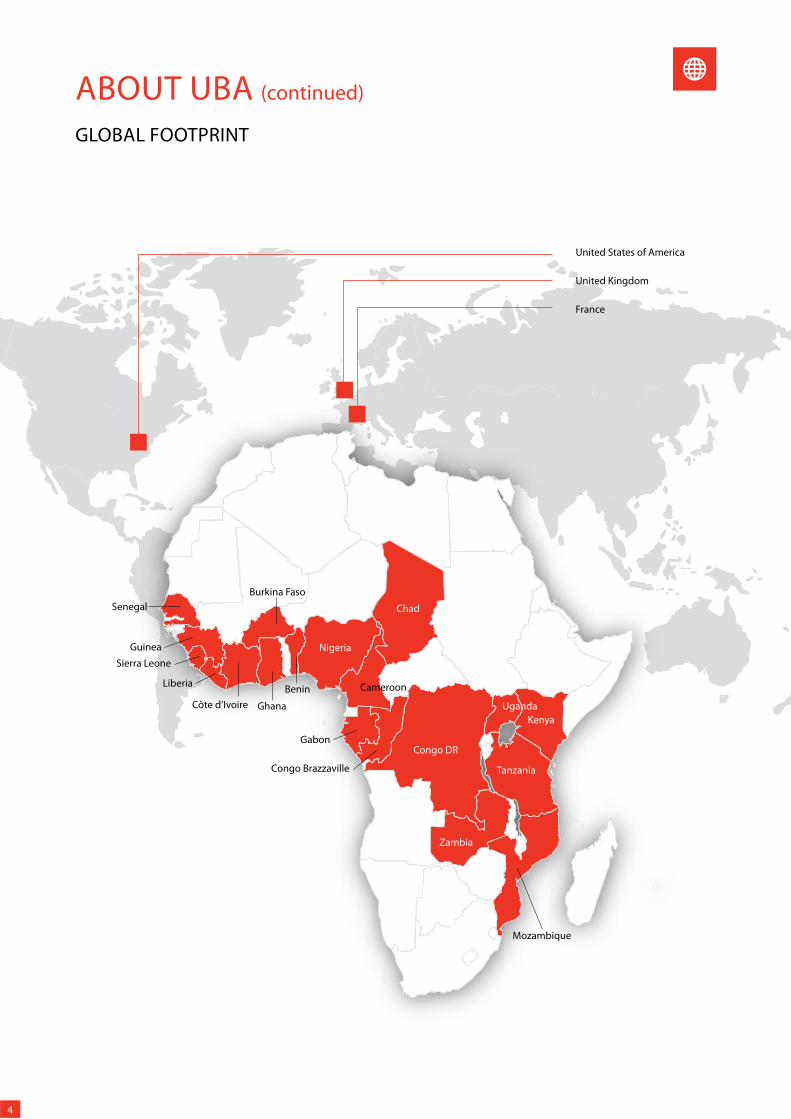
ABOUT UBA (continued)
Mozambique
Zambia
Tanzania
Kenya
Congo DR
Uganda
Congo Brazzaville
Gabon
Cameroon
Chad
Nigeria
Benin
Ghana
Burkina Faso
Côte d’Ivoire
Liberia
Sierra Leone
Guinea
Senegal
United Kingdom
France
United States of America
GLOBAL FOOTPRINT
4

BOARD OF DIRECTORS
Front row: Left to right
Mrs Owanari Duke
Mrs Rose Okwechime
Mrs Foluke Abdulrazaq
Ms Obi Ibekwe
Back row: Standing – Left to right
Mr Emeke Iweriebor
Chief Kola Jamodu, CFR
Alhaji Ja’afaru Paki
Mr Kennedy Uzoka
Ambassador Joe C Keshi, OON
Mr Adekunle Olumide, OON
Mr Tony O Elumelu, CON
Mr Dan Okeke
Mr Phillips Oduoza
Mr Femi Olaloku
High Chief Samuel Oni, FCA
Mr Yahaya Zekeri
5
20
15
AN
NU
AL
RE
PO
RT
AN
D A
CC
OU
NT
S

ABOUT UBA (continued)
DIRECTORS’ PROFILES
Mr Elumelu chairs privately held investment firm Heirs Holdings and Nigeria’s largest quoted conglomerate, Transcorp.
Mr Elumelu invests across Africa, primarily in the oil and gas, financial services, hospitality and power sectors. His investments
are informed by his philosophy of Africapitalism: the belief that the private sector can lead Africa’s economic renaissance and
that investment should create both economic prosperity and social wealth.
Mr Elumelu sits on a number of public and social sector boards including the United Nations Sustainable Energy for
All Initiative (SE4ALL) and USAID’s Private Capital Group for Africa Partners Forum (PCGA). He is also the founder of the Tony
Elumelu Foundation, which has seeded $100 million through the Tony Elumelu Entrepreneurship Programme, to champion
entrepreneurship across Africa over the next 10 years.
Tony O Elumelu, CON
Chairman
Tony O Elumelu is an economist, investor and philanthropist.
A graduate of political science from the University of Ibadan, Nigeria, he holds a post-graduate diploma in International
Relations and Diplomacy from the Nigerian Institute of International Affairs and a Masters in Administration and Development
from the Institute of Social Studies, the Hague, the Netherlands. He is both a Fellow of the John Kennedy School of Government,
Harvard University and the Harvard Business School. He has, since joining the Board, attended a number of trainings organised
by the Board for its Directors. He joined the Nigerian Public Service in 1975 and has over thirty-five years’ working experience
as a career diplomat. Apart from serving in a number of Nigeria’s diplomatic missions and heading a few, he was at various
times National Coordinator, Nigeria National Volunteer Service, Permanent Secretary, Cabinet Secretariat, the Presidency, and
Permanent Secretary, Ministry of Foreign Affairs. He is a Director of South Strategy and Chairman of Afrigrowth Foundation.
Joe C Keshi, OON
Vice-Chairman
Appointed Non-Executive Director in 2010 and is the Vice-Chairman of the Board
Prior to his appointment as Group Managing Director/CEO, he was the Deputy Managing Director responsible for the banking business of UBA Plc in the southern part of Nigeria. He held several senior level appointments before joining Standard Trust Bank in 2004.
His banking career spans over two decades with experience in several areas, including credit and marketing, treasury, commercial/consumer banking, information technology, business development, strategic planning, financial control, human resources, internal control and international operations.
He holds a first class degree in Civil Engineering, and MBA (Finance), both from University of Lagos. He is also an alumnus of the prestigious Harvard Business School’s Advanced Management Program.
He has attended numerous banking, management and leadership programs in some of the most famous training centres of the world. His strength is in execution, talent management, technology integration, lean banking and relationship management.
He is an honorary fellow of the Chartered Institute of Bankers.
Phillips Oduoza, FCIB
Group Managing Director/CEO
Appointed Executive Director in 2005 and Group Managing Director/CEO in August 2010
He holds a BSc in Mechanical Engineering from the University of Benin and an MBA from the University of Lagos. Mr Uzoka has
over two decades’ experience covering core banking, corporate marketing, strategic business advisory services and resources
management.
Kennedy currently manages the Group’s operations across 18 countries in Africa as CEO UBA, Africa. He also supervises
e-Banking and Information Technology.
Prior to his appointment as CEO UBA Africa, Mr Uzoka supervised the Bank’s businesses in New York and London, in addition
to Strategic Support Groups such as HR, Legal Advisory Services, Procurement & Vendor Management, Corporate Relations
& Marketing amongst others, he also had responsibility for other critical business functions including Group Treasury,
International Financial Institutions & Transaction Banking, e-Banking, UBA Pensions Custodians, Consumer Banking and Cash
Management Services.
He was Head, Strategy & Business Transformation of UBA Group and later Regional Bank Head, South Bank covering over
17 states in southern part of Nigeria. Prior to the merger of legacy Standard Trust Bank(STB) and United Bank for Africa(UBA),
he was Regional Director-South East, Vice President-Northern Nigeria, Chief Marketing Officer – Federal Capital Territory (FCT),
Chief Marketing Officer, Lagos and later, Managing Executive Officer at STB.
He is an alumnus of Harvard Business School in Boston USA, the International Institute of Management Development (IMD) in
Lausanne, Switzerland and the London Business School, United Kingdom.”
Kennedy Uzoka
Deputy Managing Director/CEO UBA Africa
Appointed Executive Director in 2010
6

He holds degrees in Civil Engineering and Business Administration from the University of Lagos and has over two decades of
banking experience, holding several management positions in Treasury, International Banking, Risk Management, Operations
and Information Technology.
Femi Olaloku
Executive Director (Treasury And International Banking)
Appointed Executive Director in 2010.
He holds a BSc degree in Geography and Planning from the University of Nigeria, Nsukka and an MBA (Finance) degree
from the ESUT Business School Lagos. He is an associate of the Nigerian Institute of Management (NIM) and has attended
various local and international courses, including the Competition and Strategy programme at the Harvard Business School.
He acquired varied work experience in the manufacturing industry before moving to the financial services sector. He has over
17 years’ banking experience, garnering capabilities in domestic and international operations, credit and marketing. He is
currently responsible for the Bank’s retail and commercial business in Abuja and Eastern Nigeria.
Dan Okeke
Executive Director (Abuja, East and South Bank)
Appointed Executive Director in 2011
He holds a BSc and MSc in Political Science (Int’l Relations) as well as an MBA from the University of Lagos. He is also an alumnus
of the Wharton Business School’s Executive Development Programme. He has over two decades’ experience in banking.
He is currently Deputy CEO, UBA Africa. Prior to this, he was at various times, Regional CEO, Central Africa; CEO UBA CES Africa;
and, CEO UBA West Africa with responsibility for building the Bank’s business and strengthening governance in UBA country
subsidiaries in Central, East and Southern Africa; and West Africa. He also oversaw the Bank’s business in Corporate Banking
and Lagos and Western Nigeria.
Emeke was also the pioneer MD/CEO of UBA Cameroon.
Emeke Iweriebor
Executive Director (Deputy CEO UBA Africa)
Appointed Executive Director in 2013
She was called to the Nigerian Bar in1986. She practiced law at Olaniwun Ajayi and Co. before joining the banking industry
where she had 12 years of experience as Credit and Marketing Officer. She started her banking career with Universal Trust Bank
(now Union Bank), after which she joined Diamond Bank Plc. Ms Ibekwe began working at Accenture in May 2003. Ms Ibekwe
received a Bachelor of Arts degree in International Relations from Tufts University in 1980 and an LLB degree with Honours
from the University of Lagos in 1985. She also obtained an MBA degree from Ross School of Business, University of Michigan
in 2002. Ms Obi Ibekwe served as General Manager at Zenith Bank Plc prior to joining UBA Plc. She is currently the Executive
Director, Resources.
Obi Ibekwe
Executive Director (Resources)
Appointed Executive Director in 2013
7
20
15
AN
NU
AL
RE
PO
RT
AN
D A
CC
OU
NT
S

ABOUT UBA (continued)
DIRECTORS’ PROFILES (continued)
A Chartered Accountant and Chartered Global Management Accountant (CGMA), Chief Jamodu is also a fellow of the Institute
of Chartered Accountants of Nigeria (ICAN), Chartered Institute of Management Accountants, London (CIMA), Chartered
Institute of Taxation of Nigeria (CITN) and Institute of Chartered Secretaries and Administrators of Nigeria (ICSAN).
His work experience spans the multinational sector in Nigeria, having worked in UAC, Unilever Plc and PZ Industries where
he rose to the position of Chief Executive and was later appointed as the Chairman, thereby combining the position of the
Chairman/Group Chief Executive of the Group.
An alumnus of the Harvard Business School, Boston, USA, and a former Minister of Industry of the Federal Republic of Nigeria,
Chief Kola Jamodu is the immediate Past President, Manufacturers Association of Nigeria (MAN).
He is currently the Chairman of the Boards of Nigerian Breweries Plc, PZ Cussons Nigeria Plc and Nutricima Limited. He is a
recipient of National Merit Awards including Member of the Order of the Federal Republic of Nigeria (MFR), Officer of the Order
of the Federal Republic of Nigeria and Commander of the Order of the Federal Republic of Nigeria (CFR). He is also a recipient
of the National Productivity Merit Award (NPMA) having been adjudged one of the most productive Chief Executives in 1997.
Kola Jamodu, FCA, CFR
Non-Executive Director
Appointed Non-Executive Director in 2007
He is a quintessential diplomat, a distinguished career public servant and an accomplished technocrat of the organised private
sector who holds a Second Class upper honours degree in History (London) from the then University College of Ibadan.
He is a former Federal Permanent Secretary and Chairman of the Nigerian Social Insurance Trust Fund (NSITF). He has
represented Nigeria in many global fora, including as Minister-Counsellor at the Permanent Mission of Nigeria to the
United Nations office in Geneva, member of the Board of the International Atomic Energy Agency (IAEA), Chairman of the
Employment Committee of the International Labour Organisation (ILO) and Charge d’Affaires of the Nigerian Embassy in
Gabon. He retired as the first Director-General/CEO of the Lagos Chamber of Commerce and Industry in 2005. He is currently
the Consultant to the American Business Council.
Adekunle Olumide, OON
Non-Executive Director
Appointed Non-Executive Director in 2007
She holds an MSc degree in Banking and Finance from the University of Ibadan. She is also an Alumna of the Harvard Business
School. She has 17 years of practical banking experience, the height of which was her appointment by the Central Bank/NDIC
in September 1995 as the Executive Chairman of the Interim Management Board of Credite Bank Nigeria Limited
She also has vast public service experience, having served as Commissioner in the Ministries of Finance and Women Affairs
in Lagos State and it is to her credit that during her tenure, the broad policies that led to the State’s Accelerated Revenue
Generation Programme (ARGP) were formulated. She was also the Chairman of the State’s Tenders’ Board, a member of the
Federal Accounts Allocation Committee (FAAC) and the State’s Executive Council.
Mrs Abdulrazaq has held several major board positions including Julius Berger Plc. The Vice President/Council Member of the
Bank Directors Association of Nigeria (BDAN) and a member of the Institute of Directors (IOD), she is a recipient of the ‘Lagos
State Woman of Excellence’ Award in 1999 and a Justice of Peace (JP). She currently runs Bridge House College, Ikoyi – Lagos,
a sixth-form College that offers first class pre-University Foundation and ‘A’ Levels for students seeking University Education in
Nigeria and overseas.
Foluke K Abdulrazaq
Non-Executive Director
Appointed Non-Executive Director in 2007
She holds an MBA specialising in Banking and Finance. Currently the Managing Director of Abbey Building Society Plc. Fellow
of the Chartered Institute of Bankers of Nigeria, Fellow of the Institute of Directors and Fellow of the Institute of Bankers
(London). She is an alumnus of the International Institute of Management Development (IMD) in Lausanne, Switzerland. She is
a recipient of many awards including the Woman of Excellence Award.
Rose Okwechime
Non-Executive Director
Reappointed Non-Executive Director in July 2012
8

He obtained a BSc degree in Business Administration from Bradley University, USA. He has had a distinguished career working
at Mobil Oil Nigeria, the Nigerian National Petroleum Corporation (NNPC) and Unipetrol Nigeria where he served as Managing
Director/CEO between 1999 and 2001. He has held directorships in several organisations, including Kaduna State Housing
and Property Development Authority, Kaduna State Industrialisation Board, African Petroleum, and Stallion Property and
Development Company. He was Special Assistant on Petroleum Matters to Nigeria’s President, Olusegun Obasanjo (2003–
2007). He also was a member of the National Stakeholders Working Group of Nigerian Extractive Industries Transparency
Initiative. He is currently the Chairman of Nymex Investment Limited, Chairman Oxygen Manufacturing Company Limited,
Chairman Al-Shifa Nigeria Limited and a Director on the Board of Advance Link Petroleum Limited.
Ja’afaru Paki
Non-Executive Director
Appointed Non-Executive Director in 2008
He is a chartered accountant and seasoned banker with over 35 years’ banking experience across leading financial institutions.
He is an associate member, Chartered Institute of Bankers, London (ACIB) and an associate member, Institute of Chartered
Accountants of Nigeria (ICAN). He is also a fellow, Association of Chartered Certified Accountants, London (FCCA).
Yahaya Zekeri
Non-Executive Director
Appointed Non-Executive Director in 2010.
She holds an LLB degree from Ahmadu Bello University, Zaria (1983) and was called to the Nigerian Bar the following year. She
is a former First Lady of Cross River State of Nigeria, an Entrepreneur, Legal Practitioner, certified Mediation/Dispute Resolution
Consultant, business coach and philanthropist.
Mrs Duke is the Country Director, Empretec Nigeria Foundation; A United Nations Conference on Trade & Development
(UNCTAD) Private Sector Support Initiative and is also the Chairman, Child Survival and Development Organisation of Nigeria
(CS-DON); a maternal and childhood healthcare initiative. She is a Founding Partner in the Law firm of Duke and Bobmanuel
and also chairs the Empretec Africa Forum; an association of all UNCTAD Empretec Centers in Africa.
Owanari Duke
Non-Executive Director
Appointed Non-Executive Director in July 2012
High Chief Samuel Oni holds an MBA (Finance) from the University of Ilorin. Prior to his appointment, he was engaged in
private practice following his retirement as the Director of Banking Supervision at the Central Bank of Nigeria where he played
a very prominent role in the CBN intervention process during the financial crisis in 2009 which restored stability in the banking
system; a role he performed very well and received a special commendation from the Board of the Central Bank of Nigeria.
He was also the Chairman of the Committee set up by the CBN to supervise the establishment of the Asset Management
Corporation of Nigeria (AMCON). High Chief Samuel Oni is a Fellow of both the Association of Chartered Certified Accountants,
London and the Institute of Chartered Accountants of Nigeria with over thirty five years’ of work experience.
Samuel Oni, FCA
Non-Executive Director
Appointed Non-Executive Director in January 2015
9
20
15
AN
NU
AL
RE
PO
RT
AN
D A
CC
OU
NT
S

ABOUT UBA (continued)
MANAGEMENT TEAM
He holds a BSc degree in Food Science and Technology from Abia State University, Uturu, MSc in Food Technology from
University of Ibadan and an MBA degree in Banking and Finance from the Olabisi Onabanjo University, Ago-Iwoye. He has over
two decades’ experience in retail, commercial and corporate banking, academics and research.
He was a key foundation staff of Standard Trust Bank (now UBA Plc), rising to Assistant General Manager before joining
Finbank Plc (now First City Monument Bank Plc) where he rose to the position of Executive Director in 2009.
He has attended numerous foreign and local courses and is an alumnus of Senior Executive Programme (SEP’66) of London
Business School, United Kingdom and the Advanced Management Program (AMP) of INSEAD Business School, France.
He is a member of the Nigerian Institute of Management, the Nigerian Institute of Directors and Association of Bank Directors
of Nigeria.
Oliver Alawuba
Regional CEO, Anglophone Africa
He holds a BSc degree in Accountancy and an MBA both from the University of Benin, Nigeria. He is an Associate member
of the Institute of Chartered Accountants of Nigeria (ICAN). He has over two decades’ of banking experience spanning
operations, internal audit, operational risk management, fraud management and regulatory compliance. In his current role
as Group Chief Risk Officer, he has responsibility for coordinating the risk management activities of the Bank. Prior to this role,
he was the General Manager of UBA New York Branch and had also previously supervised operations in the East and South
Banks of UBA Nigeria.
Uche Ike
Group Head, Risk Management, Corporate Governance and Compliance
He holds a BSc degree from the University of Ibadan, Nigeria and an MSc degree in Finance and Management from Cranfield
University, England. He is a fellow of the Institute of Chartered Accountants of Nigeria and Chartered Institute of Taxation of
Nigeria (CITN) and a member of Cranfield Management Association.
He is a seasoned financial analyst and accountant with about two decades’ experience spanning assurance, advisory, financial
control, strategy and business transformation, investor relations, mergers and acquisitions, business integration and project
management. Prior to his current role, he was at different times, Group Financial Controller, Group Chief Compliance Officer
and Head – Performance Management in UBA. Before joining UBA in 2004, he had almost one decades’ experience with
Deloitte and PricewaterhouseCoopers.
Ugo A Nwaghodoh
Group Chief Finance Officer
He holds a BSc in Business Management from University of Nigeria, Nsukka. Ayoku is also a Chartered Accountant and member
of the Institute of Chartered Accountants of Nigeria (ICAN).
Prior to joining UBA Plc in 2014, he had over two decades of banking experience in Business Transformation, Relationship
Management, Banking Operations, Risk Management, Financial Control.
He was the Managing Director, Guaranty Trust Bank, Sierra Leone Limited between 2011 and 2013 and led the bank to win
the most profitable bank in Sierra Leone in 2013, Financial Institution of the year 2013 and The Most Customer-Focused Bank
Award 2012 by KPMG. He also worked at Zenith Bank and rose to the position of Deputy General Manager in 2006.
He has attended various local and offshore courses in Banking, Strategy, and Leadership among others. He is married with
children.
Ayoku A Liadi
Directorate Head, Lagos and Western Nigeria
10

He holds an LLB (Hons) degree from Ambrose Alli University, Ekpoma, Nigeria and was enrolled as a Solicitor and Advocate
of the Supreme Court of Nigeria in 1990. He is a member of the Chartered Institute of Arbitrators (United Kingdom), the
Nigerian Bar Association and the International Bar Association. He is an alumnus of the Lagos Business School (Chief Executive
Programme 18) and the New York Institute of Finance.
He has held high-level strategic positions in top financial service institutions in Nigeria, with responsibilities that encompass
asset management, structured finance, legal advisory, corporate governance, human resource management, administration,
knowledge management and business communication.
Bili A Odum
Group Company Secretary
He holds a BSc degree in Accountancy and an MSc in Banking and Finance both from Bayero University, Kano. He has over two
decades’ banking experience spanning Operations, Trade and Structured Finance, Retail Banking , Commercial and Corporate
Banking. He is responsible for the Retail, Commercial and Corporate Banking business in UBA’s North (Central) region. Prior
to this role, he was Head Wholesale Banking (North), Regional Director (Abuja) and Regional bank head (North West). Before
joining UBA, he was regional Controller (Northern Nigeria), responsible for consumer, commercial and corporate banking at
Universal Trust Bank Plc (now part of Union Bank Plc.) He has attended several local and international courses.
Puri Ibrahim
Directorate Head, Northern Nigeria
Chukwuma Nweke
Group Head, Operations and Technology
Chuks holds a BSc degree in Accountancy and an MBA from the University of Nigeria, Nsukka. He is an Associate member of
the Institute of Chartered Accountants of Nigeria and an Honorary Member of the Chartered Institute of Bankers of Nigeria.
He has more than two decades of experience spanning Banking Operations, Finance, Technology, Audit and Strategy.”
She holds a BSc degree (Biochemistry) and MBA degree from the Obafemi Awolowo University, Ile-Ife. She is also an alumnus
of the Lagos Business School and Harvard Business School and is a member of the Chartered Institute of bankers of Nigeria.
She has 18 years’ banking experience and has garnered capabilities in relationship management, marketing and commercial
banking. Prior to joining UBA in 2011, she was a Regional Executive in Bank PHB Plc (now Keystone Bank) where she was
responsible for developing the commercial businesses in the Bank’s Victoria Island region.
Emem Usoro
SBG Head, Abuja Bank
11
20
15
AN
NU
AL
RE
PO
RT
AN
D A
CC
OU
NT
S

ABOUT UBA (continued)
She holds an MBA from the Aberdeen Business School specialising in International Finance and a first degree in English from
the University of Ife.
Adesola Yomi-Ajayi is a highly experienced banker with over 20 years’ banking experience cutting across Business
Development (managing Corporate and Institutional relationships), Structured Lending, Transaction Banking, Commercial
Banking, Correspondent Banking and Banking Operations.
Currently, the Divisional Head, International Banking and Corporate Branch, United Bank for Africa (UBA) Plc, she manages
UBA’s international banking operations as well as UBA’s flagship corporate branch with a responsibility for the bank’s
relationship with large and strategic Corporate customers across key sectors of the economy such as the Oil & Gas sector,
trading companies, financial institutions and, Multilateral organisations.
She has also benefited from the Judge Business School, University of Cambridge’s executive education programme while also
attending several industry specific training in banking and management. Adesola is a Fellow of the Chartered Management
Institute, UK.
Adesola Yomi-Ajayi
Group Head, Correspondent Banking and EMDOs
MANAGEMENT TEAM (continued)
Franklyn Bennie
Group Chief Compliance Officer
Franklyn holds a BSc degree in Business Administration from Ahmadu Bello University Zaria and an MBA from the University
of Lagos. He is an Honorary Senior Member of the Chartered Institute Of Bankers of Nigeria; Member, Association of Certified
Anti-Money Laundering Specialist; and Associate Member Nigeria Institute of Management [Chartered]
He is an experienced Compliance, Regulatory, and AML/CFT Risks professional of over two decades in the Banking profession.
Other areas of specialty include Banking Operations; Local and International Bank Branch start-up; Internal Control and
Corporate Governance.
Prior to his current role he had worked with Citibank in various capacities including Chief Compliance Officer for
Citi Nigeria Limited; Compliance Head for Citi in West Africa and acting Compliance Head for sub-Saharan Africa. He had
a brief stint with Union Bank Plc as Regulatory and Franchise Risk Strategy Consultant leading the AML/CFT Compliance
Transformation. He has attended several local and international trainings/seminars in Banking Operations, AML/CFT;
Managing and Leading People.
He holds a BSc (Honours) degree in Accounting from the University of Benin, Nigeria and he is a fellow of the Institute of
Chartered Accountants of Nigeria (ICAN) and an Associate of the chartered Institute of Taxation of Nigeria (CITN). He is an
alumnus of the Harvard Business School, Boston and the Lagos Business School. His experience spans various areas of banking
Financial Markets, Operations, International Trade, Business Strategy and Structured Finance.
Mr Onokpasa has had a distinguished career serving at different times as Group Treasurer at Diamond bank and First Inland
Bank (now part of FCMB) after having a stint in consulting, auditing and taxation practice.
Emmanuel Onokpasa
Group Treasurer
Anant holds a Master of Commerce and an MBA from Sri Sathya Sai Institute of Higher Learning in India. A Banking Operations
and Technology Professional for last two decades. He joined UBA in 2008, prior to being the head of S&BT, he has been the
Director of Global Shared Services Centre in UBA. He was responsible for setting up of the state of the art Global Shared Services
Centre for UBA Group and managed the transition of all the operations processes across the group for all UBA Bank and Non-
Bank Subsidiaries.
Prior to UBA, Rao had a distinguished career working for 14 years in the areas of Operations and Technology in Citigroup. He
led large transformational offshore projects for Citigroup in EMEA and Asia Pacific regions. Managed Consumer and Corporate
Banking and Technology Operations for various countries under EMEA, Asia Pacific and North America regions. He has deep
domain knowledge and diverse experience in Banking Operations and Financial Technology, Outsourcing, Offshore Operations,
Business Transformation, Credit and Risk Management in the financial services industry.
Rao Anant
Head, Strategy and Business Transformation
12

Muyiwa Akinyemi
Director, Corporate Bank
Muyiwa holds a BSc degree in Accounting from Obafemi Awolowo University, Ile-Ife, Nigeria and he is an associate of the
Institute of Chartered Accountants of Nigeria as well as member of various professional institutes.
He is a seasoned financial analyst, corporate and investment banker with over two decades experience spanning business
advisory, financial control, investment banking; capital market services; wholesale banking – energy, government and
corporate banking in Nigeria and across Africa. Prior to his current role, he was at different times, Director, Wholesale Banking,
Rest of Africa, CEO, UBA Kenya, Head, Investment Banking, Head, Global Corporates, Regional Director Retail Banking in UBA
and erstwhile Standard Trust Bank Plc. Before joining Standard Trust Bank/UBA in 1998, he had worked with Diamond Bank
after having a stint in auditing and financial services firm.
He Holds an LLB degree from the Bendel State Univeristy (now Ambrose Alli University), Ekpoma Edo State Nigeria and an LL.M
degree from both his alma mater and the University of Lagos. He is a member of the Chartered Institute of Arbitrators, United
Kingdom.
Before joining the banking industry in 1997, he lectured at the Ambrose Alli University, where he was the acting head of the
department of Commercial Law in of the faculty of Law. He was appointed Company Secretary/Legal Adviser of Standard Trust
Bank (STB) Plc in 1997. Following the merger of STB Plc and UBA Plc, he became the Deputy Legal Adviser. In 2007, he was
appointed the Group General Counsel. Mr Adikamkwu has attended several courses within and outside Nigeria.
Samuel Adikamkwu
Group General Counsel
He holds a BSc (First class) degree in Accounting from the University of Lagos. He is a fellow of the Institute of Chartered
Accountants of Nigeria (ICAN). He is also an Associate member of the Chartered Institute of management Accountants, UK
(CIMA) and Chartered Institute of Taxation of Nigeria (CITA).
Ayodeji has worked in the Academia, Auditing and Consulting firms and in several other banks including NAL Merchant bank,
Diamond bank and Standard Trust bank.
He has over two decades of banking and finance experience with appreciably high competencies in financial control, financial
management, performance management, project management, audit strategic planning and business transformation.
Ayodeji Adigun
Group Executive Office
Razak holds a BSc and MBA Business Administration degrees from the University of Ilorin. He has over 27 years’ experience
in Banking spanning Development financing, operations and oil and gas. He has attended several local and international
training including DC Gardner of London. Razak is an alumnus of the USAID/IFESH Best and Brightest African Bankers program
which afforded him the opportunity to train at Mellon Bank, JP Morgan, and OPIC in the USA. Before joining UBA, he had
worked with NBCI, IMB, NNB and Ecobank.
Razak Shittu
Directorate Head, Energy Bank
13
20
15
AN
NU
AL
RE
PO
RT
AN
D A
CC
OU
NT
S

ABOUT UBA (continued)
MANAGEMENT TEAM (continued)
Gboyega Sadiq
Group Chief Internal Auditor
He holds a first class BSc (Honours) degree in Accounting from the Obafemi Awolowo University Ile-Ife and is a member of
the Institute of Chartered Accountants of Nigeria (ICAN) and Honorary Senior Member of the Chartered Institute of Bankers
of Nigeria. He also holds post-graduate degrees in Economics and Public Administration.
Gboyega has had a distinguished banking career spanning over 20 years in Operations and Control. Before joining UBA about
10 years ago, he has worked at Citibank Nigeria Ltd and Access Bank Plc where he occupied senior roles.
He holds an MSc Degree in Finance from the University of Lagos. He has over two decades of work experience in the Banking
and Financial services sector with core experience in Retail/Commercial, Corporate and Institutional Banking. He held senior
management positions in Zenith Bank Plc, Stanbic IBTC and First Bank prior to joining UBA Plc. He has attended various local
and international courses.
Johnson Agoreyo
Head, Lagos Island
He holds a BSc degree in Accounting and an MBA degree, both from the University of Lagos. He is a chartered accountant and
an associate member of the Institute of Chartered Accountants of Nigeria (ICAN), with over two decades of post-professional
qualification experience in professional accounting practice and banking.
He has functioned in various senior management capacities such as; Deputy Group Chief Operating Officer, Regional Bank
CEO, Mid West, pioneer Regional Director, West – post UBA/STB merger. As a pioneer turnaround staff member of the Standard
Trust Bank Plc in 1997, he variously functioned as Divisional Head, Internal Control and Reconciliation.
Feyi Ogoji
SBG Head, Oyo and West Central
He holds a BSc in Management and an MBA in Marketing from the Rivers State University of Science and Technology,
Port Harcourt.
Tari has over 24 years’ banking experience working at high level positions in different Nigerian banks. Prior to joining UBA in
March 2014, Tari worked with Zenith Bank Plc where he left as a General Manager.
Tari is also a fellow of the Nigerian Institute of Management (NIM), Honorary Senior Member of The Chartered Institute
of Bankers of Nigeria (CIBN); Fellow of the Institute of Credit Administration, Fellow of the National Institute of Marketing
of Nigeria amongst others. He is also a Member of the Governing Council of the Nigeria Institute of Management (NIM) and
a Member of the Governing Board, University of Port Harcourt Business School.
He has attended several Executive Management Programs locally and overseas including; Harvard Business School; Judges
Business School – Cambridge University; INSEAD; Manchester Business School and Columbia Business School, New York.
Tari Jeffrey Ekpebu
Directorate Head, South Bank
14

Roland Awo-Osagie
Chief Technology Officer
Holds a BSc in Industrial Mathematics from the University of Benin and MBA in Project Management from Federal University
of Technology Owerri. He has also attended various management courses at Lagos Business School, Parity University
London, Genesys University London among other professional and management development programmes.
He is a seasoned practitioner in Information and Communication Technologies, risk management, strategy, people and
project management with over two decades of experience spanning Banking, Telecommunications, Managed Services
and OEMs industries, playing different senior management roles in multiple geographies in Africa. He is responsible for
Information and Communication Infrastructure Technology solutions, services and IT Operations at UBA Group.
Dupe Olorunjo
Divisional Head, Corporate Banking
Dupe is a graduate of pharmacology from the University of Lagos, Nigeria and also holds a Masters in Business Administration
from the University of Benin. She is an Alumnus of Lagos Business School and Cranfield University UK.
She is a seasoned Corporate Banker with experience in Corporate Finance and Specialized credits. Before joining UBA in
2006, she also had successful careers at Nigerian American Merchant Bank; Commercial Bank Credit Lyonnais/Capital Bank
International; and Access Bank Plc.
Ebele Ogbue
Group Head, Wholesale Banking Africa and Global Account Management (Anglophone)
Ebele holds a BSc (Honours) degree in Accounting from the University of Lagos and an MBA (IT & Management) from CASS
Business School London.
His professional career started at Price Waterhouse in 1991 before his foray into banking, where he has spent the last two
decades working at international banks such as, Citibank and Standard Chartered Bank, before joining UBA in 2004. His
banking experience spans various areas of banking from Asset-Based Finance to core Corporate Banking and Trade Finance.
Prior to his current role, he was MD/CEO, UBA Capital Europe Limited and the pioneer MD/CEO, UBA Liberia.
15
20
15
AN
NU
AL
RE
PO
RT
AN
D A
CC
OU
NT
S

16
Chairman’s Statement 18
CEO’s Report 20
Group Financial Review 24
Digital Banking Report 31
BUSINESSREVIEW
16

17171717717777717
20
15
AN
NU
AL
RE
PO
RT
AN
D A
CC
OU
NT
S

IntroductionLadies and Gentlemen,
I am privileged and very happy to present the 2015
annual report of our bank, United Bank for Africa Plc.
2015 was a challenging year, without question. We
witnessed not only continuing stress in the global
economy, with China’s slow-down casting a long
shadow across our region, and the impact of a
number of specific market and regulatory dynamics
in some of our operating environments in Africa.
Most importantly, I am glad to announce that our
resilient and resolute customer-focused business
approach has, once again, allowed us to mitigate
the worst effects of these challenges and the Group
has been able to deliver a rewarding performance
to all its stakeholders.
Some of the major global and domestic events,
their impact on our business and the key highlights
of 2015 are set out below.
Effect of commodity price
decline and security challenges
on global growthThe International Monetary Fund estimated 2015
global growth at 3.1%, down from 3.7% in 2014.
The year also witnessed a dramatic decline in all
major commodity prices, on which most African
economies depend. These precipitous falls have
had a direct impact on African currencies and
government balance sheets. Growth across Africa
has been revised down, in some cases significantly.
As a case in point, at the end of December 2015, the
price of Brent crude oil, which started the year at
$58.38pb, had fallen to $37.28pb. There is no relief
in sight and market observers expect low oil prices
in the near to medium term.
In addition to a low commodity price environment,
heightened security concerns, occasioned by
terrorist attacks, also impacted on international
trade, financial markets, government policies and
security expenditure. Developed markets are not
immune to this threat as last year’s terrorist attack in
Paris is expected to negatively impact the region’s
tourism industry, consumer spending and the
‘Schengen’ border-free zone agreement, while also
heightening the fear of similar incidents in the UK
and US. Our continent was not untouched, and
our deepest sympathy is extended to victims. We
know the solution lies in a strong and equitable
form of economic growth, which we feel we are
contributing to with our operations in 19 African
countries and over 12,000 employees.
The lack of visibility in the macro environment
globally and in our own markets, reemphasises our
desire to be prudent in our operations, to continue
our focus on risk management and efficiency in our
business. We know we will emerge a stronger and
CHAIRMAN’S STATEMENT
BUSINESS REVIEW
18
more disciplined institution, creating a legacy for all stakeholders,
not least our shareholders.
Technology: disruptive influences and
implicationsShareholders, we must not be complacent. History is full of
institutions and industries that have become victims of change.
Technology continues to be a key driver within our industry
and a disruptive force. This change can have a transformational
and positive impact, but only when the opportunities it brings
are harnessed and exploited optimally. Across the world, every
industry, from retail commerce to urban utilities such as taxi
services to financial services, are being disrupted by technology.
A new economy based on mobile devices is emerging, as Africa
represents the largest Internet user base in the world, which
continues to grow at a very rapid pace. We are seeing the
increasing emergence of new technology-based businesses,
driven by entrepreneurs who are capitalising on the opportunities
of this new digital, mobile world.
Financial Technology (FinTech) companies are changing the
game, achieve lower operating costs and broad customer reach,
becoming major disruptors within the banking industry today.
In addition, what has been called the fourth industrial revolution
seems imminent, with emerging technology breakthroughs in
fields including artificial intelligence, Internet of Things, robotics,
autonomous vehicles, 3-D printing, biotechnology, quantum
computing, energy storage, and materials science.
We expect these developments to have a significant influence
on customer expectations, product enhancement, collaborative
innovation, and organisational forms. Undoubtedly, the global
and local banking industries will be profoundly impacted. At
UBA, we will continue to work in a manner which ensures that
our business adapts and is positioned to benefit from this brave
new world. To do so successfully, the Bank must become more
agile whilst adaption and innovation become embedded in our
Group DNA.
Financial performance2015 was a challenging year. However, despite this backdrop, our
Group has delivered a sterling performance in the financial year
ended 31 December 2015.
We recorded N314 billion in gross earnings (representing 10%
year-on-year growth). This was achieved in spite of sparse liquidity
in the Nigerian foreign exchange market, which reduced foreign
currency-related business and income lines. These adverse
conditions were partly offset by improved balance sheet efficiency
– we continue to seek to make your bank the most efficient bank
in Africa. In addition, increased transaction banking income
compensated for the regulatory-induced weakness in commission
on turnover (COT). More importantly, our Bank managed its cost
through the year, thus preserving bottom-line earnings to deliver
a profit before tax of N68.5 billion, which translates to 21% growth
over our performance in 2014.
Our ability to grow profit after tax significantly, in difficult
circumstances, is a source of considerable pride. I believe you will
join with me in saluting, what is an extremely creditable result
in the circumstances – confirming our long term strategy and
determination.
UBA community investmentsAs many of you know, I am a firm believer that businesses are
not just motivated by profit. Particularly as African businesses, we
need to give back, to seek social as well as economic returns. UBA
Group pursues its corporate social responsibility goals through
the UBA Foundation by contributing actively to the following
strategic areas that are of immense importance to community
development, namely: Education, Environment, and Economic
Empowerment.
On 27 May 2015, the UBA Foundation won the inaugural “Spirit
of Lagos Citizens’ Day Award” in the Business and Corporate
Organisations category for its contribution and commitment to
building a sustainable community in Lagos State.
The UBA Foundation believes that the future of Africa lies in her
youth, hence its active involvement in educational projects that
bridge the literacy-wide gap on a pan-African scale. For example,
the 2015 UBA National Essay Competition received 3,326 entries
from secondary school students across Nigeria, representing
a 50% increase over 2014. The UBA Foundation will extend the
competition to all the 19 African countries where the Bank has
presence in the coming years.
These initiatives show that not only do we talk the talk, but we
also walk the walk in terms of meaningfully giving back.
OutlookGrowth across Africa will be volatile, but the Group will continue
to adapt in a manner that ensures that it is able to make the most
of opportunities in each region, as they emerge.
The Group continues to be well positioned and there is every
expectation that as growth normalises in the coming years,
we will reap the rewards of building and maintaining our solid
foundations.
AppreciationAs I said at the outset, 2015 was a challenging year, yet it was
productive. We grew post tax profits, we made considerable
gains in efficiency, we have been prudent in risk management.
The collaborative effort of our supportive shareholders and
hardworking and dedicated staff have continued to ensure that
we deliver profitable results.
I would also like to salute our loyal customers for giving us the
opportunity to serve. Appreciation must also be extended to
members of the board and the executive management team,
whose tenacity and leadership ensure that we continue to live up
to expectations and deliver on promises.
Thank you.
Tony O Elumelu, CON
Chairman of the Board
19
20
15
AN
NU
AL
RE
PO
RT
AN
D A
CC
OU
NT
S

BUSINESS REVIEW
IntroductionDear Esteemed Shareholders,
I am pleased to present to you, on behalf of the Board of Directors,
the highlights of our performance for 2015 financial year.
We owe our success to your continued support and the resilience
of our business model which was able to withstand the various
macroeconomic headwinds and regulatory policy interventions
during the course of the year.
Highlighted below is an overview of our objectives for 2015 and
events which shaped our performance.
2015 Strategic objectivesOur strategy for 2015 was primarily focused on growth initiatives
in the following specific areas:
Corporate Banking Excellence: To intensify our global
corporate banking play with the aim of dominating
the key growth sectors in our target markets, while
continuously exploiting the value chains of our
corporate and oil and gas customers.
Public Sector Leadership: To target the immense value
chain opportunities in government business and help
the Bank to expand offerings and share of this market
segment.
Personal Banking: To intensify and deepen our focus on
the personal banking segment during this year, focusing
on the key customer segments of students, professionals,
self-employed and the expatriate community.
Treasury: To increase industry market share of our
treasury operations and enhance our share of low cost
and foreign exchange deposits to dominate African
financial markets.
African Regional Focus: To drive productivity by
exploiting regional opportunities, leveraging our
regional banking network, to dominate cross-border
trade and transaction banking opportunities.
Technology and Support: To continue leveraging
technology, our large geographic footprint and
relationship management to ensure effective support to
business units and excellent customer service delivery
at all touch-points within the Bank.
Major industry eventsIn 2015, the global economic landscape was hugely impacted
by China’s economic slowdown, commodity price decline and a
speculated climb in US interest rates. In particular, the declining
oil and commodity prices had a significant negative impact on
economies around the world. These effects included currency
depreciation and falling foreign reserves which in turn led to
heightened monetary and exchange rate policy adjustments.
CEO’S REPORT
I am pleased to prese
the highlights of our
We owe our success
of our business mod
macroeconomic hea
during the course of
Highlighted below i
events which shaped
2015 StrategOur strategy for 201
in the following spec
Corporate B
corporate b
the key gro
continuously
corporate an
Public Secto
chain oppor
the Bank to
segment.
Personal Ba
the personal
on the key cu
self-employe
Treasury: T
treasury ope
and foreign
financial ma
African Re
exploiting
regional ban
trade and tra
Technology
technology,
relationship
business un
at all touch-p
Major industIn 2015, the global
by China’s economic
speculated climb in
oil and commodity
economies around
depreciation and fa
heightened moneta
20
The economic effect was quite severe in some oil-exporting
countries where external reserves were depleted in an attempt to
maintain currency stability. For example, Nigeria’s external reserves
declined by 15.72% to close the 2015 fiscal year at $29.1billion while
the Central Bank of Nigeria (CBN) pegged the exchange rate at
about N199/$ during the same period. However, US Dollar scarcity
induced volatile rates in the parallel markets with exchange rate
trading as low as N248 to the dollar by December 2015.
Oil-importing economies were also not entirely spared as some
of these countries had to grapple with the effect of falling
commodity prices. During 2015, the Bank of Zambia raised its
policy rate from 12.5% to 15.5% in a bid to manage the country’s
inflation and currency devaluation effects following the crash in
copper prices which is a major national revenue source. Also, for
the first time in over three years, growing pressure on the Kenyan
shilling led the Central Bank of Kenya to raise its policy rate by
150 basis points to 10%.
One of the important 2015 reforms experienced by the Nigerian
banking industry was the implementation of the Bank Verification
Number (BVN) exercise whereby the CBN requested all bank
customers to capture their biometrics and obtain a unique
identification number in order to improve existing security and
administrative measures. Also, the Federal Government issued a
directive for all Deposit Money Banks to transfer all MDA balances
of approximately N1.5trillion to the Treasury Single Account (TSA)
domiciled with the CBN which consequently reduced the deposit
balances in some banks.
In the last quarter of 2015, there was a need to manage liquidity
and improve the weakening fundamentals of the Nigerian
economy and therefore, the Monetary Policy Committee (MPC)
of the CBN reduced the CRR from 25% to 20%; reduced the MPR
from 13% to 11%; and changed the symmetric corridor of 200
basis points round the MPR to an asymmetric corridor of +200
basis points and – 700 basis points around the MPR.
Despite these developments, UBA was able to retain its competitive
position within the banking industry by implementing world-class
risk management standards to manage cash flows, optimising
cost-saving opportunities of its IT infrastructure and ensuring
effective controls to minimise exposure.
UBA developments in 2015During 2015, UBA held a strategy session with subsidiary country
CEOs and heads of Strategic Support Groups in order to address
the identified business and support challenges across Africa and
explore the existing growth potentials. Decisions were also taken
towards empowering the subsidiary CEOs to improve turnaround
time and increase overall operational efficiency.
A comprehensive strategic review was undertaken for the IT
Organisation and it was restructured into focus areas for improved
oversight and efficient management of the relevant aspects of
the business. This re-alignment enabled the IT Function to be
leaner, more accountable and more efficient in fulfilling relevant
stakeholder needs.
During the year, the Bank embarked on a Core Banking
Transformation programme to radically overhaul bank’s core
business and technology capabilities delivering value to multiple
stakeholders in the form of improved product and service utility
and satisfaction, simplified methods of doing business and
superior financial returns. This transformation also facilitated
implementation of best-in-class standards and improved system
security measures.
We revitalised our UBA Academy to create an impactful learning
environment for our people and to help them progress in their
careers. The UBA Academy curriculum was revamped to enable
our people to build skill sets tapping on in-house expertise and
general practitioners.
The above strategic initiatives helped UBA to consolidate on its
gains from the previous year and to maintain its competitive edge
within the banking industry of countries where we have presence.
Embracing the digital economyUBA Plc. has been pursuing a strong innovation agenda, driven
by a desire to shape the future of banking. We recognise that
evolving customer behaviours as well as the rising usage of social
media and smart devices are rapidly changing the way banking
is done.
During the year, we launched a redesigned and intuitive Internet
banking website and a new mobile website. Together with our
comprehensive mobile banking application, ‘UMobile’, these
platforms are seeing robust growth in transactions. We also
launched a contactless, ‘Tap n Pay’ card payment solution,
which enables customers to simply tap their cards for quicker
payment transactions. We have a strong presence in social media
through banking on Facebook, which we further strengthened
by becoming the first bank in Nigeria to introduce banking alert
services on Twitter.
We have also invested in our corporate Internet and mobile
banking platforms to improve the customer experience and to
provide value-added solutions to the Corporate, Commercial and
Public sector.
21
20
15
AN
NU
AL
RE
PO
RT
AN
D A
CC
OU
NT
S
BUSINESS REVIEW
Major awardsIn recognition of UBA’s contribution to the sectors and markets
where it plays, the Bank has received a number of prestigious
awards in 2015. Some of the major awards received are listed
below.
Largest Lender To Agriculture, courtesy of Lagos
Chamber of Commerce and Industry (LCCI)
MasterCard Cashless Champions Awards; won
in three categories namely – Cashless Transactions
Champion, Cashless Volume Champion and Cashless
Cross-border Champion
Spirit of Lagos Citizens’ Day Award in the Large
Businesses (Blue Chip/Multinationals) Category
Corporate Citizens Award (Extensive Compliance
Category), courtesy of Nigeria’s Corporate Affairs
Commission (CAC)
Social Infrastructure Deal of the Year award, courtesy
of the African Investor
UBA Finance Division won the Finance Team of the Year
while UBA Group CFO won the Banking Industry CFO of
the Year at the inaugural CFO Awards in Nigeria
UBA Chad and Senegal won the “The Bank of the Year”
awards for their respective countries from the UK-Based
“The Banker Magazine” annual awards
Overview of group financial
performanceOur asset allocation and repricing strategy were timely and
successful, as evident in the 19% year-on-year growth in interest
income, which compensated for the regulatory-induced weakness
in non-interest income. Overall, we grew our gross earnings by
10%, an appreciable feat when put in the perspective of slower
economic activities in Africa in 2015.
Given the Bank’s low to moderate risk appetite in the year,
implementation of Treasury Single Account and conversion
of State Governments’ loans into Federal Government Bonds
in Nigeria, the loan book and total assets were relatively flat
year-on-year. Our adherence to best-in-class risk management
practices paid off in the year, as evident in our asset quality; 1.7%
Non-Performing Loan ratio, with adequate provisions coverage.
More so, the cost of risk remained modest at 0.5%; even as we
made provisions for probable portfolio impairment on the back
of macroeconomic pressures. We will continue to balance our
growth appetite with the commitment to asset quality. Hence,
we will explore every opportunity with prudence and work very
closely with our customers in ensuring our mutual success.
I am particularly pleased with the early outcome of our recent
cost management initiatives, which ensured a relatively stable
cost profile in the year. Despite myriads of external cost pressures,
our operating expenses grew barely 5%; a level below the average
inflation rate in most of our markets. Overall, we closed the 2015
financial year, with N68.5 billion profit before tax; a notable 22%
growth over our performance in 2014. More so, our profit after
tax of N59.7 billion translates to a 25% year-on-year growth
and an impressive 20% return on average equity. Whilst noting
the challenging operating environment, we are optimistic on
sustaining our strong performance in the years ahead, as we
remain true to our pledge of consistently delivering superior
return to our shareholders.
Strategic initiatives for 2016Building on our recorded successes in 2015, we will deliver
improved returns and growth by building on our strengths;
concentrating on high growth areas; consolidating various
Subsidiary businesses and sharpening our focus on cost.
We have articulated the following key initiatives for the year 2016:
Achieve sustainable growth in all subsidiaries
Place customers at the heart of the banking experience
through Customer First Transformation Project
Position UBA as the bank of choice for our customers
Position UBA as an Employer of Choice
Focus on strategic cost management
Strengthening our technology and infrastructure platform
and drive digital and innovation initiatives across the Bank
Proactive risk management and effective fraud and
cyber-crime management
Continuous focus on innovations in products and processes
Ensure strict regulatory compliance and contribute to
financial stability
Building a sustainable organisation
We strongly believe that prioritising these initiatives will help the
Bank achieve its next set of growth targets for 2016. We have a
strong and diversified franchise, an extensive distribution network,
and have invested in creating leading technology platforms. At the
UBA Group, we will continue to focus on leveraging technology to
deliver innovative and convenient banking solutions; capitalising
on the growth opportunities that will arise as the economies grow
and sustaining our operating parameters as we grow, to further
enhance our return on equity.
Delivering these priorities will create value for our customers and
shareholders and contribute to the long-term sustainability of the
Group. In the process, we shall maintain a robust, resilient and
sustainable business in which our customers can have confidence,
our employees can take pride and our communities can trust.
CEO’S REPORT (continued)
22
ConclusionI will like to re-emphasise our commitment to superior financial
dominance and continued support for excellence. We are
committed to executing our strategic plans by achieving scale,
driven by relentless execution. Our robust financial strength and
resilient business model, supported by a large African presence,
an inspired culture of professional entrepreneurship and team
work have put us in a strong position to address the needs of our
clients and move towards our vision of Africa’s Global Bank.
On behalf of the Board of Directors, the management and the
entire staff, we appreciate all our stakeholders and confidently
look forward to a successful year in 2016.
Thank you.
Phillips Oduoza
GMD/CEO
23
20
15
AN
NU
AL
RE
PO
RT
AN
D A
CC
OU
NT
S
BUSINESS REVIEW
24
GROUP FINANCIAL PERFORMANCE REVIEW
Operating environment The year 2015 was a year of election for a number of
African countries where UBA operates, particularly Nigeria,
where there was seamless leadership transition from the
erstwhile ruling party to a new government, led by President
Muhammadu Buhari, after a keenly contested but peaceful
general election. The concerns over election, falling crude
oil price, insecurity in the northern part of the country, all
heightened macroeconomic uncertainties in Nigeria in 2015.
The Nigerian economy grew barely 2.4% in the second quarter
of 2015, with only a modest recovery to 2.9% in the third
quarter. The growth poles of the economy, such as telecoms,
real estate and construction and trade all moderated. Whilst
lingering insecurity challenges in the north and weather
conditions subdued growth in agricultural sector, poor
power supply, fuel shortages, limited foreign currency for raw
material imports and weak consumer demand continue to
pose a challenge to the manufacturing sector.
The year was indeed a tipping point for African economies and
redefined the macroeconomic and business environments.
Given the relative dependence of African countries on
natural resources and agriculture, the prolonged plunge in
commodity prices meant lower income for all the economic
agents, governments, businesses and households. Crude oil
price slumped to USD37 per barrel in December 2015 (losing
35% in the year), with further weakness to a 12-year low of
USD32 pb in 2016. During the year, coffee, copper, coal and
gold also lost 28%, 24%, 14% and 10% in value respectively.
The lull in commodity prices brewed concern on banks’ asset
quality and doused risk appetite for loan creation in these
critical sectors of the African economy.
Given lower commodity prices, government spending
slowed, with multiplier effect on broad economic
activities in most African countries. Some planned public
infrastructure projects were suspended just as corporates
delayed final investment decisions (FIDs) on expansion
project, in response to weak consumer demand and
pressured cash flows. As a part of government’s reform
to improve fiscal conditions, the treasury single account
was implemented in Nigeria, thus sterilising banking
sector deposits.
As foreign currency receipts wane, FX demand outstripped
supply, leading to notable depreciation/devaluation of most
African currencies. Notwithstanding the stern defence of the
Central Bank of Nigeria (CBN), the Naira weakened 8.4% at the
interbank market to N199.30/USD, with a wide spread at the
parallel market, where Naira closed the year at N280/USD.
The Ghanaian Cedi depreciated 18% to 3.85/USD, despite the
IMF loan, which increased FCY supply. The Kenyan Shilling
depreciated 13% to SH50/USD, and the Zambian Kwacha
lost about one-third of its value against the greenback. Whilst
not completely immune to the broad currency volatility, the
CFA (both XOF and XAF, which are official currencies in most
Francophone African countries) was relatively stable, given
that it is pegged to the Euro. The scarcity of foreign currency
slowed trade activities, with implications for trade finance
and related transaction banking offerings.
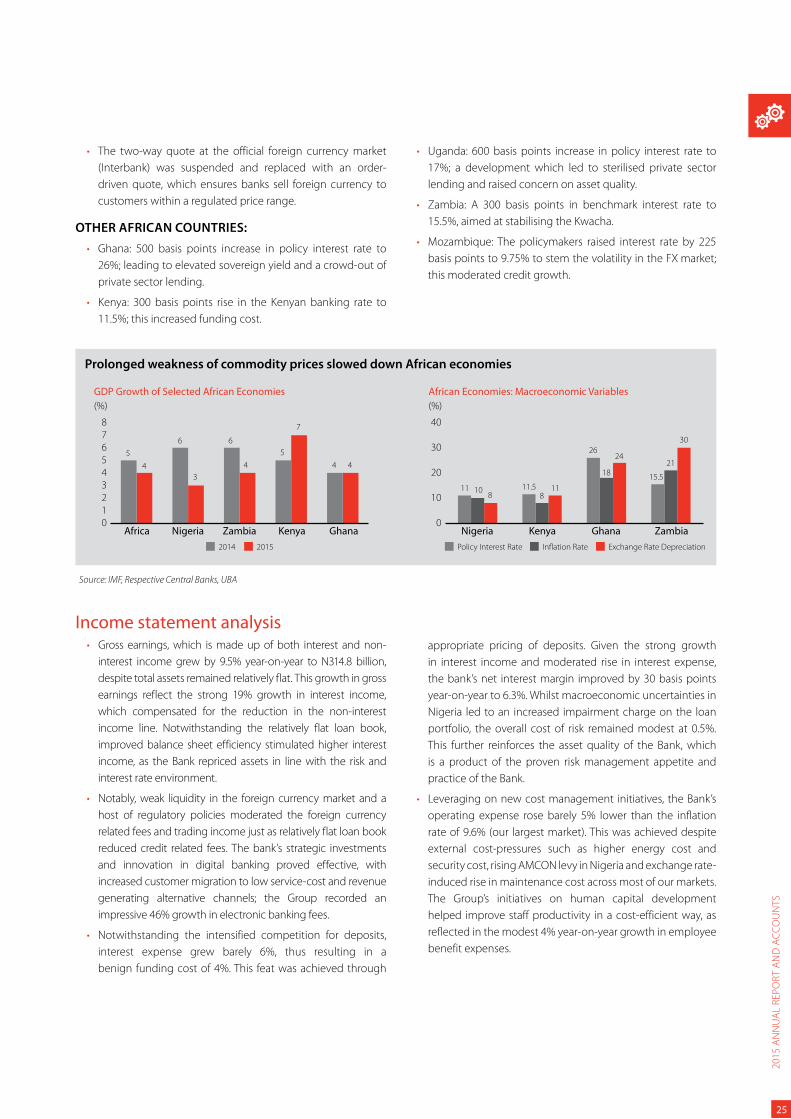
Even so, headline inflation in most African countries was
relatively benign (except in economies like Ghana and Zambia
where inflation rose to 17.7% and 21.1% respectively), the
lagged impact of local currency devaluation/depreciation
is gradually brewing imported inflation. Thus, inflationary
pressures may be a concern for monetary policy authorities in
2016. Nigeria’s headline inflation settled at 9.6% in December
2015 (from 8.0% in December 2014), largely on the back of
higher food inflation. Moreso, it spiked to 11.4% in February
2016. Hence, inflationary pressure and lagged impact of local
currency volatilities increased the cost of doing business in
most of the African countries.
Whilst monetary policy authorities in most African economies
had sentiment for stimulating economic activities, concerns
over exchange rate volatilities and inflation risk defied
accommodative policies. Thus, policy authorities across sub-
Saharan Africa adopted tighter measures, except in Nigeria,
where the monetary policy committee adopted a non-
conventional measure of easing policy interest rate, amidst
currency and inflation risks.
Some of the notable monetary policy developments that shaped
the business environment in Nigeria and some other African
countries are highlighted below;
NIGERIA:
The cash reserve requirement (CRR) on private and public
sector deposits was harmonised to 31% but later reduced to
25% in September to moderate the impact of the Treasury
Single Account (TSA) on banking sector liquidity. The CRR
was further reduced to 20% in November, with cash release
only to banks willing to create credit to the real sector.
The monetary policy rate (MPR) was reduced by 200 basis
points to 11%, albeit it had little or no effect on lending rate.
The corridor around MPR was changed from ± 2% to a
symmetric corridor of +2%/-7%; this is aimed at discouraging
banks’ placements with the CBN and stimulate lending.
The retail Dutch Auction (rDAS) window was cancelled and
CBN only sold foreign currency to the market through an
intervention window at N197/USD.
24
25
The two-way quote at the official foreign currency market
(Interbank) was suspended and replaced with an order-
driven quote, which ensures banks sell foreign currency to
customers within a regulated price range.
OTHER AFRICAN COUNTRIES:
Ghana: 500 basis points increase in policy interest rate to
26%; leading to elevated sovereign yield and a crowd-out of
private sector lending.
Kenya: 300 basis points rise in the Kenyan banking rate to
11.5%; this increased funding cost.
Uganda: 600 basis points increase in policy interest rate to
17%; a development which led to sterilised private sector
lending and raised concern on asset quality.
Zambia: A 300 basis points in benchmark interest rate to
15.5%, aimed at stabilising the Kwacha.
Mozambique: The policymakers raised interest rate by 225
basis points to 9.75% to stem the volatility in the FX market;
this moderated credit growth.
Source: IMF, Respective Central Banks, UBA
Prolonged weakness of commodity prices slowed down African economies
Income statement analysisGross earnings, which is made up of both interest and non-
interest income grew by 9.5% year-on-year to N314.8 billion,
despite total assets remained relatively flat. This growth in gross
earnings reflect the strong 19% growth in interest income,
which compensated for the reduction in the non-interest
income line. Notwithstanding the relatively flat loan book,
improved balance sheet efficiency stimulated higher interest
income, as the Bank repriced assets in line with the risk and
interest rate environment.
Notably, weak liquidity in the foreign currency market and a
host of regulatory policies moderated the foreign currency
related fees and trading income just as relatively flat loan book
reduced credit related fees. The bank’s strategic investments
and innovation in digital banking proved effective, with
increased customer migration to low service-cost and revenue
generating alternative channels; the Group recorded an
impressive 46% growth in electronic banking fees.
Notwithstanding the intensified competition for deposits,
interest expense grew barely 6%, thus resulting in a
benign funding cost of 4%. This feat was achieved through
appropriate pricing of deposits. Given the strong growth
in interest income and moderated rise in interest expense,
the bank’s net interest margin improved by 30 basis points
year-on-year to 6.3%. Whilst macroeconomic uncertainties in
Nigeria led to an increased impairment charge on the loan
portfolio, the overall cost of risk remained modest at 0.5%.
This further reinforces the asset quality of the Bank, which
is a product of the proven risk management appetite and
practice of the Bank.
Leveraging on new cost management initiatives, the Bank’s
operating expense rose barely 5% lower than the inflation
rate of 9.6% (our largest market). This was achieved despite
external cost-pressures such as higher energy cost and
security cost, rising AMCON levy in Nigeria and exchange rate-
induced rise in maintenance cost across most of our markets.
The Group’s initiatives on human capital development
helped improve staff productivity in a cost-efficient way, as
reflected in the modest 4% year-on-year growth in employee
benefit expenses.
GDP Growth of Selected African Economies
(%)
012345678
2014 2015
Africa Nigeria Zambia Kenya Ghana
5
4
6
3
6
4 4 4
5
7
African Economies: Macroeconomic Variables
(%)
0
10
20
30
40
Policy Interest Rate Inflation Rate Exchange Rate Depreciation
Nigeria ZambiaKenya Ghana
11 11108
11.58
26
18
24
15.5
21
30
25
20
15
AN
NU
AL
RE
PO
RT
AN
D A
CC
OU
NT
S
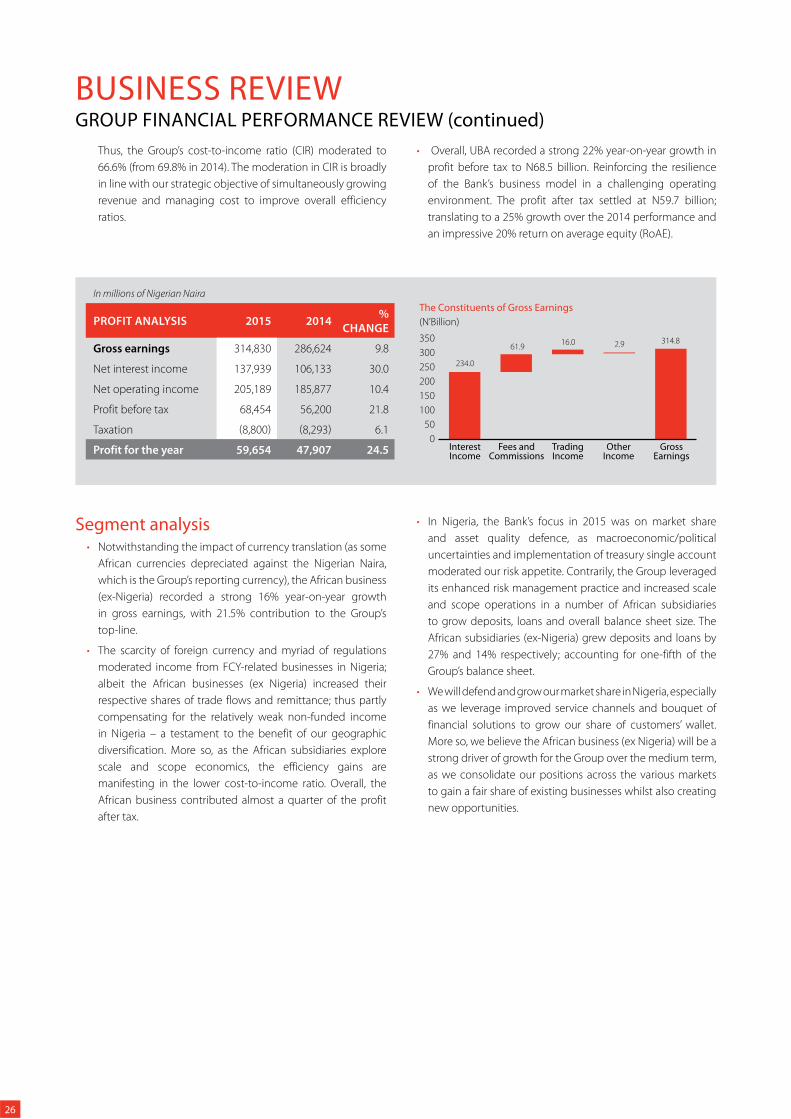
BUSINESS REVIEWGROUP FINANCIAL PERFORMANCE REVIEW (continued)
Thus, the Group’s cost-to-income ratio (CIR) moderated to
66.6% (from 69.8% in 2014). The moderation in CIR is broadly
in line with our strategic objective of simultaneously growing
revenue and managing cost to improve overall efficiency
ratios.
Overall, UBA recorded a strong 22% year-on-year growth in
profit before tax to N68.5 billion. Reinforcing the resilience
of the Bank’s business model in a challenging operating
environment. The profit after tax settled at N59.7 billion;
translating to a 25% growth over the 2014 performance and
an impressive 20% return on average equity (RoAE).
Segment analysisNotwithstanding the impact of currency translation (as some
African currencies depreciated against the Nigerian Naira,
which is the Group’s reporting currency), the African business
(ex-Nigeria) recorded a strong 16% year-on-year growth
in gross earnings, with 21.5% contribution to the Group’s
top-line.
The scarcity of foreign currency and myriad of regulations
moderated income from FCY-related businesses in Nigeria;
albeit the African businesses (ex Nigeria) increased their
respective shares of trade flows and remittance; thus partly
compensating for the relatively weak non-funded income
in Nigeria – a testament to the benefit of our geographic
diversification. More so, as the African subsidiaries explore
scale and scope economics, the efficiency gains are
manifesting in the lower cost-to-income ratio. Overall, the
African business contributed almost a quarter of the profit
after tax.
In Nigeria, the Bank’s focus in 2015 was on market share
and asset quality defence, as macroeconomic/political
uncertainties and implementation of treasury single account
moderated our risk appetite. Contrarily, the Group leveraged
its enhanced risk management practice and increased scale
and scope operations in a number of African subsidiaries
to grow deposits, loans and overall balance sheet size. The
African subsidiaries (ex-Nigeria) grew deposits and loans by
27% and 14% respectively; accounting for one-fifth of the
Group’s balance sheet.
We will defend and grow our market share in Nigeria, especially
as we leverage improved service channels and bouquet of
financial solutions to grow our share of customers’ wallet.
More so, we believe the African business (ex Nigeria) will be a
strong driver of growth for the Group over the medium term,
as we consolidate our positions across the various markets
to gain a fair share of existing businesses whilst also creating
new opportunities.
The Constituents of Gross Earnings
(N’Billion)
0
50
100
150
200
250
300
350
Interest Income
Trading Income
Other Income
GrossEarnings
Fees and Commissions
234.0
61.916.0 2.9 314.8
In millions of Nigerian Naira
PROFIT ANALYSIS 2015 2014 %
CHANGE
Gross earnings 314,830 286,624 9.8
Net interest income 137,939 106,133 30.0
Net operating income 205,189 185,877 10.4
Profit before tax 68,454 56,200 21.8
Taxation (8,800) (8,293) 6.1
Profit for the year 59,654 47,907 24.5
26
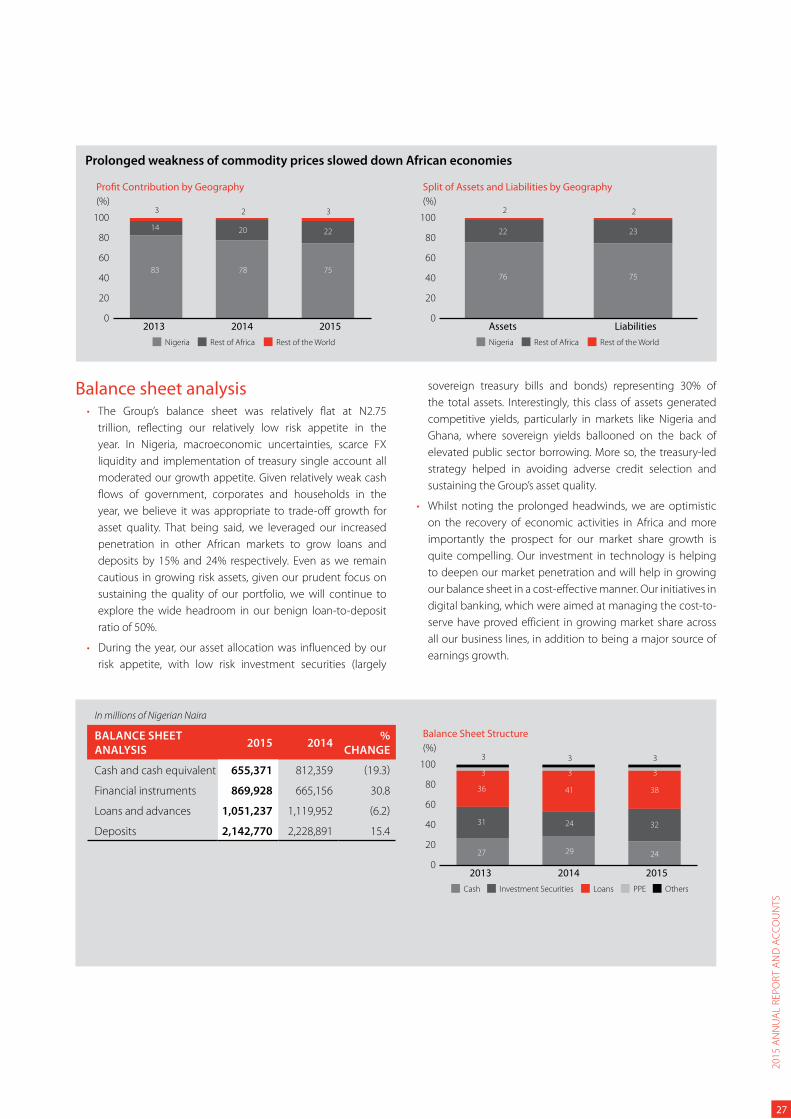
Balance sheet analysisThe Group’s balance sheet was relatively flat at N2.75
trillion, reflecting our relatively low risk appetite in the
year. In Nigeria, macroeconomic uncertainties, scarce FX
liquidity and implementation of treasury single account all
moderated our growth appetite. Given relatively weak cash
flows of government, corporates and households in the
year, we believe it was appropriate to trade-off growth for
asset quality. That being said, we leveraged our increased
penetration in other African markets to grow loans and
deposits by 15% and 24% respectively. Even as we remain
cautious in growing risk assets, given our prudent focus on
sustaining the quality of our portfolio, we will continue to
explore the wide headroom in our benign loan-to-deposit
ratio of 50%.
During the year, our asset allocation was influenced by our
risk appetite, with low risk investment securities (largely
sovereign treasury bills and bonds) representing 30% of
the total assets. Interestingly, this class of assets generated
competitive yields, particularly in markets like Nigeria and
Ghana, where sovereign yields ballooned on the back of
elevated public sector borrowing. More so, the treasury-led
strategy helped in avoiding adverse credit selection and
sustaining the Group’s asset quality.
Whilst noting the prolonged headwinds, we are optimistic
on the recovery of economic activities in Africa and more
importantly the prospect for our market share growth is
quite compelling. Our investment in technology is helping
to deepen our market penetration and will help in growing
our balance sheet in a cost-effective manner. Our initiatives in
digital banking, which were aimed at managing the cost-to-
serve have proved efficient in growing market share across
all our business lines, in addition to being a major source of
earnings growth.
Prolonged weakness of commodity prices slowed down African economies
In millions of Nigerian Naira
BALANCE SHEET
ANALYSIS 2015 2014
%
CHANGE
Cash and cash equivalent 655,371 812,359 (19.3)
Financial instruments 869,928 665,156 30.8
Loans and advances 1,051,237 1,119,952 (6.2)
Deposits 2,142,770 2,228,891 15.4
Profit Contribution by Geography
(%)
0
20
40
60
80
100
Nigeria Rest of Africa Rest of the World
2013 2014 2015
83 78 75
14 20 22
3 2 3
Split of Assets and Liabilities by Geography
(%)
0
20
40
60
80
100
Nigeria Rest of Africa Rest of the World
Assets Liabilities
76 75
22 23
2 2
Balance Sheet Structure
(%)
0
20
40
60
80
100
Cash Investment Securities Loans OthersPPE
2013 2014 2015
31 24 32
27 29 24
36 41 38
3
3 3 3
3 3
27
20
15
AN
NU
AL
RE
PO
RT
AN
D A
CC
OU
NT
S
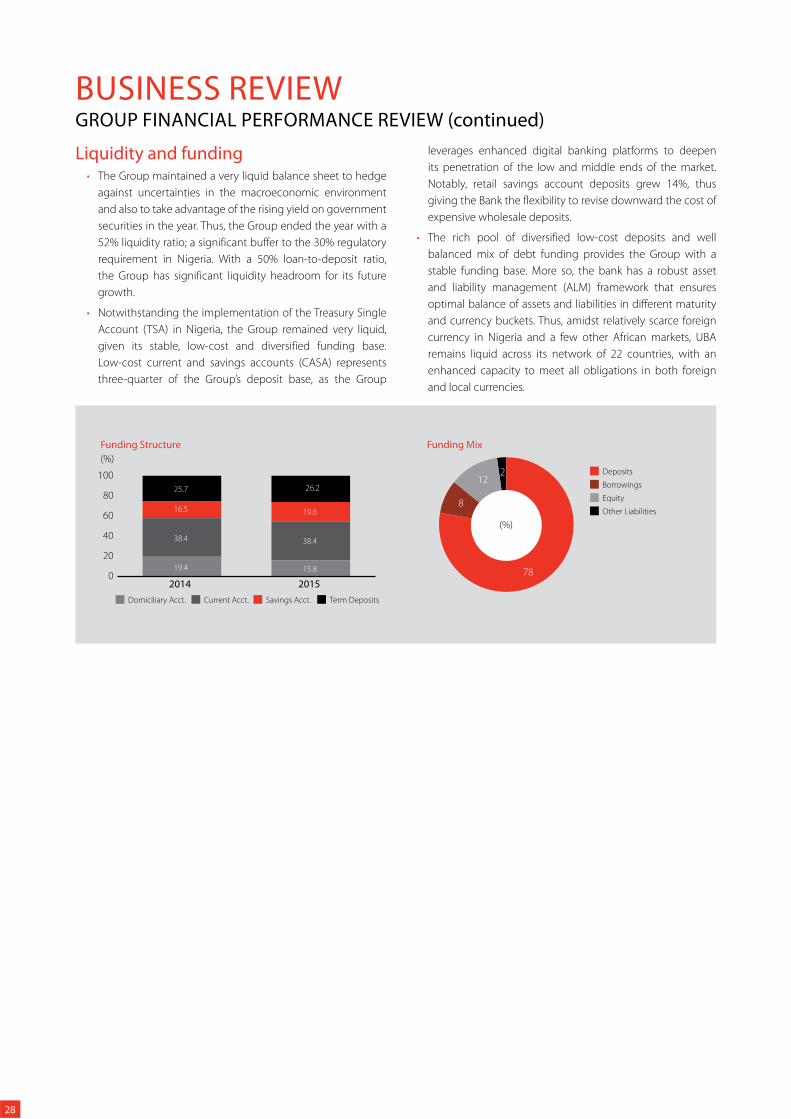
BUSINESS REVIEW
Liquidity and funding The Group maintained a very liquid balance sheet to hedge
against uncertainties in the macroeconomic environment
and also to take advantage of the rising yield on government
securities in the year. Thus, the Group ended the year with a
52% liquidity ratio; a significant buffer to the 30% regulatory
requirement in Nigeria. With a 50% loan-to-deposit ratio,
the Group has significant liquidity headroom for its future
growth.
Notwithstanding the implementation of the Treasury Single
Account (TSA) in Nigeria, the Group remained very liquid,
given its stable, low-cost and diversified funding base.
Low-cost current and savings accounts (CASA) represents
three-quarter of the Group’s deposit base, as the Group
leverages enhanced digital banking platforms to deepen
its penetration of the low and middle ends of the market.
Notably, retail savings account deposits grew 14%, thus
giving the Bank the flexibility to revise downward the cost of
expensive wholesale deposits.
The rich pool of diversified low-cost deposits and well
balanced mix of debt funding provides the Group with a
stable funding base. More so, the bank has a robust asset
and liability management (ALM) framework that ensures
optimal balance of assets and liabilities in different maturity
and currency buckets. Thus, amidst relatively scarce foreign
currency in Nigeria and a few other African markets, UBA
remains liquid across its network of 22 countries, with an
enhanced capacity to meet all obligations in both foreign
and local currencies.
Funding Structure
(%)
0
20
40
60
80
100
Domiciliary Acct. Current Acct. Savings Acct. Term Deposits
2014 2015
38.4 38.4
19.4 15.8
16.5 19.6
25.7 26.2
Funding Mix
(%)
Deposits
Borrowings
Equity
Other Liabilities
78
8
122
GROUP FINANCIAL PERFORMANCE REVIEW (continued)
28
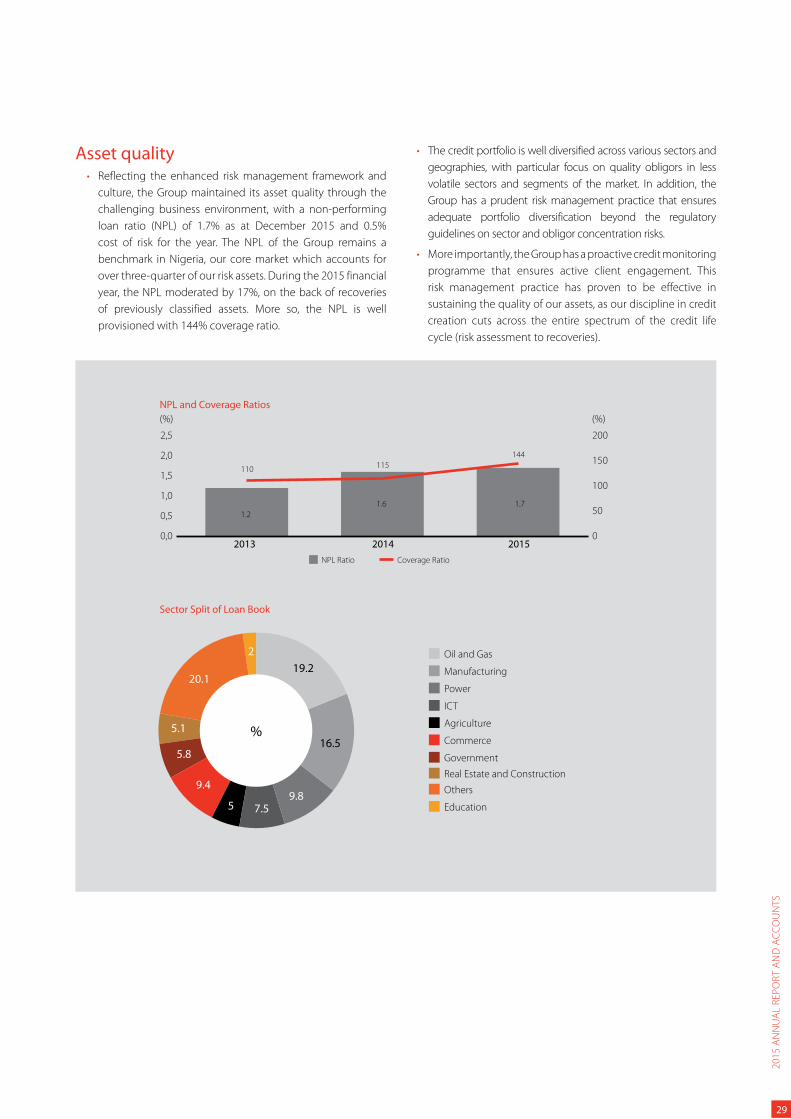
Asset quality Reflecting the enhanced risk management framework and
culture, the Group maintained its asset quality through the
challenging business environment, with a non-performing
loan ratio (NPL) of 1.7% as at December 2015 and 0.5%
cost of risk for the year. The NPL of the Group remains a
benchmark in Nigeria, our core market which accounts for
over three-quarter of our risk assets. During the 2015 financial
year, the NPL moderated by 17%, on the back of recoveries
of previously classified assets. More so, the NPL is well
provisioned with 144% coverage ratio.
The credit portfolio is well diversified across various sectors and
geographies, with particular focus on quality obligors in less
volatile sectors and segments of the market. In addition, the
Group has a prudent risk management practice that ensures
adequate portfolio diversification beyond the regulatory
guidelines on sector and obligor concentration risks.
More importantly, the Group has a proactive credit monitoring
programme that ensures active client engagement. This
risk management practice has proven to be effective in
sustaining the quality of our assets, as our discipline in credit
creation cuts across the entire spectrum of the credit life
cycle (risk assessment to recoveries).
NPL and Coverage Ratios
(%) (%)
0,0
0,5
1,0
1,5
2,0
2,5
0
50
100
150
200
NPL Ratio Coverage Ratio
20142013 2015
1.2
1.6 1.7
110 115
144
Oil and Gas
Manufacturing
Power
ICT
Agriculture
Commerce
Government
Real Estate and Construction
Others
Education
%
19.2
9.87.5
9.4
5.8
20.1
Sector Split of Loan Book
16.5
5
5.1
2
29
20
15
AN
NU
AL
RE
PO
RT
AN
D A
CC
OU
NT
S
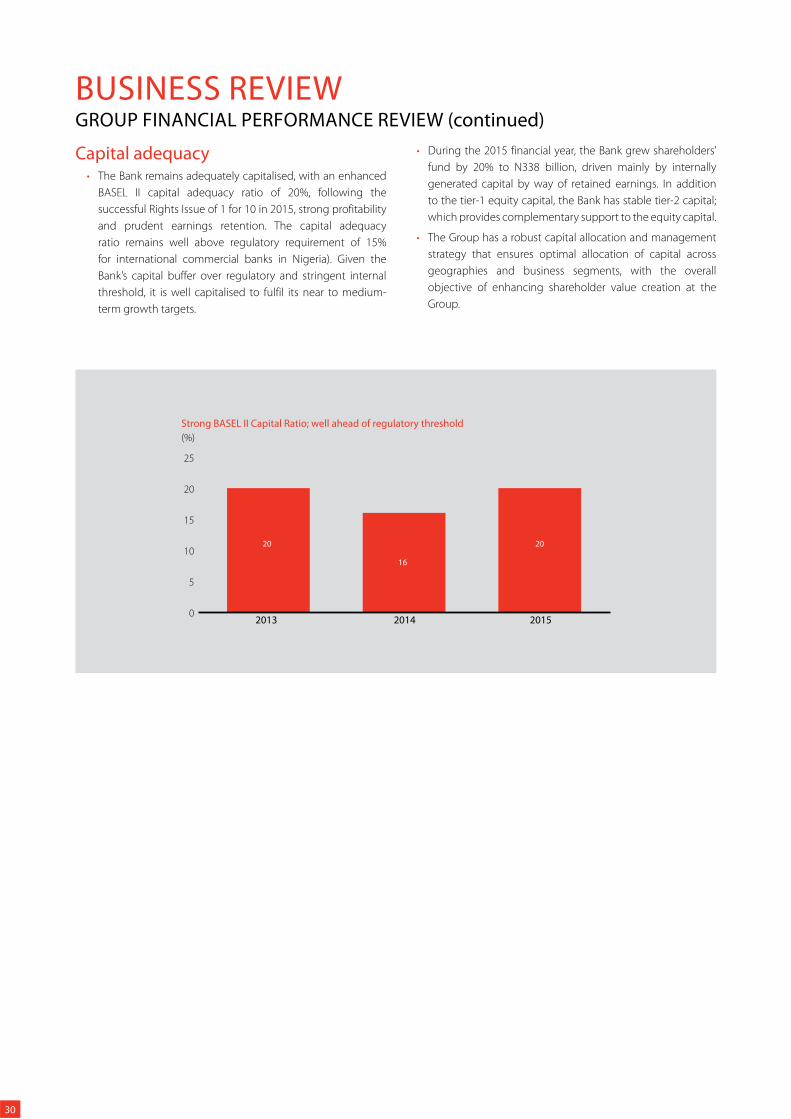
BUSINESS REVIEW
Capital adequacy The Bank remains adequately capitalised, with an enhanced
BASEL II capital adequacy ratio of 20%, following the
successful Rights Issue of 1 for 10 in 2015, strong profitability
and prudent earnings retention. The capital adequacy
ratio remains well above regulatory requirement of 15%
for international commercial banks in Nigeria). Given the
Bank’s capital buffer over regulatory and stringent internal
threshold, it is well capitalised to fulfil its near to medium-
term growth targets.
GROUP FINANCIAL PERFORMANCE REVIEW (continued)
During the 2015 financial year, the Bank grew shareholders’
fund by 20% to N338 billion, driven mainly by internally
generated capital by way of retained earnings. In addition
to the tier-1 equity capital, the Bank has stable tier-2 capital;
which provides complementary support to the equity capital.
The Group has a robust capital allocation and management
strategy that ensures optimal allocation of capital across
geographies and business segments, with the overall
objective of enhancing shareholder value creation at the
Group.
Strong BASEL II Capital Ratio; well ahead of regulatory threshold
(%)
0
5
10
15
20
25
20142013 2015
20
16
20
30
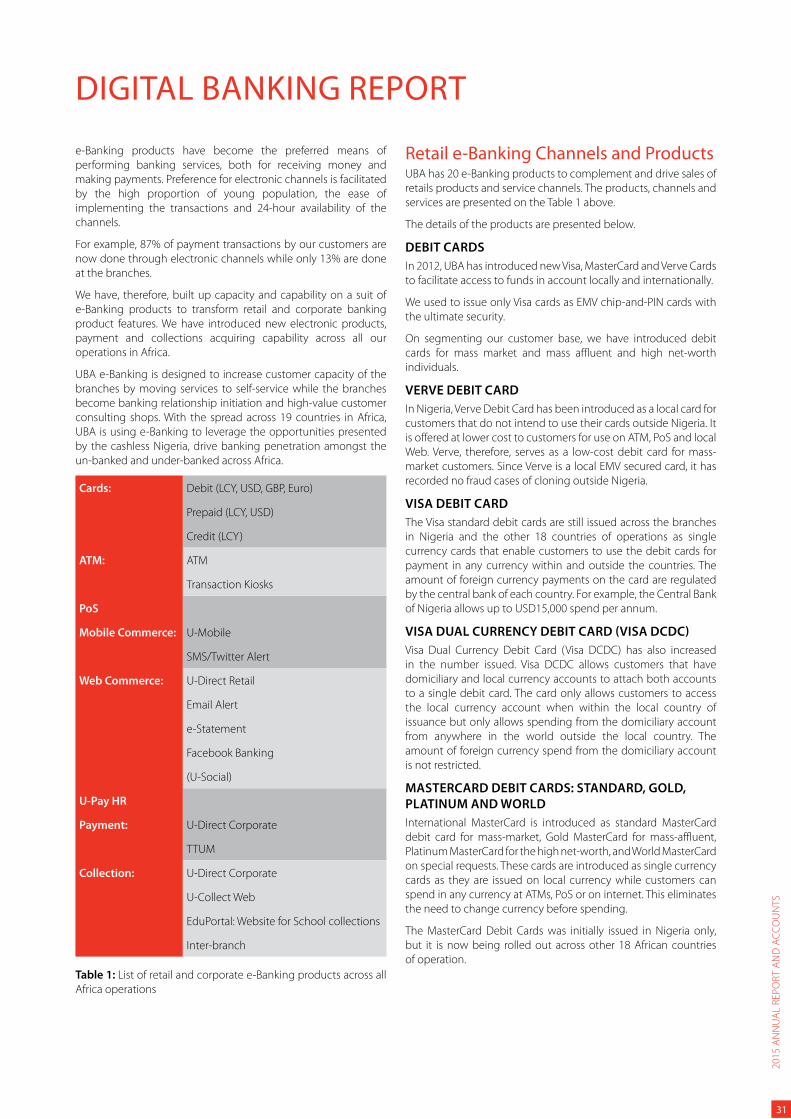
e-Banking products have become the preferred means of
performing banking services, both for receiving money and
making payments. Preference for electronic channels is facilitated
by the high proportion of young population, the ease of
implementing the transactions and 24-hour availability of the
channels.
For example, 87% of payment transactions by our customers are
now done through electronic channels while only 13% are done
at the branches.
We have, therefore, built up capacity and capability on a suit of
e-Banking products to transform retail and corporate banking
product features. We have introduced new electronic products,
payment and collections acquiring capability across all our
operations in Africa.
UBA e-Banking is designed to increase customer capacity of the
branches by moving services to self-service while the branches
become banking relationship initiation and high-value customer
consulting shops. With the spread across 19 countries in Africa,
UBA is using e-Banking to leverage the opportunities presented
by the cashless Nigeria, drive banking penetration amongst the
un-banked and under-banked across Africa.
Cards: Debit (LCY, USD, GBP, Euro)
Prepaid (LCY, USD)
Credit (LCY)
ATM: ATM
Transaction Kiosks
PoS
Mobile Commerce: U-Mobile
SMS/Twitter Alert
Web Commerce: U-Direct Retail
Email Alert
e-Statement
Facebook Banking
(U-Social)
U-Pay HR
Payment: U-Direct Corporate
TTUM
Collection: U-Direct Corporate
U-Collect Web
EduPortal: Website for School collections
Inter-branch
Table 1: List of retail and corporate e-Banking products across all
Africa operations
Retail e-Banking Channels and ProductsUBA has 20 e-Banking products to complement and drive sales of
retails products and service channels. The products, channels and
services are presented on the Table 1 above.
The details of the products are presented below.
DEBIT CARDS
In 2012, UBA has introduced new Visa, MasterCard and Verve Cards
to facilitate access to funds in account locally and internationally.
We used to issue only Visa cards as EMV chip-and-PIN cards with
the ultimate security.
On segmenting our customer base, we have introduced debit
cards for mass market and mass affluent and high net-worth
individuals.
VERVE DEBIT CARD
In Nigeria, Verve Debit Card has been introduced as a local card for
customers that do not intend to use their cards outside Nigeria. It
is offered at lower cost to customers for use on ATM, PoS and local
Web. Verve, therefore, serves as a low-cost debit card for mass-
market customers. Since Verve is a local EMV secured card, it has
recorded no fraud cases of cloning outside Nigeria.
VISA DEBIT CARD
The Visa standard debit cards are still issued across the branches
in Nigeria and the other 18 countries of operations as single
currency cards that enable customers to use the debit cards for
payment in any currency within and outside the countries. The
amount of foreign currency payments on the card are regulated
by the central bank of each country. For example, the Central Bank
of Nigeria allows up to USD15,000 spend per annum.
VISA DUAL CURRENCY DEBIT CARD (VISA DCDC)
Visa Dual Currency Debit Card (Visa DCDC) has also increased
in the number issued. Visa DCDC allows customers that have
domiciliary and local currency accounts to attach both accounts
to a single debit card. The card only allows customers to access
the local currency account when within the local country of
issuance but only allows spending from the domiciliary account
from anywhere in the world outside the local country. The
amount of foreign currency spend from the domiciliary account
is not restricted.
MASTERCARD DEBIT CARDS: STANDARD, GOLD,
PLATINUM AND WORLD
International MasterCard is introduced as standard MasterCard
debit card for mass-market, Gold MasterCard for mass-affluent,
Platinum MasterCard for the high net-worth, and World MasterCard
on special requests. These cards are introduced as single currency
cards as they are issued on local currency while customers can
spend in any currency at ATMs, PoS or on internet. This eliminates
the need to change currency before spending.
The MasterCard Debit Cards was initially issued in Nigeria only,
but it is now being rolled out across other 18 African countries
of operation.
DIGITAL BANKING REPORT
31
20
15
AN
NU
AL
RE
PO
RT
AN
D A
CC
OU
NT
S
DIGITAL BANKING REPORT (continued)
MASTERCARD: USD, EURO AND GBP
In Nigeria, we also introduced MasterCard for domiciliary accounts
in USD, GBP and Euro. The introduction of such FCY MasterCard
debit cards has elevated the value propositions of our domiciliary
accounts.
These cards are being introduced in other African countries, with
impressive market acceptance.
PREPAID CARDS
In 2012, UBA introduced prepaid cards in Visa brand. UBA prepaid
card has been launched in all 19 countries. By end of 2014, UBA
also introduced prepaid cards in MasterCard card. The prepaid are
all loadable with local currencies.
Visa Prepaid card has also been introduced in USD currency in
Nigeria, Liberia and Congo DRC only.
CHANNELS:
Mobile Banking (U-Mobile), Internet Banking (U-Direct), ATMs,
PoS and Web Payment are provided and enabled by UBA for
account holders to access and manage accounts (U-Mobile and
U-Direct), withdraw cash (ATM), and make payments (PoS and
Web Payment).
ATM CHANNEL:
ATMs are deployed across 19 countries. The ATMs have been
developed to accept payment requests from all card schemes
including local and internationally issued.
In 2014, UBA acquired MasterCard acquiring licence across all
African operations and all UBA ATMs now accept any local and
international MasterCards as well as local and international
Visa cards.
The increasing trend of non-cash withdrawal transactions that has
increased steadily from 1% in January 2013 to 10% in December
2014 on ATMs in Nigeria, has prompted the introduction of
Transaction Kiosks that will be dedicated to non-cash services.
The non-cash services include airtime vending, bill payment,
donations, money transfers. The transaction kiosks will be
introduced across the Group in 2016.
We also noticed that about 80% of the deposits are still done in
the branches which leads to branch crowding. Noting that the
deposit amount with value less than N20,000 is very high, we have
piloted note-accepting ATMs and will be introduced in 2016.
POS AND WEB ACQUIRING CHANNELS:
In 2012, UBA obtained Group acquiring licence for MasterCard to
be able to acquire MasterCard transaction on PoS and Internet.
In 2014, UBA implemented Group acquiring Visa and MasterCard
licences for PoS and Web channels.
UBA has since started deploying PoS and Web acquiring across all
countries of operations in Africa.
MOBILE BANKING (U-MOBILE)
UBA has invested in Mobile Banking capability and beyond. Mobile
Banking has been running in Nigeria and all African countries.
The Mobile Banking channel enables customer to access basic
banking services such as viewing balances, confirming cheques,
transferring money, buying airtime, paying bills, and sending
complaints to customer fulfillment centre.
Given the high potential of this market, UBA is investing in more
flexible and friend platform for easy onboarding of customers.
INTERNET BANKING (U-DIRECT)
UBA has deployed Internet banking (U-Direct) to all 19 countries
of operations.
The Internet banking channel enables customer to access basic
banking services such as viewing balances, confirming cheques,
transferring money, buying airtime, paying bills, and sending
complaints to customer fulfillment centre.
FACEBOOK BANKING (U-SOCIAL)
In 2015, we will introduce Facebook banking across all countries.
This is intended to provide banking channels to the population
that spends time and is comfortable with Facebook social media.
Services (SMS, email, Tweeter notification, periodic e-Statement)
UBA provides other notification services which include SMS, email
notification and frequent statement.
SMS and email notification services are designed to present
notification to customers when debit or credit is passed to the
customers’ accounts. SMS and eMail notifications are sent to
mobile number and e-mail address provided by the customers
and in the bank’s records.
TWEETER NOTIFICATION
Tweeter Alert was introduced in Nigeria in 2014 and will be
introduced across all the countries in 2015.
Tweeter notification is notification alert of credit and debit
transactions on customers’ accounts.
Corporate e-Banking ProductsU-DIRECT CORPORATE: GLOBAL BUSINESS
PAYMENTS PLATFORM
In 2015, all payment platforms were consolidated into a single
platform, U-Direct Corporate with a single sign-on window.
U-Direct Corporate is a payment platform designed for use by
corporate institutions, SME and Government to manage payment
from their operations account. U-Direct Corporate is a secure
web-based application that allows companies, corporate, small
businesses and government bodies to make electronic payments
to any beneficiary, in any bank (local and foreign currency), from
any location over the Internet. It supports electronic payments
with a unique rules-based logic that increases straight-through-
processing (STP).
It gives the corporate control of its accounts for various types of
payments (e.g. staff salaries, vendor payment, dividends, pensions
etc). These services are offered through a single window, along
with quick client on-boarding, simple and flexible configuration,
authorisation rules and multiple level approvals. U-Direct
32
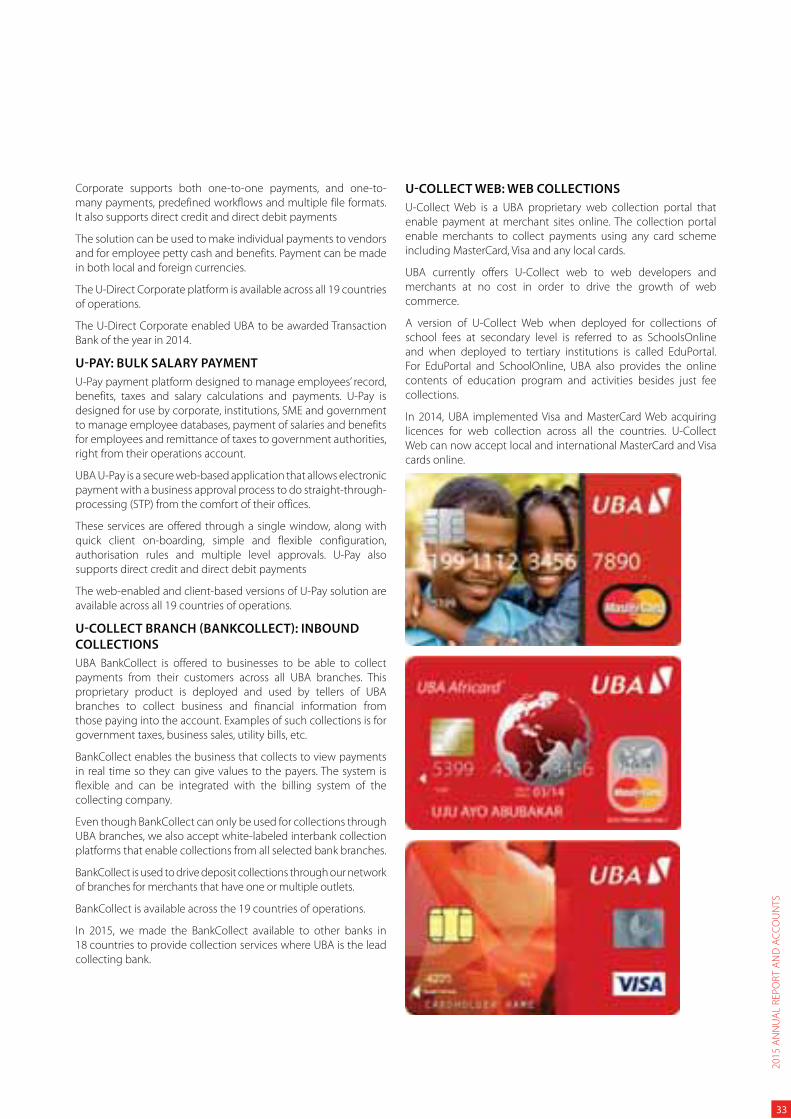
Corporate supports both one-to-one payments, and one-to-
many payments, predefined workflows and multiple file formats.
It also supports direct credit and direct debit payments
The solution can be used to make individual payments to vendors
and for employee petty cash and benefits. Payment can be made
in both local and foreign currencies.
The U-Direct Corporate platform is available across all 19 countries
of operations.
The U-Direct Corporate enabled UBA to be awarded Transaction
Bank of the year in 2014.
U-PAY: BULK SALARY PAYMENT
U-Pay payment platform designed to manage employees’ record,
benefits, taxes and salary calculations and payments. U-Pay is
designed for use by corporate, institutions, SME and government
to manage employee databases, payment of salaries and benefits
for employees and remittance of taxes to government authorities,
right from their operations account.
UBA U-Pay is a secure web-based application that allows electronic
payment with a business approval process to do straight-through-
processing (STP) from the comfort of their offices.
These services are offered through a single window, along with
quick client on-boarding, simple and flexible configuration,
authorisation rules and multiple level approvals. U-Pay also
supports direct credit and direct debit payments
The web-enabled and client-based versions of U-Pay solution are
available across all 19 countries of operations.
U-COLLECT BRANCH (BANKCOLLECT): INBOUND
COLLECTIONS
UBA BankCollect is offered to businesses to be able to collect
payments from their customers across all UBA branches. This
proprietary product is deployed and used by tellers of UBA
branches to collect business and financial information from
those paying into the account. Examples of such collections is for
government taxes, business sales, utility bills, etc.
BankCollect enables the business that collects to view payments
in real time so they can give values to the payers. The system is
flexible and can be integrated with the billing system of the
collecting company.
Even though BankCollect can only be used for collections through
UBA branches, we also accept white-labeled interbank collection
platforms that enable collections from all selected bank branches.
BankCollect is used to drive deposit collections through our network
of branches for merchants that have one or multiple outlets.
BankCollect is available across the 19 countries of operations.
In 2015, we made the BankCollect available to other banks in
18 countries to provide collection services where UBA is the lead
collecting bank.
U-COLLECT WEB: WEB COLLECTIONS
U-Collect Web is a UBA proprietary web collection portal that
enable payment at merchant sites online. The collection portal
enable merchants to collect payments using any card scheme
including MasterCard, Visa and any local cards.
UBA currently offers U-Collect web to web developers and
merchants at no cost in order to drive the growth of web
commerce.
A version of U-Collect Web when deployed for collections of
school fees at secondary level is referred to as SchoolsOnline
and when deployed to tertiary institutions is called EduPortal.
For EduPortal and SchoolOnline, UBA also provides the online
contents of education program and activities besides just fee
collections.
In 2014, UBA implemented Visa and MasterCard Web acquiring
licences for web collection across all the countries. U-Collect
Web can now accept local and international MasterCard and Visa
cards online.
33
20
15
AN
NU
AL
RE
PO
RT
AN
D A
CC
OU
NT
S

Sustainability and Corporate Responsibility 36
AND SUSTAINABILITY
34
CORPORATE RESPONSIBILITY
34

35
20
15
AN
NU
AL
RE
PO
RT
AN
D A
CC
OU
NT
S
As a financial services provider with an obligation to comply with
international best practices, UBA Plc continued to ensure that its
operations comply with international performance standards and
applicable national environmental and social regulations.
Sustainability principles are deeply entrenched in UBA’s core
values and system, so sustainability is in our DNA. We keep tabs on
the economic, social and environmental impact of our activities;
placing value on people and our environment, even as we strive
to make it a better place.
At UBA, we define sustainability in the broadest possible terms. It is
conducting our day to day business the right way as we continue
to play a part in addressing some of the biggest challenges faced
by our society.
Financial inclusion has always been at the fore of UBA’s drive
for market share and coverage. We have conducted extensive
radio campaigns and have continued to attract patronage from
economically disadvantaged members of the public for opening
of Tiers 1 and 2 Savings Accounts. During the 2015 financial
year, a total of 110,644 bank accounts were opened for this
category of people. The Bank has also strived to meet the needs
of the physically challenged by making its business offices more
accessible to physically challenged persons. We have further
reduced barriers to financial services by the increasing number
of people with access to mobile money and by providing more
digital offerings.
Female empowerment is not just about educating the female
child, the scope is way broader than that. That is why we also
focus on financial inclusion via developing products tailored to
women. At UBA, we ensure that we conduct business with more
female entrepreneurs and companies with a growing percentage
of women in management positions. We have been supporting
women across Africa who are contributing significantly to
economic growth and helping the younger generation (e.g.
committing resources to the Abia State Women Integrated
Conference in 2015).
UBA Plc attaches strong importance to women’s economic
empowerment and continuously ensures that women play
prominent roles in the affairs of the Bank. As at December 2015,
47% of the bank’s staff and 23% of Senior Management Staff
were female. This is a clear testimony to the Bank’s commitment
to gender equality and women empowerment. Our gender-
based Ruby Account (strictly for women) has continued to attract
increased patronage.
Human rights are important to retaining and attracting the best
human resources as well as for sustainable development. At UBA
we respect both human and labour rights in both business
operations and activities. We understand that social equity refers
to a fair and just distribution of economic and environmental costs
and benefits, and the ability to participate in decision-making
processes; and this is thoroughly integrated into our working
conditions, both internally (as it affects our staff ) and externally.
A part of this is also paying attention to disadvantaged groups
in society, including women, youth and children, the elderly,
indigenous groups, and ethnic minorities.
Health and safety of our employees and clients is of utmost
importance at UBA. This is that we were at the fore-front of the Ebola
eradication and created awareness about key health issues, e.g.
prostrate and breast cancer year in and year out. The World Health
Organization (WHO, 1998) has stated that, “poor environmental
quality is directly responsible for around 25% of all preventable
ill health in the world today, with diarrhoeal diseases and acute
respiratory infections (ARI), such as pneumonia heading the list.
Other diseases such as malaria, schistosomiasis, other vector-borne
diseases, chronic respiratory diseases, and childhood infections
are also strongly influenced by adverse environmental conditions,
as are injuries.” We encourage our staff to carry out routine health
check-ups and making sure we are in perfect health, as human
capital is vital for our sustainability going forward.
Also, waste production and mismanagement of resources, for
example, are both conditions that affect health. Poor health and
a decreasing quality of life dis-empower the most vulnerable and
marginalised groups, decreasing their ability to fight poverty and
injustice. Advances in development cannot be sustained in a state
of threatened human security.
Corporate Governance on environmental and social life is an
important aspect of our commitment to sustainable practices
as a financial institution. We strive to achieve a high level of
corporate governance; it is essentially balancing the interest of
all our stakeholders. We acknowledge that it is not enough for a
company to be profitable but also strive to demonstrate a global
standard practice of corporate governance. Typically, the board is
charged with overseeing corporate governance practices Group
wide. One of the tenets of corporate governance is ensuring that
there are clear lines of responsibility, authority and accountability
and making sure appropriate responsibilities and measures are
in place.
The Bank, in 2014, appointed Group Environmental Risk Managers,
who in conjunction with the Banks’ Sustainability Officers have
continued in their efforts to guide, implement and promote the
sustainable principles Bank wide.
Environmental and Social Risk Management has been
incorporated into our enterprise risk management framework,
especially in the delivery of our core business activity. Our
credit customers in the major sectors are subject to a Social
and Environmental Impact Assessment and Environmental
Impact Assessment as requested for high risk credits. These help
to identify residual risks in the credit transactions. Feedbacks
obtained thereon from these assessments is fed into our credit
decision process.
Environmental and Social Footprint: To reduce our carbon
footprint, we are building on sustainable practices we started in
previous years, aimed at reducing the bank’s carbon footprint
arising from its operations. For example, we are optimising
our power use in all our offices through the enforcement of
mandatory closing times for non-critical activities in our business
offices (6:00pm) as well as at the Head Office (7:00pm). In the
same vein, the use of our central air conditioning system at the
Head Office building which is powered by water, is restricted to
certain times, both during the working week and at the weekend.
SUSTAINABILITY AND CORPORATE
RESPONSIBILITY REPORT
36
We have continued in our efforts to reduce the use of paper in
our general operations. The use of e-mails, workflows, portals and
other e-channels is encouraged as work tools for members of staff.
Information to customers is sent electronically via text, phone calls
and e-mails. Bank statements, for example, are sent via e-mails,
except where hard copies are requested by the customer.
We have also revamped and/or developed various e-channel
products, such as the improved U-direct, U-Mobile, U-Social
and Twitter Notification, all of which aim at reducing the use of
paper in our business operations. The Bank also commenced the
deployment of Automated Teller Machines (ATM) powered by
alternative sources of energy (solar energy) in 2015.
Given the scale of our operations across over 615 business offices
in Nigeria and 18 other African countries, there is a growing need
for frequent travel across the Group. We have however reduced
the need for this travel and the associated risk by investing in a
state-of-the-art conference call infrastructure that enables us to
reduce travel and still achieve the same result within the shortest
time frame.
In terms of community support, we have continued to invest
in the communities in which we have presence through our
Corporate Social Responsibility Arm – UBA Foundation. Annual
projects like the UBA Foundation National Essay Competition for
senior secondary school students in Nigeria, Ghana and Senegal;
prostate cancer awareness campaign; Read Africa initiative; and
various donations, including 5000 school bags to school children,
to mention a few. Some of these are expatiated upon under
Corporate Social Responsibility section.
Capacity Building in the area of sustainability is a work-in-progress
at UBA Plc. Sustainability is included as a module for all compliance
training Bank wide. We recently concluded the 2015 Annual
Compliance course for members of staff – a computer-based
training and assessment, which included sustainability as a module.
Issues on sustainability are also dealt with in form of a monthly
(Compliance) digest published and circulated via email to all
members of staff. Train-the-trainer seminars on sustainability have
also commenced. We have also continued to collaborate with other
Banks and Development Finance Institutions, like the International
Finance Corporation, through our participation in regular meetings
and capacity building workshops.
Collaborative Partnerships: UBA is a member of the Joint Disaster
Rescue Initiative (JDRI) which includes the Central Bank of Nigeria,
First Bank, Union Bank and Wema Bank. JDRI provides support
and assistance within the vicinity of the Marina, whenever there
is any fire outbreak. The bank is also in collaboration with Lagos
State Fire Service, Federal Fire Service and Nigerian Emergency
Management Authority (NEMA).
Reporting: In June, 2015 we commenced the semi –annual
reports to the Central Bank of Nigeria. Sustainability issues get
reported to the Board through its Risk Management Committee,
which meets quarterly. That way, the Board gets briefed of
progress being made in implementing the sustainability policy
approved by the Board as part of its responsibility of setting the
sustainability tone from the top. UBA Plc also reports annually to
the International Finance Corporation on its Environmental and
Social Performance.
The implementation of the Nigerian Sustainability Banking
Principles and the Sustainability Policy of the Bank remains a work
in progress – progress at ingraining the sustainability culture in
the Bank, as we strive to regain our industry leadership position
in an economically viable, socially relevant and environmentally
responsible way.
Corporate Social Responsibility ReportThe UBA Group is committed to the principles and best practices
of corporate social responsibility and prides itself as being a model
corporate citizen in every country where it has presence. UBA
Group pursues its corporate social responsibility goals through
UBA Foundation.
UBA Foundation plays this role by contributing in three strategic
areas that are of immense importance to community development:
Education, Environment and Economic Empowerment. The
Foundation also embarks on special projects, which do not fall
under these three focus areas, if there is a need for intervention.
UBA Foundation draws its inspiration from the Group’s intrinsic
values of Humility, Empathy, Resilience and Integrity (H.E.I.R.).
UBA Group recognises that doing business in a sustainable
manner means doing business in a way that empowers the
present generation of Africans without compromising the future.
This is also reflected in the activities of UBA Foundation.
As in previous years, UBA Foundation in 2015 continued to
intervene in the critical areas of the socio-economic environment
that has the biggest potential to improve the livelihood and long
term sustainability of the countries in which it operates.
EducationA highly educated and well informed youth is critical to the future
of Africa. Quality education is therefore crucial in developing the
manpower needed by Africa to exploit emerging opportunities
and propel the continent to higher levels of development.
UBA Foundation is therefore actively involved in a number of
educational initiatives and projects, particularly those that will
not only bridge the literacy gap but encourage intellectual
development among African children. One of UBA Foundation’s
interventions in the educational system is the National Essay
Competition (NEC) for secondary schools. Currently, the NEC is
held annually in Nigeria, Ghana and Senegal with plans to extend
to other African countries.
37
20
15
AN
NU
AL
RE
PO
RT
AN
D A
CC
OU
NT
S

SUSTAINABILITY AND CORPORATE
RESPONSIBILITY REPORT (continued)
THE 2015 NATIONAL ESSAY COMPETITION
The 2015 National Essay Competition was held in Nigeria, Ghana
and Senegal producing a total of nine winners and 36 finalists.
Students in the in 2015 competition were invited to write on the
topic “What Matters Most to You in Life and Why?.” Twelve finalists
emerged from each of the three countries where the competition
was held and were invited to write a second essay under the
Bank’s supervision. Three winners were then selected from each
country and announced at a grand finale held in the respective
countries. All 36 finalists received a branded laptop computer
each to help with their education.
In Nigeria, 15-year old Emediong Uduak Uko of British Nigerian
Academy, FCT, Abuja, emerged winner of N1 million. Fourteen-
year old Enonuya Starish of The Lagoon School, Lagos, came
second and won N750,000.00, while third prize went to 16-year
old Eze Ugochinyere Golden of Living Word Academy School,
Aba, Abia State, who won N500,000.00. The students receive their
prizes in the form of educational grants to study in any African
University of their choice.
Title: L-R: MD/CEO, UBA Foundation, Ijeoma Aso; 2nd Runner Up, Eze Ugochinyere Golden; GMD, UBA Plc, Phillips Oduoza; Winner, 2015 National Essay Competition
for senior secondary school students in Nigeria, Emediong Uduoka Uko; MD/DMD, UBA Africa, Kennedy Uzoka and 1ST Runner Up, Enonuya Starish at the grand
finale of the 2015 National Essay Competition held in Lagos, Nigeria.
In Ghana, Adzokpa Serahine Aku Kekeli of Ola Senior High emerged as the overall winner of the 2015 competition and won the coveted
Ghs 20,000.00 prize. Frederick Nana Kwame Asante of Accra Academy was the first runner up with prize money of Ghs 14,000.00 while
the 2nd runner up was Senanum Kwabla Adjani of Sogakope Senior Secondary School, who won Ghs 8,000.00. As with the tradition of
the competition, the three winners receive their prizes in the form of educational grants to study in any African University of their choice.
38

In Senegal, the 2015 National Essay Competition was won by
Clarice Marie Faye of Maison d’Éducation Mariama Bâ. Joséphine
Nzale emerged 1st Runner up while Gilbert Diene emerged
2nd Runner-up. All three winners will receive XOF2, 500,000.00,
XOF1, 750,000.00 and XOF 1,000,000.00 respectively in the form
of educational grants to study in any African university of their
choice. In contributing to the educational development in Africa,
UBA Foundation also donated over 5,000 book bags to school
going children in Africa.
Title: L-R: Fredrick Asante; 1st Runner Up; Adzokpa Serahine Aku Kekeli; Winner,
2015 National Essay Competition in Ghana and Senanum Kwabla Adjani,
2nd runner up at the grand finale of the UBA Foundation 2015 National Essay
Competition held in Accra, Ghana.
Title: L-R: Ijeoma Aso, MD/CEO, UBA Foundation; Gilbert Diene, 3rd Prize Winner;
Clarice Marie Faye, Winner, UBA Foundation National Essay Competition in
Senegal; Joséphine Nzale, 2nd Prize Winner and Ibnou Samb, Head, Legal, UBA
Senegal at the grand finale of the UBA Foundation National Essay Competition
held in Dakar, Senegal.
Title: Members of staff helping create awareness on prostate cancer in Abuja
Special projectsPROSTATE CANCER AWARENESS
Annually, UBA organises the Prostate Cancer campaign to raise
awareness on this sensitive male health issue, while providing free
prostate cancer screening. In 2015, UBA Foundation organised a
series of sporting activities leveraging on the Bank’s first quarter
group wide Jogging to Bond exercise. The Foundation sponsored
free prostate cancer screening for men In Abuja, Port Harcourt
and Lagos. A total of 1500 men were screened in the three cities.
This campaign has helped to reduce the stigma associated with
prostate cancer, increased awareness of the disease among the
general public but letting men know that it can be easily treated
if discovered early.
Environment and economic
empowermentUBA Foundation maintains gardens in Lagos. These gardens
beautify the parts of the city where they are located. They also
provide employment to the gardeners/cleaners that maintain the
gardens and their surroundings. The Foundation employs over
25 under privileged young people who are encouraged to further
their education during the time that they are not at work. Most of
them started out with Senior Secondary School Certificates and
now have either concluded their degree programs or are in the
process.
In 2015, UBA Foundation also partnered with EMPRETEC Nigeria
Foundation (ENF), a private sector initiative of the United Nations
Conference on Trade and Development (UNCTAD). The Graduate
Entrepreneurship Training was for National Youth Corps Members
(NYSC) nationwide. The training took the participants through the
theoretical and practical aspects of entrepreneurship. They also
developed detailed business plans and simulations on running
actual small businesses during the six-day training.
39
20
15
AN
NU
AL
RE
PO
RT
AN
D A
CC
OU
NT
S

Director’s Report 42
Customer Complaints Channels 48
Corporate Governance Report 50
Audit Committee Report 54
Board Evaluation Report 55
Statement of Directors’ Responsibilities 56
GOVERNANCE
4040

41
20
15
AN
NU
AL
RE
PO
RT
AN
D A
CC
OU
NT
S
41
20
15
AN
NU
AL
RE
PO
RT
AN
D A
CC
OU
NT
S
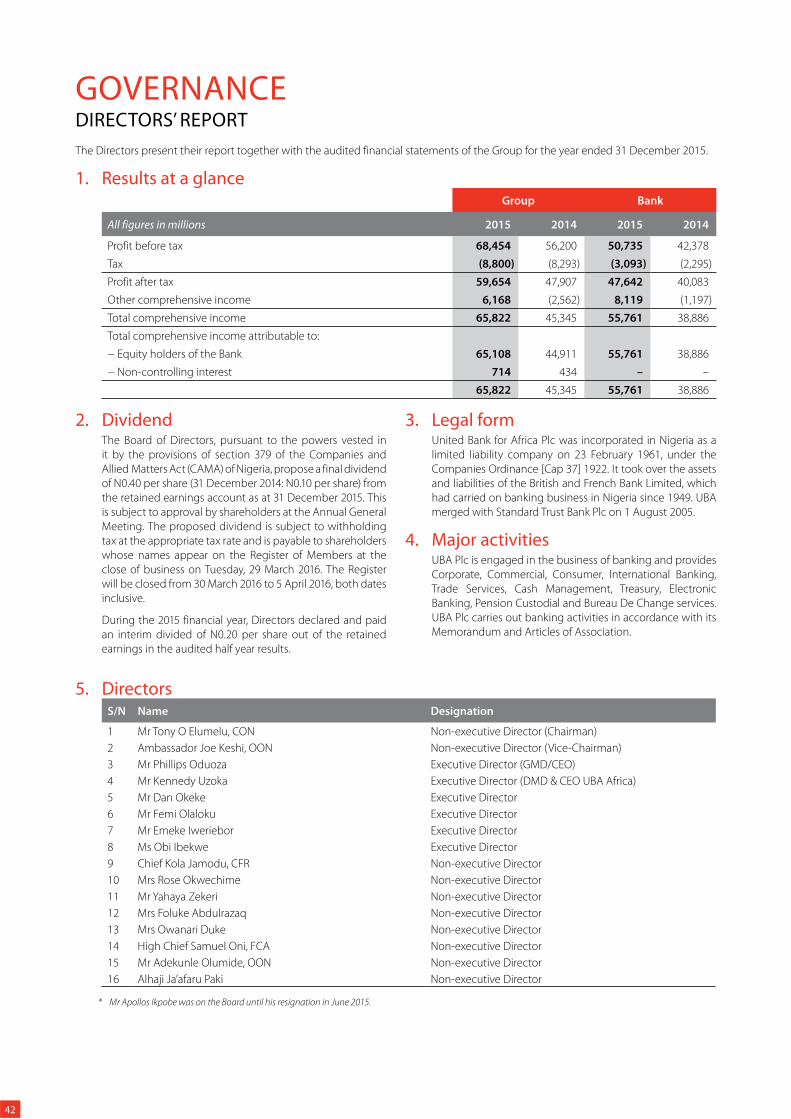
GOVERNANCEDIRECTORS’ REPORT
The Directors present their report together with the audited financial statements of the Group for the year ended 31 December 2015.
1. Results at a glance Group Bank
All figures in millions 2015 2014 2015 2014
Profit before tax 68,454 56,200 50,735 42,378
Tax (8,800) (8,293) (3,093) (2,295)
Profit after tax 59,654 47,907 47,642 40,083
Other comprehensive income 6,168 (2,562) 8,119 (1,197)
Total comprehensive income 65,822 45,345 55,761 38,886
Total comprehensive income attributable to:
− Equity holders of the Bank 65,108 44,911 55,761 38,886
− Non-controlling interest 714 434 – –
65,822 45,345 55,761 38,886
2. DividendThe Board of Directors, pursuant to the powers vested in
it by the provisions of section 379 of the Companies and
Allied Matters Act (CAMA) of Nigeria, propose a final dividend
of N0.40 per share (31 December 2014: N0.10 per share) from
the retained earnings account as at 31 December 2015. This
is subject to approval by shareholders at the Annual General
Meeting. The proposed dividend is subject to withholding
tax at the appropriate tax rate and is payable to shareholders
whose names appear on the Register of Members at the
close of business on Tuesday, 29 March 2016. The Register
will be closed from 30 March 2016 to 5 April 2016, both dates
inclusive.
During the 2015 financial year, Directors declared and paid
an interim divided of N0.20 per share out of the retained
earnings in the audited half year results.
3. Legal formUnited Bank for Africa Plc was incorporated in Nigeria as a
limited liability company on 23 February 1961, under the
Companies Ordinance [Cap 37] 1922. It took over the assets
and liabilities of the British and French Bank Limited, which
had carried on banking business in Nigeria since 1949. UBA
merged with Standard Trust Bank Plc on 1 August 2005.
4. Major activities UBA Plc is engaged in the business of banking and provides
Corporate, Commercial, Consumer, International Banking,
Trade Services, Cash Management, Treasury, Electronic
Banking, Pension Custodial and Bureau De Change services.
UBA Plc carries out banking activities in accordance with its
Memorandum and Articles of Association.
5. Directors S/N Name Designation
1 Mr Tony O Elumelu, CON Non-executive Director (Chairman)
2 Ambassador Joe Keshi, OON Non-executive Director (Vice-Chairman)
3 Mr Phillips Oduoza Executive Director (GMD/CEO)
4 Mr Kennedy Uzoka Executive Director (DMD & CEO UBA Africa)
5 Mr Dan Okeke Executive Director
6 Mr Femi Olaloku Executive Director
7 Mr Emeke Iweriebor Executive Director
8 Ms Obi Ibekwe Executive Director
9 Chief Kola Jamodu, CFR Non-executive Director
10 Mrs Rose Okwechime Non-executive Director
11 Mr Yahaya Zekeri Non-executive Director
12 Mrs Foluke Abdulrazaq Non-executive Director
13 Mrs Owanari Duke Non-executive Director
14 High Chief Samuel Oni, FCA Non-executive Director
15 Mr Adekunle Olumide, OON Non-executive Director
16 Alhaji Ja’afaru Paki Non-executive Director
* Mr Apollos Ikpobe was on the Board until his resignation in June 2015.
42
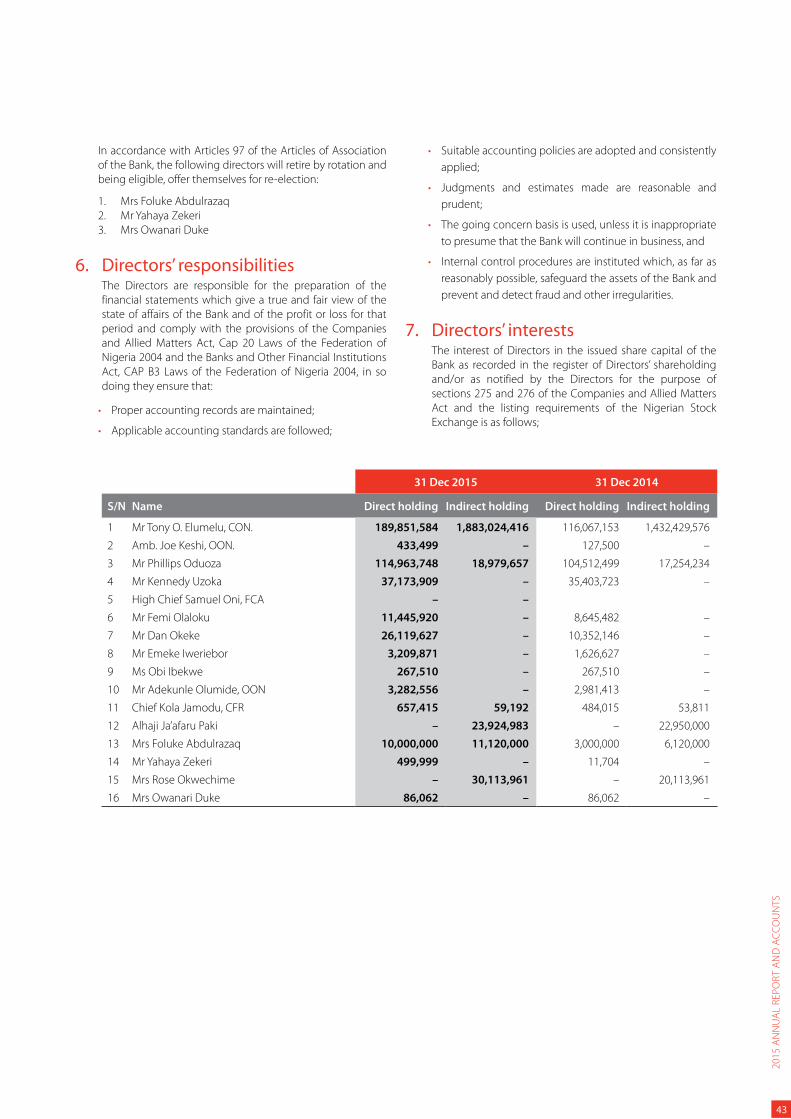
In accordance with Articles 97 of the Articles of Association
of the Bank, the following directors will retire by rotation and
being eligible, offer themselves for re-election:
1. Mrs Foluke Abdulrazaq
2. Mr Yahaya Zekeri
3. Mrs Owanari Duke
6. Directors’ responsibilities The Directors are responsible for the preparation of the
financial statements which give a true and fair view of the
state of affairs of the Bank and of the profit or loss for that
period and comply with the provisions of the Companies
and Allied Matters Act, Cap 20 Laws of the Federation of
Nigeria 2004 and the Banks and Other Financial Institutions
Act, CAP B3 Laws of the Federation of Nigeria 2004, in so
doing they ensure that:
Proper accounting records are maintained;
Applicable accounting standards are followed;
Suitable accounting policies are adopted and consistently
applied;
Judgments and estimates made are reasonable and
prudent;
The going concern basis is used, unless it is inappropriate
to presume that the Bank will continue in business, and
Internal control procedures are instituted which, as far as
reasonably possible, safeguard the assets of the Bank and
prevent and detect fraud and other irregularities.
7. Directors’ interestsThe interest of Directors in the issued share capital of the
Bank as recorded in the register of Directors’ shareholding
and/or as notified by the Directors for the purpose of
sections 275 and 276 of the Companies and Allied Matters
Act and the listing requirements of the Nigerian Stock
Exchange is as follows;
31 Dec 2015 31 Dec 2014
S/N Name Direct holding Indirect holding Direct holding Indirect holding
1 Mr Tony O. Elumelu, CON. 189,851,584 1,883,024,416 116,067,153 1,432,429,576
2 Amb. Joe Keshi, OON. 433,499 – 127,500 –
3 Mr Phillips Oduoza 114,963,748 18,979,657 104,512,499 17,254,234
4 Mr Kennedy Uzoka 37,173,909 – 35,403,723 –
5 High Chief Samuel Oni, FCA – –
6 Mr Femi Olaloku 11,445,920 – 8,645,482 –
7 Mr Dan Okeke 26,119,627 – 10,352,146 –
8 Mr Emeke Iweriebor 3,209,871 – 1,626,627 –
9 Ms Obi Ibekwe 267,510 – 267,510 –
10 Mr Adekunle Olumide, OON 3,282,556 – 2,981,413 –
11 Chief Kola Jamodu, CFR 657,415 59,192 484,015 53,811
12 Alhaji Ja’afaru Paki – 23,924,983 – 22,950,000
13 Mrs Foluke Abdulrazaq 10,000,000 11,120,000 3,000,000 6,120,000
14 Mr Yahaya Zekeri 499,999 – 11,704 –
15 Mrs Rose Okwechime – 30,113,961 – 20,113,961
16 Mrs Owanari Duke 86,062 – 86,062 –
43
20
15
AN
NU
AL
RE
PO
RT
AN
D A
CC
OU
NT
S
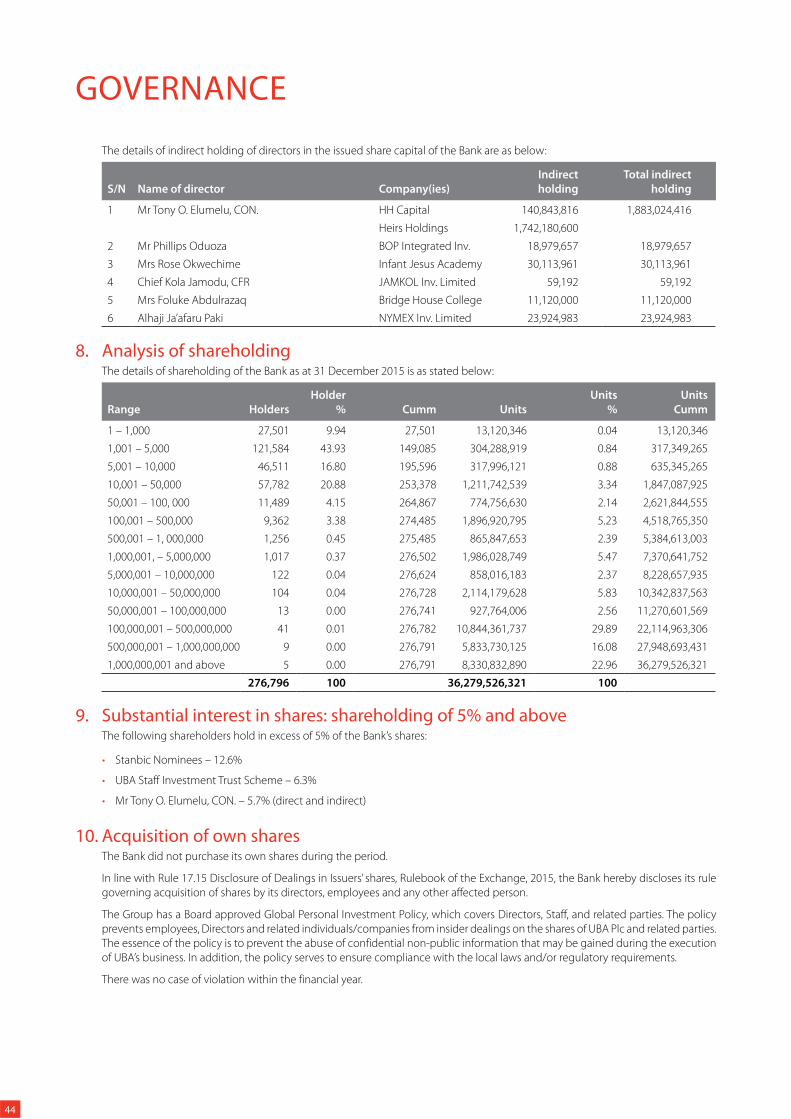
GOVERNANCE
The details of indirect holding of directors in the issued share capital of the Bank are as below:
S/N Name of director Company(ies)
Indirect
holding
Total indirect
holding
1 Mr Tony O. Elumelu, CON. HH Capital 140,843,816 1,883,024,416
Heirs Holdings 1,742,180,600
2 Mr Phillips Oduoza BOP Integrated Inv. 18,979,657 18,979,657
3 Mrs Rose Okwechime Infant Jesus Academy 30,113,961 30,113,961
4 Chief Kola Jamodu, CFR JAMKOL Inv. Limited 59,192 59,192
5 Mrs Foluke Abdulrazaq Bridge House College 11,120,000 11,120,000
6 Alhaji Ja’afaru Paki NYMEX Inv. Limited 23,924,983 23,924,983
8. Analysis of shareholdingThe details of shareholding of the Bank as at 31 December 2015 is as stated below:
Range Holders
Holder
% Cumm Units
Units
%
Units
Cumm
1 – 1,000 27,501 9.94 27,501 13,120,346 0.04 13,120,346
1,001 – 5,000 121,584 43.93 149,085 304,288,919 0.84 317,349,265
5,001 – 10,000 46,511 16.80 195,596 317,996,121 0.88 635,345,265
10,001 – 50,000 57,782 20.88 253,378 1,211,742,539 3.34 1,847,087,925
50,001 – 100, 000 11,489 4.15 264,867 774,756,630 2.14 2,621,844,555
100,001 – 500,000 9,362 3.38 274,485 1,896,920,795 5.23 4,518,765,350
500,001 – 1, 000,000 1,256 0.45 275,485 865,847,653 2.39 5,384,613,003
1,000,001, – 5,000,000 1,017 0.37 276,502 1,986,028,749 5.47 7,370,641,752
5,000,001 – 10,000,000 122 0.04 276,624 858,016,183 2.37 8,228,657,935
10,000,001 – 50,000,000 104 0.04 276,728 2,114,179,628 5.83 10,342,837,563
50,000,001 – 100,000,000 13 0.00 276,741 927,764,006 2.56 11,270,601,569
100,000,001 – 500,000,000 41 0.01 276,782 10,844,361,737 29.89 22,114,963,306
500,000,001 – 1,000,000,000 9 0.00 276,791 5,833,730,125 16.08 27,948,693,431
1,000,000,001 and above 5 0.00 276,791 8,330,832,890 22.96 36,279,526,321
276,796 100 36,279,526,321 100
9. Substantial interest in shares: shareholding of 5% and aboveThe following shareholders hold in excess of 5% of the Bank’s shares:
Stanbic Nominees – 12.6%
UBA Staff Investment Trust Scheme – 6.3%
Mr Tony O. Elumelu, CON. – 5.7% (direct and indirect)
10. Acquisition of own sharesThe Bank did not purchase its own shares during the period.
In line with Rule 17.15 Disclosure of Dealings in Issuers’ shares, Rulebook of the Exchange, 2015, the Bank hereby discloses its rule
governing acquisition of shares by its directors, employees and any other affected person.
The Group has a Board approved Global Personal Investment Policy, which covers Directors, Staff, and related parties. The policy
prevents employees, Directors and related individuals/companies from insider dealings on the shares of UBA Plc and related parties.
The essence of the policy is to prevent the abuse of confidential non-public information that may be gained during the execution
of UBA’s business. In addition, the policy serves to ensure compliance with the local laws and/or regulatory requirements.
There was no case of violation within the financial year.
44
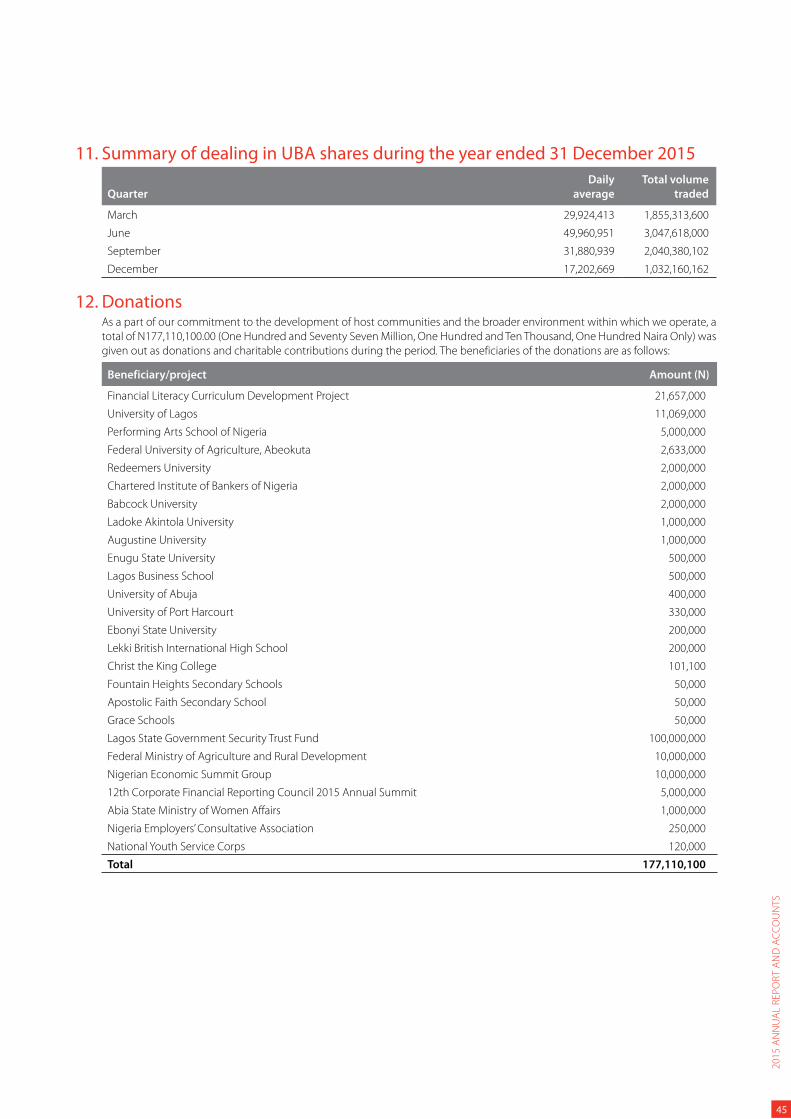
11. Summary of dealing in UBA shares during the year ended 31 December 2015
Quarter
Daily
average
Total volume
traded
March 29,924,413 1,855,313,600
June 49,960,951 3,047,618,000
September 31,880,939 2,040,380,102
December 17,202,669 1,032,160,162
12. Donations As a part of our commitment to the development of host communities and the broader environment within which we operate, a
total of N177,110,100.00 (One Hundred and Seventy Seven Million, One Hundred and Ten Thousand, One Hundred Naira Only) was
given out as donations and charitable contributions during the period. The beneficiaries of the donations are as follows:
Beneficiary/project Amount (N)
Financial Literacy Curriculum Development Project 21,657,000
University of Lagos 11,069,000
Performing Arts School of Nigeria 5,000,000
Federal University of Agriculture, Abeokuta 2,633,000
Redeemers University 2,000,000
Chartered Institute of Bankers of Nigeria 2,000,000
Babcock University 2,000,000
Ladoke Akintola University 1,000,000
Augustine University 1,000,000
Enugu State University 500,000
Lagos Business School 500,000
University of Abuja 400,000
University of Port Harcourt 330,000
Ebonyi State University 200,000
Lekki British International High School 200,000
Christ the King College 101,100
Fountain Heights Secondary Schools 50,000
Apostolic Faith Secondary School 50,000
Grace Schools 50,000
Lagos State Government Security Trust Fund 100,000,000
Federal Ministry of Agriculture and Rural Development 10,000,000
Nigerian Economic Summit Group 10,000,000
12th Corporate Financial Reporting Council 2015 Annual Summit 5,000,000
Abia State Ministry of Women Affairs 1,000,000
Nigeria Employers’ Consultative Association 250,000
National Youth Service Corps 120,000
Total 177,110,100
45
20
15
AN
NU
AL
RE
PO
RT
AN
D A
CC
OU
NT
S
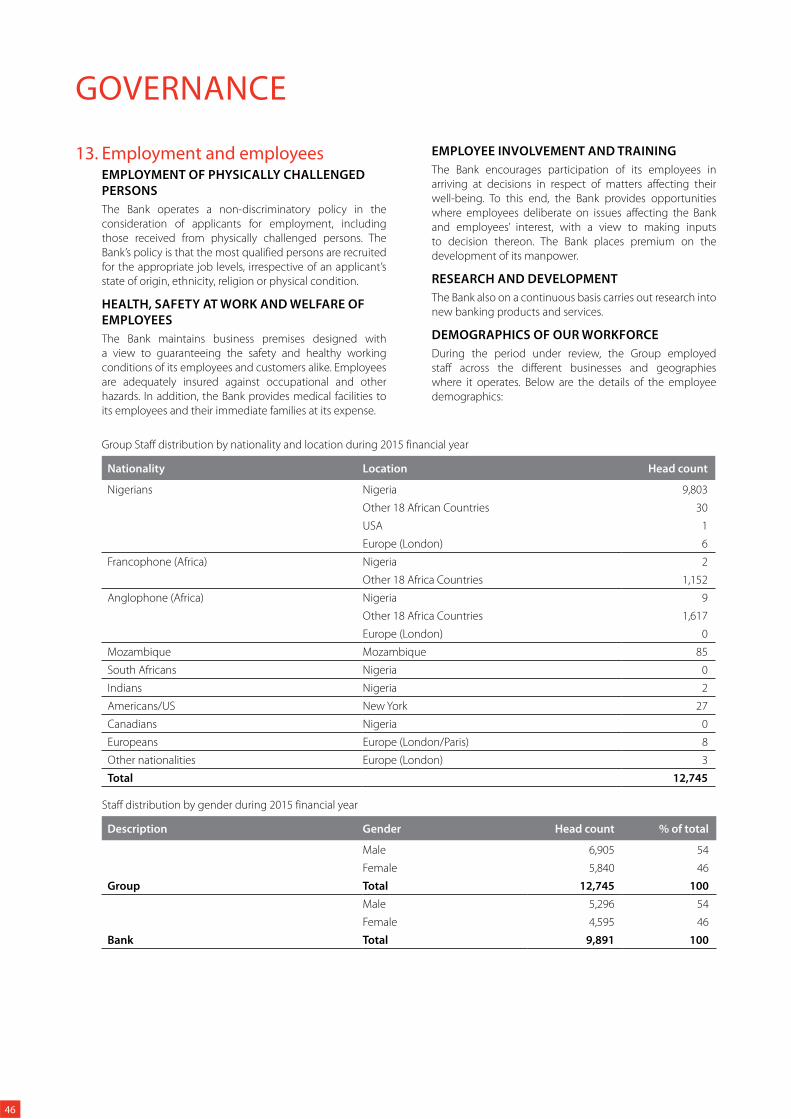
GOVERNANCE
13. Employment and employeesEMPLOYMENT OF PHYSICALLY CHALLENGED
PERSONS
The Bank operates a non-discriminatory policy in the
consideration of applicants for employment, including
those received from physically challenged persons. The
Bank’s policy is that the most qualified persons are recruited
for the appropriate job levels, irrespective of an applicant’s
state of origin, ethnicity, religion or physical condition.
HEALTH, SAFETY AT WORK AND WELFARE OF
EMPLOYEES
The Bank maintains business premises designed with
a view to guaranteeing the safety and healthy working
conditions of its employees and customers alike. Employees
are adequately insured against occupational and other
hazards. In addition, the Bank provides medical facilities to
its employees and their immediate families at its expense.
EMPLOYEE INVOLVEMENT AND TRAINING
The Bank encourages participation of its employees in
arriving at decisions in respect of matters affecting their
well-being. To this end, the Bank provides opportunities
where employees deliberate on issues affecting the Bank
and employees’ interest, with a view to making inputs
to decision thereon. The Bank places premium on the
development of its manpower.
RESEARCH AND DEVELOPMENT
The Bank also on a continuous basis carries out research into
new banking products and services.
DEMOGRAPHICS OF OUR WORKFORCE
During the period under review, the Group employed
staff across the different businesses and geographies
where it operates. Below are the details of the employee
demographics:
Group Staff distribution by nationality and location during 2015 financial year
Nationality Location Head count
Nigerians Nigeria 9,803
Other 18 African Countries 30
USA 1
Europe (London) 6
Francophone (Africa) Nigeria 2
Other 18 Africa Countries 1,152
Anglophone (Africa) Nigeria 9
Other 18 Africa Countries 1,617
Europe (London) 0
Mozambique Mozambique 85
South Africans Nigeria 0
Indians Nigeria 2
Americans/US New York 27
Canadians Nigeria 0
Europeans Europe (London/Paris) 8
Other nationalities Europe (London) 3
Total 12,745
Staff distribution by gender during 2015 financial year
Description Gender Head count % of total
Male 6,905 54
Female 5,840 46
Group Total 12,745 100
Male 5,296 54
Female 4,595 46
Bank Total 9,891 100
46
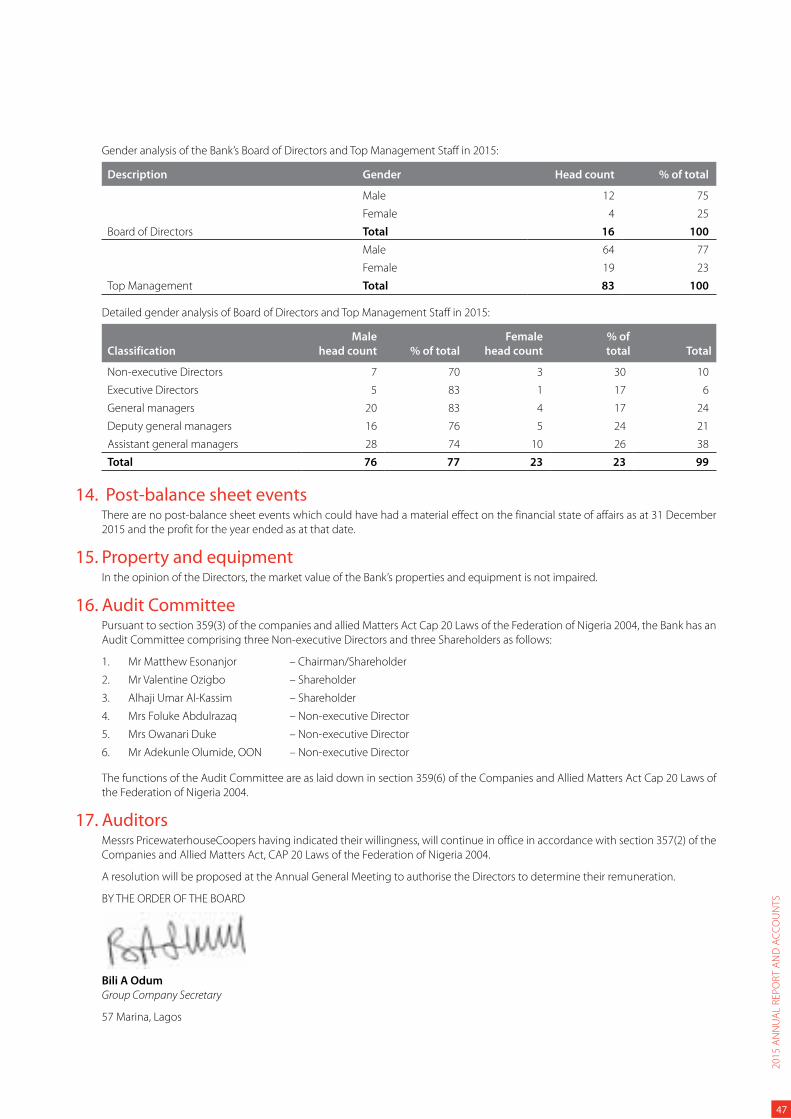
Gender analysis of the Bank’s Board of Directors and Top Management Staff in 2015:
Description Gender Head count % of total
Male 12 75
Female 4 25
Board of Directors Total 16 100
Male 64 77
Female 19 23
Top Management Total 83 100
Detailed gender analysis of Board of Directors and Top Management Staff in 2015:
Classification
Male
head count % of total
Female
head count
% of
total Total
Non-executive Directors 7 70 3 30 10
Executive Directors 5 83 1 17 6
General managers 20 83 4 17 24
Deputy general managers 16 76 5 24 21
Assistant general managers 28 74 10 26 38
Total 76 77 23 23 99
14. Post-balance sheet eventsThere are no post-balance sheet events which could have had a material effect on the financial state of affairs as at 31 December
2015 and the profit for the year ended as at that date.
15. Property and equipmentIn the opinion of the Directors, the market value of the Bank’s properties and equipment is not impaired.
16. Audit CommitteePursuant to section 359(3) of the companies and allied Matters Act Cap 20 Laws of the Federation of Nigeria 2004, the Bank has an
Audit Committee comprising three Non-executive Directors and three Shareholders as follows:
1. Mr Matthew Esonanjor – Chairman/Shareholder
2. Mr Valentine Ozigbo – Shareholder
3. Alhaji Umar Al-Kassim – Shareholder
4. Mrs Foluke Abdulrazaq – Non-executive Director
5. Mrs Owanari Duke – Non-executive Director
6. Mr Adekunle Olumide, OON – Non-executive Director
The functions of the Audit Committee are as laid down in section 359(6) of the Companies and Allied Matters Act Cap 20 Laws of
the Federation of Nigeria 2004.
17. Auditors Messrs PricewaterhouseCoopers having indicated their willingness, will continue in office in accordance with section 357(2) of the
Companies and Allied Matters Act, CAP 20 Laws of the Federation of Nigeria 2004.
A resolution will be proposed at the Annual General Meeting to authorise the Directors to determine their remuneration.
BY THE ORDER OF THE BOARD
Bili A Odum
Group Company Secretary
57 Marina, Lagos
47
20
15
AN
NU
AL
RE
PO
RT
AN
D A
CC
OU
NT
S
GOVERNANCECUSTOMER COMPLAINTS CHANNELS
Introduction United Bank for Africa Plc is a customer focused Pan-African
financial services Group. Our aim is to deliver excellent customer
service and provide high quality financial solutions to our over
eight million customers in the 22 countries where we operate.
At each of our multiple contact points with customers, we aim to
proactively exceed their expectations. Customer feedback is thus
an effective tool in our relentless effort to delight our customers at
all points of interaction with the Bank.
To achieve excellent customer service delivery in line with the
Bank’s focus, UBA Staff worldwide are continuously trained to
have a strong customer service orientation and be customer-
centric in every aspect of the Bank’s operations, thereby fulfilling
the Bank’s promise to Customers, as contained in its charter.
The Bank’s customer service charter requires all staff to:
Be respectful – We know the ‘The Customer is King’ and is the
purpose of our business;
Be courteous and friendly in all our interactions with the
customer;
Process transactions without delay and attend to enquiries
promptly;
Investigate and resolve complaints promptly;
Listen attentively;
Communicate honestly and proactively;
Leverage our technical knowledge to fully support the
customer’s needs;
Show appreciation at all times.
CUSTOMER COMPLAINT CHANNELS:
To ensure an effective feedback process, UBA has established
different channels through which customers can reach the Bank
on all issues – be it an enquiry/complaint/request or a feedback.
The channels include;
Customer Fulfilment Centre (CFC) – A 24/7 Multi-Lingual
Customer Contact Centre, where customers can call in to lodge
complaints, make requests or enquiries about our products
and services.
Dedicated E-mail address – A dedicated e-mail address cfc@
ubagroup.com is available to customers 24/7 to send in their
complaints/requests. This e-mail channel is manned by our highly
skilled and effective correspondents that accurately deliver high
quality service to UBA customers and prospects alike.
Hot lines in the branches – Branded toll-free phones called
‘UBA Hotline’ have been placed in designated Business Offices
to enable customers call the Customer Fulfilment Centre to relay
their complaints, requests and enquiries. Calls received through
this channel are handled by designated inbound call agents.
The calls are given priority so as to reassure the customers of the
Bank’s total commitment to serve them.
Suggestion/Complaint Box – Customers’ Complaint boxes are
maintained in all our Business Offices to facilitate the tracking,
resolution, reporting and dissemination of customer complaints
and feedback.
Web – On the UBA website www.ubagroup.com, customers can
also log in and register their complaints through the link “Do You
Have Feedback?” Such complaints are automatically routed to CFC
for resolution. Customers also have the option of chatting online
real time with our highly skilled agents through the ’Live Chat’
channel, Face book | Twitter | LinkedIn | Google+ | YouTube | UBA
Blog
Post – A dedicated Post Office Box number 5551, Marina Lagos
is also available exclusively for receiving customer complaints
by post.
RESOLUTION MECHANISM
In order to ensure that Customers’ complaints, enquiries and
requests are promptly resolved, the Bank has put in place a
dedicated Complaints’ Management Team supervised by a Senior
Officer of the Bank, who is responsible for prompt investigation and
resolution of customers’ complaints within the approved timelines.
The unit is manned by highly skilled personnel with rich and diverse
banking experience to promptly resolve customer complaints.
The Bank maintains a robust Customer Complaints Management
system, which is managed by well trained staff of the Customer
Service Division and reports generated are periodically reviewed by
Executive Management to see where processes can be improved to
enhance customer service.
The complaints management system ensures that customers’
issues are promptly treated as specified within the established
framework and turnaround time.
The process flow of customer complaint and resolution is as follows:
The Bank’s touch point (Business office, CFC (Calls, Telemarketing
and E-mail), Social media; Twitter, LinkedIn, Facebook and Live
chat) that receives the customer’s complaint acknowledges
and registers the complaint on the Customer Contact Manager
(CCM), the bank’s automated complaints management system.
The complaint is reviewed and it is determined if the complaint
could be resolved at first level.
Where the complaint can be resolved at the first level, a
resolution is provided to the customer.
If such a complaint cannot be resolved at the first level, the
touch point forwards the complaint to Operations Specialists
at the Resolution Unit to resolve.
Upon resolution, the customer is contacted and the required
feedback is provided to the customer.
The complaint is then closed in the system.
Where a customer is not satisfied with the resolution outcome
and a rejoinder is sent, more attention is given to it by the Unit
Head to further analyse and resolve the issues raised and the
final outcome is communicated to the customer.
48
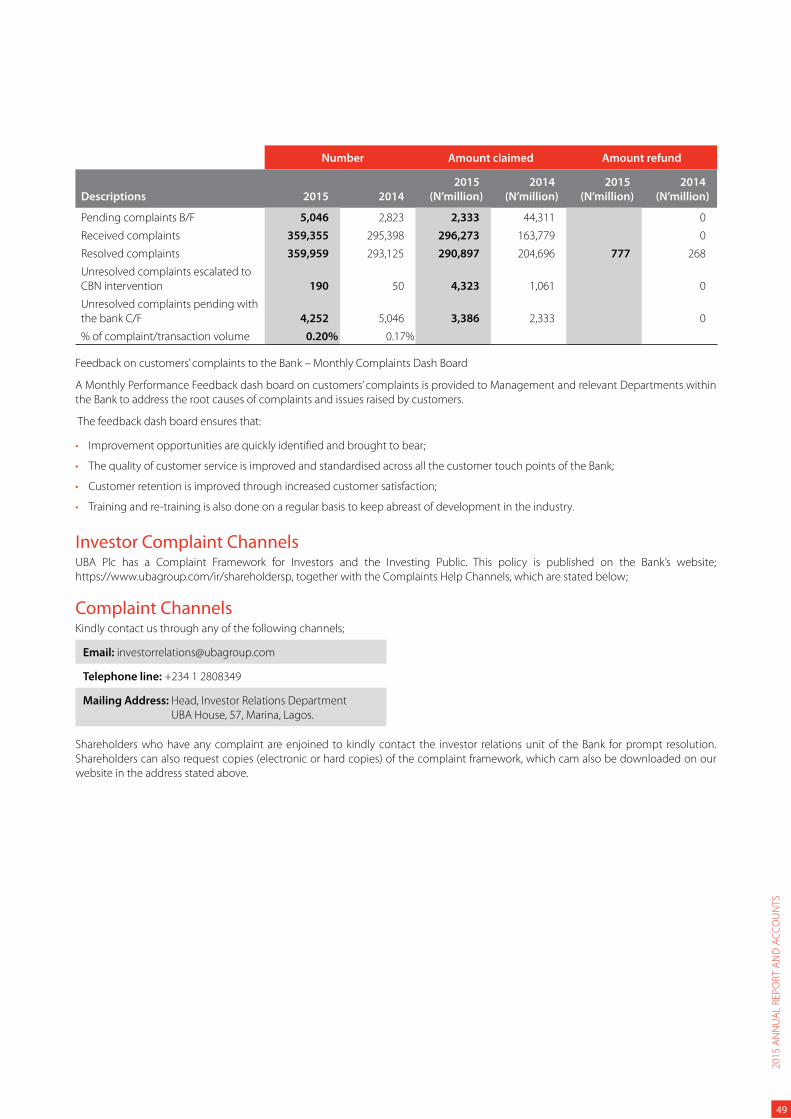
Number Amount claimed Amount refund
Descriptions 2015 2014
2015
(N’million)
2014
(N’million)
2015
(N’million)
2014
(N’million)
Pending complaints B/F 5,046 2,823 2,333 44,311 0
Received complaints 359,355 295,398 296,273 163,779 0
Resolved complaints 359,959 293,125 290,897 204,696 777 268
Unresolved complaints escalated to
CBN intervention 190 50 4,323 1,061 0
Unresolved complaints pending with
the bank C/F 4,252 5,046 3,386 2,333 0
% of complaint/transaction volume 0.20% 0.17%
Feedback on customers’ complaints to the Bank – Monthly Complaints Dash Board
A Monthly Performance Feedback dash board on customers’ complaints is provided to Management and relevant Departments within
the Bank to address the root causes of complaints and issues raised by customers.
The feedback dash board ensures that:
Improvement opportunities are quickly identified and brought to bear;
The quality of customer service is improved and standardised across all the customer touch points of the Bank;
Customer retention is improved through increased customer satisfaction;
Training and re-training is also done on a regular basis to keep abreast of development in the industry.
Investor Complaint ChannelsUBA Plc has a Complaint Framework for Investors and the Investing Public. This policy is published on the Bank’s website;
https://www.ubagroup.com/ir/shareholdersp, together with the Complaints Help Channels, which are stated below;
Complaint ChannelsKindly contact us through any of the following channels;
Email: [email protected]
Telephone line: +234 1 2808349
Mailing Address: Head, Investor Relations Department
UBA House, 57, Marina, Lagos.
Shareholders who have any complaint are enjoined to kindly contact the investor relations unit of the Bank for prompt resolution.
Shareholders can also request copies (electronic or hard copies) of the complaint framework, which cam also be downloaded on our
website in the address stated above.
49
20
15
AN
NU
AL
RE
PO
RT
AN
D A
CC
OU
NT
S
GOVERNANCE
United Bank for Africa Plc (UBA Plc) holds good governance
as one of its core values and confirms its commitment to the
implementation of effective corporate governance principles
in its business operations. The Directors endorse the principles
of best practice Corporate Governance as stated in the “Code of
Corporate Governance for Banks in Nigeria Post Consolidation”
issued by the Central Bank of Nigeria (CBN), the Securities and
Exchange Commission’s (SEC) “Code of Corporate Governance”.
The Board is of the opinion that UBA Plc has, in all material respects,
complied with the requirements of the CBN code, the SEC code,
and its own governance charters, during the 2015 financial year.
The Board of Directors of UBA Plc has the overall responsibility
for ensuring that the highest standards of corporate governance
are maintained and adhered to by the Bank. In order to promote
effective governance of the UBA Group, the following structures
have been put in place for the execution of UBA Plc’s Corporate
Governance strategy:
1. Board of Directors
2. Board Committees
3. Executive Management Committees
As at 31 December 2015, the Board comprised a Non-executive
Chairman, a Non-executive Vice Chairman, eight (8) other Non-
executive Directors which includes, two Independent Non-
executive Directors and six Non-executive Directors, all of whom
bring a wide range of skills and experience to the Board.
The Board of Directors carries out its responsibility through its
standing Committees. These are the Board Audit Committee,
the Board Risk Management Committee, the Finance and
General Purpose Committee, the Nominations and Governance
Committee, the Board Credit Committee and the Statutory Audit
Committee. Through the workings of these committees, the Board
sets broad policy guidelines and ensures the proper management
and direction of the Bank.
In addition to the Board Committees, there are a number of
Management Committees which ensure effective and good
corporate governance at the managerial level.
A. The BoardThe Board presently consists of 16 members, six of whom,
inclusive of the GMD/CEO, are Executive Directors and 10
are Non-executive directors. The Non-executive Directors
have the requisite integrity, skills and experience to bring
independent judgment to bear on Board deliberations and
discussions.
RESPONSIBILITY
The roles of Chairman and Chief Executive Officer are
separated and clearly defined. The Chairman is primarily
responsible for the working of the Board whilst the Chief
Executive Officer is responsible for the running of the
business and implementation of Board strategy and policy.
The Chief Executive Officer is assisted in managing the
business of the Bank on a day-to-day basis by the Executive
Management Committee, which he chairs and comprises
all Executive Directors. The Board’s primary responsibility is
to increase shareholder wealth. The Board is accountable to
shareholders and is responsible for the management of the
relationships with its various stakeholders.
Executive Management is accountable to the Board for the
development and implementation of strategy and policies.
The Board regularly reviews group performance, matters
of strategic concern and any other matters it regards as
material.
The Board meets quarterly and additional meetings are
convened as the need arises. In 2015 the Board met eight
times.
The Board is also responsible for the Bank’s structure and
areas of operation, financial reporting, ensuring there is an
effective system of internal control and risk management
and appointments to the Board. The Board has the authority
to delegate matters to Directors, Board Committees and the
Executive Management Committee.
APPOINTMENTS AND RETIREMENTS
During the course of the year, High Chief Samuel Oni,
FCA was appointed as a Non-executive Director and
Mr Apollos Ikpobe resigned.
PROFESSIONAL INDEPENDENT ADVICE
All Directors are aware that they may take independent
professional advice at the expense of the Company, in the
furtherance of their duties. They all have access to the advice
and services of the Company Secretary, who is responsible
to the Board for ensuring that all governance matters are
complied with and assists with professional development as
required.
B. Accountability and auditFINANCIAL REPORTING
The Board has presented a balanced assessment of the
Company’s position and prospects. The Board is mindful of
its responsibilities and is satisfied that in the preparation of
its Financial Report it has met with its obligation under the
Group’s Code of Corporate Governance.
The Directors make themselves accountable to the
shareholders through regular publication of the Group’s
financial performance and Annual Reports. The Board has
ensured that the Group’s reporting procedure is conveyed
on the most recent infrastructure to ensure accuracy.
This procedure involves the monitoring of performance
throughout the financial year, in addition to monthly
reporting of key performance indicators.
PricewaterhouseCoopers acted as external auditors to
the Group during the 2015 financial year. Their report is
contained on pages 56 and 57 of this Annual Report.
INTERNAL CONTROLS
The Group has consistently improved its internal control
system to ensure effective management of risks. The
Directors review the effectiveness of the system of internal
control through regular reports and reviews at Board and
Risk Management Committee meetings.
CORPORATE GOVERNANCE
50
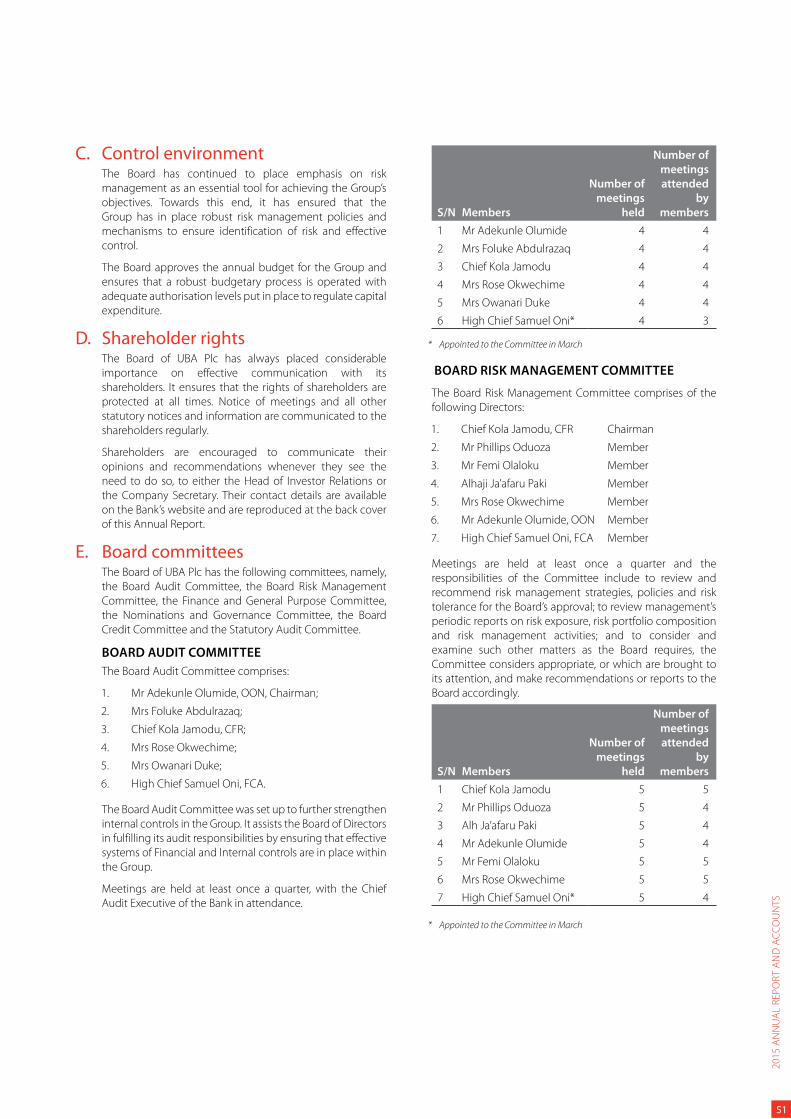
C. Control environment The Board has continued to place emphasis on risk
management as an essential tool for achieving the Group’s
objectives. Towards this end, it has ensured that the
Group has in place robust risk management policies and
mechanisms to ensure identification of risk and effective
control.
The Board approves the annual budget for the Group and
ensures that a robust budgetary process is operated with
adequate authorisation levels put in place to regulate capital
expenditure.
D. Shareholder rightsThe Board of UBA Plc has always placed considerable
importance on effective communication with its
shareholders. It ensures that the rights of shareholders are
protected at all times. Notice of meetings and all other
statutory notices and information are communicated to the
shareholders regularly.
Shareholders are encouraged to communicate their
opinions and recommendations whenever they see the
need to do so, to either the Head of Investor Relations or
the Company Secretary. Their contact details are available
on the Bank’s website and are reproduced at the back cover
of this Annual Report.
E. Board committeesThe Board of UBA Plc has the following committees, namely,
the Board Audit Committee, the Board Risk Management
Committee, the Finance and General Purpose Committee,
the Nominations and Governance Committee, the Board
Credit Committee and the Statutory Audit Committee.
BOARD AUDIT COMMITTEE
The Board Audit Committee comprises:
1. Mr Adekunle Olumide, OON, Chairman;
2. Mrs Foluke Abdulrazaq;
3. Chief Kola Jamodu, CFR;
4. Mrs Rose Okwechime;
5. Mrs Owanari Duke;
6. High Chief Samuel Oni, FCA.
The Board Audit Committee was set up to further strengthen
internal controls in the Group. It assists the Board of Directors
in fulfilling its audit responsibilities by ensuring that effective
systems of Financial and Internal controls are in place within
the Group.
Meetings are held at least once a quarter, with the Chief
Audit Executive of the Bank in attendance.
S/N Members
Number of
meetings
held
Number of
meetings
attended
by
members
1 Mr Adekunle Olumide 4 4
2 Mrs Foluke Abdulrazaq 4 4
3 Chief Kola Jamodu 4 4
4 Mrs Rose Okwechime 4 4
5 Mrs Owanari Duke 4 4
6 High Chief Samuel Oni* 4 3
* Appointed to the Committee in March
BOARD RISK MANAGEMENT COMMITTEE
The Board Risk Management Committee comprises of the
following Directors:
1. Chief Kola Jamodu, CFR Chairman
2. Mr Phillips Oduoza Member
3. Mr Femi Olaloku Member
4. Alhaji Ja’afaru Paki Member
5. Mrs Rose Okwechime Member
6. Mr Adekunle Olumide, OON Member
7. High Chief Samuel Oni, FCA Member
Meetings are held at least once a quarter and the
responsibilities of the Committee include to review and
recommend risk management strategies, policies and risk
tolerance for the Board’s approval; to review management’s
periodic reports on risk exposure, risk portfolio composition
and risk management activities; and to consider and
examine such other matters as the Board requires, the
Committee considers appropriate, or which are brought to
its attention, and make recommendations or reports to the
Board accordingly.
S/N Members
Number of
meetings
held
Number of
meetings
attended
by
members
1 Chief Kola Jamodu 5 5
2 Mr Phillips Oduoza 5 4
3 Alh Ja’afaru Paki 5 4
4 Mr Adekunle Olumide 5 4
5 Mr Femi Olaloku 5 5
6 Mrs Rose Okwechime 5 5
7 High Chief Samuel Oni* 5 4
* Appointed to the Committee in March
51
20
15
AN
NU
AL
RE
PO
RT
AN
D A
CC
OU
NT
S
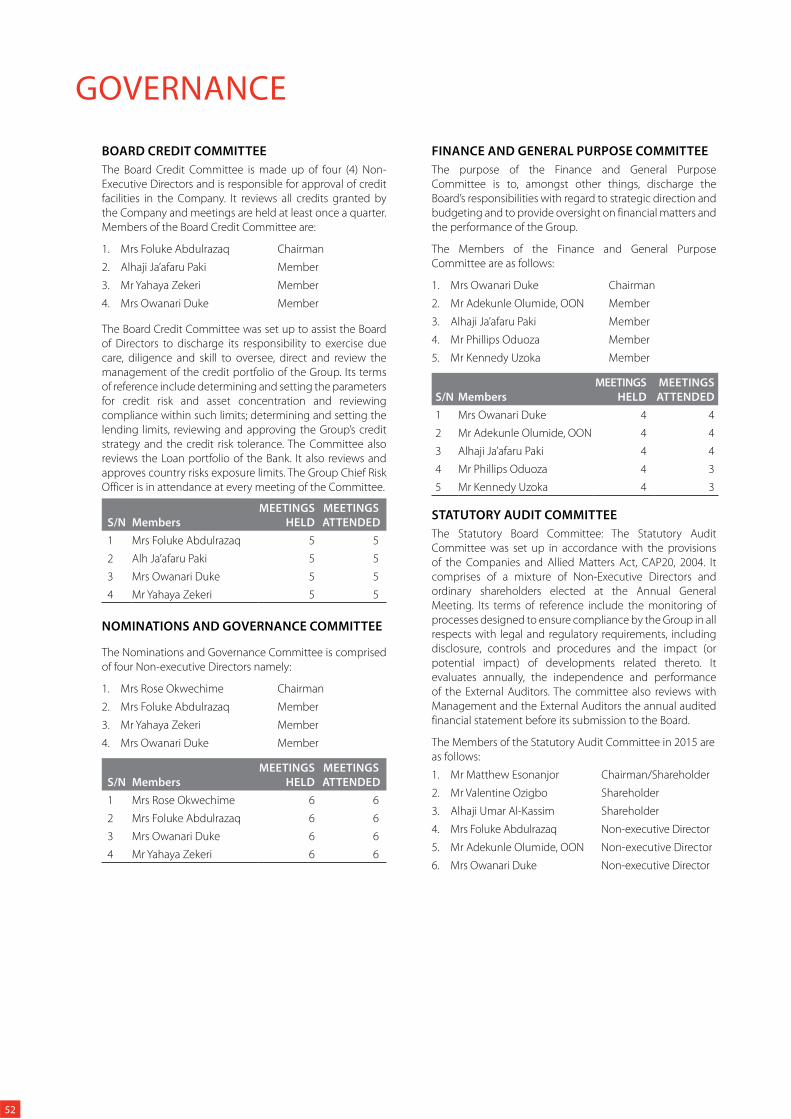
GOVERNANCE
BOARD CREDIT COMMITTEE
The Board Credit Committee is made up of four (4) Non-
Executive Directors and is responsible for approval of credit
facilities in the Company. It reviews all credits granted by
the Company and meetings are held at least once a quarter.
Members of the Board Credit Committee are:
1. Mrs Foluke Abdulrazaq Chairman
2. Alhaji Ja’afaru Paki Member
3. Mr Yahaya Zekeri Member
4. Mrs Owanari Duke Member
The Board Credit Committee was set up to assist the Board
of Directors to discharge its responsibility to exercise due
care, diligence and skill to oversee, direct and review the
management of the credit portfolio of the Group. Its terms
of reference include determining and setting the parameters
for credit risk and asset concentration and reviewing
compliance within such limits; determining and setting the
lending limits, reviewing and approving the Group’s credit
strategy and the credit risk tolerance. The Committee also
reviews the Loan portfolio of the Bank. It also reviews and
approves country risks exposure limits. The Group Chief Risk
Officer is in attendance at every meeting of the Committee.
S/N Members
MEETINGS
HELD
MEETINGS
ATTENDED
1 Mrs Foluke Abdulrazaq 5 5
2 Alh Ja’afaru Paki 5 5
3 Mrs Owanari Duke 5 5
4 Mr Yahaya Zekeri 5 5
NOMINATIONS AND GOVERNANCE COMMITTEE
The Nominations and Governance Committee is comprised
of four Non-executive Directors namely:
1. Mrs Rose Okwechime Chairman
2. Mrs Foluke Abdulrazaq Member
3. Mr Yahaya Zekeri Member
4. Mrs Owanari Duke Member
S/N Members
MEETINGS
HELD
MEETINGS
ATTENDED
1 Mrs Rose Okwechime 6 6
2 Mrs Foluke Abdulrazaq 6 6
3 Mrs Owanari Duke 6 6
4 Mr Yahaya Zekeri 6 6
FINANCE AND GENERAL PURPOSE COMMITTEE
The purpose of the Finance and General Purpose
Committee is to, amongst other things, discharge the
Board’s responsibilities with regard to strategic direction and
budgeting and to provide oversight on financial matters and
the performance of the Group.
The Members of the Finance and General Purpose
Committee are as follows:
1. Mrs Owanari Duke Chairman
2. Mr Adekunle Olumide, OON Member
3. Alhaji Ja’afaru Paki Member
4. Mr Phillips Oduoza Member
5. Mr Kennedy Uzoka Member
S/N Members
MEETINGS
HELD
MEETINGS
ATTENDED
1 Mrs Owanari Duke 4 4
2 Mr Adekunle Olumide, OON 4 4
3 Alhaji Ja’afaru Paki 4 4
4 Mr Phillips Oduoza 4 3
5 Mr Kennedy Uzoka 4 3
STATUTORY AUDIT COMMITTEE
The Statutory Board Committee: The Statutory Audit
Committee was set up in accordance with the provisions
of the Companies and Allied Matters Act, CAP20, 2004. It
comprises of a mixture of Non-Executive Directors and
ordinary shareholders elected at the Annual General
Meeting. Its terms of reference include the monitoring of
processes designed to ensure compliance by the Group in all
respects with legal and regulatory requirements, including
disclosure, controls and procedures and the impact (or
potential impact) of developments related thereto. It
evaluates annually, the independence and performance
of the External Auditors. The committee also reviews with
Management and the External Auditors the annual audited
financial statement before its submission to the Board.
The Members of the Statutory Audit Committee in 2015 are
as follows:
1. Mr Matthew Esonanjor Chairman/Shareholder
2. Mr Valentine Ozigbo Shareholder
3. Alhaji Umar Al-Kassim Shareholder
4. Mrs Foluke Abdulrazaq Non-executive Director
5. Mr Adekunle Olumide, OON Non-executive Director
6. Mrs Owanari Duke Non-executive Director
52
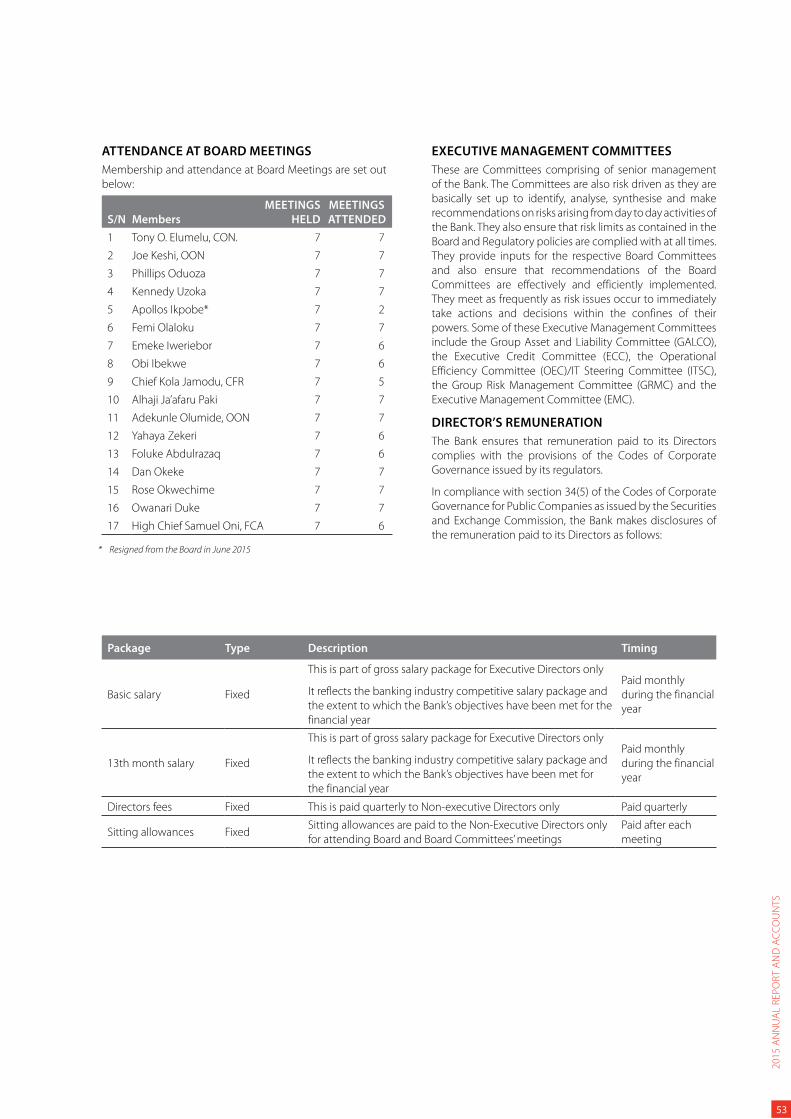
ATTENDANCE AT BOARD MEETINGS
Membership and attendance at Board Meetings are set out
below:
S/N Members
MEETINGS
HELD
MEETINGS
ATTENDED
1 Tony O. Elumelu, CON. 7 7
2 Joe Keshi, OON 7 7
3 Phillips Oduoza 7 7
4 Kennedy Uzoka 7 7
5 Apollos Ikpobe* 7 2
6 Femi Olaloku 7 7
7 Emeke Iweriebor 7 6
8 Obi Ibekwe 7 6
9 Chief Kola Jamodu, CFR 7 5
10 Alhaji Ja’afaru Paki 7 7
11 Adekunle Olumide, OON 7 7
12 Yahaya Zekeri 7 6
13 Foluke Abdulrazaq 7 6
14 Dan Okeke 7 7
15 Rose Okwechime 7 7
16 Owanari Duke 7 7
17 High Chief Samuel Oni, FCA 7 6
* Resigned from the Board in June 2015
EXECUTIVE MANAGEMENT COMMITTEES
These are Committees comprising of senior management
of the Bank. The Committees are also risk driven as they are
basically set up to identify, analyse, synthesise and make
recommendations on risks arising from day to day activities of
the Bank. They also ensure that risk limits as contained in the
Board and Regulatory policies are complied with at all times.
They provide inputs for the respective Board Committees
and also ensure that recommendations of the Board
Committees are effectively and efficiently implemented.
They meet as frequently as risk issues occur to immediately
take actions and decisions within the confines of their
powers. Some of these Executive Management Committees
include the Group Asset and Liability Committee (GALCO),
the Executive Credit Committee (ECC), the Operational
Efficiency Committee (OEC)/IT Steering Committee (ITSC),
the Group Risk Management Committee (GRMC) and the
Executive Management Committee (EMC).
DIRECTOR’S REMUNERATION
The Bank ensures that remuneration paid to its Directors
complies with the provisions of the Codes of Corporate
Governance issued by its regulators.
In compliance with section 34(5) of the Codes of Corporate
Governance for Public Companies as issued by the Securities
and Exchange Commission, the Bank makes disclosures of
the remuneration paid to its Directors as follows:
Package Type Description Timing
Basic salary Fixed
This is part of gross salary package for Executive Directors only
It reflects the banking industry competitive salary package and
the extent to which the Bank’s objectives have been met for the
financial year
Paid monthly
during the financial
year
13th month salary Fixed
This is part of gross salary package for Executive Directors only
It reflects the banking industry competitive salary package and
the extent to which the Bank’s objectives have been met for
the financial year
Paid monthly
during the financial
year
Directors fees Fixed This is paid quarterly to Non-executive Directors only Paid quarterly
Sitting allowances FixedSitting allowances are paid to the Non-Executive Directors only
for attending Board and Board Committees’ meetings
Paid after each
meeting
53
20
15
AN
NU
AL
RE
PO
RT
AN
D A
CC
OU
NT
S
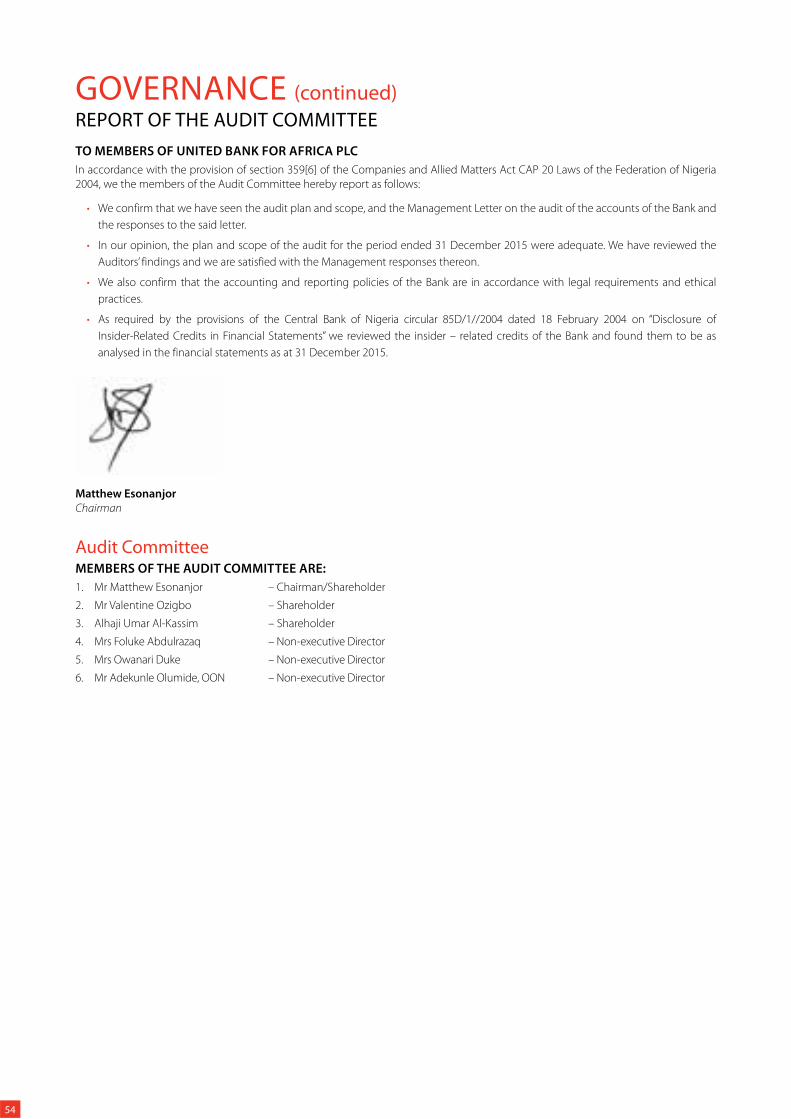
GOVERNANCE (continued)
TO MEMBERS OF UNITED BANK FOR AFRICA PLC
In accordance with the provision of section 359[6] of the Companies and Allied Matters Act CAP 20 Laws of the Federation of Nigeria
2004, we the members of the Audit Committee hereby report as follows:
We confirm that we have seen the audit plan and scope, and the Management Letter on the audit of the accounts of the Bank and
the responses to the said letter.
In our opinion, the plan and scope of the audit for the period ended 31 December 2015 were adequate. We have reviewed the
Auditors’ findings and we are satisfied with the Management responses thereon.
We also confirm that the accounting and reporting policies of the Bank are in accordance with legal requirements and ethical
practices.
As required by the provisions of the Central Bank of Nigeria circular 85D/1//2004 dated 18 February 2004 on “Disclosure of
Insider-Related Credits in Financial Statements” we reviewed the insider – related credits of the Bank and found them to be as
analysed in the financial statements as at 31 December 2015.
Matthew Esonanjor
Chairman
Audit CommitteeMEMBERS OF THE AUDIT COMMITTEE ARE:
1. Mr Matthew Esonanjor – Chairman/Shareholder
2. Mr Valentine Ozigbo – Shareholder
3. Alhaji Umar Al-Kassim – Shareholder
4. Mrs Foluke Abdulrazaq – Non-executive Director
5. Mrs Owanari Duke – Non-executive Director
6. Mr Adekunle Olumide, OON – Non-executive Director
REPORT OF THE AUDIT COMMITTEE
54
BOARD EVALUATION REPORT
55
20
15
AN
NU
AL
RE
PO
RT
AN
D A
CC
OU
NT
S
STATEMENT OF DIRECTORS’ RESPONSIBILITIES IN RELATION TO THE FINANCIAL STATEMENTS
FOR THE YEAR ENDED 31 DECEMBER 2015
In accordance with the provisions of sections 334 and 335 of the Companies and Allied Matters Act, Cap 20 Laws of the Federation of
Nigeria 2004, and sections 24 and 28 of the Banks and Other Financial Institutions Act CAP B3 Laws of the Federation of Nigeria 2004, the
Directors are responsible for the preparation of the financial statements which give a true and fair view of the state of affairs of the Bank
and of the profit or loss for the period ended 31 December 2015 and in so doing they ensure that:
Proper accounting records are maintained;
Applicable accounting standards are followed;
Suitable accounting policies are adopted and consistently applied;
Judgments and estimates made are reasonable and prudent;
The going concern basis is used, unless it is inappropriate to presume that the Bank will continue in business; and
Internal control procedures are instituted which as far as reasonably possible, safeguard the assets of the Bank and prevent and
detect fraud and other irregularities.
The Directors accept responsibility for the annual financial statements, which have been prepared using appropriate accounting
policies supported by reasonable and prudent judgments and estimates in conformity with the International Accounting Standards, the
requirements of the Companies and Allied Matters Act, Cap 20 Laws of the Federation of Nigeria 2004, the Banks and Other Financial
Institutions Act CAP B3 Laws of the Federation of Nigeria 2004, the Central Bank of Nigeria Prudential guidelines and other relevant
Circulars issued by the Central Bank of Nigeria.
The Directors are of the opinion that the 2015 financial statements give a true and fair view of the state of the financial affairs of the Bank
and Group.
The Directors accept responsibility for the maintenance of accounting records that may be relied upon in the preparation of the financial
statements as well as adequate systems of financial control.
Nothing has come to the attention of the Directors to indicate that the Group will not remain a going concern for at least 12 months
from the date of this statement.
Signed on behalf of the Directors
Phillips Oduoza
STATEMENT OF DIRECTORS’ RESPONSIBILITIES
GOVERNANCE (continued)
56

57
20
15
AN
NU
AL
RE
PO
RT
AN
D A
CC
OU
NT
S

58
Report of the Independent Auditors 60
Statements of Comprehensive Income 62
Statements of Financial Position 63
Statements of Changes in Equity 64
Statements of Cash Flows 68
Significant Accounting Policies 69
Notes to the Financial Statements 84
Statements of Value Added 184
Five-Year Financial Summary 185
FINANCIAL STATEMENTS
58

59
2015
AN
NU
AL
REP
OR
T A
ND
AC
CO
UN
TS
59
REPORT OF THE INDEPENDENT AUDITOR
TO THE MEMBERS OF UNITED BANK FOR
AFRICA PLC
60
REPORT OF THE INDEPENDENT AUDITOR
TO THE MEMBERS OF UNITED BANK FOR
AFRICA PLC
2015
AN
NU
AL
REP
OR
T A
ND
AC
CO
UN
TS
61
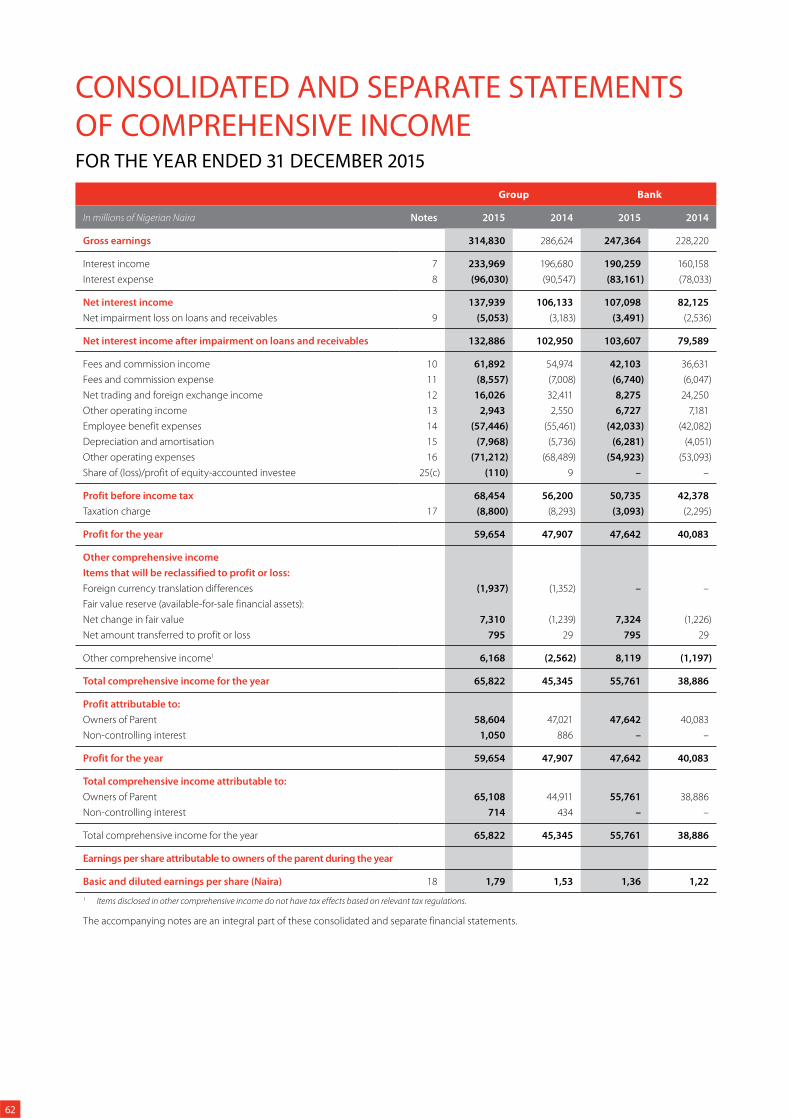
CONSOLIDATED AND SEPARATE STATEMENTS
OF COMPREHENSIVE INCOMEFOR THE YEAR ENDED 31 DECEMBER 2015
Group Bank
In millions of Nigerian Naira Notes 2015 2014 2015 2014
Gross earnings 314,830 286,624 247,364 228,220
Interest income 7 233,969 196,680 190,259 160,158
Interest expense 8 (96,030) (90,547) (83,161) (78,033)
Net interest income 137,939 106,133 107,098 82,125
Net impairment loss on loans and receivables 9 (5,053) (3,183) (3,491) (2,536)
Net interest income after impairment on loans and receivables 132,886 102,950 103,607 79,589
Fees and commission income 10 61,892 54,974 42,103 36,631
Fees and commission expense 11 (8,557) (7,008) (6,740) (6,047)
Net trading and foreign exchange income 12 16,026 32,411 8,275 24,250
Other operating income 13 2,943 2,550 6,727 7,181
Employee benefit expenses 14 (57,446) (55,461) (42,033) (42,082)
Depreciation and amortisation 15 (7,968) (5,736) (6,281) (4,051)
Other operating expenses 16 (71,212) (68,489) (54,923) (53,093)
Share of (loss)/profit of equity-accounted investee 25(c) (110) 9 – –
Profit before income tax 68,454 56,200 50,735 42,378
Taxation charge 17 (8,800) (8,293) (3,093) (2,295)
Profit for the year 59,654 47,907 47,642 40,083
Other comprehensive income
Items that will be reclassified to profit or loss:
Foreign currency translation differences (1,937) (1,352) – –
Fair value reserve (available-for-sale financial assets):
Net change in fair value 7,310 (1,239) 7,324 (1,226)
Net amount transferred to profit or loss 795 29 795 29
Other comprehensive income1 6,168 (2,562) 8,119 (1,197)
Total comprehensive income for the year 65,822 45,345 55,761 38,886
Profit attributable to:
Owners of Parent 58,604 47,021 47,642 40,083
Non-controlling interest 1,050 886 – –
Profit for the year 59,654 47,907 47,642 40,083
Total comprehensive income attributable to:
Owners of Parent 65,108 44,911 55,761 38,886
Non-controlling interest 714 434 – –
Total comprehensive income for the year 65,822 45,345 55,761 38,886
Earnings per share attributable to owners of the parent during the year
Basic and diluted earnings per share (Naira) 18 1,79 1,53 1,36 1,22
1 Items disclosed in other comprehensive income do not have tax effects based on relevant tax regulations.
The accompanying notes are an integral part of these consolidated and separate financial statements.
62
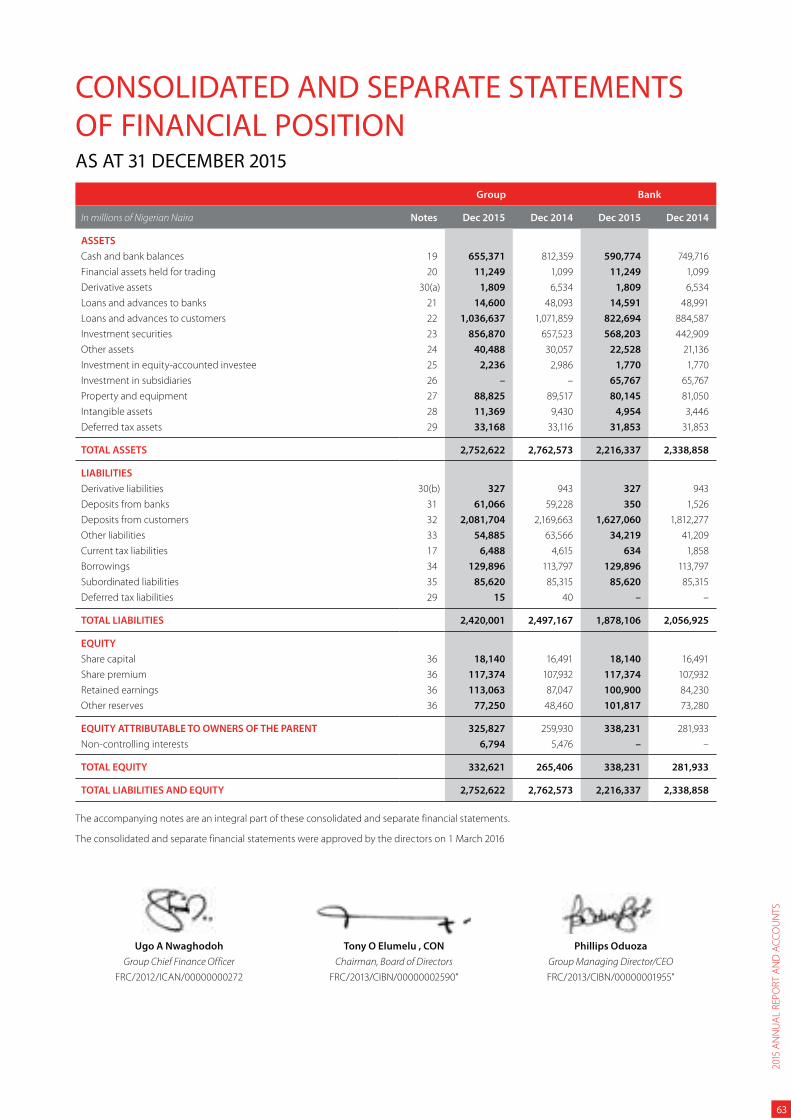
CONSOLIDATED AND SEPARATE STATEMENTS
OF FINANCIAL POSITIONAS AT 31 DECEMBER 2015
Group Bank
In millions of Nigerian Naira Notes Dec 2015 Dec 2014 Dec 2015 Dec 2014
ASSETS
Cash and bank balances 19 655,371 812,359 590,774 749,716
Financial assets held for trading 20 11,249 1,099 11,249 1,099
Derivative assets 30(a) 1,809 6,534 1,809 6,534
Loans and advances to banks 21 14,600 48,093 14,591 48,991
Loans and advances to customers 22 1,036,637 1,071,859 822,694 884,587
Investment securities 23 856,870 657,523 568,203 442,909
Other assets 24 40,488 30,057 22,528 21,136
Investment in equity-accounted investee 25 2,236 2,986 1,770 1,770
Investment in subsidiaries 26 – – 65,767 65,767
Property and equipment 27 88,825 89,517 80,145 81,050
Intangible assets 28 11,369 9,430 4,954 3,446
Deferred tax assets 29 33,168 33,116 31,853 31,853
TOTAL ASSETS 2,752,622 2,762,573 2,216,337 2,338,858
LIABILITIES
Derivative liabilities 30(b) 327 943 327 943
Deposits from banks 31 61,066 59,228 350 1,526
Deposits from customers 32 2,081,704 2,169,663 1,627,060 1,812,277
Other liabilities 33 54,885 63,566 34,219 41,209
Current tax liabilities 17 6,488 4,615 634 1,858
Borrowings 34 129,896 113,797 129,896 113,797
Subordinated liabilities 35 85,620 85,315 85,620 85,315
Deferred tax liabilities 29 15 40 – –
TOTAL LIABILITIES 2,420,001 2,497,167 1,878,106 2,056,925
EQUITY
Share capital 36 18,140 16,491 18,140 16,491
Share premium 36 117,374 107,932 117,374 107,932
Retained earnings 36 113,063 87,047 100,900 84,230
Other reserves 36 77,250 48,460 101,817 73,280
EQUITY ATTRIBUTABLE TO OWNERS OF THE PARENT 325,827 259,930 338,231 281,933
Non-controlling interests 6,794 5,476 – –
TOTAL EQUITY 332,621 265,406 338,231 281,933
TOTAL LIABILITIES AND EQUITY 2,752,622 2,762,573 2,216,337 2,338,858
The accompanying notes are an integral part of these consolidated and separate financial statements.
The consolidated and separate financial statements were approved by the directors on 1 March 2016
Ugo A Nwaghodoh Tony O Elumelu , CON Phillips Oduoza
Group Chief Finance Officer Chairman, Board of Directors Group Managing Director/CEO
FRC/2012/ICAN/00000000272 FRC/2013/CIBN/00000002590” FRC/2013/CIBN/00000001955”
2015
AN
NU
AL
REP
OR
T A
ND
AC
CO
UN
TS
63
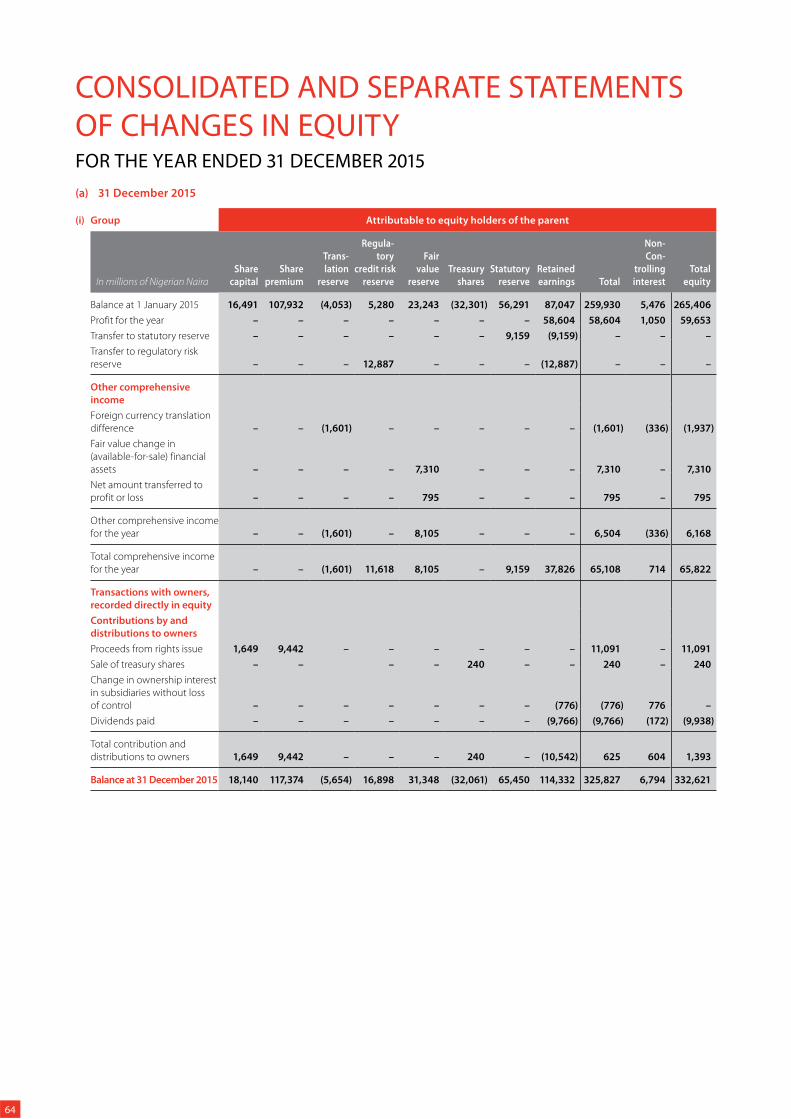
CONSOLIDATED AND SEPARATE STATEMENTS
OF CHANGES IN EQUITYFOR THE YEAR ENDED 31 DECEMBER 2015
(a) 31 December 2015
(i) Group Attributable to equity holders of the parent
In millions of Nigerian Naira
Share
capital
Share
premium
Trans-
lation
reserve
Regula-
tory
credit risk
reserve
Fair
value
reserve
Treasury
shares
Statutory
reserve
Retained
earnings Total
Non-
Con-
trolling
interest
Total
equity
Balance at 1 January 2015 16,491 107,932 (4,053) 5,280 23,243 (32,301) 56,291 87,047 259,930 5,476 265,406
Profit for the year – – – – – – – 58,604 58,604 1,050 59,653
Transfer to statutory reserve – – – – – – 9,159 (9,159) – – –
Transfer to regulatory risk
reserve – – – 12,887 – – – (12,887) – – –
Other comprehensive
income
Foreign currency translation
difference – – (1,601) – – – – – (1,601) (336) (1,937)
Fair value change in
(available-for-sale) financial
assets – – – – 7,310 – – – 7,310 – 7,310
Net amount transferred to
profit or loss – – – – 795 – – – 795 – 795
Other comprehensive income
for the year – – (1,601) – 8,105 – – – 6,504 (336) 6,168
Total comprehensive income
for the year – – (1,601) 11,618 8,105 – 9,159 37,826 65,108 714 65,822
Transactions with owners,
recorded directly in equity
Contributions by and
distributions to owners
Proceeds from rights issue 1,649 9,442 – – – – – – 11,091 – 11,091
Sale of treasury shares – – – – 240 – – 240 – 240
Change in ownership interest
in subsidiaries without loss
of control – – – – – – – (776) (776) 776 –
Dividends paid – – – – – – – (9,766) (9,766) (172) (9,938)
Total contribution and
distributions to owners 1,649 9,442 – – – 240 – (10,542) 625 604 1,393
Balance at 31 December 2015 18,140 117,374 (5,654) 16,898 31,348 (32,061) 65,450 114,332 325,827 6,794 332,621
64
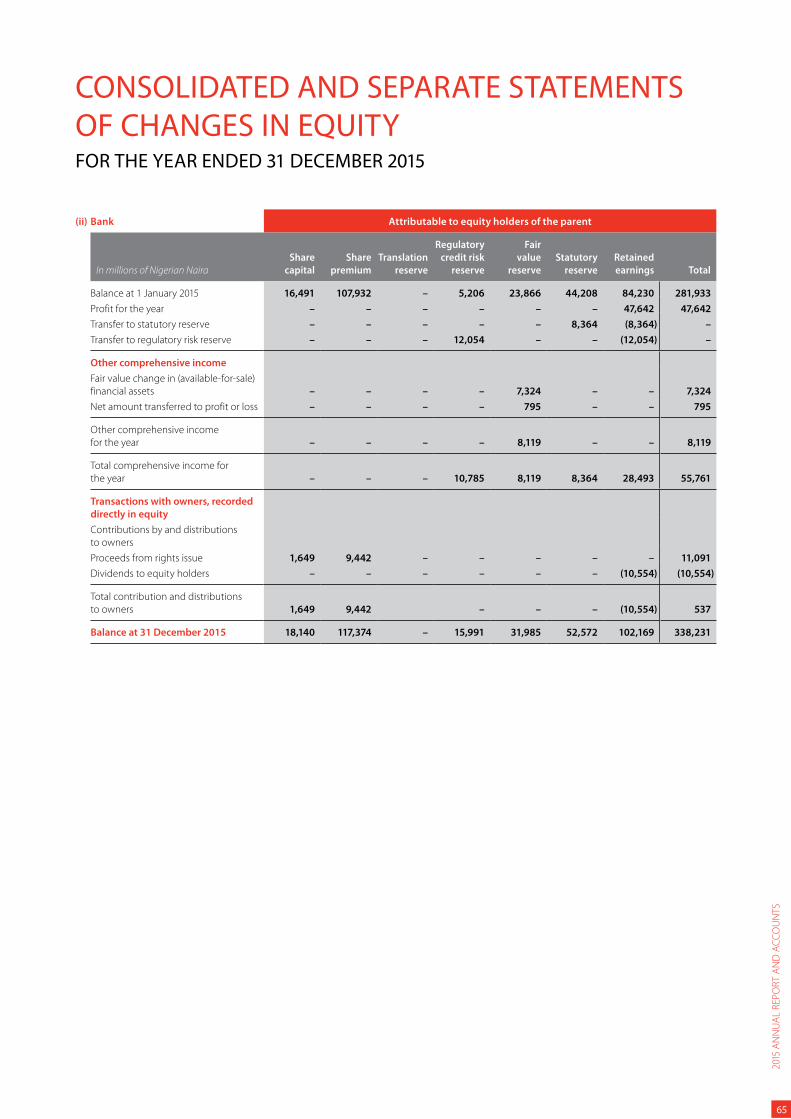
(ii) Bank Attributable to equity holders of the parent
In millions of Nigerian Naira
Share
capital
Share
premium
Translation
reserve
Regulatory
credit risk
reserve
Fair
value
reserve
Statutory
reserve
Retained
earnings Total
Balance at 1 January 2015 16,491 107,932 – 5,206 23,866 44,208 84,230 281,933
Profit for the year – – – – – – 47,642 47,642
Transfer to statutory reserve – – – – – 8,364 (8,364) –
Transfer to regulatory risk reserve – – – 12,054 – – (12,054) –
Other comprehensive income
Fair value change in (available-for-sale)
financial assets – – – – 7,324 – – 7,324
Net amount transferred to profit or loss – – – – 795 – – 795
Other comprehensive income
for the year – – – – 8,119 – – 8,119
Total comprehensive income for
the year – – – 10,785 8,119 8,364 28,493 55,761
Transactions with owners, recorded
directly in equity
Contributions by and distributions
to owners
Proceeds from rights issue 1,649 9,442 – – – – – 11,091
Dividends to equity holders – – – – – – (10,554) (10,554)
Total contribution and distributions
to owners 1,649 9,442 – – – (10,554) 537
Balance at 31 December 2015 18,140 117,374 – 15,991 31,985 52,572 102,169 338,231
CONSOLIDATED AND SEPARATE STATEMENTS
OF CHANGES IN EQUITYFOR THE YEAR ENDED 31 DECEMBER 2015
2015
AN
NU
AL
REP
OR
T A
ND
AC
CO
UN
TS
65
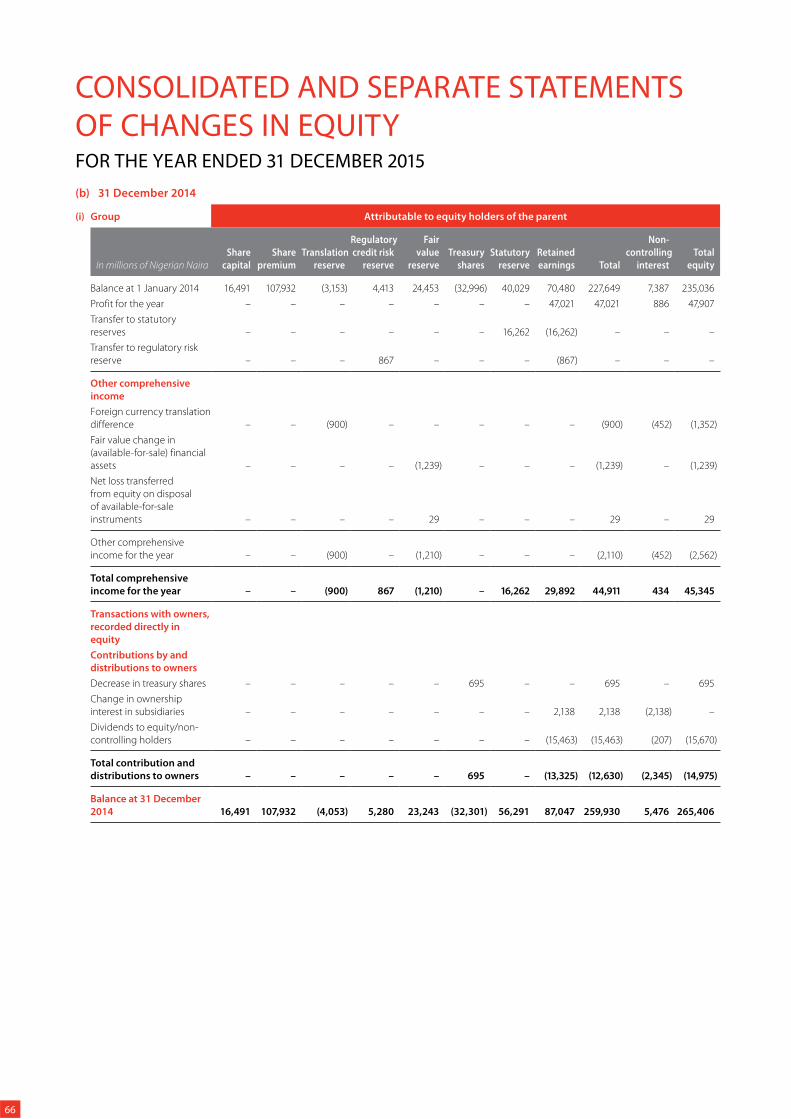
CONSOLIDATED AND SEPARATE STATEMENTS
OF CHANGES IN EQUITYFOR THE YEAR ENDED 31 DECEMBER 2015
(b) 31 December 2014
(i) Group Attributable to equity holders of the parent
In millions of Nigerian Naira
Share
capital
Share
premium
Translation
reserve
Regulatory
credit risk
reserve
Fair
value
reserve
Treasury
shares
Statutory
reserve
Retained
earnings Total
Non-
controlling
interest
Total
equity
Balance at 1 January 2014 16,491 107,932 (3,153) 4,413 24,453 (32,996) 40,029 70,480 227,649 7,387 235,036
Profit for the year – – – – – – – 47,021 47,021 886 47,907
Transfer to statutory
reserves – – – – – – 16,262 (16,262) – – –
Transfer to regulatory risk
reserve – – – 867 – – – (867) – – –
Other comprehensive
income
Foreign currency translation
difference – – (900) – – – – – (900) (452) (1,352)
Fair value change in
(available-for-sale) financial
assets – – – – (1,239) – – – (1,239) – (1,239)
Net loss transferred
from equity on disposal
of available-for-sale
instruments – – – – 29 – – – 29 – 29
Other comprehensive
income for the year – – (900) – (1,210) – – – (2,110) (452) (2,562)
Total comprehensive
income for the year – – (900) 867 (1,210) – 16,262 29,892 44,911 434 45,345
Transactions with owners,
recorded directly in
equity
Contributions by and
distributions to owners
Decrease in treasury shares – – – – – 695 – – 695 – 695
Change in ownership
interest in subsidiaries – – – – – – – 2,138 2,138 (2,138) –
Dividends to equity/non-
controlling holders – – – – – – – (15,463) (15,463) (207) (15,670)
Total contribution and
distributions to owners – – – – – 695 – (13,325) (12,630) (2,345) (14,975)
Balance at 31 December
2014 16,491 107,932 (4,053) 5,280 23,243 (32,301) 56,291 87,047 259,930 5,476 265,406
66
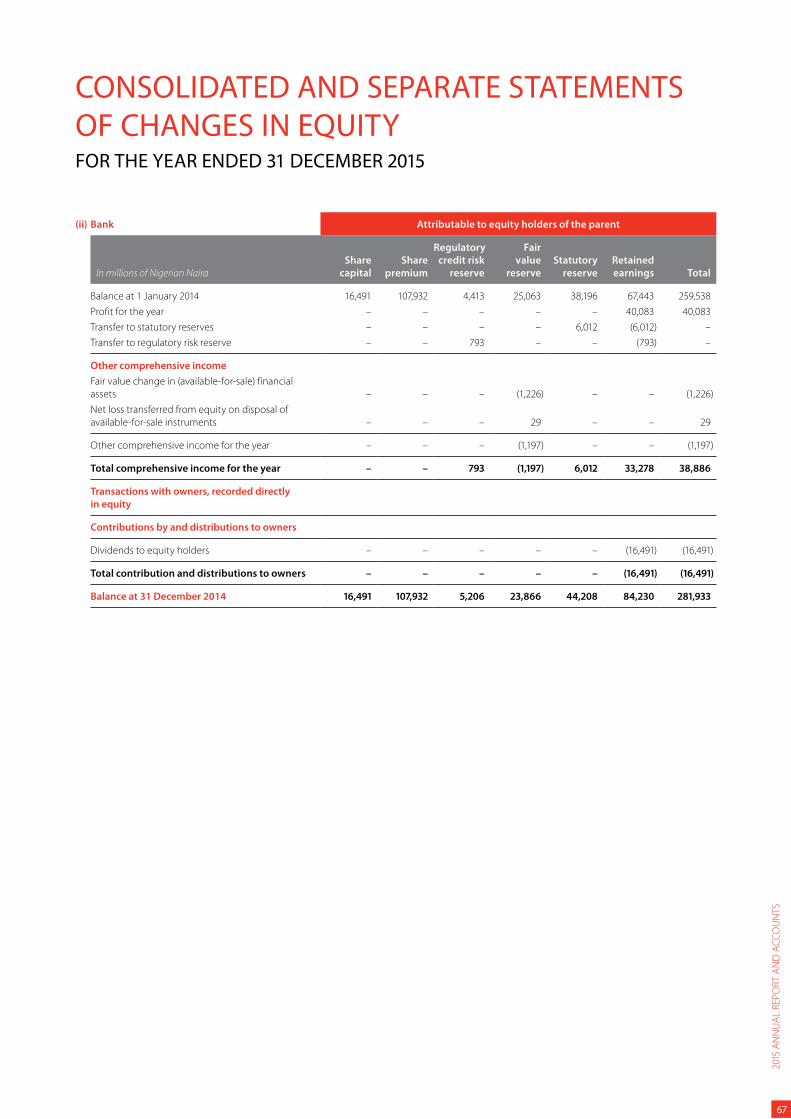
(ii) Bank Attributable to equity holders of the parent
In millions of Nigerian Naira
Share
capital
Share
premium
Regulatory
credit risk
reserve
Fair
value
reserve
Statutory
reserve
Retained
earnings Total
Balance at 1 January 2014 16,491 107,932 4,413 25,063 38,196 67,443 259,538
Profit for the year – – – – – 40,083 40,083
Transfer to statutory reserves – – – – 6,012 (6,012) –
Transfer to regulatory risk reserve – – 793 – – (793) –
Other comprehensive income
Fair value change in (available-for-sale) financial
assets – – – (1,226) – – (1,226)
Net loss transferred from equity on disposal of
available-for-sale instruments – – – 29 – – 29
Other comprehensive income for the year – – – (1,197) – – (1,197)
Total comprehensive income for the year – – 793 (1,197) 6,012 33,278 38,886
Transactions with owners, recorded directly
in equity
Contributions by and distributions to owners
Dividends to equity holders – – – – – (16,491) (16,491)
Total contribution and distributions to owners – – – – – (16,491) (16,491)
Balance at 31 December 2014 16,491 107,932 5,206 23,866 44,208 84,230 281,933
CONSOLIDATED AND SEPARATE STATEMENTS
OF CHANGES IN EQUITYFOR THE YEAR ENDED 31 DECEMBER 2015
2015
AN
NU
AL
REP
OR
T A
ND
AC
CO
UN
TS
67
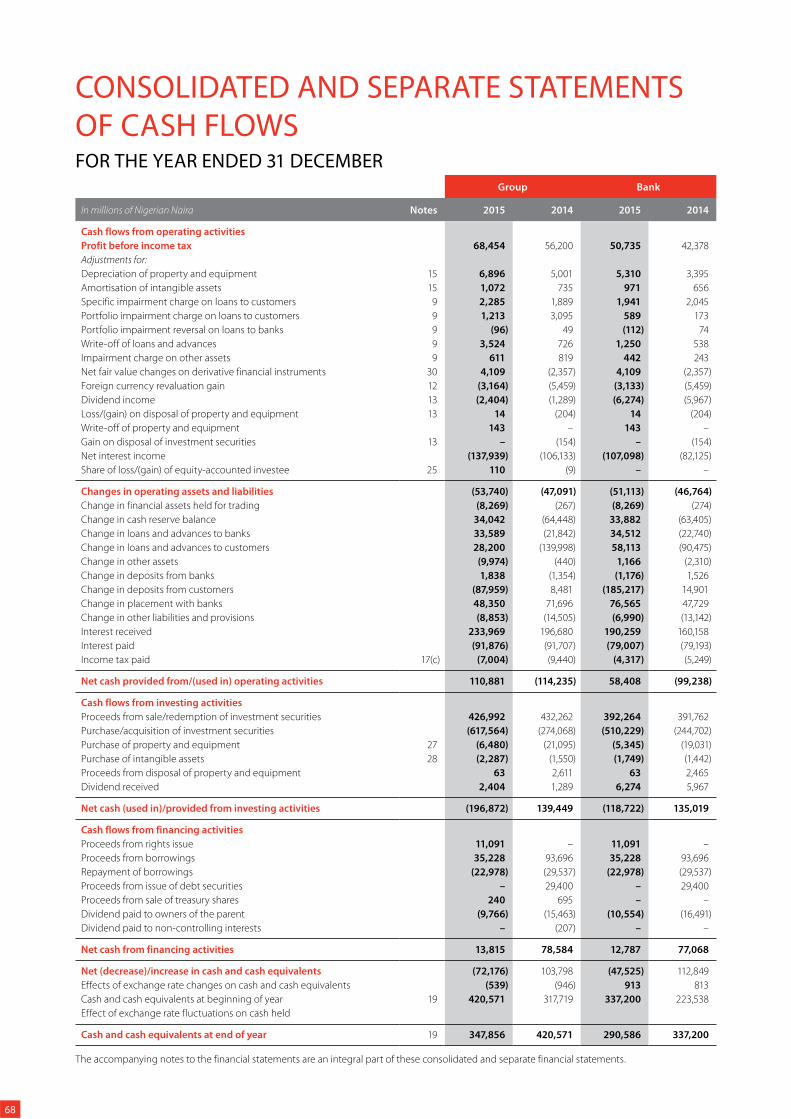
CONSOLIDATED AND SEPARATE STATEMENTS
OF CASH FLOWSFOR THE YEAR ENDED 31 DECEMBER
Group Bank
In millions of Nigerian Naira Notes 2015 2014 2015 2014
Cash flows from operating activities
Profit before income tax 68,454 56,200 50,735 42,378
Adjustments for:
Depreciation of property and equipment 15 6,896 5,001 5,310 3,395
Amortisation of intangible assets 15 1,072 735 971 656
Specific impairment charge on loans to customers 9 2,285 1,889 1,941 2,045
Portfolio impairment charge on loans to customers 9 1,213 3,095 589 173
Portfolio impairment reversal on loans to banks 9 (96) 49 (112) 74
Write-off of loans and advances 9 3,524 726 1,250 538
Impairment charge on other assets 9 611 819 442 243
Net fair value changes on derivative financial instruments 30 4,109 (2,357) 4,109 (2,357)
Foreign currency revaluation gain 12 (3,164) (5,459) (3,133) (5,459)
Dividend income 13 (2,404) (1,289) (6,274) (5,967)
Loss/(gain) on disposal of property and equipment 13 14 (204) 14 (204)
Write-off of property and equipment 143 – 143 –
Gain on disposal of investment securities 13 – (154) – (154)
Net interest income (137,939) (106,133) (107,098) (82,125)
Share of loss/(gain) of equity-accounted investee 25 110 (9) – –
Changes in operating assets and liabilities (53,740) (47,091) (51,113) (46,764)
Change in financial assets held for trading (8,269) (267) (8,269) (274)
Change in cash reserve balance 34,042 (64,448) 33,882 (63,405)
Change in loans and advances to banks 33,589 (21,842) 34,512 (22,740)
Change in loans and advances to customers 28,200 (139,998) 58,113 (90,475)
Change in other assets (9,974) (440) 1,166 (2,310)
Change in deposits from banks 1,838 (1,354) (1,176) 1,526
Change in deposits from customers (87,959) 8,481 (185,217) 14,901
Change in placement with banks 48,350 71,696 76,565 47,729
Change in other liabilities and provisions (8,853) (14,505) (6,990) (13,142)
Interest received 233,969 196,680 190,259 160,158
Interest paid (91,876) (91,707) (79,007) (79,193)
Income tax paid 17(c) (7,004) (9,440) (4,317) (5,249)
Net cash provided from/(used in) operating activities 110,881 (114,235) 58,408 (99,238)
Cash flows from investing activities
Proceeds from sale/redemption of investment securities 426,992 432,262 392,264 391,762
Purchase/acquisition of investment securities (617,564) (274,068) (510,229) (244,702)
Purchase of property and equipment 27 (6,480) (21,095) (5,345) (19,031)
Purchase of intangible assets 28 (2,287) (1,550) (1,749) (1,442)
Proceeds from disposal of property and equipment 63 2,611 63 2,465
Dividend received 2,404 1,289 6,274 5,967
Net cash (used in)/provided from investing activities (196,872) 139,449 (118,722) 135,019
Cash flows from financing activities
Proceeds from rights issue 11,091 – 11,091 –
Proceeds from borrowings 35,228 93,696 35,228 93,696
Repayment of borrowings (22,978) (29,537) (22,978) (29,537)
Proceeds from issue of debt securities – 29,400 – 29,400
Proceeds from sale of treasury shares 240 695 – –
Dividend paid to owners of the parent (9,766) (15,463) (10,554) (16,491)
Dividend paid to non-controlling interests – (207) – –
Net cash from financing activities 13,815 78,584 12,787 77,068
Net (decrease)/increase in cash and cash equivalents (72,176) 103,798 (47,525) 112,849
Effects of exchange rate changes on cash and cash equivalents (539) (946) 913 813
Cash and cash equivalents at beginning of year 19 420,571 317,719 337,200 223,538
Effect of exchange rate fluctuations on cash held
Cash and cash equivalents at end of year 19 347,856 420,571 290,586 337,200
The accompanying notes to the financial statements are an integral part of these consolidated and separate financial statements.
68
SIGNIFICANT ACCOUNTING POLICIES
1. Reporting entity United Bank for Africa Plc (the “Bank”) is a Nigerian registered company with address at 57 Marina, Lagos, Nigeria. The consolidated financial
statements of the Bank for the year ended 31 December 2015 comprise the Bank (Parent) and its subsidiaries (together referred to as the
“Group” and individually referred to as Group entities”). The Bank and its subsidiaries are primarily involved in corporate, commercial and retail
banking, trade services, cash management, treasury and custodial services.
2. Basis of preparation(A) BASIS OF PREPARATION
These financial statements have been prepared in accordance with International Accounting Standards as issued by the International
Accounting Standards Board (IASB) and in the manner required by the Companies and Allied Matters Act of Nigeria, the Financial
Reporting Council of Nigeria Act, the Banks and other Financial Institutions Act of Nigeria and relevant Central Bank of Nigeria circulars.
(B) FUNCTIONAL AND PRESENTATION CURRENCY
Items included in the financial statements of each of the Group’s entities are measured using the currency of the primary economic
environment in which the entity operates (“the functional currency”). The financial statements are presented in Nigerian Naira (N)
which is the Bank’s functional currency and the Group’s presentation currency.
(C) USE OF ESTIMATES AND JUDGEMENTS
The preparation of financial statements requires the directors to make judgments, estimates and assumptions that affect the application
of policies and reported amounts of assets and liabilities, incomes and expenses. The estimates and associated assumptions are based
on historical experience and various other factors that are believed to be reasonable under the circumstances, the results of which
form the basis of making the judgments about carrying values of assets and liabilities that are not readily apparent from other sources.
Actual results may differ from these estimates.
The estimates and underlying assumptions are reviewed on an ongoing basis. Revisions to accounting estimates are recognised
in the period in which the estimate is revised, if the revision affects only that period, or in the period of the revision and future
periods, if the revision affects both current and future periods. Information about significant areas of estimation, uncertainties and
critical judgements in applying accounting policies that have the most significant effect on the amounts recognised in the financial
statements are described in note 5.
3. Significant accounting policies(A) BASIS OF CONSOLIDATION
(i) Subsidiaries
Subsidiaries (including structured entities) are entities controlled by the Group. Control exists when the Group is exposed, or has
rights to, variable returns from its involvement with an entity and has the ability to affect those returns through its power over
the entity. In assessing control, potential voting rights that are presently are exercisable are taken into account. The Group also
assesses existence of control where it does not have more than 50% of the voting power but is able to govern the financial and
operating policies by virtue of de-facto control. Subsidiaries are fully consolidated from the date in which control is transferred
to the Group. They are deconsolidated from the date control ceases.
The accounting policies of subsidiaries have been changed, where necessary, to align with the policies adopted by the Group.
Losses applicable to the non-controlling interests in a subsidiary are allocated to the non-controlling interests, even if doing so
causes the non-controlling interests to have a deficit balance.
In the separate financial statements, investments in subsidiaries are carried at cost less impairment.
(ii) Business combinations
Business combinations are accounted for using the acquisition method as at the acquisition date, which is the date on which
control is transferred to the Group.
The Group measures goodwill at the acquisition date as the total of:
the fair value of the consideration transferred; plus
the recognised amount of any non-controlling interest in the acquiree; plus if the business combination is achieved in stages,
the fair value of the existing equity interest in the acquiree;
less the net recognised amount (generally fair value) of the identifiable assets acquired and liabilities assumed.
2015
AN
NU
AL
REP
OR
T A
ND
AC
CO
UN
TS
69
SIGNIFICANT ACCOUNTING POLICIES (continued)
3. Significant accounting policies (continued)(A) BASIS OF CONSOLIDATION (continued)
(ii) Business combinations (continued)
When this total is negative, a bargain purchase gain is recognised immediately in the income statement.
Non-controlling interests are measured at either fair value or their proportionate share of the acquiree’s identifiable net assets
at the acquisition date. Changes in the Group’s interest in a subsidiary that do not result in a loss of control are accounted for as
equity transactions.
The consideration transferred does not include amounts related to the settlement of pre-existing relationships. Such amounts
are generally recognised in profit or loss. Costs related to the acquisition, other than those associated with the issue of debt or
equity securities that the Group incurs in connection with a business combination are expensed as incurred.
The excess of the consideration transferred, the amount of any non-controlling interest in the acquiree and the acquisition date
fair value of any previous equity interest in the acquiree over the fair value of the identifiable net assets acquired is recorded as
goodwill. If the total of consideration transferred, non-controlling interest recognised previously held interest measured is less
than the fair value of the net assets of the subsidiary acquired in the case of a bargain purchase, the difference is recognised
directly in the income statement.
If the business combination is achieved in stages, the acquisition date carrying value of the acquirer’s previously held equity
interest in the acquiree is re-measured to fair value at the acquisition date; any gains or losses arising from such re-measurement
are recognised in profit or loss.
Any contingent consideration payable is recognised at fair value at the acquisition date. If the contingent consideration is
classified as equity, it is not remeasured and settlement is accounted for within equity. Otherwise, subsequent changes to the
fair value of the contingent consideration are recognised in profit or loss.
(iii) Disposal of subsidiaries
When the Group ceases to have control, any retained interest in the entity is remeasured to its fair value at the date when
control is lost, with the change in carrying amount recognised in profit or loss. The fair value is the initial carrying amount for the
purposes of subsequently accounting for the retained interest as an associate, joint venture or financial asset. In addition, any
amounts previously recognised in other comprehensive income in respect of that entity are accounted for as if the Group had
directly disposed of the related assets or liabilities. This may mean that amounts previously recognised in other comprehensive
income are reclassified to profit or loss.
(iv) Transactions eliminated on consolidation
Intra-group balances and any unrealised gains or losses or incomes and expenses arising from intra-group transactions, are
eliminated in preparing the consolidated financial statements. Unrealised gains arising from transactions with associates are
eliminated to the extent of the Group’s interest in the entity. Unrealised losses are eliminated in the same way as unrealised
gains, but only to the extent that there is no evidence of impairment.
(v) Changes in ownership interests in subsidiaries without change of control
Transactions with non-controlling interests that do not result in loss of control are accounted for as equity transactions – that is,
as transactions with the owners in their capacity as owners. The difference between fair value of any consideration paid and the
relevant share acquired of the carrying value of net assets of the subsidiary is recorded in equity. Gains or losses on disposals to
non-controlling interests are also recorded in equity.
(vi) Associates
Associates are all entities over which the group has significant influence but not control, generally accompanying a shareholding
of between 20% and 50% of the voting rights. Investments in associates are accounted for using the equity method of accounting.
Under the equity method, the investment is initially recognised at cost, and the carrying amount is increased or decreased
to recognise the investor’s share of the profit or loss of the investee after the date of acquisition. The Group’s investment in
associates includes goodwill identified on acquisition. In the separate financial statements, investments in associates are carried
at cost less impairment.
If the ownership interest in an associate is reduced but significant influence is retained, only a proportionate share of the
amounts previously recognised in other comprehensive income is reclassified to the income statement where appropriate.
70
SIGNIFICANT ACCOUNTING POLICIES (continued)
3. Significant accounting policies (continued)(A) BASIS OF CONSOLIDATION (continued)
(vi) Associates (continued)
The Group’s share of post-acquisition profit or loss is recognised in the income statement, and its share of post-acquisition
movements in other comprehensive income is recognised in other comprehensive income with a corresponding adjustment
to the carrying amount of the investment. When the Group’s share of losses in an associate equals or exceeds its interest in the
associate, including any other unsecured receivables, the Group does not recognise further losses, unless it has incurred legal or
constructive obligations or made payments on behalf of the associate.
The Group determines at each reporting date whether there is any objective evidence that the investment in the associate is
impaired. If this is the case, the Group calculates the amount of impairment as the difference between the recoverable amount
of the associate and its carrying value and recognises the amount adjacent to ‘share of profit/(loss)’ of associates in the income
statement.
Profits and losses resulting from upstream and downstream transactions between the Group and its associate are recognised
in the Group’s financial statements only to the extent of unrelated investor’s interests in the associates. Unrealised losses are
eliminated unless the transaction provides evidence of an impairment of the asset transferred. Accounting policies of associates
have been changed where necessary to ensure consistency with the policies adopted by the Group.
Dilution gains and losses arising in investments in associates are recognised in the income statement.
(B) FOREIGN CURRENCY
(i) Foreign currency transactions
Foreign currency transactions are recorded at the rate of exchange on the date of the transaction. At the reporting date,
monetary assets and liabilities denominated in foreign currencies are reported using the closing exchange rate. Exchange
differences arising on the settlement of transactions at rates different from those at the date of the transaction, as well as
unrealised foreign exchange differences on unsettled foreign currency monetary assets and liabilities, are recognised in the
income statement.
Unrealised exchange differences on non-monetary financial assets are a component of the change in their entire fair value. For
a non-monetary financial asset held for trading and for non-monetary financial assets designated at fair value through profit or
loss, unrealised exchange differences are recognised in profit or loss. For non-monetary financial investments available-for-sale,
unrealised exchange differences are recorded in other comprehensive income until the asset is sold or becomes impaired.
(ii) Foreign operations
The assets and liabilities of foreign operations, including goodwill and fair value adjustments arising on acquisition, are translated
to Nigerian Naira at exchange rates at each reporting date. The incomes and expenses of foreign operations are translated to
Nigerian Naira at average rates.
Foreign currency differences are recognised in other comprehensive income, and presented in the foreign currency translation
reserve in equity. However, if the operation is a non-wholly-owned subsidiary, then the relevant proportionate share of the
translation difference is allocated to the non-controlling interest. When a foreign operation is disposed of such that control,
significant influence or joint control is lost, the cumulative amount in the translation reserve related to that foreign operation is
re-classified to profit or loss as part of the gain or loss on disposal.
(C) INTEREST INCOME AND INTEREST EXPENSE
Interest income and expense for all interest bearing financial instruments, except for those classified at fair value through profit or loss,
are recognised within ‘interest income’ and ‘interest expense’ in the statement of comprehensive income using the effective interest
method. The effective interest rate is the rate that exactly discounts the estimated future cash payments and receipts through the
expected life of the financial asset or liability (or, where appropriate, a shorter period) to the net carrying amount of the financial asset
or liability.
The calculation of the effective interest rate includes all transaction costs and fees paid or received that are an integral part of the
effective interest rate. Transaction costs include incremental costs that are directly attributable to the acquisition or issue of a financial
asset or liability.
2015
AN
NU
AL
REP
OR
T A
ND
AC
CO
UN
TS
71
SIGNIFICANT ACCOUNTING POLICIES (continued)
3. Significant accounting policies (continued)(D) FEES AND COMMISSIONS INCOME AND EXPENSES
Fees and commission income and expenses that are integral to the effective interest rate on a financial asset or liability are included
in the measurement of the effective interest rate. Other fees and commission income, including account servicing fees, investment
management and other fiduciary activity fees, sales commission, placement fees and syndication fees, are recognised as the related
services are performed.
When a loan commitment is not expected to result in the draw-down of a loan, loan commitment fees are recognised on a straight-
line basis over the commitment period.
Other fees and commission expenses relate mainly to transaction and service fees, which are expensed as the services are received.
(E) NET TRADING AND FOREIGN EXCHANGE INCOME
Net trading income and foreign exchange income comprises gains less losses related to trading assets and liabilities, and includes all
realised and unrealised fair value changes and foreign exchange differences. Net gains or losses on derivative financial instruments
measured at fair value through profit or loss are also included in net trading income.
(F) DIVIDEND INCOME
Dividend income is recognised when the right to receive income is established. Dividends are reflected as a component of other
operating income.
(G) INCOME TAX
Income tax expense comprises current and deferred tax. Income tax expense is recognised in the income statement except to the
extent that it relates to items recognised directly in equity, in which case it is recognised in equity.
Current tax liability is the expected tax payable on taxable income for the year, using tax rates enacted or substantively enacted at the
reporting date, and any adjustment to tax payable in respect of previous years.
Deferred tax is recognised in respect of temporary differences between the carrying amounts of assets and liabilities for financial
reporting purposes and the amounts used for taxation purposes. Deferred tax is not recognised for the following temporary
differences: the initial recognition of goodwill, the initial recognition of assets or liabilities in a transaction that is not a business
combination and that affects neither accounting nor taxable profit, and differences relating to investments in subsidiaries to the
extent that they probably will not reverse in the foreseeable future. Deferred tax is measured at the tax rates that are expected to
be applied to the temporary differences when they reverse, based on laws that have been enacted or substantively enacted by the
reporting date.
Deferred income tax liabilities are provided on taxable temporary differences arising from investments in subsidiaries, associates and
joint arrangements, except for deferred income tax liability where the timing of the reversal of the temporary difference is controlled
by the Group and it is probable that the temporary difference will not reverse in the forseeable future.
Deferred income tax assets are recognised on deductible temporary differences arising from investments in subsidiaries, associates
and joint arrangements only to the extent that it is probable the temporary difference will reverse in the future and there is sufficient
taxable profit available against which the temporary difference can be utilised.
A deferred tax asset is recognised only to the extent that it is probable that future taxable profits will be available against which
the asset can be utilised. Deferred tax assets are reviewed at each reporting date and are reduced to the extent that it is no longer
probable that the related tax benefit will be realised.
Deferred tax assets and liabilities are offset if there is a legally enforceable right to offset current tax liabilities against current tax assets,
and they relate to taxes levied by the same tax authority on the same taxable entity, or on different tax entities, but they intend to
settle current tax liabilities and assets on a net basis or their tax assets and liabilities will be realised simultaneously.
(H) FINANCIAL INSTRUMENTS
Initial recognition and measurement
Regular purchases and sales of financial assets and liabilities are recognised on the settlement date. A financial asset or financial
liability is measured initially at fair value plus, for an item not at fair value through profit or loss, direct and incremental transaction costs
that are directly attributable to its acquisition or issue.
72
SIGNIFICANT ACCOUNTING POLICIES (continued)
3. Significant accounting policies (continued)(H) FINANCIAL INSTRUMENTS (continued)
Subsequent measurement
Subsequent to initial measurement, financial instruments are measured either at fair value or amortised cost, depending on their
classification:
(i) Held-to-maturity
Held-to-maturity investments are non-derivative financial assets with fixed determinable payments and fixed maturities that
management has both the positive intent and ability to hold to maturity, and which are not designated as fair value through
profit or loss or as available for sale or as loans and receivables. Where the Group sells more than an insignificant amount of held-
to-maturity assets, the entire category would be tainted and reclassified as available-for-sale assets and the difference between
amortised cost and fair value will be accounted for in other comprehensive income.
Held-to-maturity investments are carried at amortised cost, using the effective interest method, less any provisions for
impairment.
Interest on held-to-maturity investments is included in the consolidated income statement and reported as ‘Interest and similar
income’. In the case of an impairment, the impairment loss is reported as a deduction from the carrying value of the investment
and recognised in the consolidated income statement as ‘Net impairment loss on loans and receivables’.
(ii) Financial assets at fair value through profit or loss
This category has two sub-categories: financial assets held for trading, and those designated at fair value through profit or loss
upon initial recognition. A financial asset is classified as held-for-trading if acquired or incurred principally for the purpose of
selling in the short term or it is part of a portfolio of identified financial instruments that are managed together and for which
there is evidence of a recent pattern of short term profit making. Financial assets held for trading are initially recognised at fair
value with transaction costs recognised in profit or loss. Derivatives are also categorised as held-for-trading unless they are
designated as hedges and effective as hedging instruments. All derivatives are carried as assets when fair value is positive and
as liabilities when fair value is negative.
Financial assets may be designated at fair value through profit or loss when:
the designation eliminates or significantly reduces measurement or recognition inconsistency that would otherwise arise
from measuring assets or liabilities on different basis;
a group of financial assets is managed and its performance evaluated on a fair value basis;
the financial assets consist of debt host and an embedded derivatives that must be separated.
Subsequent to initial recognition, the fair values are remeasured at each reporting date. All gains and losses arising from changes
therein are recognised in the income statement in ‘net trading and foreign exchange income
(iii) Available-for-sale
Financial assets classified by the Group as available-for-sale financial assets are generally those that are not designated as
another category of financial assets, or investments held for an indefinite period of time, which may be sold in response to
needs for liquidity or changes in interest rates, exchange rates or equity prices.
Available-for-sale financial assets are subsequently carried at fair value. Unrealised gains and losses arising from changes in
the fair value of available-for-sale financial assets are recognised directly in fair value reserve in other comprehensive income
until the financial asset is derecognised or impaired. When available-for-sale financial assets are disposed of, the fair value
adjustments accumulated in other comprehensive income are recognised in the income statement.
Interest income, calculated using the effective interest method, foreign currency gains and losses on monetary assets classified
as available-for-sale is recognised in the income statement. Dividends received on available-for-sale instruments are recognised
in the income statement when the Group’s right to receive payment has been established.
2015
AN
NU
AL
REP
OR
T A
ND
AC
CO
UN
TS
73
SIGNIFICANT ACCOUNTING POLICIES (continued)
3. Significant accounting policies (continued)(H) FINANCIAL INSTRUMENTS (continued)
Subsequent measurement (continued)
(iv) Loans and receivables
Loans and receivables are non-derivative financial assets with fixed or determinable payments that are not quoted in an active
market, other than those classified by the Group as fair value through profit or loss or available-for-sale or those for which the
holder may not recover substantially all of its initial investment, other than because of credit deterioration.
Loans and receivables are measured at amortised cost using the effective interest method, less any impairment losses.
Transaction costs that are integral to the effective rate are capitalised to the value of the loan and amortised through interest
income using the effective interest rate method. All of the Group’s advances are included in the loans and receivables category.
The Group’s loans and receivables include loans and advances to banks and customers, trade receivables and cash and bank
balances.
(v) Financial liabilities
The Group classifies its financial liabilities as measured at amortised cost or fair value through profit or loss. The financial liabilities
at fair value through profit or loss are in two sub categories: financial liabilities classified as held for trading and financial liabilities
designated at fair value through profit or loss.
A financial liability is classified as held for trading if it is acquired or incurred principally for the purpose of selling or repurchasing
it in the near term or if it is part of a portfolio of identified financial instruments that are managed together and for which there
is evidence of a recent actual pattern of short term profit taking. Financial liabilities held for trading also include obligations
to deliver financial assets borrowed by a short seller. Those financial instruments are recognised in the statement of financial
position as ‘Financial liabilities held for trading’.
Borrowings and surbodinated liabilities are included as part of financial liabilities measured at amortised cost.
Fair value measurement
Subsequent to initial recognition, the fair values of financial instruments are based on quoted market prices or dealer price quotations
for financial instruments traded in active markets. If the market for a financial asset is not active or the instrument is unlisted, the fair
value is determined by using applicable valuation techniques. These include the use of recent arm’s length transactions, discounted
cash flow analyses, pricing models and valuation techniques commonly used by market participants.
Where discounted cash flow analyses are used, estimated cash flows are based on management’s best estimates and the discount rate
is a market-related rate at the reporting date from a financial asset with similar terms and conditions. Where pricing models are used,
inputs are based on observable market indicators at the reporting date and profits or losses are only recognised to the extent that they
relate to changes in factors that market participants will consider in setting a price.
Impairment of financial assets
(i) Assets carried at amortised cost
The Group assesses at each reporting date whether there is objective evidence that a financial asset or group of financial assets
is impaired. A financial asset or a group of financial assets is impaired and impairment losses are incurred if, and only if, there
is objective evidence of impairment as a result of one or more events that occurred after the initial recognition of the assets (a
‘loss event’), and that loss event (or events) has an impact on the estimated future cash flows of the financial asset or group of
financial assets that can be reliably estimated.
The following factors are considered in assessing objective evidence of impairment:
whether a loan or other financial assets or any obligation is more than 90 days past due;
the Group consents to a restructuring of the obligation, resulting in a diminished financial obligation, demonstrated by a
material forgiveness of debt or postponement of scheduled payments; or
there is an observable data indicating that there is a measurable decrease in the estimated future cash flows of a group of
financial assets, although the decrease cannot yet be identified with specific individual financial assets.
74
SIGNIFICANT ACCOUNTING POLICIES (continued)
3. Significant accounting policies (continued)(H) FINANCIAL INSTRUMENTS (continued)
Impairment of financial assets (continued)
(i) Assets carried at amortised cost (continued)
The Group first assesses whether objective evidence of impairment exists individually for financial assets that are individually
significant, and individually or collectively for financial assets that are not individually significant.
If the Group determines that no objective evidence of impairment exists for an individually assessed financial asset, whether
significant or not, it includes the asset in a group of financial assets with similar credit risk characteristics and collectively assesses
them for impairment. Assets that are individually assessed for impairment and for which an impairment loss is or continues to be
recognised, are not included in a collective assessment of impairment.
For the purposes of a collective evaluation of impairment, financial assets are grouped on the basis of similar credit risk
characteristics (that is, on the basis of the Bank’s grading process that considers asset type, industry, geographical location,
collateral type, past-due status and other relevant factors). Those characteristics are relevant to the estimation of future cash
flows for groups of such assets by being indicative of the debtors’ ability to pay all amounts due according to the contractual
terms of the assets being evaluated.
Future cash flows in a group of financial assets that are collectively evaluated for impairment are estimated on the basis of the
contractual cash flows of the assets in the group and historical loss experience for assets with credit risk characteristics similar to
those in the group. Historical loss experience is adjusted on the basis of current observable data to reflect the effects of current
conditions that did not affect the period on which the historical loss experience is based and to remove the effects of conditions
in the historical period that do not currently exist.
Estimates of changes in future cash flows for groups of assets reflect changes in related observable data from period to period
(for example, changes in unemployment rates, property prices, payment status, or other factors indicative of changes in the
probability of losses in the Bank and their magnitude). The methodology and assumptions used for estimating future cash flows
are reviewed regularly by the Bank to reduce any differences between loss estimates and actual loss experience.
When a loan is uncollectible, it is written off against the related allowance for loan impairment. Such loans are written off after all
the necessary procedures have been completed and the amount of the loss has been determined. Impairment charges relating
to loans and advances to banks and customers are classified in impairment loss on loans and receivables whilst impairment
charges relating to investment securities (held-to-maturity and loans and receivables categories) are classified in ‘Net gains/
(losses) on investment securities’.
If, in a subsequent period, the amount of the impairment loss decreases and the decrease can be related objectively to an
event occurring after the impairment was recognised (such as an improvement in the debtor’s credit rating), the previously
recognised impairment loss is reversed by adjusting the allowance account. The amount of the reversal is recognised in the
income statement.
If there is objective evidence that an impairment loss on a loan and receivable or a held-to-maturity asset has been incurred, the
amount of the loss is measured as the difference between the asset’s carrying amount and the present value of estimated future
cash flows (excluding future credit losses that have not been incurred), discounted at the asset’s original effective interest rate.
The carrying amount of the asset is reduced through the use of an allowance account and the amount of the loss is recognised
in the income statement.
The calculation of the present value of the estimated future cash flows of a collateralised financial asset reflects the cash flows
that may result from foreclosure, less costs for obtaining and selling the collateral, whether or not foreclosure is probable. For the
purposes of a collective evaluation of impairment, financial assets are grouped on the basis of similar credit risk characteristics
(i.e. on the basis of the Group’s grading process which considers asset type, industry, geographic location, collateral type, past-
due status and other relevant factors). These characteristics are relevant to the estimation of future cash flows for groups of
such assets being indicative of the debtors’ ability to pay all amounts due according to the contractual terms of the assets being
evaluated.
If a loan or held-to-maturity investment has a variable interest rate, the discount rate for measuring any impairment loss is the
current effective interest rate determined under the contract. As a practical expedient, the Bank may measure impairment on
the basis of an instrument’s fair value using an observable market price.
2015
AN
NU
AL
REP
OR
T A
ND
AC
CO
UN
TS
75
SIGNIFICANT ACCOUNTING POLICIES (continued)
3. Significant accounting policies (continued)(H) FINANCIAL INSTRUMENTS (continued)
Impairment of financial assets (continued)
(i) Assets carried at amortised cost (continued)
Future cash flows in a group of financial assets that are collectively evaluated for impairment are estimated on the basis of the
historical loss experience for assets with credit risk characteristics similar to those in the Group. Historical loss experience is
adjusted on the basis of current observable data to reflect the effects of current conditions that did not affect the period on
which the historical loss experience is based, and to remove the effects of conditions in the historical period that do not exist
currently.
To the extent that a loan is irrecoverable, it is written off against the related allowance for loan impairment. Such loans are written
off after all the necessary procedures have been completed and the amount of the loss has been determined. Subsequent
recoveries of amounts previously written off decrease the amount of the allowance for loan impairment in profit or loss. If, in
a subsequent period, the amount of the impairment loss decreases and the decrease can be related objectively to an event
occurring after the impairment was recognised (such as an improvement in the debtor’s credit rating), the previously recognised
impairment loss is reversed by adjusting the allowance account. The amount of the reversal is recognised in profit or loss.
(ii) Available-for-sale financial assets
Available-for-sale financial assets are impaired if there is objective evidence of impairment, resulting from one or more loss
events that occurred after initial recognition but before the reporting date, that have an impact on the future cash flows of the
asset. In addition, an available-for-sale equity instrument is generally considered impaired if a significant or prolonged decline in
the fair value of the instrument below its cost has occurred. Where an available-for-sale asset, which has been remeasured to fair
value directly through equity, is impaired, the impairment loss is recognised in profit or loss. If any loss on the financial asset was
previously recognised directly in equity as a reduction in fair value, the cumulative net loss that had been recognised in equity is
transferred to profit or loss and is recognised as part of the impairment loss. The amount of the loss recognised in profit or loss
is the difference between the acquisition cost and the current fair value, less any previously recognised impairment loss.
If, in a subsequent period, the amount relating to an impairment loss decreases and the decrease can be linked objectively to
an event occurring after the impairment loss was recognised, where the instrument is a debt instrument, the impairment loss
is reversed through profit or loss. An impairment loss in respect of an equity instrument classified as available-for-sale is not
reversed through profit or loss but accounted for directly in equity.
Write-off policy
The Group writes off a financial asset (and any related allowances for impairment losses) when Group Credit determines that
the assets are uncollectible. This determination is reached after considering information such as the occurrence of significant
changes in the borrower/issuer’s financial position such that the borrower/issuer can no longer pay the obligation, or that
proceeds from collateral will not be sufficient to pay back the entire exposure. For smaller balance standardised loans, charge off
decisions are generally based on a product specific past due status.
Assets pledged as collateral
Financial assets transferred to external parties that do not qualify for de-recognition are included as part not reclassified to “assets
pledged as collateral” in the statement of financial position because they cannot be re-pledged or resold by counterparties.
They are included as part of available-for-sale and held to maturity investment securities. Initial recognition is at fair value while
subsequent measurement is at amortised cost.
Offsetting financial instruments
Financial assets and liabilities are set off and the net amount presented in the statement of financial position when, and only
when, the Group has a legal right to set off the amounts and intends either to settle on a net basis or to realise the asset and
settle the liability simultaneously.
Incomes and expenses are presented on a net basis only when permitted under IFRSs, or for gains and losses arising from a
group of similar transactions such as in the Group’s trading activity.
76
SIGNIFICANT ACCOUNTING POLICIES (continued)
3. Significant accounting policies (continued)(H) FINANCIAL INSTRUMENTS (continued)
Impairment of financial assets (continued)
(ii) Available-for-sale financial assets (continued)
Sale and repurchase agreements and lending of securities
Securities sold subject to linked repurchase agreements are disclosed in the financial statements as pledged assets
when the transferee has the right by contract or custom to sell or repledge the collateral. The liability to the
counterparty is included in deposit from banks, or other deposits, as appropriate.
Securities purchased under agreements to resell are recorded as loans granted under resale agreements and
included under loans and advances to other banks or customers as appropriate. The difference between the sale
and repurchase price is treated as interest and amortised over the life of the repurchase agreement using the
effective interest method.
De-recognition of financial instruments
The Group derecognises a financial asset when the contractual rights to the cash flows from the asset expire, or it
transfers the rights to receive the contractual cash flows on the financial asset in a transaction in which substantially
all the risks and rewards of ownership of the financial asset are transferred, or has assumed an obligation to pay
those cash flows to one or more recipients, subject to certain criteria.
Any interest in transferred financial assets that is created or retained by the Group is recognised as a separate asset
or liability.
The Group may enter into transactions whereby it transfers assets recognised on its statement of financial position,
but retains either all risks and rewards of the transferred assets or a portion of them. If all or substantially all risks and
rewards are retained, then the transferred assets are not derecognised from the statement of financial position. In
transactions where the Group neither retains nor transfers substantially all the risks and rewards of ownership of a
financial asset, it derecognises the asset if control over the asset is lost.
The rights and obligations retained in the transfer are recognised separately as assets and liabilities as appropriate.
In transfers where control over the asset is retained, the Group continues to recognise the asset to the extent
of its continuing involvement, determined by the extent to which it is exposed to changes in the value of the
transferred asset.
The Group derecognises a financial liability when its contractual obligations are discharged or cancelled or expire.
Reclassification of financial assets
The Group may choose to reclassify a non-derivative financial asset held for trading out of the held-for-trading category if the
financial asset is no longer held for the purpose of selling it in the near-term. Financial assets other than loans and receivables
are permitted to be reclassified out of the held for trading category only in rare circumstances arising from a single event that is
unusual and highly unlikely to recur in the near-term. In addition, the Bank may choose to reclassify financial assets that would
meet the definition of loans and receivables out of the held-for-trading or available-for-sale categories if the Bank has the
intention and ability to hold these financial assets for the foreseeable future or until maturity at the date of reclassification.
Reclassifications are made at fair value as of the reclassification date. Fair value becomes the new cost or amortised cost as
applicable, and no reversals of fair value gains or losses recorded before reclassification date are subsequently made. Effective
interest rates for financial assets reclassified to loans and receivables and held-to-maturity categories are determined at the
reclassification date. Further increases in estimates of cash flows adjust effective interest rates prospectively.
On reclassification of a financial asset out of the ‘at fair value through profit or loss’ category, all embedded derivatives are re-
assessed and, if necessary, separately accounted for.
The Group makes transfers between levels of fair value hierarchy when reliable market information becomes available (such as
an active market or observable market input) to the Group. This transfer is done on the date in which the market information
becomes available.
2015
AN
NU
AL
REP
OR
T A
ND
AC
CO
UN
TS
77
SIGNIFICANT ACCOUNTING POLICIES (continued)
3. Significant accounting policies (continued)(I) CASH AND BANK BALANCES
Cash and bank balances include notes and coins on hand, unrestricted balances held with central banks and highly liquid financial
assets with original maturities of less than three months, which are subject to insignificant risk of changes in their fair value, and are
used by the Group in the management of its short-term commitments.
Cash and bank balances are carried at amortised cost in the statement of financial position.
(J) TRADING ASSETS
Trading assets are those assets that the Group acquires principally for the purpose of selling in the near term, or holds as part of a
portfolio that is managed together for short-term profit or position taking.
Trading assets are measured at fair value with changes in fair value recognised as part of net trading and foreign exchange income in
profit or loss.
(K) DERIVATIVE FINANCIAL INSTRUMENTS
Derivatives are initially recognised at fair value on the date on which a derivative contract is entered into and are subsequently
remeasured at their fair value. Fair values are obtained from quoted market prices in active markets, including recent market
transactions, and valuation techniques. All derivatives are carried as assets when fair value is positive and as liabilities when fair value
is negative.
Certain derivatives embedded in other financial instruments are treated as separate derivatives when their economic characteristics
and risks are not closely related to those of the host contract and the host contract is not carried at fair value through profit or loss.
These embedded derivatives are separately accounted for at fair value with changes in fair value recognised in the income statement
unless the Group chooses to designate the hybrid contracts at fair value through profit or loss.
(L) PROPERTY AND EQUIPMENT
(i) Recognition and measurement
Items of property and equipment are carried at cost less accumulated depreciation and impairment losses. Cost includes
expenditures that are directly attributable to the acquisition of the asset. When parts of an item of property and equipment
have different useful lives, they are accounted for as separate items (major components) of property and equipment.
(ii) Subsequent costs
The cost of replacing part of an item of property and equipment is recognised in the carrying amount of the item if it is probable
that the future economic benefits embodied within the part will flow to the Group and its cost can be measured reliably. The
costs of the day-to-day servicing of property and equipment are recognised in profit or loss as incurred.
(iii) Depreciation
Depreciation is recognised in profit or loss on a straight-line basis over the estimated useful lives of each part of an item of
property and equipment since this most closely reflects the expected pattern of consumption of the future economic benefits
embodied in the asset. Leased assets are depreciated over the shorter of the lease term and their useful lives. Depreciation
begins when an asset is available for use and ceases at the earlier of the date that the asset is derecognised or classified as held
for sale in accordance with IFRS 5 Non-current Assets Held for Sale and Discontinued Operations.
The estimated useful lives for the current and comparative period are as follows:
Leasehold improvements Over the shorter of the useful life of item or lease period
Buildings 50 years
Computer hardware 5 years
Furniture and fittings 5 years
Equipment 5 years
Motor vehicles 5 years
Other transportation equipment* Between 10 and 20 years
Capital work in progress Not depreciated
Land Not depreciated
* Other transportation equipment includes major components with different useful lives. They are accounted for as separate major components and are
depreciated over the respective useful lives.
78
SIGNIFICANT ACCOUNTING POLICIES (continued)
3. Significant accounting policies (continued)(L) PROPERTY AND EQUIPMENT (continued)
(iii) Depreciation (continued)
Computer hardware, equipments, furniture and fittings are disclosed as furniture and office equipment while leasehold
improvement and buildings have been aggregated in the notes.
Work in progress represents costs incurred on assets that are not available for use. On becoming available for use, the related
amounts are transferred to the appropriate category of property and equipment.
Depreciation methods, useful lives and residual values are reassessed at each reporting date and adjusted if appropriate.
(iv) De-recognition
An item of property and equipment is derecognised on disposal or when no future economic benefits are expected from its
use or disposal. Any gain or loss arising on de-recognition of the asset (calculated as the difference between the net disposal
proceeds and the carrying amount of the asset) is included in profit or loss in the year the asset is derecognised.
(M) INTANGIBLE ASSETS
(i) Goodwill
Goodwill represents the excess of consideration over the Group’s interest in net fair value of net identifiable assets, liabilities
and contingent liabilities of the acquired subsidiaries at the date of acquisition. When the excess is negative, it is recognised
immediately in profit or loss. Goodwill is measured at cost less accumulated impairment losses.
Subsequent measurement
Goodwill is allocated to cash-generating units or groups of cash-generating units for the purpose of impairment testing. The
allocation is made to those cash-generating units or groups of cash-generating units that are expected to benefit from the
business combination in which the goodwill arose. Goodwill is tested annually as well as whenever a trigger event has been
observed for impairment by comparing the present value of the expected future cashflows from a cash generating unit with the
carrying value of its net assets, including attributable goodwill. Impairment losses on goodwill are not reversed.
(ii) Software
Software acquired by the Group is stated at cost less accumulated amortisation and accumulated impairment losses.
Expenditure on internally developed software is recognised as an asset when the Group is able to demonstrate its intention and
ability to complete the development and use the software in a manner that will generate future economic benefits, and can
reliably measure the costs to complete the development. The capitalised costs of internally developed software include all costs
directly attributable to developing the software, and are amortised over its useful life. Internally developed software is stated at
capitalised cost less accumulated amortisation and impairment.
Subsequent expenditure on software assets is capitalised only when it increases the future economic benefits embodied in the
specific asset to which it relates. All other expenditure is expensed as incurred.
Amortisation is recognised in profit or loss on a straight-line basis over the estimated useful life not exceeding five years, from
the date that it is available for use. The amortisation method and useful life of software are reassessed at each financial year end
and adjusted if appropriate.
(N) REPOSSESSED COLLATERAL
Repossessed collateral represents financial and non-financial assets acquired by the Group in settlement of overdue loans. The
assets are initially recognised at fair value when acquired and included in the relevant assets depending on the nature and the
Group’s intention in respect of recovery of these assets, and are subsequently remeasured and accounted for in accordance with
the accounting policies for these categories of assets. Where repossessed collateral results in acquiring control over a business, the
business combination is accounted for using the acquisition method of accounting with fair value of the settled loan representing
the cost of acquisition (refer to the accounting policy for consolidation). Accounting policy for associates is applied to repossessed
shares where the Group obtains significant influence, but not control. The cost of the associate is the fair value of the loan settled by
repossessing the pledged shares.
2015
AN
NU
AL
REP
OR
T A
ND
AC
CO
UN
TS
79
SIGNIFICANT ACCOUNTING POLICIES (continued)
3. Significant accounting policies (continued)(O) DEPOSITS AND DEBT SECURITIES ISSUED
When the Group sells a financial asset and simultaneously enters into a “repo” or “stock lending” agreement to repurchase the asset (or
a similar asset) at a fixed price on a future date, the arrangement is accounted for as a deposit, and the underlying asset continues to
be recognised in the Group’s financial statements.
The Group classifies capital instruments as financial liabilities or equity instruments in accordance with the substance of the contractual
terms of the instrument.
Deposits are initially measured at fair value plus transaction costs, and subsequently measured at their amortised cost using the
effective interest method, except where the Group chooses to carry the liabilities at fair value through profit or loss.
(P) PROVISIONS
A provision is recognised if, as a result of a past event, the Group has a present legal or constructive obligation that can be estimated
reliably, and it is probable that an outflow of economic benefits will be required to settle the obligation. Provisions are determined by
discounting the expected future cash flows at a pre-tax rate that reflects current market assessments of the time value of money and,
where appropriate, the risks specific to the liability.
A provision for restructuring is recognised when the Group has approved a detailed and formal restructuring plan, and the restructuring
either has commenced or has been announced publicly. Future operating costs are not provided for.
A provision for onerous contracts is recognised when the expected benefits to be derived by the Group from a contract are lower than
the unavoidable cost of meeting its obligations under the contract. The provision is measured at the present value of the lower of the
expected cost of terminating the contract and the expected net cost of continuing with the contract. Before a provision is established,
the Group recognises any impairment loss on the assets associated with that contract.
(Q) FINANCIAL GUARANTEE CONTRACTS
Financial guarantee contracts are contracts that require the Group (issuer) to make specified payments to reimburse the holder for a
loss it incurs because a specified debtor fails to make payment when due in accordance with the original or modified terms of a debt
instrument.
Financial guarantee liabilities are initially recognised at their fair value, which is the premium received, and then amortised over the
life of the financial guarantee. Subsequent to initial recognition, the financial guarantee liability is measured at the higher of the
present value of any expected payment, when a payment under the guarantee has become probable, and the unamortised premium.
Financial guarantees are included within Other Liabilities.
(R) EMPLOYEE BENEFITS
Post-employment benefits
Defined contribution plans The Group operates defined contribution pension scheme. A defined contribution plan is a pension plan under which the Group
makes fixed contributions on contractual basis. The group has no legal or constructive obligations to pay further contributions if the
fund does not hold sufficient assets to pay all employees the benefits relating to employee service in the current and prior periods.
Obligations for contributions to defined contribution plans are recognised as an expense in profit or loss when they are due.”
Termination benefits
The Group recognises termination benefits as an expense when the Group is demonstrably committed , without realistic possibility
of withdrawal, to a formal detailed plan to either terminate employment before the normal retirement date, or to provide termination
benefits as a result of an offer made to encourage voluntary redundancy. The Group settles termination benefits within 12 months and
are accounted for as short-term benefits.
Short term employee benefits
Short-term employee benefit obligations are measured on an undiscounted basis and are expensed as the related service is provided.
A liability is recognised for the amount expected to be paid under short-term employee benefits if the Group has a present legal or
constructive obligation to pay this amount as a result of past service provided by the employee and the obligation can be estimated
reliably.
80
SIGNIFICANT ACCOUNTING POLICIES (continued)
3. Significant accounting policies (continued)(S) SHARE CAPITAL AND RESERVES
(i) Share issue costs
Incremental costs directly attributable to the issue of an equity instrument are deducted from the initial measurement of the
equity instruments.
(ii) Dividend on ordinary shares
Dividends on the Bank’s ordinary shares are recognised in equity in the period in which they are paid or, if earlier, approved by
the Bank’s shareholders.
(T) EARNINGS PER SHARE
The Group presents basic earnings per share (EPS) data for its ordinary shares. Basic EPS is calculated by dividing the profit or loss
attributable to ordinary shareholders of the Bank by the weighted average number of ordinary shares outstanding during the period.
Diluted EPS is determined by adjusting the profit or loss attributable to ordinary shareholders and the weighted average number of
ordinary shares outstanding for the effects of all dilutive potential ordinary shares.
(U) FIDUCIARY ACTIVITIES
The Group commonly acts as trustees in other fiduciary capacities that result in the holding or placing of assets on behalf of individuals,
trusts, retirement benefit plans and other institutions. These assets and incomes arising thereon are excluded from these financial
statements, as they are not assets of the Group.
(V) SEGMENT REPORTING
An operating segment is a component of the Group that engages in business activities from which it may earn revenues and incur
expenses, including revenues and expenses that relate to transactions with any of the Group’s other components, whose operating
results are reviewed regularly by the Chief Executive Officer of the Group, being the chief operating decision maker, to make decisions
about resources allocated to each segment and assess its performance, and for which discrete financial information is available. All
costs that are directly traceable to the operating segments are allocated to the segment concerned, while indirect costs are allocated
based on the benefits derived from such cost.
(W) NEW STANDARDS, INTERPRETATIONS AND AMENDMENTS
The Group has not early adopted any standard, interpretation or amendment that has been issued but is not yet effective. The
following amendments to existing standards became effective in 2015.
(i) Amendments to IAS 19 Defined Benefit Plans: Employee Contributions
IAS 19 requires an entity to consider contributions from employees or third parties when accounting for defined benefit plans.
Where the contributions are linked to service, they should be attributed to periods of service as a negative benefit. These
amendments clarify that, if the amount of the contributions is independent of the number of years of service, an entity is
permitted to recognise such contributions as a reduction in the service cost in the period in which the service is rendered,
instead of allocating the contributions to the periods of service. This amendment is effective for annual periods beginning on or
after 1 July 2014. This amendment is not relevant to the Group, since none of the entities within the Group has defined benefit
plans with contributions from employees or third parties.
(ii) Amendments to IAS 16 Property, Plant and Equipment and IAS 38 Intangible assets
The amendment is applied retrospectively and clarifies in IAS 16 and IAS 38 that the asset may be revalued by reference to
observable data by either adjusting the gross carrying amount of the asset to market value or by determining the market value
of the carrying value and adjusting the gross carrying amount proportionately so that the resulting carrying amount equals
the market value. In addition, the accumulated depreciation or amortisation is the difference between the gross and carrying
amounts of the asset. The Group measures Property, Plant and Equipment and Intangible assets using the cost model and as
such did not record any revaluation adjustments during the current year.
(iii) IAS 24 Related Party Disclosures
The amendment is applied retrospectively and clarifies that a management entity (an entity that provides key management
personnel services) is a related party subject to the related party disclosures. In addition, an entity that uses a management
entity is required to disclose the expenses incurred for management services. This amendment is not relevant for the Group as
it does not receive any management services from other entities.
2015
AN
NU
AL
REP
OR
T A
ND
AC
CO
UN
TS
81
SIGNIFICANT ACCOUNTING POLICIES (continued)
3. Significant accounting policies (continued)(X) NEW STANDARDS AND INTERPRETATIONS NOT YET ADOPTED
A number of new standards and amendments to standards are effective for annual periods beginning after 1 January 2015. The Group
has not applied the following new or amended standards in preparing these consolidated and separate financial statements. The
Group plans to adopt these standards at their respective effective dates.
(i) IFRS 9 Financial Instruments
IFRS 9, published in July 2014, replaces the existing guidance in IAS 39 Financial Instruments: Recognition and Measurement.
IFRS 9 includes revised guidance on the classification and measurement of financial instruments, including a new expected
credit loss model for calculating impairment on financial assets, and the new general hedge accounting requirements. It also
carries forward the guidance on recognition and derecognition of financial instruments from IAS 39. IFRS 9 is effective for annual
reporting periods beginning on or after 1 January 2018, with early adoption permitted.
The Group is assessing the potential impact on its consolidated financial statements resulting from the application of IFRS
9. Given the nature of the Group’s operations, this standard is expected to have a pervasive impact on the Group’s financial
statements. In particular, calculation of impairment of financial instruments on an expected credit loss basis is expected to result
in an increase in the overall level of impairment allowances.
(ii) IFRS 15 Revenue from Contracts with Customers
IFRS 15 establishes a comprehensive framework for determining whether, how much and when revenue is recognised. It
replaces existing revenue recognition guidance including IAS 18 Revenue, IAS 11 Construction Contracts and IFRIC 13 Customer
Loyalty Programmes. IFRS 15 is effective for annual reporting periods beginning on or after 1 January 2017, with early adoption
permitted.
The Group is assessing the potential impact on its consolidated financial statements resulting from the application of IFRS 15.
(iii) Equity Method in Separate Financial Statements (Amendments to IAS 27)
The amendments allow an entity to account for investments in subsidiaries, joint ventures and associates in its separate financial
statements either at cost, or in accordance with IFRS 9 Financial Instruments (or IAS 39 Financial Instruments Recognition and
Measurement for entities that have not yet adopted IFRS 9), or using the equity method as described in IAS 28 Investments in
Associates and Joint Ventures. The election can be made independently for each category of investment (subsidiaries, joint
ventures and associates). The amendments also clarify that when a parent ceases to be an investment entity, or becomes
an investment entity, it shall account for the change from the date when the change in status occurred. The amendment
is effective for annual periods beginning on or after 1 January 2016. Entities wishing to change to the equity method must
do so retrospectively. The Group is assessing the potential impact on its consolidated financial statements resulting from the
application of this amendment.
(iv) Disclosure Initiatives (Amendments to IAS 1)
The amendments provide additional guidance on the application of materiality and aggregation when preparing financial
statements. The amendment is effective for annual periods beginning on or after 1 January 2016. The Group is assessing the
potential impact on its consolidated financial statements resulting from the application of this amendment.
(v) Clarification of Acceptable Methods of Depreciation and Amortisation (Amendments to IAS 16
and IAS 38)
This amendment clarifies that the use of revenue based methods to calculate depreciation or amortisation of assets is not
appropriate because revenue generated by an activity that includes the use of an asset generally reflects factors other than the
consumption of the economic benefits embodied in the asset. The IASB has amended IAS 16 Property, Plant and Equipment to
clarify that a revenue based method should not be used to calculate the depreciation of items of property, plant and equipment.
The amendment is effective for annual periods beginning on or after 1 January 2016.
82
SIGNIFICANT ACCOUNTING POLICIES (continued)
3. Significant accounting policies (continued)(X) NEW STANDARDS AND INTERPRETATIONS NOT YET ADOPTED (continued)
(v) Clarification of Acceptable Methods of Depreciation and Amortisation (Amendments to IAS 16
and IAS 38) (continued)
IAS 38 Intangible Assets now includes a rebuttable presumption that the amortisation of intangible assets based on revenue is
inappropriate. This presumption can be overcome if either:
The intangible asset is expressed as a measure of revenue (i.e where a measure of revenue is the limiting factor on the value
that can be derived from the asset).
It can be shown that revenue and the consumption of economic benefits generated by the asset are highly correlated.
This amendment is not expected to have any impact on the Group as the Group does not apply revenue based methods to
calculate depreciation or amortisation of assets.
The following new or amended standards are not expected to have a significant impact on the Group’s consolidated and
separate financial statements.
(i) IFRS 14 Regulatory Deferral Accounts
IFRS 14 is designed as a limited scope Standard to provide an interim, short-term solution for rate-regulated entities that
have not yet adopted International Financial Reporting Standards (IFRS). Its purpose is to allow rate-regulated entities
adopting IFRS for the first time to avoid changes in accounting policies in respect of regulatory deferral accounts until such
time as the International Accounting Standards Board (IASB) can complete its comprehensive project on rate regulated
activities. The amendment is effective for annual periods beginning on or after 1 January 2016.
(ii) Accounting for acquisition of interests in joint operations (Amendments to IFRS 11)
The amendments state that:
Where a joint operator acquires an interest in a joint operation in which the activity of the joint operation constitutes
a business, it must apply all of the principles on business combinations accounting as set out in IFRS 3 Business
Combinations, and other standards.
In addition, the joint operator must disclose the information required by IFRS 3 and other IFRSs for business combinations.
The amendment is effective for annual periods beginning on or after 1 January 2016.
2015
AN
NU
AL
REP
OR
T A
ND
AC
CO
UN
TS
83
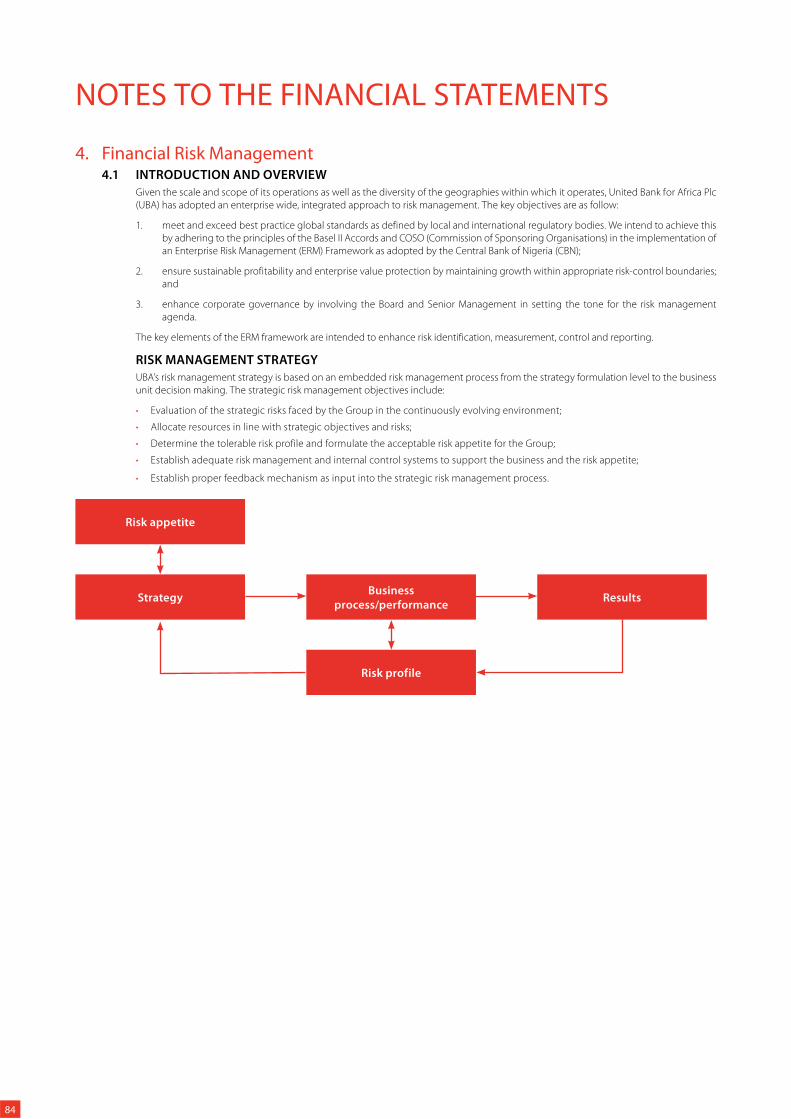
NOTES TO THE FINANCIAL STATEMENTS
4. Financial Risk Management4.1 INTRODUCTION AND OVERVIEW
Given the scale and scope of its operations as well as the diversity of the geographies within which it operates, United Bank for Africa Plc
(UBA) has adopted an enterprise wide, integrated approach to risk management. The key objectives are as follow:
1. meet and exceed best practice global standards as defined by local and international regulatory bodies. We intend to achieve this
by adhering to the principles of the Basel II Accords and COSO (Commission of Sponsoring Organisations) in the implementation of
an Enterprise Risk Management (ERM) Framework as adopted by the Central Bank of Nigeria (CBN);
2. ensure sustainable profitability and enterprise value protection by maintaining growth within appropriate risk-control boundaries;
and
3. enhance corporate governance by involving the Board and Senior Management in setting the tone for the risk management
agenda.
The key elements of the ERM framework are intended to enhance risk identification, measurement, control and reporting.
RISK MANAGEMENT STRATEGY
UBA’s risk management strategy is based on an embedded risk management process from the strategy formulation level to the business
unit decision making. The strategic risk management objectives include:
Evaluation of the strategic risks faced by the Group in the continuously evolving environment;
Allocate resources in line with strategic objectives and risks;
Determine the tolerable risk profile and formulate the acceptable risk appetite for the Group;
Establish adequate risk management and internal control systems to support the business and the risk appetite;
Establish proper feedback mechanism as input into the strategic risk management process.
Strategy
Risk appetite
Business
process/performance
Risk profile
Results
84
NOTES TO THE FINANCIAL STATEMENTS (continued)
RISK MANAGEMENT CULTURE
There is a commitment to ensuring that risk management is enshrined as a culture in the Group, from the Board of Directors to the
individual business unit. There is considerable effort to infuse the risk/reward evaluation in the decision making process in order to
ensure that there is proper assessment of risk dimension in process design, performance appraisal, limit establishment, portfolio creation,
monitoring activities and audit process. The aim is also to encourage a culture of constant re-evaluation of risk profile and prompt risk
mitigation action, where required.
In order to do this, there is proper dissemination of information and policies, development of frameworks, and staff training to ensure
that all staff is adequately aware of their roles in the risk management process of the Group. As part of the risk culture, we aim to ensure
the following:
General understanding and uniform application of risk management principles;
Strong and visible commitment from senior management;
Clearly defined responsibility and accountability;
Central oversight of risk management across the enterprise;
Central oversight of corporate governance across the enterprise;
Ownership of risk management is at all levels;
Clearly defined risk appetite.
RISK GOVERNANCE STRUCTURES
The Board of Directors has overall responsibility for risk management of the institution. They have delegated specific functional roles to
key sub-committees of the Board including the Board Risk Management Committee (BRMC), the Board Credit Committee (BCC), and the
Board Audit Committee (BAC).
These Board Committees are supported by various management committees in identifying and providing appropriate responses to risks
arising from the Group’s ongoing business activities. We have the Group Managing Director/Chief Executive Officer (GMD/CEO) and the
executive committees which include the Group Assets and Liabilities Committee (GALCO), Executive Management Committee (EMC) and
Executive Credit Committee (ECC).
This is illustrated below.
Well defined objectives and guiding
principles
A robust Group Corporate Governance Code with clearly defined objectives and guiding
principles
Full Board Committees in place Board Committees fully functional
Independent and Balanced
representation on the board
Highly experienced directors appointed in accordance with regulation; Board composed of
Executive, Non-executive and Independent directors. Directors’ performance assessed regularly.
Board members committed to
highest business ethics
Includes Global players renowned for high ethical standards
Sound and effective system of
internal control and audit
Corporate Audit, Control and Compliance – assures financial statement integrity, reviews control
environment, ensures compliance with policies and regulations
Risk management oversight over
subsidiaries and foreign branches
Sets broad policy matters for the Group
Appropriate policies and procedures in place for subsidiaries and foreign branches.
Subsidiaries/SBUs responsible for risk management in their respective offices
Heads of subsidiaries duly empowered with set Limits from Head office.
Management of conflicts of interest Timely disclosure of any conflict of interest concerning Board members and management
Management of related party transactions
Cordial Board and Stakeholder
Relationships
Excellent relationships with employees, shareholders, community, government and regulators,
customers and suppliers
2015
AN
NU
AL
REP
OR
T A
ND
AC
CO
UN
TS
85
NOTES TO THE FINANCIAL STATEMENTS (continued)
4. Financial Risk Management (continued)4.2 RISK MANAGEMENT REPORT
(a) Enterprise risk overview
Roles and responsibilities
The key players in the risk management framework are as indicated in the above governance structure and their responsibilities are
as follows:
Board of Directors
The ultimate responsibility for risk management in UBA lies with the Board of Directors. The roles and responsibilities of the Board
with respect to risk management include, but are not limited to:
ensuring an appropriate corporate governance framework is developed and operated;
providing guidelines regarding the management of risk elements in the Group;
approving Group risk management policies;
determination of the Group’s risk appetite;
ensuring that management controls and reporting procedures are satisfactory and reliable;
approving large credit exposures beyond the limit of the Board Credit Committee;
approving capital demand plans based on risk budgets.
The Board of Directors has established various Board-level risk committees, to support its risk oversight roles and responsibilities.
These committees review and advise on numerous risk matters requiring Board approvals.
The Board Risk Management Committee has direct oversight for the Bank’s overall risk management framework. The Board Credit
Committee considers and approves large exposure underwriting decisions within its authority and recommends those above its
limit to the Board for consideration. The Board Audit Committee assists the Board with regard to internal controls, audit assessments
and compliance matters.
A list of various Board Committees and their assigned responsibilities is contained in the corporate governance report.
Management Committees
Key Management Committees include:
Executive Management Committee (EMC)
The EMC is responsible for the following, among others, and shall be accountable to the Board:
executing strategy once approved by the Board;
overall performance of the Group;
managing the Group’s risks;
day-to-day oversight for the Group.
“All non-credit product approvals must go to the EMC which shall review and approve or recommend for approval to the
appropriate Board Committees in line with the Bank’s advised Approval Limits. Above the EMC approval limits, Non-credit products
are approved by the Board’s Finance and General Purpose Committee (F&GPC).
All new business activity irrespective of capital commitment must be approved by the F&GPC through the EMC.”
Executive Credit Committee (ECC)
“The Committee’s main objective is to develop and maintain a sound credit risk portfolio for the Group and to oversee the
development and deployment of credit risk practices across the Group.
Its principal activities and functions are:-
Set frameworks and guidelines for credit risk management for the Group:
Review and recommend all Credit related policies for the Group to the BCC for approval;
Monitor implementation and compliance with credit policy paying particular attention to the following:
Credit concentration;
Credit portfolio quality;
Review credit requests and recommend those above its limit to BCC for approval;
Ensure the Group’s non-performing loans portfolio is within the acceptable ratio;
Review all major credit audit issues with a view to adopting learning points for enhancement to the credit process;
86
NOTES TO THE FINANCIAL STATEMENTS (continued)
Group Asset and Liability Committee
The Group Asset and Liability Committee (GALCO), is a sub-committee of the EMC that has responsibility for managing UBA Group’s
balance sheet. This committee manages traded and non-traded market risks as well as steering the implementation of Basel II
requirements for market risk.
In playing this role, GALCO does the following:
recommend balance sheet management policies, frameworks and procedures to the Board Risk Management Committee
through EMC for approval;
recommend Treasury policies, frameworks and procedures to the F&GPC through EMC for approval;
manage the Group’s balance sheet and ensure compliance with regulatory and statutory ratios and requirements;
develop an optimal structure of the Group’s balance sheet to optimise risk-reward through a review of:
liquidity Gap Analysis;
maximum Cumulative Outflow (MCO);
stress Test;
wholesale Borrowing Guidelines;
contingency Liquidity Plan.
review Liquidity, Interest Rate and Currency Risks and approve risk mitigation proposals subject to ratification by EMC;
set pricing strategies for the Group on assets and liabilities (pool rate, asset and/or liability composition) subject to ratification
by EMC.
Criticised Assets Committee
The Criticised Assets Committee is a management committee which reviews Past Due Obligations (PDOs) and
Develops the framework to reduce the Group’s portfolio of credits on watch-list as well as delinquent accounts”
Monitor implementation of strategies developed for recoveries and reduction of loan delinquencies
Ratifies proposed classification of accounts and provisioning levels
Recommends write-offs for approval through the EMC to the Board
Group Chief Risk Officer
The Group Chief Risk Officer has oversight for the effective and efficient governance of all risk functions in the Group. He is
responsible for development and implementation of Group’s risk management frameworks, policies and processes across the
entire risk spectrum.
Central Risk Management Functions
Each risk function including Credit, Market, Operational and IT Risk has direct responsibility for the development and management
of risk management activities. The responsibilities of divisional functions with respect to risk include:
develop and maintain policies, frameworks and risk management methodologies;
provide guidance on the management of risks and ensure implementation of risk policies and strategies;
provide recommendations for improvement of risk management;
provide consolidated risk reports to the various Board and management committees such as EMC, ECC and/or Board of Directors;
provide assurance that risk management policies and strategies are operating effectively to achieve the Group’s business
objectives.
At a strategic level, our risk management objectives are as follows:
to identify, assess, control, report and manage the Group’s material risks and optimise risk/return decisions;
to ensure business growth plans are properly supported by effective risk infrastructure;
to manage the risk profile to ensure that specific financial deliverables remain possible under a range of adverse business
conditions.
The committees, responsibilities, processes and controls are replicated at the subsidiary levels to ensure standardisation group-
wide.
In pursuit of its risk management objectives, policies and standards are set for each risk type, adopting a standard methodology
consisting of five risk steps as illustrated overleaf.
2015
AN
NU
AL
REP
OR
T A
ND
AC
CO
UN
TS
87
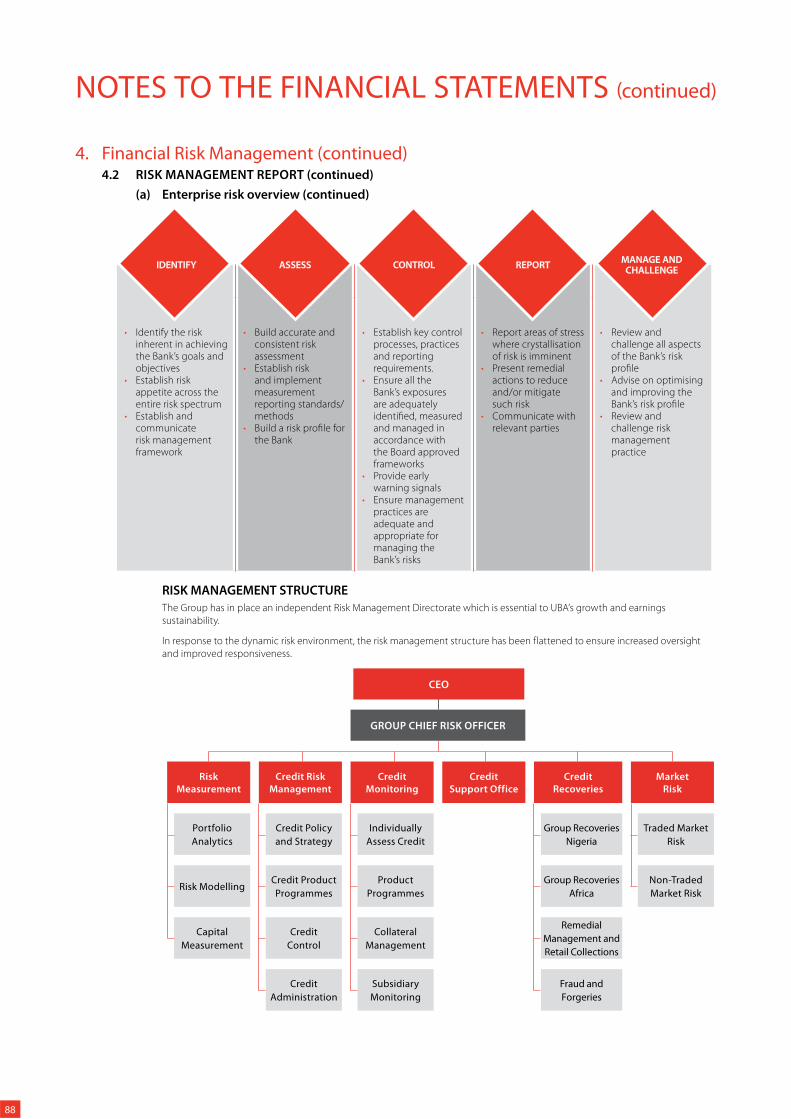
NOTES TO THE FINANCIAL STATEMENTS (continued)
4. Financial Risk Management (continued)4.2 RISK MANAGEMENT REPORT (continued)
(a) Enterprise risk overview (continued)
Identify the risk inherent in achieving the Bank’s goals and objectivesEstablish risk appetite across the entire risk spectrumEstablish and communicate risk management framework
Build accurate and consistent risk assessmentEstablish risk and implement measurement reporting standards/methodsBuild a risk profile for the Bank
Establish key control processes, practices and reporting requirements.Ensure all the Bank’s exposures are adequately identified, measured and managed in accordance with the Board approved frameworksProvide early warning signalsEnsure management practices are adequate and appropriate for managing the Bank’s risks
Report areas of stress where crystallisation of risk is imminentPresent remedial actions to reduce and/or mitigate such riskCommunicate with relevant parties
Review and challenge all aspects of the Bank’s risk profileAdvise on optimising and improving the Bank’s risk profileReview and challenge risk management practice
IDENTIFY ASSESS CONTROL REPORTMANAGE AND
CHALLENGE
RISK MANAGEMENT STRUCTURE
The Group has in place an independent Risk Management Directorate which is essential to UBA’s growth and earnings
sustainability.
In response to the dynamic risk environment, the risk management structure has been flattened to ensure increased oversight
and improved responsiveness.
GROUP CHIEF RISK OFFICER
Credit
Monitoring
Individually
Assess Credit
Product
Programmes
Collateral
Management
Subsidiary
Monitoring
Credit
Support Office
Credit
Recoveries
Group Recoveries
Nigeria
Group Recoveries
Africa
Remedial
Management and
Retail Collections
Fraud and
Forgeries
Market
Risk
Traded Market
Risk
Non-Traded
Market Risk
Credit Risk
Management
Credit Policy
and Strategy
Credit Product
Programmes
Credit
Control
Credit
Administration
Risk
Measurement
Portfolio
Analytics
Risk Modelling
Capital
Measurement
CEO
88
NOTES TO THE FINANCIAL STATEMENTS (continued)
The key functional areas and their responsibilities are highlighted below:
Credit Support Office
The Credit Office has responsibility for credit underwriting and makes recommendations to the appropriate authority level for
approval of assessed Corporate, Commercial, Public Sector and Retail Credits as spelt out in the Credit Empowerment/Approval
Framework.
Credit Risk Management (CRM)
The Credit Risk Management division acts as the custodian of Group credit policies and recommends reviews based on regulatory
changes and other developments in the operating environment. It develops and implements the Group credit risk management
framework, as well as a portfolio management strategy towards achieving a diversified, high quality asset mix to minimise
delinquencies.
In addition, CRM ensures appropriate control measures are taken in the documentation and administration of approved loans.
Credit Monitoring
Credit monitoring runs as a separate group of risk management to improve oversight of loan performance. Its primary function is
to continuously monitor the bank’s loan portfolio to ensure ongoing portfolio performance and achievement of portfolio quality
targets. Credit Monitoring ensures all loans are booked in line with the bank’s policy. They also identify exceptions which may
prevent the loan from being paid in a timely manner. Observed Credit exceptions are escalated for possible resolution, sanction
implementation and management attention. The Group takes proactive steps to ensure follow up on accounts showing signs of
delinquency.
Market Risk
This is the risk that the value of our portfolio, either an investment portfolio or a trading portfolio, will decrease due to the change
in value of the market risk factors and affect the Group’s income or the value of its holdings of financial instruments. Exposure to
market risk is separated into two portfolios:
trading portfolios comprise positions arising from market-making and warehousing of customer derived positions.
non-trading portfolios comprise positions that primarily arise from the interest rate management of our retail and commercial
banking assets and liabilities, financial investments designated as available for sale and held to maturity.
The objective of market risk management in UBA is to ensure that all significant market risks are identified, measured, and managed
in a consistent and effective manner across the Group in order to stabilise earnings and capital and also to ensure that the Group
carries out its affairs within acceptable parameters and in line with the market risk appetite.
Market risk achieves the above stated objective, through a mix of quantitative and statistical controls which covers the underlisted
activities:
market data collection and statistical analysis;
limit determination based on market volatility;
stop loss limit utilisation monitoring;
position monitoring;
new trading products risk assessment;
P&L attribution analysis;
pricing model validation and sign off;
trading portfolio stress testing;
regulatory limit monitoring;
position data extraction and Internal limit monitoring;
contingency funding plan maintenance and testing;
risk profile reporting to GALCO.
The universal market risk factors in UBA Group are foreign exchange rates, interest rates and equity/stock prices. The associated
market risks are:
foreign currency risk; arising from changes in exchange rates;
interest rate risk; arising from changes in yield curves and credit spreads;
equity risk; arising from changes in the prices of equities, equity indices and equity baskets.
2015
AN
NU
AL
REP
OR
T A
ND
AC
CO
UN
TS
89

NOTES TO THE FINANCIAL STATEMENTS (continued)
4. Financial Risk Management (continued)4.2 RISK MANAGEMENT REPORT (continued)
(a) Enterprise risk overview (continued)
RISK MANAGEMENT POLICIES
The principal risk policies cover the Group’s main risk types, assigning responsibility for the management of specific risks and
setting out requirements for control frameworks for all risk types. Fundamental to the delivery of the Group’s risk management
objectives are a series of methodologies that allow it to measure, model, price, stress-test, mitigate and report the risks that arise
from its activities.
Risk Appetite
A key responsibility of the Board is the determination of the organisation’s risk appetite. This is codified in a Risk Appetite framework
which considers the level of risk that the Group is willing to take in pursuit of its business objectives. This is expressed as the Group’s
appetite for earnings volatility across all businesses from a credit, marketing and operational risk perspective.
Risk appetite is institutionalised by establishing scale of activities through clearly defined target market criteria, product risk
acceptance criteria, portfolio limits as well as risk-return requirements.
Approval Authority
The Board of Directors also set internal approval limits which are reviewed from time to time as the circumstances of the Group
demands. These are at all times guided by maximum regulatory limit as applicable.
Limit Concentration
The Group applies a concentration risk management framework that sets exposure limits as a function of capital across all dimensions
of its asset portfolio including geography, sector, obligor, product, etc. This is closely monitored to ensure diversification of risk.
The Group has a Credit Concentration Risk Management policy (policy) which provides a framework within which lending decisions
can be made so as to ensure an adequate level of diversification of the group’s credit portfolio. The policy provides risk-based limits
that restrict lending activities to within the Group’s desired risk appetite and tolerance.
The Group ensures that:
it manages its portfolio by ensuring adequate diversification across industries, segments and jurisdictions to maintain high
portfolio quality and liquidity;
provides risk based concentration limits to ensure that exposures to single obligors, sectors and countries are contained within
acceptable risk appetite.
The Group considers the following risk types among others which are assessed, monitored and managed in terms of the Group’s
risk management framework.
Credit risk
This relates to the probability that the Group may suffer financial loss where any of its corporate borrowers or other counterparties
fail to perform on their payment, guarantee and/or other obligations as contracted.
Market risk
This is the risk that the value of our portfolio, either an investment portfolio or a trading portfolio, will decrease due to the change
in value of market risk factors and affect the Group’s income or the value of its holdings of financial instruments.
The objective of market risk management in UBA is to ensure that all significant market risks are identified, measured, and managed
in a consistent and effective manner across the Group in order to stabilise earnings and capital and also to ensure that the Group
carries out its affairs within acceptable parameters and in line with the market risk appetite.
Market risk governance
The Board through Board Risk Management Committee (BRMC) is responsible for the overall governance of market risk as well as
defining the terms of reference and delegating responsibilities to both the Group Risk Management Committee (GRMC) and Group
Asset and Liability Management Committee (GALCO). GALCO has Group oversight and is charged with ensuring that market risks
are managed homogeneously in all areas of operation. Further to the above, oversight of market risk is vested in BRMC, GALCO
and the Finance & General Purpose Committee (F& GPC) while the day to day management rests with the Group Chief Risk Officer
(GCRO). The Group Market Risk Division is not only responsible for the development of detailed risk management policies but is also
involved in the day to day review of their implementation. The market risk management policies are usually validated/approved by
BRMC, GALCO or the full Board in accordance with the approval guidelines. Trading limits are approved by GALCO while exposures
against these limits are monitored by market risk management team.
Market risk measurement
The Group uses limits, earnings-at-risk, gap analyses and scenario analyses to measure and control the market risk exposures within
its trading and banking books. The Group also performs regular stress tests on its banking and trading books.
90
NOTES TO THE FINANCIAL STATEMENTS (continued)
4. Financial Risk Management (continued)4.2 RISK MANAGEMENT REPORT (continued)
(a) Enterprise risk overview (continued)
Liquidity risk
This is the risk of loss in earnings and capital that arise from the Group’s inability to fund increases in assets or to meet its payment
obligations to its customers as they fall due or to replace funds when they are withdrawn or can only access these financial resources
at excessive cost.
The Group continued to meet all its financial commitments and obligations without any liquidity risk issues in the course of the year.
It is the Group’s policy to maintain adequate liquidity at all times, in all geographic locations and for all currencies, and hence to be
in a position to meet obligations as they fall due. Liquidity risks are managed both on a short-term and structural basis. The Group
Asset and Liability Committee (GALCO) is the responsible governing management body that monitors liquidity management
metrics. Liquidity in each country is managed by the country ALCO within pre-defined liquidity limits and in compliance with
Group liquidity policies and practices, as well as local regulatory requirements. Group Market Risk and Group Treasury propose and
oversee the implementation of policies and other controls relating to the above risks.
The Group manages its liquidity prudently in all geographical locations and for all currencies. The principal uncertainties for
liquidity risk are that customers withdraw their deposits at a substantially faster rate than expected, or that asset repayments are not
received on the expected maturity date. To mitigate these uncertainties, our funding base is diverse and largely customer-driven,
while customer assets are of short tenor. In addition we have contingency funding plans including a portfolio of liquid assets that
can be realised if a liquidity stress occurs, as well as ready access to wholesale funds under normal market conditions. We have
significant levels of marketable securities, including government securities that can be monetised or pledged as collateral in the
event of a liquidity stress
Contingency funding plans are reviewed and approved annually. They provides a broad set of Early Warning Indicators, an
escalation framework and a set of management actions that could be effectively implemented by the appropriate level of senior
management in the event of a liquidity stress. A similar plan is maintained within each country.
The Group’s liquidity risk measurement is approached from two angles; the development of cash flow projections and ratio
analysis. The Balance Sheet Management team uses a combination of both techniques to measure the Bank’s exposure to
liquidity risk.
The cash flow technique is applied through the use of maturity ladder by assessing all the bank’s cash inflows against outflows
to identify the potential for net shortfalls or net funding requirements (i.e. a cumulative net excess or deficit of funds) at selected
maturity dates. The maturity ladder is monitored on a day-to-day basis and stress testing is undertaken on a quarterly basis by
applying different scenarios to the maturity ladder and assessing the Bank’s funding requirements under each scenario.
All UBA businesses and subsidiaries also construct their maturity ladder and compile reports based on agreed assumptions which
are consolidated into a global report for Group ALCO review. The country treasurer for each subsidiary/Group Head Balance
Sheet Management also documents the appropriate actions and includes the same into the Contingency Funding Plan (CFP) for
implementation.
The Balance Sheet Management team uses liquidity ratios to quantify liquidity. Ratios are usually expressed as either a percentage
or an equivalent amount. Liquidity ratios are not interpreted on their own but in conjunction with the outcome of the maturity
ladder scenarios.
Country ALCO and Group ALCO control the Group’s exposure to liquidity risk by ensuring that limits are set and that Contingency
Funding Plans are in place across the Group and are based on realistic assumptions.
(b) Credit Risk
Credit Risk Measurement
In measuring credit risk of loans and advances to various counterparties, the Group considers the character and capacity of the
obligor to pay or meet contractual obligations, current exposures to the counter party/obligor and its likely future developments,
credit history of the counterparty/obligor; and the likely recovery ratio in case of default obligations-value of collateral and other
ways out. Our credit exposure comprises wholesale and retail loans and advances. The Group’s policy is to lend principally on the
basis of our customer’s repayment capacity through quantitative and qualitative evaluation. However, we strive to ensure that our
loans are backed by collateral to reflect the risk of the obligors and the nature of the facility.
In the estimation of credit risk, the Group estimates the following parameters:
(i) Probability of Default (PD)
(ii) Loss Given Default (LGD)
(iii) Exposure at Default
2015
AN
NU
AL
REP
OR
T A
ND
AC
CO
UN
TS
91
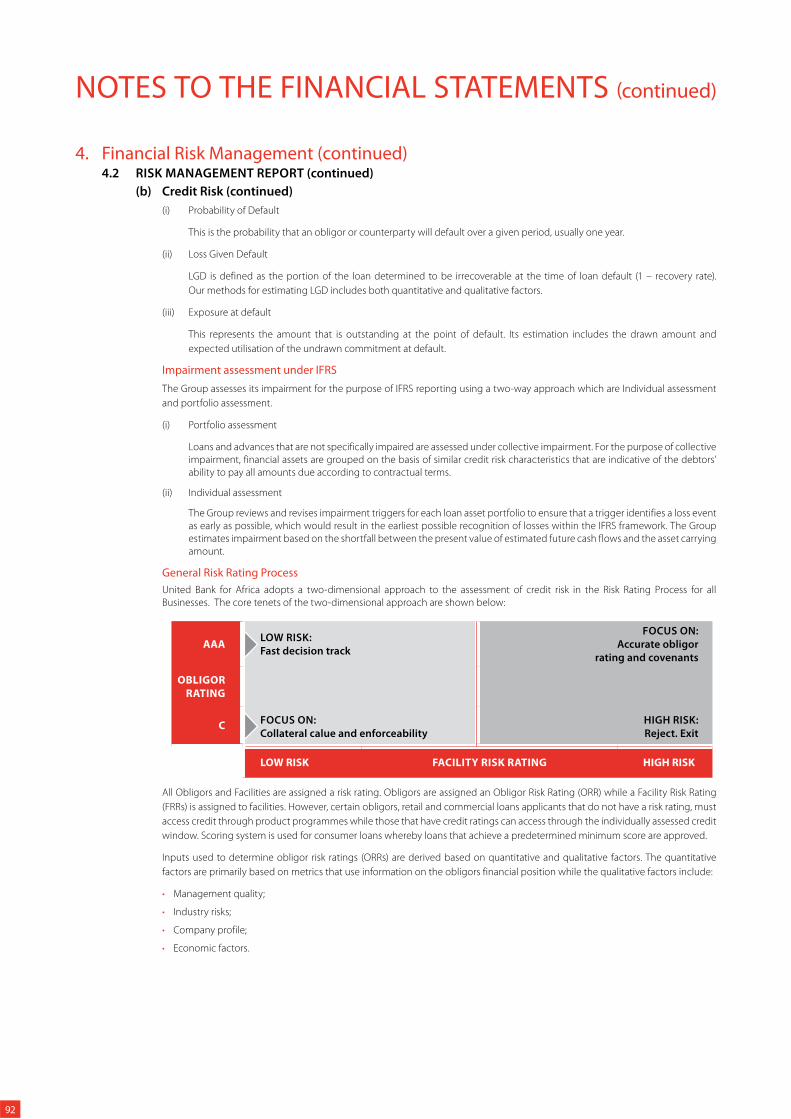
NOTES TO THE FINANCIAL STATEMENTS (continued)
4. Financial Risk Management (continued)4.2 RISK MANAGEMENT REPORT (continued)
(b) Credit Risk (continued)
(i) Probability of Default
This is the probability that an obligor or counterparty will default over a given period, usually one year.
(ii) Loss Given Default
LGD is defined as the portion of the loan determined to be irrecoverable at the time of loan default (1 – recovery rate).
Our methods for estimating LGD includes both quantitative and qualitative factors.
(iii) Exposure at default
This represents the amount that is outstanding at the point of default. Its estimation includes the drawn amount and
expected utilisation of the undrawn commitment at default.
Impairment assessment under IFRS
The Group assesses its impairment for the purpose of IFRS reporting using a two-way approach which are Individual assessment
and portfolio assessment.
(i) Portfolio assessment
Loans and advances that are not specifically impaired are assessed under collective impairment. For the purpose of collective
impairment, financial assets are grouped on the basis of similar credit risk characteristics that are indicative of the debtors’
ability to pay all amounts due according to contractual terms.
(ii) Individual assessment
The Group reviews and revises impairment triggers for each loan asset portfolio to ensure that a trigger identifies a loss event
as early as possible, which would result in the earliest possible recognition of losses within the IFRS framework. The Group
estimates impairment based on the shortfall between the present value of estimated future cash flows and the asset carrying
amount.
General Risk Rating Process
United Bank for Africa adopts a two-dimensional approach to the assessment of credit risk in the Risk Rating Process for all
Businesses. The core tenets of the two-dimensional approach are shown below:
AAA LOW RISK:
Fast decision track
FOCUS ON:
Accurate obligor
rating and covenants
OBLIGOR RATING
C FOCUS ON:
Collateral calue and enforceability
HIGH RISK:
Reject. Exit
LOW RISK FACILITY RISK RATING HIGH RISK
All Obligors and Facilities are assigned a risk rating. Obligors are assigned an Obligor Risk Rating (ORR) while a Facility Risk Rating
(FRRs) is assigned to facilities. However, certain obligors, retail and commercial loans applicants that do not have a risk rating, must
access credit through product programmes while those that have credit ratings can access through the individually assessed credit
window. Scoring system is used for consumer loans whereby loans that achieve a predetermined minimum score are approved.
Inputs used to determine obligor risk ratings (ORRs) are derived based on quantitative and qualitative factors. The quantitative
factors are primarily based on metrics that use information on the obligors financial position while the qualitative factors include:
Management quality;
Industry risks;
Company profile;
Economic factors.
92
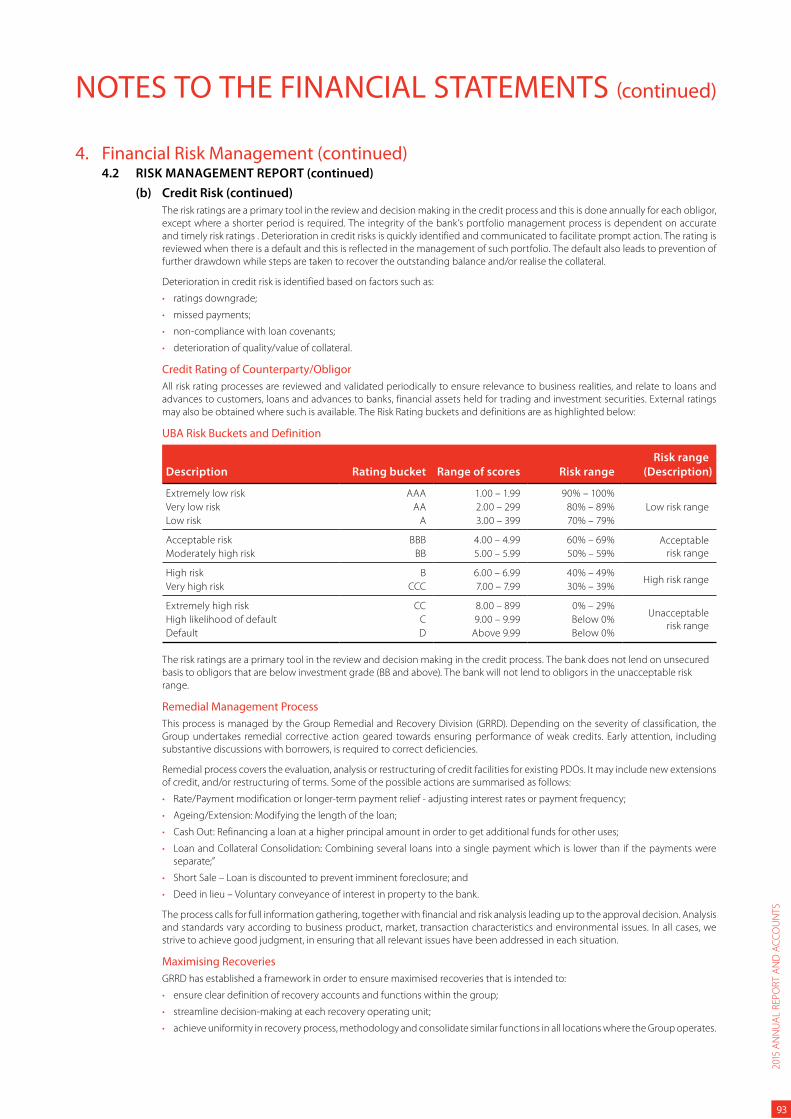
NOTES TO THE FINANCIAL STATEMENTS (continued)
4. Financial Risk Management (continued)4.2 RISK MANAGEMENT REPORT (continued)
(b) Credit Risk (continued)
The risk ratings are a primary tool in the review and decision making in the credit process and this is done annually for each obligor,
except where a shorter period is required. The integrity of the bank’s portfolio management process is dependent on accurate
and timely risk ratings . Deterioration in credit risks is quickly identified and communicated to facilitate prompt action. The rating is
reviewed when there is a default and this is reflected in the management of such portfolio. The default also leads to prevention of
further drawdown while steps are taken to recover the outstanding balance and/or realise the collateral.
Deterioration in credit risk is identified based on factors such as:
ratings downgrade;
missed payments;
non-compliance with loan covenants;
deterioration of quality/value of collateral.
Credit Rating of Counterparty/Obligor
All risk rating processes are reviewed and validated periodically to ensure relevance to business realities, and relate to loans and
advances to customers, loans and advances to banks, financial assets held for trading and investment securities. External ratings
may also be obtained where such is available. The Risk Rating buckets and definitions are as highlighted below:
UBA Risk Buckets and Definition
Description Rating bucket Range of scores Risk range
Risk range
(Description)
Extremely low risk AAA 1.00 – 1.99 90% – 100%
Low risk rangeVery low risk AA 2.00 – 299 80% – 89%
Low risk A 3.00 – 399 70% – 79%
Acceptable risk BBB 4.00 – 4.99 60% – 69% Acceptable
risk rangeModerately high risk BB 5.00 – 5.99 50% – 59%
High risk B 6.00 – 6.99 40% – 49%High risk range
Very high risk CCC 7.00 – 7.99 30% – 39%
Extremely high risk CC 8.00 – 899 0% – 29%Unacceptable
risk rangeHigh likelihood of default C 9.00 – 9.99 Below 0%
Default D Above 9.99 Below 0%
The risk ratings are a primary tool in the review and decision making in the credit process. The bank does not lend on unsecured
basis to obligors that are below investment grade (BB and above). The bank will not lend to obligors in the unacceptable risk
range.
Remedial Management Process
This process is managed by the Group Remedial and Recovery Division (GRRD). Depending on the severity of classification, the
Group undertakes remedial corrective action geared towards ensuring performance of weak credits. Early attention, including
substantive discussions with borrowers, is required to correct deficiencies.
Remedial process covers the evaluation, analysis or restructuring of credit facilities for existing PDOs. It may include new extensions
of credit, and/or restructuring of terms. Some of the possible actions are summarised as follows:
Rate/Payment modification or longer-term payment relief - adjusting interest rates or payment frequency;
Ageing/Extension: Modifying the length of the loan;
Cash Out: Refinancing a loan at a higher principal amount in order to get additional funds for other uses;
Loan and Collateral Consolidation: Combining several loans into a single payment which is lower than if the payments were
separate;”
Short Sale – Loan is discounted to prevent imminent foreclosure; and
Deed in lieu – Voluntary conveyance of interest in property to the bank.
The process calls for full information gathering, together with financial and risk analysis leading up to the approval decision. Analysis
and standards vary according to business product, market, transaction characteristics and environmental issues. In all cases, we
strive to achieve good judgment, in ensuring that all relevant issues have been addressed in each situation.
Maximising Recoveries
GRRD has established a framework in order to ensure maximised recoveries that is intended to:
ensure clear definition of recovery accounts and functions within the group;
streamline decision-making at each recovery operating unit;
achieve uniformity in recovery process, methodology and consolidate similar functions in all locations where the Group operates.
2015
AN
NU
AL
REP
OR
T A
ND
AC
CO
UN
TS
93
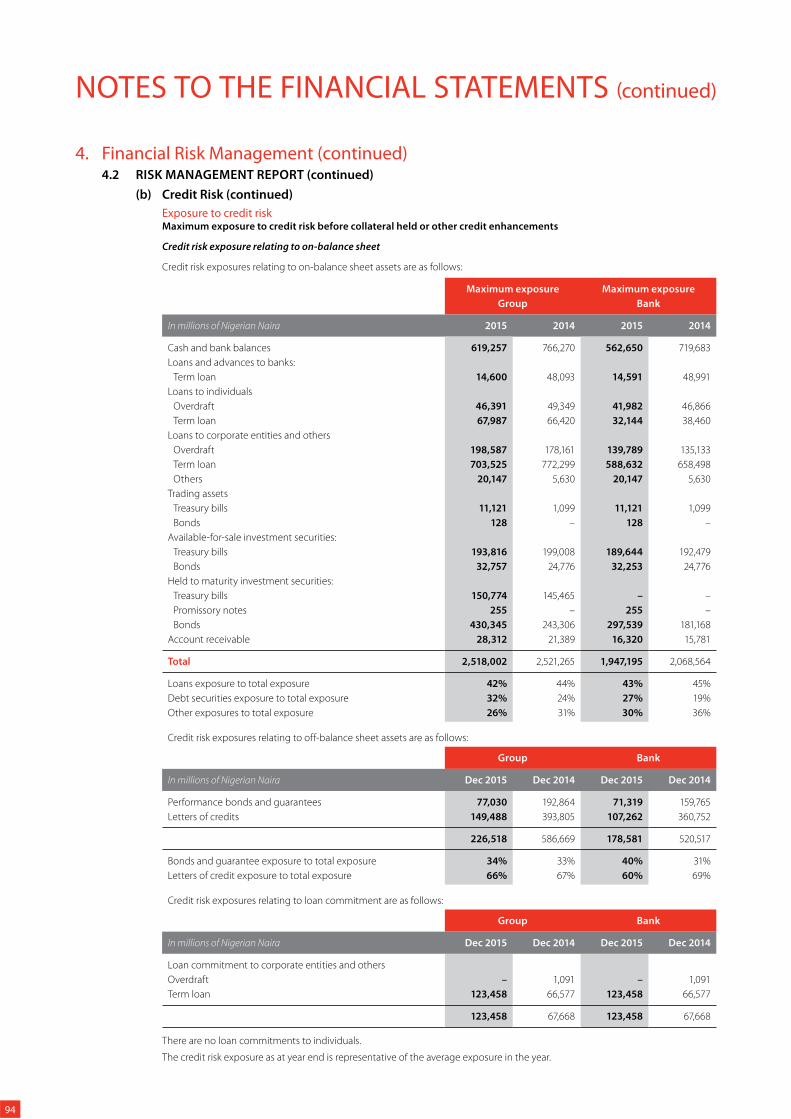
NOTES TO THE FINANCIAL STATEMENTS (continued)
4. Financial Risk Management (continued)4.2 RISK MANAGEMENT REPORT (continued)
(b) Credit Risk (continued)
Exposure to credit riskMaximum exposure to credit risk before collateral held or other credit enhancements
Credit risk exposure relating to on-balance sheet
Credit risk exposures relating to on-balance sheet assets are as follows:
Maximum exposure Maximum exposure
Group Bank
In millions of Nigerian Naira 2015 2014 2015 2014
Cash and bank balances 619,257 766,270 562,650 719,683
Loans and advances to banks:
Term loan 14,600 48,093 14,591 48,991
Loans to individuals
Overdraft 46,391 49,349 41,982 46,866
Term loan 67,987 66,420 32,144 38,460
Loans to corporate entities and others
Overdraft 198,587 178,161 139,789 135,133
Term loan 703,525 772,299 588,632 658,498
Others 20,147 5,630 20,147 5,630
Trading assets
Treasury bills 11,121 1,099 11,121 1,099
Bonds 128 – 128 –
Available-for-sale investment securities:
Treasury bills 193,816 199,008 189,644 192,479
Bonds 32,757 24,776 32,253 24,776
Held to maturity investment securities:
Treasury bills 150,774 145,465 – –
Promissory notes 255 – 255 –
Bonds 430,345 243,306 297,539 181,168
Account receivable 28,312 21,389 16,320 15,781
Total 2,518,002 2,521,265 1,947,195 2,068,564
Loans exposure to total exposure 42% 44% 43% 45%
Debt securities exposure to total exposure 32% 24% 27% 19%
Other exposures to total exposure 26% 31% 30% 36%
Credit risk exposures relating to off-balance sheet assets are as follows:
Group Bank
In millions of Nigerian Naira Dec 2015 Dec 2014 Dec 2015 Dec 2014
Performance bonds and guarantees 77,030 192,864 71,319 159,765
Letters of credits 149,488 393,805 107,262 360,752
226,518 586,669 178,581 520,517
Bonds and guarantee exposure to total exposure 34% 33% 40% 31%
Letters of credit exposure to total exposure 66% 67% 60% 69%
Credit risk exposures relating to loan commitment are as follows:
Group Bank
In millions of Nigerian Naira Dec 2015 Dec 2014 Dec 2015 Dec 2014
Loan commitment to corporate entities and others
Overdraft – 1,091 – 1,091
Term loan 123,458 66,577 123,458 66,577
123,458 67,668 123,458 67,668
There are no loan commitments to individuals.
The credit risk exposure as at year end is representative of the average exposure in the year.
94
NOTES TO THE FINANCIAL STATEMENTS (continued)
4. Financial Risk Management (continued)4.2 RISK MANAGEMENT REPORT (continued)
(b) Credit Risk (continued)
Credit Collateral
The Group holds collateral against loans and advances to customers in the form of mortgage interests over property, other
registered securities over assets, and guarantees. Estimates of fair value are based on the value of collateral assessed at the time
of borrowing, and updated periodically. Collateral generally is not held over loans and advances to banks, except when securities
are held as part of reverse repurchase and securities borrowing activity. Collateral usually is not held against investment securities.
Irrespective of how well a credit proposal is structured, a second way out in form of adequate collateral coverage for all loans is a
major requirement in order to protect the bank from incurring loan losses due to unforeseen events resulting from deterioration
of the quality of a loan.
Consequently, the bank issues appropriate guidelines for acceptability of loan collateral from time to time. These articulate
acceptable collateral in respect of each credit product including description, required documentation for perfection of collateral
and minimum realisable value.
All items pledged, as security for loan facilities are insured with the Bank noted as the first loss payee. The Bank also keeps all
documents required for perfection of collateral title.
Some of the collaterals acceptable to the bank under appropriate documentations are briefly described as follows:
1. Cash
Cash is the most liquid and readily realisable form of security and, therefore, the most acceptable to the bank. Furthermore,
cash pledged must be in the same currency as the credit and also in the possession of the bank either in savings or a deposit
account.
2. Treasury bills/certificates
Treasury bills/certificates are acceptable as bank security provided the instruments are purchased through the bank and
have been properly assigned to the bank. Since payment are channelled through the bank on due dates, realisation of the
security is relatively easy.
3. Stock and shares
Stocks and shares of reputable quoted companies are acceptable collateral securities. Unquoted shares are usually not
acceptable as collaterals.
4. Legal Mortgage
The Bank takes and perfects its interest in acceptable property that is transferred by the obligor as collateral for loan, such
that In case of any default by the obligor, the Bank would not require a court order before realising the security. Location
restrictions are however specified in respect of landed property.
5. Debenture
The bank accepts to take a charge on both current and non-current assets of a borrower by a debenture, which is a written
acknowledgement of indebtedness by a company usually given under its seal and also sets out the terms for repayment
of interest and principal of the credit. A debenture is executed by an obligor in favour of the Bank, and it gives a specific or
general charge on the company’s assets, both present and future.
6. Life Insurance Policies
Generally, life policy with a reputable insurance company approved by the Bank and free of restrictions adverse to the Bank’s
interest is acceptable security for loan. This could be an endowment policy or whole life policy, though the Bank prefers the
endowment policy.
7. Guarantees
The Banks accepts guarantees from well rated banks as well as acceptable parties (guarantors) as additional comfort and
security for her credits. A guarantee is a written promise by one person called the guarantor or surety to be answerable for
the debt, default or miscarriage of another person called principal debtor.
UBA also accepts unconditional insurance credit and performance bonds of first class Insurance companies and also the
guarantee of the Federal and State Governments. Other guarantees must however be supported by tangible assets for them
to become valid for lending.
8. Negative Pledge
Lending on the basis of negative pledges are restricted to only clients with an investment grade or “A” risk rating. A negative
pledge is a mere commitment given by the borrower to the bank not to charge its assets in favour of a third party for as long
as the loan remains outstanding.
2015
AN
NU
AL
REP
OR
T A
ND
AC
CO
UN
TS
95
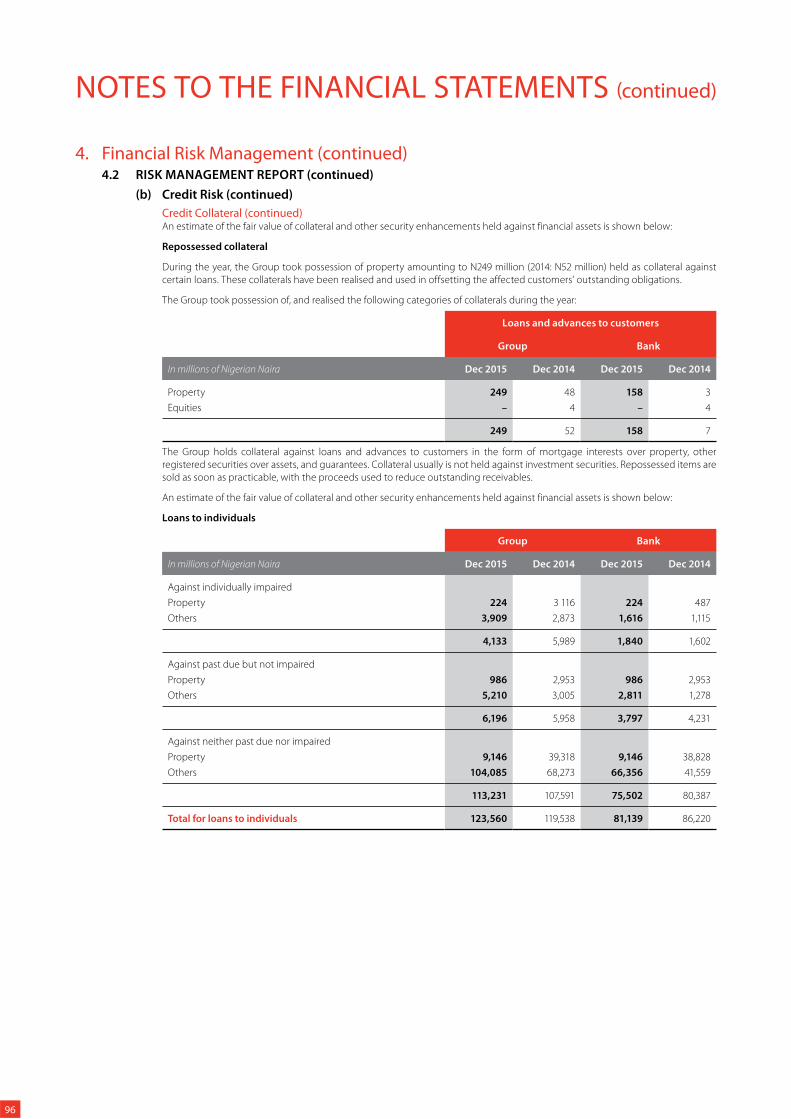
NOTES TO THE FINANCIAL STATEMENTS (continued)
4. Financial Risk Management (continued)4.2 RISK MANAGEMENT REPORT (continued)
(b) Credit Risk (continued)
Credit Collateral (continued)An estimate of the fair value of collateral and other security enhancements held against financial assets is shown below:
Repossessed collateral
During the year, the Group took possession of property amounting to N249 million (2014: N52 million) held as collateral against
certain loans. These collaterals have been realised and used in offsetting the affected customers’ outstanding obligations.
The Group took possession of, and realised the following categories of collaterals during the year:
Loans and advances to customers
Group Bank
In millions of Nigerian Naira Dec 2015 Dec 2014 Dec 2015 Dec 2014
Property 249 48 158 3
Equities – 4 – 4
249 52 158 7
The Group holds collateral against loans and advances to customers in the form of mortgage interests over property, other
registered securities over assets, and guarantees. Collateral usually is not held against investment securities. Repossessed items are
sold as soon as practicable, with the proceeds used to reduce outstanding receivables.
An estimate of the fair value of collateral and other security enhancements held against financial assets is shown below:
Loans to individuals
Group Bank
In millions of Nigerian Naira Dec 2015 Dec 2014 Dec 2015 Dec 2014
Against individually impaired
Property 224 3 116 224 487
Others 3,909 2,873 1,616 1,115
4,133 5,989 1,840 1,602
Against past due but not impaired
Property 986 2,953 986 2,953
Others 5,210 3,005 2,811 1,278
6,196 5,958 3,797 4,231
Against neither past due nor impaired
Property 9,146 39,318 9,146 38,828
Others 104,085 68,273 66,356 41,559
113,231 107,591 75,502 80,387
Total for loans to individuals 123,560 119,538 81,139 86,220
96
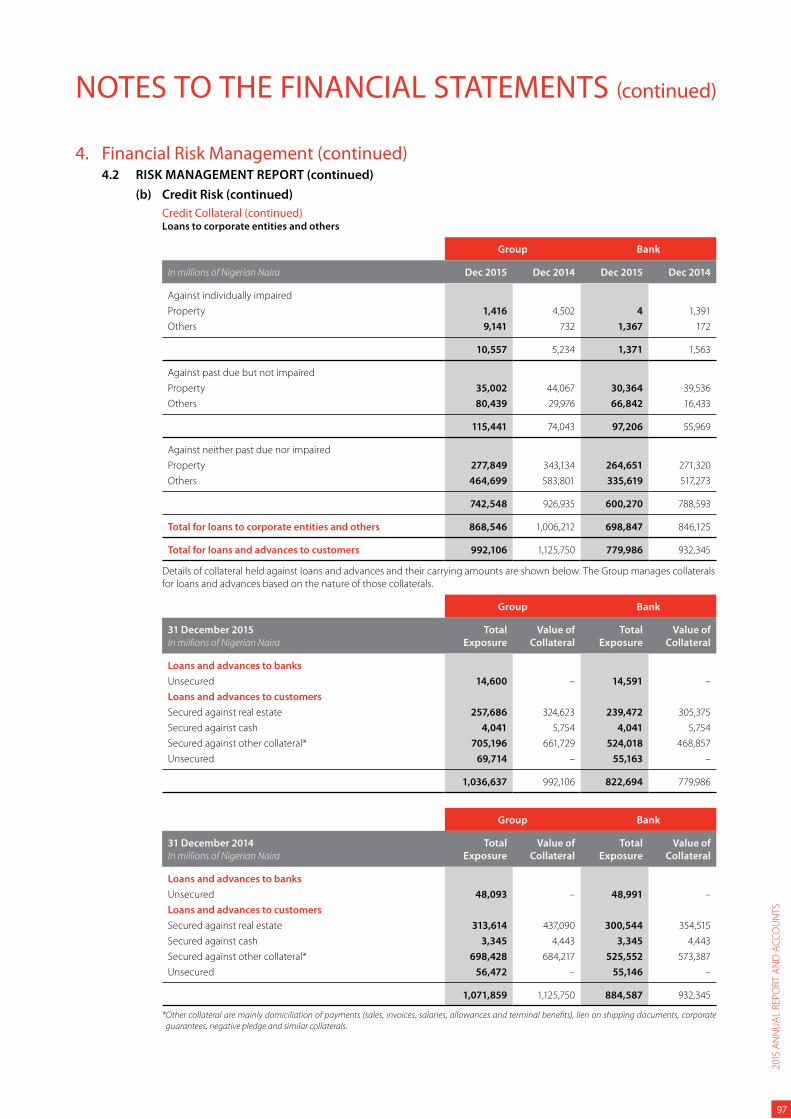
NOTES TO THE FINANCIAL STATEMENTS (continued)
4. Financial Risk Management (continued)4.2 RISK MANAGEMENT REPORT (continued)
(b) Credit Risk (continued)
Credit Collateral (continued)Loans to corporate entities and others
Group Bank
In millions of Nigerian Naira Dec 2015 Dec 2014 Dec 2015 Dec 2014
Against individually impaired
Property 1,416 4,502 4 1,391
Others 9,141 732 1,367 172
10,557 5,234 1,371 1,563
Against past due but not impaired
Property 35,002 44,067 30,364 39,536
Others 80,439 29,976 66,842 16,433
115,441 74,043 97,206 55,969
Against neither past due nor impaired
Property 277,849 343,134 264,651 271,320
Others 464,699 583,801 335,619 517,273
742,548 926,935 600,270 788,593
Total for loans to corporate entities and others 868,546 1,006,212 698,847 846,125
Total for loans and advances to customers 992,106 1,125,750 779,986 932,345
Details of collateral held against loans and advances and their carrying amounts are shown below. The Group manages collaterals
for loans and advances based on the nature of those collaterals.
Group Bank
31 December 2015
In millions of Nigerian Naira
Total
Exposure
Value of
Collateral
Total
Exposure
Value of
Collateral
Loans and advances to banks
Unsecured 14,600 – 14,591 –
Loans and advances to customers
Secured against real estate 257,686 324,623 239,472 305,375
Secured against cash 4,041 5,754 4,041 5,754
Secured against other collateral* 705,196 661,729 524,018 468,857
Unsecured 69,714 – 55,163 –
1,036,637 992,106 822,694 779,986
Group Bank
31 December 2014
In millions of Nigerian Naira
Total
Exposure
Value of
Collateral
Total
Exposure
Value of
Collateral
Loans and advances to banks
Unsecured 48,093 – 48,991 –
Loans and advances to customers
Secured against real estate 313,614 437,090 300,544 354,515
Secured against cash 3,345 4,443 3,345 4,443
Secured against other collateral* 698,428 684,217 525,552 573,387
Unsecured 56,472 – 55,146 –
1,071,859 1,125,750 884,587 932,345
* Other collateral are mainly domiciliation of payments (sales, invoices, salaries, allowances and terminal benefits), lien on shipping documents, corporate
guarantees, negative pledge and similar collaterals.
2015
AN
NU
AL
REP
OR
T A
ND
AC
CO
UN
TS
97
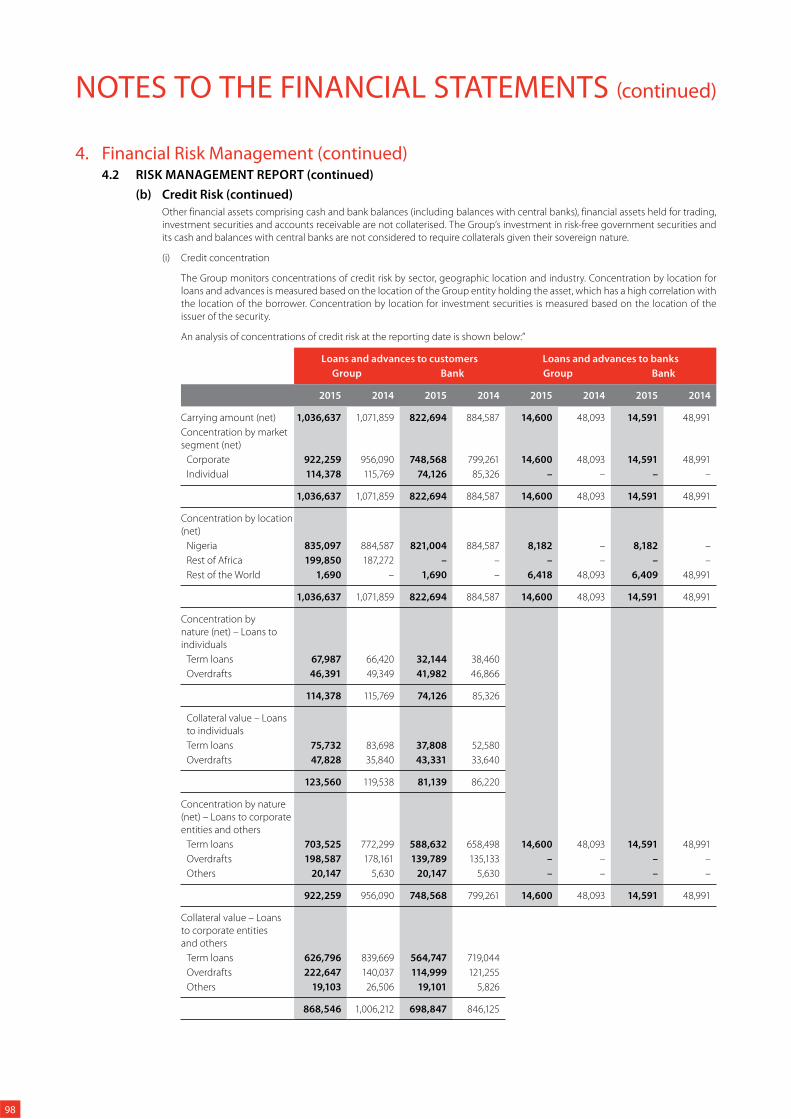
NOTES TO THE FINANCIAL STATEMENTS (continued)
4. Financial Risk Management (continued)4.2 RISK MANAGEMENT REPORT (continued)
(b) Credit Risk (continued)
Other financial assets comprising cash and bank balances (including balances with central banks), financial assets held for trading,
investment securities and accounts receivable are not collaterised. The Group’s investment in risk-free government securities and
its cash and balances with central banks are not considered to require collaterals given their sovereign nature.
(i) Credit concentration
The Group monitors concentrations of credit risk by sector, geographic location and industry. Concentration by location for
loans and advances is measured based on the location of the Group entity holding the asset, which has a high correlation with
the location of the borrower. Concentration by location for investment securities is measured based on the location of the
issuer of the security.
An analysis of concentrations of credit risk at the reporting date is shown below:”
Loans and advances to customers Loans and advances to banks
Group Bank Group Bank
2015 2014 2015 2014 2015 2014 2015 2014
Carrying amount (net) 1,036,637 1,071,859 822,694 884,587 14,600 48,093 14,591 48,991
Concentration by market
segment (net)
Corporate 922,259 956,090 748,568 799,261 14,600 48,093 14,591 48,991
Individual 114,378 115,769 74,126 85,326 – – – –
1,036,637 1,071,859 822,694 884,587 14,600 48,093 14,591 48,991
Concentration by location
(net)
Nigeria 835,097 884,587 821,004 884,587 8,182 – 8,182 –
Rest of Africa 199,850 187,272 – – – – – –
Rest of the World 1,690 – 1,690 – 6,418 48,093 6,409 48,991
1,036,637 1,071,859 822,694 884,587 14,600 48,093 14,591 48,991
Concentration by
nature (net) – Loans to
individuals
Term loans 67,987 66,420 32,144 38,460
Overdrafts 46,391 49,349 41,982 46,866
114,378 115,769 74,126 85,326
Collateral value – Loans
to individuals
Term loans 75,732 83,698 37,808 52,580
Overdrafts 47,828 35,840 43,331 33,640
123,560 119,538 81,139 86,220
Concentration by nature
(net) – Loans to corporate
entities and others
Term loans 703,525 772,299 588,632 658,498 14,600 48,093 14,591 48,991
Overdrafts 198,587 178,161 139,789 135,133 – – – –
Others 20,147 5,630 20,147 5,630 – – – –
922,259 956,090 748,568 799,261 14,600 48,093 14,591 48,991
Collateral value – Loans
to corporate entities
and others
Term loans 626,796 839,669 564,747 719,044
Overdrafts 222,647 140,037 114,999 121,255
Others 19,103 26,506 19,101 5,826
868,546 1,006,212 698,847 846,125
98
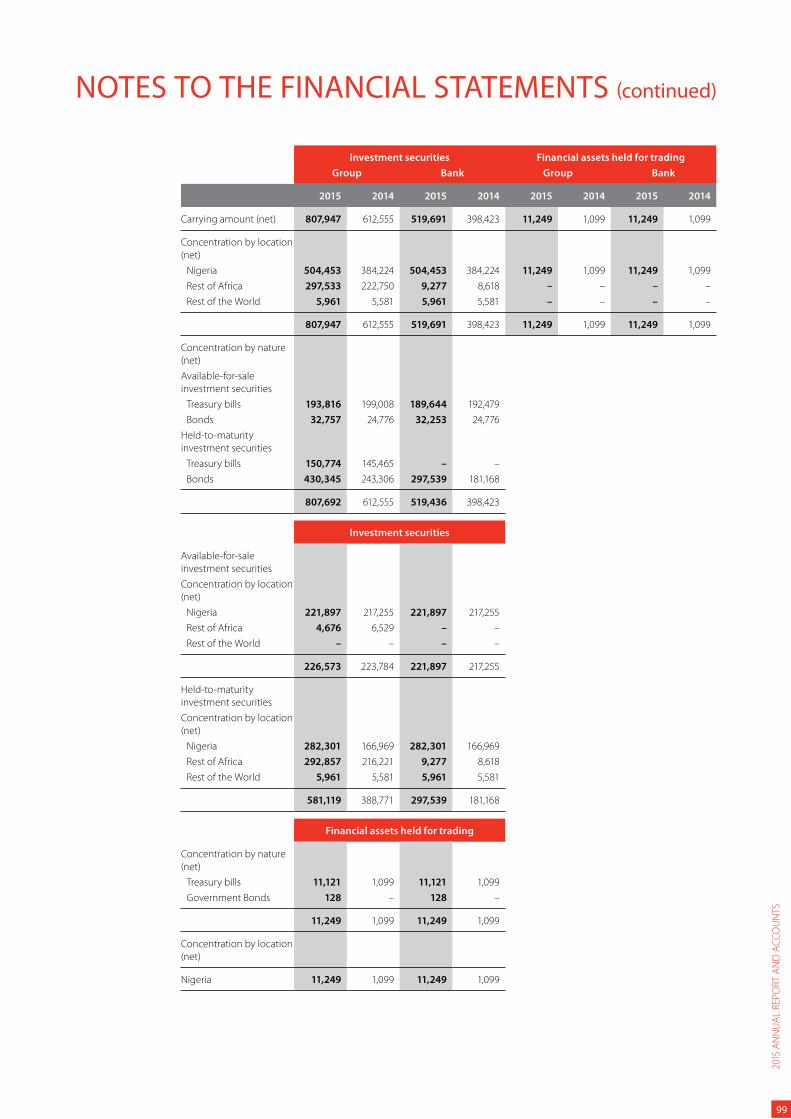
NOTES TO THE FINANCIAL STATEMENTS (continued)
Investment securities Financial assets held for trading
Group Bank Group Bank
2015 2014 2015 2014 2015 2014 2015 2014
Carrying amount (net) 807,947 612,555 519,691 398,423 11,249 1,099 11,249 1,099
Concentration by location
(net)
Nigeria 504,453 384,224 504,453 384,224 11,249 1,099 11,249 1,099
Rest of Africa 297,533 222,750 9,277 8,618 – – – –
Rest of the World 5,961 5,581 5,961 5,581 – – – –
807,947 612,555 519,691 398,423 11,249 1,099 11,249 1,099
Concentration by nature
(net)
Available-for-sale
investment securities
Treasury bills 193,816 199,008 189,644 192,479
Bonds 32,757 24,776 32,253 24,776
Held-to-maturity
investment securities
Treasury bills 150,774 145,465 – –
Bonds 430,345 243,306 297,539 181,168
807,692 612,555 519,436 398,423
Investment securities
Available-for-sale
investment securities
Concentration by location
(net)
Nigeria 221,897 217,255 221,897 217,255
Rest of Africa 4,676 6,529 – –
Rest of the World – – – –
226,573 223,784 221,897 217,255
Held-to-maturity
investment securities
Concentration by location
(net)
Nigeria 282,301 166,969 282,301 166,969
Rest of Africa 292,857 216,221 9,277 8,618
Rest of the World 5,961 5,581 5,961 5,581
581,119 388,771 297,539 181,168
Financial assets held for trading
Concentration by nature
(net)
Treasury bills 11,121 1,099 11,121 1,099
Government Bonds 128 – 128 –
11,249 1,099 11,249 1,099
Concentration by location
(net)
Nigeria 11,249 1,099 11,249 1,099
2015
AN
NU
AL
REP
OR
T A
ND
AC
CO
UN
TS
99
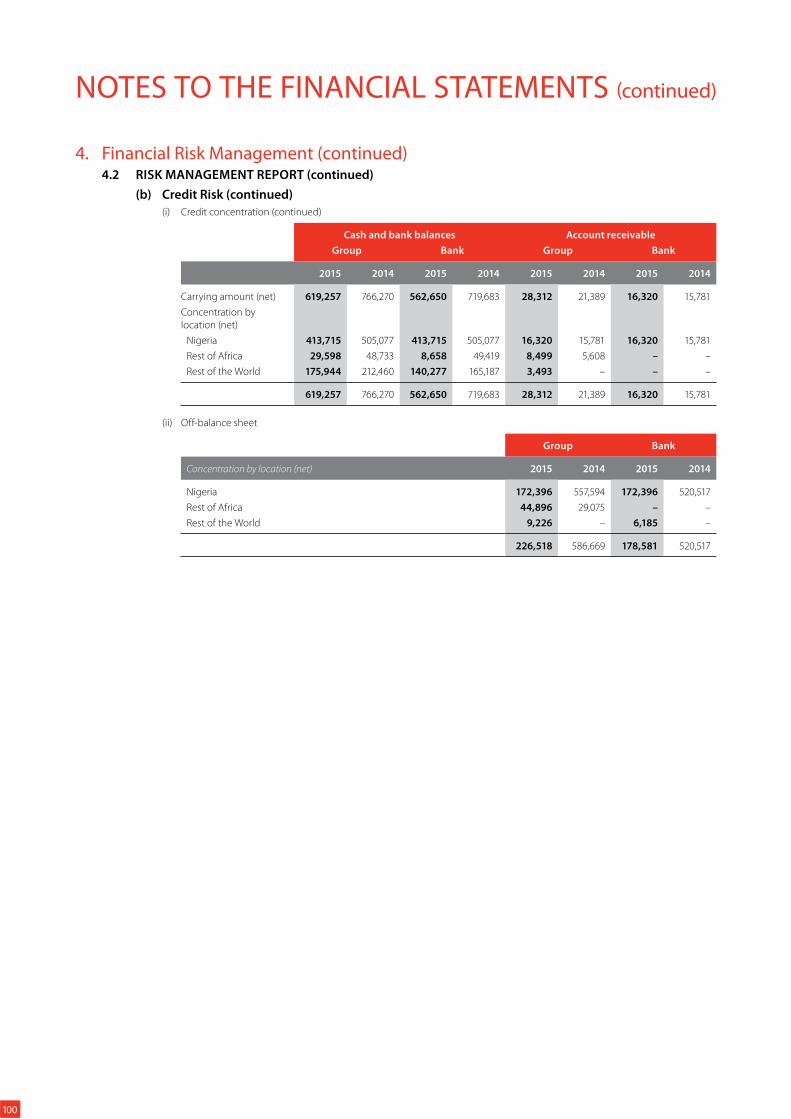
NOTES TO THE FINANCIAL STATEMENTS (continued)
4. Financial Risk Management (continued)4.2 RISK MANAGEMENT REPORT (continued)
(b) Credit Risk (continued)
(i) Credit concentration (continued)
Cash and bank balances Account receivable
Group Bank Group Bank
2015 2014 2015 2014 2015 2014 2015 2014
Carrying amount (net) 619,257 766,270 562,650 719,683 28,312 21,389 16,320 15,781
Concentration by
location (net)
Nigeria 413,715 505,077 413,715 505,077 16,320 15,781 16,320 15,781
Rest of Africa 29,598 48,733 8,658 49,419 8,499 5,608 – –
Rest of the World 175,944 212,460 140,277 165,187 3,493 – – –
619,257 766,270 562,650 719,683 28,312 21,389 16,320 15,781
(ii) Off-balance sheet
Group Bank
Concentration by location (net) 2015 2014 2015 2014
Nigeria 172,396 557,594 172,396 520,517
Rest of Africa 44,896 29,075 – –
Rest of the World 9,226 – 6,185 –
226,518 586,669 178,581 520,517
100
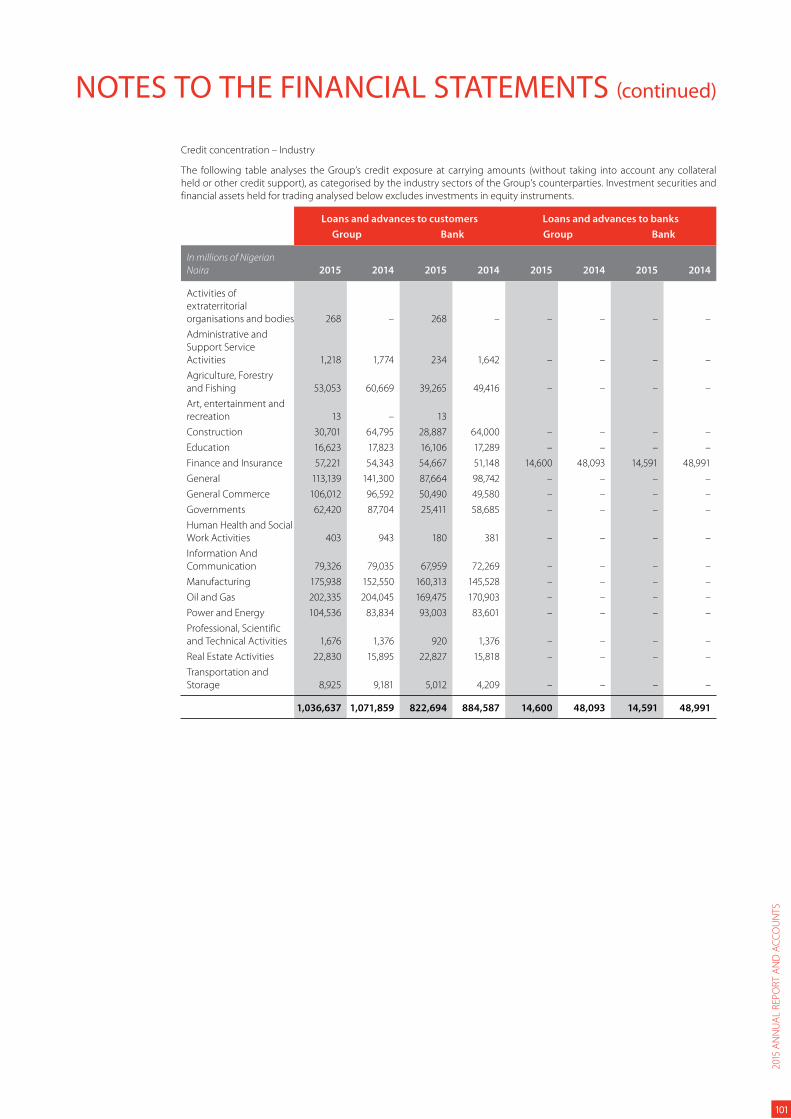
NOTES TO THE FINANCIAL STATEMENTS (continued)
Credit concentration – Industry
The following table analyses the Group’s credit exposure at carrying amounts (without taking into account any collateral
held or other credit support), as categorised by the industry sectors of the Group’s counterparties. Investment securities and
financial assets held for trading analysed below excludes investments in equity instruments.
Loans and advances to customers Loans and advances to banks
Group Bank Group Bank
In millions of Nigerian
Naira 2015 2014 2015 2014 2015 2014 2015 2014
Activities of
extraterritorial
organisations and bodies 268 – 268 – – – – –
Administrative and
Support Service
Activities 1,218 1,774 234 1,642 – – – –
Agriculture, Forestry
and Fishing 53,053 60,669 39,265 49,416 – – – –
Art, entertainment and
recreation 13 – 13
Construction 30,701 64,795 28,887 64,000 – – – –
Education 16,623 17,823 16,106 17,289 – – – –
Finance and Insurance 57,221 54,343 54,667 51,148 14,600 48,093 14,591 48,991
General 113,139 141,300 87,664 98,742 – – – –
General Commerce 106,012 96,592 50,490 49,580 – – – –
Governments 62,420 87,704 25,411 58,685 – – – –
Human Health and Social
Work Activities 403 943 180 381 – – – –
Information And
Communication 79,326 79,035 67,959 72,269 – – – –
Manufacturing 175,938 152,550 160,313 145,528 – – – –
Oil and Gas 202,335 204,045 169,475 170,903 – – – –
Power and Energy 104,536 83,834 93,003 83,601 – – – –
Professional, Scientific
and Technical Activities 1,676 1,376 920 1,376 – – – –
Real Estate Activities 22,830 15,895 22,827 15,818 – – – –
Transportation and
Storage 8,925 9,181 5,012 4,209 – – – –
1,036,637 1,071,859 822,694 884,587 14,600 48,093 14,591 48,991
2015
AN
NU
AL
REP
OR
T A
ND
AC
CO
UN
TS
101
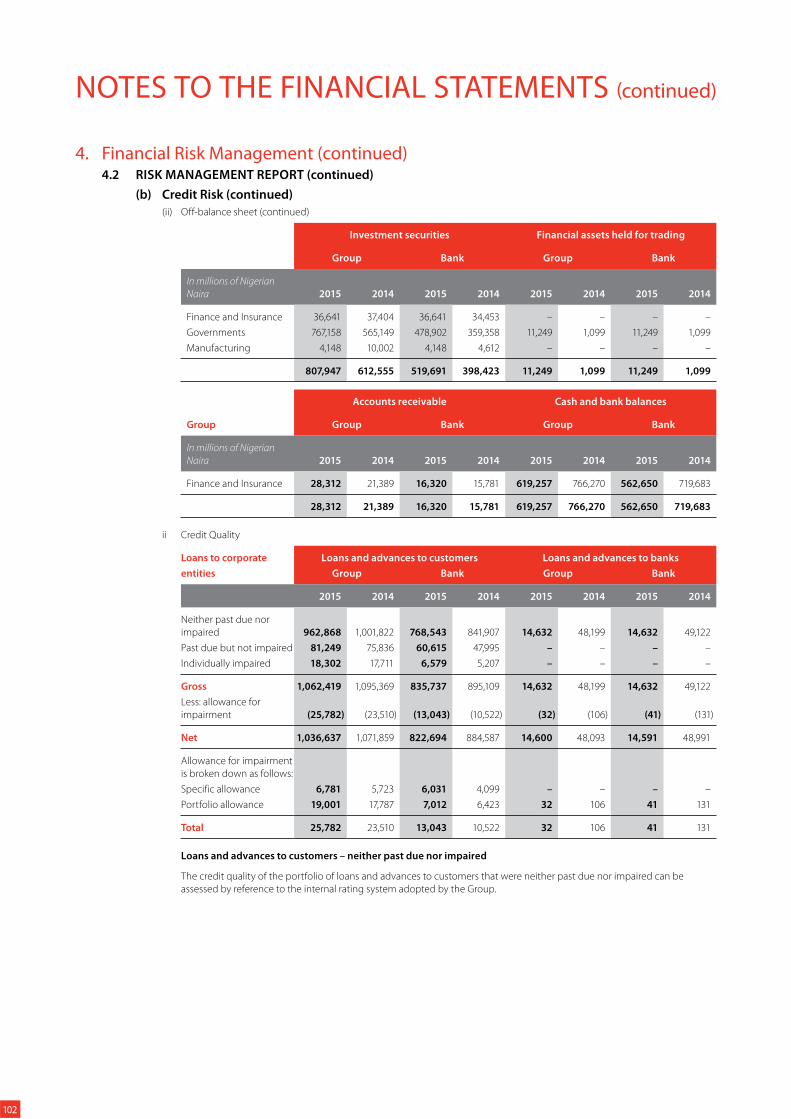
NOTES TO THE FINANCIAL STATEMENTS (continued)
4. Financial Risk Management (continued)4.2 RISK MANAGEMENT REPORT (continued)
(b) Credit Risk (continued)
(ii) Off-balance sheet (continued)
Investment securities Financial assets held for trading
Group Bank Group Bank
In millions of Nigerian
Naira 2015 2014 2015 2014 2015 2014 2015 2014
Finance and Insurance 36,641 37,404 36,641 34,453 – – – –
Governments 767,158 565,149 478,902 359,358 11,249 1,099 11,249 1,099
Manufacturing 4,148 10,002 4,148 4,612 – – – –
807,947 612,555 519,691 398,423 11,249 1,099 11,249 1,099
Accounts receivable Cash and bank balances
Group Group Bank Group Bank
In millions of Nigerian
Naira 2015 2014 2015 2014 2015 2014 2015 2014
Finance and Insurance 28,312 21,389 16,320 15,781 619,257 766,270 562,650 719,683
28,312 21,389 16,320 15,781 619,257 766,270 562,650 719,683
ii Credit Quality
Loans to corporate Loans and advances to customers Loans and advances to banks
entities Group Bank Group Bank
2015 2014 2015 2014 2015 2014 2015 2014
Neither past due nor
impaired 962,868 1,001,822 768,543 841,907 14,632 48,199 14,632 49,122
Past due but not impaired 81,249 75,836 60,615 47,995 – – – –
Individually impaired 18,302 17,711 6,579 5,207 – – – –
Gross 1,062,419 1,095,369 835,737 895,109 14,632 48,199 14,632 49,122
Less: allowance for
impairment (25,782) (23,510) (13,043) (10,522) (32) (106) (41) (131)
Net 1,036,637 1,071,859 822,694 884,587 14,600 48,093 14,591 48,991
Allowance for impairment
is broken down as follows:
Specific allowance 6,781 5,723 6,031 4,099 – – – –
Portfolio allowance 19,001 17,787 7,012 6,423 32 106 41 131
Total 25,782 23,510 13,043 10,522 32 106 41 131
Loans and advances to customers – neither past due nor impaired
The credit quality of the portfolio of loans and advances to customers that were neither past due nor impaired can be
assessed by reference to the internal rating system adopted by the Group.
102
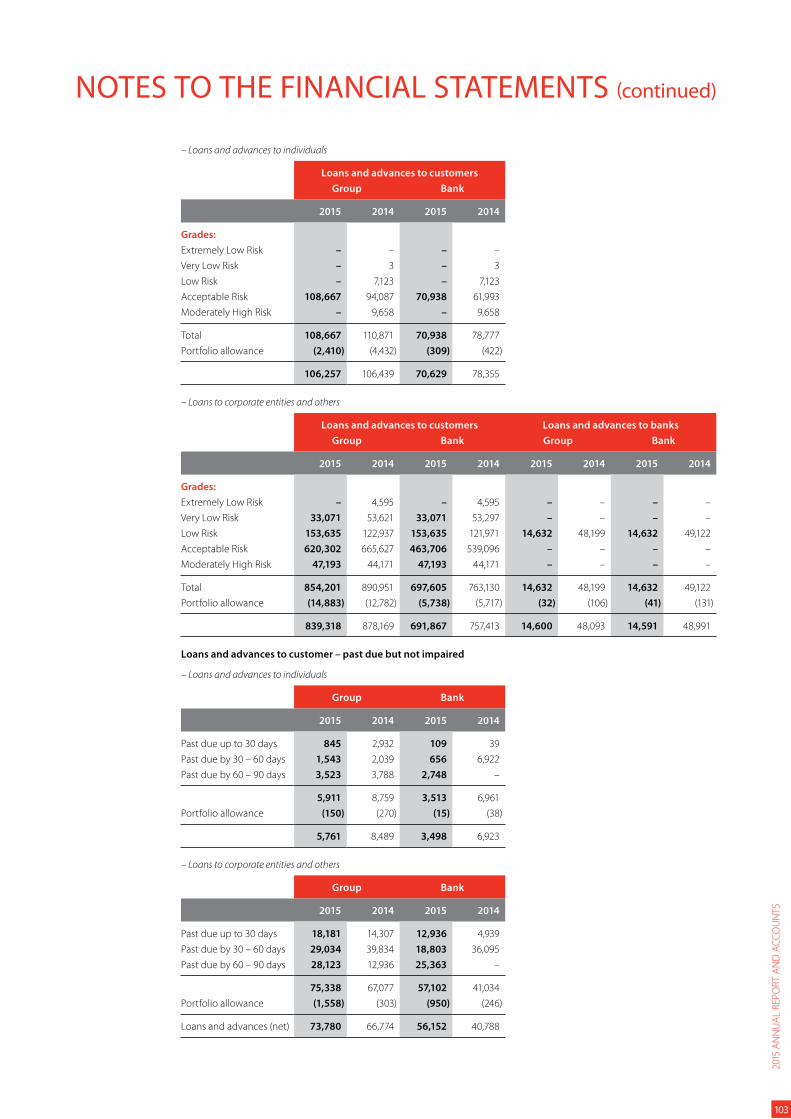
NOTES TO THE FINANCIAL STATEMENTS (continued)
– Loans and advances to individuals
Loans and advances to customers
Group Bank
2015 2014 2015 2014
Grades:
Extremely Low Risk – – – –
Very Low Risk – 3 – 3
Low Risk – 7,123 – 7,123
Acceptable Risk 108,667 94,087 70,938 61,993
Moderately High Risk – 9,658 – 9,658
Total 108,667 110,871 70,938 78,777
Portfolio allowance (2,410) (4,432) (309) (422)
106,257 106,439 70,629 78,355
– Loans to corporate entities and others
Loans and advances to customers Loans and advances to banks
Group Bank Group Bank
2015 2014 2015 2014 2015 2014 2015 2014
Grades:
Extremely Low Risk – 4,595 – 4,595 – – – –
Very Low Risk 33,071 53,621 33,071 53,297 – – – –
Low Risk 153,635 122,937 153,635 121,971 14,632 48,199 14,632 49,122
Acceptable Risk 620,302 665,627 463,706 539,096 – – – –
Moderately High Risk 47,193 44,171 47,193 44,171 – – – –
Total 854,201 890,951 697,605 763,130 14,632 48,199 14,632 49,122
Portfolio allowance (14,883) (12,782) (5,738) (5,717) (32) (106) (41) (131)
839,318 878,169 691,867 757,413 14,600 48,093 14,591 48,991
Loans and advances to customer – past due but not impaired
– Loans and advances to individuals
Group Bank
2015 2014 2015 2014
Past due up to 30 days 845 2,932 109 39
Past due by 30 – 60 days 1,543 2,039 656 6,922
Past due by 60 – 90 days 3,523 3,788 2,748 –
5,911 8,759 3,513 6,961
Portfolio allowance (150) (270) (15) (38)
5,761 8,489 3,498 6,923
– Loans to corporate entities and others
Group Bank
2015 2014 2015 2014
Past due up to 30 days 18,181 14,307 12,936 4,939
Past due by 30 – 60 days 29,034 39,834 18,803 36,095
Past due by 60 – 90 days 28,123 12,936 25,363 –
75,338 67,077 57,102 41,034
Portfolio allowance (1,558) (303) (950) (246)
Loans and advances (net) 73,780 66,774 56,152 40,788
2015
AN
NU
AL
REP
OR
T A
ND
AC
CO
UN
TS
103
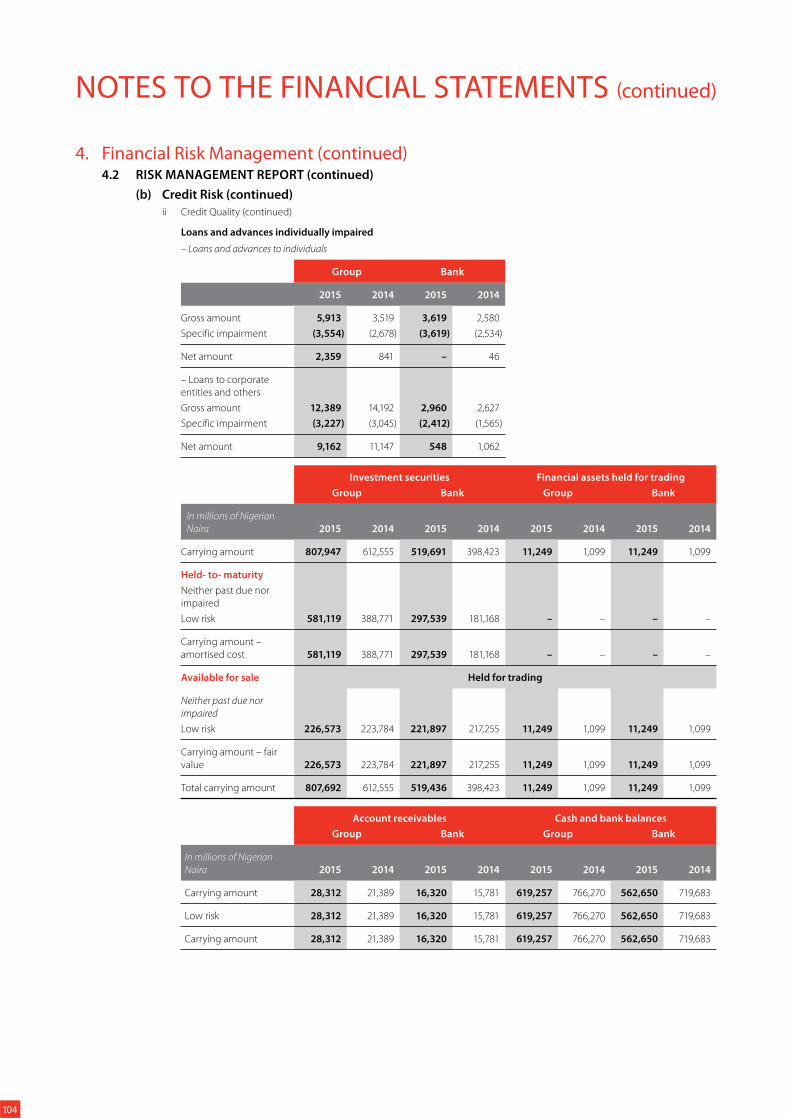
NOTES TO THE FINANCIAL STATEMENTS (continued)
4. Financial Risk Management (continued)4.2 RISK MANAGEMENT REPORT (continued)
(b) Credit Risk (continued)
ii Credit Quality (continued)
Loans and advances individually impaired
– Loans and advances to individuals
Group Bank
2015 2014 2015 2014
Gross amount 5,913 3,519 3,619 2,580
Specific impairment (3,554) (2,678) (3,619) (2,534)
Net amount 2,359 841 – 46
– Loans to corporate
entities and others
Gross amount 12,389 14,192 2,960 2,627
Specific impairment (3,227) (3,045) (2,412) (1,565)
Net amount 9,162 11,147 548 1,062
Investment securities Financial assets held for trading
Group Bank Group Bank
In millions of Nigerian
Naira 2015 2014 2015 2014 2015 2014 2015 2014
Carrying amount 807,947 612,555 519,691 398,423 11,249 1,099 11,249 1,099
Held- to- maturity
Neither past due nor
impaired
Low risk 581,119 388,771 297,539 181,168 – – – –
Carrying amount –
amortised cost 581,119 388,771 297,539 181,168 – – – –
Available for sale Held for trading
Neither past due nor
impaired
Low risk 226,573 223,784 221,897 217,255 11,249 1,099 11,249 1,099
Carrying amount – fair
value 226,573 223,784 221,897 217,255 11,249 1,099 11,249 1,099
Total carrying amount 807,692 612,555 519,436 398,423 11,249 1,099 11,249 1,099
Account receivables Cash and bank balances
Group Bank Group Bank
In millions of Nigerian
Naira 2015 2014 2015 2014 2015 2014 2015 2014
Carrying amount 28,312 21,389 16,320 15,781 619,257 766,270 562,650 719,683
Low risk 28,312 21,389 16,320 15,781 619,257 766,270 562,650 719,683
Carrying amount 28,312 21,389 16,320 15,781 619,257 766,270 562,650 719,683
104
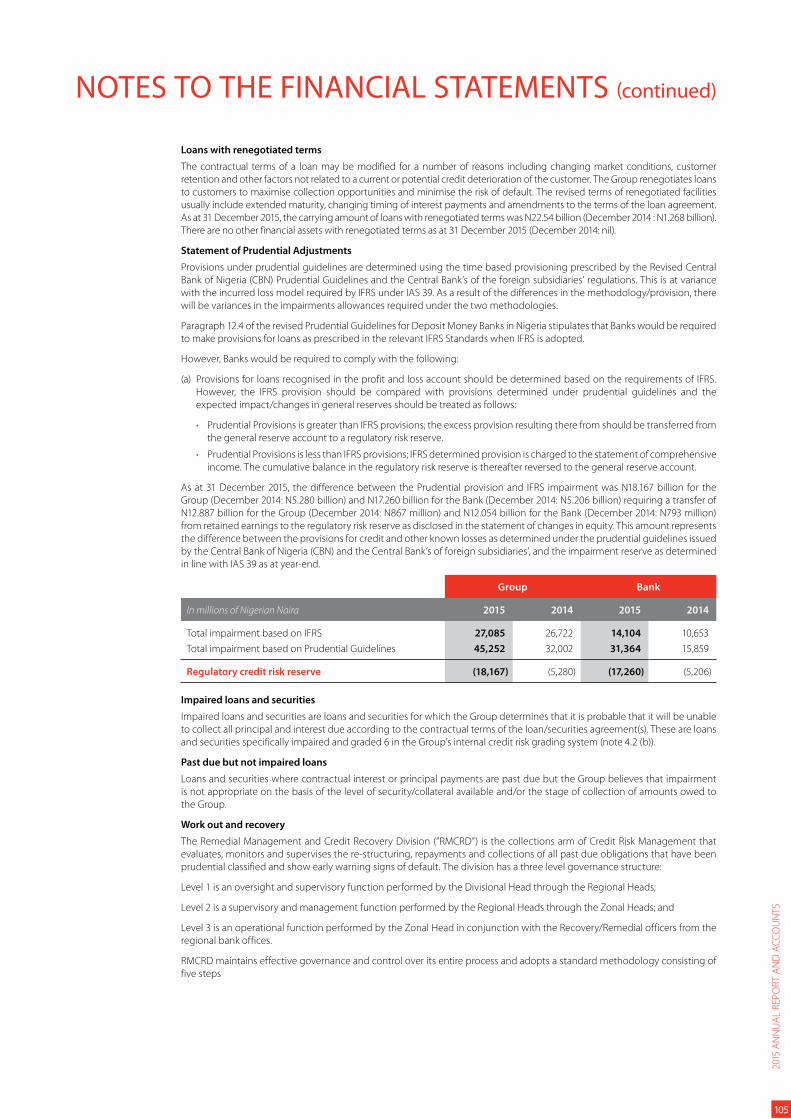
NOTES TO THE FINANCIAL STATEMENTS (continued)
Loans with renegotiated terms
The contractual terms of a loan may be modified for a number of reasons including changing market conditions, customer
retention and other factors not related to a current or potential credit deterioration of the customer. The Group renegotiates loans
to customers to maximise collection opportunities and minimise the risk of default. The revised terms of renegotiated facilities
usually include extended maturity, changing timing of interest payments and amendments to the terms of the loan agreement.
As at 31 December 2015, the carrying amount of loans with renegotiated terms was N22.54 billion (December 2014 : N1.268 billion).
There are no other financial assets with renegotiated terms as at 31 December 2015 (December 2014: nil).
Statement of Prudential Adjustments
Provisions under prudential guidelines are determined using the time based provisioning prescribed by the Revised Central
Bank of Nigeria (CBN) Prudential Guidelines and the Central Bank’s of the foreign subsidiaries’ regulations. This is at variance
with the incurred loss model required by IFRS under IAS 39. As a result of the differences in the methodology/provision, there
will be variances in the impairments allowances required under the two methodologies.
Paragraph 12.4 of the revised Prudential Guidelines for Deposit Money Banks in Nigeria stipulates that Banks would be required
to make provisions for loans as prescribed in the relevant IFRS Standards when IFRS is adopted.
However, Banks would be required to comply with the following:
(a) Provisions for loans recognised in the profit and loss account should be determined based on the requirements of IFRS.
However, the IFRS provision should be compared with provisions determined under prudential guidelines and the
expected impact/changes in general reserves should be treated as follows:
Prudential Provisions is greater than IFRS provisions; the excess provision resulting there from should be transferred from
the general reserve account to a regulatory risk reserve.
Prudential Provisions is less than IFRS provisions; IFRS determined provision is charged to the statement of comprehensive
income. The cumulative balance in the regulatory risk reserve is thereafter reversed to the general reserve account.
As at 31 December 2015, the difference between the Prudential provision and IFRS impairment was N18.167 billion for the
Group (December 2014: N5.280 billion) and N17.260 billion for the Bank (December 2014: N5.206 billion) requiring a transfer of
N12.887 billion for the Group (December 2014: N867 million) and N12.054 billion for the Bank (December 2014: N793 million)
from retained earnings to the regulatory risk reserve as disclosed in the statement of changes in equity. This amount represents
the difference between the provisions for credit and other known losses as determined under the prudential guidelines issued
by the Central Bank of Nigeria (CBN) and the Central Bank’s of foreign subsidiaries’, and the impairment reserve as determined
in line with IAS 39 as at year-end.
Group Bank
In millions of Nigerian Naira 2015 2014 2015 2014
Total impairment based on IFRS 27,085 26,722 14,104 10,653
Total impairment based on Prudential Guidelines 45,252 32,002 31,364 15,859
Regulatory credit risk reserve (18,167) (5,280) (17,260) (5,206)
Impaired loans and securities
Impaired loans and securities are loans and securities for which the Group determines that it is probable that it will be unable
to collect all principal and interest due according to the contractual terms of the loan/securities agreement(s). These are loans
and securities specifically impaired and graded 6 in the Group’s internal credit risk grading system (note 4.2 (b)).
Past due but not impaired loans
Loans and securities where contractual interest or principal payments are past due but the Group believes that impairment
is not appropriate on the basis of the level of security/collateral available and/or the stage of collection of amounts owed to
the Group.
Work out and recovery
The Remedial Management and Credit Recovery Division (“RMCRD”) is the collections arm of Credit Risk Management that
evaluates, monitors and supervises the re-structuring, repayments and collections of all past due obligations that have been
prudential classified and show early warning signs of default. The division has a three level governance structure:
Level 1 is an oversight and supervisory function performed by the Divisional Head through the Regional Heads;
Level 2 is a supervisory and management function performed by the Regional Heads through the Zonal Heads; and
Level 3 is an operational function performed by the Zonal Head in conjunction with the Recovery/Remedial officers from the
regional bank offices.
RMCRD maintains effective governance and control over its entire process and adopts a standard methodology consisting of
five steps
2015
AN
NU
AL
REP
OR
T A
ND
AC
CO
UN
TS
105
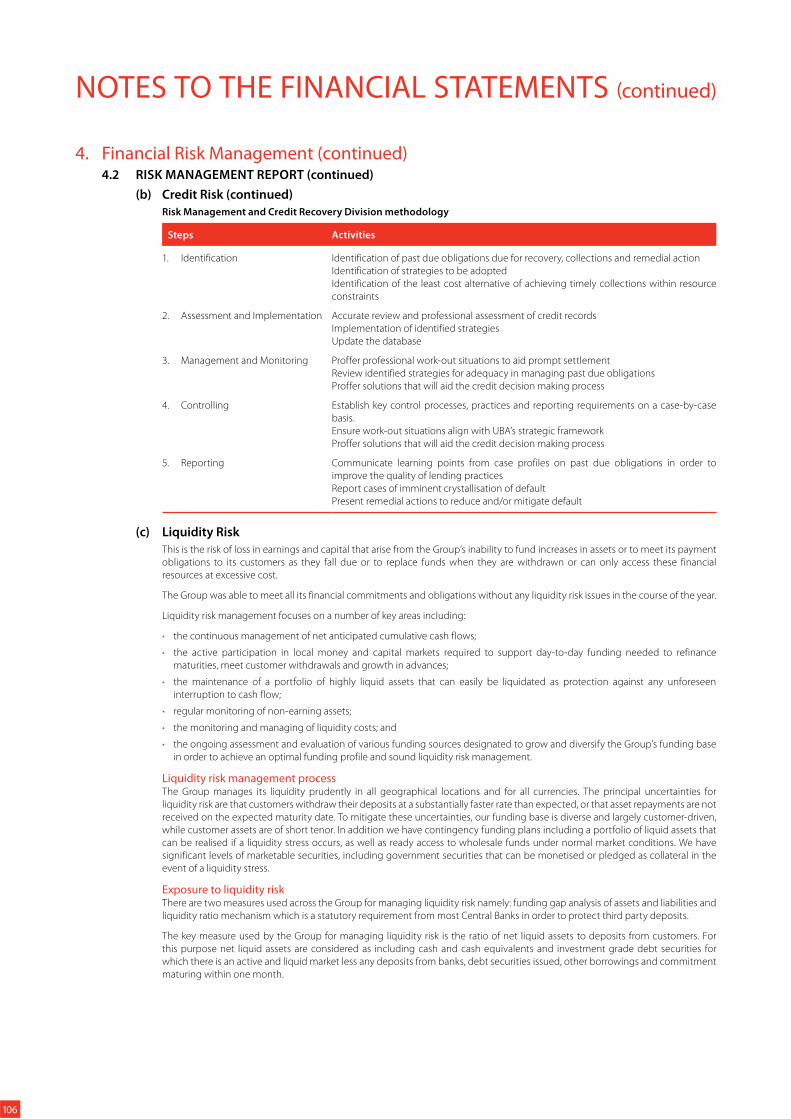
NOTES TO THE FINANCIAL STATEMENTS (continued)
4. Financial Risk Management (continued)4.2 RISK MANAGEMENT REPORT (continued)
(b) Credit Risk (continued)
Risk Management and Credit Recovery Division methodology
Steps Activities
1. Identification Identification of past due obligations due for recovery, collections and remedial action
Identification of strategies to be adopted
Identification of the least cost alternative of achieving timely collections within resource
constraints
2. Assessment and Implementation Accurate review and professional assessment of credit records
Implementation of identified strategies
Update the database
3. Management and Monitoring Proffer professional work-out situations to aid prompt settlement
Review identified strategies for adequacy in managing past due obligations
Proffer solutions that will aid the credit decision making process
4. Controlling Establish key control processes, practices and reporting requirements on a case-by-case
basis.
Ensure work-out situations align with UBA’s strategic framework
Proffer solutions that will aid the credit decision making process
5. Reporting Communicate learning points from case profiles on past due obligations in order to
improve the quality of lending practices
Report cases of imminent crystallisation of default
Present remedial actions to reduce and/or mitigate default
(c) Liquidity Risk
This is the risk of loss in earnings and capital that arise from the Group’s inability to fund increases in assets or to meet its payment
obligations to its customers as they fall due or to replace funds when they are withdrawn or can only access these financial
resources at excessive cost.
The Group was able to meet all its financial commitments and obligations without any liquidity risk issues in the course of the year.
Liquidity risk management focuses on a number of key areas including:
the continuous management of net anticipated cumulative cash flows;
the active participation in local money and capital markets required to support day-to-day funding needed to refinance
maturities, meet customer withdrawals and growth in advances;
the maintenance of a portfolio of highly liquid assets that can easily be liquidated as protection against any unforeseen
interruption to cash flow;
regular monitoring of non-earning assets;
the monitoring and managing of liquidity costs; and
the ongoing assessment and evaluation of various funding sources designated to grow and diversify the Group’s funding base
in order to achieve an optimal funding profile and sound liquidity risk management.
Liquidity risk management processThe Group manages its liquidity prudently in all geographical locations and for all currencies. The principal uncertainties for
liquidity risk are that customers withdraw their deposits at a substantially faster rate than expected, or that asset repayments are not
received on the expected maturity date. To mitigate these uncertainties, our funding base is diverse and largely customer-driven,
while customer assets are of short tenor. In addition we have contingency funding plans including a portfolio of liquid assets that
can be realised if a liquidity stress occurs, as well as ready access to wholesale funds under normal market conditions. We have
significant levels of marketable securities, including government securities that can be monetised or pledged as collateral in the
event of a liquidity stress.
Exposure to liquidity riskThere are two measures used across the Group for managing liquidity risk namely: funding gap analysis of assets and liabilities and
liquidity ratio mechanism which is a statutory requirement from most Central Banks in order to protect third party deposits.
The key measure used by the Group for managing liquidity risk is the ratio of net liquid assets to deposits from customers. For
this purpose net liquid assets are considered as including cash and cash equivalents and investment grade debt securities for
which there is an active and liquid market less any deposits from banks, debt securities issued, other borrowings and commitment
maturing within one month.
106
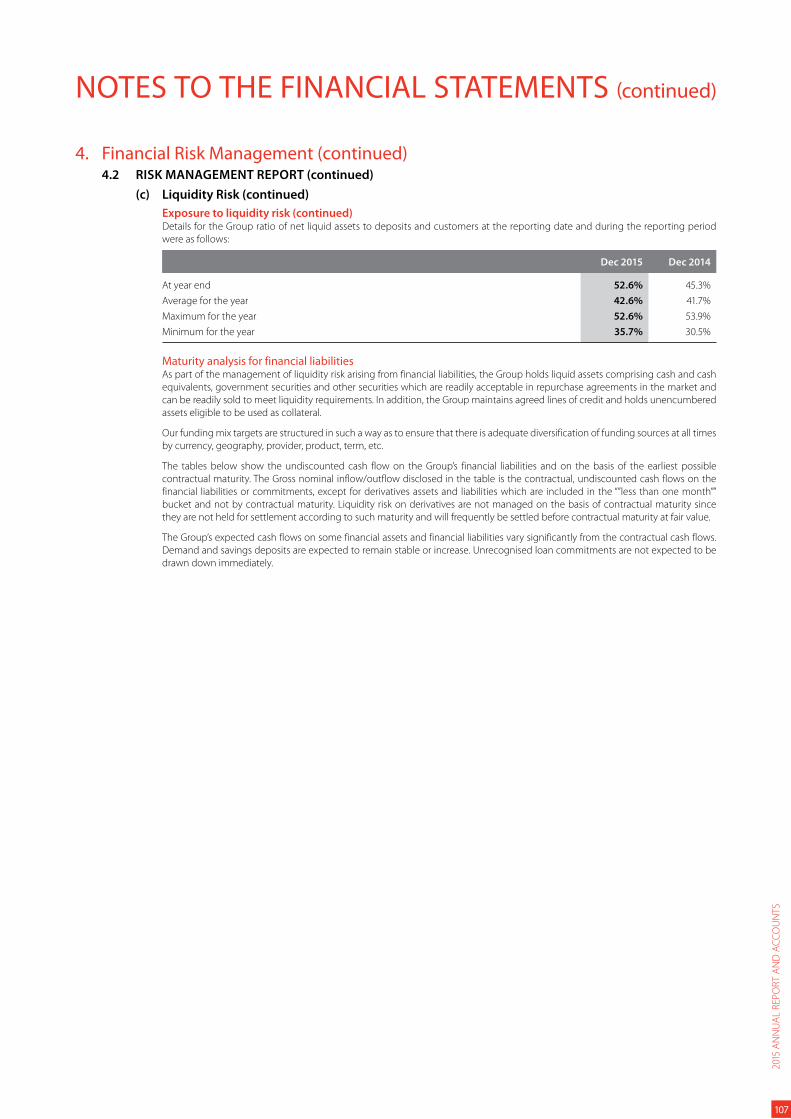
NOTES TO THE FINANCIAL STATEMENTS (continued)
4. Financial Risk Management (continued)4.2 RISK MANAGEMENT REPORT (continued)
(c) Liquidity Risk (continued)
Exposure to liquidity risk (continued)Details for the Group ratio of net liquid assets to deposits and customers at the reporting date and during the reporting period
were as follows:
Dec 2015 Dec 2014
At year end 52.6% 45.3%
Average for the year 42.6% 41.7%
Maximum for the year 52.6% 53.9%
Minimum for the year 35.7% 30.5%
Maturity analysis for financial liabilitiesAs part of the management of liquidity risk arising from financial liabilities, the Group holds liquid assets comprising cash and cash
equivalents, government securities and other securities which are readily acceptable in repurchase agreements in the market and
can be readily sold to meet liquidity requirements. In addition, the Group maintains agreed lines of credit and holds unencumbered
assets eligible to be used as collateral.
Our funding mix targets are structured in such a way as to ensure that there is adequate diversification of funding sources at all times
by currency, geography, provider, product, term, etc.
The tables below show the undiscounted cash flow on the Group’s financial liabilities and on the basis of the earliest possible
contractual maturity. The Gross nominal inflow/outflow disclosed in the table is the contractual, undiscounted cash flows on the
financial liabilities or commitments, except for derivatives assets and liabilities which are included in the “”less than one month””
bucket and not by contractual maturity. Liquidity risk on derivatives are not managed on the basis of contractual maturity since
they are not held for settlement according to such maturity and will frequently be settled before contractual maturity at fair value.
The Group’s expected cash flows on some financial assets and financial liabilities vary significantly from the contractual cash flows.
Demand and savings deposits are expected to remain stable or increase. Unrecognised loan commitments are not expected to be
drawn down immediately.
2015
AN
NU
AL
REP
OR
T A
ND
AC
CO
UN
TS
107
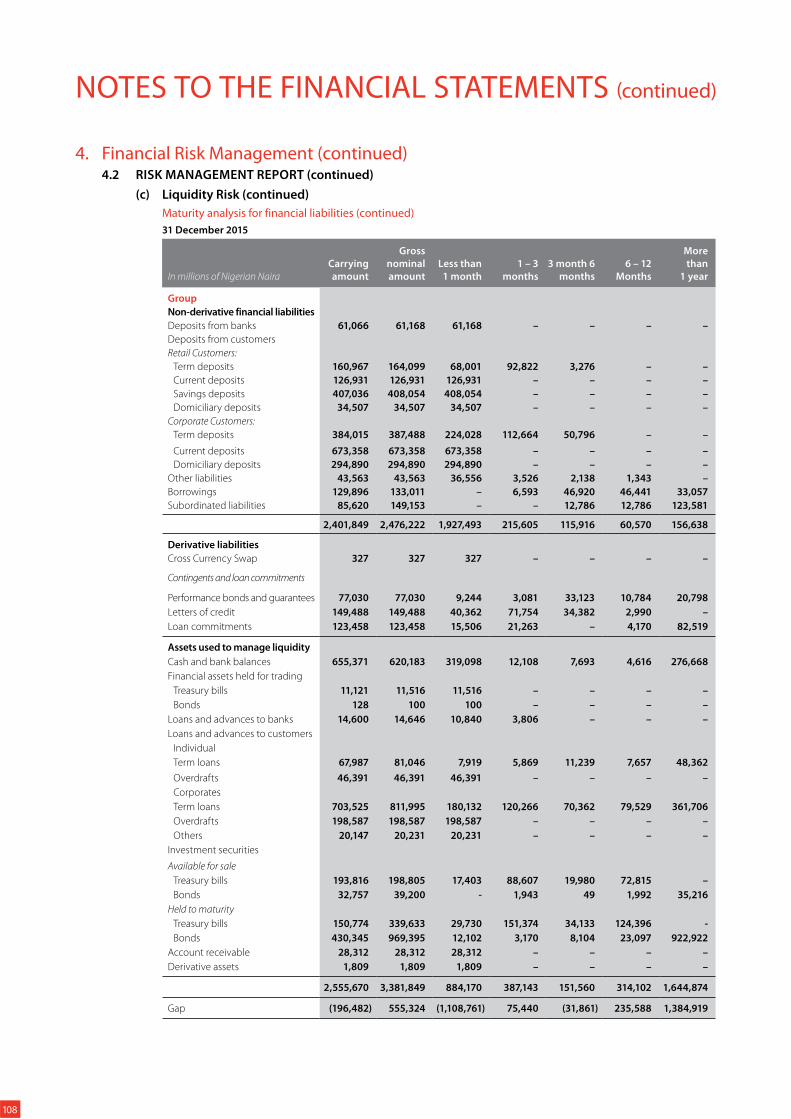
NOTES TO THE FINANCIAL STATEMENTS (continued)
4. Financial Risk Management (continued)4.2 RISK MANAGEMENT REPORT (continued)
(c) Liquidity Risk (continued)
Maturity analysis for financial liabilities (continued)
31 December 2015
In millions of Nigerian Naira
Carrying
amount
Gross
nominal
amount
Less than
1 month
1 – 3
months
3 month 6
months
6 – 12
Months
More
than
1 year
Group
Non-derivative financial liabilities
Deposits from banks 61,066 61,168 61,168 – – – –
Deposits from customers
Retail Customers:
Term deposits 160,967 164,099 68,001 92,822 3,276 – –
Current deposits 126,931 126,931 126,931 – – – –
Savings deposits 407,036 408,054 408,054 – – – –
Domiciliary deposits 34,507 34,507 34,507 – – – –
Corporate Customers:
Term deposits 384,015 387,488 224,028 112,664 50,796 – –
Current deposits 673,358 673,358 673,358 – – – –
Domiciliary deposits 294,890 294,890 294,890 – – – –
Other liabilities 43,563 43,563 36,556 3,526 2,138 1,343 –
Borrowings 129,896 133,011 – 6,593 46,920 46,441 33,057
Subordinated liabilities 85,620 149,153 – – 12,786 12,786 123,581
2,401,849 2,476,222 1,927,493 215,605 115,916 60,570 156,638
Derivative liabilities
Cross Currency Swap 327 327 327 – – – –
Contingents and loan commitments
Performance bonds and guarantees 77,030 77,030 9,244 3,081 33,123 10,784 20,798
Letters of credit 149,488 149,488 40,362 71,754 34,382 2,990 –
Loan commitments 123,458 123,458 15,506 21,263 – 4,170 82,519
Assets used to manage liquidity
Cash and bank balances 655,371 620,183 319,098 12,108 7,693 4,616 276,668
Financial assets held for trading
Treasury bills 11,121 11,516 11,516 – – – –
Bonds 128 100 100 – – – –
Loans and advances to banks 14,600 14,646 10,840 3,806 – – –
Loans and advances to customers
Individual
Term loans 67,987 81,046 7,919 5,869 11,239 7,657 48,362
Overdrafts 46,391 46,391 46,391 – – – –
Corporates
Term loans 703,525 811,995 180,132 120,266 70,362 79,529 361,706
Overdrafts 198,587 198,587 198,587 – – – –
Others 20,147 20,231 20,231 – – – –
Investment securities
Available for sale
Treasury bills 193,816 198,805 17,403 88,607 19,980 72,815 –
Bonds 32,757 39,200 - 1,943 49 1,992 35,216
Held to maturity
Treasury bills 150,774 339,633 29,730 151,374 34,133 124,396 -
Bonds 430,345 969,395 12,102 3,170 8,104 23,097 922,922
Account receivable 28,312 28,312 28,312 – – – –
Derivative assets 1,809 1,809 1,809 – – – –
2,555,670 3,381,849 884,170 387,143 151,560 314,102 1,644,874
Gap (196,482) 555,324 (1,108,761) 75,440 (31,861) 235,588 1,384,919
108
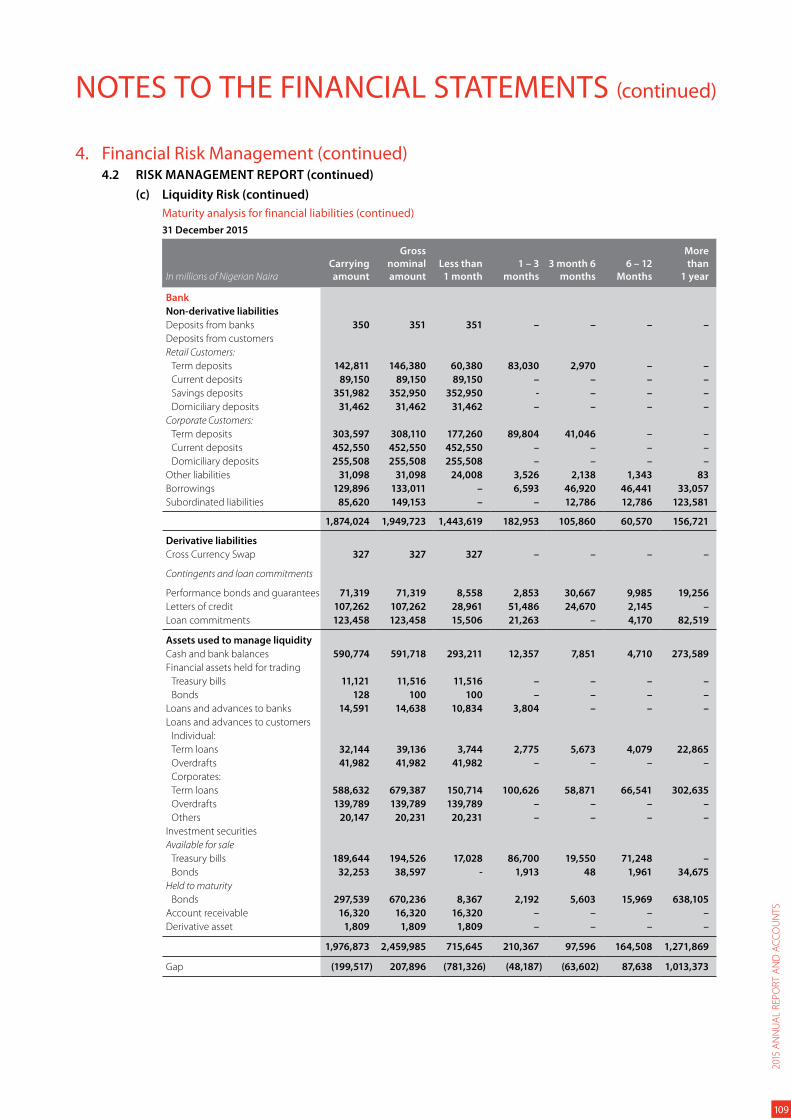
NOTES TO THE FINANCIAL STATEMENTS (continued)
4. Financial Risk Management (continued)4.2 RISK MANAGEMENT REPORT (continued)
(c) Liquidity Risk (continued)
Maturity analysis for financial liabilities (continued)
31 December 2015
In millions of Nigerian Naira
Carrying
amount
Gross
nominal
amount
Less than
1 month
1 – 3
months
3 month 6
months
6 – 12
Months
More
than
1 year
Bank
Non-derivative liabilities
Deposits from banks 350 351 351 – – – –
Deposits from customers
Retail Customers:
Term deposits 142,811 146,380 60,380 83,030 2,970 – –
Current deposits 89,150 89,150 89,150 – – – –
Savings deposits 351,982 352,950 352,950 - – – –
Domiciliary deposits 31,462 31,462 31,462 – – – –
Corporate Customers:
Term deposits 303,597 308,110 177,260 89,804 41,046 – –
Current deposits 452,550 452,550 452,550 – – – –
Domiciliary deposits 255,508 255,508 255,508 – – – –
Other liabilities 31,098 31,098 24,008 3,526 2,138 1,343 83
Borrowings 129,896 133,011 – 6,593 46,920 46,441 33,057
Subordinated liabilities 85,620 149,153 – – 12,786 12,786 123,581
1,874,024 1,949,723 1,443,619 182,953 105,860 60,570 156,721
Derivative liabilities
Cross Currency Swap 327 327 327 – – – –
Contingents and loan commitments
Performance bonds and guarantees 71,319 71,319 8,558 2,853 30,667 9,985 19,256
Letters of credit 107,262 107,262 28,961 51,486 24,670 2,145 –
Loan commitments 123,458 123,458 15,506 21,263 – 4,170 82,519
Assets used to manage liquidity
Cash and bank balances 590,774 591,718 293,211 12,357 7,851 4,710 273,589
Financial assets held for trading
Treasury bills 11,121 11,516 11,516 – – – –
Bonds 128 100 100 – – – –
Loans and advances to banks 14,591 14,638 10,834 3,804 – – –
Loans and advances to customers
Individual:
Term loans 32,144 39,136 3,744 2,775 5,673 4,079 22,865
Overdrafts 41,982 41,982 41,982 – – – –
Corporates:
Term loans 588,632 679,387 150,714 100,626 58,871 66,541 302,635
Overdrafts 139,789 139,789 139,789 – – – –
Others 20,147 20,231 20,231 – – – –
Investment securities
Available for sale
Treasury bills 189,644 194,526 17,028 86,700 19,550 71,248 –
Bonds 32,253 38,597 - 1,913 48 1,961 34,675
Held to maturity
Bonds 297,539 670,236 8,367 2,192 5,603 15,969 638,105
Account receivable 16,320 16,320 16,320 – – – –
Derivative asset 1,809 1,809 1,809 – – – –
1,976,873 2,459,985 715,645 210,367 97,596 164,508 1,271,869
Gap (199,517) 207,896 (781,326) (48,187) (63,602) 87,638 1,013,373
2015
AN
NU
AL
REP
OR
T A
ND
AC
CO
UN
TS
109
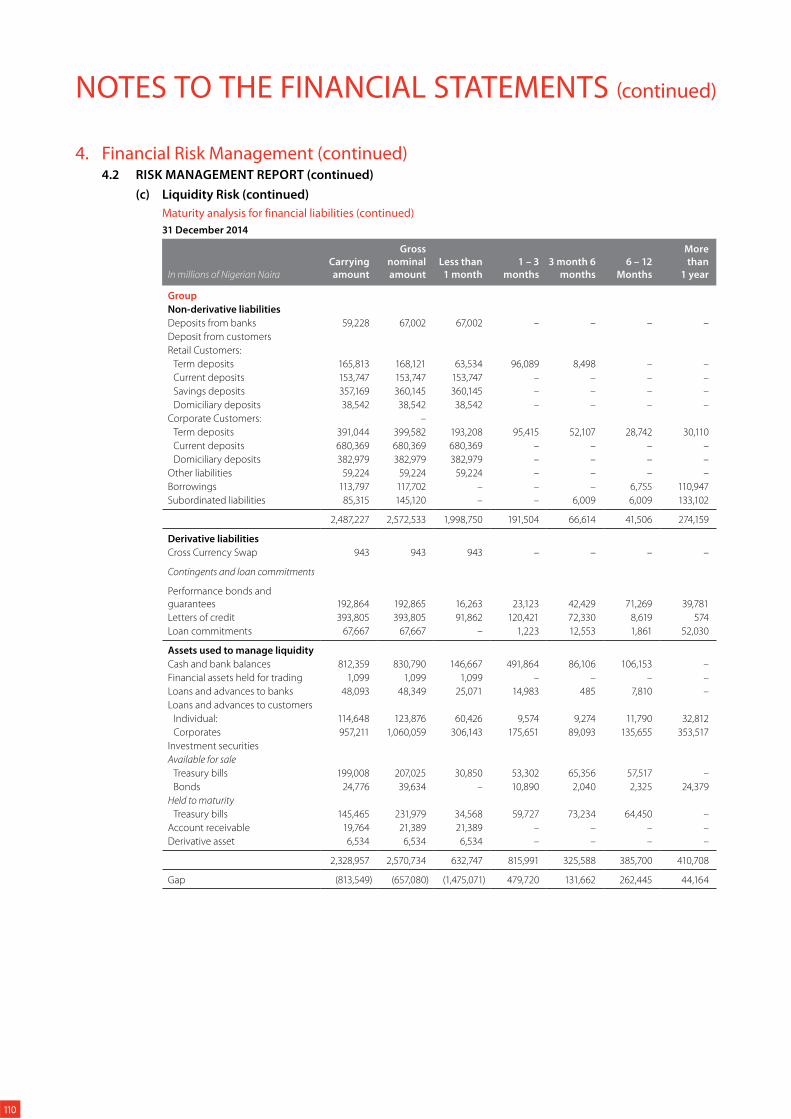
NOTES TO THE FINANCIAL STATEMENTS (continued)
4. Financial Risk Management (continued)4.2 RISK MANAGEMENT REPORT (continued)
(c) Liquidity Risk (continued)
Maturity analysis for financial liabilities (continued)
31 December 2014
In millions of Nigerian Naira
Carrying
amount
Gross
nominal
amount
Less than
1 month
1 – 3
months
3 month 6
months
6 – 12
Months
More
than
1 year
Group
Non-derivative liabilities
Deposits from banks 59,228 67,002 67,002 – – – –
Deposit from customers
Retail Customers:
Term deposits 165,813 168,121 63,534 96,089 8,498 – –
Current deposits 153,747 153,747 153,747 – – – –
Savings deposits 357,169 360,145 360,145 – – – –
Domiciliary deposits 38,542 38,542 38,542 – – – –
Corporate Customers: –
Term deposits 391,044 399,582 193,208 95,415 52,107 28,742 30,110
Current deposits 680,369 680,369 680,369 – – – –
Domiciliary deposits 382,979 382,979 382,979 – – – –
Other liabilities 59,224 59,224 59,224 – – – –
Borrowings 113,797 117,702 – – – 6,755 110,947
Subordinated liabilities 85,315 145,120 – – 6,009 6,009 133,102
2,487,227 2,572,533 1,998,750 191,504 66,614 41,506 274,159
Derivative liabilities
Cross Currency Swap 943 943 943 – – – –
Contingents and loan commitments
Performance bonds and
guarantees 192,864 192,865 16,263 23,123 42,429 71,269 39,781
Letters of credit 393,805 393,805 91,862 120,421 72,330 8,619 574
Loan commitments 67,667 67,667 – 1,223 12,553 1,861 52,030
Assets used to manage liquidity
Cash and bank balances 812,359 830,790 146,667 491,864 86,106 106,153 –
Financial assets held for trading 1,099 1,099 1,099 – – – –
Loans and advances to banks 48,093 48,349 25,071 14,983 485 7,810 –
Loans and advances to customers
Individual: 114,648 123,876 60,426 9,574 9,274 11,790 32,812
Corporates 957,211 1,060,059 306,143 175,651 89,093 135,655 353,517
Investment securities
Available for sale
Treasury bills 199,008 207,025 30,850 53,302 65,356 57,517 –
Bonds 24,776 39,634 – 10,890 2,040 2,325 24,379
Held to maturity
Treasury bills 145,465 231,979 34,568 59,727 73,234 64,450 –
Account receivable 19,764 21,389 21,389 – – – –
Derivative asset 6,534 6,534 6,534 – – – –
2,328,957 2,570,734 632,747 815,991 325,588 385,700 410,708
Gap (813,549) (657,080) (1,475,071) 479,720 131,662 262,445 44,164
110
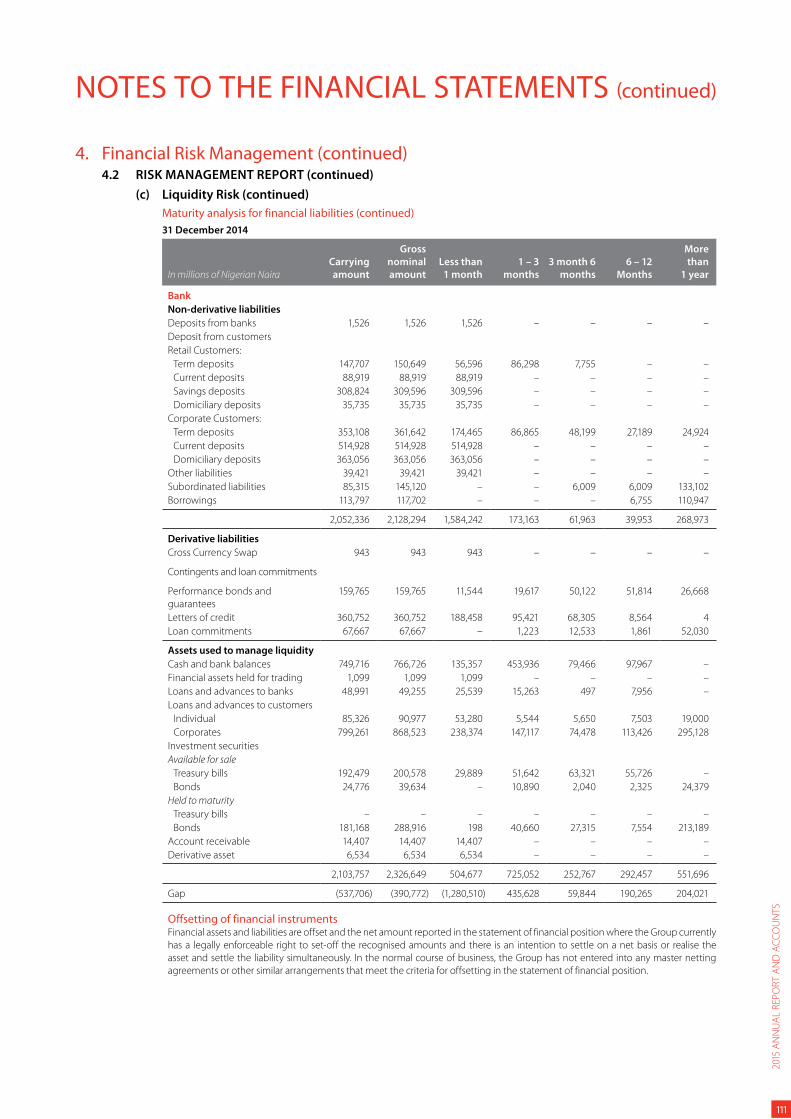
NOTES TO THE FINANCIAL STATEMENTS (continued)
4. Financial Risk Management (continued)4.2 RISK MANAGEMENT REPORT (continued)
(c) Liquidity Risk (continued)
Maturity analysis for financial liabilities (continued)
31 December 2014
In millions of Nigerian Naira
Carrying
amount
Gross
nominal
amount
Less than
1 month
1 – 3
months
3 month 6
months
6 – 12
Months
More
than
1 year
Bank
Non-derivative liabilities
Deposits from banks 1,526 1,526 1,526 – – – –
Deposit from customers
Retail Customers:
Term deposits 147,707 150,649 56,596 86,298 7,755 – –
Current deposits 88,919 88,919 88,919 – – – –
Savings deposits 308,824 309,596 309,596 – – – –
Domiciliary deposits 35,735 35,735 35,735 – – – –
Corporate Customers:
Term deposits 353,108 361,642 174,465 86,865 48,199 27,189 24,924
Current deposits 514,928 514,928 514,928 – – – –
Domiciliary deposits 363,056 363,056 363,056 – – – –
Other liabilities 39,421 39,421 39,421 – – – –
Subordinated liabilities 85,315 145,120 – – 6,009 6,009 133,102
Borrowings 113,797 117,702 – – – 6,755 110,947
2,052,336 2,128,294 1,584,242 173,163 61,963 39,953 268,973
Derivative liabilities
Cross Currency Swap 943 943 943 – – – –
Contingents and loan commitments
Performance bonds and
guarantees
159,765 159,765 11,544 19,617 50,122 51,814 26,668
Letters of credit 360,752 360,752 188,458 95,421 68,305 8,564 4
Loan commitments 67,667 67,667 – 1,223 12,533 1,861 52,030
Assets used to manage liquidity
Cash and bank balances 749,716 766,726 135,357 453,936 79,466 97,967 –
Financial assets held for trading 1,099 1,099 1,099 – – – –
Loans and advances to banks 48,991 49,255 25,539 15,263 497 7,956 –
Loans and advances to customers
Individual 85,326 90,977 53,280 5,544 5,650 7,503 19,000
Corporates 799,261 868,523 238,374 147,117 74,478 113,426 295,128
Investment securities
Available for sale
Treasury bills 192,479 200,578 29,889 51,642 63,321 55,726 –
Bonds 24,776 39,634 – 10,890 2,040 2,325 24,379
Held to maturity
Treasury bills – – – – – – –
Bonds 181,168 288,916 198 40,660 27,315 7,554 213,189
Account receivable 14,407 14,407 14,407 – – – –
Derivative asset 6,534 6,534 6,534 – – – –
2,103,757 2,326,649 504,677 725,052 252,767 292,457 551,696
Gap (537,706) (390,772) (1,280,510) 435,628 59,844 190,265 204,021
Offsetting of financial instrumentsFinancial assets and liabilities are offset and the net amount reported in the statement of financial position where the Group currently
has a legally enforceable right to set-off the recognised amounts and there is an intention to settle on a net basis or realise the
asset and settle the liability simultaneously. In the normal course of business, the Group has not entered into any master netting
agreements or other similar arrangements that meet the criteria for offsetting in the statement of financial position.
2015
AN
NU
AL
REP
OR
T A
ND
AC
CO
UN
TS
111
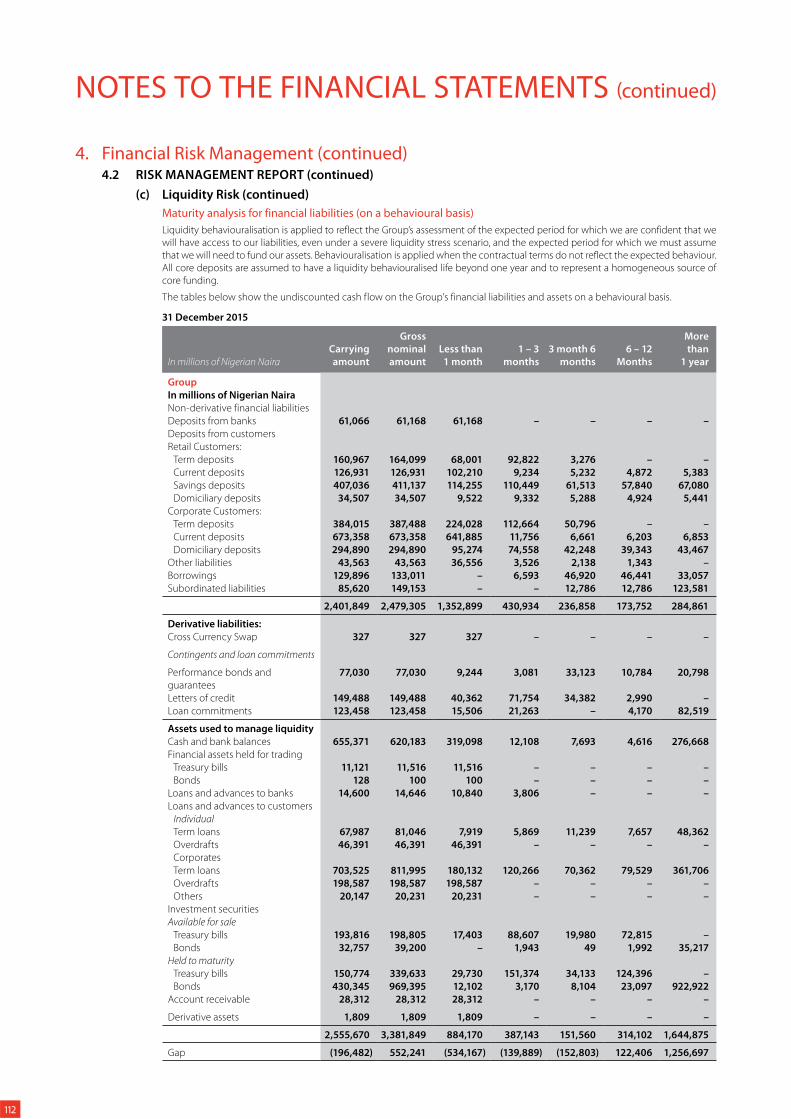
NOTES TO THE FINANCIAL STATEMENTS (continued)
4. Financial Risk Management (continued)4.2 RISK MANAGEMENT REPORT (continued)
(c) Liquidity Risk (continued)
Maturity analysis for financial liabilities (on a behavioural basis)
Liquidity behaviouralisation is applied to reflect the Group’s assessment of the expected period for which we are confident that we will have access to our liabilities, even under a severe liquidity stress scenario, and the expected period for which we must assume that we will need to fund our assets. Behaviouralisation is applied when the contractual terms do not reflect the expected behaviour. All core deposits are assumed to have a liquidity behaviouralised life beyond one year and to represent a homogeneous source of core funding.
The tables below show the undiscounted cash flow on the Group’s financial liabilities and assets on a behavioural basis.
31 December 2015
In millions of Nigerian Naira
Carrying
amount
Gross
nominal
amount
Less than
1 month
1 – 3
months
3 month 6
months
6 – 12
Months
More
than
1 year
Group
In millions of Nigerian Naira
Non-derivative financial liabilities
Deposits from banks 61,066 61,168 61,168 – – – –
Deposits from customers
Retail Customers:
Term deposits 160,967 164,099 68,001 92,822 3,276 – –
Current deposits 126,931 126,931 102,210 9,234 5,232 4,872 5,383
Savings deposits 407,036 411,137 114,255 110,449 61,513 57,840 67,080
Domiciliary deposits 34,507 34,507 9,522 9,332 5,288 4,924 5,441
Corporate Customers:
Term deposits 384,015 387,488 224,028 112,664 50,796 – –
Current deposits 673,358 673,358 641,885 11,756 6,661 6,203 6,853
Domiciliary deposits 294,890 294,890 95,274 74,558 42,248 39,343 43,467
Other liabilities 43,563 43,563 36,556 3,526 2,138 1,343 –
Borrowings 129,896 133,011 – 6,593 46,920 46,441 33,057
Subordinated liabilities 85,620 149,153 – – 12,786 12,786 123,581
2,401,849 2,479,305 1,352,899 430,934 236,858 173,752 284,861
Derivative liabilities:
Cross Currency Swap 327 327 327 – – – –
Contingents and loan commitments
Performance bonds and
guarantees
77,030 77,030 9,244 3,081 33,123 10,784 20,798
Letters of credit 149,488 149,488 40,362 71,754 34,382 2,990 –
Loan commitments 123,458 123,458 15,506 21,263 – 4,170 82,519
Assets used to manage liquidity
Cash and bank balances 655,371 620,183 319,098 12,108 7,693 4,616 276,668
Financial assets held for trading
Treasury bills 11,121 11,516 11,516 – – – –
Bonds 128 100 100 – – – –
Loans and advances to banks 14,600 14,646 10,840 3,806 – – –
Loans and advances to customers
Individual
Term loans 67,987 81,046 7,919 5,869 11,239 7,657 48,362
Overdrafts 46,391 46,391 46,391 – – – –
Corporates
Term loans 703,525 811,995 180,132 120,266 70,362 79,529 361,706
Overdrafts 198,587 198,587 198,587 – – – –
Others 20,147 20,231 20,231 – – – –
Investment securities
Available for sale
Treasury bills 193,816 198,805 17,403 88,607 19,980 72,815 –
Bonds 32,757 39,200 – 1,943 49 1,992 35,217
Held to maturity
Treasury bills 150,774 339,633 29,730 151,374 34,133 124,396 –
Bonds 430,345 969,395 12,102 3,170 8,104 23,097 922,922
Account receivable 28,312 28,312 28,312 – – – –
Derivative assets 1,809 1,809 1,809 – – – –
2,555,670 3,381,849 884,170 387,143 151,560 314,102 1,644,875
Gap (196,482) 552,241 (534,167) (139,889) (152,803) 122,406 1,256,697
112
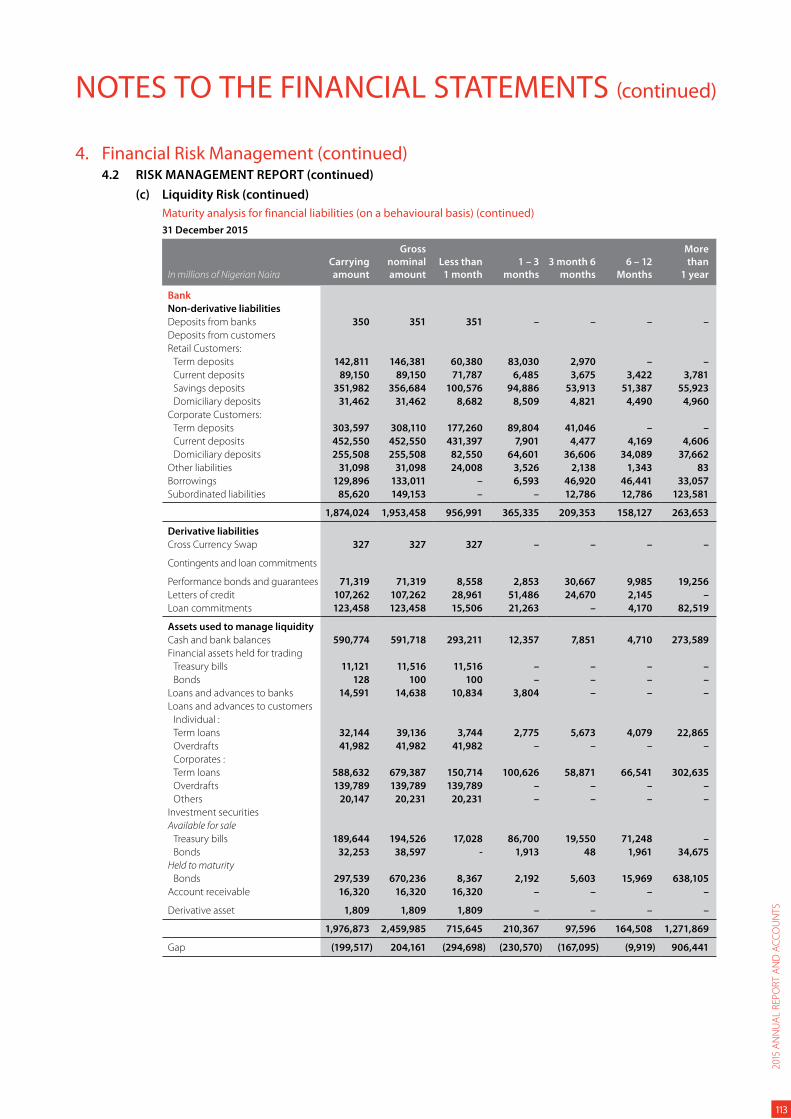
NOTES TO THE FINANCIAL STATEMENTS (continued)
4. Financial Risk Management (continued)4.2 RISK MANAGEMENT REPORT (continued)
(c) Liquidity Risk (continued)
Maturity analysis for financial liabilities (on a behavioural basis) (continued)
31 December 2015
In millions of Nigerian Naira
Carrying
amount
Gross
nominal
amount
Less than
1 month
1 – 3
months
3 month 6
months
6 – 12
Months
More
than
1 year
Bank
Non-derivative liabilities
Deposits from banks 350 351 351 – – – –
Deposits from customers
Retail Customers:
Term deposits 142,811 146,381 60,380 83,030 2,970 – –
Current deposits 89,150 89,150 71,787 6,485 3,675 3,422 3,781
Savings deposits 351,982 356,684 100,576 94,886 53,913 51,387 55,923
Domiciliary deposits 31,462 31,462 8,682 8,509 4,821 4,490 4,960
Corporate Customers:
Term deposits 303,597 308,110 177,260 89,804 41,046 – –
Current deposits 452,550 452,550 431,397 7,901 4,477 4,169 4,606
Domiciliary deposits 255,508 255,508 82,550 64,601 36,606 34,089 37,662
Other liabilities 31,098 31,098 24,008 3,526 2,138 1,343 83
Borrowings 129,896 133,011 – 6,593 46,920 46,441 33,057
Subordinated liabilities 85,620 149,153 – – 12,786 12,786 123,581
1,874,024 1,953,458 956,991 365,335 209,353 158,127 263,653
Derivative liabilities
Cross Currency Swap 327 327 327 – – – –
Contingents and loan commitments
Performance bonds and guarantees 71,319 71,319 8,558 2,853 30,667 9,985 19,256
Letters of credit 107,262 107,262 28,961 51,486 24,670 2,145 –
Loan commitments 123,458 123,458 15,506 21,263 – 4,170 82,519
Assets used to manage liquidity
Cash and bank balances 590,774 591,718 293,211 12,357 7,851 4,710 273,589
Financial assets held for trading
Treasury bills 11,121 11,516 11,516 – – – –
Bonds 128 100 100 – – – –
Loans and advances to banks 14,591 14,638 10,834 3,804 – – –
Loans and advances to customers
Individual :
Term loans 32,144 39,136 3,744 2,775 5,673 4,079 22,865
Overdrafts 41,982 41,982 41,982 – – – –
Corporates :
Term loans 588,632 679,387 150,714 100,626 58,871 66,541 302,635
Overdrafts 139,789 139,789 139,789 – – – –
Others 20,147 20,231 20,231 – – – –
Investment securities
Available for sale
Treasury bills 189,644 194,526 17,028 86,700 19,550 71,248 –
Bonds 32,253 38,597 - 1,913 48 1,961 34,675
Held to maturity
Bonds 297,539 670,236 8,367 2,192 5,603 15,969 638,105
Account receivable 16,320 16,320 16,320 – – – –
Derivative asset 1,809 1,809 1,809 – – – –
1,976,873 2,459,985 715,645 210,367 97,596 164,508 1,271,869
Gap (199,517) 204,161 (294,698) (230,570) (167,095) (9,919) 906,441
2015
AN
NU
AL
REP
OR
T A
ND
AC
CO
UN
TS
113
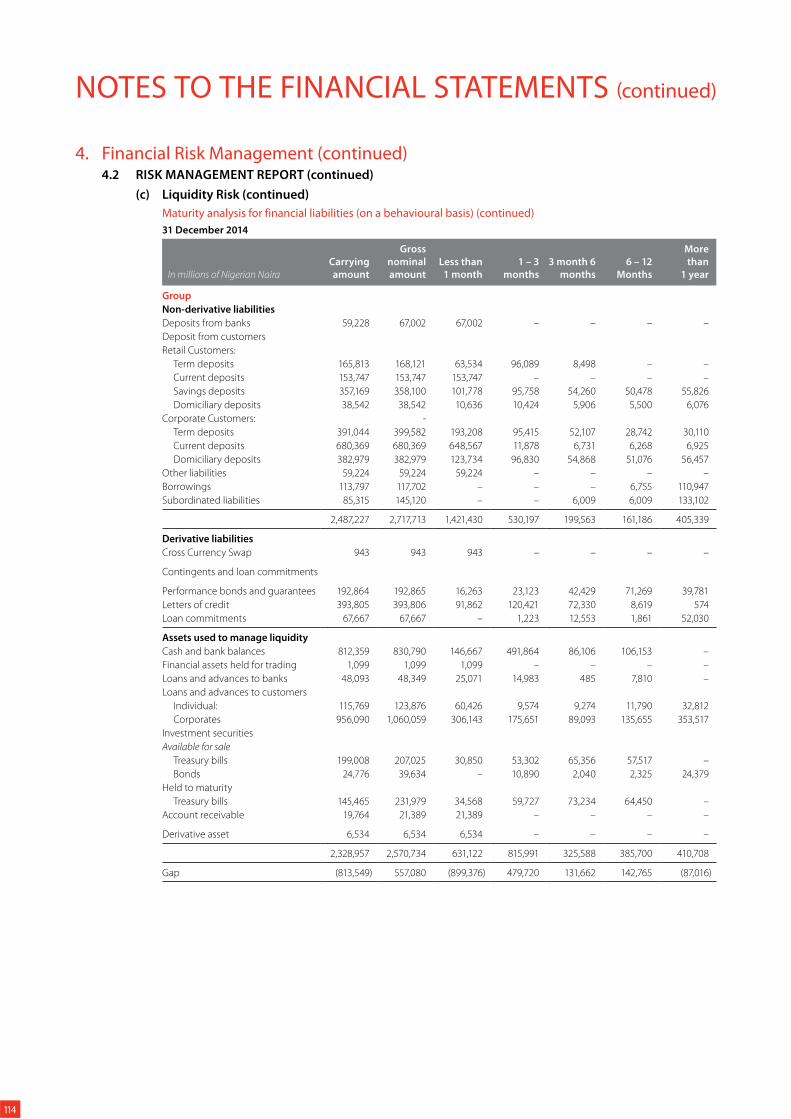
NOTES TO THE FINANCIAL STATEMENTS (continued)
4. Financial Risk Management (continued)4.2 RISK MANAGEMENT REPORT (continued)
(c) Liquidity Risk (continued)
Maturity analysis for financial liabilities (on a behavioural basis) (continued)
31 December 2014
In millions of Nigerian Naira
Carrying
amount
Gross
nominal
amount
Less than
1 month
1 – 3
months
3 month 6
months
6 – 12
Months
More
than
1 year
Group
Non-derivative liabilities
Deposits from banks 59,228 67,002 67,002 – – – –
Deposit from customers
Retail Customers:
Term deposits 165,813 168,121 63,534 96,089 8,498 – –
Current deposits 153,747 153,747 153,747 – – – –
Savings deposits 357,169 358,100 101,778 95,758 54,260 50,478 55,826
Domiciliary deposits 38,542 38,542 10,636 10,424 5,906 5,500 6,076
Corporate Customers: -
Term deposits 391,044 399,582 193,208 95,415 52,107 28,742 30,110
Current deposits 680,369 680,369 648,567 11,878 6,731 6,268 6,925
Domiciliary deposits 382,979 382,979 123,734 96,830 54,868 51,076 56,457
Other liabilities 59,224 59,224 59,224 – – – –
Borrowings 113,797 117,702 – – – 6,755 110,947
Subordinated liabilities 85,315 145,120 – – 6,009 6,009 133,102
2,487,227 2,717,713 1,421,430 530,197 199,563 161,186 405,339
Derivative liabilities
Cross Currency Swap 943 943 943 – – – –
Contingents and loan commitments
Performance bonds and guarantees 192,864 192,865 16,263 23,123 42,429 71,269 39,781
Letters of credit 393,805 393,806 91,862 120,421 72,330 8,619 574
Loan commitments 67,667 67,667 – 1,223 12,553 1,861 52,030
Assets used to manage liquidity
Cash and bank balances 812,359 830,790 146,667 491,864 86,106 106,153 –
Financial assets held for trading 1,099 1,099 1,099 – – – –
Loans and advances to banks 48,093 48,349 25,071 14,983 485 7,810 –
Loans and advances to customers
Individual: 115,769 123,876 60,426 9,574 9,274 11,790 32,812
Corporates 956,090 1,060,059 306,143 175,651 89,093 135,655 353,517
Investment securities
Available for sale
Treasury bills 199,008 207,025 30,850 53,302 65,356 57,517 –
Bonds 24,776 39,634 – 10,890 2,040 2,325 24,379
Held to maturity
Treasury bills 145,465 231,979 34,568 59,727 73,234 64,450 –
Account receivable 19,764 21,389 21,389 – – – –
Derivative asset 6,534 6,534 6,534 – – – –
2,328,957 2,570,734 631,122 815,991 325,588 385,700 410,708
Gap (813,549) 557,080 (899,376) 479,720 131,662 142,765 (87,016)
114
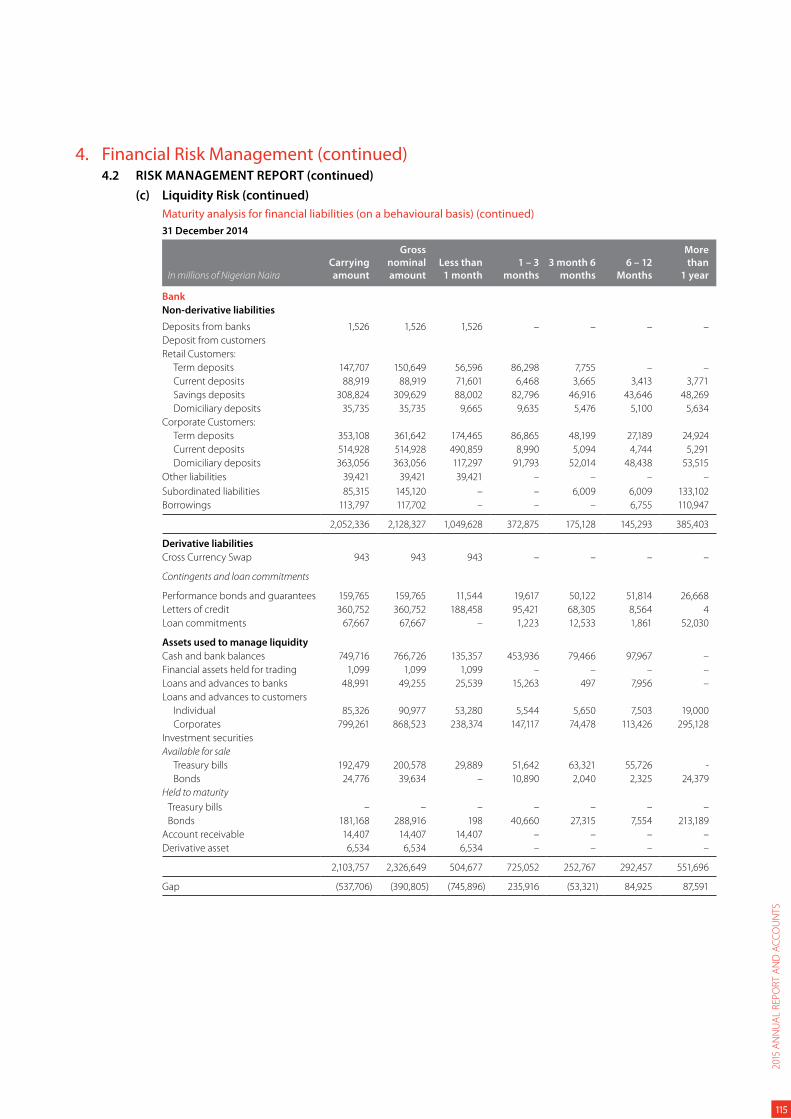
4. Financial Risk Management (continued)4.2 RISK MANAGEMENT REPORT (continued)
(c) Liquidity Risk (continued)
Maturity analysis for financial liabilities (on a behavioural basis) (continued)
31 December 2014
In millions of Nigerian Naira
Carrying
amount
Gross
nominal
amount
Less than
1 month
1 – 3
months
3 month 6
months
6 – 12
Months
More
than
1 year
Bank
Non-derivative liabilities
Deposits from banks 1,526 1,526 1,526 – – – –
Deposit from customers
Retail Customers:
Term deposits 147,707 150,649 56,596 86,298 7,755 – –
Current deposits 88,919 88,919 71,601 6,468 3,665 3,413 3,771
Savings deposits 308,824 309,629 88,002 82,796 46,916 43,646 48,269
Domiciliary deposits 35,735 35,735 9,665 9,635 5,476 5,100 5,634
Corporate Customers:
Term deposits 353,108 361,642 174,465 86,865 48,199 27,189 24,924
Current deposits 514,928 514,928 490,859 8,990 5,094 4,744 5,291
Domiciliary deposits 363,056 363,056 117,297 91,793 52,014 48,438 53,515
Other liabilities 39,421 39,421 39,421 – – – –
Subordinated liabilities 85,315 145,120 – – 6,009 6,009 133,102
Borrowings 113,797 117,702 – – – 6,755 110,947
2,052,336 2,128,327 1,049,628 372,875 175,128 145,293 385,403
Derivative liabilities
Cross Currency Swap 943 943 943 – – – –
Contingents and loan commitments
Performance bonds and guarantees 159,765 159,765 11,544 19,617 50,122 51,814 26,668
Letters of credit 360,752 360,752 188,458 95,421 68,305 8,564 4
Loan commitments 67,667 67,667 – 1,223 12,533 1,861 52,030
Assets used to manage liquidity
Cash and bank balances 749,716 766,726 135,357 453,936 79,466 97,967 –
Financial assets held for trading 1,099 1,099 1,099 – – – –
Loans and advances to banks 48,991 49,255 25,539 15,263 497 7,956 –
Loans and advances to customers
Individual 85,326 90,977 53,280 5,544 5,650 7,503 19,000
Corporates 799,261 868,523 238,374 147,117 74,478 113,426 295,128
Investment securities
Available for sale
Treasury bills 192,479 200,578 29,889 51,642 63,321 55,726 -
Bonds 24,776 39,634 – 10,890 2,040 2,325 24,379
Held to maturity
Treasury bills – – – – – – –
Bonds 181,168 288,916 198 40,660 27,315 7,554 213,189
Account receivable 14,407 14,407 14,407 – – – –
Derivative asset 6,534 6,534 6,534 – – – –
2,103,757 2,326,649 504,677 725,052 252,767 292,457 551,696
Gap (537,706) (390,805) (745,896) 235,916 (53,321) 84,925 87,591
2015
AN
NU
AL
REP
OR
T A
ND
AC
CO
UN
TS
115
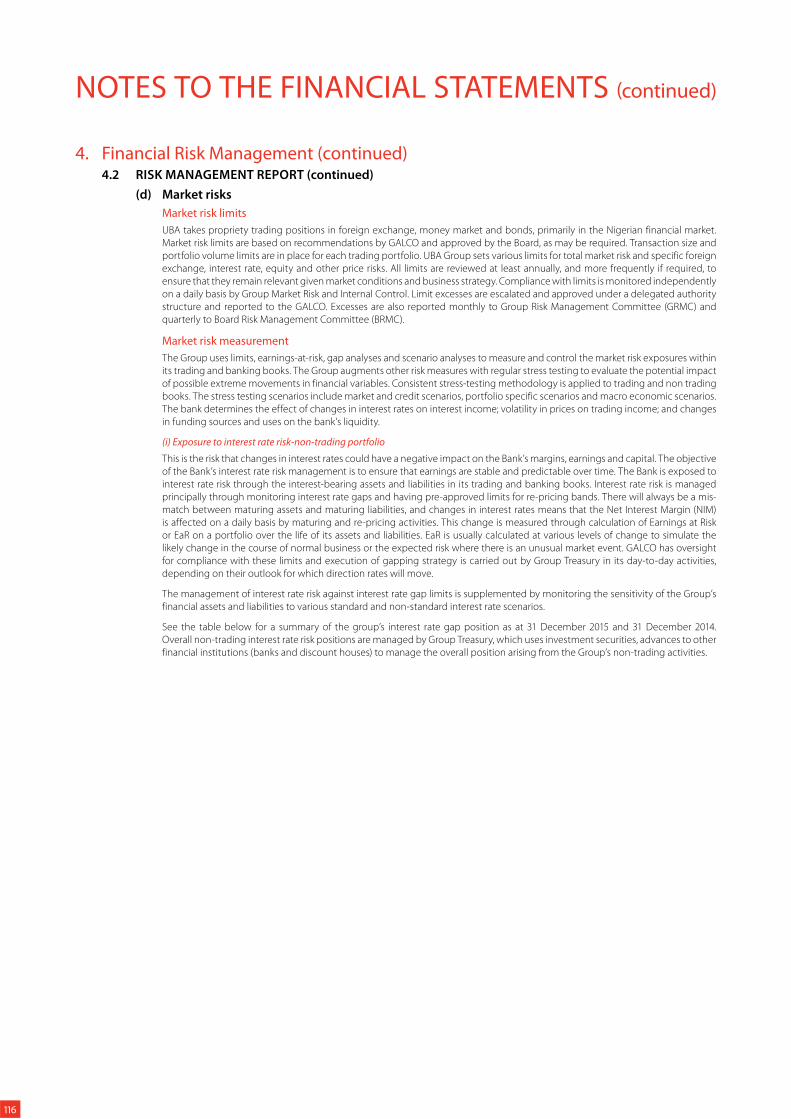
NOTES TO THE FINANCIAL STATEMENTS (continued)
4. Financial Risk Management (continued)4.2 RISK MANAGEMENT REPORT (continued)
(d) Market risks
Market risk limits
UBA takes propriety trading positions in foreign exchange, money market and bonds, primarily in the Nigerian financial market.
Market risk limits are based on recommendations by GALCO and approved by the Board, as may be required. Transaction size and
portfolio volume limits are in place for each trading portfolio. UBA Group sets various limits for total market risk and specific foreign
exchange, interest rate, equity and other price risks. All limits are reviewed at least annually, and more frequently if required, to
ensure that they remain relevant given market conditions and business strategy. Compliance with limits is monitored independently
on a daily basis by Group Market Risk and Internal Control. Limit excesses are escalated and approved under a delegated authority
structure and reported to the GALCO. Excesses are also reported monthly to Group Risk Management Committee (GRMC) and
quarterly to Board Risk Management Committee (BRMC).
Market risk measurement
The Group uses limits, earnings-at-risk, gap analyses and scenario analyses to measure and control the market risk exposures within
its trading and banking books. The Group augments other risk measures with regular stress testing to evaluate the potential impact
of possible extreme movements in financial variables. Consistent stress-testing methodology is applied to trading and non trading
books. The stress testing scenarios include market and credit scenarios, portfolio specific scenarios and macro economic scenarios.
The bank determines the effect of changes in interest rates on interest income; volatility in prices on trading income; and changes
in funding sources and uses on the bank’s liquidity.
(i) Exposure to interest rate risk-non-trading portfolio
This is the risk that changes in interest rates could have a negative impact on the Bank’s margins, earnings and capital. The objective
of the Bank’s interest rate risk management is to ensure that earnings are stable and predictable over time. The Bank is exposed to
interest rate risk through the interest-bearing assets and liabilities in its trading and banking books. Interest rate risk is managed
principally through monitoring interest rate gaps and having pre-approved limits for re-pricing bands. There will always be a mis-
match between maturing assets and maturing liabilities, and changes in interest rates means that the Net Interest Margin (NIM)
is affected on a daily basis by maturing and re-pricing activities. This change is measured through calculation of Earnings at Risk
or EaR on a portfolio over the life of its assets and liabilities. EaR is usually calculated at various levels of change to simulate the
likely change in the course of normal business or the expected risk where there is an unusual market event. GALCO has oversight
for compliance with these limits and execution of gapping strategy is carried out by Group Treasury in its day-to-day activities,
depending on their outlook for which direction rates will move.
The management of interest rate risk against interest rate gap limits is supplemented by monitoring the sensitivity of the Group’s
financial assets and liabilities to various standard and non-standard interest rate scenarios.
See the table below for a summary of the group’s interest rate gap position as at 31 December 2015 and 31 December 2014.
Overall non-trading interest rate risk positions are managed by Group Treasury, which uses investment securities, advances to other
financial institutions (banks and discount houses) to manage the overall position arising from the Group’s non-trading activities.
116
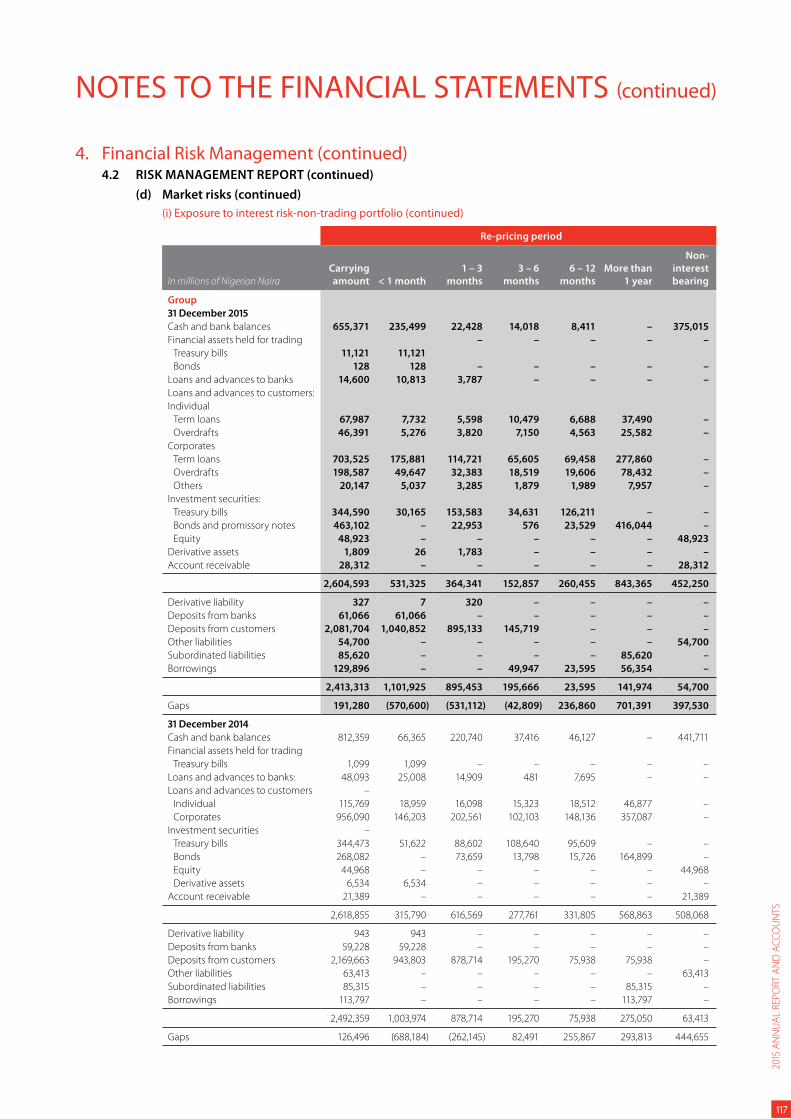
NOTES TO THE FINANCIAL STATEMENTS (continued)
4. Financial Risk Management (continued)4.2 RISK MANAGEMENT REPORT (continued)
(d) Market risks (continued)
(i) Exposure to interest risk-non-trading portfolio (continued)
Re-pricing period
In millions of Nigerian Naira
Carrying
amount < 1 month
1 – 3
months
3 – 6
months
6 – 12
months
More than
1 year
Non-
interest
bearing
Group
31 December 2015
Cash and bank balances 655,371 235,499 22,428 14,018 8,411 – 375,015
Financial assets held for trading – – – – –
Treasury bills 11,121 11,121
Bonds 128 128 – – – – –
Loans and advances to banks 14,600 10,813 3,787 – – – –
Loans and advances to customers:
Individual
Term loans 67,987 7,732 5,598 10,479 6,688 37,490 –
Overdrafts 46,391 5,276 3,820 7,150 4,563 25,582 –
Corporates
Term loans 703,525 175,881 114,721 65,605 69,458 277,860 –
Overdrafts 198,587 49,647 32,383 18,519 19,606 78,432 –
Others 20,147 5,037 3,285 1,879 1,989 7,957 –
Investment securities:
Treasury bills 344,590 30,165 153,583 34,631 126,211 – –
Bonds and promissory notes 463,102 – 22,953 576 23,529 416,044 –
Equity 48,923 – – – – – 48,923
Derivative assets 1,809 26 1,783 – – – –
Account receivable 28,312 – – – – – 28,312
2,604,593 531,325 364,341 152,857 260,455 843,365 452,250
Derivative liability 327 7 320 – – – –
Deposits from banks 61,066 61,066 – – – – –
Deposits from customers 2,081,704 1,040,852 895,133 145,719 – – –
Other liabilities 54,700 – – – – – 54,700
Subordinated liabilities 85,620 – – – – 85,620 –
Borrowings 129,896 – – 49,947 23,595 56,354 –
2,413,313 1,101,925 895,453 195,666 23,595 141,974 54,700
Gaps 191,280 (570,600) (531,112) (42,809) 236,860 701,391 397,530
31 December 2014
Cash and bank balances 812,359 66,365 220,740 37,416 46,127 – 441,711
Financial assets held for trading
Treasury bills 1,099 1,099 – – – – –
Loans and advances to banks: 48,093 25,008 14,909 481 7,695 – –
Loans and advances to customers –
Individual 115,769 18,959 16,098 15,323 18,512 46,877 –
Corporates 956,090 146,203 202,561 102,103 148,136 357,087 –
Investment securities –
Treasury bills 344,473 51,622 88,602 108,640 95,609 – –
Bonds 268,082 – 73,659 13,798 15,726 164,899 –
Equity 44,968 – – – – – 44,968
Derivative assets 6,534 6,534 – – – – –
Account receivable 21,389 – – – – – 21,389
2,618,855 315,790 616,569 277,761 331,805 568,863 508,068
Derivative liability 943 943 – – – – –
Deposits from banks 59,228 59,228 – – – – –
Deposits from customers 2,169,663 943,803 878,714 195,270 75,938 75,938 –
Other liabilities 63,413 – – – – – 63,413
Subordinated liabilities 85,315 – – – – 85,315 –
Borrowings 113,797 – – – – 113,797 –
2,492,359 1,003,974 878,714 195,270 75,938 275,050 63,413
Gaps 126,496 (688,184) (262,145) 82,491 255,867 293,813 444,655
2015
AN
NU
AL
REP
OR
T A
ND
AC
CO
UN
TS
117
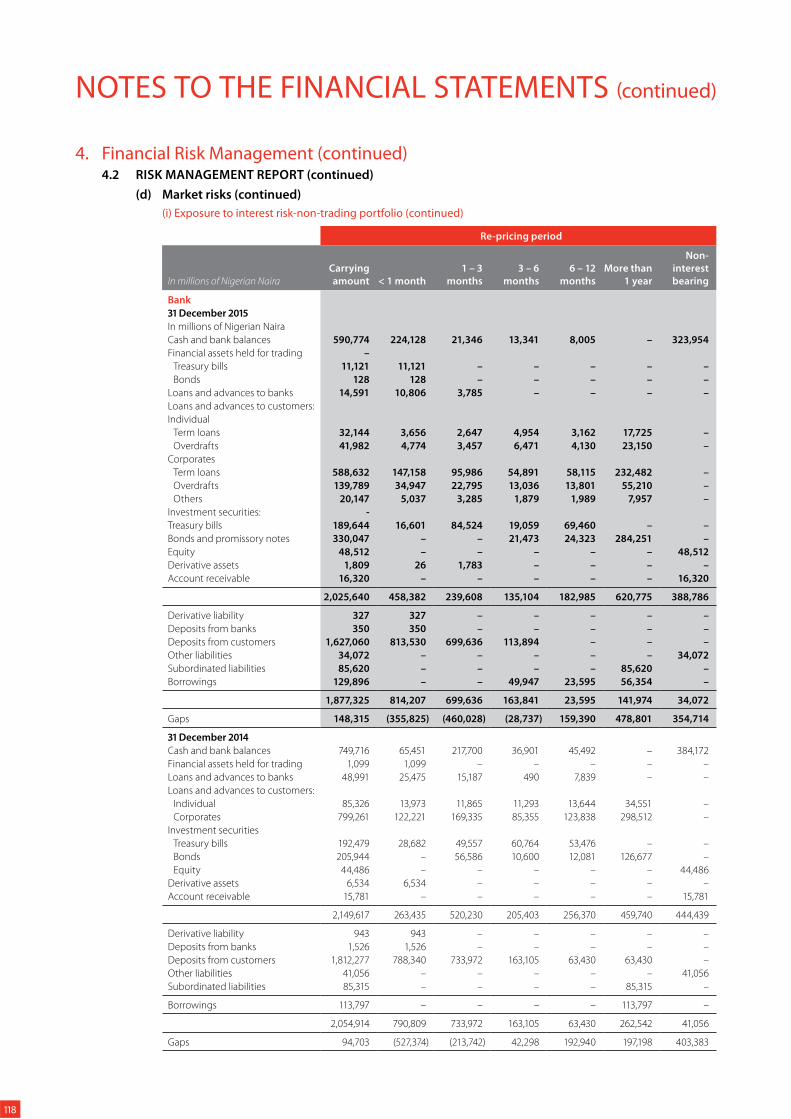
NOTES TO THE FINANCIAL STATEMENTS (continued)
4. Financial Risk Management (continued)4.2 RISK MANAGEMENT REPORT (continued)
(d) Market risks (continued)
(i) Exposure to interest risk-non-trading portfolio (continued)
Re-pricing period
In millions of Nigerian Naira
Carrying
amount < 1 month
1 – 3
months
3 – 6
months
6 – 12
months
More than
1 year
Non-
interest
bearing
Bank
31 December 2015
In millions of Nigerian Naira
Cash and bank balances 590,774 224,128 21,346 13,341 8,005 – 323,954
Financial assets held for trading –
Treasury bills 11,121 11,121 – – – – –
Bonds 128 128 – – – – –
Loans and advances to banks 14,591 10,806 3,785 – – – –
Loans and advances to customers:
Individual
Term loans 32,144 3,656 2,647 4,954 3,162 17,725 –
Overdrafts 41,982 4,774 3,457 6,471 4,130 23,150 –
Corporates
Term loans 588,632 147,158 95,986 54,891 58,115 232,482 –
Overdrafts 139,789 34,947 22,795 13,036 13,801 55,210 –
Others 20,147 5,037 3,285 1,879 1,989 7,957 –
Investment securities: -
Treasury bills 189,644 16,601 84,524 19,059 69,460 – –
Bonds and promissory notes 330,047 – – 21,473 24,323 284,251 –
Equity 48,512 – – – – – 48,512
Derivative assets 1,809 26 1,783 – – – –
Account receivable 16,320 – – – – – 16,320
2,025,640 458,382 239,608 135,104 182,985 620,775 388,786
Derivative liability 327 327 – – – – –
Deposits from banks 350 350 – – – – –
Deposits from customers 1,627,060 813,530 699,636 113,894 – – –
Other liabilities 34,072 – – – – – 34,072
Subordinated liabilities 85,620 – – – – 85,620 –
Borrowings 129,896 – – 49,947 23,595 56,354 –
1,877,325 814,207 699,636 163,841 23,595 141,974 34,072
Gaps 148,315 (355,825) (460,028) (28,737) 159,390 478,801 354,714
31 December 2014
Cash and bank balances 749,716 65,451 217,700 36,901 45,492 – 384,172
Financial assets held for trading 1,099 1,099 – – – – –
Loans and advances to banks 48,991 25,475 15,187 490 7,839 – –
Loans and advances to customers:
Individual 85,326 13,973 11,865 11,293 13,644 34,551 –
Corporates 799,261 122,221 169,335 85,355 123,838 298,512 –
Investment securities
Treasury bills 192,479 28,682 49,557 60,764 53,476 – –
Bonds 205,944 – 56,586 10,600 12,081 126,677 –
Equity 44,486 – – – – – 44,486
Derivative assets 6,534 6,534 – – – – –
Account receivable 15,781 – – – – – 15,781
2,149,617 263,435 520,230 205,403 256,370 459,740 444,439
Derivative liability 943 943 – – – – –
Deposits from banks 1,526 1,526 – – – – –
Deposits from customers 1,812,277 788,340 733,972 163,105 63,430 63,430 –
Other liabilities 41,056 – – – – – 41,056
Subordinated liabilities 85,315 – – – – 85,315 –
Borrowings 113,797 – – – – 113,797 –
2,054,914 790,809 733,972 163,105 63,430 262,542 41,056
Gaps 94,703 (527,374) (213,742) 42,298 192,940 197,198 403,383
118
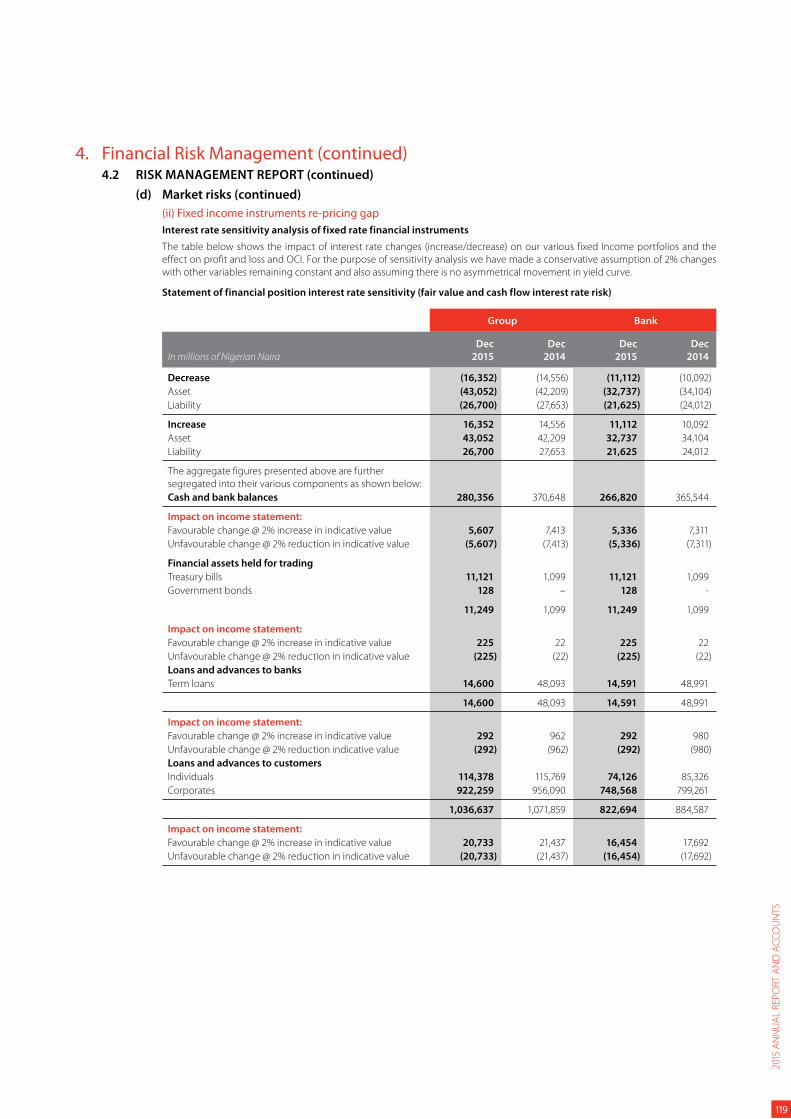
4. Financial Risk Management (continued)4.2 RISK MANAGEMENT REPORT (continued)
(d) Market risks (continued)
(ii) Fixed income instruments re-pricing gap
Interest rate sensitivity analysis of fixed rate financial instruments
The table below shows the impact of interest rate changes (increase/decrease) on our various fixed Income portfolios and the
effect on profit and loss and OCI. For the purpose of sensitivity analysis we have made a conservative assumption of 2% changes
with other variables remaining constant and also assuming there is no asymmetrical movement in yield curve.
Statement of financial position interest rate sensitivity (fair value and cash flow interest rate risk)
Group Bank
In millions of Nigerian Naira
Dec
2015
Dec
2014
Dec
2015
Dec
2014
Decrease (16,352) (14,556) (11,112) (10,092)
Asset (43,052) (42,209) (32,737) (34,104)
Liability (26,700) (27,653) (21,625) (24,012)
Increase 16,352 14,556 11,112 10,092
Asset 43,052 42,209 32,737 34,104
Liability 26,700 27,653 21,625 24,012
The aggregate figures presented above are further
segregated into their various components as shown below:
Cash and bank balances 280,356 370,648 266,820 365,544
Impact on income statement:
Favourable change @ 2% increase in indicative value 5,607 7,413 5,336 7,311
Unfavourable change @ 2% reduction in indicative value (5,607) (7,413) (5,336) (7,311)
Financial assets held for trading
Treasury bills 11,121 1,099 11,121 1,099
Government bonds 128 – 128 -
11,249 1,099 11,249 1,099
Impact on income statement:
Favourable change @ 2% increase in indicative value 225 22 225 22
Unfavourable change @ 2% reduction in indicative value (225) (22) (225) (22)
Loans and advances to banks
Term loans 14,600 48,093 14,591 48,991
14,600 48,093 14,591 48,991
Impact on income statement:
Favourable change @ 2% increase in indicative value 292 962 292 980
Unfavourable change @ 2% reduction indicative value (292) (962) (292) (980)
Loans and advances to customers
Individuals 114,378 115,769 74,126 85,326
Corporates 922,259 956,090 748,568 799,261
1,036,637 1,071,859 822,694 884,587
Impact on income statement:
Favourable change @ 2% increase in indicative value 20,733 21,437 16,454 17,692
Unfavourable change @ 2% reduction in indicative value (20,733) (21,437) (16,454) (17,692)
2015
AN
NU
AL
REP
OR
T A
ND
AC
CO
UN
TS
119
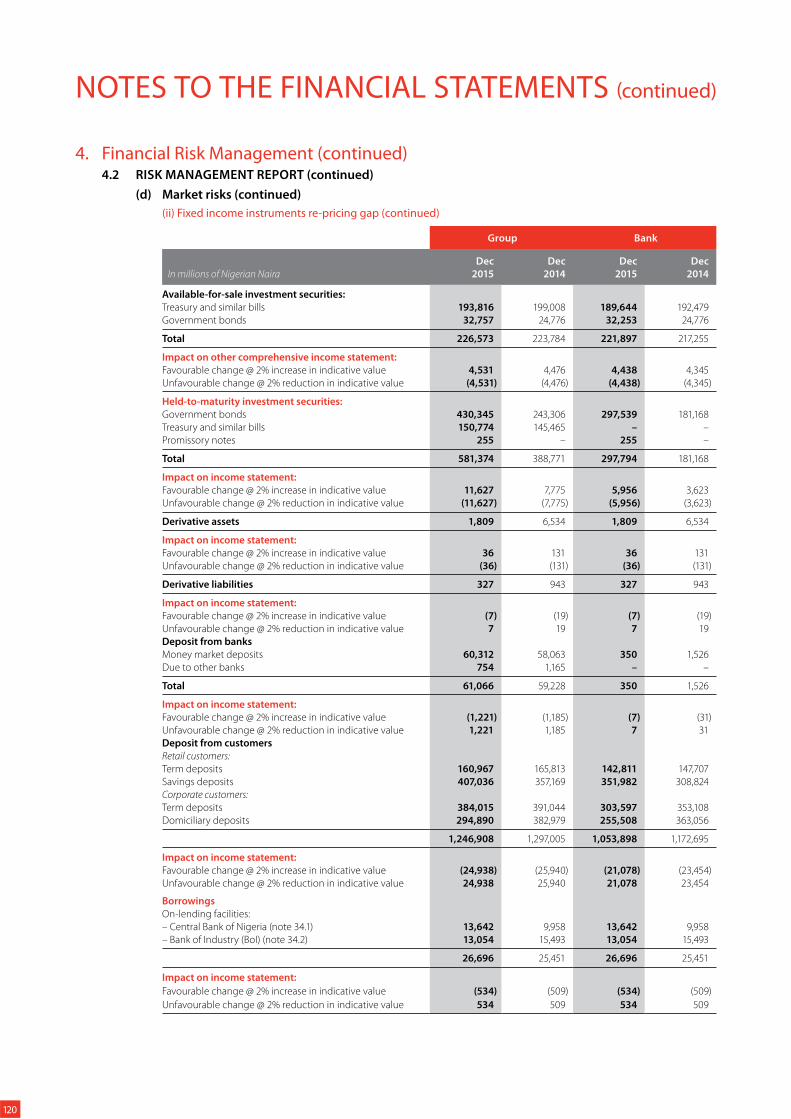
NOTES TO THE FINANCIAL STATEMENTS (continued)
4. Financial Risk Management (continued)4.2 RISK MANAGEMENT REPORT (continued)
(d) Market risks (continued)
(ii) Fixed income instruments re-pricing gap (continued)
Group Bank
In millions of Nigerian Naira
Dec
2015
Dec
2014
Dec
2015
Dec
2014
Available-for-sale investment securities:
Treasury and similar bills 193,816 199,008 189,644 192,479
Government bonds 32,757 24,776 32,253 24,776
Total 226,573 223,784 221,897 217,255
Impact on other comprehensive income statement:
Favourable change @ 2% increase in indicative value 4,531 4,476 4,438 4,345
Unfavourable change @ 2% reduction in indicative value (4,531) (4,476) (4,438) (4,345)
Held-to-maturity investment securities:
Government bonds 430,345 243,306 297,539 181,168
Treasury and similar bills 150,774 145,465 – –
Promissory notes 255 – 255 –
Total 581,374 388,771 297,794 181,168
Impact on income statement:
Favourable change @ 2% increase in indicative value 11,627 7,775 5,956 3,623
Unfavourable change @ 2% reduction in indicative value (11,627) (7,775) (5,956) (3,623)
Derivative assets 1,809 6,534 1,809 6,534
Impact on income statement:
Favourable change @ 2% increase in indicative value 36 131 36 131
Unfavourable change @ 2% reduction in indicative value (36) (131) (36) (131)
Derivative liabilities 327 943 327 943
Impact on income statement:
Favourable change @ 2% increase in indicative value (7) (19) (7) (19)
Unfavourable change @ 2% reduction in indicative value 7 19 7 19
Deposit from banks
Money market deposits 60,312 58,063 350 1,526
Due to other banks 754 1,165 – –
Total 61,066 59,228 350 1,526
Impact on income statement:
Favourable change @ 2% increase in indicative value (1,221) (1,185) (7) (31)
Unfavourable change @ 2% reduction in indicative value 1,221 1,185 7 31
Deposit from customers
Retail customers:
Term deposits 160,967 165,813 142,811 147,707
Savings deposits 407,036 357,169 351,982 308,824
Corporate customers:
Term deposits 384,015 391,044 303,597 353,108
Domiciliary deposits 294,890 382,979 255,508 363,056
1,246,908 1,297,005 1,053,898 1,172,695
Impact on income statement:
Favourable change @ 2% increase in indicative value (24,938) (25,940) (21,078) (23,454)
Unfavourable change @ 2% reduction in indicative value 24,938 25,940 21,078 23,454
Borrowings
On-lending facilities:
– Central Bank of Nigeria (note 34.1) 13,642 9,958 13,642 9,958
– Bank of Industry (BoI) (note 34.2) 13,054 15,493 13,054 15,493
26,696 25,451 26,696 25,451
Impact on income statement:
Favourable change @ 2% increase in indicative value (534) (509) (534) (509)
Unfavourable change @ 2% reduction in indicative value 534 509 534 509
120
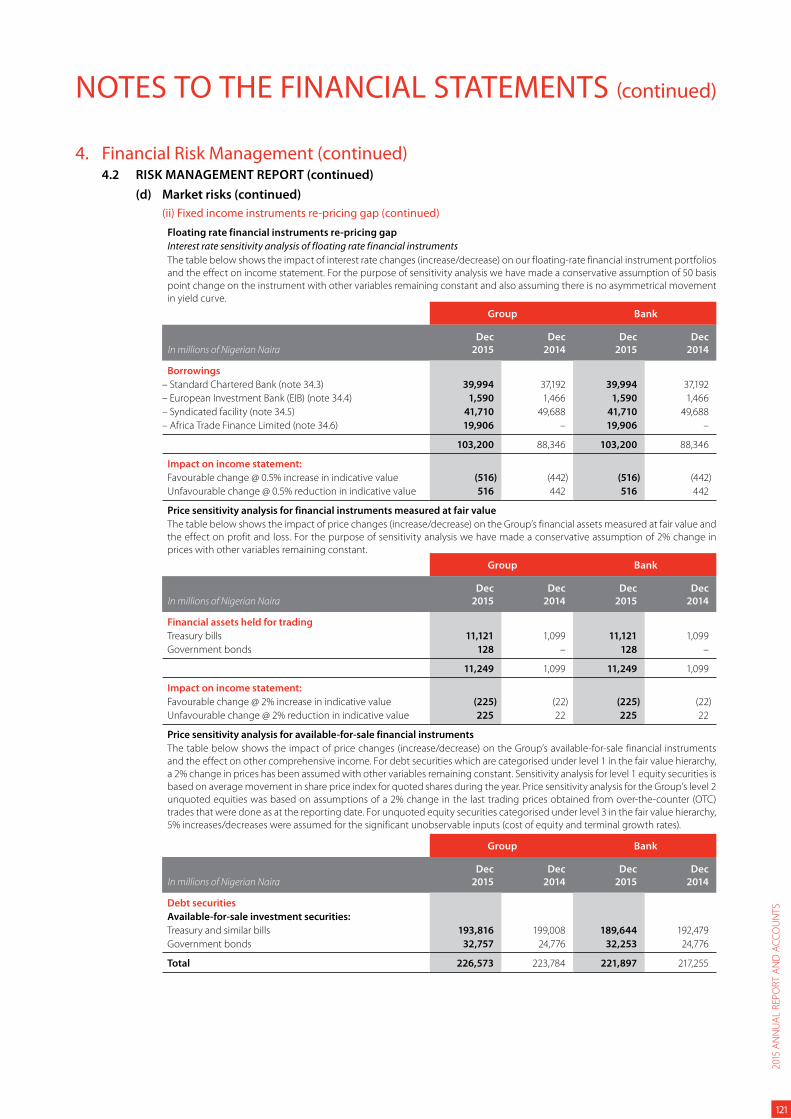
NOTES TO THE FINANCIAL STATEMENTS (continued)
4. Financial Risk Management (continued)4.2 RISK MANAGEMENT REPORT (continued)
(d) Market risks (continued)
(ii) Fixed income instruments re-pricing gap (continued)
Floating rate financial instruments re-pricing gap
Interest rate sensitivity analysis of floating rate financial instrumentsThe table below shows the impact of interest rate changes (increase/decrease) on our floating-rate financial instrument portfolios
and the effect on income statement. For the purpose of sensitivity analysis we have made a conservative assumption of 50 basis
point change on the instrument with other variables remaining constant and also assuming there is no asymmetrical movement
in yield curve.
Group Bank
In millions of Nigerian Naira
Dec
2015
Dec
2014
Dec
2015
Dec
2014
Borrowings
– Standard Chartered Bank (note 34.3) 39,994 37,192 39,994 37,192
– European Investment Bank (EIB) (note 34.4) 1,590 1,466 1,590 1,466
– Syndicated facility (note 34.5) 41,710 49,688 41,710 49,688
– Africa Trade Finance Limited (note 34.6) 19,906 – 19,906 –
103,200 88,346 103,200 88,346
Impact on income statement:
Favourable change @ 0.5% increase in indicative value (516) (442) (516) (442)
Unfavourable change @ 0.5% reduction in indicative value 516 442 516 442
Price sensitivity analysis for financial instruments measured at fair value
The table below shows the impact of price changes (increase/decrease) on the Group’s financial assets measured at fair value and
the effect on profit and loss. For the purpose of sensitivity analysis we have made a conservative assumption of 2% change in
prices with other variables remaining constant.
Group Bank
In millions of Nigerian Naira
Dec
2015
Dec
2014
Dec
2015
Dec
2014
Financial assets held for trading
Treasury bills 11,121 1,099 11,121 1,099
Government bonds 128 – 128 –
11,249 1,099 11,249 1,099
Impact on income statement:
Favourable change @ 2% increase in indicative value (225) (22) (225) (22)
Unfavourable change @ 2% reduction in indicative value 225 22 225 22
Price sensitivity analysis for available-for-sale financial instruments
The table below shows the impact of price changes (increase/decrease) on the Group’s available-for-sale financial instruments
and the effect on other comprehensive income. For debt securities which are categorised under level 1 in the fair value hierarchy,
a 2% change in prices has been assumed with other variables remaining constant. Sensitivity analysis for level 1 equity securities is
based on average movement in share price index for quoted shares during the year. Price sensitivity analysis for the Group’s level 2
unquoted equities was based on assumptions of a 2% change in the last trading prices obtained from over-the-counter (OTC)
trades that were done as at the reporting date. For unquoted equity securities categorised under level 3 in the fair value hierarchy,
5% increases/decreases were assumed for the significant unobservable inputs (cost of equity and terminal growth rates).
Group Bank
In millions of Nigerian Naira
Dec
2015
Dec
2014
Dec
2015
Dec
2014
Debt securities
Available-for-sale investment securities:
Treasury and similar bills 193,816 199,008 189,644 192,479
Government bonds 32,757 24,776 32,253 24,776
Total 226,573 223,784 221,897 217,255
2015
AN
NU
AL
REP
OR
T A
ND
AC
CO
UN
TS
121
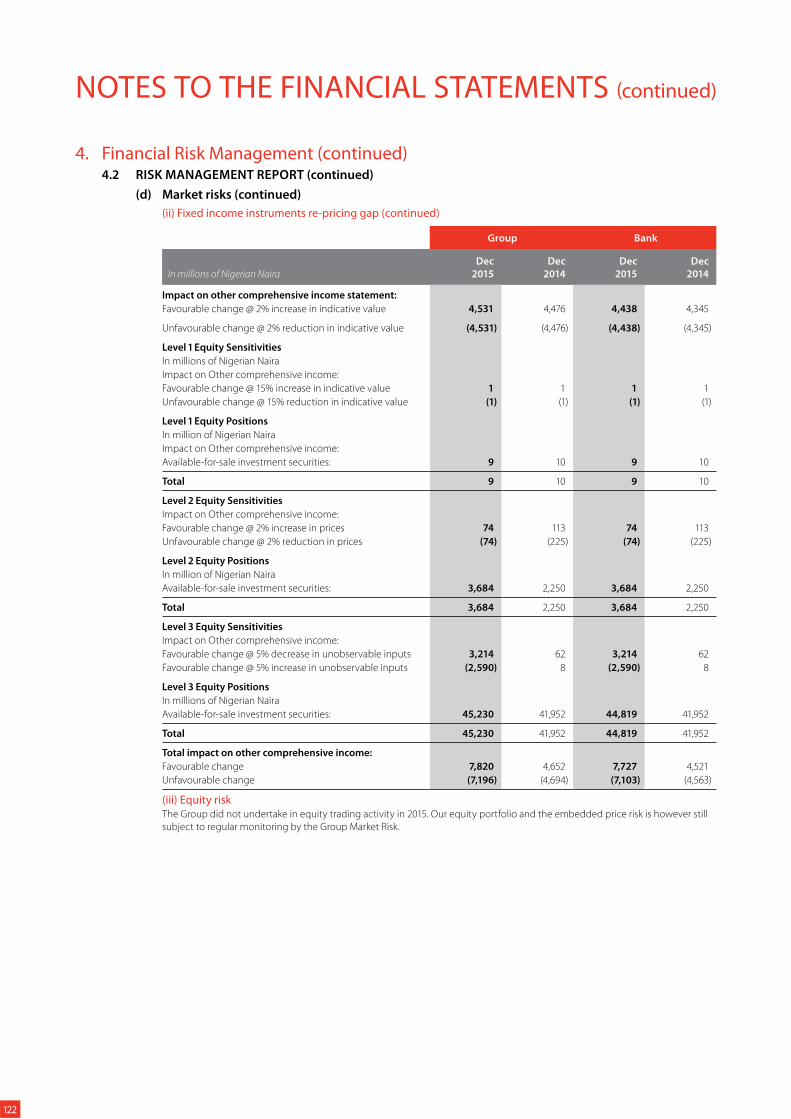
NOTES TO THE FINANCIAL STATEMENTS (continued)
4. Financial Risk Management (continued)4.2 RISK MANAGEMENT REPORT (continued)
(d) Market risks (continued)
(ii) Fixed income instruments re-pricing gap (continued)
Group Bank
In millions of Nigerian Naira
Dec
2015
Dec
2014
Dec
2015
Dec
2014
Impact on other comprehensive income statement:
Favourable change @ 2% increase in indicative value 4,531 4,476 4,438 4,345
Unfavourable change @ 2% reduction in indicative value (4,531) (4,476) (4,438) (4,345)
Level 1 Equity Sensitivities
In millions of Nigerian Naira
Impact on Other comprehensive income:
Favourable change @ 15% increase in indicative value 1 1 1 1
Unfavourable change @ 15% reduction in indicative value (1) (1) (1) (1)
Level 1 Equity Positions
In million of Nigerian Naira
Impact on Other comprehensive income:
Available-for-sale investment securities: 9 10 9 10
Total 9 10 9 10
Level 2 Equity Sensitivities
Impact on Other comprehensive income:
Favourable change @ 2% increase in prices 74 113 74 113
Unfavourable change @ 2% reduction in prices (74) (225) (74) (225)
Level 2 Equity Positions
In million of Nigerian Naira
Available-for-sale investment securities: 3,684 2,250 3,684 2,250
Total 3,684 2,250 3,684 2,250
Level 3 Equity Sensitivities
Impact on Other comprehensive income:
Favourable change @ 5% decrease in unobservable inputs 3,214 62 3,214 62
Favourable change @ 5% increase in unobservable inputs (2,590) 8 (2,590) 8
Level 3 Equity Positions
In millions of Nigerian Naira
Available-for-sale investment securities: 45,230 41,952 44,819 41,952
Total 45,230 41,952 44,819 41,952
Total impact on other comprehensive income:
Favourable change 7,820 4,652 7,727 4,521
Unfavourable change (7,196) (4,694) (7,103) (4,563)
(iii) Equity riskThe Group did not undertake in equity trading activity in 2015. Our equity portfolio and the embedded price risk is however still
subject to regular monitoring by the Group Market Risk.
122
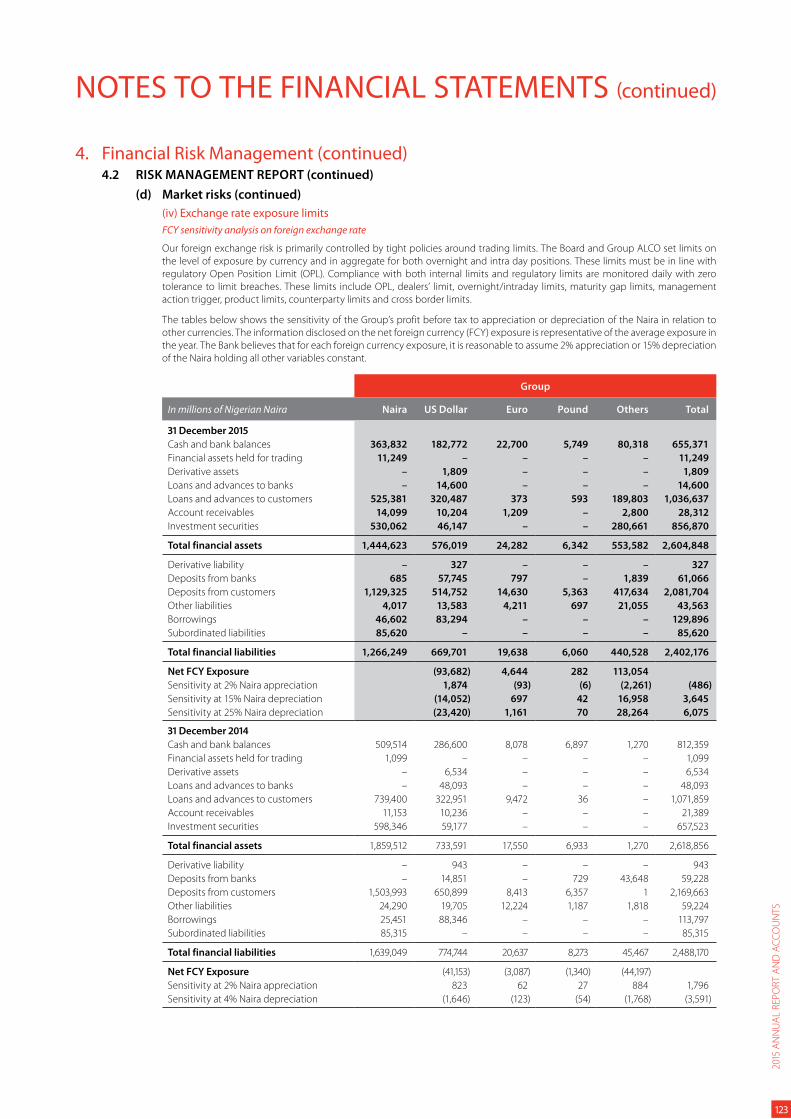
NOTES TO THE FINANCIAL STATEMENTS (continued)
4. Financial Risk Management (continued)4.2 RISK MANAGEMENT REPORT (continued)
(d) Market risks (continued)
(iv) Exchange rate exposure limits
FCY sensitivity analysis on foreign exchange rate
Our foreign exchange risk is primarily controlled by tight policies around trading limits. The Board and Group ALCO set limits on
the level of exposure by currency and in aggregate for both overnight and intra day positions. These limits must be in line with
regulatory Open Position Limit (OPL). Compliance with both internal limits and regulatory limits are monitored daily with zero
tolerance to limit breaches. These limits include OPL, dealers’ limit, overnight/intraday limits, maturity gap limits, management
action trigger, product limits, counterparty limits and cross border limits.
The tables below shows the sensitivity of the Group’s profit before tax to appreciation or depreciation of the Naira in relation to
other currencies. The information disclosed on the net foreign currency (FCY) exposure is representative of the average exposure in
the year. The Bank believes that for each foreign currency exposure, it is reasonable to assume 2% appreciation or 15% depreciation
of the Naira holding all other variables constant.
Group
In millions of Nigerian Naira Naira US Dollar Euro Pound Others Total
31 December 2015
Cash and bank balances 363,832 182,772 22,700 5,749 80,318 655,371
Financial assets held for trading 11,249 – – – – 11,249
Derivative assets – 1,809 – – – 1,809
Loans and advances to banks – 14,600 – – – 14,600
Loans and advances to customers 525,381 320,487 373 593 189,803 1,036,637
Account receivables 14,099 10,204 1,209 – 2,800 28,312
Investment securities 530,062 46,147 – – 280,661 856,870
Total financial assets 1,444,623 576,019 24,282 6,342 553,582 2,604,848
Derivative liability – 327 – – – 327
Deposits from banks 685 57,745 797 – 1,839 61,066
Deposits from customers 1,129,325 514,752 14,630 5,363 417,634 2,081,704
Other liabilities 4,017 13,583 4,211 697 21,055 43,563
Borrowings 46,602 83,294 – – – 129,896
Subordinated liabilities 85,620 – – – – 85,620
Total financial liabilities 1,266,249 669,701 19,638 6,060 440,528 2,402,176
Net FCY Exposure (93,682) 4,644 282 113,054
Sensitivity at 2% Naira appreciation 1,874 (93) (6) (2,261) (486)
Sensitivity at 15% Naira depreciation (14,052) 697 42 16,958 3,645
Sensitivity at 25% Naira depreciation (23,420) 1,161 70 28,264 6,075
31 December 2014
Cash and bank balances 509,514 286,600 8,078 6,897 1,270 812,359
Financial assets held for trading 1,099 – – – – 1,099
Derivative assets – 6,534 – – – 6,534
Loans and advances to banks – 48,093 – – – 48,093
Loans and advances to customers 739,400 322,951 9,472 36 – 1,071,859
Account receivables 11,153 10,236 – – – 21,389
Investment securities 598,346 59,177 – – – 657,523
Total financial assets 1,859,512 733,591 17,550 6,933 1,270 2,618,856
Derivative liability – 943 – – – 943
Deposits from banks – 14,851 – 729 43,648 59,228
Deposits from customers 1,503,993 650,899 8,413 6,357 1 2,169,663
Other liabilities 24,290 19,705 12,224 1,187 1,818 59,224
Borrowings 25,451 88,346 – – – 113,797
Subordinated liabilities 85,315 – – – – 85,315
Total financial liabilities 1,639,049 774,744 20,637 8,273 45,467 2,488,170
Net FCY Exposure (41,153) (3,087) (1,340) (44,197)
Sensitivity at 2% Naira appreciation 823 62 27 884 1,796
Sensitivity at 4% Naira depreciation (1,646) (123) (54) (1,768) (3,591)
2015
AN
NU
AL
REP
OR
T A
ND
AC
CO
UN
TS
123
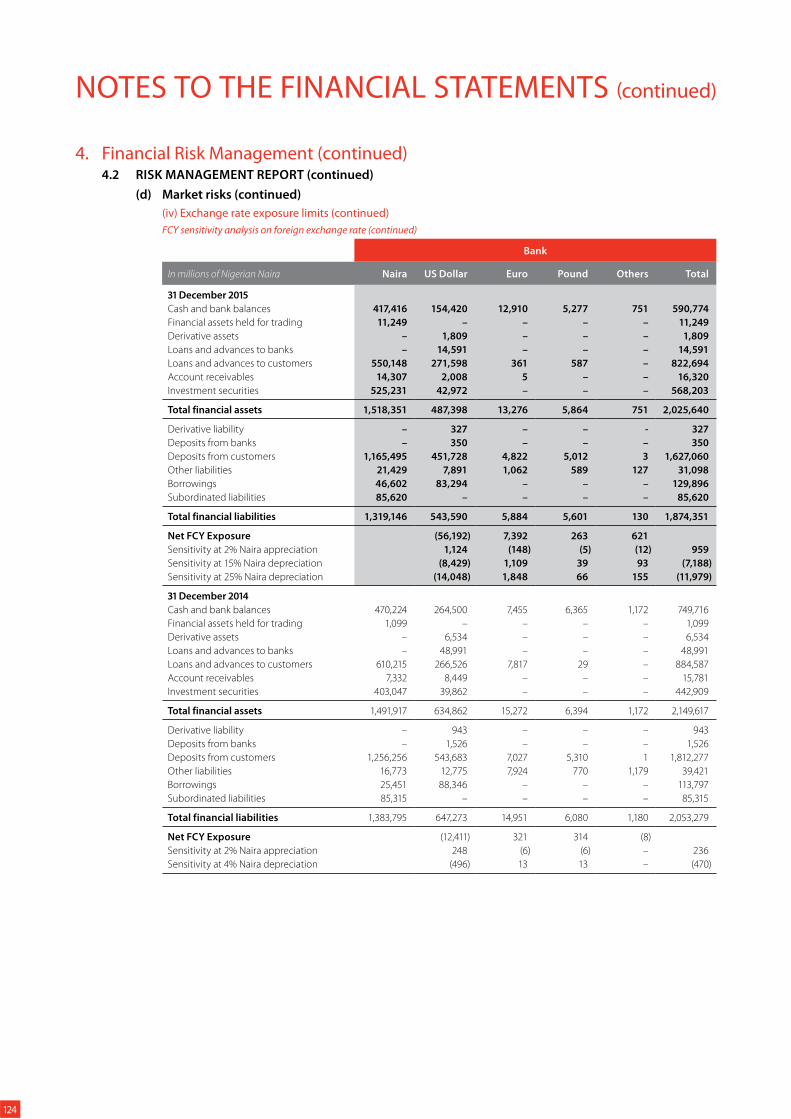
NOTES TO THE FINANCIAL STATEMENTS (continued)
4. Financial Risk Management (continued)4.2 RISK MANAGEMENT REPORT (continued)
(d) Market risks (continued)
(iv) Exchange rate exposure limits (continued)
FCY sensitivity analysis on foreign exchange rate (continued)
Bank
In millions of Nigerian Naira Naira US Dollar Euro Pound Others Total
31 December 2015
Cash and bank balances 417,416 154,420 12,910 5,277 751 590,774
Financial assets held for trading 11,249 – – – – 11,249
Derivative assets – 1,809 – – – 1,809
Loans and advances to banks – 14,591 – – – 14,591
Loans and advances to customers 550,148 271,598 361 587 – 822,694
Account receivables 14,307 2,008 5 – – 16,320
Investment securities 525,231 42,972 – – – 568,203
Total financial assets 1,518,351 487,398 13,276 5,864 751 2,025,640
Derivative liability – 327 – – - 327
Deposits from banks – 350 – – – 350
Deposits from customers 1,165,495 451,728 4,822 5,012 3 1,627,060
Other liabilities 21,429 7,891 1,062 589 127 31,098
Borrowings 46,602 83,294 – – – 129,896
Subordinated liabilities 85,620 – – – – 85,620
Total financial liabilities 1,319,146 543,590 5,884 5,601 130 1,874,351
Net FCY Exposure (56,192) 7,392 263 621
Sensitivity at 2% Naira appreciation 1,124 (148) (5) (12) 959
Sensitivity at 15% Naira depreciation (8,429) 1,109 39 93 (7,188)
Sensitivity at 25% Naira depreciation (14,048) 1,848 66 155 (11,979)
31 December 2014
Cash and bank balances 470,224 264,500 7,455 6,365 1,172 749,716
Financial assets held for trading 1,099 – – – – 1,099
Derivative assets – 6,534 – – – 6,534
Loans and advances to banks – 48,991 – – – 48,991
Loans and advances to customers 610,215 266,526 7,817 29 – 884,587
Account receivables 7,332 8,449 – – – 15,781
Investment securities 403,047 39,862 – – – 442,909
Total financial assets 1,491,917 634,862 15,272 6,394 1,172 2,149,617
Derivative liability – 943 – – – 943
Deposits from banks – 1,526 – – – 1,526
Deposits from customers 1,256,256 543,683 7,027 5,310 1 1,812,277
Other liabilities 16,773 12,775 7,924 770 1,179 39,421
Borrowings 25,451 88,346 – – – 113,797
Subordinated liabilities 85,315 – – – – 85,315
Total financial liabilities 1,383,795 647,273 14,951 6,080 1,180 2,053,279
Net FCY Exposure (12,411) 321 314 (8)
Sensitivity at 2% Naira appreciation 248 (6) (6) – 236
Sensitivity at 4% Naira depreciation (496) 13 13 – (470)
124
NOTES TO THE FINANCIAL STATEMENTS (continued)
4. Financial Risk Management (continued)4.2 RISK MANAGEMENT REPORT (continued)
(e) Capital management
There is a risk that the Group may not have adequate capital in relation to its risk profile and/or to absorb losses when they arise.
There is also a risk that the capital may fall below the required regulatory minimum. Capital management is overseen by the Board
of Directors who have overall responsibility for ensuring adequate capital is maintained for the Group. The Group has therefore put
in place a process of ensuring adequate capital is maintained and this process includes:
capital planning;
prudent portfolio management;
maintaining adequate capital across all jurisdictions;
capital adequacy stress testing;
contingency Planning.
The objective of the capital management process is to:
adequately assess impairment losses and impact on capital impairment;
meet CBN’s requirements capital adequacy requirements;
optimise the use and allocation of capital resources and align our target capital with our optimum capital structure.
Regulatory capital
The Group’s objectives when managing capital are to safeguard the Group’s ability to continue as a going concern in order to
provide returns for shareholders and benefits for other stakeholders and to maintain an optimal structure to reduce the cost of
capital. Consistent with others in the industry, the group monitors regulatory capital using the capital adequacy ratio. This ratio is
calculated as total regulatory capital divided by risk weighted assets. Total regulatory capital and risk weighted assets are calculated
as shown in the table below.
The Group’s lead regulator, the Central Bank of Nigeria sets and monitors capital requirements for the Bank. The parent company
and individual banking operations are directly supervised by the Central Bank of Nigeria and the respective regulatory authorities
in the countries in which the subsidiary banking operations are domiciled.
The Central Bank of Nigeria requires the Bank to maintain a prescribed ratio of total capital to total risk-weighted assets.
The Group’s regulatory capital is split into two tiers:
Tier 1 capital includes ordinary share capital, share premium, retained earnings, translation reserve and minority interests after
deductions for goodwill and intangible assets, and other regulatory adjustments relating to items that are included in equity but
are treated differently for capital adequacy purposes.
Tier 2 capital includes qualifying subordinated liabilities, collective impairment allowances and the element of the fair value reserve
relating to unrealised gains on financial instruments classified as available-for-sale.
Various limits are applied to elements of the capital base. The qualifying tier 2 capital cannot exceed tier 1 capital. There are also
restrictions on the amount of collective impairment allowances that may be included as part of tier 2 capital.
Banking operations are categorised mainly as trading book or banking book, and risk-weighted assets are determined according to
specified requirements that seek to reflect the varying levels of risk attached to assets and off-balance sheet exposures.
During the year, the Group’s strategy, which was unchanged, was to maintain a strong capital base so as to retain investor, creditor
and market confidence and to sustain future development of the business. The impact of the level of capital on shareholders’ return
is also recognised and the Group recognises the need to maintain a balance between the higher returns that might be possible
with greater gearing and the advantages and security afforded by a sound capital position.
Capital adequacy ratio is the quotient of the capital base of the Bank and the Bank’s risk weighted asset base. UBA Plc operates
under an international banking authorisation with a minimum regulatory capital of N50 billion and a minimum capital adequacy
ratio of 15%. During the year, the Group complied with all external capital requirements to which it is subject.
2015
AN
NU
AL
REP
OR
T A
ND
AC
CO
UN
TS
125
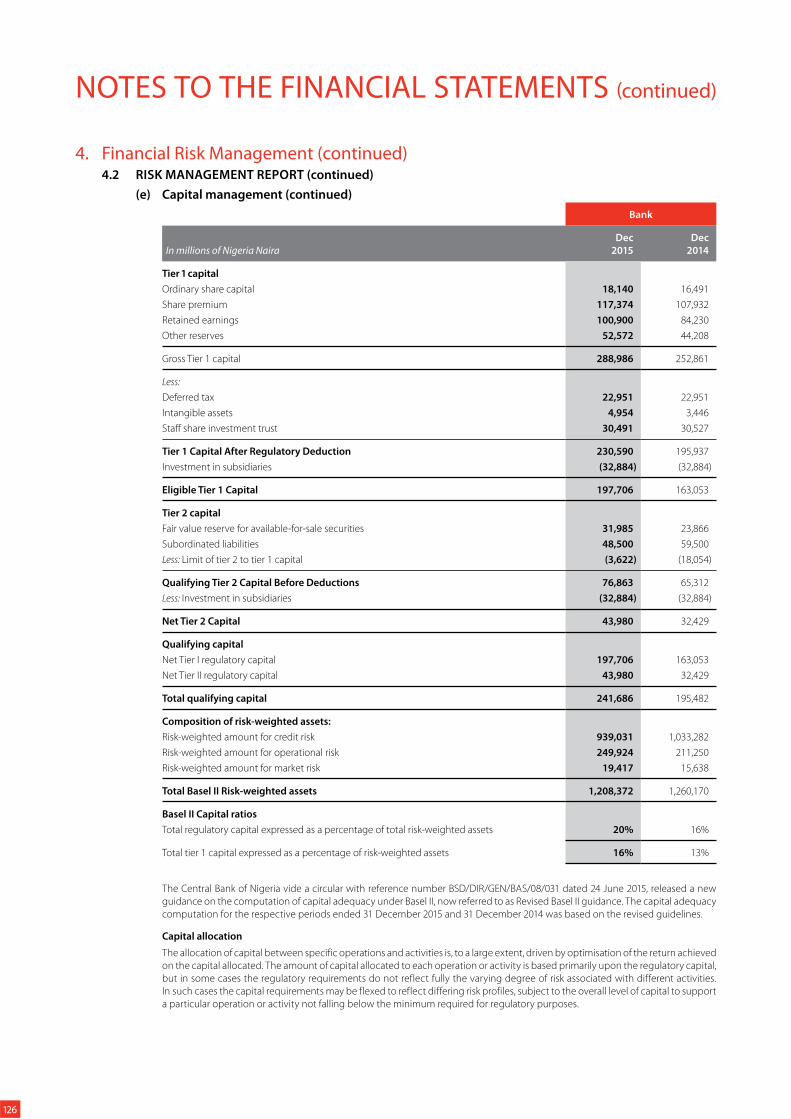
NOTES TO THE FINANCIAL STATEMENTS (continued)
4. Financial Risk Management (continued)4.2 RISK MANAGEMENT REPORT (continued)
(e) Capital management (continued)
Bank
In millions of Nigeria Naira Dec
2015
Dec
2014
Tier 1 capital
Ordinary share capital 18,140 16,491
Share premium 117,374 107,932
Retained earnings 100,900 84,230
Other reserves 52,572 44,208
Gross Tier 1 capital 288,986 252,861
Less:
Deferred tax 22,951 22,951
Intangible assets 4,954 3,446
Staff share investment trust 30,491 30,527
Tier 1 Capital After Regulatory Deduction 230,590 195,937
Investment in subsidiaries (32,884) (32,884)
Eligible Tier 1 Capital 197,706 163,053
Tier 2 capital
Fair value reserve for available-for-sale securities 31,985 23,866
Subordinated liabilities 48,500 59,500
Less: Limit of tier 2 to tier 1 capital (3,622) (18,054)
Qualifying Tier 2 Capital Before Deductions 76,863 65,312
Less: Investment in subsidiaries (32,884) (32,884)
Net Tier 2 Capital 43,980 32,429
Qualifying capital
Net Tier I regulatory capital 197,706 163,053
Net Tier II regulatory capital 43,980 32,429
Total qualifying capital 241,686 195,482
Composition of risk-weighted assets:
Risk-weighted amount for credit risk 939,031 1,033,282
Risk-weighted amount for operational risk 249,924 211,250
Risk-weighted amount for market risk 19,417 15,638
Total Basel II Risk-weighted assets 1,208,372 1,260,170
Basel II Capital ratios
Total regulatory capital expressed as a percentage of total risk-weighted assets 20% 16%
Total tier 1 capital expressed as a percentage of risk-weighted assets 16% 13%
The Central Bank of Nigeria vide a circular with reference number BSD/DIR/GEN/BAS/08/031 dated 24 June 2015, released a new
guidance on the computation of capital adequacy under Basel II, now referred to as Revised Basel II guidance. The capital adequacy
computation for the respective periods ended 31 December 2015 and 31 December 2014 was based on the revised guidelines.
Capital allocation
The allocation of capital between specific operations and activities is, to a large extent, driven by optimisation of the return achieved
on the capital allocated. The amount of capital allocated to each operation or activity is based primarily upon the regulatory capital,
but in some cases the regulatory requirements do not reflect fully the varying degree of risk associated with different activities.
In such cases the capital requirements may be flexed to reflect differing risk profiles, subject to the overall level of capital to support
a particular operation or activity not falling below the minimum required for regulatory purposes.
126
NOTES TO THE FINANCIAL STATEMENTS (continued)
4. Financial Risk Management (continued)4.2 RISK MANAGEMENT REPORT (continued)
(f) Fair value measurement
Although maximisation of the return on risk-adjusted capital is the principal basis used in determining how capital is allocated
within the Group to particular operations or activities, it is not the sole basis used for decision making. Account also is taken of
synergies with other operations and activities, the availability of management and other resources, and the fit of the activity with
the Group’s longer term strategic objectives.
Fair values of financial instruments
The fair values of financial assets and financial liabilities that are traded in active markets are based on quoted market prices or
dealer price quotations. For all other financial instruments, the Group determines fair values using other valuation techniques.
For financial instruments that trade infrequently and have little price transparency, fair value is less objective, and requires varying
degrees of judgment depending on liquidity, concentration, uncertainty of market factors, pricing assumptions and other risks
affecting the specific instrument.
Valuation models
The Group measures fair values using the following fair value hierarchy, which reflects the significance of the inputs used in making
the measurements.
Level 1: inputs that are quoted market prices (unadjusted) in active markets for identical instruments. The fair value of financial
instruments traded in active markets is based on quoted market prices at the balance sheet date. A market is regarded as active
if quoted prices are readily and regularly available from an exchange, dealer, broker, industry group, pricing service, or regulatory
agency, and those prices represent actual and regularly occurring market transactions on an arm’s length basis. The quoted market
price used for financial assets held by the Group is the current bid price. These instruments are included in level 1. Instruments
included in level 1 comprise primarily quoted equity and debt investments classified as trading securities or available for sale.
Level 2: inputs other than quoted prices included within level 1 that are observable either directly (i.e. as prices) or indirectly (i.e. derived
from prices). This category includes instruments valued using: quoted market prices in active markets for similar instruments; quoted
prices for identical or similar instruments in markets that are considered less than active; or other valuation techniques in which all
significant inputs are directly or indirectly observable from market data. The fair value of financial instruments that are not traded in
an active market (for example, over-the-counter derivatives) is determined by using valuation techniques. These valuation techniques
maximise the use of observable market data where it is available and rely as little as possible on entity specific estimates. If all significant
inputs required to fair value an instrument are observable, the instrument is included in level 2. If one or more of the significant inputs
is not based on observable market data, the instrument is included in level 3.
Specific valuation techniques used to value financial instruments include:
Quoted market prices or dealer quotes for similar instruments;
The fair value of interest rate swaps is calculated as the present value of the estimated future cash flows based on observable
yield curves;
The fair value of forward foreign exchange contracts is determined using forward exchange rates at the balance sheet date, with
the resulting value discounted back to present value;
Other techniques, such as discounted cash flow analysis, are used to determine fair value for the remaining financial instruments.
Level 3: inputs that are unobservable. This category includes all instruments for which the valuation technique includes
inputs not based on observable data and the unobservable inputs have a significant effect on the instrument’s valuation. This
category includes instruments that are valued based on quoted prices for similar instruments for which significant unobservable
adjustments or assumptions are required to reflect differences between the instruments.
Valuation techniques include net present value and discounted cash flow models, comparison with similar instruments for which
market observable prices exist, Black-Scholes and polynomial option pricing models and other valuation models. Assumptions
and inputs used in valuation techniques include risk-free and benchmark interest rates, credit spreads and other premia used in
estimating discount rate, bond and equity prices, foreign currency exchange rates, equity and equity index prices and expected
price volatilities and correlations.
The objective of valuation techniques is to arrive at a fair value measurement that reflects the price that would be received to sell
the asset or paid to transfer the liability in an orderly transaction between market participants at the measurement date.
The Group uses widely recognised valuation models for determining the fair value of common and more simple financial
instruments, such as interest rate and currency swaps that use only observable market data and require little management
judgment and estimation. Observable prices or model inputs are usually available in the market for listed debt and equity securities,
exchange-traded derivatives and simple over-the-counter derivatives such as interest rate swaps. Availability of observable market
prices and model inputs reduces the need for management judgment and estimation and also reduces the uncertainty associated
with determining fair values. Availability of observable market prices and inputs varies depending on the products and markets and
is prone to changes based on specific events and general conditions in the financial markets. The Group’s valuation methodology
for securities uses a discounted cash flow methodology and dividend discount methodology. The methodologies are often used
by market participants to price similar securities.
2015
AN
NU
AL
REP
OR
T A
ND
AC
CO
UN
TS
127
NOTES TO THE FINANCIAL STATEMENTS (continued)
4. Financial Risk Management (continued)4.2 RISK MANAGEMENT REPORT (continued)
(f) Fair value measurement (continued)
For more complex instruments, the Group uses proprietary valuation models, which are usually developed from recognised
valuation models. Some or all of the significant inputs into these models may not be observable in the market, and are derived
from market prices or rates or are estimated based on assumptions. Valuation models that employ significant unobservable inputs
require a higher degree of management judgment and estimation in the determination of fair value. Management judgment and
estimation are usually required for selection of the appropriate valuation model to be used, determination of expected future cash
flows on the financial instrument being valued, determination of the probability of counterparty default and prepayments and
selection of appropriate discount rates.
Fair value estimates obtained from models are adjusted for any other factors, such as liquidity risk or model uncertainties, to the
extent that the Group believes that a third party market participant would take them into account in pricing a transaction. Fair
values reflect the credit risk of the instrument and include adjustments to take account of the credit risk of the Group entity and
the counterparty where appropriate. For measuring derivatives that might change classification from being an asset to a liability
or vice versa such as interest rate swaps, fair values take into account both credit valuation adjustment (CVA) and debit valuation
adjustment (DVA) when market participants take this into consideration in pricing the derivatives.
Model inputs and values are calibrated against historical data and published forecasts and, where possible against current or recent
observed transactions in different instruments and against broker quotes. This calibration process is inherently subjective and it
yields ranges of possible inputs and estimates of fair value, and management judgment is required to select the most appropriate
point in the range.
If the Group measures portfolios of financial assets and financial liabilities on the basis of net exposures to market risks, then it
applies judgment in determining appropriate portfolio-level adjustments such as bid-ask spreads and relevant risk premiums.
These significant assumptions to these valuations have been disclosed in note 5.
Valuation framework
The Group has an established control framework with respect to the measurement of fair values. This framework includes a Financial
Analysis and Technical Unit which is independent of front office management and reports to the Group Chief Financial Officer, and
which has overall responsibility for valuations. There is also the Risk Measurement unit responsible for independent independently
verifying the results of third party valuation. Specific controls include:
verification of observable pricing;
re-performance of model valuations;
a review and approval process for new models and changes to models involving both Product Control and Group Market Risk;
periodic calibration and back-testing of models against observed market transactions;
analysis and investigation of significant daily valuation movements; and
review of significant unobservable inputs, valuation adjustments and significant changes to the fair value measurement of
level 3 instruments compared with the previous month, by a committee of senior Product Control and Group Market Risk
personnel.
When third party information, such as broker quotes or pricing services, is used to measure fair value, The risk measurement unit
assesses and documents the evidence obtained from the third parties to support the conclusion that such valuations meet the
requirements of IFRS. This includes:
verifying that the broker or pricing service is approved by the Group for use in pricing the relevant type of financial instrument;
understanding how the fair value has been arrived at and the extent to which it represents actual market transactions;
when prices for similar instruments are used to measure fair value, how these prices have been adjusted to reflect the
characteristics of the instrument subject to measurement; and
if a number of quotes for the same financial instrument have been obtained, then how fair value has been determined using
those quotes.
The table below analyses financial instruments measured at fair value at the end of the reporting period, by the level in the fair
value hierarchy into which the fair value measurement is categorised. The amounts are based on the values recognised in the
statement of financial position. All fair value measurements are recurring.
128
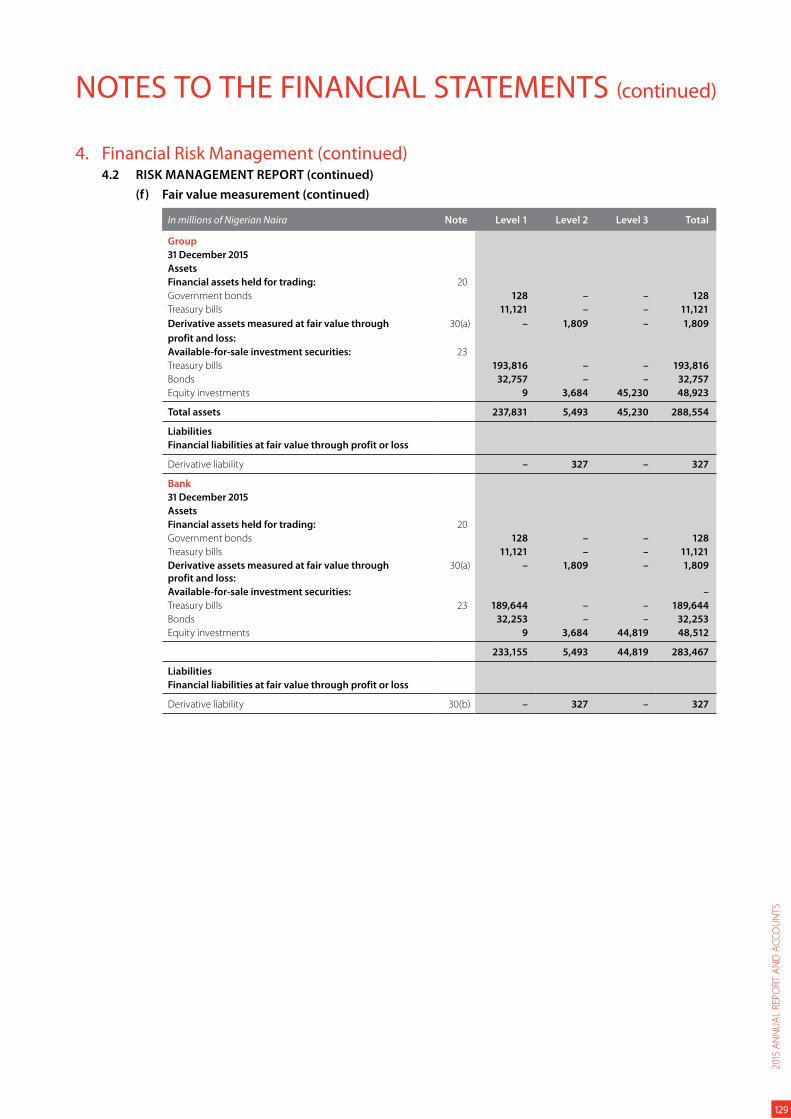
NOTES TO THE FINANCIAL STATEMENTS (continued)
4. Financial Risk Management (continued)4.2 RISK MANAGEMENT REPORT (continued)
(f) Fair value measurement (continued)
In millions of Nigerian Naira Note Level 1 Level 2 Level 3 Total
Group
31 December 2015
Assets
Financial assets held for trading: 20
Government bonds 128 – – 128
Treasury bills 11,121 – – 11,121
Derivative assets measured at fair value through
profit and loss:
30(a) – 1,809 – 1,809
Available-for-sale investment securities: 23
Treasury bills 193,816 – – 193,816
Bonds 32,757 – – 32,757
Equity investments 9 3,684 45,230 48,923
Total assets 237,831 5,493 45,230 288,554
Liabilities
Financial liabilities at fair value through profit or loss
Derivative liability – 327 – 327
Bank
31 December 2015
Assets
Financial assets held for trading: 20
Government bonds 128 – – 128
Treasury bills 11,121 – – 11,121
Derivative assets measured at fair value through
profit and loss:
30(a) – 1,809 – 1,809
Available-for-sale investment securities: –
Treasury bills 23 189,644 – – 189,644
Bonds 32,253 – – 32,253
Equity investments 9 3,684 44,819 48,512
233,155 5,493 44,819 283,467
Liabilities
Financial liabilities at fair value through profit or loss
Derivative liability 30(b) – 327 – 327
2015
AN
NU
AL
REP
OR
T A
ND
AC
CO
UN
TS
129
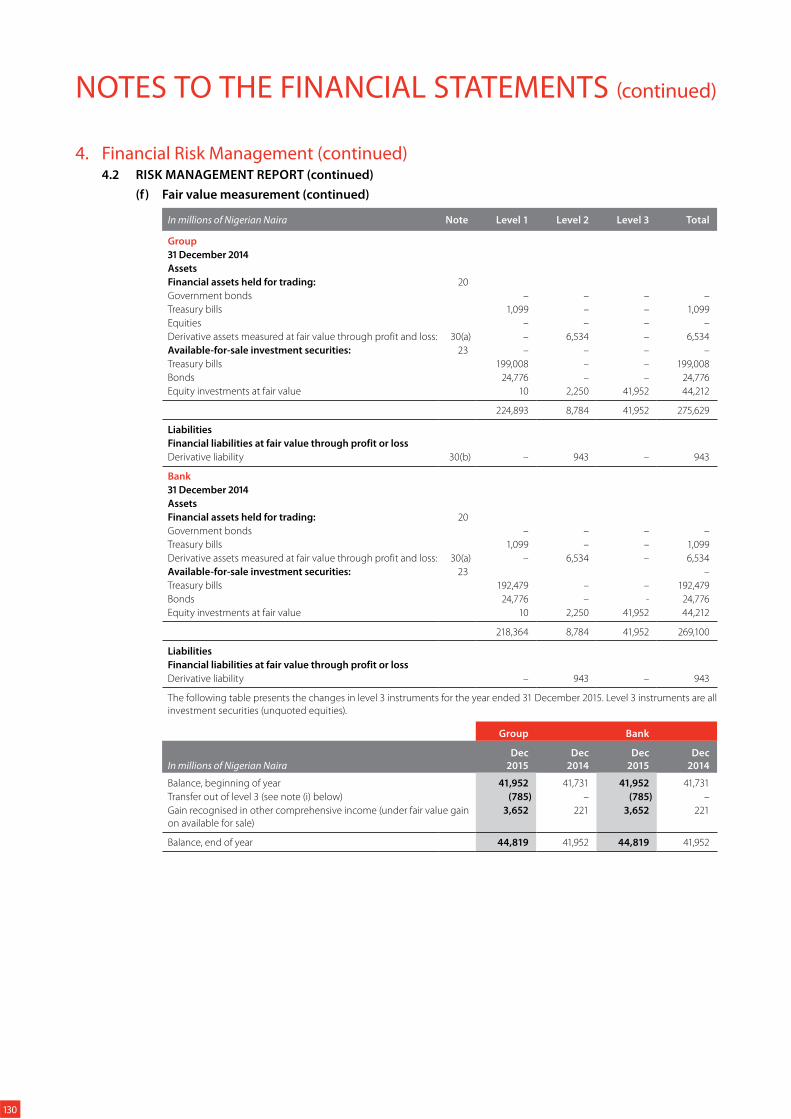
NOTES TO THE FINANCIAL STATEMENTS (continued)
4. Financial Risk Management (continued)4.2 RISK MANAGEMENT REPORT (continued)
(f) Fair value measurement (continued)
In millions of Nigerian Naira Note Level 1 Level 2 Level 3 Total
Group
31 December 2014
Assets
Financial assets held for trading: 20
Government bonds – – – –
Treasury bills 1,099 – – 1,099
Equities – – – –
Derivative assets measured at fair value through profit and loss: 30(a) – 6,534 – 6,534
Available-for-sale investment securities: 23 – – – –
Treasury bills 199,008 – – 199,008
Bonds 24,776 – – 24,776
Equity investments at fair value 10 2,250 41,952 44,212
224,893 8,784 41,952 275,629
Liabilities
Financial liabilities at fair value through profit or loss
Derivative liability 30(b) – 943 – 943
Bank
31 December 2014
Assets
Financial assets held for trading: 20
Government bonds – – – –
Treasury bills 1,099 – – 1,099
Derivative assets measured at fair value through profit and loss: 30(a) – 6,534 – 6,534
Available-for-sale investment securities: 23 –
Treasury bills 192,479 – – 192,479
Bonds 24,776 – - 24,776
Equity investments at fair value 10 2,250 41,952 44,212
218,364 8,784 41,952 269,100
Liabilities
Financial liabilities at fair value through profit or loss
Derivative liability – 943 – 943
The following table presents the changes in level 3 instruments for the year ended 31 December 2015. Level 3 instruments are all
investment securities (unquoted equities).
Group Bank
In millions of Nigerian Naira Dec
2015
Dec
2014
Dec
2015
Dec
2014
Balance, beginning of year 41,952 41,731 41,952 41,731
Transfer out of level 3 (see note (i) below) (785) – (785) –
Gain recognised in other comprehensive income (under fair value gain
on available for sale)
3,652 221 3,652 221
Balance, end of year 44,819 41,952 44,819 41,952
130
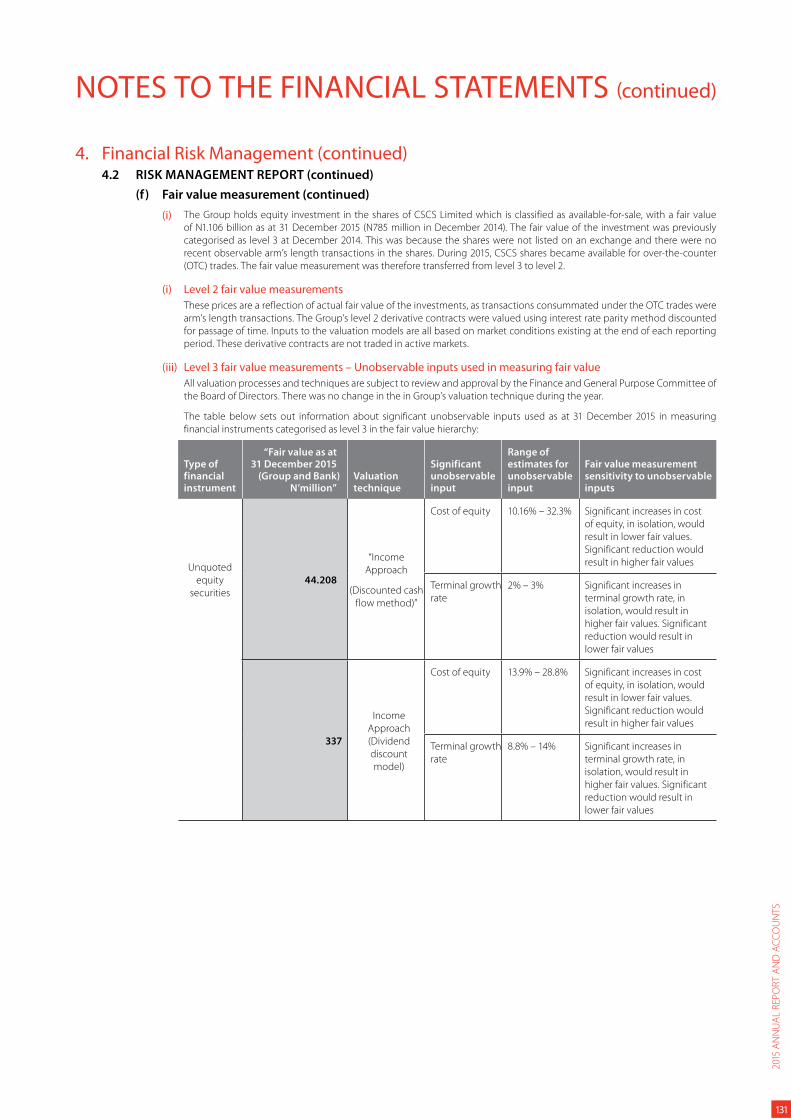
NOTES TO THE FINANCIAL STATEMENTS (continued)
4. Financial Risk Management (continued)4.2 RISK MANAGEMENT REPORT (continued)
(f) Fair value measurement (continued)
(i) The Group holds equity investment in the shares of CSCS Limited which is classified as available-for-sale, with a fair value
of N1.106 billion as at 31 December 2015 (N785 million in December 2014). The fair value of the investment was previously
categorised as level 3 at December 2014. This was because the shares were not listed on an exchange and there were no
recent observable arm’s length transactions in the shares. During 2015, CSCS shares became available for over-the-counter
(OTC) trades. The fair value measurement was therefore transferred from level 3 to level 2.
(i) Level 2 fair value measurements
These prices are a reflection of actual fair value of the investments, as transactions consummated under the OTC trades were
arm’s length transactions. The Group’s level 2 derivative contracts were valued using interest rate parity method discounted
for passage of time. Inputs to the valuation models are all based on market conditions existing at the end of each reporting
period. These derivative contracts are not traded in active markets.
(iii) Level 3 fair value measurements – Unobservable inputs used in measuring fair value
All valuation processes and techniques are subject to review and approval by the Finance and General Purpose Committee of
the Board of Directors. There was no change in the in Group’s valuation technique during the year.
The table below sets out information about significant unobservable inputs used as at 31 December 2015 in measuring
financial instruments categorised as level 3 in the fair value hierarchy:
Type of financial instrument
“Fair value as at 31 December 2015
(Group and Bank) N’million”
Valuation technique
Significant unobservable input
Range of estimates for unobservable input
Fair value measurement sensitivity to unobservable inputs
Unquoted
equity
securities
44.208
“Income
Approach
(Discounted cash
flow method)”
Cost of equity 10.16% – 32.3% Significant increases in cost
of equity, in isolation, would
result in lower fair values.
Significant reduction would
result in higher fair values
Terminal growth
rate
2% – 3% Significant increases in
terminal growth rate, in
isolation, would result in
higher fair values. Significant
reduction would result in
lower fair values
337
Income
Approach
(Dividend
discount
model)
Cost of equity 13.9% – 28.8% Significant increases in cost
of equity, in isolation, would
result in lower fair values.
Significant reduction would
result in higher fair values
Terminal growth
rate
8.8% – 14% Significant increases in
terminal growth rate, in
isolation, would result in
higher fair values. Significant
reduction would result in
lower fair values
2015
AN
NU
AL
REP
OR
T A
ND
AC
CO
UN
TS
131
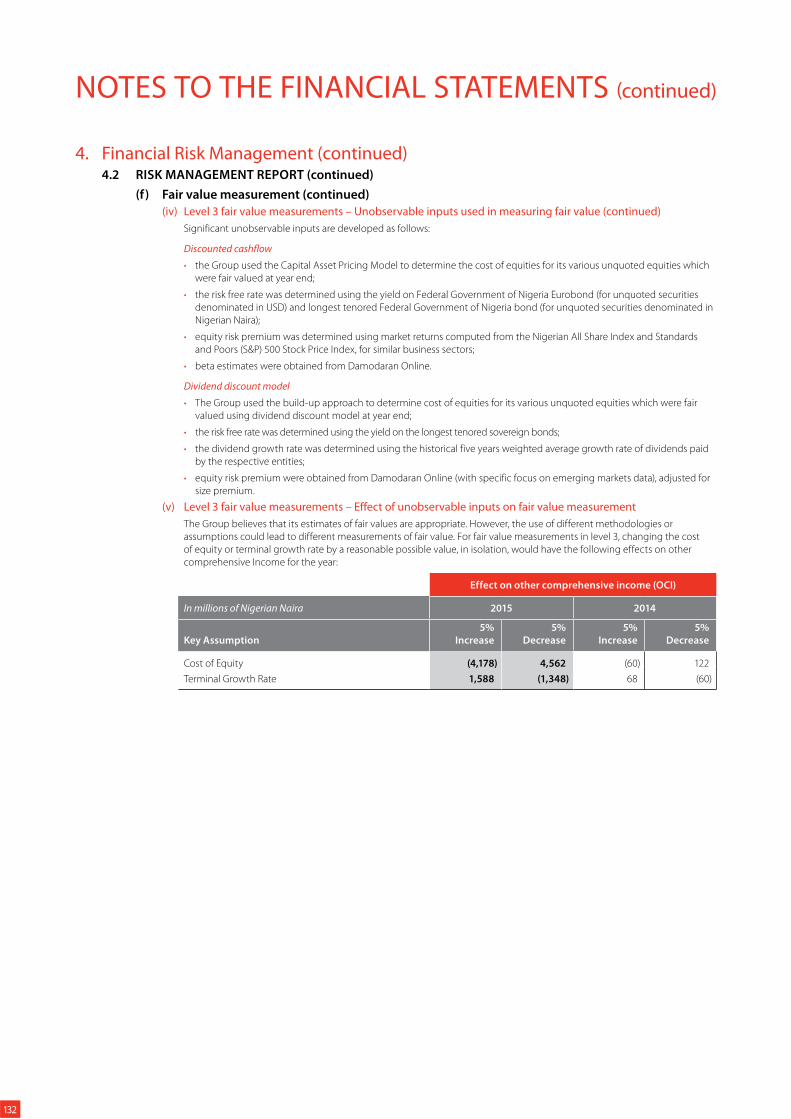
NOTES TO THE FINANCIAL STATEMENTS (continued)
4. Financial Risk Management (continued)4.2 RISK MANAGEMENT REPORT (continued)
(f) Fair value measurement (continued)
(iv) Level 3 fair value measurements – Unobservable inputs used in measuring fair value (continued)
Significant unobservable inputs are developed as follows:
Discounted cashflow
the Group used the Capital Asset Pricing Model to determine the cost of equities for its various unquoted equities which
were fair valued at year end;
the risk free rate was determined using the yield on Federal Government of Nigeria Eurobond (for unquoted securities
denominated in USD) and longest tenored Federal Government of Nigeria bond (for unquoted securities denominated in
Nigerian Naira);
equity risk premium was determined using market returns computed from the Nigerian All Share Index and Standards
and Poors (S&P) 500 Stock Price Index, for similar business sectors;
beta estimates were obtained from Damodaran Online.
Dividend discount model
The Group used the build-up approach to determine cost of equities for its various unquoted equities which were fair
valued using dividend discount model at year end;
the risk free rate was determined using the yield on the longest tenored sovereign bonds;
the dividend growth rate was determined using the historical five years weighted average growth rate of dividends paid
by the respective entities;
equity risk premium were obtained from Damodaran Online (with specific focus on emerging markets data), adjusted for
size premium.
(v) Level 3 fair value measurements – Effect of unobservable inputs on fair value measurement
The Group believes that its estimates of fair values are appropriate. However, the use of different methodologies or
assumptions could lead to different measurements of fair value. For fair value measurements in level 3, changing the cost
of equity or terminal growth rate by a reasonable possible value, in isolation, would have the following effects on other
comprehensive Income for the year:
Effect on other comprehensive income (OCI)
In millions of Nigerian Naira 2015 2014
Key Assumption
5%
Increase
5%
Decrease
5%
Increase
5%
Decrease
Cost of Equity (4,178) 4,562 (60) 122
Terminal Growth Rate 1,588 (1,348) 68 (60)
132
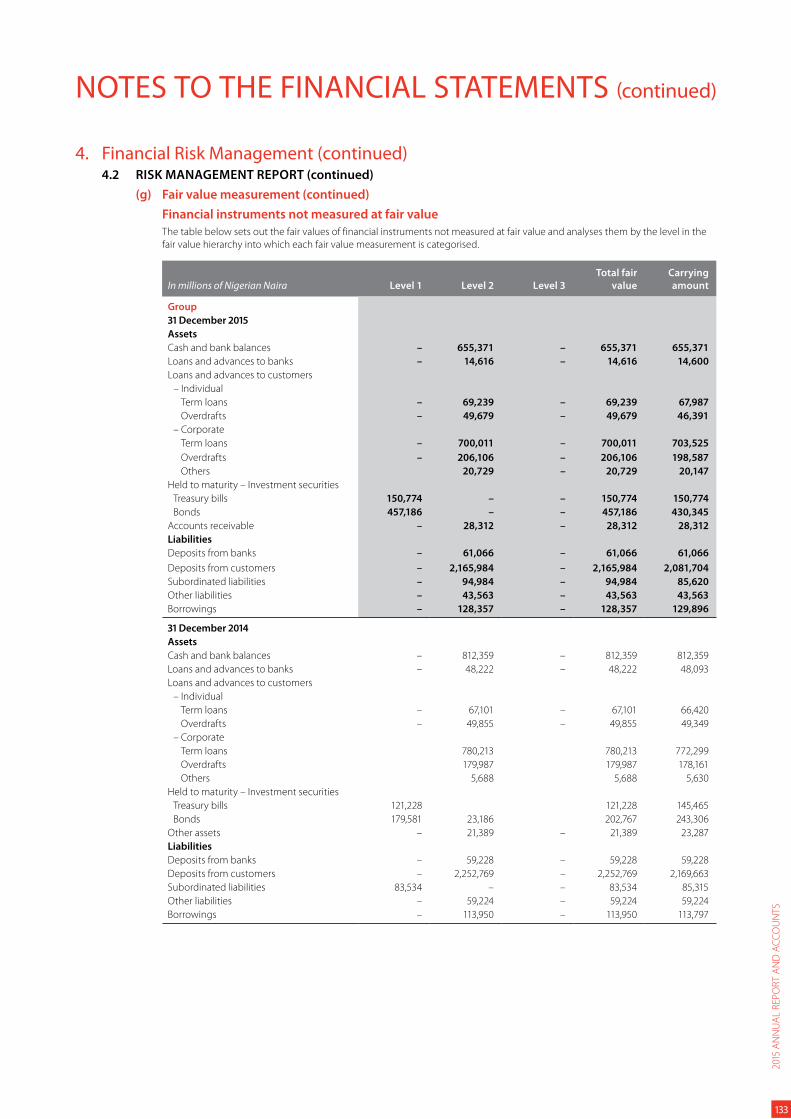
NOTES TO THE FINANCIAL STATEMENTS (continued)
4. Financial Risk Management (continued)4.2 RISK MANAGEMENT REPORT (continued)
(g) Fair value measurement (continued)
Financial instruments not measured at fair value
The table below sets out the fair values of financial instruments not measured at fair value and analyses them by the level in the
fair value hierarchy into which each fair value measurement is categorised.
In millions of Nigerian Naira Level 1 Level 2 Level 3
Total fair
value
Carrying
amount
Group
31 December 2015
Assets
Cash and bank balances – 655,371 – 655,371 655,371
Loans and advances to banks – 14,616 – 14,616 14,600
Loans and advances to customers
– Individual
Term loans – 69,239 – 69,239 67,987
Overdrafts – 49,679 – 49,679 46,391
– Corporate
Term loans – 700,011 – 700,011 703,525
Overdrafts – 206,106 – 206,106 198,587
Others 20,729 – 20,729 20,147
Held to maturity – Investment securities
Treasury bills 150,774 – – 150,774 150,774
Bonds 457,186 – – 457,186 430,345
Accounts receivable – 28,312 – 28,312 28,312
Liabilities
Deposits from banks – 61,066 – 61,066 61,066
Deposits from customers – 2,165,984 – 2,165,984 2,081,704
Subordinated liabilities – 94,984 – 94,984 85,620
Other liabilities – 43,563 – 43,563 43,563
Borrowings – 128,357 – 128,357 129,896
31 December 2014
Assets
Cash and bank balances – 812,359 – 812,359 812,359
Loans and advances to banks – 48,222 – 48,222 48,093
Loans and advances to customers
– Individual
Term loans – 67,101 – 67,101 66,420
Overdrafts – 49,855 – 49,855 49,349
– Corporate
Term loans 780,213 780,213 772,299
Overdrafts 179,987 179,987 178,161
Others 5,688 5,688 5,630
Held to maturity – Investment securities
Treasury bills 121,228 121,228 145,465
Bonds 179,581 23,186 202,767 243,306
Other assets – 21,389 – 21,389 23,287
Liabilities
Deposits from banks – 59,228 – 59,228 59,228
Deposits from customers – 2,252,769 – 2,252,769 2,169,663
Subordinated liabilities 83,534 – – 83,534 85,315
Other liabilities – 59,224 – 59,224 59,224
Borrowings – 113,950 – 113,950 113,797
2015
AN
NU
AL
REP
OR
T A
ND
AC
CO
UN
TS
133
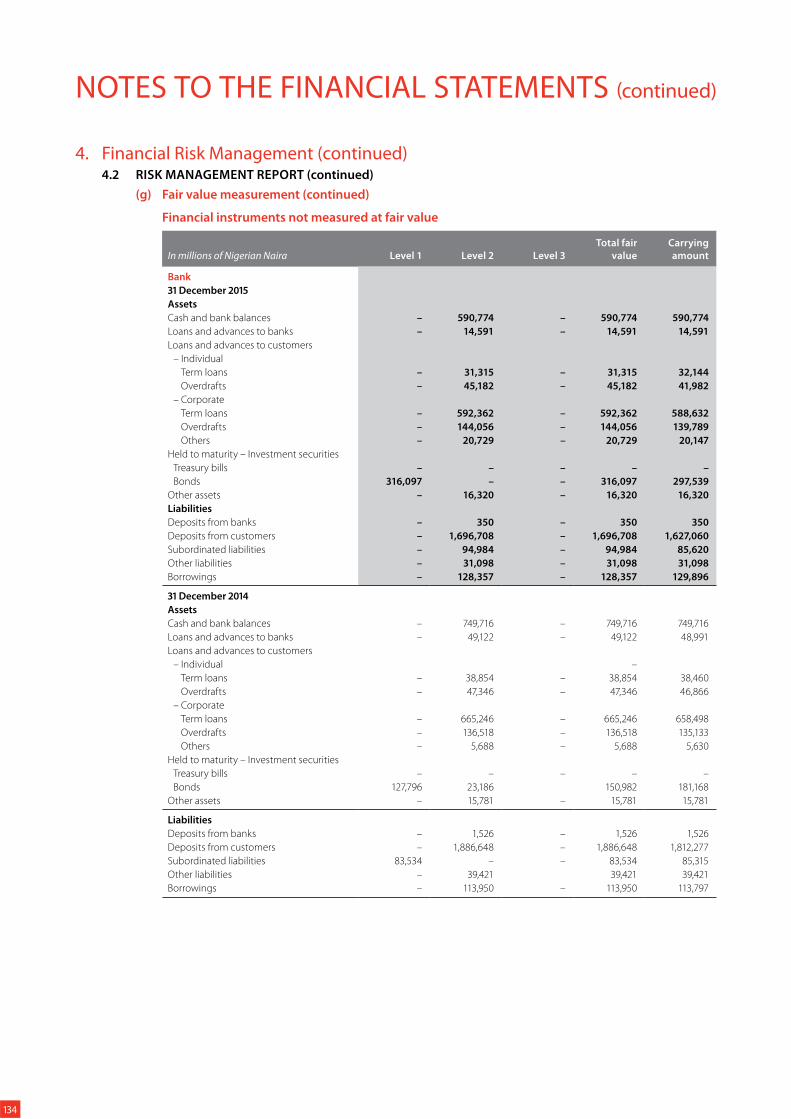
NOTES TO THE FINANCIAL STATEMENTS (continued)
4. Financial Risk Management (continued)4.2 RISK MANAGEMENT REPORT (continued)
(g) Fair value measurement (continued)
Financial instruments not measured at fair value
In millions of Nigerian Naira Level 1 Level 2 Level 3
Total fair
value
Carrying
amount
Bank
31 December 2015
Assets
Cash and bank balances – 590,774 – 590,774 590,774
Loans and advances to banks – 14,591 – 14,591 14,591
Loans and advances to customers
– Individual
Term loans – 31,315 – 31,315 32,144
Overdrafts – 45,182 – 45,182 41,982
– Corporate
Term loans – 592,362 – 592,362 588,632
Overdrafts – 144,056 – 144,056 139,789
Others – 20,729 – 20,729 20,147
Held to maturity – Investment securities
Treasury bills – – – – –
Bonds 316,097 – – 316,097 297,539
Other assets – 16,320 – 16,320 16,320
Liabilities
Deposits from banks – 350 – 350 350
Deposits from customers – 1,696,708 – 1,696,708 1,627,060
Subordinated liabilities – 94,984 – 94,984 85,620
Other liabilities – 31,098 – 31,098 31,098
Borrowings – 128,357 – 128,357 129,896
31 December 2014
Assets
Cash and bank balances – 749,716 – 749,716 749,716
Loans and advances to banks – 49,122 – 49,122 48,991
Loans and advances to customers
– Individual –
Term loans – 38,854 – 38,854 38,460
Overdrafts – 47,346 – 47,346 46,866
– Corporate
Term loans – 665,246 – 665,246 658,498
Overdrafts – 136,518 – 136,518 135,133
Others – 5,688 – 5,688 5,630
Held to maturity – Investment securities
Treasury bills – – – – –
Bonds 127,796 23,186 150,982 181,168
Other assets – 15,781 – 15,781 15,781
Liabilities
Deposits from banks – 1,526 – 1,526 1,526
Deposits from customers – 1,886,648 – 1,886,648 1,812,277
Subordinated liabilities 83,534 – – 83,534 85,315
Other liabilities – 39,421 39,421 39,421
Borrowings – 113,950 – 113,950 113,797
134

NOTES TO THE FINANCIAL STATEMENTS (continued)
4. Financial Risk Management (continued)4.2 RISK MANAGEMENT REPORT (continued)
(g) Fair value measurement (continued)
Financial instruments not measured at fair value
The fair value for financial assets and liabilities that are not carried at fair value were determined respectively as follows:
(i) CashThe carrying amount of cash and balances with banks is a reasonable approximation of fair value.
(ii) Loans and advancesLoans and advances are net of charges for impairment. To improve the accuracy of the valuation estimate for loans,
homogenous loans are grouped into portfolios with similar characteristics. The estimated fair value of loans and advances
represents the discounted amount of estimated future cash flows expected to be received. Expected cash flows are
discounted at current market rates to determine fair value.
(iii) Investment securities The fair value for investment securities is based on market prices from financial market dealer price quotations. Where this
information is not available, fair value is estimated using quoted market prices for securities with similar credit, maturity and
yield characteristics.
(iv) Other assetsThe bulk of these financial assets have short (less than three months) maturities and their amounts are a reasonable
approximation of fair value.
(v) Deposits from banks and customersThe estimated fair value of deposits with no stated maturity, which includes non-interest bearing deposits, is the amount
repayable on demand. The estimated fair value of fixed interest-bearing deposits not quoted in an active market is based on
discounted cash flows using interest rates for new debts with similar remaining maturity.
(vi) Other liabilitiesThe carrying amount of financial liabilities in other liabilities is a reasonable approximation of fair value.
(vii) Interest bearing loans and borrowingsThe estimated fair value of fixed interest-bearing borrowings not quoted in an active market is based on discounted cash
flows using the contractual interest rates for these debts over their remaining maturity.
(viii) Subordinated liabilitiesThe fair value of subordinated liabilities is based on market prices from financial market dealer price quotations.
No fair value disclosures are provided for equity investment securities that are measured at cost because their value cannot
be reliably measured.
2015
AN
NU
AL
REP
OR
T A
ND
AC
CO
UN
TS
135
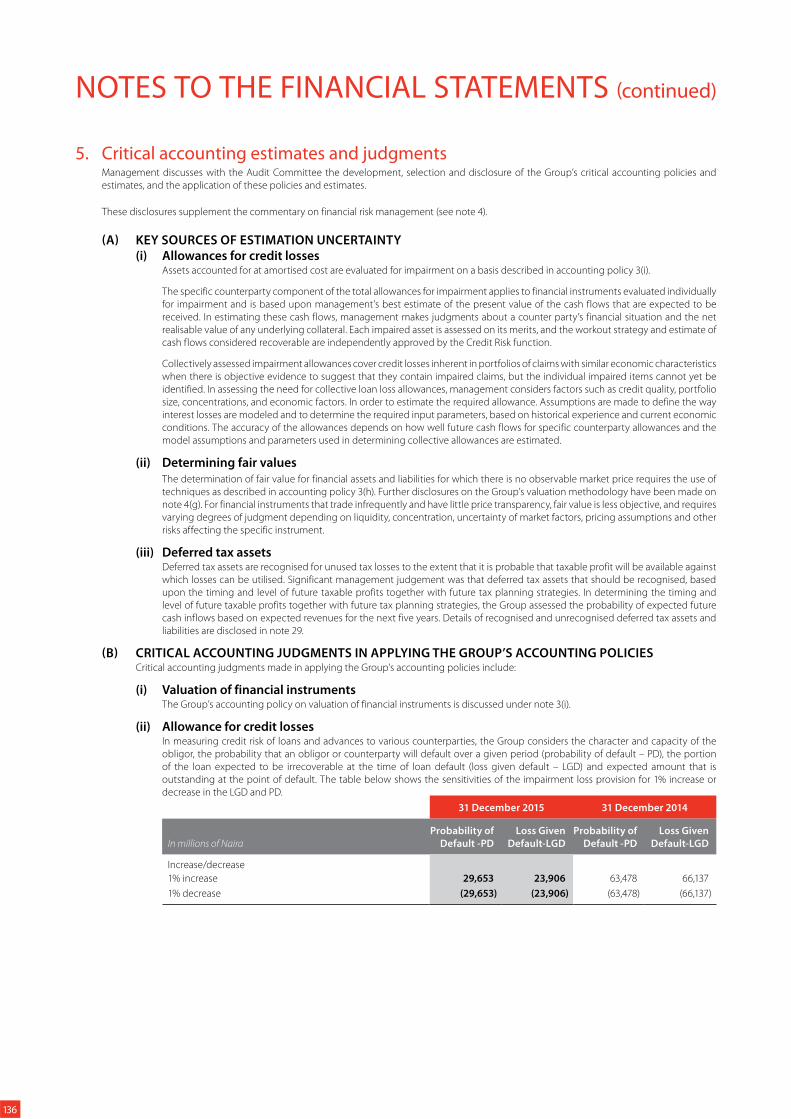
NOTES TO THE FINANCIAL STATEMENTS (continued)
5. Critical accounting estimates and judgmentsManagement discusses with the Audit Committee the development, selection and disclosure of the Group’s critical accounting policies and
estimates, and the application of these policies and estimates.
These disclosures supplement the commentary on financial risk management (see note 4).
(A) KEY SOURCES OF ESTIMATION UNCERTAINTY(i) Allowances for credit losses
Assets accounted for at amortised cost are evaluated for impairment on a basis described in accounting policy 3(i).
The specific counterparty component of the total allowances for impairment applies to financial instruments evaluated individually
for impairment and is based upon management’s best estimate of the present value of the cash flows that are expected to be
received. In estimating these cash flows, management makes judgments about a counter party’s financial situation and the net
realisable value of any underlying collateral. Each impaired asset is assessed on its merits, and the workout strategy and estimate of
cash flows considered recoverable are independently approved by the Credit Risk function.
Collectively assessed impairment allowances cover credit losses inherent in portfolios of claims with similar economic characteristics
when there is objective evidence to suggest that they contain impaired claims, but the individual impaired items cannot yet be
identified. In assessing the need for collective loan loss allowances, management considers factors such as credit quality, portfolio
size, concentrations, and economic factors. In order to estimate the required allowance. Assumptions are made to define the way
interest losses are modeled and to determine the required input parameters, based on historical experience and current economic
conditions. The accuracy of the allowances depends on how well future cash flows for specific counterparty allowances and the
model assumptions and parameters used in determining collective allowances are estimated.
(ii) Determining fair valuesThe determination of fair value for financial assets and liabilities for which there is no observable market price requires the use of
techniques as described in accounting policy 3(h). Further disclosures on the Group’s valuation methodology have been made on
note 4(g). For financial instruments that trade infrequently and have little price transparency, fair value is less objective, and requires
varying degrees of judgment depending on liquidity, concentration, uncertainty of market factors, pricing assumptions and other
risks affecting the specific instrument.
(iii) Deferred tax assetsDeferred tax assets are recognised for unused tax losses to the extent that it is probable that taxable profit will be available against
which losses can be utilised. Significant management judgement was that deferred tax assets that should be recognised, based
upon the timing and level of future taxable profits together with future tax planning strategies. In determining the timing and
level of future taxable profits together with future tax planning strategies, the Group assessed the probability of expected future
cash inflows based on expected revenues for the next five years. Details of recognised and unrecognised deferred tax assets and
liabilities are disclosed in note 29.
(B) CRITICAL ACCOUNTING JUDGMENTS IN APPLYING THE GROUP’S ACCOUNTING POLICIESCritical accounting judgments made in applying the Group’s accounting policies include:
(i) Valuation of financial instrumentsThe Group’s accounting policy on valuation of financial instruments is discussed under note 3(i).
(ii) Allowance for credit lossesIn measuring credit risk of loans and advances to various counterparties, the Group considers the character and capacity of the
obligor, the probability that an obligor or counterparty will default over a given period (probability of default – PD), the portion
of the loan expected to be irrecoverable at the time of loan default (loss given default – LGD) and expected amount that is
outstanding at the point of default. The table below shows the sensitivities of the impairment loss provision for 1% increase or
decrease in the LGD and PD.
31 December 2015 31 December 2014
In millions of Naira
Probability of
Default -PD
Loss Given
Default-LGD
Probability of
Default -PD
Loss Given
Default-LGD
Increase/decrease
1% increase 29,653 23,906 63,478 66,137
1% decrease (29,653) (23,906) (63,478) (66,137)
136
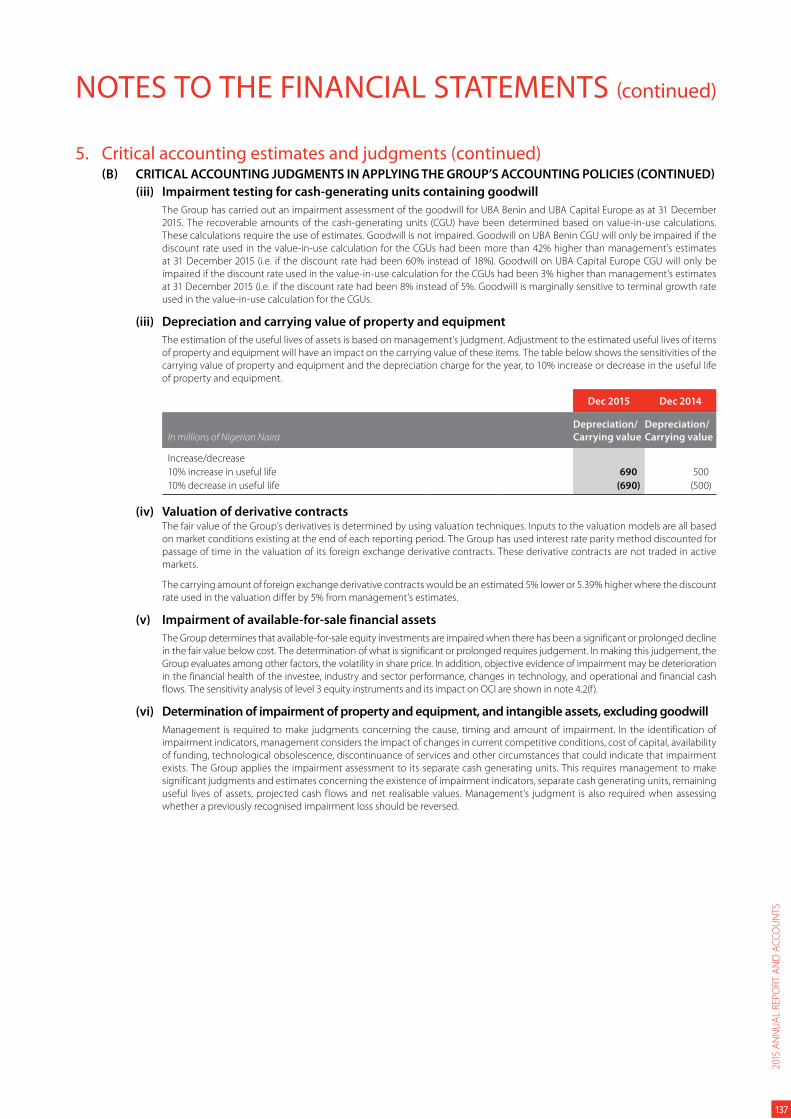
NOTES TO THE FINANCIAL STATEMENTS (continued)
5. Critical accounting estimates and judgments (continued)(B) CRITICAL ACCOUNTING JUDGMENTS IN APPLYING THE GROUP’S ACCOUNTING POLICIES (CONTINUED)
(iii) Impairment testing for cash-generating units containing goodwill
The Group has carried out an impairment assessment of the goodwill for UBA Benin and UBA Capital Europe as at 31 December
2015. The recoverable amounts of the cash-generating units (CGU) have been determined based on value-in-use calculations.
These calculations require the use of estimates. Goodwill is not impaired. Goodwill on UBA Benin CGU will only be impaired if the
discount rate used in the value-in-use calculation for the CGUs had been more than 42% higher than management’s estimates
at 31 December 2015 (i.e. if the discount rate had been 60% instead of 18%). Goodwill on UBA Capital Europe CGU will only be
impaired if the discount rate used in the value-in-use calculation for the CGUs had been 3% higher than management’s estimates
at 31 December 2015 (i.e. if the discount rate had been 8% instead of 5%. Goodwill is marginally sensitive to terminal growth rate
used in the value-in-use calculation for the CGUs.
(iii) Depreciation and carrying value of property and equipment
The estimation of the useful lives of assets is based on management’s judgment. Adjustment to the estimated useful lives of items
of property and equipment will have an impact on the carrying value of these items. The table below shows the sensitivities of the
carrying value of property and equipment and the depreciation charge for the year, to 10% increase or decrease in the useful life
of property and equipment.
Dec 2015 Dec 2014
In millions of Nigerian Naira
Depreciation/
Carrying value
Depreciation/
Carrying value
Increase/decrease
10% increase in useful life 690 500
10% decrease in useful life (690) (500)
(iv) Valuation of derivative contractsThe fair value of the Group’s derivatives is determined by using valuation techniques. Inputs to the valuation models are all based
on market conditions existing at the end of each reporting period. The Group has used interest rate parity method discounted for
passage of time in the valuation of its foreign exchange derivative contracts. These derivative contracts are not traded in active
markets.
The carrying amount of foreign exchange derivative contracts would be an estimated 5% lower or 5.39% higher where the discount
rate used in the valuation differ by 5% from management’s estimates.
(v) Impairment of available-for-sale financial assets
The Group determines that available-for-sale equity investments are impaired when there has been a significant or prolonged decline
in the fair value below cost. The determination of what is significant or prolonged requires judgement. In making this judgement, the
Group evaluates among other factors, the volatility in share price. In addition, objective evidence of impairment may be deterioration
in the financial health of the investee, industry and sector performance, changes in technology, and operational and financial cash
flows. The sensitivity analysis of level 3 equity instruments and its impact on OCI are shown in note 4.2(f).
(vi) Determination of impairment of property and equipment, and intangible assets, excluding goodwill
Management is required to make judgments concerning the cause, timing and amount of impairment. In the identification of
impairment indicators, management considers the impact of changes in current competitive conditions, cost of capital, availability
of funding, technological obsolescence, discontinuance of services and other circumstances that could indicate that impairment
exists. The Group applies the impairment assessment to its separate cash generating units. This requires management to make
significant judgments and estimates concerning the existence of impairment indicators, separate cash generating units, remaining
useful lives of assets, projected cash flows and net realisable values. Management’s judgment is also required when assessing
whether a previously recognised impairment loss should be reversed.
2015
AN
NU
AL
REP
OR
T A
ND
AC
CO
UN
TS
137
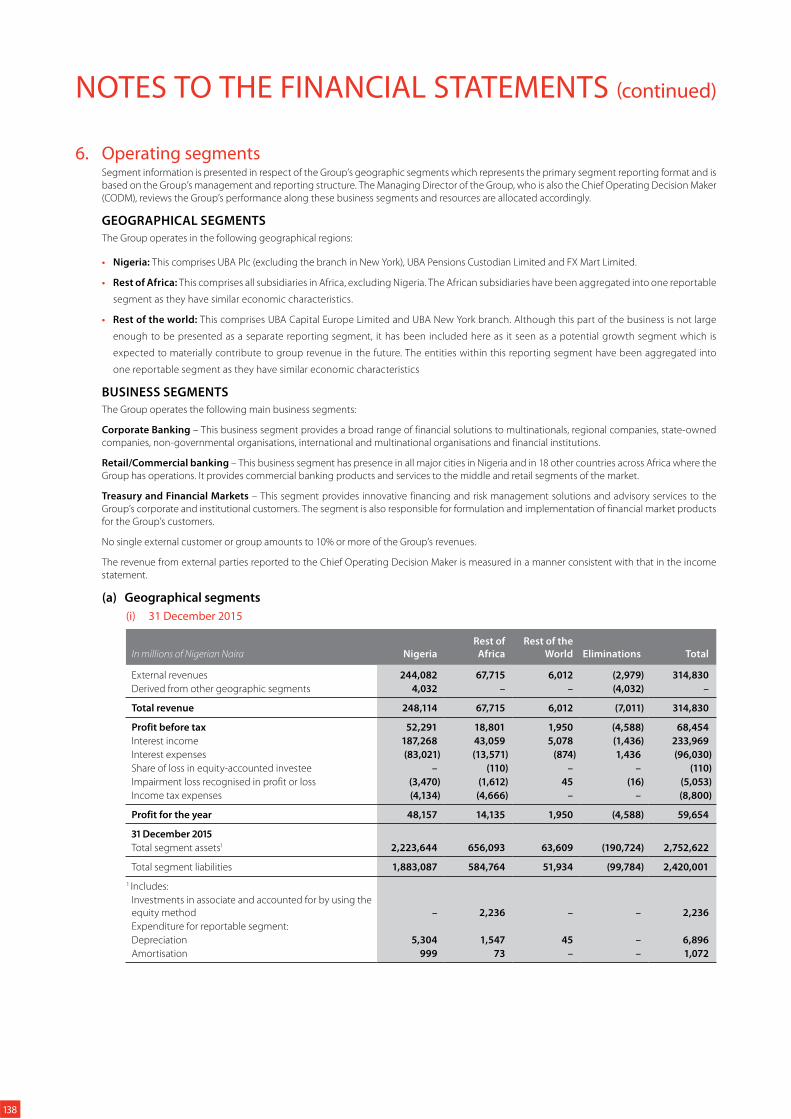
NOTES TO THE FINANCIAL STATEMENTS (continued)
6. Operating segmentsSegment information is presented in respect of the Group’s geographic segments which represents the primary segment reporting format and is
based on the Group’s management and reporting structure. The Managing Director of the Group, who is also the Chief Operating Decision Maker
(CODM), reviews the Group’s performance along these business segments and resources are allocated accordingly.
GEOGRAPHICAL SEGMENTS
The Group operates in the following geographical regions:
Nigeria: This comprises UBA Plc (excluding the branch in New York), UBA Pensions Custodian Limited and FX Mart Limited.
Rest of Africa: This comprises all subsidiaries in Africa, excluding Nigeria. The African subsidiaries have been aggregated into one reportable
segment as they have similar economic characteristics.
Rest of the world: This comprises UBA Capital Europe Limited and UBA New York branch. Although this part of the business is not large
enough to be presented as a separate reporting segment, it has been included here as it seen as a potential growth segment which is
expected to materially contribute to group revenue in the future. The entities within this reporting segment have been aggregated into
one reportable segment as they have similar economic characteristics
BUSINESS SEGMENTS
The Group operates the following main business segments:
Corporate Banking – This business segment provides a broad range of financial solutions to multinationals, regional companies, state-owned
companies, non-governmental organisations, international and multinational organisations and financial institutions.
Retail/Commercial banking – This business segment has presence in all major cities in Nigeria and in 18 other countries across Africa where the
Group has operations. It provides commercial banking products and services to the middle and retail segments of the market.
Treasury and Financial Markets – This segment provides innovative financing and risk management solutions and advisory services to the
Group’s corporate and institutional customers. The segment is also responsible for formulation and implementation of financial market products
for the Group’s customers.
No single external customer or group amounts to 10% or more of the Group’s revenues.
The revenue from external parties reported to the Chief Operating Decision Maker is measured in a manner consistent with that in the income
statement.
(a) Geographical segments
(i) 31 December 2015
In millions of Nigerian Naira Nigeria
Rest of
Africa
Rest of the
World Eliminations Total
External revenues 244,082 67,715 6,012 (2,979) 314,830
Derived from other geographic segments 4,032 – – (4,032) –
Total revenue 248,114 67,715 6,012 (7,011) 314,830
Profit before tax 52,291 18,801 1,950 (4,588) 68,454
Interest income 187,268 43,059 5,078 (1,436) 233,969
Interest expenses (83,021) (13,571) (874) 1,436 (96,030)
Share of loss in equity-accounted investee – (110) – – (110)
Impairment loss recognised in profit or loss (3,470) (1,612) 45 (16) (5,053)
Income tax expenses (4,134) (4,666) – – (8,800)
Profit for the year 48,157 14,135 1,950 (4,588) 59,654
31 December 2015
Total segment assets1 2,223,644 656,093 63,609 (190,724) 2,752,622
Total segment liabilities 1,883,087 584,764 51,934 (99,784) 2,420,001
1 Includes:
Investments in associate and accounted for by using the
equity method – 2,236 – – 2,236
Expenditure for reportable segment:
Depreciation 5,304 1,547 45 – 6,896
Amortisation 999 73 – – 1,072
138
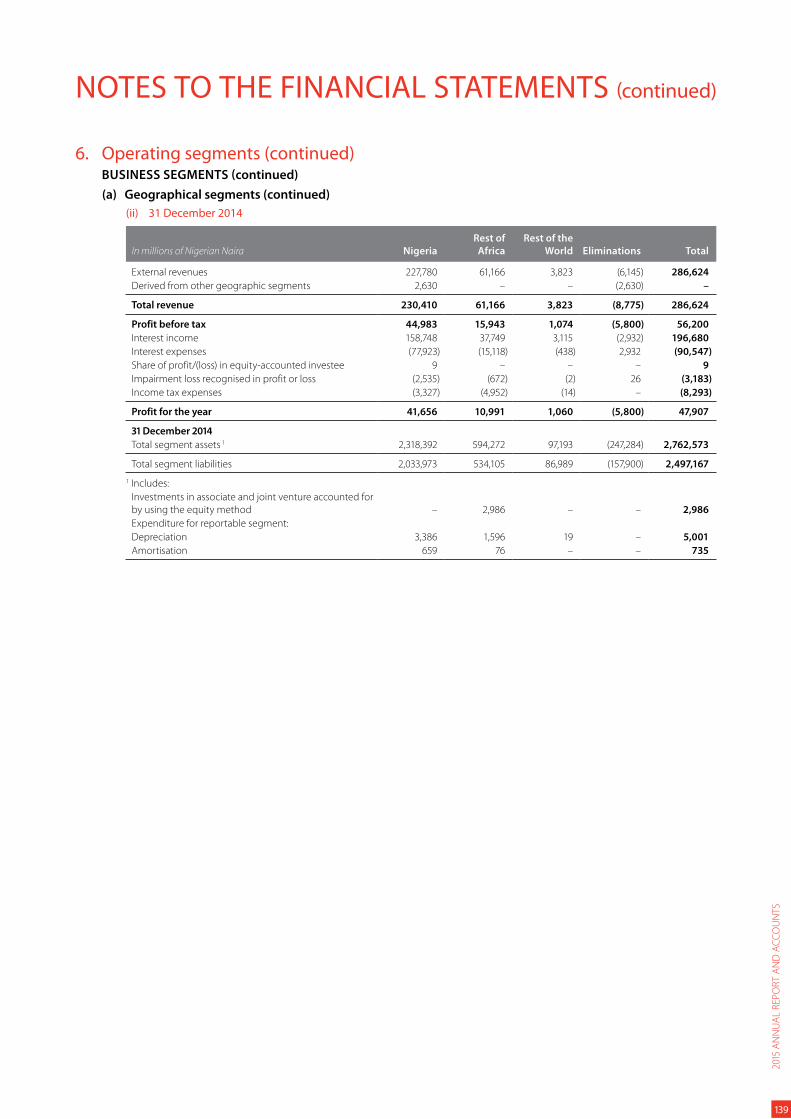
NOTES TO THE FINANCIAL STATEMENTS (continued)
6. Operating segments (continued)BUSINESS SEGMENTS (continued)
(a) Geographical segments (continued)
(ii) 31 December 2014
In millions of Nigerian Naira Nigeria
Rest of
Africa
Rest of the
World Eliminations Total
External revenues 227,780 61,166 3,823 (6,145) 286,624
Derived from other geographic segments 2,630 – – (2,630) –
Total revenue 230,410 61,166 3,823 (8,775) 286,624
Profit before tax 44,983 15,943 1,074 (5,800) 56,200
Interest income 158,748 37,749 3,115 (2,932) 196,680
Interest expenses (77,923) (15,118) (438) 2,932 (90,547)
Share of profit/(loss) in equity-accounted investee 9 – – – 9
Impairment loss recognised in profit or loss (2,535) (672) (2) 26 (3,183)
Income tax expenses (3,327) (4,952) (14) – (8,293)
Profit for the year 41,656 10,991 1,060 (5,800) 47,907
31 December 2014
Total segment assets 1 2,318,392 594,272 97,193 (247,284) 2,762,573
Total segment liabilities 2,033,973 534,105 86,989 (157,900) 2,497,167
1 Includes:
Investments in associate and joint venture accounted for
by using the equity method – 2,986 – – 2,986
Expenditure for reportable segment:
Depreciation 3,386 1,596 19 – 5,001
Amortisation 659 76 – – 735
2015
AN
NU
AL
REP
OR
T A
ND
AC
CO
UN
TS
139
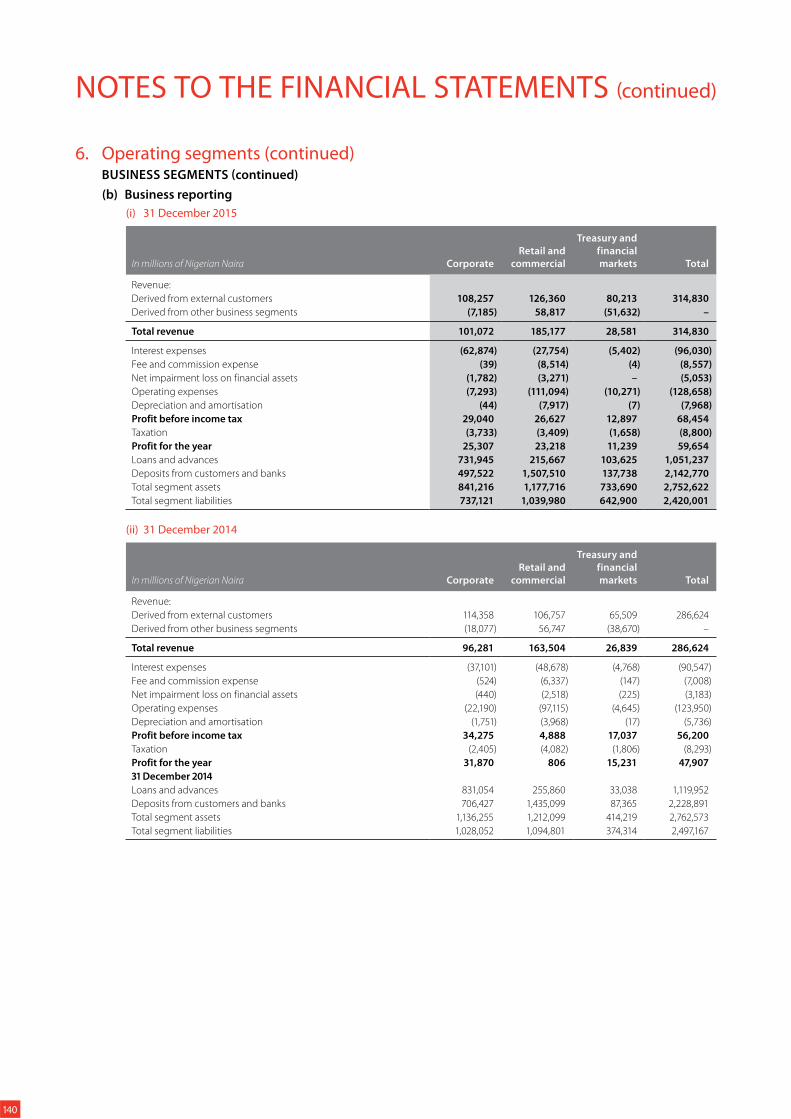
NOTES TO THE FINANCIAL STATEMENTS (continued)
6. Operating segments (continued)BUSINESS SEGMENTS (continued)
(b) Business reporting
(i) 31 December 2015
In millions of Nigerian Naira Corporate
Retail and
commercial
Treasury and
financial
markets Total
Revenue:
Derived from external customers 108,257 126,360 80,213 314,830
Derived from other business segments (7,185) 58,817 (51,632) –
Total revenue 101,072 185,177 28,581 314,830
Interest expenses (62,874) (27,754) (5,402) (96,030)
Fee and commission expense (39) (8,514) (4) (8,557)
Net impairment loss on financial assets (1,782) (3,271) – (5,053)
Operating expenses (7,293) (111,094) (10,271) (128,658)
Depreciation and amortisation (44) (7,917) (7) (7,968)
Profit before income tax 29,040 26,627 12,897 68,454
Taxation (3,733) (3,409) (1,658) (8,800)
Profit for the year 25,307 23,218 11,239 59,654
Loans and advances 731,945 215,667 103,625 1,051,237
Deposits from customers and banks 497,522 1,507,510 137,738 2,142,770
Total segment assets 841,216 1,177,716 733,690 2,752,622
Total segment liabilities 737,121 1,039,980 642,900 2,420,001
(ii) 31 December 2014
In millions of Nigerian Naira Corporate
Retail and
commercial
Treasury and
financial
markets Total
Revenue:
Derived from external customers 114,358 106,757 65,509 286,624
Derived from other business segments (18,077) 56,747 (38,670) –
Total revenue 96,281 163,504 26,839 286,624
Interest expenses (37,101) (48,678) (4,768) (90,547)
Fee and commission expense (524) (6,337) (147) (7,008)
Net impairment loss on financial assets (440) (2,518) (225) (3,183)
Operating expenses (22,190) (97,115) (4,645) (123,950)
Depreciation and amortisation (1,751) (3,968) (17) (5,736)
Profit before income tax 34,275 4,888 17,037 56,200
Taxation (2,405) (4,082) (1,806) (8,293)
Profit for the year 31,870 806 15,231 47,907
31 December 2014
Loans and advances 831,054 255,860 33,038 1,119,952
Deposits from customers and banks 706,427 1,435,099 87,365 2,228,891
Total segment assets 1,136,255 1,212,099 414,219 2,762,573
Total segment liabilities 1,028,052 1,094,801 374,314 2,497,167
140
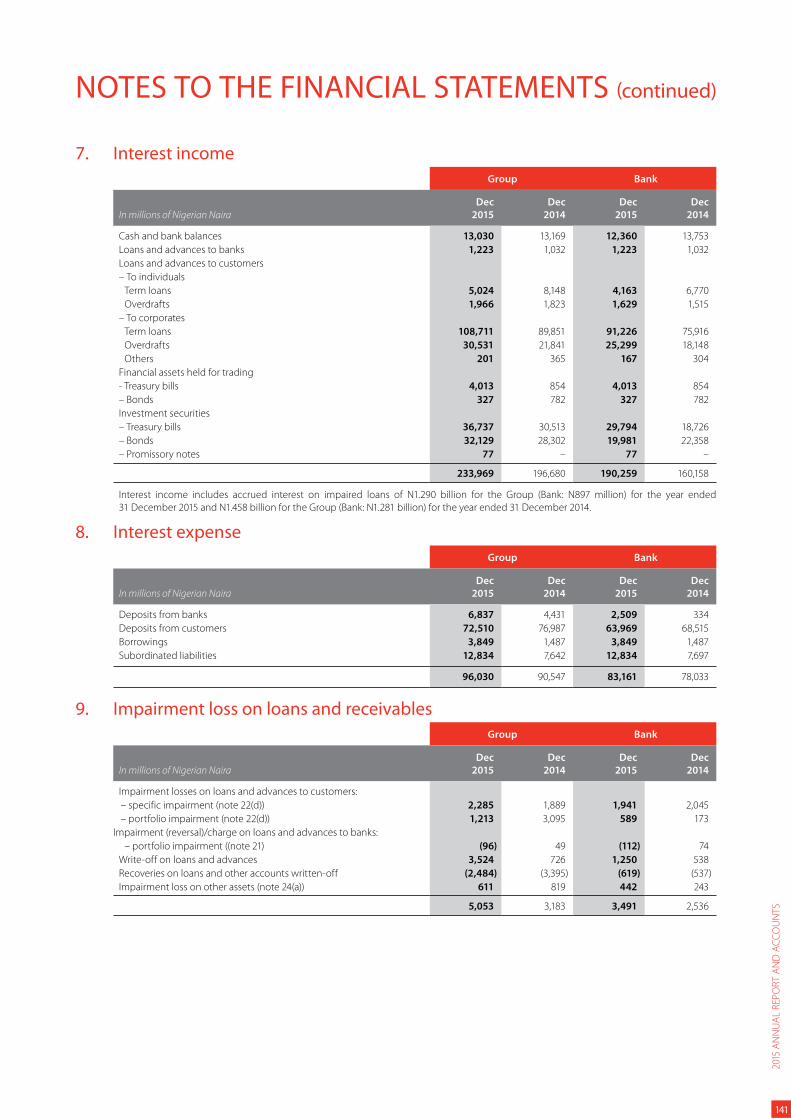
NOTES TO THE FINANCIAL STATEMENTS (continued)
7. Interest income
Group Bank
In millions of Nigerian Naira
Dec
2015
Dec
2014
Dec
2015
Dec
2014
Cash and bank balances 13,030 13,169 12,360 13,753
Loans and advances to banks 1,223 1,032 1,223 1,032
Loans and advances to customers
– To individuals
Term loans 5,024 8,148 4,163 6,770
Overdrafts 1,966 1,823 1,629 1,515
– To corporates
Term loans 108,711 89,851 91,226 75,916
Overdrafts 30,531 21,841 25,299 18,148
Others 201 365 167 304
Financial assets held for trading
- Treasury bills 4,013 854 4,013 854
– Bonds 327 782 327 782
Investment securities
– Treasury bills 36,737 30,513 29,794 18,726
– Bonds 32,129 28,302 19,981 22,358
– Promissory notes 77 – 77 –
233,969 196,680 190,259 160,158
Interest income includes accrued interest on impaired loans of N1.290 billion for the Group (Bank: N897 million) for the year ended
31 December 2015 and N1.458 billion for the Group (Bank: N1.281 billion) for the year ended 31 December 2014.
8. Interest expense
Group Bank
In millions of Nigerian Naira
Dec
2015
Dec
2014
Dec
2015
Dec
2014
Deposits from banks 6,837 4,431 2,509 334
Deposits from customers 72,510 76,987 63,969 68,515
Borrowings 3,849 1,487 3,849 1,487
Subordinated liabilities 12,834 7,642 12,834 7,697
96,030 90,547 83,161 78,033
9. Impairment loss on loans and receivables
Group Bank
In millions of Nigerian Naira
Dec
2015
Dec
2014
Dec
2015
Dec
2014
Impairment losses on loans and advances to customers:
– specific impairment (note 22(d)) 2,285 1,889 1,941 2,045
– portfolio impairment (note 22(d)) 1,213 3,095 589 173
Impairment (reversal)/charge on loans and advances to banks:
– portfolio impairment ((note 21) (96) 49 (112) 74
Write-off on loans and advances 3,524 726 1,250 538
Recoveries on loans and other accounts written-off (2,484) (3,395) (619) (537)
Impairment loss on other assets (note 24(a)) 611 819 442 243
5,053 3,183 3,491 2,536
2015
AN
NU
AL
REP
OR
T A
ND
AC
CO
UN
TS
141
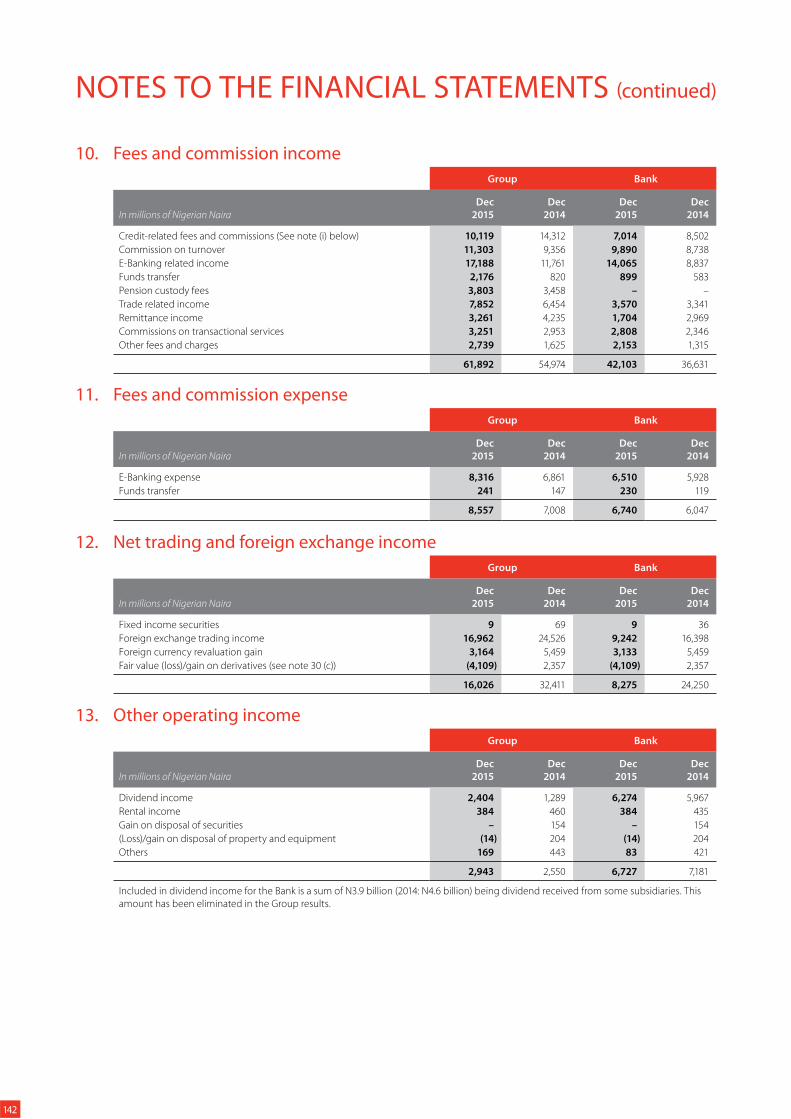
NOTES TO THE FINANCIAL STATEMENTS (continued)
10. Fees and commission income
Group Bank
In millions of Nigerian Naira
Dec
2015
Dec
2014
Dec
2015
Dec
2014
Credit-related fees and commissions (See note (i) below) 10,119 14,312 7,014 8,502
Commission on turnover 11,303 9,356 9,890 8,738
E-Banking related income 17,188 11,761 14,065 8,837
Funds transfer 2,176 820 899 583
Pension custody fees 3,803 3,458 – –
Trade related income 7,852 6,454 3,570 3,341
Remittance income 3,261 4,235 1,704 2,969
Commissions on transactional services 3,251 2,953 2,808 2,346
Other fees and charges 2,739 1,625 2,153 1,315
61,892 54,974 42,103 36,631
11. Fees and commission expense
Group Bank
In millions of Nigerian Naira
Dec
2015
Dec
2014
Dec
2015
Dec
2014
E-Banking expense 8,316 6,861 6,510 5,928
Funds transfer 241 147 230 119
8,557 7,008 6,740 6,047
12. Net trading and foreign exchange income
Group Bank
In millions of Nigerian Naira
Dec
2015
Dec
2014
Dec
2015
Dec
2014
Fixed income securities 9 69 9 36
Foreign exchange trading income 16,962 24,526 9,242 16,398
Foreign currency revaluation gain 3,164 5,459 3,133 5,459
Fair value (loss)/gain on derivatives (see note 30 (c)) (4,109) 2,357 (4,109) 2,357
16,026 32,411 8,275 24,250
13. Other operating income
Group Bank
In millions of Nigerian Naira
Dec
2015
Dec
2014
Dec
2015
Dec
2014
Dividend income 2,404 1,289 6,274 5,967
Rental income 384 460 384 435
Gain on disposal of securities – 154 – 154
(Loss)/gain on disposal of property and equipment (14) 204 (14) 204
Others 169 443 83 421
2,943 2,550 6,727 7,181
Included in dividend income for the Bank is a sum of N3.9 billion (2014: N4.6 billion) being dividend received from some subsidiaries. This
amount has been eliminated in the Group results.
142
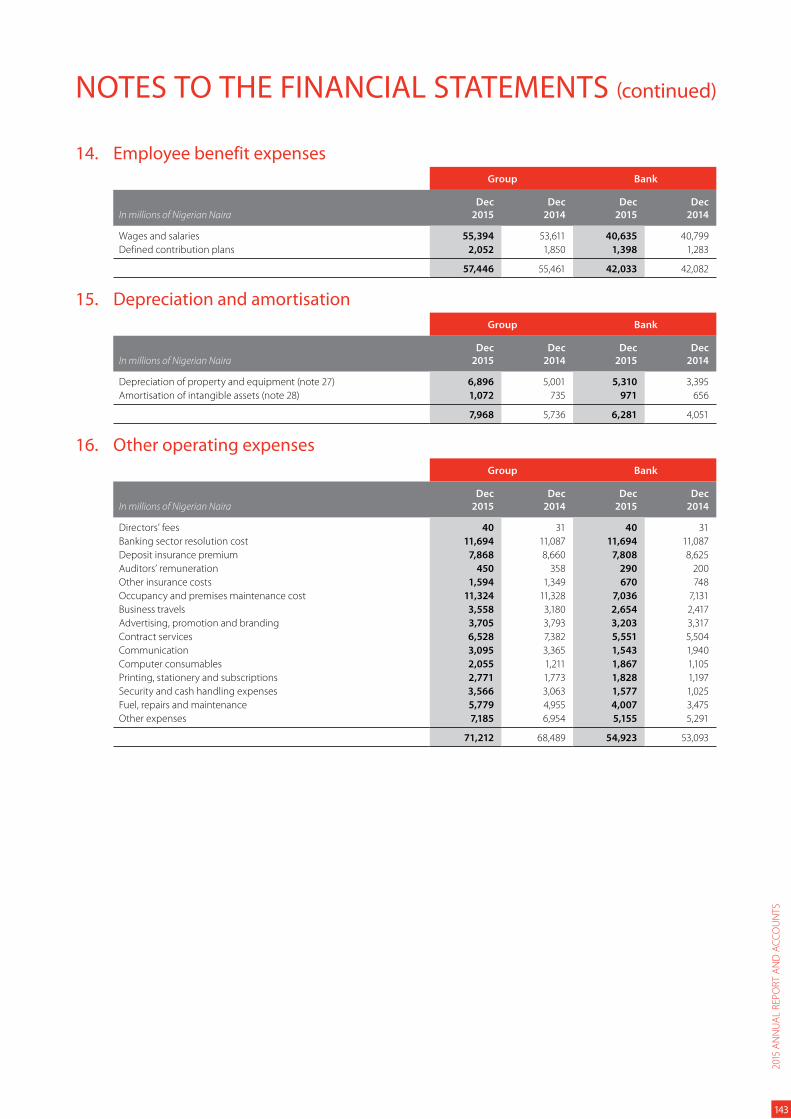
NOTES TO THE FINANCIAL STATEMENTS (continued)
14. Employee benefit expenses
Group Bank
In millions of Nigerian Naira
Dec
2015
Dec
2014
Dec
2015
Dec
2014
Wages and salaries 55,394 53,611 40,635 40,799
Defined contribution plans 2,052 1,850 1,398 1,283
57,446 55,461 42,033 42,082
15. Depreciation and amortisation
Group Bank
In millions of Nigerian Naira
Dec
2015
Dec
2014
Dec
2015
Dec
2014
Depreciation of property and equipment (note 27) 6,896 5,001 5,310 3,395
Amortisation of intangible assets (note 28) 1,072 735 971 656
7,968 5,736 6,281 4,051
16. Other operating expenses
Group Bank
In millions of Nigerian Naira
Dec
2015
Dec
2014
Dec
2015
Dec
2014
Directors’ fees 40 31 40 31
Banking sector resolution cost 11,694 11,087 11,694 11,087
Deposit insurance premium 7,868 8,660 7,808 8,625
Auditors’ remuneration 450 358 290 200
Other insurance costs 1,594 1,349 670 748
Occupancy and premises maintenance cost 11,324 11,328 7,036 7,131
Business travels 3,558 3,180 2,654 2,417
Advertising, promotion and branding 3,705 3,793 3,203 3,317
Contract services 6,528 7,382 5,551 5,504
Communication 3,095 3,365 1,543 1,940
Computer consumables 2,055 1,211 1,867 1,105
Printing, stationery and subscriptions 2,771 1,773 1,828 1,197
Security and cash handling expenses 3,566 3,063 1,577 1,025
Fuel, repairs and maintenance 5,779 4,955 4,007 3,475
Other expenses 7,185 6,954 5,155 5,291
71,212 68,489 54,923 53,093
2015
AN
NU
AL
REP
OR
T A
ND
AC
CO
UN
TS
143
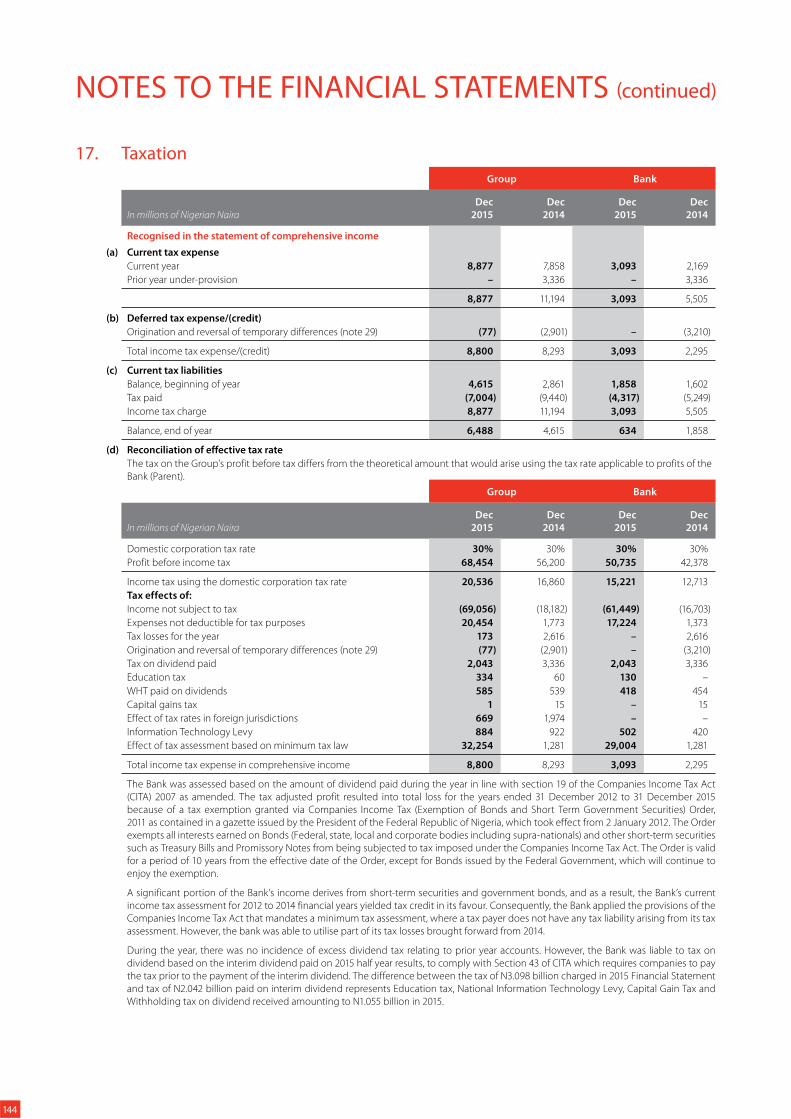
NOTES TO THE FINANCIAL STATEMENTS (continued)
17. Taxation
Group Bank
In millions of Nigerian Naira
Dec
2015
Dec
2014
Dec
2015
Dec
2014
Recognised in the statement of comprehensive income
(a) Current tax expense
Current year 8,877 7,858 3,093 2,169
Prior year under-provision – 3,336 – 3,336
8,877 11,194 3,093 5,505
(b) Deferred tax expense/(credit)
Origination and reversal of temporary differences (note 29) (77) (2,901) – (3,210)
Total income tax expense/(credit) 8,800 8,293 3,093 2,295
(c) Current tax liabilities
Balance, beginning of year 4,615 2,861 1,858 1,602
Tax paid (7,004) (9,440) (4,317) (5,249)
Income tax charge 8,877 11,194 3,093 5,505
Balance, end of year 6,488 4,615 634 1,858
(d) Reconciliation of effective tax rate
The tax on the Group’s profit before tax differs from the theoretical amount that would arise using the tax rate applicable to profits of the
Bank (Parent).
Group Bank
In millions of Nigerian Naira
Dec
2015
Dec
2014
Dec
2015
Dec
2014
Domestic corporation tax rate 30% 30% 30% 30%
Profit before income tax 68,454 56,200 50,735 42,378
Income tax using the domestic corporation tax rate 20,536 16,860 15,221 12,713
Tax effects of:
Income not subject to tax (69,056) (18,182) (61,449) (16,703)
Expenses not deductible for tax purposes 20,454 1,773 17,224 1,373
Tax losses for the year 173 2,616 – 2,616
Origination and reversal of temporary differences (note 29) (77) (2,901) – (3,210)
Tax on dividend paid 2,043 3,336 2,043 3,336
Education tax 334 60 130 –
WHT paid on dividends 585 539 418 454
Capital gains tax 1 15 – 15
Effect of tax rates in foreign jurisdictions 669 1,974 – –
Information Technology Levy 884 922 502 420
Effect of tax assessment based on minimum tax law 32,254 1,281 29,004 1,281
Total income tax expense in comprehensive income 8,800 8,293 3,093 2,295
The Bank was assessed based on the amount of dividend paid during the year in line with section 19 of the Companies Income Tax Act
(CITA) 2007 as amended. The tax adjusted profit resulted into total loss for the years ended 31 December 2012 to 31 December 2015
because of a tax exemption granted via Companies Income Tax (Exemption of Bonds and Short Term Government Securities) Order,
2011 as contained in a gazette issued by the President of the Federal Republic of Nigeria, which took effect from 2 January 2012. The Order
exempts all interests earned on Bonds (Federal, state, local and corporate bodies including supra-nationals) and other short-term securities
such as Treasury Bills and Promissory Notes from being subjected to tax imposed under the Companies Income Tax Act. The Order is valid
for a period of 10 years from the effective date of the Order, except for Bonds issued by the Federal Government, which will continue to
enjoy the exemption.
A significant portion of the Bank’s income derives from short-term securities and government bonds, and as a result, the Bank’s current
income tax assessment for 2012 to 2014 financial years yielded tax credit in its favour. Consequently, the Bank applied the provisions of the
Companies Income Tax Act that mandates a minimum tax assessment, where a tax payer does not have any tax liability arising from its tax
assessment. However, the bank was able to utilise part of its tax losses brought forward from 2014.
During the year, there was no incidence of excess dividend tax relating to prior year accounts. However, the Bank was liable to tax on
dividend based on the interim dividend paid on 2015 half year results, to comply with Section 43 of CITA which requires companies to pay
the tax prior to the payment of the interim dividend. The difference between the tax of N3.098 billion charged in 2015 Financial Statement
and tax of N2.042 billion paid on interim dividend represents Education tax, National Information Technology Levy, Capital Gain Tax and
Withholding tax on dividend received amounting to N1.055 billion in 2015.
144
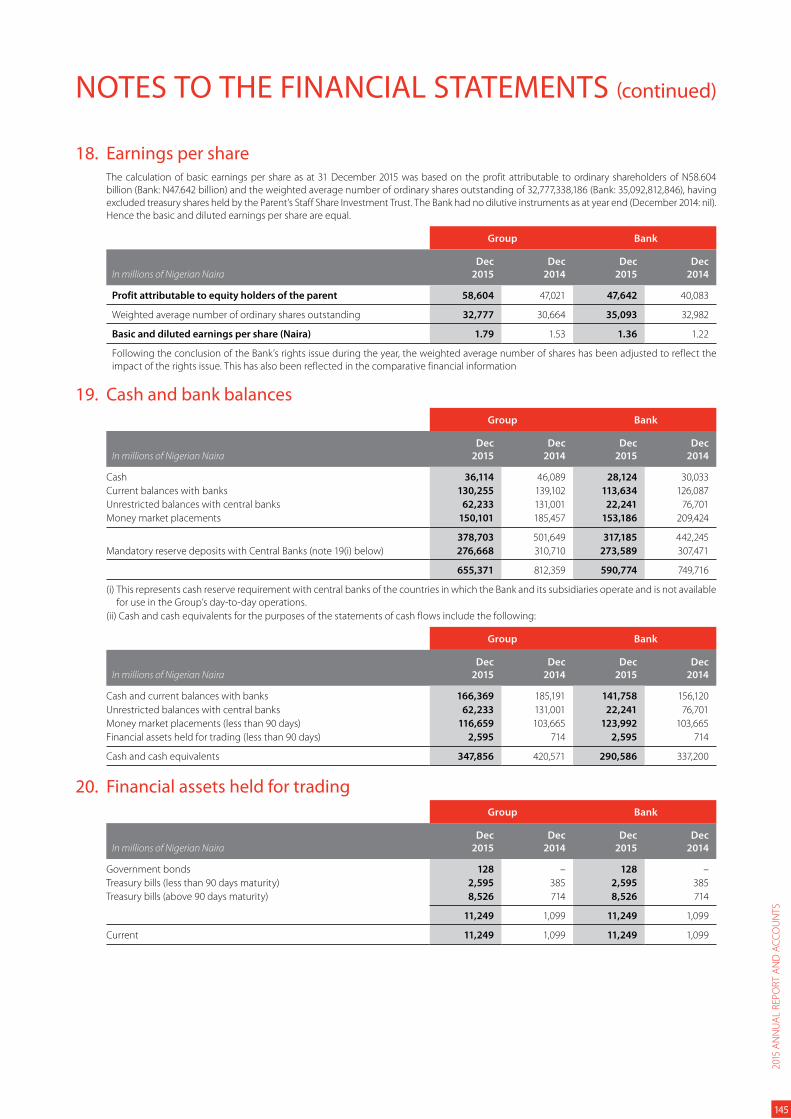
NOTES TO THE FINANCIAL STATEMENTS (continued)
18. Earnings per shareThe calculation of basic earnings per share as at 31 December 2015 was based on the profit attributable to ordinary shareholders of N58.604
billion (Bank: N47.642 billion) and the weighted average number of ordinary shares outstanding of 32,777,338,186 (Bank: 35,092,812,846), having
excluded treasury shares held by the Parent’s Staff Share Investment Trust. The Bank had no dilutive instruments as at year end (December 2014: nil).
Hence the basic and diluted earnings per share are equal.
Group Bank
In millions of Nigerian Naira
Dec
2015
Dec
2014
Dec
2015
Dec
2014
Profit attributable to equity holders of the parent 58,604 47,021 47,642 40,083
Weighted average number of ordinary shares outstanding 32,777 30,664 35,093 32,982
Basic and diluted earnings per share (Naira) 1.79 1.53 1.36 1.22
Following the conclusion of the Bank’s rights issue during the year, the weighted average number of shares has been adjusted to reflect the
impact of the rights issue. This has also been reflected in the comparative financial information
19. Cash and bank balances
Group Bank
In millions of Nigerian Naira
Dec
2015
Dec
2014
Dec
2015
Dec
2014
Cash 36,114 46,089 28,124 30,033
Current balances with banks 130,255 139,102 113,634 126,087
Unrestricted balances with central banks 62,233 131,001 22,241 76,701
Money market placements 150,101 185,457 153,186 209,424
378,703 501,649 317,185 442,245
Mandatory reserve deposits with Central Banks (note 19(i) below) 276,668 310,710 273,589 307,471
655,371 812,359 590,774 749,716
(i) This represents cash reserve requirement with central banks of the countries in which the Bank and its subsidiaries operate and is not available
for use in the Group’s day-to-day operations.
(ii) Cash and cash equivalents for the purposes of the statements of cash flows include the following:
Group Bank
In millions of Nigerian Naira
Dec
2015
Dec
2014
Dec
2015
Dec
2014
Cash and current balances with banks 166,369 185,191 141,758 156,120
Unrestricted balances with central banks 62,233 131,001 22,241 76,701
Money market placements (less than 90 days) 116,659 103,665 123,992 103,665
Financial assets held for trading (less than 90 days) 2,595 714 2,595 714
Cash and cash equivalents 347,856 420,571 290,586 337,200
20. Financial assets held for trading
Group Bank
In millions of Nigerian Naira
Dec
2015
Dec
2014
Dec
2015
Dec
2014
Government bonds 128 – 128 –
Treasury bills (less than 90 days maturity) 2,595 385 2,595 385
Treasury bills (above 90 days maturity) 8,526 714 8,526 714
11,249 1,099 11,249 1,099
Current 11,249 1,099 11,249 1,099
2015
AN
NU
AL
REP
OR
T A
ND
AC
CO
UN
TS
145
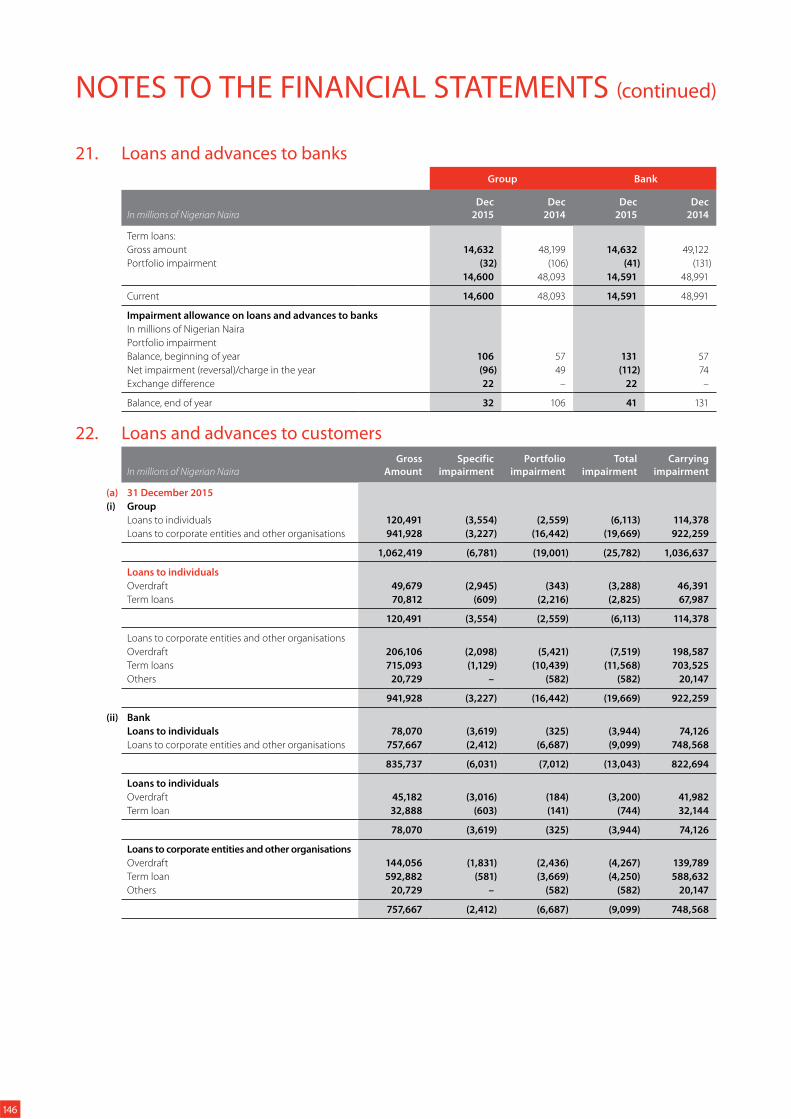
NOTES TO THE FINANCIAL STATEMENTS (continued)
21. Loans and advances to banks
Group Bank
In millions of Nigerian Naira
Dec
2015
Dec
2014
Dec
2015
Dec
2014
Term loans:
Gross amount 14,632 48,199 14,632 49,122
Portfolio impairment (32) (106) (41) (131)
14,600 48,093 14,591 48,991
Current 14,600 48,093 14,591 48,991
Impairment allowance on loans and advances to banks
In millions of Nigerian Naira
Portfolio impairment
Balance, beginning of year 106 57 131 57
Net impairment (reversal)/charge in the year (96) 49 (112) 74
Exchange difference 22 – 22 –
Balance, end of year 32 106 41 131
22. Loans and advances to customers
In millions of Nigerian Naira
Gross
Amount
Specific
impairment
Portfolio
impairment
Total
impairment
Carrying
impairment
(a) 31 December 2015
(i) Group
Loans to individuals 120,491 (3,554) (2,559) (6,113) 114,378
Loans to corporate entities and other organisations 941,928 (3,227) (16,442) (19,669) 922,259
1,062,419 (6,781) (19,001) (25,782) 1,036,637
Loans to individuals
Overdraft 49,679 (2,945) (343) (3,288) 46,391
Term loans 70,812 (609) (2,216) (2,825) 67,987
120,491 (3,554) (2,559) (6,113) 114,378
Loans to corporate entities and other organisations
Overdraft 206,106 (2,098) (5,421) (7,519) 198,587
Term loans 715,093 (1,129) (10,439) (11,568) 703,525
Others 20,729 – (582) (582) 20,147
941,928 (3,227) (16,442) (19,669) 922,259
(ii) Bank
Loans to individuals 78,070 (3,619) (325) (3,944) 74,126
Loans to corporate entities and other organisations 757,667 (2,412) (6,687) (9,099) 748,568
835,737 (6,031) (7,012) (13,043) 822,694
Loans to individuals
Overdraft 45,182 (3,016) (184) (3,200) 41,982
Term loan 32,888 (603) (141) (744) 32,144
78,070 (3,619) (325) (3,944) 74,126
Loans to corporate entities and other organisations
Overdraft 144,056 (1,831) (2,436) (4,267) 139,789
Term loan 592,882 (581) (3,669) (4,250) 588,632
Others 20,729 – (582) (582) 20,147
757,667 (2,412) (6,687) (9,099) 748,568
146
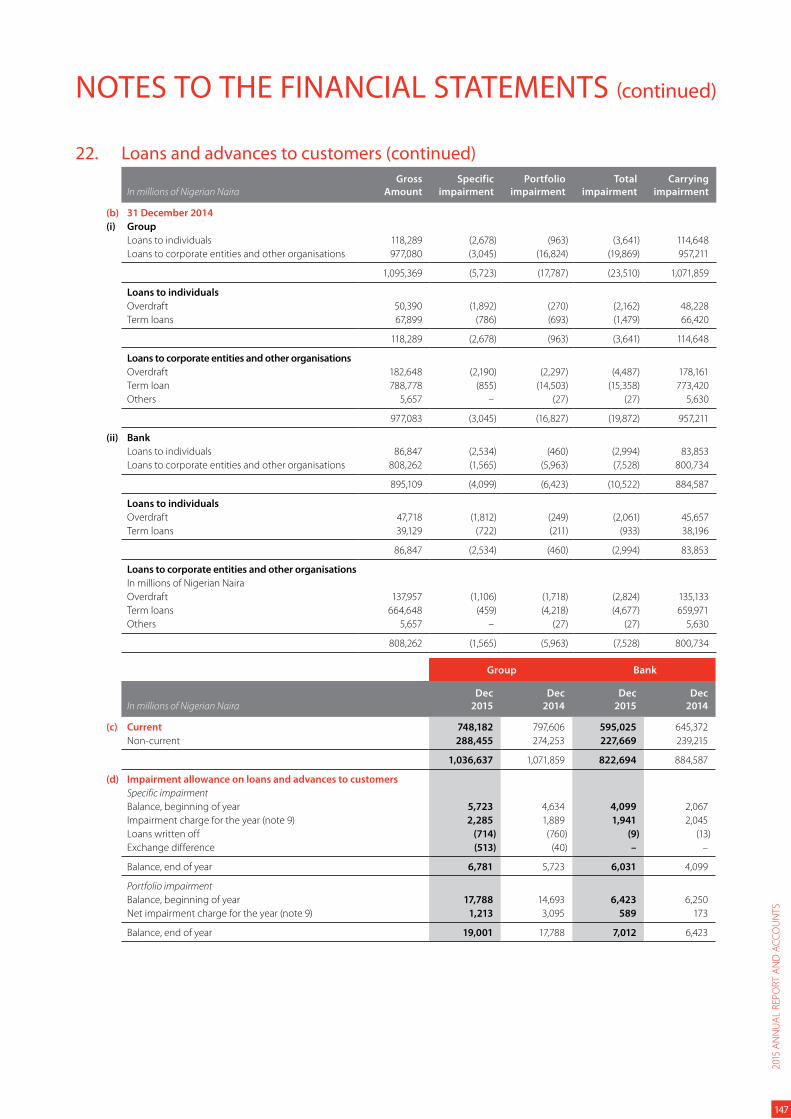
NOTES TO THE FINANCIAL STATEMENTS (continued)
22. Loans and advances to customers (continued)
In millions of Nigerian Naira
Gross
Amount
Specific
impairment
Portfolio
impairment
Total
impairment
Carrying
impairment
(b) 31 December 2014
(i) Group
Loans to individuals 118,289 (2,678) (963) (3,641) 114,648
Loans to corporate entities and other organisations 977,080 (3,045) (16,824) (19,869) 957,211
1,095,369 (5,723) (17,787) (23,510) 1,071,859
Loans to individuals
Overdraft 50,390 (1,892) (270) (2,162) 48,228
Term loans 67,899 (786) (693) (1,479) 66,420
118,289 (2,678) (963) (3,641) 114,648
Loans to corporate entities and other organisations
Overdraft 182,648 (2,190) (2,297) (4,487) 178,161
Term loan 788,778 (855) (14,503) (15,358) 773,420
Others 5,657 – (27) (27) 5,630
977,083 (3,045) (16,827) (19,872) 957,211
(ii) Bank
Loans to individuals 86,847 (2,534) (460) (2,994) 83,853
Loans to corporate entities and other organisations 808,262 (1,565) (5,963) (7,528) 800,734
895,109 (4,099) (6,423) (10,522) 884,587
Loans to individuals
Overdraft 47,718 (1,812) (249) (2,061) 45,657
Term loans 39,129 (722) (211) (933) 38,196
86,847 (2,534) (460) (2,994) 83,853
Loans to corporate entities and other organisations
In millions of Nigerian Naira
Overdraft 137,957 (1,106) (1,718) (2,824) 135,133
Term loans 664,648 (459) (4,218) (4,677) 659,971
Others 5,657 – (27) (27) 5,630
808,262 (1,565) (5,963) (7,528) 800,734
Group Bank
In millions of Nigerian Naira
Dec
2015
Dec
2014
Dec
2015
Dec
2014
(c) Current 748,182 797,606 595,025 645,372
Non-current 288,455 274,253 227,669 239,215
1,036,637 1,071,859 822,694 884,587
(d) Impairment allowance on loans and advances to customers
Specific impairment
Balance, beginning of year 5,723 4,634 4,099 2,067
Impairment charge for the year (note 9) 2,285 1,889 1,941 2,045
Loans written off (714) (760) (9) (13)
Exchange difference (513) (40) – –
Balance, end of year 6,781 5,723 6,031 4,099
Portfolio impairment
Balance, beginning of year 17,788 14,693 6,423 6,250
Net impairment charge for the year (note 9) 1,213 3,095 589 173
Balance, end of year 19,001 17,788 7,012 6,423
2015
AN
NU
AL
REP
OR
T A
ND
AC
CO
UN
TS
147
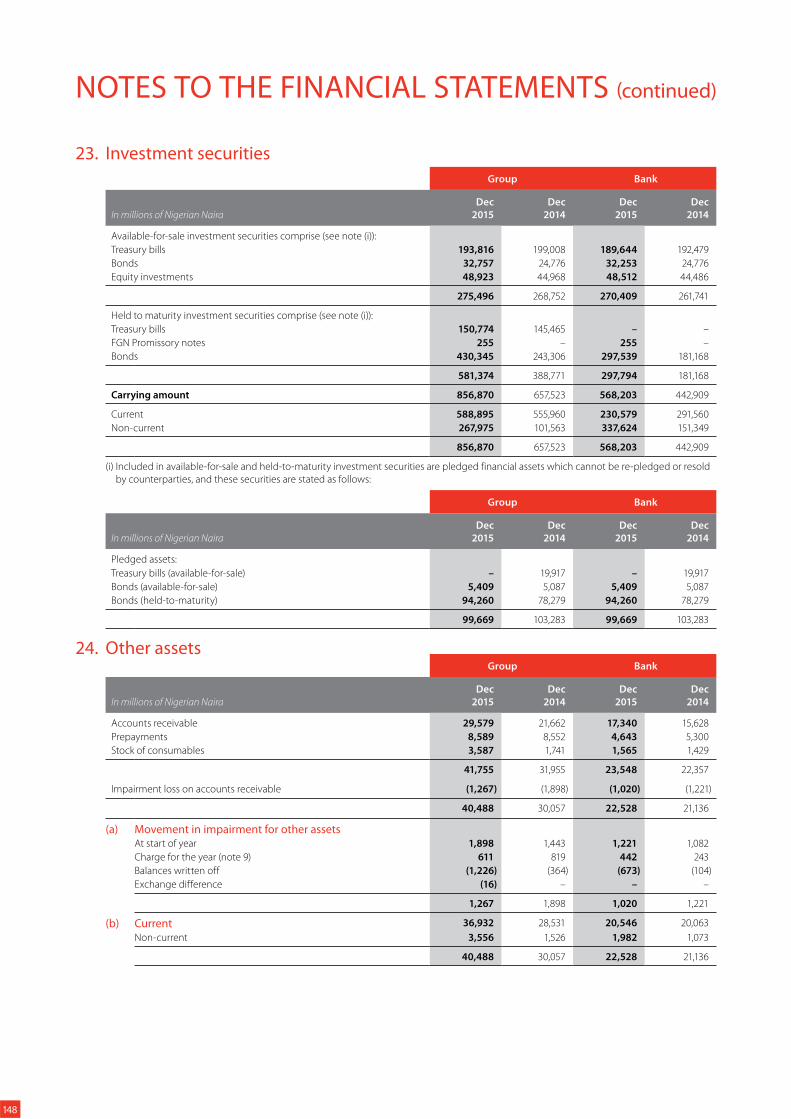
NOTES TO THE FINANCIAL STATEMENTS (continued)
23. Investment securities
Group Bank
In millions of Nigerian Naira
Dec
2015
Dec
2014
Dec
2015
Dec
2014
Available-for-sale investment securities comprise (see note (i)):
Treasury bills 193,816 199,008 189,644 192,479
Bonds 32,757 24,776 32,253 24,776
Equity investments 48,923 44,968 48,512 44,486
275,496 268,752 270,409 261,741
Held to maturity investment securities comprise (see note (i)):
Treasury bills 150,774 145,465 – –
FGN Promissory notes 255 – 255 –
Bonds 430,345 243,306 297,539 181,168
581,374 388,771 297,794 181,168
Carrying amount 856,870 657,523 568,203 442,909
Current 588,895 555,960 230,579 291,560
Non-current 267,975 101,563 337,624 151,349
856,870 657,523 568,203 442,909
(i) Included in available-for-sale and held-to-maturity investment securities are pledged financial assets which cannot be re-pledged or resold
by counterparties, and these securities are stated as follows:
Group Bank
In millions of Nigerian Naira
Dec
2015
Dec
2014
Dec
2015
Dec
2014
Pledged assets:
Treasury bills (available-for-sale) – 19,917 – 19,917
Bonds (available-for-sale) 5,409 5,087 5,409 5,087
Bonds (held-to-maturity) 94,260 78,279 94,260 78,279
99,669 103,283 99,669 103,283
24. Other assets Group Bank
In millions of Nigerian Naira
Dec
2015
Dec
2014
Dec
2015
Dec
2014
Accounts receivable 29,579 21,662 17,340 15,628
Prepayments 8,589 8,552 4,643 5,300
Stock of consumables 3,587 1,741 1,565 1,429
41,755 31,955 23,548 22,357
Impairment loss on accounts receivable (1,267) (1,898) (1,020) (1,221)
40,488 30,057 22,528 21,136
(a) Movement in impairment for other assetsAt start of year 1,898 1,443 1,221 1,082
Charge for the year (note 9) 611 819 442 243
Balances written off (1,226) (364) (673) (104)
Exchange difference (16) – – –
1,267 1,898 1,020 1,221
(b) Current 36,932 28,531 20,546 20,063
Non-current 3,556 1,526 1,982 1,073
40,488 30,057 22,528 21,136
148
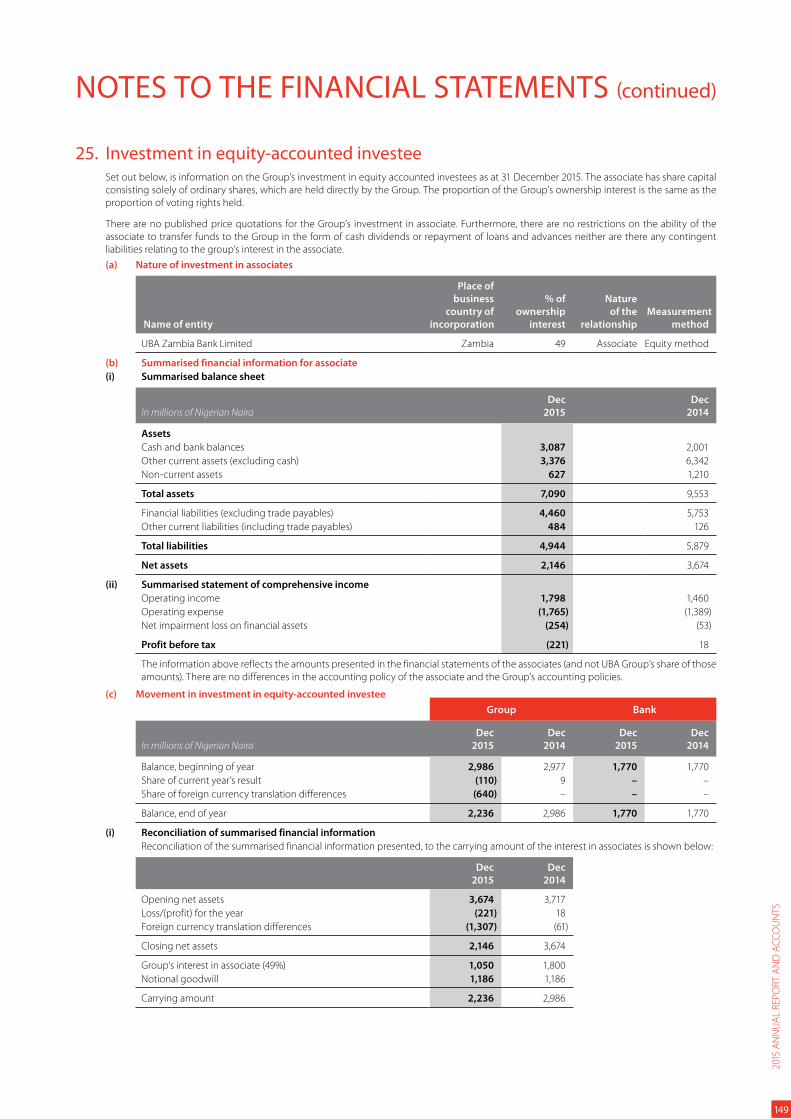
NOTES TO THE FINANCIAL STATEMENTS (continued)
25. Investment in equity-accounted investeeSet out below, is information on the Group’s investment in equity accounted investees as at 31 December 2015. The associate has share capital
consisting solely of ordinary shares, which are held directly by the Group. The proportion of the Group’s ownership interest is the same as the
proportion of voting rights held.
There are no published price quotations for the Group’s investment in associate. Furthermore, there are no restrictions on the ability of the
associate to transfer funds to the Group in the form of cash dividends or repayment of loans and advances neither are there any contingent
liabilities relating to the group’s interest in the associate.
(a) Nature of investment in associates
Name of entity
Place of
business
country of
incorporation
% of
ownership
interest
Nature
of the
relationship
Measurement
method
UBA Zambia Bank Limited Zambia 49 Associate Equity method
(b) Summarised financial information for associate
(i) Summarised balance sheet
In millions of Nigerian Naira
Dec
2015
Dec
2014
Assets
Cash and bank balances 3,087 2,001
Other current assets (excluding cash) 3,376 6,342
Non-current assets 627 1,210
Total assets 7,090 9,553
Financial liabilities (excluding trade payables) 4,460 5,753
Other current liabilities (including trade payables) 484 126
Total liabilities 4,944 5,879
Net assets 2,146 3,674
(ii) Summarised statement of comprehensive income
Operating income 1,798 1,460
Operating expense (1,765) (1,389)
Net impairment loss on financial assets (254) (53)
Profit before tax (221) 18
The information above reflects the amounts presented in the financial statements of the associates (and not UBA Group’s share of those
amounts). There are no differences in the accounting policy of the associate and the Group’s accounting policies.
(c) Movement in investment in equity-accounted investee
Group Bank
In millions of Nigerian Naira
Dec
2015
Dec
2014
Dec
2015
Dec
2014
Balance, beginning of year 2,986 2,977 1,770 1,770
Share of current year’s result (110) 9 – –
Share of foreign currency translation differences (640) – – –
Balance, end of year 2,236 2,986 1,770 1,770
(i) Reconciliation of summarised financial information
Reconciliation of the summarised financial information presented, to the carrying amount of the interest in associates is shown below:
Dec
2015
Dec
2014
Opening net assets 3,674 3,717
Loss/(profit) for the year (221) 18
Foreign currency translation differences (1,307) (61)
Closing net assets 2,146 3,674
Group’s interest in associate (49%) 1,050 1,800
Notional goodwill 1,186 1,186
Carrying amount 2,236 2,986
2015
AN
NU
AL
REP
OR
T A
ND
AC
CO
UN
TS
149
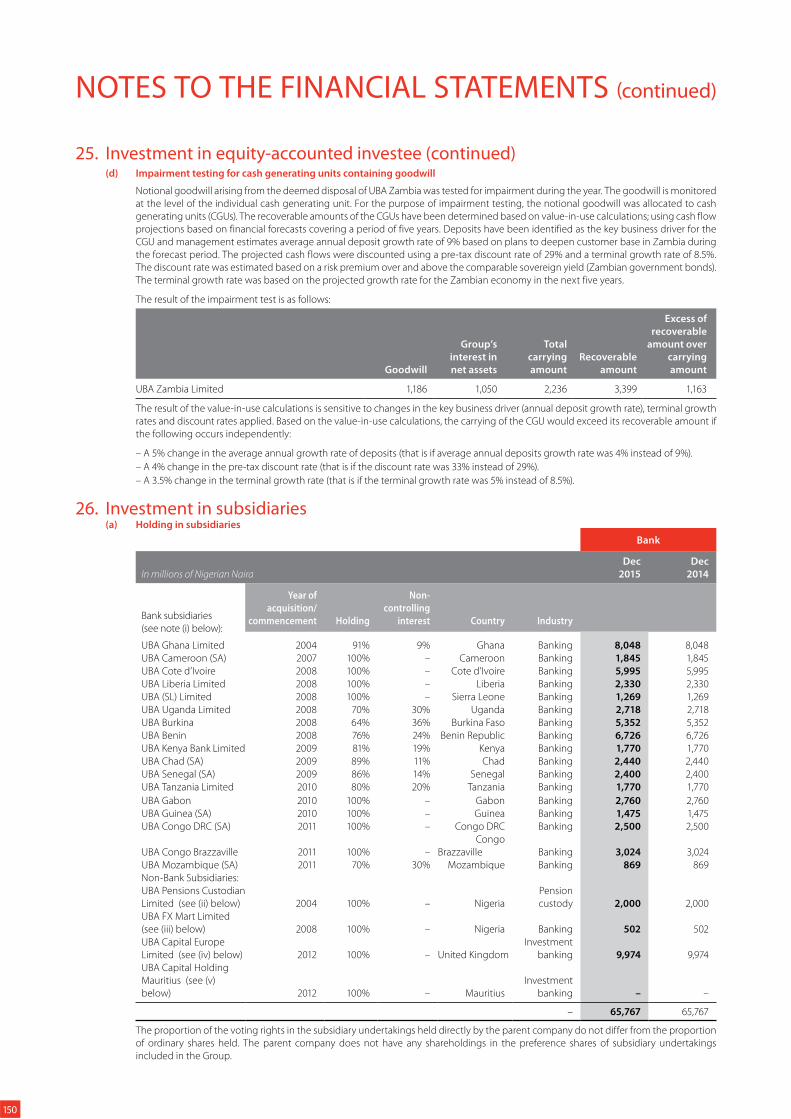
NOTES TO THE FINANCIAL STATEMENTS (continued)
25. Investment in equity-accounted investee (continued)(d) Impairment testing for cash generating units containing goodwill
Notional goodwill arising from the deemed disposal of UBA Zambia was tested for impairment during the year. The goodwill is monitored
at the level of the individual cash generating unit. For the purpose of impairment testing, the notional goodwill was allocated to cash
generating units (CGUs). The recoverable amounts of the CGUs have been determined based on value-in-use calculations; using cash flow
projections based on financial forecasts covering a period of five years. Deposits have been identified as the key business driver for the
CGU and management estimates average annual deposit growth rate of 9% based on plans to deepen customer base in Zambia during
the forecast period. The projected cash flows were discounted using a pre-tax discount rate of 29% and a terminal growth rate of 8.5%.
The discount rate was estimated based on a risk premium over and above the comparable sovereign yield (Zambian government bonds).
The terminal growth rate was based on the projected growth rate for the Zambian economy in the next five years.
The result of the impairment test is as follows:
Goodwill
Group’s
interest in
net assets
Total
carrying
amount
Recoverable
amount
Excess of
recoverable
amount over
carrying
amount
UBA Zambia Limited 1,186 1,050 2,236 3,399 1,163
The result of the value-in-use calculations is sensitive to changes in the key business driver (annual deposit growth rate), terminal growth
rates and discount rates applied. Based on the value-in-use calculations, the carrying of the CGU would exceed its recoverable amount if
the following occurs independently:
– A 5% change in the average annual growth rate of deposits (that is if average annual deposits growth rate was 4% instead of 9%).
– A 4% change in the pre-tax discount rate (that is if the discount rate was 33% instead of 29%).
– A 3.5% change in the terminal growth rate (that is if the terminal growth rate was 5% instead of 8.5%).
26. Investment in subsidiaries(a) Holding in subsidiaries
Bank
In millions of Nigerian Naira
Dec
2015
Dec
2014
Bank subsidiaries
(see note (i) below):
Year of
acquisition/
commencement Holding
Non-
controlling
interest Country Industry
UBA Ghana Limited 2004 91% 9% Ghana Banking 8,048 8,048
UBA Cameroon (SA) 2007 100% – Cameroon Banking 1,845 1,845
UBA Cote d’Ivoire 2008 100% – Cote d’Ivoire Banking 5,995 5,995
UBA Liberia Limited 2008 100% – Liberia Banking 2,330 2,330
UBA (SL) Limited 2008 100% – Sierra Leone Banking 1,269 1,269
UBA Uganda Limited 2008 70% 30% Uganda Banking 2,718 2,718
UBA Burkina 2008 64% 36% Burkina Faso Banking 5,352 5,352
UBA Benin 2008 76% 24% Benin Republic Banking 6,726 6,726
UBA Kenya Bank Limited 2009 81% 19% Kenya Banking 1,770 1,770
UBA Chad (SA) 2009 89% 11% Chad Banking 2,440 2,440
UBA Senegal (SA) 2009 86% 14% Senegal Banking 2,400 2,400
UBA Tanzania Limited 2010 80% 20% Tanzania Banking 1,770 1,770
UBA Gabon 2010 100% – Gabon Banking 2,760 2,760
UBA Guinea (SA) 2010 100% – Guinea Banking 1,475 1,475
UBA Congo DRC (SA) 2011 100% – Congo DRC Banking 2,500 2,500
UBA Congo Brazzaville 2011 100% –
Congo
Brazzaville Banking 3,024 3,024
UBA Mozambique (SA) 2011 70% 30% Mozambique Banking 869 869
Non-Bank Subsidiaries:
UBA Pensions Custodian
Limited (see (ii) below) 2004 100% – Nigeria
Pension
custody 2,000 2,000
UBA FX Mart Limited
(see (iii) below) 2008 100% – Nigeria Banking 502 502
UBA Capital Europe
Limited (see (iv) below) 2012 100% – United Kingdom
Investment
banking 9,974 9,974
UBA Capital Holding
Mauritius (see (v)
below) 2012 100% – Mauritius
Investment
banking – –
– 65,767 65,767
The proportion of the voting rights in the subsidiary undertakings held directly by the parent company do not differ from the proportion
of ordinary shares held. The parent company does not have any shareholdings in the preference shares of subsidiary undertakings
included in the Group.
150
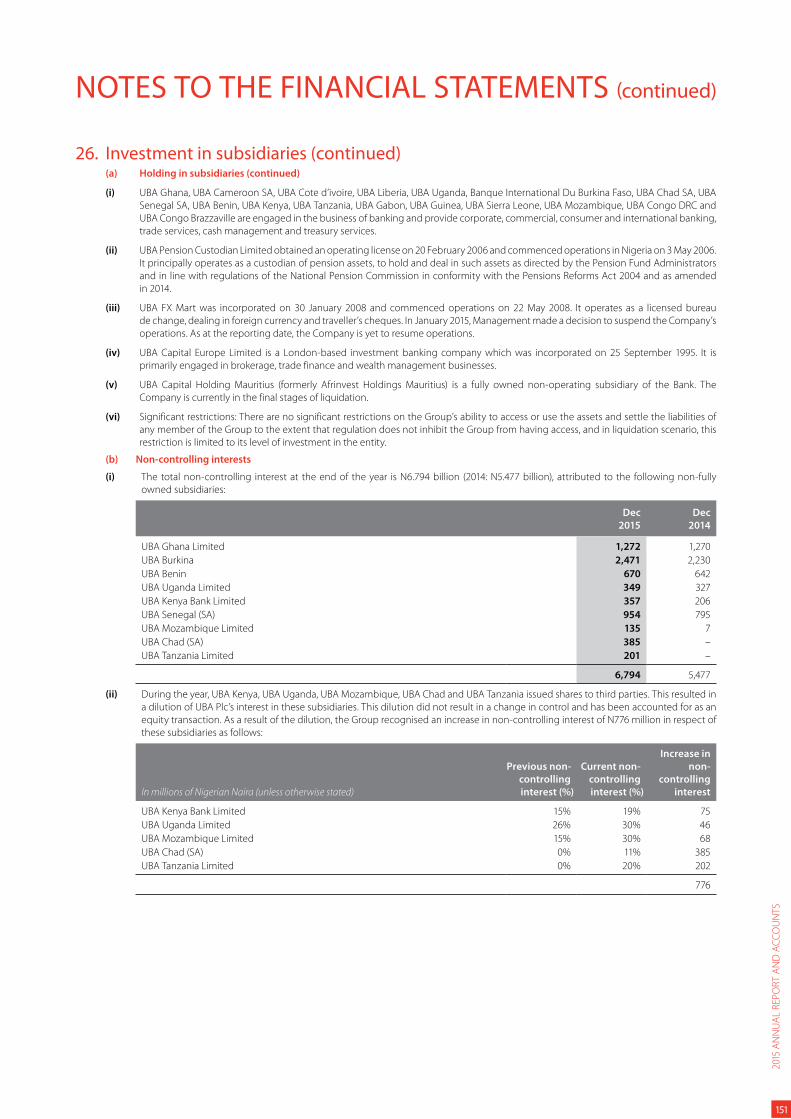
NOTES TO THE FINANCIAL STATEMENTS (continued)
26. Investment in subsidiaries (continued)(a) Holding in subsidiaries (continued)
(i) UBA Ghana, UBA Cameroon SA, UBA Cote d’ivoire, UBA Liberia, UBA Uganda, Banque International Du Burkina Faso, UBA Chad SA, UBA
Senegal SA, UBA Benin, UBA Kenya, UBA Tanzania, UBA Gabon, UBA Guinea, UBA Sierra Leone, UBA Mozambique, UBA Congo DRC and
UBA Congo Brazzaville are engaged in the business of banking and provide corporate, commercial, consumer and international banking,
trade services, cash management and treasury services.
(ii) UBA Pension Custodian Limited obtained an operating license on 20 February 2006 and commenced operations in Nigeria on 3 May 2006.
It principally operates as a custodian of pension assets, to hold and deal in such assets as directed by the Pension Fund Administrators
and in line with regulations of the National Pension Commission in conformity with the Pensions Reforms Act 2004 and as amended
in 2014.
(iii) UBA FX Mart was incorporated on 30 January 2008 and commenced operations on 22 May 2008. It operates as a licensed bureau
de change, dealing in foreign currency and traveller’s cheques. In January 2015, Management made a decision to suspend the Company’s
operations. As at the reporting date, the Company is yet to resume operations.
(iv) UBA Capital Europe Limited is a London-based investment banking company which was incorporated on 25 September 1995. It is
primarily engaged in brokerage, trade finance and wealth management businesses.
(v) UBA Capital Holding Mauritius (formerly Afrinvest Holdings Mauritius) is a fully owned non-operating subsidiary of the Bank. The
Company is currently in the final stages of liquidation.
(vi) Significant restrictions: There are no significant restrictions on the Group’s ability to access or use the assets and settle the liabilities of
any member of the Group to the extent that regulation does not inhibit the Group from having access, and in liquidation scenario, this
restriction is limited to its level of investment in the entity.
(b) Non-controlling interests
(i) The total non-controlling interest at the end of the year is N6.794 billion (2014: N5.477 billion), attributed to the following non-fully
owned subsidiaries:
Dec
2015
Dec
2014
UBA Ghana Limited 1,272 1,270
UBA Burkina 2,471 2,230
UBA Benin 670 642
UBA Uganda Limited 349 327
UBA Kenya Bank Limited 357 206
UBA Senegal (SA) 954 795
UBA Mozambique Limited 135 7
UBA Chad (SA) 385 –
UBA Tanzania Limited 201 –
6,794 5,477
(ii) During the year, UBA Kenya, UBA Uganda, UBA Mozambique, UBA Chad and UBA Tanzania issued shares to third parties. This resulted in
a dilution of UBA Plc’s interest in these subsidiaries. This dilution did not result in a change in control and has been accounted for as an
equity transaction. As a result of the dilution, the Group recognised an increase in non-controlling interest of N776 million in respect of
these subsidiaries as follows:
In millions of Nigerian Naira (unless otherwise stated)
Previous non-
controlling
interest (%)
Current non-
controlling
interest (%)
Increase in
non-
controlling
interest
UBA Kenya Bank Limited 15% 19% 75
UBA Uganda Limited 26% 30% 46
UBA Mozambique Limited 15% 30% 68
UBA Chad (SA) 0% 11% 385
UBA Tanzania Limited 0% 20% 202
776
2015
AN
NU
AL
REP
OR
T A
ND
AC
CO
UN
TS
151
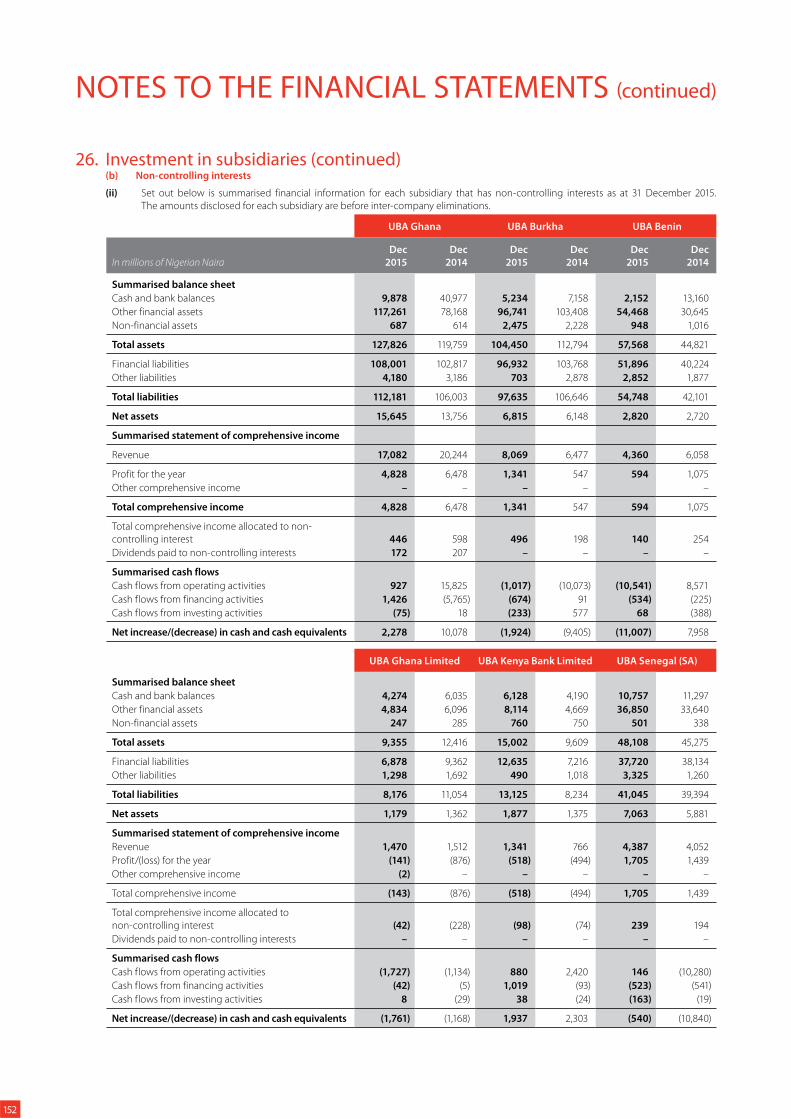
NOTES TO THE FINANCIAL STATEMENTS (continued)
26. Investment in subsidiaries (continued)(b) Non-controlling interests
(ii) Set out below is summarised financial information for each subsidiary that has non-controlling interests as at 31 December 2015.
The amounts disclosed for each subsidiary are before inter-company eliminations.
UBA Ghana UBA Burkha UBA Benin
In millions of Nigerian Naira
Dec
2015
Dec
2014
Dec
2015
Dec
2014
Dec
2015
Dec
2014
Summarised balance sheet
Cash and bank balances 9,878 40,977 5,234 7,158 2,152 13,160
Other financial assets 117,261 78,168 96,741 103,408 54,468 30,645
Non-financial assets 687 614 2,475 2,228 948 1,016
Total assets 127,826 119,759 104,450 112,794 57,568 44,821
Financial liabilities 108,001 102,817 96,932 103,768 51,896 40,224
Other liabilities 4,180 3,186 703 2,878 2,852 1,877
Total liabilities 112,181 106,003 97,635 106,646 54,748 42,101
Net assets 15,645 13,756 6,815 6,148 2,820 2,720
Summarised statement of comprehensive income
Revenue 17,082 20,244 8,069 6,477 4,360 6,058
Profit for the year 4,828 6,478 1,341 547 594 1,075
Other comprehensive income – – – – –
Total comprehensive income 4,828 6,478 1,341 547 594 1,075
Total comprehensive income allocated to non-
controlling interest 446 598 496 198 140 254
Dividends paid to non-controlling interests 172 207 – – – –
Summarised cash flows
Cash flows from operating activities 927 15,825 (1,017) (10,073) (10,541) 8,571
Cash flows from financing activities 1,426 (5,765) (674) 91 (534) (225)
Cash flows from investing activities (75) 18 (233) 577 68 (388)
Net increase/(decrease) in cash and cash equivalents 2,278 10,078 (1,924) (9,405) (11,007) 7,958
UBA Ghana Limited UBA Kenya Bank Limited UBA Senegal (SA)
Summarised balance sheet
Cash and bank balances 4,274 6,035 6,128 4,190 10,757 11,297
Other financial assets 4,834 6,096 8,114 4,669 36,850 33,640
Non-financial assets 247 285 760 750 501 338
Total assets 9,355 12,416 15,002 9,609 48,108 45,275
Financial liabilities 6,878 9,362 12,635 7,216 37,720 38,134
Other liabilities 1,298 1,692 490 1,018 3,325 1,260
Total liabilities 8,176 11,054 13,125 8,234 41,045 39,394
Net assets 1,179 1,362 1,877 1,375 7,063 5,881
Summarised statement of comprehensive income
Revenue 1,470 1,512 1,341 766 4,387 4,052
Profit/(loss) for the year (141) (876) (518) (494) 1,705 1,439
Other comprehensive income (2) – – – – –
Total comprehensive income (143) (876) (518) (494) 1,705 1,439
Total comprehensive income allocated to
non-controlling interest (42) (228) (98) (74) 239 194
Dividends paid to non-controlling interests – – – – – –
Summarised cash flows
Cash flows from operating activities (1,727) (1,134) 880 2,420 146 (10,280)
Cash flows from financing activities (42) (5) 1,019 (93) (523) (541)
Cash flows from investing activities 8 (29) 38 (24) (163) (19)
Net increase/(decrease) in cash and cash equivalents (1,761) (1,168) 1,937 2,303 (540) (10,840)
152
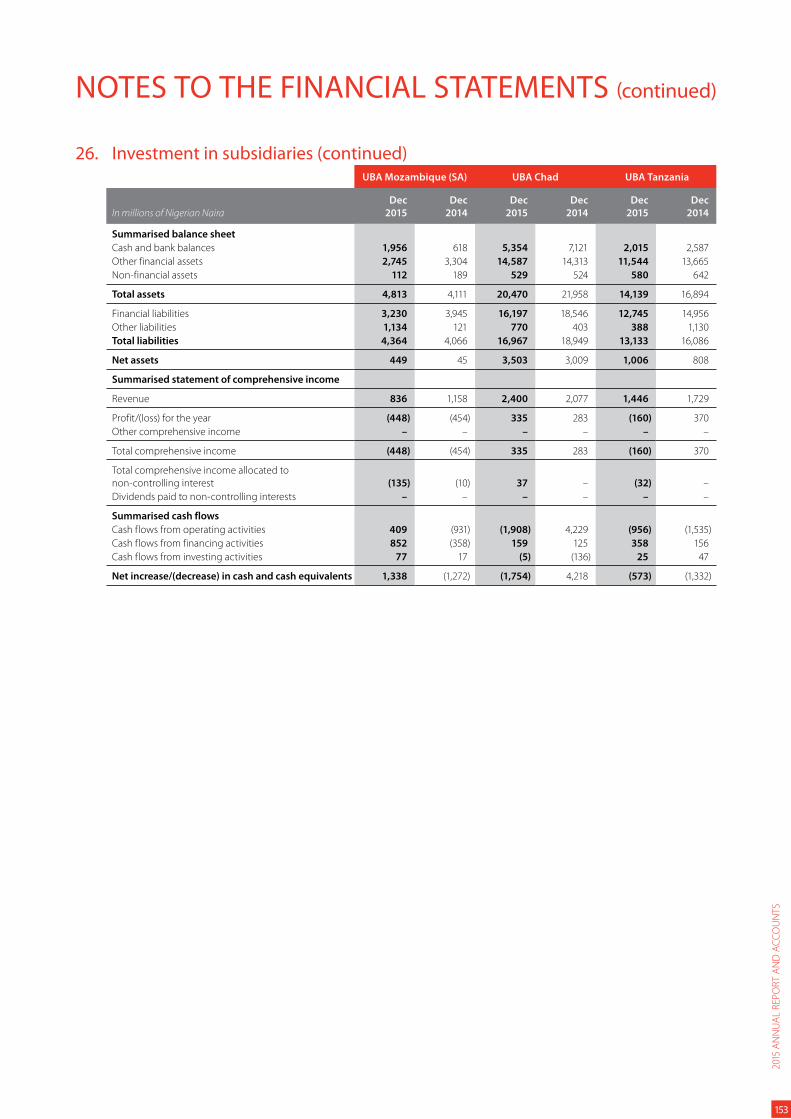
NOTES TO THE FINANCIAL STATEMENTS (continued)
26. Investment in subsidiaries (continued)UBA Mozambique (SA) UBA Chad UBA Tanzania
In millions of Nigerian Naira
Dec
2015
Dec
2014
Dec
2015
Dec
2014
Dec
2015
Dec
2014
Summarised balance sheet
Cash and bank balances 1,956 618 5,354 7,121 2,015 2,587
Other financial assets 2,745 3,304 14,587 14,313 11,544 13,665
Non-financial assets 112 189 529 524 580 642
Total assets 4,813 4,111 20,470 21,958 14,139 16,894
Financial liabilities 3,230 3,945 16,197 18,546 12,745 14,956
Other liabilities 1,134 121 770 403 388 1,130
Total liabilities 4,364 4,066 16,967 18,949 13,133 16,086
Net assets 449 45 3,503 3,009 1,006 808
Summarised statement of comprehensive income
Revenue 836 1,158 2,400 2,077 1,446 1,729
Profit/(loss) for the year (448) (454) 335 283 (160) 370
Other comprehensive income – – – – – –
Total comprehensive income (448) (454) 335 283 (160) 370
Total comprehensive income allocated to
non-controlling interest (135) (10) 37 – (32) –
Dividends paid to non-controlling interests – – – – – –
Summarised cash flows
Cash flows from operating activities 409 (931) (1,908) 4,229 (956) (1,535)
Cash flows from financing activities 852 (358) 159 125 358 156
Cash flows from investing activities 77 17 (5) (136) 25 47
Net increase/(decrease) in cash and cash equivalents 1,338 (1,272) (1,754) 4,218 (573) (1,332)
2015
AN
NU
AL
REP
OR
T A
ND
AC
CO
UN
TS
153
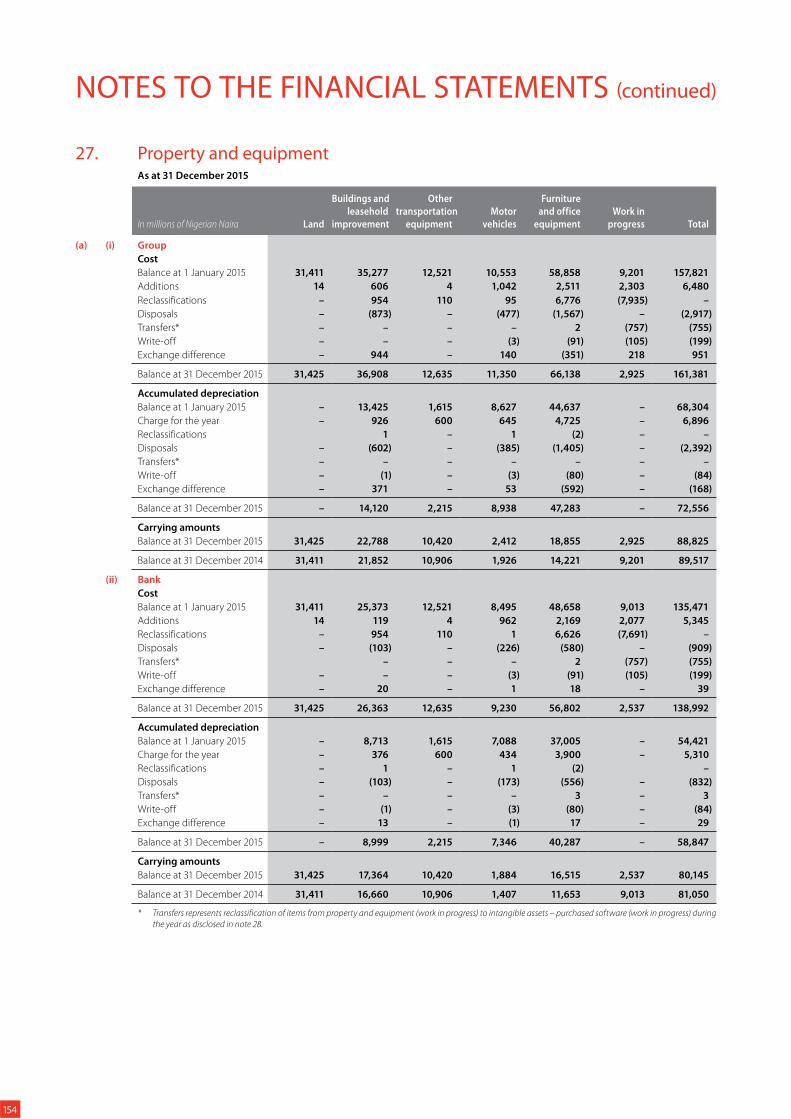
NOTES TO THE FINANCIAL STATEMENTS (continued)
27. Property and equipmentAs at 31 December 2015
In millions of Nigerian Naira Land
Buildings and
leasehold
improvement
Other
transportation
equipment
Motor
vehicles
Furniture
and office
equipment
Work in
progress Total
(a) (i) Group
Cost
Balance at 1 January 2015 31,411 35,277 12,521 10,553 58,858 9,201 157,821
Additions 14 606 4 1,042 2,511 2,303 6,480
Reclassifications – 954 110 95 6,776 (7,935) –
Disposals – (873) – (477) (1,567) – (2,917)
Transfers* – – – – 2 (757) (755)
Write-off – – – (3) (91) (105) (199)
Exchange difference – 944 – 140 (351) 218 951
Balance at 31 December 2015 31,425 36,908 12,635 11,350 66,138 2,925 161,381
Accumulated depreciation
Balance at 1 January 2015 – 13,425 1,615 8,627 44,637 – 68,304
Charge for the year – 926 600 645 4,725 – 6,896
Reclassifications 1 – 1 (2) – –
Disposals – (602) – (385) (1,405) – (2,392)
Transfers* – – – – – – –
Write-off – (1) – (3) (80) – (84)
Exchange difference – 371 – 53 (592) – (168)
Balance at 31 December 2015 – 14,120 2,215 8,938 47,283 – 72,556
Carrying amounts
Balance at 31 December 2015 31,425 22,788 10,420 2,412 18,855 2,925 88,825
Balance at 31 December 2014 31,411 21,852 10,906 1,926 14,221 9,201 89,517
(ii) Bank
Cost
Balance at 1 January 2015 31,411 25,373 12,521 8,495 48,658 9,013 135,471
Additions 14 119 4 962 2,169 2,077 5,345
Reclassifications – 954 110 1 6,626 (7,691) –
Disposals – (103) – (226) (580) – (909)
Transfers* – – – 2 (757) (755)
Write-off – – – (3) (91) (105) (199)
Exchange difference – 20 – 1 18 – 39
Balance at 31 December 2015 31,425 26,363 12,635 9,230 56,802 2,537 138,992
Accumulated depreciation
Balance at 1 January 2015 – 8,713 1,615 7,088 37,005 – 54,421
Charge for the year – 376 600 434 3,900 – 5,310
Reclassifications – 1 – 1 (2) –
Disposals – (103) – (173) (556) – (832)
Transfers* – – – – 3 – 3
Write-off – (1) – (3) (80) – (84)
Exchange difference – 13 – (1) 17 – 29
Balance at 31 December 2015 – 8,999 2,215 7,346 40,287 – 58,847
Carrying amounts
Balance at 31 December 2015 31,425 17,364 10,420 1,884 16,515 2,537 80,145
Balance at 31 December 2014 31,411 16,660 10,906 1,407 11,653 9,013 81,050
* Transfers represents reclassification of items from property and equipment (work in progress) to intangible assets – purchased software (work in progress) during
the year as disclosed in note 28.
154
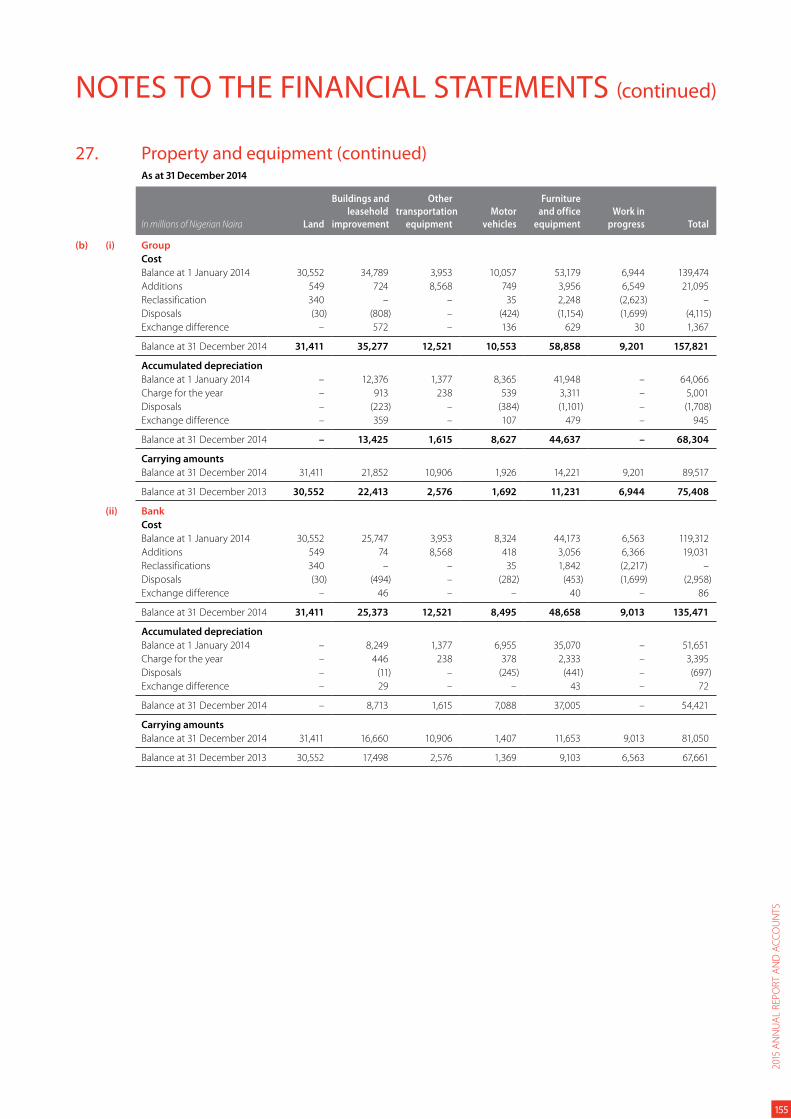
NOTES TO THE FINANCIAL STATEMENTS (continued)
27. Property and equipment (continued)As at 31 December 2014
In millions of Nigerian Naira Land
Buildings and
leasehold
improvement
Other
transportation
equipment
Motor
vehicles
Furniture
and office
equipment
Work in
progress Total
(b) (i) Group
Cost
Balance at 1 January 2014 30,552 34,789 3,953 10,057 53,179 6,944 139,474
Additions 549 724 8,568 749 3,956 6,549 21,095
Reclassification 340 – – 35 2,248 (2,623) –
Disposals (30) (808) – (424) (1,154) (1,699) (4,115)
Exchange difference – 572 – 136 629 30 1,367
Balance at 31 December 2014 31,411 35,277 12,521 10,553 58,858 9,201 157,821
Accumulated depreciation
Balance at 1 January 2014 – 12,376 1,377 8,365 41,948 – 64,066
Charge for the year – 913 238 539 3,311 – 5,001
Disposals – (223) – (384) (1,101) – (1,708)
Exchange difference – 359 – 107 479 – 945
Balance at 31 December 2014 – 13,425 1,615 8,627 44,637 – 68,304
Carrying amounts
Balance at 31 December 2014 31,411 21,852 10,906 1,926 14,221 9,201 89,517
Balance at 31 December 2013 30,552 22,413 2,576 1,692 11,231 6,944 75,408
(ii) Bank
Cost
Balance at 1 January 2014 30,552 25,747 3,953 8,324 44,173 6,563 119,312
Additions 549 74 8,568 418 3,056 6,366 19,031
Reclassifications 340 – – 35 1,842 (2,217) –
Disposals (30) (494) – (282) (453) (1,699) (2,958)
Exchange difference – 46 – – 40 – 86
Balance at 31 December 2014 31,411 25,373 12,521 8,495 48,658 9,013 135,471
Accumulated depreciation
Balance at 1 January 2014 – 8,249 1,377 6,955 35,070 – 51,651
Charge for the year – 446 238 378 2,333 – 3,395
Disposals – (11) – (245) (441) – (697)
Exchange difference – 29 – – 43 – 72
Balance at 31 December 2014 – 8,713 1,615 7,088 37,005 – 54,421
Carrying amounts
Balance at 31 December 2014 31,411 16,660 10,906 1,407 11,653 9,013 81,050
Balance at 31 December 2013 30,552 17,498 2,576 1,369 9,103 6,563 67,661
2015
AN
NU
AL
REP
OR
T A
ND
AC
CO
UN
TS
155
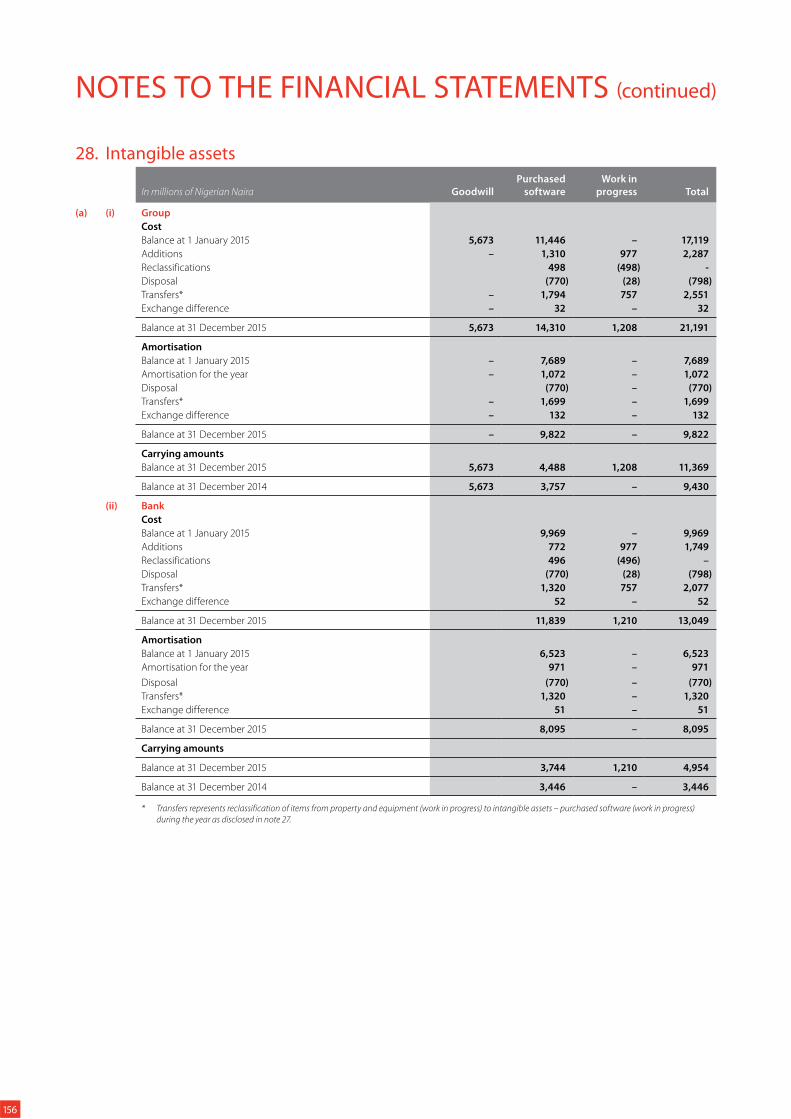
NOTES TO THE FINANCIAL STATEMENTS (continued)
28. Intangible assets
In millions of Nigerian Naira Goodwill
Purchased
software
Work in
progress Total
(a) (i) Group
Cost
Balance at 1 January 2015 5,673 11,446 – 17,119
Additions – 1,310 977 2,287
Reclassifications 498 (498) -
Disposal (770) (28) (798)
Transfers* – 1,794 757 2,551
Exchange difference – 32 – 32
Balance at 31 December 2015 5,673 14,310 1,208 21,191
Amortisation
Balance at 1 January 2015 – 7,689 – 7,689
Amortisation for the year – 1,072 – 1,072
Disposal (770) – (770)
Transfers* – 1,699 – 1,699
Exchange difference – 132 – 132
Balance at 31 December 2015 – 9,822 – 9,822
Carrying amounts
Balance at 31 December 2015 5,673 4,488 1,208 11,369
Balance at 31 December 2014 5,673 3,757 – 9,430
(ii) Bank
Cost
Balance at 1 January 2015 9,969 – 9,969
Additions 772 977 1,749
Reclassifications 496 (496) –
Disposal (770) (28) (798)
Transfers* 1,320 757 2,077
Exchange difference 52 – 52
Balance at 31 December 2015 11,839 1,210 13,049
Amortisation
Balance at 1 January 2015 6,523 – 6,523
Amortisation for the year 971 – 971
Disposal (770) – (770)
Transfers* 1,320 – 1,320
Exchange difference 51 – 51
Balance at 31 December 2015 8,095 – 8,095
Carrying amounts
Balance at 31 December 2015 3,744 1,210 4,954
Balance at 31 December 2014 3,446 – 3,446
* Transfers represents reclassification of items from property and equipment (work in progress) to intangible assets – purchased software (work in progress)
during the year as disclosed in note 27.
156
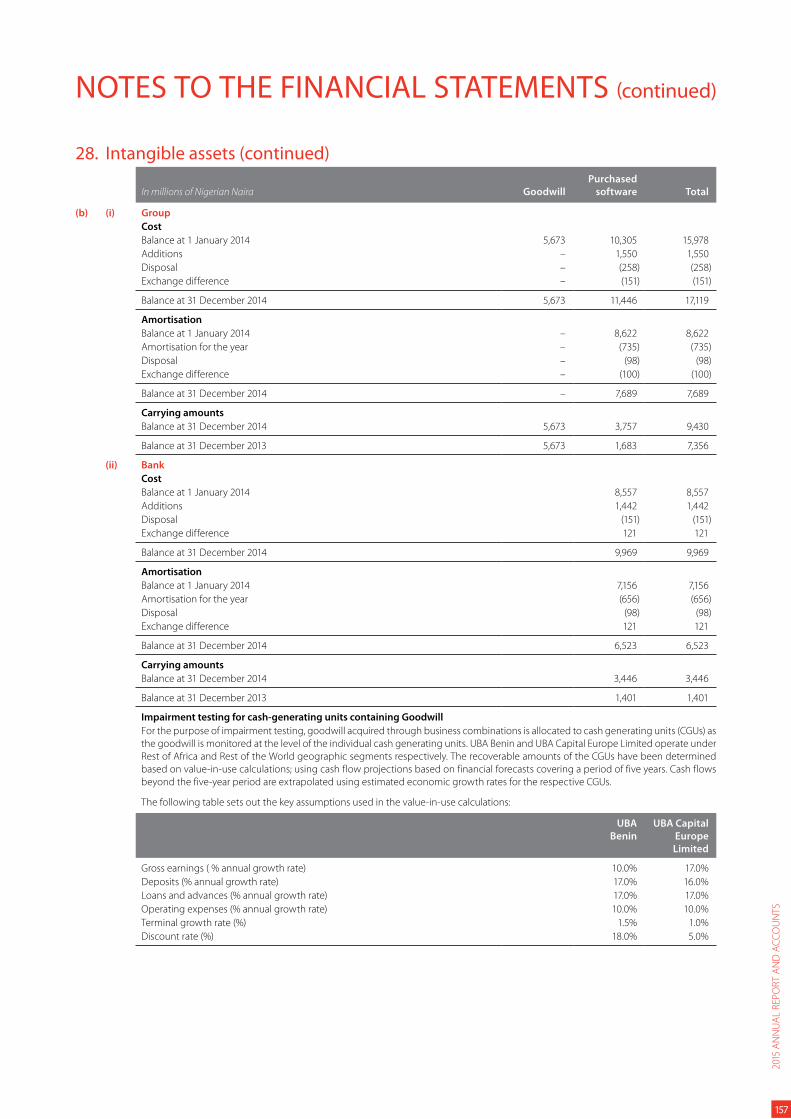
NOTES TO THE FINANCIAL STATEMENTS (continued)
28. Intangible assets (continued)
In millions of Nigerian Naira Goodwill
Purchased
software Total
(b) (i) Group
Cost
Balance at 1 January 2014 5,673 10,305 15,978
Additions – 1,550 1,550
Disposal – (258) (258)
Exchange difference – (151) (151)
Balance at 31 December 2014 5,673 11,446 17,119
Amortisation
Balance at 1 January 2014 – 8,622 8,622
Amortisation for the year – (735) (735)
Disposal – (98) (98)
Exchange difference – (100) (100)
Balance at 31 December 2014 – 7,689 7,689
Carrying amounts
Balance at 31 December 2014 5,673 3,757 9,430
Balance at 31 December 2013 5,673 1,683 7,356
(ii) Bank
Cost
Balance at 1 January 2014 8,557 8,557
Additions 1,442 1,442
Disposal (151) (151)
Exchange difference 121 121
Balance at 31 December 2014 9,969 9,969
Amortisation
Balance at 1 January 2014 7,156 7,156
Amortisation for the year (656) (656)
Disposal (98) (98)
Exchange difference 121 121
Balance at 31 December 2014 6,523 6,523
Carrying amounts
Balance at 31 December 2014 3,446 3,446
Balance at 31 December 2013 1,401 1,401
Impairment testing for cash-generating units containing Goodwill
For the purpose of impairment testing, goodwill acquired through business combinations is allocated to cash generating units (CGUs) as
the goodwill is monitored at the level of the individual cash generating units. UBA Benin and UBA Capital Europe Limited operate under
Rest of Africa and Rest of the World geographic segments respectively. The recoverable amounts of the CGUs have been determined
based on value-in-use calculations; using cash flow projections based on financial forecasts covering a period of five years. Cash flows
beyond the five-year period are extrapolated using estimated economic growth rates for the respective CGUs.
The following table sets out the key assumptions used in the value-in-use calculations:
UBA
Benin
UBA Capital
Europe
Limited
Gross earnings ( % annual growth rate) 10.0% 17.0%
Deposits (% annual growth rate) 17.0% 16.0%
Loans and advances (% annual growth rate) 17.0% 17.0%
Operating expenses (% annual growth rate) 10.0% 10.0%
Terminal growth rate (%) 1.5% 1.0%
Discount rate (%) 18.0% 5.0%
2015
AN
NU
AL
REP
OR
T A
ND
AC
CO
UN
TS
157
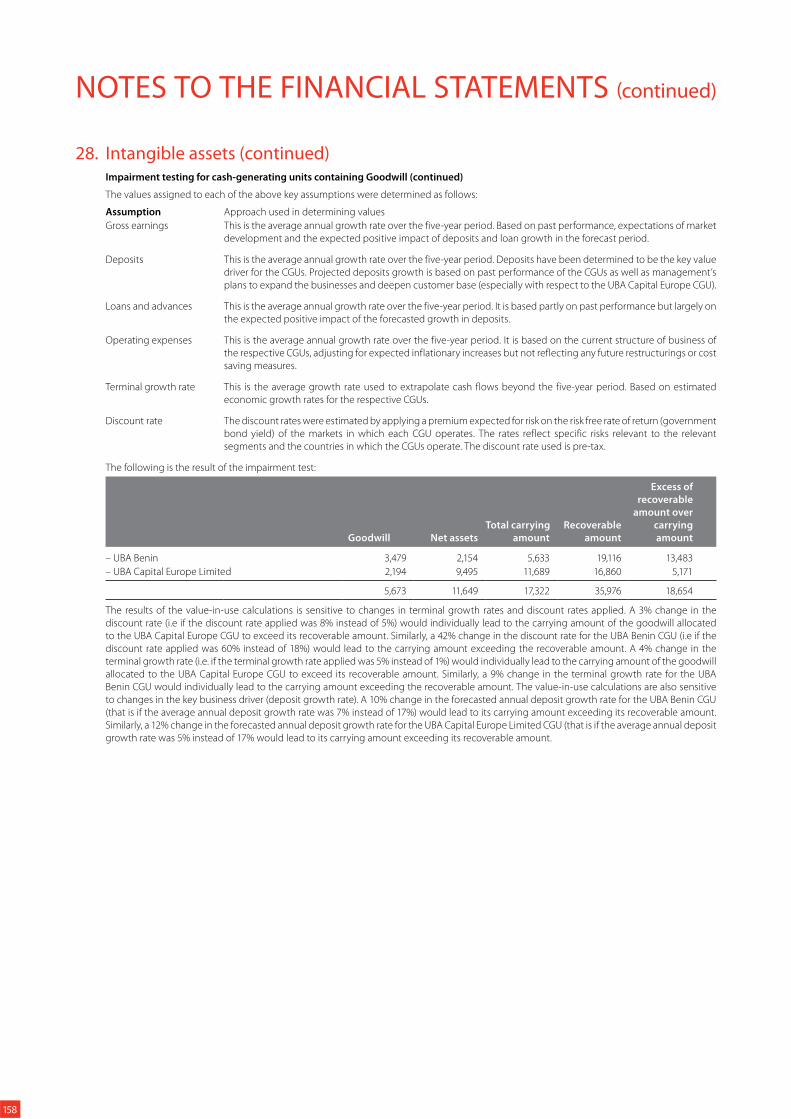
NOTES TO THE FINANCIAL STATEMENTS (continued)
28. Intangible assets (continued)Impairment testing for cash-generating units containing Goodwill (continued)
The values assigned to each of the above key assumptions were determined as follows:
Assumption Approach used in determining values
Gross earnings This is the average annual growth rate over the five-year period. Based on past performance, expectations of market
development and the expected positive impact of deposits and loan growth in the forecast period.
Deposits This is the average annual growth rate over the five-year period. Deposits have been determined to be the key value
driver for the CGUs. Projected deposits growth is based on past performance of the CGUs as well as management’s
plans to expand the businesses and deepen customer base (especially with respect to the UBA Capital Europe CGU).
Loans and advances This is the average annual growth rate over the five-year period. It is based partly on past performance but largely on
the expected positive impact of the forecasted growth in deposits.
Operating expenses This is the average annual growth rate over the five-year period. It is based on the current structure of business of
the respective CGUs, adjusting for expected inflationary increases but not reflecting any future restructurings or cost
saving measures.
Terminal growth rate This is the average growth rate used to extrapolate cash flows beyond the five-year period. Based on estimated
economic growth rates for the respective CGUs.
Discount rate The discount rates were estimated by applying a premium expected for risk on the risk free rate of return (government
bond yield) of the markets in which each CGU operates. The rates reflect specific risks relevant to the relevant
segments and the countries in which the CGUs operate. The discount rate used is pre-tax.
The following is the result of the impairment test:
Goodwill Net assets
Total carrying
amount
Recoverable
amount
Excess of
recoverable
amount over
carrying
amount
– UBA Benin 3,479 2,154 5,633 19,116 13,483
– UBA Capital Europe Limited 2,194 9,495 11,689 16,860 5,171
5,673 11,649 17,322 35,976 18,654
The results of the value-in-use calculations is sensitive to changes in terminal growth rates and discount rates applied. A 3% change in the
discount rate (i.e if the discount rate applied was 8% instead of 5%) would individually lead to the carrying amount of the goodwill allocated
to the UBA Capital Europe CGU to exceed its recoverable amount. Similarly, a 42% change in the discount rate for the UBA Benin CGU (i.e if the
discount rate applied was 60% instead of 18%) would lead to the carrying amount exceeding the recoverable amount. A 4% change in the
terminal growth rate (i.e. if the terminal growth rate applied was 5% instead of 1%) would individually lead to the carrying amount of the goodwill
allocated to the UBA Capital Europe CGU to exceed its recoverable amount. Similarly, a 9% change in the terminal growth rate for the UBA
Benin CGU would individually lead to the carrying amount exceeding the recoverable amount. The value-in-use calculations are also sensitive
to changes in the key business driver (deposit growth rate). A 10% change in the forecasted annual deposit growth rate for the UBA Benin CGU
(that is if the average annual deposit growth rate was 7% instead of 17%) would lead to its carrying amount exceeding its recoverable amount.
Similarly, a 12% change in the forecasted annual deposit growth rate for the UBA Capital Europe Limited CGU (that is if the average annual deposit
growth rate was 5% instead of 17% would lead to its carrying amount exceeding its recoverable amount.
158
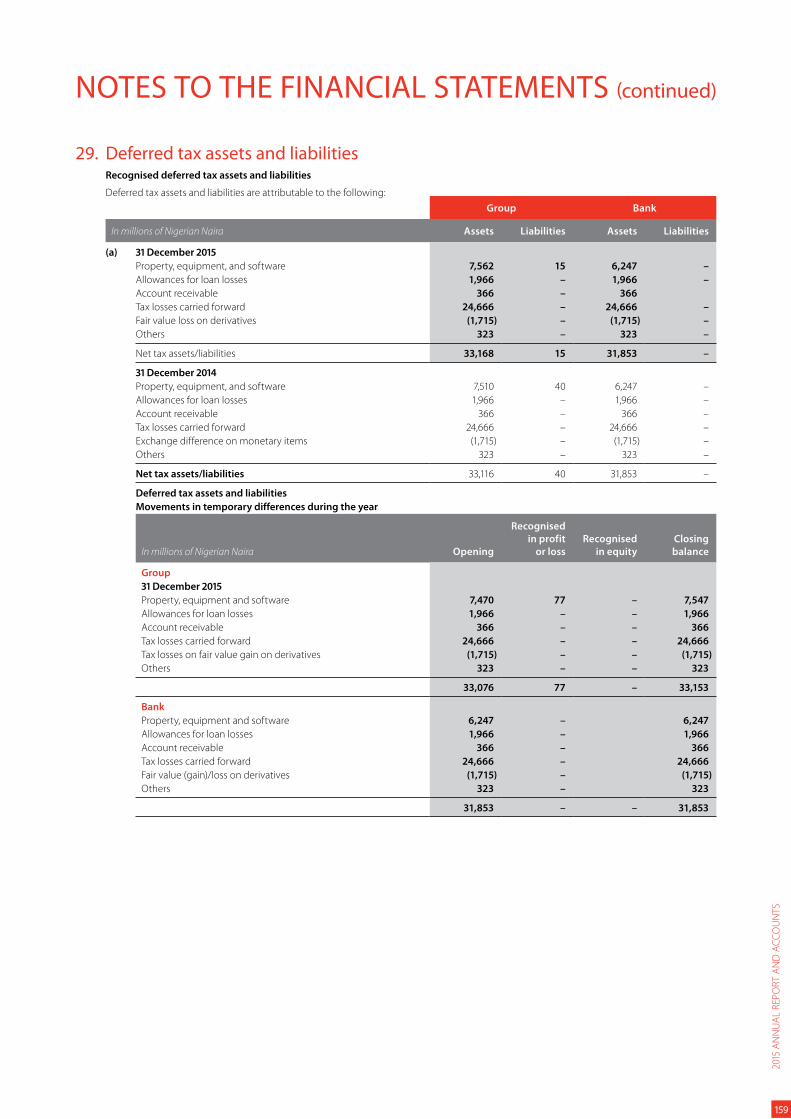
NOTES TO THE FINANCIAL STATEMENTS (continued)
29. Deferred tax assets and liabilitiesRecognised deferred tax assets and liabilities
Deferred tax assets and liabilities are attributable to the following:
Group Bank
In millions of Nigerian Naira Assets Liabilities Assets Liabilities
(a) 31 December 2015
Property, equipment, and software 7,562 15 6,247 –
Allowances for loan losses 1,966 – 1,966 –
Account receivable 366 – 366
Tax losses carried forward 24,666 – 24,666 –
Fair value loss on derivatives (1,715) – (1,715) –
Others 323 – 323 –
Net tax assets/liabilities 33,168 15 31,853 –
31 December 2014
Property, equipment, and software 7,510 40 6,247 –
Allowances for loan losses 1,966 – 1,966 –
Account receivable 366 – 366 –
Tax losses carried forward 24,666 – 24,666 –
Exchange difference on monetary items (1,715) – (1,715) –
Others 323 – 323 –
Net tax assets/liabilities 33,116 40 31,853 –
Deferred tax assets and liabilities
Movements in temporary differences during the year
In millions of Nigerian Naira Opening
Recognised
in profit
or loss
Recognised
in equity
Closing
balance
Group
31 December 2015
Property, equipment and software 7,470 77 – 7,547
Allowances for loan losses 1,966 – – 1,966
Account receivable 366 – – 366
Tax losses carried forward 24,666 – – 24,666
Tax losses on fair value gain on derivatives (1,715) – – (1,715)
Others 323 – – 323
33,076 77 – 33,153
Bank
Property, equipment and software 6,247 – 6,247
Allowances for loan losses 1,966 – 1,966
Account receivable 366 – 366
Tax losses carried forward 24,666 – 24,666
Fair value (gain)/loss on derivatives (1,715) – (1,715)
Others 323 – 323
31,853 – – 31,853
2015
AN
NU
AL
REP
OR
T A
ND
AC
CO
UN
TS
159
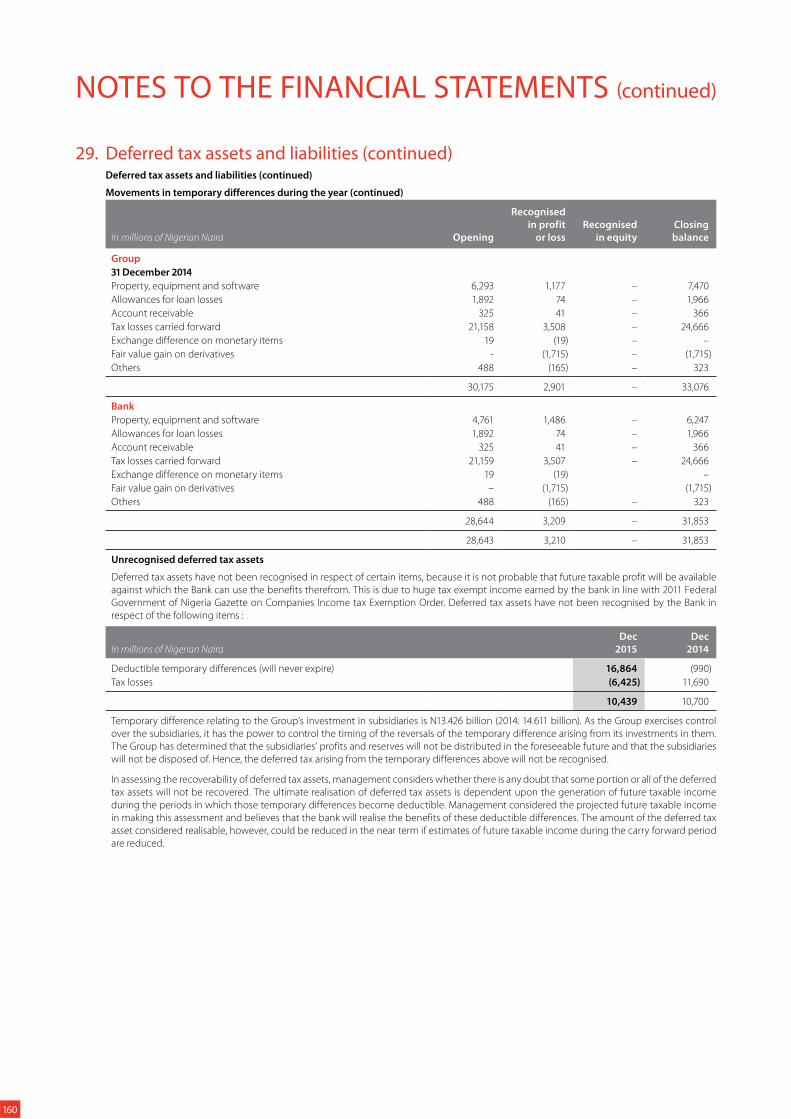
NOTES TO THE FINANCIAL STATEMENTS (continued)
29. Deferred tax assets and liabilities (continued)Deferred tax assets and liabilities (continued)
Movements in temporary differences during the year (continued)
In millions of Nigerian Naira Opening
Recognised
in profit
or loss
Recognised
in equity
Closing
balance
Group
31 December 2014
Property, equipment and software 6,293 1,177 – 7,470
Allowances for loan losses 1,892 74 – 1,966
Account receivable 325 41 – 366
Tax losses carried forward 21,158 3,508 – 24,666
Exchange difference on monetary items 19 (19) – –
Fair value gain on derivatives - (1,715) – (1,715)
Others 488 (165) – 323
30,175 2,901 – 33,076
Bank
Property, equipment and software 4,761 1,486 – 6,247
Allowances for loan losses 1,892 74 – 1,966
Account receivable 325 41 – 366
Tax losses carried forward 21,159 3,507 – 24,666
Exchange difference on monetary items 19 (19) –
Fair value gain on derivatives – (1,715) (1,715)
Others 488 (165) – 323
28,644 3,209 – 31,853
28,643 3,210 – 31,853
Unrecognised deferred tax assets
Deferred tax assets have not been recognised in respect of certain items, because it is not probable that future taxable profit will be available
against which the Bank can use the benefits therefrom. This is due to huge tax exempt income earned by the bank in line with 2011 Federal
Government of Nigeria Gazette on Companies Income tax Exemption Order. Deferred tax assets have not been recognised by the Bank in
respect of the following items :
In millions of Nigerian Naira
Dec
2015
Dec
2014
Deductible temporary differences (will never expire) 16,864 (990)
Tax losses (6,425) 11,690
10,439 10,700
Temporary difference relating to the Group’s investment in subsidiaries is N13.426 billion (2014: 14.611 billion). As the Group exercises control
over the subsidiaries, it has the power to control the timing of the reversals of the temporary difference arising from its investments in them.
The Group has determined that the subsidiaries’ profits and reserves will not be distributed in the foreseeable future and that the subsidiaries
will not be disposed of. Hence, the deferred tax arising from the temporary differences above will not be recognised.
In assessing the recoverability of deferred tax assets, management considers whether there is any doubt that some portion or all of the deferred
tax assets will not be recovered. The ultimate realisation of deferred tax assets is dependent upon the generation of future taxable income
during the periods in which those temporary differences become deductible. Management considered the projected future taxable income
in making this assessment and believes that the bank will realise the benefits of these deductible differences. The amount of the deferred tax
asset considered realisable, however, could be reduced in the near term if estimates of future taxable income during the carry forward period
are reduced.
160
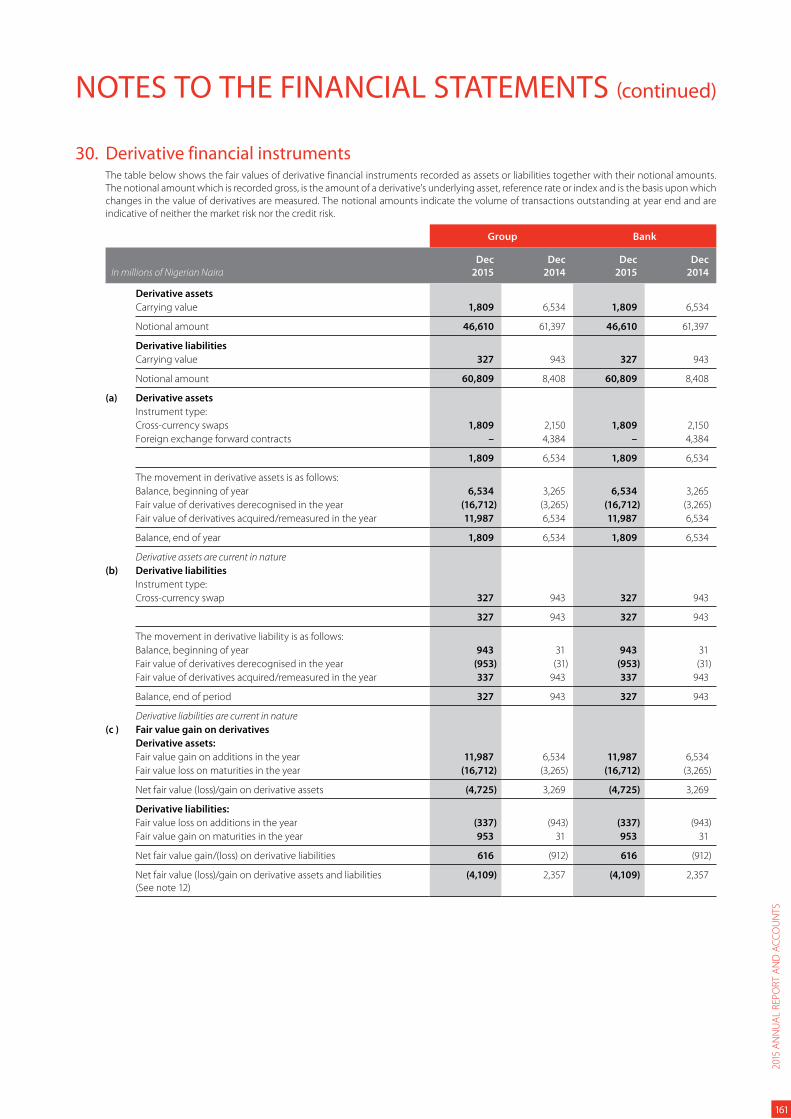
NOTES TO THE FINANCIAL STATEMENTS (continued)
30. Derivative financial instrumentsThe table below shows the fair values of derivative financial instruments recorded as assets or liabilities together with their notional amounts.
The notional amount which is recorded gross, is the amount of a derivative’s underlying asset, reference rate or index and is the basis upon which
changes in the value of derivatives are measured. The notional amounts indicate the volume of transactions outstanding at year end and are
indicative of neither the market risk nor the credit risk.
Group Bank
In millions of Nigerian Naira
Dec
2015
Dec
2014
Dec
2015
Dec
2014
Derivative assets
Carrying value 1,809 6,534 1,809 6,534
Notional amount 46,610 61,397 46,610 61,397
Derivative liabilities
Carrying value 327 943 327 943
Notional amount 60,809 8,408 60,809 8,408
(a) Derivative assets
Instrument type:
Cross-currency swaps 1,809 2,150 1,809 2,150
Foreign exchange forward contracts – 4,384 – 4,384
1,809 6,534 1,809 6,534
The movement in derivative assets is as follows:
Balance, beginning of year 6,534 3,265 6,534 3,265
Fair value of derivatives derecognised in the year (16,712) (3,265) (16,712) (3,265)
Fair value of derivatives acquired/remeasured in the year 11,987 6,534 11,987 6,534
Balance, end of year 1,809 6,534 1,809 6,534
Derivative assets are current in nature
(b) Derivative liabilities
Instrument type:
Cross-currency swap 327 943 327 943
327 943 327 943
The movement in derivative liability is as follows:
Balance, beginning of year 943 31 943 31
Fair value of derivatives derecognised in the year (953) (31) (953) (31)
Fair value of derivatives acquired/remeasured in the year 337 943 337 943
Balance, end of period 327 943 327 943
Derivative liabilities are current in nature
(c ) Fair value gain on derivatives
Derivative assets:
Fair value gain on additions in the year 11,987 6,534 11,987 6,534
Fair value loss on maturities in the year (16,712) (3,265) (16,712) (3,265)
Net fair value (loss)/gain on derivative assets (4,725) 3,269 (4,725) 3,269
Derivative liabilities:
Fair value loss on additions in the year (337) (943) (337) (943)
Fair value gain on maturities in the year 953 31 953 31
Net fair value gain/(loss) on derivative liabilities 616 (912) 616 (912)
Net fair value (loss)/gain on derivative assets and liabilities
(See note 12)
(4,109) 2,357 (4,109) 2,357
2015
AN
NU
AL
REP
OR
T A
ND
AC
CO
UN
TS
161
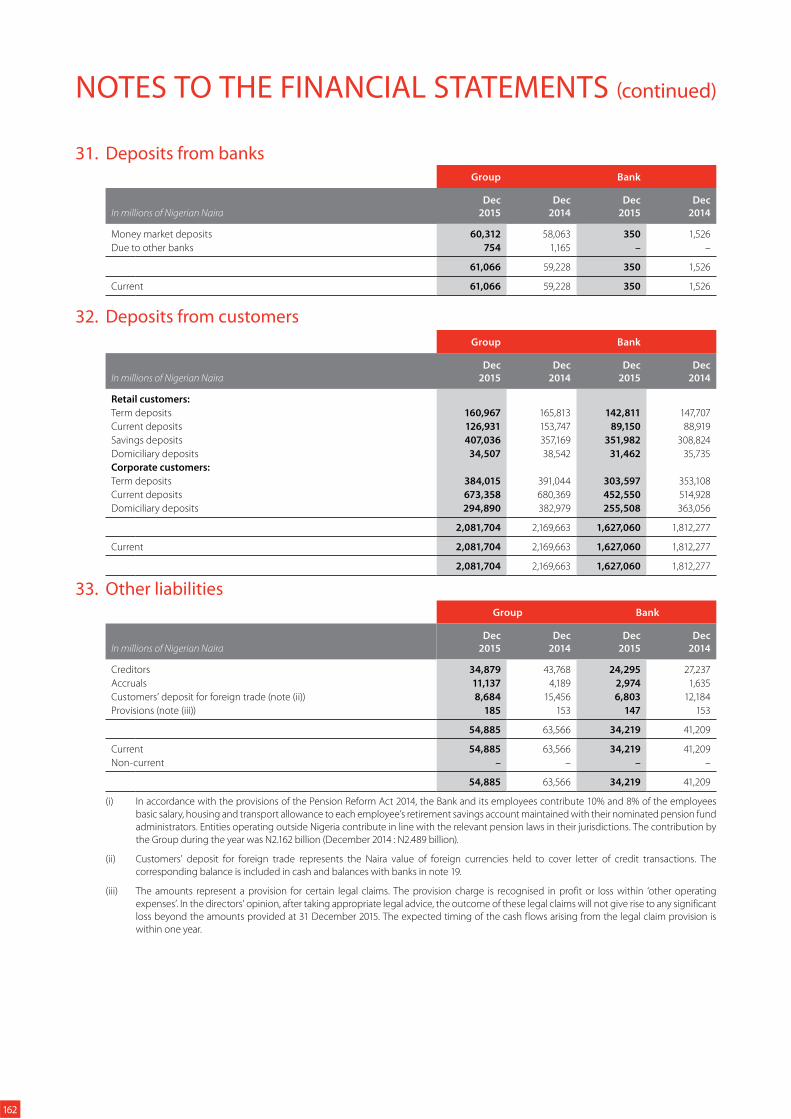
NOTES TO THE FINANCIAL STATEMENTS (continued)
31. Deposits from banks Group Bank
In millions of Nigerian Naira
Dec
2015
Dec
2014
Dec
2015
Dec
2014
Money market deposits 60,312 58,063 350 1,526
Due to other banks 754 1,165 – –
61,066 59,228 350 1,526
Current 61,066 59,228 350 1,526
32. Deposits from customers
Group Bank
In millions of Nigerian Naira
Dec
2015
Dec
2014
Dec
2015
Dec
2014
Retail customers:
Term deposits 160,967 165,813 142,811 147,707
Current deposits 126,931 153,747 89,150 88,919
Savings deposits 407,036 357,169 351,982 308,824
Domiciliary deposits 34,507 38,542 31,462 35,735
Corporate customers:
Term deposits 384,015 391,044 303,597 353,108
Current deposits 673,358 680,369 452,550 514,928
Domiciliary deposits 294,890 382,979 255,508 363,056
2,081,704 2,169,663 1,627,060 1,812,277
Current 2,081,704 2,169,663 1,627,060 1,812,277
2,081,704 2,169,663 1,627,060 1,812,277
33. Other liabilities Group Bank
In millions of Nigerian Naira
Dec
2015
Dec
2014
Dec
2015
Dec
2014
Creditors 34,879 43,768 24,295 27,237
Accruals 11,137 4,189 2,974 1,635
Customers’ deposit for foreign trade (note (ii)) 8,684 15,456 6,803 12,184
Provisions (note (iii)) 185 153 147 153
54,885 63,566 34,219 41,209
Current 54,885 63,566 34,219 41,209
Non-current – – – –
54,885 63,566 34,219 41,209
(i) In accordance with the provisions of the Pension Reform Act 2014, the Bank and its employees contribute 10% and 8% of the employees
basic salary, housing and transport allowance to each employee’s retirement savings account maintained with their nominated pension fund
administrators. Entities operating outside Nigeria contribute in line with the relevant pension laws in their jurisdictions. The contribution by
the Group during the year was N2.162 billion (December 2014 : N2.489 billion).
(ii) Customers’ deposit for foreign trade represents the Naira value of foreign currencies held to cover letter of credit transactions. The
corresponding balance is included in cash and balances with banks in note 19.
(iii) The amounts represent a provision for certain legal claims. The provision charge is recognised in profit or loss within ‘other operating
expenses’. In the directors’ opinion, after taking appropriate legal advice, the outcome of these legal claims will not give rise to any significant
loss beyond the amounts provided at 31 December 2015. The expected timing of the cash flows arising from the legal claim provision is
within one year.
162
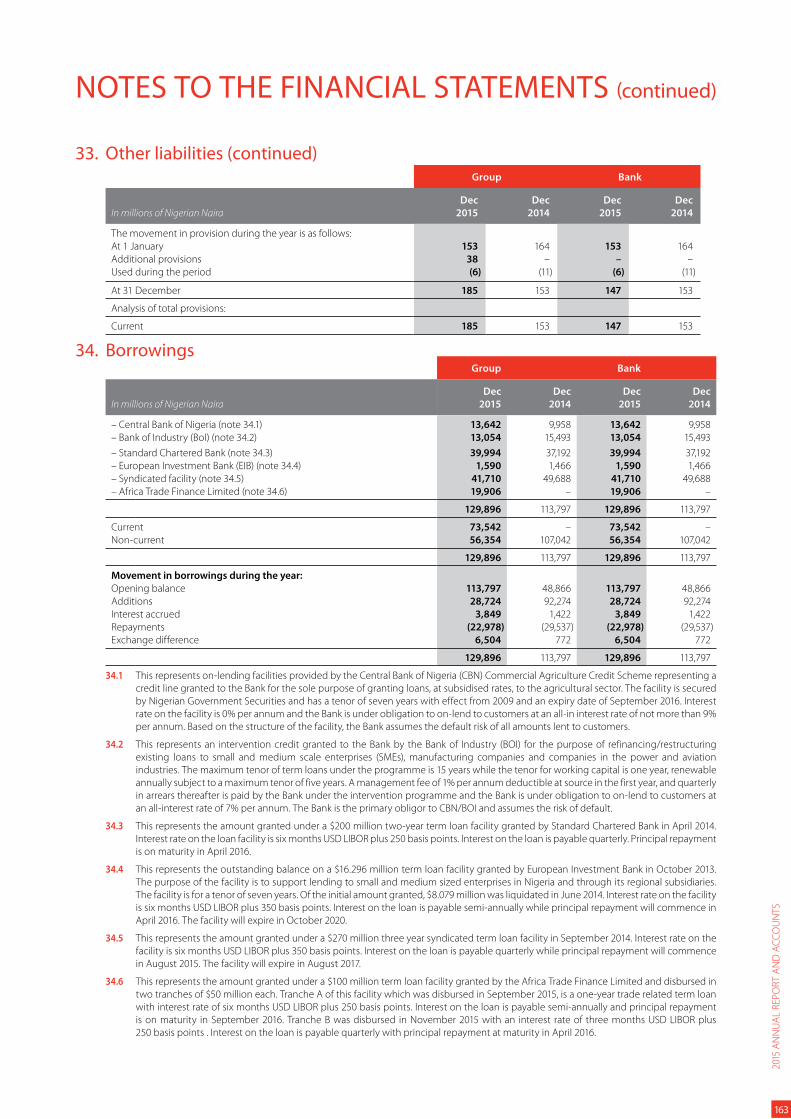
NOTES TO THE FINANCIAL STATEMENTS (continued)
33. Other liabilities (continued) Group Bank
In millions of Nigerian Naira
Dec
2015
Dec
2014
Dec
2015
Dec
2014
The movement in provision during the year is as follows:
At 1 January 153 164 153 164
Additional provisions 38 – – –
Used during the period (6) (11) (6) (11)
At 31 December 185 153 147 153
Analysis of total provisions:
Current 185 153 147 153
34. BorrowingsGroup Bank
In millions of Nigerian Naira
Dec
2015
Dec
2014
Dec
2015
Dec
2014
– Central Bank of Nigeria (note 34.1) 13,642 9,958 13,642 9,958
– Bank of Industry (BoI) (note 34.2) 13,054 15,493 13,054 15,493
– Standard Chartered Bank (note 34.3) 39,994 37,192 39,994 37,192
– European Investment Bank (EIB) (note 34.4) 1,590 1,466 1,590 1,466
– Syndicated facility (note 34.5) 41,710 49,688 41,710 49,688
– Africa Trade Finance Limited (note 34.6) 19,906 – 19,906 –
129,896 113,797 129,896 113,797
Current 73,542 – 73,542 –
Non-current 56,354 107,042 56,354 107,042
129,896 113,797 129,896 113,797
Movement in borrowings during the year:
Opening balance 113,797 48,866 113,797 48,866
Additions 28,724 92,274 28,724 92,274
Interest accrued 3,849 1,422 3,849 1,422
Repayments (22,978) (29,537) (22,978) (29,537)
Exchange difference 6,504 772 6,504 772
129,896 113,797 129,896 113,797
34.1 This represents on-lending facilities provided by the Central Bank of Nigeria (CBN) Commercial Agriculture Credit Scheme representing a
credit line granted to the Bank for the sole purpose of granting loans, at subsidised rates, to the agricultural sector. The facility is secured
by Nigerian Government Securities and has a tenor of seven years with effect from 2009 and an expiry date of September 2016. Interest
rate on the facility is 0% per annum and the Bank is under obligation to on-lend to customers at an all-in interest rate of not more than 9%
per annum. Based on the structure of the facility, the Bank assumes the default risk of all amounts lent to customers.
34.2 This represents an intervention credit granted to the Bank by the Bank of Industry (BOI) for the purpose of refinancing/restructuring
existing loans to small and medium scale enterprises (SMEs), manufacturing companies and companies in the power and aviation
industries. The maximum tenor of term loans under the programme is 15 years while the tenor for working capital is one year, renewable
annually subject to a maximum tenor of five years. A management fee of 1% per annum deductible at source in the first year, and quarterly
in arrears thereafter is paid by the Bank under the intervention programme and the Bank is under obligation to on-lend to customers at
an all-interest rate of 7% per annum. The Bank is the primary obligor to CBN/BOI and assumes the risk of default.
34.3 This represents the amount granted under a $200 million two-year term loan facility granted by Standard Chartered Bank in April 2014.
Interest rate on the loan facility is six months USD LIBOR plus 250 basis points. Interest on the loan is payable quarterly. Principal repayment
is on maturity in April 2016.
34.4 This represents the outstanding balance on a $16.296 million term loan facility granted by European Investment Bank in October 2013.
The purpose of the facility is to support lending to small and medium sized enterprises in Nigeria and through its regional subsidiaries.
The facility is for a tenor of seven years. Of the initial amount granted, $8.079 million was liquidated in June 2014. Interest rate on the facility
is six months USD LIBOR plus 350 basis points. Interest on the loan is payable semi-annually while principal repayment will commence in
April 2016. The facility will expire in October 2020.
34.5 This represents the amount granted under a $270 million three year syndicated term loan facility in September 2014. Interest rate on the
facility is six months USD LIBOR plus 350 basis points. Interest on the loan is payable quarterly while principal repayment will commence
in August 2015. The facility will expire in August 2017.
34.6 This represents the amount granted under a $100 million term loan facility granted by the Africa Trade Finance Limited and disbursed in
two tranches of $50 million each. Tranche A of this facility which was disbursed in September 2015, is a one-year trade related term loan
with interest rate of six months USD LIBOR plus 250 basis points. Interest on the loan is payable semi-annually and principal repayment
is on maturity in September 2016. Tranche B was disbursed in November 2015 with an interest rate of three months USD LIBOR plus
250 basis points . Interest on the loan is payable quarterly with principal repayment at maturity in April 2016.
2015
AN
NU
AL
REP
OR
T A
ND
AC
CO
UN
TS
163
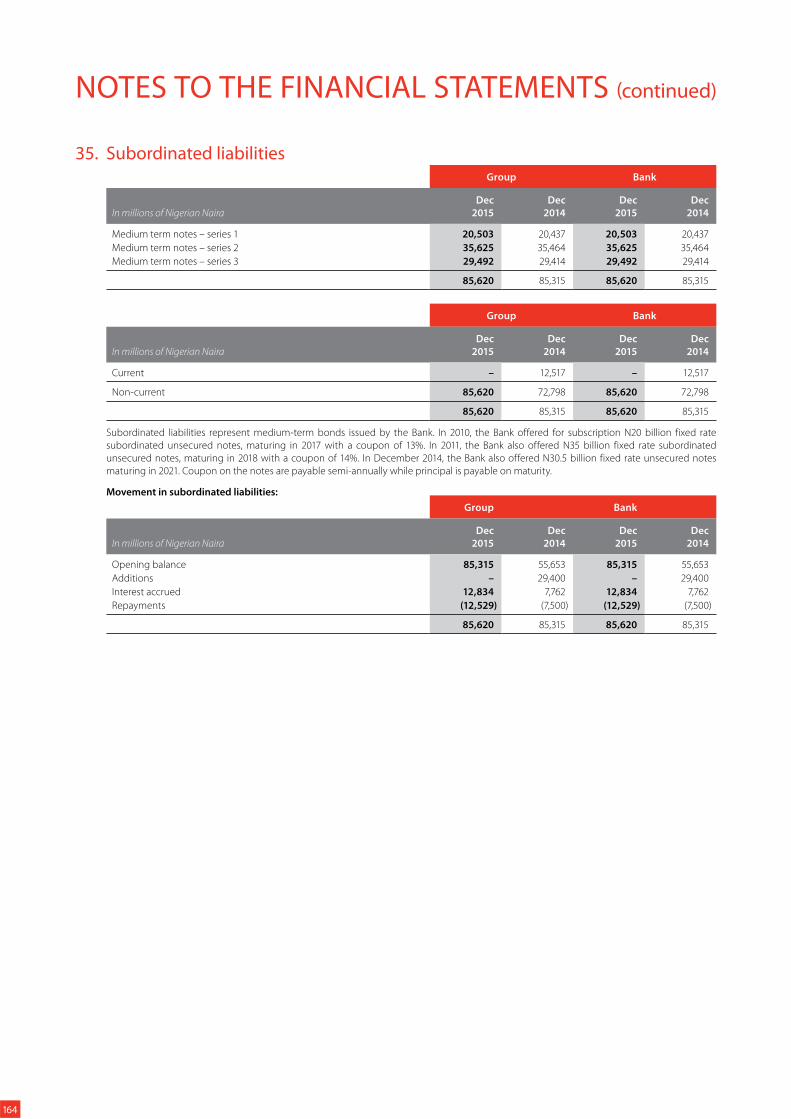
NOTES TO THE FINANCIAL STATEMENTS (continued)
35. Subordinated liabilitiesGroup Bank
In millions of Nigerian Naira
Dec
2015
Dec
2014
Dec
2015
Dec
2014
Medium term notes – series 1 20,503 20,437 20,503 20,437
Medium term notes – series 2 35,625 35,464 35,625 35,464
Medium term notes – series 3 29,492 29,414 29,492 29,414
85,620 85,315 85,620 85,315
Group Bank
In millions of Nigerian Naira
Dec
2015
Dec
2014
Dec
2015
Dec
2014
Current – 12,517 – 12,517
Non-current 85,620 72,798 85,620 72,798
85,620 85,315 85,620 85,315
Subordinated liabilities represent medium-term bonds issued by the Bank. In 2010, the Bank offered for subscription N20 billion fixed rate
subordinated unsecured notes, maturing in 2017 with a coupon of 13%. In 2011, the Bank also offered N35 billion fixed rate subordinated
unsecured notes, maturing in 2018 with a coupon of 14%. In December 2014, the Bank also offered N30.5 billion fixed rate unsecured notes
maturing in 2021. Coupon on the notes are payable semi-annually while principal is payable on maturity.
Movement in subordinated liabilities:
Group Bank
In millions of Nigerian Naira
Dec
2015
Dec
2014
Dec
2015
Dec
2014
Opening balance 85,315 55,653 85,315 55,653
Additions – 29,400 – 29,400
Interest accrued 12,834 7,762 12,834 7,762
Repayments (12,529) (7,500) (12,529) (7,500)
85,620 85,315 85,620 85,315
164
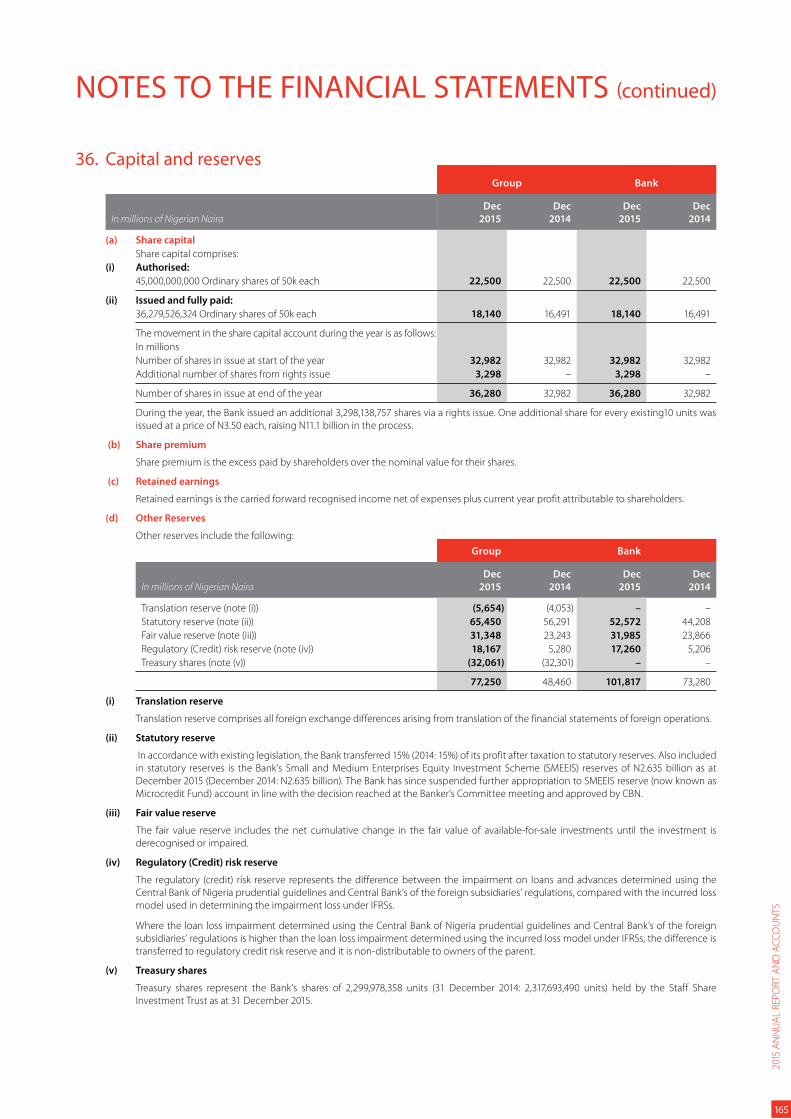
NOTES TO THE FINANCIAL STATEMENTS (continued)
36. Capital and reservesGroup Bank
In millions of Nigerian Naira
Dec
2015
Dec
2014
Dec
2015
Dec
2014
(a) Share capital
Share capital comprises:
(i) Authorised:
45,000,000,000 Ordinary shares of 50k each 22,500 22,500 22,500 22,500
(ii) Issued and fully paid:
36,279,526,324 Ordinary shares of 50k each 18,140 16,491 18,140 16,491
The movement in the share capital account during the year is as follows:
In millions
Number of shares in issue at start of the year 32,982 32,982 32,982 32,982
Additional number of shares from rights issue 3,298 – 3,298 –
Number of shares in issue at end of the year 36,280 32,982 36,280 32,982
During the year, the Bank issued an additional 3,298,138,757 shares via a rights issue. One additional share for every existing10 units was
issued at a price of N3.50 each, raising N11.1 billion in the process.
(b) Share premium
Share premium is the excess paid by shareholders over the nominal value for their shares.
(c) Retained earnings
Retained earnings is the carried forward recognised income net of expenses plus current year profit attributable to shareholders.
(d) Other Reserves
Other reserves include the following:
Group Bank
In millions of Nigerian Naira
Dec
2015
Dec
2014
Dec
2015
Dec
2014
Translation reserve (note (i)) (5,654) (4,053) – –
Statutory reserve (note (ii)) 65,450 56,291 52,572 44,208
Fair value reserve (note (iii)) 31,348 23,243 31,985 23,866
Regulatory (Credit) risk reserve (note (iv)) 18,167 5,280 17,260 5,206
Treasury shares (note (v)) (32,061) (32,301) – –
77,250 48,460 101,817 73,280
(i) Translation reserve
Translation reserve comprises all foreign exchange differences arising from translation of the financial statements of foreign operations.
(ii) Statutory reserve
In accordance with existing legislation, the Bank transferred 15% (2014: 15%) of its profit after taxation to statutory reserves. Also included
in statutory reserves is the Bank’s Small and Medium Enterprises Equity Investment Scheme (SMEEIS) reserves of N2.635 billion as at
December 2015 (December 2014: N2.635 billion). The Bank has since suspended further appropriation to SMEEIS reserve (now known as
Microcredit Fund) account in line with the decision reached at the Banker’s Committee meeting and approved by CBN.
(iii) Fair value reserve
The fair value reserve includes the net cumulative change in the fair value of available-for-sale investments until the investment is
derecognised or impaired.
(iv) Regulatory (Credit) risk reserve
The regulatory (credit) risk reserve represents the difference between the impairment on loans and advances determined using the
Central Bank of Nigeria prudential guidelines and Central Bank’s of the foreign subsidiaries’ regulations, compared with the incurred loss
model used in determining the impairment loss under IFRSs.
Where the loan loss impairment determined using the Central Bank of Nigeria prudential guidelines and Central Bank’s of the foreign
subsidiaries’ regulations is higher than the loan loss impairment determined using the incurred loss model under IFRSs, the difference is
transferred to regulatory credit risk reserve and it is non-distributable to owners of the parent.
(v) Treasury shares
Treasury shares represent the Bank’s shares of 2,299,978,358 units (31 December 2014: 2,317,693,490 units) held by the Staff Share
Investment Trust as at 31 December 2015.
2015
AN
NU
AL
REP
OR
T A
ND
AC
CO
UN
TS
165
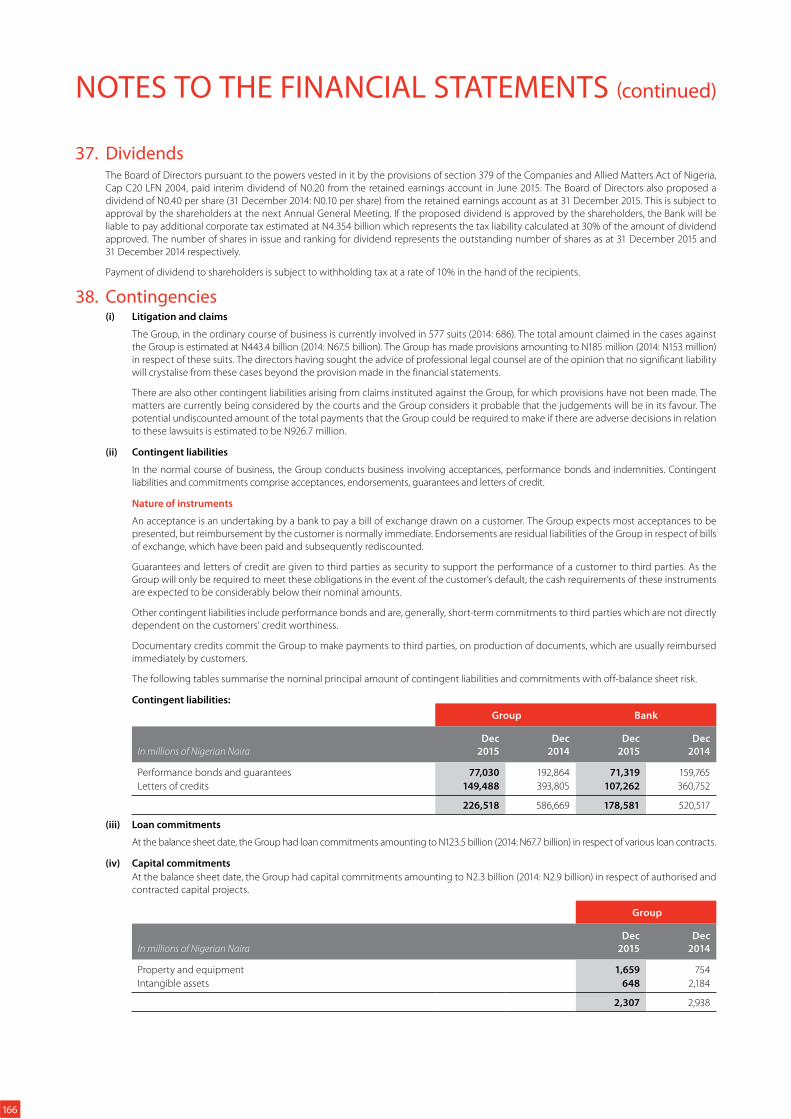
NOTES TO THE FINANCIAL STATEMENTS (continued)
37. DividendsThe Board of Directors pursuant to the powers vested in it by the provisions of section 379 of the Companies and Allied Matters Act of Nigeria,
Cap C20 LFN 2004, paid interim dividend of N0.20 from the retained earnings account in June 2015. The Board of Directors also proposed a
dividend of N0.40 per share (31 December 2014: N0.10 per share) from the retained earnings account as at 31 December 2015. This is subject to
approval by the shareholders at the next Annual General Meeting. If the proposed dividend is approved by the shareholders, the Bank will be
liable to pay additional corporate tax estimated at N4.354 billion which represents the tax liability calculated at 30% of the amount of dividend
approved. The number of shares in issue and ranking for dividend represents the outstanding number of shares as at 31 December 2015 and
31 December 2014 respectively.
Payment of dividend to shareholders is subject to withholding tax at a rate of 10% in the hand of the recipients.
38. Contingencies(i) Litigation and claims
The Group, in the ordinary course of business is currently involved in 577 suits (2014: 686). The total amount claimed in the cases against
the Group is estimated at N443.4 billion (2014: N67.5 billion). The Group has made provisions amounting to N185 million (2014: N153 million)
in respect of these suits. The directors having sought the advice of professional legal counsel are of the opinion that no significant liability
will crystalise from these cases beyond the provision made in the financial statements.
There are also other contingent liabilities arising from claims instituted against the Group, for which provisions have not been made. The
matters are currently being considered by the courts and the Group considers it probable that the judgements will be in its favour. The
potential undiscounted amount of the total payments that the Group could be required to make if there are adverse decisions in relation
to these lawsuits is estimated to be N926.7 million.
(ii) Contingent liabilities
In the normal course of business, the Group conducts business involving acceptances, performance bonds and indemnities. Contingent
liabilities and commitments comprise acceptances, endorsements, guarantees and letters of credit.
Nature of instruments
An acceptance is an undertaking by a bank to pay a bill of exchange drawn on a customer. The Group expects most acceptances to be
presented, but reimbursement by the customer is normally immediate. Endorsements are residual liabilities of the Group in respect of bills
of exchange, which have been paid and subsequently rediscounted.
Guarantees and letters of credit are given to third parties as security to support the performance of a customer to third parties. As the
Group will only be required to meet these obligations in the event of the customer’s default, the cash requirements of these instruments
are expected to be considerably below their nominal amounts.
Other contingent liabilities include performance bonds and are, generally, short-term commitments to third parties which are not directly
dependent on the customers’ credit worthiness.
Documentary credits commit the Group to make payments to third parties, on production of documents, which are usually reimbursed
immediately by customers.
The following tables summarise the nominal principal amount of contingent liabilities and commitments with off-balance sheet risk.
Contingent liabilities:
Group Bank
In millions of Nigerian Naira
Dec
2015
Dec
2014
Dec
2015
Dec
2014
Performance bonds and guarantees 77,030 192,864 71,319 159,765
Letters of credits 149,488 393,805 107,262 360,752
226,518 586,669 178,581 520,517
(iii) Loan commitments
At the balance sheet date, the Group had loan commitments amounting to N123.5 billion (2014: N67.7 billion) in respect of various loan contracts.
(iv) Capital commitments
At the balance sheet date, the Group had capital commitments amounting to N2.3 billion (2014: N2.9 billion) in respect of authorised and
contracted capital projects.
Group
In millions of Nigerian Naira
Dec
2015
Dec
2014
Property and equipment 1,659 754
Intangible assets 648 2,184
2,307 2,938
166
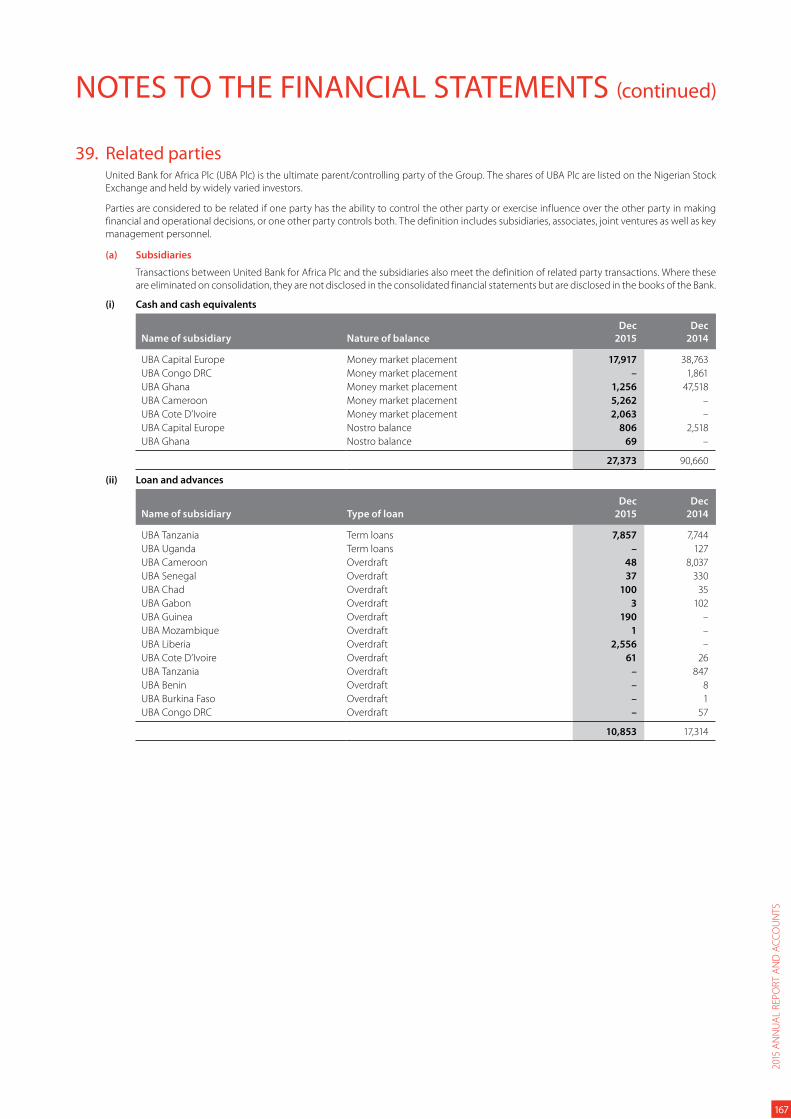
NOTES TO THE FINANCIAL STATEMENTS (continued)
39. Related partiesUnited Bank for Africa Plc (UBA Plc) is the ultimate parent/controlling party of the Group. The shares of UBA Plc are listed on the Nigerian Stock
Exchange and held by widely varied investors.
Parties are considered to be related if one party has the ability to control the other party or exercise influence over the other party in making
financial and operational decisions, or one other party controls both. The definition includes subsidiaries, associates, joint ventures as well as key
management personnel.
(a) Subsidiaries
Transactions between United Bank for Africa Plc and the subsidiaries also meet the definition of related party transactions. Where these
are eliminated on consolidation, they are not disclosed in the consolidated financial statements but are disclosed in the books of the Bank.
(i) Cash and cash equivalents
Name of subsidiary Nature of balance
Dec
2015
Dec
2014
UBA Capital Europe Money market placement 17,917 38,763
UBA Congo DRC Money market placement – 1,861
UBA Ghana Money market placement 1,256 47,518
UBA Cameroon Money market placement 5,262 –
UBA Cote D’Ivoire Money market placement 2,063 –
UBA Capital Europe Nostro balance 806 2,518
UBA Ghana Nostro balance 69 –
27,373 90,660
(ii) Loan and advances
Name of subsidiary Type of loan
Dec
2015
Dec
2014
UBA Tanzania Term loans 7,857 7,744
UBA Uganda Term loans – 127
UBA Cameroon Overdraft 48 8,037
UBA Senegal Overdraft 37 330
UBA Chad Overdraft 100 35
UBA Gabon Overdraft 3 102
UBA Guinea Overdraft 190 –
UBA Mozambique Overdraft 1 –
UBA Liberia Overdraft 2,556 –
UBA Cote D’Ivoire Overdraft 61 26
UBA Tanzania Overdraft – 847
UBA Benin Overdraft – 8
UBA Burkina Faso Overdraft – 1
UBA Congo DRC Overdraft – 57
10,853 17,314
2015
AN
NU
AL
REP
OR
T A
ND
AC
CO
UN
TS
167
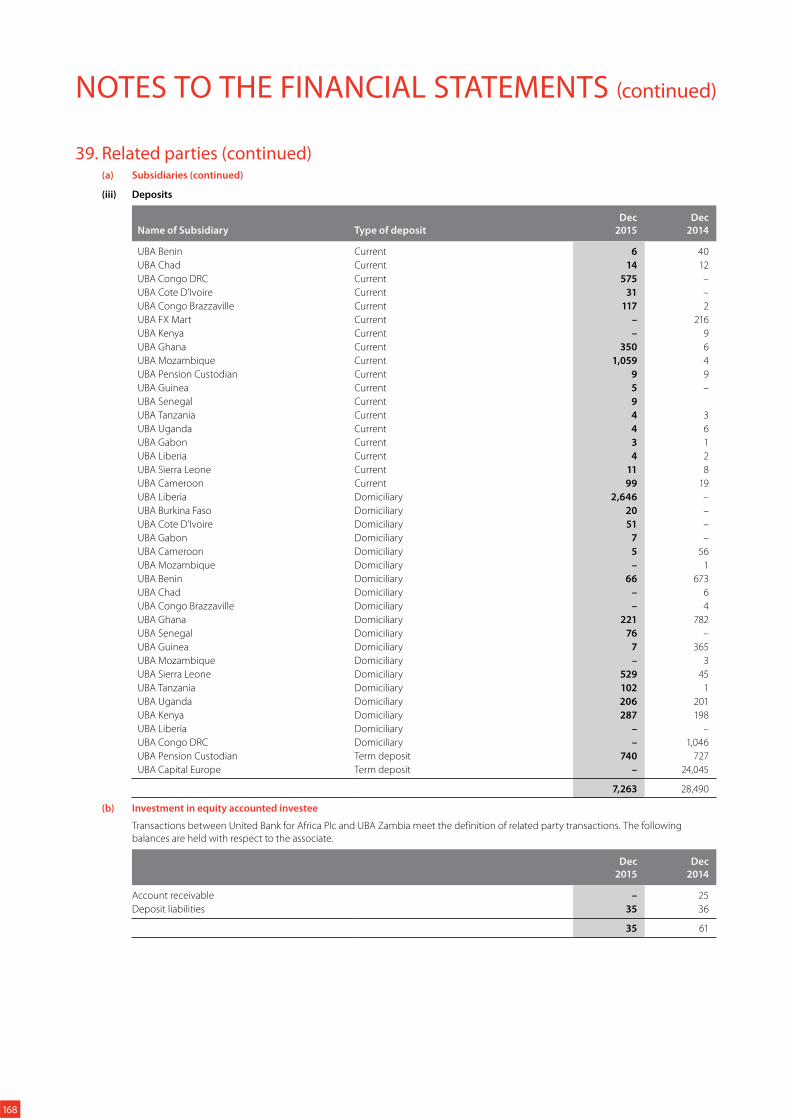
NOTES TO THE FINANCIAL STATEMENTS (continued)
39. Related parties (continued)(a) Subsidiaries (continued)
(iii) Deposits
Name of Subsidiary Type of deposit
Dec
2015
Dec
2014
UBA Benin Current 6 40
UBA Chad Current 14 12
UBA Congo DRC Current 575 –
UBA Cote D’Ivoire Current 31 –
UBA Congo Brazzaville Current 117 2
UBA FX Mart Current – 216
UBA Kenya Current – 9
UBA Ghana Current 350 6
UBA Mozambique Current 1,059 4
UBA Pension Custodian Current 9 9
UBA Guinea Current 5 –
UBA Senegal Current 9
UBA Tanzania Current 4 3
UBA Uganda Current 4 6
UBA Gabon Current 3 1
UBA Liberia Current 4 2
UBA Sierra Leone Current 11 8
UBA Cameroon Current 99 19
UBA Liberia Domiciliary 2,646 –
UBA Burkina Faso Domiciliary 20 –
UBA Cote D’Ivoire Domiciliary 51 –
UBA Gabon Domiciliary 7 –
UBA Cameroon Domiciliary 5 56
UBA Mozambique Domiciliary – 1
UBA Benin Domiciliary 66 673
UBA Chad Domiciliary – 6
UBA Congo Brazzaville Domiciliary – 4
UBA Ghana Domiciliary 221 782
UBA Senegal Domiciliary 76 –
UBA Guinea Domiciliary 7 365
UBA Mozambique Domiciliary – 3
UBA Sierra Leone Domiciliary 529 45
UBA Tanzania Domiciliary 102 1
UBA Uganda Domiciliary 206 201
UBA Kenya Domiciliary 287 198
UBA Liberia Domiciliary – –
UBA Congo DRC Domiciliary – 1,046
UBA Pension Custodian Term deposit 740 727
UBA Capital Europe Term deposit – 24,045
7,263 28,490
(b) Investment in equity accounted investee
Transactions between United Bank for Africa Plc and UBA Zambia meet the definition of related party transactions. The following
balances are held with respect to the associate.
Dec
2015
Dec
2014
Account receivable – 25
Deposit liabilities 35 36
35 61
168
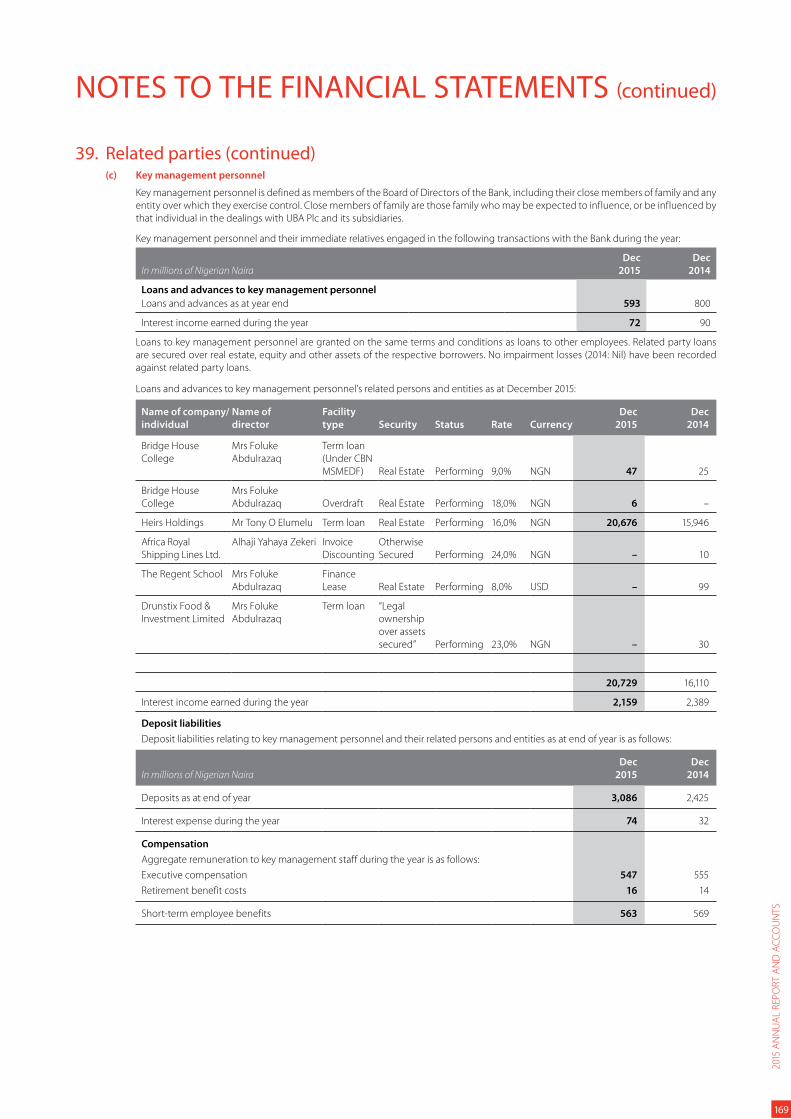
NOTES TO THE FINANCIAL STATEMENTS (continued)
39. Related parties (continued)(c) Key management personnel
Key management personnel is defined as members of the Board of Directors of the Bank, including their close members of family and any
entity over which they exercise control. Close members of family are those family who may be expected to influence, or be influenced by
that individual in the dealings with UBA Plc and its subsidiaries.
Key management personnel and their immediate relatives engaged in the following transactions with the Bank during the year:
In millions of Nigerian Naira
Dec
2015
Dec
2014
Loans and advances to key management personnel
Loans and advances as at year end 593 800
Interest income earned during the year 72 90
Loans to key management personnel are granted on the same terms and conditions as loans to other employees. Related party loans
are secured over real estate, equity and other assets of the respective borrowers. No impairment losses (2014: Nil) have been recorded
against related party loans.
Loans and advances to key management personnel’s related persons and entities as at December 2015:
Name of company/
individual
Name of
director
Facility
type Security Status Rate Currency
Dec
2015
Dec
2014
Bridge House
College
Mrs Foluke
Abdulrazaq
Term loan
(Under CBN
MSMEDF) Real Estate Performing 9,0% NGN 47 25
Bridge House
College
Mrs Foluke
Abdulrazaq Overdraft Real Estate Performing 18,0% NGN 6 –
Heirs Holdings Mr Tony O Elumelu Term loan Real Estate Performing 16,0% NGN 20,676 15,946
Africa Royal
Shipping Lines Ltd.
Alhaji Yahaya Zekeri Invoice
Discounting
Otherwise
Secured Performing 24,0% NGN – 10
The Regent School Mrs Foluke
Abdulrazaq
Finance
Lease Real Estate Performing 8,0% USD – 99
Drunstix Food &
Investment Limited
Mrs Foluke
Abdulrazaq
Term loan “Legal
ownership
over assets
secured” Performing 23,0% NGN – 30
20,729 16,110
Interest income earned during the year 2,159 2,389
Deposit liabilities
Deposit liabilities relating to key management personnel and their related persons and entities as at end of year is as follows:
In millions of Nigerian Naira
Dec
2015
Dec
2014
Deposits as at end of year 3,086 2,425
Interest expense during the year 74 32
Compensation
Aggregate remuneration to key management staff during the year is as follows:
Executive compensation 547 555
Retirement benefit costs 16 14
Short-term employee benefits 563 569
2015
AN
NU
AL
REP
OR
T A
ND
AC
CO
UN
TS
169
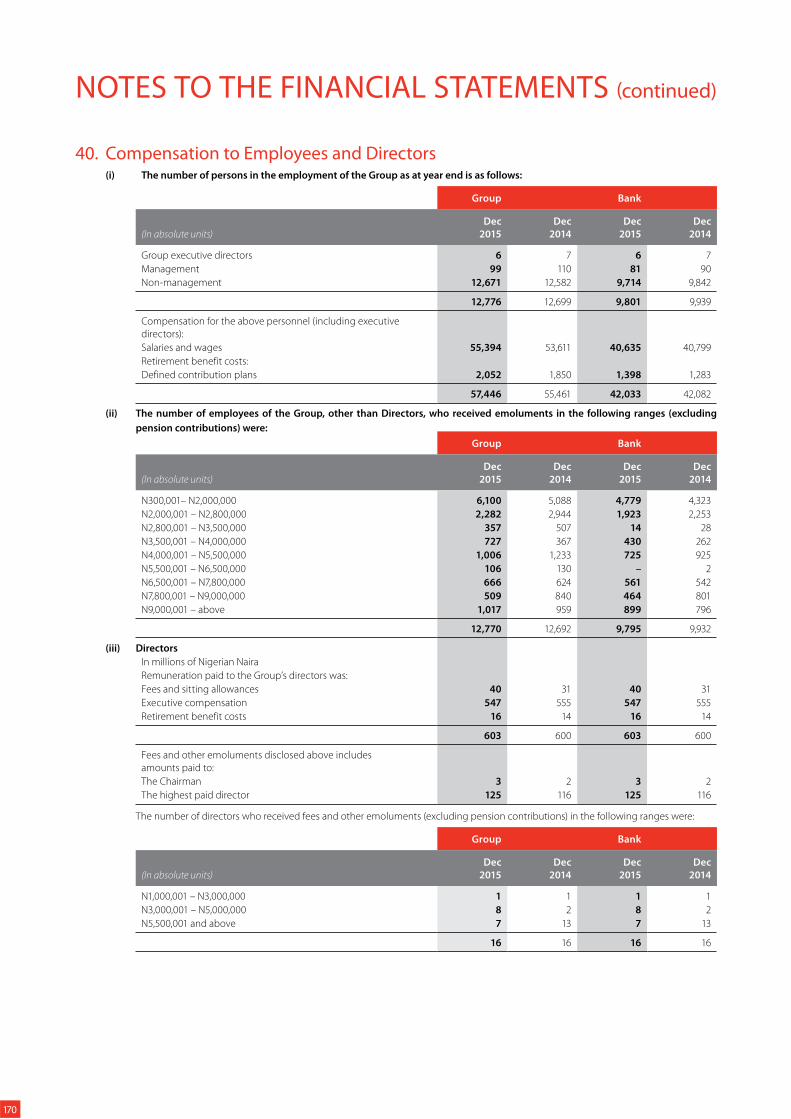
NOTES TO THE FINANCIAL STATEMENTS (continued)
40. Compensation to Employees and Directors(i) The number of persons in the employment of the Group as at year end is as follows:
Group Bank
(In absolute units)
Dec
2015
Dec
2014
Dec
2015
Dec
2014
Group executive directors 6 7 6 7
Management 99 110 81 90
Non-management 12,671 12,582 9,714 9,842
12,776 12,699 9,801 9,939
Compensation for the above personnel (including executive
directors):
Salaries and wages 55,394 53,611 40,635 40,799
Retirement benefit costs:
Defined contribution plans 2,052 1,850 1,398 1,283
57,446 55,461 42,033 42,082
(ii) The number of employees of the Group, other than Directors, who received emoluments in the following ranges (excluding
pension contributions) were:
Group Bank
(In absolute units)
Dec
2015
Dec
2014
Dec
2015
Dec
2014
N300,001– N2,000,000 6,100 5,088 4,779 4,323
N2,000,001 – N2,800,000 2,282 2,944 1,923 2,253
N2,800,001 – N3,500,000 357 507 14 28
N3,500,001 – N4,000,000 727 367 430 262
N4,000,001 – N5,500,000 1,006 1,233 725 925
N5,500,001 – N6,500,000 106 130 – 2
N6,500,001 – N7,800,000 666 624 561 542
N7,800,001 – N9,000,000 509 840 464 801
N9,000,001 – above 1,017 959 899 796
12,770 12,692 9,795 9,932
(iii) Directors
In millions of Nigerian Naira
Remuneration paid to the Group’s directors was:
Fees and sitting allowances 40 31 40 31
Executive compensation 547 555 547 555
Retirement benefit costs 16 14 16 14
603 600 603 600
Fees and other emoluments disclosed above includes
amounts paid to:
The Chairman 3 2 3 2
The highest paid director 125 116 125 116
The number of directors who received fees and other emoluments (excluding pension contributions) in the following ranges were:
Group Bank
(In absolute units)
Dec
2015
Dec
2014
Dec
2015
Dec
2014
N1,000,001 – N3,000,000 1 1 1 1
N3,000,001 – N5,000,000 8 2 8 2
N5,500,001 and above 7 13 7 13
16 16 16 16
170
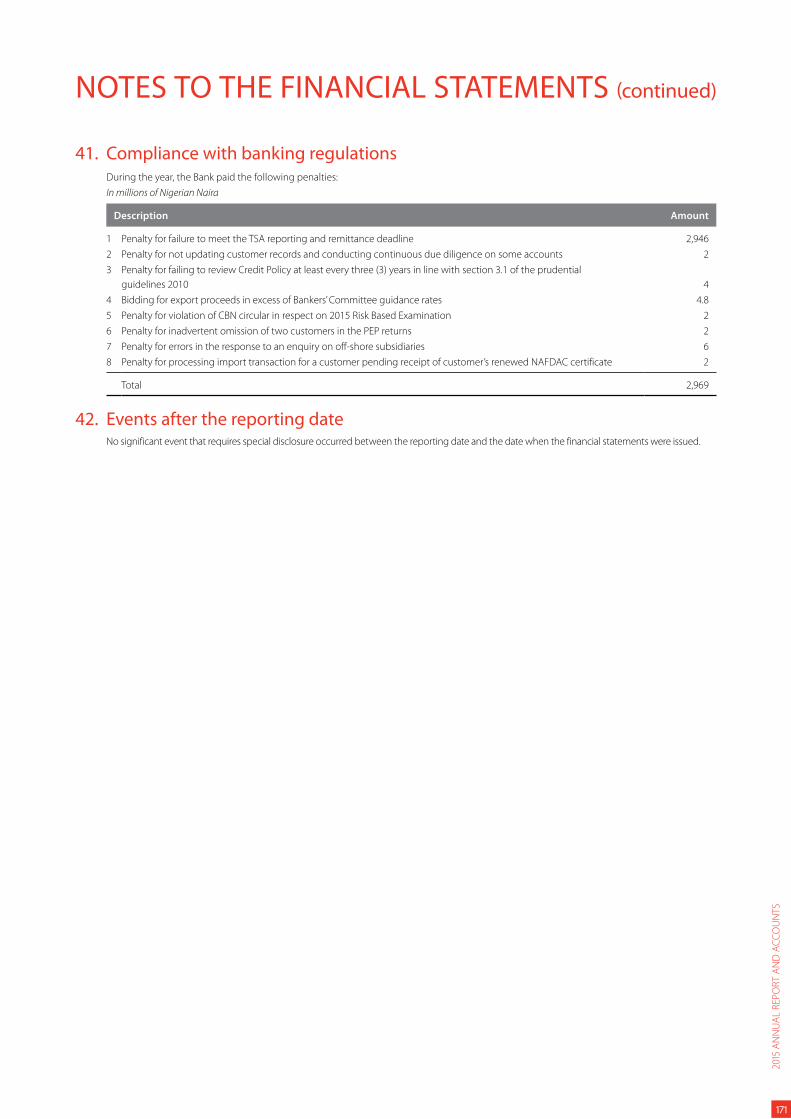
NOTES TO THE FINANCIAL STATEMENTS (continued)
41. Compliance with banking regulationsDuring the year, the Bank paid the following penalties:
In millions of Nigerian Naira
Description Amount
1 Penalty for failure to meet the TSA reporting and remittance deadline 2,946
2 Penalty for not updating customer records and conducting continuous due diligence on some accounts 2
3 Penalty for failing to review Credit Policy at least every three (3) years in line with section 3.1 of the prudential
guidelines 2010 4
4 Bidding for export proceeds in excess of Bankers’ Committee guidance rates 4.8
5 Penalty for violation of CBN circular in respect on 2015 Risk Based Examination 2
6 Penalty for inadvertent omission of two customers in the PEP returns 2
7 Penalty for errors in the response to an enquiry on off-shore subsidiaries 6
8 Penalty for processing import transaction for a customer pending receipt of customer’s renewed NAFDAC certificate 2
Total 2,969
42. Events after the reporting dateNo significant event that requires special disclosure occurred between the reporting date and the date when the financial statements were issued.
2015
AN
NU
AL
REP
OR
T A
ND
AC
CO
UN
TS
171

NOTES TO THE FINANCIAL STATEMENTS (continued)
43. Condensed result of consolidated subsidiariesFor the year ended 31 December 2015
UBA
Ghana
UBA
Liberia
UBA
Cote
D’ Ivoire
UBA
Senegal
UBA
Kenya
UBA
Guinea
UBA
Gabon
UBA
Benin
In millions of Nigerian Naira
Condensed statements of
comprehensive income
Operating income 17,082 969 3,615 4,387 1,341 4,620 2,001 4,360
Total operating expenses (9,860) (777) (3,228) (2,527) (1,691) (1,872) (1,545) (3,634)
Net impairment gain/(loss)
on financial assets (344) (24) 174 70 (243) (385) (53) (92)
Profit/(loss) before
income tax 6,878 168 561 1,930 (593) 2,363 403 634
Income tax expense (2,050) (20) (4) (225) 75 (938) (70) (40)
Profit/(loss) for the year 4,828 148 557 1,705 (518) 1,425 333 594
Condensed statements
of financial position
Assets
Cash and bank balances 9,878 4,537 3,609 10,757 6,128 5,700 5,585 2,152
Financial assets held
for trading – – – – – – – –
Derivative assets – – – – – – – –
Loans and advances to Banks – – – – – – – –
Loans and advances
to customers 42,584 3,590 14,342 20,763 5,189 6,108 10,634 15,461
Investment securities 72,228 707 15,587 15,441 2,729 21,725 901 38,062
Other assets 2,449 388 8,567 646 196 607 77 945
Investments in equity-
accounted investee – – – – – – – –
Investments in subsidiaries – – – – – – – –
Property and equipment 542 255 237 499 106 325 184 941
Intangible assets 54 8 127 2 36 28 20 7
Deferred tax assets 91 – – – 618 – – –
127,826 9,485 42,469 48,108 15,002 34,493 17,401 57,568
172
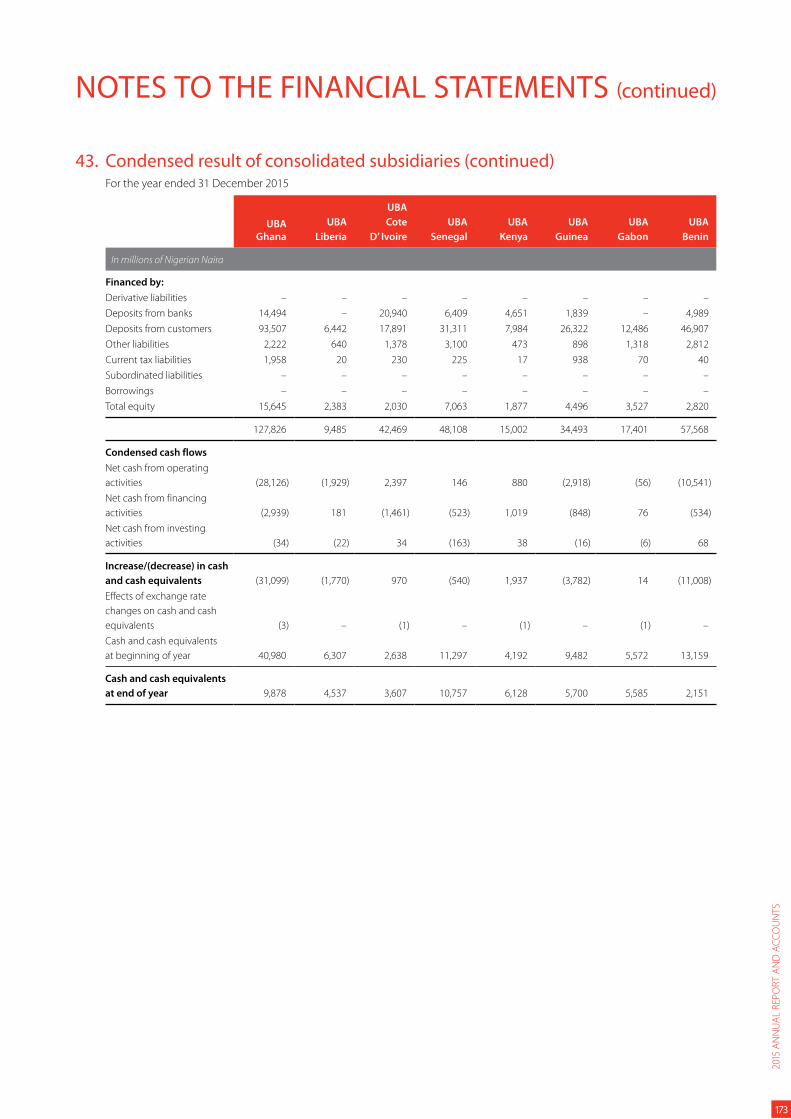
NOTES TO THE FINANCIAL STATEMENTS (continued)
UBA
Ghana
UBA
Liberia
UBA
Cote
D’ Ivoire
UBA
Senegal
UBA
Kenya
UBA
Guinea
UBA
Gabon
UBA
Benin
In millions of Nigerian Naira
Financed by:
Derivative liabilities – – – – – – – –
Deposits from banks 14,494 – 20,940 6,409 4,651 1,839 – 4,989
Deposits from customers 93,507 6,442 17,891 31,311 7,984 26,322 12,486 46,907
Other liabilities 2,222 640 1,378 3,100 473 898 1,318 2,812
Current tax liabilities 1,958 20 230 225 17 938 70 40
Subordinated liabilities – – – – – – – –
Borrowings – – – – – – – –
Total equity 15,645 2,383 2,030 7,063 1,877 4,496 3,527 2,820
127,826 9,485 42,469 48,108 15,002 34,493 17,401 57,568
Condensed cash flows
Net cash from operating
activities (28,126) (1,929) 2,397 146 880 (2,918) (56) (10,541)
Net cash from financing
activities (2,939) 181 (1,461) (523) 1,019 (848) 76 (534)
Net cash from investing
activities (34) (22) 34 (163) 38 (16) (6) 68
Increase/(decrease) in cash
and cash equivalents (31,099) (1,770) 970 (540) 1,937 (3,782) 14 (11,008)
Effects of exchange rate
changes on cash and cash
equivalents (3) – (1) – (1) – (1) –
Cash and cash equivalents
at beginning of year 40,980 6,307 2,638 11,297 4,192 9,482 5,572 13,159
Cash and cash equivalents
at end of year 9,878 4,537 3,607 10,757 6,128 5,700 5,585 2,151
43. Condensed result of consolidated subsidiaries (continued)For the year ended 31 December 2015
2015
AN
NU
AL
REP
OR
T A
ND
AC
CO
UN
TS
173
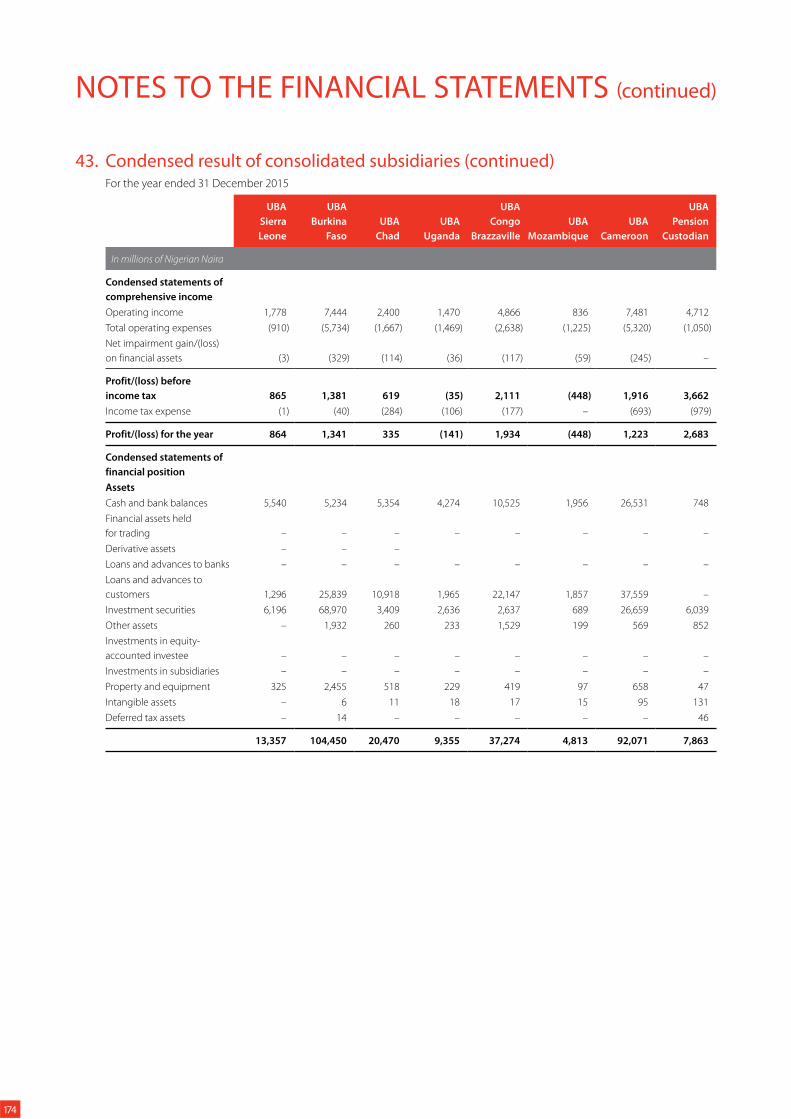
NOTES TO THE FINANCIAL STATEMENTS (continued)
43. Condensed result of consolidated subsidiaries (continued)For the year ended 31 December 2015
UBA
Sierra
Leone
UBA
Burkina
Faso
UBA
Chad
UBA
Uganda
UBA
Congo
Brazzaville
UBA
Mozambique
UBA
Cameroon
UBA
Pension
Custodian
In millions of Nigerian Naira
Condensed statements of
comprehensive income
Operating income 1,778 7,444 2,400 1,470 4,866 836 7,481 4,712
Total operating expenses (910) (5,734) (1,667) (1,469) (2,638) (1,225) (5,320) (1,050)
Net impairment gain/(loss)
on financial assets (3) (329) (114) (36) (117) (59) (245) –
Profit/(loss) before
income tax 865 1,381 619 (35) 2,111 (448) 1,916 3,662
Income tax expense (1) (40) (284) (106) (177) – (693) (979)
Profit/(loss) for the year 864 1,341 335 (141) 1,934 (448) 1,223 2,683
Condensed statements of
financial position
Assets
Cash and bank balances 5,540 5,234 5,354 4,274 10,525 1,956 26,531 748
Financial assets held
for trading – – – – – – – –
Derivative assets – – –
Loans and advances to banks – – – – – – – –
Loans and advances to
customers 1,296 25,839 10,918 1,965 22,147 1,857 37,559 –
Investment securities 6,196 68,970 3,409 2,636 2,637 689 26,659 6,039
Other assets – 1,932 260 233 1,529 199 569 852
Investments in equity-
accounted investee – – – – – – – –
Investments in subsidiaries – – – – – – – –
Property and equipment 325 2,455 518 229 419 97 658 47
Intangible assets – 6 11 18 17 15 95 131
Deferred tax assets – 14 – – – – – 46
13,357 104,450 20,470 9,355 37,274 4,813 92,071 7,863
174

NOTES TO THE FINANCIAL STATEMENTS (continued)
UBA
Sierra
Leone
UBA
Burkina
Faso
UBA
Chad
UBA
Uganda
UBA
Congo
Brazzaville
UBA
Mozambique
UBA
Cameroon
UBA
Pension
Custodian
In millions of Nigerian Naira
Financed by:
Derivative liabilities – – – – – – – –
Deposits from banks 396 23,382 – – 32 – – –
Deposits from customers 9,632 73,550 16,197 6,878 29,048 3,230 77,045 –
Managed funds
Other liabilities 265 662 501 1,192 2,019 1,134 7,301 3,147
Current tax liabilities 21 41 269 106 177 – 693 982
Subordinated liabilities – – – – – – – –
Borrowings – – – – – – – –
Deferred tax liabilities 15 – – – – – – –
Total equity 3,028 6,815 3,503 1,179 5,998 449 7,032 3,734
13,357 104,450 20,470 9,355 37,274 4,813 92,071 7,863
Condensed cash flows
Net cash from operating
activities 927 (1,017) (1,908) (1,727) 2,259 409 5,822 2,536
Net cash from financing
activities 1,426 (674) 159 (42) 28 852 (422) (2,507)
Net cash from investing
activities (75) (233) (5) 8 10 77 (145) (12)
Increase/(decrease) in cash
and cash equivalents 2,278 (1,924) (1,754) (1,761) 2,297 1,338 5,255 17
Effects of exchange rate
changes on cash and cash
equivalents (1) (1) – 1 – 1 1 –
Cash and cash equivalents
at beginning of year 3,263 7,159 7,108 6,034 8,228 617 21,275 731
Cash and cash equivalents
at end of year 5,540 5,234 5,354 4,274 10,525 1,956 26,531 748
43. Condensed result of consolidated subsidiaries (continued)For the year ended 31 December 2015
2015
AN
NU
AL
REP
OR
T A
ND
AC
CO
UN
TS
175
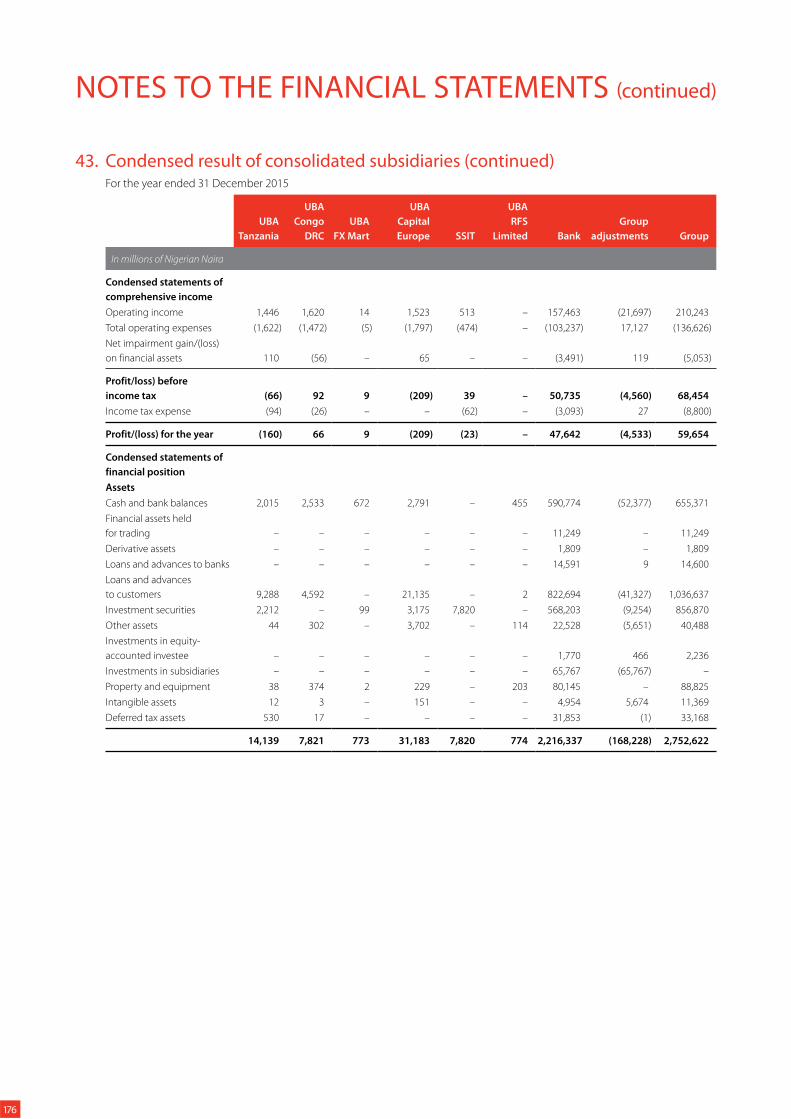
NOTES TO THE FINANCIAL STATEMENTS (continued)
43. Condensed result of consolidated subsidiaries (continued)For the year ended 31 December 2015
UBA
Tanzania
UBA
Congo
DRC
UBA
FX Mart
UBA
Capital
Europe SSIT
UBA
RFS
Limited Bank
Group
adjustments Group
In millions of Nigerian Naira
Condensed statements of
comprehensive income
Operating income 1,446 1,620 14 1,523 513 – 157,463 (21,697) 210,243
Total operating expenses (1,622) (1,472) (5) (1,797) (474) – (103,237) 17,127 (136,626)
Net impairment gain/(loss)
on financial assets 110 (56) – 65 – – (3,491) 119 (5,053)
Profit/loss) before
income tax (66) 92 9 (209) 39 – 50,735 (4,560) 68,454
Income tax expense (94) (26) – – (62) – (3,093) 27 (8,800)
Profit/(loss) for the year (160) 66 9 (209) (23) – 47,642 (4,533) 59,654
Condensed statements of
financial position
Assets
Cash and bank balances 2,015 2,533 672 2,791 – 455 590,774 (52,377) 655,371
Financial assets held
for trading – – – – – – 11,249 – 11,249
Derivative assets – – – – – – 1,809 – 1,809
Loans and advances to banks – – – – – – 14,591 9 14,600
Loans and advances
to customers 9,288 4,592 – 21,135 – 2 822,694 (41,327) 1,036,637
Investment securities 2,212 – 99 3,175 7,820 – 568,203 (9,254) 856,870
Other assets 44 302 – 3,702 – 114 22,528 (5,651) 40,488
Investments in equity-
accounted investee – – – – – – 1,770 466 2,236
Investments in subsidiaries – – – – – – 65,767 (65,767) –
Property and equipment 38 374 2 229 – 203 80,145 – 88,825
Intangible assets 12 3 – 151 – – 4,954 5,674 11,369
Deferred tax assets 530 17 – – – – 31,853 (1) 33,168
14,139 7,821 773 31,183 7,820 774 2,216,337 (168,228) 2,752,622
176
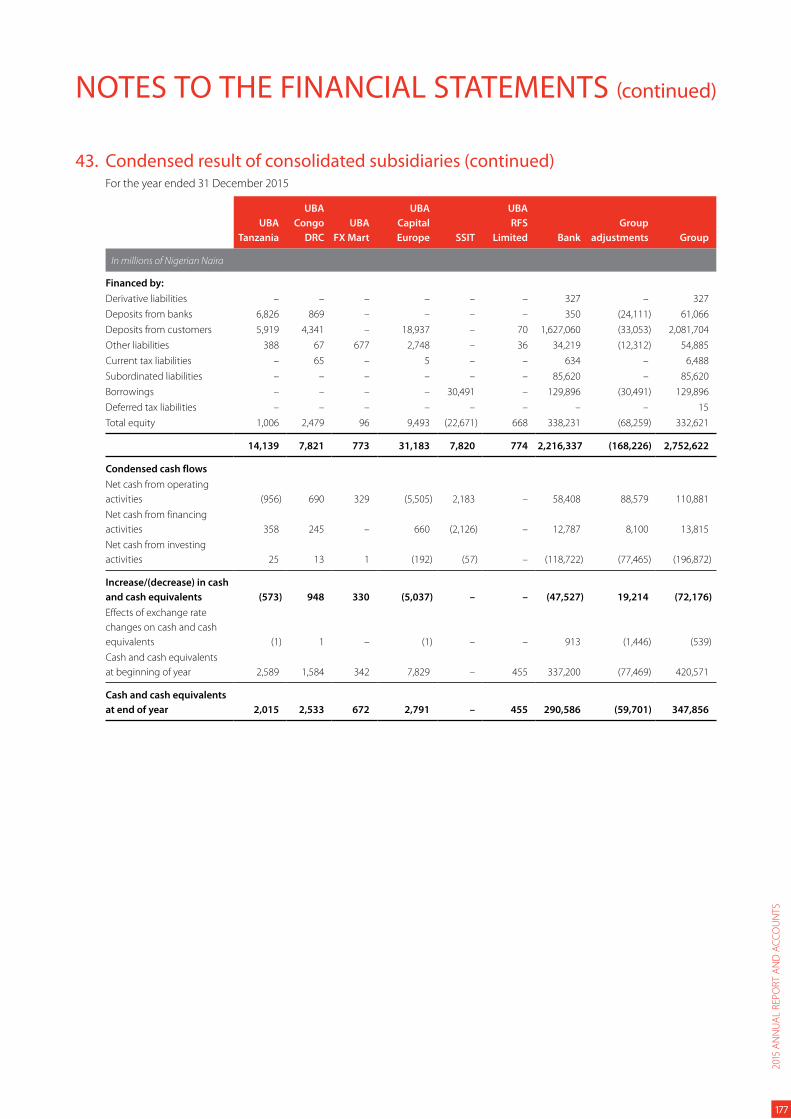
NOTES TO THE FINANCIAL STATEMENTS (continued)
43. Condensed result of consolidated subsidiaries (continued)For the year ended 31 December 2015
UBA
Tanzania
UBA
Congo
DRC
UBA
FX Mart
UBA
Capital
Europe SSIT
UBA
RFS
Limited Bank
Group
adjustments Group
In millions of Nigerian Naira
Financed by:
Derivative liabilities – – – – – – 327 – 327
Deposits from banks 6,826 869 – – – – 350 (24,111) 61,066
Deposits from customers 5,919 4,341 – 18,937 – 70 1,627,060 (33,053) 2,081,704
Other liabilities 388 67 677 2,748 – 36 34,219 (12,312) 54,885
Current tax liabilities – 65 – 5 – – 634 – 6,488
Subordinated liabilities – – – – – – 85,620 – 85,620
Borrowings – – – – 30,491 – 129,896 (30,491) 129,896
Deferred tax liabilities – – – – – – – – 15
Total equity 1,006 2,479 96 9,493 (22,671) 668 338,231 (68,259) 332,621
14,139 7,821 773 31,183 7,820 774 2,216,337 (168,226) 2,752,622
Condensed cash flows
Net cash from operating
activities (956) 690 329 (5,505) 2,183 – 58,408 88,579 110,881
Net cash from financing
activities 358 245 – 660 (2,126) – 12,787 8,100 13,815
Net cash from investing
activities 25 13 1 (192) (57) – (118,722) (77,465) (196,872)
Increase/(decrease) in cash
and cash equivalents (573) 948 330 (5,037) – – (47,527) 19,214 (72,176)
Effects of exchange rate
changes on cash and cash
equivalents (1) 1 – (1) – – 913 (1,446) (539)
Cash and cash equivalents
at beginning of year 2,589 1,584 342 7,829 – 455 337,200 (77,469) 420,571
Cash and cash equivalents
at end of year 2,015 2,533 672 2,791 – 455 290,586 (59,701) 347,856
2015
AN
NU
AL
REP
OR
T A
ND
AC
CO
UN
TS
177
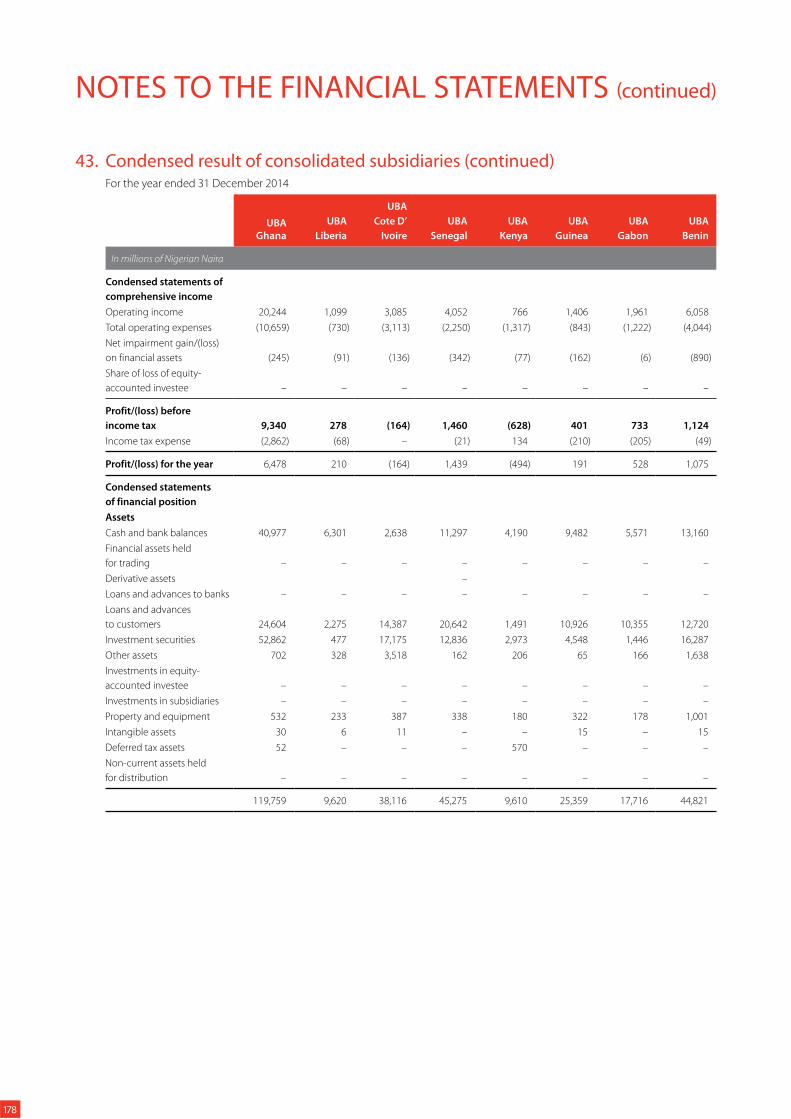
NOTES TO THE FINANCIAL STATEMENTS (continued)
UBA
Ghana
UBA
Liberia
UBA
Cote D’
Ivoire
UBA
Senegal
UBA
Kenya
UBA
Guinea
UBA
Gabon
UBA
Benin
In millions of Nigerian Naira
Condensed statements of
comprehensive income
Operating income 20,244 1,099 3,085 4,052 766 1,406 1,961 6,058
Total operating expenses (10,659) (730) (3,113) (2,250) (1,317) (843) (1,222) (4,044)
Net impairment gain/(loss)
on financial assets (245) (91) (136) (342) (77) (162) (6) (890)
Share of loss of equity-
accounted investee – – – – – – – –
Profit/(loss) before
income tax 9,340 278 (164) 1,460 (628) 401 733 1,124
Income tax expense (2,862) (68) – (21) 134 (210) (205) (49)
Profit/(loss) for the year 6,478 210 (164) 1,439 (494) 191 528 1,075
Condensed statements
of financial position
Assets
Cash and bank balances 40,977 6,301 2,638 11,297 4,190 9,482 5,571 13,160
Financial assets held
for trading – – – – – – – –
Derivative assets –
Loans and advances to banks – – – – – – – –
Loans and advances
to customers 24,604 2,275 14,387 20,642 1,491 10,926 10,355 12,720
Investment securities 52,862 477 17,175 12,836 2,973 4,548 1,446 16,287
Other assets 702 328 3,518 162 206 65 166 1,638
Investments in equity-
accounted investee – – – – – – – –
Investments in subsidiaries – – – – – – – –
Property and equipment 532 233 387 338 180 322 178 1,001
Intangible assets 30 6 11 – – 15 – 15
Deferred tax assets 52 – – – 570 – – –
Non-current assets held
for distribution – – – – – – – –
119,759 9,620 38,116 45,275 9,610 25,359 17,716 44,821
43. Condensed result of consolidated subsidiaries (continued)For the year ended 31 December 2014
178

NOTES TO THE FINANCIAL STATEMENTS (continued)
UBA
Ghana
UBA
Liberia
UBA
Cote D’
Ivoire
UBA
Senegal
UBA
Kenya
UBA
Guinea
UBA
Gabon
UBA
Benin
In millions of Nigerian Naira
Financed by:
Derivative liabilities – – – – – – – –
Deposits from banks 43,257 – 13,960 5,077 – 9,343 – –
Deposits from customers 59,560 7,256 20,204 33,057 7,216 12,649 11,732 40,224
Other liabilities 3,116 242 1,018 1,239 1,018 275 2,731 1,828
Current tax liabilities 70 68 – 21 – 104 205 49
Subordinated liabilities – – – – – – – –
Borrowings – – – – – – – –
Deferred tax liabilities – – – – – – – –
Total equity 13,756 2,054 2,934 5,881 1,376 2,988 3,048 2,720
119,759 9,620 38,116 45,275 9,610 25,359 17,716 44,821
Condensed cash flows
Net cash from operating
activities 15,825 11,605 152 (10,280) 2,420 6,004 628 8,571
Net cash from financing
activities (5,765) (5,963) 868 (541) (93) 172 (150) (225)
Net cash from investing
activities 18 (228) 61 (19) (24) (180) (53) (388)
Increase/(decrease) in cash
and cash equivalents 10,078 5,414 1,081 (10,840) 2,303 5,996 425 7,958
Effects of exchange rate
changes on cash and cash
equivalents (1) – – – 1 – – –
Cash and cash equivalents
at beginning of year 30,899 893 1,557 22,137 1,889 3,486 5,147 5,201
Cash and cash equivalents
at end of year 40,976 6,307 2,638 11,297 4,193 9,482 5,572 13,159
43. Condensed result of consolidated subsidiaries (continued)For the year ended 31 December 2014
2015
AN
NU
AL
REP
OR
T A
ND
AC
CO
UN
TS
179
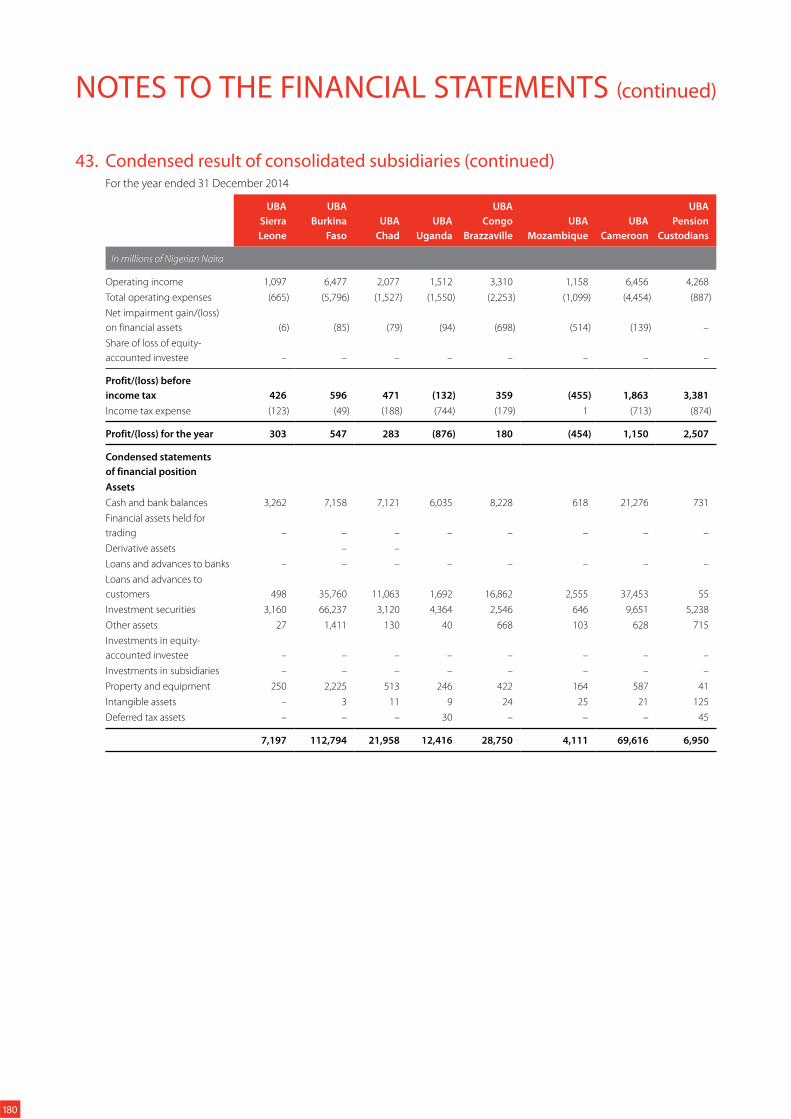
NOTES TO THE FINANCIAL STATEMENTS (continued)
UBA
Sierra
Leone
UBA
Burkina
Faso
UBA
Chad
UBA
Uganda
UBA
Congo
Brazzaville
UBA
Mozambique
UBA
Cameroon
UBA
Pension
Custodians
In millions of Nigerian Naira
Operating income 1,097 6,477 2,077 1,512 3,310 1,158 6,456 4,268
Total operating expenses (665) (5,796) (1,527) (1,550) (2,253) (1,099) (4,454) (887)
Net impairment gain/(loss)
on financial assets (6) (85) (79) (94) (698) (514) (139) –
Share of loss of equity-
accounted investee – – – – – – – –
Profit/(loss) before
income tax 426 596 471 (132) 359 (455) 1,863 3,381
Income tax expense (123) (49) (188) (744) (179) 1 (713) (874)
Profit/(loss) for the year 303 547 283 (876) 180 (454) 1,150 2,507
Condensed statements
of financial position
Assets
Cash and bank balances 3,262 7,158 7,121 6,035 8,228 618 21,276 731
Financial assets held for
trading – – – – – – – –
Derivative assets – –
Loans and advances to banks – – – – – – – –
Loans and advances to
customers 498 35,760 11,063 1,692 16,862 2,555 37,453 55
Investment securities 3,160 66,237 3,120 4,364 2,546 646 9,651 5,238
Other assets 27 1,411 130 40 668 103 628 715
Investments in equity-
accounted investee – – – – – – – –
Investments in subsidiaries – – – – – – – –
Property and equipment 250 2,225 513 246 422 164 587 41
Intangible assets – 3 11 9 24 25 21 125
Deferred tax assets – – – 30 – – – 45
7,197 112,794 21,958 12,416 28,750 4,111 69,616 6,950
43. Condensed result of consolidated subsidiaries (continued)For the year ended 31 December 2014
180

NOTES TO THE FINANCIAL STATEMENTS (continued)
UBA
Sierra
Leone
UBA
Burkina
Faso
UBA
Chad
UBA
Uganda
UBA
Congo
Brazzaville
UBA
Mozambique
UBA
Cameroon
UBA
Pension
Custodians
In millions of Nigerian Naira
Financed by:
Derivative liabilities – – – – – – – –
Deposits from banks – 32,622 1,774 – 7 – – –
Deposits from customers 5,252 71,146 16,772 9,362 23,410 3,945 61,399 –
Other liabilities 218 2,840 223 1,692 1,118 121 1,273 2,473
Current tax liabilities 110 24 180 – 179 – 713 919
Subordinated liabilities – – – – – – – –
Borrowings – – – – – – – –
Deferred tax liabilities 15 14 – – – – – –
Total equity 1,602 6,148 3,009 1,362 4,036 45 6,231 3,558
7,197 112,794 21,958 12,416 28,750 4,111 69,616 6,950
Condensed cash flows
Net cash from operating
activities (5,209) (10,073) 4,229 (1,134) (1,411) (931) 5,977 2,866
Net cash from financing
activities 197 91 125 (5) 149 (358) (615) (2,009)
Net cash from investing
activities (22) 577 (136) (29) (108) 17 1,118 (131)
Increase/(decrease) in cash
and cash equivalents (5,034) (9,405) 4,218 (1,168) (1,370) (1,272) 6,480 726
Effects of exchange rate
changes on cash and cash
equivalents – – – – – – – –
Cash and cash equivalents
at beginning of year 8,296 16,548 2,903 7,202 9,598 1,889 14,795 5
Cash and cash equivalents
at end of year 3,262 7,143 7,121 6,034 8,228 617 21,275 731
43. Condensed result of consolidated subsidiaries (continued)For the year ended 31 December 2014
2015
AN
NU
AL
REP
OR
T A
ND
AC
CO
UN
TS
181

NOTES TO THE FINANCIAL STATEMENTS (continued)
UBA
Tanzania
UBA
Congo
DRC
UBA
FX Mart
UBA
Capital
Europe SSIT
UBA
RFS
Limited Bank
Group
adjustments Group
In millions of Nigerian Naira
Condensed statements of
comprehensive income
Operating income 1,729 1,535 340 1,054 308 – 144,677 (22,214) 192,455
Total operating expenses (1,717) (1,312) (80) (1,069) (300) – (99,226) 16,427 (129,686)
Net impairment gain/(loss)
on financial assets – 31 – – – – (3,073) 27 (6,578)
Share of loss of equity-
accounted investee – – – – – – – 9 9
Profit/(loss) before
income tax 12 254 260 (15) 8 – 42,378 (5,751) 56,200
Income tax expense 358 (45) (54) (15) (103) – (2,295) 11 (8,293)
Profit/(loss) for the year 370 209 206 (30) (95) – 40,083 (5,740) 47,907
Condensed statements of
financial position
Assets
Cash and bank balances 2,587 1,585 341 7,828 – 455 749,716 (98,197) 812,359
Financial assets held
for trading – – – – – – 1,099 – 1,099
Derivative assets – – – – – – 6,534 – 6,534
Loans and advances to banks – – – – – – 48,991 (898) 48,093
Loans and advances
to customers 11,951 6,619 – 36,510 – 2 884,587 (71,147) 1,071,859
Investment securities 1,593 1,121 637 8,821 10,026 – 442,909 (11,149) 657,523
Other assets 121 546 – 104 – 114 21,136 (2,472) 30,057
Investments in equity-
accounted investee – – – – – – 1,770 1,216 2,986
Investments in subsidiaries – – – – – – 65,767 (65,767) –
Property and equipment 71 380 3 188 – 203 81,050 2 89,517
Intangible assets 5 10 1 – – – 3,446 5,673 9,430
Deferred tax assets 566 – – – – – 31,853 – 33,116
16,894 10,261 982 53,451 10,026 774 2,338,858 (242,739) 2,762,573
43. Condensed result of consolidated subsidiaries (continued)For the year ended 31 December 2014
182
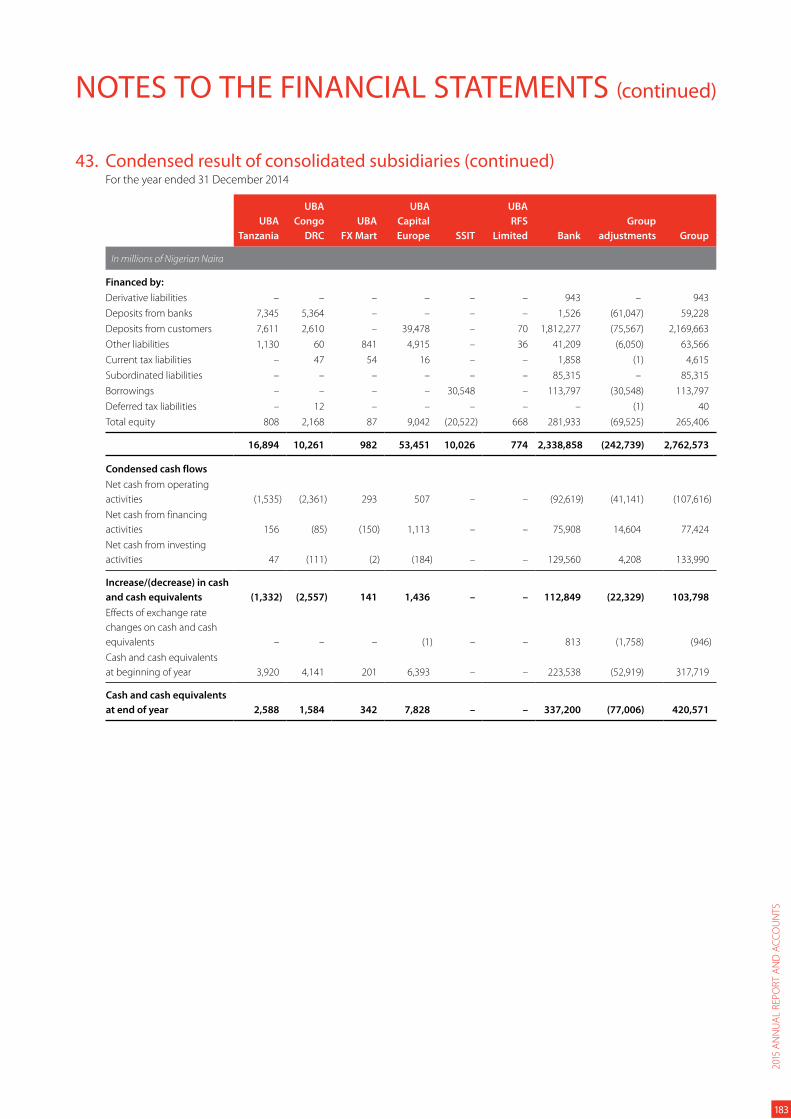
NOTES TO THE FINANCIAL STATEMENTS (continued)
UBA
Tanzania
UBA
Congo
DRC
UBA
FX Mart
UBA
Capital
Europe SSIT
UBA
RFS
Limited Bank
Group
adjustments Group
In millions of Nigerian Naira
Financed by:
Derivative liabilities – – – – – – 943 – 943
Deposits from banks 7,345 5,364 – – – – 1,526 (61,047) 59,228
Deposits from customers 7,611 2,610 – 39,478 – 70 1,812,277 (75,567) 2,169,663
Other liabilities 1,130 60 841 4,915 – 36 41,209 (6,050) 63,566
Current tax liabilities – 47 54 16 – – 1,858 (1) 4,615
Subordinated liabilities – – – – – – 85,315 – 85,315
Borrowings – – – – 30,548 – 113,797 (30,548) 113,797
Deferred tax liabilities – 12 – – – – – (1) 40
Total equity 808 2,168 87 9,042 (20,522) 668 281,933 (69,525) 265,406
16,894 10,261 982 53,451 10,026 774 2,338,858 (242,739) 2,762,573
Condensed cash flows
Net cash from operating
activities (1,535) (2,361) 293 507 – – (92,619) (41,141) (107,616)
Net cash from financing
activities 156 (85) (150) 1,113 – – 75,908 14,604 77,424
Net cash from investing
activities 47 (111) (2) (184) – – 129,560 4,208 133,990
Increase/(decrease) in cash
and cash equivalents (1,332) (2,557) 141 1,436 – – 112,849 (22,329) 103,798
Effects of exchange rate
changes on cash and cash
equivalents – – – (1) – – 813 (1,758) (946)
Cash and cash equivalents
at beginning of year 3,920 4,141 201 6,393 – – 223,538 (52,919) 317,719
Cash and cash equivalents
at end of year 2,588 1,584 342 7,828 – – 337,200 (77,006) 420,571
43. Condensed result of consolidated subsidiaries (continued)For the year ended 31 December 2014
2015
AN
NU
AL
REP
OR
T A
ND
AC
CO
UN
TS
183
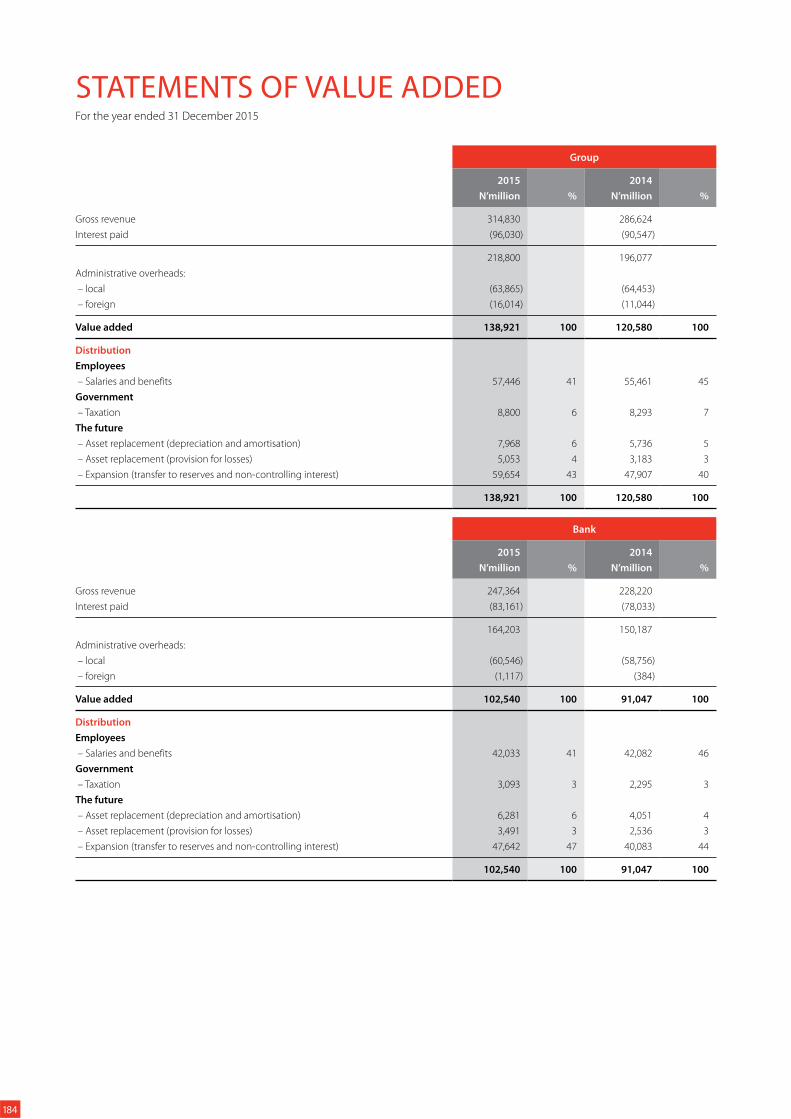
STATEMENTS OF VALUE ADDEDFor the year ended 31 December 2015
Group
2015 2014
N’million % N’million %
Gross revenue 314,830 286,624
Interest paid (96,030) (90,547)
218,800 196,077
Administrative overheads:
– local (63,865) (64,453)
– foreign (16,014) (11,044)
Value added 138,921 100 120,580 100
Distribution
Employees
– Salaries and benefits 57,446 41 55,461 45
Government
– Taxation 8,800 6 8,293 7
The future
– Asset replacement (depreciation and amortisation) 7,968 6 5,736 5
– Asset replacement (provision for losses) 5,053 4 3,183 3
– Expansion (transfer to reserves and non-controlling interest) 59,654 43 47,907 40
138,921 100 120,580 100
Bank
2015 2014
N’million % N’million %
Gross revenue 247,364 228,220
Interest paid (83,161) (78,033)
164,203 150,187
Administrative overheads:
– local (60,546) (58,756)
– foreign (1,117) (384)
Value added 102,540 100 91,047 100
Distribution
Employees
– Salaries and benefits 42,033 41 42,082 46
Government
– Taxation 3,093 3 2,295 3
The future
– Asset replacement (depreciation and amortisation) 6,281 6 4,051 4
– Asset replacement (provision for losses) 3,491 3 2,536 3
– Expansion (transfer to reserves and non-controlling interest) 47,642 47 40,083 44
102,540 100 91,047 100
184
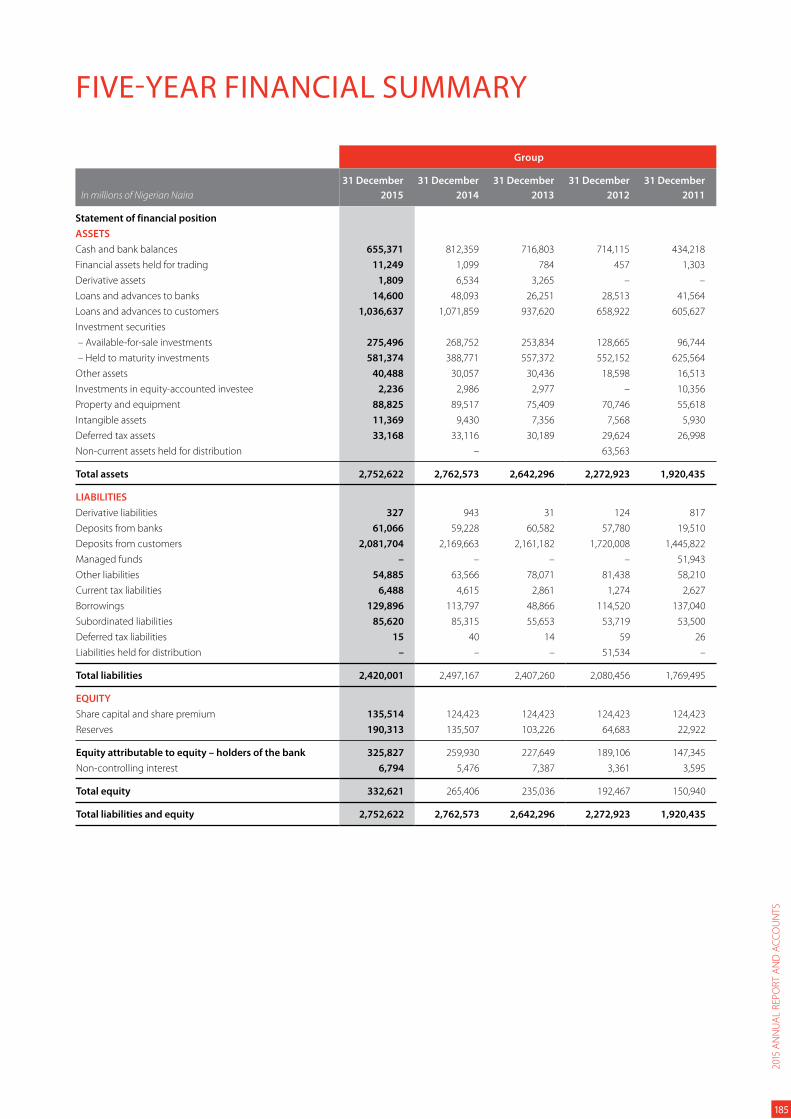
FIVE-YEAR FINANCIAL SUMMARY
Group
In millions of Nigerian Naira
31 December
2015
31 December
2014
31 December
2013
31 December
2012
31 December
2011
Statement of financial position
ASSETS
Cash and bank balances 655,371 812,359 716,803 714,115 434,218
Financial assets held for trading 11,249 1,099 784 457 1,303
Derivative assets 1,809 6,534 3,265 – –
Loans and advances to banks 14,600 48,093 26,251 28,513 41,564
Loans and advances to customers 1,036,637 1,071,859 937,620 658,922 605,627
Investment securities
– Available-for-sale investments 275,496 268,752 253,834 128,665 96,744
– Held to maturity investments 581,374 388,771 557,372 552,152 625,564
Other assets 40,488 30,057 30,436 18,598 16,513
Investments in equity-accounted investee 2,236 2,986 2,977 – 10,356
Property and equipment 88,825 89,517 75,409 70,746 55,618
Intangible assets 11,369 9,430 7,356 7,568 5,930
Deferred tax assets 33,168 33,116 30,189 29,624 26,998
Non-current assets held for distribution – 63,563
Total assets 2,752,622 2,762,573 2,642,296 2,272,923 1,920,435
LIABILITIES
Derivative liabilities 327 943 31 124 817
Deposits from banks 61,066 59,228 60,582 57,780 19,510
Deposits from customers 2,081,704 2,169,663 2,161,182 1,720,008 1,445,822
Managed funds – – – – 51,943
Other liabilities 54,885 63,566 78,071 81,438 58,210
Current tax liabilities 6,488 4,615 2,861 1,274 2,627
Borrowings 129,896 113,797 48,866 114,520 137,040
Subordinated liabilities 85,620 85,315 55,653 53,719 53,500
Deferred tax liabilities 15 40 14 59 26
Liabilities held for distribution – – – 51,534 –
Total liabilities 2,420,001 2,497,167 2,407,260 2,080,456 1,769,495
EQUITY
Share capital and share premium 135,514 124,423 124,423 124,423 124,423
Reserves 190,313 135,507 103,226 64,683 22,922
Equity attributable to equity – holders of the bank 325,827 259,930 227,649 189,106 147,345
Non-controlling interest 6,794 5,476 7,387 3,361 3,595
Total equity 332,621 265,406 235,036 192,467 150,940
Total liabilities and equity 2,752,622 2,762,573 2,642,296 2,272,923 1,920,435
2015
AN
NU
AL
REP
OR
T A
ND
AC
CO
UN
TS
185
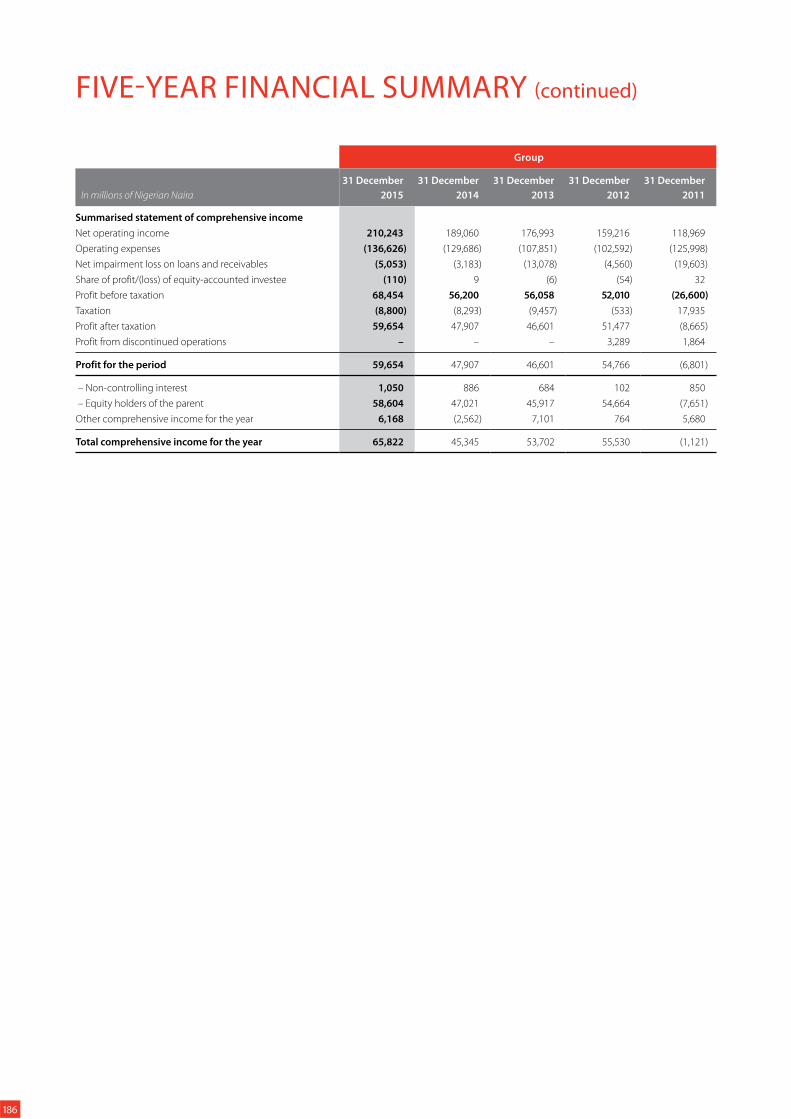
FIVE-YEAR FINANCIAL SUMMARY (continued)
Group
In millions of Nigerian Naira
31 December
2015
31 December
2014
31 December
2013
31 December
2012
31 December
2011
Summarised statement of comprehensive income
Net operating income 210,243 189,060 176,993 159,216 118,969
Operating expenses (136,626) (129,686) (107,851) (102,592) (125,998)
Net impairment loss on loans and receivables (5,053) (3,183) (13,078) (4,560) (19,603)
Share of profit/(loss) of equity-accounted investee (110) 9 (6) (54) 32
Profit before taxation 68,454 56,200 56,058 52,010 (26,600)
Taxation (8,800) (8,293) (9,457) (533) 17,935
Profit after taxation 59,654 47,907 46,601 51,477 (8,665)
Profit from discontinued operations – – – 3,289 1,864
Profit for the period 59,654 47,907 46,601 54,766 (6,801)
– Non-controlling interest 1,050 886 684 102 850
– Equity holders of the parent 58,604 47,021 45,917 54,664 (7,651)
Other comprehensive income for the year 6,168 (2,562) 7,101 764 5,680
Total comprehensive income for the year 65,822 45,345 53,702 55,530 (1,121)
186
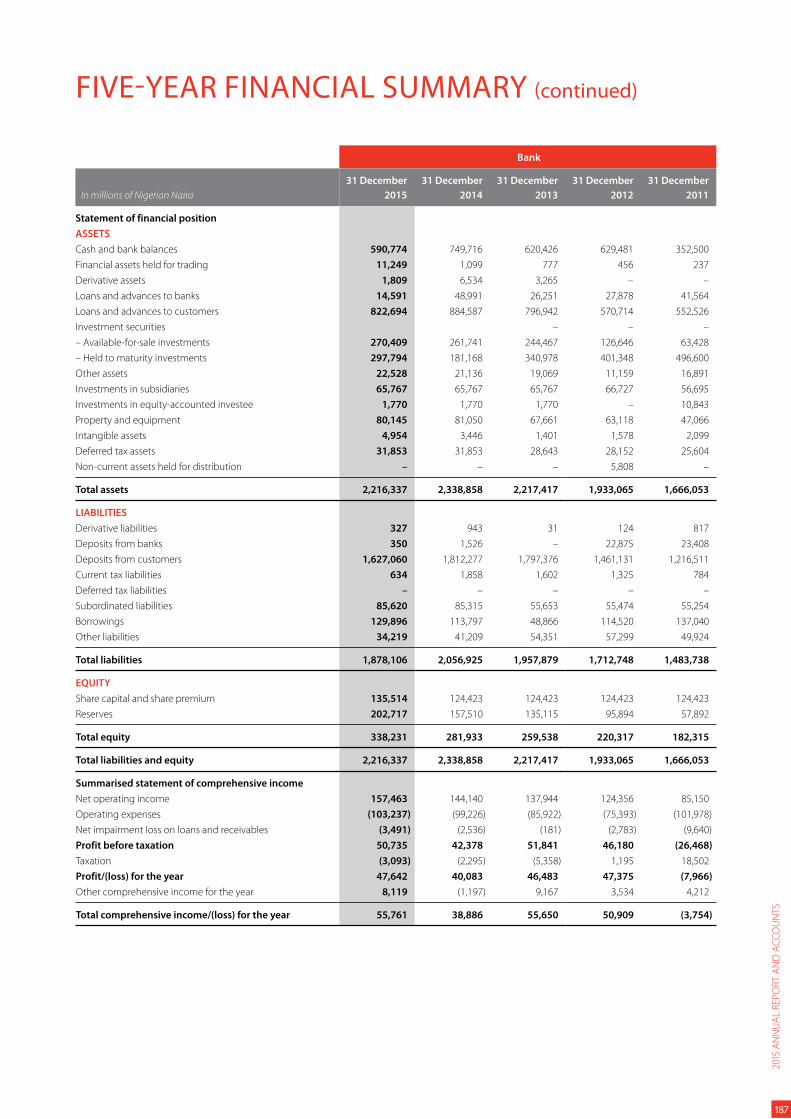
FIVE-YEAR FINANCIAL SUMMARY (continued)
Bank
In millions of Nigerian Naira
31 December
2015
31 December
2014
31 December
2013
31 December
2012
31 December
2011
Statement of financial position
ASSETS
Cash and bank balances 590,774 749,716 620,426 629,481 352,500
Financial assets held for trading 11,249 1,099 777 456 237
Derivative assets 1,809 6,534 3,265 – –
Loans and advances to banks 14,591 48,991 26,251 27,878 41,564
Loans and advances to customers 822,694 884,587 796,942 570,714 552,526
Investment securities – – –
– Available-for-sale investments 270,409 261,741 244,467 126,646 63,428
– Held to maturity investments 297,794 181,168 340,978 401,348 496,600
Other assets 22,528 21,136 19,069 11,159 16,891
Investments in subsidiaries 65,767 65,767 65,767 66,727 56,695
Investments in equity-accounted investee 1,770 1,770 1,770 – 10,843
Property and equipment 80,145 81,050 67,661 63,118 47,066
Intangible assets 4,954 3,446 1,401 1,578 2,099
Deferred tax assets 31,853 31,853 28,643 28,152 25,604
Non-current assets held for distribution – – – 5,808 –
Total assets 2,216,337 2,338,858 2,217,417 1,933,065 1,666,053
LIABILITIES
Derivative liabilities 327 943 31 124 817
Deposits from banks 350 1,526 – 22,875 23,408
Deposits from customers 1,627,060 1,812,277 1,797,376 1,461,131 1,216,511
Current tax liabilities 634 1,858 1,602 1,325 784
Deferred tax liabilities – – – – –
Subordinated liabilities 85,620 85,315 55,653 55,474 55,254
Borrowings 129,896 113,797 48,866 114,520 137,040
Other liabilities 34,219 41,209 54,351 57,299 49,924
Total liabilities 1,878,106 2,056,925 1,957,879 1,712,748 1,483,738
EQUITY
Share capital and share premium 135,514 124,423 124,423 124,423 124,423
Reserves 202,717 157,510 135,115 95,894 57,892
Total equity 338,231 281,933 259,538 220,317 182,315
Total liabilities and equity 2,216,337 2,338,858 2,217,417 1,933,065 1,666,053
Summarised statement of comprehensive income
Net operating income 157,463 144,140 137,944 124,356 85,150
Operating expenses (103,237) (99,226) (85,922) (75,393) (101,978)
Net impairment loss on loans and receivables (3,491) (2,536) (181) (2,783) (9,640)
Profit before taxation 50,735 42,378 51,841 46,180 (26,468)
Taxation (3,093) (2,295) (5,358) 1,195 18,502
Profit/(loss) for the year 47,642 40,083 46,483 47,375 (7,966)
Other comprehensive income for the year 8,119 (1,197) 9,167 3,534 4,212
Total comprehensive income/(loss) for the year 55,761 38,886 55,650 50,909 (3,754)
2015
AN
NU
AL
REP
OR
T A
ND
AC
CO
UN
TS
187

188
Shareholder Information 190
Notice of Annual General Meeting 194
Shareholder Data Form 195
INVESTORINFORMATION
188

2015
AN
NU
AL
REP
OR
T A
ND
AC
CO
UN
TS
189
2015
AN
NU
AL
REP
OR
T A
ND
AC
CO
UN
TS
189
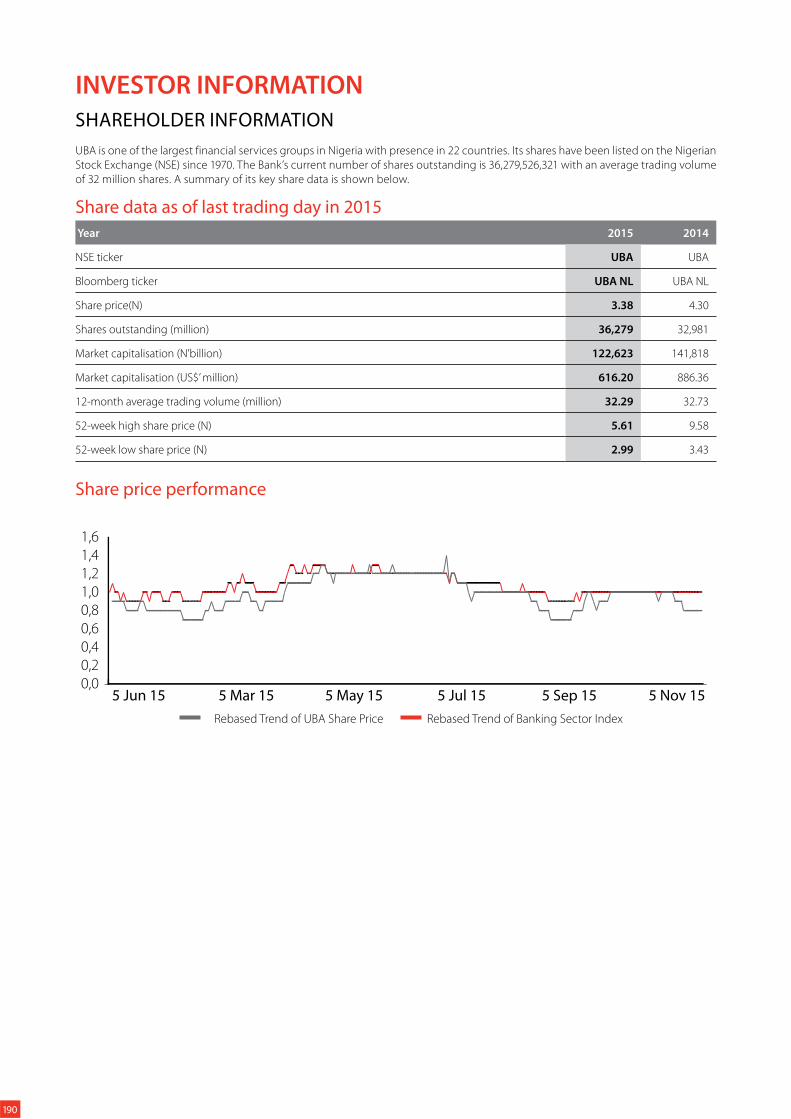
INVESTOR INFORMATION
SHAREHOLDER INFORMATION
UBA is one of the largest financial services groups in Nigeria with presence in 22 countries. Its shares have been listed on the Nigerian
Stock Exchange (NSE) since 1970. The Bank’s current number of shares outstanding is 36,279,526,321 with an average trading volume
of 32 million shares. A summary of its key share data is shown below.
Share data as of last trading day in 2015
Year 2015 2014
NSE ticker UBA UBA
Bloomberg ticker UBA NL UBA NL
Share price(N) 3.38 4.30
Shares outstanding (million) 36,279 32,981
Market capitalisation (N’billion) 122,623 141,818
Market capitalisation (US$’ million) 616.20 886.36
12-month average trading volume (million) 32.29 32.73
52-week high share price (N) 5.61 9.58
52-week low share price (N) 2.99 3.43
Share price performance
0,00,20,40,60,81,01,21,41,6
Rebased Trend of UBA Share Price Rebased Trend of Banking Sector Index
5 Mar 155 Jun 15 5 Sep 15 5 Nov 155 Jul 155 May 15
190
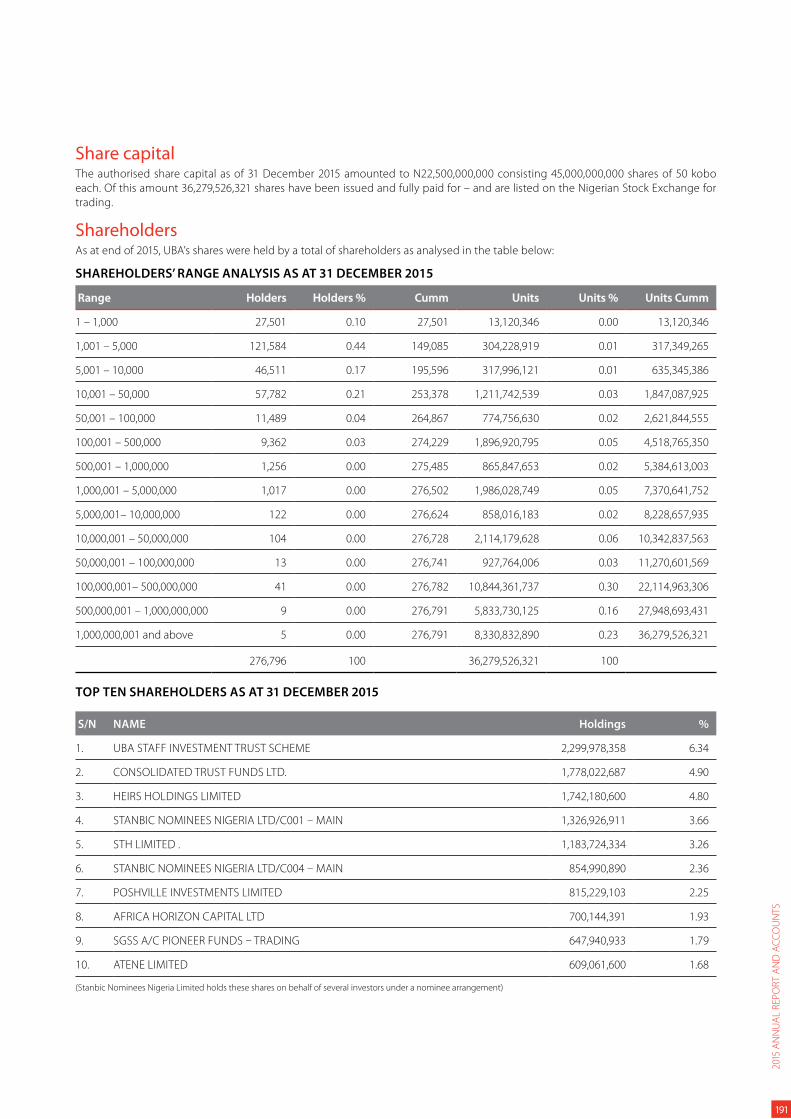
Share capitalThe authorised share capital as of 31 December 2015 amounted to N22,500,000,000 consisting 45,000,000,000 shares of 50 kobo
each. Of this amount 36,279,526,321 shares have been issued and fully paid for – and are listed on the Nigerian Stock Exchange for
trading.
ShareholdersAs at end of 2015, UBA’s shares were held by a total of shareholders as analysed in the table below:
SHAREHOLDERS’ RANGE ANALYSIS AS AT 31 DECEMBER 2015
Range Holders Holders % Cumm Units Units % Units Cumm
1 – 1,000 27,501 0.10 27,501 13,120,346 0.00 13,120,346
1,001 – 5,000 121,584 0.44 149,085 304,228,919 0.01 317,349,265
5,001 – 10,000 46,511 0.17 195,596 317,996,121 0.01 635,345,386
10,001 – 50,000 57,782 0.21 253,378 1,211,742,539 0.03 1,847,087,925
50,001 – 100,000 11,489 0.04 264,867 774,756,630 0.02 2,621,844,555
100,001 – 500,000 9,362 0.03 274,229 1,896,920,795 0.05 4,518,765,350
500,001 – 1,000,000 1,256 0.00 275,485 865,847,653 0.02 5,384,613,003
1,000,001 – 5,000,000 1,017 0.00 276,502 1,986,028,749 0.05 7,370,641,752
5,000,001– 10,000,000 122 0.00 276,624 858,016,183 0.02 8,228,657,935
10,000,001 – 50,000,000 104 0.00 276,728 2,114,179,628 0.06 10,342,837,563
50,000,001 – 100,000,000 13 0.00 276,741 927,764,006 0.03 11,270,601,569
100,000,001– 500,000,000 41 0.00 276,782 10,844,361,737 0.30 22,114,963,306
500,000,001 – 1,000,000,000 9 0.00 276,791 5,833,730,125 0.16 27,948,693,431
1,000,000,001 and above 5 0.00 276,791 8,330,832,890 0.23 36,279,526,321
276,796 100 36,279,526,321 100
TOP TEN SHAREHOLDERS AS AT 31 DECEMBER 2015
S/N NAME Holdings %
1. UBA STAFF INVESTMENT TRUST SCHEME 2,299,978,358 6.34
2. CONSOLIDATED TRUST FUNDS LTD. 1,778,022,687 4.90
3. HEIRS HOLDINGS LIMITED 1,742,180,600 4.80
4. STANBIC NOMINEES NIGERIA LTD/C001 – MAIN 1,326,926,911 3.66
5. STH LIMITED . 1,183,724,334 3.26
6. STANBIC NOMINEES NIGERIA LTD/C004 – MAIN 854,990,890 2.36
7. POSHVILLE INVESTMENTS LIMITED 815,229,103 2.25
8. AFRICA HORIZON CAPITAL LTD 700,144,391 1.93
9. SGSS A/C PIONEER FUNDS – TRADING 647,940,933 1.79
10. ATENE LIMITED 609,061,600 1.68
(Stanbic Nominees Nigeria Limited holds these shares on behalf of several investors under a nominee arrangement)
2015
AN
NU
AL
REP
OR
T A
ND
AC
CO
UN
TS
191
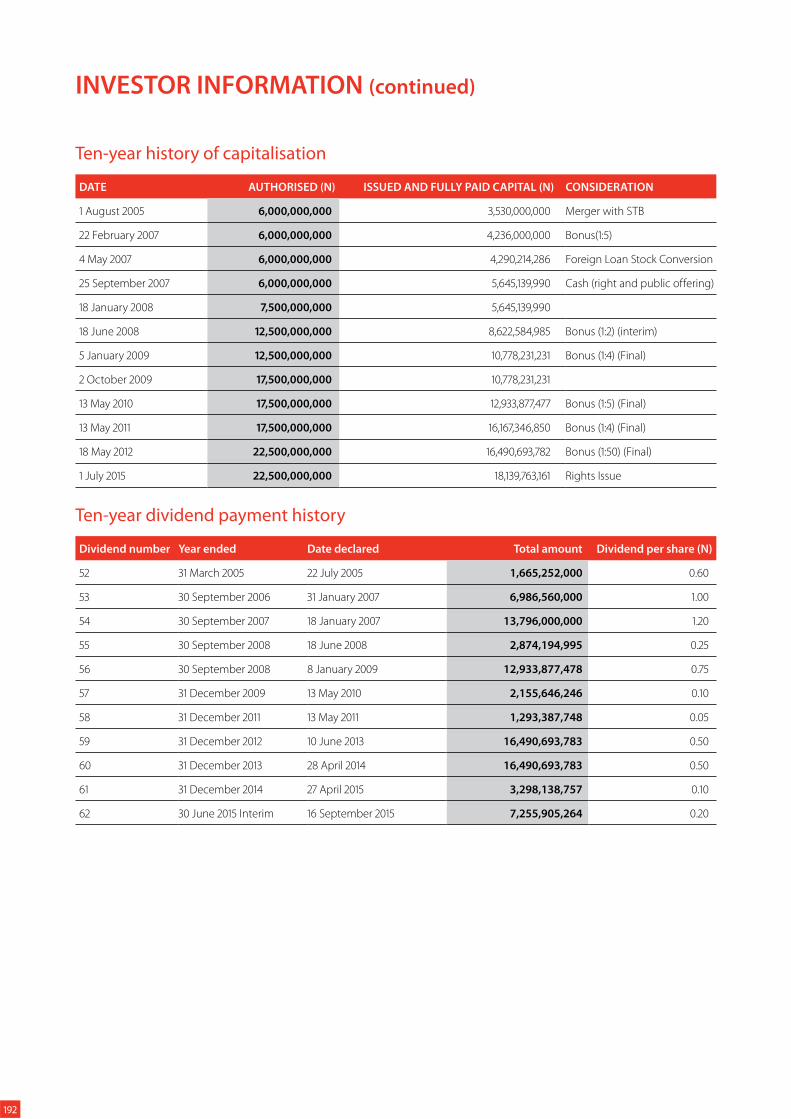
Ten-year history of capitalisation
DATE AUTHORISED (N) ISSUED AND FULLY PAID CAPITAL (N) CONSIDERATION
1 August 2005 6,000,000,000 3,530,000,000 Merger with STB
22 February 2007 6,000,000,000 4,236,000,000 Bonus(1:5)
4 May 2007 6,000,000,000 4,290,214,286 Foreign Loan Stock Conversion
25 September 2007 6,000,000,000 5,645,139,990 Cash (right and public offering)
18 January 2008 7,500,000,000 5,645,139,990
18 June 2008 12,500,000,000 8,622,584,985 Bonus (1:2) (interim)
5 January 2009 12,500,000,000 10,778,231,231 Bonus (1:4) (Final)
2 October 2009 17,500,000,000 10,778,231,231
13 May 2010 17,500,000,000 12,933,877,477 Bonus (1:5) (Final)
13 May 2011 17,500,000,000 16,167,346,850 Bonus (1:4) (Final)
18 May 2012 22,500,000,000 16,490,693,782 Bonus (1:50) (Final)
1 July 2015 22,500,000,000 18,139,763,161 Rights Issue
Ten-year dividend payment history
Dividend number Year ended Date declared Total amount Dividend per share (N)
52 31 March 2005 22 July 2005 1,665,252,000 0.60
53 30 September 2006 31 January 2007 6,986,560,000 1.00
54 30 September 2007 18 January 2007 13,796,000,000 1.20
55 30 September 2008 18 June 2008 2,874,194,995 0.25
56 30 September 2008 8 January 2009 12,933,877,478 0.75
57 31 December 2009 13 May 2010 2,155,646,246 0.10
58 31 December 2011 13 May 2011 1,293,387,748 0.05
59 31 December 2012 10 June 2013 16,490,693,783 0.50
60 31 December 2013 28 April 2014 16,490,693,783 0.50
61 31 December 2014 27 April 2015 3,298,138,757 0.10
62 30 June 2015 Interim 16 September 2015 7,255,905,264 0.20
INVESTOR INFORMATION (continued)
192
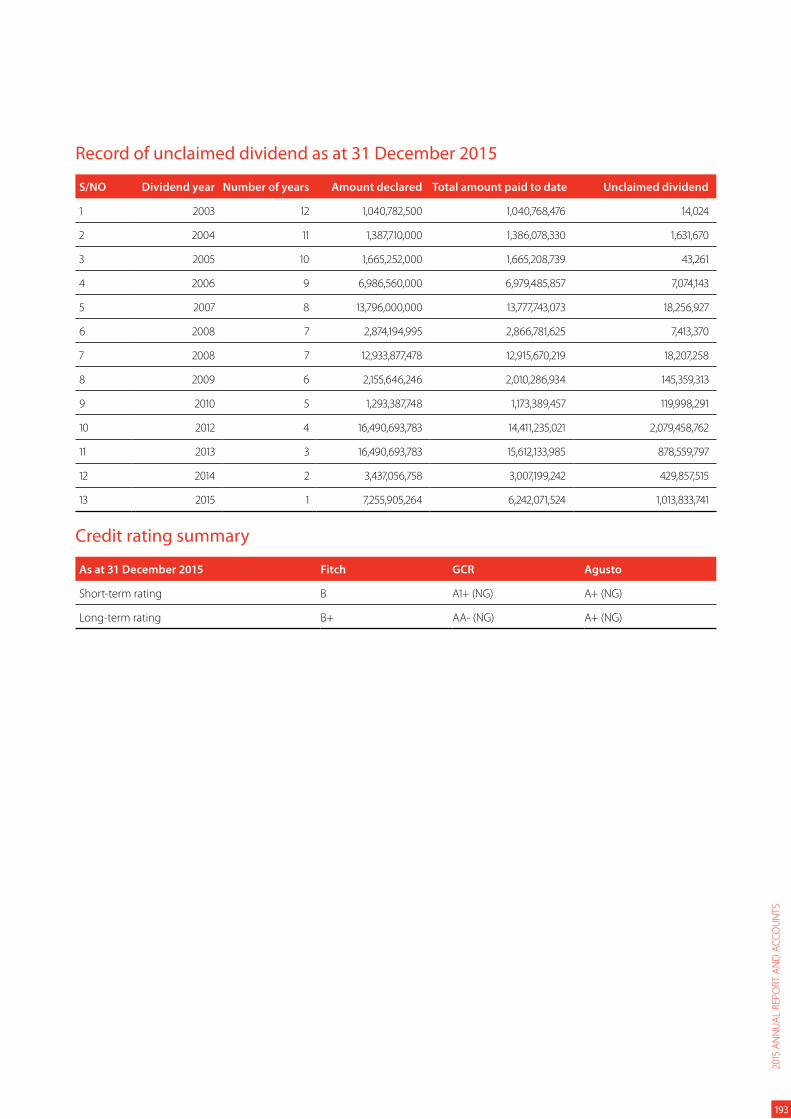
Record of unclaimed dividend as at 31 December 2015
S/NO Dividend year Number of years Amount declared Total amount paid to date Unclaimed dividend
1 2003 12 1,040,782,500 1,040,768,476 14,024
2 2004 11 1,387,710,000 1,386,078,330 1,631,670
3 2005 10 1,665,252,000 1,665,208,739 43,261
4 2006 9 6,986,560,000 6,979,485,857 7,074,143
5 2007 8 13,796,000,000 13,777,743,073 18,256,927
6 2008 7 2,874,194,995 2,866,781,625 7,413,370
7 2008 7 12,933,877,478 12,915,670,219 18,207,258
8 2009 6 2,155,646,246 2,010,286,934 145,359,313
9 2010 5 1,293,387,748 1,173,389,457 119,998,291
10 2012 4 16,490,693,783 14,411,235,021 2,079,458,762
11 2013 3 16,490,693,783 15,612,133,985 878,559,797
12 2014 2 3,437,056,758 3,007,199,242 429,857,515
13 2015 1 7,255,905,264 6,242,071,524 1,013,833,741
Credit rating summary
As at 31 December 2015 Fitch GCR Agusto
Short-term rating B A1+ (NG) A+ (NG)
Long-term rating B+ AA- (NG) A+ (NG)
2015
AN
NU
AL
REP
OR
T A
ND
AC
CO
UN
TS
193

NOTICE IS HEREBY GIVEN that the 54th Annual General Meeting of United Bank for Africa Plc will hold at the Eko Hotels and Suites, Plot 1415,
Ademola Adetokunbo Street, Victoria Island, Lagos State on Friday, 8 April 2016 at 10:00 AM to transact the following business:
ORDINARY BUSINESS1 To receive the Audited Accounts for the year ended 31 December 2015 together with the reports of the Directors, Auditors and the Audit
Committee thereon
2 To declare a dividend
3 To elect/re-elect Directors
4 To authorise the Directors to fix the remuneration of the Auditors
5 To elect members of the Audit Committee
SPECIAL BUSINESS 6. To consider and, if thought fit, pass the following as Special Resolutions:
(a) That the Share Capital of United Bank for Africa Plc be and is hereby reduced by the cancellation of approximately 2,299,978,358
(two billion, two hundred and ninety-nine million, nine hundred and seventy-eight thousand, three hundred and fifty-eight) Ordinary
Shares of 50k (Fifty Kobo) each held under the cancelled Employee Share Ownership Scheme managed by the Staff Share Investment
Trust (“In Dissolution”).
(b) That the Directors be and are hereby authorised to take all actions necessary to effect the cancellation of the shares and reduction of
Share Capital.
NOTES 1. PROXY
A member entitled to attend and vote at the General Meeting is entitled to appoint a proxy to attend and vote in his/her stead. A proxy need
not be a member of the Company. To be valid, a proxy form must be duly stamped at the Stamp Duties office and returned to the Registrar,
Africa Prudential Registrars Plc, 220B Ikorodu Road, Palmgrove, Lagos Nigeria, not less than 48 hours prior to the time of the meeting.
2. DIVIDEND WARRANTS
If the dividend recommended by the Directors is approved, dividend warrants will be posted on Tuesday, 12 April 2016 to all shareholders
whose names are registered in the Company’s Register of Members as at the close of business on Tuesday, 29 March 2016.
3. CLOSURE OF REGISTER OF MEMBERS
The Register of Members will be closed from Wednesday, 30 March 2016 to Tuesday, 5 April 2016, both dates inclusive, for the purpose
of paying a dividend.
4. AUDIT COMMITTEE
The Audit Committee consists of three shareholders and three Directors. Any member may nominate a shareholder as a member of the
Audit Committee by giving notice in writing of such nomination to the Secretary of the Company at least twenty one days before the Annual
General Meeting.
Dated 1 March 2016.
By Order of the Board.
Bili A Odum
Group Company Secretary
57 Marina, Lagos
NOTE: Securities holders (shareholders) of UBA Plc are entitled to ask questions both orally and written form before, during and after the Annual
General Meeting.
NOTICE OF ANNUAL GENERAL MEETING
194
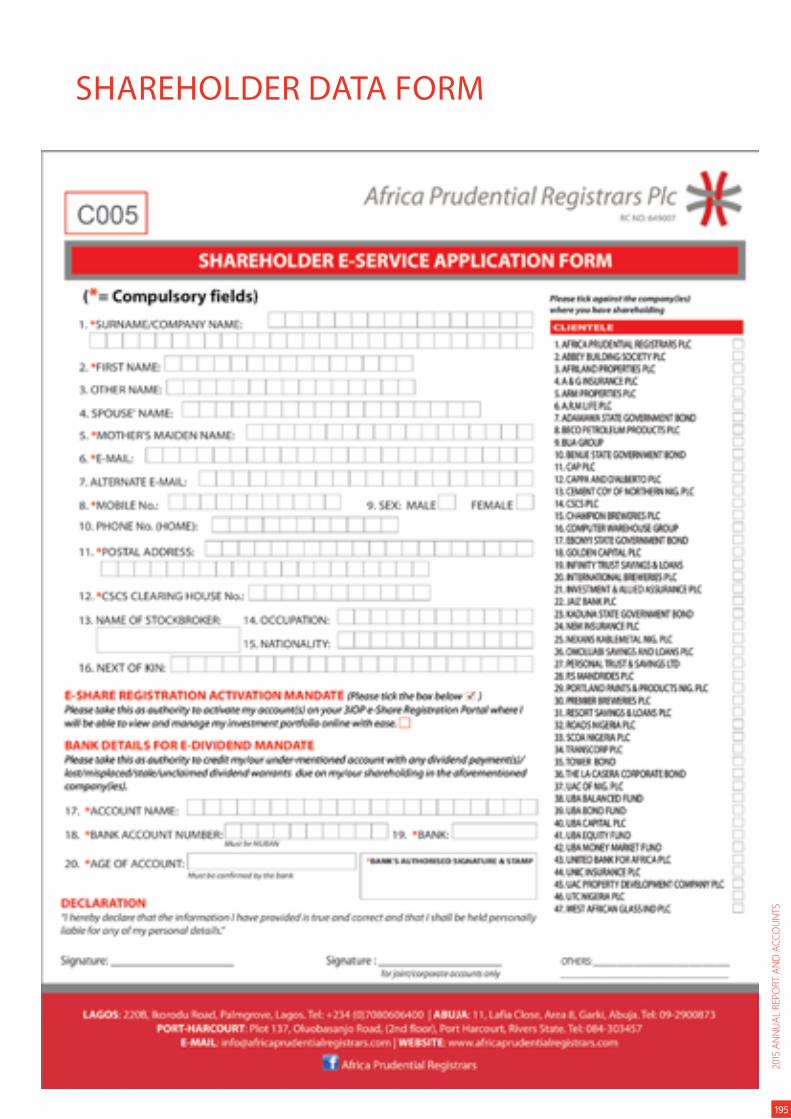
SHAREHOLDER DATA FORM
2015
AN
NU
AL
REP
OR
T A
ND
AC
CO
UN
TS
195

196

ADMISSION FORM
PLEASE RETAIN THIS SECTION TO FACILITATE YOUR ADMISSION TO THE MEETING
ADMISSION FORM
ANNUAL GENERAL MEETINGUnited Bank for Africa Plc RC 2457
Please admit the shareholder named on this admission form or his/her duly appointed proxy to the Annual General
Meeting of the Company to be held as follows:
DATE: 8 April 2016
TIME: 10:00 am
VENUE: EKO Hotel, Lagos
Name of Shareholder:
Address:
Account number: Number of shares held:
Proxy Shareholder
Please tick appropriate box before
admission to the meeting
Bili A Odum
Company Secretary
Shareholder’s signature:
This card is to be signed at the venue in the presence of the Registrar.
Africa Prudential Registrars Plc
Africa Prudential Registrars Plc
2208, Ikorodu Road, Palmgrove
Lagos
Registrar’s stamp
2015
AN
NU
AL
REP
OR
T A
ND
AC
CO
UN
TS
197

198
PROXY FORMI/We,
Shareholder’s name:
Address:
Number of shares held:
being the registered holder(s) of the ordinary shares of United Bank for
Africa Plc hereby appoint*
(block letters please)
or failing him, the Chairman of the Meeting as my/our proxy to vote for me/us
on my/our behalf at the Annual General Meeting of the Company to be held
at the Eko Hotels and Suites, Plot 1415, Ademola Adetokunbo Street, Victoria
Island, Lagos State on Friday, 8 April 2016 or at any adjournment thereof.
Dated this day of 2016
Shareholder’s signature:
NOTE:
1. A member (shareholder) who is unable to attend an Annual General
Meeting is allowed to vote by proxy. This proxy form has been prepared
to enable you exercise your vote if you cannot personally attend. This form
of proxy together with the power of attorney or other authority, if any,
under which it is signed or a notorial certified copy thereof must reach the
Registrar, Africa Prudential Registrars Plc, 220B, Ikorodu Road, Palmgrove,
Lagos, not later than 48 hours before the time of holding the meeting.
2. If executed by a corporation, the proxy form should be sealed with the
common seal or under the hand of some officers or an attorney duly
authorised.
3. In the case of joint holders, the signature of any one of them will suffice, but
the names of all joint holders should be shown.
4. Provision has been made on this form for the Chairman of the meeting
to act as your proxy, but if you wish you may insert in the blank space on
the form (marked*) the name of any person, whether a member of the
Company or not, who will attend the Meeting and vote on your behalf
instead of the Chairman of the meeting.
5. This proxy will be used only in the event of poll being directed, or
demanded.
6. It is a legal requirement that all instruments of proxy must bear appropriate
stamp duty (currently N500.00) from the Stamp Duties Office, and not
adhesive postage stamps.
Please indicate by marking “X” in the appropriate space, how you wish
your votes to be cast on the resolutions set out here, unless otherwise
instructed, the proxy will vote or abstain from voting at his or her discretion.
7. The proxy must produce the admission form sent with the report and
accounts to obtain entrance at the meeting.
This proxy form is solicited on behalf of the Board of Directors and is to be
used at the Annual General Meeting to be held on Friday, 8 April 2016.
RESOLUTIONS For Against Abstain
Ordinary business
1. To receive the audited accounts for the
year ended 31 December 2014, together
with the reports of the Directors, Auditors
and the Audit Committee thereon
2. To declare a dividend
3. To elect/re-elect Directors*
4. To authorise the Directors to fix the
remuneration of the Auditors
5. To elect members of the Audit Committee
Special business
To consider and, if thought fit, pass the
following as Special Resolutions:
(a) That the share capital of United Bank
for Africa Plc be and is hereby reduced
by the cancellation of approximately
2,299,978,358 (two billion, two hundred
and ninety-nine million, nine hundred
and seventy-eight thousand, three
hundred and fifty-eight) Ordinary
Shares of 50 kobo (Fifty Kobo) each
held under the cancelled Employee
Share Ownership Scheme managed
by the Staff Share Investment Trust
(“In Dissolution”).
(b) That the Directors be and are hereby
authorised to take all actions necessary
to effect the cancellation of the shares
and reduction of share capital.
*Note: The Directors seeking election/re-election are: (1) Mrs Foluke Abdulrazaq, (2) Mr Yahaya
Zekeri and (3) Mrs Owanari Duke.
This proxy form should NOT be completed and/or sent to the registered office
of the Registrars if the member would be attending the meeting in person.
ADMISSION CARD
Before posting the above form, please tear off this part and retain for admission at the meeting.
UNITED BANK FOR AFRICA PLC (RC 2457)
ANNUAL GENERAL MEETING
Please admit the shareholder named on this admission form or his/her duly
appointed proxy to the Annual General Meeting of the Company to be held
at the Eko Hotels and Suites, Plot 1415, Ademola Adetokunbo Street, Victoria
Island, Lagos State at 10:00 am on Friday, 8 April 2016.
Please tick appropriate box before
admission to the meeting
Proxy
Shareholder
Name and address of Shareholder:
Account number:
Number of shares held:
Shareholder’s signature:
This card is to be signed at the venue in the presence of the Registrar.
Bili A Odum
Group Company Secretary
57 Marina, Lagos
2015
AN
NU
AL
REP
OR
T A
ND
AC
CO
UN
TS
199

200
Corporate Information 202
Subsidiaries with Contact Details 203
CORPORATEINFORMATION
200

2015
AN
NU
AL
REP
OR
T A
ND
AC
CO
UN
TS
201
2015
AN
NU
AL
REP
OR
T A
ND
AC
CO
UN
TS
201
CORPORATE INFORMATION
Registered OfficeUBA House
57 Marina
Lagos, Nigeria
Company registrationRC: 2457
COMPANY SECRETARYBili Odum
AUDITORSPricewaterhouseCoopers
Landmark Towers
5B, Water Corporation Road
Victoria Island
Lagos, Nigeria
REGISTRARSAfrica Prudential Registrars Limited
220B IKorodu Road
Palmgrove Bus Stop
Palmgrove, Lagos, Nigeria
Phone +234-1-8752604
www.africaprudentialregistrars.com
SHAREHOLDER INFORMATION
The Bank maintains an investor relations section on its website (www.ubagroup.com/ir), which provides access to share price
data, management biographies, copies of annual reports, presentations on interim reports, credit rating reports and other useful
investor information.
CONTACT US:For all enquiries on shareholding, financial and business update, please contact our investor relations desk as follows:
Abiola Rasaq
Head Investor Relations
Bili Odum
Group Company Secretary
UBA House (14th Floor) UBA House (18th Floor)
57 Marina, Lagos 57 Marina, Lagos
Tel: +234 1 2808 349 Tel: +234 1 2807 012
Email: [email protected] Email: [email protected]
You can also visit the investor relations section of our website for more information. www.ubagroup.com/ir.
202
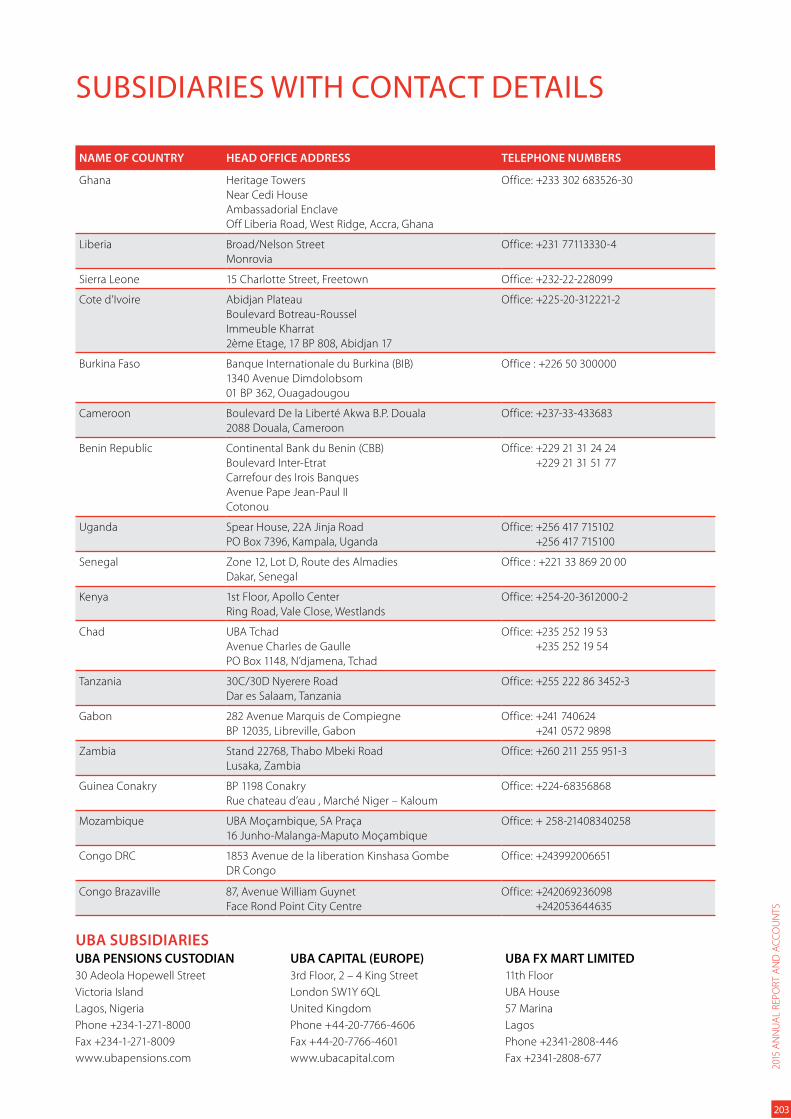
SUBSIDIARIES WITH CONTACT DETAILS
NAME OF COUNTRY HEAD OFFICE ADDRESS TELEPHONE NUMBERS
Ghana Heritage Towers
Near Cedi House
Ambassadorial Enclave
Off Liberia Road, West Ridge, Accra, Ghana
Office: +233 302 683526-30
Liberia Broad/Nelson Street
Monrovia
Office: +231 77113330-4
Sierra Leone 15 Charlotte Street, Freetown Office: +232-22-228099
Cote d’Ivoire Abidjan Plateau
Boulevard Botreau-Roussel
Immeuble Kharrat
2ème Etage, 17 BP 808, Abidjan 17
Office: +225-20-312221-2
Burkina Faso Banque Internationale du Burkina (BIB)
1340 Avenue Dimdolobsom
01 BP 362, Ouagadougou
Office : +226 50 300000
Cameroon Boulevard De la Liberté Akwa B.P. Douala
2088 Douala, Cameroon
Office: +237-33-433683
Benin Republic Continental Bank du Benin (CBB)
Boulevard Inter-Etrat
Carrefour des Irois Banques
Avenue Pape Jean-Paul II
Cotonou
Office: +229 21 31 24 24
+229 21 31 51 77
Uganda Spear House, 22A Jinja Road
PO Box 7396, Kampala, Uganda
Office: +256 417 715102
+256 417 715100
Senegal Zone 12, Lot D, Route des Almadies
Dakar, Senegal
Office : +221 33 869 20 00
Kenya 1st Floor, Apollo Center
Ring Road, Vale Close, Westlands
Office: +254-20-3612000-2
Chad UBA Tchad
Avenue Charles de Gaulle
PO Box 1148, N’djamena, Tchad
Office: +235 252 19 53
+235 252 19 54
Tanzania 30C/30D Nyerere Road
Dar es Salaam, Tanzania
Office: +255 222 86 3452-3
Gabon 282 Avenue Marquis de Compiegne
BP 12035, Libreville, Gabon
Office: +241 740624
+241 0572 9898
Zambia Stand 22768, Thabo Mbeki Road
Lusaka, Zambia
Office: +260 211 255 951-3
Guinea Conakry BP 1198 Conakry
Rue chateau d’eau , Marché Niger – Kaloum
Office: +224-68356868
Mozambique UBA Moçambique, SA Praça
16 Junho-Malanga-Maputo Moçambique
Office: + 258-21408340258
Congo DRC 1853 Avenue de la liberation Kinshasa Gombe
DR Congo
Office: +243992006651
Congo Brazaville 87, Avenue William Guynet
Face Rond Point City Centre
Office: +242069236098
+242053644635
UBA SUBSIDIARIESUBA PENSIONS CUSTODIAN UBA CAPITAL (EUROPE) UBA FX MART LIMITED
30 Adeola Hopewell Street 3rd Floor, 2 – 4 King Street 11th Floor
Victoria Island London SW1Y 6QL UBA House
Lagos, Nigeria United Kingdom 57 Marina
Phone +234-1-271-8000 Phone +44-20-7766-4606 Lagos
Fax +234-1-271-8009 Fax +44-20-7766-4601 Phone +2341-2808-446
www.ubapensions.com www.ubacapital.com Fax +2341-2808-677
2015
AN
NU
AL
REP
OR
T A
ND
AC
CO
UN
TS
203

204
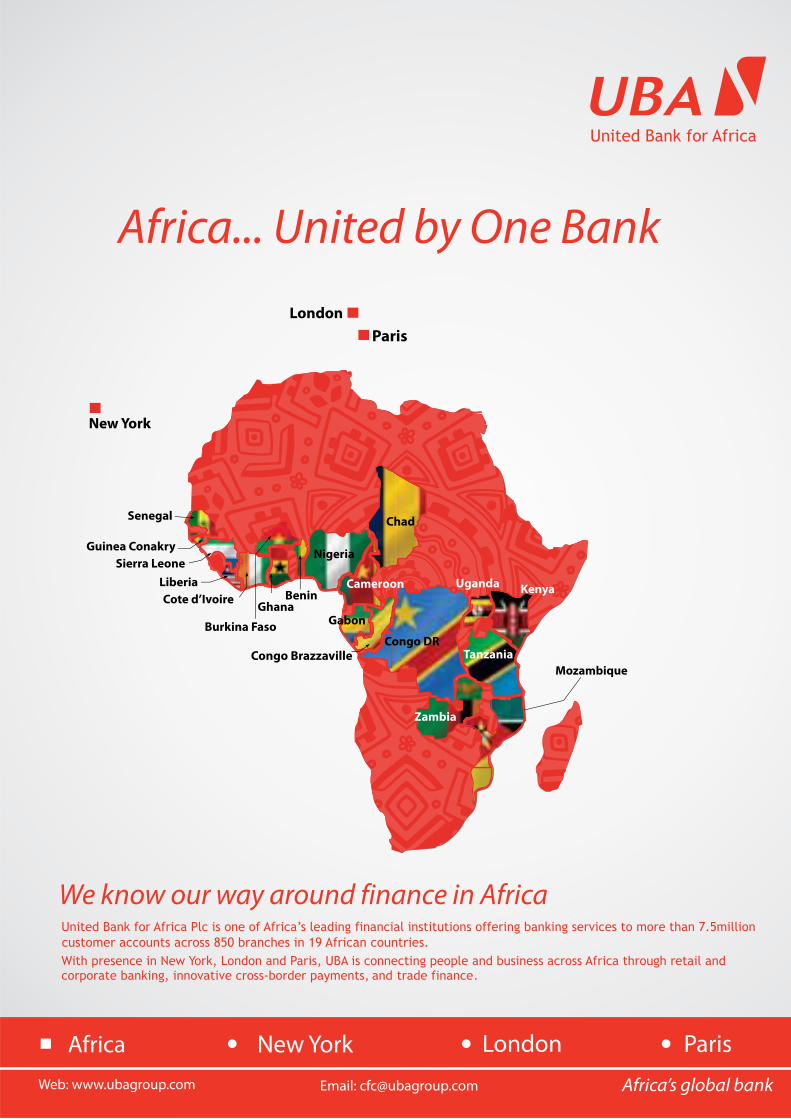
Africa New York London Paris

United Bank for Africa PlcHead Office: 57 Marina, Lagos, Nigeria.
Tel: +234-1-2808822
Website: www.ubagroup.com