Embed Size (px)
Citation preview

ANNUAL REPORTASSOCIATION OF VOLKSBANKS
2015

2 ANNUAL REPORT ASSOCIATION OF VOLKSBANKS 2015
CONTENTS
3ANNUAL REPORT ASSOCIATION OF VOLKSBANKS 2015
AssociationManagement Report
4 Report on business developmentand the economic situation4 Business development9 Report on branches9 Financial and non-financial
performance indicators11 Significant events after the
balance sheet date12 Report on the company’s future
development and risks12 Future development of
the company13 Material risks and uncertainties
13 Report on research anddevelopment
13 Report on key characteristics of the internal control and riskmanagement system with regard to accounting processes
Financial Statements
18 Statement of comprehensive income19 Statement of financial position20 Changes in equity and cooperative
capital shares21 Cash flow statement22 Table of contents Notes24 Notes
132 Auditor’s report
Terminology and imprint
134 Terminology135 Imprint
4 ANNUAL REPORT ASSOCIATION OF VOLKSBANKS 2015 / MANAGEMENT REPORT
ASSOCIATION MANAGEMENT REPORT
Report on business development and the economic situation
Business development
The most significant restructuring of the Austrian Association of Volksbanks to date tookplace in the 2015 business year. The Annual General Meeting of Volksbank Wien AG (VBW)on 29 May 2015 resolved that the company would assume the central organisation functionfrom Österreichische Volksbanken-Aktiengesellschaft (VBAG), and also approved a capitalincrease and the spin-off and transfer agreement. Regarding the shares transferred toVBW within the framework of the 2015 restructuring agreement, please refer to detailsgiven in the Notes. Under a demerger which took place on 4 July 2015, with retroactiveeffect under company law to 1 January 2015, the former central organisation (CO) of VBAGwas transferred to VBW, while the remainder of VBAG was continued as a wind-downentity under the name immigon portfolioabbau ag (immigon) pursuant to Section 162 of theAustrian Federal Act on the Recovery and Resolution of Banks (Bundesgesetz über dieSanierung und Abwicklung von Banken – BaSAG). The reorganisation took full legal effectupon its entry in the Commercial Register on 4 July 2015. All immigon bonds held withinthe Association were subject to a regulatory requirement to be secured with a financialguarantee. This financial guarantee was concluded with Deutsche Bank AG in June 2015.The costs arising from this, along with the profit or loss arising from any potential disposal,were distributed across the Association of Volksbanks on a pro-rata basis. As a consequenceof the conversion of the remainder of VBAG into a wind-down entity, the previous Associationwas wound up and a new Association established. The members of this new Associationof Volksbanks have joint, unlimited liability and have contractually agreed to bear the costsand risks of the CO on a pro rata basis. The ECB approved the Association of Volksbanksas a banking association pursuant to section 30a BWG with VBW as the CO. The approvalwas resolved on 2 July 2015 and is valid up to 30 June 2016. As yet, therefore, no newSREP ratio has been stipulated for the newly approved Association of Volksbanks. Sinceapproval was granted by the ECB, VBW has been the central organisation of the newAustrian Association of Volksbanks pursuant to section 30a of the Austrian Banking Act(Bankwesengesetz – BWG) and has assumed far-reaching management and steeringfunctions, one of which is responsibility for risk and liquidity management throughout theAssociation. The general meeting of Volksbank Marchfeld e.Gen. did not approve the newbanking association agreements or the merger with VBW. It was therefore decided, inaccordance with the existing banking association agreements, to exclude VolksbankMarchfeld e.Gen. from the Association of Volksbanks with effect from 24 May 2016. Followingthe changes and internal approval of the banking association agreements in line withregulatory requirements, the CO's management took the view that the criteria for furtherECB approval of the Association of Volksbanks were met.
Under the Association-wide restructuring process, the Volksbanks are merging to form eightregional providers of banking services and two specialist banks (8+2 structure). As a result,nine mergers within the Association of Volksbanks were successfully completed during 2015.
Fitch downgraded its rating for the Association of Volksbanks in mid-May 2015. Alongsideother Austrian banks, the rating for the Association of Volksbanks was also subject to a reviewlooking at government support. The rating was subsequently downgraded from A to BB-. Thedowngrade had no significant negative impact on the Association’s liquidity situation.
The Association of Volksbanks was subject to another rating by Fitch at the end of August 2015because of VBAG’s departure from the Association of Volksbanks and the restructuringof the Association. The rating was upgraded from BB- to BB+ with a positive outlook.
5ANNUAL REPORT ASSOCIATION OF VOLKSBANKS 2015 / MANAGEMENT REPORT
immigon implemented programmes to buy back issued debt during 2015. All seniorunsecured issues in the Association of Volksbanks were sold back early, and the financialguarantee with Deutsche Bank AG was terminated.
Economic environment2015 was marked by comparatively robust economic performance in industrialised countries,while growth was below average in many emerging countries and even negative in somecases.
Austrian gross domestic product (GDP) grew by 0.9% in 2015 according to recent calculationsby the Austrian Institute of Economic Research (WIFO). All components increased, withprivate and public consumption gaining impetus over the course of the year, while exportsand investment lost momentum toward the end of the year. Despite the slight economicrecovery, Austria’s unemployment rate remained high by historical standards. Accordingto Eurostat, seasonally adjusted unemployment grew – bucking the trend in the euro zone– from 5.6% in January to 5.8% in December 2015, although it remained low comparedwith other European countries. According to the European Harmonised Index of ConsumerPrices, the Austrian rate of inflation fluctuated between 0.5% and 1.1% during the year.Austria therefore recorded one of the highest levels of inflation in the euro zone.
Economic growth within Austria showed an east-west divide in the first nine months of 2015.Gross value added grew more strongly in Salzburg, Vorarlberg, Tyrol and Upper Austriathan in Austria as a whole.
The Viennese economy suffered from weak performance in the information and communication,construction and retail sectors. On the other hand, public services, real estate and tourismshowed positive growth. Despite above-average employment growth, the unemploymentrate also rose more than average owing to a substantial increase in the labour supply andwas far higher than anywhere else in the country.
In Lower Austria, manufacturing – a very important sector for the province – performedpoorly, while performance in public services and real estate was robust, as in the rest ofAustria. The labour market was in better shape than average compared with Austria as awhole, but unemployment rose.
Burgenland reported better than average figures, mainly thanks to the construction andmanufacturing sectors, though tourism was weaker than in other provinces with only aslight increase over the summer season (May to October). Burgenland ranked second foremployment growth.
Manufacturing in Styria suffered from the automotive industry's weak performance. Onthe other hand, gross value added grew strongly in the construction sector, and also theservice sector in the third quarter, resulting in above-average employment growth.
As measured by the increase in gross value added, Carinthia recorded the weakestperformance of all provinces, though construction and manufacturing stood out positively.The number of people in work stagnated and the province recorded the second highestunemployment rate after Vienna. In tourism, the provisional number of overnight staysincreased by 3% in 2015, exceeding the national average.
Due to weaker performance in construction and business services, gross value added inUpper Austria grew only slightly faster than average. The labour market performed better
than the Austrian average. Tourism also outperformed the Austrian average, with theprovisional number of overnight stays increasing at an annual rate of 5.1%.
Salzburg recorded the highest increase in gross value added of all provinces, with only retailand business services remaining weak, while employment growth was average. Despite risingunemployment, Salzburg maintained its position as the state with the lowest unemploymentrate, but by the end of the year was on a par with Vorarlberg. In tourism, the provisionalnumber of overnight stays increased by 2.6% in 2015, just exceeding the national average. Good performance in the manufacturing sector meant that Tyrol recorded an above-averageincrease in gross value added. Tourism also contributed to the region's economic growth,though preliminary statistics show that overnight stays increased by slightly less than theAustrian average, rising at an annual rate of 2.2%. Employment growth was slightly belowaverage, partly owing to a non-recurrent effect in the transport sector (Tyrolean).
Construction, trading and manufacturing were the main drivers of Vorarlberg's above-average economic performance. The province's retail sector also performed very well againstthe trend. Its favourable performance was reflected in the highest rate of employmentgrowth of all the provinces. However, tourism growth was muted compared with the nationaltrend (according to preliminary statistics, overnight stays rose by 1.5% compared with2.5% in Austria as a whole).
Austrian residential real estate prices rose in the first nine months of the year, continuingtheir long-standing upward trend. In the third quarter, the National Bank of Austria'sResidential Property Price Index was 4.0% higher than the prior-year level, with pricesoutside Vienna having increased somewhat more than in Vienna (+4.3% versus +3.4%).
Tourism performed very well, both in the past winter season and in the summer season.In the 2014/15 winter season, overnight stays increased by 2.1% (foreign visitors: +2.5%).In the summer season, overnight stays throughout Austria increased by 3.3% overall andby 3.5% for foreign guests. Vienna achieved the highest overall growth rates, with onlyBurgenland and Vorarlberg performing relatively weakly. The trends for different countriesof origin partly reflected exchange rate movements against the euro: Countries with above-average increases in overnight stays for guests included Switzerland and Liechtenstein(5.8%), the United Kingdom (5.5%) and the US (12.3%), while overnight stays from Russiafell by 34%.
In the euro zone the real GDP growth rate for 2015 according to the European Commission'swinter forecast was 1.6%, the highest figure since 2011. Most peripheral euro zone countriescontinued their recovery – only Greece (and Finland) did not grow over the past year. Averageinflation in the euro zone was almost one percentage point lower than in Austria. It roseslightly (from -0.6% in January to +0.2% in December 2015), but remained well below theEuropean Central Bank's target of just under 2%. One of the main reasons for the lowrate of inflation was the 35% decline in the price of oil over the course of the year.
The European Central Bank (ECB) left its main refinancing rate unchanged at 0.05%throughout the year and also maintained a negative deposit rate, which was lowered furtherin December to -0.30% at year-end. In March, the ECB began the enhanced bond purchaseprogramme it had agreed at the end of 2014 in order to boost inflation. Against this backdrop,yields on government bonds perceived as safe havens initially fell to historic lows beforerising again to finish 2015 moderately higher than they had been at the start of the year.The yield on ten-year government bonds increased in Austria from 0.66% to 0.90% andin Germany from 0.50% to 0.63%. The three-month Euribor fell steadily throughout the year
6 ANNUAL REPORT ASSOCIATION OF VOLKSBANKS 2015 / MANAGEMENT REPORT
and was consistently negative from mid-April onwards. It declined from 0.08% at the startof the year to -0.13% by year-end.
The euro depreciated by around 10% against the US dollar over the year, in part becauseof the contrary monetary policies of the ECB and the US Federal Reserve (the FederalReserve raised the federal funds rate for the first time in nine years in 2015). The euro alsodepreciated 10% overall against the Swiss franc after the Swiss National Bank discontinuedits minimum exchange rate of 1.20 on 15 January 2015. The euro even fell below parity withthe Swiss franc after the peg was discontinued. Stock markets again posted gains in 2015,despite a sharp decline in August. The ATX rose by 11% over the year and the EuroSTOXX50by just under 4%.
Association result for the 2015 business yearFollowing its demerger from the Association, the remainder of VBAG represents a discontinuedoperation under IFRS 5. The comparative figures for the previous year have therefore beenreclassified from individual income statement items to the result from discontinued operation.Comparability is nevertheless limited given the numerous changes in the scope of consolidation.
The Association result before taxes amounted to euro -106 million (2014: euro -240 million).The Association result after taxes and non-controlling interest was euro -69 million (2014:euro -320 million).
Net interest income for the 2015 business year amounted to euro 540 million, euro 74 millionlower than in the previous year (2014: euro 614 million). There were essentially three reasonsfor the decline: first, receivables from customers were down on the previous year becauseof current demand for credit. Second, securities portfolios were reduced or converted intoinvestments with lower risk content or risk weight, resulting in lower margins. Finally, marginswere squeezed by declining interest rates.
Risk provisions for 2015 stood at euro -50 million, a deterioration of euro 22 million comparedwith the previous year (2014: euro -28 million). The decline in the level of write-downsrequired in Styria was more than offset by increases at other primary banks.
Net fee and commission income in the reporting period was euro 233 million, down euro34 million on the prior-year period (2014: euro 266 million). This was mainly due to thedeconsolidation of the remainder of VBAG.
Net trading income in the 2015 business year was euro 13 million, a decline of euro 11 millioncompared with the prior-year period (2014: euro 24 million). In the previous year, net tradingincome was boosted by income from restructuring of hedges to optimise the hedge accountingsystem.
At euro 671 million, administrative expenses were lower than in the previous year (2014: euro 703million). The number of employees has declined by 1,110 from 6,104 at the end of 2014 to 4,994,of whom 65 are employed outside Austria. The reduction is largely attributable to thedeconsolidation of the remainder of VBAG. For the regional merger groups, costs (afterconsolidation) were virtually unchanged, since the decline in current personnel expenses was offsetby merger costs and additional regulatory costs (deposit insurance, resolution financing fund).
Planned restructuring efforts led to restructuring costs of euro 36 million in the 2014 businessyear. There was a slight increase in the restructuring provision in the reporting year, primarilyfor personnel measures.
7ANNUAL REPORT ASSOCIATION OF VOLKSBANKS 2015 / MANAGEMENT REPORT
Other operating result for the 2015 business year came to euro 27 million (2014: 43 million).The supplementary capital recognised in the Association for the first time in 2015 due tothe deconsolidation of VB Regio Invest AG was measured at fair value. The resultingincome of euro 7 million was recognised in other operating income. In the previous year,income of euro 49 million was recognised arising from the measurement of loss-bearingliabilities pursuant to IAS 39 AG 8. Income of euro 3 million (2014: euro -25 million) wasachieved in the reporting period from the buyback of issues.
Income from financial investments stood at euro -5 million in the reporting period, up euro19 million on the comparative period (2014: euro -24 million). Income of euro 4 millionwas achieved in the reporting period from the measurement and sale of securities. In thecomparative period, a loss of euro 13 million was recorded. Negative valuations of derivativeswere offset by positive measurement results on investment property assets.
Income from discontinued operation for the reporting period was euro -192 million (2014:euro -397 million). In addition to the result of the remainder of VBAG up to the time of itsdemerger from the Association on 4 July 2015 (euro -46 million), the effect on earningsresulting from debt securities and promissory note loans of VBAG to be recorded again forthe first time after the demerger from VBAG in the individual Volksbanks was recognisedin the amount of euro -135 million. In the comparative period, the reclassified result fromVBAG's non-core areas was recognised in the sum of euro -122 million. This item alsoincludes the deconsolidation of VB Romania S.A. (VBRO), measured at equity, the sale ofwhich was closed on 7 April 2015. Reclassification of other comprehensive income to profitor loss for the period led to a result of euro -12 million in the 2015 business year (2014:euro -275 million).
As a result of tax planning activities covering the next four years, deferred tax assets wererecognised in respect of some tax losses brought forward in 2015. As in the past, nodeferred tax assets were recognised in respect of a further 523 million of tax losses broughtforward. Deferred taxes were recognised in respect of the remaining measurementdifferences, primarily relating to the valuation of derivatives and securities.
Statement of financial position and own fundsDue to the demerger of the remainder of VBAG in the 2015 business year and the changesto the scope of consolidation, the figures for the reporting year are not entirely comparablewith those for the previous year. Declines in individual balance sheet items are mainly dueto the demerger of the remainder of VBAG from the Association and will therefore not beexplained separately in such cases.
Total assets amounted to euro 27.8 billion as at 31 December 2015, a decline of euro8.9 billion compared with the end of 2014 (euro 36.7 billion).
Loans and advances to credit institutions came to euro 0.6 billion, representing a fall of euro0.7 billion compared with the end of the previous period (euro 1.4 billion).
Loans and advances to customers amounted to euro 22.6 billion as at 31 December 2015and thus declined by euro 3.9 billion compared with the end of the previous year (euro26.5 billion). The main changes arose from the demerger of the remainder of VBAG (euro-2.5 billion) and the deconsolidation of banks demerged from the Association in 2015 (euro-0.4 billion). The rest of the decline was due to lower demand for credit and the Association'sdeleveraging strategy.
8 ANNUAL REPORT ASSOCIATION OF VOLKSBANKS 2015 / MANAGEMENT REPORT
Trading assets stood at euro 0.2 billion, a decline of euro 1.4 billion compared with the endof 2014 (euro 1.5 billion). At the same time, trading liabilities declined by euro 1.1 billion,from euro 1.4 billion to euro 0.4 billion as at 31 December 2015.
Financial investments fell by euro 1.7 billion compared with the end of 2014 (euro 4.1 billion)to euro 2.4 billion. This was due to sales and redemptions as well as the deconsolidationof the remainder of VBAG and banks which demerged from the Association in 2015.
Assets held for sale include loans whose sale had been contractually agreed or was highlylikely as at 31 December 2015. At the balance sheet date this included customer receivablesof the credit unions (Vorschusskassen) which were sold to the National Bank of Austria witheffect from January 2016 as part of their planned liquidation. The assets previously presentedhere in 2014 were disposed of during the 2015 business year. This related mainly to therefinancing of VBRO and a non-performing loan portfolio.
Amounts owed to credit institutions fell by euro 1.6 billion compared with the end of 2014(euro 2.1 billion), to euro 0.4 billion. Amounts owed to customers came to euro 22.3 billion, adecline of euro 1.8 billion compared with the end of 2014 (euro 24.1 billion). The demerger ofthe remainder of VBAG shrank the figure by euro 0.8 billion, while the deconsolidation ofbanks no longer belonging to the Association as of 2015 caused a reduction of euro0.4 billion. The remaining volume was wound down in the course of business so as to reducethe Association's excess liquidity.
Debts evidenced by certificates stood at euro 1.7 billion as at 31 December 2015, a fall ofeuro 2.2 billion compared with 31 December 2014 (euro 3.9 billion), primarily due to thedemerger of the remainder of VBAG. Subordinated capital declined by euro 0.4 billionfrom euro 0.8 billion at the end of the previous year to euro 0.4 billion at the end of thereporting year, largely owing to the deconsolidation of the remainder of VBAG.
Equity items (including shares and non-controlling interest) declined in the reporting yearfrom euro 2.6 billion to euro 1.8 billion at the end of 2015. The greatest decrease was insubscribed capital and largely resulted from the deconsolidation of the remainder of VBAG.
Report on branch offices
The Association does not have any branches.
Financial and non-financial performance indicators
Financial performance indicatorsThe regulatory own funds of the banking association stood at euro 2.3 billion as at 31December 2015 (2014: euro 3.4 billion). The total risk exposure as at 31 December2015 was euro 15.1 billion (2014: euro 23.3 billion). The tier 1 ratio in relation to totalrisk was 12.1% (2014: 10.3%). The equity ratio in relation to total risk stood at 15.4%(2014: 14.7%).
The Association’s return on equity (ROE) before taxes was 3.9% in 2015 (2014: 1.3%).ROE before taxes is calculated as the result before taxes divided by the average ofequity at the current and prior-year balance sheet dates. ROE after taxes for the 2015business year was 5.2% (2014: -1.0%). ROE after taxes is calculated as the result after
9ANNUAL REPORT ASSOCIATION OF VOLKSBANKS 2015 / MANAGEMENT REPORT
taxes divided by the average of equity at the current and prior-year balance sheet dates.
The Association's operating cost-income ratio for the reporting period was 85.4% (2014: 77.7%).The operating cost-income ratio is calculated as net interest income, net fee and commissionincome and net trading income as a proportion of general administrative expenses.
Non-financial performance indicators
Human ResourcesThe 2015 business year was dominated by the preparation and implementation of mergerswithin the Association, rigorously continuing down the path taken in 2014. Aside from themergers of regional Volksbanks, the spin-off of the former VBAG to immigon and themerger with VBW presented particular challenges. The resulting process of change placedexceptionally heavy demands on employees and executives in the Volksbank sector.
As well as successfully integrating different employee groups and harmonising processesand employment terms, our main priority is to provide efficient support to our customers. TheVolksbank sector also places great emphasis on extensive staff training and development.Suitable programmes are updated and developed on an ongoing basis. This ensures thatthe Association maintains its usual high quality standards, which are appreciated byemployees and customers alike.
At the end of 2015, the Association of Volksbanks employed 4,994 people (full-timeequivalents). There were 464 business locations at the reporting date.
Significant organisational and IT projectsFrom an organisational and IT perspective, 2015 was dominated by restructuring activitieswithin the Association. In particular, ten mergers were completed, starting with the transfer ofVBAG's central organisation to VBW. The success of this project was one of the prerequisitesfor the new Association, which in future will consist of eight strong provincial Volksbanksand two specialist institutions, under an "8+2" structure.
Central organisation functions were transferred to VBW in the middle of the year as partof the "Transformation" project. This covered legal, human resources, procedural and ITactivities (supported by the Association's data centre operated by ARZ AllgemeinesRechenzentrum GmbH), and was carried out by both banks' organisational and IT areas.Following the merger, top-level functions (such as Association-wide liquidity management)and the service and processing tasks performed for the Association's banks through VBServices für Banken Ges.m.b.H. were transferred from VBAG to VBW.
The purpose of the "Model Client" project (Mustermandant) is to harmonise the parametersand system-supported processes of the core banking system in the Volksbank sector. This isfacilitating mergers, creating synergies and saving costs. Uniform system parameters havealready been rolled out, and a uniform product offering and pricing packages are currentlybeing introduced. The central organisation has had its own technical client and supportteam set up for system support and maintenance. Parameters can now be changed centrallyfor the entire Volksbank sector. The migration of the retail banks to the model client simplifieswork and was an obligatory prerequisite for the mergers above.
The aim of the Association-wide IT consolidation project begun in 2013 was to achieve along-term reduction in the costs of IT infrastructure and associated IT processes within theAssociation's banks. The two most important elements of the project are the harmonisationof the data network (Network Cloud), which is to be implemented across the Association
10 ANNUAL REPORT ASSOCIATION OF VOLKSBANKS 2015 / MANAGEMENT REPORT
11ANNUAL REPORT ASSOCIATION OF VOLKSBANKS 2015 / MANAGEMENT REPORT
as early as the first half of 2016, and the centralisation of all servers at ARZ (CeBrA Cloud),which is to be completed by the end of 2017 with the Association's final merger. Alongsidealready tangible cost reductions, the measures implemented also entail a significant reductionin operational risks in the main institutions.
The “Electronic Banking Platform – Mobile Generation” project was initiated in 2015 withthe aim of creating a modern online banking system. The new platform is being rolled outin the first half of 2016 and increasingly positioned as an information, communication andtransaction channel between bank and customers. The application of agile methods enablescontinually evolving functions to be provided, allowing ongoing adaptation to market andcustomer requirements as well as reducing the burden on in-house support units.
In 2012, the Austrian banks agreed to establish a joint reporting platform (GemeinsameMeldewesen-Plattform – GMP). The "securities cube" and "loans cube" went live in 2015,representing successful achievement of the first GMP milestones by the Volksbanks incollaboration with ARZ. The securities cube looked at the entire organisational, proceduraland technological set-up, while the loans cube focussed on content-related and qualityassurance measures necessitated by the sheer extent of the loan data. Despite significantupheavals in 2015 (“Transformation” project), the Association of Volksbanks defined andimplemented a collaboration model governing the distribution of reporting responsibilitiesbetween the central organisation and the primary banks and realising maximum potentialsynergies between process steps performed on a centralised and decentralised basis.One demonstration of the success of this collaboration is that the Association has becomethe first banking group in Austria to submit a live securities cube to the National Bank ofAustria.
Organisational and IT projects are planned and implemented with due consideration forenvironmental concerns.
Significant events after the balance sheet date
The General Meeting of 17 March 2016 resolved to amend the 2014 banking associationagreements. Alongside amendments to the 2014 banking association agreement andcollaboration agreement, one of the measures implemented was to set up a trust fund(Leistungsfonds) at the central organisation. The central organisation thereby bears soleresponsibility for restructuring within the Association in future, and the common fund(Gemeinschaftsfonds) has been replaced by the trust fund.
With effect from 24 May 2016, Volksbank Marchfeld e.Gen. was excluded from the 2014banking association agreement for a compelling reason. In view of the bank's small size, thiswill have no material impact on the Association of Volksbanks' liquidity, planned profitabilityor capital base.
The positive outlook for the long-term issuer rating of the Association of Volksbanks reflectsthe progress in consolidating the Association members and the high probability that the ratingwill be upgraded by up to two notches once the risk of implementing the consolidation hasdecreased sufficiently. On the other hand, there is a risk that the viability and long-termissuer ratings will be downgraded if the necessary cost reductions are not achieved from therestructuring, if there is a significant downturn in the Austrian economy or if the Associationof Volksbanks is unable to repay the Republic of Austria in line with the repayment plan.However, these risks are not currently expected to materialise.
The new branch concept was authorised at the Supervisory Board meeting of 31 March 2016.
Report on the Association’s future development and risks
Future development of the Association
Economic environmentThe first few weeks of the year were marked by growing concerns about the global economy.Weak economic data from China and the sharp decline in oil prices led to considerablelosses on stock markets and declining yields on government bonds considered safehavens. In oil-importing countries, falling oil prices also increased the risk of general deflation,which can undermine demand through postponement effects on private consumption andinvestment. In addition, weak commodity prices – while advantageous for importers inprinciple – mean lower demand from commodity-exporting countries, which in turn affectsthe capital goods market. Other uncertainties include the geopolitical situation and itsconsequences (particularly migration), disagreement within the European Union on how todeal with such challenges, ongoing negotiations over new oil production quotas, theformation of new governments in many countries and the UK referendum on leaving theEU on 23 June.
As a result, economists have slightly reduced their growth forecasts for the current year.Inflation forecasts have been scaled back rather more significantly. In December, the EuropeanCentral Bank predicted an average inflation rate of 1% for the euro zone. It lowered itsaverage projection to just 0.1% in March and raised it only marginally in June to 0.2%.
In March, the ECB maintained its basic assumption of a moderate economic recovery inthe euro zone, and this began to be reflected in the credit market data for January andFebruary. However, it further reduced its key interest rates to ward off deflation, anddecided on a further expansion of its unconventional monetary policy measures. Thedeposit rate was reduced by ten basis points to -0.40%, while the main refinancing rateand the marginal lending rate were each reduced by five basis points, to 0% and 0.25%respectively. In addition, the bond purchase programme was increased by euro 20 billionto euro 80 billion per month. Investment-grade corporate bonds – but not bank bonds –will now also be eligible for the purchase programme. There are to be four new targetedlong-term refinancing operations (TLTRO II), taking place quarterly from June 2016 with amaturity of four years. Participants who increase their lending by at least 2.5% will be ableto borrow at the deposit rate. Otherwise, interest up to but no higher than the mainrefinancing rate may be applied. In contrast to previous long-term refinancing operations,the interest rate is only tied to the base rate that applies at the time the transactionis concluded and is independent of later changes in base rates.
As a result of the new ECB measures, the expected level of interest rates has continuedto shift downwards for the current year, especially at the short end of the interest ratecurve. Interest rates should therefore remain low overall, although the tightening of monetarypolicy introduced at the end of 2015 in the US may lead to a certain upward trend. Thisshould have a stronger impact on capital market interest rates than on the money market.
The low level of interest rates should help consolidate economic growth this year in Austriaand the euro zone. For the euro zone, the ECB (macroeconomic projection published inJune) and the European Commission (spring forecast) expect economic growth of 1.6%,while the International Monetary Fund's World Economic Outlook published in Aprilanticipates that the zone will grow by1.5%. There are somewhat larger discrepanciesbetween assessments of Austria's economic prospects in the current year. While theAustrian Institute of Economic Research (WIFO) expects real GDP growth of 1.6% and
12 ANNUAL REPORT ASSOCIATION OF VOLKSBANKS 2015 / MANAGEMENT REPORT
the European Commission 1.5%, the IMF is relatively sceptical with a forecast of 1.2%.Forecasters agree, however, that the current year should bring a noticeable increase inprivate consumption in Austria, partly thanks to the effects of the tax reform. Public sectorconsumption should also increase, driven partly by expenditure relating to the refugee crisis.Exports and investments depend more heavily on the international environment and shouldlose momentum only gradually. Setbacks arising from the above-mentioned risk factorswould also weaken the economic outlook outlined here.
Outlook for planned mergers in 2016Numerous other mergers are taking place within the Association of Volksbanks during2016, in order to realise the envisaged 8+2 structure. Seven mergers are planned for thefirst half-year and ten for the second.
Future development of the AssociationFollowing the successful demerger of immigon from the Association and VBW's assumptionof the central organisation function in 2015, the Association's focus is now on increasingcustomer business. The planned mergers should also allow the Association of Volksbanksto realise potential cost-savings and grow by strengthening the lending and commissionbusiness. The new cooperation agreement with Union Investment Austria GmbH andAssociation-wide reorganisation of branches will also support commission business. It isanticipated that these measures will enable an annual profit in the low double-digit rangeonce again.
Material risks and uncertainties With respect to the disclosures required by law relating to the use of financial instruments,risk management objectives and methods and the existence of price, default, liquidity andcash-flow risks, please see the information presented in the notes to the financial statements(in particular the risk report in section 51).
Report on research and development
The Association does not carry out any research or development.
Report on key characteristics of the internal control and risk management system with regard to accounting processes
Control environmentThe ultimate goal of the Association's financial reporting is to comply with all relevant legalrequirements. To this end, the central organisation has also issued a General AccountingDirective as part of the IFRS reporting. The Managing Board of the central organisation isresponsible for establishing and organising an appropriate internal control and riskmanagement system with respect to the accounting process, and provides a Group-wideframework for implementing this in its Group guideline for internal control systems. TheOPRISK group is responsible for implementing the system at Association level, whileresponsibility within VBW itself falls to the Risk Governance unit.
At each company included in the Association's financial statements, the respectiveManaging Board or management team are responsible for establishing and organising anappropriate system of internal controls and for ensuring compliance with Association-wideguidelines and regulations. To guarantee that data provided by Association companies is
13ANNUAL REPORT ASSOCIATION OF VOLKSBANKS 2015 / MANAGEMENT REPORT
incorporated correctly, all supplied data is first checked for plausibility. Once this has beencarried out, the data is processed further using Tagetik consolidation software. The controlsare subject to the principle of dual control and an additional review by department managers.
Control measures are applied in day-to-day business processes to ensure that potentialerrors are prevented and that any discrepancies in financial reporting are identified andrectified. Control measures range from management reviews of results for different periodsto specific account and balance reconciliation and analysis of ongoing Group accountingprocesses. As part of this process, a distinction is made between two different types ofcontrol:
– Operational controls comprise manual controls in the form of specific procedures carried out by employees, automated controls performed using IT systems and preventative controls whose purpose is the proactive avoidance of errors and risks through separation of functions, definition of responsibilities and access permissions.
– Management controls serve to ensure, on the basis of spot checks, that managers are complying with operational controls. The frequency of checks is determined by the manager concerned (head of division, head of department) based on the associated level of risk. Spot checks are documented in the control plan in a way that is comprehensible to third parties, and the results are presented every six months as part of management reporting.
Internal Audit also performs regular independent checks of compliance with internalregulations for accounting processes. As an administrative department, Internal Audit isassigned directly to the Managing Board. It reports directly to the Chairman of the ManagingBoard and submits a report to the Supervisory Board on a quarterly basis.
Risk assessmentRisks relating to the accounting process are recorded and monitored by the processmanagers, with a focus on materiality.
For the preparation of the financial statements, estimates must regularly be made in areaswhere there is an intrinsic risk that future developments may deviate from these estimates. Thisapplies particularly to the following items and information in the Association's financialstatements: impairment of financial assets, risks to the banking business, employee benefitsand the outcome of legal disputes. In some cases, publicly available sources are used orexternal experts consulted in order to minimise the risk of inaccurate estimates.
Information and communicationGuidelines and regulations relating to financial reporting are regularly updated bymanagement and communicated to all employees concerned.
Employees in Group accounting are also trained on an ongoing basis with regard tointernational accounting reforms, so that risks relating to unintentional errors in reporting canbe identified at an early stage. Group accounting staff also communicate this informationto employees at Association companies.
A management report is produced twice a year and contains information on the completeness,comprehensibility, active implementation and effectiveness of the control system withregard to the accounting process.
14 ANNUAL REPORT ASSOCIATION OF VOLKSBANKS 2015 / MANAGEMENT REPORT
15ANNUAL REPORT ASSOCIATION OF VOLKSBANKS 2015 / MANAGEMENT REPORT
MonitoringSenior management regularly receives condensed financial reporting such as quarterlyreports on the performance of the various segments and key financial indicators. Financialstatements that are to be published are subject to a final check by senior employees inaccounting, divisional management and the Managing Board before they are forwardedto the relevant committees. The results of monitoring activities covering accounting processesare included in the management report. The report contains a risk assessment of the processeson a qualitative basis, and documents the number of controls being carried out in relationto the control guidelines.
Vienna, 15 June 2016
Gerald FLEISCHMANNChairman of the Managing Board
General Secretariat, Organisation / IT,HR Management, Press Office, Risk Control, Banking Association Strategy
Josef PREISSLDeputy Chairman of the Managing Board
Compliance Office, Property Subsidiaries, Integration/Operational Risk Governance,Legal, Audit, Association Risk Management, Risk Retail/SME,
Reorganisation Management, VB Services for Banks
Wolfgang SCHAUER Rainer BORNSMember of the Managing Board Member of the Managing Board
Major Commercial, Marketing/Communication, FinanceRegional Management/Branches, Treasury,
Sales Management, Front Office Service Center

16
FINANCIAL STATEMENTS

17
18 Statement of comprehensive income19 Statement of financial position20 Changes in equity and cooperative
capital shares21 Cash flow statement22 Table of contents Notes24 Notes138 Auditor’s report
Statement of comprehensive income
Income Statement 1-12/2015restated
1-12/2014Euro thousand Euro thousand Euro thousand %
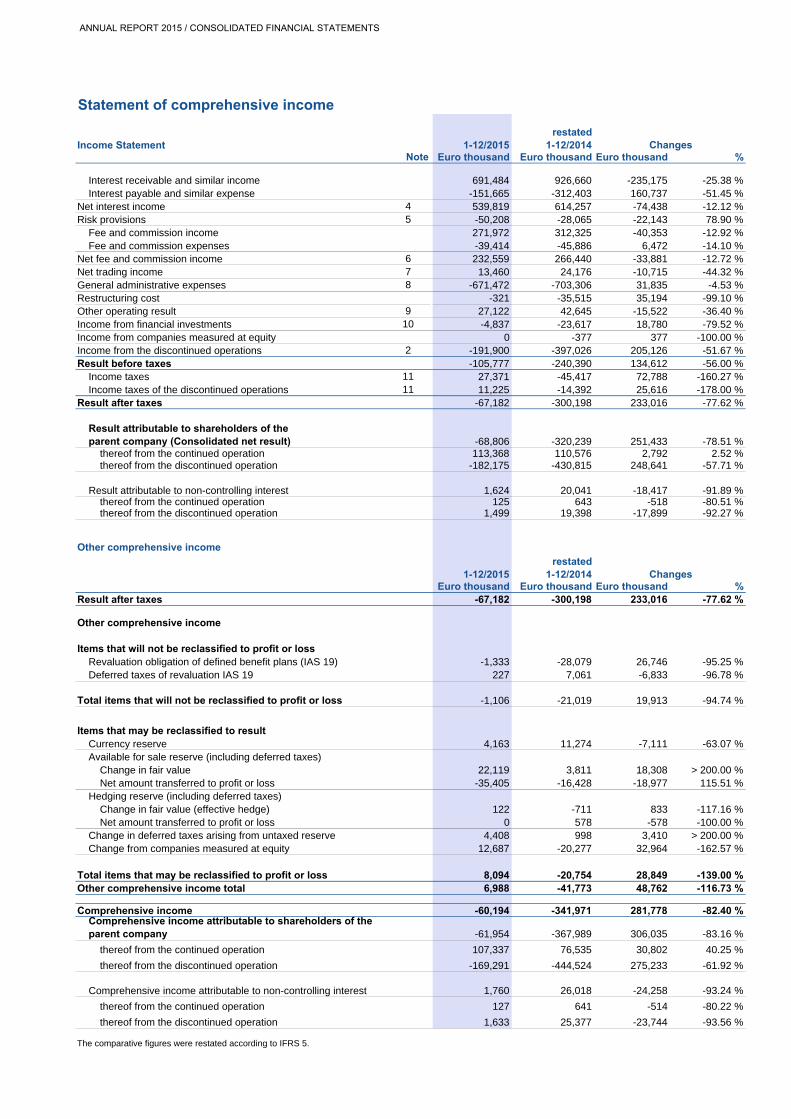
Interest receivable and similar income 691,484 926,660 -235,175 -25.38 %Interest payable and similar expense -151,665 -312,403 160,737 -51.45 %
Net interest income 4 539,819 614,257 -74,438 -12.12 %Risk provisions 5 -50,208 -28,065 -22,143 78.90 %
Fee and commission income 271,972 312,325 -40,353 -12.92 %Fee and commission expenses -39,414 -45,886 6,472 -14.10 %
Net fee and commission income 6 232,559 266,440 -33,881 -12.72 %Net trading income 7 13,460 24,176 -10,715 -44.32 %General administrative expenses 8 -671,472 -703,306 31,835 -4.53 %Restructuring cost -321 -35,515 35,194 -99.10 %Other operating result 9 27,122 42,645 -15,522 -36.40 %Income from financial investments 10 -4,837 -23,617 18,780 -79.52 %Income from companies measured at equity 0 -377 377 -100.00 %Income from the discontinued operations 2 -191,900 -397,026 205,126 -51.67 %Result before taxes -105,777 -240,390 134,612 -56.00 %
Income taxes 11 27,371 -45,417 72,788 -160.27 %Income taxes of the discontinued operations 11 11,225 -14,392 25,616 -178.00 %
Result after taxes -67,182 -300,198 233,016 -77.62 %
-68,806 -320,239 251,433 -78.51 %thereof from the continued operation 113,368 110,576 2,792 2.52 %thereof from the discontinued operation -182,175 -430,815 248,641 -57.71 %
1,624 20,041 -18,417 -91.89 %thereof from the continued operation 125 643 -518 -80.51 %thereof from the discontinued operation 1,499 19,398 -17,899 -92.27 %
Other comprehensive income
1-12/2015restated
1-12/2014Euro thousand Euro thousand Euro thousand %
Result after taxes -67,182 -300,198 233,016 -77.62 %
Other comprehensive income
Revaluation obligation of defined benefit plans (IAS 19) -1,333 -28,079 26,746 -95.25 %Deferred taxes of revaluation IAS 19 227 7,061 -6,833 -96.78 %
-1,106 -21,019 19,913 -94.74 %
Currency reserve 4,163 11,274 -7,111 -63.07 %Available for sale reserve (including deferred taxes)
Change in fair value 22,119 3,811 18,308 > 200.00 %Net amount transferred to profit or loss -35,405 -16,428 -18,977 115.51 %
Hedging reserve (including deferred taxes)Change in fair value (effective hedge) 122 -711 833 -117.16 %Net amount transferred to profit or loss 0 578 -578 -100.00 %
Change in deferred taxes arising from untaxed reserve 4,408 998 3,410 > 200.00 %Change from companies measured at equity 12,687 -20,277 32,964 -162.57 %
8,094 -20,754 28,849 -139.00 %Other comprehensive income total 6,988 -41,773 48,762 -116.73 %
Comprehensive income -60,194 -341,971 281,778 -82.40 %
-61,954 -367,989 306,035 -83.16 %
thereof from the continued operation 107,337 76,535 30,802 40.25 %
thereof from the discontinued operation -169,291 -444,524 275,233 -61.92 %
1,760 26,018 -24,258 -93.24 %
thereof from the continued operation 127 641 -514 -80.22 %
thereof from the discontinued operation 1,633 25,377 -23,744 -93.56 %
The comparative figures were restated according to IFRS 5.
Changes
Comprehensive income attributable to shareholders of the parent company
Comprehensive income attributable to non-controlling interest
ChangesNote
Result attributable to shareholders of theparent company (Consolidated net result)
Result attributable to non-controlling interest
Items that will not be reclassified to profit or loss
Total items that will not be reclassified to profit or loss
Items that may be reclassified to result
Total items that may be reclassified to profit or loss
ANNUAL REPORT 2015 / CONSOLIDATED FINANCIAL STATEMENTS
Statement of financial position as at 31 December 2015 December 20151 December 2014
Euro thousand Euro thousand Euro thousand %
Assets
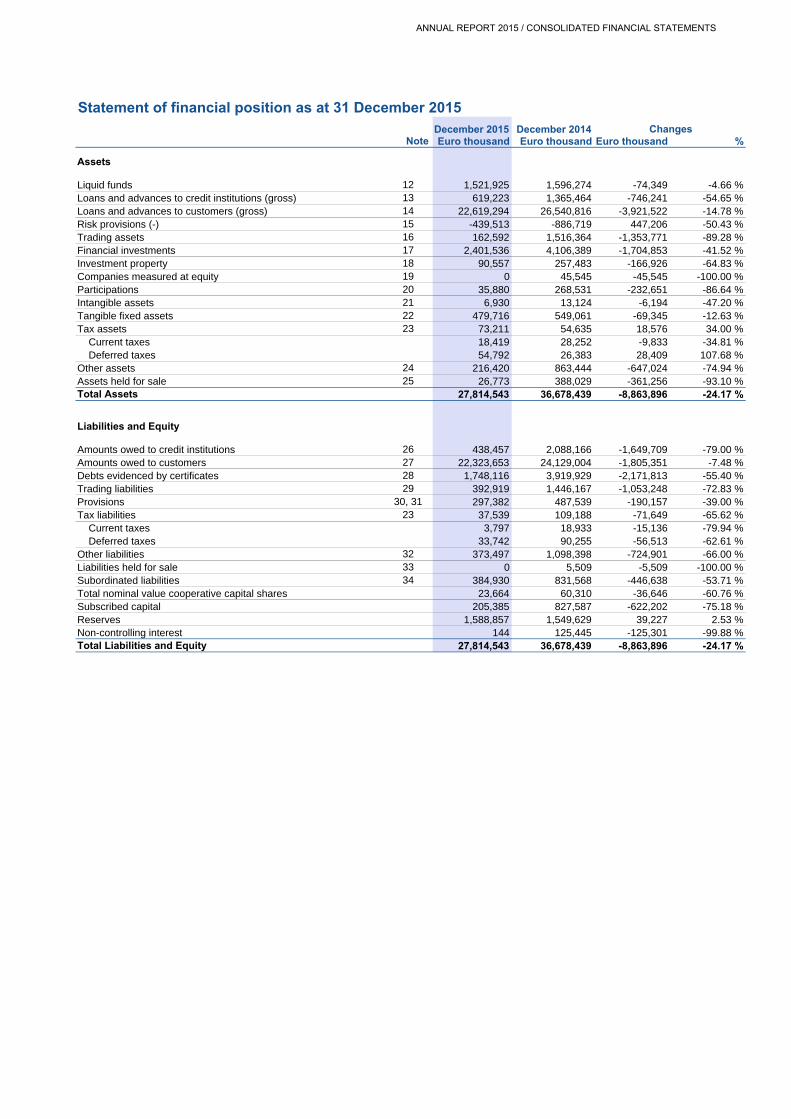
Liquid funds 12 1,521,925 1,596,274 -74,349 -4.66 %Loans and advances to credit institutions (gross) 13 619,223 1,365,464 -746,241 -54.65 %Loans and advances to customers (gross) 14 22,619,294 26,540,816 -3,921,522 -14.78 %Risk provisions (-) 15 -439,513 -886,719 447,206 -50.43 %Trading assets 16 162,592 1,516,364 -1,353,771 -89.28 %Financial investments 17 2,401,536 4,106,389 -1,704,853 -41.52 %Investment property 18 90,557 257,483 -166,926 -64.83 %Companies measured at equity 19 0 45,545 -45,545 -100.00 %Participations 20 35,880 268,531 -232,651 -86.64 %Intangible assets 21 6,930 13,124 -6,194 -47.20 %Tangible fixed assets 22 479,716 549,061 -69,345 -12.63 %Tax assets 23 73,211 54,635 18,576 34.00 %
Current taxes 18,419 28,252 -9,833 -34.81 %Deferred taxes 54,792 26,383 28,409 107.68 %
Other assets 24 216,420 863,444 -647,024 -74.94 %Assets held for sale 25 26,773 388,029 -361,256 -93.10 %Total Assets 27,814,543 36,678,439 -8,863,896 -24.17 %
Liabilities and Equity
Amounts owed to credit institutions 26 438,457 2,088,166 -1,649,709 -79.00 %Amounts owed to customers 27 22,323,653 24,129,004 -1,805,351 -7.48 %Debts evidenced by certificates 28 1,748,116 3,919,929 -2,171,813 -55.40 %Trading liabilities 29 392,919 1,446,167 -1,053,248 -72.83 %Provisions 30, 31 297,382 487,539 -190,157 -39.00 %Tax liabilities 23 37,539 109,188 -71,649 -65.62 %
Current taxes 3,797 18,933 -15,136 -79.94 %Deferred taxes 33,742 90,255 -56,513 -62.61 %
Other liabilities 32 373,497 1,098,398 -724,901 -66.00 %Liabilities held for sale 33 0 5,509 -5,509 -100.00 %Subordinated liabilities 34 384,930 831,568 -446,638 -53.71 %Total nominal value cooperative capital shares 23,664 60,310 -36,646 -60.76 %Subscribed capital 205,385 827,587 -622,202 -75.18 %Reserves 1,588,857 1,549,629 39,227 2.53 %Non-controlling interest 144 125,445 -125,301 -99.88 %Total Liabilities and Equity 27,814,543 36,678,439 -8,863,896 -24.17 %
ChangesNote
ANNUAL REPORT 2015 / CONSOLIDATED FINANCIAL STATEMENTS
Beilage III
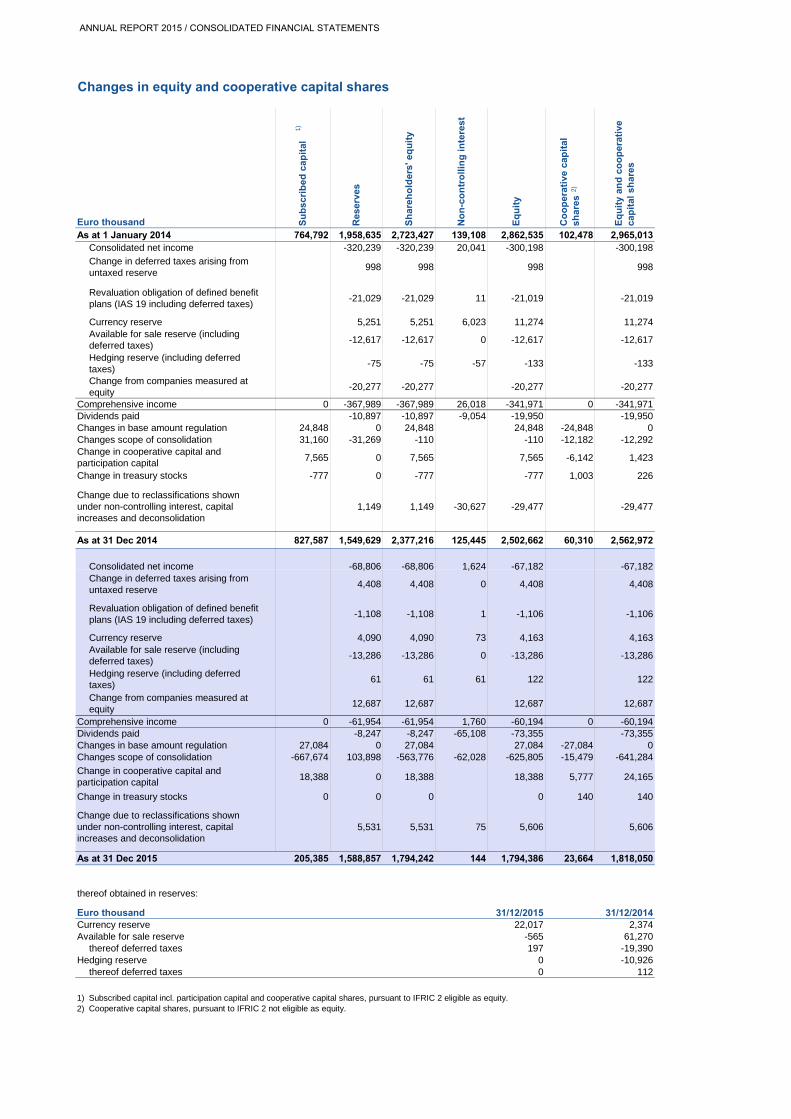
Changes in equity and cooperative capital shares
Euro thousandAs at 1 January 2014 764,792 1,958,635 2,723,427 139,108 2,862,535 102,478 2,965,013
Consolidated net income -320,239 -320,239 20,041 -300,198 -300,198
Change in deferred taxes arising from untaxed reserve
998 998 998 998
Revaluation obligation of defined benefit plans (IAS 19 including deferred taxes)
-21,029 -21,029 11 -21,019 -21,019
Currency reserve 5,251 5,251 6,023 11,274 11,274Available for sale reserve (including deferred taxes)
-12,617 -12,617 0 -12,617 -12,617
Hedging reserve (including deferred taxes)
-75 -75 -57 -133 -133
Change from companies measured at equity
-20,277 -20,277 -20,277 -20,277
Comprehensive income 0 -367,989 -367,989 26,018 -341,971 0 -341,971Dividends paid -10,897 -10,897 -9,054 -19,950 -19,950Changes in base amount regulation 24,848 0 24,848 24,848 -24,848 0Changes scope of consolidation 31,160 -31,269 -110 -110 -12,182 -12,292
7,565 0 7,565 7,565 -6,142 1,423
-777 0 -777 -777 1,003 226
1,149 1,149 -30,627 -29,477 -29,477
As at 31 Dec 2014 827,587 1,549,629 2,377,216 125,445 2,502,662 60,310 2,562,972
Consolidated net income -68,806 -68,806 1,624 -67,182 -67,182
Change due to reclassifications shown under non-controlling interest, capital increases and deconsolidation
Su
bsc
rib
ed c
apit
al
Res
erve
s
Change in treasury stocks
Change in cooperative capital and participation capital
Sh
areh
old
ers'
eq
uit
y
No
n-c
on
tro
llin
g i
nte
rest
Eq
uit
y
Co
op
erat
ive
cap
ital
sh
ares
Eq
uit
y an
d c
oo
per
ativ
e ca
pit
al s
har
es
1)
2)Consolidated net income 68,806 68,806 1,624 67,182 67,182Change in deferred taxes arising from untaxed reserve
4,408 4,408 0 4,408 4,408
Revaluation obligation of defined benefit plans (IAS 19 including deferred taxes)
-1,108 -1,108 1 -1,106 -1,106
Currency reserve 4,090 4,090 73 4,163 4,163Available for sale reserve (including deferred taxes)
-13,286 -13,286 0 -13,286 -13,286
Hedging reserve (including deferred taxes)
61 61 61 122 122
Change from companies measured at equity
12,687 12,687 12,687 12,687
Comprehensive income 0 -61,954 -61,954 1,760 -60,194 0 -60,194Dividends paid -8,247 -8,247 -65,108 -73,355 -73,355Changes in base amount regulation 27,084 0 27,084 27,084 -27,084 0Changes scope of consolidation -667,674 103,898 -563,776 -62,028 -625,805 -15,479 -641,284
18,388 0 18,388 18,388 5,777 24,165
Change in treasury stocks 0 0 0 0 140 140
5,531 5,531 75 5,606 5,606
As at 31 Dec 2015 205,385 1,588,857 1,794,242 144 1,794,386 23,664 1,818,050
thereof obtained in reserves:
Euro thousand 31/12/2015 31/12/2014Currency reserve 22,017 2,374Available for sale reserve -565 61,270
thereof deferred taxes 197 -19,390Hedging reserve 0 -10,926
thereof deferred taxes 0 112
1)2)
Change in cooperative capital and participation capital
Change due to reclassifications shown under non-controlling interest, capital increases and deconsolidation
Cooperative capital shares, pursuant to IFRIC 2 not eligible as equity.Subscribed capital incl. participation capital and cooperative capital shares, pursuant to IFRIC 2 eligible as equity.
J:\Verbundabschluss\IAS\2015\122015\KapKons\VERB_Eigenkapital_122015_ok.xlsxVERB_Eigenkapital_122015_ok.xlsx 06/07/2016
ANNUAL REPORT 2015 / CONSOLIDATED FINANCIAL STATEMENTS
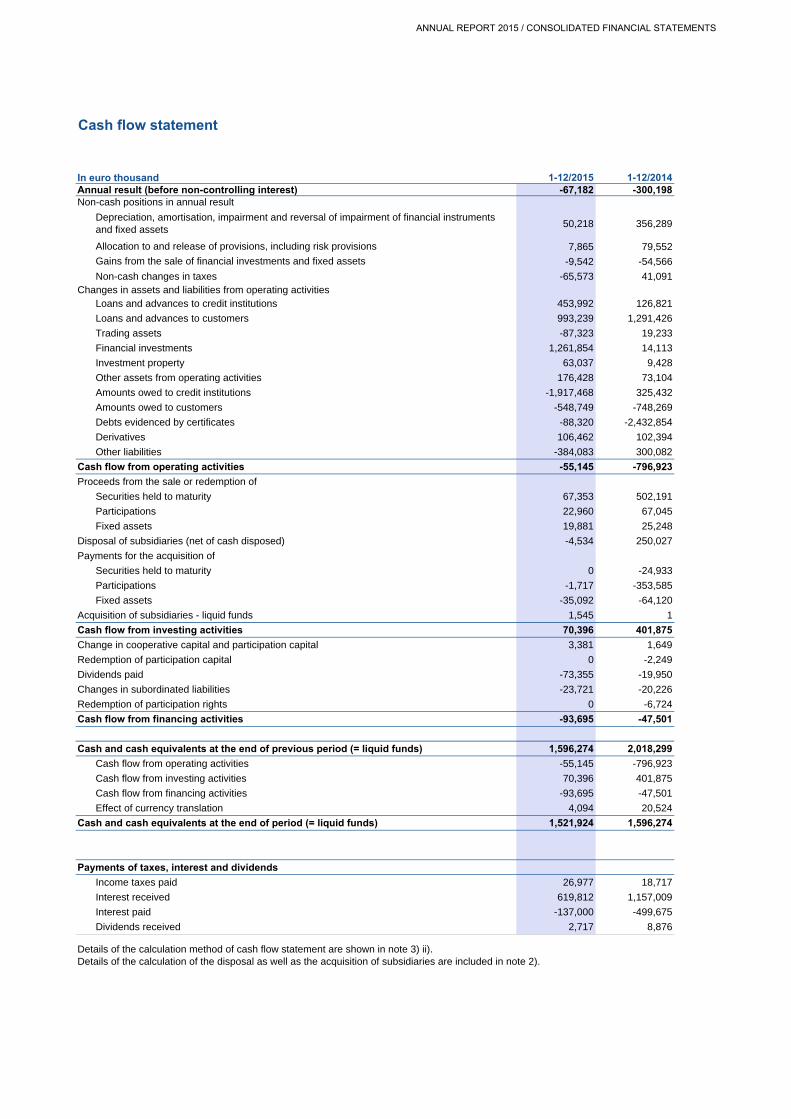
Cash flow statement
In euro thousand 1-12/2015 1-12/2014Annual result (before non-controlling interest) -67,182 -300,198
50,218 356,289
7,865 79,552
-9,542 -54,566
Non-cash changes in taxes -65,573 41,091
Loans and advances to credit institutions 453,992 126,821
Loans and advances to customers 993,239 1,291,426
Trading assets -87,323 19,233
Financial investments 1,261,854 14,113
Investment property 63,037 9,428
Other assets from operating activities 176,428 73,104
Amounts owed to credit institutions -1,917,468 325,432
Amounts owed to customers -548,749 -748,269
Debts evidenced by certificates -88,320 -2,432,854
Derivatives 106,462 102,394
Other liabilities -384,083 300,082
Cash flow from operating activities -55,145 -796,923
Proceeds from the sale or redemption of
Securities held to maturity 67,353 502,191
Participations 22,960 67,045
Fixed assets 19,881 25,248
Disposal of subsidiaries (net of cash disposed) -4,534 250,027
Payments for the acquisition of
Securities held to maturity 0 -24,933
Participations -1,717 -353,585
Fixed assets -35,092 -64,120
Acquisition of subsidiaries - liquid funds 1,545 1
Cash flow from investing activities 70,396 401,875
Change in cooperative capital and participation capital 3,381 1,649
Redemption of participation capital 0 -2,249
Dividends paid -73,355 -19,950
Changes in subordinated liabilities -23,721 -20,226
Redemption of participation rights 0 -6,724
Cash flow from financing activities -93,695 -47,501
Cash and cash equivalents at the end of previous period (= liquid funds) 1,596,274 2,018,299
Cash flow from operating activities -55,145 -796,923
Cash flow from investing activities 70,396 401,875
Cash flow from financing activities -93,695 -47,501
Effect of currency translation 4,094 20,524
Cash and cash equivalents at the end of period (= liquid funds) 1,521,924 1,596,274
Payments of taxes, interest and dividends
Income taxes paid 26,977 18,717
Interest received 619,812 1,157,009
Interest paid -137,000 -499,675
Dividends received 2,717 8,876
Details of the calculation method of cash flow statement are shown in note 3) ii).Details of the calculation of the disposal as well as the acquisition of subsidiaries are included in note 2).
Non-cash positions in annual result
Depreciation, amortisation, impairment and reversal of impairment of financial instruments and fixed assets
Allocation to and release of provisions, including risk provisions
Gains from the sale of financial investments and fixed assets
Changes in assets and liabilities from operating activities
ANNUAL REPORT 2015 / CONSOLIDATED FINANCIAL STATEMENTS
22 ANNUAL REPORT 2015 / NOTES
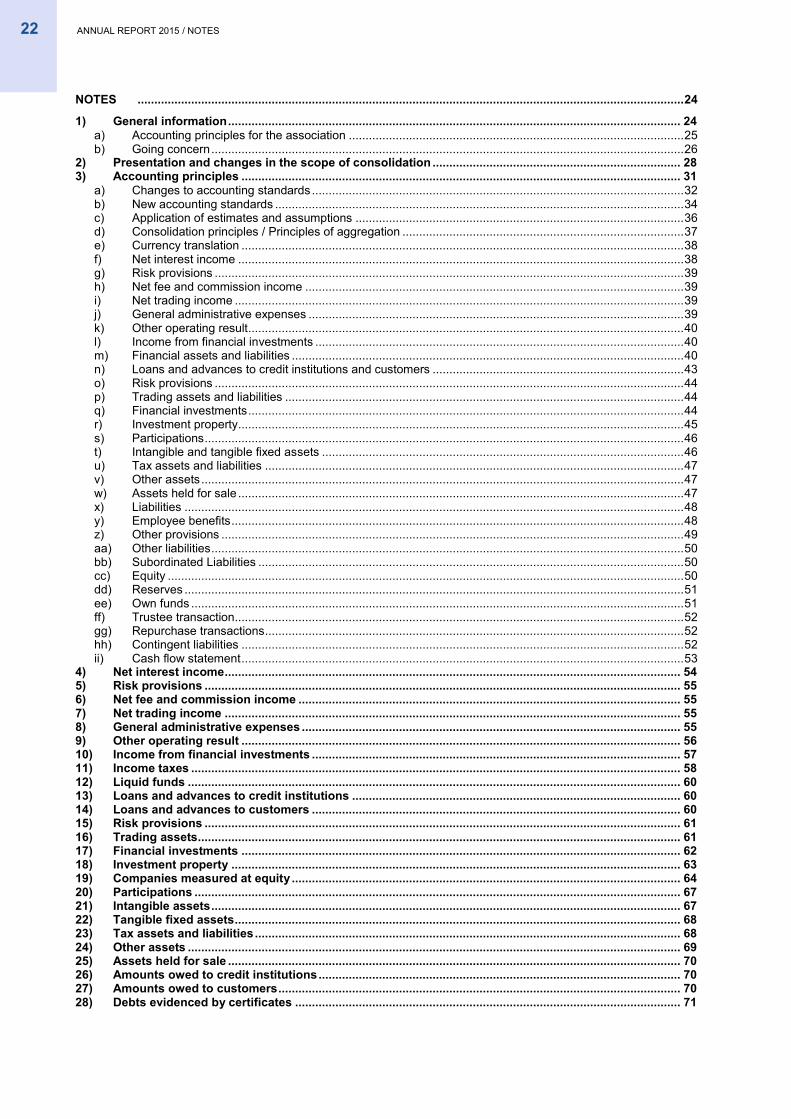
NOTES ................................................................................................................................................................... 24
1) General information ....................................................................................................................................... 24 a) Accounting principles for the association .................................................................................................... 25 b) Going concern ............................................................................................................................................. 26
2) Presentation and changes in the scope of consolidation .......................................................................... 28 3) Accounting principles ................................................................................................................................... 31
a) Changes to accounting standards ............................................................................................................... 32 b) New accounting standards .......................................................................................................................... 34 c) Application of estimates and assumptions .................................................................................................. 36 d) Consolidation principles / Principles of aggregation .................................................................................... 37 e) Currency translation .................................................................................................................................... 38 f) Net interest income ..................................................................................................................................... 38 g) Risk provisions ............................................................................................................................................ 39 h) Net fee and commission income ................................................................................................................. 39 i) Net trading income ...................................................................................................................................... 39 j) General administrative expenses ................................................................................................................ 39 k) Other operating result .................................................................................................................................. 40 l) Income from financial investments .............................................................................................................. 40 m) Financial assets and liabilities ..................................................................................................................... 40 n) Loans and advances to credit institutions and customers ........................................................................... 43 o) Risk provisions ............................................................................................................................................ 44 p) Trading assets and liabilities ....................................................................................................................... 44 q) Financial investments .................................................................................................................................. 44 r) Investment property ..................................................................................................................................... 45 s) Participations ............................................................................................................................................... 46 t) Intangible and tangible fixed assets ............................................................................................................ 46 u) Tax assets and liabilities ............................................................................................................................. 47 v) Other assets ................................................................................................................................................ 47 w) Assets held for sale ..................................................................................................................................... 47 x) Liabilities ..................................................................................................................................................... 48 y) Employee benefits ....................................................................................................................................... 48 z) Other provisions .......................................................................................................................................... 49 aa) Other liabilities ............................................................................................................................................. 50 bb) Subordinated Liabilities ............................................................................................................................... 50 cc) Equity .......................................................................................................................................................... 50 dd) Reserves ..................................................................................................................................................... 51 ee) Own funds ................................................................................................................................................... 51 ff) Trustee transaction ...................................................................................................................................... 52 gg) Repurchase transactions ............................................................................................................................. 52 hh) Contingent liabilities .................................................................................................................................... 52 ii) Cash flow statement .................................................................................................................................... 53
4) Net interest income ........................................................................................................................................ 54 5) Risk provisions .............................................................................................................................................. 55 6) Net fee and commission income .................................................................................................................. 55 7) Net trading income ........................................................................................................................................ 55 8) General administrative expenses ................................................................................................................. 55 9) Other operating result ................................................................................................................................... 56 10) Income from financial investments .............................................................................................................. 57 11) Income taxes .................................................................................................................................................. 58 12) Liquid funds ................................................................................................................................................... 60 13) Loans and advances to credit institutions .................................................................................................. 60 14) Loans and advances to customers .............................................................................................................. 60 15) Risk provisions .............................................................................................................................................. 61 16) Trading assets ................................................................................................................................................ 61 17) Financial investments ................................................................................................................................... 62 18) Investment property ...................................................................................................................................... 63 19) Companies measured at equity .................................................................................................................... 64 20) Participations ................................................................................................................................................. 67 21) Intangible assets ............................................................................................................................................ 67 22) Tangible fixed assets ..................................................................................................................................... 68 23) Tax assets and liabilities ............................................................................................................................... 68 24) Other assets ................................................................................................................................................... 69 25) Assets held for sale ....................................................................................................................................... 70 26) Amounts owed to credit institutions ............................................................................................................ 70 27) Amounts owed to customers ........................................................................................................................ 70 28) Debts evidenced by certificates ................................................................................................................... 71
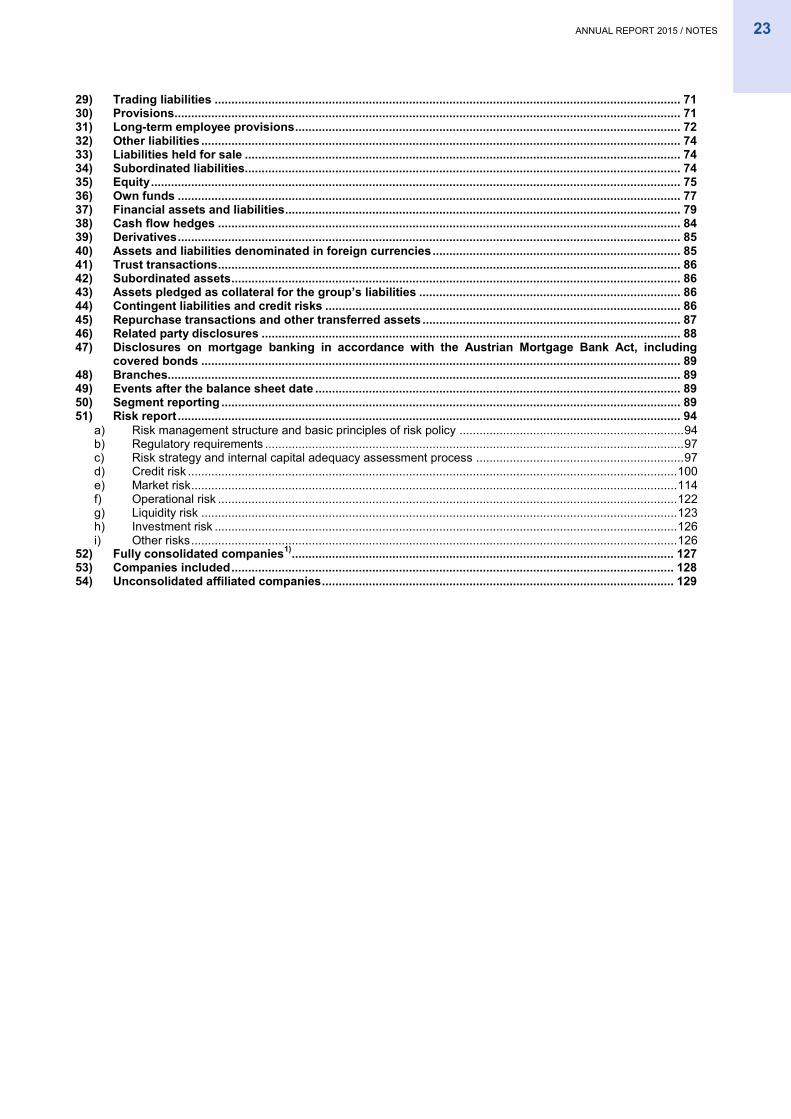
ANNUAL REPORT 2015 / NOTES 23
29) Trading liabilities ........................................................................................................................................... 71 30) Provisions ....................................................................................................................................................... 71 31) Long-term employee provisions ................................................................................................................... 72 32) Other liabilities ............................................................................................................................................... 74 33) Liabilities held for sale .................................................................................................................................. 74 34) Subordinated liabilities.................................................................................................................................. 74 35) Equity .............................................................................................................................................................. 75 36) Own funds ...................................................................................................................................................... 77 37) Financial assets and liabilities ...................................................................................................................... 79 38) Cash flow hedges .......................................................................................................................................... 84 39) Derivatives ...................................................................................................................................................... 85 40) Assets and liabilities denominated in foreign currencies .......................................................................... 85 41) Trust transactions .......................................................................................................................................... 86 42) Subordinated assets ...................................................................................................................................... 86 43) Assets pledged as collateral for the group’s liabilities .............................................................................. 86 44) Contingent liabilities and credit risks .......................................................................................................... 86 45) Repurchase transactions and other transferred assets ............................................................................. 87 46) Related party disclosures ............................................................................................................................. 88 47) Disclosures on mortgage banking in accordance with the Austrian Mortgage Bank Act, including
covered bonds ............................................................................................................................................... 89 48) Branches......................................................................................................................................................... 89 49) Events after the balance sheet date ............................................................................................................. 89 50) Segment reporting ......................................................................................................................................... 89 51) Risk report ...................................................................................................................................................... 94
a) Risk management structure and basic principles of risk policy ................................................................... 94 b) Regulatory requirements ............................................................................................................................. 97 c) Risk strategy and internal capital adequacy assessment process .............................................................. 97 d) Credit risk .................................................................................................................................................. 100 e) Market risk ................................................................................................................................................. 114 f) Operational risk ......................................................................................................................................... 122 g) Liquidity risk .............................................................................................................................................. 123 h) Investment risk .......................................................................................................................................... 126 i) Other risks ................................................................................................................................................. 126
52) Fully consolidated companies1) .................................................................................................................. 127 53) Companies included .................................................................................................................................... 128 54) Unconsolidated affiliated companies ......................................................................................................... 129
24 ANNUAL REPORT 2015 / NOTES
NOTES
1) General information VOLKSBANK WIEN AG (VBW), which has its registered office at Schottengasse 10, 1010 Vienna, Austria, is the central
organisation (CO) of the Austrian Volksbank sector. Until 4 July 2015, Österreichische Volksbanken-Aktiengesellschaft
(VBAG) was the CO of the Austrian Association of Volksbanks. The Annual General Meeting of VBAG held on
28 May 2015 passed a resolution providing for the separation by way of demerger of the VBAG business unit responsible
for central organisation and central institution functions, as the transferor company, and its transfer to VBW as the trans-
feree company. In its decision issued on 2 July 2015, the Austrian Financial Market Authority authorised the company to
operate as a wind-down entity in accordance with section 162 of the Federal Act on the Recovery and Resolution of
Banks (Bundesgesetz über die Sanierung und Abwicklung von Banken – BaSAG), subject to entry of the demerger in the
Commercial Register. VBAG waived its right to appeal in a written statement dated 3 July 2015. The demerger thus took
legal effect upon its entry in the Commercial Register on 4 July 2015. On that date, the CO function was transferred to
VBW, and VBAG ceased to be part of the Association of Volksbanks. VBAG was renamed immigon portfolioabbau ag
(immigon) and is now a wind-down entity in accordance with section 162 BaSAG.
VBW has concluded a banking association agreement with the primary banks (Volksbanks, VB) in accordance with sec-
tion 30a of the Austrian Banking Act. The purpose of this banking association agreement is to create a joint liability
scheme between the primary sector institutions and to monitor and ensure compliance with the standards of the Austrian
Banking Act at association level. Section 30a (10) of the Austrian Banking Act requires an association's central organisa-
tion to have the right to issue instructions to the member credit institutions.
Under section 30a (7) of the Austrian Banking Act (Bankwesengesetz – BWG), the CO is required to prepare consoli-
dated financial statements pursuant to sections 59 and 59a BWG for the Association of Volksbanks. The association's
financial statements are prepared according to IFRS rules. For full consolidation purposes, section 30a (8) BWG speci-
fies that the CO is to be regarded as a higher-level institution, while each associated institution and, under certain condi-
tions, each transferring legal entity, is to be treated as a subordinate institution.
In accordance with IFRS, a full consolidation only can take place if a company has full authority over decisions of the
associated company, in other words, it has the ability to influence returns on equity by its power of disposition
(IFRS 10.6). The association’s central organisation has the right to issue instructions, but doesn’t receive returns from
the member credit institutions; therefore the association’s central organisation has no control as defined by IFRS 10. The
lack of an ultimate controlling parent company means that despite the central organisation's extensive powers to issue
instructions, the consolidated accounts can only be drawn up by treating the Association of Volksbanks as a group of
companies which are legally separate entities under unified control without a parent company. It was therefore necessary
to define a set of rules for preparing the association's financial statements.
The accounts have been prepared on the assumption that it will remain a going concern. The Association of Volksbanks
consolidated financial statements are reported in euros, as this is the association’s functional currency. All figures are
indicated in thousand of euro unless specified otherwise. The following tables may contain rounding differences. Any role
discriptions in this annual report that are used only in the masculine form apply analogously to the feminine form.
The present consolidated financial statements were signed by the Managing Board of VBW on 15 June 2016 and then
subsequently submitted to the Supervisory Board for notice.
ANNUAL REPORT 2015 / NOTES 25
a) Accounting principles for the association The financial statements for the association are prepared in accordance with all the latest valid versions of the IFRS/IAS
as at the reporting date, as published by the International Accounting Standards Board (IASB). The financial statements
also comply with all interpretations (IFRIC/SIC) of the International Financial Reporting Interpretation Committee and
Standing Interpretations Committee, provided these have also been adopted by the European Union in its endorsement
process.
The following exceptions to the application of individual IFRS apply to the 2015 association financial statements:
Exceptions affecting the overall scope of consolidation
IFRS 3 Business Combinations: Given the CO's lack of control within the meaning of IFRS 10, the equity components of
the CO, the associated credit institutions and the higher-level holding companies are combined. When aggregating the
included companies' investments in Volksbanks and VBW, the aggregated carrying amounts of the investments are
deducted from the aggregated equity components. Aggregation as a group of companies which are legally separate
entities, but under unified control without a parent company means that the capital consolidation does not result in any
minority interests. The general principles of IFRS/IAS are applied to the consolidation of companies subject to control by
another company included in the financial statements.
IFRS 8 Operating Segments: IFRS 8 is not applied. The reporting structure implemented for the association is described
in the Notes in the section on segment reporting.
IAS 1 Presentation of Financial Statements – Comparative information: No comparative figures are provided for items in
the Notes that were not included in the previous year.
IAS 39 AG 33 Financial instruments: Embedded derivatives are not reported separately in the case of credit and loan
agreements which already have an intrinsic value at the time of concluding the underlying transaction. This has been the
case since the 2015 business year, as banks have embedded a zero percent floor at negative interest rates.
IAS 24 Related Party Disclosure: As this standard is also based on the concept of control, the following shall apply here:
The key management personnel are:
1. Members of the VBW Supervisory Board
2. Members of the VBW Managing Board
3. The Managing Board members and managing directors of the individual Volksbanks
Information on significant agreements, outstanding loans, liabilities assumed, compensation to board members and ex-
penditure for severance payments and pensions in relation to these key management personnel is contained in the
Notes. If a member of the key management personnel occupies several board positions, he/she is recorded only once
and at the highest applicable level of the hierarchy listed above.
Balances and transactions with companies that are controlled by one of the companies included in the financial state-
ments, but not included in the statements themselves, are also reported.
The Republic of Austria exercises significant influence over the CO. Only limited information on related parties is pro-
vided for securities issued by the Republic of Austria that are held by companies included in the statements.
26 ANNUAL REPORT 2015 / NOTES
IAS 40 Investment property: Information about sensitivities of properties measured at fair value is not shown due to lack
of data.
IFRS 7 Financial Instruments Disclosure:
Due to a lack of data, the following IFRS 7 disclosures are not provided:
Undiscounted maturity analyses in accordance with IFRS 7.39a and 7.39b
Exceptions affecting the member institutions
IAS 18 Revenue: Commission payments for the award of loans are not recorded by the member institutions over the
term of the loan in accordance with IAS 18 using the effective interest method, but instead immediately recognised as
revenues when the commission payable is specified.
Accounting principles in the comparative period
Due to a lack of data, the following IFRS 7 disclosures were not provided in the previous year:
Quantitative disclosures in relation to credit risks
Quantitative disclosures in relation to market risks
Undiscounted maturity analyses in accordance with IFRS 7.39a and 7.39b
IAS 24 Related Party Disclosure: In the comparative period the key management personnel were:
1. Members of the Council of Delegates
2. Members of the VBAG Supervisory Board
3. Members of the VBAG Managing Board
4. Members of the VB Holding eGen Managing Board
5. The Managing Board members and managing directors of the individual Volksbanks
Concerning IAS 40 Investment property Information about sensitivities of properties measured at fair value is not shown
due to lack of data.
b) Going concern The primary banks of the Austrian Volksbank sector created a banking association pursuant to section 30a BWG in 2012
with the conclusion of the 2012 banking association agreement, to better meet both the economic challenges of a chang-
ing market environment and increasing regulatory requirements.
The primary banks of the Austrian Volksbank sector adopted a resolution in autumn 2014 to strategically restructure the
Association of Volksbanks, in order to ensure a sustainable Association of Volksbanks retaining its core competency as a
regionally rooted financial services provider.
The core element of the restructuring was, firstly, the splitting up of Österreichische Volksbanken-Aktiengesellschaft
(VBAG) into a wind-down entity and the transfer of its central organisation duties to VBW, as well as the conclusion of
the 2014 banking association agreement. The CO function was assumed when the demerger was entered in the Com-
mercial Register on 4 July 2015.
ANNUAL REPORT 2015 / NOTES 27
A further core element of the restructuring is the binding creation of a target structure made up of eight regional banks
and two specialist banks, to be implemented mainly through mergers of primary banks by 31 December 2017. This struc-
ture is intended to enable the Association of Volksbanks to operate on capital markets over the medium term.
The third core element is the contractual leveraging of maximum potential synergies within the Association of
Volksbanks. In particular, previously identified functions within the Association of Volksbanks will now only be performed
at a single point for the whole association (and no longer decentrally). Structures and processes within the Association of
Volksbanks are also to be simplified. The overall aim is to create sustainable, high-performance regional Volksbanks
across the association, to ensure greater success regionally and greater efficiency within the Association of Volksbanks.
The members of the Association of Volksbanks have joint, unlimited liability and have contractually agreed to bear the
costs and risks of the CO on a pro rata basis. The ECB approved the Association of Volksbanks as a banking associa-
tion pursuant to section 30a BWG with VBW as the CO. The approval was resolved on 2 July 2015 and is valid up to
30 June 2016. As yet, therefore, no new SREP ratio has been stipulated for the newly approved Association of
Volksbanks. The general meeting of Volksbank Marchfeld e.Gen. did not approve the new banking association agree-
ments or the merger with VBW. It was therefore decided, in accordance with the existing banking association agree-
ments, to exclude Volksbank Marchfeld e.Gen. from the Association of Volksbanks with effect from 24 May 2016. Follow-
ing the changes and internal approval of the agreements in line with supervisory requirements, the CO's management
took the view that the criteria for further ECB approval of the Association of Volksbanks were met.
Numerous other mergers are taking place within the Association of Volksbanks during 2016, in order to realise the envis-
aged 8+2 structure. Seven mergers are planned for the first half-year and ten for the second.
VBW as the central organisation in accordance with section 30a BWG is part of the banking association (joint liability and
liquidity association). The Association of Volksbanks is required to comply with the regulatory provisions of Parts Two to
Eight of Regulation (EU) No 575/2013 and section 39a BWG, on the basis of the consolidated financial position (section
30a (7) BWG). VBW must continue to comply with all applicable regulatory provisions on a single-entity basis and at
group level.
Fitch downgraded its rating for the Association of Volksbanks in mid-May 2015. Alongside other Austrian banks, the
rating for the Association of Volksbanks was also subject to a review looking at government support. The rating was
subsequently downgraded from A to BB-. The downgrade has no significant negative impact on the association's liquidity
situation.
The Association of Volksbanks was subject to another rating by Fitch at the end of August 2015, because of the depar-
ture of VBAG from the Association of Volksbanks and the restructuring of the association. The rating was upgraded from
BB- to BB+ with a positive outlook.
The 2015 restructuring agreement between the Republic of Austria and VBW – supplemented by an implementation
agreement between VBW, the Volksbanks and other shareholders in VBW – includes, amongst others, provisions for a
participation rights issue ("Austrian government's participation right") by VB Rückzahlungsgesellschaft mbH (VB RZG),
which is a direct subsidiary of VBW. The participation rights were issued to fulfil the commitments made to the Austrian
government in order to obtain approval for the restructuring from the European Commission under state aid law.
Dividends paid by VB RZG in respect of the Austrian government's participation rights are at the discretion of VBW as
the sole shareholder of VB RZG. The Austrian government has no claim to a share of profits under the participation right.
The shareholders of VBW granted shares in VBW to the Austrian government without consideration (25 % of the share
28 ANNUAL REPORT 2015 / NOTES
capital plus one share). The shares were transferred to the Austrian government on 28 January 2016. The Austrian gov-
ernment is obliged to return these shares back to the relevant shareholders without consideration as soon as the total of
the payments received by the Austrian government for participation rights and other specified eligible payments reach a
certain amount. If the dividends received by the Austrian government in respect of its participation rights and further
specified eligible payments (such as any dividends paid with respect to shares held by the Austrian government in VBW)
do not reach the minimum thresholds set out by certain contractually stipulated reference dates (a “control event”), the
government is entitled to full rights to the shares without further consideration and to claim further ordinary shares in
VBW from the shareholders of VBW up to 8 % of the share capital of VBW without further consideration. In such a case,
therefore, up to 33 % plus one share of the shares in VBW may become (legal and economic) property of the Austrian
government, and the government may obtain full rights to this shareholding (excepting the pre-emption right granted). In
the case that the pre-emption right granted by the Austrian government is exercised by a buyer designated by VBW and
the minimum threshold for the total payments in respect of participation rights and other eligible payments is not met, the
shareholders of VBW have committed to transfer further ordinary shares in VBW to the Austrian government as soon as
the government gains full rights to the shares and covering the amount of shares previously transferred to the govern-
ment and the shares acquired by the buyer designated by VBW.
In line with its contractual obligations towards the Austrian government, every year VBW must submit a proposal to the
Volksbanks by 30 November for the total payments to be made by VB RZG in respect of the government's participation
right and the necessary contributions to be made by the primary banks towards the total amount (with VBW’s contribu-
tions being paid directly to VB RZG and the Volksbanks’ contributions being paid indirectly through VBW). The cost
borne by VBW is based on the share of its retail segment in the Association of Volksbanks (total assets according to
UGB/BWG).
2) Presentation and changes in the scope of consolidation From the 2015 business year onwards, the scope of consolidation is determined according to supervisory regulations
pursuant to section 30a (8) BWG in conjunction with Art. 18 (3) CRR. The following entities are therefore included in the
Association's financial statements:
Credit institutions that have signed the banking association agreement; these are VBW and the associated
banks
Transferring entities as defined in section 92 (9) BWG under the conditions defined in section 30a (8) BWG
Subordinate credit institutions, financial institutions, providers of ancillary services and asset management
companies
Higher-level financial holding companies and mixed financial holding companies.
Additions to the scope of consolidation
Eleven subordinate companies were included in the association's financial statements for the first time as a result of this
change. The main asset additions were: loans and advances to customers in the amount of euro 79 million, investment
property assets in the amount of euro 39 million and real estate properties for own use in the amount of euro 14 million.
These assets are partially refinanced by the association or through equity. Earnings from previous years are recognised
directly in equity. Six holding companies were also included for the first time. Their principal assets are investments in
fully consolidated companies, which were eliminated in the course of capital consolidation.
The savings and credit cooperatives in liquidation "Spar- und Vorschuss-Verein der Beamtenschaft der Oesterreichi-
schen Nationalbank registrierte Genossenschaft mit beschränkter Haftung in Liqu." and "Spar- und Vorschussverein
"Graphik" registrierte Genossenschaft mit beschränkter Haftung in Liqu." were also included for the first time. These
companies had previously been omitted from the scope of consolidation for lack of materiality. The process of liquidating
ANNUAL REPORT 2015 / NOTES 29
both companies was initiated in December 2015. Loans and advances to customers in the amount of euro 27 million
were sold to the National Bank of Austria (OeNB) with effect from January 2016, and are therefore recognised in the
association's 2015 financial statements under the heading 'Assets held for sale'. These assets are refinanced by third
parties in the amount of euro 27 million. Until liquidation is completed, both companies' equity will continue to be recog-
nised in the association's equity, with euro 207 thousand in shares, euro 436 thousand in subscribed capital and
euro 5,761 thousand in retained earnings.
Additions from holding companies and associated institutions are recognised directly in equity under changes in the
scope of consolidation.
The company VB Rückzahlungsgesellschaft mbH was founded in June 2015. It issued a participation right (Genussrecht)
to the Republic of Austria in fulfilment of commitments made to the Austrian government in order to obtain approval for
restructuring from the European Commission under state aid law. Further information can be found in section 1) b) Going
concern.
A subsidiary not previously included in the association's financial statements was merged with Volksbank Tirol Inns-
bruck-Schwaz AG in the 2015 business year. This resulted in the addition of real estate properties for own use in the
amount of euro 6 million. Earnings from previous years of euro 3 million are recognised directly in equity.
The process of merging Volksbanks to form eight regional banks and two specialist institutions continued in the 2015
business year. These mergers had no impact on the association's financial statements.
Removals from the scope of consolidation
Following approval of the demerger of VBAG and of the new banking association agreement, the remainder of VBAG
with its subsidiaries (remainder of VBAG), the company Volksbanken Holding eGen and its subsidiary VB Regio Invest
AG ceased to belong to the association. Furthermore, Volksbank Almtal e. Gen., DolomitenBank Osttirol-Westkärnten
eG and Volksbank Gmünd eingetragene Genossenschaft did not sign the new banking association agreement, and thus
also left the association with effect from 4 July 2015. Since these companies are associated institutions and no control
relationship exists in the association, no gain on disposal is recognised in the income statement. The disposal of equity is
recognised under changes in the scope of consolidation with no effect on profit or loss.
The remainder of VBAG represents a discontinued operation under IFRS 5. The result up to 4 July 2015 has therefore
been reclassified from individual income statement items to the result from discontinued operation. VBAG's non-core
segments were used to reclassify the previous year's figures in the income statement.
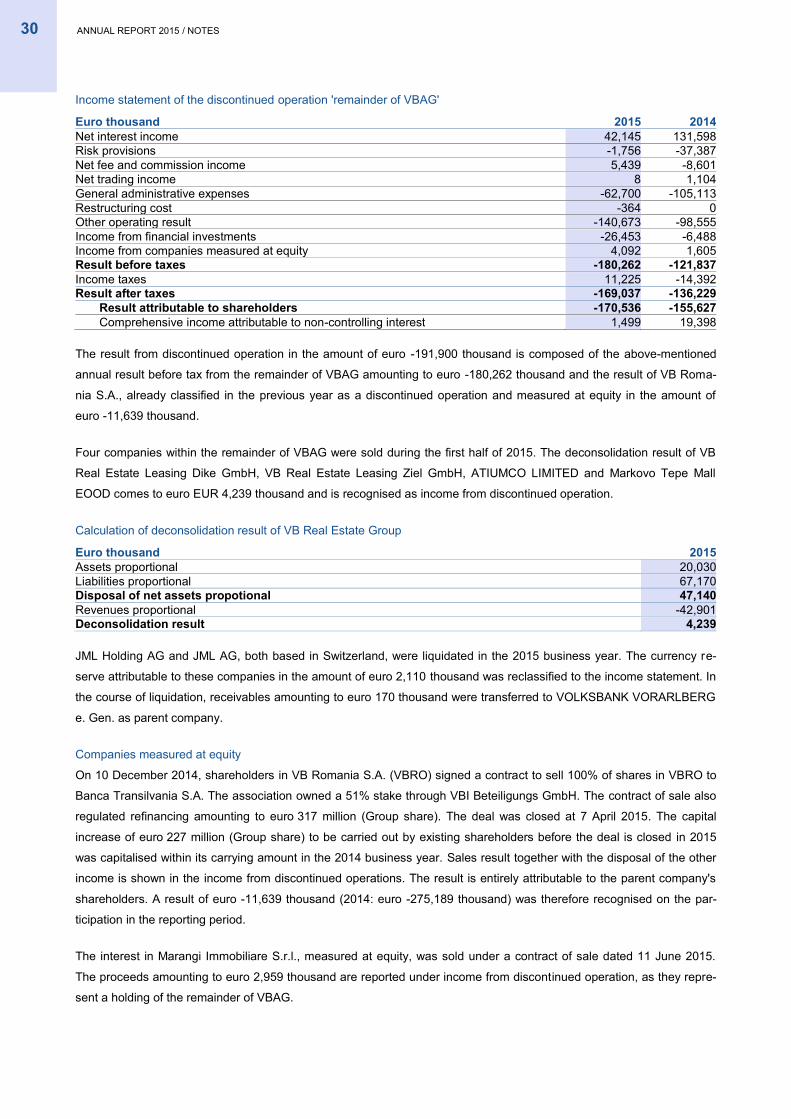
30 ANNUAL REPORT 2015 / NOTES
Income statement of the discontinued operation 'remainder of VBAG'
Euro thousand 2015 2014 Net interest income 42,145 131,598 Risk provisions -1,756 -37,387 Net fee and commission income 5,439 -8,601 Net trading income 8 1,104 General administrative expenses -62,700 -105,113 Restructuring cost -364 0 Other operating result -140,673 -98,555 Income from financial investments -26,453 -6,488 Income from companies measured at equity 4,092 1,605 Result before taxes -180,262 -121,837 Income taxes 11,225 -14,392 Result after taxes -169,037 -136,229
Result attributable to shareholders -170,536 -155,627 Comprehensive income attributable to non-controlling interest 1,499 19,398
The result from discontinued operation in the amount of euro -191,900 thousand is composed of the above-mentioned
annual result before tax from the remainder of VBAG amounting to euro -180,262 thousand and the result of VB Roma-
nia S.A., already classified in the previous year as a discontinued operation and measured at equity in the amount of
euro -11,639 thousand.
Four companies within the remainder of VBAG were sold during the first half of 2015. The deconsolidation result of VB
Real Estate Leasing Dike GmbH, VB Real Estate Leasing Ziel GmbH, ATIUMCO LIMITED and Markovo Tepe Mall
EOOD comes to euro EUR 4,239 thousand and is recognised as income from discontinued operation.
Calculation of deconsolidation result of VB Real Estate Group
Euro thousand 2015 Assets proportional 20,030 Liabilities proportional 67,170 Disposal of net assets propotional 47,140 Revenues proportional -42,901 Deconsolidation result 4,239
JML Holding AG and JML AG, both based in Switzerland, were liquidated in the 2015 business year. The currency re-
serve attributable to these companies in the amount of euro 2,110 thousand was reclassified to the income statement. In
the course of liquidation, receivables amounting to euro 170 thousand were transferred to VOLKSBANK VORARLBERG
e. Gen. as parent company.
Companies measured at equity
On 10 December 2014, shareholders in VB Romania S.A. (VBRO) signed a contract to sell 100% of shares in VBRO to
Banca Transilvania S.A. The association owned a 51% stake through VBI Beteiligungs GmbH. The contract of sale also
regulated refinancing amounting to euro 317 million (Group share). The deal was closed at 7 April 2015. The capital
increase of euro 227 million (Group share) to be carried out by existing shareholders before the deal is closed in 2015
was capitalised within its carrying amount in the 2014 business year. Sales result together with the disposal of the other
income is shown in the income from discontinued operations. The result is entirely attributable to the parent company's
shareholders. A result of euro -11,639 thousand (2014: euro -275,189 thousand) was therefore recognised on the par-
ticipation in the reporting period.
The interest in Marangi Immobiliare S.r.l., measured at equity, was sold under a contract of sale dated 11 June 2015.
The proceeds amounting to euro 2,959 thousand are reported under income from discontinued operation, as they repre-
sent a holding of the remainder of VBAG.

ANNUAL REPORT 2015 / NOTES 31
Number of consolidated companies
31 Dec 2015
31 Dec 2014
Domestic Foreign Total Domestic Foreign Total Fully consolidated companies
Credit institutions 37 2 39 52 2 54 Financial institutions 6 0 6 20 14 34 Other enterprises 30 0 30 37 39 76 Total 73 2 75 109 55 164
Companies measured at equity Credit institutions 0 0 0 1 1 2
Other enterprises 0 0 0 3 2 5 Total 0 0 0 4 3 7
Number of unconsolidated companies
31 Dec 2015 31 Dec 2014
Domestic Foreign Total Domestic Foreign Total
Affiliates 56 1 57 67 25 92 Associated companies 19 1 20 24 11 35 Companies total 75 2 77 91 36 127
The unconsolidated companies in their entirety were deemed immaterial to the presentation of a true and fair view of the
net assets, liabilities, financial position and profit or loss of the association. Beside quantitative criteria like total assets
and result after taxes also the effect of consolidation on specific positions as well as on the true and fair view of the con-
solidated financial statements for the association is taking into account for the assessment of materiality. The calculation
of the quantitative characteristics was based on the latest available financial statements of the companies and the asso-
ciation’s consolidated financial statements for 2015.
The list of companies included in the association’s consolidated financial statements, as well as the unconsolidated com-
panies including detailed information, is shown at the end of the notes (see note 52), 53), 54)).
3) Accounting principles The accounting principles described below and in note 1) have been consistently applied to all reporting periods covered
by these financial statements and have been followed by all association members without exception.
The consolidated financial statements for the association have been prepared on the basis of costs excluding the follow-
ing items:
- Derivative financial instruments – measured at fair value
- Financial instruments in the category at fair value through profit or loss and available for sale – measured at fair
value
- Investment property assets – measured at fair value
- Financial assets and liabilities which constitute underlying instruments for fair value hedges – amortised costs
are adjusted for changes in fair value, which are to be allocated to hedged risks
- Employee benefit provisions – recognised at net present value less the net present value of plan assets
The two following chapters present altered and new accounting standards that are of significance to the consolidated
financial statements for the association.
32 ANNUAL REPORT 2015 / NOTES
a) Changes to accounting standards Changes to accounting rules adopted by the EU
Amendments have been made to four standards as part of the annual improvement project. Changes to the wording of
individual IFRSs are designed to clarify the existing rules. The changes concern IFRS 1, IFRS 3, IFRS 13 and IAS 40.
These amendments were adopted by the EU on 18 December 2014 with publication in the Official Journal of the Euro-
pean Union. They are applicable to financial years beginning on or after 1 January 2015.
IFRS 1 – First-time Adoption of International Financial Reporting Standards: An amendment to the basis for conclusions
clarifies the significance of the date of effectiveness in connection with IFRS 1. If, at the time when an entity first adopts
IFRSs, two published versions of an IFRS exist – i.e. an existing IFRS and a new or revised IFRS that is not yet manda-
tory but is eligible for voluntary early application – the entity shall be free to choose which version it applies. However, the
chosen standard version must then be applied to all periods covered by those first IFRS financial statements, except
where IFRS 1 provides otherwise. The standard will not be applied early. This amendment does not have any significant
impact.
IFRS 3 – Business Combinations: The amendments reword the existing exception of joint ventures from the scope of
IFRS 3. This clarifies that the exception applies to all joint arrangements within the meaning of IFRS 11. It is also clarified
that the exception only applies to the financial statements of the joint arrangement or joint activity itself, not to the ac-
counting of the parties involved in the joint activity. The amendment is to be applied prospectively; the standard will not
be applied early. This amendment does not have any significant impact.
IFRS 13 – Fair Value Measurement: IFRS 13.48 permits an entity managing a group of financial assets and financial
liabilities on the basis of its net exposure to market risk or default risk to calculate the fair value of this group in accor-
dance with the net risk exposure as measured by market participants as at the reporting date (“portfolio exception”). The
proposed change clarifies that this exception for determining fair value applies to all contracts accounted for within the
scope of IAS 39 or IFRS 9, regardless of whether they meet the definition of financial assets or financial liabilities in
IAS 32 (e.g. certain contracts for purchase or sale of non-financial items that can be settled in cash or other financial
instruments). The change applies prospectively from the beginning of the financial year in which IFRS 13 was first ap-
plied; the standard will not be applied early. This amendment does not have any significant impact.
IAS 40 – Investment Property: The amendment clarifies that IAS 40 and IFRS 3 are to be applied independently of each
other, i.e. that they are never mutually exclusive. All acquisitions of investment property must therefore be examined on
the basis of IFRS 3 criteria to establish whether the acquisition of a single asset, group of assets or business falls within
the scope of IFRS 3. The criteria set out in IAS 40.7ff. must also be applied to establish whether property is investment
property or owner-occupied property. The change applies prospectively for all acquisitions of investment property from
the period when the amendment is first applied onward. No adjustment of previous years’ figures is required. The change
may be applied individually to previous acquisitions on a voluntary basis provided the necessary information is available;
the standard will not be applied early. This amendment does not have any significant impact.
Changes to accounting rules not yet adopted by the EU
Amendments to IFRS 10 – Consolidated Financial Statements and IAS 28 – Investments in Associates and Joint Ven-
tures by the IASB: The IASB has amended the rules for the sale or contribution of assets between an investor and its
associate or joint venture. The amendments were originally to be applied from 1 January 2016. The IASB has postponed
the deadline for initial application indefinitely. However, the option for early application remains. These amendments will
not have any significant impact.
ANNUAL REPORT 2015 / NOTES 33
Amendments to IFRS 10, IFRS 12 and IAS 28 - Investment Entities: The standard serves to clarify issues relating to
application of the consolidation exception under IFRS 10 if the parent company meets the definition of an investment
entity. Companies are also exempted from the consolidation obligation if the higher-level parent company measures its
subsidiaries at fair value in accordance with IFRS 10. If a subsidiary itself meets the definition of an investment entity and
provides services related to the parent company’s investment activities, it is not to be consolidated. When applying the
equity method to an associate or joint venture, an investor that does not meet the definition of an investment entity may
retain the fair value measurement applied by the associate or joint venture to its interests in its subsidiaries. In the
amended standard, the IASB also states that an investment entity measuring all of its subsidiaries at fair value must
provide the disclosures relating to investment entities required by IFRS 12. Subject to adoption by the EU, the amend-
ments will apply for reporting periods beginning on or after 1 January 2016. The standards are not being applied early.
These amendments will not have any significant impact.
Amendments to IFRS 11 – Joint Arrangements: Acquisition of an interest in a joint operation. The amendment clarifies
that the acquisition of initial and additional interests in joint operations that constitute a business as defined in IFRS 3
should be accounted for in accordance with the principles for business combinations accounting in IFRS 3 and other
applicable IFRSs, provided these do not conflict with the provisions of IFRS 11. The new rules are to be applied prospec-
tively for all acquisitions in reporting periods beginning on or after 1 January 2016; the standard is not being applied
early. These amendments will not have any significant impact.
Amendments to IAS 1 – Presentation of Financial Statements: The amendments are intended to give entities greater
discretion to adapt their financial statements to their specific circumstances. They largely consist of clarification that in-
formation only has to be disclosed in the notes if its content is material. This explicitly applies even if an IFRS specifies a
list of minimum disclosures. A model structure for the notes is no longer prescribed. This facilitates more entity-specific
presentation. The amendments clarify that entities are free to decide where to explain accounting and valuation methods
in the notes. The amendments also include explanations of the aggregation and disaggregation of items in the statement
of financial position and statement of comprehensive income as well as clarification that items of other comprehensive
income of companies measured at equity are to be grouped and presented separately based on whether they will subse-
quently be reclassified to profit or loss. The amendments are applicable to financial years beginning on or after
1 January 2016. Earlier application is permitted, but is subject to EU endorsement; the standard is not being applied
early. These amendments will not have any significant impact.
Amendments to IAS 7 – Statement of Cash Flows: The objective of the amendments is to improve information on
changes in the entity's liabilities. Disclosures have to be made on changes in financial liabilities whose cash inflows and
outflows are shown under cash flows from financing activities on the statement of cash flows. The necessary disclosures
can be made in the form of a reconciliation between balance sheet items. The amendments are applicable to business
years beginning on or after 1 January 2017. These amendments will have no significant impact.
Amendments to IAS 12 – Income Taxes: The amendments clarify that unrealised losses related to debt instruments
measured at fair value but reported at amortised cost for tax purposes may lead to a deferred tax asset. The amend-
ments also clarify that the tax value as opposed to the carrying value of an asset is the relevant amount for estimating
future taxable profits and that the carrying value does not constitute an upper limit for the calculation. The effect from the
change in the deferred tax position due to reversal of these temporary differences may not be taken into account in esti-
mating future taxable profits for impairment testing of deferred tax assets. The amendments are applicable to business
years beginning on or after 1 January 2017. These amendments will have no significant impact.
34 ANNUAL REPORT 2015 / NOTES
Amendments to IAS 16 – Property Plant and Equipment and IAS 38 – Intangible Assets: Clarification of acceptable
methods of depreciation and amortisation. The amendment clarifies the choice of methods used for depreciation and
amortisation of property, plant and equipment and intangible assets. In principle, depreciation and amortisation of prop-
erty, plant and equipment and intangible assets must reflect consumption of the expected future economic benefits em-
bodied in the asset. The IASB has now clarified that depreciation of property, plant and equipment based on sales reve-
nues from the goods produced by these assets does not reflect such consumption and is therefore not an appropriate
method. Revenues are determined not only by consumption of the assets concerned, but also by other factors such as
sales volume, price and inflation. This clarification is also adopted in principle by IAS 38 for the amortisation of finite-lived
intangible assets. In this case, however, the IASB has also introduced a rebuttable presumption. This allows for revenue-
based amortisation of finite-lived intangible assets in the following two exceptional cases. Firstly, if the value of the asset
is directly expressed as a measure of revenue, or, secondly, if it can be demonstrated that revenue and the consumption
of economic benefits of the intangible asset are highly correlated. It is explained that the basis for determining an appro-
priate method of amortisation for intangible assets is always to identify the predominant factor limiting use. The IASB has
also indicated that an alternative basis for amortisation should be used if this better illustrates the consumption of the
intangible asset. The standards will not be applied early. These amendments will not have any significant impact.
Amendments to IAS 27 – Separate Financial Statements: Equity method in separate financial statements: The changes
will enable investments in subsidiaries, joint ventures and associates to be measured using the equity method in single-
entity IFRS financial statements in future. This reinstates all previously available options for inclusion of such companies
in the separate financial statements: measurement at (amortised) cost, recognition as financial instruments available for
sale under IAS 39 and IAS 9, and measurement using the equity method. The standard will not be applied early. These
amendments will not have any impacts.
Annual Improvements to IFRSs (2012-2014 cycle)
Amendments have been made to four standards as part of the annual improvement project. Changes to the wording of
individual IFRSs are designed to clarify the existing rules. The amendments concern IFRS 5, IFRS 7, IAS 19 and IAS 34.
The new rules must be applied – either prospectively or retrospectively depending on the amendment concerned – for
reporting periods beginning on or after 1 January 2016; the standards are not being applied early. These amendments
will not have any significant impact.
b) New accounting standards
New accounting standards already endorsed by the European Union
IFRIC 21 – Levies is an interpretation of IAS 37 – Provisions, Contingent Liabilities and Contingent Assets: It primarily
clarifies when a present obligation to pay levies imposed by governments arises and when a provision or liability should
be recognised. The interpretation does not cover fines or levies resulting from public law contracts or that fall under an-
other IFRS, e.g. IAS 12 Income Taxes. Under IFRIC 21, a liability must be recognised when the event triggering the levy
occurs. This trigger event giving rise to the obligation to pay a levy is determined by the wording of the applicable legisla-
tion. This wording is thus pivotal to the accounting treatment. Earlier voluntary application of the interpretation is permit-
ted. Adoption by the EU was on 13 June 2014 with publication in the Official Journal of the European Union. The
amendments are effective for financial years beginning on or after 1 July 2014 and must be applied retrospectively.
New accounting standards not yet adopted by the European Union
New standards and interpretations
IFRS 9 – Financial Instruments: The final version of IFRS 9 was published in July 2014.
ANNUAL REPORT 2015 / NOTES 35
Classification and measurement of financial instruments
Financial assets will be separated into just two groups for classification and measurement in future: amortised cost and
fair value. The group of financial assets measured at amortised cost consists of those financial assets that give rise on
specified dates to cash flows that are solely payments of principal and interest and that are held in the context of a busi-
ness model where the objective is to hold assets in order to collect contractual cash flows. All other financial assets are
allocated to the group measured at fair value. Under certain circumstances, an entity may continue to designate financial
assets that fall under the first category to the fair value category instead (fair value option). Changes in value of the fi-
nancial assets in the fair value category are generally to be recognised in profit or loss. In the case of certain equity in-
struments, however, there is an option to recognise changes in value in other comprehensive income, although dividends
arising from these assets are to be recognised in profit or loss. The rules for financial liabilities have generally been taken
from IAS 39. The main difference concerns the recognition of changes in value of financial liabilities measured at fair
value. These are to be separated in future: the change in value attributable to an entity’s own credit risk is to be recog-
nised in other comprehensive income, and the remaining change in value in profit or loss.
Accounting for impairments of financial assets
The new rules require recognition not only of actual losses but also of expected losses. The scope of expected losses
recorded is also differentiated according to whether or not the default risk of financial assets has materially worsened
since the time of acquisition. If the default risk has increased and, at the reporting date, is not categorised as low, all
lifetime expected credit losses should be recognised from this time onwards. Otherwise, the entity should only recognise
the expected losses over the lifetime of the instrument that result from potential future loss events within the next 12
months. Exceptions apply to trade receivables and lease receivables. For these assets, entities must (in the case of
receivables that do not contain a significant financing component) or may (in the case of receivables that contain a sig-
nificant financing component and in the case of lease receivables) recognise all expected losses upon acquisition.
Hedge accounting
The objective of the new rules is to more closely align hedge accounting with an entity’s economic risk management. As
in the past, entities must document the relevant risk management strategy and risk management objectives at the begin-
ning of each hedging relationship. In future, however, the ratio between the hedged item and the hedging instrument
must, as a rule, be in line with the requirements of the risk management strategy. If, during the term of a hedging rela-
tionship, there is a change in this hedge ratio but not in the risk management objective, the quantities of the hedged item
and hedging instrument involved in the hedging relationship must be adjusted without discontinuing the hedging relation-
ship. Unlike in IAS 39, it is no longer possible under IFRS 9 to discontinue hedge accounting at any time without reason.
A hedging relationship must be continued for accounting purposes for as long as the risk management objective docu-
mented for this hedging relationship remains unchanged and the other requirements for hedge accounting are met. In
certain circumstances, entities may still designate individual risk components under IFRS 9, including for non-financial
items. The requirements for demonstrating hedge effectiveness have changed. Under IAS 39, hedging relationships
could only be included in hedge accounting if they were demonstrated to be highly effective (within a range of 80 % to
125 % effectiveness) by an assessment performed both retrospectively and prospectively. IFRS 9 abolishes both the
retrospective assessment and the effectiveness range. Instead, entities must demonstrate, without being bound to any
specific quantitative thresholds, that an economic relationship exists between the hedged item and the hedging instru-
ment and that the values of the hedged item and the hedging instrument would move in the opposite direction as a result
of the common underlying or hedged risk. This demonstration may be based on a qualitative assessment alone. How-
ever, credit risk is not permitted to dominate the value changes resulting from the economic relationship. Subject to EU
adoption, which is still outstanding, IFRS 9 is to be applied to reporting periods beginning on or after 1 January 2018. In
principle, the standard is to be applied retrospectively. Various options for simplification are provided, however. Earlier,
36 ANNUAL REPORT 2015 / NOTES
voluntary application is permitted. Given the Group’s business activities, this standard will have a substantial impact on
the consolidated financial statements.
IFRS 14 – Regulatory Deferral Accounts: has been published as an interim standard to provide a temporary solution until
the relevant IASB project has reached agreement on the accounting of rate-regulated activities. The provisions of this
standard will allow an entity that is a first-time adopter of IFRSs within the meaning of IFRS 1 to retain regulatory deferral
account balances recognised under its previous national GAAP in its IFRS financial statements and to continue to ac-
count for these balances in accordance with its previous accounting methods. The aim is to facilitate the transition to
IFRSs for such companies. Application of this standard is explicitly intended for IFRS first-time adopters only; entities that
already use IFRSs are excluded. If an entity elects to apply the provisions of IFRS 14 (option), it must meet mandatory
presentation and disclosure requirements. For example, regulatory deferral account balances must be presented sepa-
rately in the statement of financial position, divided into assets and liabilities. The same applies to presentation in the
statement of comprehensive income. Disclosures are also required on the nature of the rate regulation that establishes
prices and on the risks associated with this. IFRS 14 limits the options for amending the accounting methods previously
applied to regulatory deferral accounts. It does not permit first-time recognition of items that did not qualify as regulatory
deferral account balances in the entity’s previous national GAAP. Earlier voluntary application of the rules is permitted.
The European Commission has decided not to begin the endorsement process for this interim standard, but instead to
await the final standard. The new standard will not have any impact.
IFRS 15 – Revenue from Contracts with Customers: The aim of the revised standard is to harmonise the existing, less
detailed provisions in the IFRSs with the highly detailed and, in some cases, industry-specific provisions of US GAAP so
as to improve the transparency and comparability of financial information. Under IFRS 15, sales revenues are to be rec-
ognised when the customer gains control of the agreed goods and services and can draw benefit from them. Unlike in
the old rules under IAS 18, the decisive factor is no longer the transfer of significant risks and rewards. Revenues are to
be recognised at the amount of the consideration that the entity expects to receive. The new model features a five-step
framework, which first identifies the contract with a customer and the separate performance obligations contained
therein. The transaction price of the customer contract is then determined and allocated to the individual performance
obligations. Finally, when the agreed service is provided and control passes to the customer, revenue is recognised for
the relevant performance obligation in the amount of the proportionate transaction price allocated to that obligation. In
accordance with specified criteria, a distinction is to be made here between performance obligations satisfied at a point in
time and those satisfied over a period of time. The new standard does not distinguish between different types of orders
and services, but establishes standard criteria determining when a performance obligation should be recognised at a
point in time or over a period of time. The rules and definitions of IFRS 15 will replace the content of IAS 18 and IAS 11
in future. The new standard will not have any significant impact.
IFRS 16 - Leases: IFRS 16 specifies how leases are reported in financial statements. Compared with the previous stan-
dard IAS 17, significant changes have been made to the reporting of operating lease contracts by the lessee. With some
exceptions for materiality reasons (short-term leases and leases for low-value assets), right-of-use assets are to be rec-
ognised on the assets side and corresponding lease liabilities on the liabilities side of the balance sheet. The accounting
rules for the lessor have not changed significantly compared with IAS 17. The notes will be more extensive than under
the previous IAS 17. The amendments are applicable to financial years beginning on or after 1 January 2019. The
amendments will not have any significant impact.
c) Application of estimates and assumptions All assumptions, estimates and assessments required as part of recognition and measurement in line with IFRS are
carried out in accordance with the relevant standard, are re-evaluated on an ongoing basis and are based on historical
ANNUAL REPORT 2015 / NOTES 37
experience and other factors including expectations with regard to future events that appear reasonable in the particular
circumstances. These estimates and assumptions have an influence on the amounts shown for assets and liabilities in
the statement of financial positions and income and expenses in the income statement.
In the case of the following assumptions and estimates, there is the inherent possibility that the development of overall
conditions contrary to expectations as at the balance sheet date may lead to considerable adjustments of assets and
liabilities in the next business year.
- Alternative investment measurement methods are used to assess the recoverability of financial instruments for
which no active market is available. Some of the parameters taken as a basis when determining fair value are based
on assumptions concerning the future.
- The assessment of the recoverability of intangible assets, goodwill, investment properties and property, plant and
equipment is based on assumptions concerning the future.
- The recoverability of financial instruments measured at amortised cost or assigned to the available for sale category
is based on future assumptions.
- The recognition of deferred tax assets is based on the assumption that sufficient tax income will be generated in
future in order to realise existing tax loss carryforwards; where required no deferred tax assets were recognized.
- Assumptions regarding the interest rate, retirement age, life expectancy and future salary increases are applied
when measuring existing long-term employee provisions.
- Provisions are measured on the basis of cost estimates from contractual partners, past experience and investment
calculation methods.
- Assessments are regularly carried out for liabilities and impairment not recognised in the balance sheet due to guar-
antees and contingencies in order to determine whether on-balance sheet recognition in the financial statements is
to be carried out.
If estimates were required to a greater extent, the assumptions made are shown with the note on the corresponding item.
Actual values may deviate from the assumptions and estimates made if overall conditions develop contrary to expecta-
tions as at the balance sheet date. Amendments are recognised in profit or loss and assumptions adjusted accordingly
once better information is obtained.
d) Consolidation principles / Principles of aggregation These association financial statements are based on consolidated financial statements prepared in accordance with
IFRS and single-institution financial statements of the included entities prepared in accordance with the regulations. The
figures reported in the individual financial statements of associated companies measured at equity have been adjusted to
group accounting principles where the effects on the consolidated financial statements were significant.
The financial statements of the fully consolidated companies and the companies consolidated using the equity method
were prepared on the basis of the group’s balance sheet date of 31 December 2015.
Owing to the lack of an ultimate controlling parent company, the equity components reported in the financial statements,
which were converted in accordance with the relevant principles of the credit institutions, included, as stated in the list of
companies in section 53), are aggregated. When aggregating the included companies' investments in Volksbanks and
VBW, the aggregated carrying amounts of the investments are deducted from the aggregated equity components. Con-
solidation as a group of companies which are legally separate entities, but under unified control without a parent compa-
ny means that the capital consolidation does not result in any minority interests. Cooperative shares of the member credit
institutions are reported under total nominal value of members' shares.
38 ANNUAL REPORT 2015 / NOTES
Business combinations with a contract date on or after 31 March 2004 are accounted for using the purchase method set
out in IFRS 3. Accordingly, all identifiable assets, liabilities and contingent liabilities are recognised at their fair values at
the acquisition date. If the cost of acquisition exceeds the fair value of the identifiable assets, liabilities and contingent
liabilities, goodwill is recognised as an asset. The full goodwill methode is not in use. Goodwill is not amortised over the
estimated useful life, but instead is tested for impairment annually in accordance with IAS 36. Negative goodwill is recog-
nised directly in income in accordance with IFRS 3 after re-examination. Any change in contingent consideration recog-
nised as a liability at the acquisition date is recognised in profit or loss. Transactions, which do not lead to a loss of con-
trol are recognised directly in equity.
Subsidiaries under the direct or indirect control of the association are fully consolidated if these are material for a true
and fair view of the net assets, liabilities, financial position and profit or loss of the association. Companies in which the
association holds an equity interest of between 20 % and 50 % and for which controlling agreements do not exist are
consolidated using the equity method; they are not consolidated if they are not significant for the association.
Intragroup balances and any unrealised gains and losses or income and expenses arising from intragroup transactions
are eliminated in preparing the consolidated financial statements for the association.
e) Currency translation In accordance with IAS 21, foreign currency monetary assets and debts, non-monetary positions stated at fair value and
unsettled spot transactions are translated using the spot exchange mean rate, whereas unsettled forward transactions
are translated at the forward exchange mean rate prevailing on the balance sheet date. Non-monetary assets and liabili-
ties carried at amortised cost are recognised at the prevailing rate on the acquisition date.
The individual financial statements of fully consolidated companies prepared in currencies other than the euro are trans-
lated using the modified closing rate method set out in IAS 21. Under this method, all assets and liabilities are translated
at the spot exchange mean rate effective on the balance sheet date, while the historical rate is applied for the translation
of equity. Differences resulting from the translation of the financial statements of foreign subsidiaries are recognised in
the currency translation reserve in equity. Any goodwill, disclosed hidden reserves and liabilities arising from the initial
consolidation of foreign subsidiaries prior to 1 January 2005 have been translated at historical rates. Any goodwill, dis-
closed hidden reserves and liabilities arising from business combinations after 1 January 2005 are translated at the spot
exchange mean rate on the group’s balance sheet date.
Income and expense items are translated at the average spot exchange mean rate for the reporting period, calculated on
the basis of the end-of-month rates. Exchange differences between the closing rate applied for the translation of balance
sheet items and the average rate used for translating income and expense items are recognised in the currency transla-
tion reserve in equity.
f) Net interest income Interest income and interest expenses are recognised on an accrual basis in the income statement. Current or non-
recurring income or expenses similar to interest, such as commitment fees, overdraft commissions or handling fees, are
reported in net interest income in accordance with the effective interest method providing that there are no exceptions in
the accounting policy. Premiums and discounts are allocated over the term of the financial instrument using the effective
interest method and reported in net interest income.
The unwinding effect resulting from the calculation of the risk provision is shown in interest income.
ANNUAL REPORT 2015 / NOTES 39
Net interest income consists of:
- Interest and similar income from credit and money market transactions (including unwinding effect from risk provi-
sion)
- Interest and similar income from debt securities
- Income from equities and other variable-yield securities
- Income from affiliated companies and other participations
- Rental income from operating lease contracts and investment property assets, as well as depreciation of operating
lease assets
- Interest and similar expenses for deposits
- Interest and similar expenses for debts evidenced by certificates and subordinated liabilities
- The interest components of derivatives reported in the investment book
Interest income and expenses from trading assets and liabilities are recognised in net trading income.
The result of the valuation and disposal of securities, shares and participations is reported in income from financial in-
vestments.
g) Risk provisions Risk provisions reflect the allocation to and release of provisions for impairments of loans and advances on individual
and portfolio basis (see note 3) m)). Loans and advances directly written off and receipts from loans and advances al-
ready written off are also recognised in this item. Furthermore, this item contains additions to and releases of provisions
for risks.
h) Net fee and commission income This item contains all income and expenditure relating to the provision of services as accrued within the respective re-
porting period.
i) Net trading income All realised and unrealised results from securities, from items in foreign currency and derivatives allocated to the trading
book (trading assets and trading liabilities) are reported in this item. This includes changes in market value as well as all
interest income, dividend payments and refinancing expenses for trading assets.
Results from the daily measurement of foreign currencies are also reported in net trading income.
j) General administrative expenses General administrative expenses contain all expenditure incurred in connection with the group’s operations.
Staff expenses include wages and salaries, statutory social security contributions and fringe benefits, payments to pen-
sion funds and internal pension plans as well as all expenses resulting from severance and pension payments.
Administrative expenses include expenses for premises, communications, public relations and marketing, costs for legal
advice and other consultancy, as well as training and EDP expenditure.
Amortisation of intangible assets – excluding impairment of goodwill – and depreciation of tangible fixed assets is also
reported in this item.
40 ANNUAL REPORT 2015 / NOTES
k) Other operating result In addition to the result from measurement or repurchasing of financial liabilities, impairment of goodwill, measurement of
IFRS 5 disposal groups, and the deconsolidation result from the disposal of subsidiaries, this item contains all results
from the association’s other operating activities. This item also includes income from the recovery funding (Besserungs-
geld) issued to some Volksbanks from the common fund, less the discounted repayment obligations.
l) Income from financial investments This item contains all realised and unrealised results from financial investments at fair value through profit or loss and all
derivatives reported in the investment book. The result from interest or dividends is recognised in net interest income.
In addition, the results of disposals of securitised financial investments classified as available for sale (including participa-
tions), loans & receivables and held to maturity are included in this item. Remeasurement results attributable to material
or lasting impairment are also reported in this item as well as the increase of the fair value, which can be objectively
related to an event occurring after the impairment loss was recognised, up to a maximum of amortised cost.
Results from the daily measurement of foreign currencies are reported in net trading income.
m) Financial assets and liabilities
Recognition
A financial asset or a financial liability is initially recognised in the balance sheet when the association becomes party to
a contract on the financial instrument and thus acquires the right to receive or assumes a legal obligation to pay liquid
funds. A financial instrument is deemed to be added or disposed of at the trade date. The trade date is relevant for the
initial recognition of a financial instrument in the balance sheet, its measurement in the income statement and the ac-
counting treatment of its sale.
Derecognition
A financial asset is derecognised on the date on which the contractual rights to its cash flows expire. A financial liability is
derecognised once it has been redeemed.
The association conducts transactions in which financial assets are transferred but the risks or rewards incident to the
ownership of the asset remain with the association. If the association retains all or substantially all risks and rewards, the
financial asset is not derecognised, but instead continues to be reported in the balance sheet. Such transactions include,
for example, securities lending and repurchase agreements.
Offsetting
Financial assets and liabilities are set off and the net amount presented in the balance sheet when, and only when, the
association has a legal right to set off the amounts and intends either to settle on a net basis or to realise the asset and
settle the liability simultaneously.
Income and expenses are presented on a net basis only when permitted by the accounting standards or for gains and
losses arising from a group of similar transactions, such as in the association’s trading activities.
Amortised cost
The amortised cost of financial assets and liabilities is defined as the amount consisting of the original purchase price
adjusted for account redemptions, the allocation of premiums or discounts over the term of the instrument in accordance
with the effective interest method, and value adjustments or depreciation due to impairment or uncollectibility.
ANNUAL REPORT 2015 / NOTES 41
Fair value measurement
Fair value is the price that would be received to sell an asset or paid to transfer a liability in an orderly transaction be-
tween market participants at the measurement date.
For calculation of fair values, the following hierarchy is used and shows the meaning of the single parameters.
Level 1: Quoted prices in active markets of identical assets or liabilities. A market is regarded as active if quoted prices
are readily and regularly available and represent actual and regularly occurring market transactions on an arm’s length
basis.
Level 2: Valuation techniques based on observable data – either directly as prices or indirectly derived from prices. Valu-
ation techniques include using recent arm’s length transactions between knowledgeable, willing parties, as well as refer-
ence to the current fair value of other instruments that are substantially the same. For discounted cash flow analyses and
option pricing models all important parameters are derived either directly or indirectly from observable market data. All
factors that market participants would consider in setting prices are taken into account, and are consistent with accepted
economic methodologies for pricing financial instruments. Inputs to valuation techniques reasonably represent market
expectations and measures of the risk-return factors inherent in the financial instrument.
Level 3: Measurement methods that largely use parameters which are not observable on the market. These parameters
have a significant impact on the calculation of fair value. This category also contains instruments which are measured by
adjusting non-observable inputs, provided such adjustment is considerable.
The group calibrates valuation techniques and tests them for validity using prices from observable current market trans-
actions in the same instrument or based on other available observable market data.
Impairment
There is a quarterly procedure for the evaluation of lending under which the organisational units responsible for risk are
required to make a proposal for risk provisioning on the basis of current developments. An impairment is recognised if,
subsequent to the initial recognition of a financial instrument, there is objective evidence of an event that will have an
effect on the future cash flows from the financial instrument and reliable assumptions can be made with regard to the
extent of such an effect.
Objective evidence that financial assets are impaired includes, for example, financial difficulties of the debtor; the re-
scheduling of receivables on terms which would otherwise not be granted; indications that the debtor will enter bankrupt-
cy; the disappearance of securities from an active market and other observable data in connection with a group of finan-
cial assets, such as changes in the payment status of borrowers or economic conditions correlating with defaults on the
assets in the group.
In calculating the level of risk provisioning required, all assets are individually analysed if there is objective evidence of
impairment. All significant assets are individually tested on the base of the expected cash flow. Financial assets that are
not individually significant are grouped together on the basis of similar risk profiles and assessed collectively. In the case
of assets for which there is no objective indication of impairment, impairment is recognised in the form of portfolio-based
allowances to reflect impairment that has occurred but not yet been detected.
All customers with an internal rating of 4C to 4E (watch list loans) and all other customers for which other indications
show a risk of default, i.e. the contractual redemption is at risk, are examined more intensively in accordance with the
association’s credit risk manual, respectively in accordance to the General Instructions on Risk Management. A corre-
42 ANNUAL REPORT 2015 / NOTES
sponding risk provision is recognised for uncollateralised or partly collateralised exposures. For non-performing loans
(rating category 5A – 5E), the appropriateness of the level of risk provisioning is examined.
The amount of impairment for assets carried at amortised cost is calculated as the difference between the carrying
amount and the net present value of the future cash flows, taking any collateral into account, discounted using the effec-
tive interest rate of the asset. The impairment amount is reported in the income statement. In the event that the reason
for impairment ceases to exist at a later date, the impairment loss is reversed through profit or loss. The amount of risk
provisions for non-securitised receivables is presented in a separate account. Securitised receivables are impaired or
revalued directly. Non-securitised receivables are impaired directly if the asset is derecognised and the risk provision
allocated up to the date of recognition was insufficient.
Portfolio-based allowances are calculated for homogeneous portfolios. The parameters listed below are used in as-
sessing the amounts of these value adjustments:
- historical loss experience with non-performing loans
- the estimated losses for the following period
- the estimated period between the occurrence of the loss and its identification (loss identification period: 30 – 360
days)
- Management's experienced judgment as to whether the expected losses in the current period are greater or lower
than suggested by historical data.
In the case of available for sale financial assets and a corresponding impairment it is recognised immediately as a write-
down in the income statement. The amounts that have been recognised so far in the available for sale reserve will also
be reclassified to the income statement. If the reason for impairment ceases to exist, the impairment loss is reversed
through profit or loss in the case of debt instruments or recognised directly in comprehensive income taking into account
deferred taxes in the case of equity instruments.
Financial instruments designated at fair value through profit or loss
The association makes use of the option to irrevocably designate financial instruments at fair value through profit or loss.
Allocation to this category is performed if one of the three following criteria is met:
- Groups of financial assets and financial liabilities are managed on a fair value basis in accordance with a document-
ed risk management and investment strategy.
- Fair value measurement can be demonstrated to prevent inconsistencies in the valuation of financial assets and
liabilities.
- A financial instrument contains an embedded derivative that is generally required to be reported separately from the
host agreement at fair value.
Interest, dividends and relating commission income and expenses are recognised in the corresponding items in profit
and loss for financial assets and liabilities in the investment book measured at fair value through profit or loss. Result of
fair value measurement is shown in income from financial investments.
In note 37) Financial assets and liabilities, the amounts allocated to the at fair value through profit or loss category are
indicated for each class of financial asset and liability. The reasons for the designation are described in the notes on the
individual financial assets and liabilities.
ANNUAL REPORT 2015 / NOTES 43
Derivatives Derivatives are always recognised in income at their fair value.
For calculation of fair value the credit value adjustments (CVA) and debt value adjustments (DVA) are taken into ac-
count. Counterparty risk for positive market values arising from unsecured interest rate management derivatives in the
trading book is taken into account by means of CVA or DVA – a way of approximating potential future loss in relation to
counterparty risk. The expected future exposure (EFE) is calculated using a Monte Carlo simulation. As no observable
credit spreads are available for these counterparties on the market, the default probabilities for the counterparties are
based on the association's internal ratings.
Changes in the market value of derivatives that are used for a fair value hedge are recognised immediately in the income
statement under income from financial investments. The change in market value of the underlying transaction resulting
from the hedged risk is also recognised under net income from financial instruments, irrespective of its allocation to indi-
vidual categories under IAS 39. The association uses fair value hedges to hedge against interest rate and currency risks
arising from fixed-income financial investments and liabilities, foreign currency receivables and liabilities and structured
issues.
In the case of cash flow hedges, the change in the fair value of the derivative is recognised in the cash flow hedge re-
serve in the other comprehensive income, taking into account deferred taxes. The ineffective part of the hedge is recog-
nised in income statement. The valuation of the underlying transaction depends on the classification of the underlying
transaction into the different categories. The association currently doesn’t use cash flow hedges.
Embedded derivatives are reported and measured separately, irrespective of the financial instrument in which they are
embedded, unless the structured investment has been designated and allocated to the at fair value through profit or loss
category.
Own equity and debt instruments
Own equity instruments are carried at cost and deducted from equity on the liabilities side of the balance sheet. Own
issues are deducted from issues at their redemption amounts on the liabilities side of the balance sheet, with the differ-
ence between the redemption amount and cost reported in other operating result.
n) Loans and advances to credit institutions and customers Loans and advances represent non-derivative financial assets with fixed or determinable redemption amounts which are
not traded on an active market and are not securitised.
Loans and advances to credit institutions and customers are recognised at their gross amounts before deductions for
impairment losses, including deferred interest. The total amount of risk provisions for balance sheet receivables is recog-
nised as a reduction on the asset side of the balance sheet under loans and advances to credit institutions and loans and
advances to customers. Risk provisions for off-balance sheet transactions are included in provisions.
Receivables are initially measured at fair value plus incremental direct transaction costs. Subsequent measurement is
performed at amortised cost using the effective interest method unless the receivables are designated to the at fair value
through profit or loss category.
Finance lease The association concludes finance lease contracts for real estate and for movable goods. In these contracts it acts as a
lessor in a leasing transaction in which significantly all the risks and rewards are transferred to the lessee, who hence
44 ANNUAL REPORT 2015 / NOTES
becomes the owner of the leased asset, this transaction is reported in receivables. In this case, instead of the leased
asset, the present value of future payments is recognised, taking into account any residual value.
Real Estate leasing contracts basically have a maturity of 10 to 20 years, movable goods leasing for the retail section
basically have a maturity of 3 to 6 years. The interest rate of the customer for the lease agreement is fixed for the whole
maturity at the time the contract is closed. The effective interest rate can be adapted to changes on capital markets
through an interest adjustment clause.
o) Risk provisions Provisions for individual and portfolio-based impairment are recognised in order to cover the specific risks inherent to
banking. For further details, see section 3) m) Financial assets and liabilities.
p) Trading assets and liabilities Trading assets include all financial assets acquired with a view to short-term sale or forming part of a portfolio which is
intended to yield short-term profits. Trading liabilities consist of all negative fair values of derivative financial instruments
used for trading purposes. In this position there are no financial assets and liabilities reported which are designated to
the at fair value through profit or loss category.
Both initial recognition and subsequent measurement are performed at fair value. Transaction costs are expensed as
incurred. All changes in fair value as well as all interest and dividend payments and refinancing allocable to the trading
portfolio are reported in net trading income.
q) Financial investments Financial investments comprise all securitised debt and equity instruments not classified as participations. Financial
investments are initially recognised at fair values plus incremental direct transaction cost. Subsequent measurement
depends on whether the financial assets are allocated to the at fair value through profit or loss, available for sale, loans &
receivables or held to maturity categories.
At fair value through profit or loss
The group allocates some securities to this category and records changes in the fair value of such securities directly in
the income statement as described in section 3) m) Financial assets and liabilities.
Available for sale
This category comprises all financial instruments which are not allocated to the at fair value through profit or loss, loans &
receivables or held to maturity categories. It also includes all equity instruments with no maturity date, provided that they
have not been classified as at fair value through profit or loss. Shares which are not traded on a stock exchange and
whose fair value cannot be reliably determined are carried at cost less any impairment losses. All other available for sale
assets are measured at fair value. Changes in fair value are taken directly to equity until these financial investments are
sold or impaired and the remeasurement result is transferred from equity to the income statement. With regard to debt
securities, the difference between cost including transaction cost and the redemption amount is amortised in accordance
with the effective interest method and recognised in income. Accordingly, only the difference between amortised cost and
fair value is recognised in the available for sale reserve.
ANNUAL REPORT 2015 / NOTES 45
Loans & receivables
All securitised financial investments with fixed or determinable payments that are not quoted in an active market and
which the group does not intend to sell immediately or in the near term are classified as loans & receivables. These fi-
nancial instruments are recognised at amortised cost in accordance with the effective interest method.
Held to maturity
The group allocates financial instruments to this category if it has the positive intention and ability to hold them to maturi-
ty and they have fixed or determinable payments and a fixed maturity.
These financial instruments are recognised at amortised cost in accordance with the effective interest method. Any sale
or reallocation of a substantial part of these financial instruments which does not occur on a date that is close to the
redemption date or is attributable to a non-recurring isolated event that is beyond the group’s control and that could not
have been reasonably anticipated, results in the reallocation of all held to maturity financial investments to the available
for sale category for the two subsequent fiscal years. In 2015 no such reallocations took place.
r) Investment property All land and buildings that meet the definition of investment property as set out in IAS 40 are reported at market value.
Annual measurement is essentially based on RICS standards (Royal Institution of Chartered Surveyors). The RICS de-
fines market value (sale value) as the estimated amount for which a property could be sold on the date of valuation by a
willing seller to a willing buyer in an arm’s-length transaction after a suitable marketing period, wherein the parties had
each acted knowledgeably, prudently and without compulsion. These calculations are earnings calculations prepared on
the basis of current rent lists and lease expiry profiles, and are subject to assumptions regarding market developments
and interest rates. Yields are defined by appraisers and reflect the current market situation as well as the strengths and
weaknesses of the given property. Comparative value methods are also used for plots of land where development is not
expected in the near future. Transaction prices for similar properties recently sold on the open market are taken as a
basis. These sales prices are analysed using comparable properties and adjusted with regard to differences in size,
layout, location, use and other factors to fit the property being valued.
The real estate portfolio is valued exclusively by external appraisers. The criteria for selecting appraisers include proven
professional qualification and experience of the locations and categories of property being valued. In Austria, appraisals
are carried out by IMMO-CONTRACT Maklerges.m.b.H.. External appraisers are paid a fixed fee which does not depend
on the appraised market value of the property.
Since parameters are used to measure investment property which are not based on market information, investment
property is classified in Level 3 of the fair value category. The assumptions and parameters used in the valuation are
updated on every valuation date, which can lead to considerable fluctuations in the figures.
Tenancy agreements are in place with commercial and privat lessees; these vary owing to the diversity of the portfolio.
These tenancy agreements generally have longer terms of up to 10 years and are secured with deposits. Adjustments to
indexes in line with the market are taken into account. Rents are not linked to revenue. Purchase options have been
granted for some properties.
Rental income is recognised on a straight-line basis in accordance with the term of the respective lease and rental con-
tracts and reported in interest and similar income.
46 ANNUAL REPORT 2015 / NOTES
s) Participations The group establishes subsidiaries and acquires participations for strategic reasons and as financial investments. Strate-
gic participations relate to companies operating in the group’s lines of business or companies supporting the group’s
business activities.
Companies over which the group exercises a significant influence are measured using the equity method. All other par-
ticipations are recognised at their respective fair values. Fair values are determined by reference to quoted market prices
on active markets, or by using a valuation method if there is no active market. Valuation methods include using discount-
ed cash flow techniques and valuations using multiples. If discounted cash flow procedures are used, the discount rates
applied are based on the current recommendations of the Expert Committee of the Austrian Chamber of Public Account-
ants and Tax Advisers and international financial information service companies. In 2015 it was at 9.0 %
(2014: 5.6 % -8.1 %). Market risk premium used in these calculations in 2015 was at 6.75 % (2014: 5.75 %) beta values
were at 1.1 (2014: 0.66 - 1.1), while discounts of up to 20 % are applied to illiquidity and for other price risks up to 32 %.
Additional sovereign risks were not observed. Procedures are also used where fair values are determined by adapting
available market data for similar financial instruments. Participations whose fair value cannot be reliably determined are
carried at cost. Impairment is recorded for losses in value. If the reason for impairment ceases to exist, the impairment
loss is reversed and recognised directly in equity with due consideration of deferred taxes.
t) Intangible and tangible fixed assets Intangible assets are carried at cost less straight-line amortisation and impairment. This item primarily comprises ac-
quired goodwill and software.
Goodwill is not depreciated on a straight-line basis, but instead is tested for impairment at least once a year in accord-
ance with IAS 36, or more frequently if events or changes in circumstances indicate that impairment may have occurred.
Impairment testing is performed for the cash generating units (CGUs) to which goodwill is allocated. Impairment require-
ments for CGUs are calculated by comparing carrying value with their realisable value. Where realisable value is less
than the carrying value, the difference is recognised as an impairment expense. Impairment of goodwill may not be re-
versed in the subsequent period. Assets used in operating lease transactions are allocated to the association and report-
ed in the tangible fixed assets. Tangible fixed assets are carried at cost and depreciated on a straight-line basis over
their estimated life in the case of depreciable assets.
Write-downs are recognised for permanent impairment. If the circumstances resulting in the recognition of a write-down
cease to exist, the write-down is reversed up to a maximum of amortised cost.
The useful life is the period of time during which an asset is expected to be used by the group and is calculated as fol-
lows:
Office furniture and equipment up to 10 years EDP hardware (including calculators, etc.) up to 5 years EDP software up to 4 years Vehicles up to 5 years Strongrooms and safes up to 20 years Buildings, reconstructed buildings up to 50 years Rental rights up to the period of lease
Lease contracts for operating lease assets have an average maturity of four years and are basically for vehicles. The
lessee has the right of premature cancellation of the contract. A takeover of the leasing object by the lessee after the end
of the contract (also in case of premature cancellation) is excluded.
ANNUAL REPORT 2015 / NOTES 47
Leasing income from operating lease assets is recognized on a straight-line basis over the term of the contract through
profit and loss and presented with depreciation in interest and similar income.
u) Tax assets and liabilities This item is used to report current and deferred tax assets and liabilities.
According to the balance sheet liability method set out in IAS 12, deferred taxes are derived from all temporary di ffer-
ences between the tax base of an asset or liability and its carrying amount in the balance sheet prepared in accordance
with IFRS. Deferred taxes are calculated for subsidiaries on the basis of the tax rates that apply or have been announced
in the individual countries on the balance sheet date. Deferred tax assets are offset against deferred tax liabilities for
each individual subsidiary.
Deferred tax assets in respect of unutilised tax loss carryforwards are recognised to the extent that it is probable that
future taxable profit will be available at the same company against which the unused tax losses can be utilised or if suffi-
cient taxable temporary differences exist. The appraisal period is up to 4 years. Deferred tax assets from tax loss car-
ryforwards are impaired, if it is unlikely that the tax benefit can be realised. Deferred taxes are not discounted.
v) Other assets Deferred items are used for accruing income and expenses and are shown in this item together with other assets. Value
adjustments are recognised for impairment. This item also includes all positive fair values of derivatives that are reported
in the investment book and carried at fair value. With the exception of derivatives used in cash flow hedges, which are
taken directly to other comprehensive income, changes in fair value are reported in income from financial investments.
w) Assets held for sale A non-current asset (or disposal group) is classified as held for sale if its carrying amount will be recovered principally
through a sale transaction rather than through continuing use.
For this to be the case, the asset (or disposal group) must be available for immediate sale in its present condition subject
to terms that are customary and usual for sale of such assets (or disposal groups) and its sale must be highly probable.
These criteria are fulfilled if the necessary decisions by management bodies have been made, the assets can be sold
without significant modification or restructuring, marketing of the assets has begun and there is either a binding offer or a
signed contract on the balance sheet date with closing expected within the next 12 months. Loans repaid early by the
borrower do not meet the definition of a sales transaction, even if a company within the association initiates the early
repayment by reducing the loan amount.
A disposal group comprises non-current assets held for sale, other assets, and liabilities that are sold together in a single
transaction. It therefore does not include liabilities that are repaid using the proceeds from sale of the disposal group but
which are not transferred.
A discontinued operation is a component of an entity that either has been disposed of, or is classified as held for sale
and represents a separate major line of business or geographical area of operations, is part of a single co-ordinated plan
to dispose of a separate major line of business or geographical area of operations, or is a subsidiary acquired exclusively
with a view to resale.
Discontinued operations are reportable segments at the association. A major line of business or geographical area of
operations that is reported to the Managing Board and has a significant impact on the association´s financial situation is
48 ANNUAL REPORT 2015 / NOTES
presented as a discontinued operation if all the requirements are met. If the association discontinues business activities
in a particular country, this only constitutes a discontinued operation if certain size-related criteria are exceeded. If the
association discontinues business activities in an entire region, this always constitutes a discontinued operation regard-
less of the above-mentioned size criteria. A region is any area presented separately in the annual report in the regional
allocation of total receivables to the strategic business fields.
After being classified as held for sale, non-current assets or groups of assets are reported at the lower of the carrying
amount and fair value less costs to sell. Impairment expenses are recognised in profit or loss in other operating ex-
penses.
Non-current assets or disposal groups and associated liabilities classified as held for sale are reported separately from
other assets and liabilities on the statement of financial position.
In the case of a discontinued operation, the post-tax profit or loss of the discontinued operation and the post-tax gain or
loss recognised on the measurement to fair value less costs to sell or on the disposal of the assets or disposal groups
constituting the discontinued operation are reported on the statement of comprehensive income.
The previous year's income statement is to be adjusted accordingly.
x) Liabilities The initial recognition of amounts owed to credit institutions and customers as well as debts evidenced by certificates is
performed at fair value plus directly attributable transaction costs. Subsequent measurement is performed at amortised
cost in accordance with the effective interest method, unless these liabilities were designated as liabilities at fair value
through profit or loss.
y) Employee benefits Payments to defined contribution plans are expensed as incurred. Irregular payments are allocated to the respective
reporting period.
The Association of Volksbanks has made defined benefit commitments for individual staff members for the amounts of
future benefits. All of these plans are partly unfunded, i.e. the funds required as cover are retained and the association
recognises the necessary provisions. These plans are funded exclusively by the group; employees are not required to
make contributions to the plans. In the association, staff pension entitlements were transferred to a pension fund in pre-
vious years and are shown as plan assets. There are no extraordinary risks, risks specific to the company or plans, or
significant risk concentrations.
The pension fund has established an asset risk management process (ARM process) for those pension obligations trans-
ferred to it.
At VICTORIA-VOLKSBANKEN Pensionskassen AG, risk is measured at investment and risk association (VRG) level
using the value at risk (VaR) and shortfall risk (SFR) indicators. These quantify maximum loss probabilities under normal
market conditions. Scenario analyses are also performed in order to take into account rarely occurring extreme market
movements. VaR and SFR are the core indicators used to manage risk at VRG level. Defined limits for VaR and SFR
values along with hedging measures in the event of negative market developments provide the framework for the VRG’s
investments.
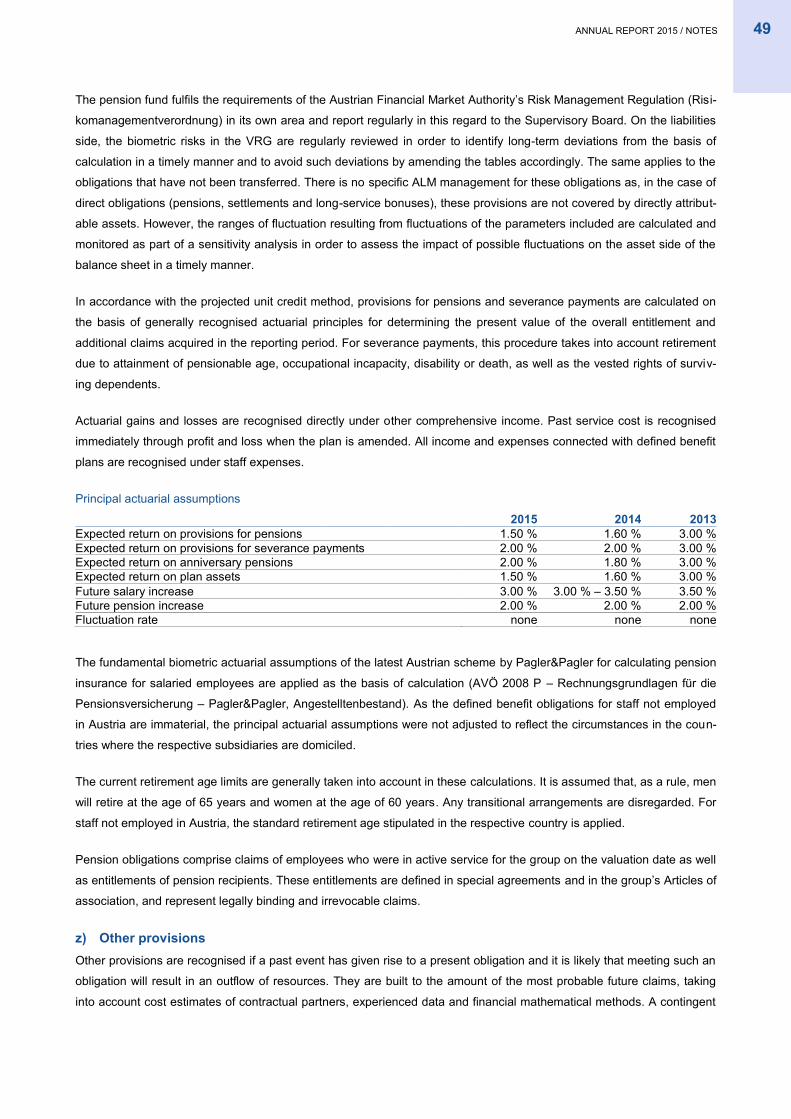
ANNUAL REPORT 2015 / NOTES 49
The pension fund fulfils the requirements of the Austrian Financial Market Authority’s Risk Management Regulation (Risi-
komanagementverordnung) in its own area and report regularly in this regard to the Supervisory Board. On the liabilities
side, the biometric risks in the VRG are regularly reviewed in order to identify long-term deviations from the basis of
calculation in a timely manner and to avoid such deviations by amending the tables accordingly. The same applies to the
obligations that have not been transferred. There is no specific ALM management for these obligations as, in the case of
direct obligations (pensions, settlements and long-service bonuses), these provisions are not covered by directly attribut-
able assets. However, the ranges of fluctuation resulting from fluctuations of the parameters included are calculated and
monitored as part of a sensitivity analysis in order to assess the impact of possible fluctuations on the asset side of the
balance sheet in a timely manner.
In accordance with the projected unit credit method, provisions for pensions and severance payments are calculated on
the basis of generally recognised actuarial principles for determining the present value of the overall entitlement and
additional claims acquired in the reporting period. For severance payments, this procedure takes into account retirement
due to attainment of pensionable age, occupational incapacity, disability or death, as well as the vested rights of surviv-
ing dependents.
Actuarial gains and losses are recognised directly under other comprehensive income. Past service cost is recognised
immediately through profit and loss when the plan is amended. All income and expenses connected with defined benefit
plans are recognised under staff expenses.
Principal actuarial assumptions
2015 2014 2013 Expected return on provisions for pensions 1.50 % 1.60 % 3.00 % Expected return on provisions for severance payments 2.00 % 2.00 % 3.00 % Expected return on anniversary pensions 2.00 % 1.80 % 3.00 % Expected return on plan assets 1.50 % 1.60 % 3.00 % Future salary increase 3.00 % 3.00 % – 3.50 % 3.50 % Future pension increase 2.00 % 2.00 % 2.00 % Fluctuation rate none none none
The fundamental biometric actuarial assumptions of the latest Austrian scheme by Pagler&Pagler for calculating pension
insurance for salaried employees are applied as the basis of calculation (AVÖ 2008 P – Rechnungsgrundlagen für die
Pensionsversicherung – Pagler&Pagler, Angestelltenbestand). As the defined benefit obligations for staff not employed
in Austria are immaterial, the principal actuarial assumptions were not adjusted to reflect the circumstances in the coun-
tries where the respective subsidiaries are domiciled.
The current retirement age limits are generally taken into account in these calculations. It is assumed that, as a rule, men
will retire at the age of 65 years and women at the age of 60 years. Any transitional arrangements are disregarded. For
staff not employed in Austria, the standard retirement age stipulated in the respective country is applied.
Pension obligations comprise claims of employees who were in active service for the group on the valuation date as well
as entitlements of pension recipients. These entitlements are defined in special agreements and in the group’s Articles of
association, and represent legally binding and irrevocable claims.
z) Other provisions Other provisions are recognised if a past event has given rise to a present obligation and it is likely that meeting such an
obligation will result in an outflow of resources. They are built to the amount of the most probable future claims, taking
into account cost estimates of contractual partners, experienced data and financial mathematical methods. A contingent
50 ANNUAL REPORT 2015 / NOTES
liability is reported if an eventual obligation exists and an outflow of resources does not appear probable or no reliable
estimate of the amount of the obligation can be made. Riskprovisions are discounted.
Risk provisions comprise loan loss provisions for contingent liabilities (in particular financial guarantees). Other provi-
sions contain provisions for legal disputes and restructuring. Risk provisions allocated and released are recorded under
risk provisions in the income statement. Amounts allocated to and released from the restructuring provision are included
under restructuring expense, while income and expenses from all other provisions are mainly recognised under other
operating result.
aa) Other liabilities Deferred items are used for accruing income and expenses and are shown in this item together with other liabilities. This
item also includes all negative market values of derivatives that are reported in the investment book and carried at fair
value. With the exception of derivatives used in cash flow hedges and hedges of a net investment, which are taken di-
rectly to other comprehensive income, changes in fair value are reported in income from financial investments.
bb) Subordinated Liabilities Subordinated capital is initially recognised at market value plus directly attributable transaction costs. It is subsequently
measured at amortised cost using the effective interest method, unless these liabilities were designated as liabilities at
fair value through profit or loss.
In case of bankruptcy or the winding up of the enterprise, all amounts accounted for as subordinated liabilities may be
satisfied after having met the demands of all other non-subordinated creditors.
In addition to subordination, the contractual terms for supplementary capital contain a performance-based interest pay-
ment. Interest may only be paid insofar as this is covered by annual profit before changes in reserves of the company
issuing the capital. Supplementary capital interests also participate in any loss. The repayment amount is lowered by
current losses. Repayment at nominal value is only possible once more if the proven losses are covered by profits.
cc) Equity Financial instruments which do not involve a contractual obligation to transfer cash or another financial asset to another
entity or to exchange financial assets or liabilities with another entity under conditions that are potentially unfavourable to
the issuer are reported in equity.
Capital management is done on the basis of the supervisory capital. For further details see chapter ee) Own funds and
chapter 51) c) Risk strategy and internal capital adequacy assessment process.
There is no ultimate parent company in the association as the central organisation does not exercise control as defined
by IFRS 10. The association financial statements are therefore prepared on the basis of a group of companies which are
legally separate entities, but under unified control without a parent company. The equity components of the non-
controlled companies included are aggregated. The aggregated carrying amounts of the investments in these member
companies are then subtracted. The remaining equity components are reported as equity under the relevant items. This
type of consolidation does not result in any minority interests.
The Volksbanks' cooperative capital is reported separately under cooperative capital shares. Under IAS 32, cooperative
capital is not eligible for inclusion as equity since it is "puttable" – the holder may request redemption at any time, subject
to a notice period. If, however, the redemption of shares is fully or partially prohibited, IFRIC 2 permits these shares to be
ANNUAL REPORT 2015 / NOTES 51
classified as equity. Therefore, shares subject to this prohibition are recognised in subscribed capital. Shares that are
redeemable at any time are reported as a separate item alongside equity, because these are included as tier I capital in
eligible own funds and capital management takes place on the basis of regulatory capital.
dd) Reserves The reserves item includes capital reserves, retained earnings and valuation reserves. In accordance with IAS 32, the
transaction costs of an equity transaction are accounted for as a deduction from equity, taking into account deferred
taxes, to the extent that they constitute incremental costs that are directly attributable to the equity transaction. Further-
more the difference between face value and repurchase value of own shares, as far as it is covered in capital reserves, is
shown there. If the difference exceeds capital reserves, this amount is deducted from retained earnings.
All legal and statutory reserves as well as voluntary reserves, provisions against a specific liability as defined by
section 57 (5) of the Austrian Banking Act, untaxed reserves and all other undistributed profits are reported in retained
earnings.
Currency reserves for currency conversions relating to foreign subsidiaries, the available for sale reserve and the hedg-
ing reserve are reported as valuation reserves. Any deferred taxes are deducted from the reserves.
ee) Own funds The company is subject to external capital requirements based on the European Union's CRD IV and CRR (Basel III).
The rules on capital ratios specified here constitute the central management variable in the association. These ratios
reflect the relationship between regulatory own funds and credit, market and operational risk. Accordingly, the risk/return
management of the association is based on the capital allocated to one business or, ultimately, one organisational unit
and the income to be generated from this, taking into account the corresponding risk considerations.
Credit risk is determined by multiplying on-balance-sheet and off-balance-sheet exposures on the basis of their relative
risks by the risk weighting to be allocated to a counterparty. The procedures for determining risk-relevant parameters
(exposure, risk weighting) are based on percentages specified by regulatory requirements (standard approach). There is
also an equity capital requirement for credit valuation adjustments in derivatives transactions. This is derived from regula-
tory requirements and, in particular, reflects the counterparty risk in the derivatives transaction. The market risk compo-
nent of the association is also calculated using the standard approach. The capital requirements for operational risk are
calculated by multiplying the revenues by the respective percentages for the divisions.
Regulatory own funds can be broken down into three elements:
Common Equity Tier I (CET1)
Additional Tier I (AT1)
Supplementary capital or Tier II (T2)
The first two components comprise the Tier I capital.
CET1 comprises the equity and participation capital that meets the CRR requirements. These are as follows: classified
as equity with separate disclosure in the accounts, perpetual, fully loss-bearing, no reduction in the principal amount
except in the case of liquidation or repayment without particular incentive mechanisms, no obligation to make distribu-
tions, distributions not linked to the nominal price. Transition arrangements apply for existing participation capital that
does not fulfil the CET1 criteria. In the period until 2021, this capital will be applied at a rate reduced by ten percentage
52 ANNUAL REPORT 2015 / NOTES
points each year. From 2022, this capital will no longer be eligible at all. CET1 also includes capital reserves, retained
earnings, other reserves and non-controlling interests used to meet the regulatory capital requirement. Intangible assets
and goodwill, deferred tax assets and participations in other credit institutions constitute significant deductions.
T2 includes non-current subordinated liabilities.
The minimum equity ratio (total of Tier I and Tier II) is 8 %. 4.5 % for CET1 and 6.0 % for Tier I are regarded as minimum
core capital requirement. The association complied with these relevant supervisory requirements throughout the entire
reporting period and its own funds exceeded the minimum requirements.
From 2016, banks must also build up a capital conservation buffer step by step each year to reach 2.5 percentage points
in 2019. This must consist of CET1 capital. In 2016 the required capital conservation buffer is 0.625 %.
The Austrian Financial Market Authority (FMA) has stipulated an additional systemic risk buffer for some Austrian banks
on an individual basis based on the Capital Buffer Regulation (Kapitalpuffer-Verordnung) effective from 1 January 2016.
The capital buffer is intended to absorb the risks arising from the large degree of interdependence between banks. This
requirement does not apply to the banking association of austrian Volksbanks.
Alongside the systemic risk buffer, the Capital Buffer Regulation also governs the FMA's countercyclical capital buffer.
This buffer is intended to counteract any credit bubbles that emerge and is currently set at 0.0 percentage points for
claims in Austria. The suitability of this buffer will in future be evaluated on a quarterly basis by the Financial Market
Stability Board.
The JRAD process – a periodic process used by the supervisory authorities to assess banks’ capital adequacy – may
give rise to higher regulatory ratios. As the ECB approved the new banking association pursuant to section 30a BWG
with VBW as the CO by a resolution of 2 July 2015, no new SREP ratio has yet been stipulated for the newly approved
association.
The association's own funds are described in note 36) Own funds.
ff) Trustee transaction Transactions in which an affiliate of the association acts as a trustee or in any other trusteeship function and thus man-
ages or places assets on a third-party account are not shown in the balance sheet. Commission payments from such
transactions are reported in net fee and commission income.
gg) Repurchase transactions Under genuine repurchase agreements, the group sells assets to a contractual partner and simultaneously undertakes to
repurchase these assets at the agreed price on a predefined date. The assets remain in the consolidated balance sheet
as no risk or rewards are transferred and are measured in accordance with the rules applying to the respective balance
sheet items. At the same time, the received payment is recognised as a liability.
hh) Contingent liabilities Possible obligations for which an outflow of resources does not appear probable or no reliable estimate of the amount of
the obligation can be made are reported under contingent liabilities. Provisions are recognised for acceptances and en-
dorsements as part of provisions for risks if there are likely to be future claims.
ANNUAL REPORT 2015 / NOTES 53
Obligations arising from financial guarantees are recognised as soon as the association becomes a contracting party, i.e.
when the guarantee offer is accepted. Initial measurement is performed at fair value. Generally the fair value corre-
sponds to the value of the premium agreed.
Guaranteed amounts of members in the case of participations in cooperatives are reported under other contingent liabili-
ties.
A follow-up check is regularly performed in order to determine whether on-balance sheet recognition in the consolidated
financial statements is necessary.
ii) Cash flow statement The cash flow statement is calculated in accordance with the indirect method. Here, the net cash flow from operating
activities is calculated based on the annual result after taxes and before non-controlling interest, whereby non-cash ex-
penses and income during the business year are included and deducted respectively first of all. Moreover, all expenses
and income which did serve as cash, but were not allocated to operating activities, are eliminated. These payments are
recognised under the cash flow from investing activities or financing activities. The interest, dividend and tax payments,
which are stated separately, are solely from operating activities.
Cash flows from non-current assets such as held to maturity securities, participations and fixed assets are assigned to
the cash flow from investing activities. The cash flow from financing activities includes all cash flows of the owners as
well as changes to subordinated liabilities and non-controlling interest. Liquid funds have been defined as cash and cash
equivalents and comprise balances with central banks as well as cash in hand. These balances are composed of the
minimum reserve to be held according to statutory provisions and current investments with various central banks.
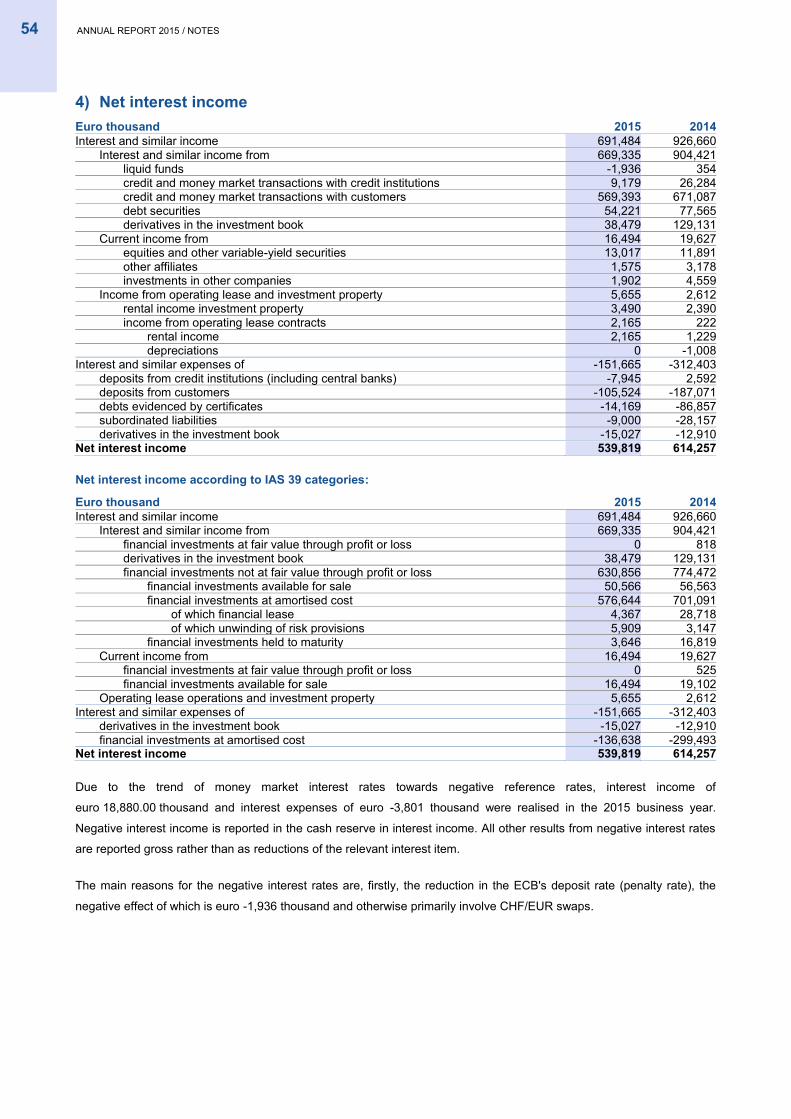
54 ANNUAL REPORT 2015 / NOTES
4) Net interest income
Euro thousand 2015 2014 Interest and similar income 691,484 926,660
Interest and similar income from 669,335 904,421 liquid funds -1,936 354 credit and money market transactions with credit institutions 9,179 26,284 credit and money market transactions with customers 569,393 671,087 debt securities 54,221 77,565 derivatives in the investment book 38,479 129,131
Current income from 16,494 19,627 equities and other variable-yield securities 13,017 11,891 other affiliates 1,575 3,178 investments in other companies 1,902 4,559
Income from operating lease and investment property 5,655 2,612 rental income investment property 3,490 2,390 income from operating lease contracts 2,165 222
rental income 2,165 1,229 depreciations 0 -1,008
Interest and similar expenses of -151,665 -312,403 deposits from credit institutions (including central banks) -7,945 2,592 deposits from customers -105,524 -187,071 debts evidenced by certificates -14,169 -86,857 subordinated liabilities -9,000 -28,157 derivatives in the investment book -15,027 -12,910
Net interest income 539,819 614,257
Net interest income according to IAS 39 categories:
Euro thousand 2015 2014 Interest and similar income 691,484 926,660
Interest and similar income from 669,335 904,421 financial investments at fair value through profit or loss 0 818 derivatives in the investment book 38,479 129,131 financial investments not at fair value through profit or loss 630,856 774,472
financial investments available for sale 50,566 56,563 financial investments at amortised cost 576,644 701,091
of which financial lease 4,367 28,718 of which unwinding of risk provisions 5,909 3,147
financial investments held to maturity 3,646 16,819 Current income from 16,494 19,627
financial investments at fair value through profit or loss 0 525 financial investments available for sale 16,494 19,102
Operating lease operations and investment property 5,655 2,612 Interest and similar expenses of -151,665 -312,403
derivatives in the investment book -15,027 -12,910 financial investments at amortised cost -136,638 -299,493
Net interest income 539,819 614,257
Due to the trend of money market interest rates towards negative reference rates, interest income of
euro 18,880.00 thousand and interest expenses of euro -3,801 thousand were realised in the 2015 business year.
Negative interest income is reported in the cash reserve in interest income. All other results from negative interest rates
are reported gross rather than as reductions of the relevant interest item.
The main reasons for the negative interest rates are, firstly, the reduction in the ECB's deposit rate (penalty rate), the
negative effect of which is euro -1,936 thousand and otherwise primarily involve CHF/EUR swaps.
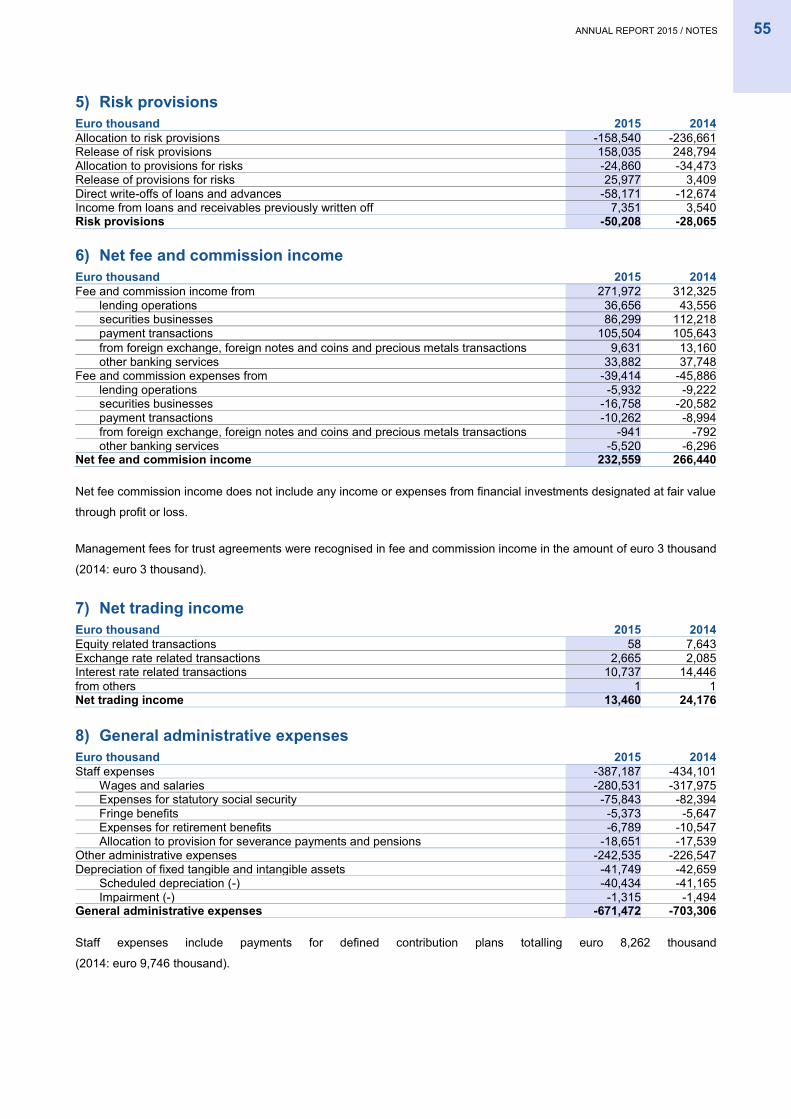
ANNUAL REPORT 2015 / NOTES 55
5) Risk provisions
Euro thousand 2015 2014 Allocation to risk provisions -158,540 -236,661 Release of risk provisions 158,035 248,794 Allocation to provisions for risks -24,860 -34,473 Release of provisions for risks 25,977 3,409 Direct write-offs of loans and advances -58,171 -12,674 Income from loans and receivables previously written off 7,351 3,540 Risk provisions -50,208 -28,065
6) Net fee and commission income
Euro thousand 2015 2014 Fee and commission income from 271,972 312,325
lending operations 36,656 43,556 securities businesses 86,299 112,218 payment transactions 105,504 105,643 from foreign exchange, foreign notes and coins and precious metals transactions 9,631 13,160 other banking services 33,882 37,748
Fee and commission expenses from -39,414 -45,886 lending operations -5,932 -9,222 securities businesses -16,758 -20,582 payment transactions -10,262 -8,994 from foreign exchange, foreign notes and coins and precious metals transactions -941 -792 other banking services -5,520 -6,296
Net fee and commision income 232,559 266,440
Net fee commission income does not include any income or expenses from financial investments designated at fair value
through profit or loss.
Management fees for trust agreements were recognised in fee and commission income in the amount of euro 3 thousand
(2014: euro 3 thousand).
7) Net trading income
Euro thousand 2015 2014 Equity related transactions 58 7,643 Exchange rate related transactions 2,665 2,085 Interest rate related transactions 10,737 14,446 from others 1 1 Net trading income 13,460 24,176
8) General administrative expenses
Euro thousand 2015 2014 Staff expenses -387,187 -434,101
Wages and salaries -280,531 -317,975 Expenses for statutory social security -75,843 -82,394 Fringe benefits -5,373 -5,647 Expenses for retirement benefits -6,789 -10,547 Allocation to provision for severance payments and pensions -18,651 -17,539
Other administrative expenses -242,535 -226,547 Depreciation of fixed tangible and intangible assets -41,749 -42,659
Scheduled depreciation (-) -40,434 -41,165 Impairment (-) -1,315 -1,494
General administrative expenses -671,472 -703,306
Staff expenses include payments for defined contribution plans totalling euro 8,262 thousand
(2014: euro 9,746 thousand).
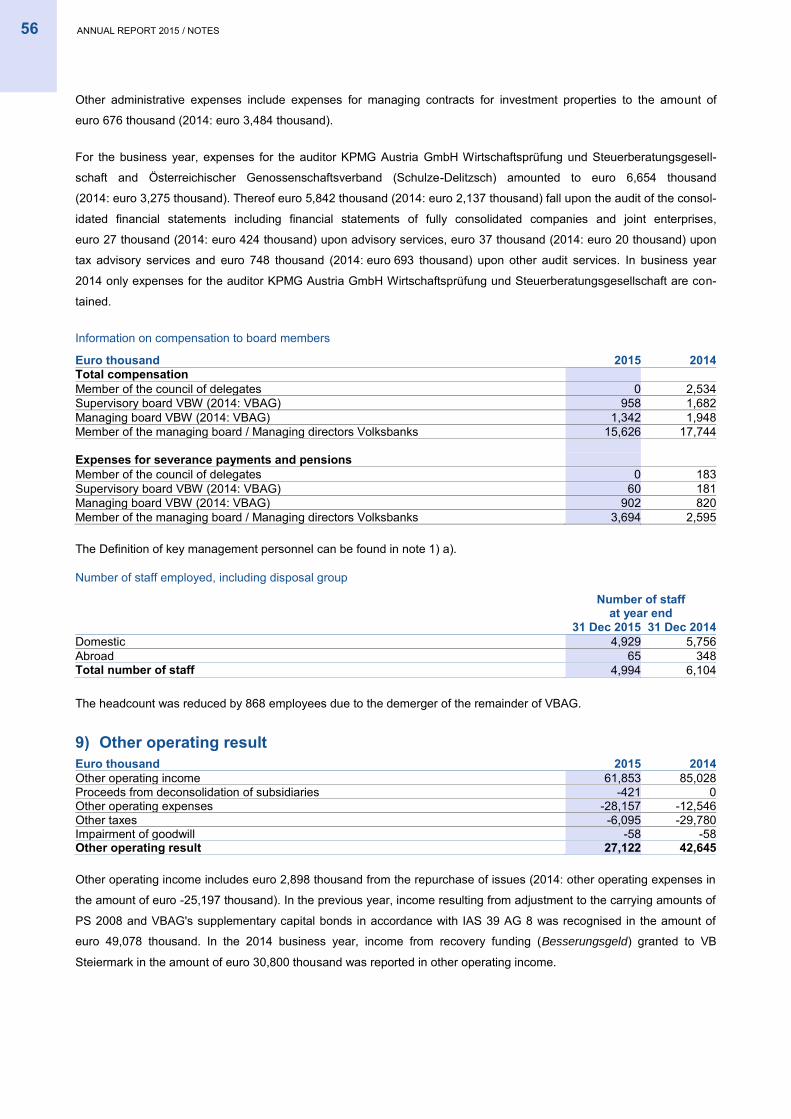
56 ANNUAL REPORT 2015 / NOTES
Other administrative expenses include expenses for managing contracts for investment properties to the amount of
euro 676 thousand (2014: euro 3,484 thousand).
For the business year, expenses for the auditor KPMG Austria GmbH Wirtschaftsprüfung und Steuerberatungsgesell-
schaft and Österreichischer Genossenschaftsverband (Schulze-Delitzsch) amounted to euro 6,654 thousand
(2014: euro 3,275 thousand). Thereof euro 5,842 thousand (2014: euro 2,137 thousand) fall upon the audit of the consol-
idated financial statements including financial statements of fully consolidated companies and joint enterprises,
euro 27 thousand (2014: euro 424 thousand) upon advisory services, euro 37 thousand (2014: euro 20 thousand) upon
tax advisory services and euro 748 thousand (2014: euro 693 thousand) upon other audit services. In business year
2014 only expenses for the auditor KPMG Austria GmbH Wirtschaftsprüfung und Steuerberatungsgesellschaft are con-
tained.
Information on compensation to board members
Euro thousand 2015 2014 Total compensation
Member of the council of delegates 0 2,534 Supervisory board VBW (2014: VBAG) 958 1,682 Managing board VBW (2014: VBAG) 1,342 1,948 Member of the managing board / Managing directors Volksbanks 15,626 17,744
Expenses for severance payments and pensions Member of the council of delegates 0 183
Supervisory board VBW (2014: VBAG) 60 181 Managing board VBW (2014: VBAG) 902 820 Member of the managing board / Managing directors Volksbanks 3,694 2,595
The Definition of key management personnel can be found in note 1) a).
Number of staff employed, including disposal group
Number of staff at year end
31 Dec 2015 31 Dec 2014
Domestic 4,929 5,756 Abroad 65 348 Total number of staff 4,994 6,104
The headcount was reduced by 868 employees due to the demerger of the remainder of VBAG.
9) Other operating result
Euro thousand 2015 2014 Other operating income 61,853 85,028 Proceeds from deconsolidation of subsidiaries -421 0 Other operating expenses -28,157 -12,546 Other taxes -6,095 -29,780 Impairment of goodwill -58 -58 Other operating result 27,122 42,645
Other operating income includes euro 2,898 thousand from the repurchase of issues (2014: other operating expenses in
the amount of euro -25,197 thousand). In the previous year, income resulting from adjustment to the carrying amounts of
PS 2008 and VBAG's supplementary capital bonds in accordance with IAS 39 AG 8 was recognised in the amount of
euro 49,078 thousand. In the 2014 business year, income from recovery funding (Besserungsgeld) granted to VB
Steiermark in the amount of euro 30,800 thousand was reported in other operating income.
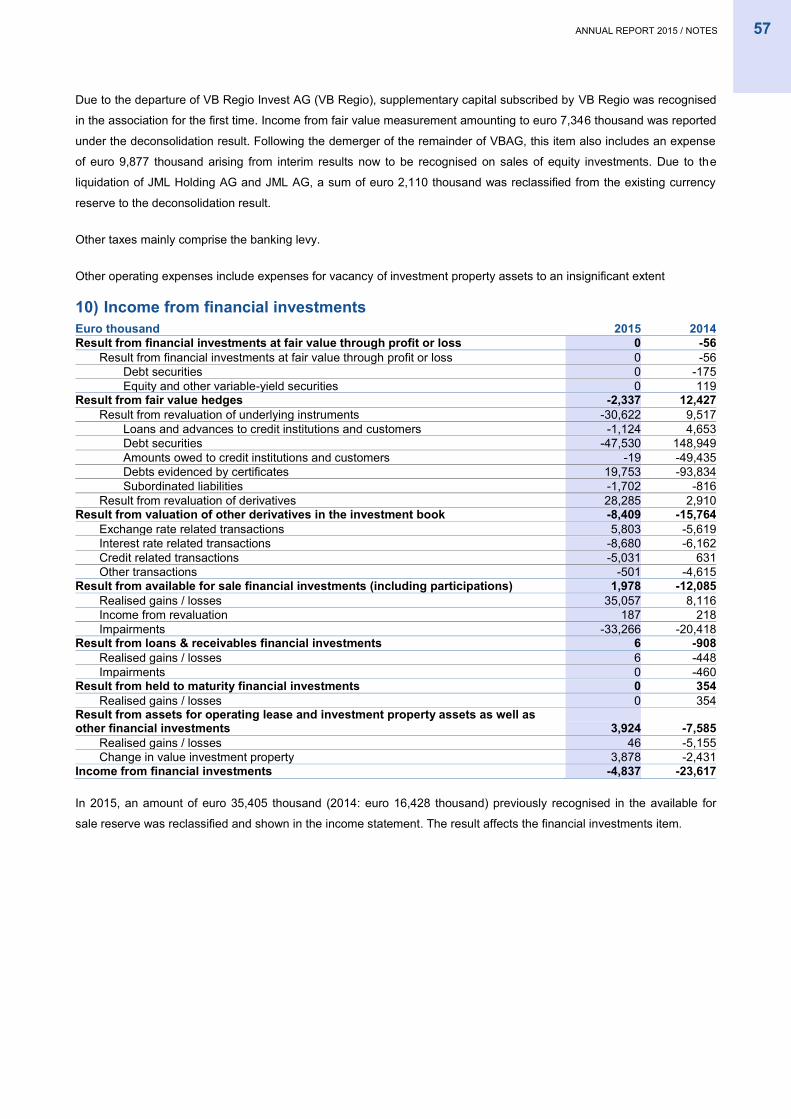
ANNUAL REPORT 2015 / NOTES 57
Due to the departure of VB Regio Invest AG (VB Regio), supplementary capital subscribed by VB Regio was recognised
in the association for the first time. Income from fair value measurement amounting to euro 7,346 thousand was reported
under the deconsolidation result. Following the demerger of the remainder of VBAG, this item also includes an expense
of euro 9,877 thousand arising from interim results now to be recognised on sales of equity investments. Due to the
liquidation of JML Holding AG and JML AG, a sum of euro 2,110 thousand was reclassified from the existing currency
reserve to the deconsolidation result.
Other taxes mainly comprise the banking levy.
Other operating expenses include expenses for vacancy of investment property assets to an insignificant extent
10) Income from financial investments
Euro thousand 2015 2014 Result from financial investments at fair value through profit or loss 0 -56
Result from financial investments at fair value through profit or loss 0 -56 Debt securities 0 -175 Equity and other variable-yield securities 0 119
Result from fair value hedges -2,337 12,427 Result from revaluation of underlying instruments -30,622 9,517
Loans and advances to credit institutions and customers -1,124 4,653 Debt securities -47,530 148,949 Amounts owed to credit institutions and customers -19 -49,435 Debts evidenced by certificates 19,753 -93,834 Subordinated liabilities -1,702 -816
Result from revaluation of derivatives 28,285 2,910 Result from valuation of other derivatives in the investment book -8,409 -15,764
Exchange rate related transactions 5,803 -5,619 Interest rate related transactions -8,680 -6,162 Credit related transactions -5,031 631 Other transactions -501 -4,615
Result from available for sale financial investments (including participations) 1,978 -12,085 Realised gains / losses 35,057 8,116 Income from revaluation 187 218 Impairments -33,266 -20,418
Result from loans & receivables financial investments 6 -908 Realised gains / losses 6 -448 Impairments 0 -460
Result from held to maturity financial investments 0 354 Realised gains / losses 0 354
Result from assets for operating lease and investment property assets as well as other financial investments 3,924 -7,585
Realised gains / losses 46 -5,155 Change in value investment property 3,878 -2,431
Income from financial investments -4,837 -23,617
In 2015, an amount of euro 35,405 thousand (2014: euro 16,428 thousand) previously recognised in the available for
sale reserve was reclassified and shown in the income statement. The result affects the financial investments item.
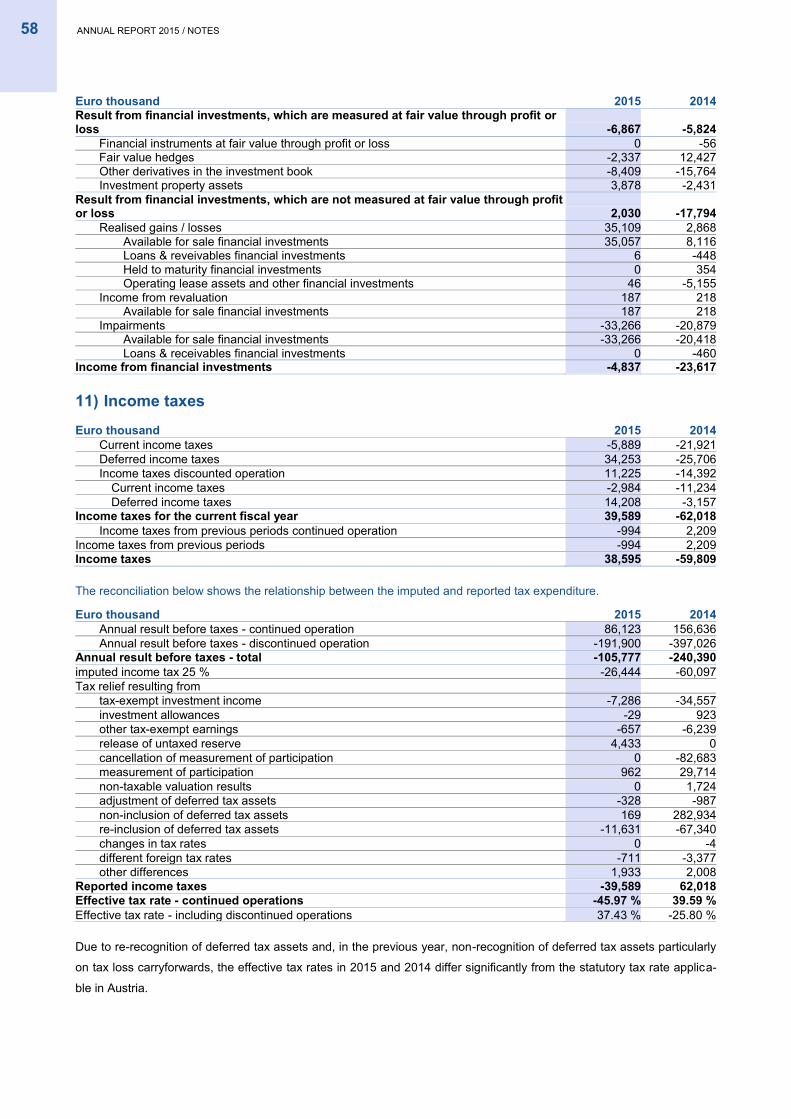
58 ANNUAL REPORT 2015 / NOTES
Euro thousand 2015 2014 Result from financial investments, which are measured at fair value through profit or loss -6,867 -5,824
Financial instruments at fair value through profit or loss 0 -56 Fair value hedges -2,337 12,427 Other derivatives in the investment book -8,409 -15,764 Investment property assets 3,878 -2,431
Result from financial investments, which are not measured at fair value through profit or loss 2,030 -17,794
Realised gains / losses 35,109 2,868 Available for sale financial investments 35,057 8,116 Loans & reveivables financial investments 6 -448 Held to maturity financial investments 0 354 Operating lease assets and other financial investments 46 -5,155
Income from revaluation 187 218 Available for sale financial investments 187 218
Impairments -33,266 -20,879 Available for sale financial investments -33,266 -20,418 Loans & receivables financial investments 0 -460
Income from financial investments -4,837 -23,617
11) Income taxes
Euro thousand 2015 2014 Current income taxes -5,889 -21,921 Deferred income taxes 34,253 -25,706 Income taxes discounted operation 11,225 -14,392
Current income taxes -2,984 -11,234 Deferred income taxes 14,208 -3,157
Income taxes for the current fiscal year 39,589 -62,018 Income taxes from previous periods continued operation -994 2,209
Income taxes from previous periods -994 2,209 Income taxes 38,595 -59,809
The reconciliation below shows the relationship between the imputed and reported tax expenditure.
Euro thousand 2015 2014 Annual result before taxes - continued operation 86,123 156,636 Annual result before taxes - discontinued operation -191,900 -397,026
Annual result before taxes - total -105,777 -240,390 imputed income tax 25 % -26,444 -60,097 Tax relief resulting from
tax-exempt investment income -7,286 -34,557 investment allowances -29 923 other tax-exempt earnings -657 -6,239 release of untaxed reserve 4,433 0 cancellation of measurement of participation 0 -82,683 measurement of participation 962 29,714 non-taxable valuation results 0 1,724 adjustment of deferred tax assets -328 -987 non-inclusion of deferred tax assets 169 282,934 re-inclusion of deferred tax assets -11,631 -67,340 changes in tax rates 0 -4 different foreign tax rates -711 -3,377 other differences 1,933 2,008
Reported income taxes -39,589 62,018 Effective tax rate - continued operations -45.97 % 39.59 % Effective tax rate - including discontinued operations 37.43 % -25.80 %
Due to re-recognition of deferred tax assets and, in the previous year, non-recognition of deferred tax assets particularly
on tax loss carryforwards, the effective tax rates in 2015 and 2014 differ significantly from the statutory tax rate applica-
ble in Austria.
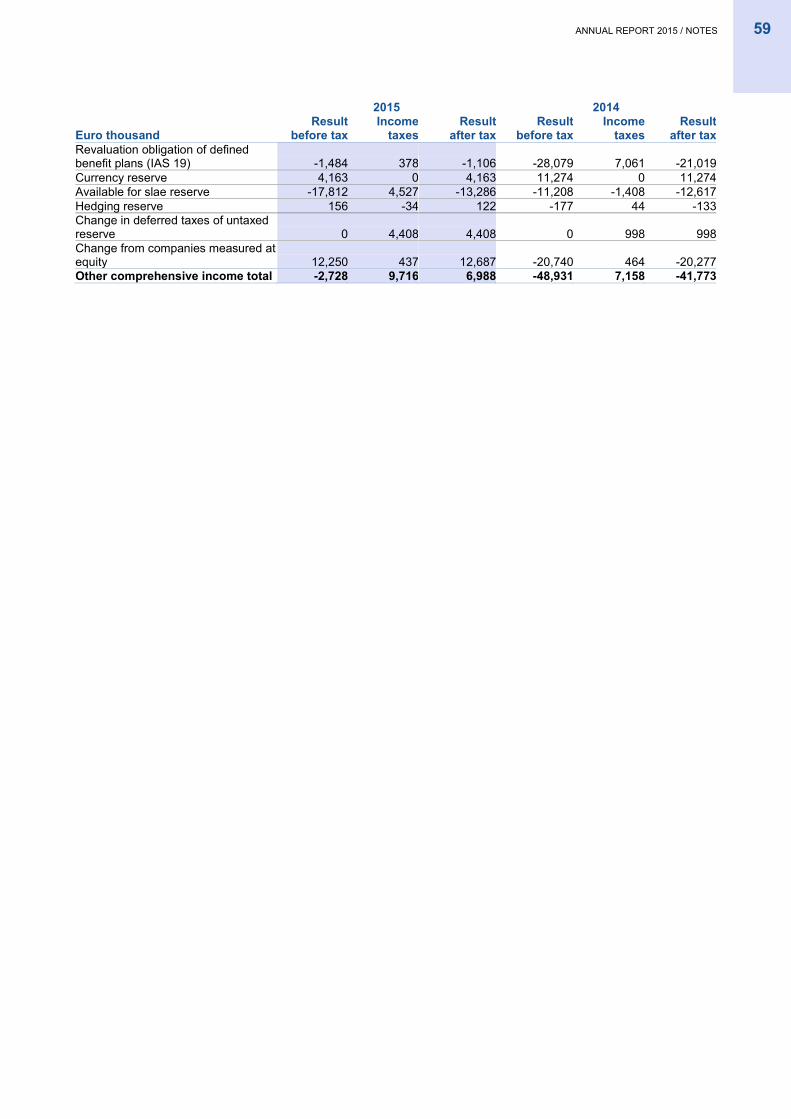
ANNUAL REPORT 2015 / NOTES 59
2015 2014
Euro thousand Result
before tax Income
taxes Result
after tax Result
before tax Income
taxes Result
after tax Revaluation obligation of defined benefit plans (IAS 19) -1,484 378 -1,106 -28,079 7,061 -21,019 Currency reserve 4,163 0 4,163 11,274 0 11,274 Available for slae reserve -17,812 4,527 -13,286 -11,208 -1,408 -12,617 Hedging reserve 156 -34 122 -177 44 -133 Change in deferred taxes of untaxed reserve 0 4,408 4,408 0 998 998 Change from companies measured at equity 12,250 437 12,687 -20,740 464 -20,277 Other comprehensive income total -2,728 9,716 6,988 -48,931 7,158 -41,773
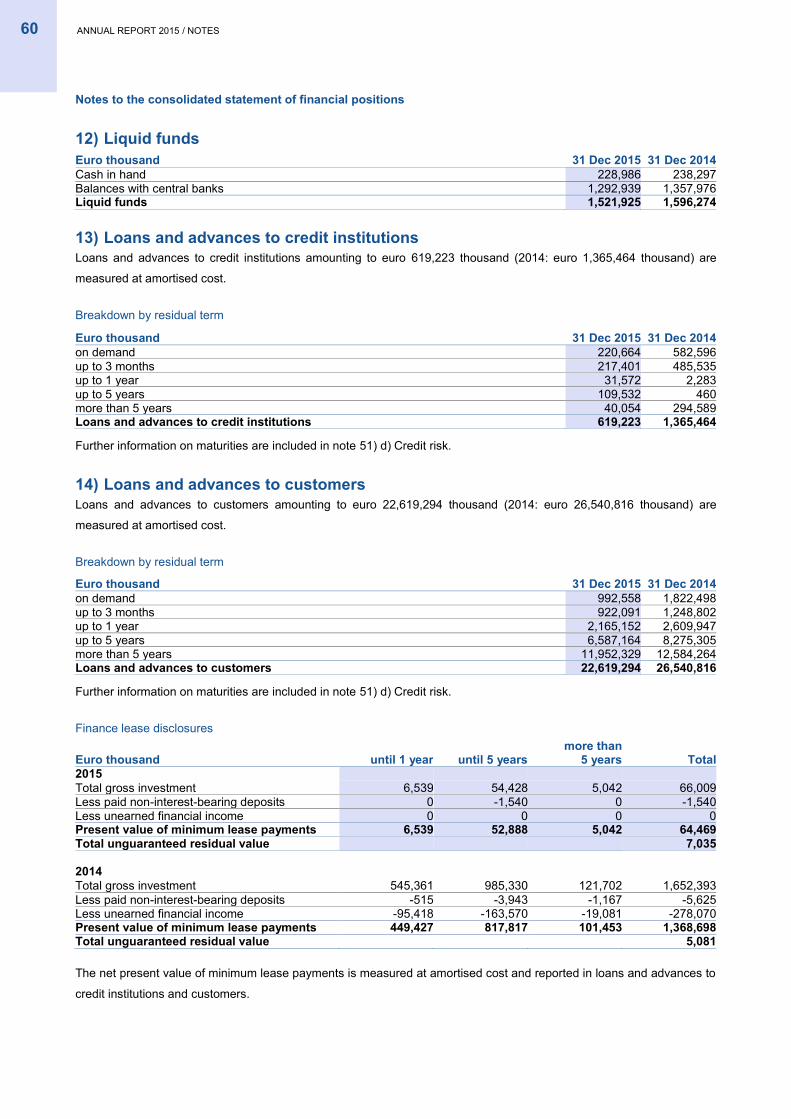
60 ANNUAL REPORT 2015 / NOTES
Notes to the consolidated statement of financial positions
12) Liquid funds
Euro thousand 31 Dec 2015 31 Dec 2014 Cash in hand 228,986 238,297 Balances with central banks 1,292,939 1,357,976 Liquid funds 1,521,925 1,596,274
13) Loans and advances to credit institutions Loans and advances to credit institutions amounting to euro 619,223 thousand (2014: euro 1,365,464 thousand) are
measured at amortised cost.
Breakdown by residual term
Euro thousand 31 Dec 2015 31 Dec 2014 on demand 220,664 582,596 up to 3 months 217,401 485,535 up to 1 year 31,572 2,283 up to 5 years 109,532 460 more than 5 years 40,054 294,589 Loans and advances to credit institutions 619,223 1,365,464
Further information on maturities are included in note 51) d) Credit risk.
14) Loans and advances to customers Loans and advances to customers amounting to euro 22,619,294 thousand (2014: euro 26,540,816 thousand) are
measured at amortised cost.
Breakdown by residual term
Euro thousand 31 Dec 2015 31 Dec 2014 on demand 992,558 1,822,498 up to 3 months 922,091 1,248,802 up to 1 year 2,165,152 2,609,947 up to 5 years 6,587,164 8,275,305 more than 5 years 11,952,329 12,584,264 Loans and advances to customers 22,619,294 26,540,816
Further information on maturities are included in note 51) d) Credit risk.
Finance lease disclosures
Euro thousand until 1 year until 5 years more than
5 years Total 2015
Total gross investment 6,539 54,428 5,042 66,009 Less paid non-interest-bearing deposits 0 -1,540 0 -1,540 Less unearned financial income 0 0 0 0 Present value of minimum lease payments 6,539 52,888 5,042 64,469 Total unguaranteed residual value
7,035
2014 Total gross investment 545,361 985,330 121,702 1,652,393
Less paid non-interest-bearing deposits -515 -3,943 -1,167 -5,625 Less unearned financial income -95,418 -163,570 -19,081 -278,070 Present value of minimum lease payments 449,427 817,817 101,453 1,368,698 Total unguaranteed residual value
5,081
The net present value of minimum lease payments is measured at amortised cost and reported in loans and advances to
credit institutions and customers.
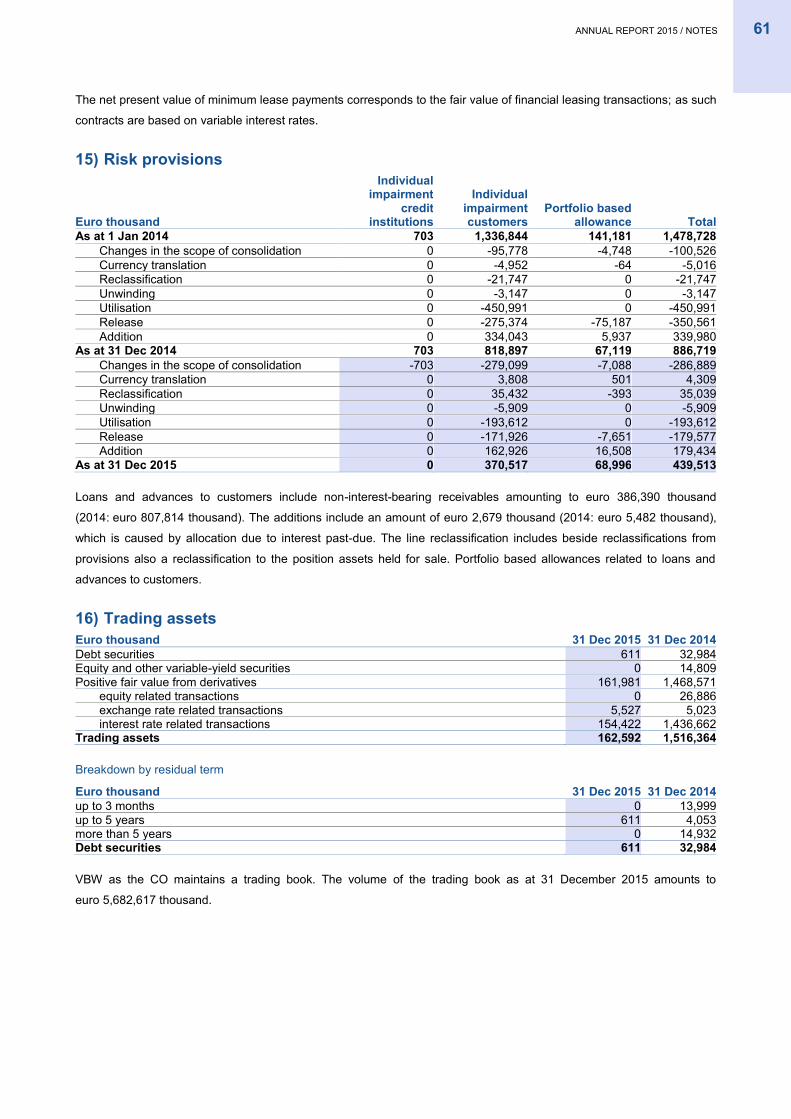
ANNUAL REPORT 2015 / NOTES 61
The net present value of minimum lease payments corresponds to the fair value of financial leasing transactions; as such
contracts are based on variable interest rates.
15) Risk provisions
Euro thousand
Individual impairment
credit institutions
Individual impairment customers
Portfolio based allowance Total
As at 1 Jan 2014 703 1,336,844 141,181 1,478,728 Changes in the scope of consolidation 0 -95,778 -4,748 -100,526 Currency translation 0 -4,952 -64 -5,016 Reclassification 0 -21,747 0 -21,747 Unwinding 0 -3,147 0 -3,147 Utilisation 0 -450,991 0 -450,991 Release 0 -275,374 -75,187 -350,561 Addition 0 334,043 5,937 339,980
As at 31 Dec 2014 703 818,897 67,119 886,719 Changes in the scope of consolidation -703 -279,099 -7,088 -286,889 Currency translation 0 3,808 501 4,309 Reclassification 0 35,432 -393 35,039 Unwinding 0 -5,909 0 -5,909 Utilisation 0 -193,612 0 -193,612 Release 0 -171,926 -7,651 -179,577 Addition 0 162,926 16,508 179,434
As at 31 Dec 2015 0 370,517 68,996 439,513
Loans and advances to customers include non-interest-bearing receivables amounting to euro 386,390 thousand
(2014: euro 807,814 thousand). The additions include an amount of euro 2,679 thousand (2014: euro 5,482 thousand),
which is caused by allocation due to interest past-due. The line reclassification includes beside reclassifications from
provisions also a reclassification to the position assets held for sale. Portfolio based allowances related to loans and
advances to customers.
16) Trading assets
Euro thousand 31 Dec 2015 31 Dec 2014 Debt securities 611 32,984 Equity and other variable-yield securities 0 14,809 Positive fair value from derivatives 161,981 1,468,571
equity related transactions 0 26,886 exchange rate related transactions 5,527 5,023 interest rate related transactions 154,422 1,436,662
Trading assets 162,592 1,516,364
Breakdown by residual term
Euro thousand 31 Dec 2015 31 Dec 2014 up to 3 months 0 13,999 up to 5 years 611 4,053 more than 5 years 0 14,932 Debt securities 611 32,984
VBW as the CO maintains a trading book. The volume of the trading book as at 31 December 2015 amounts to
euro 5,682,617 thousand.

62 ANNUAL REPORT 2015 / NOTES
17) Financial investments
Euro thousand 31 Dec 2015 31 Dec 2014 Financial investments at fair value through profit or loss 0 20,542
Debt securities 0 11,571 Equity and other variable-yield securities 0 8,970
Financial investments available for sale 2,330,406 3,532,092 Debt securities 2,031,659 3,148,341 Equity and other variable-yield securities 298,747 383,751
Financial investments loans & receivables 414 187,182 Financial investments held to maturity 70,716 366,574 Financial investments 2,401,536 4,106,389
Financial investments held to maturity also include deferred interest of euro 1,383 thousand (2014: euro 4,417 thou-
sand).
Breakdown by residual term
Euro thousand 31 Dec 2015 31 Dec 2014 up to 3 months 35,292 139,163 up to 1 year 80,493 313,212 up to 5 years 809,344 1,432,081 more than 5 years 1,177,660 1,829,211 Debt securities 2,102,789 3,713,667
Breakdown of debt securities in accordance with the Austrian Banking Act
Euro thousand 31 Dec 2015 31 Dec 2014 Listed securities 2,131,967 3,685,565
Debt securities 2,077,332 3,612,082 Equity and other variable-yield securities 54,635 73,483
Securities allocated to fixed assets 2,195,289 3,557,711 Securities eligible for rediscounting 1,937,942 3,008,945
Financial investments measured at fair value through profit or loss
Financial investments have been designated at fair value through profit or loss as the group manages these investments
on a fair value basis in accordance with its investment strategy. Internal reporting and performance measurement for
these investments are conducted on a fair value basis.
Reclassification from available for sale to loans & receivables
In accordance with the amendments to IAS 39 and IFRS 7, available for sale financial investments were reclassified to
the loans & receivables category in 2008. On initial recognition, these securities met the definition for the loans & receiv-
ables category but were instead designated as available for sale. The reclassification to the loans & receivables category
was performed on 1 July 2008. The fair value at the reclassification date was applied as the new carrying amount of
these securities.
Portfolios are allocated to the remainder of VBAG and deconsolidated with effect from 4 July 2015.
Euro thousand 31 Dec 2015 31 Dec 2014 01 Jul 2008 Carrying amount 0 27,120 1,140,363 Fair value 0 28,002 1,140,363 Available for sale reserve with reclassification 0 -76 -79,177 Available for sale reserve without reclassification 0 -861 -79,177
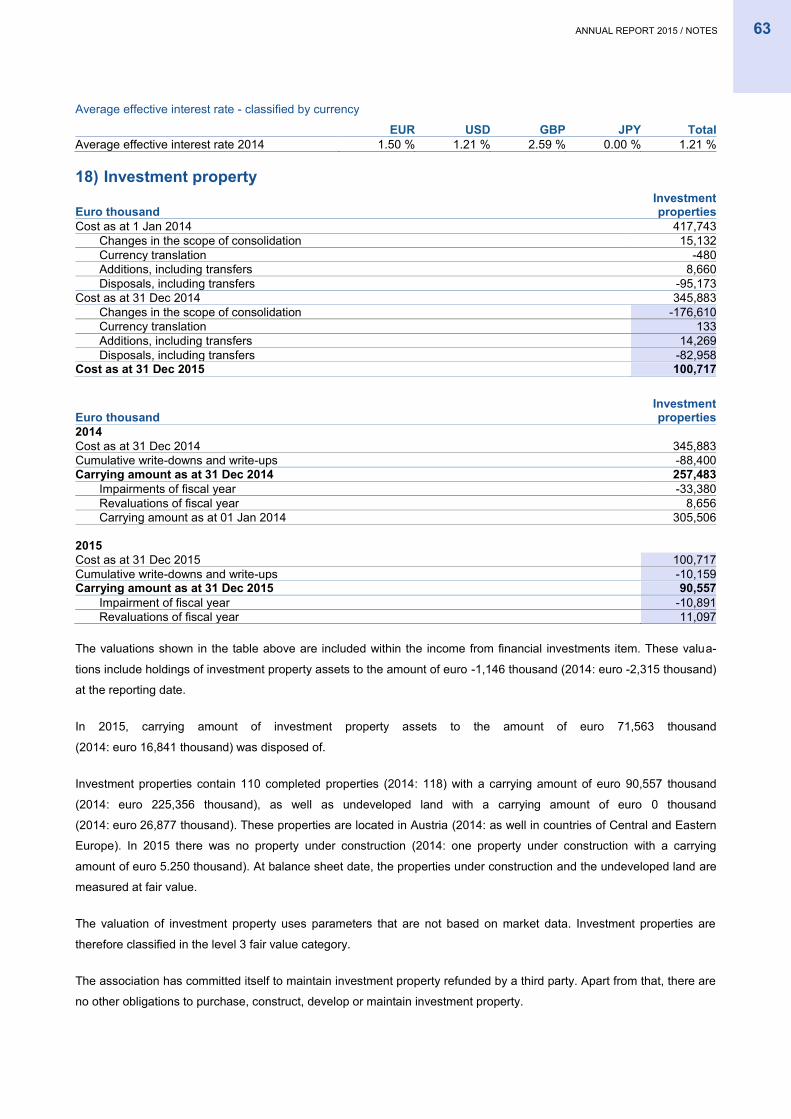
ANNUAL REPORT 2015 / NOTES 63
Average effective interest rate - classified by currency
EUR USD GBP JPY Total Average effective interest rate 2014 1.50 % 1.21 % 2.59 % 0.00 % 1.21 %
18) Investment property
Euro thousand Investment properties
Cost as at 1 Jan 2014 417,743 Changes in the scope of consolidation 15,132 Currency translation -480 Additions, including transfers 8,660 Disposals, including transfers -95,173
Cost as at 31 Dec 2014 345,883 Changes in the scope of consolidation -176,610 Currency translation 133 Additions, including transfers 14,269 Disposals, including transfers -82,958
Cost as at 31 Dec 2015 100,717
Euro thousand Investment properties
2014 Cost as at 31 Dec 2014 345,883
Cumulative write-downs and write-ups -88,400 Carrying amount as at 31 Dec 2014 257,483
Impairments of fiscal year -33,380 Revaluations of fiscal year 8,656 Carrying amount as at 01 Jan 2014 305,506
2015 Cost as at 31 Dec 2015 100,717 Cumulative write-downs and write-ups -10,159 Carrying amount as at 31 Dec 2015 90,557
Impairment of fiscal year -10,891 Revaluations of fiscal year 11,097
The valuations shown in the table above are included within the income from financial investments item. These valua-
tions include holdings of investment property assets to the amount of euro -1,146 thousand (2014: euro -2,315 thousand)
at the reporting date.
In 2015, carrying amount of investment property assets to the amount of euro 71,563 thousand
(2014: euro 16,841 thousand) was disposed of.
Investment properties contain 110 completed properties (2014: 118) with a carrying amount of euro 90,557 thousand
(2014: euro 225,356 thousand), as well as undeveloped land with a carrying amount of euro 0 thousand
(2014: euro 26,877 thousand). These properties are located in Austria (2014: as well in countries of Central and Eastern
Europe). In 2015 there was no property under construction (2014: one property under construction with a carrying
amount of euro 5.250 thousand). At balance sheet date, the properties under construction and the undeveloped land are
measured at fair value.
The valuation of investment property uses parameters that are not based on market data. Investment properties are
therefore classified in the level 3 fair value category.
The association has committed itself to maintain investment property refunded by a third party. Apart from that, there are
no other obligations to purchase, construct, develop or maintain investment property.
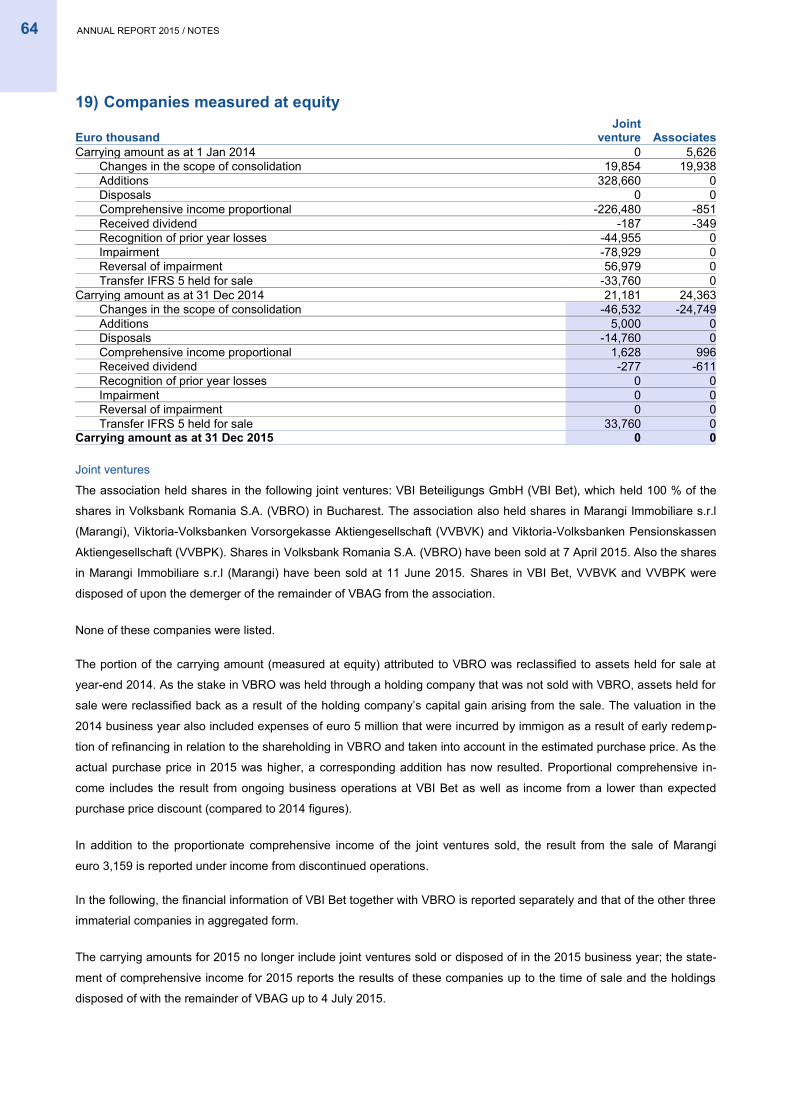
64 ANNUAL REPORT 2015 / NOTES
19) Companies measured at equity
Euro thousand Joint
venture Associates Carrying amount as at 1 Jan 2014 0 5,626
Changes in the scope of consolidation 19,854 19,938 Additions 328,660 0 Disposals 0 0 Comprehensive income proportional -226,480 -851 Received dividend -187 -349 Recognition of prior year losses -44,955 0 Impairment -78,929 0 Reversal of impairment 56,979 0 Transfer IFRS 5 held for sale -33,760 0
Carrying amount as at 31 Dec 2014 21,181 24,363 Changes in the scope of consolidation -46,532 -24,749 Additions 5,000 0 Disposals -14,760 0 Comprehensive income proportional 1,628 996 Received dividend -277 -611 Recognition of prior year losses 0 0 Impairment 0 0 Reversal of impairment 0 0 Transfer IFRS 5 held for sale 33,760 0
Carrying amount as at 31 Dec 2015 0 0
Joint ventures
The association held shares in the following joint ventures: VBI Beteiligungs GmbH (VBI Bet), which held 100 % of the
shares in Volksbank Romania S.A. (VBRO) in Bucharest. The association also held shares in Marangi Immobiliare s.r.l
(Marangi), Viktoria-Volksbanken Vorsorgekasse Aktiengesellschaft (VVBVK) and Viktoria-Volksbanken Pensionskassen
Aktiengesellschaft (VVBPK). Shares in Volksbank Romania S.A. (VBRO) have been sold at 7 April 2015. Also the shares
in Marangi Immobiliare s.r.l (Marangi) have been sold at 11 June 2015. Shares in VBI Bet, VVBVK and VVBPK were
disposed of upon the demerger of the remainder of VBAG from the association.
None of these companies were listed.
The portion of the carrying amount (measured at equity) attributed to VBRO was reclassified to assets held for sale at
year-end 2014. As the stake in VBRO was held through a holding company that was not sold with VBRO, assets held for
sale were reclassified back as a result of the holding company’s capital gain arising from the sale. The valuation in the
2014 business year also included expenses of euro 5 million that were incurred by immigon as a result of early redemp-
tion of refinancing in relation to the shareholding in VBRO and taken into account in the estimated purchase price. As the
actual purchase price in 2015 was higher, a corresponding addition has now resulted. Proportional comprehensive in-
come includes the result from ongoing business operations at VBI Bet as well as income from a lower than expected
purchase price discount (compared to 2014 figures).
In addition to the proportionate comprehensive income of the joint ventures sold, the result from the sale of Marangi
euro 3,159 is reported under income from discontinued operations.
In the following, the financial information of VBI Bet together with VBRO is reported separately and that of the other three
immaterial companies in aggregated form.
The carrying amounts for 2015 no longer include joint ventures sold or disposed of in the 2015 business year; the state-
ment of comprehensive income for 2015 reports the results of these companies up to the time of sale and the holdings
disposed of with the remainder of VBAG up to 4 July 2015.
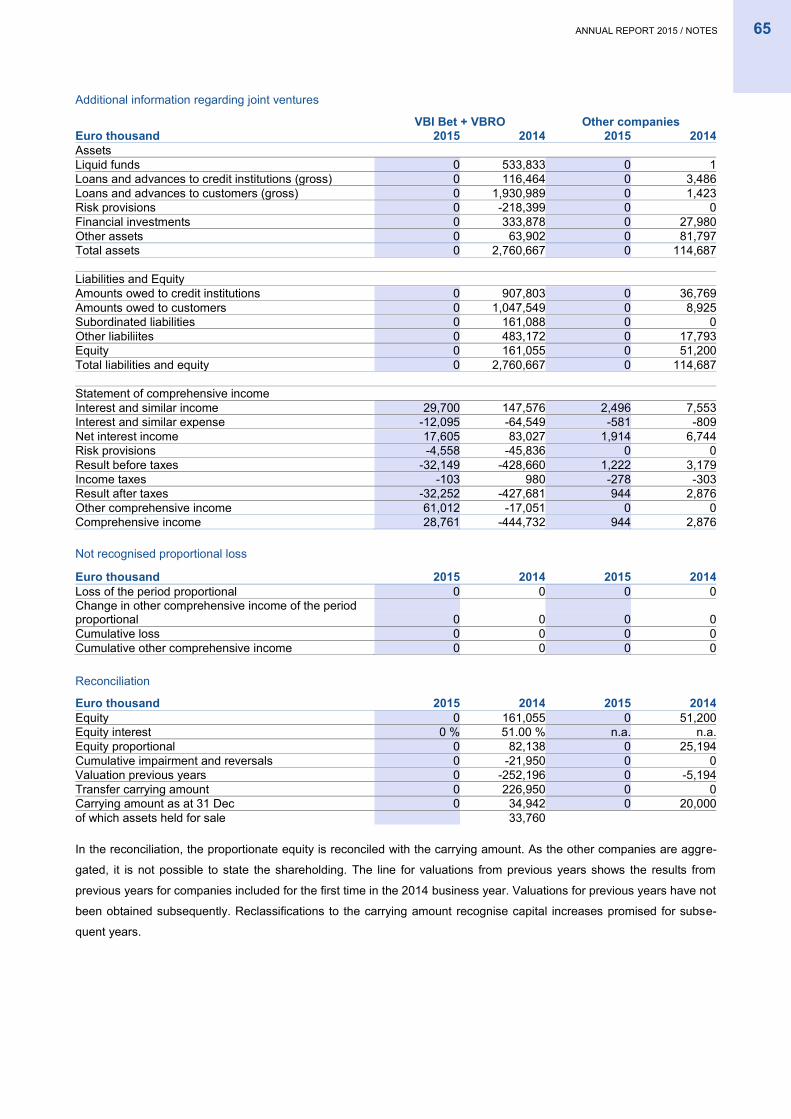
ANNUAL REPORT 2015 / NOTES 65
Additional information regarding joint ventures
VBI Bet + VBRO Other companies
Euro thousand 2015 2014 2015 2014 Assets
Liquid funds 0 533,833 0 1 Loans and advances to credit institutions (gross) 0 116,464 0 3,486 Loans and advances to customers (gross) 0 1,930,989 0 1,423 Risk provisions 0 -218,399 0 0 Financial investments 0 333,878 0 27,980 Other assets 0 63,902 0 81,797 Total assets 0 2,760,667 0 114,687
Liabilities and Equity Amounts owed to credit institutions 0 907,803 0 36,769
Amounts owed to customers 0 1,047,549 0 8,925 Subordinated liabilities 0 161,088 0 0 Other liabiliites 0 483,172 0 17,793 Equity 0 161,055 0 51,200 Total liabilities and equity 0 2,760,667 0 114,687
Statement of comprehensive income Interest and similar income 29,700 147,576 2,496 7,553
Interest and similar expense -12,095 -64,549 -581 -809 Net interest income 17,605 83,027 1,914 6,744 Risk provisions -4,558 -45,836 0 0 Result before taxes -32,149 -428,660 1,222 3,179 Income taxes -103 980 -278 -303 Result after taxes -32,252 -427,681 944 2,876 Other comprehensive income 61,012 -17,051 0 0 Comprehensive income 28,761 -444,732 944 2,876
Not recognised proportional loss
Euro thousand 2015 2014 2015 2014 Loss of the period proportional 0 0 0 0 Change in other comprehensive income of the period proportional 0 0 0 0 Cumulative loss 0 0 0 0 Cumulative other comprehensive income 0 0 0 0
Reconciliation
Euro thousand 2015 2014 2015 2014 Equity 0 161,055 0 51,200 Equity interest 0 % 51.00 % n.a. n.a. Equity proportional 0 82,138 0 25,194 Cumulative impairment and reversals 0 -21,950 0 0 Valuation previous years 0 -252,196 0 -5,194 Transfer carrying amount 0 226,950 0 0 Carrying amount as at 31 Dec 0 34,942 0 20,000 of which assets held for sale
33,760
In the reconciliation, the proportionate equity is reconciled with the carrying amount. As the other companies are aggre-
gated, it is not possible to state the shareholding. The line for valuations from previous years shows the results from
previous years for companies included for the first time in the 2014 business year. Valuations for previous years have not
been obtained subsequently. Reclassifications to the carrying amount recognise capital increases promised for subse-
quent years.
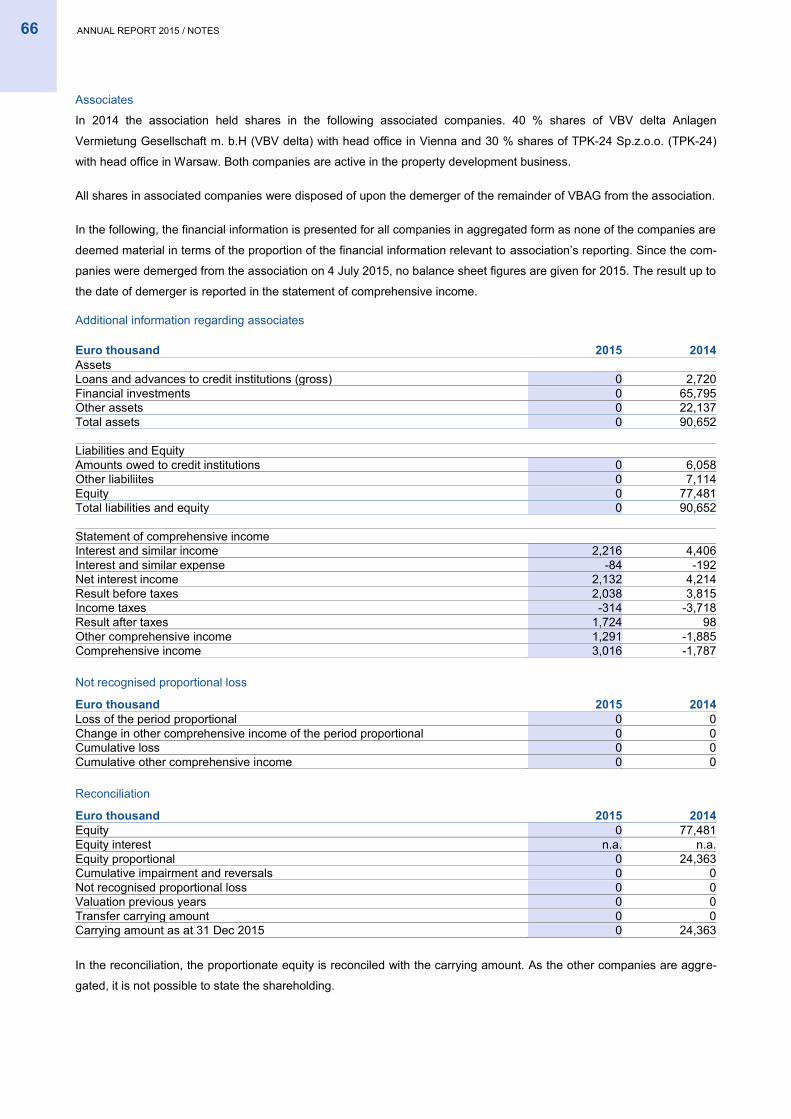
66 ANNUAL REPORT 2015 / NOTES
Associates
In 2014 the association held shares in the following associated companies. 40 % shares of VBV delta Anlagen
Vermietung Gesellschaft m. b.H (VBV delta) with head office in Vienna and 30 % shares of TPK-24 Sp.z.o.o. (TPK-24)
with head office in Warsaw. Both companies are active in the property development business.
All shares in associated companies were disposed of upon the demerger of the remainder of VBAG from the association.
In the following, the financial information is presented for all companies in aggregated form as none of the companies are
deemed material in terms of the proportion of the financial information relevant to association’s reporting. Since the com-
panies were demerged from the association on 4 July 2015, no balance sheet figures are given for 2015. The result up to
the date of demerger is reported in the statement of comprehensive income.
Additional information regarding associates
Euro thousand 2015 2014 Assets
Loans and advances to credit institutions (gross) 0 2,720 Financial investments 0 65,795 Other assets 0 22,137 Total assets 0 90,652
Liabilities and Equity Amounts owed to credit institutions 0 6,058
Other liabiliites 0 7,114 Equity 0 77,481 Total liabilities and equity 0 90,652
Statement of comprehensive income Interest and similar income 2,216 4,406
Interest and similar expense -84 -192 Net interest income 2,132 4,214 Result before taxes 2,038 3,815 Income taxes -314 -3,718 Result after taxes 1,724 98 Other comprehensive income 1,291 -1,885 Comprehensive income 3,016 -1,787
Not recognised proportional loss
Euro thousand 2015 2014 Loss of the period proportional 0 0 Change in other comprehensive income of the period proportional 0 0 Cumulative loss 0 0 Cumulative other comprehensive income 0 0
Reconciliation
Euro thousand 2015 2014 Equity 0 77,481 Equity interest n.a. n.a. Equity proportional 0 24,363 Cumulative impairment and reversals 0 0 Not recognised proportional loss 0 0 Valuation previous years 0 0 Transfer carrying amount 0 0 Carrying amount as at 31 Dec 2015 0 24,363
In the reconciliation, the proportionate equity is reconciled with the carrying amount. As the other companies are aggre-
gated, it is not possible to state the shareholding.
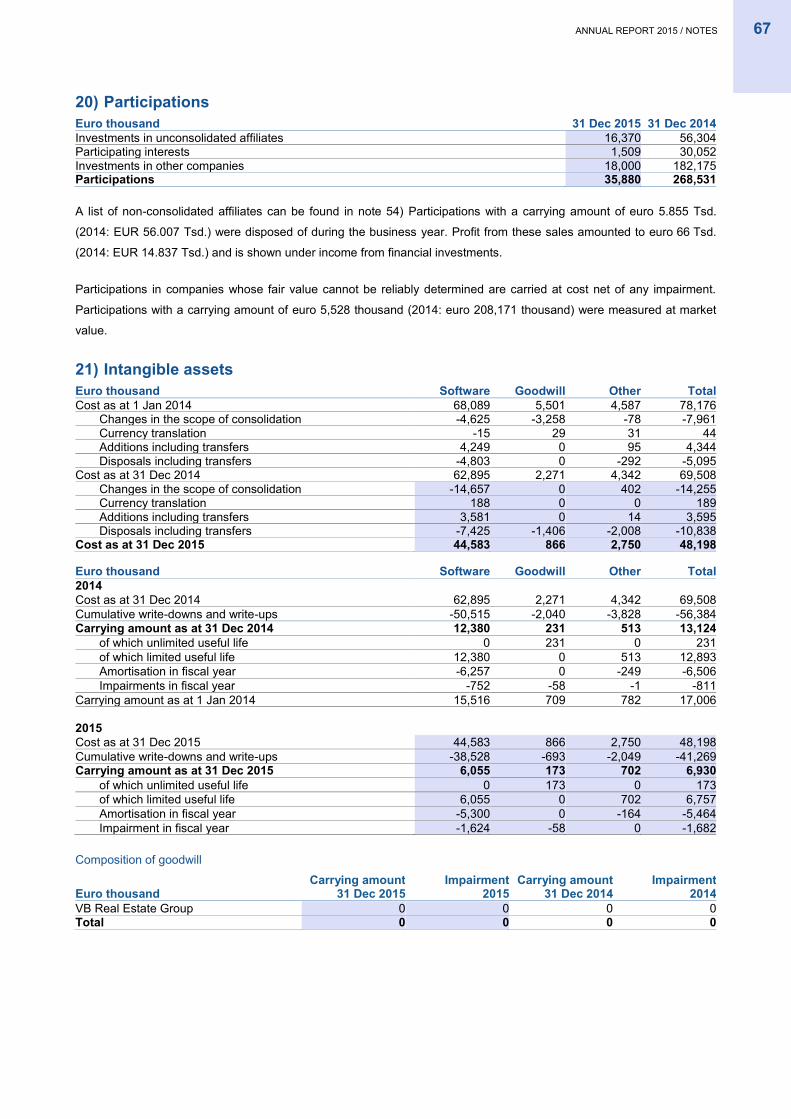
ANNUAL REPORT 2015 / NOTES 67
20) Participations
Euro thousand 31 Dec 2015 31 Dec 2014 Investments in unconsolidated affiliates 16,370 56,304 Participating interests 1,509 30,052 Investments in other companies 18,000 182,175 Participations 35,880 268,531
A list of non-consolidated affiliates can be found in note 54) Participations with a carrying amount of euro 5.855 Tsd.
(2014: EUR 56.007 Tsd.) were disposed of during the business year. Profit from these sales amounted to euro 66 Tsd.
(2014: EUR 14.837 Tsd.) and is shown under income from financial investments.
Participations in companies whose fair value cannot be reliably determined are carried at cost net of any impairment.
Participations with a carrying amount of euro 5,528 thousand (2014: euro 208,171 thousand) were measured at market
value.
21) Intangible assets
Euro thousand Software Goodwill Other Total Cost as at 1 Jan 2014 68,089 5,501 4,587 78,176
Changes in the scope of consolidation -4,625 -3,258 -78 -7,961 Currency translation -15 29 31 44 Additions including transfers 4,249 0 95 4,344 Disposals including transfers -4,803 0 -292 -5,095
Cost as at 31 Dec 2014 62,895 2,271 4,342 69,508 Changes in the scope of consolidation -14,657 0 402 -14,255 Currency translation 188 0 0 189 Additions including transfers 3,581 0 14 3,595 Disposals including transfers -7,425 -1,406 -2,008 -10,838
Cost as at 31 Dec 2015 44,583 866 2,750 48,198
Euro thousand Software Goodwill Other Total 2014
Cost as at 31 Dec 2014 62,895 2,271 4,342 69,508 Cumulative write-downs and write-ups -50,515 -2,040 -3,828 -56,384 Carrying amount as at 31 Dec 2014 12,380 231 513 13,124
of which unlimited useful life 0 231 0 231 of which limited useful life 12,380 0 513 12,893 Amortisation in fiscal year -6,257 0 -249 -6,506 Impairments in fiscal year -752 -58 -1 -811
Carrying amount as at 1 Jan 2014 15,516 709 782 17,006
2015 Cost as at 31 Dec 2015 44,583 866 2,750 48,198
Cumulative write-downs and write-ups -38,528 -693 -2,049 -41,269 Carrying amount as at 31 Dec 2015 6,055 173 702 6,930
of which unlimited useful life 0 173 0 173 of which limited useful life 6,055 0 702 6,757 Amortisation in fiscal year -5,300 0 -164 -5,464 Impairment in fiscal year -1,624 -58 0 -1,682
Composition of goodwill
Euro thousand Carrying amount
31 Dec 2015 Impairment
2015 Carrying amount
31 Dec 2014 Impairment
2014 VB Real Estate Group 0 0 0 0 Total 0 0 0 0
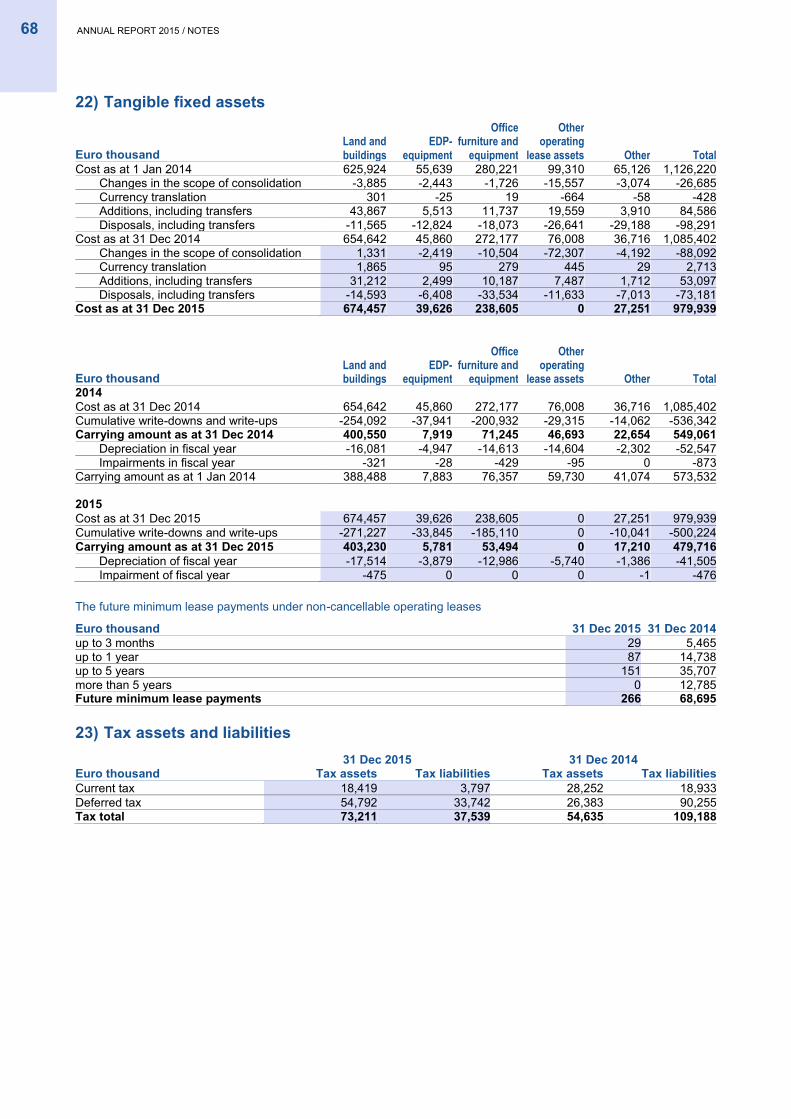
68 ANNUAL REPORT 2015 / NOTES
22) Tangible fixed assets
Euro thousand Land and buildings
EDP-equipment
Office furniture and
equipment
Other operating
lease assets Other Total
Cost as at 1 Jan 2014 625,924 55,639 280,221 99,310 65,126 1,126,220 Changes in the scope of consolidation -3,885 -2,443 -1,726 -15,557 -3,074 -26,685 Currency translation 301 -25 19 -664 -58 -428 Additions, including transfers 43,867 5,513 11,737 19,559 3,910 84,586 Disposals, including transfers -11,565 -12,824 -18,073 -26,641 -29,188 -98,291
Cost as at 31 Dec 2014 654,642 45,860 272,177 76,008 36,716 1,085,402 Changes in the scope of consolidation 1,331 -2,419 -10,504 -72,307 -4,192 -88,092 Currency translation 1,865 95 279 445 29 2,713 Additions, including transfers 31,212 2,499 10,187 7,487 1,712 53,097 Disposals, including transfers -14,593 -6,408 -33,534 -11,633 -7,013 -73,181
Cost as at 31 Dec 2015 674,457 39,626 238,605 0 27,251 979,939
Euro thousand Land and buildings
EDP-equipment
Office furniture and
equipment
Other operating
lease assets Other Total 2014
Cost as at 31 Dec 2014 654,642 45,860 272,177 76,008 36,716 1,085,402 Cumulative write-downs and write-ups -254,092 -37,941 -200,932 -29,315 -14,062 -536,342 Carrying amount as at 31 Dec 2014 400,550 7,919 71,245 46,693 22,654 549,061
Depreciation in fiscal year -16,081 -4,947 -14,613 -14,604 -2,302 -52,547 Impairments in fiscal year -321 -28 -429 -95 0 -873
Carrying amount as at 1 Jan 2014 388,488 7,883 76,357 59,730 41,074 573,532
2015 Cost as at 31 Dec 2015 674,457 39,626 238,605 0 27,251 979,939
Cumulative write-downs and write-ups -271,227 -33,845 -185,110 0 -10,041 -500,224 Carrying amount as at 31 Dec 2015 403,230 5,781 53,494 0 17,210 479,716
Depreciation of fiscal year -17,514 -3,879 -12,986 -5,740 -1,386 -41,505 Impairment of fiscal year -475 0 0 0 -1 -476
The future minimum lease payments under non-cancellable operating leases
Euro thousand 31 Dec 2015 31 Dec 2014 up to 3 months 29 5,465 up to 1 year 87 14,738 up to 5 years 151 35,707 more than 5 years 0 12,785 Future minimum lease payments 266 68,695
23) Tax assets and liabilities
31 Dec 2015 31 Dec 2014
Euro thousand Tax assets Tax liabilities Tax assets Tax liabilities Current tax 18,419 3,797 28,252 18,933 Deferred tax 54,792 33,742 26,383 90,255 Tax total 73,211 37,539 54,635 109,188
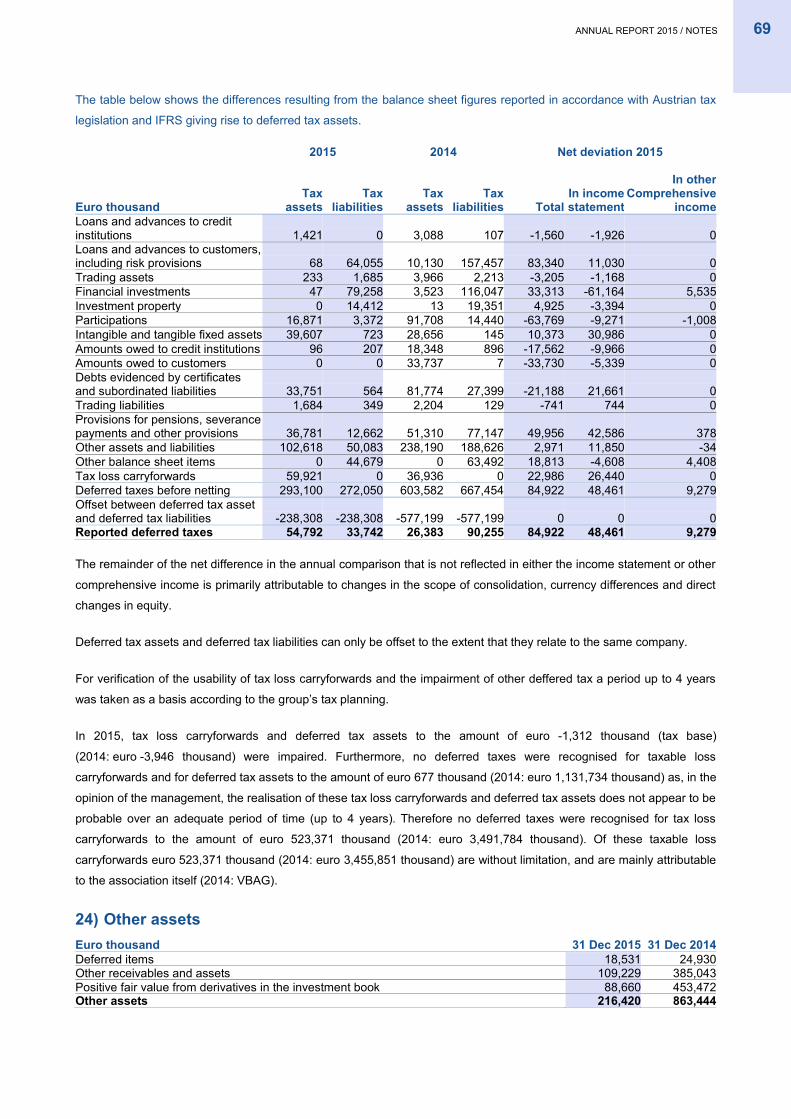
ANNUAL REPORT 2015 / NOTES 69
The table below shows the differences resulting from the balance sheet figures reported in accordance with Austrian tax
legislation and IFRS giving rise to deferred tax assets.
2015 2014 Net deviation 2015
Euro thousand Tax
assets
Tax
liabilities Tax
assets
Tax liabilities Total
In income statement
In other Comprehensive
income Loans and advances to credit institutions 1,421 0 3,088 107 -1,560 -1,926 0 Loans and advances to customers, including risk provisions 68 64,055 10,130 157,457 83,340 11,030 0 Trading assets 233 1,685 3,966 2,213 -3,205 -1,168 0 Financial investments 47 79,258 3,523 116,047 33,313 -61,164 5,535 Investment property 0 14,412 13 19,351 4,925 -3,394 0 Participations 16,871 3,372 91,708 14,440 -63,769 -9,271 -1,008 Intangible and tangible fixed assets 39,607 723 28,656 145 10,373 30,986 0 Amounts owed to credit institutions 96 207 18,348 896 -17,562 -9,966 0 Amounts owed to customers 0 0 33,737 7 -33,730 -5,339 0 Debts evidenced by certificates and subordinated liabilities 33,751 564 81,774 27,399 -21,188 21,661 0 Trading liabilities 1,684 349 2,204 129 -741 744 0 Provisions for pensions, severance payments and other provisions 36,781 12,662 51,310 77,147 49,956 42,586 378 Other assets and liabilities 102,618 50,083 238,190 188,626 2,971 11,850 -34 Other balance sheet items 0 44,679 0 63,492 18,813 -4,608 4,408 Tax loss carryforwards 59,921 0 36,936 0 22,986 26,440 0 Deferred taxes before netting 293,100 272,050 603,582 667,454 84,922 48,461 9,279 Offset between deferred tax asset and deferred tax liabilities -238,308 -238,308 -577,199 -577,199 0 0 0 Reported deferred taxes 54,792 33,742 26,383 90,255 84,922 48,461 9,279
The remainder of the net difference in the annual comparison that is not reflected in either the income statement or other
comprehensive income is primarily attributable to changes in the scope of consolidation, currency differences and direct
changes in equity.
Deferred tax assets and deferred tax liabilities can only be offset to the extent that they relate to the same company.
For verification of the usability of tax loss carryforwards and the impairment of other deffered tax a period up to 4 years
was taken as a basis according to the group’s tax planning.
In 2015, tax loss carryforwards and deferred tax assets to the amount of euro -1,312 thousand (tax base)
(2014: euro -3,946 thousand) were impaired. Furthermore, no deferred taxes were recognised for taxable loss
carryforwards and for deferred tax assets to the amount of euro 677 thousand (2014: euro 1,131,734 thousand) as, in the
opinion of the management, the realisation of these tax loss carryforwards and deferred tax assets does not appear to be
probable over an adequate period of time (up to 4 years). Therefore no deferred taxes were recognised for tax loss
carryforwards to the amount of euro 523,371 thousand (2014: euro 3,491,784 thousand). Of these taxable loss
carryforwards euro 523,371 thousand (2014: euro 3,455,851 thousand) are without limitation, and are mainly attributable
to the association itself (2014: VBAG).
24) Other assets
Euro thousand 31 Dec 2015 31 Dec 2014 Deferred items 18,531 24,930 Other receivables and assets 109,229 385,043 Positive fair value from derivatives in the investment book 88,660 453,472 Other assets 216,420 863,444
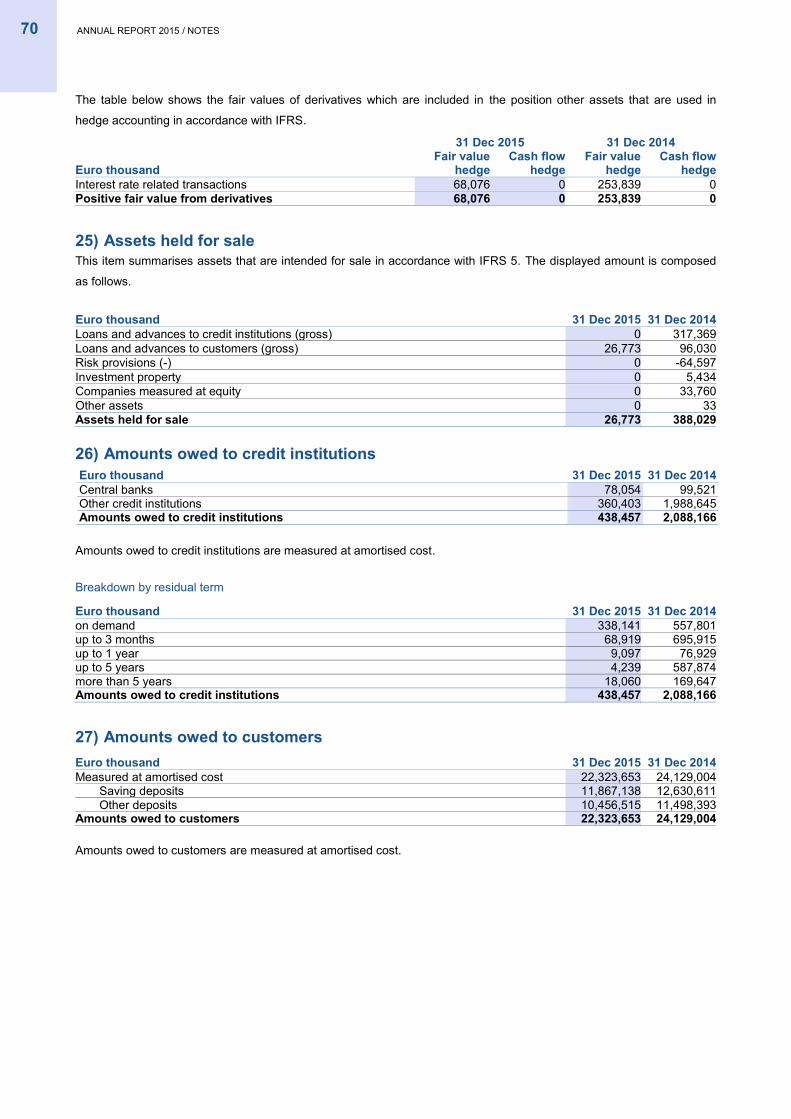
70 ANNUAL REPORT 2015 / NOTES
The table below shows the fair values of derivatives which are included in the position other assets that are used in
hedge accounting in accordance with IFRS.
31 Dec 2015 31 Dec 2014
Euro thousand Fair value
hedge Cash flow
hedge Fair value
hedge Cash flow
hedge Interest rate related transactions 68,076 0 253,839 0 Positive fair value from derivatives 68,076 0 253,839 0
25) Assets held for sale This item summarises assets that are intended for sale in accordance with IFRS 5. The displayed amount is composed
as follows.
Euro thousand 31 Dec 2015 31 Dec 2014 Loans and advances to credit institutions (gross) 0 317,369 Loans and advances to customers (gross) 26,773 96,030 Risk provisions (-) 0 -64,597 Investment property 0 5,434 Companies measured at equity 0 33,760 Other assets 0 33 Assets held for sale 26,773 388,029
26) Amounts owed to credit institutions
Euro thousand 31 Dec 2015 31 Dec 2014 Central banks 78,054 99,521 Other credit institutions 360,403 1,988,645 Amounts owed to credit institutions 438,457 2,088,166
Amounts owed to credit institutions are measured at amortised cost.
Breakdown by residual term
Euro thousand 31 Dec 2015 31 Dec 2014 on demand 338,141 557,801 up to 3 months 68,919 695,915 up to 1 year 9,097 76,929 up to 5 years 4,239 587,874 more than 5 years 18,060 169,647 Amounts owed to credit institutions 438,457 2,088,166
27) Amounts owed to customers
Euro thousand 31 Dec 2015 31 Dec 2014 Measured at amortised cost 22,323,653 24,129,004
Saving deposits 11,867,138 12,630,611 Other deposits 10,456,515 11,498,393
Amounts owed to customers 22,323,653 24,129,004
Amounts owed to customers are measured at amortised cost.

ANNUAL REPORT 2015 / NOTES 71
Breakdown by residual term
Euro thousand 31 Dec 2015 31 Dec 2014 on demand 12,183,774 11,453,473 up to 3 months 1,810,224 2,267,524 up to 1 year 3,938,030 4,348,497 up to 5 years 3,612,104 4,562,684 more than 5 years 779,521 1,496,827 Amounts owed to customers 22,323,653 24,129,004
28) Debts evidenced by certificates
Euro thousand 31 Dec 2015 31 Dec 2014 Bonds 1,485,908 3,431,055 Medium-term notes 262,208 488,874 Debts evidenced by certificates 1,748,116 3,919,929
Debts evidenced by certificates are measured at amortised cost.
Breakdown by residual term
Euro thousand 31 Dec 2015 31 Dec 2014 on demand 233 0 up to 3 months 91,876 227,448 up to 1 year 84,336 284,030 up to 5 years 609,020 2,121,508 more than 5 years 962,650 1,286,943 Debts evidenced by certificates 1,748,116 3,919,929
29) Trading liabilities
Euro thousand 31 Dec 2015 31 Dec 2014 Negative fair values from derivatives
Equity related transactions 0 36,516 Exchange rate related transactions 19,243 16,115 Interest rate related transactions 371,644 1,392,601 others 2,032 935
Trading liabilities 392,919 1,446,167
30) Provisions
Euro thousand Provisions for risk Other provisions Total As at 1 Jan 2014 25,511 103,547 129,058
Changes in the scope of consolidation 0 -199 -199 Currency translation 165 47 212 Reclassification 4,081 -2,531 1,550 Utilisation -5,635 -33,112 -38,747 Release -5,086 -14,624 -19,710 Addition 34,473 61,752 96,225
As at 31 Dec 2014 53,508 114,880 168,388 Change in the scope of consolidation -8,128 -73,194 -81,322 Currency translation 77 19 96 Reclassification 500 453 953 Utilisation -10,967 -15,038 -26,006 Release -28,343 -6,061 -34,404 Addition 24,860 11,586 36,445
As at 31 Dec 2015 31,505 32,644 64,150
Provisions for risk include provisions for off-balance transactions particularly for commitments and guarantees. These
provisions are mainly long-term provisions.
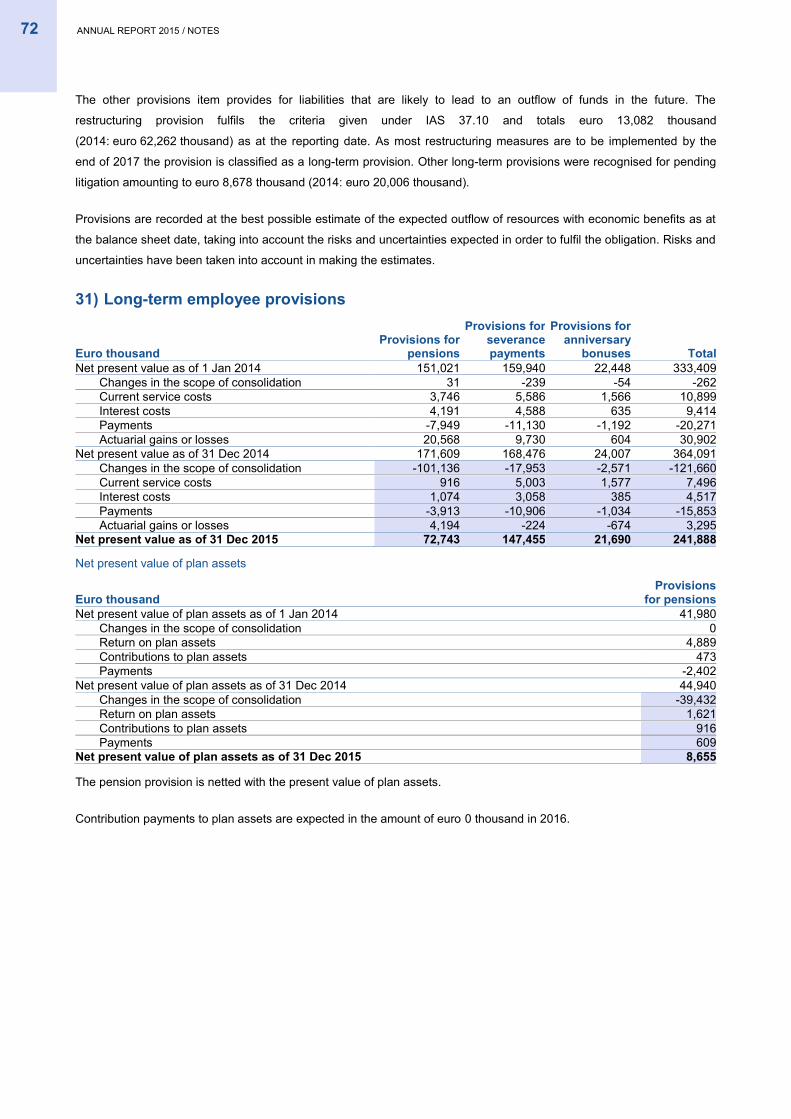
72 ANNUAL REPORT 2015 / NOTES
The other provisions item provides for liabilities that are likely to lead to an outflow of funds in the future. The
restructuring provision fulfils the criteria given under IAS 37.10 and totals euro 13,082 thousand
(2014: euro 62,262 thousand) as at the reporting date. As most restructuring measures are to be implemented by the
end of 2017 the provision is classified as a long-term provision. Other long-term provisions were recognised for pending
litigation amounting to euro 8,678 thousand (2014: euro 20,006 thousand).
Provisions are recorded at the best possible estimate of the expected outflow of resources with economic benefits as at
the balance sheet date, taking into account the risks and uncertainties expected in order to fulfil the obligation. Risks and
uncertainties have been taken into account in making the estimates.
31) Long-term employee provisions
Euro thousand Provisions for
pensions
Provisions for severance payments
Provisions for anniversary
bonuses Total Net present value as of 1 Jan 2014 151,021 159,940 22,448 333,409
Changes in the scope of consolidation 31 -239 -54 -262 Current service costs 3,746 5,586 1,566 10,899 Interest costs 4,191 4,588 635 9,414 Payments -7,949 -11,130 -1,192 -20,271 Actuarial gains or losses 20,568 9,730 604 30,902
Net present value as of 31 Dec 2014 171,609 168,476 24,007 364,091 Changes in the scope of consolidation -101,136 -17,953 -2,571 -121,660 Current service costs 916 5,003 1,577 7,496 Interest costs 1,074 3,058 385 4,517 Payments -3,913 -10,906 -1,034 -15,853 Actuarial gains or losses 4,194 -224 -674 3,295
Net present value as of 31 Dec 2015 72,743 147,455 21,690 241,888
Net present value of plan assets
Euro thousand Provisions
for pensions Net present value of plan assets as of 1 Jan 2014 41,980
Changes in the scope of consolidation 0 Return on plan assets 4,889 Contributions to plan assets 473 Payments -2,402
Net present value of plan assets as of 31 Dec 2014 44,940 Changes in the scope of consolidation -39,432 Return on plan assets 1,621 Contributions to plan assets 916 Payments 609
Net present value of plan assets as of 31 Dec 2015 8,655
The pension provision is netted with the present value of plan assets.
Contribution payments to plan assets are expected in the amount of euro 0 thousand in 2016.
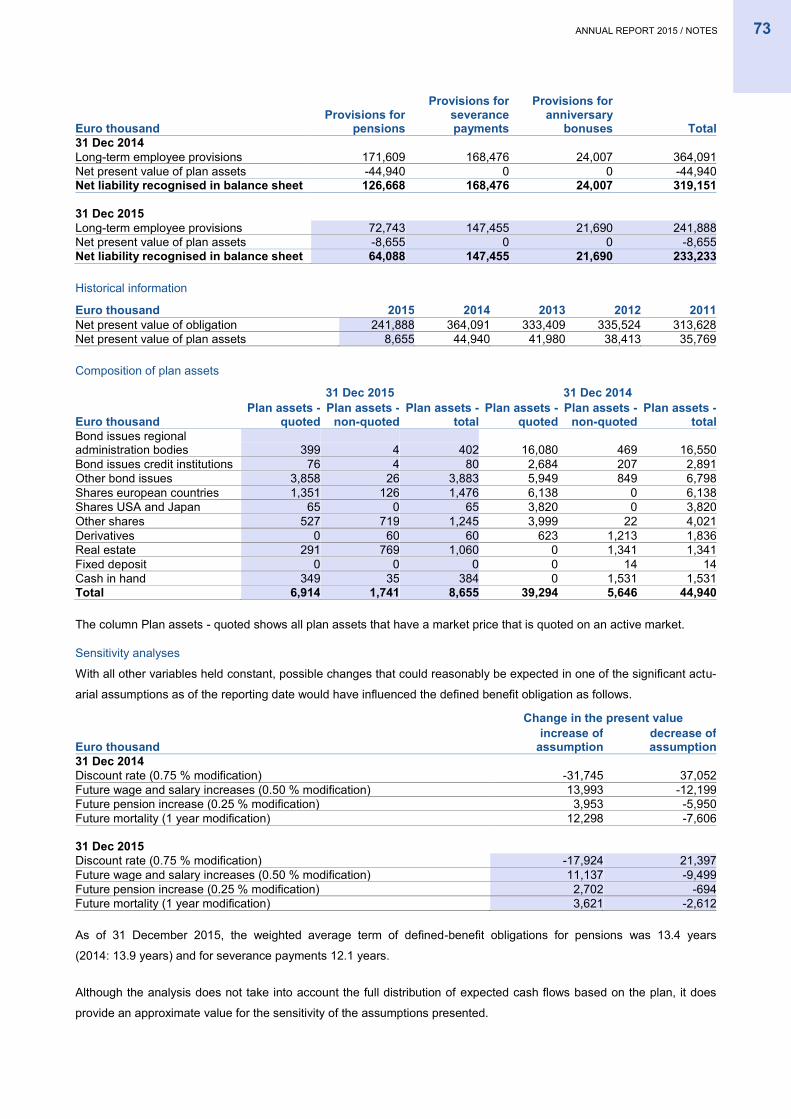
ANNUAL REPORT 2015 / NOTES 73
Euro thousand Provisions for
pensions
Provisions for severance payments
Provisions for anniversary
bonuses Total 31 Dec 2014
Long-term employee provisions 171,609 168,476 24,007 364,091 Net present value of plan assets -44,940 0 0 -44,940 Net liability recognised in balance sheet 126,668 168,476 24,007 319,151
31 Dec 2015 Long-term employee provisions 72,743 147,455 21,690 241,888
Net present value of plan assets -8,655 0 0 -8,655 Net liability recognised in balance sheet 64,088 147,455 21,690 233,233
Historical information
Euro thousand 2015 2014 2013 2012 2011 Net present value of obligation 241,888 364,091 333,409 335,524 313,628 Net present value of plan assets 8,655 44,940 41,980 38,413 35,769
Composition of plan assets
31 Dec 2015 31 Dec 2014
Euro thousand Plan assets -
quoted Plan assets -
non-quoted Plan assets -
total Plan assets -
quoted Plan assets -
non-quoted Plan assets -
total Bond issues regional administration bodies 399 4 402 16,080 469 16,550 Bond issues credit institutions 76 4 80 2,684 207 2,891 Other bond issues 3,858 26 3,883 5,949 849 6,798 Shares european countries 1,351 126 1,476 6,138 0 6,138 Shares USA and Japan 65 0 65 3,820 0 3,820 Other shares 527 719 1,245 3,999 22 4,021 Derivatives 0 60 60 623 1,213 1,836 Real estate 291 769 1,060 0 1,341 1,341 Fixed deposit 0 0 0 0 14 14 Cash in hand 349 35 384 0 1,531 1,531 Total 6,914 1,741 8,655 39,294 5,646 44,940
The column Plan assets - quoted shows all plan assets that have a market price that is quoted on an active market.
Sensitivity analyses
With all other variables held constant, possible changes that could reasonably be expected in one of the significant actu-
arial assumptions as of the reporting date would have influenced the defined benefit obligation as follows.
Change in the present value
Euro thousand increase of
assumption decrease of assumption
31 Dec 2014 Discount rate (0.75 % modification) -31,745 37,052
Future wage and salary increases (0.50 % modification) 13,993 -12,199 Future pension increase (0.25 % modification) 3,953 -5,950 Future mortality (1 year modification) 12,298 -7,606
31 Dec 2015 Discount rate (0.75 % modification) -17,924 21,397
Future wage and salary increases (0.50 % modification) 11,137 -9,499 Future pension increase (0.25 % modification) 2,702 -694 Future mortality (1 year modification) 3,621 -2,612
As of 31 December 2015, the weighted average term of defined-benefit obligations for pensions was 13.4 years
(2014: 13.9 years) and for severance payments 12.1 years.
Although the analysis does not take into account the full distribution of expected cash flows based on the plan, it does
provide an approximate value for the sensitivity of the assumptions presented.
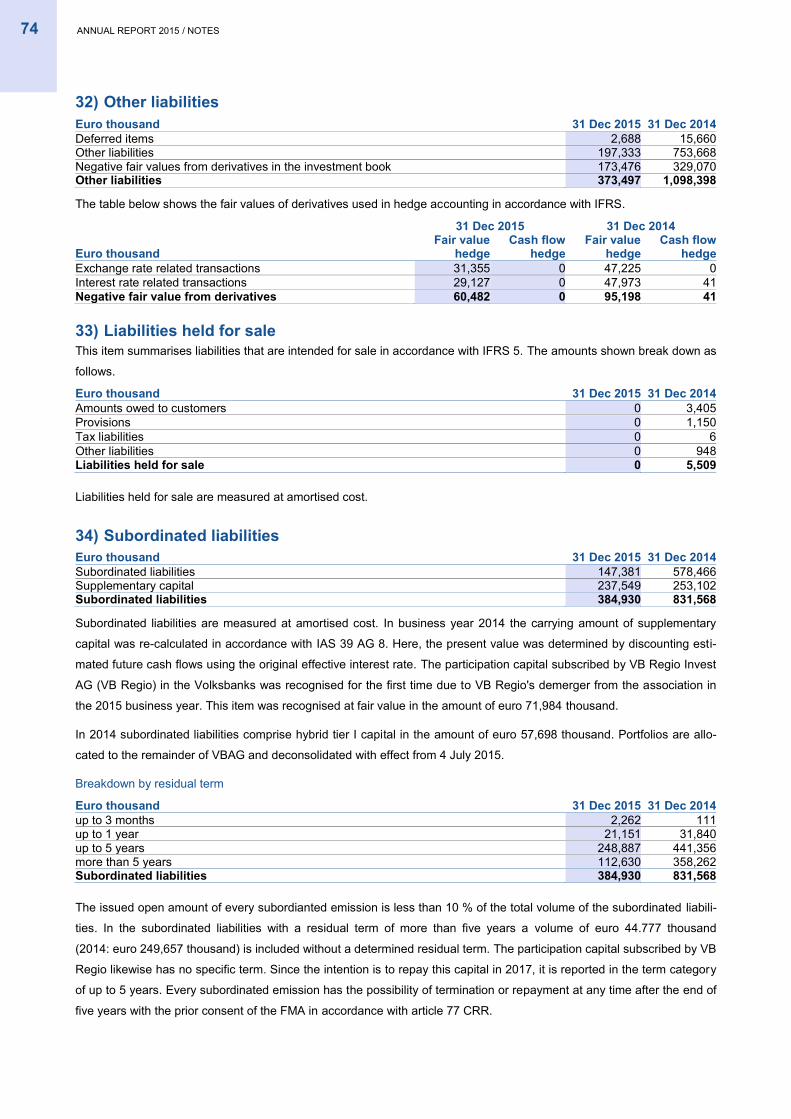
74 ANNUAL REPORT 2015 / NOTES
32) Other liabilities
Euro thousand 31 Dec 2015 31 Dec 2014 Deferred items 2,688 15,660 Other liabilities 197,333 753,668 Negative fair values from derivatives in the investment book 173,476 329,070 Other liabilities 373,497 1,098,398
The table below shows the fair values of derivatives used in hedge accounting in accordance with IFRS.
31 Dec 2015 31 Dec 2014
Euro thousand Fair value
hedge Cash flow
hedge Fair value
hedge Cash flow
hedge Exchange rate related transactions 31,355 0 47,225 0 Interest rate related transactions 29,127 0 47,973 41 Negative fair value from derivatives 60,482 0 95,198 41
33) Liabilities held for sale This item summarises liabilities that are intended for sale in accordance with IFRS 5. The amounts shown break down as
follows.
Euro thousand 31 Dec 2015 31 Dec 2014 Amounts owed to customers 0 3,405 Provisions 0 1,150 Tax liabilities 0 6 Other liabilities 0 948 Liabilities held for sale 0 5,509
Liabilities held for sale are measured at amortised cost.
34) Subordinated liabilities
Euro thousand 31 Dec 2015 31 Dec 2014 Subordinated liabilities 147,381 578,466 Supplementary capital 237,549 253,102 Subordinated liabilities 384,930 831,568
Subordinated liabilities are measured at amortised cost. In business year 2014 the carrying amount of supplementary
capital was re-calculated in accordance with IAS 39 AG 8. Here, the present value was determined by discounting esti-
mated future cash flows using the original effective interest rate. The participation capital subscribed by VB Regio Invest
AG (VB Regio) in the Volksbanks was recognised for the first time due to VB Regio's demerger from the association in
the 2015 business year. This item was recognised at fair value in the amount of euro 71,984 thousand.
In 2014 subordinated liabilities comprise hybrid tier I capital in the amount of euro 57,698 thousand. Portfolios are allo-
cated to the remainder of VBAG and deconsolidated with effect from 4 July 2015.
Breakdown by residual term
Euro thousand 31 Dec 2015 31 Dec 2014 up to 3 months 2,262 111 up to 1 year 21,151 31,840 up to 5 years 248,887 441,356 more than 5 years 112,630 358,262 Subordinated liabilities 384,930 831,568
The issued open amount of every subordianted emission is less than 10 % of the total volume of the subordinated liabili-
ties. In the subordinated liabilities with a residual term of more than five years a volume of euro 44.777 thousand
(2014: euro 249,657 thousand) is included without a determined residual term. The participation capital subscribed by VB
Regio likewise has no specific term. Since the intention is to repay this capital in 2017, it is reported in the term category
of up to 5 years. Every subordinated emission has the possibility of termination or repayment at any time after the end of
five years with the prior consent of the FMA in accordance with article 77 CRR.
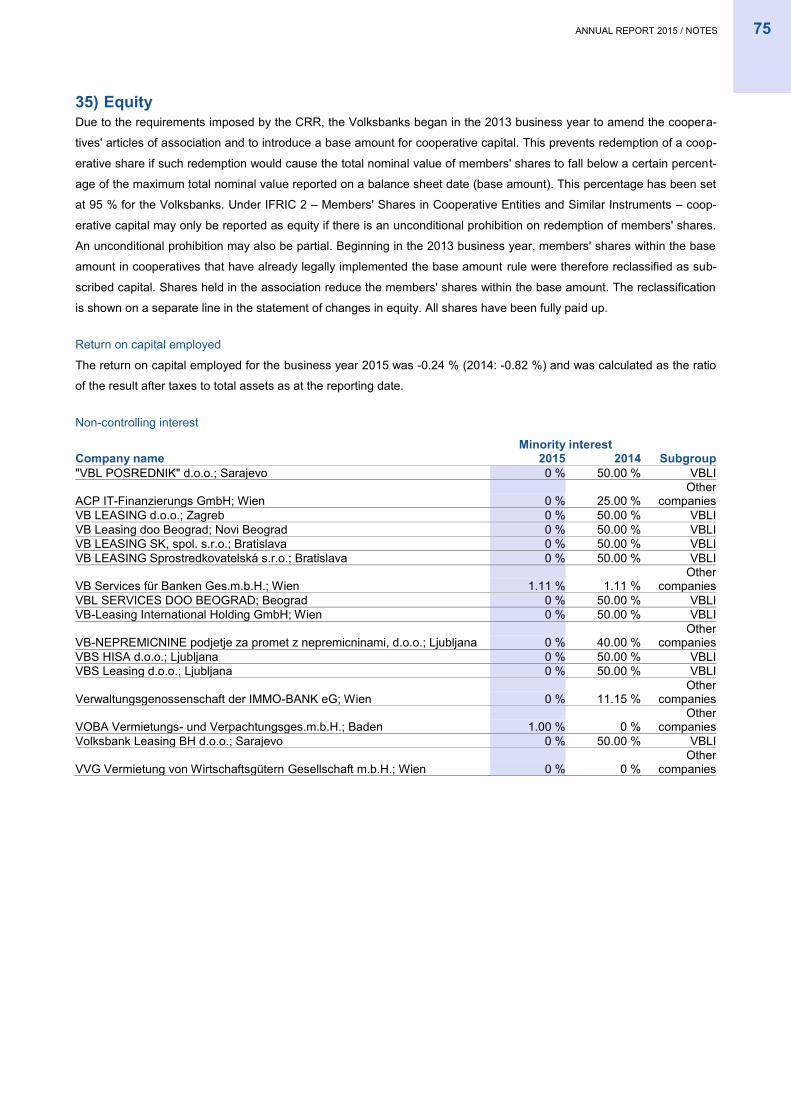
ANNUAL REPORT 2015 / NOTES 75
35) Equity Due to the requirements imposed by the CRR, the Volksbanks began in the 2013 business year to amend the coopera-
tives' articles of association and to introduce a base amount for cooperative capital. This prevents redemption of a coop-
erative share if such redemption would cause the total nominal value of members' shares to fall below a certain percent-
age of the maximum total nominal value reported on a balance sheet date (base amount). This percentage has been set
at 95 % for the Volksbanks. Under IFRIC 2 – Members' Shares in Cooperative Entities and Similar Instruments – coop-
erative capital may only be reported as equity if there is an unconditional prohibition on redemption of members' shares.
An unconditional prohibition may also be partial. Beginning in the 2013 business year, members' shares within the base
amount in cooperatives that have already legally implemented the base amount rule were therefore reclassified as sub-
scribed capital. Shares held in the association reduce the members' shares within the base amount. The reclassification
is shown on a separate line in the statement of changes in equity. All shares have been fully paid up.
Return on capital employed
The return on capital employed for the business year 2015 was -0.24 % (2014: -0.82 %) and was calculated as the ratio
of the result after taxes to total assets as at the reporting date.
Non-controlling interest
Minority interest
Company name 2015 2014 Subgroup "VBL POSREDNIK" d.o.o.; Sarajevo 0 % 50.00 % VBLI
ACP IT-Finanzierungs GmbH; Wien 0 % 25.00 % Other
companies VB LEASING d.o.o.; Zagreb 0 % 50.00 % VBLI VB Leasing doo Beograd; Novi Beograd 0 % 50.00 % VBLI VB LEASING SK, spol. s.r.o.; Bratislava 0 % 50.00 % VBLI VB LEASING Sprostredkovatelská s.r.o.; Bratislava 0 % 50.00 % VBLI
VB Services für Banken Ges.m.b.H.; Wien 1.11 % 1.11 % Other
companies VBL SERVICES DOO BEOGRAD; Beograd 0 % 50.00 % VBLI VB-Leasing International Holding GmbH; Wien 0 % 50.00 % VBLI
VB-NEPREMICNINE podjetje za promet z nepremicninami, d.o.o.; Ljubljana 0 % 40.00 % Other
companies VBS HISA d.o.o.; Ljubljana 0 % 50.00 % VBLI VBS Leasing d.o.o.; Ljubljana 0 % 50.00 % VBLI
Verwaltungsgenossenschaft der IMMO-BANK eG; Wien 0 % 11.15 % Other
companies
VOBA Vermietungs- und Verpachtungsges.m.b.H.; Baden 1.00 % 0 % Other
companies Volksbank Leasing BH d.o.o.; Sarajevo 0 % 50.00 % VBLI
VVG Vermietung von Wirtschaftsgütern Gesellschaft m.b.H.; Wien 0 % 0 % Other
companies
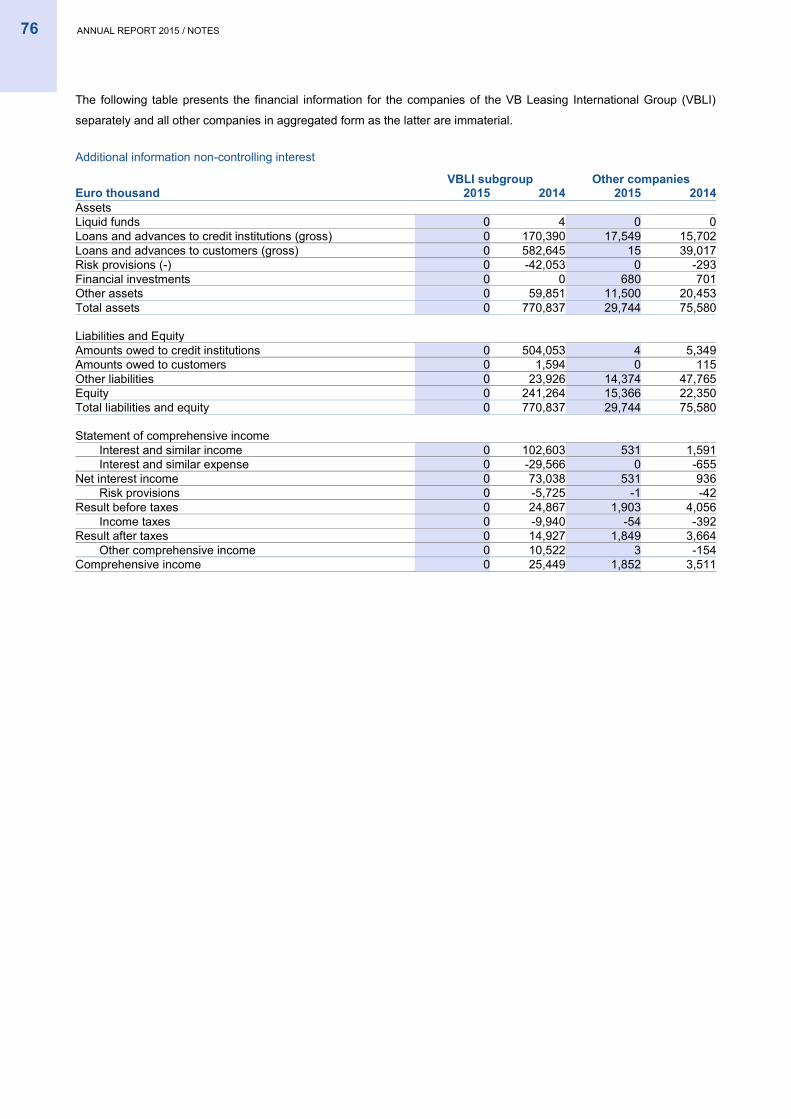
76 ANNUAL REPORT 2015 / NOTES
The following table presents the financial information for the companies of the VB Leasing International Group (VBLI)
separately and all other companies in aggregated form as the latter are immaterial.
Additional information non-controlling interest
VBLI subgroup Other companies
Euro thousand 2015 2014 2015 2014 Assets
Liquid funds 0 4 0 0 Loans and advances to credit institutions (gross) 0 170,390 17,549 15,702 Loans and advances to customers (gross) 0 582,645 15 39,017 Risk provisions (-) 0 -42,053 0 -293 Financial investments 0 0 680 701 Other assets 0 59,851 11,500 20,453 Total assets 0 770,837 29,744 75,580
Liabilities and Equity Amounts owed to credit institutions 0 504,053 4 5,349
Amounts owed to customers 0 1,594 0 115 Other liabilities 0 23,926 14,374 47,765 Equity 0 241,264 15,366 22,350 Total liabilities and equity 0 770,837 29,744 75,580
Statement of comprehensive income Interest and similar income 0 102,603 531 1,591
Interest and similar expense 0 -29,566 0 -655 Net interest income 0 73,038 531 936
Risk provisions 0 -5,725 -1 -42 Result before taxes 0 24,867 1,903 4,056
Income taxes 0 -9,940 -54 -392 Result after taxes 0 14,927 1,849 3,664
Other comprehensive income 0 10,522 3 -154 Comprehensive income 0 25,449 1,852 3,511
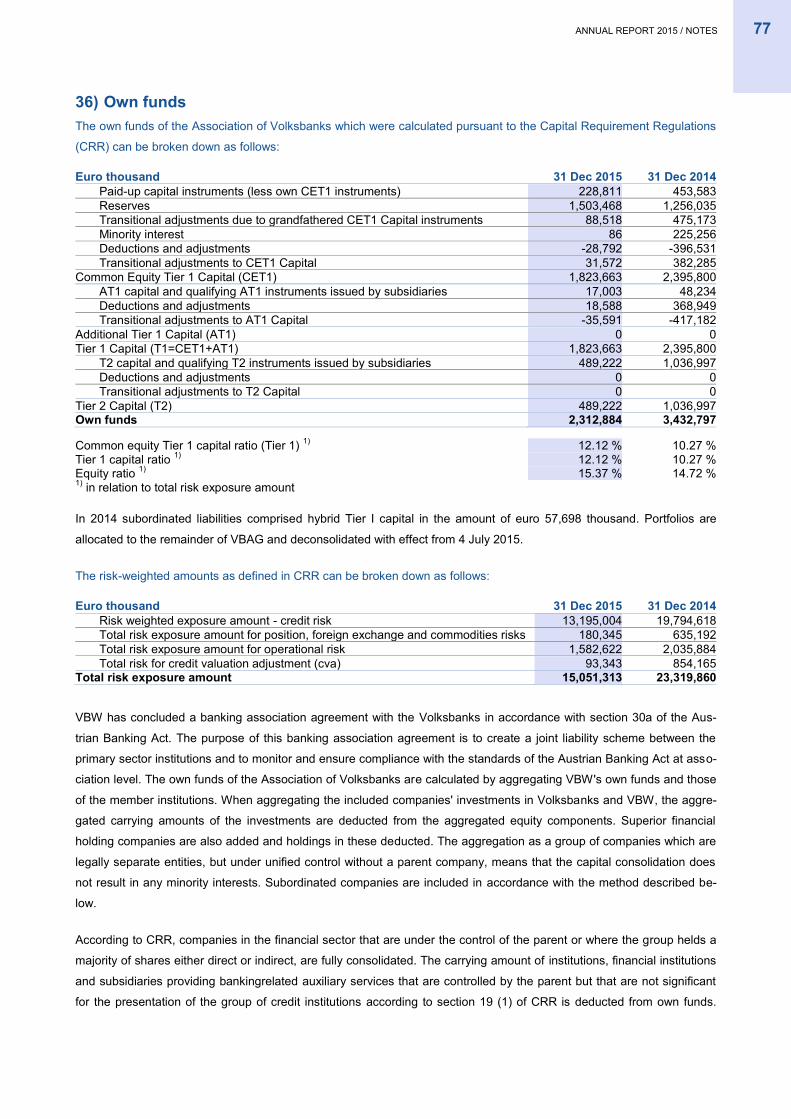
ANNUAL REPORT 2015 / NOTES 77
36) Own funds The own funds of the Association of Volksbanks which were calculated pursuant to the Capital Requirement Regulations
(CRR) can be broken down as follows:
Euro thousand 31 Dec 2015 31 Dec 2014 Paid-up capital instruments (less own CET1 instruments) 228,811 453,583 Reserves 1,503,468 1,256,035 Transitional adjustments due to grandfathered CET1 Capital instruments 88,518 475,173 Minority interest 86 225,256 Deductions and adjustments -28,792 -396,531 Transitional adjustments to CET1 Capital 31,572 382,285
Common Equity Tier 1 Capital (CET1) 1,823,663 2,395,800 AT1 capital and qualifying AT1 instruments issued by subsidiaries 17,003 48,234 Deductions and adjustments 18,588 368,949 Transitional adjustments to AT1 Capital -35,591 -417,182
Additional Tier 1 Capital (AT1) 0 0 Tier 1 Capital (T1=CET1+AT1) 1,823,663 2,395,800
T2 capital and qualifying T2 instruments issued by subsidiaries 489,222 1,036,997 Deductions and adjustments 0 0 Transitional adjustments to T2 Capital 0 0
Tier 2 Capital (T2) 489,222 1,036,997 Own funds 2,312,884 3,432,797
Common equity Tier 1 capital ratio (Tier 1) 1) 12.12 % 10.27 % Tier 1 capital ratio 1) 12.12 % 10.27 % Equity ratio 1) 15.37 % 14.72 % 1) in relation to total risk exposure amount
In 2014 subordinated liabilities comprised hybrid Tier I capital in the amount of euro 57,698 thousand. Portfolios are
allocated to the remainder of VBAG and deconsolidated with effect from 4 July 2015.
The risk-weighted amounts as defined in CRR can be broken down as follows:
Euro thousand 31 Dec 2015 31 Dec 2014 Risk weighted exposure amount - credit risk 13,195,004 19,794,618 Total risk exposure amount for position, foreign exchange and commodities risks 180,345 635,192 Total risk exposure amount for operational risk 1,582,622 2,035,884 Total risk for credit valuation adjustment (cva) 93,343 854,165
Total risk exposure amount 15,051,313 23,319,860
VBW has concluded a banking association agreement with the Volksbanks in accordance with section 30a of the Aus-
trian Banking Act. The purpose of this banking association agreement is to create a joint liability scheme between the
primary sector institutions and to monitor and ensure compliance with the standards of the Austrian Banking Act at asso-
ciation level. The own funds of the Association of Volksbanks are calculated by aggregating VBW's own funds and those
of the member institutions. When aggregating the included companies' investments in Volksbanks and VBW, the aggre-
gated carrying amounts of the investments are deducted from the aggregated equity components. Superior financial
holding companies are also added and holdings in these deducted. The aggregation as a group of companies which are
legally separate entities, but under unified control without a parent company, means that the capital consolidation does
not result in any minority interests. Subordinated companies are included in accordance with the method described be-
low.
According to CRR, companies in the financial sector that are under the control of the parent or where the group helds a
majority of shares either direct or indirect, are fully consolidated. The carrying amount of institutions, financial institutions
and subsidiaries providing bankingrelated auxiliary services that are controlled by the parent but that are not significant
for the presentation of the group of credit institutions according to section 19 (1) of CRR is deducted from own funds.

78 ANNUAL REPORT 2015 / NOTES
Subsidiaries which are managed jointly with non-Group companies are proportionately consolidated. Investments in
companies in the financial sector with a share of between 10 % and 50 % that are not jointly managed are also deducted
from own funds unless they are voluntarily consolidated on a pro rata basis. Investments in companies in the financial
sector of less than 10 % are deducted from own funds considering the eligibility according to section 46 CRR. All other
participating interests are included in the assessment base at their carrying amounts.
All credit institutions under control or where the group holds a majority of shares either direct or indirect are considered in
the scope of consolidation according to CRR.
In 2015, no substantial, practical or legal obstacles existed which would have prevented the transfer of equity or the
repayment of liabilities between the parent institution and institutions subordinated to the former.
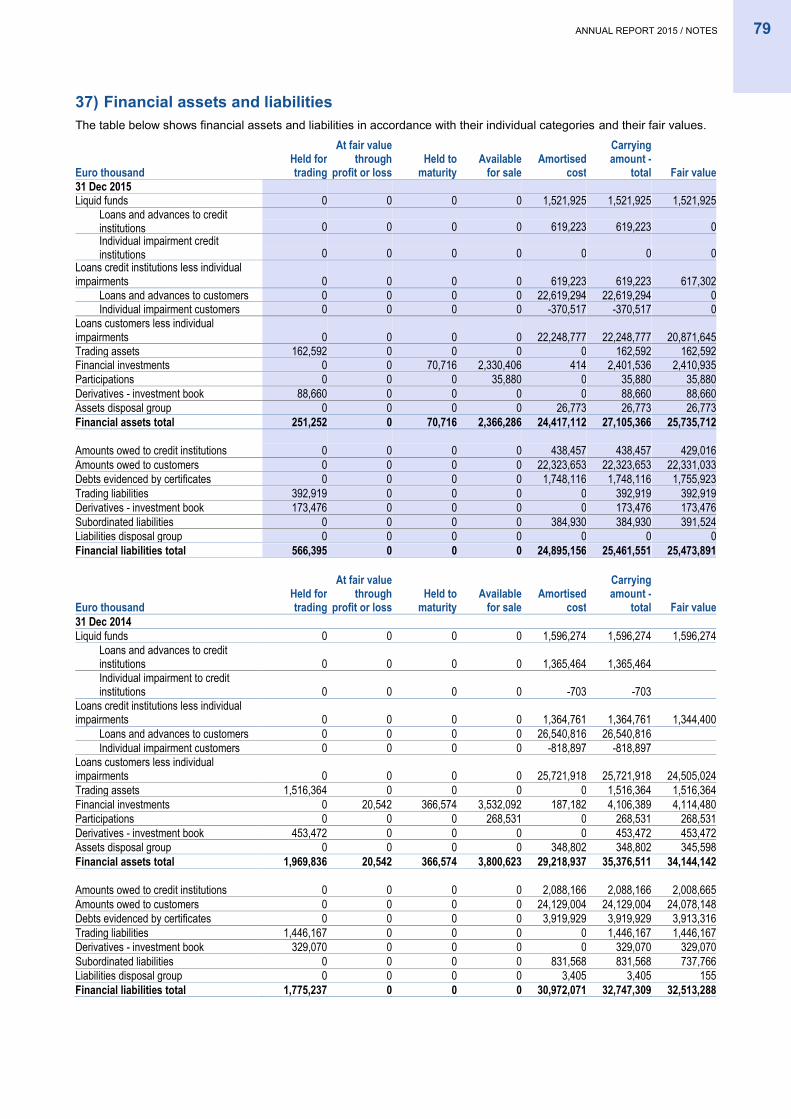
ANNUAL REPORT 2015 / NOTES 79
37) Financial assets and liabilities
The table below shows financial assets and liabilities in accordance with their individual categories and their fair values.
Euro thousand Held for trading
At fair value through
profit or loss Held to
maturity Available
for sale Amortised
cost
Carrying amount -
total Fair value
31 Dec 2015 Liquid funds 0 0 0 0 1,521,925 1,521,925 1,521,925
Loans and advances to credit institutions 0 0 0 0 619,223 619,223 0
Individual impairment credit institutions 0 0 0 0 0 0 0
Loans credit institutions less individual impairments 0 0 0 0 619,223 619,223 617,302
Loans and advances to customers 0 0 0 0 22,619,294 22,619,294 0 Individual impairment customers 0 0 0 0 -370,517 -370,517 0
Loans customers less individual impairments 0 0 0 0 22,248,777 22,248,777 20,871,645
Trading assets 162,592 0 0 0 0 162,592 162,592 Financial investments 0 0 70,716 2,330,406 414 2,401,536 2,410,935
Participations 0 0 0 35,880 0 35,880 35,880
Derivatives - investment book 88,660 0 0 0 0 88,660 88,660
Assets disposal group 0 0 0 0 26,773 26,773 26,773
Financial assets total 251,252 0 70,716 2,366,286 24,417,112 27,105,366 25,735,712
Amounts owed to credit institutions 0 0 0 0 438,457 438,457 429,016
Amounts owed to customers 0 0 0 0 22,323,653 22,323,653 22,331,033
Debts evidenced by certificates 0 0 0 0 1,748,116 1,748,116 1,755,923
Trading liabilities 392,919 0 0 0 0 392,919 392,919
Derivatives - investment book 173,476 0 0 0 0 173,476 173,476
Subordinated liabilities 0 0 0 0 384,930 384,930 391,524
Liabilities disposal group 0 0 0 0 0 0 0
Financial liabilities total 566,395 0 0 0 24,895,156 25,461,551 25,473,891
Euro thousand Held for trading
At fair value through
profit or loss Held to
maturity Available
for sale Amortised
cost
Carrying amount -
total Fair value
31 Dec 2014 Liquid funds 0 0 0 0 1,596,274 1,596,274 1,596,274
Loans and advances to credit institutions 0 0 0 0 1,365,464 1,365,464
Individual impairment to credit institutions 0 0 0 0 -703 -703
Loans credit institutions less individual impairments 0 0 0 0 1,364,761 1,364,761 1,344,400
Loans and advances to customers 0 0 0 0 26,540,816 26,540,816 Individual impairment customers 0 0 0 0 -818,897 -818,897 Loans customers less individual
impairments 0 0 0 0 25,721,918 25,721,918 24,505,024
Trading assets 1,516,364 0 0 0 0 1,516,364 1,516,364
Financial investments 0 20,542 366,574 3,532,092 187,182 4,106,389 4,114,480
Participations 0 0 0 268,531 0 268,531 268,531
Derivatives - investment book 453,472 0 0 0 0 453,472 453,472
Assets disposal group 0 0 0 0 348,802 348,802 345,598
Financial assets total 1,969,836 20,542 366,574 3,800,623 29,218,937 35,376,511 34,144,142
Amounts owed to credit institutions 0 0 0 0 2,088,166 2,088,166 2,008,665
Amounts owed to customers 0 0 0 0 24,129,004 24,129,004 24,078,148
Debts evidenced by certificates 0 0 0 0 3,919,929 3,919,929 3,913,316
Trading liabilities 1,446,167 0 0 0 0 1,446,167 1,446,167
Derivatives - investment book 329,070 0 0 0 0 329,070 329,070
Subordinated liabilities 0 0 0 0 831,568 831,568 737,766
Liabilities disposal group 0 0 0 0 3,405 3,405 155
Financial liabilities total 1,775,237 0 0 0 30,972,071 32,747,309 32,513,288
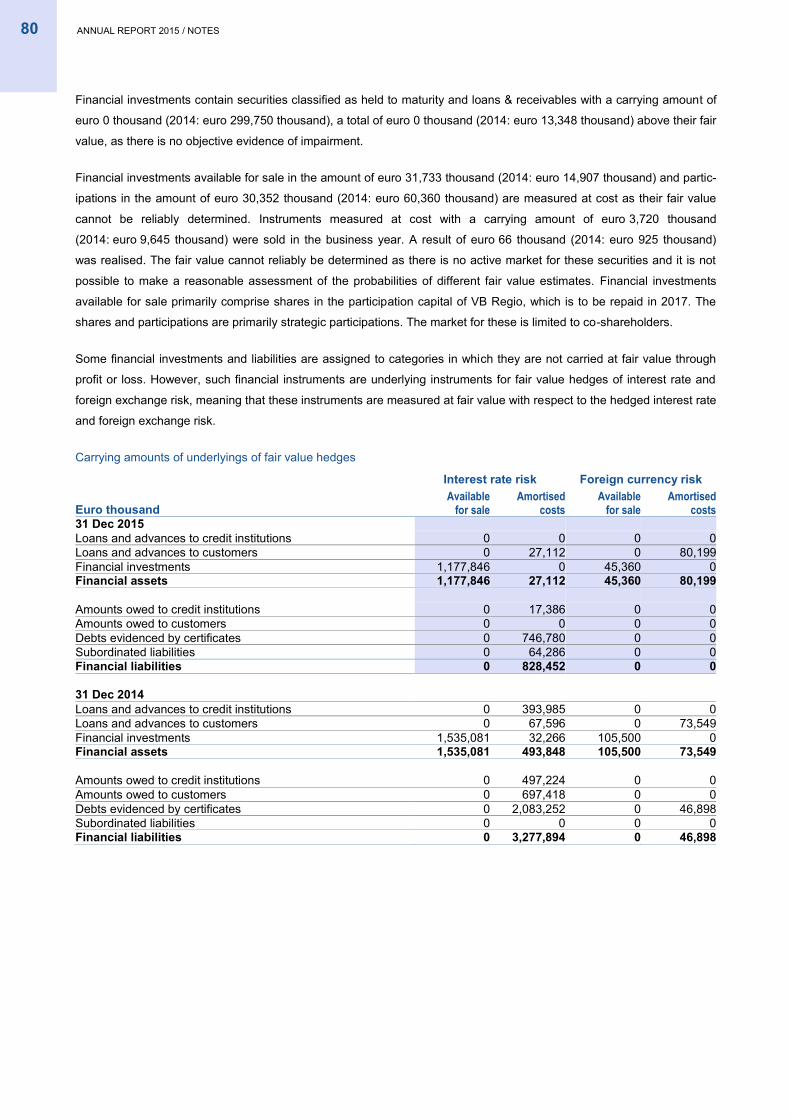
80 ANNUAL REPORT 2015 / NOTES
Financial investments contain securities classified as held to maturity and loans & receivables with a carrying amount of
euro 0 thousand (2014: euro 299,750 thousand), a total of euro 0 thousand (2014: euro 13,348 thousand) above their fair
value, as there is no objective evidence of impairment.
Financial investments available for sale in the amount of euro 31,733 thousand (2014: euro 14,907 thousand) and partic-
ipations in the amount of euro 30,352 thousand (2014: euro 60,360 thousand) are measured at cost as their fair value
cannot be reliably determined. Instruments measured at cost with a carrying amount of euro 3,720 thousand
(2014: euro 9,645 thousand) were sold in the business year. A result of euro 66 thousand (2014: euro 925 thousand)
was realised. The fair value cannot reliably be determined as there is no active market for these securities and it is not
possible to make a reasonable assessment of the probabilities of different fair value estimates. Financial investments
available for sale primarily comprise shares in the participation capital of VB Regio, which is to be repaid in 2017. The
shares and participations are primarily strategic participations. The market for these is limited to co-shareholders.
Some financial investments and liabilities are assigned to categories in which they are not carried at fair value through
profit or loss. However, such financial instruments are underlying instruments for fair value hedges of interest rate and
foreign exchange risk, meaning that these instruments are measured at fair value with respect to the hedged interest rate
and foreign exchange risk.
Carrying amounts of underlyings of fair value hedges
Interest rate risk Foreign currency risk
Euro thousand Available
for sale Amortised
costs Available
for sale Amortised
costs 31 Dec 2015
Loans and advances to credit institutions 0 0 0 0 Loans and advances to customers 0 27,112 0 80,199 Financial investments 1,177,846 0 45,360 0 Financial assets 1,177,846 27,112 45,360 80,199
Amounts owed to credit institutions 0 17,386 0 0 Amounts owed to customers 0 0 0 0 Debts evidenced by certificates 0 746,780 0 0 Subordinated liabilities 0 64,286 0 0 Financial liabilities 0 828,452 0 0
31 Dec 2014 Loans and advances to credit institutions 0 393,985 0 0
Loans and advances to customers 0 67,596 0 73,549 Financial investments 1,535,081 32,266 105,500 0 Financial assets 1,535,081 493,848 105,500 73,549
Amounts owed to credit institutions 0 497,224 0 0 Amounts owed to customers 0 697,418 0 0 Debts evidenced by certificates 0 2,083,252 0 46,898 Subordinated liabilities 0 0 0 0 Financial liabilities 0 3,277,894 0 46,898
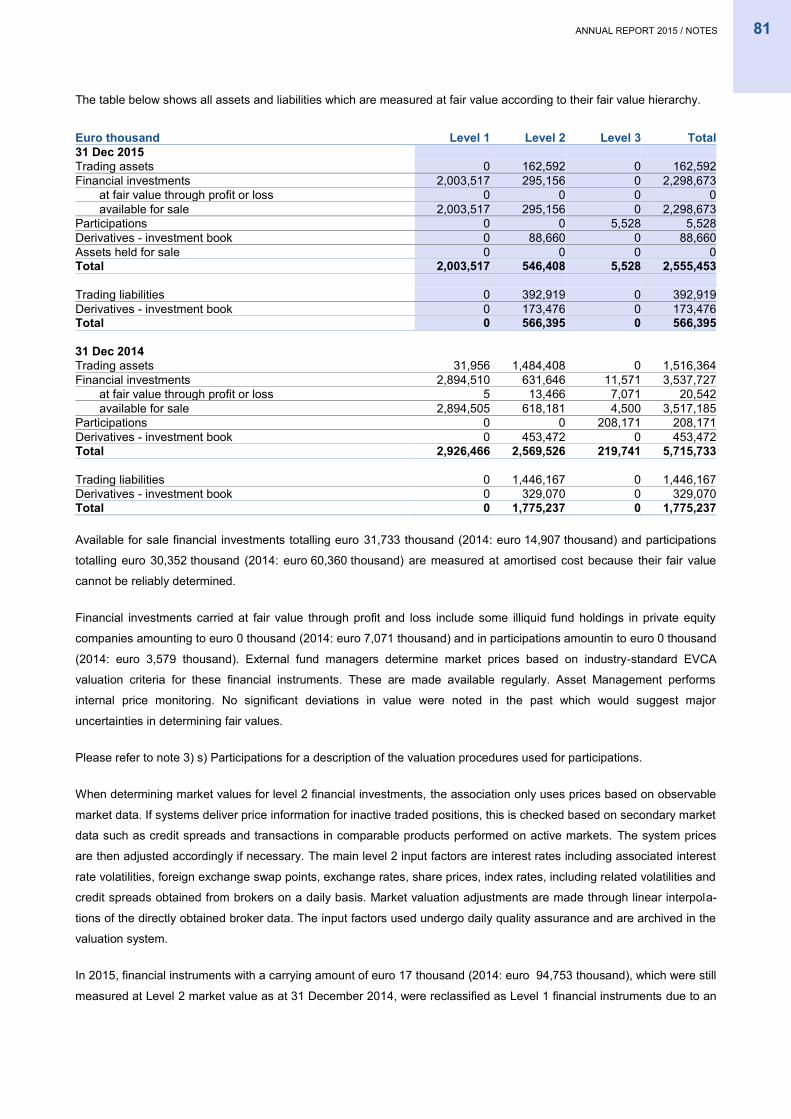
ANNUAL REPORT 2015 / NOTES 81
The table below shows all assets and liabilities which are measured at fair value according to their fair value hierarchy.
Euro thousand Level 1 Level 2 Level 3 Total 31 Dec 2015
Trading assets 0 162,592 0 162,592 Financial investments 2,003,517 295,156 0 2,298,673
at fair value through profit or loss 0 0 0 0 available for sale 2,003,517 295,156 0 2,298,673
Participations 0 0 5,528 5,528 Derivatives - investment book 0 88,660 0 88,660 Assets held for sale 0 0 0 0 Total 2,003,517 546,408 5,528 2,555,453
Trading liabilities 0 392,919 0 392,919 Derivatives - investment book 0 173,476 0 173,476 Total 0 566,395 0 566,395
31 Dec 2014 Trading assets 31,956 1,484,408 0 1,516,364
Financial investments 2,894,510 631,646 11,571 3,537,727 at fair value through profit or loss 5 13,466 7,071 20,542 available for sale 2,894,505 618,181 4,500 3,517,185
Participations 0 0 208,171 208,171 Derivatives - investment book 0 453,472 0 453,472 Total 2,926,466 2,569,526 219,741 5,715,733
Trading liabilities 0 1,446,167 0 1,446,167 Derivatives - investment book 0 329,070 0 329,070 Total 0 1,775,237 0 1,775,237
Available for sale financial investments totalling euro 31,733 thousand (2014: euro 14,907 thousand) and participations
totalling euro 30,352 thousand (2014: euro 60,360 thousand) are measured at amortised cost because their fair value
cannot be reliably determined.
Financial investments carried at fair value through profit and loss include some illiquid fund holdings in private equity
companies amounting to euro 0 thousand (2014: euro 7,071 thousand) and in participations amountin to euro 0 thousand
(2014: euro 3,579 thousand). External fund managers determine market prices based on industry-standard EVCA
valuation criteria for these financial instruments. These are made available regularly. Asset Management performs
internal price monitoring. No significant deviations in value were noted in the past which would suggest major
uncertainties in determining fair values.
Please refer to note 3) s) Participations for a description of the valuation procedures used for participations.
When determining market values for level 2 financial investments, the association only uses prices based on observable
market data. If systems deliver price information for inactive traded positions, this is checked based on secondary market
data such as credit spreads and transactions in comparable products performed on active markets. The system prices
are then adjusted accordingly if necessary. The main level 2 input factors are interest rates including associated interest
rate volatilities, foreign exchange swap points, exchange rates, share prices, index rates, including related volatilities and
credit spreads obtained from brokers on a daily basis. Market valuation adjustments are made through linear interpola-
tions of the directly obtained broker data. The input factors used undergo daily quality assurance and are archived in the
valuation system.
In 2015, financial instruments with a carrying amount of euro 17 thousand (2014: euro 94,753 thousand), which were still
measured at Level 2 market value as at 31 December 2014, were reclassified as Level 1 financial instruments due to an
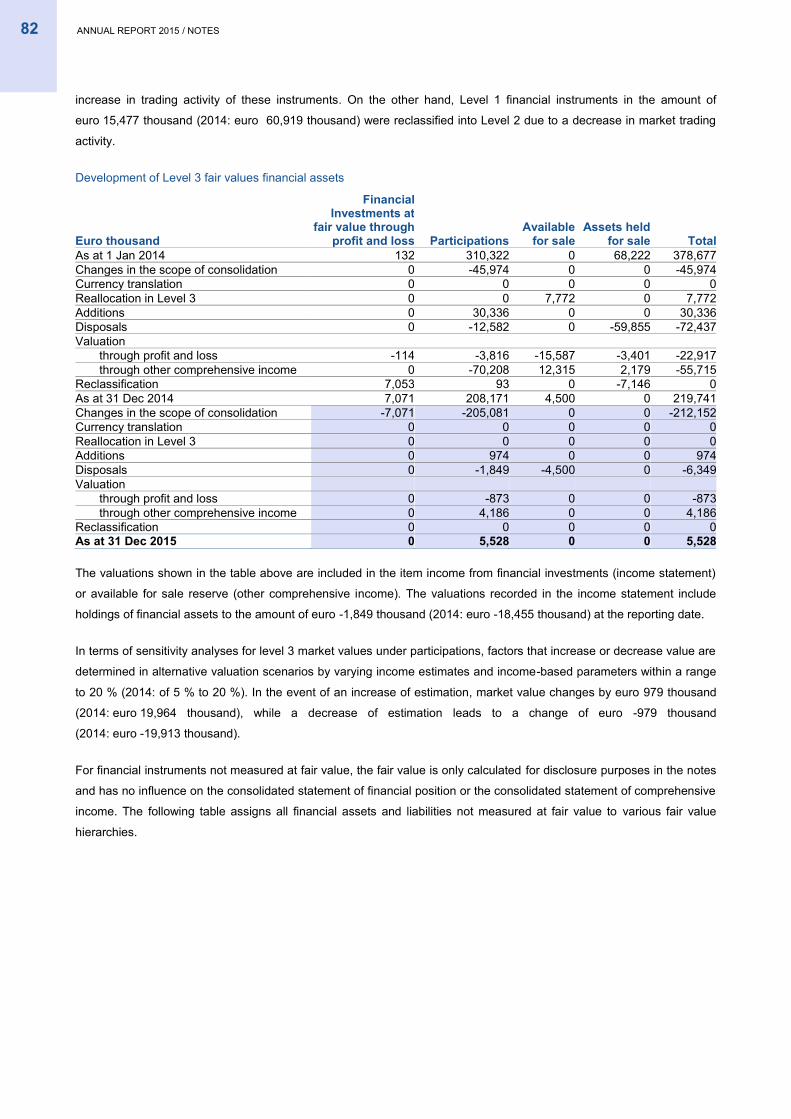
82 ANNUAL REPORT 2015 / NOTES
increase in trading activity of these instruments. On the other hand, Level 1 financial instruments in the amount of
euro 15,477 thousand (2014: euro 60,919 thousand) were reclassified into Level 2 due to a decrease in market trading
activity.
Development of Level 3 fair values financial assets
Euro thousand
Financial Investments at
fair value through profit and loss Participations
Available for sale
Assets held for sale Total
As at 1 Jan 2014 132 310,322 0 68,222 378,677 Changes in the scope of consolidation 0 -45,974 0 0 -45,974 Currency translation 0 0 0 0 0 Reallocation in Level 3 0 0 7,772 0 7,772 Additions 0 30,336 0 0 30,336 Disposals 0 -12,582 0 -59,855 -72,437 Valuation
through profit and loss -114 -3,816 -15,587 -3,401 -22,917 through other comprehensive income 0 -70,208 12,315 2,179 -55,715
Reclassification 7,053 93 0 -7,146 0 As at 31 Dec 2014 7,071 208,171 4,500 0 219,741 Changes in the scope of consolidation -7,071 -205,081 0 0 -212,152 Currency translation 0 0 0 0 0 Reallocation in Level 3 0 0 0 0 0 Additions 0 974 0 0 974 Disposals 0 -1,849 -4,500 0 -6,349 Valuation
through profit and loss 0 -873 0 0 -873 through other comprehensive income 0 4,186 0 0 4,186
Reclassification 0 0 0 0 0 As at 31 Dec 2015 0 5,528 0 0 5,528
The valuations shown in the table above are included in the item income from financial investments (income statement)
or available for sale reserve (other comprehensive income). The valuations recorded in the income statement include
holdings of financial assets to the amount of euro -1,849 thousand (2014: euro -18,455 thousand) at the reporting date.
In terms of sensitivity analyses for level 3 market values under participations, factors that increase or decrease value are
determined in alternative valuation scenarios by varying income estimates and income-based parameters within a range
to 20 % (2014: of 5 % to 20 %). In the event of an increase of estimation, market value changes by euro 979 thousand
(2014: euro 19,964 thousand), while a decrease of estimation leads to a change of euro -979 thousand
(2014: euro -19,913 thousand).
For financial instruments not measured at fair value, the fair value is only calculated for disclosure purposes in the notes
and has no influence on the consolidated statement of financial position or the consolidated statement of comprehensive
income. The following table assigns all financial assets and liabilities not measured at fair value to various fair value
hierarchies.
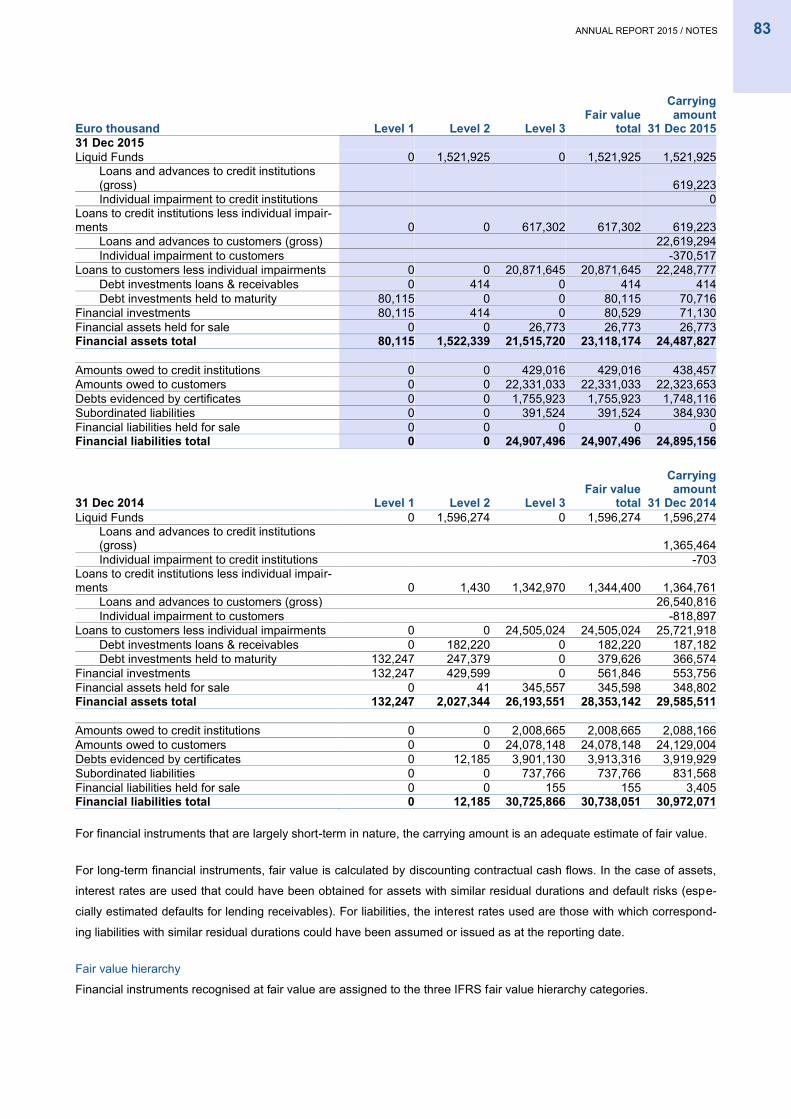
ANNUAL REPORT 2015 / NOTES 83
Euro thousand Level 1 Level 2 Level 3 Fair value
total
Carrying amount
31 Dec 2015 31 Dec 2015
Liquid Funds 0 1,521,925 0 1,521,925 1,521,925 Loans and advances to credit institutions (gross)
619,223
Individual impairment to credit institutions
0 Loans to credit institutions less individual impair-ments 0 0 617,302 617,302 619,223
Loans and advances to customers (gross)
22,619,294 Individual impairment to customers
-370,517
Loans to customers less individual impairments 0 0 20,871,645 20,871,645 22,248,777 Debt investments loans & receivables 0 414 0 414 414 Debt investments held to maturity 80,115 0 0 80,115 70,716
Financial investments 80,115 414 0 80,529 71,130 Financial assets held for sale 0 0 26,773 26,773 26,773 Financial assets total 80,115 1,522,339 21,515,720 23,118,174 24,487,827
Amounts owed to credit institutions 0 0 429,016 429,016 438,457 Amounts owed to customers 0 0 22,331,033 22,331,033 22,323,653 Debts evidenced by certificates 0 0 1,755,923 1,755,923 1,748,116 Subordinated liabilities 0 0 391,524 391,524 384,930 Financial liabilities held for sale 0 0 0 0 0 Financial liabilities total 0 0 24,907,496 24,907,496 24,895,156
31 Dec 2014 Level 1 Level 2 Level 3 Fair value
total
Carrying amount
31 Dec 2014 Liquid Funds 0 1,596,274 0 1,596,274 1,596,274
Loans and advances to credit institutions (gross)
1,365,464
Individual impairment to credit institutions
-703 Loans to credit institutions less individual impair-ments 0 1,430 1,342,970 1,344,400 1,364,761
Loans and advances to customers (gross)
26,540,816 Individual impairment to customers
-818,897
Loans to customers less individual impairments 0 0 24,505,024 24,505,024 25,721,918 Debt investments loans & receivables 0 182,220 0 182,220 187,182 Debt investments held to maturity 132,247 247,379 0 379,626 366,574
Financial investments 132,247 429,599 0 561,846 553,756 Financial assets held for sale 0 41 345,557 345,598 348,802 Financial assets total 132,247 2,027,344 26,193,551 28,353,142 29,585,511
Amounts owed to credit institutions 0 0 2,008,665 2,008,665 2,088,166 Amounts owed to customers 0 0 24,078,148 24,078,148 24,129,004 Debts evidenced by certificates 0 12,185 3,901,130 3,913,316 3,919,929 Subordinated liabilities 0 0 737,766 737,766 831,568 Financial liabilities held for sale 0 0 155 155 3,405 Financial liabilities total 0 12,185 30,725,866 30,738,051 30,972,071
For financial instruments that are largely short-term in nature, the carrying amount is an adequate estimate of fair value.
For long-term financial instruments, fair value is calculated by discounting contractual cash flows. In the case of assets,
interest rates are used that could have been obtained for assets with similar residual durations and default risks (espe-
cially estimated defaults for lending receivables). For liabilities, the interest rates used are those with which correspond-
ing liabilities with similar residual durations could have been assumed or issued as at the reporting date.
Fair value hierarchy
Financial instruments recognised at fair value are assigned to the three IFRS fair value hierarchy categories.
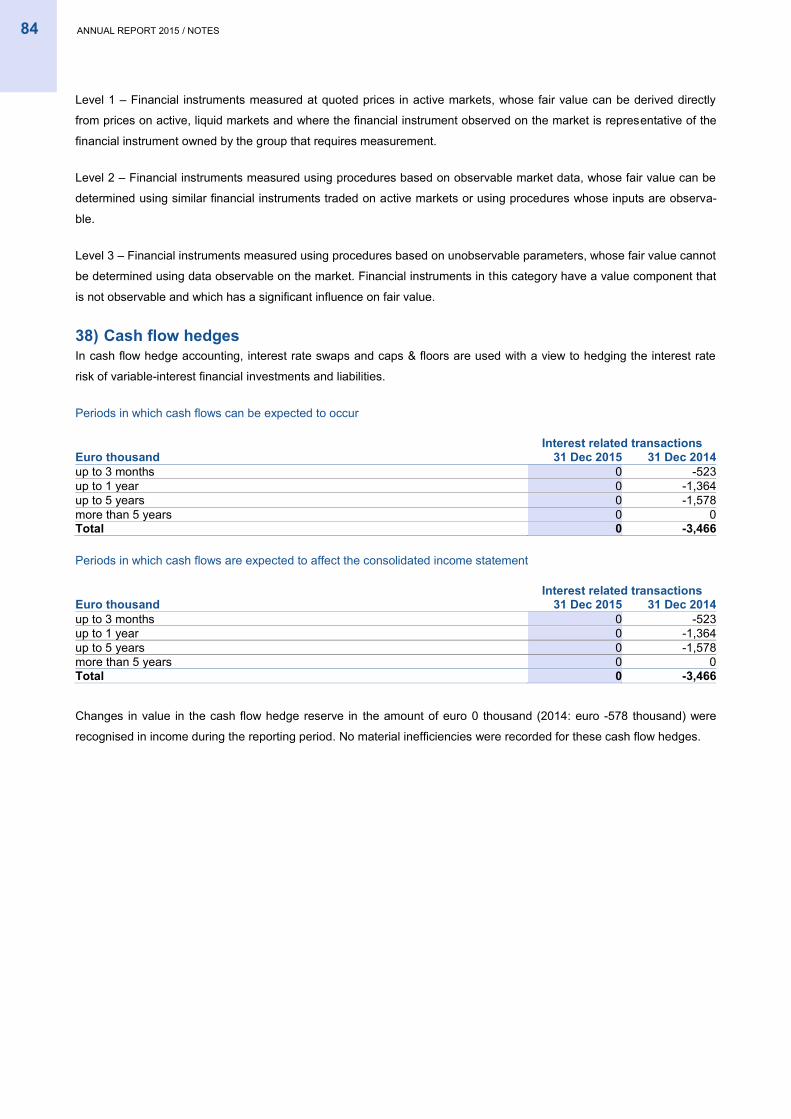
84 ANNUAL REPORT 2015 / NOTES
Level 1 – Financial instruments measured at quoted prices in active markets, whose fair value can be derived directly
from prices on active, liquid markets and where the financial instrument observed on the market is representative of the
financial instrument owned by the group that requires measurement.
Level 2 – Financial instruments measured using procedures based on observable market data, whose fair value can be
determined using similar financial instruments traded on active markets or using procedures whose inputs are observa-
ble.
Level 3 – Financial instruments measured using procedures based on unobservable parameters, whose fair value cannot
be determined using data observable on the market. Financial instruments in this category have a value component that
is not observable and which has a significant influence on fair value.
38) Cash flow hedges In cash flow hedge accounting, interest rate swaps and caps & floors are used with a view to hedging the interest rate
risk of variable-interest financial investments and liabilities.
Periods in which cash flows can be expected to occur
Interest related transactions
Euro thousand 31 Dec 2015 31 Dec 2014 up to 3 months 0 -523 up to 1 year 0 -1,364 up to 5 years 0 -1,578 more than 5 years 0 0 Total 0 -3,466
Periods in which cash flows are expected to affect the consolidated income statement
Interest related transactions
Euro thousand 31 Dec 2015 31 Dec 2014 up to 3 months 0 -523 up to 1 year 0 -1,364 up to 5 years 0 -1,578 more than 5 years 0 0 Total 0 -3,466
Changes in value in the cash flow hedge reserve in the amount of euro 0 thousand (2014: euro -578 thousand) were
recognised in income during the reporting period. No material inefficiencies were recorded for these cash flow hedges.
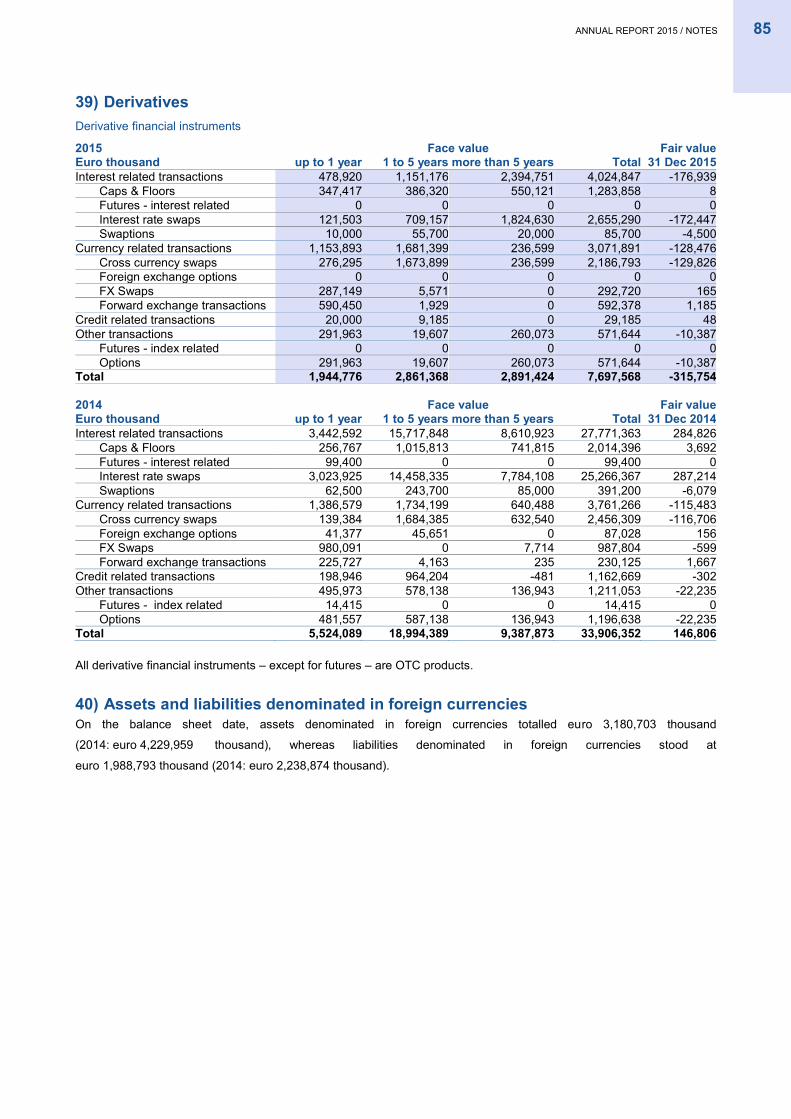
ANNUAL REPORT 2015 / NOTES 85
39) Derivatives Derivative financial instruments
2015 Face value Fair value Euro thousand up to 1 year 1 to 5 years more than 5 years Total 31 Dec 2015 Interest related transactions 478,920 1,151,176 2,394,751 4,024,847 -176,939
Caps & Floors 347,417 386,320 550,121 1,283,858 8 Futures - interest related 0 0 0 0 0 Interest rate swaps 121,503 709,157 1,824,630 2,655,290 -172,447 Swaptions 10,000 55,700 20,000 85,700 -4,500
Currency related transactions 1,153,893 1,681,399 236,599 3,071,891 -128,476 Cross currency swaps 276,295 1,673,899 236,599 2,186,793 -129,826 Foreign exchange options 0 0 0 0 0 FX Swaps 287,149 5,571 0 292,720 165 Forward exchange transactions 590,450 1,929 0 592,378 1,185
Credit related transactions 20,000 9,185 0 29,185 48 Other transactions 291,963 19,607 260,073 571,644 -10,387
Futures - index related 0 0 0 0 0 Options 291,963 19,607 260,073 571,644 -10,387
Total 1,944,776 2,861,368 2,891,424 7,697,568 -315,754
2014 Face value Fair value Euro thousand up to 1 year 1 to 5 years more than 5 years Total 31 Dec 2014 Interest related transactions 3,442,592 15,717,848 8,610,923 27,771,363 284,826
Caps & Floors 256,767 1,015,813 741,815 2,014,396 3,692 Futures - interest related 99,400 0 0 99,400 0 Interest rate swaps 3,023,925 14,458,335 7,784,108 25,266,367 287,214 Swaptions 62,500 243,700 85,000 391,200 -6,079
Currency related transactions 1,386,579 1,734,199 640,488 3,761,266 -115,483 Cross currency swaps 139,384 1,684,385 632,540 2,456,309 -116,706 Foreign exchange options 41,377 45,651 0 87,028 156 FX Swaps 980,091 0 7,714 987,804 -599 Forward exchange transactions 225,727 4,163 235 230,125 1,667
Credit related transactions 198,946 964,204 -481 1,162,669 -302 Other transactions 495,973 578,138 136,943 1,211,053 -22,235
Futures - index related 14,415 0 0 14,415 0 Options 481,557 587,138 136,943 1,196,638 -22,235
Total 5,524,089 18,994,389 9,387,873 33,906,352 146,806
All derivative financial instruments – except for futures – are OTC products.
40) Assets and liabilities denominated in foreign currencies On the balance sheet date, assets denominated in foreign currencies totalled euro 3,180,703 thousand
(2014: euro 4,229,959 thousand), whereas liabilities denominated in foreign currencies stood at
euro 1,988,793 thousand (2014: euro 2,238,874 thousand).
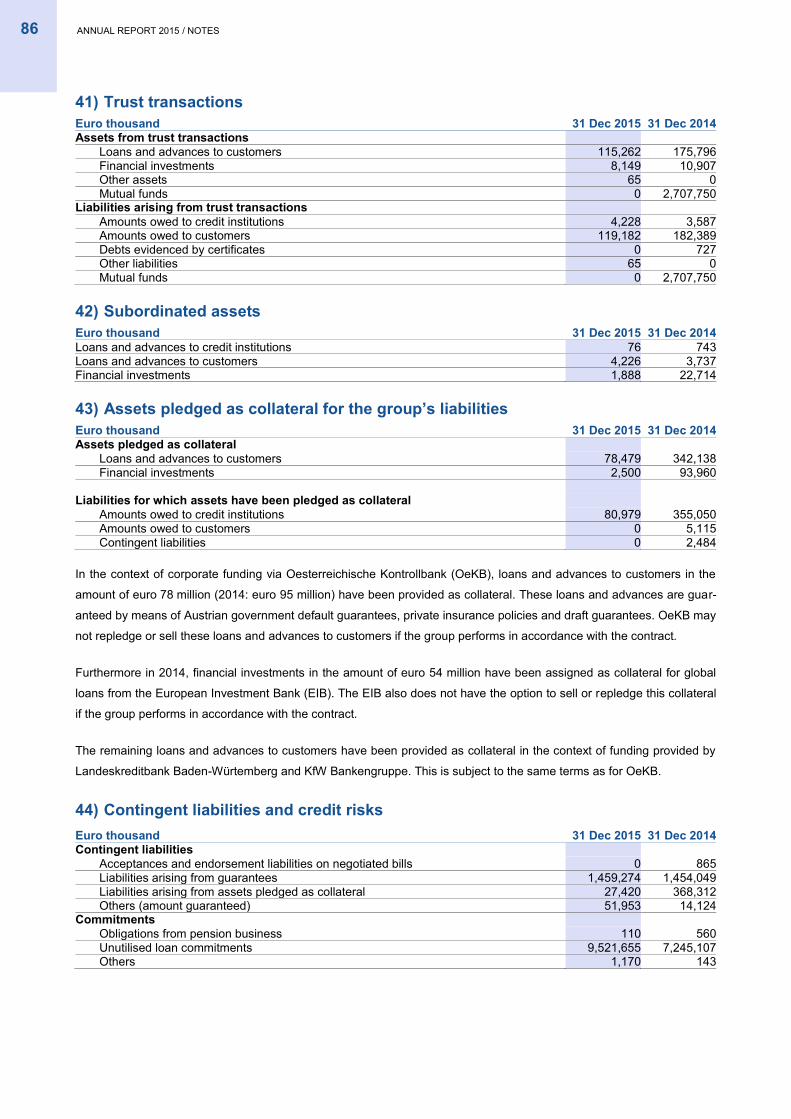
86 ANNUAL REPORT 2015 / NOTES
41) Trust transactions
Euro thousand 31 Dec 2015 31 Dec 2014 Assets from trust transactions
Loans and advances to customers 115,262 175,796 Financial investments 8,149 10,907 Other assets 65 0 Mutual funds 0 2,707,750
Liabilities arising from trust transactions Amounts owed to credit institutions 4,228 3,587
Amounts owed to customers 119,182 182,389 Debts evidenced by certificates 0 727 Other liabilities 65 0 Mutual funds 0 2,707,750
42) Subordinated assets
Euro thousand 31 Dec 2015 31 Dec 2014 Loans and advances to credit institutions 76 743 Loans and advances to customers 4,226 3,737 Financial investments 1,888 22,714
43) Assets pledged as collateral for the group’s liabilities
Euro thousand 31 Dec 2015 31 Dec 2014 Assets pledged as collateral
Loans and advances to customers 78,479 342,138 Financial investments 2,500 93,960
Liabilities for which assets have been pledged as collateral Amounts owed to credit institutions 80,979 355,050
Amounts owed to customers 0 5,115 Contingent liabilities 0 2,484
In the context of corporate funding via Oesterreichische Kontrollbank (OeKB), loans and advances to customers in the
amount of euro 78 million (2014: euro 95 million) have been provided as collateral. These loans and advances are guar-
anteed by means of Austrian government default guarantees, private insurance policies and draft guarantees. OeKB may
not repledge or sell these loans and advances to customers if the group performs in accordance with the contract.
Furthermore in 2014, financial investments in the amount of euro 54 million have been assigned as collateral for global
loans from the European Investment Bank (EIB). The EIB also does not have the option to sell or repledge this collateral
if the group performs in accordance with the contract.
The remaining loans and advances to customers have been provided as collateral in the context of funding provided by
Landeskreditbank Baden-Würtemberg and KfW Bankengruppe. This is subject to the same terms as for OeKB.
44) Contingent liabilities and credit risks
Euro thousand 31 Dec 2015 31 Dec 2014 Contingent liabilities
Acceptances and endorsement liabilities on negotiated bills 0 865 Liabilities arising from guarantees 1,459,274 1,454,049 Liabilities arising from assets pledged as collateral 27,420 368,312 Others (amount guaranteed) 51,953 14,124
Commitments Obligations from pension business 110 560
Unutilised loan commitments 9,521,655 7,245,107 Others 1,170 143
ANNUAL REPORT 2015 / NOTES 87
If the management estimates a cash out flow for financial guarantees, a provision was built for off-balance risks to the
amount of the probable cash out flow under consideration of possible available collaterals. Therefore the provision
amounts to euro 31,505 thousand (2014: euro 53,508 thousand).
45) Repurchase transactions and other transferred assets As at 31 December 2015, as well as at 31 December 2014 the association as pledgor had none buy-back commitments
under genuine repurchase agreements.
The 2015 restructuring agreement between the Republic of Austria and VBW – supplemented by an implementation
agreement between VBW, the Volksbanks and other shareholders in VBW – includes, amongst others, provisions for a
participation rights issue ("Austrian government's participation right") by VB Rückzahlungsgesellschaft mbH (VB RZG),
which is a direct subsidiary of VBW. The participation rights were issued to fulfil the commitments made to the Austrian
government in order to obtain approval for the restructuring from the European Commission under state aid law.
Dividends paid by VB RZG in respect of the Austrian government's participation rights are at the discretion of VBW as
the sole shareholder of VB RZG. The Austrian government has no claim to a share of profits under the participation right.
The shareholders of VBW granted shares in VBW to the Austrian government without consideration (25 % of the share
capital plus one share). The shares were transferred to the Austrian government on 28 January 2016. The Austrian gov-
ernment is obliged to return these shares back to the relevant shareholders without consideration as soon as the total of
the payments received by the Austrian government for participation rights and other specified eligible payments reach a
certain amount. If the dividends received by the Austrian government in respect of its participation rights and further
specified eligible payments (such as any dividends paid with respect to shares held by the Austrian government in VBW)
do not reach the minimum thresholds set out by certain contractually stipulated reference dates (a “control event”), the
government is entitled to full rights to the shares without further consideration and to claim further ordinary shares in
VBW from the shareholders of VBW up to 8 % of the share capital of VBW without further consideration. In such a case,
therefore, up to 33 % plus one share of the shares in VBW may become (legal and economic) property of the Austrian
government, and the government may obtain full rights to this shareholding (excepting the pre-emption right granted). In
the case that the pre-emption right granted by the Austrian government is exercised by a buyer designated by VBW and
the minimum threshold for the total payments in respect of participation rights and other eligible payments is not met, the
shareholders of VBW have committed to transfer further ordinary shares in VBW to the Austrian government as soon as
the government gains full rights to the shares and covering the amount of shares previously transferred to the govern-
ment and the shares acquired by the buyer designated by VBW. Since the shareholders – essentially VB – retain benefi-
cial ownership of the shares until a "control event" (Verfügungsfall) occurs, the shares were not de-recognised. In the
association's financial statements, these shares in VBW therefore continue to be offset against the equity of VBW follow-
ing capital consolidation.
The balance sheet does not contain any further financial assets for which material risks or rewards were retained.
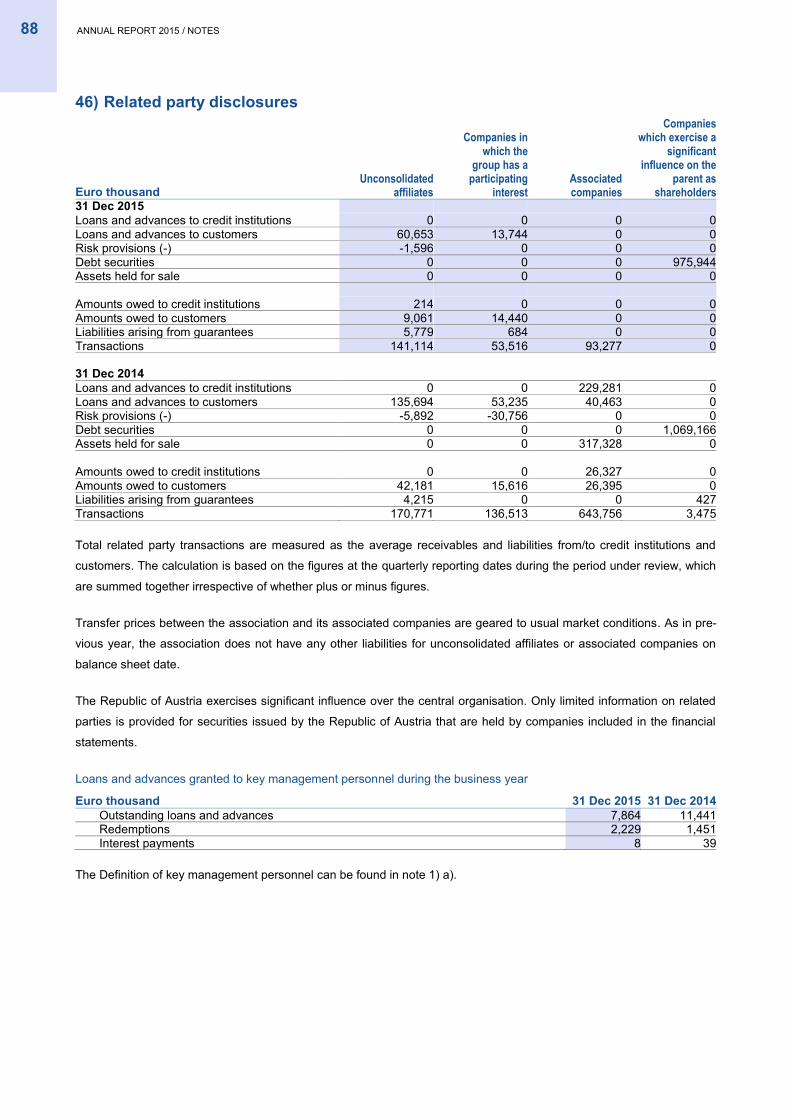
88 ANNUAL REPORT 2015 / NOTES
46) Related party disclosures
Euro thousand Unconsolidated
affiliates
Companies in which the
group has a participating
interest Associated companies
Companies which exercise a
significant influence on the
parent as shareholders
31 Dec 2015 Loans and advances to credit institutions 0 0 0 0
Loans and advances to customers 60,653 13,744 0 0 Risk provisions (-) -1,596 0 0 0 Debt securities 0 0 0 975,944 Assets held for sale 0 0 0 0
Amounts owed to credit institutions 214 0 0 0 Amounts owed to customers 9,061 14,440 0 0 Liabilities arising from guarantees 5,779 684 0 0 Transactions 141,114 53,516 93,277 0
31 Dec 2014 Loans and advances to credit institutions 0 0 229,281 0
Loans and advances to customers 135,694 53,235 40,463 0 Risk provisions (-) -5,892 -30,756 0 0 Debt securities 0 0 0 1,069,166 Assets held for sale 0 0 317,328 0
Amounts owed to credit institutions 0 0 26,327 0 Amounts owed to customers 42,181 15,616 26,395 0 Liabilities arising from guarantees 4,215 0 0 427 Transactions 170,771 136,513 643,756 3,475
Total related party transactions are measured as the average receivables and liabilities from/to credit institutions and
customers. The calculation is based on the figures at the quarterly reporting dates during the period under review, which
are summed together irrespective of whether plus or minus figures.
Transfer prices between the association and its associated companies are geared to usual market conditions. As in pre-
vious year, the association does not have any other liabilities for unconsolidated affiliates or associated companies on
balance sheet date.
The Republic of Austria exercises significant influence over the central organisation. Only limited information on related
parties is provided for securities issued by the Republic of Austria that are held by companies included in the financial
statements.
Loans and advances granted to key management personnel during the business year
Euro thousand 31 Dec 2015 31 Dec 2014 Outstanding loans and advances 7,864 11,441 Redemptions 2,229 1,451 Interest payments 8 39
The Definition of key management personnel can be found in note 1) a).
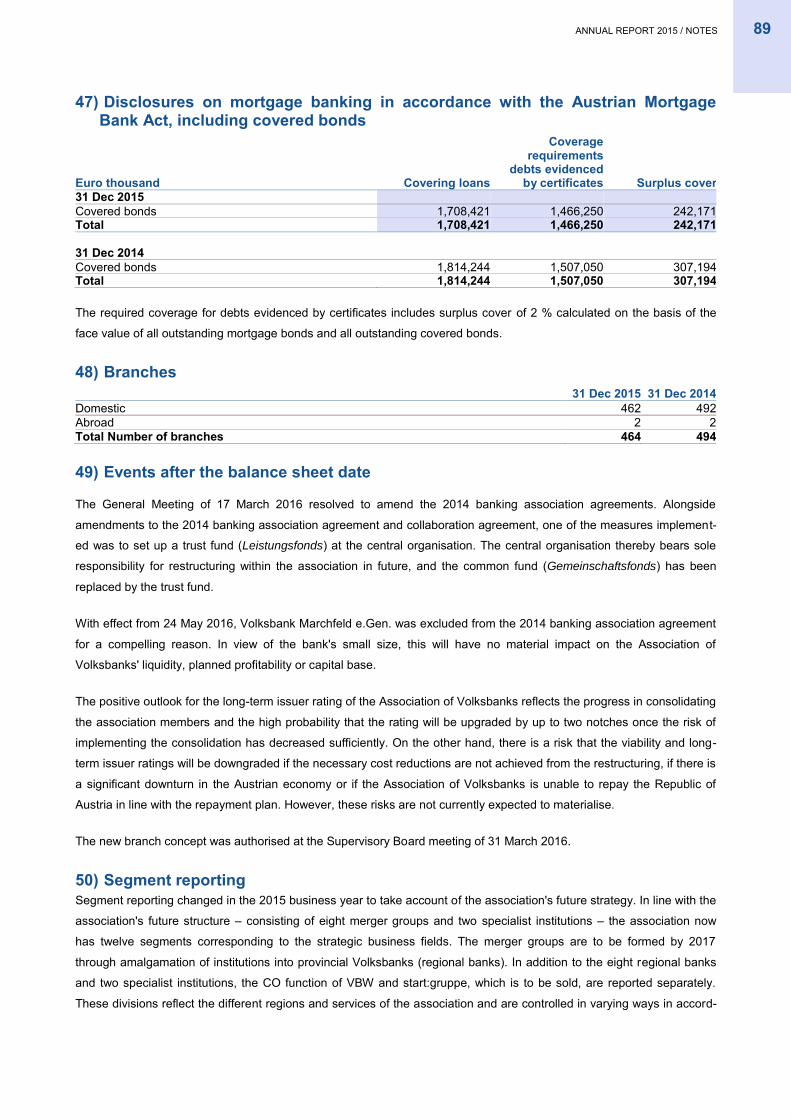
ANNUAL REPORT 2015 / NOTES 89
47) Disclosures on mortgage banking in accordance with the Austrian Mortgage Bank Act, including covered bonds
Euro thousand Covering loans
Coverage requirements
debts evidenced by certificates Surplus cover
31 Dec 2015 Covered bonds 1,708,421 1,466,250 242,171
Total 1,708,421 1,466,250 242,171
31 Dec 2014 Covered bonds 1,814,244 1,507,050 307,194
Total 1,814,244 1,507,050 307,194
The required coverage for debts evidenced by certificates includes surplus cover of 2 % calculated on the basis of the
face value of all outstanding mortgage bonds and all outstanding covered bonds.
48) Branches
31 Dec 2015 31 Dec 2014
Domestic 462 492 Abroad 2 2 Total Number of branches 464 494
49) Events after the balance sheet date
The General Meeting of 17 March 2016 resolved to amend the 2014 banking association agreements. Alongside
amendments to the 2014 banking association agreement and collaboration agreement, one of the measures implement-
ed was to set up a trust fund (Leistungsfonds) at the central organisation. The central organisation thereby bears sole
responsibility for restructuring within the association in future, and the common fund (Gemeinschaftsfonds) has been
replaced by the trust fund.
With effect from 24 May 2016, Volksbank Marchfeld e.Gen. was excluded from the 2014 banking association agreement
for a compelling reason. In view of the bank's small size, this will have no material impact on the Association of
Volksbanks' liquidity, planned profitability or capital base.
The positive outlook for the long-term issuer rating of the Association of Volksbanks reflects the progress in consolidating
the association members and the high probability that the rating will be upgraded by up to two notches once the risk of
implementing the consolidation has decreased sufficiently. On the other hand, there is a risk that the viability and long-
term issuer ratings will be downgraded if the necessary cost reductions are not achieved from the restructuring, if there is
a significant downturn in the Austrian economy or if the Association of Volksbanks is unable to repay the Republic of
Austria in line with the repayment plan. However, these risks are not currently expected to materialise.
The new branch concept was authorised at the Supervisory Board meeting of 31 March 2016.
50) Segment reporting Segment reporting changed in the 2015 business year to take account of the association's future strategy. In line with the
association's future structure – consisting of eight merger groups and two specialist institutions – the association now
has twelve segments corresponding to the strategic business fields. The merger groups are to be formed by 2017
through amalgamation of institutions into provincial Volksbanks (regional banks). In addition to the eight regional banks
and two specialist institutions, the CO function of VBW and start:gruppe, which is to be sold, are reported separately.
These divisions reflect the different regions and services of the association and are controlled in varying ways in accord-
90 ANNUAL REPORT 2015 / NOTES
ance with the internal management and reporting structure. Control is based on the individual merger groups/regional
banks and their higher-level holding companies and subordinate entities. In the case of VBW, reporting is based on allo-
cation to the CO or Retail profit centres, which means that all results of VBW, its subordinate entities and higher-level
holding companies are allocated to these two profit centres. The previous year's figures have been adjusted accordingly.
The measurement and accounting principles used in the consolidated financial statements are also applied to the seg-
ment reporting. Net interest income of profit centres is calculated according to the market interest method. Transfer
prices for investments and refinancing between corporate entities are in line with standard market conditions.
CO
The CO segment comprises the top institution activities as well as the central organisation duties for the entire Austrian
Association of Volksbanks. Treasury is primarily responsible for obtaining liquidity on the money and capital markets and
for balancing liquidity within the Association of Volksbanks. Liquidity control in connection with regulatory requirements
on managing the investment book in the areas of liquidity and interest rate risk is another key component of VBW's tasks
as top institution and CO.
The syndicated financing division, including large-scale house-building, belongs to this profit centre. VBW provides its
services as a syndicate partner for large loan commitments held by commercial clients of the Volksbanks. The results of
VB Services für Banken GmbH, which provides services to the Volksbanks for payment processing and settling securi-
ties transactions, are also included here.
Finally, all other activities are reported that are undertaken in managing the Association of Volksbanks and performed by
VBW as the central organisation within the meaning of the CRR and BWG.
All activities from the remainder of VBAG and all companies demerged from the association have also been allocated to
the CO segment if they could not be allocated to a regional bank.
Regional banks
The eight regional bank segments comprise standard banking services for retail customers, SMEs and commercial cli-
ents in the areas of investment and financing, advisory and investment services for securities, payment services, broker-
age of insurance products, and foreign exchange business in the different regions.
Services are typically provided through the branches as well as through the internet and direct sales. Higher-level holding
companies and subordinate companies related to the individual regional banks are likewise recognised in the relevant
segments.
start:group
The company start:bausparkasse e.Gen. and its subsidiary IMMO-Bank Aktiengesellschaft are reported in this segment.
VBAG initiated a sale process for this group in 2014, which is still ongoing.
Specialist institutions
The two segments Sparda and Doctors/Pharmacies comprise the specialist institutions SPARDA-BANK AUSTRIA Süd
eGen, SPARDA-BANK AUSTRIA Nord eGen, Bank für Ärzte und Freie Berufe Aktiengesellschaft and Österreichische
Apothekerbank eG, which provide Association of Volksbanks services to their specific customer groups.

ANNUAL REPORT 2015 / NOTES 91
Consolidation
Consolidation matters are reported separately from other activities in the Consolidation column. These items contain
amounts arising from consolidation processes that are not performed within a segment.
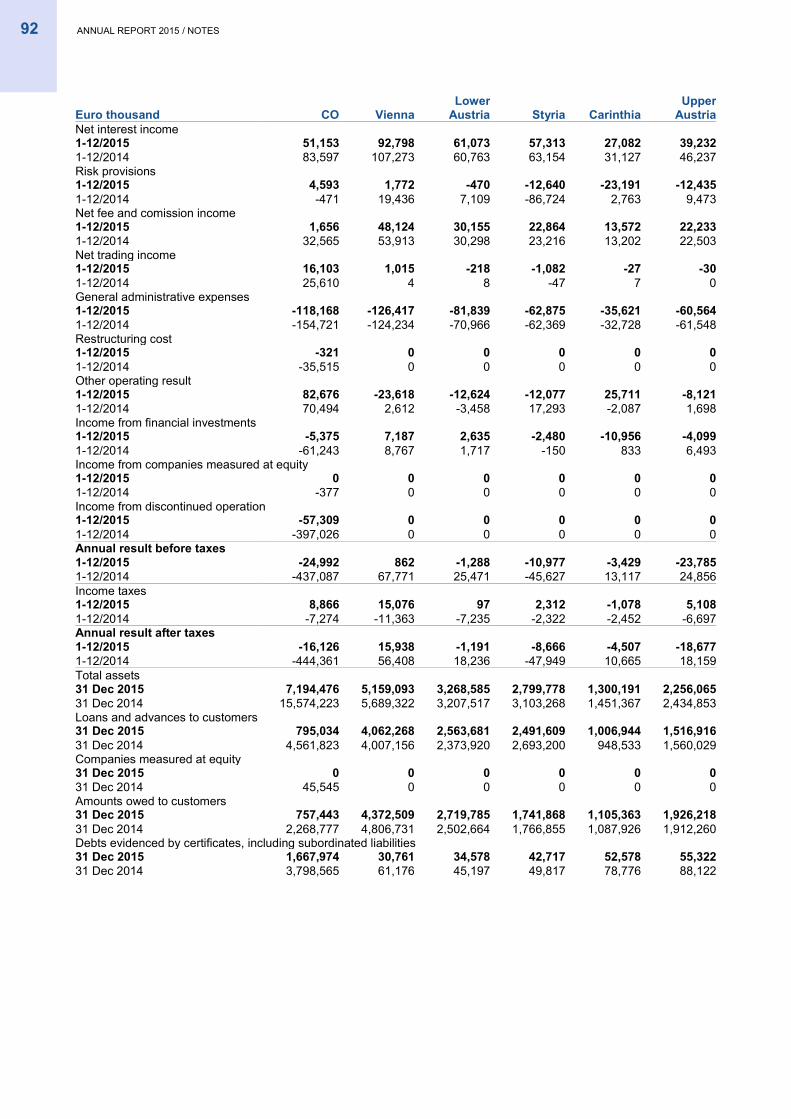
92 ANNUAL REPORT 2015 / NOTES
Euro thousand CO Vienna
Lower Austria Styria Carinthia
Upper Austria
Net interest income 1-12/2015 51,153 92,798 61,073 57,313 27,082 39,232
1-12/2014 83,597 107,273 60,763 63,154 31,127 46,237 Risk provisions
1-12/2015 4,593 1,772 -470 -12,640 -23,191 -12,435 1-12/2014 -471 19,436 7,109 -86,724 2,763 9,473 Net fee and comission income
1-12/2015 1,656 48,124 30,155 22,864 13,572 22,233 1-12/2014 32,565 53,913 30,298 23,216 13,202 22,503 Net trading income
1-12/2015 16,103 1,015 -218 -1,082 -27 -30 1-12/2014 25,610 4 8 -47 7 0 General administrative expenses
1-12/2015 -118,168 -126,417 -81,839 -62,875 -35,621 -60,564 1-12/2014 -154,721 -124,234 -70,966 -62,369 -32,728 -61,548 Restructuring cost
1-12/2015 -321 0 0 0 0 0 1-12/2014 -35,515 0 0 0 0 0 Other operating result
1-12/2015 82,676 -23,618 -12,624 -12,077 25,711 -8,121 1-12/2014 70,494 2,612 -3,458 17,293 -2,087 1,698 Income from financial investments
1-12/2015 -5,375 7,187 2,635 -2,480 -10,956 -4,099 1-12/2014 -61,243 8,767 1,717 -150 833 6,493 Income from companies measured at equity 1-12/2015 0 0 0 0 0 0 1-12/2014 -377 0 0 0 0 0 Income from discontinued operation 1-12/2015 -57,309 0 0 0 0 0 1-12/2014 -397,026 0 0 0 0 0 Annual result before taxes
1-12/2015 -24,992 862 -1,288 -10,977 -3,429 -23,785 1-12/2014 -437,087 67,771 25,471 -45,627 13,117 24,856 Income taxes
1-12/2015 8,866 15,076 97 2,312 -1,078 5,108 1-12/2014 -7,274 -11,363 -7,235 -2,322 -2,452 -6,697 Annual result after taxes
1-12/2015 -16,126 15,938 -1,191 -8,666 -4,507 -18,677 1-12/2014 -444,361 56,408 18,236 -47,949 10,665 18,159 Total assets
31 Dec 2015 7,194,476 5,159,093 3,268,585 2,799,778 1,300,191 2,256,065 31 Dec 2014 15,574,223 5,689,322 3,207,517 3,103,268 1,451,367 2,434,853 Loans and advances to customers
31 Dec 2015 795,034 4,062,268 2,563,681 2,491,609 1,006,944 1,516,916 31 Dec 2014 4,561,823 4,007,156 2,373,920 2,693,200 948,533 1,560,029 Companies measured at equity
31 Dec 2015 0 0 0 0 0 0 31 Dec 2014 45,545 0 0 0 0 0 Amounts owed to customers
31 Dec 2015 757,443 4,372,509 2,719,785 1,741,868 1,105,363 1,926,218 31 Dec 2014 2,268,777 4,806,731 2,502,664 1,766,855 1,087,926 1,912,260 Debts evidenced by certificates, including subordinated liabilities 31 Dec 2015 1,667,974 30,761 34,578 42,717 52,578 55,322 31 Dec 2014 3,798,565 61,176 45,197 49,817 78,776 88,122
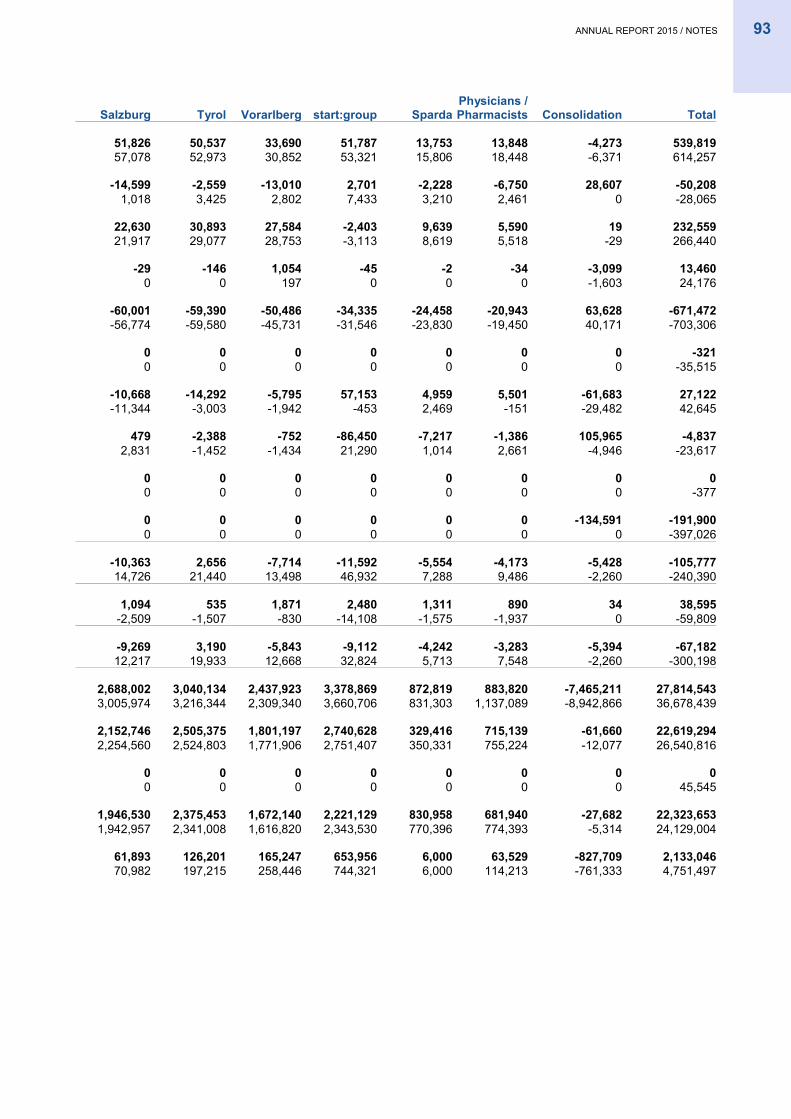
ANNUAL REPORT 2015 / NOTES 93
Salzburg Tyrol Vorarlberg start:group Sparda Physicians / Pharmacists Consolidation Total
51,826 50,537 33,690 51,787 13,753 13,848 -4,273 539,819 57,078 52,973 30,852 53,321 15,806 18,448 -6,371 614,257
-14,599 -2,559 -13,010 2,701 -2,228 -6,750 28,607 -50,208 1,018 3,425 2,802 7,433 3,210 2,461 0 -28,065
22,630 30,893 27,584 -2,403 9,639 5,590 19 232,559 21,917 29,077 28,753 -3,113 8,619 5,518 -29 266,440
-29 -146 1,054 -45 -2 -34 -3,099 13,460 0 0 197 0 0 0 -1,603 24,176
-60,001 -59,390 -50,486 -34,335 -24,458 -20,943 63,628 -671,472 -56,774 -59,580 -45,731 -31,546 -23,830 -19,450 40,171 -703,306
0 0 0 0 0 0 0 -321 0 0 0 0 0 0 0 -35,515
-10,668 -14,292 -5,795 57,153 4,959 5,501 -61,683 27,122 -11,344 -3,003 -1,942 -453 2,469 -151 -29,482 42,645
479 -2,388 -752 -86,450 -7,217 -1,386 105,965 -4,837 2,831 -1,452 -1,434 21,290 1,014 2,661 -4,946 -23,617
0 0 0 0 0 0 0 0 0 0 0 0 0 0 0 -377
0 0 0 0 0 0 -134,591 -191,900 0 0 0 0 0 0 0 -397,026
-10,363 2,656 -7,714 -11,592 -5,554 -4,173 -5,428 -105,777 14,726 21,440 13,498 46,932 7,288 9,486 -2,260 -240,390
1,094 535 1,871 2,480 1,311 890 34 38,595 -2,509 -1,507 -830 -14,108 -1,575 -1,937 0 -59,809
-9,269 3,190 -5,843 -9,112 -4,242 -3,283 -5,394 -67,182 12,217 19,933 12,668 32,824 5,713 7,548 -2,260 -300,198
2,688,002 3,040,134 2,437,923 3,378,869 872,819 883,820 -7,465,211 27,814,543 3,005,974 3,216,344 2,309,340 3,660,706 831,303 1,137,089 -8,942,866 36,678,439
2,152,746 2,505,375 1,801,197 2,740,628 329,416 715,139 -61,660 22,619,294 2,254,560 2,524,803 1,771,906 2,751,407 350,331 755,224 -12,077 26,540,816
0 0 0 0 0 0 0 0 0 0 0 0 0 0 0 45,545
1,946,530 2,375,453 1,672,140 2,221,129 830,958 681,940 -27,682 22,323,653 1,942,957 2,341,008 1,616,820 2,343,530 770,396 774,393 -5,314 24,129,004
61,893 126,201 165,247 653,956 6,000 63,529 -827,709 2,133,046 70,982 197,215 258,446 744,321 6,000 114,213 -761,333 4,751,497
94 ANNUAL REPORT 2015 / NOTES
51) Risk report
General
Assuming and professionally managing the risks connected with business activities is a core function of every bank. As
the central organisation of the banking association in accordance with section 30a of the Austrian Banking Act, consisting
of Volksbank Wien AG and the primary institutions of the Volksbank sector, VBW performs the key tasks of implementing
and supporting processes and methods for identifying, managing, measuring and monitoring all risks relating to banking
operations, both at VBW Group level and as the central organisation of the banking association (Kreditinstitute-Verbund)
pursuant to section 30a of the Austrian Banking Act with the primary institutions. Focus of control and therefore also the
reporting is placed on the Association of Volksbanks including VBW as part of it.
To this end, the following risks are addressed in the context of the risk strategy specified annually by the managing
Board on the basis of risk policy principles in force across the association:
- Credit risks (default, counterparty, concentration, repayment vehicle, transfer, migration, macroeconomic and
foreign currency loan risks)
- Market risk (trading book market risk, foreign exchange risk of open currency positions, interest-rate risk and
credit spread risk)
- Investment risk (default, impairment and foreign exchange risk)
- Operational risk
- Structural liquidity risk
- Other risks (strategic risk, reputational risk, equity risk and business risk)
In its new role as the central organisation of the Association of Volksbanks, VBW must ensure that the banking associa-
tion has administration, accounting and control procedures in place to record, assess, manage and monitor business and
operational banking risks as well as compensation policies and practices (section 39 (2) of the Austrian Banking Act).
The necessary instruction rights are implemented based on the General Instructions. Harmonising and refocusing the
risk management methods, processes and systems previously employed by VBAG and the Volksbanks represented the
start of a new chapter in 2012 based on the motto of “One association – one system”.
Current developments
In the process of restructuring the Association of Volksbanks and converting VBAG into a wind-down entity, the division
of VBAG enabling VBW to assume and fulfil the central organisation and central institution function in the new Associa-
tion of Volksbanks created by the 2014 banking association agreement was spun off and transferred on 4 July 2015.
VBW has acted as central organisation since 4 July 2015 and is responsible for ensuring the Association of Volksbanks
complies with regulatory requirements. Risk management and control particularly entails implementation and support of
processes and methods for identifying, managing, measuring and monitoring all risks related to banking operations.
a) Risk management structure and basic principles of risk policy
Risik management structure
The Association of Volksbanks in accordance with section 30a of the Austrian Banking Act of the local credit co-
operatives has implemented all organisational precautions necessary to meet the requirements of a modern risk man-
agement system as formulated, for example, in the minimum standards for lending business and in the credit institutions-
risk management regulation - CI-RMR. There is clear separation of market and risk assessment, measurement and con-
trol. In order to prevent conflicts of interest, these tasks are performed by different organisational units.
ANNUAL REPORT 2015 / NOTES 95
All centrally managed and regulated strategic risk management activities in the Association of Volksbanks are concen-
trated in the Risk Control department within the General Management division headed by Gerald Fleischmann. Alongside
Risk Control, this division also encompasses Association Strategy, Organisation & IT and HR Management. Operational
risk management activities are concentrated in the Back Office division headed by Josef Preissl. The division includes
the Retail / SME Risk, Association Risk Management and Reorganisation Management departments.
Basic principles of risk policy
The basic risk policy principles encompass the standards applicable within the Association of Volksbanks for dealing with
risks and are determined together with the risk appetite by the central organisation’s Managing Board. A broadly shared
understanding of risk management throughout the association is the foundation for developing risk awareness and a risk
culture within the company.
General Instructions on Risk Management
As part of performing its management function, the central organisation has issued general instructions to the banks
belonging to the Association of Volksbanks. The General Instructions on Risk Management and related manuals provide
binding regulations on risk management across the association. They comprise the processes and methods that have
been put in place for managing, measuring and monitoring risks in the association.
The aim of the General Instructions is to provide clear and comprehensible documentation on general frameworks and
principles for measuring and managing risks to be applied consistently across the association and on the design of ap-
propriate processes and organisational structures. The General Instructions lay the foundation for implementing the risk
strategy in operations and set the basic risk targets and limits that are to guide business decisions in line with the main
areas of business focus. The General Instructions on Risk Management apply to all members of the Association of
Volksbanks as defined in section 30a of the Austrian Banking Act.
As part of their general duty of care in the interest of the companies, the Managing Boards and senior management of all
association members must ensure, without exception or limitation, that the General Instructions on Risk Management are
applied in their respective companies on both a formal and a de facto basis. The General Instructions on Risk Manage-
ment are applied either through full implementation at the entity or through their content being included in the entity's own
risk manual. Any deviations from or special provisions relating to the General Instructions on Risk Management are per-
mitted only in exceptional cases and must be agreed in advance with the OPRISK and Risk Governance organisational
unit (OE 632) within VBW as the CO.
Clear organisational structures: Particular attention is paid to the separation of risk-taking on the one hand and calculat-
ing risk and specifying risk standards on the other (risk controlling/risk management). Separation of functions within the
association ensures that conflicts of interest are avoided.
Systems and methods: Uniform risk measurement methods form the basis for comparing and aggregating risks within
the association. They are also an important element in developing effective internal limit structures for the association
and calculating utilisation of limits. Major focus is placed on standardised risk management systems, including with re-
gard to cost-effectiveness and conserving resources. Contingency plans ensure that the necessary system availability is
maintained.
Limit system: All measurable and controllable risks in the association are subject to a limit structure that is in turn subject
to ongoing operational monitoring. The “no risk without limit” principle applies. Risks for which current theory does not
provide sufficiently exact measurement methods or instruments are considered either on the basis of regulatory equity
96 ANNUAL REPORT 2015 / NOTES
requirements or conservative calculation methods, taking stress assumptions into consideration, or in the form of safety
buffers. The prudence principle is applied in such cases.
Risk reporting: Prompt, regular and comprehensive risk reporting is implemented in various forms, including an associa-
tion risk report. This is an important element for identifying, measuring, managing and monitoring risks within the asso-
ciation. It is produced on a quarterly basis and covers all relevant types of risk. The risk report periodically informs the
central organisation’s Managing Board of the development of risk-bearing ability and the risk situation of the association
and focuses on a quantitative presentation of management-related information on the risk categories addressed, which is
supplemented by brief assessments of the situation and further qualitative information where appropriate. During prepa-
ration of the report, particular emphasis is placed on data quality in order to ensure the findings are meaningful.
Processes: Functioning processes form the basis of risk management. Developing these processes and integrating them
into day-to-day business procedures is thus a key risk management task in the association.
New product launches: For the implementation of new products a uniform approach has been established within the
association. In addition to the proper recording of all risks and their correct entry in controlling and accounting systems,
the emphasis is on mapping them in the centralised systems of the association, thus ensuring meaningful standardised
risk reports and correct external reporting.
An efficient, system-supported approval process for treasury products has been implemented and is improved and de-
veloped on an ongoing basis. A focus here is on correctly mapping all risks in the risk management systems. Particular
attention is paid to ensuring that it is possible to carry out an independent assessment. This also applies to closed posi-
tions. This ensures that the legal requirements for presenting counterparty default risk and collateral management re-
quirements are met.
Backtesting: As estimations of parameters such as probability of default (PD), loss given default (LGD), exposure at
default (EAD), credit conversion factor (CCF) and value at risk (VaR) are always based on past values, their accuracy
must be validated periodically by way of backtesting. Backtesting reports are prepared for credit and market risk in all
cases. Although the frequency of reporting depends on the type of risk, the reports are produced at least once a year.
The central organistation’s Managing Board is promptly informed of the findings. Any findings giving cause for concern
(e.g. the number of outliers is too high from a statistical perspective) lead to an immediate analysis of the calculation
methods or the models.
Stresstesting: Credit, market and liquidity risks undergo regular risk-type specific stress tests. The crisis scenarios in
such tests are designed in such a way that the occurrence of very unlikely but not impossible events is simulated. Based
on this approach, atypical tail losses (extreme losses), among other things, can be identified and analysed. This method
is a useful supplement to the VaR method, particularly in relation to fat tails.
As well as these stress tests and sensitivity analyses for specific risk types, stress tests are regularly carried out across
multiple risk types. This process initially involves defining economic crisis scenarios and deriving the changed risk pa-
rameters for the individual risk categories and segments from this. In addition to the risk side, the effects of crisis scenar-
ios on the risk-covering equity are identified. Finally, the various effects of the crisis scenarios on the risk-bearing ability
are compiled and analysed in a stressed risk sustainability account. Reverse stress tests and portfolio-specific stress
tests are also performed.
ANNUAL REPORT 2015 / NOTES 97
b) Regulatory requirements Regulatory requirements are split into three pillars within association in accordance with Basel II/ III. Pillar 1, minimum
capital requirements, regulates the calculation of the minimum capital requirements for credit risks, market risks and
operational risks. Pillar 2, supervisory review, defines minimum requirements of banks’ risk management systems as part
of the ICAAP (internal capital adequacy assessment process – see also point c)). Pillar 3, disclosure, regulates disclo-
sure for market participants.
Pillar 1 minimum capital requirements
In accordance with the central organisation’s Managing Board resolution, the implementation of pillar 1 in the association
not only fulfils minimum requirements but also provides for efficient implementation of internal models, in order to im-
prove the risk management systems for all risk types on an ongoing basis.
The relevant standard regulatory approaches are used to determine the minimum capital requirements both for credit risk
and for market and operational risks.
Pillar 2 Internal capital adequacy assessment process
The internal capital adequacy assessment process (ICAAP) requires banks to take all necessary measures to guarantee
at all times that there are sufficient capital resources for current business activities and those planned for the future as
well as the associated risks. Internal methods and procedures developed by banks may be used for this purpose. The
size and complexity of the business activities plays a key role in the design of the strategies, methods and systems re-
quired for implementing the ICAAP (proportionality principle). The implementation of the ICAAP is explained in more
detail in point c).
Pillar 3 disclosure
The requirements of pillar 3 are met through publication of the qualitative and quantitative disclosure requirements de-
fined under the Austrian Financial Market Authority (FMA) regulation on implementation of the Austrian Banking Act as it
relates to the disclosure obligations of banks (EU regulation No. 575 / 2013 Part VIII disclosure), on the Bank’s website
under Association of Volksbanks/Association-disclosure.
c) Risk strategy and internal capital adequacy assessment process The Association of Volksbanks is subject to the association’s risk strategy. This is re-evaluated and redefined annually by
the managing Board, taking into account results from the internal capital adequacy assessment process (ICAAP). It
forms the basis for a uniform approach to dealing with risks throughout the association. The risk strategy sets out and
documents the general framework and principles for risk management to be applied consistently across the association
and the design of appropriate processes and organisational structures in a clear and comprehensible manner. En-
hancements of the methods applied for measuring and managing risks are integrated into the risk strategy via the annual
update process.
The ICAAP is established as a revolving management circuit in accordance with international best practice. This starts by
defining a risk strategy, then goes through the process of identifying, quantifying and aggregating risks, and finishes by
determining risk-bearing ability, allocating capital and establishing limits, leading to ongoing risk monitoring. The individ-
ual elements of the circuit are performed with varying regularity (daily for measurement of trading book market risk,
monthly for creation of the risk sustainability account and annually for risk inventory and risk strategy). All the activities
described in the circuit are examined at least once a year to ensure that they are up to date and adequate and are ad-
justed to current underlying conditions if necessary.
98 ANNUAL REPORT 2015 / NOTES
The association defines a risk strategy on the basis of the association business strategy, in order to create consistent
conditions and policies for uniform risk management across the association. The association risk strategy applies for the
entire association. Each member of the Association of Volksbanks derives its own risk strategy from the association risk
strategy. The core elements of the risk strategy are an integrated limit system and the risk appetite statement (RAS),
which are intended to ensure that the risk, capital and performance targets are properly aligned. The limit system – bro-
ken down to sub-risk types – and the RAS provide the framework for the maximum risk which the association is prepared
to incur in order to achieve its strategic goals. The RAS indicators have target, trigger and limit values and, like the bank-
wide and sub-risk limits, are monitored on an ongoing basis, ensuring that deviations from the risk strategy are promptly
identified and corrective measures can be quickly implemented.
The aim of the risk inventory is to ascertain the potential danger posed by significant new risks entered into and to as-
sess significant existing risks. The results of the risk inventory are compiled and analysed for the Association of
Volksbanks. The results of the risk inventory are incorporated into the risk strategy and provide the starting point for the
risk sustainability account, as it has to take significant risk types into account.
The basis for the quantitative implementation of the ICAAP is the risk sustainability account. It demonstrates that ade-
quate risk-covering capital is in place at all times to provide sufficient cover for risks that have been entered into and
which also ensures such cover is available for the future. For this purpose, firstly all relevant individual risks are aggre-
gated. The existing, previously defined risk coverage capital is then compared with this total risk. Compliance with the
total bank risk limit and the single-entity limit determined by the central organisation’s Managing Board for the whole
association is monitored on a monthly basis, and a risk report is prepared.
When determining the risk-bearing ability, different objectives may be pursued, which are reflected in three different
views.
- Regulatory view (observance of regulatory capital ratios)
- Economic liquidation view
- Economic going concern view
The regulatory view compares the sum of all risks required by the regulator to be covered by capital according to speci-
fied risk measurement methods and the defined risk-covering capital (based on CRR/CRD IV and the Austrian Banking
Act). Assurance of regulatory riskbearing ability is a minimum requirement, since it is stipulated by law.
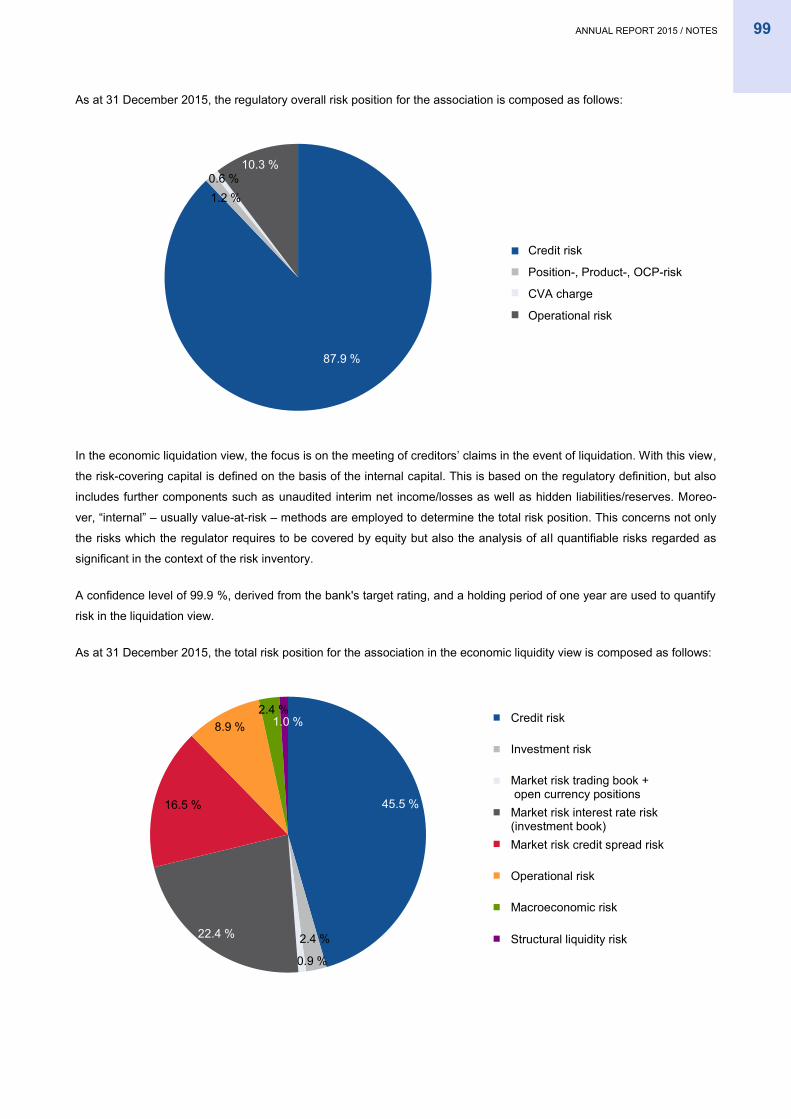
ANNUAL REPORT 2015 / NOTES 99
As at 31 December 2015, the regulatory overall risk position for the association is composed as follows:
In the economic liquidation view, the focus is on the meeting of creditors’ claims in the event of liquidation. With this view,
the risk-covering capital is defined on the basis of the internal capital. This is based on the regulatory definition, but also
includes further components such as unaudited interim net income/losses as well as hidden liabilities/reserves. Moreo-
ver, “internal” – usually value-at-risk – methods are employed to determine the total risk position. This concerns not only
the risks which the regulator requires to be covered by equity but also the analysis of all quantifiable risks regarded as
significant in the context of the risk inventory.
A confidence level of 99.9 %, derived from the bank's target rating, and a holding period of one year are used to quantify
risk in the liquidation view.
As at 31 December 2015, the total risk position for the association in the economic liquidity view is composed as follows:
87.9 %
1.2 % 0.6 %
10.3 %
Kreditrisiko
Positions-, Waren-, ODP-Risiko
CVA Charge
operationelles Risiko
45.5 %
2.4 %
0.9 %
22.4 %
16.5 %
8.9 % 2.4 %
1.0 % Kreditrisiken
Beteiligungsrisiken
Marktrisiko HB + offene Devisenpositionen Marktrisiko Zinsänderungsrisiko BB
Marktrisiko Credit Spread Risiko
operationelle Risiken
makroökonomisches Risiko
strukturelles Liquiditätsrisiko
Credit risk
Investment risk
Market risk trading book + open currency positions Market risk interest rate risk (investment book) Market risk credit spread risk
Operational risk
Macroeconomic risk
Structural liquidity risk
Credit risk
Position-, Product-, OCP-risk
CVA charge
Operational risk
100 ANNUAL REPORT 2015 / NOTES
The going-concern view seeks to ensure the continuation of normal business operations. The going-concern view is
based on coverage of risks through capital available in the short term in day-to-day business. Minor, highly probable risks
should be accommodated without jeopardizing ongoing business operations. Therefore, the risk-covering capital essen-
tially comprises only hidden reserves/liabiliies, the net profit/loss achieved in the current financial year and the target
profit/loss for the next 12 months, as well as the capital that exceeds the fixed capital ratio of the risk strategy. The risk
quantification is based on a moderate confidence level of 95 % and a holding period of one year.
The economic risk sustainability account is regarded as an important view from a management perspective, as the com-
bination of risk measurement and income accounting allows risk-adjusted income management. Standard performance
measurement methods such as return on equity (ROE) are supplemented by the meaningful return on economic capital
(ROEC) measurement, which takes adequate account of risks and facilitates comparison of segment performance, thus
laying the foundation for value-oriented bank management.
d) Credit risk The following risk sub-types are grouped under the heading of credit risk.
- Default risk
- Counterparty risk
- Credit concentration risk
- Repayment vehicle risk
- Transfer risk
- Migration risk
- Macroeconomic risk
- Foreign exchange risk from loans
Default risk denotes potential losses that may arise from the default of business partners who constitute borrowers at the
association.
The counterparty risk is defined as the risk that a business partner in an unsecured over-the-counter (OTC) derivative
transaction will not meet its contractual obligations or will not fully meet them, thus causing an actual loss resulting from
the positive fair value of the derivative transaction (replacement risk) for the association.
Concentration risk denotes the risk that a default by a customer will lead to defaults across the whole group of its busi-
ness relations, even though this relationship would not necessarily entail a group default.
Repayment vehicle risk is the risk that a repayment vehicle that has been saved into in order to repay a debt does not
achieve the desired performance and is finally insufficient to cover the debt. This shortfall between expected savings
volume and outstanding debt at maturity serves as a guide to the potential loss.
Transfer risk occurs in the case of receivables that cross national borders. In the case of a deferment of payment (mora-
torium), cash flows out of a country are prohibited, even if the borrower is willing and able to pay. The probability of this
happening is modelled as a surcharge on the probability of insolvency.
Migration risk represents the risk of change in a debtor's creditworthiness expressed as a change in the credit rating and
thus the probability of default. These are cases in which losses have not yet materialised but where the likelihood of
potential defaults has significantly increased.
ANNUAL REPORT 2015 / NOTES 101
Macroeconomic risk is the risk of losses arising from changes in the general economic situation.
Risk from foreign currency loans arises due to a mismatch between the currency of the debtor's income and the financ-
ing currency. If the exchange rate changes to the customer's disadvantage, the monthly cost to the customer increases,
which can result in additional defaults.
Organisation and risk strategy
Strict separation of sales and risk management units is in place in all association units that generate credit risk. All case-
by-case decisions are made under strict observance of the principle of dual control, which led to stipulation of clear pro-
cesses for the collaboration between the risk management units in the central organisation and in the members of the
Association of Volksbanks. For large-volume transactions, processes have been created to ensure the involvement of
operational central organisation’s risk management and the central organisation’s Managing Board in risk analyses and
credit decisions. Limit systems that combine the decision-making competences of the individual units in a single frame-
work play a key role in this process.
Measuring and controlling the credit risk also necessitates the development of sophisticated models, systems and pro-
cesses tailored to the bank’s own portfolio. The aim is firstly to structure and improve credit decision making and second-
ly to use such instruments and their findings as a basis for portfolio management. When implementing these systems,
the association paid particular attention to ensuring that all rating systems used in the association show a comparable
probability of default (PD) and are connected with the VB master scale, which comprises a total of 25 rating categories.
The PD band used enables both comparison of internal ratings with the classifications of external rating agencies and,
most importantly, comparison of credit ratings across countries and customer segments.
Loan portfolio and credit value at risk
The term economic capital describes the minimum economic capital necessary from an economic perspective based on
the result of a risk measurement. Along with regulatory capital, it is held for the purpose of covering unexpected losses
exceeding expected losses. The calculation of the economic capital requirements needed for the credit risk is based on
the credit value at risk (CVaR) method. For this purpose, the association has selected an analytical calculation method
based on an actuarial approach. In particular, a CreditRisk+ model adapted in line with internal requirements will be used
for modelling credit risks in the loan portfolio.
The CVaR method is used at association level as a basis for the following tasks:
- Breaking down the CVaR into individual segments respectively members of the association and customers
- Identifying portfolio concentrations
- Analysing the development of the CVaR in portfolio business
- Analysis of individual customers’ marginal contributions
- Identifying the major drivers behind CVaR changes (for example: new business, Exposure at Default (EAD), col-
lateral, loss and default rate, risk factor)
102 ANNUAL REPORT 2015 / NOTES
The CVaR for the credit risk is also used for the following purposes as part of general bank management:
- Calculating economic capital
- Ensuring comparability of the risk situation for different types of risk (e.g. credit risk and market risk)
- Calculating risk-adjusted performance ratios (e.g. ROEC)
- Allocating capital
- Cost of capital for a loan in the preliminary and final costing
The CVaR results also serve as a means of obtaining additional information for portfolio analysis and management. A
corresponding report is compiled every month.
The most important aim of using credit risk methods and instruments is preventing loss through identifying risks at an
early stage.
Risk management and risk controlling function
Limits
Monitoring, controlling and restricting the risk of individual exposures and risk clusters are managed on the basis of the
following limits:
- Credit limits for groups of affiliated customers
- Portfolio limits
The group of affiliated customers is used as the basis for limits in new lending within the Association of Volksbanks.
Limits stipulated for the Association of Volksbanks differ from those for merger groups or individual banks. Credit limits
for groups of affiliated customers are essentially limits with regard to:
Sovereign and similar risks, including country, central bank, supranational organisation (e.g. EU) and state-
guaranteed risks
Bank and similar risks: these primarily apply to the CO's treasury business as well as investment book investments
Companies and all other borrowers not categorised as countries or banks; retail clients and municipalities are there-
by to be treated as companies for the purpose of credit risk limits.
The limits for the maximum gross total exposure are calculated based on percentages of the relevant eligible own funds
in line with rating classes. The maximum unsecured exposure is calculated as the percentage of the maximum total
exposure (likewise in accordance with rating class) less protection class 1 collateral. If special circumstances mean that
the limits have to be exceeded in individual business areas (e.g. charities or pharmacies), the relevant reasons must be
given and prior authorisation must be obtained. Limits are reviewed on an ongoing basis at single-entity level through
operational risk management at the individual banks and are monitored through central analyses performed by VBW in
its role as the central organisation.
At present, when setting limits for portfolios, the association primarily uses country risk limits with the aim of limiting the
transfer risk. The target portfolio of the Association of Volksbanks is Austrian business. Foreign business therefore has a
limit of 5 %.
Concentrations
Concentrations are quantified and assessed on a association-wide basis in two ways: on a monthly basis in the CVaR
calculation and on a quarterly basis when preparing the association risk report. This analysis includes, for example, con-
ANNUAL REPORT 2015 / NOTES 103
centrations at individual customer level as regards corporates, banks and the public sector. In addition, the concentration
risk shows the effects of a group view rather than the individual customer view.
The 25 largest items in loans and advances to corporate customers of the Association of Volksbanks come to a total of
euro 1.7 billion, corresponding to 5.4 % of the total portfolio. At euro 1.2 billion, the collateralised EAD for these top 25
companies represents 70 % of the total amount. Of the total figure of euro 1.7 billion, euro 1.6 billion relates to Austria,
euro 54 million to Great Britain and euro 28 million to Germany. A breakdown of these 25 corporate customers shows
that euro 1.0 billion relates to classic corporate financing, euro 594 million to off-balance sheet transactions (commit-
ments and derivatives), euro 96 million to participations.
Rating system
Standardised models are applied across the association to determine credit ratings (the VB rating family) and to deter-
mine the loss amount in the event of default. The expected likelihood of each customer defaulting is estimated across the
VB rating family and expressed via the VB master scale. The concept behind the VB master scale allows for the compar-
ison of borrower credit ratings across regions and customer groups.
The rating classes in rating category 5 cover the reasons for defaulting on a loan applied across the association and are
also used for reporting nonperforming loans (NPL). Loans from parts of rating category 4 and loans past due more than
60 days are defined as problem loans. An in-depth description of rating methods can be found in the regulatory disclo-
sure on the institutions website.
Forbearance
Based on the EBA FINAL draft ITS on supervisory reporting on forbearance and non-performing exposures as well as
Commission Implementing Regulation (EU) 2015/227 of 9 January 2015 laying down implementing technical standards
with regard to supervisory reporting of institutions according to Regulation (EU) No 575/2013, all loans and bonds as well
as revocable and irrevocable loan commitments, balances held with central banks and other demand deposits in all
valuation categories, with the exception of items held for trading, fall within the scope of application of supervisory report-
ing on forbearance and non-performing exposures. Non-current assets held for sale and disposal groups also fall within
the scope of application pursuant to IFRS 5. Forbearance refers to concessions made by the lender to a debtor linked to
financial difficulties or impending financial difficulties experienced by the debtor, which the lender would not grant other-
wise. Forborne credit exposures are assigned to the categories of performing forborne credit exposures and non-
performing forborne credit exposures. Regulations on subsequent monitoring of exposures (special monitoring require-
ments in the Association of Volksbanks) and criteria for recovery are derived from this categorisation.
Concessions have been agreed for economic reasons in connection with customer loans with a total carrying amount of
euro 572,526 thousand. This amount relates to performing forborne credit exposures amounting to
euro 245,078 thousand and non-performing forborne credit exposures amounting to euro 327,448 thousand; value ad-
justments of euro 95,917 thousand have been made for the non-performing forborne credit exposures.
The decision on when a transaction is no longer classified as forborne is made on the basis of fixed criteria, which must
be cumulatively fulfilled. For customers undergoing intensive supervision, the decision is made as part of the scheduled
monitoring process, while in cases involving restructuring it is made during ongoing monitoring of the exposure.
Counterparty default risk
Counterparty risk for market values arising from unsecured derivatives is accounted for by means of credit value adjust-
ments (CVA) or debt value adjustments (DVA), as an approximation function for the potential future exposure in relation

104 ANNUAL REPORT 2015 / NOTES
to counterparty default risk. The expected future exposure (EFE) is calculated using a Monte Carlo simulation. As no
observable credit spreads are available for these counterparties on the market, the default probabilities are based on the
internal ratings of the Association of Volksbanks.
Legally enforceable netting agreements are in place with key counterparties of the association, which have been taken
into consideration internal risk controlling and determining capital requirements. The association does not use an internal
model to calculate counterparty default risk.
The amount of the counterparty limits (off-balance limits) for derivative transactions with banks and financial institutions
depends on the following criteria:
- Internal credit rating
- Amount of the counterparty's own funds
- Amount of the bank's own funds
- Intensity of the business relationship with the counterparty (strategically important, small number of transac-
tions, sporadic)
- Legally enforceable netting agreements in place
The terms of the off-balance limits set are determined taking counterparty default risks into consideration.
The market and liquidity risk department of VBW is responsible for monitoring the counterparty limits for treasury that are
set in line with various maturity bands. The inclusion of derivative transactions in the off-balance lines is based on the
principle of positive fair value plus a term-dependent add-on for counterparties without legally enforceable netting
agreements. If valid netting agreements are in place, positive and negative fair values are netted and any cash collateral
is taken into account.
For institutional counterparties without netting, the amount of the add-ons is based on article 274 CRR. The add-on cal-
culation is carried out in accordance with article 298 CRR, applying the off-balance netting. More conservative markups
are used for internal risk management for non-credit institutions.
Utilisation reports and any overdraft reports are made available to the credit and treasury departments concerned on a
daily basis.
Collateral management - Derivative trading
As part of internal risk controlling in the association, a daily comparison of the fair value of derivative transactions is cur-
rently performed with counterparties for transactions concluded on the basis of framework contracts (ISDA – international
swaps and derivatives association, Austrian or German framework contract) or credit support annex (CSA) contracts. If
the fair values exceed certain contractually defined thresholds, these surpluses must be covered by collateral. The repo
transactions are also examined with regard to the amount of collateral. In line with agreed margin calls, collateral is most-
ly transferred in the form of cash or government bonds in euro.
Credit risk reporting
The association performs credit risk reporting on a monthly basis and provides a detailed presentation of prevailing credit
risk as at the reporting date, and within the banking association in accordance with section 30a of the Austrian Banking
Act. Corresponding reports are produced for the association, major association units and key business areas. This infor-
mation is also included in the credit risk sections of the association risk report.
ANNUAL REPORT 2015 / NOTES 105
The reports contain a quantitative presentation of management-related information on the credit risk, which is supple-
mented by a brief assessment of the situation and further qualitative information where appropriate.
The following analyses form part of the report:
- Portfolio distributions
- Development of new business
- Credit rating distributions
- Non-performing loans
- Credit risk concentrations
- Country group analyses
- Customer segments (customer segment split)
- Sector distributions (commerce)
- Significant CVaR information
These analyses are presented according to different sizes and ratios, for example: unsecured exposure, total exposure,
expected loss, existing risk provisions, standard risk costs, non-performing loans, CVaR. The key ratios used to describe
credit risks for the various business segments as at the balance sheet date and in comparison to the previous year are
shown in the following tables and are excerpts taken from the association risk report.
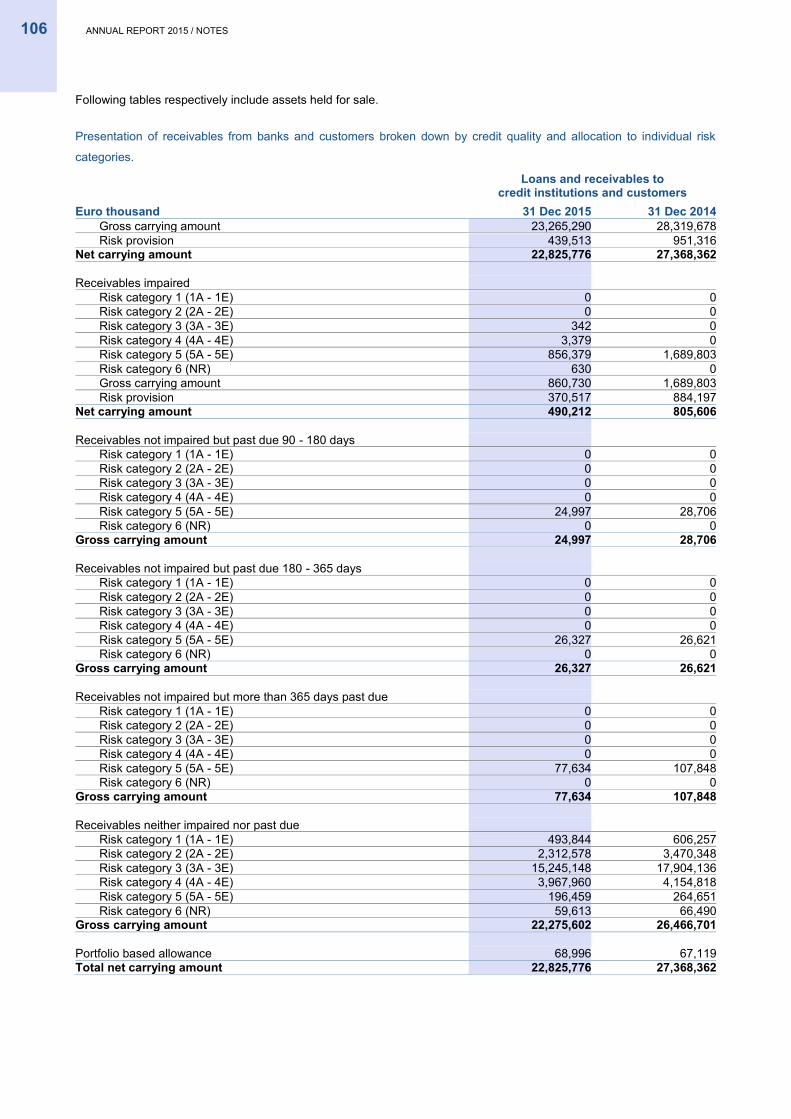
106 ANNUAL REPORT 2015 / NOTES
Following tables respectively include assets held for sale.
Presentation of receivables from banks and customers broken down by credit quality and allocation to individual risk
categories.
Loans and receivables to credit institutions and customers
Euro thousand 31 Dec 2015 31 Dec 2014 Gross carrying amount 23,265,290 28,319,678 Risk provision 439,513 951,316
Net carrying amount 22,825,776 27,368,362
Receivables impaired Risk category 1 (1A - 1E) 0 0
Risk category 2 (2A - 2E) 0 0 Risk category 3 (3A - 3E) 342 0 Risk category 4 (4A - 4E) 3,379 0 Risk category 5 (5A - 5E) 856,379 1,689,803 Risk category 6 (NR) 630 0 Gross carrying amount 860,730 1,689,803 Risk provision 370,517 884,197
Net carrying amount 490,212 805,606
Receivables not impaired but past due 90 - 180 days Risk category 1 (1A - 1E) 0 0
Risk category 2 (2A - 2E) 0 0 Risk category 3 (3A - 3E) 0 0 Risk category 4 (4A - 4E) 0 0 Risk category 5 (5A - 5E) 24,997 28,706 Risk category 6 (NR) 0 0
Gross carrying amount 24,997 28,706
Receivables not impaired but past due 180 - 365 days Risk category 1 (1A - 1E) 0 0
Risk category 2 (2A - 2E) 0 0 Risk category 3 (3A - 3E) 0 0 Risk category 4 (4A - 4E) 0 0 Risk category 5 (5A - 5E) 26,327 26,621 Risk category 6 (NR) 0 0
Gross carrying amount 26,327 26,621
Receivables not impaired but more than 365 days past due Risk category 1 (1A - 1E) 0 0
Risk category 2 (2A - 2E) 0 0 Risk category 3 (3A - 3E) 0 0 Risk category 4 (4A - 4E) 0 0 Risk category 5 (5A - 5E) 77,634 107,848 Risk category 6 (NR) 0 0
Gross carrying amount 77,634 107,848
Receivables neither impaired nor past due Risk category 1 (1A - 1E) 493,844 606,257
Risk category 2 (2A - 2E) 2,312,578 3,470,348 Risk category 3 (3A - 3E) 15,245,148 17,904,136 Risk category 4 (4A - 4E) 3,967,960 4,154,818 Risk category 5 (5A - 5E) 196,459 264,651 Risk category 6 (NR) 59,613 66,490
Gross carrying amount 22,275,602 26,466,701
Portfolio based allowance 68,996 67,119 Total net carrying amount 22,825,776 27,368,362
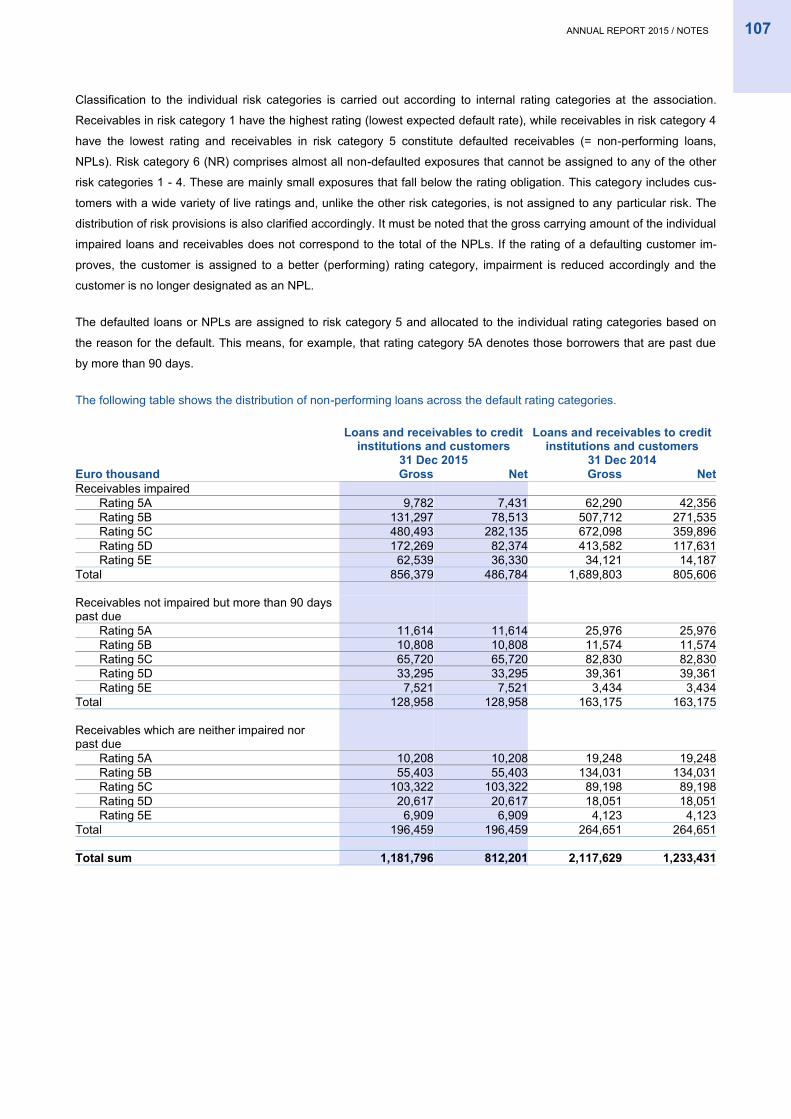
ANNUAL REPORT 2015 / NOTES 107
Classification to the individual risk categories is carried out according to internal rating categories at the association.
Receivables in risk category 1 have the highest rating (lowest expected default rate), while receivables in risk category 4
have the lowest rating and receivables in risk category 5 constitute defaulted receivables (= non-performing loans,
NPLs). Risk category 6 (NR) comprises almost all non-defaulted exposures that cannot be assigned to any of the other
risk categories 1 - 4. These are mainly small exposures that fall below the rating obligation. This category includes cus-
tomers with a wide variety of live ratings and, unlike the other risk categories, is not assigned to any particular risk. The
distribution of risk provisions is also clarified accordingly. It must be noted that the gross carrying amount of the individual
impaired loans and receivables does not correspond to the total of the NPLs. If the rating of a defaulting customer im-
proves, the customer is assigned to a better (performing) rating category, impairment is reduced accordingly and the
customer is no longer designated as an NPL.
The defaulted loans or NPLs are assigned to risk category 5 and allocated to the individual rating categories based on
the reason for the default. This means, for example, that rating category 5A denotes those borrowers that are past due
by more than 90 days.
The following table shows the distribution of non-performing loans across the default rating categories.
Loans and receivables to credit institutions and customers
Loans and receivables to credit institutions and customers
31 Dec 2015 31 Dec 2014
Euro thousand Gross Net Gross Net Receivables impaired
Rating 5A 9,782 7,431 62,290 42,356 Rating 5B 131,297 78,513 507,712 271,535 Rating 5C 480,493 282,135 672,098 359,896 Rating 5D 172,269 82,374 413,582 117,631 Rating 5E 62,539 36,330 34,121 14,187
Total 856,379 486,784 1,689,803 805,606
Receivables not impaired but more than 90 days past due
Rating 5A 11,614 11,614 25,976 25,976 Rating 5B 10,808 10,808 11,574 11,574 Rating 5C 65,720 65,720 82,830 82,830 Rating 5D 33,295 33,295 39,361 39,361 Rating 5E 7,521 7,521 3,434 3,434
Total 128,958 128,958 163,175 163,175
Receivables which are neither impaired nor past due
Rating 5A 10,208 10,208 19,248 19,248 Rating 5B 55,403 55,403 134,031 134,031 Rating 5C 103,322 103,322 89,198 89,198 Rating 5D 20,617 20,617 18,051 18,051 Rating 5E 6,909 6,909 4,123 4,123
Total 196,459 196,459 264,651 264,651
Total sum 1,181,796 812,201 2,117,629 1,233,431
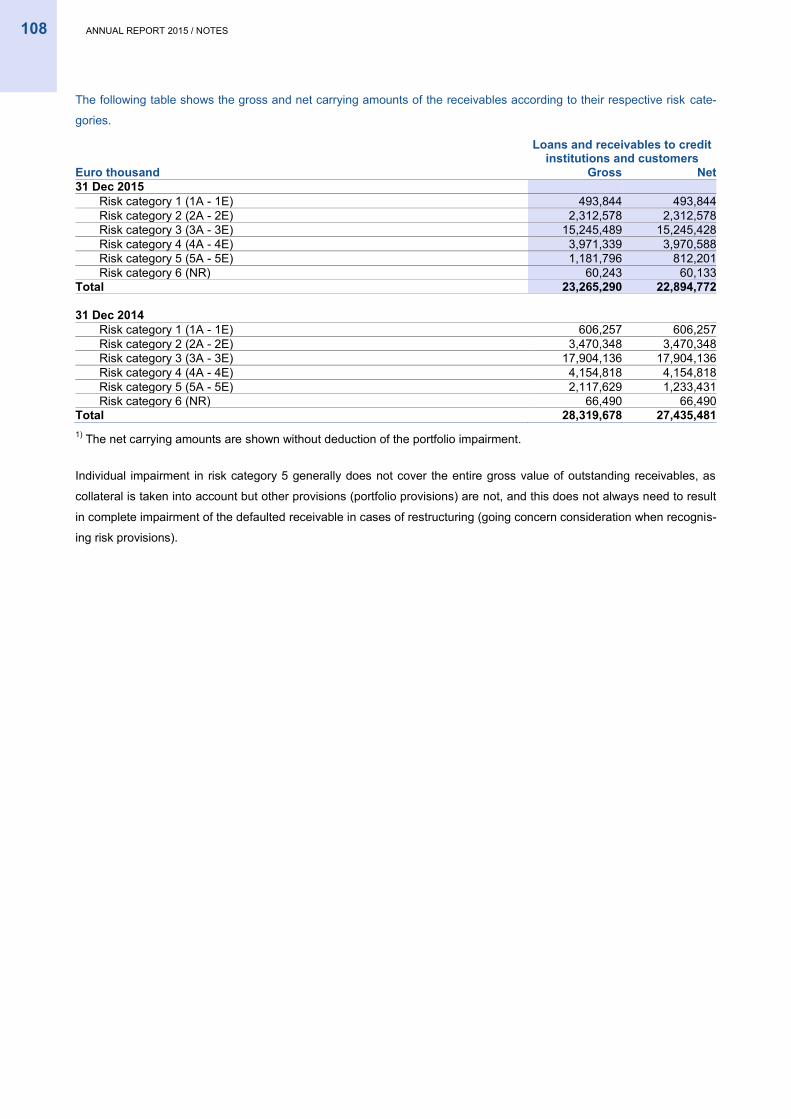
108 ANNUAL REPORT 2015 / NOTES
The following table shows the gross and net carrying amounts of the receivables according to their respective risk cate-
gories.
Loans and receivables to credit institutions and customers
Euro thousand Gross Net 31 Dec 2015
Risk category 1 (1A - 1E) 493,844 493,844 Risk category 2 (2A - 2E) 2,312,578 2,312,578 Risk category 3 (3A - 3E) 15,245,489 15,245,428 Risk category 4 (4A - 4E) 3,971,339 3,970,588 Risk category 5 (5A - 5E) 1,181,796 812,201 Risk category 6 (NR) 60,243 60,133
Total 23,265,290 22,894,772
31 Dec 2014 Risk category 1 (1A - 1E) 606,257 606,257
Risk category 2 (2A - 2E) 3,470,348 3,470,348 Risk category 3 (3A - 3E) 17,904,136 17,904,136 Risk category 4 (4A - 4E) 4,154,818 4,154,818 Risk category 5 (5A - 5E) 2,117,629 1,233,431 Risk category 6 (NR) 66,490 66,490
Total 28,319,678 27,435,481
1) The net carrying amounts are shown without deduction of the portfolio impairment.
Individual impairment in risk category 5 generally does not cover the entire gross value of outstanding receivables, as
collateral is taken into account but other provisions (portfolio provisions) are not, and this does not always need to result
in complete impairment of the defaulted receivable in cases of restructuring (going concern consideration when recognis-
ing risk provisions).
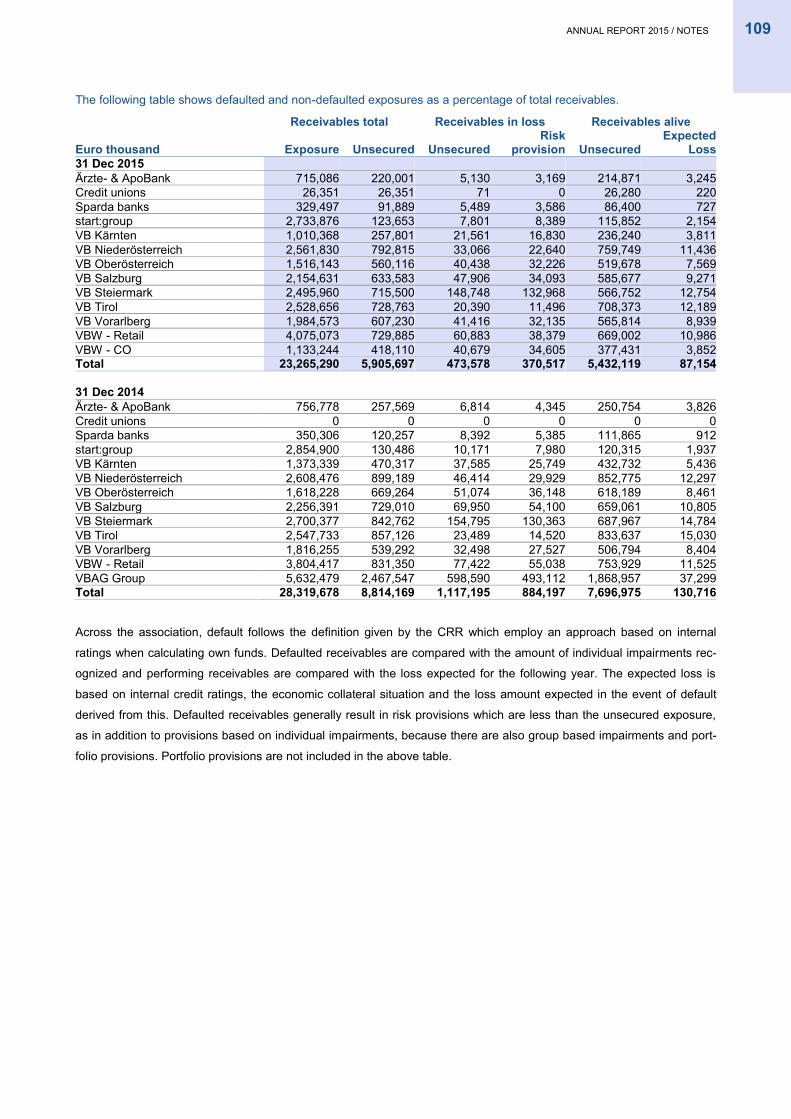
ANNUAL REPORT 2015 / NOTES 109
The following table shows defaulted and non-defaulted exposures as a percentage of total receivables.
Receivables total Receivables in loss Receivables alive
Euro thousand Exposure Unsecured Unsecured Risk
provision Unsecured Expected
Loss 31 Dec 2015
Ärzte- & ApoBank 715,086 220,001 5,130 3,169 214,871 3,245 Credit unions 26,351 26,351 71 0 26,280 220 Sparda banks 329,497 91,889 5,489 3,586 86,400 727 start:group 2,733,876 123,653 7,801 8,389 115,852 2,154 VB Kärnten 1,010,368 257,801 21,561 16,830 236,240 3,811 VB Niederösterreich 2,561,830 792,815 33,066 22,640 759,749 11,436 VB Oberösterreich 1,516,143 560,116 40,438 32,226 519,678 7,569 VB Salzburg 2,154,631 633,583 47,906 34,093 585,677 9,271 VB Steiermark 2,495,960 715,500 148,748 132,968 566,752 12,754 VB Tirol 2,528,656 728,763 20,390 11,496 708,373 12,189 VB Vorarlberg 1,984,573 607,230 41,416 32,135 565,814 8,939 VBW - Retail 4,075,073 729,885 60,883 38,379 669,002 10,986 VBW - CO 1,133,244 418,110 40,679 34,605 377,431 3,852 Total 23,265,290 5,905,697 473,578 370,517 5,432,119 87,154
31 Dec 2014 Ärzte- & ApoBank 756,778 257,569 6,814 4,345 250,754 3,826
Credit unions 0 0 0 0 0 0 Sparda banks 350,306 120,257 8,392 5,385 111,865 912 start:group 2,854,900 130,486 10,171 7,980 120,315 1,937 VB Kärnten 1,373,339 470,317 37,585 25,749 432,732 5,436 VB Niederösterreich 2,608,476 899,189 46,414 29,929 852,775 12,297 VB Oberösterreich 1,618,228 669,264 51,074 36,148 618,189 8,461 VB Salzburg 2,256,391 729,010 69,950 54,100 659,061 10,805 VB Steiermark 2,700,377 842,762 154,795 130,363 687,967 14,784 VB Tirol 2,547,733 857,126 23,489 14,520 833,637 15,030 VB Vorarlberg 1,816,255 539,292 32,498 27,527 506,794 8,404 VBW - Retail 3,804,417 831,350 77,422 55,038 753,929 11,525 VBAG Group 5,632,479 2,467,547 598,590 493,112 1,868,957 37,299 Total 28,319,678 8,814,169 1,117,195 884,197 7,696,975 130,716
Across the association, default follows the definition given by the CRR which employ an approach based on internal
ratings when calculating own funds. Defaulted receivables are compared with the amount of individual impairments rec-
ognized and performing receivables are compared with the loss expected for the following year. The expected loss is
based on internal credit ratings, the economic collateral situation and the loss amount expected in the event of default
derived from this. Defaulted receivables generally result in risk provisions which are less than the unsecured exposure,
as in addition to provisions based on individual impairments, because there are also group based impairments and port-
folio provisions. Portfolio provisions are not included in the above table.
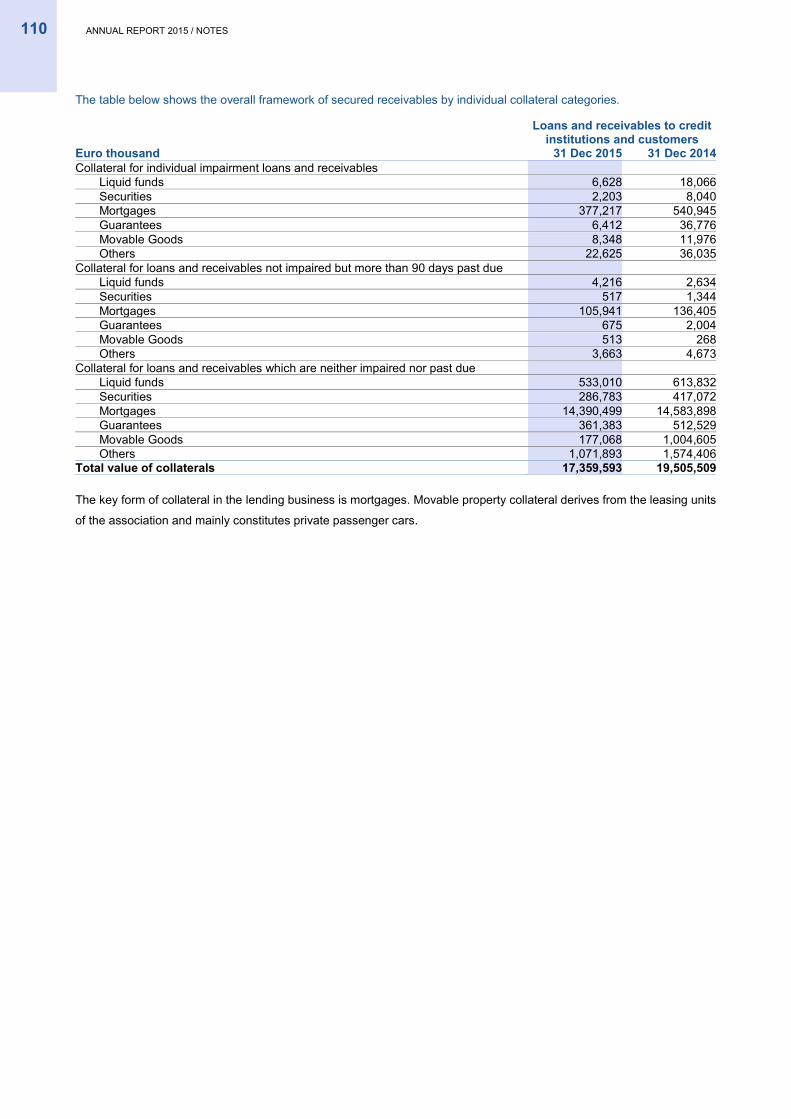
110 ANNUAL REPORT 2015 / NOTES
The table below shows the overall framework of secured receivables by individual collateral categories.
Loans and receivables to credit institutions and customers
Euro thousand 31 Dec 2015 31 Dec 2014 Collateral for individual impairment loans and receivables
Liquid funds 6,628 18,066 Securities 2,203 8,040 Mortgages 377,217 540,945 Guarantees 6,412 36,776 Movable Goods 8,348 11,976 Others 22,625 36,035
Collateral for loans and receivables not impaired but more than 90 days past due Liquid funds 4,216 2,634
Securities 517 1,344 Mortgages 105,941 136,405 Guarantees 675 2,004 Movable Goods 513 268 Others 3,663 4,673
Collateral for loans and receivables which are neither impaired nor past due Liquid funds 533,010 613,832
Securities 286,783 417,072 Mortgages 14,390,499 14,583,898 Guarantees 361,383 512,529 Movable Goods 177,068 1,004,605 Others 1,071,893 1,574,406
Total value of collaterals 17,359,593 19,505,509
The key form of collateral in the lending business is mortgages. Movable property collateral derives from the leasing units
of the association and mainly constitutes private passenger cars.
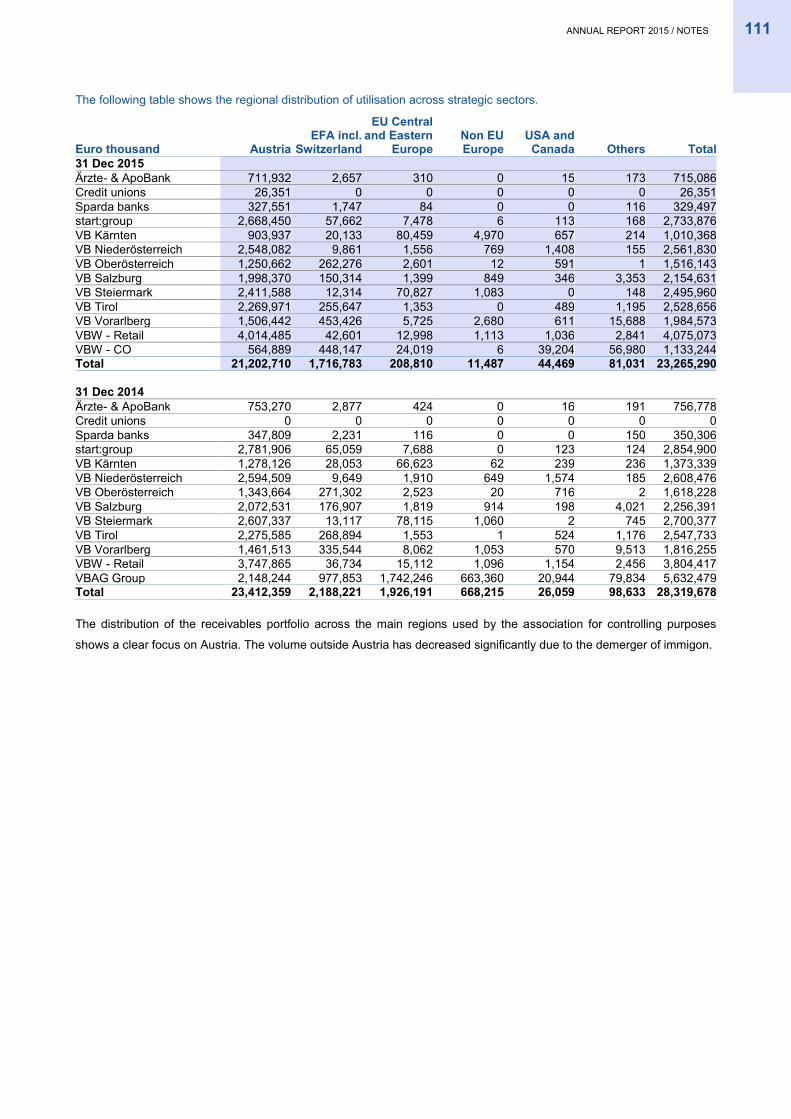
ANNUAL REPORT 2015 / NOTES 111
The following table shows the regional distribution of utilisation across strategic sectors.
Euro thousand Austria EFA incl.
Switzerland
EU Central and Eastern
Europe Non EU Europe
USA and Canada Others Total
31 Dec 2015 Ärzte- & ApoBank 711,932 2,657 310 0 15 173 715,086
Credit unions 26,351 0 0 0 0 0 26,351 Sparda banks 327,551 1,747 84 0 0 116 329,497 start:group 2,668,450 57,662 7,478 6 113 168 2,733,876 VB Kärnten 903,937 20,133 80,459 4,970 657 214 1,010,368 VB Niederösterreich 2,548,082 9,861 1,556 769 1,408 155 2,561,830 VB Oberösterreich 1,250,662 262,276 2,601 12 591 1 1,516,143 VB Salzburg 1,998,370 150,314 1,399 849 346 3,353 2,154,631 VB Steiermark 2,411,588 12,314 70,827 1,083 0 148 2,495,960 VB Tirol 2,269,971 255,647 1,353 0 489 1,195 2,528,656 VB Vorarlberg 1,506,442 453,426 5,725 2,680 611 15,688 1,984,573 VBW - Retail 4,014,485 42,601 12,998 1,113 1,036 2,841 4,075,073 VBW - CO 564,889 448,147 24,019 6 39,204 56,980 1,133,244 Total 21,202,710 1,716,783 208,810 11,487 44,469 81,031 23,265,290
31 Dec 2014 Ärzte- & ApoBank 753,270 2,877 424 0 16 191 756,778
Credit unions 0 0 0 0 0 0 0 Sparda banks 347,809 2,231 116 0 0 150 350,306 start:group 2,781,906 65,059 7,688 0 123 124 2,854,900 VB Kärnten 1,278,126 28,053 66,623 62 239 236 1,373,339 VB Niederösterreich 2,594,509 9,649 1,910 649 1,574 185 2,608,476 VB Oberösterreich 1,343,664 271,302 2,523 20 716 2 1,618,228 VB Salzburg 2,072,531 176,907 1,819 914 198 4,021 2,256,391 VB Steiermark 2,607,337 13,117 78,115 1,060 2 745 2,700,377 VB Tirol 2,275,585 268,894 1,553 1 524 1,176 2,547,733 VB Vorarlberg 1,461,513 335,544 8,062 1,053 570 9,513 1,816,255 VBW - Retail 3,747,865 36,734 15,112 1,096 1,154 2,456 3,804,417 VBAG Group 2,148,244 977,853 1,742,246 663,360 20,944 79,834 5,632,479 Total 23,412,359 2,188,221 1,926,191 668,215 26,059 98,633 28,319,678
The distribution of the receivables portfolio across the main regions used by the association for controlling purposes
shows a clear focus on Austria. The volume outside Austria has decreased significantly due to the demerger of immigon.

112 ANNUAL REPORT 2015 / NOTES
The table below shows the portfolio sub-divided by sector and by customer segments.
Euro thousand Public sector Banks Corporates Retail SME
Retail private
Special finance Total
31 Dec 2015 Ärzte- & ApoBank 137 40 168,327 374,425 168,875 3,281 715,086
Credit unions 0 0 0 0 26,351 0 26,351 Sparda banks 0 151 4,432 349 324,565 0 329,497 start:group 324 9,045 875,289 153,201 1,604,865 91,153 2,733,876 VB Kärnten 8,316 0 212,378 377,210 406,051 6,411 1,010,368 VB Niederösterreich 58,922 3,569 585,464 784,431 1,114,746 14,698 2,561,830 VB Oberösterreich 67,130 425 434,840 431,944 520,845 60,958 1,516,143 VB Salzburg 18,922 1,692 802,828 636,575 694,147 468 2,154,631 VB Steiermark 44,603 4 994,969 690,141 746,942 19,302 2,495,960 VB Tirol 15,998 102 1,055,672 577,147 879,434 302 2,528,656 VB Vorarlberg 48,364 143,667 529,964 228,650 1,033,928 0 1,984,573 VBW - Retail 55,116 2,659 1,487,855 847,757 1,671,382 10,305 4,075,073 VBW - CO 70,380 457,867 527,561 17,490 2,040 57,906 1,133,244 Total 388,211 619,223 7,679,581 5,119,321 9,194,169 264,784 23,265,290
31 Dec 2014 Ärzte- & ApoBank 0 1,823 181,231 382,767 186,358 4,600 756,778
Credit unions 0 0 0 0 0 0 0 Sparda banks 0 5 5,230 518 344,553 0 350,306 start:group 11,391 9,048 880,134 140,396 1,721,181 92,749 2,854,900 VB Kärnten 12,770 0 318,348 494,609 542,663 4,949 1,373,339 VB Niederösterreich 60,275 3,863 605,834 834,832 1,089,382 14,289 2,608,476 VB Oberösterreich 58,538 63 475,204 468,303 563,511 52,609 1,618,228 VB Salzburg 18,287 1,778 895,850 647,172 692,786 519 2,256,391 VB Steiermark 52,034 0 1,128,459 733,917 758,405 27,561 2,700,377 VB Tirol 14,681 279 1,070,157 576,253 868,413 17,951 2,547,733 VB Vorarlberg 11,988 47,087 517,956 242,071 961,411 35,742 1,816,255 VBW - Retail 59,933 2,401 1,348,408 871,126 1,497,169 25,380 3,804,417 VBAG Group 113,533 1,616,486 1,652,708 834,733 562,317 852,703 5,632,479 Total 413,429 1,682,833 9,079,520 6,226,697 9,788,148 1,129,052 28,319,678
The sectors and curiae of the association represent the way in which the receivables portfolio is broken down within the
association for controlling purposes, while the breakdown according to customer segment conforms to the customer
groups as defined by the Austrian Banking Act.
Loan collateral
Use of loan collateral
The use and management of loan collateral are regarded as important components of credit risk management in the
association. Alongside borrowers’ creditworthiness, they are a decisive factor in determining the credit risk of an expo-
sure. The primary significance of loan collateral is in making provision for unforeseeable future risks from loan expo-
sures, thus limiting the risk of loss arising from a loan exposure in the event of insolvency or restructuring.
The types of collateral used in the association and their treatment are comprehensively set out in the association manu-
als Collateral Management Parts I-IV and the General Instructions on Risk Management. These categorise collateral
according to both legal hedging transactions and by the type of goods on which they are based.
In the association, a key requirement when selecting a type of collateral is its congruence with the loan to be secured. If
collateral is created for a loan exposure, it must be objectively valued in accordance with binding valuation rules. Fur-
thermore, there are clearly defined guidelines and processes for creating, managing and realising loan collateral. The
soundness of all loan collateral is examined regularly. Periodicity largely depends on the type of collateral and is regulat-
ed on a standard basis.
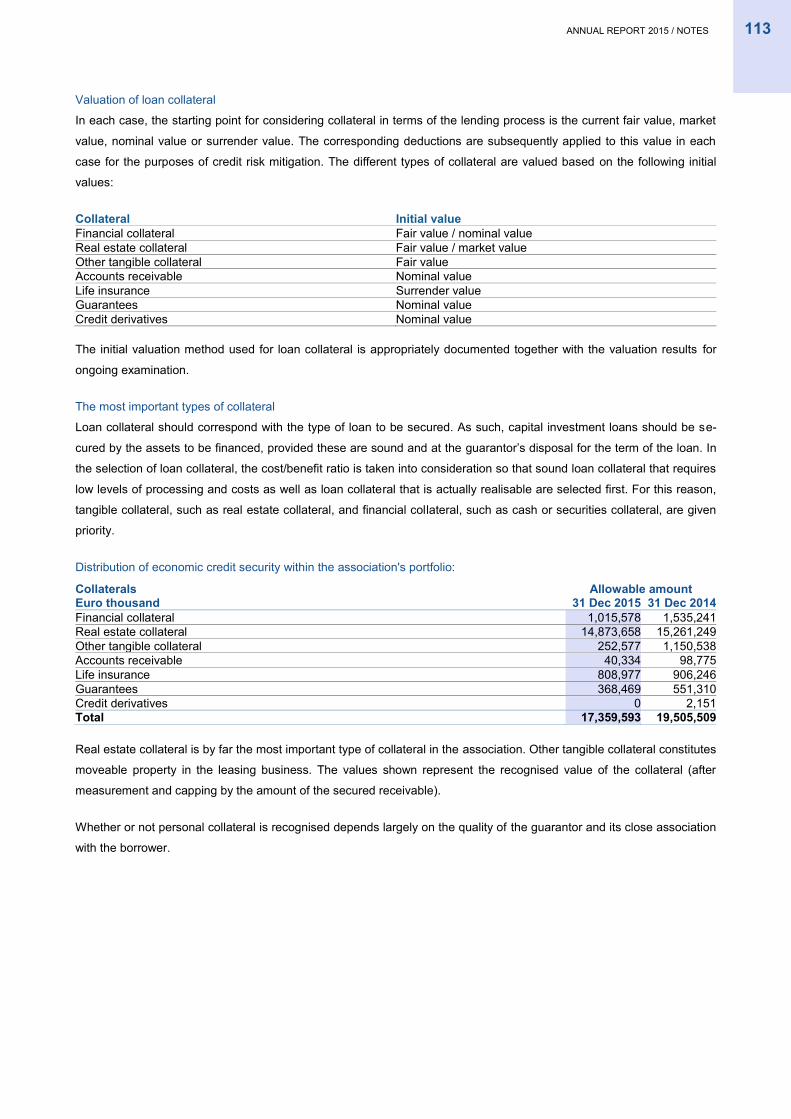
ANNUAL REPORT 2015 / NOTES 113
Valuation of loan collateral
In each case, the starting point for considering collateral in terms of the lending process is the current fair value, market
value, nominal value or surrender value. The corresponding deductions are subsequently applied to this value in each
case for the purposes of credit risk mitigation. The different types of collateral are valued based on the following initial
values:
Collateral Initial value Financial collateral Fair value / nominal value Real estate collateral Fair value / market value Other tangible collateral Fair value Accounts receivable Nominal value Life insurance Surrender value Guarantees Nominal value Credit derivatives Nominal value
The initial valuation method used for loan collateral is appropriately documented together with the valuation results for
ongoing examination.
The most important types of collateral
Loan collateral should correspond with the type of loan to be secured. As such, capital investment loans should be se-
cured by the assets to be financed, provided these are sound and at the guarantor’s disposal for the term of the loan. In
the selection of loan collateral, the cost/benefit ratio is taken into consideration so that sound loan collateral that requires
low levels of processing and costs as well as loan collateral that is actually realisable are selected first. For this reason,
tangible collateral, such as real estate collateral, and financial collateral, such as cash or securities collateral, are given
priority.
Distribution of economic credit security within the association's portfolio:
Collaterals Allowable amount Euro thousand 31 Dec 2015 31 Dec 2014 Financial collateral 1,015,578 1,535,241 Real estate collateral 14,873,658 15,261,249 Other tangible collateral 252,577 1,150,538 Accounts receivable 40,334 98,775 Life insurance 808,977 906,246 Guarantees 368,469 551,310 Credit derivatives 0 2,151 Total 17,359,593 19,505,509
Real estate collateral is by far the most important type of collateral in the association. Other tangible collateral constitutes
moveable property in the leasing business. The values shown represent the recognised value of the collateral (after
measurement and capping by the amount of the secured receivable).
Whether or not personal collateral is recognised depends largely on the quality of the guarantor and its close association
with the borrower.
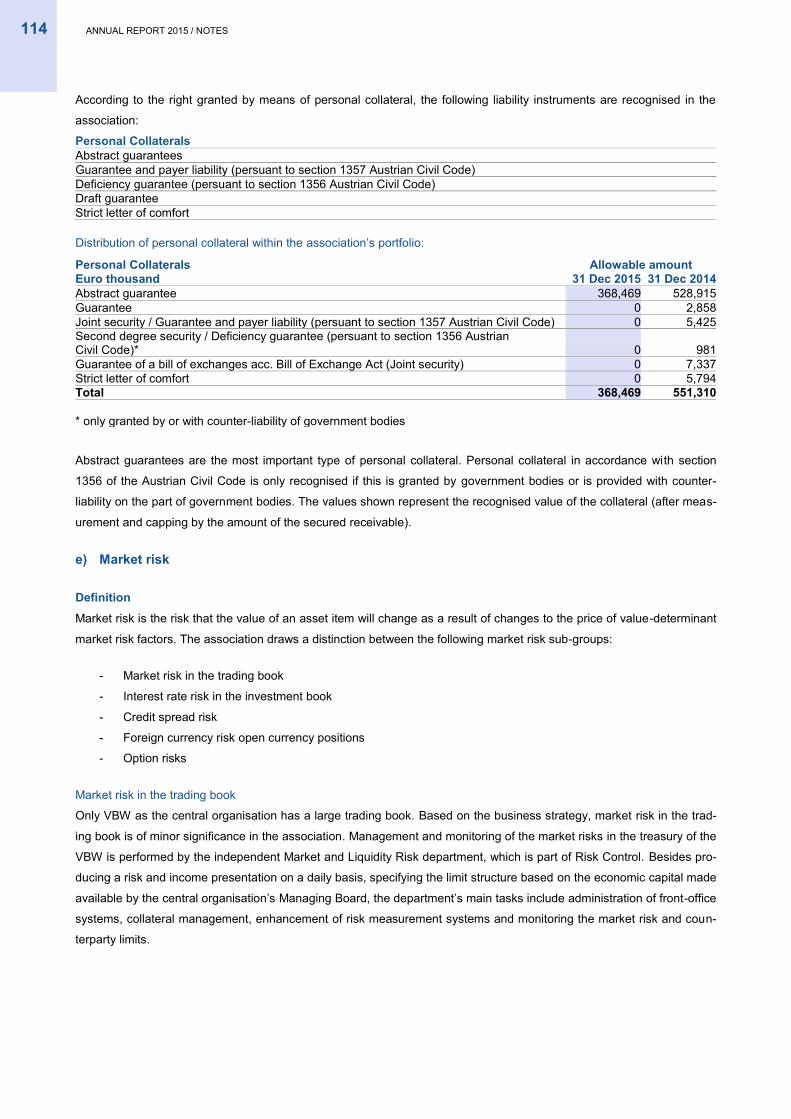
114 ANNUAL REPORT 2015 / NOTES
According to the right granted by means of personal collateral, the following liability instruments are recognised in the
association:
Personal Collaterals Abstract guarantees Guarantee and payer liability (persuant to section 1357 Austrian Civil Code) Deficiency guarantee (persuant to section 1356 Austrian Civil Code) Draft guarantee Strict letter of comfort
Distribution of personal collateral within the association’s portfolio:
Personal Collaterals Allowable amount Euro thousand 31 Dec 2015 31 Dec 2014 Abstract guarantee 368,469 528,915 Guarantee 0 2,858 Joint security / Guarantee and payer liability (persuant to section 1357 Austrian Civil Code) 0 5,425 Second degree security / Deficiency guarantee (persuant to section 1356 Austrian Civil Code)* 0 981 Guarantee of a bill of exchanges acc. Bill of Exchange Act (Joint security) 0 7,337 Strict letter of comfort 0 5,794 Total 368,469 551,310
* only granted by or with counter-liability of government bodies
Abstract guarantees are the most important type of personal collateral. Personal collateral in accordance with section
1356 of the Austrian Civil Code is only recognised if this is granted by government bodies or is provided with counter-
liability on the part of government bodies. The values shown represent the recognised value of the collateral (after meas-
urement and capping by the amount of the secured receivable).
e) Market risk
Definition
Market risk is the risk that the value of an asset item will change as a result of changes to the price of value-determinant
market risk factors. The association draws a distinction between the following market risk sub-groups:
- Market risk in the trading book
- Interest rate risk in the investment book
- Credit spread risk
- Foreign currency risk open currency positions
- Option risks
Market risk in the trading book
Only VBW as the central organisation has a large trading book. Based on the business strategy, market risk in the trad-
ing book is of minor significance in the association. Management and monitoring of the market risks in the treasury of the
VBW is performed by the independent Market and Liquidity Risk department, which is part of Risk Control. Besides pro-
ducing a risk and income presentation on a daily basis, specifying the limit structure based on the economic capital made
available by the central organisation’s Managing Board, the department’s main tasks include administration of front-office
systems, collateral management, enhancement of risk measurement systems and monitoring the market risk and coun-
terparty limits.
ANNUAL REPORT 2015 / NOTES 115
Interest rate risks in the investment book
Entering into interest rate risks is a normal part of banking business and a key source of income. However, excessive
interest rate risks represent a significant threat to the earnings and capital situation. Accordingly, an effective risk control-
ling system that monitors and limits the interest rate risk in line with the scope of business is vital for maintaining the
bank’s ability to bear risk.
Functional separation of the units that enter into interest rate risks and those that monitor such risks is in place.
Asset liability committees (ALCOs) are the coordination bodies for managing the ALM processes and are in place at all
the association's member institutions. These meet at least monthly or at short notice if required.
Asset liability management (ALM) is responsible for ensuring the ALM organisation is adequate, chairs the meetings of
the ALCO and devises the bases and analyses relevant for decision-making.
The central organisation’s department market and liquidity risk is responsible for specifying risk measurement methods
and enhancing them on an ongoing basis. Preparing creation and analyses, setting parameters and monitoring limits
also fall within its remit. The produced reports serve as a decisionmaking tool for the ALCOs in performance of its man-
agement tasks.
The declared aim of interest rate risk management is to identify all material interest rate risks from assets, liabilities and
off-balance positions in the investment book. This requires analysis of both the income effect and the present value effect
of interest rate changes using simulation scenarios in the form of statistical and dynamic reports that also incorporate
new business.
The following interest rate risks in the bank book are relevant to the association:
Repricing risk
Repricing risk arises due to time differences in the remaining maturity (fixed-interest instruments) or in the period until the
interest rate is next fixed (variable-interest instruments) for receivables, liabilities and off-balance positions. It manifests
itself in changes in the present value and future earnings of the banks brought about by changes in interest rates.
Yield curve risk
Yield curve risk results from disadvantageous changes in an interest rate curve, for example a parallel shift, a change in
gradient or a change in curve.
Basis risk
In this context, basis risk results from imperfect correlations between the interest rates levied and paid on various finan-
cial instruments with otherwise similar characteristics, such as the same maturities.
Credit spread risk
Credit spread is defined as a surcharge on the risk-free interest rate which the purchaser of a security receives for not
investing without risk. The credit spread results from the difference between the relevant interest rate (reference interest
rate) and the risk-free interest rate. Accordingly, credit spread risk arises from fluctuations in the present value of assets
due to the change in credit spreads over time.
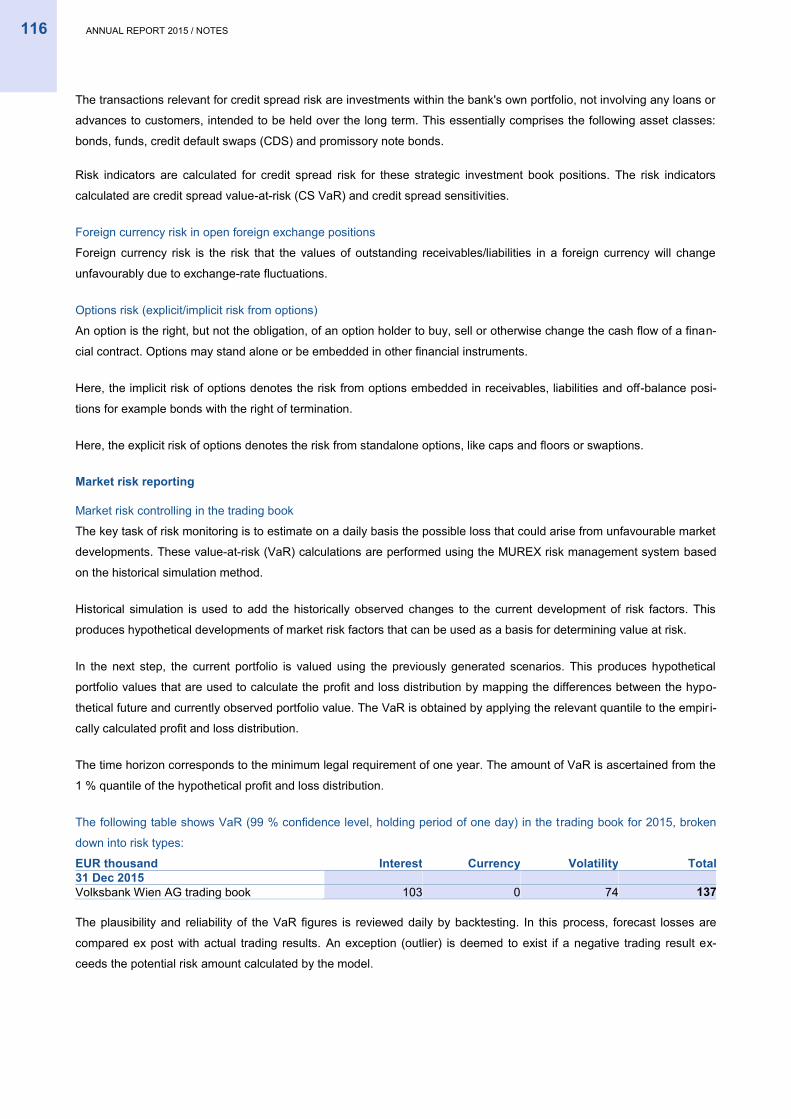
116 ANNUAL REPORT 2015 / NOTES
The transactions relevant for credit spread risk are investments within the bank's own portfolio, not involving any loans or
advances to customers, intended to be held over the long term. This essentially comprises the following asset classes:
bonds, funds, credit default swaps (CDS) and promissory note bonds.
Risk indicators are calculated for credit spread risk for these strategic investment book positions. The risk indicators
calculated are credit spread value-at-risk (CS VaR) and credit spread sensitivities.
Foreign currency risk in open foreign exchange positions
Foreign currency risk is the risk that the values of outstanding receivables/liabilities in a foreign currency will change
unfavourably due to exchange-rate fluctuations.
Options risk (explicit/implicit risk from options)
An option is the right, but not the obligation, of an option holder to buy, sell or otherwise change the cash flow of a finan-
cial contract. Options may stand alone or be embedded in other financial instruments.
Here, the implicit risk of options denotes the risk from options embedded in receivables, liabilities and off-balance posi-
tions for example bonds with the right of termination.
Here, the explicit risk of options denotes the risk from standalone options, like caps and floors or swaptions.
Market risk reporting
Market risk controlling in the trading book
The key task of risk monitoring is to estimate on a daily basis the possible loss that could arise from unfavourable market
developments. These value-at-risk (VaR) calculations are performed using the MUREX risk management system based
on the historical simulation method.
Historical simulation is used to add the historically observed changes to the current development of risk factors. This
produces hypothetical developments of market risk factors that can be used as a basis for determining value at risk.
In the next step, the current portfolio is valued using the previously generated scenarios. This produces hypothetical
portfolio values that are used to calculate the profit and loss distribution by mapping the differences between the hypo-
thetical future and currently observed portfolio value. The VaR is obtained by applying the relevant quantile to the empiri-
cally calculated profit and loss distribution.
The time horizon corresponds to the minimum legal requirement of one year. The amount of VaR is ascertained from the
1 % quantile of the hypothetical profit and loss distribution.
The following table shows VaR (99 % confidence level, holding period of one day) in the trading book for 2015, broken
down into risk types:
EUR thousand Interest Currency Volatility Total 31 Dec 2015 Volksbank Wien AG trading book 103 0 74 137
The plausibility and reliability of the VaR figures is reviewed daily by backtesting. In this process, forecast losses are
compared ex post with actual trading results. An exception (outlier) is deemed to exist if a negative trading result ex-
ceeds the potential risk amount calculated by the model.
ANNUAL REPORT 2015 / NOTES 117
Backtesting at VBW is based on hypothetical trading results assuming an unchanged portfolio. The portfolio used as the
basis for the VaR calculation is then revalued the following day with the current market risk factors. In 2015 there was
one backtesting outlier.
A structure of limits reflecting the risk and treasury strategy and approved by the central organisation’s Managing Board
is a key element of market risk management.
In addition to VaR, a further series of risk ratios are calculated daily. These chiefly include interest rate sensitivities and
option risk ratios (delta, gamma, vega, rho).
Volume limits for all currencies limit the liquidity risk. Management action triggers and stop loss limits are also in place.
The MUREX and Bloomberg TOMS front office and risk management systems are available for daily risk controlling
purposes. The external pricing software UnRisk is also used to support the valuation of structured products.
Stresstesting
As VaR cannot cover the impact of extreme situations on earnings, extensive stress tests are performed on all trading
book portfolios on a monthly basis or as required.
Through crisis tests firstly, assessing whether the bank's own funds can absorb potential major losses, and secondly,
taking necessary measures to enable the bank to reduce its risk and retain its equity.
VBW applies various methods to generate scenarios. These can be divided into two categories: non-portfolio-specific
and portfolio-specific methods.
Non-portfolio-specific scenarios such as parallel shifts, curve tilts or reconstructions of historical crises are applied to the
current portfolio in the same way within each crisis test.
Portfolio-specific scenarios attempt to find the least favourable possible impacts for the current portfolio. At VBW, such
scenarios are sought subjectively and empirically.
Valuations
All trading book positions are managed using the MUREX, front office and risk management system. MUREX is linked to
real-time market data, which means positions are valued at market prices. Products that are not referenced to direct
prices are valued using various pricing models based on current market parameters. The external pricing software
UnRisk can be used to measure complex derivatives.
The systems described above ensure a daily, independent valuation of trading book positions.
The CO Market Risk association manual of the VBW sets out all rules and organisational processes for measuring and
monitoring market risks.
Interest rate change risk in the investment book
The risk controlling records all the main forms of interest rate risk, such as basis and option risks. All positions of the
association sensitive to interest rate movements are included. The objective of risk controlling is to keep the bank’s inter-
est rate risks within specific parameters defined by the bank itself.
Positions with no specific lock-in period, which are primarily core deposit products such as savings deposits, current
account deposits and loans with no fixed maturity are incorporated in the risk measurement using fictions. The assump-
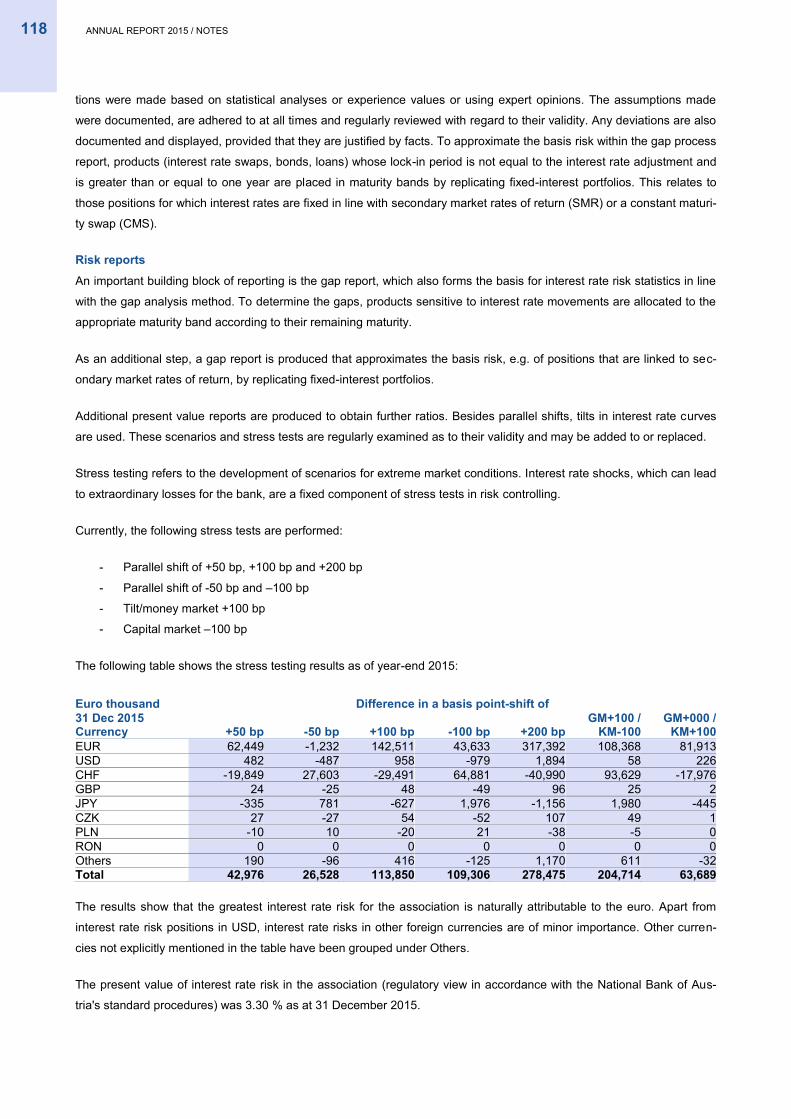
118 ANNUAL REPORT 2015 / NOTES
tions were made based on statistical analyses or experience values or using expert opinions. The assumptions made
were documented, are adhered to at all times and regularly reviewed with regard to their validity. Any deviations are also
documented and displayed, provided that they are justified by facts. To approximate the basis risk within the gap process
report, products (interest rate swaps, bonds, loans) whose lock-in period is not equal to the interest rate adjustment and
is greater than or equal to one year are placed in maturity bands by replicating fixed-interest portfolios. This relates to
those positions for which interest rates are fixed in line with secondary market rates of return (SMR) or a constant maturi-
ty swap (CMS).
Risk reports
An important building block of reporting is the gap report, which also forms the basis for interest rate risk statistics in line
with the gap analysis method. To determine the gaps, products sensitive to interest rate movements are allocated to the
appropriate maturity band according to their remaining maturity.
As an additional step, a gap report is produced that approximates the basis risk, e.g. of positions that are linked to sec-
ondary market rates of return, by replicating fixed-interest portfolios.
Additional present value reports are produced to obtain further ratios. Besides parallel shifts, tilts in interest rate curves
are used. These scenarios and stress tests are regularly examined as to their validity and may be added to or replaced.
Stress testing refers to the development of scenarios for extreme market conditions. Interest rate shocks, which can lead
to extraordinary losses for the bank, are a fixed component of stress tests in risk controlling.
Currently, the following stress tests are performed:
- Parallel shift of +50 bp, +100 bp and +200 bp
- Parallel shift of -50 bp and –100 bp
- Tilt/money market +100 bp
- Capital market –100 bp
The following table shows the stress testing results as of year-end 2015:
Euro thousand Difference in a basis point-shift of 31 Dec 2015 Currency +50 bp -50 bp +100 bp -100 bp +200 bp
GM+100 / KM-100
GM+000 / KM+100
EUR 62,449 -1,232 142,511 43,633 317,392 108,368 81,913 USD 482 -487 958 -979 1,894 58 226 CHF -19,849 27,603 -29,491 64,881 -40,990 93,629 -17,976 GBP 24 -25 48 -49 96 25 2 JPY -335 781 -627 1,976 -1,156 1,980 -445 CZK 27 -27 54 -52 107 49 1 PLN -10 10 -20 21 -38 -5 0 RON 0 0 0 0 0 0 0 Others 190 -96 416 -125 1,170 611 -32 Total 42,976 26,528 113,850 109,306 278,475 204,714 63,689
The results show that the greatest interest rate risk for the association is naturally attributable to the euro. Apart from
interest rate risk positions in USD, interest rate risks in other foreign currencies are of minor importance. Other curren-
cies not explicitly mentioned in the table have been grouped under Others.
The present value of interest rate risk in the association (regulatory view in accordance with the National Bank of Aus-
tria's standard procedures) was 3.30 % as at 31 December 2015.

ANNUAL REPORT 2015 / NOTES 119
Credit spread risik
Particular attention is paid to credit spread risk in the strategic investment book (strategic banking book positions –
SBBP) and the Volksbanks' A-depots (own accounts). These essentially include all bonds, fonds, credit default swaps
and bonded loans. For SBBP positions monthly reporting has been implemented. The Managing Board is notified of
SBBP positions as part of the quarterly association risk reporting process of the association. The SBBP report is split into
a portfolio section and a risk section.
The SBBP portfolio report describes assets with regard to their fair values and carrying amounts and presents them in
structural analyses according to various characteristics, such as asset class, IFRS and local GAAP treatment, credit
rating, sector or duration. All portfolios are presented on the basis of the end of the respective quarter and their quarterly
performance.
Portfolio structure according to IAS 39 categories
Euro thousand Bond Securisation Syndicated
loans & SSD Fund & Equity CLN, LPN &
CL-SSD Total 31 Dec 2015
At fair value through profit or loss 0 0 0 0 0 0 Available for sale 1,971,899 0 0 228,633 0 2,200,532 Held to maturity and loans & receivables 69,747 0 75,096 0 0 144,843 Total 2,041,646 0 75,096 228,633 0 2,345,375
Euro thousand Bond Securisation
Syndicated loans & SSD Fund & Equity
CLN, LPN & CL-SSD Total
31 Dec 2014 At fair value through profit or loss 11,519 0 0 1,900 0 13,419
Available for sale 3,049,335 0 0 290,995 19,853 3,360,183 Held to maturity and loans & receivables 338,510 208,113 348,247 0 0 894,869 Total 3,399,364 208,113 348,247 292,894 19,853 4,268,471
The on-balance-sheet portion of the strategic investment book corresponds to the portion of the financial investments
eligible for the capital market. As well as the off-balance-sheet portion of the strategic investment book positions, only
some of the figures in the SBBP report include deferred interest. Participation capital, bonds not eligible for the capital
market and short-term government securities are not recorded in the strategic investment book, as these are excluded
due to technical or regulatory requirements rather than for strategic reasons.
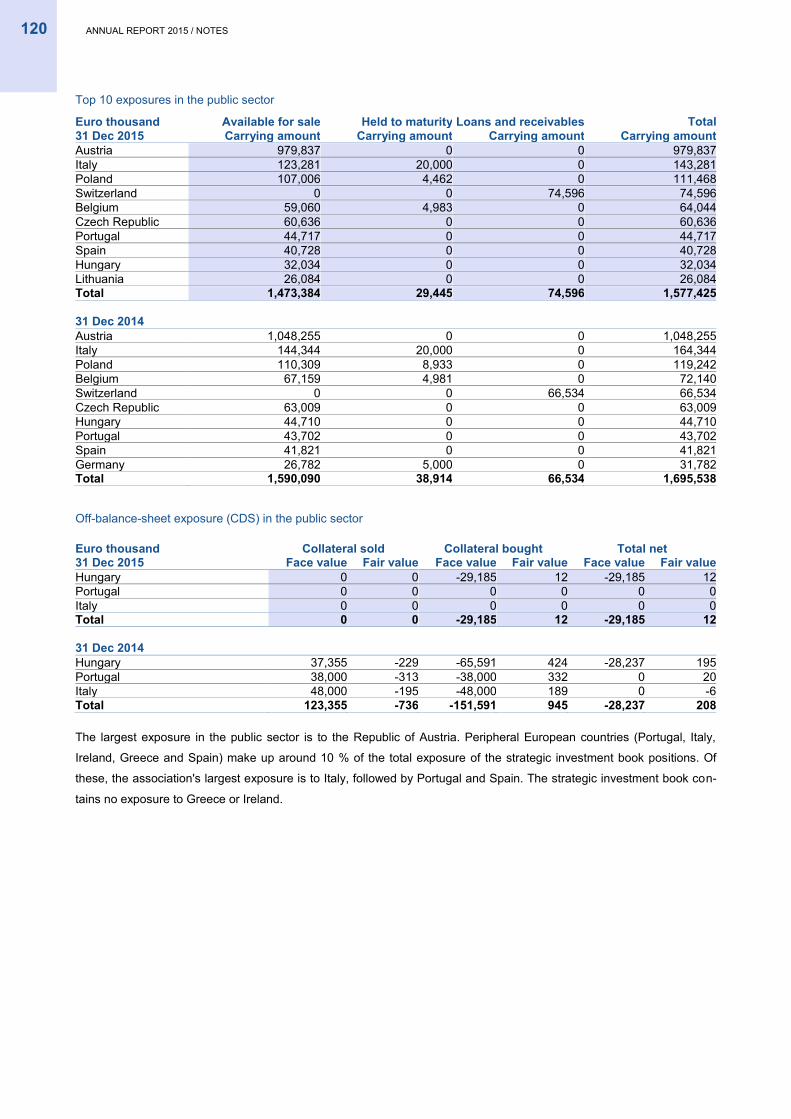
120 ANNUAL REPORT 2015 / NOTES
Top 10 exposures in the public sector
Euro thousand Available for sale Held to maturity Loans and receivables Total 31 Dec 2015 Carrying amount Carrying amount Carrying amount Carrying amount Austria 979,837 0 0 979,837 Italy 123,281 20,000 0 143,281 Poland 107,006 4,462 0 111,468 Switzerland 0 0 74,596 74,596 Belgium 59,060 4,983 0 64,044 Czech Republic 60,636 0 0 60,636 Portugal 44,717 0 0 44,717 Spain 40,728 0 0 40,728 Hungary 32,034 0 0 32,034 Lithuania 26,084 0 0 26,084 Total 1,473,384 29,445 74,596 1,577,425
31 Dec 2014 Austria 1,048,255 0 0 1,048,255
Italy 144,344 20,000 0 164,344 Poland 110,309 8,933 0 119,242 Belgium 67,159 4,981 0 72,140 Switzerland 0 0 66,534 66,534 Czech Republic 63,009 0 0 63,009 Hungary 44,710 0 0 44,710 Portugal 43,702 0 0 43,702 Spain 41,821 0 0 41,821 Germany 26,782 5,000 0 31,782 Total 1,590,090 38,914 66,534 1,695,538
Off-balance-sheet exposure (CDS) in the public sector
Euro thousand Collateral sold Collateral bought Total net 31 Dec 2015 Face value Fair value Face value Fair value Face value Fair value Hungary 0 0 -29,185 12 -29,185 12 Portugal 0 0 0 0 0 0 Italy 0 0 0 0 0 0 Total 0 0 -29,185 12 -29,185 12
31 Dec 2014 Hungary 37,355 -229 -65,591 424 -28,237 195
Portugal 38,000 -313 -38,000 332 0 20 Italy 48,000 -195 -48,000 189 0 -6 Total 123,355 -736 -151,591 945 -28,237 208
The largest exposure in the public sector is to the Republic of Austria. Peripheral European countries (Portugal, Italy,
Ireland, Greece and Spain) make up around 10 % of the total exposure of the strategic investment book positions. Of
these, the association's largest exposure is to Italy, followed by Portugal and Spain. The strategic investment book con-
tains no exposure to Greece or Ireland.
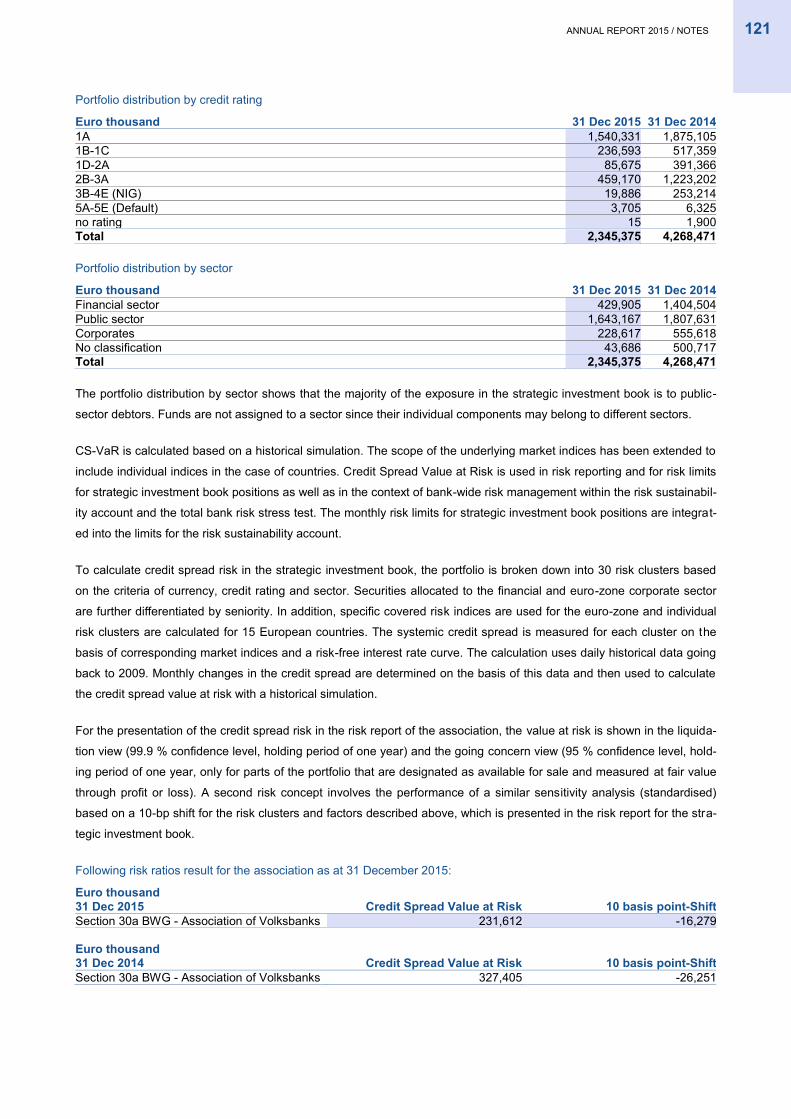
ANNUAL REPORT 2015 / NOTES 121
Portfolio distribution by credit rating
Euro thousand 31 Dec 2015 31 Dec 2014 1A 1,540,331 1,875,105 1B-1C 236,593 517,359 1D-2A 85,675 391,366 2B-3A 459,170 1,223,202 3B-4E (NIG) 19,886 253,214 5A-5E (Default) 3,705 6,325 no rating 15 1,900 Total 2,345,375 4,268,471
Portfolio distribution by sector
Euro thousand 31 Dec 2015 31 Dec 2014 Financial sector 429,905 1,404,504 Public sector 1,643,167 1,807,631 Corporates 228,617 555,618 No classification 43,686 500,717 Total 2,345,375 4,268,471
The portfolio distribution by sector shows that the majority of the exposure in the strategic investment book is to public-
sector debtors. Funds are not assigned to a sector since their individual components may belong to different sectors.
CS-VaR is calculated based on a historical simulation. The scope of the underlying market indices has been extended to
include individual indices in the case of countries. Credit Spread Value at Risk is used in risk reporting and for risk limits
for strategic investment book positions as well as in the context of bank-wide risk management within the risk sustainabil-
ity account and the total bank risk stress test. The monthly risk limits for strategic investment book positions are integrat-
ed into the limits for the risk sustainability account.
To calculate credit spread risk in the strategic investment book, the portfolio is broken down into 30 risk clusters based
on the criteria of currency, credit rating and sector. Securities allocated to the financial and euro-zone corporate sector
are further differentiated by seniority. In addition, specific covered risk indices are used for the euro-zone and individual
risk clusters are calculated for 15 European countries. The systemic credit spread is measured for each cluster on the
basis of corresponding market indices and a risk-free interest rate curve. The calculation uses daily historical data going
back to 2009. Monthly changes in the credit spread are determined on the basis of this data and then used to calculate
the credit spread value at risk with a historical simulation.
For the presentation of the credit spread risk in the risk report of the association, the value at risk is shown in the liquida-
tion view (99.9 % confidence level, holding period of one year) and the going concern view (95 % confidence level, hold-
ing period of one year, only for parts of the portfolio that are designated as available for sale and measured at fair value
through profit or loss). A second risk concept involves the performance of a similar sensitivity analysis (standardised)
based on a 10-bp shift for the risk clusters and factors described above, which is presented in the risk report for the stra-
tegic investment book.
Following risk ratios result for the association as at 31 December 2015:
Euro thousand 31 Dec 2015 Credit Spread Value at Risk 10 basis point-Shift Section 30a BWG - Association of Volksbanks 231,612 -16,279
Euro thousand 31 Dec 2014 Credit Spread Value at Risk 10 basis point-Shift Section 30a BWG - Association of Volksbanks 327,405 -26,251
122 ANNUAL REPORT 2015 / NOTES
As well as the portfolio and risk report, carrying out various stress tests is also an important aspect of risk controlling for
the SBBP. Uniform association-wide standards based on economic group research are vital for risk controlling here.
These stress tests take place every six months. Three historical stress scenarios based on historical EBA stress scenar-
ios (2001 recession, subprime crisis and European sovereign debt crisis) are also calculated, these scenarios are also
mapped in the risk reporting.
All of the models described here are subject to regular backtesting in strategic risk management and are further devel-
oped on an ongoing basis in collaboration with other key departments.
f) Operational risk
Definition
The association defines operational risk based on chapter 4 paragraph 52 CRR as the risk of loss resulting from inade-
quate or failed internal processes, people, systems or external events. Furthermore, legal risk is also taken into account
in the operational risk.
Organisation and risk strategy
Within the association, line management is responsible for managing operational risks, with support from experts from
the Operational Risk and Internal Control Systems divisions. The aim is to optimise processes to decrease the likelihood
of operational risks occurring and/or the impact of operational losses. Close collaboration with security, safety and insur-
ance management also enables optimal, comprehensive management of operational risks.
Both, quantitative and qualitative methods are used to analyse operational risks. Quantitative methods include, for ex-
ample, performance of stress tests and analysis of risk reports. If there is a significant accumulation of losses in specific
areas of the business, qualitative risk analyses are carried out.
Risk management and -controlling
The following policies and principles derived from the associations risk strategy apply to OpRisk management:
- The foremost aim of the entire OpRisk management process is to optimise processes to decrease the likelihood
of events occurring and/or the impact of operational losses.
- Events are fully documented on an electronic platform, in a sufficiently comprehensible manner, to enable third-
party experts to make use of the documentation. Since April 2014, operational events throughout the associa-
tion have been recorded in a standardised fashion. The resulting transparency with regard to the events that
have occurred makes it possible to produce a risk assessment derived from historical data.
- The methods, systems and processes in OpRisk management must be adapted to the respective institution in
observance of group requirements in line with the proportionality principle.
- The adequacy of risk management and monitoring measures and of additional measures aimed at minimising
risk is assessed on a continual basis and at least once a year and is reported to the Board. Measures to spread
risk include, for example, awareness-raising initiatives/training, ensuring confidentiality, availability and integrity
of customer and company data and operational contingency planning, as well as, in particular, adequate sepa-
ration of responsibilities and application of the principle of dual control. Management must formally and verifia-
bly accept (remaining) operational risks that cannot be prevented, reduced or transferred.
- The effectiveness of the operational risk management is also confirmed by way of periodic independent audits.
ANNUAL REPORT 2015 / NOTES 123
The association has implemented an internal control system (ICS) in accordance with the internationally recognised
COSO standard. There are detailed descriptions of ICS procedures and controls. Responsibilities and roles with regard
to the ICS are clearly defined, and ICS reporting is regularly carried out. Control activities are documented and reviewed,
and ICS-relevant risks are regularly evaluated and updated. This ensures an ongoing process of optimisation. The Audit
department reviews the internal control system in its function as an independent monitoring entity. It reviews the effec-
tiveness and adequacy of the ICS as well as compliance with internal rules and regulations.
One of the priorities for 2015 was to optimise the OpRisk program within the Association of Volksbanks pursuant to sec-
tion 30a BWG, to ensure that the requirements of the standard approach were met throughout the association. Training
and awareness-raising activities were carried out in parallel.
g) Liquidity risk
Definition
Liquidity risk is defined as the risk of not being able to meet payment obligations on their due date or not being able to
raise the liquidity required at the conditions expected as and when necessary. Liquidity risk is controlled by means of
monitoring surpluses from the allocation of cash flows of all asset and liability items to defined maturity bands.
Organisation and strategy
In accordance with the legal requirement to ensure segregation of front and back office functions, liquidity management
and control is carried out based on a holistic ALM approach in the central organisation’s Treasury. Monitoring and limita-
tion of liquidity risk and the methodological principles of risk measurement are the responsibility of the association’s Risk
controlling.
ALM Liquidity management
ALM Liquidity management comprises the sub-areas of operational liquidity management, liquidity control and liquidity
strategy and is responsible for operational liquidity management, short-term reporting and long-term, strategic liquidity
management. Liquidity management is the central department for liquidity issues in the VBW and the Association of
Volksbanks. These include in particular liquidity pricing (transfer pricing), association-wide, central management of col-
lateral, establishing the funding structure, managing available liquid assets and ensuring compliance with the refinancing
strategy.
In addition, liquidity management is documented via the liquidity and funding strategy, the liquidity manual and the liquidi-
ty emergency manual.
Operative risk management and risk controlling function
Operational liquidity management
The operational liquidity management unit uses various instruments and tools to ensure adherence to risk controlling
policies and legal regulations, for daily reporting, as well as for the supply of short-term liquidity in VBW and the Associa-
tion of Volksbanks.
Operational liquidity management comprises the following key tasks:
- Cash management, supported by a real-time cash management system, provides for settlement of all the associa-
tion’s transactions and management of the nostro accounts maintained by VBW in all currencies. An intraday com-
parison of data from cash management with the cash flows from day-to-day liquidity planning is performed. Further
124 ANNUAL REPORT 2015 / NOTES
cash management tasks include monitoring of various payment transaction platforms including the TARGET II plat-
form.
- Collateral management: ECB-eligible collateral (eligible bonds and credit claims) of the association, as well as the
initiation/use of ECB refinancing, facilitates optimal use of the collateral portfolio, with due consideration of planning
data, cash management requirements and regulatory requirements under section 25 of the Austrian Banking Act.
- A planning tool enables daily liquidity planning for the next 31 days, and weekly planning for the next 12 months for
all relevant currencies. This tool also allows for a liquidity outlook covering the Association of Volksbanks, based on
net cash flow up to product level. Cash flows are modelled at product level on a daily basis, including market, institu-
tional and product-specific data as well as a daily valuation of all positions presented in foreign currencies, in order
to model liquidity requirements arising from currency fluctuations.
- Compliance with the legal provisions of section 25 of the Austrian Banking Act and CEBS guidelines by VBW and
the association in connection with managing ECB collateral and monitoring liquid assets is another key part of oper-
ational liquidity management.
- Monitoring the association’s refinancing positions in all currencies and the “liquidity control system” for association
banks implemented by VBW as central organisation in accordance with section 30a of the Austrian Banking Act –
including liquidity notifications, refinancing management, use of collateral and an early warning system – constitute a
further element of operational liquidity management.
- Planning and complying with the minimum reserve provisions (compliance) for the Association of Volksbanks while
taking liquidity planning into account and regularly reporting to the central organisation’s Managing Board are also
part of the task area.
Liquidity risk management
Risk reports
To present the structural liquidity risk, the central organisation’s market and liquidity risk department creates a liquidity
gap report that takes into account both deterministic and stochastic capital cash flows and interest rate cash flows of on-
and off-balance sheet products. The cash flows are calculated and modelled in their original currency first of all and are
then aggregated and translated into euro. Surplus cover and deficits from the cumulative cash flows are identified and
analysed using the GAP method. The report visualises the net cash flows for each maturity band, the cumulative cash
flow and the liquidity buffer. The liquidity buffer corresponds to the lending value of the unencumbered assets/collaterals
at the central banks as well as the cash and cash reserve deposited and accepted at the Austrian national bank.

ANNUAL REPORT 2015 / NOTES 125
Liquidity gap report for the association as at 31 December 2015 in euro million
The addition of inflows and (negative) outflows shows the gap as the net cash flow for each maturity band. The point at
which a negative cumulative gap could no longer be offset by the liquidity buffer (freely available assets, represented by
the dotted line) indicates the survival period. As shown in the illustration, the survival period is greater than 10 years.
In addition to the real case scenario, stress scenarios are also calculated. As determined by CEBS, this involves a bank,
a market and a combined stress scenario. In these cases, the liquidity buffer is stressed with regard to sufficient cover.
Limits for the structural liquidity risk are set in the real case scenario and in the stress scenarios using the structural
survival period and the net concentration ratio. The structural survival period is the period up to which the institution is
able to make its due payments with deposits and the liquidity buffer. Additional funding measures are not taken into ac-
count here and would extend the structural survival period. The net concentration ratio is the net of cash inflows and
cash outflows for a certain maturity band in relation to the liquidity buffer.
LCR & NSFR
The aim of the liquidity coverage ratio (LCR) is to ensure the short-term solvency of banks in stress situations. The net
stable funding ratio (NSFR) is aimed at banks' medium to long-term liquidity position and is intended to limit their use of
liquidity maturity transformation.
VBW has reported LCR and NSFR to the regulator since 31 March 2014. The ratios form an integral component of risk
management and reporting.
As at 31 December 2015, LCR in the association stood at 101 %. The LCR is composed as follows:
Euro thousand 31 Dec 2015 Assets 3,185,573 Outflows 3,407,912 Inflows 245,627 Netto Outflow 3,162,284 LCR 100.74 %
-8.000
-6.000
-4.000
-2.000
0
2.000
4.000
6.000 1
M
2M
3M
4M
5M
6M
7M
8M
9M
10
M
11
M
12
M
15
M
18
M
21
M
2J
3J
4J
5J
6J
7J
8J
9J
10
J
>10
J
Gap Gap Vormonat Gap kumuliert
6,000
4,000
2,000
0
-2,000
-4,000
-6,000
-8,000
1m
2m
3m
4m
5m
6m
7m
8m
9m
10m
11m
12m
15m
18m
21m
2y
3y
4y
5y
6y
7y
8y
9y
10y
>10y
gap gap previous month gap cumulative
126 ANNUAL REPORT 2015 / NOTES
h) Investment risk The association defines investment risk as the risk that a held investment will default or lose value. Since this risk is
material for the association, it is quantified and taken into account when determining risk-bearing capacity. Investment
risk is divided into the following characteristics:
- Default risk of investments
- Impairment risk of investments
- Foreign exchange risk of investments
The default risk of investments is calculated using the credit value at risk model and included in credit risk reporting (see
section d) Credit risk). This risk category includes not only traditional investments, but also loans to these investments,
which correspond to the definition of IAS 24 Related Parties.
The impairment risk of investments is taken into account by means of discounts on the carrying amounts of the invest-
ments in the risk sustainability account.
The foreign exchange risk of investments refers to the risk of a change in the value of consolidated core capital compo-
nents in non-euro currencies due to exchange rate fluctuations and is calculated based on value at risk via the internal
market risk model.
i) Other risks In terms of other risks, the association is confronted with strategic risk, reputational risk, equity risk and business risk.
Strategic risk is the risk of a negative impact on capital and income due to business-policy decisions or failure to adapt to
changes in the economic environment.
Reputational risk is the risk of adverse effects on the Bank’s result due to a loss of reputation and associated negative
effects on stakeholders (regulator, owners, creditors, employees, customers).
The association defines equity risk as the risk of an unbalanced composition of internal equity in relation to the type and
size of the Bank or difficulties in absorbing additional risk-covering capital quickly in case of need.
Business risk is the risk arising from earnings volatility and hence the risk of being unable to (fully) cover unavoidable
fixed costs.
Although other risks are not of key significance to the association, they are intrinsic to its operations. Mainly organisa-
tional measures are implemented for the management of other risks.
Therefore, to protect against other risks, a capital buffer is defined on the basis of the economic total bank risk limit.
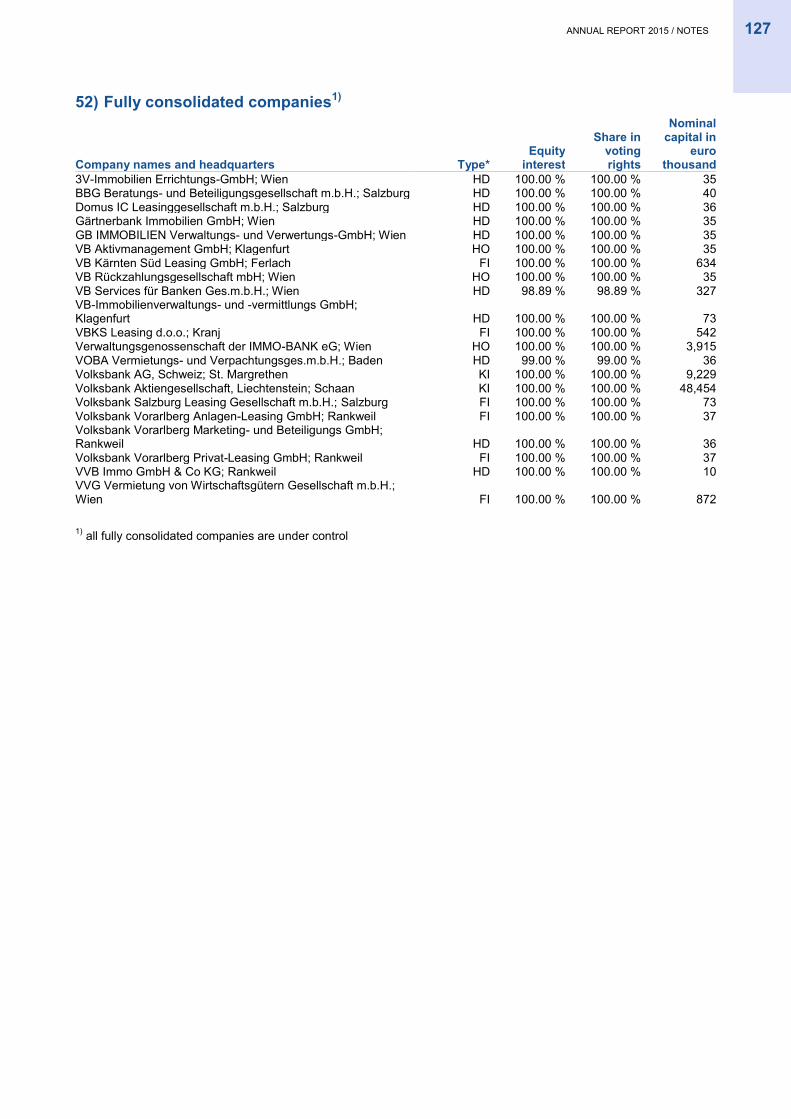
ANNUAL REPORT 2015 / NOTES 127
52) Fully consolidated companies1)
Company names and headquarters Type* Equity
interest
Share in voting rights
Nominal capital in
euro thousand
3V-Immobilien Errichtungs-GmbH; Wien HD 100.00 % 100.00 % 35 BBG Beratungs- und Beteiligungsgesellschaft m.b.H.; Salzburg HD 100.00 % 100.00 % 40 Domus IC Leasinggesellschaft m.b.H.; Salzburg HD 100.00 % 100.00 % 36 Gärtnerbank Immobilien GmbH; Wien HD 100.00 % 100.00 % 35 GB IMMOBILIEN Verwaltungs- und Verwertungs-GmbH; Wien HD 100.00 % 100.00 % 35 VB Aktivmanagement GmbH; Klagenfurt HO 100.00 % 100.00 % 35 VB Kärnten Süd Leasing GmbH; Ferlach FI 100.00 % 100.00 % 634 VB Rückzahlungsgesellschaft mbH; Wien HO 100.00 % 100.00 % 35 VB Services für Banken Ges.m.b.H.; Wien HD 98.89 % 98.89 % 327 VB-Immobilienverwaltungs- und -vermittlungs GmbH; Klagenfurt HD 100.00 % 100.00 % 73 VBKS Leasing d.o.o.; Kranj FI 100.00 % 100.00 % 542 Verwaltungsgenossenschaft der IMMO-BANK eG; Wien HO 100.00 % 100.00 % 3,915 VOBA Vermietungs- und Verpachtungsges.m.b.H.; Baden HD 99.00 % 99.00 % 36 Volksbank AG, Schweiz; St. Margrethen KI 100.00 % 100.00 % 9,229 Volksbank Aktiengesellschaft, Liechtenstein; Schaan KI 100.00 % 100.00 % 48,454 Volksbank Salzburg Leasing Gesellschaft m.b.H.; Salzburg FI 100.00 % 100.00 % 73 Volksbank Vorarlberg Anlagen-Leasing GmbH; Rankweil FI 100.00 % 100.00 % 37 Volksbank Vorarlberg Marketing- und Beteiligungs GmbH; Rankweil HD 100.00 % 100.00 % 36 Volksbank Vorarlberg Privat-Leasing GmbH; Rankweil FI 100.00 % 100.00 % 37 VVB Immo GmbH & Co KG; Rankweil HD 100.00 % 100.00 % 10 VVG Vermietung von Wirtschaftsgütern Gesellschaft m.b.H.; Wien FI 100.00 % 100.00 % 872
1) all fully consolidated companies are under control
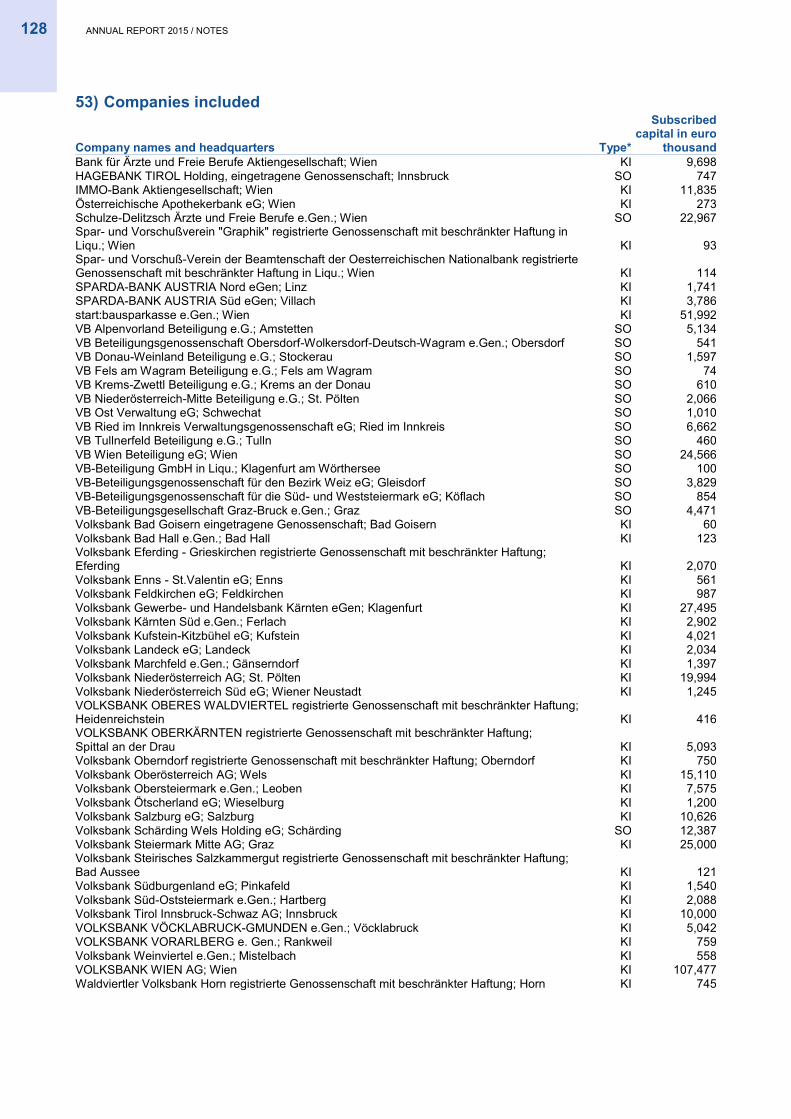
128 ANNUAL REPORT 2015 / NOTES
53) Companies included
Company names and headquarters Type*
Subscribed capital in euro
thousand Bank für Ärzte und Freie Berufe Aktiengesellschaft; Wien KI 9,698 HAGEBANK TIROL Holding, eingetragene Genossenschaft; Innsbruck SO 747 IMMO-Bank Aktiengesellschaft; Wien KI 11,835 Österreichische Apothekerbank eG; Wien KI 273 Schulze-Delitzsch Ärzte und Freie Berufe e.Gen.; Wien SO 22,967 Spar- und Vorschußverein "Graphik" registrierte Genossenschaft mit beschränkter Haftung in Liqu.; Wien KI 93 Spar- und Vorschuß-Verein der Beamtenschaft der Oesterreichischen Nationalbank registrierte Genossenschaft mit beschränkter Haftung in Liqu.; Wien KI 114 SPARDA-BANK AUSTRIA Nord eGen; Linz KI 1,741 SPARDA-BANK AUSTRIA Süd eGen; Villach KI 3,786 start:bausparkasse e.Gen.; Wien KI 51,992 VB Alpenvorland Beteiligung e.G.; Amstetten SO 5,134 VB Beteiligungsgenossenschaft Obersdorf-Wolkersdorf-Deutsch-Wagram e.Gen.; Obersdorf SO 541 VB Donau-Weinland Beteiligung e.G.; Stockerau SO 1,597 VB Fels am Wagram Beteiligung e.G.; Fels am Wagram SO 74 VB Krems-Zwettl Beteiligung e.G.; Krems an der Donau SO 610 VB Niederösterreich-Mitte Beteiligung e.G.; St. Pölten SO 2,066 VB Ost Verwaltung eG; Schwechat SO 1,010 VB Ried im Innkreis Verwaltungsgenossenschaft eG; Ried im Innkreis SO 6,662 VB Tullnerfeld Beteiligung e.G.; Tulln SO 460 VB Wien Beteiligung eG; Wien SO 24,566 VB-Beteiligung GmbH in Liqu.; Klagenfurt am Wörthersee SO 100 VB-Beteiligungsgenossenschaft für den Bezirk Weiz eG; Gleisdorf SO 3,829 VB-Beteiligungsgenossenschaft für die Süd- und Weststeiermark eG; Köflach SO 854 VB-Beteiligungsgesellschaft Graz-Bruck e.Gen.; Graz SO 4,471 Volksbank Bad Goisern eingetragene Genossenschaft; Bad Goisern KI 60 Volksbank Bad Hall e.Gen.; Bad Hall KI 123 Volksbank Eferding - Grieskirchen registrierte Genossenschaft mit beschränkter Haftung; Eferding KI 2,070 Volksbank Enns - St.Valentin eG; Enns KI 561 Volksbank Feldkirchen eG; Feldkirchen KI 987 Volksbank Gewerbe- und Handelsbank Kärnten eGen; Klagenfurt KI 27,495 Volksbank Kärnten Süd e.Gen.; Ferlach KI 2,902 Volksbank Kufstein-Kitzbühel eG; Kufstein KI 4,021 Volksbank Landeck eG; Landeck KI 2,034 Volksbank Marchfeld e.Gen.; Gänserndorf KI 1,397 Volksbank Niederösterreich AG; St. Pölten KI 19,994 Volksbank Niederösterreich Süd eG; Wiener Neustadt KI 1,245 VOLKSBANK OBERES WALDVIERTEL registrierte Genossenschaft mit beschränkter Haftung; Heidenreichstein KI 416 VOLKSBANK OBERKÄRNTEN registrierte Genossenschaft mit beschränkter Haftung; Spittal an der Drau KI 5,093 Volksbank Oberndorf registrierte Genossenschaft mit beschränkter Haftung; Oberndorf KI 750 Volksbank Oberösterreich AG; Wels KI 15,110 Volksbank Obersteiermark e.Gen.; Leoben KI 7,575 Volksbank Ötscherland eG; Wieselburg KI 1,200 Volksbank Salzburg eG; Salzburg KI 10,626 Volksbank Schärding Wels Holding eG; Schärding SO 12,387 Volksbank Steiermark Mitte AG; Graz KI 25,000 Volksbank Steirisches Salzkammergut registrierte Genossenschaft mit beschränkter Haftung; Bad Aussee KI 121 Volksbank Südburgenland eG; Pinkafeld KI 1,540 Volksbank Süd-Oststeiermark e.Gen.; Hartberg KI 2,088 Volksbank Tirol Innsbruck-Schwaz AG; Innsbruck KI 10,000 VOLKSBANK VÖCKLABRUCK-GMUNDEN e.Gen.; Vöcklabruck KI 5,042 VOLKSBANK VORARLBERG e. Gen.; Rankweil KI 759 Volksbank Weinviertel e.Gen.; Mistelbach KI 558 VOLKSBANK WIEN AG; Wien KI 107,477 Waldviertler Volksbank Horn registrierte Genossenschaft mit beschränkter Haftung; Horn KI 745
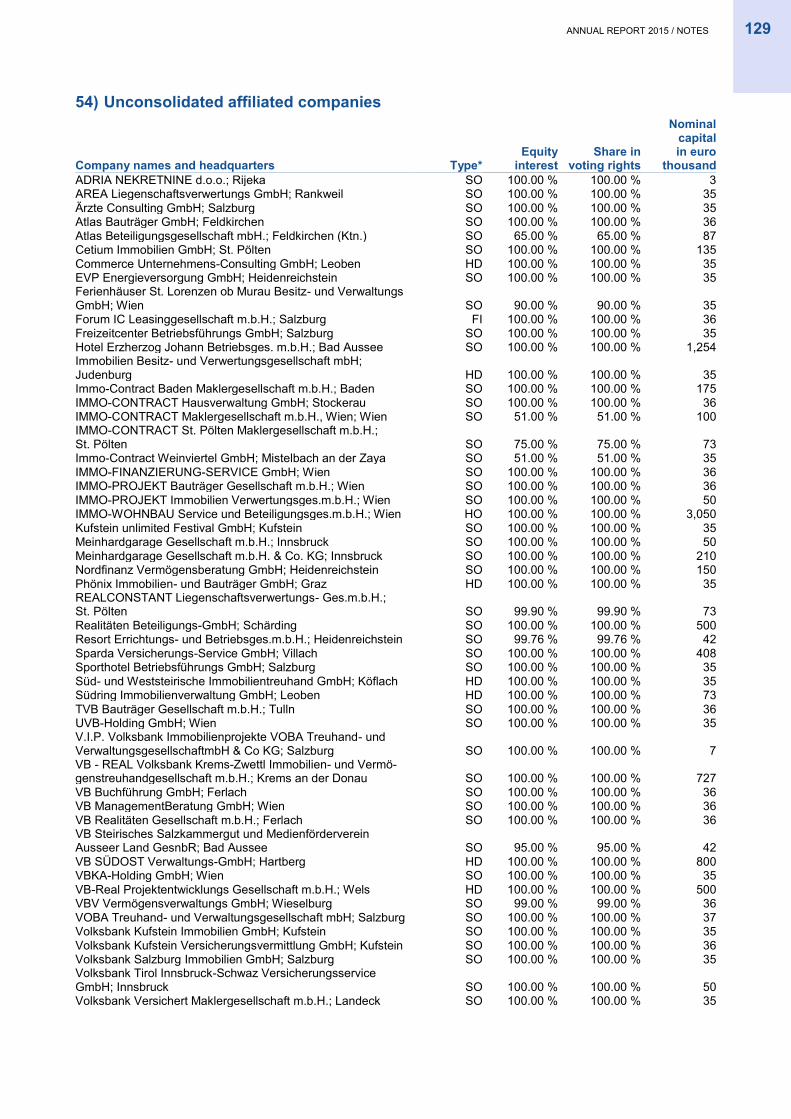
ANNUAL REPORT 2015 / NOTES 129
54) Unconsolidated affiliated companies
Company names and headquarters Type* Equity
interest Share in
voting rights
Nominal capital in euro
thousand ADRIA NEKRETNINE d.o.o.; Rijeka SO 100.00 % 100.00 % 3 AREA Liegenschaftsverwertungs GmbH; Rankweil SO 100.00 % 100.00 % 35 Ärzte Consulting GmbH; Salzburg SO 100.00 % 100.00 % 35 Atlas Bauträger GmbH; Feldkirchen SO 100.00 % 100.00 % 36 Atlas Beteiligungsgesellschaft mbH.; Feldkirchen (Ktn.) SO 65.00 % 65.00 % 87 Cetium Immobilien GmbH; St. Pölten SO 100.00 % 100.00 % 135 Commerce Unternehmens-Consulting GmbH; Leoben HD 100.00 % 100.00 % 35 EVP Energieversorgung GmbH; Heidenreichstein SO 100.00 % 100.00 % 35 Ferienhäuser St. Lorenzen ob Murau Besitz- und Verwaltungs GmbH; Wien SO 90.00 % 90.00 % 35 Forum IC Leasinggesellschaft m.b.H.; Salzburg FI 100.00 % 100.00 % 36 Freizeitcenter Betriebsführungs GmbH; Salzburg SO 100.00 % 100.00 % 35 Hotel Erzherzog Johann Betriebsges. m.b.H.; Bad Aussee SO 100.00 % 100.00 % 1,254 Immobilien Besitz- und Verwertungsgesellschaft mbH; Judenburg HD 100.00 % 100.00 % 35 Immo-Contract Baden Maklergesellschaft m.b.H.; Baden SO 100.00 % 100.00 % 175 IMMO-CONTRACT Hausverwaltung GmbH; Stockerau SO 100.00 % 100.00 % 36 IMMO-CONTRACT Maklergesellschaft m.b.H., Wien; Wien SO 51.00 % 51.00 % 100 IMMO-CONTRACT St. Pölten Maklergesellschaft m.b.H.; St. Pölten SO 75.00 % 75.00 % 73 Immo-Contract Weinviertel GmbH; Mistelbach an der Zaya SO 51.00 % 51.00 % 35 IMMO-FINANZIERUNG-SERVICE GmbH; Wien SO 100.00 % 100.00 % 36 IMMO-PROJEKT Bauträger Gesellschaft m.b.H.; Wien SO 100.00 % 100.00 % 36 IMMO-PROJEKT Immobilien Verwertungsges.m.b.H.; Wien SO 100.00 % 100.00 % 50 IMMO-WOHNBAU Service und Beteiligungsges.m.b.H.; Wien HO 100.00 % 100.00 % 3,050 Kufstein unlimited Festival GmbH; Kufstein SO 100.00 % 100.00 % 35 Meinhardgarage Gesellschaft m.b.H.; Innsbruck SO 100.00 % 100.00 % 50 Meinhardgarage Gesellschaft m.b.H. & Co. KG; Innsbruck SO 100.00 % 100.00 % 210 Nordfinanz Vermögensberatung GmbH; Heidenreichstein SO 100.00 % 100.00 % 150 Phönix Immobilien- und Bauträger GmbH; Graz HD 100.00 % 100.00 % 35 REALCONSTANT Liegenschaftsverwertungs- Ges.m.b.H.; St. Pölten SO 99.90 % 99.90 % 73 Realitäten Beteiligungs-GmbH; Schärding SO 100.00 % 100.00 % 500 Resort Errichtungs- und Betriebsges.m.b.H.; Heidenreichstein SO 99.76 % 99.76 % 42 Sparda Versicherungs-Service GmbH; Villach SO 100.00 % 100.00 % 408 Sporthotel Betriebsführungs GmbH; Salzburg SO 100.00 % 100.00 % 35 Süd- und Weststeirische Immobilientreuhand GmbH; Köflach HD 100.00 % 100.00 % 35 Südring Immobilienverwaltung GmbH; Leoben HD 100.00 % 100.00 % 73 TVB Bauträger Gesellschaft m.b.H.; Tulln SO 100.00 % 100.00 % 36 UVB-Holding GmbH; Wien SO 100.00 % 100.00 % 35 V.I.P. Volksbank Immobilienprojekte VOBA Treuhand- und VerwaltungsgesellschaftmbH & Co KG; Salzburg SO 100.00 % 100.00 % 7 VB - REAL Volksbank Krems-Zwettl Immobilien- und Vermö-genstreuhandgesellschaft m.b.H.; Krems an der Donau SO 100.00 % 100.00 % 727 VB Buchführung GmbH; Ferlach SO 100.00 % 100.00 % 36 VB ManagementBeratung GmbH; Wien SO 100.00 % 100.00 % 36 VB Realitäten Gesellschaft m.b.H.; Ferlach SO 100.00 % 100.00 % 36 VB Steirisches Salzkammergut und Medienförderverein Ausseer Land GesnbR; Bad Aussee SO 95.00 % 95.00 % 42 VB SÜDOST Verwaltungs-GmbH; Hartberg HD 100.00 % 100.00 % 800 VBKA-Holding GmbH; Wien SO 100.00 % 100.00 % 35 VB-Real Projektentwicklungs Gesellschaft m.b.H.; Wels HD 100.00 % 100.00 % 500 VBV Vermögensverwaltungs GmbH; Wieselburg SO 99.00 % 99.00 % 36 VOBA Treuhand- und Verwaltungsgesellschaft mbH; Salzburg SO 100.00 % 100.00 % 37 Volksbank Kufstein Immobilien GmbH; Kufstein SO 100.00 % 100.00 % 35 Volksbank Kufstein Versicherungsvermittlung GmbH; Kufstein SO 100.00 % 100.00 % 36 Volksbank Salzburg Immobilien GmbH; Salzburg SO 100.00 % 100.00 % 35 Volksbank Tirol Innsbruck-Schwaz Versicherungsservice GmbH; Innsbruck SO 100.00 % 100.00 % 50 Volksbank Versichert Maklergesellschaft m.b.H.; Landeck SO 100.00 % 100.00 % 35
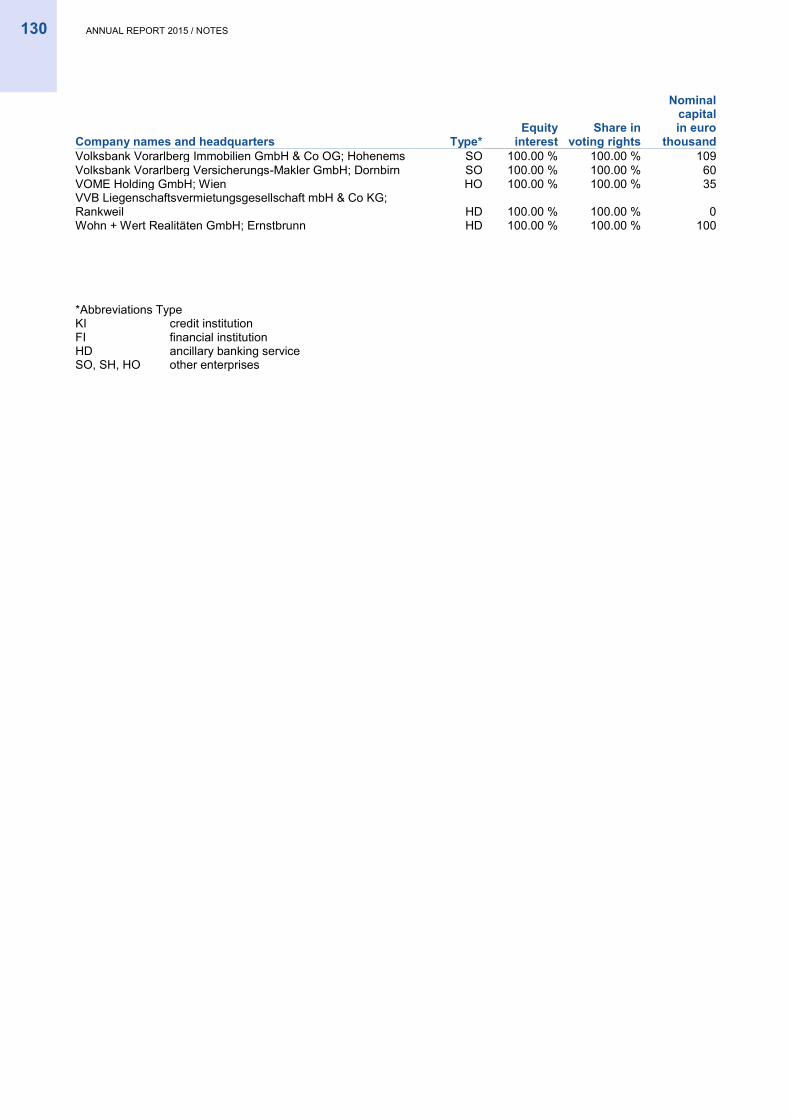
130 ANNUAL REPORT 2015 / NOTES
Company names and headquarters Type* Equity
interest Share in
voting rights
Nominal capital in euro
thousand Volksbank Vorarlberg Immobilien GmbH & Co OG; Hohenems SO 100.00 % 100.00 % 109 Volksbank Vorarlberg Versicherungs-Makler GmbH; Dornbirn SO 100.00 % 100.00 % 60 VOME Holding GmbH; Wien HO 100.00 % 100.00 % 35 VVB Liegenschaftsvermietungsgesellschaft mbH & Co KG; Rankweil HD 100.00 % 100.00 % 0 Wohn + Wert Realitäten GmbH; Ernstbrunn HD 100.00 % 100.00 % 100
*Abbreviations Type KI credit institution FI financial institution HD ancillary banking service SO, SH, HO other enterprises
131ANNUAL REPORT 2015 / NOTES
Vienna, 15 June 2016
Gerald FLEISCHMANNChairman of the Managing Board
General Secretariat, Organisation / IT,HR Management, Press Office, Risk Control, Banking Association Strategy
Josef PREISSLDeputy Chairman of the Managing Board
Compliance Office, Property Subsidiaries, Integration/Operational Risk Governance,Legal, Audit, Association Risk Management, Risk Retail/SME,
Reorganisation Management, VB Services for Banks
Wolfgang SCHAUER Rainer BORNSMember of the Managing Board Member of the Managing Board
Major Commercial, Marketing/Communication, FinanceRegional Management/Branches, Treasury,
Sales Management, Front Office Service Center
132 ANNUAL REPORT ASSOCIATION OF VOLKSBANKS 2015 / AUDITOR’S REPORT
AUDITOR’S REPORT
Report on the Consolidated Financial Statements of the Banking Association
We have audited the accompanying consolidated financial statements of the Banking Association according to section 30a of the Austrian Banking Act of
VOLKSBANK WIEN AG,Vienna, Austria,
for the year from 1 January 2015 to 31 December 2015. These consolidated financial statements comprise the BankingAssociation’s consolidated statement of financial position as of 31 December 2015, the consolidated statement ofcomprehensive income, the consolidated statement of cash flows and the consolidated statement of changes in equityfor the fiscal year 2015 and a summary of significant accounting policies and other explanatory notes. Our liability asauditors toward the Company and third parties is guided under Section 275 UGB (Austrian Commercial Code) (EUR twomillion).
Management's Responsibility for the Consolidated Financial Statements of the Banking Association The management of VOLKSBANK WIEN AG, Vienna, Austria, as the Banking Association's central organization is responsiblefor the accounting system of the Banking Association and for the preparation and fair presentation of the consolidatedfinancial statements of the Banking Association in accordance with the accounting and valuation principles described inthe Framework of Rules for the preparation of the consolidated financial statements of the Banking Association 2015.This responsibility includes: designing, implementing and maintaining internal control relevant to the preparation and fairpresentation of the consolidated financial statements that are free from material misstatement, whether due to fraud or error;selecting and applying appropriate accounting policies; and making accounting estimates that are reasonable in thecircumstances.
Auditor's Responsibility and Description of Type and Scope of the Audit of the Consolidated Financial Statements of the Banking Association Our responsibility is to express an opinion on these consolidated financial statements of the Banking Association based onour audit. We conducted our audit in accordance with laws and regulations applicable in Austria and Austrian Standards onAuditing. Those standards require that we comply with professional guidelines and that we plan and perform the audit toobtain reasonable assurance about whether the consolidated financial statements of the Banking Association are free frommaterial misstatement.
An audit involves performing procedures to obtain audit evidence about the amounts and disclosures in the consolidatedfinancial statements of the Banking Association. The procedures selected depend on the Banking Association's auditor'sjudgment, including the assessment of the risk of material misstatement, whether due to fraud or error. In making such riskassessment, the Banking Association's auditor considers internal control relevant to the preparation and fair presentation ofthe consolidated financial statements of the Banking Association in order to design audit procedures that are appropriate inthe circumstances, but not for the purpose of expressing an opinion on the effectiveness of the Banking Association'sinternal control. The audit also includes evaluating the appropriateness of accounting policies used and the reasonablenessof accounting estimates made by management, as well as evaluating the overall presentation of the consolidated financialstatements of the Banking Association.
We believe that the audit evidence we have obtained is sufficient and appropriate to provide a basis for our audit opinion.
133ANNUAL REPORT ASSOCIATION OF VOLKSBANKS 2015 / AUDITOR’S REPORT
OpinionOur audit did not give rise to any objections. In our opinion, which is based on the results of our audit, the consolidatedfinancial statements of the Banking Association were prepared in accordance with the accounting and valuation principlesdescribed in the Framework of Rules of the Banking Association 2015.
Emphasis of MatterWithout qualifying our opinion, we refer to the disclosures made by Management of the Banking Association's centralorganization in the notes relating to the Banking Association's ability to continue as a going concern, in particular to thedisclosures concerning the ECB approval of the banking association according section 30a of the Austrian Banking Actwith VBW as central organization until June 30, 2016.
Furthermore
• the consolidated financial statements of the Banking Association were prepared in accordance with the Framework ofRules for the preparation of the consolidated financial statements of the Banking Association 2015 and
• their only purpose is to assist VOLKSBANK WIEN AG, Vienna, Austria, to meet the regulatory requirements and theyshall not be used for any other purpose.
Our opinion is not modified in respect of these matters.
Report on the Banking Association's Management Report for the Consolidated Financial Statements of the Banking Association Pursuant to regulatory provisions, the management report for the consolidated financial statements of the Banking Associationis to be audited as to whether it is consistent with the consolidated financial statements of the Banking Association and as towhether the other disclosures are not misleading with respect to the Banking Association's financial position. The auditor'sreport also has to contain a statement as to whether the management report for the consolidated financial statements of theBanking Association is consistent with the consolidated financial statements of the Banking Association.
In our opinion, the management report for the consolidated financial statements of the Banking Association is consistent withthe consolidated financial statements of the Banking Association.
Restriction of UseOur report must not be used for any other purpose than to meet regulatory requirements and shall not be used for any otherpurpose. Third party claims cannot be derived from our report. A transmission of our report requires our explicit prior consent.
Vienna, 15 June 2016
KPMG Austria GmbHWirtschaftsprüfungs- und Steuerberatungsgesellschaft
signed by:Martin WagnerWirtschaftsprüfer(Austrian Chartered Accountants)
This report is a translation of the original report in German, which is solely valid.
Association of VolksbanksThe Association of Volksbanks includes the VOLKSBANKWIEN AG as the central organisation and the Association'sdeposit insurance organisation.
Banking association in accordance withsection 30a of the Austrian Banking Act (BWG)The banking association comprises the primary banks asassociated banking institutions and VOLKSBANK WIEN AGas the central organisation.
Primary banks status: 26 April 2016
26 regional Volksbanks, 5 specialist banks (Ärztebank, IMMO-BANK AG, Österreichische Apothekerbank,SPARDA-BANK AUSTRIA and start:bausparkasse). Mergers will reduce the number of primary banks to 8 regional Volksbanks and 2 specialist banks.
VOLKSBANK WIEN AGis a primary bank – as one of the regional Volksbanks –and also the central organisation of the banking associationin accordance with section 30a of the Austrian BankingAct (BWG).
Austrian Cooperative AssociationAuditing and early detection within the banking association iscarried out by the Österreichischer Genossenschaftsverband(Schulze-Delitzsch) – for short: ÖGV. The primary banks,Volksbank Haftungsgenossenschaft eG and VolksbankEinlagensicherung eG are ordinary members of the ÖGV.
134 ANNUAL REPORT ASSOCIATION OF VOLKSBANKS 2015 / TERMINOLOGY
TERMINOLOGY
ANNUAL REPORT ASSOCIATION OF VOLKSBANKS 2015 / IMPRINT 135
Imprint:
VOLKSBANK WIEN AGA-1010 Vienna, Schottengasse 10A-1090 Vienna, Kolingasse 14-16 (from end of July 2016)Telephone: +43 (1) 40137-0e-Mail: [email protected]: www.volksbankwien.at
Annual Report-Team and Editors:Monika Bäumel, Gudrun Zillich, Karl Kinsky
Design and Production:VOLKSBANK WIEN AG
Translation:BBi (Scotland) Ltd.
Copy deadline: June 2016
While every care has been taken to ensure that the data and information provided is correct,no liability is accepted for the completeness or accuracy of the data and information.


![INTERNATIONAL CHIROPRACTORS ASSOCIATION REPORT …INTERNATIONAL CHIROPRACTORS ASSOCIATION REPORT TO THE MARYLAND CHIROPRACTIC ASSOCIATION Submitted By ... Public Law 15,[1] ... help](https://img.pdfslide.us/doc/110x75/5f0ed6397e708231d4412d47/international-chiropractors-association-report-international-chiropractors-association.jpg)