Embed Size (px)
Citation preview

September 30, 2018
Annual Report
to Shareholders
DWS High Income Fund(formerly Deutsche High Income Fund)

Contents
3 Letter to Shareholders
4 Portfolio ManagementReview
9 Performance Summary
13 Portfolio Summary
14 Investment Portfolio
29 Statement of Assets andLiabilities
31 Statement of Operations
32 Statements of Changes inNet Assets
33 Financial Highlights
40 Notes to FinancialStatements
56 Report of IndependentRegistered PublicAccounting Firm
58 Information About YourFund’s Expenses
59 Tax Information
60 Advisory Agreement BoardConsiderations and FeeEvaluation
65 Board Members and Officers
70 Account ManagementResources
This report must be preceded or accompanied by a prospectus. To
obtain a summary prospectus, if available, or prospectus for any of our
funds, refer to the Account Management Resources information
provided in the back of this booklet. We advise you to consider the
Fund’s objectives, risks, charges and expenses carefully before
investing. The summary prospectus and prospectus contain this and
other important information about the Fund. Please read the prospectus
carefully before you invest.
Bond investments are subject to interest-rate, credit, liquidity and market risks tovarying degrees. When interest rates rise, bond prices generally fall. Credit risk refersto the ability of an issuer to make timely payments of principal and interest.Investments in lower-quality (“junk bonds”) and non-rated securities present greaterrisk of loss than investments in higher-quality securities. Investing in derivatives entailsspecial risks relating to liquidity, leverage and credit that may reduce returns and/orincrease volatility. The fund may lend securities to approved institutions. Please readthe prospectus for details.
The brand DWS represents DWS Group GmbH & Co. KGaA and any of its subsidiaries suchas DWS Distributors, Inc. which offers investment products or DWS InvestmentManagement Americas, Inc. and RREEF America L.L.C. which offer advisory services.
NOT FDIC/NCUA INSURED NO BANK GUARANTEE MAY LOSE VALUENOT A DEPOSIT NOT INSURED BY ANY FEDERAL GOVERNMENT AGENCY
2 | DWS High Income Fund

Letter to Shareholders
Dear Shareholder:
Earlier this year, we adopted our existing European brand, DWS, globally.In connection with that change, “DWS” has replaced “Deutsche” in mostof our open-end mutual fund names, including share classes for certainmoney market funds which previously included the “Deutsche” in theirnames.
Building on more than 60 years of experience and a reputation forexcellence in Germany and across Europe, DWS is known for the valuesthat we see as core elements to our investors’ success: Excellence,Entrepreneurship, Sustainability and Integrity. We aim to demonstratethese qualities in all that we do.
Please remember that, as part of this name change, our website also hasa new address: DWS.com. For your convenience, the deutschefunds.comaddress will remain live and automatically redirect you to our new site. Asalways, we invite you to visit us online frequently to access the mostcurrent insights from our CIO, economists and investment specialists.
Thank you for your ongoing trust in us. We look forward to bringing youthe very best in investment insight, strategies and solutions for manyyears to come.
Best regards,
Hepsen UzcanPresident, DWS Funds
Assumptions, estimates and opinions contained in this document constitute our judgment asof the date of the document and are subject to change without notice. Any projections arebased on a number of assumptions as to market conditions and there can be no guaranteethat any projected results will be achieved. Past performance is not a guarantee of futureresults.
DWS High Income Fund | 3
Portfolio Management Review (Unaudited)
Market Overview and Fund Performance
All performance information below is historical and does not guarantee future
results. Returns shown are for Class A shares, unadjusted for sales charges.
Investment return and principal fluctuate, so your shares may be worth more or
less when redeemed. Current performance may differ from performance data
shown. Please visit dws.com for the most recent month-end performance of all
share classes. Fund performance includes reinvestment of all distributions.
Unadjusted returns do not reflect sales charges and would have been lower if
they had. Please refer to pages 9 through 12 for more complete performance
information.
Investment Strategy and Process
Portfolio management focuses on cash flow and total return analysis, andbroad diversification among countries, sectors, industries and individualissuers and maturities. Portfolio management uses an active process thatemphasizes relative value in a global environment, managing on a totalreturn basis, and using intensive research to identify stable to improvingcredit situations that may provide yield compensation for the risk ofinvesting in high-yield bonds.
The investment process involves a bottom-up approach, where relativevalue and fundamental analysis are used to select the best securities withineach industry, and a top-down approach to assess the overall risk and returnin the market and which considers macro trends in the economy. To selectsecurities or investments, portfolio management:— Analyzes economic conditions for improving or undervalued sectors and
industries— Uses independent credit research to evaluate individual issuers’ debt
service, growth rate, and both downgrade and upgrade potential— Assesses new offerings versus secondary market opportunities— Seeks issuers within attractive industry sectors and with strong long-term
fundamentals and improving credit.
Class A shares of the Fund returned 2.53% (unadjusted for sales charges)during the 12-month period ended September 30, 2018, trailing the2.94% return of the ICE BofAML US High Yield Index but outperformingthe 2.36% average return of the funds in its Morningstar peer group, HighYield Bond Funds. The Fund outpaced the average return of its peers inthe one-, three-, five- and ten-year periods ended September 30, 2018.
The positive showing for the high-yield market reflected the favorablecombination of improving credit fundamentals, continued strength in
4 | DWS High Income Fund

corporate earnings, and investors’ hearty appetite for risk. The marketwas further supported by strong economic conditions and the low level ofperceived recession risk in the U.S. economy.
A positive supply-and-demand picture was an additional tailwind forperformance. Although high-yield funds generally experienced outflows,the effect was outweighed by a sharp reduction in new-issue volumeduring the second half of the period. Notably, the use of new-issuanceproceeds continued to be dominated by refinancing. Credit investorstypically view companies’ refinancing of older, higher-yielding debt morefavorably than equity-friendly uses such as dividends or general corporatepurposes. Refinancing also reduces the amount of near-term debtmaturities and contributes to lower default expectations.
“We continued to use our bottom-up, research-basedapproach to identify securities that we believe offer the bestrisk-adjusted relative values.”
In this environment, yield spreads — i.e., the yield advantage offered byhigh-yield bonds in relation to Treasuries — declined by 29 basis points(0.29 percentage points) to 339 basis points, as gauged by the ICEBofAML US High Yield Index. Tighter spreads indicate outperformancerelative to government issues. During the course of the year, yieldspreads moved in range from a mid-November high of 408 basis points toa low of 334 basis points in late January.
CCC rated securities produced the best returns in the period, followed bysingle B and BB rated issues, respectively. The continued strength inlower-quality debt was fueled by favorable economic conditions andinvestors’ ongoing search for higher-yielding assets.
Contributors and Detractors
The Fund’s sector allocation and security selection both added value inthe period, but its positioning with regard to credit ratings detracted.
From a ratings perspective, an overweight in single B rated bondscontributed, while an underweight in lower-rated bonds, including thoserated CCC rated and below, detracted. The below-benchmark weighting inlower-quality bonds was the primary factor in the Fund’s shortfall versusthe index.
DWS High Income Fund | 5
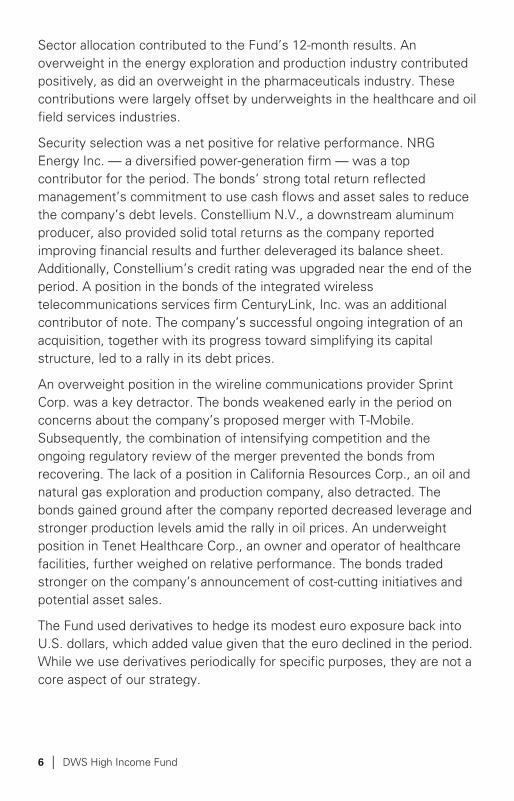
Sector allocation contributed to the Fund’s 12-month results. Anoverweight in the energy exploration and production industry contributedpositively, as did an overweight in the pharmaceuticals industry. Thesecontributions were largely offset by underweights in the healthcare and oilfield services industries.
Security selection was a net positive for relative performance. NRGEnergy Inc. — a diversified power-generation firm — was a topcontributor for the period. The bonds’ strong total return reflectedmanagement’s commitment to use cash flows and asset sales to reducethe company’s debt levels. Constellium N.V., a downstream aluminumproducer, also provided solid total returns as the company reportedimproving financial results and further deleveraged its balance sheet.Additionally, Constellium’s credit rating was upgraded near the end of theperiod. A position in the bonds of the integrated wirelesstelecommunications services firm CenturyLink, Inc. was an additionalcontributor of note. The company’s successful ongoing integration of anacquisition, together with its progress toward simplifying its capitalstructure, led to a rally in its debt prices.
An overweight position in the wireline communications provider SprintCorp. was a key detractor. The bonds weakened early in the period onconcerns about the company’s proposed merger with T-Mobile.Subsequently, the combination of intensifying competition and theongoing regulatory review of the merger prevented the bonds fromrecovering. The lack of a position in California Resources Corp., an oil andnatural gas exploration and production company, also detracted. Thebonds gained ground after the company reported decreased leverage andstronger production levels amid the rally in oil prices. An underweightposition in Tenet Healthcare Corp., an owner and operator of healthcarefacilities, further weighed on relative performance. The bonds tradedstronger on the company’s announcement of cost-cutting initiatives andpotential asset sales.
The Fund used derivatives to hedge its modest euro exposure back intoU.S. dollars, which added value given that the euro declined in the period.While we use derivatives periodically for specific purposes, they are not acore aspect of our strategy.
6 | DWS High Income Fund

Outlook and Positioning
We retain a positive view on the high-yield market, but the recent declinein yield spreads over U.S. Treasuries to the narrowest level in nearly tenyears has caused us to become more cautious. Still, we continue tobelieve high-yield bonds have the potential to provide total returns thatcan exceed those of other fixed-income categories. This view is based onthe solid fundamentals of the asset class and our expectation that defaultrates can remain very low. We consider forecasts for continuingeconomic strength in the United States, combined with the U.S. FederalReserve’s consistent and measured shift away from an accommodativestance, as being supportive for the market. In addition, the majority of theproceeds from new issuance continue to be focused on refinancing older,higher-yielding debt. We also see tight yield spreads as an opportunity toemploy fundamental credit analysis to identify investments with favorablerisk profiles and the potential for attractive total returns.
Possible disruptions to this outlook include faster-than-expectedtightening by the Fed and lingering geopolitical/macroeconomic issues,including tariffs and resurgent global trade tensions. We continue tomonitor the overall credit quality and covenant terms of new-issue bonds,as we view an increase in equity-friendly use of proceeds as a possiblesource of market disruption once the business cycle turns and creditconditions tighten. With this as the backdrop, we continued to use ourbottom-up, research-based approach to identify securities that we believeoffer the best risk-adjusted relative values.
Portfolio Management Team
Gary Russell, CFA, Managing DirectorPortfolio Manager of the Fund. Began managing the Fund in 2006.� Joined DWS in 1996. Served as the Head of the High Yield group in Europe and as an
Emerging Markets Portfolio Manager.� Prior to that, he spent four years at Citicorp as a research analyst and structurer of
collateralized mortgage obligations. Prior to Citicorp, he served as an officer in the USArmy from 1988 to 1991.
� Co-Head of US Credit – Head of US High Yield Bonds and Loans: New York.� BS, United States Military Academy (West Point); MBA, New York University, Stern
School of Business.
DWS High Income Fund | 7

Thomas R. Bouchard, DirectorPortfolio Manager of the Fund. Began managing the Fund in 2016.� Joined DWS in 2006 with 6 years of industry experience. Prior to joining, served as a
High Yield Investment Analyst at Flagship Capital Management. He also served as anofficer in the US Army from 1989 to 1997.
� Portfolio Manager for High Yield Strategies: New York.� BS, University of Wisconsin – Madison; MBA in Finance, Boston College; MA in Strategic
Studies from US Army War College.
Lonnie Fox, Director (Began managing the Fund on August 9, 2018)Portfolio Manager of the Fund. Began managing the Fund in 2018.� Joined DWS in 2004 with one year of industry experience. Prior to his current role, he
worked as a high yield credit analyst. Prior to joining, he served as a business analyst atDeloitte Consulting.
� Portfolio Manager for High Yield Strategies: New York.� BS in Applied Economics and Management, Cornell University; MBA in Finance and
Strategy, New York University, Stern School of Business.The views expressed reflect those of the portfolio management team only through the endof the period of the report as stated on the cover. The management team’s views aresubject to change at any time based on market and other conditions and should not beconstrued as a recommendation. Past performance is no guarantee of future results. Currentand future portfolio holdings are subject to risk.
Terms to Know
The ICE BofAML US High Yield Index (formerly BofAML US High Yield Master IIConstrained Index) tracks the performance of U.S. dollar denominated below-investment-grade corporate debt publicly issued in the U.S. domestic market.
The Morningstar High Yield Bond category portfolios concentrate on lower-qualitybonds, which are riskier than those of higher-quality companies. These portfoliosgenerally offer higher yields than other types of portfolios, but they are also morevulnerable to economic and credit risk. It is not possible to invest directly in aMorningstar category. The category returns for the one-, three-, five- and 10-yearperiods ended September 30, 2018 were 2.36%, 6.41%, 4.31% and 7.62%,respectively.
Yield spread refers to differences between yields on differing debt instruments,calculated by deducting the yield of one instrument from another. The higher the yieldspread, the greater the difference between the yields offered by each instrument.
Credit quality measures a bond issuer’s ability to repay interest and principal in atimely manner. Rating agencies assign letter designations, such as AAA, AA and soforth. The lower the rating, the higher the probability of default. Credit quality does notremove market risk and is subject to change.
Overweight means a fund holds a higher weighting in a given sector or individual securitycompared with its benchmark index; underweight means a fund holds a lower weighting.
Contribution and detraction incorporate both an investment’s total return and itsweighting in the Fund.
Derivatives are contracts whose values can be based on a variety of instrumentsincluding indices, currencies or securities. They can be utilized for a variety of reasonsincluding for hedging purposes; for risk management; for non-hedging purposes toseek to enhance potential gains; or as a substitute for direct investment in a particularasset class or to keep cash on hand to meet shareholder redemptions. Investing inderivatives entails special risks relating to liquidity, leverage and credit that may reducereturns and/or increase volatility.
8 | DWS High Income Fund
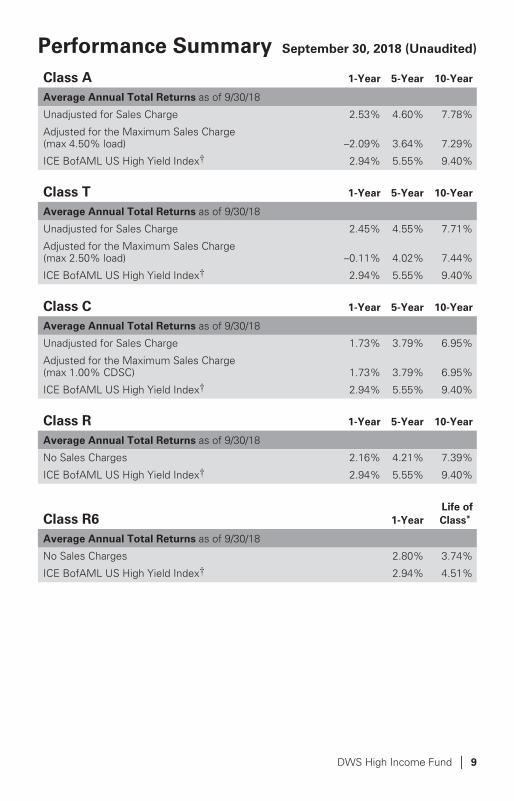
Performance Summary September 30, 2018 (Unaudited)
Class A 1-Year 5-Year 10-Year
Average Annual Total Returns as of 9/30/18
Unadjusted for Sales Charge 2.53% 4.60% 7.78%
Adjusted for the Maximum Sales Charge(max 4.50% load) –2.09% 3.64% 7.29%
ICE BofAML US High Yield Index† 2.94% 5.55% 9.40%
Class T 1-Year 5-Year 10-Year
Average Annual Total Returns as of 9/30/18
Unadjusted for Sales Charge 2.45% 4.55% 7.71%
Adjusted for the Maximum Sales Charge(max 2.50% load) –0.11% 4.02% 7.44%
ICE BofAML US High Yield Index† 2.94% 5.55% 9.40%
Class C 1-Year 5-Year 10-Year
Average Annual Total Returns as of 9/30/18
Unadjusted for Sales Charge 1.73% 3.79% 6.95%
Adjusted for the Maximum Sales Charge(max 1.00% CDSC) 1.73% 3.79% 6.95%
ICE BofAML US High Yield Index† 2.94% 5.55% 9.40%
Class R 1-Year 5-Year 10-Year
Average Annual Total Returns as of 9/30/18
No Sales Charges 2.16% 4.21% 7.39%
ICE BofAML US High Yield Index† 2.94% 5.55% 9.40%
Class R6 1-Year
Life of
Class*
Average Annual Total Returns as of 9/30/18
No Sales Charges 2.80% 3.74%
ICE BofAML US High Yield Index† 2.94% 4.51%
DWS High Income Fund | 9
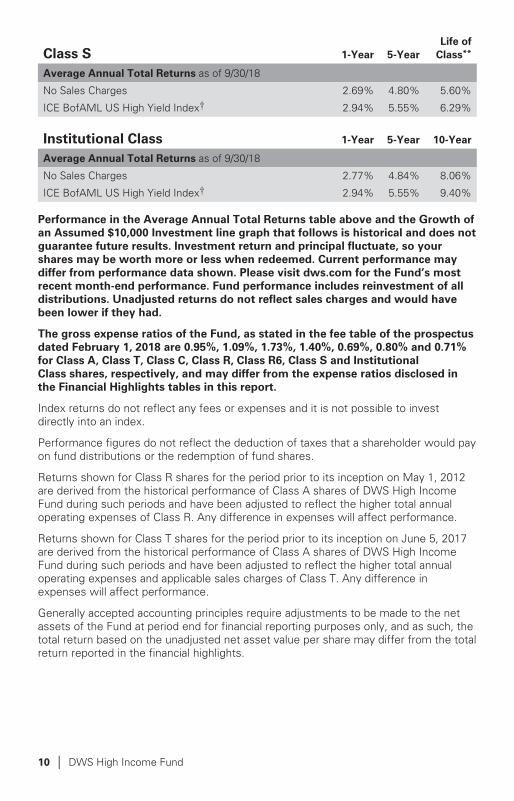
Class S 1-Year 5-Year
Life of
Class**
Average Annual Total Returns as of 9/30/18
No Sales Charges 2.69% 4.80% 5.60%
ICE BofAML US High Yield Index† 2.94% 5.55% 6.29%
Institutional Class 1-Year 5-Year 10-Year
Average Annual Total Returns as of 9/30/18
No Sales Charges 2.77% 4.84% 8.06%
ICE BofAML US High Yield Index† 2.94% 5.55% 9.40%
Performance in the Average Annual Total Returns table above and the Growth of
an Assumed $10,000 Investment line graph that follows is historical and does not
guarantee future results. Investment return and principal fluctuate, so your
shares may be worth more or less when redeemed. Current performance may
differ from performance data shown. Please visit dws.com for the Fund’s most
recent month-end performance. Fund performance includes reinvestment of all
distributions. Unadjusted returns do not reflect sales charges and would have
been lower if they had.
The gross expense ratios of the Fund, as stated in the fee table of the prospectus
dated February 1, 2018 are 0.95%, 1.09%, 1.73%, 1.40%, 0.69%, 0.80% and 0.71%
for Class A, Class T, Class C, Class R, Class R6, Class S and Institutional
Class shares, respectively, and may differ from the expense ratios disclosed in
the Financial Highlights tables in this report.
Index returns do not reflect any fees or expenses and it is not possible to investdirectly into an index.
Performance figures do not reflect the deduction of taxes that a shareholder would payon fund distributions or the redemption of fund shares.
Returns shown for Class R shares for the period prior to its inception on May 1, 2012are derived from the historical performance of Class A shares of DWS High IncomeFund during such periods and have been adjusted to reflect the higher total annualoperating expenses of Class R. Any difference in expenses will affect performance.
Returns shown for Class T shares for the period prior to its inception on June 5, 2017are derived from the historical performance of Class A shares of DWS High IncomeFund during such periods and have been adjusted to reflect the higher total annualoperating expenses and applicable sales charges of Class T. Any difference inexpenses will affect performance.
Generally accepted accounting principles require adjustments to be made to the netassets of the Fund at period end for financial reporting purposes only, and as such, thetotal return based on the unadjusted net asset value per share may differ from the totalreturn reported in the financial highlights.
10 | DWS High Income Fund

Growth of an Assumed $10,000 Investment(Adjusted for Maximum Sales Charge)
DWS High Income Fund — Class A
'08
$24,554$25,000
$20,000
$0
'18'17'16
$10,000
$5,000
$15,000
$20,203
'15'09 '10 '11 '12 '13 '14
Yearly periods ended September 30
ICE BofAML US High Yield Index
The Fund’s growth of an assumed $10,000 investment is adjusted for the maximumsales charge of 4.50%. This results in a net initial investment of $9,550.
The growth of $10,000 is cumulative.
Performance of other share classes will vary based on the sales charges and the feestructure of those classes.
* Class R6 shares commenced operations on August 25, 2014.
** Class S shares commenced operations on May 1, 2012.
† ICE BofAML US High Yield Index (formerly BofAML US High Yield Master II ConstrainedIndex) tracks the performance of U.S. dollar denominated below investment gradecorporate debt publicly issued in the U.S. domestic market.
DWS High Income Fund | 11

Class A Class T Class C Class R Class R6 Class S
Institutional
Class
Net Asset Value
9/30/18 $4.67 $4.67 $4.67 $4.66 $4.67 $4.67 $4.67
9/30/17 $4.81 $4.82 $4.82 $4.81 $4.82 $4.82 $4.82
Distribution Information as of 9/30/18
Income Dividends,Twelve Months $.25 $.24 $.21 $.23 $.26 $.25 $.26
September IncomeDividend $.0210 $.0208 $.0180 $.0197 $.0221 $.0216 $.0219
SEC 30-day Yield‡‡ 4.66% 4.90% 4.13% 4.49% 5.13% 5.18% 5.10%
Current AnnualizedDistribution Rate‡‡ 5.40% 5.34% 4.63% 5.07% 5.68% 5.55% 5.63%
‡‡ The SEC yield is net investment income per share earned over the month endedSeptember 30, 2018, shown as the annualized percentage of the maximum offeringprice per share on the last day of the period. The SEC yield is computed in accordancewith a standardized method prescribed by the Securities and Exchange Commission.The SEC yield would have been 4.36% for Class R shares had certain expenses notbeen reduced. Current annualized distribution rate is the latest monthly dividend shownas an annualized percentage of net asset value on September 30, 2018. Distribution ratesimply measures the level of dividends and is not a complete measure of performance.The current annualized distribution rate would have been 4.94% for Class R shares hadcertain expenses not been reduced. Yields and distribution rates are historical, notguaranteed and will fluctuate.
12 | DWS High Income Fund
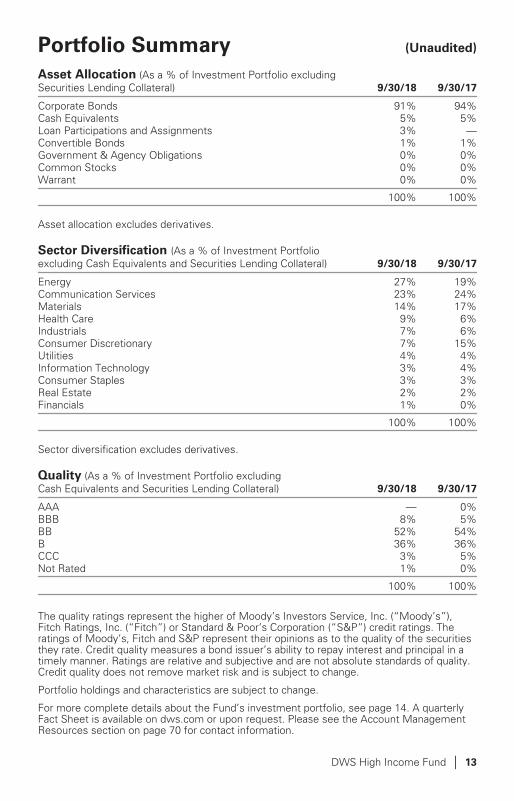
Portfolio Summary (Unaudited)
Asset Allocation (As a % of Investment Portfolio excludingSecurities Lending Collateral) 9/30/18 9/30/17
Corporate Bonds 91% 94%Cash Equivalents 5% 5%Loan Participations and Assignments 3% —Convertible Bonds 1% 1%Government & Agency Obligations 0% 0%Common Stocks 0% 0%Warrant 0% 0%
100% 100%
Asset allocation excludes derivatives.
Sector Diversification (As a % of Investment Portfolioexcluding Cash Equivalents and Securities Lending Collateral) 9/30/18 9/30/17
Energy 27% 19%Communication Services 23% 24%Materials 14% 17%Health Care 9% 6%Industrials 7% 6%Consumer Discretionary 7% 15%Utilities 4% 4%Information Technology 3% 4%Consumer Staples 3% 3%Real Estate 2% 2%Financials 1% 0%
100% 100%
Sector diversification excludes derivatives.
Quality (As a % of Investment Portfolio excludingCash Equivalents and Securities Lending Collateral) 9/30/18 9/30/17
AAA — 0%BBB 8% 5%BB 52% 54%B 36% 36%CCC 3% 5%Not Rated 1% 0%
100% 100%
The quality ratings represent the higher of Moody’s Investors Service, Inc. (“Moody’s”),Fitch Ratings, Inc. (“Fitch”) or Standard & Poor’s Corporation (“S&P”) credit ratings. Theratings of Moody’s, Fitch and S&P represent their opinions as to the quality of the securitiesthey rate. Credit quality measures a bond issuer’s ability to repay interest and principal in atimely manner. Ratings are relative and subjective and are not absolute standards of quality.Credit quality does not remove market risk and is subject to change.
Portfolio holdings and characteristics are subject to change.
For more complete details about the Fund’s investment portfolio, see page 14. A quarterlyFact Sheet is available on dws.com or upon request. Please see the Account ManagementResources section on page 70 for contact information.
DWS High Income Fund | 13

Investment Portfolio as of September 30, 2018
PrincipalAmount ($)(a) Value ($)
Corporate Bonds 91.1%
Communication Services 20.1%
Altice France SA:144A, 7.375%, 5/1/2026 8,050,000 8,050,000144A, 8.125%, 2/1/2027 2,926,000 3,013,780
Altice Luxembourg SA, 144A, 7.75%, 5/15/2022 (b) 1,726,000 1,676,378Altice U.S. Finance I Corp., 144A, 5.5%, 5/15/2026 2,430,000 2,426,962Cablevision Systems Corp., 5.875%, 9/15/2022 4,700,000 4,791,062CCO Holdings LLC:
144A, 5.0%, 2/1/2028 2,205,000 2,072,479144A, 5.125%, 5/1/2027 1,665,000 1,577,5885.25%, 9/30/2022 6,700,000 6,773,264144A, 5.5%, 5/1/2026 6,245,000 6,174,744144A, 5.875%, 4/1/2024 2,375,000 2,413,594144A, 5.875%, 5/1/2027 2,240,000 2,220,400
CenturyLink, Inc.:Series V, 5.625%, 4/1/2020 2,800,000 2,849,000Series W, 6.75%, 12/1/2023 (b) 1,305,000 1,355,569Series Y, 7.5%, 4/1/2024 (b) 1,795,000 1,916,163
Cequel Communications Holdings I LLC:144A, 5.125%, 12/15/2021 8,700,000 8,754,375144A, 7.5%, 4/1/2028 1,800,000 1,887,750
Clear Channel Worldwide Holdings, Inc., Series A, 6.5%,11/15/2022 2,270,000 2,312,562
CSC Holdings LLC:144A, 5.5%, 4/15/2027 5,380,000 5,218,600144A, 10.125%, 1/15/2023 5,040,000 5,513,760144A, 10.875%, 10/15/2025 2,353,000 2,735,362
DISH DBS Corp.:5.875%, 7/15/2022 (b) 2,500,000 2,440,1505.875%, 11/15/2024 2,000,000 1,792,500
Frontier Communications Corp.:7.125%, 1/15/2023 (b) 5,505,000 3,894,78710.5%, 9/15/2022 (b) 750,000 667,50011.0%, 9/15/2025 1,185,000 923,956
Intelsat Jackson Holdings SA:144A, 8.0%, 2/15/2024 7,000,000 7,367,500144A, 8.5%, 10/15/2024 3,020,000 3,053,220144A, 9.75%, 7/15/2025 5,035,000 5,330,806
Level 3 Financing, Inc., 5.375%, 8/15/2022 5,500,000 5,557,612Netflix, Inc.:
4.375%, 11/15/2026 (b) 2,400,000 2,244,7205.875%, 2/15/2025 1,335,000 1,380,056144A, 5.875%, 11/15/2028 1,035,000 1,031,119
The accompanying notes are an integral part of the financial statements.
14 | DWS High Income Fund

PrincipalAmount ($)(a) Value ($)
Sprint Capital Corp.:6.875%, 11/15/2028 2,950,000 2,964,7508.75%, 3/15/2032 1,575,000 1,771,875
Sprint Corp.:7.125%, 6/15/2024 10,120,000 10,499,5007.625%, 3/1/2026 2,445,000 2,588,644
T-Mobile U.S.A., Inc.:4.75%, 2/1/2028 530,000 498,8636.0%, 4/15/2024 2,271,000 2,353,3246.375%, 3/1/2025 4,479,000 4,666,2226.5%, 1/15/2026 120,000 125,724
Telesat Canada, 144A, 8.875%, 11/15/2024 3,645,000 3,900,150UPC Holding BV, 144A, 5.5%, 1/15/2028 2,285,000 2,168,625UPCB Finance IV Ltd., 144A, 5.375%, 1/15/2025 2,365,000 2,362,044ViaSat, Inc., 144A, 5.625%, 9/15/2025 755,000 713,702Virgin Media Secured Finance PLC:
144A, 5.25%, 1/15/2026 3,725,000 3,642,268144A, 5.5%, 8/15/2026 2,310,000 2,281,125
Zayo Group LLC:144A, 5.75%, 1/15/2027 5,200,000 5,200,0006.0%, 4/1/2023 5,085,000 5,237,5506.375%, 5/15/2025 3,580,000 3,715,217
Ziggo Bond Finance BV, 144A, 5.875%, 1/15/2025 1,475,000 1,384,656
165,491,557
Consumer Discretionary 7.2%
Adient Global Holdings Ltd., REG S, 3.5%, 8/15/2024 EUR 2,800,000 3,025,651Ally Financial, Inc.:
4.125%, 2/13/2022 3,000,000 2,996,2505.75%, 11/20/2025 (b) 1,250,000 1,290,625
American Axle & Manufacturing, Inc.:6.25%, 4/1/2025 (b) 1,450,000 1,443,9836.25%, 3/15/2026 935,000 918,638
Asbury Automotive Group, Inc., 6.0%, 12/15/2024 1,577,000 1,592,770Ashton Woods U.S.A. LLC, 144A, 6.75%, 8/1/2025 1,635,000 1,524,637Boyd Gaming Corp.:
6.0%, 8/15/2026 2,325,000 2,342,4376.875%, 5/15/2023 1,295,000 1,360,398
Carlson Travel, Inc., 144A, 9.5%, 12/15/2024 (b) 1,930,000 1,862,450Cumberland Farms, Inc., 144A, 6.75%, 5/1/2025 650,000 666,250Dana Financing Luxembourg Sarl:
144A, 5.75%, 4/15/2025 2,150,000 2,111,730144A, 6.5%, 6/1/2026 2,405,000 2,450,815
Delta Merger Sub, Inc., 144A, 6.0%, 9/15/2026 2,468,000 2,498,850Fiat Chrysler Automobiles NV, 5.25%, 4/15/2023 (b) 4,217,000 4,300,117HD Supply, Inc., Step-up Coupon, 5.75% to 4/15/2019,
7.00% to 4/15/2024 1,180,000 1,240,475
The accompanying notes are an integral part of the financial statements.
DWS High Income Fund | 15
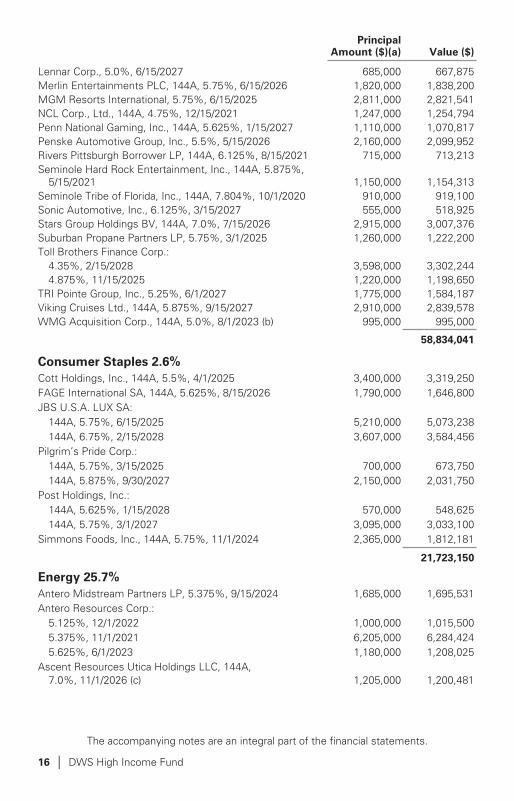
PrincipalAmount ($)(a) Value ($)
Lennar Corp., 5.0%, 6/15/2027 685,000 667,875Merlin Entertainments PLC, 144A, 5.75%, 6/15/2026 1,820,000 1,838,200MGM Resorts International, 5.75%, 6/15/2025 2,811,000 2,821,541NCL Corp., Ltd., 144A, 4.75%, 12/15/2021 1,247,000 1,254,794Penn National Gaming, Inc., 144A, 5.625%, 1/15/2027 1,110,000 1,070,817Penske Automotive Group, Inc., 5.5%, 5/15/2026 2,160,000 2,099,952Rivers Pittsburgh Borrower LP, 144A, 6.125%, 8/15/2021 715,000 713,213Seminole Hard Rock Entertainment, Inc., 144A, 5.875%,
5/15/2021 1,150,000 1,154,313Seminole Tribe of Florida, Inc., 144A, 7.804%, 10/1/2020 910,000 919,100Sonic Automotive, Inc., 6.125%, 3/15/2027 555,000 518,925Stars Group Holdings BV, 144A, 7.0%, 7/15/2026 2,915,000 3,007,376Suburban Propane Partners LP, 5.75%, 3/1/2025 1,260,000 1,222,200Toll Brothers Finance Corp.:
4.35%, 2/15/2028 3,598,000 3,302,2444.875%, 11/15/2025 1,220,000 1,198,650
TRI Pointe Group, Inc., 5.25%, 6/1/2027 1,775,000 1,584,187Viking Cruises Ltd., 144A, 5.875%, 9/15/2027 2,910,000 2,839,578WMG Acquisition Corp., 144A, 5.0%, 8/1/2023 (b) 995,000 995,000
58,834,041
Consumer Staples 2.6%
Cott Holdings, Inc., 144A, 5.5%, 4/1/2025 3,400,000 3,319,250FAGE International SA, 144A, 5.625%, 8/15/2026 1,790,000 1,646,800JBS U.S.A. LUX SA:
144A, 5.75%, 6/15/2025 5,210,000 5,073,238144A, 6.75%, 2/15/2028 3,607,000 3,584,456
Pilgrim’s Pride Corp.:144A, 5.75%, 3/15/2025 700,000 673,750144A, 5.875%, 9/30/2027 2,150,000 2,031,750
Post Holdings, Inc.:144A, 5.625%, 1/15/2028 570,000 548,625144A, 5.75%, 3/1/2027 3,095,000 3,033,100
Simmons Foods, Inc., 144A, 5.75%, 11/1/2024 2,365,000 1,812,181
21,723,150
Energy 25.7%
Antero Midstream Partners LP, 5.375%, 9/15/2024 1,685,000 1,695,531Antero Resources Corp.:
5.125%, 12/1/2022 1,000,000 1,015,5005.375%, 11/1/2021 6,205,000 6,284,4245.625%, 6/1/2023 1,180,000 1,208,025
Ascent Resources Utica Holdings LLC, 144A,7.0%, 11/1/2026 (c) 1,205,000 1,200,481
The accompanying notes are an integral part of the financial statements.
16 | DWS High Income Fund

PrincipalAmount ($)(a) Value ($)
Blue Racer Midstream LLC, 144A, 6.125%, 11/15/2022 5,920,000 6,075,400Carrizo Oil & Gas, Inc., 8.25%, 7/15/2025 1,355,000 1,456,625Cheniere Corpus Christi Holdings LLC:
5.125%, 6/30/2027 5,040,000 5,058,9005.875%, 3/31/2025 2,200,000 2,312,7507.0%, 6/30/2024 5,525,000 6,049,875
Cheniere Energy Partners LP, 144A, 5.625%, 10/1/2026 2,305,000 2,321,596Chesapeake Energy Corp.:
7.0%, 10/1/2024 1,905,000 1,905,0007.5%, 10/1/2026 1,160,000 1,160,000144A, 8.0%, 12/15/2022 1,739,000 1,817,2558.0%, 1/15/2025 (b) 2,255,000 2,325,4698.0%, 6/15/2027 (b) 5,340,000 5,446,800
CNX Midstream Partners LP, 144A, 6.5%, 3/15/2026 1,565,000 1,553,263Continental Resources, Inc., 5.0%, 9/15/2022 4,934,000 5,005,543Crestwood Midstream Partners LP:
5.75%, 4/1/2025 3,085,000 3,150,5566.25%, 4/1/2023 4,835,000 5,004,225
DCP Midstream Operating LP:3.875%, 3/15/2023 (b) 1,400,000 1,365,0005.375%, 7/15/2025 2,980,000 3,035,875
Diamondback Energy, Inc.:4.75%, 11/1/2024 1,650,000 1,652,063144A, 4.75%, 11/1/2024 3,345,000 3,349,181
Endeavor Energy Resources LP:144A, 5.5%, 1/30/2026 540,000 540,000144A, 5.75%, 1/30/2028 540,000 540,000
Energy Transfer Equity LP, 5.5%, 6/1/2027 5,140,000 5,334,292Extraction Oil & Gas, Inc.:
144A, 5.625%, 2/1/2026 2,065,000 1,827,525144A, 7.375%, 5/15/2024 920,000 908,500
Genesis Energy LP:6.25%, 5/15/2026 3,235,000 3,081,3376.5%, 10/1/2025 4,100,000 3,966,750
Gulfport Energy Corp.:6.0%, 10/15/2024 875,000 853,1256.375%, 5/15/2025 1,415,000 1,386,7006.375%, 1/15/2026 2,080,000 2,022,800
Halcon Resources Corp., 6.75%, 2/15/2025 3,760,000 3,609,600Hilcorp Energy I LP:
144A, 5.0%, 12/1/2024 2,605,000 2,541,829144A, 5.75%, 10/1/2025 3,030,000 3,041,362
Holly Energy Partners LP, 144A, 6.0%, 8/1/2024 2,995,000 3,062,387Ithaca Energy, Inc., 144A, 8.125%, 7/1/2019 1,490,000 1,476,963
The accompanying notes are an integral part of the financial statements.
DWS High Income Fund | 17
PrincipalAmount ($)(a) Value ($)
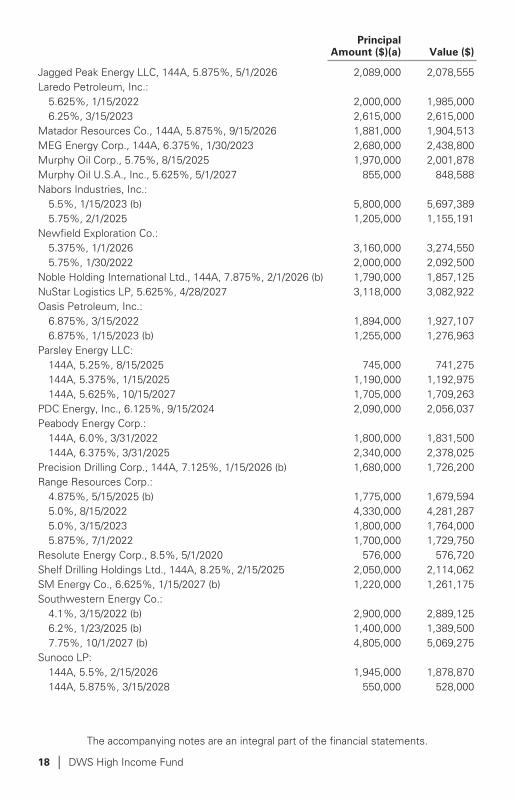
Jagged Peak Energy LLC, 144A, 5.875%, 5/1/2026 2,089,000 2,078,555Laredo Petroleum, Inc.:
5.625%, 1/15/2022 2,000,000 1,985,0006.25%, 3/15/2023 2,615,000 2,615,000
Matador Resources Co., 144A, 5.875%, 9/15/2026 1,881,000 1,904,513MEG Energy Corp., 144A, 6.375%, 1/30/2023 2,680,000 2,438,800Murphy Oil Corp., 5.75%, 8/15/2025 1,970,000 2,001,878Murphy Oil U.S.A., Inc., 5.625%, 5/1/2027 855,000 848,588Nabors Industries, Inc.:
5.5%, 1/15/2023 (b) 5,800,000 5,697,3895.75%, 2/1/2025 1,205,000 1,155,191
Newfield Exploration Co.:5.375%, 1/1/2026 3,160,000 3,274,5505.75%, 1/30/2022 2,000,000 2,092,500
Noble Holding International Ltd., 144A, 7.875%, 2/1/2026 (b) 1,790,000 1,857,125NuStar Logistics LP, 5.625%, 4/28/2027 3,118,000 3,082,922Oasis Petroleum, Inc.:
6.875%, 3/15/2022 1,894,000 1,927,1076.875%, 1/15/2023 (b) 1,255,000 1,276,963
Parsley Energy LLC:144A, 5.25%, 8/15/2025 745,000 741,275144A, 5.375%, 1/15/2025 1,190,000 1,192,975144A, 5.625%, 10/15/2027 1,705,000 1,709,263
PDC Energy, Inc., 6.125%, 9/15/2024 2,090,000 2,056,037Peabody Energy Corp.:
144A, 6.0%, 3/31/2022 1,800,000 1,831,500144A, 6.375%, 3/31/2025 2,340,000 2,378,025
Precision Drilling Corp., 144A, 7.125%, 1/15/2026 (b) 1,680,000 1,726,200Range Resources Corp.:
4.875%, 5/15/2025 (b) 1,775,000 1,679,5945.0%, 8/15/2022 4,330,000 4,281,2875.0%, 3/15/2023 1,800,000 1,764,0005.875%, 7/1/2022 1,700,000 1,729,750
Resolute Energy Corp., 8.5%, 5/1/2020 576,000 576,720Shelf Drilling Holdings Ltd., 144A, 8.25%, 2/15/2025 2,050,000 2,114,062SM Energy Co., 6.625%, 1/15/2027 (b) 1,220,000 1,261,175Southwestern Energy Co.:
4.1%, 3/15/2022 (b) 2,900,000 2,889,1256.2%, 1/23/2025 (b) 1,400,000 1,389,5007.75%, 10/1/2027 (b) 4,805,000 5,069,275
Sunoco LP:144A, 5.5%, 2/15/2026 1,945,000 1,878,870144A, 5.875%, 3/15/2028 550,000 528,000
The accompanying notes are an integral part of the financial statements.
18 | DWS High Income Fund

PrincipalAmount ($)(a) Value ($)
Targa Resources Partners LP:4.25%, 11/15/2023 2,200,000 2,147,750144A, 5.0%, 1/15/2028 4,240,000 4,123,4005.375%, 2/1/2027 3,600,000 3,600,000144A, 5.875%, 4/15/2026 1,682,000 1,734,563
Transocean, Inc., 144A, 9.0%, 7/15/2023 1,600,000 1,740,000Trinidad Drilling Ltd., 144A, 6.625%, 2/15/2025 700,000 693,000U.S.A. Compression Partners LP, 144A, 6.875%, 4/1/2026 2,652,000 2,738,190Weatherford International Ltd.:
4.5%, 4/15/2022 (b) 1,540,000 1,347,5007.75%, 6/15/2021 (b) 2,302,000 2,290,4908.25%, 6/15/2023 (b) 1,000,000 945,000
Whiting Petroleum Corp., 5.75%, 3/15/2021 5,435,000 5,570,875WildHorse Resource Development Corp., 6.875%, 2/1/2025 1,905,000 1,966,912WPX Energy, Inc.:
5.25%, 9/15/2024 2,015,000 2,025,0756.0%, 1/15/2022 590,000 611,3888.25%, 8/1/2023 3,005,000 3,410,675
211,620,039
Financials 0.8%
CIT Group, Inc.:4.75%, 2/16/2024 2,940,000 2,947,2034.125%, 3/9/2021 230,000 230,000
Lincoln Finance Ltd., 144A, 7.375%, 4/15/2021 855,000 882,856Tempo Acquisition LLC, 144A, 6.75%, 6/1/2025 935,000 909,287Travelport Corporate Finance PLC, 144A, 6.0%, 3/15/2026 1,765,000 1,792,658
6,762,004
Health Care 8.5%
Avantor, Inc., 144A, 6.0%, 10/1/2024 1,000,000 1,015,000Bausch Health Companies, Inc.:
144A, 5.625%, 12/1/2021 1,850,000 1,843,063144A, 5.875%, 5/15/2023 2,040,000 1,989,000144A, 6.125%, 4/15/2025 (b) 2,385,000 2,265,750144A, 6.5%, 3/15/2022 3,590,000 3,733,600144A, 7.0%, 3/15/2024 3,335,000 3,523,428144A, 7.5%, 7/15/2021 3,443,000 3,507,556144A, 8.5%, 1/31/2027 3,330,000 3,496,500144A, 9.25%, 4/1/2026 1,280,000 1,380,800
Centene Corp., 144A, 5.375%, 6/1/2026 1,375,000 1,407,794Charles River Laboratories International, Inc., 144A,
5.5%, 4/1/2026 320,000 324,800DaVita, Inc.:
5.0%, 5/1/2025 1,500,000 1,430,6255.125%, 7/15/2024 1,500,000 1,447,500
Endo Dac, 144A, 6.0%, 7/15/2023 1,860,000 1,650,750
The accompanying notes are an integral part of the financial statements.
DWS High Income Fund | 19

PrincipalAmount ($)(a) Value ($)
HCA, Inc.:5.625%, 9/1/2028 4,870,000 4,894,3505.25%, 6/15/2026 8,285,000 8,523,1945.375%, 9/1/2026 2,400,000 2,424,0005.875%, 2/15/2026 4,470,000 4,654,387
LifePoint Health, Inc., 5.5%, 12/1/2021 1,230,000 1,250,184Mallinckrodt International Finance SA, 144A,
5.625%, 10/15/2023 (b) 1,275,000 1,128,375Tenet Healthcare Corp.:
4.5%, 4/1/2021 1,400,000 1,393,0005.125%, 5/1/2025 1,370,000 1,349,4506.75%, 6/15/2023 (b) 675,000 672,4697.0%, 8/1/2025 (b) 200,000 197,500
Teva Pharmaceutical Finance Netherlands III BV:2.2%, 7/21/2021 10,000,000 9,397,0006.0%, 4/15/2024 600,000 609,2666.75%, 3/1/2028 (b) 1,620,000 1,708,882
WellCare Health Plans, Inc., 144A, 5.375%, 8/15/2026 3,060,000 3,113,550
70,331,773
Industrials 6.5%
Bombardier, Inc.:144A, 5.75%, 3/15/2022 2,850,000 2,866,031144A, 6.0%, 10/15/2022 2,320,000 2,325,893REG S, 6.125%, 1/15/2023 2,330,000 2,340,194144A, 7.5%, 12/1/2024 3,095,000 3,265,225
Brand Industrial Services, Inc., 144A, 8.5%, 7/15/2025 1,400,000 1,439,032BWX Technologies, Inc., 144A, 5.375%, 7/15/2026 440,000 441,650Covanta Holding Corp.:
5.875%, 3/1/2024 1,940,000 1,980,6435.875%, 7/1/2025 1,120,000 1,131,200
DAE Funding LLC:144A, 4.5%, 8/1/2022 134,000 130,650144A, 5.0%, 8/1/2024 346,000 338,648
Energizer Gamma Acquisition, Inc., 144A,6.375%, 7/15/2026 (b) 1,695,000 1,752,206
GFL Environmental, Inc., 144A, 5.625%, 5/1/2022 1,085,000 1,049,738Hulk Finance Corp., 144A, 7.0%, 6/1/2026 2,150,000 2,077,437Moog, Inc., 144A, 5.25%, 12/1/2022 1,565,000 1,576,738Novelis Corp.:
144A, 5.875%, 9/30/2026 2,625,000 2,564,625144A, 6.25%, 8/15/2024 5,095,000 5,216,006
Park Aerospace Holdings Ltd.:144A, 4.5%, 3/15/2023 3,280,000 3,202,100144A, 5.25%, 8/15/2022 2,470,000 2,491,612144A, 5.5%, 2/15/2024 3,265,000 3,346,625
The accompanying notes are an integral part of the financial statements.
20 | DWS High Income Fund
PrincipalAmount ($)(a) Value ($)
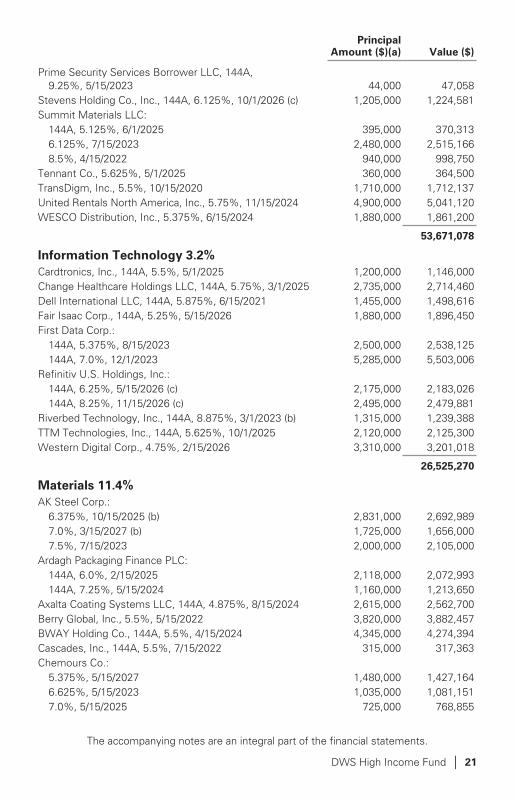
Prime Security Services Borrower LLC, 144A,9.25%, 5/15/2023 44,000 47,058
Stevens Holding Co., Inc., 144A, 6.125%, 10/1/2026 (c) 1,205,000 1,224,581Summit Materials LLC:
144A, 5.125%, 6/1/2025 395,000 370,3136.125%, 7/15/2023 2,480,000 2,515,1668.5%, 4/15/2022 940,000 998,750
Tennant Co., 5.625%, 5/1/2025 360,000 364,500TransDigm, Inc., 5.5%, 10/15/2020 1,710,000 1,712,137United Rentals North America, Inc., 5.75%, 11/15/2024 4,900,000 5,041,120WESCO Distribution, Inc., 5.375%, 6/15/2024 1,880,000 1,861,200
53,671,078
Information Technology 3.2%
Cardtronics, Inc., 144A, 5.5%, 5/1/2025 1,200,000 1,146,000Change Healthcare Holdings LLC, 144A, 5.75%, 3/1/2025 2,735,000 2,714,460Dell International LLC, 144A, 5.875%, 6/15/2021 1,455,000 1,498,616Fair Isaac Corp., 144A, 5.25%, 5/15/2026 1,880,000 1,896,450First Data Corp.:
144A, 5.375%, 8/15/2023 2,500,000 2,538,125144A, 7.0%, 12/1/2023 5,285,000 5,503,006
Refinitiv U.S. Holdings, Inc.:144A, 6.25%, 5/15/2026 (c) 2,175,000 2,183,026144A, 8.25%, 11/15/2026 (c) 2,495,000 2,479,881
Riverbed Technology, Inc., 144A, 8.875%, 3/1/2023 (b) 1,315,000 1,239,388TTM Technologies, Inc., 144A, 5.625%, 10/1/2025 2,120,000 2,125,300Western Digital Corp., 4.75%, 2/15/2026 3,310,000 3,201,018
26,525,270
Materials 11.4%
AK Steel Corp.:6.375%, 10/15/2025 (b) 2,831,000 2,692,9897.0%, 3/15/2027 (b) 1,725,000 1,656,0007.5%, 7/15/2023 2,000,000 2,105,000
Ardagh Packaging Finance PLC:144A, 6.0%, 2/15/2025 2,118,000 2,072,993144A, 7.25%, 5/15/2024 1,160,000 1,213,650
Axalta Coating Systems LLC, 144A, 4.875%, 8/15/2024 2,615,000 2,562,700Berry Global, Inc., 5.5%, 5/15/2022 3,820,000 3,882,457BWAY Holding Co., 144A, 5.5%, 4/15/2024 4,345,000 4,274,394Cascades, Inc., 144A, 5.5%, 7/15/2022 315,000 317,363Chemours Co.:
5.375%, 5/15/2027 1,480,000 1,427,1646.625%, 5/15/2023 1,035,000 1,081,1517.0%, 5/15/2025 725,000 768,855
The accompanying notes are an integral part of the financial statements.
DWS High Income Fund | 21

PrincipalAmount ($)(a) Value ($)
Clearwater Paper Corp., 144A, 5.375%, 2/1/2025 1,375,000 1,275,313Constellium NV:
144A, 4.625%, 5/15/2021 EUR 2,500,000 2,946,003144A, 5.75%, 5/15/2024 1,325,000 1,316,719144A, 5.875%, 2/15/2026 3,936,000 3,852,360144A, 6.625%, 3/1/2025 (b) 6,000,000 6,075,000
First Quantum Minerals Ltd.:144A, 6.5%, 3/1/2024 798,000 730,170144A, 6.875%, 3/1/2026 1,260,000 1,145,025
Flex Acquisition Co., Inc, 144A, 7.875%, 7/15/2026 2,395,000 2,365,062Freeport-McMoRan, Inc.:
3.55%, 3/1/2022 1,800,000 1,741,5003.875%, 3/15/2023 1,500,000 1,450,0504.0%, 11/14/2021 3,000,000 2,973,7505.4%, 11/14/2034 1,841,000 1,730,5405.45%, 3/15/2043 435,000 395,850
Hexion, Inc.:6.625%, 4/15/2020 2,010,000 1,889,400144A, 10.375%, 2/1/2022 560,000 544,600
Hudbay Minerals, Inc.:144A, 7.25%, 1/15/2023 2,425,000 2,491,954144A, 7.625%, 1/15/2025 2,675,000 2,761,937
Kaiser Aluminum Corp., 5.875%, 5/15/2024 2,110,000 2,156,842Mercer International, Inc.:
5.5%, 1/15/2026 425,000 416,5006.5%, 2/1/2024 1,390,000 1,421,414
NOVA Chemicals Corp.:144A, 4.875%, 6/1/2024 2,460,000 2,368,365144A, 5.25%, 6/1/2027 1,685,000 1,569,156
OCI NV:144A, 5.0%, 4/15/2023 EUR 470,000 574,997144A, 6.625%, 4/15/2023 2,002,000 2,072,070
Platform Specialty Products Corp.:144A, 5.875%, 12/1/2025 1,360,000 1,342,007144A, 6.5%, 2/1/2022 4,325,000 4,400,687
Reynolds Group Issuer, Inc.:144A, 5.125%, 7/15/2023 3,925,000 3,905,375144A, 7.0%, 7/15/2024 465,000 473,138
Starfruit Finco BV, 144A, 8.0%, 10/1/2026 (c) 1,910,000 1,938,650Teck Resources Ltd.:
6.125%, 10/1/2035 1,800,000 1,894,5006.25%, 7/15/2041 1,750,000 1,837,500
Tronox, Inc., 144A, 6.5%, 4/15/2026 (b) 1,746,000 1,680,525
The accompanying notes are an integral part of the financial statements.
22 | DWS High Income Fund

PrincipalAmount ($)(a) Value ($)
United States Steel Corp.:6.25%, 3/15/2026 (b) 917,000 908,9766.875%, 8/15/2025 4,035,000 4,120,744
WR Grace & Co-Conn, 144A, 5.125%, 10/1/2021 840,000 861,000
93,682,395
Real Estate 1.8%
CyrusOne LP, (REIT), 5.375%, 3/15/2027 4,000,000 4,090,000Iron Mountain, Inc.:
144A, (REIT), 5.25%, 3/15/2028 1,820,000 1,688,050(REIT), 6.0%, 8/15/2023 4,000,000 4,102,520
MPT Operating Partnership LP, (REIT), 6.375%, 3/1/2024 2,365,000 2,471,425SBA Communications Corp., (REIT), 4.0%, 10/1/2022 2,700,000 2,646,000
14,997,995
Utilities 3.3%
AmeriGas Partners LP:5.5%, 5/20/2025 1,565,000 1,537,6125.75%, 5/20/2027 1,445,000 1,416,100
Calpine Corp.:144A, 5.25%, 6/1/2026 1,360,000 1,259,7005.75%, 1/15/2025 (b) 1,100,000 973,500
Clearway Energy Operating LLC, 144A,5.75%, 10/15/2025 (c) 585,000 590,148
NGL Energy Partners LP, 5.125%, 7/15/2019 1,705,000 1,713,525NRG Energy, Inc.:
144A, 5.75%, 1/15/2028 (b) 3,000,000 3,030,0006.25%, 7/15/2022 6,617,000 6,826,759
Vistra Energy Corp.:5.875%, 6/1/2023 998,000 1,026,6937.375%, 11/1/2022 2,650,000 2,752,6877.625%, 11/1/2024 3,607,000 3,882,034
Vistra Operations Co., LLC, 144A, 5.5%, 9/1/2026 2,415,000 2,442,169
27,450,927
Total Corporate Bonds (Cost $747,102,639) 751,090,229
Government & Agency Obligation 0.1%
U.S. Treasury Obligation
U.S. Treasury Bill, 1.381%***, 10/11/2018 (Cost $1,099,578) 1,100,000 1,099,375
The accompanying notes are an integral part of the financial statements.
DWS High Income Fund | 23

PrincipalAmount ($)(a) Value ($)
Loan Participations and Assignments 2.9%
Senior Loans**
Axalta Coating Systems U.S. Holdings, Inc., Term Loan B3,3-month USD LIBOR + 1.750%, 4.136%, 6/1/2024 2,000,000 2,006,480
Calpine Corp., Term Loan B5, 3-month USD LIBOR +2.500%, 4.89%, 1/15/2024 4,552,941 4,559,110
CenturyLink, Inc., Term Loan B, 1-month USD LIBOR +2.750%, 4.992%, 1/31/2025 8,506,074 8,457,164
Crown Finance U.S., Inc., Term Loan, 1-month USD LIBOR +2.500%, 4.742%, 2/28/2025 941,435 941,435
CSC Holdings LLC, First Lien Term Loan, 1-month USDLIBOR + 2.250%, 4.408%, 7/17/2025 3,482,368 3,488,166
Energy Transfer Equity LP, Term Loan B, 1-month USDLIBOR + 2.000%, 4.242%, 2/2/2024 3,000,000 3,006,390
Unitymedia Finance LLC, Term Loan D, USD LIBOR +2.250%, 1/15/2026 1,179,901 1,182,190
Total Loan Participations and Assignments (Cost $23,548,350) 23,640,935
Convertible Bonds 1.2%
Consumer Discretionary 0.0%
DISH Network Corp., 2.375%, 3/15/2024 450,000 398,851
Materials 1.2%
GEO Specialty Chemicals, Inc., 3-month USD-LIBOR +14.0%, 16.321% PIK, 10/18/2025** (d) 8,903,205 9,606,558
Total Convertible Bonds (Cost $9,394,008) 10,005,409
Shares Value ($)
Common Stocks 0.1%
Industrials 0.0%
Quad Graphics, Inc. 1,950 40,638
Materials 0.1%
GEO Specialty Chemicals, Inc.* (d) 3,832,909 651,595GEO Specialty Chemicals, Inc. 144A* (d) 12,448 2,116
653,711
Total Common Stocks (Cost $2,455,000) 694,349
Warrant 0.0%
Materials
Hercules Trust II, Expiration Date 3/31/2029* (d)(Cost $1,482,531) 6,700 278,560
The accompanying notes are an integral part of the financial statements.
24 | DWS High Income Fund

Shares Value ($)
Securities Lending Collateral 8.3%
DWS Government & Agency Securities Portfolio “DWSGovernment Cash Institutional Shares”, 1.89% (e) (f)(Cost $68,111,774) 68,111,774 68,111,774
Cash Equivalents 4.7%
DWS Central Cash Management Government Fund,2.03% (e) (Cost $38,285,871) 38,285,871 38,285,871
% of NetAssets Value ($)
Total Investment Portfolio (Cost $891,479,751) 108.4 893,206,502
Other Assets and Liabilities, Net (8.4) (69,134,479)
Net Assets 100.0 824,072,023
A summary of the Fund’s transactions with affiliated investments during the year endedSeptember 30, 2018 are as follows:
Value ($)at
9/30/2017
Pur-chases
Cost($)
SalesProceeds
($)
NetRealized
Gain/(Loss)
($)
NetChange
inUnreal
izedAppreci-
ation(Depreci-
ation)($)
Income($)
CapitalGain
Distri-butions
($)
Number ofShares at
9/30/2018
Value ($)at
9/30/2018
Securities Lending Collateral 8.3%
DWS Government & Agency Securities Portfolio “DWS Government Cash Institutional Shares”,1.89% (e) (f)
87,495,171 — 19,383,397 (g) — — 801,750 — 68,111,774 68,111,774
Cash Equivalents 4.6%
DWS Central Cash Management Government Fund, 2.03% (e)43,198,550 441,352,214 446,264,893 — — 741,164 — 38,285,871 38,285,871
130,693,721 441,352,214 465,648,290 — — 1,542,914 —106,397,645 106,397,645
* Non-income producing security.** Variable or floating rate security. These securities are shown at their current rate as of
September 30, 2018. For securities based on a published reference rate and spread, thereference rate and spread are indicated within the description above. Certain variablerate securities are not based on a published reference rate and spread but adjustperiodically based on current market conditions, prepayment of underlying positions and/or other variables.
*** Annualized yield at time of purchase; not a coupon rate.(a) Principal amount stated in U.S. dollars unless otherwise noted.(b) All or a portion of these securities were on loan. In addition, “Other Assets and
Liabilities, Net” may include pending sales that are also on loan. The value of securitiesloaned at September 30, 2018 amounted to $65,545,661, which is 8.0% of net assets.
(c) When-issued or delayed delivery securities included.(d) Investment was valued using significant unobservable inputs.
The accompanying notes are an integral part of the financial statements.
DWS High Income Fund | 25

(e) Affiliated fund managed by DWS Investment Management Americas, Inc. The rateshown is the annualized seven-day yield at period end.
(f) Represents collateral held in connection with securities lending. Income earned by theFund is net of borrower rebates.
(g) Represents the net increase (purchase cost) or decrease (sales proceeds) in the amountinvested for the year ended September 30, 2018.
144A: Security exempt from registration under Rule 144A of the Securities Act of 1933.These securities may be resold in transactions exempt from registration, normally toqualified institutional buyers.LIBOR: London Interbank Offered RatePIK: Denotes that all or a portion of the income is paid in-kind in the form of additionalprincipal.REG S: Securities sold under Regulation S may not be offered, sold or delivered within theUnited States or to, or for the account or benefit of, U.S. persons, except pursuant to anexemption from, or in a transaction not subject to, the registration requirements of theSecurities Act of 1933.REIT: Real Estate Investment Trust
At September 30, 2018, the Fund had the following open forward foreign currency contracts:
Contracts toDeliver In Exchange For
SettlementDate
UnrealizedAppreciation ($) Counterparty
EUR 5,727,635 USD 6,767,653 10/31/2018 101,485 Merrill Lynch & Co., Inc.
Currency Abbreviations
EUR EuroUSD United States Dollar
For information on the Fund’s policy and additional disclosures regarding forward foreigncurrency contracts, please refer to the Derivatives section of Note B in the accompanyingNotes to Financial Statements.
Fair Value Measurements
Various inputs are used in determining the value of the Fund’s investments. These inputsare summarized in three broad levels. Level 1 includes quoted prices in active markets foridentical securities. Level 2 includes other significant observable inputs (including quotedprices for similar securities, interest rates, prepayment speeds and credit risk). Level 3includes significant unobservable inputs (including the Fund’s own assumptions indetermining the fair value of investments). The level assigned to the securities valuationsmay not be an indication of the risk or liquidity associated with investing in those securities.
The accompanying notes are an integral part of the financial statements.
26 | DWS High Income Fund
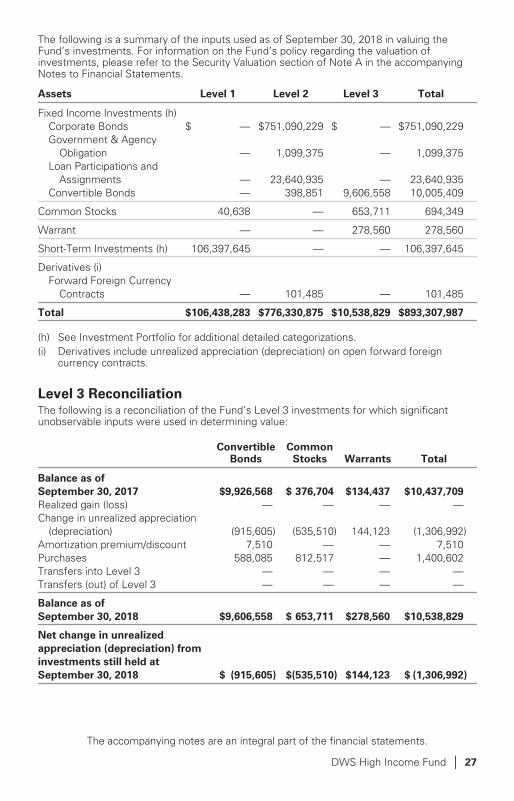
The following is a summary of the inputs used as of September 30, 2018 in valuing theFund’s investments. For information on the Fund’s policy regarding the valuation ofinvestments, please refer to the Security Valuation section of Note A in the accompanyingNotes to Financial Statements.
Assets Level 1 Level 2 Level 3 Total
Fixed Income Investments (h)Corporate Bonds $ — $751,090,229 $ — $751,090,229Government & Agency
Obligation — 1,099,375 — 1,099,375Loan Participations and
Assignments — 23,640,935 — 23,640,935Convertible Bonds — 398,851 9,606,558 10,005,409
Common Stocks 40,638 — 653,711 694,349
Warrant — — 278,560 278,560
Short-Term Investments (h) 106,397,645 — — 106,397,645
Derivatives (i)Forward Foreign Currency
Contracts — 101,485 — 101,485
Total $106,438,283 $776,330,875 $10,538,829 $893,307,987
(h) See Investment Portfolio for additional detailed categorizations.(i) Derivatives include unrealized appreciation (depreciation) on open forward foreign
currency contracts.
Level 3 ReconciliationThe following is a reconciliation of the Fund’s Level 3 investments for which significantunobservable inputs were used in determining value:
ConvertibleBonds
CommonStocks Warrants Total
Balance as of
September 30, 2017 $9,926,568 $ 376,704 $134,437 $10,437,709
Realized gain (loss) — — — —Change in unrealized appreciation
(depreciation) (915,605) (535,510) 144,123 (1,306,992)Amortization premium/discount 7,510 — — 7,510Purchases 588,085 812,517 — 1,400,602Transfers into Level 3 — — — —Transfers (out) of Level 3 — — — —
Balance as of
September 30, 2018 $9,606,558 $ 653,711 $278,560 $10,538,829
Net change in unrealized
appreciation (depreciation) from
investments still held at
September 30, 2018 $ (915,605) $(535,510) $144,123 $ (1,306,992)
The accompanying notes are an integral part of the financial statements.
DWS High Income Fund | 27
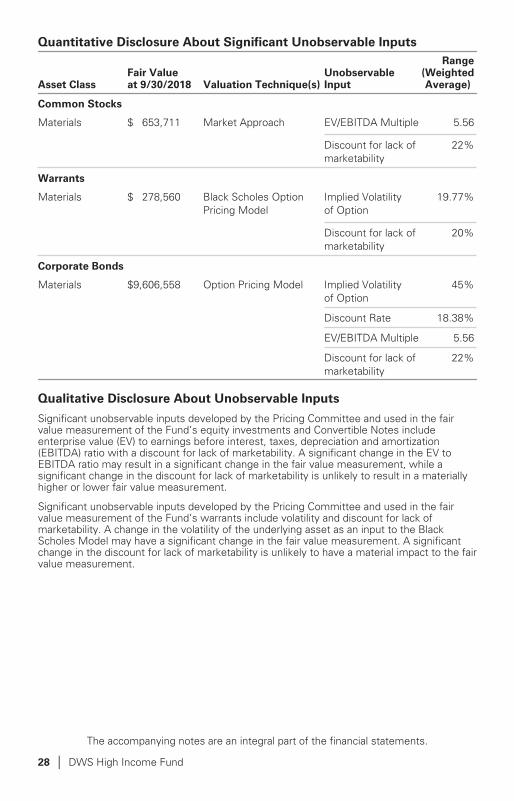
Quantitative Disclosure About Significant Unobservable Inputs
Asset ClassFair Valueat 9/30/2018 Valuation Technique(s)
UnobservableInput
Range(WeightedAverage)
Common Stocks
Materials $ 653,711 Market Approach EV/EBITDA Multiple 5.56
Discount for lack ofmarketability
22%
Warrants
Materials $ 278,560 Black Scholes OptionPricing Model
Implied Volatilityof Option
19.77%
Discount for lack ofmarketability
20%
Corporate Bonds
Materials $9,606,558 Option Pricing Model Implied Volatilityof Option
45%
Discount Rate 18.38%
EV/EBITDA Multiple 5.56
Discount for lack ofmarketability
22%
Qualitative Disclosure About Unobservable Inputs
Significant unobservable inputs developed by the Pricing Committee and used in the fairvalue measurement of the Fund’s equity investments and Convertible Notes includeenterprise value (EV) to earnings before interest, taxes, depreciation and amortization(EBITDA) ratio with a discount for lack of marketability. A significant change in the EV toEBITDA ratio may result in a significant change in the fair value measurement, while asignificant change in the discount for lack of marketability is unlikely to result in a materiallyhigher or lower fair value measurement.
Significant unobservable inputs developed by the Pricing Committee and used in the fairvalue measurement of the Fund’s warrants include volatility and discount for lack ofmarketability. A change in the volatility of the underlying asset as an input to the BlackScholes Model may have a significant change in the fair value measurement. A significantchange in the discount for lack of marketability is unlikely to have a material impact to the fairvalue measurement.
The accompanying notes are an integral part of the financial statements.
28 | DWS High Income Fund
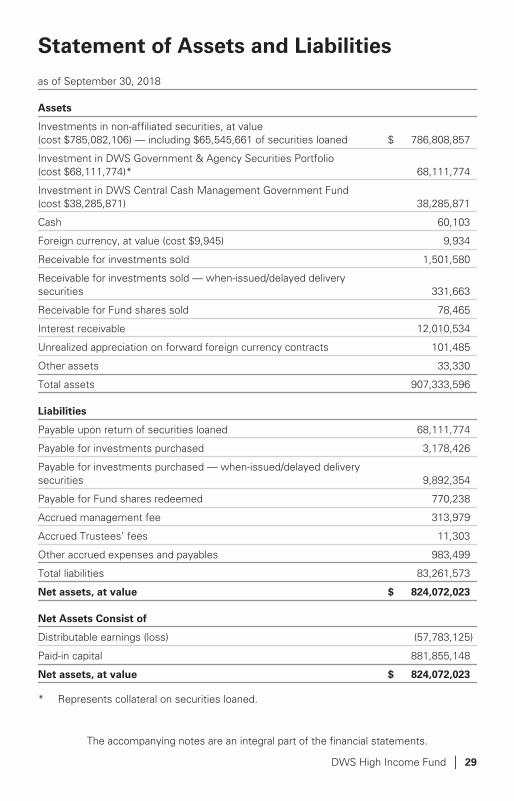
Statement of Assets and Liabilities
as of September 30, 2018
Assets
Investments in non-affiliated securities, at value(cost $785,082,106) — including $65,545,661 of securities loaned $ 786,808,857
Investment in DWS Government & Agency Securities Portfolio(cost $68,111,774)* 68,111,774
Investment in DWS Central Cash Management Government Fund(cost $38,285,871) 38,285,871
Cash 60,103
Foreign currency, at value (cost $9,945) 9,934
Receivable for investments sold 1,501,580
Receivable for investments sold — when-issued/delayed deliverysecurities 331,663
Receivable for Fund shares sold 78,465
Interest receivable 12,010,534
Unrealized appreciation on forward foreign currency contracts 101,485
Other assets 33,330
Total assets 907,333,596
Liabilities
Payable upon return of securities loaned 68,111,774
Payable for investments purchased 3,178,426
Payable for investments purchased — when-issued/delayed deliverysecurities 9,892,354
Payable for Fund shares redeemed 770,238
Accrued management fee 313,979
Accrued Trustees’ fees 11,303
Other accrued expenses and payables 983,499
Total liabilities 83,261,573
Net assets, at value $ 824,072,023
Net Assets Consist of
Distributable earnings (loss) (57,783,125)
Paid-in capital 881,855,148
Net assets, at value $ 824,072,023
* Represents collateral on securities loaned.
The accompanying notes are an integral part of the financial statements.
DWS High Income Fund | 29
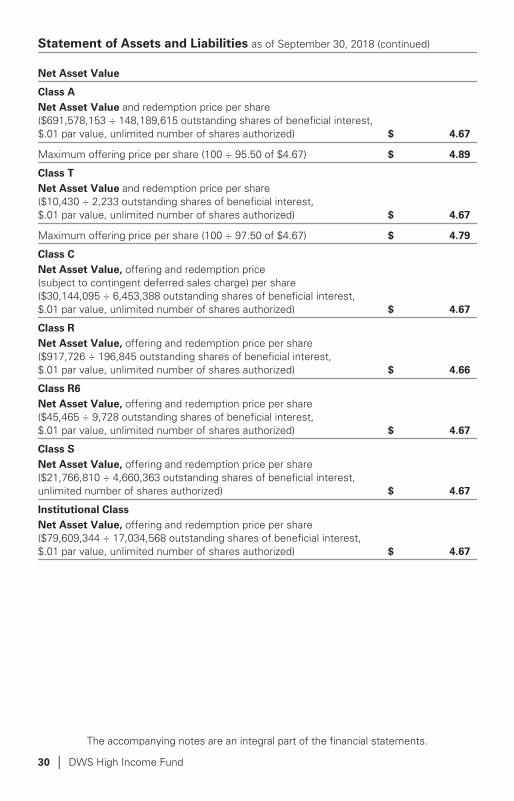
Statement of Assets and Liabilities as of September 30, 2018 (continued)
Net Asset Value
Class A
Net Asset Value and redemption price per share($691,578,153 ÷ 148,189,615 outstanding shares of beneficial interest,$.01 par value, unlimited number of shares authorized) $ 4.67
Maximum offering price per share (100 ÷ 95.50 of $4.67) $ 4.89
Class T
Net Asset Value and redemption price per share($10,430 ÷ 2,233 outstanding shares of beneficial interest,$.01 par value, unlimited number of shares authorized) $ 4.67
Maximum offering price per share (100 ÷ 97.50 of $4.67) $ 4.79
Class C
Net Asset Value, offering and redemption price(subject to contingent deferred sales charge) per share($30,144,095 ÷ 6,453,388 outstanding shares of beneficial interest,$.01 par value, unlimited number of shares authorized) $ 4.67
Class R
Net Asset Value, offering and redemption price per share($917,726 ÷ 196,845 outstanding shares of beneficial interest,$.01 par value, unlimited number of shares authorized) $ 4.66
Class R6
Net Asset Value, offering and redemption price per share($45,465 ÷ 9,728 outstanding shares of beneficial interest,$.01 par value, unlimited number of shares authorized) $ 4.67
Class S
Net Asset Value, offering and redemption price per share($21,766,810 ÷ 4,660,363 outstanding shares of beneficial interest,unlimited number of shares authorized) $ 4.67
Institutional Class
Net Asset Value, offering and redemption price per share($79,609,344 ÷ 17,034,568 outstanding shares of beneficial interest,$.01 par value, unlimited number of shares authorized) $ 4.67
The accompanying notes are an integral part of the financial statements.
30 | DWS High Income Fund

Statement of Operations
for the year ended September 30, 2018
Investment Income
Income:Dividends $ 2,261
Interest 51,541,410
Income distributions — DWS Central Cash ManagementGovernment Fund 741,164
Securities lending income, net of borrower rebates 801,750
Total income 53,086,585
Expenses:Management fee 4,051,596
Administration fee 883,688
Services to shareholders 924,318
Distribution and service fees 2,252,267
Custodian fee 16,961
Professional fees 123,626
Reports to shareholders 87,816
Registration fees 99,685
Trustees’ fees and expenses 51,885
Other 88,751
Total expenses before expense reductions 8,580,593
Expense reductions (1,023)
Total expenses after expense reductions 8,579,570
Net investment income 44,507,015
Realized and Unrealized Gain (Loss)
Net realized gain (loss) from:Investments 4,799,898
Swap contracts 50,714
Forward foreign currency contracts 441,530
Foreign currency 90,159
5,382,301
Change in net unrealized appreciation (depreciation) on:Investments (33,040,228)
Forward foreign currency contracts 164,224
Foreign currency (5,687)
(32,881,691)
Net gain (loss) (27,499,390)
Net increase (decrease) in net assets resulting from operations $ 17,007,625
The accompanying notes are an integral part of the financial statements.
DWS High Income Fund | 31

Statements of Changes in Net Assets
Years Ended September 30,
Increase (Decrease) in Net Assets 2018 2017
Operations:Net investment income $ 44,507,015 $ 48,177,544
Net realized gain (loss) 5,382,301 20,222,086
Change in net unrealized appreciation(depreciation) (32,881,691) 6,961,580
Net increase (decrease) in net assets resultingfrom operations 17,007,625 75,361,210
Distributions to shareholders:Class A (37,138,257) (42,270,499)
Class T (527) (179)*
Class C (2,567,326) (3,528,899)
Class R (49,365) (49,146)
Class R6 (2,447) (2,371)
Class S (1,645,934) (1,823,202)
Institutional Class (4,447,679) (4,247,227)
Total distributions (45,851,535) (51,921,523)**
Fund share transactions:Proceeds from shares sold 152,355,112 120,018,867
Reinvestment of distributions 41,219,169 46,370,596
Payments for shares redeemed (296,460,624) (244,190,519)
Redemption fees — 4,364
Net increase (decrease) in net assets from Fundshare transactions (102,886,343) (77,796,692)
Increase (decrease) in net assets (131,730,253) (54,357,005)
Net assets at beginning of period 955,802,276 1,010,159,281
Net assets at end of period $ 824,072,023 $ 955,802,276***
* For the period from June 5, 2017 (commencement of operations of Class T) toSeptember 30, 2017.
** Includes distributions from net investment income.*** Includes undistributed net investment income of $1,464,489.
The accompanying notes are an integral part of the financial statements.
32 | DWS High Income Fund
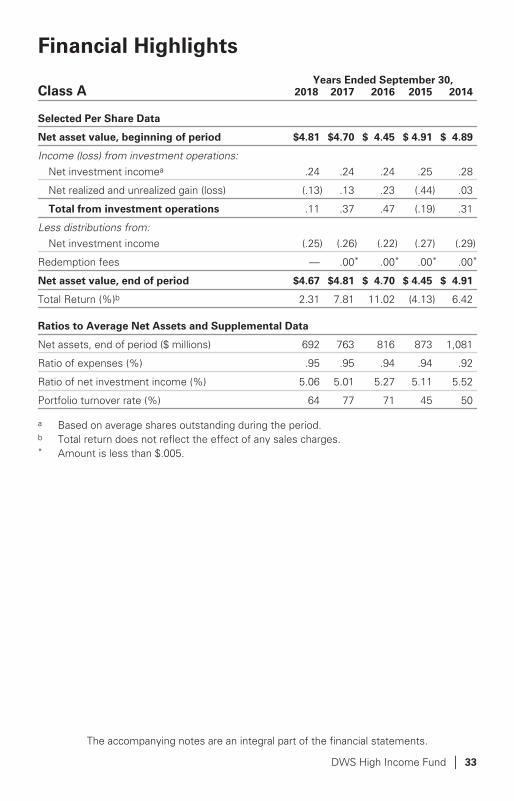
Financial Highlights
Years Ended September 30,Class A 2018 2017 2016 2015 2014
Selected Per Share Data
Net asset value, beginning of period $4.81 $4.70 $ 4.45 $ 4.91 $ 4.89
Income (loss) from investment operations:Net investment incomea .24 .24 .24 .25 .28
Net realized and unrealized gain (loss) (.13) .13 .23 (.44) .03
Total from investment operations .11 .37 .47 (.19) .31
Less distributions from:Net investment income (.25) (.26) (.22) (.27) (.29)
Redemption fees — .00* .00* .00* .00*
Net asset value, end of period $4.67 $4.81 $ 4.70 $ 4.45 $ 4.91
Total Return (%)b 2.31 7.81 11.02 (4.13) 6.42
Ratios to Average Net Assets and Supplemental Data
Net assets, end of period ($ millions) 692 763 816 873 1,081
Ratio of expenses (%) .95 .95 .94 .94 .92
Ratio of net investment income (%) 5.06 5.01 5.27 5.11 5.52
Portfolio turnover rate (%) 64 77 71 45 50
a Based on average shares outstanding during the period.b Total return does not reflect the effect of any sales charges.* Amount is less than $.005.
The accompanying notes are an integral part of the financial statements.
DWS High Income Fund | 33

Class T
YearEnded
9/30/18
PeriodEnded
9/30/17a
Selected Per Share Data
Net asset value, beginning of period $4.82 $4.80
Income (loss) from investment operations:Net investment incomeb .24 .07
Net realized and unrealized gain (loss) (.15) .04
Total from investment operations .09 .11
Less distributions from:Net investment income (.24) (.09)
Net asset value, end of period $4.67 $4.82
Total Return (%)c 2.01 2.22d**
Ratios to Average Net Assets and Supplemental Data
Net assets, end of period ($ thousands) 10 10
Ratio of expenses before expense reductions (%) .97 1.09*
Ratio of expenses after expense reductions (%) .97 1.05*
Ratio of net investment income (%) 5.04 4.75*
Portfolio turnover rate (%) 64 77e
a For the period from June 5, 2017 (commencement of operations) toSeptember 30, 2017.
b Based on average shares outstanding during the period.c Total return does not reflect the effect of any sales charges.d Total return would have been lower had certain expenses not been reduced.e Represents the Fund’s portfolio turnover rate for the year ended September 30, 2017.* Annualized** Not annualized
The accompanying notes are an integral part of the financial statements.
34 | DWS High Income Fund

Years Ended September 30,Class C 2018 2017 2016 2015 2014
Selected Per Share Data
Net asset value, beginning of period $4.82 $4.70 $4.46 $ 4.91 $4.90
Income (loss) from investment operations:Net investment incomea .20 .20 .20 .21 .24
Net realized and unrealized gain (loss) (.14) .14 .23 (.43) .02
Total from investment operations .06 .34 .43 (.22) .26
Less distributions from:Net investment income (.21) (.22) (.19) (.23) (.25)
Redemption fees — .00* .00* .00* .00*
Net asset value, end of period $4.67 $4.82 $4.70 $ 4.46 $4.91
Total Return (%)b 1.31 7.20 9.90 (4.64) 5.38
Ratios to Average Net Assets and Supplemental Data
Net assets, end of period ($ millions) 30 68 94 88 111
Ratio of expenses (%) 1.70 1.73 1.71 1.72 1.69
Ratio of net investment income (%) 4.30 4.24 4.51 4.33 4.75
Portfolio turnover rate (%) 64 77 71 45 50
a Based on average shares outstanding during the period.b Total return does not reflect the effect of any sales charges.* Amount is less than $.005.
The accompanying notes are an integral part of the financial statements.
DWS High Income Fund | 35

Years Ended September 30,Class R 2018 2017 2016 2015 2014
Selected Per Share Data
Net asset value, beginning of period $4.81 $ 4.69 $ 4.45 $ 4.90 $4.89
Income (loss) from investment operations:Net investment incomea .22 .22 .22 .23 .26
Net realized and unrealized gain (loss) (.14) .14 .23 (.43) .02
Total from investment operations .08 .36 .45 (.20) .28
Less distributions from:Net investment income (.23) (.24) (.21) (.25) (.27)
Redemption fees — .00* .00* .00* .00*
Net asset value, end of period $4.66 $ 4.81 $ 4.69 $ 4.45 $4.90
Total Return (%) 1.73b 7.65b 10.39b (4.26)b 5.78
Ratios to Average Net Assets and Supplemental Data
Net assets, end of period ($ thousands) 919 1,073 892 690 426
Ratio of expenses before expense reductions (%) 1.40 1.40 1.32 1.38 1.27
Ratio of expenses after expense reductions (%) 1.30 1.30 1.30 1.30 1.27
Ratio of net investment income (%) 4.71 4.65 4.90 4.74 5.18
Portfolio turnover rate (%) 64 77 71 45 50
a Based on average shares outstanding during the period.b Total return would have been lower had certain expenses not been reduced.* Amount is less than $.005.
The accompanying notes are an integral part of the financial statements.
36 | DWS High Income Fund

Years Ended September 30,PeriodEnded
Class R6 2018 2017 2016 2015 9/30/14a
Selected Per Share Data
Net asset value, beginning of period $4.82 $4.70 $ 4.46 $ 4.91 $ 5.05
Income (loss) from investment operations:Net investment incomeb .25 .25 .24 .25 .03
Net realized and unrealized gain (loss) (.14) .14 .23 (.42) (.14)
Total from investment operations .11 .39 .47 (.17) (.11)
Less distributions from:Net investment income (.26) (.27) (.23) (.28) (.03)
Redemption fees — .00*** .00*** .00*** .00***
Net asset value, end of period $4.67 $4.82 $ 4.70 $ 4.46 $ 4.91
Total Return (%) 2.37 8.23 10.93c (3.67)c (2.26)**
Ratios to Average Net Assets and Supplemental Data
Net assets, end of period ($ thousands) 46 44 10 9 10
Ratio of expenses before expensereductions (%) .70 .69 .85 .85 .62*
Ratio of expenses after expense reductions (%) .70 .69 .80 .80 .62*
Ratio of net investment income (%) 5.31 5.27 5.40 5.24 5.92*
Portfolio turnover rate (%) 64 77 71 45 50d
a For the period from August 25, 2014 (commencement of operations) toSeptember 30, 2014.
b Based on average shares outstanding during the period.c Total return would have been lower had certain expenses not been reduced.d Represents the Fund’s portfolio turnover rate for the year ended September 30, 2014.* Annualized** Not annualized*** Amount is less than $.005.
The accompanying notes are an integral part of the financial statements.
DWS High Income Fund | 37
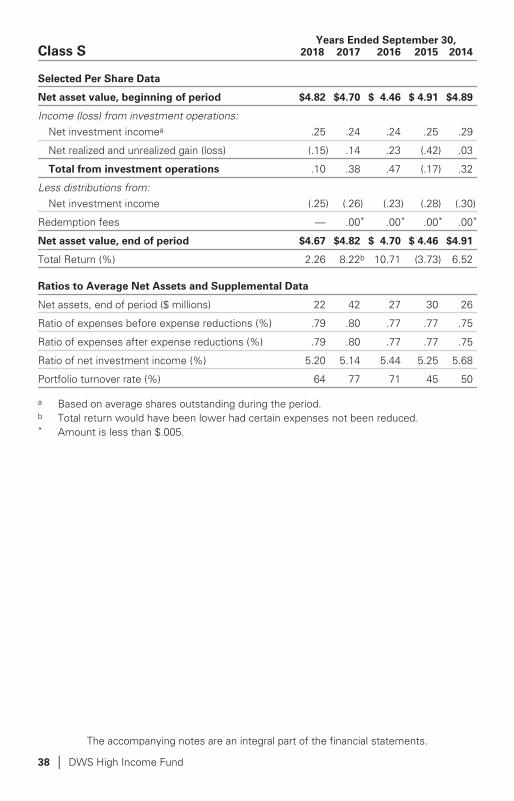
Years Ended September 30,Class S 2018 2017 2016 2015 2014
Selected Per Share Data
Net asset value, beginning of period $4.82 $4.70 $ 4.46 $ 4.91 $4.89
Income (loss) from investment operations:Net investment incomea .25 .24 .24 .25 .29
Net realized and unrealized gain (loss) (.15) .14 .23 (.42) .03
Total from investment operations .10 .38 .47 (.17) .32
Less distributions from:Net investment income (.25) (.26) (.23) (.28) (.30)
Redemption fees — .00* .00* .00* .00*
Net asset value, end of period $4.67 $4.82 $ 4.70 $ 4.46 $4.91
Total Return (%) 2.26 8.22b 10.71 (3.73) 6.52
Ratios to Average Net Assets and Supplemental Data
Net assets, end of period ($ millions) 22 42 27 30 26
Ratio of expenses before expense reductions (%) .79 .80 .77 .77 .75
Ratio of expenses after expense reductions (%) .79 .80 .77 .77 .75
Ratio of net investment income (%) 5.20 5.14 5.44 5.25 5.68
Portfolio turnover rate (%) 64 77 71 45 50
a Based on average shares outstanding during the period.b Total return would have been lower had certain expenses not been reduced.* Amount is less than $.005.
The accompanying notes are an integral part of the financial statements.
38 | DWS High Income Fund

Years Ended September 30,Institutional Class 2018 2017 2016 2015 2014
Selected Per Share Data
Net asset value, beginning of period $4.82 $4.70 $ 4.46 $ 4.91 $4.90
Income (loss) from investment operations:Net investment incomea .25 .25 .25 .26 .29
Net realized and unrealized gain (loss) (.14) .14 .22 (.43) .02
Total from investment operations .11 .39 .47 (.17) .31
Less distributions from:Net investment income (.26) (.27) (.23) (.28) (.30)
Redemption fees — .00* .00* .00* .00*
Net asset value, end of period $4.67 $4.82 $ 4.70 $ 4.46 $4.91
Total Return (%) 2.34 8.28 10.78 (3.68) 6.46
Ratios to Average Net Assets and Supplemental Data
Net assets, end of period ($ millions) 80 82 71 72 88
Ratio of expenses (%) .72 .71 .71 .70 .69
Ratio of net investment income (%) 5.28 5.25 5.52 5.35 5.74
Portfolio turnover rate (%) 64 77 71 45 50
a Based on average shares outstanding during the period.* Amount is less than $.005.
The accompanying notes are an integral part of the financial statements.
DWS High Income Fund | 39
Notes to Financial Statements
A. Organization and Significant Accounting Policies
DWS High Income Fund (formerly Deutsche High Income Fund) (the“Fund”) is a diversified series of Deutsche DWS Income Trust (formerlyDeutsche Income Trust) (the “Trust”), which is registered under theInvestment Company Act of 1940, as amended (the “1940 Act”), as anopen-end investment management company organized as aMassachusetts business trust.
The Fund offers multiple classes of shares which provide investors withdifferent purchase options. Class A shares are subject to an initial salescharge. Class T shares are subject to an initial sales charge and are onlyavailable through certain financial intermediaries. Effective October 1,2018, Class T shares will be closed to new purchases, except inconnection with the reinvestment of dividends or other distributions.Class C shares are not subject to an initial sales charge but are subject tohigher ongoing expenses than Class A shares and a contingent deferredsales charge payable upon certain redemptions within one year ofpurchase. Effective on August 10, 2018, Class C shares automaticallyconvert to Class A shares in the same fund after 10 years, provided thatthe fund or the financial intermediary through which the shareholderpurchased the Class C shares has records verifying that the Class Cshares have been held for at least 10 years. Class R shares and Class R6shares are not subject to initial or contingent deferred sales charges andare generally available only to certain retirement plans. Class S shares arenot subject to initial or contingent deferred sales charges and are onlyavailable to a limited group of investors. Institutional Class shares are notsubject to initial or contingent deferred sales charges and are generallyavailable only to qualified institutions.
Investment income, realized and unrealized gains and losses, and certainfund-level expenses and expense reductions, if any, are borne pro rata onthe basis of relative net assets by the holders of all classes of shares,except that each class bears certain expenses unique to that class suchas distribution and service fees, services to shareholders and certain otherclass-specific expenses. Differences in class-level expenses may result inpayment of different per share dividends by class. All shares of the Fundhave equal rights with respect to voting subject to class-specificarrangements.
The Fund’s financial statements are prepared in accordance withaccounting principles generally accepted in the United States of America(“U.S. GAAP”) which require the use of management estimates. Actualresults could differ from those estimates. The Fund qualifies as aninvestment company under Topic 946 of Accounting Standards
40 | DWS High Income Fund

Codification of U.S. GAAP. The policies described below are followedconsistently by the Fund in the preparation of its financial statements.
In October 2018, the Securities and Exchange Commission adoptedamendments to certain disclosure requirements in Securities Act ReleaseNo. 33-10532, Disclosure Update and Simplification, which is intended tofacilitate the disclosure of information to investors and simplifycompliance without significantly altering the total mix of informationprovided to investors. Effective with the current reporting period, theFund adopted the amendments with the impacts being that the Fund isno longer required to present components of distributable earnings on theStatement of Assets and Liabilities or the sources of distributableearnings and the amount of undistributed net investment income on theStatements of Changes in Net Assets.
Security Valuation. Investments are stated at value determined as of theclose of regular trading on the New York Stock Exchange on each day theexchange is open for trading.
Various inputs are used in determining the value of the Fund’s investments.These inputs are summarized in three broad levels. Level 1 includes quotedprices in active markets for identical securities. Level 2 includes othersignificant observable inputs (including quoted prices for similar securities,interest rates, prepayment speeds, and credit risk). Level 3 includessignificant unobservable inputs (including the Fund’s own assumptions indetermining the fair value of investments). The inputs or methodology usedfor valuing securities are not necessarily an indication of the risk associatedwith investing in those securities.
Equity securities are valued at the most recent sale price or official closingprice reported on the exchange (U.S. or foreign) or over-the-counter marketon which they trade. Securities for which no sales are reported are valuedat the calculated mean between the most recent bid and asked quotationson the relevant market or, if a mean cannot be determined, at the mostrecent bid quotation. Equity securities are generally categorized as Level 1.
Debt securities and senior loans are valued at prices supplied byindependent pricing services approved by the Fund’s Board. If the pricingservices are unable to provide valuations, securities are valued at themost recent bid quotation or evaluated price, as applicable, obtained fromone or more broker-dealers. Such services may use various pricingtechniques which take into account appropriate factors such as yield,quality, coupon rate, maturity, type of issue, trading characteristics andother data, as well as broker quotes. These securities are generallycategorized as Level 2.
Investments in open-end investment companies are valued at their netasset value each business day and are categorized as Level 1.
DWS High Income Fund | 41

Forward currency contracts are valued at the prevailing forward exchangerate of the underlying currencies and are categorized as Level 2.
Swap contracts are valued daily based upon prices supplied by a Boardapproved pricing vendor, if available, and otherwise are valued at the priceprovided by the broker-dealer. Swaps contracts are generally categorizedas Level 2.
Securities and other assets for which market quotations are not readilyavailable or for which the above valuation procedures are deemed not toreflect fair value are valued in a manner that is intended to reflect their fairvalue as determined in accordance with procedures approved by the Boardand are generally categorized as Level 3. In accordance with the Fund’svaluation procedures, factors considered in determining value may include,but are not limited to, the type of the security; the size of the holding; theinitial cost of the security; the existence of any contractual restrictions onthe security’s disposition; the price and extent of public trading in similarsecurities of the issuer or of comparable companies; quotations orevaluated prices from broker-dealers and/or pricing services; informationobtained from the issuer, analysts, and/or the appropriate stock exchange(for exchange-traded securities); an analysis of the company’s or issuer’sfinancial statements; an evaluation of the forces that influence the issuerand the market(s) in which the security is purchased and sold; and withrespect to debt securities, the maturity, coupon, creditworthiness,currency denomination, and the movement of the market in which thesecurity is normally traded. The value determined under these proceduresmay differ from published values for the same securities.
Disclosure about the classification of fair value measurements is includedin a table following the Fund’s Investment Portfolio.
Foreign Currency Translations. The books and records of the Fund aremaintained in U.S. dollars. Investment securities and other assets andliabilities denominated in a foreign currency are translated into U.S. dollarsat the prevailing exchange rates at period end. Purchases and sales ofinvestment securities, income and expenses are translated into U.S.dollars at the prevailing exchange rates on the respective dates of thetransactions.
Net realized and unrealized gains and losses on foreign currencytransactions represent net gains and losses between trade andsettlement dates on securities transactions, the acquisition anddisposition of foreign currencies, and the difference between the amountof net investment income accrued and the U.S. dollar amount actuallyreceived. The portion of both realized and unrealized gains and losses oninvestments that results from fluctuations in foreign currency exchangerates is not separately disclosed but is included with net realized andunrealized gains/appreciation and loss/depreciation on investments.
42 | DWS High Income Fund

Securities Lending. Deutsche Bank AG serves as security lending agentto the Fund. The lending agent lends securities of the Fund to certainfinancial institutions under the terms of its securities lending agreement.During the term of the loans, the Fund continues to receive interest anddividends generated by the securities and to participate in any changes intheir market value. The Fund requires the borrowers of the securities tomaintain collateral with the Fund consisting of either cash or liquid,unencumbered assets having a value at least equal to the value of thesecurities loaned. When the collateral falls below specified amounts, thelending agent will use its best efforts to obtain additional collateral on thenext business day to meet required amounts under the securities lendingagreement. As of period end, any securities on loan were collateralized bycash. During the year ended September 30, 2018, the Fund invested thecash collateral into a joint trading account in affiliated money market fundsmanaged by DWS Investment Management Americas, Inc. As ofSeptember 30, 2018, the Fund invested the cash collateral in DWSGovernment & Agency Securities Portfolio. DWS InvestmentManagement Americas, Inc. receives a management/administration fee(0.14% annualized effective rate as of September 30, 2018) on the cashcollateral invested in DWS Government & Agency Securities Portfolio. TheFund receives compensation for lending its securities either in the form offees or by earning interest on invested cash collateral net of borrowerrebates and fees paid to a lending agent. Either the Fund or the borrowermay terminate the loan at any time, and the borrower, after notice, isrequired to return borrowed securities within a standard time period.There may be risks of delay and costs in recovery of securities or evenloss of rights in the collateral should the borrower of the securities failfinancially. If the Fund is not able to recover securities lent, the Fund maysell the collateral and purchase a replacement investment in the market,incurring the risk that the value of the replacement security is greater thanthe value of the collateral. The Fund is also subject to all investment risksassociated with the reinvestment of any cash collateral received,including, but not limited to, interest rate, credit and liquidity riskassociated with such investments.
As of September 30, 2018, the Fund had securities on loan, all of whichwere classified as corporate bonds in the Investment Portfolio. The valueof the related collateral exceeded the value of the securities loaned atperiod end. As of period end, the remaining contractual maturity of thecollateral agreements was overnight and continuous.
When-Issued/Delayed Delivery Securities. The Fund may purchase orsell securities with delivery or payment to occur at a later date beyond thenormal settlement period. At the time the Fund enters into a commitmentto purchase or sell a security, the transaction is recorded and the value ofthe transaction is reflected in the net asset value. The price of suchsecurity and the date when the security will be delivered and paid for are
DWS High Income Fund | 43

fixed at the time the transaction is negotiated. The value of the securitymay vary with market fluctuations. At the time the Fund enters into apurchase transaction it is required to segregate cash or other liquid assetsat least equal to the amount of the commitment. Additionally, the Fundmay be required to post securities and/or cash collateral in accordancewith the terms of the commitment.
Certain risks may arise upon entering into when-issued or delayeddelivery transactions from the potential inability of counterparties to meetthe terms of their contracts or if the issuer does not issue the securitiesdue to political, economic, or other factors. Additionally, losses may arisedue to changes in the value of the underlying securities.
Taxes. The Fund’s policy is to comply with the requirements of theInternal Revenue Code, as amended, which are applicable to regulatedinvestment companies, and to distribute all of its taxable income to itsshareholders.
Under the Regulated Investment Company Modernization Act of 2010, netcapital losses incurred post-enactment may be carried forward indefinitely,and their character is retained as short-term and/or long-term. Previously, netcapital losses were carried forward for eight years and treated as short-termlosses. As a transition rule, the Act requires that post-enactment net capitallosses be used before pre-enactment net capital losses.
At September 30, 2018, the Fund had a net tax basis capital losscarryforward of approximately $60,446,000, including $10,925,000 ofpre-enactment losses, which may be applied against any realized nettaxable capital gains of each succeeding year until fully utilized or untilSeptember 30, 2019; and approximately $49,521,000 of post-enactmentlosses, which may be applied against realized net taxable capital gainsindefinitely, including short-term losses ($5,316,000) and long-term losses($44,205,000).
The Fund has reviewed the tax positions for the open tax years as ofSeptember 30, 2018, and has determined that no provision for income taxand/or uncertain tax positions is required in the Fund’s financialstatements. The Fund’s federal tax returns for the prior three fiscal yearsremain open subject to examination by the Internal Revenue Service.
Distribution of Income and Gains. Distributions from net investmentincome of the Fund are declared and distributed to shareholders monthly.Net realized gains from investment transactions, in excess of availablecapital loss carryforwards, would be taxable to the Fund if not distributed,and, therefore, will be distributed to shareholders at least annually. TheFund may also make additional distributions for tax purposes if necessary.
The timing and characterization of certain income and capital gaindistributions are determined annually in accordance with federal tax
44 | DWS High Income Fund

regulations which may differ from accounting principles generallyaccepted in the United States of America. These differences primarilyrelate to premium amortization on debt securities, forward currencycontracts, swap contracts, certain securities sold at a loss and expiredcapital loss carryforwards. As a result, net investment income (loss) andnet realized gain (loss) on investment transactions for a reporting periodmay differ significantly from distributions during such period. Accordingly,the Fund may periodically make reclassifications among certain of itscapital accounts without impacting the net asset value of the Fund.
At September 30, 2018, the Fund’s components of distributable earnings(accumulated losses) on a tax basis are as follows:
Undistributed ordinary income* $ 2,230,005
Capital loss carryforwards $ (60,446,000)
Net unrealized appreciation (depreciation) on investments $ 433,270
At September 30, 2018, the aggregate cost of investments for federalincome tax purposes was $892,773,232. The net unrealized appreciationfor all investments based on tax cost was $433,270. This consisted ofaggregate gross unrealized appreciation for all investments in which therewas an excess of value over tax cost of $16,165,316 and aggregate grossunrealized depreciation for all investments in which there was an excessof tax cost over value of $15,732,046.
In addition, the tax character of distributions paid to shareholders by theFund is summarized as follows:
Years Ended September 30,
2018 2017
Distributions from ordinary income* $ 45,851,535 $ 51,921,523
* For tax purposes, short-term capital gain distributions are considered ordinary incomedistributions.
Redemption Fees. Prior to February 1, 2017, the Fund imposed aredemption fee of 2% of the total redemption amount on Fund sharesredeemed or exchanged within 30 days of buying them, either bypurchase or exchange (subject to certain exceptions). This fee wasassessed and retained by the Fund for the benefit of the remainingshareholders. The redemption fee was accounted for as an addition topaid-in capital.
Expenses. Expenses of the Trust arising in connection with a specificfund are allocated to that fund. Other Trust expenses which cannot bedirectly attributed to a fund are apportioned among the funds in the Trustbased upon the relative net assets or other appropriate measures.
Contingencies. In the normal course of business, the Fund may enterinto contracts with service providers that contain general indemnification
DWS High Income Fund | 45

clauses. The Fund’s maximum exposure under these arrangements isunknown, as this would involve future claims that may be made againstthe Fund that have not yet been made. However, based on experience,the Fund expects the risk of loss to be remote.
Other. Investment transactions are accounted for on a trade date plusone basis for daily net asset value calculations. However, for financialreporting purposes, investment transactions are reported on trade date.Interest income is recorded on the accrual basis. Dividend income isrecorded on the ex-dividend date. Realized gains and losses frominvestment transactions are recorded on an identified cost basis.Proceeds from litigation payments, if any, are included in net realized gain(loss) from investments. All premiums and discounts are amortized/accreted for financial reporting purposes, with the exception of securitiesin default of principal.
B. Derivative Instruments
Swaps. A swap is a contract between two parties to exchange futurecash flows at periodic intervals based on the notional amount of theswap. A bilateral swap is a transaction between the fund and acounterparty where cash flows are exchanged between the two parties.A centrally cleared swap is a transaction executed between the fund anda counterparty, then cleared by a clearing member through a centralclearinghouse. The central clearinghouse serves as the counterparty, withwhom the fund exchanges cash flows.
The value of a swap is adjusted daily, and the change in value, if any, isrecorded as unrealized appreciation or depreciation in the Statement ofAssets and Liabilities. Gains or losses are realized when the swap expiresor is closed. Certain risks may arise when entering into swap transactionsincluding counterparty default; liquidity; or unfavorable changes in interestrates or the value of the underlying reference security, commodity orindex. In connection with bilateral swaps, securities and/or cash may beidentified as collateral in accordance with the terms of the swapagreement to provide assets of value and recourse in the event of default.The maximum counterparty credit risk is the net present value of the cashflows to be received from or paid to the counterparty over the term of theswap, to the extent that this amount is beneficial to the Fund, in additionto any related collateral posted to the counterparty by the Fund. This riskmay be partially reduced by a master netting arrangement between theFund and the counterparty. Upon entering into a centrally cleared swap,the Fund is required to deposit with a financial intermediary cash orsecurities (“initial margin”) in an amount equal to a certain percentage ofthe notional amount of the swap. Subsequent payments (“variationmargin”) are made or received by the Fund dependent upon the daily
46 | DWS High Income Fund

fluctuations in the value of the swap. In a cleared swap transaction,counterparty risk is minimized as the central clearinghouse acts as thecounterparty.
An upfront payment, if any, made by the Fund is recorded as an asset inthe Statement of Assets and Liabilities. An upfront payment, if any,received by the Fund is recorded as a liability in the Statement of Assetsand Liabilities. Payments received or made at the end of themeasurement period are recorded as realized gain or loss in theStatement of Operations.
Credit default swaps are agreements between a buyer and a seller ofprotection against predefined credit events for the reference entity. TheFund may enter into credit default swaps to gain exposure to anunderlying issuer’s credit quality characteristics without directly investingin that issuer or to hedge against the risk of a credit event on debtsecurities. As a seller of a credit default swap, the Fund is required to paythe par (or other agreed-upon) value of the referenced entity to thecounterparty with the occurrence of a credit event by a third party, suchas a U.S. or foreign corporate issuer, on the reference entity, which wouldlikely result in a loss to the Fund. In return, the Fund receives from thecounterparty a periodic stream of payments over the term of the swapprovided that no credit event has occurred. If no credit event occurs, theFund keeps the stream of payments with no payment obligations. TheFund may also buy credit default swaps, in which case the Fund functionsas the counterparty referenced above. This involves the risk that the swapmay expire worthless. It also involves counterparty risk that the sellermay fail to satisfy its payment obligations to the Fund with the occurrenceof a credit event. When the Fund sells a credit default swap, it willcover its commitment. This may be achieved by, among other methods,maintaining cash or liquid assets equal to the aggregate notional value ofthe reference entities for all outstanding credit default swaps sold by theFund. For the year ended September 30, 2018, the Fund entered intocredit default swap agreements to gain exposure to the underlyingissuer’s credit quality characteristics.
Under the terms of a credit default swap, the Fund receives or makesperiodic payments based on a specified interest rate on a fixed notionalamount. These payments are recorded as a realized gain or loss in theStatement of Operations. Payments received or made as a result of acredit event or termination of the swap are recognized, net of aproportional amount of the upfront payment, as realized gains or losses inthe Statement of Operations.
As of September 30, 2018, the Fund did not hold open credit defaultswap contracts. For the year ended September 30, 2018, the investmentin credit default swap contracts sold had a total notional amount generallyindicative of a range from $0 to approximately $26,550,000.
DWS High Income Fund | 47

Forward Foreign Currency Contracts. A forward foreign currencycontract (“forward currency contract”) is a commitment to purchase orsell a foreign currency at the settlement date at a negotiated rate. For theyear ended September 30, 2018, the Fund entered into forward currencycontracts in order to hedge its exposure to changes in foreign currencyexchange rates on its foreign currency denominated portfolio holdings andto facilitate transactions in foreign currency denominated securities.
Forward currency contracts are valued at the prevailing forward exchangerate of the underlying currencies and unrealized gain (loss) is recordeddaily. On the settlement date of the forward currency contract, the fundrecords a realized gain or loss equal to the difference between the valueof the contract at the time it was opened and the value of the contract atthe time it was closed. Certain risks may arise upon entering into forwardcurrency contracts from the potential inability of counterparties to meetthe terms of their contracts. The maximum counterparty credit risk to theFund is measured by the unrealized gain on appreciated contracts.Additionally, when utilizing forward currency contracts to hedge, the Fundgives up the opportunity to profit from favorable exchange ratemovements during the term of the contract.
A summary of the open forward currency contracts as of September 30,2018 is included in a table following the Fund’s Investment Portfolio. Forthe year ended September 30, 2018, the investment in forward currencycontracts short vs. U.S. dollars had a total contract value generallyindicative of a range from approximately $6,768,000 to $15,676,000.
The following tables summarize the value of the Fund’s derivativeinstruments held as of September 30, 2018 and the related location in theaccompanying Statement of Assets and Liabilities, presented by primaryunderlying risk exposure:
Asset DerivativeForward
Contracts
Foreign Exchange Contracts (a) $ 101,485
The above derivative is located in the following Statement of Assets and Liabilities accounts:(a) Unrealized appreciation on forward foreign currency contracts
Additionally, the amount of unrealized and realized gains and losses onderivative instruments recognized in Fund earnings during the year endedSeptember 30, 2018 and the related location in the accompanyingStatement of Operations is summarized in the following tables by primaryunderlying risk exposure:
Realized Gain (Loss)Forward
Contracts Swap Contracts Total
Credit Contracts (b) $ — $ 50,714 $ 50,714
Foreign ExchangeContracts (c) 441,530 — 441,530
$ 441,530 $ 50,714 $ 492,244
48 | DWS High Income Fund

Each of the above derivatives is located in the following Statement of Operations accounts:(b) Net realized gain (loss) from swap contracts(c) Net realized gain (loss) from forward foreign currency contracts
Change in Net UnrealizedAppreciation (Depreciation)
ForwardContracts
Foreign Exchange Contracts (d) $ 164,224
The above derivative is located in the following Statement of Operations accounts:(d) Change in net unrealized appreciation (depreciation) on forward foreign currency contracts
As of September 30, 2018, the Fund has transactions subject toenforceable master netting agreements which govern the terms of certaintransactions, and reduce the counterparty risk associated with suchtransactions. Master netting agreements allow a Fund to close out andnet total exposure to a counterparty in the event of a deterioration in thecredit quality or contractual default with respect to all of the transactionswith a counterparty. As defined by the master netting agreement, theFund may have collateral agreements with certain counterparties tomitigate risk. For financial reporting purposes the Statement of Assetsand Liabilities generally shows derivatives assets and liabilities on a grossbasis, which reflects the full risks and exposures prior to netting. Areconciliation of the gross amounts on the Statement of Assets andLiabilities to the net amounts by a counterparty, including any collateralexposure, is included in the following tables:
Counterparty
Gross Amountsof Assets
Presented inthe Statementof Assets and
Liabilities
FinancialInstruments
andDerivativesAvailablefor Offset
CollateralPledged
Net Amountof Derivative
Assets
Merrill Lynch & Co., Inc. $ 101,485 $ — $ — $ 101,485
C. Purchases and Sales of Securities
During the year ended September 30, 2018, purchases and sales ofinvestment securities (excluding short-term investments and U.S.Treasury obligations) aggregated $535,047,953 and $633,037,816,respectively.
D. Related Parties
Management Agreement. Under the Investment Management Agreementwith DWS Investment Management Americas, Inc. (formerly DeutscheInvestment Management Americas Inc.) (“DIMA” or the “Advisor”), anindirect, wholly owned subsidiary of DWS Group GmbH & Co. KGaA(“DWS Group”), the Advisor directs the investments of the Fund inaccordance with its investment objectives, policies and restrictions. The
DWS High Income Fund | 49
Advisor determines the securities, instruments and other contracts relatingto investments to be purchased, sold or entered into by the Fund.
Under the Investment Management Agreement with the Advisor, theFund paid a monthly management fee, computed and accrued daily andpayable monthly, at the following annual rates:
First $250 million of the Fund’s average daily net assets .48%
Next $750 million of such net assets .45%
Next $1.5 billion of such net assets .43%
Next $2.5 billion of such net assets .41%
Next $2.5 billion of such net assets .38%
Next $2.5 billion of such net assets .36%
Next $2.5 billion of such net assets .34%
Over $12.5 billion of such net assets .32%
Accordingly, for the year ended September 30, 2018, the fee pursuant tothe Investment Management Agreement was equivalent to an annual rate(exclusive of any applicable waivers/reimbursements) of 0.46% of theFund’s average daily net assets.
For the period from October 1, 2017 through September 30, 2018(through January 31, 2018 for Class R6 shares), the Advisor hadcontractually agreed to waive its fees and/or reimburse certain operatingexpenses of the Fund to the extent necessary to maintain the total annualoperating expenses (excluding certain expenses such as extraordinaryexpenses, taxes, brokerage and interest) as follows:
Class A 1.05%
Class T 1.05%
Class C 1.80%
Class R 1.30%
Class R6 .71%
Class S .80%
Institutional Class .80%
For the period from February 1, 2018 through September 30, 2018, theAdvisor had contractually agreed to waive its fees and/or reimbursecertain operating expenses of Class R6 to the extent necessary tomaintain the total annual operating expenses (excluding certain expensessuch as extraordinary expenses, taxes, brokerage and interest) at 0.75%.
Effective October 1, 2018 through September 30, 2019, the Advisor hascontractually agreed to waive its fees and/or reimburse certain operatingexpenses of the Fund to the extent necessary to maintain the total annual
50 | DWS High Income Fund

operating expenses (excluding certain expenses such as extraordinaryexpenses, taxes, brokerage and interest) as follows:
Class A 1.04%
Class T 1.04%
Class C 1.79%
Class R 1.29%
Class R6 .79%
Class S .79%
Institutional Class .79%
For the period from October 1, 2017 through September 30, 2018, feeswaived and/or expenses reimbursed for Class R were $1,023.
Administration Fee. Pursuant to an Administrative Services Agreement,DIMA provides most administrative services to the Fund. For all servicesprovided under the Administrative Services Agreement, the Fund pays theAdvisor an annual fee (“Administration Fee”) of 0.10% of the Fund’saverage daily net assets, computed and accrued daily and payablemonthly. For the year ended September 30, 2018, the Administration Feewas $883,688, of which $68,010 is unpaid.
Service Provider Fees. DWS Service Company (“DSC”), an affiliate of theAdvisor, is the transfer agent, dividend-paying agent and shareholderservice agent for the Fund. Pursuant to a sub-transfer agency agreementbetween DSC and DST Systems, Inc. (“DST”), DSC has delegated certaintransfer agent, dividend-paying agent and shareholder service agentfunctions to DST. DSC compensates DST out of the shareholder servicingfee it receives from the Fund. For the year ended September 30, 2018,the amounts charged to the Fund by DSC were as follows:
Service Provider FeesTotal
AggregatedUnpaid at
September 30, 2018
Class A $ 233,388 $ 78,938
Class T 19 7
Class C 10,700 3,547
Class R 71 22
Class R6 34 11
Class S 6,422 2,107
Institutional Class 2,617 867
$ 253,251 $ 85,499
In addition, for the year ended September 30, 2018, the amounts chargedto the Fund for recordkeeping and other administrative services provided
DWS High Income Fund | 51

by unaffiliated third parties, included in the Statement of Operations under“Services to shareholders”, were as follows:
Sub-RecordkeepingTotal
Aggregated
Class A $ 399,045
Class C 34,771
Class R 2,738
Class S 44,637
Institutional Class 76,137
$ 557,328
Distribution and Service Fees. Under the Fund’s Class C and R 12b-1Plans, DWS Distributors, Inc. (“DDI”), an affiliate of the Advisor, receivesa fee (“Distribution Fee”) of 0.75% of average daily net assets of Class Cshares and 0.25% of the average daily net assets of Class R shares. Inaccordance with the Fund’s Underwriting and Distribution Servicesagreement, DDI enters into related selling group agreements with variousfirms at various rates for sales of Class C and Class R shares. For the yearended September 30, 2018, the Distribution Fee was as follows:
Distribution FeeTotal
AggregatedUnpaid at
September 30, 2018
Class C $ 441,996 $ 18,856
Class R 2,541 188
$ 444,537 $ 19,044
In addition, DDI provides information and administrative services for a fee(“Service Fee”) to Class A, T, C and R shareholders at an annual rate ofup to 0.25% of average daily net assets for each such class. DDI in turnhas various agreements with financial services firms that provide theseservices and pay these fees based upon the assets of shareholderaccounts the firms service. For the year ended September 30, 2018, theService Fee was as follows:
Service FeeTotal
AggregatedUnpaid at
September 30, 2018Annual
Rate
Class A $ 1,658,841 $ 403,443 .23%
Class T 15 9 .15%
Class C 146,335 27,309 .25%
Class R 2,538 585 .25%
$ 1,807,729 $ 431,346
Underwriting Agreement and Contingent Deferred Sales Charge. DDI isthe principal underwriter for the Fund. Underwriting commissions paid inconnection with the distribution of Class A shares for the year endedSeptember 30, 2018, aggregated $34,333.
52 | DWS High Income Fund
In addition, DDI receives any contingent deferred sales charge (“CDSC”)from Class C share redemptions occurring within one year of purchase.There is no such charge upon redemption of any share appreciation orreinvested dividends. The CDSC is 1% of the value of the sharesredeemed for Class C. For the year ended September 30, 2018, the CDSCfor Class C shares aggregated $1,182. A deferred sales charge of up to0.85% is assessed on certain redemptions of Class A shares. For the yearended September 30, 2018, DDI received $115 for Class A shares.
Typesetting and Filing Service Fees. Under an agreement with DIMA,DIMA is compensated for providing certain pre-press and regulatory filingservices to the Fund. For the year ended September 30, 2018, theamount charged to the Fund by DIMA included in the Statement ofOperations under “Reports to shareholders” aggregated $20,531, ofwhich $13,678 is unpaid.
Trustees’ Fees and Expenses. The Fund paid retainer fees to each Trusteenot affiliated with the Advisor, plus specified amounts to the BoardChairperson and Vice Chairperson and to each committee Chairperson.
Affiliated Cash Management Vehicles. The Fund may invest uninvestedcash balances in DWS Central Cash Management Government Fund andDWS ESG Liquidity Fund, affiliated money market funds which aremanaged by the Advisor. Each affiliated money market fund is managedin accordance with Rule 2a-7 under the 1940 Act, which governs thequality, maturity, diversity and liquidity of instruments in which a moneymarket fund may invest. DWS Central Cash Management GovernmentFund seeks to maintain a stable net asset value, and DWS ESG LiquidityFund maintains a floating net asset value. The Fund indirectly bears itsproportionate share of the expenses of each affiliated money market fundin which it invests. DWS Central Cash Management Government Funddoes not pay the Advisor an investment management fee. To the extentthat DWS ESG Liquidity Fund pays an investment management fee to theAdvisor, the Advisor will waive an amount of the investment managementfee payable to the Advisor by the Fund equal to the amount of theinvestment management fee payable on the Fund’s assets invested inDWS ESG Liquidity Fund.
Security Lending Fees. Deutsche Bank AG serves as lending agent for theFund. For the year ended September 30, 2018, the Fund incurred lendingagent fees to Deutsche Bank AG for the amount of $60,347.
E. Investing in High-Yield Debt Securities
High-yield debt securities or junk bonds are generally regarded asspeculative with respect to the issuer’s continuing ability to meet principaland interest payments. The Fund’s performance could be hurt if an issuerof a debt security suffers an adverse change in financial condition that
DWS High Income Fund | 53

results in the issuer not making timely payments of interest or principal, asecurity downgrade or an inability to meet a financial obligation. High-yielddebt securities’ total return and yield may generally be expected tofluctuate more than the total return and yield of investment-grade debtsecurities. A real or perceived economic downturn or an increase inmarket interest rates could cause a decline in the value of high-yield debtsecurities, result in increased redemptions and/or result in increasedportfolio turnover, which could result in a decline in net asset value of thefund, reduce liquidity for certain investments and/or increase costs.High-yield debt securities are often thinly traded and can be more difficultto sell and value accurately than investment-grade debt securities as theremay be no established secondary market. Investments in high yield debtsecurities could increase liquidity risk for the fund. In addition, the marketfor high-yield debt securities can experience sudden and sharp volatilitywhich is generally associated more with investments in stocks.
F. Line of Credit
The Fund and other affiliated funds (the “Participants”) share in a$400 million revolving credit facility provided by a syndication of banks. TheFund may borrow for temporary or emergency purposes, including themeeting of redemption requests that otherwise might require the untimelydisposition of securities. The Participants are charged an annualcommitment fee, which is allocated based on net assets, among each ofthe Participants. Interest is calculated at a rate per annum equal to the sumof the Federal Funds Rate plus 1.25 percent plus if the one-month LIBORexceeds the Federal Funds Rate, the amount of such excess. The Fundmay borrow up to a maximum of 33 percent of its net assets under theagreement. The Fund had no outstanding loans at September 30, 2018.
G. Fund Share Transactions
The following table summarizes share and dollar activity in the Fund:
Year Ended September 30, 2018 Year Ended September 30, 2017
Shares Dollars Shares Dollars
Shares sold
Class A 14,312,364 $ 67,346,551 7,716,895 $ 36,584,918
Class T — — 2,083.8* 10,000*
Class C 554,158 2,618,571 1,042,432 4,929,984
Class R 25,796 121,608 75,893 358,643
Class R6 — — 6,484 30,803
Class S 4,835,317 22,953,731 9,500,735 45,142,665
Institutional Class 12,540,848 59,314,651 6,956,006 32,961,854
$152,355,112 $120,018,867
54 | DWS High Income Fund

Year Ended September 30, 2018 Year Ended September 30, 2017
Shares Dollars Shares Dollars
Shares issued to shareholders in reinvestment of distributions
Class A 7,022,610 $ 32,976,023 7,859,341 $ 37,142,931
Class T 112 527 37* 179*
Class C 516,553 2,429,101 703,793 3,329,324
Class R 10,520 49,365 10,400 49,146
Class R6 521 2,447 501 2,371
Class S 303,383 1,428,368 338,008 1,600,510
Institutional Class 921,961 4,333,338 896,882 4,246,135
$ 41,219,169 $ 46,370,596
Shares redeemed
Class A (31,602,501) $ (148,712,715) (30,952,034) $ (146,466,070)
Class C (8,746,744) (40,943,977) (7,677,720) (36,189,079)
Class R (62,643) (292,809) (53,221) (250,135)
Class S (9,099,727) (42,839,719) (6,997,297) (33,186,408)
Institutional Class (13,510,049) (63,671,404) (5,939,754) (28,098,827)
$ (296,460,624) $ (244,190,519)
Redemption fees $ — $ 4,364
Net increase (decrease)
Class A (10,267,527) $ (48,390,141) (15,375,798) $ (72,735,071)
Class T 112 527 2,120.8* 10,179*
Class C (7,676,033) (35,896,305) (5,931,495) (27,929,771)
Class R (26,327) (121,836) 33,072 157,654
Class R6 521 2,447 6,985 33,174
Class S (3,961,027) (18,457,620) 2,841,446 13,556,767
Institutional Class (47,240) (23,415) 1,913,134 9,110,376
$ (102,886,343) $ (77,796,692)
* For the period from June 5, 2017 (commencement of operations of Class T) toSeptember 30, 2017.
DWS High Income Fund | 55
Report of Independent RegisteredPublic Accounting Firm
To the Board of Trustees of Deutsche DWS Income Trust
and Shareholders of DWS High Income Fund:
Opinion on the Financial Statements
We have audited the accompanying statement of assets and liabilities ofDWS High Income Fund (formerly Deutsche High Income Fund) (the“Fund”) (one of the funds constituting Deutsche DWS Income Trust(formerly Deutsche Income Trust)) (the “Trust”), including the investmentportfolio, as of September 30, 2018, and the related statement ofoperations for the year then ended, the statements of changes in netassets for each of the two years in the period then ended, the financialhighlights for each of the five years in the period then ended and therelated notes (collectively referred to as the “financial statements”). Inour opinion, the financial statements present fairly, in all materialrespects, the financial position of the Fund (one of the funds constitutingDeutsche DWS Income Trust) at September 30, 2018, the results of itsoperations for the year then ended, the changes in its net assets for eachof the two years in the period then ended and its financial highlights foreach of the five years in the period then ended, in conformity with U.S.generally accepted accounting principles.
Basis for Opinion
These financial statements are the responsibility of the Trust’smanagement. Our responsibility is to express an opinion on the Fund’sfinancial statements based on our audits. We are a public accounting firmregistered with the Public Company Accounting Oversight Board (UnitedStates) (“PCAOB”) and are required to be independent with respect tothe Trust in accordance with the U.S. federal securities laws and theapplicable rules and regulations of the Securities and ExchangeCommission and the PCAOB.
We conducted our audits in accordance with the standards of the PCAOB.Those standards require that we plan and perform the audit to obtainreasonable assurance about whether the financial statements are free ofmaterial misstatement, whether due to error or fraud. The Trust is notrequired to have, nor were we engaged to perform, an audit of the Trust’s
56 | DWS High Income Fund

internal control over financial reporting. As part of our audits, we arerequired to obtain an understanding of internal control over financialreporting, but not for the purpose of expressing an opinion on theeffectiveness of the Trust’s internal control over financial reporting.Accordingly, we express no such opinion.
Our audits included performing procedures to assess the risks of materialmisstatement of the financial statements, whether due to error or fraud,and performing procedures that respond to those risks. Such proceduresincluded examining, on a test basis, evidence regarding the amounts anddisclosures in the financial statements. Our procedures includedconfirmation of securities owned as of September 30, 2018, bycorrespondence with the custodian and brokers or by other appropriateauditing procedures where replies from brokers were not received. Ouraudits also included evaluating the accounting principles used andsignificant estimates made by management, as well as evaluating theoverall presentation of the financial statements. We believe that ouraudits provide a reasonable basis for our opinion.
We have served as the auditor of one or more investment companies inthe DWS family of funds since at least 1979, but we are unable todetermine the specific year.
Boston, MassachusettsNovember 28, 2018
DWS High Income Fund | 57
Information About Your Fund’s ExpensesAs an investor of the Fund, you incur two types of costs: ongoingexpenses and transaction costs. Ongoing expenses include managementfees, distribution and service (12b-1) fees and other Fund expenses.Examples of transaction costs include sales charges (loads) and accountmaintenance fees, which are not shown in this section. The followingtables are intended to help you understand your ongoing expenses (indollars) of investing in the Fund and to help you compare these expenseswith the ongoing expenses of investing in other mutual funds. In the mostrecent six-month period, the Fund limited these expenses for Class Rshares; had it not done so, expenses would have been higher. Theexample in the table is based on an investment of $1,000 invested at thebeginning of the six-month period and held for the entire period (April 1,2018 to September 30, 2018).
The tables illustrate your Fund’s expenses in two ways:
�Actual Fund Return. This helps you estimate the actual dollar amountof ongoing expenses (but not transaction costs) paid on a $1,000investment in the Fund using the Fund’s actual return during theperiod. To estimate the expenses you paid over the period, simplydivide your account value by $1,000 (for example, an $8,600 accountvalue divided by $1,000 = 8.6), then multiply the result by the numberin the “Expenses Paid per $1,000” line under the share class you hold.
�Hypothetical 5% Fund Return. This helps you to compare yourFund’s ongoing expenses (but not transaction costs) with those ofother mutual funds using the Fund’s actual expense ratio and ahypothetical rate of return of 5% per year before expenses. Examplesusing a 5% hypothetical fund return may be found in the shareholderreports of other mutual funds. The hypothetical account values andexpenses may not be used to estimate the actual ending accountbalance or expenses you paid for the period.
Please note that the expenses shown in these tables are meant tohighlight your ongoing expenses only and do not reflect any transactioncosts. The “Expenses Paid per $1,000” line of the tables is useful incomparing ongoing expenses only and will not help you determine therelative total expense of owning different funds. Subject to certainexceptions, an account maintenance fee of $20.00 assessed once percalendar year for Classes A, C and S shares may apply for accounts withbalances less than $10,000. This fee is not included in these tables. If itwas, the estimate of expenses paid for Classes A, C and S shares duringthe period would be higher, and account value during the period would belower, by this amount.
58 | DWS High Income Fund
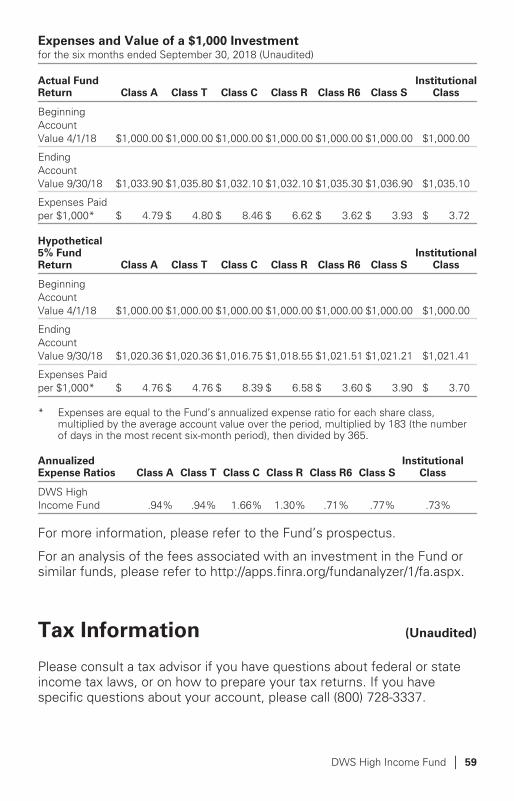
Expenses and Value of a $1,000 Investmentfor the six months ended September 30, 2018 (Unaudited)
Actual FundReturn Class A Class T Class C Class R Class R6 Class S
InstitutionalClass
BeginningAccountValue 4/1/18 $1,000.00 $1,000.00 $1,000.00 $1,000.00 $1,000.00 $1,000.00 $1,000.00
EndingAccountValue 9/30/18 $1,033.90 $1,035.80 $1,032.10 $1,032.10 $1,035.30 $1,036.90 $1,035.10
Expenses Paidper $1,000* $ 4.79 $ 4.80 $ 8.46 $ 6.62 $ 3.62 $ 3.93 $ 3.72
Hypothetical5% FundReturn Class A Class T Class C Class R Class R6 Class S
InstitutionalClass
BeginningAccountValue 4/1/18 $1,000.00 $1,000.00 $1,000.00 $1,000.00 $1,000.00 $1,000.00 $1,000.00
EndingAccountValue 9/30/18 $1,020.36 $1,020.36 $1,016.75 $1,018.55 $1,021.51 $1,021.21 $1,021.41
Expenses Paidper $1,000* $ 4.76 $ 4.76 $ 8.39 $ 6.58 $ 3.60 $ 3.90 $ 3.70
* Expenses are equal to the Fund’s annualized expense ratio for each share class,multiplied by the average account value over the period, multiplied by 183 (the numberof days in the most recent six-month period), then divided by 365.
AnnualizedExpense Ratios Class A Class T Class C Class R Class R6 Class S
InstitutionalClass
DWS HighIncome Fund .94% .94% 1.66% 1.30% .71% .77% .73%
For more information, please refer to the Fund’s prospectus.
For an analysis of the fees associated with an investment in the Fund orsimilar funds, please refer to http://apps.finra.org/fundanalyzer/1/fa.aspx.
Tax Information (Unaudited)
Please consult a tax advisor if you have questions about federal or stateincome tax laws, or on how to prepare your tax returns. If you havespecific questions about your account, please call (800) 728-3337.
DWS High Income Fund | 59

Advisory Agreement Board Considerationsand Fee Evaluation
The Board of Trustees (hereinafter referred to as the “Board” or“Trustees”) approved the renewal of DWS High Income Fund’s (the“Fund”) investment management agreement (the “Agreement”) withDWS Investment Management Americas, Inc. (“DIMA”) in September2018.
In terms of the process that the Board followed prior to approving theAgreement, shareholders should know that:
�During the entire process, all of the Fund’s Trustees were independentof DIMA and its affiliates (the “Independent Trustees”).
�The Board met frequently during the past year to discuss fund mattersand dedicated a substantial amount of time to contract review matters.Over the course of several months, the Board’s Contract Committeereviewed extensive materials received from DIMA, independent thirdparties and independent counsel. These materials included an analysisof the Fund’s performance, fees and expenses, and profitability from afee consultant retained by the Fund’s Independent Trustees (the “FeeConsultant”). Based on its evaluation of the information provided, theContract Committee presented its findings and recommendations tothe Board. The Board then reviewed the Contract Committee’sfindings and recommendations.
�The Board also received extensive information throughout the yearregarding performance of the Fund.
�The Independent Trustees regularly met privately with counsel todiscuss contract review and other matters. In addition, theIndependent Trustees were advised by the Fee Consultant in thecourse of their review of the Fund’s contractual arrangements andconsidered a comprehensive report prepared by the Fee Consultant inconnection with their deliberations.
� In connection with reviewing the Agreement, the Board also reviewedthe terms of the Fund’s Rule 12b-1 plan, distribution agreement,administrative services agreement, transfer agency agreement andother material service agreements.
In connection with the contract review process, the Contract Committeeand the Board considered the factors discussed below, among others.The Board also considered that DIMA and its predecessors have managedthe Fund since its inception, and the Board believes that a long-termrelationship with a capable, conscientious advisor is in the best interestsof the Fund. The Board considered, generally, that shareholders chose to
60 | DWS High Income Fund

invest or remain invested in the Fund knowing that DIMA managed theFund. DIMA is part of DWS Group GmbH & Co. KGaA (“DWS Group”).DWS Group is a global asset management business that offers a widerange of investing expertise and resources, including research capabilitiesin many countries throughout the world. In 2018, approximately 20% ofDWS Group’s shares were sold in an initial public offering, with DeutscheBank AG owning the remaining shares.
As part of the contract review process, the Board carefully considered thefees and expenses of each DWS fund overseen by the Board in light ofthe fund’s performance. In many cases, this led to the negotiation andimplementation of expense caps. As part of these negotiations, the Boardindicated that it would consider relaxing these caps in future yearsfollowing sustained improvements in performance, among otherconsiderations.
While shareholders may focus primarily on fund performance and fees,the Fund’s Board considers these and many other factors, including thequality and integrity of DIMA’s personnel and administrative supportservices provided by DIMA, such as back-office operations, fundvaluations, and compliance policies and procedures.
Nature, Quality and Extent of Services. The Board considered the termsof the Agreement, including the scope of advisory services providedunder the Agreement. The Board noted that, under the Agreement, DIMAprovides portfolio management services to the Fund and that, pursuant toa separate administrative services agreement, DIMA providesadministrative services to the Fund. The Board considered the experienceand skills of senior management and investment personnel and theresources made available to such personnel. The Board reviewed theFund’s performance over short-term and long-term periods and comparedthose returns to various agreed-upon performance measures, includingmarket index(es) and a peer universe compiled using information suppliedby Morningstar Direct (“Morningstar”), an independent fund data service.The Board also noted that it has put into place a process of identifying“Funds in Review” (e.g., funds performing poorly relative to a peeruniverse), and receives additional reporting from DIMA regarding suchfunds and, where appropriate, DIMA’s plans to addressunderperformance. The Board believes this process is an effectivemanner of identifying and addressing underperforming funds. Based onthe information provided, the Board noted that, for the one-, three- andfive-year periods ended December 31, 2017, the Fund’s performance(Class A shares) was in the 2nd quartile of the applicable Morningstaruniverse (the 1st quartile being the best performers and the 4th quartilebeing the worst performers). The Board also observed that the Fund hasunderperformed its benchmark in the one-, three- and five-year periodsended December 31, 2017.
DWS High Income Fund | 61
Fees and Expenses. The Board considered the Fund’s investmentmanagement fee schedule, operating expenses and total expense ratios,and comparative information provided by Broadridge Financial Solutions,Inc. (“Broadridge”) and the Fee Consultant regarding investmentmanagement fee rates paid to other investment advisors by similar funds(1st quartile being the most favorable and 4th quartile being the leastfavorable). With respect to management fees paid to other investmentadvisors by similar funds, the Board noted that the contractual fee ratespaid by the Fund, which include a 0.10% fee paid to DIMA under theFund’s administrative services agreement, were lower than the median(2nd quartile) of the applicable Broadridge peer group (based onBroadridge data provided as of December 31, 2017). The Board noted thatthe Fund’s Class A shares total (net) operating expenses (excluding 12b-1fees) were expected to be lower than the median (1st quartile) of theapplicable Broadridge expense universe (based on Broadridge dataprovided as of December 31, 2017, and analyzing Broadridge expenseuniverse Class A (net) expenses less any applicable 12b-1 fees)(“Broadridge Universe Expenses”). The Board also reviewed datacomparing each share class’s total (net) operating expenses to theapplicable Broadridge Universe Expenses. The Board noted that theexpense limitations agreed to by DIMA were expected to help the Fund’stotal (net) operating expenses remain competitive. The Board consideredthe Fund’s management fee rate as compared to fees charged by DIMAto comparable DWS U.S. registered funds (“DWS Funds”) andconsidered differences between the Fund and the comparable DWSFunds. The information requested by the Board as part of its review offees and expenses also included information about institutional accounts(including any sub-advised funds and accounts) and funds offeredprimarily to European investors (“DWS Europe Funds”) managed by DWSGroup. The Board noted that DIMA indicated that DWS Group manages aDWS Europe Fund comparable to the Fund, but does not manage anycomparable institutional accounts. The Board took note of the differencesin services provided to DWS Funds as compared to DWS Europe Fundsand that such differences made comparison difficult.
On the basis of the information provided, the Board concluded thatmanagement fees were reasonable and appropriate in light of the nature,quality and extent of services provided by DIMA.
Profitability. The Board reviewed detailed information regarding revenuesreceived by DIMA under the Agreement. The Board considered theestimated costs to DIMA, and pre-tax profits realized by DIMA, fromadvising the DWS Funds, as well as estimates of the pre-tax profitsattributable to managing the Fund in particular. The Board also receivedinformation regarding the estimated enterprise-wide profitability of DIMAand its affiliates with respect to all fund services in totality and by fund.
62 | DWS High Income Fund

The Board and the Fee Consultant reviewed DIMA’s methodology inallocating its costs to the management of the Fund. Based on theinformation provided, the Board concluded that the pre-tax profits realizedby DIMA in connection with the management of the Fund were notunreasonable. The Board also reviewed certain publicly availableinformation regarding the profitability of certain similar investmentmanagement firms. The Board noted that, while information regarding theprofitability of such firms is limited (and in some cases is not necessarilyprepared on a comparable basis), DIMA and its affiliates’ overallprofitability with respect to the DWS Funds (after taking into accountdistribution and other services provided to the funds by DIMA and itsaffiliates) was lower than the overall profitability levels of mostcomparable firms for which such data was available.
Economies of Scale. The Board considered whether there are economiesof scale with respect to the management of the Fund and whether theFund benefits from any economies of scale. The Board noted that theFund’s investment management fee schedule includes fee breakpoints.The Board concluded that the Fund’s fee schedule represents anappropriate sharing between the Fund and DIMA of such economies ofscale as may exist in the management of the Fund at current asset levels.
Other Benefits to DIMA and Its Affiliates. The Board also considered thecharacter and amount of other incidental or “fall-out” benefits received byDIMA and its affiliates, including any fees received by DIMA foradministrative services provided to the Fund, any fees received by anaffiliate of DIMA for transfer agency services provided to the Fund andany fees received by an affiliate of DIMA for distribution services. TheBoard also considered benefits to DIMA related to brokerage and soft-dollar allocations, including allocating brokerage to pay for researchgenerated by parties other than the executing broker dealers, whichpertain primarily to funds investing in equity securities. In addition, theBoard considered the incidental public relations benefits to DIMA relatedto DWS Funds advertising and cross-selling opportunities among DIMAproducts and services. The Board considered these benefits in reachingits conclusion that the Fund’s management fees were reasonable.
Compliance. The Board considered the significant attention and resourcesdedicated by DIMA to its compliance processes in recent years. TheBoard noted in particular (i) the experience, seniority and timecommitment of the individuals serving as DIMA’s and the Fund’s chiefcompliance officers and (ii) the substantial commitment of resources byDIMA and its affiliates to compliance matters, including the retention ofcompliance personnel.
Based on all of the information considered and the conclusions reached,the Board unanimously determined that the continuation of theAgreement is in the best interests of the Fund. In making this
DWS High Income Fund | 63

determination, the Board did not give particular weight to any single factoridentified above. The Board considered these factors over the course ofnumerous meetings, certain of which were in executive session with onlythe Independent Trustees and counsel present. It is possible thatindividual Independent Trustees may have weighed these factorsdifferently in reaching their individual decisions to approve thecontinuation of the Agreement.
64 | DWS High Income Fund

Board Members and Officers
The following table presents certain information regarding the BoardMembers and Officers of the Fund. Each Board Member’s year of birth isset forth in parentheses after his or her name. Unless otherwise noted,(i) each Board Member has engaged in the principal occupation(s) noted inthe table for at least the most recent five years, although not necessarilyin the same capacity; and (ii) the address of each Independent BoardMember is c/o Keith R. Fox, DWS Funds Board Chair, c/o Thomas R.Hiller, Ropes & Gray LLP, Prudential Tower, 800 Boylston Street, Boston,MA 02199-3600. Except as otherwise noted below, the term of office foreach Board Member is until the election and qualification of a successor,or until such Board Member sooner dies, resigns, is removed or asotherwise provided in the governing documents of the Fund. Because theFund does not hold an annual meeting of shareholders, each BoardMember will hold office for an indeterminate period. The Board Membersmay also serve in similar capacities with other funds in the fund complex.
Independent Board Members
Name, Year ofBirth, Positionwith the Fundand Length ofTime Served1
Business Experience and DirectorshipsDuring the Past Five Years
Number ofFunds inDWS FundComplexOverseen
OtherDirectorshipsHeld by BoardMember
Keith R. Fox,CFA (1954)Chairpersonsince 2017, andBoard Membersince 1996
Managing General Partner, Exeter CapitalPartners (a series of private investment funds)(since 1986). Directorships: ProgressiveInternational Corporation (kitchen goodsimporter and distributor); The Kennel Shop(retailer); former Chairman, NationalAssociation of Small Business InvestmentCompanies; former Directorships: BoxTopMedia Inc. (advertising); Sun Capital AdvisersTrust (mutual funds) (2011–2012)
86 —
John W.Ballantine(1946)Board Membersince 1999
Retired; formerly, Executive Vice Presidentand Chief Risk Management Officer, FirstChicago NBD Corporation/The First NationalBank of Chicago (1996–1998); Executive VicePresident and Head of International Banking(1995–1996); former Directorships: Directorand former Chairman of the Board,Healthways, Inc.2 (population well-being andwellness services) (2003–2014); StockwellCapital Investments PLC (private equity);Enron Corporation; FNB Corporation; TokheimCorporation; First Oak Brook Bancshares, Inc.and Oak Brook Bank; Prisma EnergyInternational. Not-for-Profit Director, Trustee:Palm Beach Civic Association; Public RadioInternational; Window to the WorldCommunications (public media); Harris Theaterfor Music and Dance (Chicago)
86 PortlandGeneralElectric2
(utilitycompany)(2003–present)
DWS High Income Fund | 65

Name, Year ofBirth, Positionwith the Fundand Length ofTime Served1
Business Experience and DirectorshipsDuring the Past Five Years
Number ofFunds inDWS FundComplexOverseen
OtherDirectorshipsHeld by BoardMember
Henry P.Becton, Jr.(1943)Board Membersince 1990
Vice Chair and former President, WGBHEducational Foundation. Directorships: PublicRadio International; Public Radio Exchange(PRX); The Pew Charitable Trusts (charitableorganization); Massachusetts HumaneSociety; American Documentary, Inc. (publicmedia); Overseer of the New EnglandConservatory; former Directorships: BectonDickinson and Company2 (medical technologycompany); Belo Corporation2 (mediacompany); The PBS Foundation; Association ofPublic Television Stations; Boston Museum ofScience; American Public Television; ConcordAcademy; New England Aquarium; Mass.Corporation for EducationalTelecommunications; Committee forEconomic Development; Public BroadcastingService; Connecticut College; North BennettStreet School (Boston)
86 —
Dawn-MarieDriscoll (1946)Board Membersince 1987
Emeritus Executive Fellow, Center forBusiness Ethics, Bentley University; formerly:President, Driscoll Associates (consultingfirm); Partner, Palmer & Dodge (law firm)(1988–1990); Vice President of CorporateAffairs and General Counsel, Filene’s (retail)(1978–1988). Directorships: Advisory Board,Center for Business Ethics, Bentley University;Trustee and former Chairman of the Board,Southwest Florida Community Foundation(charitable organization); former Directorships:ICI Mutual Insurance Company (2007–2015);Sun Capital Advisers Trust (mutual funds)(2007–2012), Investment Company Institute(audit, executive, nominating committees) andIndependent Directors Council (governance,executive committees)
86 —
Paul K.Freeman (1950)Board Membersince 1993
Consultant, World Bank/Inter-AmericanDevelopment Bank; Independent DirectorsCouncil (former chair); Investment CompanyInstitute (executive committee); AdjunctProfessor, University of Denver Law School(2017–present); formerly: Chairman of EducationCommittee of Independent Directors Council;Project Leader, International Institute for AppliedSystems Analysis (1998–2001); Chief ExecutiveOfficer, The Eric Group, Inc. (environmentalinsurance) (1986–1998); Directorships: KnoebelInstitute for Healthy Aging, University of Denver(2017–present); former Directorships: PrismaEnergy International; Denver Zoo Foundation(2012–2018)
86 —
66 | DWS High Income Fund
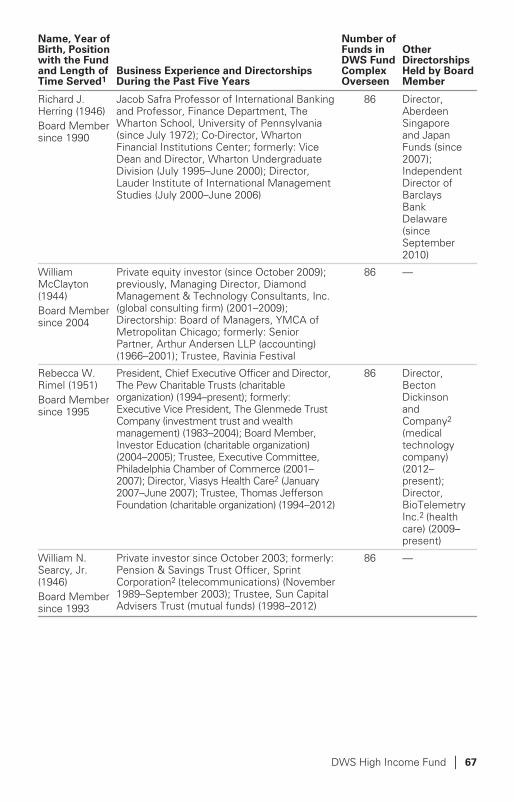
Name, Year ofBirth, Positionwith the Fundand Length ofTime Served1
Business Experience and DirectorshipsDuring the Past Five Years
Number ofFunds inDWS FundComplexOverseen
OtherDirectorshipsHeld by BoardMember
Richard J.Herring (1946)Board Membersince 1990
Jacob Safra Professor of International Bankingand Professor, Finance Department, TheWharton School, University of Pennsylvania(since July 1972); Co-Director, WhartonFinancial Institutions Center; formerly: ViceDean and Director, Wharton UndergraduateDivision (July 1995–June 2000); Director,Lauder Institute of International ManagementStudies (July 2000–June 2006)
86 Director,AberdeenSingaporeand JapanFunds (since2007);IndependentDirector ofBarclaysBankDelaware(sinceSeptember2010)
WilliamMcClayton(1944)Board Membersince 2004
Private equity investor (since October 2009);previously, Managing Director, DiamondManagement & Technology Consultants, Inc.(global consulting firm) (2001–2009);Directorship: Board of Managers, YMCA ofMetropolitan Chicago; formerly: SeniorPartner, Arthur Andersen LLP (accounting)(1966–2001); Trustee, Ravinia Festival
86 —
Rebecca W.Rimel (1951)Board Membersince 1995
President, Chief Executive Officer and Director,The Pew Charitable Trusts (charitableorganization) (1994–present); formerly:Executive Vice President, The Glenmede TrustCompany (investment trust and wealthmanagement) (1983–2004); Board Member,Investor Education (charitable organization)(2004–2005); Trustee, Executive Committee,Philadelphia Chamber of Commerce (2001–2007); Director, Viasys Health Care2 (January2007–June 2007); Trustee, Thomas JeffersonFoundation (charitable organization) (1994–2012)
86 Director,BectonDickinsonandCompany2
(medicaltechnologycompany)(2012–present);Director,BioTelemetryInc.2 (healthcare) (2009–present)
William N.Searcy, Jr.(1946)Board Membersince 1993
Private investor since October 2003; formerly:Pension & Savings Trust Officer, SprintCorporation2 (telecommunications) (November1989–September 2003); Trustee, Sun CapitalAdvisers Trust (mutual funds) (1998–2012)
86 —
DWS High Income Fund | 67
Name, Year ofBirth, Positionwith the Fundand Length ofTime Served1
Business Experience and DirectorshipsDuring the Past Five Years
Number ofFunds inDWS FundComplexOverseen
OtherDirectorshipsHeld by BoardMember
Jean GleasonStromberg(1943)Board Membersince 1997
Retired. Formerly, Consultant (1997–2001);Director, Financial Markets U.S. GovernmentAccountability Office (1996–1997); Partner,Norton Rose Fulbright, L.L.P. (law firm) (1978–1996); former Directorships: The William andFlora Hewlett Foundation (charitableorganization) (2000–2015); Service Source, Inc.(nonprofit), Mutual Fund Directors Forum(2002–2004), American Bar RetirementAssociation (funding vehicle for retirementplans) (1987–1990 and 1994–1996)
86 —
Officers4
Name, Year of Birth,Position with the Fund andLength of Time Served5
Business Experience and Directorships During thePast Five Years
Hepsen Uzcan6,9 (1974)President and Chief ExecutiveOfficer, 2017–presentAssistant Secretary, 2013–present
Managing Director,3 DWS; Secretary, DWS USA Corporation(since March 2018); Assistant Secretary, DWS Distributors,Inc. (since June 25, 2018); Director and Vice President, DWSService Company (since June 25, 2018); Assistant Secretary,DWS Investment Management Americas, Inc. (sinceJune 25, 2018); and Director and President, DB InvestmentManagers, Inc. (since June 25, 2018); formerly: VicePresident for the Deutsche funds (2016–2017)
John Millette8 (1962)Vice President and Secretary,1999–present
Director,3 DWS; Chief Legal Officer, DWS InvestmentManagement Americas, Inc. (2015–present); and Directorand Vice President, DWS Trust Company (2016–present);formerly: Secretary, Deutsche Investment ManagementAmericas Inc. (2015–2017)
Diane Kenneally8,10 (1966)Treasurer and Chief FinancialOfficer since 2018
Director,3 DWS; formerly: Assistant Treasurer for the DWSfunds (2007–2018)
Caroline Pearson8 (1962)Chief Legal Officer, 2010–present
Managing Director,3 DWS; formerly: Secretary, DeutscheAM Distributors, Inc. (2002–2017); and Secretary, DeutscheAM Service Company (2010–2017)
Scott D. Hogan8 (1970)Chief Compliance Officer,2016–present
Director,3 DWS
Wayne Salit7 (1967)Anti-Money LaunderingCompliance Officer, 2014–present
Director,3 Deutsche Bank; and AML Officer, DWS TrustCompany; formerly: Managing Director, AML ComplianceOfficer at BNY Mellon (2011–2014); and Director, AMLCompliance Officer at Deutsche Bank (2004–2011)
Sheila Cadogan8 (1966)Assistant Treasurer, 2017–present
Director,3 DWS; Director and Vice President, DWS TrustCompany (since 2018)
68 | DWS High Income Fund

Name, Year of Birth,Position with the Fund andLength of Time Served5
Business Experience and Directorships During thePast Five Years
Paul Antosca8 (1957)Assistant Treasurer, 2007–present
Director,3 DWS
1 The length of time served represents the year in which the Board Member joined theboard of one or more DWS funds currently overseen by the Board.
2 A publicly held company with securities registered pursuant to Section 12 of theSecurities Exchange Act of 1934.
3 Executive title, not a board directorship.4 As a result of their respective positions held with the Advisor or its affiliates, these
individuals are considered “interested persons” of the Advisor within the meaning ofthe 1940 Act. Interested persons receive no compensation from the Fund.
5 The length of time served represents the year in which the officer was first elected insuch capacity for one or more DWS funds.
6 Address: 345 Park Avenue, New York, NY 10154.7 Address: 60 Wall Street, New York, NY 10005.8 Address: One International Place, Boston, MA 02110.9 Appointed President and Chief Executive Officer effective December 1, 2017.10 Appointed Treasurer and Chief Financial Officer effective July 2, 2018.
The Fund’s Statement of Additional Information (“SAI”) includes additional information aboutthe Board Members. The SAI is available, without charge, upon request. If you would like torequest a copy of the SAI, you may do so by calling the following toll-free number:(800) 728-3337.
DWS High Income Fund | 69

Account Management Resources
For More
Information
The automated telephone system allows you to access personalizedaccount information and obtain information on other DWS fundsusing either your voice or your telephone keypad. Certain accounttypes within Classes A, T, C and S also have the ability to purchase,exchange or redeem shares using this system.For more information, contact your financial advisor. You may alsoaccess our automated telephone system or speak with aShareholder Service representative by calling:(800) 728-3337
Web Site dws.com
View your account transactions and balances, trade shares, monitoryour asset allocation, subscribe to fund and account updates bye-mail, and change your address, 24 hours a day.Obtain prospectuses and applications, news about DWS funds,insight from DWS economists and investment specialists and accessto DWS fund account information.
Written
Correspondence
DWS
PO Box 219151 Kansas City, MO 64121-9151
Proxy Voting The Fund’s policies and procedures for voting proxies for portfoliosecurities and information about how the Fund voted proxiesrelated to its portfolio securities during the most recent 12-monthperiod ended June 30 are available on our Web site —dws.com/en-us/resources/proxy-voting — or on the SEC’sWeb site — sec.gov. To obtain a written copy of the Fund’s policiesand procedures without charge, upon request, call us toll free at(800) 728-3337.
Portfolio Holdings Following the Fund’s fiscal first and third quarter-end, a completeportfolio holdings listing is filed with the SEC on Form N-Q. This formwill be available on the SEC’s Web site at sec.gov. The Fund’sportfolio holdings are also posted on dws.com from time to time.Please see the Fund’s current prospectus for more information.
Principal
Underwriter
If you have questions, comments or complaints, contact:DWS Distributors, Inc.
222 South Riverside PlazaChicago, IL 60606-5808(800) 621-1148
70 | DWS High Income Fund
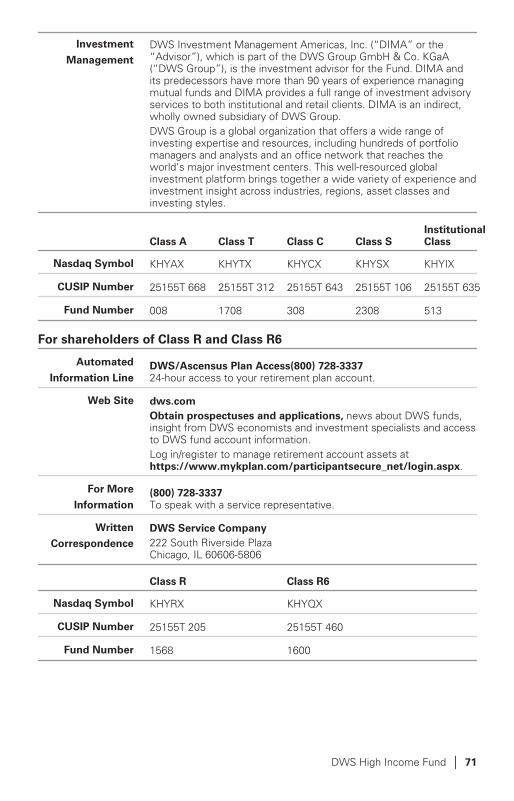
Investment
Management
DWS Investment Management Americas, Inc. (“DIMA” or the“Advisor”), which is part of the DWS Group GmbH & Co. KGaA(“DWS Group”), is the investment advisor for the Fund. DIMA andits predecessors have more than 90 years of experience managingmutual funds and DIMA provides a full range of investment advisoryservices to both institutional and retail clients. DIMA is an indirect,wholly owned subsidiary of DWS Group.DWS Group is a global organization that offers a wide range ofinvesting expertise and resources, including hundreds of portfoliomanagers and analysts and an office network that reaches theworld’s major investment centers. This well-resourced globalinvestment platform brings together a wide variety of experience andinvestment insight across industries, regions, asset classes andinvesting styles.
Class A Class T Class C Class SInstitutionalClass
Nasdaq Symbol KHYAX KHYTX KHYCX KHYSX KHYIX
CUSIP Number 25155T 668 25155T 312 25155T 643 25155T 106 25155T 635
Fund Number 008 1708 308 2308 513
For shareholders of Class R and Class R6
Automated
Information LineDWS/Ascensus Plan Access(800) 728-333724-hour access to your retirement plan account.
Web Site dws.com
Obtain prospectuses and applications, news about DWS funds,insight from DWS economists and investment specialists and accessto DWS fund account information.Log in/register to manage retirement account assets athttps://www.mykplan.com/participantsecure_net/login.aspx.
For More
Information(800) 728-3337To speak with a service representative.
Written
Correspondence
DWS Service Company
222 South Riverside PlazaChicago, IL 60606-5806
Class R Class R6
Nasdaq Symbol KHYRX KHYQX
CUSIP Number 25155T 205 25155T 460
Fund Number 1568 1600
DWS High Income Fund | 71

222
Sou
th R
iver
side
Pla
zaC
hica
go, I
L 60
606-
5808
PRSR
T ST
DU
.S. P
OST
AG
EPA
IDLA
NC
AST
ER, P
APE
RMIT
NO
. 179
3
DH
IF-2
(R-0
2536
2-8
11/1
8)


![SUBSCRIPTION AND SHAREHOLDERS' AGREEMENT · Draft 1 10 September30 November 2015 SUBSCRIPTION AND SHAREHOLDERS' AGREEMENT [NAME(S) OF INVESTOR(S)] and [NZVIF INVESTMENTS LIMITED]](https://img.pdfslide.us/doc/110x75/5e20311c3df41b4ed225d7f5/subscription-and-shareholders-agreement-draft-1-10-september30-november-2015-subscription.jpg)