Embed Size (px)
DESCRIPTION
Â
Citation preview
1 July 2013 - 30 June 2014
2013/14
12012/13
32014/15
42015/16
52016/17
62017/18
72018/19
82019/20
92020/21
102021/22
22013/14
ANNUAL REPORT summary

1Annual Report Summary for the year ended 30 June 2014140918101491
ContentsMESSAGE FROM THE MAYOR ................................................................2
COUNCIL'S FINANCIAL RESULTS ...............................................5
OVERALL SERVICE PERFORMANCE ...................................... 11
FINANCIAL BENCHMARKING ................................................... 12
COMMUNITY OUTCOMES AND HOW THE ACTIVITY CONTRIBUTES ........................................................... 17
AUDIT REPORT ............................................................................. 41
MORE INFOMore information can be found in the Council’s financial statements of the full Annual Report. The full Annual Report is available from Council’s Service Centres, website waimakariri.govt.nz or by phoning (03) 311 8900 or (03) 327 6834.
2 Waimakariri District Council140918101491
MessageFROM THE MAYOR
I have pleasure in presenting the Council’s Annual Report, the second year in the three year cycle of the 2012-2022 Ten Year Plan, and the first full financial year of this Council’s term (2013-2016).
MESSAGE FROM THE MAYOR
I have pleasure in presenting the Council’s Annual Report,
the second year in the three year cycle of the 2012-2022
Ten Year Plan, and the first full financial year of this
Council’s term (2013-2016).
The Council has continued to focus 0n town centre
redevelopment and rapid population growth over the
2013/14 year, and the year has seen a number of key
projects underway and some brought to closure.
Reconstruction and redevelopment of essential
community infrastructure has seen the completion of the
redevelopment of the Kaiapoi Aquatic Centre and the
new road works around Kaiapoi’s Williams Street Bridge.
The new Kaiapoi Library and Service Centre, including a
museum and community art space, is well underway and
will be completed at the end of January 2015. The works
on the Rangiora Town Hall and Performing Arts Complex
have been ongoing throughout the year. Detailed planning
and negotiation with property owners for the realignment
of Red Lion Corner in Rangiora has been undertaken
during the year, and works on earthquake strengthening
and current redevelopment of the Oxford Town Hall sees
an expected completion by November 2014.
Construction of the Cones Road Bridge over the Ashley
River, with a 60% contribution from Central Government,
started in the year and is on target to be completed by
the end of March 2015. Detailed planning for the Giles
Road bypass of Silverstream was undertaken which will
provide a strategic link and alternative access to Rangiora
from the Christchurch motorway. Construction of the
bypass is due to commence in late 2014.
Business development in Rangiora and Kaiapoi has been
impaired throughout the year as earthquake prone buildings
have been closed, repaired, or, in some cases, demolished.
Both town centres have been significantly disrupted as
landowners work through time-intensive processes with
engineers, insurers and tenants. There are, however,
encouraging signs as plans emerge for reconstruction, using
the opportunities of these forced changes to bring about
improvements to business and customer service.
The Council’s Building Unit has experienced
unprecedented pressure over the last few years and has
approved 1,154 consents for new dwellings in 2013/14.
This compares with 1,125 consents for residential
dwellings in 2012/13. This is more than double the number
of new building consents that this District normally
approves, typically four or five hundred per year. These
large numbers of new building consents have been
trending upwards since March 2012 and, based on this
and other analyses, the estimated residential population
for the Waimakariri District as at 30 June 2014 is 53,000.
The estimated population of the District is expected to
increase to more than 65,000 people by 2031.
Waimakariri District is rated the second most successful
local authority in the country in terms of economic
3Annual Report Summary for the year ended 30 June 2014140918101491
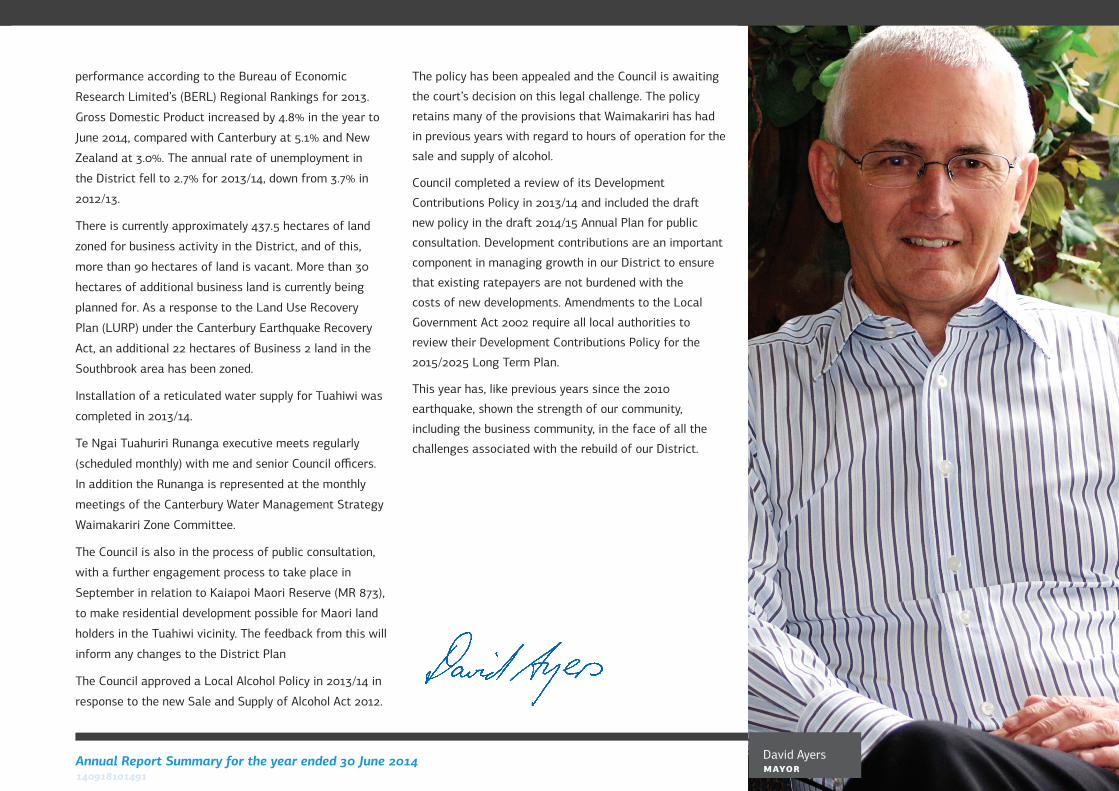
David Ayers MAYOR
performance according to the Bureau of Economic
Research Limited’s (BERL) Regional Rankings for 2013.
Gross Domestic Product increased by 4.8% in the year to
June 2014, compared with Canterbury at 5.1% and New
Zealand at 3.0%. The annual rate of unemployment in
the District fell to 2.7% for 2013/14, down from 3.7% in
2012/13.
There is currently approximately 437.5 hectares of land
zoned for business activity in the District, and of this,
more than 90 hectares of land is vacant. More than 30
hectares of additional business land is currently being
planned for. As a response to the Land Use Recovery
Plan (LURP) under the Canterbury Earthquake Recovery
Act, an additional 22 hectares of Business 2 land in the
Southbrook area has been zoned.
Installation of a reticulated water supply for Tuahiwi was
completed in 2013/14.
Te Ngai Tuahuriri Runanga executive meets regularly
(scheduled monthly) with me and senior Council officers.
In addition the Runanga is represented at the monthly
meetings of the Canterbury Water Management Strategy
Waimakariri Zone Committee.
The Council is also in the process of public consultation,
with a further engagement process to take place in
September in relation to Kaiapoi Maori Reserve (MR 873),
to make residential development possible for Maori land
holders in the Tuahiwi vicinity. The feedback from this will
inform any changes to the District Plan
The Council approved a Local Alcohol Policy in 2013/14 in
response to the new Sale and Supply of Alcohol Act 2012.
The policy has been appealed and the Council is awaiting
the court’s decision on this legal challenge. The policy
retains many of the provisions that Waimakariri has had
in previous years with regard to hours of operation for the
sale and supply of alcohol.
Council completed a review of its Development
Contributions Policy in 2013/14 and included the draft
new policy in the draft 2014/15 Annual Plan for public
consultation. Development contributions are an important
component in managing growth in our District to ensure
that existing ratepayers are not burdened with the
costs of new developments. Amendments to the Local
Government Act 2002 require all local authorities to
review their Development Contributions Policy for the
2015/2025 Long Term Plan.
This year has, like previous years since the 2010
earthquake, shown the strength of our community,
including the business community, in the face of all the
challenges associated with the rebuild of our District.
4 Waimakariri District Council140918101491
5Annual Report Summary for the year ended 30 June 2014140918101491
The following information was taken from the financial statements for the year ended 30 June 2014, which were adopted by Council on 7 October 2014. This summary was authorised for release by Council on the same date. The financial statements and the summary financial statements have been audited by Audit New Zealand, who have provided an unmodified audit opinion.
Council's Financial Results
6 Waimakariri District Council140918101491
COUNCIL'S FINANCIAL RESULTS
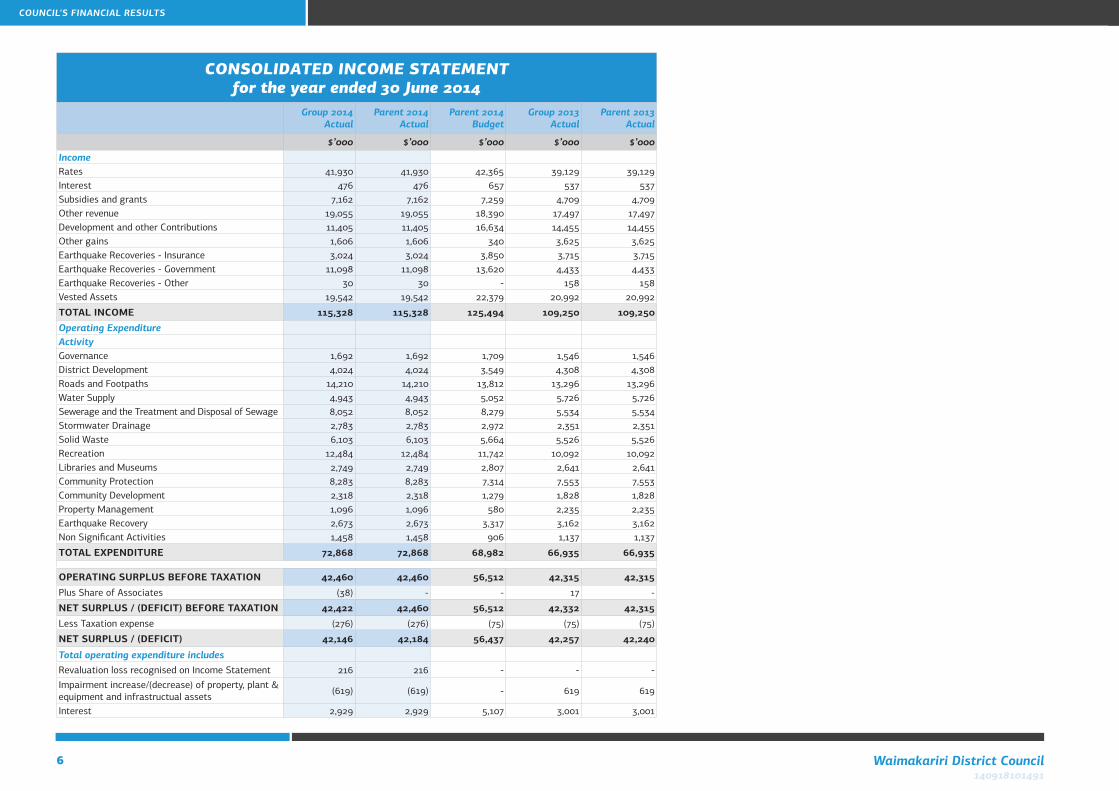
CONSOLIDATED INCOME STATEMENT for the year ended 30 June 2014
Group 2014 Actual
Parent 2014 Actual
Parent 2014 Budget
Group 2013 Actual
Parent 2013 Actual
$’000 $’000 $’000 $’000 $’000IncomeRates 41,930 41,930 42,365 39,129 39,129 Interest 476 476 657 537 537 Subsidies and grants 7,162 7,162 7,259 4,709 4,709 Other revenue 19,055 19,055 18,390 17,497 17,497 Development and other Contributions 11,405 11,405 16,634 14,455 14,455 Other gains 1,606 1,606 340 3,625 3,625 Earthquake Recoveries - Insurance 3,024 3,024 3,850 3,715 3,715 Earthquake Recoveries - Government 11,098 11,098 13,620 4,433 4,433 Earthquake Recoveries - Other 30 30 - 158 158 Vested Assets 19,542 19,542 22,379 20,992 20,992
TOTAL INCOME 115,328 115,328 125,494 109,250 109,250Operating ExpenditureActivityGovernance 1,692 1,692 1,709 1,546 1,546District Development 4,024 4,024 3,549 4,308 4,308Roads and Footpaths 14,210 14,210 13,812 13,296 13,296Water Supply 4,943 4,943 5,052 5,726 5,726Sewerage and the Treatment and Disposal of Sewage 8,052 8,052 8,279 5,534 5,534Stormwater Drainage 2,783 2,783 2,972 2,351 2,351Solid Waste 6,103 6,103 5,664 5,526 5,526Recreation 12,484 12,484 11,742 10,092 10,092Libraries and Museums 2,749 2,749 2,807 2,641 2,641Community Protection 8,283 8,283 7,314 7,553 7,553Community Development 2,318 2,318 1,279 1,828 1,828Property Management 1,096 1,096 580 2,235 2,235Earthquake Recovery 2,673 2,673 3,317 3,162 3,162Non Significant Activities 1,458 1,458 906 1,137 1,137
TOTAL EXPENDITURE 72,868 72,868 68,982 66,935 66,935
OPERATING SURPLUS BEFORE TAXATION 42,460 42,460 56,512 42,315 42,315Plus Share of Associates (38) - - 17 -
NET SURPLUS / (DEFICIT) BEFORE TAXATION 42,422 42,460 56,512 42,332 42,315Less Taxation expense (276) (276) (75) (75) (75)
NET SURPLUS / (DEFICIT) 42,146 42,184 56,437 42,257 42,240
Total operating expenditure includesRevaluation loss recognised on Income Statement 216 216 - - - Impairment increase/(decrease) of property, plant & equipment and infrastructual assets (619) (619) - 619 619
Interest 2,929 2,929 5,107 3,001 3,001
7Annual Report Summary for the year ended 30 June 2014140918101491
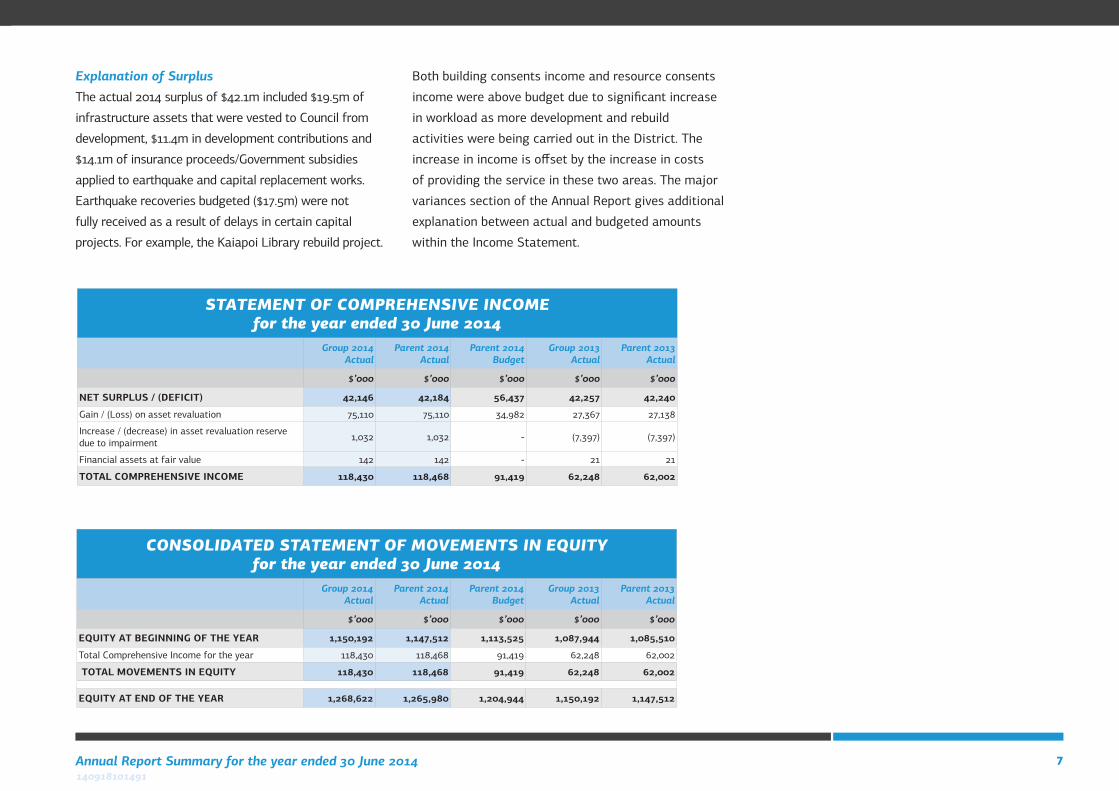
Explanation of SurplusThe actual 2014 surplus of $42.1m included $19.5m of
infrastructure assets that were vested to Council from
development, $11.4m in development contributions and
$14.1m of insurance proceeds/Government subsidies
applied to earthquake and capital replacement works.
Earthquake recoveries budgeted ($17.5m) were not
fully received as a result of delays in certain capital
projects. For example, the Kaiapoi Library rebuild project.
Both building consents income and resource consents
income were above budget due to significant increase
in workload as more development and rebuild
activities were being carried out in the District. The
increase in income is offset by the increase in costs
of providing the service in these two areas. The major
variances section of the Annual Report gives additional
explanation between actual and budgeted amounts
within the Income Statement.
STATEMENT OF COMPREHENSIVE INCOME for the year ended 30 June 2014
Group 2014 Actual
Parent 2014 Actual
Parent 2014 Budget
Group 2013 Actual
Parent 2013 Actual
$’000 $’000 $’000 $’000 $’000
NET SURPLUS / (DEFICIT) 42,146 42,184 56,437 42,257 42,240
Gain / (Loss) on asset revaluation 75,110 75,110 34,982 27,367 27,138
Increase / (decrease) in asset revaluation reserve due to impairment 1,032 1,032 - (7,397) (7,397)
Financial assets at fair value 142 142 - 21 21
TOTAL COMPREHENSIVE INCOME 118,430 118,468 91,419 62,248 62,002
CONSOLIDATED STATEMENT OF MOVEMENTS IN EQUITY for the year ended 30 June 2014
Group 2014 Actual
Parent 2014 Actual
Parent 2014 Budget
Group 2013 Actual
Parent 2013 Actual
$’000 $’000 $’000 $’000 $’000
EQUITY AT BEGINNING OF THE YEAR 1,150,192 1,147,512 1,113,525 1,087,944 1,085,510
Total Comprehensive Income for the year 118,430 118,468 91,419 62,248 62,002
TOTAL MOVEMENTS IN EQUITY 118,430 118,468 91,419 62,248 62,002
EQUITY AT END OF THE YEAR 1,268,622 1,265,980 1,204,944 1,150,192 1,147,512
8 Waimakariri District Council140918101491
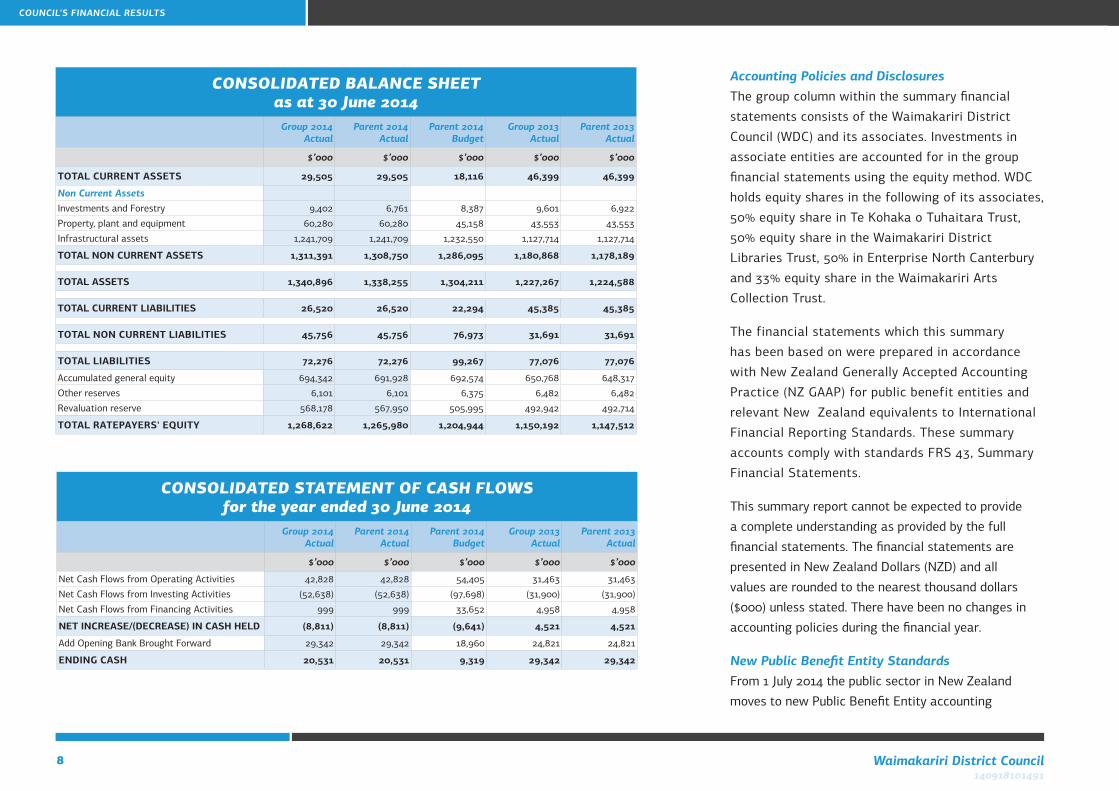
CONSOLIDATED BALANCE SHEET as at 30 June 2014
Group 2014 Actual
Parent 2014 Actual
Parent 2014 Budget
Group 2013 Actual
Parent 2013 Actual
$’000 $’000 $’000 $’000 $’000
TOTAL CURRENT ASSETS 29,505 29,505 18,116 46,399 46,399
Non Current AssetsInvestments and Forestry 9,402 6,761 8,387 9,601 6,922
Property, plant and equipment 60,280 60,280 45,158 43,553 43,553
Infrastructural assets 1,241,709 1,241,709 1,232,550 1,127,714 1,127,714
TOTAL NON CURRENT ASSETS 1,311,391 1,308,750 1,286,095 1,180,868 1,178,189
TOTAL ASSETS 1,340,896 1,338,255 1,304,211 1,227,267 1,224,588
TOTAL CURRENT LIABILITIES 26,520 26,520 22,294 45,385 45,385
TOTAL NON CURRENT LIABILITIES 45,756 45,756 76,973 31,691 31,691
TOTAL LIABILITIES 72,276 72,276 99,267 77,076 77,076
Accumulated general equity 694,342 691,928 692,574 650,768 648,317
Other reserves 6,101 6,101 6,375 6,482 6,482
Revaluation reserve 568,178 567,950 505,995 492,942 492,714
TOTAL RATEPAYERS' EQUITY 1,268,622 1,265,980 1,204,944 1,150,192 1,147,512
CONSOLIDATED STATEMENT OF CASH FLOWS for the year ended 30 June 2014
Group 2014 Actual
Parent 2014 Actual
Parent 2014 Budget
Group 2013 Actual
Parent 2013 Actual
$’000 $’000 $’000 $’000 $’000
Net Cash Flows from Operating Activities 42,828 42,828 54,405 31,463 31,463
Net Cash Flows from Investing Activities (52,638) (52,638) (97,698) (31,900) (31,900)
Net Cash Flows from Financing Activities 999 999 33,652 4,958 4,958
NET INCREASE/(DECREASE) IN CASH HELD (8,811) (8,811) (9,641) 4,521 4,521
Add Opening Bank Brought Forward 29,342 29,342 18,960 24,821 24,821
ENDING CASH 20,531 20,531 9,319 29,342 29,342
Accounting Policies and Disclosures The group column within the summary financial
statements consists of the Waimakariri District
Council (WDC) and its associates. Investments in
associate entities are accounted for in the group
financial statements using the equity method. WDC
holds equity shares in the following of its associates,
50% equity share in Te Kohaka o Tuhaitara Trust,
50% equity share in the Waimakariri District
Libraries Trust, 50% in Enterprise North Canterbury
and 33% equity share in the Waimakariri Arts
Collection Trust.
The financial statements which this summary
has been based on were prepared in accordance
with New Zealand Generally Accepted Accounting
Practice (NZ GAAP) for public benefit entities and
relevant New Zealand equivalents to International
Financial Reporting Standards. These summary
accounts comply with standards FRS 43, Summary
Financial Statements.
This summary report cannot be expected to provide
a complete understanding as provided by the full
financial statements. The financial statements are
presented in New Zealand Dollars (NZD) and all
values are rounded to the nearest thousand dollars
($000) unless stated. There have been no changes in
accounting policies during the financial year.
New Public Benefit Entity StandardsFrom 1 July 2014 the public sector in New Zealand
moves to new Public Benefit Entity accounting
COUNCIL'S FINANCIAL RESULTS
9Annual Report Summary for the year ended 30 June 2014140918101491
standards (PBE standards). These standards are issued
by the New Zealand Accounting Standards Board
(NZASB) of the External Reporting Board comprising:
• Public Benefit Entity International Public Sector
Accounting Standards (PBE IPSAS);
• Public Benefit Entity International Financial
Reporting Standards (PBE IFRS), including Public
Benefit Entity International Accounting Standards
(PBE IAS); and
• Public Benefit Entity Financial Reporting Standards
(PBE FRS).
The financial impacts of any changes at 1 July 2014 will
be accounted for through opening retained earnings
and will not have a material effect on Council financial
performance in the 2014/15 year.
Contingent Assets As at 30 June 2014 there are 12 facilities on reserve
land owned by sports clubs which would become a
Council asset if the club vacates the facility. The value
is $3.4m (2013: 12 facilities, $3.3m). This estimate has
been based on government valuations for the area.
The Council holds one bond for development
commitments of $1.6m (2013: $6.5m). Developers
have been bonded to complete the subdivision to
Council's requirements. Failure to complete the
subdivision will result in Council retaining the bond
and completing the outstanding work. The assets
will in turn be vested once the subdivision warranty
period is complete.
Council will be eligible for reimbursement from
central government of 60% of planned earthquake
recovery work on infrastructure assets. This was
estimated to be $13.6m for 2013-14 excluding
subsidy income recorded in the financial statements.
For the year ended 30 June 2014 the Council
recognised income of $11.1m (2013: $4.4m).
Insurance recoveries relating to damage on its insured
buildings and community facilities were estimated at
$8.3m in the Council’s Ten Year Plan. This is contingent
upon the Council's Insurer's continued acceptance of
claims. For the year ended 30 June 2014 the Council
recognised income of $3.0m (2013: $3.7m).
Contingent Liabilities and Contractual Commitments Other than the guarantee of the loan for Oxford
Community Trust Oxford Art of $165,000 (2013:
165,000), there are no other significant guarantees.
Events After Balance Date There were no significant events after 30 June 2014.
Last year, there was a storm event in September 2013,
which had damaged 13% of Council's forestry assets.
The estimated loss in forestry value, clean-up costs
and repairs to fences after the sale of damaged trees
was about $270,000 and not considered significant.
Borrowing Management As at 30 June 2014, the Council held $50.0m in bank
debt and bonds (2013: $49.0m). This is lower than the
$77.7m budget for debt due to the timing delays of
implementing the capital works.
Explanation of major variance against budget Explanations for major variations from Council’s
estimated figures in the 2013-14 Annual Plan are as
follows:
Other revenue is more than budgeted, primarily due
to the high level of activity being generated through
Resource Consents and Building Services.
Development and other contributions were lower than
budgeted. Some reserves development contributions
were received as vested land. The completion of some
subdivision projects was delayed. Funds received from
development are recognised as income where capacity
In the network exists. Excess funds are held in reserves
and applied as the funding is required. Actual $11.4m,
Budget $16.6m.
Other gains of $1.6m included gain on interest rate
swaps of $1.0m, this was not budgeted.
The Council continued its response to the Canterbury
Earthquake events in 2011-12. The Council is entitled
to recover certain earthquake related expenditure
through our insurers and the Government (including
EQC and NZTA). Income of $14.2m has been recorded
for the period 30 June 2014, which is $3.3m lower
than budgeted. The Council will receive the income
budgeted in the Long Term Plan as the recovery work
is completed.
10 Waimakariri District Council140918101491
Assets vested into Council ownership relates to the
assets received from subdivisional developments. The
actual amount vested is highly variable from year to
year as it is dependent on the progress of subdivision
developments within the District. The total vesting to
30 June was $19.5m, compared to $22.4m budgeted.
Expenditure District Development expenditure was over budget due
to significant increase in Resource Consent processing
expenditure as a result of rebuild and development
activity in the District. Actual $4.0m, Budget $3.5m.
Roads and Footpaths was over budget due to more
depreciation expenses as a result of valuation increase
assessed last year. Unexpected flood events also
resulted in more maintenance costs. Actual $14.2m,
Budget $13.8m.
Solid Waste was over budget due to increased volume
of refuse to landfill. There has been a corresponding
increase in income. Actual $6.1m, Budget $5.7m.
Recreation was over budget due to increased
depreciation expenses as a result of increased
valuation assessed last year. Staff costs at Kaiapoi
Aquatic Centre were also over budget. Actual $12.5m,
Budget $11.7m
Community Protection was $1.0m above budget
mainly due to increased demand for building consents
from the rebuild of the District after the Canterbury
Earthquakes. Actual $8.3m, Budget $7.3m.
Community Development was over budget by $1.0m because of the write-off of Housing for the Elderly units in the Kaiapoi red-zone. Actual $2.3m, Budget $1.3m.
Property Management was significantly over budget due to the change in the fair value from the revaluation of forestry assets and more expenses in relation to general forestry maintenance costs due to unexpected wind storm events. Actual $1.1m, Budget $0.6m.
Earthquake Recovery was $0.6m below budget due to the maintenance required for earthquake damaged infrastructure reducing over time. Actual $2.7m, Budget $3.3m.
Non significant activities was $0.5m above the budget as a result of increase in operating costs of the internal support functions. Actual $1.5m, Budget $1.0m.
Comprehensive IncomeAn impairment reversal of $1.0m was recorded in Comprehensive Income. This represents the change in the Council's assessment of the impairment to the Council's assets, which was not budgeted for. The Council recorded a $75.1m gain on asset revaluation (budget $35.0m). This represents the increase in the value of roading, 3 waters and solid waste assets which were revalued at 30 June 2014.
Movements in EquityThe variance of $27.0m in Movements in Equity was due to the items identified above within the Comprehensive Income variance explanation. Actual $118.4m, Budget $91.4m.
Balance Sheet Assets Current assets are $11.4m higher than budget. Cash was higher than budgeted due to earthquake settlements received for Earthquake Recovery work. Non-current assets held for sale were $1.1m at year end and this was not budgeted.
Forestry assets were $1.9m less than budget as a result of the revaluation assessment performed at 30 June 2014.
Investment properties were $0.9m less than the budget due to disposals occurred during the year and the transfers to Non-current assets held for sale.
Property, plant and equipment are $15.1m higher than budget principally due to land and buildings additions.
Infrastructural assets are $9.2m more than budget principally due to favourable revaluation movements.
Liabilities Trade and other payables were $2.3m more than budget due to expenditure on construction projects and deposits and bonds from developers.
Total borrowings were $27.7m under budget mainly due to Earthquake recovery projects not progressing as budgeted.
COUNCIL'S FINANCIAL RESULTS
11Annual Report Summary for the year ended 30 June 2014140918101491
Non-financial Performance MeasuresThe non-financial activity performance measures
indicate how Council intended to measure its service
provision during the 2013/2014 year.
There were five projects that ended the financial year
in the ‘significantly behind’ category. Two measures
were behind as a result of significant flooding this
financial year and Council staff were unable to respond
within service level timeframes.
One measure related to a non-compliance of consent
conditions relating to unapproved dumping and bores
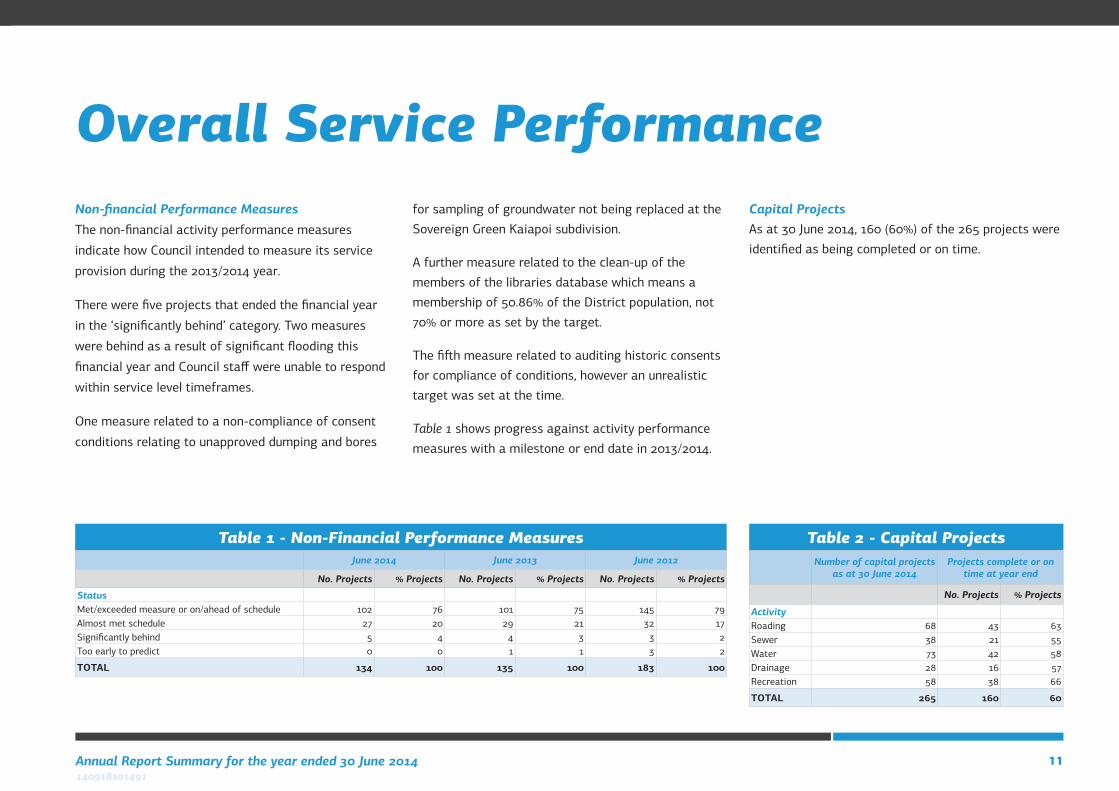
Table 1 - Non-Financial Performance MeasuresJune 2014 June 2013 June 2012
No. Projects % Projects No. Projects % Projects No. Projects % Projects
StatusMet/exceeded measure or on/ahead of schedule 102 76 101 75 145 79Almost met schedule 27 20 29 21 32 17Significantly behind 5 4 4 3 3 2Too early to predict 0 0 1 1 3 2
TOTAL 134 100 135 100 183 100
Table 2 - Capital ProjectsNumber of capital projects
as at 30 June 2014Projects complete or on
time at year end
No. Projects % Projects
ActivityRoading 68 43 63Sewer 38 21 55Water 73 42 58Drainage 28 16 57Recreation 58 38 66
TOTAL 265 160 60
for sampling of groundwater not being replaced at the Sovereign Green Kaiapoi subdivision.
A further measure related to the clean-up of the members of the libraries database which means a membership of 50.86% of the District population, not 70% or more as set by the target.
The fifth measure related to auditing historic consents for compliance of conditions, however an unrealistic target was set at the time.
Table 1 shows progress against activity performance measures with a milestone or end date in 2013/2014.
Overall Service PerformanceCapital ProjectsAs at 30 June 2014, 160 (60%) of the 265 projects were identified as being completed or on time.
12 Waimakariri District Council140918101491
Financial BenchmarkingAnnual report disclosure statement for year ending 30 June 2014
What is the purpose of this statement?The purpose of this statement is to disclose the Council's financial performance in relation to various benchmarks to enable the assessment of whether the Council is prudently managing its revenues, expenses, assets, liabilities, and general financial dealings.
The Council is required to include this statement in its annual report in accordance with the Local Government (Financial Reporting Prudence) Regulations 2014 (the regulations). Refer to the regulations for more information, including definitions of some of the terms used in this statement.
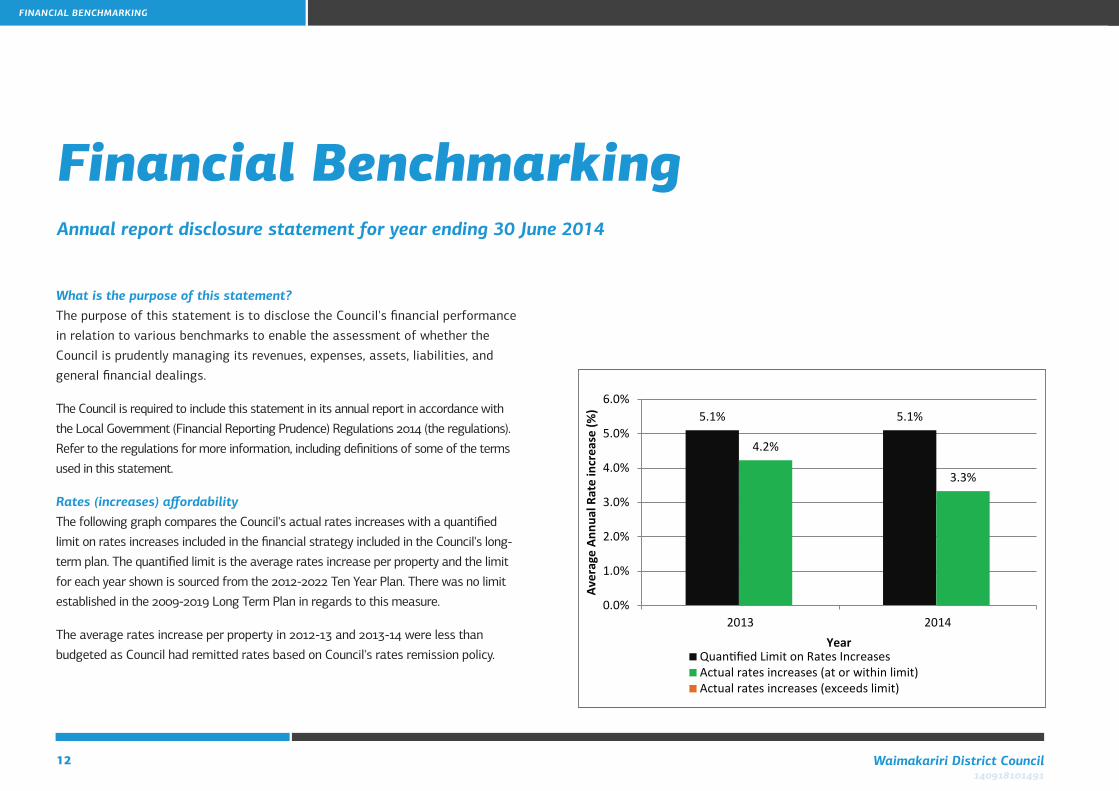
Rates (increases) affordabilityThe following graph compares the Council's actual rates increases with a quantified limit on rates increases included in the financial strategy included in the Council's long-term plan. The quantified limit is the average rates increase per property and the limit for each year shown is sourced from the 2012-2022 Ten Year Plan. There was no limit established in the 2009-2019 Long Term Plan in regards to this measure.
The average rates increase per property in 2012-13 and 2013-14 were less than budgeted as Council had remitted rates based on Council's rates remission policy.
FINANCIAL BENCHMARKING
5.1% 5.1%
4.2%
3.3%
0.0%
1.0%
2.0%
3.0%
4.0%
5.0%
6.0%
2013 2014
Aver
age
Annu
al R
ate
incr
ease
(%)
YearQuantified Limit on Rates IncreasesActual rates increases (at or within limit)Actual rates increases (exceeds limit)
13Annual Report Summary for the year ended 30 June 2014140918101491
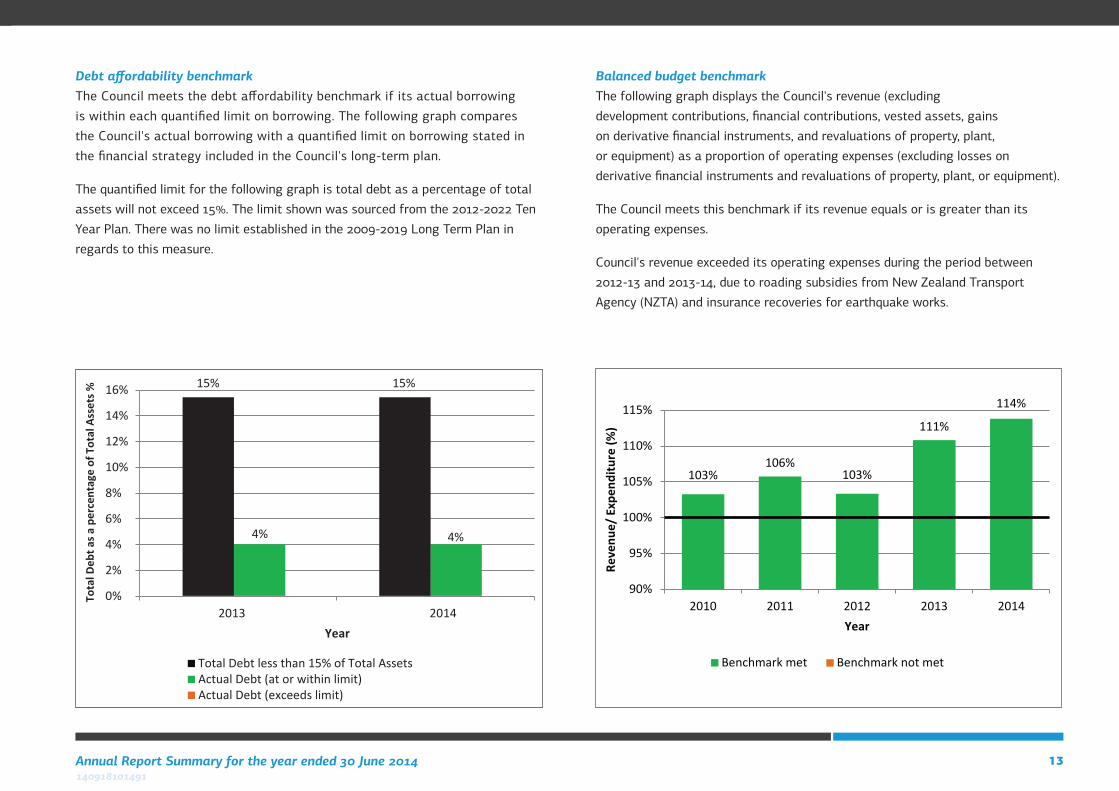
Debt affordability benchmarkThe Council meets the debt affordability benchmark if its actual borrowing is within each quantified limit on borrowing. The following graph compares the Council's actual borrowing with a quantified limit on borrowing stated in the financial strategy included in the Council's long-term plan.
The quantified limit for the following graph is total debt as a percentage of total assets will not exceed 15%. The limit shown was sourced from the 2012-2022 Ten Year Plan. There was no limit established in the 2009-2019 Long Term Plan in regards to this measure.
0%
2%
4%
6%
8%
10%
12%
14%
16%
2013 2014
Tota
l Deb
t as a
per
cent
age
of T
otal
Ass
ets %
Year
Total Debt less than 15% of Total AssetsActual Debt (at or within limit)Actual Debt (exceeds limit)
15%
4%
15%
4%
Balanced budget benchmarkThe following graph displays the Council's revenue (excluding development contributions, financial contributions, vested assets, gains on derivative financial instruments, and revaluations of property, plant, or equipment) as a proportion of operating expenses (excluding losses on derivative financial instruments and revaluations of property, plant, or equipment).
The Council meets this benchmark if its revenue equals or is greater than its operating expenses.
Council's revenue exceeded its operating expenses during the period between 2012-13 and 2013-14, due to roading subsidies from New Zealand Transport Agency (NZTA) and insurance recoveries for earthquake works.
103%106%
103%
111%
114%
90%
95%
100%
105%
110%
115%
2010 2011 2012 2013 2014Re
venu
e/ E
xpen
ditu
re (%
)Year
Benchmark met Benchmark not met
14 Waimakariri District Council140918101491
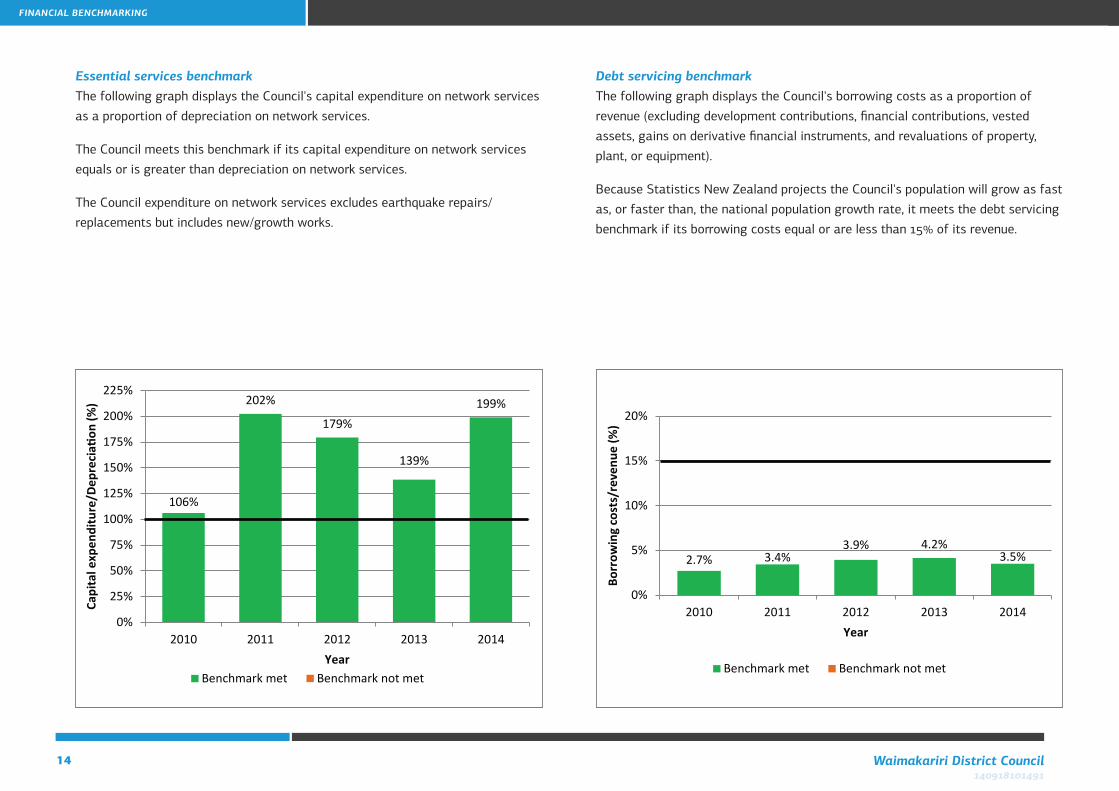
Essential services benchmarkThe following graph displays the Council's capital expenditure on network services as a proportion of depreciation on network services.
The Council meets this benchmark if its capital expenditure on network services equals or is greater than depreciation on network services.
The Council expenditure on network services excludes earthquake repairs/replacements but includes new/growth works.
Debt servicing benchmarkThe following graph displays the Council's borrowing costs as a proportion of revenue (excluding development contributions, financial contributions, vested assets, gains on derivative financial instruments, and revaluations of property, plant, or equipment).
Because Statistics New Zealand projects the Council's population will grow as fast as, or faster than, the national population growth rate, it meets the debt servicing benchmark if its borrowing costs equal or are less than 15% of its revenue.
106%
202%
179%
139%
199%
0%
25%
50%
75%
100%
125%
150%
175%
200%
225%
2010 2011 2012 2013 2014
Capi
tal e
xpen
ditu
re/D
epre
ciati
on (%
)
YearBenchmark met Benchmark not met
2.7% 3.4%3.9% 4.2%
3.5%
0%
5%
10%
15%
20%
2010 2011 2012 2013 2014Bo
rrow
ing
cost
s/re
venu
e (%
)Year
Benchmark met Benchmark not met
FINANCIAL BENCHMARKING
15Annual Report Summary for the year ended 30 June 2014140918101491
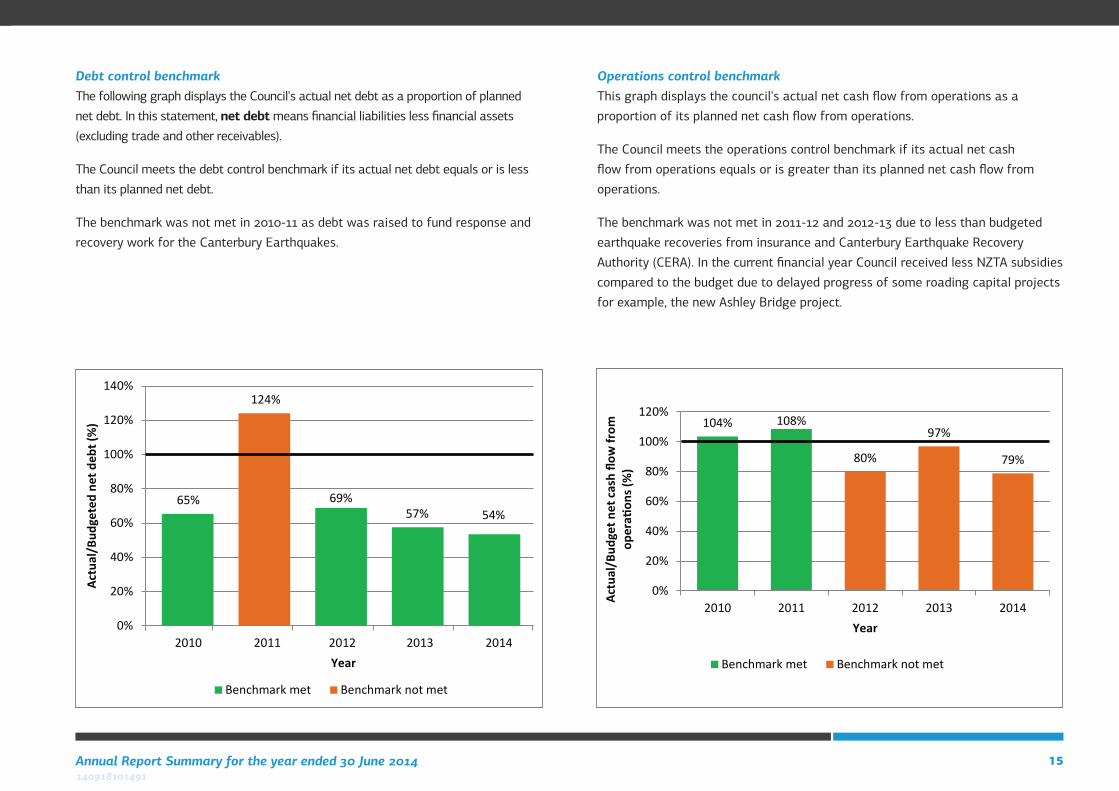
Debt control benchmarkThe following graph displays the Council's actual net debt as a proportion of planned net debt. In this statement, net debt means financial liabilities less financial assets (excluding trade and other receivables).
The Council meets the debt control benchmark if its actual net debt equals or is less than its planned net debt.
The benchmark was not met in 2010-11 as debt was raised to fund response and recovery work for the Canterbury Earthquakes.
65% 69%57% 54%
124%
0%
20%
40%
60%
80%
100%
120%
140%
2010 2011 2012 2013 2014
Actu
al/B
udge
ted
net d
ebt (
%)
Year
Benchmark met Benchmark not met
Operations control benchmarkThis graph displays the council's actual net cash flow from operations as a proportion of its planned net cash flow from operations.
The Council meets the operations control benchmark if its actual net cash flow from operations equals or is greater than its planned net cash flow from operations.
The benchmark was not met in 2011-12 and 2012-13 due to less than budgeted earthquake recoveries from insurance and Canterbury Earthquake Recovery Authority (CERA). In the current financial year Council received less NZTA subsidies compared to the budget due to delayed progress of some roading capital projects for example, the new Ashley Bridge project.
104% 108%
80%
97%
79%
0%
20%
40%
60%
80%
100%
120%
2010 2011 2012 2013 2014Ac
tual
/Bud
get n
et c
ash flo
w fr
om
oper
ation
s (%
)Year
Benchmark met Benchmark not met

16 Waimakariri District Council140918101491
17Annual Report Summary for the year ended 30 June 2014140918101491
The Waimakariri District Council identified through its Ten Year Plan how each of its activities contributes to the community outcomes of the Waimakariri District.
Community outcomes are the outcomes that a local authority aims to achieve in meeting the current and future needs of communities for good-quality local infrastructure, local public services and performance of regulatory functions.
The following tables provides a sample of outcomes from those provided in the Annual Report together with progress on some of the key measures.
Community outcomes and how the activity contributes
18 Waimakariri District Council140918101491
GOVERNANCE
COMMUNITY OUTCOMES
That this activity contributes to
COUNCIL RESPONSEHow this activity
contributes to outcomes
WHAT COUNCIL PROVIDESMajor levels of service
MEASURING PERFORMANCE PROGRESSfor the 2013-2014 Year
COUNCIL’S ACCOUNTABILITY TO THE COMMUNITY
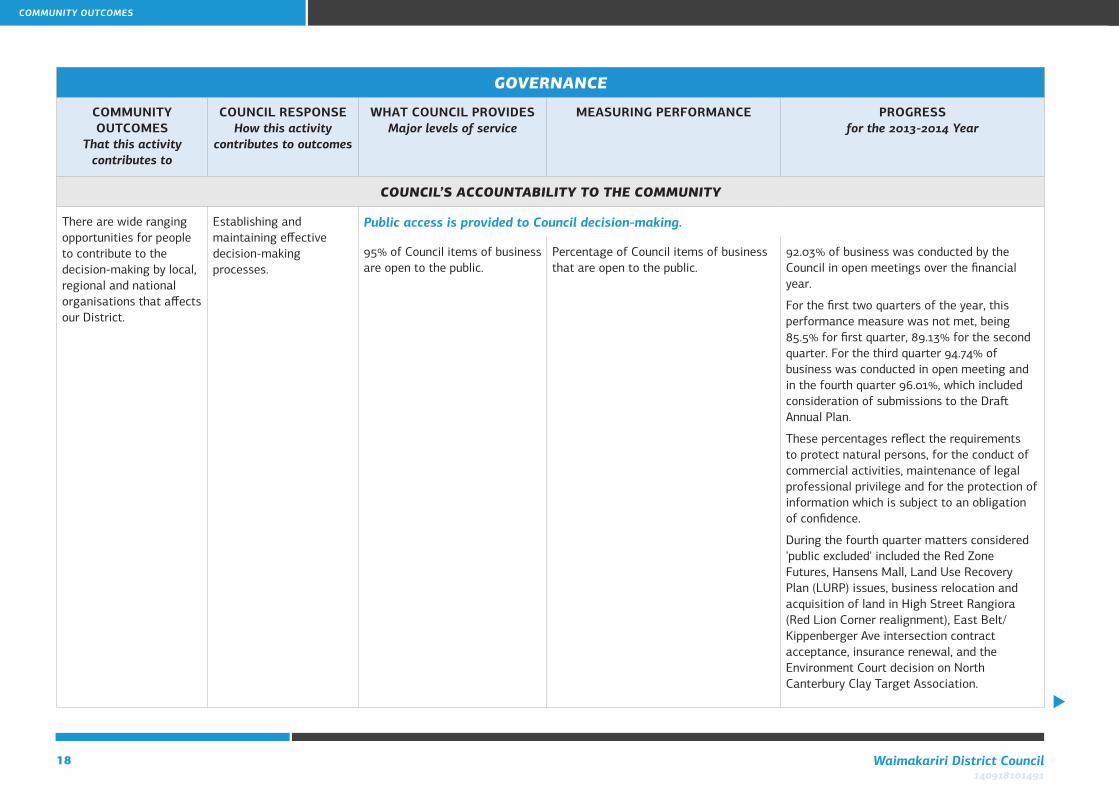
There are wide ranging opportunities for people to contribute to the decision-making by local, regional and national organisations that affects our District.
Establishing and maintaining effective decision-making processes.
Public access is provided to Council decision-making.
95% of Council items of business are open to the public.
Percentage of Council items of business that are open to the public.
92.03% of business was conducted by the Council in open meetings over the financial year.
For the first two quarters of the year, this performance measure was not met, being 85.5% for first quarter, 89.13% for the second quarter. For the third quarter 94.74% of business was conducted in open meeting and in the fourth quarter 96.01%, which included consideration of submissions to the Draft Annual Plan.
These percentages reflect the requirements to protect natural persons, for the conduct of commercial activities, maintenance of legal professional privilege and for the protection of information which is subject to an obligation of confidence.
During the fourth quarter matters considered 'public excluded' included the Red Zone Futures, Hansens Mall, Land Use Recovery Plan (LURP) issues, business relocation and acquisition of land in High Street Rangiora (Red Lion Corner realignment), East Belt/Kippenberger Ave intersection contract acceptance, insurance renewal, and the Environment Court decision on North Canterbury Clay Target Association.
COMMUNITY OUTCOMES
19Annual Report Summary for the year ended 30 June 2014140918101491
GOVERNANCE
COMMUNITY OUTCOMES
That this activity contributes to
COUNCIL RESPONSEHow this activity
contributes to outcomes
WHAT COUNCIL PROVIDESMajor levels of service
MEASURING PERFORMANCE PROGRESSfor the 2013-2014 Year
COUNCIL’S ACCOUNTABILITY TO THE COMMUNITY
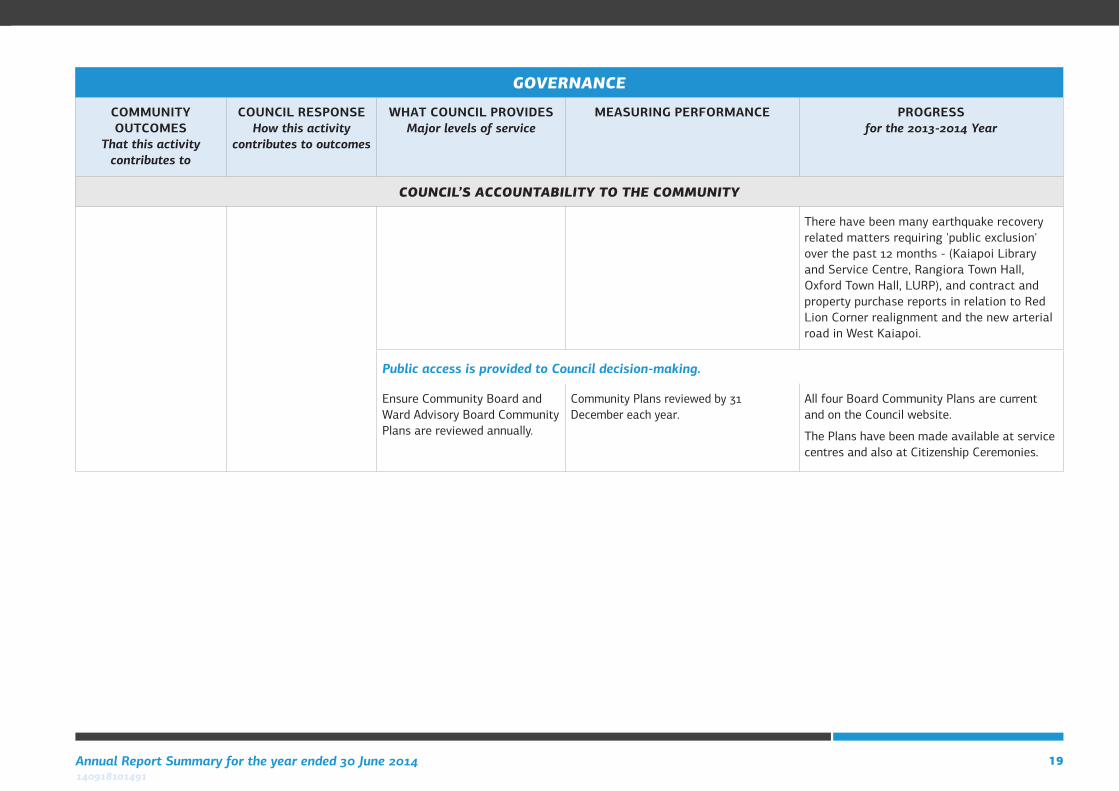
There have been many earthquake recovery related matters requiring 'public exclusion' over the past 12 months - (Kaiapoi Library and Service Centre, Rangiora Town Hall, Oxford Town Hall, LURP), and contract and property purchase reports in relation to Red Lion Corner realignment and the new arterial road in West Kaiapoi.
Public access is provided to Council decision-making.
Ensure Community Board and Ward Advisory Board Community Plans are reviewed annually.
Community Plans reviewed by 31 December each year.
All four Board Community Plans are current and on the Council website.
The Plans have been made available at service centres and also at Citizenship Ceremonies.
20 Waimakariri District Council140918101491
DISTRICT DEVELOPMENT
COMMUNITY OUTCOMES
That this activity contributes to
COUNCIL RESPONSEHow this activity
contributes to outcomes
WHAT COUNCIL PROVIDESMajor levels of service
MEASURING PERFORMANCE PROGRESSfor the 2013-2014 Year
DISTRICT DEVELOPMENT
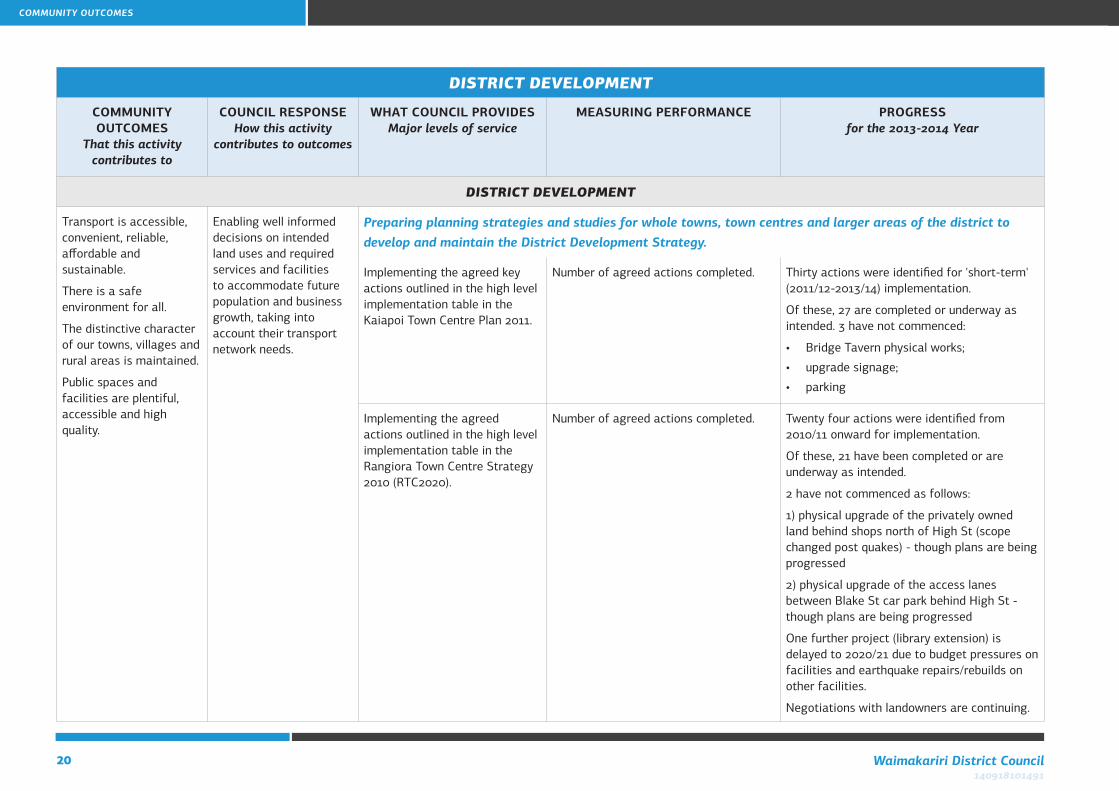
Transport is accessible, convenient, reliable, affordable and sustainable.
There is a safe environment for all.
The distinctive character of our towns, villages and rural areas is maintained.
Public spaces and facilities are plentiful, accessible and high quality.
Enabling well informed decisions on intended land uses and required services and facilities to accommodate future population and business growth, taking into account their transport network needs.
Preparing planning strategies and studies for whole towns, town centres and larger areas of the district to develop and maintain the District Development Strategy.
Implementing the agreed key actions outlined in the high level implementation table in the Kaiapoi Town Centre Plan 2011.
Number of agreed actions completed.
Thirty actions were identified for 'short-term' (2011/12-2013/14) implementation.
Of these, 27 are completed or underway as intended. 3 have not commenced:
• BridgeTavernphysicalworks;
• upgradesignage;
• parking
Implementing the agreed actions outlined in the high level implementation table in the Rangiora Town Centre Strategy 2010 (RTC2020).
Number of agreed actions completed. Twenty four actions were identified from 2010/11 onward for implementation.
Of these, 21 have been completed or are underway as intended.
2 have not commenced as follows:
1) physical upgrade of the privately owned land behind shops north of High St (scope changed post quakes) - though plans are being progressed
2) physical upgrade of the access lanes between Blake St car park behind High St - though plans are being progressed
One further project (library extension) is delayed to 2020/21 due to budget pressures on facilities and earthquake repairs/rebuilds on other facilities.
Negotiations with landowners are continuing.
COMMUNITY OUTCOMES
21Annual Report Summary for the year ended 30 June 2014140918101491
ROADS AND FOOTPATHS
COMMUNITY OUTCOMES
That this activity contributes to
COUNCIL RESPONSEHow this activity
contributes to outcomes
WHAT COUNCIL PROVIDESMajor levels of service
MEASURING PERFORMANCE PROGRESSfor the 2013-2014 Year
SUPPORTING BUSINESS AND EMPLOYMENT
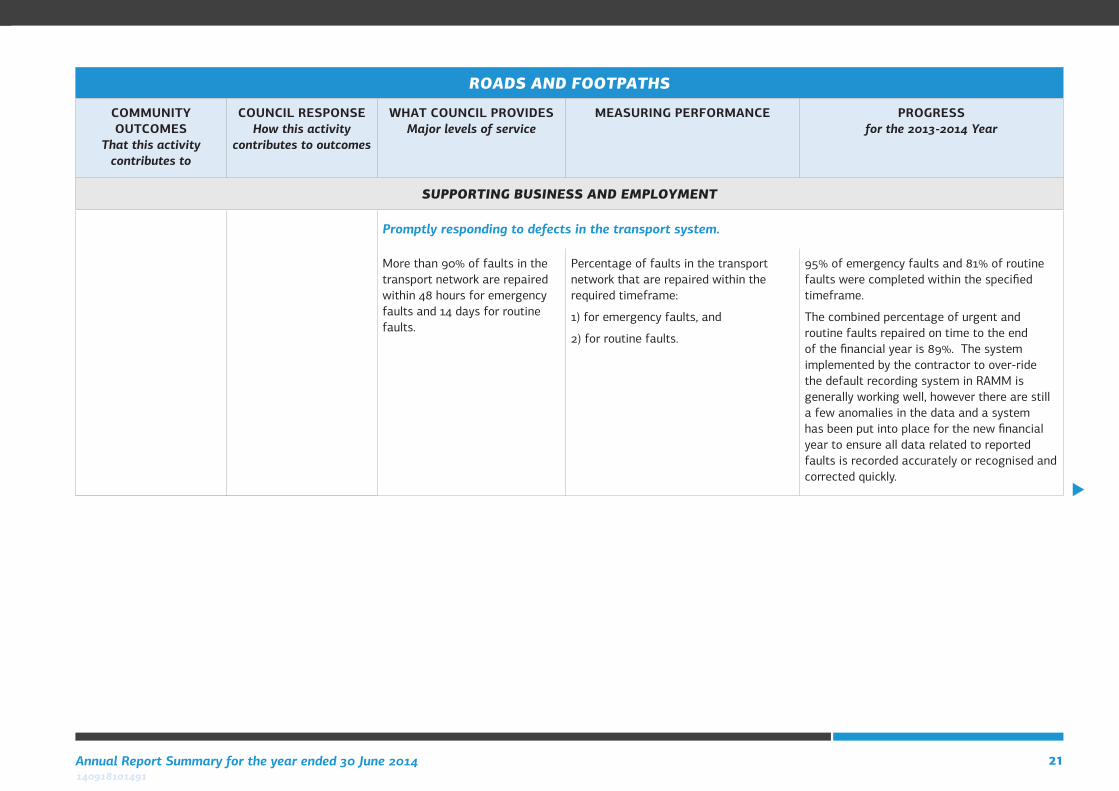
Promptly responding to defects in the transport system.
More than 90% of faults in the transport network are repaired within 48 hours for emergency faults and 14 days for routine faults.
Percentage of faults in the transport network that are repaired within the required timeframe:
1) for emergency faults, and
2) for routine faults.
95% of emergency faults and 81% of routine faults were completed within the specified timeframe.
The combined percentage of urgent and routine faults repaired on time to the end of the financial year is 89%. The system implemented by the contractor to over-ride the default recording system in RAMM is generally working well, however there are still a few anomalies in the data and a system has been put into place for the new financial year to ensure all data related to reported faults is recorded accurately or recognised and corrected quickly.
22 Waimakariri District Council140918101491
ROADS AND FOOTPATHS
COMMUNITY OUTCOMES
That this activity contributes to
COUNCIL RESPONSEHow this activity
contributes to outcomes
WHAT COUNCIL PROVIDESMajor levels of service
MEASURING PERFORMANCE PROGRESSfor the 2013-2014 Year
PROTECTING AND PROMOTING HEALTH, SAFETY AND SECURITY
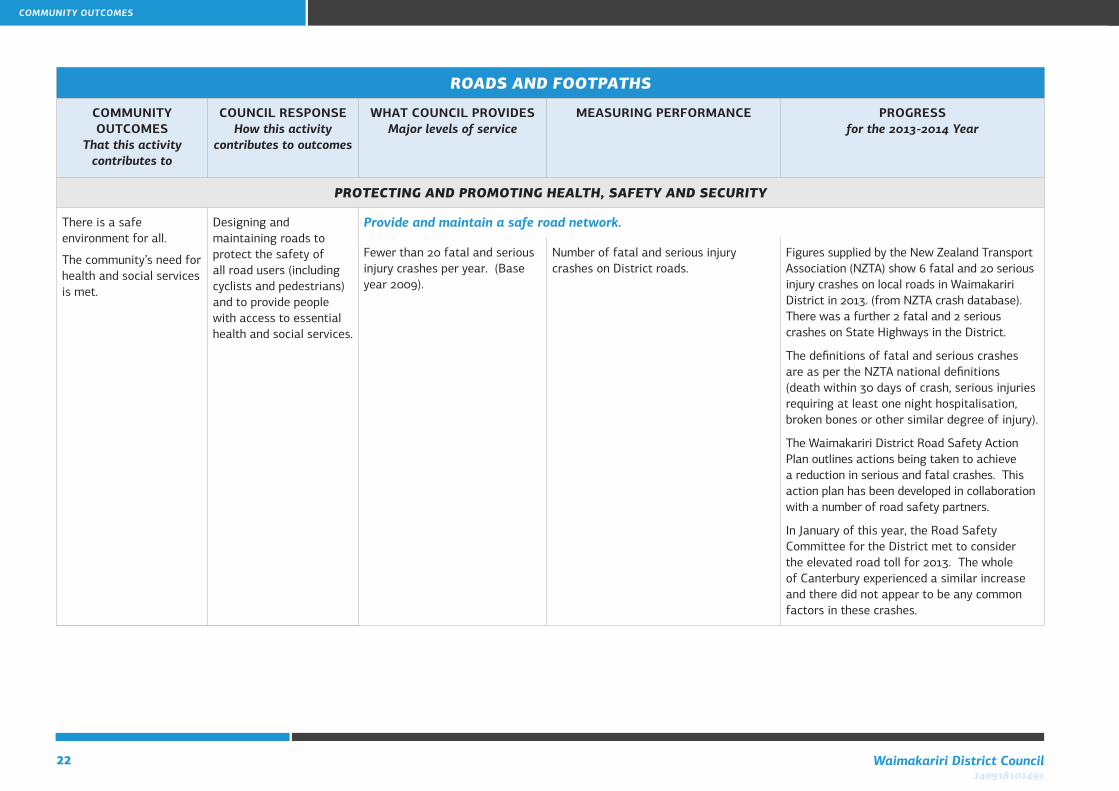
There is a safe environment for all.
The community’s need for health and social services is met.
Designing and maintaining roads to protect the safety of all road users (including cyclists and pedestrians) and to provide people with access to essential health and social services.
Provide and maintain a safe road network.
Fewer than 20 fatal and serious injury crashes per year. (Base year 2009).
Number of fatal and serious injury crashes on District roads.
Figures supplied by the New Zealand Transport Association (NZTA) show 6 fatal and 20 serious injury crashes on local roads in Waimakariri District in 2013. (from NZTA crash database). There was a further 2 fatal and 2 serious crashes on State Highways in the District.
The definitions of fatal and serious crashes are as per the NZTA national definitions (death within 30 days of crash, serious injuries requiring at least one night hospitalisation, broken bones or other similar degree of injury).
The Waimakariri District Road Safety Action Plan outlines actions being taken to achieve a reduction in serious and fatal crashes. This action plan has been developed in collaboration with a number of road safety partners.
In January of this year, the Road Safety Committee for the District met to consider the elevated road toll for 2013. The whole of Canterbury experienced a similar increase and there did not appear to be any common factors in these crashes.
COMMUNITY OUTCOMES
23Annual Report Summary for the year ended 30 June 2014140918101491
WATER SUPPLY
COMMUNITY OUTCOMES
That this activity contributes to
COUNCIL RESPONSEHow this activity
contributes to outcomes
WHAT COUNCIL PROVIDESMajor levels of service
MEASURING PERFORMANCE PROGRESSfor the 2013-2014 Year
WATER SUPPLY AND QUALITY
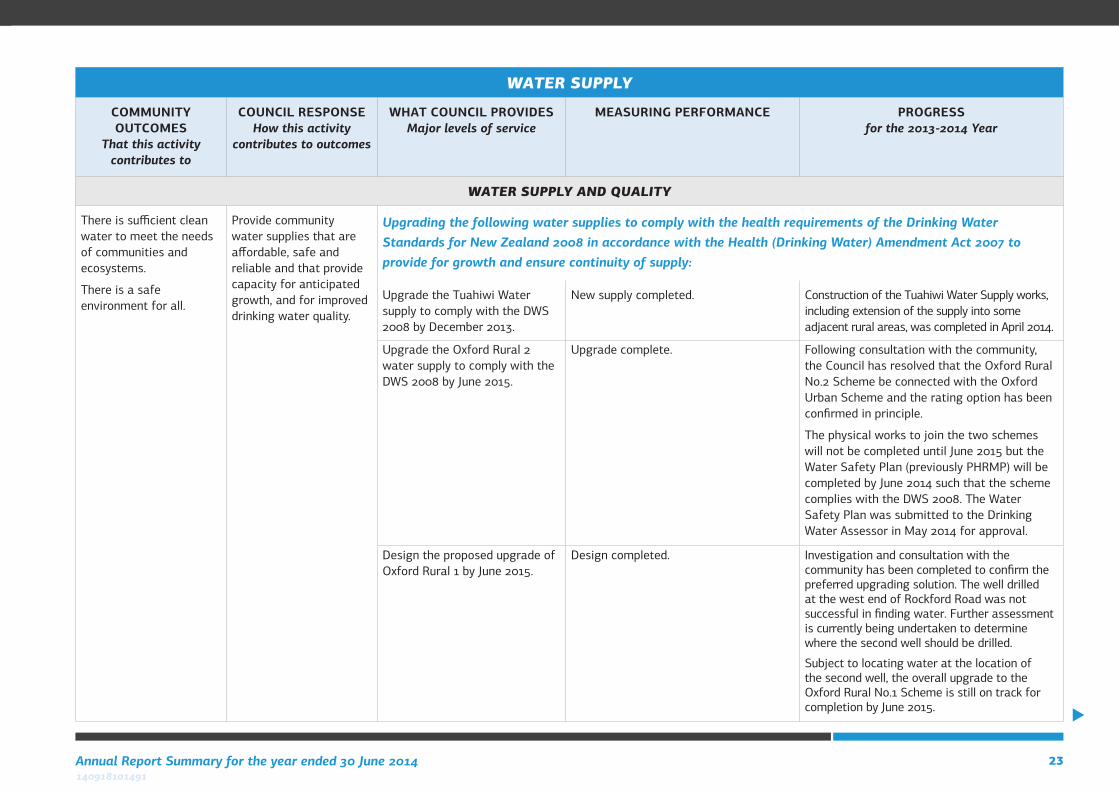
There is sufficient clean water to meet the needs of communities and ecosystems.
There is a safe environment for all.
Provide community water supplies that are affordable, safe and reliable and that provide capacity for anticipated growth, and for improved drinking water quality.
Upgrading the following water supplies to comply with the health requirements of the Drinking Water Standards for New Zealand 2008 in accordance with the Health (Drinking Water) Amendment Act 2007 to provide for growth and ensure continuity of supply:
Upgrade the Tuahiwi Water supply to comply with the DWS 2008 by December 2013.
New supply completed. Construction of the Tuahiwi Water Supply works, including extension of the supply into some adjacent rural areas, was completed in April 2014.
Upgrade the Oxford Rural 2 water supply to comply with the DWS 2008 by June 2015.
Upgrade complete. Following consultation with the community, the Council has resolved that the Oxford Rural No.2 Scheme be connected with the Oxford Urban Scheme and the rating option has been confirmed in principle.
The physical works to join the two schemes will not be completed until June 2015 but the Water Safety Plan (previously PHRMP) will be completed by June 2014 such that the scheme complies with the DWS 2008. The Water Safety Plan was submitted to the Drinking Water Assessor in May 2014 for approval.
Design the proposed upgrade of Oxford Rural 1 by June 2015.
Design completed. Investigation and consultation with the community has been completed to confirm the preferred upgrading solution. The well drilled at the west end of Rockford Road was not successful in finding water. Further assessment is currently being undertaken to determine where the second well should be drilled.
Subject to locating water at the location of the second well, the overall upgrade to the Oxford Rural No.1 Scheme is still on track for completion by June 2015.
24 Waimakariri District Council140918101491
WATER SUPPLY
COMMUNITY OUTCOMES
That this activity contributes to
COUNCIL RESPONSEHow this activity
contributes to outcomes
WHAT COUNCIL PROVIDESMajor levels of service
MEASURING PERFORMANCE PROGRESSfor the 2013-2014 Year
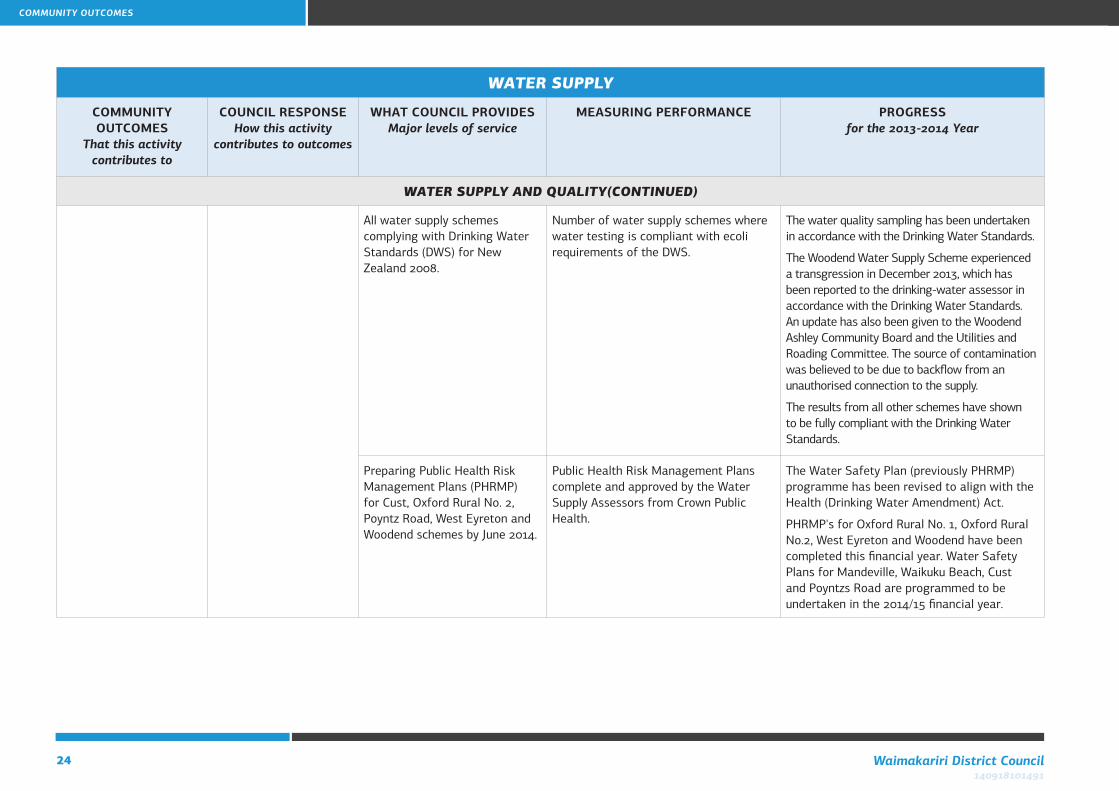
WATER SUPPLY AND QUALITY(CONTINUED)
All water supply schemes complying with Drinking Water Standards (DWS) for New Zealand 2008.
Number of water supply schemes where water testing is compliant with ecoli requirements of the DWS.
The water quality sampling has been undertaken in accordance with the Drinking Water Standards.
The Woodend Water Supply Scheme experienced a transgression in December 2013, which has been reported to the drinking-water assessor in accordance with the Drinking Water Standards. An update has also been given to the Woodend Ashley Community Board and the Utilities and Roading Committee. The source of contamination was believed to be due to backflow from an unauthorised connection to the supply.
The results from all other schemes have shown to be fully compliant with the Drinking Water Standards.
Preparing Public Health Risk Management Plans (PHRMP) for Cust, Oxford Rural No. 2, Poyntz Road, West Eyreton and Woodend schemes by June 2014.
Public Health Risk Management Plans complete and approved by the Water Supply Assessors from Crown Public Health.
The Water Safety Plan (previously PHRMP) programme has been revised to align with the Health (Drinking Water Amendment) Act.
PHRMP's for Oxford Rural No. 1, Oxford Rural No.2, West Eyreton and Woodend have been completed this financial year. Water Safety Plans for Mandeville, Waikuku Beach, Cust and Poyntzs Road are programmed to be undertaken in the 2014/15 financial year.
COMMUNITY OUTCOMES
25Annual Report Summary for the year ended 30 June 2014140918101491
SEWERAGE AND THE TREATMENT AND DISPOSAL OF SEWAGE
COMMUNITY OUTCOMES
That this activity contributes to
COUNCIL RESPONSEHow this activity
contributes to outcomes
WHAT COUNCIL PROVIDESMajor levels of service
MEASURING PERFORMANCE PROGRESSfor the 2013-2014 Year
EFFLUENT QUALITY
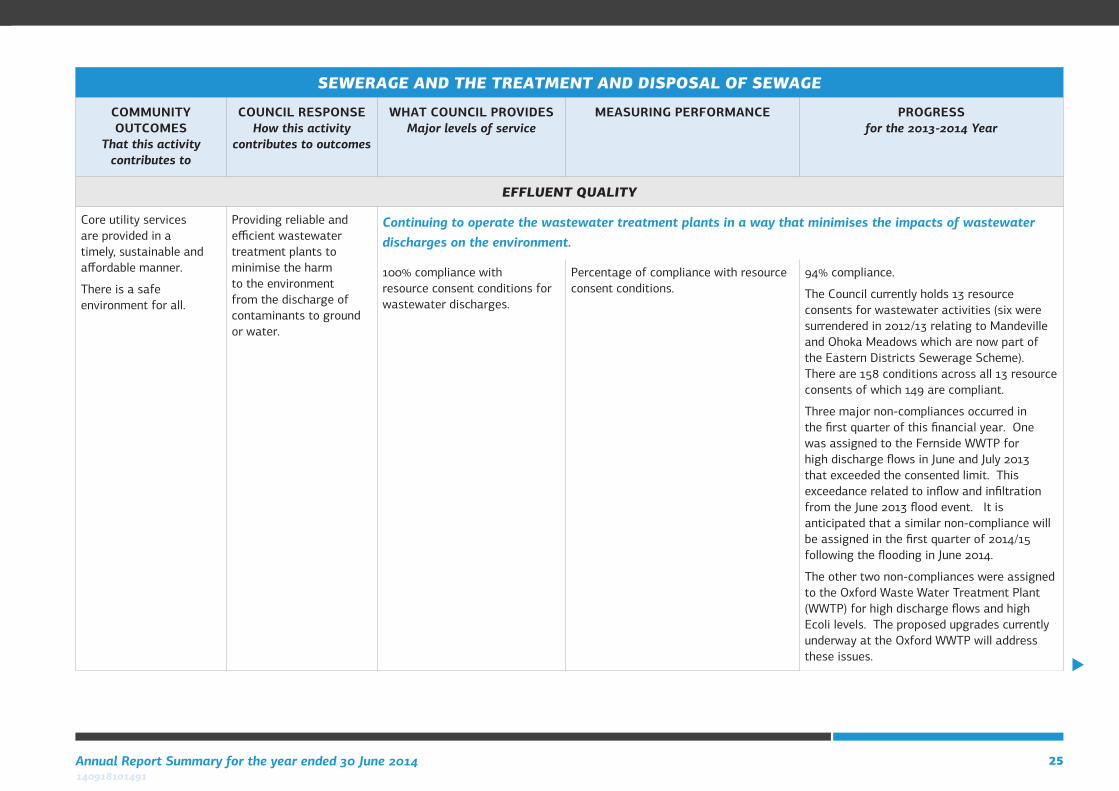
Core utility services are provided in a timely, sustainable and affordable manner.
There is a safe environment for all.
Providing reliable and efficient wastewater treatment plants to minimise the harm to the environment from the discharge of contaminants to ground or water.
Continuing to operate the wastewater treatment plants in a way that minimises the impacts of wastewater discharges on the environment.
100% compliance with resource consent conditions for wastewater discharges.
Percentage of compliance with resource consent conditions.
94% compliance.
The Council currently holds 13 resource consents for wastewater activities (six were surrendered in 2012/13 relating to Mandeville and Ohoka Meadows which are now part of the Eastern Districts Sewerage Scheme). There are 158 conditions across all 13 resource consents of which 149 are compliant.
Three major non-compliances occurred in the first quarter of this financial year. One was assigned to the Fernside WWTP for high discharge flows in June and July 2013 that exceeded the consented limit. This exceedance related to inflow and infiltration from the June 2013 flood event. It is anticipated that a similar non-compliance will be assigned in the first quarter of 2014/15 following the flooding in June 2014.
The other two non-compliances were assigned to the Oxford Waste Water Treatment Plant (WWTP) for high discharge flows and high Ecoli levels. The proposed upgrades currently underway at the Oxford WWTP will address these issues.
26 Waimakariri District Council140918101491
SEWERAGE AND THE TREATMENT AND DISPOSAL OF SEWAGE
COMMUNITY OUTCOMES
That this activity contributes to
COUNCIL RESPONSEHow this activity
contributes to outcomes
WHAT COUNCIL PROVIDESMajor levels of service
MEASURING PERFORMANCE PROGRESSfor the 2013-2014 Year
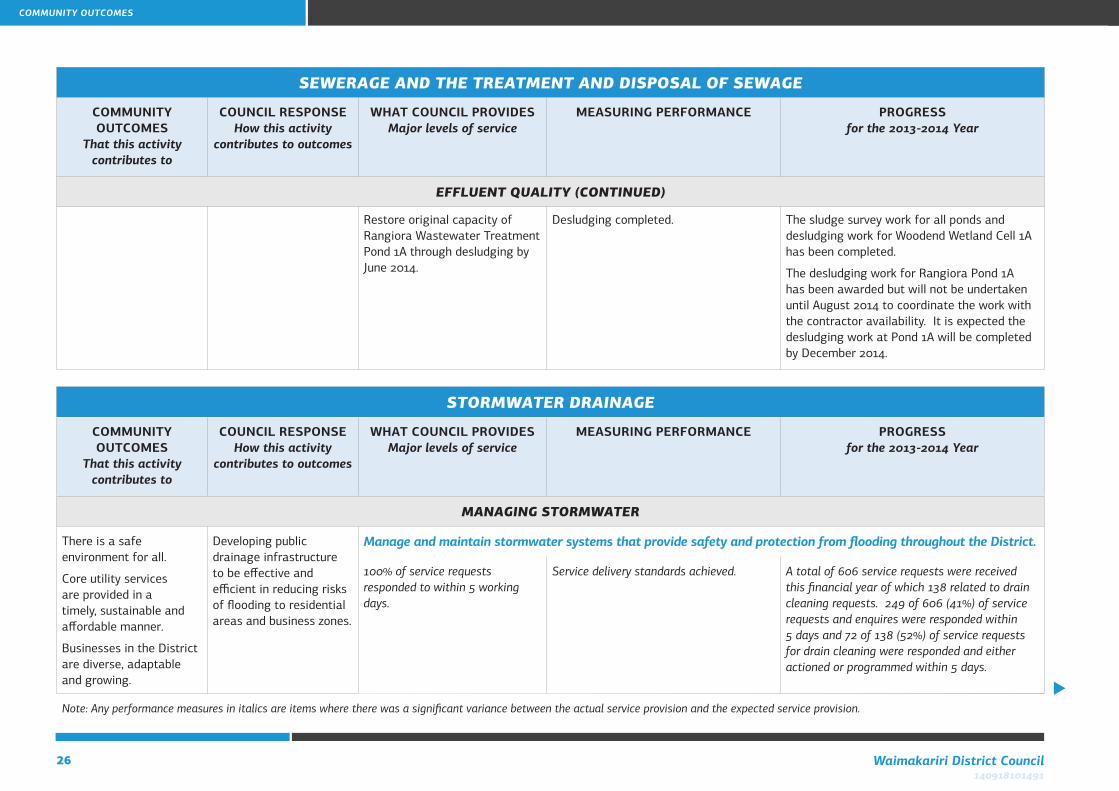
EFFLUENT QUALITY (CONTINUED)
Restore original capacity of Rangiora Wastewater Treatment Pond 1A through desludging by June 2014.
Desludging completed. The sludge survey work for all ponds and desludging work for Woodend Wetland Cell 1A has been completed.
The desludging work for Rangiora Pond 1A has been awarded but will not be undertaken until August 2014 to coordinate the work with the contractor availability. It is expected the desludging work at Pond 1A will be completed by December 2014.
STORMWATER DRAINAGE
COMMUNITY OUTCOMES
That this activity contributes to
COUNCIL RESPONSEHow this activity
contributes to outcomes
WHAT COUNCIL PROVIDESMajor levels of service
MEASURING PERFORMANCE PROGRESSfor the 2013-2014 Year
MANAGING STORMWATER
There is a safe environment for all.
Core utility services are provided in a timely, sustainable and affordable manner.
Businesses in the District are diverse, adaptable and growing.
Developing public drainage infrastructure to be effective and efficient in reducing risks of flooding to residential areas and business zones.
Manage and maintain stormwater systems that provide safety and protection from flooding throughout the District.
100% of service requests responded to within 5 working days.
Service delivery standards achieved. A total of 606 service requests were received this financial year of which 138 related to drain cleaning requests. 249 of 606 (41%) of service requests and enquires were responded within 5 days and 72 of 138 (52%) of service requests for drain cleaning were responded and either actioned or programmed within 5 days.
Note: Any performance measures in italics are items where there was a significant variance between the actual service provision and the expected service provision.
COMMUNITY OUTCOMES
27Annual Report Summary for the year ended 30 June 2014140918101491
STORMWATER DRAINAGE
COMMUNITY OUTCOMES
That this activity contributes to
COUNCIL RESPONSEHow this activity
contributes to outcomes
WHAT COUNCIL PROVIDESMajor levels of service
MEASURING PERFORMANCE PROGRESSfor the 2013-2014 Year
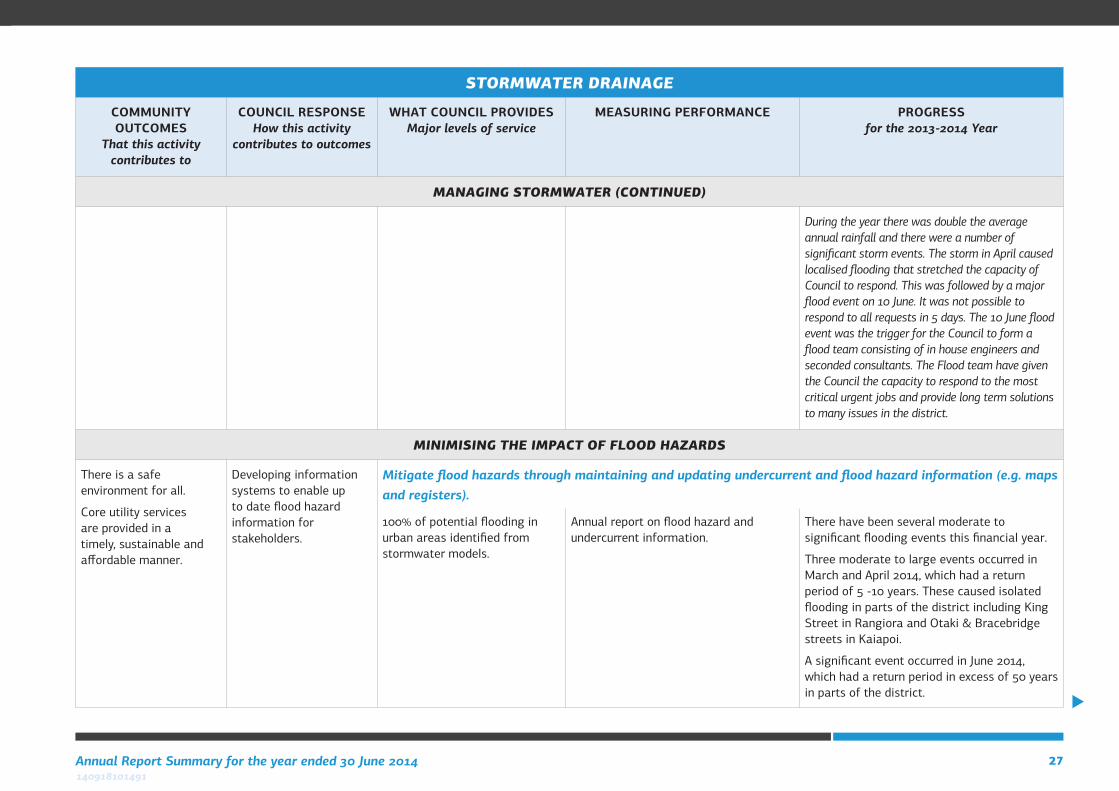
MANAGING STORMWATER (CONTINUED)
During the year there was double the average annual rainfall and there were a number of significant storm events. The storm in April caused localised flooding that stretched the capacity of Council to respond. This was followed by a major flood event on 10 June. It was not possible to respond to all requests in 5 days. The 10 June flood event was the trigger for the Council to form a flood team consisting of in house engineers and seconded consultants. The Flood team have given the Council the capacity to respond to the most critical urgent jobs and provide long term solutions to many issues in the district.
MINIMISING THE IMPACT OF FLOOD HAZARDS
There is a safe environment for all.
Core utility services are provided in a timely, sustainable and affordable manner.
Developing information systems to enable up to date flood hazard information for stakeholders.
Mitigate flood hazards through maintaining and updating undercurrent and flood hazard information (e.g. maps and registers).
100% of potential flooding in urban areas identified from stormwater models.
Annual report on flood hazard and undercurrent information.
There have been several moderate to significant flooding events this financial year.
Three moderate to large events occurred in March and April 2014, which had a return period of 5 -10 years. These caused isolated flooding in parts of the district including King Street in Rangiora and Otaki & Bracebridge streets in Kaiapoi.
A significant event occurred in June 2014, which had a return period in excess of 50 years in parts of the district.
28 Waimakariri District Council140918101491
STORMWATER DRAINAGE
COMMUNITY OUTCOMES
That this activity contributes to
COUNCIL RESPONSEHow this activity
contributes to outcomes
WHAT COUNCIL PROVIDESMajor levels of service
MEASURING PERFORMANCE PROGRESSfor the 2013-2014 Year
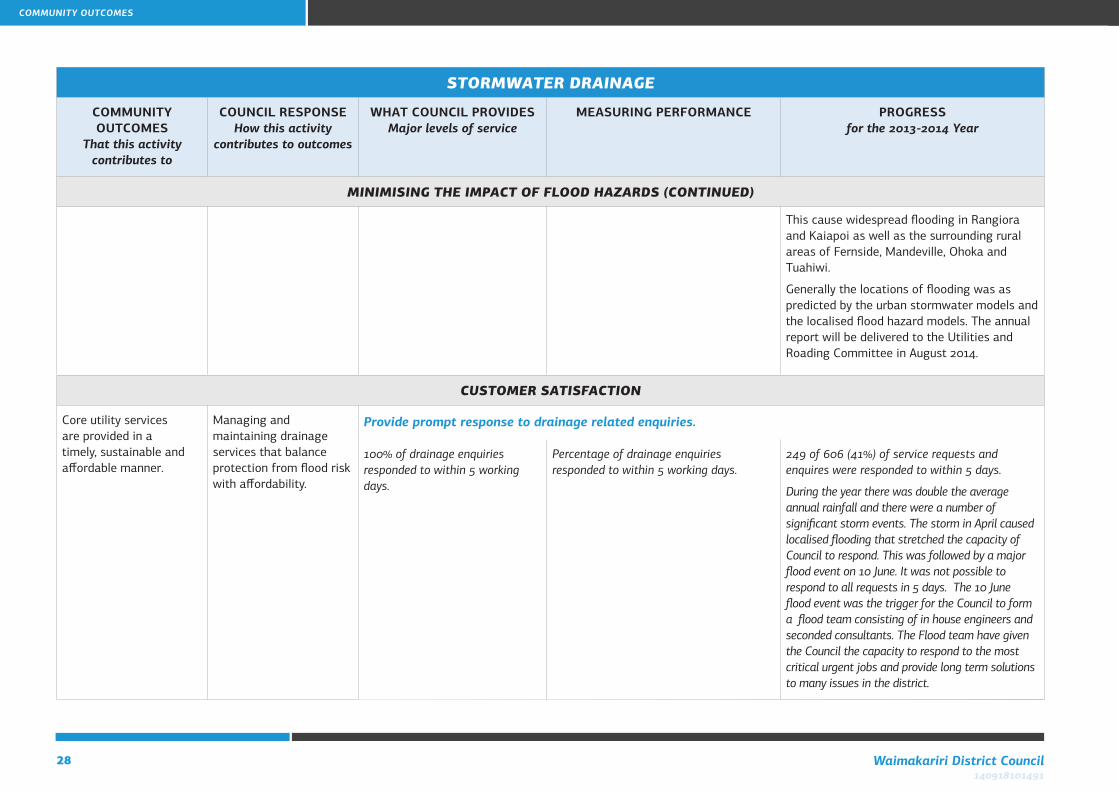
MINIMISING THE IMPACT OF FLOOD HAZARDS (CONTINUED)
This cause widespread flooding in Rangiora and Kaiapoi as well as the surrounding rural areas of Fernside, Mandeville, Ohoka and Tuahiwi.
Generally the locations of flooding was as predicted by the urban stormwater models and the localised flood hazard models. The annual report will be delivered to the Utilities and Roading Committee in August 2014.
CUSTOMER SATISFACTION
Core utility services are provided in a timely, sustainable and affordable manner.
Managing and maintaining drainage services that balance protection from flood risk with affordability.
Provide prompt response to drainage related enquiries.
100% of drainage enquiries responded to within 5 working days.
Percentage of drainage enquiries responded to within 5 working days.
249 of 606 (41%) of service requests and enquires were responded to within 5 days.
During the year there was double the average annual rainfall and there were a number of significant storm events. The storm in April caused localised flooding that stretched the capacity of Council to respond. This was followed by a major flood event on 10 June. It was not possible to respond to all requests in 5 days. The 10 June flood event was the trigger for the Council to form a flood team consisting of in house engineers and seconded consultants. The Flood team have given the Council the capacity to respond to the most critical urgent jobs and provide long term solutions to many issues in the district.
COMMUNITY OUTCOMES
29Annual Report Summary for the year ended 30 June 2014140918101491
SOLID WASTE
COMMUNITY OUTCOMES
That this activity contributes to
COUNCIL RESPONSEHow this activity
contributes to outcomes
WHAT COUNCIL PROVIDESMajor levels of service
MEASURING PERFORMANCE PROGRESSfor the 2013-2014 Year
WASTE COLLECTION
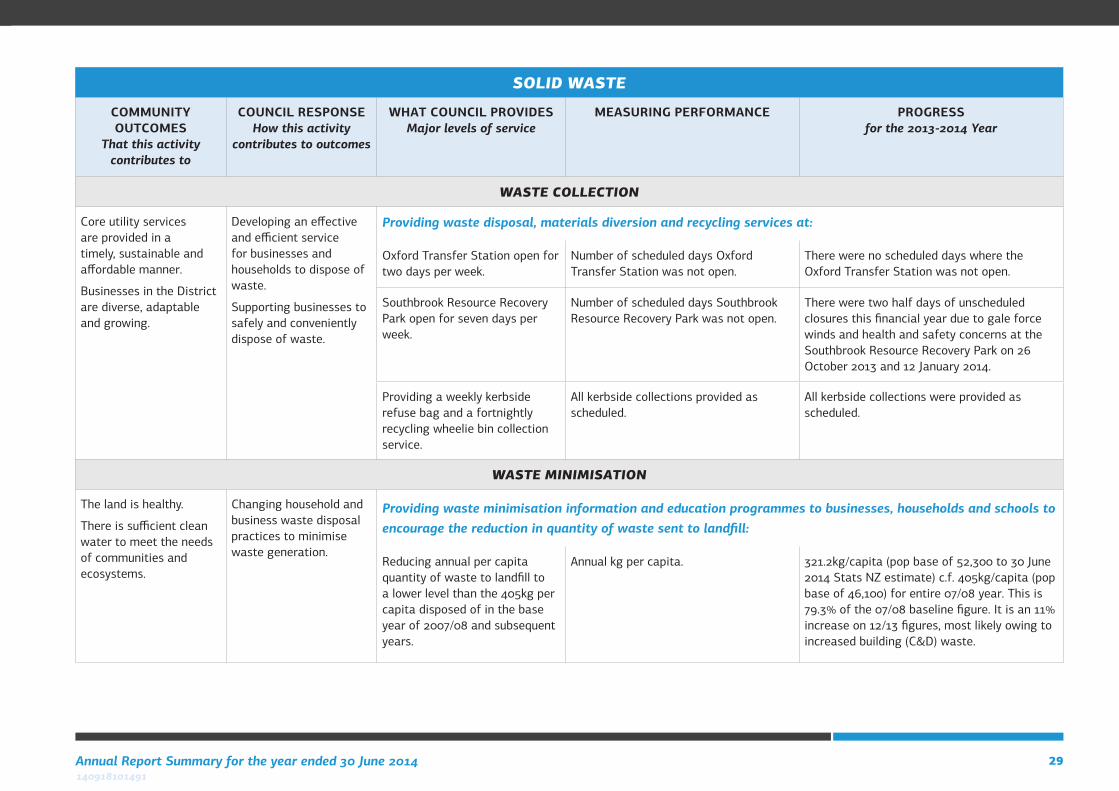
Core utility services are provided in a timely, sustainable and affordable manner.
Businesses in the District are diverse, adaptable and growing.
Developing an effective and efficient service for businesses and households to dispose of waste.
Supporting businesses to safely and conveniently dispose of waste.
Providing waste disposal, materials diversion and recycling services at:
Oxford Transfer Station open for two days per week.
Number of scheduled days Oxford Transfer Station was not open.
There were no scheduled days where the Oxford Transfer Station was not open.
Southbrook Resource Recovery Park open for seven days per week.
Number of scheduled days Southbrook Resource Recovery Park was not open.
There were two half days of unscheduled closures this financial year due to gale force winds and health and safety concerns at the Southbrook Resource Recovery Park on 26 October 2013 and 12 January 2014.
Providing a weekly kerbside refuse bag and a fortnightly recycling wheelie bin collection service.
All kerbside collections provided as scheduled.
All kerbside collections were provided as scheduled.
WASTE MINIMISATION
The land is healthy.
There is sufficient clean water to meet the needs of communities and ecosystems.
Changing household and business waste disposal practices to minimise waste generation.
Providing waste minimisation information and education programmes to businesses, households and schools to encourage the reduction in quantity of waste sent to landfill:
Reducing annual per capita quantity of waste to landfill to a lower level than the 405kg per capita disposed of in the base year of 2007/08 and subsequent years.
Annual kg per capita. 321.2kg/capita (pop base of 52,300 to 30 June 2014 Stats NZ estimate) c.f. 405kg/capita (pop base of 46,100) for entire 07/08 year. This is 79.3% of the 07/08 baseline figure. It is an 11% increase on 12/13 figures, most likely owing to increased building (C&D) waste.
30 Waimakariri District Council140918101491
RECREATION
COMMUNITY OUTCOMES
That this activity contributes to
COUNCIL RESPONSEHow this activity
contributes to outcomes
WHAT COUNCIL PROVIDESMajor levels of service
MEASURING PERFORMANCE PROGRESSfor the 2013-2014 Year
COUNCIL OWNED COMMUNITY BUILDINGS
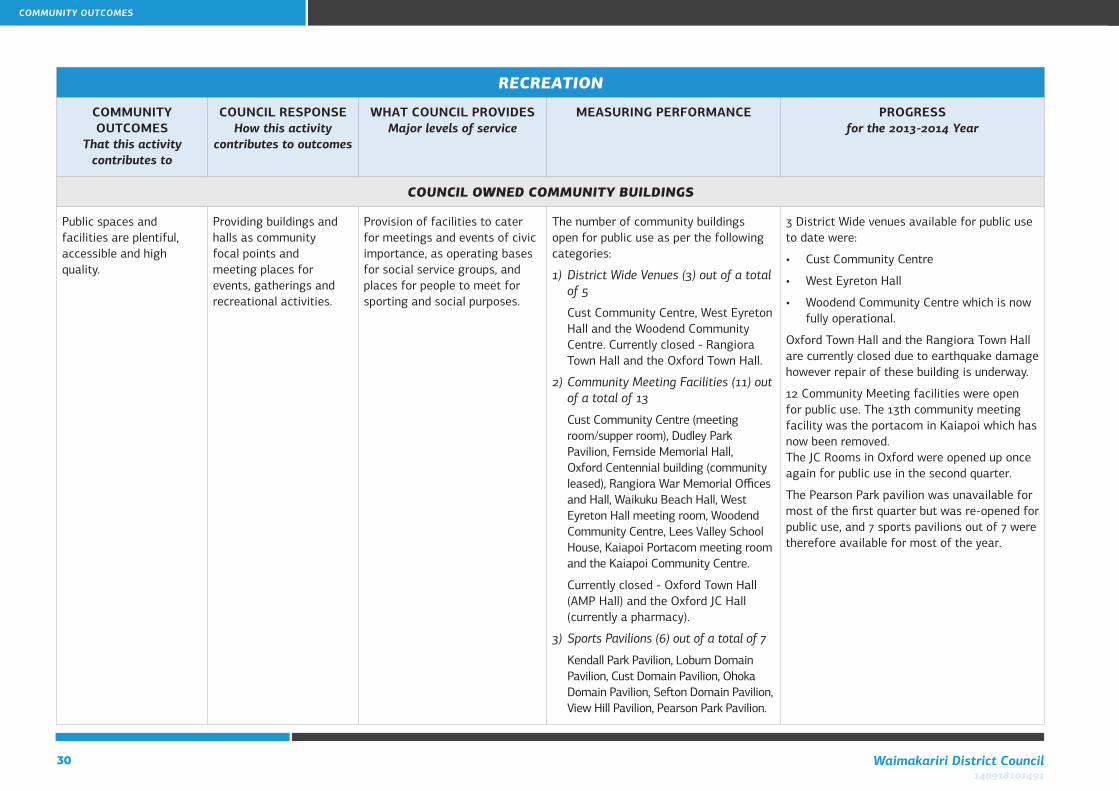
Public spaces and facilities are plentiful, accessible and high quality.
Providing buildings and halls as community focal points and meeting places for events, gatherings and recreational activities.
Provision of facilities to cater for meetings and events of civic importance, as operating bases for social service groups, and places for people to meet for sporting and social purposes.
The number of community buildings open for public use as per the following categories:
1) District Wide Venues (3) out of a total of 5
Cust Community Centre, West Eyreton Hall and the Woodend Community Centre. Currently closed - Rangiora Town Hall and the Oxford Town Hall.
2) Community Meeting Facilities (11) out of a total of 13
Cust Community Centre (meeting room/supper room), Dudley Park Pavilion, Fernside Memorial Hall, Oxford Centennial building (community leased), Rangiora War Memorial Offices and Hall, Waikuku Beach Hall, West Eyreton Hall meeting room, Woodend Community Centre, Lees Valley School House, Kaiapoi Portacom meeting room and the Kaiapoi Community Centre.
Currently closed - Oxford Town Hall (AMP Hall) and the Oxford JC Hall (currently a pharmacy).
3) Sports Pavilions (6) out of a total of 7
Kendall Park Pavilion, Loburn Domain Pavilion, Cust Domain Pavilion, Ohoka Domain Pavilion, Sefton Domain Pavilion, View Hill Pavilion, Pearson Park Pavilion.
3 District Wide venues available for public use to date were:
• CustCommunityCentre
• WestEyretonHall
• WoodendCommunityCentrewhichisnowfully operational.
Oxford Town Hall and the Rangiora Town Hall are currently closed due to earthquake damage however repair of these building is underway.
12 Community Meeting facilities were open for public use. The 13th community meeting facility was the portacom in Kaiapoi which has now been removed. The JC Rooms in Oxford were opened up once again for public use in the second quarter.
The Pearson Park pavilion was unavailable for most of the first quarter but was re-opened for public use, and 7 sports pavilions out of 7 were therefore available for most of the year.
COMMUNITY OUTCOMES
31Annual Report Summary for the year ended 30 June 2014140918101491
RECREATION
COMMUNITY OUTCOMES
That this activity contributes to
COUNCIL RESPONSEHow this activity
contributes to outcomes
WHAT COUNCIL PROVIDESMajor levels of service
MEASURING PERFORMANCE PROGRESSfor the 2013-2014 Year
AQUATIC FACILITIES
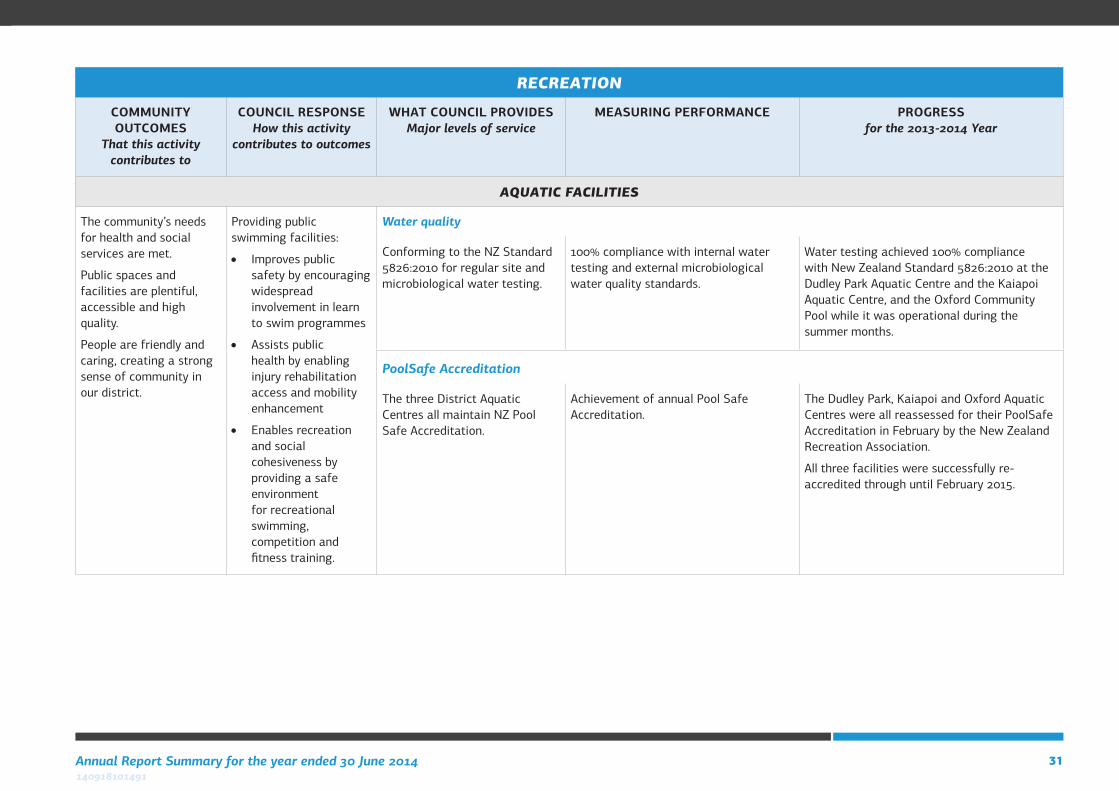
The community’s needs for health and social services are met.
Public spaces and facilities are plentiful, accessible and high quality.
People are friendly and caring, creating a strong sense of community in our district.
Providing public swimming facilities:
• Improves public safety by encouraging widespread involvement in learn to swim programmes
• Assists public health by enabling injury rehabilitation access and mobility enhancement
• Enables recreation and social cohesiveness by providing a safe environment for recreational swimming, competition and fitness training.
Water quality
Conforming to the NZ Standard 5826:2010 for regular site and microbiological water testing.
100% compliance with internal water testing and external microbiological water quality standards.
Water testing achieved 100% compliance with New Zealand Standard 5826:2010 at the Dudley Park Aquatic Centre and the Kaiapoi Aquatic Centre, and the Oxford Community Pool while it was operational during the summer months.
PoolSafe Accreditation
The three District Aquatic Centres all maintain NZ Pool Safe Accreditation.
Achievement of annual Pool Safe Accreditation.
The Dudley Park, Kaiapoi and Oxford Aquatic Centres were all reassessed for their PoolSafe Accreditation in February by the New Zealand Recreation Association.
All three facilities were successfully re-accredited through until February 2015.
32 Waimakariri District Council140918101491
LIBRARIES AND MUSEUMS
COMMUNITY OUTCOMES
That this activity contributes to
COUNCIL RESPONSEHow this activity
contributes to outcomes
WHAT COUNCIL PROVIDESMajor levels of service
MEASURING PERFORMANCE PROGRESSfor the 2013-2014 Year
LIBRARY SERVICES
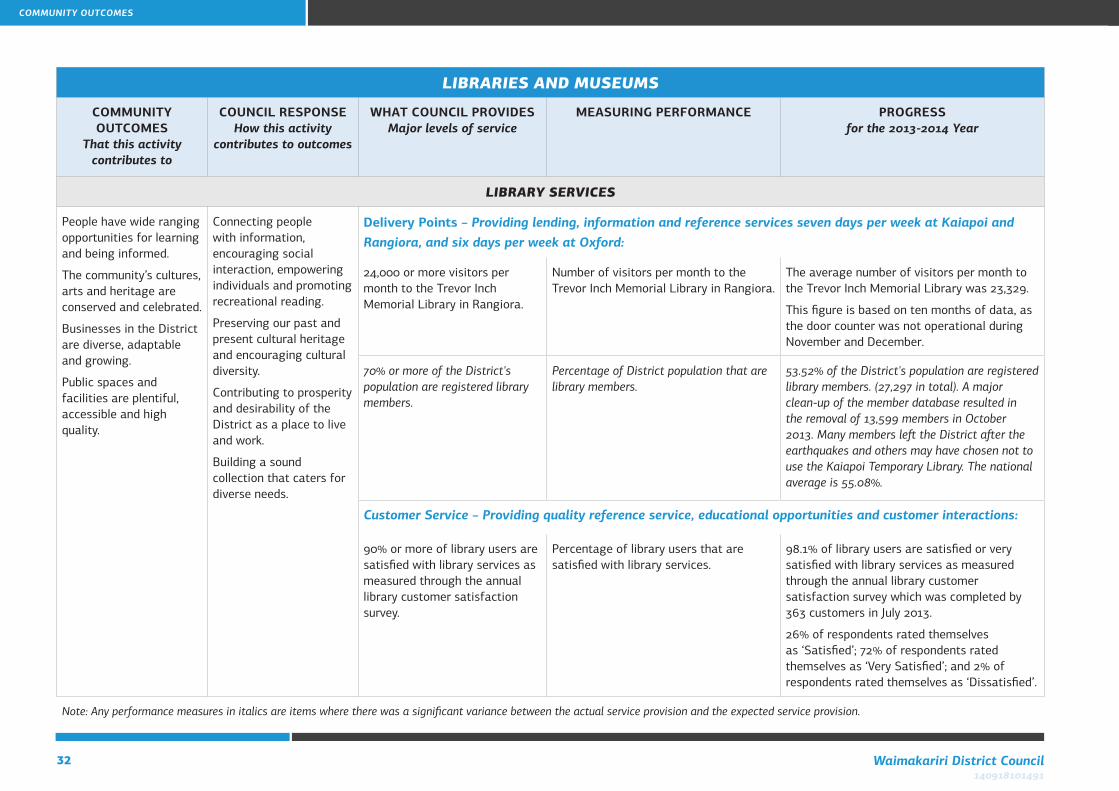
People have wide ranging opportunities for learning and being informed.
The community’s cultures, arts and heritage are conserved and celebrated.
Businesses in the District are diverse, adaptable and growing.
Public spaces and facilities are plentiful, accessible and high quality.
Connecting people with information, encouraging social interaction, empowering individuals and promoting recreational reading.
Preserving our past and present cultural heritage and encouraging cultural diversity.
Contributing to prosperity and desirability of the District as a place to live and work.
Building a sound collection that caters for diverse needs.
Delivery Points – Providing lending, information and reference services seven days per week at Kaiapoi and Rangiora, and six days per week at Oxford:
24,000 or more visitors per month to the Trevor Inch Memorial Library in Rangiora.
Number of visitors per month to the Trevor Inch Memorial Library in Rangiora.
The average number of visitors per month to the Trevor Inch Memorial Library was 23,329.
This figure is based on ten months of data, as the door counter was not operational during November and December.
70% or more of the District's population are registered library members.
Percentage of District population that are library members.
53.52% of the District's population are registered library members. (27,297 in total). A major clean-up of the member database resulted in the removal of 13,599 members in October 2013. Many members left the District after the earthquakes and others may have chosen not to use the Kaiapoi Temporary Library. The national average is 55.08%.
Customer Service – Providing quality reference service, educational opportunities and customer interactions:
90% or more of library users are satisfied with library services as measured through the annual library customer satisfaction survey.
Percentage of library users that are satisfied with library services.
98.1% of library users are satisfied or very satisfied with library services as measured through the annual library customer satisfaction survey which was completed by 363 customers in July 2013.
26% of respondents rated themselves as ‘Satisfied’; 72% of respondents rated themselves as ‘Very Satisfied’; and 2% of respondents rated themselves as ‘Dissatisfied’.
Note: Any performance measures in italics are items where there was a significant variance between the actual service provision and the expected service provision.
COMMUNITY OUTCOMES
33Annual Report Summary for the year ended 30 June 2014140918101491
COMMUNITY PROTECTION
COMMUNITY OUTCOMES
That this activity contributes to
COUNCIL RESPONSEHow this activity
contributes to outcomes
WHAT COUNCIL PROVIDESMajor levels of service
MEASURING PERFORMANCE PROGRESSfor the 2013-2014 Year
EMERGENCY MANAGEMENT
There is a safe environment for all.
People have wide ranging opportunities for learning and being informed.
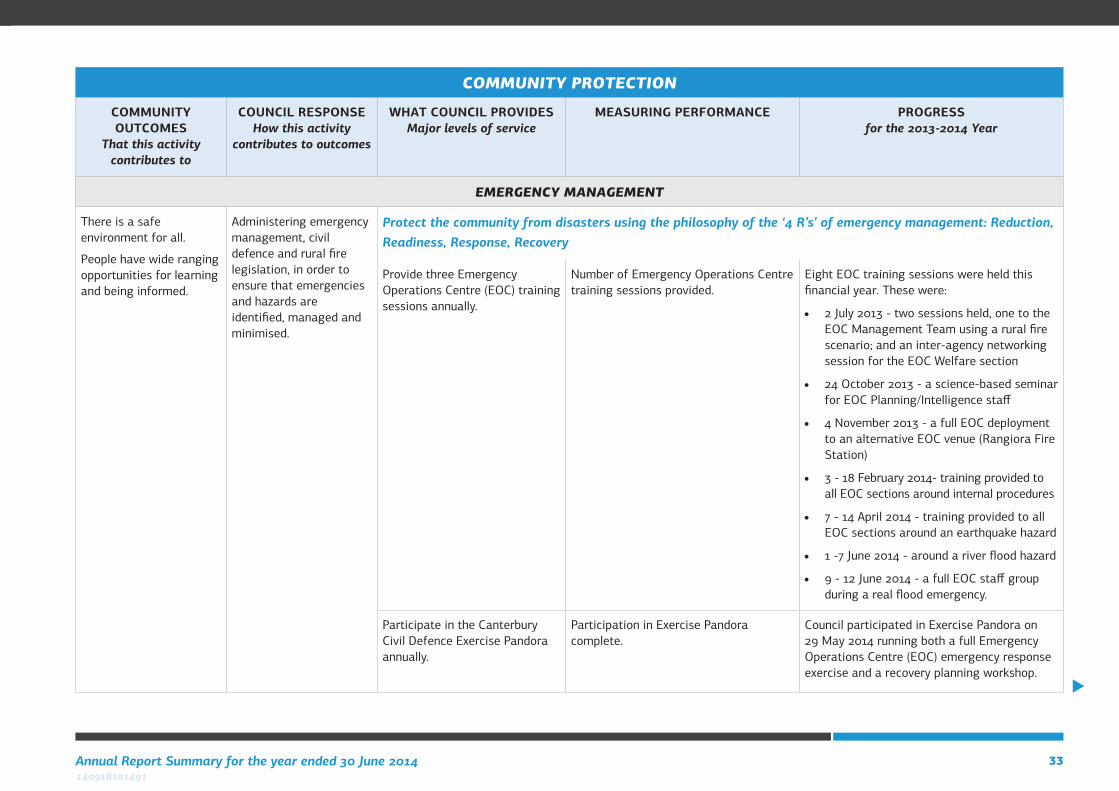
Administering emergency management, civil defence and rural fire legislation, in order to ensure that emergencies and hazards are identified, managed and minimised.
Protect the community from disasters using the philosophy of the ‘4 R’s’ of emergency management: Reduction, Readiness, Response, Recovery
Provide three Emergency Operations Centre (EOC) training sessions annually.
Number of Emergency Operations Centre training sessions provided.
Eight EOC training sessions were held this financial year. These were:
• 2 July 2013 - two sessions held, one to the EOC Management Team using a rural fire scenario; and an inter-agency networking session for the EOC Welfare section
• 24 October 2013 - a science-based seminar for EOC Planning/Intelligence staff
• 4 November 2013 - a full EOC deployment to an alternative EOC venue (Rangiora Fire Station)
• 3 - 18 February 2014- training provided to all EOC sections around internal procedures
• 7 - 14 April 2014 - training provided to all EOC sections around an earthquake hazard
• 1 -7 June 2014 - around a river flood hazard
• 9 - 12 June 2014 - a full EOC staff group during a real flood emergency.
Participate in the Canterbury Civil Defence Exercise Pandora annually.
Participation in Exercise Pandora complete.
Council participated in Exercise Pandora on 29 May 2014 running both a full Emergency Operations Centre (EOC) emergency response exercise and a recovery planning workshop.
34 Waimakariri District Council140918101491
COMMUNITY PROTECTION
COMMUNITY OUTCOMES
That this activity contributes to
COUNCIL RESPONSEHow this activity
contributes to outcomes
WHAT COUNCIL PROVIDESMajor levels of service
MEASURING PERFORMANCE PROGRESSfor the 2013-2014 Year
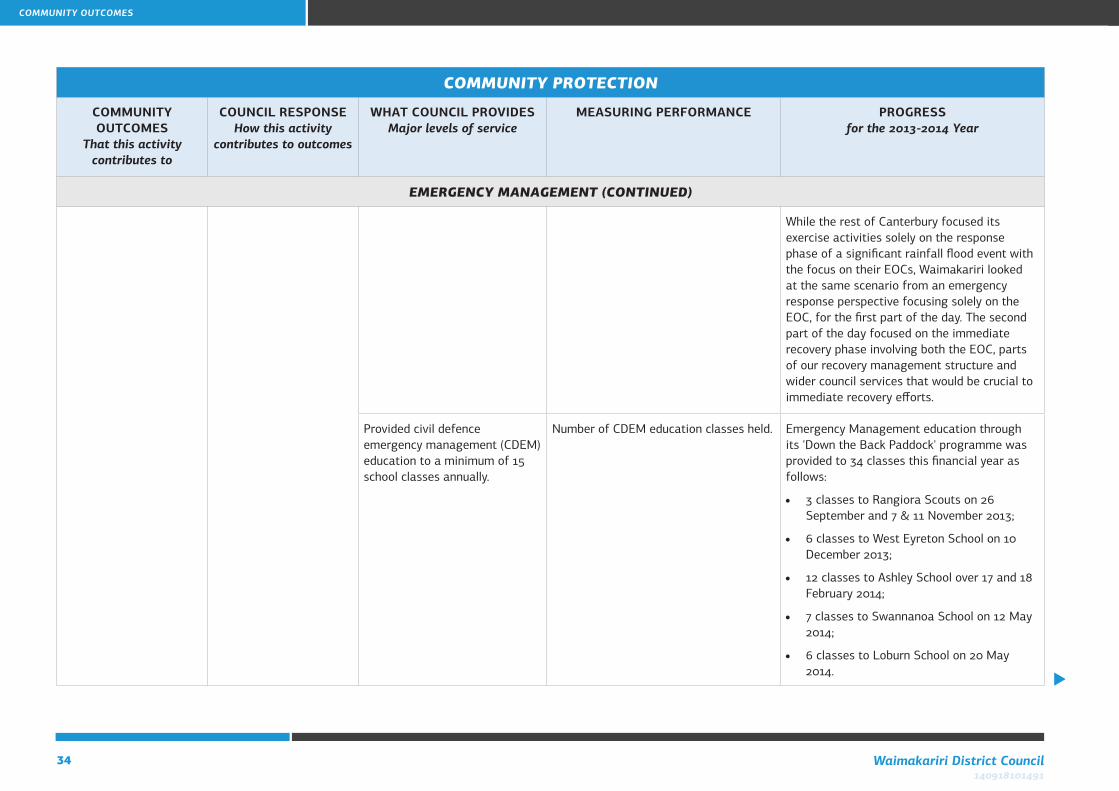
EMERGENCY MANAGEMENT (CONTINUED)
While the rest of Canterbury focused its exercise activities solely on the response phase of a significant rainfall flood event with the focus on their EOCs, Waimakariri looked at the same scenario from an emergency response perspective focusing solely on the EOC, for the first part of the day. The second part of the day focused on the immediate recovery phase involving both the EOC, parts of our recovery management structure and wider council services that would be crucial to immediate recovery efforts.
Provided civil defence emergency management (CDEM) education to a minimum of 15 school classes annually.
Number of CDEM education classes held. Emergency Management education through its 'Down the Back Paddock' programme was provided to 34 classes this financial year as follows:
• 3 classes to Rangiora Scouts on 26 September and 7 & 11 November 2013;
• 6 classes to West Eyreton School on 10 December 2013;
• 12 classes to Ashley School over 17 and 18 February 2014;
• 7 classes to Swannanoa School on 12 May 2014;
• 6 classes to Loburn School on 20 May 2014.
COMMUNITY OUTCOMES
35Annual Report Summary for the year ended 30 June 2014140918101491
COMMUNITY PROTECTION
COMMUNITY OUTCOMES
That this activity contributes to
COUNCIL RESPONSEHow this activity
contributes to outcomes
WHAT COUNCIL PROVIDESMajor levels of service
MEASURING PERFORMANCE PROGRESSfor the 2013-2014 Year
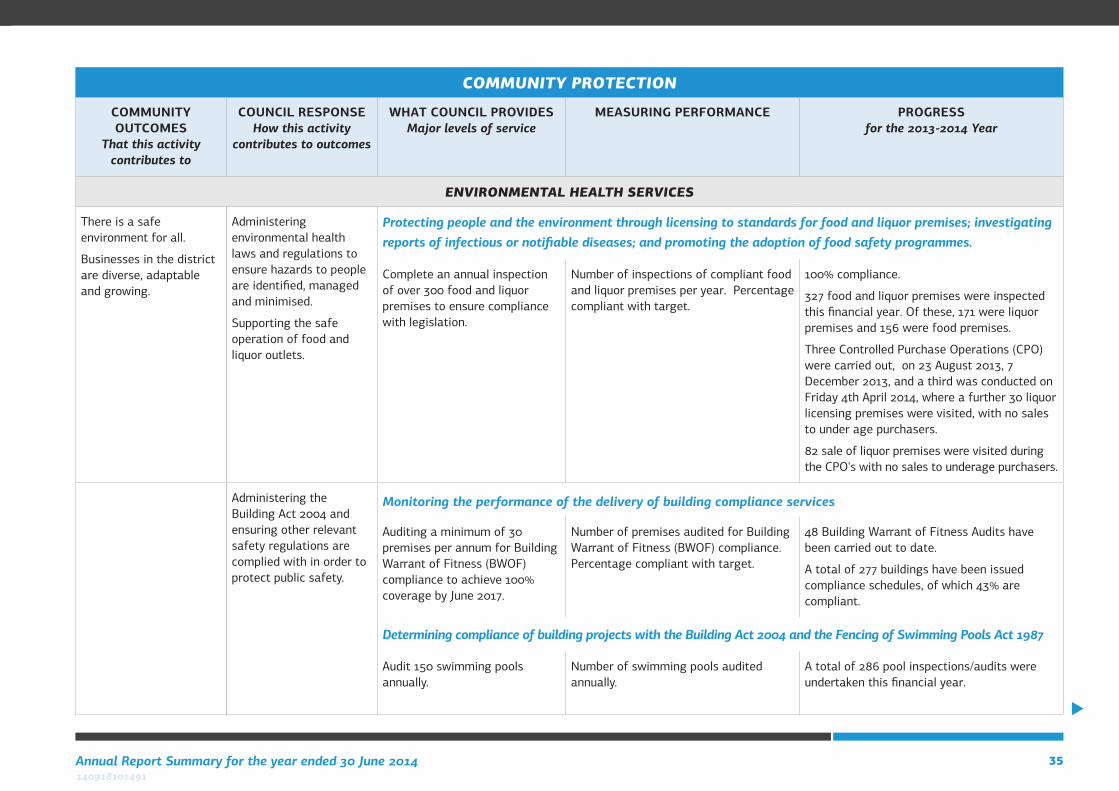
ENVIRONMENTAL HEALTH SERVICES
There is a safe environment for all.
Businesses in the district are diverse, adaptable and growing.
Administering environmental health laws and regulations to ensure hazards to people are identified, managed and minimised.
Supporting the safe operation of food and liquor outlets.
Protecting people and the environment through licensing to standards for food and liquor premises; investigating reports of infectious or notifiable diseases; and promoting the adoption of food safety programmes.
Complete an annual inspection of over 300 food and liquor premises to ensure compliance with legislation.
Number of inspections of compliant food and liquor premises per year. Percentage compliant with target.
100% compliance.
327 food and liquor premises were inspected this financial year. Of these, 171 were liquor premises and 156 were food premises.
Three Controlled Purchase Operations (CPO) were carried out, on 23 August 2013, 7 December 2013, and a third was conducted on Friday 4th April 2014, where a further 30 liquor licensing premises were visited, with no sales to under age purchasers.
82 sale of liquor premises were visited during the CPO's with no sales to underage purchasers.
Administering the Building Act 2004 and ensuring other relevant safety regulations are complied with in order to protect public safety.
Monitoring the performance of the delivery of building compliance services
Auditing a minimum of 30 premises per annum for Building Warrant of Fitness (BWOF) compliance to achieve 100% coverage by June 2017.
Number of premises audited for Building Warrant of Fitness (BWOF) compliance. Percentage compliant with target.
48 Building Warrant of Fitness Audits have been carried out to date.
A total of 277 buildings have been issued compliance schedules, of which 43% are compliant.
Determining compliance of building projects with the Building Act 2004 and the Fencing of Swimming Pools Act 1987
Audit 150 swimming pools annually.
Number of swimming pools audited annually.
A total of 286 pool inspections/audits were undertaken this financial year.
36 Waimakariri District Council140918101491
COMMUNITY PROTECTION
COMMUNITY OUTCOMES
That this activity contributes to
COUNCIL RESPONSEHow this activity
contributes to outcomes
WHAT COUNCIL PROVIDESMajor levels of service
MEASURING PERFORMANCE PROGRESSfor the 2013-2014 Year
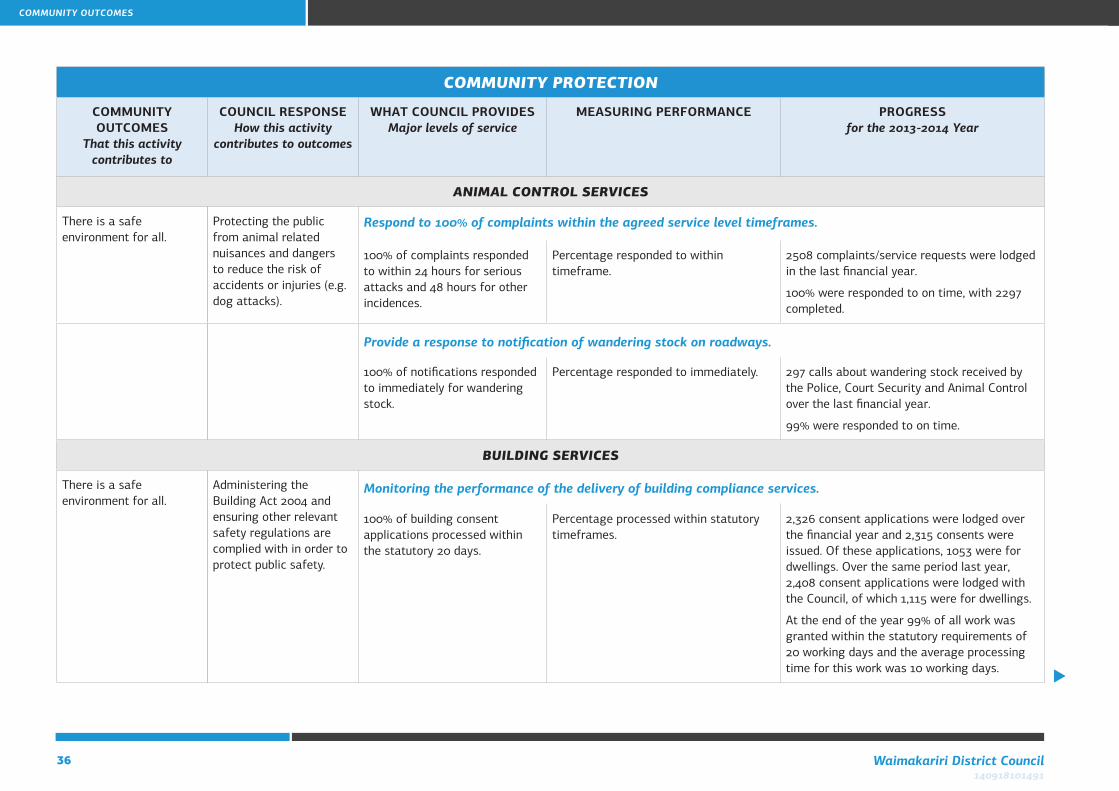
ANIMAL CONTROL SERVICES
There is a safe environment for all.
Protecting the public from animal related nuisances and dangers to reduce the risk of accidents or injuries (e.g. dog attacks).
Respond to 100% of complaints within the agreed service level timeframes.
100% of complaints responded to within 24 hours for serious attacks and 48 hours for other incidences.
Percentage responded to within timeframe.
2508 complaints/service requests were lodged in the last financial year.
100% were responded to on time, with 2297 completed.
Provide a response to notification of wandering stock on roadways.
100% of notifications responded to immediately for wandering stock.
Percentage responded to immediately. 297 calls about wandering stock received by the Police, Court Security and Animal Control over the last financial year.
99% were responded to on time.
BUILDING SERVICES
There is a safe environment for all.
Administering the Building Act 2004 and ensuring other relevant safety regulations are complied with in order to protect public safety.
Monitoring the performance of the delivery of building compliance services.
100% of building consent applications processed within the statutory 20 days.
Percentage processed within statutory timeframes.
2,326 consent applications were lodged over the financial year and 2,315 consents were issued. Of these applications, 1053 were for dwellings. Over the same period last year, 2,408 consent applications were lodged with the Council, of which 1,115 were for dwellings.
At the end of the year 99% of all work was granted within the statutory requirements of 20 working days and the average processing time for this work was 10 working days.
COMMUNITY OUTCOMES
37Annual Report Summary for the year ended 30 June 2014140918101491
COMMUNITY DEVELOPMENT
COMMUNITY OUTCOMES
That this activity contributes to
COUNCIL RESPONSEHow this activity
contributes to outcomes
WHAT COUNCIL PROVIDESMajor levels of service
MEASURING PERFORMANCE PROGRESSfor the 2013-2014 Year
STRENGTHENING COMMUNITIES
People are friendly and caring, creating a strong sense of community in our District.
The community’s needs for health and social services are met.
People have wide ranging opportunities for learning and being informed.
Fostering and supporting community inclusion, coordination, cooperation and participation at all levels.
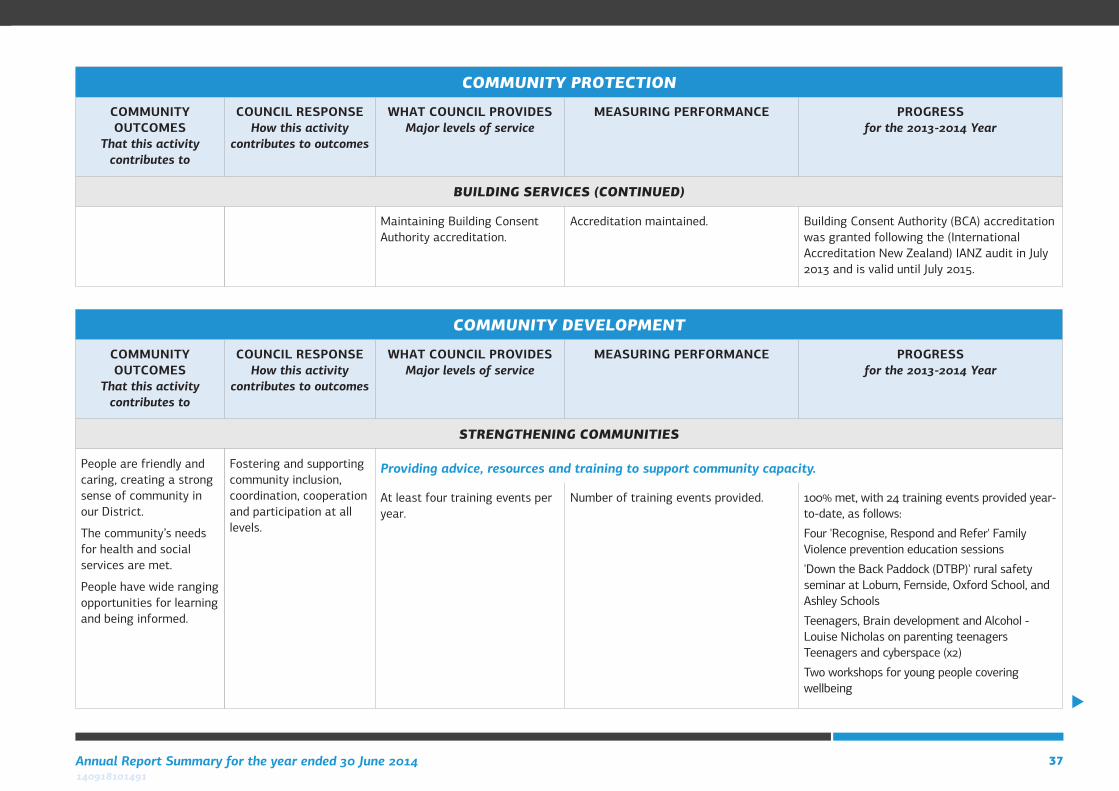
Providing advice, resources and training to support community capacity.
At least four training events per year.
Number of training events provided. 100% met, with 24 training events provided year-to-date, as follows:
Four 'Recognise, Respond and Refer' Family Violence prevention education sessions
'Down the Back Paddock (DTBP)' rural safety seminar at Loburn, Fernside, Oxford School, and Ashley Schools
Teenagers, Brain development and Alcohol - Louise Nicholas on parenting teenagers Teenagers and cyberspace (x2)
Two workshops for young people covering wellbeing
COMMUNITY PROTECTION
COMMUNITY OUTCOMES
That this activity contributes to
COUNCIL RESPONSEHow this activity
contributes to outcomes
WHAT COUNCIL PROVIDESMajor levels of service
MEASURING PERFORMANCE PROGRESSfor the 2013-2014 Year
BUILDING SERVICES (CONTINUED)
Maintaining Building Consent Authority accreditation.
Accreditation maintained. Building Consent Authority (BCA) accreditation was granted following the (International Accreditation New Zealand) IANZ audit in July 2013 and is valid until July 2015.
38 Waimakariri District Council140918101491
COMMUNITY DEVELOPMENT
COMMUNITY OUTCOMES
That this activity contributes to
COUNCIL RESPONSEHow this activity
contributes to outcomes
WHAT COUNCIL PROVIDESMajor levels of service
MEASURING PERFORMANCE PROGRESSfor the 2013-2014 Year
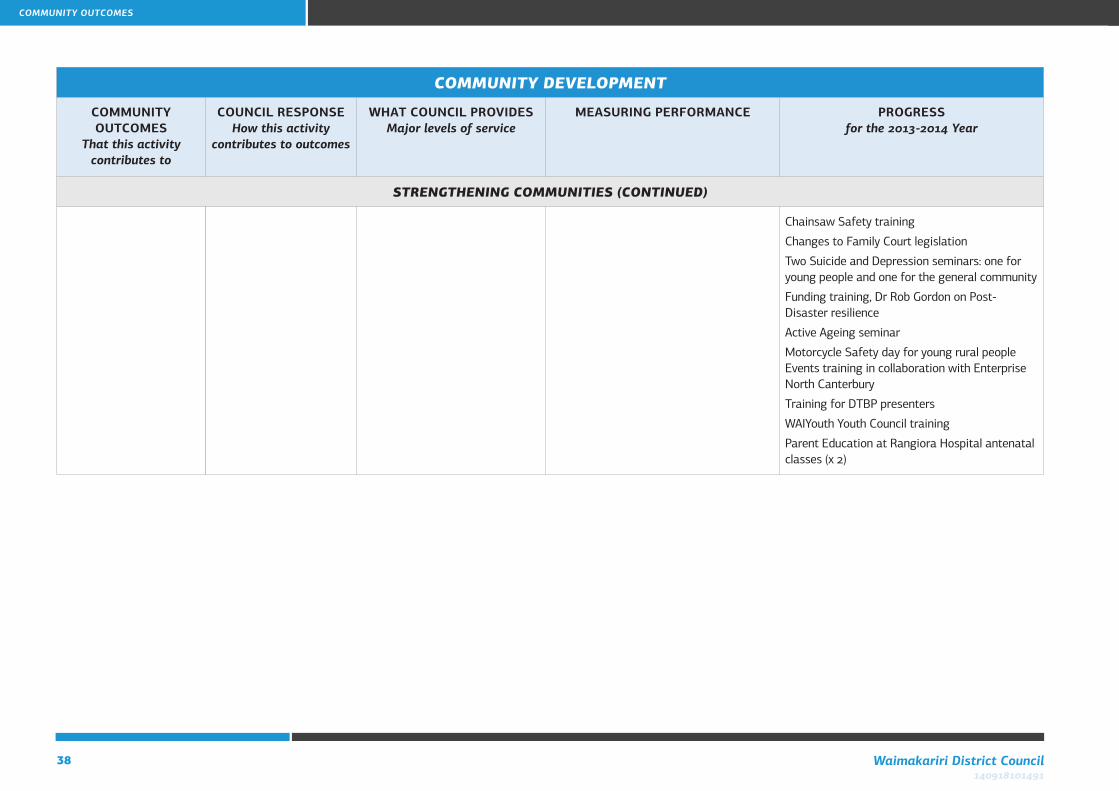
STRENGTHENING COMMUNITIES (CONTINUED)
Chainsaw Safety training
Changes to Family Court legislation
Two Suicide and Depression seminars: one for young people and one for the general community
Funding training, Dr Rob Gordon on Post-Disaster resilience
Active Ageing seminar
Motorcycle Safety day for young rural people Events training in collaboration with Enterprise North Canterbury
Training for DTBP presenters
WAIYouth Youth Council training
Parent Education at Rangiora Hospital antenatal classes (x 2)
COMMUNITY OUTCOMES
39Annual Report Summary for the year ended 30 June 2014140918101491
PROPERTY MANAGEMENT
COMMUNITY OUTCOMES
That this activity contributes to
COUNCIL RESPONSEHow this activity
contributes to outcomes
WHAT COUNCIL PROVIDESMajor levels of service
MEASURING PERFORMANCE PROGRESSfor the 2013-2014 Year
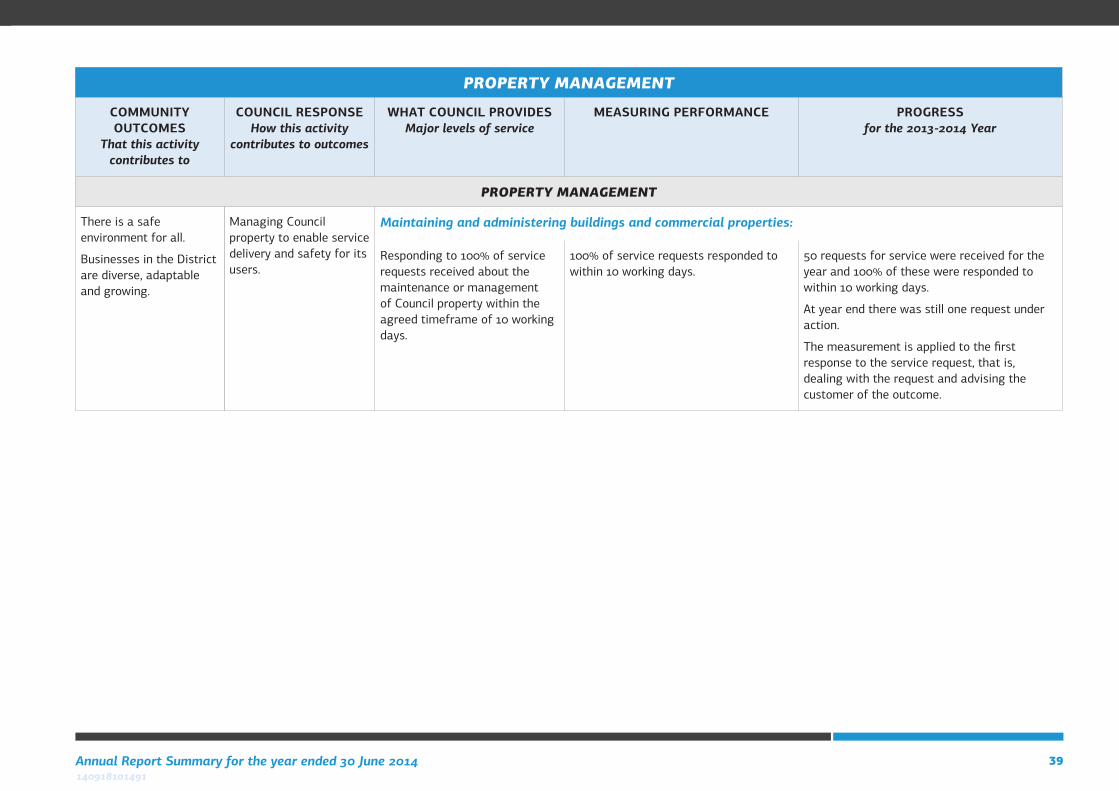
PROPERTY MANAGEMENT
There is a safe environment for all.
Businesses in the District are diverse, adaptable and growing.
Managing Council property to enable service delivery and safety for its users.
Maintaining and administering buildings and commercial properties:
Responding to 100% of service requests received about the maintenance or management of Council property within the agreed timeframe of 10 working days.
100% of service requests responded to within 10 working days.
50 requests for service were received for the year and 100% of these were responded to within 10 working days.
At year end there was still one request under action.
The measurement is applied to the first response to the service request, that is, dealing with the request and advising the customer of the outcome.
40 Waimakariri District Council140918101491
COMMUNITY OUTCOMES
EARTHQUAKE RECOVERY
COMMUNITY OUTCOMES
That this activity contributes to
COUNCIL RESPONSEHow this activity
contributes to outcomes
WHAT COUNCIL PROVIDESMajor levels of service
MEASURING PERFORMANCE PROGRESSfor the 2013-2014 Year
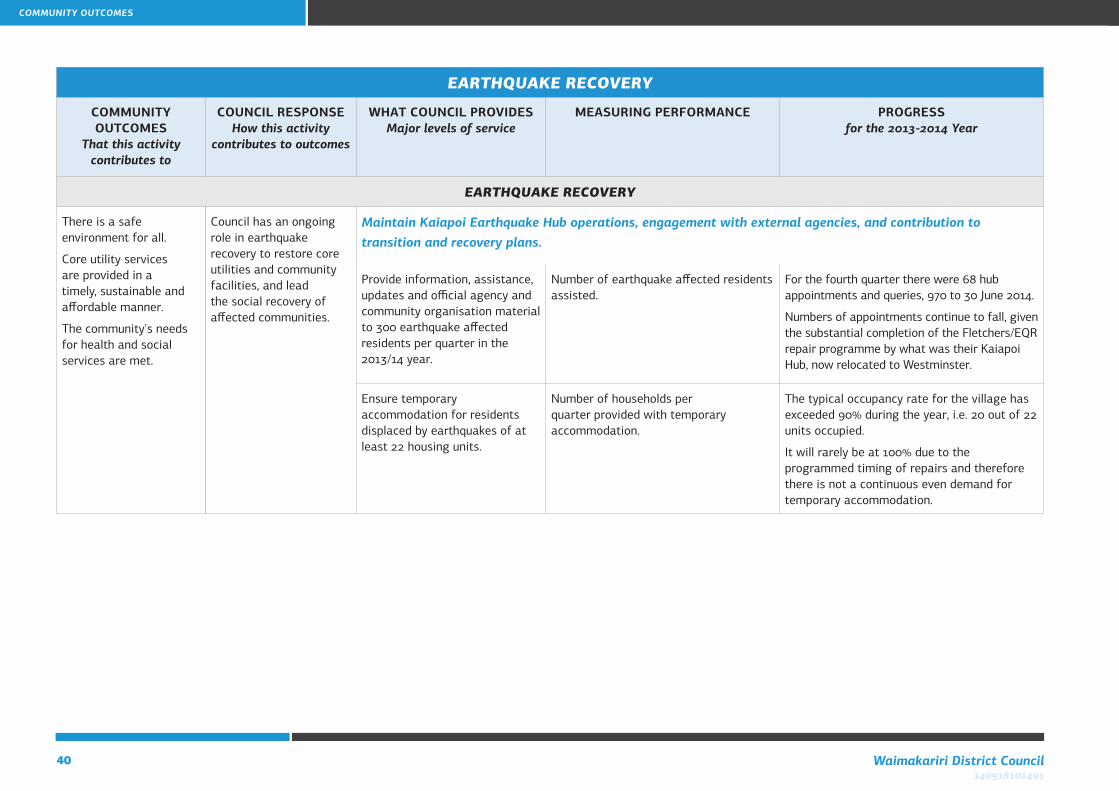
EARTHQUAKE RECOVERY
There is a safe environment for all.
Core utility services are provided in a timely, sustainable and affordable manner.
The community's needs for health and social services are met.
Council has an ongoing role in earthquake recovery to restore core utilities and community facilities, and lead the social recovery of affected communities.
Maintain Kaiapoi Earthquake Hub operations, engagement with external agencies, and contribution to transition and recovery plans.
Provide information, assistance, updates and official agency and community organisation material to 300 earthquake affected residents per quarter in the 2013/14 year.
Number of earthquake affected residents assisted.
For the fourth quarter there were 68 hub appointments and queries, 970 to 30 June 2014.
Numbers of appointments continue to fall, given the substantial completion of the Fletchers/EQR repair programme by what was their Kaiapoi Hub, now relocated to Westminster.
Ensure temporary accommodation for residents displaced by earthquakes of at least 22 housing units.
Number of households per quarter provided with temporary accommodation.
The typical occupancy rate for the village has exceeded 90% during the year, i.e. 20 out of 22 units occupied.
It will rarely be at 100% due to the programmed timing of repairs and therefore there is not a continuous even demand for temporary accommodation.
41Annual Report Summary for the year ended 30 June 2014140918101491
The summary annual report was derived from the annual report
of the Waimakariri District Council (the District Council) for
the year ended 30 June 2014. We have considered whether
the summary annual report represents, fairly and consistently,
the information regarding the major matters dealt with in the
annual report.
The annual report included full audited statements, and the
summary annual report includes summary statements. We
have audited the following summary statements reported in
the summary annual report on pages 6 to 10 and 18 to 40:
• the summary balance sheet as at 30 June 2014;
• the summaries of the income statement, statement of
comprehensive income, statement of changes in equity and
statement of cash flows for the year ended 30 June 2014;
• the notes to the summary financial statements that include
accounting policies and other explanatory information; and
• the summary statement of service provision referred to as
community outcomes of the District Council.
We expressed an unmodified audit opinion on the District Council's
full audited statements in our report dated 7 October 2014.
Opinion
In our opinion:
• the summary annual report represents, fairly and
Audit ReportINDEPENDENT AUDITOR’S REPORTTo the readers of Waimakariri District Council's summary annual report for the year ended 30 June 2014
consistently, the information regarding the major matters
dealt with in the annual report; and
• the summary statements comply with FRS-43 (PBE):
Summary Financial Statements.
Basis of opinion
Our audit was carried out in accordance with the Auditor-
General's Auditing Standards, which incorporate the
International Standards on Auditing (New Zealand), and
in particular with the International Standard on Auditing
(New Zealand) 810: Engagements to Report on Summary
Financial Statements. These standards require us to carry out
procedures to confirm whether the summary annual report
contains the information necessary, and at an appropriate
level of aggregation, so as not to be misleading.
The summary statements and the full audited statements
from which they were derived, do not reflect the effects
of events that occurred subsequent to our report dated 7
October 2014 on the full audited statements.
The summary statements do not contain all the disclosures
required for full audited statements under generally
accepted accounting practice in New Zealand. Reading
the summary statements, therefore, is not a substitute for
reading the full audited statements in the annual report of
the District Council.
Responsibilities of the Council and the Auditor
The Council is responsible for preparing the summary
annual report so that it represents, fairly and consistently,
the information regarding the major matters dealt with
in the annual report. This includes preparing summary
statements, in accordance with FRS-43 (PBE): Summary
Financial Statements. The Council is also responsible for the
publication of the summary annual report, whether in printed
or electronic form.
We are responsible for expressing an opinion on whether the
summary annual report represents, fairly and consistently,
the information regarding the major matters dealt with in
the annual report and whether the summary statements
comply with FRS-43 (PBE): Summary Financial Statements.
Other that in our capacity as auditor we have no relationship
with, or Interest in, the District Council.
John Mackey
Audit New Zealand
On behalf of the Auditor General
Christchurch, New Zealand, 17 October 2014

Annual Report Summary 2013/14
PUBLISHERWaimakariri District Council
215 High StreetPrivate Bag 1005
Rangiora 7400
Published October 2014
FileFIN-12-10
Computer File140918101491
ISSN2324-2477 (Print)
2324-2485 (Online)
COPYRIGHTCopying of this publication is encouraged,
providing the source is acknowledged.