Embed Size (px)
Citation preview
2018
ANNUAL REPORT

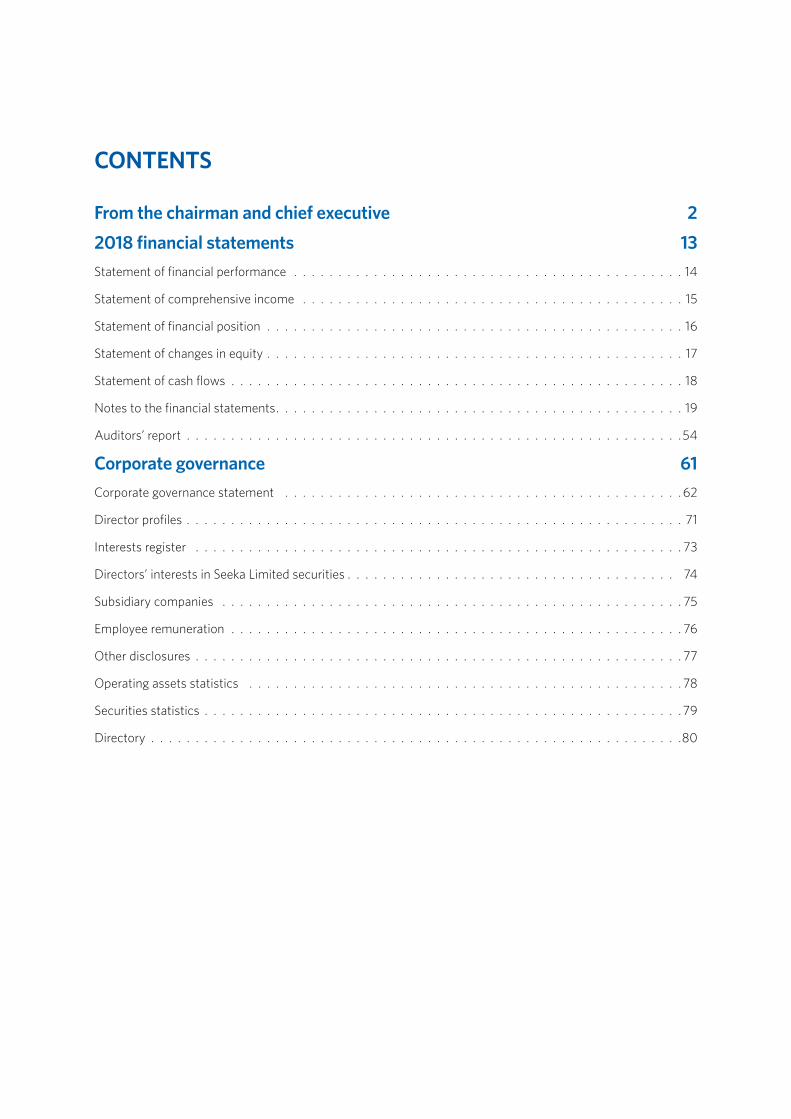
CONTENTS
From the chairman and chief executive 22018 financial statements 13Statement of financial performance 14
Statement of comprehensive income 15
Statement of financial position 16
Statement of changes in equity 17
Statement of cash flows 18
Notes to the financial statements 19
Auditors’ report 54
Corporate governance 61Corporate governance statement 62
Director profiles 71
Interests register 73
Directors’ interests in Seeka Limited securities 74
Subsidiary companies 75
Employee remuneration 76
Other disclosures 77
Operating assets statistics 78
Securities statistics 79
Directory 80
2 ANNUAL REPORT 2018 | SEEKA LIMITED
FROM THE CHAIRMAN AND CHIEF EXECUTIVE
Seeka is pleased to provide you with the 2018 financial report and review. The company successfully achieved a number of financial, operational, and strategic goals this year, grew and is well positioned for further growth.
We are expanding our coolstore capacity and packing capability to meet both growing kiwifruit production and additional market share. Through the $47.9m (net) capital raise in November 2018 we reduced the company’s borrowing from a high of $105m to a more sustainable level, aligned our debt ratios with stakeholder expectations and placed the company in a strong position for growth when opportunities arise.
The year wasn’t all straight forward with some operational challenges in Australia and in the banana business. In response to the Australian challenges the management team was restructured and new operational responsibilities assigned. Despite the challenges of 2018, the New Zealand kiwifruit operations performed well. Our net profit after tax increased by 27% to $7.42m.
A highlight for Seeka was the purchase of the Northland kiwifruit packhouse, orchards, and related business from Turners and Growers Horticulture Limited (T&G Horticulture). This significant and successful acquisition was the result of substantial planning as Seeka sought to grow its Northland operations alongside its loyal grower base. The business seamlessly transitioned mid-harvest, and performed operationally and financially to expectations. As planned, Seeka immediately commenced selling the Northland orchards to buyers prepared to commit to a long term Seeka supply contract.
At balance date 140 hectares amounting to $24.2m are recorded in the balance sheet as orchards held for sale, of which 54 hectares are sold under conditional contracts. There are 86 hectares that remain to be marketed and sold this year. The company achieved a modest gain of $0.616m on the orchards sold before year end with further gains expected in 2019. As at the 31 December 2018 Seeka is still to pay for 28 hectares of orchard as land titles are still to be finalised, and in the meantime has taken possession of them through a lease.
Seeka is further investing in the Northland business with nearly $20m in the construction of a new packhouse, packing machine and coolstores over the next two years. We are seeing a significant increase in trays supplied by new growers with 0.250m committed so far. Once complete our Northland facility will be world class and a leader in the Northland kiwifruit community.
New Zealand kiwifruit volumes rebounded in 2018. Seeka packed its second highest volume being 31.4m trays, including 10.8m trays of SunGold. In anticipation of this volume, infrastructure and personnel were put in place to ensure fruit was processed at its optimal maturity for fruit storage and quality. Fruit performance in store was good, particularly in SunGold where Seeka delivered industry leading results. Seeka conducted a safe and timely harvest without a serious incident.
Seeka faced a difficult year in Australia. While Psa-V has been confirmed in a small area of the Australian orchards, this had little impact on Seeka’s 2018 earnings. Seeka took proactive and immediate steps to limit the impact, based on the experience gained on New Zealand orchards. Psa-V has led Seeka to reconsider the varietal mix on its orchards, and the orchards coming into production will be delayed a year. The orchard development will provide significant opportunity in future years. The development plan together with management changes provide a positive outlook for the Australian business.
The banana business remains lacklustre with Seeka impairing Glassfield’s goodwill by $0.946m in the first six months of the year.
Volume growth in kiwifruit, growing in Australia through orchard improvement and development, our debt repositioning and further infrastructure investment all contribute to a positive outlook for the company.
3SEEKA LIMITED | ANNUAL REPORT 2018
HighlightsKey highlights of the 2018 financial year include:
– Profit after tax of $7.42m (2017: $5.83m), an increase of 27%
– Earnings per share of $0.37 (2017: $0.32 1), an increase of 16%
– Earnings before interest, tax, depreciation and amortisation (EBITDA) of $26.22m (2017: $23.13m), an increase of 13%
– Total of 31.4m trays of kiwifruit harvested and packed in New Zealand, an increase of 23%
– SunGold fruit conventional loss of 0.78% (industry leading), SunGold organic fruit loss 0.17% (exceptional), Hayward organic fruit loss at 1.09% (excellent), Hayward conventional fruit loss 3.73% (average)
– Completed acquisition of the T&G Horticulture post harvest facility, with five of the six kiwifruit orchards being settled, and associated business for $32.31m. Additionally purchased 19.9 hectares of Zespri SunGold licence for $5.66m for grafting
– Completed sales of Northland orchards totaling $7.00m, with the sales process continuing
– Proactive response to the Psa-V outbreak in Australia, including detecting the disease and notifying the key Australian authorities and then proactively responding to minimise impact
– Implementation of Seeka’s Australia’s orchard plan resulting in the development of 53 hectares of new kiwifruit orchards over the next five years together with the introduction of exciting new pear varieties
– Increased earnings at the Delicious Nutritious Food Company in the second year of operations delivering earnings before interest, tax and depreciation of $0.46m, (2017: $0.29m)
– Major investment plan underway to handle forward growth in volume from our growers. Upgrades at Oakside will increase packing and coolstore capacity totaling $18.56m over two years and new packhouse and coolstores at Kerikeri totaling $17.62m over two years. Both projects were underway at year end
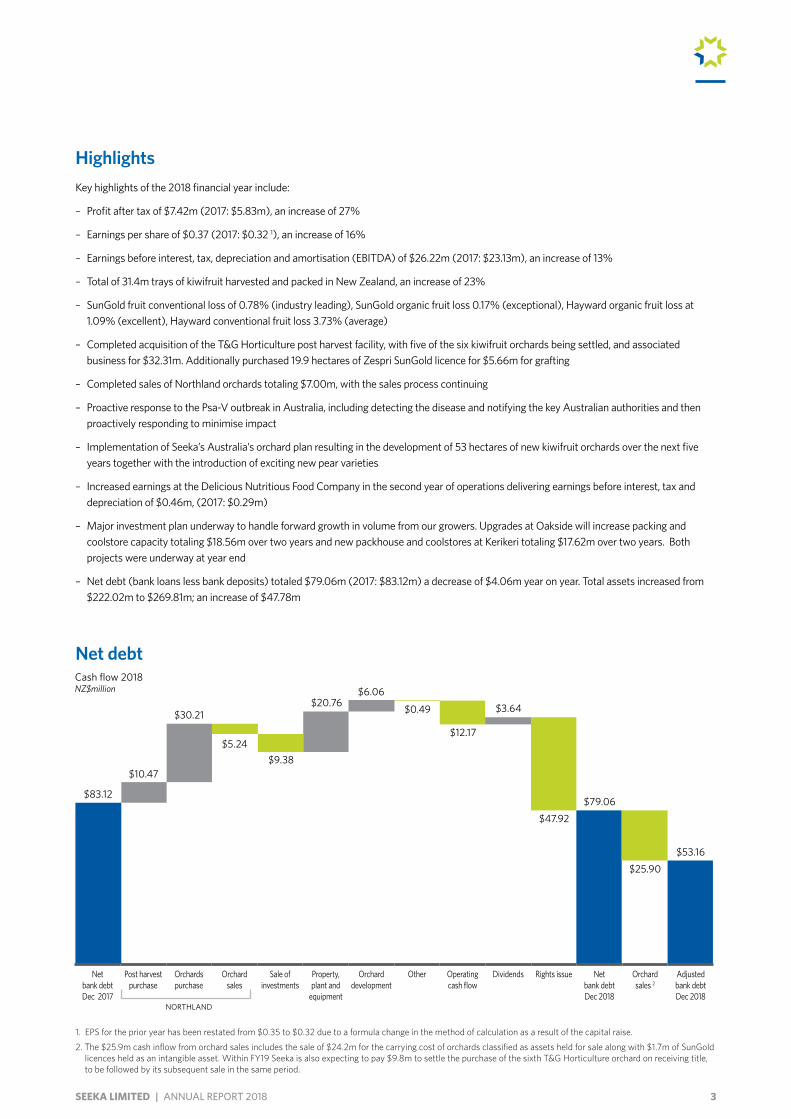
– Net debt (bank loans less bank deposits) totaled $79.06m (2017: $83.12m) a decrease of $4.06m year on year. Total assets increased from $222.02m to $269.81m; an increase of $47.78m
Net debt
$83.12
$10.47
$30.21
$5.24$9.38
$20.76$6.06
$0.49 $3.64
$47.92
$12.17
$79.06
$25.90$53.16
Cash flow 2018NZ$million
1 EPS for the prior year has been restated from $0 35 to $0 32 due to a formula change in the method of calculation as a result of the capital raise
2 The $25 9m cash inflow from orchard sales includes the sale of $24 2m for the carrying cost of orchards classified as assets held for sale along with $1 7m of SunGold licences held as an intangible asset Within FY19 Seeka is also expecting to pay $9 8m to settle the purchase of the sixth T&G Horticulture orchard on receiving title, to be followed by its subsequent sale in the same period
Net bank debt Dec 2017
Post harvest purchase
Orchards purchase
Orchard sales
Sale of investments
Property, plant and
equipment
Orchard development
Other Operating cash flow
Dividends Rights issue Net bank debt Dec 2018
Orchard sales 2
Adjusted bank debt Dec 2018
NORTHLAND
4 ANNUAL REPORT 2018 | SEEKA LIMITED
Note 1: 2018 non-recurring items
EBITDA was reduced by $0 9m ($0 7m after tax) for the gain on sale of investment in shares and gain on sale of property held for sale (see note 3) and increased by $0 5m ($0 5m after tax) for non-recurring legal expenses, including the Northland T&G acquisition (see note 18)
EBIT was increased by $0 9m ($0 9m after tax) for the impairment on intangible assets and $0 4m ($0 4m after tax) for the accelerated amortization of a supplier contract (see note 10) and $0 3m ($0 3m after tax) for the impairment of property, plant and equipment (see note 9)
These are all considered to be non-recurring items
Note 2: 2017 non-recurring items
EBITDA was reduced by $0 1m ($0 1m after tax) for insurance proceeds received
EBIT was increased by $2 0m ($1 4m after tax) for the impairment on intangible assets (see note 10) and $0 1m ($0 1m after tax) for the impairment of property, plant and equipment (see note 9) EBIT was reduced by $1 4m ($1 0m after tax) for the revaluation of land and buildings and interest in leased land (see note 4)
These are all considered to be non-recurring items
New Zealand dollars
Reported result
December 2017
Non-recurring items (Note 2)
December 2017
underlying trading result)
Reported result
December 2018
Non-recurring items (Note 1)
December 2018
underlying trading result
(Decrease) / increase to
reported 2017 result
(Decrease) / increase to
underlying 2017
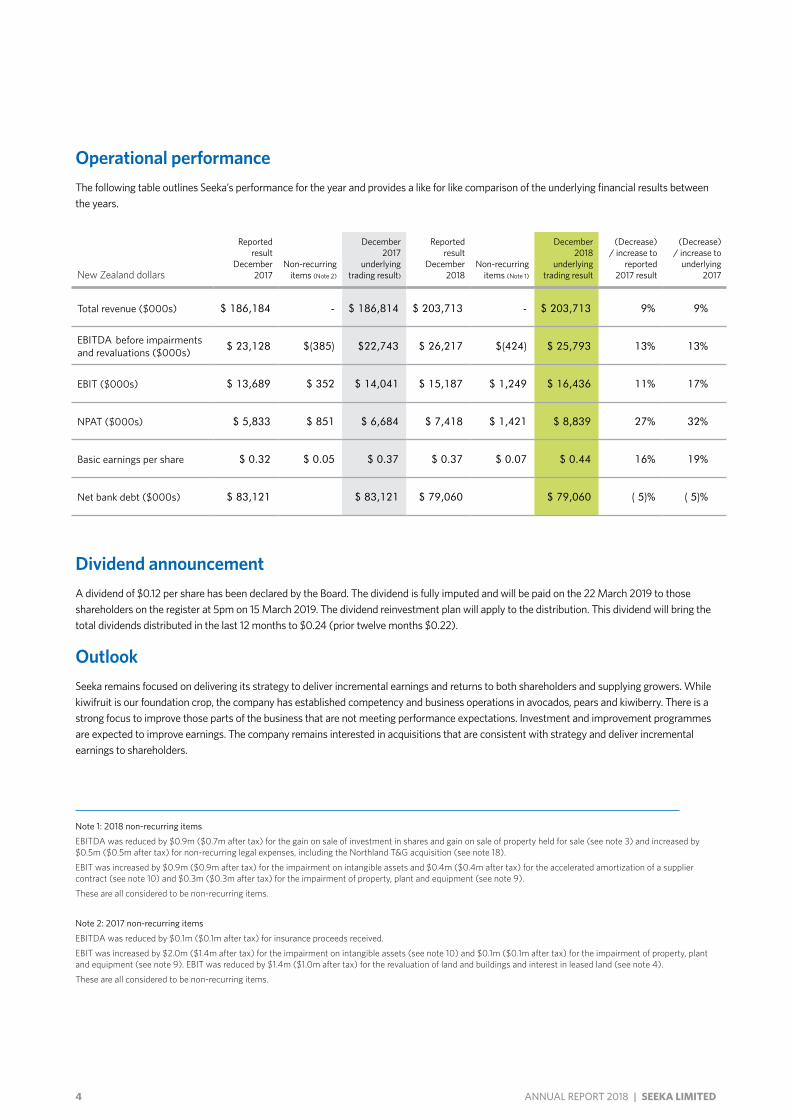
Total revenue ($000s) $ 186,184 - $ 186,814 $ 203,713 - $ 203,713 9% 9%
EBITDA before impairments and revaluations ($000s) $ 23,128 $(385) $22,743 $ 26,217 $(424) $ 25,793 13% 13%
EBIT ($000s) $ 13,689 $ 352 $ 14,041 $ 15,187 $ 1,249 $ 16,436 11% 17%
NPAT ($000s) $ 5,833 $ 851 $ 6,684 $ 7,418 $ 1,421 $ 8,839 27% 32%
Basic earnings per share $ 0.32 $ 0.05 $ 0.37 $ 0.37 $ 0.07 $ 0.44 16% 19%
Net bank debt ($000s) $ 83,121 $ 83,121 $ 79,060 $ 79,060 ( 5)% ( 5)%
Operational performanceThe following table outlines Seeka’s performance for the year and provides a like for like comparison of the underlying financial results between the years.
Dividend announcementA dividend of $0.12 per share has been declared by the Board. The dividend is fully imputed and will be paid on the 22 March 2019 to those shareholders on the register at 5pm on 15 March 2019. The dividend reinvestment plan will apply to the distribution. This dividend will bring the total dividends distributed in the last 12 months to $0.24 (prior twelve months $0.22).
OutlookSeeka remains focused on delivering its strategy to deliver incremental earnings and returns to both shareholders and supplying growers. While kiwifruit is our foundation crop, the company has established competency and business operations in avocados, pears and kiwiberry. There is a strong focus to improve those parts of the business that are not meeting performance expectations. Investment and improvement programmes are expected to improve earnings. The company remains interested in acquisitions that are consistent with strategy and deliver incremental earnings to shareholders.
5SEEKA LIMITED | ANNUAL REPORT 2018
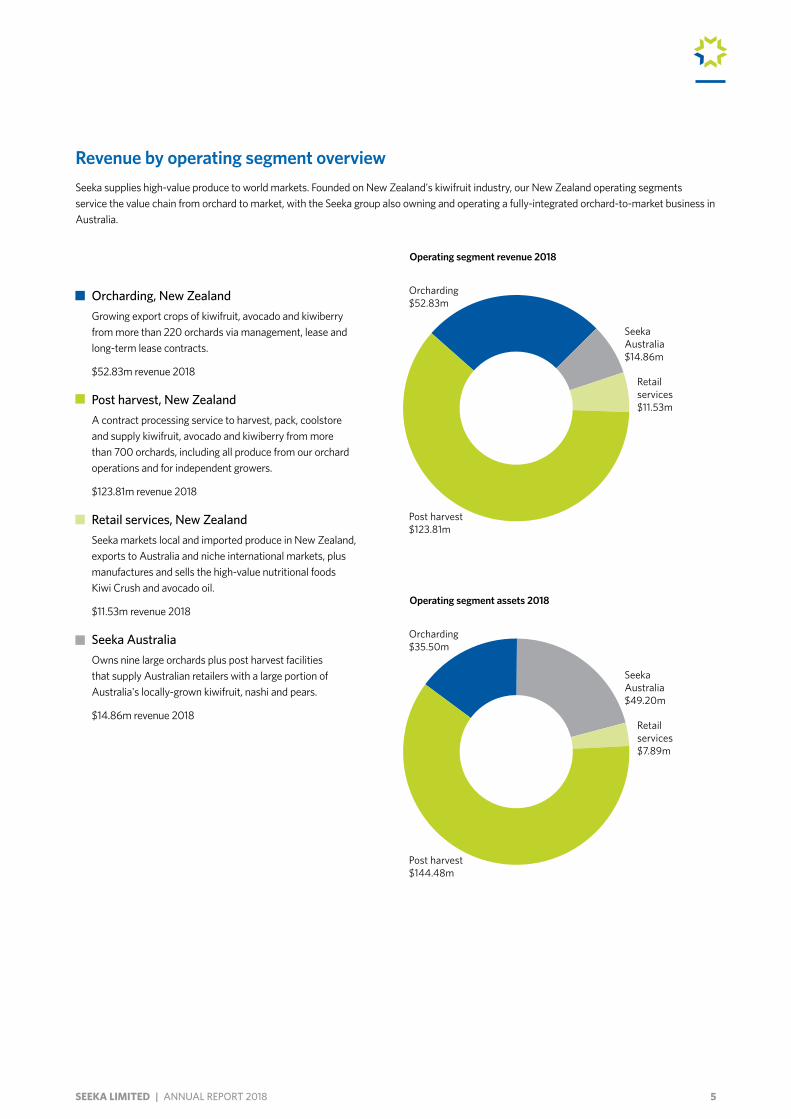
Orcharding $52.83m
Orcharding $35.50m
Post harvest $123.81m
Post harvest $144.48m
Retail services $11.53m
Retail services $7.89m
Seeka Australia $14.86m
Seeka Australia $49.20m
Operating segment revenue 2018
Operating segment assets 2018
Revenue by operating segment overviewSeeka supplies high-value produce to world markets. Founded on New Zealand's kiwifruit industry, our New Zealand operating segments service the value chain from orchard to market, with the Seeka group also owning and operating a fully-integrated orchard-to-market business in Australia.
Orcharding, New ZealandGrowing export crops of kiwifruit, avocado and kiwiberry from more than 220 orchards via management, lease and long-term lease contracts.
$52.83m revenue 2018
Post harvest, New ZealandA contract processing service to harvest, pack, coolstore and supply kiwifruit, avocado and kiwiberry from more than 700 orchards, including all produce from our orchard operations and for independent growers.
$123.81m revenue 2018
Retail services, New ZealandSeeka markets local and imported produce in New Zealand, exports to Australia and niche international markets, plus manufactures and sells the high-value nutritional foods Kiwi Crush and avocado oil.
$11.53m revenue 2018
Seeka Australia Owns nine large orchards plus post harvest facilities that supply Australian retailers with a large portion of Australia's locally-grown kiwifruit, nashi and pears.
$14.86m revenue 2018
6 ANNUAL REPORT 2018 | SEEKA LIMITED
7SEEKA LIMITED | ANNUAL REPORT 2018
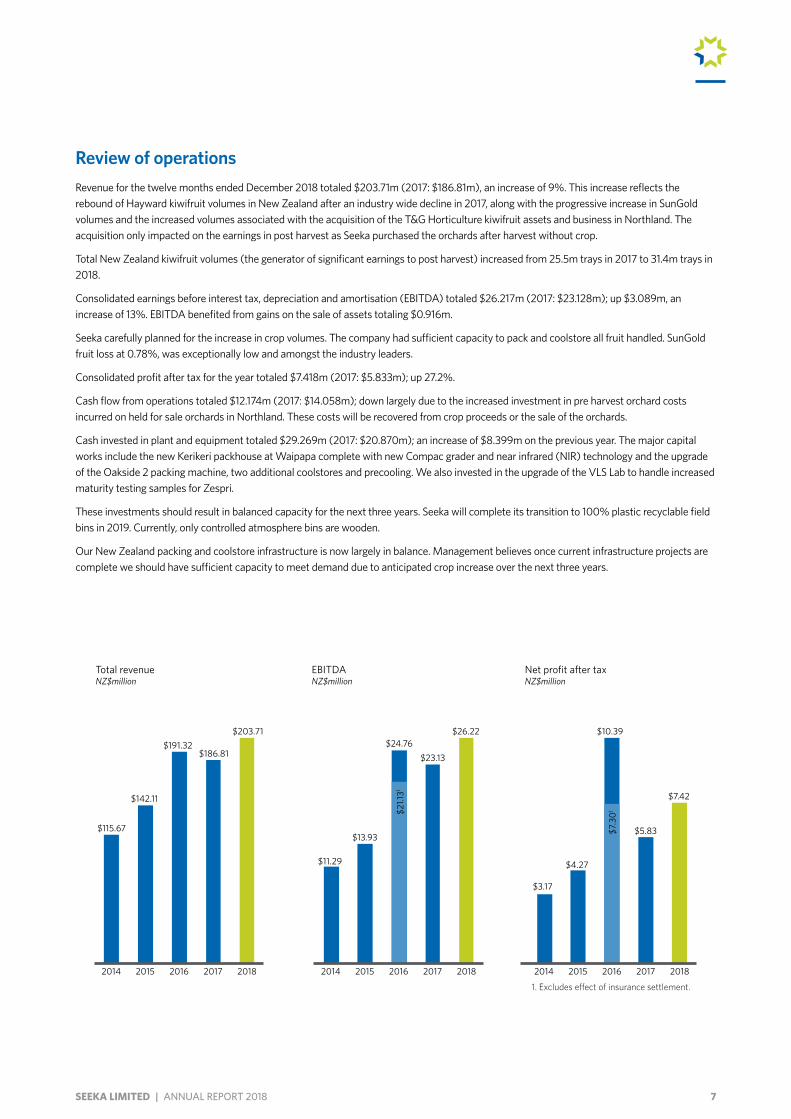
Review of operationsRevenue for the twelve months ended December 2018 totaled $203.71m (2017: $186.81m), an increase of 9%. This increase reflects the rebound of Hayward kiwifruit volumes in New Zealand after an industry wide decline in 2017, along with the progressive increase in SunGold volumes and the increased volumes associated with the acquisition of the T&G Horticulture kiwifruit assets and business in Northland. The acquisition only impacted on the earnings in post harvest as Seeka purchased the orchards after harvest without crop.
Total New Zealand kiwifruit volumes (the generator of significant earnings to post harvest) increased from 25.5m trays in 2017 to 31.4m trays in 2018.
Consolidated earnings before interest tax, depreciation and amortisation (EBITDA) totaled $26.217m (2017: $23.128m); up $3.089m, an increase of 13%. EBITDA benefited from gains on the sale of assets totaling $0.916m.
Seeka carefully planned for the increase in crop volumes. The company had sufficient capacity to pack and coolstore all fruit handled. SunGold fruit loss at 0.78%, was exceptionally low and amongst the industry leaders.
Consolidated profit after tax for the year totaled $7.418m (2017: $5.833m); up 27.2%.
Cash flow from operations totaled $12.174m (2017: $14.058m); down largely due to the increased investment in pre harvest orchard costs incurred on held for sale orchards in Northland. These costs will be recovered from crop proceeds or the sale of the orchards.
Cash invested in plant and equipment totaled $29.269m (2017: $20.870m); an increase of $8.399m on the previous year. The major capital works include the new Kerikeri packhouse at Waipapa complete with new Compac grader and near infrared (NIR) technology and the upgrade of the Oakside 2 packing machine, two additional coolstores and precooling. We also invested in the upgrade of the VLS Lab to handle increased maturity testing samples for Zespri.
These investments should result in balanced capacity for the next three years. Seeka will complete its transition to 100% plastic recyclable field bins in 2019. Currently, only controlled atmosphere bins are wooden.
Our New Zealand packing and coolstore infrastructure is now largely in balance. Management believes once current infrastructure projects are complete we should have sufficient capacity to meet demand due to anticipated crop increase over the next three years.
$191.32$186.81
Total revenueNZ$million
$115.67
$142.11
2014 2015 2016 2017 2018 2014 2015 2016 2017 2018
$11.29
$13.93
$24.76$23.13
EBITDANZ$million
$3.17
$4.27
$10.39
$5.83
2014 2015 2016 2017 2018
$203.71 $26.22
$7.42
Net profit after taxNZ$million
$21.1
31
1 Excludes effect of insurance settlement
$7.3
01
8 ANNUAL REPORT 2018 | SEEKA LIMITED
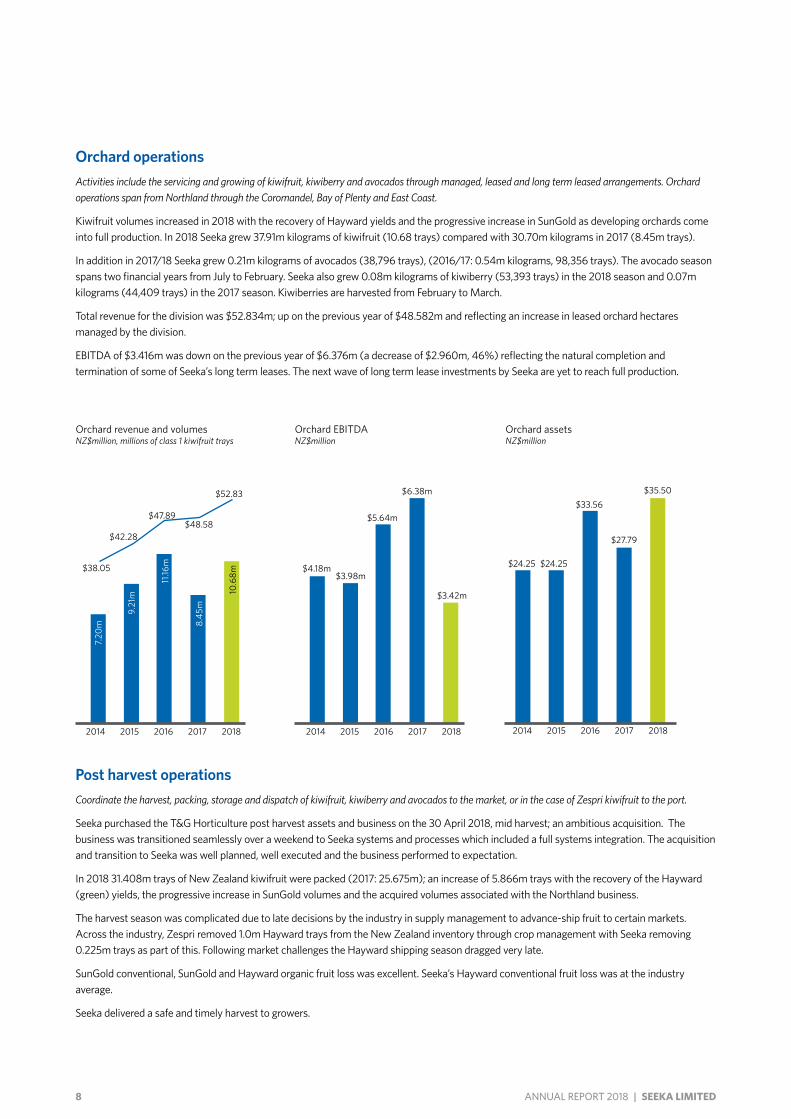
Orchard operations Activities include the servicing and growing of kiwifruit, kiwiberry and avocados through managed, leased and long term leased arrangements. Orchard operations span from Northland through the Coromandel, Bay of Plenty and East Coast.
Kiwifruit volumes increased in 2018 with the recovery of Hayward yields and the progressive increase in SunGold as developing orchards come into full production. In 2018 Seeka grew 37.91m kilograms of kiwifruit (10.68 trays) compared with 30.70m kilograms in 2017 (8.45m trays).
In addition in 2017/18 Seeka grew 0.21m kilograms of avocados (38,796 trays), (2016/17: 0.54m kilograms, 98,356 trays). The avocado season spans two financial years from July to February. Seeka also grew 0.08m kilograms of kiwiberry (53,393 trays) in the 2018 season and 0.07m kilograms (44,409 trays) in the 2017 season. Kiwiberries are harvested from February to March.
Total revenue for the division was $52.834m; up on the previous year of $48.582m and reflecting an increase in leased orchard hectares managed by the division.
EBITDA of $3.416m was down on the previous year of $6.376m (a decrease of $2.960m, 46%) reflecting the natural completion and termination of some of Seeka’s long term leases. The next wave of long term lease investments by Seeka are yet to reach full production.
11.16
m
8.45
m
10.6
8m
2014 2015 2016 2017 2018
7.20
m
9.21
m
Orchard revenue and volumesNZ$million, millions of class 1 kiwifruit trays
$4.18m$3.98m
$5.64m
$6.38m
$3.42m
2014 2015 2016 2017 2018
Orchard EBITDANZ$million
Orchard assetsNZ$million
$24.25 $24.25
2014 2015 2016 2017 2018
$33.56
$27.79
$35.50
$38.05
$42.28
$47.89$48.58
$52.83
Post harvest operations Coordinate the harvest, packing, storage and dispatch of kiwifruit, kiwiberry and avocados to the market, or in the case of Zespri kiwifruit to the port.
Seeka purchased the T&G Horticulture post harvest assets and business on the 30 April 2018, mid harvest; an ambitious acquisition. The business was transitioned seamlessly over a weekend to Seeka systems and processes which included a full systems integration. The acquisition and transition to Seeka was well planned, well executed and the business performed to expectation.
In 2018 31.408m trays of New Zealand kiwifruit were packed (2017: 25.675m); an increase of 5.866m trays with the recovery of the Hayward (green) yields, the progressive increase in SunGold volumes and the acquired volumes associated with the Northland business.
The harvest season was complicated due to late decisions by the industry in supply management to advance-ship fruit to certain markets. Across the industry, Zespri removed 1.0m Hayward trays from the New Zealand inventory through crop management with Seeka removing 0.225m trays as part of this. Following market challenges the Hayward shipping season dragged very late.
SunGold conventional, SunGold and Hayward organic fruit loss was excellent. Seeka’s Hayward conventional fruit loss was at the industry average.
Seeka delivered a safe and timely harvest to growers.
9SEEKA LIMITED | ANNUAL REPORT 2018
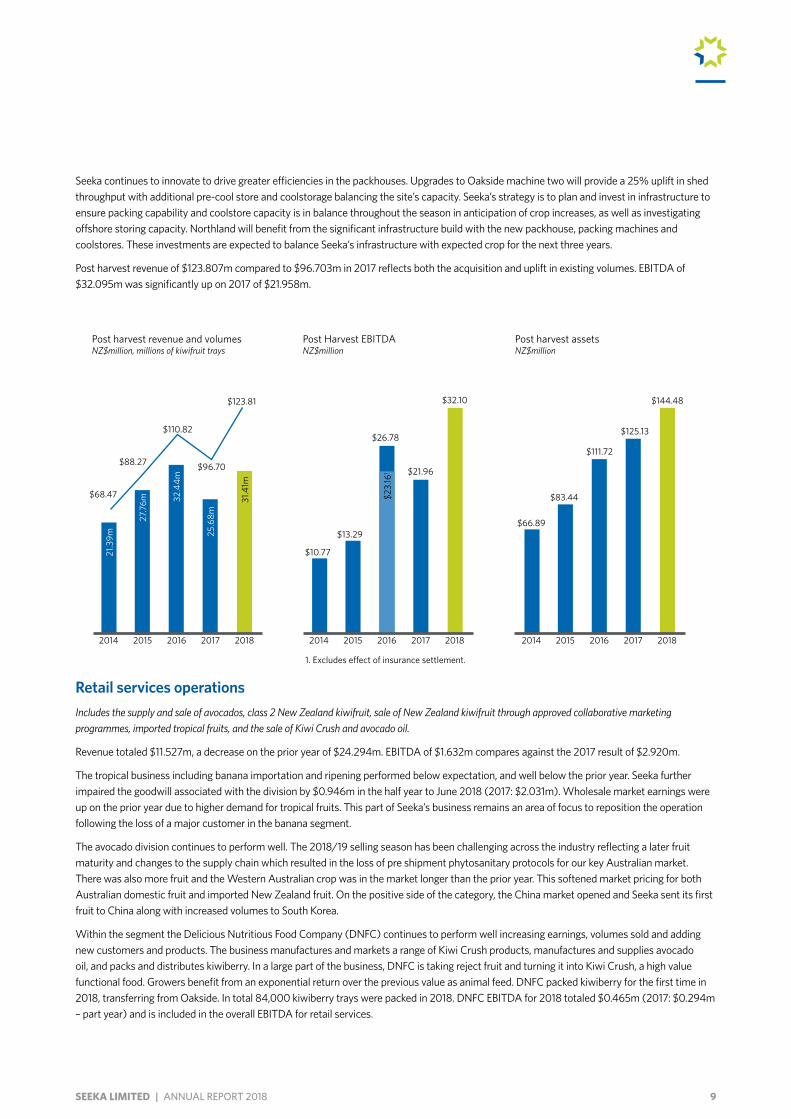
Seeka continues to innovate to drive greater efficiencies in the packhouses. Upgrades to Oakside machine two will provide a 25% uplift in shed throughput with additional pre-cool store and coolstorage balancing the site’s capacity. Seeka’s strategy is to plan and invest in infrastructure to ensure packing capability and coolstore capacity is in balance throughout the season in anticipation of crop increases, as well as investigating offshore storing capacity. Northland will benefit from the significant infrastructure build with the new packhouse, packing machines and coolstores. These investments are expected to balance Seeka’s infrastructure with expected crop for the next three years.
Post harvest revenue of $123.807m compared to $96.703m in 2017 reflects both the acquisition and uplift in existing volumes. EBITDA of $32.095m was significantly up on 2017 of $21.958m.
Post harvest revenue and volumesNZ$million, millions of kiwifruit trays
Post harvest assetsNZ$million
21.3
9m
27.7
6m 32.4
4m
25.6
8m
31.4
1m
2014 2015 2016 2017 2018
1. Excludes effect of insurance settlement.
Post Harvest EBITDANZ$million
$10.77
$13.29
2014 2015 2016 2017 2018
$26.78
$21.96
$32.10$2
3.16
1
$66.89
$83.44
2014 2015 2016 2017 2018
$111.72
$125.13
$144.48
$68.47
$88.27
$110.82
$96.70
$123.81
Retail services operationsIncludes the supply and sale of avocados, class 2 New Zealand kiwifruit, sale of New Zealand kiwifruit through approved collaborative marketing programmes, imported tropical fruits, and the sale of Kiwi Crush and avocado oil.
Revenue totaled $11.527m, a decrease on the prior year of $24.294m. EBITDA of $1.632m compares against the 2017 result of $2.920m.
The tropical business including banana importation and ripening performed below expectation, and well below the prior year. Seeka further impaired the goodwill associated with the division by $0.946m in the half year to June 2018 (2017: $2.031m). Wholesale market earnings were up on the prior year due to higher demand for tropical fruits. This part of Seeka’s business remains an area of focus to reposition the operation following the loss of a major customer in the banana segment.
The avocado division continues to perform well. The 2018/19 selling season has been challenging across the industry reflecting a later fruit maturity and changes to the supply chain which resulted in the loss of pre shipment phytosanitary protocols for our key Australian market. There was also more fruit and the Western Australian crop was in the market longer than the prior year. This softened market pricing for both Australian domestic fruit and imported New Zealand fruit. On the positive side of the category, the China market opened and Seeka sent its first fruit to China along with increased volumes to South Korea.
Within the segment the Delicious Nutritious Food Company (DNFC) continues to perform well increasing earnings, volumes sold and adding new customers and products. The business manufactures and markets a range of Kiwi Crush products, manufactures and supplies avocado oil, and packs and distributes kiwiberry. In a large part of the business, DNFC is taking reject fruit and turning it into Kiwi Crush, a high value functional food. Growers benefit from an exponential return over the previous value as animal feed. DNFC packed kiwiberry for the first time in 2018, transferring from Oakside. In total 84,000 kiwiberry trays were packed in 2018. DNFC EBITDA for 2018 totaled $0.465m (2017: $0.294m – part year) and is included in the overall EBITDA for retail services.
10 ANNUAL REPORT 2018 | SEEKA LIMITED
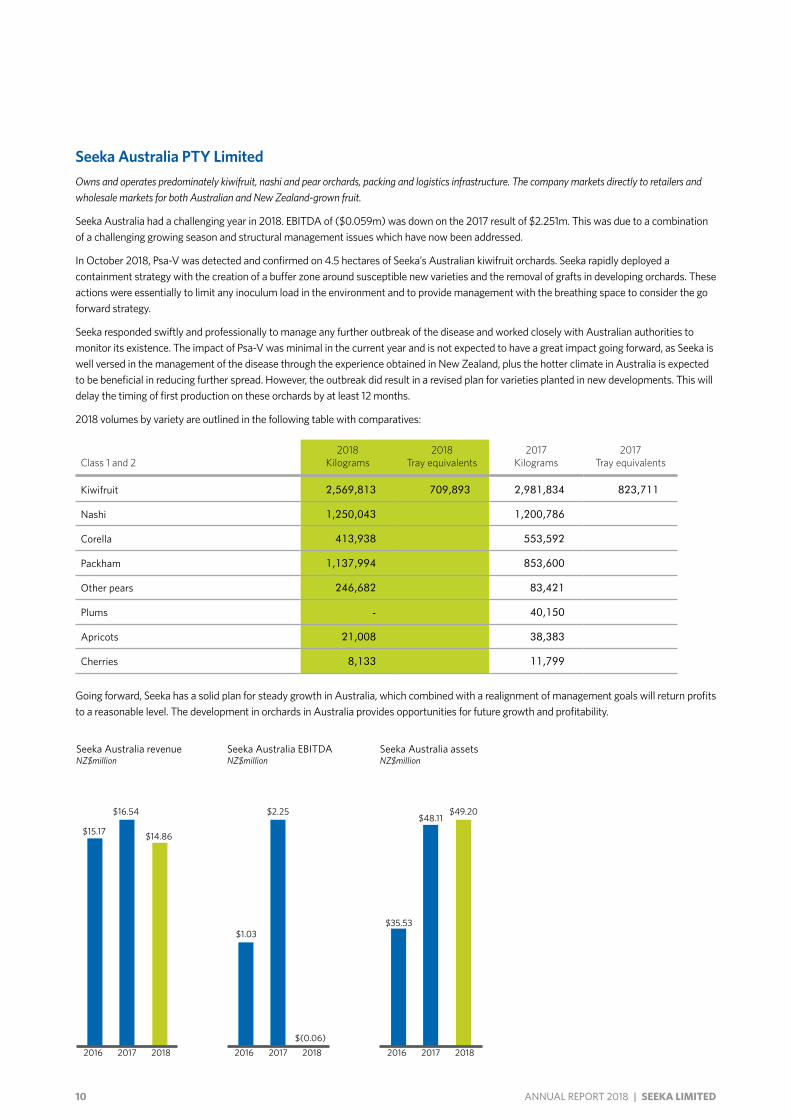
Seeka Australia PTY LimitedOwns and operates predominately kiwifruit, nashi and pear orchards, packing and logistics infrastructure. The company markets directly to retailers and wholesale markets for both Australian and New Zealand-grown fruit.
Seeka Australia had a challenging year in 2018. EBITDA of ($0.059m) was down on the 2017 result of $2.251m. This was due to a combination of a challenging growing season and structural management issues which have now been addressed.
In October 2018, Psa-V was detected and confirmed on 4.5 hectares of Seeka’s Australian kiwifruit orchards. Seeka rapidly deployed a containment strategy with the creation of a buffer zone around susceptible new varieties and the removal of grafts in developing orchards. These actions were essentially to limit any inoculum load in the environment and to provide management with the breathing space to consider the go forward strategy.
Seeka responded swiftly and professionally to manage any further outbreak of the disease and worked closely with Australian authorities to monitor its existence. The impact of Psa-V was minimal in the current year and is not expected to have a great impact going forward, as Seeka is well versed in the management of the disease through the experience obtained in New Zealand, plus the hotter climate in Australia is expected to be beneficial in reducing further spread. However, the outbreak did result in a revised plan for varieties planted in new developments. This will delay the timing of first production on these orchards by at least 12 months.
2018 volumes by variety are outlined in the following table with comparatives:
Class 1 and 22018
Kilograms2018
Tray equivalents2017
Kilograms2017
Tray equivalents
Kiwifruit 2,569,813 709,893 2,981,834 823,711
Nashi 1,250,043 1,200,786
Corella 413,938 553,592
Packham 1,137,994 853,600
Other pears 246,682 83,421
Plums - 40,150
Apricots 21,008 38,383
Cherries 8,133 11,799
Going forward, Seeka has a solid plan for steady growth in Australia, which combined with a realignment of management goals will return profits to a reasonable level. The development in orchards in Australia provides opportunities for future growth and profitability.
2016 2017 2018
Seeka Australia revenueNZ$million
$16.54
$14.86$15.17
2016 2017 2018
Seeka Australia EBITDANZ$million
$2.25
$(0.06)
$1.03
2016 2017 2018
Seeka Australia assets NZ$million
$48.11$49.20
$35.53
11SEEKA LIMITED | ANNUAL REPORT 2018
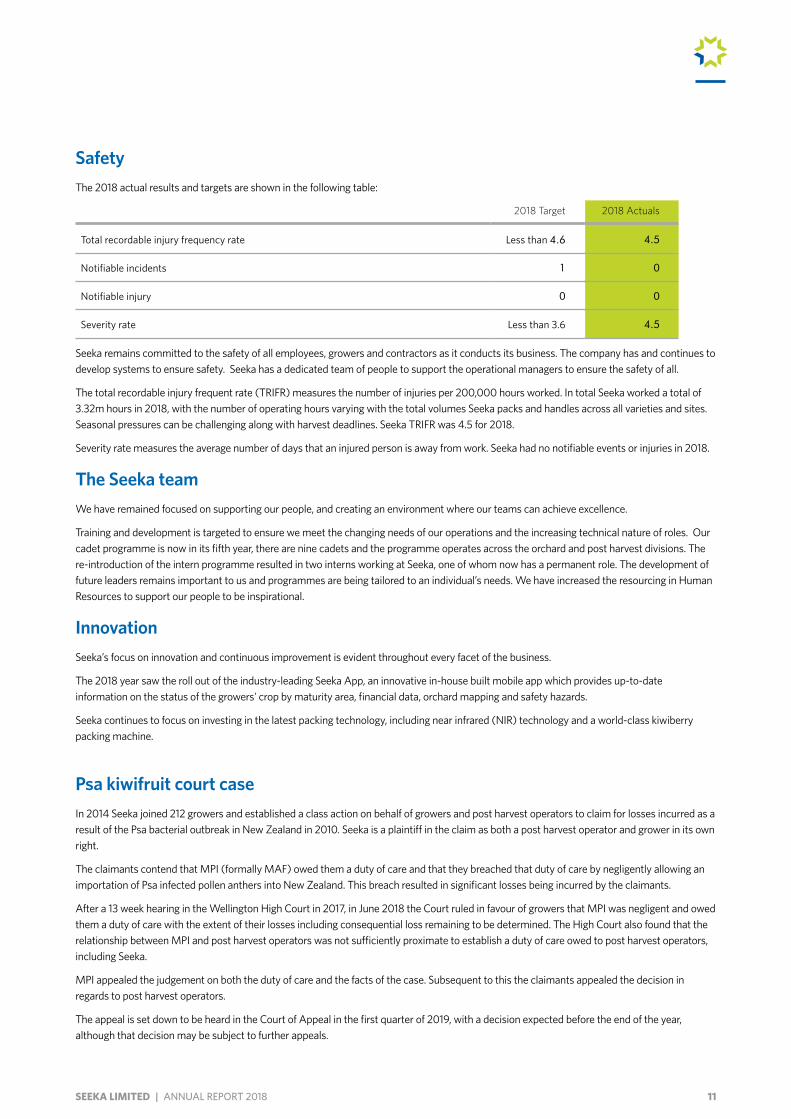
SafetyThe 2018 actual results and targets are shown in the following table:
2018 Target 2018 Actuals
Total recordable injury frequency rate Less than 4.6 4.5
Notifiable incidents 1 0
Notifiable injury 0 0
Severity rate Less than 3.6 4.5
Seeka remains committed to the safety of all employees, growers and contractors as it conducts its business. The company has and continues to develop systems to ensure safety. Seeka has a dedicated team of people to support the operational managers to ensure the safety of all.
The total recordable injury frequent rate (TRIFR) measures the number of injuries per 200,000 hours worked. In total Seeka worked a total of 3.32m hours in 2018, with the number of operating hours varying with the total volumes Seeka packs and handles across all varieties and sites. Seasonal pressures can be challenging along with harvest deadlines. Seeka TRIFR was 4.5 for 2018.
Severity rate measures the average number of days that an injured person is away from work. Seeka had no notifiable events or injuries in 2018.
The Seeka teamWe have remained focused on supporting our people, and creating an environment where our teams can achieve excellence.
Training and development is targeted to ensure we meet the changing needs of our operations and the increasing technical nature of roles. Our cadet programme is now in its fifth year, there are nine cadets and the programme operates across the orchard and post harvest divisions. The re-introduction of the intern programme resulted in two interns working at Seeka, one of whom now has a permanent role. The development of future leaders remains important to us and programmes are being tailored to an individual’s needs. We have increased the resourcing in Human Resources to support our people to be inspirational.
InnovationSeeka’s focus on innovation and continuous improvement is evident throughout every facet of the business.
The 2018 year saw the roll out of the industry-leading Seeka App, an innovative in-house built mobile app which provides up-to-date information on the status of the growers' crop by maturity area, financial data, orchard mapping and safety hazards.
Seeka continues to focus on investing in the latest packing technology, including near infrared (NIR) technology and a world-class kiwiberry packing machine.
Psa kiwifruit court caseIn 2014 Seeka joined 212 growers and established a class action on behalf of growers and post harvest operators to claim for losses incurred as a result of the Psa bacterial outbreak in New Zealand in 2010. Seeka is a plaintiff in the claim as both a post harvest operator and grower in its own right.
The claimants contend that MPI (formally MAF) owed them a duty of care and that they breached that duty of care by negligently allowing an importation of Psa infected pollen anthers into New Zealand. This breach resulted in significant losses being incurred by the claimants.
After a 13 week hearing in the Wellington High Court in 2017, in June 2018 the Court ruled in favour of growers that MPI was negligent and owed them a duty of care with the extent of their losses including consequential loss remaining to be determined. The High Court also found that the relationship between MPI and post harvest operators was not sufficiently proximate to establish a duty of care owed to post harvest operators, including Seeka.
MPI appealed the judgement on both the duty of care and the facts of the case. Subsequent to this the claimants appealed the decision in regards to post harvest operators.
The appeal is set down to be heard in the Court of Appeal in the first quarter of 2019, with a decision expected before the end of the year, although that decision may be subject to further appeals.
12 ANNUAL REPORT 2018 | SEEKA LIMITED
SummaryThe 2018 year was a big year for Seeka. A bounce back in kiwifruit volumes had a positive effect on earnings for the year. The major acquisition of the Northland packhouse, orchards and business in the middle of a busy harvest was carried out seamlessly and the operations were integrated successfully by the highly skilled team involved.
Seeka focused on reducing debt through a capital raise, whilst simultaneously investing in major infrastructure at the Oakside and Kerikeri post harvest facilities which will continue into 2019. The sale of the Northland orchards will continue throughout 2019, which will secure long term supply for kiwifruit packing.
The roll out of the Seeka App to Seeka’s growers provides industry leading clarity into growing information on orchards. Never before has such information been made so readily available and easy to access to growers and orchard managers.
The 2018 year has realigned Seeka so that we are poised for future growth.
Seeka’s stakeholders are integral to the business and the continued success of the company. We would like to thank all our growers, shareholders and commercial partners for your support and for selecting Seeka. We look forward to another busy year ahead in 2019, as we continue to be an industry leader in stewarding fruit for our growers.
Fred Hutchings Michael Franks Chairman Chief executive
13SEEKA LIMITED | ANNUAL REPORT 2018
2018 FINANCIAL STATEMENTS
Statement of financial performance 14
Statement of comprehensive income 15
Statement of financial position 16
Statement of changes in equity 17
Statement of cash flows 18
Notes to the financial statements 19
Auditors’ report 54
14 ANNUAL REPORT 2018 | SEEKA LIMITED
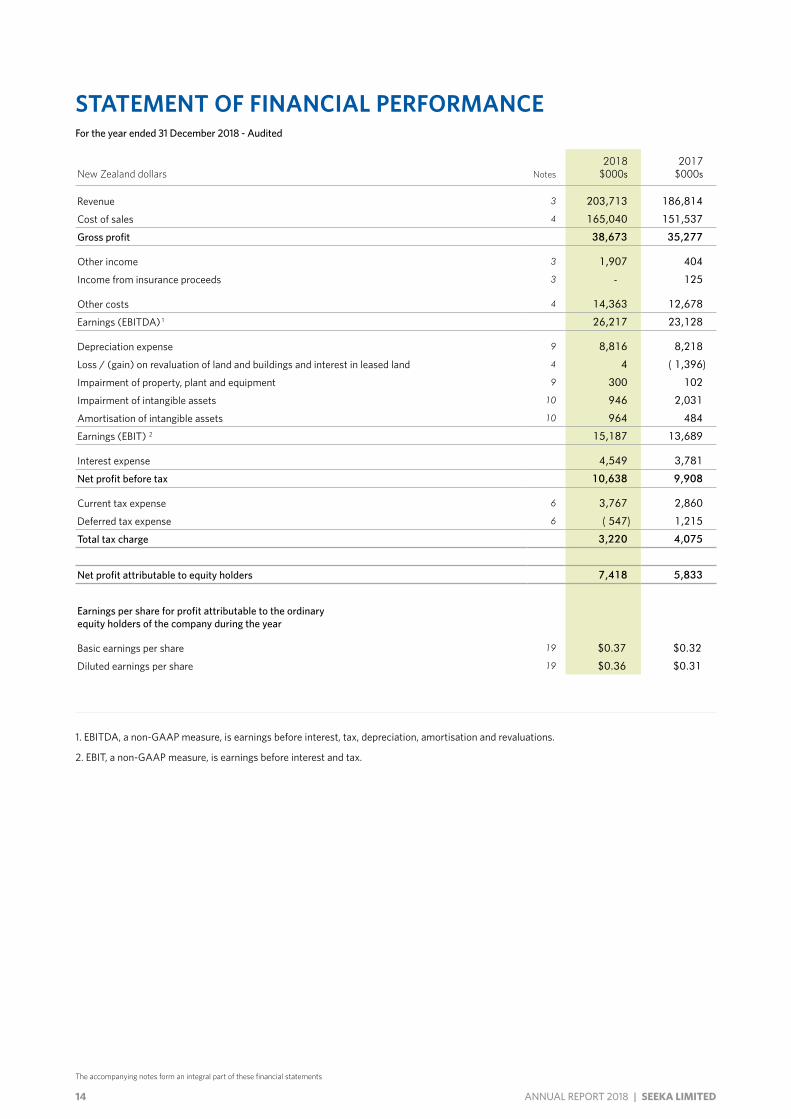
STATEMENT OF FINANCIAL PERFORMANCEFor the year ended 31 December 2018 - Audited
The accompanying notes form an integral part of these financial statements
New Zealand dollars Notes2018
$000s2017
$000s
Revenue 3 203,713 186,814
Cost of sales 4 165,040 151,537
Gross profit 38,673 35,277
Other income 3 1,907 404
Income from insurance proceeds 3 - 125
Other costs 4 14,363 12,678
Earnings (EBITDA) 1 26,217 23,128
Depreciation expense 9 8,816 8,218
Loss / (gain) on revaluation of land and buildings and interest in leased land 4 4 ( 1,396)
Impairment of property, plant and equipment 9 300 102
Impairment of intangible assets 10 946 2,031
Amortisation of intangible assets 10 964 484
Earnings (EBIT) 2 15,187 13,689
Interest expense 4,549 3,781
Net profit before tax 10,638 9,908
Current tax expense 6 3,767 2,860
Deferred tax expense 6 ( 547) 1,215
Total tax charge 3,220 4,075
Net profit attributable to equity holders 7,418 5,833
Earnings per share for profit attributable to the ordinary equity holders of the company during the year
Basic earnings per share 19 $0.37 $0.32
Diluted earnings per share 19 $0.36 $0.31
1. EBITDA, a non-GAAP measure, is earnings before interest, tax, depreciation, amortisation and revaluations.
2. EBIT, a non-GAAP measure, is earnings before interest and tax.
15SEEKA LIMITED | ANNUAL REPORT 2018
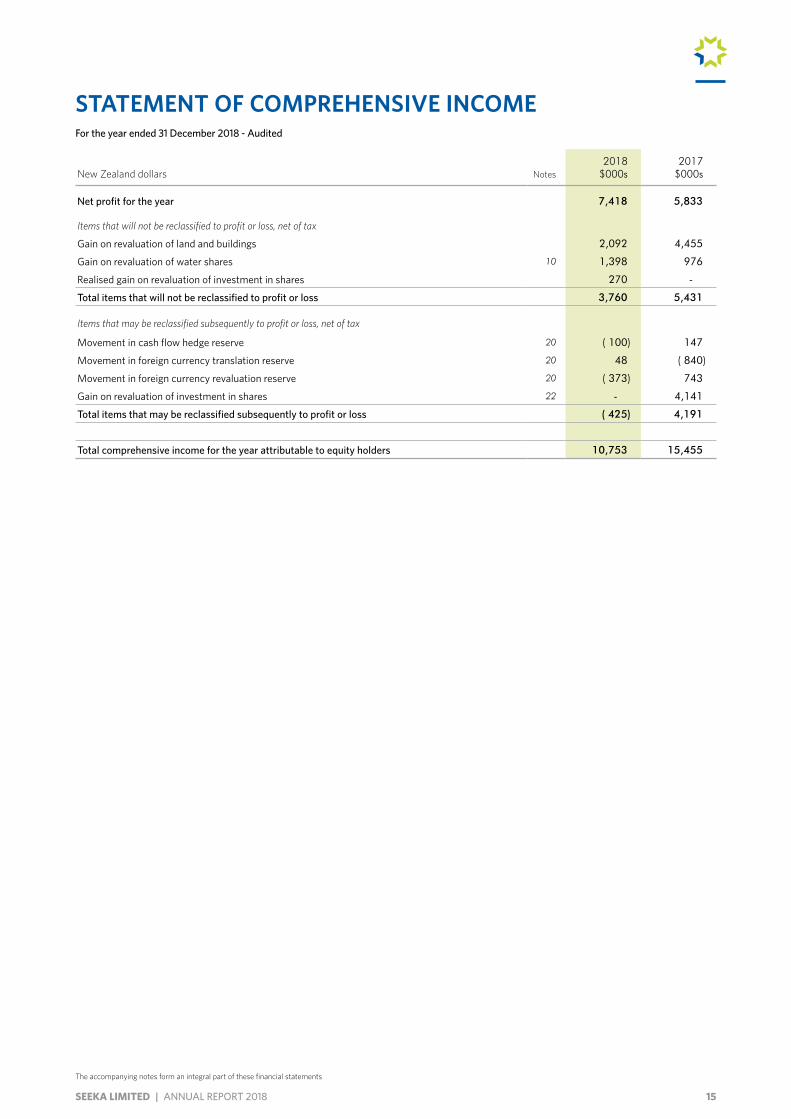
STATEMENT OF COMPREHENSIVE INCOMEFor the year ended 31 December 2018 - Audited
New Zealand dollars Notes2018
$000s2017
$000s
Net profit for the year 7,418 5,833
Items that will not be reclassified to profit or loss, net of tax
Gain on revaluation of land and buildings 2,092 4,455
Gain on revaluation of water shares 10 1,398 976
Realised gain on revaluation of investment in shares 270 -
Total items that will not be reclassified to profit or loss 3,760 5,431
Items that may be reclassified subsequently to profit or loss, net of tax
Movement in cash flow hedge reserve 20 ( 100) 147
Movement in foreign currency translation reserve 20 48 ( 840)
Movement in foreign currency revaluation reserve 20 ( 373) 743
Gain on revaluation of investment in shares 22 - 4,141
Total items that may be reclassified subsequently to profit or loss ( 425) 4,191
Total comprehensive income for the year attributable to equity holders 10,753 15,455
The accompanying notes form an integral part of these financial statements
16 ANNUAL REPORT 2018 | SEEKA LIMITED
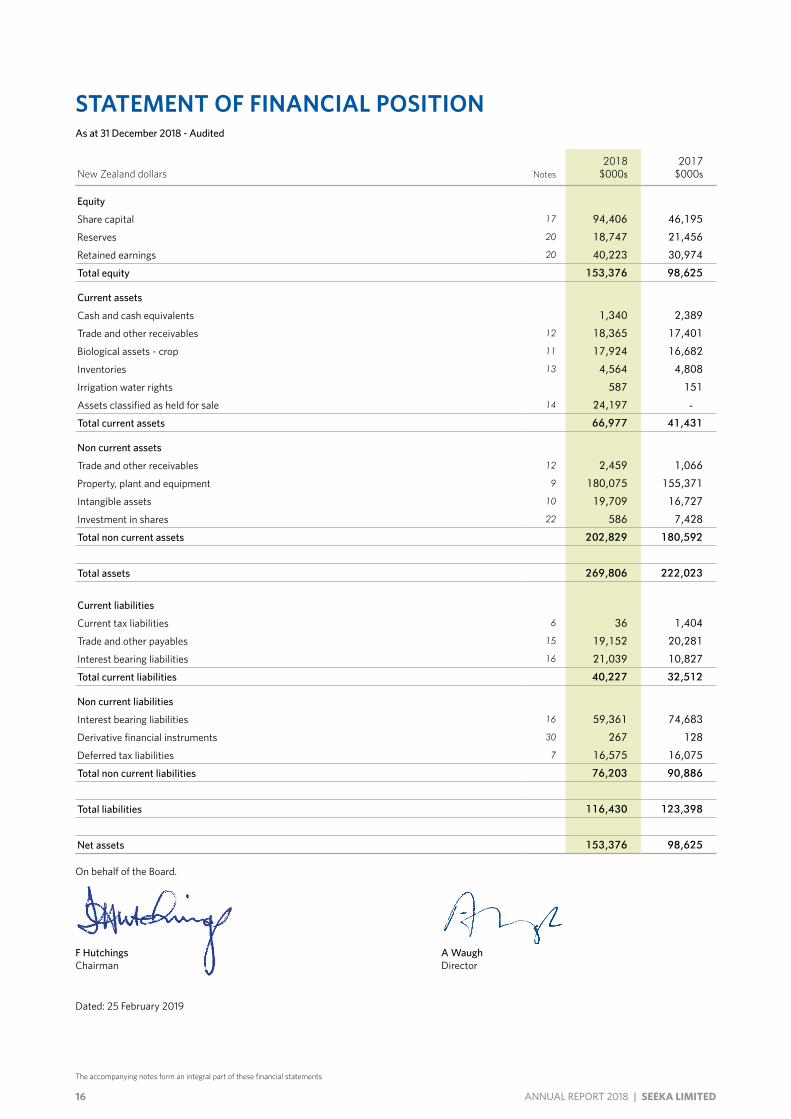
STATEMENT OF FINANCIAL POSITIONAs at 31 December 2018 - Audited
New Zealand dollars Notes2018
$000s2017
$000s
Equity
Share capital 17 94,406 46,195
Reserves 20 18,747 21,456
Retained earnings 20 40,223 30,974
Total equity 153,376 98,625
Current assets
Cash and cash equivalents 1,340 2,389
Trade and other receivables 12 18,365 17,401
Biological assets - crop 11 17,924 16,682
Inventories 13 4,564 4,808
Irrigation water rights 587 151
Assets classified as held for sale 14 24,197 -
Total current assets 66,977 41,431
Non current assets
Trade and other receivables 12 2,459 1,066
Property, plant and equipment 9 180,075 155,371
Intangible assets 10 19,709 16,727
Investment in shares 22 586 7,428
Total non current assets 202,829 180,592
Total assets 269,806 222,023
Current liabilities
Current tax liabilities 6 36 1,404
Trade and other payables 15 19,152 20,281
Interest bearing liabilities 16 21,039 10,827
Total current liabilities 40,227 32,512
Non current liabilities
Interest bearing liabilities 16 59,361 74,683
Derivative financial instruments 30 267 128
Deferred tax liabilities 7 16,575 16,075
Total non current liabilities 76,203 90,886
Total liabilities 116,430 123,398
Net assets 153,376 98,625
The accompanying notes form an integral part of these financial statements
On behalf of the Board.
F Hutchings A Waugh Chairman Director
Dated: 25 February 2019
17SEEKA LIMITED | ANNUAL REPORT 2018
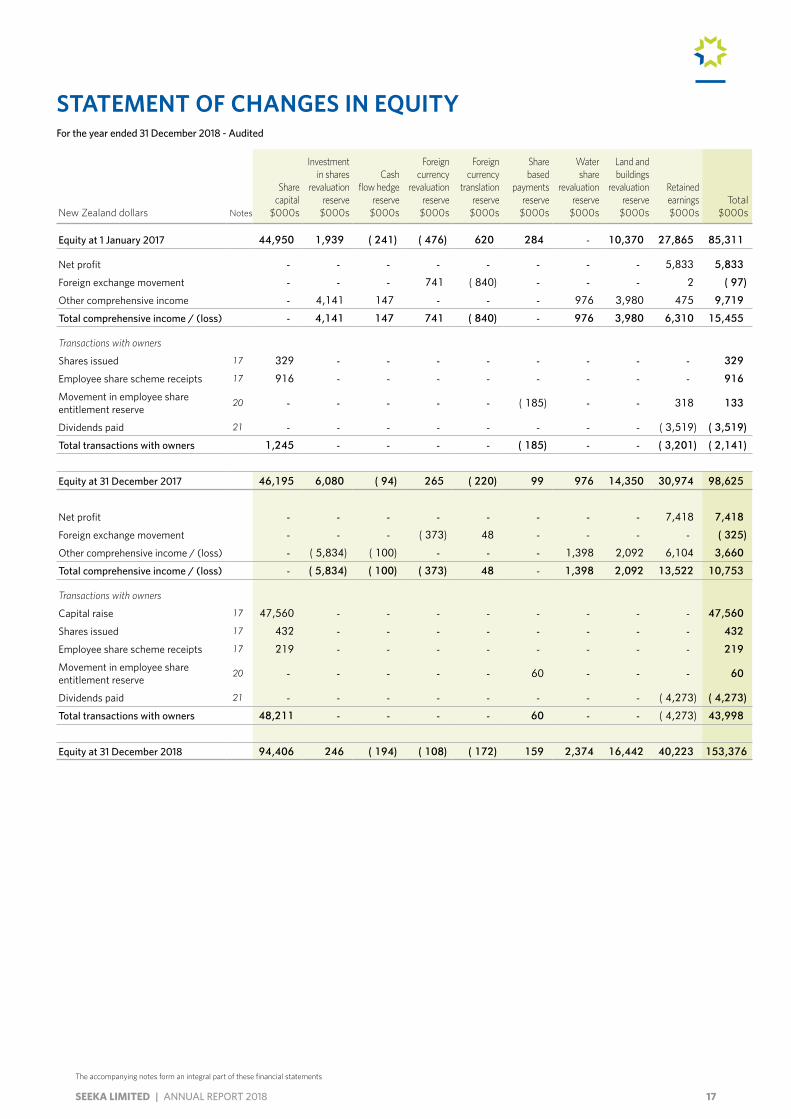
STATEMENT OF CHANGES IN EQUITYFor the year ended 31 December 2018 - Audited
New Zealand dollars Notes
Share capital
$000s
Investment in shares
revaluation reserve
$000s
Cash flow hedge
reserve $000s
Foreign currency
revaluation reserve
$000s
Foreign currency
translation reserve
$000s
Share based
payments reserve
$000s
Water share
revaluation reserve
$000s
Land and buildings
revaluation reserve
$000s
Retained earnings $000s
Total $000s
Equity at 1 January 2017 44,950 1,939 ( 241) ( 476) 620 284 - 10,370 27,865 85,311
Net profit - - - - - - - - 5,833 5,833
Foreign exchange movement - - - 741 ( 840) - - - 2 ( 97)
Other comprehensive income - 4,141 147 - - - 976 3,980 475 9,719
Total comprehensive income / (loss) - 4,141 147 741 ( 840) - 976 3,980 6,310 15,455
Transactions with owners
Shares issued 17 329 - - - - - - - - 329
Employee share scheme receipts 17 916 - - - - - - - - 916
Movement in employee share entitlement reserve
20 - - - - - ( 185) - - 318 133
Dividends paid 21 - - - - - - - - ( 3,519) ( 3,519)
Total transactions with owners 1,245 - - - - ( 185) - - ( 3,201) ( 2,141)
Equity at 31 December 2017 46,195 6,080 ( 94) 265 ( 220) 99 976 14,350 30,974 98,625
Net profit - - - - - - - - 7,418 7,418
Foreign exchange movement - - - ( 373) 48 - - - - ( 325)
Other comprehensive income / (loss) - ( 5,834) ( 100) - - - 1,398 2,092 6,104 3,660
Total comprehensive income / (loss) - ( 5,834) ( 100) ( 373) 48 - 1,398 2,092 13,522 10,753
Transactions with owners
Capital raise 17 47,560 - - - - - - - - 47,560
Shares issued 17 432 - - - - - - - - 432
Employee share scheme receipts 17 219 - - - - - - - - 219
Movement in employee share entitlement reserve
20 - - - - - 60 - - - 60
Dividends paid 21 - - - - - - - - ( 4,273) ( 4,273)
Total transactions with owners 48,211 - - - - 60 - - ( 4,273) 43,998
Equity at 31 December 2018 94,406 246 ( 194) ( 108) ( 172) 159 2,374 16,442 40,223 153,376
The accompanying notes form an integral part of these financial statements
18 ANNUAL REPORT 2018 | SEEKA LIMITED
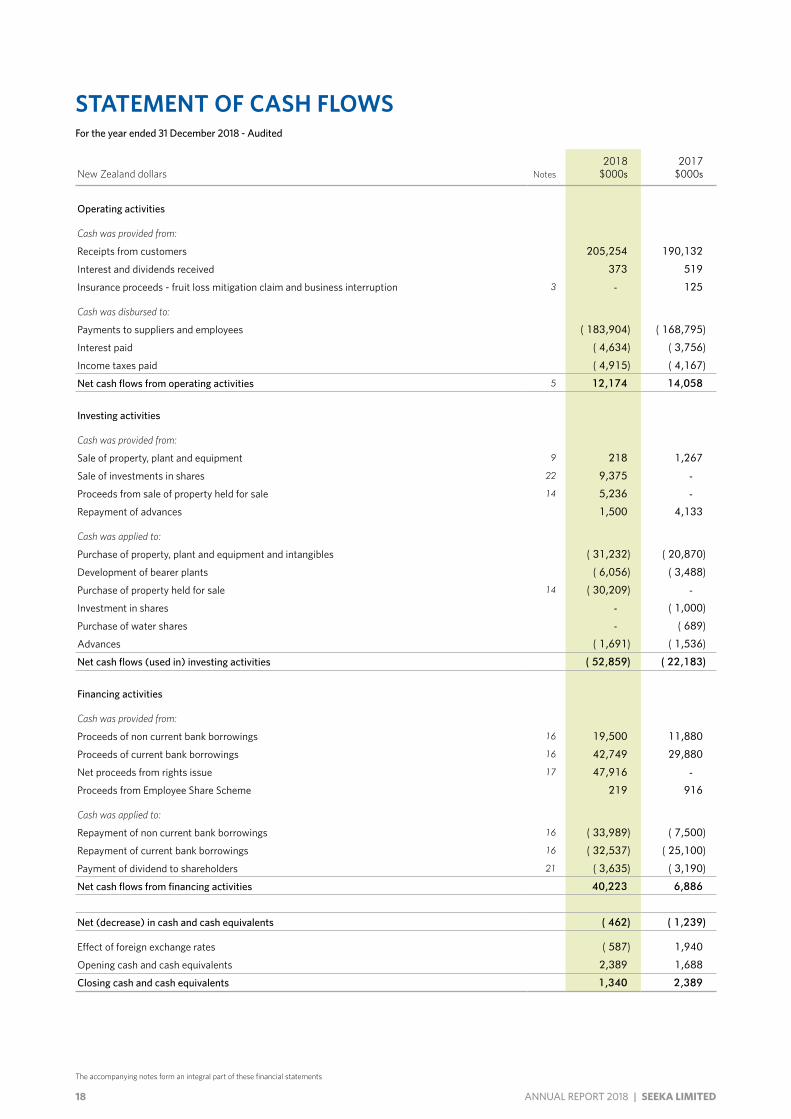
STATEMENT OF CASH FLOWSFor the year ended 31 December 2018 - Audited
New Zealand dollars Notes2018
$000s2017
$000s
Operating activities
Cash was provided from:
Receipts from customers 205,254 190,132
Interest and dividends received 373 519
Insurance proceeds - fruit loss mitigation claim and business interruption 3 - 125
Cash was disbursed to:
Payments to suppliers and employees ( 183,904) ( 168,795)
Interest paid ( 4,634) ( 3,756)
Income taxes paid ( 4,915) ( 4,167)
Net cash flows from operating activities 5 12,174 14,058
Investing activities
Cash was provided from:
Sale of property, plant and equipment 9 218 1,267
Sale of investments in shares 22 9,375 -
Proceeds from sale of property held for sale 14 5,236 -
Repayment of advances 1,500 4,133
Cash was applied to:
Purchase of property, plant and equipment and intangibles ( 31,232) ( 20,870)
Development of bearer plants ( 6,056) ( 3,488)
Purchase of property held for sale 14 ( 30,209) -
Investment in shares - ( 1,000)
Purchase of water shares - ( 689)
Advances ( 1,691) ( 1,536)
Net cash flows (used in) investing activities ( 52,859) ( 22,183)
Financing activities
Cash was provided from:
Proceeds of non current bank borrowings 16 19,500 11,880
Proceeds of current bank borrowings 16 42,749 29,880
Net proceeds from rights issue 17 47,916 -
Proceeds from Employee Share Scheme 219 916
Cash was applied to:
Repayment of non current bank borrowings 16 ( 33,989) ( 7,500)
Repayment of current bank borrowings 16 ( 32,537) ( 25,100)
Payment of dividend to shareholders 21 ( 3,635) ( 3,190)
Net cash flows from financing activities 40,223 6,886
Net (decrease) in cash and cash equivalents ( 462) ( 1,239)
Effect of foreign exchange rates ( 587) 1,940
Opening cash and cash equivalents 2,389 1,688
Closing cash and cash equivalents 1,340 2,389
The accompanying notes form an integral part of these financial statements
19SEEKA LIMITED | ANNUAL REPORT 2018
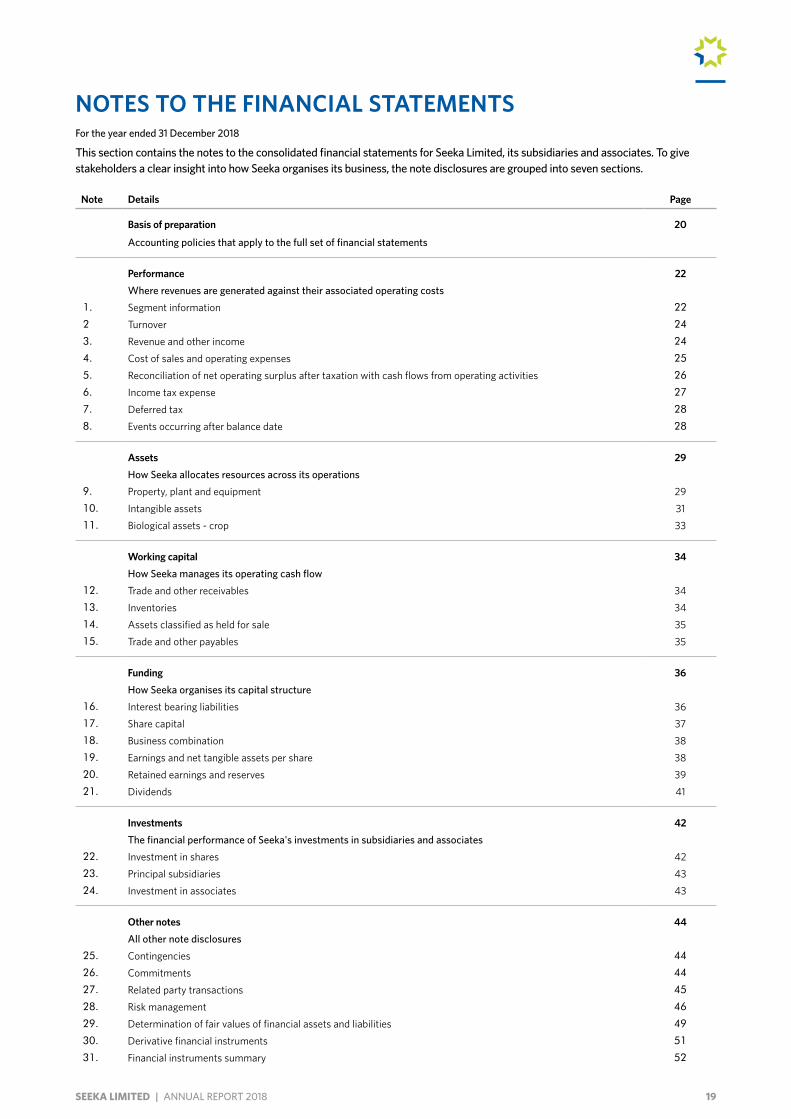
NOTES TO THE FINANCIAL STATEMENTSFor the year ended 31 December 2018
This section contains the notes to the consolidated financial statements for Seeka Limited, its subsidiaries and associates. To give stakeholders a clear insight into how Seeka organises its business, the note disclosures are grouped into seven sections.
Note Details Page
Basis of preparation 20
Accounting policies that apply to the full set of financial statements
Performance 22Where revenues are generated against their associated operating costs
1. Segment information 22
2 Turnover 24
3. Revenue and other income 24
4. Cost of sales and operating expenses 25
5. Reconciliation of net operating surplus after taxation with cash flows from operating activities 26
6. Income tax expense 27
7. Deferred tax 28
8. Events occurring after balance date 28
Assets 29How Seeka allocates resources across its operations
9. Property, plant and equipment 2910. Intangible assets 3111. Biological assets - crop 33
Working capital 34How Seeka manages its operating cash flow
12. Trade and other receivables 3413. Inventories 3414. Assets classified as held for sale 3515. Trade and other payables 35
Funding 36How Seeka organises its capital structure
16. Interest bearing liabilities 3617. Share capital 3718. Business combination 3819. Earnings and net tangible assets per share 3820. Retained earnings and reserves 3921. Dividends 41
Investments 42The financial performance of Seeka's investments in subsidiaries and associates
22. Investment in shares 4223. Principal subsidiaries 4324. Investment in associates 43
Other notes 44All other note disclosures
25. Contingencies 44
26. Commitments 44
27. Related party transactions 45
28. Risk management 46
29. Determination of fair values of financial assets and liabilities 49
30. Derivative financial instruments 51
31. Financial instruments summary 52
20 ANNUAL REPORT 2018 | SEEKA LIMITED
Reporting entity and statutory baseThe financial statements presented are those of the consolidated Seeka group. Seeka Limited is referred to as Seeka Limited or the Company. The group is referred to as the Group, Seeka, or Seeka Group.
Seeka Limited is a profit-orientated company registered in New Zealand under the Companies Act 1993 and a Financial Markets Conduct (FMC) Reporting Entity for the purposes of the FMC Act 2013. Seeka Limited is listed and its ordinary shares are quoted on the NZX main board equity security market (NZX Main Board).
Nature of operationsSeeka is a produce business operating in New Zealand and Australia.
In New Zealand the Group provides orcharding, post harvest and retail services to New Zealand’s kiwifruit, avocado, citrus, berry, and kiwiberry industries. Seeka manufactures and sells the Kiwi Crush and Kiwi Crushies ranges along with avocado oil. The Group also provides retail and ripening services for imported tropical produce, and operates a wholesale market.
In Australia, Seeka owns and operates orchards and associated post harvest assets, making the Group the largest producer and supplier of Australian kiwifruit and nashi pears, a major supplier of European pears, plus lesser production of other temperate-climate fruits.
Statement of compliance and basis of preparationThe consolidated financial statements for the Group have been prepared in accordance with the requirements of Part 7 of the FMC Act 2013. The financial statements have been prepared in accordance with New Zealand Generally Accepted Accounting Principles (GAAP), incorporating New Zealand equivalents to International Financial Reporting Standards (NZ IFRS) and other applicable financial reporting standards as appropriate for profit-oriented entities. The Group financial statements also comply with International Financial Reporting Standards (IFRS).
The financial statements are prepared on a historical cost basis, with the exception of:
– financial assets and liabilities (including derivative instruments) at fair value through comprehensive income (note 30 and 31)
– biological assets - crop at fair value (note 11)
– land and buildings at fair value (note 9)
– water shares at fair value (note 10)
– assets held for sale at fair value (note 14)
The significant accounting policies applied in the preparation of the financial statements are set out below.
The financial statements were approved by the Board of directors (the Board) on 25 February 2019.
Basis of consolidationSubsidiariesSubsidiaries are fully consolidated from the date of acquisition, being the date on which the Group obtains control, and continue to be consolidated until the date when such control ceases. The financial statements of the subsidiaries are prepared for the same reporting period as the Company, using consistent accounting policies. All intra-group balances, transactions, unrealised gains and losses resulting from intra-group transactions and dividends are eliminated in full.
The acquisition method of accounting is used to account for the acquisition of subsidiaries by the Group. The cost of an acquisition is measured as the fair value of the assets given, equity instruments issued and liabilities incurred or assumed at the date of exchange. Direct acquisition costs are expensed as incurred.
Intercompany transactions, balances and unrealised gains on transactions between companies are eliminated. Unrealised losses are also eliminated unless the transaction provides evidence of the impairment of the asset transferred. Accounting policies of subsidiaries have been changed where necessary to ensure consistency with the policies adopted by the Group.
Foreign currency transactionsForeign currency transactions are translated into the functional currency (NZD) using the exchange rates prevailing during the month of that transaction. Foreign exchange gains and losses resulting from the settlement of such transactions are recognised in the income statement. The presentational currency is the New Zealand dollar (NZD).
Foreign operationsThe results and financial position of all the Group entities (none of which has the currency of a hyper-inflationary economy) that have a functional currency different from the presentation currency are translated into the presentation currency as follows:
– Assets and liabilities for each entity's balance sheet within the Group are translated at the closing rate at the date of that balance sheet;
– Income and expenses for each entity's income statement and statement of other comprehensive income, are translated at average exchange rates (unless this average is not a reasonable approximation of the cumulative effect of the rates prevailing on the transaction dates, in which case income and expenses are translated at the rate on the dates of the transactions); and
– All resulting exchange differences are recognised in other comprehensive income.
Goodwill and fair value adjustments arising on the acquisition of a foreign entity are treated as assets and liabilities of the foreign entity and translated at the closing rate. Exchange differences arising are recognised in other comprehensive income.
Summary of significant changes in accounting policiesThe accounting policies have been applied consistently throughout the periods presented in the financial statements. A number of new and amended standards became applicable for the current reporting period and the Group had to change its accounting policies as a result of adopting the following standards:
NZ IFRS 9: Financial InstrumentsThe new financial instrument standard alters the requirements for recognising and measuring financial assets and financial liabilities. The standard is effective for periods beginning 1 January 2018. The Group has reclassified its investments in shares to financial assets recognised at fair value through other comprehensive income and financial assets recognised at fair value through profit or loss. These are detailed in note 22. The Group's cash and cash equivalents, trade and other receivables, and trade and other payables continue to be recognised at cost. The new standard introduced a new model for calculating the provision for doubtful debts, based on expected credit losses. There was no material change to the provision recognised. The calculation is detailed in note 28. The standard introduced new requirements for hedging documentation and consideration. Hedging relationships continue to be effective. The Group holds a number of interest rate swaps, which continue to be recognised in the cash flow hedge reserve. Any ineffectiveness in the hedge relationship will be recognised in profit or loss. Disclosure changes have been adjusted in accordance with the standard.
NZ IFRS 15: Revenue from Contracts with CustomersThe new revenue standard requires the recognition of revenue based on contracts with a customer for goods and services. Revenue is recognised with the completion of performance obligations. Revenue is recognised either at a point in time or over a period of
Basis of preparationThis section sets out the Group’s accounting policies that apply to the full set of financial statements. Accounting policies which are limited to a specific note, are described in that note.
21SEEKA LIMITED | ANNUAL REPORT 2018
time, depending on when the performance obligations are met. The standard is effective for periods beginning 1 January 2018. The Group has split revenue into four difference streams, being post harvest, orcharding, retail services and Australian generated revenue. The timing and allocation of revenue was not materially impacted by the implementation of the new standard. The new standard redefines the definition of principal versus agency relationships. There was no material reclassification between principal and agent under the new standard. No costs were capitalised to obtain or fulfil a contract. Revenue accounting policies are detailed in note 3.
There are no other new standards that had a material impact on the Group’s accounting policies.
Where the presentational format of the financial statements have changed during the period, comparative figures were accordingly restated.
Impact of standards issued but not yet applied by the entityNZ IFRS 16, Leases, was issued January 2016. It will result in almost all leases being recognised in the statement of financial position, as the distinction between operating and finance lease is removed. Under the new standard, an asset (the right to use the lease item) and a financial liability to pay rentals are recognised. The only exceptions are short term and low-value leases.
Accounting for lessors will not significantly change.
The standard will primarily affect the accounting for the Group’s operating leases as a lessee. As at reporting date, the Group expects to recognise $30m to $35m of leased assets with an offsetting liability in the statement of financial position. Further, approximately $6.0m of rental operating expenses is expected to be reclassified to lease interest expense and lease depreciation expense. The Group’s key ratios presented in the statement of financial performance will be impacted by this reclassification.
The standard is effective for reporting periods beginning on or after 1 January 2019. The Group intends to adopt the standard from its effective date.
The Group does not expect to be significantly impacted by any other new standards, amendments or interpretations that have been issued and are effective.
Critical accounting estimates and judgementsThe Group makes estimates and assumptions concerning future operational and financial performance. By definition, these assumptions may not always equal actual results. The estimates and assumptions that have a significant risk of causing a material adjustment to the carrying amounts of assets and liabilities are identified in the notes below. Estimates and judgements are continually evaluated and are based on historical experience as adjusted for current market conditions and other factors, including expectations of future events that are believed to be reasonable under the circumstances. Assumptions underlying management’s estimates can be found in the following notes to the financial statements.
Area of estimation or judgement Note
Property, plant and equipment 9Goodwill 10Biological assets - crop 11Assets held for sale 14Business combination 18
Going concern assumptionThe consolidated financial statements have been prepared on a going concern basis.
Goods and services tax (GST)The statement of financial performance and statement of comprehensive income have been prepared so that all components are stated exclusive of GST. All items in the statement of financial position are stated net of GST, with the exception of receivables and payables, which include GST invoiced.
22 ANNUAL REPORT 2018 | SEEKA LIMITED
PerformanceThis section focuses on the Group’s financial performance and details the contributions made from the individual operating segments.
Note 1. Segment informationThe Group’s operating segments are entities that engage in business activities that earn revenues, incur expenses and are reported in a manner consistent with the internal reports provided to the chief decision makers, being the Directors, who regularly evaluate the allocation of resources alongside operational outcomes, such as EBITDA and EBIT, and are responsible for implementing strategic decisions.
The Group has five operating segments:
– Four New Zealand segments express the range of complementary services delivered to New Zealand’s produce industries and the retail sector.
– A single Australian segment encompasses the integrated business associated with the Group’s Australian-grown produce.
Direct segment revenues and operating costs are allocated to each segment. Administration costs, overheads, grower service costs and insurance proceeds recorded in the statement of financial performance are allocated to all other segments. Transactions between segments are conducted at arm’s length and are eliminated on consolidation.
New Zealand segmentsOrchard operationsThe Group provides on-orchard management services to orchard owners who produce kiwifruit, avocado and kiwiberry crops.
The Group produces kiwifruit, avocado and kiwiberry crops from:
– Short term leased orchards (typically three-year rolling contracts) whereby the Group recovers costs and shares any profits with the orchard owners.
– Long term leased land which the Group has developed into productive orchards, pays all development and production costs, owns all crops for the term of the lease, and shares profit with the landowner after all costs are recovered.
Post harvest operationsThe Group provides post harvest services to the kiwifruit, avocado, citrus and berry industries. This includes all crops from the Group’s orchard management and lease operations, plus crops from independent orchard owners.
Retail service operationsThe Group provides fruit marketing services in New Zealand and internationally, particularly in the Australian and Asian markets. This includes fruit from the Group’s New Zealand based orchard and post harvest operations. In New Zealand the Group also provides retail and ripening services for imported fruit produce, and operates a wholesale market.
Retail service operations include the production and selling of Kiwi Crush, Kiwi Crushies and avocado oil to the retail sector and hospitals, along with post harvest services for kiwiberry.
All other segments - New ZealandThis represents the Group’s aggregated administration, grower services and overhead sections along with insurance proceeds recorded in the statement of financial performance and impairment and revaluations of other assets not attributed directly to any other segment.
Australian operationsThe Group owns and operates Australian orchards, provides post harvest operations and markets the fruit produced from those orchards, primarily in Australia. The main products are kiwifruit, nashi pears and European pears.
EBITDA and EBITEBITDA is earnings before interest, tax, depreciation, amortisation, impairments and revaluations. EBITDA is an indicator of profitability and reflects operating cash flow generation.
EBIT is earnings before interest and tax; an indicator of profitability that excludes interest and income tax expenses.
23SEEKA LIMITED | ANNUAL REPORT 2018
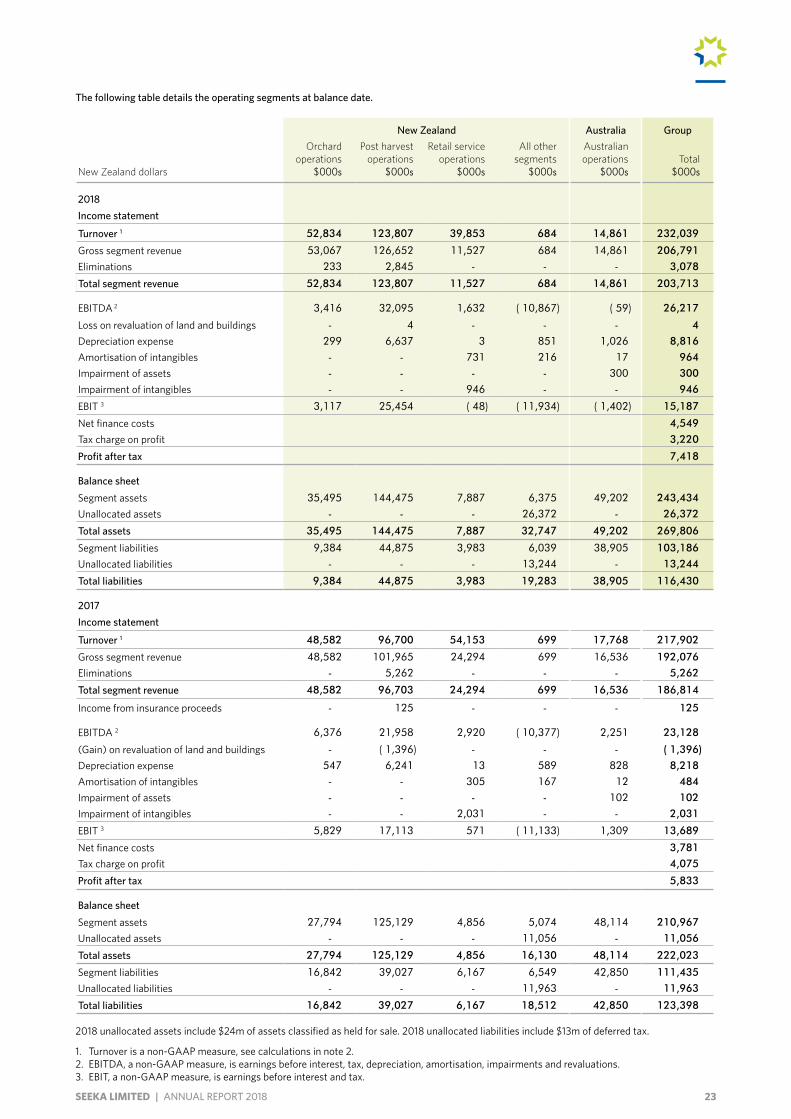
The following table details the operating segments at balance date.
New Zealand Australia Group
New Zealand dollars
Orchard operations
$000s
Post harvest operations
$000s
Retail service operations
$000s
All other segments
$000s
Australian operations
$000sTotal
$000s
2018Income statement
Turnover 1 52,834 123,807 39,853 684 14,861 232,039
Gross segment revenue 53,067 126,652 11,527 684 14,861 206,791
Eliminations 233 2,845 - - - 3,078
Total segment revenue 52,834 123,807 11,527 684 14,861 203,713
EBITDA 2 3,416 32,095 1,632 ( 10,867) ( 59) 26,217
Loss on revaluation of land and buildings - 4 - - - 4
Depreciation expense 299 6,637 3 851 1,026 8,816
Amortisation of intangibles - - 731 216 17 964
Impairment of assets - - - - 300 300
Impairment of intangibles - - 946 - - 946
EBIT 3 3,117 25,454 ( 48) ( 11,934) ( 1,402) 15,187
Net finance costs 4,549
Tax charge on profit 3,220
Profit after tax 7,418
Balance sheetSegment assets 35,495 144,475 7,887 6,375 49,202 243,434
Unallocated assets - - - 26,372 - 26,372
Total assets 35,495 144,475 7,887 32,747 49,202 269,806
Segment liabilities 9,384 44,875 3,983 6,039 38,905 103,186
Unallocated liabilities - - - 13,244 - 13,244
Total liabilities 9,384 44,875 3,983 19,283 38,905 116,430
2017Income statement
Turnover 1 48,582 96,700 54,153 699 17,768 217,902
Gross segment revenue 48,582 101,965 24,294 699 16,536 192,076
Eliminations - 5,262 - - - 5,262
Total segment revenue 48,582 96,703 24,294 699 16,536 186,814
Income from insurance proceeds - 125 - - - 125
EBITDA 2 6,376 21,958 2,920 ( 10,377) 2,251 23,128
(Gain) on revaluation of land and buildings - ( 1,396) - - - ( 1,396)
Depreciation expense 547 6,241 13 589 828 8,218
Amortisation of intangibles - - 305 167 12 484
Impairment of assets - - - - 102 102
Impairment of intangibles - - 2,031 - - 2,031
EBIT 3 5,829 17,113 571 ( 11,133) 1,309 13,689
Net finance costs 3,781
Tax charge on profit 4,075
Profit after tax 5,833
Balance sheetSegment assets 27,794 125,129 4,856 5,074 48,114 210,967
Unallocated assets - - - 11,056 - 11,056
Total assets 27,794 125,129 4,856 16,130 48,114 222,023
Segment liabilities 16,842 39,027 6,167 6,549 42,850 111,435
Unallocated liabilities - - - 11,963 - 11,963
Total liabilities 16,842 39,027 6,167 18,512 42,850 123,398
2018 unallocated assets include $24m of assets classified as held for sale. 2018 unallocated liabilities include $13m of deferred tax.
1. Turnover is a non-GAAP measure, see calculations in note 2. 2. EBITDA, a non-GAAP measure, is earnings before interest, tax, depreciation, amortisation, impairments and revaluations. 3. EBIT, a non-GAAP measure, is earnings before interest and tax.
24 ANNUAL REPORT 2018 | SEEKA LIMITED
New Zealand dollars2018
$000s2017
$000s
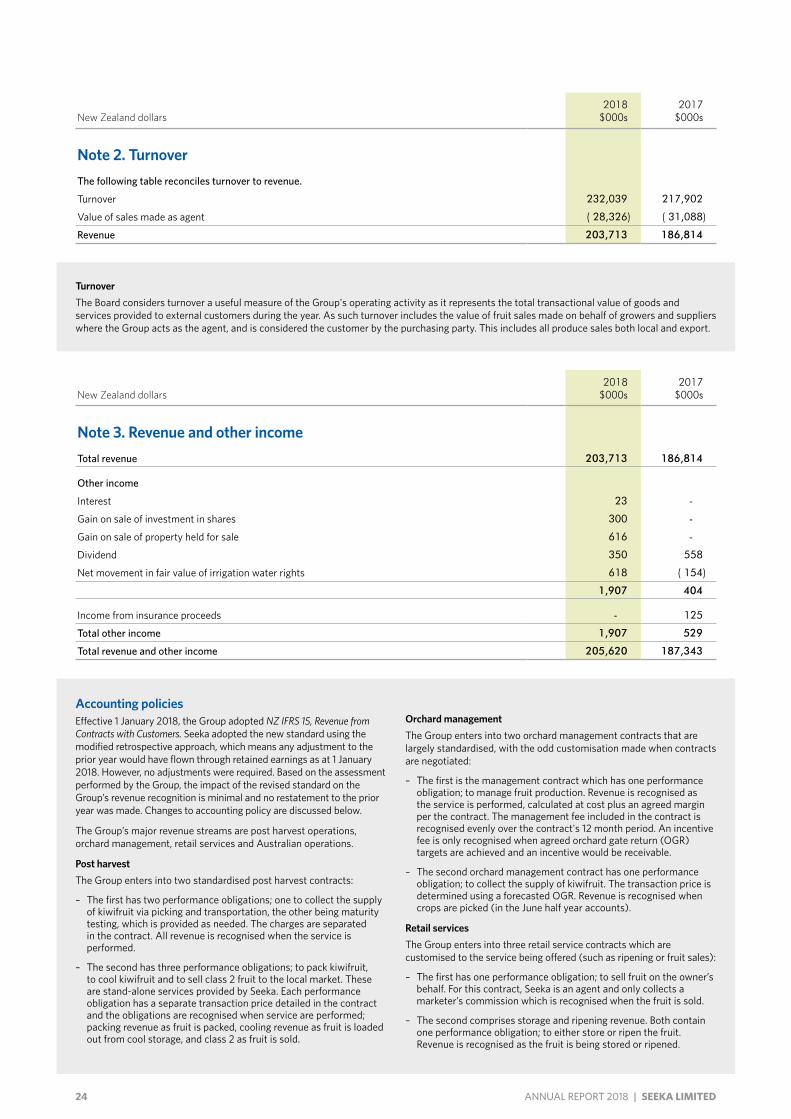
Note 2. TurnoverThe following table reconciles turnover to revenue.
Turnover 232,039 217,902
Value of sales made as agent ( 28,326) ( 31,088)
Revenue 203,713 186,814
TurnoverThe Board considers turnover a useful measure of the Group's operating activity as it represents the total transactional value of goods and services provided to external customers during the year. As such turnover includes the value of fruit sales made on behalf of growers and suppliers where the Group acts as the agent, and is considered the customer by the purchasing party. This includes all produce sales both local and export.
New Zealand dollars2018
$000s2017
$000s
Note 3. Revenue and other incomeTotal revenue 203,713 186,814
Other income
Interest 23 -
Gain on sale of investment in shares 300 -
Gain on sale of property held for sale 616 -
Dividend 350 558
Net movement in fair value of irrigation water rights 618 ( 154)
1,907 404
Income from insurance proceeds - 125
Total other income 1,907 529
Total revenue and other income 205,620 187,343
Accounting policiesEffective 1 January 2018, the Group adopted NZ IFRS 15, Revenue from Contracts with Customers. Seeka adopted the new standard using the modified retrospective approach, which means any adjustment to the prior year would have flown through retained earnings as at 1 January 2018. However, no adjustments were required. Based on the assessment performed by the Group, the impact of the revised standard on the Group’s revenue recognition is minimal and no restatement to the prior year was made. Changes to accounting policy are discussed below.
The Group’s major revenue streams are post harvest operations, orchard management, retail services and Australian operations.
Post harvestThe Group enters into two standardised post harvest contracts:
– The first has two performance obligations; one to collect the supply of kiwifruit via picking and transportation, the other being maturity testing, which is provided as needed. The charges are separated in the contract. All revenue is recognised when the service is performed.
– The second has three performance obligations; to pack kiwifruit, to cool kiwifruit and to sell class 2 fruit to the local market. These are stand-alone services provided by Seeka. Each performance obligation has a separate transaction price detailed in the contract and the obligations are recognised when service are performed; packing revenue as fruit is packed, cooling revenue as fruit is loaded out from cool storage, and class 2 as fruit is sold.
Orchard managementThe Group enters into two orchard management contracts that are largely standardised, with the odd customisation made when contracts are negotiated:
– The first is the management contract which has one performance obligation; to manage fruit production. Revenue is recognised as the service is performed, calculated at cost plus an agreed margin per the contract. The management fee included in the contract is recognised evenly over the contract's 12 month period. An incentive fee is only recognised when agreed orchard gate return (OGR) targets are achieved and an incentive would be receivable.
– The second orchard management contract has one performance obligation; to collect the supply of kiwifruit. The transaction price is determined using a forecasted OGR. Revenue is recognised when crops are picked (in the June half year accounts).
Retail servicesThe Group enters into three retail service contracts which are customised to the service being offered (such as ripening or fruit sales):
– The first has one performance obligation; to sell fruit on the owner’s behalf. For this contract, Seeka is an agent and only collects a marketer’s commission which is recognised when the fruit is sold.
– The second comprises storage and ripening revenue. Both contain one performance obligation; to either store or ripen the fruit. Revenue is recognised as the fruit is being stored or ripened.
25SEEKA LIMITED | ANNUAL REPORT 2018
New Zealand dollars Notes2018
$000s2017
$000s
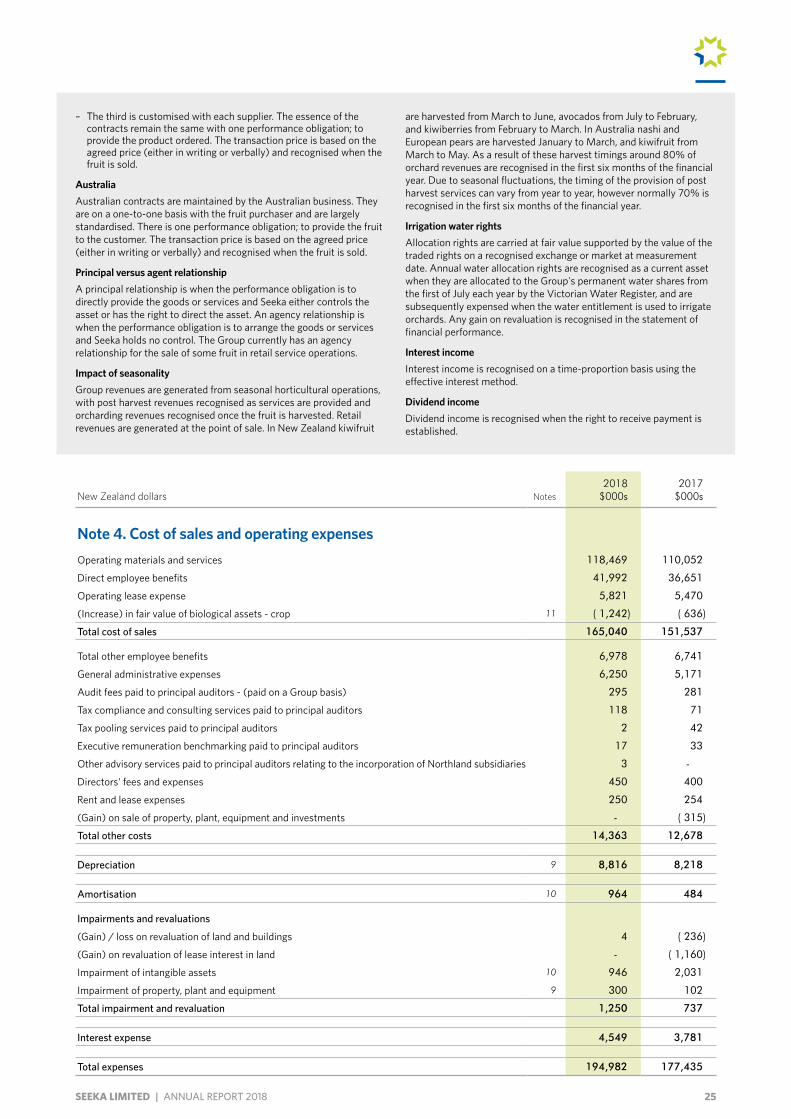
Note 4. Cost of sales and operating expensesOperating materials and services 118,469 110,052
Direct employee benefits 41,992 36,651
Operating lease expense 5,821 5,470
(Increase) in fair value of biological assets - crop 11 ( 1,242) ( 636)
Total cost of sales 165,040 151,537
Total other employee benefits 6,978 6,741
General administrative expenses 6,250 5,171
Audit fees paid to principal auditors - (paid on a Group basis) 295 281
Tax compliance and consulting services paid to principal auditors 118 71
Tax pooling services paid to principal auditors 2 42
Executive remuneration benchmarking paid to principal auditors 17 33
Other advisory services paid to principal auditors relating to the incorporation of Northland subsidiaries 3 -
Directors' fees and expenses 450 400
Rent and lease expenses 250 254
(Gain) on sale of property, plant, equipment and investments - ( 315)
Total other costs 14,363 12,678
Depreciation 9 8,816 8,218
Amortisation 10 964 484
Impairments and revaluations
(Gain) / loss on revaluation of land and buildings 4 ( 236)
(Gain) on revaluation of lease interest in land - ( 1,160)
Impairment of intangible assets 10 946 2,031
Impairment of property, plant and equipment 9 300 102
Total impairment and revaluation 1,250 737
Interest expense 4,549 3,781
Total expenses 194,982 177,435
– The third is customised with each supplier. The essence of the contracts remain the same with one performance obligation; to provide the product ordered. The transaction price is based on the agreed price (either in writing or verbally) and recognised when the fruit is sold.
AustraliaAustralian contracts are maintained by the Australian business. They are on a one-to-one basis with the fruit purchaser and are largely standardised. There is one performance obligation; to provide the fruit to the customer. The transaction price is based on the agreed price (either in writing or verbally) and recognised when the fruit is sold.
Principal versus agent relationshipA principal relationship is when the performance obligation is to directly provide the goods or services and Seeka either controls the asset or has the right to direct the asset. An agency relationship is when the performance obligation is to arrange the goods or services and Seeka holds no control. The Group currently has an agency relationship for the sale of some fruit in retail service operations.
Impact of seasonality Group revenues are generated from seasonal horticultural operations, with post harvest revenues recognised as services are provided and orcharding revenues recognised once the fruit is harvested. Retail revenues are generated at the point of sale. In New Zealand kiwifruit
are harvested from March to June, avocados from July to February, and kiwiberries from February to March. In Australia nashi and European pears are harvested January to March, and kiwifruit from March to May. As a result of these harvest timings around 80% of orchard revenues are recognised in the first six months of the financial year. Due to seasonal fluctuations, the timing of the provision of post harvest services can vary from year to year, however normally 70% is recognised in the first six months of the financial year.
Irrigation water rightsAllocation rights are carried at fair value supported by the value of the traded rights on a recognised exchange or market at measurement date. Annual water allocation rights are recognised as a current asset when they are allocated to the Group's permanent water shares from the first of July each year by the Victorian Water Register, and are subsequently expensed when the water entitlement is used to irrigate orchards. Any gain on revaluation is recognised in the statement of financial performance.
Interest incomeInterest income is recognised on a time-proportion basis using the effective interest method.
Dividend incomeDividend income is recognised when the right to receive payment is established.
26 ANNUAL REPORT 2018 | SEEKA LIMITED
New Zealand dollars2018
$000s2017
$000s
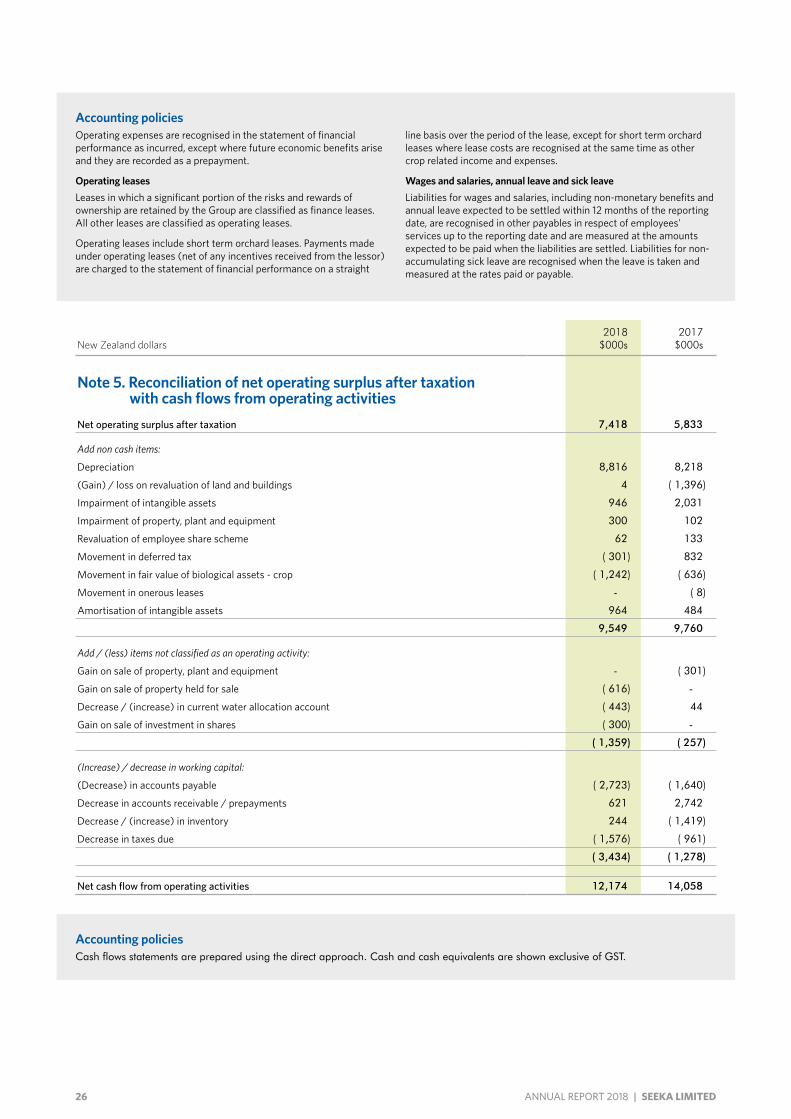
Note 5. Reconciliation of net operating surplus after taxation with cash flows from operating activitiesNet operating surplus after taxation 7,418 5,833
Add non cash items:
Depreciation 8,816 8,218
(Gain) / loss on revaluation of land and buildings 4 ( 1,396)
Impairment of intangible assets 946 2,031
Impairment of property, plant and equipment 300 102
Revaluation of employee share scheme 62 133
Movement in deferred tax ( 301) 832
Movement in fair value of biological assets - crop ( 1,242) ( 636)
Movement in onerous leases - ( 8)
Amortisation of intangible assets 964 484
9,549 9,760
Add / (less) items not classified as an operating activity:
Gain on sale of property, plant and equipment - ( 301)
Gain on sale of property held for sale ( 616) -
Decrease / (increase) in current water allocation account ( 443) 44
Gain on sale of investment in shares ( 300) -
( 1,359) ( 257)
(Increase) / decrease in working capital:
(Decrease) in accounts payable ( 2,723) ( 1,640)
Decrease in accounts receivable / prepayments 621 2,742
Decrease / (increase) in inventory 244 ( 1,419)
Decrease in taxes due ( 1,576) ( 961)
( 3,434) ( 1,278)
Net cash flow from operating activities 12,174 14,058
Accounting policiesCash flows statements are prepared using the direct approach. Cash and cash equivalents are shown exclusive of GST.
Accounting policiesOperating expenses are recognised in the statement of financial performance as incurred, except where future economic benefits arise and they are recorded as a prepayment.
Operating leasesLeases in which a significant portion of the risks and rewards of ownership are retained by the Group are classified as finance leases. All other leases are classified as operating leases.
Operating leases include short term orchard leases. Payments made under operating leases (net of any incentives received from the lessor) are charged to the statement of financial performance on a straight
line basis over the period of the lease, except for short term orchard leases where lease costs are recognised at the same time as other crop related income and expenses.
Wages and salaries, annual leave and sick leaveLiabilities for wages and salaries, including non-monetary benefits and annual leave expected to be settled within 12 months of the reporting date, are recognised in other payables in respect of employees' services up to the reporting date and are measured at the amounts expected to be paid when the liabilities are settled. Liabilities for non-accumulating sick leave are recognised when the leave is taken and measured at the rates paid or payable.
27SEEKA LIMITED | ANNUAL REPORT 2018
New Zealand dollars Notes2018
$000s2017
$000s
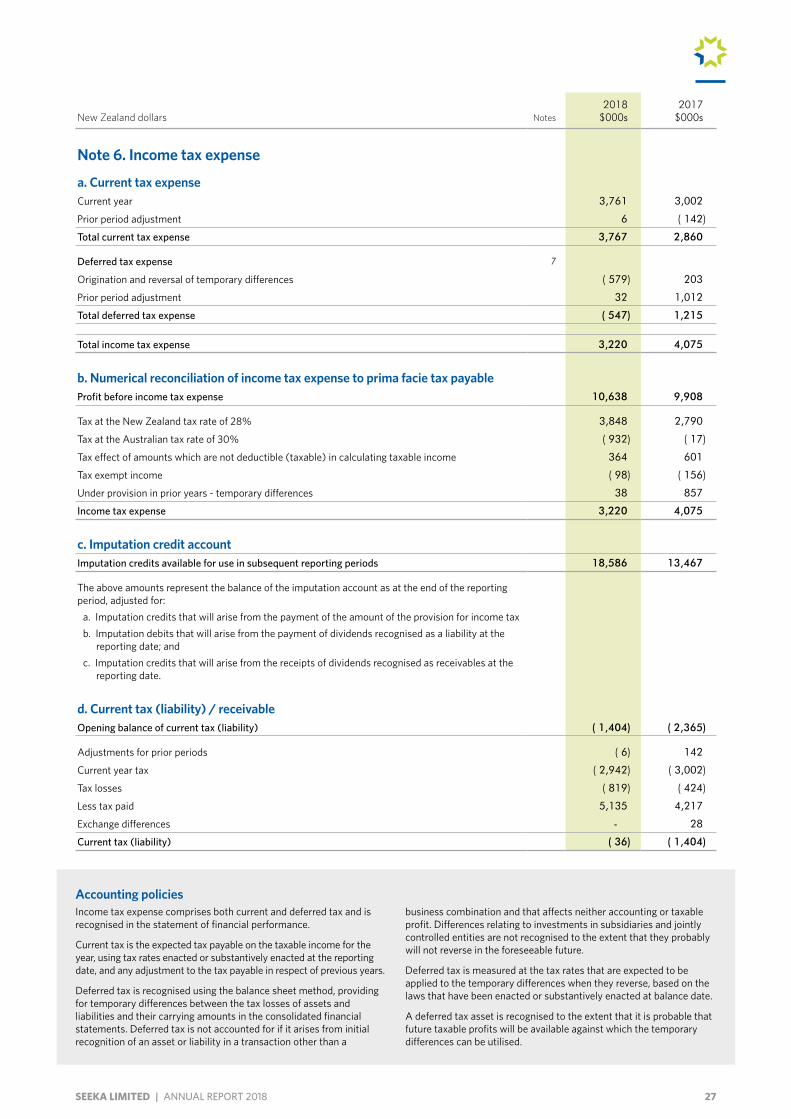
Note 6. Income tax expense
a. Current tax expenseCurrent year 3,761 3,002
Prior period adjustment 6 ( 142)
Total current tax expense 3,767 2,860
Deferred tax expense 7
Origination and reversal of temporary differences ( 579) 203
Prior period adjustment 32 1,012
Total deferred tax expense ( 547) 1,215
Total income tax expense 3,220 4,075
b. Numerical reconciliation of income tax expense to prima facie tax payableProfit before income tax expense 10,638 9,908
Tax at the New Zealand tax rate of 28% 3,848 2,790
Tax at the Australian tax rate of 30% ( 932) ( 17)
Tax effect of amounts which are not deductible (taxable) in calculating taxable income 364 601
Tax exempt income ( 98) ( 156)
Under provision in prior years - temporary differences 38 857
Income tax expense 3,220 4,075
c. Imputation credit accountImputation credits available for use in subsequent reporting periods 18,586 13,467
The above amounts represent the balance of the imputation account as at the end of the reporting period, adjusted for:
a. Imputation credits that will arise from the payment of the amount of the provision for income taxb. Imputation debits that will arise from the payment of dividends recognised as a liability at the
reporting date; andc. Imputation credits that will arise from the receipts of dividends recognised as receivables at the
reporting date.
d. Current tax (liability) / receivableOpening balance of current tax (liability) ( 1,404) ( 2,365)
Adjustments for prior periods ( 6) 142
Current year tax ( 2,942) ( 3,002)
Tax losses ( 819) ( 424)
Less tax paid 5,135 4,217
Exchange differences - 28
Current tax (liability) ( 36) ( 1,404)
Accounting policiesIncome tax expense comprises both current and deferred tax and is recognised in the statement of financial performance.
Current tax is the expected tax payable on the taxable income for the year, using tax rates enacted or substantively enacted at the reporting date, and any adjustment to the tax payable in respect of previous years.
Deferred tax is recognised using the balance sheet method, providing for temporary differences between the tax losses of assets and liabilities and their carrying amounts in the consolidated financial statements. Deferred tax is not accounted for if it arises from initial recognition of an asset or liability in a transaction other than a
business combination and that affects neither accounting or taxable profit. Differences relating to investments in subsidiaries and jointly controlled entities are not recognised to the extent that they probably will not reverse in the foreseeable future.
Deferred tax is measured at the tax rates that are expected to be applied to the temporary differences when they reverse, based on the laws that have been enacted or substantively enacted at balance date.
A deferred tax asset is recognised to the extent that it is probable that future taxable profits will be available against which the temporary differences can be utilised.
28 ANNUAL REPORT 2018 | SEEKA LIMITED
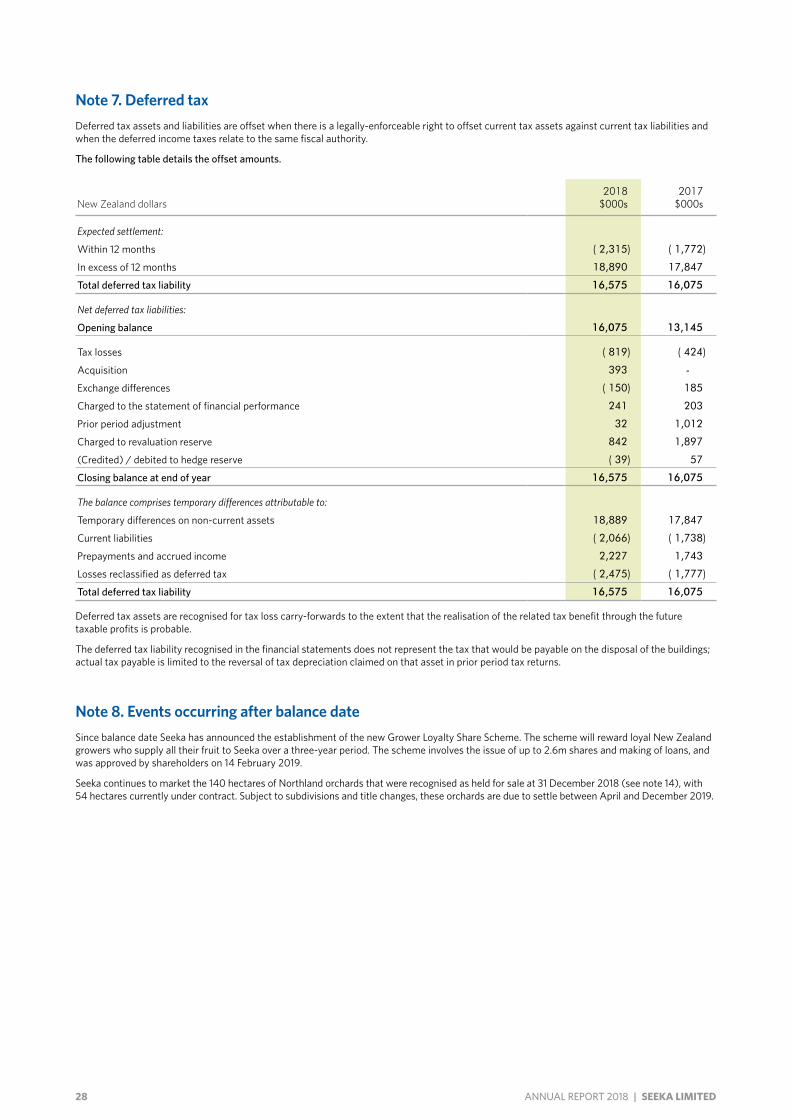
Note 7. Deferred taxDeferred tax assets and liabilities are offset when there is a legally-enforceable right to offset current tax assets against current tax liabilities and when the deferred income taxes relate to the same fiscal authority.
The following table details the offset amounts.
New Zealand dollars2018
$000s2017
$000s
Expected settlement:
Within 12 months ( 2,315) ( 1,772)
In excess of 12 months 18,890 17,847
Total deferred tax liability 16,575 16,075
Net deferred tax liabilities:
Opening balance 16,075 13,145
Tax losses ( 819) ( 424)
Acquisition 393 -
Exchange differences ( 150) 185
Charged to the statement of financial performance 241 203
Prior period adjustment 32 1,012
Charged to revaluation reserve 842 1,897
(Credited) / debited to hedge reserve ( 39) 57
Closing balance at end of year 16,575 16,075
The balance comprises temporary differences attributable to:
Temporary differences on non-current assets 18,889 17,847
Current liabilities ( 2,066) ( 1,738)
Prepayments and accrued income 2,227 1,743
Losses reclassified as deferred tax ( 2,475) ( 1,777)
Total deferred tax liability 16,575 16,075
Deferred tax assets are recognised for tax loss carry-forwards to the extent that the realisation of the related tax benefit through the future taxable profits is probable.
The deferred tax liability recognised in the financial statements does not represent the tax that would be payable on the disposal of the buildings; actual tax payable is limited to the reversal of tax depreciation claimed on that asset in prior period tax returns.
Note 8. Events occurring after balance dateSince balance date Seeka has announced the establishment of the new Grower Loyalty Share Scheme. The scheme will reward loyal New Zealand growers who supply all their fruit to Seeka over a three-year period. The scheme involves the issue of up to 2.6m shares and making of loans, and was approved by shareholders on 14 February 2019.
Seeka continues to market the 140 hectares of Northland orchards that were recognised as held for sale at 31 December 2018 (see note 14), with 54 hectares currently under contract. Subject to subdivisions and title changes, these orchards are due to settle between April and December 2019.
29SEEKA LIMITED | ANNUAL REPORT 2018
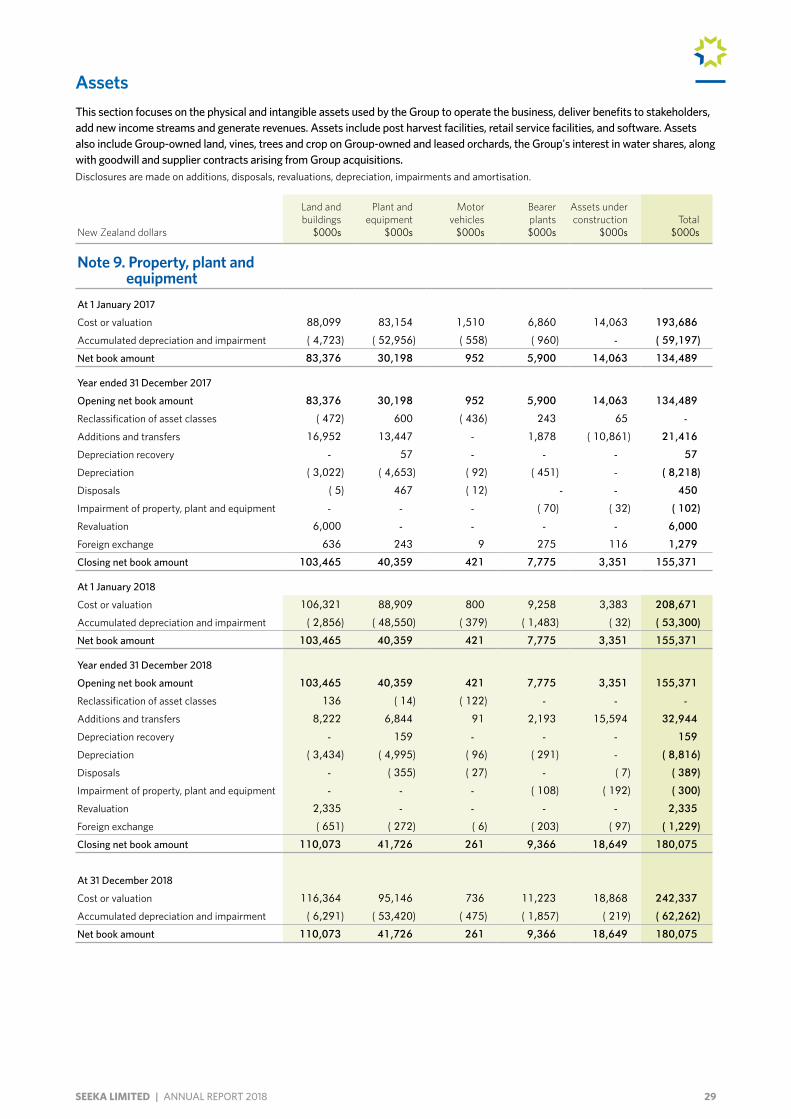
AssetsThis section focuses on the physical and intangible assets used by the Group to operate the business, deliver benefits to stakeholders, add new income streams and generate revenues. Assets include post harvest facilities, retail service facilities, and software. Assets also include Group-owned land, vines, trees and crop on Group-owned and leased orchards, the Group's interest in water shares, along with goodwill and supplier contracts arising from Group acquisitions.Disclosures are made on additions, disposals, revaluations, depreciation, impairments and amortisation.
New Zealand dollars
Land and buildings
$000s
Plant and equipment
$000s
Motor vehicles
$000s
Bearer plants $000s
Assets under construction
$000sTotal
$000s
Note 9. Property, plant and equipmentAt 1 January 2017
Cost or valuation 88,099 83,154 1,510 6,860 14,063 193,686
Accumulated depreciation and impairment ( 4,723) ( 52,956) ( 558) ( 960) - ( 59,197)
Net book amount 83,376 30,198 952 5,900 14,063 134,489
Year ended 31 December 2017
Opening net book amount 83,376 30,198 952 5,900 14,063 134,489
Reclassification of asset classes ( 472) 600 ( 436) 243 65 -
Additions and transfers 16,952 13,447 - 1,878 ( 10,861) 21,416
Depreciation recovery - 57 - - - 57
Depreciation ( 3,022) ( 4,653) ( 92) ( 451) - ( 8,218)
Disposals ( 5) 467 ( 12) - - 450
Impairment of property, plant and equipment - - - ( 70) ( 32) ( 102)
Revaluation 6,000 - - - - 6,000
Foreign exchange 636 243 9 275 116 1,279
Closing net book amount 103,465 40,359 421 7,775 3,351 155,371
At 1 January 2018
Cost or valuation 106,321 88,909 800 9,258 3,383 208,671
Accumulated depreciation and impairment ( 2,856) ( 48,550) ( 379) ( 1,483) ( 32) ( 53,300)
Net book amount 103,465 40,359 421 7,775 3,351 155,371
Year ended 31 December 2018
Opening net book amount 103,465 40,359 421 7,775 3,351 155,371
Reclassification of asset classes 136 ( 14) ( 122) - - -
Additions and transfers 8,222 6,844 91 2,193 15,594 32,944
Depreciation recovery - 159 - - - 159
Depreciation ( 3,434) ( 4,995) ( 96) ( 291) - ( 8,816)
Disposals - ( 355) ( 27) - ( 7) ( 389)
Impairment of property, plant and equipment - - - ( 108) ( 192) ( 300)
Revaluation 2,335 - - - - 2,335
Foreign exchange ( 651) ( 272) ( 6) ( 203) ( 97) ( 1,229)
Closing net book amount 110,073 41,726 261 9,366 18,649 180,075
At 31 December 2018
Cost or valuation 116,364 95,146 736 11,223 18,868 242,337
Accumulated depreciation and impairment ( 6,291) ( 53,420) ( 475) ( 1,857) ( 219) ( 62,262)
Net book amount 110,073 41,726 261 9,366 18,649 180,075
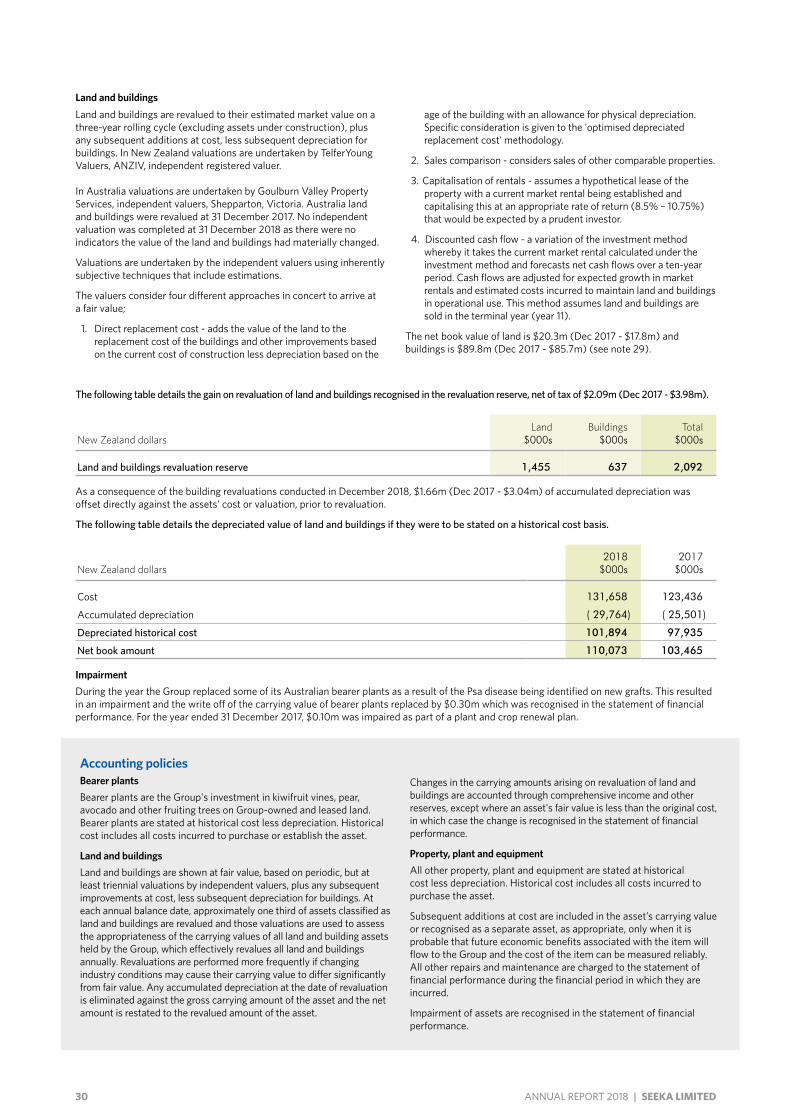
30 ANNUAL REPORT 2018 | SEEKA LIMITED
Land and buildings
The following table details the gain on revaluation of land and buildings recognised in the revaluation reserve, net of tax of $2.09m (Dec 2017 - $3.98m).
New Zealand dollarsLand
$000sBuildings
$000sTotal
$000s
Land and buildings revaluation reserve 1,455 637 2,092
As a consequence of the building revaluations conducted in December 2018, $1.66m (Dec 2017 - $3.04m) of accumulated depreciation was offset directly against the assets' cost or valuation, prior to revaluation.
The following table details the depreciated value of land and buildings if they were to be stated on a historical cost basis.
New Zealand dollars2018
$000s2017
$000s
Cost 131,658 123,436
Accumulated depreciation ( 29,764) ( 25,501)
Depreciated historical cost 101,894 97,935
Net book amount 110,073 103,465
ImpairmentDuring the year the Group replaced some of its Australian bearer plants as a result of the Psa disease being identified on new grafts. This resulted in an impairment and the write off of the carrying value of bearer plants replaced by $0.30m which was recognised in the statement of financial performance. For the year ended 31 December 2017, $0.10m was impaired as part of a plant and crop renewal plan.
Accounting policiesBearer plantsBearer plants are the Group's investment in kiwifruit vines, pear, avocado and other fruiting trees on Group-owned and leased land. Bearer plants are stated at historical cost less depreciation. Historical cost includes all costs incurred to purchase or establish the asset.
Land and buildingsLand and buildings are shown at fair value, based on periodic, but at least triennial valuations by independent valuers, plus any subsequent improvements at cost, less subsequent depreciation for buildings. At each annual balance date, approximately one third of assets classified as land and buildings are revalued and those valuations are used to assess the appropriateness of the carrying values of all land and building assets held by the Group, which effectively revalues all land and buildings annually. Revaluations are performed more frequently if changing industry conditions may cause their carrying value to differ significantly from fair value. Any accumulated depreciation at the date of revaluation is eliminated against the gross carrying amount of the asset and the net amount is restated to the revalued amount of the asset.
Changes in the carrying amounts arising on revaluation of land and buildings are accounted through comprehensive income and other reserves, except where an asset's fair value is less than the original cost, in which case the change is recognised in the statement of financial performance.
Property, plant and equipmentAll other property, plant and equipment are stated at historical cost less depreciation. Historical cost includes all costs incurred to purchase the asset.
Subsequent additions at cost are included in the asset’s carrying value or recognised as a separate asset, as appropriate, only when it is probable that future economic benefits associated with the item will flow to the Group and the cost of the item can be measured reliably. All other repairs and maintenance are charged to the statement of financial performance during the financial period in which they are incurred.
Impairment of assets are recognised in the statement of financial performance.
Land and buildings are revalued to their estimated market value on a three-year rolling cycle (excluding assets under construction), plus any subsequent additions at cost, less subsequent depreciation for buildings. In New Zealand valuations are undertaken by TelferYoung Valuers, ANZIV, independent registered valuer. In Australia valuations are undertaken by Goulburn Valley Property Services, independent valuers, Shepparton, Victoria. Australia land and buildings were revalued at 31 December 2017. No independent valuation was completed at 31 December 2018 as there were no indicators the value of the land and buildings had materially changed.
Valuations are undertaken by the independent valuers using inherently subjective techniques that include estimations.
The valuers consider four different approaches in concert to arrive at a fair value;
1. Direct replacement cost - adds the value of the land to the replacement cost of the buildings and other improvements based on the current cost of construction less depreciation based on the
age of the building with an allowance for physical depreciation. Specific consideration is given to the 'optimised depreciated replacement cost' methodology.
2. Sales comparison - considers sales of other comparable properties.
3. Capitalisation of rentals - assumes a hypothetical lease of the property with a current market rental being established and capitalising this at an appropriate rate of return (8.5% – 10.75%) that would be expected by a prudent investor.
4. Discounted cash flow - a variation of the investment method whereby it takes the current market rental calculated under the investment method and forecasts net cash flows over a ten-year period. Cash flows are adjusted for expected growth in market rentals and estimated costs incurred to maintain land and buildings in operational use. This method assumes land and buildings are sold in the terminal year (year 11).
The net book value of land is $20.3m (Dec 2017 - $17.8m) and buildings is $89.8m (Dec 2017 - $85.7m) (see note 29).
31SEEKA LIMITED | ANNUAL REPORT 2018
DepreciationLand is not depreciated. Depreciation on other assets is calculated using the straight line or diminishing value method to allocate their cost or revalued amounts, net of their residual values, over their estimated useful lives. The depreciation of bearer plants on leased land orchards is aligned to the term of the lease.
The estimated useful lives of assets are as follows:
– Buildings: 20 - 50 years
– Machinery: 10 - 20 years
– Vehicles: 4 - 7 years
– Furniture, fittings and equipment: 3 - 10 years
– Bearer plants: 5 - 50 years
The assets’ residual values and useful lives are reviewed, and adjusted if appropriate, at balance date.
An asset’s carrying amount is immediately written down to its recoverable amount.
Gains and losses on disposals are determined by comparing proceeds with the carrying amount, and any gain or loss is included in the statement of financial performance. When revalued assets are sold, the amounts included in the revaluation reserve in respect of those assets is transferred to retained earnings.
New Zealand dollarsSoftware
$000sGoodwill
$000s
Water shares $000s
Supplier contract
$000s
Interest in leased land
$000s
Other intangibles
$000sTotal
$000s
Note 10. Intangible assetsAt 1 January 2017
Cost 2,352 9,542 3,846 1,877 768 105 18,490
Accumulated amortisation and impairment ( 1,950) - - ( 841) ( 423) - ( 3,214)
Net book amount 402 9,542 3,846 1,036 345 105 15,276
Year ended 31 December 2017
Opening net book amount 402 9,542 3,846 1,036 345 105 15,276
Additions 164 689 - - - 853
Disposals - - - - - ( 105) ( 105)
Revaluation - - 1,393 - - - 1,393
Reversal of impairment - - - - 1,262 - 1,262
Impairment - ( 2,031) - - - - ( 2,031)
Exchange differences 1 340 222 - - - 563
Amortisation ( 147) - - ( 305) ( 32) - ( 484)
Closing net book amount 420 7,851 6,150 731 1,575 - 16,727
At 1 January 2018
Cost 2,517 9,882 6,150 1,877 2,030 - 22,456
Accumulated amortisation and impairment ( 2,097) ( 2,031) - ( 1,146) ( 455) - ( 5,729)
Net book amount 420 7,851 6,150 731 1,575 - 16,727
Year ended 31 December 2018
Opening net book amount 420 7,851 6,150 731 1,575 - 16,727
Additions 583 - - - - 1,662 2,245
Additions from business combination - 1,220 - - - - 1,220
Revaluation - - 1,981 - - - 1,981
Impairment - ( 946) - - - - ( 946)
Exchange differences ( 3) ( 278) ( 273) - - - ( 554)
Amortisation ( 201) - - ( 731) ( 32) - ( 964)
Closing net book amount 799 7,847 7,858 - 1,543 1,662 19,709
At 31 December 2018
Cost 3,097 10,824 7,858 1,877 2,030 1,662 27,348
Accumulated amortisation and impairment ( 2,298) ( 2,977) - ( 1,877) ( 487) - ( 7,639)
Net book amount 799 7,847 7,858 - 1,543 1,662 19,709
Other intangibles are SunGold kiwifruit licences purchased from Zespri Limited on 1 May 2018. The licences give Seeka the right to plant this gold kiwifruit variety and were purchased with the intention of using them on the orchards purchased in Northland and not yet settled to Seeka's ownership (see note 18). Amortisation was not applied to the licences as they will be classified as held for sale with the Northland orchards once Seeka obtains property title.
The software amortisation period is four to five years and the remaining amortisation period for the interest in leased land is from 32 to 90 years.
The Group's interest in leased land occupied, or held for future development, arose on the acquisition of Huka Pak and is the difference in the value of the lease terms to relative market terms.
32 ANNUAL REPORT 2018 | SEEKA LIMITED
The following table details the key assumptions used for value-in-use calculations and the recoverable amount in 2018.
Cash generating unit within the business
Carrying amount $000s
Discount rate
Revenue growth rate
1-5 yearsTerminal
growth rate
Goodwill
Glassfields Retail services segment 433 10.10% 4.0% - 5.0% 2.0%
Kiwi Crush Retail services segment 244 10.90% 2.0% - 4.0% 2.0%
Seeka Australia Pty Limited Australian operations 5,950 9.85% 3.0% - 9.0% 2.0%
Seeka Australia Pty Limited revenue growth reflects an expected improvement in future production yields, cost containment strategies and an increase in market share in better quality product varieties.
The following table details how water shares would be stated on the historical cost basis.
New Zealand dollars2018
$000s2017
$000s
Cost 4,535 4,535
Amortised cost 4,535 4,535
Net book amount 7,858 6,150
Accounting policiesIntangible assetsAssets with a finite useful life are subject to depreciation and amortisation and reviewed for impairment whenever events or changes in circumstances indicate that the carrying amount may not be recoverable. Intangible assets that have an indefinite life are not subject to amortisation and are tested at least annually for impairment, with impairment losses recognised when the carrying amount exceeds the recoverable amount. When assessing impairment, assets are grouped at the lowest identifiable unit able to generate cash flow.
SoftwareAcquired computer software licences are capitalised on the basis of the costs incurred to acquire and bring to use the specific software. Internally developed computer software is capitalised when it enters the development phase per NZ IAS 38 on the basis of costs incurred to develop and test the software for use. Intangible assets are amortised over their estimated useful life (typically three to five years).
GoodwillGoodwill represents the excess of the cost of an acquisition over the fair value of the Group’s share of the net identifiable assets of the acquired business or associate at the date of acquisition. Goodwill on acquisition of a business is included in intangible assets. Goodwill on acquisition of an associate is included in investments in associates.
Goodwill acquired in business combinations is not amortised. Instead, goodwill is tested for impairment annually, or more frequently if deemed prudent, with goodwill carried at cost less accumulated impairment losses. Gains and losses on the disposal of an entity include the carrying amount of goodwill relating to that entity.
Supplier contractsWhen an intangible asset is recognised on a supplier contract it is amortised over the life of the contract on a straight line basis. The expense is charged to the statement of financial performance.
Lease interest in landThe Group’s interest in long term leased land occupied, or held for future development, is amortised over the life of the lease and tested for impairment on a triennial basis along with land and buildings when impairment indicators exist.
Water sharesThe Group records permanent water shares at fair value based on the market price at balance date. The shares are fully tradeable, have an indefinite life and are not amortised.
Other intangiblesOther intangibles subject to amortisation will be amortised over the life of the asset on a straight line basis. The expense is charged to the statement of financial performance.
Water shares are an integral part of land and irrigation infrastructure required to grow pears, kiwifruit and other annual crops in Australia and are carried at fair value based on the closing water share market price. The movement in the fair value is recognised in the statement of other comprehensive income.
Impairment tests for goodwillThe Board reviews business performance based on operating segments and monitors goodwill at the operating segment level in accordance with the policy below. Goodwill represents the Group's retail services acquired with Glassfields, the acquisition of Seeka Australia (Pty) Limited and the acquisition of the Kiwi Crush and Kiwi Crushies product ranges.
The recoverable amount is based on the net present value of the five-year after-tax cash flow projection, with a terminal value beyond five years. Cash flows beyond the five year period are extrapolated using estimated growth rates and discount rates stated below. The assumptions used for the analysis of the net present value of forecast
gross margin for the cash generating unit, is determined based on past performance and the Board's expectations of future market development.
Following a major customer moving to their own direct supply of bananas in 2018, the Board reassessed the useful life remaining on the intangible asset associated with the contract. The useful life was reduced from 6 years to 4 years and with no remaining term to run the supplier contract intangible asset is now fully amortised. Further, the Board reviewed the latest forecasts and further impaired the carrying value of the goodwill associated with the Glassfield's banana business by $0.95m. The remaining goodwill recognised as an intangible asset on the balance sheet is $0.43m. In December 2017 the Board impaired $2.03m of goodwill in relation to these operations.
During the year $1.2m of goodwill was recognised from the acquisition of the Kerikeri post harvest facility (see note 18). Management assessed that there were no indicators of impairment as at 31 December 2018.
No other impairment arose in the current year.
33SEEKA LIMITED | ANNUAL REPORT 2018
Note 11. Biological assets - cropCrops growing on bearer plants are classified as biological assets and measured at fair value.
Crop assets are kiwifruit, nashi pears, Packham pears, Corella pears, other pears, cherries, avocado, apricot, and plum crops growing on leased and owned orchards and yet to be harvested at balance date.
The following table reconciles beginning balances to end balances for biological assets crop measured at fair value defined as level 3 in note 29.
New Zealand dollars2018
$000s2017
$000s
Carrying amount at beginning of period 16,682 16,046
Crop harvested during the period
Fair value movement from the beginning of the period to point of harvest 20,000 20,903
Fair value when harvested ( 36,682) ( 36,949)
Crop growing on bearer plants at end of period
Crop where cost is deemed fair value 17,745 16,470
Crop at fair value 179 212
Carrying value at end of period 17,924 16,682
The following table reconciles fair value movement of biological assets - crop.
New Zealand dollars2018
$000s2017
$000s
Movement in carrying amount 1,491 346
Exchange differences ( 249) 290
Net fair value movement in crop 1,242 636
The following table details the classification of biological assets - crop.
New Zealand dollars2018
$000s2017
$000s
Australia - all varieties 5,020 5,918
New Zealand - kiwifruit crop 12,775 10,656
New Zealand - avocado crop 129 108
Carrying value at end of period 17,924 16,682
Crop where cost is deemed fair valueKiwifruit, nashi, Packham and Corella pear crops are not considered to have achieved sufficient biological transformation at balance date and as such costs are deemed fair value (note 29).
During the year $0.50m of development costs were expensed due to the effect of Psa on recently grafted crops on producing orchards in Australia. This is reflected in the change in the fair value of the biological asset.
Accounting policiesBiological assets are the crops growing on bearer plants in the Group’s leased and owned orchards. The method to determine fair value depends on the degree of biological transformation (the maturity of the fruit) at balance date.
When insufficient biological transformation has occurred, the fair value is the costs incurred at balance date to grow the crops (provided the costs are considered recoverable). When costs are not considered recoverable they are expensed in the statement of financial performance.
When sufficient biological transformation has occurred, fair value is the estimated net market return less selling cost and costs to market.
The estimated market return less selling cost is established by reference to current and expected sales returns when available. When market data is not available an assessment is made based on historical data.
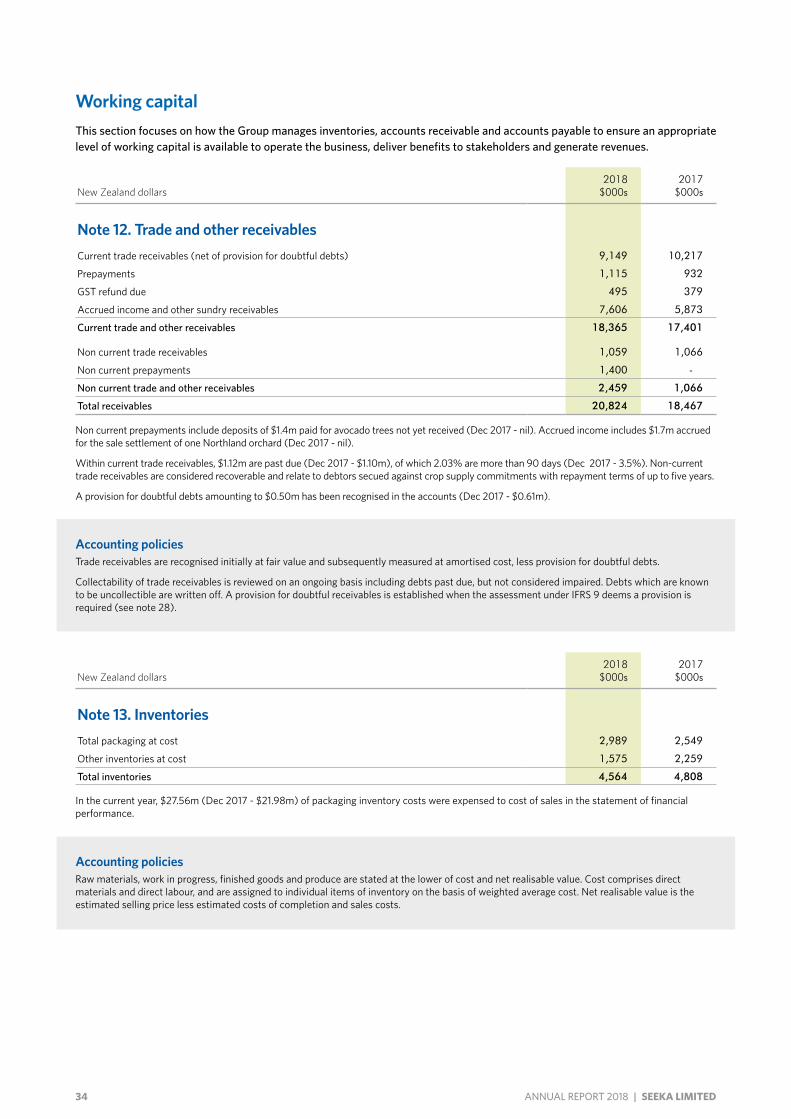
34 ANNUAL REPORT 2018 | SEEKA LIMITED
Working capitalThis section focuses on how the Group manages inventories, accounts receivable and accounts payable to ensure an appropriate level of working capital is available to operate the business, deliver benefits to stakeholders and generate revenues.
New Zealand dollars2018
$000s2017
$000s
Note 12. Trade and other receivablesCurrent trade receivables (net of provision for doubtful debts) 9,149 10,217
Prepayments 1,115 932
GST refund due 495 379
Accrued income and other sundry receivables 7,606 5,873
Current trade and other receivables 18,365 17,401
Non current trade receivables 1,059 1,066
Non current prepayments 1,400 -
Non current trade and other receivables 2,459 1,066
Total receivables 20,824 18,467
Non current prepayments include deposits of $1.4m paid for avocado trees not yet received (Dec 2017 - nil). Accrued income includes $1.7m accrued for the sale settlement of one Northland orchard (Dec 2017 - nil).
Within current trade receivables, $1.12m are past due (Dec 2017 - $1.10m), of which 2.03% are more than 90 days (Dec 2017 - 3.5%). Non-current trade receivables are considered recoverable and relate to debtors secued against crop supply commitments with repayment terms of up to five years.
A provision for doubtful debts amounting to $0.50m has been recognised in the accounts (Dec 2017 - $0.61m).
Accounting policiesTrade receivables are recognised initially at fair value and subsequently measured at amortised cost, less provision for doubtful debts.
Collectability of trade receivables is reviewed on an ongoing basis including debts past due, but not considered impaired. Debts which are known to be uncollectible are written off. A provision for doubtful receivables is established when the assessment under IFRS 9 deems a provision is required (see note 28).
New Zealand dollars2018
$000s2017
$000s
Note 13. InventoriesTotal packaging at cost 2,989 2,549
Other inventories at cost 1,575 2,259
Total inventories 4,564 4,808
In the current year, $27.56m (Dec 2017 - $21.98m) of packaging inventory costs were expensed to cost of sales in the statement of financial performance.
Accounting policiesRaw materials, work in progress, finished goods and produce are stated at the lower of cost and net realisable value. Cost comprises direct materials and direct labour, and are assigned to individual items of inventory on the basis of weighted average cost. Net realisable value is the estimated selling price less estimated costs of completion and sales costs.
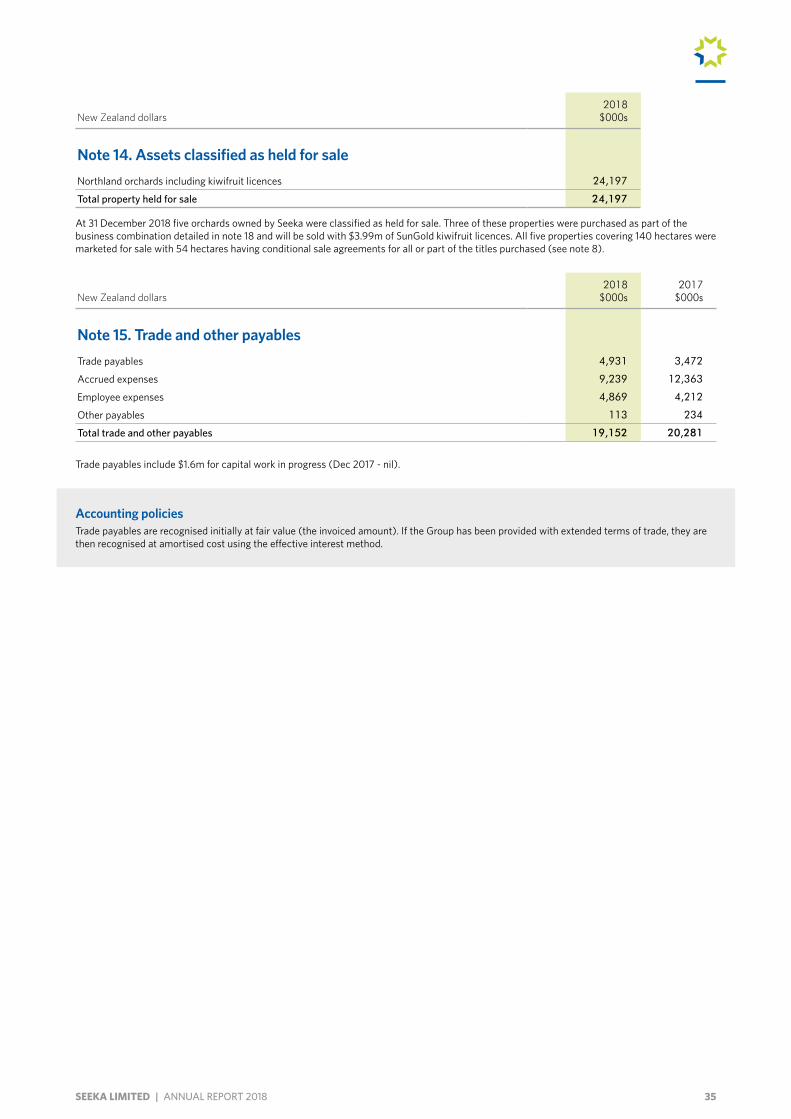
35SEEKA LIMITED | ANNUAL REPORT 2018
New Zealand dollars2018
$000s
Note 14. Assets classified as held for saleNorthland orchards including kiwifruit licences 24,197
Total property held for sale 24,197
At 31 December 2018 five orchards owned by Seeka were classified as held for sale. Three of these properties were purchased as part of the business combination detailed in note 18 and will be sold with $3.99m of SunGold kiwifruit licences. All five properties covering 140 hectares were marketed for sale with 54 hectares having conditional sale agreements for all or part of the titles purchased (see note 8).
New Zealand dollars2018
$000s2017
$000s
Note 15. Trade and other payablesTrade payables 4,931 3,472
Accrued expenses 9,239 12,363
Employee expenses 4,869 4,212
Other payables 113 234
Total trade and other payables 19,152 20,281
Trade payables include $1.6m for capital work in progress (Dec 2017 - nil).
Accounting policiesTrade payables are recognised initially at fair value (the invoiced amount). If the Group has been provided with extended terms of trade, they are then recognised at amortised cost using the effective interest method.
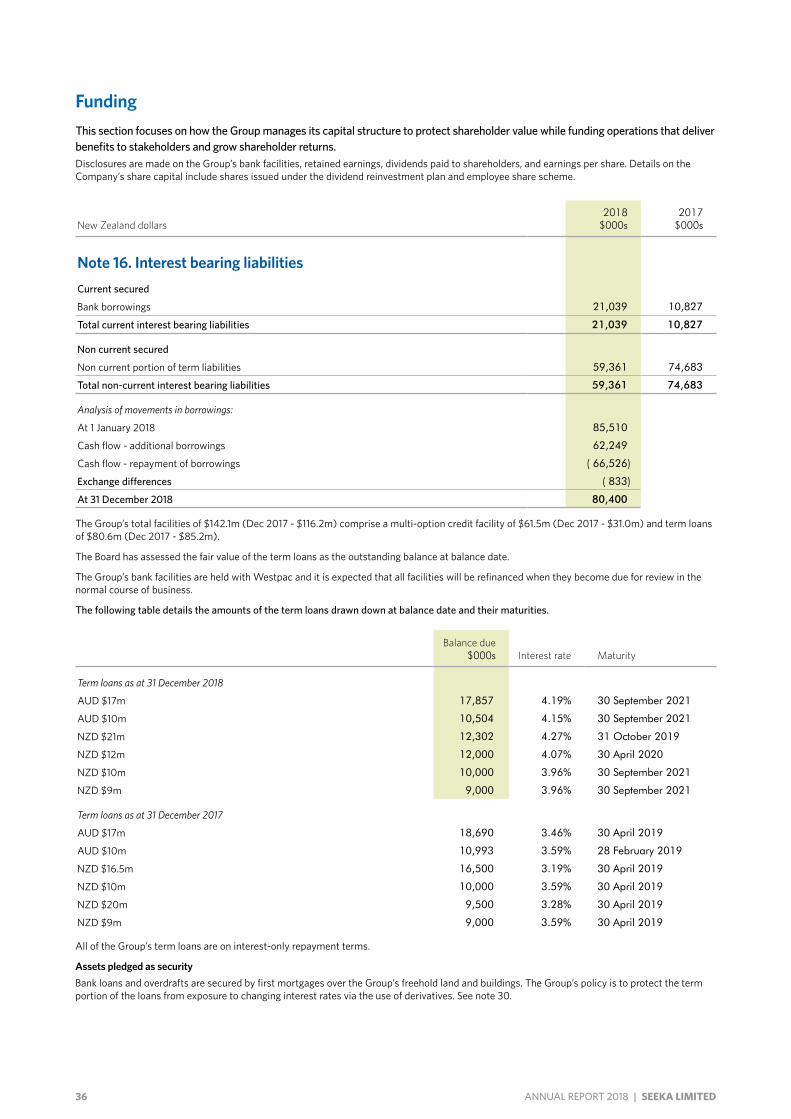
36 ANNUAL REPORT 2018 | SEEKA LIMITED
FundingThis section focuses on how the Group manages its capital structure to protect shareholder value while funding operations that deliver benefits to stakeholders and grow shareholder returns.Disclosures are made on the Group’s bank facilities, retained earnings, dividends paid to shareholders, and earnings per share. Details on the Company’s share capital include shares issued under the dividend reinvestment plan and employee share scheme.
New Zealand dollars2018
$000s2017
$000s
Note 16. Interest bearing liabilitiesCurrent secured
Bank borrowings 21,039 10,827
Total current interest bearing liabilities 21,039 10,827
Non current secured
Non current portion of term liabilities 59,361 74,683
Total non-current interest bearing liabilities 59,361 74,683
Analysis of movements in borrowings:
At 1 January 2018 85,510
Cash flow - additional borrowings 62,249
Cash flow - repayment of borrowings ( 66,526)
Exchange differences ( 833)
At 31 December 2018 80,400
The Group’s total facilities of $142.1m (Dec 2017 - $116.2m) comprise a multi-option credit facility of $61.5m (Dec 2017 - $31.0m) and term loans of $80.6m (Dec 2017 - $85.2m).
The Board has assessed the fair value of the term loans as the outstanding balance at balance date.
The Group’s bank facilities are held with Westpac and it is expected that all facilities will be refinanced when they become due for review in the normal course of business.
The following table details the amounts of the term loans drawn down at balance date and their maturities.
Balance due $000s Interest rate Maturity
Term loans as at 31 December 2018
AUD $17m 17,857 4.19% 30 September 2021
AUD $10m 10,504 4.15% 30 September 2021
NZD $21m 12,302 4.27% 31 October 2019
NZD $12m 12,000 4.07% 30 April 2020
NZD $10m 10,000 3.96% 30 September 2021
NZD $9m 9,000 3.96% 30 September 2021
Term loans as at 31 December 2017
AUD $17m 18,690 3.46% 30 April 2019
AUD $10m 10,993 3.59% 28 February 2019
NZD $16.5m 16,500 3.19% 30 April 2019
NZD $10m 10,000 3.59% 30 April 2019
NZD $20m 9,500 3.28% 30 April 2019
NZD $9m 9,000 3.59% 30 April 2019
All of the Group’s term loans are on interest-only repayment terms.
Assets pledged as securityBank loans and overdrafts are secured by first mortgages over the Group’s freehold land and buildings. The Group’s policy is to protect the term portion of the loans from exposure to changing interest rates via the use of derivatives. See note 30.
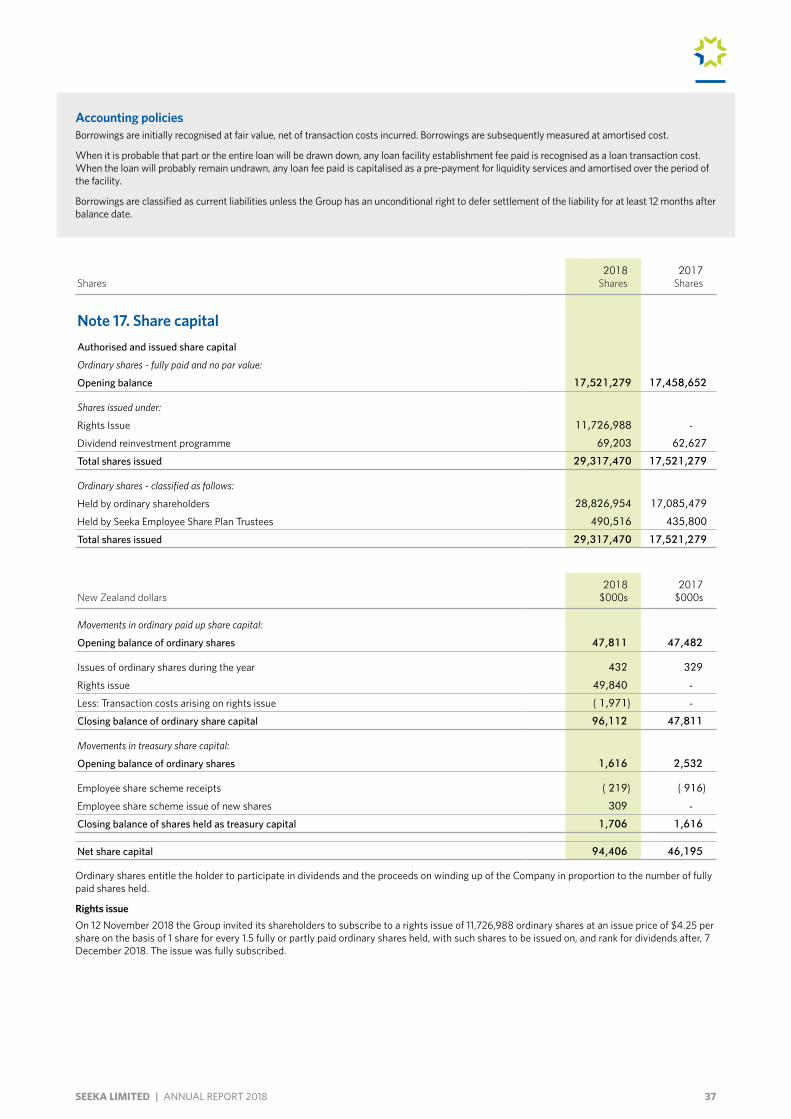
37SEEKA LIMITED | ANNUAL REPORT 2018
Accounting policiesBorrowings are initially recognised at fair value, net of transaction costs incurred. Borrowings are subsequently measured at amortised cost.
When it is probable that part or the entire loan will be drawn down, any loan facility establishment fee paid is recognised as a loan transaction cost. When the loan will probably remain undrawn, any loan fee paid is capitalised as a pre-payment for liquidity services and amortised over the period of the facility.
Borrowings are classified as current liabilities unless the Group has an unconditional right to defer settlement of the liability for at least 12 months after balance date.
Shares2018
Shares2017
Shares
Note 17. Share capitalAuthorised and issued share capital
Ordinary shares - fully paid and no par value:
Opening balance 17,521,279 17,458,652
Shares issued under:
Rights Issue 11,726,988 -
Dividend reinvestment programme 69,203 62,627
Total shares issued 29,317,470 17,521,279
Ordinary shares - classified as follows:
Held by ordinary shareholders 28,826,954 17,085,479
Held by Seeka Employee Share Plan Trustees 490,516 435,800
Total shares issued 29,317,470 17,521,279
New Zealand dollars2018
$000s2017
$000s
Movements in ordinary paid up share capital:
Opening balance of ordinary shares 47,811 47,482
Issues of ordinary shares during the year 432 329
Rights issue 49,840 -
Less: Transaction costs arising on rights issue ( 1,971) -
Closing balance of ordinary share capital 96,112 47,811
Movements in treasury share capital:
Opening balance of ordinary shares 1,616 2,532
Employee share scheme receipts ( 219) ( 916)
Employee share scheme issue of new shares 309 -
Closing balance of shares held as treasury capital 1,706 1,616
Net share capital 94,406 46,195
Ordinary shares entitle the holder to participate in dividends and the proceeds on winding up of the Company in proportion to the number of fully paid shares held.
Rights issueOn 12 November 2018 the Group invited its shareholders to subscribe to a rights issue of 11,726,988 ordinary shares at an issue price of $4.25 per share on the basis of 1 share for every 1.5 fully or partly paid ordinary shares held, with such shares to be issued on, and rank for dividends after, 7 December 2018. The issue was fully subscribed.
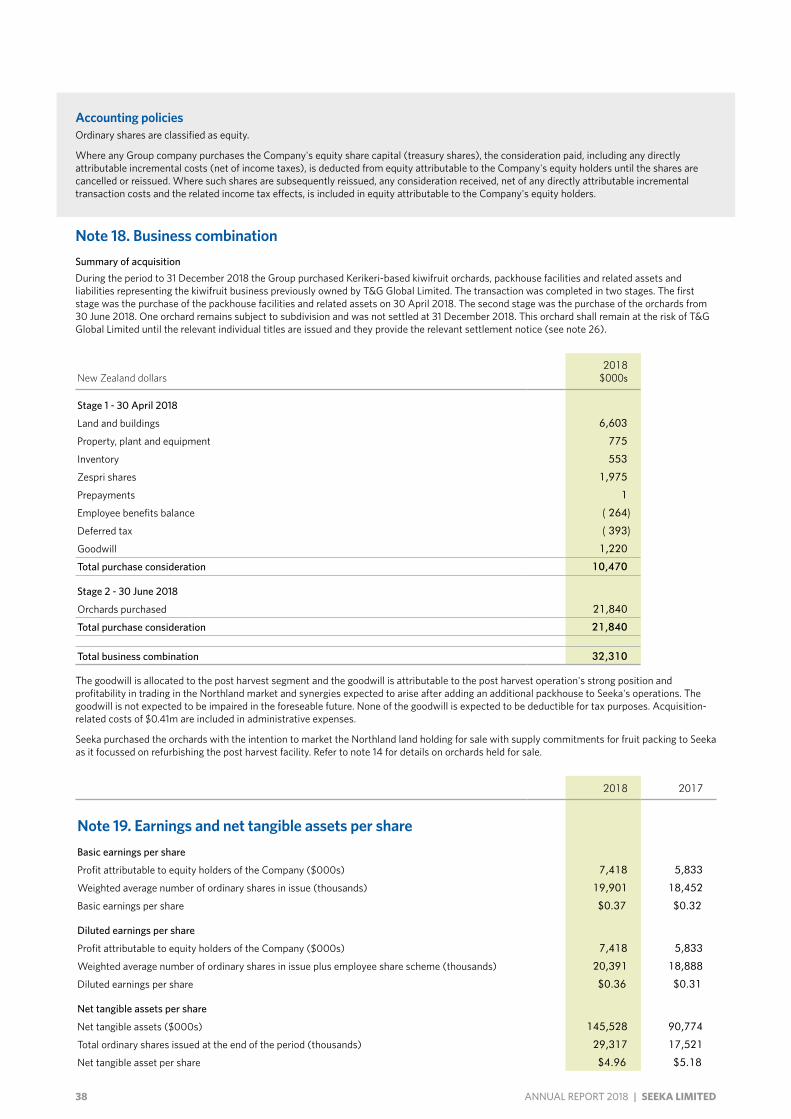
38 ANNUAL REPORT 2018 | SEEKA LIMITED
Note 18. Business combinationSummary of acquisitionDuring the period to 31 December 2018 the Group purchased Kerikeri-based kiwifruit orchards, packhouse facilities and related assets and liabilities representing the kiwifruit business previously owned by T&G Global Limited. The transaction was completed in two stages. The first stage was the purchase of the packhouse facilities and related assets on 30 April 2018. The second stage was the purchase of the orchards from 30 June 2018. One orchard remains subject to subdivision and was not settled at 31 December 2018. This orchard shall remain at the risk of T&G Global Limited until the relevant individual titles are issued and they provide the relevant settlement notice (see note 26).
New Zealand dollars2018
$000s
Stage 1 - 30 April 2018
Land and buildings 6,603
Property, plant and equipment 775
Inventory 553
Zespri shares 1,975
Prepayments 1
Employee benefits balance ( 264)
Deferred tax ( 393)
Goodwill 1,220
Total purchase consideration 10,470
Stage 2 - 30 June 2018
Orchards purchased 21,840
Total purchase consideration 21,840
Total business combination 32,310
The goodwill is allocated to the post harvest segment and the goodwill is attributable to the post harvest operation's strong position and profitability in trading in the Northland market and synergies expected to arise after adding an additional packhouse to Seeka's operations. The goodwill is not expected to be impaired in the foreseable future. None of the goodwill is expected to be deductible for tax purposes. Acquisition-related costs of $0.41m are included in administrative expenses.
Seeka purchased the orchards with the intention to market the Northland land holding for sale with supply commitments for fruit packing to Seeka as it focussed on refurbishing the post harvest facility. Refer to note 14 for details on orchards held for sale.
2018 2017
Note 19. Earnings and net tangible assets per share Basic earnings per share
Profit attributable to equity holders of the Company ($000s) 7,418 5,833
Weighted average number of ordinary shares in issue (thousands) 19,901 18,452
Basic earnings per share $0.37 $0.32
Diluted earnings per share
Profit attributable to equity holders of the Company ($000s) 7,418 5,833
Weighted average number of ordinary shares in issue plus employee share scheme (thousands) 20,391 18,888
Diluted earnings per share $0.36 $0.31
Net tangible assets per share
Net tangible assets ($000s) 145,528 90,774
Total ordinary shares issued at the end of the period (thousands) 29,317 17,521
Net tangible asset per share $4.96 $5.18
Accounting policiesOrdinary shares are classified as equity.
Where any Group company purchases the Company's equity share capital (treasury shares), the consideration paid, including any directly attributable incremental costs (net of income taxes), is deducted from equity attributable to the Company's equity holders until the shares are cancelled or reissued. Where such shares are subsequently reissued, any consideration received, net of any directly attributable incremental transaction costs and the related income tax effects, is included in equity attributable to the Company's equity holders.
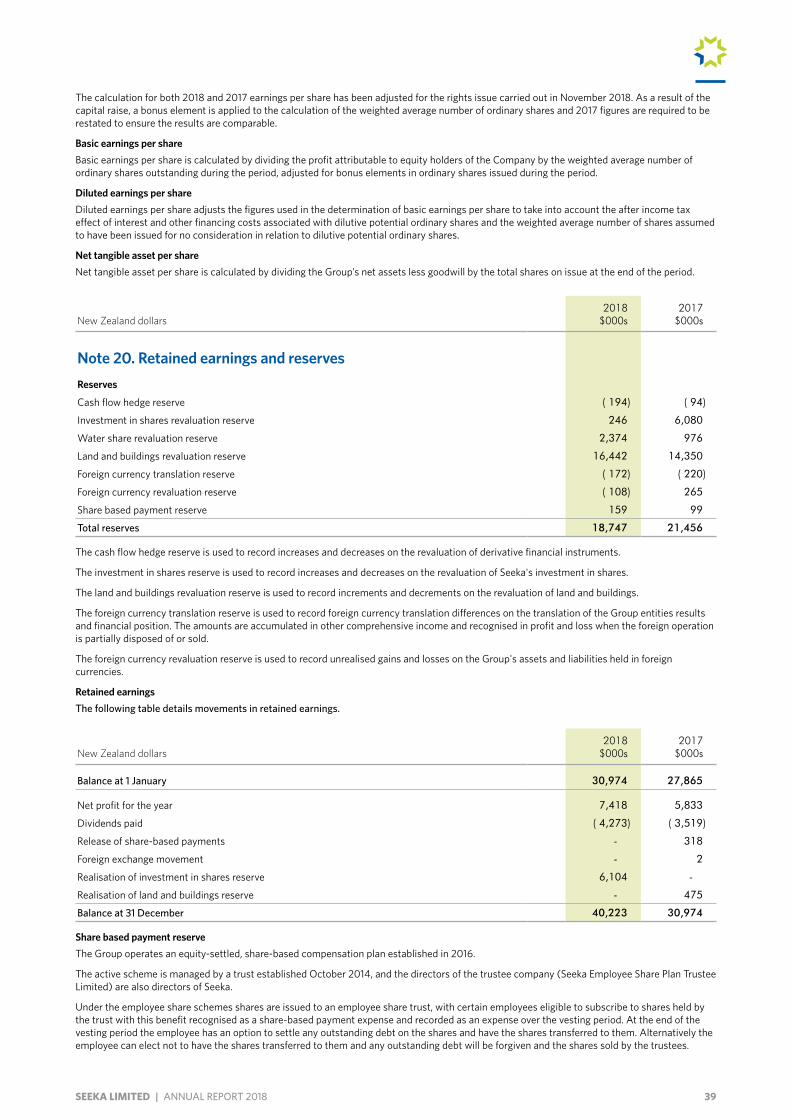
39SEEKA LIMITED | ANNUAL REPORT 2018
The calculation for both 2018 and 2017 earnings per share has been adjusted for the rights issue carried out in November 2018. As a result of the capital raise, a bonus element is applied to the calculation of the weighted average number of ordinary shares and 2017 figures are required to be restated to ensure the results are comparable.
Basic earnings per shareBasic earnings per share is calculated by dividing the profit attributable to equity holders of the Company by the weighted average number of ordinary shares outstanding during the period, adjusted for bonus elements in ordinary shares issued during the period.
Diluted earnings per shareDiluted earnings per share adjusts the figures used in the determination of basic earnings per share to take into account the after income tax effect of interest and other financing costs associated with dilutive potential ordinary shares and the weighted average number of shares assumed to have been issued for no consideration in relation to dilutive potential ordinary shares.
Net tangible asset per shareNet tangible asset per share is calculated by dividing the Group’s net assets less goodwill by the total shares on issue at the end of the period.
New Zealand dollars2018
$000s2017
$000s
Note 20. Retained earnings and reservesReserves
Cash flow hedge reserve ( 194) ( 94)
Investment in shares revaluation reserve 246 6,080
Water share revaluation reserve 2,374 976
Land and buildings revaluation reserve 16,442 14,350
Foreign currency translation reserve ( 172) ( 220)
Foreign currency revaluation reserve ( 108) 265
Share based payment reserve 159 99
Total reserves 18,747 21,456
The cash flow hedge reserve is used to record increases and decreases on the revaluation of derivative financial instruments.
The investment in shares reserve is used to record increases and decreases on the revaluation of Seeka's investment in shares.
The land and buildings revaluation reserve is used to record increments and decrements on the revaluation of land and buildings.
The foreign currency translation reserve is used to record foreign currency translation differences on the translation of the Group entities results and financial position. The amounts are accumulated in other comprehensive income and recognised in profit and loss when the foreign operation is partially disposed of or sold.
The foreign currency revaluation reserve is used to record unrealised gains and losses on the Group's assets and liabilities held in foreign currencies.
Retained earningsThe following table details movements in retained earnings.
New Zealand dollars2018
$000s2017
$000s
Balance at 1 January 30,974 27,865
Net profit for the year 7,418 5,833
Dividends paid ( 4,273) ( 3,519)
Release of share-based payments - 318
Foreign exchange movement - 2
Realisation of investment in shares reserve 6,104 -
Realisation of land and buildings reserve - 475
Balance at 31 December 40,223 30,974
Share based payment reserveThe Group operates an equity-settled, share-based compensation plan established in 2016.
The active scheme is managed by a trust established October 2014, and the directors of the trustee company (Seeka Employee Share Plan Trustee Limited) are also directors of Seeka.
Under the employee share schemes shares are issued to an employee share trust, with certain employees eligible to subscribe to shares held by the trust with this benefit recognised as a share-based payment expense and recorded as an expense over the vesting period. At the end of the vesting period the employee has an option to settle any outstanding debt on the shares and have the shares transferred to them. Alternatively the employee can elect not to have the shares transferred to them and any outstanding debt will be forgiven and the shares sold by the trustees.
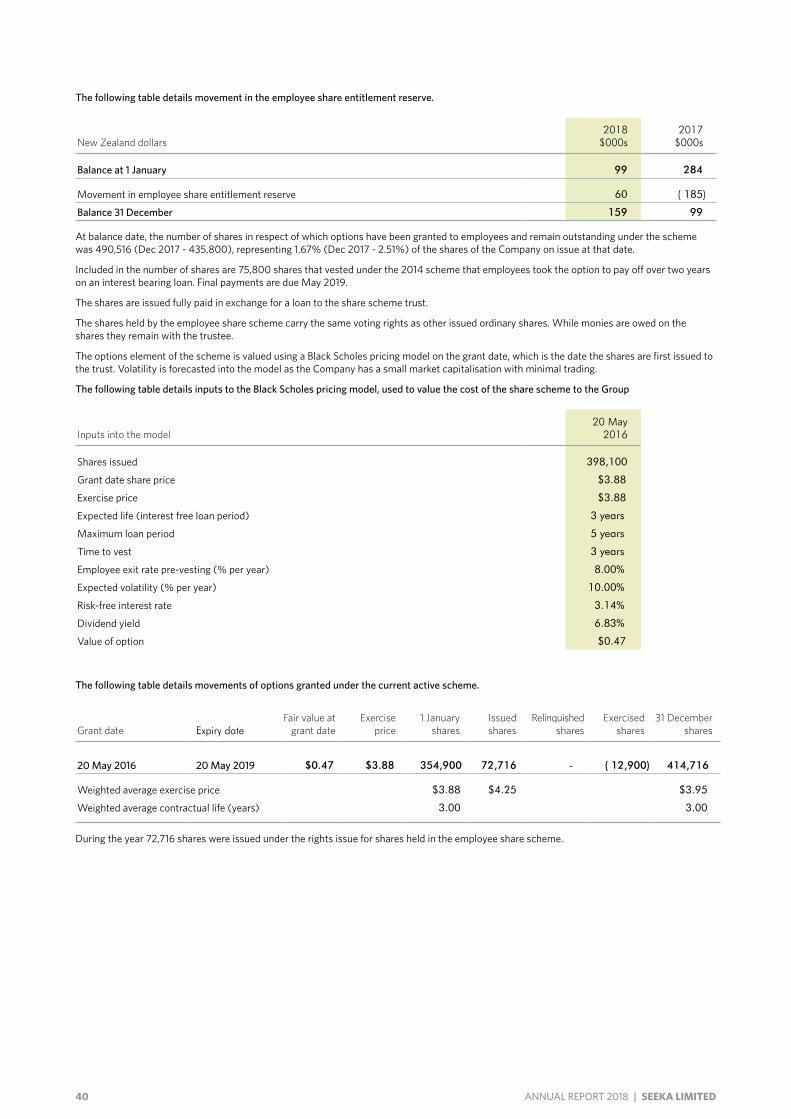
40 ANNUAL REPORT 2018 | SEEKA LIMITED
The following table details movement in the employee share entitlement reserve.
New Zealand dollars2018
$000s2017
$000s
Balance at 1 January 99 284
Movement in employee share entitlement reserve 60 ( 185)
Balance 31 December 159 99
At balance date, the number of shares in respect of which options have been granted to employees and remain outstanding under the scheme was 490,516 (Dec 2017 - 435,800), representing 1.67% (Dec 2017 - 2.51%) of the shares of the Company on issue at that date.
Included in the number of shares are 75,800 shares that vested under the 2014 scheme that employees took the option to pay off over two years on an interest bearing loan. Final payments are due May 2019.
The shares are issued fully paid in exchange for a loan to the share scheme trust.
The shares held by the employee share scheme carry the same voting rights as other issued ordinary shares. While monies are owed on the shares they remain with the trustee.
The options element of the scheme is valued using a Black Scholes pricing model on the grant date, which is the date the shares are first issued to the trust. Volatility is forecasted into the model as the Company has a small market capitalisation with minimal trading.
The following table details inputs to the Black Scholes pricing model, used to value the cost of the share scheme to the Group
Inputs into the model20 May
2016
Shares issued 398,100
Grant date share price $3.88
Exercise price $3.88
Expected life (interest free loan period) 3 years
Maximum loan period 5 years
Time to vest 3 years
Employee exit rate pre-vesting (% per year) 8.00%
Expected volatility (% per year) 10.00%
Risk-free interest rate 3.14%
Dividend yield 6.83%
Value of option $0.47
The following table details movements of options granted under the current active scheme.
Grant date Expiry dateFair value at
grant dateExercise
price1 January
sharesIssued shares
Relinquished shares
Exercised shares
31 December shares
20 May 2016 20 May 2019 $0.47 $3.88 354,900 72,716 - ( 12,900) 414,716
Weighted average exercise price $3.88 $4.25 $3.95
Weighted average contractual life (years) 3.00 3.00
During the year 72,716 shares were issued under the rights issue for shares held in the employee share scheme.
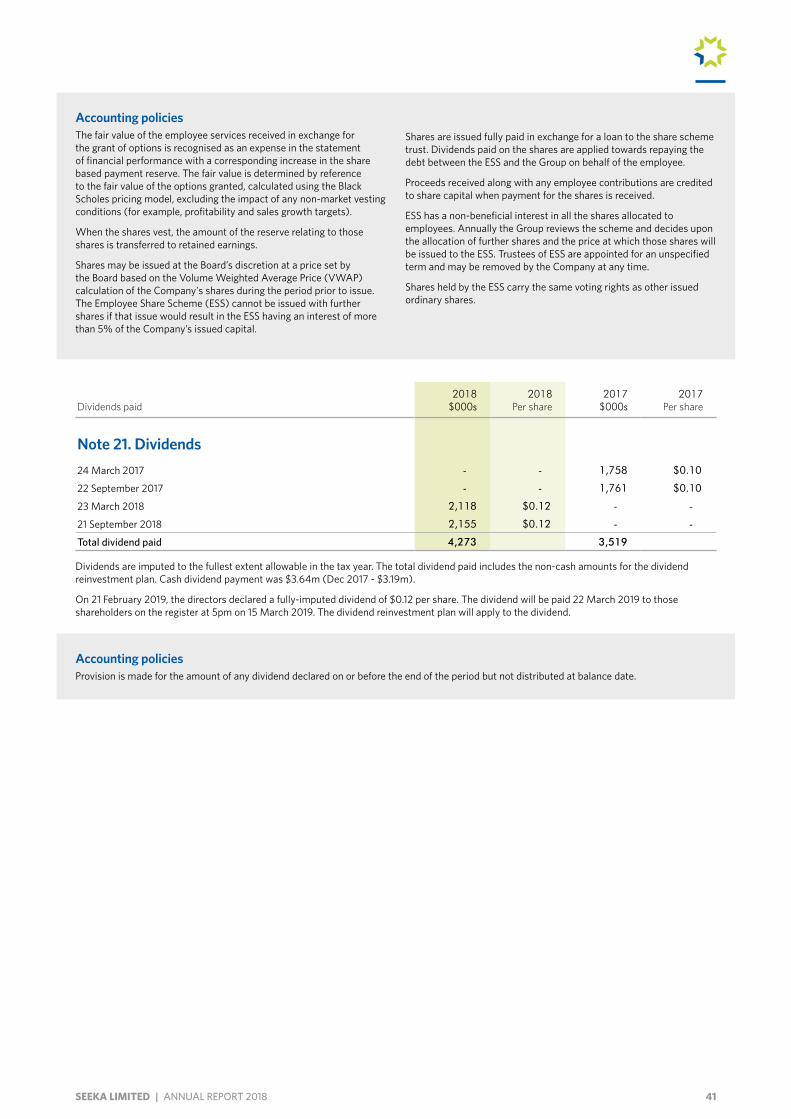
41SEEKA LIMITED | ANNUAL REPORT 2018
Accounting policiesThe fair value of the employee services received in exchange for the grant of options is recognised as an expense in the statement of financial performance with a corresponding increase in the share based payment reserve. The fair value is determined by reference to the fair value of the options granted, calculated using the Black Scholes pricing model, excluding the impact of any non-market vesting conditions (for example, profitability and sales growth targets).
When the shares vest, the amount of the reserve relating to those shares is transferred to retained earnings.
Shares may be issued at the Board’s discretion at a price set by the Board based on the Volume Weighted Average Price (VWAP) calculation of the Company's shares during the period prior to issue. The Employee Share Scheme (ESS) cannot be issued with further shares if that issue would result in the ESS having an interest of more than 5% of the Company’s issued capital.
Shares are issued fully paid in exchange for a loan to the share scheme trust. Dividends paid on the shares are applied towards repaying the debt between the ESS and the Group on behalf of the employee.
Proceeds received along with any employee contributions are credited to share capital when payment for the shares is received.
ESS has a non-beneficial interest in all the shares allocated to employees. Annually the Group reviews the scheme and decides upon the allocation of further shares and the price at which those shares will be issued to the ESS. Trustees of ESS are appointed for an unspecified term and may be removed by the Company at any time.
Shares held by the ESS carry the same voting rights as other issued ordinary shares.
Dividends paid2018
$000s2018
Per share2017
$000s2017
Per share
Note 21. Dividends24 March 2017 - - 1,758 $0.10
22 September 2017 - - 1,761 $0.10
23 March 2018 2,118 $0.12 - -
21 September 2018 2,155 $0.12 - -
Total dividend paid 4,273 3,519
Dividends are imputed to the fullest extent allowable in the tax year. The total dividend paid includes the non-cash amounts for the dividend reinvestment plan. Cash dividend payment was $3.64m (Dec 2017 - $3.19m).
On 21 February 2019, the directors declared a fully-imputed dividend of $0.12 per share. The dividend will be paid 22 March 2019 to those shareholders on the register at 5pm on 15 March 2019. The dividend reinvestment plan will apply to the dividend.
Accounting policiesProvision is made for the amount of any dividend declared on or before the end of the period but not distributed at balance date.
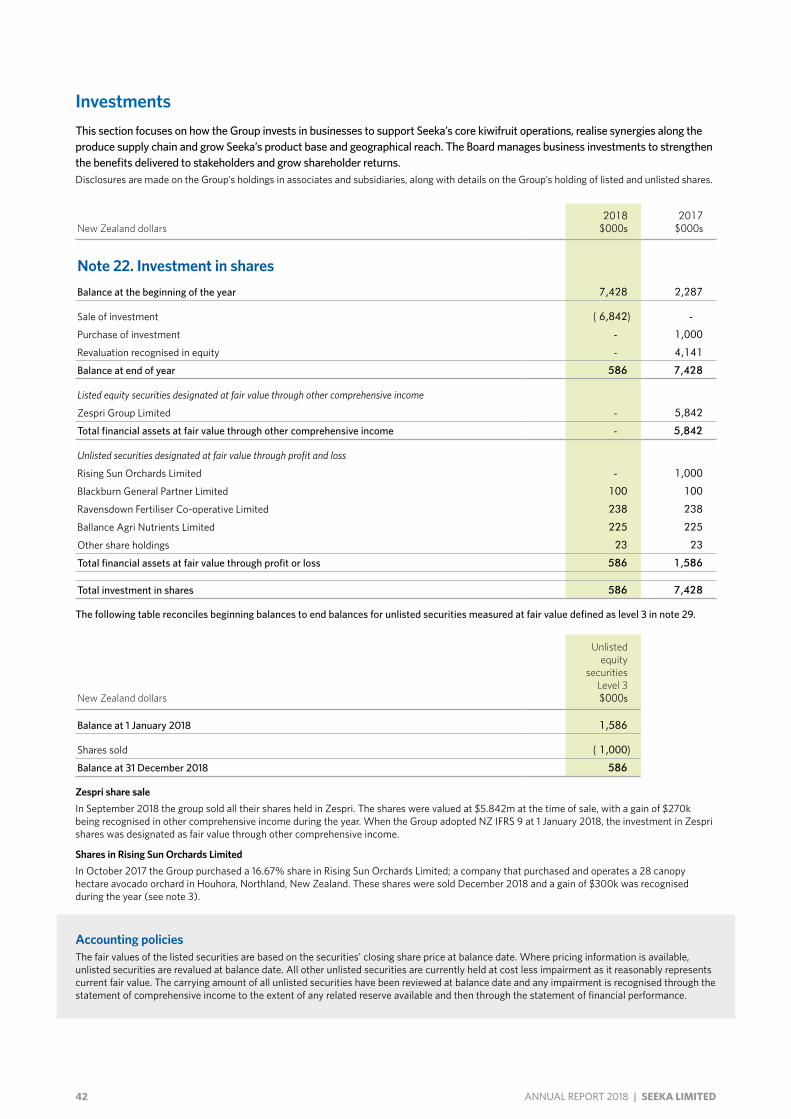
42 ANNUAL REPORT 2018 | SEEKA LIMITED
InvestmentsThis section focuses on how the Group invests in businesses to support Seeka’s core kiwifruit operations, realise synergies along the produce supply chain and grow Seeka’s product base and geographical reach. The Board manages business investments to strengthen the benefits delivered to stakeholders and grow shareholder returns.Disclosures are made on the Group’s holdings in associates and subsidiaries, along with details on the Group’s holding of listed and unlisted shares.
New Zealand dollars2018
$000s2017
$000s
Note 22. Investment in sharesBalance at the beginning of the year 7,428 2,287
Sale of investment ( 6,842) -
Purchase of investment - 1,000
Revaluation recognised in equity - 4,141
Balance at end of year 586 7,428
Listed equity securities designated at fair value through other comprehensive income
Zespri Group Limited - 5,842
Total financial assets at fair value through other comprehensive income - 5,842
Unlisted securities designated at fair value through profit and loss
Rising Sun Orchards Limited - 1,000
Blackburn General Partner Limited 100 100
Ravensdown Fertiliser Co-operative Limited 238 238
Ballance Agri Nutrients Limited 225 225
Other share holdings 23 23
Total financial assets at fair value through profit or loss 586 1,586
Total investment in shares 586 7,428
The following table reconciles beginning balances to end balances for unlisted securities measured at fair value defined as level 3 in note 29.
New Zealand dollars
Unlisted equity
securities Level 3 $000s
Balance at 1 January 2018 1,586
Shares sold ( 1,000)
Balance at 31 December 2018 586
Zespri share saleIn September 2018 the group sold all their shares held in Zespri. The shares were valued at $5.842m at the time of sale, with a gain of $270k being recognised in other comprehensive income during the year. When the Group adopted NZ IFRS 9 at 1 January 2018, the investment in Zespri shares was designated as fair value through other comprehensive income.
Shares in Rising Sun Orchards LimitedIn October 2017 the Group purchased a 16.67% share in Rising Sun Orchards Limited; a company that purchased and operates a 28 canopy hectare avocado orchard in Houhora, Northland, New Zealand. These shares were sold December 2018 and a gain of $300k was recognised during the year (see note 3).
Accounting policiesThe fair values of the listed securities are based on the securities' closing share price at balance date. Where pricing information is available, unlisted securities are revalued at balance date. All other unlisted securities are currently held at cost less impairment as it reasonably represents current fair value. The carrying amount of all unlisted securities have been reviewed at balance date and any impairment is recognised through the statement of comprehensive income to the extent of any related reserve available and then through the statement of financial performance.
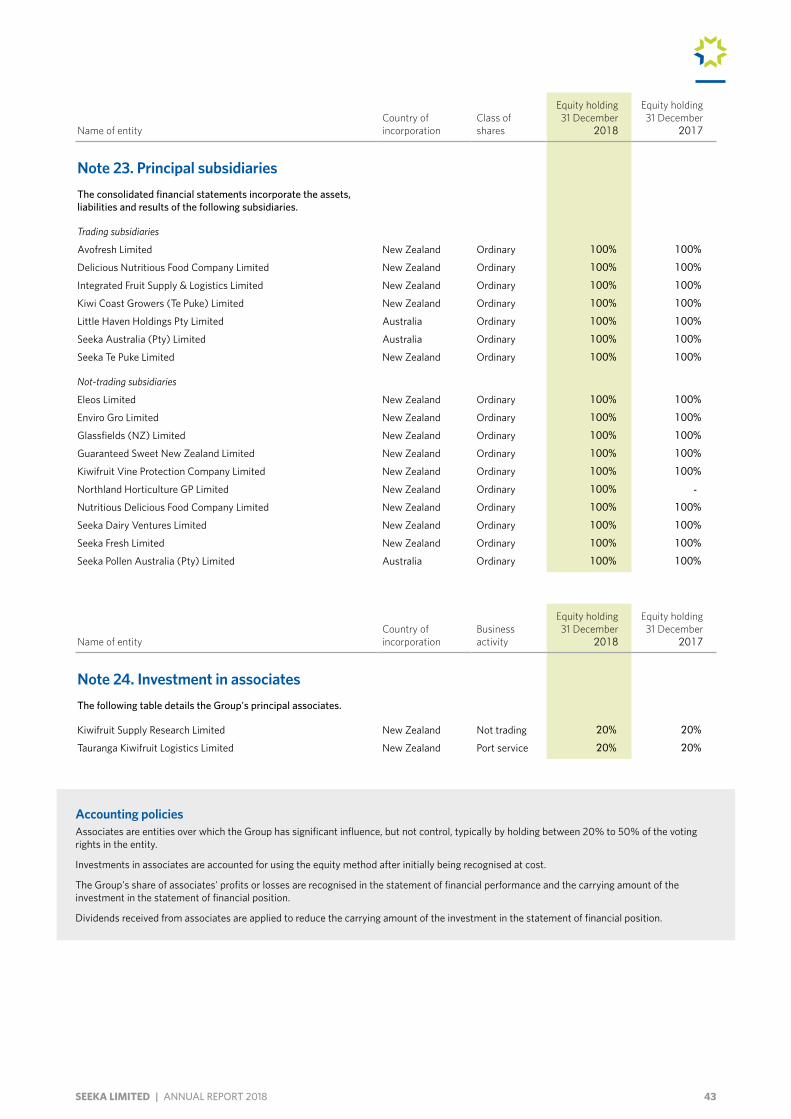
43SEEKA LIMITED | ANNUAL REPORT 2018
Name of entityCountry of incorporation
Class of shares
Equity holding 31 December
2018
Equity holding 31 December
2017
Note 23. Principal subsidiariesThe consolidated financial statements incorporate the assets, liabilities and results of the following subsidiaries.
Trading subsidiaries
Avofresh Limited New Zealand Ordinary 100% 100%
Delicious Nutritious Food Company Limited New Zealand Ordinary 100% 100%
Integrated Fruit Supply & Logistics Limited New Zealand Ordinary 100% 100%
Kiwi Coast Growers (Te Puke) Limited New Zealand Ordinary 100% 100%
Little Haven Holdings Pty Limited Australia Ordinary 100% 100%
Seeka Australia (Pty) Limited Australia Ordinary 100% 100%
Seeka Te Puke Limited New Zealand Ordinary 100% 100%
Not-trading subsidiaries
Eleos Limited New Zealand Ordinary 100% 100%
Enviro Gro Limited New Zealand Ordinary 100% 100%
Glassfields (NZ) Limited New Zealand Ordinary 100% 100%
Guaranteed Sweet New Zealand Limited New Zealand Ordinary 100% 100%
Kiwifruit Vine Protection Company Limited New Zealand Ordinary 100% 100%
Northland Horticulture GP Limited New Zealand Ordinary 100% -
Nutritious Delicious Food Company Limited New Zealand Ordinary 100% 100%
Seeka Dairy Ventures Limited New Zealand Ordinary 100% 100%
Seeka Fresh Limited New Zealand Ordinary 100% 100%
Seeka Pollen Australia (Pty) Limited Australia Ordinary 100% 100%
Name of entityCountry of incorporation
Business activity
Equity holding 31 December
2018
Equity holding 31 December
2017
Note 24. Investment in associatesThe following table details the Group's principal associates.
Kiwifruit Supply Research Limited New Zealand Not trading 20% 20%
Tauranga Kiwifruit Logistics Limited New Zealand Port service 20% 20%
Accounting policiesAssociates are entities over which the Group has significant influence, but not control, typically by holding between 20% to 50% of the voting rights in the entity.
Investments in associates are accounted for using the equity method after initially being recognised at cost.
The Group's share of associates' profits or losses are recognised in the statement of financial performance and the carrying amount of the investment in the statement of financial position.
Dividends received from associates are applied to reduce the carrying amount of the investment in the statement of financial position.
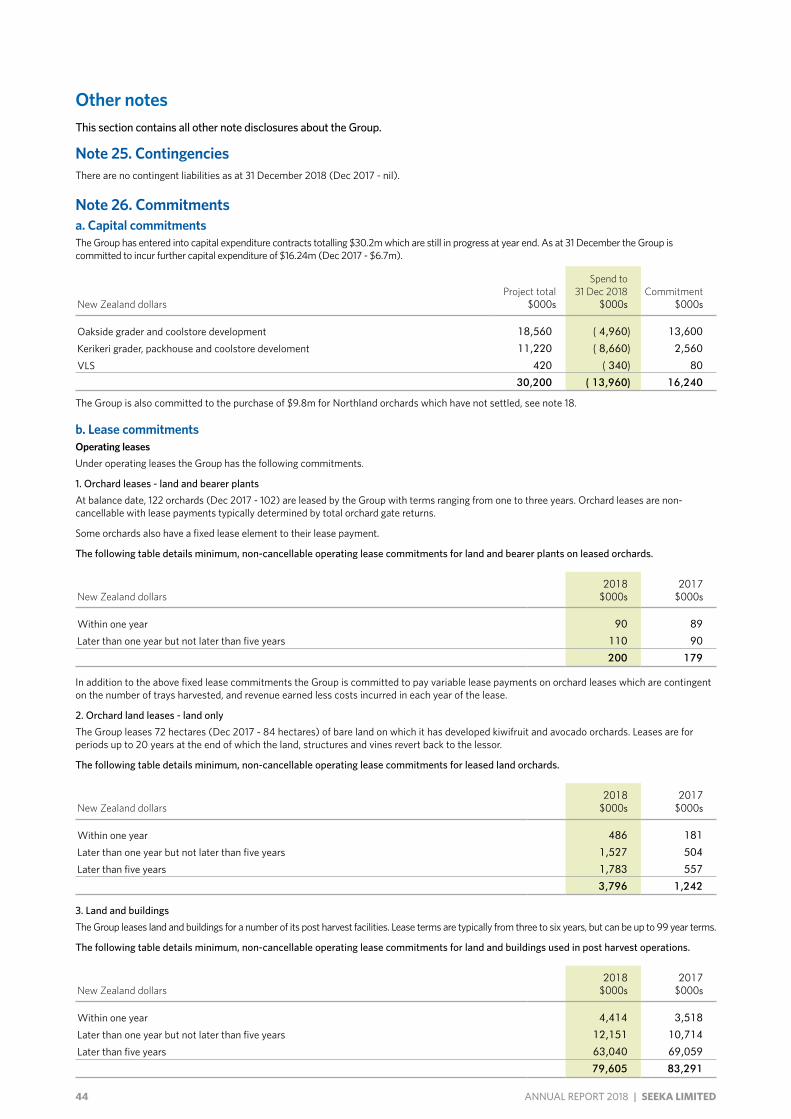
44 ANNUAL REPORT 2018 | SEEKA LIMITED
Other notesThis section contains all other note disclosures about the Group.
Note 25. ContingenciesThere are no contingent liabilities as at 31 December 2018 (Dec 2017 - nil).
Note 26. Commitmentsa. Capital commitmentsThe Group has entered into capital expenditure contracts totalling $30.2m which are still in progress at year end. As at 31 December the Group is committed to incur further capital expenditure of $16.24m (Dec 2017 - $6.7m).
New Zealand dollarsProject total
$000s
Spend to 31 Dec 2018
$000sCommitment
$000s
Oakside grader and coolstore development 18,560 ( 4,960) 13,600
Kerikeri grader, packhouse and coolstore develoment 11,220 ( 8,660) 2,560
VLS 420 ( 340) 80
30,200 ( 13,960) 16,240
The Group is also committed to the purchase of $9.8m for Northland orchards which have not settled, see note 18.
b. Lease commitmentsOperating leasesUnder operating leases the Group has the following commitments.
1. Orchard leases - land and bearer plantsAt balance date, 122 orchards (Dec 2017 - 102) are leased by the Group with terms ranging from one to three years. Orchard leases are non-cancellable with lease payments typically determined by total orchard gate returns.
Some orchards also have a fixed lease element to their lease payment.
The following table details minimum, non-cancellable operating lease commitments for land and bearer plants on leased orchards.
New Zealand dollars2018
$000s2017
$000s
Within one year 90 89
Later than one year but not later than five years 110 90
200 179
In addition to the above fixed lease commitments the Group is committed to pay variable lease payments on orchard leases which are contingent on the number of trays harvested, and revenue earned less costs incurred in each year of the lease.
2. Orchard land leases - land onlyThe Group leases 72 hectares (Dec 2017 - 84 hectares) of bare land on which it has developed kiwifruit and avocado orchards. Leases are for periods up to 20 years at the end of which the land, structures and vines revert back to the lessor.
The following table details minimum, non-cancellable operating lease commitments for leased land orchards.
New Zealand dollars2018
$000s2017
$000s
Within one year 486 181
Later than one year but not later than five years 1,527 504
Later than five years 1,783 557
3,796 1,242
3. Land and buildingsThe Group leases land and buildings for a number of its post harvest facilities. Lease terms are typically from three to six years, but can be up to 99 year terms.
The following table details minimum, non-cancellable operating lease commitments for land and buildings used in post harvest operations.
New Zealand dollars2018
$000s2017
$000s
Within one year 4,414 3,518
Later than one year but not later than five years 12,151 10,714
Later than five years 63,040 69,059
79,605 83,291
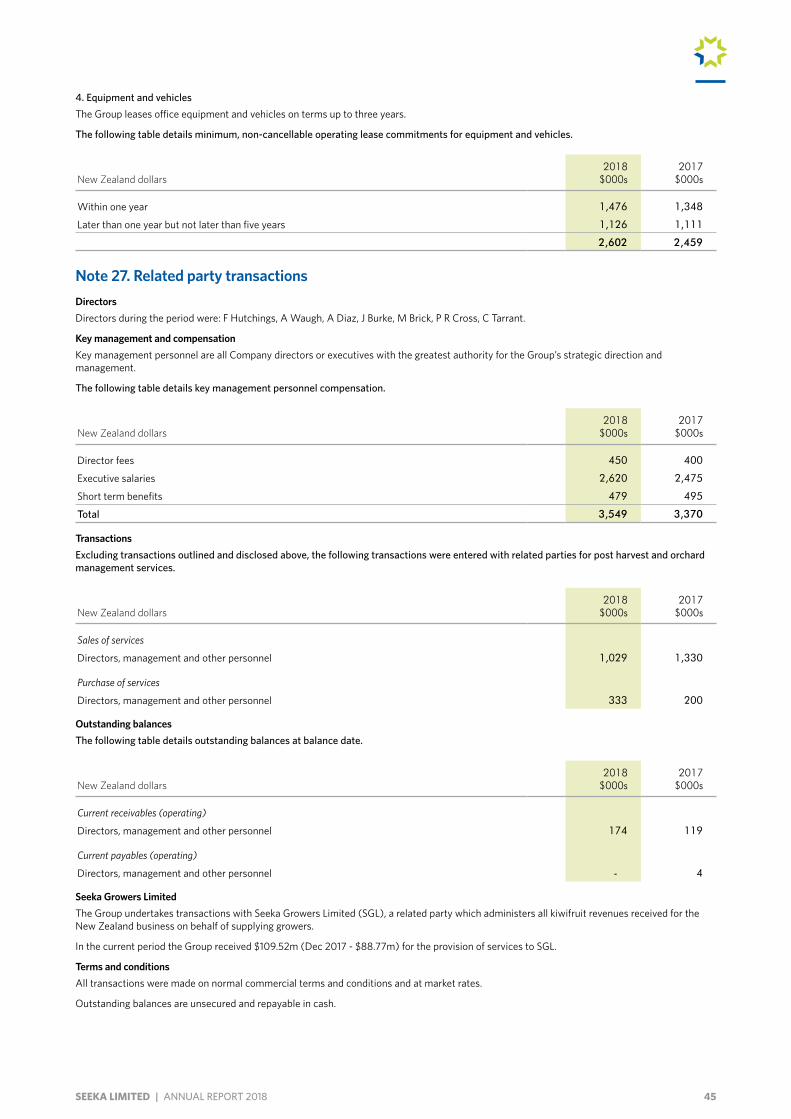
45SEEKA LIMITED | ANNUAL REPORT 2018
4. Equipment and vehiclesThe Group leases office equipment and vehicles on terms up to three years.
The following table details minimum, non-cancellable operating lease commitments for equipment and vehicles.
New Zealand dollars2018
$000s2017
$000s
Within one year 1,476 1,348
Later than one year but not later than five years 1,126 1,111
2,602 2,459
Note 27. Related party transactionsDirectorsDirectors during the period were: F Hutchings, A Waugh, A Diaz, J Burke, M Brick, P R Cross, C Tarrant.
Key management and compensationKey management personnel are all Company directors or executives with the greatest authority for the Group’s strategic direction and management.
The following table details key management personnel compensation.
New Zealand dollars2018
$000s2017
$000s
Director fees 450 400
Executive salaries 2,620 2,475
Short term benefits 479 495
Total 3,549 3,370
TransactionsExcluding transactions outlined and disclosed above, the following transactions were entered with related parties for post harvest and orchard management services.
New Zealand dollars2018
$000s2017
$000s
Sales of services
Directors, management and other personnel 1,029 1,330
Purchase of services
Directors, management and other personnel 333 200
Outstanding balancesThe following table details outstanding balances at balance date.
New Zealand dollars2018
$000s2017
$000s
Current receivables (operating)
Directors, management and other personnel 174 119
Current payables (operating)
Directors, management and other personnel - 4
Seeka Growers LimitedThe Group undertakes transactions with Seeka Growers Limited (SGL), a related party which administers all kiwifruit revenues received for the New Zealand business on behalf of supplying growers.
In the current period the Group received $109.52m (Dec 2017 - $88.77m) for the provision of services to SGL.
Terms and conditionsAll transactions were made on normal commercial terms and conditions and at market rates.
Outstanding balances are unsecured and repayable in cash.
46 ANNUAL REPORT 2018 | SEEKA LIMITED
Note 28. Risk managementThe Group’s activities expose it to a variety of risks specific to producing and selling horticultural crops, along with corporate financial risks related to credit, liquidity and capital risk. The Group operates a comprehensive risk assessment and mitigation programme via its audit and risk committee.
The Group's policy is to ensure that the Group creates value and maximises returns to its shareholders and benefits for other stakeholders, as well as ensuring that adequate financial resources are available for the development of the Group’s business whilst managing its financial risks.
a. Risk management strategies related to orchard and retail operationsHorticultural operations expose the Group to risks to production and market returns. The main production risks are climatic events, diseases and pests. These impact on volumes produced from the Group's orchards, volumes to post harvest (both from Group operations and independent growers) and volumes available for retail.
Market risks of pricing and exchange rates impact on orchard operations (the amount the Group is paid for growing crops) and impact on retail revenues where the Group imports and sells fruit produce, mainly bananas. The exchange rate risk on imports is managed through the use of foreign exchange contracts to match known and planned purchases. Market risks do not directly impact on post harvest operations, as charges are normally set prior to harvest and deducted before sales revenues are paid to supplying growers.
The Group operates in four regions spread over two countries; New Zealand's Northland, Coromandel and the Bay of Plenty, and in Australia's Mundoona region of Victoria. Main produce lines are kiwifruit, nashi pears, European pears and avocados, with small production of other temperate-climate fruits. Group retail activities are in New Zealand (including imported tropical produce), Australia and Asia. The Group's geographical, product and market spread limits the impact on Group operations from an adverse event occurring in a specific region, produce or market. To further mitigate risks, the Board uses the following strategies.
Production risks - climatic events, disease and pestsThe Group follows industry best practice to mitigate production risks. This includes orchard management practices to optimise production from Group orchards, and extensive planning to ensure post harvest and retail services are suitably resourced to manage each season's crop volumes.
In New Zealand, the major climatic risks are hail, frost and storm damage.
– Hail events are typically highly localised, and for kiwifruit the Group has access to industry hail insurance for its orchard operations, plus top-up payments from a Seeka Growers Limited hail insurance programme.
– Frost events are typically regional, and the Group advocates best-practice crop protection, including active frost management on kiwifruit orchards operated by the Group and other growers supplying the Group's post harvest operations.
– Storm events are typically regional, and the Group advocates best-practice crop protection, including shelter belts on all orchards operated by the Group and other growers supplying the Group's post harvest operations.
In Australia, the major climatic risks are drought, hail and fire. As the owner and operator of all orchards supplying its Australian operations, the Group actively manages climatic risks of its total production base. The orchards are located on three sites in the Mundoona region.
– Drought events are typically regional, and to secure adequate irrigation, the Group has purchased extensive, long-term water shares from a reliable irrigation programme.
– Hail events are typically localised, and the Group currently has hail cloth protecting one orchard.
– Fire risk is typically from serious grass wild-fire occuring during periods of extreme weather, with the Country Fire Authority
responsible for risk assessment and management of fire events. The Group takes all practical steps to internally manage fire risk including removing excess vegetation from Group properties.
All horticultural undertakings are susceptible to disease and pest incursions. The kiwifruit vine disease Pseudomonas syringae pv. actinidiae (Psa) is widespread throughout New Zealand, and is being actively managed. In 2018 Psa was detected on 4.5 hecares of the Group's orchards in Australia. Seeka has moved to contain the outbreak and works to proactively monitor the orchards. The brown marmorated stink bug is also a potential threat to the horticulture industry. To minimise the risk of crop loss the Group monitors its orchards and undertakes recognised spray programmes to protect crops to the fullest extent possible. Seeka also relies on the Ministry for Primary Industries to protect New Zealand's borders from introduced diseases.
Market returnsNew Zealand kiwifruit
The Group has no direct market risk from the sale of kiwifruit harvested from lease operations, as all export marketing activities beyond Australia are undertaken by Zespri Group Limited (Zespri) under statutory regulations. The Group, however, is impacted by the level of Zespri's market returns which impact on the Group's orchard profitability. The Group monitors Zespri returns and uses modelling techniques to analyse current and projected orchard income. This information is used when setting Group budgets and orchard lease terms.
New Zealand avocados and kiwiberries
The Group has a direct market risk from the sale of avocados and kiwiberries, with half of kiwiberry sales and all avocado sales managed by the Group's retail operations. The Group forecasts seasonal supply, monitors market conditions, develops a sales programme around the needs of key retailers and controls product quality and supply to optimise market access and returns. This information is used when setting Group budgets and orchard lease terms.
The Group has no direct currency risk from export sales as it does not own the products but acts as the growers’ agent.
Imported tropical produce
The Group has a direct market, price and currency risk from imported fruit produce (banana, pineapple and papaya) where the Group imports fruit produce for sale as the principal through its supply and sale contracts. The Group may hedge up to the total known and projected cash flows to manage exchange risk. The Group has no material direct price and currency risk from imported fruit produce where the supply agreement enables the Group to amend its purchase price according to trading conditions.
Australian produce
The Group has a direct market and price risk from the sale of all Australian product which is managed by the Group's Australian operations. As the largest single grower and supplier of Australian kiwifruit and nashi pears, the Group has developed strong relationships with key retailers. The Group forecasts seasonal supply, monitors market conditions, develops a sales programme around the needs of key retailers and controls product quality and supply to optimise market access and returns.
Seeka Australia is the Group’s single major international operation, exposing the Group to the Australian dollar. Foreign exchange risk includes future commercial transactions, assets, liabilities and net investments. Currency exposure from net assets is managed through borrowings in Australian dollars.
b. Credit riskCredit risk arises from cash and cash equivalents and deposits with banks and financial institutions, as well as credit exposures to customers, including outstanding receivables, derivative financial instruments and committed transactions.
The maximum credit risk is the financial loss to the Group if counterparties fail to discharge a contractual obligation.
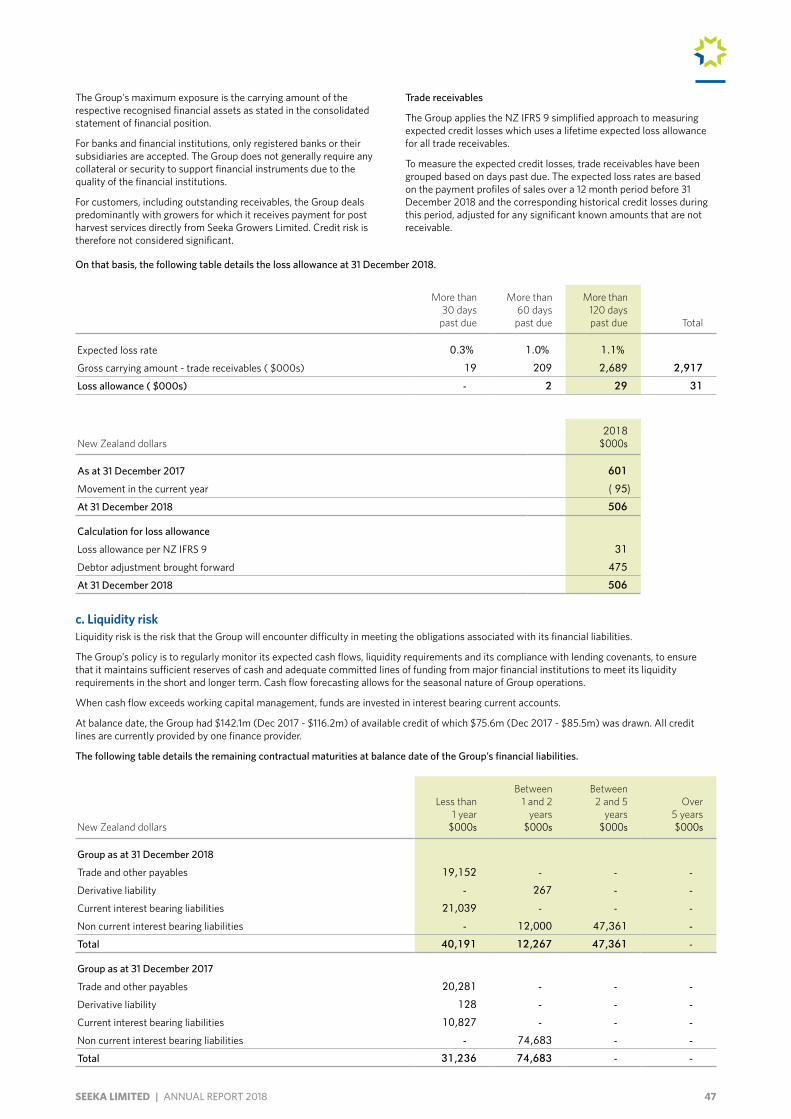
47SEEKA LIMITED | ANNUAL REPORT 2018
The Group's maximum exposure is the carrying amount of the respective recognised financial assets as stated in the consolidated statement of financial position.
For banks and financial institutions, only registered banks or their subsidiaries are accepted. The Group does not generally require any collateral or security to support financial instruments due to the quality of the financial institutions.
For customers, including outstanding receivables, the Group deals predominantly with growers for which it receives payment for post harvest services directly from Seeka Growers Limited. Credit risk is therefore not considered significant.
Trade receivables
The Group applies the NZ IFRS 9 simplified approach to measuring expected credit losses which uses a lifetime expected loss allowance for all trade receivables.
To measure the expected credit losses, trade receivables have been grouped based on days past due. The expected loss rates are based on the payment profiles of sales over a 12 month period before 31 December 2018 and the corresponding historical credit losses during this period, adjusted for any significant known amounts that are not receivable.
On that basis, the following table details the loss allowance at 31 December 2018.
More than 30 days
past due
More than 60 days past due
More than 120 days past due Total
Expected loss rate 0.3% 1.0% 1.1%
Gross carrying amount - trade receivables ( $000s) 19 209 2,689 2,917
Loss allowance ( $000s) - 2 29 31
New Zealand dollars2018
$000s
As at 31 December 2017 601
Movement in the current year ( 95)
At 31 December 2018 506
Calculation for loss allowance
Loss allowance per NZ IFRS 9 31
Debtor adjustment brought forward 475
At 31 December 2018 506
c. Liquidity riskLiquidity risk is the risk that the Group will encounter difficulty in meeting the obligations associated with its financial liabilities.
The Group’s policy is to regularly monitor its expected cash flows, liquidity requirements and its compliance with lending covenants, to ensure that it maintains sufficient reserves of cash and adequate committed lines of funding from major financial institutions to meet its liquidity requirements in the short and longer term. Cash flow forecasting allows for the seasonal nature of Group operations.
When cash flow exceeds working capital management, funds are invested in interest bearing current accounts.
At balance date, the Group had $142.1m (Dec 2017 - $116.2m) of available credit of which $75.6m (Dec 2017 - $85.5m) was drawn. All credit lines are currently provided by one finance provider.
The following table details the remaining contractual maturities at balance date of the Group’s financial liabilities.
New Zealand dollars
Less than 1 year
$000s
Between 1 and 2
years $000s
Between 2 and 5
years $000s
Over 5 years $000s
Group as at 31 December 2018
Trade and other payables 19,152 - - -
Derivative liability - 267 - -
Current interest bearing liabilities 21,039 - - -
Non current interest bearing liabilities - 12,000 47,361 -
Total 40,191 12,267 47,361 -
Group as at 31 December 2017
Trade and other payables 20,281 - - -
Derivative liability 128 - - -
Current interest bearing liabilities 10,827 - - -
Non current interest bearing liabilities - 74,683 - -
Total 31,236 74,683 - -
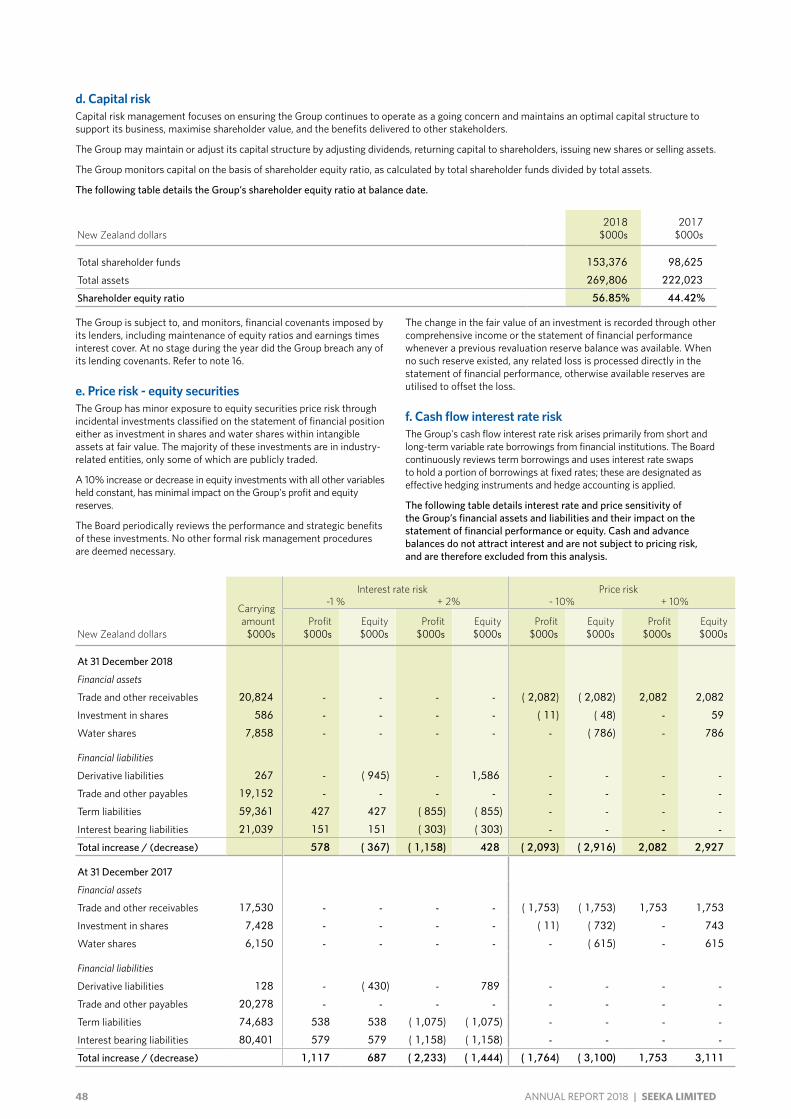
48 ANNUAL REPORT 2018 | SEEKA LIMITED
d. Capital riskCapital risk management focuses on ensuring the Group continues to operate as a going concern and maintains an optimal capital structure to support its business, maximise shareholder value, and the benefits delivered to other stakeholders.
The Group may maintain or adjust its capital structure by adjusting dividends, returning capital to shareholders, issuing new shares or selling assets.
The Group monitors capital on the basis of shareholder equity ratio, as calculated by total shareholder funds divided by total assets.
The following table details the Group’s shareholder equity ratio at balance date.
New Zealand dollars2018
$000s2017
$000s
Total shareholder funds 153,376 98,625
Total assets 269,806 222,023
Shareholder equity ratio 56.85% 44.42%
The Group is subject to, and monitors, financial covenants imposed by its lenders, including maintenance of equity ratios and earnings times interest cover. At no stage during the year did the Group breach any of its lending covenants. Refer to note 16.
e. Price risk - equity securitiesThe Group has minor exposure to equity securities price risk through incidental investments classified on the statement of financial position either as investment in shares and water shares within intangible assets at fair value. The majority of these investments are in industry-related entities, only some of which are publicly traded.
A 10% increase or decrease in equity investments with all other variables held constant, has minimal impact on the Group's profit and equity reserves.
The Board periodically reviews the performance and strategic benefits of these investments. No other formal risk management procedures are deemed necessary.
The change in the fair value of an investment is recorded through other comprehensive income or the statement of financial performance whenever a previous revaluation reserve balance was available. When no such reserve existed, any related loss is processed directly in the statement of financial performance, otherwise available reserves are utilised to offset the loss.
f. Cash flow interest rate riskThe Group's cash flow interest rate risk arises primarily from short and long-term variable rate borrowings from financial institutions. The Board continuously reviews term borrowings and uses interest rate swaps to hold a portion of borrowings at fixed rates; these are designated as effective hedging instruments and hedge accounting is applied.
The following table details interest rate and price sensitivity of the Group’s financial assets and liabilities and their impact on the statement of financial performance or equity. Cash and advance balances do not attract interest and are not subject to pricing risk, and are therefore excluded from this analysis.
Interest rate risk Price risk
Carrying amount $000s
-1 % + 2% - 10% + 10%
New Zealand dollarsProfit
$000sEquity $000s
Profit $000s
Equity $000s
Profit $000s
Equity $000s
Profit $000s
Equity $000s
At 31 December 2018
Financial assets
Trade and other receivables 20,824 - - - - ( 2,082) ( 2,082) 2,082 2,082
Investment in shares 586 - - - - ( 11) ( 48) - 59
Water shares 7,858 - - - - - ( 786) - 786
Financial liabilities
Derivative liabilities 267 - ( 945) - 1,586 - - - -
Trade and other payables 19,152 - - - - - - - -
Term liabilities 59,361 427 427 ( 855) ( 855) - - - -
Interest bearing liabilities 21,039 151 151 ( 303) ( 303) - - - -
Total increase / (decrease) 578 ( 367) ( 1,158) 428 ( 2,093) ( 2,916) 2,082 2,927
At 31 December 2017
Financial assets
Trade and other receivables 17,530 - - - - ( 1,753) ( 1,753) 1,753 1,753
Investment in shares 7,428 - - - - ( 11) ( 732) - 743
Water shares 6,150 - - - - - ( 615) - 615
Financial liabilities
Derivative liabilities 128 - ( 430) - 789 - - - -
Trade and other payables 20,278 - - - - - - - -
Term liabilities 74,683 538 538 ( 1,075) ( 1,075) - - - -
Interest bearing liabilities 80,401 579 579 ( 1,158) ( 1,158) - - - -
Total increase / (decrease) 1,117 687 ( 2,233) ( 1,444) ( 1,764) ( 3,100) 1,753 3,111
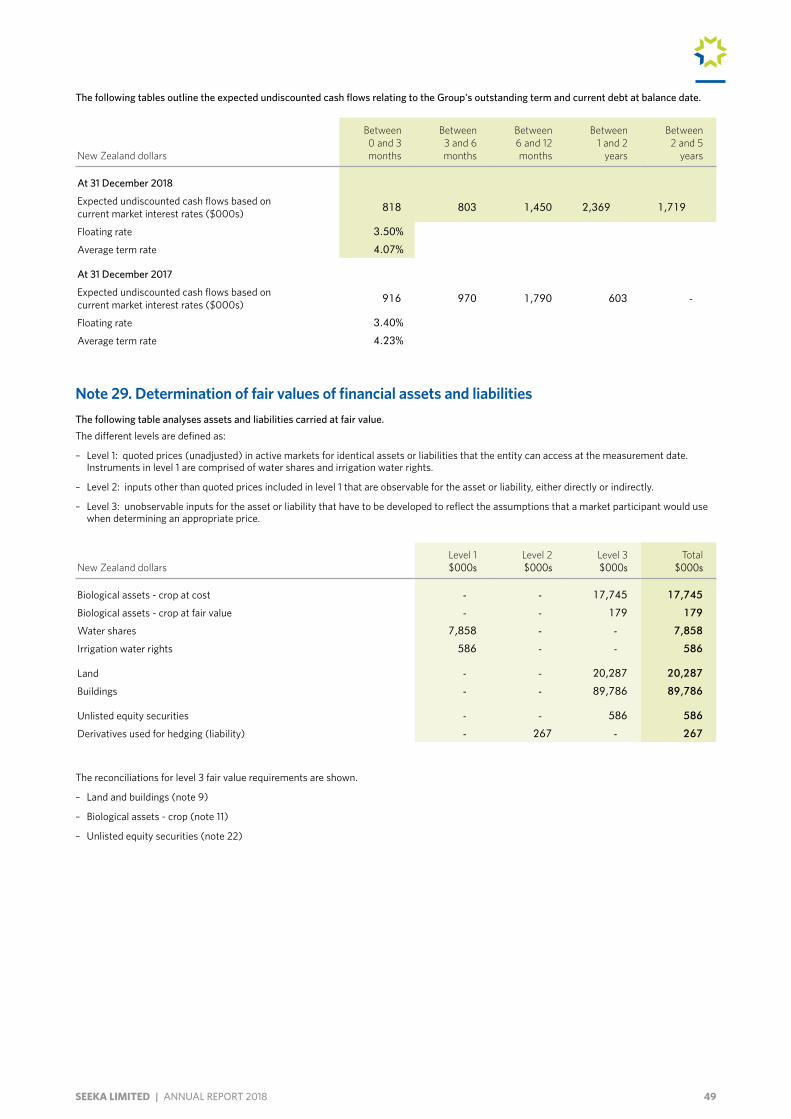
49SEEKA LIMITED | ANNUAL REPORT 2018
The following tables outline the expected undiscounted cash flows relating to the Group's outstanding term and current debt at balance date.
New Zealand dollars
Between 0 and 3
months
Between 3 and 6
months
Between 6 and 12 months
Between 1 and 2
years
Between 2 and 5
years
At 31 December 2018
Expected undiscounted cash flows based on current market interest rates ($000s) 818 803 1,450 2,369 1,719
Floating rate 3.50%
Average term rate 4.07%
At 31 December 2017
Expected undiscounted cash flows based on current market interest rates ($000s) 916 970 1,790 603 -
Floating rate 3.40%
Average term rate 4.23%
Note 29. Determination of fair values of financial assets and liabilitiesThe following table analyses assets and liabilities carried at fair value.The different levels are defined as:
– Level 1: quoted prices (unadjusted) in active markets for identical assets or liabilities that the entity can access at the measurement date. Instruments in level 1 are comprised of water shares and irrigation water rights.
– Level 2: inputs other than quoted prices included in level 1 that are observable for the asset or liability, either directly or indirectly.
– Level 3: unobservable inputs for the asset or liability that have to be developed to reflect the assumptions that a market participant would use when determining an appropriate price.
New Zealand dollarsLevel 1 $000s
Level 2 $000s
Level 3 $000s
Total $000s
Biological assets - crop at cost - - 17,745 17,745
Biological assets - crop at fair value - - 179 179
Water shares 7,858 - - 7,858
Irrigation water rights 586 - - 586
Land - - 20,287 20,287
Buildings - - 89,786 89,786
Unlisted equity securities - - 586 586
Derivatives used for hedging (liability) - 267 - 267
The reconciliations for level 3 fair value requirements are shown.
– Land and buildings (note 9)
– Biological assets - crop (note 11)
– Unlisted equity securities (note 22)
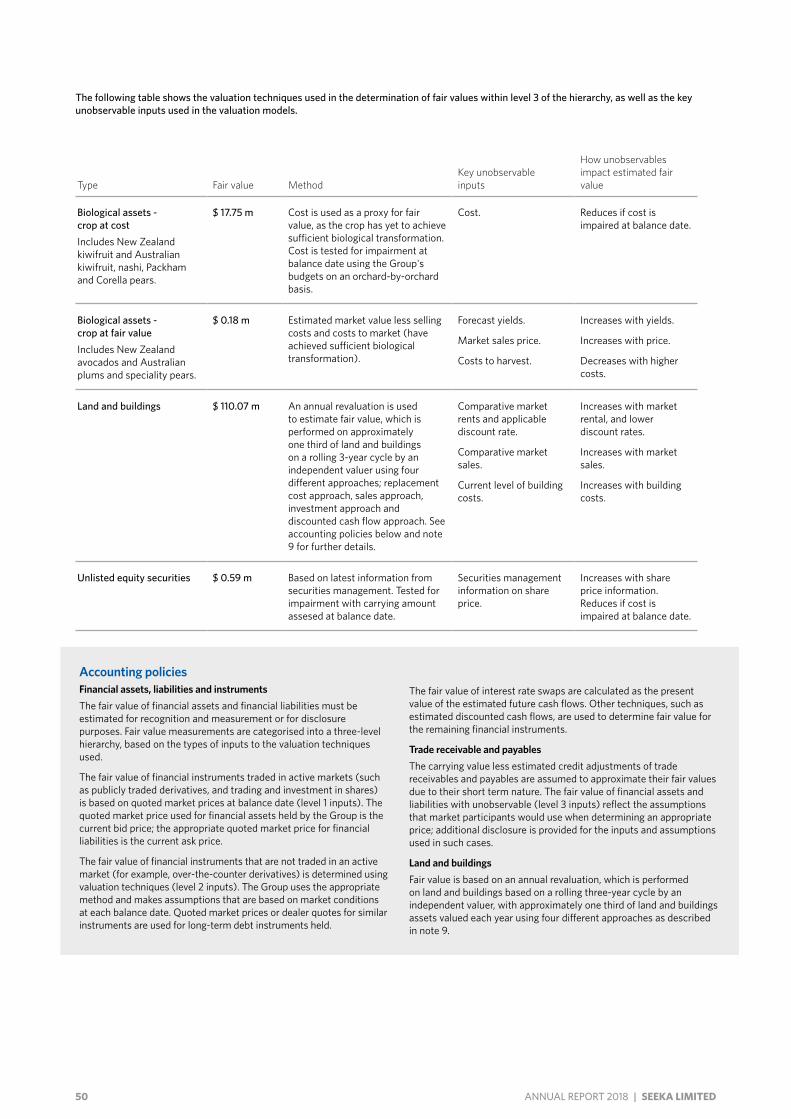
50 ANNUAL REPORT 2018 | SEEKA LIMITED
The following table shows the valuation techniques used in the determination of fair values within level 3 of the hierarchy, as well as the key unobservable inputs used in the valuation models.
Type Fair value MethodKey unobservable inputs
How unobservables impact estimated fair value
Biological assets - crop at costIncludes New Zealand kiwifruit and Australian kiwifruit, nashi, Packham and Corella pears.
$ 17.75 m Cost is used as a proxy for fair value, as the crop has yet to achieve sufficient biological transformation. Cost is tested for impairment at balance date using the Group's budgets on an orchard-by-orchard basis.
Cost. Reduces if cost is impaired at balance date.
Biological assets - crop at fair valueIncludes New Zealand avocados and Australian plums and speciality pears.
$ 0.18 m Estimated market value less selling costs and costs to market (have achieved sufficient biological transformation).
Forecast yields.
Market sales price.
Costs to harvest.
Increases with yields.
Increases with price.
Decreases with higher costs.
Land and buildings $ 110.07 m An annual revaluation is used to estimate fair value, which is performed on approximately one third of land and buildings on a rolling 3-year cycle by an independent valuer using four different approaches; replacement cost approach, sales approach, investment approach and discounted cash flow approach. See accounting policies below and note 9 for further details.
Comparative market rents and applicable discount rate.
Comparative market sales.
Current level of building costs.
Increases with market rental, and lower discount rates.
Increases with market sales.
Increases with building costs.
Unlisted equity securities $ 0.59 m Based on latest information from securities management. Tested for impairment with carrying amount assesed at balance date.
Securities management information on share price.
Increases with share price information. Reduces if cost is impaired at balance date.
Accounting policiesFinancial assets, liabilities and instrumentsThe fair value of financial assets and financial liabilities must be estimated for recognition and measurement or for disclosure purposes. Fair value measurements are categorised into a three-level hierarchy, based on the types of inputs to the valuation techniques used.
The fair value of financial instruments traded in active markets (such as publicly traded derivatives, and trading and investment in shares) is based on quoted market prices at balance date (level 1 inputs). The quoted market price used for financial assets held by the Group is the current bid price; the appropriate quoted market price for financial liabilities is the current ask price.
The fair value of financial instruments that are not traded in an active market (for example, over-the-counter derivatives) is determined using valuation techniques (level 2 inputs). The Group uses the appropriate method and makes assumptions that are based on market conditions at each balance date. Quoted market prices or dealer quotes for similar instruments are used for long-term debt instruments held.
The fair value of interest rate swaps are calculated as the present value of the estimated future cash flows. Other techniques, such as estimated discounted cash flows, are used to determine fair value for the remaining financial instruments.
Trade receivable and payablesThe carrying value less estimated credit adjustments of trade receivables and payables are assumed to approximate their fair values due to their short term nature. The fair value of financial assets and liabilities with unobservable (level 3 inputs) reflect the assumptions that market participants would use when determining an appropriate price; additional disclosure is provided for the inputs and assumptions used in such cases.
Land and buildingsFair value is based on an annual revaluation, which is performed on land and buildings based on a rolling three-year cycle by an independent valuer, with approximately one third of land and buildings assets valued each year using four different approaches as described in note 9.
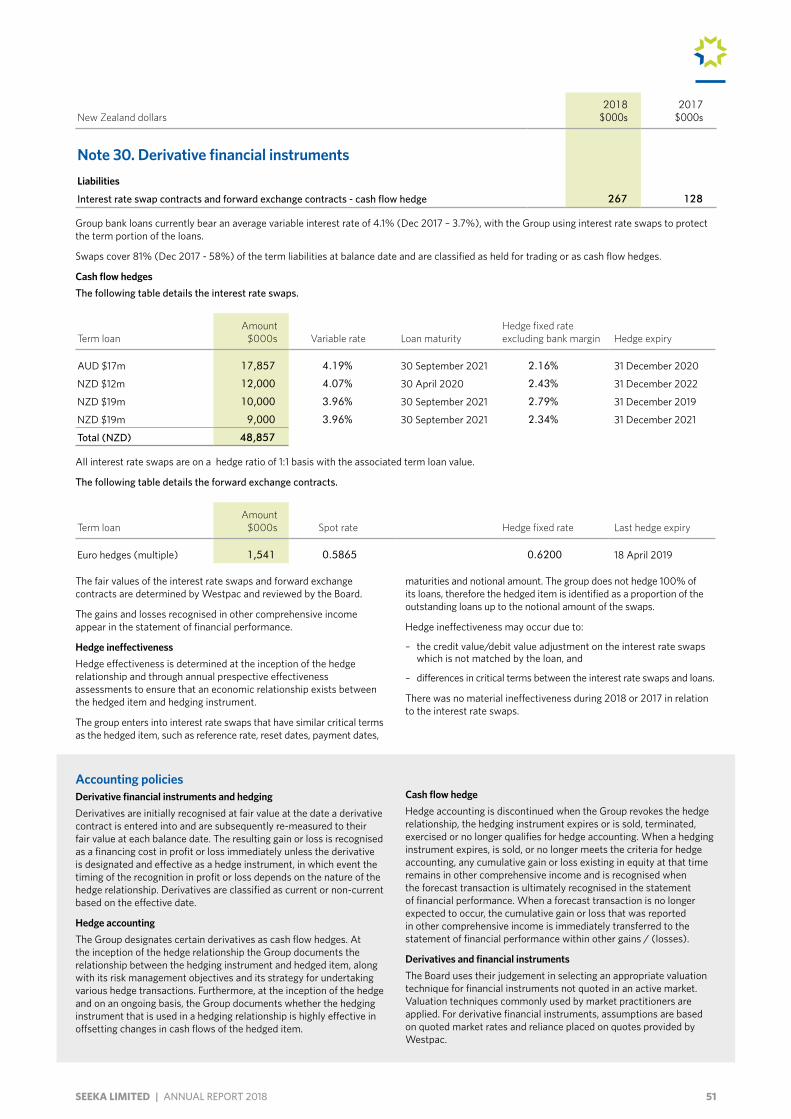
51SEEKA LIMITED | ANNUAL REPORT 2018
New Zealand dollars2018
$000s2017
$000s
Note 30. Derivative financial instrumentsLiabilities
Interest rate swap contracts and forward exchange contracts - cash flow hedge 267 128
Group bank loans currently bear an average variable interest rate of 4.1% (Dec 2017 – 3.7%), with the Group using interest rate swaps to protect the term portion of the loans.
Swaps cover 81% (Dec 2017 - 58%) of the term liabilities at balance date and are classified as held for trading or as cash flow hedges.
Cash flow hedgesThe following table details the interest rate swaps.
Term loanAmount $000s Variable rate Loan maturity
Hedge fixed rate excluding bank margin Hedge expiry
AUD $17m 17,857 4.19% 30 September 2021 2.16% 31 December 2020
NZD $12m 12,000 4.07% 30 April 2020 2.43% 31 December 2022
NZD $19m 10,000 3.96% 30 September 2021 2.79% 31 December 2019
NZD $19m 9,000 3.96% 30 September 2021 2.34% 31 December 2021
Total (NZD) 48,857
All interest rate swaps are on a hedge ratio of 1:1 basis with the associated term loan value.
The following table details the forward exchange contracts.
Term loanAmount $000s Spot rate Hedge fixed rate Last hedge expiry
Euro hedges (multiple) 1,541 0.5865 0.6200 18 April 2019
Accounting policiesDerivative financial instruments and hedgingDerivatives are initially recognised at fair value at the date a derivative contract is entered into and are subsequently re-measured to their fair value at each balance date. The resulting gain or loss is recognised as a financing cost in profit or loss immediately unless the derivative is designated and effective as a hedge instrument, in which event the timing of the recognition in profit or loss depends on the nature of the hedge relationship. Derivatives are classified as current or non-current based on the effective date.
Hedge accountingThe Group designates certain derivatives as cash flow hedges. At the inception of the hedge relationship the Group documents the relationship between the hedging instrument and hedged item, along with its risk management objectives and its strategy for undertaking various hedge transactions. Furthermore, at the inception of the hedge and on an ongoing basis, the Group documents whether the hedging instrument that is used in a hedging relationship is highly effective in offsetting changes in cash flows of the hedged item.
Cash flow hedgeHedge accounting is discontinued when the Group revokes the hedge relationship, the hedging instrument expires or is sold, terminated, exercised or no longer qualifies for hedge accounting. When a hedging instrument expires, is sold, or no longer meets the criteria for hedge accounting, any cumulative gain or loss existing in equity at that time remains in other comprehensive income and is recognised when the forecast transaction is ultimately recognised in the statement of financial performance. When a forecast transaction is no longer expected to occur, the cumulative gain or loss that was reported in other comprehensive income is immediately transferred to the statement of financial performance within other gains / (losses).
Derivatives and financial instrumentsThe Board uses their judgement in selecting an appropriate valuation technique for financial instruments not quoted in an active market. Valuation techniques commonly used by market practitioners are applied. For derivative financial instruments, assumptions are based on quoted market rates and reliance placed on quotes provided by Westpac.
The fair values of the interest rate swaps and forward exchange contracts are determined by Westpac and reviewed by the Board.
The gains and losses recognised in other comprehensive income appear in the statement of financial performance.
Hedge ineffectivenessHedge effectiveness is determined at the inception of the hedge relationship and through annual prespective effectiveness assessments to ensure that an economic relationship exists between the hedged item and hedging instrument.
The group enters into interest rate swaps that have similar critical terms as the hedged item, such as reference rate, reset dates, payment dates,
maturities and notional amount. The group does not hedge 100% of its loans, therefore the hedged item is identified as a proportion of the outstanding loans up to the notional amount of the swaps.
Hedge ineffectiveness may occur due to:
– the credit value/debit value adjustment on the interest rate swaps which is not matched by the loan, and
– differences in critical terms between the interest rate swaps and loans.
There was no material ineffectiveness during 2018 or 2017 in relation to the interest rate swaps.
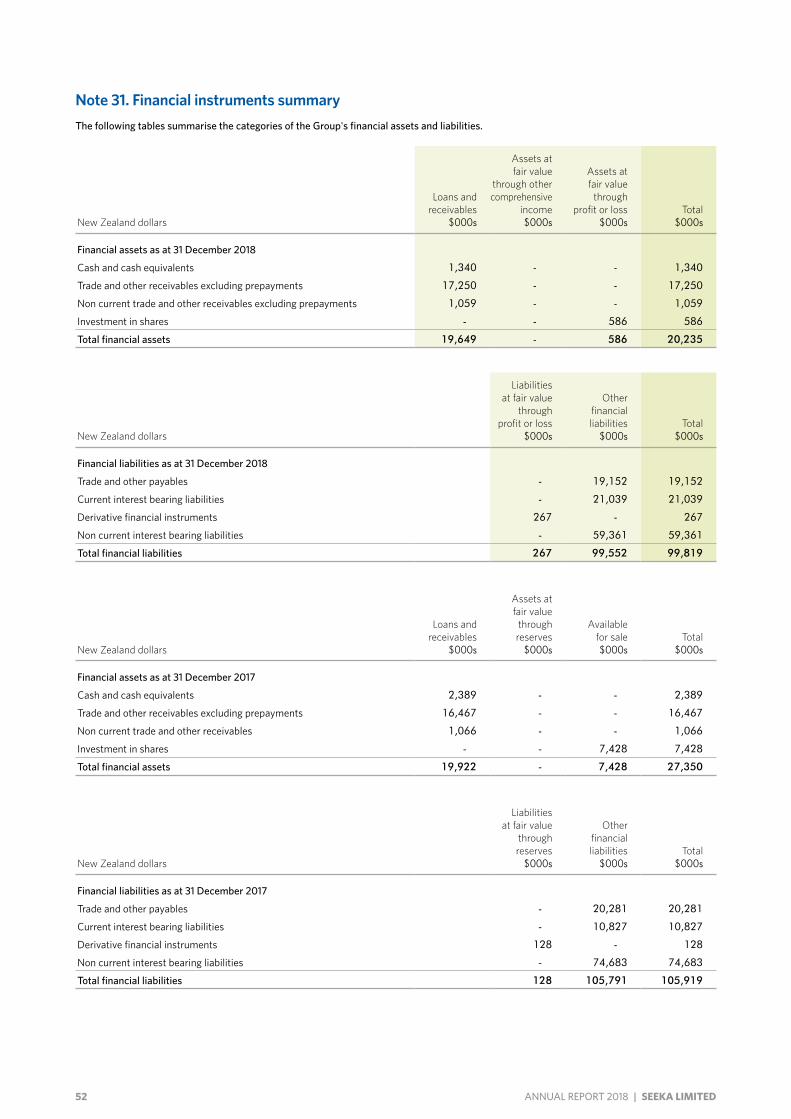
52 ANNUAL REPORT 2018 | SEEKA LIMITED
Note 31. Financial instruments summaryThe following tables summarise the categories of the Group's financial assets and liabilities.
New Zealand dollars
Loans and receivables
$000s
Assets at fair value
through other comprehensive
income $000s
Assets at fair value
through profit or loss
$000sTotal
$000s
Financial assets as at 31 December 2018
Cash and cash equivalents 1,340 - - 1,340
Trade and other receivables excluding prepayments 17,250 - - 17,250
Non current trade and other receivables excluding prepayments 1,059 - - 1,059
Investment in shares - - 586 586
Total financial assets 19,649 - 586 20,235
New Zealand dollars
Liabilities at fair value
through profit or loss
$000s
Other financial liabilities
$000sTotal
$000s
Financial liabilities as at 31 December 2018
Trade and other payables - 19,152 19,152
Current interest bearing liabilities - 21,039 21,039
Derivative financial instruments 267 - 267
Non current interest bearing liabilities - 59,361 59,361
Total financial liabilities 267 99,552 99,819
New Zealand dollars
Loans and receivables
$000s
Assets at fair value
through reserves
$000s
Available for sale $000s
Total $000s
Financial assets as at 31 December 2017
Cash and cash equivalents 2,389 - - 2,389
Trade and other receivables excluding prepayments 16,467 - - 16,467
Non current trade and other receivables 1,066 - - 1,066
Investment in shares - - 7,428 7,428
Total financial assets 19,922 - 7,428 27,350
New Zealand dollars
Liabilities at fair value
through reserves
$000s
Other financial liabilities
$000sTotal
$000s
Financial liabilities as at 31 December 2017
Trade and other payables - 20,281 20,281
Current interest bearing liabilities - 10,827 10,827
Derivative financial instruments 128 - 128
Non current interest bearing liabilities - 74,683 74,683
Total financial liabilities 128 105,791 105,919
53SEEKA LIMITED | ANNUAL REPORT 2018
Accounting policiesThe Group classifies its investment in the following categories in accordance with NZ IFRS 9: assets at amortised cost, fair value through other comprehensive income (FVOCI) and fair value through profit and loss (FVTPL). The classification of financial assets under NZ IFRS 9 is generally based on the business model in which the financial assets is managed and its contractual cash flows characteristics.
On initial recognition, a financial asset is classified as measured at amortised cost, FVOCI and FVTPL.
Financial assets are not reclassified subsequent to their initial recognition unless the Group changes its business model for managing financial assets in which case all affected financial assets are reclassified on the first day of the first reporting period following the change in the business model.
A financial asset is measured at amortised cost if it meets both of the following conditions and is not designated at FVTPL:
– it is held with the objective is to hold the assets to collect contractual cashflows; and
– its contractual terms give rise on specified dates to cash flows that are solely for the payments of principal and interest on the principal amount being outstanding.
On initial recognition of an equity investment that is not held for trading, the Group may irrevocable elect to present subsequent changes in the investment’s fair value in other comprehensive income. The election is made on an investment by investment basis.
All financial assets not classified as measured at amortised cost or FVOCI as described above are measured at FVTPL.
54 ANNUAL REPORT 2018 | SEEKA LIMITED
PricewaterhouseCoopers, 188 Quay Street, Private Bag 92162, Auckland 1142, New Zealand T: +64 9 355 8000, F: +64 9 355 8001, pwc.co.nz
Independent auditor’s report To the shareholders of Seeka Limited
We have audited the consolidated financial statements which comprise: the statement of financial position as at 31 December 2018; the statement of financial performance for the year then ended; the statement of comprehensive income for the year then ended; the statement of changes in equity for the year then ended; the statement of cash flows for the year then ended; and the notes to the financial statements, which include significant accounting policies.
Our opinion In our opinion, the accompanying consolidated financial statements of Seeka Limited (the Company), including its subsidiaries (the Group), present fairly, in all material respects, the financial position of the Group as at 31 December 2018, its financial performance and its cash flows for the year then ended in accordance with New Zealand Equivalents to International Financial Reporting Standards (NZ IFRS) and International Financial Reporting Standards (IFRS).
Basis for opinion We conducted our audit in accordance with International Standards on Auditing (New Zealand) (ISAs (NZ)) and International Standards on Auditing (ISAs). Our responsibilities under those standards are further described in the Auditor’s responsibilities for the audit of the consolidated financial statements section of our report.
We believe that the audit evidence we have obtained is sufficient and appropriate to provide a basis for our opinion.
We are independent of the Group in accordance with Professional and Ethical Standard 1 (Revised) Code of Ethics for Assurance Practitioners (PES 1) issued by the New Zealand Auditing and Assurance Standards Board and the International Ethics Standards Board for Accountants’ Code of Ethics for Professional Accountants (IESBA Code), and we have fulfilled our other ethical responsibilities in accordance with these requirements.
Our firm carries out other services for the Group in the areas of taxation compliance and consulting services, tax pooling services, executive remuneration benchmarking advisory services and other advisory services. The provision of these other services has not impaired our independence as auditor of the Group.
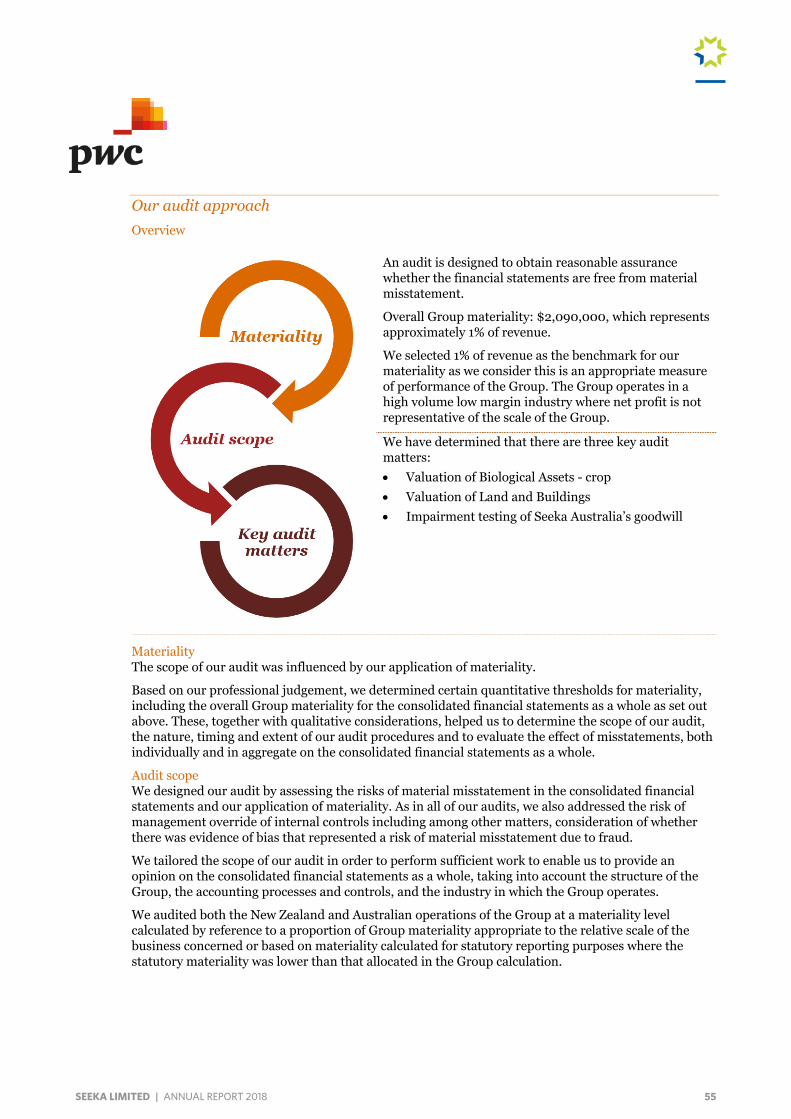
55SEEKA LIMITED | ANNUAL REPORT 2018
PwC 61
Our audit approach Overview
An audit is designed to obtain reasonable assurance whether the financial statements are free from material misstatement.
Overall Group materiality: $2,090,000, which represents approximately 1% of revenue.
We selected 1% of revenue as the benchmark for our materiality as we consider this is an appropriate measure of performance of the Group. The Group operates in a high volume low margin industry where net profit is not representative of the scale of the Group.
We have determined that there are three key audit matters: Valuation of Biological Assets - crop Valuation of Land and Buildings Impairment testing of Seeka Australia’s goodwill
Materiality The scope of our audit was influenced by our application of materiality.
Based on our professional judgement, we determined certain quantitative thresholds for materiality, including the overall Group materiality for the consolidated financial statements as a whole as set out above. These, together with qualitative considerations, helped us to determine the scope of our audit, the nature, timing and extent of our audit procedures and to evaluate the effect of misstatements, both individually and in aggregate on the consolidated financial statements as a whole.
Audit scope We designed our audit by assessing the risks of material misstatement in the consolidated financial statements and our application of materiality. As in all of our audits, we also addressed the risk of management override of internal controls including among other matters, consideration of whether there was evidence of bias that represented a risk of material misstatement due to fraud.
We tailored the scope of our audit in order to perform sufficient work to enable us to provide an opinion on the consolidated financial statements as a whole, taking into account the structure of the Group, the accounting processes and controls, and the industry in which the Group operates.
We audited both the New Zealand and Australian operations of the Group at a materiality level calculated by reference to a proportion of Group materiality appropriate to the relative scale of the business concerned or based on materiality calculated for statutory reporting purposes where the statutory materiality was lower than that allocated in the Group calculation.
56 ANNUAL REPORT 2018 | SEEKA LIMITED
PwC 62
Key audit matters Key audit matters are those matters that, in our professional judgment, were of most significance in our audit of the consolidated financial statements of the current year. These matters were addressed in the context of our audit of the consolidated financial statements as a whole, and in forming our opinion thereon, and we do not provide a separate opinion on these matters.
Key audit matter How our audit addressed the key audit matter
Valuation of Biological Assets – crop The total value of biological assets at balance date was $17.9 million. Biological assets are disclosed in note 11 of the financial statements and comprise the crops on the vines and trees in the Group’s leased and owned orchards.
Biological assets are recorded at fair value. The method to determine fair value depends on the degree of biological transformation (the maturity of the fruit) at balance date. As at 31 December 2018, a total of $17.7 million (99%) of biological assets used cost as a proxy for fair value because of insufficient biological transformation.
In determining the fair value of the biological assets, management exercises judgement utilising industry knowledge and internal experts in determining the level of biological transformation at balance date. When insufficient biological transformation has occurred, the fair value is the costs incurred at balance date to grow the crops (provided the costs are considered recoverable).
For those biological assets where cost has been used as a proxy for fair value, management assessed the recoverability of capitalised costs by comparing the carrying amount to budgeted costs at year end and ensuring that actual costs incurred plus costs to be incurred in order to get the crop to market did not exceed budgeted revenues from the sale of the crops less selling costs. Management uses historical results and anticipated crop levels as a basis for budgeted revenues. An impairment is recognised when the actual costs incurred plus costs to be incurred in order to get the crop to market exceed budgeted revenues less selling costs.
Our audit focused on the biological assets valued at cost, being the most significant component of the balance. We have evaluated judgements applied by management to determine the crop value including the degree of biological transformation, the attribution of costs capitalised to the following year’s crop and the recoverability of capitalised costs.
Our audit procedures included: Gaining an understanding of the crop life cycle and
growth periods with reference to relevant independent horticultural industry information to determine the appropriateness of management’s assessment of biological transformation.
Testing a sample of expenses that were capitalised to determine whether capitalisation was valid and directly related to the unharvested crop at 31 December 2018.
Testing the mathematical accuracy of the models used by management in their calculation of the fair value of the crops.
Reviewing management’s assessment of the recoverability of capitalised costs. Our procedures included comparing the expected crop yield determined by management to the historical production yield and expected number of trays that can be produced per hectare based on the land that is currently owned and leased. We assessed whether any variances between historical and expected volumes are consistent with our understanding of planned changes in the Group’s operations. Additionally we compared the future selling price used by management in their model to available industry information.
Evaluating the historical accuracy of management’s forecasted information through comparing prior year forecast to actual results.
We had no matters to report as a result of our procedures.
57SEEKA LIMITED | ANNUAL REPORT 2018
PwC 63
Key audit matter How our audit addressed the key audit matter
Valuation of Land and Buildings As reflected in note 9 of the financial statements, the Group has a policy of revaluing their land and buildings on a three year rolling cycle (excluding assets under construction). At each balance date approximately one third of the New Zealand Group’s properties are revalued by an independent external valuer using a combination of market approach, income capitalisation and discounted cash flow methods. The Australia properties were last revalued on 31 December 2017. The Group then utilises their internal valuation expertise to evaluate whether, based on the results of the third party valuations and other recent market data, the remaining asset values remain appropriate and materially reflect fair value.
The total value of the Group’s land and buildings at year end is $110.1 million.
Our audit of the land and buildings of the Group focused on the judgements inherent in the valuation of those assets.
Our procedures included: Assessing the objectivity and competence of
management’s internal valuation experts and third party valuers, in addition to assessing the independence of the third party valuers utilised by management.
Utilising our PwC valuation expert, we have assessed key assumptions used in the external valuations by comparing the valuation assumptions and inputs used, such as capitalisation and discount rates, to externally available data. Where external data was not available, our internal valuation expert has utilised his experience and knowledge to determine whether the assumptions used by the third party valuer were reasonable and appropriate in the circumstances.
Reviewing and challenging management’s assessment of the carrying values of the land and buildings not independently revalued during 2018 by comparing our own independent assessment of valuation ranges using our PwC valuation expert.
We had no matters to report as a result of our procedures.
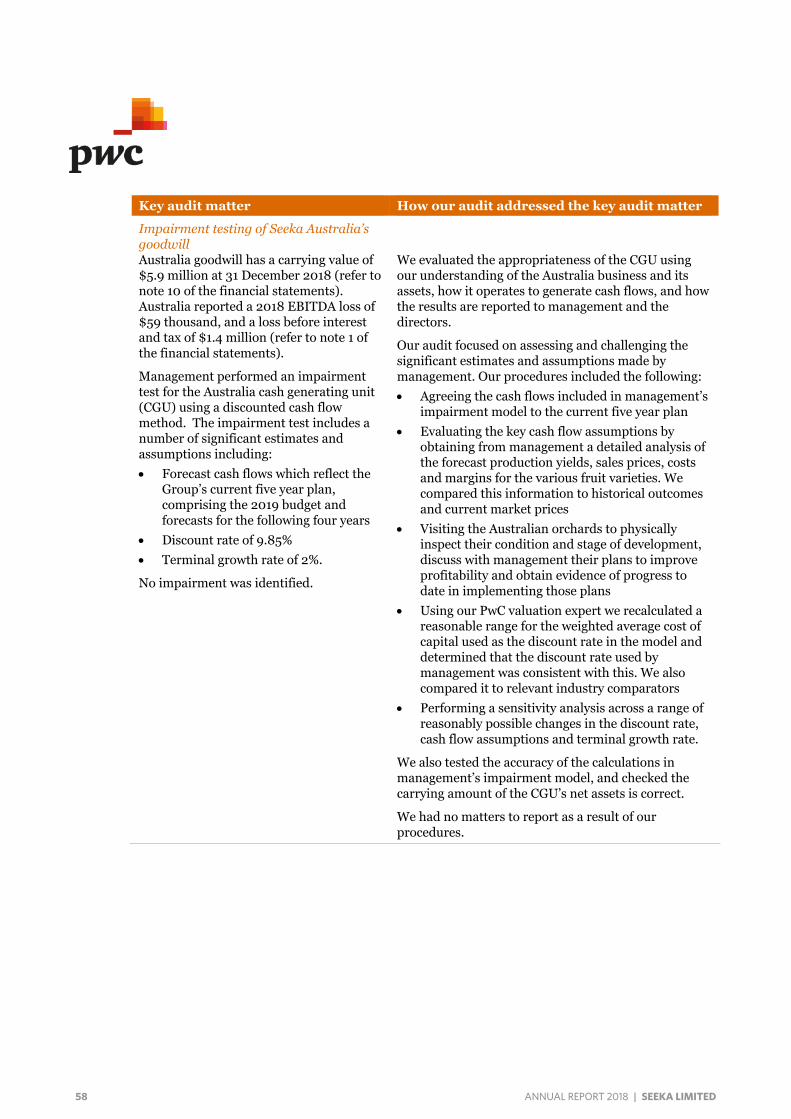
58 ANNUAL REPORT 2018 | SEEKA LIMITED
PwC 64
Key audit matter How our audit addressed the key audit matter
Impairment testing of Seeka Australia’s goodwill Australia goodwill has a carrying value of $5.9 million at 31 December 2018 (refer to note 10 of the financial statements). Australia reported a 2018 EBITDA loss of $59 thousand, and a loss before interest and tax of $1.4 million (refer to note 1 of the financial statements).
Management performed an impairment test for the Australia cash generating unit (CGU) using a discounted cash flow method. The impairment test includes a number of significant estimates and assumptions including: Forecast cash flows which reflect the
Group’s current five year plan, comprising the 2019 budget and forecasts for the following four years
Discount rate of 9.85% Terminal growth rate of 2%.
No impairment was identified.
We evaluated the appropriateness of the CGU using our understanding of the Australia business and its assets, how it operates to generate cash flows, and how the results are reported to management and the directors.
Our audit focused on assessing and challenging the significant estimates and assumptions made by management. Our procedures included the following: Agreeing the cash flows included in management’s
impairment model to the current five year plan Evaluating the key cash flow assumptions by
obtaining from management a detailed analysis of the forecast production yields, sales prices, costs and margins for the various fruit varieties. We compared this information to historical outcomes and current market prices
Visiting the Australian orchards to physically inspect their condition and stage of development, discuss with management their plans to improve profitability and obtain evidence of progress to date in implementing those plans
Using our PwC valuation expert we recalculated a reasonable range for the weighted average cost of capital used as the discount rate in the model and determined that the discount rate used by management was consistent with this. We also compared it to relevant industry comparators
Performing a sensitivity analysis across a range of reasonably possible changes in the discount rate, cash flow assumptions and terminal growth rate.
We also tested the accuracy of the calculations in management’s impairment model, and checked the carrying amount of the CGU’s net assets is correct.
We had no matters to report as a result of our procedures.
59SEEKA LIMITED | ANNUAL REPORT 2018
PwC 65
Information other than the financial statements and auditor’s report.
The Directors are responsible for the annual report. Our opinion on the consolidated financial statements does not cover the other information included in the annual report and we do not express any form of assurance conclusion on the other information. In connection with our audit of the consolidated financial statements, our responsibility is to read the other information and, in doing so, consider whether the other information is materially inconsistent with the consolidated financial statements or our knowledge obtained in the audit, or otherwise appears to be materially misstated. If, based on the work we have performed on the other information that we obtained prior to the date of this auditor’s report, we conclude that there is a material misstatement of this other information, we are required to report that fact. We have nothing to report in this regard.
Responsibilities of the Directors for the consolidated financial statements The Directors are responsible, on behalf of the Company, for the preparation and fair presentation of the consolidated financial statements in accordance with NZ IFRS and IFRS, and for such internal control as the Directors determine is necessary to enable the preparation of consolidated financial statements that are free from material misstatement, whether due to fraud or error.
In preparing the consolidated financial statements, the Directors are responsible for assessing the Group’s ability to continue as a going concern, disclosing, as applicable, matters related to going concern and using the going concern basis of accounting unless the Directors either intend to liquidate the Group or to cease operations, or have no realistic alternative but to do so.
Auditor’s responsibilities for the audit of the consolidated financial statements Our objectives are to obtain reasonable assurance about whether the consolidated financial statements, as a whole, are free from material misstatement, whether due to fraud or error, and to issue an auditor’s report that includes our opinion. Reasonable assurance is a high level of assurance, but is not a guarantee that an audit conducted in accordance with ISAs (NZ) and ISAs will always detect a material misstatement when it exists. Misstatements can arise from fraud or error and are considered material if, individually or in the aggregate, they could reasonably be expected to influence the economic decisions of users taken on the basis of these consolidated financial statements.
A further description of our responsibilities for the audit of the financial statements is located at the External Reporting Board’s website at: https://www.xrb.govt.nz/standards-for-assurance-practitioners/auditors-responsibilities/audit-report-1/
This description forms part of our auditor’s report.
60 ANNUAL REPORT 2018 | SEEKA LIMITED
PwC 66
Who we report to This report is made solely to the Company’s shareholders, as a body. Our audit work has been undertaken so that we might state those matters which we are required to state to them in an auditor’s report and for no other purpose. To the fullest extent permitted by law, we do not accept or assume responsibility to anyone other than the Company and the Company’s shareholders, as a body, for our audit work, for this report or for the opinions we have formed.
The engagement partner on the audit resulting in this independent auditor’s report is Pip Cameron.
For and on behalf of: Chartered Accountants 25 February 2019
Auckland
61SEEKA LIMITED | ANNUAL REPORT 2018
CORPORATE GOVERNANCE
Corporate governance statement 62
Director profiles 71
Interests register 73
Directors’ interests in Seeka Limited securities 74
Subsidiary companies 75
Employee remuneration 76
Other disclosures 77
Operating assets statistics 78
Securities statistics 79
Directory 80
62 ANNUAL REPORT 2018 | SEEKA LIMITED
CORPORATE GOVERNANCE STATEMENT
As at 31 December 2018
At Seeka, we conduct our business safely and ethically, within the legal and regulatory framework, so we can deliver the best outcomes for our growers, clients, employees, shareholders, customers and the communities we operate in.
Seeka supports the NZX Corporate Governance Code 2017 (the Code), and Seeka’s Board has reviewed and refined the company’s corporate governance policies against the eight principles of the Code.
Seeka’s corporate governance statement and governance policies are available on Seeka’s website Seeka.co.nz/corporate-governance.
The following is a summary of Seeka’s governance actions and performance against each of the Code’s eight principles during the reporting period. Seeka’s governance complies with the Code, with exceptions to any principle noted in this governance statement, and listed on page 70 of this annual report.
The Board approved this governance statement on 25 February 2019.
Principle 1. Code of ethical behaviour“Directors should set high standards of ethical behaviour, model this behaviour and hold management accountable for these standards being followed throughout the organisation.”
Seeka commits to high ethical standards in all dealings undertaken by the Group’s directors, employees and suppliers. We are a produce business that connects growers with customers. Our business spans cultural, regulatory and country boundaries, and our directors and management understand that high ethical standards deliver the best outcomes for our growers, clients, employees, shareholders, customers and communities.
Our commitment to ethical dealings is captured by Seeka’s published core brand attribute “founded on relationships.”
Seeka’s Code of Ethics is included in employee induction packs, is available on Seeka’s intranet, and the Code's principles and objectives are promoted to staff each year including at staff meetings. The code outlines how directors and management are to consistently act with honesty and integrity, and model high ethical standards to all employees and stakeholders, adhering to the principle “we do what we say and are accountable for what we do.”
The Code of Ethics provides clear guidance on:
• Conflicts of interest
• Use of Seeka information, assets and property
• Dealing with gifts or gratuities
• Respecting all stakeholders
• Whistle blowing for safe reporting of potential wrong doing
• Compliance with laws and Seeka policies
• Managing any breaches of Seeka’s Code of Ethics
Seeka also has a strict Insider Trading Policy prohibiting the direct or indirect dealing of Seeka securities when holding inside information, plus a duty of confidentiality that protects the dissemination and use of confidential company information.
The Insider Trading Policy includes a black-out period during which restricted persons are prohibited in trading in Seeka shares unless provided by a specific exemption by the Board. Each black out period starts 30 days prior to and finishes the first trading day after key events; being the half-year and full-year balance dates, and the release to the NZX of any announcement relating to an offer in Seeka shares. Restricted persons includes all directors, executive officers, members of the management executive team and their administrative staff, any trusts and companies controlled by such persons, and advisors.
Prior to trading in Seeka shares, directors must notify the chairman, and the chairman must notify the chair of the Audit and Risk committee.
No breaches of the Code of Ethics or Insider Trading Policy were reported in the year.
Principle 2. Board composition and performance“To ensure an effective board, there should be a balance of independence, skills, knowledge, experience and perspective.”
Seeka’s Board commits to acting in the best interest of the company, deliver benefits to stakeholders and grow shareholder returns.
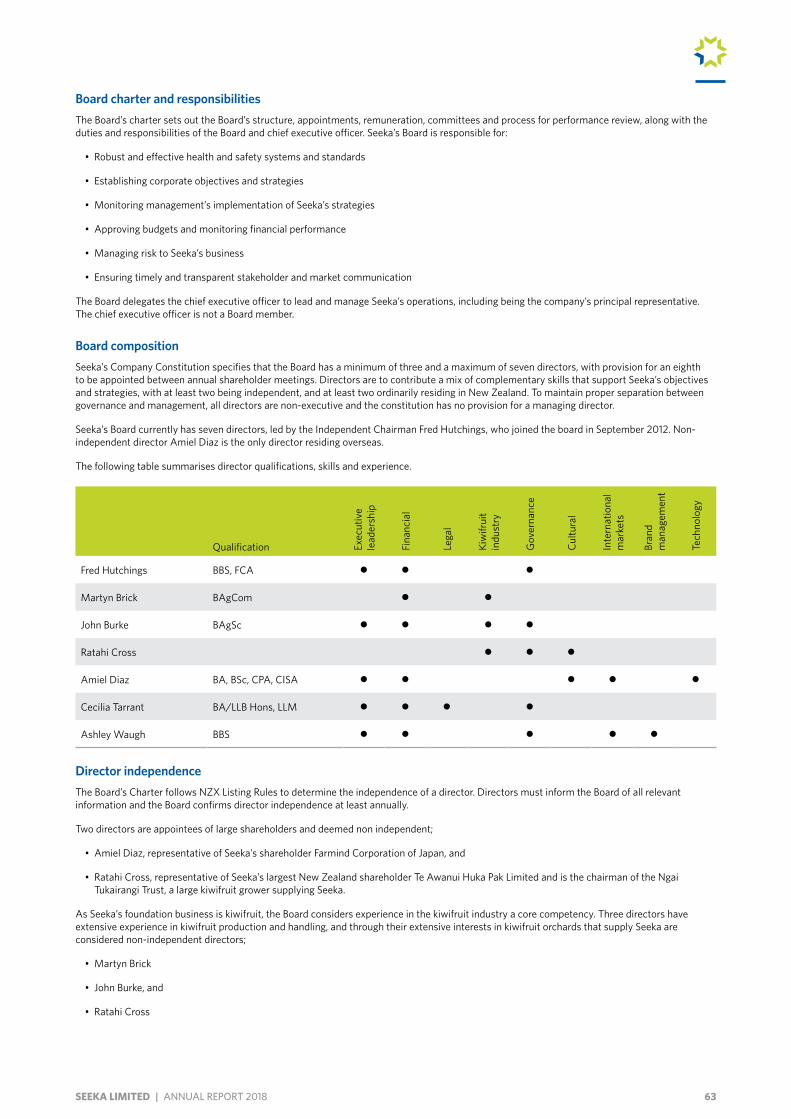
63SEEKA LIMITED | ANNUAL REPORT 2018
Board charter and responsibilitiesThe Board’s charter sets out the Board’s structure, appointments, remuneration, committees and process for performance review, along with the duties and responsibilities of the Board and chief executive officer. Seeka’s Board is responsible for:
• Robust and effective health and safety systems and standards
• Establishing corporate objectives and strategies
• Monitoring management’s implementation of Seeka’s strategies
• Approving budgets and monitoring financial performance
• Managing risk to Seeka’s business
• Ensuring timely and transparent stakeholder and market communication
The Board delegates the chief executive officer to lead and manage Seeka’s operations, including being the company’s principal representative. The chief executive officer is not a Board member.
Board compositionSeeka’s Company Constitution specifies that the Board has a minimum of three and a maximum of seven directors, with provision for an eighth to be appointed between annual shareholder meetings. Directors are to contribute a mix of complementary skills that support Seeka’s objectives and strategies, with at least two being independent, and at least two ordinarily residing in New Zealand. To maintain proper separation between governance and management, all directors are non-executive and the constitution has no provision for a managing director.
Seeka’s Board currently has seven directors, led by the Independent Chairman Fred Hutchings, who joined the board in September 2012. Non-independent director Amiel Diaz is the only director residing overseas.
The following table summarises director qualifications, skills and experience.
Qualification Exec
utiv
e le
ader
ship
Fina
ncia
l
Lega
l
Kiw
ifrui
t in
dust
ry
Gov
erna
nce
Cultu
ral
Inte
rnat
iona
l m
arke
ts
Bran
d m
anag
emen
t
Tech
nolo
gy
Fred Hutchings BBS, FCA
Martyn Brick BAgCom
John Burke BAgSc
Ratahi Cross
Amiel Diaz BA, BSc, CPA, CISA
Cecilia Tarrant BA/LLB Hons, LLM
Ashley Waugh BBS
Director independenceThe Board’s Charter follows NZX Listing Rules to determine the independence of a director. Directors must inform the Board of all relevant information and the Board confirms director independence at least annually.
Two directors are appointees of large shareholders and deemed non independent;
• Amiel Diaz, representative of Seeka’s shareholder Farmind Corporation of Japan, and
• Ratahi Cross, representative of Seeka’s largest New Zealand shareholder Te Awanui Huka Pak Limited and is the chairman of the Ngai Tukairangi Trust, a large kiwifruit grower supplying Seeka.
As Seeka’s foundation business is kiwifruit, the Board considers experience in the kiwifruit industry a core competency. Three directors have extensive experience in kiwifruit production and handling, and through their extensive interests in kiwifruit orchards that supply Seeka are considered non-independent directors;
• Martyn Brick
• John Burke, and
• Ratahi Cross
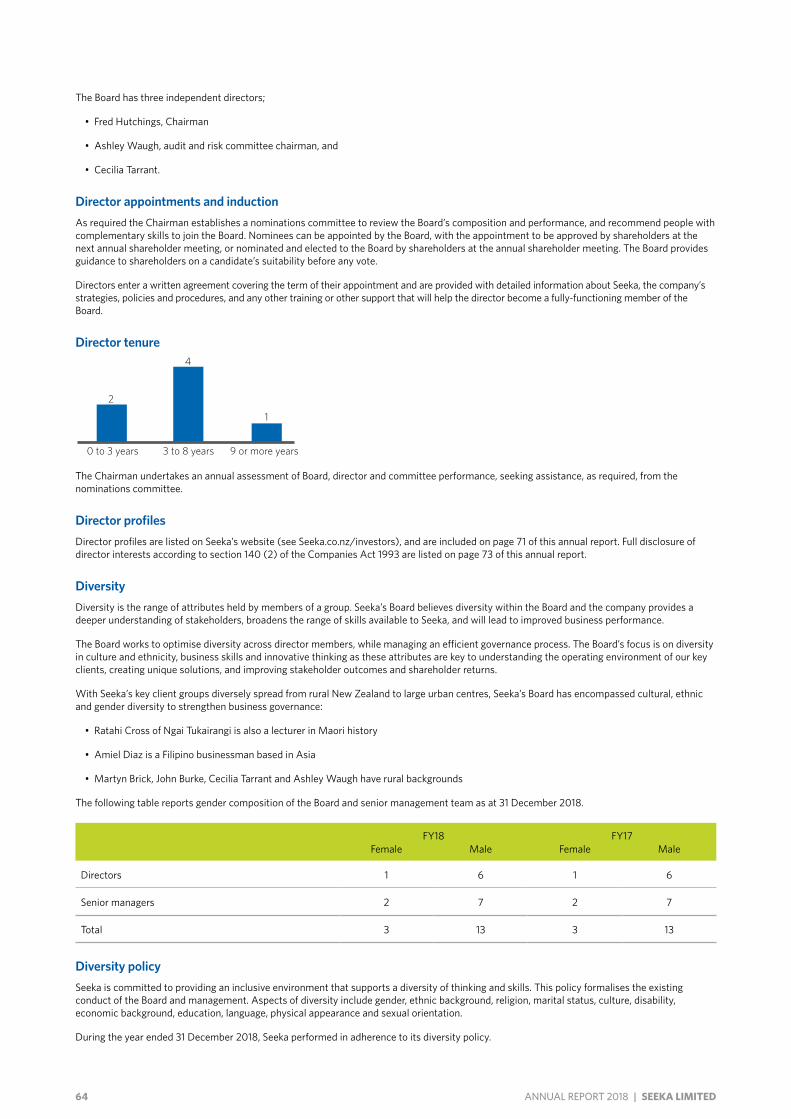
64 ANNUAL REPORT 2018 | SEEKA LIMITED
The Board has three independent directors;
• Fred Hutchings, Chairman
• Ashley Waugh, audit and risk committee chairman, and
• Cecilia Tarrant.
Director appointments and inductionAs required the Chairman establishes a nominations committee to review the Board’s composition and performance, and recommend people with complementary skills to join the Board. Nominees can be appointed by the Board, with the appointment to be approved by shareholders at the next annual shareholder meeting, or nominated and elected to the Board by shareholders at the annual shareholder meeting. The Board provides guidance to shareholders on a candidate’s suitability before any vote.
Directors enter a written agreement covering the term of their appointment and are provided with detailed information about Seeka, the company’s strategies, policies and procedures, and any other training or other support that will help the director become a fully-functioning member of the Board.
Director tenure
0 to 3 years 3 to 8 years 9 or more years
2
4
1
The Chairman undertakes an annual assessment of Board, director and committee performance, seeking assistance, as required, from the nominations committee.
Director profilesDirector profiles are listed on Seeka’s website (see Seeka.co.nz/investors), and are included on page 71 of this annual report. Full disclosure of director interests according to section 140 (2) of the Companies Act 1993 are listed on page 73 of this annual report.
DiversityDiversity is the range of attributes held by members of a group. Seeka’s Board believes diversity within the Board and the company provides a deeper understanding of stakeholders, broadens the range of skills available to Seeka, and will lead to improved business performance.
The Board works to optimise diversity across director members, while managing an efficient governance process. The Board’s focus is on diversity in culture and ethnicity, business skills and innovative thinking as these attributes are key to understanding the operating environment of our key clients, creating unique solutions, and improving stakeholder outcomes and shareholder returns.
With Seeka’s key client groups diversely spread from rural New Zealand to large urban centres, Seeka’s Board has encompassed cultural, ethnic and gender diversity to strengthen business governance:
• Ratahi Cross of Ngai Tukairangi is also a lecturer in Maori history
• Amiel Diaz is a Filipino businessman based in Asia
• Martyn Brick, John Burke, Cecilia Tarrant and Ashley Waugh have rural backgrounds
The following table reports gender composition of the Board and senior management team as at 31 December 2018.
FY18 FY17Female Male Female Male
Directors 1 6 1 6
Senior managers 2 7 2 7
Total 3 13 3 13
Diversity policySeeka is committed to providing an inclusive environment that supports a diversity of thinking and skills. This policy formalises the existing conduct of the Board and management. Aspects of diversity include gender, ethnic background, religion, marital status, culture, disability, economic background, education, language, physical appearance and sexual orientation.
During the year ended 31 December 2018, Seeka performed in adherence to its diversity policy.
65SEEKA LIMITED | ANNUAL REPORT 2018
Professional developmentDirectors are supported to undertake professional development and Seeka provides relevant industry training and strategic exposure.
Evaluation of board and director performanceThe Board Charter specifies that Board and director performance are to be reviewed annually by the chairman. At balance date, the chairman is completing this performance review according to the provisions of the Board Charter.
Principle 3. Board committees“The board should use committees where this will enhance its effectiveness in key areas, while still retaining board responsibility.”
The Board has established permanent committees and will form ad-hoc committees to efficiently and effectively carry out key governance functions, while retaining ultimate responsibility for all decisions and actions.
All committees operate under written charters which define the role, authority and operations of the committee. All Seeka directors and committee members are non-executive, and Seeka management and other employees may only attend committee meetings when invited by the committee. The Board reviews the remuneration and nominations committee charters biennially and the audit and risk committee charter annually.
Committee membership and workload managementSeeka is governed by a seven-member Board with three independent directors. To provide effective and transparent committee governance, while managing workload across Board members, Seeka’s committee charters ensure each committee is chaired by an independent director, with committee members drawn from both independent and non-independent directors that furnish the best skill set.
The current standing committees are:
Audit and risk
Composition Role Members
Independent chair with a minimum of two other directors. The chair may not be the Board Chairman.
Examines financial reporting, compliance, external and internal auditing, risk management and risk insurance.
Ashley Waugh, chair Martyn Brick John Burke Ex-officio – Fred Hutchings
While audit and risk committee members Ashley Waugh, Martyn Brick and John Burke do not have an accounting background, specialist accounting and financial expertise is available from ex-officio member Fred Hutchings who is a Fellow Chartered Accountant.
Remuneration
Composition Role Members
Independent chair with a minimum of two other directors.
Examines the performance, remuneration and succession planning of the chief executive officer, the remuneration of senior managers, company-wide employee remuneration policy and human resource plans and policies.
Fred Hutchings, chair Ratahi Cross Cecilia Tarrant
In addition, the Chairman periodically establishes an ad-hoc nominations committee.
Nominations
Composition Role Members
Independent chair with a minimum of two other directors.
Examines the directors’ terms of engagement, Board succession planning, seeks and evaluates nominees, and advises the Board on director appointments.
Appointed by the Board.
In the event of a takeover offer, the Board Charter provides for the formation of an ad-hoc initial response committee and an independent takeover response committee to enact the procedures and protocols of the Board's Takeover Response Manual, adopted July 2018.
Initial response committee
Composition Role Members
Independent directors. Manage the initial response to an unexpected takeover notice. Fred Hutchings Cecilia Tarrant Ashley Waugh
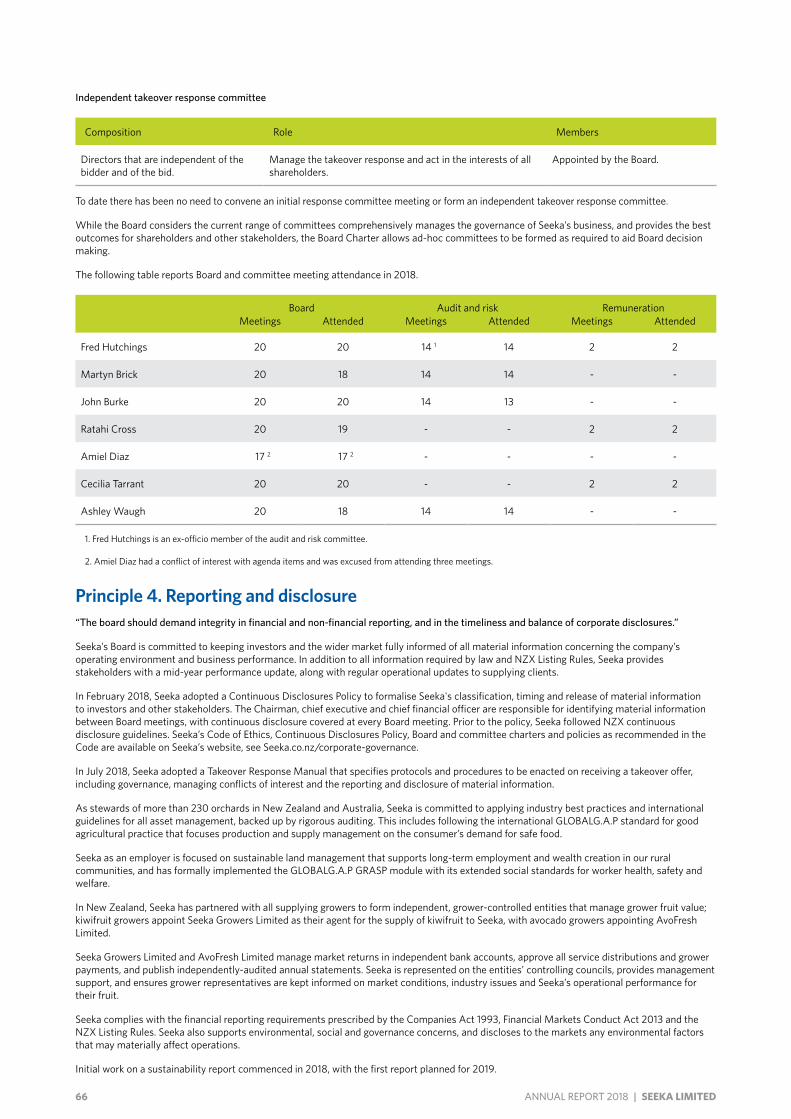
66 ANNUAL REPORT 2018 | SEEKA LIMITED
Independent takeover response committee
Composition Role Members
Directors that are independent of the bidder and of the bid.
Manage the takeover response and act in the interests of all shareholders.
Appointed by the Board.
To date there has been no need to convene an initial response committee meeting or form an independent takeover response committee.
While the Board considers the current range of committees comprehensively manages the governance of Seeka’s business, and provides the best outcomes for shareholders and other stakeholders, the Board Charter allows ad-hoc committees to be formed as required to aid Board decision making.
The following table reports Board and committee meeting attendance in 2018.
Board Audit and risk RemunerationMeetings Attended Meetings Attended Meetings Attended
Fred Hutchings 20 20 14 1 14 2 2
Martyn Brick 20 18 14 14 - -
John Burke 20 20 14 13 - -
Ratahi Cross 20 19 - - 2 2
Amiel Diaz 17 2 17 2 - - - -
Cecilia Tarrant 20 20 - - 2 2
Ashley Waugh 20 18 14 14 - -
1. Fred Hutchings is an ex-officio member of the audit and risk committee.
2. Amiel Diaz had a conflict of interest with agenda items and was excused from attending three meetings.
Principle 4. Reporting and disclosure“The board should demand integrity in financial and non-financial reporting, and in the timeliness and balance of corporate disclosures.”
Seeka’s Board is committed to keeping investors and the wider market fully informed of all material information concerning the company’s operating environment and business performance. In addition to all information required by law and NZX Listing Rules, Seeka provides stakeholders with a mid-year performance update, along with regular operational updates to supplying clients.
In February 2018, Seeka adopted a Continuous Disclosures Policy to formalise Seeka's classification, timing and release of material information to investors and other stakeholders. The Chairman, chief executive and chief financial officer are responsible for identifying material information between Board meetings, with continuous disclosure covered at every Board meeting. Prior to the policy, Seeka followed NZX continuous disclosure guidelines. Seeka’s Code of Ethics, Continuous Disclosures Policy, Board and committee charters and policies as recommended in the Code are available on Seeka’s website, see Seeka.co.nz/corporate-governance.
In July 2018, Seeka adopted a Takeover Response Manual that specifies protocols and procedures to be enacted on receiving a takeover offer, including governance, managing conflicts of interest and the reporting and disclosure of material information.
As stewards of more than 230 orchards in New Zealand and Australia, Seeka is committed to applying industry best practices and international guidelines for all asset management, backed up by rigorous auditing. This includes following the international GLOBALG.A.P standard for good agricultural practice that focuses production and supply management on the consumer’s demand for safe food.
Seeka as an employer is focused on sustainable land management that supports long-term employment and wealth creation in our rural communities, and has formally implemented the GLOBALG.A.P GRASP module with its extended social standards for worker health, safety and welfare.
In New Zealand, Seeka has partnered with all supplying growers to form independent, grower-controlled entities that manage grower fruit value; kiwifruit growers appoint Seeka Growers Limited as their agent for the supply of kiwifruit to Seeka, with avocado growers appointing AvoFresh Limited.
Seeka Growers Limited and AvoFresh Limited manage market returns in independent bank accounts, approve all service distributions and grower payments, and publish independently-audited annual statements. Seeka is represented on the entities’ controlling councils, provides management support, and ensures grower representatives are kept informed on market conditions, industry issues and Seeka’s operational performance for their fruit.
Seeka complies with the financial reporting requirements prescribed by the Companies Act 1993, Financial Markets Conduct Act 2013 and the NZX Listing Rules. Seeka also supports environmental, social and governance concerns, and discloses to the markets any environmental factors that may materially affect operations.
Initial work on a sustainability report commenced in 2018, with the first report planned for 2019.
67SEEKA LIMITED | ANNUAL REPORT 2018
Principle 5. Remuneration“The remuneration of directors and executives should be transparent, fair and reasonable.”
Director remunerationIn accordance with the Board Charter, the Chairman uses professional advice and market information to review director remuneration within a two year period, with shareholders having to approve any increase to the pool available to pay directors’ fees. Approval was last sought in April 2018, when the pool limit was set at $450,000 per annum. Directors are remunerated by fixed fees that are set according to expected time commitments and responsibilities as determined by the Board. Directors receive no equity-based remuneration, and receive no performance or retirement benefits. Directors are not required to own Seeka shares.
The following table reports the allocation of the pool at the date of this report, and directors’ fees paid during the financial year. No other benefits were remunerated to directors during the year.
Position Base director fee Chairman fee
Audit and risk committee chair
fee
Director fees paid during the
year
Fred Hutchings Chairman $56,500 $43,500 $100,000
Ashley Waugh Director, Audit and risk committee chair $56,500 $11,000 $67,500
Martyn Brick Director $56,500 $56,500
John Burke Director $56,500 $56,500
Ratahi Cross Director $56,500 $56,500
Amiel Diaz Director $56,500 $56,500
Cecilia Tarrant Director $56,500 $56,500
Total $395,500 $43,500 $11,000 $450,000
The base director fee includes remuneration for committee membership.
Chief executive officer remunerationThe review of the chief executive’s remuneration is undertaken by the remunerations committee with the remuneration package the responsibility of the Board.
Michael Franks was appointed chief executive in 2006. His remuneration package comprises a fixed annual remuneration that covers base salary, vehicle, Kiwisaver contributions, medical and life insurance, and an at-risk annual performance incentive.
The following table reports chief executive remuneration in 2018.
Base salary Benefits1 Annual performance incentive2 Total remuneration
Michael Franks $575,302 $51,501 $156,800 $783,603
1. Benefits are delivered through vehicle, Kiwisaver contributions, medical and life insurance.
2. Performance incentive earned from FY17 and paid in 2018.
Performance incentive
The chief executive officer’s performance incentive has a maximum value of 40% of fixed remuneration for achieving annual targets set by the Board, including financial performance, strategic goals, health and safety, and risk management. For the 2017 financial year, chief executive officer Michael Franks earned an $156,800 performance incentive. This payment was made in 2018.
For the 2018 financial year, the chief executive officer earned a $247,500 performance incentive. This payment will be made in 2019.
Employee share scheme
At balance date, the chief executive had 8,000 shares allocated at $3.88 per share under the 2016 employee share scheme. These shares vest in 2019.
68 ANNUAL REPORT 2018 | SEEKA LIMITED
Principle 6. Risk management“Directors should have a sound understanding of the material risks faced by the issuer and how to manage them. The board should regularly verify that the issuer has appropriate processes that identify and manage potential and material risks.”
The Board consider risk management a major governance function that protects all stakeholders, builds long-term wealth in our communities and optimises shareholder value. The Board retains ultimate control of risk management, with the audit and risk committee providing a specific focus on material risks as defined in the Audit and Risk Committee Charter.
Business risks are identified, recorded on a risk register, assessed, managed through risk mitigation strategies and reviewed at least annually.
Financial statements and key operational measures are prepared monthly and reviewed by the Board throughout the year to assess business performance against budget and forecasts.
The Board composition includes directors with long-term experience in New Zealand’s kiwifruit industry, and Australian and Asian produce handling and marketing. Board meetings include periodic site visits in New Zealand and Australia to ensure all directors understand the Group’s operating environments when assessing material risk.
The Board’s complementary skill set and understanding of the core business have allowed it to implement strategies to mitigate risk associated with being a New Zealand kiwifruit handler by diversifying operations across multiple products, expanding into the Australian market and sourcing revenue from more points along the value chain. Since the incursion of the kiwifruit vine-killing disease Psa in 2010, Seeka has transformed from being a New Zealand kiwifruit handler to become an Australasian produce business involved in the growing, handling, supply and marketing of multiple products.
Seeka has appropriate insurance cover, as available, for property damage to its offices, post harvest, processing and fruit handling facilities, along with insurance cover for hail damage to crops.
During 2018, the Brown Marmorated Stink Bug (BMSB; Halyomorpha halys) was confirmed as one of the top pests of concern for New Zealand's horticultural industry. A native to China, Japan, Korea and Taiwan, and accidentally introduced in the United States in the mid-1990s, adult BMSB feed on fruit and make them unmarketable. The Ministry of Primary Industries is working with industry groups along with the public to prevent the unintended import of BMSB, including eradication protocols if BMSB are detected in New Zealand. Seeka personnel and supplying growers are informed on how to identify BMSB and the immediate actions to be undertaken if the pest is found.
Health and safetyOperating in a seasonal industry, in 2018 Seeka employed more than 3,000 people working in multiple complex environments. This includes 24-hour operations over the harvest period. Group salary and wages equate to 1,045 full time equivalents.
The Board is responsible for health and safety across Group operations, with the chief executive appointing a health and safety manager to ensure Seeka complies with legislation and operates industry best practice across the Group, while also supporting the management of health and safety risks by clients and suppliers. The Board reviews performance against set targets at each meeting.
The following table reports key health and safety measures and targets in 2018.
2018 Annual threshold 2018 Actuals
Total recordable injury frequency rate 1 Less than 4.6 4.5
Notifiable incidents 1 0
Notifiable injury 0 0
Severity rate 2 Less than 3.6 4.5
1. Total recordable injury frequency rate (TRIFR) is a key measure that compares total lost time injuries and medical treatments against the total number of hours worked. TRIFR = (number of recordable lost time and medical treatment injuries) x 200,000 / (number of employee hours worked).
2. Severity rate = (number of lost time injuries) / (number of days lost).
Principle 7. Auditors“The board should ensure the quality and independence of the external audit process.”
Seeka’s Audit and Risk Committee Charter outlines Seeka’s commitment to an independent audit process that provides shareholders and the markets with objective, clear and timely financial reporting.
The audit and risk committee in consultation with management and the external auditor reviews the efficiency and effectiveness of the external audit process, and provides a formal channel of communication between the Board, senior management and the external auditor. The audit and risk committee:
• Oversees the independence of the auditor and ensures they conduct their operations free from any actual or perceived impairments, and
• Monitors the provision of any services beyond the auditor’s statutory audit services.
69SEEKA LIMITED | ANNUAL REPORT 2018
For financial year 2018, PricewaterhouseCoopers (PwC) was the external auditor for Seeka Limited, having been reappointed Seeka’s auditor under the Companies Act 1993 at the 2018 annual shareholder meeting. PwC have confirmed their independence to the audit and risk committee, and their independence was not compromised during the reporting period. The last audit partner rotation was in FY16.
PwC auditors attend the annual shareholder meeting to answer any shareholder questions about the audit.
Internal auditSeeka has a number of internal controls overseen by the audit and risk committee to ensure the integrity of key financial and operational data. This includes data access, internal financial controls, adequate resourcing, targeted internal audit programmes and monitoring management’s response to external audit findings.
Due to the size of Group operations, rather than operating a dedicated audit function, Seeka uses its compliance team to conduct internal audit processes and monitor operational compliance, along with independent providers to regularly test the integrity of the Group’s financial systems.
Principle 8. Shareholder rights and relations“The board should respect the rights of shareholders and foster constructive relationships with shareholders that encourage them to engage with the issuer.”
Seeka’s shareholders include a significant number of grower clients, employees, suppliers and people living in our rural communities. Seeka maintains open channels of communication with a diverse range of groups to uphold our key brand attribute of delivering excellence to all stakeholders.
The Board is motivated and committed to transparent and regular reporting and engagement with shareholders including:
• Annual and interim reports
• Market announcements
• Annual shareholder meeting
• Mid-year stakeholder meeting
• Ad-hoc investor presentations
• Attendance of directors at seasonal grower roadshows held throughout the catchment for each produce type
• Quarterly all staff updates
• Clear access to investor information on the company’s website, see Seeka.co.nz/investors
• Open access to senior managers via phone and email, see Seeka.co.nz/senior-management-team
Shareholders are actively encouraged to attend the annual shareholder meeting and mid-year stakeholder update, where they can raise matters for discussion by directors and senior management. Shareholders vote on major decisions which affect Seeka at the annual shareholder meeting. Voting is by poll, conducted by the Company’s registrar Link Market Services and overseen by the company’s auditor PwC, on a one share, one vote principle.
Shareholders are provided with copies of the annual and interim report, and are encouraged to receive electronic communication by contacting our registrar Link Market Services, see Linkmarketservices.co.nz. The annual shareholders notice of meeting is posted on the NZX website and sent to shareholders at least 20 working days prior to the meeting. A link to Seeka’s announcements can be directly accessed from Seeka’s website, see Seeka.co.nz/nzx-announcements.
Seeka’s current and historical share price is located on the NZX website, see nzx.com/instruments/SEK
Corporate calendarIn the normal course of business, the Board reports to the following schedule.
End of year market announcement Late February
Dividend payment Late March
Annual shareholder meeting April
Dividend payment Late September
Stakeholder update Mid October
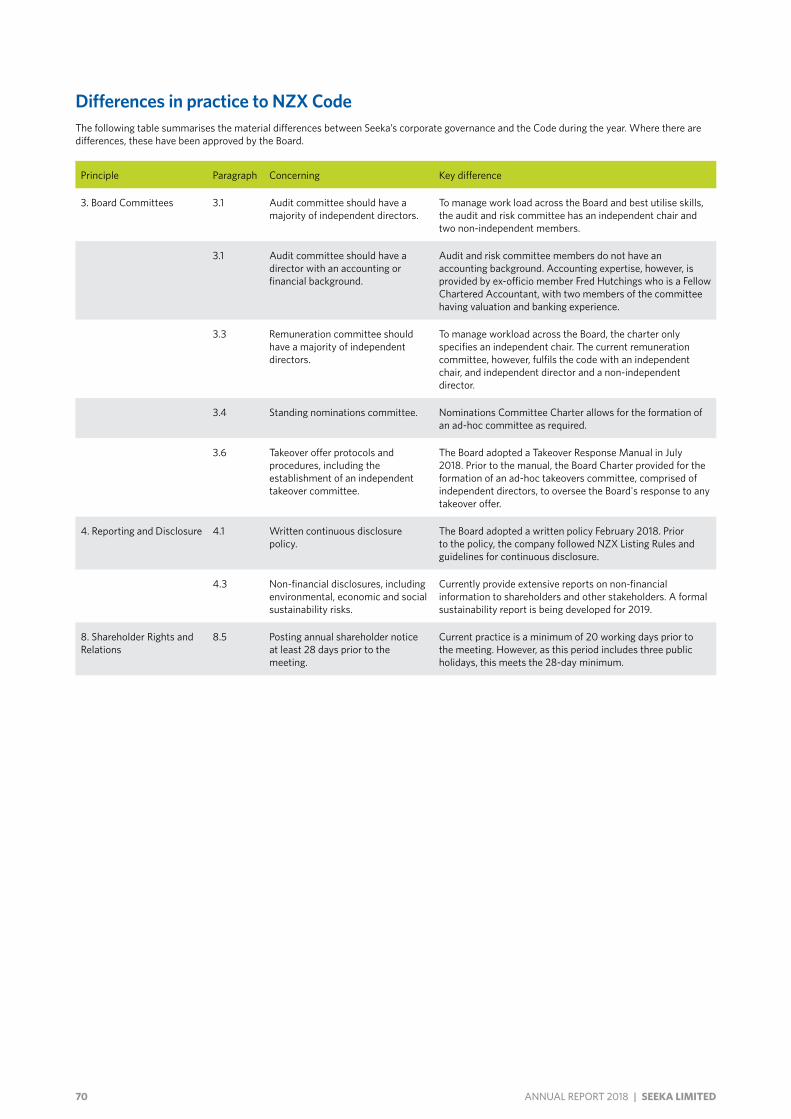
70 ANNUAL REPORT 2018 | SEEKA LIMITED
Differences in practice to NZX CodeThe following table summarises the material differences between Seeka’s corporate governance and the Code during the year. Where there are differences, these have been approved by the Board.
Principle Paragraph Concerning Key difference
3. Board Committees 3.1 Audit committee should have a majority of independent directors.
To manage work load across the Board and best utilise skills, the audit and risk committee has an independent chair and two non-independent members.
3.1 Audit committee should have a director with an accounting or financial background.
Audit and risk committee members do not have an accounting background. Accounting expertise, however, is provided by ex-officio member Fred Hutchings who is a Fellow Chartered Accountant, with two members of the committee having valuation and banking experience.
3.3 Remuneration committee should have a majority of independent directors.
To manage workload across the Board, the charter only specifies an independent chair. The current remuneration committee, however, fulfils the code with an independent chair, and independent director and a non-independent director.
3.4 Standing nominations committee. Nominations Committee Charter allows for the formation of an ad-hoc committee as required.
3.6 Takeover offer protocols and procedures, including the establishment of an independent takeover committee.
The Board adopted a Takeover Response Manual in July 2018. Prior to the manual, the Board Charter provided for the formation of an ad-hoc takeovers committee, comprised of independent directors, to oversee the Board's response to any takeover offer.
4. Reporting and Disclosure 4.1 Written continuous disclosure policy.
The Board adopted a written policy February 2018. Prior to the policy, the company followed NZX Listing Rules and guidelines for continuous disclosure.
4.3 Non-financial disclosures, including environmental, economic and social sustainability risks.
Currently provide extensive reports on non-financial information to shareholders and other stakeholders. A formal sustainability report is being developed for 2019.
8. Shareholder Rights and Relations
8.5 Posting annual shareholder notice at least 28 days prior to the meeting.
Current practice is a minimum of 20 working days prior to the meeting. However, as this period includes three public holidays, this meets the 28-day minimum.
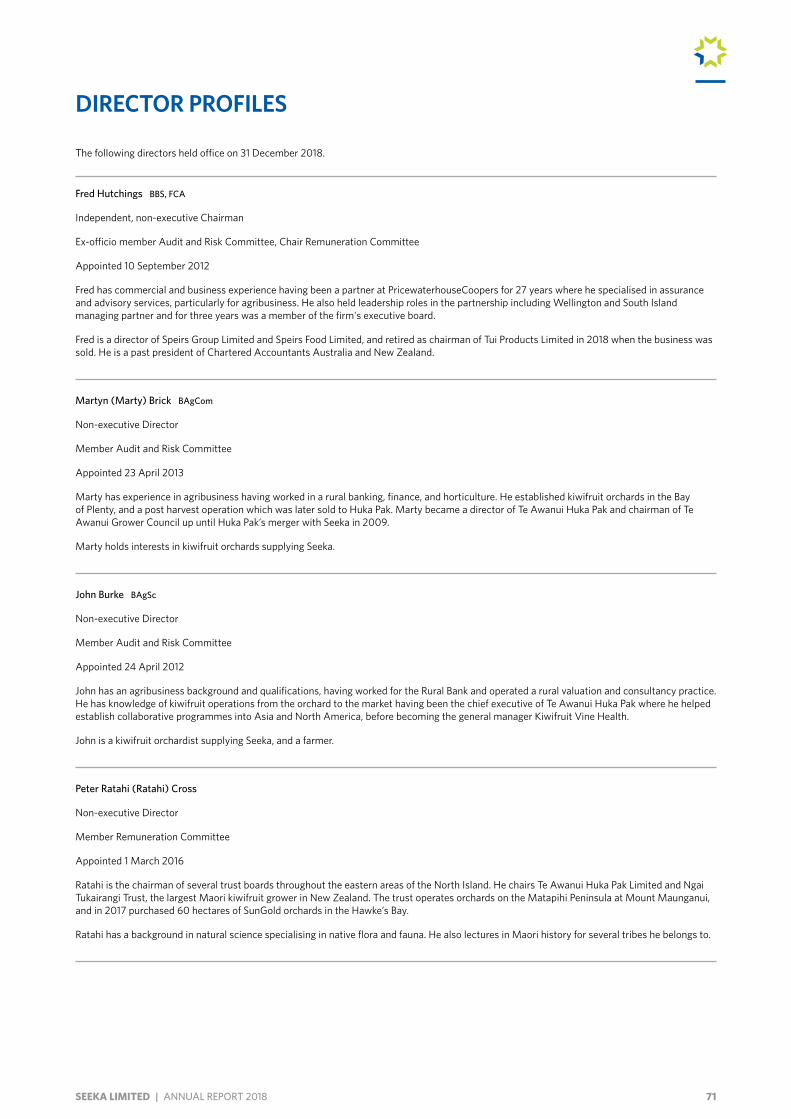
71SEEKA LIMITED | ANNUAL REPORT 2018
DIRECTOR PROFILES
The following directors held office on 31 December 2018.
Fred Hutchings BBS, FCA
Independent, non-executive Chairman
Ex-officio member Audit and Risk Committee, Chair Remuneration Committee
Appointed 10 September 2012
Fred has commercial and business experience having been a partner at PricewaterhouseCoopers for 27 years where he specialised in assurance and advisory services, particularly for agribusiness. He also held leadership roles in the partnership including Wellington and South Island managing partner and for three years was a member of the firm's executive board.
Fred is a director of Speirs Group Limited and Speirs Food Limited, and retired as chairman of Tui Products Limited in 2018 when the business was sold. He is a past president of Chartered Accountants Australia and New Zealand.
Martyn (Marty) Brick BAgCom
Non-executive Director
Member Audit and Risk Committee
Appointed 23 April 2013
Marty has experience in agribusiness having worked in a rural banking, finance, and horticulture. He established kiwifruit orchards in the Bay of Plenty, and a post harvest operation which was later sold to Huka Pak. Marty became a director of Te Awanui Huka Pak and chairman of Te Awanui Grower Council up until Huka Pak’s merger with Seeka in 2009.
Marty holds interests in kiwifruit orchards supplying Seeka.
John Burke BAgSc
Non-executive Director
Member Audit and Risk Committee
Appointed 24 April 2012
John has an agribusiness background and qualifications, having worked for the Rural Bank and operated a rural valuation and consultancy practice. He has knowledge of kiwifruit operations from the orchard to the market having been the chief executive of Te Awanui Huka Pak where he helped establish collaborative programmes into Asia and North America, before becoming the general manager Kiwifruit Vine Health.
John is a kiwifruit orchardist supplying Seeka, and a farmer.
Peter Ratahi (Ratahi) Cross
Non-executive Director
Member Remuneration Committee
Appointed 1 March 2016
Ratahi is the chairman of several trust boards throughout the eastern areas of the North Island. He chairs Te Awanui Huka Pak Limited and Ngai Tukairangi Trust, the largest Maori kiwifruit grower in New Zealand. The trust operates orchards on the Matapihi Peninsula at Mount Maunganui, and in 2017 purchased 60 hectares of SunGold orchards in the Hawke’s Bay.
Ratahi has a background in natural science specialising in native flora and fauna. He also lectures in Maori history for several tribes he belongs to.
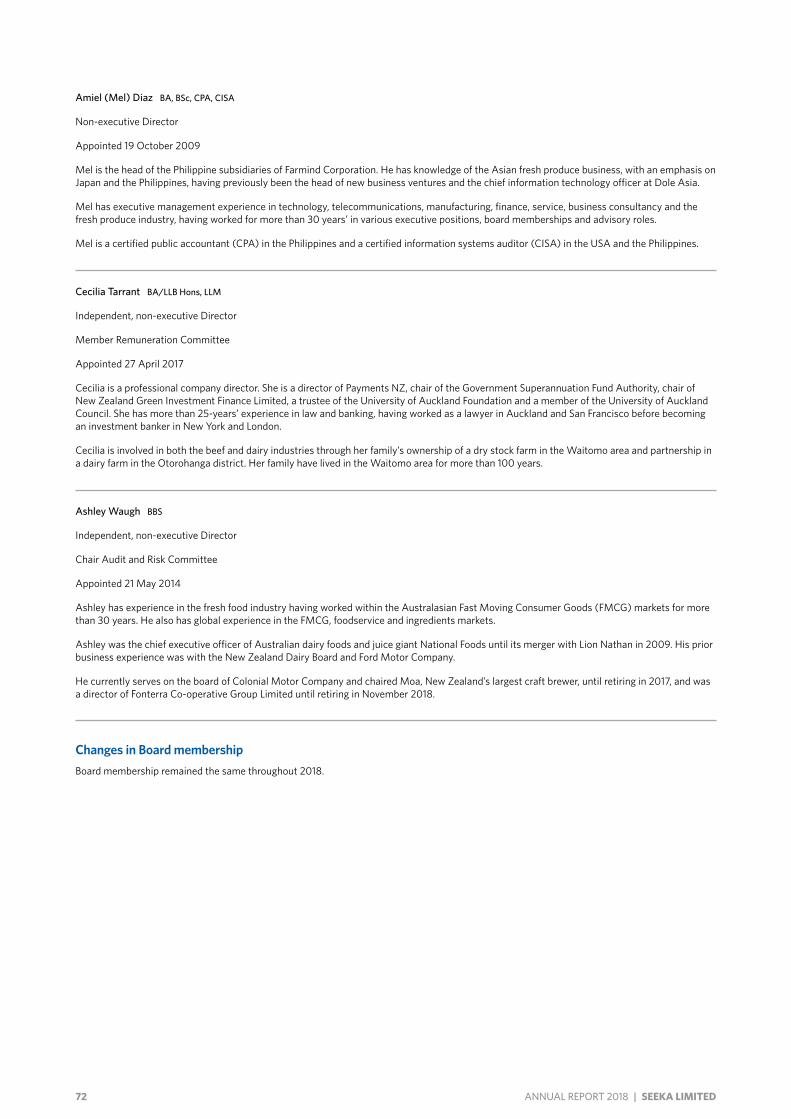
72 ANNUAL REPORT 2018 | SEEKA LIMITED
Amiel (Mel) Diaz BA, BSc, CPA, CISA
Non-executive Director
Appointed 19 October 2009
Mel is the head of the Philippine subsidiaries of Farmind Corporation. He has knowledge of the Asian fresh produce business, with an emphasis on Japan and the Philippines, having previously been the head of new business ventures and the chief information technology officer at Dole Asia.
Mel has executive management experience in technology, telecommunications, manufacturing, finance, service, business consultancy and the fresh produce industry, having worked for more than 30 years’ in various executive positions, board memberships and advisory roles.
Mel is a certified public accountant (CPA) in the Philippines and a certified information systems auditor (CISA) in the USA and the Philippines.
Cecilia Tarrant BA/LLB Hons, LLM
Independent, non-executive Director
Member Remuneration Committee
Appointed 27 April 2017
Cecilia is a professional company director. She is a director of Payments NZ, chair of the Government Superannuation Fund Authority, chair of New Zealand Green Investment Finance Limited, a trustee of the University of Auckland Foundation and a member of the University of Auckland Council. She has more than 25-years’ experience in law and banking, having worked as a lawyer in Auckland and San Francisco before becoming an investment banker in New York and London.
Cecilia is involved in both the beef and dairy industries through her family’s ownership of a dry stock farm in the Waitomo area and partnership in a dairy farm in the Otorohanga district. Her family have lived in the Waitomo area for more than 100 years.
Ashley Waugh BBS
Independent, non-executive Director
Chair Audit and Risk Committee
Appointed 21 May 2014
Ashley has experience in the fresh food industry having worked within the Australasian Fast Moving Consumer Goods (FMCG) markets for more than 30 years. He also has global experience in the FMCG, foodservice and ingredients markets.
Ashley was the chief executive officer of Australian dairy foods and juice giant National Foods until its merger with Lion Nathan in 2009. His prior business experience was with the New Zealand Dairy Board and Ford Motor Company.
He currently serves on the board of Colonial Motor Company and chaired Moa, New Zealand’s largest craft brewer, until retiring in 2017, and was a director of Fonterra Co-operative Group Limited until retiring in November 2018.
Changes in Board membershipBoard membership remained the same throughout 2018.
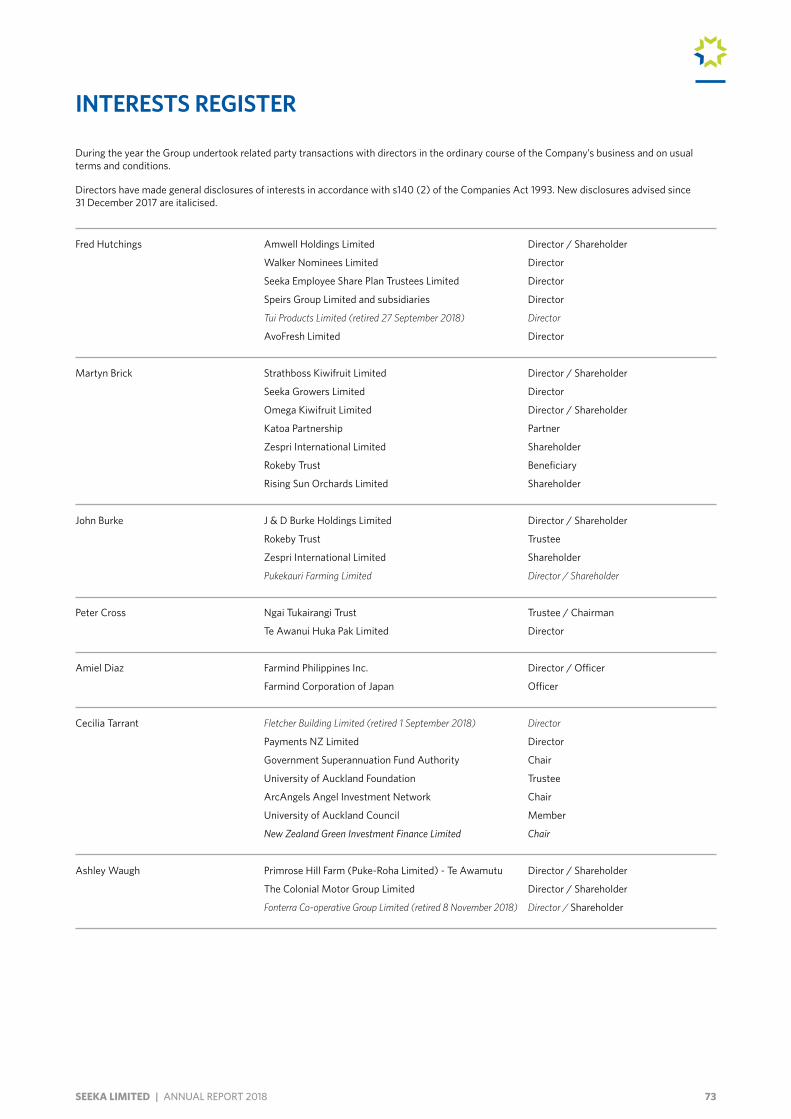
73SEEKA LIMITED | ANNUAL REPORT 2018
INTERESTS REGISTER
During the year the Group undertook related party transactions with directors in the ordinary course of the Company’s business and on usual terms and conditions.
Directors have made general disclosures of interests in accordance with s140 (2) of the Companies Act 1993. New disclosures advised since 31 December 2017 are italicised.
Fred Hutchings Amwell Holdings Limited Director / Shareholder
Walker Nominees Limited Director
Seeka Employee Share Plan Trustees Limited Director
Speirs Group Limited and subsidiaries Director
Tui Products Limited (retired 27 September 2018) Director
AvoFresh Limited Director
Martyn Brick Strathboss Kiwifruit Limited Director / Shareholder
Seeka Growers Limited Director
Omega Kiwifruit Limited Director / Shareholder
Katoa Partnership Partner
Zespri International Limited Shareholder
Rokeby Trust Beneficiary
Rising Sun Orchards Limited Shareholder
John Burke J & D Burke Holdings Limited Director / Shareholder
Rokeby Trust Trustee
Zespri International Limited Shareholder
Pukekauri Farming Limited Director / Shareholder
Peter Cross Ngai Tukairangi Trust Trustee / Chairman
Te Awanui Huka Pak Limited Director
Amiel Diaz Farmind Philippines Inc. Director / Officer
Farmind Corporation of Japan Officer
Cecilia Tarrant Fletcher Building Limited (retired 1 September 2018) Director
Payments NZ Limited Director
Government Superannuation Fund Authority Chair
University of Auckland Foundation Trustee
ArcAngels Angel Investment Network Chair
University of Auckland Council Member
New Zealand Green Investment Finance Limited Chair
Ashley Waugh Primrose Hill Farm (Puke-Roha Limited) - Te Awamutu Director / Shareholder
The Colonial Motor Group Limited Director / Shareholder
Fonterra Co-operative Group Limited (retired 8 November 2018) Director / Shareholder
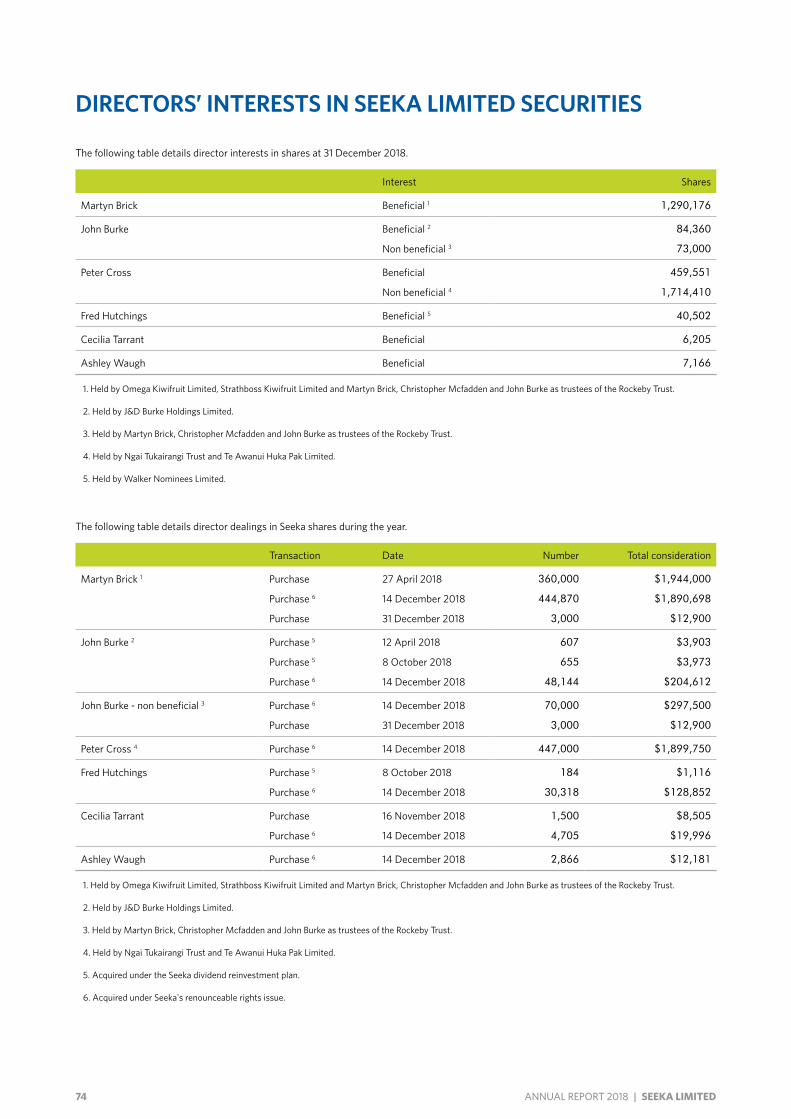
74 ANNUAL REPORT 2018 | SEEKA LIMITED
DIRECTORS’ INTERESTS IN SEEKA LIMITED SECURITIES
The following table details director interests in shares at 31 December 2018.
Interest Shares
Martyn Brick Beneficial 1 1,290,176
John Burke Beneficial 2 84,360
Non beneficial 3 73,000
Peter Cross Beneficial 459,551
Non beneficial 4 1,714,410
Fred Hutchings Beneficial 5 40,502
Cecilia Tarrant Beneficial 6,205
Ashley Waugh Beneficial 7,166
1. Held by Omega Kiwifruit Limited, Strathboss Kiwifruit Limited and Martyn Brick, Christopher Mcfadden and John Burke as trustees of the Rockeby Trust.
2. Held by J&D Burke Holdings Limited.
3. Held by Martyn Brick, Christopher Mcfadden and John Burke as trustees of the Rockeby Trust.
4. Held by Ngai Tukairangi Trust and Te Awanui Huka Pak Limited.
5. Held by Walker Nominees Limited.
The following table details director dealings in Seeka shares during the year.
Transaction Date Number Total consideration
Martyn Brick 1 Purchase 27 April 2018 360,000 $1,944,000
Purchase 6 14 December 2018 444,870 $1,890,698
Purchase 31 December 2018 3,000 $12,900
John Burke 2 Purchase 5 12 April 2018 607 $3,903
Purchase 5 8 October 2018 655 $3,973
Purchase 6 14 December 2018 48,144 $204,612
John Burke - non beneficial 3 Purchase 6 14 December 2018 70,000 $297,500
Purchase 31 December 2018 3,000 $12,900
Peter Cross 4 Purchase 6 14 December 2018 447,000 $1,899,750
Fred Hutchings Purchase 5 8 October 2018 184 $1,116
Purchase 6 14 December 2018 30,318 $128,852
Cecilia Tarrant Purchase 16 November 2018 1,500 $8,505
Purchase 6 14 December 2018 4,705 $19,996
Ashley Waugh Purchase 6 14 December 2018 2,866 $12,181
1. Held by Omega Kiwifruit Limited, Strathboss Kiwifruit Limited and Martyn Brick, Christopher Mcfadden and John Burke as trustees of the Rockeby Trust.
2. Held by J&D Burke Holdings Limited.
3. Held by Martyn Brick, Christopher Mcfadden and John Burke as trustees of the Rockeby Trust.
4. Held by Ngai Tukairangi Trust and Te Awanui Huka Pak Limited.
5. Acquired under the Seeka dividend reinvestment plan.
6. Acquired under Seeka's renounceable rights issue.
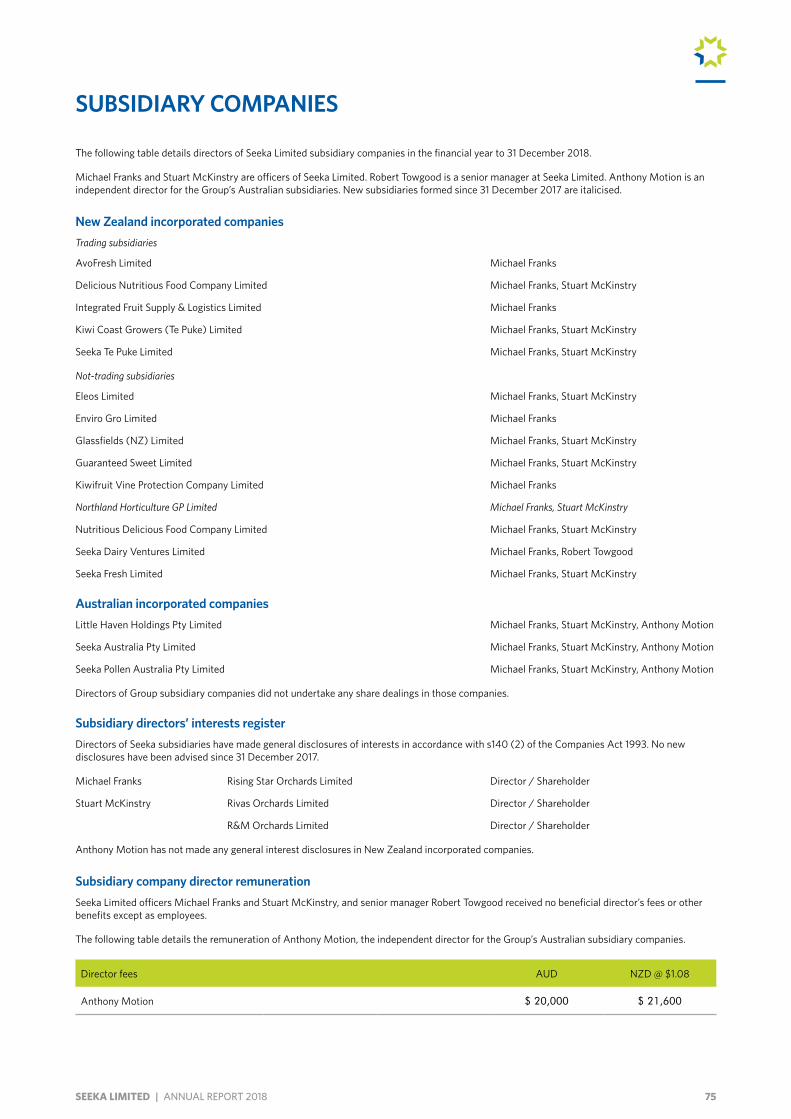
75SEEKA LIMITED | ANNUAL REPORT 2018
SUBSIDIARY COMPANIES
The following table details directors of Seeka Limited subsidiary companies in the financial year to 31 December 2018.
Michael Franks and Stuart McKinstry are officers of Seeka Limited. Robert Towgood is a senior manager at Seeka Limited. Anthony Motion is an independent director for the Group’s Australian subsidiaries. New subsidiaries formed since 31 December 2017 are italicised.
New Zealand incorporated companiesTrading subsidiaries
AvoFresh Limited Michael Franks
Delicious Nutritious Food Company Limited Michael Franks, Stuart McKinstry
Integrated Fruit Supply & Logistics Limited Michael Franks
Kiwi Coast Growers (Te Puke) Limited Michael Franks, Stuart McKinstry
Seeka Te Puke Limited Michael Franks, Stuart McKinstry
Not-trading subsidiaries
Eleos Limited Michael Franks, Stuart McKinstry
Enviro Gro Limited Michael Franks
Glassfields (NZ) Limited Michael Franks, Stuart McKinstry
Guaranteed Sweet Limited Michael Franks, Stuart McKinstry
Kiwifruit Vine Protection Company Limited Michael Franks
Northland Horticulture GP Limited Michael Franks, Stuart McKinstry
Nutritious Delicious Food Company Limited Michael Franks, Stuart McKinstry
Seeka Dairy Ventures Limited Michael Franks, Robert Towgood
Seeka Fresh Limited Michael Franks, Stuart McKinstry
Australian incorporated companiesLittle Haven Holdings Pty Limited Michael Franks, Stuart McKinstry, Anthony Motion
Seeka Australia Pty Limited Michael Franks, Stuart McKinstry, Anthony Motion
Seeka Pollen Australia Pty Limited Michael Franks, Stuart McKinstry, Anthony Motion
Directors of Group subsidiary companies did not undertake any share dealings in those companies.
Subsidiary directors’ interests registerDirectors of Seeka subsidiaries have made general disclosures of interests in accordance with s140 (2) of the Companies Act 1993. No new disclosures have been advised since 31 December 2017.
Michael Franks Rising Star Orchards Limited Director / Shareholder
Stuart McKinstry Rivas Orchards Limited Director / Shareholder
R&M Orchards Limited Director / Shareholder
Anthony Motion has not made any general interest disclosures in New Zealand incorporated companies.
Subsidiary company director remunerationSeeka Limited officers Michael Franks and Stuart McKinstry, and senior manager Robert Towgood received no beneficial director’s fees or other benefits except as employees.
The following table details the remuneration of Anthony Motion, the independent director for the Group’s Australian subsidiary companies.
Director fees AUD NZD @ $1.08
Anthony Motion $ 20,000 $ 21,600
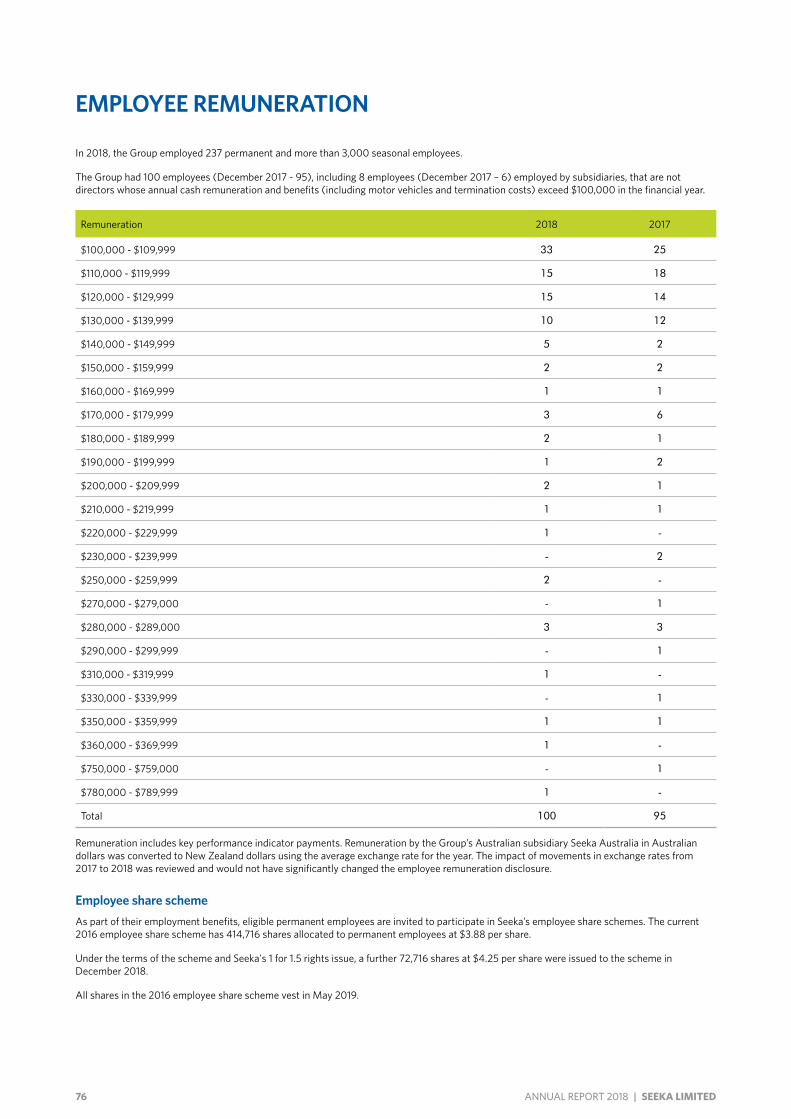
76 ANNUAL REPORT 2018 | SEEKA LIMITED
EMPLOYEE REMUNERATION
In 2018, the Group employed 237 permanent and more than 3,000 seasonal employees.
The Group had 100 employees (December 2017 - 95), including 8 employees (December 2017 – 6) employed by subsidiaries, that are not directors whose annual cash remuneration and benefits (including motor vehicles and termination costs) exceed $100,000 in the financial year.
Remuneration 2018 2017
$100,000 - $109,999 33 25
$110,000 - $119,999 15 18
$120,000 - $129,999 15 14
$130,000 - $139,999 10 12
$140,000 - $149,999 5 2
$150,000 - $159,999 2 2
$160,000 - $169,999 1 1
$170,000 - $179,999 3 6
$180,000 - $189,999 2 1
$190,000 - $199,999 1 2
$200,000 - $209,999 2 1
$210,000 - $219,999 1 1
$220,000 - $229,999 1 -
$230,000 - $239,999 - 2
$250,000 - $259,999 2 -
$270,000 - $279,000 - 1
$280,000 - $289,000 3 3
$290,000 - $299,999 - 1
$310,000 - $319,999 1 -
$330,000 - $339,999 - 1
$350,000 - $359,999 1 1
$360,000 - $369,999 1 -
$750,000 - $759,000 - 1
$780,000 - $789,999 1 -
Total 100 95
Remuneration includes key performance indicator payments. Remuneration by the Group’s Australian subsidiary Seeka Australia in Australian dollars was converted to New Zealand dollars using the average exchange rate for the year. The impact of movements in exchange rates from 2017 to 2018 was reviewed and would not have significantly changed the employee remuneration disclosure.
Employee share schemeAs part of their employment benefits, eligible permanent employees are invited to participate in Seeka’s employee share schemes. The current 2016 employee share scheme has 414,716 shares allocated to permanent employees at $3.88 per share.
Under the terms of the scheme and Seeka's 1 for 1.5 rights issue, a further 72,716 shares at $4.25 per share were issued to the scheme in December 2018.
All shares in the 2016 employee share scheme vest in May 2019.
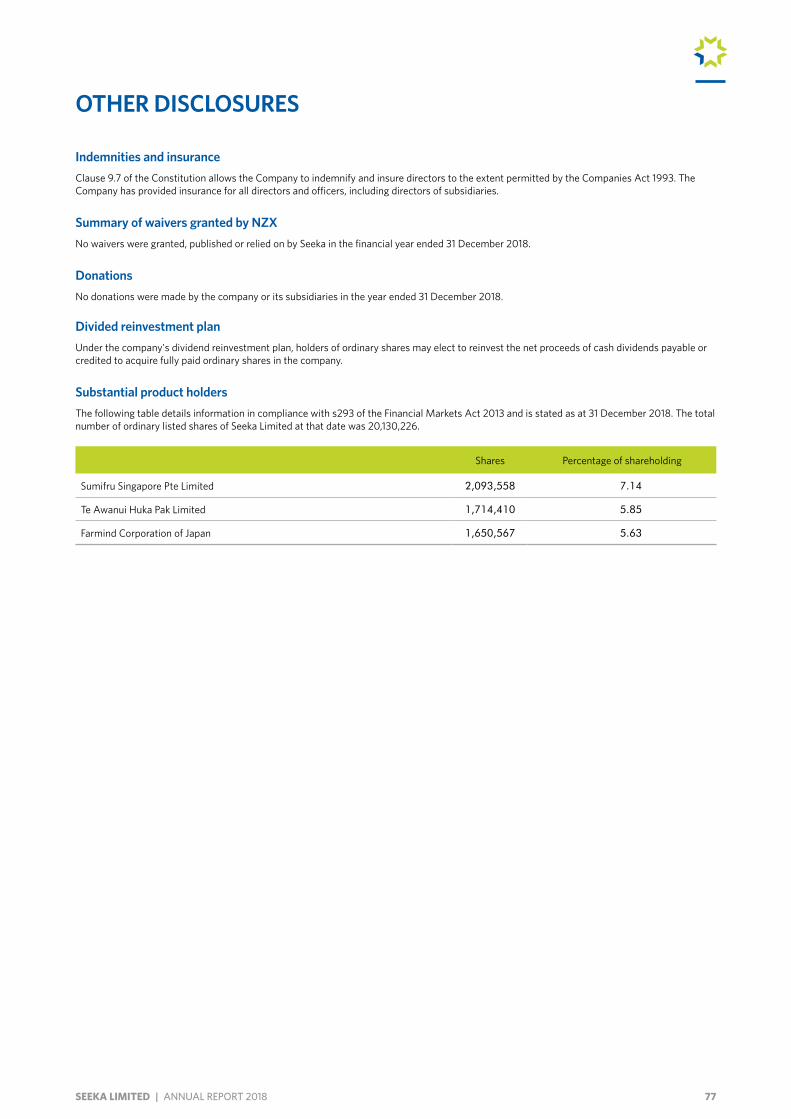
77SEEKA LIMITED | ANNUAL REPORT 2018
OTHER DISCLOSURES
Indemnities and insuranceClause 9.7 of the Constitution allows the Company to indemnify and insure directors to the extent permitted by the Companies Act 1993. The Company has provided insurance for all directors and officers, including directors of subsidiaries.
Summary of waivers granted by NZXNo waivers were granted, published or relied on by Seeka in the financial year ended 31 December 2018.
DonationsNo donations were made by the company or its subsidiaries in the year ended 31 December 2018.
Divided reinvestment planUnder the company's dividend reinvestment plan, holders of ordinary shares may elect to reinvest the net proceeds of cash dividends payable or credited to acquire fully paid ordinary shares in the company.
Substantial product holdersThe following table details information in compliance with s293 of the Financial Markets Act 2013 and is stated as at 31 December 2018. The total number of ordinary listed shares of Seeka Limited at that date was 20,130,226.
Shares Percentage of shareholding
Sumifru Singapore Pte Limited 2,093,558 7.14
Te Awanui Huka Pak Limited 1,714,410 5.85
Farmind Corporation of Japan 1,650,567 5.63
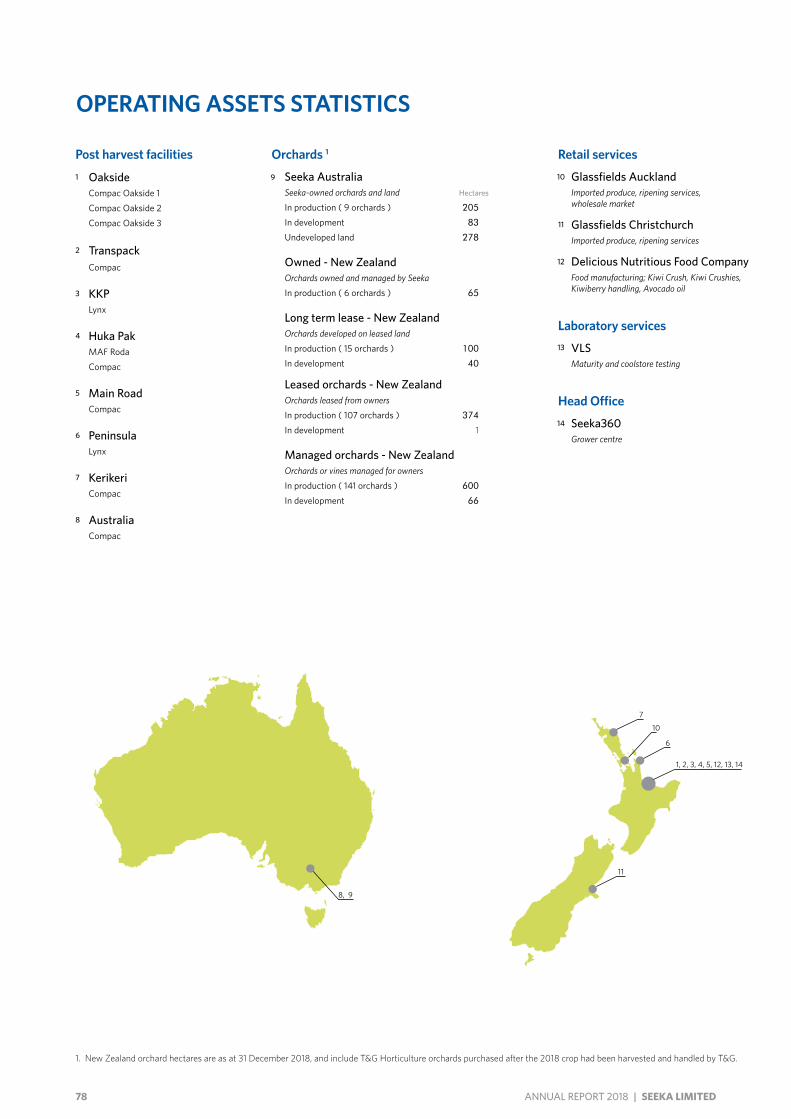
78 ANNUAL REPORT 2018 | SEEKA LIMITED
OPERATING ASSETS STATISTICS
Retail services
Glassfields AucklandImported produce, ripening services, wholesale market
Glassfields ChristchurchImported produce, ripening services
Delicious Nutritious Food CompanyFood manufacturing; Kiwi Crush, Kiwi Crushies, Kiwiberry handling, Avocado oil
Laboratory services
VLSMaturity and coolstore testing
Head Office
Seeka360Grower centre
10
11
12
13
14
1, 2, 3, 4, 5, 12, 13, 14
6
7
11
10
8, 9
Post harvest facilities1 Oakside
Compac Oakside 1
Compac Oakside 2
Compac Oakside 3
2 TranspackCompac
3 KKPLynx
4 Huka PakMAF Roda
Compac
5 Main RoadCompac
6 PeninsulaLynx
7 KerikeriCompac
8 AustraliaCompac
9
Orchards 1
Seeka Australia Seeka-owned orchards and land Hectares
In production ( 9 orchards ) 205
In development 83
Undeveloped land 278
Owned - New ZealandOrchards owned and managed by Seeka
In production ( 6 orchards ) 65
Long term lease - New ZealandOrchards developed on leased land
In production ( 15 orchards ) 100
In development 40
Leased orchards - New ZealandOrchards leased from owners
In production ( 107 orchards ) 374
In development 1
Managed orchards - New ZealandOrchards or vines managed for owners
In production ( 141 orchards ) 600
In development 66
1 New Zealand orchard hectares are as at 31 December 2018, and include T&G Horticulture orchards purchased after the 2018 crop had been harvested and handled by T&G
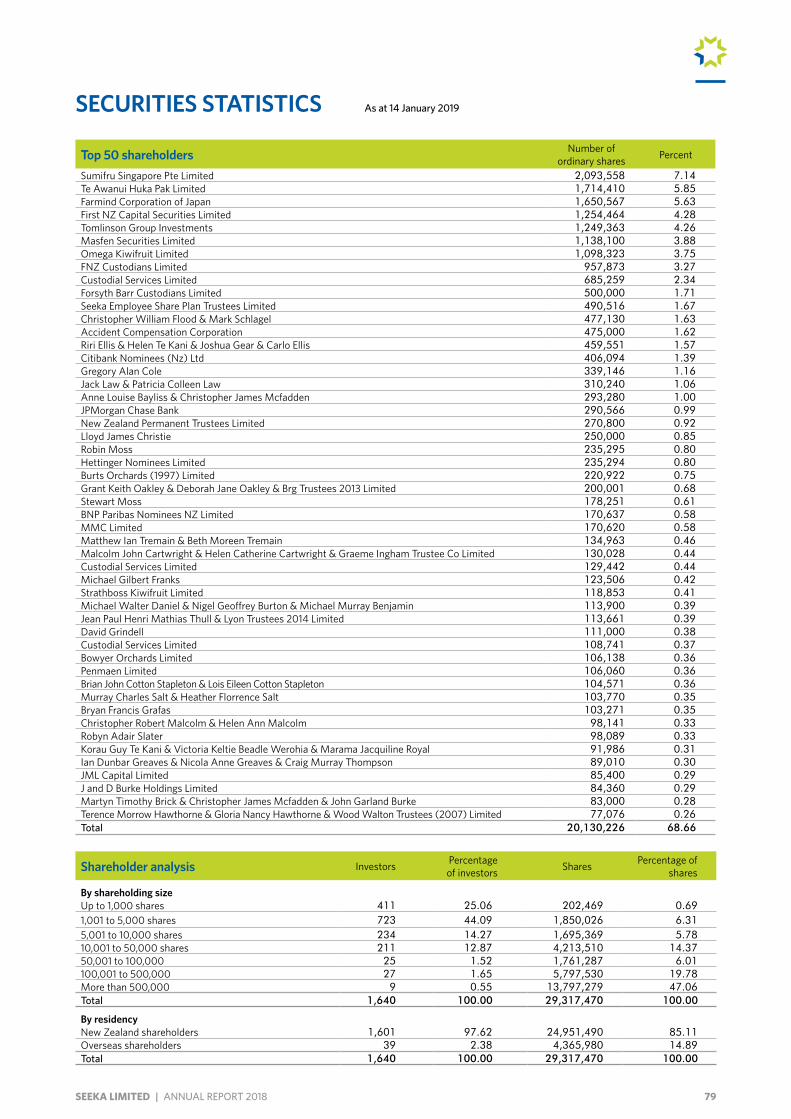
79SEEKA LIMITED | ANNUAL REPORT 2018
SECURITIES STATISTICS
Top 50 shareholders Number of ordinary shares Percent
Sumifru Singapore Pte Limited 2,093,558 7.14Te Awanui Huka Pak Limited 1,714,410 5.85Farmind Corporation of Japan 1,650,567 5.63First NZ Capital Securities Limited 1,254,464 4.28Tomlinson Group Investments 1,249,363 4.26Masfen Securities Limited 1,138,100 3.88Omega Kiwifruit Limited 1,098,323 3.75FNZ Custodians Limited 957,873 3.27Custodial Services Limited 685,259 2.34Forsyth Barr Custodians Limited 500,000 1.71Seeka Employee Share Plan Trustees Limited 490,516 1.67Christopher William Flood & Mark Schlagel 477,130 1.63Accident Compensation Corporation 475,000 1.62Riri Ellis & Helen Te Kani & Joshua Gear & Carlo Ellis 459,551 1.57Citibank Nominees (Nz) Ltd 406,094 1.39Gregory Alan Cole 339,146 1.16Jack Law & Patricia Colleen Law 310,240 1.06Anne Louise Bayliss & Christopher James Mcfadden 293,280 1.00JPMorgan Chase Bank 290,566 0.99New Zealand Permanent Trustees Limited 270,800 0.92Lloyd James Christie 250,000 0.85Robin Moss 235,295 0.80Hettinger Nominees Limited 235,294 0.80Burts Orchards (1997) Limited 220,922 0.75Grant Keith Oakley & Deborah Jane Oakley & Brg Trustees 2013 Limited 200,001 0.68Stewart Moss 178,251 0.61BNP Paribas Nominees NZ Limited 170,637 0.58MMC Limited 170,620 0.58Matthew Ian Tremain & Beth Moreen Tremain 134,963 0.46Malcolm John Cartwright & Helen Catherine Cartwright & Graeme Ingham Trustee Co Limited 130,028 0.44Custodial Services Limited 129,442 0.44Michael Gilbert Franks 123,506 0.42Strathboss Kiwifruit Limited 118,853 0.41Michael Walter Daniel & Nigel Geoffrey Burton & Michael Murray Benjamin 113,900 0.39Jean Paul Henri Mathias Thull & Lyon Trustees 2014 Limited 113,661 0.39David Grindell 111,000 0.38Custodial Services Limited 108,741 0.37Bowyer Orchards Limited 106,138 0.36Penmaen Limited 106,060 0.36Brian John Cotton Stapleton & Lois Eileen Cotton Stapleton 104,571 0.36Murray Charles Salt & Heather Florrence Salt 103,770 0.35Bryan Francis Grafas 103,271 0.35Christopher Robert Malcolm & Helen Ann Malcolm 98,141 0.33Robyn Adair Slater 98,089 0.33Korau Guy Te Kani & Victoria Keltie Beadle Werohia & Marama Jacquiline Royal 91,986 0.31Ian Dunbar Greaves & Nicola Anne Greaves & Craig Murray Thompson 89,010 0.30JML Capital Limited 85,400 0.29J and D Burke Holdings Limited 84,360 0.29Martyn Timothy Brick & Christopher James Mcfadden & John Garland Burke 83,000 0.28Terence Morrow Hawthorne & Gloria Nancy Hawthorne & Wood Walton Trustees (2007) Limited 77,076 0.26Total 20,130,226 68.66
Shareholder analysis Investors Percentage of investors Shares Percentage of
shares
By shareholding sizeUp to 1,000 shares 411 25.06 202,469 0.691,001 to 5,000 shares 723 44.09 1,850,026 6.315,001 to 10,000 shares 234 14.27 1,695,369 5.7810,001 to 50,000 shares 211 12.87 4,213,510 14.3750,001 to 100,000 25 1.52 1,761,287 6.01100,001 to 500,000 27 1.65 5,797,530 19.78More than 500,000 9 0.55 13,797,279 47.06Total 1,640 100.00 29,317,470 100.00
By residencyNew Zealand shareholders 1,601 97.62 24,951,490 85.11Overseas shareholders 39 2.38 4,365,980 14.89Total 1,640 100.00 29,317,470 100.00
As at 14 January 2019
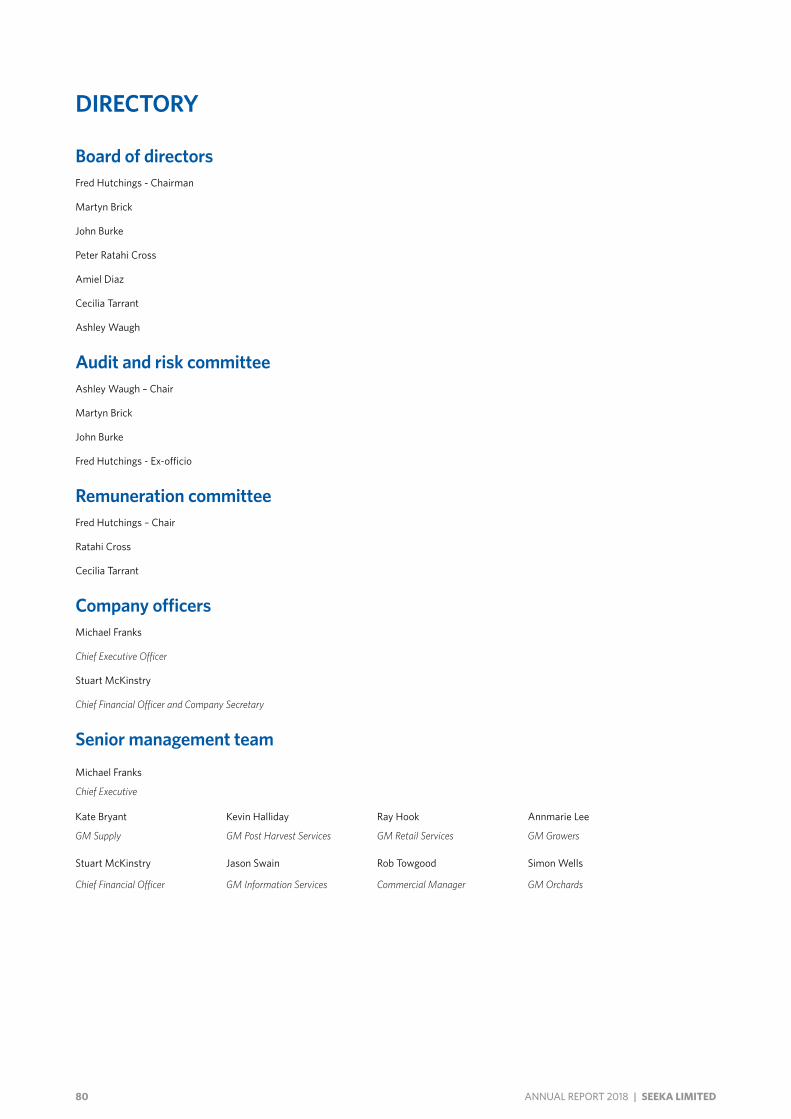
80 ANNUAL REPORT 2018 | SEEKA LIMITED
DIRECTORY
Board of directorsFred Hutchings - Chairman
Martyn Brick
John Burke
Peter Ratahi Cross
Amiel Diaz
Cecilia Tarrant
Ashley Waugh
Audit and risk committeeAshley Waugh – Chair
Martyn Brick
John Burke
Fred Hutchings - Ex-officio
Remuneration committeeFred Hutchings – Chair
Ratahi Cross
Cecilia Tarrant
Company officersMichael Franks
Chief Executive Officer
Stuart McKinstry
Chief Financial Officer and Company Secretary
Senior management team
Michael Franks
Chief Executive
Kate Bryant Kevin Halliday Ray Hook Annmarie Lee
GM Supply GM Post Harvest Services GM Retail Services GM Growers
Stuart McKinstry Jason Swain Rob Towgood Simon Wells
Chief Financial Officer GM Information Services Commercial Manager GM Orchards
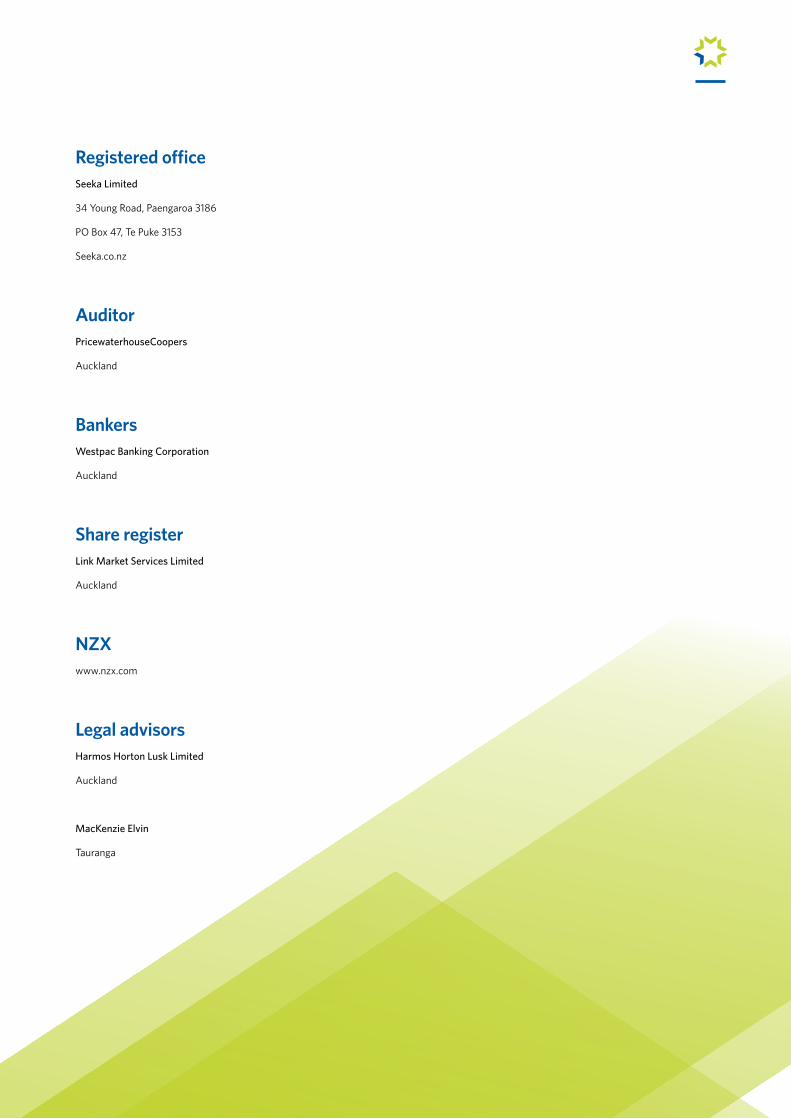
81SEEKA LIMITED | ANNUAL REPORT 2018
Registered officeSeeka Limited
34 Young Road, Paengaroa 3186
PO Box 47, Te Puke 3153
Seeka.co.nz
AuditorPricewaterhouseCoopers
Auckland
BankersWestpac Banking Corporation
Auckland
Share registerLink Market Services Limited
Auckland
NZXwww.nzx.com
Legal advisorsHarmos Horton Lusk Limited
Auckland
MacKenzie Elvin
Tauranga

seeka.co.nz
34 Young Road, RD 9, Te Puke 3189PO Box 47, Te Puke 3153, New Zealand
+64 7 573 0303, [email protected]