Embed Size (px)
Citation preview
1PB
Annual Report

Annual Report | 2018
32
32
Annual Report
2018
Annual Report | 2018
54
Contents
54
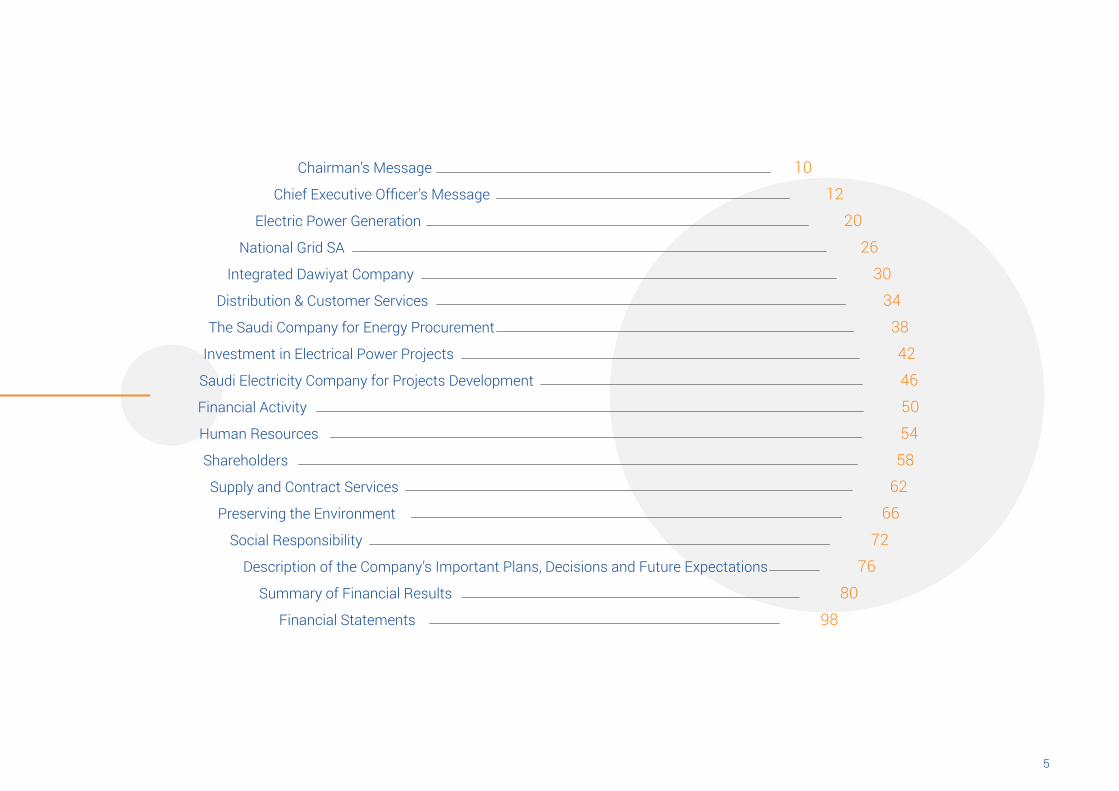
Chairman’s Message
Chief Executive Officer’s Message
Electric Power Generation
National Grid SA
Integrated Dawiyat Company
Distribution & Customer Services
The Saudi Company for Energy Procurement
Investment in Electrical Power Projects
Saudi Electricity Company for Projects Development
Financial Activity
Human Resources
Shareholders
Supply and Contract Services
Preserving the Environment
Social Responsibility
Description of the Company’s Important Plans, Decisions and Future Expectations
Summary of Financial Results
Financial Statements
10
12
20
26
30
34
38
42
46
50
54
58
62
66
72
76
80
98
Annual Report | 2018
76
CUSTODIAN OF THE TWO HOLY MOSQUES
KING SALMAN BIN ABDUL AZIZ AL SAUD
76
HIS ROYAL HIGHNESSPRINCE MOHAMMAD BIN SALMAN BIN ABDUL AZIZ AL SAUD
CROWN PRINCE, DEPUTY PRIME MINISTERAND MINISTER OF DEFENSE
Annual Report | 2018
Saudi Electricity Company
Members of theBoard of Directors
8
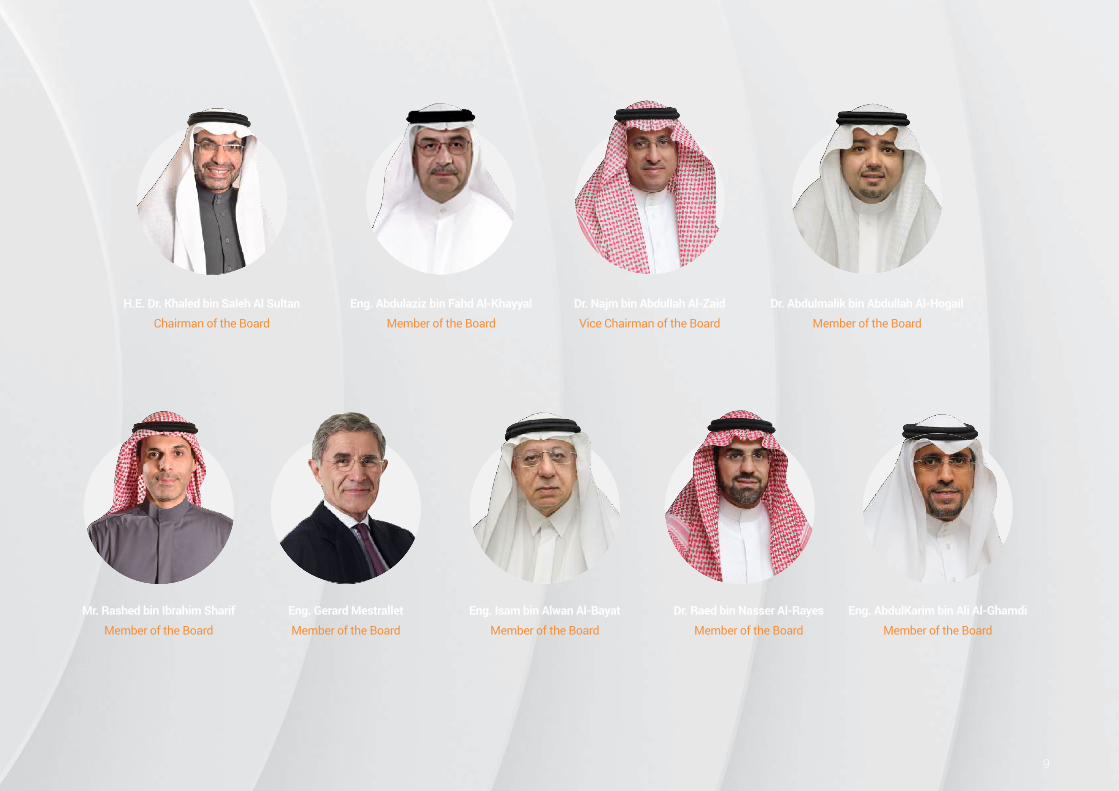
H.E. Dr. Khaled bin Saleh Al Sultan
Chairman of the Board
Mr. Rashed bin Ibrahim Sharif
Member of the Board
Eng. Abdulaziz bin Fahd Al-Khayyal
Member of the Board
Eng. Gerard Mestrallet
Member of the Board
Dr. Najm bin Abdullah Al-Zaid
Vice Chairman of the Board
Dr. Raed bin Nasser Al-Rayes
Member of the Board
Dr. Abdulmalik bin Abdullah Al-Hogail
Member of the Board
Eng. AbdulKarim bin Ali Al-Ghamdi
Member of the Board
Eng. Isam bin Alwan Al-Bayat
Member of the Board
9
Annual Report | 2018
10
The electrical power industry in the Kingdom underwent significant positive changes during 2018. This was due to the great attention devoted to the sector which resulted in positive changes being achieved. These changes and projects constitute a strong start in meeting the Company’s new sense of direction and plans in the coming period. Whilst it remains early to witness all of the outcomes of this transformation in meeting the full expectations of the Board of Directors for this pioneering institution locally, regionally and globally, solid progress has been achieved during the report year. These achievements represent a beginning in our drive to significantly impact the modernization, development and support of all sectors, in meeting our goal for 9.4 million customers enjoying a high-reliability electrical service, accompanied by rationalization of electricity consumption in accordance with the highest international safety standards.
Since taking-up its full responsibilities, the Board of Directors has been keen
to see all plans for the transformation and change in performance of the Saudi
Electricity Company are in line with the Kingdom’s Vision 2030, and thus aligned
with ambitious targets for economic growth, housing and urban expansion. This
expansion is accompanied by increased demand for electricity and is in parallel with
policies of the wise government led by the Custodian of the Two Holy Mosques King
Salman bin Abdul Aziz Al Saud and HRH Crown Prince Mohammad bin Salman, may
God protect them, who are looking forward to seeing the Kingdom join the world’s
best economies; supported by promising economic thought, accumulated national
expertise, and modern technologies localized in order to transform the Kingdom
into a promising regional base within the electricity industry.
Chairman’s Message
11
of 39.9%, SEC achieved a saving of 22 million barrels of oil equivalent and 16.7 million barrels of diesel as part of the SEC’s plan to keep pace with the Kingdom’s objective to reduce dependence on liquid fuels and diesel.
This report highlights all significant achievements as detailed, in addition to the Company’s major projects as implemented during the year. These projects and achievements would not have been possible without the Almighty Allah’s blessings and then the combined efforts of the citizens of this country, from executives to employees of Saudi Electricity Company for their diligence and commitment to work which contributed to achieving its leading position among its corporate peers, and the unlimited and continuous support of His Excellency Eng. Khalid bin Abdul Aziz Al Falih, Minister of Energy, Industry and Mineral Resources, for all of the Company’s plans and projects.
On the occasion of this final report, and on behalf of my colleagues and members of the Board of Directors, I would like to extend my heartfelt thanks and appreciation to the Custodian of the Two Holy Mosques King Salman bin Abdul Aziz and HRH Crown Prince Mohammad bin Salman, may God protect them, for their benevolent support for the Company which contributed to fulfillment of these achievements. I sincerely ask Allah the Almighty to grace us all in even greater achievements in further development of the electric power industry supporting the Kingdom’s growth ambitions.
Dr. Khaled bin Saleh Al-SultanChairman of the Board of Directors
Over the past few years, the Company has made significant strides in implementing its long-term strategy for localization of manufacturing industries. It has succeeded in raising the percentage of purchases from national factories to 68% over the past four years, enhancing the capabilities of local and national companies, supporting long-term employment opportunities for Saudi Nationals and their competencies as SEC seeks to strengthen the capabilities of Saudis in this field, especially given SEC employs 34,599 employees, of whom the Saudis constitute 92%, of the total workforce, being one of the highest rates of localization among companies in the Kingdom.
From its initial outset, the new Board of Directors has taken deliberate steps to develop SEC into becoming a ‘pioneering power house’ within the Middle East and North Africa region. Among these steps was the establishment of the The Saudi Company for Energy Procurement, a wholly owned subsidiary of SEC, to increase operational efficiency and optimum utilization of resources, and to achieve optimum results, both for the Company and its shareholders, and its 9.4 million customers.
The Company’s record and achievements during 2018 reflect positive growth in meeting the needs of SEC customers for power efficiency and reliability, as well as achievement of its plans to carry out large-scale projects aligned with the Kingdom’s ambition to reduce dependence on fuel equivalents in power generation, and the trend towards usage of renewable energy in electricity generation, in addition to shift towards smart networks in the field of transmission and the distribution of electricity.
The year 2018 witnessed a remarkable increase in the performance of the electrical system and the achievements of the Company. The value of the Company’s assets increased by SR 18.8 billion to SR 464 billion whilst generating capacity exceeded 76.9 gigawatts. In addition to improving thermal efficiency in electric power production in line with the electricity sector
Annual Report | 2018
12
Chief Executive Officer’s MessageAs the journey continues and achievements accrue year after year, our inspiring goals and ambitions accelerate as we develop the largest electric energy system in the Middle East and North Africathrough the efforts and accumulated experience of the citizens of our country and the talents of our youth. The Saudi Electricity Company is eager to support these efforts through training and development programs, and the application of the latest technologies to the electric power industry. This is based on a firm belief and deep awareness that these technologies are no longer a luxury nor a transient stage of the operational processes in all of the company’s facilities and equipment, but are considered urgent requirements necessary to achieve a high degree of performance in the field of operation and maintenance. These technologies will enable the company to compete strongly for the highest level of global competence in the electric power industry; producing clean energy, achieving global environmental standards, supporting and developing customer services and achieving the aspirations of more than 9.4 million customers for a reliable electrical service in accordance with the highest global safety standards.
In this context, during 2018, the Saudi Electricity Company witnessed a significant improvement in all its services which came as a natural outcome of the various electrical projects that have been implemented in various regions and sectors of the Kingdom, especially the sectors responsible for the generation, transmission and distribution of electricity. In addition to increasing the thermal efficiency of power plants and the development of the operational processes, the company has effectively lengthened the electrical transmission lines in order to connect more areas of the Kingdom to the main network. All these efforts helped achieve a savings of 22 million barrels of oil equivalent and reduce diesel consumption by 16.7 million barrels. Other projects that have benefited from the company’s potential to serve in economic and community development in the Kingdom include the broadband and fiber optic projects being implemented by Dawiyat company and supported by the Ministry of Communications and Information Technology in cooperation with a number of telecommunications companies. Moreover, the Saudi Electricity Company implements social responsibility projects and is looking forward to cooperating with many different institutions, entities and charities in all regions of the Kingdom.
13
There is no doubt that the many challenges we face do not differ from those of other companies. Yet, these trials cannot stop us from accomplishing our ambitions and achievements, because we are aware of the scale of these challenges and that we work in a scientific way to overcome them. Instead, we turn them into opportunities to be able to raise the strength to support and promote our goals, and to seek innovative solutions that would enable us to overcome such challenges and serve our future strategic plans.
In this report, it may not be possible to list all the achievements that have been made during 2018, but we can highlight some of these achievements, namely:
• The electricity generation capacity in the Kingdom reached a total of 76.9 gigawatts and the total company’s capacity reached 53.5 gigawatts with the addition of 1,146 MW generation capacity.
• Delivering electricity services to 393,000 new customers and establishing a center for supporting meter reading to increase its efficiency.
• Strengthening the fiber optic system owned by the company to approximately 73,000 kilometers across the Kingdom.
• Increasing the number of local factories registered with the company by qualifying 63 factories during 2018, bringing the total number of national qualified factories to 575.
• Reducing crude fuel consumption by 22 million barrels of oil equivalent and decreasing diesel fuel consumption by 16.7 million barrels.
• Expanding the electrical transmission network by adding overhead networks and underground cables to existing networks measuring about 6,914 km-circular.
• Construction of 78 new transmission substations with 295 new transformers with a total capacity of 45,351 MVA and the enhancement and completion of 18 stations with 32 transformers with a net capacity of 5,817 MVA.
• The total workforce reached 34,599 employees compared to the approved ceiling of 35,905 with a Saudi localization rate of approximately 92%.
• The establishment of the Saudi Company for Energy Procurement, a wholly owned subsidiary of the Saudi Electricity Company with the aim of raising the operational efficiency, enabling the electricity sector in the Kingdom, and reaching the best results for the company, shareholders, and customers.
• The establishment of Dawiyat Integrated Telecommunications and Information Technology Company and obtaining the first and only license in the Kingdom for wholesale services for broadband infrastructure.
• The addition of 25,530 new distribution transformers for the 69 KV and below, an increase of 5% over 2017, and with a total capacity of 14,390 MVA.
• The addition of overhead and underground cable networks for 69 KV and below, with a length of 32,977 km-circular, an increase of 5.4% over 2017.
• Signing 30 agreements and partnerships with charities and government agencies in support of sustainable social responsibility programs which include: training, education, culture, health, rehabilitation of people with special needs, and addressing family problems.
• Signing two cooperation agreements with the Ministry of Education and Civil Defense in the field of electrical safety and the implementation of more than 50 blood donation campaigns in all of the company’s facilities, including buildings, stations and clubs.
• Receiving the highest national quality award, the King Abdulaziz Quality Award, for the Large Service Facilities category at the Gold Level, and the Idea of the Year Grand Prize in the 13th Arab Ideas Competition held in Dubai.
• Signing three memorandums of understanding for promoting strategic cooperation with international companies to enhance international cooperation with leading companies in the electricity sector.
• Signing six memorandums of understanding to enhance the role of research and development with a number of universities, organizations and research centers around the world.
• The completion of audits of the Occupational Safety and Health Management System (5-Star) for 2018 that included 46 departments benefiting from different activities, and achieving five-star level for six departments for the first time, as well as achieving 83.4% as an application rate for occupational safety and health management system (5-STAR) at the company level.
• The level of environmental compatibility with updated environmental standards (PME 2014) increased from 28% in 2014 to more than 71% by the end of 2018.
We realize that there is still a long way to go and that our achievements are only a step toward our high-reaching ambitions, where the objectives and aspirations of the Board of Directors are aligned with the plans and achievements of the executive management and employees of the Saudi Electricity Company; compliant with the best international standards in providing reliable and safe electrical services to its customers, in light of the extraordinary economic resurgence witnessed by the Kingdom under our wise government led by the Custodian of the Two Holy Mosques King Salman bin Abdulaziz and His Royal Highness the Crown Prince, may God bless them, and the support of our loyal national cadres who are at the highest level of training, competence and responsibility.
Fahad bin Hussein Al-SudairiChief Executive Officer
We serve our customers and country by deliveringworld-class power services
Our Vision
Annual Report | 2018
14

15

Annual Report | 2018
16
17
We power the Kingdomthat energizes the world
Our Mission

Annual Report | 2018
18
Our Values

19
ExcellenceActive excellence
We are focused,detailed and agile.
InterestHuman focus
We are empathetic,caring and supportive.
Progressive duty
We are forward-looking,public and leading.
Development
Annual Report | 2018
Electric PowerGeneration
20
Supply of electricity and sufficient generating
capacity with state- of-the-art production
techniques
21
The Generation activity’s plans focus on the operation and maintenance of the power plants, and reinforcing their capacities to meet the growing demand for electrical power. In this respect, in 2018, the generation activity accomplished many notable achievements, including providing about 22 million barrels of oil equivalent and decreasing the consumption of diesel oil, during 2018, by 17 million barrels, as well as adding new capacities estimated at 1,146 MW.
Annual Report | 2018
22
Electric Power Generation
Electric power generation is considered the company’s principal activity. Its mission is to provide electricity and enough generating capacity using highly reliable and high-readiness production techniques to meet the growing demand for electricity. The company achieves this with an optimum use of resources and investing all capabilities towards reaching its main purpose, i.e., decreasing the cost of electrical power production. The transmitted power produced from the company’s generation stations is regarded as the main source of electrical power in the Kingdom of Saudi Arabia with a participation rate of 53% of the total electrical power in 2018.
23
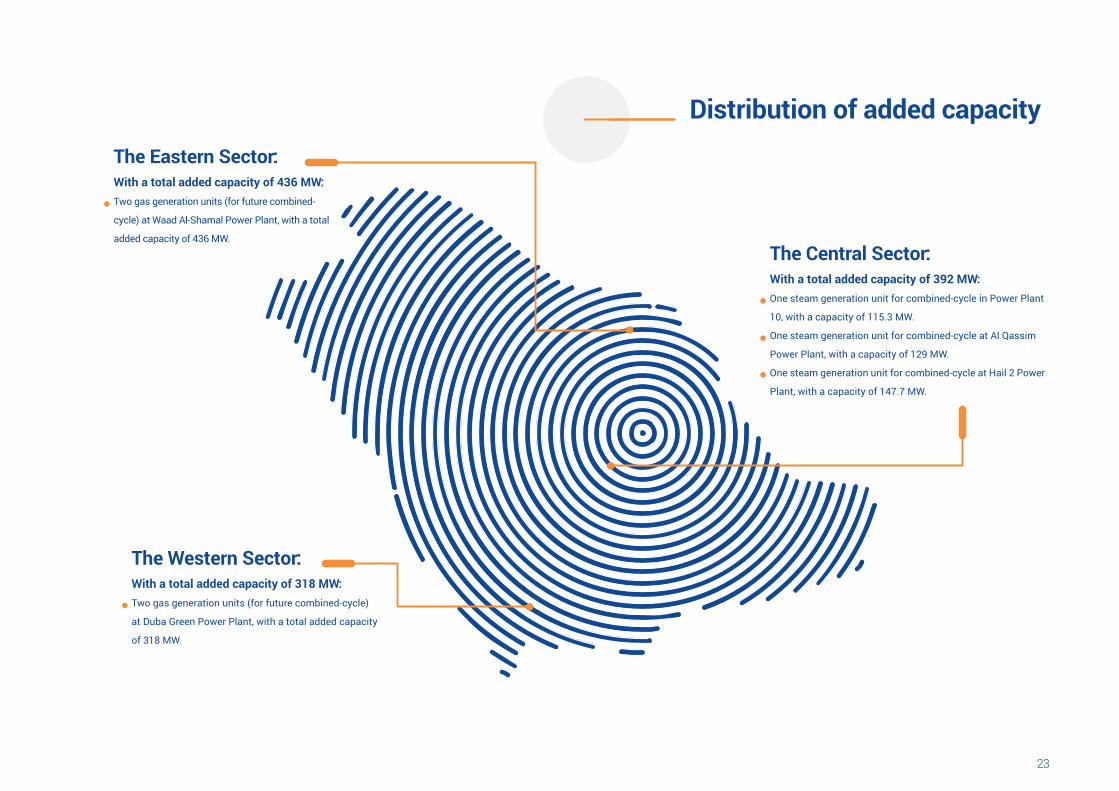
The Central Sector:With a total added capacity of 392 MW:One steam generation unit for combined-cycle in Power Plant
10, with a capacity of 115.3 MW.
One steam generation unit for combined-cycle at Al Qassim
Power Plant, with a capacity of 129 MW.
One steam generation unit for combined-cycle at Hail 2 Power
Plant, with a capacity of 147.7 MW.
Distribution of added capacity
The Eastern Sector:With a total added capacity of 436 MW:Two gas generation units (for future combined-
cycle) at Waad Al-Shamal Power Plant, with a total
added capacity of 436 MW.
The Western Sector: With a total added capacity of 318 MW:Two gas generation units (for future combined-cycle)
at Duba Green Power Plant, with a total added capacity
of 318 MW.

Annual Report | 2018
24
The Generation activity is continuously evolving and remains committed in complying with the outstanding practices in the application of Occupational Safety, Health and Environmental policies for a safe environment; providing a 5-STAR level of safety and occupational health service requirements and protecting the environment. These practices align with the Kingdom’s Vision 2030 to achieve a safe and healthy working environment, and stimulate creative insights to achieve high efficiency and reliability in a way that will not affect the company’s commitment to providing electricity services to its customers in the best professional way, while reducing the risks of occupational hazards and losses, injuries to employees, contractors, visitors, the public and external environment. The company’s policies aim also at reducing pollution and protecting the environment, by complying with all laws, regulations and requirements, and relying on clean energy sources, optimal use of resources, reuse and recycling, waste minimization measures, and contributing to greenhouse gas emission reduction to support sustainable development.
Occupational Safety, Health and Environmental Protection Policy:
25
By the grace of God, the company achieved in 2018 numerous outstanding achievements in the field of occupational health and environmental protection as follows:
• The gas power generation plants in the Southern region achieved 91% in the 5-STAR occupational safety and health system audit and are ready to undergo a third-party audit according to the system requirements.
• Improvement in the application of the 5-STAR occupational safety and health system elements, and the generation activity achieving 86% gain in internal audit in 2018, an increase of 3% over 2017.
• Achieving proactive safety indicators of 94% for 2018, compared to 90% for 2017. • No recorded deaths or serious disabling occupational injuries, but on the other hand, the company achieved high-
risk safety compliance in all power stations. • Holding of more than 456 safety meetings by the safety committees throughout the company led by station
managers, officials, supervisors, safety coordinators and environmentalists. • Implementing more than 70 emergency evacuation simulations at the company’s power stations. • 13 power plants received ISO 14001:2015 certifications. • Achieving continuous environmental compatibility rate of 70% in 2018, with an increase of 11.42% over 2017. • Installing and operating more than 283 monitoring devices to continuously track emissions from flue-gas stacks
to the end of 2018. • Holding of more than 47 specialized courses, seen as investing in employee training, by qualified trainers from
the Generation activity employees and attended by more than 500 trainees who have the potential to become trainers of their colleagues in specialized and accurate courses in the company’s stations in 2018, including in the field of safety, occupational health and environmental protection.
Occupational Safety, Health and Environmental Protection Achievements:
Annual Report | 2018
26
The National Grid SA
Annual Report | 2018
27
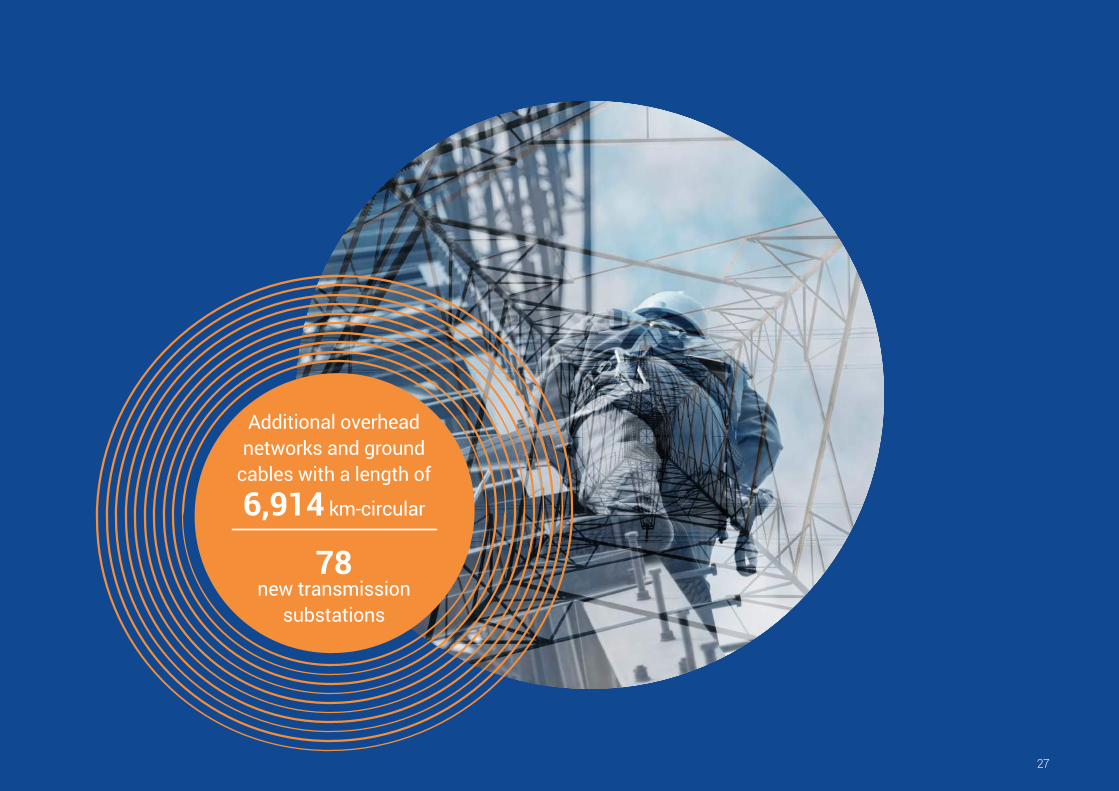
Additional overhead networks and ground
cables with a length of
6,914 km-circular
78 new transmission
substations
Annual Report | 2018
2928
Tasks of the National Grid SAIt is responsible operating the electrical system and following up loads around the clock while raising the efficiency of the electrical system through the economic operation of all power plants connected to the electrical grid, and maintaining the electrical network to ensure a reliable and stable transfer of electrical power to load centers throughout the Kingdom. The responsibilities of the National Grid SA also include the strengthening of the electrical network with transmission substations and high voltage cable networks 110/132 KV, as well as enhancing the capacity of the telecommunications network through multiple stages including planning, designing, implementing projects, and ensuring the development of programs and operations in the different sectors.The National Grid SA’s organizational structure includes five main activities: operations and control, maintenance, planning, engineering, technical services, in addition to two central departments.The company’s mission is to operate the power generating stations economically and to transmit highly reliable electrical power from its production sites to consumption centers, study the expected loads, develop plans that will enhance the electrical network to meet the expected demand for the coming years, in addition to serving major customers and determine their needs and the best way to supply them with electricity. The company also strives to create a suitable and stimulating environment for its staff with the aim of developing their expertise to achieve excellence in operational planning.
It is a company fully-owned by the Saudi Electricity Company. It was established on 1/1/2012, having been tasked with carrying out the transmission of electricity and providing smart services that meet market developments and support the sustainable development of the national economy in order to achieve the vision of Saudi Arabia through a thriving economy aiming to maximize the achievable value of the energy sector.
During 2018, the company launched the Strategic Transformation Program (Ittikan) to complement the company’s main strategy since its inception, which includes three strategic projects: the grid company’s governance model project, the investment model project, and the asset management expansion project, in addition to a study aimed at monitoring the challenges and, in general, the potential variables in the electricity and energy industry in the Kingdom aiming at creating a suitable platform that will raise the readiness to face these variables, and the challenges associated with them.The plans and objectives of the company are dedicated to promoting the electricity supplies, reducing costs, and completing the national electrical network. Based on these plans, throughout 2018, the company completed several new projects, as well as enhanced ongoing projects aimed at improving and developing the transmission networks, as well as increasing their efficiency.
Transmission NetworksAdded overhead networks and ground cables to the existing networks, measuring about 6,914 km-circular, which represents 8.2% of the existing networks by the end of 2018.
Transmission Substations• Established 78 new transmission substations with 295 new transformers with a total capacity
of 45,351 MVA.• Enhanced and completed 18 substations by adding 32 transformers with a net capacity of
5,817 MVA.
Fiber Optic NetworkThe National Grid SA owns the latest communications modes to transmit information at very high speeds through light signals passing through a bundle of fiber optic cables drawn out with the electrical transmission lines throughout the electrical transmission network in order to connect the generation plants and transmission stations to each other. Monitoring and controlling these plants and stations with high reliability and speed through regional and national control centres, with the necessary readings transmitted and followed directly through them, is one of the most important elements of smart networks because of their characteristics that are in line with modern technologies. Starting in 2009, planning on the project to expand and strengthen the electricity transmission networks to reach their current position started by strengthening the transmission network with a network of fiber optics connecting all regions of the Kingdom, while enhancing the internal network in each region separately and thus obtaining a strong infrastructure that supports the company’s operational and investment directions. In 2018, the longest fiber optic network measuring 6,489 km was added, bringing the total length of the fiber optic network to nearly 73,000 km, placing the company among the largest fiber optic networks in the region.
The National Grid SA
2928
The Scientific Council of the National Grid SA The Council made many effective contributions to the National Grid SA during 2018, the most prominent of which were:
• Supporting and monitoring eight joint research projects with EPRI International for 2018, where the Council formed teams from within the company to manage these projects and provide all means of support. These projects contributed to the financial savings in operational costs through the development of procedures and technical specifications.
• Strengthening the partnership with universities and research centers, where the Center of Research Excellence in Renewable Energy (CoRE-RE) at King Fahd University of Petroleum and Minerals was visited, and where a workshop with the Vice-Chancellor of the University for Research and a number of heads of institutes and research centers at the university was held to discuss ways of cooperation between the two parties. This partnership has resulted in establishing the university’s Master of Renewable Energy program and adopted the admission of staff from the Experience Development Program after the evaluation of a number of candidates.
• Raising the quality of scientific papers submitted at local and international conferences by reviewing and evaluating the papers submitted by the company’s employees.
Scientific Participations In the context of increasing the visibility of the National Grid SA in local and international forums, the company has participated in presenting numerous scientific papers during 2018, where the total number of papers submitted to conferences and to internal and external meetings reached 37 scientific papers, an increase of 37% compared to 2017. The company also published, in September 2018, a scientific paper in the Journal of Engineering Research. The company has been honored on several occasions and received important awards, the most prominent of which were:
• Gulf CIGRE’s organizing committee honored and awarded the company for having the largest number of participants in the conference who have presented 15 scientific papers.
• The company won the best work paper for its participation in the Saudi Conference of Smart Electrical Networks.
Training and Development The training and development programs of the National Grid SA contributed to raising the technical and administrative level of the company’s employees, where the ratio of training days to working days reached 2.35% in 2018, including attendance at conferences, workshops, factory training programs and short courses. The number of conferences the company participated in reached 28 conferences, attended by 177 participants, a 22% increase from 2017. The company also participated in 13 workshops, attended by 114 employees, and in 36 factory training programs (training on project contracts), in which 104 candidates participated.The technical specifications of 50 new functional positions (technician/specialist/engineer) were also set within the project of building technical capabilities that included the provision of introducing the employees of the National Grid SA to 13 introductory workshops to the project in the four business areas.
It should be noted that, by the grace of God, the company completed the DMDP development program for department managers in the National Grid SA, which lasted for 3.5 years, and the implementation of the leadership development program which benefited 127 of the company’s supervisors.
Experience Development Program By the end of 2018, the program provided 50 participants with the skills and expertise needed to perform some specialized tasks, including 26 specializations.
Improvement Program The program contributed to numerous operational improvements in the company’s departments during 2018, within which 54 studies were adopted, an increase of 42% over the previous year. In addition, four program related introductory workshops were held in all business areas with 158 employees in attendance. By the end of the year, all studies were concluded and 52 recommendations from the studies were adopted.
King Abdulaziz Quality Award The award honors the establishments that have provided a distinct level of performance and achieved the highest levels of quality, which in turn obtain the appropriate recognition at the national level for their achievements and for reaching a distinguished position among the best local establishments.
A team from the National Grid SA has efficiently and effectively contributed towards the success of the Saudi Electricity Company winning the King Abdulaziz Quality Award in its fourth session in the category of large service enterprises at the golden level.
Annual Report | 2018
30
Integrated Dawiyat Company
Annual Report | 2018

31
Huge Fiber Optic Network
Annual Report | 2018
3332
Obtaining the first license to provide wholesale services for infrastructure in the KingdomIn an effort to support the knowledge economy and to provide a highly reliable infrastructure in the telecommunications and information technology sector to achieve the Kingdom’s vision 2030 and the National Transformation Program 2020, which included many initiatives in this aspect, most notably the broadband deployment and fiber-optic delivery initiative for homes, the fiber broadband initiative agreement was signed with the Ministry of Communications and Information Technology in 2017, and Dawiyat has been commissioned to implement more than 27% of this initiative.
At the ministry’s request, a new entity was established under the name ‘Dawiyat Integrated Telecommunications and Information Technology Company’ on 23/11/1439 H. On 22/12/1439, the Telecommunications and Information Technology Authority granted the company the first and only license in the Kingdom for wholesale services for infrastructure, which entitles the Dawiyat Integrated Telecommunications and Information Technology Company to:
• Build, sell, buy and rent dark fibers. • Build, sell, buy and rent fiber optics. • Connect fiber optics to homes. • Buy, sell and rent communication towers. • Construct, install and operate communication systems within buildings.
With this in mind, Integrated Dawiyat has begun to implement the fiber broadband deployment initiative project.
Dawiyat Telecommunications Company, wholly-owned by the Saudi Electricity Company, was founded as a telecommunications company on 25/12/1430 H, with the aim of achieving optimal investment in the company’s resources in the field of company-owned fiber optic systems covering approximately 73,000 kilometers throughout the Kingdom including villages, hamlets, and borders and to use them to provide integrated telecom services and improve the quality and speed of the Internet in the Kingdom.
Commercial ProjectsFollowing the adoption of the policy and strategy of Integrated Dawiyat company by its board of directors, which aims at opening channels of communication and understanding with many entities to provide telecommunications services in partnership with infrastructure service providers, and to provide services to the business sector and to individuals, many projects were achieved among which:
Broadband Deployment Initiative • Governmental support amounting to SR 146 million was received from the value of the Broadband
Deployment Initiative agreement. • Six confirmation orders were received to begin the delivery of the service to 600,000 homes as part of
the broadband deployment initiative with government support amounting to SR 1,653,851,030. • 202 residential neighborhoods in 30 cities in the central, western, eastern, southern and northern regions
were covered by broadband fiber networks. • The total length of the broadband fiber optic network’s built infastructure reached 3,470 km and
connected to 270,616 homes. • The total number of Dawiyat broadband network connection stations reached 250 (OLT) stations located
in 90 locations on the main power stations and spread in most areas and cities of the Kingdom, where the highest safety standards are applied, and equipped with a backup card that operates automatically in the event of a sudden power outage.
• The construction of the National Network (MPLS), the main network of Dawiyat that connects broadband networks and call stations across cities, regions or the kingdom as a whole, is currently being completed. It connects major customers and Dawiyat partners from retail broadband service providers’ and licensed network operators, whether at the local, regional or international level.
• Dawiyat optical line termination (OLT) stations for broadband networks have been linked to Dawiyat partners from retail broadband service providers through the Multiprotocol Label Switching (MPLS) networks.
• The company’s main network is designed with multiple fiber-optic line paths and different routes to ensure the continuity of communication services.
• A partnership agreement has been signed with Zain Saudi Arabia to provide commercial broadband services to 182,000 homes.
• Broadband service was launched with Zain Saudi Arabia and introduced in four major cities (Riyadh, Jeddah, Dammam and Medina) to more than 10,000 customers within 3 months of its launch.
Integrated Dawiyat Company
3332
Promoting international access to fiber optic networksTo enable the international connectivity of service operators with infrastructure, the implementation of the fiber-optic delivery to Jordan through the Haql area has been completed.
Participating in conferencesOne of the objectives and strategies of Integrated Dawiyat Company is to highlight its infrastructure, capabilities and know-how in the telecommunications and information technology sector. As such, the Saudi Arabia Smart Grid Conference 2018 and ArabNet 2018 conference were selected to present Integrated Dawiyat as the first wholesale services provider for infrastructure and communications in the Kingdom and its positive contribution to the broadband deployment project of the Ministry of Communications and Information Technology, and the National Transformation Program 2020 as well.
Building the companyThe company continues to adjust its organizational structure to remain competitive as it continues to build its capabilities by attracting outstanding young Saudis in the telecommunications and information technology sector in the Kingdom.
Renting fiber optics to Zain and Mobily and connect more of their sites as follows: • Achieving an annual income from Zain’s contract to connect sites within the dark fiber network for SR
23 million. • Signing a contract with Zain to sell dark fibers to link Jeddah and Abha for SR 32 million for a period
of 15 years. • Signing a contract with Mobily to sell dark fibers to link Jizan and Abha for SR 14 million for 10 years. • Signing a contract with Atheeb to sell dark fibers for SR 600,000 for a period of one year. • Al Awwal Bank was leased and linked for an annual amount of SR 1.43 million and Riyad Bank for an
annual amount of SR 1.2 million in partnership with an infrastructure service provider.
Signing a partnership contract (Global Data Center) • A partnership contract was signed on February 17, 2018, with Gulf Data Hub, a UAE company
specializing in data center services, to establish a level 3 global data center with neutral communication, at King Abdullah University of Science and Technology, to build and dedicate 8,000 square meters to host telecom and information technology equipment with a capacity of more than 22 MW.
• Based on the partnership contract, the Global Data Center Company was established with headquarters in Jeddah, where Dawiyat owns a 50% stake and the Commercial Register was issued on September 11, 2018.
• Construction work has begun with a completion rate of approximately 30%.
Memorandums of Understanding• A memorandum of understanding has been signed with Aramco to provide
telecommunications services to King Salman City that include fiber optic links and other services that will provide the city’s residents with fixed communications and data services through licensed infrastructure service providers.
• A memorandum of understanding has been signed with the Industrial Property Authority to provide fiber-optic connections and other services in an open neutral network manner which will provide their residents with fixed communications and data services through licensed infrastructure service providers.
• A memorandum of understanding has been signed with the Ministry of Housing to study the connection of residential products to the fiber optic network.
• Signing a memorandum of understanding with Cinturion to lease a dark fiber network from Ghunan in the eastern region to Haditha on the northern border, with a length of 1,551 km for 25 years, and with projected annual revenues of SR 5 million. On the other hand, the link of the Jordanian border with two operators (Orange & iLevant) was tested to start marketing it internationally through infrastructure service providers.
Annual Report | 2018
34
Distribution and Customer Services
Annual Report | 2018
35
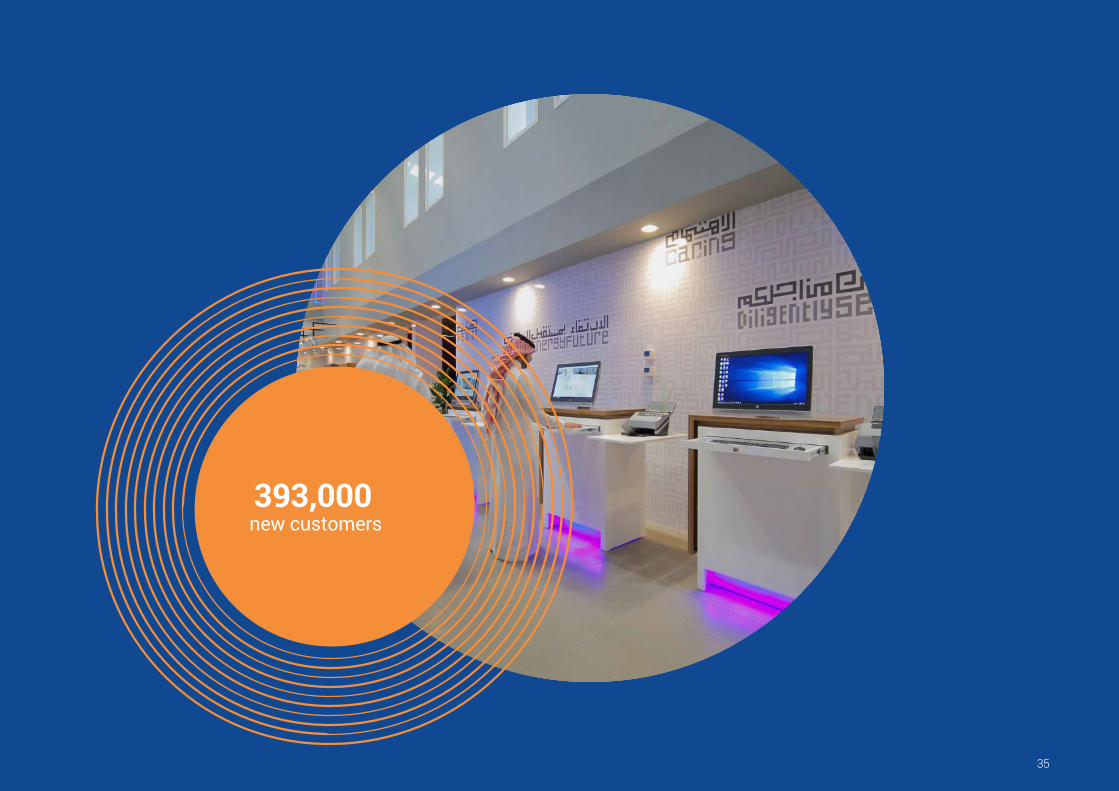
393,000new customers
Annual Report | 2018
3736
The plans of the activity include a number of pillars, objectives and performance standards, including: raising the rates of delivery of electricity services to new customers in cities, villages and communities, and continuous improvement of distribution networks to ensure their performance is at the desired level, raising energy efficiency and facilitating the procedures of delivery and simplification of electricity services, developing customer service centers, applying the latest technologies, employee skills development in calculating customer consumption and reading of bills, and continuous attention to raising the efficiency and performance of frontline employees.
Servicing the Two Holy Mosques and SitesProviding the Two Holy Mosques and Holy Places with electric power tops the list of interests of the Distribution and Customer Services activity each year. The preparations and planning for the next season begin immediately after the completion of the hajj plan for the current season, which further boost the performance of the Distribution activity for these seasons to constantly evolve and improve steadily, as manifested by the amount of responsibility adopted by all employees of this activity.
The main activity is to receive and distribute energy from transmission networks and to provide customers with reliable electrical service, while improving the level of services provided to them. The activity generates and distributes electricity consumption bills to customers and carries out its annual plans and programs to provide high quality services through the use of the latest technology use and facilitating access to the service.
The successful implementation of the company’s plan for the hajj season 1439 H, stemming from the adopted plans, delivers a tangible result of these great efforts and firm plans, as there were no major interruptions recorded during the hajj season, thanks to God Almighty. It was such a great achievement for the company that everyone is proud of, especially after gaining recognition from the Custodian of the Two Holy Mosques, King Salman bin Abdul Aziz, and His Royal Highness Crown Prince Mohammed bin Salman, may God protect them, which reflects the leadership’s interest in bringing high level of quality in services provided to citizens notably the electrical services.The Saudi Electricity Company was honored by the Advisor to the Custodian of the Two Holy Mosques, His Royal Highness Prince Khalid Al-Faisal, and the participating team at the Makkah Cultural Forum for the year 1439 H, under the umbrella of the Makkah Region Emirate. By attaining third place, the SEC continues to showcase its successive achievements in raising the quality of electrical services for all beneficiaries.
Customer Services
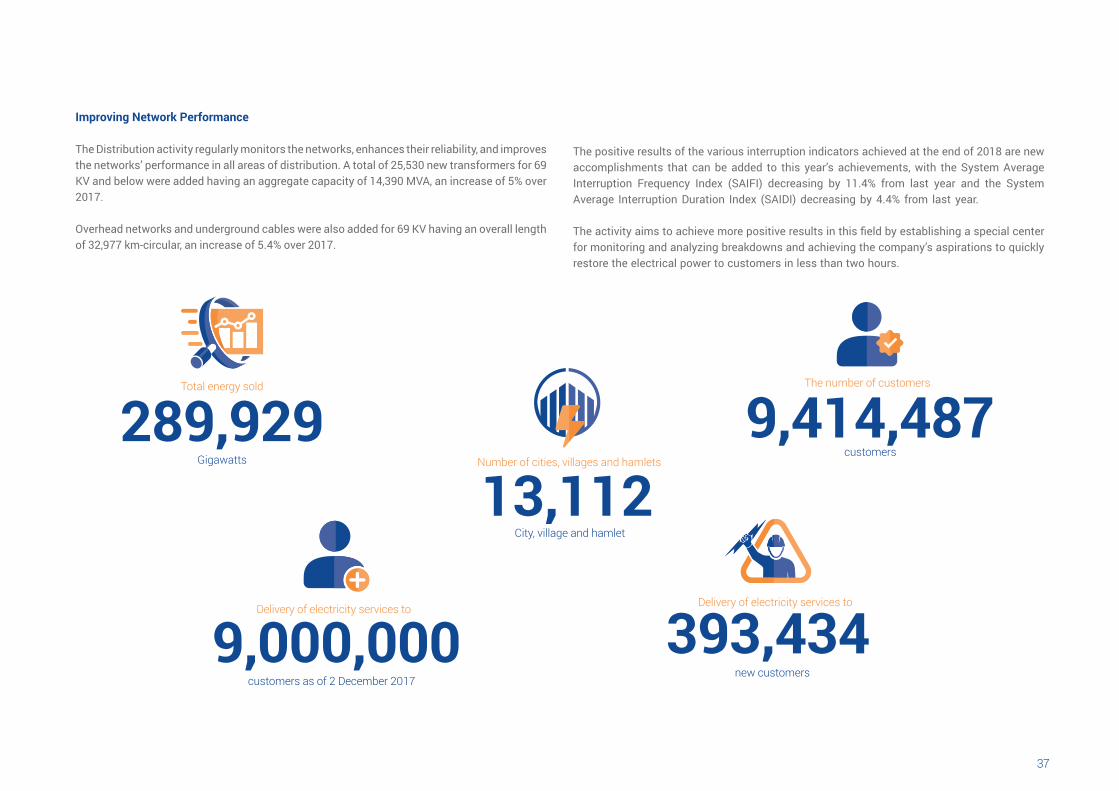
The Distribution and Customer Services activity continues to work diligently toward achieving customer satisfaction and raising the level of confidence in the electrical services provided to them, by launching a succession of initiatives and projects. The activity also formed high-efficiency specialized teams to meet the challenges and overcome difficulties, and to benefit from all modern technologies available for digital transformation and service delivery through multiple communication channels which allow customers to take advantage of the company’s services in an easy and fast way.Special centers for meter reading and billing processes have also been established to develop the process of meter reading from its initial stages, starting with downloading meter readings with tracks, through the follow up of unread meters during the day and on to the processing of all the notes and shortcomings of all meters that require reading during the day to achieve a 100% reading rate.With the aim of continuously providing electricity services to new customers, more than 393,000 new customers have received the services, bringing the total number of customers to more than 9.4 million the company is proud to serve.Initiatives to reduce the electricity delivery period continue to achieve tangible accomplishments, with the average electricity delivery period being reduced from 29 working days to only 19.3 working days. These initiatives are part of an ambitious plan to bring this rate to global levels in the coming period, God willing, and will be achieved through the application of the capital efficiency principle, as the cost of delivery to the customer was reduced by 4% from last year.
Distribution andCustomer Services
3736
Improving Network Performance
The Distribution activity regularly monitors the networks, enhances their reliability, and improves the networks’ performance in all areas of distribution. A total of 25,530 new transformers for 69 KV and below were added having an aggregate capacity of 14,390 MVA, an increase of 5% over 2017.
Overhead networks and underground cables were also added for 69 KV having an overall length of 32,977 km-circular, an increase of 5.4% over 2017.
The positive results of the various interruption indicators achieved at the end of 2018 are new accomplishments that can be added to this year’s achievements, with the System Average Interruption Frequency Index (SAIFI) decreasing by 11.4% from last year and the System Average Interruption Duration Index (SAIDI) decreasing by 4.4% from last year.
The activity aims to achieve more positive results in this field by establishing a special center for monitoring and analyzing breakdowns and achieving the company’s aspirations to quickly restore the electrical power to customers in less than two hours.
Delivery of electricity services to
Number of cities, villages and hamlets
City, village and hamlet
Gigawatts
9,000,000customers as of 2 December 2017
13,112
The number of customers
customers9,414,487
Delivery of electricity services to
new customers
393,434
Total energy sold
289,929
Annual Report | 2018
38
Saudi Company for Energy Procurement
39
Principal Buyer
Annual Report | 2018
40
Saudi Company for Energy Procurement
The The Saudi Company for the Purchase of Energy (principal buyer) is a wholly-owned limited liability subsidiary of the Saudi Electricity Company, established under Saudi Arabian Regulations, with a commercial register No. 1010608947 dated 5/9/1438 H, corresponding to 31/5/2017, and with a paid-up capital of SR 2,000,000. The company has obtained the license as principal buyer from the Electricity and Cogeneration Regulatory Authority (No. R-170656) dated 12/10/1438 H corresponding to 6/7/2017.
Tasks of the Saudi Company for Energy Procurement
The tasks of the Saudi Company for Energy Procurement include the administration of trade in electricity, , the development and establishment of new partnerships, renewable energy projects, the independent production and monitoring of their implementation, the management of trade agreements for the sale and purchase of energy, the provision of fuel and the efficiency of its use, and the participation of regulators in establishing and developing the electric power market. The license issued by the Electricity and Cogeneration Regulatory Authority includes its role as the main buyer in the purchase and sale of energy and fuel supply agreements currently concluded with the Saudi Electricity Company. Prior to the transfer of the agreements from the Saudi Electricity Company to The Saudi Company for Energy Procurement is completed, the company managed these agreements on behalf of the Saudi Electricity Company.
Interest in Renewable Energy
In 2018, and in the context of the company’s interest in renewable energy sources, it signed a 25-year agreement to purchase power from the 300 MW Sakaka Solar Energy, which is expected to be commercially operational in 2020.
The company is managed by a Board of Directors formed by the General Assembly of Shareholders, in accordance with the regulations approved by the Electricity and Cogeneration Regulatory Authority. The Board of Directors is subordinate to the Executive Committee, the Nominations and Remuneration Committee, and the Review Committee.
The principal buyer has three main organizational units: the trading sector, the independent production and renewable energy sector, the fuel supply and agreement sector, as well as the support units. Since the approval of its establishment, the company has been completing its establishment requirements with the relevant government agencies.
41
1 6
7
8
9
10
2
3
4
5
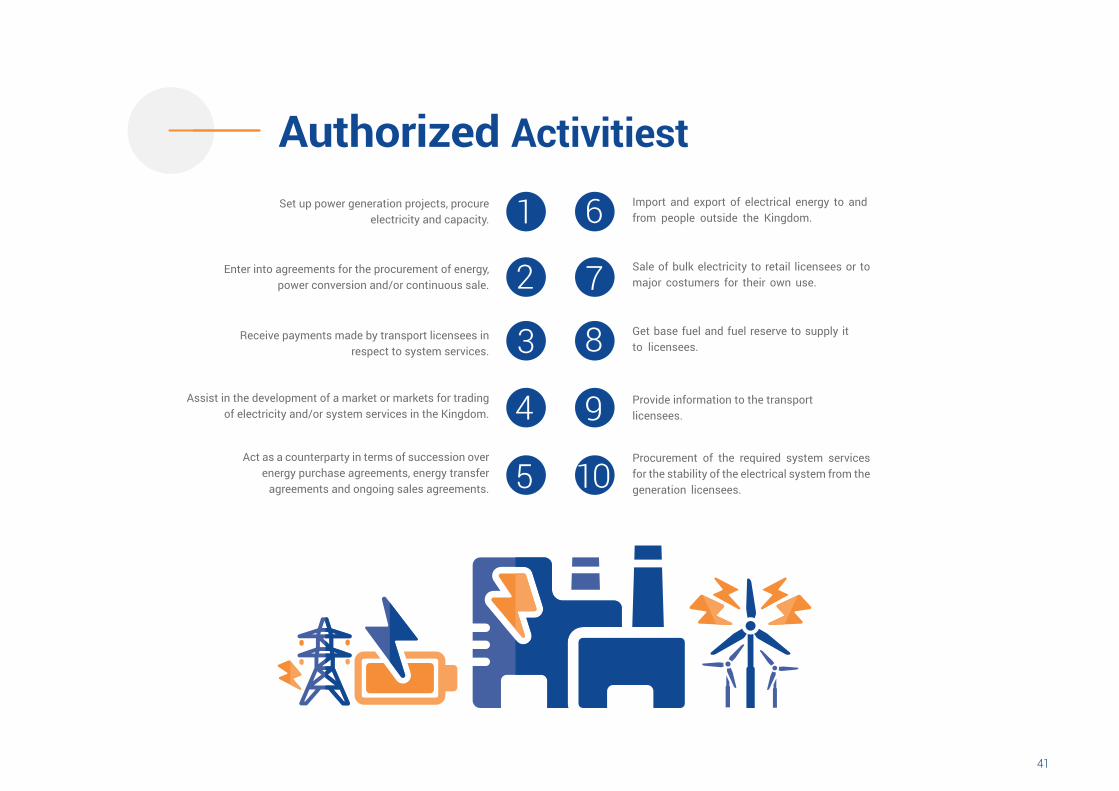
Assist in the development of a market or markets for trading of electricity and/or system services in the Kingdom.
Set up power generation projects, procure electricity and capacity.
Enter into agreements for the procurement of energy, power conversion and/or continuous sale.
Sale of bulk electricity to retail licensees or to major costumers for their own use.
Import and export of electrical energy to and from people outside the Kingdom.
Get base fuel and fuel reserve to supply it to licensees.
Provide information to the transport licensees.
Receive payments made by transport licensees in respect to system services.
Procurement of the required system services for the stability of the electrical system from the generation licensees.
Act as a counterparty in terms of succession over energy purchase agreements, energy transfer
agreements and ongoing sales agreements.
Authorized Activitiest
Annual Report | 2018
42
Investment in Electricity Production Projects
43
Provide Large Quantities of Electric Power to Keep Pace
with EconomicDevelopment
Annual Report | 2018
4544
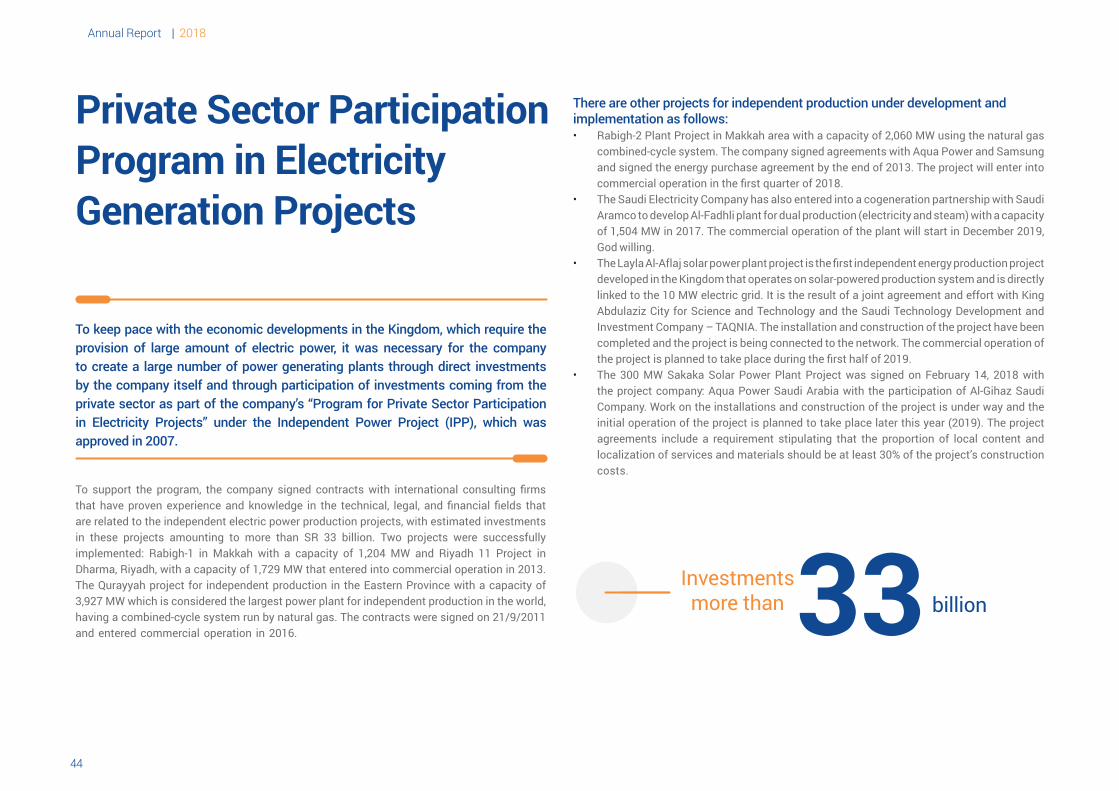
Private Sector Participation Program in Electricity Generation Projects
Investmentsmore than 33 billion
To support the program, the company signed contracts with international consulting firms that have proven experience and knowledge in the technical, legal, and financial fields that are related to the independent electric power production projects, with estimated investments in these projects amounting to more than SR 33 billion. Two projects were successfully implemented: Rabigh-1 in Makkah with a capacity of 1,204 MW and Riyadh 11 Project in Dharma, Riyadh, with a capacity of 1,729 MW that entered into commercial operation in 2013. The Qurayyah project for independent production in the Eastern Province with a capacity of 3,927 MW which is considered the largest power plant for independent production in the world, having a combined-cycle system run by natural gas. The contracts were signed on 21/9/2011 and entered commercial operation in 2016.
To keep pace with the economic developments in the Kingdom, which require the provision of large amount of electric power, it was necessary for the company to create a large number of power generating plants through direct investments by the company itself and through participation of investments coming from the private sector as part of the company’s “Program for Private Sector Participation in Electricity Projects” under the Independent Power Project (IPP), which was approved in 2007.
There are other projects for independent production under development andimplementation as follows:• Rabigh-2 Plant Project in Makkah area with a capacity of 2,060 MW using the natural gas
combined-cycle system. The company signed agreements with Aqua Power and Samsung and signed the energy purchase agreement by the end of 2013. The project will enter into commercial operation in the first quarter of 2018.
• The Saudi Electricity Company has also entered into a cogeneration partnership with Saudi Aramco to develop Al-Fadhli plant for dual production (electricity and steam) with a capacity of 1,504 MW in 2017. The commercial operation of the plant will start in December 2019, God willing.
• The Layla Al-Aflaj solar power plant project is the first independent energy production project developed in the Kingdom that operates on solar-powered production system and is directly linked to the 10 MW electric grid. It is the result of a joint agreement and effort with King Abdulaziz City for Science and Technology and the Saudi Technology Development and Investment Company – TAQNIA. The installation and construction of the project have been completed and the project is being connected to the network. The commercial operation of the project is planned to take place during the first half of 2019.
• The 300 MW Sakaka Solar Power Plant Project was signed on February 14, 2018 with the project company: Aqua Power Saudi Arabia with the participation of Al-Gihaz Saudi Company. Work on the installations and construction of the project is under way and the initial operation of the project is planned to take place later this year (2019). The project agreements include a requirement stipulating that the proportion of local content and localization of services and materials should be at least 30% of the project’s construction costs.
4544
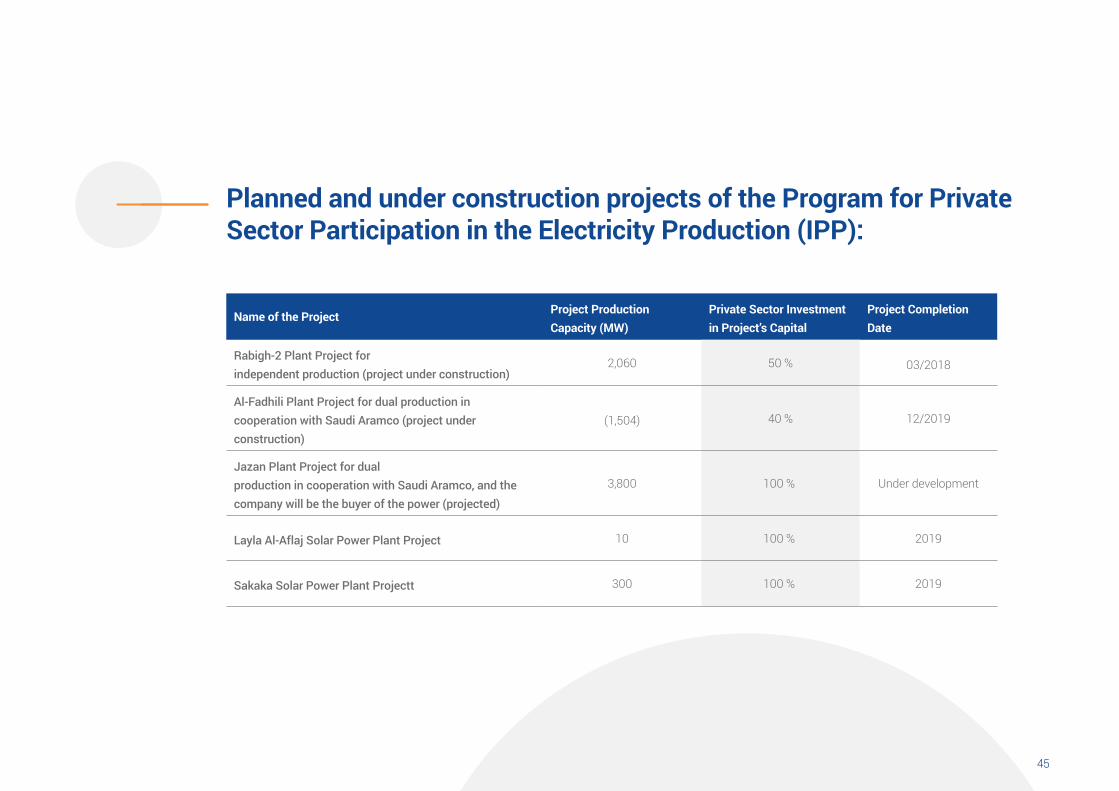
Name of the Project Project Production Capacity (MW)
Private Sector Investment in Project’s Capital
Project Completion Date
Rabigh-2 Plant Project forindependent production (project under construction)
2,060 50 % 03/2018
Al-Fadhili Plant Project for dual production in cooperation with Saudi Aramco (project under construction)
)1,504( 40 % 12/2019
Jazan Plant Project for dualproduction in cooperation with Saudi Aramco, and the company will be the buyer of the power (projected)
3,800 100 % Under development
Layla Al-Aflaj Solar Power Plant Project 10 100 % 2019
Sakaka Solar Power Plant Projectt 300 100 % 2019
Planned and under construction projects of the Program for Private Sector Participation in the Electricity Production (IPP):
Annual Report | 2018
46
Saudi Electricity Company for Projects Development
47
Enhancing power generation and
transmission capabilities
Annual Report | 2018
48
Mission of Saudi Electricity Company for Projects Development Engineering, design and supervision involved in the implementation of power generation and transmission projects according to the engineering specifications and quality applied by the company including cost and schedules monitoring, and maintaining environmental and social requirements and the safety of employees. The company is also involved in research, development and innovation in terms of improving the performance efficiency of the electrical system along with enhancing its reliability and stability.
The Extent of the Company’s Activity Over 450 projects are being implemented to enhance the power generation and transmission capacity with a contractual value exceeding SR 53 billion.
Saudi Electricity Company for Projects DevelopmentThe Saudi Electricity Company for Projects Development is a wholly-owned limited liability company of the Saudi Electricity Company, established under Saudi Arabia’s Regulations.
to enhance power generation and transmission capacity
valued at SR 53 billion.
450 Implementation of
over
Projects
49
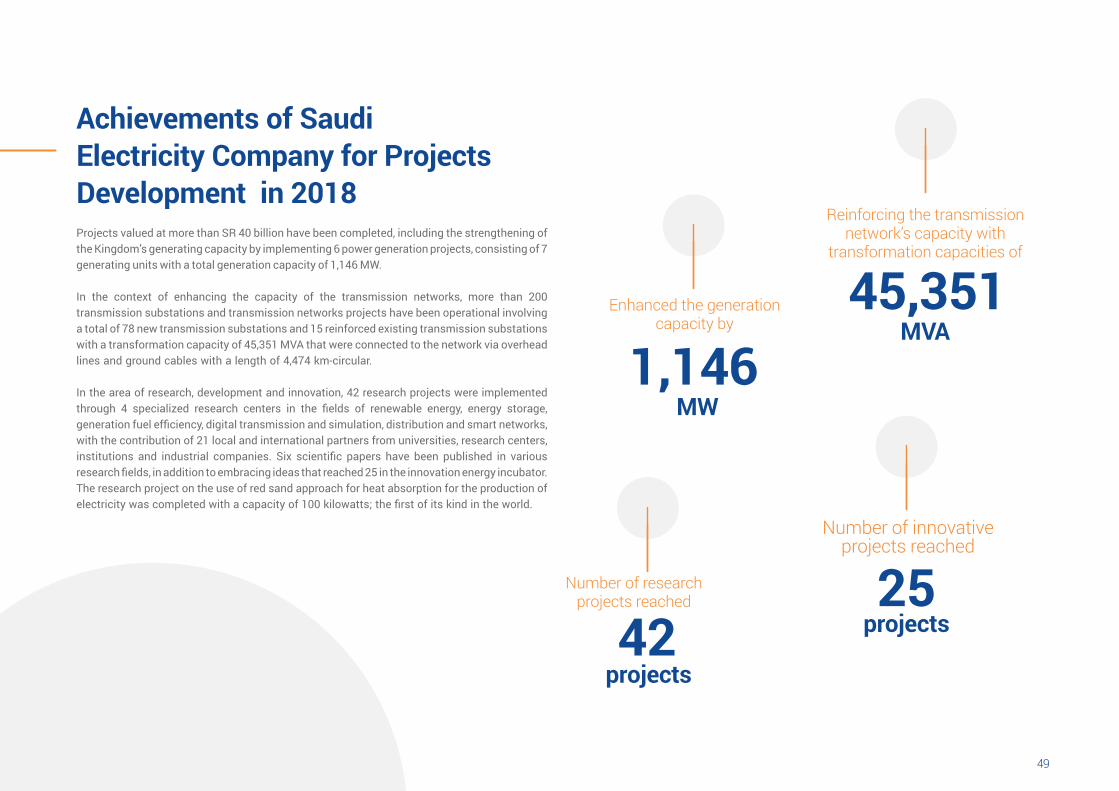
45,351
Reinforcing the transmission network’s capacity with
transformation capacities of
MVA
42Number of research
projects reached
projects
Achievements of Saudi Electricity Company for Projects Development in 2018Projects valued at more than SR 40 billion have been completed, including the strengthening of the Kingdom’s generating capacity by implementing 6 power generation projects, consisting of 7 generating units with a total generation capacity of 1,146 MW.
In the context of enhancing the capacity of the transmission networks, more than 200 transmission substations and transmission networks projects have been operational involving a total of 78 new transmission substations and 15 reinforced existing transmission substations with a transformation capacity of 45,351 MVA that were connected to the network via overhead lines and ground cables with a length of 4,474 km-circular.
In the area of research, development and innovation, 42 research projects were implemented through 4 specialized research centers in the fields of renewable energy, energy storage, generation fuel efficiency, digital transmission and simulation, distribution and smart networks, with the contribution of 21 local and international partners from universities, research centers, institutions and industrial companies. Six scientific papers have been published in various research fields, in addition to embracing ideas that reached 25 in the innovation energy incubator. The research project on the use of red sand approach for heat absorption for the production of electricity was completed with a capacity of 100 kilowatts; the first of its kind in the world.
1,146Enhanced the generation
capacity by
MW
25Number of innovative
projects reached
projects
Annual Report | 2018
50
Financial Activity
51
2018 Annual Report
Annual Report | 2018
52
Financial Activity
Credit rating
The company continues to receive an investment grade credit rating from global credit rating agencies. It has maintained high credit ratings, as rated by Standard & Poor’s (A-), Fitch Group (A) and Moody’s (A2).
The company’s rating by Standard & Poor’s is the same sovereign credit rating achieved by the Kingdom of Saudi Arabia. This indicates the soundness of the company’s strategic orientations, the success of its administrative and operational policies, and the effective management of its business. These ratings, reinforced by government’s support, have enabled the company to continue its efforts to implement its fiscal policies aimed at strengthening SEC’s financial position, working on managing cash flows and providing what it takes to spend on its projects and funding commitments from various domestic and international sources of funding.
Strong Credit RatingWith a Stable
Outlook
53
• On Thursday, 18/01/2018, the company signed a one-year joint international bridge loan agreement effective from the date of signing, worth US$2.6 billion (equivalent to SR 9.75 billion) to be repaid in one payment.
• Financed with the participation of eight leading internation-al banks: Citibank, Bank of Tokyo-Mitsubishi UFJ Limited, First Abu Dhabi Bank, The Hongkong and Shanghai Bank-ing Corporation (HSBC), Mizuho Bank Limited, Natixis Bank, Sumitomo Mitsui Banking Corporation, Standard Chartered Bank. Financing was obtained without presenting any guar-antees, and for the purpose of spending on the general ac-tivities of the company including its capital expenditures.
• The Saudi Electricity Company succeeded in issuing $2 bil-lion worth of International Islamic Sukuk during the month of September 2018, amid a high demand from investors.
• The Sukuk are divided into two segments, one worth $800 million (SR 3 billion) and due after five years, and the second worth $1.2 billion (SR 4.5 billion), and due after 10 years.
• The IPO had a strong turnout, with subscription applica-tions reaching $7 billion, covering the release three and a half times.
The Company’s Financial Achievements during 2018
• The release comes in line with the company’s strategy of diversifying its financing sources and the growth of its investor base in international markets, indicating a high interest among investors as the offering attracted more than 380 international investors in 25 countries around the world, confirming the international investors’ confi-dence in the strength of the Saudi economy.
• The $2 billion release is the first premium investment class issue put forward by Saudi companies since 2014.
• In September 2018, an agreement was reached to increase the maximum borrowing limit through a murabaha facility agreement by SR 2 billion to a total of SR 10 billion.
• This is a result of the company’s eagerness to finance its pro-jects and subsidiaries and to pay and cover its current and future obligations, and to use and employ funds to achieve the company’s commitments from time to time, as well as to pay any costs required to facilitate the company’s business in order to achieve its general objectives.
• On Thursday, November 29, 2018, the company entered into a $2.15 billion (SR 8.06 billion) international joint revolving credit facility agreement. The first tranche is for $1,577.5 million, over a three-year period and the second tranche is worth $572.5 million, over five years to finance the the gen-eral purposes of the company.
• The agreement was funded by several banks: First Abu Dha-bi Bank, Mizuho Bank Limited, MUFG Bank, Standard Char-tered Bank, Sumitomo Mitsui Banking Corporation, HSBC Middle East Bank, The Hongkong and Shanghai Banking Corporation, JPMorgan Chase Bank, and Natixis Bank.
• The Saudi Electricity Company also announced on Tuesday, December 25, 2018, the signing of a bilateral Murabaha fi-nancing agreement with Samba Financial Group worth SR 2.4 billion for five years to finance the company’s general activities and capital projects.
• The full repayment of a revolving international financing agreement with several banks worth SR 5.25 billion was made in December 2018.
• The full repayment of a revolving domestic financing agree-ment worth SR 2.5 billion was made in the month of Decem-ber 2018.

Annual Report | 2018
54
Human Resources
55
The Nation’s Wealth
Annual Report | 2018
56
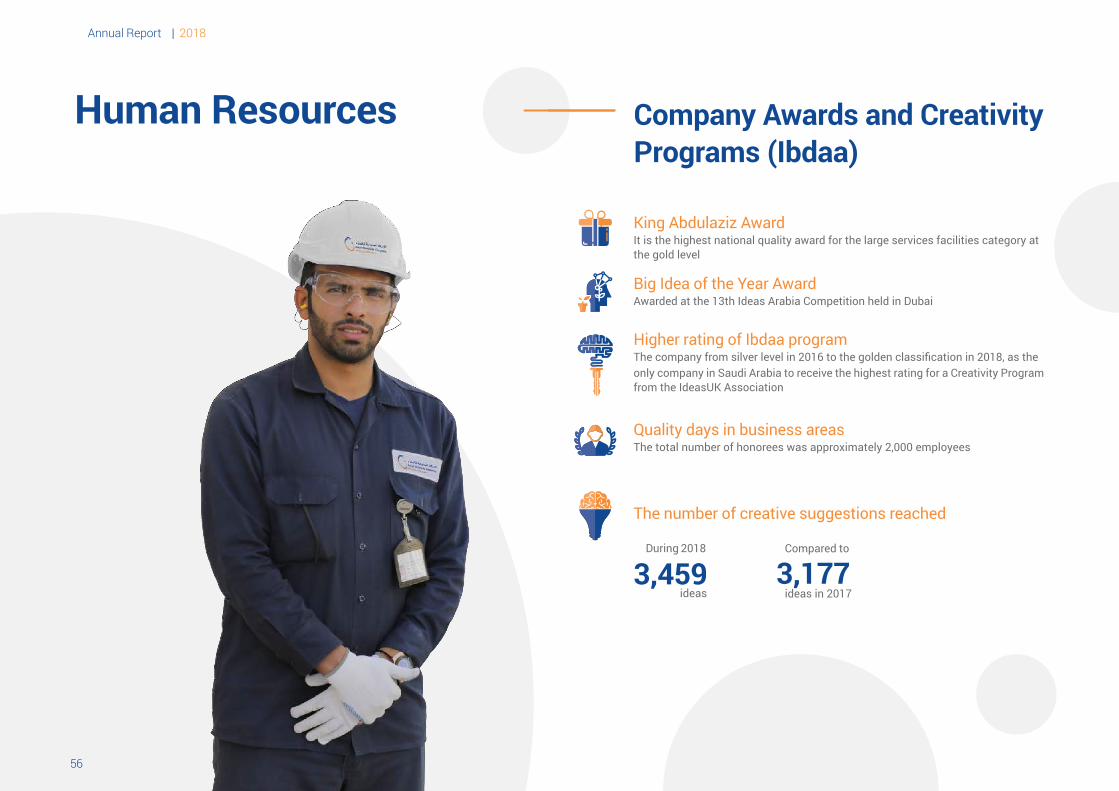
Human Resources
King Abdulaziz Award It is the highest national quality award for the large services facilities category at the gold level
Big Idea of the Year Award Awarded at the 13th Ideas Arabia Competition held in Dubai
Higher rating of Ibdaa program The company from silver level in 2016 to the golden classification in 2018, as the only company in Saudi Arabia to receive the highest rating for a Creativity Program from the IdeasUK Association
Quality days in business areasThe total number of honorees was approximately 2,000 employees
The number of creative suggestions reached
3,459During 2018
ideas3,177
ideas in 2017
Compared to
Company Awards and Creativity Programs (Ibdaa)
57
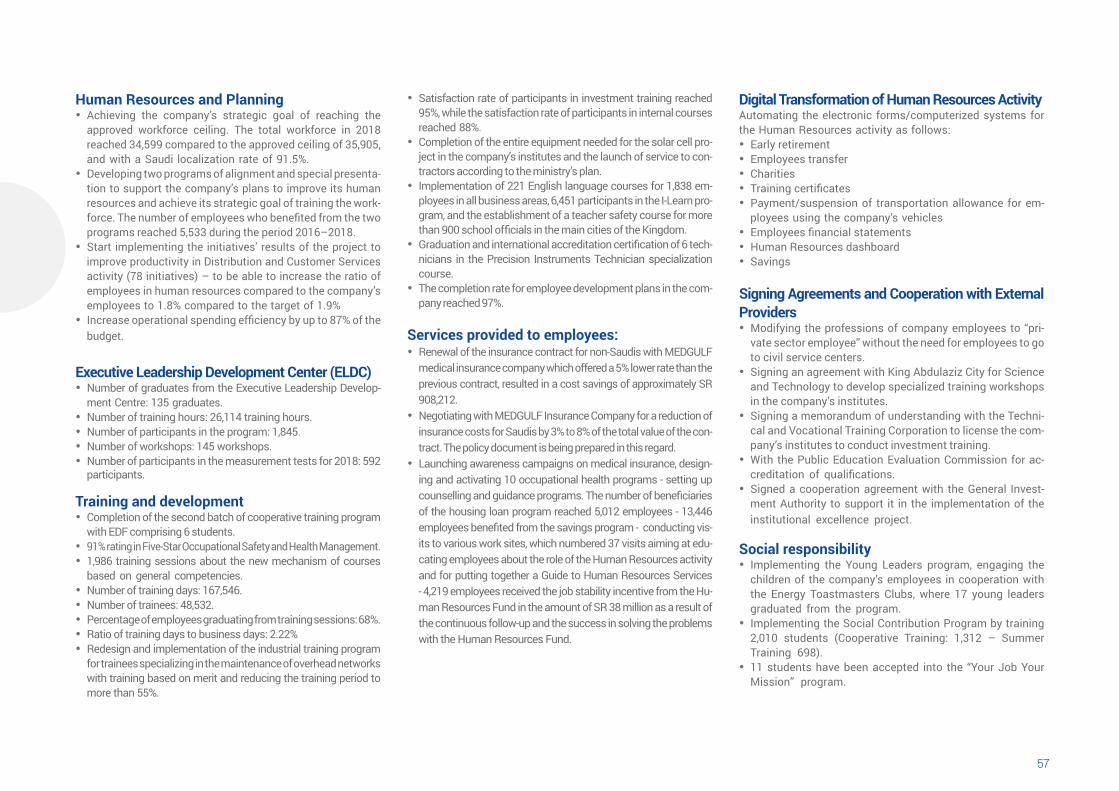
Human Resources and Planning • Achieving the company’s strategic goal of reaching the
approved workforce ceiling. The total workforce in 2018 reached 34,599 compared to the approved ceiling of 35,905, and with a Saudi localization rate of 91.5%.
• Developing two programs of alignment and special presenta-tion to support the company’s plans to improve its human resources and achieve its strategic goal of training the work-force. The number of employees who benefited from the two programs reached 5,533 during the period 2016–2018.
• Start implementing the initiatives’ results of the project to improve productivity in Distribution and Customer Services activity (78 initiatives) – to be able to increase the ratio of employees in human resources compared to the company’s employees to 1.8% compared to the target of 1.9%
• Increase operational spending efficiency by up to 87% of the budget.
Executive Leadership Development Center (ELDC) • Number of graduates from the Executive Leadership Develop-
ment Centre: 135 graduates. • Number of training hours: 26,114 training hours. • Number of participants in the program: 1,845. • Number of workshops: 145 workshops. • Number of participants in the measurement tests for 2018: 592
participants.
Training and development • Completion of the second batch of cooperative training program
with EDF comprising 6 students. • 91% rating in Five-Star Occupational Safety and Health Management. • 1,986 training sessions about the new mechanism of courses
based on general competencies. • Number of training days: 167,546. • Number of trainees: 48,532. • Percentage of employees graduating from training sessions: 68%. • Ratio of training days to business days: 2.22% • Redesign and implementation of the industrial training program
for trainees specializing in the maintenance of overhead networks with training based on merit and reducing the training period to more than 55%.
• Satisfaction rate of participants in investment training reached 95%, while the satisfaction rate of participants in internal courses reached 88%.
• Completion of the entire equipment needed for the solar cell pro-ject in the company’s institutes and the launch of service to con-tractors according to the ministry’s plan.
• Implementation of 221 English language courses for 1,838 em-ployees in all business areas, 6,451 participants in the I-Learn pro-gram, and the establishment of a teacher safety course for more than 900 school officials in the main cities of the Kingdom.
• Graduation and international accreditation certification of 6 tech-nicians in the Precision Instruments Technician specialization course.
• The completion rate for employee development plans in the com-pany reached 97%.
Services provided to employees: • Renewal of the insurance contract for non-Saudis with MEDGULF
medical insurance company which offered a 5% lower rate than the previous contract, resulted in a cost savings of approximately SR 908,212.
• Negotiating with MEDGULF Insurance Company for a reduction of insurance costs for Saudis by 3% to 8% of the total value of the con-tract. The policy document is being prepared in this regard.
• Launching awareness campaigns on medical insurance, design-ing and activating 10 occupational health programs - setting up counselling and guidance programs. The number of beneficiaries of the housing loan program reached 5,012 employees - 13,446 employees benefited from the savings program - conducting vis-its to various work sites, which numbered 37 visits aiming at edu-cating employees about the role of the Human Resources activity and for putting together a Guide to Human Resources Services - 4,219 employees received the job stability incentive from the Hu-man Resources Fund in the amount of SR 38 million as a result of the continuous follow-up and the success in solving the problems with the Human Resources Fund.
Digital Transformation of Human Resources ActivityAutomating the electronic forms/computerized systems for the Human Resources activity as follows:
• Early retirement • Employees transfer • Charities • Training certificates • Payment/suspension of transportation allowance for em-
ployees using the company’s vehicles • Employees financial statements • Human Resources dashboard • Savings
Signing Agreements and Cooperation with External Providers
• Modifying the professions of company employees to “pri-vate sector employee” without the need for employees to go to civil service centers.
• Signing an agreement with King Abdulaziz City for Science and Technology to develop specialized training workshops in the company’s institutes.
• Signing a memorandum of understanding with the Techni-cal and Vocational Training Corporation to license the com-pany’s institutes to conduct investment training.
• With the Public Education Evaluation Commission for ac-creditation of qualifications.
• Signed a cooperation agreement with the General Invest-ment Authority to support it in the implementation of the institutional excellence project.
Social responsibility • Implementing the Young Leaders program, engaging the
children of the company’s employees in cooperation with the Energy Toastmasters Clubs, where 17 young leaders graduated from the program.
• Implementing the Social Contribution Program by training 2,010 students (Cooperative Training: 1,312 – Summer Training 698).
• 11 students have been accepted into the “Your Job Your Mission” program.

58
Shareholders
59
Diligently Serving You
Annual Report | 2018
60
Shareholders
The company has made continuous efforts to enhance its effective ways of communication with its shareholders and to motivate them to deposit their stock certificates in investment portfolios, thus facilitating smooth profit deposits into their accounts, which are linked to their portfolios at different banks during the first day of dividend disbursement. The company is keen on effectively communicating with concerned authorities of the Capital Market and to exchange relevant information with the company’s investors and financial and investment institutions.
The Saudi Electricity Company attaches great importance to its shareholders and works to preserve and develop their rights, and it also provides investors and financial and investment institutions with the relevant and transparent information about the company.
The company has adopted a governance system that includes the provisions of the Corporate Governance Regulations issued by the Capital Market Authority, particularly with regard to shareholders’ rights, instructions and disclosure and transparency procedures, and conformance to its internal regulations with the financial market system and its executive regulations.
The company is committed to the rules and regulations of the Capital Market Authority and has complied with the principles of disclosure and transparency provided in Article (43) of the listing and registration rules and Corporate Governance Regulation issued by the Capital Market Authority. The company has worked to fulfill the aspirations of the shareholders, to promote their rights, and to facilitate their access to information. It also attaches great importance to enhancing the disclosure quality of financial statements, important developments and essential changes, with a focus on timely delivery to shareholders.
Complying with the principle of disclosure and transparency
Fulfilling the aspirations of the shareholders
Facilitating access to information
Enhancing the quality of disclosure
61
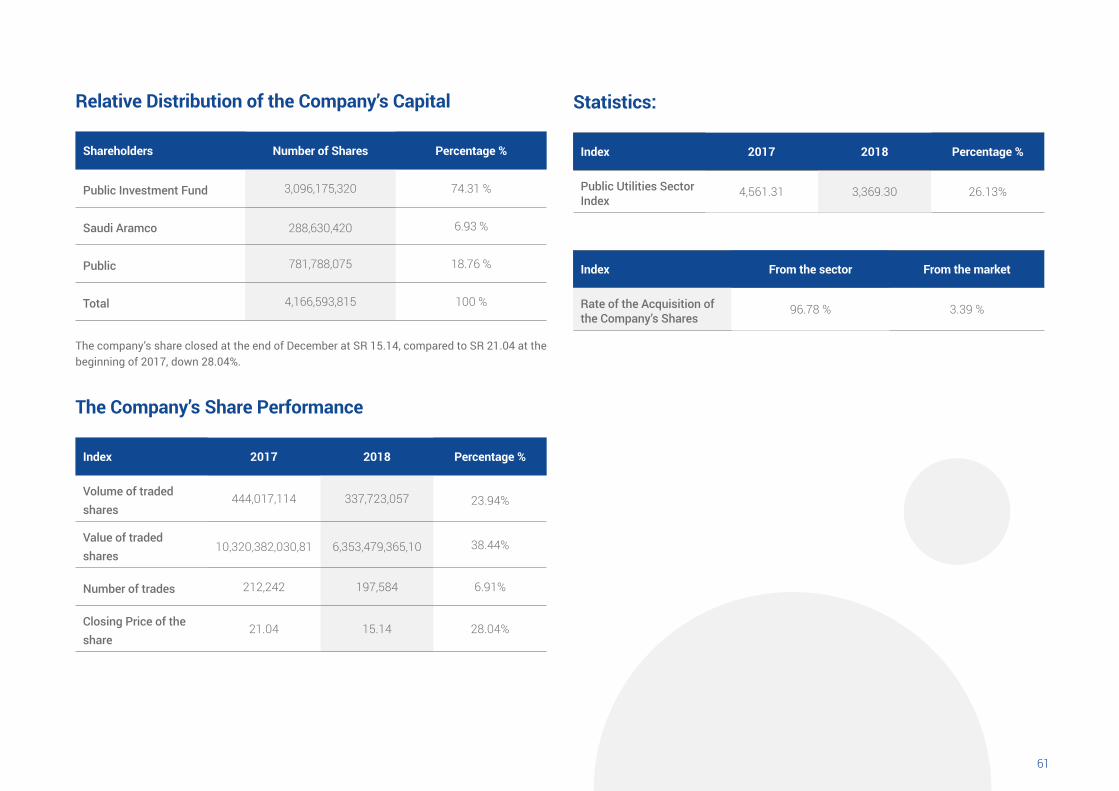
Relative Distribution of the Company’s Capital
Shareholders Number of Shares Percentage %
Public Investment Fund 3,096,175,320 74.31 %
Saudi Aramco 288,630,420 6.93 %
Public 781,788,075 18.76 %
Total 4,166,593,815 100 %
The company’s share closed at the end of December at SR 15.14, compared to SR 21.04 at the beginning of 2017, down 28.04%.
The Company’s Share Performance
Index 2017 2018 Percentage %
Volume of traded shares
444,017,114 337,723,057 23.94%
Value of traded shares
10,320,382,030,81 6,353,479,365,10 38.44%
Number of trades 212,242 197,584 6.91%
Closing Price of the share
21.04 15.14 28.04%
Statistics:
Index 2017 2018 Percentage %
Public Utilities Sector Index
4,561.31 3,369.30 26.13%
Index From the sector From the market
Rate of the Acquisition of the Company’s Shares
96.78 % 3.39 %
Annual Report | 2018
62
Supply and Contract Services
63
Effective and reliable supply chain
Annual Report | 2018
6564
8,083
1% 12% 13% 13%
426 2,900 747 4,010Transfer Receipt Return Issue
4.3 M
MSAR
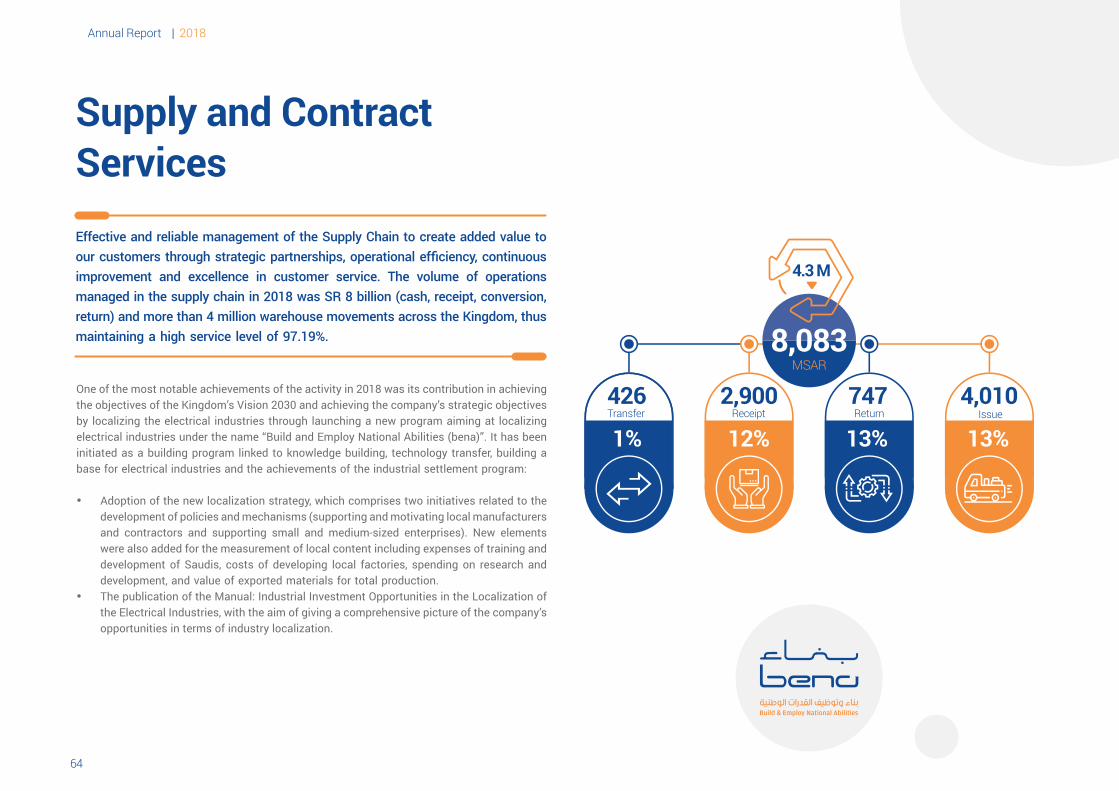
Supply and Contract ServicesEffective and reliable management of the Supply Chain to create added value to our customers through strategic partnerships, operational efficiency, continuous improvement and excellence in customer service. The volume of operations managed in the supply chain in 2018 was SR 8 billion (cash, receipt, conversion, return) and more than 4 million warehouse movements across the Kingdom, thus maintaining a high service level of 97.19%.
One of the most notable achievements of the activity in 2018 was its contribution in achieving the objectives of the Kingdom’s Vision 2030 and achieving the company’s strategic objectives by localizing the electrical industries through launching a new program aiming at localizing electrical industries under the name “Build and Employ National Abilities (bena)”. It has been initiated as a building program linked to knowledge building, technology transfer, building a base for electrical industries and the achievements of the industrial settlement program:
• Adoption of the new localization strategy, which comprises two initiatives related to the development of policies and mechanisms (supporting and motivating local manufacturers and contractors and supporting small and medium-sized enterprises). New elements were also added for the measurement of local content including expenses of training and development of Saudis, costs of developing local factories, spending on research and development, and value of exported materials for total production.
• The publication of the Manual: Industrial Investment Opportunities in the Localization of the Electrical Industries, with the aim of giving a comprehensive picture of the company’s opportunities in terms of industry localization.
6564
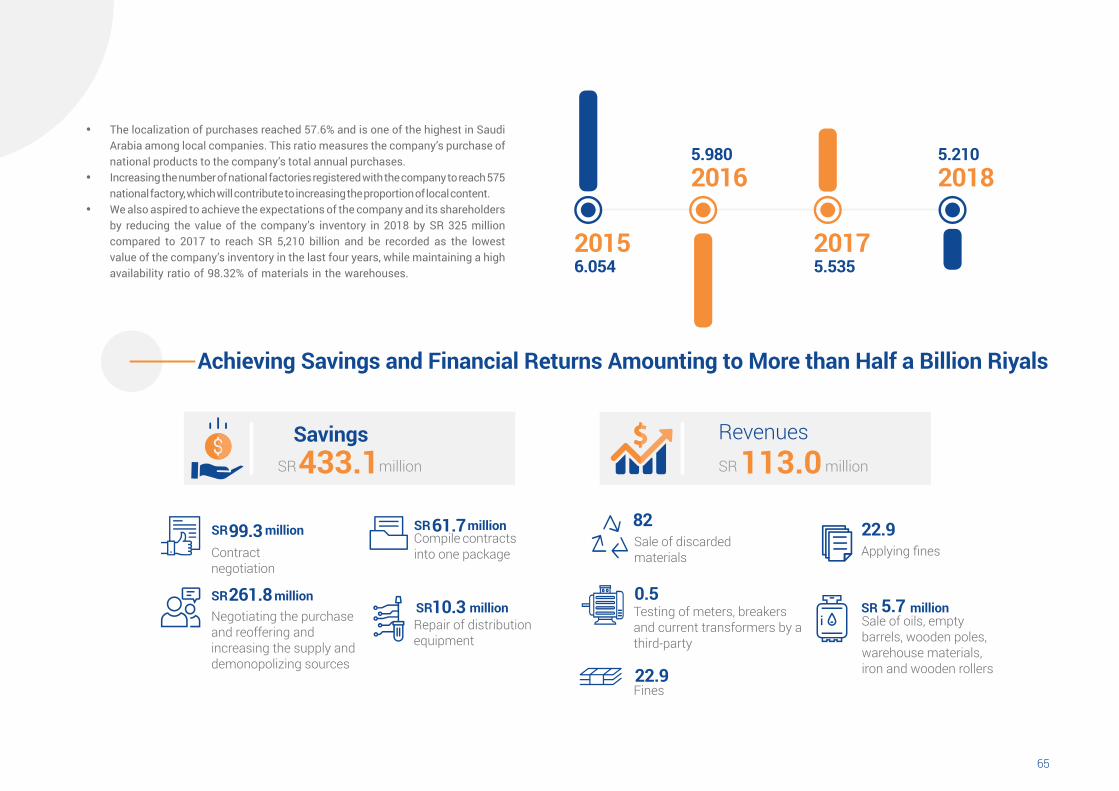
6.054 5.535
5.980 5.210
2015 2017
2016 2018
Achieving Savings and Financial Returns Amounting to More than Half a Billion Riyals
million million
millionmillion million
SR SR
SRSR SRTesting of meters, breakers
and current transformers by a third-party
Fines
Sale of oils, empty barrels, wooden poles, warehouse materials, iron and wooden rollers
Sale of discarded materials Applying fines
Compile contractsinto one package
Repair of distribution equipment
Contract negotiation
Savingsmillion 433.1
Revenues113.0
0.55.7
22.9
82 22.961.7
10.3
99.3
Negotiating the purchase and reoffering and increasing the supply and demonopolizing sources
261.8
• The localization of purchases reached 57.6% and is one of the highest in Saudi Arabia among local companies. This ratio measures the company’s purchase of national products to the company’s total annual purchases.
• Increasing the number of national factories registered with the company to reach 575 national factory, which will contribute to increasing the proportion of local content.
• We also aspired to achieve the expectations of the company and its shareholders by reducing the value of the company’s inventory in 2018 by SR 325 million compared to 2017 to reach SR 5,210 billion and be recorded as the lowest value of the company’s inventory in the last four years, while maintaining a high availability ratio of 98.32% of materials in the warehouses.
millionSRSR
Annual Report | 2018
66
Preserving the Environment
67
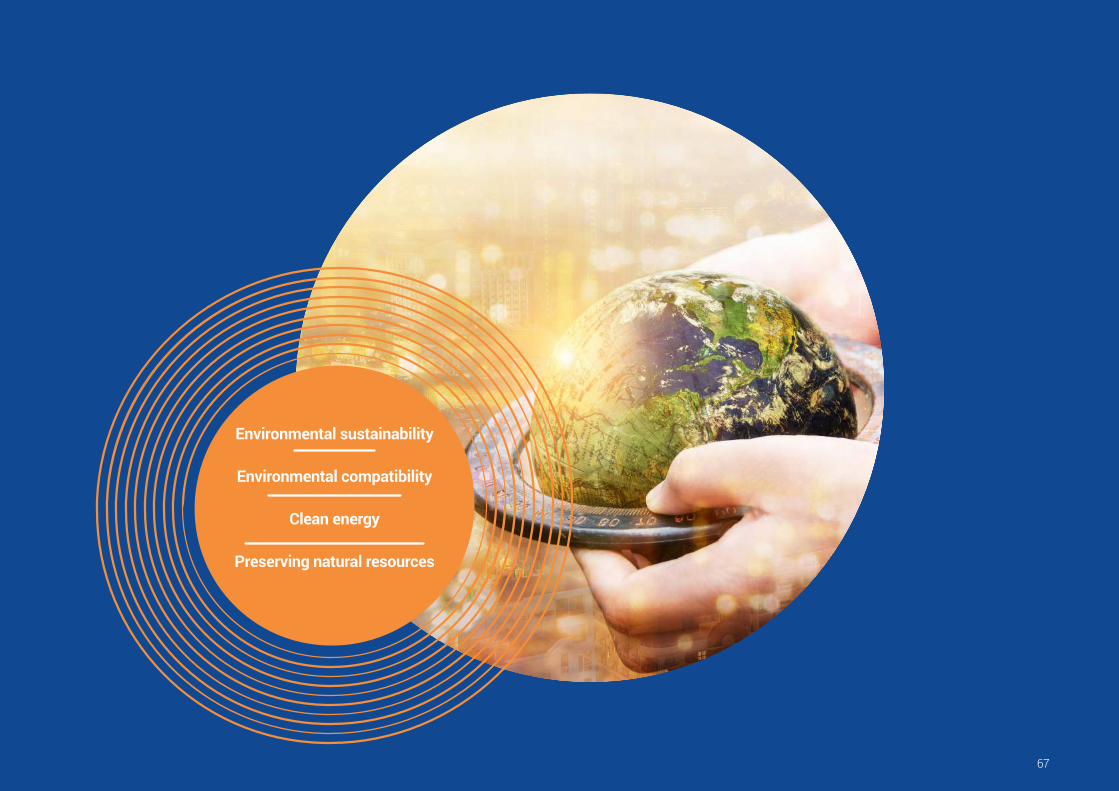
Environmental sustainability
Environmental compatibility
Clean energy
Preserving natural resources
Annual Report | 2018
6968
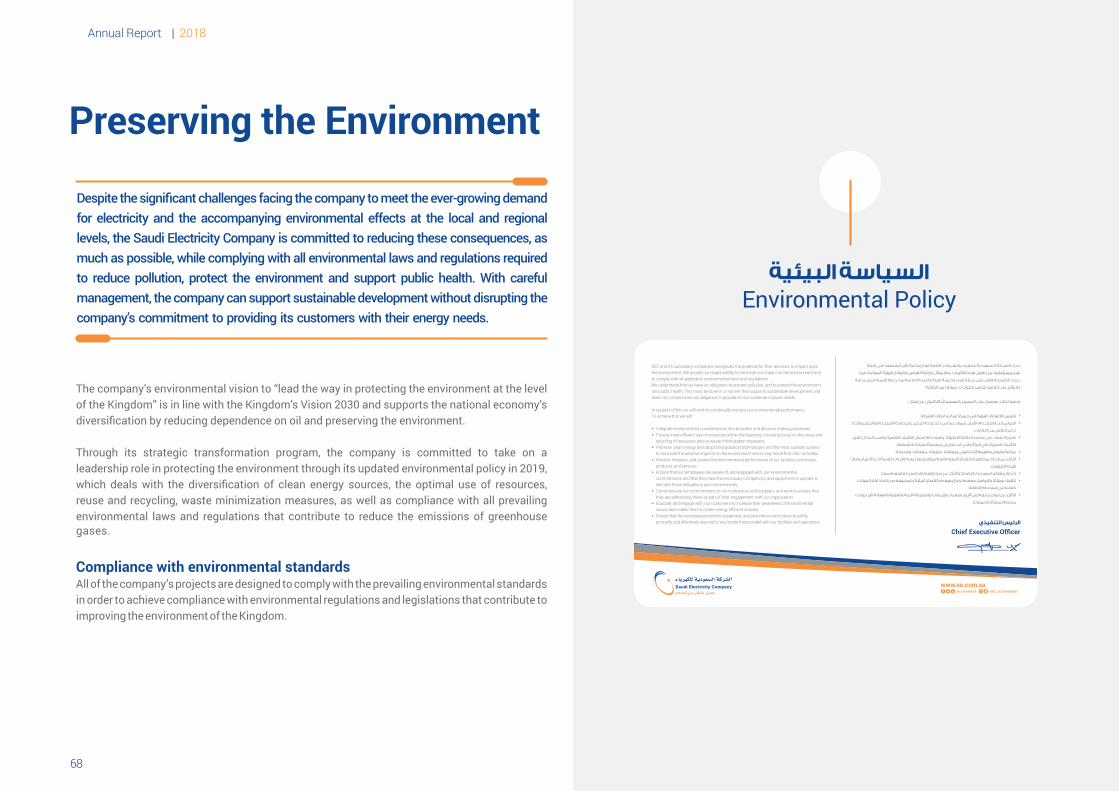
Preserving the Environment
The company’s environmental vision to “lead the way in protecting the environment at the level of the Kingdom” is in line with the Kingdom’s Vision 2030 and supports the national economy’s diversification by reducing dependence on oil and preserving the environment.
Through its strategic transformation program, the company is committed to take on a leadership role in protecting the environment through its updated environmental policy in 2019, which deals with the diversification of clean energy sources, the optimal use of resources, reuse and recycling, waste minimization measures, as well as compliance with all prevailing environmental laws and regulations that contribute to reduce the emissions of greenhouse gases.
Compliance with environmental standardsAll of the company’s projects are designed to comply with the prevailing environmental standards in order to achieve compliance with environmental regulations and legislations that contribute to improving the environment of the Kingdom.
Despite the significant challenges facing the company to meet the ever-growing demand for electricity and the accompanying environmental effects at the local and regional levels, the Saudi Electricity Company is committed to reducing these consequences, as much as possible, while complying with all environmental laws and regulations required to reduce pollution, protect the environment and support public health. With careful management, the company can support sustainable development without disrupting the company’s commitment to providing its customers with their energy needs.
السياسة البيئيةEnvironmental Policy
SEC and it’s subsidiary companies recognizes the potential for their activities to impact upon the environment. We accept our responsibility to minimize our impact on the environment and to comply with all applicable environmental laws and regulations.We understand that we have an obligation to prevent pollution, and to protect the environment and public health. This must be done in a manner that supports sustainable development and does not compromise our obligation to provide for our customer›s power needs.
In support of this we will work to continually improve our environmental performance.To achieve this we will:
• Integrate environmental considerations into business and decision making processes.
• Pursue more efficient use of resources within the business, including focus on the reuse and recycling of resources and on waste minimization measures.
• Promote clean energy and adopt best practical technologies and the most suitable options to minimize the adverse impacts on the environment which may result from SEC activities.
• Monitor, measure, and assess the environmental performance of our facilities, processes, products, and services.
• Ensure that our employees are aware of, and engaged with, our environmental commitments and that they have the necessary competency and equipment to operate in line with these obligations and commitments.
• Communicate our commitments to our contractors and suppliers, and work to ensure that they are addressing these as part of their engagement with our organization.
• Educate, and engage with, our customers to increase their awareness of environmental issues and enable them to make energy efficient choices.
• Ensure that the necessary personnel, equipment, and procedures are in place to safely, promptly, and effectively respond to any incident associated with our facilities and operations.
تدرك الشــركة الســعودية للكهرباء والشــركات التابعة لها إمكانية تأثير أنشطتها على البيئة.
نقــر بمســؤوليتنا عــن تقليل هذه التأثيرات ، وبالامتثال لكافة القوانين واللوائح البيئية الســائدة، كما
نــدرك التزامنــا بالفعل على منــع التلوث وحماية البيئة والصحة العامة بما يدعم التنمية المســتدامة ،
ولا يؤثــر على التزامنا بتوفيــر احتياجات عملائنا من الطاقة.
ودعماً لذلك ، سنعمل على التحسين المستمر لأدائنا البيئي من خلال:
تضمين الاعتبارات البيئية في جميع أعمال و قرارات الشركة. •
السعي إلى الاستخدام الأمثل للموارد بما في ذلك زيادة التركيز علي إعادة الاستخدام والتدوير واتخاذ •
تدابير التقليل من النفايات.
تعزيز الاعتماد على مصادر الطاقة النظيفة ، واستخدام افضل التقنيات العلمية وأنسب البدائل لتقيل •
التأثيرات السلبية علي البيئة والتي قد تنتج من ممارسة الشركة لأنشطتها.
مراقبة وقياس وتقييم الأداء البيئي لمنشآتنا ، عملياتنا ، منتجاتنا ، وخدماتنا. •
التأكد من إدراك موظفينا لالتزاماتنا البيئية وانهم مؤهلون ولديهم الأدوات اللازمة لأداء الأعمال وفقاً •
لهذه الالتزامات.
إخطار مقاولينا وموردينا بالتزاماتنا والتأكد من مراعاتهم لها ضمن تعاملهم معنا. •
تثقيف عملائنا والتواصل معهم لرفع وعيهم بالقضايا البيئية و تمكينهم من اتخاذ أكثر الخيارات •
كفاءة في استخدام الطاقة.
التأكد من توفر ما يلزم من أفراد ومعدات وإجراءات للاستجابة الآمنة والفورية والفعالة لأي حوادث •
مرتبطة بمنشآتنا وعملياتنا.
الرئيس التنفيذي
Environmental Policyالسياسة البيئية
Chief Executive Officer
6968
Executive Summary of Safety Indicators in 2018Safety Management System Indicators (5-STAR)
• The level of application of the safety management system ‘5-STAR’ in 2018 reached 83.4%, up by 2.4% over 2017.
• The company’s safety level reached 88%, up by 4% over 2017. • The recorded level of daily business risk control was 82%, an increase of 1% over 2017. • The recorded level of measurement of commitment to personal safety tasks was 89%, an
increase of 1% over 2017. • The recorded level of measurement of the integrity of the company’s assets was 84%, an
increase of 1% over 2017. • The recorded level of measurement of training and awareness was 90%, an increase of 3%
over 2017. • The recorded level of incident reporting and investigation was 93%, an increase of 4% over 2017. • The recorded level of measurement of emergency preparedness was 88%, an increase of
3% over 2017. • The recorded level of measurement of continuous improvement was 83% which is the same
as the result of 2017.Loss Indicators in 2018
• Maintained a fatality-free record for the second year in a row. • A decrease in contractor deaths by 78% compared to 2017. • A decrease in vehicle accidents by 47% compared to 2017. • A decrease in workplace injuries (employees – contractors) by 9% compared to 2017. • A decrease in vehicle accident injuries by 44% compared to 2017. • A decrease in total losses for the company’s employees and contractors by 33% compared to 2017. • A decrease in fire incidents by 25% compared to 2017.
Meetings and visits of the Executive Safety Committee (EXCO)Four visits were carried out by the Executive Safety Committee (EXCO) during 2018 in which 19 teams were formed. The visits covered all business areas and activities to conduct workplace safety inspection in the company on a continual basis.
Personal prevention tasks • Invitation to bidding in several stages for 171 items of personal prevention tasks and has
been contested by 57 suppliers. • Safety Inspection visits. • The implementation of 7,531 safety inspection visits during which 15,129 safety
observations were noted, 95% of which have been rectified.
In this context, the company monitors the level of compatibility with the general environmental regulations issued in 2001 and the updated environmental standards issued by the Presidency of Meteorology and Environment (PME) in 2014, through the periodic inspection based on the company’s environmental inspection protocol that is compatible with ISO 19011: 2011, which specifies the level of compatibility of each site of the company. It also identifies cases of non-compliance with environmental requirements and the correction plans during the period of time granted until the end of 2019. With this objective, the company prepared and implemented 24 approved environmental compliance documents, implemented awareness and training programs, prepared environmental studies and surveys, established waste management facilities, installed Volatile Organic Compounds (VOCs) systems in fuel tanks, constructed evaporation ponds and hazardous substance tanks, improved the separation of oil and contaminated water systems in the stations, and installed air pollutant emission control systems at generating plants such as sulphur oxide and nitrogen oxide emission control systems and suspended particles.
The company’s sites monitor emissions of SO2, NOx, PM10, and PM2.5 from stacks by installing 288 continuous flue emission monitoring devices. They also monitor stray emissions and emissions from fixed and mobile sources; control industrial wastewater discharge; groundwater pollution, environmental noise in the company and the air quality in surrounding areas with company facilities; ozone-depleting substances; control and management of hazardous and non-hazardous waste.The company invests large amounts of money to control emissions by using the Dry Low NOx (DLN) combustion system that reduces emissions of nitrogen oxide by up to 60%; the electrostatic precipitators in units operated by heavy fuel to reduce the emission of suspended particles by up to 99%. The company is also investing in Seawater Flue Gas Desulfurization (FGD) technology to reduce air pollution from sulphuric oxide emissions by up to 90%; chemical treating of wastewater from boilers; separating fuel residues from water reservoir prior to sending it to evaporation ponds, and controlling the temperature of cooling water drained to the sea within the permissible limits.The company has prepared environmental impact review and evaluation studies (environmental licenses) for 38 sites, all of which have improved the level of environmental compatibility in the company and the level of environmental compliance with the updated environmental standards in 2014 (PME2014), which increased from 28% in 2014 to 91.6% level by the end of 2018. The percentage of awareness of the environmental requirements of concerned authorities was 100%, while the percentage of documented plans at the sites to achieve compliance reached 96.5% and the availability of procedures at 92%.
Annual Report | 2018
7170
Environmental sustainabilityThe Saudi Electricity Company and its subsidiaries are the largest electric power producer in the Middle East and North Africa. SEC is keeping pace with the increasing demands for electricity by providing continuous electric power with high reliability despite the great challenges and the accompanying environmental effects at the local and regional levels. The Saudi Electricity Company and its subsidiaries are committed to producing electric power with the highest professional level to reduce any environmental impacts while complying with environmental laws, regulations and requirements in order to reduce pollution, protect the environment and public health, achieve environmental compatibility and support sustainable development.The company’s environmental vision to “lead the way in protecting the environment at the level of the Kingdom” is in line with the Kingdom’s Vision 2030 and supports the national economy’s diversification by reducing dependence on oil and preserving the environment. Through its strategic transformation program, the company is committed to achieve a leadership role in protecting the environment throughout Saudi Arabia through its environmental policies, which promote the diversification of clean energy sources, the optimal use of resources, reuse and recycling, waste minimization measures, as well as compliance with all prevailing environmental laws and regulations that contribute to reduce the emissions of greenhouse gases.Compliance with environmental standardsAll the company’s projects are designed to comply with the prevailing environmental standards in order to achieve compliance with environmental regulations and legislations that contribute to improving the environment in the Kingdom. These efforts resulted in getting 13 generating stations, the ISO 14001:2015 certification for environmental compatibility, and work is underway to complete certification for other generating plants. The company also invests large amounts of money to control emissions by usingthe Dry Low NOx )DLN( combustion system that reduces NOx emissions by up to 60%; electrostatic precipitators in units operated by heavy fuel to reduce the emission of suspended particles by up to 99%. The company also invests in modern technology to remove sulphur oxides from exhaust gases by using Seawater Flue Gas Desulfurization )FGD( to reduce air pollution from sulphuric oxide emissions by up to 90% and chemical cleaning of waterwastes from boilers, separating fuel residues from water reservoir before sending it to evaporation ponds, and controlling the temperature of cooling water drained to the sea within the permissible limits and replacing old low-efficiency generating units with more efficient units, where 243 units were retired during the period from 2015 to 2018, and more than 283 continuous flue emission control devices were installed and operated.
The company monitors the level of compatibility with the prevailing environmental standards for all its facilities through periodic environmental audit to check its compliance with environmental requirements. The results of the environmental compatibility audit report showed a continuous increase in the rate of environmental compatibility that comply with the demands of the General Authority of Meteorology and Environmental Protection from 58.6% in 2017 to 70% in 2018. The company is eager to continue its efforts to maintain what has been achieved and raise the continuous compatibility ratio to 100% for all environmental requirements.
Clean energyTo enhance the reliance on clean electric power, the company has increased its production from high-efficiency combined-cycle, which is based on the use of exhaust heat from gas turbine generating units as a thermal source for boilers instead of burning more fuel. The company’s production from the combined-cycle increased from 8.3% in 2010 to 30.8% in 2018, while the use of the simple-cycle decreased from 50% in 2010 to 19% in 2018. The total amount of clean energy produced from the combined-cycle was 3,790,358 MWH, representing about 1.98% of the total energy produced in 2018 which reached 191,016,000 MWH.The company is currently implementing projects to raise the combined-cycle generating capacity, just like in power generation projects of the Qassim, Duba, Hail, Power Plants 13 and 14, and Waad Al-Shamal plants.The Saudi Electricity Company was able to convert diesel-powered generating units to work on crude oil fuel and this coincided with the focus on the operation of units that run on crude oil as well as other diesel fuel, while ensuring that the reliability of the electrical system is continuously enhanced and resulted in diesel fuel savings, where a reduction in consumption in 2018 reached about 14.6 million barrels.SEC has signed an agreement with one of the local cement factories to reduce the risk of carbon ash and eliminate the construction of carbon ash landfill cells at a rate of six cells per year, thus neutralizing the environmental and technical risks of carbon ash to a product that benefits and give returns to the company. Saudi Electricity also won the award for creativity and excellence for achieving the largest financial savings during 2017 worth SR 46,516,880.The company started moving towards the production of electricity from renewable energy sources, such as solar energy at the Farasan Island plant and at Al-Aflaj plant project, and the thermal power plants projects integrated with solar energy, such as at Waad Al-Shamal and Green Duba plants, which include 100 MW of solar power. Since the announcement of
7170
Saudi Arabia Vision 2030, the Saudi Electricity Company has been working closely with the concerned authorities from the Ministry of Energy and Mineral Resources to develop its plans and initiatives to implement renewable energy projects with a capacity of 5.9 GW. The Com-pany’s renewable energy projects include Tayba and Northern Qassim projects )under prepa-ration and tender( to generate electricity by combined-cycle with 360 MW of solar power.To take advantage of the Kingdom’s wind power resources, the company implemented a project in the Huraymila area to produce 7,502 kW, which will save 29,810 barrels of oil per year and reduce CO2 emissions by 5,046 tons per year. The company’s buildings have also been provided with clean energy, starting with the company’s complex building in Dammam, Eastern Province, which has been fully supplied with solar generated electricity.The Saudi Electricity Company also signed a partnership agreement with Petroleum Chem-icals & Mining Company PCMC )Saudi Binladin Group( to establish the Green Saudi Compa-ny for Carbon Services, which aims to develop and manage carbon emission reduction pro-grams and the clean development mechanism projects, and prevent environmental pollution in accordance with international and regional protocols and treaties and local regulations.The company is also working to build specialized national competencies in this field, which can operate and manage these projects in the future, and even contribute to the selection of the best technologies for solar energy projects during the process of establishing these projects. For this purpose, the company sent a team of Saudi engineers and technicians from the company to conduct state-of-the-art technical training in the United States of America and Europe in preparation for the operation and management of solar power plants in the Kingdom.
Preserving Natural ResourcesTo reduce natural resources consumption, the company has taken several measures to im-prove energy efficiency, with fuel consumption falling from 2.1 barrels of oil/megawatt per hour in 2009 to 1.5 barrels of oil/megawatt per hour in 2017. The company plans to increase energy efficiency to 44.8% in 2030, which will in turn contribute to reducing consumption, including replacing low-efficiency generation units with a new generation of high-efficiency units, where 243 units were put out of commission from 2015 to 2018. The company also completed the electrical interconnection project between the regions of the Kingdom and the Arab Gulf states, which contributed to the import and export of electric power and reduced the revolving reserves in the network. The application of thermal insulation imposed by the company in the new buildings has also contributed to reducing the loss in energy consump-tion, as well as the application of electric power rationing projects in all administrative loca-tions of the company through the use of technical programs and modern technical solutions
to control the operation of the services in the company’s buildings, such as the use of timers and replacement of traditional light bulbs with LED bulbs.Water consumption is also inspected in all of the company’s locations to ensure that its water consumption is managed in terms of measuring consumption, using rationing methods, and taking the best option on reusing and recycling water. Currently, the generating stations are processing and reusing sanitary water to increase green areas. Power Plants 10 and 12 also use treated sanitary water instead of non-renewable groundwater in electricity production. Programs are also being implemented to reduce paper consumption and reduce the produc-tion of municipal waste from the company’s facilities, as such paper consumption decreased from 533 sheets per employee in 2011 to 287 sheets per employee in 2017, and municipal waste production decreased from 13,016 tons in 2012 to 8,674 tons in 2017. Transformer oils are also recycled, SF6 gas is to be withdrawn, stored and activated in order to reduce resource loss and hazardous waste production. The company also signed a mem-orandum of understanding with the Municipality of Dammam to produce electricity from waste instead of fossil fuels.On World Environment Day, the company celebrated in all its main locations for this interna-tional occasion, which included the submission of a number of working papers and hosting several prominent environmental specialists and personalities working in the Kingdom, along with the participation of a number of private sector companies at the accompanying exhibi-tions.The company understands the importance of cooperating with the community to support their environmental programs and activities by: sponsoring important events, such as the Gulf Environment Forum, which is supervised by the General Authority of Meteorology and Environmental Protection; participating in environmental conferences through working pa-pers; raising public awareness about the importance of preserving the environment and of rationing electricity consumption by printing guidelines on electricity bills and by distributing brochures and pamphlets via customer services offices; contributing to articles and publica-tions in newspapers; giving lectures in schools; and participating in international environmen-tal events, such as the “Earth Hour” and “Earth Day.”
72
Social Responsibility
Annual Report | 2018
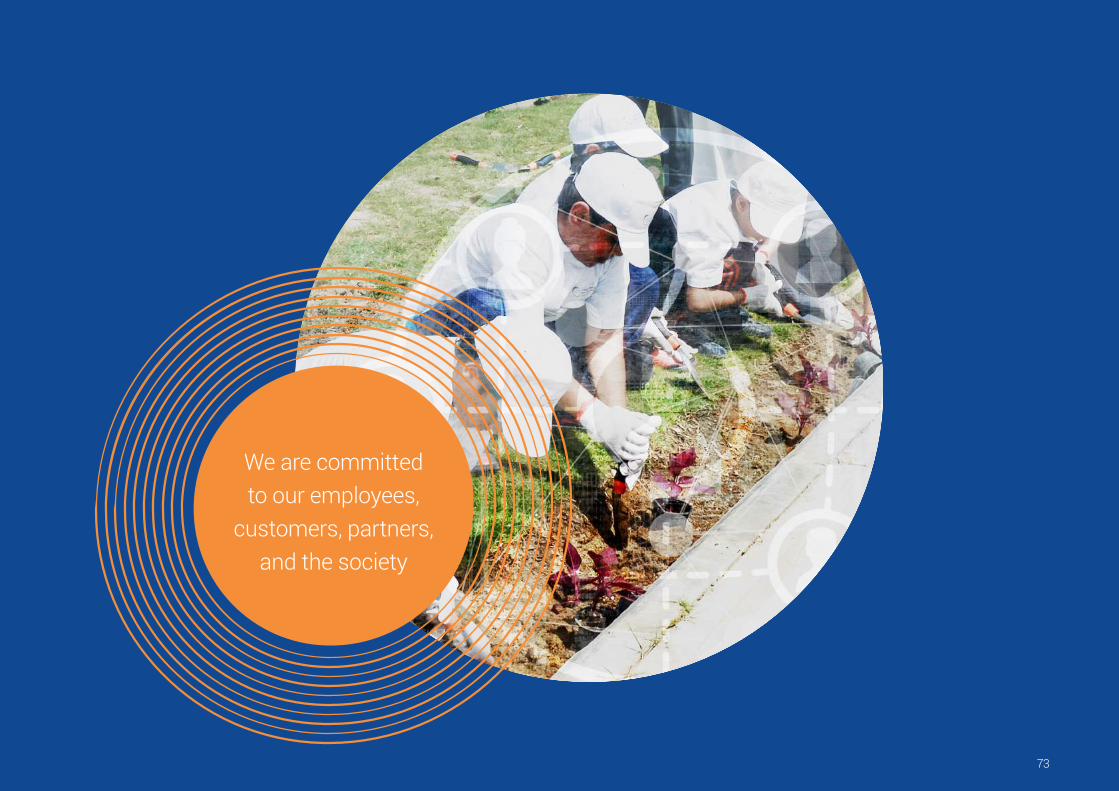
73
We are committed to our employees,
customers, partners, and the society
Annual Report | 2018
7574
1. Toward the Employees • Providing a suitable work environment. • Providing equal opportunities in training and development. • Motivating for excellence and innovation initiatives. • Instilling the culture of quality in word and deed. • Embodying the values governed by the workplace code of ethics, engaging employees
through e-mails and opinion polls on the programs, activities and services provided to them.
2. Toward societyEffectively contributing to social and economic development by:
• Supporting social welfare activities and programs. • Interacting with the developmental and humanitarian issues and concerns of society. • Engaging the community in the initiatives and leading the programs for the rationalization
of electricity consumption and dissemination of a culture of safety and security against electricity consumption risks.
• Supporting the research centers by choosing to adopt and support initiatives and research chairs, which would contribute to the rationalization of electricity consumption, improving the electrical systems performance, maintaining the environment, and supporting renewable energy initiatives and projects.
Our Strategies
Social Responsibility 3. Toward Our Partners and CustomersOur responsibility for the generation, transmission, and distribution of electric power was a strong motivation to prove our capabilities that will help us to build strategic relationships on the basis of fairness and transparency. In this context, we communicate with our customers and partners to ensure the sustainability of interaction, trust, and partnership. We also motivate them to participate in the electricity industry’s issues and to follow up with its development. We listen to their views and suggestions about the level of our performance in order to enhance our position and public image.
4. Social activities • Implementing various programs, events, lectures, graduation ceremonies, and honorary
and private parties. • Promoting social communication with employees and their families through the
implementation of an internal communication plan. • Organizing sports, cultural and social activities at the company’s clubs, and providing
training opportunities for the employees’ children to teach them the English language and computer skills in cooperation with specialized training institutes, and offer them many different sports activities.
We are committed to our employees, customers, partners and the society
7574
Social contributions
• Signing 30 strategic agreements and partnerships with several charities and government agencies in support of sustainable social responsibility programs which include training, education, jobs, health, rehabilitation of people with special needs, and family problems.
• Signing two cooperation agreements with the Ministry of Education and Civil Defense in the field of electrical safety.
• Contributing to the World Alzheimer’s Month with the cooperation of the Saudi Alzheimer Society in an ongoing strategic partnership across all the company’s platforms.
• Establishing a volunteer team and registering more than 2,000 volunteers from the company’s employees.
• The contribution of the company’s voluntary team in the distribution of the baskets of goodies and Ramadan Iftar meals throughout the Kingdom.
• Establishing a team of electricity volunteers in all areas of business to carry out volunteer work within the social responsibility plans and to participate with the Saudi Red Crescent Authority in its activities during the pilgrimage season of 1439.
• Deducting from employees’ salaries (if desired) for the benefit of authorized charities in building effective community, in 2018.
• Holding training workshops under the name “School Safety” for 900 employees of the Ministry of Education in all regions of the Kingdom.
• Holding the opening ceremony of “The World Breast Cancer Month” with Zahra Society, sponsored by His Royal Highness the Prince of Riyadh.
• Hosting the children of martyrs of duty to participate in the company’s celebrations on the occasion of the National Day, which were conducted in hospitals and at the company’s clubs in all the regions of the Kingdom.
• Carrying out the “Safe Driving Campaign” in 25 districts in conjunction with the decision to allow women to drive in the Kingdom.
• Setting up ‘electric safety and environmental’ tents in 4 major cities in the Kingdom. • To coincide with “The International Day for Older Persons”, events for older men and
women are held in collaboration with the social welfare homes at the company’s clubs. • Carrying out more than 50 blood donation campaigns in all of the company’s facilities,
including buildings, stations, and clubs. • Participating in the annual Hareed Festival on Farasan Island under the patronage of His
Royal Highness the Prince of Jazan Region.
Cooperating with 30 entities
Annual Report | 2018
76
Description of the Company’s Important Plans, Decisions, and Future Expectations
77
Saudi Electricity Company
Annual Report | 2018
7978
Description of the Company’s Important Plans, Decisions, and Future Expectations
A) Restructuring the Company’s Activities To keep up with the Kingdom’s Vision 2030 and the National Transformation Program which aim to develop the Kingdom’s electricity industry and build a competitive electricity market, the company made significant efforts during 2018 to achieve the objectives of this vision by examining many options and strategic plans to restructure its activities in coordination with all relevant authorities.The restructuring aims to improve the electricity system and work on achieving competition between different energy providers in the Kingdom. This will be reflected in the quality of service provided to customers in all walks of life, in all cities, villages and hamlets of the Kingdom, and will increase the confidence of investors and the private sector in the viability of investment in the electricity sector. The most important challenges and opportunities facing the electricity sector in the Kingdom which the company is working to overcome or achieve are:
• Meeting the growing demand for electricity.• Sustainability and diversification of energy sources.• Operating efficiency.
The restructuring plan of the company – monitored by the Ministry of Energy, Industry and Mineral Resources, Electricity and Cogeneration Regulatory Authority, Public Investment Fund and Ministry of Finance – aims at developing the electricity market in the Kingdom by increasing competition in the economic operation of the electricity system in a way that increases its operating efficiency, reduces costs and increases the reliability of the network.
During last year, the Company’s General Assembly took an important decision to establish the Saudi Energy Production Company to produce energy as an independent company wholly-owned by the Saudi Electricity Company.
The company will complete the remaining steps of its plan to restructure its activities in coordination with the Ministry of Energy, Industry and Mineral Resources and the Electricity and Cogeneration Regulatory Authority according to the objectives and strategies that contribute to the development of the electricity market. This will play a major role in advancing the national economy and the comprehensive development plans in the Kingdom, God willing.
B) Important decisions: • On Thursday, 18/01/2018, the company signed a one-year international co-financing agree-
ment for one year starting from the date of signing, valued at US$2.6 billion (equivalent to SR 9.75 billion), which should be paid in one payment.
• The company on Thursday, 20/09/2018, completed the launch of the issuance of Islamic Sukuk in the form of RegS in the international markets, divided into two tranches, the first worth US$800 million (equivalent to SR 3,000 million) and a fixed annual periodic return of 4.222% and due after five years and four months on 27/1/2024, and the second tranche worth US$1,200 million (equivalent to SR 4,500 million) and a fixed annual periodic return of 4,723% due after 10 years on 27/09/2028.
• On Wednesday, 03/10/2018, the company’s Board of Directors approved the resignation of Engineer Ziyad Bin Mohammed Alshiha, from his position as CEO of the company, and the ap-pointment of Mr. Fahad bin Hussein Al-Sudairi, (then Deputy Chief Executive Officer and Chief Financial Officer) as CEO of the company, as of 16/11/ 2018.
7978
• A decision was reached by the Council of Ministers under no. 91 and the date of 7/2/1440 H, which includes the inclusion of the Saudi Arabian Oil Company’s (Saudi Aramco) shares among the beneficiaries in any future distribution of dividends.
• On Tuesday, 13/11/2018, the company signed a contract with MEDGULF Insurance for approx-imately SR 575 million per insurance year to provide health insurance services to the compa-ny’s employees and their family members.
• On Thursday, 29/11/2018, the company signed a $2.15 billion (SR 8.06 billion) international joint revolving financing agreement with several international banks.
• The company’s 19th General Assembly approved on Tuesday, 18/12/2018, the establishment of a power generating company affiliated with the Saudi Electricity Company.
• On Tuesday, 25/12/2018, the company signed a five-year bilateral financing murabaha agree-ment with Samba Financial Group.
C) Future plans and expectationsIn light of the steady growth of the national economy and the expansion in all aspects of life in the Kingdom, the company aims to meet this expansion demand and to achieve, by the end of 2023, the following:
• To add new generating capacity to the company’s plants by about 5,894 MW. • Within the private sector participation program, 11,034 MW will be added to increase gener-
ating capacity to meet future loads. • To add transmission lines measuring 11,239 km-circular and 174 transmission stations. • To deliver electricity services to about 1.4 million new customers by the end of 2023, which
will bring the total of customers to 10.8 million customers. • To strengthen the distribution networks by adding 152,200 km of distribution lines.
• Through its development programs, the company seeks to raise the efficiency of employees and provide them with the necessary training to perform their jobs efficiently and effectively, with a 2.1% increase in training days by the end of 2023. Within the framework of the compa-ny’s program for job localization and community service, the company will maintain a locali-zation rate of 92%.
D) Accelerated Strategic Transformation ProgramThe company will continue to leverage performance efficiency efforts, improve productivity and bring the company’s performance indicators to the benchmark performance rates of the world’s best energy companies. The total savings from the Accelerated Strategic Transformation Pro-gram since its launch at the beginning of 2014 until the end of 2018, amounted to SR 16.8 billion, of which SR 2.9 billion savings achieved during 2018 as follows:
• Save SR 1.2 billion by switching from copper to aluminum cables. • Loss of revenues of SR 1.4 billion by reclassifying consumption categories, meter collection,
multiplication factors, etc. • Save SR 188 million after the introduction of the new methodology for collecting contracts. • Save SR 165 million as a result of the implementation of the strategic procurement mechanism.
Developing the Electricity market to boost the NationalEconomy & Comprehensive Development plans in the Kingdom
Annual Report | 2018
80
Summary of Financial Results
81
Saudi Electricity Company
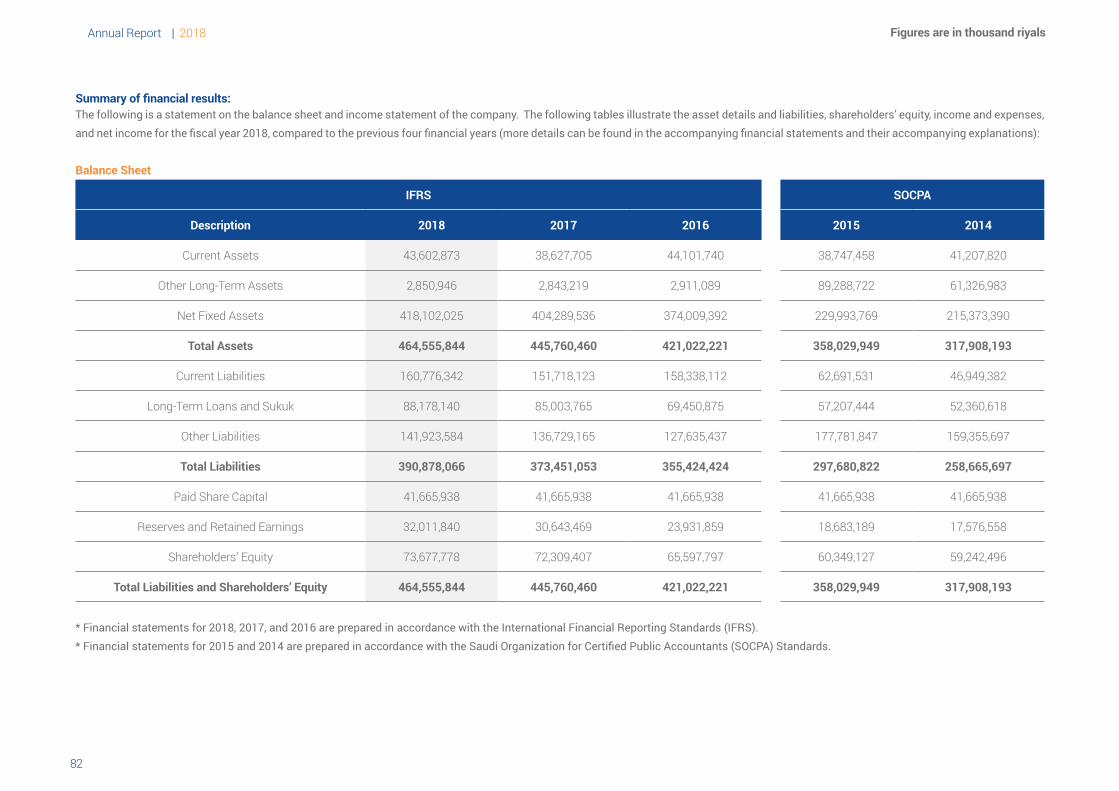
Annual Report | 2018
8382
Summary of financial results:The following is a statement on the balance sheet and income statement of the company. The following tables illustrate the asset details and liabilities, shareholders’ equity, income and expenses, and net income for the fiscal year 2018, compared to the previous four financial years (more details can be found in the accompanying financial statements and their accompanying explanations):
Balance Sheet
IFRS SOCPA
Description 2018 2017 2016 2015 2014
Current Assets 43,602,873 38,627,705 44,101,740 38,747,458 41,207,820
Other Long-Term Assets 2,850,946 2,843,219 2,911,089 89,288,722 61,326,983
Net Fixed Assets 418,102,025 404,289,536 374,009,392 229,993,769 215,373,390
Total Assets 464,555,844 445,760,460 421,022,221 358,029,949 317,908,193
Current Liabilities 160,776,342 151,718,123 158,338,112 62,691,531 46,949,382
Long-Term Loans and Sukuk 88,178,140 85,003,765 69,450,875 57,207,444 52,360,618
Other Liabilities 141,923,584 136,729,165 127,635,437 177,781,847 159,355,697
Total Liabilities 390,878,066 373,451,053 355,424,424 297,680,822 258,665,697
Paid Share Capital 41,665,938 41,665,938 41,665,938 41,665,938 41,665,938
Reserves and Retained Earnings 32,011,840 30,643,469 23,931,859 18,683,189 17,576,558
Shareholders’ Equity 73,677,778 72,309,407 65,597,797 60,349,127 59,242,496
Total Liabilities and Shareholders’ Equity 464,555,844 445,760,460 421,022,221 358,029,949 317,908,193
* Financial statements for 2018, 2017, and 2016 are prepared in accordance with the International Financial Reporting Standards (IFRS). * Financial statements for 2015 and 2014 are prepared in accordance with the Saudi Organization for Certified Public Accountants (SOCPA) Standards.
Figures are in thousand riyals
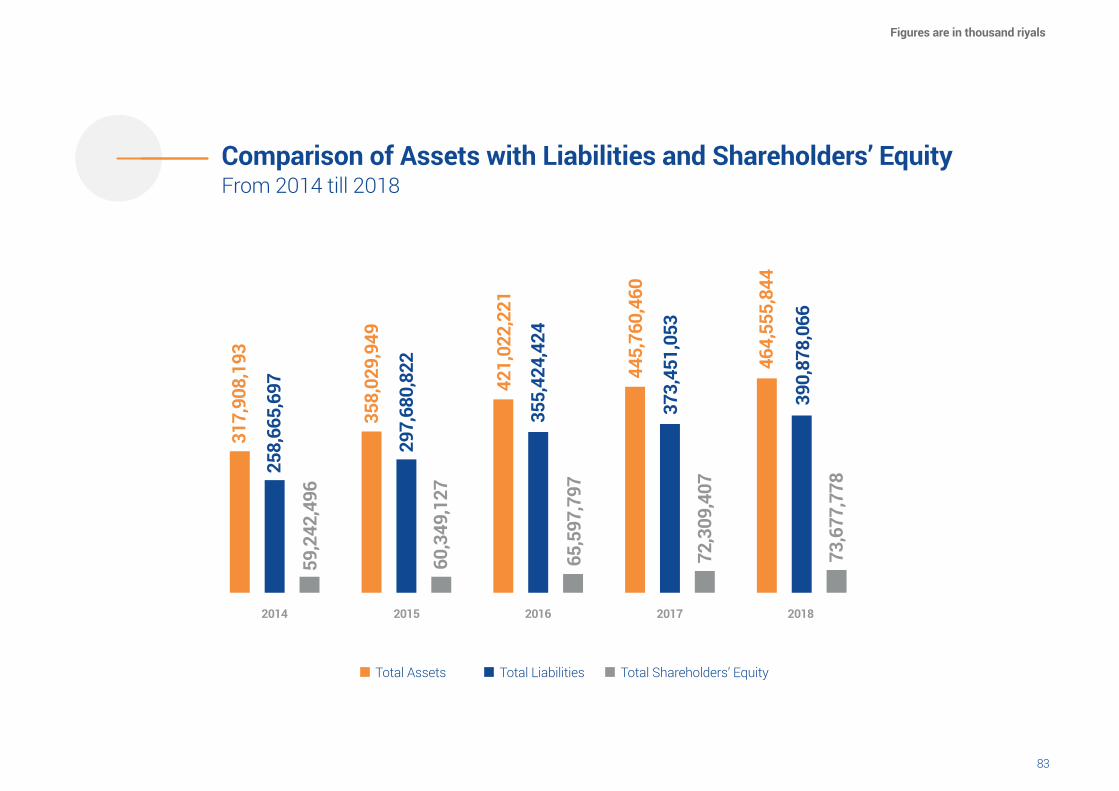
8382
2015 201720162014
317,
908,
193
358,
029,
949
421,
022,
221
445,
760,
460
464,
555,
844
258,
665,
697
297,
680,
822
355,
424,
424
373,
451,
053
390,
878,
066
59,2
42,4
96
60,3
49,1
27
65,5
97,7
97
72,3
09,4
07
73,6
77,7
78
2018
Figures are in thousand riyals
Total Assets Total Liabilities Total Shareholders’ Equity
Comparison of Assets with Liabilities and Shareholders’ EquityFrom 2014 till 2018
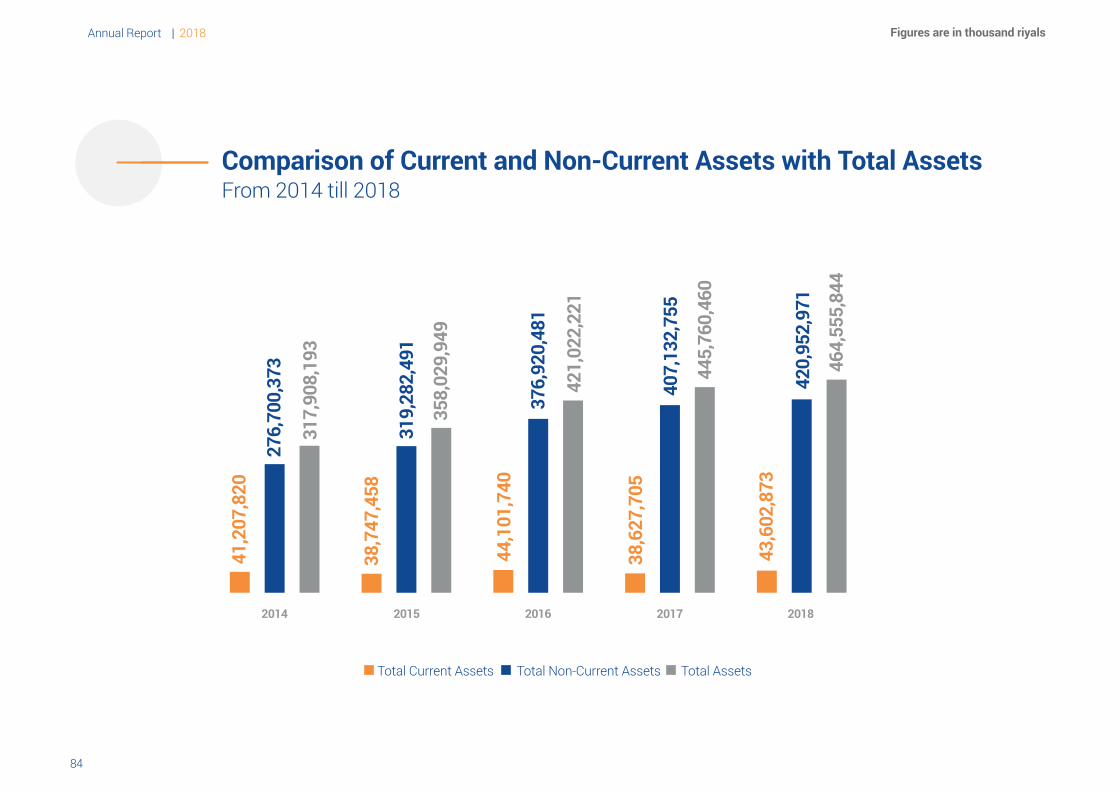
Annual Report | 2018
8584
Comparison of Current and Non-Current Assets with Total AssetsFrom 2014 till 2018
2015 201720162014
41,2
07,8
20
38,7
47,4
58
44,1
01,7
40
38,6
27,7
05
43,6
02,8
73
276,
700,
373
319,
282,
491
376,
920,
481
407,
132,
755
420,
952,
971
317,
908,
193
358,
029,
949
421,
022,
221
445,
760,
460
464,
555,
844
2018
Figures are in thousand riyals
Total Current Assets Total Non-Current Assets Total Assets
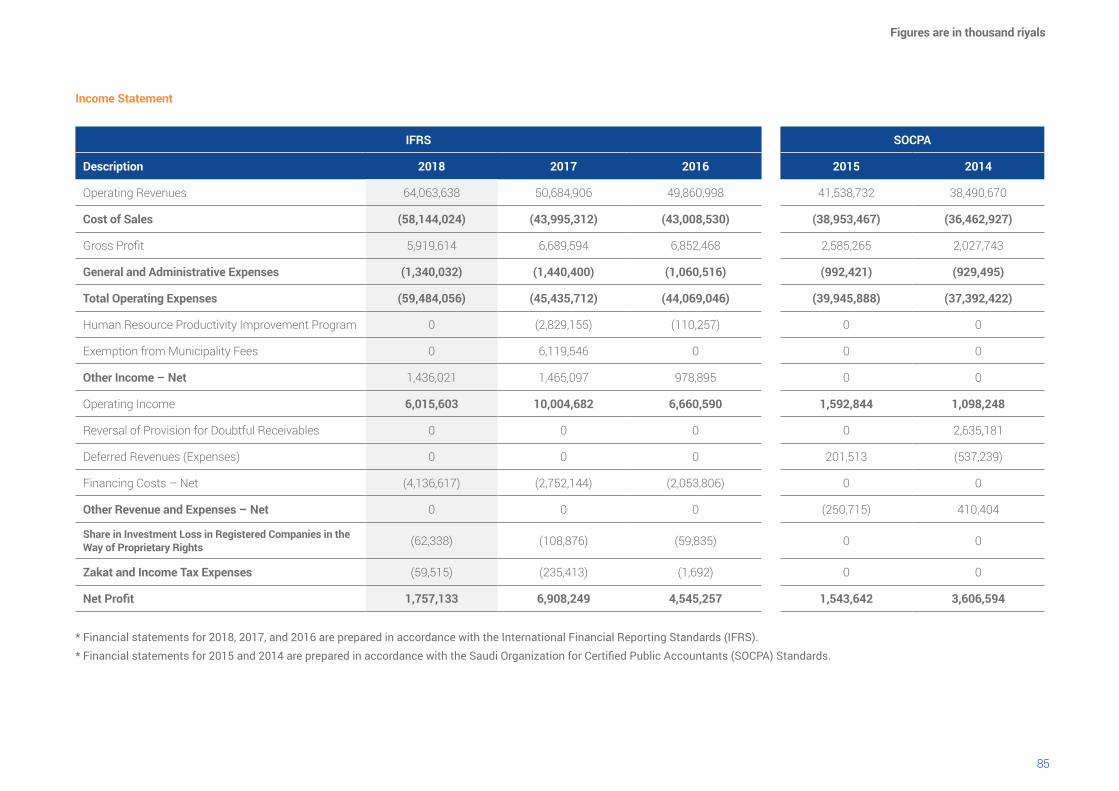
8584
Income Statement
IFRS SOCPA
Description 2018 2017 2016 2015 2014
Operating Revenues 64,063,638 50,684,906 49,860,998 41,538,732 38,490,670
Cost of Sales (58,144,024) (43,995,312) (43,008,530) (38,953,467) (36,462,927)
Gross Profit 5,919,614 6,689,594 6,852,468 2,585,265 2,027,743
General and Administrative Expenses (1,340,032) (1,440,400) (1,060,516) (992,421) (929,495)
Total Operating Expenses (59,484,056) (45,435,712) (44,069,046) (39,945,888) (37,392,422)
Human Resource Productivity Improvement Program 0 )2,829,155( )110,257( 0 0
Exemption from Municipality Fees 0 6,119,546 0 0 0
Other Income – Net 1,436,021 1,465,097 978,895 0 0
Operating Income 6,015,603 10,004,682 6,660,590 1,592,844 1,098,248
Reversal of Provision for Doubtful Receivables 0 0 0 0 2,635,181
Deferred Revenues )Expenses( 0 0 0 201,513 )537,239(
Financing Costs – Net )4,136,617( )2,752,144( )2,053,806( 0 0
Other Revenue and Expenses – Net 0 0 0 )250,715( 410,404
Share in Investment Loss in Registered Companies in theWay of Proprietary Rights )62,338( )108,876( )59,835( 0 0
Zakat and Income Tax Expenses )59,515( )235,413( )1,692( 0 0
Net Profit 1,757,133 6,908,249 4,545,257 1,543,642 3,606,594
* Financial statements for 2018, 2017, and 2016 are prepared in accordance with the International Financial Reporting Standards (IFRS).* Financial statements for 2015 and 2014 are prepared in accordance with the Saudi Organization for Certified Public Accountants (SOCPA) Standards.
Figures are in thousand riyals
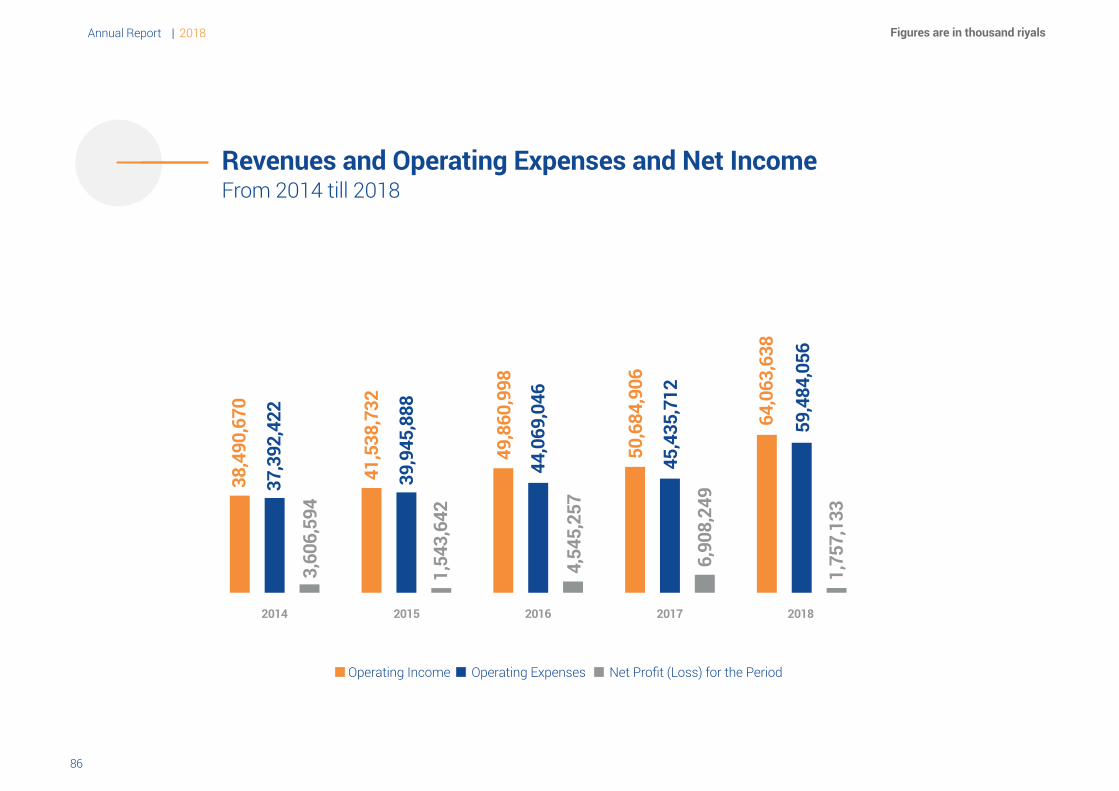
Annual Report | 2018
8786
Operating Income Operating Expenses Net Profit (Loss) for the Period
Revenues and Operating Expenses and Net IncomeFrom 2014 till 2018
2015 201720162014
38,4
90,6
70
41,5
38,7
32
49,8
60,9
98
50,6
84,9
06
64,0
63,6
38
37,3
92,4
22
39,9
45,8
88
44,0
69,0
46
45,4
35,7
12
59,4
84,0
56
3,60
6,59
4
1,54
3,64
2
4,54
5,25
7
6,90
8,24
9
1,75
7,13
3
2018
Figures are in thousand riyals
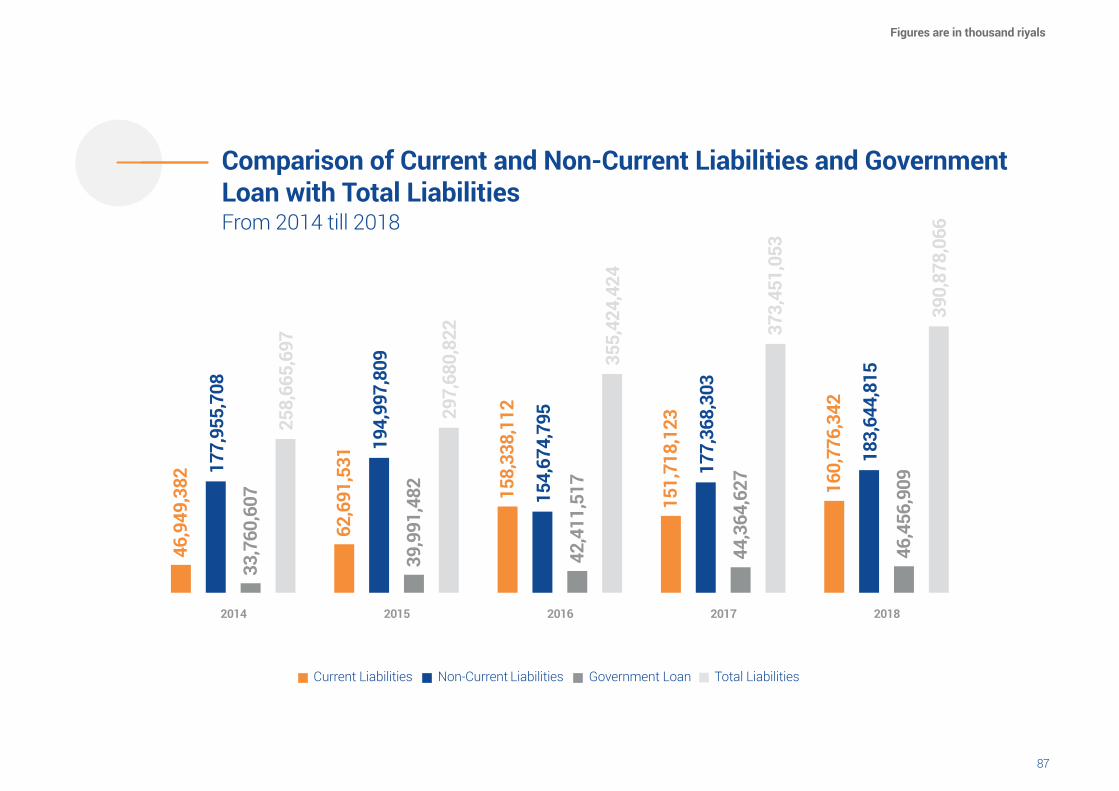
8786
160,
776,
342
183,
644,
815
46,4
56,9
09
2018
158,
338,
112
154,
674,
795
42,4
11,5
17
2016
151,
718,
123
177,
368,
303
44,3
64,6
27
2017
62,6
91,5
31
194,
997,
809
39,9
91,4
82
2015
46,9
49,3
82
177,
955,
708
33,7
60,6
07
355,
424,
424
373,
451,
053
390,
878,
066
297,
680,
822
258,
665,
697
2014
Current Liabilities Non-Current Liabilities Government Loan Total Liabilities
Figures are in thousand riyals
Comparison of Current and Non-Current Liabilities and Government Loan with Total LiabilitiesFrom 2014 till 2018
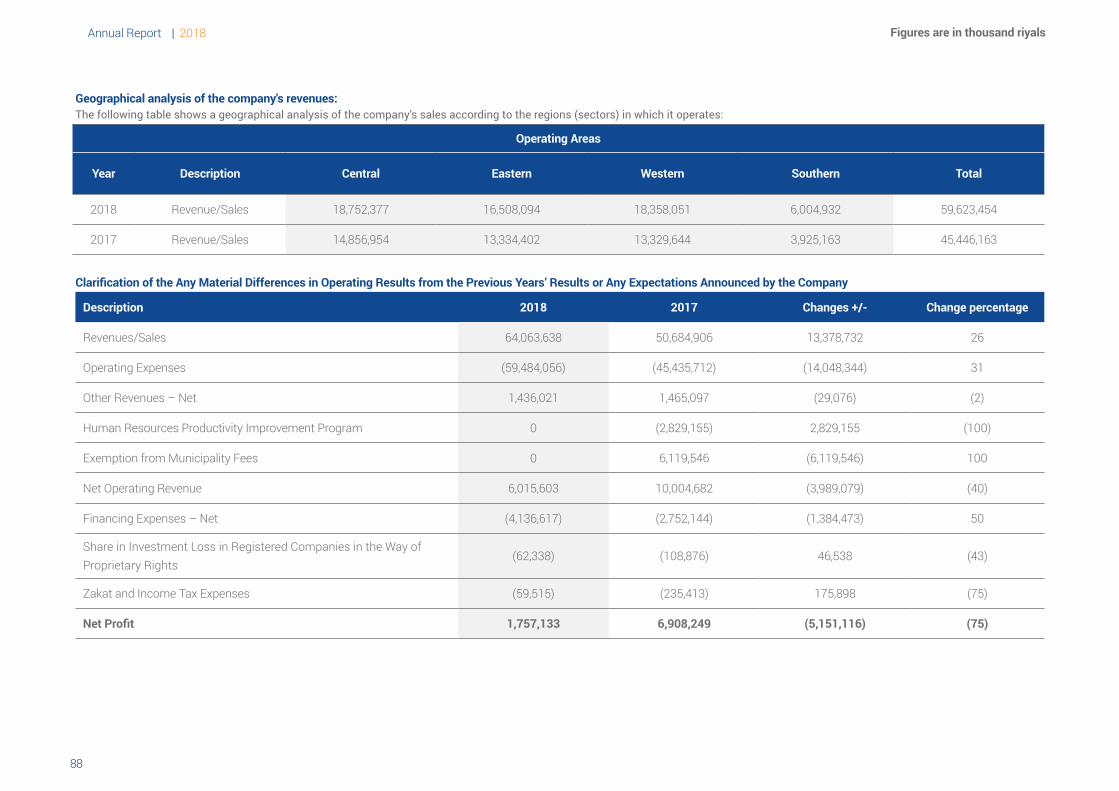
Annual Report | 2018
8988
Geographical analysis of the company's revenues:The following table shows a geographical analysis of the company's sales according to the regions (sectors) in which it operates:
Operating Areas
Year Description Central Eastern Western Southern Total
2018 Revenue/Sales 18,752,377 16,508,094 18,358,051 6,004,932 59,623,454
2017 Revenue/Sales 14,856,954 13,334,402 13,329,644 3,925,163 45,446,163
Clarification of the Any Material Differences in Operating Results from the Previous Years’ Results or Any Expectations Announced by the Company
Description 2018 2017 Changes +/- Change percentage
Revenues/Sales 64,063,638 50,684,906 13,378,732 26
Operating Expenses )59,484,056( )45,435,712( )14,048,344( 31
Other Revenues – Net 1,436,021 1,465,097 )29,076( )2(
Human Resources Productivity Improvement Program 0 )2,829,155( 2,829,155 )100(
Exemption from Municipality Fees 0 6,119,546 )6,119,546( 100
Net Operating Revenue 6,015,603 10,004,682 )3,989,079( )40(
Financing Expenses – Net )4,136,617( )2,752,144( )1,384,473( 50
Share in Investment Loss in Registered Companies in the Way ofProprietary Rights
)62,338( )108,876( 46,538 )43(
Zakat and Income Tax Expenses )59,515( )235,413( 175,898 )75(
Net Profit 1,757,133 6,908,249 (5,151,116) (75)
Figures are in thousand riyals
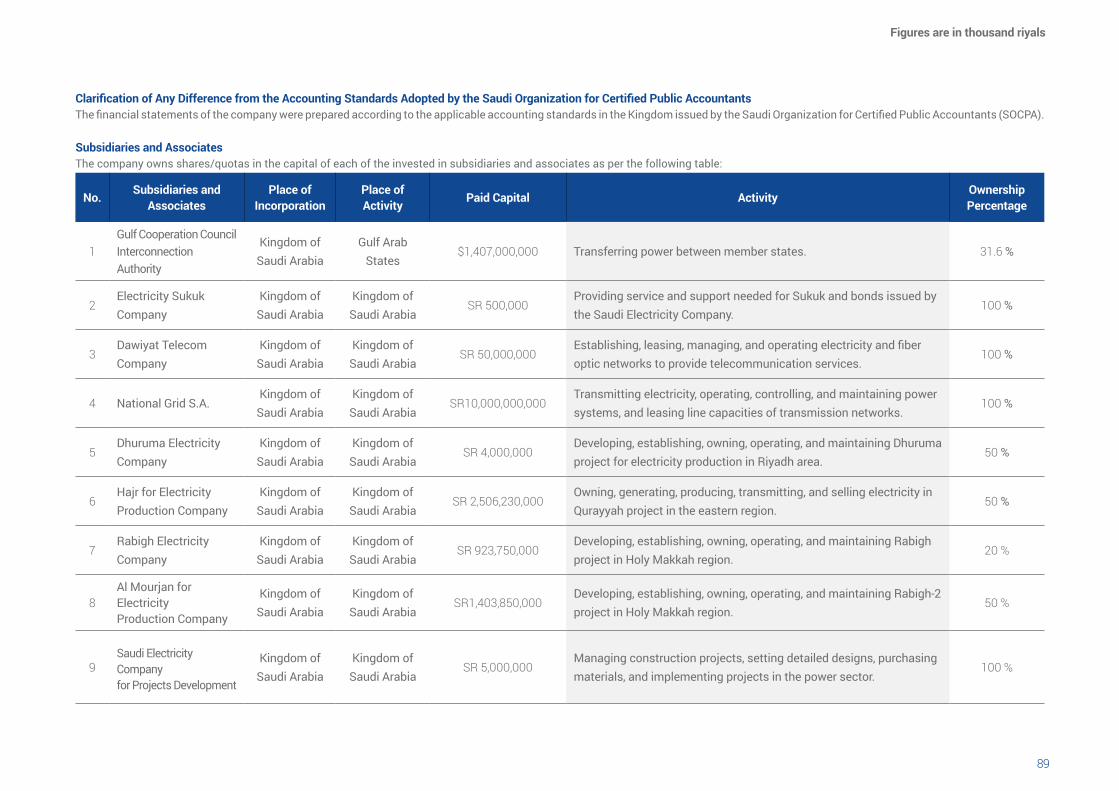
8988
Clarification of Any Difference from the Accounting Standards Adopted by the Saudi Organization for Certified Public AccountantsThe financial statements of the company were prepared according to the applicable accounting standards in the Kingdom issued by the Saudi Organization for Certified Public Accountants (SOCPA).
Subsidiaries and AssociatesThe company owns shares/quotas in the capital of each of the invested in subsidiaries and associates as per the following table:
No. Subsidiaries and
Associates Place of
Incorporation Place ofActivity
Paid Capital Activity OwnershipPercentage
1Gulf Cooperation Council InterconnectionAuthority
Kingdom ofSaudi Arabia
Gulf ArabStates
$1,407,000,000 Transferring power between member states. 31.6 %
2 Electricity SukukCompany
Kingdom ofSaudi Arabia
Kingdom ofSaudi Arabia
SR 500,000Providing service and support needed for Sukuk and bonds issued by the Saudi Electricity Company.
100 %
3Dawiyat Telecom Company
Kingdom ofSaudi Arabia
Kingdom ofSaudi Arabia
SR 50,000,000Establishing, leasing, managing, and operating electricity and fiber optic networks to provide telecommunication services.
100 %
4 National Grid S.A. Kingdom ofSaudi Arabia
Kingdom ofSaudi Arabia
SR10,000,000,000Transmitting electricity, operating, controlling, and maintaining power systems, and leasing line capacities of transmission networks.
100 %
5Dhuruma Electricity Company
Kingdom ofSaudi Arabia
Kingdom ofSaudi Arabia
SR 4,000,000Developing, establishing, owning, operating, and maintaining Dhuruma project for electricity production in Riyadh area.
50 %
6 Hajr for ElectricityProduction Company
Kingdom ofSaudi Arabia
Kingdom ofSaudi Arabia
SR 2,506,230,000 Owning, generating, producing, transmitting, and selling electricity in Qurayyah project in the eastern region.
50 %
7Rabigh Electricity Company
Kingdom ofSaudi Arabia
Kingdom ofSaudi Arabia
SR 923,750,000Developing, establishing, owning, operating, and maintaining Rabigh project in Holy Makkah region.
20 %
8 Al Mourjan forElectricityProduction Company
Kingdom ofSaudi Arabia
Kingdom ofSaudi Arabia
SR1,403,850,000Developing, establishing, owning, operating, and maintaining Rabigh-2 project in Holy Makkah region.
50 %
9Saudi Electricity Companyfor Projects Development
Kingdom ofSaudi Arabia
Kingdom ofSaudi Arabia
SR 5,000,000Managing construction projects, setting detailed designs, purchasing materials, and implementing projects in the power sector.
100 %
Figures are in thousand riyals
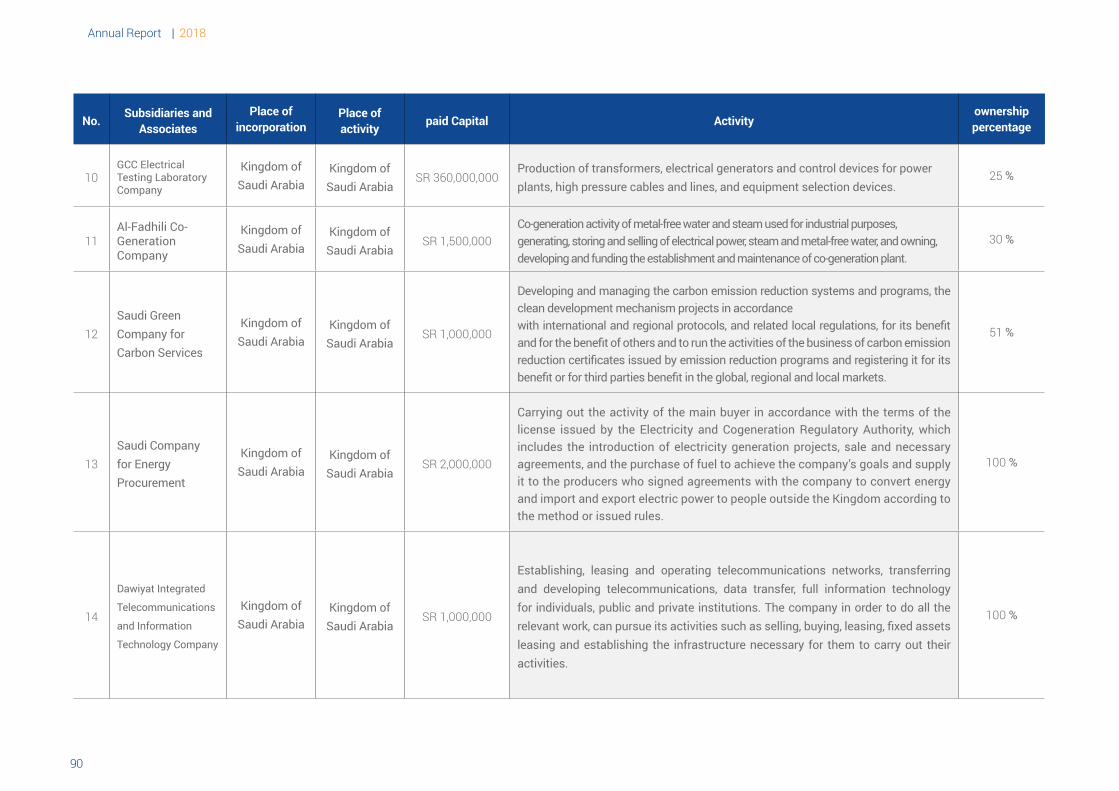
Annual Report | 2018
9190
No. Subsidiaries and
Associates Place of
incorporation Place ofactivity
paid Capital Activityownershippercentage
10 GCC Electrical Testing LaboratoryCompany
Kingdom ofSaudi Arabia
Kingdom ofSaudi Arabia
SR 360,000,000 Production of transformers, electrical generators and control devices for power plants, high pressure cables and lines, and equipment selection devices.
25 %
11Al-Fadhili Co-GenerationCompany
Kingdom ofSaudi Arabia
Kingdom ofSaudi Arabia
SR 1,500,000Co-generation activity of metal-free water and steam used for industrial purposes, generating, storing and selling of electrical power, steam and metal-free water, and owning, developing and funding the establishment and maintenance of co-generation plant.
30 %
12 Saudi GreenCompany forCarbon Services
Kingdom ofSaudi Arabia
Kingdom ofSaudi Arabia
SR 1,000,000
Developing and managing the carbon emission reduction systems and programs, theclean development mechanism projects in accordance with international and regional protocols, and related local regulations, for its benefit and for the benefit of others and to run the activities of the business of carbon emission reduction certificates issued by emission reduction programs and registering it for itsbenefit or for third parties benefit in the global, regional and local markets.
51 %
13 Saudi Company for EnergyProcurement
Kingdom ofSaudi Arabia
Kingdom ofSaudi Arabia
SR 2,000,000
Carrying out the activity of the main buyer in accordance with the terms of the license issued by the Electricity and Cogeneration Regulatory Authority, which includes the introduction of electricity generation projects, sale and necessary agreements, and the purchase of fuel to achieve the company’s goals and supply it to the producers who signed agreements with the company to convert energy and import and export electric power to people outside the Kingdom according to the method or issued rules.
100 %
14
Dawiyat Integrated
Telecommunications
and Information
Technology Company
Kingdom ofSaudi Arabia
Kingdom ofSaudi Arabia
SR 1,000,000
Establishing, leasing and operating telecommunications networks, transferring and developing telecommunications, data transfer, full information technology for individuals, public and private institutions. The company in order to do all the relevant work, can pursue its activities such as selling, buying, leasing, fixed assets leasing and establishing the infrastructure necessary for them to carry out their activities.
100 %
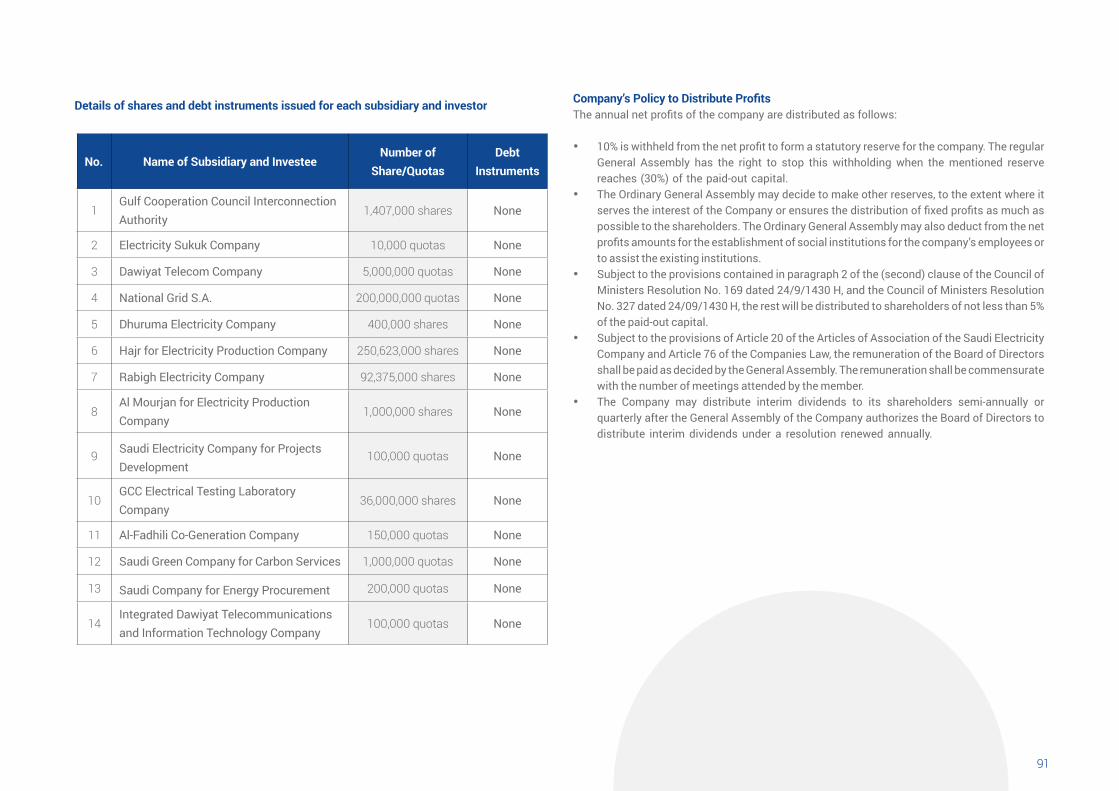
9190
Details of shares and debt instruments issued for each subsidiary and investor
No. Name of Subsidiary and InvesteeNumber of
Share/Quotas Debt
Instruments
1 Gulf Cooperation Council Interconnection Authority
1,407,000 shares None
2 Electricity Sukuk Company 10,000 quotas None
3 Dawiyat Telecom Company 5,000,000 quotas None
4 National Grid S.A. 200,000,000 quotas None
5 Dhuruma Electricity Company 400,000 shares None
6 Hajr for Electricity Production Company 250,623,000 shares None
7 Rabigh Electricity Company 92,375,000 shares None
8 Al Mourjan for Electricity Production Company
1,000,000 shares None
9 Saudi Electricity Company for ProjectsDevelopment
100,000 quotas None
10 GCC Electrical Testing Laboratory Company
36,000,000 shares None
11 Al-Fadhili Co-Generation Company 150,000 quotas None
12 Saudi Green Company for Carbon Services 1,000,000 quotas None
13 Saudi Company for Energy Procurement 200,000 quotas None
14 Integrated Dawiyat Telecommunicationsand Information Technology Company
100,000 quotas None
Company’s Policy to Distribute Profits The annual net profits of the company are distributed as follows:
• 10% is withheld from the net profit to form a statutory reserve for the company. The regular General Assembly has the right to stop this withholding when the mentioned reserve reaches (30%) of the paid-out capital.
• The Ordinary General Assembly may decide to make other reserves, to the extent where it serves the interest of the Company or ensures the distribution of fixed profits as much as possible to the shareholders. The Ordinary General Assembly may also deduct from the net profits amounts for the establishment of social institutions for the company’s employees or to assist the existing institutions.
• Subject to the provisions contained in paragraph 2 of the (second) clause of the Council of Ministers Resolution No. 169 dated 24/9/1430 H, and the Council of Ministers Resolution No. 327 dated 24/09/1430 H, the rest will be distributed to shareholders of not less than 5% of the paid-out capital.
• Subject to the provisions of Article 20 of the Articles of Association of the Saudi Electricity Company and Article 76 of the Companies Law, the remuneration of the Board of Directors shall be paid as decided by the General Assembly. The remuneration shall be commensurate with the number of meetings attended by the member.
• The Company may distribute interim dividends to its shareholders semi-annually or quarterly after the General Assembly of the Company authorizes the Board of Directors to distribute interim dividends under a resolution renewed annually.
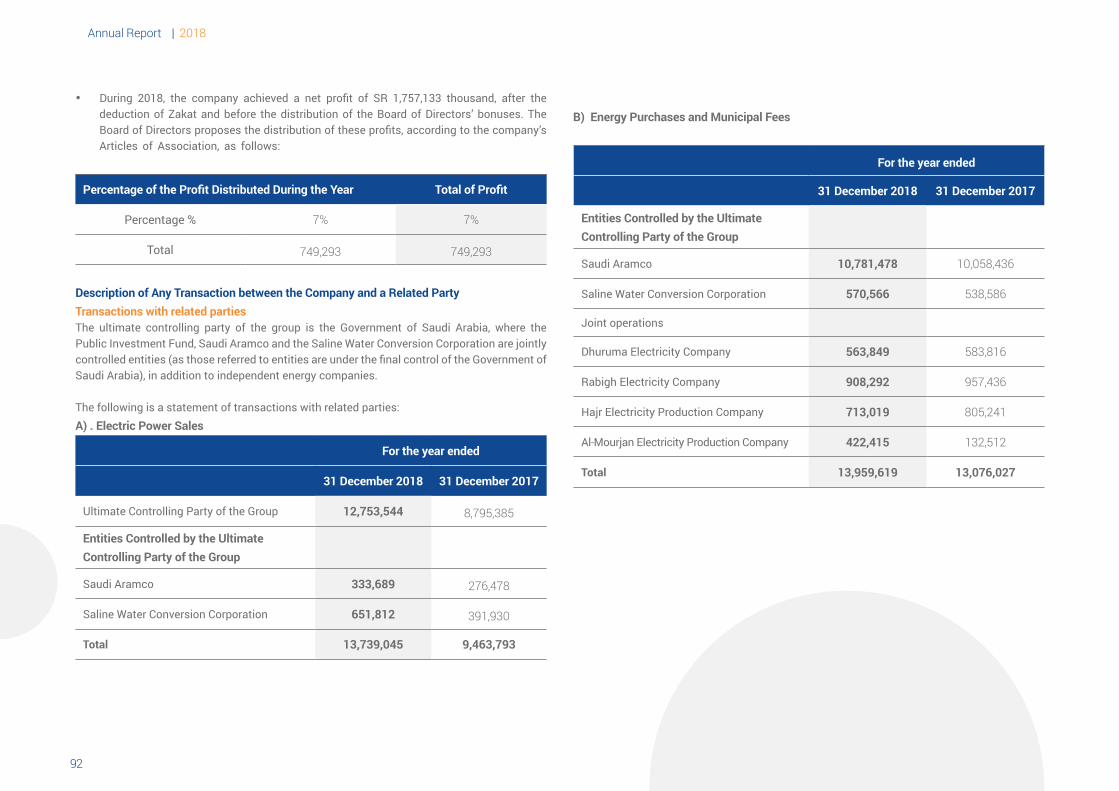
Annual Report | 2018
9392
• During 2018, the company achieved a net profit of SR 1,757,133 thousand, after the deduction of Zakat and before the distribution of the Board of Directors’ bonuses. The Board of Directors proposes the distribution of these profits, according to the company’s Articles of Association, as follows:
Percentage of the Profit Distributed During the Year Total of Profit
Percentage % 7% 7%
Total 749,293 749,293
Description of Any Transaction between the Company and a Related PartyTransactions with related partiesThe ultimate controlling party of the group is the Government of Saudi Arabia, where the Public Investment Fund, Saudi Aramco and the Saline Water Conversion Corporation are jointly controlled entities (as those referred to entities are under the final control of the Government of Saudi Arabia), in addition to independent energy companies.
The following is a statement of transactions with related parties:A) . Electric Power Sales
For the year ended
31 December 2018 31 December 2017
Ultimate Controlling Party of the Group 12,753,544 8,795,385
Entities Controlled by the Ultimate Controlling Party of the Group
Saudi Aramco 333,689 276,478
Saline Water Conversion Corporation 651,812 391,930
Total 13,739,045 9,463,793
B) Energy Purchases and Municipal Fees
For the year ended
31 December 2018 31 December 2017
Entities Controlled by the Ultimate Controlling Party of the Group
Saudi Aramco 10,781,478 10,058,436
Saline Water Conversion Corporation 570,566 538,586
Joint operations
Dhuruma Electricity Company 563,849 583,816
Rabigh Electricity Company 908,292 957,436
Hajr Electricity Production Company 713,019 805,241
Al-Mourjan Electricity Production Company 422,415 132,512
Total 13,959,619 13,076,027
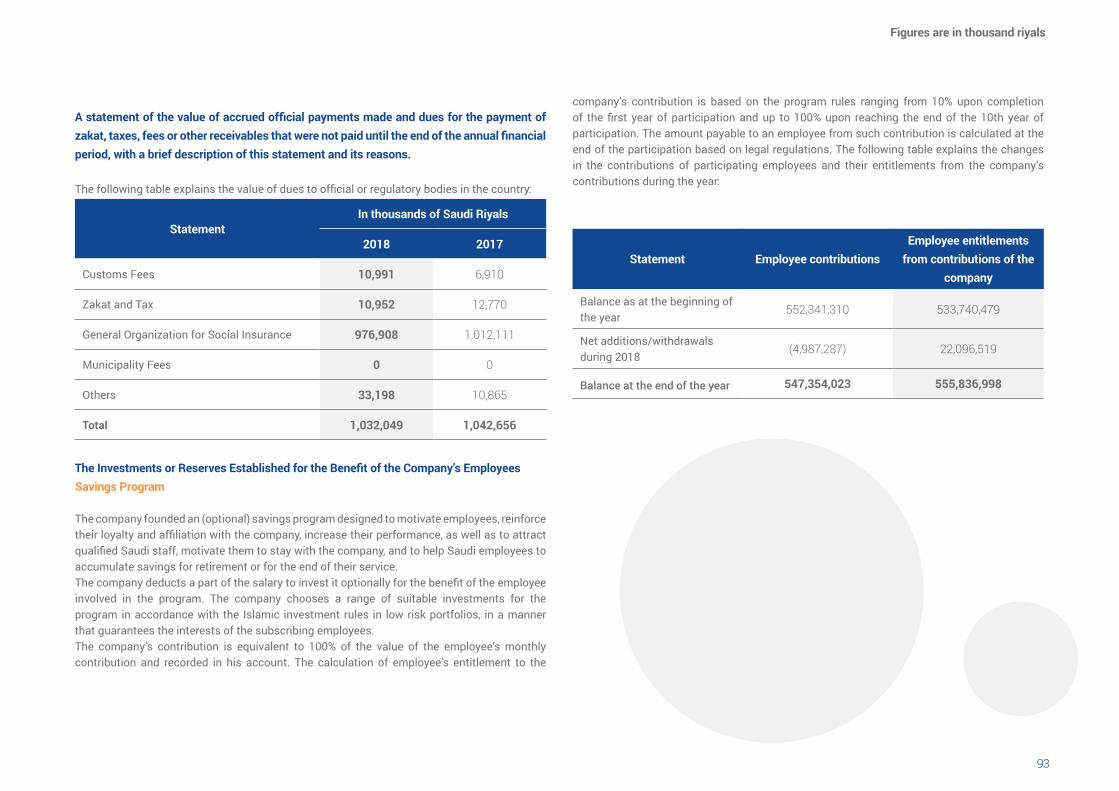
9392
A statement of the value of accrued official payments made and dues for the payment of zakat, taxes, fees or other receivables that were not paid until the end of the annual financial period, with a brief description of this statement and its reasons.
The following table explains the value of dues to official or regulatory bodies in the country:
StatementIn thousands of Saudi Riyals
2018 2017
Customs Fees 10,991 6,910
Zakat and Tax 10,952 12,770
General Organization for Social Insurance 976,908 1,012,111
Municipality Fees 0 0
Others 33,198 10,865
Total 1,032,049 1,042,656
The Investments or Reserves Established for the Benefit of the Company’s EmployeesSavings Program
The company founded an (optional) savings program designed to motivate employees, reinforce their loyalty and affiliation with the company, increase their performance, as well as to attract qualified Saudi staff, motivate them to stay with the company, and to help Saudi employees to accumulate savings for retirement or for the end of their service.The company deducts a part of the salary to invest it optionally for the benefit of the employee involved in the program. The company chooses a range of suitable investments for the program in accordance with the Islamic investment rules in low risk portfolios, in a manner that guarantees the interests of the subscribing employees.The company’s contribution is equivalent to 100% of the value of the employee’s monthly contribution and recorded in his account. The calculation of employee’s entitlement to the
company’s contribution is based on the program rules ranging from 10% upon completion of the first year of participation and up to 100% upon reaching the end of the 10th year of participation. The amount payable to an employee from such contribution is calculated at the end of the participation based on legal regulations. The following table explains the changes in the contributions of participating employees and their entitlements from the company’s contributions during the year:
Statement Employee contributions Employee entitlements
from contributions of thecompany
Balance as at the beginning of the year
552,341,310 533,740,479
Net additions/withdrawals during 2018
)4,987,287( 22,096,519
Balance at the end of the year 547,354,023 555,836,998
Figures are in thousand riyals
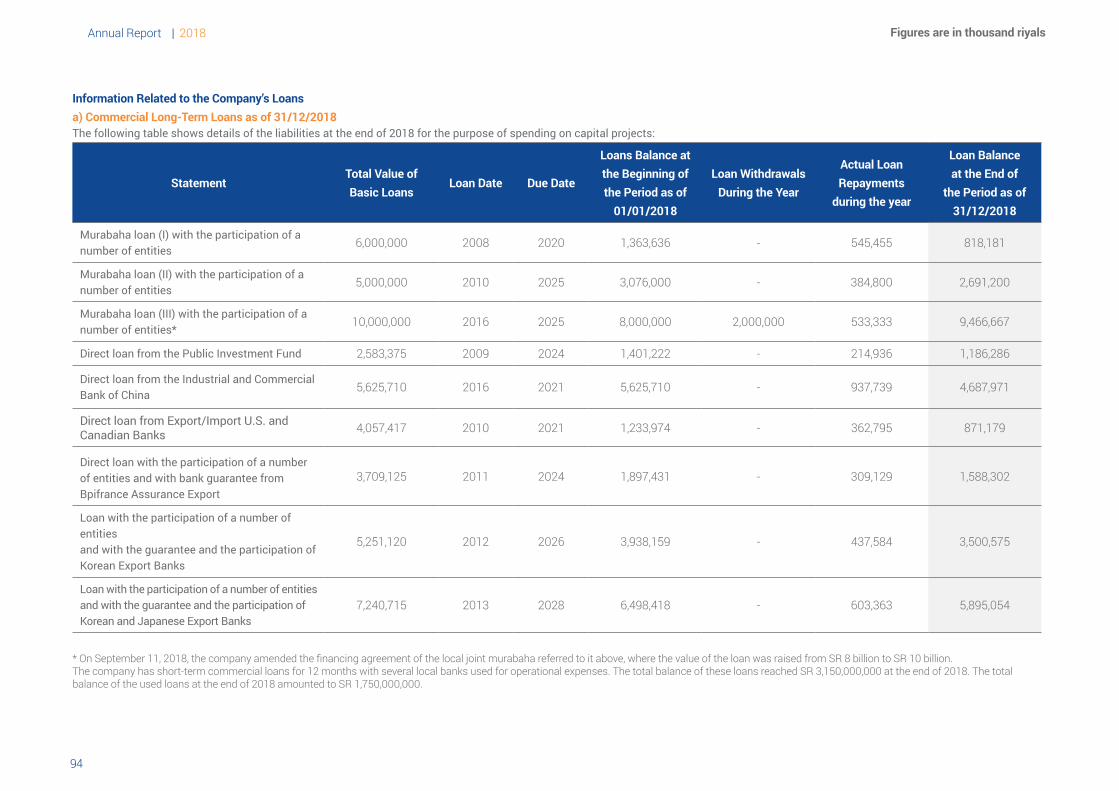
Annual Report | 2018
9594
Information Related to the Company’s Loansa) Commercial Long-Term Loans as of 31/12/2018The following table shows details of the liabilities at the end of 2018 for the purpose of spending on capital projects:
StatementTotal Value of Basic Loans
Loan Date Due Date
Loans Balance at the Beginning of the Period as of
01/01/2018
Loan Withdrawals During the Year
Actual Loan Repayments
during the year
Loan Balance at the End of
the Period as of 31/12/2018
Murabaha loan (I) with the participation of a number of entities
6,000,000 2008 2020 1,363,636 - 545,455 818,181
Murabaha loan (II) with the participation of a number of entities
5,000,000 2010 2025 3,076,000 - 384,800 2,691,200
Murabaha loan (III) with the participation of a number of entities*
10,000,000 2016 2025 8,000,000 2,000,000 533,333 9,466,667
Direct loan from the Public Investment Fund 2,583,375 2009 2024 1,401,222 - 214,936 1,186,286
Direct loan from the Industrial and Commercial Bank of China
5,625,710 2016 2021 5,625,710 - 937,739 4,687,971
Direct loan from Export/Import U.S. and Canadian Banks 4,057,417 2010 2021 1,233,974 - 362,795 871,179
Direct loan with the participation of a number of entities and with bank guarantee from Bpifrance Assurance Export
3,709,125 2011 2024 1,897,431 - 309,129 1,588,302
Loan with the participation of a number of entitiesand with the guarantee and the participation ofKorean Export Banks
5,251,120 2012 2026 3,938,159 - 437,584 3,500,575
Loan with the participation of a number of entitiesand with the guarantee and the participation ofKorean and Japanese Export Banks
7,240,715 2013 2028 6,498,418 - 603,363 5,895,054
* On September 11, 2018, the company amended the financing agreement of the local joint murabaha referred to it above, where the value of the loan was raised from SR 8 billion to SR 10 billion.The company has short-term commercial loans for 12 months with several local banks used for operational expenses. The total balance of these loans reached SR 3,150,000,000 at the end of 2018. The total balance of the used loans at the end of 2018 amounted to SR 1,750,000,000.
Figures are in thousand riyals
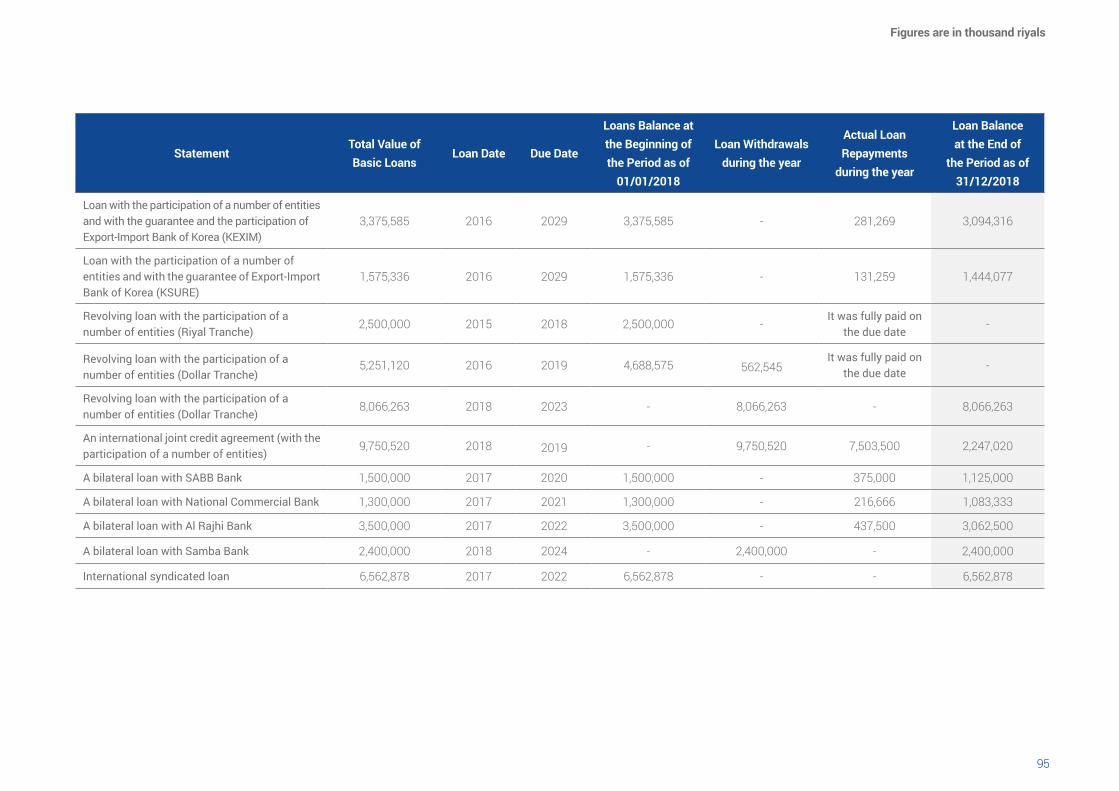
9594
StatementTotal Value of Basic Loans
Loan Date Due Date
Loans Balance at the Beginning of the Period as of
01/01/2018
Loan Withdrawals during the year
Actual Loan Repayments
during the year
Loan Balance at the End of
the Period as of31/12/2018
Loan with the participation of a number of entitiesand with the guarantee and the participation ofExport-Import Bank of Korea (KEXIM)
3,375,585 2016 2029 3,375,585 - 281,269 3,094,316
Loan with the participation of a number of entities and with the guarantee of Export-Import Bank of Korea (KSURE)
1,575,336 2016 2029 1,575,336 - 131,259 1,444,077
Revolving loan with the participation of a number of entities (Riyal Tranche)
2,500,000 2015 2018 2,500,000 -It was fully paid on
the due date-
Revolving loan with the participation of a number of entities (Dollar Tranche)
5,251,120 2016 2019 4,688,575 562,545It was fully paid on
the due date-
Revolving loan with the participation of a number of entities (Dollar Tranche)
8,066,263 2018 2023 - 8,066,263 - 8,066,263
An international joint credit agreement (with the participation of a number of entities)
9,750,520 2018 2019 - 9,750,520 7,503,500 2,247,020
A bilateral loan with SABB Bank 1,500,000 2017 2020 1,500,000 - 375,000 1,125,000
A bilateral loan with National Commercial Bank 1,300,000 2017 2021 1,300,000 - 216,666 1,083,333
A bilateral loan with Al Rajhi Bank 3,500,000 2017 2022 3,500,000 - 437,500 3,062,500
A bilateral loan with Samba Bank 2,400,000 2018 2024 - 2,400,000 - 2,400,000
International syndicated loan 6,562,878 2017 2022 6,562,878 - - 6,562,878
Figures are in thousand riyals
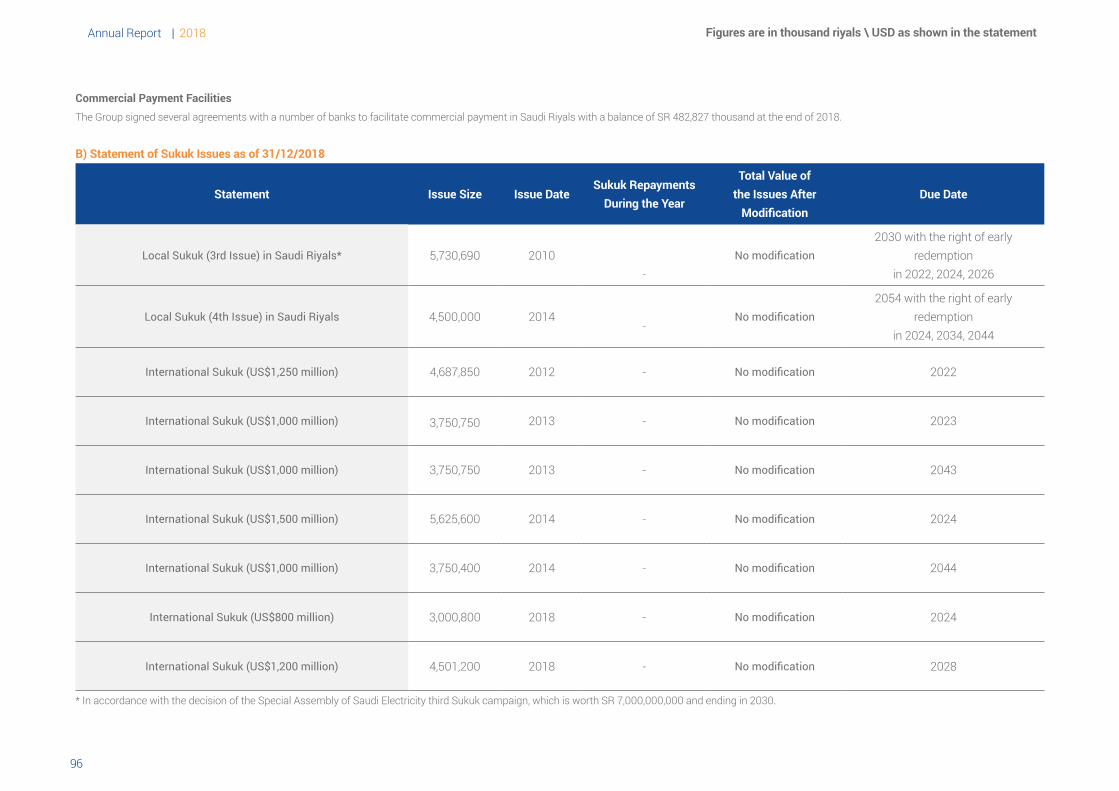
Annual Report | 2018
9796
Commercial Payment FacilitiesThe Group signed several agreements with a number of banks to facilitate commercial payment in Saudi Riyals with a balance of SR 482,827 thousand at the end of 2018.
B) Statement of Sukuk Issues as of 31/12/2018
Statement Issue Size Issue Date Sukuk Repayments
During the Year
Total Value of the Issues After
ModificationDue Date
Local Sukuk (3rd Issue) in Saudi Riyals* 5,730,690 2010-
No modification2030 with the right of early
redemptionin 2022, 2024, 2026
Local Sukuk (4th Issue) in Saudi Riyals 4,500,000 2014-
No modification2054 with the right of early
redemptionin 2024, 2034, 2044
International Sukuk (US$1,250 million) 4,687,850 2012 - No modification 2022
International Sukuk (US$1,000 million) 3,750,750 2013 - No modification 2023
International Sukuk (US$1,000 million) 3,750,750 2013 - No modification 2043
International Sukuk (US$1,500 million) 5,625,600 2014 - No modification 2024
International Sukuk (US$1,000 million) 3,750,400 2014 - No modification 2044
International Sukuk (US$800 million) 3,000,800 2018 - No modification 2024
International Sukuk (US$1,200 million) 4,501,200 2018 - No modification 2028
* In accordance with the decision of the Special Assembly of Saudi Electricity third Sukuk campaign, which is worth SR 7,000,000,000 and ending in 2030.
Figures are in thousand riyals \ USD as shown in the statement
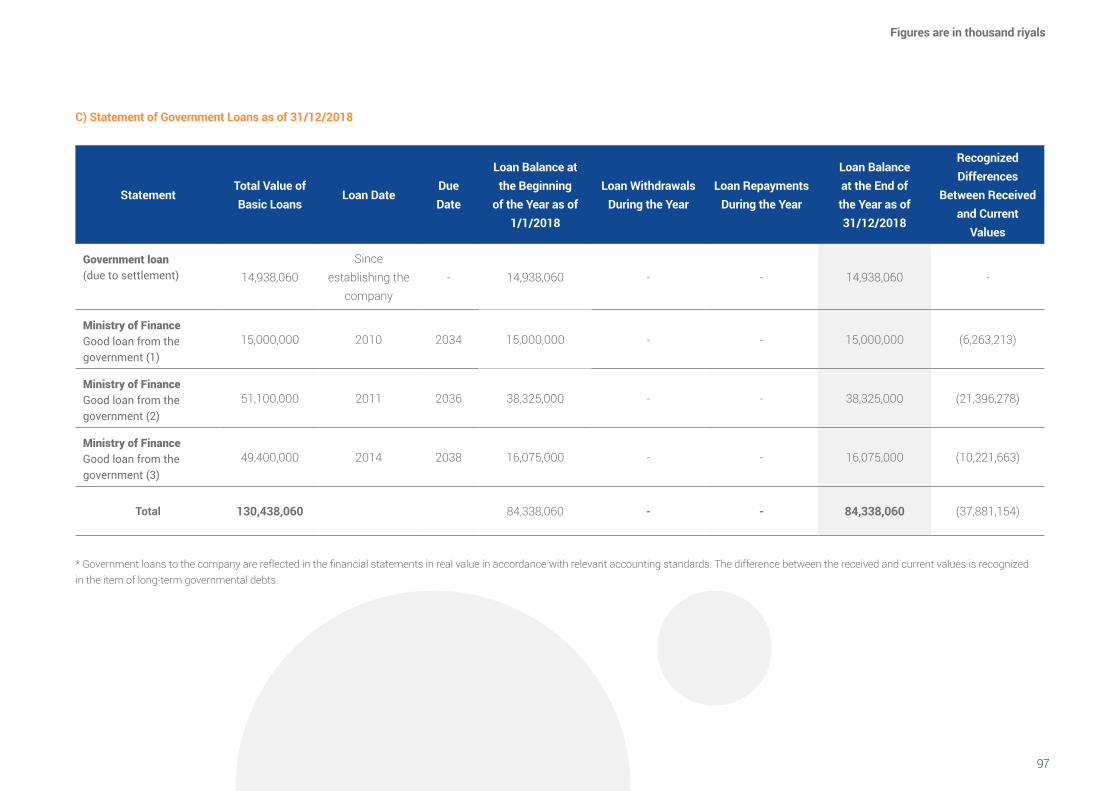
9796
C) Statement of Government Loans as of 31/12/2018
Statement Total Value of
Basic LoansLoan Date
DueDate
Loan Balance at the Beginning
of the Year as of 1/1/2018
Loan Withdrawals During the Year
Loan RepaymentsDuring the Year
Loan Balance at the End of the Year as of 31/12/2018
Recognized Differences
Between Received and Current
Values
Government loan (due to settlement) 14,938,060
Since establishing the
company- 14,938,060 - - 14,938,060 -
Ministry of FinanceGood loan from thegovernment (1)
15,000,000 2010 2034 15,000,000 - - 15,000,000 )6,263,213(
Ministry of FinanceGood loan from thegovernment (2)
51,100,000 2011 2036 38,325,000 - - 38,325,000 )21,396,278(
Ministry of FinanceGood loan from thegovernment (3)
49,400,000 2014 2038 16,075,000 - - 16,075,000 )10,221,663(
Total 130,438,060 84,338,060 - - 84,338,060 )37,881,154(
* Government loans to the company are reflected in the financial statements in real value in accordance with relevant accounting standards. The difference between the received and current values is recognized in the item of long-term governmental debts.
Figures are in thousand riyals
Annual Report | 2018
98
The Consolidated Financial Statements
99
Saudi Electricity Company
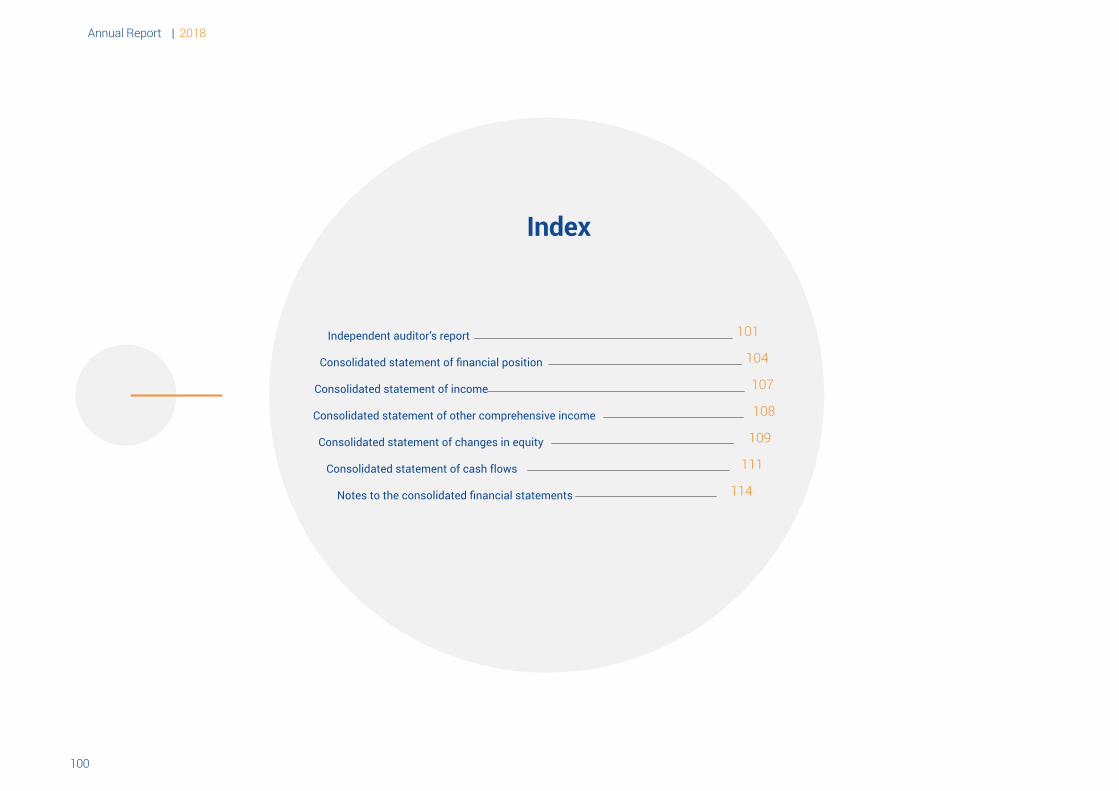
Annual Report | 2018
101100
Independent auditor’s report
Consolidated statement of financial position
Consolidated statement of income
Consolidated statement of other comprehensive income
Consolidated statement of changes in equity
Consolidated statement of cash flows
Notes to the consolidated financial statements
101
104
107
108
109
111
114
Index
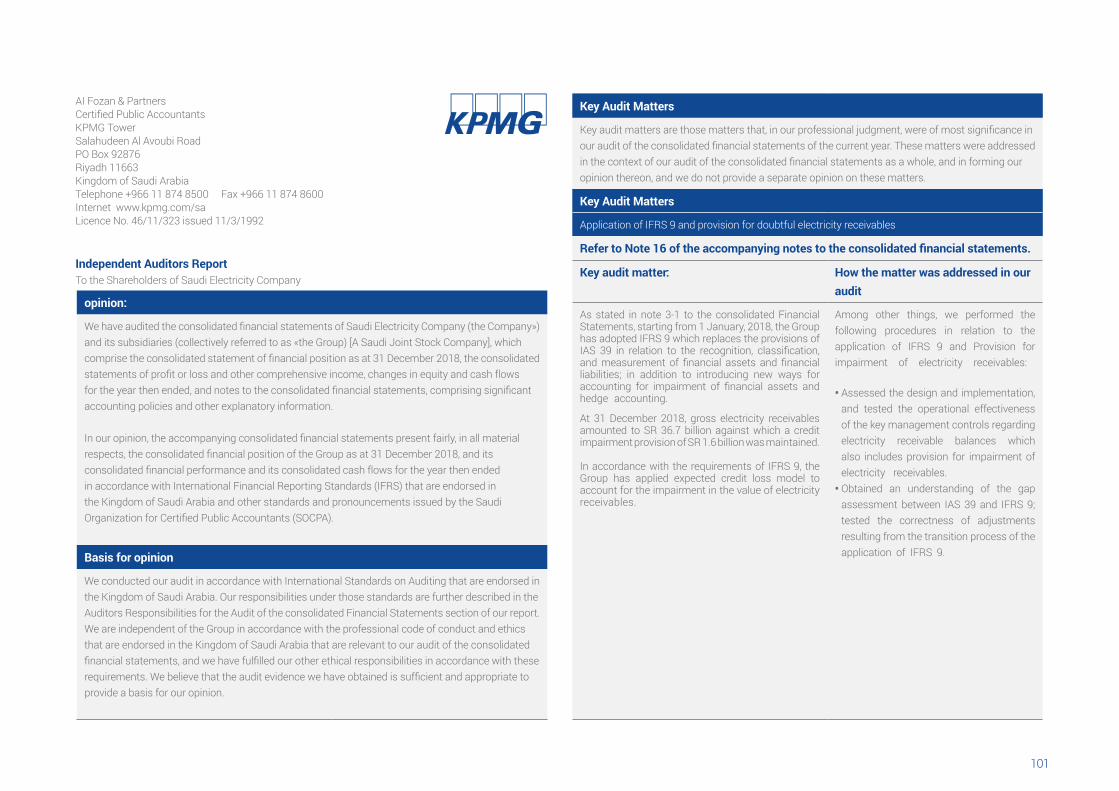
101100
AI Fozan & PartnersCertified Public AccountantsKPMG TowerSalahudeen Al Avoubi RoadPO Box 92876Riyadh 11663Kingdom of Saudi ArabiaTelephone +966 11 874 8500 Fax +966 11 874 8600Internet www.kpmg.com/saLicence No. 46/11/323 issued 11/3/1992
opinion:
We have audited the consolidated financial statements of Saudi Electricity Company (the Company») and its subsidiaries )collectively referred to as «the Group( [A Saudi Joint Stock Company], which comprise the consolidated statement of financial position as at 31 December 2018, the consolidated statements of profit or loss and other comprehensive income, changes in equity and cash flows for the year then ended, and notes to the consolidated financial statements, comprising significant accounting policies and other explanatory information.
In our opinion, the accompanying consolidated financial statements present fairly, in all material respects, the consolidated financial position of the Group as at 31 December 2018, and its consolidated financial performance and its consolidated cash flows for the year then ended in accordance with International Financial Reporting Standards )IFRS( that are endorsed in the Kingdom of Saudi Arabia and other standards and pronouncements issued by the Saudi Organization for Certified Public Accountants (SOCPA).
Basis for opinion
We conducted our audit in accordance with International Standards on Auditing that are endorsed in the Kingdom of Saudi Arabia. Our responsibilities under those standards are further described in the Auditors Responsibilities for the Audit of the consolidated Financial Statements section of our report. We are independent of the Group in accordance with the professional code of conduct and ethics that are endorsed in the Kingdom of Saudi Arabia that are relevant to our audit of the consolidated financial statements, and we have fulfilled our other ethical responsibilities in accordance with these requirements. We believe that the audit evidence we have obtained is sufficient and appropriate to provide a basis for our opinion.
Independent Auditors ReportTo the Shareholders of Saudi Electricity Company
Key Audit Matters
Key audit matters are those matters that, in our professional judgment, were of most significance in our audit of the consolidated financial statements of the current year. These matters were addressed in the context of our audit of the consolidated financial statements as a whole, and in forming our opinion thereon, and we do not provide a separate opinion on these matters.
Key Audit Matters
Application of IFRS 9 and provision for doubtful electricity receivables
Refer to Note 16 of the accompanying notes to the consolidated financial statements.
Key audit matter: How the matter was addressed in our audit
As stated in note 3-1 to the consolidated Financial Statements, starting from 1 January, 2018, the Group has adopted IFRS 9 which replaces the provisions of IAS 39 in relation to the recognition, classification, and measurement of financial assets and financial liabilities; in addition to introducing new ways for accounting for impairment of financial assets and hedge accounting.
At 31 December 2018, gross electricity receivables amounted to SR 36.7 billion against which a credit impairment provision of SR 1.6 billion was maintained.
In accordance with the requirements of IFRS 9, the Group has applied expected credit loss model to account for the impairment in the value of electricity receivables.
Among other things, we performed the following procedures in relation to the application of IFRS 9 and Provision for impairment of electricity receivables:
• Assessed the design and implementation, and tested the operational effectiveness of the key management controls regarding electricity receivable balances which also includes provision for impairment of electricity receivables.
• Obtained an understanding of the gap assessment between IAS 39 and IFRS 9; tested the correctness of adjustments resulting from the transition process of the application of IFRS 9.
Annual Report | 2018
103102
Key Audit Matters
Application of IFRS 9 and provision for doubtful electricity receivables
Refer to Note 16 of the accompanying notes to the consolidated financial statements.
Key audit matter: How the matter was addressed in our audit:
The implementation of the requirements of this standard has not resulted in any significant adjustments except for the recognition of impairment losses in the balances of electricity receivables amounting to SR 454 million .This is recorded in the Group›s equity in the consolidated financial statements as at 1 January 2018 as mentioned in note 3-1 in the consolidated financial statements.
Accordingly, the application of IFRS 9 and the related application of expected credit loss model to account for the impairment in the balances of electricity receivables was considered a key audit matter as the determination of the impairment in electricity receivables using expected credit loss model includes significant judgments and estimates that might have a significant impact on the consolidated financial statements of the Group.
• Obtained a sample of electricity receivable balances against which provision has been recognized during the year to assess the reasonableness of estimates used by the management of the Group.
• Evaluated the adequacy of disclosures made by the management in the consolidated financial statements.
Key Audit Matters (Continued)Application of IFRS 15 and recognition of Electricity Sales
Refer to Note 39 of the accompanying notes to the consolidated financial statements.
Key audit matte: How the matter was addressed in our audit
As stated in note 3-1 to the consolidated Financial Statements, starting from 1 January, 2018, the Group has adopted IFRS 15 which replaces the provisions of IAS 18.
The application of the new standard did not result in significant changes regarding the revenues from contracts with customers.
Among other things, we performed the following procedures in relation to application of IFRS 15 and recognition of electricity sales:
For the year ended 31 December 2018, the Group recognized total electricity sales of SR 59.6 billion.
Unbilled electricity revenue which has not been invoiced up to the date of the consolidated financia statements is recorded using estimates, assumptions and internal policies that are significantly based on the management experience.
Revenue is considered one of the significant indicators for measuring the performance of the Group.Accordingly, there are inherent risks regarding the possibility of revenue overstatements.
Therefore, given the significance of revenue and the inherent risks in overstating the revenue amount and the existence of significant estimates relating to the calculation of unbilled electricity revenue, revenue recognition is considered one of the key audit matters.
• Assessed the design and implementation, and tested the operational effectiveness of the key controls relevant to manage electricity sales recognition.
• controls over Obtained an Understanding of the gap differences between requirements of the application of IFRS 15 and IAS 18.
• Inquired from the management representatives regarding fraud awareness and the existence of any actual fraud cases.
• Tested sample of journal entries of accounts relating to significant risk areas identified and compared them to the supporting documents.
• Assessed the reasonableness of management›s estimates and assumptions in relation to the revenue recognized during the year.
• Evaluated the adequacy of disclosures made by the management in the consolidated financial statements.
Other information:
Management is responsible for the other information. The other information comprises the information included in the annual report but does not include the consolidated financial statements and our auditors’ report thereon. The annual report is expected to be made available to us after the date of this auditors’ report. Our opinion on the consolidated financial statements does not cover the other information and we will not express any form of assurance conclusion thereon. In connection with our audit of the consolidated financial statements, our responsibility is to read the olther information identified above when it becomes available and, in doing so, consider whether the other information is materially inconsistent with the consolidated financial statements or our knowledge obtained in the audit, or otherwise appears to be materially misstated.
When we read the annual report, when made available to us, if we conclude that there is a material misstatement therein, we are required communicate the matter to those charged with governance.
103102
Responsibilities of Management and Those Charged with Governance for the Consolidated Financial Statements
Management is responsible for the preparation and fair presentation of the consolidated financial statements in accordance with IFRS that are endorsed in the Kingdom of Saudi Arabia and other standards and pronouncements issued by SOCPA, the applicable requirements of the Regulations for Companies and Company›s By-laws and for such internal control as management determines is necessary to enable the preparation of consolidated financial statements that are free from material misstatement, whether due to fraud or error.
In preparing the consolidated financial statements, management is responsible for assessing the Group›s ability to continue as a going concern, disclosing, as applicalble, matters related to going concern and using the going concern basis of accounting unless management either intends to liquidate the Group or to cease operations, or has no realistic alternative but to do so. Those charged with governance are responsible for overseeing the Group›s financial reporting process.
Auditor’s responsibilities for the audit of the consolidated financial statements
Our objectives are to obtain reasonable assurance about whether the consolidated financial statements as a whole are free from material misstatement, whether due to fraud or error, and to issue an auditors› report that includes our opinion. ‹Reasonable assurance› is a high level of assurance, but is not a guarantee that an audit conducted in accordance with International Standards on Auditing that are endorsed in the Kingdom of Saudi Arabia, will always detect a material misstatement when it exists. Misstatements can arise from fraud or error and are considered material if, individually or in aggregate, they could reasonably be expected to influence the economic decisions of users taken on the basis of these consolidated financial statements.
• Identify and assess the risks of material misstatement of the consolidated financial statements, whether due to fraud or error, design and perform audit procedures responsive to those risks, and obtain audit evidence that is sufficient and appropriate to provide a basis for our opinion. The risk of not detecting a material misstatement resulting from fraud is higher than for one resulting from error, as fraud may involve collusion, forgery, intentional omissions, misrepresentations or the override of internal control.
• Obtain an understanding of internal control relevant to the audit in order to design audit procedures that are appropriate in the circumstances, but not for the purpose of expressing an opinion on the effectiveness of the Group›s internal control.
• Evaluate the appropriateness of accounting policies used and the reasonableness of accounting estimates and related disclosures made by management.
About KPMG Al Fouzan & AssociatesAccountants & Auditors
Abdullah Hamad Al-FawzanLicense No. 348
Date: 5 Rajab 144012 March 2019
Auditor's responsibilities for the audit of the consolidated financial statements
• Conclude on the appropriateness of management›s use of the going concern basis of accounting and, based on the audit evidence obtained, whether a material uncertainty exists related to events or conditions that may cast significant doubt on the Group›s ability to continue as a going concern. If we conclude that a material uncertainty exists, then we are required to draw attention in our auditors› report to the related disclosures in the consolidated financial statements or, if such disclosures are inadequate, to modify our opinion. Our conclusions are based on the audit evidence obtained up to the date of our auditors› report. However, future events or conditions may cause the Group to cease to continue as a going concern.
•Evaluate the overall presentation, structure and content of the consolidated financial statements, including the disclosures, and whether the consolidated financial statements represent the underlying transactions and events in a manner that achieves fair presentation.
• Obtain sufficient appropriate audit evidence regarding the financial information of the entities or business activities within the Group to express an opinion on the consolidated financial statements. We are responsible for the direction, supervision and performance of the group audit. We remain solely responsible for our audit opinion.
We communicate with those charged with governance regarding, among other matters, the planned scope and timing of the audit and significant audit findings, including any significant deficiencies in intenal control that we identify during our audit of Saudi Electricity Company (the Company») and its subsidiaries (the Group»).
We also provide those charged with governance with a statement that we have complied with relevant ethical requirements regarding independence, and communicate with them all relationships and other matters that may reasonably be thought to bear on our independence and where applicable, related safeguards.
From the matters communicated with those charged with governance, we determine those matters that were of most significance in the audit of the consolidated financial statements of the current year and are therefore the key audit matters. We describe these matters in our auditors› report unless law or regulation precludes public disclosure about the mater or when, in extremely rare circumstances, we determine that a matter should not be communicated in our report because the adverse consequences of doing so would reasonably be expected to outweigh the public interest benefits of such communication.
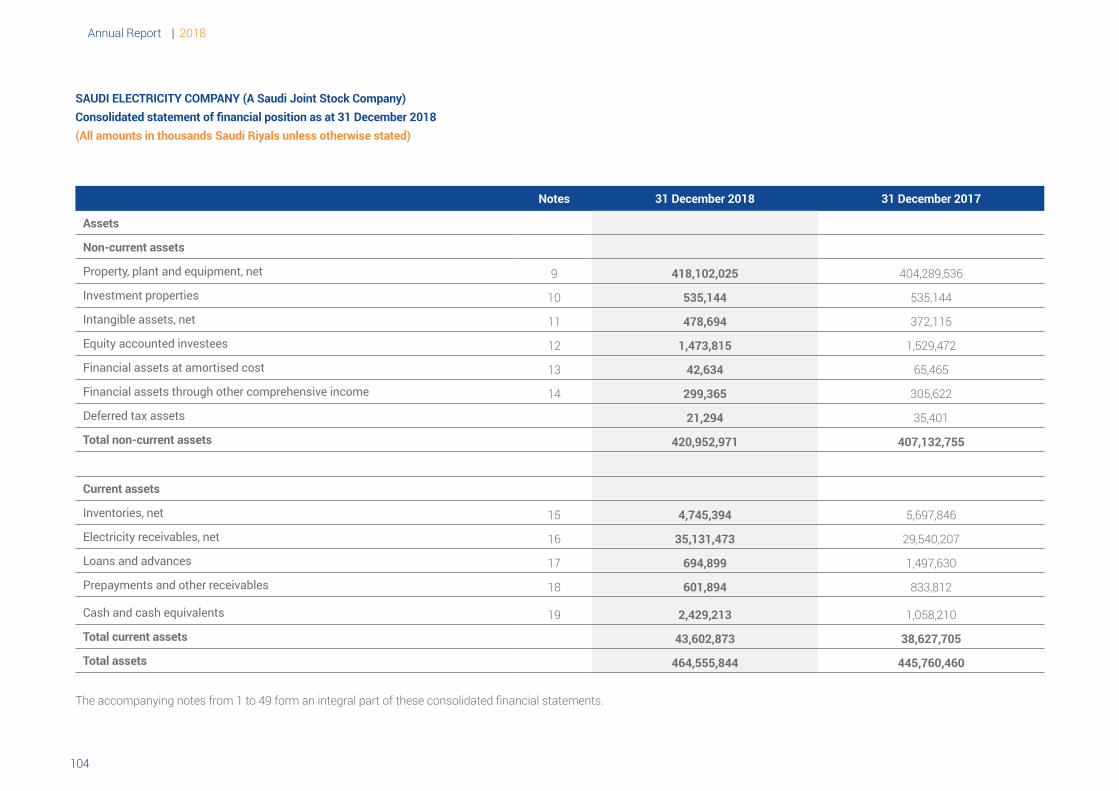
Annual Report | 2018
105104
Notes 31 December 2018 31 December 2017
Assets
Non-current assets
Property, plant and equipment, net 9 418,102,025 404,289,536
Investment properties 10 535,144 535,144
Intangible assets, net 11 478,694 372,115
Equity accounted investees 12 1,473,815 1,529,472
Financial assets at amortised cost 13 42,634 65,465
Financial assets through other comprehensive income 14 299,365 305,622
Deferred tax assets 21,294 35,401
Total non-current assets 420,952,971 407,132,755
Current assets
Inventories, net 15 4,745,394 5,697,846
Electricity receivables, net 16 35,131,473 29,540,207
Loans and advances 17 694,899 1,497,630
Prepayments and other receivables 18 601,894 833,812
Cash and cash equivalents 19 2,429,213 1,058,210
Total current assets 43,602,873 38,627,705
Total assets 464,555,844 445,760,460
The accompanying notes from 1 to 49 form an integral part of these consolidated financial statements.
SAUDI ELECTRICITY COMPANY (A Saudi Joint Stock Company) Consolidated statement of financial position as at 31 December 2018 (All amounts in thousands Saudi Riyals unless otherwise stated)
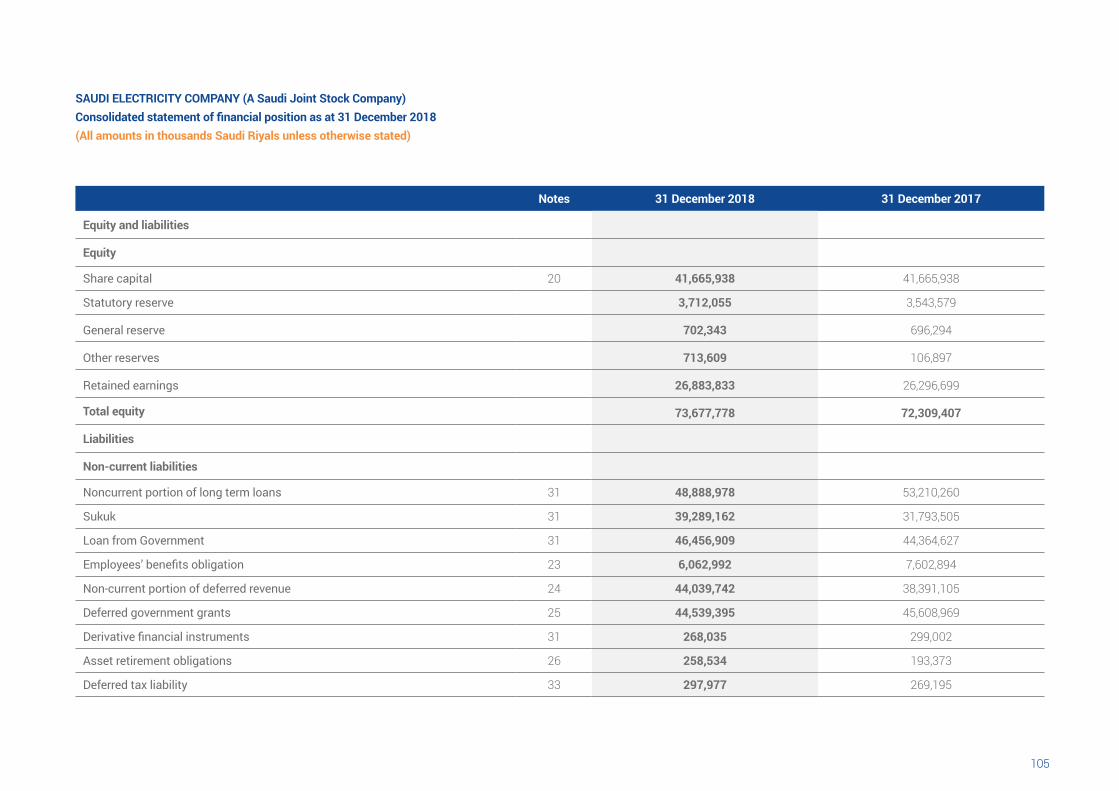
105104
Notes 31 December 2018 31 December 2017
Equity and liabilities
Equity
Share capital 20 41,665,938 41,665,938
Statutory reserve 3,712,055 3,543,579
General reserve 702,343 696,294
Other reserves 713,609 106,897
Retained earnings 26,883,833 26,296,699
Total equity 73,677,778 72,309,407
Liabilities
Non-current liabilities
Noncurrent portion of long term loans 31 48,888,978 53,210,260
Sukuk 31 39,289,162 31,793,505
Loan from Government 31 46,456,909 44,364,627
Employees’ benefits obligation 23 6,062,992 7,602,894
Non-current portion of deferred revenue 24 44,039,742 38,391,105
Deferred government grants 25 44,539,395 45,608,969
Derivative financial instruments 31 268,035 299,002
Asset retirement obligations 26 258,534 193,373
Deferred tax liability 33 297,977 269,195
SAUDI ELECTRICITY COMPANY (A Saudi Joint Stock Company) Consolidated statement of financial position as at 31 December 2018 (All amounts in thousands Saudi Riyals unless otherwise stated)
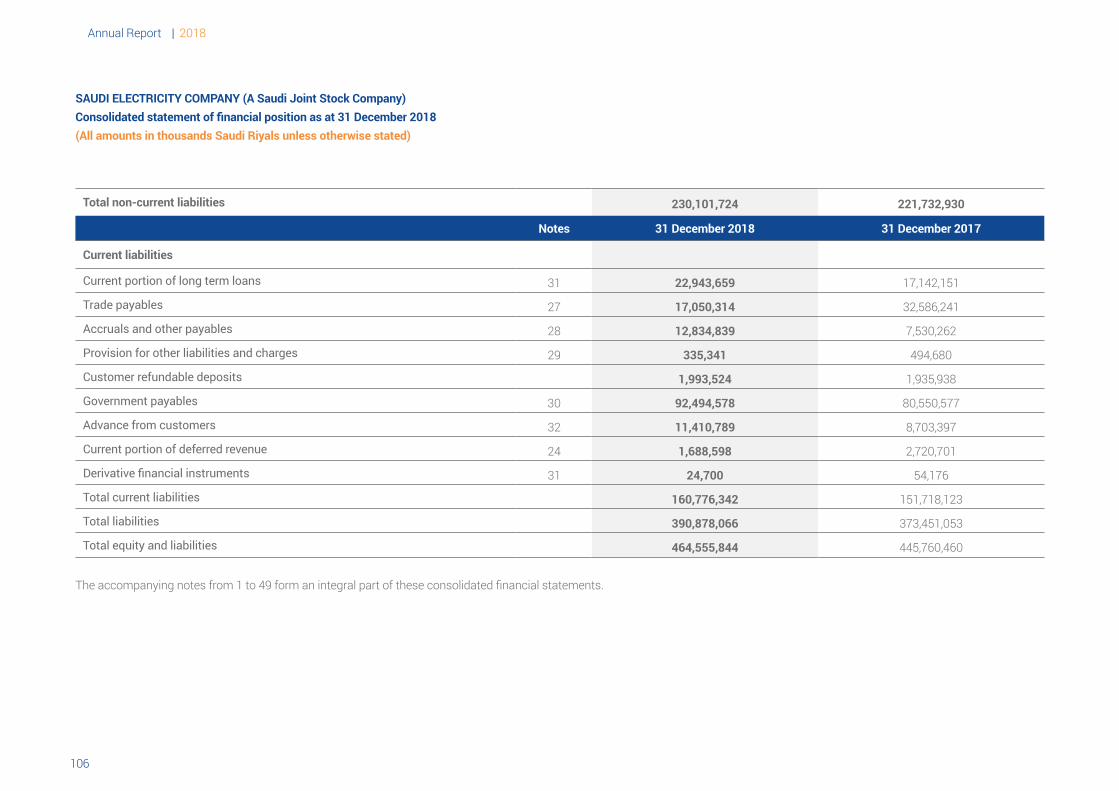
Annual Report | 2018
107106
Total non-current liabilities 230,101,724 221,732,930
Notes 31 December 2018 31 December 2017
Current liabilities
Current portion of long term loans 31 22,943,659 17,142,151
Trade payables 27 17,050,314 32,586,241
Accruals and other payables 28 12,834,839 7,530,262
Provision for other liabilities and charges 29 335,341 494,680
Customer refundable deposits 1,993,524 1,935,938
Government payables 30 92,494,578 80,550,577
Advance from customers 32 11,410,789 8,703,397
Current portion of deferred revenue 24 1,688,598 2,720,701
Derivative financial instruments 31 24,700 54,176
Total current liabilities 160,776,342 151,718,123
Total liabilities 390,878,066 373,451,053
Total equity and liabilities 464,555,844 445,760,460
The accompanying notes from 1 to 49 form an integral part of these consolidated financial statements.
SAUDI ELECTRICITY COMPANY (A Saudi Joint Stock Company) Consolidated statement of financial position as at 31 December 2018 (All amounts in thousands Saudi Riyals unless otherwise stated)
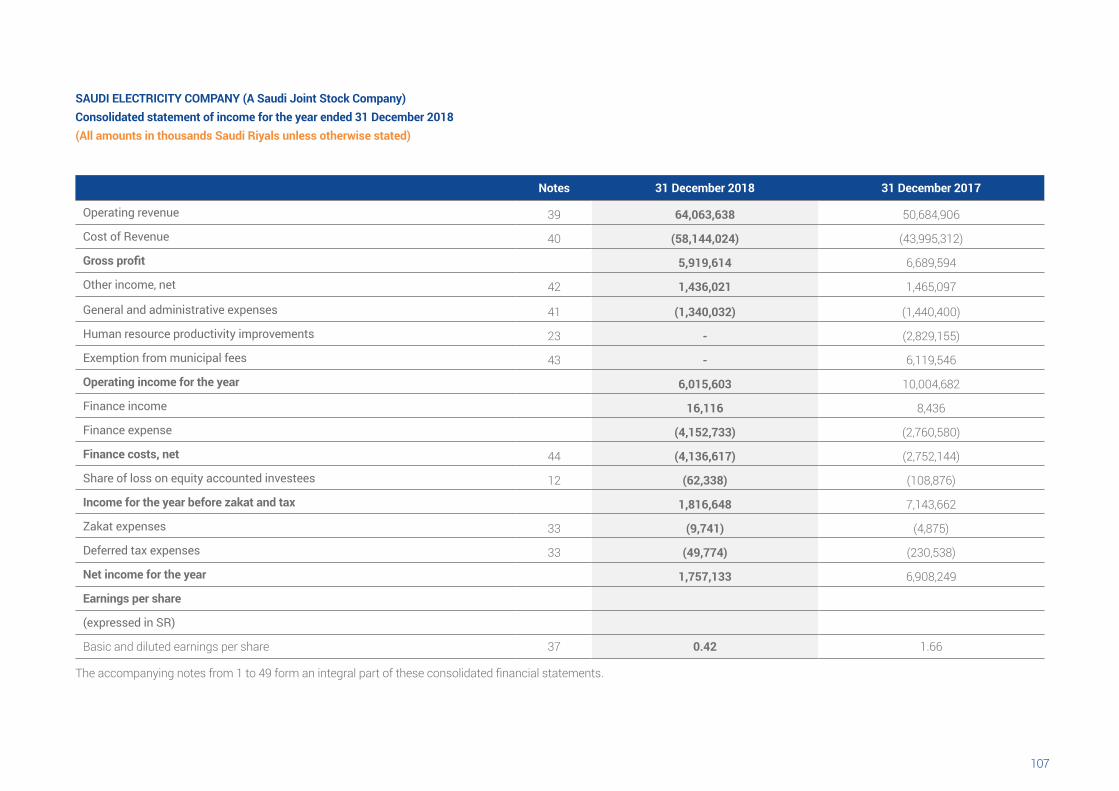
107106
Notes 31 December 2018 31 December 2017
Operating revenue 39 64,063,638 50,684,906
Cost of Revenue 40 (58,144,024) )43,995,312(
Gross profit 5,919,614 6,689,594
Other income, net 42 1,436,021 1,465,097
General and administrative expenses 41 (1,340,032) )1,440,400(
Human resource productivity improvements 23 - )2,829,155(
Exemption from municipal fees 43 - 6,119,546
Operating income for the year 6,015,603 10,004,682
Finance income 16,116 8,436
Finance expense (4,152,733) )2,760,580(
Finance costs, net 44 (4,136,617) )2,752,144(
Share of loss on equity accounted investees 12 (62,338) )108,876(
Income for the year before zakat and tax 1,816,648 7,143,662
Zakat expenses 33 (9,741) )4,875(
Deferred tax expenses 33 (49,774) )230,538(
Net income for the year 1,757,133 6,908,249
Earnings per share
(expressed in SR)
Basic and diluted earnings per share 37 0.42 1.66
SAUDI ELECTRICITY COMPANY (A Saudi Joint Stock Company) Consolidated statement of income for the year ended 31 December 2018(All amounts in thousands Saudi Riyals unless otherwise stated)
The accompanying notes from 1 to 49 form an integral part of these consolidated financial statements.
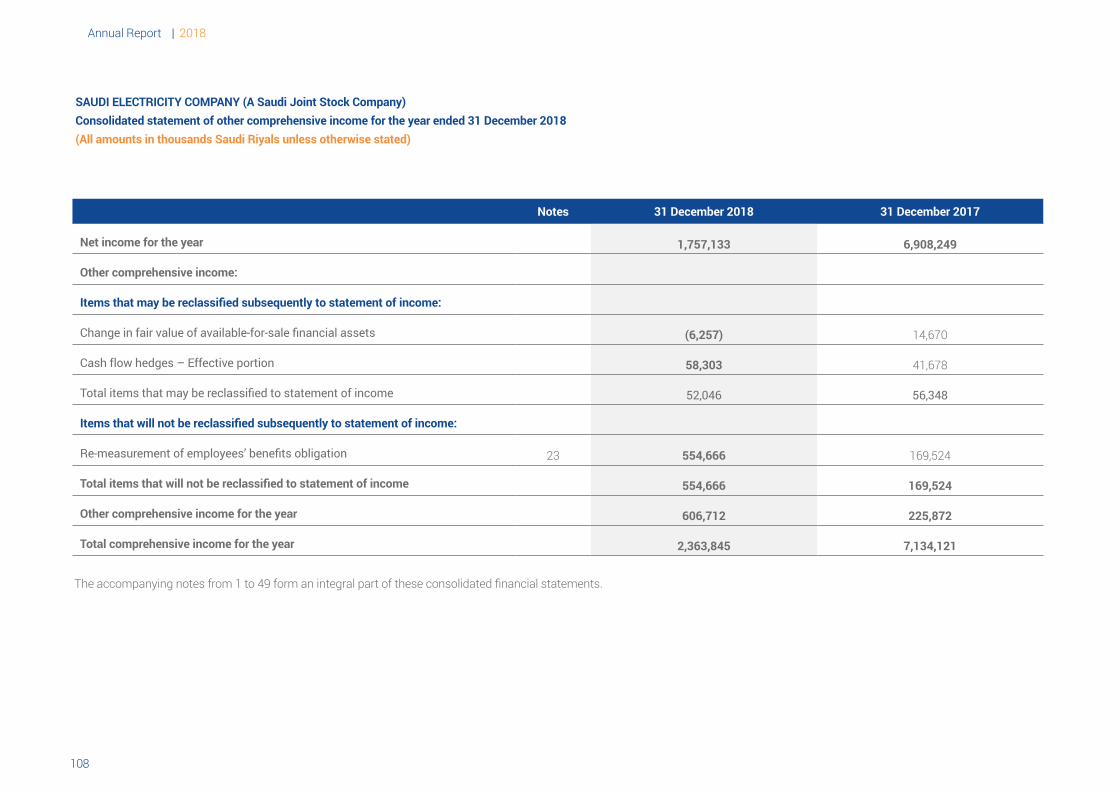
Annual Report | 2018
109108
Notes 31 December 2018 31 December 2017
Net income for the year 1,757,133 6,908,249
Other comprehensive income:
Items that may be reclassified subsequently to statement of income:
Change in fair value of available-for-sale financial assets (6,257) 14,670
Cash flow hedges – Effective portion 58,303 41,678
Total items that may be reclassified to statement of income 52,046 56,348
Items that will not be reclassified subsequently to statement of income:
Re-measurement of employees’ benefits obligation 23 554,666 169,524
Total items that will not be reclassified to statement of income 554,666 169,524
Other comprehensive income for the year 606,712 225,872
Total comprehensive income for the year 2,363,845 7,134,121
The accompanying notes from 1 to 49 form an integral part of these consolidated financial statements.
SAUDI ELECTRICITY COMPANY (A Saudi Joint Stock Company) Consolidated statement of other comprehensive income for the year ended 31 December 2018(All amounts in thousands Saudi Riyals unless otherwise stated)
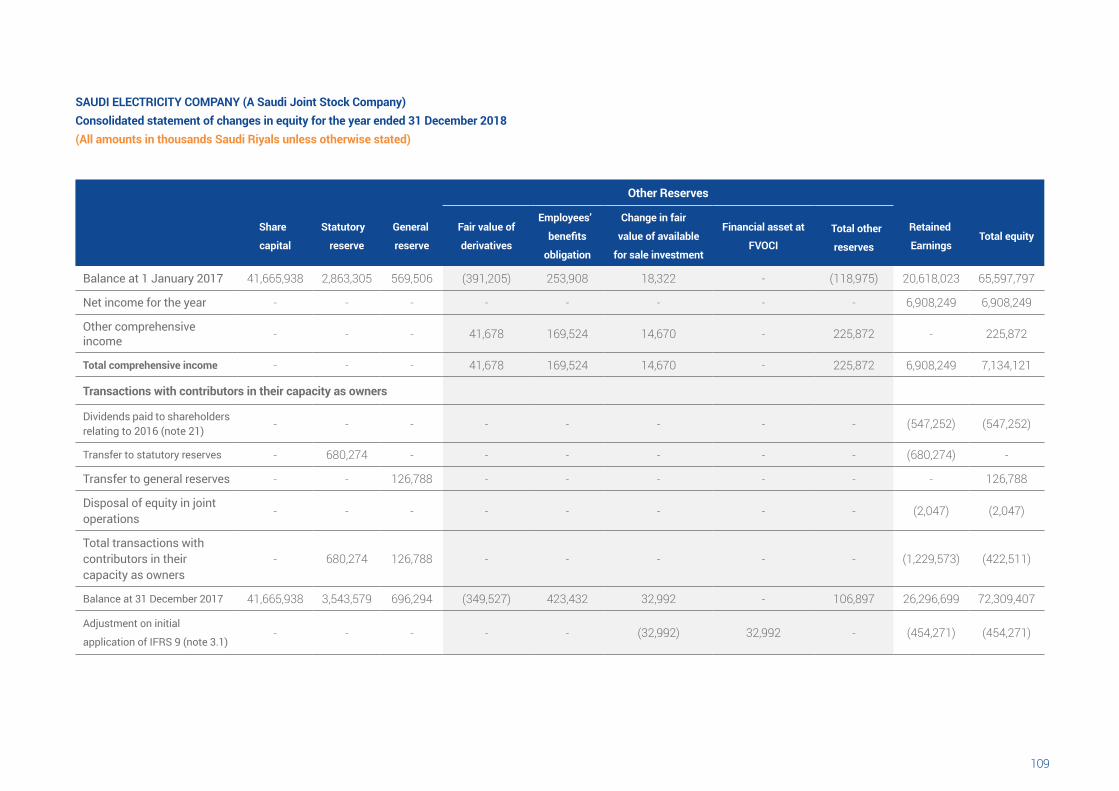
109108
Other Reserves
Share
capital
Statutory
reserve
General
reserve
Fair value of
derivatives
Employees’
benefits
obligation
Change in fair
value of available
for sale investment
Financial asset at
FVOCI Total other
reserves
Retained
EarningsTotal equity
Balance at 1 January 2017 41,665,938 2,863,305 569,506 )391,205( 253,908 18,322 - )118,975( 20,618,023 65,597,797
Net income for the year - - - - - - - - 6,908,249 6,908,249
Other comprehensiveincome - - - 41,678 169,524 14,670 - 225,872 - 225,872
Total comprehensive income - - - 41,678 169,524 14,670 - 225,872 6,908,249 7,134,121
Transactions with contributors in their capacity as owners
Dividends paid to shareholdersrelating to 2016 (note 21) - - - - - - - - )547,252( )547,252(
Transfer to statutory reserves - 680,274 - - - - - - )680,274( -
Transfer to general reserves - - 126,788 - - - - - - 126,788
Disposal of equity in jointoperations
- - - - - - - - )2,047( )2,047(
Total transactions with contributors in theircapacity as owners
- 680,274 126,788 - - - - - )1,229,573( )422,511(
Balance at 31 December 2017 41,665,938 3,543,579 696,294 )349,527( 423,432 32,992 - 106,897 26,296,699 72,309,407
Adjustment on initial
application of IFRS 9 (note 3.1)- - - - - )32,992( 32,992 - )454,271( )454,271(
SAUDI ELECTRICITY COMPANY (A Saudi Joint Stock Company) Consolidated statement of changes in equity for the year ended 31 December 2018(All amounts in thousands Saudi Riyals unless otherwise stated)
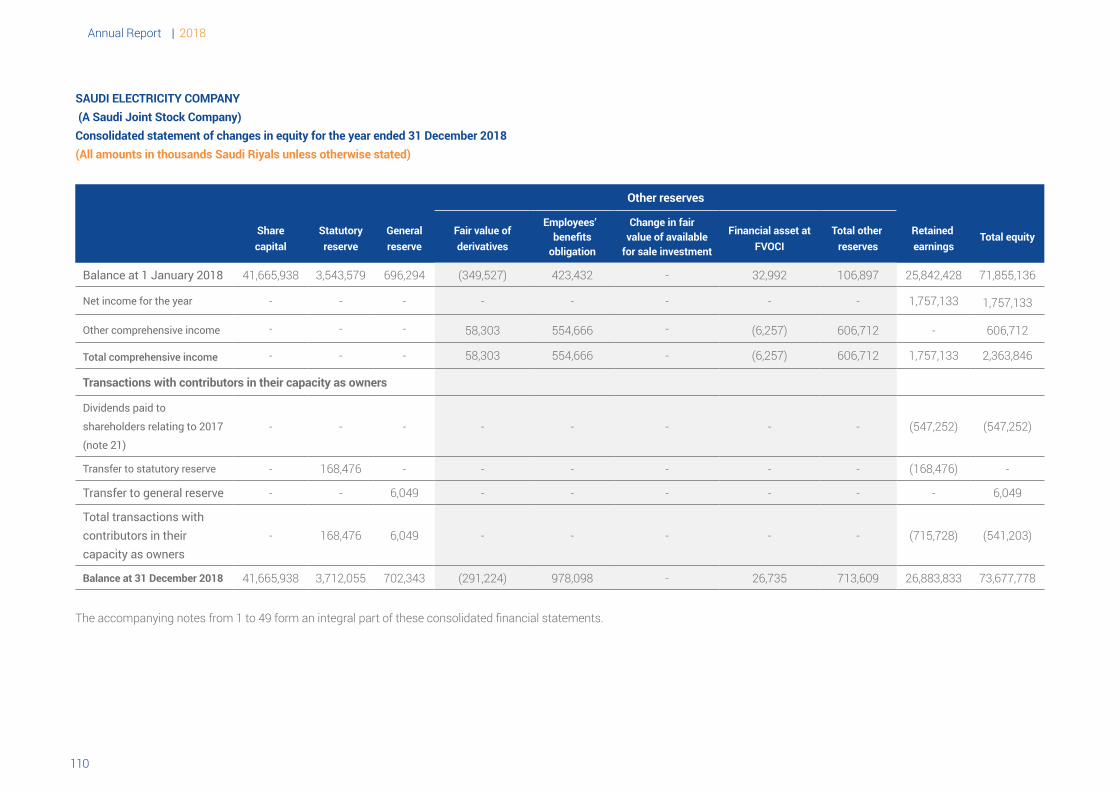
Annual Report | 2018
111110
SAUDI ELECTRICITY COMPANY (A Saudi Joint Stock Company) Consolidated statement of changes in equity for the year ended 31 December 2018(All amounts in thousands Saudi Riyals unless otherwise stated)
Other reserves
Sharecapital
Statutoryreserve
Generalreserve
Fair value ofderivatives
Employees’ benefitsobligation
Change in fair value of availablefor sale investment
Financial asset atFVOCI
Total other reserves
Retained earnings
Total equity
Balance at 1 January 2018 41,665,938 3,543,579 696,294 )349,527( 423,432 - 32,992 106,897 25,842,428 71,855,136
Net income for the year - - - - - - - - 1,757,133 1,757,133
Other comprehensive income - - - 58,303 554,666 - )6,257( 606,712 - 606,712
Total comprehensive income - - - 58,303 554,666 - )6,257( 606,712 1,757,133 2,363,846
Transactions with contributors in their capacity as owners
Dividends paid to
shareholders relating to 2017
(note 21)
- - - - - - - - )547,252( )547,252(
Transfer to statutory reserve - 168,476 - - - - - - )168,476( -
Transfer to general reserve - - 6,049 - - - - - - 6,049
Total transactions with contributors in theircapacity as owners
- 168,476 6,049 - - - - - )715,728( )541,203(
Balance at 31 December 2018 41,665,938 3,712,055 702,343 )291,224( 978,098 - 26,735 713,609 26,883,833 73,677,778
The accompanying notes from 1 to 49 form an integral part of these consolidated financial statements.
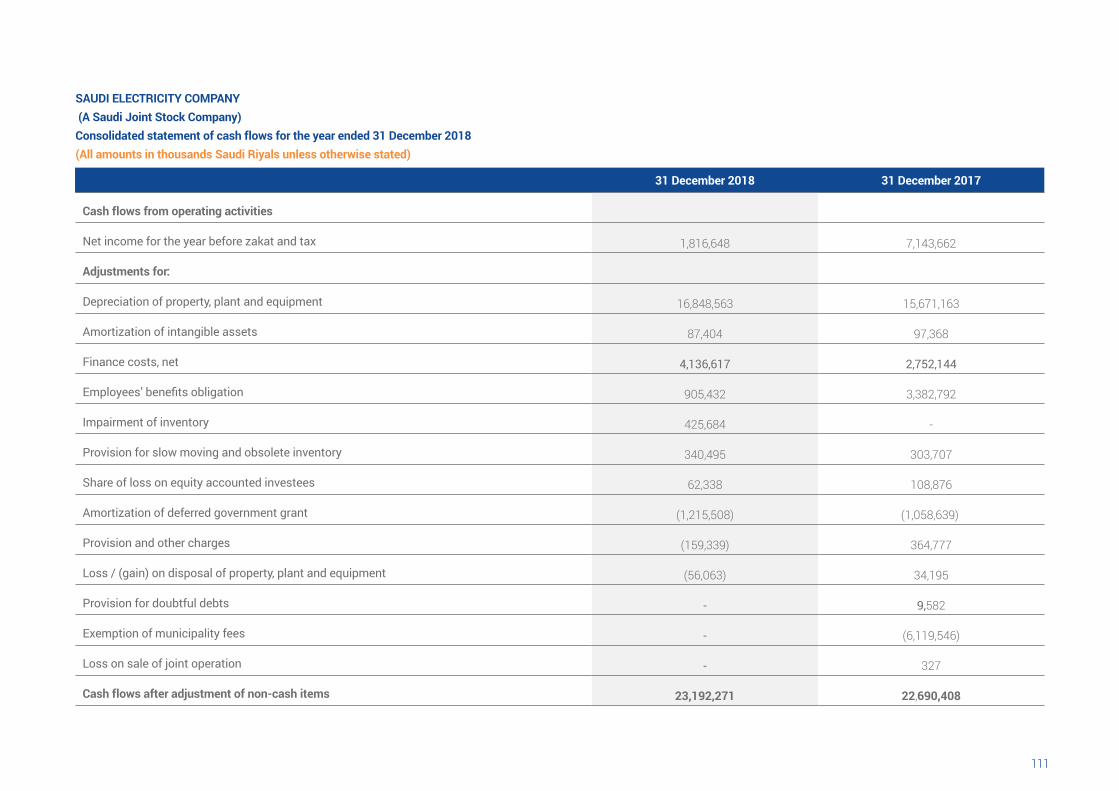
111110
SAUDI ELECTRICITY COMPANY (A Saudi Joint Stock Company)
Consolidated statement of cash flows for the year ended 31 December 2018(All amounts in thousands Saudi Riyals unless otherwise stated)
31 December 2018 31 December 2017
Cash flows from operating activities
Net income for the year before zakat and tax 1,816,648 7,143,662
Adjustments for:
Depreciation of property, plant and equipment 16,848,563 15,671,163
Amortization of intangible assets 87,404 97,368
Finance costs, net 4,136,617 2,752,144
Employees’ benefits obligation 905,432 3,382,792
Impairment of inventory 425,684 -
Provision for slow moving and obsolete inventory 340,495 303,707
Share of loss on equity accounted investees 62,338 108,876
Amortization of deferred government grant )1,215,508( )1,058,639(
Provision and other charges )159,339( 364,777
Loss / (gain) on disposal of property, plant and equipment )56,063( 34,195
Provision for doubtful debts - 9,582
Exemption of municipality fees - )6,119,546(
Loss on sale of joint operation - 327
Cash flows after adjustment of non-cash items 23,192,271 22,690,408
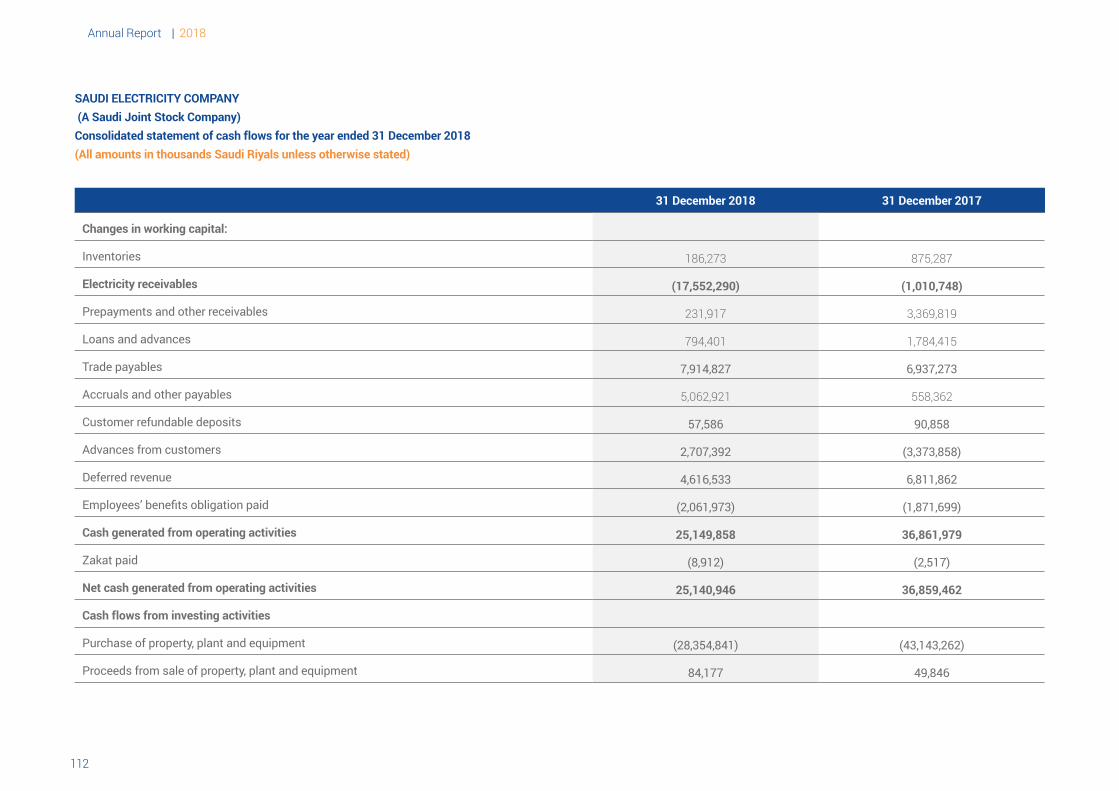
Annual Report | 2018
113112
SAUDI ELECTRICITY COMPANY (A Saudi Joint Stock Company)
Consolidated statement of cash flows for the year ended 31 December 2018(All amounts in thousands Saudi Riyals unless otherwise stated)
31 December 2018 31 December 2017
Changes in working capital:
Inventories 186,273 875,287
Electricity receivables (17,552,290) (1,010,748)
Prepayments and other receivables 231,917 3,369,819
Loans and advances 794,401 1,784,415
Trade payables 7,914,827 6,937,273
Accruals and other payables 5,062,921 558,362
Customer refundable deposits 57,586 90,858
Advances from customers 2,707,392 )3,373,858)
Deferred revenue 4,616,533 6,811,862
Employees’ benefits obligation paid )2,061,973) )1,871,699)
Cash generated from operating activities 25,149,858 36,861,979
Zakat paid )8,912) )2,517)
Net cash generated from operating activities 25,140,946 36,859,462
Cash flows from investing activities
Purchase of property, plant and equipment )28,354,841) )43,143,262)
Proceeds from sale of property, plant and equipment 84,177 49,846
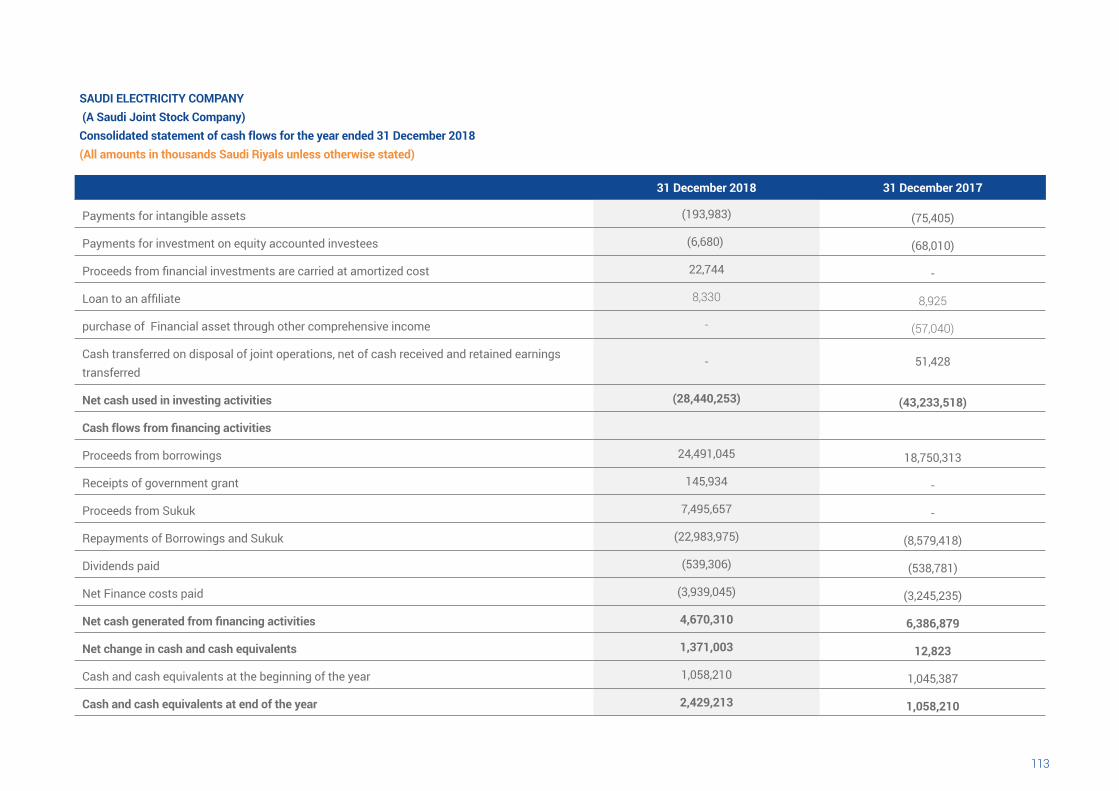
113112
SAUDI ELECTRICITY COMPANY (A Saudi Joint Stock Company)
Consolidated statement of cash flows for the year ended 31 December 2018(All amounts in thousands Saudi Riyals unless otherwise stated)
31 December 2018 31 December 2017
Payments for intangible assets )193,983) )75,405)
Payments for investment on equity accounted investees )6,680) )68,010)
Proceeds from financial investments are carried at amortized cost 22,744 -
Loan to an affiliate 8,330 8,925
purchase of Financial asset through other comprehensive income - )57,040(
Cash transferred on disposal of joint operations, net of cash received and retained earningstransferred
- 51,428
Net cash used in investing activities (28,440,253) (43,233,518)
Cash flows from financing activities
Proceeds from borrowings 24,491,045 18,750,313
Receipts of government grant 145,934 -
Proceeds from Sukuk 7,495,657 -
Repayments of Borrowings and Sukuk )22,983,975) )8,579,418)
Dividends paid )539,306) )538,781)
Net Finance costs paid )3,939,045) )3,245,235)
Net cash generated from financing activities 4,670,310 6,386,879
Net change in cash and cash equivalents 1,371,003 12,823
Cash and cash equivalents at the beginning of the year 1,058,210 1,045,387
Cash and cash equivalents at end of the year 2,429,213 1,058,210
Annual Report | 2018
115114
SAUDI ELECTRICITY COMPANY (A Saudi Joint Stock Company) Consolidated statement of financial position as at 31 December 2018 (All amounts in thousands Saudi Riyals unless otherwise stated)
1 Corporate informationThe Saudi Electricity Company was formed pursuant to the Council of Ministers’ Resolution Number 169 dated 11 Sha’ban 1419H corresponding to 29 November 1998, which reorganised the Electricity Sector in the Kingdom of Saudi Arabia by merging all local companies that provided electricity services (10 joint stock companies that covered most of the geographical areas of the Kingdom), in addition to the projects of the General Electricity Corporation, a governmental corporation belonging to the Ministry of Industry and Electricity (11 operating projects that covered various areas in the north of the Kingdom) into the Company. The Company was founded as a Saudi joint stock company pursuant to the Royal Decree No. M/16 dated 6 Ramadan 1420H corresponding to 13 December 1999, in accordance with the Council of Ministers’ Resolution Number 153, dated 5 Ramadan 1420H corresponding to 12 December 1999 and the Minister of Commerce’s Resolution Number 2047 dated 30 Dhul-Hijjah 1420H corresponding to 5 April 2000 and got registered in Riyadh under Commercial Registration Number 1010158683, dated 28 Muhurram1421H corresponding to 3 May 2000.
The Company’s principal main activities are generation, transmission and distribution of electric power. The Company is the major provider of electric power all over the Kingdom of Saudi Arabia, serving governmental, industrial, agricultural, commercial and residential consumers.
The Company is a tariff-regulated company of electricity. Electricity tariffs are determined by the Council of Ministers based on recommendations from the Electricity and Co-generation Regulatory Authority (the “Authority”) which was established on 13 November 2001 according to Council of Ministers’ Resolution No. 169 dated 11 Sha’aban 1419H. The change on tariff was made through the Council of Ministers’ Resolution Number 170 dated 12 Rajab 1421H and was effective from 1 Sha’aban 1421H corresponding to 28 October 2000 whereby the tariff on the highest bracket was set at a rate of 26 Halala per Kilowatts/hour.
This was further amended by the Council of Ministers in its Decision (Number 333) dated 16 Shawwal 1430H, corresponding to 5 October 2009, which granted the Board of Directors of the Electricity and Co-generation Regulatory Authority the right to review and adjust the non-
residential (commercial, industrial and governmental) electricity tariff and approve them as long as the change does not exceed 26 Halala for each kilowatt per hour, taking into consideration, among other matters, the electrical consumption at peak times. This tariff was implemented starting 19 Rajab 1431H, corresponding to 1 July 2010.
On 17 of Rabi Awal 1437H corresponding to 28 December 2015, Council of Ministers issued its resolution (number 95), to increase power products prices effective from 18 Rabi Awal 1437H corresponding to 29 December 2015, and to increase electricity consumption tariff for all categories with the highest tranche of 32 Halala per Kilowatts/hour, which came into effect from 1 Rabi Thani 1437H corresponding to 11 January 2016. On 24 of Rabi Awal 1439H corresponding to 12 December 2017, the Council of Ministers issued a resolution (166) to increase the prices of energy products and electricity consumption rates for some categories of subscribers and change after consumption segments from 1 January 2018. According to Royal Decree No. 14006 dated 23 Rabi ‘al-Awwal 1439 H corresponding to 11 December 2017, the Holding Company shall pay a State fee equivalent to the difference between the previous tariff and the new tariff.
During 2018, the Communications and Information Technology Commission granted license to Dawiyat Telecom Company for Communication and Information Technology for wholesale services of infrastructure projects licence and granted Dawiyat telecom Company for telecommunication utilities lease licence.
According to the Company’s bylaws, the financial year begins on 1st January and ends on 31st December of each Gregorian year.
Saudi Electricity Company will be referred to as (“Company”) or together with its subsidiaries and joint operations as (“Group”) throughout the financials.
The address of its registered headquarter is located in Riyadh, Kingdom of Saudi Arabia.
-
115114
2 Basis of preparationThe consolidated financial statements of the Group have been prepared in accordance with International Financial Reporting Standards (“IFRS”) adopted in Saudi Arabia and other standards and regulations adopted by the Saudi Organization of Certified Public Accountants.
During 2018, the Group applied IFRS 9 “Financial Instrument” and IFRS 15 “Revenue from Contracts with Customers ”. For the significant changes in accounting policies refer note 3.1.
3 Changes in accounting policies3.1 Effect of changes in accounting policies as a result of application of new standardsThe Group has adopted IFRS 9 “Financial Instruments” and IFRS 15 “Revenue from Contracts with Customers”.
IFRS 9: Financial Instruments / TransitionIn accordance with the transitional provisions in IFRS 9, comparative figures have not been restated. The difference in the carrying amounts of financial assets and financial liabilities arising from the adoption of IFRS 9 is recognized in retained earnings as at 1 January 2018.
The accounting policies were changed to comply with IFRS 9. IFRS 9 replaces the provisions of IAS 39 that relate to the recognition, classification and measurement of financial assets and financial liabilities; de-recognition of financial instruments; impairment of financial assets and hedge accounting. IFRS 9 also significantly amends other standards dealing with financial instruments such as IFRS 7 Financial Instruments: Disclosures.
Classification of financial asset and financial liabilityUnder IFRS 9, on initial recognition, a financial asset is classified as measured at amortised cost or fair value through other comprehensive income - debt investment; fair value through other comprehensive income - equity investment; or fair value through profit and loss. The classification of financial assets under IFRS 9 is generally based on the business model in which a financial asset is managed and its contractual cash flow characteristics. Derivatives embedded in contracts where the host is a financial asset in the scope of the standard are never separated. Instead, the hybrid financial instrument as a whole is assessed for classification.
Financial assets at amortised costFinancial assets are measured at amortised cost if it meets both of the following conditions and is not designated as at fair value through profit or loss: • it is held within a business model whose objective is to hold assets to collect contractual
cash flows; and • its contractual terms give rise on specified dates to cash flows that are solely payments of
principal and interest on the principal amount outstanding.
Financial assets at fair value through other comprehensive incomeFinancial assets are measured at fair value through other comprehensive income if it meets both of the following conditions and is not designated as at FVTPL:• it is held within a business model whose objective is achieved by both collecting contractual
cash flows and selling financial assets; and • its contractual terms give rise on specified dates to cash flows that are solely payments of
principal and interest on the principal amount outstanding.
Classifications of financial instruments On initial recognition of an equity investment that is not held for trading, the Group may irrevocably elect to present subsequent changes in the investment’s fair value in other comprehensive income. This election is made on an investment-by-investment basis.
All financial assets not classified as measured at amortised cost or fair value through other comprehensive income as described above are measured at fair value through profit or loss. This includes all derivative financial assets. On initial recognition, the Group may irrevocably designate a financial asset that otherwise meets the requirements to be measured at amortised cost or at fair value through other comprehensive income as at fair value through profit or loss if doing so eliminates or significantly reduces an accounting mismatch that would otherwise arise.
A financial asset is initially measured at fair value plus, for an item not at fair value through profit or loss, transaction costs that are directly attributable to its acquisition.
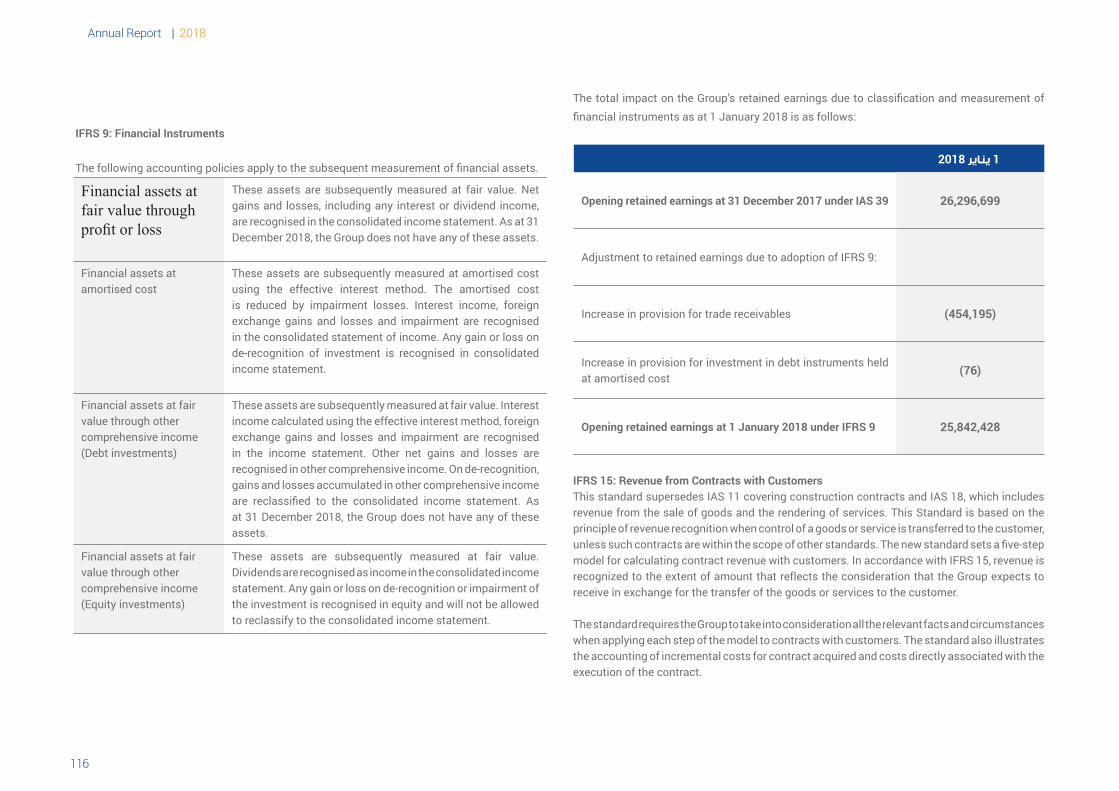
Annual Report | 2018
117116
IFRS 9: Financial Instruments
The following accounting policies apply to the subsequent measurement of financial assets.
These assets are subsequently measured at fair value. Net gains and losses, including any interest or dividend income, are recognised in the consolidated income statement. As at 31 December 2018, the Group does not have any of these assets.
Financial assets at fair value through profit or loss
These assets are subsequently measured at amortised cost using the effective interest method. The amortised cost is reduced by impairment losses. Interest income, foreign exchange gains and losses and impairment are recognised in the consolidated statement of income. Any gain or loss on de-recognition of investment is recognised in consolidated income statement.
Financial assets at amortised cost
These assets are subsequently measured at fair value. Interest income calculated using the effective interest method, foreign exchange gains and losses and impairment are recognised in the income statement. Other net gains and losses are recognised in other comprehensive income. On de-recognition, gains and losses accumulated in other comprehensive income are reclassified to the consolidated income statement. As at 31 December 2018, the Group does not have any of these assets.
Financial assets at fair value through other comprehensive income (Debt investments)
These assets are subsequently measured at fair value. Dividends are recognised as income in the consolidated income statement. Any gain or loss on de-recognition or impairment of the investment is recognised in equity and will not be allowed to reclassify to the consolidated income statement.
Financial assets at fair value through other comprehensive income (Equity investments)
The total impact on the Group’s retained earnings due to classification and measurement of financial instruments as at 1 January 2018 is as follows:
1 يناير 2018
26,296,699Opening retained earnings at 31 December 2017 under IAS 39
Adjustment to retained earnings due to adoption of IFRS 9:
(454,195)Increase in provision for trade receivables
(76)Increase in provision for investment in debt instruments held at amortised cost
25,842,428Opening retained earnings at 1 January 2018 under IFRS 9
IFRS 15: Revenue from Contracts with CustomersThis standard supersedes IAS 11 covering construction contracts and IAS 18, which includes revenue from the sale of goods and the rendering of services. This Standard is based on the principle of revenue recognition when control of a goods or service is transferred to the customer, unless such contracts are within the scope of other standards. The new standard sets a five-step model for calculating contract revenue with customers. In accordance with IFRS 15, revenue is recognized to the extent of amount that reflects the consideration that the Group expects to receive in exchange for the transfer of the goods or services to the customer.
The standard requires the Group to take into consideration all the relevant facts and circumstances when applying each step of the model to contracts with customers. The standard also illustrates the accounting of incremental costs for contract acquired and costs directly associated with the execution of the contract.
117116
Application of IFRS 15-Transition The Group has adopted IFRS 15, resulting in adjustments to the amounts recognised in the financial statements.
The Group has applied the exemption from the requirement to restate contracts that were completed before 1 January 2018 and applied IFRS 15 only to contracts that are not completed at the date of initial application 1 January 2018.
In accordance with the requirement of IFRS 15, the Group has revised the period over which the connection revenue is amortised to match the satisfaction of performance obligations over the useful lives of the related assets. As a result, the Group revised the useful life to 35 years instead of previously estimated useful life of 20 and 30 years. This change is applied prospectively as a change in estimate. Due to which, there is a decrease in revenue in the current period amounting to SAR 1.34 billion.
3.2 New standards and amendments issued but not yet effective The standards and interpretations that are issued, but not yet effective, up to the date of issuance of the Group’s consolidated financial statements are disclosed below. The Group intends to adopt these standards, if applicable, when they become effective.
IFRS 16: Leases
The IASB has issued a new standard for the recognition of leases. This standard will replace:• IAS 17 Leases• IFRIC 4 Whether an arrangement contains a lease• SIC 15 Operating leases – Incentives• SIC-27 Evaluating the substance of transactions involving the legal form of a lease
Under IAS 17, lessees were required to make a distinction between a finance lease (on statement of financial position) and an operating lease (off statement of financial position). IFRS 16 now requires lessees to recognise a lease liability reflecting future lease payments and a ‘right-of-use asset’ for virtually all lease contracts. The IASB has included an optional exemption of certain short-term leases and leases of low-value assets.
3.2.2 Annual improvement to IFRS standards 2015-2017 Cycle - IFRS 3 Business combinations - IFRS 11 Joint arrangements. - IAS 23 Borrowing cost3.2.3 IFRIC 23 uncertainty over tax treatment3.2.4 Long term interest in Associates and Joint ventures (Amendments to IAS 28)3.2.5 Plan Amendment, Curtailment or settlement (Amendments to IAS 19)3.2.6 Prepayment Features with Negative Compensation (Amendments to IFRS 9)
The mandatory date for adoption for the standard is for annual periods beginning on or after 1 January 2019. The Group has not early adopted the new or revised standards in the preparation of these consolidated financial statements. The Group is currently assessing the impact of the application of the standard and the amendment mentioned above.
4 Measurement basis
The consolidated financial statements have been prepared on a historical cost basis, except for financial assets at fair value through other comprehensive income, employees benefit obligation, financial assets and financial liabilities that have been measured at fair value.
The Group is required to comply with the cost model for real estate, property, plant and equipment and intangible assets for a period of 3 years from the date of application of the International Financial Reporting Standards in accordance with the circular issued by the Capital Market Authority on 16 October 2016.
These consolidated financial statements of the Group have been presented in Saudi Riyal, which also represents the functional and presentation currency. All values are shown to the nearest thousand SR unless otherwise stated.
Annual Report | 2018
119118
5 Use of estimates, assumptions and judgementsThe preparation of the Group’s consolidated financial statements in accordance with IFRS requires management to make judgments, estimates and assumptions that affect the reported amounts of revenues, costs, assets and liabilities, and the disclosure of contingent liabilities, at the reporting date.
Estimates and judgements are continually evaluated and are based on historical experience and other factors, including expectations of future events that are believed to be reasonable under the circumstances.
Revisions to accounting estimates are recognised in the period in which the estimates are revised or in the revision period and future periods if the changed estimates affect both current and future periods.
5.1 Use of estimates and assumptionsThe Group makes estimates and assumptions concerning the future. The resulting accounting estimates may, by definition, seldom equal the related actual results. The estimates and assumptions that have a significant risk of causing a material adjustment to the carrying amounts of assets and liabilities within the next financial year are addressed below.
Impairment of non-financial assetsAt each reporting date, the Group reviews the carrying amounts of its assets to assess whether there is an indication that those assets may be impaired. If any such indication exists, the Group makes an estimate of the asset’s recoverable amount. An asset’s recoverable amount is the higher of an asset’s fair value less costs to sell and its value in use. In assessing value in use, the estimated future cash flows attributable to the asset are discounted to their present value using a pre-tax discount rate that reflects current market assessments of the time value of money and the risks specific to the asset. In determining fair value less costs to sell, recent market transactions are taken into account.
If the recoverable amount of an asset is estimated to be less than its carrying amount, the carrying amount of the asset is reduced to its recoverable amount. An impairment loss is recognised immediately in the consolidated statement of income.
Where an impairment loss subsequently reverses, the carrying amount of the asset is increased to the revised estimate of its recoverable amount, but only to the extent that the increased carrying amount does not exceed the carrying amount that would have been determined had no impairment loss been recognised for the asset in prior years. A reversal of an impairment loss is recognised immediately in the consolidated statement of income. ProvisionsProvisions are recognised when the Group has a present obligation (legal or constructive) as a result of a past event, it is probable that the Group will be required to settle the obligation, and a reliable estimate can be made of the amount of the obligation.
The amount recognised as a provision is the best estimate of the consideration required to settle the present obligation at the reporting date, taking into account the risks and uncertainties surrounding the obligation. Where a provision is measured using the cash flows estimated to settle the present obligation, its carrying amount is the present value of those cash flows.
When some or all of the economic benefits required to settle a provision are expected to be recovered from a third party, the receivable is recognised as an asset if it is virtually certain that reimbursement will be received and the amount of the receivable can be measured reliably.
Useful lives of property, plant and equipmentThe Group’s management determines the estimated useful life of its property, plant and equipment for calculating depreciation. This estimate is determined after considering the expected usage of the asset or physical wear and tear. The management at least annually reviews the estimated useful lives and the depreciation method to ensure that the method and periods of depreciation are consistent with the expected pattern of economic benefit of the assets.
Assumptions for employees’ benefits obligationEmployees’ benefits obligation represent obligations that will be settled in the future and require assumptions to project obligations. IAS 19 requires management to make further assumptions regarding variables such as discount rates, rate of compensation increases, mortality rates, employment turnover and future healthcare costs. The Group’s management use an external actuary for performing this calculation. Changes in key assumptions can have a significant impact on the projected benefit obligation and/or periodic employees’ benefits costs incurred.
119118
Asset retirement obligation (ARO)Significant estimates and assumptions are made in determining the provision for ARO as there are numerous factors that will affect the ultimate amount payable. These factors include estimates of the extent and costs of rehabilitation activities, technological changes, regulatory changes, cost increases as compared to the inflation rates and changes in discount rates. These uncertainties may result in future actual expenditure differing from the amounts currently provided. The provision at the reporting date represents management’s best estimate of the present value of the future costs.
Zakat and taxThe Holding Company and its subsidiaries are subject to the legislation of the General Authority of Zakat and Tax (”GAZT”). Accrual of Zakat is recognised in the consolidated statement of income. Additional zakat and tax liabilities, calculated by Authorities, if any, related to prior years zakat declaration is recognised in the year in which final declaration is issued.
Some of the shareholders and Foreign shareholders in the Group are subject to income tax. Tax expense, which includes current tax expense and deferred tax, is charged to the statement of income of the company and its subsidiaries as per the legislation of the General Authority of Zakat and Tax.
Tax expense, which includes current tax expense and deferred tax, is charged to the consolidated statement of income.
The current tax payable is calculated on the basis of the taxable income for the year. The tax income differs from the net income presented in the consolidated statement of income because it excludes taxable or deductible items of income or expense in subsequent years and excludes items that are not taxable or non-deductible. The Group’s liabilities are charged to the current tax using the applicable tax rates or substantially expected to be applied at the reporting date.
Deferred tax is recognised in respect of temporary differences between the carrying amounts of assets and liabilities for the purposes of the financial report and tax amounts used for tax purposes. Deferred tax liabilities are normally recognised for all taxable temporary differences. Deferred tax assets are recognised to the extent that it is probable that there will be taxable income that can be used against temporary differences that are deductible. These assets and liabilities are not recognised in the event that temporary differences arise from the initial recognition of goodwill or return to assets or liabilities in an ineffective operation over tax or accounting income except in the case of a business combination.
Deferred tax liabilities relating to temporary taxable differences arising from investments in subsidiaries, joint operations and associates are recognised, except when the Group has the ability to reverse these temporary differences. These temporary differences may not be reversed in the foreseeable future.
The carrying amount of deferred tax assets is reviewed at each reporting date and reduced to the extent that it is no longer probable that sufficient taxable income will be available to allow all or part of the deferred tax asset to be utilised.
Deferred tax is calculated on the basis of the tax rates expected to be applied in the period in which the liability is settled or the asset is recognised based on the applicable laws or substantially expected to be enacted at the reporting date. The deferred tax is charged or reversed from the consolidated statement of income except in the case that it is attributable to items carried or reversed directly from equity. In this case, deferred tax is treated directly in equity.
Assumptions for fair value financial derivativesThe Group uses the most observable market inputs when measuring the fair value of an asset or a liability. Fair values are classified in a fair value hierarchy based on the inputs used in the valuation which are shown as follows:
• Level 1: Quoted prices (unadjusted) in active markets for identical assets or liabilities that can be obtained at the measurement date.
• Level 2: Inputs other than quoted prices included within level 1 that are observable for the asset or liability, either directly (that is, as prices) or indirectly (that is, derived from prices).
• Level 3: Inputs for the asset or liability that are not based on observable market data (that is, unobservable inputs).
Deferred revenueDeferred electricity revenue for the period that are not yet invoiced at the date of the reporting are recognized in the consolidated statement of income.
Annual Report | 2018
121120
5.2 Use of judgements in applying the Group’s accounting policies5.2.1 Joint operations - Independent Power Producers A joint operation is a joint arrangement whereby the parties that have joint control of the arrangement have rights to the assets and obligations for the liabilities relating to the arrangement.
Based on the Group’s control assessment, investments held in four different companies are classified as joint operations. Based on management’s judgement, the contractual arrangement establishes that the parties to the joint arrangement share their interests in all assets relating to the arrangement. Therefore, the Group recognises in relation to their interest in assets, liabilities, income and expenses in the above mentioned joint operations.
5.2.2 Determining whether an arrangement contains a lease• Independent Power ProducersOver a period of time, the Group established a number of Independent Power Project arrangements in order to develop, construct, own, operate and maintain electricity generation plants all over the Kingdom. A key input to these power plants is the fuel used in the turbines for the production of electricity, this is provided to SEC at a subsidised rate that has been agreed between the Group and Saudi Aramco (sole supplier of fuel in KSA) and is supplied to the power plants free of charge under Independent power projects arrangement.
Standard agreements are in place to govern Independent Power Projects. Under the terms of the arrangements, Independent power projects will build and operate a power plants to generate electricity using fuel supplied by the Group. The Group will offtake all of the plants’ generated power.
By analysing the substance of the current terms of the arrangements, the management considers that they do not meet the finance lease requirements in accordance with IAS 17 and should be classified as operating leases.
• Other items of property, plant and equipmentThe Group has established a number of short-term lease arrangements for the lease of different types of motor vehicles and computers in order to support its day to day operations. It is highly improbable for the Group to renew the rental lease agreements for a period more than the initial 3-year agreement period.
Management considers the Group is not exposed to a majority of the risks and rewards of ownership of the leased assets. Accordingly, in consideration of the facts and evidence, it is deemed appropriate to classify the motor vehicle and computers arrangement as an operating lease in accordance with the requirements of IAS 17.6 Summary of significant accounting policies
6.1 Basis of consolidation of financial statements 6.1.1 Subsidiaries Subsidiaries are all entities over which the Group has control. Control is achieved when the Group is exposed, or has rights, to variable returns from its involvement with the investee and has the ability to affect those returns through its power over the investee. Specifically, the Group controls an investee if and only if the Group has:
• Power over the investee (i.e. existing rights that give it the current ability to direct the relevant activities of the investee);
• Exposure, or rights, to variable returns from its involvement with the investee;• The ability to use its power over the investee to affect its returns; and
Generally, there is a presumption that a majority of voting rights results in control. To support this presumption and when the Group has less than a majority of the voting or similar rights of an investee, the Group considers all relevant facts and circumstances in assessing whether it has power over an investee, including:
• The contractual arrangement with the other vote holders of the investee; • Rights arising from other contractual arrangements; and • The Group’s voting rights and potential voting rights.
Non-controlling interests are measured by their proportionate share of the identifiable net assets of the acquiree at the date of acquisition.
The Group re-assesses whether or not it controls an investee if facts and circumstances indicate that there are changes to one or more of the three elements of control. The consolidation of a subsidiary is commenced when the Group obtains control over the subsidiary and ceases when the Group loses control of the subsidiary. Subsidiaries are fully consolidated from the date on which control is transferred to the Group and deconsolidated from the date that control ceases. The share of income or loss and net assets not controlled by the Group are presented separately in the consolidated statement of income and within equity in the consolidated statement of financial position. If the Group retains any interest in the former subsidiary, that interest is measured at fair value on the date that control ceases.
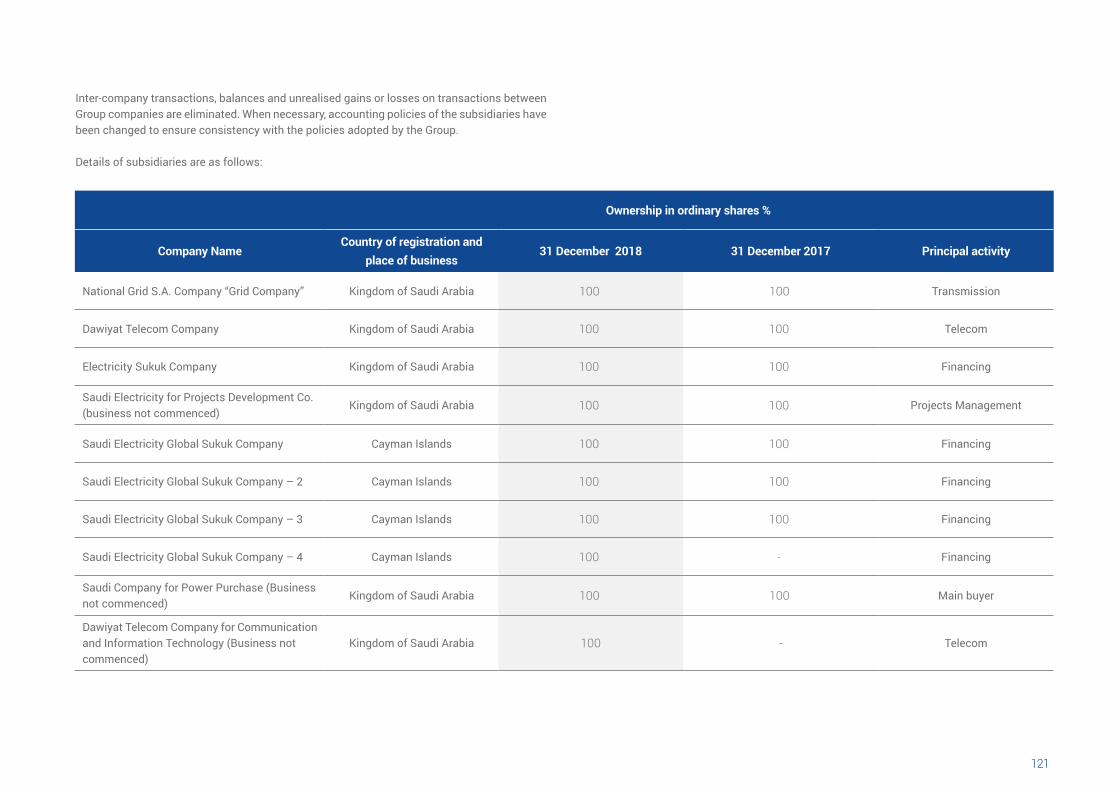
121120
Inter-company transactions, balances and unrealised gains or losses on transactions between Group companies are eliminated. When necessary, accounting policies of the subsidiaries have been changed to ensure consistency with the policies adopted by the Group.
Details of subsidiaries are as follows:
Ownership in ordinary shares %
Company Name Country of registration and
place of business31 December 2018 31 December 2017 Principal activity
National Grid S.A. Company “Grid Company” Kingdom of Saudi Arabia 100 100 Transmission
Dawiyat Telecom Company Kingdom of Saudi Arabia 100 100 Telecom
Electricity Sukuk Company Kingdom of Saudi Arabia 100 100 Financing
Saudi Electricity for Projects Development Co. (business not commenced)
Kingdom of Saudi Arabia 100 100 Projects Management
Saudi Electricity Global Sukuk Company Cayman Islands 100 100 Financing
Saudi Electricity Global Sukuk Company – 2 Cayman Islands 100 100 Financing
Saudi Electricity Global Sukuk Company – 3 Cayman Islands 100 100 Financing
Saudi Electricity Global Sukuk Company – 4 Cayman Islands 100 - Financing
Saudi Company for Power Purchase )Business not commenced)
Kingdom of Saudi Arabia 100 100 Main buyer
Dawiyat Telecom Company for Communication and Information Technology )Business not commenced)
Kingdom of Saudi Arabia 100 - Telecom
Annual Report | 2018
123122
These consolidated financial statements include the assets, liabilities and results of operations of the subsidiaries referred to in the table above. The percentage of voting rights owned by the Company in subsidiaries is not different from that of the ordinary shares held. The financial year of the subsidiaries starts from the beginning of January and ends at the end of December of each calendar year. The following is a breakdown of the Saudi Electricity Company’s subsidiaries:
1. The National Grid S.A. is a limited liability company registererd in Riyadh, Kingdom of Saudi Arabia under commercial registration numbered 1010306123 dated 29 Rabi Thani 1432H, (corresponding to 3 April 2011). NGS is wholly owned by Saudi Electricity Company. The Company is engaged in electricity transmission activities including operating, controlling and maintenance of the electricity transmission system and leasing of transmisson line capacity. The Company provides services to one customer (the Saudi Electricity Company).
National Grid Company was formed as a part of the Company’s plan to split its main activities
into separate companies pursuant to the Board of Directors resolution no. 1/81/2008 dated 25 Dhul Hijjah 1429H corresponding to 23 December 2008 and resolution no. 1/86/2009 dated 7 Jumada Al Awal 1430H corresponding to 3 May 2009. Accordingly, the Company’s Board of Directors agreed on 1 January 2012 to transfer all of the Saudi Electricity Company tranmission activity’s assets and liabilities to National Grid Company at their net book value as of 1 January 2012.
2. Dawiyat Telecom Company is a limited liability company established in Riyadh, Kingdom of Saudi Arabia under commercial registration number 1010277672 dated 25 Dhul-Hijjah 1430H (corresponding to 12 December 2009), in accordance with the Company’s articles of association dated 23 Jumad Thani 1430H (corresponding to 16 June 2009), and is wholly owned by Saudi Electricity Company.
On 25 Rajab 1437H (corresponding to 2 May 2016), Dawiyat Telecom Company obtained license
no. 37-20-001 to provide type (B) services from the Telecommunication and Information Technology Authority. The license period is for 10 Years that ends on 24/7/1447H.
Dawiyat Telecom Company main activity is the construction, leasing, managing and operating
of electric and fibre optics networks to provide telecommunication services.
3. Electricity Sukuk Company is a limited liability company established in Riyadh, Kingdom of Saudi Arabia under commercial registration number 1010233775 dated 16 Jumad Awal 1428H (corresponding to 2 June 2007), ESC is wholly owned by Saudi Electricity Company.
The principal activity of Electricity Sukuk Company is to provide support services required with respect to Sukuks issued by the Holding Company, its subsidiaries and other related companies, after obtaining the required approvals from relevant authorities. Electricity Sukuk Company was incorporated to act as a trustee of special assets (Sukuk assets) according to the agreements of transferring the Sukuk assets between ESC (as a trustee or custodian), the Holding Company (as issuer) and SABB for financial instruments (as agent for the sukuk holders).
4. Saudi Electricity for Projects Development Company was established in the Kingdom of Saudi Arabia as a limited liability company. The company’s activity is to manage construction projects, develop detailed designs, purchase materials, and execute projects in the energy sector.
5. Saudi Electricity Global Sukuk Company was established in the Cayman Islands as a limited liability company, The company was established to provide the necessary services and support for the issuance of international bonds and Sukuks.
6. The Electric Company for International Sukuk-2 was established in the Cayman Islands as a limited liability company. The company was established to provide the necessary services and support in the issuance of international bonds and Sukuks.
7. The Electric Company for International Sukuk-3 was established in the Cayman Islands as a limited liability company. The company was established to provide the necessary services and support in the issuance of international bonds and Sukuks.
8. The Electric Company for International Sukuk-4 was established in the Cayman Islands as a limited liability company. The company was established to provide the necessary services and support in the issuance of international bonds and Sukuks.
9. The Group has established the Saudi Company for Power Purchase, wholly owned by the Saudi Electricity Company under Commercial Registration No. 1010608947 dated 31 May 2017. The main activity of the Company is to carry out the main buyer’s activity in accordance with the provisions of the license issued by the Electricity and Co-Generation Regulatory Authority which includes offer power generation projects, purchasing and selling power and perform the related agreements so the company do not yet have any assets or liabilities and have not engaged in any material transactions and therefore have no balances that have been consolidated in the accompanying consolidated financial statements.
10. Dawiyat Telecom Company is a limited liability company established in Kingdom of Saudi Arabia, Riyadh under the Company’s Memorandum of Association on 21 Rabi Thani 1439 H corresponding to 4 January 2018 and is fully owned by the Saudi Electricity Company.
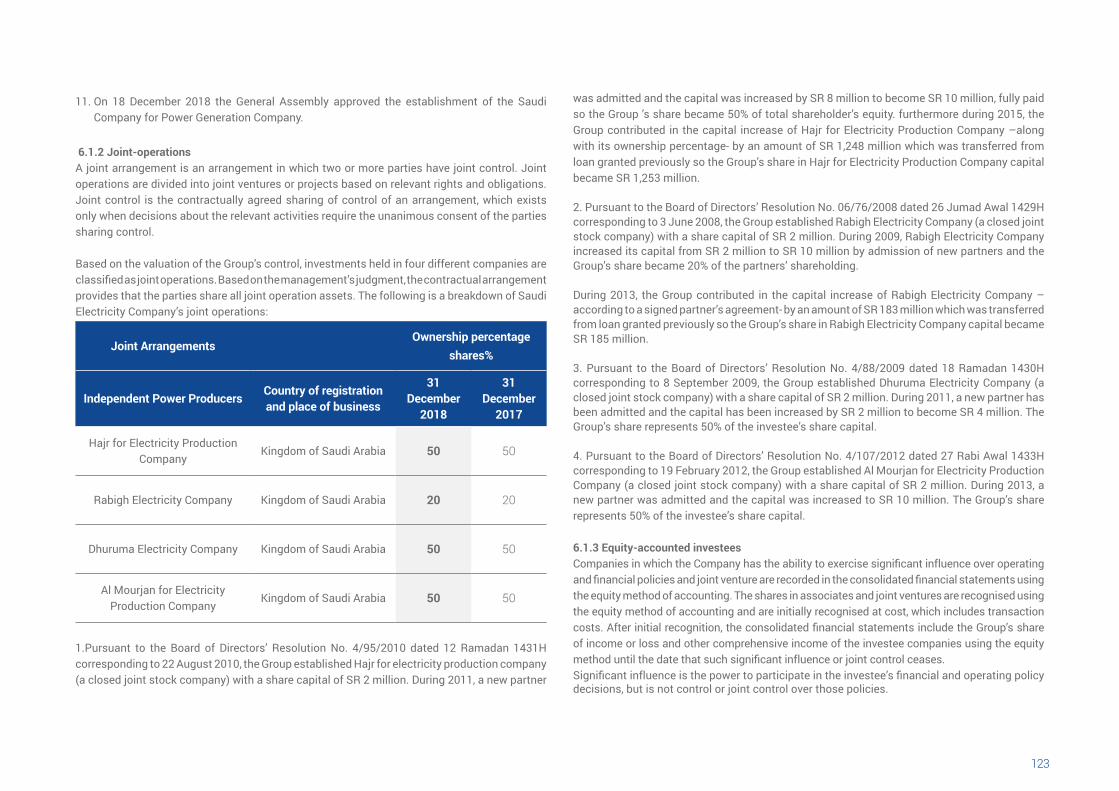
123122
11. On 18 December 2018 the General Assembly approved the establishment of the Saudi Company for Power Generation Company.
6.1.2 Joint-operationsA joint arrangement is an arrangement in which two or more parties have joint control. Joint operations are divided into joint ventures or projects based on relevant rights and obligations. Joint control is the contractually agreed sharing of control of an arrangement, which exists only when decisions about the relevant activities require the unanimous consent of the parties sharing control.
Based on the valuation of the Group’s control, investments held in four different companies are classified as joint operations. Based on the management’s judgment, the contractual arrangement provides that the parties share all joint operation assets. The following is a breakdown of Saudi Electricity Company’s joint operations:
Joint Arrangements Ownership percentage
shares%
Independent Power Producers Country of registrationand place of business
31 December
2018
31 December
2017
Hajr for Electricity Production Company
Kingdom of Saudi Arabia 50 50
Rabigh Electricity Company Kingdom of Saudi Arabia 20 20
Dhuruma Electricity Company Kingdom of Saudi Arabia 50 50
Al Mourjan for Electricity Production Company
Kingdom of Saudi Arabia 50 50
1.Pursuant to the Board of Directors’ Resolution No. 4/95/2010 dated 12 Ramadan 1431H corresponding to 22 August 2010, the Group established Hajr for electricity production company (a closed joint stock company) with a share capital of SR 2 million. During 2011, a new partner
was admitted and the capital was increased by SR 8 million to become SR 10 million, fully paid so the Group ’s share became 50% of total shareholder’s equity. furthermore during 2015, the Group contributed in the capital increase of Hajr for Electricity Production Company –along with its ownership percentage- by an amount of SR 1,248 million which was transferred from loan granted previously so the Group’s share in Hajr for Electricity Production Company capital became SR 1,253 million.
2. Pursuant to the Board of Directors’ Resolution No. 06/76/2008 dated 26 Jumad Awal 1429H corresponding to 3 June 2008, the Group established Rabigh Electricity Company (a closed joint stock company) with a share capital of SR 2 million. During 2009, Rabigh Electricity Company increased its capital from SR 2 million to SR 10 million by admission of new partners and the Group’s share became 20% of the partners’ shareholding.
During 2013, the Group contributed in the capital increase of Rabigh Electricity Company –according to a signed partner’s agreement- by an amount of SR 183 million which was transferred from loan granted previously so the Group’s share in Rabigh Electricity Company capital became SR 185 million.
3. Pursuant to the Board of Directors’ Resolution No. 4/88/2009 dated 18 Ramadan 1430H corresponding to 8 September 2009, the Group established Dhuruma Electricity Company (a closed joint stock company) with a share capital of SR 2 million. During 2011, a new partner has been admitted and the capital has been increased by SR 2 million to become SR 4 million. The Group’s share represents 50% of the investee’s share capital.
4. Pursuant to the Board of Directors’ Resolution No. 4/107/2012 dated 27 Rabi Awal 1433H corresponding to 19 February 2012, the Group established Al Mourjan for Electricity Production Company (a closed joint stock company) with a share capital of SR 2 million. During 2013, a new partner was admitted and the capital was increased to SR 10 million. The Group’s share represents 50% of the investee’s share capital.
6.1.3 Equity-accounted investeesCompanies in which the Company has the ability to exercise significant influence over operating and financial policies and joint venture are recorded in the consolidated financial statements using the equity method of accounting. The shares in associates and joint ventures are recognised using the equity method of accounting and are initially recognised at cost, which includes transaction costs. After initial recognition, the consolidated financial statements include the Group’s share of income or loss and other comprehensive income of the investee companies using the equity method until the date that such significant influence or joint control ceases.Significant influence is the power to participate in the investee’s financial and operating policy decisions, but is not control or joint control over those policies.
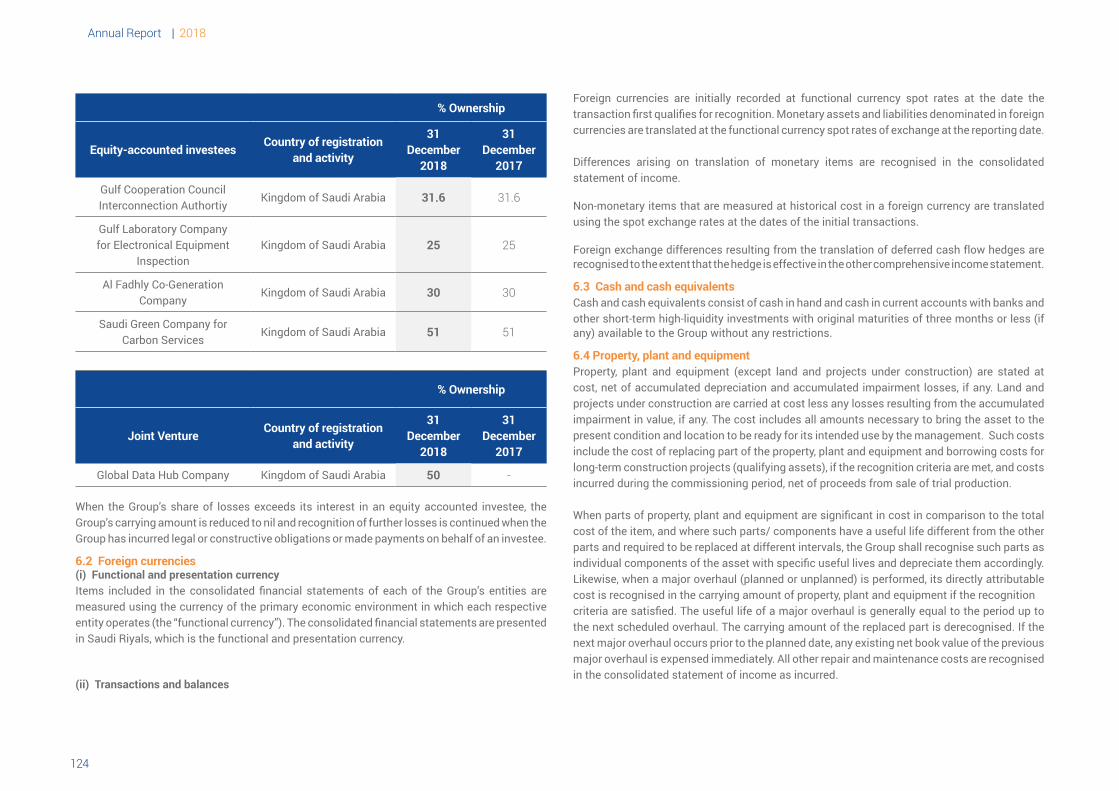
Annual Report | 2018
125124
% Ownership
Equity-accounted investees Country of registration
and activity
31 December
2018
31 December
2017
Gulf Cooperation Council Interconnection Authortiy
Kingdom of Saudi Arabia 31.6 31.6
Gulf Laboratory Companyfor Electronical Equipment
InspectionKingdom of Saudi Arabia 25 25
Al Fadhly Co-Generation Company
Kingdom of Saudi Arabia 30 30
Saudi Green Company for Carbon Services
Kingdom of Saudi Arabia 51 51
% Ownership
Joint Venture Country of registration
and activity
31 December
2018
31 December
2017
Global Data Hub Company Kingdom of Saudi Arabia 50 -
When the Group’s share of losses exceeds its interest in an equity accounted investee, the Group’s carrying amount is reduced to nil and recognition of further losses is continued when the Group has incurred legal or constructive obligations or made payments on behalf of an investee.
6.2 Foreign currencies (i) Functional and presentation currencyItems included in the consolidated financial statements of each of the Group’s entities are measured using the currency of the primary economic environment in which each respective entity operates (the “functional currency”). The consolidated financial statements are presented in Saudi Riyals, which is the functional and presentation currency.
(ii) Transactions and balances
Foreign currencies are initially recorded at functional currency spot rates at the date the transaction first qualifies for recognition. Monetary assets and liabilities denominated in foreign currencies are translated at the functional currency spot rates of exchange at the reporting date.
Differences arising on translation of monetary items are recognised in the consolidated statement of income.
Non-monetary items that are measured at historical cost in a foreign currency are translated using the spot exchange rates at the dates of the initial transactions.
Foreign exchange differences resulting from the translation of deferred cash flow hedges are recognised to the extent that the hedge is effective in the other comprehensive income statement.
6.3 Cash and cash equivalentsCash and cash equivalents consist of cash in hand and cash in current accounts with banks and other short-term high-liquidity investments with original maturities of three months or less (if any) available to the Group without any restrictions.
6.4 Property, plant and equipmentProperty, plant and equipment (except land and projects under construction) are stated at cost, net of accumulated depreciation and accumulated impairment losses, if any. Land and projects under construction are carried at cost less any losses resulting from the accumulated impairment in value, if any. The cost includes all amounts necessary to bring the asset to the present condition and location to be ready for its intended use by the management. Such costs include the cost of replacing part of the property, plant and equipment and borrowing costs for long-term construction projects (qualifying assets), if the recognition criteria are met, and costs incurred during the commissioning period, net of proceeds from sale of trial production.
When parts of property, plant and equipment are significant in cost in comparison to the total cost of the item, and where such parts/ components have a useful life different from the other parts and required to be replaced at different intervals, the Group shall recognise such parts as individual components of the asset with specific useful lives and depreciate them accordingly. Likewise, when a major overhaul (planned or unplanned) is performed, its directly attributable cost is recognised in the carrying amount of property, plant and equipment if the recognition criteria are satisfied. The useful life of a major overhaul is generally equal to the period up to the next scheduled overhaul. The carrying amount of the replaced part is derecognised. If the next major overhaul occurs prior to the planned date, any existing net book value of the previous major overhaul is expensed immediately. All other repair and maintenance costs are recognised in the consolidated statement of income as incurred.
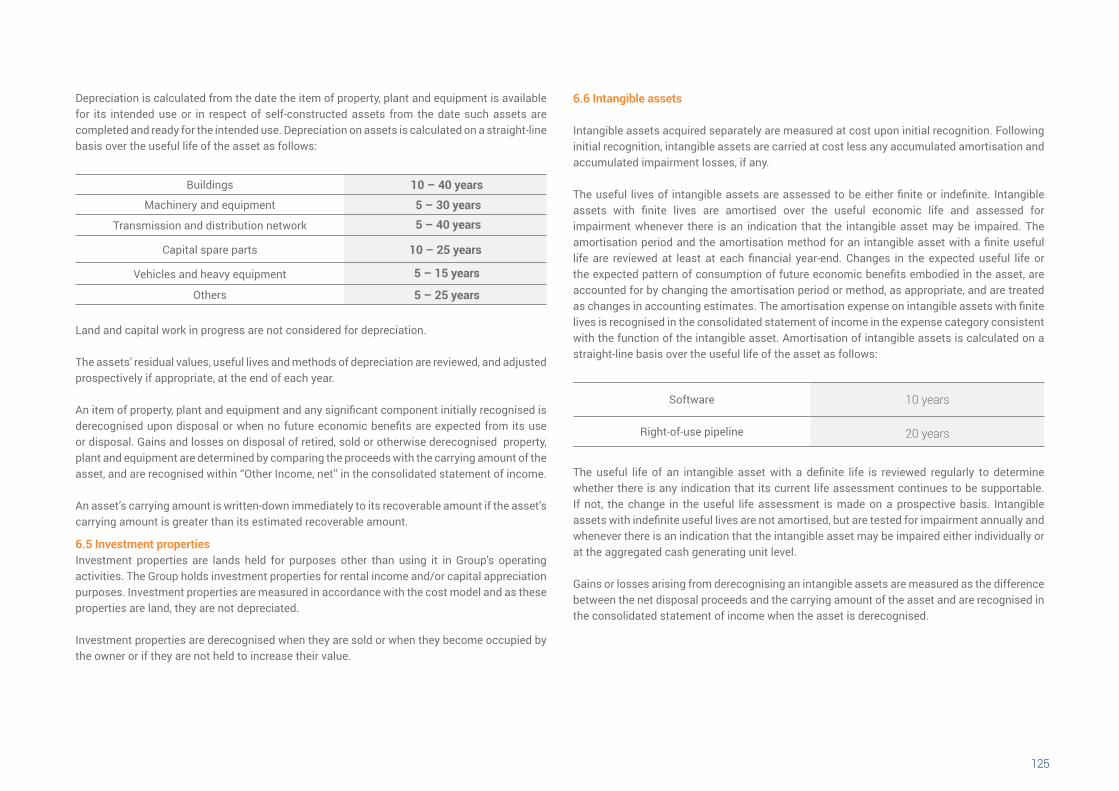
125124
Depreciation is calculated from the date the item of property, plant and equipment is available for its intended use or in respect of self-constructed assets from the date such assets are completed and ready for the intended use. Depreciation on assets is calculated on a straight-line basis over the useful life of the asset as follows:
Buildings 10 – 40 years Machinery and equipment 5 – 30 years
Transmission and distribution network 5 – 40 years
Capital spare parts 10 – 25 years
Vehicles and heavy equipment 5 – 15 years
Others 5 – 25 years
Land and capital work in progress are not considered for depreciation.
The assets’ residual values, useful lives and methods of depreciation are reviewed, and adjusted prospectively if appropriate, at the end of each year.
An item of property, plant and equipment and any significant component initially recognised is derecognised upon disposal or when no future economic benefits are expected from its use or disposal. Gains and losses on disposal of retired, sold or otherwise derecognised property, plant and equipment are determined by comparing the proceeds with the carrying amount of the asset, and are recognised within ‘‘Other Income, net’’ in the consolidated statement of income.
An asset’s carrying amount is written-down immediately to its recoverable amount if the asset’s carrying amount is greater than its estimated recoverable amount.
6.5 Investment propertiesInvestment properties are lands held for purposes other than using it in Group’s operating activities. The Group holds investment properties for rental income and/or capital appreciation purposes. Investment properties are measured in accordance with the cost model and as these properties are land, they are not depreciated.
Investment properties are derecognised when they are sold or when they become occupied by the owner or if they are not held to increase their value.
6.6 Intangible assets
Intangible assets acquired separately are measured at cost upon initial recognition. Following initial recognition, intangible assets are carried at cost less any accumulated amortisation and accumulated impairment losses, if any.
The useful lives of intangible assets are assessed to be either finite or indefinite. Intangible assets with finite lives are amortised over the useful economic life and assessed for impairment whenever there is an indication that the intangible asset may be impaired. The amortisation period and the amortisation method for an intangible asset with a finite useful life are reviewed at least at each financial year-end. Changes in the expected useful life or the expected pattern of consumption of future economic benefits embodied in the asset, are accounted for by changing the amortisation period or method, as appropriate, and are treated as changes in accounting estimates. The amortisation expense on intangible assets with finite lives is recognised in the consolidated statement of income in the expense category consistent with the function of the intangible asset. Amortisation of intangible assets is calculated on a straight-line basis over the useful life of the asset as follows:
Software 10 years
Right-of-use pipeline 20 years
The useful life of an intangible asset with a definite life is reviewed regularly to determine whether there is any indication that its current life assessment continues to be supportable. If not, the change in the useful life assessment is made on a prospective basis. Intangible assets with indefinite useful lives are not amortised, but are tested for impairment annually and whenever there is an indication that the intangible asset may be impaired either individually or at the aggregated cash generating unit level.
Gains or losses arising from derecognising an intangible assets are measured as the difference between the net disposal proceeds and the carrying amount of the asset and are recognised in the consolidated statement of income when the asset is derecognised.
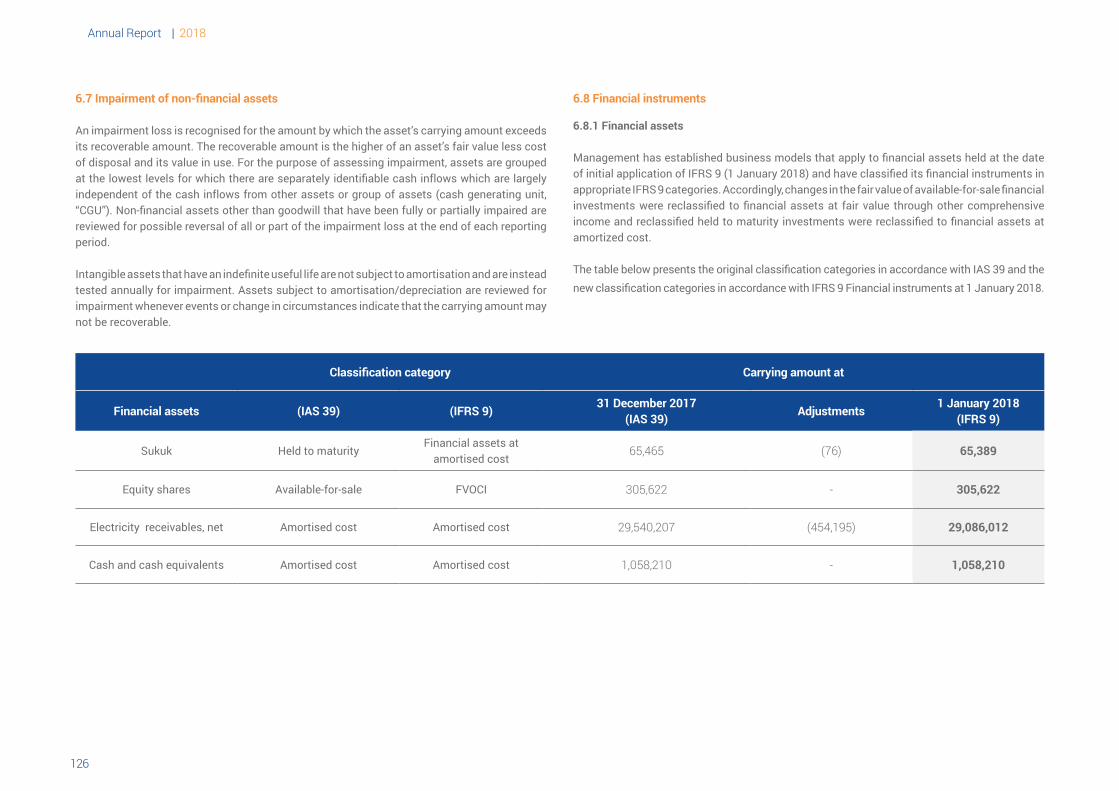
Annual Report | 2018
127126
6.7 Impairment of non-financial assets
An impairment loss is recognised for the amount by which the asset’s carrying amount exceeds its recoverable amount. The recoverable amount is the higher of an asset’s fair value less cost of disposal and its value in use. For the purpose of assessing impairment, assets are grouped at the lowest levels for which there are separately identifiable cash inflows which are largely independent of the cash inflows from other assets or group of assets (cash generating unit, “CGU”). Non-financial assets other than goodwill that have been fully or partially impaired are reviewed for possible reversal of all or part of the impairment loss at the end of each reporting period.
Intangible assets that have an indefinite useful life are not subject to amortisation and are instead tested annually for impairment. Assets subject to amortisation/depreciation are reviewed for impairment whenever events or change in circumstances indicate that the carrying amount may not be recoverable.
6.8 Financial instruments
6.8.1 Financial assets
Management has established business models that apply to financial assets held at the date of initial application of IFRS 9 (1 January 2018) and have classified its financial instruments in appropriate IFRS 9 categories. Accordingly, changes in the fair value of available-for-sale financial investments were reclassified to financial assets at fair value through other comprehensive income and reclassified held to maturity investments were reclassified to financial assets at amortized cost.
The table below presents the original classification categories in accordance with IAS 39 and the new classification categories in accordance with IFRS 9 Financial instruments at 1 January 2018.
Carrying amount atClassification category
1 January 2018 (IFRS 9)
Adjustments 31 December 2017
(IAS 39)(IFRS 9)(IAS 39)Financial assets
65,389)76(65,465Financial assets at
amortised costHeld to maturitySukuk
305,622-305,622FVOCIAvailable-for-saleEquity shares
29,086,012)454,195(29,540,207Amortised costAmortised costElectricity receivables, net
1,058,210-1,058,210Amortised costAmortised costCash and cash equivalents
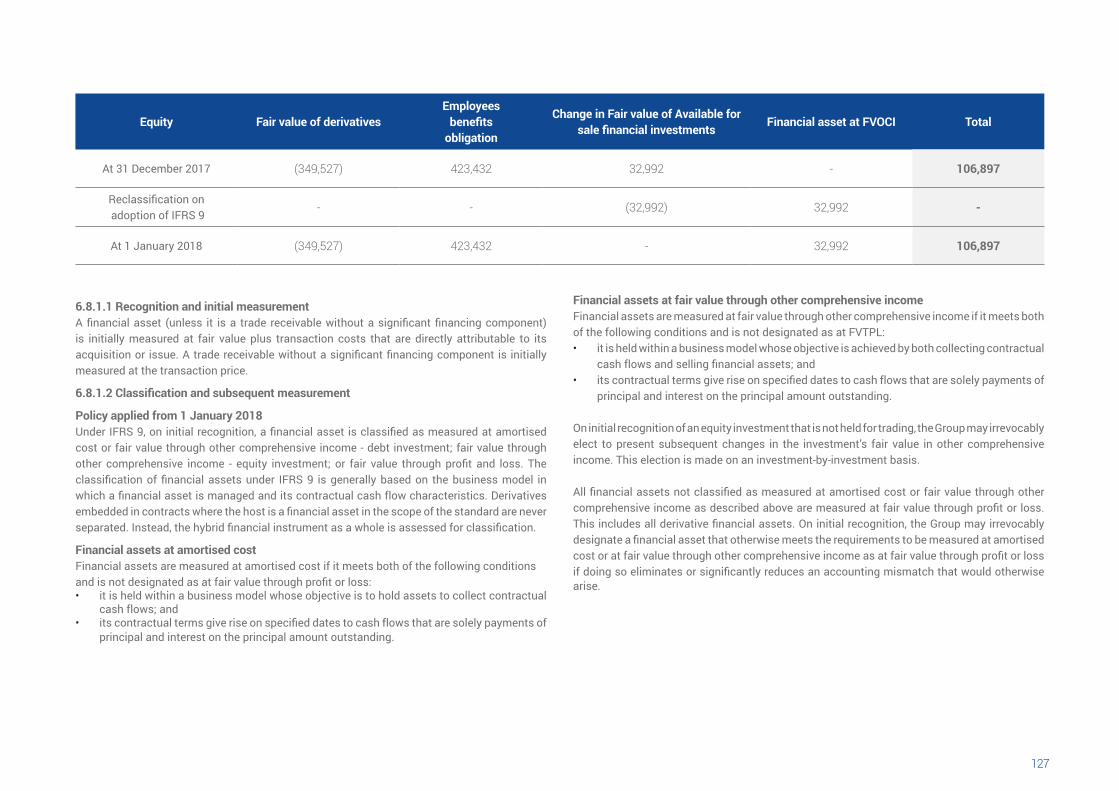
127126
TotalFinancial asset at FVOCI Change in Fair value of Available for
sale financial investments
Employeesbenefits
obligationFair value of derivativesEquity
106,897-32,992423,432)349,527(At 31 December 2017
-32,992)32,992(--Reclassification on adoption of IFRS 9
106,89732,992-423,432)349,527(At 1 January 2018
6.8.1.1 Recognition and initial measurementA financial asset (unless it is a trade receivable without a significant financing component) is initially measured at fair value plus transaction costs that are directly attributable to its acquisition or issue. A trade receivable without a significant financing component is initially measured at the transaction price.
6.8.1.2 Classification and subsequent measurement
Policy applied from 1 January 2018Under IFRS 9, on initial recognition, a financial asset is classified as measured at amortised cost or fair value through other comprehensive income - debt investment; fair value through other comprehensive income - equity investment; or fair value through profit and loss. The classification of financial assets under IFRS 9 is generally based on the business model in which a financial asset is managed and its contractual cash flow characteristics. Derivatives embedded in contracts where the host is a financial asset in the scope of the standard are never separated. Instead, the hybrid financial instrument as a whole is assessed for classification.
Financial assets at amortised cost Financial assets are measured at amortised cost if it meets both of the following conditions and is not designated as at fair value through profit or loss: • it is held within a business model whose objective is to hold assets to collect contractual
cash flows; and • its contractual terms give rise on specified dates to cash flows that are solely payments of
principal and interest on the principal amount outstanding.
Financial assets at fair value through other comprehensive incomeFinancial assets are measured at fair value through other comprehensive income if it meets both of the following conditions and is not designated as at FVTPL:• it is held within a business model whose objective is achieved by both collecting contractual
cash flows and selling financial assets; and • its contractual terms give rise on specified dates to cash flows that are solely payments of
principal and interest on the principal amount outstanding.
On initial recognition of an equity investment that is not held for trading, the Group may irrevocably elect to present subsequent changes in the investment’s fair value in other comprehensive income. This election is made on an investment-by-investment basis.
All financial assets not classified as measured at amortised cost or fair value through other comprehensive income as described above are measured at fair value through profit or loss. This includes all derivative financial assets. On initial recognition, the Group may irrevocably designate a financial asset that otherwise meets the requirements to be measured at amortised cost or at fair value through other comprehensive income as at fair value through profit or loss if doing so eliminates or significantly reduces an accounting mismatch that would otherwise arise.
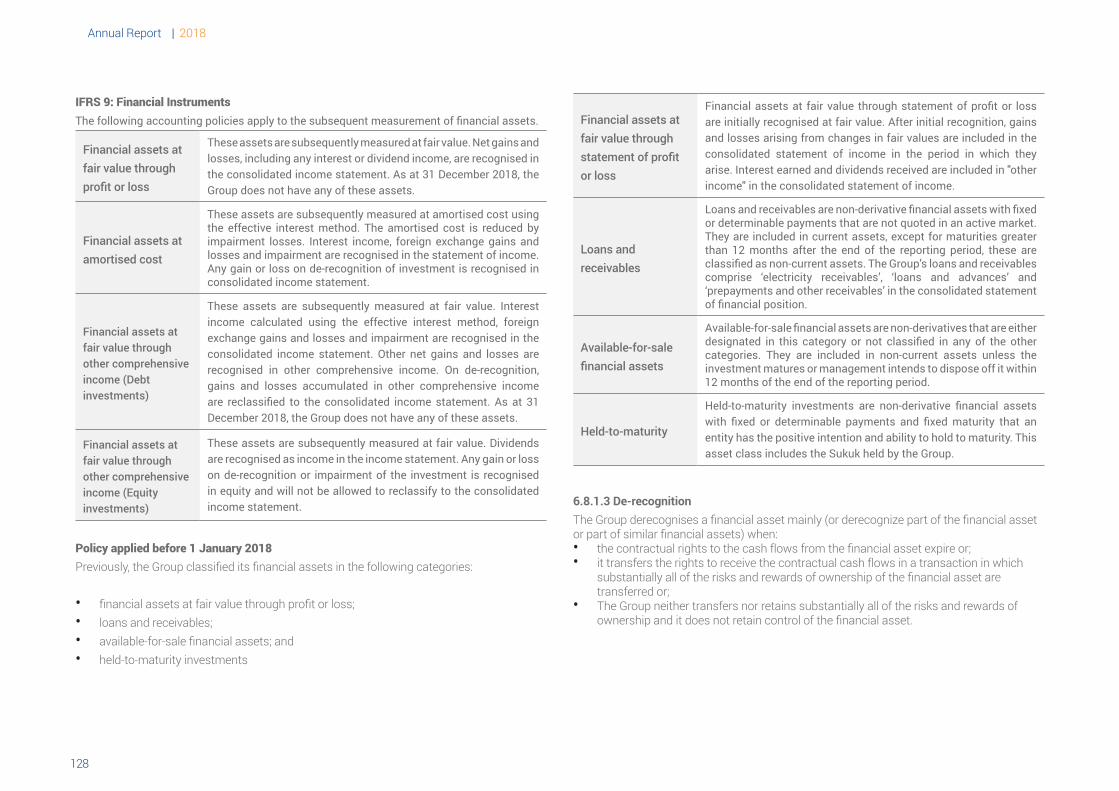
Annual Report | 2018
129128
IFRS 9: Financial Instruments The following accounting policies apply to the subsequent measurement of financial assets.
These assets are subsequently measured at fair value. Net gains and losses, including any interest or dividend income, are recognised in the consolidated income statement. As at 31 December 2018, the Group does not have any of these assets.
Financial assets at fair value throughprofit or loss
These assets are subsequently measured at amortised cost using the effective interest method. The amortised cost is reduced by impairment losses. Interest income, foreign exchange gains and losses and impairment are recognised in the statement of income. Any gain or loss on de-recognition of investment is recognised in consolidated income statement.
Financial assets at amortised cost
These assets are subsequently measured at fair value. Interest income calculated using the effective interest method, foreign exchange gains and losses and impairment are recognised in the consolidated income statement. Other net gains and losses are recognised in other comprehensive income. On de-recognition, gains and losses accumulated in other comprehensive income are reclassified to the consolidated income statement. As at 31 December 2018, the Group does not have any of these assets.
Financial assets at fair value through other comprehensive income (Debt investments)
These assets are subsequently measured at fair value. Dividends are recognised as income in the income statement. Any gain or loss on de-recognition or impairment of the investment is recognised in equity and will not be allowed to reclassify to the consolidated income statement.
Financial assets at fair value through other comprehensive income (Equity investments)
Policy applied before 1 January 2018Previously, the Group classified its financial assets in the following categories:
• financial assets at fair value through profit or loss;• loans and receivables;• available-for-sale financial assets; and• held-to-maturity investments
Financial assets at fair value through statement of profitor loss
Financial assets at fair value through statement of profit or loss are initially recognised at fair value. After initial recognition, gains and losses arising from changes in fair values are included in the consolidated statement of income in the period in which they arise. Interest earned and dividends received are included in "other income" in the consolidated statement of income.
Loans andreceivables
Loans and receivables are non-derivative financial assets with fixed or determinable payments that are not quoted in an active market. They are included in current assets, except for maturities greater than 12 months after the end of the reporting period, these are classified as non-current assets. The Group’s loans and receivables comprise ‘electricity receivables’, ‘loans and advances’ and ‘prepayments and other receivables’ in the consolidated statement of financial position.
Available-for-salefinancial assets
Available-for-sale financial assets are non-derivatives that are either designated in this category or not classified in any of the other categories. They are included in non-current assets unless the investment matures or management intends to dispose off it within 12 months of the end of the reporting period.
Held-to-maturity
Held-to-maturity investments are non-derivative financial assets with fixed or determinable payments and fixed maturity that an entity has the positive intention and ability to hold to maturity. This asset class includes the Sukuk held by the Group.
6.8.1.3 De-recognitionThe Group derecognises a financial asset mainly (or derecognize part of the financial asset or part of similar financial assets) when:• the contractual rights to the cash flows from the financial asset expire or;• it transfers the rights to receive the contractual cash flows in a transaction in which
substantially all of the risks and rewards of ownership of the financial asset are transferred or;
• The Group neither transfers nor retains substantially all of the risks and rewards of ownership and it does not retain control of the financial asset.
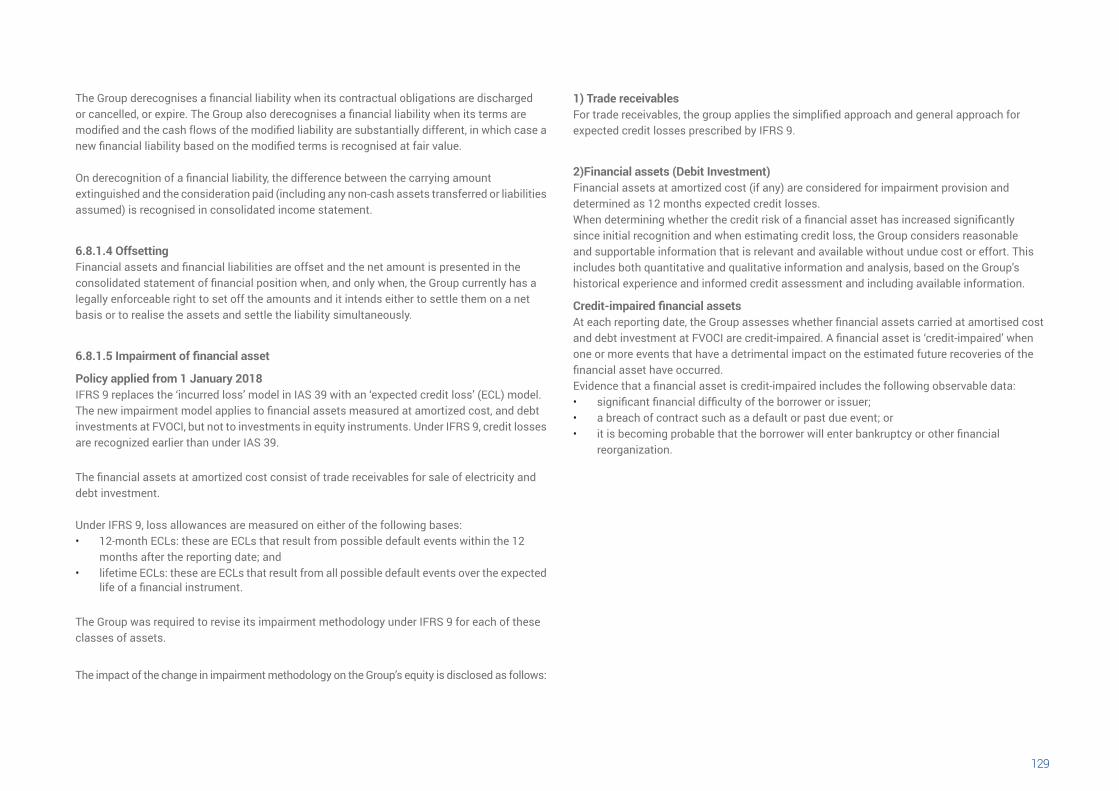
129128
The Group derecognises a financial liability when its contractual obligations are discharged or cancelled, or expire. The Group also derecognises a financial liability when its terms are modified and the cash flows of the modified liability are substantially different, in which case a new financial liability based on the modified terms is recognised at fair value.
On derecognition of a financial liability, the difference between the carrying amount extinguished and the consideration paid (including any non-cash assets transferred or liabilities assumed) is recognised in consolidated income statement.
6.8.1.4 Offsetting Financial assets and financial liabilities are offset and the net amount is presented in the consolidated statement of financial position when, and only when, the Group currently has a legally enforceable right to set off the amounts and it intends either to settle them on a net basis or to realise the assets and settle the liability simultaneously.
6.8.1.5 Impairment of financial asset
Policy applied from 1 January 2018 IFRS 9 replaces the ‘incurred loss’ model in IAS 39 with an ‘expected credit loss’ (ECL) model. The new impairment model applies to financial assets measured at amortized cost, and debt investments at FVOCI, but not to investments in equity instruments. Under IFRS 9, credit losses are recognized earlier than under IAS 39.
The financial assets at amortized cost consist of trade receivables for sale of electricity and debt investment.
Under IFRS 9, loss allowances are measured on either of the following bases:• 12-month ECLs: these are ECLs that result from possible default events within the 12
months after the reporting date; and • lifetime ECLs: these are ECLs that result from all possible default events over the expected
life of a financial instrument.
The Group was required to revise its impairment methodology under IFRS 9 for each of these classes of assets.
The impact of the change in impairment methodology on the Group’s equity is disclosed as follows:
1) Trade receivables For trade receivables, the group applies the simplified approach and general approach for expected credit losses prescribed by IFRS 9.
2)Financial assets (Debit Investment)Financial assets at amortized cost (if any) are considered for impairment provision and determined as 12 months expected credit losses.When determining whether the credit risk of a financial asset has increased significantly since initial recognition and when estimating credit loss, the Group considers reasonable and supportable information that is relevant and available without undue cost or effort. This includes both quantitative and qualitative information and analysis, based on the Group’s historical experience and informed credit assessment and including available information.
Credit-impaired financial assetsAt each reporting date, the Group assesses whether financial assets carried at amortised cost and debt investment at FVOCI are credit-impaired. A financial asset is ‘credit-impaired’ when one or more events that have a detrimental impact on the estimated future recoveries of the financial asset have occurred.Evidence that a financial asset is credit-impaired includes the following observable data:• significant financial difficulty of the borrower or issuer;• a breach of contract such as a default or past due event; or• it is becoming probable that the borrower will enter bankruptcy or other financial
reorganization.
Annual Report | 2018
131130
An assessment is made as to whether the credit risk of a financial instrument has increased substantially since its initial recognition by taking into account the change in the risk of default occurring over the remaining life of the financial instrument.
When determining whether the credit risk of a financial asset has increased significantly since initial recognition and when estimating ECLs, the Group considers reasonable and supportable information that is relevant and available without undue cost or effort. This includes both quantitative and qualitative information and analysis, based on the Group’s historical experience and informed credit assessment and including forward-looking information.
The Group believes that the credit risk on the financial instrument has not increased significantly since initial recognition if the instrument is identified as having a low credit risk at the reporting date. A financial instrument with a low credit risk is identified if: (i) the financial instrument has a low risk of default; and (ii) the borrower has a strong ability to meet its contractual cash commitments in the near term. (Iii) adverse changes in long-term economic and trade conditions, but not necessarily, and a reduction in the borrower’s ability to meet contractual cash flow obligations.
The Expected Credit Losses are a probability-weighted estimate of credit losses. Credit losses are measured as the present value of all cash shortfalls (i.e. the difference between the cash flows due to the entity in accordance with the contract and the cash flows that the Group expects to receive). The Expected Credit losses are discounted at the effective interest rate of the financial asset.
Provisions for losses on financial assets measured at amortized cost are deducted from the gross carrying amount of the assets. For debt securities at fair value at other comprehensive income, the loss allowance is recognized in other comprehensive income instead of reducing the carrying amount of the asset.
Policy applied before 1 January 2018The Group assesses at the end of each reporting period whether there is objective evidence that a financial asset or Group of financial assets is impaired. A financial asset or a Group of financial assets is impaired, and impairment losses are incurred only if there is objective evidence of impairment as a result of one or more events that occurred after the initial recognition of the asset (a ‘loss event’ or ‘loss events’). The loss has an impact on the estimated future cash flows of the financial asset or Group of financial assets that can be reliably estimated.
In the case of equity investments classified as available-for-sale, a significant or prolonged decline in the fair value of the security below its cost is considered an indicator that the assets are impaired.
If there is an objective evidence of impairment for available-for-sale financial assets, the cumulative loss – measured as the difference between the acquisition cost and the current fair value, less any impairment loss on that financial asset previously recognised in the consolidated statement of income – is removed from equity and recognised in the consolidated statement of income.
For loans and receivables, the amount of the loss is measured as the difference between the asset’s carrying amount and the present value of estimated future cash flows (excluding future credit losses that have not been incurred) discounted at the financial asset’s original effective interest rate. The carrying amount of the asset is reduced and the amount of the loss is recognised in the consolidated statement of income.
If a loan has a variable interest rate, the discount rate for measuring any impairment loss is the current effective interest rate determined under the contract. As a practical expedient, the Group may measure impairment on the basis of an instrument’s fair value using an observable market price.
If, in a subsequent period, the amount of the impairment loss decreases and the decrease can be related objectively to an event occurring after the impairment was recognised (such as an improvement in the debtor’s credit rating), the reversal of the previously recognised impairment loss is recognised in the consolidated statement of income.
If the fair value of a debt instrument classified as available-for-sale increases in a subsequent period and the increase can be objectively related to an event occurring after the impairment loss was recognised in the consolidated statement of income, the impairment loss is reversed through the consolidated statement of income.
6.8.2 Financial liabilities The Group classifies non-derivative primary liabilities in the following categories: financial liabilities at fair value through profit or loss and other financial liabilities.
After initial recognition, the Group measures financial liabilities (other than financial liabilities which are measured at fair value through profit or loss) at amortised cost. Amortised cost
131130
is the amount at which the debt was measured at initial recognition minus repayments, plus interest calculated using the effective interest method. The adjustments are calculated using the effective interest method. The difference between the proceeds (net of transaction cost) and the redemption value is recognised in the consolidated statement of income over the period of the loan or borrowing.
Loans, sukuks and government loans is derecognised when the obligation under the liability is discharged or cancelled, or expires. When an existing financial liability is replaced by another from the same lender on substantially different terms, or the terms of an existing liability are substantially modified, such an exchange or modification is treated as the de-recognition of the original liability and the recognition of a new liability. The difference in the respective carrying amounts is recognised in the consolidated statement of income.
6.8.3 Derivative financial instruments and hedging activities
Policy applied from 1 January 2018Derivatives are initially recognised at fair value on the date a derivative contract is entered into and are subsequently re-measured at their fair value at the end of each reporting date. The method of recognising the resulting gain or loss depends on whether the derivative is designated as a hedging instrument, and if so, the nature of the item being hedged.
The Group designates certain derivatives as hedges of a particular risk associated with a recognised asset or liability or a highly probable forecast transaction (cash flow hedge).
The Group documents at the inception of the hedging transaction the relationship between hedging instruments and hedged items, as well as its risk management objectives and strategy for undertaking various hedging transactions. The Group also documents its assessment, both at hedge inception and on an ongoing basis, of whether the derivatives that are used in hedging transactions have been and will continue to be highly effective in offsetting changes in fair values or cash flows of hedged items.
The full fair value of a hedging derivative is classified as a non-current asset or liability when the remaining hedged item is more than 12 months, and as a current asset or liability when the remaining maturity of the hedged item is less than 12 months. Trading derivatives are classified as a current asset or liability.
Cash flow hedge The effective portion of changes in the fair value of derivatives that are designated and qualify as cash flow hedges is recognised in the consolidated statement of other comprehensive income. The gain or loss relating to the ineffective portion is recognised immediately in the consolidated statement of income within ‘Other income / expense- net’.
Amounts accumulated in equity are reclassified to consolidated statement of income in the periods when the hedged item affects statement of income. The gain or loss relating to the effective portion of interest rate swaps hedging variable rate borrowings is recognised in the consolidated statement of income within ‘Finance income/cost’. When a hedging instrument expires or is sold, or when a hedge no longer meets the criteria for hedge accounting, any cumulative gain or loss existing in equity at that time remains in equity and is recognised when the forecast transaction is ultimately recognised in the consolidated statement of income. When a forecast transaction is no longer expected to occur, the cumulative gain or loss that was reported in equity is immediately transferred to the consolidated statement of income within ‘Other income / (expense) - net’.
Policy applied before 1 January 2018 The policy applied in the comparative information presented for 2017 is similar to that applied for 2018. However, for all cash flow hedges, including hedges of transactions resulting in the recognition of non-financial items, the amounts accumulated in the cash flow hedge reserve were reclassified to profit or loss in the same period or periods during which the hedged expected future cash flows affected profit or loss. Furthermore, for cash flow hedges that were terminated before 2017, forward points were recognised immediately in the consolidated income statement.
6.9 Employees benefits
Short-term obligationsShort-term benefits are those amounts expected to be settled wholly within 12 months of the end of the period in which the employees render the service that gives rise to the benefits. Liabilities for wages and salaries, including non-monetary benefits and accumulating leaves and benefits-in-kind that are expected to be settled wholly within twelve months after the end of the period in which the employees render the related service are recognised in respect of employees’ services up to the end of the reporting period and are measured at the amounts expected to be paid when the liabilities are settled. The liabilities are presented as current employee benefit obligations under “accruals and other payables” in the consolidated statement of financial position.
Annual Report | 2018
133132
Post-employment obligation The Group provides end of service benefits to its employees in accordance with the requirements of Articles 87 and 88 of the Saudi Arabia Labour and Workmen Law. The entitlement to these benefits, is based upon the employees’ basic salary and length of service, subject to the completion of a minimum service period. The expected costs of these benefits are recognised over the service period.
The employee benefits obligation plans are not funded. Accordingly, valuations of the obligations under those plans are carried out by an independent actuary based on the projected unit credit method and the liability is recorded based on an actuarial valuation.
The liability recognised in the consolidated statement of financial position in respect of defined benefit pension plans is the present value of the defined benefit obligation at the end of the reporting period. The defined benefit obligation is calculated annually by independent actuaries using the projected unit credit method.
The present value of the defined benefit obligation is determined by discounting the estimated future cash outflows using interest rates of high-quality United States government bonds that are denominated in the currency in which the benefits will be paid, and that have terms to maturity approximating to the terms of the related pension obligation.
Past-service costs are recognised immediately in the consolidated statement of income.
The interest cost is calculated by applying the discount rate to the balance of the defined benefit obligation. This cost is included in employee benefit expense in the consolidated statement of income. Actuarial gains and losses arising from experience adjustments and changes in actuarial assumptions are charged or credited in other comprehensive income in the period in which they arise.
Defined contribution planThe Company operates the defined contribution plan which named the savings plan. The Company’s contribution to the contribution plans identified as an expense is recognised in the consolidated statement of income when the related service is provided. The share of the company will only be paid at the written request of the employee to terminate the plan or upon retirement, death or full disability of the employee in accordance with the approved regulations. The assets of the plan are accounted for in accordance with the Company’s accounting policies where the liabilities and assets of the plan were offset.
Termination BenefitsThe Group shall pay termination benefits upon the termination of the employee’s services before the date of normal retirement, or when the employee accepts the voluntary termination
of his services. The Group recognises termination benefits at the earlier of when; a. The Group can no longer withdraw the offer; or b. The Group recognises restructuring costs and includes termination benefits in the event of
an offer to encourage retirement, termination benefits are measured based on the number of employees expected to accept the offer. Benefits that occur more than 12 months after the end of the reporting period are discounted at their present value.
6.10 Asset retirement obligationThe Group records the present value of estimated costs of legal decommissioning obligations required to restore the site to its original condition in the period in which the obligation is incurred. The nature of these activities includes dismantling and removing structures, dismantling operating facilities, closure of plant and waste sites, restoration, reclamation and re-vegetation of affected areas.
The obligation generally arises when the asset is installed or the ground/environment is disturbed at the location. When the liability is initially recognised, the present value of the estimated costs is capitalised by increasing the carrying amount of the related property, plant and equipment to the extent that it was incurred as a result of the development / construction of the asset.
Over time, the discounted liability is increased for the change in present value based on the discount rates that reflect current market assessments and the risks specific to the liability. The periodic unwinding of the discount is recognised in the consolidated statement of income as part of financial charges.
6.11 Government grantsGovernment grants are assistance by government in the form of transfers of resources to an entity in return for past or future compliance with certain conditions relating to the operating activities of the entity. In the particular case of SEC, the Company is tariff-regulated. They exclude those forms of government assistance which cannot reasonably have a value placed upon them and transactions with government which cannot be distinguished from the normal trading transactions of the entity.
Government grants, including non-monetary grants at fair value are recognised provided that there is a reasonable assurance that:
• The Group will comply with the conditions attaching to them; and• The grants will be received.Receipt of a grant does not itself provide conclusive evidence that the conditions attaching to the grant have been or will be fulfilled.
133132
The manner in which a grant is received does not affect the accounting method to be adopted in regard to the grant. Thus a grant is accounted for in the same manner whether it is received in cash or as a reduction of a liability to the government.
Grants received against specific expenses are recognised in the consolidated statement of income in the same period in which its relevant expenses are recognised. The Group assesses the relationship between the grant and the relevant expenses upon recognition.
A provision of the estimated-results obligations is provided if it seems probable to pay the grant that was recognised previously.
Government grants related to depreciable assets are recognised in the consolidated statement of income over the periods and on the basis of the percentages used to recognise the depreciation expenses of the underlying assets.
Government grants related to non-depreciable assets which require the attainment of certain obligations are recognised in the consolidated statement of income over the periods where the cost of achievement of obligations are incurred.
However, grants relating to non-depreciable assets that are unconditional of the attainment of some obligations are recognised in the consolidated statement of income at their nominal values in the same period.
The accounting treatment of below-market interest rate loans are recognised as: the difference between the nominal value of the loan and its fair value is recognised within non-current liabilities in the consolidated statement of financial position as a deferred government grant.
6.12 ProvisionsProvisions are recognised when the Group has a present obligation (legal or constructive) as a result of a past event, it is probable that an outflow of resources embodying economic benefits will be required to settle the obligation and a reliable estimate can be made of the amount of the obligation. Provisions are not recognised for future operating losses.
Where there are a number of similar obligations, the likelihood that an outflow will be required in settlement is determined by considering the class of obligations as a whole. A provision is recognised even if the likelihood of an outflow with respect to any one item included in the same class of obligations may be small.
Provisions are measured at the present value of management’s best estimate of the expenditure required to settle the present obligation at the end of the reporting period. The discount rate used to determine the present value is a pre-zakat rate that reflects current market assessments of the time value of money and the risks specific to liability. The increase in the provision due to the passage of time is recognised as interest expense.
6.13 Deferred revenueDeferred revenue relates to electricity service connection tariffs received from consumers which are deferred and recognised on a straight-line basis over the average useful lives of the equipment used in serving the consumers, estimated 35 years.
6.14 ZakatThe Holding Company and its subsidiaries are subject to Zakat according to the regulations of the General Authority for Zakat and Income in the Kingdom of Saudi Arabia (“the Authority”). Zakat is recognised in the consolidated statement of income of the Group. Additional Zakat liabilities, calculated by the Authority, if any, relating to the prior years zakat declaration is recognised in the year in which final declaration is issued.
6.15 Income tax and withholding tax Some of shareholders and Foreign shareholders in the Group are subject to income tax. Tax expense, which includes current tax expense is charged to the consolidated income statement.
The Group deducts taxes on certain transactions with non-resident entities in the Kingdom of Saudi Arabia according to the Saudi Income Tax Law.
The share of the foreign shareholders is taxed on its share in the income of the company invested directly and indirectly in accordance with the requirements of the General Authority for Zakat and Income.
The current tax payable is calculated on the basis of the taxable income for the year. The tax income differs from the net income presented in the consolidated statement of income because it excludes taxable or deductible items of income or expense in subsequent years and excludes items that are not taxable or non-deductible. The liability is charged to the Group for the current tax using the applicable tax rates or substantially expected to be applied at the reporting date.
Annual Report | 2018
135134
6.16 Deferred taxDeferred tax is recognised in respect of temporary differences between the carrying amounts of assets and liabilities for the purposes of the financial report and tax amounts used for tax purposes. Deferred tax liabilities are normally recognised for all taxable temporary differences. Deferred tax assets are recognised to the extent that they are likely to have taxable income that can be used for temporary differences that can be deducted. These assets and liabilities are not recognised in the event that temporary differences arise from the initial recognition of goodwill or return to assets or liabilities in an ineffective operation on tax or accounting income except in the case of a merger.
Deferred tax liabilities relating to temporary taxable differences arising from investments in subsidiaries, joint operations and associates are recognised except when the Group has the ability to reverse these temporary differences and these temporary differences may not be reversed in the foreseeable future.
The carrying amount of deferred tax assets is reviewed at each reporting date and adjusted to the extent that it is probable that there will be sufficient taxable income allowing the recovery of the asset or part thereof.
Deferred tax is calculated on the basis of the tax rates expected to be applied in the period in which the liability is settled or the asset is recognised based on the applicable laws or substantially expected to be enacted at the reporting date. The deferred tax is charged or reversed from the consolidated statement of income except in the case that it is attributable to items carried or reversed directly from equity. In this case, deferred tax is treated directly in equity.
6.17 Statutory reserve In accordance with the Holding Company’s Articles of Association, which have been amended in accordance with the new corporate regulations adopted by the Extraordinary General Assembly on 19 April 2017 corresponding to 22 Rajab 1438H, the Holding Company is required to transfer 10% of the net consolidated income to the statutory reserve until this reserve reaches 30% of the capital.
6.18 tRevenue recognition The Group recognises the following revenue from contracts with customers:• Revenue from electricity sales;• Revenue from meter reading, maintenance and bills preparation tariff;• Revenue from electricity connection tariff; • Revenue of transmission system; and• Other operating revenue.
The Group recognises revenue when it transfers control of a good or service to a customer either over time or at a point in time. When connecting electricity to customers, the Group provides the following services:• Connecting the customer to the electricity grid;• Supply of electricity• The right of the customer to use the meter;• Maintenance of the meter.For the purpose of recognizing revenue in accordance with IFRS 15, the above-mentioned services are not separate services or goods but have a set of services or goods (collectively referred to as “bundled services”) and are a single performance obligation for all services or goods secured by the Services Collected. The details of the above revenues and the method of their recognition in accordance with IFRS 15 are as follows:
6.18.1 Revenue from electricity salesRevenue from electricity sales is recognised in the accounting period in which the services are rendered. Revenue from electricity sales is recognised when customers are invoiced for their electricity consumption measured in kilowatt / hours. Since electricity has no form or shape of its own, the transfer of control is evidenced when a particular bill is generated which forms the basis of consumption of the electricity for the month. There is no volume discounts or variable consideration and there is no unfulfilled obligation that could affect the acceptance of the goods and services.
The performance obligation underlying the revenue stream is not a separate performance obligation and forms part of the bundle services in form of provision of electricity to customers. The payment for such service is due after transfer of the services. Therefore, revenue is recognised at a point in time once the services are transferred to the customer and bills are issued. Electricity sales receivable for the period not yet invoiced at the reporting date are recognized in the condensed consolidated income statement.
6.18.2 Revenue from meter reading, maintenance and bills preparation tariffRevenue from meter reading, maintenance and bills preparation tariff is recognised in the accounting period in which the services are rendered. Revenue from meter reading, maintenance and bills preparation tariff represents the monthly fixed tariff based on the capacity of the meter used by the consumers. For this fixed-price obligation, revenue is recognised based on the actual service provided till end of the reporting period as a proportion of the total services to be provided, because the customer receives and uses the benefits simultaneously.
135134
Revenue from meter reading, maintenance and bills preparation tariff that is not billed as at the reporting date is recognised in the consolidated income statement.
6.18.3 Revenue from electricity connection tariffElectricity service connection tariff received from consumers is deferred and recognised on a straight-line basis over the average useful lives of the equipment used in serving the subscribers. Such connection fee is received once from a customer at the time the customer applies for electricity connection.
The electricity connection fee does not represent a separately identifiable component of the contract to provide ongoing access to the supply of electricity to the customer and it is part of the aforementioned bundle of services provided to customer. The revenue recognition policy is to recognise revenue from such electricity connection fee over the useful lives of the equipment used in serving the subscribers.
6.18.4 Revenue from transmission systemRevenue from transmission system comprises of fees for use of transmission networks, and is recognised over the time when bills are issued to licensed co-generation and power providers. Revenue is measured based on the fees approved by Electricity and Co-generation Regulatory Authority according to capacity and quantities of power transmitted.
6.18.5 Other operating revenueOther operating revenue comprises of operation and maintenance revenue related to lease of fibre optic cables, sale of water, oil residues, penalty, re-connection, disconnection charges etc. The revenue is recognised upon satisfaction of the related performance obligation.
6.19 Dividend income from investmentsDividend income is recognised when the right to receive payment is established.
6.20 Borrowing costs General and specific borrowing costs directly attributable to the acquisition, construction or production of qualifying assets, which are assets that necessarily take a substantial period of time to get ready for their intended use or sale, are added to the cost of those assets, until such time as the assets are substantially ready for their intended use or sale. To the extent that the Group borrows funds generally and uses them for the purpose of obtaining a qualifying asset, the Group determine the amount of borrowing costs eligible for capitalisation by applying a capitalisation rate to the expenditures on that asset. The capitalisation rate shall be the weighted average of the borrowing costs applicable to the borrowings of the Group that are outstanding during the year, other than borrowings made specifically for the purpose
of constructing a qualifying asset. The amount of borrowing costs that the Group capitalises during a period does not exceed the amount of borrowing costs it incur during that year.All other borrowing costs are recognised in the consolidated statement of income in the year in which they are incurred.
6.21 Leases Leases of assets or properties where the Group, as lessee, has substantially all the risks and rewards of ownership are classified as finance leases. Finance leases are capitalised at the lease’s inception at the fair value of the leased property or, if lower, the present value of the minimum lease payments. The corresponding rental obligations, net of finance charges, are included in other short-term and long-term payables. Each lease payment is allocated between the liability and finance cost. The finance cost is charged to the consolidated statement of income over the lease period so as to produce a constant periodic rate of interest on the remaining balance of the liability for each period. The assets and properties acquired under finance leases are depreciated over the shorter of the asset’s useful life and the lease term if there is no reasonable certainty that the Group will obtain ownership at the end of the lease term.
Leases in which a significant portion of the risks and rewards of ownership are not transferred to the Group as lessee are classified as operating leases. Payments made under operating leases (net of any incentives received from the lessor) are charged to consolidated statement of income on a straight-line basis over the period of the lease.
6.22 Dividend distribution Dividend distribution to the Company’s shareholders is recognised as a liability in the Consolidated financial statements in the period in which the dividends are approved by the Company’s shareholders.
Annual Report | 2018
137136
6.23 Segments reportingAn operating segment is one of the Group components which carries out operating activities through which it can earn revenues or incur expenses (including revenues and expenses related to transactions with other components of the same Group), where its operating results are regularly reviewed by the entity’s operating decision maker regarding the resources that will be allocated to the segment and to evaluate its performance and which have separate financial information available.
An operating segment may carry out activities from which it has not earned revenues yet. For example, pre-operating transactions can be considered as operating segments before they earn revenues.
6.24 Fair valueFair value is the price that may be received against the sale of an asset or the conversion of an obligation in an organized transaction between the market participants on the measurement date. The fair value measurement is based on the assumption that the transaction for the sale of the asset or the transfer of the obligation can occur either:
• In the primary market of the asset or obligation or• In the absence of the primary market, in the most appropriate markets for the asset or liability.
The Group uses appropriate valuation techniques with surrounding conditions for which sufficient data are available to measure fair value, maximizing the use of appropriate inputs that can be monitored and minimizing the use of inputs that cannot be monitored to the greatest extent possible.
The measurement of the fair value of a non-financial asset takes into account the ability of the market participant to generate economic benefits by using the asset at its maximum and best use or by selling it to another market participant who may use the asset at its maximum and best use.
All assets and liabilities whose fair values are measured or disclosed in the consolidated financial statements are classified in the fair value hierarchy. This is described as follows, based on the lowest input level that is important for the overall measurement:
• Level 1 - Quoted prices (unadjusted) in active markets for identical assets or liabilities;• Level 2 - Evaluation techniques where the lowest entry level is important for measuring
fair value directly or indirectly;
• Level 3 - Evaluation techniques where the lowest input level cannot be monitored is important for fair value measurement.
For assets and liabilities that are measured in the financial statements at fair value on a recurring basis, the Group determines whether transfers have been made between hierarchy levels by reassessing the classification (based on the lowest input level that is significant for the overall measurement) at the end of each reporting period.
6.25 InventoriesInventories include material and supplies for generation, transmission and distribution business, fuel inventory and other materials.
Inventories are initially measured at cost which comprises costs of purchase, costs of conversion and other costs incurred in bringing the inventories to their present location and condition.The Group uses the weighted average cost method to value its inventories. Under the weighted average cost formula, the cost of each item is determined from the weighted average of the cost of similar items at the beginning of a period and the cost of similar items purchased or produced during the year. Subsequent to initial recognition, inventories are to be measured at the lower of cost and net realisable value.
Net realisable value is the estimated selling price in the ordinary course of business, less applicable variable selling expenses.
6.26 Contingent Liabilities A possible obligations that arises from past events and whose existence will be confirmed only by the occurrence or non-occurrence of one or more uncertain future events not wholly within the control of the Group or present obligation that arises from past events but is not recognised because it is not probable that an outflow of resources embodying economic benefits will be required to settle obligation or the amount of obligation cannot be measured with sufficient reliability. The Group did not recognised the contingent liabilities but only disclose them in the notes to the consolidated financial statements.
7 Seasonal changesThe Group’s activity and revenues are affected by seasonal weather conditions during the year. The Group’s revenues are significantly reduced during the winter months due to lower power consumption while revenue is increased during the summer months due to the increase in electricity consumption due to higher temperatures. These changes are reflected in the financial results of the Group during the year.
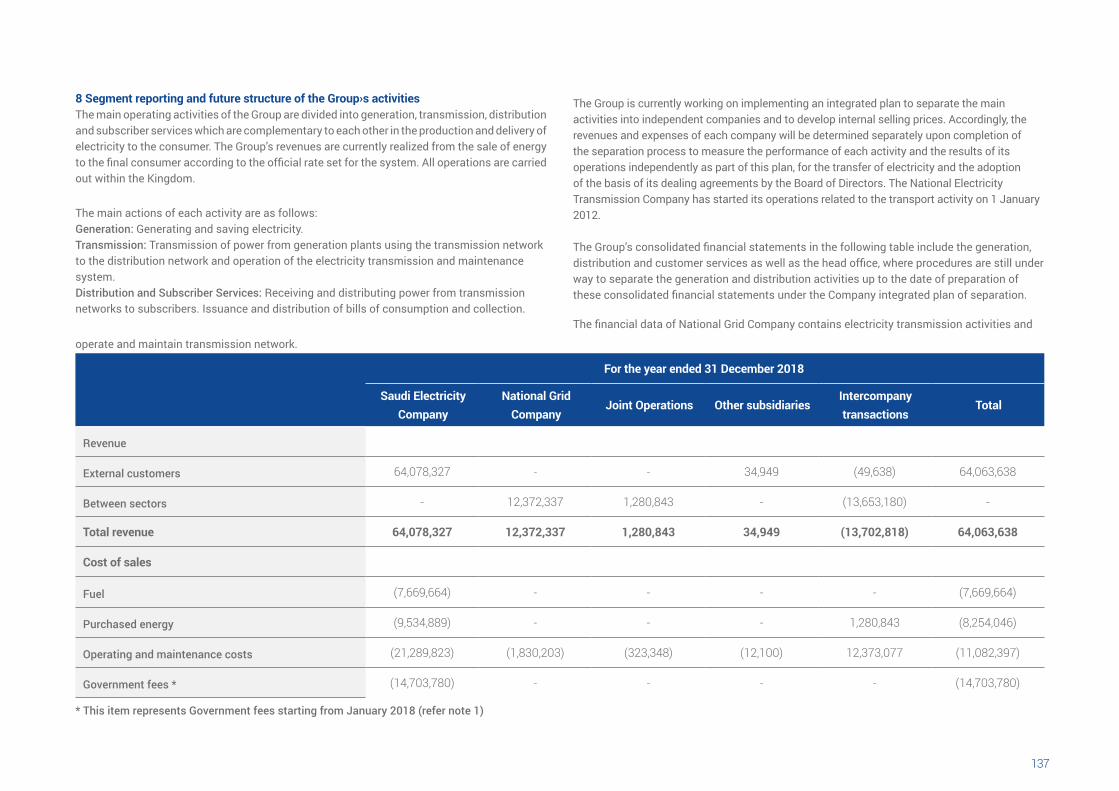
137136
8 Segment reporting and future structure of the Group›s activitiesThe main operating activities of the Group are divided into generation, transmission, distribution and subscriber services which are complementary to each other in the production and delivery of electricity to the consumer. The Group’s revenues are currently realized from the sale of energy to the final consumer according to the official rate set for the system. All operations are carried out within the Kingdom. The main actions of each activity are as follows:Generation: Generating and saving electricity.Transmission: Transmission of power from generation plants using the transmission network to the distribution network and operation of the electricity transmission and maintenance system.Distribution and Subscriber Services: Receiving and distributing power from transmission networks to subscribers. Issuance and distribution of bills of consumption and collection.
The Group is currently working on implementing an integrated plan to separate the main activities into independent companies and to develop internal selling prices. Accordingly, the revenues and expenses of each company will be determined separately upon completion of the separation process to measure the performance of each activity and the results of its operations independently as part of this plan, for the transfer of electricity and the adoption of the basis of its dealing agreements by the Board of Directors. The National Electricity Transmission Company has started its operations related to the transport activity on 1 January 2012.
The Group’s consolidated financial statements in the following table include the generation, distribution and customer services as well as the head office, where procedures are still under way to separate the generation and distribution activities up to the date of preparation of these consolidated financial statements under the Company integrated plan of separation.
The financial data of National Grid Company contains electricity transmission activities and
operate and maintain transmission network.
For the year ended 31 December 2018
Saudi Electricity Company
National Grid Company
Joint Operations Other subsidiariesIntercompany transactions
Total
Revenue
External customers 64,078,327 - - 34,949 )49,638( 64,063,638
Between sectors - 12,372,337 1,280,843 - )13,653,180( -
Total revenue 64,078,327 12,372,337 1,280,843 34,949 (13,702,818) 64,063,638
Cost of sales
Fuel )7,669,664( - - - - )7,669,664(
Purchased energy )9,534,889( - - - 1,280,843 )8,254,046(
Operating and maintenance costs )21,289,823( )1,830,203( )323,348( )12,100( 12,373,077 )11,082,397(
Government fees * )14,703,780( - - - - )14,703,780(
* This item represents Government fees starting from January 2018 (refer note 1)
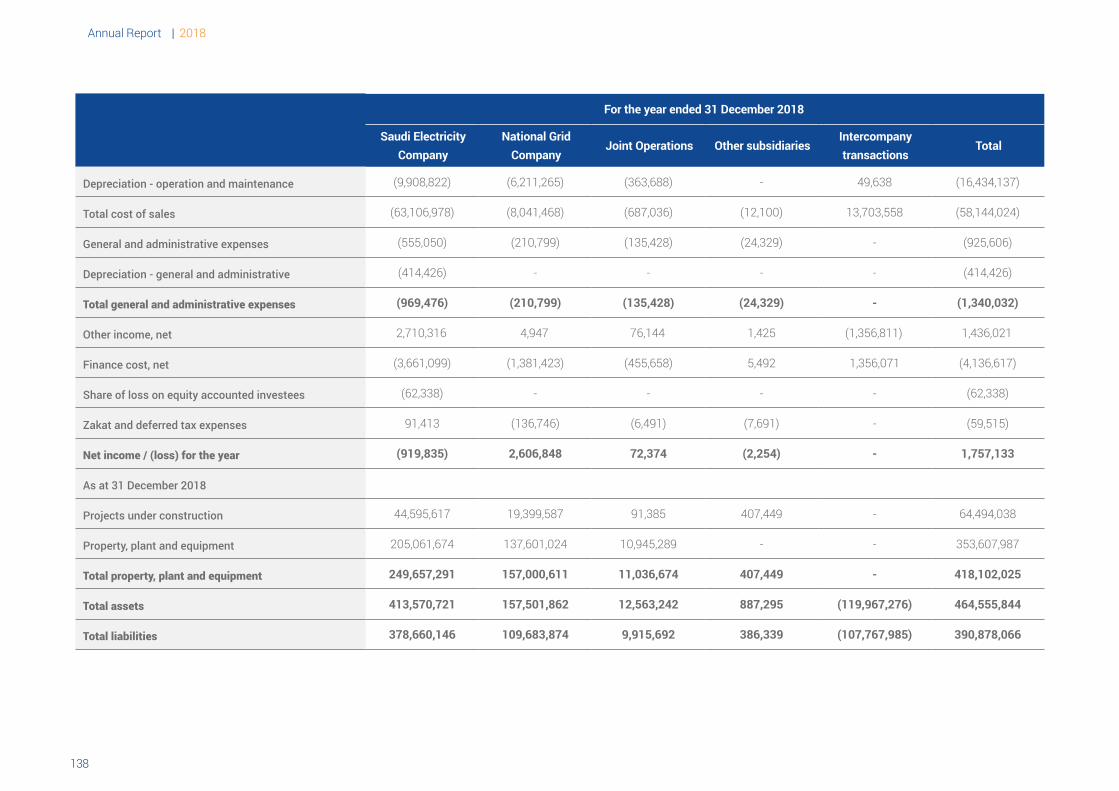
Annual Report | 2018
139138
For the year ended 31 December 2018
Saudi Electricity Company
National Grid Company
Joint Operations Other subsidiariesIntercompany transactions
Total
Depreciation - operation and maintenance )9,908,822( )6,211,265( )363,688( - 49,638 )16,434,137(
Total cost of sales )63,106,978( )8,041,468( )687,036( )12,100( 13,703,558 )58,144,024(
General and administrative expenses )555,050( )210,799( )135,428( )24,329( - )925,606(
Depreciation - general and administrative )414,426( - - - - )414,426(
Total general and administrative expenses (969,476) (210,799) (135,428) (24,329) - (1,340,032)
Other income, net 2,710,316 4,947 76,144 1,425 )1,356,811( 1,436,021
Finance cost, net )3,661,099( )1,381,423( )455,658( 5,492 1,356,071 )4,136,617(
Share of loss on equity accounted investees )62,338( - - - - )62,338(
Zakat and deferred tax expenses 91,413 )136,746( )6,491( )7,691( - )59,515(
Net income / (loss) for the year (919,835) 2,606,848 72,374 (2,254) - 1,757,133
As at 31 December 2018
Projects under construction 44,595,617 19,399,587 91,385 407,449 - 64,494,038
Property, plant and equipment 205,061,674 137,601,024 10,945,289 - - 353,607,987
Total property, plant and equipment 249,657,291 157,000,611 11,036,674 407,449 - 418,102,025
Total assets 413,570,721 157,501,862 12,563,242 887,295 (119,967,276) 464,555,844
Total liabilities 378,660,146 109,683,874 9,915,692 386,339 (107,767,985) 390,878,066
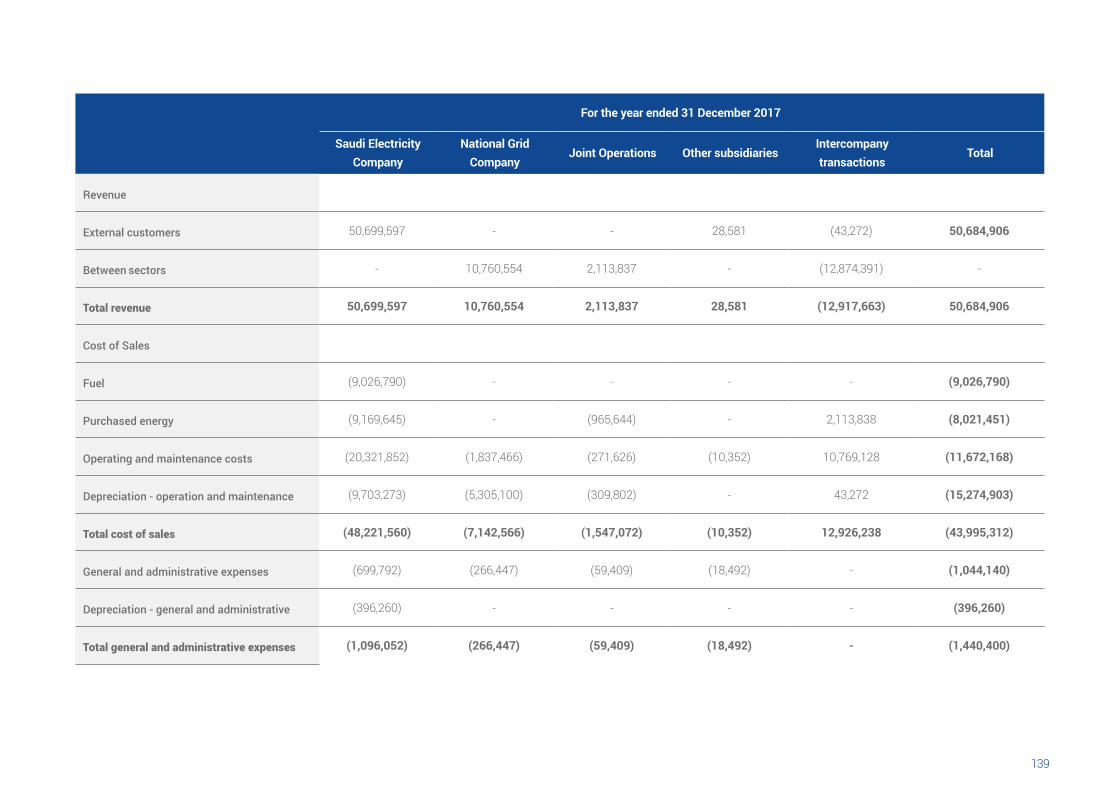
139138
For the year ended 31 December 2017
Saudi Electricity Company
National Grid Company
Joint Operations Other subsidiariesIntercompany transactions
Total
Revenue
External customers 50,699,597 - - 28,581 )43,272( 50,684,906
Between sectors - 10,760,554 2,113,837 - )12,874,391( -
Total revenue 50,699,597 10,760,554 2,113,837 28,581 (12,917,663) 50,684,906
Cost of Sales
Fuel )9,026,790( - - - - (9,026,790)
Purchased energy )9,169,645( - )965,644( - 2,113,838 (8,021,451)
Operating and maintenance costs )20,321,852( )1,837,466( )271,626( )10,352( 10,769,128 (11,672,168)
Depreciation - operation and maintenance )9,703,273( )5,305,100( )309,802( - 43,272 (15,274,903)
Total cost of sales (48,221,560) (7,142,566) (1,547,072) (10,352) 12,926,238 (43,995,312)
General and administrative expenses )699,792( )266,447( )59,409( )18,492( - (1,044,140)
Depreciation - general and administrative )396,260( - - - - (396,260)
Total general and administrative expenses (1,096,052) (266,447) (59,409) (18,492) - (1,440,400)
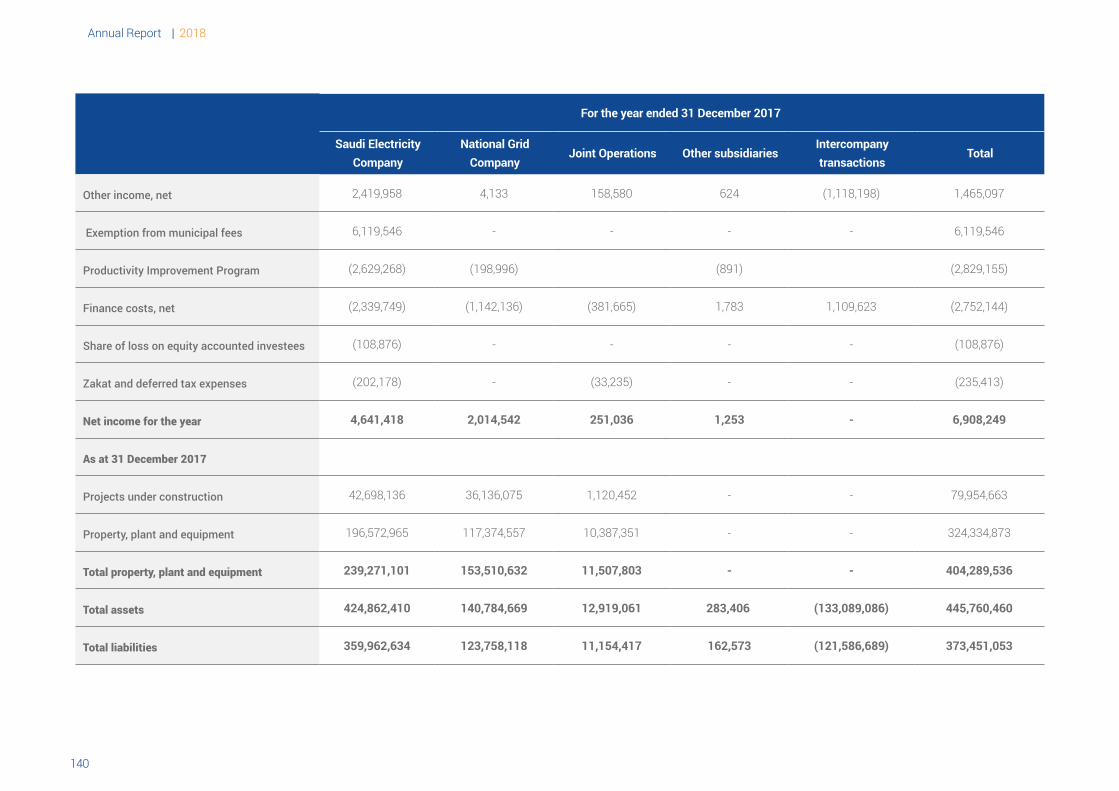
Annual Report | 2018
141140
For the year ended 31 December 2017
Saudi Electricity Company
National Grid Company
Joint Operations Other subsidiariesIntercompany transactions
Total
Other income, net 2,419,958 4,133 158,580 624 )1,118,198( 1,465,097
Exemption from municipal fees 6,119,546 - - - - 6,119,546
Productivity Improvement Program )2,629,268( )198,996( )891( )2,829,155(
Finance costs, net )2,339,749( )1,142,136( )381,665( 1,783 1,109,623 )2,752,144(
Share of loss on equity accounted investees )108,876( - - - - )108,876(
Zakat and deferred tax expenses )202,178( - )33,235( - - )235,413(
Net income for the year 4,641,418 2,014,542 251,036 1,253 - 6,908,249
As at 31 December 2017
Projects under construction 42,698,136 36,136,075 1,120,452 - - 79,954,663
Property, plant and equipment 196,572,965 117,374,557 10,387,351 - - 324,334,873
Total property, plant and equipment 239,271,101 153,510,632 11,507,803 - - 404,289,536
Total assets 424,862,410 140,784,669 12,919,061 283,406 (133,089,086) 445,760,460
Total liabilities 359,962,634 123,758,118 11,154,417 162,573 (121,586,689) 373,451,053
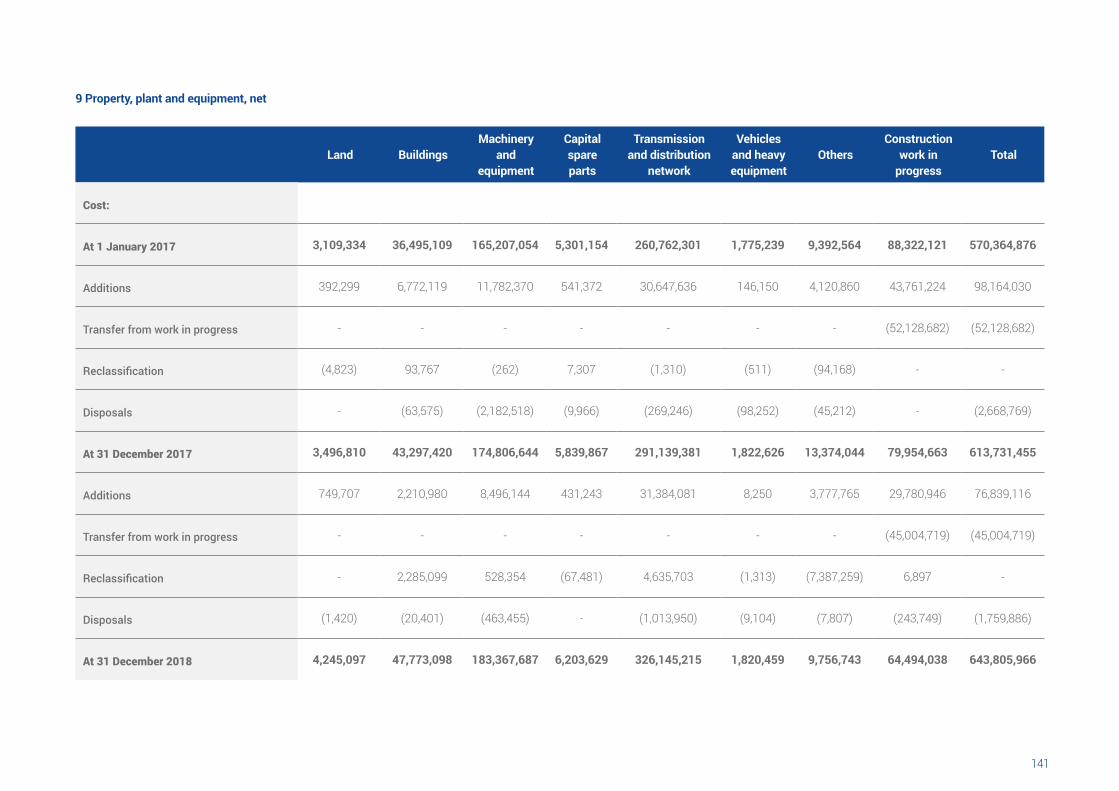
141140
9 Property, plant and equipment, net
Land BuildingsMachinery
and equipment
Capital spare parts
Transmission and distribution
network
Vehicles and heavy equipment
OthersConstruction
work in progress
Total
Cost:
At 1 January 2017 3,109,334 36,495,109 165,207,054 5,301,154 260,762,301 1,775,239 9,392,564 88,322,121 570,364,876
Additions 392,299 6,772,119 11,782,370 541,372 30,647,636 146,150 4,120,860 43,761,224 98,164,030
Transfer from work in progress - - - - - - - )52,128,682( )52,128,682(
Reclassification )4,823( 93,767 )262( 7,307 )1,310( )511( )94,168( - -
Disposals - )63,575( )2,182,518( )9,966( )269,246( )98,252( )45,212( - )2,668,769(
At 31 December 2017 3,496,810 43,297,420 174,806,644 5,839,867 291,139,381 1,822,626 13,374,044 79,954,663 613,731,455
Additions 749,707 2,210,980 8,496,144 431,243 31,384,081 8,250 3,777,765 29,780,946 76,839,116
Transfer from work in progress - - - - - - - )45,004,719( )45,004,719(
Reclassification - 2,285,099 528,354 )67,481( 4,635,703 )1,313( )7,387,259( 6,897 -
Disposals )1,420( )20,401( )463,455( - )1,013,950( )9,104( )7,807( )243,749( )1,759,886(
At 31 December 2018 4,245,097 47,773,098 183,367,687 6,203,629 326,145,215 1,820,459 9,756,743 64,494,038 643,805,966
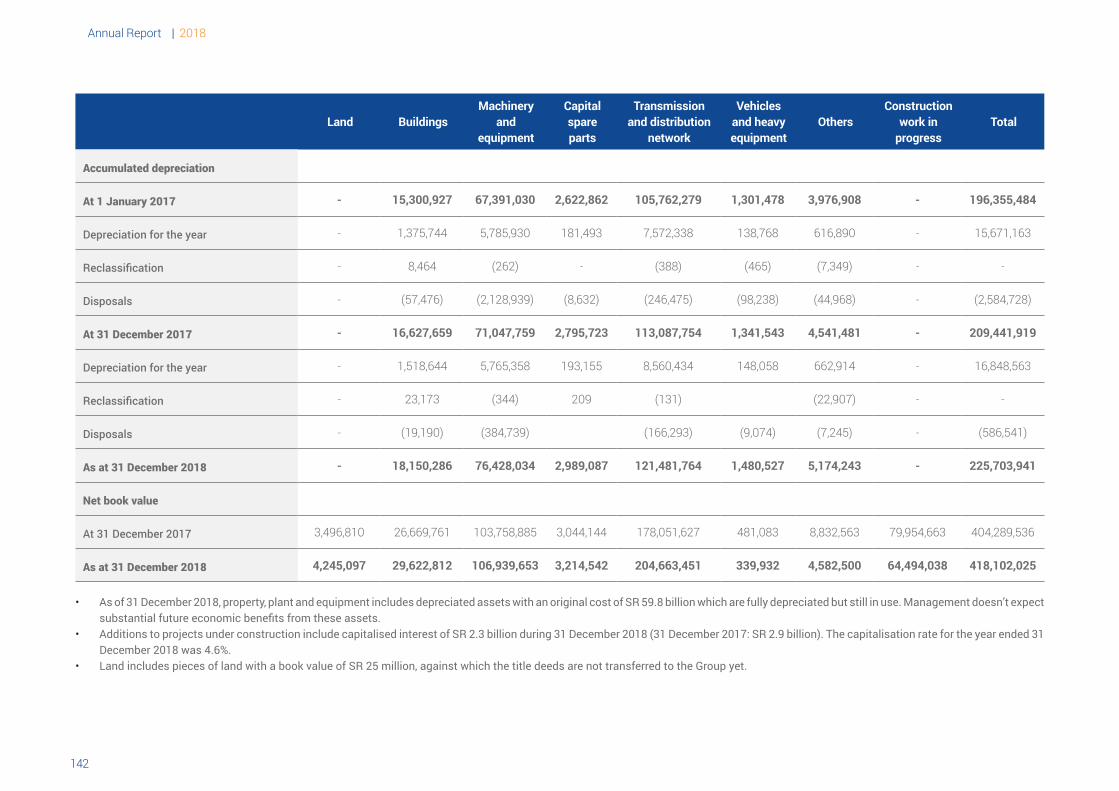
Annual Report | 2018
143142
Land BuildingsMachinery
and equipment
Capital spare parts
Transmission and distribution
network
Vehicles and heavy equipment
OthersConstruction
work in progress
Total
Accumulated depreciation
At 1 January 2017 - 15,300,927 67,391,030 2,622,862 105,762,279 1,301,478 3,976,908 - 196,355,484
Depreciation for the year - 1,375,744 5,785,930 181,493 7,572,338 138,768 616,890 - 15,671,163
Reclassification - 8,464 )262( - )388( )465( )7,349( - -
Disposals - )57,476( )2,128,939( )8,632( )246,475( )98,238( )44,968( - )2,584,728(
At 31 December 2017 - 16,627,659 71,047,759 2,795,723 113,087,754 1,341,543 4,541,481 - 209,441,919
Depreciation for the year - 1,518,644 5,765,358 193,155 8,560,434 148,058 662,914 - 16,848,563
Reclassification - 23,173 )344( 209 )131( )22,907( - -
Disposals - )19,190( )384,739( )166,293( )9,074( )7,245( - )586,541(
As at 31 December 2018 - 18,150,286 76,428,034 2,989,087 121,481,764 1,480,527 5,174,243 - 225,703,941
Net book value
At 31 December 2017 3,496,810 26,669,761 103,758,885 3,044,144 178,051,627 481,083 8,832,563 79,954,663 404,289,536
As at 31 December 2018 4,245,097 29,622,812 106,939,653 3,214,542 204,663,451 339,932 4,582,500 64,494,038 418,102,025
• As of 31 December 2018, property, plant and equipment includes depreciated assets with an original cost of SR 59.8 billion which are fully depreciated but still in use. Management doesn’t expect substantial future economic benefits from these assets.
• Additions to projects under construction include capitalised interest of SR 2.3 billion during 31 December 2018 (31 December 2017: SR 2.9 billion). The capitalisation rate for the year ended 31 December 2018 was 4.6%.
• Land includes pieces of land with a book value of SR 25 million, against which the title deeds are not transferred to the Group yet.
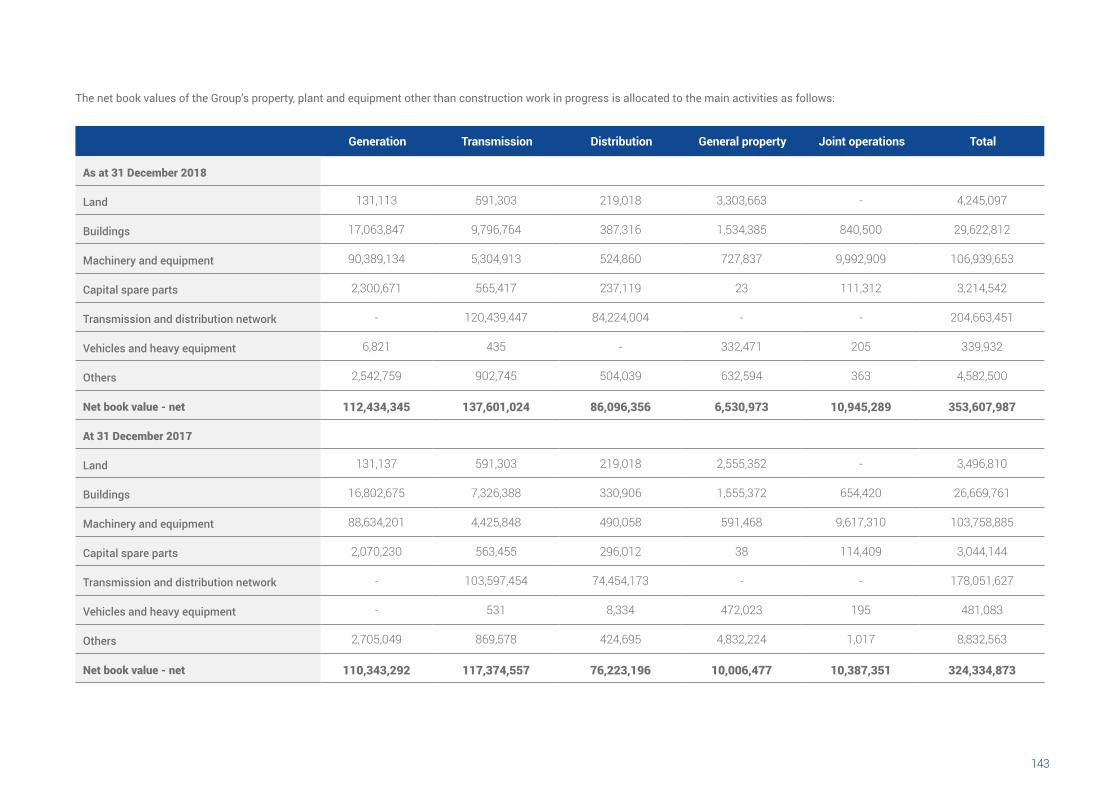
143142
The net book values of the Group’s property, plant and equipment other than construction work in progress is allocated to the main activities as follows:
Generation Transmission Distribution General property Joint operations Total
As at 31 December 2018
Land 131,113 591,303 219,018 3,303,663 - 4,245,097
Buildings 17,063,847 9,796,764 387,316 1,534,385 840,500 29,622,812
Machinery and equipment 90,389,134 5,304,913 524,860 727,837 9,992,909 106,939,653
Capital spare parts 2,300,671 565,417 237,119 23 111,312 3,214,542
Transmission and distribution network - 120,439,447 84,224,004 - - 204,663,451
Vehicles and heavy equipment 6,821 435 - 332,471 205 339,932
Others 2,542,759 902,745 504,039 632,594 363 4,582,500
Net book value - net 112,434,345 137,601,024 86,096,356 6,530,973 10,945,289 353,607,987
At 31 December 2017
Land 131,137 591,303 219,018 2,555,352 - 3,496,810
Buildings 16,802,675 7,326,388 330,906 1,555,372 654,420 26,669,761
Machinery and equipment 88,634,201 4,425,848 490,058 591,468 9,617,310 103,758,885
Capital spare parts 2,070,230 563,455 296,012 38 114,409 3,044,144
Transmission and distribution network - 103,597,454 74,454,173 - - 178,051,627
Vehicles and heavy equipment - 531 8,334 472,023 195 481,083
Others 2,705,049 869,578 424,695 4,832,224 1,017 8,832,563
Net book value - net 110,343,292 117,374,557 76,223,196 10,006,477 10,387,351 324,334,873
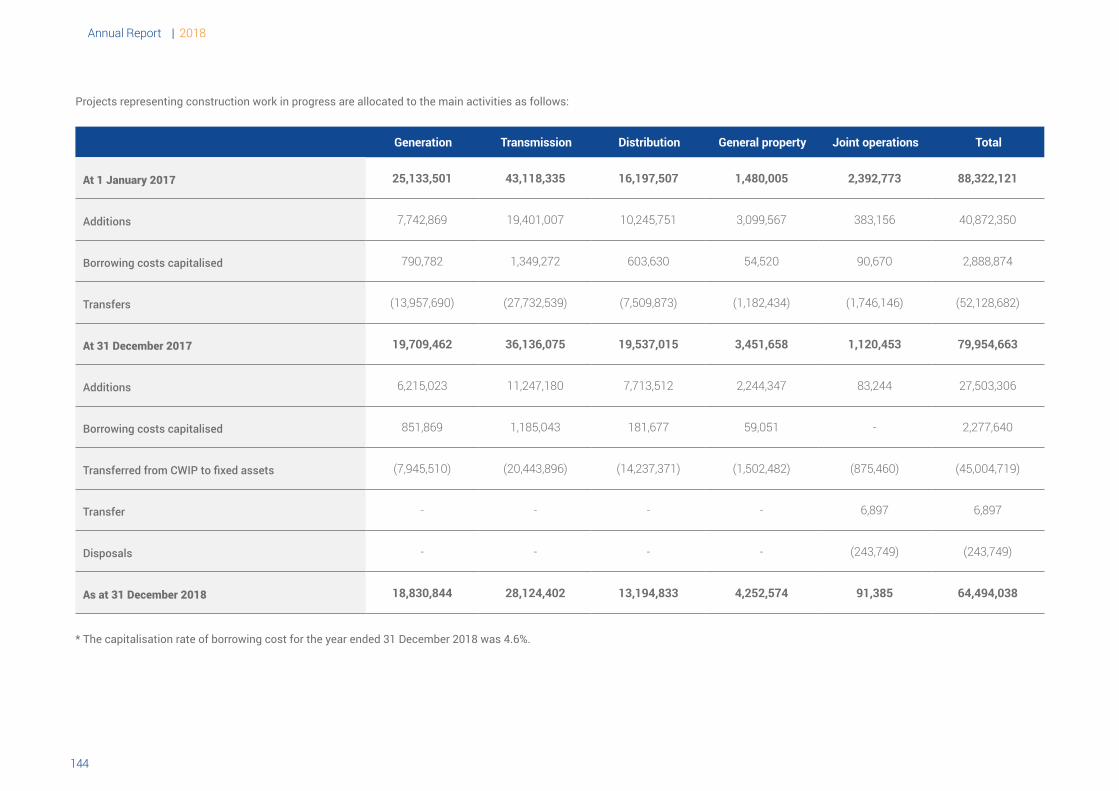
Annual Report | 2018
145144
Projects representing construction work in progress are allocated to the main activities as follows:
Generation Transmission Distribution General property Joint operations Total
At 1 January 2017 25,133,501 43,118,335 16,197,507 1,480,005 2,392,773 88,322,121
Additions 7,742,869 19,401,007 10,245,751 3,099,567 383,156 40,872,350
Borrowing costs capitalised 790,782 1,349,272 603,630 54,520 90,670 2,888,874
Transfers )13,957,690( )27,732,539( )7,509,873( )1,182,434( )1,746,146( )52,128,682(
At 31 December 2017 19,709,462 36,136,075 19,537,015 3,451,658 1,120,453 79,954,663
Additions 6,215,023 11,247,180 7,713,512 2,244,347 83,244 27,503,306
Borrowing costs capitalised 851,869 1,185,043 181,677 59,051 - 2,277,640
Transferred from CWIP to fixed assets )7,945,510( )20,443,896( )14,237,371( )1,502,482( )875,460( )45,004,719(
Transfer - - - - 6,897 6,897
Disposals - - - - )243,749( )243,749(
As at 31 December 2018 18,830,844 28,124,402 13,194,833 4,252,574 91,385 64,494,038
* The capitalisation rate of borrowing cost for the year ended 31 December 2018 was 4.6%.
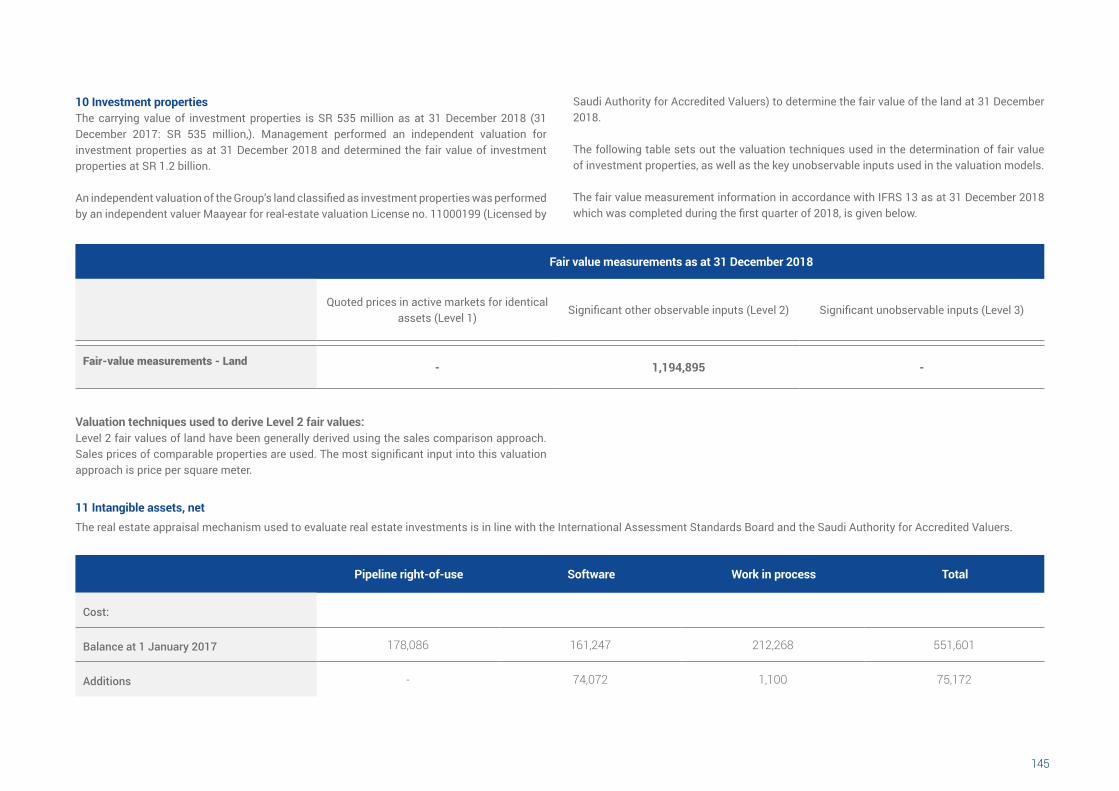
145144
The real estate appraisal mechanism used to evaluate real estate investments is in line with the International Assessment Standards Board and the Saudi Authority for Accredited Valuers.
Pipeline right-of-use Software Work in process Total
Cost:
Balance at 1 January 2017 178,086 161,247 212,268 551,601
Additions - 74,072 1,100 75,172
10 Investment propertiesThe carrying value of investment properties is SR 535 million as at 31 December 2018 (31 December 2017: SR 535 million,). Management performed an independent valuation for investment properties as at 31 December 2018 and determined the fair value of investment properties at SR 1.2 billion.
An independent valuation of the Group’s land classified as investment properties was performed by an independent valuer Maayear for real-estate valuation License no. 11000199 (Licensed by
Saudi Authority for Accredited Valuers) to determine the fair value of the land at 31 December 2018.
The following table sets out the valuation techniques used in the determination of fair value of investment properties, as well as the key unobservable inputs used in the valuation models.
The fair value measurement information in accordance with IFRS 13 as at 31 December 2018 which was completed during the first quarter of 2018, is given below.
Fair value measurements as at 31 December 2018
Quoted prices in active markets for identical assets (Level 1)
Significant other observable inputs (Level 2) Significant unobservable inputs (Level 3)
Fair-value measurements - Land - 1,194,895 -
Valuation techniques used to derive Level 2 fair values:Level 2 fair values of land have been generally derived using the sales comparison approach. Sales prices of comparable properties are used. The most significant input into this valuation approach is price per square meter.
11 Intangible assets, net
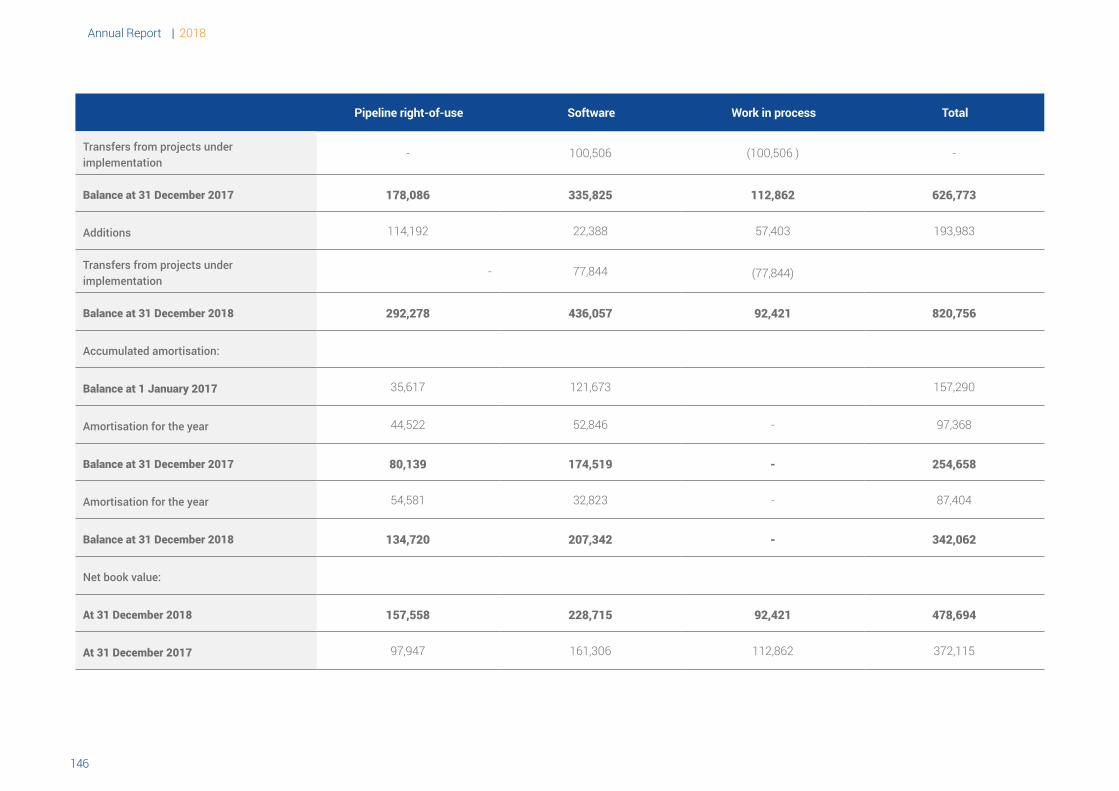
Annual Report | 2018
147146
Pipeline right-of-use Software Work in process Total
Transfers from projects under implementation
- 100,506 )100,506 ( -
Balance at 31 December 2017 178,086 335,825 112,862 626,773
Additions 114,192 22,388 57,403 193,983
Transfers from projects under implementation
- 77,844 )77,844(
Balance at 31 December 2018 292,278 436,057 92,421 820,756
Accumulated amortisation:
Balance at 1 January 2017 35,617 121,673 157,290
Amortisation for the year 44,522 52,846 - 97,368
Balance at 31 December 2017 80,139 174,519 - 254,658
Amortisation for the year 54,581 32,823 - 87,404
Balance at 31 December 2018 134,720 207,342 - 342,062
Net book value:
At 31 December 2018 157,558 228,715 92,421 478,694
At 31 December 2017 97,947 161,306 112,862 372,115
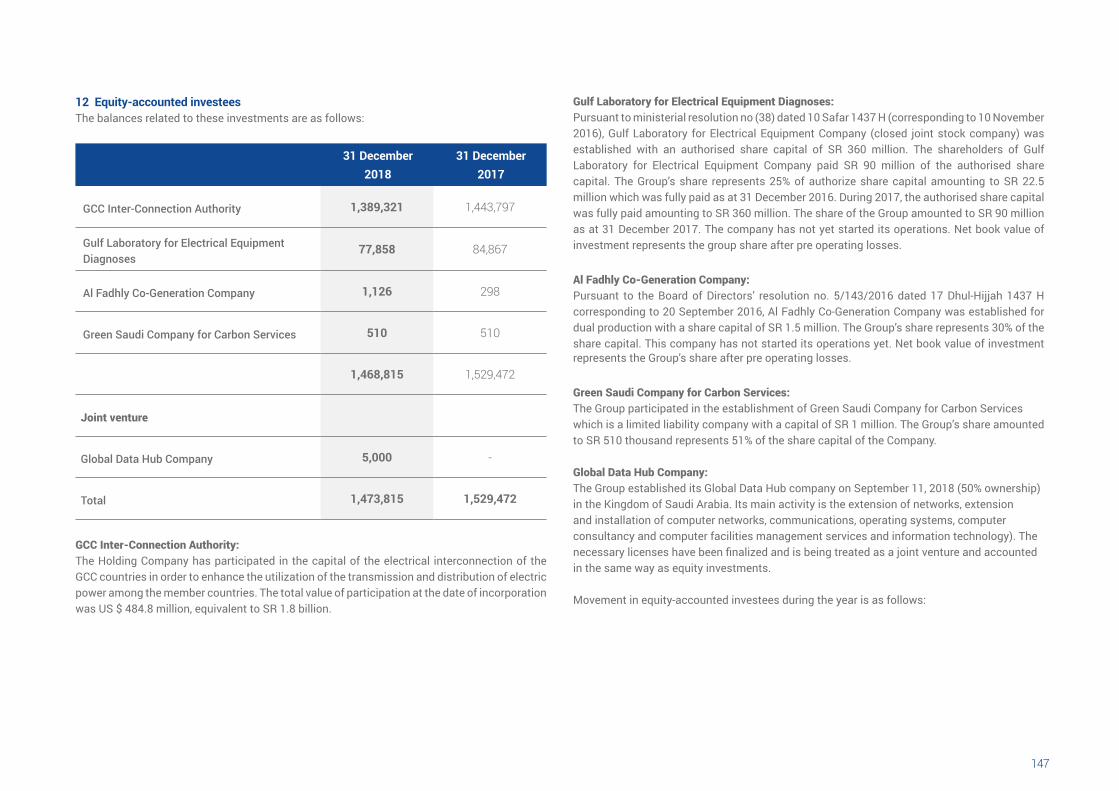
147146
12 Equity-accounted investeesThe balances related to these investments are as follows:
31 December 2018
31 December 2017
GCC Inter-Connection Authority 1,389,321 1,443,797
Gulf Laboratory for Electrical Equipment Diagnoses
77,858 84,867
Al Fadhly Co-Generation Company 1,126 298
Green Saudi Company for Carbon Services 510 510
1,468,815 1,529,472
Joint venture
Global Data Hub Company 5,000 -
Total 1,473,815 1,529,472
GCC Inter-Connection Authority:The Holding Company has participated in the capital of the electrical interconnection of the GCC countries in order to enhance the utilization of the transmission and distribution of electric power among the member countries. The total value of participation at the date of incorporation was US $ 484.8 million, equivalent to SR 1.8 billion.
Gulf Laboratory for Electrical Equipment Diagnoses:Pursuant to ministerial resolution no (38) dated 10 Safar 1437 H (corresponding to 10 November 2016), Gulf Laboratory for Electrical Equipment Company (closed joint stock company) was established with an authorised share capital of SR 360 million. The shareholders of Gulf Laboratory for Electrical Equipment Company paid SR 90 million of the authorised share capital. The Group’s share represents 25% of authorize share capital amounting to SR 22.5 million which was fully paid as at 31 December 2016. During 2017, the authorised share capital was fully paid amounting to SR 360 million. The share of the Group amounted to SR 90 million as at 31 December 2017. The company has not yet started its operations. Net book value of investment represents the group share after pre operating losses.
Al Fadhly Co-Generation Company:Pursuant to the Board of Directors’ resolution no. 5/143/2016 dated 17 Dhul-Hijjah 1437 H corresponding to 20 September 2016, Al Fadhly Co-Generation Company was established for dual production with a share capital of SR 1.5 million. The Group’s share represents 30% of the share capital. This company has not started its operations yet. Net book value of investment represents the Group’s share after pre operating losses.
Green Saudi Company for Carbon Services:The Group participated in the establishment of Green Saudi Company for Carbon Services which is a limited liability company with a capital of SR 1 million. The Group’s share amounted to SR 510 thousand represents 51% of the share capital of the Company.
Global Data Hub Company:The Group established its Global Data Hub company on September 11, 2018 (50% ownership) in the Kingdom of Saudi Arabia. Its main activity is the extension of networks, extension and installation of computer networks, communications, operating systems, computer consultancy and computer facilities management services and information technology). The necessary licenses have been finalized and is being treated as a joint venture and accounted in the same way as equity investments.
Movement in equity-accounted investees during the year is as follows:
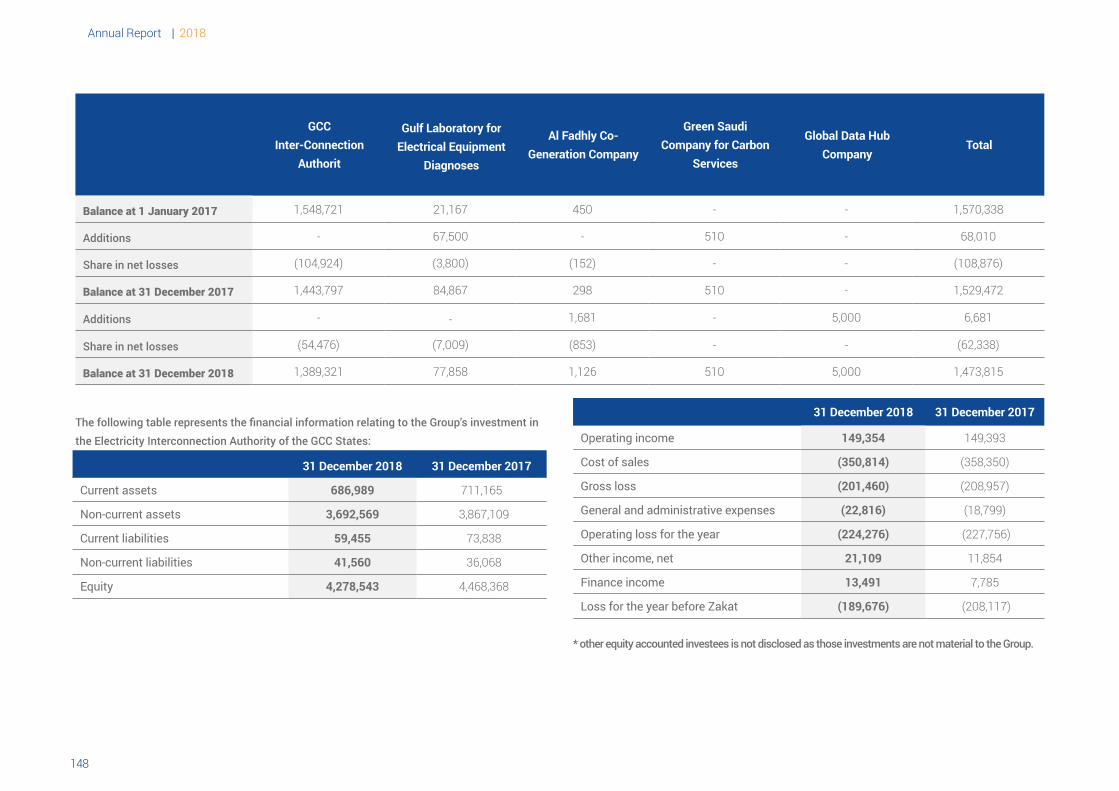
Annual Report | 2018
149148
TotalGlobal Data Hub
Company
Green Saudi Company for Carbon
Services
Al Fadhly Co-Generation Company
Gulf Laboratory for Electrical Equipment
Diagnoses
GCCInter-Connection
Authorit
1,570,338--45021,1671,548,721Balance at 1 January 2017
68,010-510-67,500-Additions
)108,876(--)152()3,800()104,924(Share in net losses
1,529,472-51029884,8671,443,797Balance at 31 December 2017
6,6815,000-1,681--Additions
)62,338(--)853()7,009()54,476(Share in net losses
1,473,8155,0005101,12677,8581,389,321Balance at 31 December 2018
The following table represents the financial information relating to the Group’s investment in the Electricity Interconnection Authority of the GCC States:
31 December 2018 31 December 2017
Current assets 686,989 711,165
Non-current assets 3,692,569 3,867,109
Current liabilities 59,455 73,838
Non-current liabilities 41,560 36,068
Equity 4,278,543 4,468,368
31 December 2018 31 December 2017
Operating income 149,354 149,393
Cost of sales (350,814) )358,350(
Gross loss (201,460) )208,957(
General and administrative expenses (22,816) )18,799(
Operating loss for the year (224,276) )227,756(
Other income, net 21,109 11,854
Finance income 13,491 7,785
Loss for the year before Zakat (189,676) )208,117(
* other equity accounted investees is not disclosed as those investments are not material to the Group.
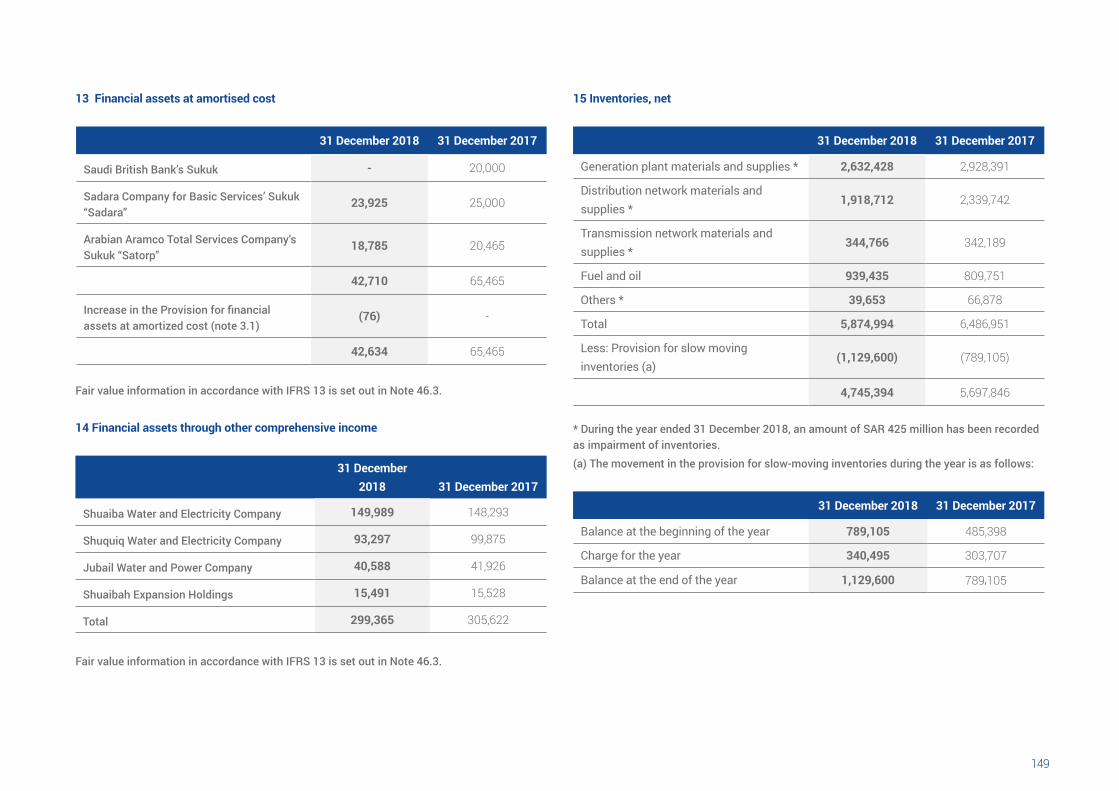
149148
13 Financial assets at amortised cost
31 December 2018 31 December 2017
Saudi British Bank’s Sukuk - 20,000
Sadara Company for Basic Services’ Sukuk “Sadara”
23,925 25,000
Arabian Aramco Total Services Company’s Sukuk “Satorp”
18,785 20,465
42,710 65,465
Increase in the Provision for financial assets at amortized cost (note 3.1)
(76) -
42,634 65,465
Fair value information in accordance with IFRS 13 is set out in Note 46.3.
14 Financial assets through other comprehensive income
31 December 2018 31 December 2017
Shuaiba Water and Electricity Company 149,989 148,293
Shuquiq Water and Electricity Company 93,297 99,875
Jubail Water and Power Company 40,588 41,926
Shuaibah Expansion Holdings 15,491 15,528
Total 299,365 305,622
Fair value information in accordance with IFRS 13 is set out in Note 46.3.
15 Inventories, net
31 December 201731 December 2018
2,928,3912,632,428 Generation plant materials and supplies *
2,339,7421,918,712 Distribution network materials and supplies *
342,189344,766 Transmission network materials andsupplies *
809,751939,435 Fuel and oil
66,87839,653Others *
6,486,9515,874,994Total
)789,105((1,129,600) Less: Provision for slow movinginventories (a)
5,697,8464,745,394
* During the year ended 31 December 2018, an amount of SAR 425 million has been recorded as impairment of inventories.(a) The movement in the provision for slow-moving inventories during the year is as follows:
31 December 201731 December 2018
485,398789,105Balance at the beginning of the year
303,707340,495Charge for the year
789،1051,129,600Balance at the end of the year
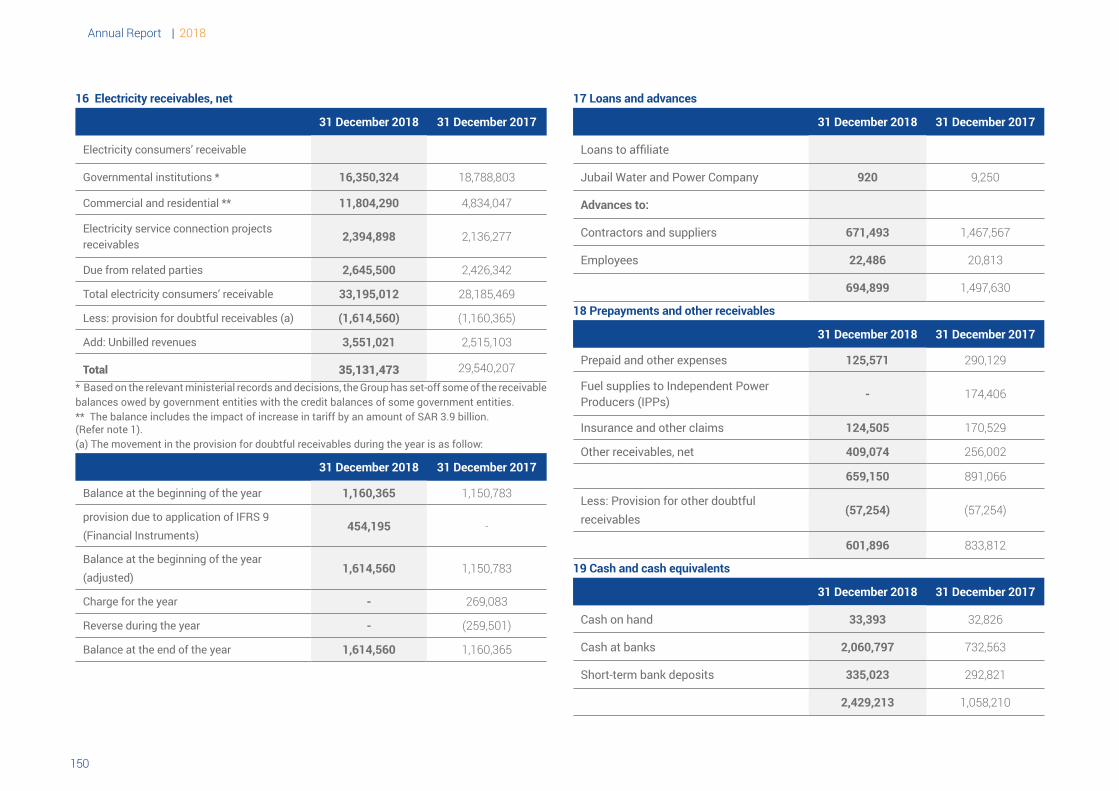
Annual Report | 2018
151150
16 Electricity receivables, net
31 December 2017 31 December 2018
Electricity consumers’ receivable
18,788,80316,350,324Governmental institutions *
4,834,04711,804,290 Commercial and residential **
2,136,2772,394,898 Electricity service connection projectsreceivables
2,426,3422,645,500 Due from related parties
28,185,46933,195,012Total electricity consumers’ receivable
)1,160,365((1,614,560)Less: provision for doubtful receivables (a)
2,515,1033,551,021Add: Unbilled revenues
29,540,20735,131,473Total* Based on the relevant ministerial records and decisions, the Group has set-off some of the receivable balances owed by government entities with the credit balances of some government entities.** The balance includes the impact of increase in tariff by an amount of SAR 3.9 billion. (Refer note 1).(a) The movement in the provision for doubtful receivables during the year is as follow:
31 December 2018 31 December 2017
Balance at the beginning of the year 1,160,365 1,150,783
provision due to application of IFRS 9(Financial Instruments)
454,195 -
Balance at the beginning of the year(adjusted)
1,614,560 1,150,783
Charge for the year - 269,083
Reverse during the year - )259,501(
Balance at the end of the year 1,614,560 1,160,365
17 Loans and advances
31 December 2017 31 December 2018
Loans to affiliate
9,250920Jubail Water and Power Company
Advances to:
1,467,567671,493Contractors and suppliers
20,81322,486 Employees
1,497,630694,899
18 Prepayments and other receivables
31 December 2017 31 December 2018
290,129125,571Prepaid and other expenses
174,406- Fuel supplies to Independent PowerProducers (IPPs)
170,529124,505Insurance and other claims
256,002409,074Other receivables, net
891,066659,150
)57,254((57,254) Less: Provision for other doubtfulreceivables
833,812601,896
19 Cash and cash equivalents
31 December 2017 31 December 2018
32,82633,393Cash on hand
732,5632,060,797Cash at banks
292,821335,023Short-term bank deposits
1,058,2102,429,213
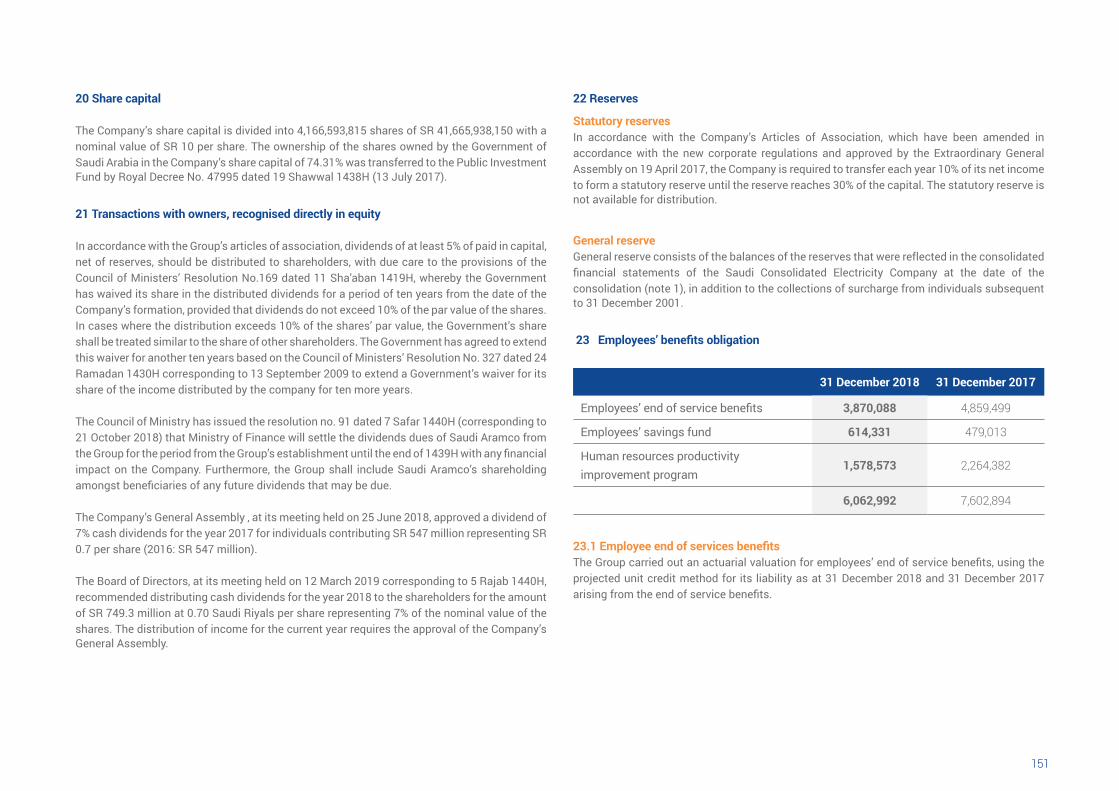
151150
20 Share capital
The Company’s share capital is divided into 4,166,593,815 shares of SR 41,665,938,150 with a nominal value of SR 10 per share. The ownership of the shares owned by the Government of Saudi Arabia in the Company’s share capital of 74.31% was transferred to the Public Investment Fund by Royal Decree No. 47995 dated 19 Shawwal 1438H (13 July 2017).
21 Transactions with owners, recognised directly in equity
In accordance with the Group’s articles of association, dividends of at least 5% of paid in capital, net of reserves, should be distributed to shareholders, with due care to the provisions of the Council of Ministers’ Resolution No.169 dated 11 Sha’aban 1419H, whereby the Government has waived its share in the distributed dividends for a period of ten years from the date of the Company’s formation, provided that dividends do not exceed 10% of the par value of the shares. In cases where the distribution exceeds 10% of the shares’ par value, the Government’s share shall be treated similar to the share of other shareholders. The Government has agreed to extend this waiver for another ten years based on the Council of Ministers’ Resolution No. 327 dated 24 Ramadan 1430H corresponding to 13 September 2009 to extend a Government’s waiver for its share of the income distributed by the company for ten more years.
The Council of Ministry has issued the resolution no. 91 dated 7 Safar 1440H (corresponding to 21 October 2018) that Ministry of Finance will settle the dividends dues of Saudi Aramco from the Group for the period from the Group’s establishment until the end of 1439H with any financial impact on the Company. Furthermore, the Group shall include Saudi Aramco’s shareholding amongst beneficiaries of any future dividends that may be due.
The Company’s General Assembly , at its meeting held on 25 June 2018, approved a dividend of 7% cash dividends for the year 2017 for individuals contributing SR 547 million representing SR 0.7 per share (2016: SR 547 million).
The Board of Directors, at its meeting held on 12 March 2019 corresponding to 5 Rajab 1440H, recommended distributing cash dividends for the year 2018 to the shareholders for the amount of SR 749.3 million at 0.70 Saudi Riyals per share representing 7% of the nominal value of the shares. The distribution of income for the current year requires the approval of the Company’s General Assembly.
22 Reserves
Statutory reservesIn accordance with the Company’s Articles of Association, which have been amended in accordance with the new corporate regulations and approved by the Extraordinary General Assembly on 19 April 2017, the Company is required to transfer each year 10% of its net income to form a statutory reserve until the reserve reaches 30% of the capital. The statutory reserve is not available for distribution.
General reserveGeneral reserve consists of the balances of the reserves that were reflected in the consolidated financial statements of the Saudi Consolidated Electricity Company at the date of the consolidation (note 1), in addition to the collections of surcharge from individuals subsequent to 31 December 2001.
23 Employees’ benefits obligation
31 December 2018 31 December 2017
Employees’ end of service benefits 3,870,088 4,859,499
Employees’ savings fund 614,331 479,013
Human resources productivityimprovement program
1,578,573 2,264,382
6,062,992 7,602,894
23.1 Employee end of services benefitsThe Group carried out an actuarial valuation for employees’ end of service benefits, using the projected unit credit method for its liability as at 31 December 2018 and 31 December 2017 arising from the end of service benefits.
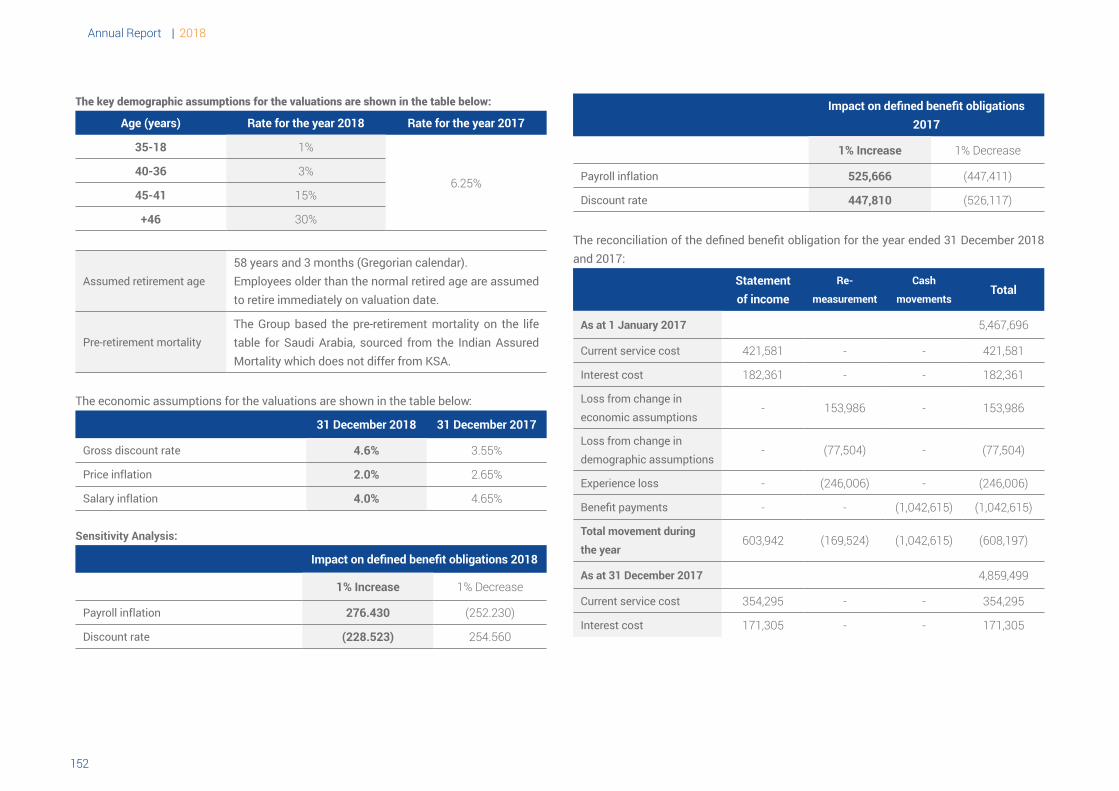
Annual Report | 2018
153152
The key demographic assumptions for the valuations are shown in the table below:
Age (years) Rate for the year 2018 Rate for the year 2017
35-18 1%
6.25%40-36 3%
45-41 15%
+46 30%
Assumed retirement age58 years and 3 months (Gregorian calendar).Employees older than the normal retired age are assumed to retire immediately on valuation date.
Pre-retirement mortalityThe Group based the pre-retirement mortality on the life table for Saudi Arabia, sourced from the Indian Assured Mortality which does not differ from KSA.
The economic assumptions for the valuations are shown in the table below:
31 December 2018 31 December 2017
Gross discount rate 4.6% 3.55%
Price inflation 2.0% 2.65%
Salary inflation 4.0% 4.65%
Sensitivity Analysis:
Impact on defined benefit obligations 2018
1% Increase 1% Decrease
Payroll inflation 276.430 )252.230(
Discount rate (228.523) 254.560
Impact on defined benefit obligations 2017
1% Increase 1% Decrease
Payroll inflation 525,666 )447,411(
Discount rate 447,810 )526,117(
The reconciliation of the defined benefit obligation for the year ended 31 December 2018 and 2017:
Statement of income
Re-
measurement
Cash
movementsTotal
As at 1 January 2017 5,467,696
Current service cost 421,581 - - 421,581
Interest cost 182,361 - - 182,361
Loss from change ineconomic assumptions
- 153,986 - 153,986
Loss from change indemographic assumptions
- )77,504( - )77,504(
Experience loss - )246,006( - )246,006(
Benefit payments - - )1,042,615( )1,042,615(
Total movement duringthe year
603,942 )169,524( )1,042,615( )608,197(
As at 31 December 2017 4,859,499
Current service cost 354,295 - - 354,295
Interest cost 171,305 - - 171,305
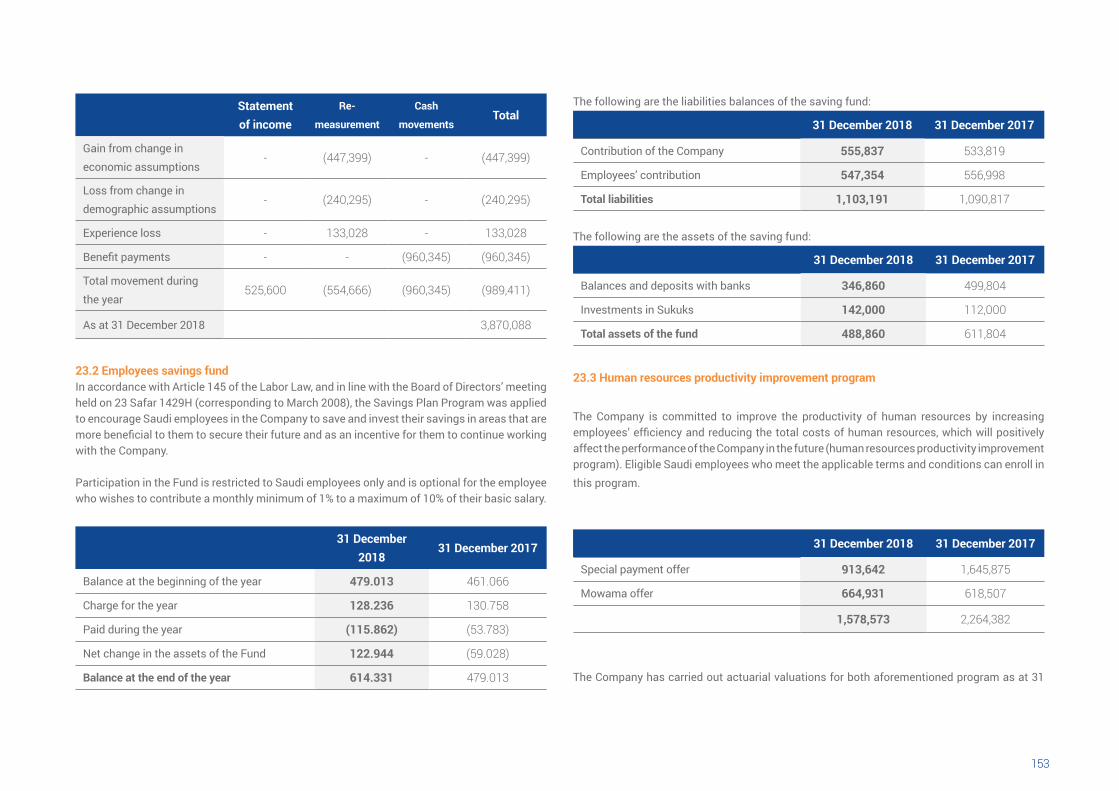
153152
Statement of income
Re-
measurement
Cash
movementsTotal
Gain from change ineconomic assumptions
- )447,399( - )447,399(
Loss from change indemographic assumptions
- )240,295( - )240,295(
Experience loss - 133,028 - 133,028
Benefit payments - - )960,345( )960,345(
Total movement duringthe year
525,600 )554,666( )960,345( )989,411(
As at 31 December 2018 3,870,088
23.2 Employees savings fundIn accordance with Article 145 of the Labor Law, and in line with the Board of Directors’ meeting held on 23 Safar 1429H (corresponding to March 2008), the Savings Plan Program was applied to encourage Saudi employees in the Company to save and invest their savings in areas that are more beneficial to them to secure their future and as an incentive for them to continue working with the Company.
Participation in the Fund is restricted to Saudi employees only and is optional for the employee who wishes to contribute a monthly minimum of 1% to a maximum of 10% of their basic salary.
31 December 2018
31 December 2017
Balance at the beginning of the year 479.013 461.066
Charge for the year 128.236 130.758
Paid during the year (115.862) )53.783(
Net change in the assets of the Fund 122.944 )59.028(
Balance at the end of the year 614.331 479.013
The following are the liabilities balances of the saving fund:
31 December 2018 31 December 2017
Contribution of the Company 555,837 533,819
Employees’ contribution 547,354 556,998
Total liabilities 1,103,191 1,090,817
The following are the assets of the saving fund:
31 December 2018 31 December 2017
Balances and deposits with banks 346,860 499,804
Investments in Sukuks 142,000 112,000
Total assets of the fund 488,860 611,804
23.3 Human resources productivity improvement program
The Company is committed to improve the productivity of human resources by increasing employees’ efficiency and reducing the total costs of human resources, which will positively affect the performance of the Company in the future (human resources productivity improvement program). Eligible Saudi employees who meet the applicable terms and conditions can enroll in this program.
31 December 2018 31 December 2017
Special payment offer 913,642 1,645,875
Mowama offer 664,931 618,507
1,578,573 2,264,382
The Company has carried out actuarial valuations for both aforementioned program as at 31
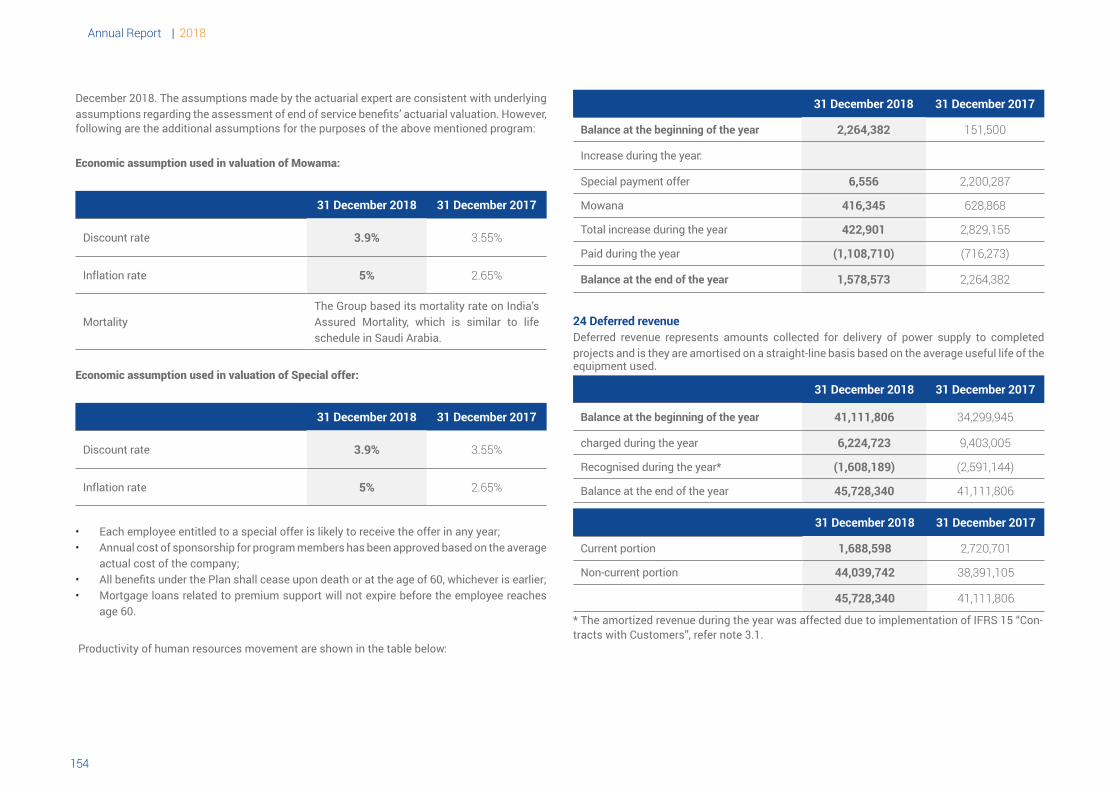
Annual Report | 2018
155154
December 2018. The assumptions made by the actuarial expert are consistent with underlying assumptions regarding the assessment of end of service benefits’ actuarial valuation. However, following are the additional assumptions for the purposes of the above mentioned program:
Economic assumption used in valuation of Mowama:
31 December 2018 31 December 2017
Discount rate 3.9% 3.55%
Inflation rate 5% 2.65%
MortalityThe Group based its mortality rate on India’s Assured Mortality, which is similar to life schedule in Saudi Arabia.
Economic assumption used in valuation of Special offer:
31 December 2018 31 December 2017
Discount rate 3.9% 3.55%
Inflation rate 5% 2.65%
• Each employee entitled to a special offer is likely to receive the offer in any year;• Annual cost of sponsorship for program members has been approved based on the average
actual cost of the company;• All benefits under the Plan shall cease upon death or at the age of 60, whichever is earlier;• Mortgage loans related to premium support will not expire before the employee reaches
age 60.
Productivity of human resources movement are shown in the table below:
31 December 2018 31 December 2017
Balance at the beginning of the year 2,264,382 151,500
Increase during the year:
Special payment offer 6,556 2,200,287
Mowana 416,345 628,868
Total increase during the year 422,901 2,829,155
Paid during the year (1,108,710) )716,273(
Balance at the end of the year 1,578,573 2,264,382
24 Deferred revenue Deferred revenue represents amounts collected for delivery of power supply to completed projects and is they are amortised on a straight-line basis based on the average useful life of the equipment used.
31 December 2018 31 December 2017
Balance at the beginning of the year 41,111,806 34,299,945
charged during the year 6,224,723 9,403,005
Recognised during the year* (1,608,189) )2,591,144(
Balance at the end of the year 45,728,340 41,111,806
31 December 2018 31 December 2017
Current portion 1,688,598 2,720,701
Non-current portion 44,039,742 38,391,105
45,728,340 41,111,806
* The amortized revenue during the year was affected due to implementation of IFRS 15 “Con-tracts with Customers”, refer note 3.1.
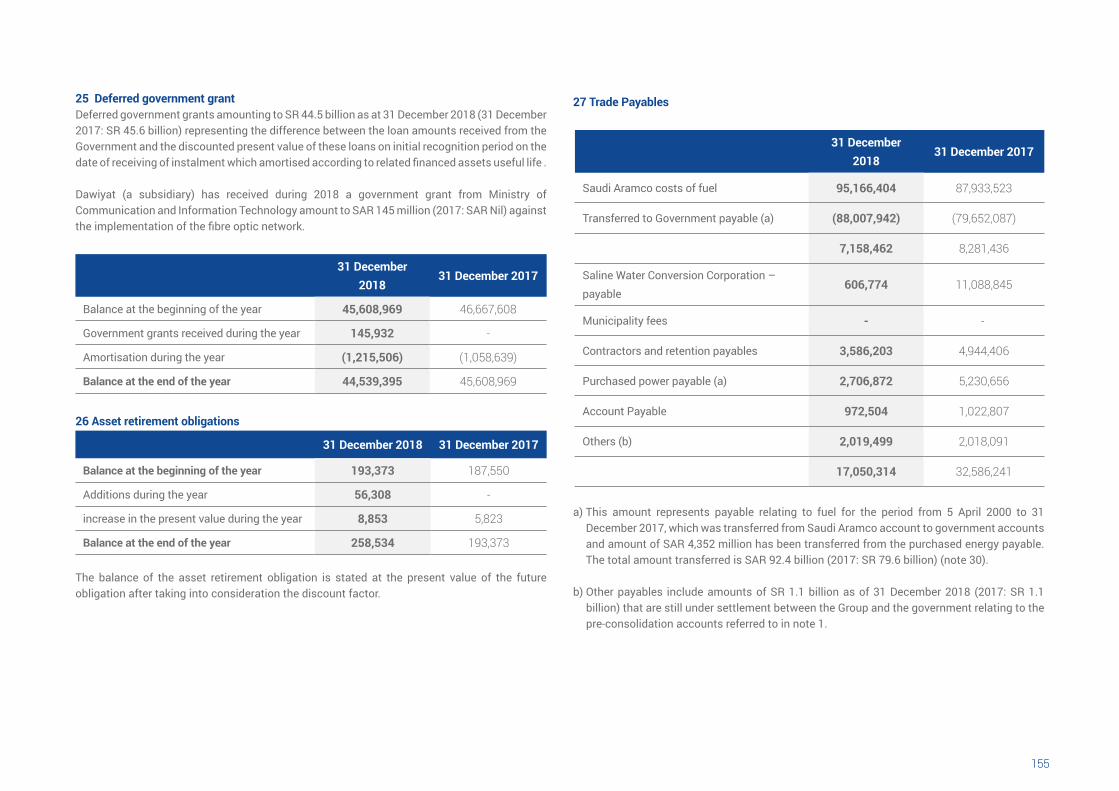
155154
25 Deferred government grantDeferred government grants amounting to SR 44.5 billion as at 31 December 2018 (31 December 2017: SR 45.6 billion) representing the difference between the loan amounts received from the Government and the discounted present value of these loans on initial recognition period on the date of receiving of instalment which amortised according to related financed assets useful life .
Dawiyat (a subsidiary) has received during 2018 a government grant from Ministry of Communication and Information Technology amount to SAR 145 million (2017: SAR Nil) againstthe implementation of the fibre optic network.
31 December 2018
31 December 2017
Balance at the beginning of the year 45,608,969 46,667,608
Government grants received during the year 145,932 -
Amortisation during the year (1,215,506) )1,058,639(
Balance at the end of the year 44,539,395 45,608,969
26 Asset retirement obligations
31 December 2018 31 December 2017
Balance at the beginning of the year 193,373 187,550
Additions during the year 56,308 -
increase in the present value during the year 8,853 5,823
Balance at the end of the year 258,534 193,373
The balance of the asset retirement obligation is stated at the present value of the future obligation after taking into consideration the discount factor.
27 Trade Payables
31 December 2018
31 December 2017
Saudi Aramco costs of fuel 95,166,404 87,933,523
Transferred to Government payable (a) (88,007,942) )79,652,087(
7,158,462 8,281,436
Saline Water Conversion Corporation –payable
606,774 11,088,845
Municipality fees - -
Contractors and retention payables 3,586,203 4,944,406
Purchased power payable (a) 2,706,872 5,230,656
Account Payable 972,504 1,022,807
Others (b) 2,019,499 2,018,091
17,050,314 32,586,241
a) This amount represents payable relating to fuel for the period from 5 April 2000 to 31 December 2017, which was transferred from Saudi Aramco account to government accounts and amount of SAR 4,352 million has been transferred from the purchased energy payable. The total amount transferred is SAR 92.4 billion (2017: SR 79.6 billion) (note 30).
b) Other payables include amounts of SR 1.1 billion as of 31 December 2018 (2017: SR 1.1 billion) that are still under settlement between the Group and the government relating to the pre-consolidation accounts referred to in note 1.
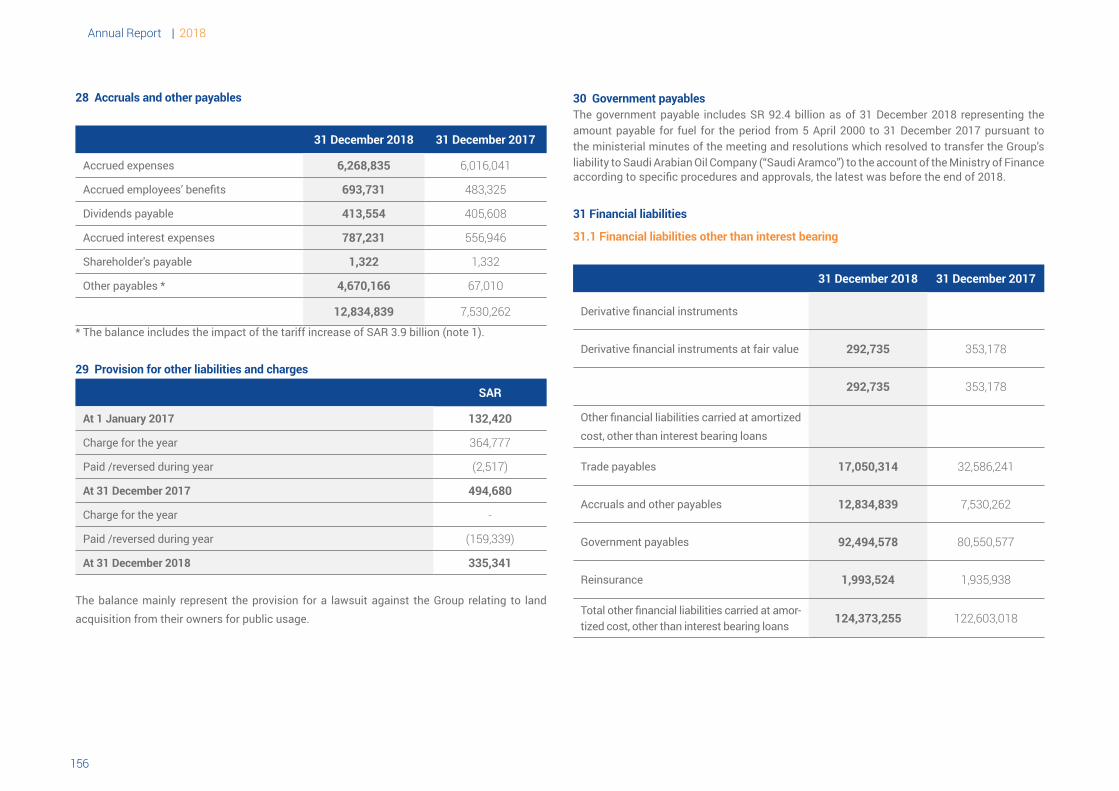
Annual Report | 2018
157156
28 Accruals and other payables
31 December 2018 31 December 2017
Accrued expenses 6,268,835 6,016,041
Accrued employees’ benefits 693,731 483,325
Dividends payable 413,554 405,608
Accrued interest expenses 787,231 556,946
Shareholder's payable 1,322 1,332
Other payables * 4,670,166 67,010
12,834,839 7,530,262
* The balance includes the impact of the tariff increase of SAR 3.9 billion (note 1).
29 Provision for other liabilities and charges
SAR
At 1 January 2017 132,420
Charge for the year 364,777
Paid /reversed during year )2,517(
At 31 December 2017 494,680
Charge for the year -
Paid /reversed during year )159,339(
At 31 December 2018 335,341
The balance mainly represent the provision for a lawsuit against the Group relating to land acquisition from their owners for public usage.
30 Government payablesThe government payable includes SR 92.4 billion as of 31 December 2018 representing the amount payable for fuel for the period from 5 April 2000 to 31 December 2017 pursuant to the ministerial minutes of the meeting and resolutions which resolved to transfer the Group’s liability to Saudi Arabian Oil Company (“Saudi Aramco”) to the account of the Ministry of Finance according to specific procedures and approvals, the latest was before the end of 2018.
31 Financial liabilities
31.1 Financial liabilities other than interest bearing
31 December 2018 31 December 2017
Derivative financial instruments
Derivative financial instruments at fair value 292,735 353,178
292,735 353,178
Other financial liabilities carried at amortizedcost, other than interest bearing loans
Trade payables 17,050,314 32,586,241
Accruals and other payables 12,834,839 7,530,262
Government payables 92,494,578 80,550,577
Reinsurance 1,993,524 1,935,938
Total other financial liabilities carried at amor-tized cost, other than interest bearing loans
124,373,255 122,603,018
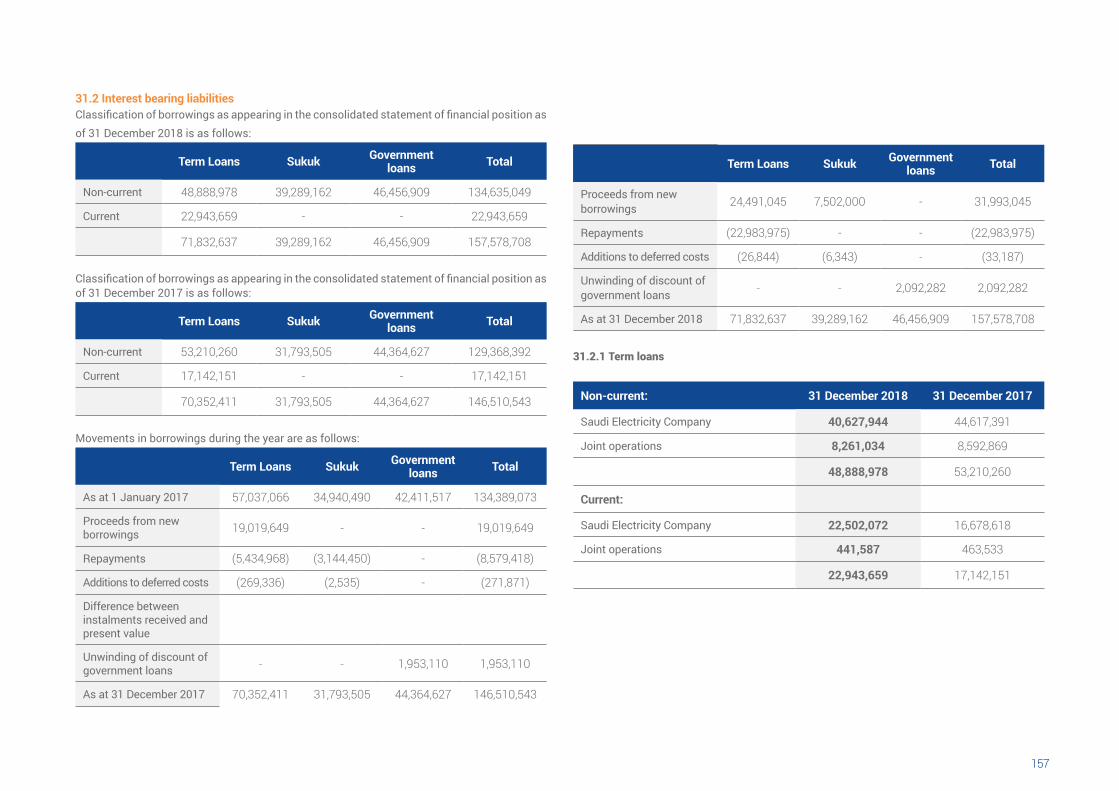
157156
31.2 Interest bearing liabilitiesClassification of borrowings as appearing in the consolidated statement of financial position as of 31 December 2018 is as follows:
Term Loans Sukuk Government loans Total
Non-current 48,888,978 39,289,162 46,456,909 134,635,049
Current 22,943,659 - - 22,943,659
71,832,637 39,289,162 46,456,909 157,578,708
Classification of borrowings as appearing in the consolidated statement of financial position as of 31 December 2017 is as follows:
Term Loans Sukuk Government loans Total
Non-current 53,210,260 31,793,505 44,364,627 129,368,392
Current 17,142,151 - - 17,142,151
70,352,411 31,793,505 44,364,627 146,510,543
Movements in borrowings during the year are as follows:
Term Loans Sukuk Government loans Total
As at 1 January 2017 57,037,066 34,940,490 42,411,517 134,389,073
Proceeds from new borrowings 19,019,649 - - 19,019,649
Repayments )5,434,968( )3,144,450( - )8,579,418(
Additions to deferred costs )269,336( )2,535( - )271,871(
Difference between instalments received andpresent value
Unwinding of discount ofgovernment loans - - 1,953,110 1,953,110
As at 31 December 2017 70,352,411 31,793,505 44,364,627 146,510,543
Term Loans Sukuk Government loans Total
Proceeds from new borrowings 24,491,045 7,502,000 - 31,993,045
Repayments )22,983,975( - - )22,983,975(
Additions to deferred costs )26,844( )6,343( - )33,187(
Unwinding of discount ofgovernment loans - - 2,092,282 2,092,282
As at 31 December 2018 71,832,637 39,289,162 46,456,909 157,578,708
31.2.1 Term loans
Non-current: 31 December 2018 31 December 2017
Saudi Electricity Company 40,627,944 44,617,391
Joint operations 8,261,034 8,592,869
48,888,978 53,210,260
Current:
Saudi Electricity Company 22,502,072 16,678,618
Joint operations 441,587 463,533
22,943,659 17,142,151
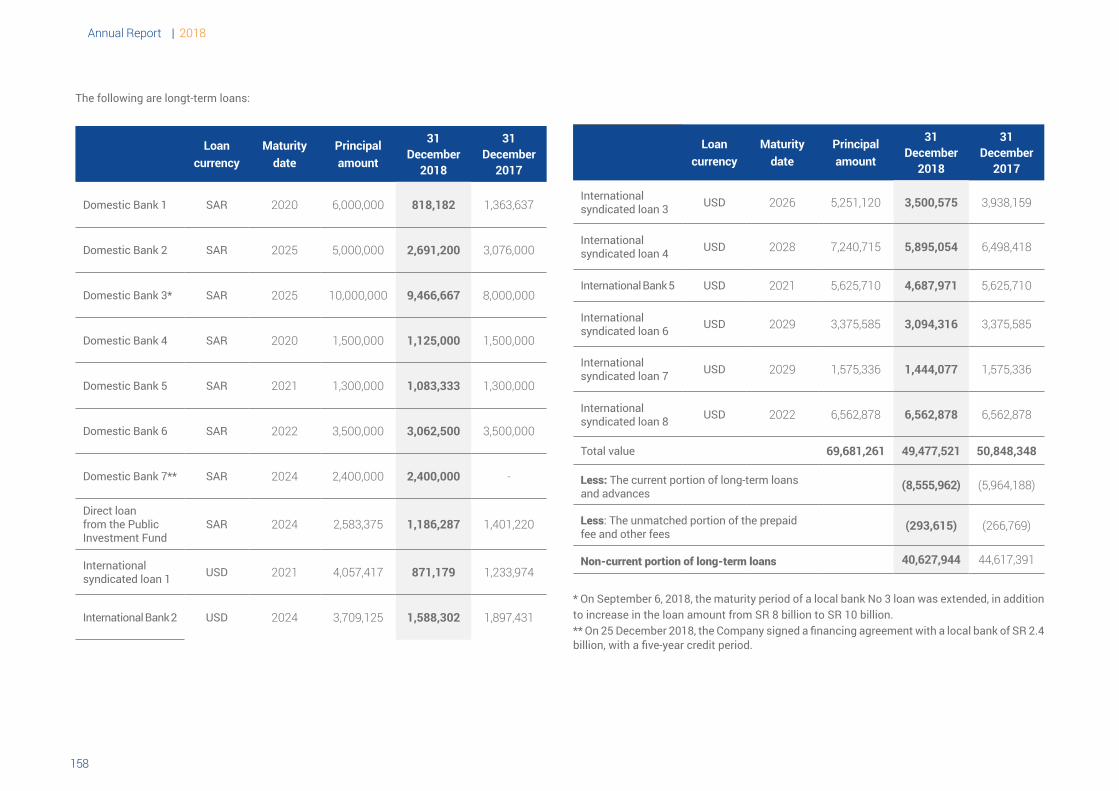
Annual Report | 2018
159158
The following are longt-term loans:
Loan currency
Maturity date
Principal amount
31 December
2018
31 December
2017
Domestic Bank 1 SAR 2020 6,000,000 818,182 1,363,637
Domestic Bank 2 SAR 2025 5,000,000 2,691,200 3,076,000
Domestic Bank 3* SAR 2025 10,000,000 9,466,667 8,000,000
Domestic Bank 4 SAR 2020 1,500,000 1,125,000 1,500,000
Domestic Bank 5 SAR 2021 1,300,000 1,083,333 1,300,000
Domestic Bank 6 SAR 2022 3,500,000 3,062,500 3,500,000
Domestic Bank 7** SAR 2024 2,400,000 2,400,000 -
Direct loan from the PublicInvestment Fund
SAR 2024 2,583,375 1,186,287 1,401,220
Internationalsyndicated loan 1 USD 2021 4,057,417 871,179 1,233,974
International Bank 2 USD 2024 3,709,125 1,588,302 1,897,431
Loan currency
Maturity date
Principal amount
31 December
2018
31 December
2017
Internationalsyndicated loan 3 USD 2026 5,251,120 3,500,575 3,938,159
Internationalsyndicated loan 4 USD 2028 7,240,715 5,895,054 6,498,418
International Bank 5 USD 2021 5,625,710 4,687,971 5,625,710
Internationalsyndicated loan 6 USD 2029 3,375,585 3,094,316 3,375,585
Internationalsyndicated loan 7 USD 2029 1,575,336 1,444,077 1,575,336
International syndicated loan 8 USD 2022 6,562,878 6,562,878 6,562,878
Total value 69,681,261 49,477,521 50,848,348
Less: The current portion of long-term loansand advances
(8,555,962) )5,964,188(
Less: The unmatched portion of the prepaidfee and other fees
(293,615) )266,769(
Non-current portion of long-term loans 40,627,944 44,617,391
* On September 6, 2018, the maturity period of a local bank No 3 loan was extended, in addition to increase in the loan amount from SR 8 billion to SR 10 billion.** On 25 December 2018, the Company signed a financing agreement with a local bank of SR 2.4 billion, with a five-year credit period.
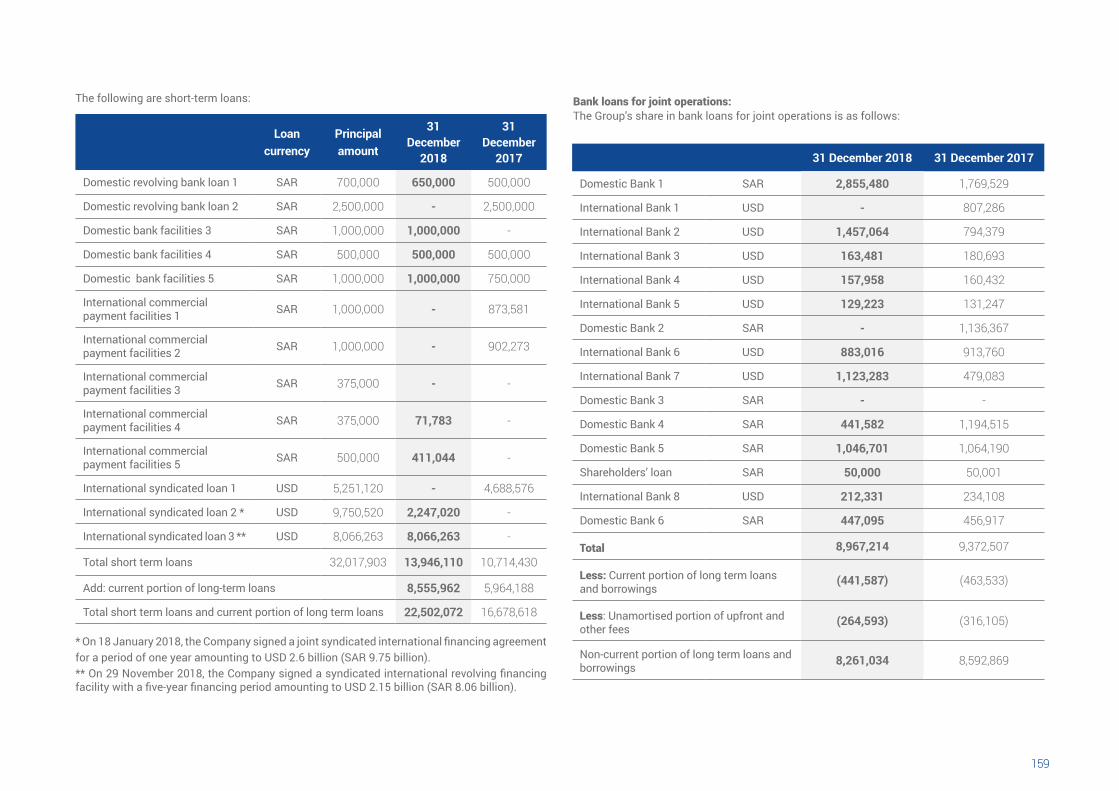
159158
The following are short-term loans:
Loan currency
Principal amount
31 December
2018
31 December
2017
Domestic revolving bank loan 1 SAR 700,000 650,000 500,000
Domestic revolving bank loan 2 SAR 2,500,000 - 2,500,000
Domestic bank facilities 3 SAR 1,000,000 1,000,000 -
Domestic bank facilities 4 SAR 500,000 500,000 500,000
Domestic bank facilities 5 SAR 1,000,000 1,000,000 750,000
International commercialpayment facilities 1 SAR 1,000,000 - 873,581
International commercialpayment facilities 2 SAR 1,000,000 - 902,273
International commercialpayment facilities 3 SAR 375,000 - -
International commercialpayment facilities 4 SAR 375,000 71,783 -
International commercialpayment facilities 5 SAR 500,000 411,044 -
International syndicated loan 1 USD 5,251,120 - 4,688,576
International syndicated loan 2 * USD 9,750,520 2,247,020 -
International syndicated loan 3 ** USD 8,066,263 8,066,263 -
Total short term loans 32,017,903 13,946,110 10,714,430
Add: current portion of long-term loans 8,555,962 5,964,188
Total short term loans and current portion of long term loans 22,502,072 16,678,618
* On 18 January 2018, the Company signed a joint syndicated international financing agreement for a period of one year amounting to USD 2.6 billion (SAR 9.75 billion).** On 29 November 2018, the Company signed a syndicated international revolving financing facility with a five-year financing period amounting to USD 2.15 billion (SAR 8.06 billion).
Bank loans for joint operations:The Group’s share in bank loans for joint operations is as follows:
31 December 2018 31 December 2017
Domestic Bank 1 SAR 2,855,480 1,769,529
International Bank 1 USD - 807,286
International Bank 2 USD 1,457,064 794,379
International Bank 3 USD 163,481 180,693
International Bank 4 USD 157,958 160,432
International Bank 5 USD 129,223 131,247
Domestic Bank 2 SAR - 1,136,367
International Bank 6 USD 883,016 913,760
International Bank 7 USD 1,123,283 479,083
Domestic Bank 3 SAR - -
Domestic Bank 4 SAR 441,582 1,194,515
Domestic Bank 5 SAR 1,046,701 1,064,190
Shareholders’ loan SAR 50,000 50,001
International Bank 8 USD 212,331 234,108
Domestic Bank 6 SAR 447,095 456,917
Total 8,967,214 9,372,507
Less: Current portion of long term loansand borrowings
(441,587) )463,533(
Less: Unamortised portion of upfront and other fees
(264,593) )316,105(
Non-current portion of long term loans andborrowings 8,261,034 8,592,869
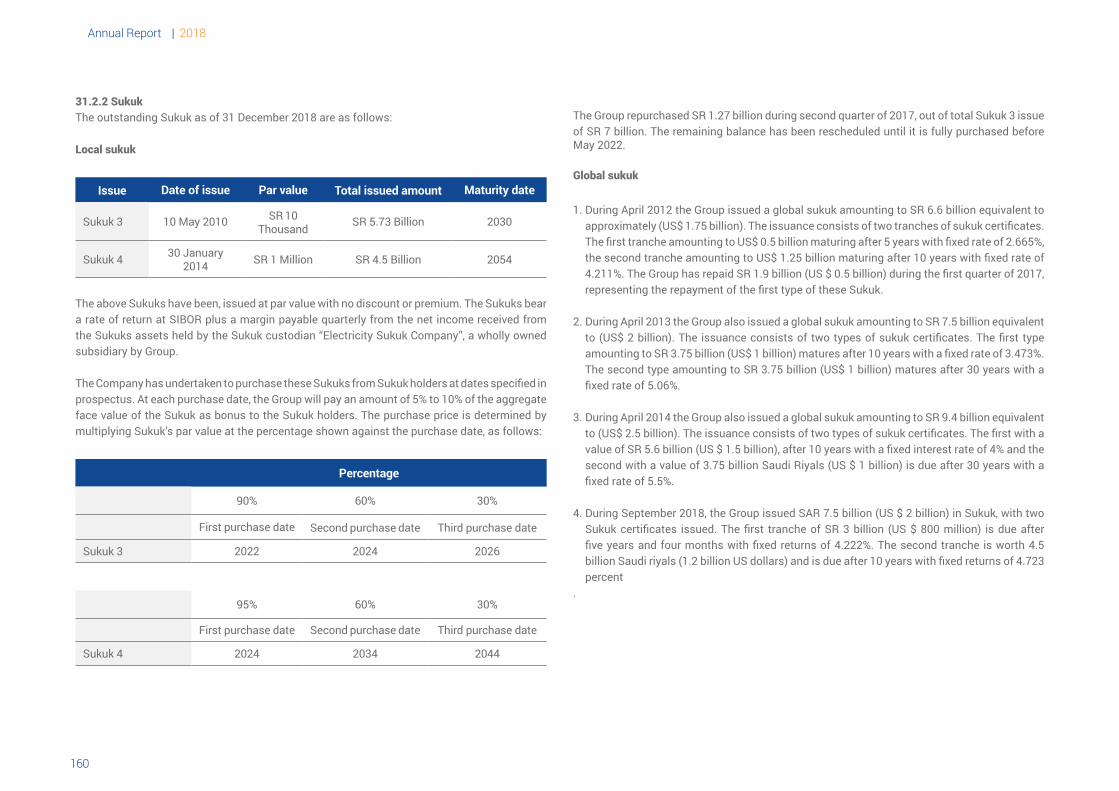
Annual Report | 2018
161160
31.2.2 SukukThe outstanding Sukuk as of 31 December 2018 are as follows:
Local sukuk
Issue Date of issue Par value Total issued amount Maturity date
Sukuk 3 10 May 2010 SR 10 Thousand SR 5.73 Billion 2030
Sukuk 4 30 January 2014 SR 1 Million SR 4.5 Billion 2054
The above Sukuks have been, issued at par value with no discount or premium. The Sukuks bear a rate of return at SIBOR plus a margin payable quarterly from the net income received from the Sukuks assets held by the Sukuk custodian “Electricity Sukuk Company”, a wholly owned subsidiary by Group.
The Company has undertaken to purchase these Sukuks from Sukuk holders at dates specified in prospectus. At each purchase date, the Group will pay an amount of 5% to 10% of the aggregate face value of the Sukuk as bonus to the Sukuk holders. The purchase price is determined by multiplying Sukuk’s par value at the percentage shown against the purchase date, as follows:
Percentage
90% 60% 30%
First purchase date Second purchase date Third purchase date
Sukuk 3 2022 2024 2026
95% 60% 30%
First purchase date Second purchase date Third purchase date
Sukuk 4 2024 2034 2044
The Group repurchased SR 1.27 billion during second quarter of 2017, out of total Sukuk 3 issue of SR 7 billion. The remaining balance has been rescheduled until it is fully purchased before May 2022.
Global sukuk
1. During April 2012 the Group issued a global sukuk amounting to SR 6.6 billion equivalent to approximately (US$ 1.75 billion). The issuance consists of two tranches of sukuk certificates. The first tranche amounting to US$ 0.5 billion maturing after 5 years with fixed rate of 2.665%, the second tranche amounting to US$ 1.25 billion maturing after 10 years with fixed rate of 4.211%. The Group has repaid SR 1.9 billion (US $ 0.5 billion) during the first quarter of 2017, representing the repayment of the first type of these Sukuk.
2. During April 2013 the Group also issued a global sukuk amounting to SR 7.5 billion equivalent to (US$ 2 billion). The issuance consists of two types of sukuk certificates. The first type amounting to SR 3.75 billion (US$ 1 billion) matures after 10 years with a fixed rate of 3.473%. The second type amounting to SR 3.75 billion (US$ 1 billion) matures after 30 years with a fixed rate of 5.06%.
3. During April 2014 the Group also issued a global sukuk amounting to SR 9.4 billion equivalent to (US$ 2.5 billion). The issuance consists of two types of sukuk certificates. The first with a value of SR 5.6 billion (US $ 1.5 billion), after 10 years with a fixed interest rate of 4% and the second with a value of 3.75 billion Saudi Riyals (US $ 1 billion) is due after 30 years with a fixed rate of 5.5%.
4. During September 2018, the Group issued SAR 7.5 billion (US $ 2 billion) in Sukuk, with two Sukuk certificates issued. The first tranche of SR 3 billion (US $ 800 million) is due after five years and four months with fixed returns of 4.222%. The second tranche is worth 4.5 billion Saudi riyals (1.2 billion US dollars) and is due after 10 years with fixed returns of 4.723 percent
.
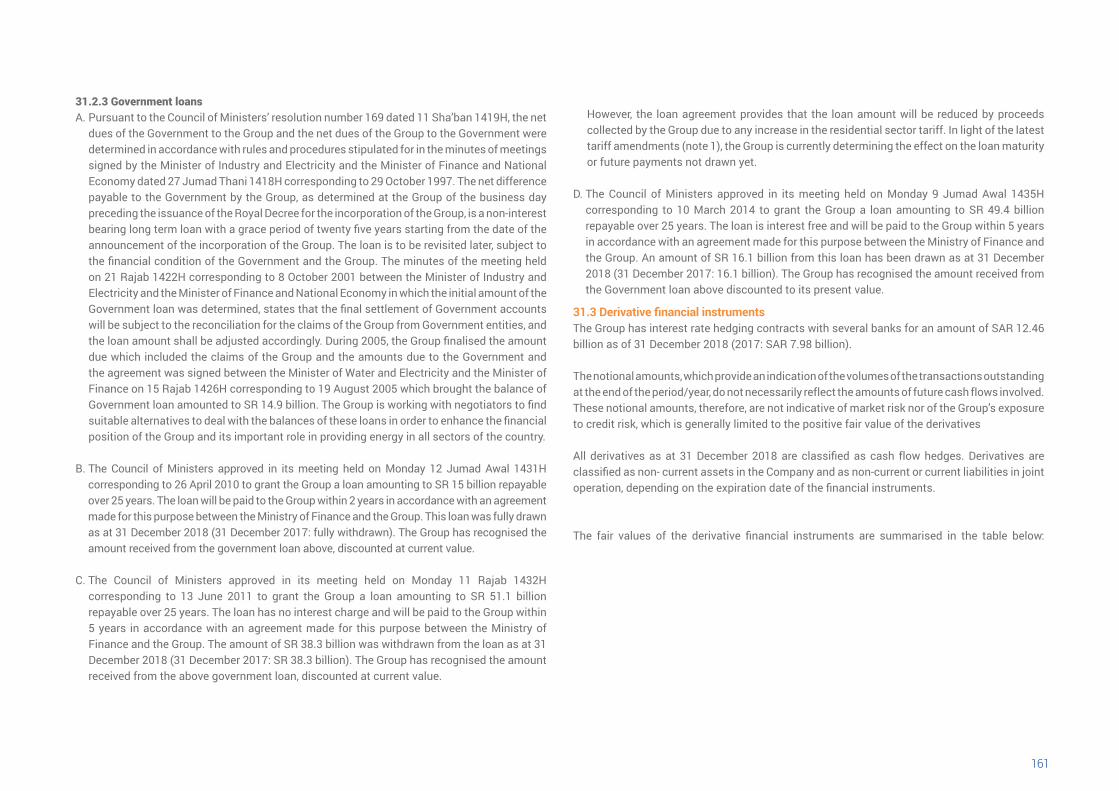
161160
31.2.3 Government loans A. Pursuant to the Council of Ministers’ resolution number 169 dated 11 Sha’ban 1419H, the net
dues of the Government to the Group and the net dues of the Group to the Government were determined in accordance with rules and procedures stipulated for in the minutes of meetings signed by the Minister of Industry and Electricity and the Minister of Finance and National Economy dated 27 Jumad Thani 1418H corresponding to 29 October 1997. The net difference payable to the Government by the Group, as determined at the Group of the business day preceding the issuance of the Royal Decree for the incorporation of the Group, is a non-interest bearing long term loan with a grace period of twenty five years starting from the date of the announcement of the incorporation of the Group. The loan is to be revisited later, subject to the financial condition of the Government and the Group. The minutes of the meeting held on 21 Rajab 1422H corresponding to 8 October 2001 between the Minister of Industry and Electricity and the Minister of Finance and National Economy in which the initial amount of the Government loan was determined, states that the final settlement of Government accounts will be subject to the reconciliation for the claims of the Group from Government entities, and the loan amount shall be adjusted accordingly. During 2005, the Group finalised the amount due which included the claims of the Group and the amounts due to the Government and the agreement was signed between the Minister of Water and Electricity and the Minister of Finance on 15 Rajab 1426H corresponding to 19 August 2005 which brought the balance of Government loan amounted to SR 14.9 billion. The Group is working with negotiators to find suitable alternatives to deal with the balances of these loans in order to enhance the financial position of the Group and its important role in providing energy in all sectors of the country.
B. The Council of Ministers approved in its meeting held on Monday 12 Jumad Awal 1431H corresponding to 26 April 2010 to grant the Group a loan amounting to SR 15 billion repayable over 25 years. The loan will be paid to the Group within 2 years in accordance with an agreement made for this purpose between the Ministry of Finance and the Group. This loan was fully drawn as at 31 December 2018 (31 December 2017: fully withdrawn). The Group has recognised the amount received from the government loan above, discounted at current value.
C. The Council of Ministers approved in its meeting held on Monday 11 Rajab 1432H corresponding to 13 June 2011 to grant the Group a loan amounting to SR 51.1 billion repayable over 25 years. The loan has no interest charge and will be paid to the Group within 5 years in accordance with an agreement made for this purpose between the Ministry of Finance and the Group. The amount of SR 38.3 billion was withdrawn from the loan as at 31 December 2018 (31 December 2017: SR 38.3 billion). The Group has recognised the amount received from the above government loan, discounted at current value.
However, the loan agreement provides that the loan amount will be reduced by proceeds collected by the Group due to any increase in the residential sector tariff. In light of the latest tariff amendments (note 1), the Group is currently determining the effect on the loan maturity or future payments not drawn yet.
D. The Council of Ministers approved in its meeting held on Monday 9 Jumad Awal 1435H corresponding to 10 March 2014 to grant the Group a loan amounting to SR 49.4 billion repayable over 25 years. The loan is interest free and will be paid to the Group within 5 years in accordance with an agreement made for this purpose between the Ministry of Finance and the Group. An amount of SR 16.1 billion from this loan has been drawn as at 31 December 2018 (31 December 2017: 16.1 billion). The Group has recognised the amount received from the Government loan above discounted to its present value.
31.3 Derivative financial instruments The Group has interest rate hedging contracts with several banks for an amount of SAR 12.46 billion as of 31 December 2018 (2017: SAR 7.98 billion).
The notional amounts, which provide an indication of the volumes of the transactions outstanding at the end of the period/year, do not necessarily reflect the amounts of future cash flows involved. These notional amounts, therefore, are not indicative of market risk nor of the Group’s exposure to credit risk, which is generally limited to the positive fair value of the derivatives
All derivatives as at 31 December 2018 are classified as cash flow hedges. Derivatives are classified as non- current assets in the Company and as non-current or current liabilities in joint operation, depending on the expiration date of the financial instruments.
The fair values of the derivative financial instruments are summarised in the table below:
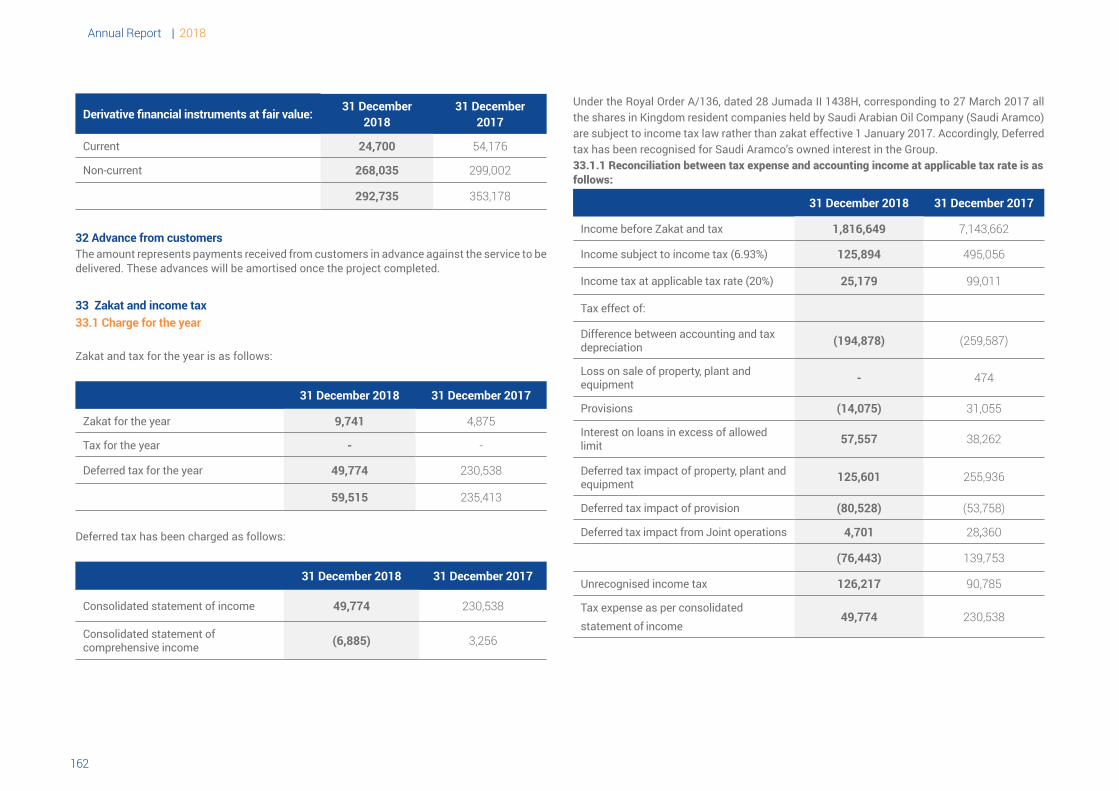
Annual Report | 2018
163162
Derivative financial instruments at fair value:31 December
201831 December
2017
Current 24,700 54,176
Non-current 268,035 299,002
292,735 353,178
32 Advance from customers The amount represents payments received from customers in advance against the service to be delivered. These advances will be amortised once the project completed.
33 Zakat and income tax33.1 Charge for the year
Zakat and tax for the year is as follows:
31 December 2018 31 December 2017
Zakat for the year 9,741 4,875
Tax for the year - -
Deferred tax for the year 49,774 230,538
59,515 235,413
Deferred tax has been charged as follows:
31 December 201731 December 2018
230,53849,774Consolidated statement of income
3,256(6,885) Consolidated statement ofcomprehensive income
Under the Royal Order A/136, dated 28 Jumada II 1438H, corresponding to 27 March 2017 all the shares in Kingdom resident companies held by Saudi Arabian Oil Company (Saudi Aramco) are subject to income tax law rather than zakat effective 1 January 2017. Accordingly, Deferred tax has been recognised for Saudi Aramco’s owned interest in the Group.33.1.1 Reconciliation between tax expense and accounting income at applicable tax rate is as follows:
31 December 201731 December 2018
7,143,6621,816,649Income before Zakat and tax
495,056125,894Income subject to income tax (6.93%)
99,01125,179Income tax at applicable tax rate (20%)
Tax effect of:
)259,587((194,878) Difference between accounting and taxdepreciation
474- Loss on sale of property, plant andequipment
31,055(14,075)Provisions
38,26257,557 Interest on loans in excess of allowedlimit
255,936125,601 Deferred tax impact of property, plant andequipment
)53,758((80,528)Deferred tax impact of provision
28,3604,701Deferred tax impact from Joint operations
139,753(76,443)
90,785126,217 Unrecognised income tax
230,53849,774 Tax expense as per consolidatedstatement of income
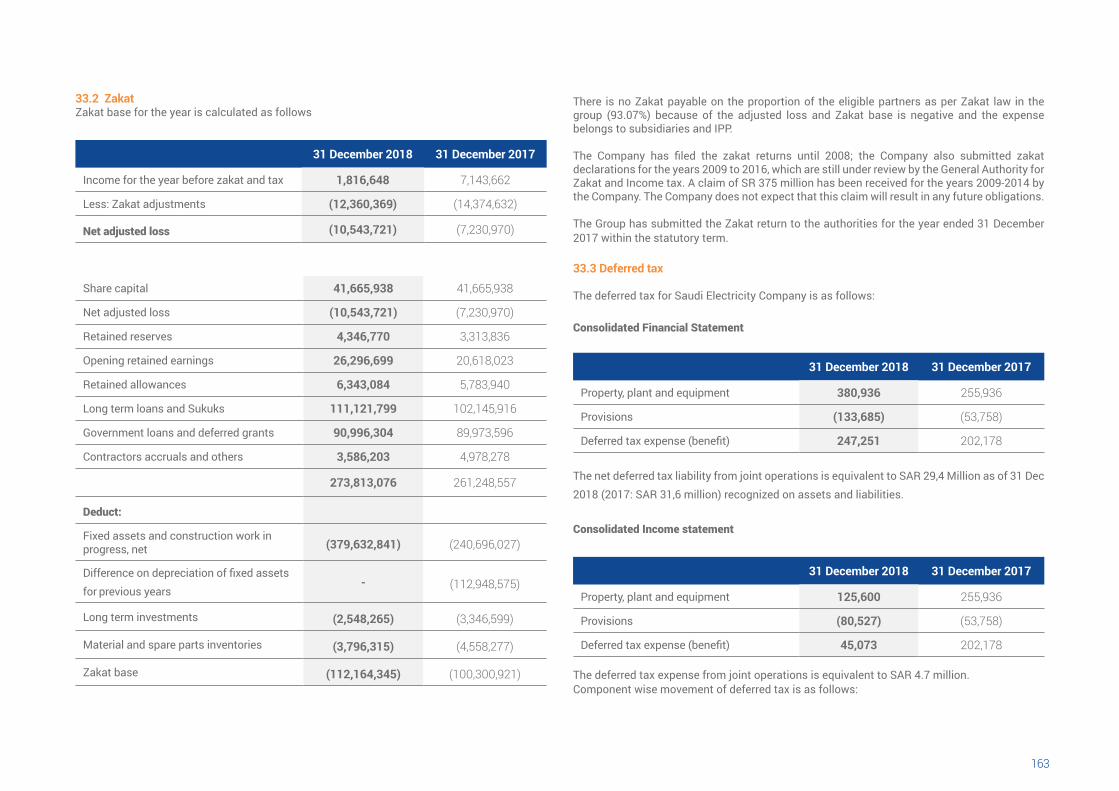
163162
33.2 ZakatZakat base for the year is calculated as follows
31 December 2018 31 December 2017
Income for the year before zakat and tax 1,816,648 7,143,662
Less: Zakat adjustments (12,360,369) )14,374,632(
Net adjusted loss (10,543,721) )7,230,970(
31 December 2018 31 December 2017
Share capital 41,665,938 41,665,938
Net adjusted loss (10,543,721) )7,230,970(
Retained reserves 4,346,770 3,313,836
Opening retained earnings 26,296,699 20,618,023
Retained allowances 6,343,084 5,783,940
Long term loans and Sukuks 111,121,799 102,145,916
Government loans and deferred grants 90,996,304 89,973,596
Contractors accruals and others 3,586,203 4,978,278
273,813,076 261,248,557
Deduct:
Fixed assets and construction work inprogress, net (379,632,841) )240,696,027(
Difference on depreciation of fixed assetsfor previous years
- )112,948,575(
Long term investments (2,548,265) )3,346,599(
Material and spare parts inventories (3,796,315) )4,558,277(
Zakat base (112,164,345) )100,300,921(
There is no Zakat payable on the proportion of the eligible partners as per Zakat law in the group (93.07%) because of the adjusted loss and Zakat base is negative and the expense belongs to subsidiaries and IPP.
The Company has filed the zakat returns until 2008; the Company also submitted zakat declarations for the years 2009 to 2016, which are still under review by the General Authority for Zakat and Income tax. A claim of SR 375 million has been received for the years 2009-2014 by the Company. The Company does not expect that this claim will result in any future obligations.
The Group has submitted the Zakat return to the authorities for the year ended 31 December 2017 within the statutory term.
33.3 Deferred tax
The deferred tax for Saudi Electricity Company is as follows:
Consolidated Financial Statement
31 December 2018 31 December 2017
Property, plant and equipment 380,936 255,936
Provisions (133,685) )53,758(
Deferred tax expense (benefit) 247,251 202,178
The net deferred tax liability from joint operations is equivalent to SAR 29,4 Million as of 31 Dec 2018 (2017: SAR 31,6 million) recognized on assets and liabilities.
Consolidated Income statement
31 December 2018 31 December 2017
Property, plant and equipment 125,600 255,936
Provisions (80,527) )53,758(
Deferred tax expense (benefit) 45,073 202,178
The deferred tax expense from joint operations is equivalent to SAR 4.7 million.Component wise movement of deferred tax is as follows:
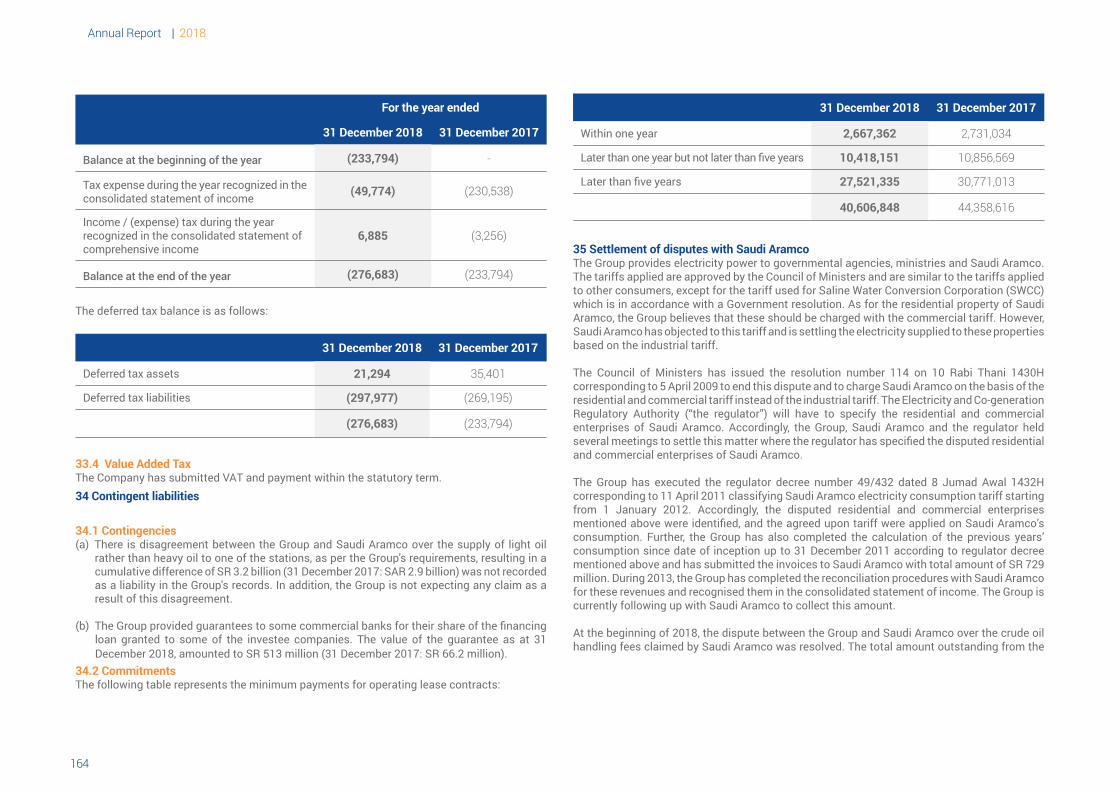
Annual Report | 2018
165164
For the year ended
31 December 2018 31 December 2017
Balance at the beginning of the year (233,794) -
Tax expense during the year recognized in theconsolidated statement of income (49,774) )230,538(
Income / (expense) tax during the year recognized in the consolidated statement ofcomprehensive income
6,885 )3,256(
Balance at the end of the year (276,683) )233,794(
The deferred tax balance is as follows:
31 December 2018 31 December 2017
Deferred tax assets 21,294 35,401
Deferred tax liabilities (297,977) )269,195(
(276,683) )233,794(
33.4 Value Added TaxThe Company has submitted VAT and payment within the statutory term.34 Contingent liabilities
34.1 Contingencies(a) There is disagreement between the Group and Saudi Aramco over the supply of light oil
rather than heavy oil to one of the stations, as per the Group's requirements, resulting in a cumulative difference of SR 3.2 billion (31 December 2017: SAR 2.9 billion) was not recorded as a liability in the Group's records. In addition, the Group is not expecting any claim as a result of this disagreement.
(b) The Group provided guarantees to some commercial banks for their share of the financing
loan granted to some of the investee companies. The value of the guarantee as at 31 December 2018, amounted to SR 513 million (31 December 2017: SR 66.2 million).
34.2 CommitmentsThe following table represents the minimum payments for operating lease contracts:
31 December 2018 31 December 2017
Within one year 2,667,362 2,731,034
Later than one year but not later than five years 10,418,151 10,856,569
Later than five years 27,521,335 30,771,013
40,606,848 44,358,616
35 Settlement of disputes with Saudi AramcoThe Group provides electricity power to governmental agencies, ministries and Saudi Aramco. The tariffs applied are approved by the Council of Ministers and are similar to the tariffs applied to other consumers, except for the tariff used for Saline Water Conversion Corporation (SWCC) which is in accordance with a Government resolution. As for the residential property of Saudi Aramco, the Group believes that these should be charged with the commercial tariff. However, Saudi Aramco has objected to this tariff and is settling the electricity supplied to these properties based on the industrial tariff.
The Council of Ministers has issued the resolution number 114 on 10 Rabi Thani 1430H corresponding to 5 April 2009 to end this dispute and to charge Saudi Aramco on the basis of the residential and commercial tariff instead of the industrial tariff. The Electricity and Co-generation Regulatory Authority (“the regulator”) will have to specify the residential and commercial enterprises of Saudi Aramco. Accordingly, the Group, Saudi Aramco and the regulator held several meetings to settle this matter where the regulator has specified the disputed residential and commercial enterprises of Saudi Aramco.
The Group has executed the regulator decree number 49/432 dated 8 Jumad Awal 1432H corresponding to 11 April 2011 classifying Saudi Aramco electricity consumption tariff starting from 1 January 2012. Accordingly, the disputed residential and commercial enterprises mentioned above were identified, and the agreed upon tariff were applied on Saudi Aramco’s consumption. Further, the Group has also completed the calculation of the previous years’ consumption since date of inception up to 31 December 2011 according to regulator decree mentioned above and has submitted the invoices to Saudi Aramco with total amount of SR 729 million. During 2013, the Group has completed the reconciliation procedures with Saudi Aramco for these revenues and recognised them in the consolidated statement of income. The Group is currently following up with Saudi Aramco to collect this amount.
At the beginning of 2018, the dispute between the Group and Saudi Aramco over the crude oil handling fees claimed by Saudi Aramco was resolved. The total amount outstanding from the
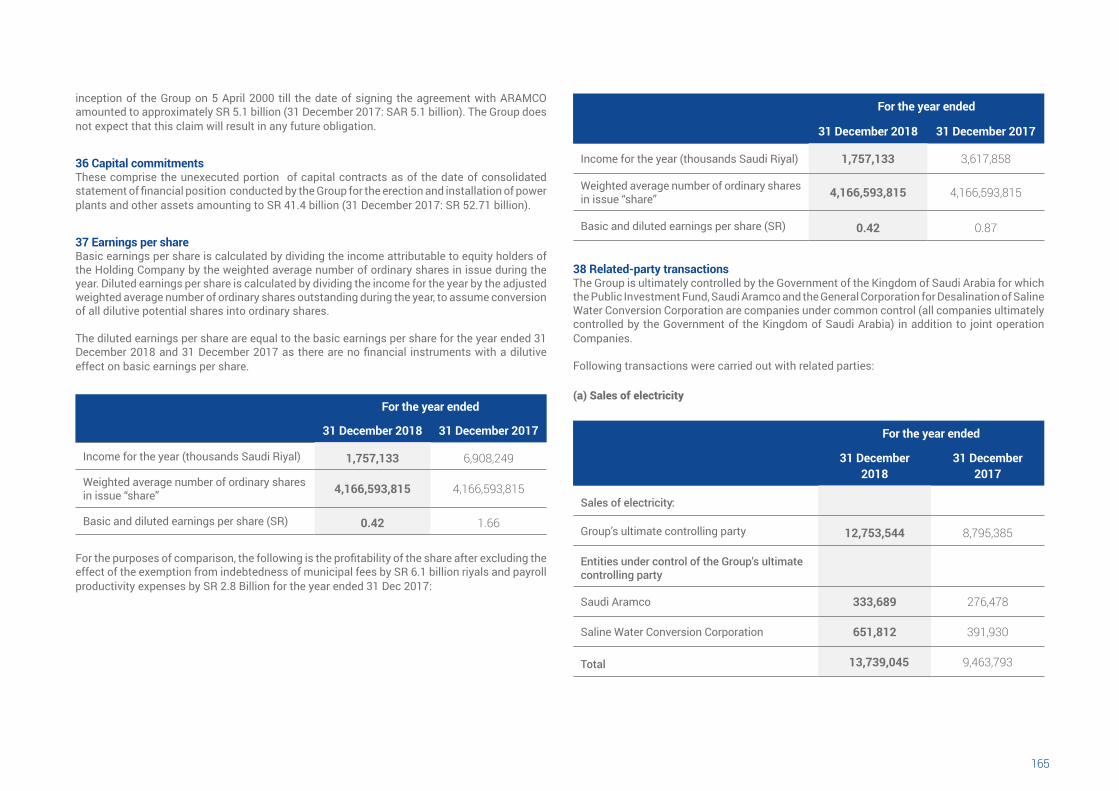
165164
inception of the Group on 5 April 2000 till the date of signing the agreement with ARAMCO amounted to approximately SR 5.1 billion (31 December 2017: SAR 5.1 billion). The Group does not expect that this claim will result in any future obligation.
36 Capital commitmentsThese comprise the unexecuted portion of capital contracts as of the date of consolidated statement of financial position conducted by the Group for the erection and installation of power plants and other assets amounting to SR 41.4 billion (31 December 2017: SR 52.71 billion).
37 Earnings per shareBasic earnings per share is calculated by dividing the income attributable to equity holders of the Holding Company by the weighted average number of ordinary shares in issue during the year. Diluted earnings per share is calculated by dividing the income for the year by the adjusted weighted average number of ordinary shares outstanding during the year, to assume conversion of all dilutive potential shares into ordinary shares.
The diluted earnings per share are equal to the basic earnings per share for the year ended 31 December 2018 and 31 December 2017 as there are no financial instruments with a dilutive effect on basic earnings per share.
For the year ended
31 December 2018 31 December 2017
Income for the year (thousands Saudi Riyal) 1,757,133 6,908,249
Weighted average number of ordinary sharesin issue “share” 4,166,593,815 4,166,593,815
Basic and diluted earnings per share (SR) 0.42 1.66
For the purposes of comparison, the following is the profitability of the share after excluding the effect of the exemption from indebtedness of municipal fees by SR 6.1 billion riyals and payroll productivity expenses by SR 2.8 Billion for the year ended 31 Dec 2017:
For the year ended
31 December 2018 31 December 2017
Income for the year (thousands Saudi Riyal) 1,757,133 3,617,858
Weighted average number of ordinary sharesin issue “share” 4,166,593,815 4,166,593,815
Basic and diluted earnings per share (SR) 0.42 0.87
38 Related-party transactions The Group is ultimately controlled by the Government of the Kingdom of Saudi Arabia for which the Public Investment Fund, Saudi Aramco and the General Corporation for Desalination of Saline Water Conversion Corporation are companies under common control (all companies ultimately controlled by the Government of the Kingdom of Saudi Arabia) in addition to joint operation Companies.
Following transactions were carried out with related parties:
(a) Sales of electricity
For the year ended
31 December 2018
31 December 2017
Sales of electricity:
Group’s ultimate controlling party 12,753,544 8,795,385
Entities under control of the Group’s ultimatecontrolling party
Saudi Aramco 333,689 276,478
Saline Water Conversion Corporation 651,812 391,930
Total 13,739,045 9,463,793
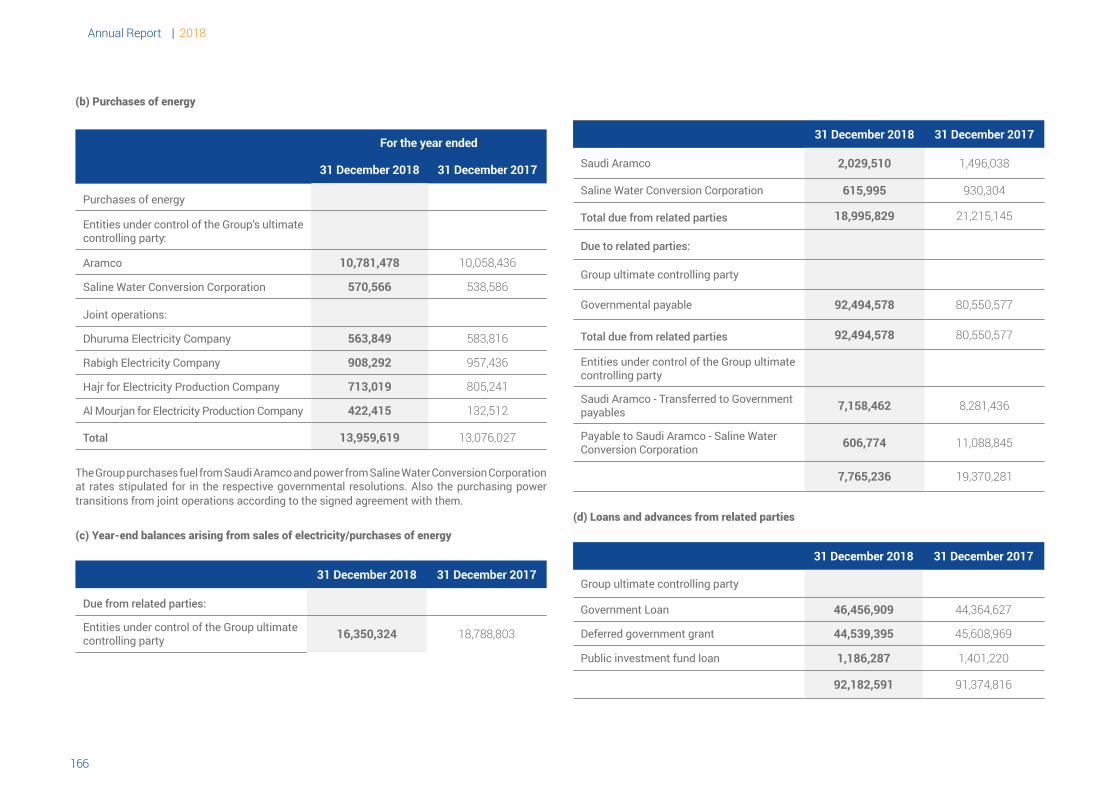
Annual Report | 2018
167166
(b) Purchases of energy
For the year ended
31 December 2018 31 December 2017
Purchases of energy
Entities under control of the Group’s ultimatecontrolling party:
Aramco 10,781,478 10,058,436
Saline Water Conversion Corporation 570,566 538,586
Joint operations:
Dhuruma Electricity Company 563,849 583,816
Rabigh Electricity Company 908,292 957,436
Hajr for Electricity Production Company 713,019 805,241
Al Mourjan for Electricity Production Company 422,415 132,512
Total 13,959,619 13,076,027
The Group purchases fuel from Saudi Aramco and power from Saline Water Conversion Corporation at rates stipulated for in the respective governmental resolutions. Also the purchasing power transitions from joint operations according to the signed agreement with them.
(c) Year-end balances arising from sales of electricity/purchases of energy
31 December 2018 31 December 2017
Due from related parties:
Entities under control of the Group ultimate controlling party 16,350,324 18,788,803
31 December 2018 31 December 2017
Saudi Aramco 2,029,510 1,496,038
Saline Water Conversion Corporation 615,995 930,304
Total due from related parties 18,995,829 21,215,145
Due to related parties:
Group ultimate controlling party
Governmental payable 92,494,578 80,550,577
Total due from related parties 92,494,578 80,550,577
Entities under control of the Group ultimate controlling party
Saudi Aramco - Transferred to Government payables 7,158,462 8,281,436
Payable to Saudi Aramco - Saline Water Conversion Corporation 606,774 11,088,845
7,765,236 19,370,281
(d) Loans and advances from related parties
31 December 2018 31 December 2017
Group ultimate controlling party
Government Loan 46,456,909 44,364,627
Deferred government grant 44,539,395 45,608,969
Public investment fund loan 1,186,287 1,401,220
92,182,591 91,374,816
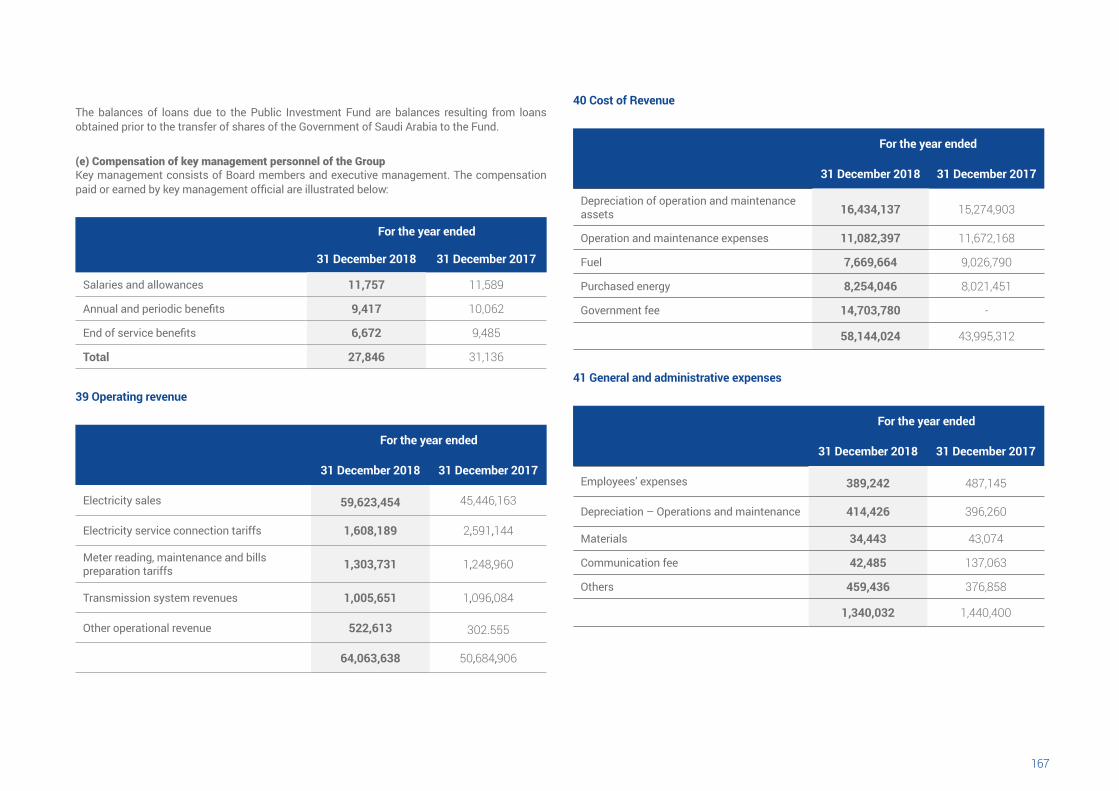
167166
The balances of loans due to the Public Investment Fund are balances resulting from loans obtained prior to the transfer of shares of the Government of Saudi Arabia to the Fund.
(e) Compensation of key management personnel of the GroupKey management consists of Board members and executive management. The compensation paid or earned by key management official are illustrated below:
For the year ended
31 December 201731 December 2018
11,58911,757Salaries and allowances
10,0629,417Annual and periodic benefits
9,4856,672End of service benefits
31,13627,846Total
39 Operating revenue
For the year ended
31 December 2018 31 December 2017
Electricity sales 59,623,454 45,446,163
Electricity service connection tariffs 1,608,189 2,591,144
Meter reading, maintenance and bills preparation tariffs 1,303,731 1,248,960
Transmission system revenues 1,005,651 1,096,084
Other operational revenue 522,613 302.555
64,063,638 50,684,906
40 Cost of Revenue
For the year ended
31 December 2018 31 December 2017
Depreciation of operation and maintenance assets 16,434,137 15,274,903
Operation and maintenance expenses 11,082,397 11,672,168
Fuel 7,669,664 9,026,790
Purchased energy 8,254,046 8,021,451
Government fee 14,703,780 -
58,144,024 43,995,312
41 General and administrative expenses
For the year ended
31 December 2018 31 December 2017
Employees’ expenses 389,242 487,145
Depreciation – Operations and maintenance 414,426 396,260
Materials 34,443 43,074
Communication fee 42,485 137,063
Others 459,436 376,858
1,340,032 1,440,400
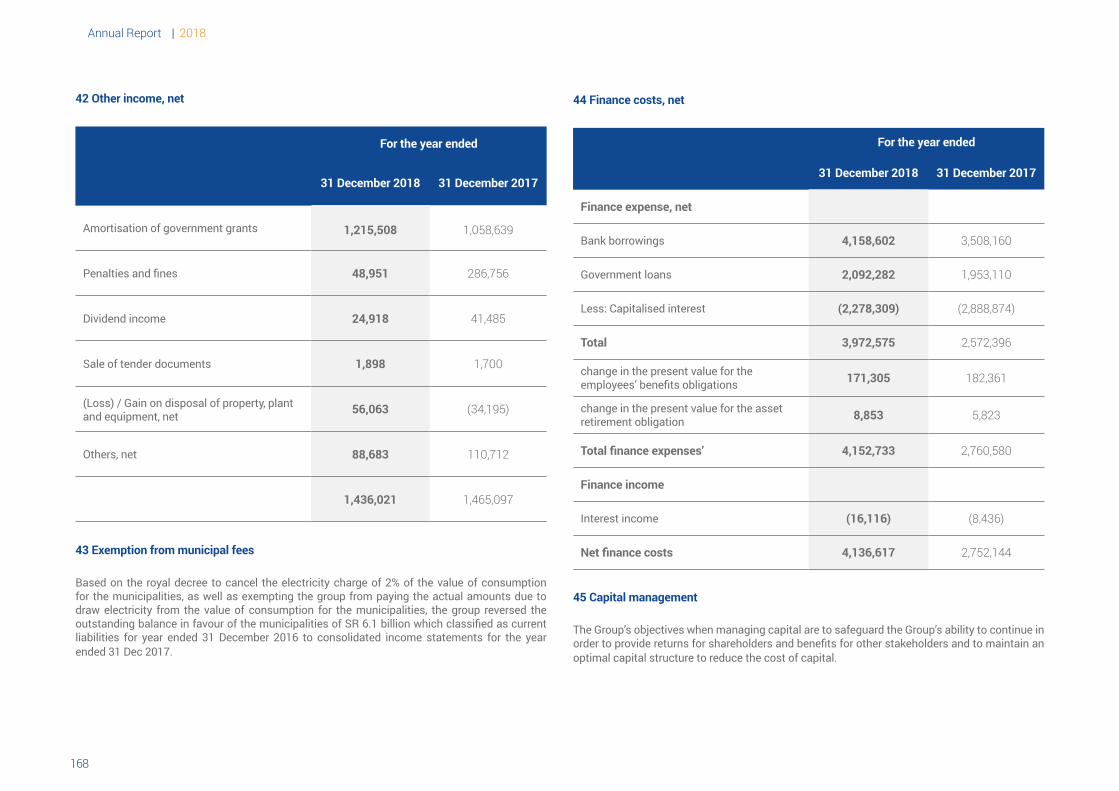
Annual Report | 2018
169168
42 Other income, net
For the year ended
31 December 2018 31 December 2017
Amortisation of government grants 1,215,508 1,058,639
Penalties and fines 48,951 286,756
Dividend income 24,918 41,485
Sale of tender documents 1,898 1,700
(Loss) / Gain on disposal of property, plantand equipment, net 56,063 )34,195(
Others, net 88,683 110,712
1,436,021 1,465,097
43 Exemption from municipal fees
Based on the royal decree to cancel the electricity charge of 2% of the value of consumption for the municipalities, as well as exempting the group from paying the actual amounts due to draw electricity from the value of consumption for the municipalities, the group reversed the outstanding balance in favour of the municipalities of SR 6.1 billion which classified as current liabilities for year ended 31 December 2016 to consolidated income statements for the year ended 31 Dec 2017.
44 Finance costs, net
For the year ended
31 December 201731 December 2018
Finance expense, net
3,508,1604,158,602Bank borrowings
1,953,1102,092,282Government loans
)2,888,874((2,278,309)Less: Capitalised interest
2,572,3963,972,575Total
182,361171,305 change in the present value for theemployees’ benefits obligations
5,8238,853 change in the present value for the assetretirement obligation
2,760,5804,152,733Total finance expenses’
Finance income
)8,436((16,116)Interest income
2,752,1444,136,617Net finance costs
45 Capital management
The Group’s objectives when managing capital are to safeguard the Group’s ability to continue in order to provide returns for shareholders and benefits for other stakeholders and to maintain an optimal capital structure to reduce the cost of capital.
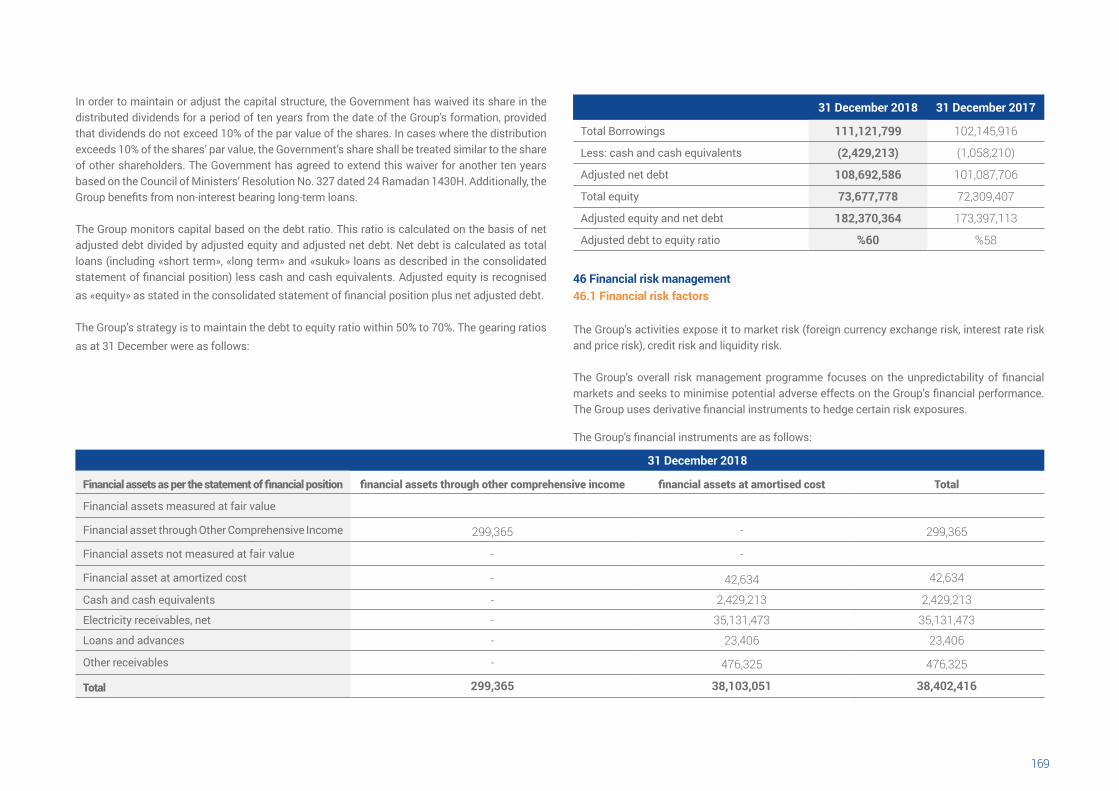
169168
In order to maintain or adjust the capital structure, the Government has waived its share in the distributed dividends for a period of ten years from the date of the Group’s formation, provided that dividends do not exceed 10% of the par value of the shares. In cases where the distribution exceeds 10% of the shares’ par value, the Government’s share shall be treated similar to the share of other shareholders. The Government has agreed to extend this waiver for another ten years based on the Council of Ministers’ Resolution No. 327 dated 24 Ramadan 1430H. Additionally, the Group benefits from non-interest bearing long-term loans.
The Group monitors capital based on the debt ratio. This ratio is calculated on the basis of net adjusted debt divided by adjusted equity and adjusted net debt. Net debt is calculated as total loans (including «short term», «long term» and «sukuk» loans as described in the consolidated statement of financial position) less cash and cash equivalents. Adjusted equity is recognised as «equity» as stated in the consolidated statement of financial position plus net adjusted debt.
The Group’s strategy is to maintain the debt to equity ratio within 50% to 70%. The gearing ratios as at 31 December were as follows:
31 December 201731 December 2018
102,145,916111,121,799Total Borrowings
)1,058,210((2,429,213) Less: cash and cash equivalents
101,087,706108,692,586 Adjusted net debt
72,309,40773,677,778 Total equity
173,397,113182,370,364Adjusted equity and net debt
%58%60Adjusted debt to equity ratio
46 Financial risk management46.1 Financial risk factors
The Group’s activities expose it to market risk (foreign currency exchange risk, interest rate risk and price risk), credit risk and liquidity risk.
The Group’s overall risk management programme focuses on the unpredictability of financial markets and seeks to minimise potential adverse effects on the Group’s financial performance. The Group uses derivative financial instruments to hedge certain risk exposures.
The Group's financial instruments are as follows:
31 December 2018
Financial assets as per the statement of financial position financial assets through other comprehensive income financial assets at amortised cost Total
Financial assets measured at fair value
Financial asset through Other Comprehensive Income 299,365 - 299,365
Financial assets not measured at fair value - -
Financial asset at amortized cost - 42,634 42,634
Cash and cash equivalents - 2,429,213 2,429,213
Electricity receivables, net - 35,131,473 35,131,473
Loans and advances - 23,406 23,406
Other receivables - 476,325 476,325
Total 299,365 38,103,051 38,402,416
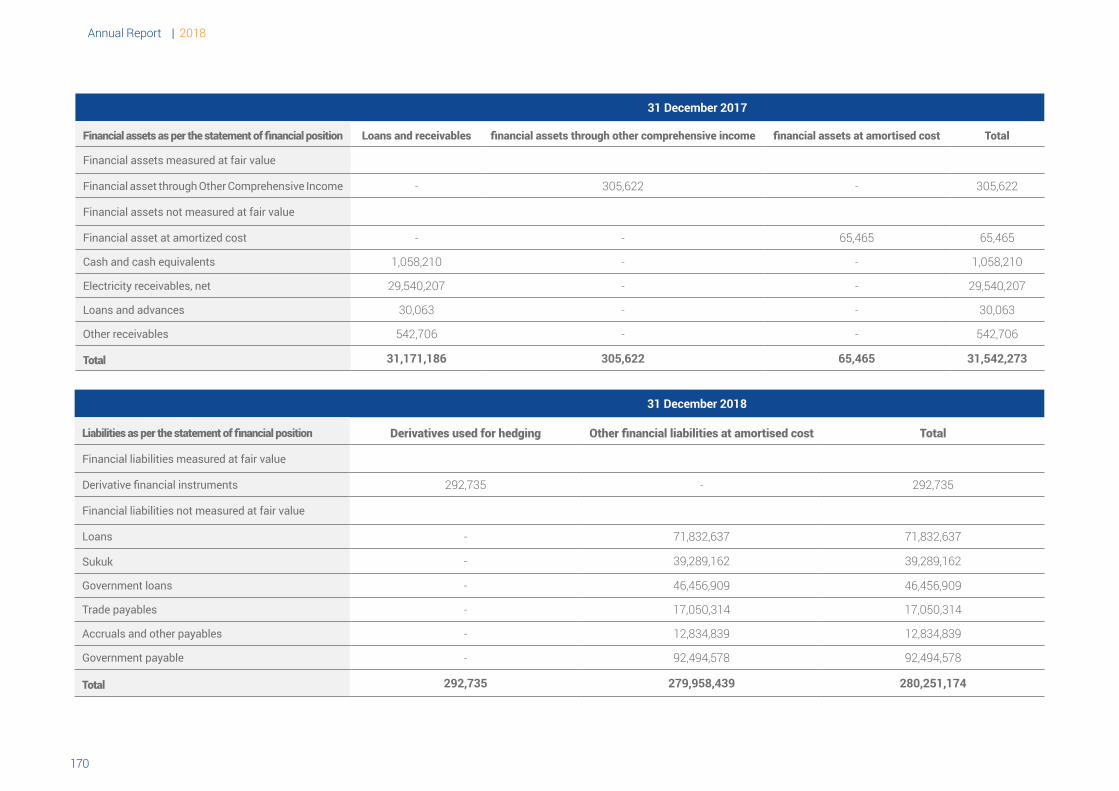
Annual Report | 2018
171170
31 December 2017
Financial assets as per the statement of financial position Loans and receivables financial assets through other comprehensive income financial assets at amortised cost Total
Financial assets measured at fair value
Financial asset through Other Comprehensive Income - 305,622 - 305,622
Financial assets not measured at fair value
Financial asset at amortized cost - - 65,465 65,465
Cash and cash equivalents 1,058,210 - - 1,058,210
Electricity receivables, net 29,540,207 - - 29,540,207
Loans and advances 30,063 - - 30,063
Other receivables 542,706 - - 542,706
Total 31,171,186 305,622 65,465 31,542,273
31 December 2018
Liabilities as per the statement of financial position Derivatives used for hedging Other financial liabilities at amortised cost Total
Financial liabilities measured at fair value
Derivative financial instruments 292,735 - 292,735
Financial liabilities not measured at fair value
Loans - 71,832,637 71,832,637
Sukuk - 39,289,162 39,289,162
Government loans - 46,456,909 46,456,909
Trade payables - 17,050,314 17,050,314
Accruals and other payables - 12,834,839 12,834,839
Government payable - 92,494,578 92,494,578
Total 292,735 279,958,439 280,251,174
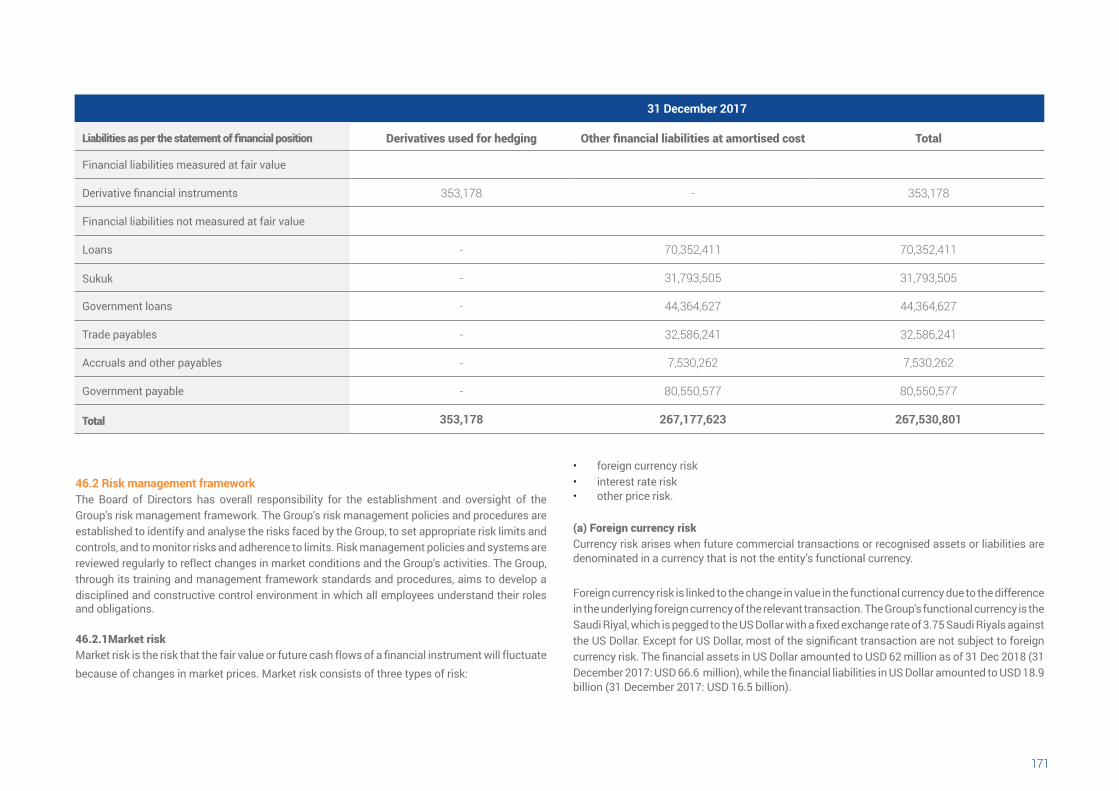
171170
31 December 2017
Liabilities as per the statement of financial position Derivatives used for hedging Other financial liabilities at amortised cost Total
Financial liabilities measured at fair value
Derivative financial instruments 353,178 - 353,178
Financial liabilities not measured at fair value
Loans - 70,352,411 70,352,411
Sukuk - 31,793,505 31,793,505
Government loans - 44,364,627 44,364,627
Trade payables - 32,586,241 32,586,241
Accruals and other payables - 7,530,262 7,530,262
Government payable - 80,550,577 80,550,577
Total 353,178 267,177,623 267,530,801
46.2 Risk management frameworkThe Board of Directors has overall responsibility for the establishment and oversight of the Group’s risk management framework. The Group’s risk management policies and procedures are established to identify and analyse the risks faced by the Group, to set appropriate risk limits and controls, and to monitor risks and adherence to limits. Risk management policies and systems are reviewed regularly to reflect changes in market conditions and the Group’s activities. The Group, through its training and management framework standards and procedures, aims to develop a disciplined and constructive control environment in which all employees understand their roles and obligations.
46.2.1Market riskMarket risk is the risk that the fair value or future cash flows of a financial instrument will fluctuate because of changes in market prices. Market risk consists of three types of risk:
• foreign currency risk• interest rate risk• other price risk.
(a) Foreign currency risk Currency risk arises when future commercial transactions or recognised assets or liabilities are denominated in a currency that is not the entity’s functional currency.
Foreign currency risk is linked to the change in value in the functional currency due to the difference in the underlying foreign currency of the relevant transaction. The Group's functional currency is the Saudi Riyal, which is pegged to the US Dollar with a fixed exchange rate of 3.75 Saudi Riyals against the US Dollar. Except for US Dollar, most of the significant transaction are not subject to foreign currency risk. The financial assets in US Dollar amounted to USD 62 million as of 31 Dec 2018 (31 December 2017: USD 66.6 million), while the financial liabilities in US Dollar amounted to USD 18.9 billion (31 December 2017: USD 16.5 billion).
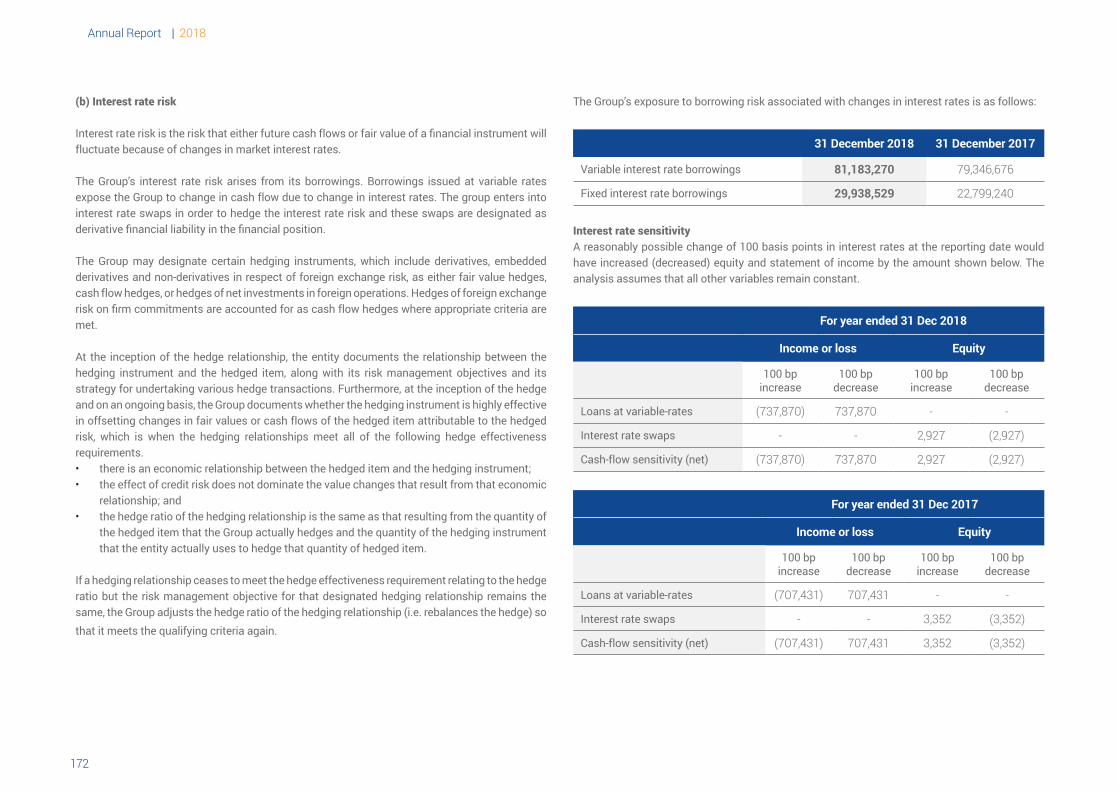
Annual Report | 2018
173172
(b) Interest rate risk
Interest rate risk is the risk that either future cash flows or fair value of a financial instrument will fluctuate because of changes in market interest rates.
The Group’s interest rate risk arises from its borrowings. Borrowings issued at variable rates expose the Group to change in cash flow due to change in interest rates. The group enters into interest rate swaps in order to hedge the interest rate risk and these swaps are designated as derivative financial liability in the financial position.
The Group may designate certain hedging instruments, which include derivatives, embedded derivatives and non-derivatives in respect of foreign exchange risk, as either fair value hedges, cash flow hedges, or hedges of net investments in foreign operations. Hedges of foreign exchange risk on firm commitments are accounted for as cash flow hedges where appropriate criteria are met.
At the inception of the hedge relationship, the entity documents the relationship between the hedging instrument and the hedged item, along with its risk management objectives and its strategy for undertaking various hedge transactions. Furthermore, at the inception of the hedge and on an ongoing basis, the Group documents whether the hedging instrument is highly effective in offsetting changes in fair values or cash flows of the hedged item attributable to the hedged risk, which is when the hedging relationships meet all of the following hedge effectiveness requirements.• there is an economic relationship between the hedged item and the hedging instrument;• the effect of credit risk does not dominate the value changes that result from that economic
relationship; and• the hedge ratio of the hedging relationship is the same as that resulting from the quantity of
the hedged item that the Group actually hedges and the quantity of the hedging instrument that the entity actually uses to hedge that quantity of hedged item.
If a hedging relationship ceases to meet the hedge effectiveness requirement relating to the hedge ratio but the risk management objective for that designated hedging relationship remains the same, the Group adjusts the hedge ratio of the hedging relationship (i.e. rebalances the hedge) so that it meets the qualifying criteria again.
The Group’s exposure to borrowing risk associated with changes in interest rates is as follows:
31 December 2018 31 December 2017
Variable interest rate borrowings 81,183,270 79,346,676
Fixed interest rate borrowings 29,938,529 22,799,240
Interest rate sensitivity A reasonably possible change of 100 basis points in interest rates at the reporting date would have increased (decreased) equity and statement of income by the amount shown below. The analysis assumes that all other variables remain constant.
For year ended 31 Dec 2018
Income or loss Equity
100 bp increase
100 bp decrease
100 bp increase
100 bp decrease
Loans at variable-rates )737,870( 737,870 - -
Interest rate swaps - - 2,927 )2,927(
Cash-flow sensitivity (net) )737,870( 737,870 2,927 )2,927(
For year ended 31 Dec 2017
Income or loss Equity
100 bp increase
100 bp decrease
100 bp increase
100 bp decrease
Loans at variable-rates )707,431( 707,431 - -
Interest rate swaps - - 3,352 )3,352(
Cash-flow sensitivity (net) )707,431( 707,431 3,352 )3,352(
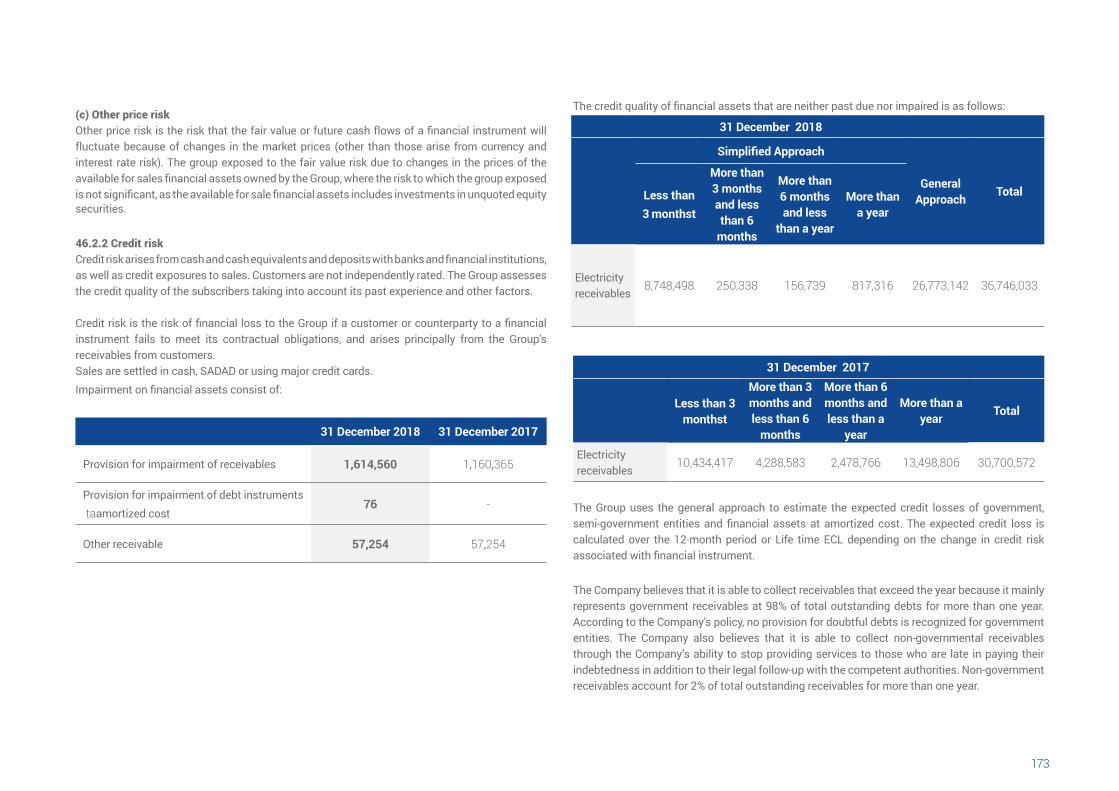
173172
(c) Other price riskOther price risk is the risk that the fair value or future cash flows of a financial instrument will fluctuate because of changes in the market prices (other than those arise from currency and interest rate risk). The group exposed to the fair value risk due to changes in the prices of the available for sales financial assets owned by the Group, where the risk to which the group exposed is not significant, as the available for sale financial assets includes investments in unquoted equity securities.
46.2.2 Credit riskCredit risk arises from cash and cash equivalents and deposits with banks and financial institutions, as well as credit exposures to sales. Customers are not independently rated. The Group assesses the credit quality of the subscribers taking into account its past experience and other factors.
Credit risk is the risk of financial loss to the Group if a customer or counterparty to a financial instrument fails to meet its contractual obligations, and arises principally from the Group’s receivables from customers.Sales are settled in cash, SADAD or using major credit cards. Impairment on financial assets consist of:
31 December 201731 December 2018
1,160,3651,614,560Provision for impairment of receivables
-76Provision for impairment of debt instruments taamortized cost
57,25457,254Other receivable
The credit quality of financial assets that are neither past due nor impaired is as follows:
31 December 2018
Simplified Approach
General Approach
TotalLess than 3 monthst
More than 3 months and less than 6
months
More than 6 months and less
than a year
More than a year
Electricity receivables
8,748,498 250,338 156,739 817,316 26,773,142 36,746,033
31 December 2017
Less than 3 monthst
More than 3 months and less than 6
months
More than 6 months and less than a
year
More than a year
Total
Electricity receivables
10,434,417 4,288,583 2,478,766 13,498,806 30,700,572
The Group uses the general approach to estimate the expected credit losses of government, semi-government entities and financial assets at amortized cost. The expected credit loss is calculated over the 12-month period or Life time ECL depending on the change in credit risk associated with financial instrument.
The Company believes that it is able to collect receivables that exceed the year because it mainly represents government receivables at 98% of total outstanding debts for more than one year. According to the Company's policy, no provision for doubtful debts is recognized for government entities. The Company also believes that it is able to collect non-governmental receivables through the Company’s ability to stop providing services to those who are late in paying their indebtedness in addition to their legal follow-up with the competent authorities. Non-government receivables account for 2% of total outstanding receivables for more than one year.
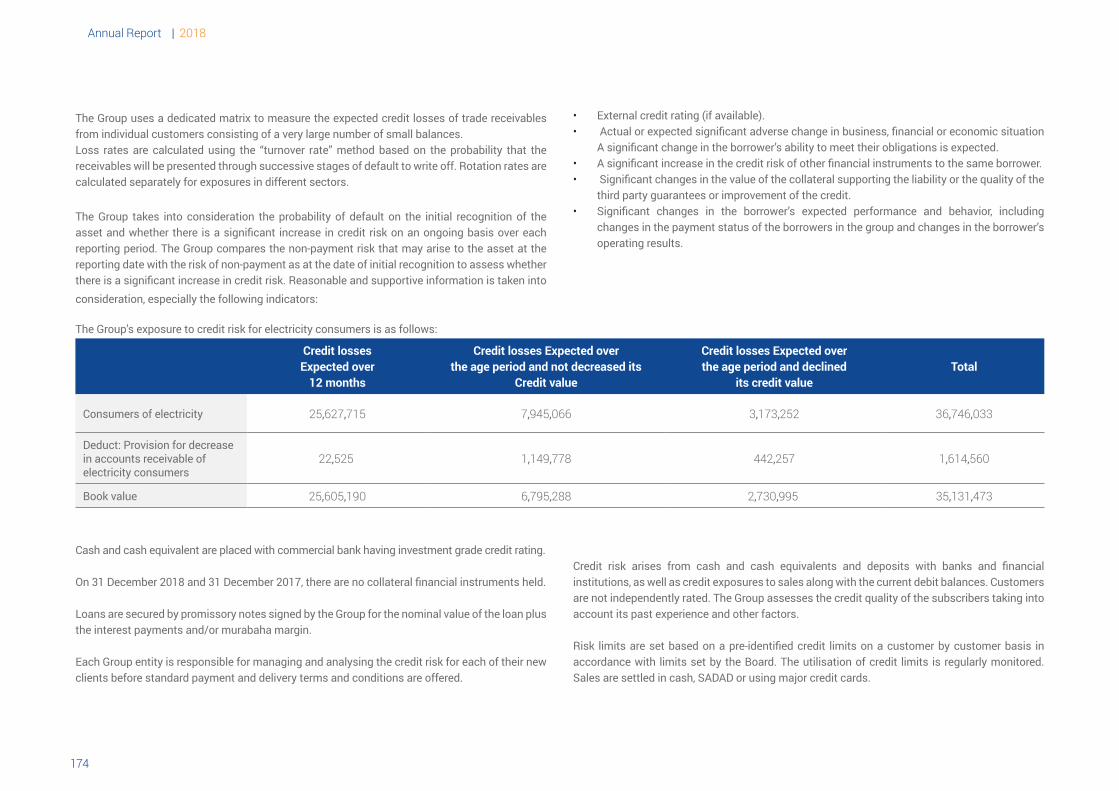
Annual Report | 2018
175174
The Group uses a dedicated matrix to measure the expected credit losses of trade receivables from individual customers consisting of a very large number of small balances.Loss rates are calculated using the “turnover rate” method based on the probability that the receivables will be presented through successive stages of default to write off. Rotation rates are calculated separately for exposures in different sectors.
The Group takes into consideration the probability of default on the initial recognition of the asset and whether there is a significant increase in credit risk on an ongoing basis over each reporting period. The Group compares the non-payment risk that may arise to the asset at the reporting date with the risk of non-payment as at the date of initial recognition to assess whether there is a significant increase in credit risk. Reasonable and supportive information is taken into consideration, especially the following indicators:
• External credit rating (if available).• Actual or expected significant adverse change in business, financial or economic situation
A significant change in the borrower’s ability to meet their obligations is expected.• A significant increase in the credit risk of other financial instruments to the same borrower.• Significant changes in the value of the collateral supporting the liability or the quality of the
third party guarantees or improvement of the credit.• Significant changes in the borrower’s expected performance and behavior, including
changes in the payment status of the borrowers in the group and changes in the borrower’s operating results.
The Group’s exposure to credit risk for electricity consumers is as follows:
Credit lossesExpected over
12 months
Credit losses Expected overthe age period and not decreased its
Credit value
Credit losses Expected overthe age period and declined
its credit value Total
Consumers of electricity 25,627,715 7,945,066 3,173,252 36,746,033
Deduct: Provision for decrease in accounts receivable of electricity consumers
22,525 1,149,778 442,257 1,614,560
Book value 25,605,190 6,795,288 2,730,995 35,131,473
Cash and cash equivalent are placed with commercial bank having investment grade credit rating.
On 31 December 2018 and 31 December 2017, there are no collateral financial instruments held.
Loans are secured by promissory notes signed by the Group for the nominal value of the loan plus the interest payments and/or murabaha margin.
Each Group entity is responsible for managing and analysing the credit risk for each of their new clients before standard payment and delivery terms and conditions are offered.
Credit risk arises from cash and cash equivalents and deposits with banks and financial institutions, as well as credit exposures to sales along with the current debit balances. Customers are not independently rated. The Group assesses the credit quality of the subscribers taking into account its past experience and other factors.
Risk limits are set based on a pre-identified credit limits on a customer by customer basis in accordance with limits set by the Board. The utilisation of credit limits is regularly monitored. Sales are settled in cash, SADAD or using major credit cards.
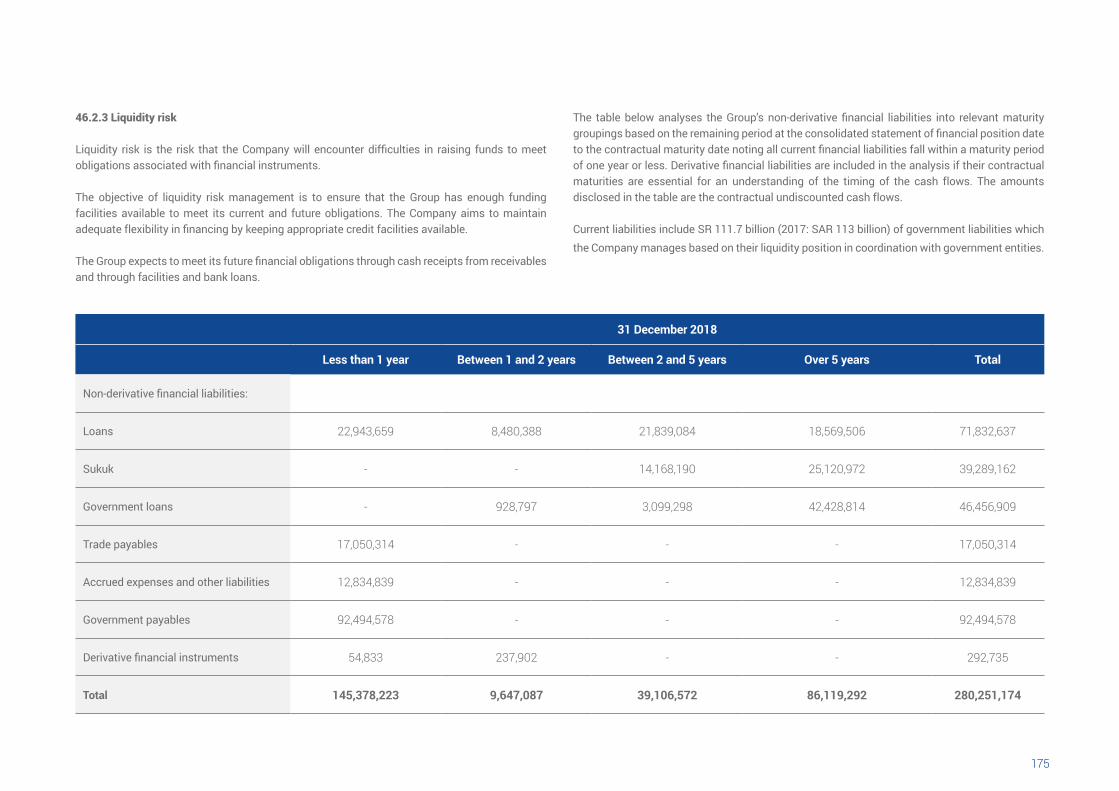
175174
46.2.3 Liquidity risk
Liquidity risk is the risk that the Company will encounter difficulties in raising funds to meet obligations associated with financial instruments.
The objective of liquidity risk management is to ensure that the Group has enough funding facilities available to meet its current and future obligations. The Company aims to maintain adequate flexibility in financing by keeping appropriate credit facilities available.
The Group expects to meet its future financial obligations through cash receipts from receivables and through facilities and bank loans.
The table below analyses the Group’s non-derivative financial liabilities into relevant maturity groupings based on the remaining period at the consolidated statement of financial position date to the contractual maturity date noting all current financial liabilities fall within a maturity period of one year or less. Derivative financial liabilities are included in the analysis if their contractual maturities are essential for an understanding of the timing of the cash flows. The amounts disclosed in the table are the contractual undiscounted cash flows.
Current liabilities include SR 111.7 billion (2017: SAR 113 billion) of government liabilities which the Company manages based on their liquidity position in coordination with government entities.
31 December 2018
Less than 1 year Between 1 and 2 years Between 2 and 5 years Over 5 years Total
Non-derivative financial liabilities:
Loans 22,943,659 8,480,388 21,839,084 18,569,506 71,832,637
Sukuk - - 14,168,190 25,120,972 39,289,162
Government loans - 928,797 3,099,298 42,428,814 46,456,909
Trade payables 17,050,314 - - - 17,050,314
Accrued expenses and other liabilities 12,834,839 - - - 12,834,839
Government payables 92,494,578 - - - 92,494,578
Derivative financial instruments 54,833 237,902 - - 292,735
Total 145,378,223 9,647,087 39,106,572 86,119,292 280,251,174
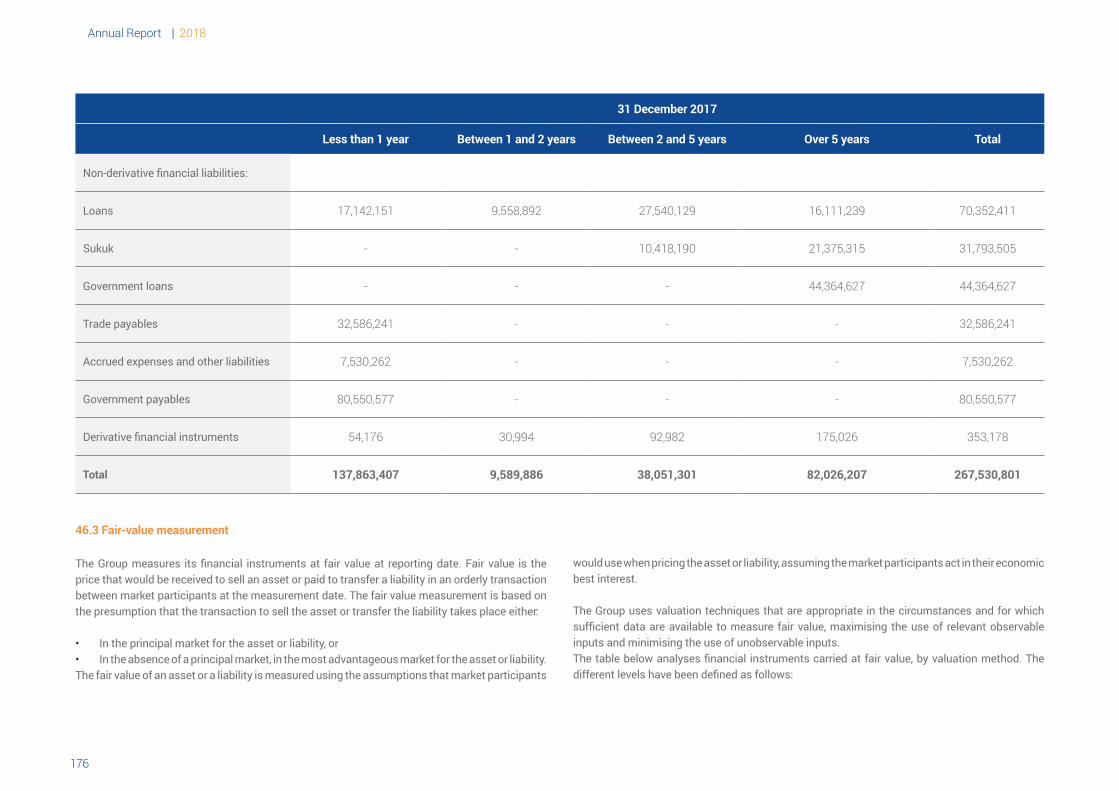
Annual Report | 2018
177176
31 December 2017
Less than 1 year Between 1 and 2 years Between 2 and 5 years Over 5 years Total
Non-derivative financial liabilities:
Loans 17,142,151 9,558,892 27,540,129 16,111,239 70,352,411
Sukuk - - 10,418,190 21,375,315 31,793,505
Government loans - - - 44,364,627 44,364,627
Trade payables 32,586,241 - - - 32,586,241
Accrued expenses and other liabilities 7,530,262 - - - 7,530,262
Government payables 80,550,577 - - - 80,550,577
Derivative financial instruments 54,176 30,994 92,982 175,026 353,178
Total 137,863,407 9,589,886 38,051,301 82,026,207 267,530,801
46.3 Fair-value measurement
The Group measures its financial instruments at fair value at reporting date. Fair value is the price that would be received to sell an asset or paid to transfer a liability in an orderly transaction between market participants at the measurement date. The fair value measurement is based on the presumption that the transaction to sell the asset or transfer the liability takes place either:
• In the principal market for the asset or liability, or• In the absence of a principal market, in the most advantageous market for the asset or liability.The fair value of an asset or a liability is measured using the assumptions that market participants
would use when pricing the asset or liability, assuming the market participants act in their economic best interest.
The Group uses valuation techniques that are appropriate in the circumstances and for which sufficient data are available to measure fair value, maximising the use of relevant observable inputs and minimising the use of unobservable inputs.The table below analyses financial instruments carried at fair value, by valuation method. The different levels have been defined as follows:
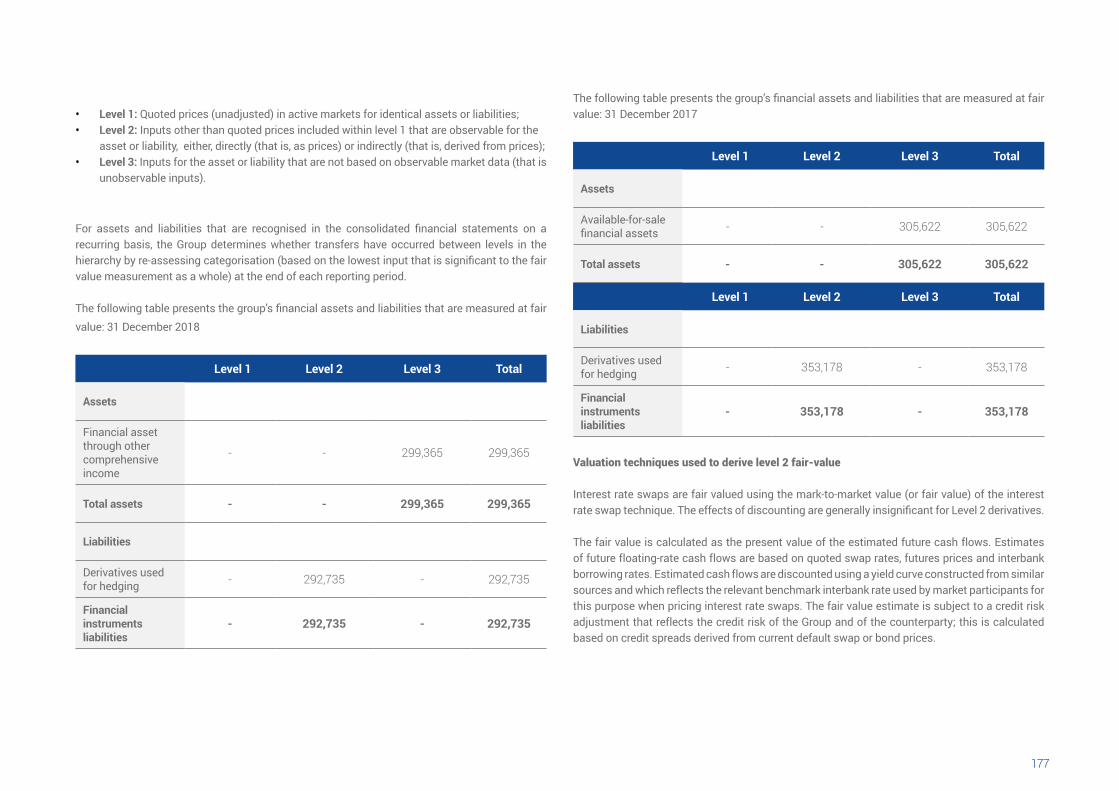
177176
• Level 1: Quoted prices (unadjusted) in active markets for identical assets or liabilities;• Level 2: Inputs other than quoted prices included within level 1 that are observable for the
asset or liability, either, directly (that is, as prices) or indirectly (that is, derived from prices);• Level 3: Inputs for the asset or liability that are not based on observable market data (that is
unobservable inputs).
For assets and liabilities that are recognised in the consolidated financial statements on a recurring basis, the Group determines whether transfers have occurred between levels in the hierarchy by re-assessing categorisation (based on the lowest input that is significant to the fair value measurement as a whole) at the end of each reporting period.
The following table presents the group’s financial assets and liabilities that are measured at fair value: 31 December 2018
TotalLevel 3 Level 2 Level 1
Assets
299,365299,365--
Financial asset through other comprehensive income
299,365299,365--Total assets
Liabilities
292,735-292,735-Derivatives used for hedging
292,735-292,735-Financial instruments liabilities
The following table presents the group’s financial assets and liabilities that are measured at fair value: 31 December 2017
TotalLevel 3 Level 2 Level 1
Assets
305,622305,622--Available-for-sale financial assets
305,622305,622--Total assets
TotalLevel 3 Level 2 Level 1
Liabilities
353,178-353,178-Derivatives used for hedging
353,178-353,178-Financial instruments liabilities
Valuation techniques used to derive level 2 fair-value
Interest rate swaps are fair valued using the mark-to-market value (or fair value) of the interest rate swap technique. The effects of discounting are generally insignificant for Level 2 derivatives.
The fair value is calculated as the present value of the estimated future cash flows. Estimates of future floating-rate cash flows are based on quoted swap rates, futures prices and interbank borrowing rates. Estimated cash flows are discounted using a yield curve constructed from similar sources and which reflects the relevant benchmark interbank rate used by market participants for this purpose when pricing interest rate swaps. The fair value estimate is subject to a credit risk adjustment that reflects the credit risk of the Group and of the counterparty; this is calculated based on credit spreads derived from current default swap or bond prices.
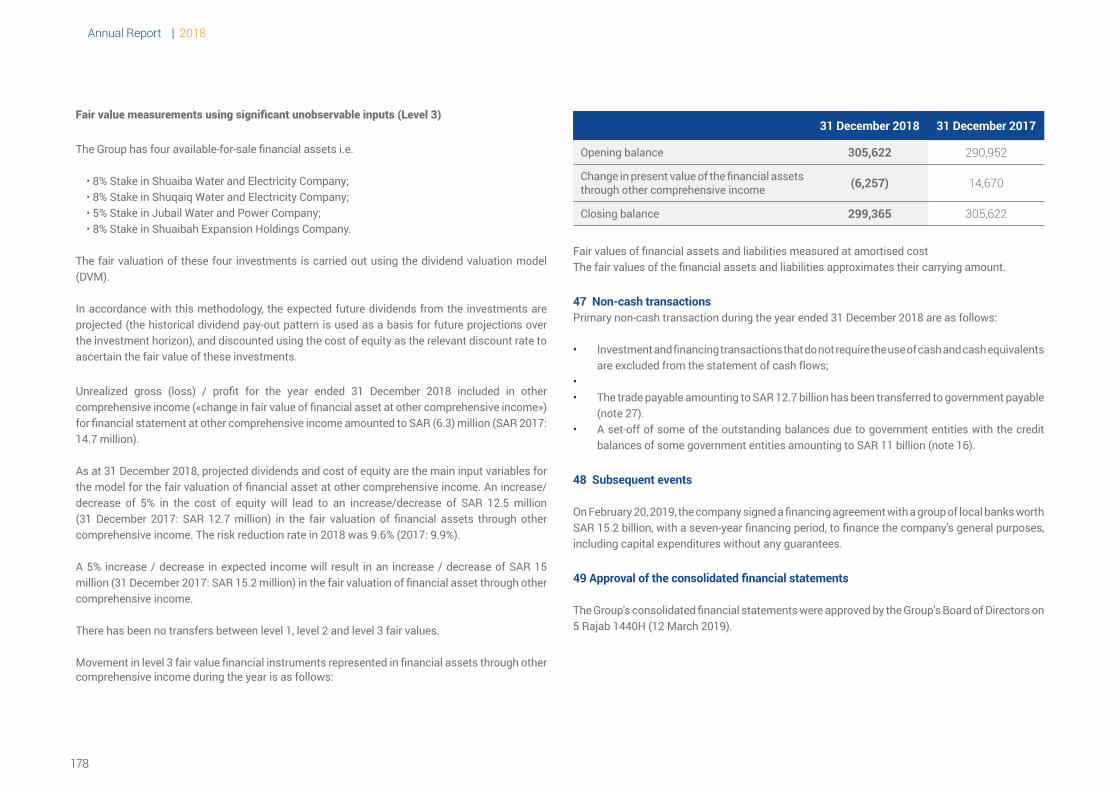
Annual Report | 2018
178
Fair value measurements using significant unobservable inputs (Level 3)
The Group has four available-for-sale financial assets i.e.
• 8% Stake in Shuaiba Water and Electricity Company; • 8% Stake in Shuqaiq Water and Electricity Company; • 5% Stake in Jubail Water and Power Company; • 8% Stake in Shuaibah Expansion Holdings Company.
The fair valuation of these four investments is carried out using the dividend valuation model (DVM).
In accordance with this methodology, the expected future dividends from the investments are projected (the historical dividend pay-out pattern is used as a basis for future projections over the investment horizon), and discounted using the cost of equity as the relevant discount rate to ascertain the fair value of these investments.
Unrealized gross (loss) / profit for the year ended 31 December 2018 included in other comprehensive income («change in fair value of financial asset at other comprehensive income») for financial statement at other comprehensive income amounted to SAR (6.3) million (SAR 2017: 14.7 million).
As at 31 December 2018, projected dividends and cost of equity are the main input variables for the model for the fair valuation of financial asset at other comprehensive income. An increase/decrease of 5% in the cost of equity will lead to an increase/decrease of SAR 12.5 million (31 December 2017: SAR 12.7 million) in the fair valuation of financial assets through other comprehensive income. The risk reduction rate in 2018 was 9.6% (2017: 9.9%).
A 5% increase / decrease in expected income will result in an increase / decrease of SAR 15 million (31 December 2017: SAR 15.2 million) in the fair valuation of financial asset through other comprehensive income.
There has been no transfers between level 1, level 2 and level 3 fair values.
Movement in level 3 fair value financial instruments represented in financial assets through other comprehensive income during the year is as follows:
31 December 201731 December 2018
290,952305,622Opening balance
14,670(6,257)Change in present value of the financial assets through other comprehensive income
305,622299,365Closing balance
Fair values of financial assets and liabilities measured at amortised costThe fair values of the financial assets and liabilities approximates their carrying amount. 47 Non-cash transactionsPrimary non-cash transaction during the year ended 31 December 2018 are as follows:
• Investment and financing transactions that do not require the use of cash and cash equivalents are excluded from the statement of cash flows;
• • The trade payable amounting to SAR 12.7 billion has been transferred to government payable
(note 27).• A set-off of some of the outstanding balances due to government entities with the credit
balances of some government entities amounting to SAR 11 billion (note 16).
48 Subsequent events
On February 20, 2019, the company signed a financing agreement with a group of local banks worth SAR 15.2 billion, with a seven-year financing period, to finance the company's general purposes, including capital expenditures without any guarantees.
49 Approval of the consolidated financial statements
The Group's consolidated financial statements were approved by the Group’s Board of Directors on 5 Rajab 1440H (12 March 2019).

Annual Report | 2018


![Annual Report 2015 - BCHSFINAL] BCH ANNUAL REPORT...Annual Report Working Together ... (Dip A ccou nting, Grad D ip H ealth Administr ation, ... de velo ped in respon se t o 201 3](https://img.pdfslide.us/doc/110x75/5ae6a9a07f8b9aee078d377d/annual-report-2015-final-bch-annual-reportannual-report-working-together-.jpg)