Embed Size (px)
Citation preview
Schaffer C
orporation Limited
2019 AN
NU
AL R
EP
OR
T
19ANNUAL REPORT
06 1108
Corporate TimetableFinal 2019 dividend record date 6 September 2019
Final 2019 dividend payment date 20 September 2019
Despatch of 2019 Annual Report and notice of AGM 9 October 2019
Annual General Meeting 13 November 2019
2020 half-year earnings release and dividend announcement February 2020
Interim 2020 dividend payment date March 2020
69SCHAFFER CORPORATION LIMITED 2019 ANNUAL REPORT
SHAREHOLDER INFORMATION
Annual General MeetingSchaffer Corporation will hold its Annual General Meeting on Wednesday 13 November 2019 at 11:30am at Pagoda Resort and Spa, 112 Melville Parade, Como, Western Australia.
Direct Credit of DividendsSchaffer Corporation provides shareholders with the option to have dividends paid electronically to a nominated bank, building society or credit union account. Payments are credited electronically on the dividend date and confirmed by a payment advice by mail.
The Company encourages shareholders not already using this facility to contact Computershare Investor Services Pty Limited, who can arrange for an instruction advice to be sent to shareholders for completion.
Change of addresses/provide or update banking detailsShareholders who have changed their address or banking particulars should advise our share registry of their new details:
Computershare Investor Services Pty Limited GPO Box D182 Perth WA 6840 AustraliaTelephone: 1300 557 010 (in Australia)
or +61 8 9323 2000Facsimile: +61 8 9323 2033Website: www.computershare.com/au
Corporate DirectorySchaffer Corporation Limited ABN 73 008 675 689
ASX Code: SFC
Head Office and Registered Office1305 Hay Street West Perth WA 6005 AustraliaTelephone: +61 8 9483 1222Facsimile: +61 8 9481 0439Website: www.schaffer.com.au
Board of DirectorsExecutive DirectorsJM Schaffer AM BCom(Hons), FCPA (Chairman and Managing Director) AK Mayer (Executive Chairman – Howe Automotive Limited)
Non-executive DirectorsDE Blain AM, BA MD Perrott AM, BCom, FAIM FAICD DJ Schwartz
Chief Financial OfficerRalph Leib BComm, BAcc
Group Financial Controller and Company SecretaryJ Cantwell B Bus(Acc), CPA, MBA, GIA(Cert)
Share RegistryComputershare Investor Services Pty Limited GPO Box D182 Perth WA 6840 AustraliaTelephone: 1300 557 010 (in Australia)
or +61 8 9323 2000Facsimile: +61 8 9323 2033 Website: www.computershare.com/au
AuditorsErnst & Young 11 Mounts Bay Road Perth WA 6000 Australia Telephone: +61 8 9429 2222 Facsimile: +61 8 9429 2436
SolicitorsAshurst Level 32 Exchange Plaza 2 The Esplanade Perth WA 6000 AustraliaTelephone: +61 8 9366 8000 Facsimile: +61 8 9366 8111
About Schaffer Corporation 1Managing Director’s Report 2
Review of Operations:
Financial Statements 13Independent Auditor's Report 49Directors’ Report 54Statement of Corporate Governance Practices 62ASX Additional Information 67Shareholder Information 69
Building Materials InvestmentsAutomotive Leather
SCHAFFER CORPORATION LIMITED 2019 ANNUAL REPORT 1
ABOUT SCHAFFER CORPORATION
A DIVERSIFIED AUSTRALIAN INDUSTRIAL COMPANY
ANTON MAYER DANIELLE BLAIN AM DAVID SCHWARTZ MICHAEL PERROTT AM
Schaffer Corporation Limited (SFC) is a diversified industrial company with three core operating divisions in Automotive Leather, Building Materials, and Investments. Originally incorporated in 1955, the company was first listed on the Australian Securities Exchange (ASX) in 1963 and currently employs over 1,000 employees in three countries.
The Automotive Leather division is a world-class, globally competitive automotive leather producer, supplying quality interior leather products to such household names as Land Rover, Audi, Mercedes, Nissan and Ford. The division operates leather processing and finishing operations in Slovakia and Australia. Component cutting plants are located in Slovakia and China. Exports account for virtually all sales.
The Building Materials division currently comprises the 100% owned subsidiary, Delta Corporation, which manufactures a range of precast and prestressed concrete floor, beam and wall products, together with custom made precast panel and beam products, including TeeRoff beams, for major infrastructure, building and resource projects in Australia.
The Group’s Investments division currently has various property and equity investment interests both directly through Schaffer Corporation and via a subsidiary investment company, Gosh Capital.
Group property interests include land held for future development in the Western Australian suburbs of Jandakot and North Coogee, a bulky goods property at Rockingham, Western Australia, and various syndicated interests in commercial, industrial, hotel and retail properties across Australia and the United States.
Schaffer Corporation’s key internal performance measure is Return on Average Capital Employed (ROACE*), which reflects the earnings achieved in relation to the debt and equity capital invested in its businesses. The Company applies the ROACE measure in pursuing its long-term growth strategy to organically develop its core businesses and to acquire businesses, properties or make other investments.
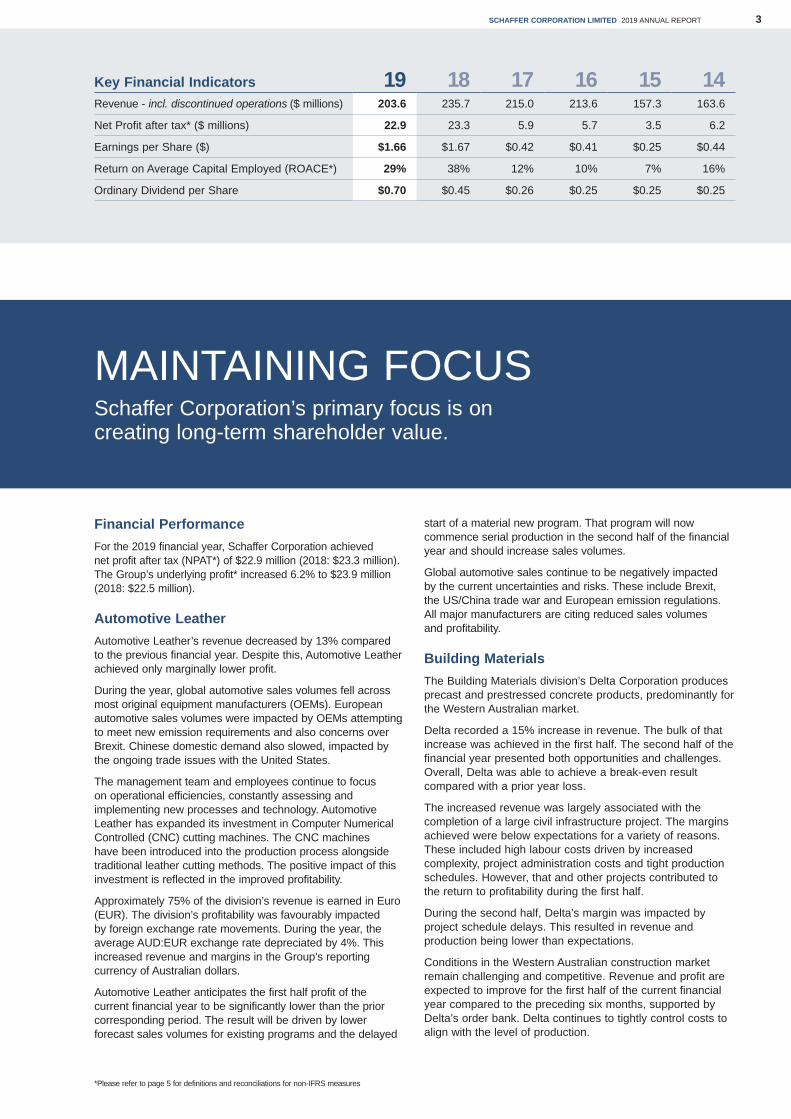
Schaffer Corporation has a proud history of paying a dividend in every one of the past 56 years since it was originally listed as Calsil Ltd in 1963. For the past 19 years, the company has paid approximately $138 million in fully franked dividends to shareholders.
Board of directors
JOHN SCHAFFER AM
*Please refer to page 5 for definitions and reconciliations for non-IFRS measures
SFC 5 YR FINANCIAL PERFORMANCE(including discontinued operations)
RE
VE
NU
E $
M’S
240
220
200
180
160
140
120
1002015 2016 2017 2018 2019
STATUTORY NPAT REVENUE
25
NPAT $M
’S
20
15
10
5
0
3.55.7 5.9
23.322.9
SHAREHOLDER DIVIDENDS$0.90
$0.80
$0.70
$0.60
$0.50
$0.40
$0.30
$0.20
$0.10
$-FY11 FY12 FY13 FY14 FY15 FY16 FY17 FY18 FY19
INTERIM DIVIDEND PER SHARE FINAL DIVIDEND PER SHARE
SCHAFFER CORPORATION LIMITED 2019 ANNUAL REPORT2
MANAGING DIRECTOR’S REPORT
John Schaffer AM Anton Mayer Matt Perrella Ralph LeibBCom(Hons), FCPAAge 68
Age 77 NPCAAAge 70
BComm, BAccAge 48
Mr Schaffer joined the Group in 1972 and has held the positions of Managing Director since 1987 and Chairman since 1988.
Mr Mayer joined the Group in 1998. In 2001, Mr Mayer joined the Board of Schaffer Corporation Limited and he is currently Executive Chairman of Howe Automotive Limited.
Mr Perrella joined the Group in 1980. From 1989 until 2009, Mr Perrella was General Manager of Delta Corporation Limited. He is currently Executive Director of Delta Corporation.
Mr Leib joined the Group in 2016 and was promoted to Chief Financial Officer in July 2017.
Jason Cantwell Dan Birks Jason WalshBBus(Acc), CPA, MBA, GIA(Cert)Age 47
BAgrSc, MBAAge 53
B Bus, MBAAge 49
Mr Cantwell joined the Group in 2011 as Group Financial Controller and Company Secretary.
Mr Birks joined the Group in 2000 and was promoted to General Manager of Howe Automotive Limited in 2016.
Mr Walsh joined the Group in 1999 and was promoted to the position of General Manager of Delta Corporation Limited in 2009.
EXECUTIVE MANAGEMENT TEAM
SCHAFFER CORPORATION LIMITED 2019 ANNUAL REPORT 3
MAINTAINING FOCUSSchaffer Corporation’s primary focus is on creating long-term shareholder value.
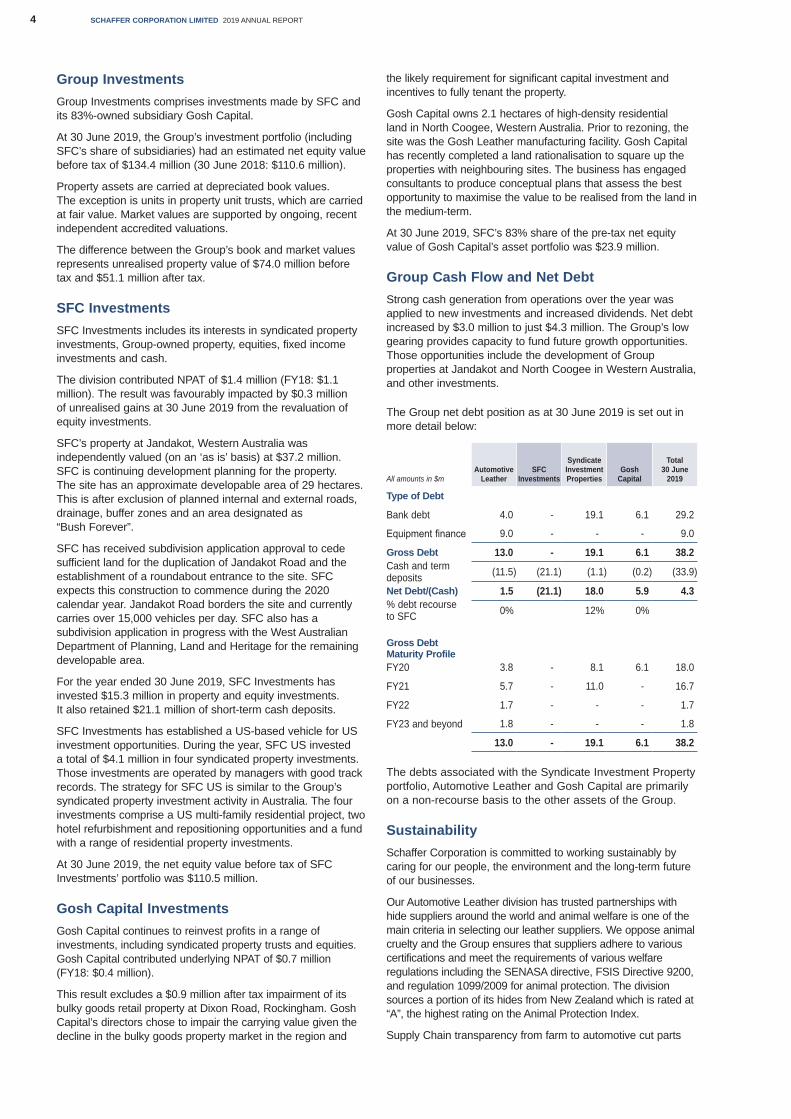
Financial PerformanceFor the 2019 financial year, Schaffer Corporation achieved net profit after tax (NPAT*) of $22.9 million (2018: $23.3 million). The Group’s underlying profit* increased 6.2% to $23.9 million (2018: $22.5 million).
Automotive LeatherAutomotive Leather’s revenue decreased by 13% compared to the previous financial year. Despite this, Automotive Leather achieved only marginally lower profit.
During the year, global automotive sales volumes fell across most original equipment manufacturers (OEMs). European automotive sales volumes were impacted by OEMs attempting to meet new emission requirements and also concerns over Brexit. Chinese domestic demand also slowed, impacted by the ongoing trade issues with the United States.
The management team and employees continue to focus on operational efficiencies, constantly assessing and implementing new processes and technology. Automotive Leather has expanded its investment in Computer Numerical Controlled (CNC) cutting machines. The CNC machines have been introduced into the production process alongside traditional leather cutting methods. The positive impact of this investment is reflected in the improved profitability.
Approximately 75% of the division’s revenue is earned in Euro (EUR). The division’s profitability was favourably impacted by foreign exchange rate movements. During the year, the average AUD:EUR exchange rate depreciated by 4%. This increased revenue and margins in the Group’s reporting currency of Australian dollars.
Automotive Leather anticipates the first half profit of the current financial year to be significantly lower than the prior corresponding period. The result will be driven by lower forecast sales volumes for existing programs and the delayed
start of a material new program. That program will now commence serial production in the second half of the financial year and should increase sales volumes.
Global automotive sales continue to be negatively impacted by the current uncertainties and risks. These include Brexit, the US/China trade war and European emission regulations. All major manufacturers are citing reduced sales volumes and profitability.
Building Materials The Building Materials division’s Delta Corporation produces precast and prestressed concrete products, predominantly for the Western Australian market.
Delta recorded a 15% increase in revenue. The bulk of that increase was achieved in the first half. The second half of the financial year presented both opportunities and challenges. Overall, Delta was able to achieve a break-even result compared with a prior year loss.
The increased revenue was largely associated with the completion of a large civil infrastructure project. The margins achieved were below expectations for a variety of reasons. These included high labour costs driven by increased complexity, project administration costs and tight production schedules. However, that and other projects contributed to the return to profitability during the first half.
During the second half, Delta’s margin was impacted by project schedule delays. This resulted in revenue and production being lower than expectations.
Conditions in the Western Australian construction market remain challenging and competitive. Revenue and profit are expected to improve for the first half of the current financial year compared to the preceding six months, supported by Delta’s order bank. Delta continues to tightly control costs to align with the level of production.
*Please refer to page 5 for definitions and reconciliations for non-IFRS measures
Key Financial Indicators 19 18 17 16 15 14Revenue - incl. discontinued operations ($ millions) 203.6 235.7 215.0 213.6 157.3 163.6
Net Profit after tax* ($ millions) 22.9 23.3 5.9 5.7 3.5 6.2
Earnings per Share ($) $1.66 $1.67 $0.42 $0.41 $0.25 $0.44
Return on Average Capital Employed (ROACE*) 29% 38% 12% 10% 7% 16%
Ordinary Dividend per Share $0.70 $0.45 $0.26 $0.25 $0.25 $0.25
SCHAFFER CORPORATION LIMITED 2019 ANNUAL REPORT4
Group InvestmentsGroup Investments comprises investments made by SFC and its 83%-owned subsidiary Gosh Capital.
At 30 June 2019, the Group’s investment portfolio (including SFC’s share of subsidiaries) had an estimated net equity value before tax of $134.4 million (30 June 2018: $110.6 million).
Property assets are carried at depreciated book values. The exception is units in property unit trusts, which are carried at fair value. Market values are supported by ongoing, recent independent accredited valuations.
The difference between the Group’s book and market values represents unrealised property value of $74.0 million before tax and $51.1 million after tax.
SFC InvestmentsSFC Investments includes its interests in syndicated property investments, Group-owned property, equities, fixed income investments and cash.
The division contributed NPAT of $1.4 million (FY18: $1.1 million). The result was favourably impacted by $0.3 million of unrealised gains at 30 June 2019 from the revaluation of equity investments.
SFC’s property at Jandakot, Western Australia was independently valued (on an ‘as is’ basis) at $37.2 million. SFC is continuing development planning for the property. The site has an approximate developable area of 29 hectares. This is after exclusion of planned internal and external roads, drainage, buffer zones and an area designated as “Bush Forever”.
SFC has received subdivision application approval to cede sufficient land for the duplication of Jandakot Road and the establishment of a roundabout entrance to the site. SFC expects this construction to commence during the 2020 calendar year. Jandakot Road borders the site and currently carries over 15,000 vehicles per day. SFC also has a subdivision application in progress with the West Australian Department of Planning, Land and Heritage for the remaining developable area.
For the year ended 30 June 2019, SFC Investments has invested $15.3 million in property and equity investments. It also retained $21.1 million of short-term cash deposits.
SFC Investments has established a US-based vehicle for US investment opportunities. During the year, SFC US invested a total of $4.1 million in four syndicated property investments. Those investments are operated by managers with good track records. The strategy for SFC US is similar to the Group’s syndicated property investment activity in Australia. The four investments comprise a US multi-family residential project, two hotel refurbishment and repositioning opportunities and a fund with a range of residential property investments.
At 30 June 2019, the net equity value before tax of SFC Investments’ portfolio was $110.5 million.
Gosh Capital InvestmentsGosh Capital continues to reinvest profits in a range of investments, including syndicated property trusts and equities. Gosh Capital contributed underlying NPAT of $0.7 million (FY18: $0.4 million).
This result excludes a $0.9 million after tax impairment of its bulky goods retail property at Dixon Road, Rockingham. Gosh Capital’s directors chose to impair the carrying value given the decline in the bulky goods property market in the region and
the likely requirement for significant capital investment and incentives to fully tenant the property.
Gosh Capital owns 2.1 hectares of high-density residential land in North Coogee, Western Australia. Prior to rezoning, the site was the Gosh Leather manufacturing facility. Gosh Capital has recently completed a land rationalisation to square up the properties with neighbouring sites. The business has engaged consultants to produce conceptual plans that assess the best opportunity to maximise the value to be realised from the land in the medium-term.
At 30 June 2019, SFC’s 83% share of the pre-tax net equity value of Gosh Capital’s asset portfolio was $23.9 million.
Group Cash Flow and Net DebtStrong cash generation from operations over the year was applied to new investments and increased dividends. Net debt increased by $3.0 million to just $4.3 million. The Group’s low gearing provides capacity to fund future growth opportunities. Those opportunities include the development of Group properties at Jandakot and North Coogee in Western Australia, and other investments.
The Group net debt position as at 30 June 2019 is set out in more detail below:
All amounts in $mAutomotive
LeatherSFC
Investments
Syndicate Investment Properties
Gosh Capital
Total30 June
2019
Type of Debt
Bank debt 4.0 - 19.1 6.1 29.2
Equipment finance 9.0 - - - 9.0
Gross Debt 13.0 - 19.1 6.1 38.2Cash and term deposits (11.5) (21.1) (1.1) (0.2) (33.9)
Net Debt/(Cash) 1.5 (21.1) 18.0 5.9 4.3% debt recourse to SFC 0% 12% 0%
Gross Debt Maturity ProfileFY20 3.8 - 8.1 6.1 18.0
FY21 5.7 - 11.0 - 16.7
FY22 1.7 - - - 1.7
FY23 and beyond 1.8 - - - 1.8
13.0 - 19.1 6.1 38.2
The debts associated with the Syndicate Investment Property portfolio, Automotive Leather and Gosh Capital are primarily on a non-recourse basis to the other assets of the Group.
SustainabilitySchaffer Corporation is committed to working sustainably by caring for our people, the environment and the long-term future of our businesses.
Our Automotive Leather division has trusted partnerships with hide suppliers around the world and animal welfare is one of the main criteria in selecting our leather suppliers. We oppose animal cruelty and the Group ensures that suppliers adhere to various certifications and meet the requirements of various welfare regulations including the SENASA directive, FSIS Directive 9200, and regulation 1099/2009 for animal protection. The division sources a portion of its hides from New Zealand which is rated at “A”, the highest rating on the Animal Protection Index.
Supply Chain transparency from farm to automotive cut parts
SCHAFFER CORPORATION LIMITED 2019 ANNUAL REPORT 5
is important for maintaining brand reputation but also for avoidance of animal welfare issues, forced or child labour issues, and to demonstrate a best practice supply chain to our customers. Our Automotive Leather division has established 100% traceability from each batch of hides to cut parts.
Automotive Leather has also conducted comprehensive Life Cycle Assessment (LCA) on our products to assess the potential for environmental impacts associated with the production of our cut leather throughout the entire production life cycle. This has allowed the identification of factors that lower carbon footprint. This includes factors influenced by the supplier such as breeding, feeding and raising the animals, our own leather finishing methods including energy consumption and waste treatment, and transport factors such as fuel consumption and packaging. Environmental considerations play an integral role in the way we source our materials, manufacture our products, and deliver to customers.
Schaffer Corporation is also committed to providing all our employees with a safe and healthy working environment. SFC continues to review and improve occupational health and safety management to further improve outcomes. Our Group Lost Time Injury Frequency Rate (LTIFR) has decreased by 25% over the past year and workers compensation days have decreased by 6%.
DividendsSchaffer Corporation’s long-standing policy is to pay dividends to its shareholders. On an ongoing basis, the directors manage the proportion of earnings paid out as dividends. The Board has regard to capital expenditure requirements, acquisition activity, liquidity needs and the availability of franking credits. We also reflect on prevailing economic conditions and uncertainty in setting dividends.
For the 2019 financial year, Schaffer Corporation has declared fully franked dividends totalling $0.70 per share, which is $0.25 per share (56%) more than the prior year. Schaffer Corporation intends to increase the 2020 financial year interim dividend to $0.40 per share supported by strong cash flows, balance sheet and financial position.
As always, I look forward to seeing as many shareholders as possible at Schaffer Corporation’s Annual General Meeting. This year’s meeting will be held on Wednesday, 13 November 2019, at which time I will provide a further update on the outlook for the 2020 financial year.
JOHN SCHAFFER AMManaging Director
Non-IFRS Measures* Schaffer Corporation results are reported under Australian Accounting Standards and
International Financial Reporting Standards (IFRS) as issued by the International Accounting Standards Board. The Company discloses certain non-IFRS financial measures. The non-IFRS measures should only be considered in addition to, and not as a substitute for, other measures of financial performance prepared in accordance with IFRS.
The following are non-IFRS measures that are important to management as additional means to evaluate the Group’s performance:
1. Return on Average Capital Employed (ROACE) is calculated as EBIT divided by the average of total assets (excluding cash and cash equivalents, term deposits, and deferred income tax assets) less trade and other payables, and provisions over the period.
2. Net Profit After Tax (NPAT) is profit/(loss) for the period attributable to owners of the parent.3. Extraordinary costs are defined as those costs that resulted from unusual or once-off
events that are unlikely to occur again in the normal course of business.Extraordinary costs (unaudited) are as follows:
Extraordinary costs ($000's)All items after tax and minority interest Full-Year Ending
June 2019 June 2018Redundancies and Facility Shutdown Costs - Automotive Leather 179 473
Redundancies - Building Materials 69 -
Total extraordinary costs after tax and minority interests 248 473
Underlying profit (unaudited) is reconciled as follows:
Underlying Profit Reconciliation ($000's)All items after tax and minority interest Full-Year Ending
June 2019 June 2018
NPAT 22,899 23,292
Profit on sale of Building Products division - (4,393)
Impairment of assets 711 3,150
Extraordinary costs 248 473
Underlying Profit 23,858 22,522
The directors believe that the presentation of non-IFRS financial information is useful for investors as the measures are utilised by the Group for rewarding performance and they reflect the underlying performance of the businesses.Non-IFRS financial information has been extracted from the audited financial statements.

SCHAFFER CORPORATION LIMITED 2019 ANNUAL REPORT6
AUTOMOTIVE LEATHER
SCHAFFER CORPORATION LIMITED 2019 ANNUAL REPORT 7
Schaffer Corporation owns 83% of the Automotive Leather division, which produces high-quality leather for the global automotive industry and focuses on supplying premium OEM customers such as Jaguar Land Rover, Audi and Mercedes.
Production facilities are located globally to separately service both the European and Asian markets; for Europe, the leather finishing and cutting are located together in Kosice, Slovakia; for Asia, the leather finishing is located at the head office site in Thomastown, Victoria and the cutting in Shanghai, China.
The division’s global footprint provides a local presence in the key European and Asian automotive markets. This allows the division to be close to its key customers and provides the opportunity to remain competitive and responsive in a highly demanding global environment.
Revenue decreased by 13% compared to the previous year as a result of a general softening of the automotive industry related to tougher emission requirements in Europe, reduced sales in China and ongoing Brexit uncertainty.
During the 2019 financial year, the division had an ongoing focus on implementing new technologies in all aspects of its business that have contributed toward improved operating efficiencies.
Products sold in foreign currencies are translated back to Australian Dollars for financial reporting purposes. Fluctuations in the Euro, US Dollar and Chinese Renminbi against the Australian Dollar can have a significant impact on the financial performance of the Automotive Leather division, and accordingly management utilises hedges to manage these risks.
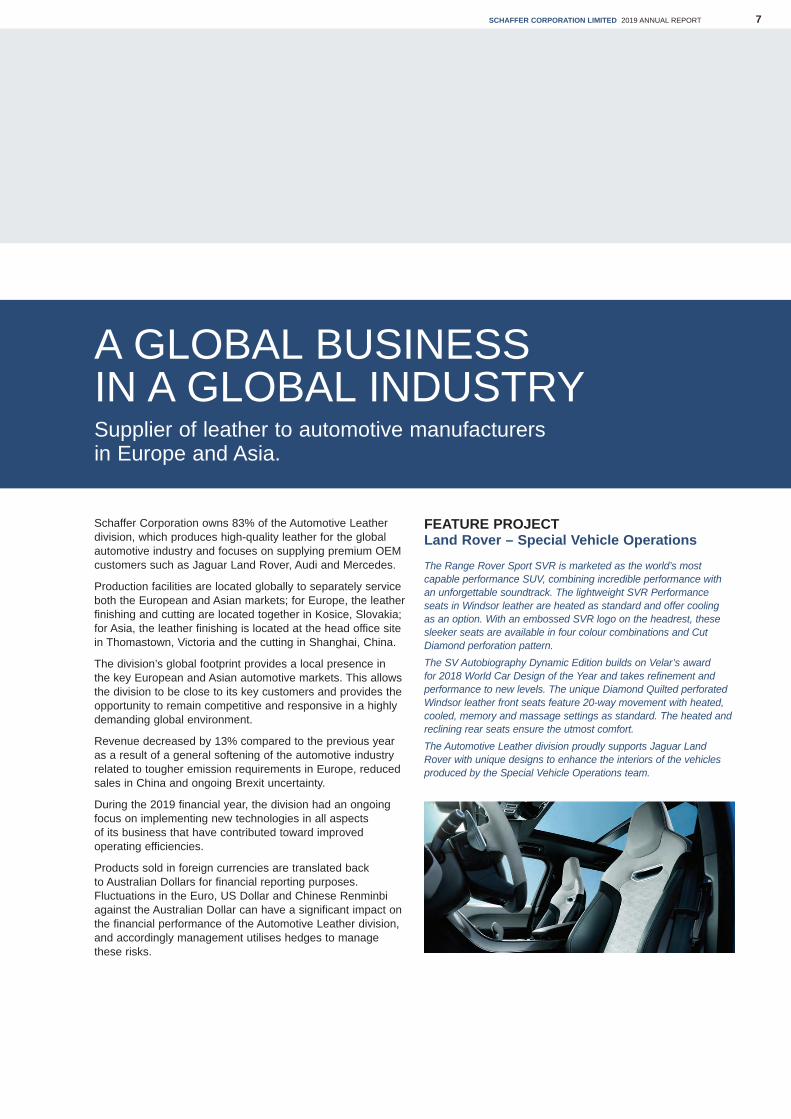
FEATURE PROJECTLand Rover – Special Vehicle Operations
The Range Rover Sport SVR is marketed as the world’s most capable performance SUV, combining incredible performance with an unforgettable soundtrack. The lightweight SVR Performance seats in Windsor leather are heated as standard and offer cooling as an option. With an embossed SVR logo on the headrest, these sleeker seats are available in four colour combinations and Cut Diamond perforation pattern.The SV Autobiography Dynamic Edition builds on Velar’s award for 2018 World Car Design of the Year and takes refinement and performance to new levels. The unique Diamond Quilted perforated Windsor leather front seats feature 20-way movement with heated, cooled, memory and massage settings as standard. The heated and reclining rear seats ensure the utmost comfort.The Automotive Leather division proudly supports Jaguar Land Rover with unique designs to enhance the interiors of the vehicles produced by the Special Vehicle Operations team.
A GLOBAL BUSINESS IN A GLOBAL INDUSTRYSupplier of leather to automotive manufacturers in Europe and Asia.
SCHAFFER CORPORATION LIMITED 2019 ANNUAL REPORT8
BUILDING MATERIALS
PROFITABLE NICHE FOCUSDelta deliver niche products and design solutions for the construction, resource and landscaping markets.
SCHAFFER CORPORATION LIMITED 2019 ANNUAL REPORT 9
Delta Corporationwww.deltacorp.com.au
Over the past 20 years, Delta has made a significant contribution to the construction industry delivering critical public infrastructure and commercial projects key to the development of Western Australia.
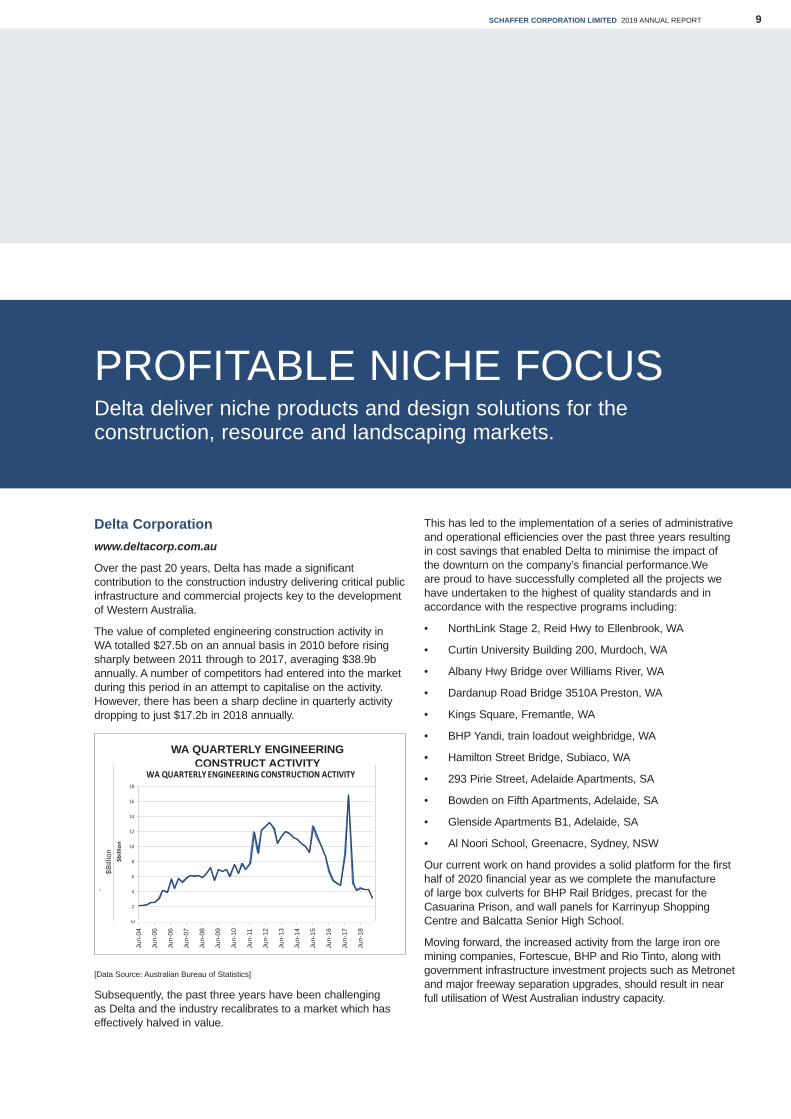
The value of completed engineering construction activity in WA totalled $27.5b on an annual basis in 2010 before rising sharply between 2011 through to 2017, averaging $38.9b annually. A number of competitors had entered into the market during this period in an attempt to capitalise on the activity. However, there has been a sharp decline in quarterly activity dropping to just $17.2b in 2018 annually.
[Data Source: Australian Bureau of Statistics]
Subsequently, the past three years have been challenging as Delta and the industry recalibrates to a market which has effectively halved in value.
This has led to the implementation of a series of administrative and operational efficiencies over the past three years resulting in cost savings that enabled Delta to minimise the impact of the downturn on the company’s financial performance.We are proud to have successfully completed all the projects we have undertaken to the highest of quality standards and in accordance with the respective programs including:
• NorthLink Stage 2, Reid Hwy to Ellenbrook, WA
• Curtin University Building 200, Murdoch, WA
• Albany Hwy Bridge over Williams River, WA
• Dardanup Road Bridge 3510A Preston, WA
• Kings Square, Fremantle, WA
• BHP Yandi, train loadout weighbridge, WA
• Hamilton Street Bridge, Subiaco, WA
• 293 Pirie Street, Adelaide Apartments, SA
• Bowden on Fifth Apartments, Adelaide, SA
• Glenside Apartments B1, Adelaide, SA
• Al Noori School, Greenacre, Sydney, NSW
Our current work on hand provides a solid platform for the first half of 2020 financial year as we complete the manufacture of large box culverts for BHP Rail Bridges, precast for the Casuarina Prison, and wall panels for Karrinyup Shopping Centre and Balcatta Senior High School.
Moving forward, the increased activity from the large iron ore mining companies, Fortescue, BHP and Rio Tinto, along with government infrastructure investment projects such as Metronet and major freeway separation upgrades, should result in near full utilisation of West Australian industry capacity.
WA QUARTERLY ENGINEERING CONSTRUCT ACTIVITY
18
$Bill
ion
16
14
12
10
8
6
4
2
0
Jun-
04
Jun-
05
Jun-
06
Jun-
07
Jun-
08
Jun-
09
Jun-
10
Jun-
11
Jun-
12
Jun-
13
Jun-
14
Jun-
15
Jun-
16
Jun-
17
Jun-
18
0
2
4
6
8
10
12
14
16
18
Jun-
2004
Jun-
2005
Jun-
2006
Jun-
2007
Jun-
2008
Jun-
2009
Jun-
2010
Jun-
2011
Jun-
2012
Jun-
2013
Jun-
2014
Jun-
2015
Jun-
2016
Jun-
2017
Jun-
2018
$bill
ion
WA QUARTERLY ENGINEERING CONSTRUCTION ACTIVITY
SCHAFFER CORPORATION LIMITED 2019 ANNUAL REPORT10
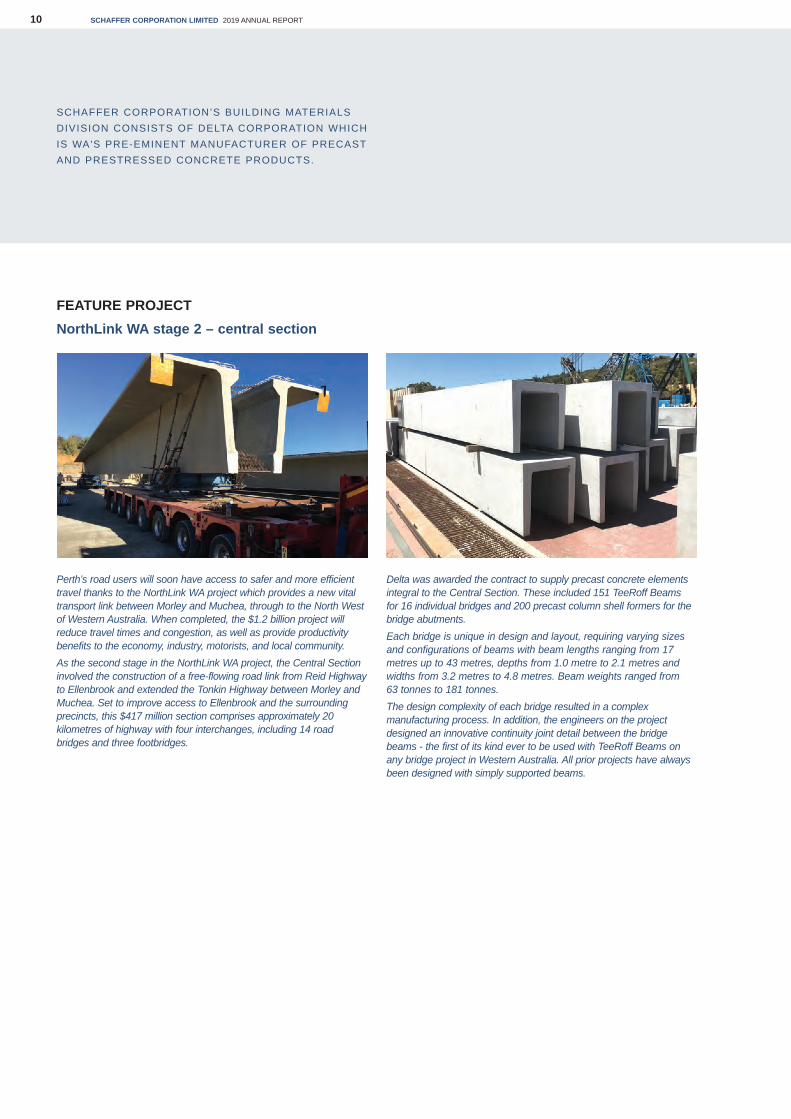
FEATURE PROJECT NorthLink WA stage 2 – central section
Perth’s road users will soon have access to safer and more efficient travel thanks to the NorthLink WA project which provides a new vital transport link between Morley and Muchea, through to the North West of Western Australia. When completed, the $1.2 billion project will reduce travel times and congestion, as well as provide productivity benefits to the economy, industry, motorists, and local community.As the second stage in the NorthLink WA project, the Central Section involved the construction of a free-flowing road link from Reid Highway to Ellenbrook and extended the Tonkin Highway between Morley and Muchea. Set to improve access to Ellenbrook and the surrounding precincts, this $417 million section comprises approximately 20 kilometres of highway with four interchanges, including 14 road bridges and three footbridges.
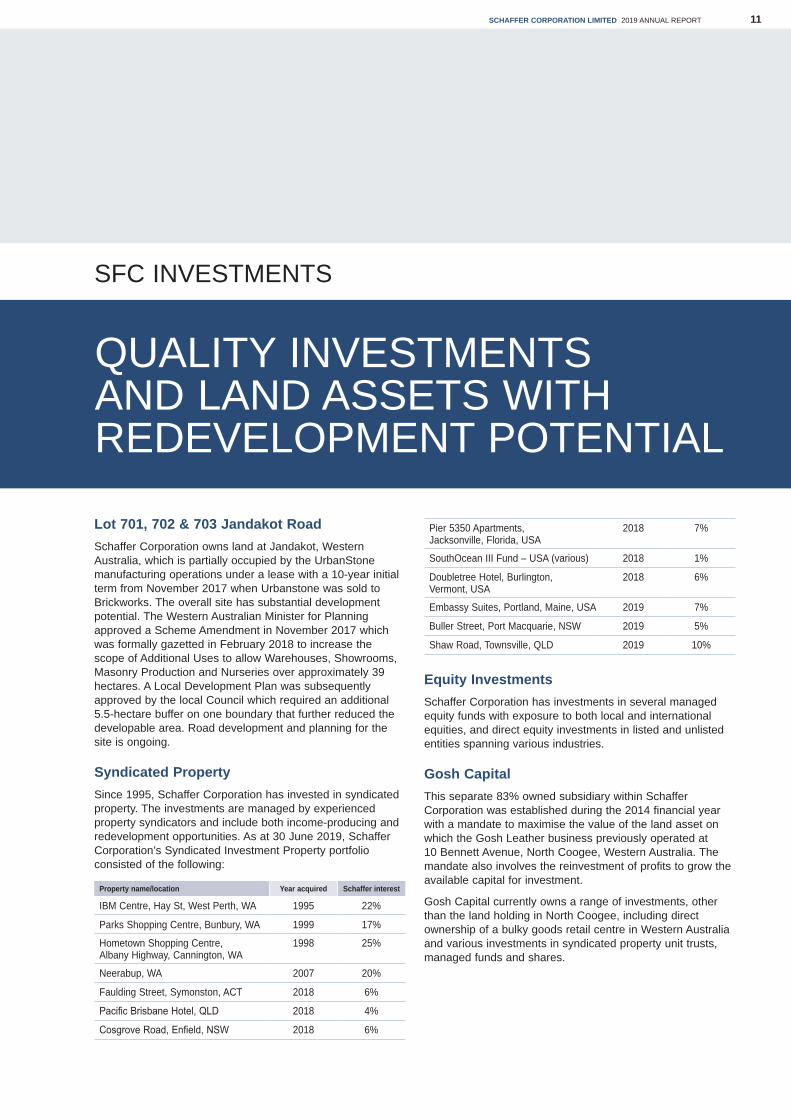
Delta was awarded the contract to supply precast concrete elements integral to the Central Section. These included 151 TeeRoff Beams for 16 individual bridges and 200 precast column shell formers for the bridge abutments.Each bridge is unique in design and layout, requiring varying sizes and configurations of beams with beam lengths ranging from 17 metres up to 43 metres, depths from 1.0 metre to 2.1 metres and widths from 3.2 metres to 4.8 metres. Beam weights ranged from 63 tonnes to 181 tonnes. The design complexity of each bridge resulted in a complex manufacturing process. In addition, the engineers on the project designed an innovative continuity joint detail between the bridge beams - the first of its kind ever to be used with TeeRoff Beams on any bridge project in Western Australia. All prior projects have always been designed with simply supported beams.
SCHAFFER CORPORATION’S BUILDING MATERIALS DIVISION CONSISTS OF DELTA CORPORATION WHICH IS WA'S PRE-EMINENT MANUFACTURER OF PRECAST AND PRESTRESSED CONCRETE PRODUCTS.
SCHAFFER CORPORATION LIMITED 2019 ANNUAL REPORT 11
SFC INVESTMENTS
QUALITY INVESTMENTS AND LAND ASSETS WITH REDEVELOPMENT POTENTIAL
Lot 701, 702 & 703 Jandakot RoadSchaffer Corporation owns land at Jandakot, Western Australia, which is partially occupied by the UrbanStone manufacturing operations under a lease with a 10-year initial term from November 2017 when Urbanstone was sold to Brickworks. The overall site has substantial development potential. The Western Australian Minister for Planning approved a Scheme Amendment in November 2017 which was formally gazetted in February 2018 to increase the scope of Additional Uses to allow Warehouses, Showrooms, Masonry Production and Nurseries over approximately 39 hectares. A Local Development Plan was subsequently approved by the local Council which required an additional 5.5-hectare buffer on one boundary that further reduced the developable area. Road development and planning for the site is ongoing.
Syndicated PropertySince 1995, Schaffer Corporation has invested in syndicated property. The investments are managed by experienced property syndicators and include both income-producing and redevelopment opportunities. As at 30 June 2019, Schaffer Corporation’s Syndicated Investment Property portfolio consisted of the following:
Property name/location Year acquired Schaffer interest
IBM Centre, Hay St, West Perth, WA 1995 22%
Parks Shopping Centre, Bunbury, WA 1999 17%
Hometown Shopping Centre, Albany Highway, Cannington, WA
1998 25%
Neerabup, WA 2007 20%
Faulding Street, Symonston, ACT 2018 6%
Pacific Brisbane Hotel, QLD 2018 4%
Cosgrove Road, Enfield, NSW 2018 6%
Pier 5350 Apartments, Jacksonville, Florida, USA
2018 7%
SouthOcean III Fund – USA (various) 2018 1%
Doubletree Hotel, Burlington, Vermont, USA
2018 6%
Embassy Suites, Portland, Maine, USA 2019 7%
Buller Street, Port Macquarie, NSW 2019 5%
Shaw Road, Townsville, QLD 2019 10%
Equity InvestmentsSchaffer Corporation has investments in several managed equity funds with exposure to both local and international equities, and direct equity investments in listed and unlisted entities spanning various industries.
Gosh CapitalThis separate 83% owned subsidiary within Schaffer Corporation was established during the 2014 financial year with a mandate to maximise the value of the land asset on which the Gosh Leather business previously operated at 10 Bennett Avenue, North Coogee, Western Australia. The mandate also involves the reinvestment of profits to grow the available capital for investment.
Gosh Capital currently owns a range of investments, other than the land holding in North Coogee, including direct ownership of a bulky goods retail centre in Western Australia and various investments in syndicated property unit trusts, managed funds and shares.
SCHAFFER CORPORATION LIMITED 2019 ANNUAL REPORT12
The following table represents the property holdings of the Group:
Address DescriptionOwnership structure
Land Size (sqm)
Current Lettable
Area (sqm)
SFC Ownership
%
SFC Share
of Book Value ($m)
SFC Share of Market Value ($m)
SFC Share of
Debt ($m)
Tax on Capital (Gain) /loss ($m)
Net Equity Value ($m)
Property used by SFC operations
218 Campersic Road, Herne Hill, WA
Delta SFC Direct 134,305 - 100% 5.8 9.5 - (1.1) 8.4
1305 Hay Street, West Perth, WA
Head Office SFC Direct 413 - 100% 0.7 1.9 - (0.4) 1.5
6.7 11.4 - (1.4) 10.0
Rental Properties
Hometown, 1480 Albany Hwy, Cannington, WA
Bulky Goods Syndicate 59,319 20,637 25% 5.4 15.9 (7.2) (3.1) 5.6
39 Dixon Rd, Rockingham, Western Australia
Bulky Goods Gosh Direct
12,047 5,434 83% 6.5 6.5 (5.0) 0.4 1.9
Auburn Megamall, 265 Parramatta Road, NSW
Bulky Goods Gosh - Unit Trust
24,690 32,348 2% 1.2 1.2 - (0.2) 1.0
IBM Centre, 1060 Hay Street, West Perth, WA
Commercial Syndicate 5,797 8,466 22% 1.1 12.4 (7.1) (3.4) 1.9
Faulding Street, Symonston, ACT Commercial SFC - Unit Trust
7,360 3,479 6% 0.4 0.4 - - 0.4
Buller Street, Port Macquarie, NSW
Commercial Syndicate 5,042 6,214 5% 0.3 0.3 - - 0.3
Shaw Road, Townsville Commercial Syndicate 14,650 4,728 10% 0.2 0.2 - - 0.2
Doubletree Hotel, Burlington, Vermont, USA
Hotel SFC US 64,600 - 6% 1.5 1.5 - - 1.5
Pacific Brisbane Hotel, Brisbane, QLD
Hotel SFC Direct 2,899 7,759 4% 0.9 0.9 - - 0.9
Pacific Suites, Canberra, ACT Hotel Gosh - Unit Trust
- 16,045 2% 0.9 0.9 - - 0.9
Embassy Suites, Portland, Maine, USA
Hotel SFC US 11,250 11,250 7% 0.7 0.7 - - 0.7
Lot 701 Jandakot Road, Jandakot, WA
Industrial SFC Direct 62,097 - 100% 3.2 11.2 - (2.4) 8.8
Willung Rd, Rosedale, Victoria Industrial/Rural
Howe Direct
510,530 9,854 83% 2.0 2.4 - - 2.4
Cope Logistics – 7 properties nationwide
Industrial Gosh - Unit Trust
78,042 23,575 3% 0.3 0.3 - - 0.3
Pier 5350 Apartments, Jacksonville, Florida, USA
Residential SFC US 89,000 43,200 7% 1.3 1.3 - - 1.3
Parks Shopping Centre, Bunbury, WA
Retail Syndicate 30,804 10,622 17% 2.0 6.9 (3.8) (1.5) 1.6
27.9 63.0 (23.1) (10.2) 29.7
Development sites
Lot 702 Jandakot Road, Jandakot, WA
Commercial SFC Direct 32,442 500 100% 1.2 6.5 - (1.6) 4.9
Lot 561 Paris Road, Australind, WA
Commercial Gosh - Unit Trust
12,000 - 4% 0.4 0.4 - - 0.4
Lot 703 Jandakot Road, Jandakot, WA
Industrial SFC Direct 449,639 - 100% 3.1 19.5 - (4.9) 14.6
170 Flynn Drive, Neerabup, WA Industrial Syndicate 260,000 - 20% 1.5 4.0 (1.0) (0.8) 2.2
62 Cosgrove Road, Enfield, NSW
Industrial Syndicate 23,267 - 6% 0.8 0.8 - - 0.8
10 Bennett Avenue, North Coogee, WA
Residential Gosh Direct
21,035 - 83% 1.6 11.3 - (2.9) 8.4
South Ocean Real Estate Fund Residential SFC US 1% 0.7 0.8 - - 0.8
Part Lot 602 Yanchep Beach Road, WA
Residential Gosh - Unit Trust
42,600 - 3% 0.2 0.2 - 0.1 0.3
9.5 43.5 (1.0) (10.1) 32.4
Total SFC Property Value 43.9 117.9 (24.1) (21.8) 72.0
NOTES TO THE CONSOLIDATED FINANCIAL STATEMENTSyear ended 30 June 2019
SCHAFFER CORPORATION LIMITED 2019 ANNUAL REPORT 13
2OI9 F I N A N C I A L R E P O R TConsolidated Statement of Comprehensive Income 14Consolidated Statement of Financial Position 15Consolidated Statement of Changes in Equity 16Consolidated Statement of Cash Flows 17Notes to the Consolidated Financial Statements 18Directors’ Declaration 48Independent Auditor’s Report 49Directors’ Report 54Statement of Corporate Governance Practices 62ASX Additional Information 67
SCHAFFER CORPORATION LIMITEDABN 73 008 675 689
at 30 June 2019
SCHAFFER CORPORATION LIMITED 2019 ANNUAL REPORT14
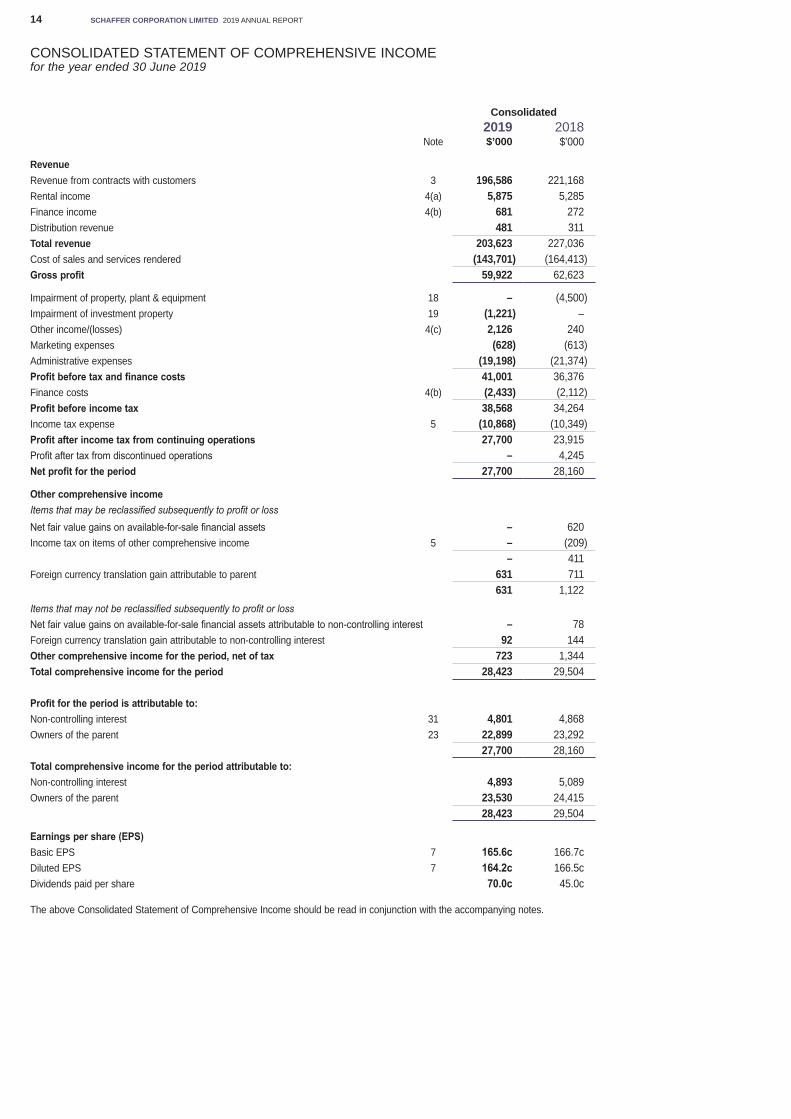
CONSOLIDATED STATEMENT OF COMPREHENSIVE INCOMEfor the year ended 30 June 2019
Consolidated2019 2018
Note $’000 $’000
RevenueRevenue from contracts with customers 3 196,586 221,168Rental income 4(a) 5,875 5,285Finance income 4(b) 681 272Distribution revenue 481 311Total revenue 203,623 227,036Cost of sales and services rendered (143,701) (164,413)Gross profit 59,922 62,623
Impairment of property, plant & equipment 18 – (4,500)Impairment of investment property 19 (1,221) –Other income/(losses) 4(c) 2,126 240Marketing expenses (628) (613)Administrative expenses (19,198) (21,374)Profit before tax and finance costs 41,001 36,376Finance costs 4(b) (2,433) (2,112)Profit before income tax 38,568 34,264Income tax expense 5 (10,868) (10,349)Profit after income tax from continuing operations 27,700 23,915Profit after tax from discontinued operations – 4,245Net profit for the period 27,700 28,160
Other comprehensive incomeItems that may be reclassified subsequently to profit or lossNet fair value gains on available-for-sale financial assets – 620Income tax on items of other comprehensive income 5 – (209)
– 411Foreign currency translation gain attributable to parent 631 711
631 1,122Items that may not be reclassified subsequently to profit or lossNet fair value gains on available-for-sale financial assets attributable to non-controlling interest – 78Foreign currency translation gain attributable to non-controlling interest 92 144Other comprehensive income for the period, net of tax 723 1,344Total comprehensive income for the period 28,423 29,504
Profit for the period is attributable to:Non-controlling interest 31 4,801 4,868Owners of the parent 23 22,899 23,292
27,700 28,160Total comprehensive income for the period attributable to:Non-controlling interest 4,893 5,089Owners of the parent 23,530 24,415
28,423 29,504
Earnings per share (EPS)Basic EPS 7 165.6c 166.7cDiluted EPS 7 164.2c 166.5cDividends paid per share 70.0c 45.0c
The above Consolidated Statement of Comprehensive Income should be read in conjunction with the accompanying notes.
SCHAFFER CORPORATION LIMITED 2019 ANNUAL REPORT 15
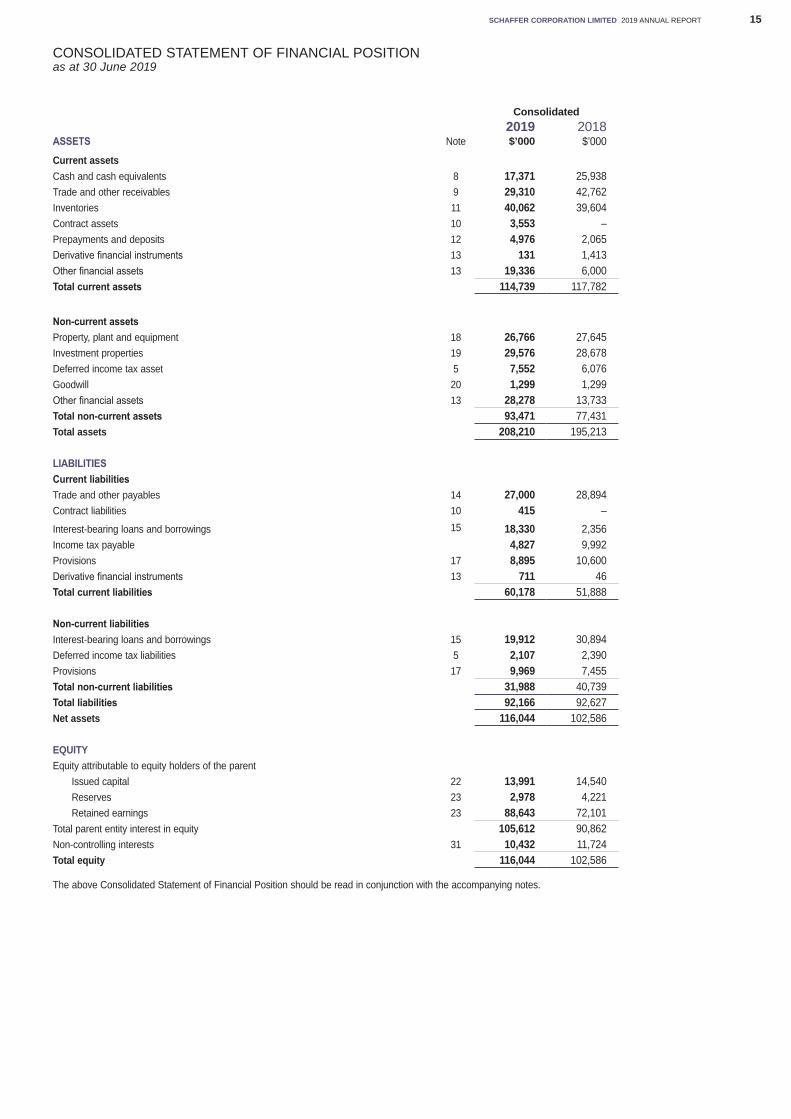
CONSOLIDATED STATEMENT OF FINANCIAL POSITIONas at 30 June 2019
Consolidated2019 2018
ASSETS Note $’000 $’000
Current assetsCash and cash equivalents 8 17,371 25,938Trade and other receivables 9 29,310 42,762Inventories 11 40,062 39,604Contract assets 10 3,553 –Prepayments and deposits 12 4,976 2,065Derivative financial instruments 13 131 1,413Other financial assets 13 19,336 6,000Total current assets 114,739 117,782
Non-current assetsProperty, plant and equipment 18 26,766 27,645Investment properties 19 29,576 28,678Deferred income tax asset 5 7,552 6,076Goodwill 20 1,299 1,299Other financial assets 13 28,278 13,733Total non-current assets 93,471 77,431Total assets 208,210 195,213
LIABILITIESCurrent liabilitiesTrade and other payables 14 27,000 28,894Contract liabilities 10 415 –Interest-bearing loans and borrowings 15 18,330 2,356Income tax payable 4,827 9,992Provisions 17 8,895 10,600Derivative financial instruments 13 711 46Total current liabilities 60,178 51,888
Non-current liabilitiesInterest-bearing loans and borrowings 15 19,912 30,894Deferred income tax liabilities 5 2,107 2,390Provisions 17 9,969 7,455Total non-current liabilities 31,988 40,739Total liabilities 92,166 92,627Net assets 116,044 102,586
EQUITYEquity attributable to equity holders of the parent Issued capital 22 13,991 14,540 Reserves 23 2,978 4,221 Retained earnings 23 88,643 72,101Total parent entity interest in equity 105,612 90,862Non-controlling interests 31 10,432 11,724Total equity 116,044 102,586
The above Consolidated Statement of Financial Position should be read in conjunction with the accompanying notes.
SCHAFFER CORPORATION LIMITED 2019 ANNUAL REPORT16
Attributable to Equity Holders of the Parent
Non-controlling
interestTotal
equityIssued capital
Retained earnings
Reserves
TotalAsset
revaluation
Share- based
payments
Net unrealised
gains/ (losses)
Foreign currency
translation
$’000 $’000 $’000 $’000 $’000 $’000 $’000 $’000 $’000
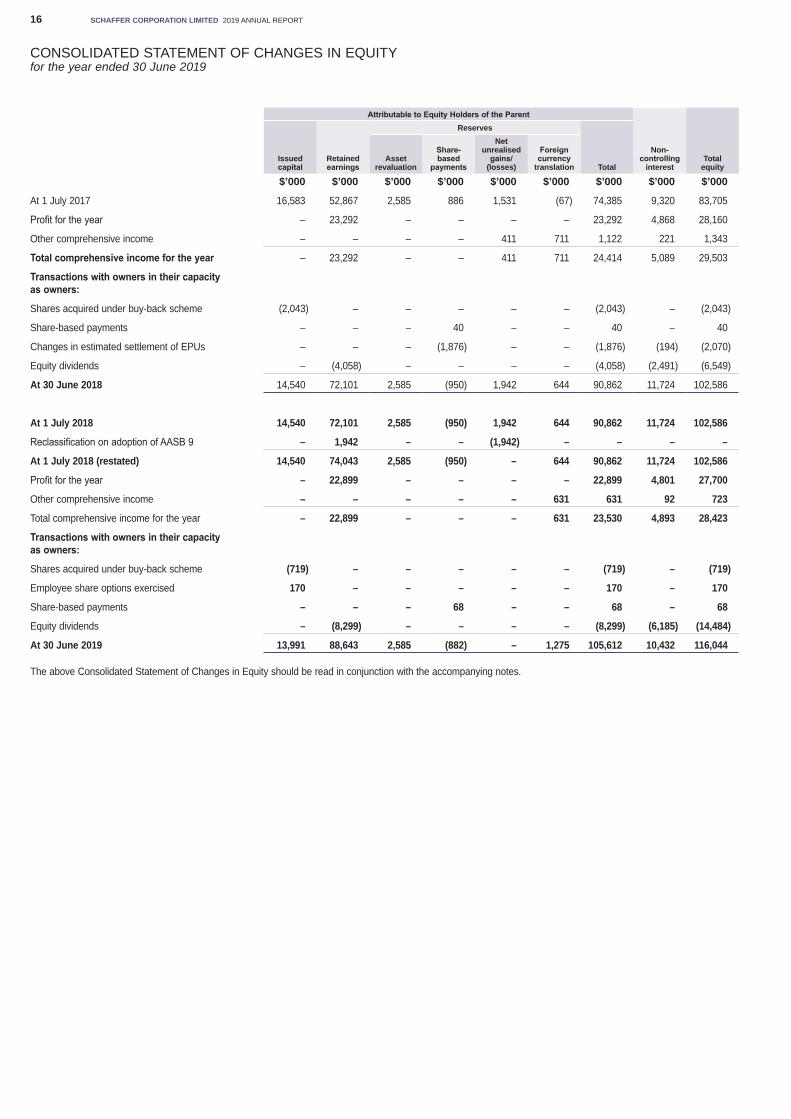
At 1 July 2017 16,583 52,867 2,585 886 1,531 (67) 74,385 9,320 83,705
Profit for the year – 23,292 – – – – 23,292 4,868 28,160
Other comprehensive income – – – – 411 711 1,122 221 1,343
Total comprehensive income for the year – 23,292 – – 411 711 24,414 5,089 29,503
Transactions with owners in their capacity as owners:
Shares acquired under buy-back scheme (2,043) – – – – – (2,043) – (2,043)
Share-based payments – – – 40 – – 40 – 40
Changes in estimated settlement of EPUs – – – (1,876) – – (1,876) (194) (2,070)
Equity dividends – (4,058) – – – – (4,058) (2,491) (6,549)
At 30 June 2018 14,540 72,101 2,585 (950) 1,942 644 90,862 11,724 102,586
At 1 July 2018 14,540 72,101 2,585 (950) 1,942 644 90,862 11,724 102,586
Reclassification on adoption of AASB 9 – 1,942 – – (1,942) – – – –
At 1 July 2018 (restated) 14,540 74,043 2,585 (950) – 644 90,862 11,724 102,586
Profit for the year – 22,899 – – – – 22,899 4,801 27,700
Other comprehensive income – – – – – 631 631 92 723
Total comprehensive income for the year – 22,899 – – – 631 23,530 4,893 28,423
Transactions with owners in their capacity as owners:
Shares acquired under buy-back scheme (719) – – – – – (719) – (719)
Employee share options exercised 170 – – – – – 170 – 170
Share-based payments – – – 68 – – 68 – 68
Equity dividends – (8,299) – – – – (8,299) (6,185) (14,484)
At 30 June 2019 13,991 88,643 2,585 (882) – 1,275 105,612 10,432 116,044
The above Consolidated Statement of Changes in Equity should be read in conjunction with the accompanying notes.
CONSOLIDATED STATEMENT OF CHANGES IN EQUITYfor the year ended 30 June 2019
SCHAFFER CORPORATION LIMITED 2019 ANNUAL REPORT 17
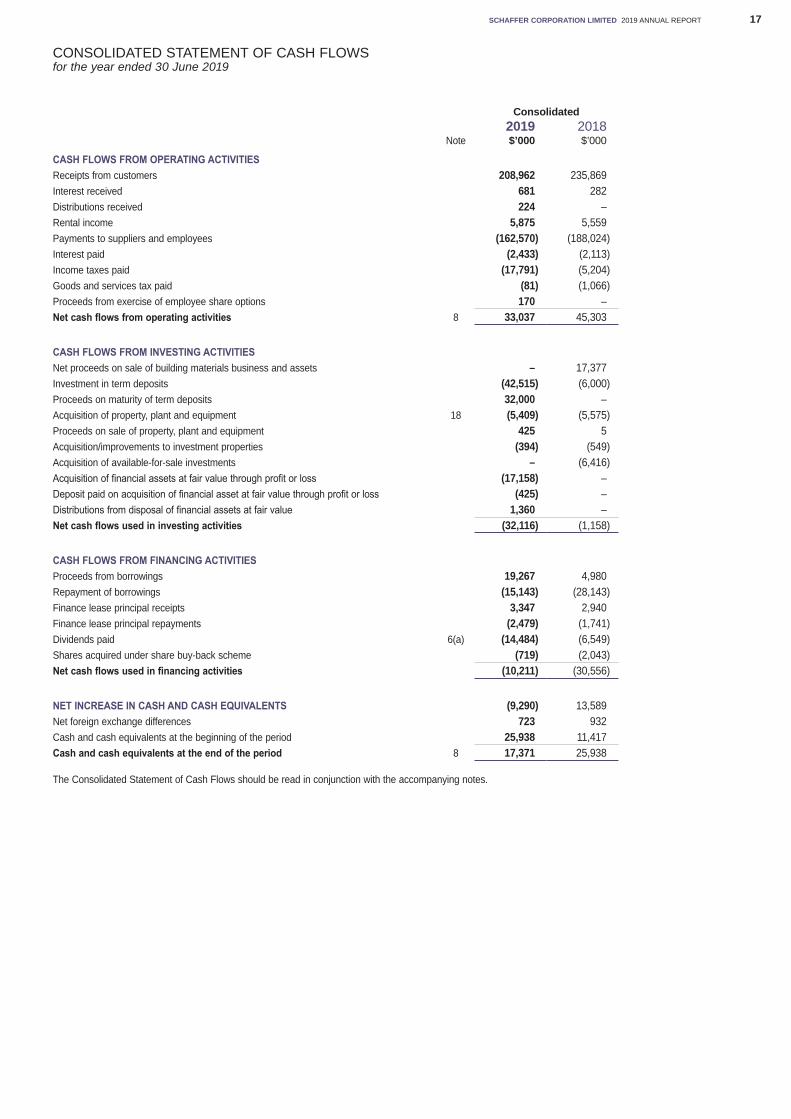
CONSOLIDATED STATEMENT OF CASH FLOWSfor the year ended 30 June 2019
Consolidated2019 2018
Note $’000 $’000
CASH FLOWS FROM OPERATING ACTIVITIESReceipts from customers 208,962 235,869Interest received 681 282Distributions received 224 –Rental income 5,875 5,559Payments to suppliers and employees (162,570) (188,024)Interest paid (2,433) (2,113)Income taxes paid (17,791) (5,204)Goods and services tax paid (81) (1,066)Proceeds from exercise of employee share options 170 –Net cash flows from operating activities 8 33,037 45,303
CASH FLOWS FROM INVESTING ACTIVITIESNet proceeds on sale of building materials business and assets – 17,377Investment in term deposits (42,515) (6,000)Proceeds on maturity of term deposits 32,000 –Acquisition of property, plant and equipment 18 (5,409) (5,575)Proceeds on sale of property, plant and equipment 425 5Acquisition/improvements to investment properties (394) (549)Acquisition of available-for-sale investments – (6,416)Acquisition of financial assets at fair value through profit or loss (17,158) –Deposit paid on acquisition of financial asset at fair value through profit or loss (425) –Distributions from disposal of financial assets at fair value 1,360 – Net cash flows used in investing activities (32,116) (1,158)
CASH FLOWS FROM FINANCING ACTIVITIESProceeds from borrowings 19,267 4,980Repayment of borrowings (15,143) (28,143)Finance lease principal receipts 3,347 2,940Finance lease principal repayments (2,479) (1,741)Dividends paid 6(a) (14,484) (6,549)Shares acquired under share buy-back scheme (719) (2,043)Net cash flows used in financing activities (10,211) (30,556)
NET INCREASE IN CASH AND CASH EQUIVALENTS (9,290) 13,589Net foreign exchange differences 723 932Cash and cash equivalents at the beginning of the period 25,938 11,417Cash and cash equivalents at the end of the period 8 17,371 25,938
The Consolidated Statement of Cash Flows should be read in conjunction with the accompanying notes.
SCHAFFER CORPORATION LIMITED 2019 ANNUAL REPORT18
NOTES TO THE CONSOLIDATED FINANCIAL STATEMENTSyear ended 30 June 2019
NOTE 1 CORPORATE INFORMATIONThe consolidated financial report of Schaffer Corporation Limited and its controlled entities (the Group or Consolidated Entity) for the year ended 30 June 2019 was authorised for issue in accordance with a resolution of the Directors on 27 September 2019.
Schaffer Corporation Limited (SFC, the Parent or the Company) is a for profit company limited by shares incorporated in Australia whose shares are publicly traded on the Australian Securities Exchange. The Company is domiciled in Australia.
The nature of the operations and principal activities of the Group are described in note 21.
NOTE 2 SUMMARY OF SIGNIFICANT ACCOUNTING POLICIES
(a) Basis of preparationThe financial report is a general-purpose financial report, which has been prepared in accordance with the requirements of the Corporations Act 2001 and Australian Accounting Standards. The financial report has been prepared on a historical cost basis, except for financial instruments held at fair value through profit or loss which have been measured at fair value.The financial report is presented in Australian dollars and all values are rounded to the nearest thousand dollars ($’000) unless otherwise stated under the option available to the Company under ASIC Instrument 2016/191 Corporations (Rounding in Financial/Directors Report). The Company is an entity to which the instrument applies.The financial report also complies with International Financial Reporting Standards (IFRS) as issued by the International Accounting Standards Board.
(b) New accounting standards and interpretationsAdoption of new accounting standardsThe Group applied AASB 15 Revenue from Contracts with Customers and AASB 9 Financial Instruments for the first time. The nature and effect of these new accounting standards are described below.Several other amendments and interpretations apply for the first time as of 1 July 2018, but do not have an impact on the consolidated financial statements of the Group. The Group has not early adopted any standards, interpretations or amendments that have been issued but are not yet effective.
AASB 15 Revenue from Contracts with Customers (“AASB 15”)AASB 15 supersedes AASB 111 Construction Contracts, AASB 118 Revenue and related interpretations. It applies to all revenue arising from contracts with customers, unless those contracts are in the scope of other standards. The new standard establishes a five-step model to account for revenue arising from contracts with customers. Under AASB 15, revenue is recognised at an amount that reflects the consideration to which an entity expects to be entitled in exchange for transferring goods or services to a customer.The standard requires entities to exercise judgment, taking into consideration all the relevant facts and circumstances when applying each step of the model to contracts with their customers. The standard also specifies the accounting for the incremental costs of obtaining a contract and the costs directly related to fulfilling a contract.Impact of AdoptionThe Group adopted AASB 15 using the modified retrospective method so transitional adjustments are recognised in retained earnings at the date of initial application. No adjustments have been made to the comparative period or for completed contracts, as allowed under the practical expedient in the standard. The Group will also apply the practical expedient not to disclose transaction price allocated to remaining performance obligations that are unsatisfied, or partly unsatisfied, as of the end of the reporting period for contracts with original durations of less than one year. The Group has not applied any other practical expedience available under the standard. The adoption of AASB 15 has not resulted in any material transitional adjustments and therefore no change has been made to retained earnings as at 1 July 2018.Under AASB 118, revenue was recognised and measured at the fair value of the consideration received or receivable to the extent it was probable that the economic benefits would flow to the Group and the revenue could be reliably measured. Under AASB 15, revenue is recognised when control of the good or services passes to the customer. Furthermore, revenue is only recognised to the extent that it is highly probable that a significant reversal of revenue will not occur.
(i) Sale of goodsThe Group’s contracts with customers for the sale of automotive leather components by the Automotive Leather segment generally include one performance obligation. The Group has concluded that revenue from the sale of automotive leather components should be recognised at the point in time when control of the goods is transferred to the customer, generally on collection by the customer.The contracts for the sale of automotive leather components provide customers with the right to claim a credit or refund for components that don’t satisfy agreed quality standards. The customer’s right to claim is a variable consideration that is estimated at contract inception and constrained until the associated uncertainty is resolved. The estimate of constrained revenue is based on all available information including historic performance. For the current and prior financial year, the application of the constraint on variable consideration had no impact on the amount of revenue that has been or would be deferred because the Group had previously provided for estimated claims as an offset to recognised revenue.The Group also recognises its share of hospitality sales from an associated syndicated property investment that includes a hospitality business. Revenue from these sales are recognised at the points in time when control of the goods is transferred to the customer.There was no impact on the recognition of Sale of Goods revenue on the adoption of AASB 15.
(ii) Construction servicesThe Group’s Building Materials segment constructs precast concrete components. The Group transfers control of goods to customers over time because the assets constructed are specific to a customer’s requirements, do not have an alternative use, and the customers have an enforceable obligation to pay for the percentage of the contract completed to date. The Group recognises construction services revenue and expenses on an individual contract basis using the percentage of completion method based on cost inputs which aligns with the calculation of the contractually enforceable obligation a customer must pay for work completed to date.Once the financial outcome of a construction contract can be estimated reliably, contract revenues and expenses are recognised in the Consolidated Statement of Comprehensive Income in proportion to the stage of completion of the contract. Where modifications in design or contract requirements are entered into, the transaction price is updated to reflect these. Where the price of a modification has not been confirmed, an estimate is made of the amount of revenue to recognise whilst also considering any constrained revenue requirement.There was no impact on the recognition of Construction Services revenue on the adoption of AASB 15.
(iii) TransportThe Building Materials segment delivers precast concrete components to customers. Transport services are a separately identifiable performance obligation in contracts to construct and deliver precast concrete components to customers; accordingly, the Group allocates a transaction price based on the relative stand-alone selling prices of construction and transport services.The Group recognises revenue from transport services at the specific point in time when the components are delivered to the customer.There was no impact on the recognition of Transport revenue on the adoption of AASB 15, but the revenue is disclosed separately due to the adoption of the new standard.
NOTES TO THE CONSOLIDATED FINANCIAL STATEMENTSyear ended 30 June 2019
SCHAFFER CORPORATION LIMITED 2019 ANNUAL REPORT 19
(iv) Other revenueThe accounting policies for rental income, interest income, dividends and distributions from managed funds are not impacted by AASB 15 and are disclosed in the most recent annual report.
AASB 9 Financial Instruments (“AASB 9”)AASB 9 Financial Instruments replaces AASB 139 Financial Instruments: Recognition and Measurement, bringing together all three aspects of the accounting for financial instruments: classification and measurement; impairment; and hedge accounting.The Group has applied the standard retrospectively without the restatement of comparatives as permitted by the standard. The cumulative effect on initial application of AASB 9 is an increase to opening retained profits of $1,942,000 and a corresponding decrease to the net unrealised gains/losses reserve within the Consolidated Statement of Changes in Equity.
(i) Classification and measurementExcept for certain trade receivables which are recognised at transaction price and assets at fair value through profit or loss which are initially measured at fair value, under AASB 9, the Group initially measures a financial asset at its fair value less transaction costs.Under AASB 9, debt financial instruments are subsequently measured at fair value through profit or loss (FVTPL), amortised costs, or fair value through other comprehensive income (FVOCI).The classification is based on two criteria: The Group’s business model for managing the assets; and whether the instruments’ contractual cash flows represent ‘solely payments of principal and interest’ on the principal amounts outstanding (the ‘SPPI criterion’).The Group’s debt financial assets are classified as debt instruments at amortised cost as they are held with the objective of holding the financial asset to collect contractual cash flows and meet the SPPI criterion. This category includes the Group’s trade and other receivables, and loans included under other financial assets.The Group’s other financial assets are classified as financial assets at FVTPL and comprise derivative instruments, plus quoted and unquoted equity instruments which the Group has not irrevocably elected, at initial recognition or transition, to classify at FVOCI. Under AASB 139, the Group’s quoted and unquoted equity securities were classified as available-for-sale financial assets. Upon transition the reserve relating to the Group’s quoted and unquoted equity securities, which had been previously recognised under net unrealised gains/losses in the Consolidated Statement of Changes in Equity, was reclassified as retained earnings. The value of this reclassification was an increase of $1,942,000 to retained earnings.The accounting for the Group’s financial liabilities remains largely the same as it was under AASB 139.
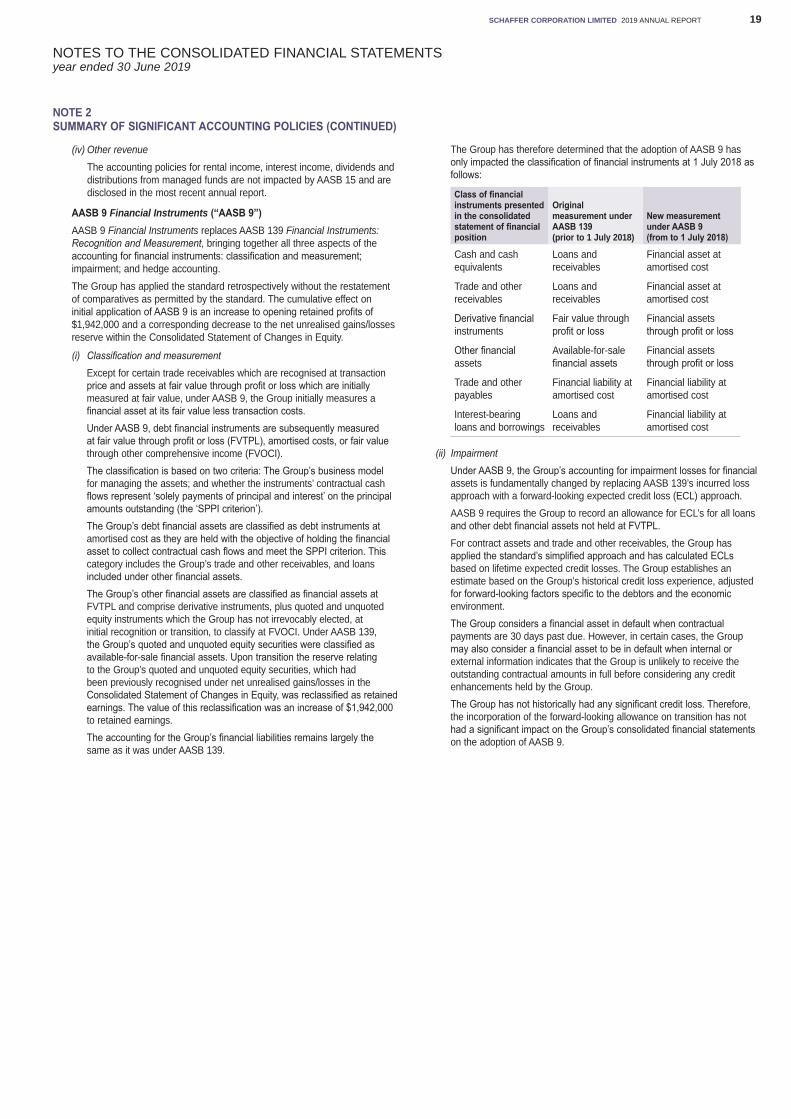
The Group has therefore determined that the adoption of AASB 9 has only impacted the classification of financial instruments at 1 July 2018 as follows:
Class of financial instruments presented in the consolidated statement of financial position
Original measurement under AASB 139 (prior to 1 July 2018)
New measurement under AASB 9 (from to 1 July 2018)
Cash and cash equivalents
Loans and receivables
Financial asset at amortised cost
Trade and other receivables
Loans and receivables
Financial asset at amortised cost
Derivative financial instruments
Fair value through profit or loss
Financial assets through profit or loss
Other financial assets
Available-for-sale financial assets
Financial assets through profit or loss
Trade and other payables
Financial liability at amortised cost
Financial liability at amortised cost
Interest-bearing loans and borrowings
Loans and receivables
Financial liability at amortised cost
(ii) ImpairmentUnder AASB 9, the Group’s accounting for impairment losses for financial assets is fundamentally changed by replacing AASB 139’s incurred loss approach with a forward-looking expected credit loss (ECL) approach.AASB 9 requires the Group to record an allowance for ECL’s for all loans and other debt financial assets not held at FVTPL.For contract assets and trade and other receivables, the Group has applied the standard’s simplified approach and has calculated ECLs based on lifetime expected credit losses. The Group establishes an estimate based on the Group’s historical credit loss experience, adjusted for forward-looking factors specific to the debtors and the economic environment.The Group considers a financial asset in default when contractual payments are 30 days past due. However, in certain cases, the Group may also consider a financial asset to be in default when internal or external information indicates that the Group is unlikely to receive the outstanding contractual amounts in full before considering any credit enhancements held by the Group.The Group has not historically had any significant credit loss. Therefore, the incorporation of the forward-looking allowance on transition has not had a significant impact on the Group’s consolidated financial statements on the adoption of AASB 9.
NOTE 2 SUMMARY OF SIGNIFICANT ACCOUNTING POLICIES (CONTINUED)
NOTES TO THE CONSOLIDATED FINANCIAL STATEMENTSyear ended 30 June 2019
SCHAFFER CORPORATION LIMITED 2019 ANNUAL REPORT20
(iii) Hedge AccountingAs the Group did not have any hedge relationships that are designated as effective hedges in place as at 30 June 2018, there is no impact from the application of hedging requirement on the financial statements.
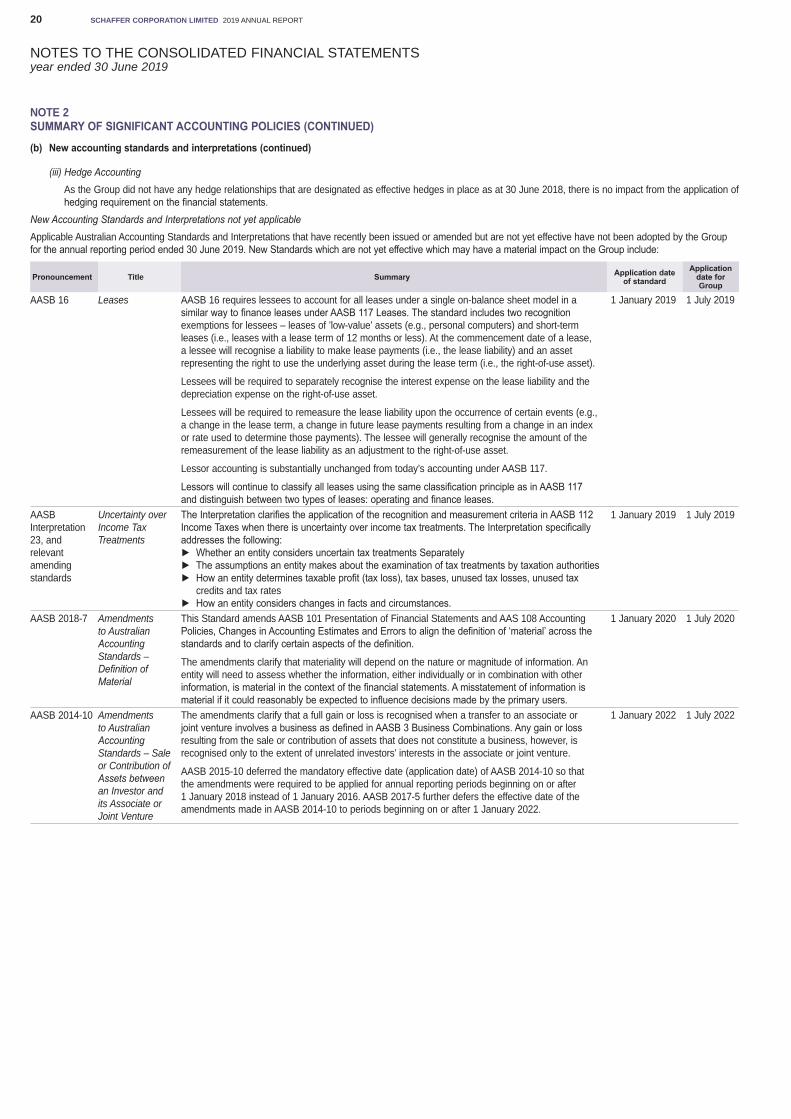
New Accounting Standards and Interpretations not yet applicableApplicable Australian Accounting Standards and Interpretations that have recently been issued or amended but are not yet effective have not been adopted by the Group for the annual reporting period ended 30 June 2019. New Standards which are not yet effective which may have a material impact on the Group include:
Pronouncement Title Summary Application date of standard
Application date for Group
AASB 16 Leases AASB 16 requires lessees to account for all leases under a single on-balance sheet model in a similar way to finance leases under AASB 117 Leases. The standard includes two recognition exemptions for lessees – leases of ’low-value’ assets (e.g., personal computers) and short-term leases (i.e., leases with a lease term of 12 months or less). At the commencement date of a lease, a lessee will recognise a liability to make lease payments (i.e., the lease liability) and an asset representing the right to use the underlying asset during the lease term (i.e., the right-of-use asset).
Lessees will be required to separately recognise the interest expense on the lease liability and the depreciation expense on the right-of-use asset.
Lessees will be required to remeasure the lease liability upon the occurrence of certain events (e.g., a change in the lease term, a change in future lease payments resulting from a change in an index or rate used to determine those payments). The lessee will generally recognise the amount of the remeasurement of the lease liability as an adjustment to the right-of-use asset.
Lessor accounting is substantially unchanged from today’s accounting under AASB 117.
Lessors will continue to classify all leases using the same classification principle as in AASB 117 and distinguish between two types of leases: operating and finance leases.
1 January 2019 1 July 2019
AASB Interpretation 23, and relevant amending standards
Uncertainty over Income Tax Treatments
The Interpretation clarifies the application of the recognition and measurement criteria in AASB 112 Income Taxes when there is uncertainty over income tax treatments. The Interpretation specifically addresses the following:► Whether an entity considers uncertain tax treatments Separately► The assumptions an entity makes about the examination of tax treatments by taxation authorities► How an entity determines taxable profit (tax loss), tax bases, unused tax losses, unused tax
credits and tax rates► How an entity considers changes in facts and circumstances.
1 January 2019 1 July 2019
AASB 2018-7 Amendments to Australian Accounting Standards – Definition of Material
This Standard amends AASB 101 Presentation of Financial Statements and AAS 108 Accounting Policies, Changes in Accounting Estimates and Errors to align the definition of ‘material’ across the standards and to clarify certain aspects of the definition.
The amendments clarify that materiality will depend on the nature or magnitude of information. An entity will need to assess whether the information, either individually or in combination with other information, is material in the context of the financial statements. A misstatement of information is material if it could reasonably be expected to influence decisions made by the primary users.
1 January 2020 1 July 2020
AASB 2014-10 Amendments to Australian Accounting Standards – Sale or Contribution of Assets between an Investor and its Associate or Joint Venture
The amendments clarify that a full gain or loss is recognised when a transfer to an associate or joint venture involves a business as defined in AASB 3 Business Combinations. Any gain or loss resulting from the sale or contribution of assets that does not constitute a business, however, is recognised only to the extent of unrelated investors’ interests in the associate or joint venture.
AASB 2015-10 deferred the mandatory effective date (application date) of AASB 2014-10 so that the amendments were required to be applied for annual reporting periods beginning on or after 1 January 2018 instead of 1 January 2016. AASB 2017-5 further defers the effective date of the amendments made in AASB 2014-10 to periods beginning on or after 1 January 2022.
1 January 2022 1 July 2022
NOTE 2 SUMMARY OF SIGNIFICANT ACCOUNTING POLICIES (CONTINUED)
(b) New accounting standards and interpretations (continued)
NOTES TO THE CONSOLIDATED FINANCIAL STATEMENTSyear ended 30 June 2019
SCHAFFER CORPORATION LIMITED 2019 ANNUAL REPORT 21
(b) New accounting standards and interpretations (continued)The impact of new and amended accounting standards and interpretations issued but not yet effective:
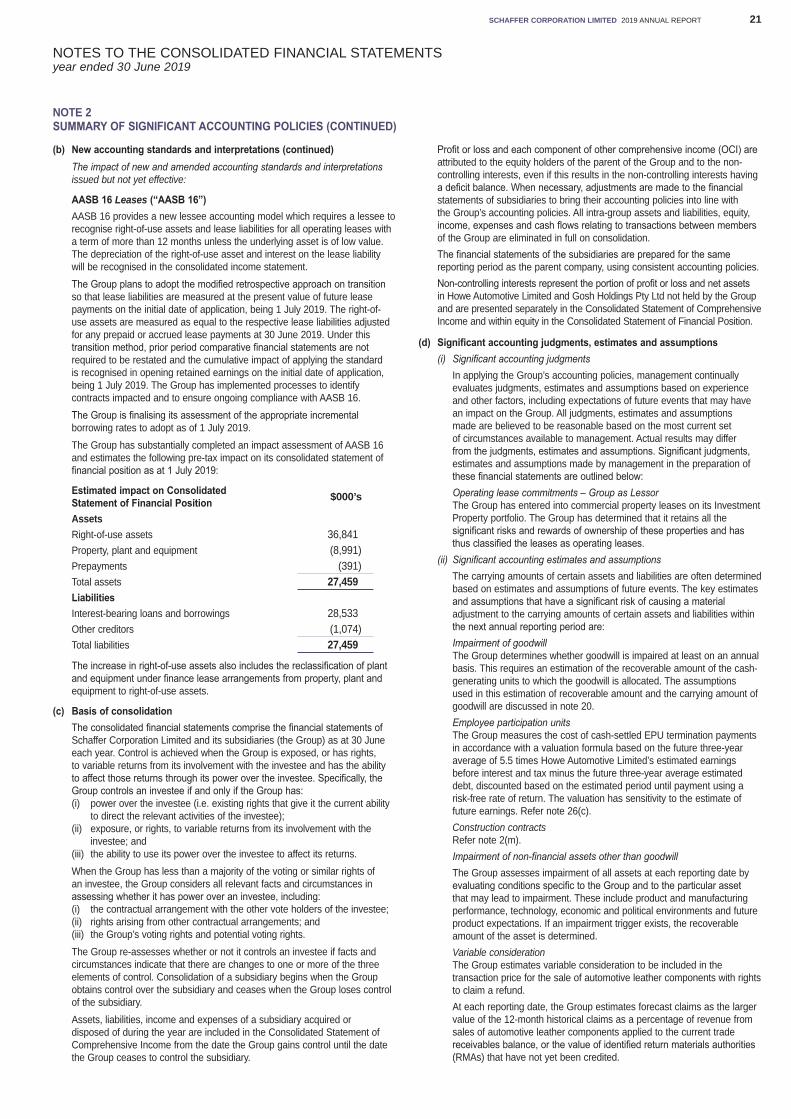
AASB 16 Leases (“AASB 16”)AASB 16 provides a new lessee accounting model which requires a lessee to recognise right-of-use assets and lease liabilities for all operating leases with a term of more than 12 months unless the underlying asset is of low value. The depreciation of the right-of-use asset and interest on the lease liability will be recognised in the consolidated income statement.The Group plans to adopt the modified retrospective approach on transition so that lease liabilities are measured at the present value of future lease payments on the initial date of application, being 1 July 2019. The right-of-use assets are measured as equal to the respective lease liabilities adjusted for any prepaid or accrued lease payments at 30 June 2019. Under this transition method, prior period comparative financial statements are not required to be restated and the cumulative impact of applying the standard is recognised in opening retained earnings on the initial date of application, being 1 July 2019. The Group has implemented processes to identify contracts impacted and to ensure ongoing compliance with AASB 16. The Group is finalising its assessment of the appropriate incremental borrowing rates to adopt as of 1 July 2019.The Group has substantially completed an impact assessment of AASB 16 and estimates the following pre-tax impact on its consolidated statement of financial position as at 1 July 2019:
Estimated impact on Consolidated Statement of Financial Position $000’s
AssetsRight-of-use assets 36,841Property, plant and equipment (8,991)Prepayments (391)Total assets 27,459LiabilitiesInterest-bearing loans and borrowings 28,533Other creditors (1,074)Total liabilities 27,459
The increase in right-of-use assets also includes the reclassification of plant and equipment under finance lease arrangements from property, plant and equipment to right-of-use assets.
(c) Basis of consolidationThe consolidated financial statements comprise the financial statements of Schaffer Corporation Limited and its subsidiaries (the Group) as at 30 June each year. Control is achieved when the Group is exposed, or has rights, to variable returns from its involvement with the investee and has the ability to affect those returns through its power over the investee. Specifically, the Group controls an investee if and only if the Group has:(i) power over the investee (i.e. existing rights that give it the current ability
to direct the relevant activities of the investee);(ii) exposure, or rights, to variable returns from its involvement with the
investee; and(iii) the ability to use its power over the investee to affect its returns.When the Group has less than a majority of the voting or similar rights of an investee, the Group considers all relevant facts and circumstances in assessing whether it has power over an investee, including:(i) the contractual arrangement with the other vote holders of the investee;(ii) rights arising from other contractual arrangements; and(iii) the Group’s voting rights and potential voting rights.The Group re-assesses whether or not it controls an investee if facts and circumstances indicate that there are changes to one or more of the three elements of control. Consolidation of a subsidiary begins when the Group obtains control over the subsidiary and ceases when the Group loses control of the subsidiary.Assets, liabilities, income and expenses of a subsidiary acquired or disposed of during the year are included in the Consolidated Statement of Comprehensive Income from the date the Group gains control until the date the Group ceases to control the subsidiary.
Profit or loss and each component of other comprehensive income (OCI) are attributed to the equity holders of the parent of the Group and to the non-controlling interests, even if this results in the non-controlling interests having a deficit balance. When necessary, adjustments are made to the financial statements of subsidiaries to bring their accounting policies into line with the Group’s accounting policies. All intra-group assets and liabilities, equity, income, expenses and cash flows relating to transactions between members of the Group are eliminated in full on consolidation.The financial statements of the subsidiaries are prepared for the same reporting period as the parent company, using consistent accounting policies.Non-controlling interests represent the portion of profit or loss and net assets in Howe Automotive Limited and Gosh Holdings Pty Ltd not held by the Group and are presented separately in the Consolidated Statement of Comprehensive Income and within equity in the Consolidated Statement of Financial Position.
(d) Significant accounting judgments, estimates and assumptions(i) Significant accounting judgments
In applying the Group’s accounting policies, management continually evaluates judgments, estimates and assumptions based on experience and other factors, including expectations of future events that may have an impact on the Group. All judgments, estimates and assumptions made are believed to be reasonable based on the most current set of circumstances available to management. Actual results may differ from the judgments, estimates and assumptions. Significant judgments, estimates and assumptions made by management in the preparation of these financial statements are outlined below:Operating lease commitments – Group as LessorThe Group has entered into commercial property leases on its Investment Property portfolio. The Group has determined that it retains all the significant risks and rewards of ownership of these properties and has thus classified the leases as operating leases.
(ii) Significant accounting estimates and assumptionsThe carrying amounts of certain assets and liabilities are often determined based on estimates and assumptions of future events. The key estimates and assumptions that have a significant risk of causing a material adjustment to the carrying amounts of certain assets and liabilities within the next annual reporting period are:Impairment of goodwillThe Group determines whether goodwill is impaired at least on an annual basis. This requires an estimation of the recoverable amount of the cash-generating units to which the goodwill is allocated. The assumptions used in this estimation of recoverable amount and the carrying amount of goodwill are discussed in note 20.Employee participation unitsThe Group measures the cost of cash-settled EPU termination payments in accordance with a valuation formula based on the future three-year average of 5.5 times Howe Automotive Limited’s estimated earnings before interest and tax minus the future three-year average estimated debt, discounted based on the estimated period until payment using a risk-free rate of return. The valuation has sensitivity to the estimate of future earnings. Refer note 26(c).Construction contractsRefer note 2(m).Impairment of non-financial assets other than goodwillThe Group assesses impairment of all assets at each reporting date by evaluating conditions specific to the Group and to the particular asset that may lead to impairment. These include product and manufacturing performance, technology, economic and political environments and future product expectations. If an impairment trigger exists, the recoverable amount of the asset is determined.Variable considerationThe Group estimates variable consideration to be included in the transaction price for the sale of automotive leather components with rights to claim a refund.At each reporting date, the Group estimates forecast claims as the larger value of the 12-month historical claims as a percentage of revenue from sales of automotive leather components applied to the current trade receivables balance, or the value of identified return materials authorities (RMAs) that have not yet been credited.
NOTE 2 SUMMARY OF SIGNIFICANT ACCOUNTING POLICIES (CONTINUED)
NOTES TO THE CONSOLIDATED FINANCIAL STATEMENTSyear ended 30 June 2019
SCHAFFER CORPORATION LIMITED 2019 ANNUAL REPORT22
(d) Significant accounting judgements, estimates and assumptions (continued)The Group estimates variable consideration to be included in the transaction price for the construction of precast concrete elements with rights for liquidated damages. The Group has no history of liquidated damages and accordingly has estimated forecasted liquidated damages to be nil.Estimates of expected variable consideration are sensitive to changes in circumstances and the Group’s past experience may not be representative of actual customer claims and liquidated damages in the future. Any significant change in experience as compared to history will impact the expected variable consideration in the future.Provision for expected credit losses of trade receivables and contract assetsThe provision for expected credit losses of trade receivables and contract assets is based on the historical default rates experienced by the Group, forecast economic conditions, financial strength of ongoing customers and the Group’s credit policies. The Group has suffered negligible default rates in recent years and accordingly has not provided for expected credit losses in the future. The Group’s historical credit loss experience may not be representative of actual customer defaults in the future.
(e) Foreign currency translationEach entity in the Group determines its own functional currency and items included in the financial statements of each entity are measured using that functional currency. Both the functional and presentation currency of Schaffer Corporation Limited and its Australian subsidiaries is Australian dollars.Transactions in foreign currencies are initially recorded in the functional currency at the exchange rates ruling at the date of the transaction. Monetary assets and liabilities denominated in foreign currencies are retranslated at the rate of exchange ruling at the balance sheet date. All exchange differences arising from the above procedures are taken to the Consolidated Statement of Comprehensive Income.As at the reporting date, the assets and liabilities of overseas subsidiaries (refer note 30) are translated into the presentation currency of Schaffer Corporation Limited at the rate of exchange ruling at the balance date and the Consolidated Statement of Comprehensive Income is translated at the average exchange rates for the year.The exchange differences arising on the translation are taken directly to other comprehensive income.On disposal of a foreign entity, the deferred cumulative amount recognised in the component of other comprehensive income relating to that particular foreign operation and attributable to the parent entity is recognised in the Consolidated Statement of Comprehensive Income.
(f) Investment propertiesInvestment properties are measured at cost less accumulated depreciation.Investment properties are derecognised either when they have been disposed of or when the investment property is permanently withdrawn from use and no future economic benefit is expected from its disposal. Any gains or losses on the retirement or disposal of an investment property are recognised in the Consolidated Statement of Comprehensive Income in the year of retirement or disposal.Depreciation is calculated on a straight-line basis over the estimated useful life as follows:• land – not depreciated• buildings – over 40 years• improvements – over 5 to 15 years
(g) Property, plant and equipmentProperty, plant and equipment is stated at cost less accumulated depreciation and any accumulated impairment losses. Such cost includes the cost of replacing parts that are eligible for capitalisation when the cost of replacing the parts is incurred.Depreciation is calculated on a straight-line basis over the estimated useful life of the asset as follows:• land – not depreciated• buildings – over 40 years• leasehold improvements – the shorter of the lease term and the asset’s
useful life• plant and equipment – over 5 to 15 years
(h) GoodwillGoodwill is initially recognised at cost (being the excess of the aggregate of the consideration transferred and the amount recognised for non-controlling interest and any previous interest held over the net identifiable assets acquired and the liabilities assumed). If the fair value of the net assets acquired is in excess of the aggregate consideration transferred, the Group re-assesses whether it has correctly identified all of the assets acquired and all of the liabilities assumed and reviews the procedures used to measure the amounts to be recognised at the acquisition date. If the re-assessment still results in an excess of the fair value of the net assets acquired over the aggregate consideration transferred, then the gain is recognised in profit or loss.Following initial recognition, goodwill is measured at cost less any accumulated impairment losses.Goodwill is not amortised.Goodwill is reviewed for impairment, annually or more frequently if events or changes in circumstances indicate that the carrying value may be impaired.As at the acquisition date, any goodwill acquired is allocated to each of the cash-generating units expected to benefit from the combination’s synergies.Impairment is determined by assessing the recoverable amount of the cash-generating unit to which the goodwill relates.Where the recoverable amount of the cash-generating unit is less than the carrying amount, an impairment loss is recognised.When goodwill forms part of a cash-generating unit and part of the operation within that unit is disposed of, the goodwill associated with the operation disposed is included in the carrying amount of the operation when determining the gain or loss on disposal of the operation.Goodwill disposed in this circumstance is measured on the basis of the relative values of the operation disposed and the portion of the cash-generating unit retained.Impairment losses for goodwill are not subsequently reversed.
(i) Impairment of non-financial assets other than goodwillThe Group assesses at each reporting date whether there is an indication that an asset may be impaired. If any such indication exists, or when annual impairment testing for an asset is required, the Group makes an estimate of the asset’s recoverable amount. An asset’s recoverable amount is the higher of its fair value less costs of disposal and its value-in-use and is determined for an individual asset, unless the asset does not generate cash inflows that are largely independent of those from other assets or groups of assets and the asset’s value-in-use cannot be estimated to be close to its fair value. In such cases the asset is tested for impairment as part of the cash-generating unit to which it belongs. When the carrying amount of an asset or cash-generating unit exceeds its recoverable amount, the asset or cash-generating unit is considered impaired and is written down to its recoverable amount.In assessing value-in-use, the estimated future cash flows are discounted to their present value using a pre-tax discount rate that reflects current market assessments of the time value of money and the risks specific to the asset. Impairment losses relating to continuing operations are recognised in those expense categories consistent with the function of the impaired asset unless the asset is carried at revalued amount (in which case the impairment loss is treated as a revaluation decrease).An assessment is also made at each reporting date as to whether there is any indication that previously recognised impairment losses may no longer exist or may have decreased. If such indication exists, the recoverable amount is estimated. A previously recognised impairment loss is reversed only if there has been a change in the estimates used to determine the asset’s recoverable amount since the last impairment loss was recognised. If that is the case the carrying amount of the asset is increased to its recoverable amount.That increased amount cannot exceed the carrying amount that would have been determined, net of depreciation, had no impairment loss been recognised for the asset in prior years. Such reversal is recognised in profit or loss unless the asset is carried at revalued amount, in which case the reversal is treated as a revaluation increase. After such a reversal, the depreciation charge is adjusted in future period to allocate the asset’s revised carrying amount, less any residual value, on a systematic basis over its remaining useful life.
NOTE 2 SUMMARY OF SIGNIFICANT ACCOUNTING POLICIES (CONTINUED)
NOTES TO THE CONSOLIDATED FINANCIAL STATEMENTSyear ended 30 June 2019
SCHAFFER CORPORATION LIMITED 2019 ANNUAL REPORT 23
(j) Investments and other financial assetsPrior to 1 July 2018, financial assets were in the scope of AASB 139 Financial Instruments: Recognition and Measurement and classified as financial assets at fair value through profit or loss, loans and receivables, held-to-maturity investments, or available-for-sale financial assets.When financial assets were recognised initially, they were measured at fair value plus directly attributable transaction costs. The Group determined the classification of its financial assets on initial recognition.
(i) Available-for-sale financial assetsAvailable-for-sale financial assets were non-derivatives that were either designated as available for sale or not classified in any of the other categories. They were included in current assets unless the Group intended to dispose of the investment longer than 12 months after the balance sheet date.After initial recognition, these financial assets were measured at fair value. Gains or losses were recognised as a separate component of equity until the financial asset was sold, collected or otherwise disposed, or until the financial asset was determined to be impaired, at which time the cumulative gain or loss previously reported in equity was included in the Consolidated Statement of Comprehensive Income.For financial instruments traded in organised financial markets, fair value was the current quoted market bid price for an asset or offer price for a liability.Dividends or distributions on available-for-sale equity instruments were recognised in the Consolidated Statement of Comprehensive Income when the Group’s right to receive payments as dividends or distributions was established.Purchases and sales of financial assets that required delivery of assets within the time frame generally established by regulation or convention in the market place were recognised on the trade date i.e. the date that the Group committed to purchase the asset.
(ii) Loans and receivablesLoans and receivables were non-derivative financial assets with fixed or determinable payments that were not quoted in an active market. Such assets were carried at amortised cost using the effective interest method. Gains and losses were recognised in profit or loss when the loans and receivables were derecognised or impaired, as well as through the amortisation process.
From 1 July 2018, AASB 9 Financial Instruments replaced AASB 139 Financial Instruments: Recognition and Measurement.
(i) Financial assets at fair value through profit or lessThe Group’s other financial assets are classified as financial assets at FVTPL and comprise derivative instruments, plus quoted and unquoted equity instruments which the Group has not irrevocably elected, at initial recognition or transition, to classify at FVOCI.
(ii) Debt instruments at amortised costThe Group’s debt financial assets included in other financial assets are classified as debt instruments at amortised cost as they are held with the objective of holding the financial asset to collect contractual cash flows and the cash flows are solely payments of principal and interest.
(k) InventoriesInventories are valued at the lower of cost and net realisable value except for contract work in progress.Costs incurred in bringing each product to its present location and condition are accounted for as follows:• Raw materials – purchase cost on a first-in, first-out basis.• Finished goods – cost of direct materials and labour and a proportion
of manufacturing overheads based on normal operating capacity but excluding borrowing costs. Costs are assigned on the first-in first-out basis.
Net realisable value is the estimated selling price in the ordinary course of business, less estimated costs of completion and the estimated costs necessary to make the sale.
(l) Trade and other receivablesPrior to 1 July 2018, trade receivables, which generally have 30-90 day terms, were recognised and carried at original invoice amount less an allowance for any uncollectible amounts. The carrying amount approximated fair value.Collectability of trade receivables was reviewed on an ongoing basis at an operating unit level. Individual debts that are known to be uncollectable were written off when identified. An impairment allowance was recognised when there was objective evidence that the Group would not be able to collect the receivable. Financial difficulties of the debtor or default payments were considered objective evidence of impairment. The amount of the impairment loss was the portion of the individual receivable carrying amount estimated to be uncollectable.From 1 July 2018, trade and other receivables are classified as debt instruments at amortised cost. An allowance is recognised for expected credit loss based on the Group’s historical loss experience, adjusted for forward looking factors specific to the debtors and the economic environment.The Group considers a financial asset in default when contractual payments are 30 days past due. However, in certain cases, the Group may also consider a financial asset to be in default when internal or external information indicates that the Group is unlikely to receive the outstanding contractual amounts in full before considering any credit enhancements held by the Group.
(m) Contract assets and liabilitiesContract work in progressPrior to 1 July 2018, contract work in progress for the construction of precast concrete elements within the Building Materials segment was included in trade and other receivables and stated at cost plus profit recognised to date calculated in accordance with the percentage of completion method, less a provision for foreseeable losses and progress payments received to date.A contract was not considered complete until the defects liability period had expired, and monies withheld had been received. Any expected losses on a contract were recognised immediately in the period the loss became foreseeable. That is, when it became probable that total contract costs would exceed total contract revenues.Costs included all variable and fixed costs directly related to specific construction contracts, those costs related to contract activity in general which could be allocated to specific contracts on a reasonable basis and other costs specifically chargeable under the contract. Also included were costs expected to be incurred under penalty clauses and rectification provisions.The gross amount due from customers for contract work for all contracts in progress for which costs incurred plus recognised profits (less recognised losses) exceeded progress billings, was presented in trade and other receivables.The gross amount due to customers for contract work for all contracts in progress for which progress billings exceeded costs incurred plus recognised profits (less recognised losses) was presented in other current liabilities.From 1 July 2018, contract work in progress is classified as contract assets or contract liabilities in accordance with AASB 15.Contract work in progress is stated at cost plus profit recognised to date calculated in accordance with the percentage of completion method, less an allowance for expected credit loss and progress payments received to date.An allowance for expected credit loss is based on the Group’s historical loss experience, adjusted for forward looking factors specific to the debtors and the economic environment.The gross amount due from customers for contract work for all contracts in progress for which costs incurred plus recognised profits (less recognised losses) exceeded progress billings, is presented in contract assets.The gross amount due to customers for contract work for all contracts in progress for which progress billings exceeded costs incurred plus recognised profits (less recognised losses) is presented in contract liabilities.
(n) Cash and short-term depositsCash and short-term deposits in the Consolidated Statement of Financial Position comprise cash at banks and on hand and short-term deposits with a maturity of 90 days or less.For the purpose of the Consolidated Statement of Cash Flows, cash and cash equivalents consist of cash and short-term deposits as defined above, net of outstanding bank overdrafts.
NOTE 2 SUMMARY OF SIGNIFICANT ACCOUNTING POLICIES (CONTINUED)
NOTES TO THE CONSOLIDATED FINANCIAL STATEMENTSyear ended 30 June 2019
SCHAFFER CORPORATION LIMITED 2019 ANNUAL REPORT24
(o) Interest-bearing loans and borrowingsAll loans and borrowings are initially recognised at the fair value of the consideration received less directly attributable transaction costs.After initial recognition, interest-bearing loans and borrowings are subsequently measured at amortised cost using the effective interest method.Gains and losses are recognised in profit or loss when the liabilities are derecognised.
(p) ProvisionsProvisions are recognised when the Group has a present obligation (legal or constructive) as a result of a past event, it is probable that an outflow of resources embodying economic benefits will be required to settle the obligation and a reliable estimate can be made of the amount of the obligation.Where the Group expects some or all of a provision to be reimbursed, for example under an insurance contract, the reimbursement is recognised as a separate asset but only when the reimbursement is virtually certain. The expense relating to any provision is presented in the Consolidated Statement of Comprehensive Income net of any reimbursement.If the effect of the time value of money is material, provisions are determined by discounting the expected future cash flows at a pre-tax rate that reflects current market assessments of the time value of money and, where appropriate, the risks specific to the liability.Where discounting is used, the increase in the provision due to the passage of time is recognised as a finance cost.
Restructure provisionsProvisions relating to restructures are recognised when:• the Group has a detailed formal plan for the restructuring; and• has raised a valid expectation in those affected that it will carry out
the restructuring by starting to implement it or by announcing its main features to those affected.
(q) Employee entitlementsProvision is made for employee entitlement benefits accumulated as a result of employees rendering services up to the reporting date. These benefits include wages and salaries, annual leave and long service leave, and associated taxes and on-costs. Liabilities arising in respect of employee entitlements expected to be settled within twelve months of the reporting date are measured at the amounts expected to be settled. All other employee entitlement liabilities are measured at the present value of the estimated future cash outflows to be made in respect of services provided by employees up to the reporting date. In determining the present value of future cash outflows, the interest rates attaching to national corporate bonds which have terms to maturity approximating the terms of the related liability are used. Employee entitlements, expenses and revenues arising in respect of the following categories:• wages and salaries, non-monetary benefits, annual leave, long service
leave and other leave entitlements;• other types of employee entitlements;are charged against profit or loss on a net basis in their respective categories.Contributions to defined contribution superannuation plans are expensed when incurred.
(r) Executive share option arrangementThe Directors of Schaffer Corporation Limited may grant in their absolute discretion, without payment, share options to employees under an employee share scheme approved by shareholders at the Annual General Meeting in November 1999. Each option is convertible into one ordinary share of Schaffer Corporation Limited on payment of the exercise price, after a vesting period, but prior to the expiry date.The exercise price is determined at the grant date at the absolute discretion of the Directors but not less than the greater of:• the weighted average of the last sale price on the Australian Stock
Exchange Limited of the shares in the Company for each of the five trading days on which a sale of the Company’s shares was effected immediately preceding the date on which any options are issued to any participant; and
• 20 cents.
The options hold no voting or dividend rights and are not transferable. Schaffer Corporation Limited does not provide any loans or guarantees to enable executives to finance the exercise of their options. When an executive ceases to be employed by the entity any unexercised options automatically lapse and are forfeited.The cost of these equity-settled transactions with employees is measured by reference to the fair value at the date at which they are granted. The fair value is determined using a Black-Scholes model.In valuing equity-settled transactions, no account is taken of any performance conditions, other than conditions linked to the price of the shares of Schaffer Corporation Limited (market conditions). There are no non-vesting conditions attached to the employee share scheme.The cost of equity-settled transactions is recognised, together with a corresponding increase in equity, over the period in which the performance conditions are fulfilled, ending on the date on which the relevant employees become fully entitled to the award (vesting date).The cumulative expense recognised for equity-settled transactions at each reporting date until vesting date reflects (i) the extent to which the vesting period has expired and (ii) the Group’s best estimate of the number of equity instruments that will ultimately vest. No adjustment is made for the likelihood of market performance conditions being met as the effect of these conditions is included in the determination of fair value at grant date. The Consolidated Statement of Comprehensive Income charge or credit for a period represents the movement in cumulative expense recognised as at the beginning and end of that period.No expense is recognised for awards that do not ultimately vest, except for awards where vesting is only conditional upon a market condition.If the terms of an equity-settled award are modified, as a minimum an expense is recognised as if the terms had not been modified. In addition, an expense is recognised for any modification that increases the total fair value of the share-based payment arrangement, or is otherwise beneficial to the employee, as measured at the date of modification.If an equity-settled award is cancelled, it is treated as if it had vested on the date of cancellation, and any expense not yet recognised for the award is recognised immediately. However, if a new award is substituted for the cancelled award and designated as a replacement award on the date that it is granted, the cancelled and new award are treated as if they were a modification of the original award, as described in the previous paragraph.The dilutive effect, if any, of outstanding options is reflected as additional share dilution in the computation of earnings per share (refer note 7).
(s) Employee participation unitsA controlled entity Howe Automotive Limited (Howe) may grant employee participation units (EPUs) in accordance with its Employee Incentive Plan adopted by Howe shareholders on 20 December 2001. For conditions refer to note 26(c).An EPU provides an employee with a right on termination of employment under certain conditions and in certain other circumstances to receive a cash payment from Howe. Schaffer Corporation Limited has the option to compel the employee to use the whole or part of that cash payment to subscribe for Schaffer Corporation Limited shares.The Group records a provision for EPU termination entitlements calculated using estimates of the probable future EPU cash payments for issued EPUs discounted based on the estimated period until payment using a risk-free rate of return. The amount estimated for EPU cash payments on termination is calculated in accordance with an equity valuation formula based on the three-year average, including one full year following termination, of 5.5 times Howe Automotive Limited’s estimated earnings before interest and tax minus debt.EPUs are cancelled once they are paid out. EPUs are also cancelled if the employee ceases to be an employee prior to the third anniversary of the grant date for any reason other than death or permanent disablement, if the employee acts in competition with Howe after the third anniversary but prior to pay out, or if the employee is a director or general manager and does not provide a minimum of 90 days’ notice of intention to terminate employment.Howe may at any time amend this plan, but amendments cannot prejudice the accrued rights of an employee without consent of not less than 75% in the number of employees who hold EPUs at the time of the amendment.
NOTE 2 SUMMARY OF SIGNIFICANT ACCOUNTING POLICIES (CONTINUED)
NOTES TO THE CONSOLIDATED FINANCIAL STATEMENTSyear ended 30 June 2019
SCHAFFER CORPORATION LIMITED 2019 ANNUAL REPORT 25
(t) LeasesThe determination of whether an arrangement is or contains a lease is based on the substance of the arrangement and requires an assessment of whether the fulfilment of the arrangements is dependent on the use of a specific asset or assets and the arrangement conveys a right to use the asset.
(i) Group as LesseeFinance leases, which transfer to the Group substantially all the risks and benefits incidental to ownership of the leased item, are capitalised at the inception of the lease at the fair value of the leased property or, if lower, at the present value of the minimum lease payments.Lease payments are apportioned between the finance charges and reduction of the lease liability so as to achieve a constant rate of interest on the remaining balance of the liability. Finance charges are recognised as an expense in the Consolidated Statement of Comprehensive Income.Capitalised leased assets are depreciated over the shorter of the estimated useful life of the asset or the lease term.Operating lease payments are recognised as an expense in the Consolidated Statement of Comprehensive Income on a straight-line basis over the lease term.
(ii) Group as LessorLeases where the Group retains substantially all the risks and benefits of ownership of the asset are classified as operating leases. Initial direct costs incurred in negotiating an operating lease are added to the carrying amount of the leased asset and recognised over the lease term on the same basis as the rental income.
(u) Revenue recognitionSale of GoodsPrior to 1 July 2018, revenue was recognised when the significant risks and rewards of ownership of the goods had passed to the buyer and could be measured reliably. Risks and rewards were considered passed to the buyer at the time control of the goods had passed to the customer.From 1 July 2018:Automotive leather components – Revenue is recognised at the point in time when control of the goods is transferred to the customer, generally on collection by the customer. The contracts for the sale of automotive leather components provide customers with the right to claim a credit or refund for components that don’t satisfy agreed quality standards. The customer’s right to claim is a variable consideration that is estimated at contract inception and constrained until the associated uncertainty is resolved. The estimate of constrained revenue is based on all available information including historic performance and is recognised to the extent that it is highly probable that a significant reversal of revenue will not occur. Payment terms are generally 30 to 90 days.Hospitality sales – Revenue is recognised at the points in time when control of the goods is transferred to the customer.Construction contractsPrior to 1 July 2018, construction contracts revenues and expenses were recognised on an individual contract basis using the percentage of completion method. Once the outcome of a construction contract could be estimated reliably based on a review of the terms and conditions applicable to each individual contract, contract revenues and expenses were recognised in the Consolidated Statement of Comprehensive Income in proportion to the stage of completion of the contract. The stage of completion was measured by reference to actual costs incurred to date as a percentage of estimated total costs for each contract. The Group had determined that the outcome of its construction contracts could usually be reliably estimated at the commencement of the contract. Where the outcome of a contract could not be reliably determined, contract costs were expensed as incurred. Where it is probable that the costs would be recovered, revenue is recognised to the extent of costs incurred. Where it is probable that a loss will arise from a construction contract, the excess of total expected costs over revenue is recognised as an expense immediately.From 1 July 2018, the Group recognises construction services revenue and expenses on an individual contract basis using the percentage of completion method based on cost inputs which align with the calculation of the contractually enforceable obligation a customer must pay for work completed to date. Once the financial outcome of a construction contract can be estimated reliably, contract revenues and expenses are recognised in the Consolidated Statement of Comprehensive Income in proportion to the
stage of completion of the contract. Where modifications in design or contract requirements are entered into, the transaction price is updated to reflect these. Where the price of a modification has not been confirmed, an estimate is made of the amount of revenue to recognise whilst also considering any constrained revenue requirement. Payment terms are generally 30 to 45 days. The Group generally warrants that it will rectify construction works deemed defective for between 5 and 10 years from completion of the works.TransportThe Group recognises transport revenue on an individual contract basis once performance of the service is completed. Payment terms are generally 30 to 45 days.Interest incomeRevenue is recognised as the interest accrues (using the effective interest method, which is the rate that exactly discounts estimated future cash receipts through the expected life of the financial instrument to the net carrying amount of the financial asset).Dividends and distributionsRevenue is recognised when the shareholders’ or unitholders’ right to receive the payment is established.Rental incomeRental income arising on investment properties is accounted for on a straight-line basis over the lease term. Contingent rental income is recognised as income in the periods in which it is earned.
(v) Income taxCurrent tax assets and liabilities for the current and prior periods are measured at the amount expected to be recovered from or paid to the taxation authorities. The tax rates and tax laws used to compute the amount are those that are enacted or substantively enacted by the balance date.Deferred income tax is provided on all temporary differences at the balance date between the tax bases of assets and liabilities and their carrying amounts for financial reporting purposes.Deferred income tax liabilities are recognised for all taxable temporary differences except:• where the deferred income tax liability arises from the initial recognition
of goodwill or of an asset or liability in a transaction that is not a business combination and that at the time of the transaction, affects neither the accounting profit nor taxable profit or loss; or
• where taxable temporary differences associated with investments in subsidiaries, associates and undivided interests, and the timing of the reversal of the temporary differences can be controlled and it is probable that the temporary differences will not reverse in the foreseeable future.
Deferred income tax assets are recognised for all deductible temporary differences, carry-forward of unused tax assets and unused tax losses, to the extent that it is probable that taxable profit will be available against which the deductible temporary differences, and the carry-forward of unused tax credits and unused tax losses can be utilised except:• where the deferred income tax asset relating to the deductible temporary
differences arises from the initial recognition of an asset or liability in a transaction that is not a business combination and, at the time of the transaction, affects neither the accounting profit nor taxable profit or loss; or
• where the deductible temporary differences is associated with investments in subsidiaries, or interests in joint ventures, in which case a deferred tax asset is only recognised to the extent that it is probable that the temporary differences will reverse in the foreseeable future and taxable profit will be available against which the temporary difference can be utilised.
The carrying amount of deferred income tax assets is reviewed at each balance date and reduced to the extent that it is no longer probable that sufficient taxable profit will be available to allow all or part of the deferred income tax asset to be utilised.Unrecognised deferred income tax assets are reassessed at each balance date and are recognised to the extent that it has become probable that future taxable profit will allow the deferred tax asset to be recovered.Deferred income tax assets and liabilities are measured at the tax rates that are expected to apply to the year when the asset is realised, or the liability is settled, based on tax rates (and tax laws) that have been enacted or substantively enacted at the balance date.Income taxes relating to items recognised directly in equity are recognised in equity and not in the profit or loss.
NOTE 2 SUMMARY OF SIGNIFICANT ACCOUNTING POLICIES (CONTINUED)
NOTES TO THE CONSOLIDATED FINANCIAL STATEMENTSyear ended 30 June 2019
SCHAFFER CORPORATION LIMITED 2019 ANNUAL REPORT26
(v) Income tax (continued)Deferred tax assets and deferred tax liabilities are offset only if a legally enforceable right exists to set off current tax assets against current tax liabilities and the deferred tax assets and liabilities relate to the same taxable entity and the same taxation authority.The Company and all its wholly-owned Australian resident subsidiaries are part of a tax consolidated group. The Company, being the head entity in a tax consolidated group, assumes the current tax liability and any deferred tax assets arising from tax losses and other unused tax credits of the subsidiaries in the tax consolidated group. Deferred tax balances of the subsidiaries in the tax consolidated group are not assumed by the Parent entity.The Group allocates the tax balances for the period using the Group allocation approach, and a tax funding arrangement is in place to reimburse the parent entity for any liabilities of the subsidiaries it assumes and conversely, for the parent entity to reimburse the subsidiaries for any recognised tax losses it assumes.
(w) Other taxesRevenues, expenses and assets are recognised net of the amount of goods and services tax (‘GST’) except:• where the GST incurred on a purchase of goods and services is not
recoverable from the taxation authority, in which case the GST is recognised as part of the cost of acquisition of the asset or as part of the expense item as applicable; and
• receivables and payables are stated with the amount of GST included.The net amount of GST recoverable from, or payable to, the taxation authority is included as part of receivables or payables in the Consolidated Statement of Financial Position.Cash flows are included in the Consolidated Statement of Cash Flows on a gross basis and the GST component of cash flows arising from investing and financing activities, which is recoverable from, or payable to, the taxation authority are classified as operating cash flows.Commitments and contingencies are disclosed net of the amount of GST recoverable from, or payable to, the taxation authority.
(x) Derivative financial instrumentsThe Group uses derivative financial instruments such as forward currency contracts and interest rate swaps to manage its risks associated with foreign currency and interest rate fluctuations. Such derivative financial instruments are initially recognised at fair value on the date on which a derivative contract is entered into and are subsequently remeasured to fair value. Derivatives are carried as assets when their fair value is positive and as liabilities when their fair value is negative.The Group has determined that these derivatives do not qualify for hedge accounting and as such, any gains or losses arising from changes in fair value are taken directly to the Consolidated Statement of Comprehensive Income.Forward exchange contractsThe fair value of forward currency contracts is calculated by reference to current forward exchange rates for contracts with similar maturity profiles.Interest rate swapsThe fair value of interest rate swap contracts is determined by reference to market values for similar instruments.
(y) Contributed equityOrdinary shares are classified as equity. Incremental costs directly attributable to the issue of new shares or options are shown in equity as a deduction, net of tax, from the proceeds.
(z) Earnings per shareBasic earnings per share is calculated as net profit attributable to members of the Parent adjusted to exclude costs of servicing equity (other than dividends), divided by the weighted average number of ordinary shares outstanding during the period, adjusted for any bonus element. Diluted earnings per share, is calculated as net profit attributable to members adjusted for:• costs of servicing equity (other than dividends);• the after-tax effect of dividends and interest associated with dilutive
potential ordinary shares that have been recognised as expenses; and• other non-discretionary changes in revenues or expenses during the
period that would result from the dilution of potential ordinary shares;divided by the weighted average number of ordinary shares outstanding during the period and dilutive potential ordinary shares, adjusted for any bonus element.
(aa) Borrowing costsBorrowing costs directly attributable to the acquisition, construction or production of a qualifying asset (i.e. an asset that necessarily takes a substantial period of time to get ready for its intended use or sale) are capitalised as part of the cost of that asset. All other borrowing costs are expensed in the period they occur. Borrowing costs consist of interest and other costs that an entity incurs in connection with the borrowing of funds.
(ab) Trade and other payablesTrade payables and other payables are carried at amortised costs and represent liabilities for goods and services provided to the Group prior to the end of the financial year that are unpaid and arise when the Group become obliged to make future payments in respect of the purchase of these goods and services. The carrying amount approximates fair value.
(ac) Research costsResearch costs are expensed as incurred.
(ad) Business combinationsBusiness combinations are accounted for using the acquisition method. The consideration transferred in a business combination shall be measured at fair value, which shall be calculated as the sum of the acquisition date fair values of the assets transferred by the acquirer, the liabilities incurred by the acquirer to former owners of the acquire, the equity issued by the acquirer, and the amount of any non-controlling interest in the acquiree. For each business combination, the acquirer measures the non-controlling interest in the acquiree either at fair value or at the proportionate share of the acquiree’s identifiable net assets. Acquisition-related costs are expensed as incurred.When the Group acquires a business, it assesses the financial assets and liabilities assumed for appropriate classification and designation in accordance with the contractual terms, economic conditions, the Group’s operating or accounting policies and other pertinent conditions as at the acquisition date. This includes the separation of embedded derivatives in host contracts by the acquiree.If the business combination is achieved in stages, the acquisition date fair value of the acquirer’s previously held equity interest in the acquiree is remeasured at fair value as at the acquisition date through profit or loss.Any contingent consideration to be transferred by the acquirer will be recognised at fair value at the acquisition date. Subsequent changes to the fair value of the contingent consideration which is deemed to be an asset or liability will be recognised in accordance with AASB 139 either in profit or loss or in other comprehensive income. If the contingent consideration is classified as equity, it shall not be remeasured.The excess of the cost of the business combination over the net fair value of the Group’s share of the identifiable net assets acquired is recognised as goodwill. If the cost of acquisition is less than the Group’s share of the net fair value of the identifiable net assets of the subsidiary, the difference is recognised as a gain in the Consolidated Statement of Comprehensive Income, but only after a reassessment of the identification and measurement of the net assets acquired.
(ae) Discontinued operationsA discontinued operation is a component of the entity that has been disposed of or is classified as held for sale and that represents a separate major line of business or geographical area of operations, is part of a single coordinated plan to dispose of such a line of business or area of operations, or is a subsidiary acquired exclusively with a view to resale. The results of discontinued operations are presently separately on the face of the Consolidated Statement of Comprehensive Income and the assets and liabilities are presented separately on the face of the Consolidated Statement of Financial Position.
(af) Non-current assets held for saleNon-current assets classified as held for sale are measured at the lower of their carrying amount and fair value less costs of disposal. Non-current assets are classified as held for sale if their carrying amounts will be recovered principally through a sale transaction rather than through continuing use. This condition is regarded as met only when the sale is highly probable, and the asset is available for immediate sale in its present condition. Management must be committed to the sale, which should be expected to qualify for recognition as a completed sale within one year from the date of classification.Property, plant and equipment and intangible assets once classified as held for sale are not depreciated or amortised.
NOTE 2 SUMMARY OF SIGNIFICANT ACCOUNTING POLICIES (continued)
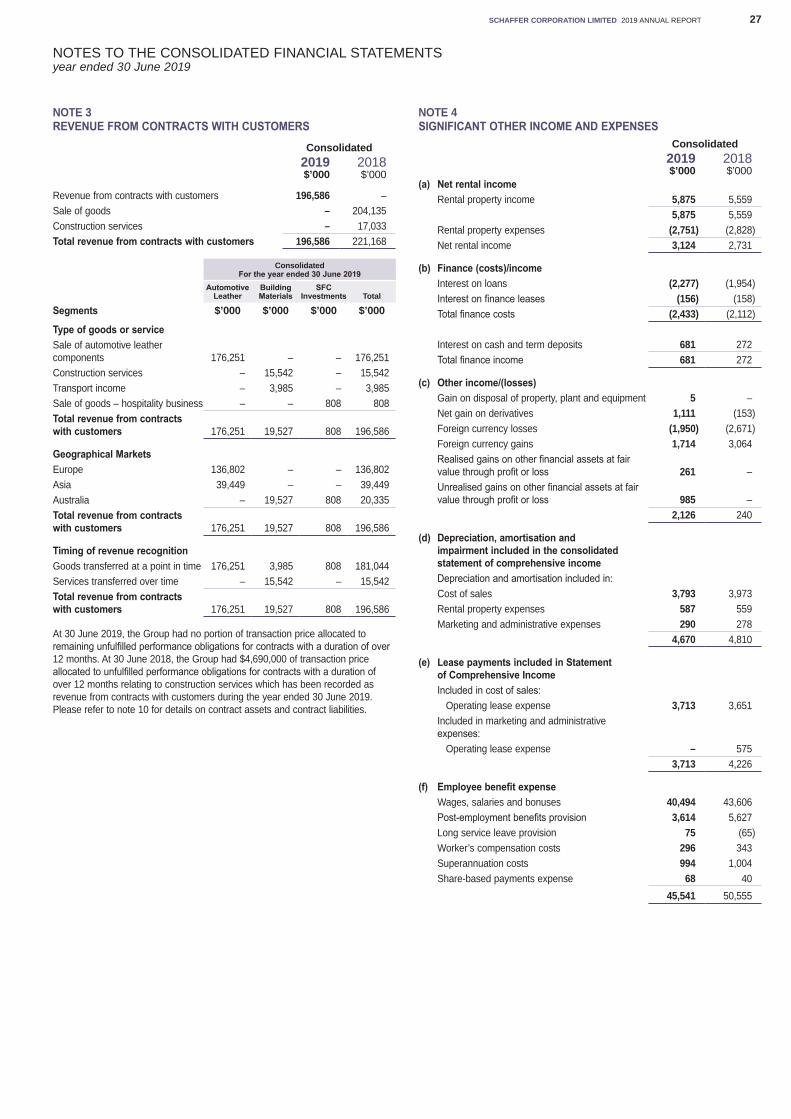
NOTES TO THE CONSOLIDATED FINANCIAL STATEMENTSyear ended 30 June 2019
SCHAFFER CORPORATION LIMITED 2019 ANNUAL REPORT 27
NOTE 3 REVENUE FROM CONTRACTS WITH CUSTOMERS
Consolidated2019 2018$’000 $’000
Revenue from contracts with customers 196,586 –Sale of goods – 204,135Construction services – 17,033Total revenue from contracts with customers 196,586 221,168
ConsolidatedFor the year ended 30 June 2019
AutomotiveLeather
BuildingMaterials
SFC Investments Total
Segments $’000 $’000 $’000 $’000
Type of goods or serviceSale of automotive leather components 176,251 – – 176,251Construction services – 15,542 – 15,542Transport income – 3,985 – 3,985Sale of goods – hospitality business – – 808 808Total revenue from contracts with customers 176,251 19,527 808 196,586
Geographical MarketsEurope 136,802 – – 136,802Asia 39,449 – – 39,449Australia – 19,527 808 20,335Total revenue from contracts with customers 176,251 19,527 808 196,586
Timing of revenue recognitionGoods transferred at a point in time 176,251 3,985 808 181,044Services transferred over time – 15,542 – 15,542Total revenue from contracts with customers 176,251 19,527 808 196,586
At 30 June 2019, the Group had no portion of transaction price allocated to remaining unfulfilled performance obligations for contracts with a duration of over 12 months. At 30 June 2018, the Group had $4,690,000 of transaction price allocated to unfulfilled performance obligations for contracts with a duration of over 12 months relating to construction services which has been recorded as revenue from contracts with customers during the year ended 30 June 2019. Please refer to note 10 for details on contract assets and contract liabilities.
NOTE 4 SIGNIFICANT OTHER INCOME AND EXPENSES
Consolidated2019 2018$’000 $’000
(a) Net rental incomeRental property income 5,875 5,559
5,875 5,559Rental property expenses (2,751) (2,828)Net rental income 3,124 2,731
(b) Finance (costs)/incomeInterest on loans (2,277) (1,954)Interest on finance leases (156) (158)Total finance costs (2,433) (2,112)
Interest on cash and term deposits 681 272Total finance income 681 272
(c) Other income/(losses)Gain on disposal of property, plant and equipment 5 –Net gain on derivatives 1,111 (153)Foreign currency losses (1,950) (2,671)Foreign currency gains 1,714 3,064Realised gains on other financial assets at fair value through profit or loss 261 –Unrealised gains on other financial assets at fair value through profit or loss 985 –
2,126 240
(d) Depreciation, amortisation and impairment included in the consolidated statement of comprehensive incomeDepreciation and amortisation included in:Cost of sales 3,793 3,973Rental property expenses 587 559Marketing and administrative expenses 290 278
4,670 4,810
(e) Lease payments included in Statement of Comprehensive IncomeIncluded in cost of sales: Operating lease expense 3,713 3,651Included in marketing and administrative expenses: Operating lease expense – 575
3,713 4,226
(f) Employee benefit expenseWages, salaries and bonuses 40,494 43,606Post-employment benefits provision 3,614 5,627Long service leave provision 75 (65)Worker’s compensation costs 296 343Superannuation costs 994 1,004Share-based payments expense 68 40
45,541 50,555
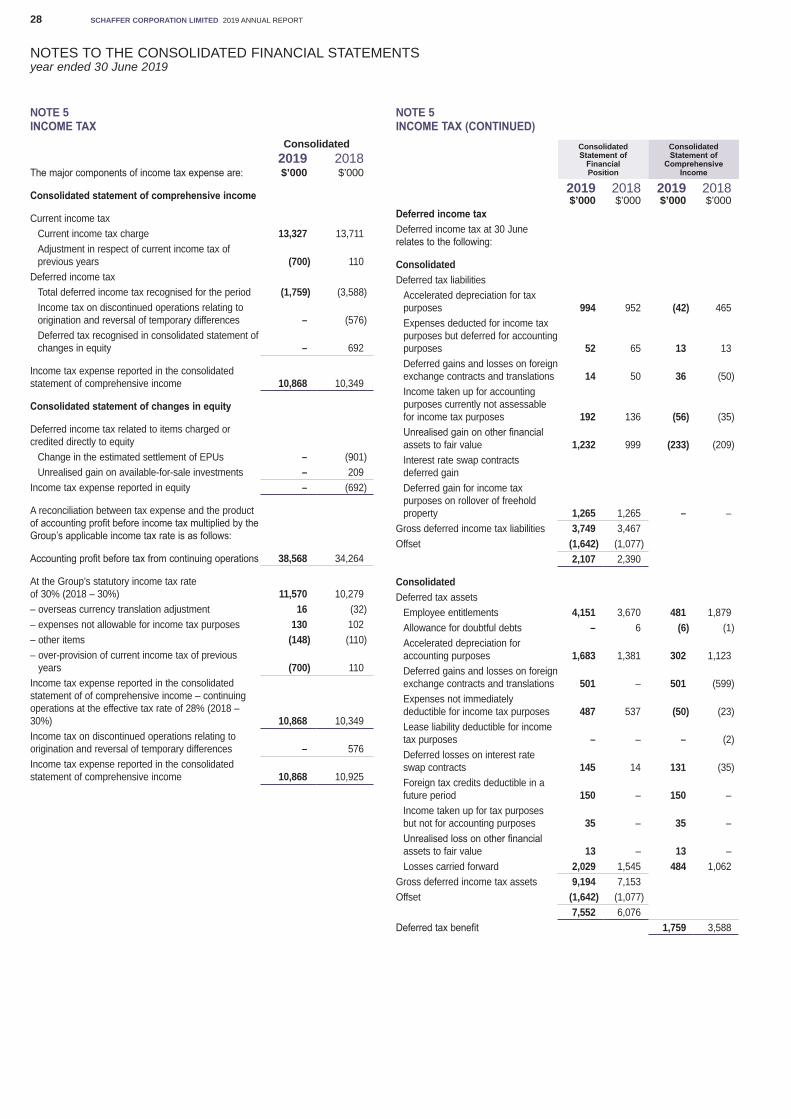
NOTES TO THE CONSOLIDATED FINANCIAL STATEMENTSyear ended 30 June 2019
SCHAFFER CORPORATION LIMITED 2019 ANNUAL REPORT28
NOTE 5 INCOME TAX (CONTINUED)
Consolidated Statement of
Financial Position
Consolidated Statement of
Comprehensive Income
2019 2018 2019 2018$’000 $’000 $’000 $’000
Deferred income taxDeferred income tax at 30 June relates to the following:
ConsolidatedDeferred tax liabilities
Accelerated depreciation for tax purposes 994 952 (42) 465Expenses deducted for income tax purposes but deferred for accounting purposes 52 65 13 13Deferred gains and losses on foreign exchange contracts and translations 14 50 36 (50)Income taken up for accounting purposes currently not assessable for income tax purposes 192 136 (56) (35)Unrealised gain on other financial assets to fair value 1,232 999 (233) (209)Interest rate swap contracts deferred gainDeferred gain for income tax purposes on rollover of freehold property 1,265 1,265 – –
Gross deferred income tax liabilities 3,749 3,467Offset (1,642) (1,077)
2,107 2,390
ConsolidatedDeferred tax assets
Employee entitlements 4,151 3,670 481 1,879Allowance for doubtful debts – 6 (6) (1)Accelerated depreciation for accounting purposes 1,683 1,381 302 1,123Deferred gains and losses on foreign exchange contracts and translations 501 – 501 (599)Expenses not immediately deductible for income tax purposes 487 537 (50) (23)Lease liability deductible for income tax purposes – – – (2)Deferred losses on interest rate swap contracts 145 14 131 (35)Foreign tax credits deductible in a future period 150 – 150 –Income taken up for tax purposes but not for accounting purposes 35 – 35 –Unrealised loss on other financial assets to fair value 13 – 13 –Losses carried forward 2,029 1,545 484 1,062
Gross deferred income tax assets 9,194 7,153Offset (1,642) (1,077)
7,552 6,076Deferred tax benefit 1,759 3,588
NOTE 5 INCOME TAX
Consolidated2019 2018
The major components of income tax expense are: $’000 $’000
Consolidated statement of comprehensive income
Current income taxCurrent income tax charge 13,327 13,711Adjustment in respect of current income tax of previous years (700) 110
Deferred income taxTotal deferred income tax recognised for the period (1,759) (3,588)Income tax on discontinued operations relating to origination and reversal of temporary differences – (576)Deferred tax recognised in consolidated statement of changes in equity – 692
Income tax expense reported in the consolidated statement of comprehensive income 10,868 10,349
Consolidated statement of changes in equity
Deferred income tax related to items charged or credited directly to equity
Change in the estimated settlement of EPUs – (901)Unrealised gain on available-for-sale investments – 209
Income tax expense reported in equity – (692)
A reconciliation between tax expense and the product of accounting profit before income tax multiplied by the Group’s applicable income tax rate is as follows:
Accounting profit before tax from continuing operations 38,568 34,264
At the Group’s statutory income tax rate of 30% (2018 – 30%) 11,570 10,279– overseas currency translation adjustment 16 (32)– expenses not allowable for income tax purposes 130 102– other items (148) (110)– over-provision of current income tax of previous
years (700) 110Income tax expense reported in the consolidated statement of of comprehensive income – continuing operations at the effective tax rate of 28% (2018 – 30%) 10,868 10,349Income tax on discontinued operations relating to origination and reversal of temporary differences – 576Income tax expense reported in the consolidated statement of comprehensive income 10,868 10,925
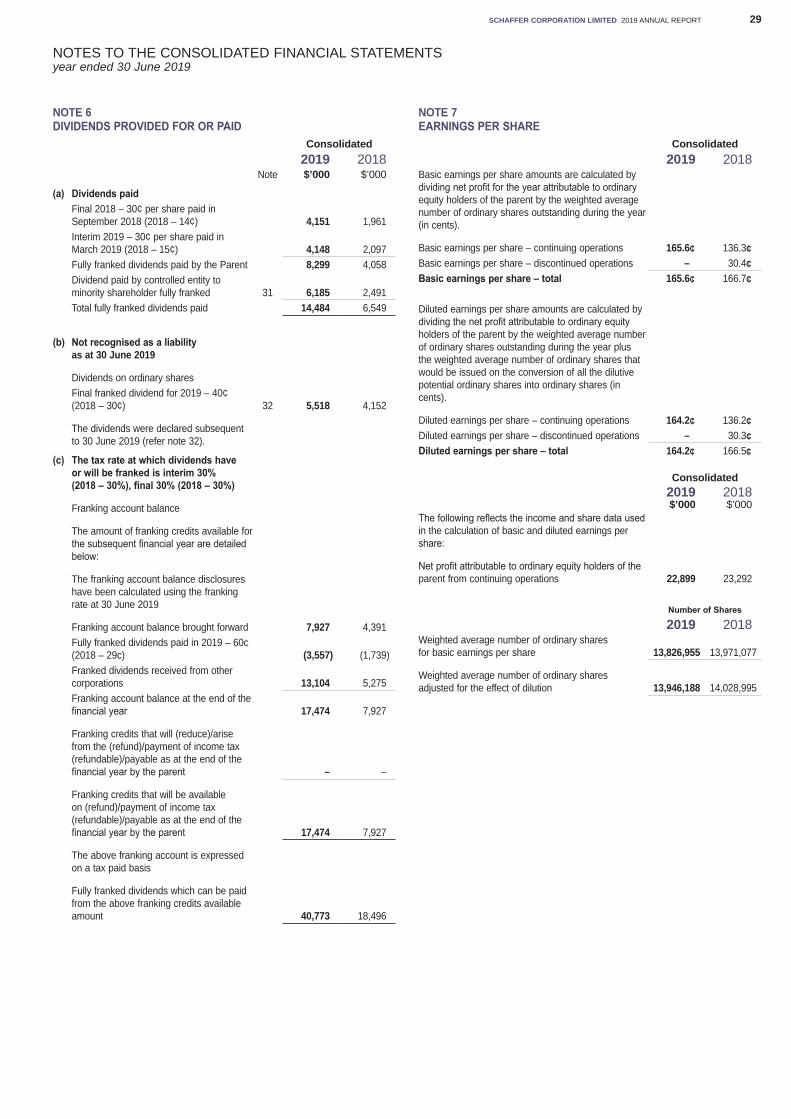
NOTES TO THE CONSOLIDATED FINANCIAL STATEMENTSyear ended 30 June 2019
SCHAFFER CORPORATION LIMITED 2019 ANNUAL REPORT 29
NOTE 6 DIVIDENDS PROVIDED FOR OR PAID
Consolidated2019 2018
Note $’000 $’000
(a) Dividends paidFinal 2018 – 30¢ per share paid in September 2018 (2018 – 14¢) 4,151 1,961Interim 2019 – 30¢ per share paid in March 2019 (2018 – 15¢) 4,148 2,097Fully franked dividends paid by the Parent 8,299 4,058Dividend paid by controlled entity to minority shareholder fully franked 31 6,185 2,491Total fully franked dividends paid 14,484 6,549
(b) Not recognised as a liability as at 30 June 2019
Dividends on ordinary sharesFinal franked dividend for 2019 – 40¢ (2018 – 30¢) 32 5,518 4,152
The dividends were declared subsequent to 30 June 2019 (refer note 32).
(c) The tax rate at which dividends have or will be franked is interim 30% (2018 – 30%), final 30% (2018 – 30%)
Franking account balance
The amount of franking credits available for the subsequent financial year are detailed below:
The franking account balance disclosures have been calculated using the franking rate at 30 June 2019
Franking account balance brought forward 7,927 4,391Fully franked dividends paid in 2019 – 60c (2018 – 29c) (3,557) (1,739)Franked dividends received from other corporations 13,104 5,275Franking account balance at the end of the financial year 17,474 7,927
Franking credits that will (reduce)/arise from the (refund)/payment of income tax (refundable)/payable as at the end of the financial year by the parent – –
Franking credits that will be available on (refund)/payment of income tax (refundable)/payable as at the end of the financial year by the parent 17,474 7,927
The above franking account is expressed on a tax paid basis
Fully franked dividends which can be paid from the above franking credits available amount 40,773 18,496
NOTE 7 EARNINGS PER SHARE
Consolidated2019 2018
Basic earnings per share amounts are calculated by dividing net profit for the year attributable to ordinary equity holders of the parent by the weighted average number of ordinary shares outstanding during the year (in cents).
Basic earnings per share – continuing operations 165.6₵ 136.3₵
Basic earnings per share – discontinued operations – 30.4₵
Basic earnings per share – total 165.6₵ 166.7₵
Diluted earnings per share amounts are calculated by dividing the net profit attributable to ordinary equity holders of the parent by the weighted average number of ordinary shares outstanding during the year plus the weighted average number of ordinary shares that would be issued on the conversion of all the dilutive potential ordinary shares into ordinary shares (in cents).
Diluted earnings per share – continuing operations 164.2₵ 136.2₵
Diluted earnings per share – discontinued operations – 30.3₵
Diluted earnings per share – total 164.2₵ 166.5₵
Consolidated2019 2018$’000 $’000
The following reflects the income and share data used in the calculation of basic and diluted earnings per share:
Net profit attributable to ordinary equity holders of the parent from continuing operations 22,899 23,292
Number of Shares
2019 2018Weighted average number of ordinary shares for basic earnings per share 13,826,955 13,971,077
Weighted average number of ordinary shares adjusted for the effect of dilution 13,946,188 14,028,995
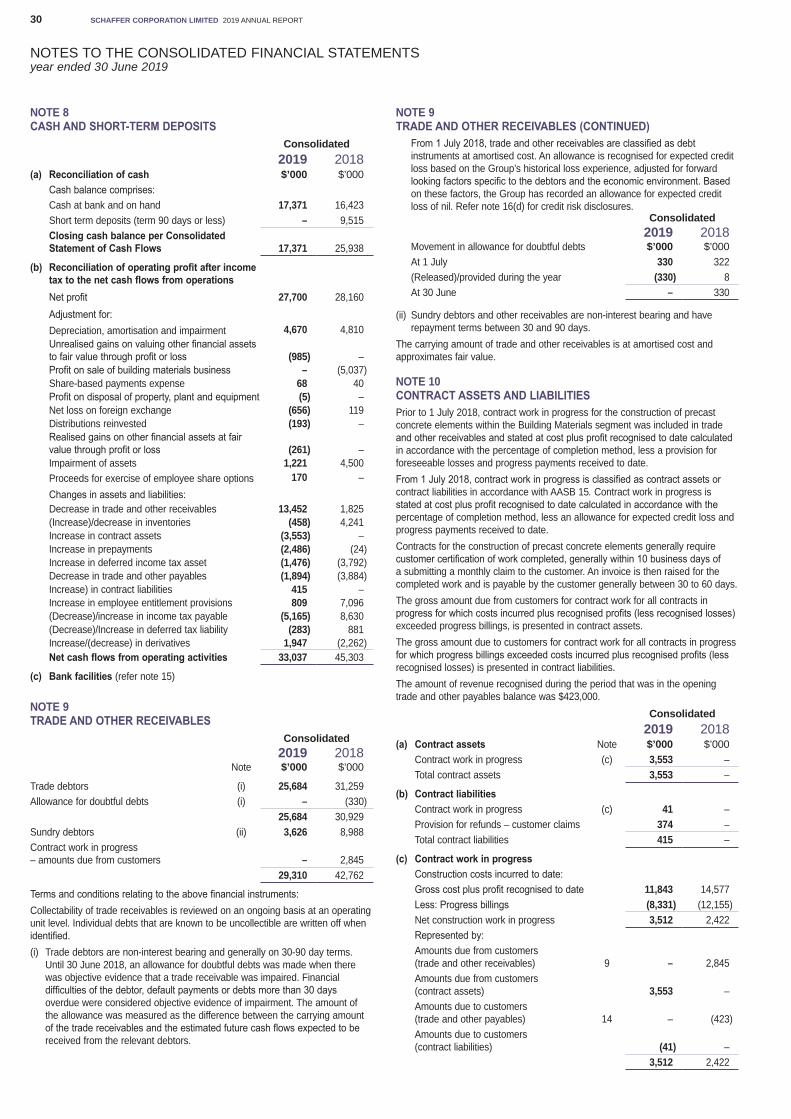
NOTES TO THE CONSOLIDATED FINANCIAL STATEMENTSyear ended 30 June 2019
SCHAFFER CORPORATION LIMITED 2019 ANNUAL REPORT30
NOTE 8 CASH AND SHORT-TERM DEPOSITS
Consolidated2019 2018
(a) Reconciliation of cash $’000 $’000Cash balance comprises:Cash at bank and on hand 17,371 16,423Short term deposits (term 90 days or less) – 9,515Closing cash balance per Consolidated Statement of Cash Flows 17,371 25,938
(b) Reconciliation of operating profit after income tax to the net cash flows from operationsNet profit 27,700 28,160Adjustment for:Depreciation, amortisation and impairment 4,670 4,810Unrealised gains on valuing other financial assets to fair value through profit or loss (985) –Profit on sale of building materials business – (5,037)Share-based payments expense 68 40Profit on disposal of property, plant and equipment (5) –Net loss on foreign exchange (656) 119Distributions reinvested (193) –Realised gains on other financial assets at fair value through profit or loss (261) –Impairment of assets 1,221 4,500Proceeds for exercise of employee share options 170 –Changes in assets and liabilities:Decrease in trade and other receivables 13,452 1,825(Increase)/decrease in inventories (458) 4,241Increase in contract assets (3,553) –Increase in prepayments (2,486) (24)Increase in deferred income tax asset (1,476) (3,792)Decrease in trade and other payables (1,894) (3,884)Increase) in contract liabilities 415 –Increase in employee entitlement provisions 809 7,096(Decrease)/increase in income tax payable (5,165) 8,630(Decrease)/Increase in deferred tax liability (283) 881Increase/(decrease) in derivatives 1,947 (2,262)Net cash flows from operating activities 33,037 45,303
(c) Bank facilities (refer note 15)
NOTE 9 TRADE AND OTHER RECEIVABLES
Consolidated2019 2018
Note $’000 $’000
Trade debtors (i) 25,684 31,259Allowance for doubtful debts (i) – (330)
25,684 30,929Sundry debtors (ii) 3,626 8,988Contract work in progress – amounts due from customers – 2,845
29,310 42,762
Terms and conditions relating to the above financial instruments:Collectability of trade receivables is reviewed on an ongoing basis at an operating unit level. Individual debts that are known to be uncollectible are written off when identified.(i) Trade debtors are non-interest bearing and generally on 30-90 day terms.
Until 30 June 2018, an allowance for doubtful debts was made when there was objective evidence that a trade receivable was impaired. Financial difficulties of the debtor, default payments or debts more than 30 days overdue were considered objective evidence of impairment. The amount of the allowance was measured as the difference between the carrying amount of the trade receivables and the estimated future cash flows expected to be received from the relevant debtors.
NOTE 9 TRADE AND OTHER RECEIVABLES (CONTINUED) From 1 July 2018, trade and other receivables are classified as debt
instruments at amortised cost. An allowance is recognised for expected credit loss based on the Group’s historical loss experience, adjusted for forward looking factors specific to the debtors and the economic environment. Based on these factors, the Group has recorded an allowance for expected credit loss of nil. Refer note 16(d) for credit risk disclosures.
Consolidated2019 2018
Movement in allowance for doubtful debts $’000 $’000At 1 July 330 322(Released)/provided during the year (330) 8At 30 June – 330
(ii) Sundry debtors and other receivables are non-interest bearing and have repayment terms between 30 and 90 days.
The carrying amount of trade and other receivables is at amortised cost and approximates fair value.
NOTE 10 CONTRACT ASSETS AND LIABILITIESPrior to 1 July 2018, contract work in progress for the construction of precast concrete elements within the Building Materials segment was included in trade and other receivables and stated at cost plus profit recognised to date calculated in accordance with the percentage of completion method, less a provision for foreseeable losses and progress payments received to date.From 1 July 2018, contract work in progress is classified as contract assets or contract liabilities in accordance with AASB 15. Contract work in progress is stated at cost plus profit recognised to date calculated in accordance with the percentage of completion method, less an allowance for expected credit loss and progress payments received to date.Contracts for the construction of precast concrete elements generally require customer certification of work completed, generally within 10 business days of a submitting a monthly claim to the customer. An invoice is then raised for the completed work and is payable by the customer generally between 30 to 60 days.The gross amount due from customers for contract work for all contracts in progress for which costs incurred plus recognised profits (less recognised losses) exceeded progress billings, is presented in contract assets.The gross amount due to customers for contract work for all contracts in progress for which progress billings exceeded costs incurred plus recognised profits (less recognised losses) is presented in contract liabilities.The amount of revenue recognised during the period that was in the opening trade and other payables balance was $423,000.
Consolidated2019 2018
(a) Contract assets Note $’000 $’000Contract work in progress (c) 3,553 –Total contract assets 3,553 –
(b) Contract liabilitiesContract work in progress (c) 41 –Provision for refunds – customer claims 374 –Total contract liabilities 415 –
(c) Contract work in progressConstruction costs incurred to date:Gross cost plus profit recognised to date 11,843 14,577Less: Progress billings (8,331) (12,155)Net construction work in progress 3,512 2,422Represented by:Amounts due from customers (trade and other receivables) 9 – 2,845Amounts due from customers (contract assets) 3,553 –Amounts due to customers (trade and other payables) 14 – (423)Amounts due to customers (contract liabilities) (41) –
3,512 2,422
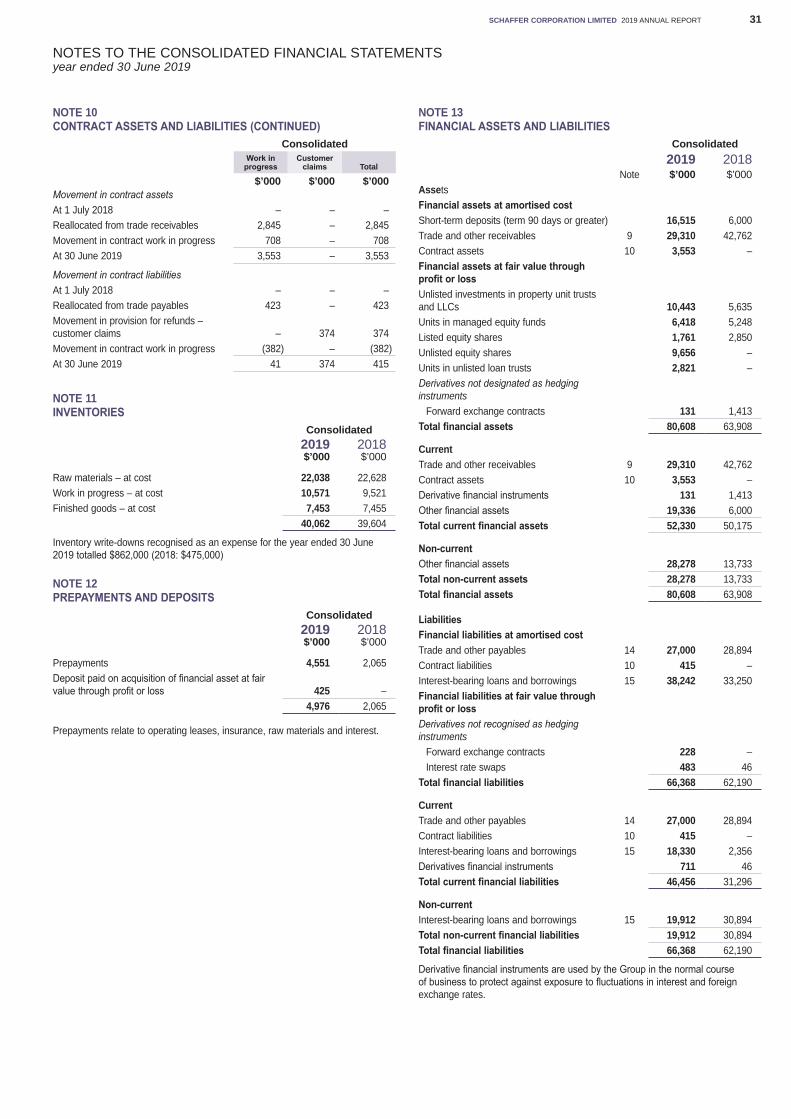
NOTES TO THE CONSOLIDATED FINANCIAL STATEMENTSyear ended 30 June 2019
SCHAFFER CORPORATION LIMITED 2019 ANNUAL REPORT 31
NOTE 10 CONTRACT ASSETS AND LIABILITIES (CONTINUED)
ConsolidatedWork in
progressCustomer
claims Total
$’000 $’000 $’000Movement in contract assetsAt 1 July 2018 – – –Reallocated from trade receivables 2,845 – 2,845Movement in contract work in progress 708 – 708At 30 June 2019 3,553 – 3,553
Movement in contract liabilitiesAt 1 July 2018 – – –Reallocated from trade payables 423 – 423Movement in provision for refunds – customer claims – 374 374Movement in contract work in progress (382) – (382)At 30 June 2019 41 374 415
NOTE 11 INVENTORIES
Consolidated2019 2018$’000 $’000
Raw materials – at cost 22,038 22,628Work in progress – at cost 10,571 9,521Finished goods – at cost 7,453 7,455
40,062 39,604
Inventory write-downs recognised as an expense for the year ended 30 June 2019 totalled $862,000 (2018: $475,000)
NOTE 12 PREPAYMENTS AND DEPOSITS
Consolidated2019 2018$’000 $’000
Prepayments 4,551 2,065Deposit paid on acquisition of financial asset at fair value through profit or loss 425 –
4,976 2,065
Prepayments relate to operating leases, insurance, raw materials and interest.
NOTE 13 FINANCIAL ASSETS AND LIABILITIES
Consolidated2019 2018
Note $’000 $’000AssetsFinancial assets at amortised costShort-term deposits (term 90 days or greater) 16,515 6,000Trade and other receivables 9 29,310 42,762Contract assets 10 3,553 –Financial assets at fair value through profit or lossUnlisted investments in property unit trusts and LLCs 10,443 5,635Units in managed equity funds 6,418 5,248Listed equity shares 1,761 2,850Unlisted equity shares 9,656 –Units in unlisted loan trusts 2,821 –Derivatives not designated as hedging instruments
Forward exchange contracts 131 1,413Total financial assets 80,608 63,908
CurrentTrade and other receivables 9 29,310 42,762Contract assets 10 3,553 –Derivative financial instruments 131 1,413Other financial assets 19,336 6,000Total current financial assets 52,330 50,175
Non-currentOther financial assets 28,278 13,733Total non-current assets 28,278 13,733Total financial assets 80,608 63,908
LiabilitiesFinancial liabilities at amortised costTrade and other payables 14 27,000 28,894Contract liabilities 10 415 –Interest-bearing loans and borrowings 15 38,242 33,250Financial liabilities at fair value through profit or lossDerivatives not recognised as hedging instruments
Forward exchange contracts 228 –Interest rate swaps 483 46
Total financial liabilities 66,368 62,190
CurrentTrade and other payables 14 27,000 28,894Contract liabilities 10 415 –Interest-bearing loans and borrowings 15 18,330 2,356Derivatives financial instruments 711 46Total current financial liabilities 46,456 31,296
Non-currentInterest-bearing loans and borrowings 15 19,912 30,894Total non-current financial liabilities 19,912 30,894Total financial liabilities 66,368 62,190
Derivative financial instruments are used by the Group in the normal course of business to protect against exposure to fluctuations in interest and foreign exchange rates.
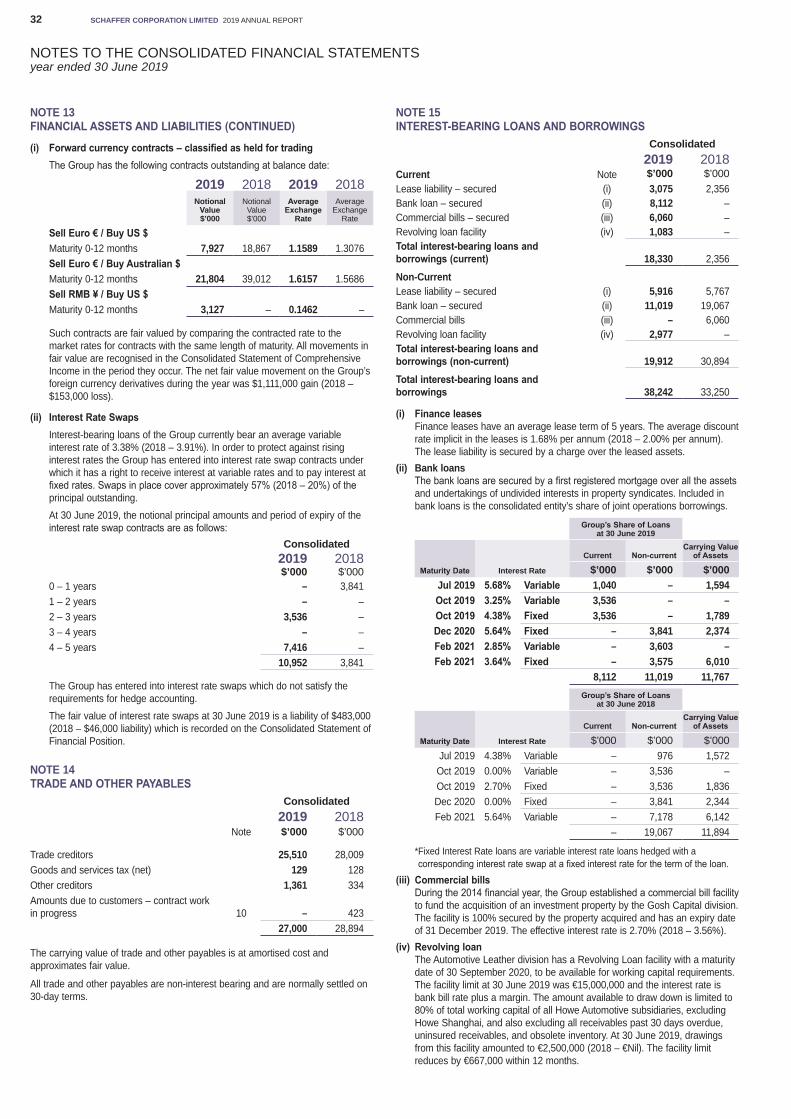
NOTES TO THE CONSOLIDATED FINANCIAL STATEMENTSyear ended 30 June 2019
SCHAFFER CORPORATION LIMITED 2019 ANNUAL REPORT32
NOTE 15 INTEREST-BEARING LOANS AND BORROWINGS
Consolidated2019 2018
Current Note $’000 $’000Lease liability – secured (i) 3,075 2,356Bank loan – secured (ii) 8,112 –Commercial bills – secured (iii) 6,060 –Revolving loan facility (iv) 1,083 –Total interest-bearing loans and borrowings (current) 18,330 2,356
Non-CurrentLease liability – secured (i) 5,916 5,767Bank loan – secured (ii) 11,019 19,067Commercial bills (iii) – 6,060Revolving loan facility (iv) 2,977 –Total interest-bearing loans and borrowings (non-current) 19,912 30,894
Total interest-bearing loans and borrowings 38,242 33,250
(i) Finance leasesFinance leases have an average lease term of 5 years. The average discount rate implicit in the leases is 1.68% per annum (2018 – 2.00% per annum). The lease liability is secured by a charge over the leased assets.
(ii) Bank loansThe bank loans are secured by a first registered mortgage over all the assets and undertakings of undivided interests in property syndicates. Included in bank loans is the consolidated entity’s share of joint operations borrowings.
Group’s Share of Loansat 30 June 2019
Maturity Date Interest Rate
Current Non-currentCarrying Value
of Assets
$’000 $’000 $’000Jul 2019 5.68% Variable 1,040 – 1,594Oct 2019 3.25% Variable 3,536 – –Oct 2019 4.38% Fixed 3,536 – 1,789Dec 2020 5.64% Fixed – 3,841 2,374Feb 2021 2.85% Variable – 3,603 –Feb 2021 3.64% Fixed – 3,575 6,010
8,112 11,019 11,767Group’s Share of Loans
at 30 June 2018
Maturity Date Interest Rate
Current Non-currentCarrying Value
of Assets
$’000 $’000 $’000Jul 2019 4.38% Variable – 976 1,572Oct 2019 0.00% Variable – 3,536 –Oct 2019 2.70% Fixed – 3,536 1,836Dec 2020 0.00% Fixed – 3,841 2,344Feb 2021 5.64% Variable – 7,178 6,142
– 19,067 11,894
* Fixed Interest Rate loans are variable interest rate loans hedged with a corresponding interest rate swap at a fixed interest rate for the term of the loan.
(iii) Commercial billsDuring the 2014 financial year, the Group established a commercial bill facility to fund the acquisition of an investment property by the Gosh Capital division. The facility is 100% secured by the property acquired and has an expiry date of 31 December 2019. The effective interest rate is 2.70% (2018 – 3.56%).
(iv) Revolving loanThe Automotive Leather division has a Revolving Loan facility with a maturity date of 30 September 2020, to be available for working capital requirements. The facility limit at 30 June 2019 was €15,000,000 and the interest rate is bank bill rate plus a margin. The amount available to draw down is limited to 80% of total working capital of all Howe Automotive subsidiaries, excluding Howe Shanghai, and also excluding all receivables past 30 days overdue, uninsured receivables, and obsolete inventory. At 30 June 2019, drawings from this facility amounted to €2,500,000 (2018 – €Nil). The facility limit reduces by €667,000 within 12 months.
NOTE 13 FINANCIAL ASSETS AND LIABILITIES (CONTINUED)
(i) Forward currency contracts – classified as held for tradingThe Group has the following contracts outstanding at balance date:
2019 2018 2019 2018Notional
Value$’000
Notional Value$’000
Average Exchange
Rate
Average Exchange
Rate
Sell Euro € / Buy US $Maturity 0-12 months 7,927 18,867 1.1589 1.3076Sell Euro € / Buy Australian $Maturity 0-12 months 21,804 39,012 1.6157 1.5686Sell RMB ¥ / Buy US $Maturity 0-12 months 3,127 – 0.1462 –
Such contracts are fair valued by comparing the contracted rate to the market rates for contracts with the same length of maturity. All movements in fair value are recognised in the Consolidated Statement of Comprehensive Income in the period they occur. The net fair value movement on the Group’s foreign currency derivatives during the year was $1,111,000 gain (2018 – $153,000 loss).
(ii) Interest Rate SwapsInterest-bearing loans of the Group currently bear an average variable interest rate of 3.38% (2018 – 3.91%). In order to protect against rising interest rates the Group has entered into interest rate swap contracts under which it has a right to receive interest at variable rates and to pay interest at fixed rates. Swaps in place cover approximately 57% (2018 – 20%) of the principal outstanding.At 30 June 2019, the notional principal amounts and period of expiry of the interest rate swap contracts are as follows:
Consolidated2019 2018$’000 $’000
0 – 1 years – 3,8411 – 2 years – –2 – 3 years 3,536 –3 – 4 years – –4 – 5 years 7,416 –
10,952 3,841
The Group has entered into interest rate swaps which do not satisfy the requirements for hedge accounting.The fair value of interest rate swaps at 30 June 2019 is a liability of $483,000 (2018 – $46,000 liability) which is recorded on the Consolidated Statement of Financial Position.
NOTE 14 TRADE AND OTHER PAYABLES
Consolidated2019 2018
Note $’000 $’000
Trade creditors 25,510 28,009Goods and services tax (net) 129 128Other creditors 1,361 334Amounts due to customers – contract work in progress 10 – 423
27,000 28,894
The carrying value of trade and other payables is at amortised cost and approximates fair value.
All trade and other payables are non-interest bearing and are normally settled on 30-day terms.
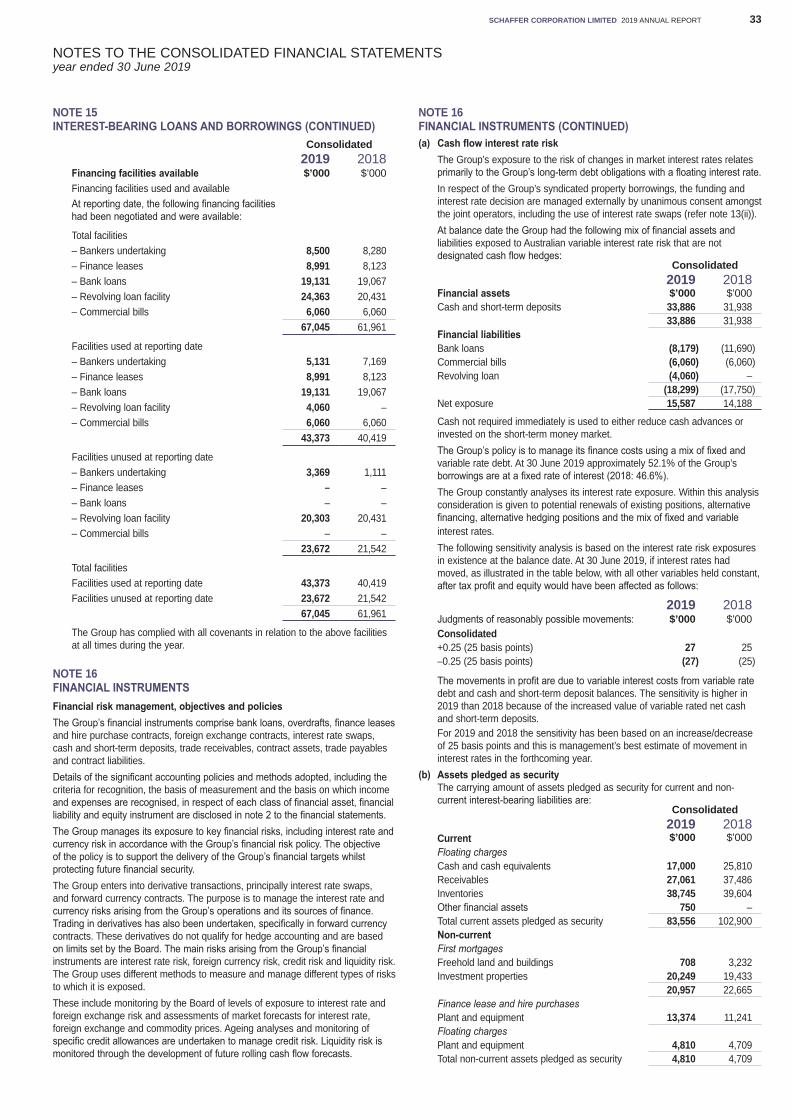
NOTES TO THE CONSOLIDATED FINANCIAL STATEMENTSyear ended 30 June 2019
SCHAFFER CORPORATION LIMITED 2019 ANNUAL REPORT 33
NOTE 15 INTEREST-BEARING LOANS AND BORROWINGS (CONTINUED)
Consolidated2019 2018
Financing facilities available $’000 $’000Financing facilities used and availableAt reporting date, the following financing facilities had been negotiated and were available:
Total facilities– Bankers undertaking 8,500 8,280– Finance leases 8,991 8,123– Bank loans 19,131 19,067– Revolving loan facility 24,363 20,431– Commercial bills 6,060 6,060
67,045 61,961
Facilities used at reporting date– Bankers undertaking 5,131 7,169– Finance leases 8,991 8,123– Bank loans 19,131 19,067– Revolving loan facility 4,060 –– Commercial bills 6,060 6,060
43,373 40,419
Facilities unused at reporting date– Bankers undertaking 3,369 1,111– Finance leases – –– Bank loans – –– Revolving loan facility 20,303 20,431– Commercial bills – –
23,672 21,542
Total facilitiesFacilities used at reporting date 43,373 40,419Facilities unused at reporting date 23,672 21,542
67,045 61,961
The Group has complied with all covenants in relation to the above facilities at all times during the year.
NOTE 16 FINANCIAL INSTRUMENTSFinancial risk management, objectives and policiesThe Group’s financial instruments comprise bank loans, overdrafts, finance leases and hire purchase contracts, foreign exchange contracts, interest rate swaps, cash and short-term deposits, trade receivables, contract assets, trade payables and contract liabilities.Details of the significant accounting policies and methods adopted, including the criteria for recognition, the basis of measurement and the basis on which income and expenses are recognised, in respect of each class of financial asset, financial liability and equity instrument are disclosed in note 2 to the financial statements.The Group manages its exposure to key financial risks, including interest rate and currency risk in accordance with the Group’s financial risk policy. The objective of the policy is to support the delivery of the Group’s financial targets whilst protecting future financial security.The Group enters into derivative transactions, principally interest rate swaps, and forward currency contracts. The purpose is to manage the interest rate and currency risks arising from the Group’s operations and its sources of finance. Trading in derivatives has also been undertaken, specifically in forward currency contracts. These derivatives do not qualify for hedge accounting and are based on limits set by the Board. The main risks arising from the Group’s financial instruments are interest rate risk, foreign currency risk, credit risk and liquidity risk. The Group uses different methods to measure and manage different types of risks to which it is exposed.These include monitoring by the Board of levels of exposure to interest rate and foreign exchange risk and assessments of market forecasts for interest rate, foreign exchange and commodity prices. Ageing analyses and monitoring of specific credit allowances are undertaken to manage credit risk. Liquidity risk is monitored through the development of future rolling cash flow forecasts.
NOTE 16 FINANCIAL INSTRUMENTS (CONTINUED)(a) Cash flow interest rate risk
The Group’s exposure to the risk of changes in market interest rates relates primarily to the Group’s long-term debt obligations with a floating interest rate.In respect of the Group’s syndicated property borrowings, the funding and interest rate decision are managed externally by unanimous consent amongst the joint operators, including the use of interest rate swaps (refer note 13(ii)).At balance date the Group had the following mix of financial assets and liabilities exposed to Australian variable interest rate risk that are not designated cash flow hedges:
Consolidated2019 2018
Financial assets $’000 $’000Cash and short-term deposits 33,886 31,938
33,886 31,938Financial liabilitiesBank loans (8,179) (11,690)Commercial bills (6,060) (6,060)Revolving loan (4,060) –
(18,299) (17,750)Net exposure 15,587 14,188
Cash not required immediately is used to either reduce cash advances or invested on the short-term money market.The Group’s policy is to manage its finance costs using a mix of fixed and variable rate debt. At 30 June 2019 approximately 52.1% of the Group’s borrowings are at a fixed rate of interest (2018: 46.6%).The Group constantly analyses its interest rate exposure. Within this analysis consideration is given to potential renewals of existing positions, alternative financing, alternative hedging positions and the mix of fixed and variable interest rates.The following sensitivity analysis is based on the interest rate risk exposures in existence at the balance date. At 30 June 2019, if interest rates had moved, as illustrated in the table below, with all other variables held constant, after tax profit and equity would have been affected as follows:
2019 2018Judgments of reasonably possible movements: $’000 $’000Consolidated+0.25 (25 basis points) 27 25–0.25 (25 basis points) (27) (25)
The movements in profit are due to variable interest costs from variable rate debt and cash and short-term deposit balances. The sensitivity is higher in 2019 than 2018 because of the increased value of variable rated net cash and short-term deposits.For 2019 and 2018 the sensitivity has been based on an increase/decrease of 25 basis points and this is management’s best estimate of movement in interest rates in the forthcoming year.
(b) Assets pledged as securityThe carrying amount of assets pledged as security for current and non-current interest-bearing liabilities are:
Consolidated2019 2018
Current $’000 $’000Floating chargesCash and cash equivalents 17,000 25,810Receivables 27,061 37,486Inventories 38,745 39,604Other financial assets 750 –Total current assets pledged as security 83,556 102,900Non-currentFirst mortgagesFreehold land and buildings 708 3,232Investment properties 20,249 19,433
20,957 22,665Finance lease and hire purchasesPlant and equipment 13,374 11,241Floating chargesPlant and equipment 4,810 4,709Total non-current assets pledged as security 4,810 4,709
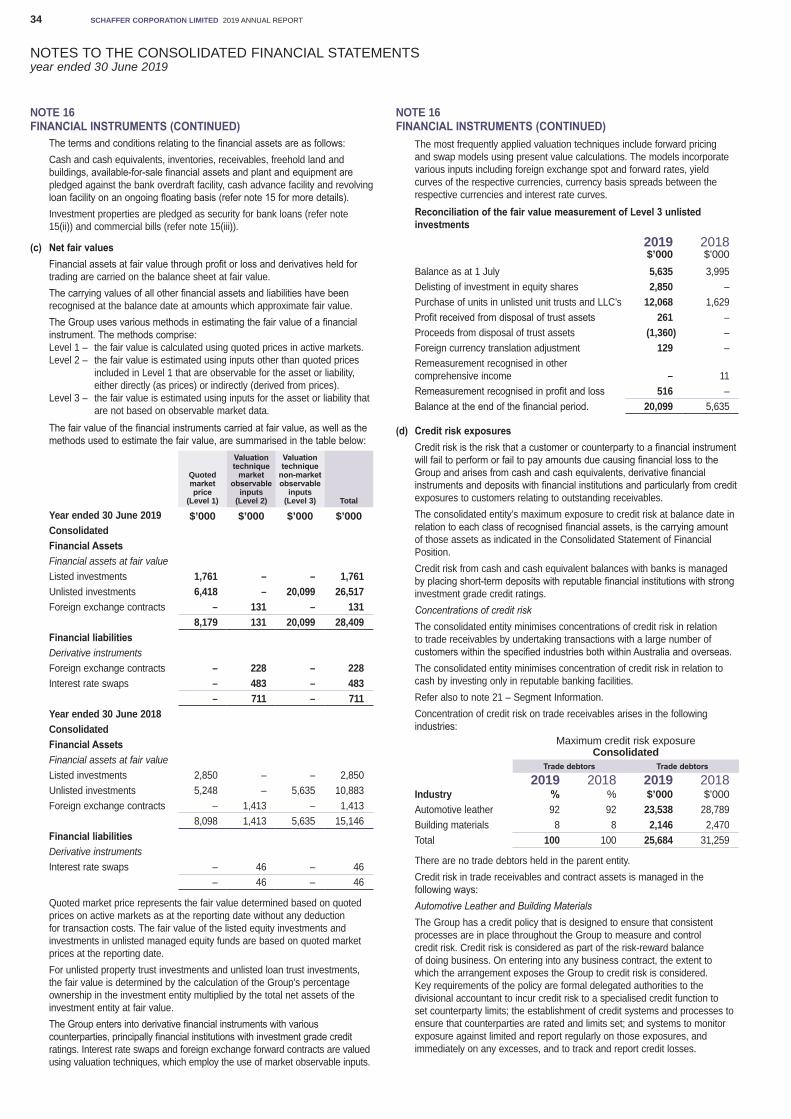
NOTES TO THE CONSOLIDATED FINANCIAL STATEMENTSyear ended 30 June 2019
SCHAFFER CORPORATION LIMITED 2019 ANNUAL REPORT34
NOTE 16 FINANCIAL INSTRUMENTS (CONTINUED)
The terms and conditions relating to the financial assets are as follows:Cash and cash equivalents, inventories, receivables, freehold land and buildings, available-for-sale financial assets and plant and equipment are pledged against the bank overdraft facility, cash advance facility and revolving loan facility on an ongoing floating basis (refer note 15 for more details).Investment properties are pledged as security for bank loans (refer note 15(ii)) and commercial bills (refer note 15(iii)).
(c) Net fair valuesFinancial assets at fair value through profit or loss and derivatives held for trading are carried on the balance sheet at fair value.The carrying values of all other financial assets and liabilities have been recognised at the balance date at amounts which approximate fair value.The Group uses various methods in estimating the fair value of a financial instrument. The methods comprise:Level 1 – the fair value is calculated using quoted prices in active markets.Level 2 – the fair value is estimated using inputs other than quoted prices
included in Level 1 that are observable for the asset or liability, either directly (as prices) or indirectly (derived from prices).
Level 3 – the fair value is estimated using inputs for the asset or liability that are not based on observable market data.
The fair value of the financial instruments carried at fair value, as well as the methods used to estimate the fair value, are summarised in the table below:
Quoted market price
(Level 1)
Valuation technique
market observable
inputs (Level 2)
Valuation technique
non-market observable
inputs (Level 3) Total
Year ended 30 June 2019 $’000 $’000 $’000 $’000ConsolidatedFinancial AssetsFinancial assets at fair valueListed investments 1,761 – – 1,761Unlisted investments 6,418 – 20,099 26,517Foreign exchange contracts – 131 – 131
8,179 131 20,099 28,409Financial liabilitiesDerivative instrumentsForeign exchange contracts – 228 – 228Interest rate swaps – 483 – 483
– 711 – 711Year ended 30 June 2018ConsolidatedFinancial AssetsFinancial assets at fair valueListed investments 2,850 – – 2,850Unlisted investments 5,248 – 5,635 10,883Foreign exchange contracts – 1,413 – 1,413
8,098 1,413 5,635 15,146Financial liabilitiesDerivative instrumentsInterest rate swaps – 46 – 46
– 46 – 46
Quoted market price represents the fair value determined based on quoted prices on active markets as at the reporting date without any deduction for transaction costs. The fair value of the listed equity investments and investments in unlisted managed equity funds are based on quoted market prices at the reporting date.For unlisted property trust investments and unlisted loan trust investments, the fair value is determined by the calculation of the Group’s percentage ownership in the investment entity multiplied by the total net assets of the investment entity at fair value.The Group enters into derivative financial instruments with various counterparties, principally financial institutions with investment grade credit ratings. Interest rate swaps and foreign exchange forward contracts are valued using valuation techniques, which employ the use of market observable inputs.
NOTE 16 FINANCIAL INSTRUMENTS (CONTINUED)
The most frequently applied valuation techniques include forward pricing and swap models using present value calculations. The models incorporate various inputs including foreign exchange spot and forward rates, yield curves of the respective currencies, currency basis spreads between the respective currencies and interest rate curves.Reconciliation of the fair value measurement of Level 3 unlisted investments
2019 2018$’000 $’000
Balance as at 1 July 5,635 3,995Delisting of investment in equity shares 2,850 –Purchase of units in unlisted unit trusts and LLC’s 12,068 1,629Profit received from disposal of trust assets 261 –Proceeds from disposal of trust assets (1,360) –Foreign currency translation adjustment 129 –Remeasurement recognised in other comprehensive income – 11Remeasurement recognised in profit and loss 516 –Balance at the end of the financial period. 20,099 5,635
(d) Credit risk exposuresCredit risk is the risk that a customer or counterparty to a financial instrument will fail to perform or fail to pay amounts due causing financial loss to the Group and arises from cash and cash equivalents, derivative financial instruments and deposits with financial institutions and particularly from credit exposures to customers relating to outstanding receivables.The consolidated entity’s maximum exposure to credit risk at balance date in relation to each class of recognised financial assets, is the carrying amount of those assets as indicated in the Consolidated Statement of Financial Position.Credit risk from cash and cash equivalent balances with banks is managed by placing short-term deposits with reputable financial institutions with strong investment grade credit ratings.Concentrations of credit riskThe consolidated entity minimises concentrations of credit risk in relation to trade receivables by undertaking transactions with a large number of customers within the specified industries both within Australia and overseas.The consolidated entity minimises concentration of credit risk in relation to cash by investing only in reputable banking facilities.Refer also to note 21 – Segment Information.Concentration of credit risk on trade receivables arises in the following industries:
Maximum credit risk exposureConsolidated
Trade debtors Trade debtors
2019 2018 2019 2018Industry % % $’000 $’000Automotive leather 92 92 23,538 28,789Building materials 8 8 2,146 2,470Total 100 100 25,684 31,259
There are no trade debtors held in the parent entity.Credit risk in trade receivables and contract assets is managed in the following ways:Automotive Leather and Building MaterialsThe Group has a credit policy that is designed to ensure that consistent processes are in place throughout the Group to measure and control credit risk. Credit risk is considered as part of the risk-reward balance of doing business. On entering into any business contract, the extent to which the arrangement exposes the Group to credit risk is considered. Key requirements of the policy are formal delegated authorities to the divisional accountant to incur credit risk to a specialised credit function to set counterparty limits; the establishment of credit systems and processes to ensure that counterparties are rated and limits set; and systems to monitor exposure against limited and report regularly on those exposures, and immediately on any excesses, and to track and report credit losses.
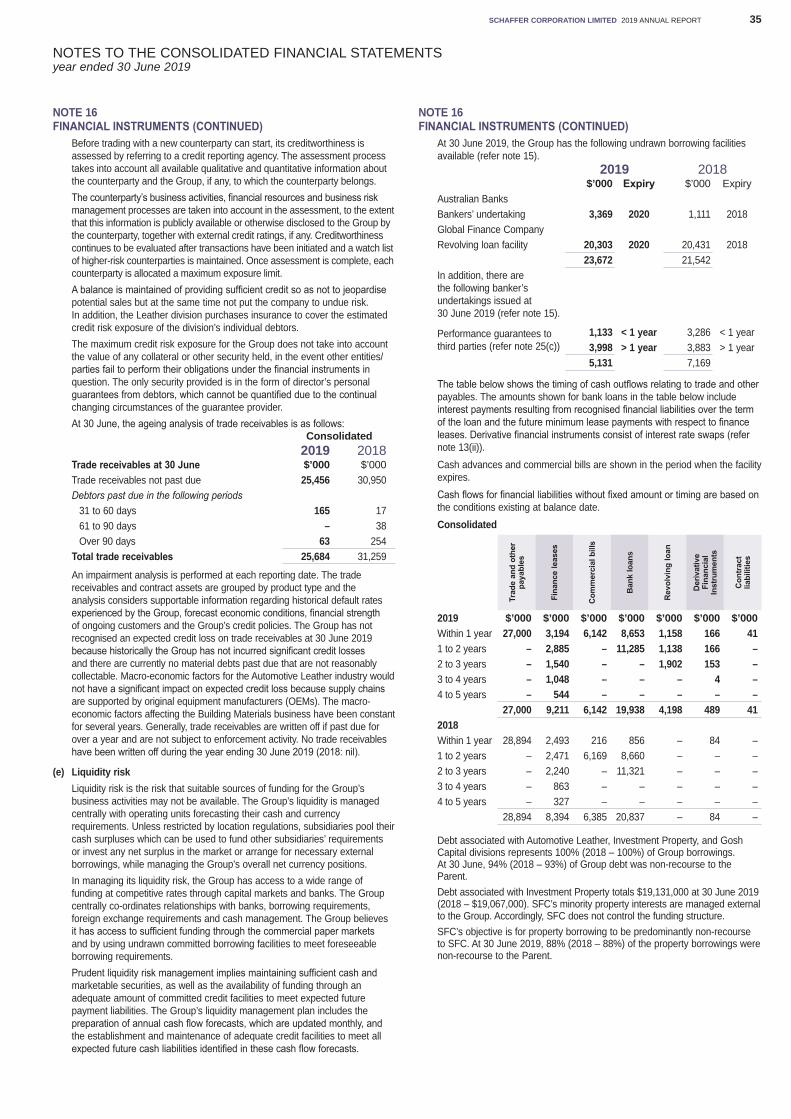
NOTES TO THE CONSOLIDATED FINANCIAL STATEMENTSyear ended 30 June 2019
SCHAFFER CORPORATION LIMITED 2019 ANNUAL REPORT 35
NOTE 16 FINANCIAL INSTRUMENTS (CONTINUED)
Before trading with a new counterparty can start, its creditworthiness is assessed by referring to a credit reporting agency. The assessment process takes into account all available qualitative and quantitative information about the counterparty and the Group, if any, to which the counterparty belongs. The counterparty’s business activities, financial resources and business risk management processes are taken into account in the assessment, to the extent that this information is publicly available or otherwise disclosed to the Group by the counterparty, together with external credit ratings, if any. Creditworthiness continues to be evaluated after transactions have been initiated and a watch list of higher-risk counterparties is maintained. Once assessment is complete, each counterparty is allocated a maximum exposure limit.A balance is maintained of providing sufficient credit so as not to jeopardise potential sales but at the same time not put the company to undue risk. In addition, the Leather division purchases insurance to cover the estimated credit risk exposure of the division’s individual debtors.The maximum credit risk exposure for the Group does not take into account the value of any collateral or other security held, in the event other entities/parties fail to perform their obligations under the financial instruments in question. The only security provided is in the form of director’s personal guarantees from debtors, which cannot be quantified due to the continual changing circumstances of the guarantee provider.At 30 June, the ageing analysis of trade receivables is as follows:
Consolidated2019 2018
Trade receivables at 30 June $’000 $’000Trade receivables not past due 25,456 30,950Debtors past due in the following periods
31 to 60 days 165 1761 to 90 days – 38Over 90 days 63 254
Total trade receivables 25,684 31,259
An impairment analysis is performed at each reporting date. The trade receivables and contract assets are grouped by product type and the analysis considers supportable information regarding historical default rates experienced by the Group, forecast economic conditions, financial strength of ongoing customers and the Group’s credit policies. The Group has not recognised an expected credit loss on trade receivables at 30 June 2019 because historically the Group has not incurred significant credit losses and there are currently no material debts past due that are not reasonably collectable. Macro-economic factors for the Automotive Leather industry would not have a significant impact on expected credit loss because supply chains are supported by original equipment manufacturers (OEMs). The macro-economic factors affecting the Building Materials business have been constant for several years. Generally, trade receivables are written off if past due for over a year and are not subject to enforcement activity. No trade receivables have been written off during the year ending 30 June 2019 (2018: nil).
(e) Liquidity riskLiquidity risk is the risk that suitable sources of funding for the Group’s business activities may not be available. The Group’s liquidity is managed centrally with operating units forecasting their cash and currency requirements. Unless restricted by location regulations, subsidiaries pool their cash surpluses which can be used to fund other subsidiaries’ requirements or invest any net surplus in the market or arrange for necessary external borrowings, while managing the Group’s overall net currency positions.In managing its liquidity risk, the Group has access to a wide range of funding at competitive rates through capital markets and banks. The Group centrally co-ordinates relationships with banks, borrowing requirements, foreign exchange requirements and cash management. The Group believes it has access to sufficient funding through the commercial paper markets and by using undrawn committed borrowing facilities to meet foreseeable borrowing requirements.Prudent liquidity risk management implies maintaining sufficient cash and marketable securities, as well as the availability of funding through an adequate amount of committed credit facilities to meet expected future payment liabilities. The Group’s liquidity management plan includes the preparation of annual cash flow forecasts, which are updated monthly, and the establishment and maintenance of adequate credit facilities to meet all expected future cash liabilities identified in these cash flow forecasts.
NOTE 16 FINANCIAL INSTRUMENTS (CONTINUED)
At 30 June 2019, the Group has the following undrawn borrowing facilities available (refer note 15).
2019 2018$’000 Expiry $’000 Expiry
Australian BanksBankers’ undertaking 3,369 2020 1,111 2018Global Finance CompanyRevolving loan facility 20,303 2020 20,431 2018
23,672 21,542In addition, there are the following banker’s undertakings issued at 30 June 2019 (refer note 15).
Performance guarantees to third parties (refer note 25(c))
1,133 < 1 year 3,286 < 1 year3,998 > 1 year 3,883 > 1 year5,131 7,169
The table below shows the timing of cash outflows relating to trade and other payables. The amounts shown for bank loans in the table below include interest payments resulting from recognised financial liabilities over the term of the loan and the future minimum lease payments with respect to finance leases. Derivative financial instruments consist of interest rate swaps (refer note 13(ii)).Cash advances and commercial bills are shown in the period when the facility expires.Cash flows for financial liabilities without fixed amount or timing are based on the conditions existing at balance date.Consolidated
Trad
e an
d ot
her
paya
bles
Fina
nce
leas
es
Com
mer
cial
bill
s
Ban
k lo
ans
Rev
olvi
ng lo
an
Der
ivat
ive
Fina
ncia
l In
stru
men
ts
Con
trac
t lia
bilit
ies
2019 $’000 $’000 $’000 $’000 $’000 $’000 $’000Within 1 year 27,000 3,194 6,142 8,653 1,158 166 411 to 2 years – 2,885 – 11,285 1,138 166 –2 to 3 years – 1,540 – – 1,902 153 –3 to 4 years – 1,048 – – – 4 –4 to 5 years – 544 – – – – –
27,000 9,211 6,142 19,938 4,198 489 412018Within 1 year 28,894 2,493 216 856 – 84 –1 to 2 years – 2,471 6,169 8,660 – – –2 to 3 years – 2,240 – 11,321 – – –3 to 4 years – 863 – – – – –4 to 5 years – 327 – – – – –
28,894 8,394 6,385 20,837 – 84 –
Debt associated with Automotive Leather, Investment Property, and Gosh Capital divisions represents 100% (2018 – 100%) of Group borrowings. At 30 June, 94% (2018 – 93%) of Group debt was non-recourse to the Parent.Debt associated with Investment Property totals $19,131,000 at 30 June 2019 (2018 – $19,067,000). SFC’s minority property interests are managed external to the Group. Accordingly, SFC does not control the funding structure.SFC’s objective is for property borrowing to be predominantly non-recourse to SFC. At 30 June 2019, 88% (2018 – 88%) of the property borrowings were non-recourse to the Parent.
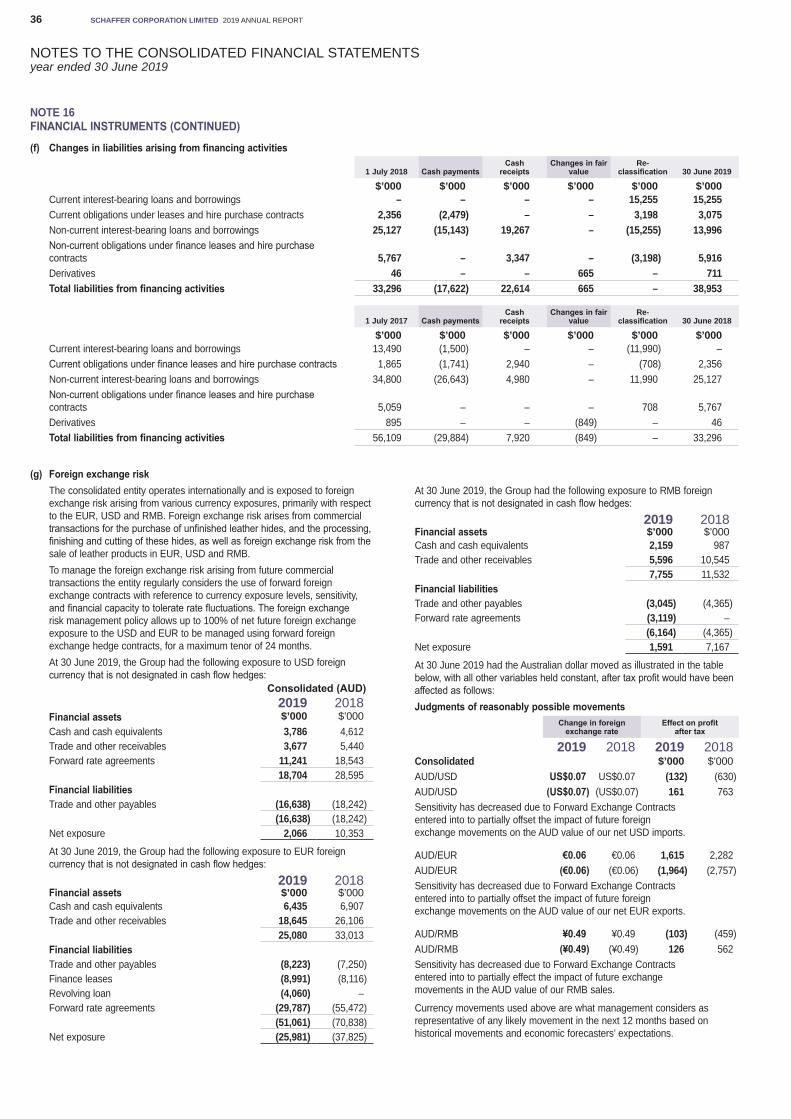
NOTES TO THE CONSOLIDATED FINANCIAL STATEMENTSyear ended 30 June 2019
SCHAFFER CORPORATION LIMITED 2019 ANNUAL REPORT36
NOTE 16 FINANCIAL INSTRUMENTS (CONTINUED)
(f) Changes in liabilities arising from financing activities
1 July 2018 Cash paymentsCash
receiptsChanges in fair
valueRe-
classification 30 June 2019
$’000 $’000 $’000 $’000 $’000 $’000Current interest-bearing loans and borrowings – – – – 15,255 15,255Current obligations under leases and hire purchase contracts 2,356 (2,479) – – 3,198 3,075Non-current interest-bearing loans and borrowings 25,127 (15,143) 19,267 – (15,255) 13,996Non-current obligations under finance leases and hire purchase contracts 5,767 – 3,347 – (3,198) 5,916Derivatives 46 – – 665 – 711Total liabilities from financing activities 33,296 (17,622) 22,614 665 – 38,953
1 July 2017 Cash paymentsCash
receiptsChanges in fair
valueRe-
classification 30 June 2018
$’000 $’000 $’000 $’000 $’000 $’000Current interest-bearing loans and borrowings 13,490 (1,500) – – (11,990) –Current obligations under finance leases and hire purchase contracts 1,865 (1,741) 2,940 – (708) 2,356Non-current interest-bearing loans and borrowings 34,800 (26,643) 4,980 – 11,990 25,127Non-current obligations under finance leases and hire purchase contracts 5,059 – – – 708 5,767Derivatives 895 – – (849) – 46Total liabilities from financing activities 56,109 (29,884) 7,920 (849) – 33,296
(g) Foreign exchange riskThe consolidated entity operates internationally and is exposed to foreign exchange risk arising from various currency exposures, primarily with respect to the EUR, USD and RMB. Foreign exchange risk arises from commercial transactions for the purchase of unfinished leather hides, and the processing, finishing and cutting of these hides, as well as foreign exchange risk from the sale of leather products in EUR, USD and RMB.To manage the foreign exchange risk arising from future commercial transactions the entity regularly considers the use of forward foreign exchange contracts with reference to currency exposure levels, sensitivity, and financial capacity to tolerate rate fluctuations. The foreign exchange risk management policy allows up to 100% of net future foreign exchange exposure to the USD and EUR to be managed using forward foreign exchange hedge contracts, for a maximum tenor of 24 months.At 30 June 2019, the Group had the following exposure to USD foreign currency that is not designated in cash flow hedges:
Consolidated (AUD)2019 2018
Financial assets $’000 $’000Cash and cash equivalents 3,786 4,612Trade and other receivables 3,677 5,440Forward rate agreements 11,241 18,543
18,704 28,595Financial liabilitiesTrade and other payables (16,638) (18,242)
(16,638) (18,242)Net exposure 2,066 10,353
At 30 June 2019, the Group had the following exposure to EUR foreign currency that is not designated in cash flow hedges:
2019 2018Financial assets $’000 $’000Cash and cash equivalents 6,435 6,907Trade and other receivables 18,645 26,106
25,080 33,013Financial liabilitiesTrade and other payables (8,223) (7,250)Finance leases (8,991) (8,116)Revolving loan (4,060) –Forward rate agreements (29,787) (55,472)
(51,061) (70,838)Net exposure (25,981) (37,825)
At 30 June 2019, the Group had the following exposure to RMB foreign currency that is not designated in cash flow hedges:
2019 2018Financial assets $’000 $’000Cash and cash equivalents 2,159 987Trade and other receivables 5,596 10,545
7,755 11,532Financial liabilitiesTrade and other payables (3,045) (4,365)Forward rate agreements (3,119) –
(6,164) (4,365)Net exposure 1,591 7,167
At 30 June 2019 had the Australian dollar moved as illustrated in the table below, with all other variables held constant, after tax profit would have been affected as follows:Judgments of reasonably possible movements
Change in foreign exchange rate
Effect on profit after tax
2019 2018 2019 2018Consolidated $’000 $’000AUD/USD US$0.07 US$0.07 (132) (630)AUD/USD (US$0.07) (US$0.07) 161 763Sensitivity has decreased due to Forward Exchange Contracts entered into to partially offset the impact of future foreign exchange movements on the AUD value of our net USD imports.
AUD/EUR €0.06 €0.06 1,615 2,282AUD/EUR (€0.06) (€0.06) (1,964) (2,757)Sensitivity has decreased due to Forward Exchange Contracts entered into to partially offset the impact of future foreign exchange movements on the AUD value of our net EUR exports.
AUD/RMB ¥0.49 ¥0.49 (103) (459)AUD/RMB (¥0.49) (¥0.49) 126 562Sensitivity has decreased due to Forward Exchange Contracts entered into to partially effect the impact of future exchange movements in the AUD value of our RMB sales.
Currency movements used above are what management considers as representative of any likely movement in the next 12 months based on historical movements and economic forecasters’ expectations.
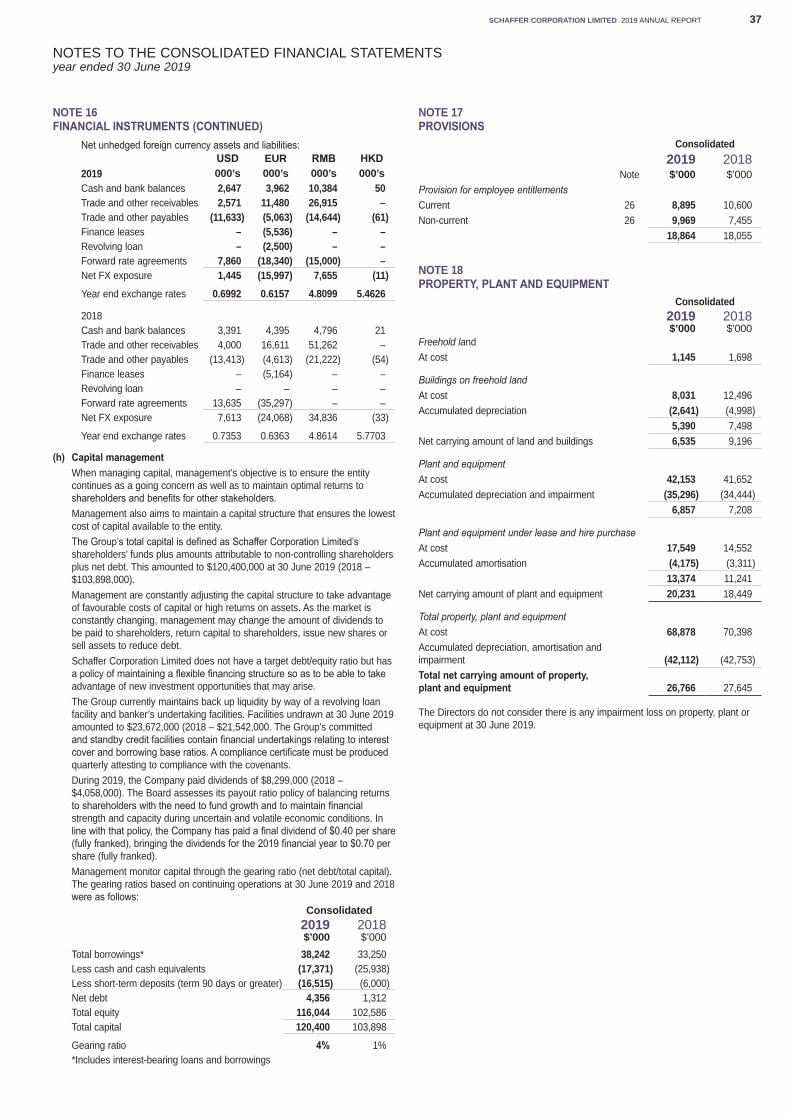
NOTES TO THE CONSOLIDATED FINANCIAL STATEMENTSyear ended 30 June 2019
SCHAFFER CORPORATION LIMITED 2019 ANNUAL REPORT 37
NOTE 16 FINANCIAL INSTRUMENTS (CONTINUED)
Net unhedged foreign currency assets and liabilities:USD EUR RMB HKD
2019 000’s 000’s 000’s 000’sCash and bank balances 2,647 3,962 10,384 50Trade and other receivables 2,571 11,480 26,915 –Trade and other payables (11,633) (5,063) (14,644) (61)Finance leases – (5,536) – –Revolving loan – (2,500) – –Forward rate agreements 7,860 (18,340) (15,000) –Net FX exposure 1,445 (15,997) 7,655 (11)Year end exchange rates 0.6992 0.6157 4.8099 5.4626
2018Cash and bank balances 3,391 4,395 4,796 21Trade and other receivables 4,000 16,611 51,262 –Trade and other payables (13,413) (4,613) (21,222) (54)Finance leases – (5,164) – –Revolving loan – – – –Forward rate agreements 13,635 (35,297) – –Net FX exposure 7,613 (24,068) 34,836 (33)
Year end exchange rates 0.7353 0.6363 4.8614 5.7703
(h) Capital managementWhen managing capital, management’s objective is to ensure the entity continues as a going concern as well as to maintain optimal returns to shareholders and benefits for other stakeholders.Management also aims to maintain a capital structure that ensures the lowest cost of capital available to the entity.The Group’s total capital is defined as Schaffer Corporation Limited’s shareholders’ funds plus amounts attributable to non-controlling shareholders plus net debt. This amounted to $120,400,000 at 30 June 2019 (2018 – $103,898,000).Management are constantly adjusting the capital structure to take advantage of favourable costs of capital or high returns on assets. As the market is constantly changing, management may change the amount of dividends to be paid to shareholders, return capital to shareholders, issue new shares or sell assets to reduce debt.Schaffer Corporation Limited does not have a target debt/equity ratio but has a policy of maintaining a flexible financing structure so as to be able to take advantage of new investment opportunities that may arise.The Group currently maintains back up liquidity by way of a revolving loan facility and banker’s undertaking facilities. Facilities undrawn at 30 June 2019 amounted to $23,672,000 (2018 – $21,542,000. The Group’s committed and standby credit facilities contain financial undertakings relating to interest cover and borrowing base ratios. A compliance certificate must be produced quarterly attesting to compliance with the covenants.During 2019, the Company paid dividends of $8,299,000 (2018 – $4,058,000). The Board assesses its payout ratio policy of balancing returns to shareholders with the need to fund growth and to maintain financial strength and capacity during uncertain and volatile economic conditions. In line with that policy, the Company has paid a final dividend of $0.40 per share (fully franked), bringing the dividends for the 2019 financial year to $0.70 per share (fully franked).Management monitor capital through the gearing ratio (net debt/total capital). The gearing ratios based on continuing operations at 30 June 2019 and 2018 were as follows:
Consolidated2019 2018$’000 $’000
Total borrowings* 38,242 33,250Less cash and cash equivalents (17,371) (25,938)Less short-term deposits (term 90 days or greater) (16,515) (6,000)Net debt 4,356 1,312Total equity 116,044 102,586Total capital 120,400 103,898
Gearing ratio 4% 1%*Includes interest-bearing loans and borrowings
NOTE 17 PROVISIONS
Consolidated2019 2018
Note $’000 $’000Provision for employee entitlementsCurrent 26 8,895 10,600Non-current 26 9,969 7,455
18,864 18,055
NOTE 18 PROPERTY, PLANT AND EQUIPMENT
Consolidated2019 2018$’000 $’000
Freehold landAt cost 1,145 1,698
Buildings on freehold landAt cost 8,031 12,496Accumulated depreciation (2,641) (4,998)
5,390 7,498Net carrying amount of land and buildings 6,535 9,196
Plant and equipmentAt cost 42,153 41,652Accumulated depreciation and impairment (35,296) (34,444)
6,857 7,208
Plant and equipment under lease and hire purchaseAt cost 17,549 14,552Accumulated amortisation (4,175) (3,311)
13,374 11,241Net carrying amount of plant and equipment 20,231 18,449
Total property, plant and equipmentAt cost 68,878 70,398Accumulated depreciation, amortisation and impairment (42,112) (42,753)Total net carrying amount of property, plant and equipment 26,766 27,645
The Directors do not consider there is any impairment loss on property, plant or equipment at 30 June 2019.
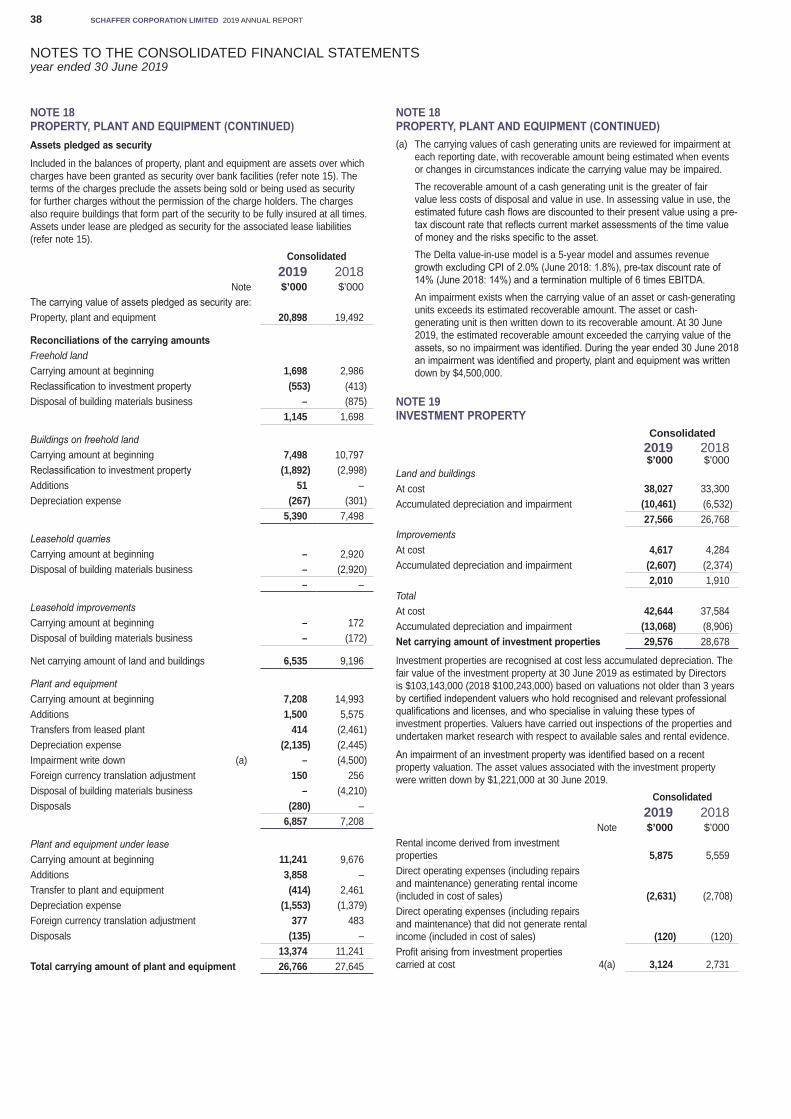
NOTES TO THE CONSOLIDATED FINANCIAL STATEMENTSyear ended 30 June 2019
SCHAFFER CORPORATION LIMITED 2019 ANNUAL REPORT38
NOTE 18 PROPERTY, PLANT AND EQUIPMENT (CONTINUED)Assets pledged as securityIncluded in the balances of property, plant and equipment are assets over which charges have been granted as security over bank facilities (refer note 15). The terms of the charges preclude the assets being sold or being used as security for further charges without the permission of the charge holders. The charges also require buildings that form part of the security to be fully insured at all times. Assets under lease are pledged as security for the associated lease liabilities (refer note 15).
Consolidated2019 2018
Note $’000 $’000The carrying value of assets pledged as security are:Property, plant and equipment 20,898 19,492
Reconciliations of the carrying amountsFreehold landCarrying amount at beginning 1,698 2,986Reclassification to investment property (553) (413)Disposal of building materials business – (875)
1,145 1,698
Buildings on freehold landCarrying amount at beginning 7,498 10,797Reclassification to investment property (1,892) (2,998)Additions 51 –Depreciation expense (267) (301)
5,390 7,498
Leasehold quarriesCarrying amount at beginning – 2,920Disposal of building materials business – (2,920)
– –
Leasehold improvementsCarrying amount at beginning – 172Disposal of building materials business – (172)
Net carrying amount of land and buildings 6,535 9,196
Plant and equipmentCarrying amount at beginning 7,208 14,993Additions 1,500 5,575Transfers from leased plant 414 (2,461)Depreciation expense (2,135) (2,445)Impairment write down (a) – (4,500)Foreign currency translation adjustment 150 256Disposal of building materials business – (4,210)Disposals (280) –
6,857 7,208
Plant and equipment under leaseCarrying amount at beginning 11,241 9,676Additions 3,858 –Transfer to plant and equipment (414) 2,461Depreciation expense (1,553) (1,379)Foreign currency translation adjustment 377 483Disposals (135) –
13,374 11,241Total carrying amount of plant and equipment 26,766 27,645
NOTE 18 PROPERTY, PLANT AND EQUIPMENT (CONTINUED)(a) The carrying values of cash generating units are reviewed for impairment at
each reporting date, with recoverable amount being estimated when events or changes in circumstances indicate the carrying value may be impaired.The recoverable amount of a cash generating unit is the greater of fair value less costs of disposal and value in use. In assessing value in use, the estimated future cash flows are discounted to their present value using a pre-tax discount rate that reflects current market assessments of the time value of money and the risks specific to the asset.The Delta value-in-use model is a 5-year model and assumes revenue growth excluding CPI of 2.0% (June 2018: 1.8%), pre-tax discount rate of 14% (June 2018: 14%) and a termination multiple of 6 times EBITDA.An impairment exists when the carrying value of an asset or cash-generating units exceeds its estimated recoverable amount. The asset or cash-generating unit is then written down to its recoverable amount. At 30 June 2019, the estimated recoverable amount exceeded the carrying value of the assets, so no impairment was identified. During the year ended 30 June 2018 an impairment was identified and property, plant and equipment was written down by $4,500,000.
NOTE 19 INVESTMENT PROPERTY
Consolidated2019 2018$’000 $’000
Land and buildingsAt cost 38,027 33,300Accumulated depreciation and impairment (10,461) (6,532)
27,566 26,768ImprovementsAt cost 4,617 4,284Accumulated depreciation and impairment (2,607) (2,374)
2,010 1,910TotalAt cost 42,644 37,584Accumulated depreciation and impairment (13,068) (8,906)Net carrying amount of investment properties 29,576 28,678
Investment properties are recognised at cost less accumulated depreciation. The fair value of the investment property at 30 June 2019 as estimated by Directors is $103,143,000 (2018 $100,243,000) based on valuations not older than 3 years by certified independent valuers who hold recognised and relevant professional qualifications and licenses, and who specialise in valuing these types of investment properties. Valuers have carried out inspections of the properties and undertaken market research with respect to available sales and rental evidence.
An impairment of an investment property was identified based on a recent property valuation. The asset values associated with the investment property were written down by $1,221,000 at 30 June 2019.
Consolidated2019 2018
Note $’000 $’000Rental income derived from investment properties 5,875 5,559Direct operating expenses (including repairs and maintenance) generating rental income (included in cost of sales) (2,631) (2,708)Direct operating expenses (including repairs and maintenance) that did not generate rental income (included in cost of sales) (120) (120)Profit arising from investment properties carried at cost 4(a) 3,124 2,731
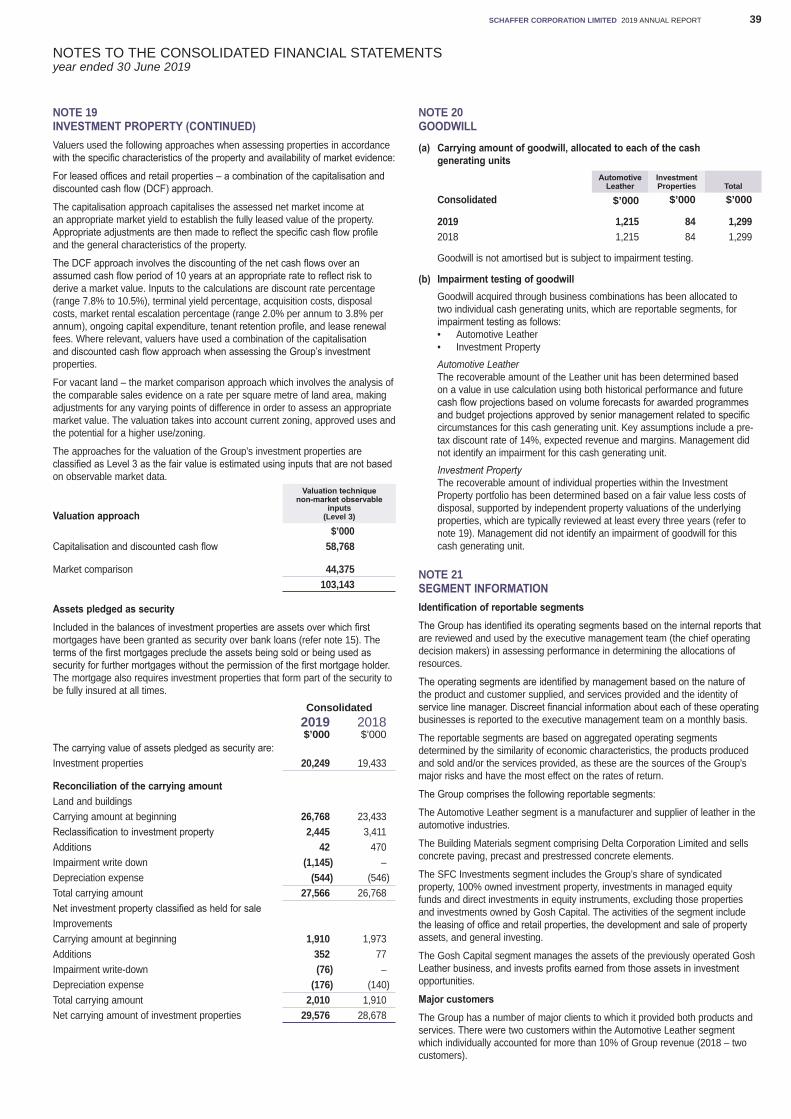
NOTES TO THE CONSOLIDATED FINANCIAL STATEMENTSyear ended 30 June 2019
SCHAFFER CORPORATION LIMITED 2019 ANNUAL REPORT 39
NOTE 19 INVESTMENT PROPERTY (CONTINUED)Valuers used the following approaches when assessing properties in accordance with the specific characteristics of the property and availability of market evidence:
For leased offices and retail properties – a combination of the capitalisation and discounted cash flow (DCF) approach.
The capitalisation approach capitalises the assessed net market income at an appropriate market yield to establish the fully leased value of the property. Appropriate adjustments are then made to reflect the specific cash flow profile and the general characteristics of the property.
The DCF approach involves the discounting of the net cash flows over an assumed cash flow period of 10 years at an appropriate rate to reflect risk to derive a market value. Inputs to the calculations are discount rate percentage (range 7.8% to 10.5%), terminal yield percentage, acquisition costs, disposal costs, market rental escalation percentage (range 2.0% per annum to 3.8% per annum), ongoing capital expenditure, tenant retention profile, and lease renewal fees. Where relevant, valuers have used a combination of the capitalisation and discounted cash flow approach when assessing the Group’s investment properties.
For vacant land – the market comparison approach which involves the analysis of the comparable sales evidence on a rate per square metre of land area, making adjustments for any varying points of difference in order to assess an appropriate market value. The valuation takes into account current zoning, approved uses and the potential for a higher use/zoning.
The approaches for the valuation of the Group’s investment properties are classified as Level 3 as the fair value is estimated using inputs that are not based on observable market data.
Valuation approach
Valuation technique non-market observable
inputs(Level 3)
$’000Capitalisation and discounted cash flow 58,768
Market comparison 44,375103,143
Assets pledged as securityIncluded in the balances of investment properties are assets over which first mortgages have been granted as security over bank loans (refer note 15). The terms of the first mortgages preclude the assets being sold or being used as security for further mortgages without the permission of the first mortgage holder. The mortgage also requires investment properties that form part of the security to be fully insured at all times.
Consolidated2019 2018$’000 $’000
The carrying value of assets pledged as security are:Investment properties 20,249 19,433
Reconciliation of the carrying amountLand and buildingsCarrying amount at beginning 26,768 23,433Reclassification to investment property 2,445 3,411Additions 42 470Impairment write down (1,145) –Depreciation expense (544) (546)Total carrying amount 27,566 26,768Net investment property classified as held for saleImprovementsCarrying amount at beginning 1,910 1,973Additions 352 77Impairment write-down (76) –Depreciation expense (176) (140)Total carrying amount 2,010 1,910Net carrying amount of investment properties 29,576 28,678
NOTE 20 GOODWILL
(a) Carrying amount of goodwill, allocated to each of the cash generating units
AutomotiveLeather
InvestmentProperties Total
Consolidated $’000 $’000 $’000
2019 1,215 84 1,2992018 1,215 84 1,299
Goodwill is not amortised but is subject to impairment testing.
(b) Impairment testing of goodwillGoodwill acquired through business combinations has been allocated to two individual cash generating units, which are reportable segments, for impairment testing as follows:• Automotive Leather• Investment PropertyAutomotive LeatherThe recoverable amount of the Leather unit has been determined based on a value in use calculation using both historical performance and future cash flow projections based on volume forecasts for awarded programmes and budget projections approved by senior management related to specific circumstances for this cash generating unit. Key assumptions include a pre-tax discount rate of 14%, expected revenue and margins. Management did not identify an impairment for this cash generating unit.Investment PropertyThe recoverable amount of individual properties within the Investment Property portfolio has been determined based on a fair value less costs of disposal, supported by independent property valuations of the underlying properties, which are typically reviewed at least every three years (refer to note 19). Management did not identify an impairment of goodwill for this cash generating unit.
NOTE 21 SEGMENT INFORMATIONIdentification of reportable segmentsThe Group has identified its operating segments based on the internal reports that are reviewed and used by the executive management team (the chief operating decision makers) in assessing performance in determining the allocations of resources.
The operating segments are identified by management based on the nature of the product and customer supplied, and services provided and the identity of service line manager. Discreet financial information about each of these operating businesses is reported to the executive management team on a monthly basis.
The reportable segments are based on aggregated operating segments determined by the similarity of economic characteristics, the products produced and sold and/or the services provided, as these are the sources of the Group’s major risks and have the most effect on the rates of return.
The Group comprises the following reportable segments:
The Automotive Leather segment is a manufacturer and supplier of leather in the automotive industries.
The Building Materials segment comprising Delta Corporation Limited and sells concrete paving, precast and prestressed concrete elements.
The SFC Investments segment includes the Group’s share of syndicated property, 100% owned investment property, investments in managed equity funds and direct investments in equity instruments, excluding those properties and investments owned by Gosh Capital. The activities of the segment include the leasing of office and retail properties, the development and sale of property assets, and general investing.
The Gosh Capital segment manages the assets of the previously operated Gosh Leather business, and invests profits earned from those assets in investment opportunities.
Major customersThe Group has a number of major clients to which it provided both products and services. There were two customers within the Automotive Leather segment which individually accounted for more than 10% of Group revenue (2018 – two customers).
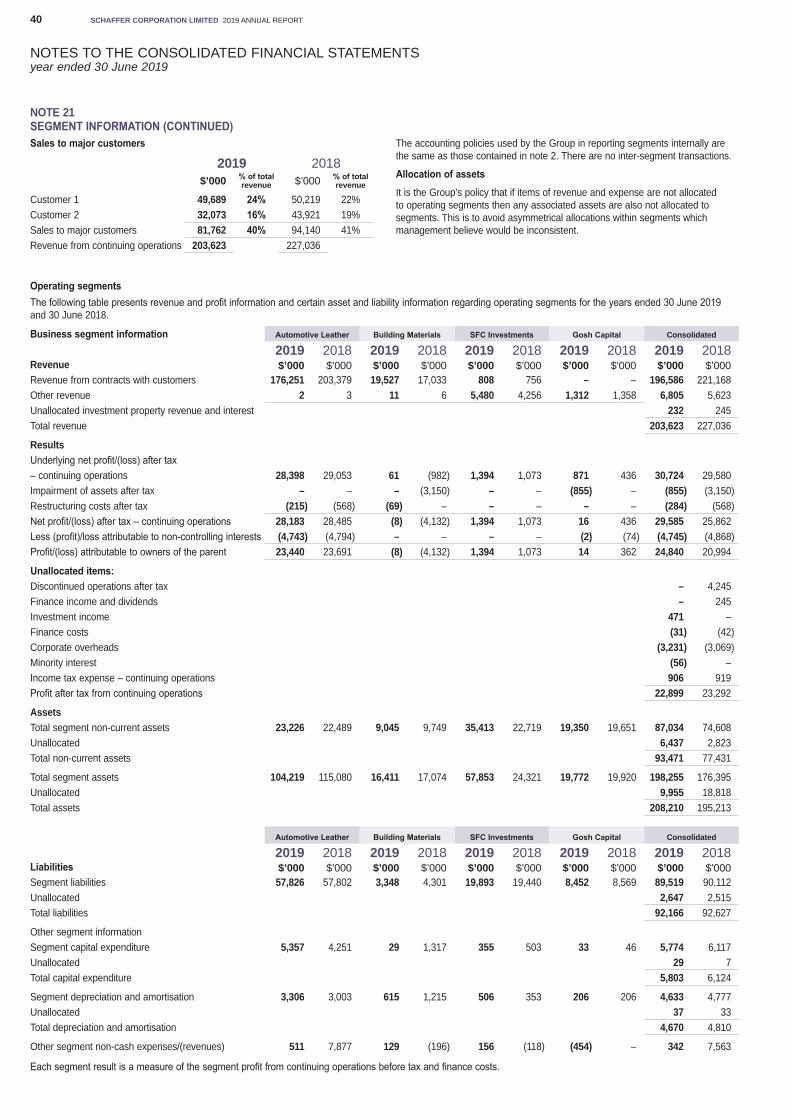
NOTES TO THE CONSOLIDATED FINANCIAL STATEMENTSyear ended 30 June 2019
SCHAFFER CORPORATION LIMITED 2019 ANNUAL REPORT40
NOTE 21 SEGMENT INFORMATION (CONTINUED)Sales to major customers
2019 2018$’000 % of total
revenue $’000 % of total revenue
Customer 1 49,689 24% 50,219 22%Customer 2 32,073 16% 43,921 19%Sales to major customers 81,762 40% 94,140 41%Revenue from continuing operations 203,623 227,036
The accounting policies used by the Group in reporting segments internally are the same as those contained in note 2. There are no inter-segment transactions.
Allocation of assetsIt is the Group’s policy that if items of revenue and expense are not allocated to operating segments then any associated assets are also not allocated to segments. This is to avoid asymmetrical allocations within segments which management believe would be inconsistent.
Operating segmentsThe following table presents revenue and profit information and certain asset and liability information regarding operating segments for the years ended 30 June 2019 and 30 June 2018.
Business segment information Automotive Leather Building Materials SFC Investments Gosh Capital Consolidated
2019 2018 2019 2018 2019 2018 2019 2018 2019 2018Revenue $’000 $’000 $’000 $’000 $’000 $’000 $’000 $’000 $’000 $’000Revenue from contracts with customers 176,251 203,379 19,527 17,033 808 756 – – 196,586 221,168Other revenue 2 3 11 6 5,480 4,256 1,312 1,358 6,805 5,623Unallocated investment property revenue and interest 232 245Total revenue 203,623 227,036
ResultsUnderlying net profit/(loss) after tax– continuing operations 28,398 29,053 61 (982) 1,394 1,073 871 436 30,724 29,580Impairment of assets after tax – – – (3,150) – – (855) – (855) (3,150)Restructuring costs after tax (215) (568) (69) – – – – – (284) (568)Net profit/(loss) after tax – continuing operations 28,183 28,485 (8) (4,132) 1,394 1,073 16 436 29,585 25,862Less (profit)/loss attributable to non-controlling interests (4,743) (4,794) – – – – (2) (74) (4,745) (4,868)Profit/(loss) attributable to owners of the parent 23,440 23,691 (8) (4,132) 1,394 1,073 14 362 24,840 20,994
Unallocated items:Discontinued operations after tax – 4,245Finance income and dividends – 245Investment income 471 –Finance costs (31) (42)Corporate overheads (3,231) (3,069)Minority interest (56) –Income tax expense – continuing operations 906 919Profit after tax from continuing operations 22,899 23,292
AssetsTotal segment non-current assets 23,226 22,489 9,045 9,749 35,413 22,719 19,350 19,651 87,034 74,608Unallocated 6,437 2,823Total non-current assets 93,471 77,431
Total segment assets 104,219 115,080 16,411 17,074 57,853 24,321 19,772 19,920 198,255 176,395Unallocated 9,955 18,818Total assets 208,210 195,213
Automotive Leather Building Materials SFC Investments Gosh Capital Consolidated
2019 2018 2019 2018 2019 2018 2019 2018 2019 2018Liabilities $’000 $’000 $’000 $’000 $’000 $’000 $’000 $’000 $’000 $’000Segment liabilities 57,826 57,802 3,348 4,301 19,893 19,440 8,452 8,569 89,519 90,112Unallocated 2,647 2,515Total liabilities 92,166 92,627
Other segment informationSegment capital expenditure 5,357 4,251 29 1,317 355 503 33 46 5,774 6,117Unallocated 29 7Total capital expenditure 5,803 6,124
Segment depreciation and amortisation 3,306 3,003 615 1,215 506 353 206 206 4,633 4,777Unallocated 37 33Total depreciation and amortisation 4,670 4,810
Other segment non-cash expenses/(revenues) 511 7,877 129 (196) 156 (118) (454) – 342 7,563
Each segment result is a measure of the segment profit from continuing operations before tax and finance costs.
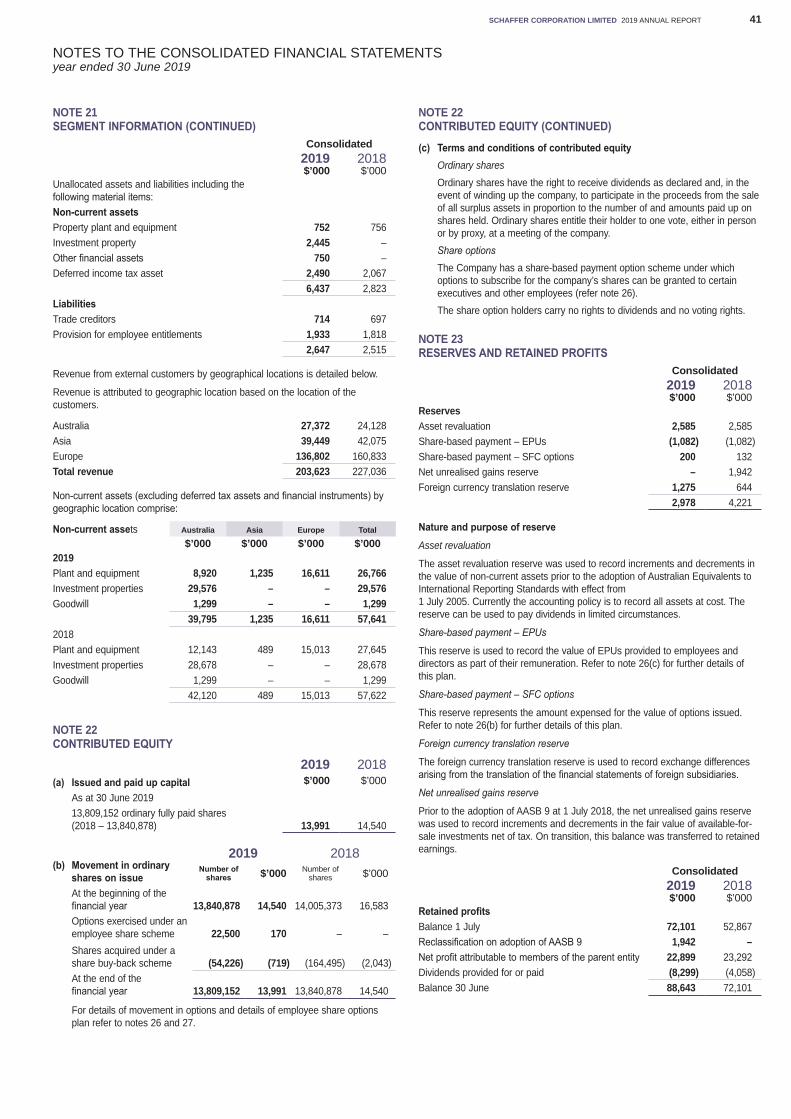
NOTES TO THE CONSOLIDATED FINANCIAL STATEMENTSyear ended 30 June 2019
SCHAFFER CORPORATION LIMITED 2019 ANNUAL REPORT 41
NOTE 21 SEGMENT INFORMATION (CONTINUED)
Consolidated2019 2018$’000 $’000
Unallocated assets and liabilities including the following material items:Non-current assetsProperty plant and equipment 752 756Investment property 2,445 –Other financial assets 750 –Deferred income tax asset 2,490 2,067
6,437 2,823LiabilitiesTrade creditors 714 697Provision for employee entitlements 1,933 1,818
2,647 2,515
Revenue from external customers by geographical locations is detailed below.
Revenue is attributed to geographic location based on the location of the customers.
Australia 27,372 24,128Asia 39,449 42,075Europe 136,802 160,833Total revenue 203,623 227,036
Non-current assets (excluding deferred tax assets and financial instruments) by geographic location comprise:
Non-current assets Australia Asia Europe Total
$’000 $’000 $’000 $’0002019Plant and equipment 8,920 1,235 16,611 26,766Investment properties 29,576 – – 29,576Goodwill 1,299 – – 1,299
39,795 1,235 16,611 57,6412018Plant and equipment 12,143 489 15,013 27,645Investment properties 28,678 – – 28,678Goodwill 1,299 – – 1,299
42,120 489 15,013 57,622
NOTE 22 CONTRIBUTED EQUITY
2019 2018(a) Issued and paid up capital $’000 $’000
As at 30 June 201913,809,152 ordinary fully paid shares (2018 – 13,840,878) 13,991 14,540
2019 2018(b) Movement in ordinary
shares on issueNumber of
shares $’000 Number of shares $’000
At the beginning of the financial year 13,840,878 14,540 14,005,373 16,583Options exercised under an employee share scheme 22,500 170 – –Shares acquired under a share buy-back scheme (54,226) (719) (164,495) (2,043)At the end of the financial year 13,809,152 13,991 13,840,878 14,540
For details of movement in options and details of employee share options plan refer to notes 26 and 27.
NOTE 22 CONTRIBUTED EQUITY (CONTINUED)
(c) Terms and conditions of contributed equityOrdinary sharesOrdinary shares have the right to receive dividends as declared and, in the event of winding up the company, to participate in the proceeds from the sale of all surplus assets in proportion to the number of and amounts paid up on shares held. Ordinary shares entitle their holder to one vote, either in person or by proxy, at a meeting of the company.Share optionsThe Company has a share-based payment option scheme under which options to subscribe for the company’s shares can be granted to certain executives and other employees (refer note 26).The share option holders carry no rights to dividends and no voting rights.
NOTE 23 RESERVES AND RETAINED PROFITS
Consolidated2019 2018$’000 $’000
ReservesAsset revaluation 2,585 2,585Share-based payment – EPUs (1,082) (1,082)Share-based payment – SFC options 200 132Net unrealised gains reserve – 1,942Foreign currency translation reserve 1,275 644
2,978 4,221
Nature and purpose of reserveAsset revaluation
The asset revaluation reserve was used to record increments and decrements in the value of non-current assets prior to the adoption of Australian Equivalents to International Reporting Standards with effect from 1 July 2005. Currently the accounting policy is to record all assets at cost. The reserve can be used to pay dividends in limited circumstances.
Share-based payment – EPUs
This reserve is used to record the value of EPUs provided to employees and directors as part of their remuneration. Refer to note 26(c) for further details of this plan.
Share-based payment – SFC options
This reserve represents the amount expensed for the value of options issued. Refer to note 26(b) for further details of this plan.
Foreign currency translation reserve
The foreign currency translation reserve is used to record exchange differences arising from the translation of the financial statements of foreign subsidiaries.
Net unrealised gains reserve
Prior to the adoption of AASB 9 at 1 July 2018, the net unrealised gains reserve was used to record increments and decrements in the fair value of available-for-sale investments net of tax. On transition, this balance was transferred to retained earnings.
Consolidated2019 2018$’000 $’000
Retained profitsBalance 1 July 72,101 52,867Reclassification on adoption of AASB 9 1,942 –Net profit attributable to members of the parent entity 22,899 23,292Dividends provided for or paid (8,299) (4,058)Balance 30 June 88,643 72,101
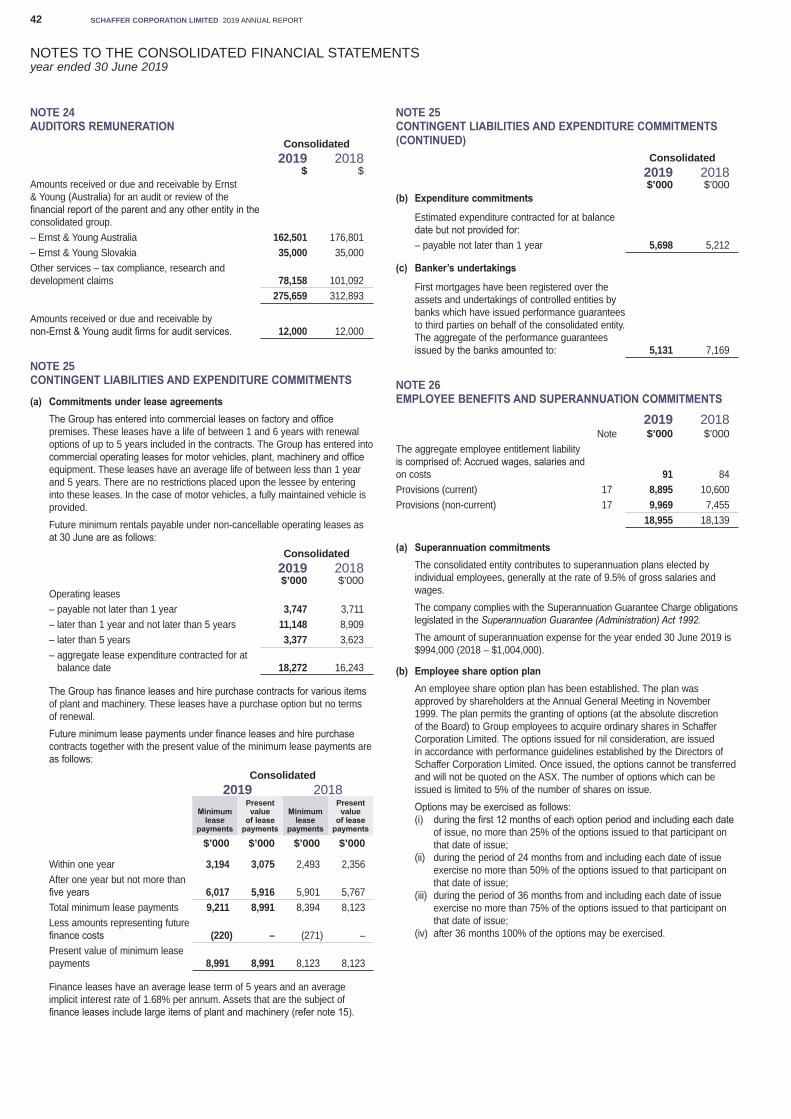
NOTES TO THE CONSOLIDATED FINANCIAL STATEMENTSyear ended 30 June 2019
SCHAFFER CORPORATION LIMITED 2019 ANNUAL REPORT42
NOTE 24 AUDITORS REMUNERATION
Consolidated2019 2018
$ $Amounts received or due and receivable by Ernst & Young (Australia) for an audit or review of the financial report of the parent and any other entity in the consolidated group.– Ernst & Young Australia 162,501 176,801– Ernst & Young Slovakia 35,000 35,000Other services – tax compliance, research and development claims 78,158 101,092
275,659 312,893
Amounts received or due and receivable by non-Ernst & Young audit firms for audit services. 12,000 12,000
NOTE 25 CONTINGENT LIABILITIES AND EXPENDITURE COMMITMENTS
(a) Commitments under lease agreementsThe Group has entered into commercial leases on factory and office premises. These leases have a life of between 1 and 6 years with renewal options of up to 5 years included in the contracts. The Group has entered into commercial operating leases for motor vehicles, plant, machinery and office equipment. These leases have an average life of between less than 1 year and 5 years. There are no restrictions placed upon the lessee by entering into these leases. In the case of motor vehicles, a fully maintained vehicle is provided.Future minimum rentals payable under non-cancellable operating leases as at 30 June are as follows:
Consolidated2019 2018$’000 $’000
Operating leases– payable not later than 1 year 3,747 3,711– later than 1 year and not later than 5 years 11,148 8,909– later than 5 years 3,377 3,623– aggregate lease expenditure contracted for at
balance date 18,272 16,243
The Group has finance leases and hire purchase contracts for various items of plant and machinery. These leases have a purchase option but no terms of renewal.Future minimum lease payments under finance leases and hire purchase contracts together with the present value of the minimum lease payments are as follows:
Consolidated2019 2018
Minimum lease
payments
Present value
of lease payments
Minimum lease
payments
Present value
of lease payments
$’000 $’000 $’000 $’000
Within one year 3,194 3,075 2,493 2,356After one year but not more than five years 6,017 5,916 5,901 5,767Total minimum lease payments 9,211 8,991 8,394 8,123Less amounts representing future finance costs (220) – (271) –Present value of minimum lease payments 8,991 8,991 8,123 8,123
Finance leases have an average lease term of 5 years and an average implicit interest rate of 1.68% per annum. Assets that are the subject of finance leases include large items of plant and machinery (refer note 15).
NOTE 25 CONTINGENT LIABILITIES AND EXPENDITURE COMMITMENTS (CONTINUED)
Consolidated2019 2018$’000 $’000
(b) Expenditure commitments
Estimated expenditure contracted for at balance date but not provided for:– payable not later than 1 year 5,698 5,212
(c) Banker’s undertakings
First mortgages have been registered over the assets and undertakings of controlled entities by banks which have issued performance guarantees to third parties on behalf of the consolidated entity. The aggregate of the performance guarantees issued by the banks amounted to: 5,131 7,169
NOTE 26 EMPLOYEE BENEFITS AND SUPERANNUATION COMMITMENTS
2019 2018Note $’000 $’000
The aggregate employee entitlement liability is comprised of: Accrued wages, salaries and on costs 91 84Provisions (current) 17 8,895 10,600Provisions (non-current) 17 9,969 7,455
18,955 18,139
(a) Superannuation commitmentsThe consolidated entity contributes to superannuation plans elected by individual employees, generally at the rate of 9.5% of gross salaries and wages.The company complies with the Superannuation Guarantee Charge obligations legislated in the Superannuation Guarantee (Administration) Act 1992.The amount of superannuation expense for the year ended 30 June 2019 is $994,000 (2018 – $1,004,000).
(b) Employee share option planAn employee share option plan has been established. The plan was approved by shareholders at the Annual General Meeting in November 1999. The plan permits the granting of options (at the absolute discretion of the Board) to Group employees to acquire ordinary shares in Schaffer Corporation Limited. The options issued for nil consideration, are issued in accordance with performance guidelines established by the Directors of Schaffer Corporation Limited. Once issued, the options cannot be transferred and will not be quoted on the ASX. The number of options which can be issued is limited to 5% of the number of shares on issue.Options may be exercised as follows:(i) during the first 12 months of each option period and including each date
of issue, no more than 25% of the options issued to that participant on that date of issue;
(ii) during the period of 24 months from and including each date of issue exercise no more than 50% of the options issued to that participant on that date of issue;
(iii) during the period of 36 months from and including each date of issue exercise no more than 75% of the options issued to that participant on that date of issue;
(iv) after 36 months 100% of the options may be exercised.
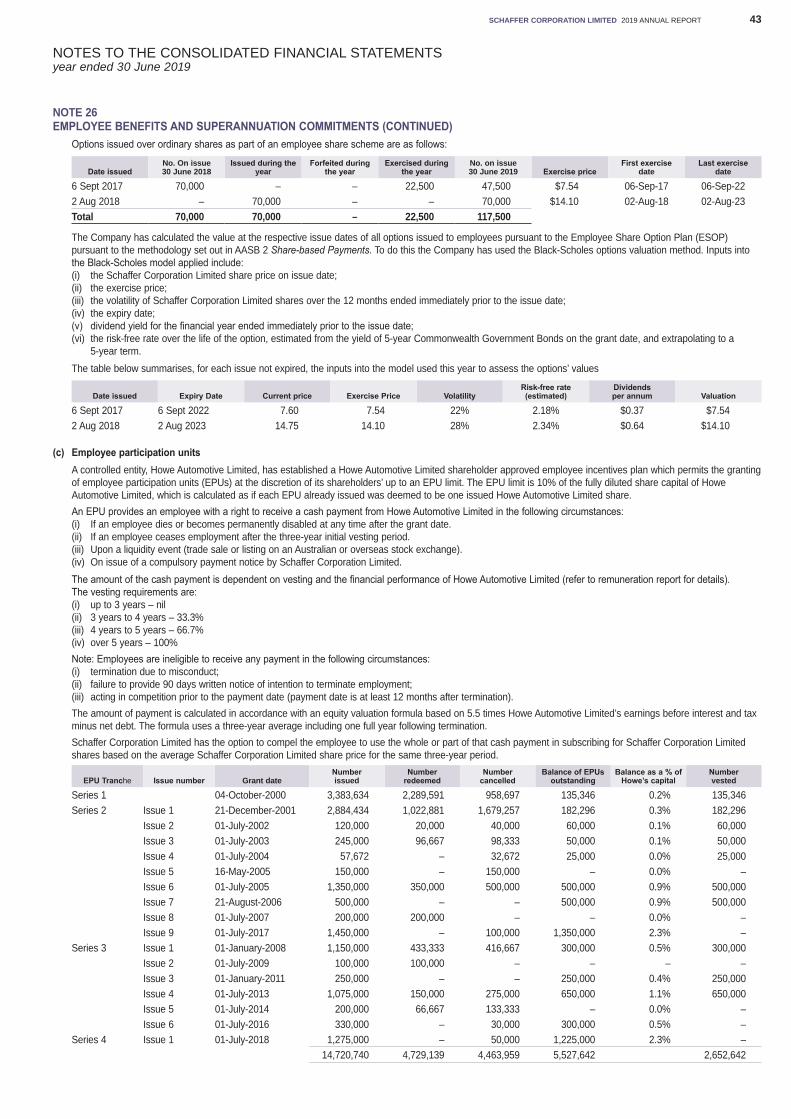
NOTES TO THE CONSOLIDATED FINANCIAL STATEMENTSyear ended 30 June 2019
SCHAFFER CORPORATION LIMITED 2019 ANNUAL REPORT 43
NOTE 26 EMPLOYEE BENEFITS AND SUPERANNUATION COMMITMENTS (CONTINUED)
Options issued over ordinary shares as part of an employee share scheme are as follows:
Date issuedNo. On issue 30 June 2018
Issued during the year
Forfeited during the year
Exercised during the year
No. on issue 30 June 2019 Exercise price
First exercise date
Last exercise date
6 Sept 2017 70,000 – – 22,500 47,500 $7.54 06-Sep-17 06-Sep-222 Aug 2018 – 70,000 – – 70,000 $14.10 02-Aug-18 02-Aug-23Total 70,000 70,000 – 22,500 117,500
The Company has calculated the value at the respective issue dates of all options issued to employees pursuant to the Employee Share Option Plan (ESOP) pursuant to the methodology set out in AASB 2 Share-based Payments. To do this the Company has used the Black-Scholes options valuation method. Inputs into the Black-Scholes model applied include:(i) the Schaffer Corporation Limited share price on issue date;(ii) the exercise price;(iii) the volatility of Schaffer Corporation Limited shares over the 12 months ended immediately prior to the issue date;(iv) the expiry date;(v) dividend yield for the financial year ended immediately prior to the issue date;(vi) the risk-free rate over the life of the option, estimated from the yield of 5-year Commonwealth Government Bonds on the grant date, and extrapolating to a
5-year term.The table below summarises, for each issue not expired, the inputs into the model used this year to assess the options’ values
Date issued Expiry Date Current price Exercise Price VolatilityRisk-free rate (estimated)
Dividends per annum Valuation
6 Sept 2017 6 Sept 2022 7.60 7.54 22% 2.18% $0.37 $7.542 Aug 2018 2 Aug 2023 14.75 14.10 28% 2.34% $0.64 $14.10
(c) Employee participation unitsA controlled entity, Howe Automotive Limited, has established a Howe Automotive Limited shareholder approved employee incentives plan which permits the granting of employee participation units (EPUs) at the discretion of its shareholders’ up to an EPU limit. The EPU limit is 10% of the fully diluted share capital of Howe Automotive Limited, which is calculated as if each EPU already issued was deemed to be one issued Howe Automotive Limited share.An EPU provides an employee with a right to receive a cash payment from Howe Automotive Limited in the following circumstances:(i) If an employee dies or becomes permanently disabled at any time after the grant date.(ii) If an employee ceases employment after the three-year initial vesting period.(iii) Upon a liquidity event (trade sale or listing on an Australian or overseas stock exchange).(iv) On issue of a compulsory payment notice by Schaffer Corporation Limited.The amount of the cash payment is dependent on vesting and the financial performance of Howe Automotive Limited (refer to remuneration report for details). The vesting requirements are:(i) up to 3 years – nil(ii) 3 years to 4 years – 33.3%(iii) 4 years to 5 years – 66.7%(iv) over 5 years – 100%Note: Employees are ineligible to receive any payment in the following circumstances:(i) termination due to misconduct;(ii) failure to provide 90 days written notice of intention to terminate employment;(iii) acting in competition prior to the payment date (payment date is at least 12 months after termination).The amount of payment is calculated in accordance with an equity valuation formula based on 5.5 times Howe Automotive Limited’s earnings before interest and tax minus net debt. The formula uses a three-year average including one full year following termination.Schaffer Corporation Limited has the option to compel the employee to use the whole or part of that cash payment in subscribing for Schaffer Corporation Limited shares based on the average Schaffer Corporation Limited share price for the same three-year period.
EPU Tranche Issue number Grant dateNumber issued
Number redeemed
Number cancelled
Balance of EPUs outstanding
Balance as a % of Howe’s capital
Number vested
Series 1 04-October-2000 3,383,634 2,289,591 958,697 135,346 0.2% 135,346Series 2 Issue 1 21-December-2001 2,884,434 1,022,881 1,679,257 182,296 0.3% 182,296
Issue 2 01-July-2002 120,000 20,000 40,000 60,000 0.1% 60,000Issue 3 01-July-2003 245,000 96,667 98,333 50,000 0.1% 50,000Issue 4 01-July-2004 57,672 – 32,672 25,000 0.0% 25,000Issue 5 16-May-2005 150,000 – 150,000 – 0.0% – Issue 6 01-July-2005 1,350,000 350,000 500,000 500,000 0.9% 500,000Issue 7 21-August-2006 500,000 – – 500,000 0.9% 500,000Issue 8 01-July-2007 200,000 200,000 – – 0.0% – Issue 9 01-July-2017 1,450,000 – 100,000 1,350,000 2.3% –
Series 3 Issue 1 01-January-2008 1,150,000 433,333 416,667 300,000 0.5% 300,000Issue 2 01-July-2009 100,000 100,000 – – – – Issue 3 01-January-2011 250,000 – – 250,000 0.4% 250,000Issue 4 01-July-2013 1,075,000 150,000 275,000 650,000 1.1% 650,000Issue 5 01-July-2014 200,000 66,667 133,333 – 0.0% – Issue 6 01-July-2016 330,000 – 30,000 300,000 0.5% –
Series 4 Issue 1 01-July-2018 1,275,000 – 50,000 1,225,000 2.3% – 14,720,740 4,729,139 4,463,959 5,527,642 2,652,642
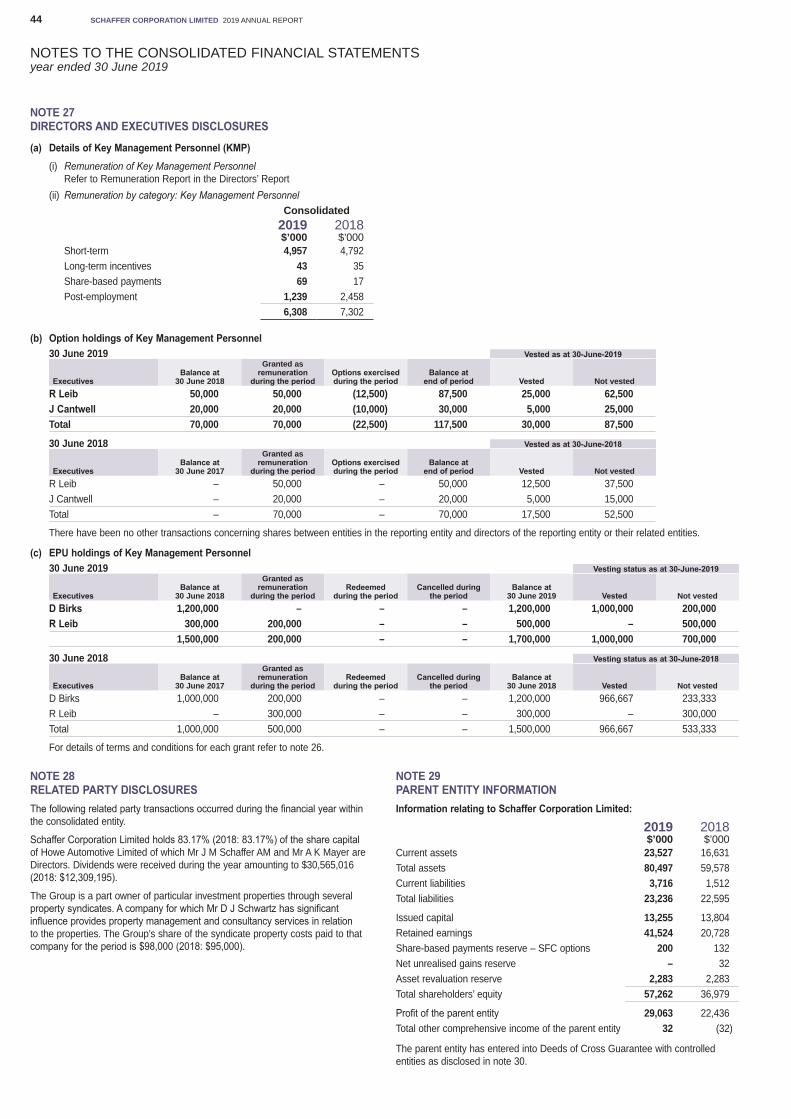
NOTES TO THE CONSOLIDATED FINANCIAL STATEMENTSyear ended 30 June 2019
SCHAFFER CORPORATION LIMITED 2019 ANNUAL REPORT44
NOTE 27 DIRECTORS AND EXECUTIVES DISCLOSURES
(a) Details of Key Management Personnel (KMP)(i) Remuneration of Key Management Personnel
Refer to Remuneration Report in the Directors’ Report(ii) Remuneration by category: Key Management Personnel
Consolidated2019 2018$’000 $’000
Short-term 4,957 4,792Long-term incentives 43 35Share-based payments 69 17Post-employment 1,239 2,458
6,308 7,302
(b) Option holdings of Key Management Personnel30 June 2019 Vested as at 30-June-2019
ExecutivesBalance at
30 June 2018
Granted as remuneration
during the periodOptions exercised during the period
Balance at end of period Vested Not vested
R Leib 50,000 50,000 (12,500) 87,500 25,000 62,500J Cantwell 20,000 20,000 (10,000) 30,000 5,000 25,000Total 70,000 70,000 (22,500) 117,500 30,000 87,500
30 June 2018 Vested as at 30-June-2018
ExecutivesBalance at
30 June 2017
Granted as remuneration
during the periodOptions exercised during the period
Balance at end of period Vested Not vested
R Leib – 50,000 – 50,000 12,500 37,500J Cantwell – 20,000 – 20,000 5,000 15,000Total – 70,000 – 70,000 17,500 52,500
There have been no other transactions concerning shares between entities in the reporting entity and directors of the reporting entity or their related entities.
(c) EPU holdings of Key Management Personnel30 June 2019 Vesting status as at 30-June-2019
ExecutivesBalance at
30 June 2018
Granted as remuneration
during the periodRedeemed
during the periodCancelled during
the periodBalance at
30 June 2019 Vested Not vestedD Birks 1,200,000 – – – 1,200,000 1,000,000 200,000R Leib 300,000 200,000 – – 500,000 – 500,000
1,500,000 200,000 – – 1,700,000 1,000,000 700,000
30 June 2018 Vesting status as at 30-June-2018
ExecutivesBalance at
30 June 2017
Granted as remuneration
during the periodRedeemed
during the periodCancelled during
the periodBalance at
30 June 2018 Vested Not vestedD Birks 1,000,000 200,000 – – 1,200,000 966,667 233,333R Leib – 300,000 – – 300,000 – 300,000Total 1,000,000 500,000 – – 1,500,000 966,667 533,333
For details of terms and conditions for each grant refer to note 26.
NOTE 28 RELATED PARTY DISCLOSURESThe following related party transactions occurred during the financial year within the consolidated entity.
Schaffer Corporation Limited holds 83.17% (2018: 83.17%) of the share capital of Howe Automotive Limited of which Mr J M Schaffer AM and Mr A K Mayer are Directors. Dividends were received during the year amounting to $30,565,016 (2018: $12,309,195).
The Group is a part owner of particular investment properties through several property syndicates. A company for which Mr D J Schwartz has significant influence provides property management and consultancy services in relation to the properties. The Group’s share of the syndicate property costs paid to that company for the period is $98,000 (2018: $95,000).
NOTE 29 PARENT ENTITY INFORMATIONInformation relating to Schaffer Corporation Limited:
2019 2018$’000 $’000
Current assets 23,527 16,631Total assets 80,497 59,578Current liabilities 3,716 1,512Total liabilities 23,236 22,595
Issued capital 13,255 13,804Retained earnings 41,524 20,728Share-based payments reserve – SFC options 200 132Net unrealised gains reserve – 32Asset revaluation reserve 2,283 2,283Total shareholders’ equity 57,262 36,979
Profit of the parent entity 29,063 22,436Total other comprehensive income of the parent entity 32 (32)
The parent entity has entered into Deeds of Cross Guarantee with controlled entities as disclosed in note 30.
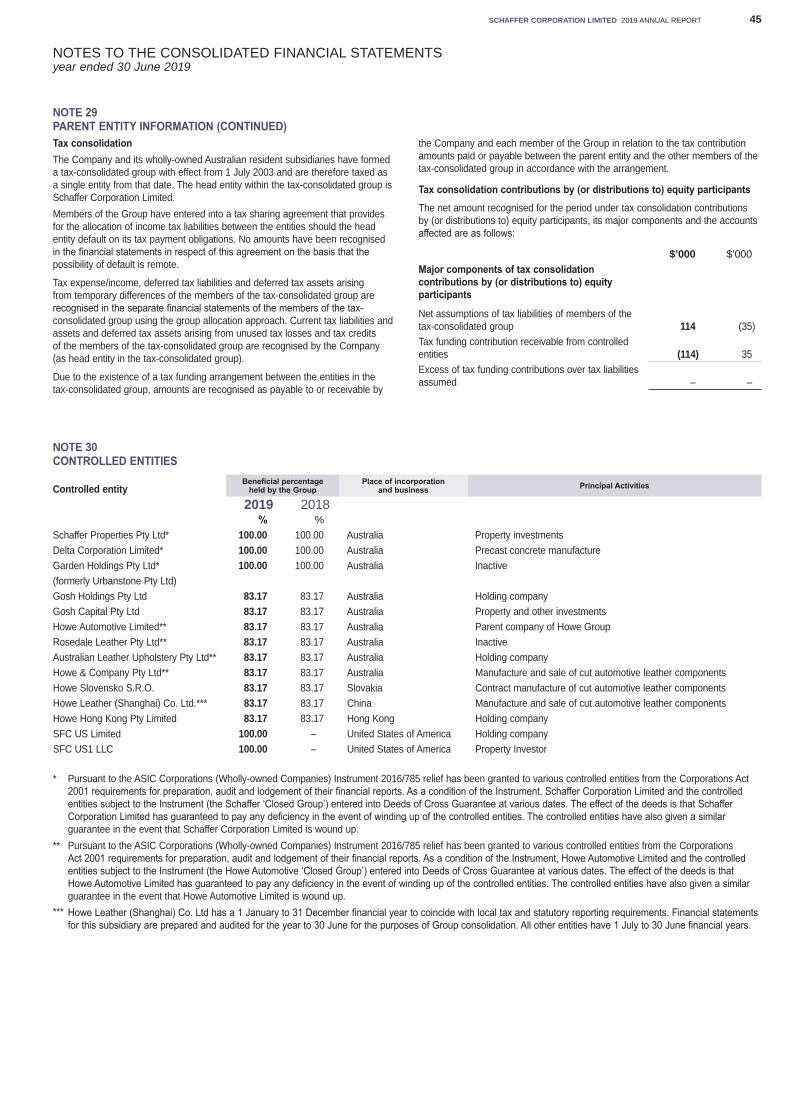
NOTES TO THE CONSOLIDATED FINANCIAL STATEMENTSyear ended 30 June 2019
SCHAFFER CORPORATION LIMITED 2019 ANNUAL REPORT 45
NOTE 29 PARENT ENTITY INFORMATION (CONTINUED)Tax consolidationThe Company and its wholly-owned Australian resident subsidiaries have formed a tax-consolidated group with effect from 1 July 2003 and are therefore taxed as a single entity from that date. The head entity within the tax-consolidated group is Schaffer Corporation Limited.Members of the Group have entered into a tax sharing agreement that provides for the allocation of income tax liabilities between the entities should the head entity default on its tax payment obligations. No amounts have been recognised in the financial statements in respect of this agreement on the basis that the possibility of default is remote.
Tax expense/income, deferred tax liabilities and deferred tax assets arising from temporary differences of the members of the tax-consolidated group are recognised in the separate financial statements of the members of the tax-consolidated group using the group allocation approach. Current tax liabilities and assets and deferred tax assets arising from unused tax losses and tax credits of the members of the tax-consolidated group are recognised by the Company (as head entity in the tax-consolidated group).
Due to the existence of a tax funding arrangement between the entities in the tax-consolidated group, amounts are recognised as payable to or receivable by
the Company and each member of the Group in relation to the tax contribution amounts paid or payable between the parent entity and the other members of the tax-consolidated group in accordance with the arrangement.
Tax consolidation contributions by (or distributions to) equity participantsThe net amount recognised for the period under tax consolidation contributions by (or distributions to) equity participants, its major components and the accounts affected are as follows:
$’000 $’000Major components of tax consolidation contributions by (or distributions to) equity participants
Net assumptions of tax liabilities of members of the tax-consolidated group 114 (35)Tax funding contribution receivable from controlled entities (114) 35Excess of tax funding contributions over tax liabilities assumed – –
NOTE 30 CONTROLLED ENTITIES
Controlled entityBeneficial percentage
held by the GroupPlace of incorporation
and business Principal Activities
2019 2018% %
Schaffer Properties Pty Ltd* 100.00 100.00 Australia Property investmentsDelta Corporation Limited* 100.00 100.00 Australia Precast concrete manufactureGarden Holdings Pty Ltd* 100.00 100.00 Australia Inactive(formerly Urbanstone Pty Ltd)Gosh Holdings Pty Ltd 83.17 83.17 Australia Holding companyGosh Capital Pty Ltd 83.17 83.17 Australia Property and other investmentsHowe Automotive Limited** 83.17 83.17 Australia Parent company of Howe GroupRosedale Leather Pty Ltd** 83.17 83.17 Australia InactiveAustralian Leather Upholstery Pty Ltd** 83.17 83.17 Australia Holding companyHowe & Company Pty Ltd** 83.17 83.17 Australia Manufacture and sale of cut automotive leather componentsHowe Slovensko S.R.O. 83.17 83.17 Slovakia Contract manufacture of cut automotive leather componentsHowe Leather (Shanghai) Co. Ltd.*** 83.17 83.17 China Manufacture and sale of cut automotive leather componentsHowe Hong Kong Pty Limited 83.17 83.17 Hong Kong Holding companySFC US Limited 100.00 – United States of America Holding companySFC US1 LLC 100.00 – United States of America Property Investor
* Pursuant to the ASIC Corporations (Wholly-owned Companies) Instrument 2016/785 relief has been granted to various controlled entities from the Corporations Act 2001 requirements for preparation, audit and lodgement of their financial reports. As a condition of the Instrument, Schaffer Corporation Limited and the controlled entities subject to the Instrument (the Schaffer ‘Closed Group’) entered into Deeds of Cross Guarantee at various dates. The effect of the deeds is that Schaffer Corporation Limited has guaranteed to pay any deficiency in the event of winding up of the controlled entities. The controlled entities have also given a similar guarantee in the event that Schaffer Corporation Limited is wound up.
** Pursuant to the ASIC Corporations (Wholly-owned Companies) Instrument 2016/785 relief has been granted to various controlled entities from the Corporations Act 2001 requirements for preparation, audit and lodgement of their financial reports. As a condition of the Instrument, Howe Automotive Limited and the controlled entities subject to the Instrument (the Howe Automotive ‘Closed Group’) entered into Deeds of Cross Guarantee at various dates. The effect of the deeds is that Howe Automotive Limited has guaranteed to pay any deficiency in the event of winding up of the controlled entities. The controlled entities have also given a similar guarantee in the event that Howe Automotive Limited is wound up.
*** Howe Leather (Shanghai) Co. Ltd has a 1 January to 31 December financial year to coincide with local tax and statutory reporting requirements. Financial statements for this subsidiary are prepared and audited for the year to 30 June for the purposes of Group consolidation. All other entities have 1 July to 30 June financial years.
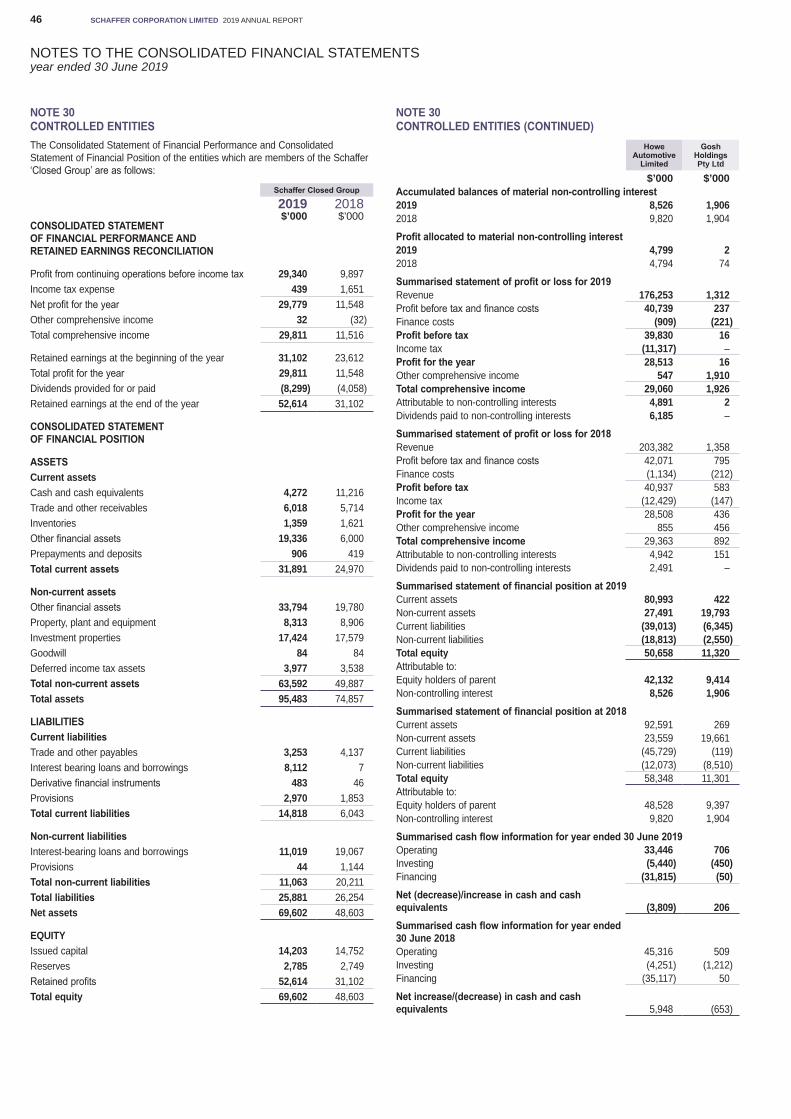
NOTES TO THE CONSOLIDATED FINANCIAL STATEMENTSyear ended 30 June 2019
SCHAFFER CORPORATION LIMITED 2019 ANNUAL REPORT46
NOTE 30 CONTROLLED ENTITIESThe Consolidated Statement of Financial Performance and Consolidated Statement of Financial Position of the entities which are members of the Schaffer ‘Closed Group’ are as follows:
Schaffer Closed Group
2019 2018$’000 $’000
CONSOLIDATED STATEMENT OF FINANCIAL PERFORMANCE AND RETAINED EARNINGS RECONCILIATION
Profit from continuing operations before income tax 29,340 9,897Income tax expense 439 1,651Net profit for the year 29,779 11,548Other comprehensive income 32 (32)Total comprehensive income 29,811 11,516
Retained earnings at the beginning of the year 31,102 23,612Total profit for the year 29,811 11,548Dividends provided for or paid (8,299) (4,058)Retained earnings at the end of the year 52,614 31,102
CONSOLIDATED STATEMENT OF FINANCIAL POSITION
ASSETSCurrent assetsCash and cash equivalents 4,272 11,216Trade and other receivables 6,018 5,714Inventories 1,359 1,621Other financial assets 19,336 6,000Prepayments and deposits 906 419Total current assets 31,891 24,970
Non-current assetsOther financial assets 33,794 19,780Property, plant and equipment 8,313 8,906Investment properties 17,424 17,579Goodwill 84 84Deferred income tax assets 3,977 3,538Total non-current assets 63,592 49,887Total assets 95,483 74,857
LIABILITIESCurrent liabilitiesTrade and other payables 3,253 4,137Interest bearing loans and borrowings 8,112 7Derivative financial instruments 483 46Provisions 2,970 1,853Total current liabilities 14,818 6,043
Non-current liabilitiesInterest-bearing loans and borrowings 11,019 19,067Provisions 44 1,144Total non-current liabilities 11,063 20,211Total liabilities 25,881 26,254Net assets 69,602 48,603
EQUITYIssued capital 14,203 14,752Reserves 2,785 2,749Retained profits 52,614 31,102Total equity 69,602 48,603
NOTE 30 CONTROLLED ENTITIES (CONTINUED)
Howe Automotive
Limited
Gosh HoldingsPty Ltd
$’000 $’000Accumulated balances of material non-controlling interest2019 8,526 1,9062018 9,820 1,904
Profit allocated to material non-controlling interest2019 4,799 22018 4,794 74
Summarised statement of profit or loss for 2019Revenue 176,253 1,312Profit before tax and finance costs 40,739 237Finance costs (909) (221)Profit before tax 39,830 16Income tax (11,317) –Profit for the year 28,513 16Other comprehensive income 547 1,910Total comprehensive income 29,060 1,926Attributable to non-controlling interests 4,891 2Dividends paid to non-controlling interests 6,185 –
Summarised statement of profit or loss for 2018Revenue 203,382 1,358Profit before tax and finance costs 42,071 795Finance costs (1,134) (212)Profit before tax 40,937 583Income tax (12,429) (147)Profit for the year 28,508 436Other comprehensive income 855 456Total comprehensive income 29,363 892Attributable to non-controlling interests 4,942 151Dividends paid to non-controlling interests 2,491 –
Summarised statement of financial position at 2019Current assets 80,993 422Non-current assets 27,491 19,793Current liabilities (39,013) (6,345)Non-current liabilities (18,813) (2,550)Total equity 50,658 11,320Attributable to:Equity holders of parent 42,132 9,414Non-controlling interest 8,526 1,906Summarised statement of financial position at 2018Current assets 92,591 269Non-current assets 23,559 19,661Current liabilities (45,729) (119)Non-current liabilities (12,073) (8,510)Total equity 58,348 11,301Attributable to:Equity holders of parent 48,528 9,397Non-controlling interest 9,820 1,904
Summarised cash flow information for year ended 30 June 2019Operating 33,446 706Investing (5,440) (450)Financing (31,815) (50)Net (decrease)/increase in cash and cash equivalents (3,809) 206Summarised cash flow information for year ended 30 June 2018Operating 45,316 509Investing (4,251) (1,212)Financing (35,117) 50
Net increase/(decrease) in cash and cash equivalents 5,948 (653)
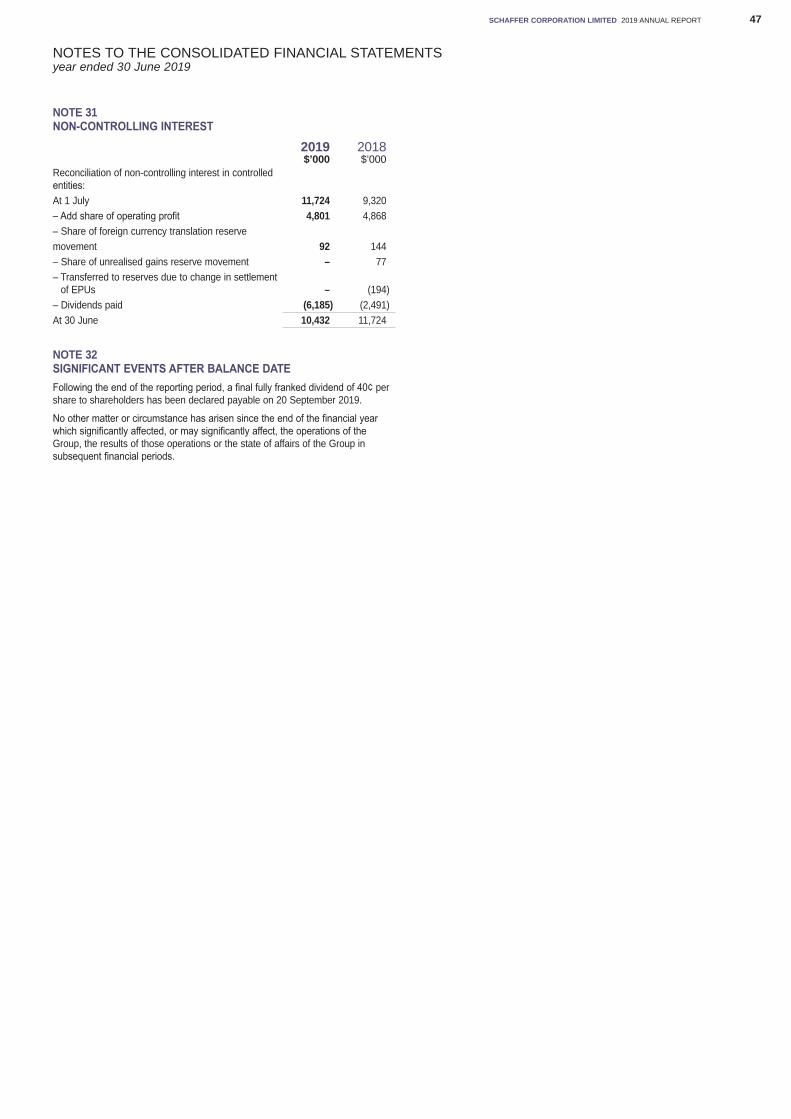
NOTES TO THE CONSOLIDATED FINANCIAL STATEMENTSyear ended 30 June 2019
SCHAFFER CORPORATION LIMITED 2019 ANNUAL REPORT 47
NOTE 31 NON-CONTROLLING INTEREST
2019 2018$’000 $’000
Reconciliation of non-controlling interest in controlled entities:At 1 July 11,724 9,320– Add share of operating profit 4,801 4,868– Share of foreign currency translation reservemovement 92 144– Share of unrealised gains reserve movement – 77– Transferred to reserves due to change in settlement
of EPUs – (194)– Dividends paid (6,185) (2,491)At 30 June 10,432 11,724
NOTE 32 SIGNIFICANT EVENTS AFTER BALANCE DATEFollowing the end of the reporting period, a final fully franked dividend of 40¢ per share to shareholders has been declared payable on 20 September 2019.
No other matter or circumstance has arisen since the end of the financial year which significantly affected, or may significantly affect, the operations of the Group, the results of those operations or the state of affairs of the Group in subsequent financial periods.
SCHAFFER CORPORATION LIMITED 2019 ANNUAL REPORT48
In accordance with a resolution of the Directors of Schaffer Corporation Limited, we state that:
1. In the opinion of the Directors:
a) the financial statements and notes of the consolidated entity are in accordance with the Corporations Act 2001, including:
i. giving a true and fair view of the consolidated entity’s financial position as at 30 June 2019 and of its performance for the year ended on that date; and
ii. complying with Accounting Standards (including the Australian Accounting Interpretations) and the Corporations Regulations 2001;
b) the financial statements and notes also comply with International Financial Reporting Standards as disclosed in note 2; and
c) there are reasonable grounds to believe that the Company will be able to pay its debts as and when they become due and payable.
2. This declaration has been made after receiving the declarations required to be made to the Directors in accordance with section 295A of the Corporations Act 2001 for the financial period ended 30 June 2019.
3. As at the date of this declaration, there are reasonable grounds to believe that the members of the Closed Group identified in note 30 will be able to meet any obligation or liabilities to which they are or may become subject to, by virtue of the Deed of Cross Guarantee.
On behalf of the Board
J M Schaffer AMChairman and Managing Director
Perth, 27 September 2019
DIRECTORS’ DECLARATIONyear ended 30 June 2019
SCHAFFER CORPORATION LIMITED 2019 ANNUAL REPORT 49
INDEPENDENT AUDITOR’S REPORT TO THE MEMBERS OF SCHAFFER CORPORATION LIMITEDyear ended 30 June 2019
A member firm of Ernst & Young Global Limited Liability limited by a scheme approved under Professional Standards Legislation
PT:CT:SCHAFFER:039
Ernst & Young 11 Mounts Bay Road Perth WA 6000, Australia GPO Box M939 Perth WA 6843
Tel: +61 8 9429 2222 Fax: +61 8 9429 2436 ey.com/au
Independent auditor's report to the members of Schaffer Corporation Limited
Report on the audit of the financial report
Opinion
We have audited the financial report of Schaffer Corporation Limited (“the Company”) and its subsidiaries (collectively “the Group”), which comprises the consolidated statement of financial position as at 30 June 2019, the consolidated statement of comprehensive income, consolidated statement of changes in equity and consolidated statement of cash flows for the year then ended, notes to the financial statements, including a summary of significant accounting policies, and the Directors' declaration.
In our opinion, the accompanying financial report of the Group is in accordance with the Corporations Act 2001, including:
a) Giving a true and fair view of the consolidated financial position of the Group as at 30 June 2019 and of its consolidated financial performance for the year ended on that date
b) Complying with Australian Accounting Standards and the Corporations Regulations 2001.
Basis for opinion
We conducted our audit in accordance with Australian Auditing Standards. Our responsibilities under those standards are further described in the Auditor’s Responsibilities for the Audit of the Financial Report section of our report. We are independent of the Group in accordance with the auditor independence requirements of the Corporations Act 2001 and the ethical requirements of the Accounting Professional and Ethical Standards Board’s APES 110 Code of Ethics for Professional Accountants (“the Code”) that are relevant to our audit of the financial report in Australia. We have also fulfilled our other ethical responsibilities in accordance with the Code.
We believe that the audit evidence we have obtained is sufficient and appropriate to provide a basis for our opinion.
Key audit matters
Key audit matters are those matters that, in our professional judgment, were of most significance in our audit of the financial report of the current year. These matters were addressed in the context of our audit of the financial report as a whole, and in forming our opinion thereon, but we do not provide a separate opinion on these matters. For each matter below, our description of how our audit addressed the matter is provided in that context.
We have fulfilled the responsibilities described in the Auditor’s Responsibilities for the Audit of the Financial Report section of our report, including in relation to these matters. Accordingly, our audit included the performance of procedures designed to respond to our assessment of the risks of material misstatement of the financial report. The results of our audit procedures, including the procedures performed to address the matters below, provide the basis for our audit opinion on the accompanying financial report.
SCHAFFER CORPORATION LIMITED 2019 ANNUAL REPORT50
INDEPENDENT AUDITOR’S REPORT TO THE MEMBERS OF SCHAFFER CORPORATION LIMITEDyear ended 30 June 2019
A member firm of Ernst & Young Global Limited Liability limited by a scheme approved under Professional Standards Legislation
Construction services revenue
Why significant How our audit addressed the key audit matter
For the year ended 30 June 2019, the Building Materials segment of the Group recognised $19.257 million in revenue from rendering construction and transport services.
Revenue from construction services is recognised over time based on costs incurred to date.
The measurement of revenue from construction services was considered a key audit matter due to the judgement required to be exercised by the Group in the estimation of total contract costs and the stage of completion of contracts.
Our audit procedures included the following:
► We evaluated the Group’s process to recognise contract revenues.
► We assessed the operating effectiveness of internal review controls including the periodic assessment of the percentage of completion, actual contract costs incurred to date and estimated total contract costs.
► We assessed the qualifications, competence and objectivity of management’s expert used in the calculations.
► For a sample of contracts, we performed the following procedures:
► We agreed total contract revenue to the original contract and approved variations or claims.
► We agreed actual contract costs incurred to date to source documentation, such as timesheets and vendor invoices.
► We considered the Group’s historic ability to accurately forecast the percentage of completion by comparing the accuracy of prior period forecasts to actual outcomes across the year ended 30 June 2019.
► We enquired of the technical specialists with direct oversight over the contract portfolio to understand the performance and status of the contracts at 30 June 2019.
► We assessed the adequacy of the disclosures in relation to construction services revenue in Note 2 and 3 to the financial report.
SCHAFFER CORPORATION LIMITED 2019 ANNUAL REPORT 51
INDEPENDENT AUDITOR’S REPORT TO THE MEMBERS OF SCHAFFER CORPORATION LIMITEDyear ended 30 June 2019
A member firm of Ernst & Young Global Limited Liability limited by a scheme approved under Professional Standards Legislation
Employee participation units
Why significant How our audit addressed the key audit matter
Howe Automotive Limited grants employee participation units (“EPUs”) to its employees under a cash settled share-based payment arrangement.
Accounting for share based compensation schemes was considered a key audit matter due to the complexity of the valuation and related assumptions described in Note 26(c) to the financial report.
Our audit procedures included the following:
► We tested the clerical accuracy of the valuation model.
► We assessed the reasonableness of assumptions applied by:
► Comparing expected earnings before interest and taxes and debt to budgets approved by the Board of Directors.
► Comparing expected forfeitures to historical employee turnover data.
► Comparing risk-free discount rates to publicly available market data.
► Testing the sensitivity of the valuation model to changes in related assumptions.
► We tested the movement in the volume of EPUs outstanding to source documentation, such as shareholder resolutions or termination letters.
► We tested the settlement of EPUs redeemed to source documentation, such as bank statements.
► We involved our valuation specialists to assess whether the calculation methodology of the valuation model complied with the terms of the Employee Incentive Plan.
► We assessed the adequacy of the disclosures in relation to EPUs in Note 26(c) to the financial report.
Information other than the financial report and auditor’s report thereon
The Directors are responsible for the other information. The other information comprises the information included in the Company’s 2019 Annual Report, but does not include the financial report and our auditor’s report thereon.
Our opinion on the financial report does not cover the other information and accordingly we do not express any form of assurance conclusion thereon, with the exception of the Remuneration Report and our related assurance opinion.
In connection with our audit of the financial report, our responsibility is to read the other information and, in doing so, consider whether the other information is materially inconsistent with the financial report or our knowledge obtained in the audit or otherwise appears to be materially misstated.
If, based on the work we have performed, we conclude that there is a material misstatement of this other information, we are required to report that fact. We have nothing to report in this regard.
SCHAFFER CORPORATION LIMITED 2019 ANNUAL REPORT52
INDEPENDENT AUDITOR’S REPORT TO THE MEMBERS OF SCHAFFER CORPORATION LIMITEDyear ended 30 June 2019
A member firm of Ernst & Young Global Limited Liability limited by a scheme approved under Professional Standards Legislation
Responsibilities of the directors for the financial report
The Directors of the Company are responsible for the preparation of the financial report that gives a true and fair view in accordance with Australian Accounting Standards and the Corporations Act 2001 and for such internal control as the Directors determine is necessary to enable the preparation of the financial report that gives a true and fair view and is free from material misstatement, whether due to fraud or error.
In preparing the financial report, the Directors are responsible for assessing the Group’s ability to continue as a going concern, disclosing, as applicable, matters relating to going concern and using the going concern basis of accounting unless the Directors either intend to liquidate the Group or to cease operations, or have no realistic alternative but to do so.
Auditor's responsibilities for the audit of the financial report
Our objectives are to obtain reasonable assurance about whether the financial report as a whole is free from material misstatement, whether due to fraud or error, and to issue an auditor’s report that includes our opinion. Reasonable assurance is a high level of assurance, but is not a guarantee that an audit conducted in accordance with the Australian Auditing Standards will always detect a material misstatement when it exists. Misstatements can arise from fraud or error and are considered material if, individually or in the aggregate, they could reasonably be expected to influence the economic decisions of users taken on the basis of this financial report.
As part of an audit in accordance with the Australian Auditing Standards, we exercise professional judgment and maintain professional scepticism throughout the audit. We also:
► Identify and assess the risks of material misstatement of the financial report, whether due to fraud or error, design and perform audit procedures responsive to those risks, and obtain audit evidence that is sufficient and appropriate to provide a basis for our opinion. The risk of not detecting a material misstatement resulting from fraud is higher than for one resulting from error, as fraud may involve collusion, forgery, intentional omissions, misrepresentations, or the override of internal control
► Obtain an understanding of internal control relevant to the audit in order to design audit procedures that are appropriate in the circumstances, but not for the purpose of expressing an opinion on the effectiveness of the Group’s internal control
► Evaluate the appropriateness of accounting policies used and the reasonableness of accounting estimates and related disclosures made by the Directors
► Conclude on the appropriateness of the Directors’ use of the going concern basis of accounting and, based on the audit evidence obtained, whether a material uncertainty exists related to events or conditions that may cast significant doubt on the Group’s ability to continue as a going concern. If we conclude that a material uncertainty exists, we are required to draw attention in our auditor’s report to the related disclosures in the financial report or, if such disclosures are inadequate, to modify our opinion. Our conclusions are based on the audit evidence obtained up to the date of our auditor’s report. However, future events or conditions may cause the Group to cease to continue as a going concern
► Evaluate the overall presentation, structure and content of the financial report, including the disclosures, and whether the financial report represents the underlying transactions and events in a manner that achieves fair presentation
SCHAFFER CORPORATION LIMITED 2019 ANNUAL REPORT 53
INDEPENDENT AUDITOR’S REPORT TO THE MEMBERS OF SCHAFFER CORPORATION LIMITEDyear ended 30 June 2019
A member firm of Ernst & Young Global Limited Liability limited by a scheme approved under Professional Standards Legislation
► Obtain sufficient appropriate audit evidence regarding the financial information of the entities or business activities within the Group to express an opinion on the financial report. We are responsible for the direction, supervision and performance of the Group audit. We remain solely responsible for our audit opinion.
We communicate with the Directors regarding, among other matters, the planned scope and timing of the audit and significant audit findings, including any significant deficiencies in internal control that we identify during our audit.
We also provide the Directors with a statement that we have complied with relevant ethical requirements regarding independence, and to communicate with them all relationships and other matters that may reasonably be thought to bear on our independence, and where applicable, related safeguards.
From the matters communicated to the Directors, we determine those matters that were of most significance in the audit of the financial report of the current year and are therefore the key audit matters. We describe these matters in our auditor’s report unless law or regulation precludes public disclosure about the matter or when, in extremely rare circumstances, we determine that a matter should not be communicated in our report because the adverse consequences of doing so would reasonably be expected to outweigh the public interest benefits of such communication.
Report on the audit of the Remuneration Report
Opinion on the Remuneration Report
We have audited the Remuneration Report included in the Directors' report for the year ended 30 June 2019.
In our opinion, the Remuneration Report of Schaffer Corporation Limited for the year ended 30 June 2019, complies with section 300A of the Corporations Act 2001.
Responsibilities
The Directors of the Company are responsible for the preparation and presentation of the Remuneration Report in accordance with section 300A of the Corporations Act 2001. Our responsibility is to express an opinion on the Remuneration Report, based on our audit conducted in accordance with Australian Auditing Standards. Ernst & Young Philip Teale Partner Perth 27 September 2019
SCHAFFER CORPORATION LIMITED 2019 ANNUAL REPORT54
ATTENDANCE AT NOMINATION AND REMUNERATION COMMITTEE MEETINGSThe SFC Board established the Nomination and Remuneration Committee on 23 February 2005.
The members of this Board sub-committee are Mrs D E Blain AM, Mr M D Perrott AM and Mr D J Schwartz. The Nomination and Remuneration Committee held one meeting during the year with all committee members attending.
INTERESTS IN THE SHARES OF THE COMPANY AND RELATED BODIES CORPORATEOn 27 September 2019 the economic interest of the Directors, including their related parties, in the shares of the Company were:
Schaffer Corporation LimitedOrdinary shares Options over
ordinary shares
J M Schaffer AM 2,769,430 –D E Blain AM 1,562,360 –A K Mayer 347,185 –M D Perrott AM 1,000 –D J Schwartz 594,542 –
PRINCIPAL ACTIVITIESThe principal activities of the entities within the consolidated entity, in the course of the financial year were automotive leather, concrete product manufacture, property and equity investing, and property leasing.
RESULTSThe consolidated entity’s operating profit after tax for the financial year was a profit of $27,700,000 (2018 – $28,160,000).
OPERATING AND FINANCIAL REVIEWPlease refer to Managing Director’s report for details.
SIGNIFICANT CHANGES IN THE STATE OF AFFAIRSIn the opinion of the Directors of the consolidated entity there has not arisen during the financial year, or in the interval between the end of the financial year and the date of this report, any matter or circumstance that has significantly affected or may significantly affect the operations of the consolidated entity, the results of those operations, or the state of affairs of the consolidated entity in subsequent financial years.
DIVIDENDSThe following dividends have been paid or declared by the company since the commencement of the financial year.
$’000On ordinary shares– 30¢ per share final, paid on 14 September 2018 4,151– 30¢ per share interim, paid on 15 March 2019 4,148
8,299Dividends paid for the year ended 30 June 2018On ordinary shares– 14¢ per share final, paid on 15 September 2017 1,821– 15¢ per share interim, paid on 16 March 2018 2,097
3,918Not recognised as a liability as at 30 June 2019Final franked dividend for 2019 – 40¢ (2018 – 30¢) 5,518
REVIEW OF OPERATIONSThe consolidated entity’s revenue from continuing operations decreased by 10% to $203,623,000 from $227,036,000 this year. The pre-tax operating profit from continuing operations of $38,568,000 was an increase compared to $34,264,000 for last year. The consolidated entity’s net profit after tax, excluding non-controlling interests, decreased by 2% to $22,899,000 from $23,292,000.
DIRECTORS’ REPORTYour directors submit their report for the year ended 30 June 2019 made in accordance with a resolution of the Directors.
DIRECTORSDetails of the Directors of the company during the financial year and up to the date of this report are:J M SCHAFFER AMBCom(Hons) FCPAManaging DirectorExecutive Director since 6/9/1972
Mr John Schaffer AM joined the company in 1972. Mr Schaffer has held the position of Managing Director since 1987.
D E BLAIN AMBANon-executive DirectorAppointed 5/6/1987
Mrs Danielle Blain AM joined the company in 1987. Mrs Blain served as Managing Director of Gosh Leather Pty Ltd from 1993 to 2001. Mrs Blain has diverse experience serving on a number of NGO boards and is also a past Pro Chancellor of Edith Cowan University.
A K MAYERExecutive DirectorAppointed 21/11/2001
Mr Anton Mayer is the Executive Chairman of Howe Automotive Limited. Mr Mayer has over 50 years of international leather experience, broad business skills and a global business perspective.
M D PERROTT AMBCom FAIM FAICDIndependent DirectorAppointed 23/2/2005
Mr Michael Perrott AM joined the Board as an independent director in February 2005. Mr Perrott AM has over 40 years’ experience in the construction and contracting industry. During the past three years Mr Perrott AM has also served as a director of the following other listed companies:GME Resources Ltd 21 November 1996 – 17 March 2017
D J SCHWARTZIndependent DirectorAppointed 29/6/1999
Mr David Schwartz joined the Board as an independent director in June 1999. He has over 25 years’ experience negotiating acquisitions and overseeing the development of property. Over the past 40 years, David has been involved in many different businesses including retail, manufacturing and distribution.
Directors were in office for the entire period unless otherwise stated.
COMPANY SECRETARYJ M CANTWELL BBus(Acc) CPA MBA GIA(Cert)
Mr Jason Cantwell joined the company in 2011 and has over 20 years’ experience in senior financial management roles within both private and publicly listed companies. Mr Cantwell is a Member of CPA Australia and a Certificated Member of the Governance Institute of Australia.
ATTENDANCE AT BOARD MEETINGSDuring the year, eight directors’ meetings were held. The number of meetings attended by each director is as follows:
Meetings eligible to attend Meetings attended
J M Schaffer AM 8 8D E Blain AM 8 8A K Mayer 8 8M D Perrott AM 8 8D J Schwartz 8 8
In accordance with the Articles of Association:
At the SFC Annual General Meeting scheduled for 13 November 2019, Mr D J Schwartz will retire by rotation and being eligible, will offer himself for re-election.
ATTENDANCE AT AUDIT COMMITTEE MEETINGSDuring the year, two audit committee meetings were held. Mr D J Schwartz, Mr M D Perrott AM and Mrs D E Blain AM attended both meetings. All the above committee members are also directors of the company.
DIRECTORS’ REPORTyear ended 30 June 2019
SCHAFFER CORPORATION LIMITED 2019 ANNUAL REPORT 55
Remuneration committeeThe SFC Board operates a Nomination and Remuneration Sub-Committee to support and advise the SFC Board in fulfilling its responsibility to shareholders to ensure that the company has remuneration policies and practices which enable it to attract and retain directors and executives who will best contribute towards achieving positive outcomes for shareholders. The committee determines the remuneration and other conditions of service of the chief executive officer and executive directors, if any. The committee makes recommendations to the Board on the remuneration of non-executive directors within the aggregate approved by shareholders in general meeting from time to time. The committee considers individual performance, company performance, internal relativity and fairness in setting levels of remuneration and may seek appropriate independent external advice to assist in its decision making. The structure of non-executive director and executive remuneration are separate and distinct.
SENIOR MANAGER AND EXECUTIVE DIRECTOR REMUNERATIONObjectiveSFC’s remuneration policy aims to remunerate executives with a level and mix of remuneration commensurate with their position and responsibilities within the Group.
StructureThe remuneration of SFC’s senior executive consists of fixed remuneration and variable remuneration (annual and long-term incentives). The company aims to reward executives for Company, business unit and individual performance, align executive remuneration with the interests of shareholders, link rewards with the strategic goals such as profitability or return on capital employed and ensure that total remuneration is effective in retaining and motivating senior executives and executive directors.
Fixed remunerationThis includes base salary and the statutory Superannuation Guarantee Contribution (SGC) which comprises the cash component. The Schaffer Corporation Limited Superannuation Fund is available to executives for superannuation contributions and life insurance. Premiums for life insurance are deducted from member accounts. Executives can elect to have the company contribute superannuation beyond the statutory SGC level by way of a salary sacrifice in lieu of cash salary. Fixed remuneration is reviewed annually by the Nomination and Remuneration Committee in respect of each executive director. The fixed remuneration of executives is reviewed annually by the SFC Managing Director in the case of the Building Materials and Corporate divisions and by the Howe Automotive Limited General Manager in the case of the Automotive Leather division. The review process considers company-wide, business unit and individual performance in the context of any annual change during the preceding 12-month period to the consumer price index and wages cost index as published by the Australian Bureau of Statistics. For the year beginning 1 July 2018, a 2% increase was applied for Senior Executives.
Variable remuneration – Short-Term IncentiveThe Group has performance-based incentive plans in place at each of its operations in which management and the labour force participate. The level of remuneration payable to participating executives is linked to the financial performance of their business. Executives are provided with cash incentives provided profitability thresholds are met. A summary of the annual incentive schemes for the Automotive Leather, Building Materials and Corporate divisions is provided below:
Automotive Leather Division – Profit Participation Scheme
Howe Automotive Limited operates a profit participation scheme for the staff and management of the Automotive Leather division. Prior to the commencement of each financial year, the division management submits an annual budget for consideration and approval by the Howe Automotive Limited Managing Director and the SFC Board. The scheme provides for a bonus pool of 5% of actual EBIT, which becomes payable when a specified return on capital employed (ROACE) has been achieved as at 30 June balance date. The profit participation bonus is subject to audited financials of each business unit and approval by the shareholders of Howe Automotive Limited. A full year 2019 bonus was approved (2018 – approved). ROACE have been chosen as the relevant performance conditions as this performance measure is readily monitored and available. ROACE performance aligns the interest of management with those of shareholders. The scheme has been designed to incentivise a wide range of the Automotive Leather division workforce from top executive management to factory floor personnel.
LIKELY DEVELOPMENTS AND EXPECTED RESULTSOther than the discussion of the Company’s operations and outlook already set out from pages 1-12 of this Annual Report, the Directors have no further comment to make on likely developments in the operations of the consolidated entity and the expected results of those operations in subsequent financial years.
ENVIRONMENTAL REGULATION AND PERFORMANCESchaffer Corporation Limited is subject to a range of environmental regulations. During the financial year Schaffer Corporation Limited met all reporting requirements under any relevant legislation. There were no incidents which required reporting. The Company aims to continually improve its environmental performance.
SIGNIFICANT EVENTS AFTER BALANCE DATEFollowing the end of the reporting period, a final fully franked dividend of 40¢ per share has been declared payable on 20 September 2019.
No other matter or circumstance has arisen since the end of the financial year which significantly affected, or may significantly affect, the operations of the Group, the results of those operations or the state of affairs of the Group in subsequent financial periods.
INDEMNIFICATION AND INSURANCE OF DIRECTORSDuring or since the financial year, the company has agreed to indemnify directors against a liability for costs and expenses incurred in defending proceedings brought against them for a liability incurred in their role as directors of the company other than in respect of any wilful misconduct. The total amount of insurance contract premiums paid is not disclosed due to a confidentially clause within the insurance policy.
INDEMNIFICATION OF AUDITORSTo the extent permitted by law, the Company has agreed to indemnify its auditors, Ernst & Young, as part of the terms of its audit engagement agreement against claims by third parties arising from the audit (for an unspecified amount). No payment has been made to indemnify Ernst & Young during or since the financial year.
REMUNERATION REPORT (AUDITED)This remuneration report outlines the director and executive remuneration arrangements of the Company and the Group in accordance with the requirements of the Corporations Act 2001 and its Regulations. For the purposes of this report, Key Management Personnel (KMP) of the Group are defined as those persons having authority and responsibility for planning, directing and controlling the major activities of the Company and the Group, directly or indirectly, including any director (whether executive or otherwise) of the parent company.
Details of Key Management PersonnelDirectors J M Schaffer AM Managing DirectorD E Blain AM Director (non-executive)A K Mayer Director (executive)M D Perrott AM Director (non-executive/independent)D J Schwartz Director (non-executive/independent)Executives D Birks General Manager, Howe Automotive LimitedR Leib Chief Financial OfficerM Perrella Executive Director, Delta Corporation LimitedJ Walsh General Manager, Delta Corporation LimitedJ Cantwell Group Financial Controller and Company Secretary
This report outlines the remuneration arrangements in place for directors and executives of the Schaffer Corporation Limited Group of companies.
Remuneration philosophySFC’s remuneration policy is directed at attracting, motivating and retaining quality directors and executives. SFC’s key internal performance measures at the business unit and consolidated levels are earnings before interest and tax (EBIT) and return on average capital employed (ROACE). EBIT and ROACE have been chosen by the Group as measures of executive performance because they align the interests of management with those of all SFC shareholders.
DIRECTORS’ REPORTyear ended 30 June 2019
SCHAFFER CORPORATION LIMITED 2019 ANNUAL REPORT56
DIRECTORS’ REPORTyear ended 30 June 2019
Building Materials Division – Management Bonus Incentive Scheme
The Company operates a Management Bonus Incentive Scheme (MBIS) for the management group of the Building Materials division. Prior to the commencement of each financial year the Building Materials division management submits an annual budget for consideration by SFC’s Managing Director and the SFC Board. Upon approval of the budget by the Board, a cash bonus (as a percentage of each participants fixed remuneration) is payable on a tiered basis provided actual EBIT profitability thresholds are met/exceeded as at 31 December and 30 June balance dates. The MBIS payment for EBIT performance is subject to reviewed/audited financial statements of each business unit and is payable at the discretion of the Managing Director in the following period. Neither a half-year bonus nor full-year bonus was approved for the year ended 30 June 2019 (2018 – no bonuses approved). A bonus is forfeited for a financial year where an employee has ceased employment prior to the end of that financial year.
Actual EBIT performance versus Budgeted EBIT performance has been chosen as the relevant performance condition as this performance measure is readily monitored and available, and EBIT performance aligns the interest of management with those of shareholders. The scheme may be discontinued at any time by the SFC Managing Director without prior notice.
Corporate – Short-Term Incentive Plan
SFC has implemented a formal Short-Term Incentive (STI) Plan for the Group Managing Director, Chief Financial Officer and Group Financial Controller approved by the Nomination and Remuneration Committee. These executives can earn a cash bonus with a value of up to 30% of their base annual remuneration, based on actual performance against defined objectives. This equates to a maximum of $261,143 for the Group Managing Director, $90,000 for the Chief Financial Officer and $61,271 for the Group Financial Controller, for the year ended 30 June 2019. The minimum possible award for the Group Managing Director, Chief Financial Officer and the Group Financial Controller is nil. 60% of any STI award is based on financial performance against the annual budget. The members of the Nomination and Remuneration Committee have the discretion to adjust the NPAT for STI purposes to eliminate the financial impact of “one off” abnormal issues which may positively or negatively affect NPAT, including adjustments related to accounting judgments on factors which may or may not eventuate and that are not reflective of management performance. 40% of any STI award is based on performance against pre-agreed KPI’s which are critical to the company’s future success. The Nominations and Remuneration Committee approved STI awards for the 2019 year on 20 August 2019. The managing director received an STI award of 100% (2018: 97.5%) of the maximum possible award. The Chief Financial Officer received an STI award of 100% (2018: 100%). The Group Financial Controller received an STI award of 100% (2018: 98.5%) of the maximum possible award.
Variable remuneration – Long-Term IncentiveLong-term incentive grants are typically made to executives who are able to influence the generation of shareholder wealth and thus have a direct impact on the Company’s performance. Howe Automotive Limited operates the Employee Participation Unit (EPU) Plan for its executives. SFC’s senior executives (other than Mr Schaffer and Mr Mayer) can participate in SFC’s Employee Share Option Plan (ESOP). The Howe Automotive Limited EPU and SFC ESOP plans have long-term vesting provisions and are designed to align the interests of the participating executives with those of all SFC shareholders. A summary of the long-term incentive schemes is provided below:
Howe Automotive Limited Employee Participation Units Plan
Howe Automotive Limited operates an employee incentives plan which permits the granting of employee participation units (EPUs) at the discretion of its shareholders up to an EPU limit. The EPU limit is 10% of the fully diluted share capital of Howe Automotive Limited, which is calculated as if each EPU already issued was deemed to be one issued Howe Automotive Limited share. Howe Automotive Limited dividends, divided by the total number of shares and EPUs on issue, is applied to reduce a bonus threshold for each EPU until the balance of the bonus threshold is reduced to nil. Once the threshold is nil, each EPU receives a remuneration bonus payment when Howe Automotive Limited makes a dividend payment, calculated based on the total dividends divided by the total number of shares and EPUs on issue.
An EPU provides an employee with a right to receive either, at the discretion of SFC, a cash payment from Howe Automotive Limited or shares in SFC in the following circumstances:(a) If an employee dies or becomes permanently disabled at any time after the
grant date.(b) If an employee ceases employment after the three-year initial vesting period.(c) Upon a liquidity event (trade sale or listing on an Australian or overseas stock
exchange).(d) On issue of a compulsory payment notice by SFC.
The amount of the payment is dependent on vesting and the financial performance of Howe Automotive Limited. The vesting requirements are:(a) up to 3 years – nil(b) 3 years to 4 years – 33.3%(c) 4 years to 5 years – 66.7%(d) over 5 years – 100%
Note: Employees are ineligible to receive any payment in the following circumstances:(i) termination due to misconduct.(ii) failure to provide 90 days’ written notice of intention to terminate employment.(iii) acting in competition prior to the payment date (payment date is at least
12 months after termination).
The performance hurdle to be eligible for a payment is a positive equity valuation for Howe Automotive Limited. The eligibility and amount of payment is calculated in accordance with an equity valuation formula based on 5.5 times Howe Automotive Limited’s earnings before interest and tax minus net debt. The formula uses a three-year average including one full year following termination. This formula is designed to incentivise EPU holders in respect of building the long-term value of Howe Automotive Limited and provides a fair and readily calculable means for valuing that long term interest.
SFC has the option to compel the employee to use the whole or part of that cash payment in subscribing for SFC shares based on the average SFC share price for the same three-year period.
SFC Employee Share Option Plan (ESOP)
An employee share option plan has been established. The plan was approved by shareholders at the Annual General Meeting in November 1999. The plan permits the granting of options (at the absolute discretion of the Board) to Group employees to acquire ordinary shares in SFC. The options issued for nil consideration, are issued in accordance with performance guidelines established by the Directors of SFC. The options cannot be transferred and will not be quoted on the ASX. The number of options which can be issued is limited to 5% of the number of shares on issue. At the date of this report, there were 117,500 options on issue (2018: 0,000)
Options may be exercised as follows:(1) during the first 12 months of each option period and including each date of
issue, no more than 25% of the options issued to that participant on that date of issue;
(2) during the period of 24 months from and including each date of issue exercise no more than 50% of the options issued to that participant on that date of issue; and
(3) during the period of 36 months from and including each date of issue exercise no more than 75% of the options issued to that participant on that date of issue.
After 36 months, 100% of the options may be exercised.
While the ESOP contains vesting conditions, the exercising of ESOP options is not dependent on a performance condition because:(1) ESOP options have been issued with an exercise price at or above the VWAP
of the share price on five preceding days that SFC shares traded on the ASX before the issue date;
(2) ESOP options do not participate in dividends; and(3) are not transferable or saleable. Accordingly, ESOP options only provide an
economic benefit to the recipient in the event the share price (which adjusts for dividends paid) significantly exceeds the exercise price (which is not adjusted for dividends paid) over the option vesting period thereby aligning the interests of management with those of all shareholders.
SCHAFFER CORPORATION LIMITED 2019 ANNUAL REPORT 57
DIRECTORS’ REPORTyear ended 30 June 2019
The following table details the proportion of fixed remuneration and variable remuneration paid for the year ended 30 June 2019 as detailed in this report:2019 Remuneration Structure % Fixed % Variable
Specified DirectorsJ M Schaffer AM 67 33D E Blain AM 100 –A K Mayer 70 30M D Perrott AM 100 –D J Schwartz 100 –Specified ExecutivesD Birks 22 78R Leib 29 71J Walsh 100 –M Perrella 100 –J Cantwell 79 21
Non-executive Director RemunerationSFC’s non-executive directors receive fees for their services (including statutory superannuation) and the reimbursement of reasonable expenses. The Constitution and the ASX Listing Rules specify that the aggregate remuneration of non-executive directors shall be determined from time to time by a general meeting. An amount not exceeding that amount is then divided between the non-executive directors as agreed. The latest determination was at the Annual General Meeting held 19 November 2003 when shareholders approved an aggregate remuneration limit of $250,000 per annum. The amount of aggregate remuneration to be approved by shareholders and the manner in which it is to be apportioned amongst the non-executive directors is reviewed annually. This limit is not currently fully utilised. The fee pool is payable only to non-executive directors. The amount payable to non-executive directors is set by the Board after having taken regard to the size of the Company and Board, the responsibilities, demands and accountabilities faced by those directors in discharging their duties and after seeking external advice to ensure the fees are in line with market standards. All three non-executive directors are members of the Audit Committee and the Nomination and Remuneration Committee and the fixed annual fee received by non-executive directors is inclusive of these sub-committee commitments. It is current SFC policy that non-executive directors do not receive shares, options or other securities and are not eligible to participate in SFC’s Employee Share Option Plan. Payment of fees (including statutory superannuation) and the
reimbursement of reasonable expenses are the only remuneration payable to Mrs Blain AM, Mr Schwartz and Mr Perrott AM.
Non-executive directors appointed prior to July 2003 are entitled to a retirement benefit equivalent to one year’s annual director’s fees. The retirement benefit was reduced from three years’ to one year’s annual director’s fees in July 2003 (a three-year retirement benefit was in place at the time Mrs Blain AM and Mr Schwartz accepted their appointment to the Board). SFC considers the reduced benefit modest and appropriate given the benefit which historically existed. It is SFC’s policy that no retirement benefit apply to new directors appointed after July 2003.
It is not a requirement of the Constitution of the Company that directors hold shares in the Company.
Relationship of Company Performance to Shareholder WealthTotal Shareholder ReturnTotal shareholder return (TSR) is an accepted and understood measure of performance. SFC calculates TSR as follows:• movement in Share Price (including bonus issues)• plus Dividends Paid• plus Dividend Imputation Credits
The chart below itemises the constituents to SFC’s TSR by year for each of the past five years. SFC’s average TSR for the past five years is 36%.
Sept 2015 Sept 2016 Sept 2017 Sept 2018 Sept 2019
Tax Rate 30% 30% 30% 30% 30%Share Price $4.81 $5.46 $7.55 $17.05 $14.81Ord Dividends $0.25 $0.25 $0.26 $0.45 $0.70Imputation Credit $0.11 $0.11 $0.11 $0.19 $0.30TSR ($0.83) $1.01 $2.46 $10.14 ($1.24)TSR (14%) 21% 45% 134% (7%)At the date of this report, on an aggregate dollars paid basis, SFC paid to shareholders $9.7 million fully-franked dividends in respect of 2019 and a total of $26.5 million was paid in fully-franked ordinary dividends over the past 5 years.
Earnings Per Share (EPS)SFC’s average EPS over the past five years has been 88.0¢.
June 2015 June 2016 June 2017 June 2018 June 2019
EPS 25.2¢ 40.6¢ 41.8¢ 166.7¢ 165.6¢
Remuneration of Key Management Personnel for the year ended 30 June 2019Short term Long term benefits Post-employment
TotalPerformance
relatedSalary & fees Cash bonusLong
service leave (2)Share-based payment (4) Superannuation Termination benefit
30/06/2019 $ $ $ $ $ $ $DirectorsJ M Schaffer AM 872,070 458,532(3) 20,883 – 25,000 17,410 1,393,895 32.90%D E Blain AM 56,374 – – – 25,000 1,627 83,001 0.00%A K Mayer 670,221 281,315 – – – – 951,536 29.56%M D Perrott AM 81,374 – – – – – 81,374 0.00%D J Schwartz 81,374 – – – – 2,565 83,939 0.00%ExecutivesD Birks 328,583 730,145 813 – 25,000 550,396(1) 1,634,937 78.32%R Leib 278,618 381,909 6,656 49,178 20,531 506,193(1) 1,243,085 71.44%J Walsh 320,883 – 5,265 – 24,999 – 351,147 0.00%M Perrella 156,414 – 5,292 – 21,314 – 183,020 0.00%J Cantwell 196,661 62,500 3,816 19,671 19,073 – 301,721 20.71%
3,042,572 1,914,401 42,725 68,849 160,917 1,078,191 6,307,655(1) Termination benefits for Mr Birks and Mr Leib include a provision for EPUs based on projections of future earnings.
This provision can increase or decrease based on profit expectations of Howe Automotive Limited(2) Net of long service leave taken during the period.(3) $200,000 of Mr Schaffer’s cash bonus relates to performance for the year ending 30 June 2018.(4) Includes the value of options issued under the SFC Employee Share Options Plan (ESOP) using the Black-Scholes model.
The amounts included in the table below represent the entire bonus earned by the following Key Management Personnel:
Percentage paidduring the year
Percentage payablesubsequent to year end
J M Schaffer AM 44% 56%A Mayer 100% –R Leib 27% 73%D Birks 37% 63%J Cantwell – 100%
The portion of bonus accrued at 30 June 2019 was 56.3%
The elements of emoluments have been determined on the basis of the cost to the company and the consolidated entity.
Executives are those directly accountable for the operational management and strategic direction of the company and the consolidated entity.
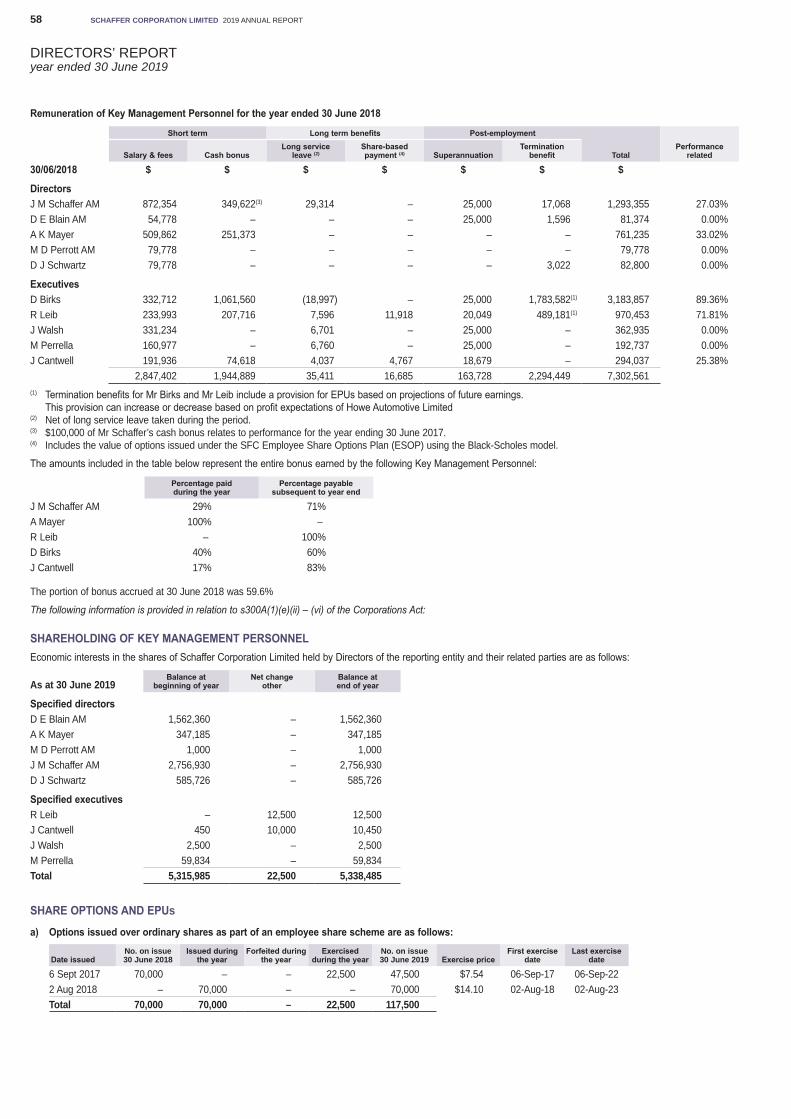
SCHAFFER CORPORATION LIMITED 2019 ANNUAL REPORT58
DIRECTORS’ REPORTyear ended 30 June 2019
Remuneration of Key Management Personnel for the year ended 30 June 2018
Short term Long term benefits Post-employment
TotalPerformance
relatedSalary & fees Cash bonusLong service
leave (2)Share-based payment (4) Superannuation
Termination benefit
30/06/2018 $ $ $ $ $ $ $
DirectorsJ M Schaffer AM 872,354 349,622(3) 29,314 – 25,000 17,068 1,293,355 27.03%D E Blain AM 54,778 – – – 25,000 1,596 81,374 0.00%A K Mayer 509,862 251,373 – – – – 761,235 33.02%M D Perrott AM 79,778 – – – – – 79,778 0.00%D J Schwartz 79,778 – – – – 3,022 82,800 0.00%
ExecutivesD Birks 332,712 1,061,560 (18,997) – 25,000 1,783,582(1) 3,183,857 89.36%R Leib 233,993 207,716 7,596 11,918 20,049 489,181(1) 970,453 71.81%J Walsh 331,234 – 6,701 – 25,000 – 362,935 0.00%M Perrella 160,977 – 6,760 – 25,000 – 192,737 0.00%J Cantwell 191,936 74,618 4,037 4,767 18,679 – 294,037 25.38%
2,847,402 1,944,889 35,411 16,685 163,728 2,294,449 7,302,561(1) Termination benefits for Mr Birks and Mr Leib include a provision for EPUs based on projections of future earnings. This provision can increase or decrease based on profit expectations of Howe Automotive Limited(2) Net of long service leave taken during the period.(3) $100,000 of Mr Schaffer’s cash bonus relates to performance for the year ending 30 June 2017.(4) Includes the value of options issued under the SFC Employee Share Options Plan (ESOP) using the Black-Scholes model.
The amounts included in the table below represent the entire bonus earned by the following Key Management Personnel:
Percentage paid during the year
Percentage payable subsequent to year end
J M Schaffer AM 29% 71%A Mayer 100% –R Leib – 100%D Birks 40% 60%J Cantwell 17% 83%
The portion of bonus accrued at 30 June 2018 was 59.6%
The following information is provided in relation to s300A(1)(e)(ii) – (vi) of the Corporations Act:
SHAREHOLDING OF KEY MANAGEMENT PERSONNELEconomic interests in the shares of Schaffer Corporation Limited held by Directors of the reporting entity and their related parties are as follows:
As at 30 June 2019Balance at
beginning of yearNet change
otherBalance at end of year
Specified directorsD E Blain AM 1,562,360 – 1,562,360A K Mayer 347,185 – 347,185M D Perrott AM 1,000 – 1,000J M Schaffer AM 2,756,930 – 2,756,930D J Schwartz 585,726 – 585,726
Specified executivesR Leib – 12,500 12,500J Cantwell 450 10,000 10,450J Walsh 2,500 – 2,500M Perrella 59,834 – 59,834Total 5,315,985 22,500 5,338,485
SHARE OPTIONS AND EPUs
a) Options issued over ordinary shares as part of an employee share scheme are as follows:
Date issuedNo. on issue 30 June 2018
Issued during the year
Forfeited during the year
Exercised during the year
No. on issue 30 June 2019 Exercise price
First exercise date
Last exercise date
6 Sept 2017 70,000 – – 22,500 47,500 $7.54 06-Sep-17 06-Sep-222 Aug 2018 – 70,000 – – 70,000 $14.10 02-Aug-18 02-Aug-23Total 70,000 70,000 – 22,500 117,500
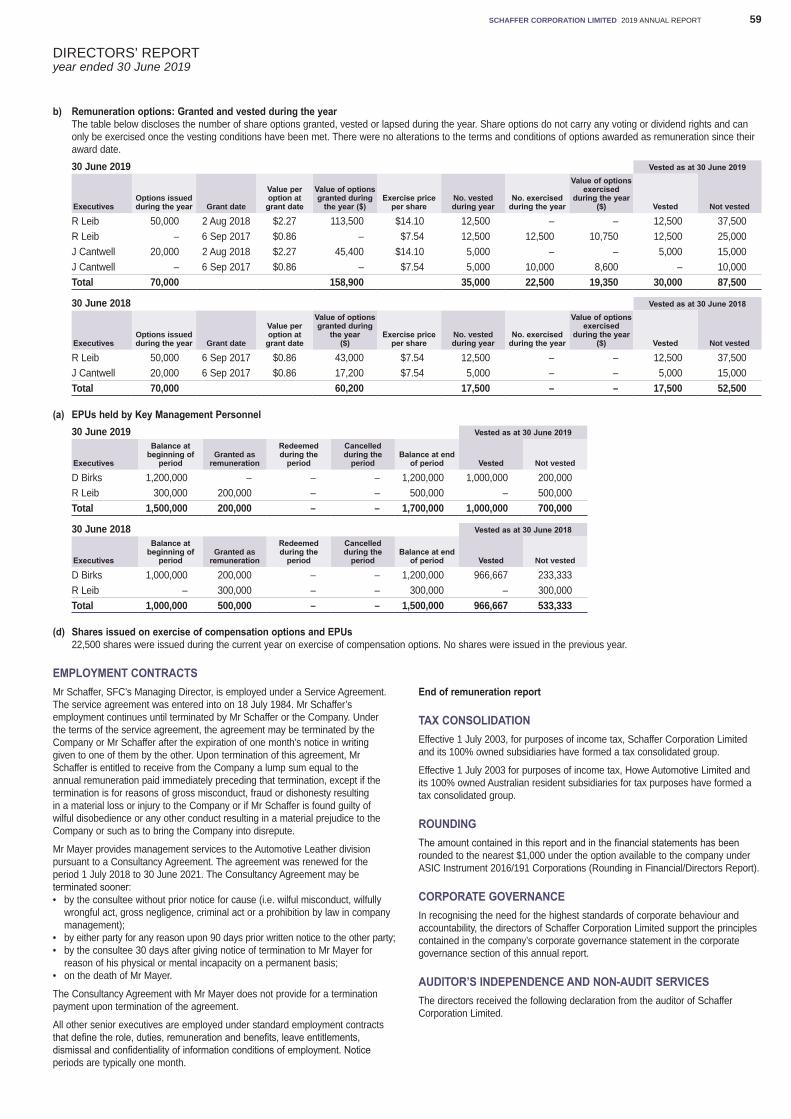
SCHAFFER CORPORATION LIMITED 2019 ANNUAL REPORT 59
DIRECTORS’ REPORTyear ended 30 June 2019
b) Remuneration options: Granted and vested during the yearThe table below discloses the number of share options granted, vested or lapsed during the year. Share options do not carry any voting or dividend rights and can only be exercised once the vesting conditions have been met. There were no alterations to the terms and conditions of options awarded as remuneration since their award date.30 June 2019 Vested as at 30 June 2019
ExecutivesOptions issued during the year Grant date
Value per option at
grant date
Value of options granted during
the year ($)Exercise price
per shareNo. vested during year
No. exercised during the year
Value of options exercised
during the year($) Vested Not vested
R Leib 50,000 2 Aug 2018 $2.27 113,500 $14.10 12,500 – – 12,500 37,500R Leib – 6 Sep 2017 $0.86 – $7.54 12,500 12,500 10,750 12,500 25,000J Cantwell 20,000 2 Aug 2018 $2.27 45,400 $14.10 5,000 – – 5,000 15,000J Cantwell – 6 Sep 2017 $0.86 – $7.54 5,000 10,000 8,600 – 10,000Total 70,000 158,900 35,000 22,500 19,350 30,000 87,500
30 June 2018 Vested as at 30 June 2018
ExecutivesOptions issued during the year Grant date
Value per option at
grant date
Value of options granted during
the year($)
Exercise price per share
No. vested during year
No. exercised during the year
Value of options exercised
during the year($) Vested Not vested
R Leib 50,000 6 Sep 2017 $0.86 43,000 $7.54 12,500 – – 12,500 37,500J Cantwell 20,000 6 Sep 2017 $0.86 17,200 $7.54 5,000 – – 5,000 15,000Total 70,000 60,200 17,500 – – 17,500 52,500
(a) EPUs held by Key Management Personnel30 June 2019 Vested as at 30 June 2019
Executives
Balance at beginning of
periodGranted as
remuneration
Redeemed during the
period
Cancelled during the
periodBalance at end
of period Vested Not vested
D Birks 1,200,000 – – – 1,200,000 1,000,000 200,000R Leib 300,000 200,000 – – 500,000 – 500,000Total 1,500,000 200,000 – – 1,700,000 1,000,000 700,000
30 June 2018 Vested as at 30 June 2018
Executives
Balance at beginning of
periodGranted as
remuneration
Redeemed during the
period
Cancelled during the
periodBalance at end
of period Vested Not vested
D Birks 1,000,000 200,000 – – 1,200,000 966,667 233,333R Leib – 300,000 – – 300,000 – 300,000Total 1,000,000 500,000 – – 1,500,000 966,667 533,333
(d) Shares issued on exercise of compensation options and EPUs22,500 shares were issued during the current year on exercise of compensation options. No shares were issued in the previous year.
EMPLOYMENT CONTRACTSMr Schaffer, SFC’s Managing Director, is employed under a Service Agreement. The service agreement was entered into on 18 July 1984. Mr Schaffer’s employment continues until terminated by Mr Schaffer or the Company. Under the terms of the service agreement, the agreement may be terminated by the Company or Mr Schaffer after the expiration of one month’s notice in writing given to one of them by the other. Upon termination of this agreement, Mr Schaffer is entitled to receive from the Company a lump sum equal to the annual remuneration paid immediately preceding that termination, except if the termination is for reasons of gross misconduct, fraud or dishonesty resulting in a material loss or injury to the Company or if Mr Schaffer is found guilty of wilful disobedience or any other conduct resulting in a material prejudice to the Company or such as to bring the Company into disrepute.
Mr Mayer provides management services to the Automotive Leather division pursuant to a Consultancy Agreement. The agreement was renewed for the period 1 July 2018 to 30 June 2021. The Consultancy Agreement may be terminated sooner:• by the consultee without prior notice for cause (i.e. wilful misconduct, wilfully
wrongful act, gross negligence, criminal act or a prohibition by law in company management);
• by either party for any reason upon 90 days prior written notice to the other party;• by the consultee 30 days after giving notice of termination to Mr Mayer for
reason of his physical or mental incapacity on a permanent basis;• on the death of Mr Mayer.
The Consultancy Agreement with Mr Mayer does not provide for a termination payment upon termination of the agreement.
All other senior executives are employed under standard employment contracts that define the role, duties, remuneration and benefits, leave entitlements, dismissal and confidentiality of information conditions of employment. Notice periods are typically one month.
End of remuneration report
TAX CONSOLIDATIONEffective 1 July 2003, for purposes of income tax, Schaffer Corporation Limited and its 100% owned subsidiaries have formed a tax consolidated group.
Effective 1 July 2003 for purposes of income tax, Howe Automotive Limited and its 100% owned Australian resident subsidiaries for tax purposes have formed a tax consolidated group.
ROUNDINGThe amount contained in this report and in the financial statements has been rounded to the nearest $1,000 under the option available to the company under ASIC Instrument 2016/191 Corporations (Rounding in Financial/Directors Report).
CORPORATE GOVERNANCEIn recognising the need for the highest standards of corporate behaviour and accountability, the directors of Schaffer Corporation Limited support the principles contained in the company’s corporate governance statement in the corporate governance section of this annual report.
AUDITOR’S INDEPENDENCE AND NON-AUDIT SERVICESThe directors received the following declaration from the auditor of Schaffer Corporation Limited.
SCHAFFER CORPORATION LIMITED 2019 ANNUAL REPORT60
DIRECTORS’ REPORTyear ended 30 June 2019
A member firm of Ernst & Young Global Limited Liability limited by a scheme approved under Professional Standards Legislation
PT:CT:SCHAFFER:037
Ernst & Young 11 Mounts Bay Road Perth WA 6000, Australia GPO Box M939 Perth WA 6843
Tel: +61 8 9429 2222 Fax: +61 8 9429 2436 ey.com/au
Auditor’s Independence Declaration to the Directors of Schaffer Corporation Limited
As lead auditor for the audit of Schaffer Corporation Limited for the financial year ended 30 June 2019, I declare to the best of my knowledge and belief, there have been:
a) no contraventions of the auditor independence requirements of the Corporations Act 2001 in relation to the audit; and
b) no contraventions of any applicable code of professional conduct in relation to the audit.
This declaration is in respect of Schaffer Corporation Limited and the entities it controlled during the financial year. Ernst & Young Philip Teale Partner 27 September 2019
SCHAFFER CORPORATION LIMITED 2019 ANNUAL REPORT 61
DIRECTORS’ REPORTyear ended 30 June 2019
NON-AUDIT SERVICESThe following non-audit services were provided by the entity’s Auditor, Ernst & Young. The directors are satisfied that the provision of non-audit services is compatible with the general standard of independence for auditors imposed by the Corporations Act. The nature and scope of each type of non-audit service provided means that auditor independence was not compromised.
Ernst & Young received or are due to receive the following amounts for the provision of non-audit services:
Tax compliance, research and development claims $78,158
Signed in accordance with a resolution of the directors.
J M Schaffer AM Chairman and Managing Director
Perth, 27 September 2019
SCHAFFER CORPORATION LIMITED 2019 ANNUAL REPORT62
ASX Corporate Governance Council issued its third edition of the Corporate Governance Principles and Recommendations on 27 March 2014 with effect from 1 July 2014.
“Corporate Governance is the framework of rules, relationships, systems and processes within and by which authority is exercised and controlled in corporations. It encompasses the mechanisms by which companies, and those in control, are held to account. Different entities may legitimately adopt different governance practices, based on a range of factors, including their size, complexity, history and corporate culture.” (ASX Corporate Governance Principles and Recommendations, March 2014).
The Board of SFC is committed to best practice in corporate governance where the Board considers these practices are appropriate and add shareholder value to a company and board of SFC’s size and structure.
This Corporate Governance Statement outlines the main corporate governance practices of Schaffer in the context of the Principles adopted by the ASX Corporate Governance Council (Council). Unless otherwise stated below, the Company has complied with the Council’s Recommendations.
LAY SOLID FOUNDATIONS FOR MANAGEMENT AND OVERSIGHTThe strategic control of the business of the Group is vested with the Board. The Board’s objective to create, build and sustain shareholder value is carried out in accordance with their duties and obligations to act honestly, fairly, diligently as are imposed upon them by the Constitution, regulatory authorities and ethical standards. Key matters reserved for the Board include the following:• Approval of the Strategic Business Plan• Approval of the Annual Budgets• Review of the operating results and approval of the financial accounts• Setting the Corporate Governance practices within the Group• Determining SFC’s dividend policies• Approval of the Group financial policies• Approval of the Group risk management strategies• Review of Board nominations and composition• Determining the terms and conditions for and evaluate the performance of the
Managing Director• Delegation of authority to the Managing Director and senior management on
operational matters, or approval of matters in excess of any discretion which may have been delegated from time to time
• Acquisition, establishment, disposal or cessation of any significant business of SFC
• Approving the issue of any securities in SFC• Approving the capital management strategy of SFC• Approving the appointment of SFC’s External Auditor
The Board has delegated authority for the management of the Group through the Managing Director to executive management. Accordingly, the Group’s executive management team are charged with implementing Board directives and the day-to-day management and reporting of the Group’s activities. The Board has a formal Charter setting out the roles of Board and Management. Consistent with Council Principle 1, the Board Charter has been posted to the corporate governance section of the Company’s website – www.schaffer.com.au
STRUCTURE THE BOARD TO ADD VALUEThe Schaffer Board currently consists of five directors: two independent; one non-executive; and two executive directors namely the Executive Chairman of the Leather division and the Group Managing Director and Chairman. The Board considers that between them, the directors bring the range of skills, knowledge and experience (both local and international) necessary to successfully direct the Group’s operations.
The Board of Directors consists of:
John Schaffer AM Chairman and Managing Director(Age 68)
John joined the Company in 1972 and has held the positions of Managing Director since 1987 and Chairman since 1988. John holds a Bachelor of Commerce degree with honours from the University of Western Australia and is an FCPA.
Danielle Blain AM Non-executive Director(Age 75)
Danielle joined the Board in 1987. Mrs Blain served as a director of Howe Automotive Limited from 1993 to 2005 and as Managing Director of Gosh Leather Pty Ltd (the furniture division) from 1993 to 2001. Mrs Blain holds a Bachelor of Arts degree from the University of Western Australia and is a member on several NGO boards. Mrs Blain is a member of the Board’s Audit Committee and the Nomination and Remuneration Committee.
Michael Perrott AM Independent Director(Age 73)
Michael joined the Board as an independent director in February 2005 and is a member of the Board’s Audit Committee and the Nomination and Remuneration Committee. Mr Perrott AM has been involved in industries associated with construction, contracting, mining and land development since 1969.
Anton Mayer Executive Director(Age 77)
Anton joined the Board in 2001. Anton is the Executive Chairman of Howe Automotive Limited, and held the position of Howe Automotive Limited Managing Director from 1998 to June 2007. Anton is also a director of a number of the Howe Automotive Limited Group subsidiaries. Anton has over 50 years of international leather experience, broad business skills and a global business perspective.
David Schwartz Independent Director(Age 65)
David joined the Board in 1999 and is independent Chairman of the Board’s Audit Committee and the Nomination and Remuneration Committee. David has many years’ experience in successfully managing manufacturing and distribution businesses in Australia and South Africa, and over 25 years’ experience negotiating acquisitions and overseeing the development of property. Mr Schwartz is Chairman of Stefani Pure Water Australasia Pty Limited and a director of Primewest Management Ltd.
The names of Schaffer’s current directors, their year of appointment, status as non-executive, executive or independent directors, their economic interest in SFC and whether they retire at the next Annual General Meeting is summarised in the table below.
Director Year appointed Classification Audit CommitteeNomin. & Remun.
CommitteeEconomic Interest
in SFC Retiring at next AGMSeeking
Re-election
J M Schaffer AM 1972 Chairman/Executive – – 20.1% No N/AD E Blain AM 1987 Non-executive Member Member 11.3% No N/AA K Mayer 2001 Executive – – 2.5% No N/AM D Perrott AM 2005 Independent Member Member – No N/AD J Schwartz 1999 Independent Chairman Chairman 4.3% Yes Yes
STATEMENT OF CORPORATE GOVERNANCE PRACTICESyear ended 30 June 2019
SCHAFFER CORPORATION LIMITED 2019 ANNUAL REPORT 63
STATEMENT OF CORPORATE GOVERNANCE PRACTICESyear ended 30 June 2019
BOARD COMMITTEESThe Board may from time to time establish committees where the Board is of the belief that the establishment of such a committee will improve the performance of the Board in accomplishing its duties.
The Board operates an Audit Committee and a Nomination and Remuneration Committee. Both committees comply with Council guidelines. The Charter of each committee is summarised later in this section. Full details of SFC Audit Committee and Nomination and Remuneration Committee can be found on the Company’s website. The Board does not believe the Board it is of sufficient size to warrant the establishment of additional dedicated Board Committees.
BOARD MEETINGSManagement provides the Board with information in a form, timeframe and quality that facilitates the Board in effectively discharging its duties. The Board meets at least 8 times per year. Board papers are, where possible, provided to directors at least four days prior to the relevant meeting. The non-executive Board members are joined at Board meetings by the Group’s Managing Director, the Executive Chairman of Howe Automotive Limited and the Company’s Company Secretary.
BOARD AND MANAGEMENT EVALUATIONUnder the Board Charter, the Chairman is responsible for ensuring that board meetings are conducted competently and ethically and that Directors individually and as a group have opportunities to air differences, explore ideas and generate the collective views and wisdom necessary for the proper operation of the Board and Company. In this context, the Chairman undertakes a continuous review of the performance and contribution of individual Directors, whilst the Board as a whole, conducts an ongoing evaluation of its performance and that of its committees.
The Nomination and Remuneration Committee annually assess the performance of the Managing Director. The Managing Director conducts annual reviews of all Senior Executives. Annual reviews were conducted during the reporting period.
DIRECTOR INDEPENDENCEThe Board applies the Council’s independence criteria in assessing director independence. Mr Schwartz and Mr Perrott are considered by the Board to be independent directors. In analysing Mr Schwartz’s independence, the Board considered the materiality of Mr Schwartz’s minority interests in the relevant syndicated property interests of the Company. Accordingly, the Board confirms Mr Schwartz’s independence on the basis that (i) operating revenue from SFC’s property interests represents less than 10% of Group revenue; and (ii) no interest held by Mr Schwartz represents a controlling interest in any single property. While the Board considers Mr Schwartz independent for the above reasons, standard Board meeting procedures and governance principles apply whereby in respect of any property business where Mr Schwartz has an interest, Mr Schwartz does not receive the relevant Board papers and does not attend that part of the Board meeting where the matter is being discussed or considered. In addition, the mere fact that Mr Schwartz and Mr Perrott have served on the Board for a substantial period does not mean that they have become too close to management to not be considered independent. Mr Schwartz and Mr Perrott contribute unbiased and differing ideas and wisdom to the Board generated from their individual and independent experience across numerous other businesses and industries.
Directors classified as not being independent directors are Mrs Blain, Mr Schaffer and Mr Mayer on the basis that:• Mr Schaffer is an executive director, a substantial shareholder of SFC (with
an economic interest of 20.1%) and has served on the Board in since 1972;• Mrs Blain is a substantial shareholder of SFC (with an economic interest of
11.3%), served as an executive director of Howe from 1993 to 2001 and has served on the SFC Board since 1987; and
• Mr Mayer is an executive director of SFC by virtue of his role as Executive Chairman of Howe Automotive Limited.
The Board does not currently comply with Council guidelines in respect of majority independence, Chairman independence and separation of the Chairman and Managing Director roles. However, the Board is currently of the view that having a competent, cohesive and functioning Board whose members have a balance of practical experience and skills relevant to SFC’s business is more beneficial to maximising returns to shareholders than it would be to expand the Board by two additional members simply for the purpose of achieving majority independence pursuant to the Council’s definition. Further, the Board is not in entire agreement with the definition of independence as defined by the Council’s guidelines.
In the Board’s view, independence is about having individuals on the Board whose interests are directly aligned with shareholders (i.e. they have a significant stake in the company) and have the capability to question and challenge management’s decision making process. On this basis, your Board is independent. Collectively the Board has a financial interest in approximately 38% of SFC’s issued capital representing a large proportion of each director’s personal asset base. When the shareholders gain, so does the Board; when shareholders lose, the Board loses significantly.
Similarly, based on the strong alignment of shareholders with the Chairman, it is not considered that having an Independent Chairman and separating the roles of Chairman and Managing Director would add shareholder value at this stage.
As a result of the Company’s departure from the Council Recommendations contained in this Principle, governance practices employed by the Board to support its objective and competent operation are:
Disclosure of interests and conflictsA director is required to disclose to all directors any material personal interest they may have, or may reasonably be perceived to have, in a matter which relates to the affairs of the Company. A director is expected to disclose their interest as soon as practicable after the director becomes aware of that interest.
In the event a potential material conflict of interest arises, the director concerned does not receive the relevant Board papers and leaves the Board meeting while the matter is discussed and considered. Directors must keep the Board advised on an ongoing basis of any interests which could cause, or may reasonably be perceived to cause, a conflict with the interests of the Company.
The minutes of the meeting should record the decision taken by those directors who do not have an interest in the matter.
Independent legal adviceWith the consent of the Chairman, individual directors may seek independent professional advice at the Company’s expense on any matter connected with the discharge of their responsibilities. The Chairman requires the submission of a cost estimate by a director in order to establish the reasonableness of the projected fee. The Chairman’s consent will not be unreasonably withheld.
Period of officeShareholders are given the opportunity to vote on the composition of the Board such that at each Annual General Meeting, one third of the Directors (excluding the Managing Director) must retire but may stand for re-election. Each director who is required by the Constitution to retire cannot hold office for more than three years without retiring within that time frame and standing for re-election. Any director who is appointed to the Board to fill a casual vacancy during a year may only hold office until the next Annual General Meeting but may stand for re-election at that meeting.
PROMOTE RESPONSIBLE AND ETHICAL DECISION MAKINGConduct and ethicsThe Company operates under a Code of Conduct a copy of which is posted to the corporate governance section of the Company’s website – www.schaffer.com.au
The Company’s Code of Conduct describes how SFC relates to its employees, customers, suppliers, shareholders and the community. SFC is committed to promoting integrity and maintaining the highest standard of ethical conduct in all of its activities.
Our business success is dependent on the development and maintenance of trusting relationships, underpinned by the continuous demonstration of corporate integrity.
The purpose of this Code of Conduct is to provide a common behavioural framework for all SFC personnel which recognises social responsibility, complies with applicable laws and standards, and is in keeping with the spirit and rules of the Australian and international markets in which SFC operates. This Code of Conduct applies to SFC and its controlled affiliates.
SFC’s directors and management team lead by example, demonstrating their commitment to this Code of Conduct at all times through their personal behaviour and through guidance provided to our personnel.
SCHAFFER CORPORATION LIMITED 2019 ANNUAL REPORT64
STATEMENT OF CORPORATE GOVERNANCE PRACTICESyear ended 30 June 2019
Securities trading policySFC’s Securities Trading Policy regulates dealing by SFC Directors and senior executives in SFC securities. Restrictions imposed by law on prohibiting anyone dealing in SFC’s securities if in possession of unpublished SFC price-sensitive information have been supplemented by Board imposed restrictions specific to SFC Directors and senior executives. Price sensitive information is information a reasonable person would expect to have a material effect on the price or value of SFC securities.
This policy provides that in addition to Directors and senior executives being prohibited from trading in the Company’s securities at any time if they possess any unpublished price sensitive information, Directors and senior executives may buy or sell the Company’s securities only within limited trading windows.
The periods within which a Director or senior executive may buy or sell SFC securities is:• from 24 hours to 4 weeks after the Company has made any Scheduled
Announcement. A scheduled announcement refers to the announcement by SFC of its (i) results for the half year, (ii) preliminary final year result, (iii) Chairman’s Address to the Annual General Meeting;
• from 24 hours to 4 weeks after the Company has made any Unscheduled Announcement. An unscheduled announcement refers to any other announcement of new information made by SFC pursuant to ASX Listing Rule 3.1; and
• during the period when a prospectus for securities is released by SFC until the last day for acceptance of securities issued pursuant to that prospectus.
SFC Directors and senior executives are prohibited from trading at all other times. For the purposes of clarity, any unscheduled ASX Listing Rule 3.1 announcement made within 4 weeks prior to a Scheduled Announcement does not enable SFC Directors and senior executives to trade SFC securities. The senior executives Group to which these restrictive trading periods apply includes all General Manager personnel at Howe & Company Pty Ltd and Delta Corporation Limited, and SFC’s Chief Financial Officer, Group Financial Controller & Company Secretary and Group Chief Accountant.
The policy also requires that Directors and senior executives do not buy or sell the Company’s securities on a short-term basis.
These rules also apply to trading by a related party of any SFC Director or senior executive. This Policy does not restrict participation by SFC senior executives in SFC’s Employee Share Options Plan (ESOP), but applies in respect of the trading of SFC’s securities to which plan participants become entitled under the ESOP.
A copy of the Company’s Securities Trading Policy can be accessed from the corporate governance section of the Company’s website – www.schaffer.com.au
Diversity policySFC recognises the benefits to be gained from a variety of skills, backgrounds and experiences being applied to specific work objectives. Therefore, SFC is committed to diversity throughout our workforce.
SFC has established a diversity policy which includes the requirement for the Board to establish measurable objectives for achieving gender diversity and for the Board to assess annually both the objectives and progress in achieving them. The copy of the Company’s Diversity Policy can be accessed from the corporate governance section of the Company’s website – www.schaffer.com.au
Our commitment to diversity will be supported by:
Communication – SFC will maintain an inclusive workplace culture via the organisation-wide awareness of workplace diversity principles and benefits. Management will ensure ongoing communication of these principles to the workforce.
Human Resource strategies – SFC Human Resource strategies and policies including recruitment, promotion and employee development will incorporate diversity principles to encourage a diverse workforce at all levels of the organisation. Where appropriate opportunities exist, and strong candidates are available for recruitment or promotion, diversity will be a consideration.
Action against inappropriate workplace behaviour – SFC does not tolerate discrimination, harassment, bullying, victimisation and/or vilification in the workplace. Action will be taken against these types of behaviour that do not value diversity.
Flexible work practices – where appropriate, flexible work practices will be accepted to meet the differing needs of a diverse workforce.
The table below outlines the gender diversity objectives established by the Board and the progress against each objective.
Objectives Progress
Comply with the Workplace Gender Equality Agency Act as determined by the Workplace Gender Equality Agency (WGEA)
The annual compliance notification was received on 28 June 2019 from WGEA.
Ensure reporting systems satisfy the reporting requirements as stipulated by the WGEA
The monthly Board reporting includes statistics on the numbers of each gender represented in senior executive positions and the total workforce at various business units and locations. Reporting systems are established to collate Group-wide information for reporting on the gender equality indicators stipulated by the WGEA.
Provide ongoing communication, education and updates on issues related to equal opportunity in the workplace.
Staff memorandums have been distributed and displayed at various SFC business unit locations presenting SFC’s policy on diversity, and encouraging contribution and communication on diversity within the workplace.
Implement and revise Business Unit specific diversity plans.
Business Unit specific plans are being continually developed, reviewed and revised according to the specific circumstances of each Business Unit.
At 30 June 2019, women represented 50% (2018: 52%) of the Group’s workforce, 16% (2018: 19%) of senior executive positions, and 20% (2018: 20%) of the Board.
SAFEGUARD INTEGRITY IN FINANCIAL REPORTINGWritten declaration by managementSFC’s Managing Director and CFO report in writing to the Audit Committee that the consolidated financial statements of SFC and its controlled entities for any accounting period are based on a sound system of risk management and present a true and fair view in all material respects of the Group’s financial condition and that operational results are in accordance with accounting standards. This statement is in turn supported by written statements provided by the senior management of all subsidiary companies within the Group.
STATEMENT OF CORPORATE GOVERNANCE PRACTICESAudit CommitteeThe SFC Audit Committee was established by the Board in 1996. The Audit Committee has adopted a formal Charter, a copy of which can be accessed from the corporate governance section of the Company’s website – www.schaffer.com.au
The Audit Committee’s purpose is to provide assistance to the Board in fulfilling its corporate governance and oversight responsibilities in relation to the company’s financial reporting, risk management systems and the external audit functions. In doing so, it is the responsibility of the Audit Committee to maintain free and open communication between the Committee, external auditors and management of the Company.
In discharging its oversight role, the Audit Committee is empowered to investigate any matter brought to its attention with full access to all books, records, facilities, and personnel of the Company and the authority to engage independent counsel and other advisers as it determines necessary to carry out its duties.
Council guidelines require the Audit Committee to consist of at least three directors and have an independent Chairperson who is not Chairperson of the Board.
The members of the SFC’s Audit Committee are Mr Schwartz (Independent Chairman), Mrs Blain (Non-executive Director) and Mr Perrott (Independent Director). Accordingly, SFC’s Audit Committee complies with the Council’s Audit Committee structure guidelines.
SCHAFFER CORPORATION LIMITED 2019 ANNUAL REPORT 65
STATEMENT OF CORPORATE GOVERNANCE PRACTICESyear ended 30 June 2019
MAKE TIMELY AND BALANCED DISCLOSUREContinuous disclosure policyThe Board is committed to ensuring that information that is expected to have a material effect on the price or value of SFC’s shares is immediately notified to the ASX for dissemination to the market in accordance with the ASX Listing Rules. The Company’s Continuous Disclosure Policy sets out the key obligations of the Board and senior management to ensure that SFC complies with its disclosure obligations pursuant to the ASX Listing Rules and the Corporations Act. In fulfilling its obligations of continuous disclosure SFC has adopted and adheres to the following practices.
• SFC’s Managing Director, Chief Financial Officer and Company Secretary constitute the executive team charged with management of all elements of the Company’s activities. This team is responsible for assessing the materiality of information and drafting all disclosures. For administrative convenience, SFC’s Company Secretary is the nominated officer of the Company responsible for communications with the ASX.
• Information is released firstly via electronic means via the ASX. Further dissemination to analysts and investors does not occur until after ASX confirms the information has been released to the market.
• The information is posted to SFC’s website at www.schaffer.com.au in order to make the information accessible to the widest audience. Investor information is posted to an area on SFC’s website separate from any promotional material about the Company or its products.
• SFC’s Managing Director, Chief Financial Officer and Company Secretary, and Howe Automotive Limited’s Executive Directors are the officers authorised to speak on SFC’s behalf at investor briefings and to the media. These officers understand that when speaking on behalf of the Company it is in respect of explanation and clarification of information previously released via the ASX. As these officers have knowledge of all information previously released to the ASX (they form part of the executive team responsible for the information disclosures), the risk of inadvertent disclosure of price sensitive information when speaking to investor briefings and the media is minimised. Presentations used in briefings which may have content which would trigger a continuous disclosure obligation are lodged with ASX prior to the briefing. All presentations are posted to SFC’s website.
• Comments on analysts’ financial projections are confined to errors in factual information and underlying assumptions. The Company will not provide price sensitive information or earnings forecast guidelines to analysts unless it has already done so to the market via the ASX.
• Unless the executive team responsible for information disclosures believes it has an obligation to make a statement on a particular matter, SFC’s policy is not to respond to market rumours or speculation.
RESPECT THE RIGHTS OF SHAREHOLDERSShareholder communications strategySFC aims to ensure that investors and the market are kept informed of all major developments affecting the Company.
Information is communicated to investors and the market in accordance with SFC’s periodic and continuous disclosure obligations pursuant to the ASX Listing Rules and the Corporations Act. SFC’s disclosure practices are aimed at ensuring timely access for all investors to Company information.
To achieve these objectives and to satisfy regulatory requirements, SFC provides information to investors and the market in a number of ways:
• SFC’s principal communication with investors is by provision of the Annual Report and financial statements, the Interim Report and the Annual General Meeting.
• Periodic and continuous disclosure announcements are released directly to the market via the ASX using ASX’s electronic lodgement service. These announcements are immediately placed on the Company’s website, at www.schaffer.com.au and typically mailed to shareholders.
• The release of Interim and Final results is typically followed by investor briefings and road shows. The purpose of the investor briefings/road shows is for explanation and clarification of previously released information and non-material company or industry specific information. Site visits are also arranged to give those who advise investors a better understanding of the Groups operating facilities.
• SFC’s website contains further information about the Group and its activities, including copies of recent Annual and Interim Reports, the full text of notices of meetings and explanatory notes and copies of road-show presentations and presentations to brokers/analysts.
• The Annual General Meeting provides an opportunity for the Board to communicate with shareholders and investors through the presentation of the Chairman’s Address and shareholders, through the Chairman, are given the opportunity to ask general questions of directors. SFC’s external auditor attends each Annual General Meeting and is available to answer any questions shareholders may have, that are relevant to the conduct of the audit. The meeting, when possible, is held at the same convenient location on the same weekday and time each year in order to encourage shareholder participation.
• SFC’s senior management meets regularly to consider its continuous disclosure obligations and assess the appropriateness of its policy in the context of any legislative amendments to the disclosure regime. Unless SFC has an obligation to make a statement on a particular matter, the Company’s policy is not to respond to market rumours and media speculation.
RECOGNISE AND MANAGE RISKRisk managementThe Board has formal written policies on risk oversight and management. SFC’s risk management policy provides the framework to manage the risks associated with SFC’s business activities.
The purpose of the policy is to identify, assess, monitor and manage risk with the objective of minimising losses and maximising shareholder value.
SFC prepares risk profiles including a description of material risks, both financial and non-financial. SFC reviews and updates its risk profile as required.
SFC implements a systematic process to assist in the identification, assessment, treatment and monitoring of risks.
SFC provides the necessary tools and resources to management and staff to support the effective management of risks.
SFC ensures that the Board is adequately informed of significant risk management issues and the actions undertaken to manage risks in a timely manner.
The Board has considered the need for an internal audit function and concluded that the size and nature of the Group’s operations do not warrant such a function at present. Responsibility for implementation and effective conduct of SFC’s risk management system rests with the Board, Chief Executive Officer, Chief Financial Officer, Company Secretary, General Managers and all employees. The Managing Director and the Chief Financial Officer are required to state in writing to the Board in respect of any accounting period that:
• The statement given in accordance with the ASX Corporate Governance Council’s Best Practice recommendation 4.1 (the integrity of financial statements) is founded on a sound system of risk management and internal compliance and control which implements the policies adopted by the Board; and
• SFC’s risk management and internal compliance and control system is operating efficiently and effectively in all material respects.
The SFC Board are able to oversee the entity’s risk management system efficiently and effectively without establishing a separate risk committee. Executive management report to the Board on the effectiveness of our management of material business risks and they are satisfied that the risk management process enables material risks to be appropriately identified, prioritised, monitored and managed. Strategic risks are reported to the board on an ongoing basis.
The Automotive Leather division of SFC is materially exposed to the economic risk of foreign exchange fluctuations. To manage the foreign exchange risk arising from future commercial transactions the entity regularly considers the use of natural hedges and forward foreign exchange contracts, with reference to currency exposure levels, sensitivity, and financial capacity to tolerate rate fluctuations.
SFC does not have any material environmental or social sustainability risks.
SCHAFFER CORPORATION LIMITED 2019 ANNUAL REPORT66
STATEMENT OF CORPORATE GOVERNANCE PRACTICESyear ended 30 June 2019
REMUNERATE FAIRLY AND RESPONSIBLYExecutive remunerationSFC’s Nomination and Remuneration Committee operates to support and advise the Board in fulfilling its responsibility to shareholders to ensure that the company has remuneration policies and practices which enable it to attract and retain directors and executives who will best contribute towards achieving positive outcomes for shareholders. The committee determines the remuneration and other conditions of service of the chief executive officer and executive directors, if any. The committee makes recommendations to the Board on the remuneration of non-executive directors within the aggregate approved by shareholders in general meeting from time to time. The committee considers individual performance, company performance, internal relativity and fairness in setting levels of remuneration and may seek appropriate independent external advice to assist in its decision making.
SFC’s remuneration policy is directed at attracting, motivating and retaining quality people.
The remuneration of SFC’s senior executive consists of fixed remuneration and annual and long-term incentives.
Fixed Remuneration – This includes base salary and the statutory Superannuation Guarantee Contribution (SGC) which comprises the cash component; and other non-cash benefits such as a motor vehicle.
The Schaffer Corporation Limited Superannuation Fund is available to executives for superannuation contributions and life insurance. Premiums for life insurance are deducted from member accounts. Executives can elect to have the company contribute superannuation beyond the statutory SGC level by way of a salary sacrifice in lieu of cash salary.
Annual Incentive – The Company has performance-based incentive plans in place at each of its operations in which management and the labour force participate. The level of remuneration payable to participating executives is linked to the financial performance of their business. Executives are provided with cash incentives provided profitability thresholds are met.
Long Term Incentive – SFC’s senior executives (other than Mr Schaffer and Mr Mayer) participate in SFC’s Employee Share Option Plan (ESOP). Howe Automotive Limited operates the Employee Participation Unit (EPU) Plan for its executives. These incentive plans have long-term vesting provisions and are designed to align the interests of the participating executives with those of all SFC shareholders.
Non-executive Director remunerationSFC’s non-executive directors receive fees for their services (including statutory superannuation) and the reimbursement of reasonable expenses. The amount payable to non-executive directors is set by the Board after having taken regard to the size of the Company and Board, the responsibilities, demands and accountabilities faced by those directors in discharging their duties and after seeking independent advice to ensure the fees are in line with market standards. It is current SFC policy that non-executive directors do not receive shares, options or other securities and are not eligible to participate in SFC’s Employee Share Option Plan.
A directors’ pool limit of $250,000 per annum was approved by shareholders at SFC’s 2003 Annual General Meeting. This limit is not currently fully utilised. The fee pool is payable only to non-executive directors. Non-executive directors were paid annual fees for the 2019 financial year of $81,374 each from the fee pool (inclusive of superannuation). Non-executive directors appointed prior to July 2003 are entitled to a retirement benefit equivalent to one year’s annual director’s fees. The retirement benefit was reduced from three years’ to one year’s annual director’s fees in July 2003 (a three year retirement benefit was in place at the time Mrs Blain AM and Mr Schwartz accepted their appointment to the Board). SFC considers the reduced benefit modest and appropriate given the benefit which historically existed. It is SFC’s policy that no retirement benefit apply to new directors appointed after July 2003.
SCHAFFER CORPORATION LIMITED 2019 ANNUAL REPORT 67
ASX ADDITIONAL INFORMATIONyear ended 30 June 2019
Additional information required by the Australian Securities Exchange is as follows.
TOTAL SHARE CAPITALIssued as at 1 September 2019 – 13,788,252 ordinary fully paid shares.
SHARE REGISTRY ADDRESSC/o Computershare Investor Services Pty Ltd Postal Address:Level 11 GPO Box D182172 St George’s Terrace Perth WA 6840Perth WA 6000 AustraliaAustralia
SECURITIES EXCHANGE LISTINGThe shares of the Company are listed on the Australian Securities Exchange. The home exchange is Perth.
VOTING RIGHTSSubject to any restrictions from time to time being attached to any class or classes of shares at general meetings of Members or classes of Members:(1) each Member entitled to vote may vote in person or by proxy, attorney or
representative;(2) on a show of hands, every person present who is a Member or a proxy,
attorney or representative of a Member has one vote;(3) on a poll, every person present who is a Member or a proxy, attorney or
representative of a Member shall, in respect of each fully paid share held by him, or in respect of which he is appointed a proxy, attorney or representative, have one vote for the share, but in respect of partly paid shares, shall have a fraction of a vote for each partly paid share. The fraction must be equivalent to the proportion which the amount paid (not credited) is of the total amounts paid and payable (excluding amounts credited). Amounts paid in advance of a call are ignored when calculating the proportion.
DISTRIBUTION OF HOLDINGS AS AT 1 SEPTEMBER 2019
Shareholdings Shareholders
1 – 1,000 6421,001 – 5,000 4465,001 – 10,000 103
10,001 – 100,000 92100,001 – and over 23
Number of shareholders holding less than a marketable parcel i.e. less than 34 shares: 54.
SUBSTANTIAL SHAREHOLDERSAs at 1 September 2019, the substantial shareholders of the company summarised below, were:
Number of shares
Economic interest as a percentage
of issued ordinary shares
Mr J M Schaffer AM & Associates 2,116,743 15.35%50% of interest held by Swan Holdings Pty. Ltd. 652,687 4.73%
2,769,430 20.08%
Mrs D E Blain AM & Associates 909,673 6.60%50% of interest held by Swan Holdings Pty. Ltd. 652,687 4.73%
1,562,360 11.33%
*Combined interest of Mr Schaffer & Mrs Blain 4,331,790 31.42%
Sterling Equity Pty Limited and Associates 1,304,209 9.46%
* Pursuant to the Corporation Act (2001), by virtue of the Swan Holdings Pty Ltd Voting Deed conferring on Mr Schaffer the power to vote all Swan Holdings Pty Ltd’s interest in Schaffer Corporation Limited’s shares, Mr Schaffer is also deemed to have an interest in all the Schaffer Corporation Limited shares held by Mrs Blain and her associates, and vice versa. The consequence of this is that each of the Substantial Shareholder notices lodged with the Regulatory Authorities by Mr Schaffer and Mrs Blain show Mr Schaffer’s and Mrs Blain’s combined interest at 31%, not their individual economic interests of 20% and 11% respectively.
TWENTY LARGEST SHAREHOLDERSAs at 1 September 2019
Number of shares
Percentage of issued
ordinary shares
Swan Holdings Pty Ltd 1,305,374 9.47
Cimbrook Nominees Pty Ltd 980,482 7.11
Mutual Trust Pty Ltd 951,062 6.90
Mrs Danielle Eva Blain 907,570 6.58
Mr John Michael Schaffer 799,554 5.80
HSBC Custody Nominees (Australia) Limited 527,546 3.83
Jobling Investments Pty Ltd 507,812 3.68
Mr David Schwartz <David Schwartz Fam Hlds A/C> 361,470 2.62
Mr Christopher Stephan Mayer 344,263 2.50
Mr Kenneth John Beer <Beer Super Fund A/C> 286,946 2.08
Maitri Pty Ltd <Coci Super Fund A/C> 274,472 1.99
The Sports Café (Australia) Pty Ltd 226,072 1.64
Frederick Bruce Wareham 160,006 1.16
SCE Superannuation Pty Ltd <SCE Superannuation A/C> 152,500 1.11
Citicorp Nominees Pty Limited 152,491 1.11
Mr Peter Canaway <Superannuation Fund A/C> 150,000 1.09
Glennlin Pty Ltd <Marilyn May Bookham Disc A/C> 143,252 1.04
Shann Investments Pty Ltd <Lynda Maree Jobling Disc A/C> 143,252 1.04
J P Morgan Nominees Australia Pty Limited 135,107 0.98
Ago Pty Ltd <Superannuation Fund A/C> 123,360 0.89
8,632,591 62.62
ANNUAL GENERAL MEETINGThe Annual General Meeting of Schaffer Corporation Limited will be held at Perth on Wednesday, 13 November 2019 at 11:30am. Further information regarding the meeting including the business to be dealt with is contained in the separate notice of meeting.

SCHAFFER CORPORATION LIMITED 2019 ANNUAL REPORT68
THIS PAGE HAS BEEN LEFT BLANK INTENTIONALLY
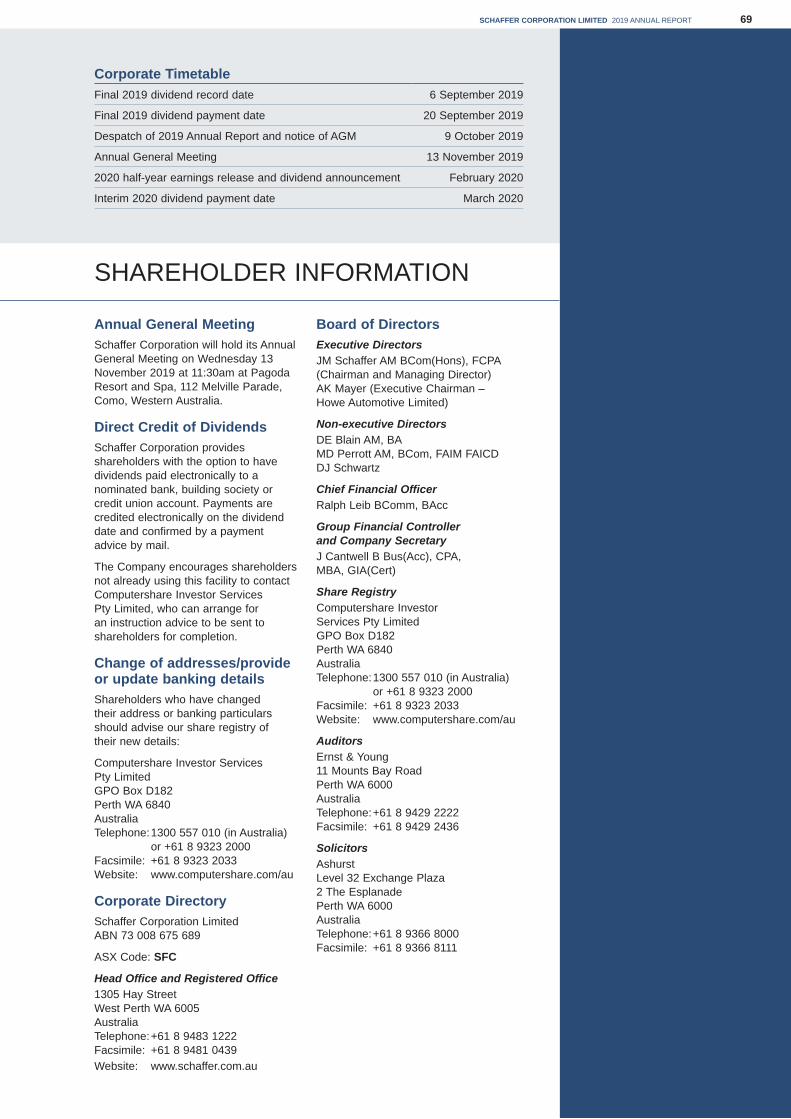
06 1108
Corporate TimetableFinal 2019 dividend record date 6 September 2019
Final 2019 dividend payment date 20 September 2019
Despatch of 2019 Annual Report and notice of AGM 9 October 2019
Annual General Meeting 13 November 2019
2020 half-year earnings release and dividend announcement February 2020
Interim 2020 dividend payment date March 2020
69SCHAFFER CORPORATION LIMITED 2019 ANNUAL REPORT
SHAREHOLDER INFORMATION
Annual General MeetingSchaffer Corporation will hold its Annual General Meeting on Wednesday 13 November 2019 at 11:30am at Pagoda Resort and Spa, 112 Melville Parade, Como, Western Australia.
Direct Credit of DividendsSchaffer Corporation provides shareholders with the option to have dividends paid electronically to a nominated bank, building society or credit union account. Payments are credited electronically on the dividend date and confirmed by a payment advice by mail.
The Company encourages shareholders not already using this facility to contact Computershare Investor Services Pty Limited, who can arrange for an instruction advice to be sent to shareholders for completion.
Change of addresses/provide or update banking detailsShareholders who have changed their address or banking particulars should advise our share registry of their new details:
Computershare Investor Services Pty Limited GPO Box D182 Perth WA 6840 AustraliaTelephone: 1300 557 010 (in Australia)
or +61 8 9323 2000Facsimile: +61 8 9323 2033Website: www.computershare.com/au
Corporate DirectorySchaffer Corporation Limited ABN 73 008 675 689
ASX Code: SFC
Head Office and Registered Office1305 Hay Street West Perth WA 6005 AustraliaTelephone: +61 8 9483 1222Facsimile: +61 8 9481 0439Website: www.schaffer.com.au
Board of DirectorsExecutive DirectorsJM Schaffer AM BCom(Hons), FCPA (Chairman and Managing Director) AK Mayer (Executive Chairman – Howe Automotive Limited)
Non-executive DirectorsDE Blain AM, BA MD Perrott AM, BCom, FAIM FAICD DJ Schwartz
Chief Financial OfficerRalph Leib BComm, BAcc
Group Financial Controller and Company SecretaryJ Cantwell B Bus(Acc), CPA, MBA, GIA(Cert)
Share RegistryComputershare Investor Services Pty Limited GPO Box D182 Perth WA 6840 AustraliaTelephone: 1300 557 010 (in Australia)
or +61 8 9323 2000Facsimile: +61 8 9323 2033 Website: www.computershare.com/au
AuditorsErnst & Young 11 Mounts Bay Road Perth WA 6000 Australia Telephone: +61 8 9429 2222 Facsimile: +61 8 9429 2436
SolicitorsAshurst Level 32 Exchange Plaza 2 The Esplanade Perth WA 6000 AustraliaTelephone: +61 8 9366 8000 Facsimile: +61 8 9366 8111
About Schaffer Corporation 1Managing Director’s Report 2
Review of Operations:
Financial Statements 13Independent Auditor's Report 49Directors’ Report 54Statement of Corporate Governance Practices 62ASX Additional Information 67Shareholder Information 69
Building Materials InvestmentsAutomotive Leather

Schaffer C
orporation Limited
2019 AN
NU
AL R
EP
OR
T
19ANNUAL REPORT