Embed Size (px)
Citation preview
Queensland Treasury
ANNUAL REPORT2020–2021
13 September 2021
The Honourable Cameron Dick MP Treasurer and Minister for Investment
1 William Street Brisbane Qld 4000
Dear Treasurer
I am pleased to submit for presentation to the Parliament the Queensland Treasury Annual Report 2020–2021 and financial statements for Queensland Treasury.
I certify that this annual report complies with:
the prescribed requirements of the Financial Accountability Act 2009 and the Financial and Performance Management Standard 2019
the detailed requirements set out in the Annual report requirements for Queensland Government agencies.
A checklist outlining the annual reporting requirements is provided at page 110 of this annual report.
Yours sincerely
Leon Allen Under Treasurer
Translating and interpreting assistanceThe Queensland Government is committed to providing accessible services to Queenslanders from all cultural and
linguistic backgrounds. If you have difficulty in understanding the annual report, you can contact us on telephone (07) 3035 3503 and we will arrange an interpreter to effectively communicate the report to you.
LicenceThis annual report is licensed by the State of Queensland (Queensland Treasury) under a Creative Commons Attribution (CC BY) 4.0 International licence.
In essence, you are free to copy, communicate and adapt this annual report, as long as you attribute the work to the State of Queensland (Queensland Treasury). To view a
copy of this licence, visit creativecommons.org/licenses/by/4.0/
ISSN 1837-2856 (online)
© The State of Queensland (Queensland Treasury) 2021
About our annual reportThe Queensland Treasury Annual Report 2020–21 is an integral part of our corporate governance framework and one of the main tools we use to ensure we are accountable to the Queensland Parliament and the community about our activities. This report details our achievements, performance and financial position for the 2020–21 financial year. It aligns with the Queensland Government’s Unite and Recover – Queensland’s Economic Recovery Plan, the Queensland Treasury Strategic Plan 2021–2025 and our Service Delivery Statement 2020–21. It also provides information on our future direction, people management and corporate governance processes.
Find our report onlineThis report is available at treasury.qld.gov.au/resources/
For enquiries about this annual report, contact the Manager, Corporate Performance on (07) 3035 3255 or via [email protected].
001Contents
Contents
Inside front cover Letter of compliance
002 Under Treasurer’s report
003 Our performance
007 About us
008 Managing our organisation
012 Our people
Service reports015 Fiscal
015 Economics and policy
016 Commercial and investment
017 Revenue management
Financial018 Our financial position explained
025 Financial statements
Appendices107 Consultancies, language services, overseas travel
107 External scrutiny
108 Publications
108 Government bodies
109 Glossary
110 Compliance checklist
Queensland Treasury Annual Report 2020–21002
Under Treasurer’s reportI am pleased to deliver the 2020–21 Annual Report for Queensland Treasury. During 2020–21, Treasury played a lead role in the government’s response to the unprecedented challenges of COVID-19 with a clear focus on economic recovery and positioning the state for sustainable growth.
Based on the tremendous efforts of its people, and in collaboration with its partner agencies, the department helped deliver 2 Budgets, a COVID-19 Fiscal and Economic Review, and an update to Queensland’s COVID-19 Economic Recovery Plan within a 10-month period. Underpinning this work was the government's recovery plan of more than $14.2 billion of initiatives supporting Queenslanders across the state, and driving economic recovery and creating jobs.
Key achievements in 2020–21 included:
economic analysis and policy advice on the impacts of COVID-19 on the economy to inform the government’s response to the crisis
leading the establishment of the Queensland Future Fund, Debt Retirement Fund, Housing Investment Fund, Carbon Reduction Fund and the Path to Treaty Fund
actively engaging in commercial and investment opportunities, generating or retaining 2,336 Queensland jobs and $1.3 billion in capital expenditure
progressing the Build-to-Rent Pilot project, boosting jobs in the construction sector and increasing access to affordable housing
administering the $2 billion Renewable Energy and Hydrogen Jobs Fund and establishing the $100 million Business Investment Fund
managing the new Invested in Queensland program with the aim of creating 5,000 ongoing jobs over the 10 year life of the program
opening a new Office of State Revenue Debt Management Centre, collecting $38.3 million in debt from fines and penalties in its first 6 months of operation
developing a new Charter of Fiscal Responsibility – positioning Queensland to support recovery and fiscal repair.
Treasury coordinated the government’s Savings and Debt Plan to drive efficiency in government services, and achieve $3 billion in savings over 4 years. Our agency has proactively supported these savings measures and total savings achieved by Treasury to date have been $15.3 million.
The Queensland economy has recovered well from COVID-19, with a range of economic indicators rebounding to higher than their pre-pandemic level. Key amongst these has been a welcome increase in employment, which rose by 2.4 per cent (or around 60,000 persons) in 2020–21. However, several sectors within the economy continue to face challenges, including services exports, business investment and tourism.
Despite these challenges, with the focus on improving Queensland’s productive capacity and competitiveness, we continue to forecast that Queensland’s economy is expected to return to strong positive growth in 2021–22 and subsequent years.
Strong partnerships with agencies and stakeholders continue to be a key to our success in achieving our vision of a strong economy for all Queenslanders. Treasury has valued the opportunity to partner with the Australian Government, and other jurisdictions, in navigating the economic impacts of the COVID-19 pandemic over the past year.
We welcomed Investment Facilitation and Partnerships into our organisation in November 2020. Introducing an investment arm to our organisation has firmly established our role in attracting and stimulating investment in priority industries to create jobs and grow the Queensland economy. The Office of Productivity and Red Tape Reduction was established within Treasury in June 2021 to drive the government’s productivity agenda while continuing to deliver regulatory review functions across government.
I commend the excellent service shown by Treasury’s workforce during these uncertain times, and know that our commitment and professionalism place us in a strong position to continue our central role in providing expert advice and services to the government.
Leon Allen Under Treasurer
003Under Treasurer’s report/Our performance
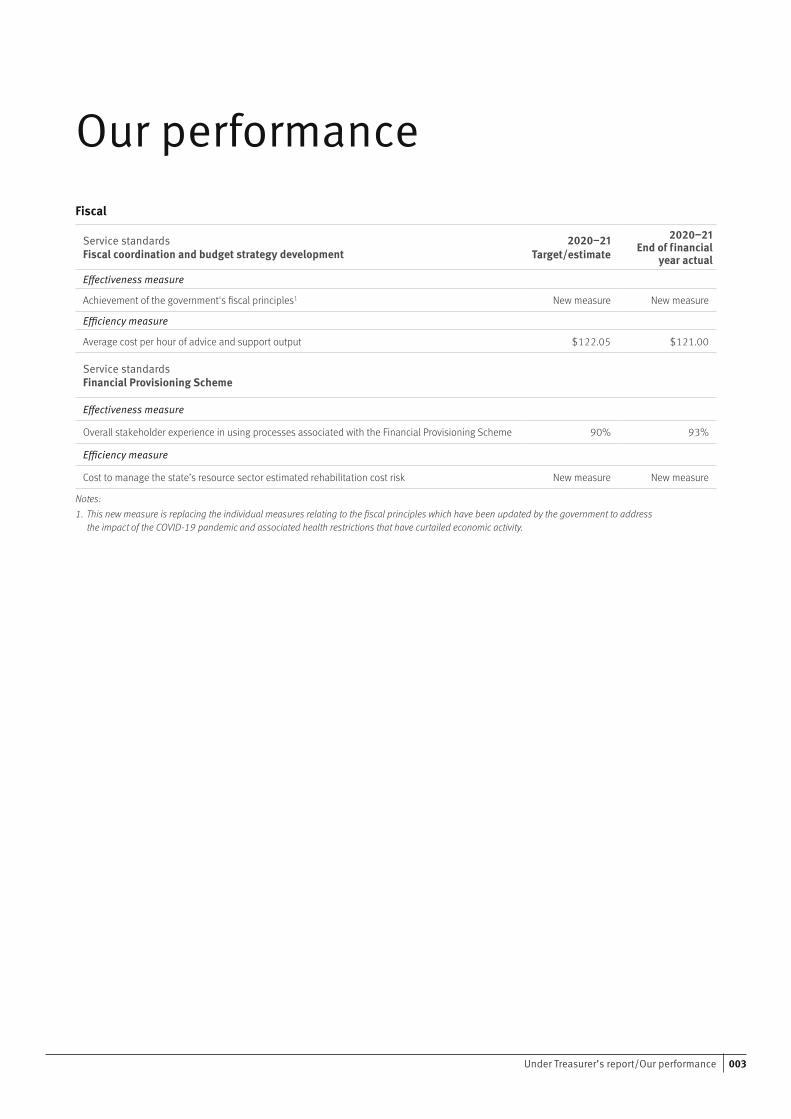
Our performanceFiscal
Service standardsFiscal coordination and budget strategy development
2020–21 Target/estimate
2020–21 End of financial
year actualEffectiveness measure
Achievement of the government's fiscal principles1 New measure New measure
Efficiency measure
Average cost per hour of advice and support output $122.05 $121.00
Service standardsFinancial Provisioning Scheme
Effectiveness measure
Overall stakeholder experience in using processes associated with the Financial Provisioning Scheme 90% 93%
Efficiency measure
Cost to manage the state’s resource sector estimated rehabilitation cost risk New measure New measure
Notes:1. This new measure is replacing the individual measures relating to the fiscal principles which have been updated by the government to address
the impact of the COVID-19 pandemic and associated health restrictions that have curtailed economic activity.
Queensland Treasury Annual Report 2020–21004
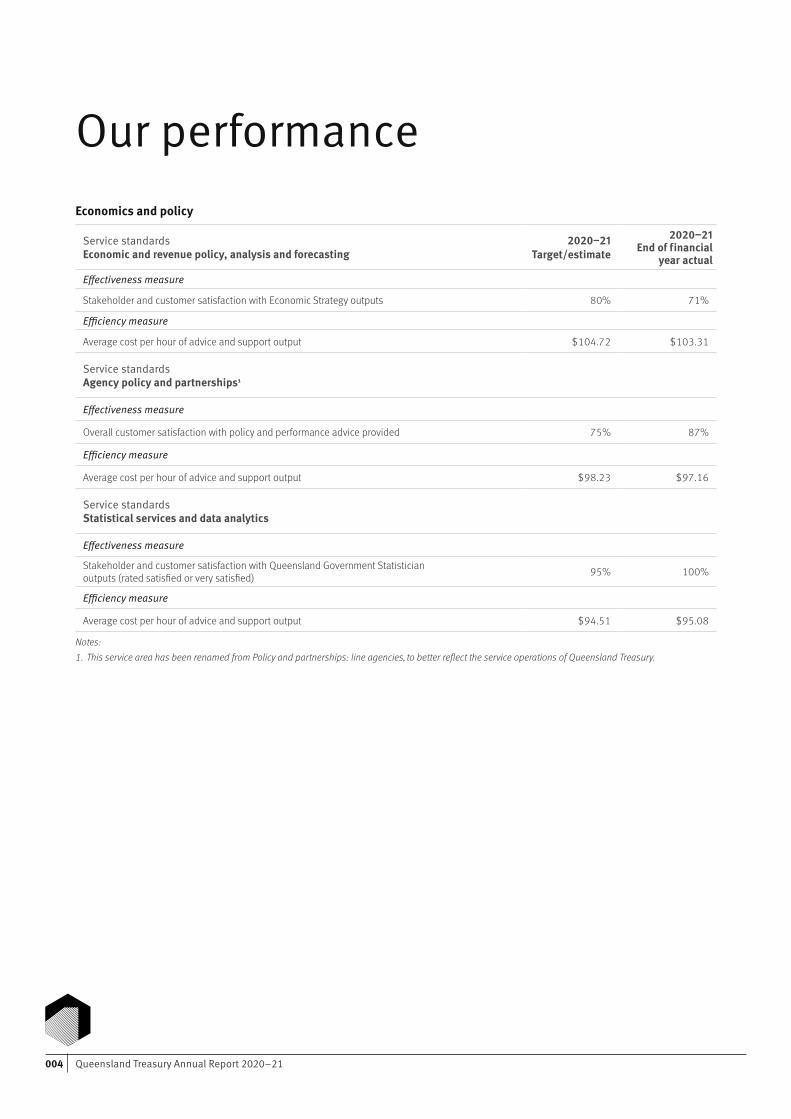
Our performanceEconomics and policy
Service standardsEconomic and revenue policy, analysis and forecasting
2020–21 Target/estimate
2020–21 End of financial
year actualEffectiveness measure
Stakeholder and customer satisfaction with Economic Strategy outputs 80% 71%
Efficiency measure
Average cost per hour of advice and support output $104.72 $103.31
Service standardsAgency policy and partnerships1
Effectiveness measure
Overall customer satisfaction with policy and performance advice provided 75% 87%
Efficiency measure
Average cost per hour of advice and support output $98.23 $97.16
Service standardsStatistical services and data analytics
Effectiveness measure
Stakeholder and customer satisfaction with Queensland Government Statistician outputs (rated satisfied or very satisfied) 95% 100%
Efficiency measure
Average cost per hour of advice and support output $94.51 $95.08
Notes:1. This service area has been renamed from Policy and partnerships: line agencies, to better reflect the service operations of Queensland Treasury.
005Our performance
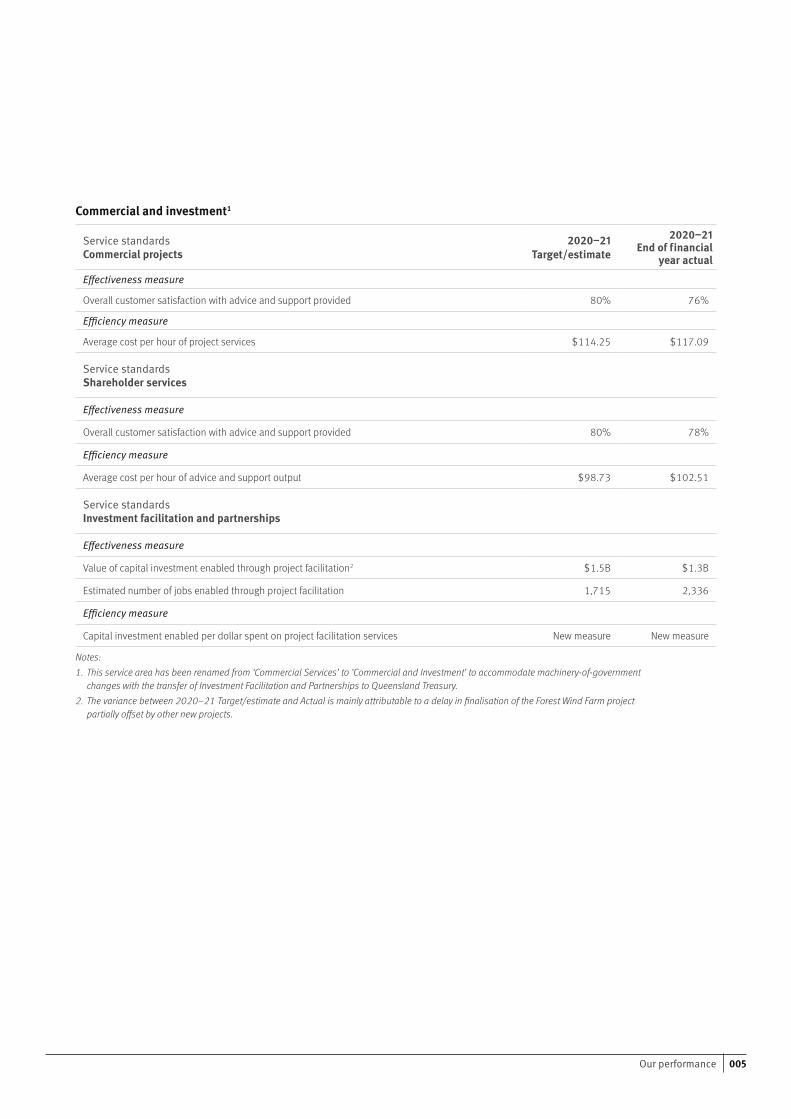
Commercial and investment1
Service standardsCommercial projects
2020–21 Target/estimate
2020–21 End of financial
year actualEffectiveness measure
Overall customer satisfaction with advice and support provided 80% 76%
Efficiency measure
Average cost per hour of project services $114.25 $117.09
Service standardsShareholder services
Effectiveness measure
Overall customer satisfaction with advice and support provided 80% 78%
Efficiency measure
Average cost per hour of advice and support output $98.73 $102.51
Service standardsInvestment facilitation and partnerships
Effectiveness measure
Value of capital investment enabled through project facilitation2 $1.5B $1.3B
Estimated number of jobs enabled through project facilitation 1,715 2,336
Efficiency measure
Capital investment enabled per dollar spent on project facilitation services New measure New measure
Notes:1. This service area has been renamed from ‘Commercial Services’ to ‘Commercial and Investment’ to accommodate machinery-of-government
changes with the transfer of Investment Facilitation and Partnerships to Queensland Treasury. 2. The variance between 2020–21 Target/estimate and Actual is mainly attributable to a delay in finalisation of the Forest Wind Farm project
partially offset by other new projects.
Queensland Treasury Annual Report 2020–21006
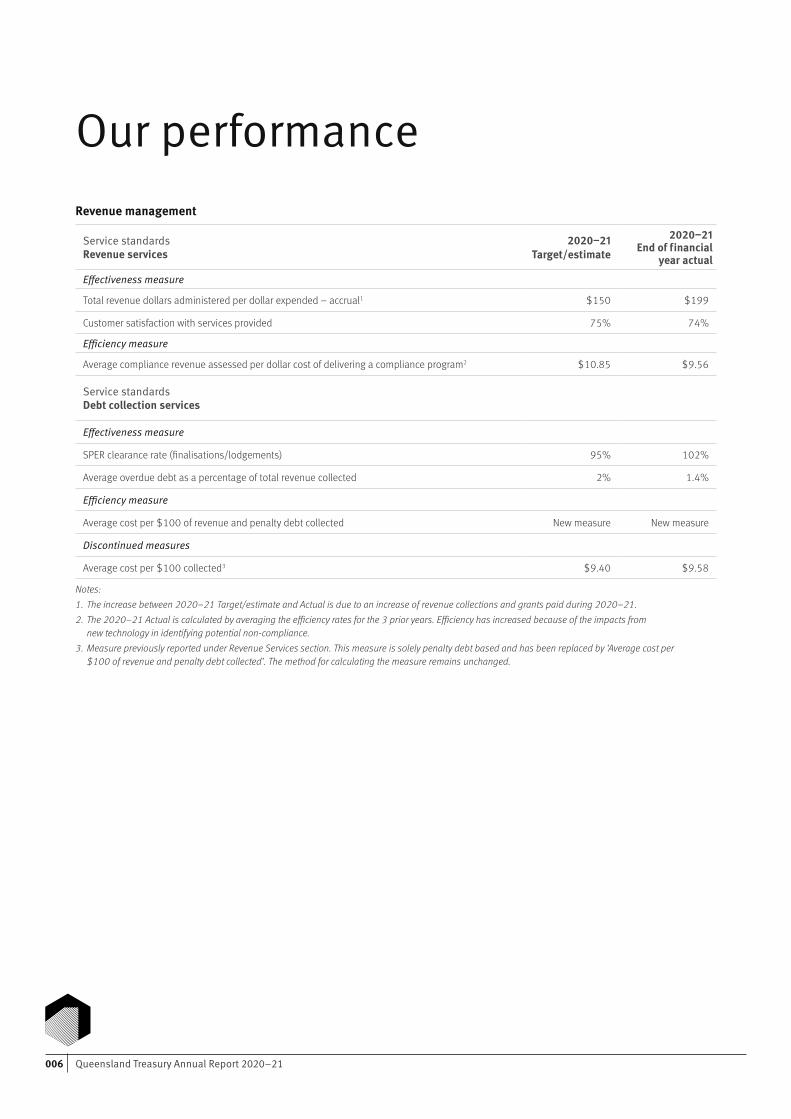
Our performanceRevenue management
Service standardsRevenue services
2020–21 Target/estimate
2020–21 End of financial
year actualEffectiveness measure
Total revenue dollars administered per dollar expended – accrual1 $150 $199
Customer satisfaction with services provided 75% 74%
Efficiency measure
Average compliance revenue assessed per dollar cost of delivering a compliance program2 $10.85 $9.56
Service standardsDebt collection services
Effectiveness measure
SPER clearance rate (finalisations/lodgements) 95% 102%
Average overdue debt as a percentage of total revenue collected 2% 1.4%
Efficiency measure
Average cost per $100 of revenue and penalty debt collected New measure New measure
Discontinued measures
Average cost per $100 collected3 $9.40 $9.58
Notes:1. The increase between 2020–21 Target/estimate and Actual is due to an increase of revenue collections and grants paid during 2020–21. 2. The 2020–21 Actual is calculated by averaging the efficiency rates for the 3 prior years. Efficiency has increased because of the impacts from
new technology in identifying potential non-compliance. 3. Measure previously reported under Revenue Services section. This measure is solely penalty debt based and has been replaced by ‘Average cost per
$100 of revenue and penalty debt collected’. The method for calculating the measure remains unchanged.

007Our performance/About us
About us
ValuesTreasury’s strength in fulfilling our vision is drawn from the public service values:
customers firstideas into actionunleash potentialbe courageousempower people.
These values are the foundation for Treasury’s purpose of driving government priorities through our expert advice and services.
ServicesAs a central agency established in 1859, Treasury leverages a government-wide perspective to provide advice and services to clients, and partners with agencies for better outcomes in the economy and state finances, revenue, and commercial and investment services.
Read more about Treasury’s services in the service reports on pages 15 to 17.
Statutory and other bodiesTreasury’s work is complemented by the following bodies:
Queensland Competition AuthorityMotor Accident Insurance
CommissionNominal DefendantNational Injury Insurance Agency
(Queensland)Queensland Treasury Corporation.
These organisations produce their own annual reports.
Information and records managementTreasury continues its commitment to quality information and records management within an embedded information security management system (ISMS) to mitigate Treasury’s cyber security risk profile. Treasury strives to equip its people with modern and effective data, analytic systems, processes and tools, providing the support and policies to use them, and recognising its obligations under the Public Records Act 2002, the Financial and Performance Management Standard 2019 and the whole-of-government record governance policy and guidelines.
Information securityAs part of the mandatory ISMS annual reporting process, the Under Treasurer attested to the appropriateness of the information security risk management within Treasury to the Queensland Government Chief Information Security Officer, noting that appropriate assurance activities have been undertaken to inform this opinion and Treasury’s information security risk position.
Machinery-of-government changes On 12 November 2020, the Investment Facilitation and Partnerships functions of the Department of State Development, Infrastructure, Local Government and Planning were transferred to Queensland Treasury to firmly establish our central role in attracting and stimulating investment in priority industries to create jobs and grow the Queensland economy.
On 2 June 2021, the Queensland Productivity Commission was abolished, and the Office of Productivity and Red Tape Reduction was established within Treasury to drive the government’s productivity agenda while continuing to deliver regulatory review functions across government.
“Our vision is a strong economy for all Queenslanders.”
Queensland Treasury Annual Report 2020–21008
Managing our organisation
The government’s fiscal strategyThe government’s fiscal strategy in the 2020–21 Queensland Budget prioritised economic recovery alongside targeted expenditure and capital investment to position the state well for fiscal repair, supporting ongoing and new government commitments since the onset of COVID-19.
The state’s finances are managed in line with the government’s fiscal principles set out in the Charter of Fiscal Responsibility. Delivery of the 2020–21 Queensland Budget prompted the review of the charter’s fiscal principles for the 2021–22 Budget. The new charter will guide fiscal recovery in the medium term, addressing key areas including debt burden, affordable expenditure growth, funding of capital expenditure, competitive taxation, and retaining the long-standing commitment to targeting full funding of superannuation and workers’ compensation liabilities.
Into the future, the government will continue to respond to the ongoing impacts and emerging risks of COVID-19. Further, the government’s fiscal strategy will focus on improving the state’s productivity and competitiveness to drive ongoing private sector growth and jobs.
Unite and Recover – Queensland’s Economic Recovery PlanTreasury continues to play a key role in delivering Queensland’s Economic Recovery Plan, which is firmly focused on protecting the health of Queenslanders, creating jobs and working together to drive sustainable economic growth. Our priorities include growing our regions and manufacturing industries, backing small businesses, driving investment in infrastructure, and investing in skills and training opportunities for Queenslanders.
Our leadersLeon Allen Under TreasurerLeon was appointed acting Under Treasurer in May 2021. He returned to Queensland Treasury in May 2020 after 13 years with the Institutional Banking and Markets division of the Commonwealth Bank of Australia where he held senior leadership positions both domestically and internationally.
Dennis Molloy Acting Deputy Under Treasurer, Economics and Fiscal Dennis was appointed acting Deputy Under Treasurer in May 2021. He has extensive experience in both the Queensland and Australian governments in economics and public policy, with a particular interest in policies that drive economic growth and achieve fiscal sustainability. Dennis has had key roles in the delivery of Queensland budgets since 2010–11.
Graham Fraine Deputy Under Treasurer, Policy, Performance and Corporate Graham was appointed to the Deputy Under Treasurer role in December 2019. In this role, Graham is responsible for leading the delivery of a range of Queensland Treasury functions. Graham has more than 25 years’ experience in public policy and social science research, specialising in transportation, program development and evaluation, policy reform, and service delivery.
Michael Carey Deputy Under Treasurer, Commercial and InvestmentMichael was appointed Deputy Under Treasurer for Commercial and Investment in May 2021. Immediately prior to this, Michael led the Investment Facilitation and Partnerships group. An experienced executive with a history of senior management roles across the private and public sectors, Michael’s career has focused on strategic policy development and engagement. He has extensive experience in working with the private sector to accelerate complex investments.
Mark Jackson Commissioner of State Revenue and Registrar of the State Penalties Enforcement RegistryMark began his public service career in Townsville in 1981 and has held a number of executive roles within the Australian public service, including Deputy Commissioner of Taxation. Mark was appointed Commissioner of State Revenue in January 2020.
Managing our organisation 009
Audit and Risk Management CommitteeThe Audit and Risk Management Committee (ARMC) supports Treasury’s accountable officer – the Under Treasurer – to meet the responsibilities under the Financial Accountability Act 2009, the Financial and Performance Management Standard 2009 and other prescribed requirements.
The role of the committee is to provide independent assurance and assistance to the Under Treasurer on Treasury’s risk and control frameworks and external accountability responsibilities as prescribed in the relevant legislation and standards.
The committee also provides oversight for select Treasury related entities that sit within Treasury’s broader portfolio (but prepare independent financial statements) which in 2020–21 included the Motor Accident Insurance Commission (MAIC) and Nominal Defendant.
Composition and membership Chair:Independent member
Members:Assistant Under Treasurer,
Policy and PerformanceInsurance CommissionerCommissioner, State RevenueIndependent member and
finance expertThe Under Treasurer, Deputy Under Treasurer, Policy Performance and Corporate, Head of Corporate,
Chief Finance Officer, Queensland Audit Office (QAO) and Internal Audit (including Head of Internal Audit) have standing invitations as observers to attend all ARMC meetings. Treasury officers are invited to attend meetings as required.
Key achievements for 2020–21In 2020–21, the committee met 6 times and fulfilled its responsibilities in accordance with its charter and an approved work plan. Key achievements included:
endorsing the 2019–20 Financial Statements for Queensland Treasury, MAIC and Nominal Defendant
endorsing the 3-year strategic Internal Audit Plan and monitoring 2020–21 internal audit activity
reviewing the effectiveness of the department’s risk management framework and overseeing the management of significant business risks
monitoring progress of the implementation status of internal audit recommendations
considering issues raised by QAO including recommendations from performance audits and Treasury related reports to Parliament.
Risk management In accordance with the Financial Accountability Act 2009, the Under Treasurer has established appropriate systems of internal control and risk management. This has been achieved through the maintenance of a risk management framework and oversight by the ARMC.
Treasury’s risk management framework aligns with the International Standard ISO 31000:2018 on risk management principles and guidelines and includes appropriate governance arrangements and risk reporting and analysis.
Additionally, Treasury operates under a Tax Risk Management Plan that is designed to ensure Treasury always conducts itself in a lawful manner with respect of all of its tax obligations and complies with all of its statutory obligations in a timely and transparent manner. The plan guides management on how to appropriately analyse, mitigate and report tax risks. Treasury’s Tax Risk Management Plan is updated annually and endorsed by ARMC.
Internal audit Internal audit is an integral part of the corporate governance framework by which Treasury maintains effective systems of accountability and control at all levels. Internal audit provides assurance to the Under Treasurer that the entity’s financial and operational controls are operating in an efficient, effective, economical and ethical manner, and assists management in improving Treasury’s business performance.
Queensland Treasury Annual Report 2020–21010
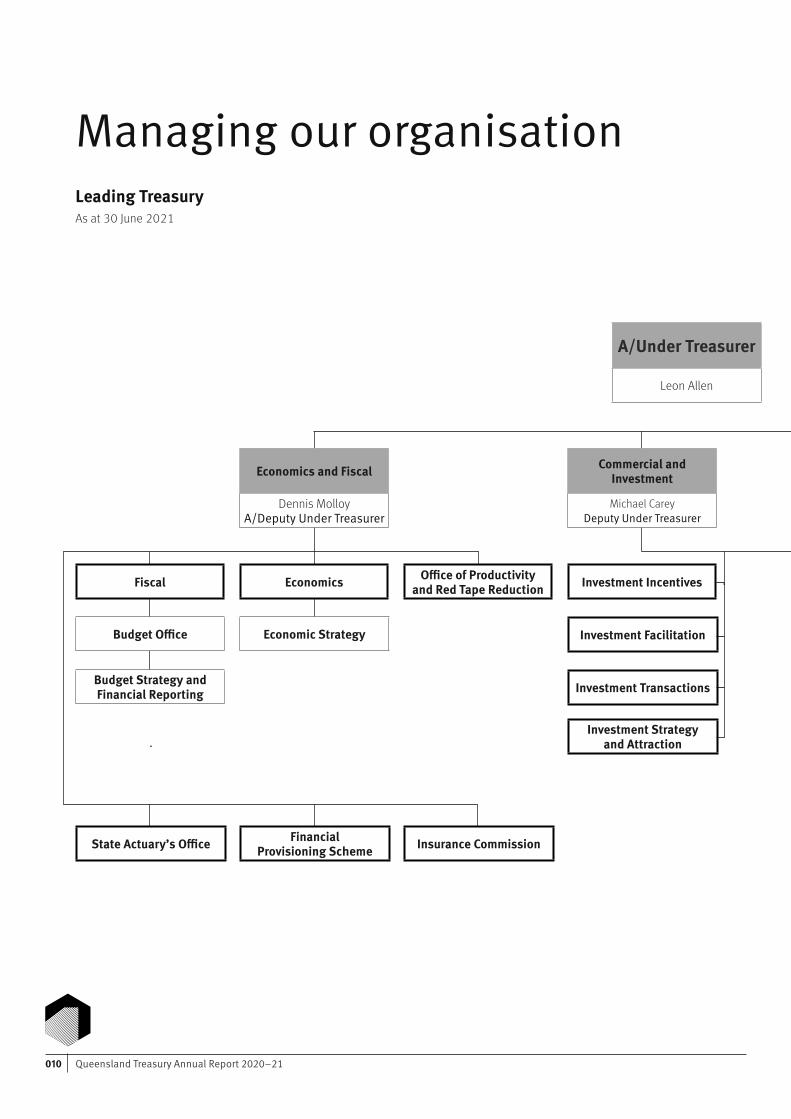
Managing our organisationLeading TreasuryAs at 30 June 2021
Economics
Economic Strategy
Fiscal
Budget Office
Budget Strategy and Financial Reporting
State Actuary’s Office Financial Provisioning Scheme
Economics and Fiscal
Dennis MolloyA/Deputy Under Treasurer
Insurance Commission
A/Under Treasurer
Leon Allen
Commercial and Investment
Michael CareyDeputy Under Treasurer
Office of Productivity and Red Tape Reduction Investment Incentives
Investment Facilitation
Investment Transactions
Investment Strategy and Attraction
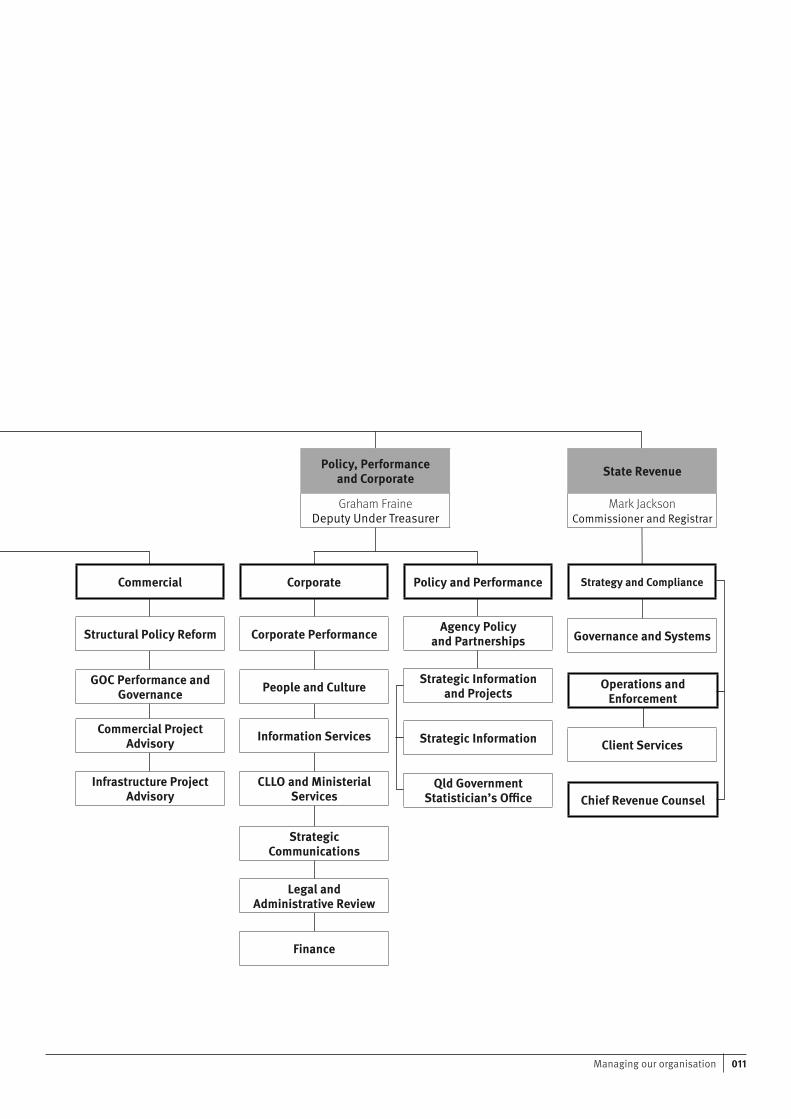
011Managing our organisation
Policy, Performance and Corporate
Graham Fraine Deputy Under Treasurer
Corporate Policy and Performance
Corporate Performance
People and Culture
Information Services
CLLO and Ministerial Services
Strategic Communications
Legal and Administrative Review
Finance
Strategic Information
Qld Government Statistician’s Office
Governance and Systems
Operations and Enforcement
Commercial
Structural Policy Reform
GOC Performance and Governance
Commercial Project Advisory
State Revenue
Mark JacksonCommissioner and Registrar
Client Services
Chief Revenue Counsel
Strategy and Compliance
Infrastructure Project Advisory
Agency Policy and Partnerships
Strategic Information and Projects

Queensland Treasury Annual Report 2020–21012
Our peopleSupporting employees through COVID-19Employee health, safety, wellbeing and human rights remained key priorities in 2020–21. Treasury’s Remote Workforce Strategy, implemented in response to COVID-19 in 2020, supported employees to work productively from home and informed the department’s return to office plan. With COVIDsafe work practices in place, Treasury employees continued to provide outstanding service for Queensland’s economic recovery.
In accordance with health advice, the department proactively managed its return to office response to COVID-19 and continued to review business practices, including workplace presence, to ensure effectiveness in the delivery of critical public service work. In 2020–21, Treasury supported flexible work arrangements where blended work arrangements, including remote working and in-office work, were able to be balanced with service delivery requirements.
Workforce planning and performanceTreasury’s workforce strategy 2020 to 2024 builds and sustains a diverse, capable, flexible and engaged workforce to deliver on key priorities for the Queensland Government.
Key areas of focus include:
embedding wellbeing into culture and operations
focusing on positive performance and capability development
building a demographically diverse workforce reflective of Queensland communities
continuing a strong focus on ethical conduct and accountability
balancing the benefits of flexible work for our employees with organisational needs
workforce planning – right staff, right skills and right place.
A Workforce Strategy Steering Committee, chaired by the Under Treasurer, guides implementation of the strategy.
Diversity and inclusion Treasury has continued its strong commitment to building a diverse workforce that reflects Queensland communities. The department’s Diversity and Inclusion Steering Committee is chaired by the Under Treasurer and supported by an employee network.
During 2020–21, Treasury established a Diversity and Inclusion Policy that required all employees to complete diversity and cultural capability training. Managers were also required to apply appropriate diversity measures across all recruitment and selection exercises.
Employment pathways for Aboriginal and Torres Strait Islander peoples continued to be a key priority in 2020–21. Treasury expanded the Aboriginal and Torres Strait Islander cadetship program to 10 places and applied diversity strategies in the 2021 Treasury graduate recruitment process to contribute to the department’s talent pipeline.
Ending domestic and family violence Treasury is in its fourth year as a White Ribbon Australia workplace. To meet this commitment, Treasury provides mandatory training for all employees on how to recognise and respond to signs of domestic and family violence, including how to support their colleagues and refer to help services. In 2020–21, 163 of our leaders have undertaken specialist face-to-face training on how to support employees impacted by domestic and family violence. A further 589 staff completed online Recognise, Respond Refer training in the same period.
Leadership development and people managementA key objective in Treasury’s strategic plan is to improve the department’s leadership and management capability and skills. Treasury’s Managers’ Development Program continued throughout 2020–21, providing current and aspiring managers with practical and fundamental frontline management skills essential to delivering Treasury’s objectives. The program is supported by specialist sessions with in-house subject matter experts.
In 2020–21, Treasury developed a Positive Performance Management framework in line with the government’s Positive performance management (Directive 15/20). As part of the new framework, Treasury will focus on regular and constructive conversations between managers and their teams throughout 2021–22, with the purpose of recognising individuals’ strengths, needs and contributions.

013Our people
Support for mental and physical wellbeingTreasury continued its longstanding commitment to employee safety and wellbeing by delivering services aligned to the government’s Be healthy, be safe, be well strategy. All employees had access to specialist advice, counselling and support through the department’s Employee Assistance Program. Services provided included personal counselling, manager hotline services, resilience programs, physical health and wellbeing coaching, and monthly webinars.
Industrial relationsTreasury and the Together Industrial, Union of Employees met quarterly in a consultative committee in 2020–21 to discuss industrial relations matters. The department continued to support and exemplify the principles of the Union Encouragement Policy. Treasury also continued to meet its commitments with regard to the management of employment and industrial matters, and reports to the Public Service Commission, Queensland Ombudsman and Crime and Corruption Commission, in line with its obligations and statutory requirements.
Ethics and valuesTreasury continued to value, actively support and promote an ethical workplace throughout 2020–21, with the Code of Conduct for the Queensland Public Service guiding how Treasury undertook its business as a public sector department.
The Code of Conduct is based on the principles outlined in the Public Sector Ethics Act 1994. During 2020–21, the department required all employees to complete Public Sector Ethics Refresher training. The Code of Conduct and public sector ethics training were also included in Treasury’s induction program for all new employees.
Human rights Treasury’s human rights community of practice continued to support the department in implementing Queensland’s Human Rights Act 2019, which commits all government agencies to respect, protect and promote the inherent dignity and worth of all human beings. This commitment has included:
all employees, including new starters, undertaking the Queensland Human Rights Commission’s ‘Introduction to Human Rights Act’ training
providing ‘Human Rights in our Work’ training for decision-making and frontline employees, with 33 employees completing this online training in 2020–21.
There were 6 human rights complaints received by Treasury:
one matter finalised – no human rights breached
one matter out of scope 3 complaints being investigatedone complaint withdrawn.
Our workforce In 2020–21, Treasury was committed to the objectives of the government’s Savings and Debt Plan, maintaining a focus on core deliverables and sustaining frontline services. In particular, Treasury implemented stringent control mechanisms to ensure there was appropriate workforce management and oversight.
At the end of the year, Treasury’s workforce comprised a total of 1,204 people1 including:
1141.61 full-time equivalent employees
156 part-time employees.
During 2020–21, one employee received a redundancy package at a cost of $190,418 and 5 employees received voluntary medical retirement packages at a cost of $227,145.1 Includes Treasury employees providing
services to Motor Accident Insurance Commission and Nominal Defendant Based on MOHRI FTE data for fortnight ending 18 June 2021.

Queensland Treasury Annual Report 2020–21014
Our people
Workforce composition Number % of workforce1
Men 531 44%
Women 673 56%
Aboriginal peoples and Torres Strait Islander peoples 17 1.41%
People from culturally and linguistically diverse backgrounds 172 14.29%
People with disability 36 2.99%
Women in middle and upper management (AO7 – AO8 equivalent)2 153 51.70%
Women in senior officer and senior executive service positions (SO – CEO equivalent)3 66 42.86%
Women in senior executive service positions (SES – CEO equivalent)4 23 32.86%
Average annual earnings by men (nominal salary)5 $111,976
Average annual earnings by women (nominal salary)5 $100,563
Permanent separation rate6 39 3.7%
1 Percentage of total workforce or demographic cohort2 Represents 12.71 per cent of total workforce3 Represents 5.48 per cent of total workforce4 Includes SES, S122 and CEO equivalent roles5 Nominal salary based on full-time earning for each gender – correct 18 June 20216 Based on MOHRI definition
Total staff by gender classification Males Females
Administration (Trainee to AO3) 55 118
Officers (AO4 – AO6) 245 335
Professional (PO2 – PO4) 1 0
Middle Management (AO7 – AO8) (PO5 – PO6) 142 154
Senior Management (SO – CEO) 88 66
015Our people/Service reports
Service reportsFiscalTreasury drives the long-term sustainability of Queensland’s fiscal position by effective statewide balance sheet and operating statement management, financial risk management and accountability through providing expert advice, policy development and disclosure of whole-of-state budget and financial statements.
It does this by:
preparing the Queensland Budget preparing whole-of-government
financial reports and accountsmanaging the balance sheet and
having oversight of the state’s interests
managing the state’s financial risks.
COVID-19 has presented a significant fiscal and economic challenge. However, Queensland’s economic recovery is underway with transition of the economic and policy response from short-term support to supporting jobs and economic growth.
Objective Deliver fiscal sustainability
COVID-19 Fiscal and Economic Review The 2020–21 Queensland Budget was delayed due to COVID-19. Instead, Treasury prepared the COVID-19 Fiscal and Economic Review in September 2020 which outlined the government’s economic strategy that built on the Unite and Recover: Queensland Economic Recovery Plan.
Queensland’s Budget Treasury delivered 2 Budgets within 7 months. The delayed 2020–21 Budget in December 2020 provided a strategy for fiscal recovery and focused on prioritising economic recovery alongside targeted expenditure and capital investment.
Queensland’s economic recovery from COVID-19 is now well underway. The 2021–22 Queensland Budget delivered in June 2021 detailed the government’s fiscal strategy which is underpinned by Treasury’s development of a new Charter of Fiscal Responsibility.
Compared to the outlook in the 2020–21 Budget, the economy has recovered faster and stronger than forecast. Revenues have rebounded from the initial impact of the pandemic. This recovery is allowing the government to balance additional funding for priority service needs with improved operating balances and significantly lower net debt and borrowings relative to the 2020–21 Budget.
Queensland Future Fund – the Debt Retirement Fund The Queensland Future Fund (QFF) legislation was introduced in June 2021. Within the QFF, the Debt Retirement Fund reduces debt by holding investments targeted for future growth to support current and future borrowings. It manages debt responsibly and is structured to offset state debt by credit rating agencies when assessing Queensland’s debt burden.
The benefits of the Debt Retirement Fund are already being seen, with General Government Sector net debt at 30 June 2021 forecast in the 2021–22 Queensland Budget to be $15.8 billion.
Financial Provisioning Scheme The Financial Provisioning Scheme continued to transition all assessable environmental authorities into the Risk Category Allocation assessment process. It administers both approved forms of surety (bank guarantees, insurance bonds, cash) and contributions to the Financial Provisioning Fund in its role in managing the state’s associated financial risk of small miners and resource sector holders of an environmental authority not meeting their obligations.
Economics and policyTreasury provides preeminent economic and revenue forecasts and policy advice to government to support economic and fiscal policy formulation and to complement specialist knowledge within line agencies.
Key functions in this service include:
developing policy, and monitoring performance and expenditure
providing economic advice and informing development of the government’s economic strategy
providing definitive economic and revenue forecasts
coordinating Treasury’s intergovernmental interactions.
Queensland Treasury Annual Report 2020–21016
Service reportsObjective Grow the Queensland economy and create jobs Treasury continued to provide economic analysis, modelling and policy advice on the potential impacts of COVID-19 on the Queensland economy, which included informing the government's Economic Recovery Plan and development of the plan’s 2021–22 Budget update.
Through providing economic leadership and expertise, Treasury played a critical role in the government’s proactive response to sustainably grow the Queensland economy and create jobs.
Partnerships with agenciesThroughout 2020–21, Treasury collaborated with other Queensland Government agencies in a range of areas including:
negotiating approval for funding agreements with the Australian Government
supporting negotiations with the Australian Government on the proposed new National Skills Agreement
advising on The Queensland Government Guide to Better Regulation to support regulatory processes across government
supporting Queensland’s implementation of new National Cabinet architecture and its impact on the Council on Federal Financial Relations and the new Federation Funding Agreements Framework
developing the Housing Investment Fund and the Housing Investment Growth Initiative with the Department of Communities, Housing and Digital Economy
assessing proposals for new and upgraded school infrastructure with the Department of Education
developing, with the Department of Regional Development, Manufacturing and Water, a roadmap of investments in water infrastructure to provide water security and promote economic development.
Objective Drive public sector reformIn 2020–21, Treasury played a critical role in driving public sector reform to improve efficiency in government services including:
establishing the Office of Productivity and Red Tape Reduction within Treasury
partnering with Queensland Health to negotiate a new National Agreement on Mental Health and Suicide Prevention
assisting in abolishing the Public Safety Business Agency (PSBA), as part of the government’s Savings and Debt Plan
working with the Department of Transport and Main Roads to deliver priority capital projects, public transport services and heavy vehicle road reform
contributing to the establishment of the Path to Treaty Fund.
Commercial and investmentTreasury is focused on structuring commercial opportunities and activities to support business investment through:
managing existing and new assets, investments, financial and commercial risks
supporting economic recovery and growth in Queensland by providing robust financial and commercial advice to the Queensland Government on commercial and strategic investments, and attracting and facilitating investment opportunities that provide enduring economic benefit to Queensland
providing strategic oversight, direction and advice to shareholding ministers in relation to the operation and performance of government-owned corporations (GOCs) and other commercial government businesses in the energy, water, ports and rail sectors, as well as QIC.
ObjectiveGrow the Queensland economy and create jobs During 2020–21, Treasury actively engaged in commercial and investment opportunities, generating or retaining 2,336 jobs and $1.3 billion in capital expenditure.
017Service reports
Achievements have included:
allocating $974.4 million to date as part of the Industry Support Package, following enquiries from transport, airline, tourism, and hospitality and entertainment businesses
announcing 35 projects under the Advance Queensland Industry Attraction Fund (AQIF) and Essential Goods and Supply Chain Program, noting AQIF commenced in 2016. These programs are expected to generate over 2,000 new direct jobs and almost $500 million in capital expenditure over the life of the fund
announcing 43 projects announced under the Jobs and Regional Growth Fund, which commenced in 2017. This program is expected to generate over $1.9 billion in capital investment and 1,850 operational jobs in regional Queensland over the life of the fund
supporting strategic investment projects that secured the head office of Virgin Australia and the commitment by Boeing to develop the ‘Loyal Wingman’ Airpower Teaming System
leading the establishment of the Debt Retirement Fund
leading the Build-to-Rent Pilot Project, as part of the Queensland Housing Strategy 2017–2027
administering the $2 billion Renewable Energy and Hydrogen Jobs Fund
establishing the $100 million Business Investment Fund
continuing to support, in partnership with the Department of Energy and Public Works, initiatives to deliver cost-effective, reliable energy supply for Queensland including fast-tracking the development, production, export and use of hydrogen in Queensland.
Commencing in 2021–22, Treasury will manage the new Invested in Queensland program with the aim of creating 5,000 ongoing jobs over the 10-year life of the program.
Revenue managementTreasury’s Office of State Revenue (OSR) administered revenue of around $16 billion in 2020–21 by delivering simple, efficient and equitable revenue management of state taxes and royalties. Key revenue sources included duties, payroll tax, betting tax and land tax, as well as mining and petroleum royalties.
OSR ensures the integrity of the state’s revenue base and compliance with revenue legislation through a robust compliance program and by collecting penalty debt owed to the state through the State Penalty Enforcement Registry. It also administers home owner and builder grants.
Objective Deliver fiscal sustainability As part of the government’s $3 billion Savings and Debt Plan, OSR commenced its Debt Recovery and Compliance Program to maximise existing revenue sources. The program aims to collect unpaid monies from within existing revenue and penalty debt systems and is expected to raise $488.1 million by 30 June 2024. OSR opened a new Debt Management Centre, collecting $38.3 million in debt from fines and penalties in its first 6 months of operation.
In 2020–21, $266.3 million of penalty debt was collected with a debt clearance rate as at 30 June 2021 of 102 per cent.
Tax relief measures, including deferral of tax obligations for eligible individuals and businesses, also remained available throughout the 2020–21 year as part of the government’s economic recovery measures.
During 2020–21, OSR completed its transformation program by delivering:
an online intelligent virtual assistant available to help with general enquiries about state taxes, royalties and home owner grants
establishing a new online taxpayer portal that provides more streamlined online processes, more pre-filled forms, enhanced automation, and greater transparency to taxpayers of their obligations and entitlements
automating processes to increase internal efficiencies and reduce work backlogs.
OSR will increase audit and investigation for taxes and royalties, and provide more client centric services throughout 2021–22.
Objective Grow the Queensland economy and create jobs During the 2020–21 financial year, OSR paid more than 13,019 home owner and builder grants worth $183 million to support eligible home owners to buy or build their home. These include the existing First Home Ownersʼ Grant and the new Regional Home Builder Boost Grant. OSR also administers the HomeBuilder Grant on behalf of the Australian Government.
Queensland Treasury Annual Report 2020–21018
Our financial position explained
Queensland Treasury’s financial statements fall into two categories:
Administered – the funds it administers on behalf of the government
Controlled – the revenue, expenses, assets and liabilities it uses to conduct its business as a department
Analysis In 2020–21, Queensland Treasury administered $38.950 billion of revenue and $6.608 billion of expenses on behalf of the State. This excludes administered item revenue which is appropriation revenue received from the Consolidated Fund to meet administered expenses.
The largest single source of administered revenue was grants and other contributions of $22.772 billion, followed by state taxes of $13.075 billion.
The main component of Commonwealth grant revenue was Queensland’s share of the GST. Other Commonwealth revenue includes funding for National Partnership Payments and Specific Purpose Payments.
In response to the Queensland Government’s measures to support Queenslandersʼ health, jobs and businesses in response to the COVID-19 pandemic, Treasury implemented Payroll Tax, Land Tax, Gaming Tax and Regional Home Builder Grant boost relief measures. Land Tax and Payroll Tax refunds provided in 2020–21 were $56.713 million.
Treasury also administered the Home Builder Grant on behalf of the Commonwealth in 2020–21.
Treasury’s controlled revenue consists principally of Parliamentary appropriations. In 2020–21, appropriation revenue allocated to services was $304.503 million (compared with $252.325 million in 2019–20).
019Our financial position explained/Administered
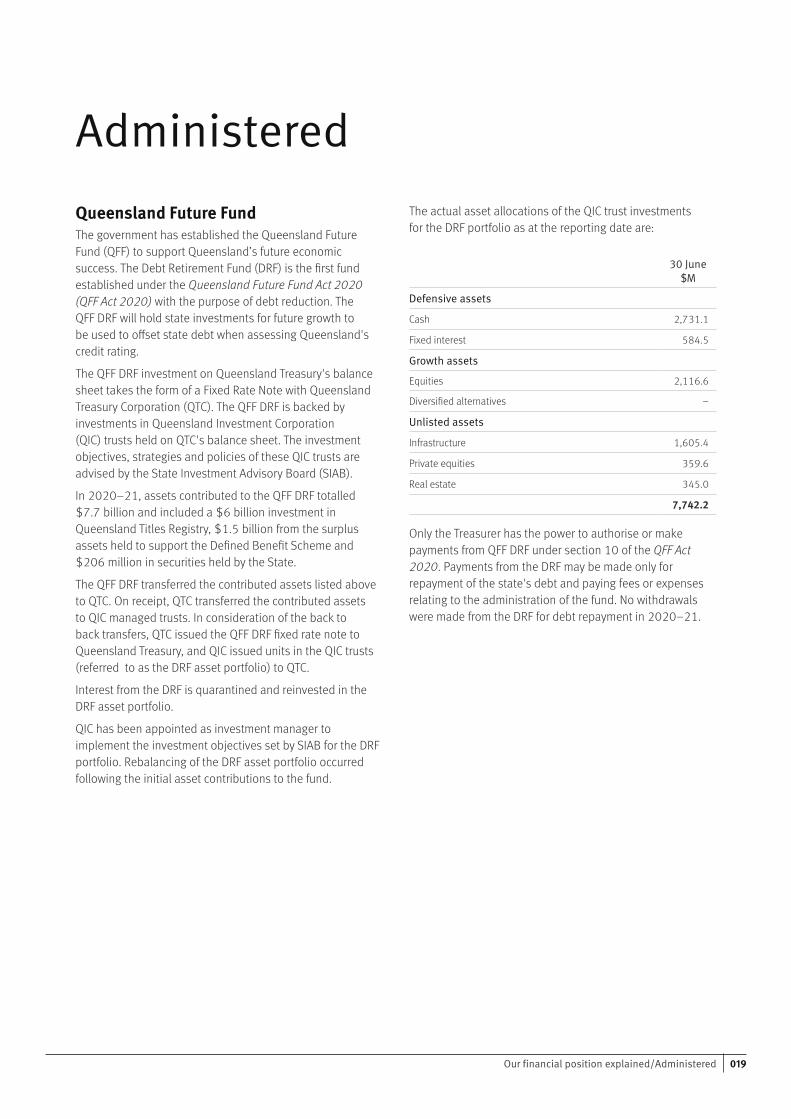
AdministeredQueensland Future Fund The government has established the Queensland Future Fund (QFF) to support Queensland’s future economic success. The Debt Retirement Fund (DRF) is the first fund established under the Queensland Future Fund Act 2020 (QFF Act 2020) with the purpose of debt reduction. The QFF DRF will hold state investments for future growth to be used to offset state debt when assessing Queensland's credit rating.
The QFF DRF investment on Queensland Treasury's balance sheet takes the form of a Fixed Rate Note with Queensland Treasury Corporation (QTC). The QFF DRF is backed by investments in Queensland Investment Corporation (QIC) trusts held on QTC's balance sheet. The investment objectives, strategies and policies of these QIC trusts are advised by the State Investment Advisory Board (SIAB).
In 2020–21, assets contributed to the QFF DRF totalled $7.7 billion and included a $6 billion investment in Queensland Titles Registry, $1.5 billion from the surplus assets held to support the Defined Benefit Scheme and $206 million in securities held by the State.
The QFF DRF transferred the contributed assets listed above to QTC. On receipt, QTC transferred the contributed assets to QIC managed trusts. In consideration of the back to back transfers, QTC issued the QFF DRF fixed rate note to Queensland Treasury, and QIC issued units in the QIC trusts (referred to as the DRF asset portfolio) to QTC.
Interest from the DRF is quarantined and reinvested in the DRF asset portfolio.
QIC has been appointed as investment manager to implement the investment objectives set by SIAB for the DRF portfolio. Rebalancing of the DRF asset portfolio occurred following the initial asset contributions to the fund.
The actual asset allocations of the QIC trust investments for the DRF portfolio as at the reporting date are:
30 June $M
Defensive assets
Cash 2,731.1
Fixed interest 584.5
Growth assets
Equities 2,116.6
Diversified alternatives –
Unlisted assets
Infrastructure 1,605.4
Private equities 359.6
Real estate 345.0
7,742.2
Only the Treasurer has the power to authorise or make payments from QFF DRF under section 10 of the QFF Act 2020. Payments from the DRF may be made only for repayment of the state's debt and paying fees or expenses relating to the administration of the fund. No withdrawals were made from the DRF for debt repayment in 2020–21.
Queensland Treasury Annual Report 2020–21020
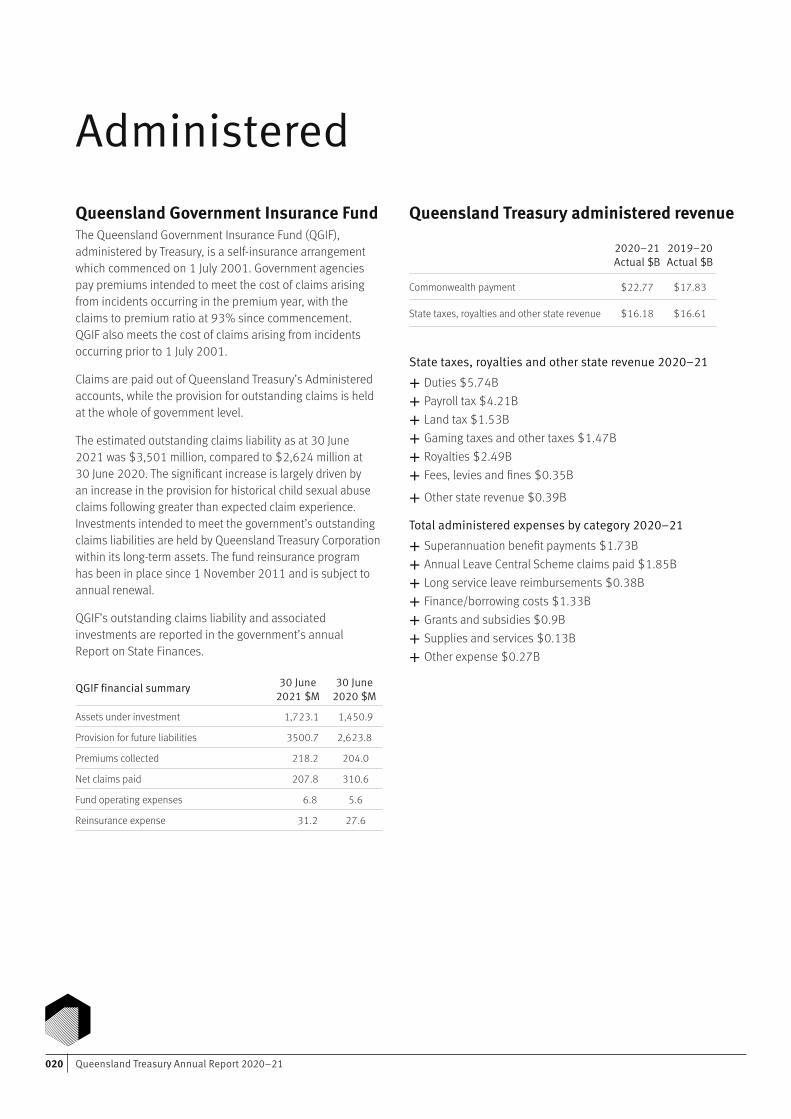
AdministeredQueensland Government Insurance Fund The Queensland Government Insurance Fund (QGIF), administered by Treasury, is a self-insurance arrangement which commenced on 1 July 2001. Government agencies pay premiums intended to meet the cost of claims arising from incidents occurring in the premium year, with the claims to premium ratio at 93% since commencement. QGIF also meets the cost of claims arising from incidents occurring prior to 1 July 2001.
Claims are paid out of Queensland Treasury’s Administered accounts, while the provision for outstanding claims is held at the whole of government level.
The estimated outstanding claims liability as at 30 June 2021 was $3,501 million, compared to $2,624 million at 30 June 2020. The significant increase is largely driven by an increase in the provision for historical child sexual abuse claims following greater than expected claim experience. Investments intended to meet the government’s outstanding claims liabilities are held by Queensland Treasury Corporation within its long-term assets. The fund reinsurance program has been in place since 1 November 2011 and is subject to annual renewal.
QGIF’s outstanding claims liability and associated investments are reported in the government’s annual Report on State Finances.
QGIF financial summary 30 June 2021 $M
30 June 2020 $M
Assets under investment 1,723.1 1,450.9
Provision for future liabilities 3500.7 2,623.8
Premiums collected 218.2 204.0
Net claims paid 207.8 310.6
Fund operating expenses 6.8 5.6
Reinsurance expense 31.2 27.6
Queensland Treasury administered revenue
State taxes, royalties and other state revenue 2020–21
Duties $5.74BPayroll tax $4.21BLand tax $1.53BGaming taxes and other taxes $1.47BRoyalties $2.49BFees, levies and fines $0.35B
Other state revenue $0.39B
Total administered expenses by category 2020–21
Superannuation benefit payments $1.73BAnnual Leave Central Scheme claims paid $1.85BLong service leave reimbursements $0.38BFinance/borrowing costs $1.33BGrants and subsidies $0.9BSupplies and services $0.13BOther expense $0.27B
2020–21Actual $B
2019–20Actual $B
Commonwealth payment $22.77 $17.83
State taxes, royalties and other state revenue $16.18 $16.61
021Administered/Administered financial summary
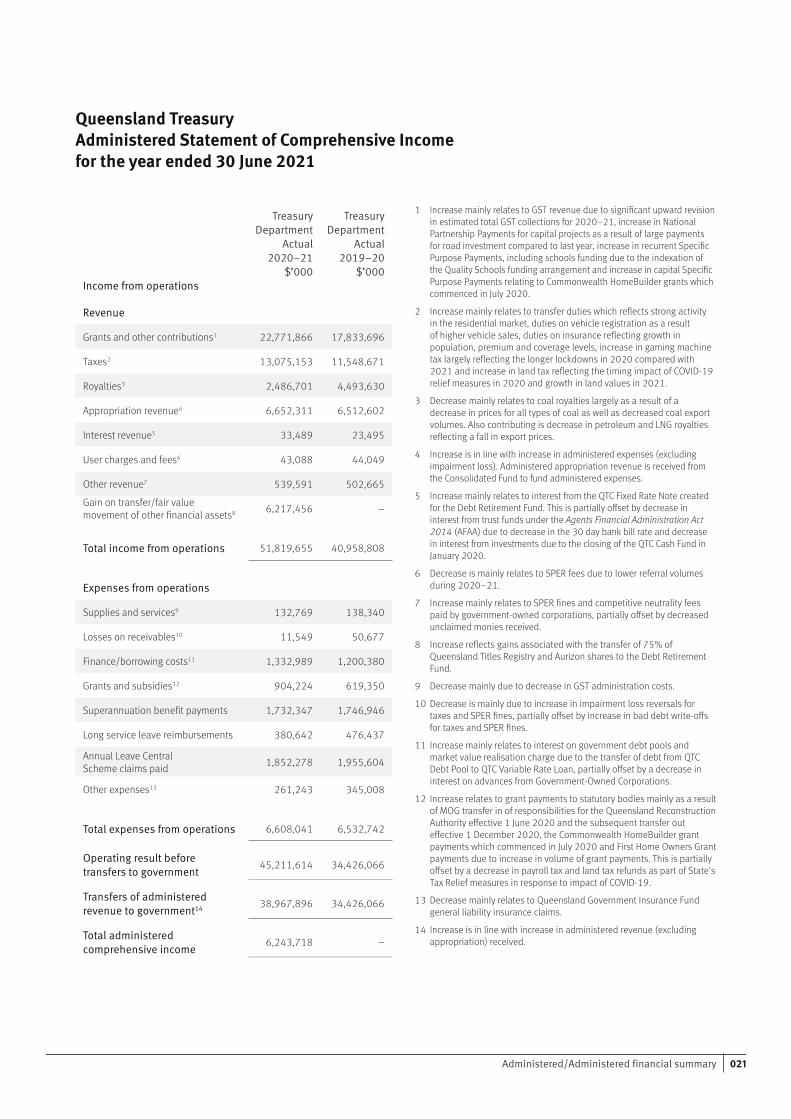
Queensland Treasury Administered Statement of Comprehensive Income for the year ended 30 June 2021
Treasury Department
Actual 2020–21
$’000
Treasury Department
Actual 2019–20
$’000Income from operations
Revenue
Grants and other contributions1 22,771,866 17,833,696
Taxes2 13,075,153 11,548,671
Royalties3 2,486,701 4,493,630
Appropriation revenue4 6,652,311 6,512,602
Interest revenue5 33,489 23,495
User charges and fees6 43,088 44,049
Other revenue7 539,591 502,665
Gain on transfer/fair value movement of other financial assets8 6,217,456 –
Total income from operations 51,819,655 40,958,808
Expenses from operations
Supplies and services9 132,769 138,340
Losses on receivables10 11,549 50,677
Finance/borrowing costs11 1,332,989 1,200,380
Grants and subsidies12 904,224 619,350
Superannuation benefit payments 1,732,347 1,746,946
Long service leave reimbursements 380,642 476,437
Annual Leave Central Scheme claims paid 1,852,278 1,955,604
Other expenses13 261,243 345,008
Total expenses from operations 6,608,041 6,532,742
Operating result before transfers to government 45,211,614 34,426,066
Transfers of administered revenue to government14 38,967,896 34,426,066
Total administered comprehensive income 6,243,718 –
1 Increase mainly relates to GST revenue due to significant upward revision in estimated total GST collections for 2020–21, increase in National Partnership Payments for capital projects as a result of large payments for road investment compared to last year, increase in recurrent Specific Purpose Payments, including schools funding due to the indexation of the Quality Schools funding arrangement and increase in capital Specific Purpose Payments relating to Commonwealth HomeBuilder grants which commenced in July 2020.
2 Increase mainly relates to transfer duties which reflects strong activity in the residential market, duties on vehicle registration as a result of higher vehicle sales, duties on insurance reflecting growth in population, premium and coverage levels, increase in gaming machine tax largely reflecting the longer lockdowns in 2020 compared with 2021 and increase in land tax reflecting the timing impact of COVID-19 relief measures in 2020 and growth in land values in 2021.
3 Decrease mainly relates to coal royalties largely as a result of a decrease in prices for all types of coal as well as decreased coal export volumes. Also contributing is decrease in petroleum and LNG royalties reflecting a fall in export prices.
4 Increase is in line with increase in administered expenses (excluding impairment loss). Administered appropriation revenue is received from the Consolidated Fund to fund administered expenses.
5 Increase mainly relates to interest from the QTC Fixed Rate Note created for the Debt Retirement Fund. This is partially offset by decrease in interest from trust funds under the Agents Financial Administration Act 2014 (AFAA) due to decrease in the 30 day bank bill rate and decrease in interest from investments due to the closing of the QTC Cash Fund in January 2020.
6 Decrease is mainly relates to SPER fees due to lower referral volumes during 2020–21.
7 Increase mainly relates to SPER fines and competitive neutrality fees paid by government-owned corporations, partially offset by decreased unclaimed monies received.
8 Increase reflects gains associated with the transfer of 75% of Queensland Titles Registry and Aurizon shares to the Debt Retirement Fund.
9 Decrease mainly due to decrease in GST administration costs.
10 Decrease is mainly due to increase in impairment loss reversals for taxes and SPER fines, partially offset by increase in bad debt write-offs for taxes and SPER fines.
11 Increase mainly relates to interest on government debt pools and market value realisation charge due to the transfer of debt from QTC Debt Pool to QTC Variable Rate Loan, partially offset by a decrease in interest on advances from Government-Owned Corporations.
12 Increase relates to grant payments to statutory bodies mainly as a result of MOG transfer in of responsibilities for the Queensland Reconstruction Authority effective 1 June 2020 and the subsequent transfer out effective 1 December 2020, the Commonwealth HomeBuilder grant payments which commenced in July 2020 and First Home Owners Grant payments due to increase in volume of grant payments. This is partially offset by a decrease in payroll tax and land tax refunds as part of State's Tax Relief measures in response to impact of COVID-19.
13 Decrease mainly relates to Queensland Government Insurance Fund general liability insurance claims.
14 Increase is in line with increase in administered revenue (excluding appropriation) received.
Queensland Treasury Annual Report 2020–21022
Controlled
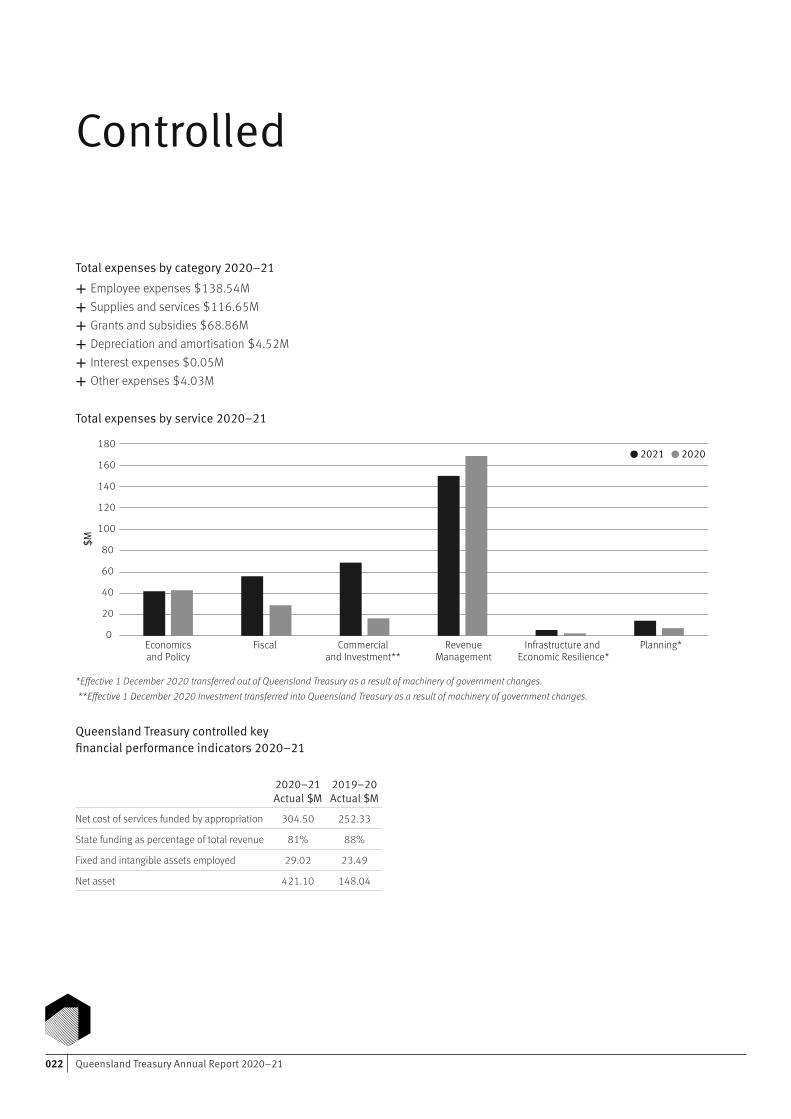
Total expenses by category 2020–21
Employee expenses $138.54MSupplies and services $116.65MGrants and subsidies $68.86MDepreciation and amortisation $4.52MInterest expenses $0.05MOther expenses $4.03M
Total expenses by service 2020–21
0
20
40
60
80
100
120
140
160
180
Economicsand Policy
Fiscal Commercialand Investment**
RevenueManagement
Infrastructure and Economic Resilience*
Planning*
$M
20202021
*Effective 1 December 2020 transferred out of Queensland Treasury as a result of machinery of government changes. **Effective 1 December 2020 Investment transferred into Queensland Treasury as a result of machinery of government changes.
Queensland Treasury controlled key financial performance indicators 2020–21
2020–21Actual $M
2019–20Actual $M
Net cost of services funded by appropriation 304.50 252.33
State funding as percentage of total revenue 81% 88%
Fixed and intangible assets employed 29.02 23.49
Net asset 421.10 148.04
023Controlled/Controlled financial summary
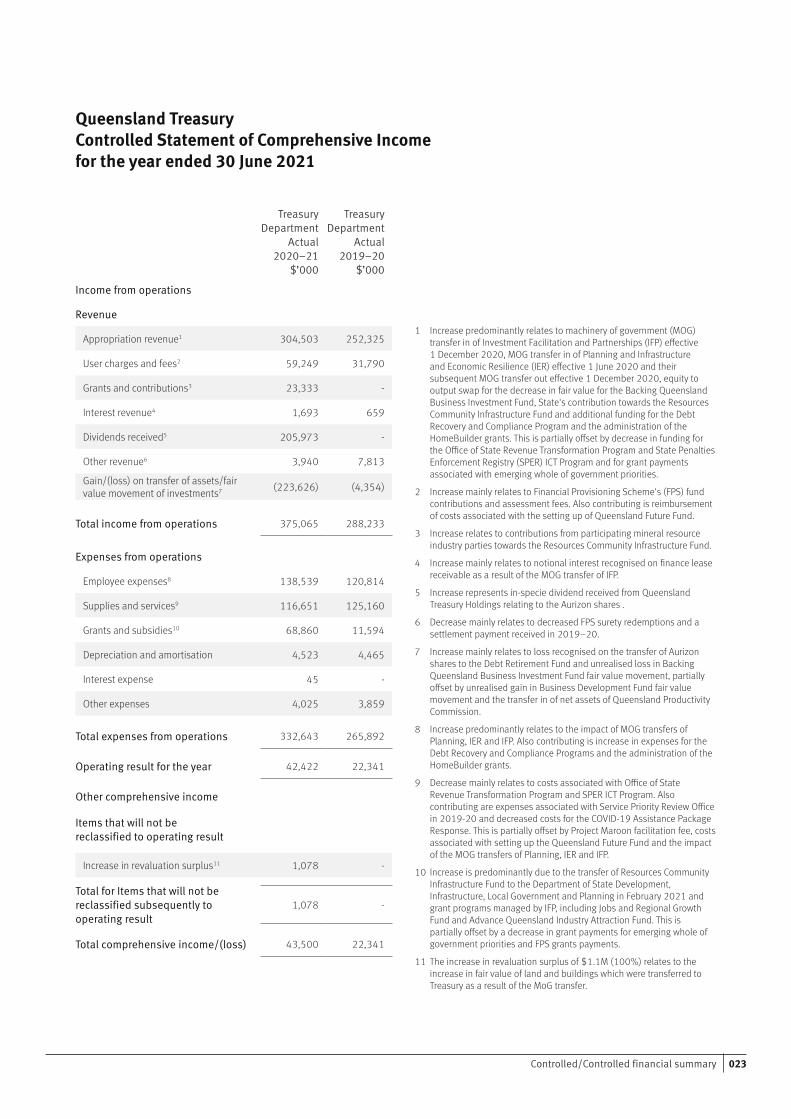
Queensland Treasury Controlled Statement of Comprehensive Income for the year ended 30 June 2021
TreasuryDepartment
Actual2020–21
$’000
TreasuryDepartment
Actual2019–20
$’000
Income from operations
Revenue
Appropriation revenue1 304,503 252,325
User charges and fees2 59,249 31,790
Grants and contributions3 23,333 -
Interest revenue4 1,693 659
Dividends received5 205,973 -
Other revenue6 3,940 7,813
Gain/(loss) on transfer of assets/fair value movement of investments7 (223,626) (4,354)
Total income from operations 375,065 288,233
Expenses from operations
Employee expenses8 138,539 120,814
Supplies and services9 116,651 125,160
Grants and subsidies10 68,860 11,594
Depreciation and amortisation 4,523 4,465
Interest expense 45 -
Other expenses 4,025 3,859
Total expenses from operations 332,643 265,892
Operating result for the year 42,422 22,341
Other comprehensive income
Items that will not be reclassified to operating result
Increase in revaluation surplus11 1,078 -
Total for Items that will not be reclassified subsequently to operating result
1,078 -
Total comprehensive income/(loss) 43,500 22,341
1 Increase predominantly relates to machinery of government (MOG) transfer in of Investment Facilitation and Partnerships (IFP) effective 1 December 2020, MOG transfer in of Planning and Infrastructure and Economic Resilience (IER) effective 1 June 2020 and their subsequent MOG transfer out effective 1 December 2020, equity to output swap for the decrease in fair value for the Backing Queensland Business Investment Fund, State's contribution towards the Resources Community Infrastructure Fund and additional funding for the Debt Recovery and Compliance Program and the administration of the HomeBuilder grants. This is partially offset by decrease in funding for the Office of State Revenue Transformation Program and State Penalties Enforcement Registry (SPER) ICT Program and for grant payments associated with emerging whole of government priorities.
2 Increase mainly relates to Financial Provisioning Scheme's (FPS) fund contributions and assessment fees. Also contributing is reimbursement of costs associated with the setting up of Queensland Future Fund.
3 Increase relates to contributions from participating mineral resource industry parties towards the Resources Community Infrastructure Fund.
4 Increase mainly relates to notional interest recognised on finance lease receivable as a result of the MOG transfer of IFP.
5 Increase represents in-specie dividend received from Queensland Treasury Holdings relating to the Aurizon shares .
6 Decrease mainly relates to decreased FPS surety redemptions and a settlement payment received in 2019–20.
7 Increase mainly relates to loss recognised on the transfer of Aurizon shares to the Debt Retirement Fund and unrealised loss in Backing Queensland Business Investment Fund fair value movement, partially offset by unrealised gain in Business Development Fund fair value movement and the transfer in of net assets of Queensland Productivity Commission.
8 Increase predominantly relates to the impact of MOG transfers of Planning, IER and IFP. Also contributing is increase in expenses for the Debt Recovery and Compliance Programs and the administration of the HomeBuilder grants.
9 Decrease mainly relates to costs associated with Office of State Revenue Transformation Program and SPER ICT Program. Also contributing are expenses associated with Service Priority Review Office in 2019-20 and decreased costs for the COVID-19 Assistance Package Response. This is partially offset by Project Maroon facilitation fee, costs associated with setting up the Queensland Future Fund and the impact of the MOG transfers of Planning, IER and IFP.
10 Increase is predominantly due to the transfer of Resources Community Infrastructure Fund to the Department of State Development, Infrastructure, Local Government and Planning in February 2021 and grant programs managed by IFP, including Jobs and Regional Growth Fund and Advance Queensland Industry Attraction Fund. This is partially offset by a decrease in grant payments for emerging whole of government priorities and FPS grants payments.
11 The increase in revaluation surplus of $1.1M (100%) relates to the increase in fair value of land and buildings which were transferred to Treasury as a result of the MoG transfer.
Queensland Treasury Annual Report 2020–21024
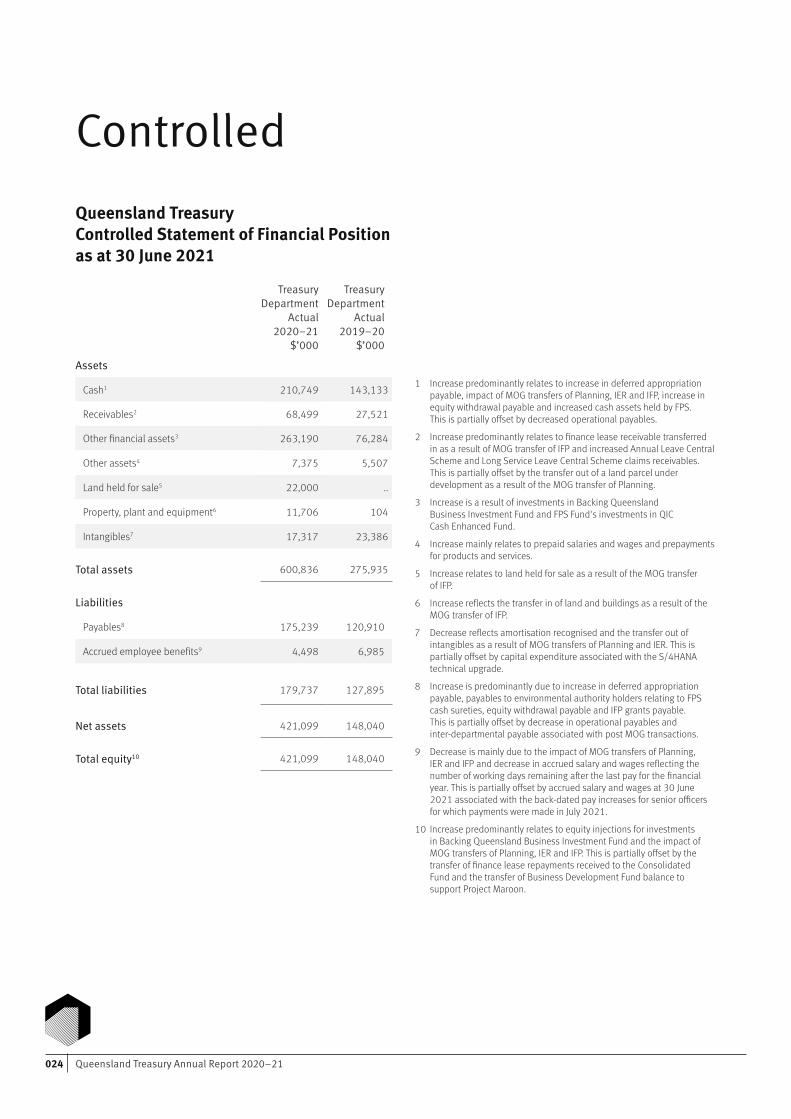
Queensland Treasury Controlled Statement of Financial Position as at 30 June 2021
TreasuryDepartment
Actual2020–21
$’000
TreasuryDepartment
Actual2019–20
$’000
Assets
Cash1 210,749 143,133
Receivables2 68,499 27,521
Other financial assets3 263,190 76,284
Other assets4 7,375 5,507
Land held for sale5 22,000 ..
Property, plant and equipment6 11,706 104
Intangibles7 17,317 23,386
Total assets 600,836 275,935
Liabilities
Payables8 175,239 120,910
Accrued employee benefits9 4,498 6,985
Total liabilities 179,737 127,895
Net assets 421,099 148,040
Total equity10 421,099 148,040
1 Increase predominantly relates to increase in deferred appropriation payable, impact of MOG transfers of Planning, IER and IFP, increase in equity withdrawal payable and increased cash assets held by FPS. This is partially offset by decreased operational payables.
2 Increase predominantly relates to finance lease receivable transferred in as a result of MOG transfer of IFP and increased Annual Leave Central Scheme and Long Service Leave Central Scheme claims receivables. This is partially offset by the transfer out of a land parcel under development as a result of the MOG transfer of Planning.
3 Increase is a result of investments in Backing Queensland Business Investment Fund and FPS Fund's investments in QIC Cash Enhanced Fund.
4 Increase mainly relates to prepaid salaries and wages and prepayments for products and services.
5 Increase relates to land held for sale as a result of the MOG transfer of IFP.
6 Increase reflects the transfer in of land and buildings as a result of the MOG transfer of IFP.
7 Decrease reflects amortisation recognised and the transfer out of intangibles as a result of MOG transfers of Planning and IER. This is partially offset by capital expenditure associated with the S/4HANA technical upgrade.
8 Increase is predominantly due to increase in deferred appropriation payable, payables to environmental authority holders relating to FPS cash sureties, equity withdrawal payable and IFP grants payable. This is partially offset by decrease in operational payables and inter-departmental payable associated with post MOG transactions.
9 Decrease is mainly due to the impact of MOG transfers of Planning, IER and IFP and decrease in accrued salary and wages reflecting the number of working days remaining after the last pay for the financial year. This is partially offset by accrued salary and wages at 30 June 2021 associated with the back-dated pay increases for senior officers for which payments were made in July 2021.
10 Increase predominantly relates to equity injections for investments in Backing Queensland Business Investment Fund and the impact of MOG transfers of Planning, IER and IFP. This is partially offset by the transfer of finance lease repayments received to the Consolidated Fund and the transfer of Business Development Fund balance to support Project Maroon.
Controlled
025
Financial statements26 Foreword
27 Controlled Statement of Comprehensive Income
28 Controlled Statement of Financial Position
29 Controlled Statement of Changes in Equity
30 Controlled Statement of Cash Flows
31 Controlled Reconciliation of Operating Result to Net Cash provided by Operating Activities
32 Controlled Reconciliation of Changes in Liabilities arising from Financing Activities
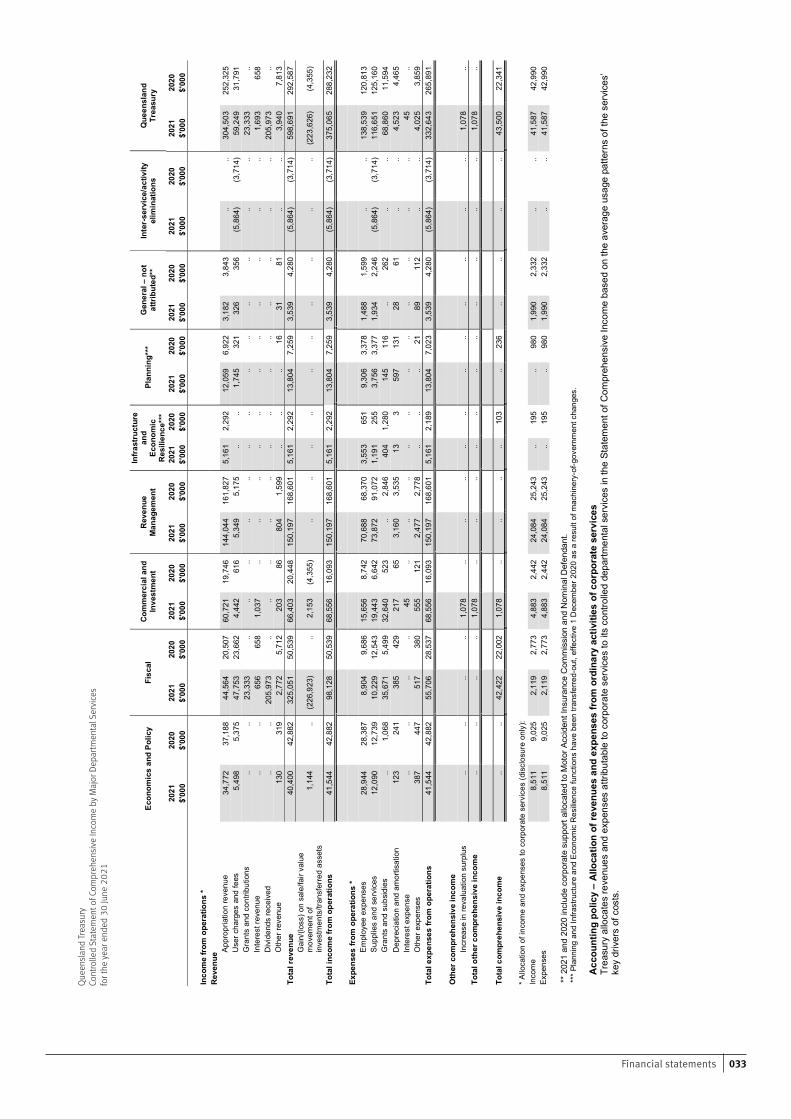
33 Controlled Statement of Comprehensive Income by Major Departmental Services
34 Controlled Statement of Assets and Liabilities by Major Departmental Services
35-36 Basis of Financial Statements Preparation
36-43 Objectives and Major Activities of the Department
44-70 Notes to the Controlled Financial Statements
71 Administered Statement of Comprehensive Income
72 Administered Statement of Financial Position
73 Administered Statement of Cash Flows
74 Administered Reconciliation of Operating Result to Net Cash provided by Operating Activities
75 Administered Reconciliation of Changes in Liabilities arising from Financing Activities
76 Administered Statement of Comprehensive Income by Major Departmental Services
77 Administered Statement of Assets and Liabilities by Major Departmental Services
78-99 Notes to the Administered Financial Statements
99-100 Other Note Disclosures
101 Management Certificate
Financial statements
Queensland Treasury Annual Report 2020–21026 Financial statements
Foreword
2 Financial Statements – Queensland Treasury
Foreword Queensland Treasury’s Financial Statements are general purpose financial statements prepared in accordance with prescribed requirements including Australian Accounting Standards and the Financial Reporting Requirements issued by the Treasurer.
The Financial Statements comprise the following components:
• Statements of Comprehensive Income
• Statements of Financial Position
• Statements of Changes in Equity
• Statements of Cash Flows
• Statements of Comprehensive Income by Major Departmental Services
• Statements of Assets and Liabilities by Major Departmental Services
• Notes to the Financial Statements.
In addition, Queensland Treasury (Treasury) administers transactions and balances in a trust or fiduciary capacity. These are identified in notes 47–50.
Treasury and Queensland Treasury Holdings Pty Ltd (QTH) are controlled by the State of Queensland which is the ultimate parent entity.
The head office and principal place of business of Treasury is:
1 William St
BRISBANE QLD 4000
027Financial statements
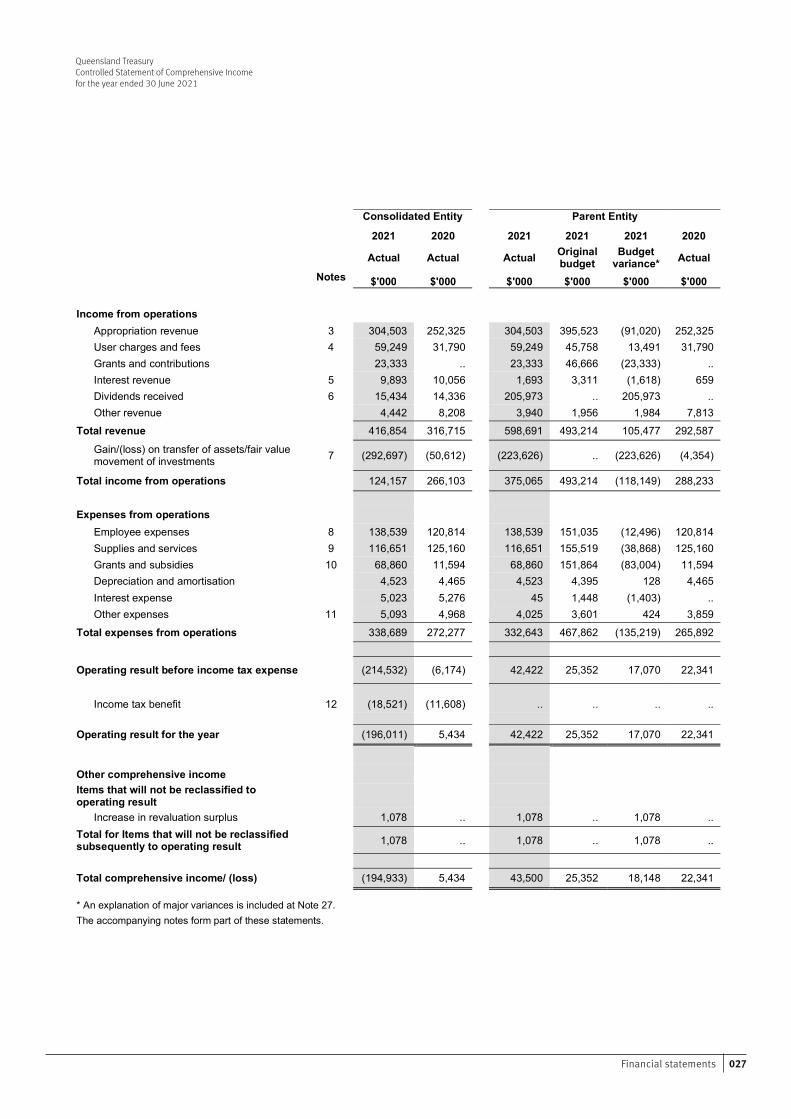
Queensland TreasuryControlled Statement of Comprehensive Income for the year ended 30 June 2021
3 Financial Statements – Queensland Treasury
Queensland Treasury
Controlled Statement of Comprehensive Income
for the year ended 30 June 2021
Consolidated Entity
Parent Entity
2021 2020 2021 2021 2021 2020 Actual Actual Actual Original
budget Budget
variance* Actual
Notes $'000 $'000 $'000 $'000 $'000 $'000
Income from operations Appropriation revenue 3 304,503 252,325 304,503 395,523 (91,020) 252,325 User charges and fees 4 59,249 31,790 59,249 45,758 13,491 31,790 Grants and contributions 23,333 .. 23,333 46,666 (23,333) .. Interest revenue 5 9,893 10,056 1,693 3,311 (1,618) 659 Dividends received 6 15,434 14,336 205,973 .. 205,973 .. Other revenue 4,442 8,208 3,940 1,956 1,984 7,813
Total revenue 416,854 316,715 598,691 493,214 105,477 292,587
Gain/(loss) on transfer of assets/fair value movement of investments 7 (292,697) (50,612) (223,626) .. (223,626) (4,354)
Total income from operations 124,157 266,103 375,065 493,214 (118,149) 288,233
Expenses from operations Employee expenses 8 138,539 120,814 138,539 151,035 (12,496) 120,814 Supplies and services 9 116,651 125,160 116,651 155,519 (38,868) 125,160 Grants and subsidies 10 68,860 11,594 68,860 151,864 (83,004) 11,594 Depreciation and amortisation 4,523 4,465 4,523 4,395 128 4,465 Interest expense 5,023 5,276 45 1,448 (1,403) .. Other expenses 11 5,093 4,968 4,025 3,601 424 3,859
Total expenses from operations 338,689 272,277 332,643 467,862 (135,219) 265,892
Operating result before income tax expense (214,532) (6,174) 42,422 25,352 17,070 22,341
Income tax benefit 12 (18,521) (11,608) .. .. .. ..
Operating result for the year (196,011) 5,434 42,422 25,352 17,070 22,341
Other comprehensive income Items that will not be reclassified to operating result
Increase in revaluation surplus 1,078 .. 1,078 .. 1,078 .. Total for Items that will not be reclassified subsequently to operating result
1,078 .. 1,078 .. 1,078 ..
Total comprehensive income/ (loss) (194,933) 5,434 43,500 25,352 18,148 22,341
* An explanation of major variances is included at Note 27. The accompanying notes form part of these statements.
Queensland Treasury Annual Report 2020–21028
Queensland TreasuryControlled Statement of Financial Position as at 30 June 2021
4 Financial Statements – Queensland Treasury
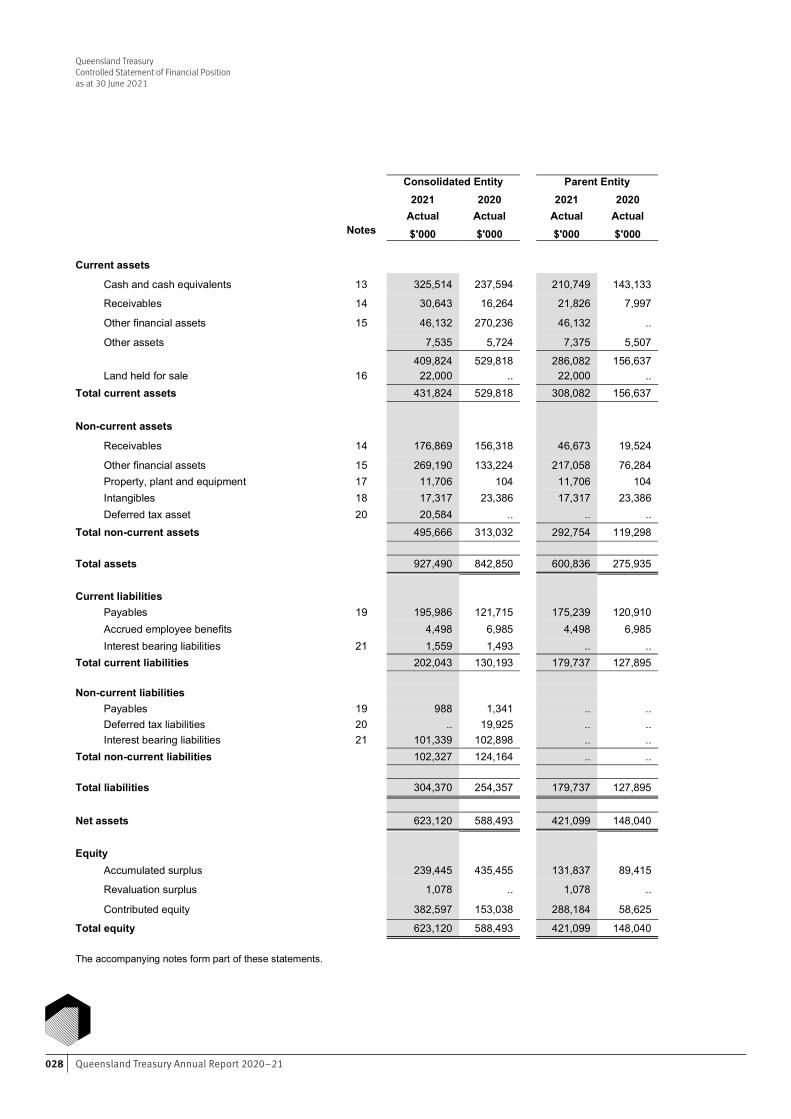
Queensland Treasury
Controlled Statement of Financial Position
as at 30 June 2021
Consolidated Entity
Parent Entity 2021 2020 2021 2020
Actual Actual Actual Actual Notes $'000 $'000 $'000 $'000
Current assets
Cash and cash equivalents 13 325,514 237,594 210,749 143,133
Receivables 14 30,643 16,264 21,826 7,997
Other financial assets 15 46,132 270,236 46,132 ..
Other assets 7,535 5,724 7,375 5,507
409,824 529,818 286,082 156,637
Land held for sale 16 22,000 .. 22,000 .. Total current assets 431,824 529,818 308,082 156,637
Non-current assets
Receivables 14 176,869 156,318 46,673 19,524
Other financial assets 15 269,190 133,224 217,058 76,284
Property, plant and equipment 17 11,706 104 11,706 104
Intangibles 18 17,317 23,386 17,317 23,386
Deferred tax asset 20 20,584 .. .. .. Total non-current assets 495,666 313,032 292,754 119,298 Total assets 927,490 842,850 600,836 275,935
Current liabilities
Payables 19 195,986 121,715 175,239 120,910
Accrued employee benefits 4,498 6,985 4,498 6,985
Interest bearing liabilities 21 1,559 1,493 .. .. Total current liabilities 202,043 130,193 179,737 127,895
Non-current liabilities Payables 19 988 1,341 .. .. Deferred tax liabilities 20 .. 19,925 .. .. Interest bearing liabilities 21 101,339 102,898 .. ..
Total non-current liabilities 102,327 124,164 .. ..
Total liabilities 304,370 254,357 179,737 127,895 Net assets 623,120 588,493 421,099 148,040
Equity
Accumulated surplus 239,445 435,455 131,837 89,415
Revaluation surplus 1,078 .. 1,078 ..
Contributed equity 382,597 153,038 288,184 58,625
Total equity 623,120 588,493 421,099 148,040
The accompanying notes form part of these statements.
029Financial statements
Queensland TreasuryControlled Statement of Changes in Equity for the year ended 30 June 2021
5 Financial Statements – Queensland Treasury
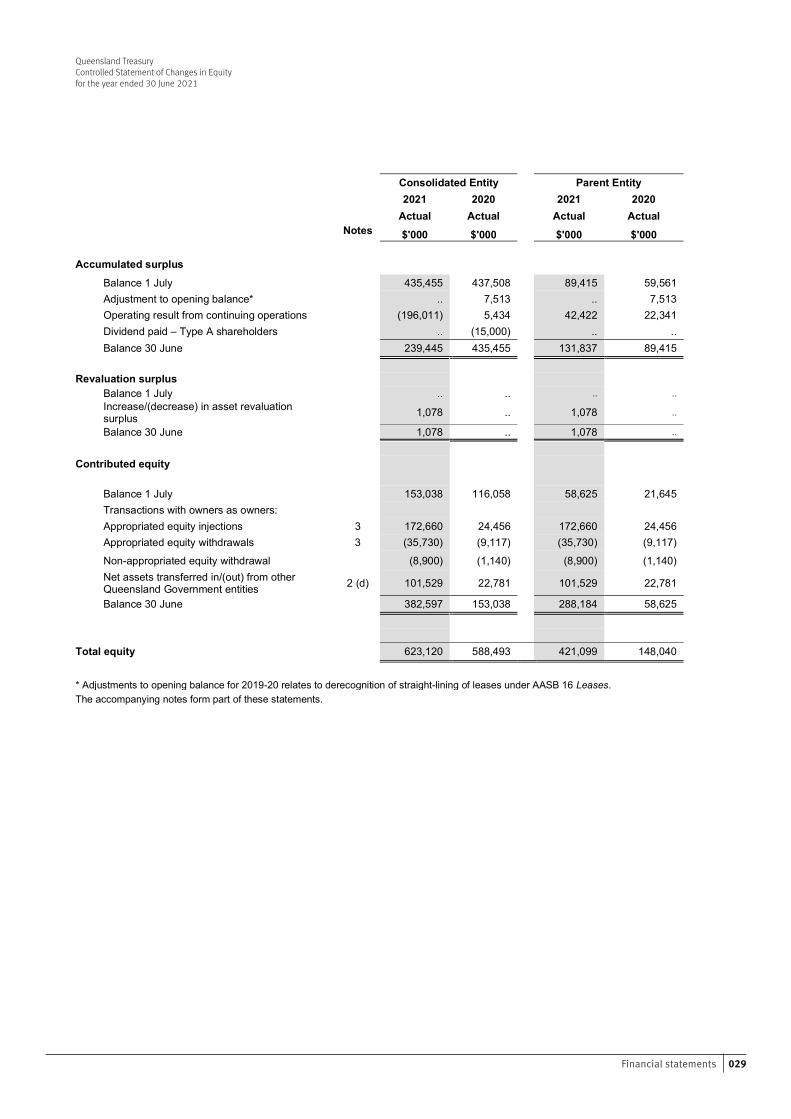
Queensland Treasury
Controlled Statement of Changes in Equity
for the year ended 30 June 2021
Consolidated Entity Parent Entity 2021 2020 2021 2020
Actual Actual Actual Actual Notes $'000 $'000 $'000 $'000
Accumulated surplus
Balance 1 July
435,455 437,508 89,415 59,561
Adjustment to opening balance* .. 7,513 .. 7,513 Operating result from continuing operations (196,011) 5,434 42,422 22,341 Dividend paid – Type A shareholders .. (15,000) .. .. Balance 30 June 239,445 435,455 131,837 89,415
Revaluation surplus Balance 1 July .. .. .. ..
Increase/(decrease) in asset revaluation surplus
1,078 .. 1,078 ..
Balance 30 June 1,078 .. 1,078 ..
Contributed equity Balance 1 July 153,038 116,058 58,625 21,645 Transactions with owners as owners: Appropriated equity injections 3 172,660 24,456 172,660 24,456 Appropriated equity withdrawals 3 (35,730) (9,117) (35,730) (9,117) Non-appropriated equity withdrawal (8,900) (1,140) (8,900) (1,140)
Net assets transferred in/(out) from other Queensland Government entities 2 (d) 101,529 22,781 101,529 22,781
Balance 30 June 382,597 153,038 288,184 58,625
Total equity 623,120 588,493 421,099 148,040
* Adjustments to opening balance for 2019-20 relates to derecognition of straight-lining of leases under AASB 16 Leases. The accompanying notes form part of these statements.
Queensland Treasury Annual Report 2020–21030
Queensland TreasuryControlled Statement of Cash Flowsfor the year ended 30 June 2021
6 Financial Statements – Queensland Treasury
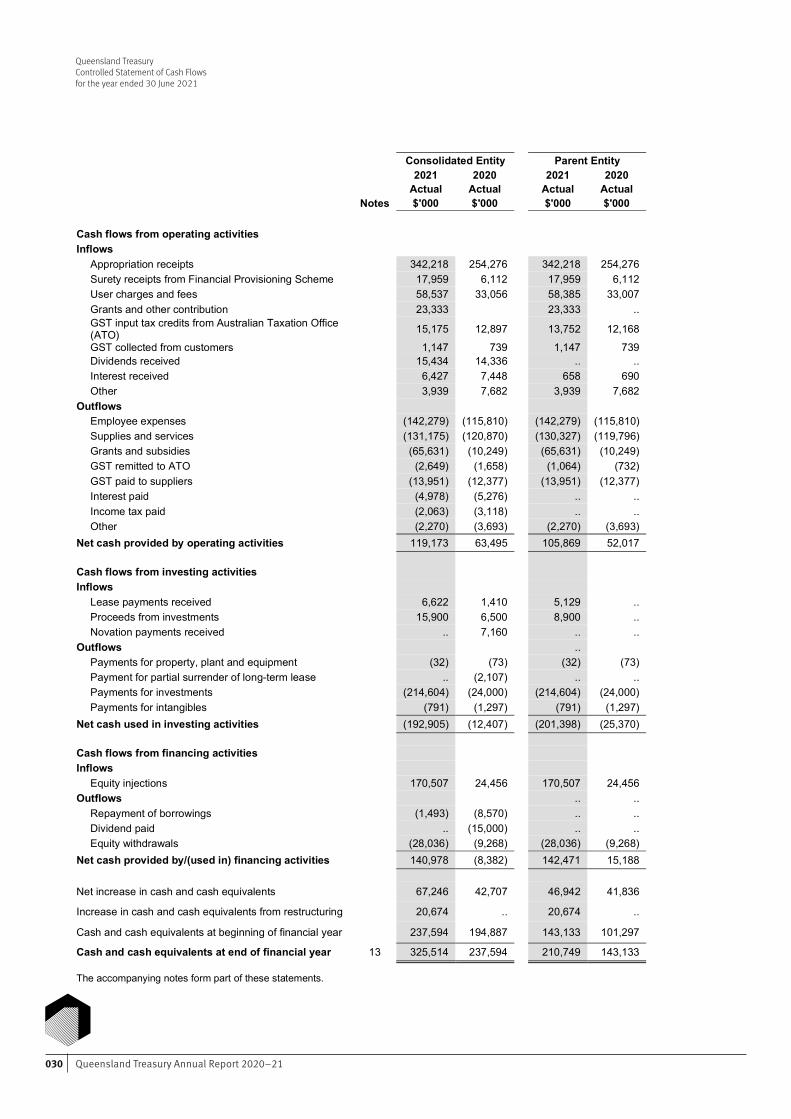
Queensland Treasury Controlled Statement of Cash Flows for the year ended 30 June 2021 Consolidated Entity Parent Entity 2021 2020 2021 2020 Actual Actual Actual Actual Notes $'000 $'000 $'000 $'000 Cash flows from operating activities Inflows Appropriation receipts 342,218 254,276 342,218 254,276 Surety receipts from Financial Provisioning Scheme 17,959 6,112 17,959 6,112 User charges and fees 58,537 33,056 58,385 33,007 Grants and other contribution 23,333 23,333 .. GST input tax credits from Australian Taxation Office
(ATO) 15,175 12,897 13,752 12,168
GST collected from customers 1,147 739 1,147 739 Dividends received 15,434 14,336 .. .. Interest received 6,427 7,448 658 690 Other 3,939 7,682 3,939 7,682 Outflows Employee expenses (142,279) (115,810) (142,279) (115,810) Supplies and services (131,175) (120,870) (130,327) (119,796) Grants and subsidies (65,631) (10,249) (65,631) (10,249) GST remitted to ATO (2,649) (1,658) (1,064) (732) GST paid to suppliers (13,951) (12,377) (13,951) (12,377) Interest paid (4,978) (5,276) .. .. Income tax paid (2,063) (3,118) .. .. Other (2,270) (3,693) (2,270) (3,693) Net cash provided by operating activities 119,173 63,495 105,869 52,017 Cash flows from investing activities
Inflows Lease payments received 6,622 1,410 5,129 .. Proceeds from investments 15,900 6,500 8,900 .. Novation payments received .. 7,160 .. .. Outflows .. Payments for property, plant and equipment (32) (73) (32) (73) Payment for partial surrender of long-term lease .. (2,107) .. .. Payments for investments (214,604) (24,000) (214,604) (24,000) Payments for intangibles (791) (1,297) (791) (1,297) Net cash used in investing activities (192,905) (12,407) (201,398) (25,370) Cash flows from financing activities
Inflows Equity injections 170,507 24,456 170,507 24,456 Outflows .. .. Repayment of borrowings (1,493) (8,570) .. .. Dividend paid .. (15,000) .. .. Equity withdrawals (28,036) (9,268) (28,036) (9,268) Net cash provided by/(used in) financing activities 140,978 (8,382) 142,471 15,188
Net increase in cash and cash equivalents 67,246 42,707 46,942 41,836
Increase in cash and cash equivalents from restructuring 20,674 .. 20,674 ..
Cash and cash equivalents at beginning of financial year 237,594 194,887 143,133 101,297
Cash and cash equivalents at end of financial year 13 325,514 237,594 210,749 143,133 The accompanying notes form part of these statements.
031Financial statements
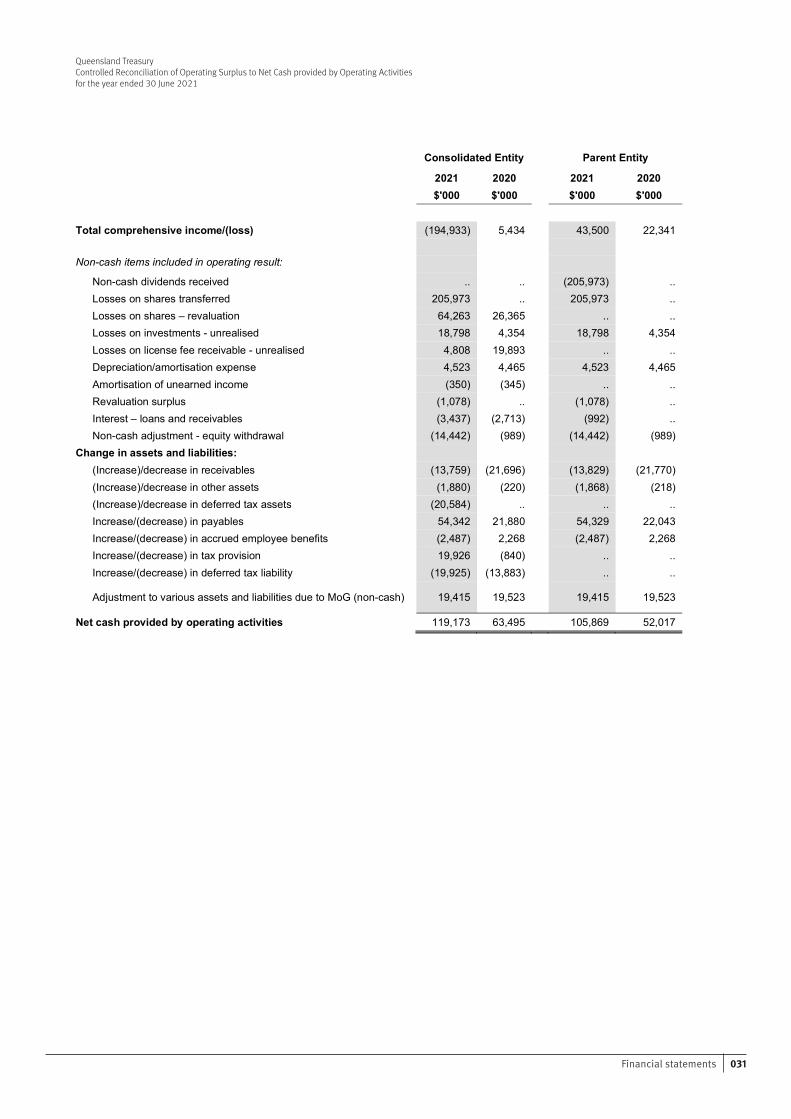
Queensland TreasuryControlled Reconciliation of Operating Surplus to Net Cash provided by Operating Activitiesfor the year ended 30 June 2021
7 Financial Statements – Queensland Treasury
Queensland Treasury
Controlled Reconciliation of Operating Result to Net Cash provided by Operating Activities
for the year ended 30 June 2021
Consolidated Entity Parent Entity
2021 2020 2021 2020 $'000 $'000 $'000 $'000
Total comprehensive income/(loss) (194,933) 5,434 43,500 22,341
Non-cash items included in operating result:
Non-cash dividends received .. .. (205,973) .. Losses on shares transferred 205,973 .. 205,973 .. Losses on shares – revaluation 64,263 26,365 .. .. Losses on investments - unrealised 18,798 4,354 18,798 4,354 Losses on license fee receivable - unrealised 4,808 19,893 .. .. Depreciation/amortisation expense 4,523 4,465 4,523 4,465 Amortisation of unearned income (350) (345) .. .. Revaluation surplus (1,078) .. (1,078) .. Interest – loans and receivables (3,437) (2,713) (992) .. Non-cash adjustment - equity withdrawal (14,442) (989) (14,442) (989)
Change in assets and liabilities:
(Increase)/decrease in receivables (13,759) (21,696) (13,829) (21,770) (Increase)/decrease in other assets (1,880) (220) (1,868) (218) (Increase)/decrease in deferred tax assets (20,584) .. .. .. Increase/(decrease) in payables 54,342 21,880 54,329 22,043 Increase/(decrease) in accrued employee benefits (2,487) 2,268 (2,487) 2,268 Increase/(decrease) in tax provision 19,926 (840) .. .. Increase/(decrease) in deferred tax liability (19,925) (13,883) .. ..
Adjustment to various assets and liabilities due to MoG (non-cash) 19,415 19,523 19,415 19,523
Net cash provided by operating activities 119,173 63,495 105,869 52,017
Queensland Treasury Annual Report 2020–21032
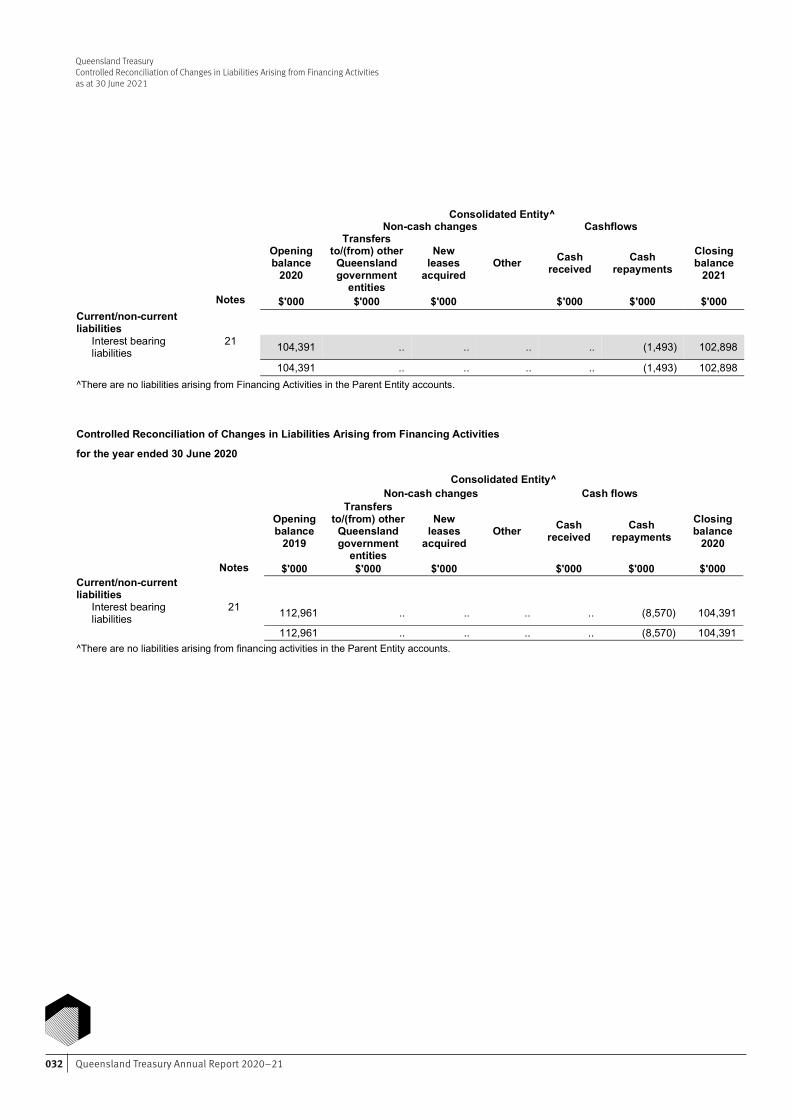
Queensland TreasuryControlled Reconciliation of Changes in Liabilities Arising from Financing Activitiesas at 30 June 2021
8 Financial Statements – Queensland Treasury
Queensland Treasury Controlled Reconciliation of Changes in Liabilities Arising from Financing Activities for the year ended 30 June 2021
Consolidated Entity^
Non-cash changes Cashflows
Opening balance
2020
Transfers to/(from) other
Queensland government
entities
New leases
acquired Other Cash
received Cash
repayments Closing balance
2021
Notes $'000 $'000 $'000 $'000 $'000 $'000 Current/non-current liabilities
Interest bearing liabilities
21 104,391 .. .. .. .. (1,493) 102,898
104,391 .. .. .. .. (1,493) 102,898 ^There are no liabilities arising from Financing Activities in the Parent Entity accounts.
Controlled Reconciliation of Changes in Liabilities Arising from Financing Activities
for the year ended 30 June 2020 Consolidated Entity^
Non-cash changes Cash flows
Opening balance
2019
Transfers to/(from) other
Queensland government
entities
New leases
acquired Other Cash
received Cash
repayments Closing balance
2020
Notes $'000 $'000 $'000 $'000 $'000 $'000 Current/non-current liabilities
Interest bearing liabilities
21 112,961 .. .. .. .. (8,570) 104,391
112,961 .. .. .. .. (8,570) 104,391 ^There are no liabilities arising from financing activities in the Parent Entity accounts.
033Financial statements
Quee
nsla
nd Tr
easu
ryCo
ntro
lled
Stat
emen
t of C
ompr
ehen
sive
Inco
me
by M
ajor
Dep
artm
enta
l Ser
vices
for t
he ye
ar e
nded
30
June
202
1
9
Fin
anci
al S
tate
men
ts –
Que
ensl
and
Trea
sury
Que
ensl
and
Trea
sury
Co
ntro
lled
Stat
emen
t of C
ompr
ehen
sive
Inco
me
by M
ajor
Dep
artm
enta
l Ser
vice
s fo
r the
yea
r end
ed 3
0 Ju
ne 2
021
Econ
omic
s an
d Po
licy
Fisc
al
Com
mer
cial
and
In
vest
men
t R
even
ue
Man
agem
ent
Infr
astr
uctu
re
and
Econ
omic
R
esili
ence
***
Plan
ning
***
Gen
eral
– n
ot
attr
ibut
ed**
In
ter-
serv
ice/
activ
ity
elim
inat
ions
Q
ueen
slan
d Tr
easu
ry
2021
20
20
2021
20
20
2021
20
20
2021
20
20
2021
20
20
2021
20
20
2021
20
20
2021
20
20
2021
20
20
$'00
0 $'
000
$'00
0 $'
000
$'00
0 $'
000
$'00
0 $'
000
$'00
0 $'
000
$'00
0 $'
000
$'00
0 $'
000
$'00
0 $'
000
$'00
0 $'
000
Inco
me
from
ope
ratio
ns *
Reve
nue
Ap
prop
riatio
n re
venu
e 34
,772
37
,188
44
,564
20
,507
60
,721
19
,746
14
4,04
4
161,
827
5,
161
2,
292
12
,059
6,
922
3,
182
3,
843
..
..
30
4,50
3
252,
325
Use
r cha
rges
and
fees
5,
498
5,
375
47
,753
23
,662
4,
442
61
6
5,34
9
5,17
5
..
..
1,74
5
321
32
6
356
(5
,864
) (3
,714
) 59
,249
31
,791
Gra
nts
and
cont
ribut
ions
..
..
23
,333
..
..
..
..
..
..
..
..
..
..
..
..
..
23
,333
..
Inte
rest
reve
nue
..
..
656
65
8
1,03
7
..
..
..
..
..
..
..
..
..
..
..
1,69
3
658
Div
iden
ds re
ceiv
ed
..
..
205,
973
..
..
..
..
..
..
..
..
..
..
..
..
..
20
5,97
3
..
O
ther
reve
nue
130
31
9
2,77
2
5,71
2
203
86
80
4
1,59
9
..
..
..
16
31
81
..
..
3,94
0
7,81
3
Tota
l rev
enue
40
,400
42
,882
32
5,05
1
50,5
39
66,4
03
20,4
48
150,
197
16
8,60
1
5,16
1
2,29
2
13,8
04
7,25
9
3,53
9
4,28
0
(5,8
64)
(3,7
14)
598,
691
29
2,58
7
G
ain/
(loss
) on
sale
/fair
valu
e m
ovem
ent o
f in
vest
men
ts/tr
ansf
erre
d as
sets
1,
144
..
(2
26,9
23)
..
2,15
3
(4,3
55)
..
..
..
..
..
..
..
..
..
..
(223
,626
) (4
,355
)
Tota
l inc
ome
from
ope
ratio
ns
41,5
44
42,8
82
98,1
28
50,5
39
68,5
56
16,0
93
150,
197
16
8,60
1
5,16
1
2,29
2
13,8
04
7,25
9
3,53
9
4,28
0
(5,8
64)
(3,7
14)
375,
065
28
8,23
2
Expe
nses
from
ope
ratio
ns *
Em
ploy
ee e
xpen
ses
28,9
44
28,3
87
8,90
4
9,68
6
15,6
56
8,74
2
70,6
88
68,3
70
3,55
3
651
9,
306
3,
378
1,
488
1,
599
..
..
13
8,53
9
120,
813
Supp
lies
and
serv
ices
12
,090
12
,739
10
,229
12
,543
19
,443
6,
642
73
,872
91
,072
1,
191
25
5
3,75
6
3,37
7
1,93
4
2,24
6
(5,8
64)
(3,7
14)
116,
651
12
5,16
0
G
rant
s an
d su
bsid
ies
..
1,06
8
35,6
71
5,49
9
32,6
40
523
..
2,
846
40
4
1,28
0
145
11
6
..
262
..
..
68
,860
11
,594
Dep
reci
atio
n an
d am
ortis
atio
n 12
3
241
38
5
429
21
7
65
3,16
0
3,53
5
13
3
597
13
1
28
61
..
..
4,52
3
4,46
5
In
tere
st e
xpen
se
..
..
..
..
45
..
..
..
..
..
..
..
..
..
..
..
45
..
O
ther
exp
ense
s 38
7
447
51
7
380
55
5
121
2,
477
2,
778
..
..
..
21
89
11
2
..
..
4,02
5
3,85
9
Tota
l exp
ense
s fro
m o
pera
tions
41
,544
42
,882
55
,706
28
,537
68
,556
16
,093
15
0,19
7
168,
601
5,
161
2,
189
13
,804
7,
023
3,
539
4,
280
(5
,864
) (3
,714
) 33
2,64
3
265,
891
Oth
er c
ompr
ehen
sive
inco
me
Incr
ease
in re
valu
atio
n su
rplu
s ..
..
..
..
1,
078
..
..
..
..
..
..
..
..
..
..
..
1,
078
..
To
tal o
ther
com
preh
ensi
ve in
com
e ..
..
..
..
1,
078
..
..
..
..
..
..
..
..
..
..
..
1,
078
..
Tota
l com
preh
ensi
ve in
com
e ..
..
42
,422
22
,002
1,
078
..
..
..
..
10
3
..
236
..
..
..
..
43
,500
22
,341
* A
lloca
tion
of in
com
e an
d ex
pens
es to
cor
pora
te s
ervi
ces
(dis
clos
ure
only
):
In
com
e 8,
511
9,
025
2,
119
2,
773
4,
883
2,
442
24
,084
25
,243
..
19
5
..
980
1,
990
2,
332
..
..
41
,587
42
,990
Ex
pens
es
8,51
1
9,02
5
2,11
9
2,77
3
4,88
3
2,44
2
24,0
84
25,2
43
..
195
..
98
0
1,99
0
2,33
2
..
..
41,5
87
42,9
90
**
202
1 an
d 20
20 in
clud
e co
rpor
ate
supp
ort a
lloca
ted
to M
otor
Acc
iden
t Ins
uran
ce C
omm
issi
on a
nd N
omin
al D
efen
dant
. **
* Pla
nnin
g an
d In
frast
ruct
ure
and
Econ
omic
Res
ilien
ce fu
nctio
ns h
ave
been
tran
sfer
red-
out,
effe
ctiv
e 1
Dec
embe
r 202
0 as
a re
sult
of m
achi
nery
-of-g
over
nmen
t cha
nges
. A
ccou
ntin
g po
licy
– Al
loca
tion
of re
venu
es a
nd e
xpen
ses
from
ord
inar
y ac
tiviti
es o
f cor
pora
te s
ervi
ces
Trea
sury
allo
cate
s re
venu
es a
nd e
xpen
ses
attri
buta
ble
to c
orpo
rate
ser
vice
s to
its
cont
rolle
d de
partm
enta
l ser
vice
s in
the
Stat
emen
t of C
ompr
ehen
sive
Inco
me
base
d on
the
aver
age
usag
e pa
ttern
s of
the
serv
ices
’ ke
y dr
iver
s of
cos
ts.
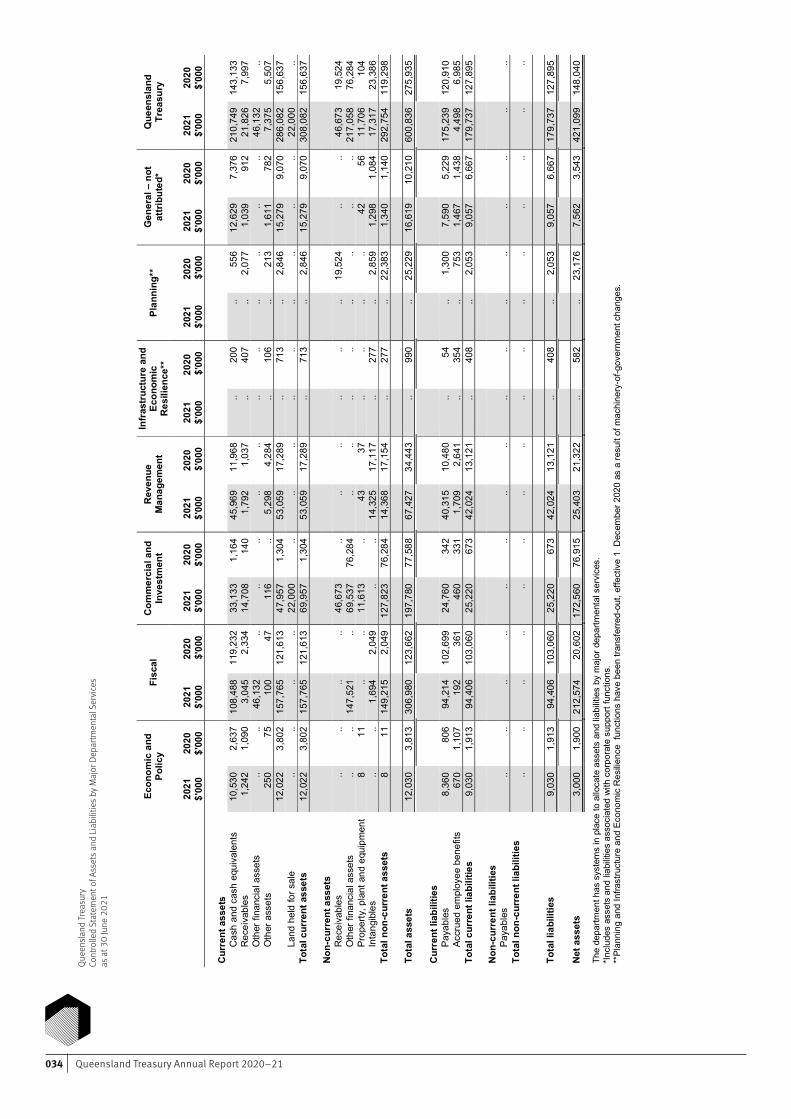
Queensland Treasury Annual Report 2020–21034
10
Fin
anci
al S
tate
men
ts –
Que
ensl
and
Trea
sury
Q
ueen
slan
d Tr
easu
ry
Con
trol
led
Stat
emen
t of A
sset
s an
d Li
abili
ties
by M
ajor
Dep
artm
enta
l Ser
vice
s
as
at 3
0 Ju
ne 2
021
Econ
omic
and
Po
licy
Fisc
al
Com
mer
cial
and
In
vest
men
t R
even
ue
Man
agem
ent
Infr
astr
uctu
re a
nd
Econ
omic
R
esili
ence
**
Plan
ning
**
Gen
eral
– n
ot
attri
bute
d*
Que
ensl
and
Trea
sury
20
21
2020
20
21
2020
20
21
2020
20
21
2020
20
21
2020
20
21
2020
20
21
2020
20
21
2020
$'
000
$'00
0 $'
000
$'0
00
$'00
0 $'
000
$'00
0 $
'000
$'
000
$'0
00
$'00
0 $
'000
$'
000
$'00
0 $'
000
$'00
0
Cur
rent
ass
ets
C
ash
and
cash
equ
ival
ents
10
,530
2,
637
108,
488
11
9,23
2 33
,133
1,
164
45
,969
11
,968
..
20
0
..
556
12
,629
7,
376
21
0,74
9
143,
133
Rec
eiva
bles
1,
242
1,
090
3,04
5
2,33
4 14
,708
14
0
1,79
2
1,03
7
..
407
..
2,
077
1,
039
91
2
21,8
26
7,99
7
O
ther
fina
ncia
l ass
ets
..
..
46,1
32
..
..
..
..
..
..
..
..
..
..
..
46,1
32
..
O
ther
ass
ets
250
75
10
0
47
116
..
5,
298
4,
284
..
10
6
..
213
1,
611
78
2
7,37
5
5,50
7
12,0
22
3,80
2
157,
765
12
1,61
3
47,9
57
1,30
4
53,0
59
17,2
89
..
713
..
2,
846
15
,279
9,
070
28
6,08
2
156,
637
Land
hel
d fo
r sal
e ..
..
..
..
22
,000
..
..
..
..
..
..
..
..
..
22
,000
..
To
tal c
urre
nt a
sset
s 12
,022
3,
802
15
7,76
5
121,
613
69
,957
1,
304
53
,059
17
,289
..
71
3
..
2,84
6
15,2
79
9,07
0
308,
082
15
6,63
7
Non
-cur
rent
ass
ets
R
ecei
vabl
es
..
..
..
..
46,6
73
..
..
..
..
..
..
19,5
24
..
..
46,6
73
19,5
24
O
ther
fina
ncia
l ass
ets
..
..
147,
521
..
69
,537
76
,284
..
..
..
..
..
..
..
..
21
7,05
8
76,2
84
Pr
oper
ty, p
lant
and
equ
ipm
ent
8
11
..
..
11,6
13
..
43
37
..
..
..
..
42
56
11,7
06
104
Inta
ngib
les
..
..
1,69
4
2,04
9
..
..
14,3
25
17,1
17
..
277
..
2,
859
1,
298
1,
084
17
,317
23
,386
To
tal n
on-c
urre
nt a
sset
s 8
11
14
9,21
5
2,04
9
127,
823
76
,284
14
,368
17
,154
..
27
7
..
22,3
83
1,34
0
1,14
0
292,
754
11
9,29
8
To
tal a
sset
s 12
,030
3,
813
30
6,98
0
123,
662
19
7,78
0
77,5
88
67,4
27
34,4
43
..
990
..
25
,229
16
,619
10
,210
60
0,83
6
275,
935
C
urre
nt li
abili
ties
Pa
yabl
es
8,36
0
806
94
,214
10
2,69
9
24,7
60
342
40
,315
10
,480
..
54
..
1,
300
7,
590
5,
229
17
5,23
9
120,
910
Accr
ued
empl
oyee
ben
efits
67
0
1,10
7
192
36
1
460
33
1
1,70
9
2,64
1
..
354
..
75
3
1,46
7
1,43
8
4,49
8
6,98
5
Tota
l cur
rent
liab
ilitie
s 9,
030
1,
913
94
,406
10
3,06
0
25,2
20
673
42
,024
13
,121
..
40
8
..
2,05
3
9,05
7
6,66
7
179,
737
12
7,89
5
Non
-cur
rent
liab
ilitie
s
Paya
bles
..
..
..
..
..
..
..
..
..
..
..
..
..
..
..
..
To
tal n
on-c
urre
nt li
abili
ties
..
..
..
..
..
..
..
..
..
..
..
..
..
..
..
..
Tota
l lia
bilit
ies
9,03
0
1,91
3
94,4
06
103,
060
25
,220
67
3
42,0
24
13,1
21
..
408
..
2,
053
9,
057
6,
667
17
9,73
7
127,
895
N
et a
sset
s 3,
000
1,
900
21
2,57
4
20,6
02
172,
560
76
,915
25
,403
21
,322
..
58
2
..
23,1
76
7,56
2
3,54
3
421,
099
14
8,04
0
The
depa
rtmen
t has
sys
tem
s in
pla
ce to
allo
cate
ass
ets
and
liabi
litie
s by
maj
or d
epar
tmen
tal s
ervi
ces.
*In
clud
es a
sset
s an
d lia
bilit
ies
asso
ciat
ed w
ith c
orpo
rate
sup
port
func
tions
.
**
Plan
ning
and
Infra
stru
ctur
e an
d Ec
onom
ic R
esilie
nce
func
tions
hav
e be
en tr
ansf
erre
d-ou
t, ef
fect
ive
1 D
ecem
ber 2
020
as a
resu
lt of
mac
hine
ry-o
f-gov
ernm
ent c
hang
es.
Quee
nsla
nd Tr
easu
ryCo
ntro
lled
Stat
emen
t of A
sset
s and
Liab
ilitie
s by M
ajor
Dep
artm
enta
l Ser
vices
as a
t 30
June
202
1
035Financial statements
Queensland Treasury Notes to the Financial Statements 2020-21
11 Financial Statements – Queensland Treasury
1 Basis of financial statement preparation
(a) Statement of compliance
Treasury has prepared these financial statements in compliance with section 38 of the Financial and Performance Management Standard 2019.
Treasury is a not-for-profit entity and has prepared these general-purpose financial statements in accordance with Australian Accounting Standards and Interpretations applicable to not-for-profit entities. In addition, the financial statements comply with the Queensland Treasury’s Financial Reporting Requirements for the year beginning 1 July 2020 and other authoritative pronouncements. New accounting standards applied for the first-time in these financial statements are outlined in note 1(h).
(b) The reporting entity
Treasury is a Queensland Government department established under the Public Service Act 2008 and controlled by the State of Queensland, which is the ultimate parent.
For financial reporting purposes, Treasury is a department in terms of the Financial Accountability Act 2009 and is subsequently consolidated into the Report on State Finances of the Queensland Government.
Treasury as an economic entity consists of the parent entity together with its controlled entity, QTH. To provide enhanced disclosure, Treasury has adopted the principles outlined in Australian Accounting Standard AASB 10 Consolidated Financial Statements and AASB 12 Disclosure of Interests in Other Entities. This approach is considered appropriate as it reflects the relationship between Treasury’s core business activities and those of its controlled entity. In the process of reporting on Treasury as a single economic entity, all transactions and balances internal to the economic entity have been eliminated in full. The consolidated financial statements include the value of all revenues, expenses, assets, liabilities and equity of Treasury and the entity that it controls. Details of Treasury’s controlled entity are disclosed in note 24. For the purposes of these financial statements, “QTH” refers to QTH and its controlled entities.
The accrual basis of accounting has been adopted for both controlled transactions and balances, and those administered by Treasury on a whole-of-government basis (except for the Statement of Cash Flows, which is prepared on a cash basis). Except when stated, the historical cost convention is used.
(c) Controlled and Administered transactions and balances
Transactions and balances are controlled by Treasury where they can be deployed for the achievement of departmental objectives.
Treasury administers, but does not control, certain resources on behalf of the government such as the borrowing and cash arrangements, collection of Australian Government grants, state taxes, royalties, State Penalties Enforcement Registry (SPER) fines and investment in the Queensland Future Fund (QFF). In doing so, it is responsible and accountable for administering related transactions and items but does not have the discretion to deploy the resources for the achievement of Treasury’s objectives.
Transactions and balances relating to administered resources are not recognised as controlled revenues, expenses, assets, liabilities and equity, but are disclosed separately as administered transactions and balances in the administered statements and associated notes.
If not otherwise stated, the controlled accounting policies also apply to administered transactions and balances.
(d) Australian Government taxes
Treasury is a state body as defined under the Income Tax Assessment Act 1936 and is exempt from Commonwealth taxation with the exception of fringe benefits tax (FBT) and goods and services tax (GST). As such, FBT and GST credits receivable from/payable to the Australian Taxation Office (ATO) are recognised and accrued.
QTH is subject to the National Tax Equivalents Regime (NTER), and payments are made to the State Treasurer (Consolidated Fund) equivalent to the amount of Commonwealth income tax.
QTH falls under the Taxation of Financial Arrangements (TOFA) legislation and applies the default realisation and accrual methods.
(e) Presentation
Rounding and comparatives
Amounts included in the financial statements are in Australian dollars and have been rounded to the nearest $1,000 or, where that amount is $500 or less, to zero unless disclosure of the full amount is specifically required. Comparative information reflects the audited 2019–20 financial statements.
Queensland TreasuryNotes to the Financial Statements 2020–21
Queensland Treasury Annual Report 2020–21036
Queensland TreasuryNotes to the Financial Statements 2020–21Queensland Treasury Notes to the Financial Statements 2020-21
12 Financial Statements – Queensland Treasury
1 Basis of financial statement preparation (continued)
Current/non-current classification
Assets and liabilities are classified as either current or non-current in the statement of financial position and associated notes. Assets are classified as current where their carrying amount is expected to be realised within 12 months after the reporting date. Liabilities are classified as current when they are due to be settled within 12 months after the reporting date, or the department does not have an unconditional right to defer settlement to beyond the 12 months after the reporting date. All other assets and liabilities are classified as non-current.
(f) Issuance of financial statements
The financial statements are authorised for issue by the Under Treasurer and Chief Finance Officer at the date of signing the Management Certificate.
(g) Accounting estimates and judgements
Estimates and assumptions that have a potential significant effect are outlined in the following notes
notes 14 and 39 (allowance for impairment)
note 15 (fair value on controlled other financial assets)
notes 16 and 17 (fair value on land held for sale and property)
notes 23 and 43 (contingencies)
note 26 (g) (fair value on controlled financial instruments)
note 40 (fair value on administered other financial assets)
note 44 (e) (fair value on administered financial instruments)
Further, the matters covered in each of those notes necessarily involve estimation uncertainty with the potential to materially impact on the carrying amount of Treasury's assets and liabilities in the next reporting period. Reference should be made to the respective notes for more information.
(h) First year application of new accounting standards
AASB 1059 Service Concession Arrangement: Grantors
AASB 1059 applied to Treasury’s financial statement in 2020–21. This standard applies to grantors in service concession arrangements and provides a control concept to the recognition of service concession assets and related liabilities.
Treasury has assessed existing arrangements with private entities including grant arrangements. Based on the assessment, the consolidated entity does not have any arrangements that fall within the scope of AASB 1059.
2 Objectives and major activities of the department
Queensland Treasury's vision is a strong economy for all Queenslanders, which is guided by our purpose of driving government priorities, expert advice and services.
Treasury's objectives are to:
grow the Queensland economy and create jobs
deliver fiscal sustainability
equip its workforce for the future
drive public sector reform.
Treasury is funded for the departmental services it delivers principally by parliamentary appropriations. Details on Treasury’s departmental service areas can be viewed in the Service Reports section of the department’s Annual Report.
037Financial statements
Queensland TreasuryNotes to the Financial Statements 2020–21Queensland Treasury Notes to the Financial Statements 2020-21
13 Financial Statements – Queensland Treasury
2 Objectives and major activities of the department (continued)
(a) Major activities of the department
Major activities of the department are detailed on the face of the statements by Major Departmental Services for both controlled and administered items.
The Financial Statements have been aggregated into the following disclosures (refer notes 1(b) and 1(c) for full details of this aggregation):
1 Controlled
(a) Treasury (as an entity in its own right and to which the remainder of this financial report refers) – column headed ‘Parent Entity’.
(b) Consolidated (Treasury and its controlled entity QTH and its subsidiaries) – column headed ‘Consolidated Entity’.
2 Administered on behalf of whole-of-government – shaded statements and notes.
(b) Financial Provisioning Scheme (FPS)
From 1 April 2019, Financial Assurance (now called Financial Provisioning) requirements for resource activities under the Environmental Protection Act 1994 (EP Act) were replaced with the Financial Provisioning Scheme (Scheme) under the Mineral and Energy Resource (Financial Provisioning) Act 2018 (MERFP Act). The Scheme manages the State’s financial risk from the potential failure of a resource activity holder of an environmental authority or small-scale mining tenure (holder) to meet their rehabilitation and environmental obligations under the EP Act.
The Scheme is administered by the Scheme Manager, a statutory officer supported by Treasury, who is responsible for administering all holders’ financial provisioning on behalf of the State of Queensland.
Under the MERFP Act, holders meet their financial provisioning obligation by providing:
• a contribution to the Financial Provisioning Fund (Fund); and/or
• surety, which can be in the form of cash, bank guarantee or insurance bond.
Under the EP Act, the Administering Authority (Department of Environment and Science (DES)) may make a claim against a holder’s financial provisioning to the Scheme Manager. Where the claim is properly made, the Scheme Manager will either make arrangements for payments from the Financial Provisioning Fund or realise the surety and transfer the funds to the Administering Authority’s designated bank account. No liability is held by Treasury for any rehabilitation obligations.
All balances/transactions relating to the Fund are reported in the Financial Statements. Fund contributions and assessment fees are recognised under user charges and fees (note 4).
Balances/transactions relating to surety are reported either in the Financial Statements or disclosed as contingencies.
• Cash surety is reported as cash asset (note 13) with a corresponding payable to the holders (note 19), as the Fund obtains the interest benefit from the cash surety held.
• Forfeitures of surety held are recognised as other revenue and transferred to DES and/or Department of Resources as grant expenses.
• Non-cash surety is disclosed in the contingency note (note 23). Non-cash surety is only redeemable for cash when claims are made. At reporting date, it is not possible to determine the quantum or timing of claims that will be made against the non-cash surety.
• Where a notice to provide surety has been issued and the surety payment is yet to be received from holders, the aggregate surety yet to be received is also disclosed in the contingency note (note 23).
(c) Financial Reporting Impact of COVID-19 response measures
The World Health Organisation declared the COVID-19 outbreak as a pandemic. Actions taken by the Australian and State Governments resulted in significant impact to business operations and increased economic uncertainty.
The Queensland Government put in measures to support Queenslanders’ health, jobs and businesses in response to the COVID-19 pandemic in 2019–20 which has continued this 2020–21 financial year.
Treasury has implemented the following COVID-19 response measures in 2020–21 and 2019–20:
Taxes, Fines and Grants
Payroll Tax measures
i. Refund of Payroll Tax for 2 months (2021: July and August 2020; 2020: November and December 2019)
ii. Payroll tax holiday for 3 months (2020: January to March 2020 )
iii. Deferral of paying Payroll Tax for the 2020 calendar year (with multiple due dates up to 14 January 2022)
iv. Extension of exclusion of JobKeeper payments for Payroll Tax
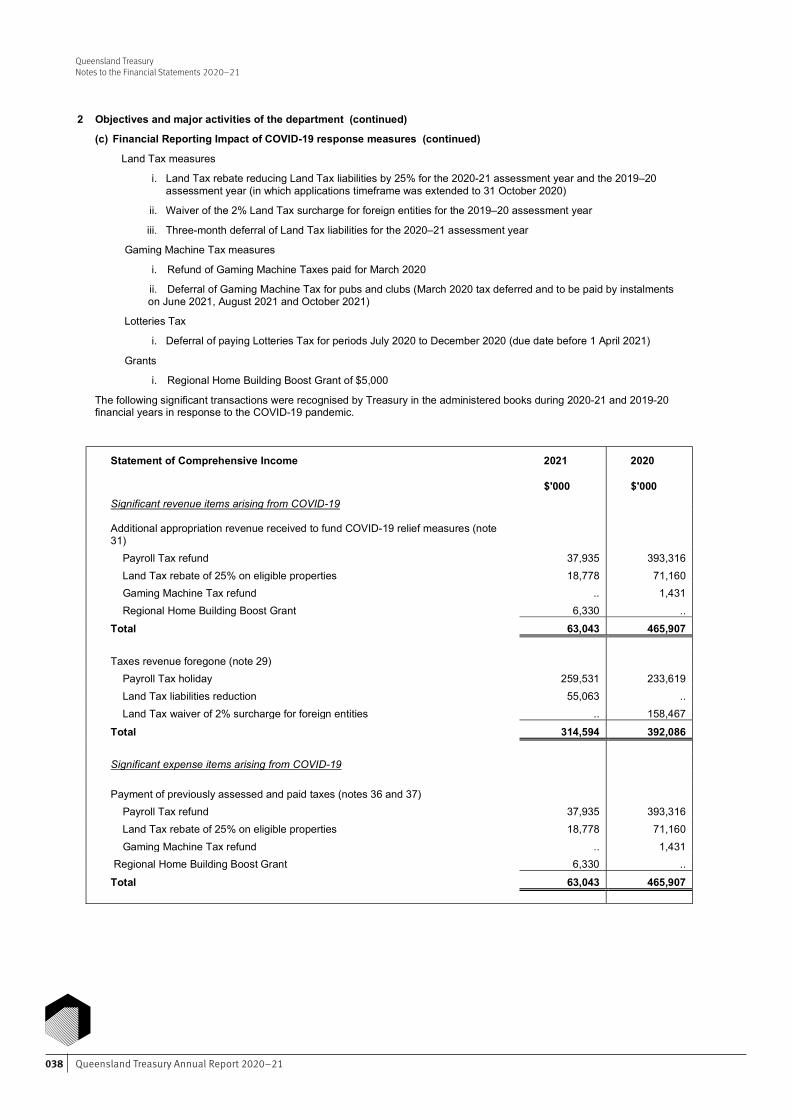
Queensland Treasury Annual Report 2020–21038
Queensland TreasuryNotes to the Financial Statements 2020–21Queensland Treasury Notes to the Financial Statements 2020-21
14 Financial Statements – Queensland Treasury
2 Objectives and major activities of the department (continued)
(c) Financial Reporting Impact of COVID-19 response measures (continued)
Land Tax measures
i. Land Tax rebate reducing Land Tax liabilities by 25% for the 2020-21 assessment year and the 2019–20 assessment year (in which applications timeframe was extended to 31 October 2020)
ii. Waiver of the 2% Land Tax surcharge for foreign entities for the 2019–20 assessment year
iii. Three-month deferral of Land Tax liabilities for the 2020–21 assessment year
Gaming Machine Tax measures
i. Refund of Gaming Machine Taxes paid for March 2020
ii. Deferral of Gaming Machine Tax for pubs and clubs (March 2020 tax deferred and to be paid by instalments on June 2021, August 2021 and October 2021)
Lotteries Tax
i. Deferral of paying Lotteries Tax for periods July 2020 to December 2020 (due date before 1 April 2021)
Grants
i. Regional Home Building Boost Grant of $5,000
The following significant transactions were recognised by Treasury in the administered books during 2020-21 and 2019-20 financial years in response to the COVID-19 pandemic.
Statement of Comprehensive Income 2021 2020
$'000 $'000 Significant revenue items arising from COVID-19
Additional appropriation revenue received to fund COVID-19 relief measures (note 31) Payroll Tax refund 37,935 393,316 Land Tax rebate of 25% on eligible properties 18,778 71,160 Gaming Machine Tax refund .. 1,431 Regional Home Building Boost Grant 6,330 .. Total 63,043 465,907 Taxes revenue foregone (note 29) Payroll Tax holiday 259,531 233,619 Land Tax liabilities reduction 55,063 .. Land Tax waiver of 2% surcharge for foreign entities .. 158,467
Total 314,594 392,086 Significant expense items arising from COVID-19 Payment of previously assessed and paid taxes (notes 36 and 37) Payroll Tax refund 37,935 393,316 Land Tax rebate of 25% on eligible properties 18,778 71,160 Gaming Machine Tax refund .. 1,431 Regional Home Building Boost Grant 6,330 ..
Total 63,043 465,907
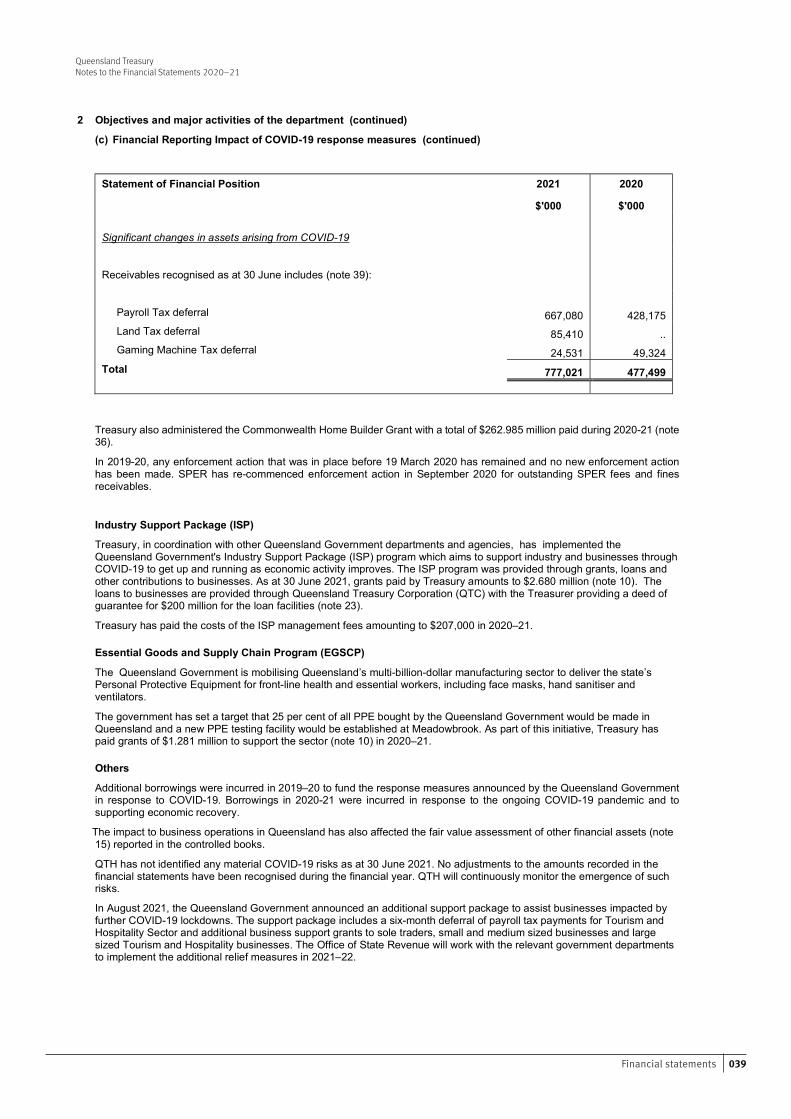
039Financial statements
Queensland TreasuryNotes to the Financial Statements 2020–21Queensland Treasury Notes to the Financial Statements 2020-21
15 Financial Statements – Queensland Treasury
2 Objectives and major activities of the department (continued)
(c) Financial Reporting Impact of COVID-19 response measures (continued)
Statement of Financial Position 2021 2020 $'000 $'000 Significant changes in assets arising from COVID-19
Receivables recognised as at 30 June includes (note 39):
Payroll Tax deferral 667,080 428,175 Land Tax deferral 85,410 .. Gaming Machine Tax deferral 24,531 49,324 Total 777,021 477,499
Treasury also administered the Commonwealth Home Builder Grant with a total of $262.985 million paid during 2020-21 (note 36).
In 2019-20, any enforcement action that was in place before 19 March 2020 has remained and no new enforcement action has been made. SPER has re-commenced enforcement action in September 2020 for outstanding SPER fees and fines receivables.
Industry Support Package (ISP)
Treasury, in coordination with other Queensland Government departments and agencies, has implemented the Queensland Government's Industry Support Package (ISP) program which aims to support industry and businesses through COVID-19 to get up and running as economic activity improves. The ISP program was provided through grants, loans and other contributions to businesses. As at 30 June 2021, grants paid by Treasury amounts to $2.680 million (note 10). The loans to businesses are provided through Queensland Treasury Corporation (QTC) with the Treasurer providing a deed of guarantee for $200 million for the loan facilities (note 23).
Treasury has paid the costs of the ISP management fees amounting to $207,000 in 2020–21.
Essential Goods and Supply Chain Program (EGSCP)
The Queensland Government is mobilising Queensland’s multi-billion-dollar manufacturing sector to deliver the state’s Personal Protective Equipment for front-line health and essential workers, including face masks, hand sanitiser and ventilators.
The government has set a target that 25 per cent of all PPE bought by the Queensland Government would be made in Queensland and a new PPE testing facility would be established at Meadowbrook. As part of this initiative, Treasury has paid grants of $1.281 million to support the sector (note 10) in 2020–21.
Others
Additional borrowings were incurred in 2019–20 to fund the response measures announced by the Queensland Government in response to COVID-19. Borrowings in 2020-21 were incurred in response to the ongoing COVID-19 pandemic and to supporting economic recovery.
The impact to business operations in Queensland has also affected the fair value assessment of other financial assets (note 15) reported in the controlled books.
QTH has not identified any material COVID-19 risks as at 30 June 2021. No adjustments to the amounts recorded in the financial statements have been recognised during the financial year. QTH will continuously monitor the emergence of such risks.
In August 2021, the Queensland Government announced an additional support package to assist businesses impacted by further COVID-19 lockdowns. The support package includes a six-month deferral of payroll tax payments for Tourism and Hospitality Sector and additional business support grants to sole traders, small and medium sized businesses and large sized Tourism and Hospitality businesses. The Office of State Revenue will work with the relevant government departments to implement the additional relief measures in 2021–22.
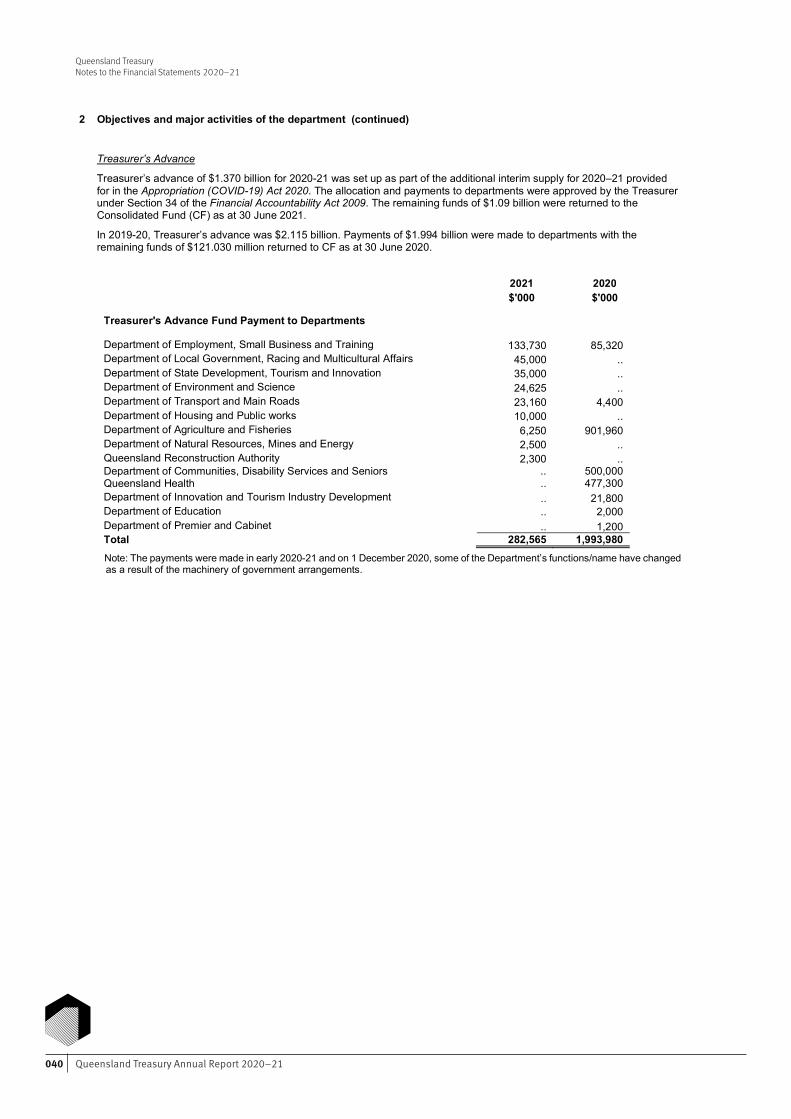
Queensland Treasury Annual Report 2020–21040
Queensland TreasuryNotes to the Financial Statements 2020–21Queensland Treasury Notes to the Financial Statements 2020-21
16 Financial Statements – Queensland Treasury
2 Objectives and major activities of the department (continued)
Treasurer’s Advance
Treasurer’s advance of $1.370 billion for 2020-21 was set up as part of the additional interim supply for 2020–21 provided for in the Appropriation (COVID-19) Act 2020. The allocation and payments to departments were approved by the Treasurer under Section 34 of the Financial Accountability Act 2009. The remaining funds of $1.09 billion were returned to the Consolidated Fund (CF) as at 30 June 2021.
In 2019-20, Treasurer’s advance was $2.115 billion. Payments of $1.994 billion were made to departments with the remaining funds of $121.030 million returned to CF as at 30 June 2020.
2021 2020
$'000 $'000 Treasurer's Advance Fund Payment to Departments Department of Employment, Small Business and Training 133,730 85,320 Department of Local Government, Racing and Multicultural Affairs 45,000 .. Department of State Development, Tourism and Innovation 35,000 .. Department of Environment and Science 24,625 .. Department of Transport and Main Roads 23,160 4,400 Department of Housing and Public works 10,000 .. Department of Agriculture and Fisheries 6,250 901,960 Department of Natural Resources, Mines and Energy 2,500 .. Queensland Reconstruction Authority 2,300 .. Department of Communities, Disability Services and Seniors .. 500,000 Queensland Health .. 477,300 Department of Innovation and Tourism Industry Development .. 21,800 Department of Education .. 2,000 Department of Premier and Cabinet .. 1,200 Total 282,565 1,993,980
Note: The payments were made in early 2020-21 and on 1 December 2020, some of the Department’s functions/name have changed as a result of the machinery of government arrangements.
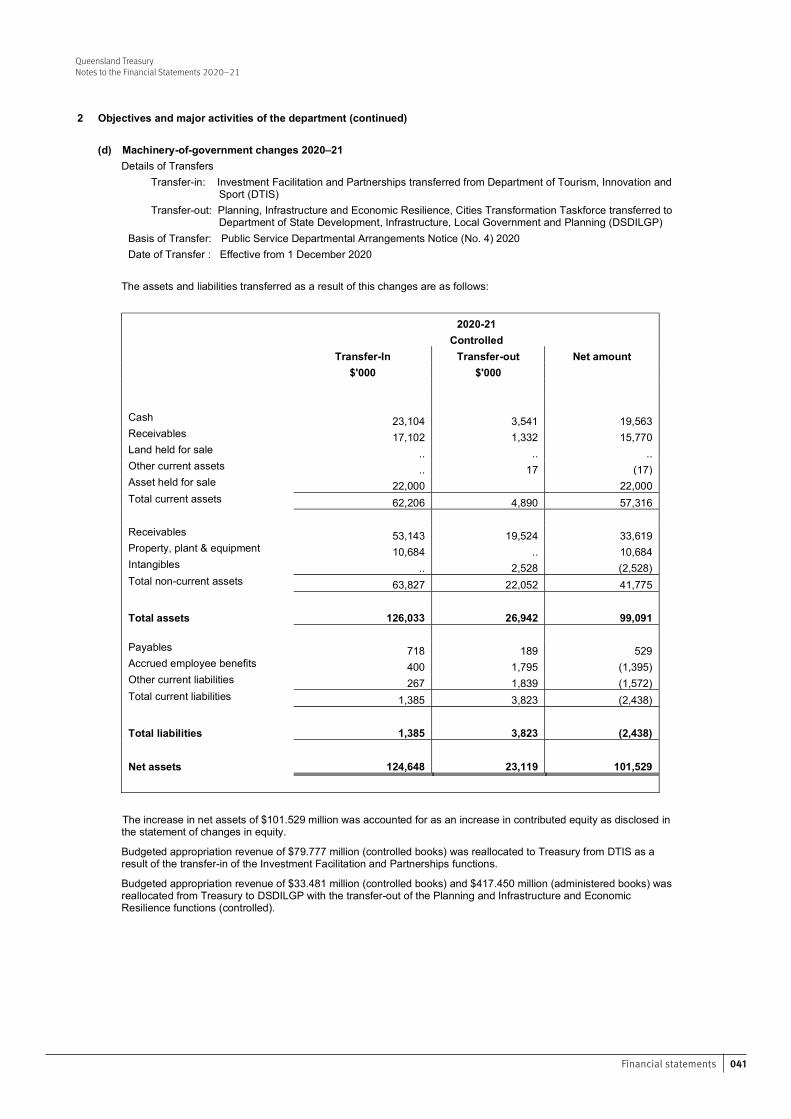
041Financial statements
Queensland TreasuryNotes to the Financial Statements 2020–21Queensland Treasury Notes to the Financial Statements 2020-21
17 Financial Statements – Queensland Treasury
2 Objectives and major activities of the department (continued) (d) Machinery-of-government changes 2020–21 Details of Transfers
Transfer-in: Investment Facilitation and Partnerships transferred from Department of Tourism, Innovation and Sport (DTIS)
Transfer-out: Planning, Infrastructure and Economic Resilience, Cities Transformation Taskforce transferred to Department of State Development, Infrastructure, Local Government and Planning (DSDILGP)
Basis of Transfer: Public Service Departmental Arrangements Notice (No. 4) 2020 Date of Transfer : Effective from 1 December 2020
The assets and liabilities transferred as a result of this changes are as follows:
2020-21 Controlled Transfer-In Transfer-out Net amount $'000 $'000 Cash 23,104 3,541 19,563 Receivables 17,102 1,332 15,770 Land held for sale .. .. .. Other current assets .. 17 (17) Asset held for sale 22,000 22,000 Total current assets 62,206 4,890 57,316 Receivables 53,143 19,524 33,619 Property, plant & equipment 10,684 .. 10,684 Intangibles .. 2,528 (2,528) Total non-current assets 63,827 22,052 41,775 Total assets 126,033 26,942 99,091 Payables 718 189 529 Accrued employee benefits 400 1,795 (1,395) Other current liabilities 267 1,839 (1,572) Total current liabilities 1,385 3,823 (2,438) Total liabilities 1,385 3,823 (2,438) Net assets 124,648 23,119 101,529
The increase in net assets of $101.529 million was accounted for as an increase in contributed equity as disclosed in
the statement of changes in equity.
Budgeted appropriation revenue of $79.777 million (controlled books) was reallocated to Treasury from DTIS as a result of the transfer-in of the Investment Facilitation and Partnerships functions.
Budgeted appropriation revenue of $33.481 million (controlled books) and $417.450 million (administered books) was reallocated from Treasury to DSDILGP with the transfer-out of the Planning and Infrastructure and Economic Resilience functions (controlled).
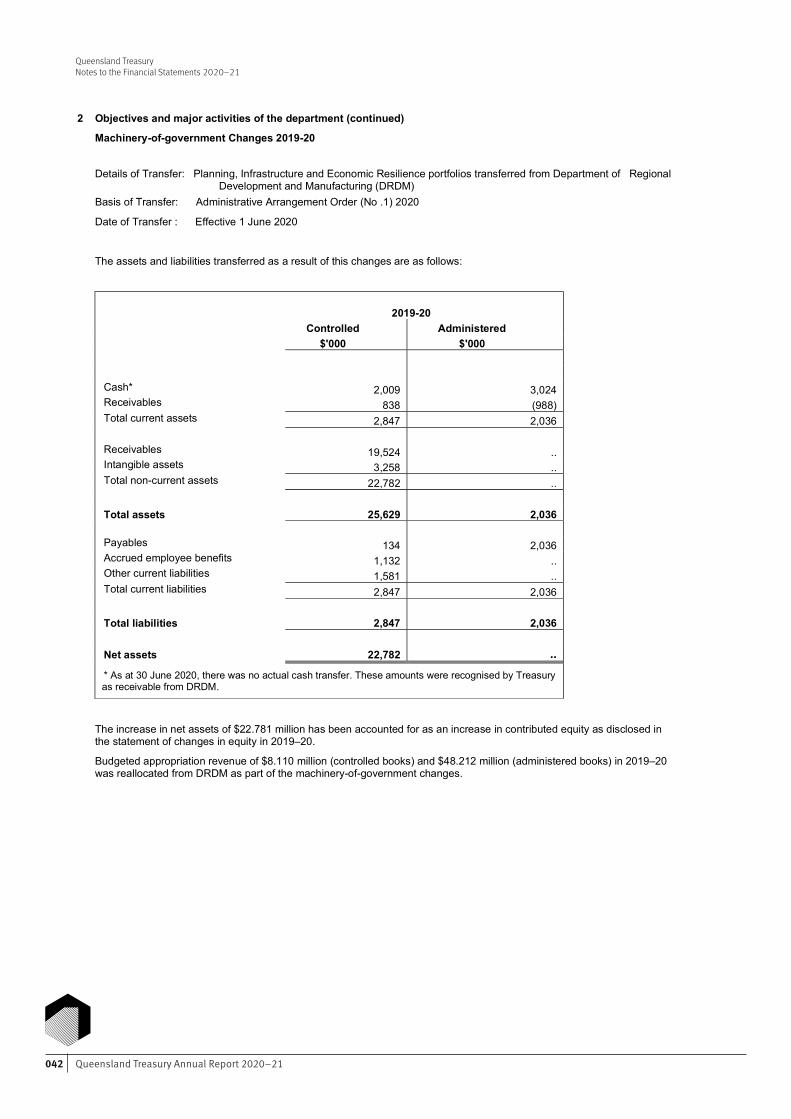
Queensland Treasury Annual Report 2020–21042
Queensland TreasuryNotes to the Financial Statements 2020–21Queensland Treasury Notes to the Financial Statements 2020-21
18 Financial Statements – Queensland Treasury
2 Objectives and major activities of the department (continued)
Machinery-of-government Changes 2019-20
Details of Transfer: Planning, Infrastructure and Economic Resilience portfolios transferred from Department of Regional
Development and Manufacturing (DRDM) Basis of Transfer: Administrative Arrangement Order (No .1) 2020
Date of Transfer : Effective 1 June 2020
The assets and liabilities transferred as a result of this changes are as follows:
2019-20 Controlled Administered
$'000 $'000
Cash* 2,009 3,024 Receivables 838 (988) Total current assets 2,847 2,036 Receivables 19,524 .. Intangible assets 3,258 .. Total non-current assets 22,782 .. Total assets 25,629 2,036 Payables 134 2,036 Accrued employee benefits 1,132 .. Other current liabilities 1,581 .. Total current liabilities 2,847 2,036 Total liabilities 2,847 2,036 Net assets 22,782 .. * As at 30 June 2020, there was no actual cash transfer. These amounts were recognised by Treasury as receivable from DRDM.
The increase in net assets of $22.781 million has been accounted for as an increase in contributed equity as disclosed in the statement of changes in equity in 2019–20.
Budgeted appropriation revenue of $8.110 million (controlled books) and $48.212 million (administered books) in 2019–20 was reallocated from DRDM as part of the machinery-of-government changes.
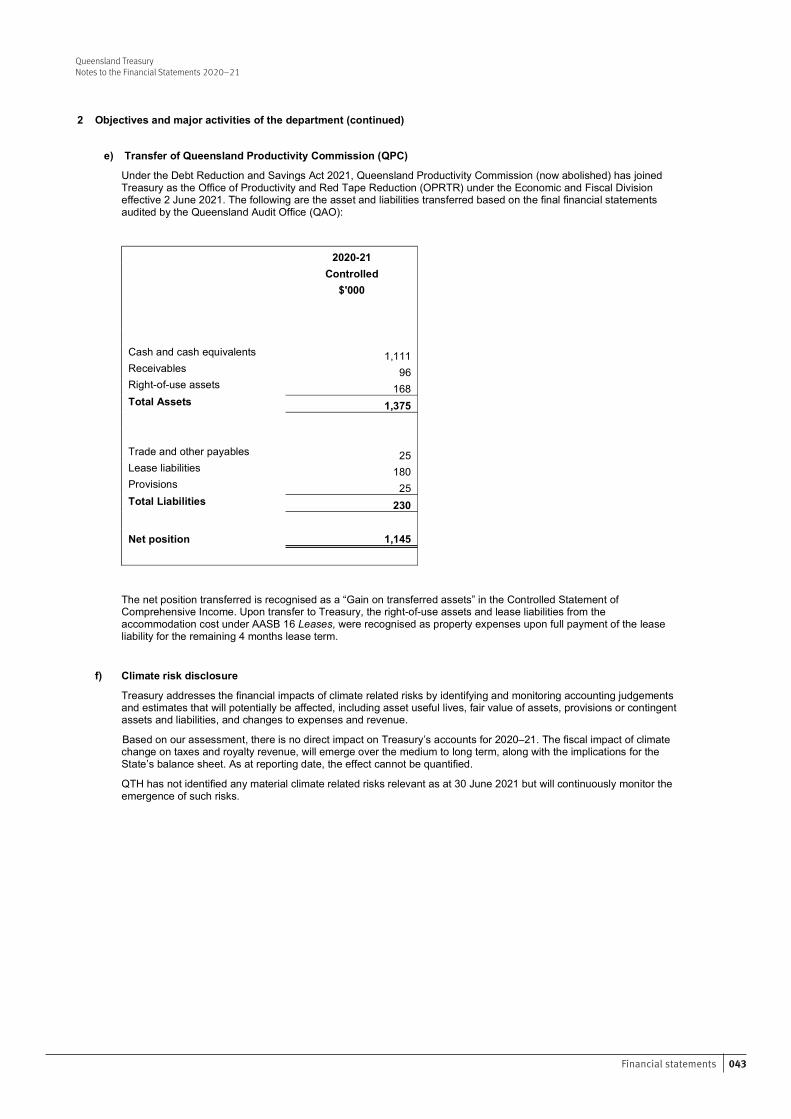
043Financial statements
Queensland TreasuryNotes to the Financial Statements 2020–21Queensland Treasury Notes to the Financial Statements 2020-21
19 Financial Statements – Queensland Treasury
2 Objectives and major activities of the department (continued)
e) Transfer of Queensland Productivity Commission (QPC)
Under the Debt Reduction and Savings Act 2021, Queensland Productivity Commission (now abolished) has joined Treasury as the Office of Productivity and Red Tape Reduction (OPRTR) under the Economic and Fiscal Division effective 2 June 2021. The following are the asset and liabilities transferred based on the final financial statements audited by the Queensland Audit Office (QAO):
2020-21 Controlled $'000 Cash and cash equivalents 1,111 Receivables 96 Right-of-use assets 168 Total Assets 1,375 Trade and other payables 25 Lease liabilities 180 Provisions 25 Total Liabilities 230 Net position 1,145
The net position transferred is recognised as a “Gain on transferred assets” in the Controlled Statement of Comprehensive Income. Upon transfer to Treasury, the right-of-use assets and lease liabilities from the accommodation cost under AASB 16 Leases, were recognised as property expenses upon full payment of the lease liability for the remaining 4 months lease term.
f) Climate risk disclosure
Treasury addresses the financial impacts of climate related risks by identifying and monitoring accounting judgements and estimates that will potentially be affected, including asset useful lives, fair value of assets, provisions or contingent assets and liabilities, and changes to expenses and revenue.
Based on our assessment, there is no direct impact on Treasury’s accounts for 2020–21. The fiscal impact of climate change on taxes and royalty revenue, will emerge over the medium to long term, along with the implications for the State’s balance sheet. As at reporting date, the effect cannot be quantified.
QTH has not identified any material climate related risks relevant as at 30 June 2021 but will continuously monitor the emergence of such risks.
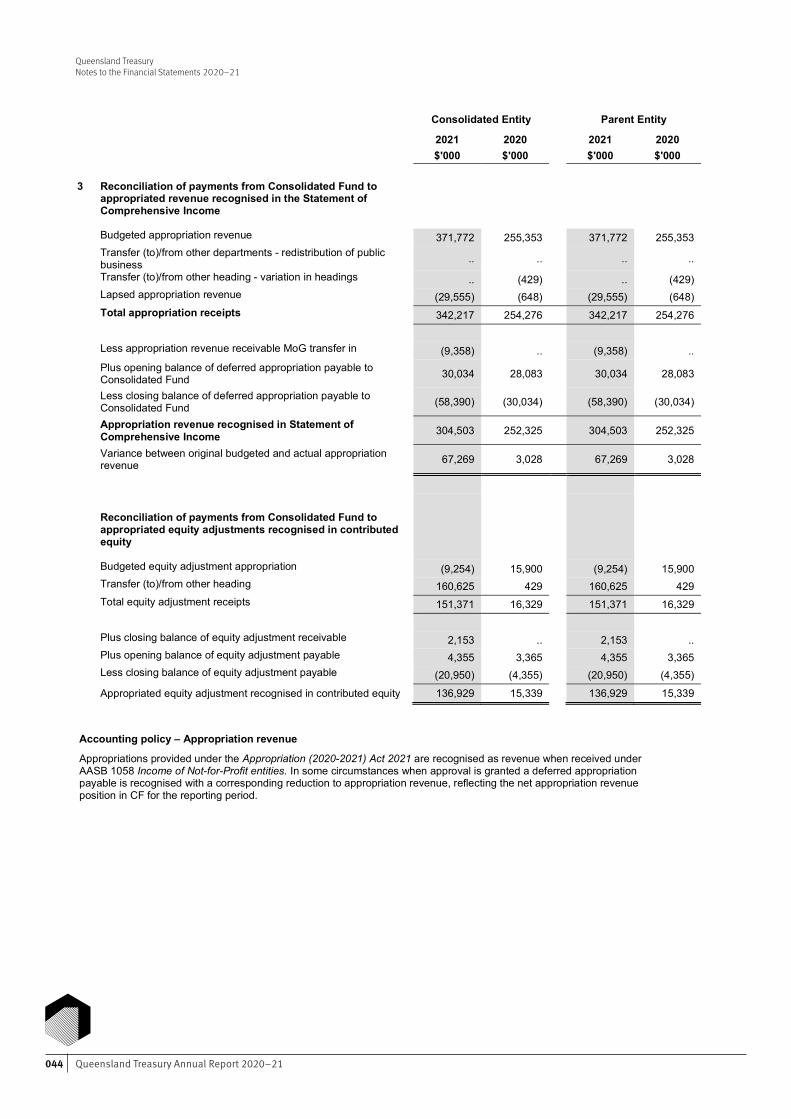
Queensland Treasury Annual Report 2020–21044
Queensland TreasuryNotes to the Financial Statements 2020–21
Queensland Treasury Notes to the Financial Statements 2020-21
20 Financial Statements – Queensland Treasury
Consolidated Entity Parent Entity
2021 2020 2021 2020 $'000 $'000 $'000 $'000
3 Reconciliation of payments from Consolidated Fund to
appropriated revenue recognised in the Statement of Comprehensive Income
Budgeted appropriation revenue 371,772 255,353 371,772 255,353 Transfer (to)/from other departments - redistribution of public business .. .. .. ..
Transfer (to)/from other heading - variation in headings .. (429) .. (429) Lapsed appropriation revenue (29,555) (648) (29,555) (648) Total appropriation receipts 342,217 254,276 342,217 254,276
Less appropriation revenue receivable MoG transfer in (9,358) ..
(9,358) ..
Plus opening balance of deferred appropriation payable to Consolidated Fund 30,034 28,083 30,034 28,083
Less closing balance of deferred appropriation payable to Consolidated Fund (58,390) (30,034) (58,390) (30,034)
Appropriation revenue recognised in Statement of Comprehensive Income 304,503 252,325 304,503 252,325
Variance between original budgeted and actual appropriation revenue 67,269 3,028 67,269 3,028
Reconciliation of payments from Consolidated Fund to appropriated equity adjustments recognised in contributed equity
Budgeted equity adjustment appropriation (9,254) 15,900 (9,254) 15,900 Transfer (to)/from other heading 160,625 429 160,625 429 Total equity adjustment receipts 151,371 16,329 151,371 16,329
Plus closing balance of equity adjustment receivable 2,153 .. 2,153 .. Plus opening balance of equity adjustment payable 4,355 3,365 4,355 3,365 Less closing balance of equity adjustment payable (20,950) (4,355) (20,950) (4,355) Appropriated equity adjustment recognised in contributed equity 136,929 15,339 136,929 15,339
Accounting policy – Appropriation revenue
Appropriations provided under the Appropriation (2020-2021) Act 2021 are recognised as revenue when received under AASB 1058 Income of Not-for-Profit entities. In some circumstances when approval is granted a deferred appropriation payable is recognised with a corresponding reduction to appropriation revenue, reflecting the net appropriation revenue position in CF for the reporting period.
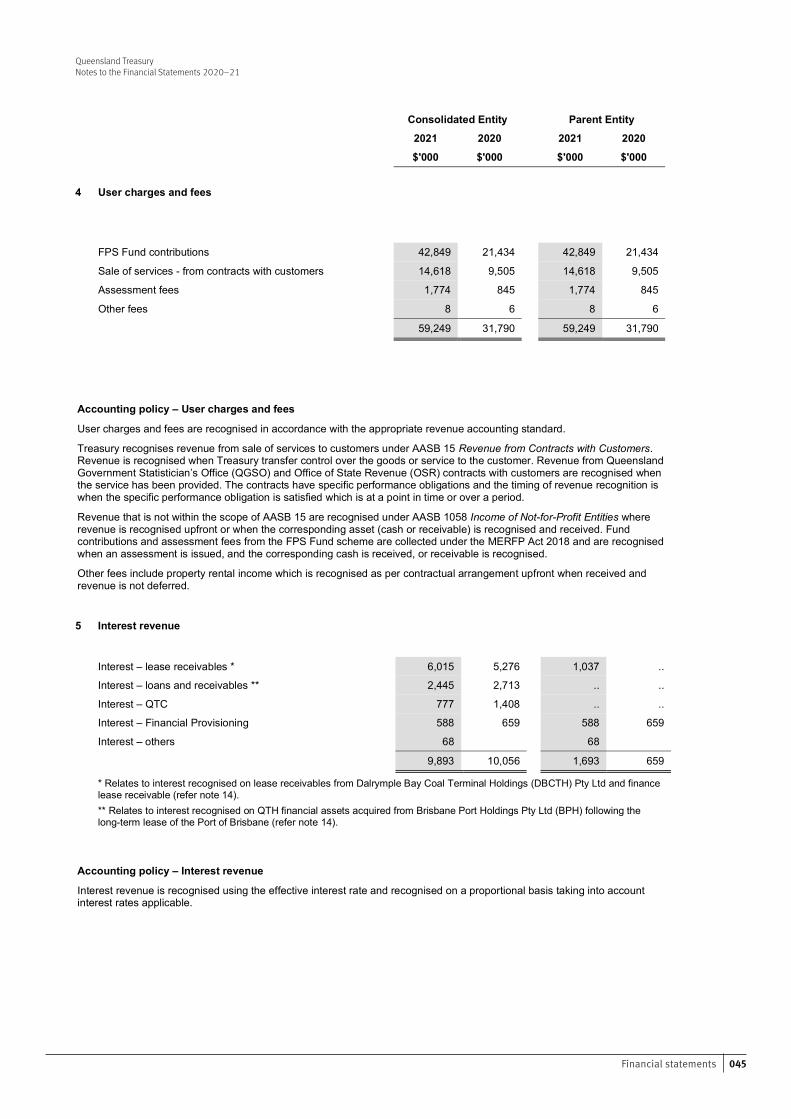
045Financial statements
Queensland TreasuryNotes to the Financial Statements 2020–21
Queensland Treasury Notes to the Financial Statements 2020-21
21 Financial Statements – Queensland Treasury
Consolidated Entity Parent Entity
2021 2020 2021 2020 $'000 $'000 $'000 $'000
4 User charges and fees
FPS Fund contributions 42,849 21,434 42,849 21,434 Sale of services - from contracts with customers 14,618 9,505 14,618 9,505 Assessment fees 1,774 845 1,774 845 Other fees 8 6 8 6
59,249 31,790 59,249 31,790
Accounting policy – User charges and fees
User charges and fees are recognised in accordance with the appropriate revenue accounting standard.
Treasury recognises revenue from sale of services to customers under AASB 15 Revenue from Contracts with Customers. Revenue is recognised when Treasury transfer control over the goods or service to the customer. Revenue from Queensland Government Statistician’s Office (QGSO) and Office of State Revenue (OSR) contracts with customers are recognised when the service has been provided. The contracts have specific performance obligations and the timing of revenue recognition is when the specific performance obligation is satisfied which is at a point in time or over a period.
Revenue that is not within the scope of AASB 15 are recognised under AASB 1058 Income of Not-for-Profit Entities where revenue is recognised upfront or when the corresponding asset (cash or receivable) is recognised and received. Fund contributions and assessment fees from the FPS Fund scheme are collected under the MERFP Act 2018 and are recognised when an assessment is issued, and the corresponding cash is received, or receivable is recognised.
Other fees include property rental income which is recognised as per contractual arrangement upfront when received and revenue is not deferred.
5 Interest revenue
Interest – lease receivables * 6,015 5,276 1,037 .. Interest – loans and receivables ** 2,445 2,713 .. .. Interest – QTC 777 1,408 .. .. Interest – Financial Provisioning 588 659 588 659 Interest – others 68 68
9,893 10,056 1,693 659
* Relates to interest recognised on lease receivables from Dalrymple Bay Coal Terminal Holdings (DBCTH) Pty Ltd and finance lease receivable (refer note 14). ** Relates to interest recognised on QTH financial assets acquired from Brisbane Port Holdings Pty Ltd (BPH) following the long-term lease of the Port of Brisbane (refer note 14).
Accounting policy – Interest revenue
Interest revenue is recognised using the effective interest rate and recognised on a proportional basis taking into account interest rates applicable.
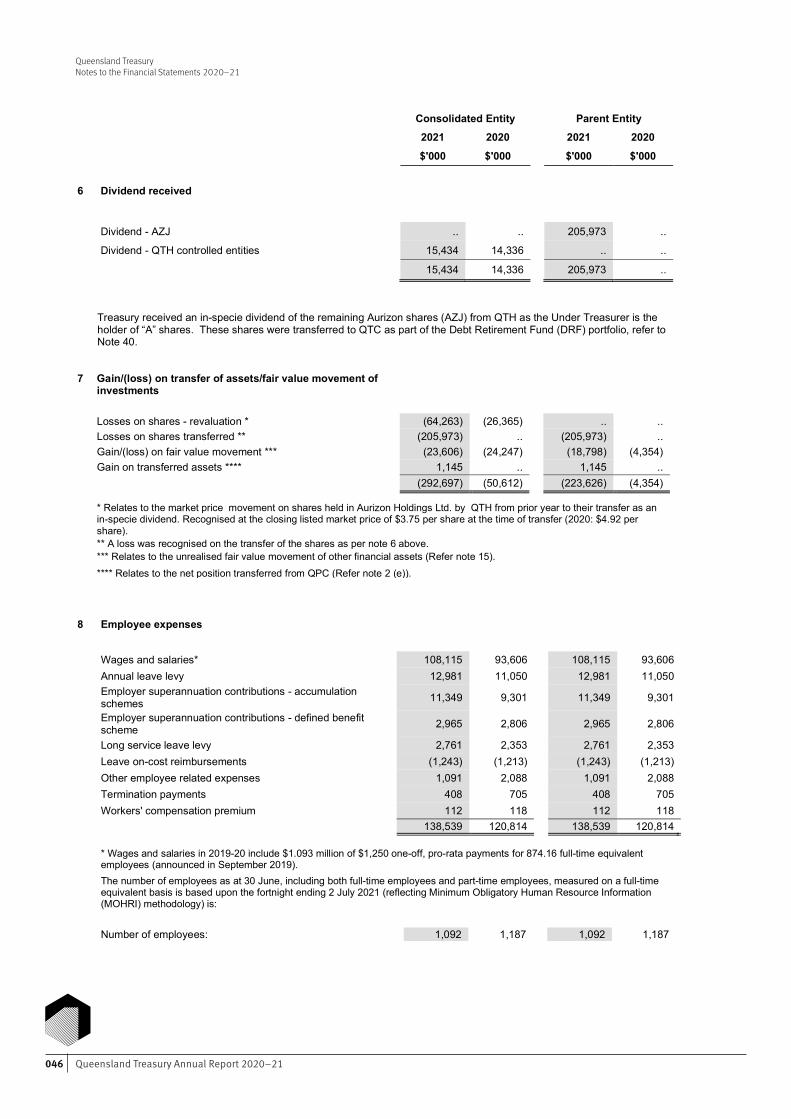
Queensland Treasury Annual Report 2020–21046
Queensland TreasuryNotes to the Financial Statements 2020–21
Queensland Treasury Notes to the Financial Statements 2020-21
22 Financial Statements – Queensland Treasury
Consolidated Entity Parent Entity
2021 2020 2021 2020 $'000 $'000 $'000 $'000
6 Dividend received
Dividend - AZJ .. .. 205,973 .. Dividend - QTH controlled entities 15,434 14,336 .. ..
15,434 14,336 205,973 ..
Treasury received an in-specie dividend of the remaining Aurizon shares (AZJ) from QTH as the Under Treasurer is the holder of “A” shares. These shares were transferred to QTC as part of the Debt Retirement Fund (DRF) portfolio, refer to Note 40.
7 Gain/(loss) on transfer of assets/fair value movement of
investments
Losses on shares - revaluation * (64,263) (26,365) .. .. Losses on shares transferred ** (205,973) .. (205,973) .. Gain/(loss) on fair value movement *** (23,606) (24,247) (18,798) (4,354) Gain on transferred assets **** 1,145 .. 1,145 ..
(292,697) (50,612) (223,626) (4,354)
* Relates to the market price movement on shares held in Aurizon Holdings Ltd. by QTH from prior year to their transfer as an in-specie dividend. Recognised at the closing listed market price of $3.75 per share at the time of transfer (2020: $4.92 per share). ** A loss was recognised on the transfer of the shares as per note 6 above. *** Relates to the unrealised fair value movement of other financial assets (Refer note 15).
**** Relates to the net position transferred from QPC (Refer note 2 (e)).
8 Employee expenses
Wages and salaries* 108,115 93,606 108,115 93,606 Annual leave levy 12,981 11,050 12,981 11,050 Employer superannuation contributions - accumulation schemes 11,349 9,301 11,349 9,301
Employer superannuation contributions - defined benefit scheme 2,965 2,806 2,965 2,806
Long service leave levy 2,761 2,353 2,761 2,353 Leave on-cost reimbursements (1,243) (1,213) (1,243) (1,213) Other employee related expenses 1,091 2,088 1,091 2,088 Termination payments 408 705 408 705 Workers' compensation premium 112 118 112 118
138,539 120,814 138,539 120,814
* Wages and salaries in 2019-20 include $1.093 million of $1,250 one-off, pro-rata payments for 874.16 full-time equivalent employees (announced in September 2019). The number of employees as at 30 June, including both full-time employees and part-time employees, measured on a full-time equivalent basis is based upon the fortnight ending 2 July 2021 (reflecting Minimum Obligatory Human Resource Information (MOHRI) methodology) is:
Number of employees: 1,092 1,187 1,092 1,187
047Financial statements
Queensland TreasuryNotes to the Financial Statements 2020–21
Queensland Treasury Notes to the Financial Statements 2020-21
23 Financial Statements – Queensland Treasury
8 Employee expenses (continued)
Accounting policy – Employee expenses
Salaries and wages
Salaries and wages expenses due but unpaid at reporting date are recognised in the statement of financial position at the current salary rates. As Treasury expects such liabilities to be wholly settled within 12 months of reporting date, the liabilities are recognised at undiscounted amounts.
Sick leave
History indicates that on average, sick leave taken each reporting period is less than the entitlement accrued. This is expected to continue in future periods. Accordingly, it is unlikely that existing accumulated entitlements will be used by employees and no liability for unused sick leave entitlements is recognised. As sick leave is non-vesting, an expense is recognised for this leave as it is taken.
Annual leave and Long service leave
Under the Annual Leave Central Scheme (ALCS) and Long Service Leave Scheme (LSL), a levy is made on Treasury to cover the cost of employees’ annual leave (including leave loading and on-costs) and long service leave. The levies are expensed in the period in which they are payable. Amounts paid to employees for annual leave and long service leave are claimed from the scheme quarterly in arrears.
No provision for annual leave and long service leave is recognised in Treasury’s financial statements, the liability being held on a whole-of-government basis and reported in those financial statements prepared pursuant to AASB 1049 Whole of Government and General Government Sector Financial Reporting.
Superannuation
Employer superannuation contributions are paid to QSuper and other members’ choice superannuation funds. Contributions are expensed in the period in which they are paid or payable. Treasury’s obligation is limited to its contribution to QSuper and other members’ choice superannuation funds.
Superannuation benefits are provided through defined contribution plan or through the Queensland Government’s QSuper defined benefit plan. Under the defined contribution plans, contributions are made to eligible complying superannuation funds based on the rates specified in the relevant EBA or other conditions of employment. For the defined benefit plan, the liability is held on a whole-of-government basis and reported in those financial statements pursuant to AASB 1049 Whole of Government and General Government Sector Financial Reporting. The amount of contributions is based upon the rates determined on the advice of the State Actuary. Contributions are paid by Treasury at the specified rate following completion of the employee’s service each pay period.
Key management personnel and remuneration
The Minister is identified as part of the Treasury’s key management personnel (KMP), consistent with additional guidance included in the revised version of AASB 124 Related Party Disclosures. The Minister is the Treasurer and Minister for Investment – Cameron Dick effective May 2020.
The Treasurer’s remuneration entitlements are outlined in the Legislative Assembly of Queensland’s Members’ Remuneration Handbook. Treasury does not bear any cost of remuneration of Ministers. The majority of ministerial entitlements are paid by the Legislative Assembly, with the remaining entitlements being provided by Ministerial Services Branch within the Department of the Premier and Cabinet. As all Ministers are reported as KMP of the Queensland Government, aggregate remuneration expenses for all Ministers is disclosed in the Queensland General Government and whole-of-government Consolidated Financial Statements, which are published as part of Queensland Treasury’s Report on State Finances.
Remuneration policy for Treasury's other KMP is set by the Queensland Public Service Commission as provided for under the Public Service Act 2008. Individual remuneration and other terms of employment (including motor vehicle entitlements and performance payments if applicable) are specified in employment contracts. No non-ministerial KMP remuneration packages provide for performance or bonus payments.
Remuneration expenses for those KMP comprise the following components: Short-term employee expenses, including:
salaries, allowances and leave entitlements earned and expensed for the entire year, or for that part of the year during which the employee occupied a KMP position
performance payments recognised as an expense during the year
non-monetary benefits - consisting of provision of vehicle together with fringe benefits tax applicable to the benefit.
Long term employee expenses include amounts expensed in respect of long service leave entitlements earned. Post-employment expenses include amounts expensed in respect of employer superannuation obligations.
Queensland Treasury Annual Report 2020–21048
Queensland TreasuryNotes to the Financial Statements 2020–21Queensland Treasury Notes to the Financial Statements 2020-21
24 Financial Statements – Queensland Treasury
8 Employee expenses (continued) Termination benefits include payments in lieu of notice on termination and other lump sum separation entitlements (excluding annual and long service leave entitlements) payable on termination of employment or acceptance of an offer of termination of employment.
Transactions with people/entities related to KMP
There are no related party transactions with the Treasury consolidated entity that involve KMP, close family members and/or their personal business interests.
The following table for non-ministerial KMP reflect those departmental positions that had authority and responsibility for planning, directing and controlling the activities of Treasury during the respective reporting periods. Further information about these positions can be found in the body of the Annual Report under the section relating to Executive Management.
There are new KMP for 2020–21 following the machinery-of-government (MoG) changes effective 1 December 2020.
In 2020-21, changes in KMP positions occurred as a result of a change in the organisational structure during the year. The KMP details in italics represents the previous responsibilities held by the KMP. In 2019–20, there was a change in some KMP positions to align with the department's new operating model that was effective from 2 January 2020. The KMP details in italics represents the positions under the Treasury organisational structure up to 31 December 2019.
The amounts disclosed below reflect expenses recognised in the Statement of Comprehensive Income:
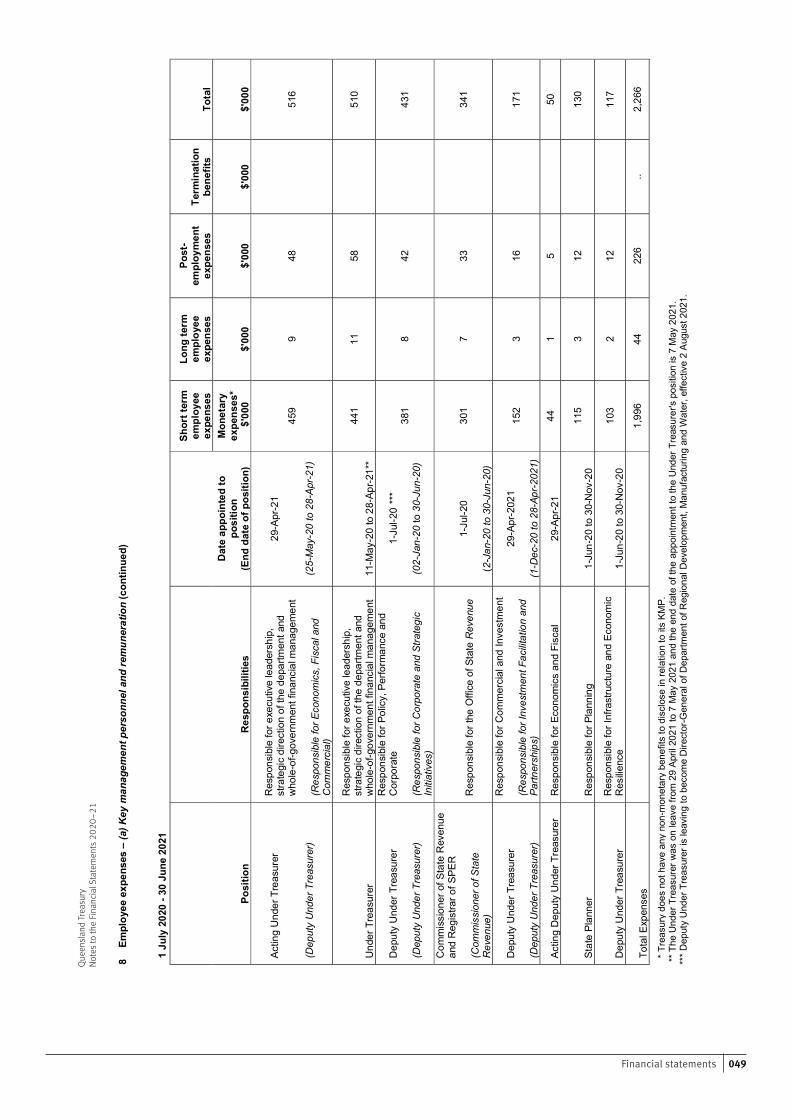
049Financial statements
Quee
nsla
nd Tr
easu
ryNo
tes t
o th
e Fin
ancia
l Sta
tem
ents
202
0–21
Que
ensl
and
Trea
sury
N
otes
to th
e Fi
nanc
ial S
tate
men
ts 2
020-
21
25
Fin
anci
al S
tate
men
ts –
Que
ensl
and
Trea
sury
8
Em
ploy
ee e
xpen
ses
– (a
) Key
man
agem
ent p
erso
nnel
and
rem
uner
atio
n (c
ontin
ued)
1 Ju
ly 2
020
- 30
June
202
1
Posi
tion
R
espo
nsib
ilitie
s
Dat
e ap
poin
ted
to
posi
tion
(End
dat
e of
pos
ition
)
Shor
t ter
m
empl
oyee
ex
pens
es
Long
term
em
ploy
ee
expe
nses
Post
-em
ploy
men
t ex
pens
es
Term
inat
ion
bene
fits
Tota
l M
onet
ary
expe
nses
*
$
'000
$'
000
$'00
0 $'
000
$'00
0
Actin
g U
nder
Tre
asur
er
(Dep
uty
Und
er T
reas
urer
)
Res
pons
ible
for e
xecu
tive
lead
ersh
ip,
stra
tegi
c di
rect
ion
of th
e de
partm
ent a
nd
who
le-o
f-gov
ernm
ent f
inan
cial
man
agem
ent
(Res
pons
ible
for E
cono
mic
s, F
isca
l and
C
omm
erci
al)
29-A
pr-2
1
(25-
May
-20
to 2
8-Ap
r-21
)
459
9 48
516
Und
er T
reas
urer
Res
pons
ible
for e
xecu
tive
lead
ersh
ip,
stra
tegi
c di
rect
ion
of th
e de
partm
ent a
nd
who
le-o
f-gov
ernm
ent f
inan
cial
man
agem
ent
11-M
ay-2
0 to
28-
Apr-2
1**
441
11
58
51
0
Dep
uty
Und
er T
reas
urer
(D
eput
y U
nder
Tre
asur
er)
Res
pons
ible
for P
olic
y, P
erfo
rman
ce a
nd
Cor
pora
te
(Res
pons
ible
for C
orpo
rate
and
Stra
tegi
c In
itiat
ives
)
1-Ju
l-20
***
(0
2-Ja
n-20
to 3
0-Ju
n-20
) 38
1 8
42
43
1
Com
mis
sion
er o
f Sta
te R
even
ue
and
Reg
istra
r of S
PER
(C
omm
issi
oner
of S
tate
R
even
ue)
Res
pons
ible
for t
he O
ffice
of S
tate
Rev
enue
1-
Jul-2
0
(2
-Jan
-20
to 3
0-Ju
n-20
)
301
7 33
341
Dep
uty
Und
er T
reas
urer
(D
eput
y U
nder
Tre
asur
er)
Res
pons
ible
for C
omm
erci
al a
nd In
vest
men
t (R
espo
nsib
le fo
r Inv
estm
ent F
acili
tatio
n an
d Pa
rtner
ship
s)
29-A
pr-2
021
(1
-Dec
-20
to 2
8-Ap
r-20
21)
152
3 16
171
Actin
g D
eput
y U
nder
Tre
asur
er
Res
pons
ible
for E
cono
mic
s an
d Fi
scal
29
-Apr
-21
44
1 5
50
Stat
e Pl
anne
r R
espo
nsib
le fo
r Pla
nnin
g 1-
Jun-
20 to
30-
Nov
-20
115
3 12
130
Dep
uty
Und
er T
reas
urer
R
espo
nsib
le fo
r Inf
rast
ruct
ure
and
Econ
omic
R
esilie
nce
1-Ju
n-20
to 3
0-N
ov-2
0 10
3 2
12
11
7
Tota
l Exp
ense
s
1,
996
44
226
.. 2,
266
* Tre
asur
y do
es n
ot h
ave
any
non-
mon
etar
y be
nefit
s to
dis
clos
e in
rela
tion
to it
s KM
P.
** T
he U
nder
Tre
asur
er w
as o
n le
ave
from
29
April
202
1 to
7 M
ay 2
021
and
the
end
date
of t
he a
ppoi
ntm
ent t
o th
e U
nder
Tre
asur
er's
pos
ition
is 7
May
202
1.
*** D
eput
y U
nder
Tre
asur
er is
leav
ing
to b
ecom
e D
irect
or-G
ener
al o
f Dep
artm
ent o
f Reg
iona
l Dev
elop
men
t, M
anuf
actu
ring
and
Wat
er, e
ffect
ive
2 Au
gust
202
1.
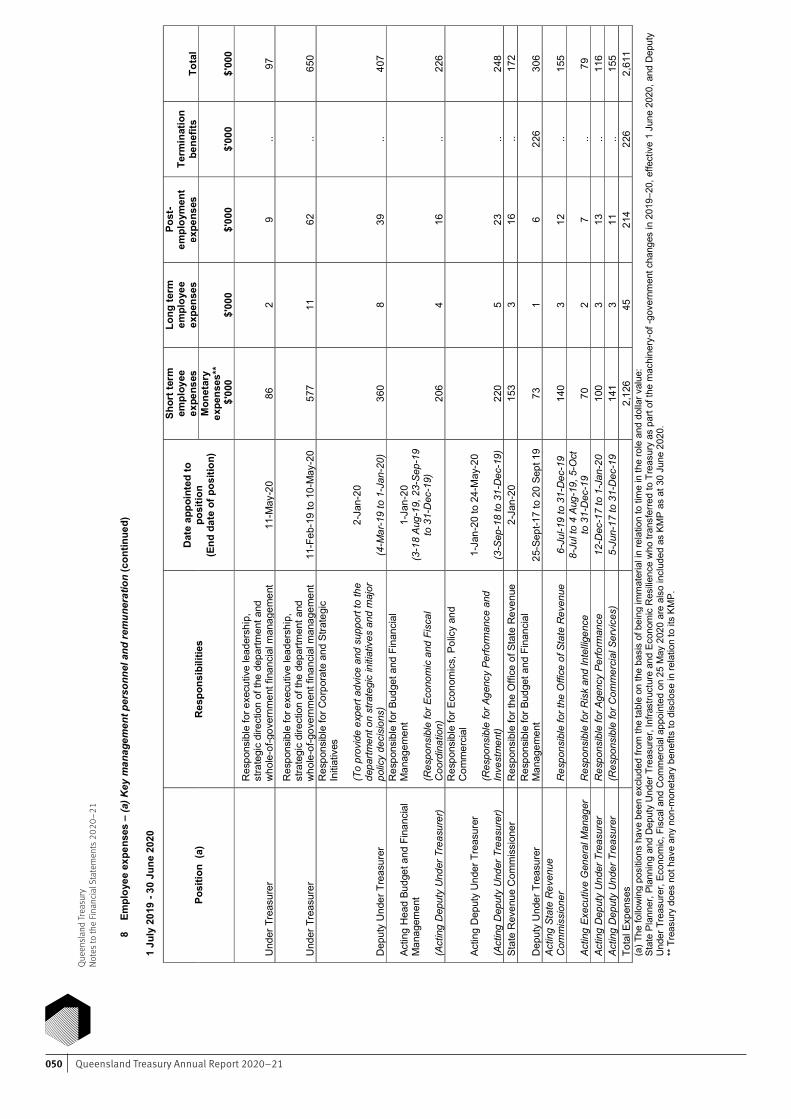
Queensland Treasury Annual Report 2020–21050
Quee
nsla
nd Tr
easu
ryNo
tes t
o th
e Fin
ancia
l Sta
tem
ents
202
0–21
Que
ensl
and
Trea
sury
N
otes
to th
e Fi
nanc
ial S
tate
men
ts 2
020-
21
26
Fin
anci
al S
tate
men
ts –
Que
ensl
and
Trea
sury
8
Em
ploy
ee e
xpen
ses
– (a
) Key
man
agem
ent p
erso
nnel
and
rem
uner
atio
n (c
ontin
ued)
1 Ju
ly 2
019
- 30
June
202
0
Posi
tion
(a)
R
espo
nsib
ilitie
s
Dat
e ap
poin
ted
to
posi
tion
(End
dat
e of
pos
ition
)
Shor
t ter
m
empl
oyee
ex
pens
es
Long
term
em
ploy
ee
expe
nses
Post
-em
ploy
men
t ex
pens
es
Term
inat
ion
bene
fits
Tota
l M
onet
ary
expe
nses
**
$
'000
$'
000
$'00
0 $'
000
$'00
0
Und
er T
reas
urer
Res
pons
ible
for e
xecu
tive
lead
ersh
ip,
stra
tegi
c di
rect
ion
of th
e de
partm
ent a
nd
who
le-o
f-gov
ernm
ent f
inan
cial
man
agem
ent
11-M
ay-2
0 86
2
9
..
97
Und
er T
reas
urer
Res
pons
ible
for e
xecu
tive
lead
ersh
ip,
stra
tegi
c di
rect
ion
of th
e de
partm
ent a
nd
who
le-o
f-gov
ernm
ent f
inan
cial
man
agem
ent
11-F
eb-1
9 to
10-
May
-20
577
11
62
..
65
0
Dep
uty
Und
er T
reas
urer
Res
pons
ible
for C
orpo
rate
and
Stra
tegi
c In
itiat
ives
(T
o pr
ovid
e ex
pert
advi
ce a
nd s
uppo
rt to
the
depa
rtmen
t on
stra
tegi
c in
itiat
ives
and
maj
or
polic
y de
cisi
ons)
2-Ja
n-20
(4-M
ar-1
9 to
1-J
an-2
0)
360
8
39
..
407
Actin
g H
ead
Budg
et a
nd F
inan
cial
M
anag
emen
t (A
ctin
g D
eput
y U
nder
Tre
asur
er)
Res
pons
ible
for B
udge
t and
Fin
anci
al
Man
agem
ent
(Res
pons
ible
for E
cono
mic
and
Fis
cal
Coo
rdin
atio
n)
1-
Jan-
20
(3-1
8 A
ug-1
9, 2
3-Se
p-19
to
31-
Dec
-19)
20
6
4
16
..
226
Actin
g D
eput
y U
nder
Tre
asur
er
(A
ctin
g D
eput
y U
nder
Tre
asur
er)
Res
pons
ible
for E
cono
mic
s, P
olic
y an
d C
omm
erci
al
(Res
pons
ible
for A
genc
y Pe
rform
ance
and
In
vest
men
t)
1-Ja
n-20
to 2
4-M
ay-2
0
(3-S
ep-1
8 to
31-
Dec
-19)
22
0
5
23
..
248
St
ate
Rev
enue
Com
mis
sion
er
Res
pons
ible
for t
he O
ffice
of S
tate
Rev
enue
2-
Jan-
20
153
3
16
..
17
2
Dep
uty
Und
er T
reas
urer
R
espo
nsib
le fo
r Bud
get a
nd F
inan
cial
M
anag
emen
t 25
-Sep
t-17
to 2
0 Se
pt 1
9 73
1
6
22
6
306
Ac
ting
Stat
e R
even
ue
Com
mis
sion
er
Res
pons
ible
for t
he O
ffice
of S
tate
Rev
enue
6-
Jul-1
9 to
31-
Dec
-19
140
3
12
..
15
5
Actin
g Ex
ecut
ive
Gen
eral
Man
ager
R
espo
nsib
le fo
r Ris
k an
d In
telli
genc
e 8-
Jul t
o 4
Aug-
19, 5
-Oct
to
31-
Dec
-19
70
2
7
..
79
Actin
g D
eput
y U
nder
Tre
asur
er
Res
pons
ible
for A
genc
y Pe
rform
ance
12
-Dec
-17
to 1
-Jan
-20
100
3
13
..
11
6
Actin
g D
eput
y U
nder
Tre
asur
er
(Res
pons
ible
for C
omm
erci
al S
ervi
ces)
5-
Jun-
17 to
31-
Dec
-19
141
3
11
..
15
5
Tota
l Exp
ense
s
2,
126
45
214
22
6
2,61
1 (a
) The
follo
win
g po
sitio
ns h
ave
been
exc
lude
d fro
m th
e ta
ble
on th
e ba
sis
of b
eing
imm
ater
ial i
n re
latio
n to
tim
e in
the
role
and
dol
lar v
alue
: St
ate
Plan
ner,
Plan
ning
and
Dep
uty
Und
er T
reas
urer
, Inf
rast
ruct
ure
and
Econ
omic
Res
ilienc
e w
ho tr
ansf
erre
d to
Tre
asur
y as
par
t of t
he m
achi
nery
-of -
gove
rnm
ent c
hang
es in
201
9–20
, effe
ctiv
e 1
June
202
0, a
nd D
eput
y U
nder
Tre
asur
er, E
cono
mic
, Fis
cal a
nd C
omm
erci
al a
ppoi
nted
on
25 M
ay 2
020
are
also
incl
uded
as
KMP
as a
t 30
June
202
0.
** T
reas
ury
does
not
hav
e an
y no
n-m
onet
ary
bene
fits
to d
iscl
ose
in re
latio
n to
its
KMP.
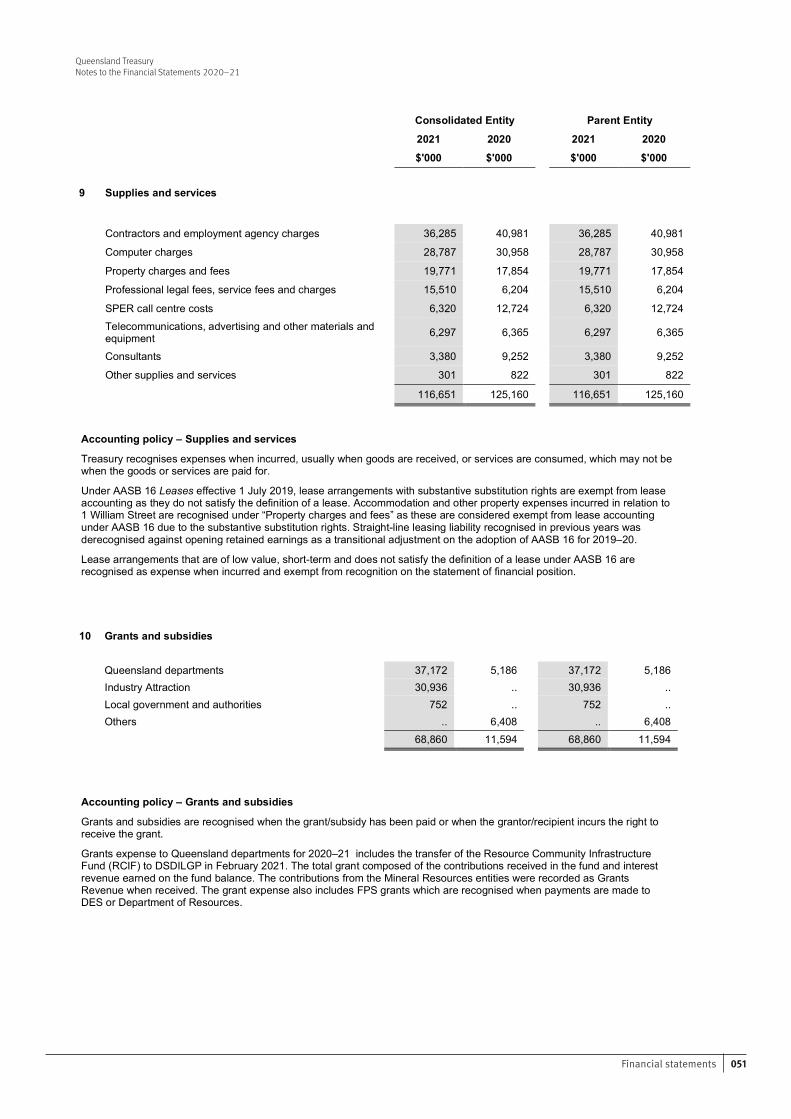
051Financial statements
Queensland TreasuryNotes to the Financial Statements 2020–21
Queensland Treasury Notes to the Financial Statements 2020-21
27 Financial Statements – Queensland Treasury
Consolidated Entity Parent Entity
2021 2020 2021 2020 $'000 $'000 $'000 $'000
9 Supplies and services
Contractors and employment agency charges 36,285 40,981 36,285 40,981 Computer charges 28,787 30,958 28,787 30,958 Property charges and fees 19,771 17,854 19,771 17,854 Professional legal fees, service fees and charges 15,510 6,204 15,510 6,204 SPER call centre costs 6,320 12,724 6,320 12,724 Telecommunications, advertising and other materials and equipment 6,297 6,365 6,297 6,365
Consultants 3,380 9,252 3,380 9,252 Other supplies and services 301 822 301 822
116,651 125,160 116,651 125,160
Accounting policy – Supplies and services
Treasury recognises expenses when incurred, usually when goods are received, or services are consumed, which may not be when the goods or services are paid for.
Under AASB 16 Leases effective 1 July 2019, lease arrangements with substantive substitution rights are exempt from lease accounting as they do not satisfy the definition of a lease. Accommodation and other property expenses incurred in relation to 1 William Street are recognised under “Property charges and fees” as these are considered exempt from lease accounting under AASB 16 due to the substantive substitution rights. Straight-line leasing liability recognised in previous years was derecognised against opening retained earnings as a transitional adjustment on the adoption of AASB 16 for 2019–20.
Lease arrangements that are of low value, short-term and does not satisfy the definition of a lease under AASB 16 are recognised as expense when incurred and exempt from recognition on the statement of financial position.
10 Grants and subsidies
Queensland departments 37,172 5,186 37,172 5,186 Industry Attraction 30,936 .. 30,936 .. Local government and authorities 752 .. 752 .. Others .. 6,408 .. 6,408
68,860 11,594 68,860 11,594
Accounting policy – Grants and subsidies
Grants and subsidies are recognised when the grant/subsidy has been paid or when the grantor/recipient incurs the right to receive the grant.
Grants expense to Queensland departments for 2020–21 includes the transfer of the Resource Community Infrastructure Fund (RCIF) to DSDILGP in February 2021. The total grant composed of the contributions received in the fund and interest revenue earned on the fund balance. The contributions from the Mineral Resources entities were recorded as Grants Revenue when received. The grant expense also includes FPS grants which are recognised when payments are made to DES or Department of Resources.
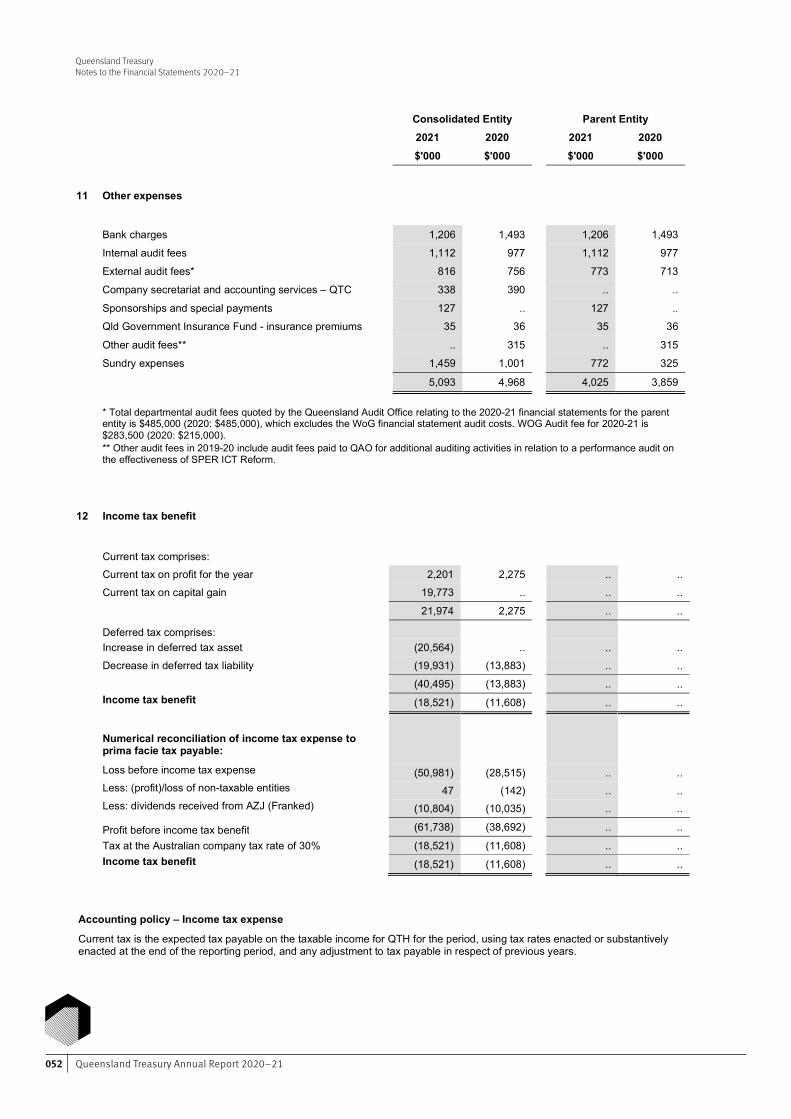
Queensland Treasury Annual Report 2020–21052
Queensland TreasuryNotes to the Financial Statements 2020–21Queensland Treasury
Notes to the Financial Statements 2020-21
28 Financial Statements – Queensland Treasury
Consolidated Entity Parent Entity
2021 2020 2021 2020 $'000 $'000 $'000 $'000
11 Other expenses
Bank charges 1,206 1,493 1,206 1,493 Internal audit fees 1,112 977 1,112 977 External audit fees* 816 756 773 713 Company secretariat and accounting services – QTC 338 390 .. .. Sponsorships and special payments 127 .. 127 .. Qld Government Insurance Fund - insurance premiums 35 36 35 36 Other audit fees** .. 315 .. 315 Sundry expenses 1,459 1,001 772 325
5,093 4,968 4,025 3,859
* Total departmental audit fees quoted by the Queensland Audit Office relating to the 2020-21 financial statements for the parent entity is $485,000 (2020: $485,000), which excludes the WoG financial statement audit costs. WOG Audit fee for 2020-21 is $283,500 (2020: $215,000).
** Other audit fees in 2019-20 include audit fees paid to QAO for additional auditing activities in relation to a performance audit on the effectiveness of SPER ICT Reform.
12 Income tax benefit
Current tax comprises:
Current tax on profit for the year 2,201 2,275 .. .. Current tax on capital gain 19,773 .. .. ..
21,974 2,275 .. .. Deferred tax comprises:
Increase in deferred tax asset (20,564) .. .. .. Decrease in deferred tax liability (19,931) (13,883) .. ..
(40,495) (13,883) .. .. Income tax benefit (18,521) (11,608) .. ..
Numerical reconciliation of income tax expense to prima facie tax payable:
Loss before income tax expense (50,981) (28,515) .. .. Less: (profit)/loss of non-taxable entities 47 (142) .. .. Less: dividends received from AZJ (Franked) (10,804) (10,035) .. .. Profit before income tax benefit (61,738) (38,692) .. ..
Tax at the Australian company tax rate of 30% (18,521) (11,608) .. .. Income tax benefit (18,521) (11,608) .. ..
Accounting policy – Income tax expense
Current tax is the expected tax payable on the taxable income for QTH for the period, using tax rates enacted or substantively enacted at the end of the reporting period, and any adjustment to tax payable in respect of previous years.
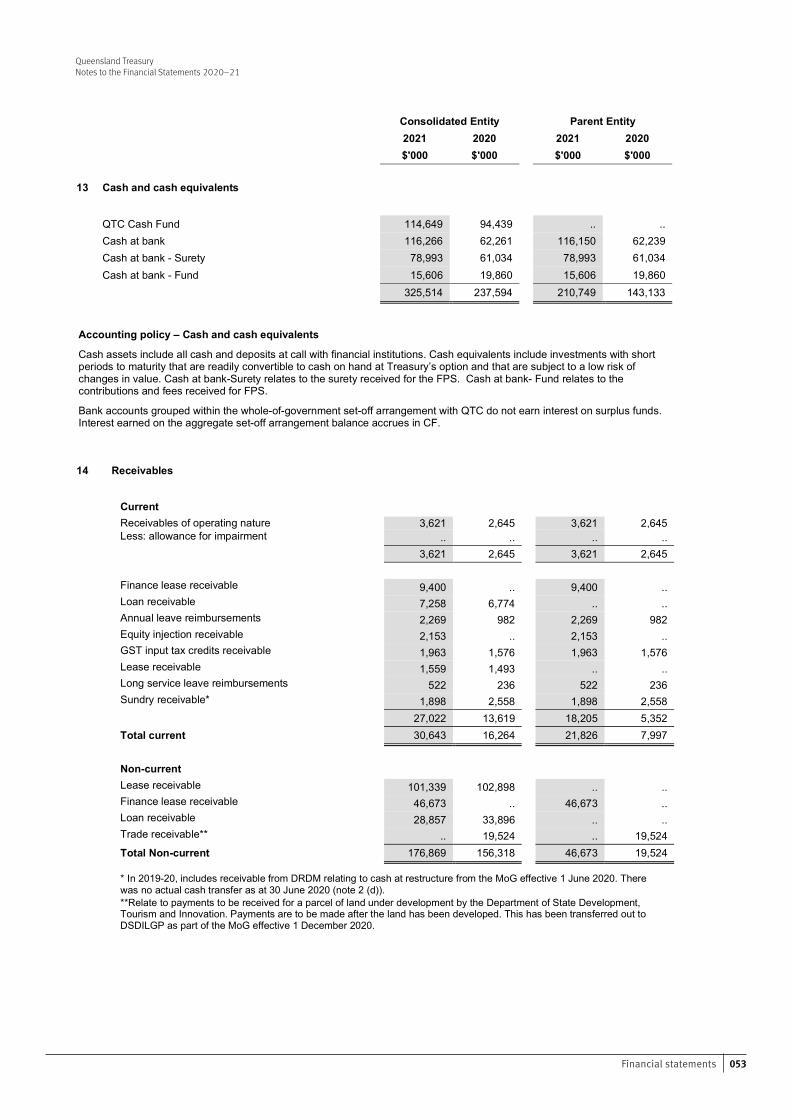
053Financial statements
Queensland TreasuryNotes to the Financial Statements 2020–21Queensland Treasury
Notes to the Financial Statements 2020-21
29 Financial Statements – Queensland Treasury
Consolidated Entity Parent Entity
2021 2020 2021 2020 $'000 $'000 $'000 $'000
13 Cash and cash equivalents
QTC Cash Fund 114,649 94,439 .. .. Cash at bank 116,266 62,261 116,150 62,239 Cash at bank - Surety 78,993 61,034 78,993 61,034 Cash at bank - Fund 15,606 19,860 15,606 19,860 325,514 237,594 210,749 143,133
Accounting policy – Cash and cash equivalents
Cash assets include all cash and deposits at call with financial institutions. Cash equivalents include investments with short periods to maturity that are readily convertible to cash on hand at Treasury’s option and that are subject to a low risk of changes in value. Cash at bank-Surety relates to the surety received for the FPS. Cash at bank- Fund relates to the contributions and fees received for FPS.
Bank accounts grouped within the whole-of-government set-off arrangement with QTC do not earn interest on surplus funds. Interest earned on the aggregate set-off arrangement balance accrues in CF.
14 Receivables
Current
Receivables of operating nature 3,621 2,645 3,621 2,645 Less: allowance for impairment .. .. .. ..
3,621 2,645 3,621 2,645
Finance lease receivable 9,400 .. 9,400 .. Loan receivable 7,258 6,774 .. .. Annual leave reimbursements 2,269 982 2,269 982 Equity injection receivable 2,153 .. 2,153 .. GST input tax credits receivable 1,963 1,576 1,963 1,576 Lease receivable 1,559 1,493 .. .. Long service leave reimbursements 522 236 522 236 Sundry receivable* 1,898 2,558 1,898 2,558
27,022 13,619 18,205 5,352 Total current 30,643 16,264 21,826 7,997
Non-current Lease receivable 101,339 102,898 .. .. Finance lease receivable. 46,673 .. 46,673 .. Loan receivable 28,857 33,896 .. .. Trade receivable** .. 19,524 .. 19,524 Total Non-current 176,869 156,318 46,673 19,524
* In 2019-20, includes receivable from DRDM relating to cash at restructure from the MoG effective 1 June 2020. There was no actual cash transfer as at 30 June 2020 (note 2 (d)). **Relate to payments to be received for a parcel of land under development by the Department of State Development, Tourism and Innovation. Payments are to be made after the land has been developed. This has been transferred out to DSDILGP as part of the MoG effective 1 December 2020.
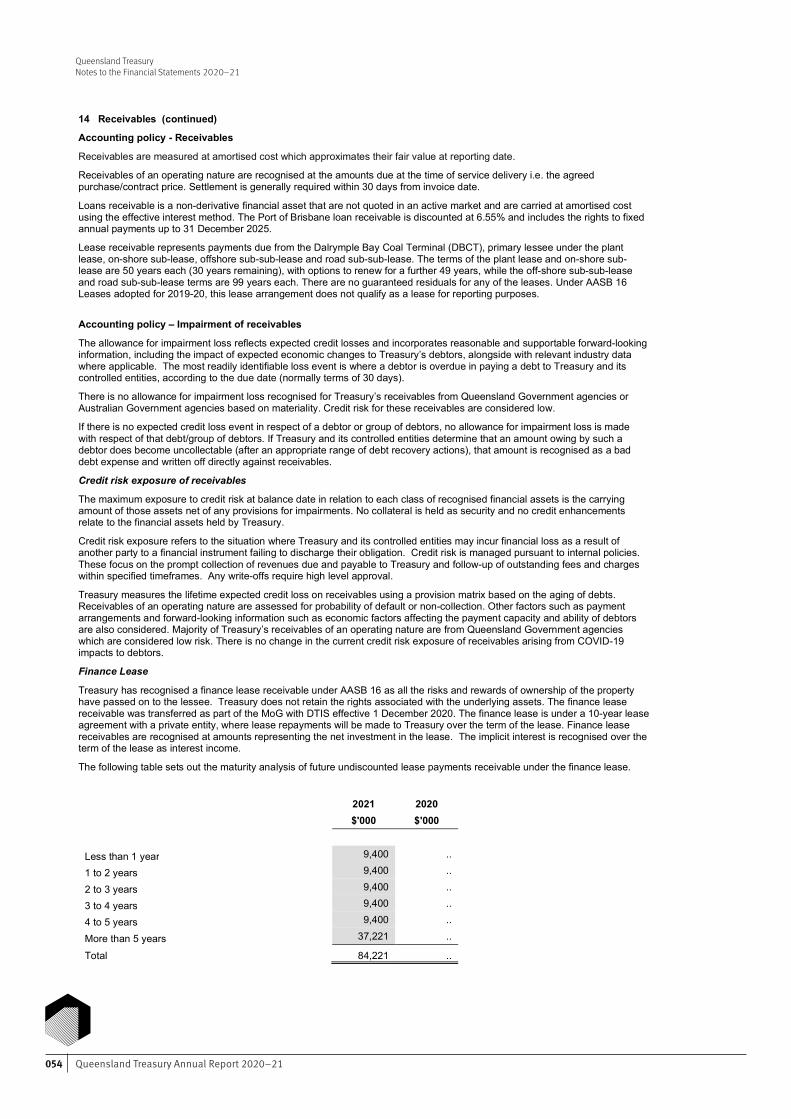
Queensland Treasury Annual Report 2020–21054
Queensland TreasuryNotes to the Financial Statements 2020–21
Queensland Treasury Notes to the Financial Statements 2020-21
30 Financial Statements – Queensland Treasury
14 Receivables (continued)
Accounting policy - Receivables
Receivables are measured at amortised cost which approximates their fair value at reporting date.
Receivables of an operating nature are recognised at the amounts due at the time of service delivery i.e. the agreed purchase/contract price. Settlement is generally required within 30 days from invoice date.
Loans receivable is a non-derivative financial asset that are not quoted in an active market and are carried at amortised cost using the effective interest method. The Port of Brisbane loan receivable is discounted at 6.55% and includes the rights to fixed annual payments up to 31 December 2025.
Lease receivable represents payments due from the Dalrymple Bay Coal Terminal (DBCT), primary lessee under the plant lease, on-shore sub-lease, offshore sub-sub-lease and road sub-sub-lease. The terms of the plant lease and on-shore sub-lease are 50 years each (30 years remaining), with options to renew for a further 49 years, while the off-shore sub-sub-lease and road sub-sub-lease terms are 99 years each. There are no guaranteed residuals for any of the leases. Under AASB 16 Leases adopted for 2019-20, this lease arrangement does not qualify as a lease for reporting purposes.
Accounting policy – Impairment of receivables
The allowance for impairment loss reflects expected credit losses and incorporates reasonable and supportable forward-looking information, including the impact of expected economic changes to Treasury’s debtors, alongside with relevant industry data where applicable. The most readily identifiable loss event is where a debtor is overdue in paying a debt to Treasury and its controlled entities, according to the due date (normally terms of 30 days).
There is no allowance for impairment loss recognised for Treasury’s receivables from Queensland Government agencies or Australian Government agencies based on materiality. Credit risk for these receivables are considered low.
If there is no expected credit loss event in respect of a debtor or group of debtors, no allowance for impairment loss is made with respect of that debt/group of debtors. If Treasury and its controlled entities determine that an amount owing by such a debtor does become uncollectable (after an appropriate range of debt recovery actions), that amount is recognised as a bad debt expense and written off directly against receivables.
Credit risk exposure of receivables
The maximum exposure to credit risk at balance date in relation to each class of recognised financial assets is the carrying amount of those assets net of any provisions for impairments. No collateral is held as security and no credit enhancements relate to the financial assets held by Treasury.
Credit risk exposure refers to the situation where Treasury and its controlled entities may incur financial loss as a result of another party to a financial instrument failing to discharge their obligation. Credit risk is managed pursuant to internal policies. These focus on the prompt collection of revenues due and payable to Treasury and follow-up of outstanding fees and charges within specified timeframes. Any write-offs require high level approval.
Treasury measures the lifetime expected credit loss on receivables using a provision matrix based on the aging of debts. Receivables of an operating nature are assessed for probability of default or non-collection. Other factors such as payment arrangements and forward-looking information such as economic factors affecting the payment capacity and ability of debtors are also considered. Majority of Treasury’s receivables of an operating nature are from Queensland Government agencies which are considered low risk. There is no change in the current credit risk exposure of receivables arising from COVID-19 impacts to debtors.
Finance Lease
Treasury has recognised a finance lease receivable under AASB 16 as all the risks and rewards of ownership of the property have passed on to the lessee. Treasury does not retain the rights associated with the underlying assets. The finance lease receivable was transferred as part of the MoG with DTIS effective 1 December 2020. The finance lease is under a 10-year lease agreement with a private entity, where lease repayments will be made to Treasury over the term of the lease. Finance lease receivables are recognised at amounts representing the net investment in the lease. The implicit interest is recognised over the term of the lease as interest income.
The following table sets out the maturity analysis of future undiscounted lease payments receivable under the finance lease.
2021 2020 $'000 $'000
Less than 1 year 9,400 ..
1 to 2 years 9,400 ..
2 to 3 years 9,400 ..
3 to 4 years 9,400 ..
4 to 5 years 9,400 ..
More than 5 years 37,221 ..
Total 84,221 ..
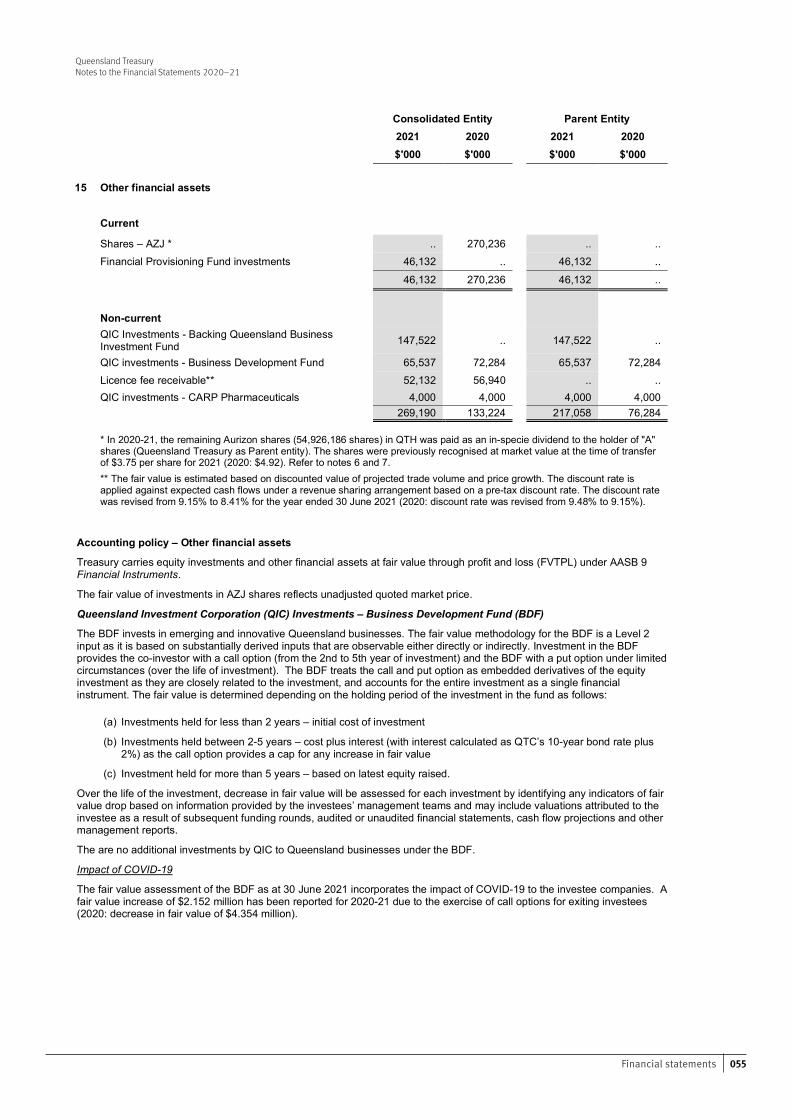
055Financial statements
Queensland TreasuryNotes to the Financial Statements 2020–21
Queensland Treasury Notes to the Financial Statements 2020-21
31 Financial Statements – Queensland Treasury
Consolidated Entity Parent Entity
2021 2020 2021 2020
$'000 $'000 $'000 $'000
15 Other financial assets
Current
Shares – AZJ * .. 270,236 .. ..
Financial Provisioning Fund investments 46,132 .. 46,132 ..
46,132 270,236 46,132 ..
Non-current
QIC Investments - Backing Queensland Business Investment Fund 147,522 .. 147,522 ..
QIC investments - Business Development Fund 65,537 72,284 65,537 72,284
Licence fee receivable** 52,132 56,940 .. ..
QIC investments - CARP Pharmaceuticals 4,000 4,000 4,000 4,000 269,190 133,224 217,058 76,284
* In 2020-21, the remaining Aurizon shares (54,926,186 shares) in QTH was paid as an in-specie dividend to the holder of "A" shares (Queensland Treasury as Parent entity). The shares were previously recognised at market value at the time of transfer of $3.75 per share for 2021 (2020: $4.92). Refer to notes 6 and 7.
** The fair value is estimated based on discounted value of projected trade volume and price growth. The discount rate is applied against expected cash flows under a revenue sharing arrangement based on a pre-tax discount rate. The discount rate was revised from 9.15% to 8.41% for the year ended 30 June 2021 (2020: discount rate was revised from 9.48% to 9.15%).
Accounting policy – Other financial assets
Treasury carries equity investments and other financial assets at fair value through profit and loss (FVTPL) under AASB 9 Financial Instruments.
The fair value of investments in AZJ shares reflects unadjusted quoted market price.
Queensland Investment Corporation (QIC) Investments – Business Development Fund (BDF)
The BDF invests in emerging and innovative Queensland businesses. The fair value methodology for the BDF is a Level 2 input as it is based on substantially derived inputs that are observable either directly or indirectly. Investment in the BDF provides the co-investor with a call option (from the 2nd to 5th year of investment) and the BDF with a put option under limited circumstances (over the life of investment). The BDF treats the call and put option as embedded derivatives of the equity investment as they are closely related to the investment, and accounts for the entire investment as a single financial instrument. The fair value is determined depending on the holding period of the investment in the fund as follows:
(a) Investments held for less than 2 years – initial cost of investment
(b) Investments held between 2-5 years – cost plus interest (with interest calculated as QTC’s 10-year bond rate plus 2%) as the call option provides a cap for any increase in fair value
(c) Investment held for more than 5 years – based on latest equity raised.
Over the life of the investment, decrease in fair value will be assessed for each investment by identifying any indicators of fair value drop based on information provided by the investees’ management teams and may include valuations attributed to the investee as a result of subsequent funding rounds, audited or unaudited financial statements, cash flow projections and other management reports.
The are no additional investments by QIC to Queensland businesses under the BDF.
Impact of COVID-19
The fair value assessment of the BDF as at 30 June 2021 incorporates the impact of COVID-19 to the investee companies. A fair value increase of $2.152 million has been reported for 2020-21 due to the exercise of call options for exiting investees (2020: decrease in fair value of $4.354 million).
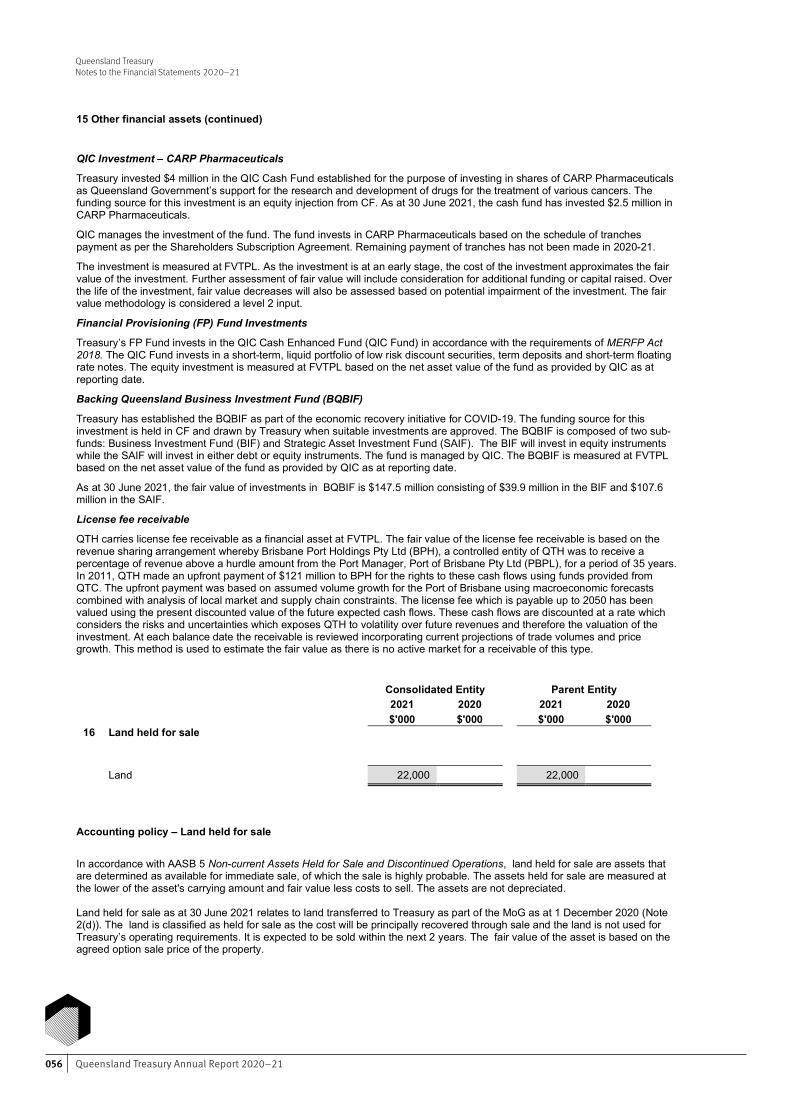
Queensland Treasury Annual Report 2020–21056
Queensland TreasuryNotes to the Financial Statements 2020–21
Queensland Treasury Notes to the Financial Statements 2020-21
32 Financial Statements – Queensland Treasury
15 Other financial assets (continued)
QIC Investment – CARP Pharmaceuticals
Treasury invested $4 million in the QIC Cash Fund established for the purpose of investing in shares of CARP Pharmaceuticals as Queensland Government’s support for the research and development of drugs for the treatment of various cancers. The funding source for this investment is an equity injection from CF. As at 30 June 2021, the cash fund has invested $2.5 million in CARP Pharmaceuticals.
QIC manages the investment of the fund. The fund invests in CARP Pharmaceuticals based on the schedule of tranches payment as per the Shareholders Subscription Agreement. Remaining payment of tranches has not been made in 2020-21.
The investment is measured at FVTPL. As the investment is at an early stage, the cost of the investment approximates the fair value of the investment. Further assessment of fair value will include consideration for additional funding or capital raised. Over the life of the investment, fair value decreases will also be assessed based on potential impairment of the investment. The fair value methodology is considered a level 2 input.
Financial Provisioning (FP) Fund Investments
Treasury’s FP Fund invests in the QIC Cash Enhanced Fund (QIC Fund) in accordance with the requirements of MERFP Act 2018. The QIC Fund invests in a short-term, liquid portfolio of low risk discount securities, term deposits and short-term floating rate notes. The equity investment is measured at FVTPL based on the net asset value of the fund as provided by QIC as at reporting date.
Backing Queensland Business Investment Fund (BQBIF)
Treasury has established the BQBIF as part of the economic recovery initiative for COVID-19. The funding source for this investment is held in CF and drawn by Treasury when suitable investments are approved. The BQBIF is composed of two sub-funds: Business Investment Fund (BIF) and Strategic Asset Investment Fund (SAIF). The BIF will invest in equity instruments while the SAIF will invest in either debt or equity instruments. The fund is managed by QIC. The BQBIF is measured at FVTPL based on the net asset value of the fund as provided by QIC as at reporting date.
As at 30 June 2021, the fair value of investments in BQBIF is $147.5 million consisting of $39.9 million in the BIF and $107.6 million in the SAIF.
License fee receivable
QTH carries license fee receivable as a financial asset at FVTPL. The fair value of the license fee receivable is based on the revenue sharing arrangement whereby Brisbane Port Holdings Pty Ltd (BPH), a controlled entity of QTH was to receive a percentage of revenue above a hurdle amount from the Port Manager, Port of Brisbane Pty Ltd (PBPL), for a period of 35 years. In 2011, QTH made an upfront payment of $121 million to BPH for the rights to these cash flows using funds provided from QTC. The upfront payment was based on assumed volume growth for the Port of Brisbane using macroeconomic forecasts combined with analysis of local market and supply chain constraints. The license fee which is payable up to 2050 has been valued using the present discounted value of the future expected cash flows. These cash flows are discounted at a rate which considers the risks and uncertainties which exposes QTH to volatility over future revenues and therefore the valuation of the investment. At each balance date the receivable is reviewed incorporating current projections of trade volumes and price growth. This method is used to estimate the fair value as there is no active market for a receivable of this type.
Consolidated Entity Parent Entity
2021 2020 2021 2020 $'000 $'000 $'000 $'000
16 Land held for sale
Land 22,000 22,000
Accounting policy – Land held for sale
In accordance with AASB 5 Non-current Assets Held for Sale and Discontinued Operations, land held for sale are assets that are determined as available for immediate sale, of which the sale is highly probable. The assets held for sale are measured at the lower of the asset's carrying amount and fair value less costs to sell. The assets are not depreciated. Land held for sale as at 30 June 2021 relates to land transferred to Treasury as part of the MoG as at 1 December 2020 (Note 2(d)). The land is classified as held for sale as the cost will be principally recovered through sale and the land is not used for Treasury’s operating requirements. It is expected to be sold within the next 2 years. The fair value of the asset is based on the agreed option sale price of the property.
Queensland Treasury Notes to the Financial Statements 2020-21
33 Financial Statements – Queensland Treasury
Consolidated Entity Parent Entity
2021 2020 2021 2020 $'000 $'000 $'000 $'000
17 Property, plant & equipment
Land - at fair value 5,515 .. 5,515 ..
Buildings - at fair value 6,317 .. 6,317 ..
Less: accumulated depreciation (219) .. (219) ..
Net carrying amount 6,098 .. 6,098 ..
Other equipment - at cost 213 189 213 189
Less: accumulated depreciation (120) (85) (120) (85)
Net carrying amount 93 104 93 104
Total Property, plant & equipment 11,706 104 11,706 104
Accounting policy – Property, plant & equipment
Recognition
Items of property, plant and equipment with a historical cost equal to or exceeding the following thresholds in the year of acquisition are recognised as property, plant and equipment in the following classes:
- Land $1
- Buildings $10,000
- Plant and Equipment $5,000
Items with a lesser value are expensed in the year of acquisition. Expenditure on property, plant and equipment is capitalised where it is probable that the expenditure will produce future service potential for Treasury. Subsequent expenditure is only added to an asset’s carrying amount if it increases the service potential or useful life of that asset. Maintenance expenditure that merely restores original service potential (lost through ordinary wear and tear) is expensed.
Historical cost is used for the initial recording of all property, plant and equipment acquisitions. Historical cost is determined as the value given as consideration and costs incidental to the acquisition, plus all other costs incurred in getting the assets ready for use.
Complex assets
Complex assets comprise separately identifiable components of significant value, that require replacement at regular intervals and at different times to other components comprising the complex asset. The asset recognition thresholds above apply to the complex asset as a single item. The measurement, depreciation and impairment of the complex asset is the same as the asset class it relates to. Treasury’s complex asset is its special purpose land and building facility used for Community Recreational Activities.
Measurement
Land and buildings are measured at fair value as required by Queensland Treasury’s Non-Current Asset Policies (NCAP) for the Queensland Public Sector. These assets are reported at their revalued amounts, being the fair value at the date of valuation, less any subsequent accumulated depreciation. The cost of items acquired during the financial year are considered to materially represent their fair value at the end of the reporting period. Other equipment is measured at historical cost in accordance with Queensland Treasury’s Non-Current Asset Policies (NCAP) for the Queensland Public Sector. The carrying amounts are not materially different from their fair value.
Revaluation at fair value
Land and Buildings measured at fair value are assessed on an annual basis either by appraisals undertaken by an independent professional valuer on a four-year rolling basis or by use of appropriate and relevant indices.
Where assets have not been specifically appraised in the reporting period, their previous valuations are materially kept up to date via the application of relevant indices. Treasury ensures that the application of such indices results in a valid estimation of the assets' fair values at reporting date. An independent professional valuer supplies the indices used for the various types of assets. Such indices are either publicly available or are derived from market information available to the valuer.
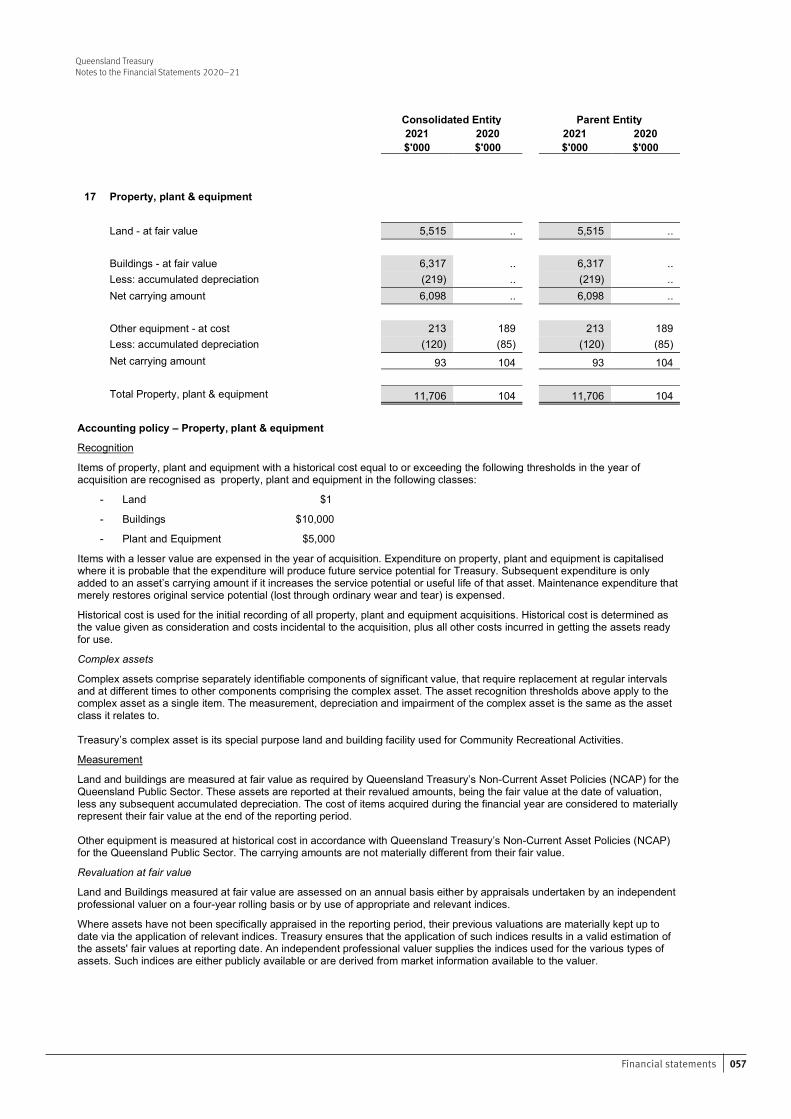
057Financial statements
Queensland TreasuryNotes to the Financial Statements 2020–21
Queensland Treasury Notes to the Financial Statements 2020-21
33 Financial Statements – Queensland Treasury
Consolidated Entity Parent Entity
2021 2020 2021 2020 $'000 $'000 $'000 $'000
17 Property, plant & equipment
Land - at fair value 5,515 .. 5,515 ..
Buildings - at fair value 6,317 .. 6,317 ..
Less: accumulated depreciation (219) .. (219) ..
Net carrying amount 6,098 .. 6,098 ..
Other equipment - at cost 213 189 213 189
Less: accumulated depreciation (120) (85) (120) (85)
Net carrying amount 93 104 93 104
Total Property, plant & equipment 11,706 104 11,706 104
Accounting policy – Property, plant & equipment
Recognition
Items of property, plant and equipment with a historical cost equal to or exceeding the following thresholds in the year of acquisition are recognised as property, plant and equipment in the following classes:
- Land $1
- Buildings $10,000
- Plant and Equipment $5,000
Items with a lesser value are expensed in the year of acquisition. Expenditure on property, plant and equipment is capitalised where it is probable that the expenditure will produce future service potential for Treasury. Subsequent expenditure is only added to an asset’s carrying amount if it increases the service potential or useful life of that asset. Maintenance expenditure that merely restores original service potential (lost through ordinary wear and tear) is expensed.
Historical cost is used for the initial recording of all property, plant and equipment acquisitions. Historical cost is determined as the value given as consideration and costs incidental to the acquisition, plus all other costs incurred in getting the assets ready for use.
Complex assets
Complex assets comprise separately identifiable components of significant value, that require replacement at regular intervals and at different times to other components comprising the complex asset. The asset recognition thresholds above apply to the complex asset as a single item. The measurement, depreciation and impairment of the complex asset is the same as the asset class it relates to. Treasury’s complex asset is its special purpose land and building facility used for Community Recreational Activities.
Measurement
Land and buildings are measured at fair value as required by Queensland Treasury’s Non-Current Asset Policies (NCAP) for the Queensland Public Sector. These assets are reported at their revalued amounts, being the fair value at the date of valuation, less any subsequent accumulated depreciation. The cost of items acquired during the financial year are considered to materially represent their fair value at the end of the reporting period. Other equipment is measured at historical cost in accordance with Queensland Treasury’s Non-Current Asset Policies (NCAP) for the Queensland Public Sector. The carrying amounts are not materially different from their fair value.
Revaluation at fair value
Land and Buildings measured at fair value are assessed on an annual basis either by appraisals undertaken by an independent professional valuer on a four-year rolling basis or by use of appropriate and relevant indices.
Where assets have not been specifically appraised in the reporting period, their previous valuations are materially kept up to date via the application of relevant indices. Treasury ensures that the application of such indices results in a valid estimation of the assets' fair values at reporting date. An independent professional valuer supplies the indices used for the various types of assets. Such indices are either publicly available or are derived from market information available to the valuer.
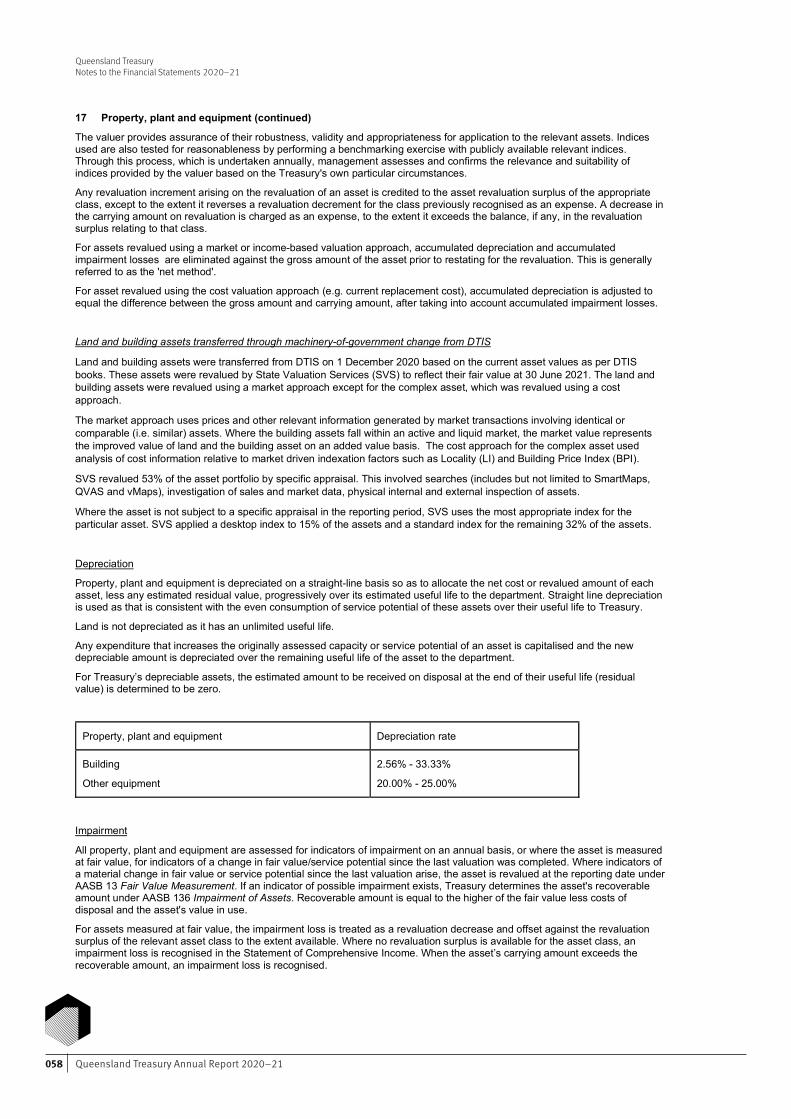
Queensland Treasury Annual Report 2020–21058
Queensland TreasuryNotes to the Financial Statements 2020–21
Queensland Treasury Notes to the Financial Statements 2020-21
34 Financial Statements – Queensland Treasury
17 Property, plant and equipment (continued)
The valuer provides assurance of their robustness, validity and appropriateness for application to the relevant assets. Indices used are also tested for reasonableness by performing a benchmarking exercise with publicly available relevant indices. Through this process, which is undertaken annually, management assesses and confirms the relevance and suitability of indices provided by the valuer based on the Treasury's own particular circumstances.
Any revaluation increment arising on the revaluation of an asset is credited to the asset revaluation surplus of the appropriate class, except to the extent it reverses a revaluation decrement for the class previously recognised as an expense. A decrease in the carrying amount on revaluation is charged as an expense, to the extent it exceeds the balance, if any, in the revaluation surplus relating to that class.
For assets revalued using a market or income-based valuation approach, accumulated depreciation and accumulated impairment losses are eliminated against the gross amount of the asset prior to restating for the revaluation. This is generally referred to as the 'net method'.
For asset revalued using the cost valuation approach (e.g. current replacement cost), accumulated depreciation is adjusted to equal the difference between the gross amount and carrying amount, after taking into account accumulated impairment losses.
Land and building assets transferred through machinery-of-government change from DTIS
Land and building assets were transferred from DTIS on 1 December 2020 based on the current asset values as per DTIS books. These assets were revalued by State Valuation Services (SVS) to reflect their fair value at 30 June 2021. The land and building assets were revalued using a market approach except for the complex asset, which was revalued using a cost approach.
The market approach uses prices and other relevant information generated by market transactions involving identical or comparable (i.e. similar) assets. Where the building assets fall within an active and liquid market, the market value represents the improved value of land and the building asset on an added value basis. The cost approach for the complex asset used analysis of cost information relative to market driven indexation factors such as Locality (LI) and Building Price Index (BPI).
SVS revalued 53% of the asset portfolio by specific appraisal. This involved searches (includes but not limited to SmartMaps, QVAS and vMaps), investigation of sales and market data, physical internal and external inspection of assets.
Where the asset is not subject to a specific appraisal in the reporting period, SVS uses the most appropriate index for the particular asset. SVS applied a desktop index to 15% of the assets and a standard index for the remaining 32% of the assets.
Depreciation
Property, plant and equipment is depreciated on a straight-line basis so as to allocate the net cost or revalued amount of each asset, less any estimated residual value, progressively over its estimated useful life to the department. Straight line depreciation is used as that is consistent with the even consumption of service potential of these assets over their useful life to Treasury.
Land is not depreciated as it has an unlimited useful life.
Any expenditure that increases the originally assessed capacity or service potential of an asset is capitalised and the new depreciable amount is depreciated over the remaining useful life of the asset to the department.
For Treasury’s depreciable assets, the estimated amount to be received on disposal at the end of their useful life (residual value) is determined to be zero.
Property, plant and equipment Depreciation rate
Building
Other equipment
2.56% - 33.33%
20.00% - 25.00%
Impairment
All property, plant and equipment are assessed for indicators of impairment on an annual basis, or where the asset is measured at fair value, for indicators of a change in fair value/service potential since the last valuation was completed. Where indicators of a material change in fair value or service potential since the last valuation arise, the asset is revalued at the reporting date under AASB 13 Fair Value Measurement. If an indicator of possible impairment exists, Treasury determines the asset's recoverable amount under AASB 136 Impairment of Assets. Recoverable amount is equal to the higher of the fair value less costs of disposal and the asset's value in use.
For assets measured at fair value, the impairment loss is treated as a revaluation decrease and offset against the revaluation surplus of the relevant asset class to the extent available. Where no revaluation surplus is available for the asset class, an impairment loss is recognised in the Statement of Comprehensive Income. When the asset’s carrying amount exceeds the recoverable amount, an impairment loss is recognised.
Queensland Treasury Notes to the Financial Statements 2020-21
35 Financial Statements – Queensland Treasury
17 Property, plant and equipment (continued)
Land Buildings Other equipment Total
Reconciliation
2021 2020 2021 2020 2021 2020 2021 2020
$'000 $'000 $'000 $'000 $'000 $'000 $'000 $'000
Carrying amount at 1 July .. .. .. .. 104 63 104 63 Acquisitions .. .. .. .. 32 73 32 73 MoG transfer in 5,113 .. 5,571 .. .. .. 10,684 .. MoG transfer out .. .. .. .. .. .. .. .. Disposals .. .. .. .. (8) .. (8) .. Transfers between asset classes .. .. .. .. .. .. .. .. Net revaluation increments in revaluation surplus 402 .. 676 .. .. .. 1,078 ..
Depreciation * .. .. (149) .. (35) (32) (184) (32) Carrying amount at 30 June 5,515 .. 6,098 .. 93 104 11,706 104
* Depreciation of Property, plant & equipment is included in the line item 'Depreciation and amortisation' in the Statement of Comprehensive Income.
Categorisation of assets measured at fair value
2021
Assets Level 1 $'000 Level 2 $'000 Level 3 $'000
Land .. 5,515 ..
Building .. 1,163 4,936
Total .. 6,678 4,936
Refer to note 26(g) for fair value hierarchy.
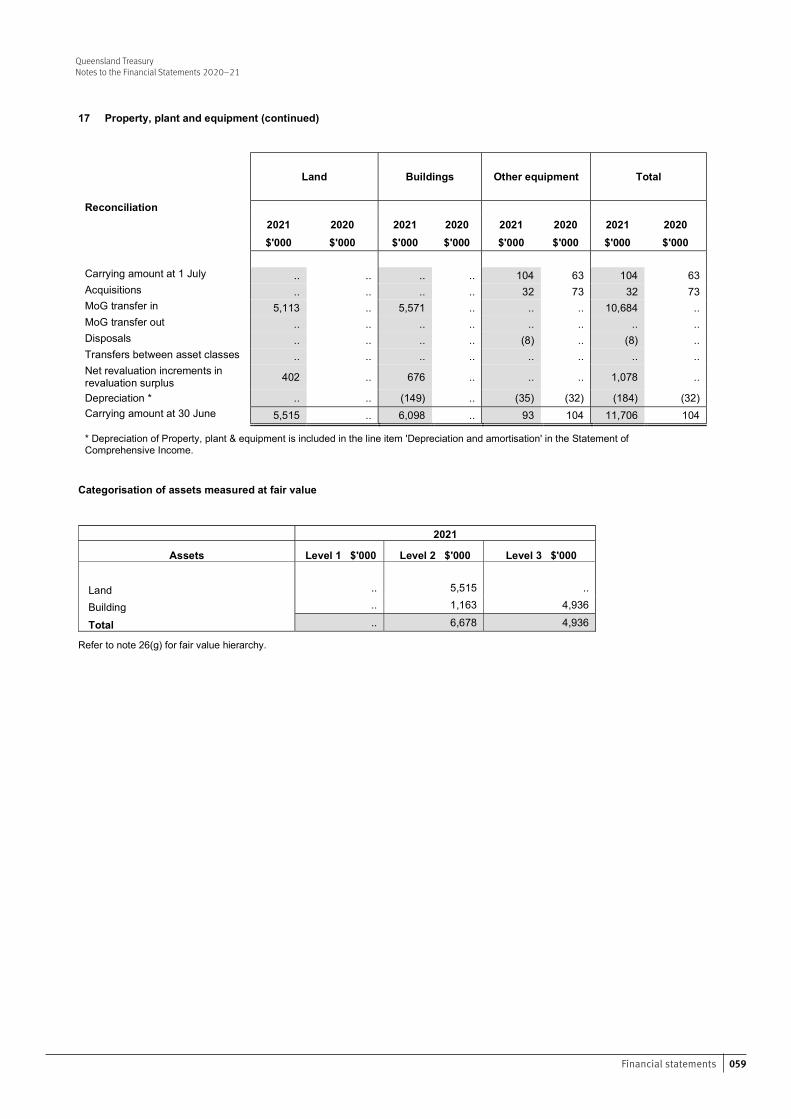
059Financial statements
Queensland TreasuryNotes to the Financial Statements 2020–21
Queensland Treasury Notes to the Financial Statements 2020-21
35 Financial Statements – Queensland Treasury
17 Property, plant and equipment (continued)
Land Buildings Other equipment Total
Reconciliation
2021 2020 2021 2020 2021 2020 2021 2020
$'000 $'000 $'000 $'000 $'000 $'000 $'000 $'000
Carrying amount at 1 July .. .. .. .. 104 63 104 63 Acquisitions .. .. .. .. 32 73 32 73 MoG transfer in 5,113 .. 5,571 .. .. .. 10,684 .. MoG transfer out .. .. .. .. .. .. .. .. Disposals .. .. .. .. (8) .. (8) .. Transfers between asset classes .. .. .. .. .. .. .. .. Net revaluation increments in revaluation surplus 402 .. 676 .. .. .. 1,078 ..
Depreciation * .. .. (149) .. (35) (32) (184) (32) Carrying amount at 30 June 5,515 .. 6,098 .. 93 104 11,706 104
* Depreciation of Property, plant & equipment is included in the line item 'Depreciation and amortisation' in the Statement of Comprehensive Income.
Categorisation of assets measured at fair value
2021
Assets Level 1 $'000 Level 2 $'000 Level 3 $'000
Land .. 5,515 ..
Building .. 1,163 4,936
Total .. 6,678 4,936
Refer to note 26(g) for fair value hierarchy.
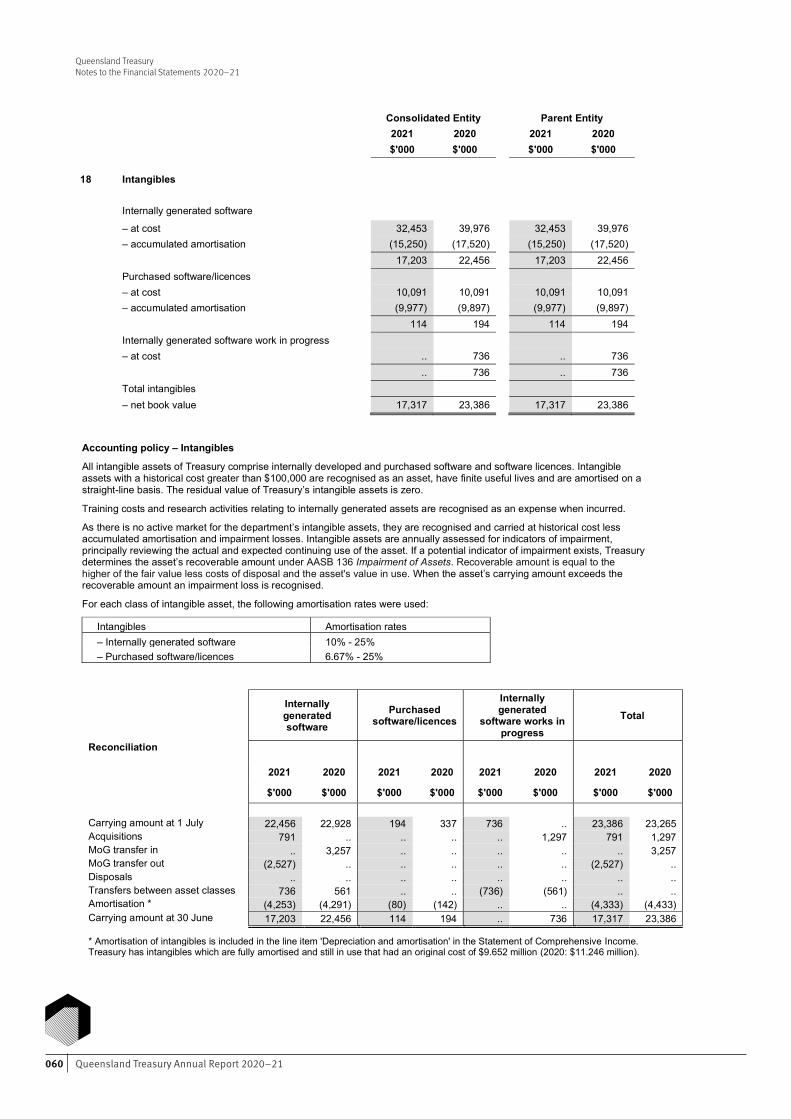
Queensland Treasury Annual Report 2020–21060
Queensland TreasuryNotes to the Financial Statements 2020–21Queensland Treasury Notes to the Financial Statements 2020-21
36 Financial Statements – Queensland Treasury
Consolidated Entity Parent Entity
2021 2020 2021 2020 $'000 $'000 $'000 $'000
18 Intangibles
Internally generated software
– at cost 32,453 39,976 32,453 39,976 – accumulated amortisation (15,250) (17,520) (15,250) (17,520) 17,203 22,456 17,203 22,456 Purchased software/licences
– at cost 10,091 10,091 10,091 10,091 – accumulated amortisation (9,977) (9,897) (9,977) (9,897) 114 194 114 194 Internally generated software work in progress
– at cost .. 736 .. 736 .. 736 .. 736 Total intangibles
– net book value 17,317 23,386 17,317 23,386
Accounting policy – Intangibles
All intangible assets of Treasury comprise internally developed and purchased software and software licences. Intangible assets with a historical cost greater than $100,000 are recognised as an asset, have finite useful lives and are amortised on a straight-line basis. The residual value of Treasury’s intangible assets is zero.
Training costs and research activities relating to internally generated assets are recognised as an expense when incurred.
As there is no active market for the department’s intangible assets, they are recognised and carried at historical cost less accumulated amortisation and impairment losses. Intangible assets are annually assessed for indicators of impairment, principally reviewing the actual and expected continuing use of the asset. If a potential indicator of impairment exists, Treasury determines the asset’s recoverable amount under AASB 136 Impairment of Assets. Recoverable amount is equal to the higher of the fair value less costs of disposal and the asset's value in use. When the asset’s carrying amount exceeds the recoverable amount an impairment loss is recognised.
For each class of intangible asset, the following amortisation rates were used:
Intangibles Amortisation rates – Internally generated software 10% - 25% – Purchased software/licences 6.67% - 25%
Internally generated software
Purchased software/licences
Internally generated
software works in progress
Total
Reconciliation
2021 2020 2021 2020 2021 2020 2021 2020
$'000 $'000 $'000 $'000 $'000 $'000 $'000 $'000
Carrying amount at 1 July 22,456 22,928 194 337 736 .. 23,386 23,265 Acquisitions 791 .. .. .. .. 1,297 791 1,297 MoG transfer in .. 3,257 .. .. .. .. .. 3,257 MoG transfer out (2,527) .. .. .. .. .. (2,527) .. Disposals .. .. .. .. .. .. .. .. Transfers between asset classes 736 561 .. .. (736) (561) .. .. Amortisation * (4,253) (4,291) (80) (142) .. .. (4,333) (4,433) Carrying amount at 30 June 17,203 22,456 114 194 .. 736 17,317 23,386 * Amortisation of intangibles is included in the line item 'Depreciation and amortisation' in the Statement of Comprehensive Income. Treasury has intangibles which are fully amortised and still in use that had an original cost of $9.652 million (2020: $11.246 million).
Queensland Treasury Notes to the Financial Statements 2020-21
37 Financial Statements – Queensland Treasury
Consolidated Entity Parent Entity
2021 2020 2021 2020 $'000 $'000 $'000 $'000
19 Payables
Current
Cash surety payable 78,993 61,034 78,993 61,034 Deferred appropriation payable to Consolidated Fund 58,390 30,034 58,390 30,034 Equity withdrawal payable 20,950 4,355 20,950 4,355 Tax payable* 20,235 246 259 195 Payables of operating nature 12,426 18,488 12,426 18,488 Grant payable 3,860 769 3,860 769 Interdepartmental payable 85 5,735 85 5,735 Sundry payables 1,046 1,054 276 300
195,985 121,715 175,239 120,910
Non-current
Payables of operating nature. 988 1,341 .. ..
988 1,341 .. ..
*Tax payable includes GST payable, FBT payable and Capital gains tax from QTH.
Accounting policy - Payables
Current payables are recognised upon receipt of goods and services at the agreed purchase price. Amounts owing are generally settled on 30-day terms and are unsecured. Deferred appropriation for services payable is recognised to reflect unused appropriation funding by Treasury to be returned to CF. Refer to note 3 for recognition of deferred appropriation for departmental services payable. Cash surety for the Financial Provisioning Scheme are recognised as a liability when the cash is received. The surety is payable on demand to the environmental authority holder as the surety provided can be replaced with another form of surety approved by the Scheme Manager.
Grants payable in 2019-20 includes an adjustment to the GST revenue grant recognised by Treasury against the actual share of the State from the GST collections by the Commonwealth for the period (refer note 41).
Interdepartmental payable in 2019–20 represents payable to DRDM in relation to transactions post machinery of government changes effective 1 June 2020 (note 2 (d)).
20 Deferred tax asset and (liabilities)
Attributable to temporary differences:
Financial assets at fair value – AZJ .. (39,052) .. .. Investments in subsidiaries – DBCTH (178) (178) .. .. Long term receivable – BPH licence fee* 20,735 19,293 .. .. Accrued audit fees 7 6 .. .. Subsidiary tax loss carry forward 20 6
20,584 (19,925) .. ..
Accounting policy - Deferred tax liability
Deferred tax liabilities are recognised by QTH for all taxable temporary differences between the carrying amount of assets and the corresponding tax base which is netted off against deferred tax asset.
*QTH has recognised a deferred tax asset in relation to the difference between the purchase price of a long-term receivable and its carrying amount. This receivable was originally recognised by QTH in 2011 at $121.2 million and is currently recognised at its fair value of $52 million due to the timing of the related cash flows which have been forecast to 2050. The long-term receivable has been discounted at 8.41% (2020: 9.15%) based on a pre-tax discount rate. The associated deferred tax asset has not been discounted based on the requirement of AASB 112 Income Taxes.
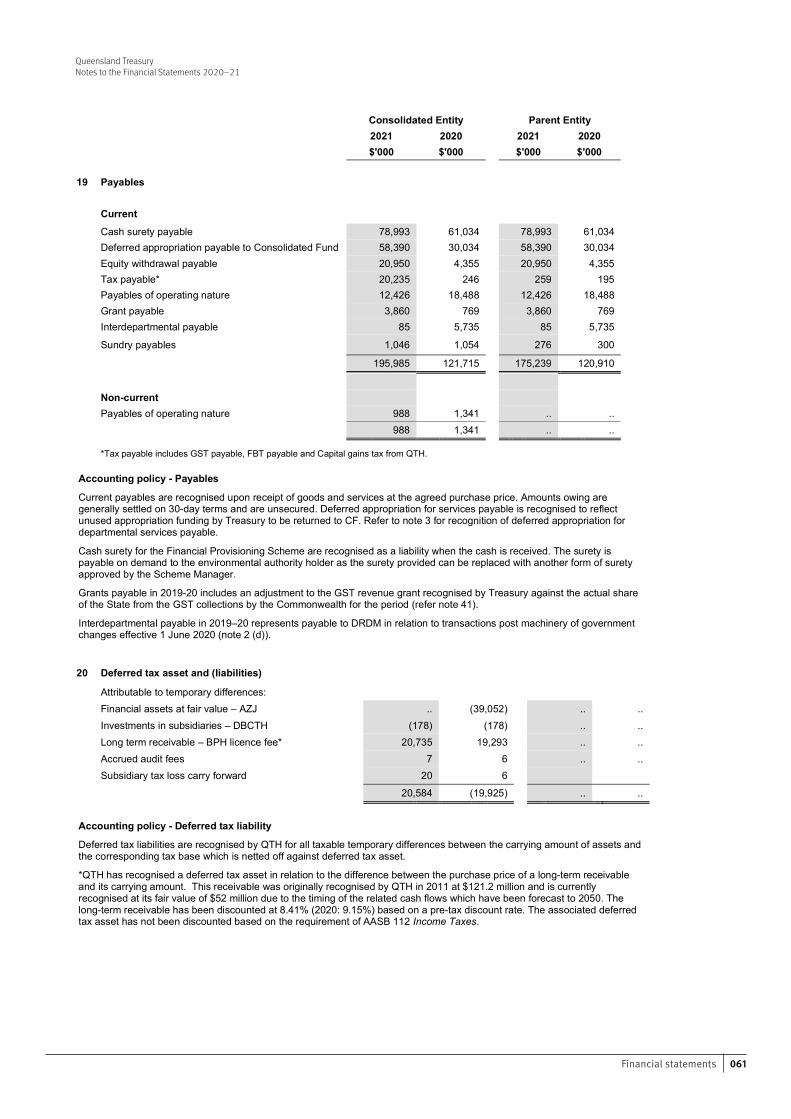
061Financial statements
Queensland TreasuryNotes to the Financial Statements 2020–21Queensland Treasury
Notes to the Financial Statements 2020-21
37 Financial Statements – Queensland Treasury
Consolidated Entity Parent Entity
2021 2020 2021 2020 $'000 $'000 $'000 $'000
19 Payables
Current
Cash surety payable 78,993 61,034 78,993 61,034 Deferred appropriation payable to Consolidated Fund 58,390 30,034 58,390 30,034 Equity withdrawal payable 20,950 4,355 20,950 4,355 Tax payable* 20,235 246 259 195 Payables of operating nature 12,426 18,488 12,426 18,488 Grant payable 3,860 769 3,860 769 Interdepartmental payable 85 5,735 85 5,735 Sundry payables 1,046 1,054 276 300
195,985 121,715 175,239 120,910
Non-current
Payables of operating nature. 988 1,341 .. ..
988 1,341 .. ..
*Tax payable includes GST payable, FBT payable and Capital gains tax from QTH.
Accounting policy - Payables
Current payables are recognised upon receipt of goods and services at the agreed purchase price. Amounts owing are generally settled on 30-day terms and are unsecured. Deferred appropriation for services payable is recognised to reflect unused appropriation funding by Treasury to be returned to CF. Refer to note 3 for recognition of deferred appropriation for departmental services payable. Cash surety for the Financial Provisioning Scheme are recognised as a liability when the cash is received. The surety is payable on demand to the environmental authority holder as the surety provided can be replaced with another form of surety approved by the Scheme Manager.
Grants payable in 2019-20 includes an adjustment to the GST revenue grant recognised by Treasury against the actual share of the State from the GST collections by the Commonwealth for the period (refer note 41).
Interdepartmental payable in 2019–20 represents payable to DRDM in relation to transactions post machinery of government changes effective 1 June 2020 (note 2 (d)).
20 Deferred tax asset and (liabilities)
Attributable to temporary differences:
Financial assets at fair value – AZJ .. (39,052) .. .. Investments in subsidiaries – DBCTH (178) (178) .. .. Long term receivable – BPH licence fee* 20,735 19,293 .. .. Accrued audit fees 7 6 .. .. Subsidiary tax loss carry forward 20 6
20,584 (19,925) .. ..
Accounting policy - Deferred tax liability
Deferred tax liabilities are recognised by QTH for all taxable temporary differences between the carrying amount of assets and the corresponding tax base which is netted off against deferred tax asset.
*QTH has recognised a deferred tax asset in relation to the difference between the purchase price of a long-term receivable and its carrying amount. This receivable was originally recognised by QTH in 2011 at $121.2 million and is currently recognised at its fair value of $52 million due to the timing of the related cash flows which have been forecast to 2050. The long-term receivable has been discounted at 8.41% (2020: 9.15%) based on a pre-tax discount rate. The associated deferred tax asset has not been discounted based on the requirement of AASB 112 Income Taxes.
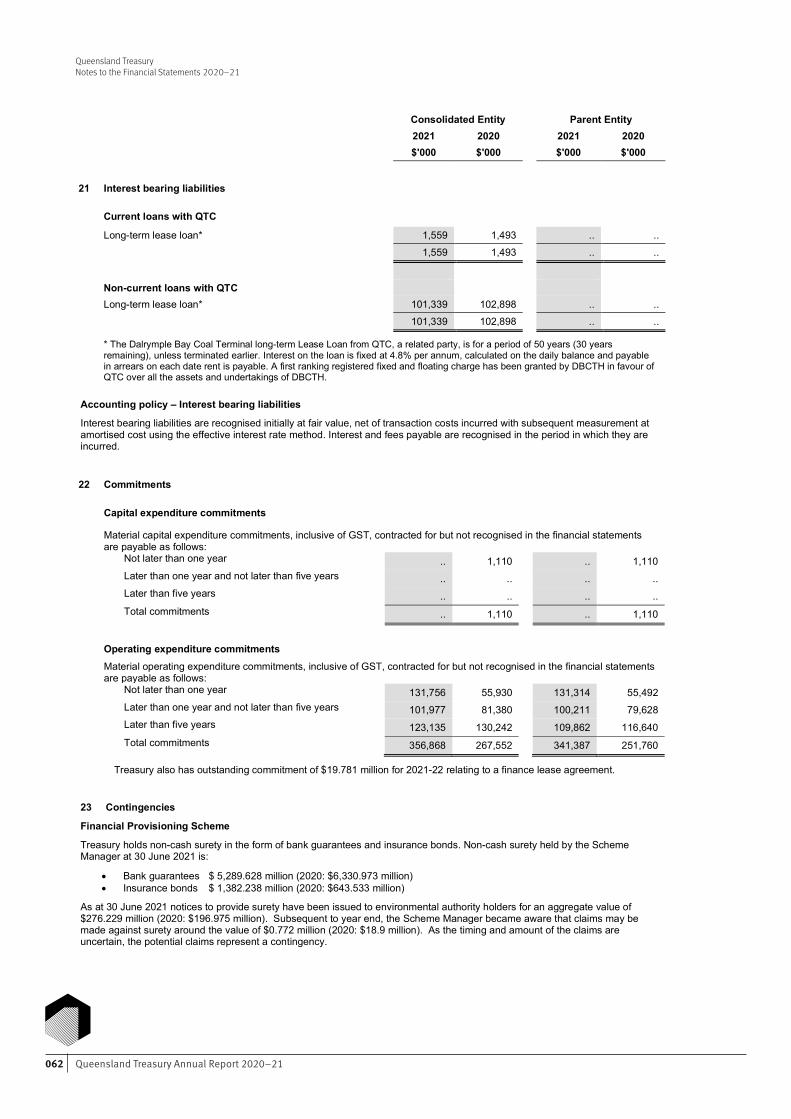
Queensland Treasury Annual Report 2020–21062
Queensland TreasuryNotes to the Financial Statements 2020–21Queensland Treasury Notes to the Financial Statements 2020-21
38 Financial Statements – Queensland Treasury
Consolidated Entity Parent Entity
2021 2020 2021 2020 $'000 $'000 $'000 $'000
21 Interest bearing liabilities
Current loans with QTC
Long-term lease loan* 1,559 1,493 .. .. 1,559 1,493 .. ..
Non-current loans with QTC
Long-term lease loan* 101,339 102,898 .. .. 101,339 102,898 .. ..
* The Dalrymple Bay Coal Terminal long-term Lease Loan from QTC, a related party, is for a period of 50 years (30 years remaining), unless terminated earlier. Interest on the loan is fixed at 4.8% per annum, calculated on the daily balance and payable in arrears on each date rent is payable. A first ranking registered fixed and floating charge has been granted by DBCTH in favour of QTC over all the assets and undertakings of DBCTH.
Accounting policy – Interest bearing liabilities
Interest bearing liabilities are recognised initially at fair value, net of transaction costs incurred with subsequent measurement at amortised cost using the effective interest rate method. Interest and fees payable are recognised in the period in which they are incurred.
22 Commitments
Capital expenditure commitments
Material capital expenditure commitments, inclusive of GST, contracted for but not recognised in the financial statements are payable as follows:
Not later than one year .. 1,110 .. 1,110 Later than one year and not later than five years .. .. .. .. Later than five years .. .. .. .. Total commitments .. 1,110 .. 1,110
Operating expenditure commitments
Material operating expenditure commitments, inclusive of GST, contracted for but not recognised in the financial statements are payable as follows:
Not later than one year 131,756 55,930 131,314 55,492 Later than one year and not later than five years 101,977 81,380 100,211 79,628 Later than five years 123,135 130,242 109,862 116,640 Total commitments 356,868 267,552 341,387 251,760
Treasury also has outstanding commitment of $19.781 million for 2021-22 relating to a finance lease agreement.
23 Contingencies
Financial Provisioning Scheme
Treasury holds non-cash surety in the form of bank guarantees and insurance bonds. Non-cash surety held by the Scheme Manager at 30 June 2021 is:
Bank guarantees $ 5,289.628 million (2020: $6,330.973 million) Insurance bonds $ 1,382.238 million (2020: $643.533 million)
As at 30 June 2021 notices to provide surety have been issued to environmental authority holders for an aggregate value of $276.229 million (2020: $196.975 million). Subsequent to year end, the Scheme Manager became aware that claims may be made against surety around the value of $0.772 million (2020: $18.9 million). As the timing and amount of the claims are uncertain, the potential claims represent a contingency.
Queensland Treasury Notes to the Financial Statements 2020-21
39 Financial Statements – Queensland Treasury
23 Contingencies (continued)
Guarantees
Guarantees held include bank guarantees in relation to the Advance Queensland Industry Attraction Fund (AQIAF) and Jobs and Regional Growth Fund (JARGF) for financial security against non-conformance of grant agreements. The total value of bank guarantees as at 30 June 2021 is $37.879 million.
Other bank guarantees and bonds amounting to $50.820 million were also held as at 30 June 2021.
Deed of Guarantee
On 31 July 2020, the Treasurer has guaranteed the financial obligations of borrowers under the Industry Support Package (ISP) loan facilities for the benefit of QTC up to maximum amount of $200 million under a Deed of Guarantee.
Native Title Claims
In January 2019, the Native Title Compensation Project Management Office (PMO) transferred from Department of Natural Resources, Mines and Energy to Queensland Treasury. The PMO is managing existing native title compensation claims that are progressing in the Federal Court and developing a whole of Government framework to settle future native title compensation claims. Liability for native title compensation will be assessed on a claim by claim basis, at the whole of Government level (note 25).
Environmental obligations
QTH has exposure to claims made against it through its subsidiaries and associated companies in relation to any pre-existing contamination of land assets. At balance date, there have been no claims made against QTH.
Land Tax
Under the Port of Brisbane Share Sale and Purchase Agreement, the State has agreed to pay to the port lessee any portion of the port lessee’s Land Tax liability in years the Land Tax assessment for the leased area exceeds the estimated Land Tax assessment. The obligations are subject to certain conditions, including the lessee pursuing any objection available to it in relation to an assessment, and are limited to assessment years up to and including 30 June 2025. At balance date, there have been no payments made to the Port lessee.
Queensland Government Insurance Fund (QGIF)
Under the QGIF, Treasury will be able to claim back, less a $10,000 deduction, the amount paid for repairs of a damaged property.
24 Controlled entities
QTH is controlled by Treasury and its revenues, expenses, assets, liabilities and equity have been included within these financial statements. The Under Treasurer, as Trustee for the Treasurer of Queensland, holds a 60% beneficial interest in QTH, which comprises ownership of “A” class capital. The remaining 40% interest is held by the QTC for and on behalf of the Under Treasurer as the corporation sole of QTC. QTH acts as a corporate vehicle through which the Queensland Government invests in assets of strategic importance to the State. QTH is audited by the Auditor-General of Queensland.
2021 2020
QTH summarised financial statements $'000 $'000
Income statement Net income/(loss) (44,935) (22,130) Expenses (6,046) (6,385) Income tax (benefit)/expense (18,521) (11,608) Operating result for the year (after income tax) (32,460) (16,907)
Balance sheet Total assets 326,654 566,915 Total liabilities (124,633) (126,462) Net assets 202,021 440,453
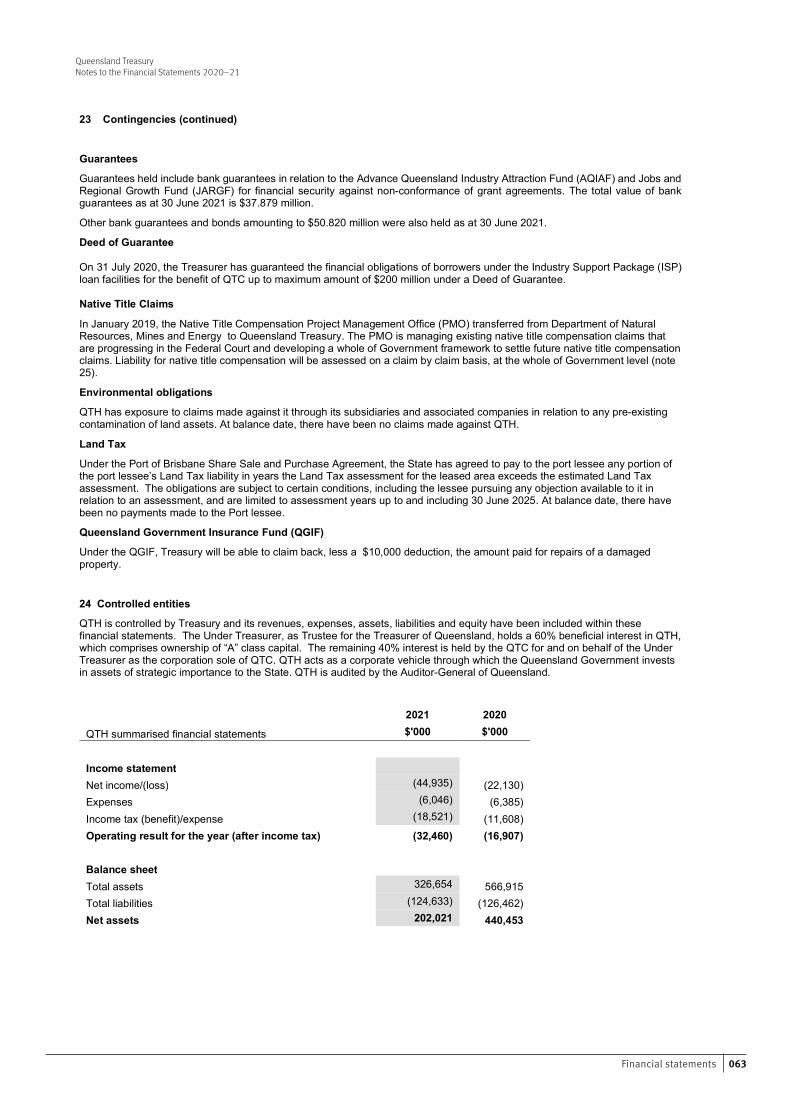
063Financial statements
Queensland TreasuryNotes to the Financial Statements 2020–21
Queensland Treasury Notes to the Financial Statements 2020-21
39 Financial Statements – Queensland Treasury
23 Contingencies (continued)
Guarantees
Guarantees held include bank guarantees in relation to the Advance Queensland Industry Attraction Fund (AQIAF) and Jobs and Regional Growth Fund (JARGF) for financial security against non-conformance of grant agreements. The total value of bank guarantees as at 30 June 2021 is $37.879 million.
Other bank guarantees and bonds amounting to $50.820 million were also held as at 30 June 2021.
Deed of Guarantee
On 31 July 2020, the Treasurer has guaranteed the financial obligations of borrowers under the Industry Support Package (ISP) loan facilities for the benefit of QTC up to maximum amount of $200 million under a Deed of Guarantee.
Native Title Claims
In January 2019, the Native Title Compensation Project Management Office (PMO) transferred from Department of Natural Resources, Mines and Energy to Queensland Treasury. The PMO is managing existing native title compensation claims that are progressing in the Federal Court and developing a whole of Government framework to settle future native title compensation claims. Liability for native title compensation will be assessed on a claim by claim basis, at the whole of Government level (note 25).
Environmental obligations
QTH has exposure to claims made against it through its subsidiaries and associated companies in relation to any pre-existing contamination of land assets. At balance date, there have been no claims made against QTH.
Land Tax
Under the Port of Brisbane Share Sale and Purchase Agreement, the State has agreed to pay to the port lessee any portion of the port lessee’s Land Tax liability in years the Land Tax assessment for the leased area exceeds the estimated Land Tax assessment. The obligations are subject to certain conditions, including the lessee pursuing any objection available to it in relation to an assessment, and are limited to assessment years up to and including 30 June 2025. At balance date, there have been no payments made to the Port lessee.
Queensland Government Insurance Fund (QGIF)
Under the QGIF, Treasury will be able to claim back, less a $10,000 deduction, the amount paid for repairs of a damaged property.
24 Controlled entities
QTH is controlled by Treasury and its revenues, expenses, assets, liabilities and equity have been included within these financial statements. The Under Treasurer, as Trustee for the Treasurer of Queensland, holds a 60% beneficial interest in QTH, which comprises ownership of “A” class capital. The remaining 40% interest is held by the QTC for and on behalf of the Under Treasurer as the corporation sole of QTC. QTH acts as a corporate vehicle through which the Queensland Government invests in assets of strategic importance to the State. QTH is audited by the Auditor-General of Queensland.
2021 2020
QTH summarised financial statements $'000 $'000
Income statement Net income/(loss) (44,935) (22,130) Expenses (6,046) (6,385) Income tax (benefit)/expense (18,521) (11,608) Operating result for the year (after income tax) (32,460) (16,907)
Balance sheet Total assets 326,654 566,915 Total liabilities (124,633) (126,462) Net assets 202,021 440,453
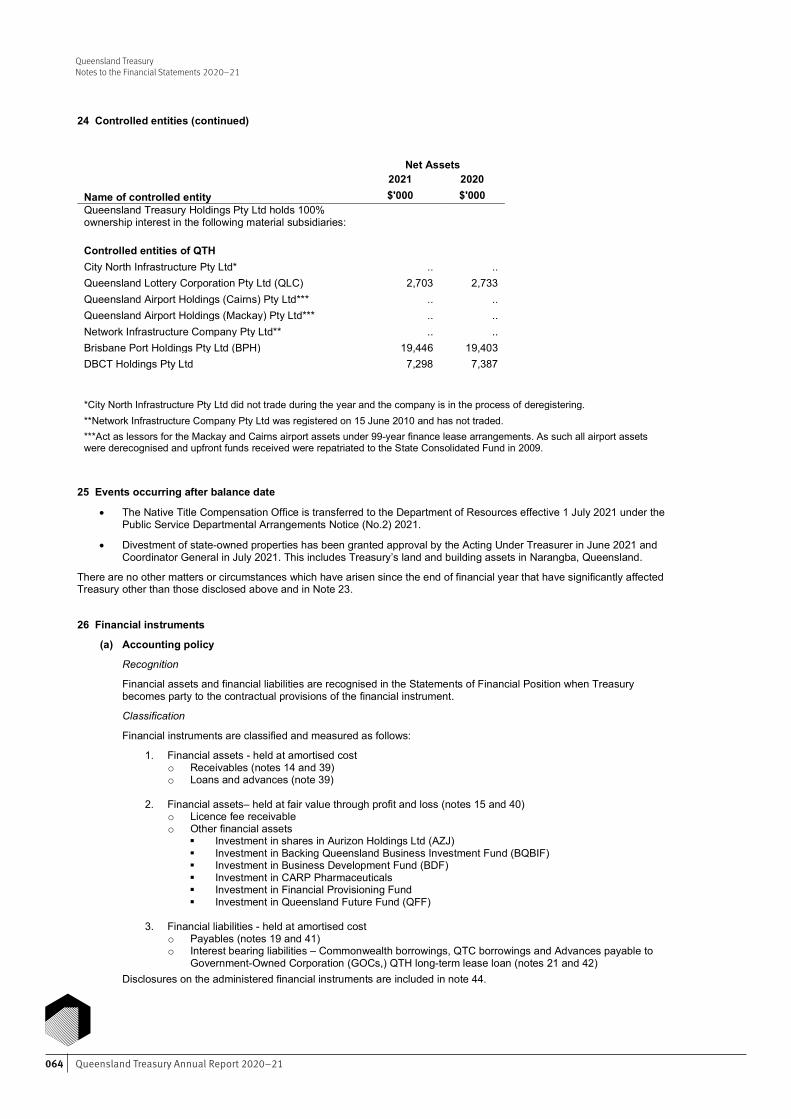
Queensland Treasury Annual Report 2020–21064
Queensland TreasuryNotes to the Financial Statements 2020–21
Queensland Treasury Notes to the Financial Statements 2020-21
40 Financial Statements – Queensland Treasury
24 Controlled entities (continued)
Net Assets 2021 2020 Name of controlled entity $'000 $'000 Queensland Treasury Holdings Pty Ltd holds 100% ownership interest in the following material subsidiaries: Controlled entities of QTH City North Infrastructure Pty Ltd* .. .. Queensland Lottery Corporation Pty Ltd (QLC) 2,703 2,733 Queensland Airport Holdings (Cairns) Pty Ltd*** .. .. Queensland Airport Holdings (Mackay) Pty Ltd*** .. .. Network Infrastructure Company Pty Ltd** .. .. Brisbane Port Holdings Pty Ltd (BPH) 19,446 19,403 DBCT Holdings Pty Ltd 7,298 7,387
*City North Infrastructure Pty Ltd did not trade during the year and the company is in the process of deregistering. **Network Infrastructure Company Pty Ltd was registered on 15 June 2010 and has not traded. ***Act as lessors for the Mackay and Cairns airport assets under 99-year finance lease arrangements. As such all airport assets were derecognised and upfront funds received were repatriated to the State Consolidated Fund in 2009.
25 Events occurring after balance date
The Native Title Compensation Office is transferred to the Department of Resources effective 1 July 2021 under the Public Service Departmental Arrangements Notice (No.2) 2021.
Divestment of state-owned properties has been granted approval by the Acting Under Treasurer in June 2021 and Coordinator General in July 2021. This includes Treasury’s land and building assets in Narangba, Queensland.
There are no other matters or circumstances which have arisen since the end of financial year that have significantly affected Treasury other than those disclosed above and in Note 23.
26 Financial instruments
(a) Accounting policy
Recognition
Financial assets and financial liabilities are recognised in the Statements of Financial Position when Treasury becomes party to the contractual provisions of the financial instrument.
Classification
Financial instruments are classified and measured as follows:
1. Financial assets - held at amortised cost o Receivables (notes 14 and 39) o Loans and advances (note 39)
2. Financial assets– held at fair value through profit and loss (notes 15 and 40)
o Licence fee receivable o Other financial assets
Investment in shares in Aurizon Holdings Ltd (AZJ) Investment in Backing Queensland Business Investment Fund (BQBIF) Investment in Business Development Fund (BDF) Investment in CARP Pharmaceuticals Investment in Financial Provisioning Fund Investment in Queensland Future Fund (QFF)
3. Financial liabilities - held at amortised cost
o Payables (notes 19 and 41) o Interest bearing liabilities – Commonwealth borrowings, QTC borrowings and Advances payable to
Government-Owned Corporation (GOCs,) QTH long-term lease loan (notes 21 and 42) Disclosures on the administered financial instruments are included in note 44.
Queensland Treasury Notes to the Financial Statements 2020-21
41 Financial Statements – Queensland Treasury
26 Financial instruments (continued)
(b) Categorisation of financial instruments
Consolidated
Category
Note 2021 2020
$'000 $'000
Financial assets Cash and cash equivalents 13 325,514 237,594
Receivables 14 207,512 172,582
Other financial assets 15
Shares – AZJ .. 270,236
QIC investment, BQBIF 147,522
QIC investments, BDF 65,537 72,284
QIC Investments, FP Fund 46,132 ..
QIC investments, CARP Pharmaceuticals 4,000 4,000
Licence fee receivable 52,132 56,940
Total 848,349 813,636
Financial liabilities Payables 19 195,625 121,357
Interest bearing liabilities 21 102,898 104,391
Total 298,523 225,748
(c) Financial risk management
The consolidated entity’s activities expose it to a variety of financial risks – interest rate risk, credit risk, liquidity risk and market risk.
Financial risk management is implemented pursuant to government and Treasury policy. These policies focus on the unpredictability of financial markets and seek to minimise potential adverse effects on the financial performance of Treasury.
Treasury and its controlled entities manage exposure to these financial risks through advice and consultation with QTC primarily in relation to borrowing activities and advice from QIC on the investments. Risk management parameters are reviewed regularly to reflect changes in market conditions and changes to Treasury and its controlled entities’ activities.
(d) Liquidity risk
Liquidity risk refers to the situation where Treasury may encounter difficulty in meeting obligations associated with financial liabilities that are settled by delivering cash or another financial asset.
Treasury and its controlled entity manage liquidity risk by ensuring that it has sufficient funds available to meet employee and supplier obligations as they fall due. This is achieved by ensuring that minimum levels of cash are held within the various bank accounts to match the expected duration of the various employee and supplier liabilities.
QTH is exposed to liquidity risk through its borrowings with QTC, however this is mitigated by back to back arrangements on debt obligations.
The following table sets out the liquidity risk in relation to financial liabilities held by consolidated entity. It represents the remaining contractual cash flows (principal and interest) of financial liabilities at the end of the reporting period.
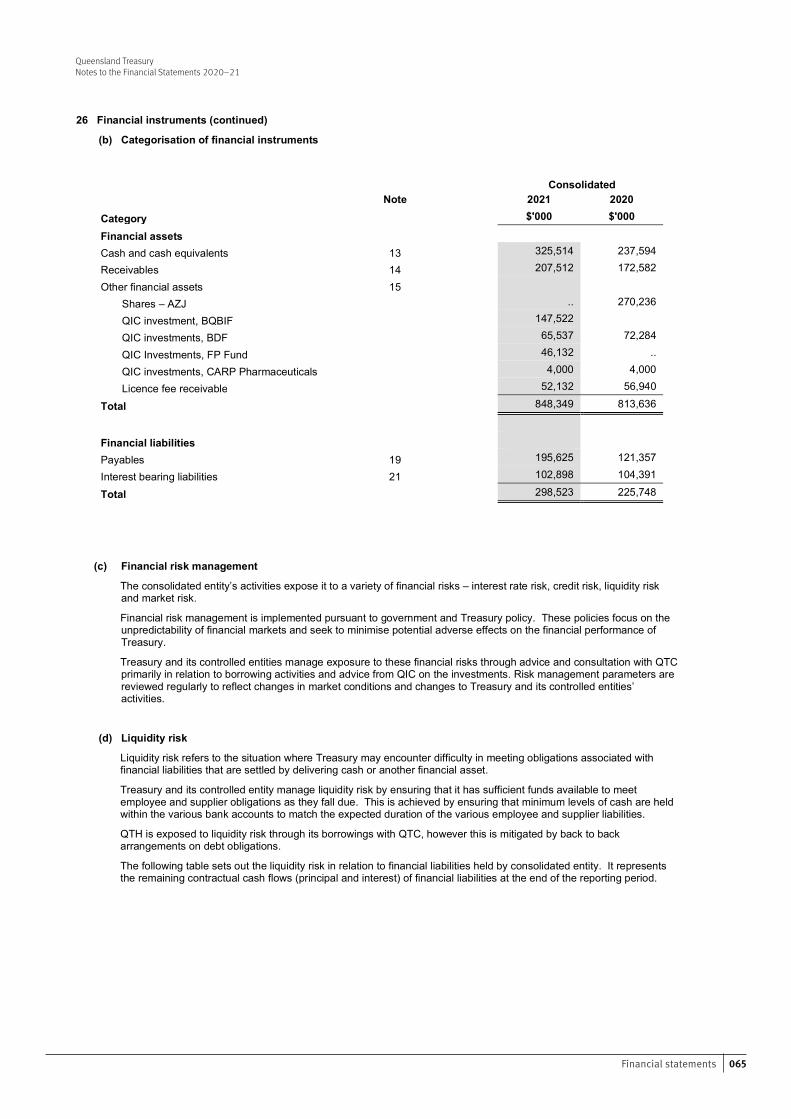
065Financial statements
Queensland TreasuryNotes to the Financial Statements 2020–21Queensland Treasury Notes to the Financial Statements 2020-21
41 Financial Statements – Queensland Treasury
26 Financial instruments (continued)
(b) Categorisation of financial instruments
Consolidated
Category
Note 2021 2020
$'000 $'000
Financial assets Cash and cash equivalents 13 325,514 237,594
Receivables 14 207,512 172,582
Other financial assets 15
Shares – AZJ .. 270,236
QIC investment, BQBIF 147,522
QIC investments, BDF 65,537 72,284
QIC Investments, FP Fund 46,132 ..
QIC investments, CARP Pharmaceuticals 4,000 4,000
Licence fee receivable 52,132 56,940
Total 848,349 813,636
Financial liabilities Payables 19 195,625 121,357
Interest bearing liabilities 21 102,898 104,391
Total 298,523 225,748
(c) Financial risk management
The consolidated entity’s activities expose it to a variety of financial risks – interest rate risk, credit risk, liquidity risk and market risk.
Financial risk management is implemented pursuant to government and Treasury policy. These policies focus on the unpredictability of financial markets and seek to minimise potential adverse effects on the financial performance of Treasury.
Treasury and its controlled entities manage exposure to these financial risks through advice and consultation with QTC primarily in relation to borrowing activities and advice from QIC on the investments. Risk management parameters are reviewed regularly to reflect changes in market conditions and changes to Treasury and its controlled entities’ activities.
(d) Liquidity risk
Liquidity risk refers to the situation where Treasury may encounter difficulty in meeting obligations associated with financial liabilities that are settled by delivering cash or another financial asset.
Treasury and its controlled entity manage liquidity risk by ensuring that it has sufficient funds available to meet employee and supplier obligations as they fall due. This is achieved by ensuring that minimum levels of cash are held within the various bank accounts to match the expected duration of the various employee and supplier liabilities.
QTH is exposed to liquidity risk through its borrowings with QTC, however this is mitigated by back to back arrangements on debt obligations.
The following table sets out the liquidity risk in relation to financial liabilities held by consolidated entity. It represents the remaining contractual cash flows (principal and interest) of financial liabilities at the end of the reporting period.
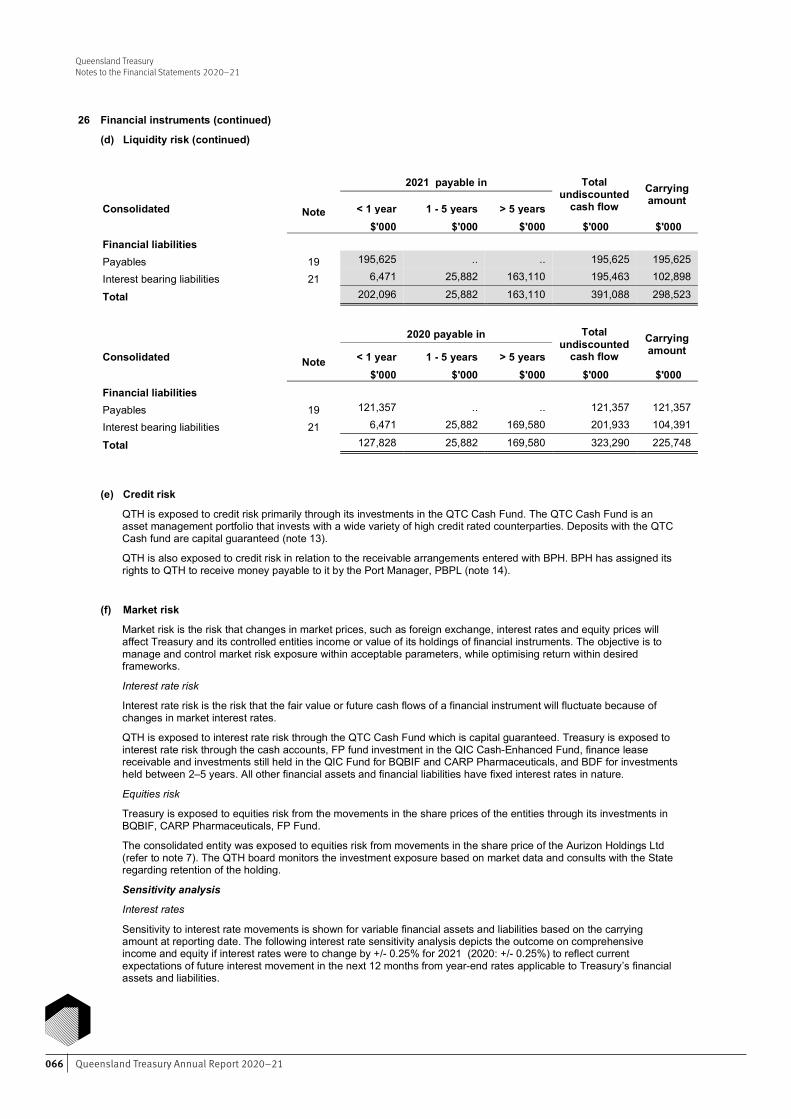
Queensland Treasury Annual Report 2020–21066
Queensland Treasury Notes to the Financial Statements 2020-21
42 Financial Statements – Queensland Treasury
26 Financial instruments (continued)
(d) Liquidity risk (continued)
2021 payable in Total undiscounted
cash flow Carrying amount
Consolidated Note < 1 year 1 - 5 years > 5 years
$'000 $'000 $'000 $'000 $'000 Financial liabilities Payables 19 195,625 .. .. 195,625 195,625
Interest bearing liabilities 21 6,471 25,882 163,110 195,463 102,898
Total 202,096 25,882 163,110 391,088 298,523
2020 payable in Total undiscounted
cash flow Carrying amount Consolidated Note < 1 year 1 - 5 years > 5 years
$'000 $'000 $'000 $'000 $'000 Financial liabilities
Payables 19 121,357 .. .. 121,357 121,357
Interest bearing liabilities 21 6,471 25,882 169,580 201,933 104,391
Total 127,828 25,882 169,580 323,290 225,748
(e) Credit risk
QTH is exposed to credit risk primarily through its investments in the QTC Cash Fund. The QTC Cash Fund is an asset management portfolio that invests with a wide variety of high credit rated counterparties. Deposits with the QTC Cash fund are capital guaranteed (note 13).
QTH is also exposed to credit risk in relation to the receivable arrangements entered with BPH. BPH has assigned its rights to QTH to receive money payable to it by the Port Manager, PBPL (note 14).
(f) Market risk
Market risk is the risk that changes in market prices, such as foreign exchange, interest rates and equity prices will affect Treasury and its controlled entities income or value of its holdings of financial instruments. The objective is to manage and control market risk exposure within acceptable parameters, while optimising return within desired frameworks.
Interest rate risk
Interest rate risk is the risk that the fair value or future cash flows of a financial instrument will fluctuate because of changes in market interest rates.
QTH is exposed to interest rate risk through the QTC Cash Fund which is capital guaranteed. Treasury is exposed to interest rate risk through the cash accounts, FP fund investment in the QIC Cash-Enhanced Fund, finance lease receivable and investments still held in the QIC Fund for BQBIF and CARP Pharmaceuticals, and BDF for investments held between 2–5 years. All other financial assets and financial liabilities have fixed interest rates in nature.
Equities risk
Treasury is exposed to equities risk from the movements in the share prices of the entities through its investments in BQBIF, CARP Pharmaceuticals, FP Fund.
The consolidated entity was exposed to equities risk from movements in the share price of the Aurizon Holdings Ltd (refer to note 7). The QTH board monitors the investment exposure based on market data and consults with the State regarding retention of the holding.
Sensitivity analysis
Interest rates
Sensitivity to interest rate movements is shown for variable financial assets and liabilities based on the carrying amount at reporting date. The following interest rate sensitivity analysis depicts the outcome on comprehensive income and equity if interest rates were to change by +/- 0.25% for 2021 (2020: +/- 0.25%) to reflect current expectations of future interest movement in the next 12 months from year-end rates applicable to Treasury’s financial assets and liabilities.
Queensland Treasury Notes to the Financial Statements 2020-21
43 Financial Statements – Queensland Treasury
26 Financial instruments (continued)
(f) Market risk (continued)
2021 Interest rate risk*
Consolidated Carrying amount
-0.25% 0.25% Financial instruments Profit Equity Profit Equity
$'000 $'000 $'000 $'000 $'000 Cash 209,364 (523) (523) 523 523
QIC Investment - BQBIF 38,545 (96) (96) 96 96
QIC Investment - BDF ** 41,142 (103) (103) 103 103
QIC Investment - FP Fund 46,132 (115) (115) 115 115
QIC Investment - CARP Pharmaceuticals 1,500 (4) (4) 4 4
Finance lease receivables 56,073 (140) (140) 140 140
Potential impact (982) (982) 982 982
2020 Interest rate risk*
Consolidated Carrying amount
-0.25% 0.25% Financial instruments Profit Equity Profit Equity
$'000 $'000 $'000 $'000 $'000 Cash 175,355 (438) (438) 438 438
QIC Investment - BDF ** 18,100 (45) (45) 45 45
Potential impact (483) (483) 483 483
* excludes fixed rate or non-interest bearing assets ** only includes investment held between 2-5 years
Equities
Sensitivity analysis for equity instruments is based on a reasonably possible change in equity prices which is estimated at +/- 10% (2019: +/- 10%).
2021 Equities
Carrying amount
-10% 10%
Financial instruments Profit Equity Profit Equity
$'000 $'000 $'000 $'000 $'000
QIC Investment - BQBIF 108,977 (10,898) (10,898) 10,898 10,898
QIC Investment - FP Fund 46,132 (4,613) (4,613) 4,613 4,613
QIC Investment - CARP Pharmaceuticals 2,500 (250) (250) 250 250
Potential impact (15,761) (15,761) 15,761 15,761
2020 Equities
Carrying amount
-10% 10%
Financial instruments Profit Equity Profit Equity
$'000 $'000 $'000 $'000 $'000
Other financial assets – Shares – AZJ 270,236 (27,024) (27,024) 27,024 27,024
Potential impact (27,024) (27,024) 27,024 27,024
Queensland TreasuryNotes to the Financial Statements 2020–21
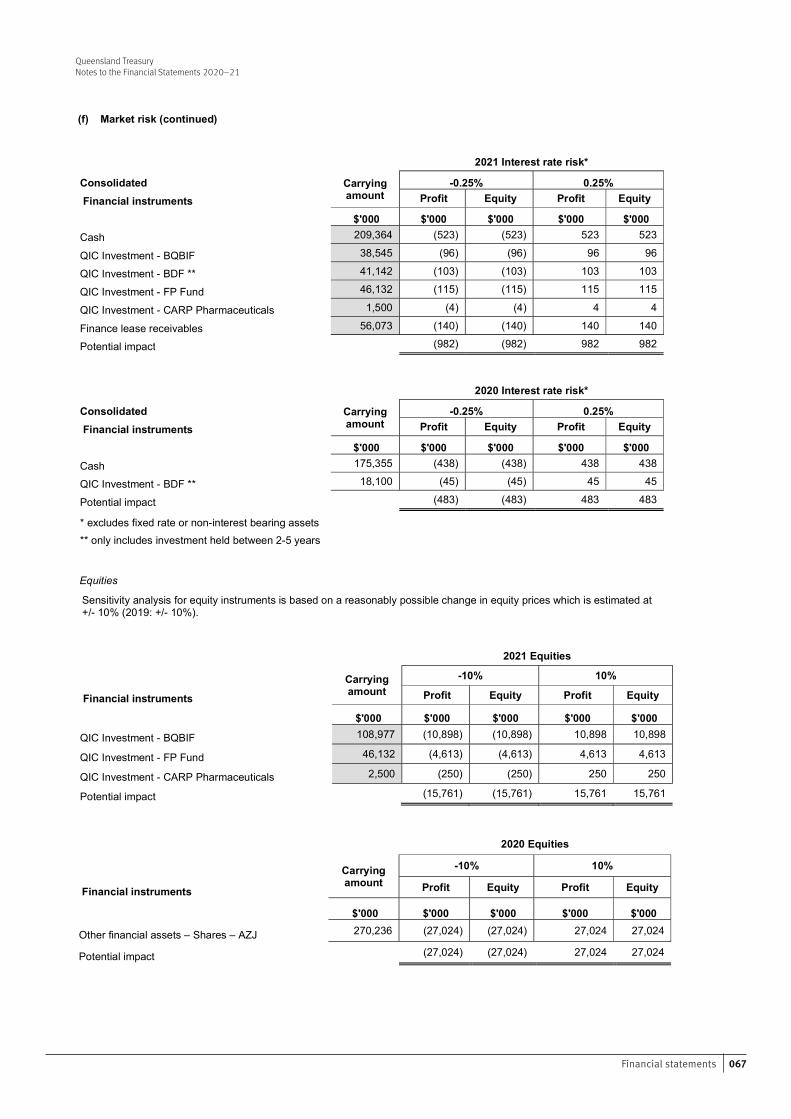
067Financial statements
Queensland Treasury Notes to the Financial Statements 2020-21
43 Financial Statements – Queensland Treasury
26 Financial instruments (continued)
(f) Market risk (continued)
2021 Interest rate risk*
Consolidated Carrying amount
-0.25% 0.25% Financial instruments Profit Equity Profit Equity
$'000 $'000 $'000 $'000 $'000 Cash 209,364 (523) (523) 523 523
QIC Investment - BQBIF 38,545 (96) (96) 96 96
QIC Investment - BDF ** 41,142 (103) (103) 103 103
QIC Investment - FP Fund 46,132 (115) (115) 115 115
QIC Investment - CARP Pharmaceuticals 1,500 (4) (4) 4 4
Finance lease receivables 56,073 (140) (140) 140 140
Potential impact (982) (982) 982 982
2020 Interest rate risk*
Consolidated Carrying amount
-0.25% 0.25% Financial instruments Profit Equity Profit Equity
$'000 $'000 $'000 $'000 $'000 Cash 175,355 (438) (438) 438 438
QIC Investment - BDF ** 18,100 (45) (45) 45 45
Potential impact (483) (483) 483 483
* excludes fixed rate or non-interest bearing assets ** only includes investment held between 2-5 years
Equities
Sensitivity analysis for equity instruments is based on a reasonably possible change in equity prices which is estimated at +/- 10% (2019: +/- 10%).
2021 Equities
Carrying amount
-10% 10%
Financial instruments Profit Equity Profit Equity
$'000 $'000 $'000 $'000 $'000
QIC Investment - BQBIF 108,977 (10,898) (10,898) 10,898 10,898
QIC Investment - FP Fund 46,132 (4,613) (4,613) 4,613 4,613
QIC Investment - CARP Pharmaceuticals 2,500 (250) (250) 250 250
Potential impact (15,761) (15,761) 15,761 15,761
2020 Equities
Carrying amount
-10% 10%
Financial instruments Profit Equity Profit Equity
$'000 $'000 $'000 $'000 $'000
Other financial assets – Shares – AZJ 270,236 (27,024) (27,024) 27,024 27,024
Potential impact (27,024) (27,024) 27,024 27,024
Queensland TreasuryNotes to the Financial Statements 2020–21
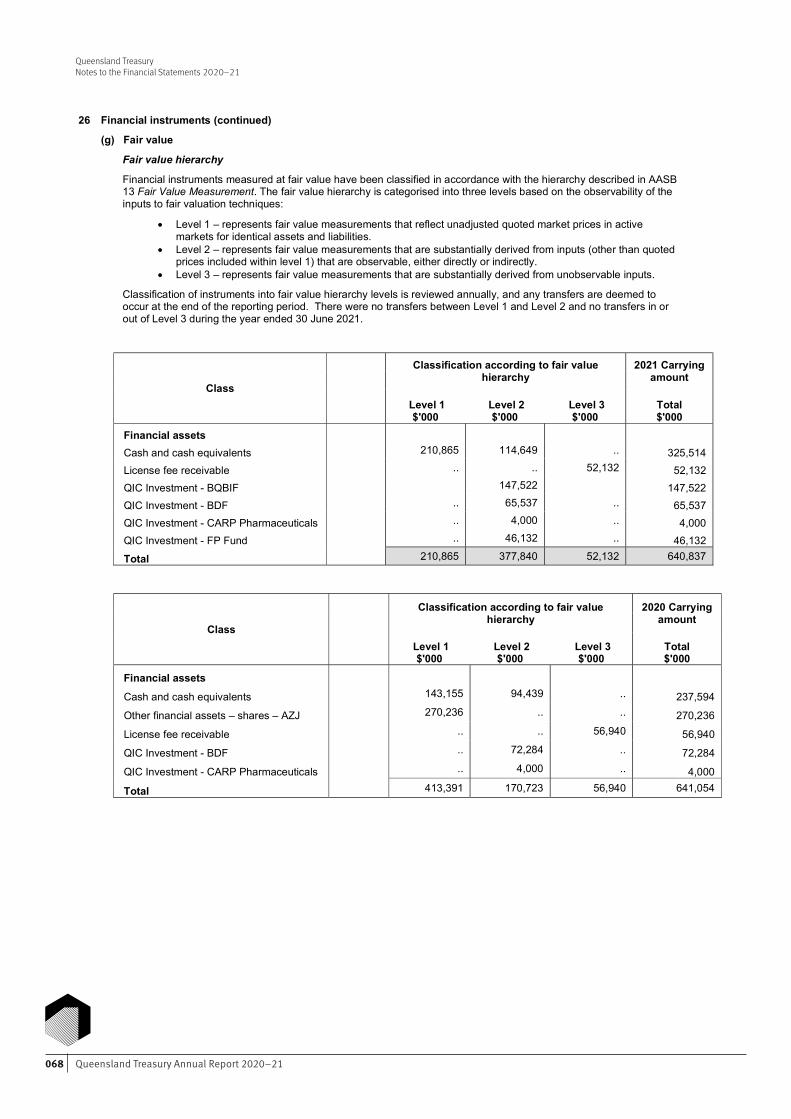
Queensland Treasury Annual Report 2020–21068
Queensland Treasury Notes to the Financial Statements 2020-21
44 Financial Statements – Queensland Treasury
26 Financial instruments (continued)
(g) Fair value
Fair value hierarchy
Financial instruments measured at fair value have been classified in accordance with the hierarchy described in AASB 13 Fair Value Measurement. The fair value hierarchy is categorised into three levels based on the observability of the inputs to fair valuation techniques:
Level 1 – represents fair value measurements that reflect unadjusted quoted market prices in active markets for identical assets and liabilities.
Level 2 – represents fair value measurements that are substantially derived from inputs (other than quoted prices included within level 1) that are observable, either directly or indirectly.
Level 3 – represents fair value measurements that are substantially derived from unobservable inputs.
Classification of instruments into fair value hierarchy levels is reviewed annually, and any transfers are deemed to occur at the end of the reporting period. There were no transfers between Level 1 and Level 2 and no transfers in or out of Level 3 during the year ended 30 June 2021.
Class
Classification according to fair value hierarchy
2021 Carrying amount
Level 1
$'000 Level 2
$'000 Level 3
$'000 Total $'000
Financial assets Cash and cash equivalents 210,865 114,649 .. 325,514 License fee receivable .. .. 52,132 52,132 QIC Investment - BQBIF 147,522 147,522 QIC Investment - BDF .. 65,537 .. 65,537 QIC Investment - CARP Pharmaceuticals .. 4,000 .. 4,000 QIC Investment - FP Fund .. 46,132 .. 46,132
Total 210,865 377,840 52,132 640,837
Class
Classification according to fair value hierarchy
2020 Carrying amount
Level 1
$'000 Level 2
$'000 Level 3
$'000 Total $'000
Financial assets
Cash and cash equivalents 143,155 94,439 .. 237,594
Other financial assets – shares – AZJ 270,236 .. .. 270,236
License fee receivable .. .. 56,940 56,940
QIC Investment - BDF .. 72,284 .. 72,284
QIC Investment - CARP Pharmaceuticals .. 4,000 .. 4,000
Total 413,391 170,723 56,940 641,054
Queensland Treasury Notes to the Financial Statements 2020-21
45 Financial Statements – Queensland Treasury
26 Financial instruments (continued)
(g) Fair value (continued)
The inputs used in the classification of Level 2 instruments at fair value are as follows:
QTC Cash Fund is measured at net realisable value. Investment in BDF is measured based on the net asset value which incorporates cost of the investment
adjusted for the interest and latest equity raised (for investments more than 5 years). Fair value decreases incorporate assessment of cash flow projections and going concern for investees.
Investment in FP Fund is measured based on the fair value of the short-term investments held in the fund such as low risk discount securities, term deposits, short-term floating rate notes.
Investment in BQBIF is measured based on the net asset value of the fund.
The input used in the classification of Level 3 instruments where fair value is disclosed:
Licence fee receivable cash flows are discounted at 8.41% per annum (2020: 9.15%) using projections of trade revenue and price growth inflated at CPI.
The lease receivable and associated interest-bearing liabilities (lease loan and novation loan) are back to back leasing arrangements held by DBCTH. Both the other receivable and associated loan fair values are reasonably approximate to the carrying value at balance date due to the offsetting nature of these arrangements.
The carrying amount of financial assets and liabilities measured at amortised cost approximates their fair value at reporting date except for the following financial asset:
2021 2020
Carrying
amount Fair value Carrying amount Fair value
$'000 $'000 $'000 $'000
Financial asset Loan receivable ^ 36,115 41,301 40,670 47,814
Total 36,115 41,301 40,670 47,814
^ QTH only The fair values have been based on the following:
Loans receivable are discounted to present value using a discount rate considering the entity specific risks and using valuation techniques.
27 Budget vs actual comparison
This note contains the explanation of major variances between Treasury’s actual 2020-21 financial results and the original budget presented to Parliament. There is no disclosure of budget to actual variance explanation for the Statement of Financial Position and Statement of Cash Flows as the Service Delivery Statement (SDS) tabled in Parliament for the 2020-21 financial year does not include a budgeted Statement of Financial Position and Statement of Cash Flows.
Explanation of major variances for Statement of Comprehensive Income
Note 3 - Appropriation revenue
The decrease is mainly due to the revision of the timeframes for a number of projects ($89.501 million) including the Jobs and Regional Growth Fund ($34.501 million), Debt Recovery and Compliance Program ($10.365 million), SPER ICT Program ($9.785 million), Southport Spit ($7.964 million), Native Title Compensation Office ($7.379 million), the Advance Queensland Industry Attraction Fund ($6.072 million), Debt Management Centre ($5.486 million) and emerging whole-of-government priorities ($5.250 million). Also contributing is the transfer of RCIF to the DSDILGP ($10 million). This is partially offset by a reimbursement to QIC for facilitation costs incurred for Project Maroon ($6.064M).
Note 4 - User charges and fees
The increase is mainly due to higher than expected contributions towards the Financial Provisioning Fund of $12.352 million and reimbursement of costs incurred relating to the Queensland Future Fund of $2.154 million.
Grants and Contributions
The decrease reflects the transfer of the Resource Communities Infrastructure Fund to DSDILGP in February 2021.
Note 5 - Interest revenue
The decrease mainly relates to lower interest earned on the Financial Provisioning Scheme's cash balance of $0.912 million. Also contributing is lower notional interest earned from the finance lease receivable of $0.774 million.
Queensland TreasuryNotes to the Financial Statements 2020–21
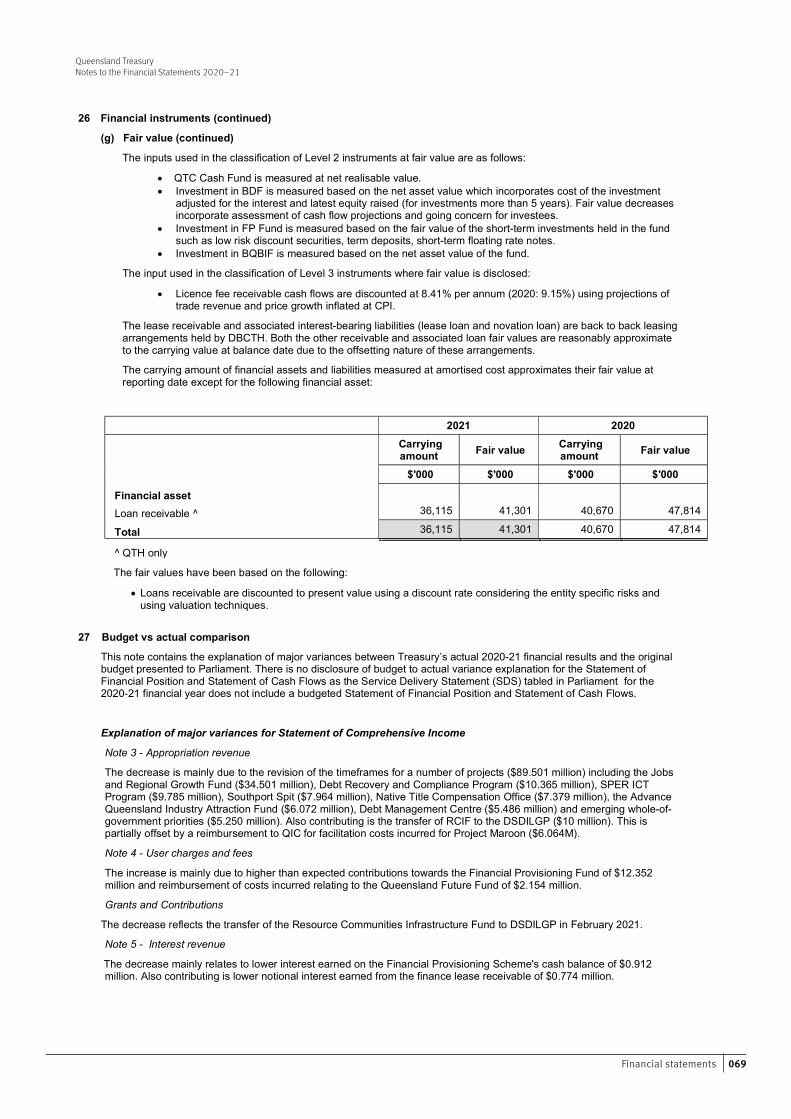
069Financial statements
Queensland Treasury Notes to the Financial Statements 2020-21
45 Financial Statements – Queensland Treasury
26 Financial instruments (continued)
(g) Fair value (continued)
The inputs used in the classification of Level 2 instruments at fair value are as follows:
QTC Cash Fund is measured at net realisable value. Investment in BDF is measured based on the net asset value which incorporates cost of the investment
adjusted for the interest and latest equity raised (for investments more than 5 years). Fair value decreases incorporate assessment of cash flow projections and going concern for investees.
Investment in FP Fund is measured based on the fair value of the short-term investments held in the fund such as low risk discount securities, term deposits, short-term floating rate notes.
Investment in BQBIF is measured based on the net asset value of the fund.
The input used in the classification of Level 3 instruments where fair value is disclosed:
Licence fee receivable cash flows are discounted at 8.41% per annum (2020: 9.15%) using projections of trade revenue and price growth inflated at CPI.
The lease receivable and associated interest-bearing liabilities (lease loan and novation loan) are back to back leasing arrangements held by DBCTH. Both the other receivable and associated loan fair values are reasonably approximate to the carrying value at balance date due to the offsetting nature of these arrangements.
The carrying amount of financial assets and liabilities measured at amortised cost approximates their fair value at reporting date except for the following financial asset:
2021 2020
Carrying
amount Fair value Carrying amount Fair value
$'000 $'000 $'000 $'000
Financial asset Loan receivable ^ 36,115 41,301 40,670 47,814
Total 36,115 41,301 40,670 47,814
^ QTH only The fair values have been based on the following:
Loans receivable are discounted to present value using a discount rate considering the entity specific risks and using valuation techniques.
27 Budget vs actual comparison
This note contains the explanation of major variances between Treasury’s actual 2020-21 financial results and the original budget presented to Parliament. There is no disclosure of budget to actual variance explanation for the Statement of Financial Position and Statement of Cash Flows as the Service Delivery Statement (SDS) tabled in Parliament for the 2020-21 financial year does not include a budgeted Statement of Financial Position and Statement of Cash Flows.
Explanation of major variances for Statement of Comprehensive Income
Note 3 - Appropriation revenue
The decrease is mainly due to the revision of the timeframes for a number of projects ($89.501 million) including the Jobs and Regional Growth Fund ($34.501 million), Debt Recovery and Compliance Program ($10.365 million), SPER ICT Program ($9.785 million), Southport Spit ($7.964 million), Native Title Compensation Office ($7.379 million), the Advance Queensland Industry Attraction Fund ($6.072 million), Debt Management Centre ($5.486 million) and emerging whole-of-government priorities ($5.250 million). Also contributing is the transfer of RCIF to the DSDILGP ($10 million). This is partially offset by a reimbursement to QIC for facilitation costs incurred for Project Maroon ($6.064M).
Note 4 - User charges and fees
The increase is mainly due to higher than expected contributions towards the Financial Provisioning Fund of $12.352 million and reimbursement of costs incurred relating to the Queensland Future Fund of $2.154 million.
Grants and Contributions
The decrease reflects the transfer of the Resource Communities Infrastructure Fund to DSDILGP in February 2021.
Note 5 - Interest revenue
The decrease mainly relates to lower interest earned on the Financial Provisioning Scheme's cash balance of $0.912 million. Also contributing is lower notional interest earned from the finance lease receivable of $0.774 million.
Queensland TreasuryNotes to the Financial Statements 2020–21
Queensland Treasury Annual Report 2020–21070
Queensland Treasury Notes to the Financial Statements 2020-21
46 Financial Statements – Queensland Treasury
27 Budget vs actual comparison (continued)
Note 6 - Dividends received
The increase relates to the Aurizon shares received as in-specie dividend from QTH.
Other revenue
The increase is mainly due to the surety redemption from the Financial Provisioning Scheme of $2.233 million.
Note 7 - Gain/(loss) on transfer of assets/fair value movement of investments This primarily relates to the transfer of shares of $205.973 million to the Debt Retirement Fund. Also contributing is the impact of fair value decrease of $20.950 million associated with the BQBIF.
Note 8 - Employee Expenses
The decrease is due to strategies in place to manage the department's full-time equivalents. Also contributing is the utilisation of agency temps to back fill vacant positions mainly in the Office of State Revenue.
Note 9 - Supplies and Services
The decrease is mainly due to the revision of the timeframes and changes in the operating model for a number of projects ($37.768 million) including the SPER ICT Program ($9.785 million), Debt Recovery and Compliance Program ($7.498 million), Native Title Compensation Office ($5.505 million), Debt Management Centre ($5.533 million) and HomeBuilder Grant administration ($2.950 million). Also contributing is a reduction in utilising of contractors and consultants for operational activities ($3.581 million) and lower SPER call centre expenditure ($2.524 million). This is partially offset by a reimbursement to QIC for facilitation costs incurred for Project Maroon ($6.064 million).
Note 10 - Grants and Subsidies
The decrease is primarily due to the transfer of the Resource Communities Infrastructure Fund to DSDILGP ($33.265 million). Also contributing are lower than anticipated grant payments from the Jobs and Regional Growth Fund ($34.501 million), the Financial Provisioning Scheme ($7.000 million), the Advance Queensland Industry Attraction Fund ($6.072 million), Southport Spit ($6.360 million) and emerging whole-of-government priorities ($5.250 million).
Interest expense
The decrease reflects the amortised cost adjustment relating to the finance lease receivable.
Note 11 - Other expenses
The increase relates to the goods and services below fair value of $0.416 million for the state archives and corporate support.
Queensland TreasuryNotes to the Financial Statements 2020–21
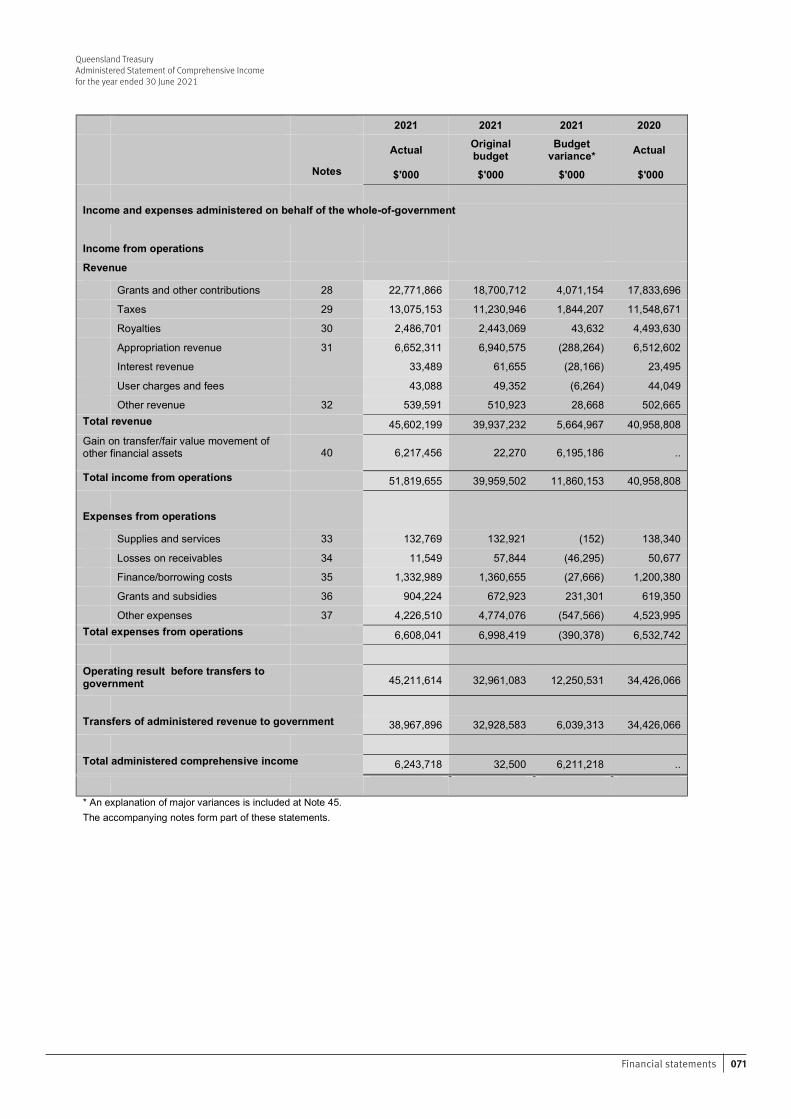
071Financial statements
Queensland TreasuryAdministered Statement of Comprehensive Incomefor the year ended 30 June 2021
47 Financial Statements – Queensland Treasury
Queensland Treasury
Administered Statement of Comprehensive Income for the year ended 30 June 2021
2021 2021 2021 2020
Actual Original budget
Budget variance* Actual
Notes $'000 $'000 $'000 $'000
Income and expenses administered on behalf of the whole-of-government
Income from operations
Revenue
Grants and other contributions 28 22,771,866 18,700,712 4,071,154 17,833,696 Taxes 29 13,075,153 11,230,946 1,844,207 11,548,671
Royalties 30 2,486,701 2,443,069 43,632 4,493,630 Appropriation revenue 31 6,652,311 6,940,575 (288,264) 6,512,602 Interest revenue 33,489 61,655 (28,166) 23,495 User charges and fees 43,088 49,352 (6,264) 44,049
Other revenue 32 539,591 510,923 28,668 502,665 Total revenue 45,602,199 39,937,232 5,664,967 40,958,808 Gain on transfer/fair value movement of other financial assets 40 6,217,456 22,270 6,195,186 ..
Total income from operations 51,819,655 39,959,502 11,860,153 40,958,808
Expenses from operations
Supplies and services 33 132,769 132,921 (152) 138,340 Losses on receivables 34 11,549 57,844 (46,295) 50,677 Finance/borrowing costs 35 1,332,989 1,360,655 (27,666) 1,200,380 Grants and subsidies 36 904,224 672,923 231,301 619,350 Other expenses 37 4,226,510 4,774,076 (547,566) 4,523,995
Total expenses from operations 6,608,041 6,998,419 (390,378) 6,532,742
Operating result before transfers to government
45,211,614 32,961,083 12,250,531 34,426,066
Transfers of administered revenue to government 38,967,896 32,928,583 6,039,313 34,426,066
Total administered comprehensive income 6,243,718 32,500 6,211,218 ..
* An explanation of major variances is included at Note 45. The accompanying notes form part of these statements.
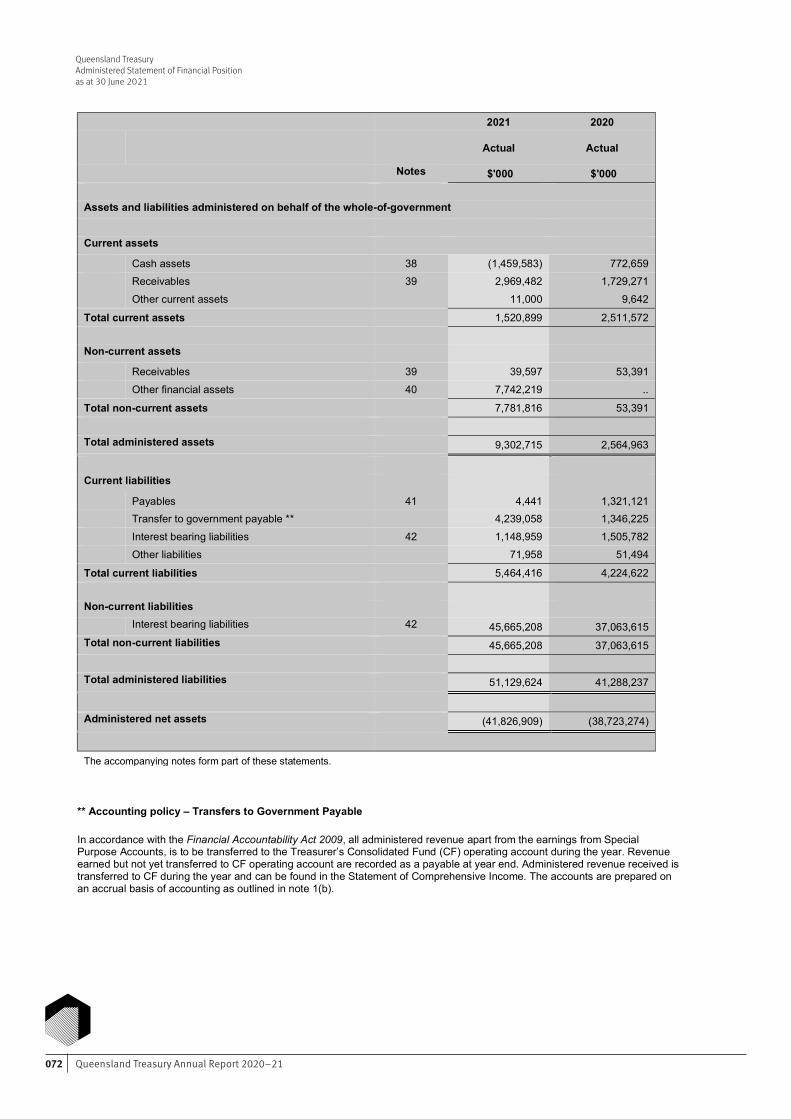
Queensland Treasury Annual Report 2020–21072
Queensland TreasuryAdministered Statement of Financial Positionas at 30 June 2021
48 Financial Statements – Queensland Treasury
Queensland Treasury Administered Statement of Financial Position as at 30 June 2021
2021 2020
Actual Actual
Notes $'000 $'000 Assets and liabilities administered on behalf of the whole-of-government
Current assets
Cash assets 38 (1,459,583) 772,659 Receivables 39 2,969,482 1,729,271
Other current assets 11,000 9,642
Total current assets 1,520,899 2,511,572
Non-current assets Receivables 39 39,597 53,391 Other financial assets 40 7,742,219 ..
Total non-current assets 7,781,816 53,391
Total administered assets 9,302,715 2,564,963
Current liabilities
Payables 41 4,441 1,321,121 Transfer to government payable ** 4,239,058 1,346,225 Interest bearing liabilities 42 1,148,959 1,505,782 Other liabilities 71,958 51,494
Total current liabilities 5,464,416 4,224,622
Non-current liabilities Interest bearing liabilities 42 45,665,208 37,063,615 Total non-current liabilities 45,665,208 37,063,615
Total administered liabilities 51,129,624 41,288,237
Administered net assets (41,826,909) (38,723,274)
The accompanying notes form part of these statements. ** Accounting policy – Transfers to Government Payable In accordance with the Financial Accountability Act 2009, all administered revenue apart from the earnings from Special Purpose Accounts, is to be transferred to the Treasurer’s Consolidated Fund (CF) operating account during the year. Revenue earned but not yet transferred to CF operating account are recorded as a payable at year end. Administered revenue received is transferred to CF during the year and can be found in the Statement of Comprehensive Income. The accounts are prepared on an accrual basis of accounting as outlined in note 1(b).
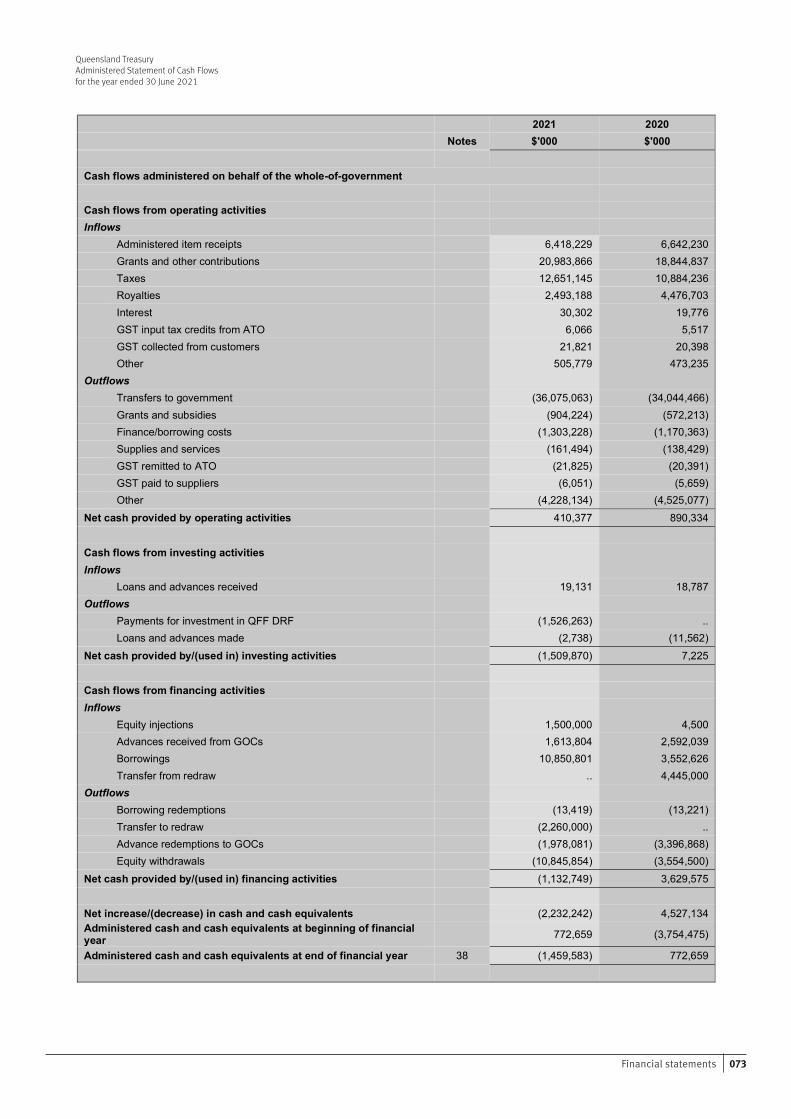
073Financial statements
49 Financial Statements – Queensland Treasury
Queensland Treasury Administered Statement of Cash Flows for the year ended 30 June 2021 2021 2020 Notes $'000 $'000 Cash flows administered on behalf of the whole-of-government Cash flows from operating activities Inflows Administered item receipts 6,418,229 6,642,230 Grants and other contributions 20,983,866 18,844,837 Taxes 12,651,145 10,884,236 Royalties 2,493,188 4,476,703 Interest 30,302 19,776 GST input tax credits from ATO 6,066 5,517 GST collected from customers 21,821 20,398 Other 505,779 473,235 Outflows Transfers to government (36,075,063) (34,044,466) Grants and subsidies (904,224) (572,213) Finance/borrowing costs (1,303,228) (1,170,363) Supplies and services (161,494) (138,429) GST remitted to ATO (21,825) (20,391) GST paid to suppliers (6,051) (5,659) Other (4,228,134) (4,525,077) Net cash provided by operating activities 410,377 890,334 Cash flows from investing activities Inflows Loans and advances received 19,131 18,787 Outflows Payments for investment in QFF DRF (1,526,263) .. Loans and advances made (2,738) (11,562) Net cash provided by/(used in) investing activities (1,509,870) 7,225 Cash flows from financing activities Inflows Equity injections 1,500,000 4,500 Advances received from GOCs 1,613,804 2,592,039 Borrowings 10,850,801 3,552,626 Transfer from redraw .. 4,445,000 Outflows Borrowing redemptions (13,419) (13,221) Transfer to redraw (2,260,000) .. Advance redemptions to GOCs (1,978,081) (3,396,868) Equity withdrawals (10,845,854) (3,554,500) Net cash provided by/(used in) financing activities (1,132,749) 3,629,575 Net increase/(decrease) in cash and cash equivalents (2,232,242) 4,527,134 Administered cash and cash equivalents at beginning of financial year 772,659 (3,754,475)
Administered cash and cash equivalents at end of financial year 38 (1,459,583) 772,659
Queensland TreasuryAdministered Statement of Cash Flowsfor the year ended 30 June 2021
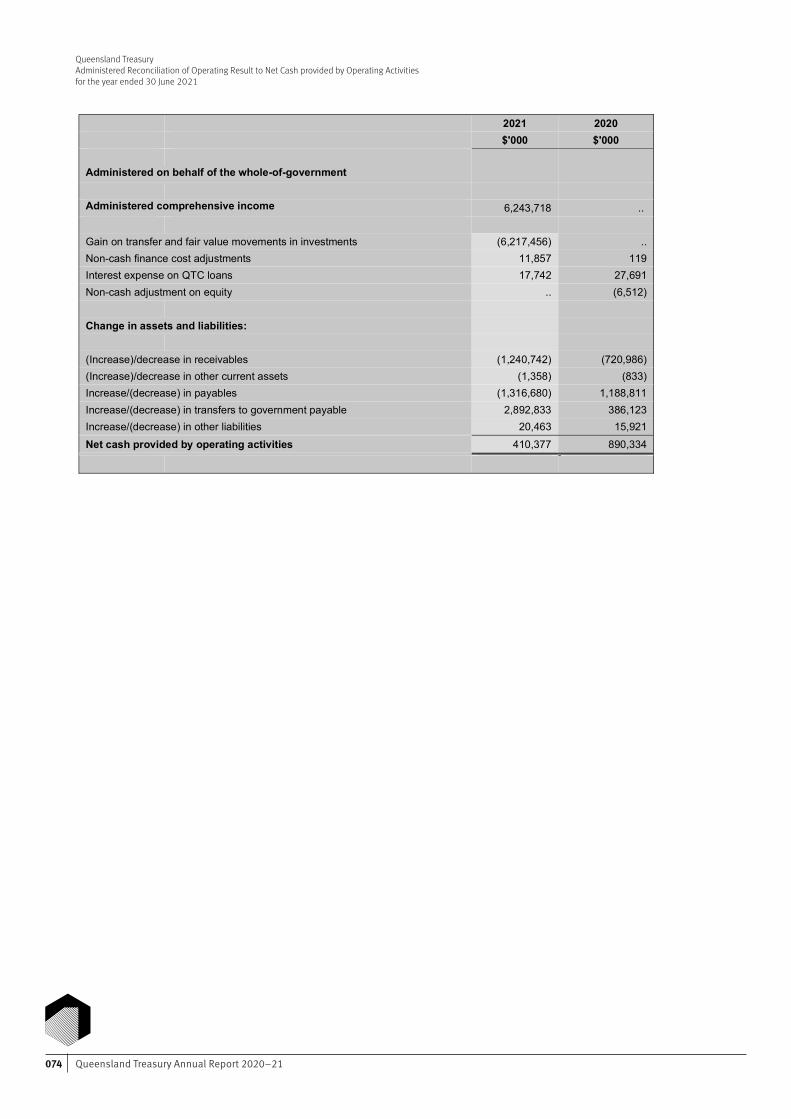
Queensland Treasury Annual Report 2020–21074
50 Financial Statements – Queensland Treasury
Queensland Treasury
Administered Reconciliation of Operating Result to Net Cash provided by Operating Activities
for the year ended 30 June 2021
2021 2020
$'000 $'000
Administered on behalf of the whole-of-government Administered comprehensive income 6,243,718 .. Gain on transfer and fair value movements in investments (6,217,456) .. Non-cash finance cost adjustments 11,857 119 Interest expense on QTC loans 17,742 27,691 Non-cash adjustment on equity .. (6,512) Change in assets and liabilities: (Increase)/decrease in receivables (1,240,742) (720,986) (Increase)/decrease in other current assets (1,358) (833) Increase/(decrease) in payables (1,316,680) 1,188,811 Increase/(decrease) in transfers to government payable 2,892,833 386,123 Increase/(decrease) in other liabilities 20,463 15,921 Net cash provided by operating activities 410,377 890,334
Queensland TreasuryAdministered Reconciliation of Operating Result to Net Cash provided by Operating Activitiesfor the year ended 30 June 2021
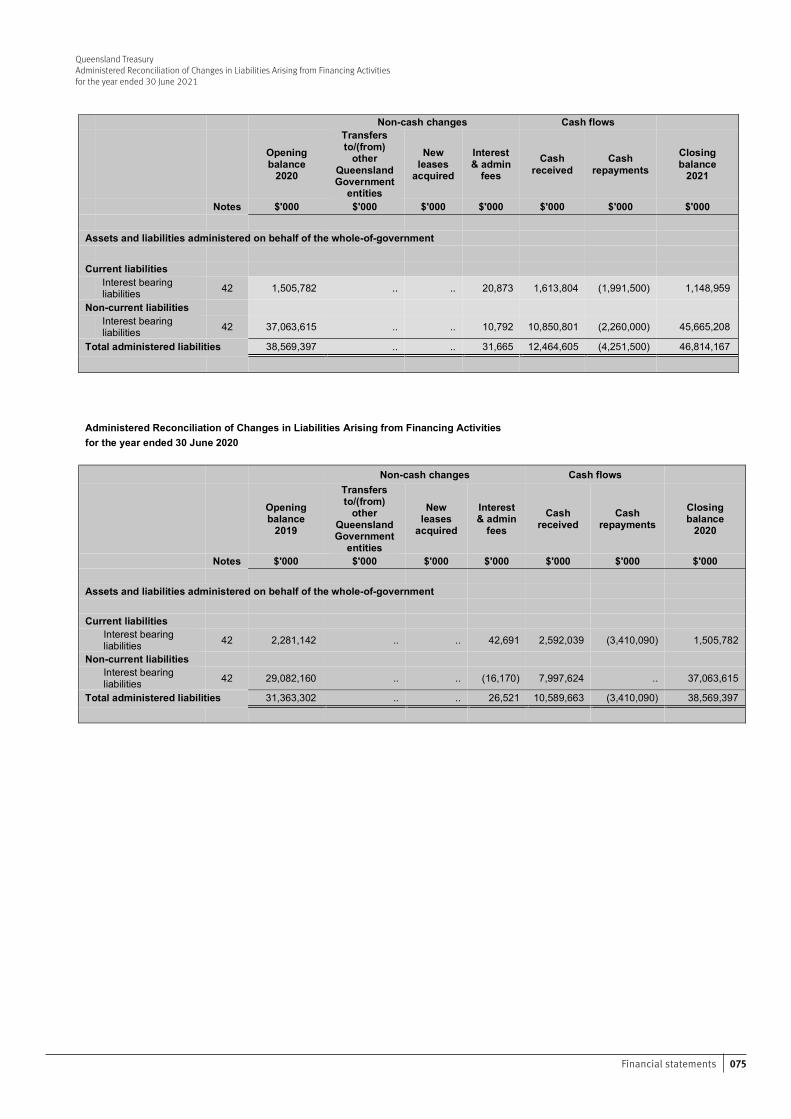
075Financial statements
51 Financial Statements – Queensland Treasury
Queensland Treasury Administered Reconciliation of Changes in Liabilities Arising from Financing Activities for the year ended 30 June 2021 Non-cash changes Cash flows
Opening balance
2020
Transfers to/(from)
other Queensland Government
entities
New leases
acquired
Interest & admin
fees Cash
received Cash
repayments Closing balance
2021
Notes $'000 $'000 $'000 $'000 $'000 $'000 $'000 Assets and liabilities administered on behalf of the whole-of-government Current liabilities
Interest bearing liabilities 42 1,505,782 .. .. 20,873 1,613,804 (1,991,500) 1,148,959
Non-current liabilities
Interest bearing liabilities 42 37,063,615 .. .. 10,792 10,850,801 (2,260,000) 45,665,208
Total administered liabilities 38,569,397 .. .. 31,665 12,464,605 (4,251,500) 46,814,167
Administered Reconciliation of Changes in Liabilities Arising from Financing Activities for the year ended 30 June 2020
Non-cash changes Cash flows
Opening balance
2019
Transfers to/(from)
other Queensland Government
entities
New leases
acquired
Interest & admin
fees Cash
received Cash
repayments Closing balance
2020
Notes $'000 $'000 $'000 $'000 $'000 $'000 $'000 Assets and liabilities administered on behalf of the whole-of-government Current liabilities
Interest bearing liabilities 42 2,281,142 .. .. 42,691 2,592,039 (3,410,090) 1,505,782
Non-current liabilities
Interest bearing liabilities 42 29,082,160 .. .. (16,170) 7,997,624 .. 37,063,615
Total administered liabilities 31,363,302 .. .. 26,521 10,589,663 (3,410,090) 38,569,397
Queensland TreasuryAdministered Reconciliation of Changes in Liabilities Arising from Financing Activitiesfor the year ended 30 June 2021
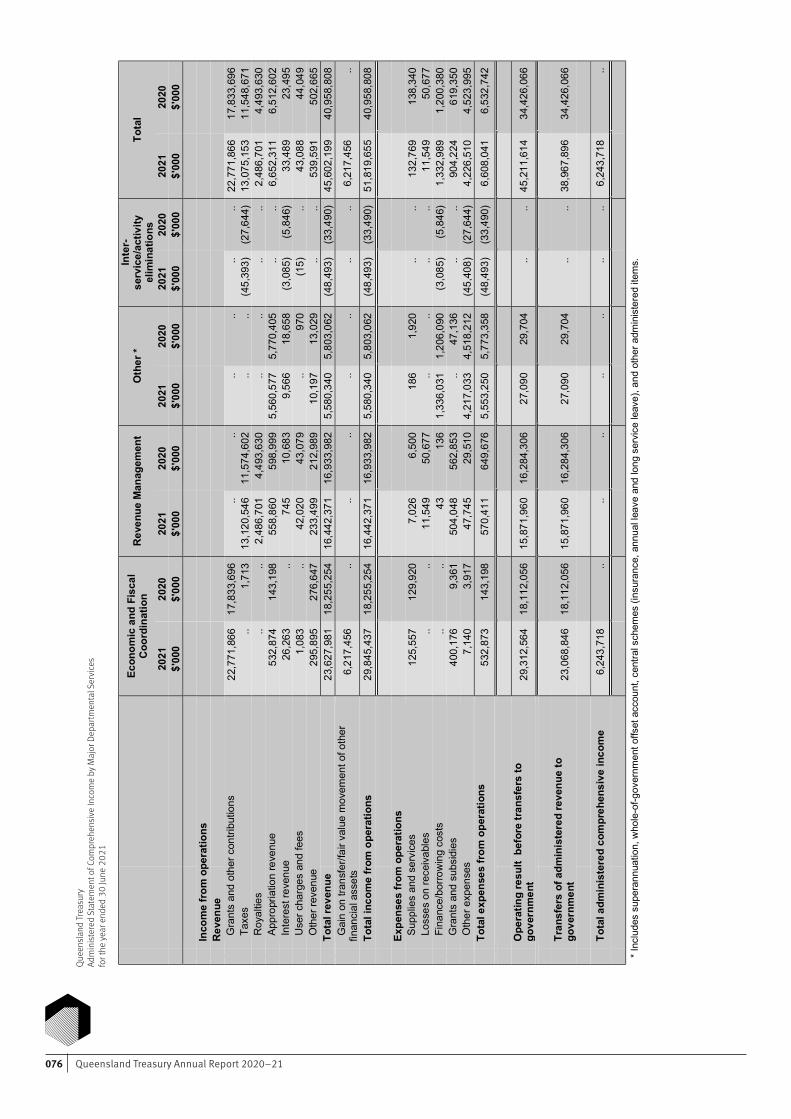
Queensland Treasury Annual Report 2020–21076
52
Fin
anci
al S
tate
men
ts –
Que
ensl
and
Trea
sury
Q
ueen
slan
d Tr
easu
ry
Adm
inis
tere
d St
atem
ent o
f Com
preh
ensi
ve In
com
e by
Maj
or D
epar
tmen
tal S
ervi
ces
for t
he y
ear e
nded
30
June
202
1
Econ
omic
and
Fis
cal
Coo
rdin
atio
n R
even
ue M
anag
emen
t O
ther
* In
ter-
serv
ice/
activ
ity
elim
inat
ions
To
tal
20
21
2020
20
21
2020
20
21
2020
20
21
2020
20
21
2020
$'00
0 $'
000
$'00
0 $'
000
$'00
0 $'
000
$'00
0 $'
000
$'00
0 $'
000
Inco
me
from
ope
ratio
ns
R
even
ue
Gra
nts
and
othe
r con
tribu
tions
22
,771
,866
17
,833
,696
..
..
..
..
..
..
22
,771
,866
17
,833
,696
Tax
es
..
1,71
3
13,1
20,5
46
11,5
74,6
02
..
..
(45,
393)
(2
7,64
4)
13,0
75,1
53
11,5
48,6
71
R
oyal
ties
..
..
2,48
6,70
1
4,49
3,63
0
..
..
..
..
2,48
6,70
1
4,49
3,63
0
A
ppro
pria
tion
reve
nue
532,
874
14
3,19
8
558,
860
59
8,99
9
5,56
0,57
7
5,77
0,40
5
..
..
6,65
2,31
1
6,51
2,60
2
I
nter
est r
even
ue
26,2
63
..
745
10
,683
9,
566
18
,658
(3
,085
) (5
,846
) 33
,489
23
,495
Use
r cha
rges
and
fees
1,
083
..
42
,020
43
,079
..
97
0
(15)
..
43
,088
44
,049
Oth
er re
venu
e 29
5,89
5
276,
647
23
3,49
9
212,
989
10
,197
13
,029
..
..
53
9,59
1
502,
665
Tota
l rev
enue
23,6
27,9
81
18,2
55,2
54
16,4
42,3
71
16,9
33,9
82
5,58
0,34
0
5,80
3,06
2
(48,
493)
(3
3,49
0)
45,6
02,1
99
40,9
58,8
08
G
ain
on tr
ansf
er/fa
ir va
lue
mov
emen
t of o
ther
fin
anci
al a
sset
s 6,
217,
456
..
..
..
..
..
..
..
6,
217,
456
..
To
tal i
ncom
e fr
om o
pera
tions
29
,845
,437
18
,255
,254
16
,442
,371
16
,933
,982
5,
580,
340
5,
803,
062
(4
8,49
3)
(33,
490)
51
,819
,655
40
,958
,808
Ex
pens
es fr
om o
pera
tions
Sup
plie
s an
d se
rvic
es
125,
557
12
9,92
0
7,02
6
6,50
0
186
1,
920
..
..
13
2,76
9
138,
340
Los
ses
on re
ceiv
able
s ..
..
11
,549
50
,677
..
..
..
..
11
,549
50
,677
Fin
ance
/bor
row
ing
cost
s ..
..
43
13
6
1,33
6,03
1
1,20
6,09
0
(3,0
85)
(5,8
46)
1,33
2,98
9
1,20
0,38
0
G
rant
s an
d su
bsid
ies
400,
176
9,
361
50
4,04
8
562,
853
..
47
,136
..
..
90
4,22
4
619,
350
Oth
er e
xpen
ses
7,14
0
3,91
7
47,7
45
29,5
10
4,21
7,03
3
4,51
8,21
2
(45,
408)
(2
7,64
4)
4,22
6,51
0
4,52
3,99
5
To
tal e
xpen
ses
from
ope
ratio
ns
532,
873
14
3,19
8
570,
411
64
9,67
6
5,55
3,25
0
5,77
3,35
8
(48,
493)
(3
3,49
0)
6,60
8,04
1
6,53
2,74
2
Ope
ratin
g re
sult
bef
ore
tran
sfer
s to
go
vern
men
t 29
,312
,564
18
,112
,056
15
,871
,960
16
,284
,306
27
,090
29
,704
..
..
45
,211
,614
34
,426
,066
Tran
sfer
s of
adm
inis
tere
d re
venu
e to
go
vern
men
t 23
,068
,846
18
,112
,056
15
,871
,960
16
,284
,306
27
,090
29
,704
..
..
38
,967
,896
34
,426
,066
Tota
l adm
inis
tere
d co
mpr
ehen
sive
inco
me
6,
243,
718
..
..
..
..
..
..
..
6,
243,
718
..
* Inc
lude
s su
pera
nnua
tion,
who
le-o
f-gov
ernm
ent o
ffset
acc
ount
, cen
tral s
chem
es (i
nsur
ance
, ann
ual l
eave
and
long
ser
vice
leav
e), a
nd o
ther
adm
inis
tere
d ite
ms.
Quee
nsla
nd Tr
easu
ryAd
min
ister
ed S
tate
men
t of C
ompr
ehen
sive
Inco
me
by M
ajor
Dep
artm
enta
l Ser
vices
for t
he ye
ar e
nded
30
June
202
1
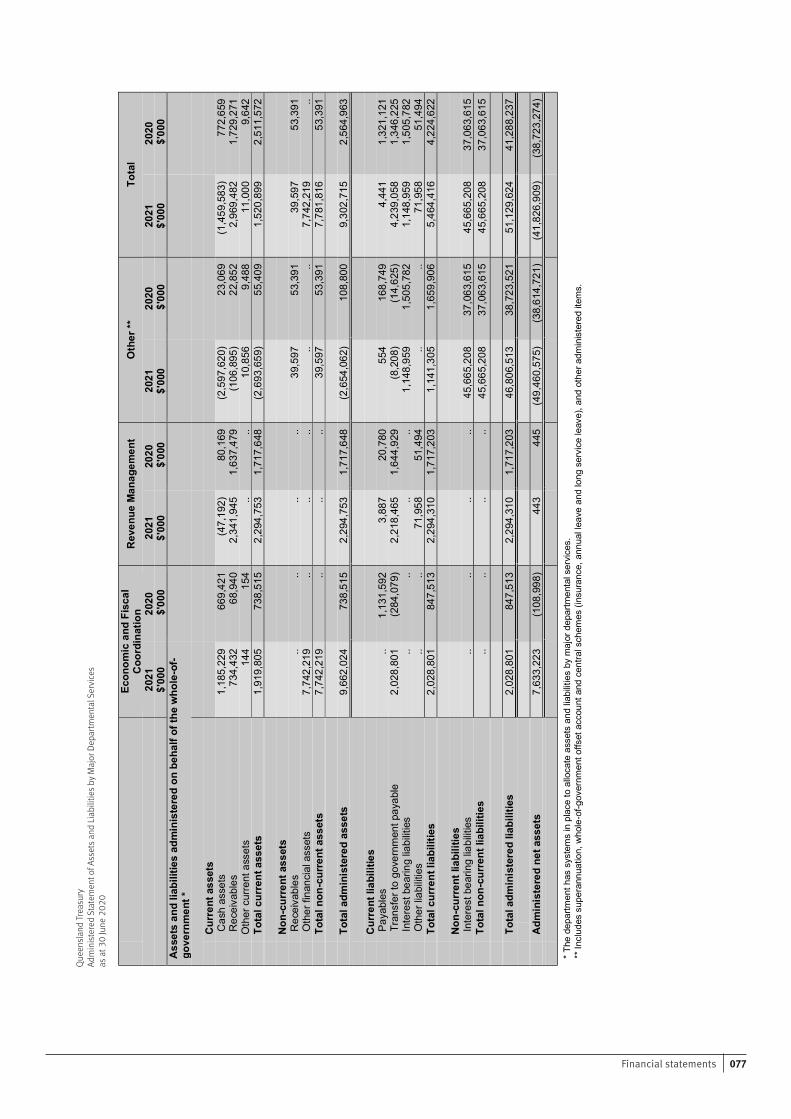
077Financial statements
53
Fin
anci
al S
tate
men
ts –
Que
ensl
and
Trea
sury
Q
ueen
slan
d Tr
easu
ry
Adm
inis
tere
d St
atem
ent o
f Ass
ets
and
Liab
ilitie
s by
Maj
or D
epar
tmen
tal S
ervi
ces
as a
t 30
June
202
1
Econ
omic
and
Fis
cal
Coo
rdin
atio
n R
even
ue M
anag
emen
t O
ther
**
Tota
l
2021
20
20
2021
20
20
2021
20
20
2021
20
20
$'
000
$'0
00
$'00
0 $
'000
$'
000
$'0
00
$'00
0 $
'000
A
sset
s an
d lia
bilit
ies
adm
inis
tere
d on
beh
alf o
f the
who
le-o
f-go
vern
men
t *
Cur
rent
ass
ets
C
ash
asse
ts
1,18
5,22
9
669,
421
(4
7,19
2)
80,1
69
(2,5
97,6
20)
23,0
69
(1,4
59,5
83)
772,
659
Rec
eiva
bles
73
4,43
2
68,9
40
2,34
1,94
5
1,63
7,47
9
(106
,895
) 22
,852
2,
969,
482
1,
729,
271
Oth
er c
urre
nt a
sset
s 14
4
154
..
..
10
,856
9,
488
11
,000
9,
642
Tota
l cur
rent
ass
ets
1,91
9,80
5
738,
515
2,
294,
753
1,71
7,64
8
(2,6
93,6
59)
55,4
09
1,52
0,89
9
2,51
1,57
2
N
on-c
urre
nt a
sset
s
Rec
eiva
bles
..
..
..
..
39
,597
53
,391
39
,597
53
,391
Oth
er fi
nanc
ial a
sset
s 7,
742,
219
..
..
..
..
..
7,
742,
219
..
Tota
l non
-cur
rent
ass
ets
7,74
2,21
9
..
..
..
39,5
97
53,3
91
7,78
1,81
6
53,3
91
To
tal a
dmin
iste
red
asse
ts
9,66
2,02
4
738,
515
2,
294,
753
1,
717,
648
(2
,654
,062
) 10
8,80
0
9,30
2,71
5
2,56
4,96
3
C
urre
nt li
abili
ties
P
ayab
les
..
1,13
1,59
2
3,88
7
20,7
80
554
16
8,74
9
4,44
1
1,32
1,12
1
T
rans
fer t
o go
vern
men
t pay
able
2,
028,
801
(2
84,0
79)
2,21
8,46
5
1,64
4,92
9
(8,2
08)
(14,
625)
4,
239,
058
1,
346,
225
Inte
rest
bea
ring
liabi
litie
s ..
..
..
..
1,
148,
959
1,
505,
782
1,
148,
959
1,
505,
782
Oth
er li
abilit
ies
..
..
71,9
58
51,4
94
..
..
71,9
58
51,4
94
To
tal c
urre
nt li
abili
ties
2,02
8,80
1
847,
513
2,
294,
310
1,
717,
203
1,
141,
305
1,
659,
906
5,
464,
416
4,22
4,62
2
N
on-c
urre
nt li
abili
ties
In
tere
st b
earin
g lia
bilit
ies
..
..
..
..
45,6
65,2
08
37,0
63,6
15
45,6
65,2
08
37,0
63,6
15
To
tal n
on-c
urre
nt li
abili
ties
..
..
..
..
45,6
65,2
08
37,0
63,6
15
45,6
65,2
08
37,0
63,6
15
To
tal a
dmin
iste
red
liabi
litie
s 2,
028,
801
84
7,51
3
2,29
4,31
0
1,71
7,20
3
46,8
06,5
13
38,7
23,5
21
51,1
29,6
24
41,2
88,2
37
Adm
inis
tere
d ne
t ass
ets
7,63
3,22
3
(108
,998
) 44
3
445
(4
9,46
0,57
5)
(38,
614,
721)
(4
1,82
6,90
9)
(38,
723,
274)
* T
he d
epar
tmen
t has
sys
tem
s in
pla
ce to
allo
cate
ass
ets
and
liabi
litie
s by
maj
or d
epar
tmen
tal s
ervi
ces.
**
Incl
udes
sup
eran
nuat
ion,
who
le-o
f-gov
ernm
ent o
ffset
acc
ount
and
cen
tral s
chem
es (i
nsur
ance
, ann
ual l
eave
and
long
ser
vice
leav
e), a
nd o
ther
adm
inis
tere
d ite
ms.
Quee
nsla
nd Tr
easu
ryAd
min
ister
ed S
tate
men
t of A
sset
s and
Liab
ilitie
s by M
ajor
Dep
artm
enta
l Ser
vices
as a
t 30
June
202
0
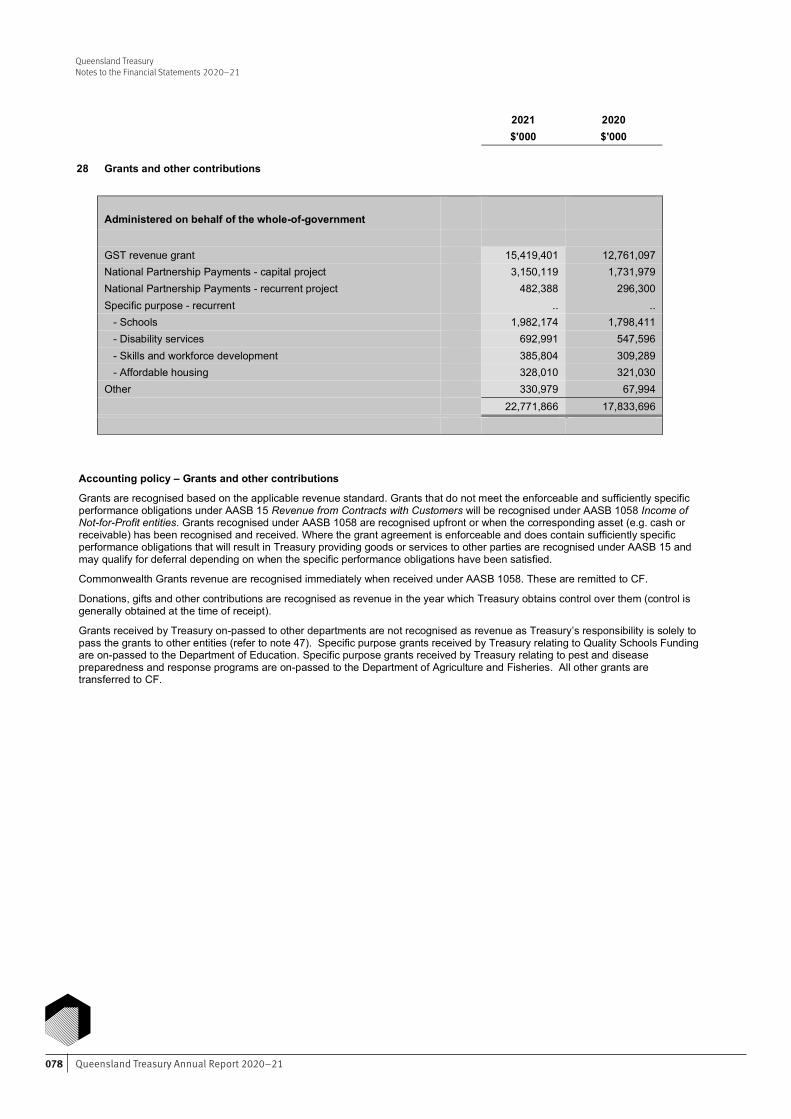
Queensland Treasury Annual Report 2020–21078
Queensland TreasuryNotes to the Financial Statements 2020–21
Queensland Treasury Notes to the Financial Statements 2020–21
54 Financial Statements – Queensland Treasury
2021 2020
$'000 $'000
28 Grants and other contributions
Administered on behalf of the whole-of-government GST revenue grant 15,419,401 12,761,097 National Partnership Payments - capital project 3,150,119 1,731,979 National Partnership Payments - recurrent project 482,388 296,300 Specific purpose - recurrent .. .. - Schools 1,982,174 1,798,411 - Disability services 692,991 547,596 - Skills and workforce development 385,804 309,289 - Affordable housing 328,010 321,030 Other 330,979 67,994 22,771,866 17,833,696
Accounting policy – Grants and other contributions
Grants are recognised based on the applicable revenue standard. Grants that do not meet the enforceable and sufficiently specific performance obligations under AASB 15 Revenue from Contracts with Customers will be recognised under AASB 1058 Income of Not-for-Profit entities. Grants recognised under AASB 1058 are recognised upfront or when the corresponding asset (e.g. cash or receivable) has been recognised and received. Where the grant agreement is enforceable and does contain sufficiently specific performance obligations that will result in Treasury providing goods or services to other parties are recognised under AASB 15 and may qualify for deferral depending on when the specific performance obligations have been satisfied.
Commonwealth Grants revenue are recognised immediately when received under AASB 1058. These are remitted to CF.
Donations, gifts and other contributions are recognised as revenue in the year which Treasury obtains control over them (control is generally obtained at the time of receipt).
Grants received by Treasury on-passed to other departments are not recognised as revenue as Treasury’s responsibility is solely to pass the grants to other entities (refer to note 47). Specific purpose grants received by Treasury relating to Quality Schools Funding are on-passed to the Department of Education. Specific purpose grants received by Treasury relating to pest and disease preparedness and response programs are on-passed to the Department of Agriculture and Fisheries. All other grants are transferred to CF.
Queensland Treasury Notes to the Financial Statements 2020–21
55 Financial Statements – Queensland Treasury
2021 2020
$'000 $'000
29 Taxes
Administered on behalf of the whole-of-government Taxes
Duties 5,741,937 4,624,138 Payroll Tax 4,214,271 4,253,926 Land Tax 1,531,441 1,411,059 Gaming Machine Tax 820,793 616,900 Lottery Tax 359,499 332,079 Betting Tax 156,636 116,671 Casino Tax 106,868 96,576 Keno Tax 21,528 17,107 Wagering Tax .. 1,798 Other taxes 1,115 1,283 12,954,088 11,471,537 Levies Health services levy 121,065 77,134 121,065 77,134 13,075,153 11,548,671
Accounting policy – Taxes
The main revenue streams and the governing Acts which underpin them include:
Duties Act 2001 Payroll Tax Act 1971 Land Tax Act 2010 Taxation Administration Act 2001 Local Government Act 2009 (National Tax Equivalents Regime (NTER)) Betting Tax Act 2018 Gaming Machine Act 1991, Casino Control Act 1982, Keno Act 1996, Lotteries Act 1997, and Wagering Act 1998
(administered by The Office of Liquor and Gaming Regulation (OLGR))
Revenue is recognised under AASB 1058 Income of Not-for-Profit entities when one or more of the following taxable events occur:
the underlying transaction or event which gives rise to the right to collect the revenue occurs and can be measured reliably the assessment is raised by the self-assessor (a person who lodges transactions online), predominantly for Payroll Tax and
Duties. Additional revenue is recognised upon amended assessment the assessment is issued because of Commissioner-assessed transactions or following compliance activities such as reviews
and audits, predominantly for Land and Gaming Taxes tax penalty and interest revenue are recognised when raised, when an assessment becomes overdue or further enforcement
activity commences.
The impact of the COVID-19 response measures to tax revenue foregone has been detailed in note 2 (c).
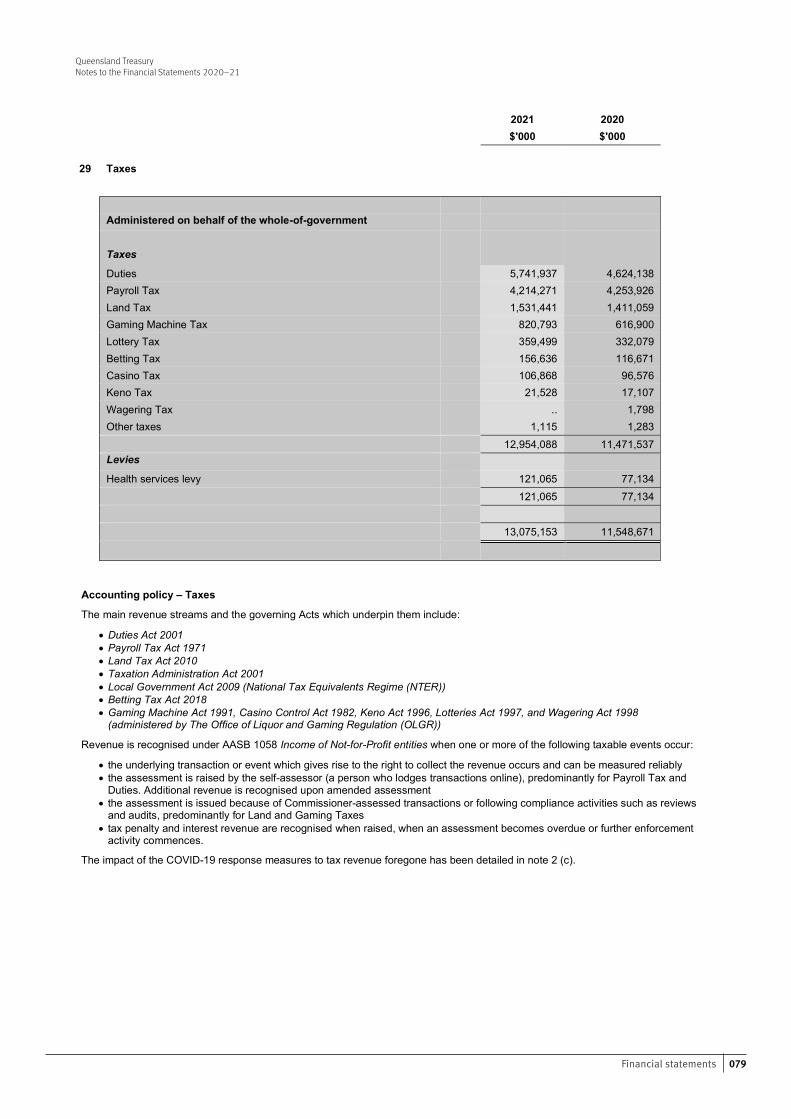
079Financial statements
Queensland TreasuryNotes to the Financial Statements 2020–21
Queensland Treasury Notes to the Financial Statements 2020–21
55 Financial Statements – Queensland Treasury
2021 2020
$'000 $'000
29 Taxes
Administered on behalf of the whole-of-government Taxes
Duties 5,741,937 4,624,138 Payroll Tax 4,214,271 4,253,926 Land Tax 1,531,441 1,411,059 Gaming Machine Tax 820,793 616,900 Lottery Tax 359,499 332,079 Betting Tax 156,636 116,671 Casino Tax 106,868 96,576 Keno Tax 21,528 17,107 Wagering Tax .. 1,798 Other taxes 1,115 1,283 12,954,088 11,471,537 Levies Health services levy 121,065 77,134 121,065 77,134 13,075,153 11,548,671
Accounting policy – Taxes
The main revenue streams and the governing Acts which underpin them include:
Duties Act 2001 Payroll Tax Act 1971 Land Tax Act 2010 Taxation Administration Act 2001 Local Government Act 2009 (National Tax Equivalents Regime (NTER)) Betting Tax Act 2018 Gaming Machine Act 1991, Casino Control Act 1982, Keno Act 1996, Lotteries Act 1997, and Wagering Act 1998
(administered by The Office of Liquor and Gaming Regulation (OLGR))
Revenue is recognised under AASB 1058 Income of Not-for-Profit entities when one or more of the following taxable events occur:
the underlying transaction or event which gives rise to the right to collect the revenue occurs and can be measured reliably the assessment is raised by the self-assessor (a person who lodges transactions online), predominantly for Payroll Tax and
Duties. Additional revenue is recognised upon amended assessment the assessment is issued because of Commissioner-assessed transactions or following compliance activities such as reviews
and audits, predominantly for Land and Gaming Taxes tax penalty and interest revenue are recognised when raised, when an assessment becomes overdue or further enforcement
activity commences.
The impact of the COVID-19 response measures to tax revenue foregone has been detailed in note 2 (c).
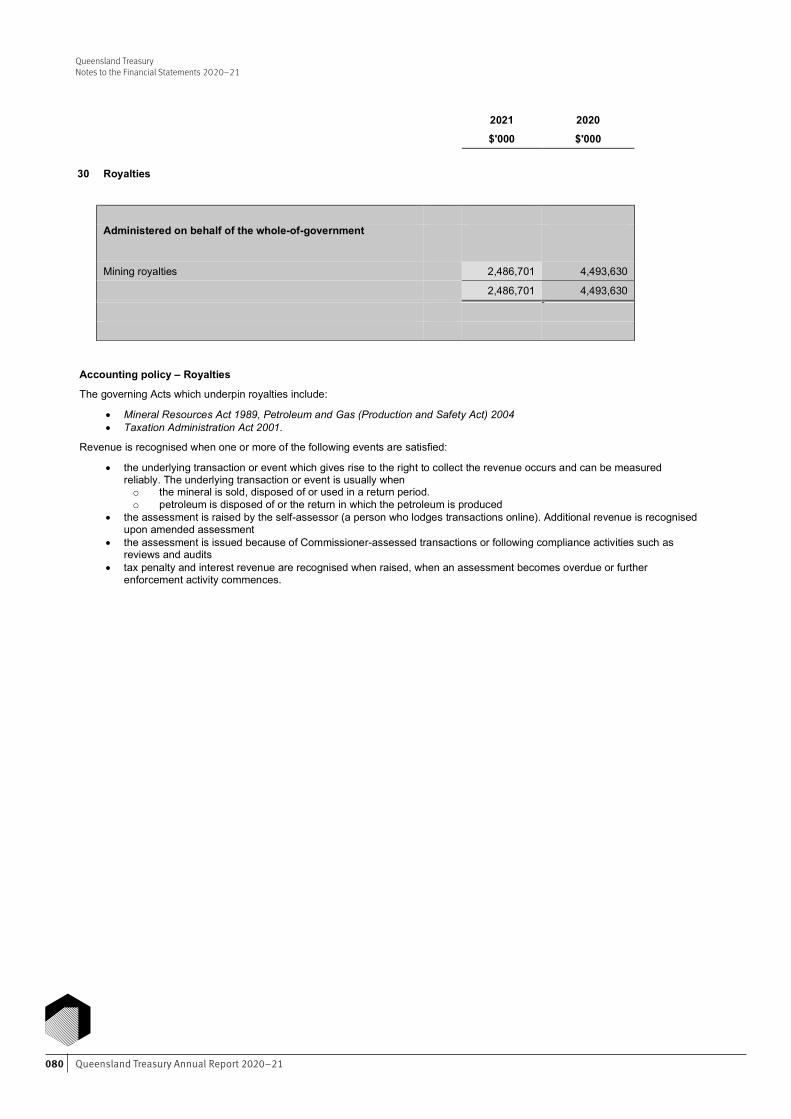
Queensland Treasury Annual Report 2020–21080
Queensland TreasuryNotes to the Financial Statements 2020–21
Queensland Treasury Notes to the Financial Statements 2020–21
56 Financial Statements – Queensland Treasury
2021 2020
$'000 $'000
30 Royalties
Administered on behalf of the whole-of-government
Mining royalties 2,486,701 4,493,630 2,486,701 4,493,630
Accounting policy – Royalties
The governing Acts which underpin royalties include:
Mineral Resources Act 1989, Petroleum and Gas (Production and Safety Act) 2004 Taxation Administration Act 2001.
Revenue is recognised when one or more of the following events are satisfied:
the underlying transaction or event which gives rise to the right to collect the revenue occurs and can be measured reliably. The underlying transaction or event is usually when o the mineral is sold, disposed of or used in a return period. o petroleum is disposed of or the return in which the petroleum is produced
the assessment is raised by the self-assessor (a person who lodges transactions online). Additional revenue is recognised upon amended assessment
the assessment is issued because of Commissioner-assessed transactions or following compliance activities such as reviews and audits
tax penalty and interest revenue are recognised when raised, when an assessment becomes overdue or further enforcement activity commences.
Queensland Treasury Notes to the Financial Statements 2020–21
57 Financial Statements – Queensland Treasury
2021 2020
$'000 $'000
31 Appropriation revenue
Administered on behalf of the whole-of-government Budgeted administered item appropriation and equity 8,156,408 9,604,083 Transfer (to)/from other departments .. (548,000) Transfer (to)/from other heading (160,625) .. Treasurer's Advance .. (1,993,980) Lapsed appropriation (77,554) (419,873) Unforeseen expenditure .. .. Total administered item receipts including equity 7,918,229 6,642,230
Plus closing balance of administered appropriation revenue receivable
89,127 ..
Plus opening balance of administered deferred appropriation payable to the Consolidated Fund
143,002 14,543
Plus non cash adjustment between departments 784 Less closing balance of administered deferred appropriation payable to
the Consolidated Fund
.. (143,002)
Plus opening balance of administered appropriation payable to Commonwealth Government
1,169 ..
Less closing balance of administered appropriation payable to Commonwealth Government
.. (1,169)
Net appropriation revenue 8,152,311 6,512,602 Plus deferred appropriation expense payable to Consolidated Fund .. .. Total administered appropriation revenue recognised in the
Statement of Comprehensive Income including equity
8,152,311 6,512,602
This is represented by: Administered item revenue recognised in Statement of
Comprehensive Income 6,652,311 6,512,602
Appropriated equity adjustment recognised in equity
injection/(withdrawal) 1,500,000 ..
Total administered appropriation revenue recognised in the
Statement of Comprehensive Income including equity
8,152,311 6,512,602
Additional appropriation revenue received to fund COVID-19 response measures has been detailed in note 2 (c).
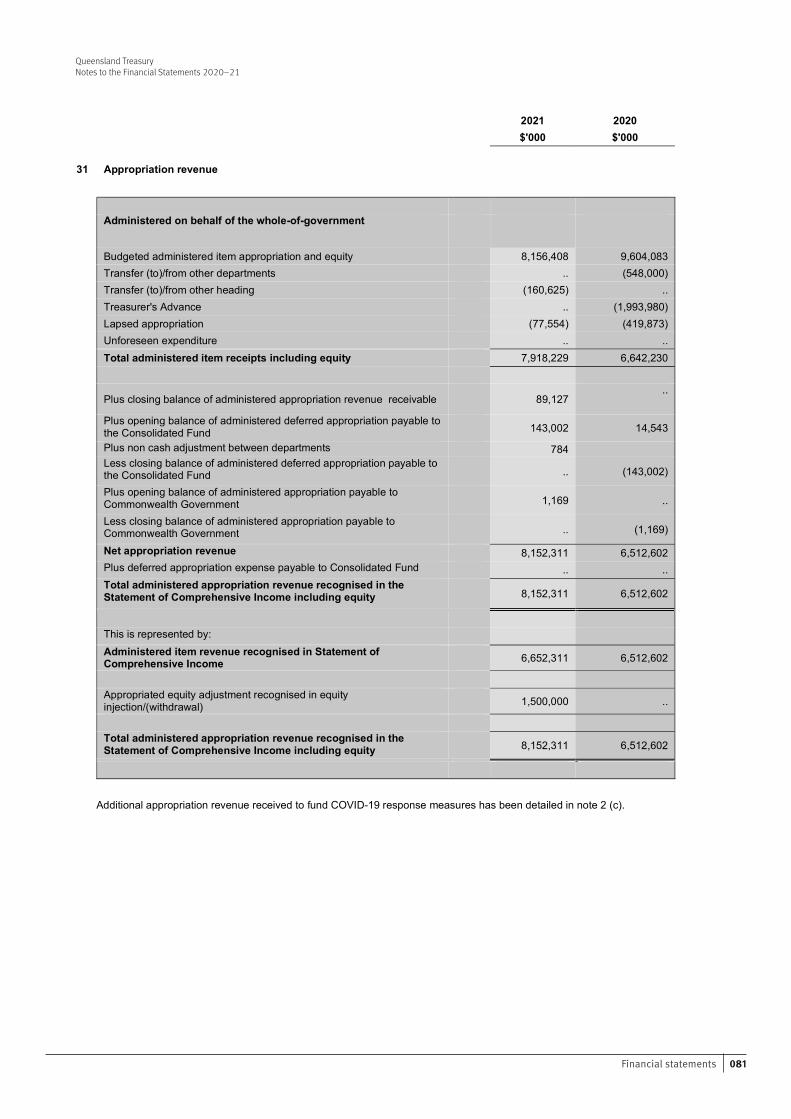
081Financial statements
Queensland TreasuryNotes to the Financial Statements 2020–21
Queensland Treasury Notes to the Financial Statements 2020–21
57 Financial Statements – Queensland Treasury
2021 2020
$'000 $'000
31 Appropriation revenue
Administered on behalf of the whole-of-government Budgeted administered item appropriation and equity 8,156,408 9,604,083 Transfer (to)/from other departments .. (548,000) Transfer (to)/from other heading (160,625) .. Treasurer's Advance .. (1,993,980) Lapsed appropriation (77,554) (419,873) Unforeseen expenditure .. .. Total administered item receipts including equity 7,918,229 6,642,230
Plus closing balance of administered appropriation revenue receivable
89,127 ..
Plus opening balance of administered deferred appropriation payable to the Consolidated Fund
143,002 14,543
Plus non cash adjustment between departments 784 Less closing balance of administered deferred appropriation payable to
the Consolidated Fund
.. (143,002)
Plus opening balance of administered appropriation payable to Commonwealth Government
1,169 ..
Less closing balance of administered appropriation payable to Commonwealth Government
.. (1,169)
Net appropriation revenue 8,152,311 6,512,602 Plus deferred appropriation expense payable to Consolidated Fund .. .. Total administered appropriation revenue recognised in the
Statement of Comprehensive Income including equity
8,152,311 6,512,602
This is represented by: Administered item revenue recognised in Statement of
Comprehensive Income 6,652,311 6,512,602
Appropriated equity adjustment recognised in equity
injection/(withdrawal) 1,500,000 ..
Total administered appropriation revenue recognised in the
Statement of Comprehensive Income including equity
8,152,311 6,512,602
Additional appropriation revenue received to fund COVID-19 response measures has been detailed in note 2 (c).
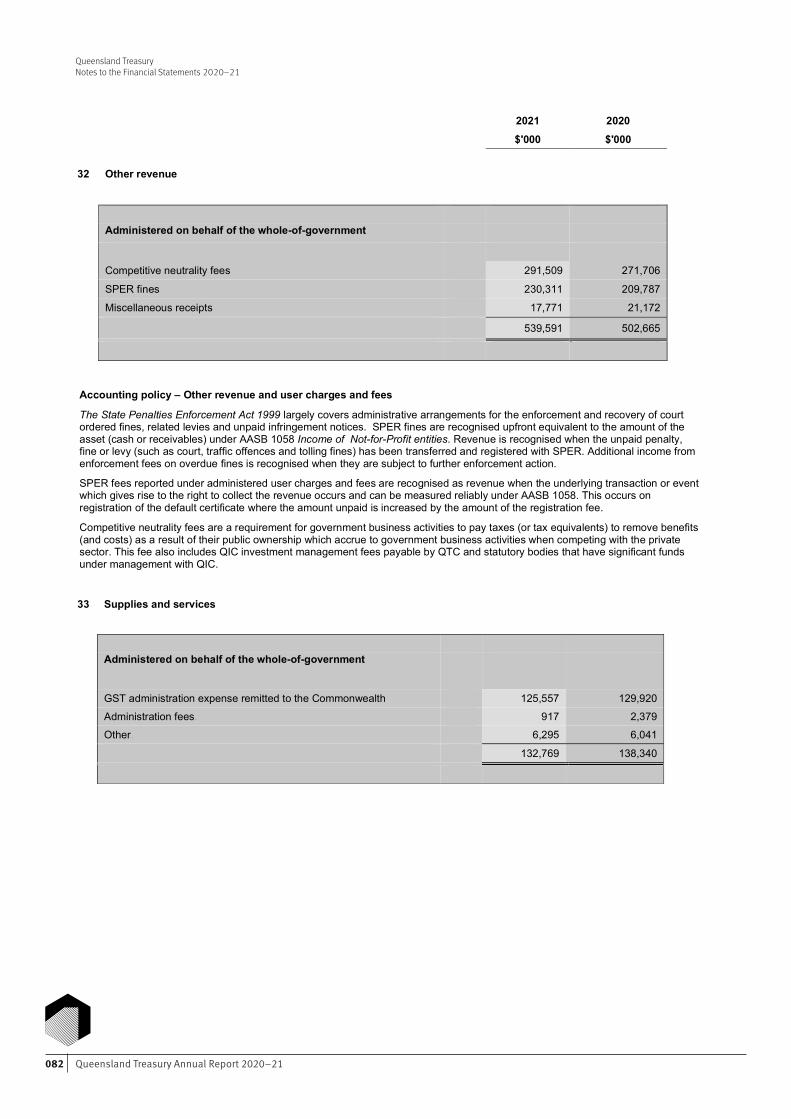
Queensland Treasury Annual Report 2020–21082
Queensland TreasuryNotes to the Financial Statements 2020–21
Queensland Treasury Notes to the Financial Statements 2020–21
58 Financial Statements – Queensland Treasury
2021 2020
$'000 $'000
32 Other revenue
Administered on behalf of the whole-of-government
Competitive neutrality fees 291,509 271,706 SPER fines 230,311 209,787 Miscellaneous receipts 17,771 21,172 539,591 502,665
Accounting policy – Other revenue and user charges and fees
The State Penalties Enforcement Act 1999 largely covers administrative arrangements for the enforcement and recovery of court ordered fines, related levies and unpaid infringement notices. SPER fines are recognised upfront equivalent to the amount of the asset (cash or receivables) under AASB 1058 Income of Not-for-Profit entities. Revenue is recognised when the unpaid penalty, fine or levy (such as court, traffic offences and tolling fines) has been transferred and registered with SPER. Additional income from enforcement fees on overdue fines is recognised when they are subject to further enforcement action.
SPER fees reported under administered user charges and fees are recognised as revenue when the underlying transaction or event which gives rise to the right to collect the revenue occurs and can be measured reliably under AASB 1058. This occurs on registration of the default certificate where the amount unpaid is increased by the amount of the registration fee.
Competitive neutrality fees are a requirement for government business activities to pay taxes (or tax equivalents) to remove benefits (and costs) as a result of their public ownership which accrue to government business activities when competing with the private sector. This fee also includes QIC investment management fees payable by QTC and statutory bodies that have significant funds under management with QIC.
33 Supplies and services
Administered on behalf of the whole-of-government
GST administration expense remitted to the Commonwealth 125,557 129,920 Administration fees. 917 2,379 Other. 6,295 6,041 132,769 138,340
Queensland Treasury Notes to the Financial Statements 2020–21
59 Financial Statements – Queensland Treasury
2021 2020
$'000 $'000
34 Losses on receivables
Administered on behalf of the whole-of-government
Impairment loss / (loss reversals) – Taxation (5,973) 28,168
Impairment loss reversals - SPER (25,619) (3,382)
Bad debts written off * 43,141 25,891
11,549 50,677
* Debt Write Off Policy (May 2020), enables the SPER Registrar to write off bad debts in all circumstances in which it is unlikely the debts could be recovered cost effectively. Bad debts written off for SPER amounts to $22.152 million for 2020-21 (2020:$9.555 million).
The total bad debts written-off includes bad debts written off directly, not through provision for impairment, $1.77 million (2020:$3.21 million)(note 39).
Credit risk exposure has been assessed for taxes and fines receivables for the impact of COVID-19. At reporting date, the impairment losses and losses reversals recognised includes the impact of COVID-19 which is reflected in the forward-looking rate applied in the estimate of credit loss. Impairment loss reversals occurred during the year due to improved economic conditions compared to last year. The full impact of COVID-19 will emerge in the next 6 to 12 months, when additional information is obtained on the viability of the State Revenue clients (note 39).
35 Finance/borrowing costs
Administered on behalf of the whole-of-government Interest on loans – QTC 1,272,790 1,135,194 Administration fees 31,143 22,268 Interest - other 14,285 37,989 Market value realisation on QTC borrowings 13,058 .. Unwind concessional loan discount - Commonwealth borrowings 1,105 839 Interest on loans – Commonwealth Government 224 496 Concessional loan discount - NDRRA loans * 384 3,421 Interest paid by Treasury offset bank account .. 173 1,332,989 1,200,380 * represents the discount on initial recognition of NDRRA loans.
Accounting policy – Finance/borrowing costs
Finance/borrowing costs are recognised in the period in which they are incurred. This includes amortisation of discounts or premiums relating to borrowings. These costs are incurred on the Treasury Offset Account (note 38 Whole-of-government TOA arrangements) and whole-of-government borrowings, GOC’s Advance and Commonwealth borrowings (note 42).
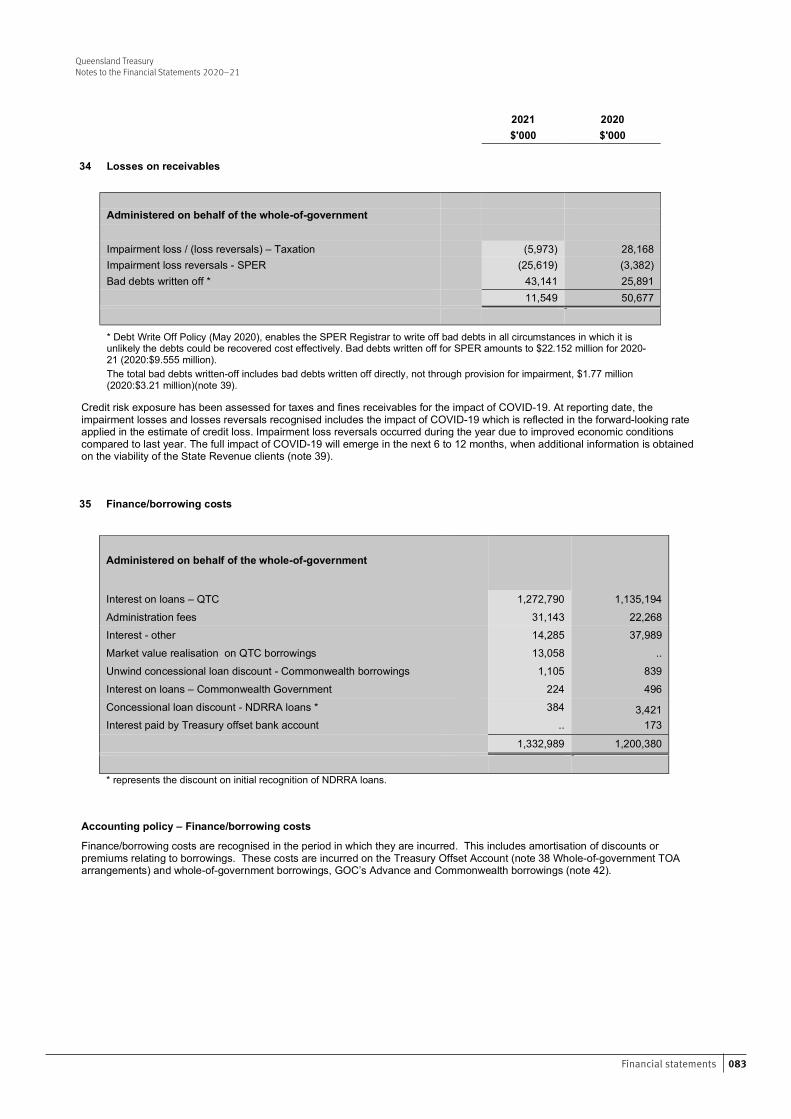
083Financial statements
Queensland TreasuryNotes to the Financial Statements 2020–21
Queensland Treasury Notes to the Financial Statements 2020–21
59 Financial Statements – Queensland Treasury
2021 2020
$'000 $'000
34 Losses on receivables
Administered on behalf of the whole-of-government
Impairment loss / (loss reversals) – Taxation (5,973) 28,168
Impairment loss reversals - SPER (25,619) (3,382)
Bad debts written off * 43,141 25,891
11,549 50,677
* Debt Write Off Policy (May 2020), enables the SPER Registrar to write off bad debts in all circumstances in which it is unlikely the debts could be recovered cost effectively. Bad debts written off for SPER amounts to $22.152 million for 2020-21 (2020:$9.555 million).
The total bad debts written-off includes bad debts written off directly, not through provision for impairment, $1.77 million (2020:$3.21 million)(note 39).
Credit risk exposure has been assessed for taxes and fines receivables for the impact of COVID-19. At reporting date, the impairment losses and losses reversals recognised includes the impact of COVID-19 which is reflected in the forward-looking rate applied in the estimate of credit loss. Impairment loss reversals occurred during the year due to improved economic conditions compared to last year. The full impact of COVID-19 will emerge in the next 6 to 12 months, when additional information is obtained on the viability of the State Revenue clients (note 39).
35 Finance/borrowing costs
Administered on behalf of the whole-of-government Interest on loans – QTC 1,272,790 1,135,194 Administration fees 31,143 22,268 Interest - other 14,285 37,989 Market value realisation on QTC borrowings 13,058 .. Unwind concessional loan discount - Commonwealth borrowings 1,105 839 Interest on loans – Commonwealth Government 224 496 Concessional loan discount - NDRRA loans * 384 3,421 Interest paid by Treasury offset bank account .. 173 1,332,989 1,200,380 * represents the discount on initial recognition of NDRRA loans.
Accounting policy – Finance/borrowing costs
Finance/borrowing costs are recognised in the period in which they are incurred. This includes amortisation of discounts or premiums relating to borrowings. These costs are incurred on the Treasury Offset Account (note 38 Whole-of-government TOA arrangements) and whole-of-government borrowings, GOC’s Advance and Commonwealth borrowings (note 42).
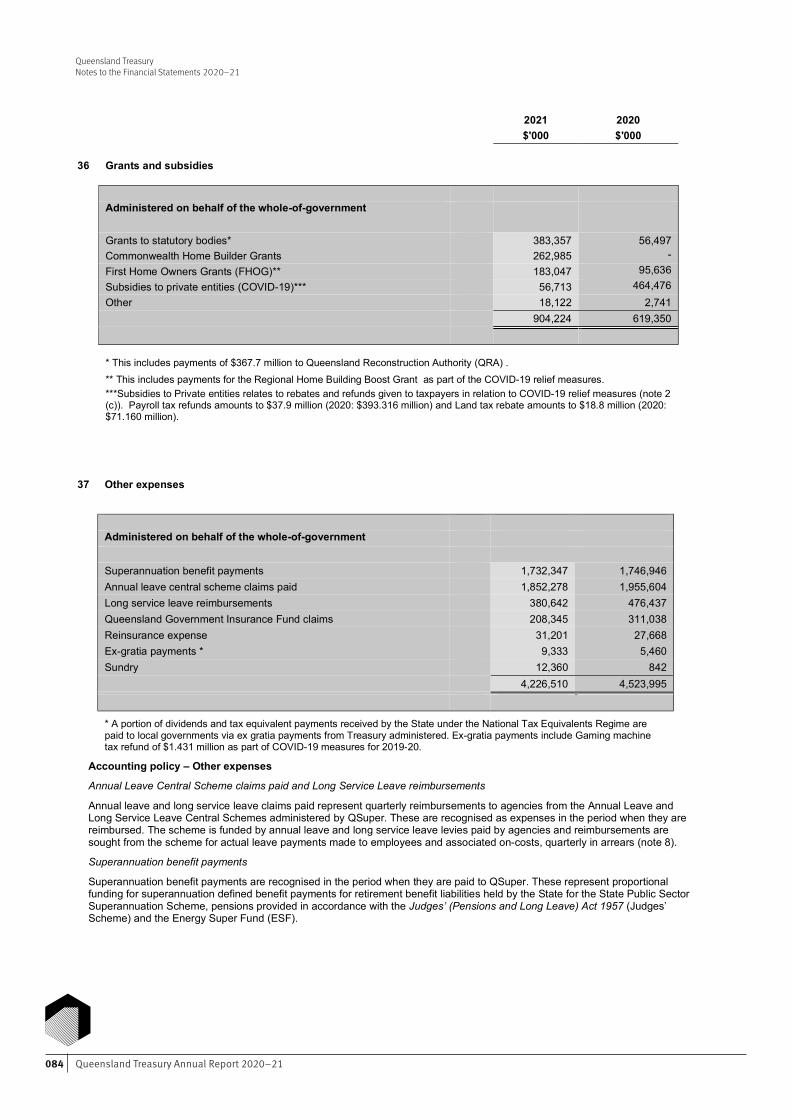
Queensland Treasury Annual Report 2020–21084
Queensland TreasuryNotes to the Financial Statements 2020–21
Queensland Treasury Notes to the Financial Statements 2020–21
60 Financial Statements – Queensland Treasury
2021 2020
$'000 $'000
36 Grants and subsidies
Administered on behalf of the whole-of-government
Grants to statutory bodies* 383,357 56,497 Commonwealth Home Builder Grants 262,985 - First Home Owners Grants (FHOG)** 183,047 95,636
Subsidies to private entities (COVID-19)*** 56,713 464,476
Other 18,122 2,741
904,224 619,350
* This includes payments of $367.7 million to Queensland Reconstruction Authority (QRA) .
** This includes payments for the Regional Home Building Boost Grant as part of the COVID-19 relief measures. ***Subsidies to Private entities relates to rebates and refunds given to taxpayers in relation to COVID-19 relief measures (note 2
(c)). Payroll tax refunds amounts to $37.9 million (2020: $393.316 million) and Land tax rebate amounts to $18.8 million (2020: $71.160 million).
37 Other expenses
Administered on behalf of the whole-of-government Superannuation benefit payments 1,732,347 1,746,946 Annual leave central scheme claims paid 1,852,278 1,955,604 Long service leave reimbursements 380,642 476,437 Queensland Government Insurance Fund claims 208,345 311,038 Reinsurance expense 31,201 27,668 Ex-gratia payments * 9,333 5,460 Sundry 12,360 842
4,226,510 4,523,995
* A portion of dividends and tax equivalent payments received by the State under the National Tax Equivalents Regime are paid to local governments via ex gratia payments from Treasury administered. Ex-gratia payments include Gaming machine tax refund of $1.431 million as part of COVID-19 measures for 2019-20.
Accounting policy – Other expenses
Annual Leave Central Scheme claims paid and Long Service Leave reimbursements
Annual leave and long service leave claims paid represent quarterly reimbursements to agencies from the Annual Leave and Long Service Leave Central Schemes administered by QSuper. These are recognised as expenses in the period when they are reimbursed. The scheme is funded by annual leave and long service leave levies paid by agencies and reimbursements are sought from the scheme for actual leave payments made to employees and associated on-costs, quarterly in arrears (note 8).
Superannuation benefit payments
Superannuation benefit payments are recognised in the period when they are paid to QSuper. These represent proportional funding for superannuation defined benefit payments for retirement benefit liabilities held by the State for the State Public Sector Superannuation Scheme, pensions provided in accordance with the Judges’ (Pensions and Long Leave) Act 1957 (Judges’ Scheme) and the Energy Super Fund (ESF).
Queensland Treasury Notes to the Financial Statements 2020–21
61 Financial Statements – Queensland Treasury
2021 2020
$'000 $'000
38 Cash assets
Administered on behalf of the whole-of-government
Whole-of-government Treasury Offset Arrangement * (2,843,882) (233,587) Other administered bank accounts 1,384,299 1,006,246
(1,459,583) 772,659
* The whole-of-government Treasury Offset Arrangement incorporates the Treasury offset bank account which is an overdraft facility as required under section 49(1) of the Financial Accountability Act 2009 and a QTC Working Capital Facility. This overdraft facility is part of an offset arrangement with other departmental bank accounts and is considered in determining the interest earned on the whole-of-government position. Cash at bank is an aggregate of Treasury administered bank accounts including the Treasury offset bank account.
In addition, Treasury has established another offset arrangement with the Commonwealth Bank of Australia to maximise interest earned on surplus cash balances held by departmental bank accounts that do not fall within the whole-of-government offset arrangement.
The QTC GOC Advances Fund is utilised to transfer Government-Owned Corporations’ surplus funds to the Treasury offset arrangement (note 42).
The QTC Working Capital Facility is used for short term borrowings. The fair value of the borrowings in the QTC Working Capital Facility at 30 June 2021 is represented by its book value (as notified by QTC). Interest is calculated daily based on the Reserve Bank’s official cash rate. Interest is charged at rates between 0.65% and 0.10% (2020: between 1.93% to 0.25%) along with an administration margin of 0.05% (2020: 0.05%).
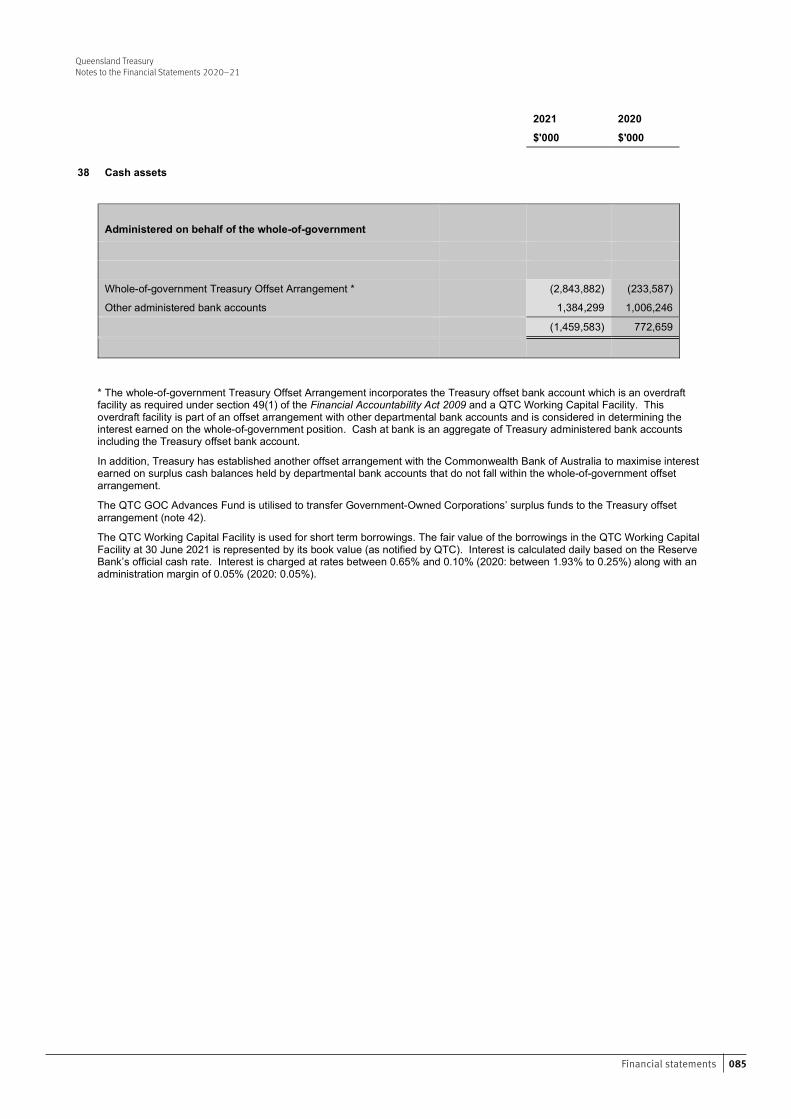
085Financial statements
Queensland TreasuryNotes to the Financial Statements 2020–21
Queensland Treasury Notes to the Financial Statements 2020–21
61 Financial Statements – Queensland Treasury
2021 2020
$'000 $'000
38 Cash assets
Administered on behalf of the whole-of-government
Whole-of-government Treasury Offset Arrangement * (2,843,882) (233,587) Other administered bank accounts 1,384,299 1,006,246
(1,459,583) 772,659
* The whole-of-government Treasury Offset Arrangement incorporates the Treasury offset bank account which is an overdraft facility as required under section 49(1) of the Financial Accountability Act 2009 and a QTC Working Capital Facility. This overdraft facility is part of an offset arrangement with other departmental bank accounts and is considered in determining the interest earned on the whole-of-government position. Cash at bank is an aggregate of Treasury administered bank accounts including the Treasury offset bank account.
In addition, Treasury has established another offset arrangement with the Commonwealth Bank of Australia to maximise interest earned on surplus cash balances held by departmental bank accounts that do not fall within the whole-of-government offset arrangement.
The QTC GOC Advances Fund is utilised to transfer Government-Owned Corporations’ surplus funds to the Treasury offset arrangement (note 42).
The QTC Working Capital Facility is used for short term borrowings. The fair value of the borrowings in the QTC Working Capital Facility at 30 June 2021 is represented by its book value (as notified by QTC). Interest is calculated daily based on the Reserve Bank’s official cash rate. Interest is charged at rates between 0.65% and 0.10% (2020: between 1.93% to 0.25%) along with an administration margin of 0.05% (2020: 0.05%).
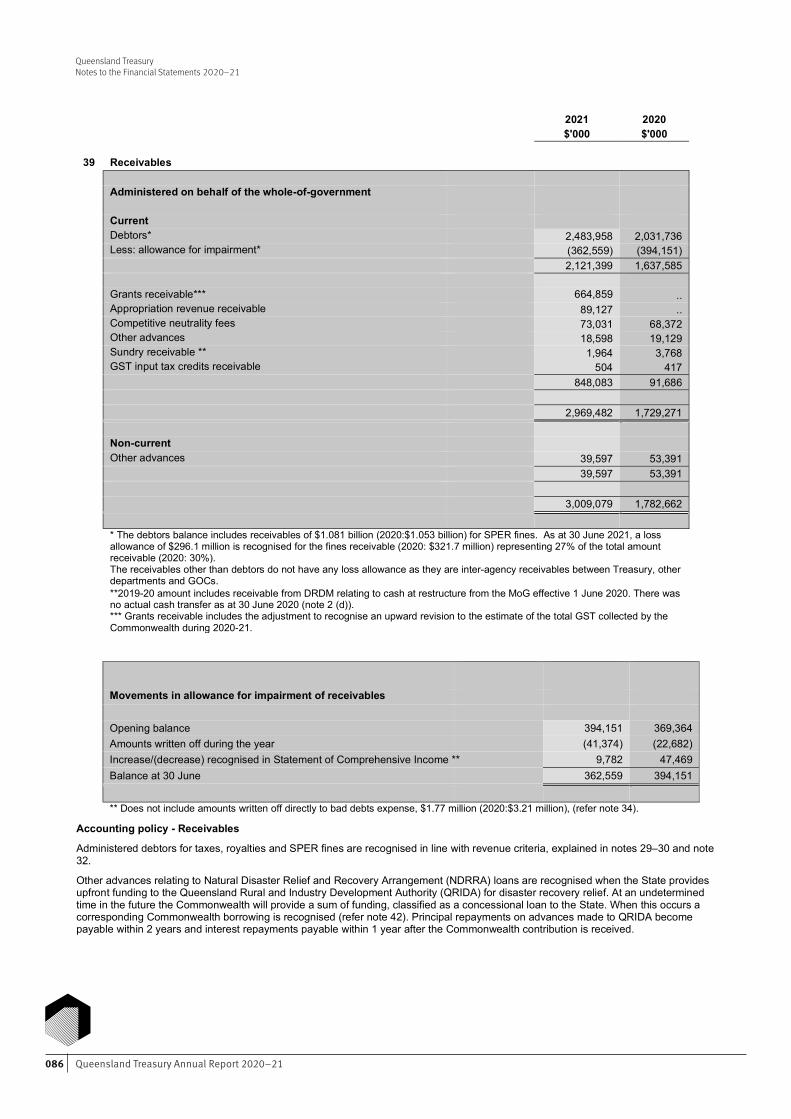
Queensland Treasury Annual Report 2020–21086
Queensland TreasuryNotes to the Financial Statements 2020–21
Queensland Treasury Notes to the Financial Statements 2020–21
62 Financial Statements – Queensland Treasury
2021 2020 $'000 $'000
39 Receivables
Administered on behalf of the whole-of-government Current Debtors* 2,483,958 2,031,736 Less: allowance for impairment* (362,559) (394,151) 2,121,399 1,637,585 Grants receivable*** 664,859 .. Appropriation revenue receivable 89,127 .. Competitive neutrality fees. 73,031 68,372 Other advances 18,598 19,129 Sundry receivable.** 1,964 3,768 GST input tax credits receivable 504 417 848,083 91,686 2,969,482 1,729,271 Non-current Other advances. 39,597 53,391 39,597 53,391 3,009,079 1,782,662 * The debtors balance includes receivables of $1.081 billion (2020:$1.053 billion) for SPER fines. As at 30 June 2021, a loss
allowance of $296.1 million is recognised for the fines receivable (2020: $321.7 million) representing 27% of the total amount receivable (2020: 30%).
The receivables other than debtors do not have any loss allowance as they are inter-agency receivables between Treasury, other departments and GOCs.
**2019-20 amount includes receivable from DRDM relating to cash at restructure from the MoG effective 1 June 2020. There was no actual cash transfer as at 30 June 2020 (note 2 (d)). *** Grants receivable includes the adjustment to recognise an upward revision to the estimate of the total GST collected by the Commonwealth during 2020-21.
Movements in allowance for impairment of receivables Opening balance 394,151 369,364 Amounts written off during the year (41,374) (22,682) Increase/(decrease) recognised in Statement of Comprehensive Income ** 9,782 47,469 Balance at 30 June 362,559 394,151 ** Does not include amounts written off directly to bad debts expense, $1.77 million (2020:$3.21 million), (refer note 34).
Accounting policy - Receivables
Administered debtors for taxes, royalties and SPER fines are recognised in line with revenue criteria, explained in notes 29–30 and note 32.
Other advances relating to Natural Disaster Relief and Recovery Arrangement (NDRRA) loans are recognised when the State provides upfront funding to the Queensland Rural and Industry Development Authority (QRIDA) for disaster recovery relief. At an undetermined time in the future the Commonwealth will provide a sum of funding, classified as a concessional loan to the State. When this occurs a corresponding Commonwealth borrowing is recognised (refer note 42). Principal repayments on advances made to QRIDA become payable within 2 years and interest repayments payable within 1 year after the Commonwealth contribution is received.
Queensland Treasury Notes to the Financial Statements 2020–21
63 Financial Statements – Queensland Treasury
39 Receivables (continued)
Allowance for impairment
The allowance for impairment reflects lifetime expected credit losses and incorporates reasonable and supportable forward-looking information, including forecast economic changes expected to impact the Treasury’s debtors, along with relevant industry and statistical data where applicable.
A number of debt collection measures are undertaken including the exercising of legislative powers contained within the Taxation Administration Act 2001 and the State Penalties Enforcement Act 1999, prior to impairing debt.
If no expected loss events have arisen in respect of a particular debtor or group of debtors, no allowance for impairment is made in respect of that debt/group of debtors. If Treasury determines that an amount owing by such a debtor does become uncollectable, the amount is impaired, then subsequently recognised as a bad debt expense and written off directly against receivables. In other cases where a debt becomes uncollectable, but the uncollectable amount exceeds the amount already allowed for impairment of that debt, the excess is recognised as a bad debt expense and written off directly against receivables.
There is no impairment loss allowance recognised for Treasury’s receivables from Queensland Government agencies or Australian Government agencies on the basis of materiality. Credit risk for these receivables are considered low.
Credit risk exposure of receivables
Treasury manages credit risk using a credit management strategy. This strategy focuses on the prompt collection of revenues due and payable to Treasury and follow up of outstanding fees and charges within specified timeframes. Exposure to credit risk is monitored on an ongoing basis.
Risk assessments are performed upon non-payment of debt and maintained in the State Revenue Risk Register with assigned risk ratings. Under this risk-based revenue management framework compliance plans are developed with reference to the debt management strategies.
Expected credit losses for taxes and royalties’ receivables is calculated based on debt type using an expected credit loss percentage by age or individually assessed. For those debts where an expected credit loss percentage is used to calculate impairment, the historical credit loss experienced over a four-year period is adjusted by current conditions and forward-looking information on macro-economic factors affecting collectability of debts. The customer groups within State Revenue (SR) were determined by debt type and whether it consisted of high or low volume transactions. The provision matrix methodology was applied for high volume transactions and the low volume transactions were individually assessed. Treasury has identified employment growth, housing upturn/downturn, interest rates movement and population growth to be the relevant economic factors affecting taxes. The expected credit loss percentage is the average rate across the debts. Individually assessed debts are reviewed and a percentage loss is applied to each based on collectability.
Credit risk exposure has been assessed for taxes and fines receivables for the impact of COVID-19. At reporting date, the expected credit loss includes the impact of COVID-19 which is reflected in the forward-looking rate applied in the estimate of credit loss. Impairment loss reversals occurred during the year due to improved economic conditions compared to last year. The full impact of COVID-19 will emerge in the next 6 to 12 months, when additional information is obtained on the viability of State Revenue’s clients. A portion of receivables as at 30 June 2021 from Payroll Tax of $667.080 million have been deferred for collection until January 2022 as part of the COVID-19 relief measures (note 2 (c)).These receivables were categorised in the “Not yet due” and a 1.2% loss rate has been applied.
Set out below is the credit risk exposure on Treasury’s administered receivables. The total gross receivables exclude receivables of $469 million (2020: $311 million) that do not have any loss allowance.
SR debtors - assessed collectively using a provision matrix
2021 2020
Administered on behalf of the whole-of-government
Gross receivable
Loss rate
Expected credit losses
Gross receivable
Loss rate Expected credit losses
$'000 % $'000 $'000 % $'000 Not yet due 790,221 1.2 9,167 510,219 2.6 13,025 Less than 30 days 13,383 5.1 684 11,968 5.3 632 30 to 60 days 8,607 24.6 2,115 14,913 15.4 2,292 61 to 90 days 10,741 29.4 3,156 21,696 20.3 4,404 Greater than 90 days 98,913 41.0 40,589 95,070 41.2 39,165 Total 921,865 55,711 653,866 59,518
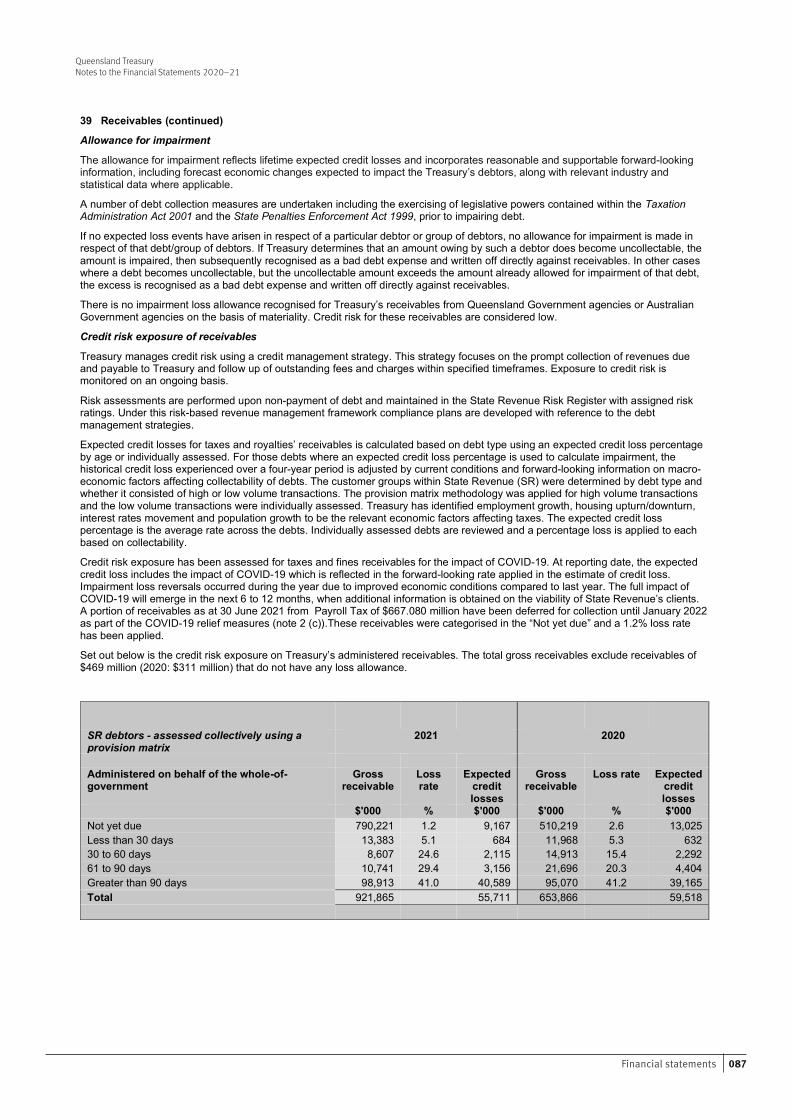
087Financial statements
Queensland TreasuryNotes to the Financial Statements 2020–21
Queensland Treasury Notes to the Financial Statements 2020–21
63 Financial Statements – Queensland Treasury
39 Receivables (continued)
Allowance for impairment
The allowance for impairment reflects lifetime expected credit losses and incorporates reasonable and supportable forward-looking information, including forecast economic changes expected to impact the Treasury’s debtors, along with relevant industry and statistical data where applicable.
A number of debt collection measures are undertaken including the exercising of legislative powers contained within the Taxation Administration Act 2001 and the State Penalties Enforcement Act 1999, prior to impairing debt.
If no expected loss events have arisen in respect of a particular debtor or group of debtors, no allowance for impairment is made in respect of that debt/group of debtors. If Treasury determines that an amount owing by such a debtor does become uncollectable, the amount is impaired, then subsequently recognised as a bad debt expense and written off directly against receivables. In other cases where a debt becomes uncollectable, but the uncollectable amount exceeds the amount already allowed for impairment of that debt, the excess is recognised as a bad debt expense and written off directly against receivables.
There is no impairment loss allowance recognised for Treasury’s receivables from Queensland Government agencies or Australian Government agencies on the basis of materiality. Credit risk for these receivables are considered low.
Credit risk exposure of receivables
Treasury manages credit risk using a credit management strategy. This strategy focuses on the prompt collection of revenues due and payable to Treasury and follow up of outstanding fees and charges within specified timeframes. Exposure to credit risk is monitored on an ongoing basis.
Risk assessments are performed upon non-payment of debt and maintained in the State Revenue Risk Register with assigned risk ratings. Under this risk-based revenue management framework compliance plans are developed with reference to the debt management strategies.
Expected credit losses for taxes and royalties’ receivables is calculated based on debt type using an expected credit loss percentage by age or individually assessed. For those debts where an expected credit loss percentage is used to calculate impairment, the historical credit loss experienced over a four-year period is adjusted by current conditions and forward-looking information on macro-economic factors affecting collectability of debts. The customer groups within State Revenue (SR) were determined by debt type and whether it consisted of high or low volume transactions. The provision matrix methodology was applied for high volume transactions and the low volume transactions were individually assessed. Treasury has identified employment growth, housing upturn/downturn, interest rates movement and population growth to be the relevant economic factors affecting taxes. The expected credit loss percentage is the average rate across the debts. Individually assessed debts are reviewed and a percentage loss is applied to each based on collectability.
Credit risk exposure has been assessed for taxes and fines receivables for the impact of COVID-19. At reporting date, the expected credit loss includes the impact of COVID-19 which is reflected in the forward-looking rate applied in the estimate of credit loss. Impairment loss reversals occurred during the year due to improved economic conditions compared to last year. The full impact of COVID-19 will emerge in the next 6 to 12 months, when additional information is obtained on the viability of State Revenue’s clients. A portion of receivables as at 30 June 2021 from Payroll Tax of $667.080 million have been deferred for collection until January 2022 as part of the COVID-19 relief measures (note 2 (c)).These receivables were categorised in the “Not yet due” and a 1.2% loss rate has been applied.
Set out below is the credit risk exposure on Treasury’s administered receivables. The total gross receivables exclude receivables of $469 million (2020: $311 million) that do not have any loss allowance.
SR debtors - assessed collectively using a provision matrix
2021 2020
Administered on behalf of the whole-of-government
Gross receivable
Loss rate
Expected credit losses
Gross receivable
Loss rate Expected credit losses
$'000 % $'000 $'000 % $'000 Not yet due 790,221 1.2 9,167 510,219 2.6 13,025 Less than 30 days 13,383 5.1 684 11,968 5.3 632 30 to 60 days 8,607 24.6 2,115 14,913 15.4 2,292 61 to 90 days 10,741 29.4 3,156 21,696 20.3 4,404 Greater than 90 days 98,913 41.0 40,589 95,070 41.2 39,165 Total 921,865 55,711 653,866 59,518
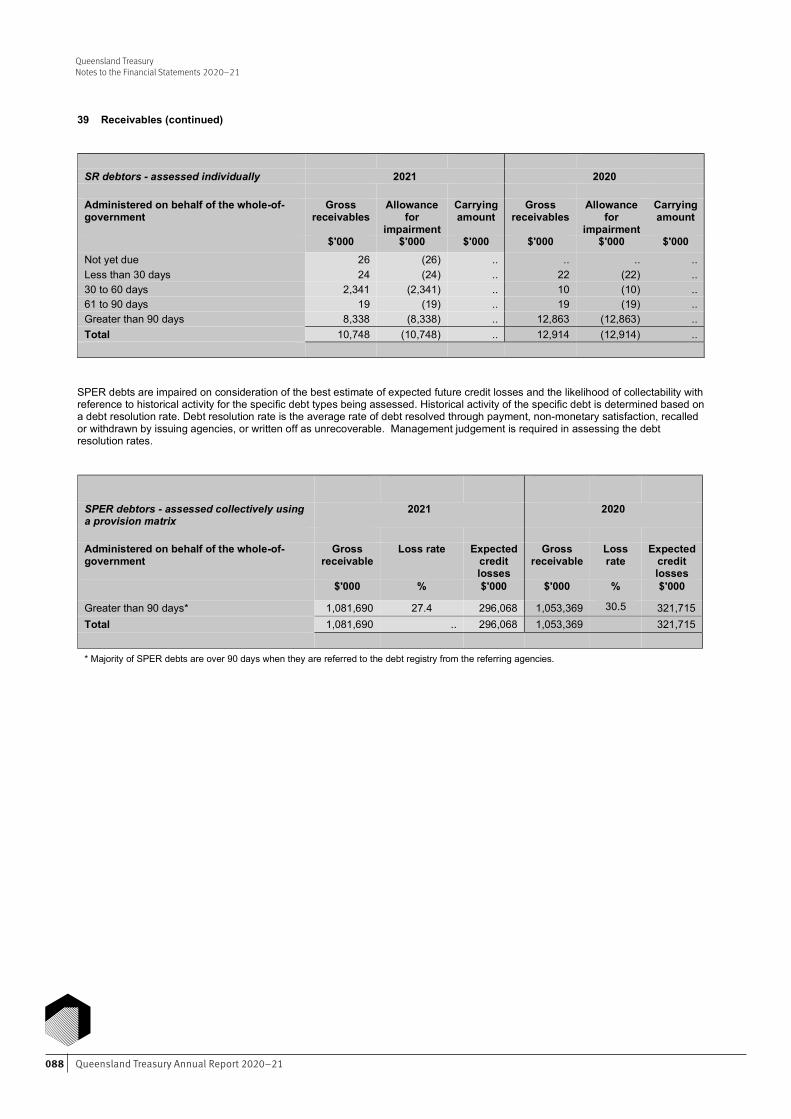
Queensland Treasury Annual Report 2020–21088
Queensland TreasuryNotes to the Financial Statements 2020–21
Queensland Treasury Notes to the Financial Statements 2020–21
64 Financial Statements – Queensland Treasury
39 Receivables (continued)
SR debtors - assessed individually 2021 2020 Administered on behalf of the whole-of-government
Gross receivables
Allowance for
impairment
Carrying amount
Gross receivables
Allowance for
impairment
Carrying amount
$'000 $'000 $'000 $'000 $'000 $'000 Not yet due 26 (26) .. .. .. .. Less than 30 days 24 (24) .. 22 (22) .. 30 to 60 days 2,341 (2,341) .. 10 (10) .. 61 to 90 days 19 (19) .. 19 (19) .. Greater than 90 days 8,338 (8,338) .. 12,863 (12,863) .. Total 10,748 (10,748) .. 12,914 (12,914) ..
SPER debts are impaired on consideration of the best estimate of expected future credit losses and the likelihood of collectability with reference to historical activity for the specific debt types being assessed. Historical activity of the specific debt is determined based on a debt resolution rate. Debt resolution rate is the average rate of debt resolved through payment, non-monetary satisfaction, recalled or withdrawn by issuing agencies, or written off as unrecoverable. Management judgement is required in assessing the debt resolution rates.
SPER debtors - assessed collectively using a provision matrix
2021 2020
Administered on behalf of the whole-of-government
Gross receivable
Loss rate Expected credit losses
Gross receivable
Loss rate
Expected credit losses
$'000 % $'000 $'000 % $'000
Greater than 90 days* 1,081,690 27.4 296,068 1,053,369 30.5 321,715 Total 1,081,690 .. 296,068 1,053,369 321,715 * Majority of SPER debts are over 90 days when they are referred to the debt registry from the referring agencies.
Queensland Treasury Notes to the Financial Statements 2020–21
65 Financial Statements – Queensland Treasury
2021 2020
$'000 $'000 40 Other financial assets
Administered on behalf of the whole-of-government Queensland Future Fund - Debt Retirement Fund (DRF) - FRN with
QTC 7,742,219 ..
Reconciliation of movements in the DRF .. Opening balance .. .. Add: Contributions - new investments 7,695,724 .. Less: Investment drawdown .. .. Add: Interest Income reinvested 26,263 .. Add: Gain/(loss) on fair value movement of investments 20,232 .. Closing balance 7,742,219 ..
Accounting policy – Other financial assets
Other Financial Assets represent the Queensland Future Fund (QFF) - Debt Retirement Fund Fixed Rate Note with Queensland Treasury Corporation (QTC). The Debt Retirement Fund was established under section 9 of the Queensland Future Fund Act 2020 (the QFF Act) as a sub-fund of the Queensland Future Fund for the purpose of providing funding for reducing the State’s debt. Funds invested in the DRF are held for future growth and are offset against state debt to support Queensland’s credit rating.
Contributions to the DRF include investments directed by the Treasurer to be contributed to the fund and amounts that must be contributed to the fund under another Act. In accordance with the QFF Act, payments from the DRF may only be made to reduce the State’s debt or pay fees or expenses relating to the administration of the fund.
On 28 April 2021, Queensland Treasury entered into a DRF Fixed Rate Note (FRN) agreement with QTC. Under the agreement, it is intended that assets will be contributed by the State to meet the purpose of the DRF from time to time. The DRF will transfer these contributed assets to QTC and in consideration, QTC will issue the DRF FRN to Queensland Treasury. QTC will invest the contributed assets in the DRF portfolio, which is held in a unit trust arrangement managed by QIC Limited and overseen by the State Investment Advisory Board (SIAB).
The FRN is recognised at FVTPL under AASB 9 Financial Instruments. Under the terms of the DRF FRN agreement, interest is calculated on a daily basis on the book value of the DRF FRN with interest capitalised monthly. The interest rate on the DRF FRN is an effective rate of 6.5% per annum. The DRF FRN is valued at the fair value of the DRF asset portfolio. The fair value methodology applied to the FRN is classified as Level 3 in the fair value hierarchy as it is based on the fair value of the corresponding assets in the DRF portfolio, which utilises significant unobservable inputs.
The fair value of the FRN is payable by QTC to Treasury on the termination date and upon payment, the DRF FRN will be cancelled. Treasury may from time to time request a payment of some part of the DRF FRN. In this event, QTC will dispose part of its interest in the DRF portfolio to fund the repayment.
Under section 10 of the QFF Act, the Treasurer may direct that specific state assets be contributed to the DRF. The following contributions were made to the DRF in the 2020-21 financial year:
In March 2021, Queensland Titles Registry Pty Ltd (Titles Registry) was established with shares in the company held by the Under Treasurer on behalf of the State. The Treasurer provided a direction for 75% of the shares in Titles Registry to be contributed to the DRF. The remaining 25% of shares in the company were held by CF to fund other Government priorities.
On 18 June 2021, title registry operations previously performed by the Department of Resources were transferred to Titles Registry in accordance with the Queensland Future Fund (Titles Registry) Act 2021. A net liability of $1.5 million was transferred to Titles Registry by the Department of Resources. On the same day, the DRF transferred its 75% of shares in Titles Registry to QTC. QTC subsequently transferred the holdings in Titles Registry into the DRF asset portfolio invested with QIC and in consideration increased the value of the DRF FRN held by Treasury.
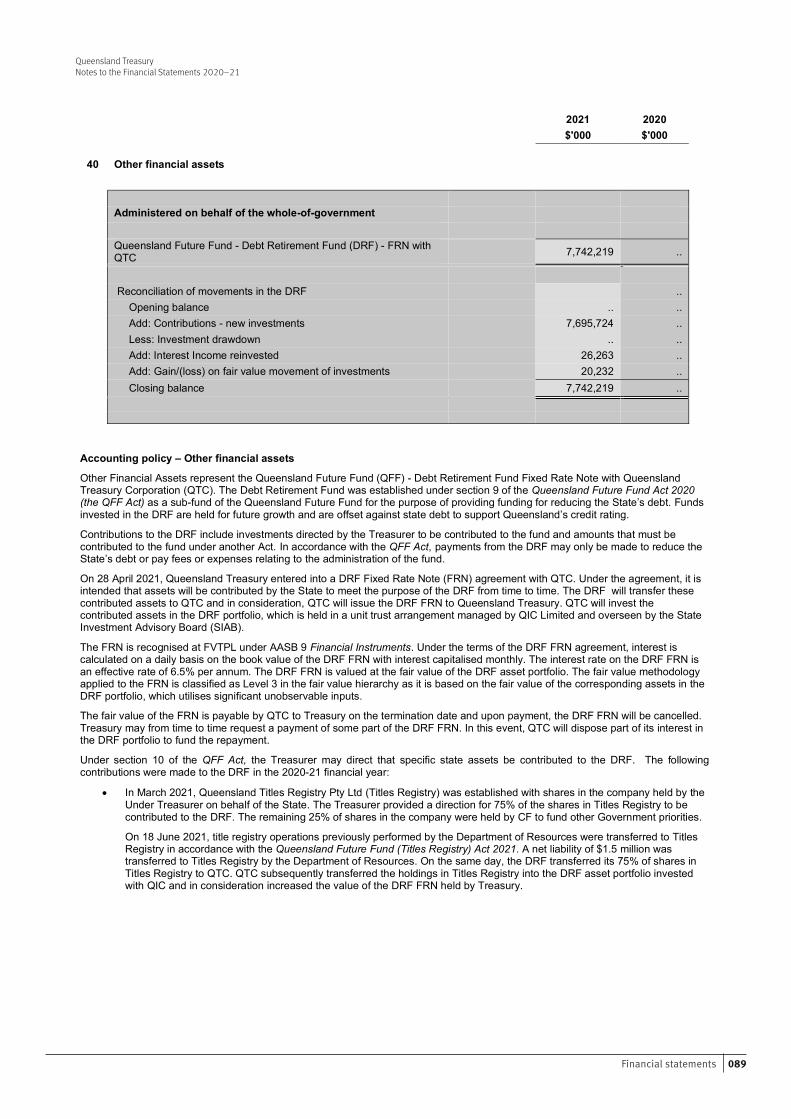
089Financial statements
Queensland TreasuryNotes to the Financial Statements 2020–21
Queensland Treasury Notes to the Financial Statements 2020–21
65 Financial Statements – Queensland Treasury
2021 2020
$'000 $'000 40 Other financial assets
Administered on behalf of the whole-of-government Queensland Future Fund - Debt Retirement Fund (DRF) - FRN with
QTC 7,742,219 ..
Reconciliation of movements in the DRF .. Opening balance .. .. Add: Contributions - new investments 7,695,724 .. Less: Investment drawdown .. .. Add: Interest Income reinvested 26,263 .. Add: Gain/(loss) on fair value movement of investments 20,232 .. Closing balance 7,742,219 ..
Accounting policy – Other financial assets
Other Financial Assets represent the Queensland Future Fund (QFF) - Debt Retirement Fund Fixed Rate Note with Queensland Treasury Corporation (QTC). The Debt Retirement Fund was established under section 9 of the Queensland Future Fund Act 2020 (the QFF Act) as a sub-fund of the Queensland Future Fund for the purpose of providing funding for reducing the State’s debt. Funds invested in the DRF are held for future growth and are offset against state debt to support Queensland’s credit rating.
Contributions to the DRF include investments directed by the Treasurer to be contributed to the fund and amounts that must be contributed to the fund under another Act. In accordance with the QFF Act, payments from the DRF may only be made to reduce the State’s debt or pay fees or expenses relating to the administration of the fund.
On 28 April 2021, Queensland Treasury entered into a DRF Fixed Rate Note (FRN) agreement with QTC. Under the agreement, it is intended that assets will be contributed by the State to meet the purpose of the DRF from time to time. The DRF will transfer these contributed assets to QTC and in consideration, QTC will issue the DRF FRN to Queensland Treasury. QTC will invest the contributed assets in the DRF portfolio, which is held in a unit trust arrangement managed by QIC Limited and overseen by the State Investment Advisory Board (SIAB).
The FRN is recognised at FVTPL under AASB 9 Financial Instruments. Under the terms of the DRF FRN agreement, interest is calculated on a daily basis on the book value of the DRF FRN with interest capitalised monthly. The interest rate on the DRF FRN is an effective rate of 6.5% per annum. The DRF FRN is valued at the fair value of the DRF asset portfolio. The fair value methodology applied to the FRN is classified as Level 3 in the fair value hierarchy as it is based on the fair value of the corresponding assets in the DRF portfolio, which utilises significant unobservable inputs.
The fair value of the FRN is payable by QTC to Treasury on the termination date and upon payment, the DRF FRN will be cancelled. Treasury may from time to time request a payment of some part of the DRF FRN. In this event, QTC will dispose part of its interest in the DRF portfolio to fund the repayment.
Under section 10 of the QFF Act, the Treasurer may direct that specific state assets be contributed to the DRF. The following contributions were made to the DRF in the 2020-21 financial year:
In March 2021, Queensland Titles Registry Pty Ltd (Titles Registry) was established with shares in the company held by the Under Treasurer on behalf of the State. The Treasurer provided a direction for 75% of the shares in Titles Registry to be contributed to the DRF. The remaining 25% of shares in the company were held by CF to fund other Government priorities.
On 18 June 2021, title registry operations previously performed by the Department of Resources were transferred to Titles Registry in accordance with the Queensland Future Fund (Titles Registry) Act 2021. A net liability of $1.5 million was transferred to Titles Registry by the Department of Resources. On the same day, the DRF transferred its 75% of shares in Titles Registry to QTC. QTC subsequently transferred the holdings in Titles Registry into the DRF asset portfolio invested with QIC and in consideration increased the value of the DRF FRN held by Treasury.
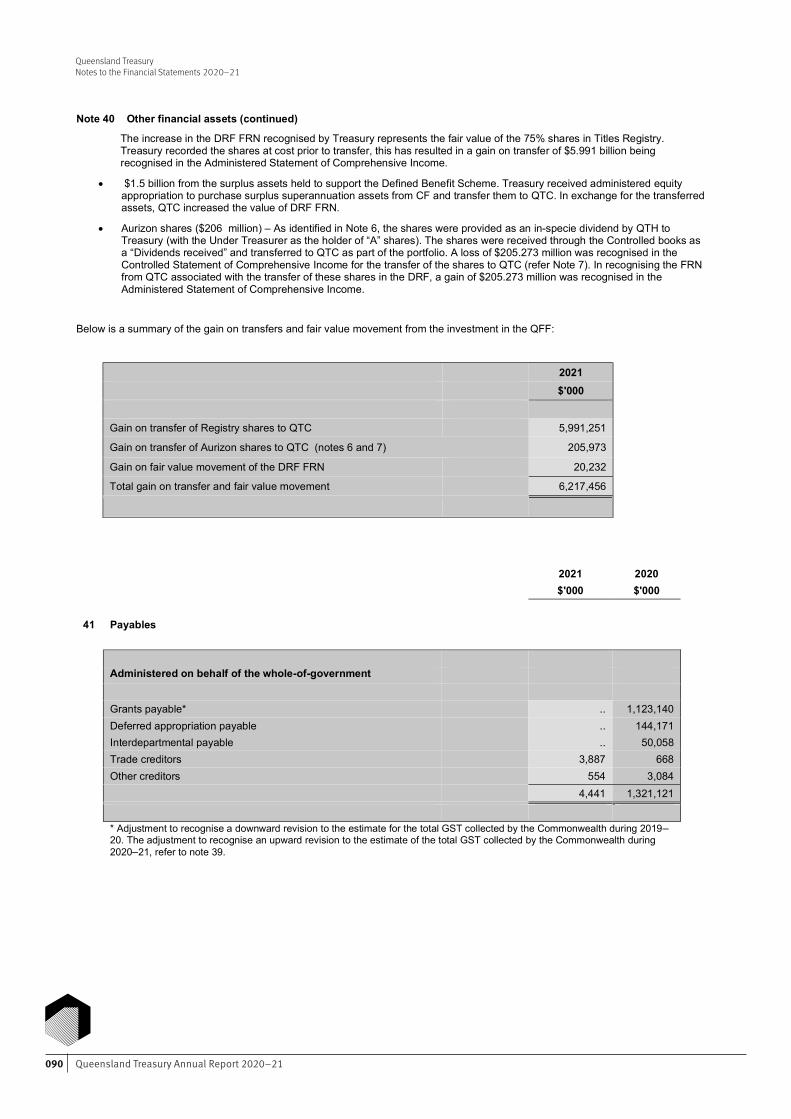
Queensland Treasury Annual Report 2020–21090
Queensland TreasuryNotes to the Financial Statements 2020–21
Queensland Treasury Notes to the Financial Statements 2020–21
66 Financial Statements – Queensland Treasury
Note 40 Other financial assets (continued)
The increase in the DRF FRN recognised by Treasury represents the fair value of the 75% shares in Titles Registry. Treasury recorded the shares at cost prior to transfer, this has resulted in a gain on transfer of $5.991 billion being recognised in the Administered Statement of Comprehensive Income.
$1.5 billion from the surplus assets held to support the Defined Benefit Scheme. Treasury received administered equity appropriation to purchase surplus superannuation assets from CF and transfer them to QTC. In exchange for the transferred assets, QTC increased the value of DRF FRN.
Aurizon shares ($206 million) – As identified in Note 6, the shares were provided as an in-specie dividend by QTH to Treasury (with the Under Treasurer as the holder of “A” shares). The shares were received through the Controlled books as a “Dividends received” and transferred to QTC as part of the portfolio. A loss of $205.273 million was recognised in the Controlled Statement of Comprehensive Income for the transfer of the shares to QTC (refer Note 7). In recognising the FRN from QTC associated with the transfer of these shares in the DRF, a gain of $205.273 million was recognised in the Administered Statement of Comprehensive Income.
Below is a summary of the gain on transfers and fair value movement from the investment in the QFF:
2021 $'000
Gain on transfer of Registry shares to QTC 5,991,251
Gain on transfer of Aurizon shares to QTC (notes 6 and 7) 205,973
Gain on fair value movement of the DRF FRN 20,232
Total gain on transfer and fair value movement 6,217,456
2021 2020
$'000 $'000
41 Payables
Administered on behalf of the whole-of-government Grants payable* .. 1,123,140 Deferred appropriation payable .. 144,171 Interdepartmental payable .. 50,058
Trade creditors 3,887 668 Other creditors 554 3,084
4,441 1,321,121
* Adjustment to recognise a downward revision to the estimate for the total GST collected by the Commonwealth during 2019–20. The adjustment to recognise an upward revision to the estimate of the total GST collected by the Commonwealth during 2020–21, refer to note 39.
Queensland Treasury Notes to the Financial Statements 2020–21
67 Financial Statements – Queensland Treasury
2021 2020
$'000 $'000
42 Interest bearing liabilities
Administered on behalf of the whole-of-government
Current Advances payable to GOC's* 1,136,165 1,492,364 Commonwealth borrowings 12,794 13,418 1,148,959 1,505,782 Non-current QTC borrowings ** 45,639,226 37,030,649 Commonwealth borrowings. 28,606 36,454 Less concessional loan discount and unwind (2,624) (3,488)
45,665,208 37,063,615
Accounting policy – Interest bearing liabilities
Borrowings are initially recognised at fair value, plus any transaction costs, then subsequently held at amortised cost using the effective interest method. The effective interest rate is the rate that exactly discounts the estimated future cash payments through the expected life of a financial instrument to the net carrying amount of that instrument. The fair value of borrowings subsequently measured at amortised costs is set out in note 44(e). Borrowings are split between current and non-current liabilities using the principles set out in note 1(e).
*Government owned corporations (GOCs) are required to make any surplus cash available to the General Government Sector through modified set-off banking arrangements. Advances are made to the Treasury Offset Bank Account Arrangement (note 38). QTC charge interest at rates between 1.20% and 0.51% (2020: between 2.17% and 0.64%) along with an administration margin of 0.15% (2020: 0.15%).
**Interest is charged on whole-of-government borrowings with QTC at rates of between 3.42% and 0.26% (2020: between 4.22% and 2.35%) along with an administration margin at the rate of 0.07% (2020: 0.07%) which is accrued and paid quarterly to QTC.
Additional borrowings for COVID-19 response measures has been detailed in note 2 (c).
43 Contingencies
Administered on behalf of whole-of-government
Litigation in progress
As at 30 June 2021, the following number of cases were filed in the courts:
Cases Estimated
amount
$'000
Supreme Court 9 153,560
Civil and Administrative Tribunal 22 3,175
Total 31 156,735
These cases relate to revenue collected by the State Revenue Office. Treasury’s legal advisers and management believe there is insufficient information available to determine the outcome of the abovementioned cases. Accordingly, no provision has been taken up in Treasury’s financial statements.
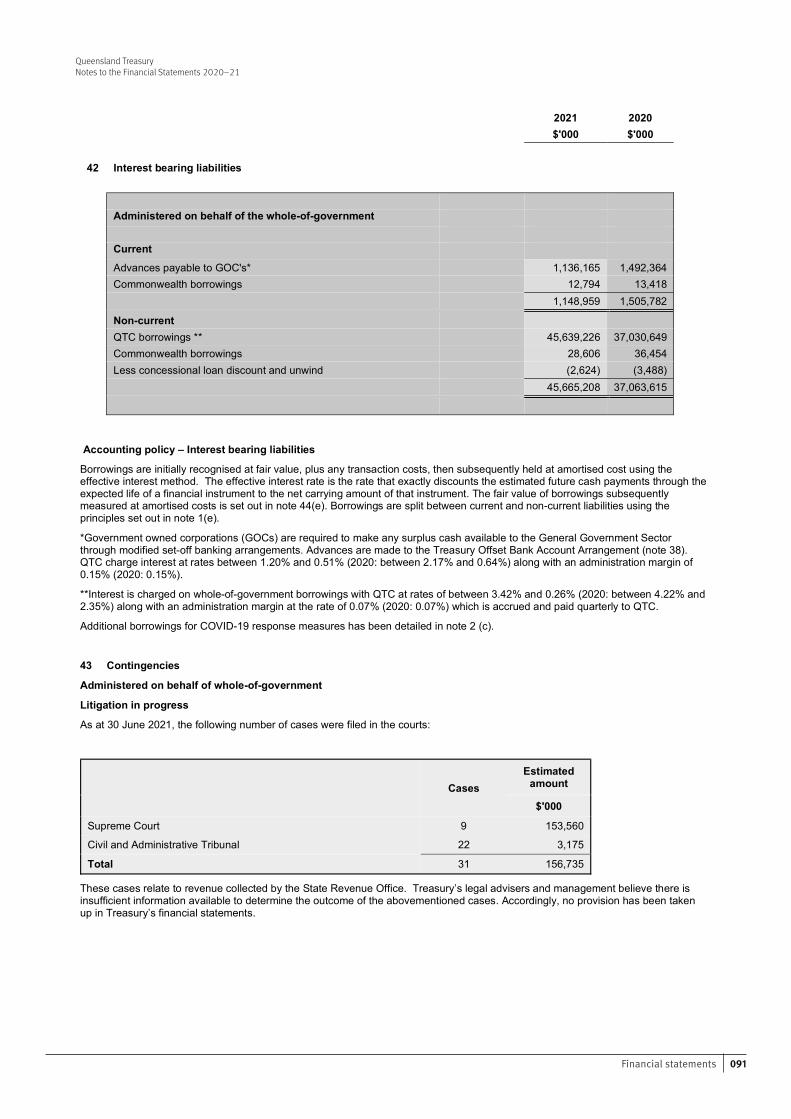
091Financial statements
Queensland TreasuryNotes to the Financial Statements 2020–21
Queensland Treasury Notes to the Financial Statements 2020–21
67 Financial Statements – Queensland Treasury
2021 2020
$'000 $'000
42 Interest bearing liabilities
Administered on behalf of the whole-of-government
Current Advances payable to GOC's* 1,136,165 1,492,364 Commonwealth borrowings 12,794 13,418 1,148,959 1,505,782 Non-current QTC borrowings ** 45,639,226 37,030,649 Commonwealth borrowings. 28,606 36,454 Less concessional loan discount and unwind (2,624) (3,488)
45,665,208 37,063,615
Accounting policy – Interest bearing liabilities
Borrowings are initially recognised at fair value, plus any transaction costs, then subsequently held at amortised cost using the effective interest method. The effective interest rate is the rate that exactly discounts the estimated future cash payments through the expected life of a financial instrument to the net carrying amount of that instrument. The fair value of borrowings subsequently measured at amortised costs is set out in note 44(e). Borrowings are split between current and non-current liabilities using the principles set out in note 1(e).
*Government owned corporations (GOCs) are required to make any surplus cash available to the General Government Sector through modified set-off banking arrangements. Advances are made to the Treasury Offset Bank Account Arrangement (note 38). QTC charge interest at rates between 1.20% and 0.51% (2020: between 2.17% and 0.64%) along with an administration margin of 0.15% (2020: 0.15%).
**Interest is charged on whole-of-government borrowings with QTC at rates of between 3.42% and 0.26% (2020: between 4.22% and 2.35%) along with an administration margin at the rate of 0.07% (2020: 0.07%) which is accrued and paid quarterly to QTC.
Additional borrowings for COVID-19 response measures has been detailed in note 2 (c).
43 Contingencies
Administered on behalf of whole-of-government
Litigation in progress
As at 30 June 2021, the following number of cases were filed in the courts:
Cases Estimated
amount
$'000
Supreme Court 9 153,560
Civil and Administrative Tribunal 22 3,175
Total 31 156,735
These cases relate to revenue collected by the State Revenue Office. Treasury’s legal advisers and management believe there is insufficient information available to determine the outcome of the abovementioned cases. Accordingly, no provision has been taken up in Treasury’s financial statements.
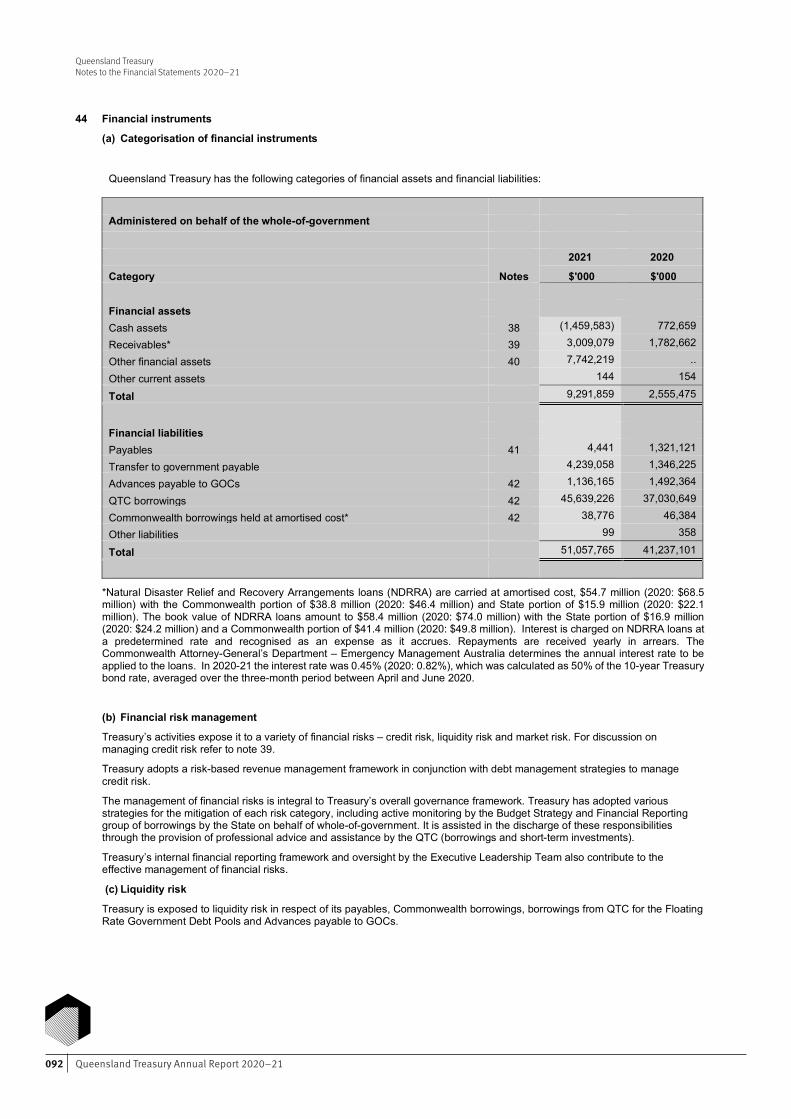
Queensland Treasury Annual Report 2020–21092
Queensland TreasuryNotes to the Financial Statements 2020–21
Queensland Treasury Notes to the Financial Statements 2020–21
68 Financial Statements – Queensland Treasury
44 Financial instruments
(a) Categorisation of financial instruments
Queensland Treasury has the following categories of financial assets and financial liabilities: Administered on behalf of the whole-of-government
Notes
2021 2020
Category $'000 $'000 Financial assets Cash assets 38 (1,459,583) 772,659
Receivables* 39 3,009,079 1,782,662
Other financial assets 40 7,742,219 ..
Other current assets 144 154
Total 9,291,859 2,555,475
Financial liabilities Payables 41 4,441 1,321,121
Transfer to government payable 4,239,058 1,346,225
Advances payable to GOCs 42 1,136,165 1,492,364
QTC borrowings 42 45,639,226 37,030,649
Commonwealth borrowings held at amortised cost* 42 38,776 46,384
Other liabilities 99 358
Total 51,057,765 41,237,101
*Natural Disaster Relief and Recovery Arrangements loans (NDRRA) are carried at amortised cost, $54.7 million (2020: $68.5 million) with the Commonwealth portion of $38.8 million (2020: $46.4 million) and State portion of $15.9 million (2020: $22.1 million). The book value of NDRRA loans amount to $58.4 million (2020: $74.0 million) with the State portion of $16.9 million (2020: $24.2 million) and a Commonwealth portion of $41.4 million (2020: $49.8 million). Interest is charged on NDRRA loans at a predetermined rate and recognised as an expense as it accrues. Repayments are received yearly in arrears. The Commonwealth Attorney-General’s Department – Emergency Management Australia determines the annual interest rate to be applied to the loans. In 2020-21 the interest rate was 0.45% (2020: 0.82%), which was calculated as 50% of the 10-year Treasury bond rate, averaged over the three-month period between April and June 2020.
(b) Financial risk management
Treasury’s activities expose it to a variety of financial risks – credit risk, liquidity risk and market risk. For discussion on managing credit risk refer to note 39.
Treasury adopts a risk-based revenue management framework in conjunction with debt management strategies to manage credit risk.
The management of financial risks is integral to Treasury’s overall governance framework. Treasury has adopted various strategies for the mitigation of each risk category, including active monitoring by the Budget Strategy and Financial Reporting group of borrowings by the State on behalf of whole-of-government. It is assisted in the discharge of these responsibilities through the provision of professional advice and assistance by the QTC (borrowings and short-term investments).
Treasury’s internal financial reporting framework and oversight by the Executive Leadership Team also contribute to the effective management of financial risks.
(c) Liquidity risk
Treasury is exposed to liquidity risk in respect of its payables, Commonwealth borrowings, borrowings from QTC for the Floating Rate Government Debt Pools and Advances payable to GOCs.
Queensland Treasury Notes to the Financial Statements 2020–21
69 Financial Statements – Queensland Treasury
44 Financial instruments (continued)
(c) Liquidity risk (continued)
The following table sets out the liquidity risk of financial liabilities held by Treasury. It represents the contractual maturity of financial liabilities, calculated based on undiscounted cash flows relating to the liabilities at reporting date. The undiscounted cash flows in these tables differ from the amounts included in the Statement of Financial Position that are based on amortised cost.
QTC borrowings are interest only with no fixed repayment date for the principal component. For the purposes of completing the maturity analysis, the principal component of these loans has been included in the more than five-year time band with no interest payment assumed in this time band.
Administered on behalf of the whole-of-government
2021 payable in Total undiscounted
cash flow $'000
Carrying amount
$'000
Notes < 1 year 1 - 5 years > 5 years
$'000 $'000 $'000 Financial liabilities Payables 41 4,441 .. .. 4,441 4,441
Transfer to government payable 4,239,058 .. .. 4,239,058 4,239,058
Commonwealth borrowings* 42 12,981 26,194 2,730 41,905 41,400 Advances payable to GOCs 42 1,136,165 .. .. 1,136,165 1,136,165
QTC borrowings 42 1,202,155 4,802,436 45,608,277 51,612,868 45,639,226 Other liabilities 99 .. .. 99 99
Total 6,594,899 4,828,630 45,611,007 57,034,536 51,060,389
Administered on behalf of the whole-of-government
2020 payable in Total undiscounted
cash flow $'000
Carrying amount
$'000
Notes < 1 year 1 - 5 years > 5 years
$'000 $'000 $'000 Financial liabilities Payables 41 1,321,122 .. .. 1,321,122 1,321,121 Transfer to government payable 1,346,225 .. .. 1,346,225 1,346,225 Commonwealth borrowings* 42 13,831 29,913 7,237 50,981 49,872 Advances payable to GOCs 42 1,492,364 .. .. 1,492,364 1,492,364 QTC borrowings 42 1,256,459 5,037,993 37,002,887 43,297,339 37,030,649 Other liabilities 358 .. .. 358 358
Total 5,430,359 5,067,906 37,010,124 47,508,389 41,240,589
*Carrying amount excludes amortised cost component of Commonwealth borrowings.
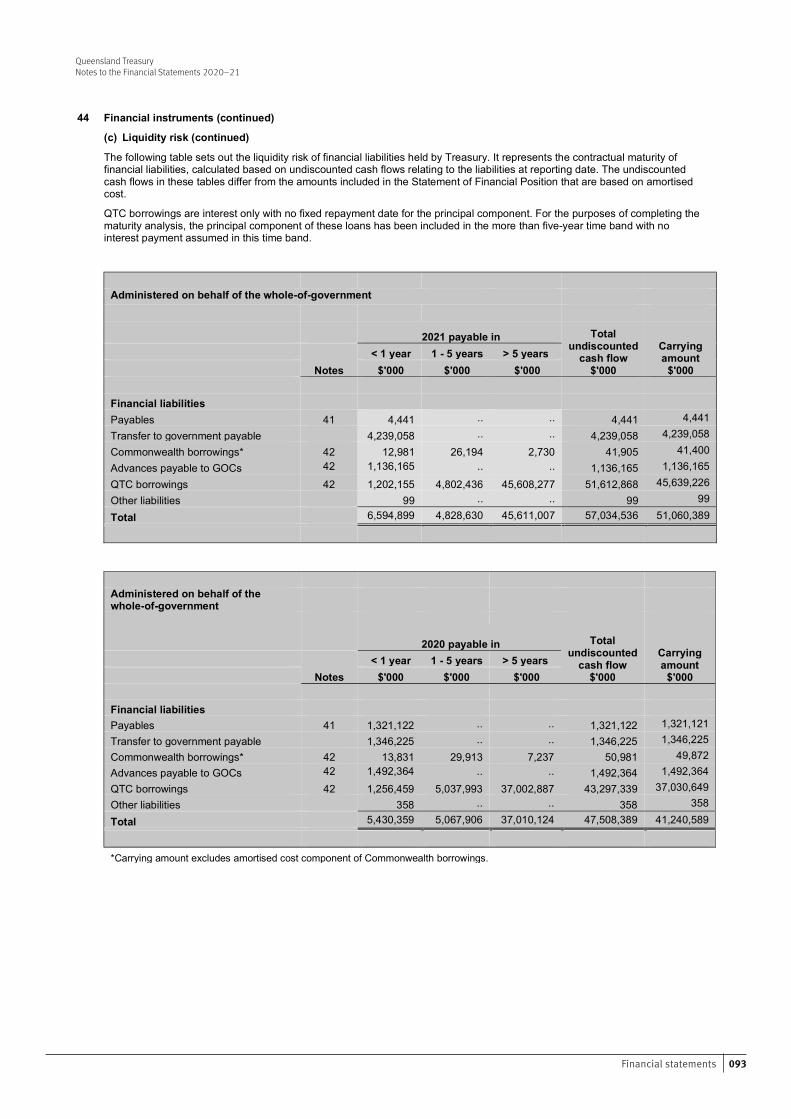
093
Queensland TreasuryNotes to the Financial Statements 2020–21
Queensland Treasury Notes to the Financial Statements 2020–21
69 Financial Statements – Queensland Treasury
44 Financial instruments (continued)
(c) Liquidity risk (continued)
The following table sets out the liquidity risk of financial liabilities held by Treasury. It represents the contractual maturity of financial liabilities, calculated based on undiscounted cash flows relating to the liabilities at reporting date. The undiscounted cash flows in these tables differ from the amounts included in the Statement of Financial Position that are based on amortised cost.
QTC borrowings are interest only with no fixed repayment date for the principal component. For the purposes of completing the maturity analysis, the principal component of these loans has been included in the more than five-year time band with no interest payment assumed in this time band.
Administered on behalf of the whole-of-government
2021 payable in Total undiscounted
cash flow $'000
Carrying amount
$'000
Notes < 1 year 1 - 5 years > 5 years
$'000 $'000 $'000 Financial liabilities Payables 41 4,441 .. .. 4,441 4,441
Transfer to government payable 4,239,058 .. .. 4,239,058 4,239,058
Commonwealth borrowings* 42 12,981 26,194 2,730 41,905 41,400 Advances payable to GOCs 42 1,136,165 .. .. 1,136,165 1,136,165
QTC borrowings 42 1,202,155 4,802,436 45,608,277 51,612,868 45,639,226 Other liabilities 99 .. .. 99 99
Total 6,594,899 4,828,630 45,611,007 57,034,536 51,060,389
Administered on behalf of the whole-of-government
2020 payable in Total undiscounted
cash flow $'000
Carrying amount
$'000
Notes < 1 year 1 - 5 years > 5 years
$'000 $'000 $'000 Financial liabilities Payables 41 1,321,122 .. .. 1,321,122 1,321,121 Transfer to government payable 1,346,225 .. .. 1,346,225 1,346,225 Commonwealth borrowings* 42 13,831 29,913 7,237 50,981 49,872 Advances payable to GOCs 42 1,492,364 .. .. 1,492,364 1,492,364 QTC borrowings 42 1,256,459 5,037,993 37,002,887 43,297,339 37,030,649 Other liabilities 358 .. .. 358 358
Total 5,430,359 5,067,906 37,010,124 47,508,389 41,240,589
*Carrying amount excludes amortised cost component of Commonwealth borrowings.
Financial statements
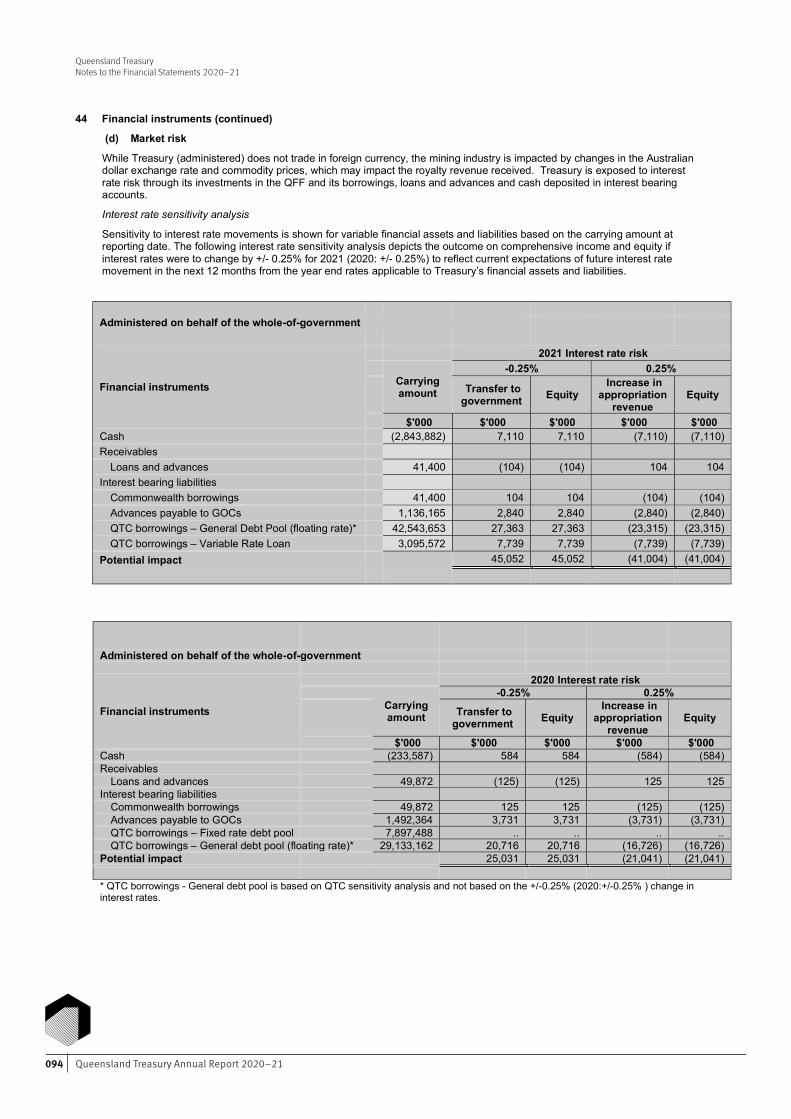
Queensland Treasury Annual Report 2020–21094
Queensland TreasuryNotes to the Financial Statements 2020–21
Queensland Treasury Notes to the Financial Statements 2020–21
70 Financial Statements – Queensland Treasury
44 Financial instruments (continued)
(d) Market risk
While Treasury (administered) does not trade in foreign currency, the mining industry is impacted by changes in the Australian dollar exchange rate and commodity prices, which may impact the royalty revenue received. Treasury is exposed to interest rate risk through its investments in the QFF and its borrowings, loans and advances and cash deposited in interest bearing accounts.
Interest rate sensitivity analysis
Sensitivity to interest rate movements is shown for variable financial assets and liabilities based on the carrying amount at reporting date. The following interest rate sensitivity analysis depicts the outcome on comprehensive income and equity if interest rates were to change by +/- 0.25% for 2021 (2020: +/- 0.25%) to reflect current expectations of future interest rate movement in the next 12 months from the year end rates applicable to Treasury’s financial assets and liabilities.
Administered on behalf of the whole-of-government
Financial instruments
2021 Interest rate risk
Carrying amount
-0.25% 0.25%
Transfer to government Equity
Increase in appropriation
revenue Equity
$'000 $'000 $'000 $'000 $'000 Cash (2,843,882) 7,110 7,110 (7,110) (7,110) Receivables
Loans and advances 41,400 (104) (104) 104 104 Interest bearing liabilities
Commonwealth borrowings 41,400 104 104 (104) (104) Advances payable to GOCs 1,136,165 2,840 2,840 (2,840) (2,840) QTC borrowings – General Debt Pool (floating rate)* 42,543,653 27,363 27,363 (23,315) (23,315) QTC borrowings – Variable Rate Loan 3,095,572 7,739 7,739 (7,739) (7,739)
Potential impact 45,052 45,052 (41,004) (41,004)
Administered on behalf of the whole-of-government
Financial instruments
2020 Interest rate risk
Carrying amount
-0.25% 0.25%
Transfer to government Equity
Increase in appropriation
revenue Equity
$'000 $'000 $'000 $'000 $'000 Cash (233,587) 584 584 (584) (584) Receivables
Loans and advances 49,872 (125) (125) 125 125 Interest bearing liabilities
Commonwealth borrowings 49,872 125 125 (125) (125) Advances payable to GOCs 1,492,364 3,731 3,731 (3,731) (3,731) QTC borrowings – Fixed rate debt pool 7,897,488 .. .. .. .. QTC borrowings – General debt pool (floating rate)* 29,133,162 20,716 20,716 (16,726) (16,726)
Potential impact 25,031 25,031 (21,041) (21,041) * QTC borrowings - General debt pool is based on QTC sensitivity analysis and not based on the +/-0.25% (2020:+/-0.25% ) change in interest rates.
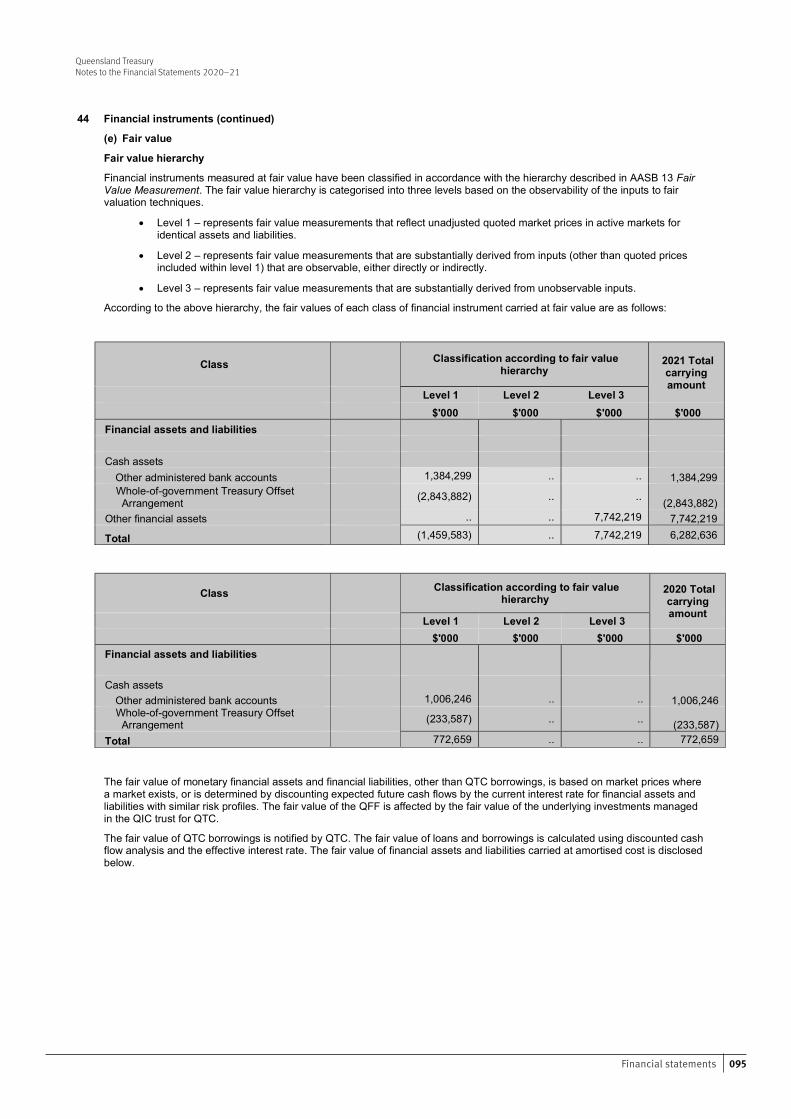
Queensland TreasuryNotes to the Financial Statements 2020–21
Queensland Treasury Notes to the Financial Statements 2020–21
71 Financial Statements – Queensland Treasury
44 Financial instruments (continued)
(e) Fair value
Fair value hierarchy
Financial instruments measured at fair value have been classified in accordance with the hierarchy described in AASB 13 Fair Value Measurement. The fair value hierarchy is categorised into three levels based on the observability of the inputs to fair valuation techniques.
Level 1 – represents fair value measurements that reflect unadjusted quoted market prices in active markets for identical assets and liabilities.
Level 2 – represents fair value measurements that are substantially derived from inputs (other than quoted prices included within level 1) that are observable, either directly or indirectly.
Level 3 – represents fair value measurements that are substantially derived from unobservable inputs.
According to the above hierarchy, the fair values of each class of financial instrument carried at fair value are as follows:
Class Classification according to fair value hierarchy
2021 Total carrying amount
Level 1 Level 2 Level 3 $'000 $'000 $'000 $'000 Financial assets and liabilities Cash assets
Other administered bank accounts 1,384,299 .. .. 1,384,299 Whole-of-government Treasury Offset
Arrangement (2,843,882) .. .. (2,843,882) Other financial assets .. .. 7,742,219 7,742,219
Total (1,459,583) .. 7,742,219 6,282,636
Class Classification according to fair value hierarchy
2020 Total carrying amount
Level 1 Level 2 Level 3 $'000 $'000 $'000 $'000 Financial assets and liabilities Cash assets
Other administered bank accounts 1,006,246 .. .. 1,006,246 Whole-of-government Treasury Offset
Arrangement (233,587) .. .. (233,587) Total 772,659 .. .. 772,659
The fair value of monetary financial assets and financial liabilities, other than QTC borrowings, is based on market prices where a market exists, or is determined by discounting expected future cash flows by the current interest rate for financial assets and liabilities with similar risk profiles. The fair value of the QFF is affected by the fair value of the underlying investments managed in the QIC trust for QTC.
The fair value of QTC borrowings is notified by QTC. The fair value of loans and borrowings is calculated using discounted cash flow analysis and the effective interest rate. The fair value of financial assets and liabilities carried at amortised cost is disclosed below.
095Financial statements
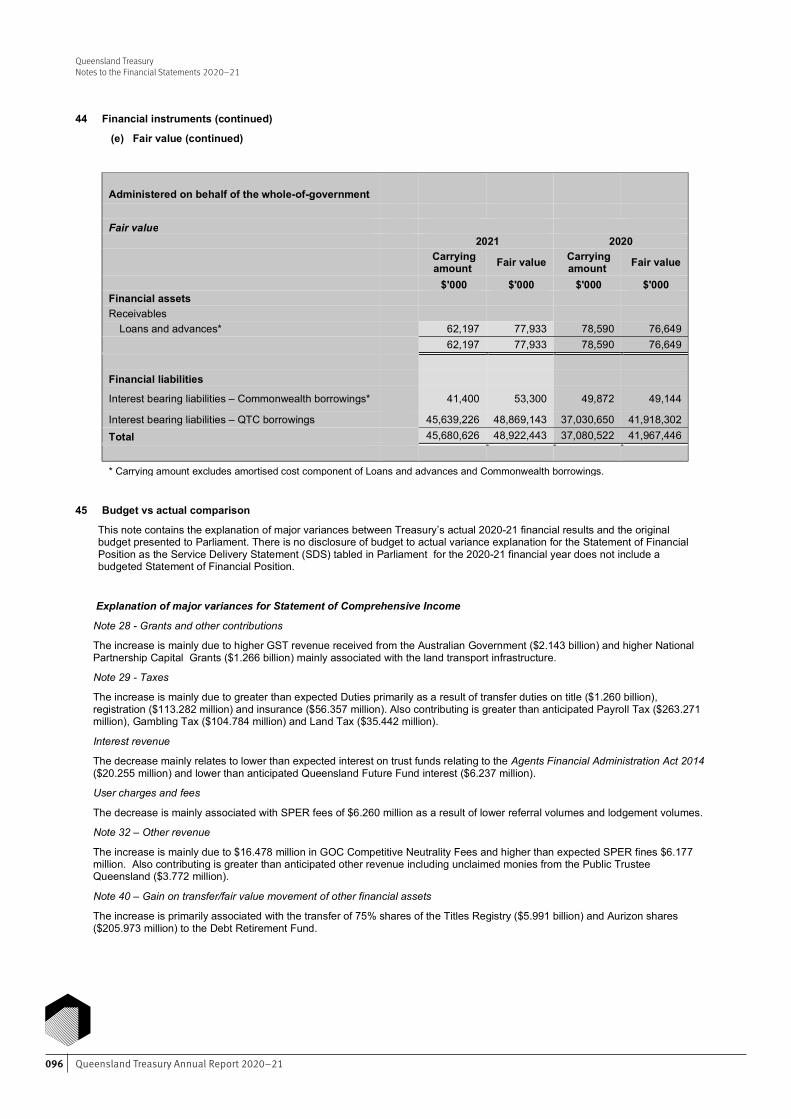
Queensland Treasury Annual Report 2020–21096
Queensland TreasuryNotes to the Financial Statements 2020–21
Queensland Treasury Notes to the Financial Statements 2020–21
72 Financial Statements – Queensland Treasury
44 Financial instruments (continued)
(e) Fair value (continued)
Administered on behalf of the whole-of-government Fair value 2021 2020
Carrying amount Fair value Carrying
amount Fair value
$'000 $'000 $'000 $'000 Financial assets Receivables
Loans and advances* 62,197 77,933 78,590 76,649 62,197 77,933 78,590 76,649 Financial liabilities
Interest bearing liabilities – Commonwealth borrowings* 41,400 53,300 49,872 49,144
Interest bearing liabilities – QTC borrowings 45,639,226 48,869,143 37,030,650 41,918,302 Total 45,680,626 48,922,443 37,080,522 41,967,446
* Carrying amount excludes amortised cost component of Loans and advances and Commonwealth borrowings.
45 Budget vs actual comparison
This note contains the explanation of major variances between Treasury’s actual 2020-21 financial results and the original budget presented to Parliament. There is no disclosure of budget to actual variance explanation for the Statement of Financial Position as the Service Delivery Statement (SDS) tabled in Parliament for the 2020-21 financial year does not include a budgeted Statement of Financial Position.
Explanation of major variances for Statement of Comprehensive Income
Note 28 - Grants and other contributions
The increase is mainly due to higher GST revenue received from the Australian Government ($2.143 billion) and higher National Partnership Capital Grants ($1.266 billion) mainly associated with the land transport infrastructure.
Note 29 - Taxes
The increase is mainly due to greater than expected Duties primarily as a result of transfer duties on title ($1.260 billion), registration ($113.282 million) and insurance ($56.357 million). Also contributing is greater than anticipated Payroll Tax ($263.271 million), Gambling Tax ($104.784 million) and Land Tax ($35.442 million).
Interest revenue
The decrease mainly relates to lower than expected interest on trust funds relating to the Agents Financial Administration Act 2014 ($20.255 million) and lower than anticipated Queensland Future Fund interest ($6.237 million).
User charges and fees
The decrease is mainly associated with SPER fees of $6.260 million as a result of lower referral volumes and lodgement volumes.
Note 32 – Other revenue
The increase is mainly due to $16.478 million in GOC Competitive Neutrality Fees and higher than expected SPER fines $6.177 million. Also contributing is greater than anticipated other revenue including unclaimed monies from the Public Trustee Queensland ($3.772 million).
Note 40 – Gain on transfer/fair value movement of other financial assets The increase is primarily associated with the transfer of 75% shares of the Titles Registry ($5.991 billion) and Aurizon shares ($205.973 million) to the Debt Retirement Fund.
097Financial statements
Queensland TreasuryNotes to the Financial Statements 2020–21
Queensland Treasury Notes to the Financial Statements 2020–21
73 Financial Statements – Queensland Treasury
45 Budget vs actual comparison (continued)
Note 34 – Losses on receivables The decrease associated with the movements in impairment losses and bad debts expenses in SPER and the Office of State Revenue due to better than expected economic conditions.
Note 36 – Grants and subsidies The increase is mainly due to Commonwealth HomeBuilder Grant ($262.985 million) and First Home Owners' Grant ($54.372 million). Also contributing is grant payments associated with Queensland Reconstruction Authority, South Bank Corporation and the State Assessment and Referral Agency of $31.783 million as a result of machinery-of-government changes effective 1 June 2020. These are partially offset by decreased payments to Payroll Tax rebates ($66.102 million), Land Tax rebates ($31.222 million) and the Jobs and Regional Growth Fund ($15.144 million).
Note 37 – Other expenses
The decrease is mainly due to QGIF claim expenses ($227.653 million), Long Service Leave Reimbursement payment ($220.789 million), Super Benefit payments made to individuals ($63.441 million) and Annual Leave Central Scheme claims ($50.177 million). This is partially offset by an indemnity for losses associated with maintaining members insurance premiums due to COVID-19 pandemic ($11.241 million).
Transfers of administered revenue to government
Transfers of Administered Revenue to Government represent revenues collected on behalf of the Queensland Government that are transferred to CF.
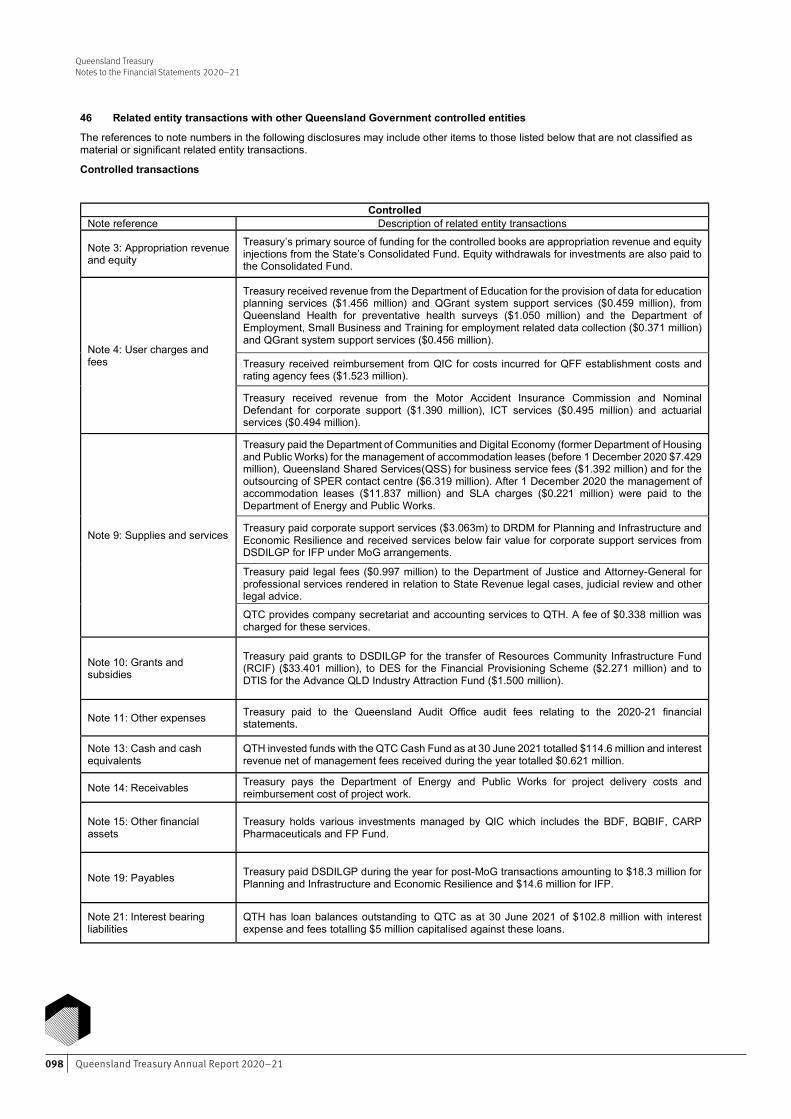
Queensland Treasury Annual Report 2020–21098
Queensland TreasuryNotes to the Financial Statements 2020–21
Queensland Treasury Notes to the Financial Statements 2020–21
74 Financial Statements – Queensland Treasury
46 Related entity transactions with other Queensland Government controlled entities
The references to note numbers in the following disclosures may include other items to those listed below that are not classified as material or significant related entity transactions.
Controlled transactions
Controlled Note reference Description of related entity transactions
Note 3: Appropriation revenue and equity
Treasury’s primary source of funding for the controlled books are appropriation revenue and equity injections from the State’s Consolidated Fund. Equity withdrawals for investments are also paid to the Consolidated Fund.
Note 4: User charges and fees
Treasury received revenue from the Department of Education for the provision of data for education planning services ($1.456 million) and QGrant system support services ($0.459 million), from Queensland Health for preventative health surveys ($1.050 million) and the Department of Employment, Small Business and Training for employment related data collection ($0.371 million) and QGrant system support services ($0.456 million).
Treasury received reimbursement from QIC for costs incurred for QFF establishment costs and rating agency fees ($1.523 million).
Treasury received revenue from the Motor Accident Insurance Commission and Nominal Defendant for corporate support ($1.390 million), ICT services ($0.495 million) and actuarial services ($0.494 million).
Note 9: Supplies and services
Treasury paid the Department of Communities and Digital Economy (former Department of Housing and Public Works) for the management of accommodation leases (before 1 December 2020 $7.429 million), Queensland Shared Services(QSS) for business service fees ($1.392 million) and for the outsourcing of SPER contact centre ($6.319 million). After 1 December 2020 the management of accommodation leases ($11.837 million) and SLA charges ($0.221 million) were paid to the Department of Energy and Public Works.
Treasury paid corporate support services ($3.063m) to DRDM for Planning and Infrastructure and Economic Resilience and received services below fair value for corporate support services from DSDILGP for IFP under MoG arrangements.
Treasury paid legal fees ($0.997 million) to the Department of Justice and Attorney-General for professional services rendered in relation to State Revenue legal cases, judicial review and other legal advice.
QTC provides company secretariat and accounting services to QTH. A fee of $0.338 million was charged for these services.
Note 10: Grants and subsidies
Treasury paid grants to DSDILGP for the transfer of Resources Community Infrastructure Fund (RCIF) ($33.401 million), to DES for the Financial Provisioning Scheme ($2.271 million) and to DTIS for the Advance QLD Industry Attraction Fund ($1.500 million).
Note 11: Other expenses Treasury paid to the Queensland Audit Office audit fees relating to the 2020-21 financial statements.
Note 13: Cash and cash equivalents
QTH invested funds with the QTC Cash Fund as at 30 June 2021 totalled $114.6 million and interest revenue net of management fees received during the year totalled $0.621 million.
Note 14: Receivables Treasury pays the Department of Energy and Public Works for project delivery costs and reimbursement cost of project work.
Note 15: Other financial assets
Treasury holds various investments managed by QIC which includes the BDF, BQBIF, CARP Pharmaceuticals and FP Fund.
Note 19: Payables
Treasury paid DSDILGP during the year for post-MoG transactions amounting to $18.3 million for Planning and Infrastructure and Economic Resilience and $14.6 million for IFP.
Note 21: Interest bearing liabilities
QTH has loan balances outstanding to QTC as at 30 June 2021 of $102.8 million with interest expense and fees totalling $5 million capitalised against these loans.
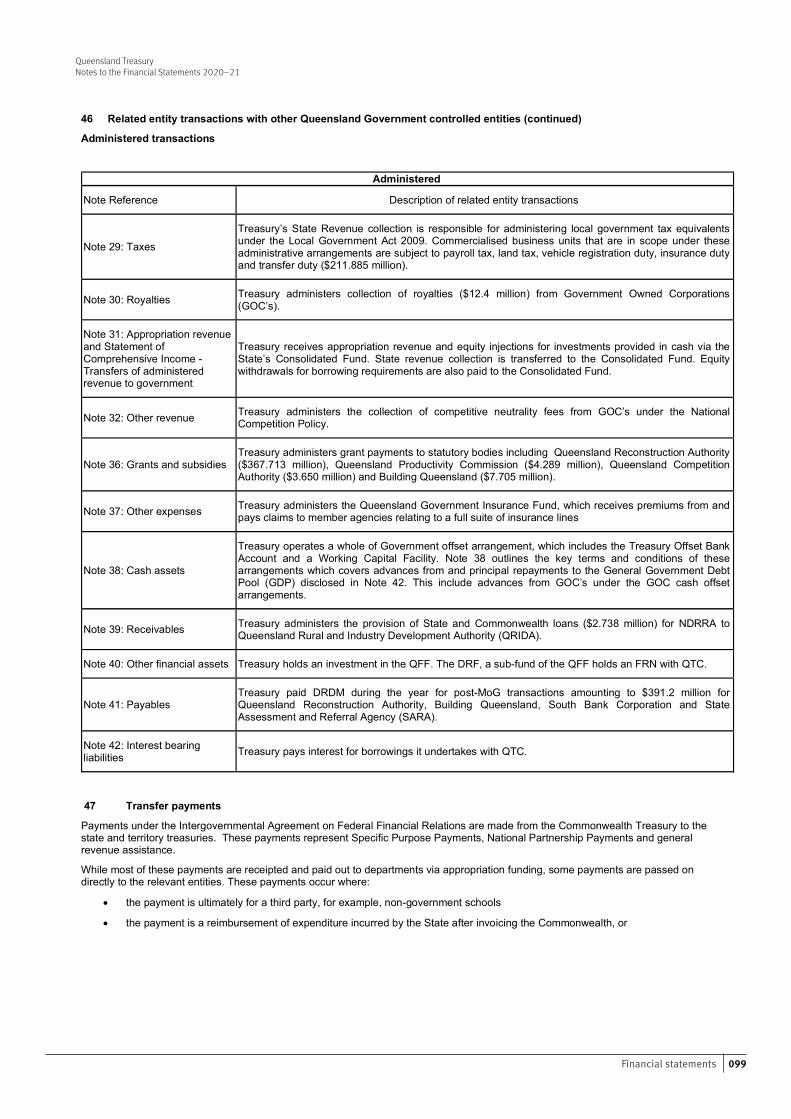
099
Queensland TreasuryNotes to the Financial Statements 2020–21
Queensland Treasury Notes to the Financial Statements 2020–21
75 Financial Statements – Queensland Treasury
46 Related entity transactions with other Queensland Government controlled entities (continued)
Administered transactions
Administered
Note Reference Description of related entity transactions
Note 29: Taxes
Treasury’s State Revenue collection is responsible for administering local government tax equivalents under the Local Government Act 2009. Commercialised business units that are in scope under these administrative arrangements are subject to payroll tax, land tax, vehicle registration duty, insurance duty and transfer duty ($211.885 million).
Note 30: Royalties Treasury administers collection of royalties ($12.4 million) from Government Owned Corporations (GOC’s).
Note 31: Appropriation revenue and Statement of Comprehensive Income - Transfers of administered revenue to government
Treasury receives appropriation revenue and equity injections for investments provided in cash via the State’s Consolidated Fund. State revenue collection is transferred to the Consolidated Fund. Equity withdrawals for borrowing requirements are also paid to the Consolidated Fund.
Note 32: Other revenue Treasury administers the collection of competitive neutrality fees from GOC’s under the National Competition Policy.
Note 36: Grants and subsidies Treasury administers grant payments to statutory bodies including Queensland Reconstruction Authority ($367.713 million), Queensland Productivity Commission ($4.289 million), Queensland Competition Authority ($3.650 million) and Building Queensland ($7.705 million).
Note 37: Other expenses Treasury administers the Queensland Government Insurance Fund, which receives premiums from and pays claims to member agencies relating to a full suite of insurance lines
Note 38: Cash assets
Treasury operates a whole of Government offset arrangement, which includes the Treasury Offset Bank Account and a Working Capital Facility. Note 38 outlines the key terms and conditions of these arrangements which covers advances from and principal repayments to the General Government Debt Pool (GDP) disclosed in Note 42. This include advances from GOC’s under the GOC cash offset arrangements.
Note 39: Receivables Treasury administers the provision of State and Commonwealth loans ($2.738 million) for NDRRA to Queensland Rural and Industry Development Authority (QRIDA).
Note 40: Other financial assets Treasury holds an investment in the QFF. The DRF, a sub-fund of the QFF holds an FRN with QTC.
Note 41: Payables Treasury paid DRDM during the year for post-MoG transactions amounting to $391.2 million for Queensland Reconstruction Authority, Building Queensland, South Bank Corporation and State Assessment and Referral Agency (SARA).
Note 42: Interest bearing liabilities Treasury pays interest for borrowings it undertakes with QTC.
47 Transfer payments
Payments under the Intergovernmental Agreement on Federal Financial Relations are made from the Commonwealth Treasury to the state and territory treasuries. These payments represent Specific Purpose Payments, National Partnership Payments and general revenue assistance.
While most of these payments are receipted and paid out to departments via appropriation funding, some payments are passed on directly to the relevant entities. These payments occur where:
the payment is ultimately for a third party, for example, non-government schools
the payment is a reimbursement of expenditure incurred by the State after invoicing the Commonwealth, or
Financial statements
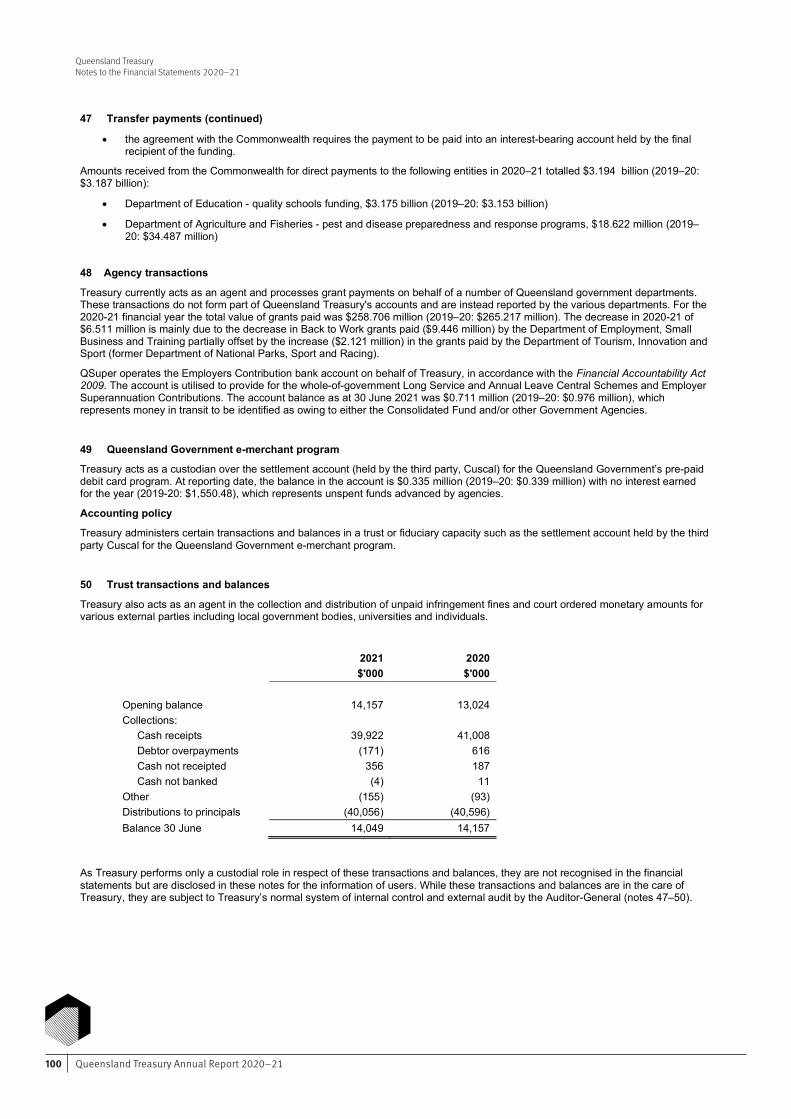
Queensland Treasury Annual Report 2020–21100
Queensland TreasuryNotes to the Financial Statements 2020–21
Queensland Treasury Notes to the Financial Statements 2020–21
76 Financial Statements – Queensland Treasury
47 Transfer payments (continued)
the agreement with the Commonwealth requires the payment to be paid into an interest-bearing account held by the final recipient of the funding.
Amounts received from the Commonwealth for direct payments to the following entities in 2020–21 totalled $3.194 billion (2019–20: $3.187 billion):
Department of Education - quality schools funding, $3.175 billion (2019–20: $3.153 billion)
Department of Agriculture and Fisheries - pest and disease preparedness and response programs, $18.622 million (2019–20: $34.487 million)
48 Agency transactions
Treasury currently acts as an agent and processes grant payments on behalf of a number of Queensland government departments. These transactions do not form part of Queensland Treasury's accounts and are instead reported by the various departments. For the 2020-21 financial year the total value of grants paid was $258.706 million (2019–20: $265.217 million). The decrease in 2020-21 of $6.511 million is mainly due to the decrease in Back to Work grants paid ($9.446 million) by the Department of Employment, Small Business and Training partially offset by the increase ($2.121 million) in the grants paid by the Department of Tourism, Innovation and Sport (former Department of National Parks, Sport and Racing).
QSuper operates the Employers Contribution bank account on behalf of Treasury, in accordance with the Financial Accountability Act 2009. The account is utilised to provide for the whole-of-government Long Service and Annual Leave Central Schemes and Employer Superannuation Contributions. The account balance as at 30 June 2021 was $0.711 million (2019–20: $0.976 million), which represents money in transit to be identified as owing to either the Consolidated Fund and/or other Government Agencies.
49 Queensland Government e-merchant program
Treasury acts as a custodian over the settlement account (held by the third party, Cuscal) for the Queensland Government’s pre-paid debit card program. At reporting date, the balance in the account is $0.335 million (2019–20: $0.339 million) with no interest earned for the year (2019-20: $1,550.48), which represents unspent funds advanced by agencies.
Accounting policy
Treasury administers certain transactions and balances in a trust or fiduciary capacity such as the settlement account held by the third party Cuscal for the Queensland Government e-merchant program.
50 Trust transactions and balances
Treasury also acts as an agent in the collection and distribution of unpaid infringement fines and court ordered monetary amounts for various external parties including local government bodies, universities and individuals.
2021 2020
$'000 $'000
Opening balance 14,157 13,024 Collections: Cash receipts 39,922 41,008 Debtor overpayments (171) 616 Cash not receipted 356 187 Cash not banked (4) 11 Other (155) (93) Distributions to principals (40,056) (40,596) Balance 30 June 14,049 14,157
As Treasury performs only a custodial role in respect of these transactions and balances, they are not recognised in the financial statements but are disclosed in these notes for the information of users. While these transactions and balances are in the care of Treasury, they are subject to Treasury’s normal system of internal control and external audit by the Auditor-General (notes 47–50).
101
Queensland Treasury Management Certificate For the year ended 30 June 2021
77 Financial Statements – Queensland Treasury
These general-purpose financial statements have been prepared pursuant to s.62(1) of the Financial Accountability Act 2009 (the Act), section 38 of the Financial and Performance Management Standard 2019 and other prescribed requirements. In accordance with s.62(1)(b) of the Act we certify that in our opinion:
the prescribed requirements for establishing and keeping the accounts have been complied with in all material respects; and
the financial statements have been drawn up to present a true and fair view, in accordance with prescribed accounting standards, of the transactions of Queensland Treasury and the consolidated entity for the financial year ended 30 June 2021 and of the financial position of Queensland Treasury and the consolidated entity at the end of that year.
The Under Treasurer, as the Accountable Officer of the Department, acknowledge(s) responsibility under s.7 and s.11 of the Financial and Performance Management Standard 2019 for the establishment and maintenance, in all material respects, of an appropriate and effective system of internal controls and risk management processes with respect to financial reporting throughout the reporting period.
L. Allen D. Brooks
Acting Under Treasurer Chief Finance Officer
25 August 2021 25 August 2021
Queensland TreasuryManagement CertificateFor the year ended 30 June 2021
Financial statements
Queensland Treasury Annual Report 2020–21102
INDEPENDENT AUDITOR’S REPORTTo the Accountable Officer of Queensland Treasury
Report on the audit of the financial report
OpinionI have audited the accompanying financial report of Queensland Treasury (the parent) and its controlled entity (the group).
In my opinion, the financial report:
a) gives a true and fair view of the parent's and group's financial position as at 30 June 2021, and their financial performance and cash flows for the year then ended
b) complies with the Financial Accountability Act 2009, the Financial and Performance Management Standard 2019 and Australian Accounting Standards.
The financial report comprises the statements of financial position and statements of assets and liabilities by major departmental services as at 30 June 2021, the statements of comprehensive income, statements of changes in equity, statements of cash flows and statements of comprehensive income by major departmental services for the year then ended, notes to the financial statements including summaries of significant accounting policies and other explanatory information, and the management certificate.
Basis for opinionI conducted my audit in accordance with the Auditor-General Auditing Standards, which incorporate the Australian Auditing Standards. My responsibilities under those standards are further described in the Auditor’s Responsibilities for the Audit of the Financial Report section of my report.
I am independent of the parent and group in accordance with the ethical requirements of the Accounting Professional and Ethical Standards Board’s APES 110 Code of Ethics for Professional Accountants (the Code) that are relevant to my audit of the financial report in Australia. I have also fulfilled my other ethical responsibilities in accordance with the Code and the Auditor-General Auditing Standards.
I believe that the audit evidence I have obtained is sufficient and appropriate to provide a basis for my opinion.
Key audit mattersKey audit matters are those matters that, in my professional judgement, were of most significance in my audit of the financial report of the current period. I addressed these matters in the context of my audit of the financial report as a whole, and in forming my opinion thereon, and I do not provide a separate opinion on these matters.
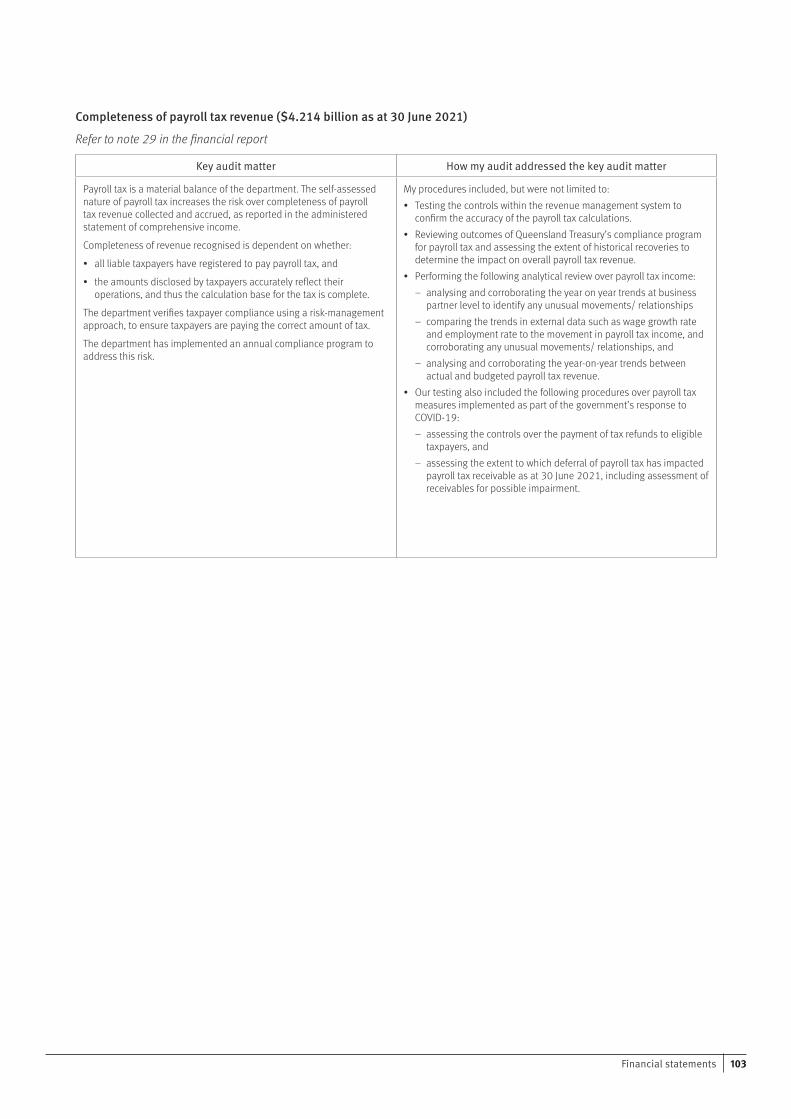
103
Completeness of payroll tax revenue ($4.214 billion as at 30 June 2021)
Refer to note 29 in the financial report
Key audit matter How my audit addressed the key audit matter
Payroll tax is a material balance of the department. The self-assessed nature of payroll tax increases the risk over completeness of payroll tax revenue collected and accrued, as reported in the administered statement of comprehensive income.
Completeness of revenue recognised is dependent on whether:
• all liable taxpayers have registered to pay payroll tax, and
• the amounts disclosed by taxpayers accurately reflect their operations, and thus the calculation base for the tax is complete.
The department verifies taxpayer compliance using a risk-management approach, to ensure taxpayers are paying the correct amount of tax.
The department has implemented an annual compliance program to address this risk.
My procedures included, but were not limited to:• Testing the controls within the revenue management system to
confirm the accuracy of the payroll tax calculations.• Reviewing outcomes of Queensland Treasury’s compliance program
for payroll tax and assessing the extent of historical recoveries to determine the impact on overall payroll tax revenue.
• Performing the following analytical review over payroll tax income: – analysing and corroborating the year on year trends at business
partner level to identify any unusual movements/ relationships – comparing the trends in external data such as wage growth rate
and employment rate to the movement in payroll tax income, and corroborating any unusual movements/ relationships, and
– analysing and corroborating the year-on-year trends between actual and budgeted payroll tax revenue.
• Our testing also included the following procedures over payroll tax measures implemented as part of the government’s response to COVID-19:
– assessing the controls over the payment of tax refunds to eligible taxpayers, and
– assessing the extent to which deferral of payroll tax has impacted payroll tax receivable as at 30 June 2021, including assessment of receivables for possible impairment.
Financial statements
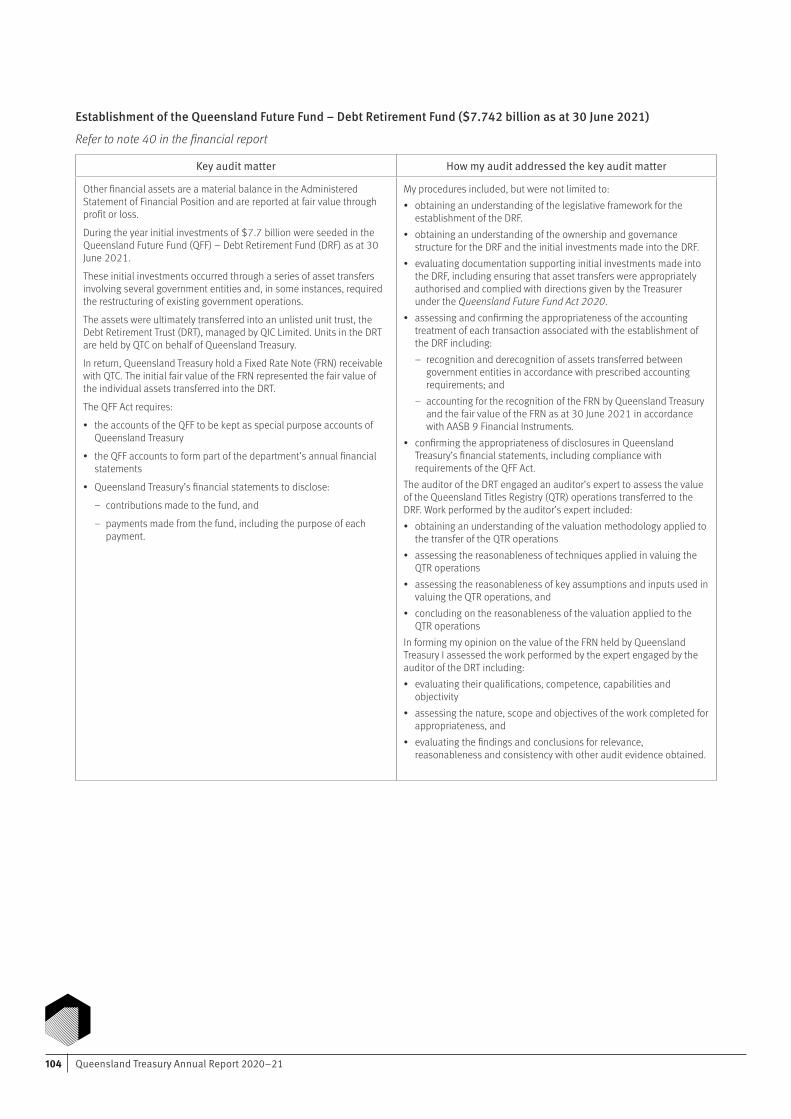
Queensland Treasury Annual Report 2020–21104
Establishment of the Queensland Future Fund – Debt Retirement Fund ($7.742 billion as at 30 June 2021)
Refer to note 40 in the financial report
Key audit matter How my audit addressed the key audit matter
Other financial assets are a material balance in the Administered Statement of Financial Position and are reported at fair value through profit or loss.
During the year initial investments of $7.7 billion were seeded in the Queensland Future Fund (QFF) – Debt Retirement Fund (DRF) as at 30 June 2021.
These initial investments occurred through a series of asset transfers involving several government entities and, in some instances, required the restructuring of existing government operations.
The assets were ultimately transferred into an unlisted unit trust, the Debt Retirement Trust (DRT), managed by QIC Limited. Units in the DRT are held by QTC on behalf of Queensland Treasury.
In return, Queensland Treasury hold a Fixed Rate Note (FRN) receivable with QTC. The initial fair value of the FRN represented the fair value of the individual assets transferred into the DRT.
The QFF Act requires:
• the accounts of the QFF to be kept as special purpose accounts of Queensland Treasury
• the QFF accounts to form part of the department’s annual financial statements
• Queensland Treasury’s financial statements to disclose:
– contributions made to the fund, and
– payments made from the fund, including the purpose of each payment.
My procedures included, but were not limited to:• obtaining an understanding of the legislative framework for the
establishment of the DRF.• obtaining an understanding of the ownership and governance
structure for the DRF and the initial investments made into the DRF.• evaluating documentation supporting initial investments made into
the DRF, including ensuring that asset transfers were appropriately authorised and complied with directions given by the Treasurer under the Queensland Future Fund Act 2020.
• assessing and confirming the appropriateness of the accounting treatment of each transaction associated with the establishment of the DRF including:
– recognition and derecognition of assets transferred between government entities in accordance with prescribed accounting requirements; and
– accounting for the recognition of the FRN by Queensland Treasury and the fair value of the FRN as at 30 June 2021 in accordance with AASB 9 Financial Instruments.
• confirming the appropriateness of disclosures in Queensland Treasury’s financial statements, including compliance with requirements of the QFF Act.
The auditor of the DRT engaged an auditor’s expert to assess the value of the Queensland Titles Registry (QTR) operations transferred to the DRF. Work performed by the auditor’s expert included:• obtaining an understanding of the valuation methodology applied to
the transfer of the QTR operations• assessing the reasonableness of techniques applied in valuing the
QTR operations• assessing the reasonableness of key assumptions and inputs used in
valuing the QTR operations, and• concluding on the reasonableness of the valuation applied to the
QTR operationsIn forming my opinion on the value of the FRN held by Queensland Treasury I assessed the work performed by the expert engaged by the auditor of the DRT including:• evaluating their qualifications, competence, capabilities and
objectivity• assessing the nature, scope and objectives of the work completed for
appropriateness, and• evaluating the findings and conclusions for relevance,
reasonableness and consistency with other audit evidence obtained.
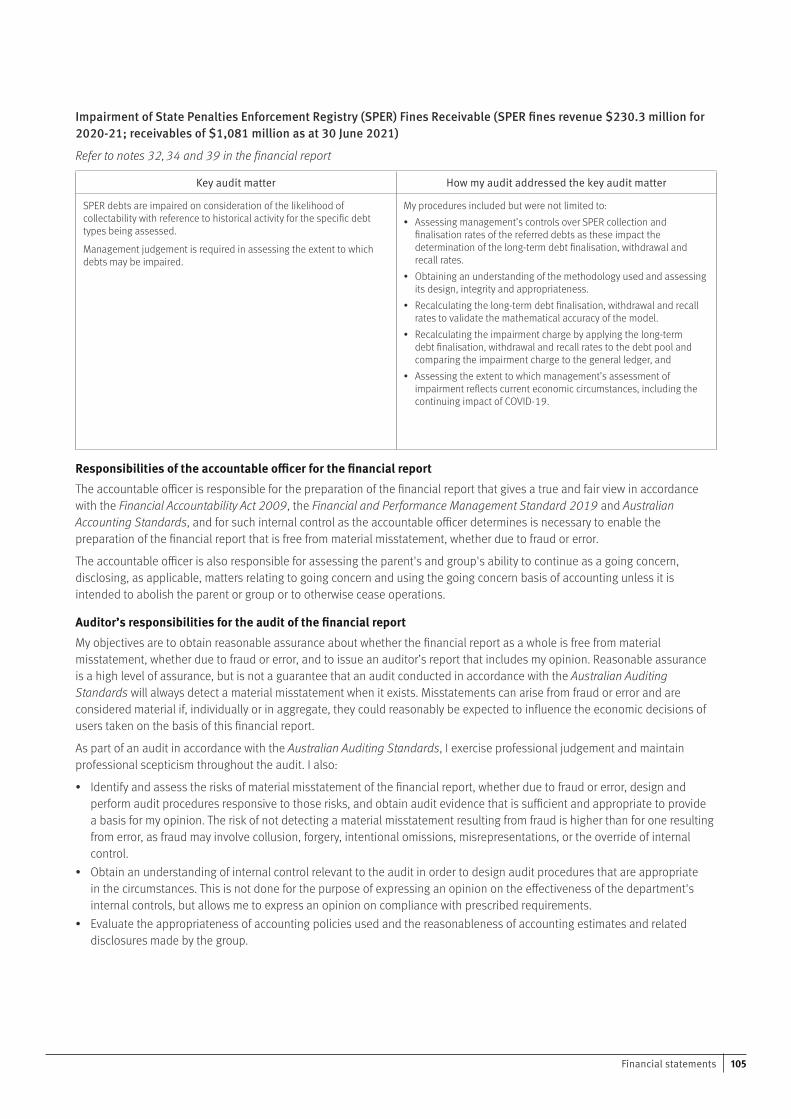
105
Impairment of State Penalties Enforcement Registry (SPER) Fines Receivable (SPER fines revenue $230.3 million for 2020-21; receivables of $1,081 million as at 30 June 2021)
Refer to notes 32, 34 and 39 in the financial report
Key audit matter How my audit addressed the key audit matter
SPER debts are impaired on consideration of the likelihood of collectability with reference to historical activity for the specific debt types being assessed.
Management judgement is required in assessing the extent to which debts may be impaired.
My procedures included but were not limited to:• Assessing management’s controls over SPER collection and
finalisation rates of the referred debts as these impact the determination of the long-term debt finalisation, withdrawal and recall rates.
• Obtaining an understanding of the methodology used and assessing its design, integrity and appropriateness.
• Recalculating the long-term debt finalisation, withdrawal and recall rates to validate the mathematical accuracy of the model.
• Recalculating the impairment charge by applying the long-term debt finalisation, withdrawal and recall rates to the debt pool and comparing the impairment charge to the general ledger, and
• Assessing the extent to which management’s assessment of impairment reflects current economic circumstances, including the continuing impact of COVID-19.
Responsibilities of the accountable officer for the financial reportThe accountable officer is responsible for the preparation of the financial report that gives a true and fair view in accordance with the Financial Accountability Act 2009, the Financial and Performance Management Standard 2019 and Australian Accounting Standards, and for such internal control as the accountable officer determines is necessary to enable the preparation of the financial report that is free from material misstatement, whether due to fraud or error.
The accountable officer is also responsible for assessing the parent's and group's ability to continue as a going concern, disclosing, as applicable, matters relating to going concern and using the going concern basis of accounting unless it is intended to abolish the parent or group or to otherwise cease operations.
Auditor’s responsibilities for the audit of the financial report My objectives are to obtain reasonable assurance about whether the financial report as a whole is free from material misstatement, whether due to fraud or error, and to issue an auditor’s report that includes my opinion. Reasonable assurance is a high level of assurance, but is not a guarantee that an audit conducted in accordance with the Australian Auditing Standards will always detect a material misstatement when it exists. Misstatements can arise from fraud or error and are considered material if, individually or in aggregate, they could reasonably be expected to influence the economic decisions of users taken on the basis of this financial report.
As part of an audit in accordance with the Australian Auditing Standards, I exercise professional judgement and maintain professional scepticism throughout the audit. I also:
• Identify and assess the risks of material misstatement of the financial report, whether due to fraud or error, design and perform audit procedures responsive to those risks, and obtain audit evidence that is sufficient and appropriate to provide a basis for my opinion. The risk of not detecting a material misstatement resulting from fraud is higher than for one resulting from error, as fraud may involve collusion, forgery, intentional omissions, misrepresentations, or the override of internal control.
• Obtain an understanding of internal control relevant to the audit in order to design audit procedures that are appropriate in the circumstances. This is not done for the purpose of expressing an opinion on the effectiveness of the department's internal controls, but allows me to express an opinion on compliance with prescribed requirements.
• Evaluate the appropriateness of accounting policies used and the reasonableness of accounting estimates and related disclosures made by the group.
Financial statements
Queensland Treasury Annual Report 2020–21106
• Conclude on the appropriateness of the parent's and group's use of the going concern basis of accounting and, based on the audit evidence obtained, whether a material uncertainty exists related to events or conditions that may cast significant doubt on the parent's or group's ability to continue as a going concern. If I conclude that a material uncertainty exists, I am required to draw attention in my auditor’s report to the related disclosures in the financial report or, if such disclosures are inadequate, to modify my opinion. I base my conclusions on the audit evidence obtained up to the date of my auditor’s report. However, future events or conditions may cause the parent or group to cease to continue as a going concern.
• Evaluate the overall presentation, structure and content of the financial report, including the disclosures, and whether the financial report represents the underlying transactions and events in a manner that achieves fair presentation.
• Obtain sufficient appropriate audit evidence regarding the financial information of the entities or business activities within the group to express an opinion on the financial report. I am responsible for the direction, supervision and performance of the audit of the group. I remain solely responsible for my audit opinion.
I communicate with the Accountable Officer regarding, among other matters, the planned scope and timing of the audit and significant audit findings, including any significant deficiencies in internal control that I identify during my audit.
From the matters communicated with the accountable officer, I determine those matters that were of most significance in the audit of the financial report of the current period and are therefore the key audit matters. I describe these matters in my auditor’s report unless law or regulation precludes public disclosure about the matter or when, in extremely rare circumstances, I determine that a matter should not be communicated in my report because the adverse consequences of doing so would reasonably be expected to outweigh the public interest benefits of such communication.
Report on other legal and regulatory requirements
StatementIn accordance with s.40 of the Auditor-General Act 2009, for the year ended 30 June 2021:
a) I received all the information and explanations I required.b) I consider that, the prescribed requirements in relation to the establishment and keeping of accounts were complied with in
all material respects.
Prescribed requirements scopeThe prescribed requirements for the establishment and keeping of accounts are contained in the Financial Accountability Act 2009, any other Act and the Financial and Performance Management Standard 2019. The applicable requirements include those for keeping financial records that correctly record and explain the department’s transactions and account balances to enable the preparation of a true and fair financial report.
26 August 2021
Brendan Worrall Queensland Audit Office Auditor-General Brisbane
107
Appendices
Consultancies, language services, overseas travelReports of Treasury’s expenditure on consultancies, language services and overseas travel are published on the Open Data website data.qld.gov.au.
External scrutiny External audits and reviews aid transparency in government, and help Treasury improve its performance and monitor its progress towards Queensland’s Economic Recovery Plan.
The following reports of independent reviews were tabled in Parliament during 2020–21:
Auditor-General Report to Parliament
Effectiveness of audit committees in State Government entities (whole of government)
Report No 2 2020–21, tabled 8 September 2020
Recommendations That all entities’ audit committees have the right members, are engaged with their leaders, understand their role, add value and continue to improve and evolve.
Specifically, that Treasury:
mandates all members of audit committees for Queensland state government entities must be independent of management and not an employee of the entity or another Queensland state government entity
coordinates with the Department of the Premier and Cabinet to actively promote the use of its Queensland Register of Nominees to prospective audit committee candidates, and to entities looking for new members
supports regional audit committees with clear guidance about how they can source suitable candidates and use technology to attract or connect with nominees
supports audit committees and entities to access appropriate training and guidance materials
provides improved guidance to audit committees on how to effectively assess and improve their performance practices.
Treasury’s responseTreasury supported a combination of internal and external members and supported all other recommendations.
To increase support and guidance, Treasury undertook work to consult and improve the Audit Committee Guidelines.
Queensland Government response to COVID-19 (whole of government)
Report No 3 2020–21, tabled 22 September 2020
Recommendations That Treasury contributes to a whole-of-government report that provides the first phase of the audit program examining Queensland Government’s response to COVID-19, and its measures and their costs.
Treasury’s responseTreasury played a critical role in advising the Queensland Government on the uptake and impact of each COVID-19 measure. Monitoring and governance of the government's response will be maintained, with continued advice to be provided to the Queensland Government on its progress. Treasury is working with agencies to monitor the actual cost of these initiatives.
Awarding of sports grants (whole of government)
Report No 6 2020–21, tabled 29 September 2020
RecommendationThat Treasury updates the Financial Accountability Handbook to provide clarity on the role of a minister in the selection and approval of grant recipients.
Treasury’s responseAs part of the work to update the handbook, practical guidance will be included on the provision of advice and recording of decisions.
State Entities 2020 (whole of government)
Report No 13 2020–21, tabled 11 February 2021
RecommendationThat all entities continue to ensure financial statements are reliable, acknowledging that a rapid response to COVID-19 can bring risk and that strong information systems are critical.
Financial statements/Appendices
Queensland Treasury Annual Report 2020–21108
The report encouraged relevant ministers and central agencies to explore opportunities for releasing the audited financial statements of public sector entities in a more timely way.
Treasury’s responseTreasury communicated to Chief Finance Officers encouraging them to table their departmental annual reports at the earliest opportunity rather than waiting for the legislative deadline of 30 September.
State Finances 2020 (whole of government)
Report No 15 2020–21, tabled 18 March 2021
RecommendationsThat Treasury:
amends the Financial Accountability Act 2009 to include a statutory timeframe for the annual certification and tabling in Parliament of the consolidated Queensland Government financial statements
certifies the financial statements prior to 31 October, in an election year, to allow for tabling prior to the state election
amends the Queensland Future Fund Act 2020 to include a requirement for financial statements to be prepared, audited, and made publicly available for each fund created.
Treasury’s responseThe preparation of the Report on State Finances is dependent on audited agency financial statements, which are only finalised by 31 August.
Treasury works to ensure that, in a non-election year, statements are certified by 31 October. In an election year, Treasury works with the Queensland Audit Office to ensure statements are finalised as soon as possible.
Treasury will disclose the Queensland Future Fund as per the Act as well as strategic asset allocation in the Queensland Treasury Annual Report.
Publications Treasury produces a range of publications, guidelines, and other useful resources about:
each year’s Queensland Budget cycle
financial and economic policygovernment-owned corporationseconomic, statistical and
demographic researchinfrastructure projectsstate revenue, including land tax,
payroll tax and dutieshome owner and builder grantsadvice on paying infringement
notices and fines.
Many of these are available through treasury.qld.gov.au or by contacting us at communications @treasury.qld.gov.au.
Government bodies A report from the Office of Best Practice Regulation on implementation of Regulatory Impact Analysis by agencies and exemptions granted by Cabinet for the period 2 June 2021 to 30 June 2021 is available at treasury.qld.gov.au.
Appendices
109Appendices/Glossary
Glossary
CFERCOVID-19 Fiscal and Economic Review, a statement of the government’s plans for state finances and the economy published in September 2020.
Code of ConductThe Code of Conduct for the Queensland public service guides the consistent standards of conduct for all public sector employees and demonstrates the government’s commitment to integrity and accountability, reflecting the ethics principles and values prescribed in the Public Sector Ethics Act 1994.
Duties/dutyA state tax on certain transactions including transfer of property (transfer duty), vehicle registration, insurance contracts and other acquisitions.
Financial Provisioning FundThe Financial Provisioning Fund was established under the Mineral and Energy Resources (Financial Provisioning) Act 2018 to provide a source of pooled funding to meet approved expenditure for environmental remediation and rehabilitation of resource sites, legacy abandoned mines, rehabilitation research and Financial Provisioning Scheme administration.
Financial Provisioning SchemeA scheme under the Mineral and Energy Resources (Financial Provisioning) Act 2008 to manage the state’s financial risks from resource sector environmental authority holders failing to meet their environmental and rehabilitation obligations under the Environmental Protection Act 1994. The scheme is managed by the Scheme Manager, a statutory officer appointed by the Governor in Council.
FTEFull-time equivalent and refers to the number of employment hours considered full-time.
GOCGovernment-owned corporation
GSTGoods and services tax
Land taxState tax on freehold land, assessed on the taxable value of an owner’s total land holdings. In Queensland, landowners are entitled to an exemption from land tax for the land they use as their home.
MOHRIMinimum obligatory human resource information used to inform the Queensland public sector workforce profile.
MYFERMid-Year Fiscal and Economic Review
Nominal DefendantA statutory body that compensates people injured by unidentified and uninsured vehicles.
Payroll taxState tax paid if an employer, or group of employers, pays more than $1.3 million in annual Australian taxable wages.
Project MaroonProject Maroon was the securing of the Virgin Australia Headquarters and a range of other benefits in Queensland.
QAOQueensland Audit Office
QICQueensland Investment Corporation
QGSOQueensland Government Statistician’s Office
Royalty revenueRoyalties are payments to the owners of a resource for the right to sell, dispose of or use that resource. In the context of Treasury’s revenue management service, these resources are usually from petroleum, coal and other mining activities.
Savings and Debt PlanThe Queensland Government’s plan to support economic recovery from COVID-19 with a target of $3 billion in savings over 4 years.
State Penalties Enforcement Registry (SPER)Part of the Office of State Revenue, SPER collects and enforces unpaid infringement notice fines, court-ordered monetary fines and offender recovery orders issued in Queensland.
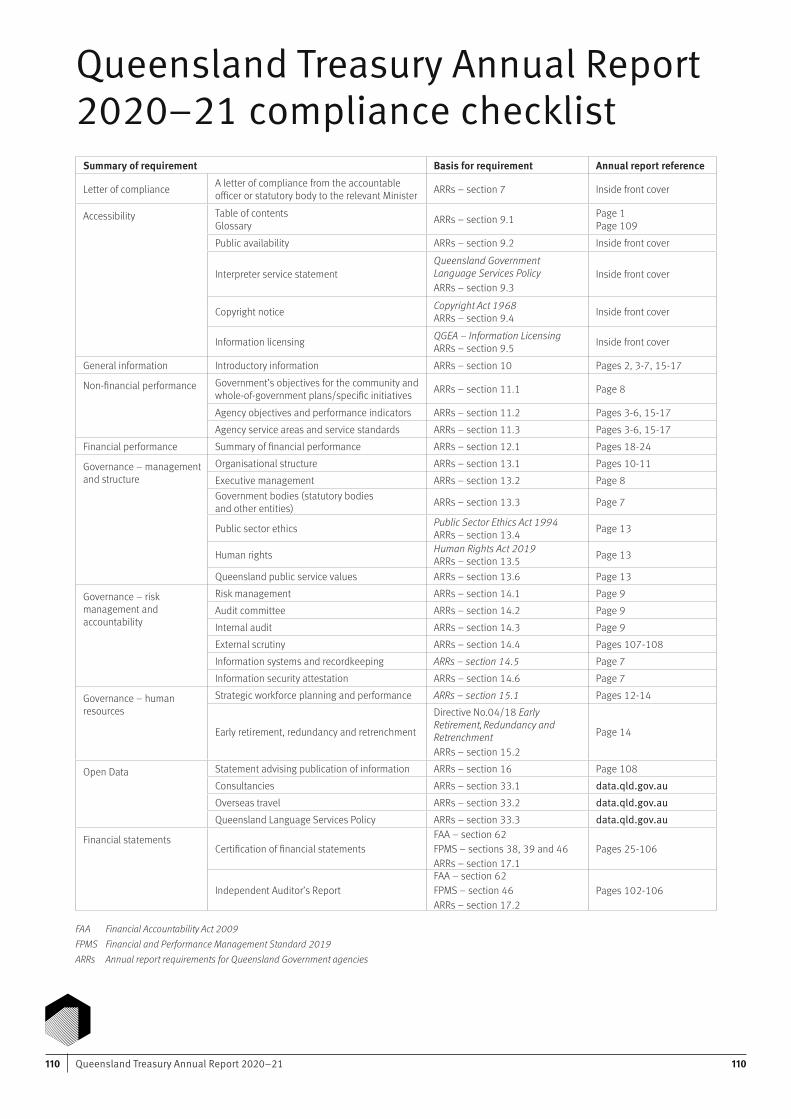
Queensland Treasury Annual Report 2020–21110 110
Queensland Treasury Annual Report 2020–21 compliance checklist
Summary of requirement Basis for requirement Annual report reference
Letter of compliance A letter of compliance from the accountable officer or statutory body to the relevant Minister ARRs – section 7 Inside front cover
Accessibility Table of contents Glossary ARRs – section 9.1 Page 1
Page 109Public availability ARRs – section 9.2 Inside front cover
Interpreter service statementQueensland Government Language Services PolicyARRs – section 9.3
Inside front cover
Copyright notice Copyright Act 1968 ARRs – section 9.4 Inside front cover
Information licensing QGEA – Information Licensing ARRs – section 9.5 Inside front cover
General information Introductory information ARRs – section 10 Pages 2, 3-7, 15-17
Non-financial performance Government’s objectives for the community and whole-of-government plans/specific initiatives ARRs – section 11.1 Page 8
Agency objectives and performance indicators ARRs – section 11.2 Pages 3-6, 15-17Agency service areas and service standards ARRs – section 11.3 Pages 3-6, 15-17
Financial performance Summary of financial performance ARRs – section 12.1 Pages 18-24
Governance – management and structure
Organisational structure ARRs – section 13.1 Pages 10-11Executive management ARRs – section 13.2 Page 8Government bodies (statutory bodies and other entities) ARRs – section 13.3 Page 7
Public sector ethics Public Sector Ethics Act 1994 ARRs – section 13.4 Page 13
Human rights Human Rights Act 2019 ARRs – section 13.5 Page 13
Queensland public service values ARRs – section 13.6 Page 13
Governance – risk management and accountability
Risk management ARRs – section 14.1 Page 9Audit committee ARRs – section 14.2 Page 9Internal audit ARRs – section 14.3 Page 9External scrutiny ARRs – section 14.4 Pages 107-108Information systems and recordkeeping ARRs – section 14.5 Page 7Information security attestation ARRs – section 14.6 Page 7
Governance – human resources
Strategic workforce planning and performance ARRs – section 15.1 Pages 12-14
Early retirement, redundancy and retrenchment
Directive No.04/18 Early Retirement, Redundancy and Retrenchment ARRs – section 15.2
Page 14
Open Data Statement advising publication of information ARRs – section 16 Page 108Consultancies ARRs – section 33.1 data.qld.gov.auOverseas travel ARRs – section 33.2 data.qld.gov.auQueensland Language Services Policy ARRs – section 33.3 data.qld.gov.au
Financial statementsCertification of financial statements
FAA – section 62FPMS – sections 38, 39 and 46ARRs – section 17.1
Pages 25-106
Independent Auditor’s ReportFAA – section 62FPMS – section 46ARRs – section 17.2
Pages 102-106
FAA Financial Accountability Act 2009 FPMS Financial and Performance Management Standard 2019ARRs Annual report requirements for Queensland Government agencies