Embed Size (px)
Citation preview
2009
ANNUAL REPORTPRESENTED TO HIS MAJESTY THE KING


ANNUAL REPORT
PRESENTED TO HIS MAJESTY THE KING
2009


! GOVERNOR
Mr Abdellatif JOUAHRI
! DIRECTOR GENERAL
Mr Abdellatif FAOUZI
! GOVERNMENT REPRESENTATIVE
Mr Abdeltif LOUDYI
! BANK BOARD
The Governor
The Director General
Mr Abdellatif BELMADANI
Mr Mohammed BENAMOUR
Mrs Meriem BENSALEH CHAQROUN
Mr Zouhair CHORFI
Mr Bassim JAI-HOKIMI
Mr Abdelaziz MEZIANE BELFKIH
Mr Mustapha MOUSSAOUI


R E P O R TON THE FINANCIAL YEAR 2009
PRESENTED TO HIS MAJESTY THE KINGBY MR ABDELLATIF JOUAHRI
GOVERNOR OF BANK AL-MAGHRIB
Your Majesty,
In application of Article 57 of Law N° 76-03 on the Statutes of Bank Al-Maghrib promulgated by Royal
Decree N° 1-05-38 of Shawal 20, 1426 (November 23, 2005), I have the honor to present to Your Majesty
the report of the year 2009, the fifty-first financial year of the bank of issue.


SUMMARY
INTRODUCTION ......................................................................................................................................................3
PART 1: ECONOMIC, MONETARY AND FINANCIAL SITUATION 1.1 International environment ..........................................................................................................................13
1.2 National output ..........................................................................................................................................31
1.3 Labor market ...............................................................................................................................................44
1.4 Demand .......................................................................................................................................................50
1.5 Economic and financial flows ......................................................................................................................54
1.6 Inflation .......................................................................................................................................................57
1.7 External commercial and financial relations ...............................................................................................68
1.8 Public finance ..............................................................................................................................................79
1.9 Monetary policy ...........................................................................................................................................91
1.10 Money, loans and liquid investments ......................................................................................................104
1.11 The Stock market, Private dept and Asset management ..........................................................................126
PART 2: BANK ACTIVITIES2.1 Governance ..............................................................................................................................................141
2.2 Bank missions ...........................................................................................................................................161
2.3 Openness and outreach ............................................................................................................................180
PART 3: FINANCIAL STATEMENTS OF BANK AL-MAGHRIB3.1 Bank Al-Maghrib balance sheet .................................................................................................................193
3.2 Profit and loss statement ..........................................................................................................................196
3.3 Legal framework and accounting principles ..............................................................................................201
3.4 Information on the balance sheet items ...................................................................................................205
3.5 Statutory audit report ................................................................................................................................209
3.6 Approval by the Bank Board ......................................................................................................................211
APPENDICES ...........................................................................................................................................................212
TABLE OF CONTENTS .......................................................................................................................................272


Your Majesty,
The year 2009 was marked by the most severe global recession since the Second World War (WWII) with the
fall in economic activity, started in late 2008, continuing during the first half of 2009. Given the scale of the
downturn and the enduring risk of the collapse of the financial system, national authorities, particularly in
the developed countries, stepped up recovery measures and diversified crisis management tools. In addition
to reducing rates or keeping them at very low levels, central banks heavily used unconventional measures
of quantitative easing, while governments put in place large-scale plans to support the economy, financial
institutions and markets. G-20 leaders, in turn, launched a series of actions primarily aimed to stabilize the
financial system, stimulate domestic demand, help emerging and developing countries affected by the crisis and
-in the longer term- strengthen the international financial architecture. Also, the International Monetary Fund
(IMF) was provided with sufficient resources and with a larger mandate to prevent and handle financial crises.
As a result of the economic policy measures, conditions in financial markets started to gradually improve as from
the second quarter. However, credit conditions in the developed countries remained very tight, especially for
investment and consumption.
Against this background, unemployment increased from one year to another in the major advanced economies,
while the significant spare capacity and the declining commodity prices caused inflation to fall markedly.
Moreover, the massive amounts of money that governments pumped into the economy, bringing fiscal deficits
and sovereign-debt ratios to unprecedented levels, led to higher risk premiums, fueled tensions on financial
markets and increased uncertainties about the sustainability of economic recovery in many advanced countries,
particularly in Europe.
The global economy started to recover gradually in the second half of the year, mostly driven by the momentum in
the emerging countries. For the full year, global gross domestic product (GDP) fell by 0.6 percent, with a contraction
of 3.2 percent in advanced economies and a slowdown from 6.1 percent to 2.4 percent in emerging countries.
In Morocco, nonagricultural GDP growth went down from 1.4 percent in the fourth quarter of 2008 to a low
BANK AL-MAGHRIB - ANNUAL REPORT - 2009
3

of 0.6 percent in the first quarter of 2009, and gradually increased to 2.6 percent in the third quarter 2009. For
the whole year 2009, it grew by a mere 1.4 percent, down from 4.2 percent in 2008, therefore reflecting the
increased alignment of the national economy with the business cycle in the main partner countries. This trend is
attributable to the sharp contraction in external demand for certain industries, particularly from the euro area,
and the slowdown in tourism and transport sector. Also, the decline in current transfers and foreign investment
flows affected the dynamics of private consumption and investment.
These effects were, however, mitigated by the resilience of domestic demand and the normal functioning of
credit markets, together with the prevailing climate of confidence and the measures taken by public authorities,
particularly under the Strategic Vigilance Committee. At the same time, the increase by almost 30.6 percent
in the agricultural value added kept overall growth at 4.9 percent. On the labor market, unemployment rate
again declined to 9.1 percent, from 9.6 percent in 2008, covering a fall in urban areas and stability in rural areas
despite the rebound in agricultural activity.
Concerning the balance of payments, the moderating effect of tourism receipts and remittances from Moroccans
living abroad did not significantly reduce the current account deficit, notwithstanding the marked reduction
in trade deficit. The negative balance of trade represented 20.8 percent of GDP instead of 24.7 percent in
2008, while the surpluses generated by travel receipts and current transfers fell 11.7 percent and 13.6 percent,
respectively. Given these developments, the current account deficit shrank to 5 percent of GDP, from 5.2 percent
in 2008 and six years of surplus. Mostly because of declining foreign direct investment, the financing of current
account transactions resulted in an increase of nearly 18 billion dirhams in commercial loans and a further
decline in foreign exchange reserves that only cover about seven months of imports of goods and services.
Although the current account position over the last two years does not impact external sustainability, it highlights
the persistence of certain structural weaknesses. Without fundamental changes, the significant demand
for imports, coupled with limited exports, would exacerbate tensions on the foreign exchange reserves or
increase dependence of the national economy on current transfers and external financing, subject to changing
international economic and financial conditions.
Fiscal policy in 2009 was characterized by measures to support growth that were focused on boosting
BANK AL-MAGHRIB - ANNUAL REPORT - 2009
4

investment and furthering tax reforms. Combined with the impact of the slowdown in nonagricultural activity
on tax revenues, these measures resulted in a budget deficit of 2.2 percent of GDP and sizable deceleration in
the downward movement of the debt-to-GDP ratio that stabilized around 47 percent. The slight widening of the
deficit, however, did not undermine fiscal sustainability over the medium term, despite an unfavorable economic
situation and the limited effects of efforts to broaden the tax base and improve tax collection.
The evolution of inflation, measured by the new consumer price index, was marked by the considerable easing
in external pressures due to the decline of commodity prices and consumer prices, as well as by the appreciable
decline in demand pressures. Headline inflation indeed fell to 1 percent, from 3.7 percent a year earlier.
Meanwhile, core inflation decreased from 4.5 percent to 0.7 percent, hitting a record low in the last twenty
years.
In terms of monetary policy decisions, the Bank Board, at its first meeting in 2009, cut the key rate by 25 basis
points to 3.25 percent, amid diminishing risks to price stability over the medium term. In its analysis, the Board
took into consideration the need to support a soft landing for the economy in 2009, mainly following the sharp
increases in some segments of the asset and credit markets which were out of line with the fundamentals.
As for liquidity management, the Board reduced the required reserve ratio three times, eventually bringing it
down to 8 percent, which helped banks to continue providing sufficient financing to the economy. Bank Al-
Maghrib also supplied banks, on the money market, with the required liquidity and mobilized all monetary policy
instruments available to ensure proper refinancing.
In a context of normal functioning of the various markets, monetary and financial developments were
characterized by less rapid growth in money and credit, and downward adjustment in asset prices which fell
back to levels consistent with the fundamentals of the economy. Growth in money supply (M3) again slowed in
2009, falling to 4.6 percent from 10.8 percent in 2008 and an average of 13.1 percent over the last five years,
thereby reducing the monetary surplus to almost nil at year end. The deceleration in the rate of money creation
in 2009 is more attributable to the decline in the growth rate of bank credit, down from 22.9 percent to 9.4
percent, than to the contraction of foreign assets. Prices for major assets trended downward, as stock market
indexes continued to decline and residential property prices went down after stagnating in 2008.
BANK AL-MAGHRIB - ANNUAL REPORT - 2009
5

Bank Al-Maghrib in 2009 continued deepening the analytical framework of monetary policy. The actions it carried
out in this direction particularly focused on the forecasting and modeling mechanisms, the range of indicators
relating to real and financial sectors, and on tools for assessing external shocks to which the national economy
is vulnerable. They also involved the analysis of transmission channels and the enhancement of transparency
through the deepening of the information made available to the public.
Indicators of the banking sector -which has shown great resilience- continued their upward trend in 2009.
Banks’ profitability was not impacted by the fact that credit gradually regained a pace of increase in harmony
with economic growth. Moreover, the effect of slowing deposits on banks’ lending capacity was largely offset by
the rise in Central Bank’s liquidity injections and banks’ increasing bond issuance. In this context, nonperforming
loans fell again and represented a mere 5.5 percent of total loans disbursed, and 1.5 percent net of provisions.
This trend is attributable not only to balance sheet consolidation but also to the lower cost of risk which recorded
its lowest levels during the past three years. Similarly, the solvency of banks strengthened after the Central
Bank raised the minimum capital adequacy ratio from 8 percent to 10 percent at end 2007. The average capital
adequacy ratio (according to the Basel II standardized approach) and core capital thus increased to 11.7 percent
and to 8.8 percent, respectively, at end 2009.
The major banks, supported by sound fundamentals, strengthened their position in the Maghreb and Africa, areas
with high growth potential. Bank Al-Maghrib has closely monitored this policy which increasingly contributes to
the performance of these banks.
Meanwhile, the Central Bank continued the actions designed to harmonize the national banking legislation
with the best international standards, through the transposition of Basel II advanced approaches and the
implementation of minimum requirements for stress testing. The regulatory framework governing microcredit
associations was enhanced by enacting rules relating to governance and nonperforming loans’ classification and
provisioning.
The progress made in financial reporting materialized in the coming into operation of the credit bureau,
enabling banks and finance companies to improve credit risk assessment by incorporating more data on the
creditworthiness of their customers.
BANK AL-MAGHRIB - ANNUAL REPORT - 2009
6

Concerning the financial inclusion strategy, the process of extending banking services significantly improved
in 2009, and the 50 percent target by end 2010 -including Barid Al-Maghrib network- now seems achievable.
Alongside this development, a range of measures were implemented, mainly aiming at building sound and
balanced relationships between banks and their customers. Indeed, in 2009 the banking mediation system
was put in place for the amicable resolution of disputes. Also, banks were asked to ensure the transparency
of contractual conditions. In 2010 a new directive defining free basic banking services will be issued, an index
of banking service prices will be constructed, and an annual statement of all commissions charged will be
sent to customers. These measures will be accompanied by financial education programs and the creation of
conditions favorable for the development of innovative products based on new information and communication
technologies.
In the area of payment systems, the process of dematerializing securities exchange was completed with the
rollout of the paperless exchange of debit advices. Also, an agreement was signed governing the oversight of
payment systems.
The year 2009 was marked by the celebration of the fiftieth anniversary of Bank Al-Maghrib. Since its inception,
the Bank has implemented policies geared toward sustaining the economic development of our country by
ensuring price stability and adequate financing of the economy, while maintaining macroeconomic equilibrium
and contributing to the development of markets and the strengthening of banking system fundamentals. In the
first decades of its history, the dirham was established as the national currency, Moroccan bank staff was hired,
and the legal framework governing the banking activity and strengthening the supervisory powers of the central
bank was adopted. Subsequently, the Bank played a key role in restoring economic balances in the eighties, and
in their consolidation on a sustainable basis in the nineties. This dynamic has gained new momentum as from
2006, with the major overhaul of the Bank’s statutes that defined its mission, made price stability the primary
objective and gave the Bank considerable independence in monetary policy. Moreover, the new statutes have
strengthened the Bank’s supervisory powers and given it clear mandate to oversee the systems and means
of payment and ensure their safety. Building on strategic planning, which covered until the end of 2009 two
three-year plans, significant progress was made toward modernizing the Bank’s organization and management
methods. Thanks to these reforms that helped bring the operational and management processes in line with the
best international practices, the Bank achieved ISO 9001 certification for all its activities.
BANK AL-MAGHRIB - ANNUAL REPORT - 2009
7

Bank Al-Maghrib is determined to continue contributing to the creation and preservation of conditions conducive
to greater integration of the Moroccan economy in the global environment, and to respond to the post-crisis
challenges. To this end, the Bank has adopted a medium and long-term vision that takes into account the lessons
learned from the international crisis. It will indeed continue adjusting the strategic, analytical and operational
frameworks of monetary policy and strengthening the macro-prudential approach to banking supervision, while
developing mechanisms of coordination among regulators. Bank Al-Maghrib will pursue efforts to improve the
attractiveness of the Casablanca financial center in order to develop it into a regional financial hub, thereby
enhancing the prospects of transforming our country into a magnet for capital flows at the regional level.
Considering the scale and scope of the global crisis and uncertainty about its outcome, there is a need to
strengthen the resilience of the national economy to external shocks and adapt to the changing international
environment in order to seize opportunities. It is important in this regard to speed up measures to continuously
improve the education system and the overall competitiveness of productive sectors. It is also necessary to
strengthen the governance of public policies and business climate, while maintaining macroeconomic stability
and enhancing the mechanisms put in place to overcome social shortages.
Moreover, it is essential to quickly address, as part of a comprehensive framework, the structural weaknesses
exacerbated by the crisis. In particular, it is imperative to redress the current account imbalance by reducing the
concentration of exports on low-technology products and on markets with limited growth potential.
In terms of public finance, it is important to continue enhancing fiscal sustainability over the medium term. There
is a need to accelerate the reform of the subsidization system and implement measures to rationalize operating
expenditures in order to generate surpluses that would contribute to reducing deficiencies in the social area. It
is also important to strengthen the dynamics of resources on a sustainable basis through the inclusion of the
informal sector. At the same time, the process of financial deepening should be enhanced by developing long-
term saving and extending access to financial services to the low-income population.
The accelerated implementation of sectoral roadmaps and the launch of new programs, particularly in energy
and mining, pose some challenges relating to the governance and efficiency of economic policies. In this regard,
particular attention should be paid to the overall coherence of these approaches, while ensuring their synergy
BANK AL-MAGHRIB - ANNUAL REPORT - 2009
8

and optimizing the allocation of financial resources which should be consistent with the overall macroeconomic
constraints, including those of the balance of payments.
Significant progress has been achieved in human development during the last ten years. Access to basic social
services has improved markedly, as evidenced by the electrification of rural areas that reached nearly 84 percent
in 2009, after having covered all urban areas. During the same period, access to drinking water rose from 14
percent to 90 percent. In the education sector, the net enrollment rate of children aged 6 to 11 years reached
96 percent in 2009. In order to place Morocco in a strong position to meet the challenge of accelerating growth
in a context of greater external openness, while ensuring the inclusion of all, it is important to capitalize on
the progress made and step up efforts in the field of education. The success of the government’s Education
Emergency Program should indeed reduce educational wastage, improve access to preschool and contribute to
increasing literacy rates, particularly in rural areas.
The granting of the advanced status to Morocco by the European Union is a major achievement for a better
integration of Morocco in the regional environment. In this connection, the roadmap put in place to harmonize
Moroccan legislation and standards with those of the European Union will stimulate the integration of our
economy in the European market. Meanwhile, the overall performance of the national economy will certainly be
enhanced by the regionalization project, which is a major breakthrough in territorial governance. This project will
bring a new dynamic to institutional reform, therefore allowing our country to optimize the contribution of all
regions within a balanced growth model that takes into account the imperatives of sustainable development and
territorial solidarity. Greater participation of the population in the development process will maximize synergies
between the different actions of government departments across the territorial units, the aim being to achieve
faster and more balanced economic and social progress.
Rabat, June 2010
Abdellatif JOUAHRI
BANK AL-MAGHRIB - ANNUAL REPORT - 2009
9


PART 1
ECONOMIC, MONETARYAND FINANCIAL SITUATION


1.1 International environment
The economic crisis, which emerged in 2008, induced the sharpest recession ever recorded since WWII, with
a 0.6 percent contraction of GDP in 2009. In fact, economic activity slowed down significantly in advanced
countries, as GDP globally fell by 3.2 percent, while it dropped, in emerging economies, from 6.1 percent in
2008 to 2.4 percent. The year 2009 also witnessed an important contraction in capital flows and in world trade.
As for unemployment rate, it generally soared in advanced economies, while inflation slowed down markedly
to the extent that it recorded negative values in most industrialized countries, due to the weak demand and to
commodity prices’ decline.
To address the scale of the crisis, public authorities enhanced their economic policy measures with the aim of
standardizing financial conditions and boosting the economic activity. Central banks reduced their key rates
to historically low levels, while intensifying the use of unconventional measures, which vary from quantitative
easing, to massive liquidity injections, to giving guarantees or to resorting to the outright purchase of long-term
financial assets. Regarding fiscal policy, governments of advanced countries, and to a lesser extent, of emerging
ones, have multiplied their measures of supporting the financial system and the economic activity.
Nevertheless, the measures taken had a limited effect on the economic activity in 2009. In fact, the recovery
recorded in the second half of the year concerned particularly emerging and developing countries. As for
advanced economies, their GDP trend varied from a contraction slowdown to slight increases, mainly due to the
one-time impact of the end of massive destocking phase, as well as to the direct effect of some demand-boosting
measures. Regarding the financial system, the support measures proved more effective, as they contributed to
the improvement of money market functioning, the reduction of risk aversion, and to the progressive recovery
of stock markets. However, credit loans remained sluggish in main advanced economies, and new sources of
weakness emerged in the financial system at the end of the year due to the increase in sovereign debts and
therefore to the rising risk premiums for some industrialized countries.
In order to mitigate the effects of the crisis, international organizations, namely the IMF and the G-20, made
sustained efforts towards coordinating their support policies. Their goal was to prepare synchronized responses
BANK AL-MAGHRIB - ANNUAL REPORT - 2009
13

to the present crisis and to set up fundamental reforms that would minimize the odds as to the emergence of
such a crisis in the future.
Overall, except for the net decrease of imported inflation, which resulted from the drop of commodity prices
and consumer prices all over the world, the international environment in 2009 has definitely had a negative
impact on the national economy. This was particularly due to the increase of unemployment rate, the decrease
of revenues, and to the decline of the output capacity utilization rates in Morocco’s main partner countries.
1.1.1 Global economic trends in 2009
Further to the distinct slowdown observed in 2008, world GDP contracted by 0.6 percent, due to the substantial
slack of the economic conditions in advanced countries. In emerging countries, growth remained positive, at 2.4
percent, though declining.
Table 1.1.1: World GDP growth trend, in %
2007 2008 2009
World 5.2 3.0 -0.6
Advanced economies 2.8 0.5 -3.2
United States 2.1 0.4 -2.4
Euro area 2.8 0.6 -4.1
France 2.3 0.3 -2.2
Germany 2.5 1.2 -5.0
Japan 2.4 -1.2 -5.2
Emerging economies 8.3 6.1 2.4
China 13.0 9.6 8.7
India 9.4 7.3 5.7
Russia 8.1 5.6 -7.9
Brazil 6.1 5.1 -0.2 Source : IMF
BANK AL-MAGHRIB - ANNUAL REPORT - 2009
14
INTERNATIONAL ENVIRONMENT
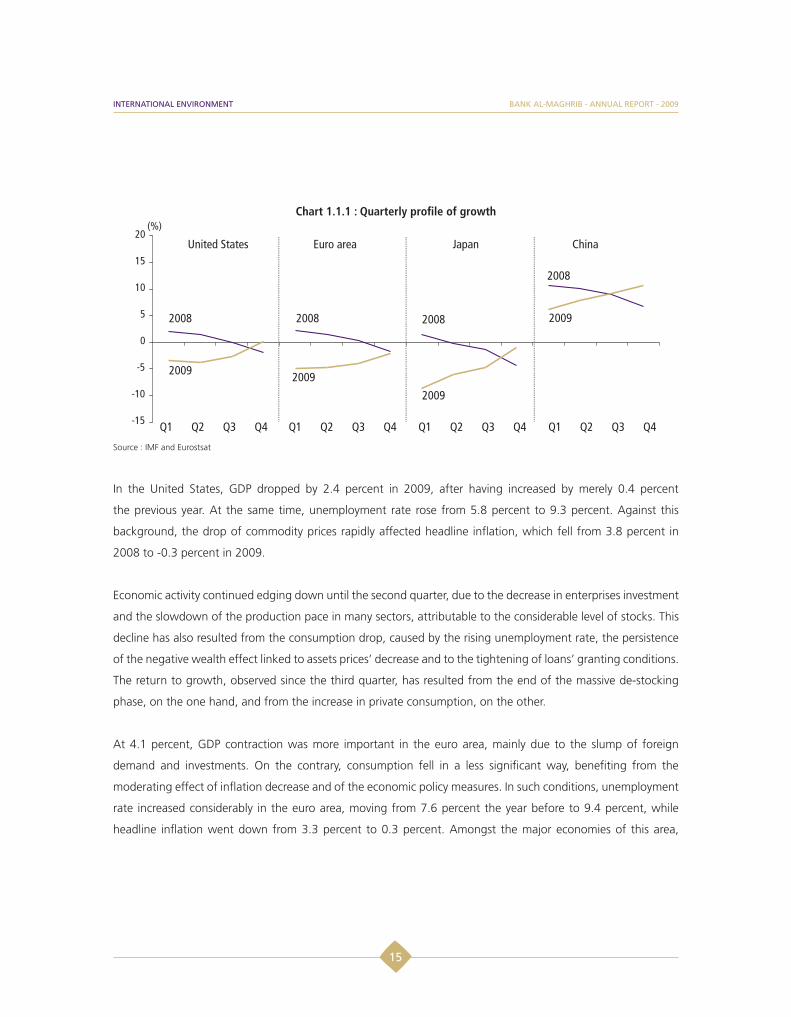
Chart 1.1.1 : Quarterly profile of growth
Source : IMF and Eurostsat
In the United States, GDP dropped by 2.4 percent in 2009, after having increased by merely 0.4 percent
the previous year. At the same time, unemployment rate rose from 5.8 percent to 9.3 percent. Against this
background, the drop of commodity prices rapidly affected headline inflation, which fell from 3.8 percent in
2008 to -0.3 percent in 2009.
Economic activity continued edging down until the second quarter, due to the decrease in enterprises investment
and the slowdown of the production pace in many sectors, attributable to the considerable level of stocks. This
decline has also resulted from the consumption drop, caused by the rising unemployment rate, the persistence
of the negative wealth effect linked to assets prices’ decrease and to the tightening of loans’ granting conditions.
The return to growth, observed since the third quarter, has resulted from the end of the massive de-stocking
phase, on the one hand, and from the increase in private consumption, on the other.
At 4.1 percent, GDP contraction was more important in the euro area, mainly due to the slump of foreign
demand and investments. On the contrary, consumption fell in a less significant way, benefiting from the
moderating effect of inflation decrease and of the economic policy measures. In such conditions, unemployment
rate increased considerably in the euro area, moving from 7.6 percent the year before to 9.4 percent, while
headline inflation went down from 3.3 percent to 0.3 percent. Amongst the major economies of this area,
BANK AL-MAGHRIB - ANNUAL REPORT - 2009
15
INTERNATIONAL ENVIRONMENT

Germany witnessed the highest degree of activity slowdown, as the GDP shrank by 5 percent in 2009, mainly
as a result of exports’ decrease. In France, the weak foreign demand also affected the economic activity, which
dropped by 2.2 percent. As for Spain, GDP recorded a 3.6 percent setback in conjunction with the continuing
degradation of real estate and tourism sectors. Economic activity decline in the euro area, year-on-year, mainly
reflects the trends observed in the first half of the year. However, many signs of recovery were observed during
the rest of the year, owing to the increase in foreign demand, and to a lesser extent, in domestic demand,
boosted by timely support measures.
In the United Kingdom, growth decreased by 4.9 percent, compared to the 0.5 percent rise recorded one
year before. In fact, household consumption continued to be affected by unemployment rate increase, by the
restricted access to bank loans, and by a negative wealth effect. Furthermore, the tightened credit conditions,
and the low output capacity utilization rate, have induced a crunch in enterprises’ investments.
Overall, in Morocco’s main partner countries (France, Germany, Italy, Spain, and the United Kingdom), GDP
shrank by 3 percent, after it rose at a limited rate of 0.6 percent in 2008. This evolution reflects the degree of
the shock faced by the national economy in 2009. Moreover, weighted unemployment rate of the main partner
countries reached, in 2009, its highest level ever recorded in the decade, thus contributing to breaking the
upward trend of Moroccan expatriates’ transfers.
Chart 1.1.2: Evolution of weighted GDP and weighted unemployment rate in main partner countries
Sources: Datastream, OECD, and BAM calculations
BANK AL-MAGHRIB - ANNUAL REPORT - 2009
16
INTERNATIONAL ENVIRONMENT

Chart 1.1.3 : Inflation trend in the world
Source: IMF
On the other hand, Japan recorded the most significant GDP decrease among main industrialized countries, as it
reached -5.2 percent compared to -1.2 percent in 2008. This decrease has mainly resulted from exports collapse
as well as from the slack in investment expenditures. The recession observed since the second quarter of 2008
continued until the third quarter of the year 2009. Subsequently, activity started recovering in the fourth quarter,
due to the improvement of foreign demand, mainly from the emerging countries of Asia.
In these countries, growth remained relatively rapid, despite its slowdown from 7.9 percent to 6.6 percent from
one year to the next, following the decrease in international trade flow. In China, growth stood at 8.7 percent
compared to 9.6 percent one year before, thus reflecting exports’ decrease as well as residential investments’
slowdown. In fact, consumer prices in China dropped by 0.7 percent after their 5.9 percent increase in 2008.
Similarly, growth in India fell from 7.3 percent to 5.7 percent in 2009, mainly due to exports’ decline.
As concerns emerging and developing countries, Latin America GDP decreased by 1.8 percent, compared to its
4.3 percent rise one year before, with a 0.2 drop in Brazil. In Russia, economic growth shrank by 7.9 percent,
after it rose by 5.6 percent in 2008, essentially due to the oil price decline. Likewise, in the emerging economies
of Europe, GDP fell by 3.7 percent, after it rose by 3 percent. As for Africa, growth slowed down considerably,
BANK AL-MAGHRIB - ANNUAL REPORT - 2009
17
INTERNATIONAL ENVIRONMENT

from 5.2 percent to 1.9 percent. In the Maghreb region, the pace of economic activity in Morocco decelerated
from 5.6 percent to 5.2 percent, while Tunisia and Algeria grew at 3 percent and 2 percent respectively, compared
to 4.6 percent and 2.4 percent one year before.
1.1.2 International trade and balance of payments
After its slight increase in 2008, fixed at 2.8 percent, the volume of world trade of goods and services shrank
by 10.7 percent, for the first time since 1982. This change has mainly resulted from the developed countries’
diminishing demand for imports, especially during the first half of the year, as well as from credit crunch, and
from the financing conditions of exports in most of these countries.
This decline in exchanges concurred with the narrowing of current accounts imbalances. In 2009, United States’
deficit reached 2.9 GDP points compared to 4.9 GDP points the year before, due to imports’ contraction. In
the euro area, the deficit reached 0.4 percent of GDP, while it stood at 0.8 percent last year. As for Japan, the
surplus fell from 3.2 percent of GDP in 2008 to 2.8 percent, affected by a more substantial decrease of exports.
Similarly, some countries of Asia witnessed a decline in their surplus, as a result of the dwindling performance of
exports, especially in China where the surplus stood at 5.8 percent of GDP compared to 9.4 percent in 2008. As
for the countries of the Middle East and North Africa, their surpluses shrank at a more rapid pace, and reached
1.8 percent of GDP compared to 15.5 percent in 2008, due to the downward adjustment of oil prices and to the
significant downturn of world demand.
BANK AL-MAGHRIB - ANNUAL REPORT - 2009
18
INTERNATIONAL ENVIRONMENT

Table 1.1.2 : Current account of the balance of payment per regions and countries of the world
(in % of GDP ) 2007 2008 2009
Advanced countries -0.9 -1.3 -0.4
United States -5.2 -4.9 -2.9
Euro area 0.3 -0.8 -0.4
Japan 4.8 3.2 2.8
United Kingdom -2.7 -1.5 -1.3
Emerging countries of Asia 7.0 5.7 4.1
China 11.0 9.4 5.8
India -1.0 -2.2 -2.2
Latin America 0.4 -0.6 -0.8
Brazil 0.1 -1.7 -1.3
Mexico -0.8 -1.5 -1.2
Countries of Central and Eastern Europe -7.9 -7.8 -3.1
Commonwealth of Independent States 4.2 4.9 2.9
Russia 5.9 6.2 3.6
Middle East and North Africa 15.7 15.5 1.8
Source : IMF
The flow of foreign direct investments was also impacted by the continuing pressures on world financial markets
and by the decline of the economic activity. According to the UNCTAD data, these flows stood at 1,040.3 billion
dollars in 2009 at the international level, down by 39 percent, compared to the 21 percent drop of 2008. On the
other hand, flows addressed to developed countries continued their slowdown, as flows bound for the United
States decreased by 57 percent, while those received by the European Union fell by 27.9 percent. Likewise, flows
destined to developing countries dropped by 34.7 percent.
1.1.3 Major economic policy measures
The joint measures taken by governments and central banks, particularly in advanced countries, have largely
contributed to the slight recovery of the international economic activity during the second half of the year 2009,
and to the improvement of many segments of the financial markets.
BANK AL-MAGHRIB - ANNUAL REPORT - 2009
19
INTERNATIONAL ENVIRONMENT
Euro area
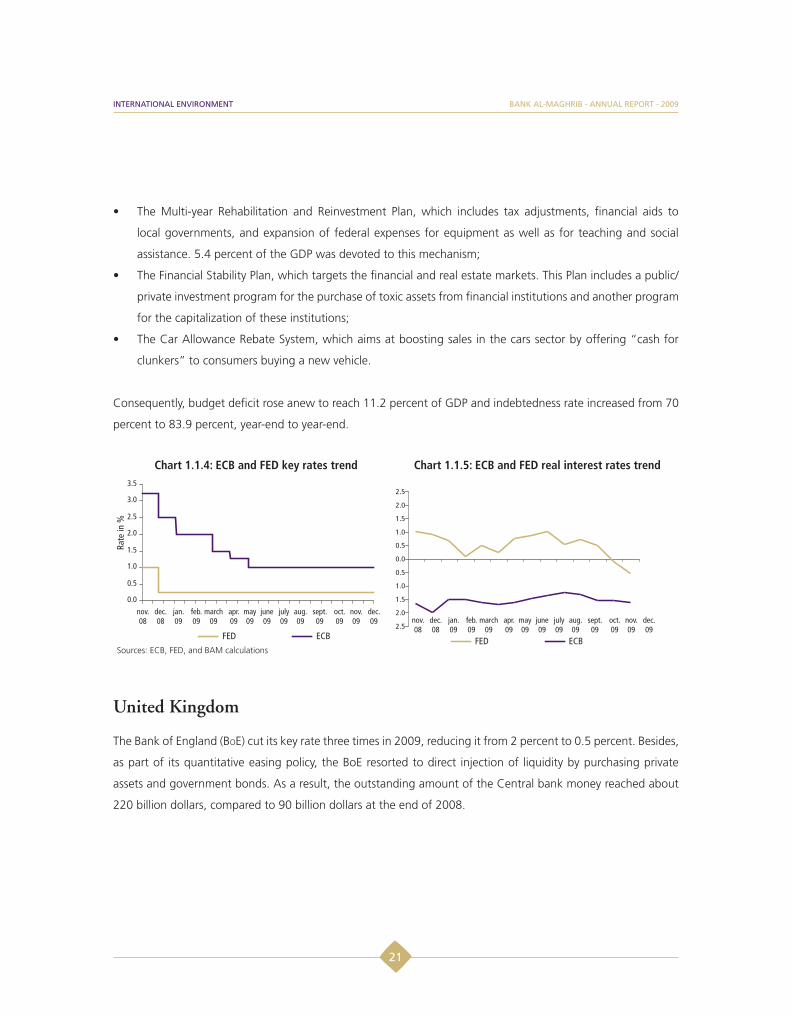
During the year, the European Central Bank (ECB) cut its basic key rate from 2.5 percent to 1 percent, and
reduced the deposit facility and marginal facility rates respectively from 3 percent and 2 percent to 0.25 percent
and 1.75 percent. With a view of easing the pressures weighing on the functioning of the money and loans
markets, the ECB resorted to massive capital injections in the interbank market. Also, in order to reduce the
systemic risk, it recapitalized the defaulting financial institutions, through purchasing or guaranteeing the toxic
assets in their portfolios, and covering the commitments of the financial sector.
Regarding fiscal policy, the measures taken within the framework of the European Economic Recovery Plan, and
which involved 1.5 percent of the EU GDP, were chiefly endeavored to strengthen households’ purchasing power;
namely through taxes reductions. In addition, the Plan aimed too at promoting investments and supporting
private enterprises, especially in the construction and automobile sectors. Some fiscal resources have also been
mobilized to support the labor market.
Public deficit rose to 4.4 percent of GDP in the whole euro area, and public debt increased by 8.9 percentage
points to reach 78.2 percent of GDP. As a result, the Economic and Financial Affairs Council (ECOFIN) decided
to review the recommendations as to the efforts to be made to consolidate public finances. It also extended the
deadline for bringing the budget deficit to less than 3 percent of GDP, and set the date at 2013 for France and
Spain and 2014 for Ireland.
United States
The Federal Reserve (FED) kept its key rate unchanged, between 0 and 0.25 percent, since the end of 2008.
It also adopted a policy whereby monetary conditions are to be eased through injecting liquidity at favorable
conditions, extending facilities to nonbanking institutions, and through acquiring long-term assets. These actions
led to widening the monetary base, which reached around 2,000 billion dollars, instead of 1,700 billion dollars
at the end of 2008 and 800 billion dollars, on average, in 2007.
In parallel, the American Government established a series of measures aiming at enhancing domestic demand
and the financial system. Amongst these measures are:
BANK AL-MAGHRIB - ANNUAL REPORT - 2009
20
INTERNATIONAL ENVIRONMENT
The Multi-year Rehabilitation and Reinvestment Plan, which includes tax adjustments, financial aids to
local governments, and expansion of federal expenses for equipment as well as for teaching and social
assistance. 5.4 percent of the GDP was devoted to this mechanism;
The Financial Stability Plan, which targets the financial and real estate markets. This Plan includes a public/
private investment program for the purchase of toxic assets from financial institutions and another program
for the capitalization of these institutions;
The Car Allowance Rebate System, which aims at boosting sales in the cars sector by offering “cash for
clunkers” to consumers buying a new vehicle.
Consequently, budget deficit rose anew to reach 11.2 percent of GDP and indebtedness rate increased from 70
percent to 83.9 percent, year-end to year-end.
Chart 1.1.4: ECB and FED key rates trend Chart 1.1.5: ECB and FED real interest rates trend
Sources: ECB, FED, and BAM calculations
United Kingdom
The Bank of England (BOE) cut its key rate three times in 2009, reducing it from 2 percent to 0.5 percent. Besides,
as part of its quantitative easing policy, the BoE resorted to direct injection of liquidity by purchasing private
assets and government bonds. As a result, the outstanding amount of the Central bank money reached about
220 billion dollars, compared to 90 billion dollars at the end of 2008.
BANK AL-MAGHRIB - ANNUAL REPORT - 2009
21
INTERNATIONAL ENVIRONMENT

On the other hand, the Government adopted measures with the aim of restoring financial stability and rebuilding
financial institutions’ lending capacity. The actions were set up around three axes:
Preserving banks’ solvency, by devising a plan against toxic assets deterioration;
Stimulating the securitization market and improving financial institutions’ access to wholesale market via an
asset-backed securities warranty plan;
Boosting the granting of facilities to households and enterprises, by setting up an assets’ purchase program,
which authorizes the BoE to buy quality assets from the private sector, especially corporate bonds and
commercial papers.
Japan
The Bank of Japan decided to keep its key rate unchanged at 0.1 percent in 2009. It also carried out different
quantitative easing operations, namely the unlimited granting of short-term loans to financial institutions as well
as the purchase of commercial papers and of long-term assets, both private and public.
In addition to the three fiscal expansion plans launched in 2008, whose envelope represents 4.8 percent of GDP,
a fourth plan was adopted in may 2009, aiming particularly at boosting household consumption of durable
goods. The State also engaged in capitalizing banks and granting them direct bailout loans. Added to the Plan
approved at the end of December, these measures led to raising the fiscal deficit from 3.5 percent of GDP in
2008 to 7.4 percent of GDP in 2009.
1.1.4 Financial and commodity markets
As a result of the significant deterioration of economic indicators during the fourth quarter of 2008, financial
markets’ conditions underwent intense pressures at the beginning of the year 2009. Later, a gradual recovery
was noted, as some countries maintained, and even strengthened, their support measures, and as the economic
outlook started improving. This recovery was particularly felt in the risk aversion decrease, the rebound in the
stock markets, and the improvement of short-term debt markets. Nonetheless, bank loans continued declining
in many economies all through the year. In addition, new pressures weighed on the financial stability, in
conjunction with the risks surrounding the solvency of some euro area countries.
BANK AL-MAGHRIB - ANNUAL REPORT - 2009
22
INTERNATIONAL ENVIRONMENT
Regarding commodity markets, the downward tendency of prices, which started at the fourth quarter of 2008,
continued during the first half of the year 2009, after which a general uptrend was observed. This trend was
driven by the improved economic outlook and the higher demand from emerging countries, as well as the dollar
depreciation and the recovery of hedge funds’ purchase. Yet, commodity prices remained, for the whole year,
largely below the record levels observed in 2008.
1.1.5 International financial markets
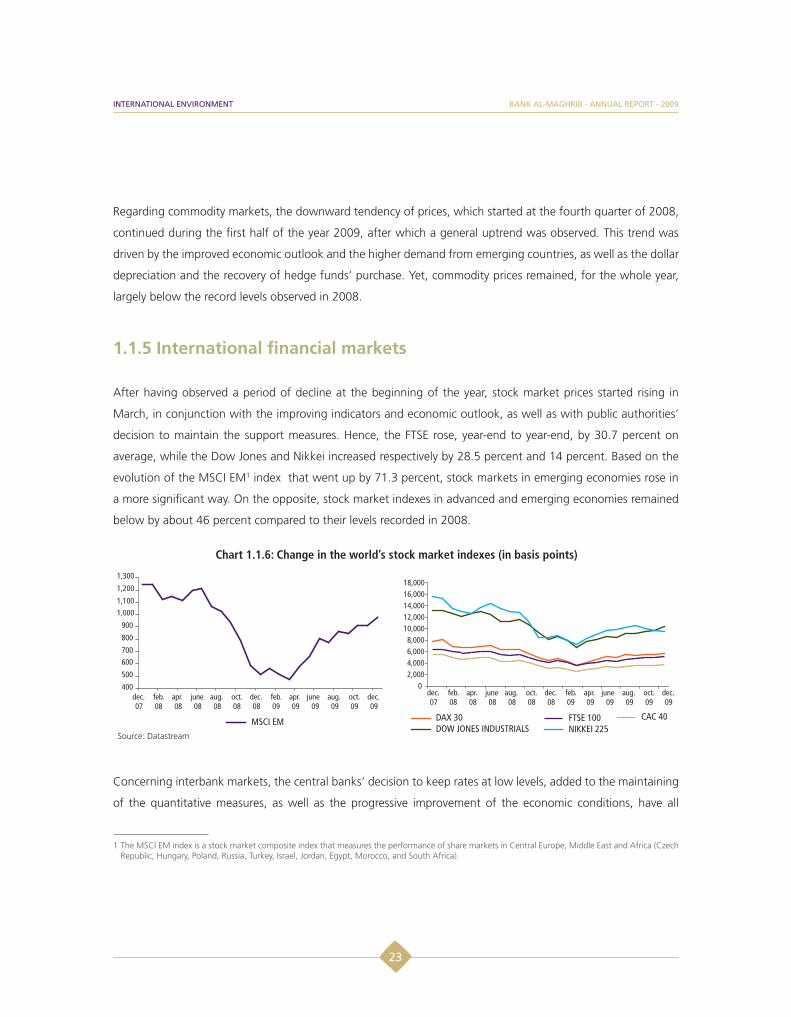
After having observed a period of decline at the beginning of the year, stock market prices started rising in
March, in conjunction with the improving indicators and economic outlook, as well as with public authorities’
decision to maintain the support measures. Hence, the FTSE rose, year-end to year-end, by 30.7 percent on
average, while the Dow Jones and Nikkei increased respectively by 28.5 percent and 14 percent. Based on the
evolution of the MSCI EM1 index that went up by 71.3 percent, stock markets in emerging economies rose in
a more significant way. On the opposite, stock market indexes in advanced and emerging economies remained
below by about 46 percent compared to their levels recorded in 2008.
Chart 1.1.6: Change in the world’s stock market indexes (in basis points)
Source: Datastream
Concerning interbank markets, the central banks’ decision to keep rates at low levels, added to the maintaining
of the quantitative measures, as well as the progressive improvement of the economic conditions, have all
1 The MSCI EM index is a stock market composite index that measures the performance of share markets in Central Europe, Middle East and Africa (Czech Republic, Hungary, Poland, Russia, Turkey, Israel, Jordan, Egypt, Morocco, and South Africa).
BANK AL-MAGHRIB - ANNUAL REPORT - 2009
23
INTERNATIONAL ENVIRONMENT

contributed to easing the pressures on loans’ granting conditions and reducing the OIS LIBOR1 spreads.
Consequently, this spread reached 9 basis points in the United States and 27 points in the euro area in December,
after it had reached 125 and 114 basis points respectively at the end of 2008. However, this spread remains
considerably above the level recorded before the emergence of the crisis in 2006, which equaled 7 basis points
in the United States and 3 basis points in the euro area.
Debt markets witnessed the same trend, as financing spreads diminished markedly, mainly as a result of short-
term government bond yields’ decrease, caused, in turn, by central banks’ decision to cut their key rates.
Chart 1.1.7: Change of the OIS-Libor and TED2 spreads (in basis points)
Source: Datastream
However, fears as to the deterioration of the fiscal balances in some advanced countries have emphasized the
pressures on the long-term financing conditions during the second half of the year. Public finance imbalances
were more perceptible in some countries of the euro area, as deficits rose up to 10 percent of GDP.
In such conditions, CDS premiums on sovereign debts recorded a sustainable increase as they reached, on
average, 157 basis points for Ireland and 116 points for Greece. The growing risks as to the states’ solvency
have also affected the evolution of long-term government bond yields, which rose considerably, therefore
contributing to pushing-up the costs necessary to finance public deficits.1 The OIS-LIBOR spread reflects the interest rate risk. It corresponds to the difference between the three-month interbank rate (LIBOR Eurodollar) and three-
month overnight indexed swaps rate (OIS).2 The TED spread is an indicator of credit risk and corresponds to the difference between interest rates of short-term assets issued by the US Treasury (Three
months) and of interbank loans at 90 days in US dollars.
BANK AL-MAGHRIB - ANNUAL REPORT - 2009
24
INTERNATIONAL ENVIRONMENT

Chart 1.1.8: Change of CDS premiums for 5-year sovereign debts (in basis points) and of public debt in some countries of the euro area
Source: Datastream
In the lending market, loans to the private sector observed a low increase despite the net easing of monetary
conditions. In fact, it is only in October that a slight recovery was recorded in the lending pace, which continued
decreasing since 2008, due to the tightening of lending conditions as well as to the weak demand. In the United
States, loans’ growth rate stood at no more than 1.2 percent, on average, compared to 8.5 percent in the
preceding year, while it stood at 1.4 percent in the euro area, compared to 9.3 percent. In addition, year-end to
year-end loans declined by 0.1 percent in the euro area and by 3 percent in the United States.
Chart 1.1.9: Credit trend in the United States and in the euro area, year-on-year (in %)
Source: Datastream
BANK AL-MAGHRIB - ANNUAL REPORT - 2009
25
INTERNATIONAL ENVIRONMENT
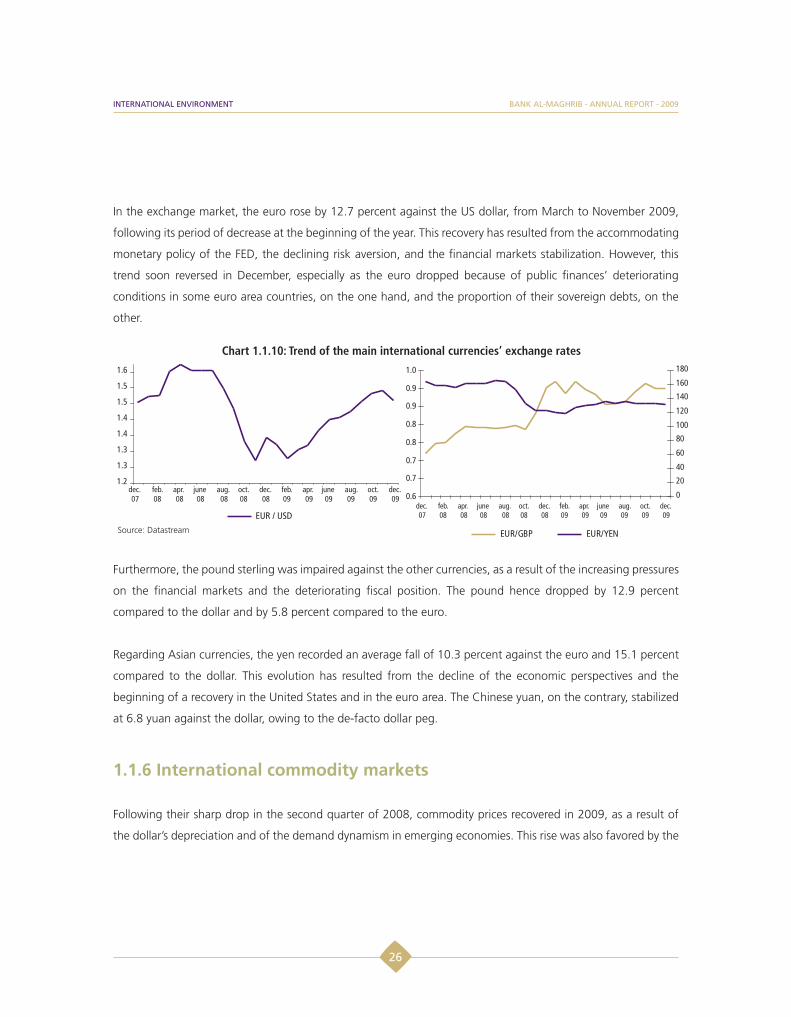
In the exchange market, the euro rose by 12.7 percent against the US dollar, from March to November 2009,
following its period of decrease at the beginning of the year. This recovery has resulted from the accommodating
monetary policy of the FED, the declining risk aversion, and the financial markets stabilization. However, this
trend soon reversed in December, especially as the euro dropped because of public finances’ deteriorating
conditions in some euro area countries, on the one hand, and the proportion of their sovereign debts, on the
other.
Chart 1.1.10: Trend of the main international currencies’ exchange rates
Source: Datastream
Furthermore, the pound sterling was impaired against the other currencies, as a result of the increasing pressures
on the financial markets and the deteriorating fiscal position. The pound hence dropped by 12.9 percent
compared to the dollar and by 5.8 percent compared to the euro.
Regarding Asian currencies, the yen recorded an average fall of 10.3 percent against the euro and 15.1 percent
compared to the dollar. This evolution has resulted from the decline of the economic perspectives and the
beginning of a recovery in the United States and in the euro area. The Chinese yuan, on the contrary, stabilized
at 6.8 yuan against the dollar, owing to the de-facto dollar peg.
1.1.6 International commodity markets
Following their sharp drop in the second quarter of 2008, commodity prices recovered in 2009, as a result of
the dollar’s depreciation and of the demand dynamism in emerging economies. This rise was also favored by the
BANK AL-MAGHRIB - ANNUAL REPORT - 2009
26
INTERNATIONAL ENVIRONMENT

upturn of purchases by hedge funds. Therefore, year-end to year-end average oil prices reached 75 dollars per
barrel, up by 81.1 percent. In addition, food products’ prices rose by 23.8 percent, mainly due to the 87 percent
surge of sugar prices, as a result of two successive bad harvests in India and Brazil, the main world producers.
Similarly, base metals prices grew by 42.8 percent, owing to China’s massive purchase operations - with the aim
of replenishing stocks- and to the decrease of production by the world’s main suppliers.
However, commodity prices remained, on average, below those observed in 2008. Energy and nonenergy
products’ prices fell by 37.3 percent and 21.6 percent respectively, compared to 2008, while agricultural
products’ prices declined, in one year, by 17.1 percent, mainly because of the drop in cereals’ prices. At the
same time, base metals’ prices dropped by 27.7 percent, because of the zinc, steel, copper and iron prices’ drop,
which varies between 11.7 percent and 28.2 percent.
Chart 1.1.11: Change of energy and nonenergy commodity price indexes
Source: World Bank
Regarding phosphates and derivatives, their prices decelerated substantially in 2009, after their strong rise
in 2008. Therefore, the average price of phosphates stood at 121.6 dollars per ton, down by 64.8 percent
compared to the previous year. Similarly, fertilizers, including DAP, TSP, and urea, declined in a more marked way,
by 71.6 percent, 66.6 percent and 49.4 percent respectively, year-on-year.
BANK AL-MAGHRIB - ANNUAL REPORT - 2009
27
INTERNATIONAL ENVIRONMENT

Chart 1.1.12: Trend of the prices of phosphates and their derivatives (dollar/ton)
Source: World Bank
1.1.7 International Financial Architecture
In addition to the economic policy measures aiming at overcoming the impacts of the crisis, governments and
international organizations’ actions focused on reform axes, which may reduce the risk of crises’ occurrence in
the future.
Hence, the G-20 engaged in following-up the efforts deployed by its members to secure the process of stabilizing
the world’s financial situation in application of the preliminary Agreement of November 2008.
At its first summit held in April 2, 2009 in London, the G-20 agreed to create a Financial Stability Council as a
replacement of the Financial Stability Forum (FSF). This body, whose membership expanded to include all G-20
countries, is endowed with larger powers, its supervision role now covering hedge funds, offshore areas, and
tax havens. Besides, it has collaborated with the IMF to set up a system of warning and early reaction to the
financial and macro economic risks. The G-20 also decided to provide international financial institutions with
over 850 billion dollars of resources to sustain the emerging and developing markets’ growth. Moreover, the
group pointed out the importance of consolidating international financial institutions’ governance in order
to grant more voice and representation to emerging and developing countries. In this context, the IMF will
undertake its next quota revision before January 2011 while World Bank reforms are expected to be complete
at the spring 2010 meetings, at the utmost.
BANK AL-MAGHRIB - ANNUAL REPORT - 2009
28
INTERNATIONAL ENVIRONMENT

In addition to their sustained commitment to maintaining expansionary policies necessary for restoring a
durable and balanced economic growth, the G-20 countries projected, during the Pittsburgh-USA summit held
on September 24-25, 2009, a series of reforms aiming particularly at raising capital requirements for risky
activities and implementing strong international standards regarding compensation within the financial sector.
Also, among the issues raised in this summit was improving over-the-counter derivatives market, converging
the accounting standards, and continuing the fight against tax havens and money laundering. As regards the
IMF reform, the G-20 agreed to shift 5 percent of the quota share of over-represented countries to under-
represented ones, based on the IMF quota formula.
In its meeting held on November 6-7, 2009 in Saint Andrews, UK, the G-20 restated its commitment to maintain
the expansionary measures, as long as the recovery is not guaranteed, and to continue the implementation of the
reforms necessary for a higher relevance, reactivity, and legitimacy of financial institutions, given the important
role of the latter in restoring stable and durable growth. In addition, and in order to continue strengthening the
global financial system, the G-20 agreed to work hand in hand with the Financial Stability Council, with a view
to preserving the momentum of the reform programs and ensuring their integral and coherent implementation
while meeting scheduled commitments.
Furthermore, the IMF made economic policy recommendations to its member states and granted them financial
support particularly via a timely financing mechanism. Hence, the IMF lending commitments reached record
levels in 2009, as the Fund granted nonconcessional facilities up to 65.8 billion SDR to 15 member countries,
and concessional loans up to 1.1 billion SDR to 26 countries.
Considering the magnitude of the IMF interventions, the member states committed to treble the institution’s
lending capacity to 750 billion dollars and to double its capacity to grant concessional loans to low-income
countries. Within this framework, the IMF board approved, on the one hand, the bilateral borrowing agreements
whose aim is to strengthen its special crisis-facing mechanism, and on the other hand, resorting to its first bond
issues ever. Besides, the IMF yielded part of its gold reserves as a way of raising additional revenue and increasing
its capacity for granting concessional loans to low-income countries. It also engaged in reforming the means of
action towards these countries by setting up new lending instruments.
BANK AL-MAGHRIB - ANNUAL REPORT - 2009
29
INTERNATIONAL ENVIRONMENT

Box 1.1.1 : Proposals of the Basel Committee on Banking Supervision to strengthen the global banking sector
On December 17, 2009, the Basel Committee on Banking Supervision released a set of proposals regarding
the regulation and management of banking risks. These proposals concerned the following areas:
- Raising the quality and transparency of the “tier-one” capital base, that should be mainly confined to
common shares and retained earnings. This capital is used as a basis for deductions and prudential filters.
- Strengthening capital requirements for the coverage of counterparty risks arising from derivatives, repurchase
agreements and financing activities. Also, banks should manage their counterparty risks by resorting to
stress scenarios and take into account the market value losses of their position in case the quality of their
counterparties’ credit declines.
- Introducing a new additional solvency requirement, in the form of a base capital to bank-owned assets ratio.
This coefficient will help contain the build-up of excessive leverage and ensure additional safeguard against
possible arbitrations between financial assets, motivated by differences in risk-weighting coefficients.
- Setting up an international framework to assess, follow-up and apply the regulatory requirements relative
to the liquidity risk.
The impact of these measures on the banking sector will be analyzed during the first half of the year 2010,
before their expected implementation in 2012.
BANK AL-MAGHRIB - ANNUAL REPORT - 2009
30
INTERNATIONAL ENVIRONMENT
1.2 National output
Despite an unfavorable international environment, national economic growth remained strong owing to an
exceptional crop year. Though limited, the recessionary effects of the economic situation in our main partner
countries impacted considerably the sectors depending most on foreign markets. The performance of theses
sectors, which showed a strong synchronization with the growth cycle in our main partners, improved gradually
as from the second half of the year. Against this background, overall growth reached 4.9 percent in 2009
compared to 5.6 percent in 2008.
Concerning the primary sector, agricultural activity grew by 30.6 percent in 2009 compared to 16.3 percent in
2008, in connection with the expansion of cereal output which almost doubled to reach an exceptional level
of 102 million quintals. At the same time, fishing activities rose by 12.2 percent compared to 19 percent a
year earlier. Overall, the share of the primary sector in the overall value added rose from 15.9 percent to 19.3
percent. Conversely, after five years of continued growth, the secondary sector dropped 4.7 percent under the
combined effect of the decline in mining output and the slowdown in industrial activity and building and public
works. Tertiary activities, including nonmarketable services provided by public administration, grew 3.9 percent
compared to 4.1 percent in 2008, in spite of the fall recorded in tourism-related services.
Overall, GDP -estimated at current prices at 736.2 billion dirhams- increased by 6.9 percent instead of 11.8
percent in 2008. On the other hand, agricultural value added grew 21.6 percent to around 100.9 billion dirhams,
while the value added of nonagricultural activities rose 3.2 percent to stand at 553.6 billion dirhams.
31
BANK AL-MAGHRIB - ANNUAL REPORT - 2009NATIONAL OUTPUT
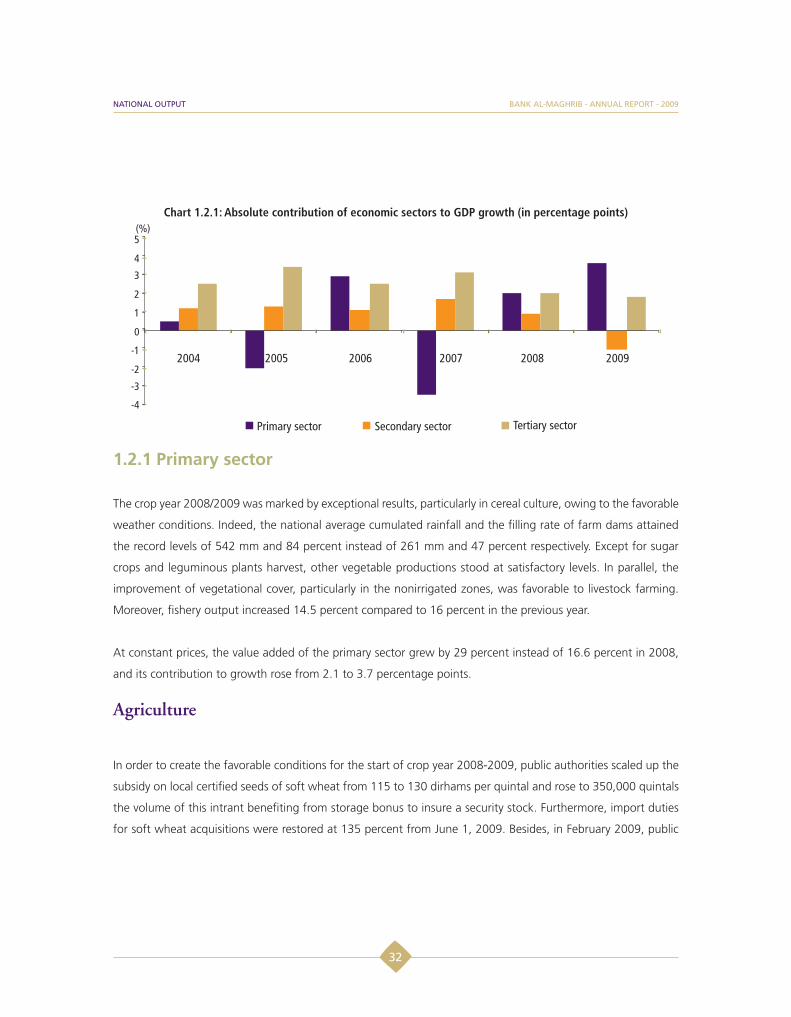
Chart 1.2.1: Absolute contribution of economic sectors to GDP growth (in percentage points)
1.2.1 Primary sector
The crop year 2008/2009 was marked by exceptional results, particularly in cereal culture, owing to the favorable
weather conditions. Indeed, the national average cumulated rainfall and the filling rate of farm dams attained
the record levels of 542 mm and 84 percent instead of 261 mm and 47 percent respectively. Except for sugar
crops and leguminous plants harvest, other vegetable productions stood at satisfactory levels. In parallel, the
improvement of vegetational cover, particularly in the nonirrigated zones, was favorable to livestock farming.
Moreover, fishery output increased 14.5 percent compared to 16 percent in the previous year.
At constant prices, the value added of the primary sector grew by 29 percent instead of 16.6 percent in 2008,
and its contribution to growth rose from 2.1 to 3.7 percentage points.
Agriculture
In order to create the favorable conditions for the start of crop year 2008-2009, public authorities scaled up the
subsidy on local certified seeds of soft wheat from 115 to 130 dirhams per quintal and rose to 350,000 quintals
the volume of this intrant benefiting from storage bonus to insure a security stock. Furthermore, import duties
for soft wheat acquisitions were restored at 135 percent from June 1, 2009. Besides, in February 2009, public
32
BANK AL-MAGHRIB - ANNUAL REPORT - 2009NATIONAL OUTPUT

authorities allocated a financial package amounting to 465 million dirhams within the context of a program
dedicated to the mitigation of flood effects.
Owing to the favorable weather conditions that marked the crop year 2008/2009, sown areas were extended
and cereal yields improved. Production of the main autumn cereals rose therefore to 102 million quintals, up
98.3 percent compared to the previous crop year and by 86.6 percent compared to the average of the last five
crop years. This expansion covers a substantial increase in harvests of soft wheat, barley and hard wheat by 71.5
percent, 179.8 percent and 64 percent respectively. Accordingly, the volume of cereals marketed from June 2008
to June 2009 grew by 168 percent compared to the same period of the last crop year, which led to a reduction
of imports by 11 percent. Conversely, the production of leguminous plants dropped 1.4 percent and 8.7 percent
compared to the preceding year and to the average of the last five crop years.
Regarding other vegetable productions, early vegetables harvest grew 12 percent, due to the increase in
tomatoes harvest. In parallel, production of oilseed recorded a rise of 21.3 percent, covering an increase by more
than half of groundnut harvest and a decline by nearly the quarter of sunflower harvest. As for citrus fruits and
olives, their output grew respectively by 10 percent and 12 percent. Conversely, sugar crops output dropped by
8 percent, due to the decrease in sugar beet and sugar cane production following the floods that occurred in
February in the Gharb region.
Chart 1.2.2: Main vegetable crops (In millions of quintals)
Source: Ministry of Agriculture and Marine Fisheries
33
BANK AL-MAGHRIB - ANNUAL REPORT - 2009NATIONAL OUTPUT

Box 1.2.1 : Green Morocco Plan
The regional implementation of the new agricultural development strategy called “Green Morocco Plan” led
to the signature, at the end of 2009, of 9 agreements between the Government and the actors of the main
compartments of agricultural output, namely cereals, seeds, sugar crops and market gardening, citrus fruits,
olive-growing, red and white meat and milk. The required budget for upgrading theses branches is estimated
at nearly 119 billion dirhams, of which approximately half is distributed equally between cereal crop and
olive-growing.
Likewise, in order to encourage small farmers, particularly those living in the poor regions, to switch to
profitable activities, a subsidy of 10 percent of the overall investment amount will be granted.
Besides, in order to enhance the financial means allocated to this sector, public authorities signed, in December
2008, with Crédit Agricole du Maroc (CAM), an agreement for the mobilization by this institution of a
20-billion-dirham budget for the period 2009-2013. Finally, the Agency for Agricultural Development, in
charge of implementing the Green Morocco plan, was created.
Livestock farming
Livestock farming saw a slight increase thanks to the availability of fodder crop and livestock feed. Based on
the census conducted in March and April 2009, the number of livestock, estimated at 25,489 thousand heads,
increased by 2 percent due to the comparable rise in the number of sheep and cattle.
Likewise, the quantities available for consumption of red and white meat rose respectively by 0.5 percent and 2
percent as well as the output of milk and eggs which increased each by 5 percent.
Marine fisheries
Fishery output grew by 14.5 percent compared to the previous year to reach 1.2 million tons, in connection with
the increase in inshore and off-shore fishery catches.
34
BANK AL-MAGHRIB - ANNUAL REPORT - 2009NATIONAL OUTPUT

Indeed, inshore fishery output improved by 13.1 percent reaching more than 1 million tons, in connection
particularly with the rise by 14 percent of pelagic fish catches. Against this background, the volume of fresh
fish intended for consumption, which constitutes 34 percent of inshore fishery catches, rose 12 percent, while
quantities processed by manufacturing plants of fish-meal and oil grew 32 percent. On the other hand, those
oriented to canned fish units have dropped 11 percent.
In parallel, off-shore fishery catches grew 25.8 percent owing to the increase of cephalopod and pelagic fish
catches by 30.5 percent and 23.8 percent respectively.
1.2.2 Secondary sector
Secondary activities, whose share in the national value added represents 25 percent, recorded a drop of 4.7
percent instead of a rise by 3.6 percent in 2008. This decline is attributable to the strong contraction of mining
activities and to the slowdown in the manufacturing industries and in building and public works.
Processing industries
In a context marked by the contraction of activity in our partner countries, the industrial production index almost
stagnated in 2009 after rising by 1.9 percent. This development covers a fall in textile, clothing and leather
industries, as well as in chemical and parachemical industries and electrical and electronic industries and a rise
in the other branches.
In order to circumscribe the repercussions of the international economic situation on the Moroccan economy,
stimulus measures of social, financial and commercial nature were decided by the Oversight Committee in
favor of the hit sectors. These measures were aimed at preserving jobs, improving access conditions to loans
and enhancing the diversification of foreign markets. They were materialized in the Government taking in
charge employer’s contributions, in strengthening government guaranties in order to improve businesses cash
holding, in supporting promotional activities and in readjusting premium rates and insurance guaranteed quotas
to export. Concurrently, public authorities launched a long term strategy called “National Pact for Industrial
Emergence” aiming particularly to develop the exportable offer (Box 1.2.2).
35
BANK AL-MAGHRIB - ANNUAL REPORT - 2009NATIONAL OUTPUT

Box 1.2.2 : National Pact for Industrial Emergence: Agreement 2009-2015
In the continuity of the Emergence Plan, this pact is based on the following axes:
- Boosting the branches in which Morocco has a competitive advantage.
- Strengthening SMEs competitiveness, matching education to economic growth needs and developing
integrated industrial platforms.
- Improving plans implementation effectiveness.
With a capital of 12.4 billion dirhams, this plan aims to create 220,000 jobs, generate an additional volume
of exports of 95 billion dirhams and drain 50 billion dirhams of private investments, leading thereby to a rise
in the sector’s value added by 50 billion dirhams.
Table 1.2.1: Changes in average yearly indexes of industrial production, in %
Industrial sectors WeightingChanges in average yearly indexes of industrial
production, in %
2007 2008 2009
Food industries 23 2.4 4.2 2.6
Textile and leather industries 21 2.2 -0.7 -0.5
Chemical and parachemical industries 36 4.5 3.5 -1.4
Mechanical and metallurgical industries 16 9.6 0.1 1.4
Electrical and electronic industries 4 3.9 1.4 -0.8
Total industries 100 4.6 2.1 0.2
As a result of the decline in our main partners’ demand, textile, clothing and leather industries’ output fell 0.5
percent. Thus, textile and leather output dropped 0.9 percent and 4.3 percent respectively while the clothing
producer index remained stable compared to 2008.
Chemical and parachemical industries output dropped 1.4 percent after increasing 3.5 percent in 2008. This
change is chiefly attributable to the decline in the refining activity by 19.8 percent caused by the delayed start
of the new refinery of Mohammedia and to the drop by 0.5 percent of other mineral nonmetal products output
36
BANK AL-MAGHRIB - ANNUAL REPORT - 2009NATIONAL OUTPUT

and also to the slowdown in chemical products activity from 3.5 percent to 2.5 percent. Conversely, the output
of phosphoric acid and phosphate fertilizers increased 19.7 percent and 15.9 percent respectively, in connection
with the pick-up in foreign demand during the second half of 2009.
Concerning the output of electrical and electronic industries, its growth rate decreased from 1.4 percent to -0.8
percent, owing mainly to the drop by 1.3 percent of the activity of machines and electrical devices industries, in
connection with the fall in wires and cables and electronic components exports. The output of radio, television
and communication equipment remained stable from one year to the next.
In spite of the availability of basic products owing to a good crop year, the output of agri-food industries
decelerated substantially because of the decline of foreign demand. Indeed, after an increase of 4.2 percent
in 2008, the growth of the sector was limited to 2.6 percent, which covers diverging changes according to
the branches. The output of canned fruits and vegetables dropped by 15.4 percent, while that of canned fish
branch and dairy products grew 8.5 percent and 5 percent respectively. Likewise, the output of meat and milling
industries increased 4.8 percent and 3.9 percent respectively.
In parallel, after a marked slowdown in 2008, the output index of mechanical and metallurgical industries
grew by 1.4 percent due to the rise of metallic products branch and of metalworking by 3.3 percent and 4.2
percent respectively. Conversely, the output index of the automotive industry dropped slightly by 0.7 percent in
connection with the deterioration of the economic situation in the automotive sector worldwide.
Building and public works
After five years of sustained growth, the expansion of building and public works dropped from 9.4 percent to
3.4 percent in 2009. This development is due, on the one hand, to the decline in the private offer in the housing
sector, especially the segment of social housing upon the abolition of tax advantages previously granted to
property developers. It is also attributed, on the other hand, to the drop in nonresident demand and foreign
direct investments in the segment of tourist and luxury real estate, which was affected by the international
economic recession. The contraction of activity in the sector led to a deceleration of cement consumption and
of loans’ outstanding amount. Its growth pace dropped respectively from 9.9 percent to 3.4 percent and from
45.6 percent to 12.8 percent, in one year.
37
BANK AL-MAGHRIB - ANNUAL REPORT - 2009NATIONAL OUTPUT
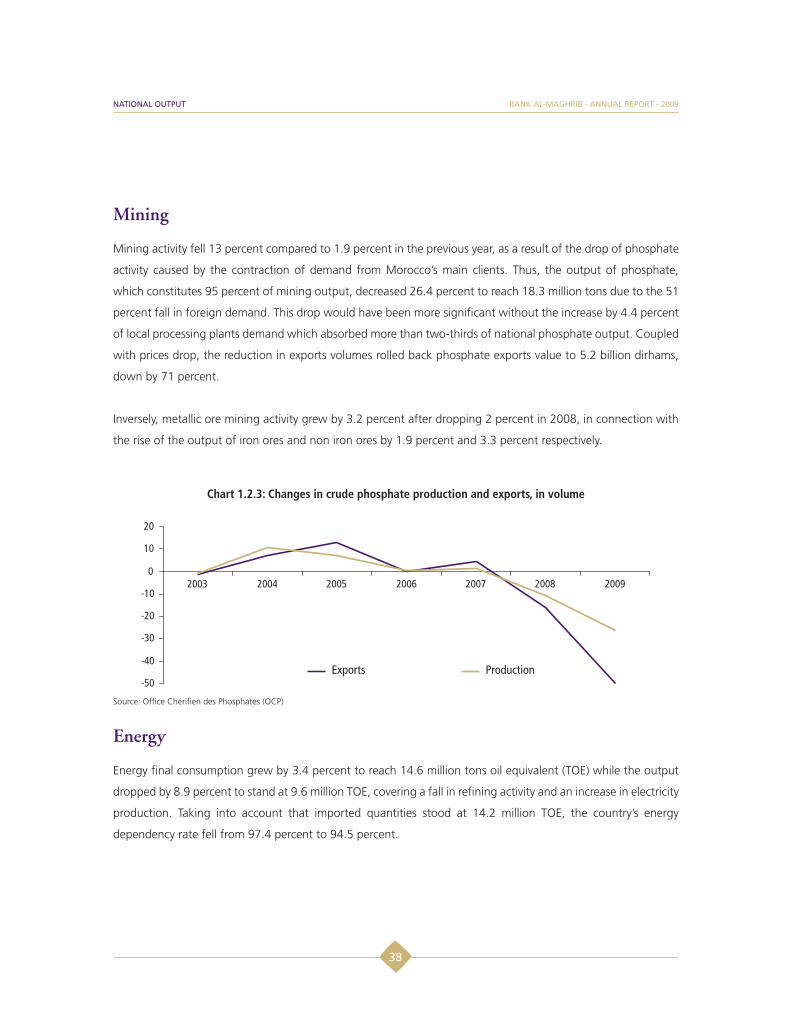
Mining
Mining activity fell 13 percent compared to 1.9 percent in the previous year, as a result of the drop of phosphate
activity caused by the contraction of demand from Morocco’s main clients. Thus, the output of phosphate,
which constitutes 95 percent of mining output, decreased 26.4 percent to reach 18.3 million tons due to the 51
percent fall in foreign demand. This drop would have been more significant without the increase by 4.4 percent
of local processing plants demand which absorbed more than two-thirds of national phosphate output. Coupled
with prices drop, the reduction in exports volumes rolled back phosphate exports value to 5.2 billion dirhams,
down by 71 percent.
Inversely, metallic ore mining activity grew by 3.2 percent after dropping 2 percent in 2008, in connection with
the rise of the output of iron ores and non iron ores by 1.9 percent and 3.3 percent respectively.
Chart 1.2.3: Changes in crude phosphate production and exports, in volume
Source: Office Chérifien des Phosphates (OCP)
Energy
Energy final consumption grew by 3.4 percent to reach 14.6 million tons oil equivalent (TOE) while the output
dropped by 8.9 percent to stand at 9.6 million TOE, covering a fall in refining activity and an increase in electricity
production. Taking into account that imported quantities stood at 14.2 million TOE, the country’s energy
dependency rate fell from 97.4 percent to 94.5 percent.
38
BANK AL-MAGHRIB - ANNUAL REPORT - 2009NATIONAL OUTPUT

Concerning refining activity, its output declined by 20.6 percent after the 10.9 percent drop a year earlier, to
stand at 4.3 million tons. Conversely, overall consumption of oil products rose 1.4 percent to reach 9 million
tons, driven mainly by the increase in diesel and butane consumption by 7.2 percent and 3 percent respectively.
Meanwhile, fuel consumption declined by 11.4 percent.
Regarding national demand for electricity, it reached 22.4 billion kWh, up 3.4 percent against 5.5 percent in
2008. The sales of high and medium voltage electricity, oriented to productive sectors and grids, and the sales
of low voltage electricity, oriented mainly to domestic use, grew respectively by 2.8 percent and 5.9 percent.
On the other hand, net domestic production of electricity stood at 20.4 billion kWh, up 3.3 percent due to the
rise of hydraulic electricity output, which benefited from the important rainfall recorded this year and more
than doubled, raising its share in the overall output to 14.5 percent instead of 7 percent in 2008. Thanks to this
development, recourse to thermal output fell 6.4 percent and the growth of electricity imports was capped at
8.5 percent compared to 21.5 percent a year earlier.
Chart 1.2.4: Evolution of national output of electricity and refined oil products
39
BANK AL-MAGHRIB - ANNUAL REPORT - 2009NATIONAL OUTPUT
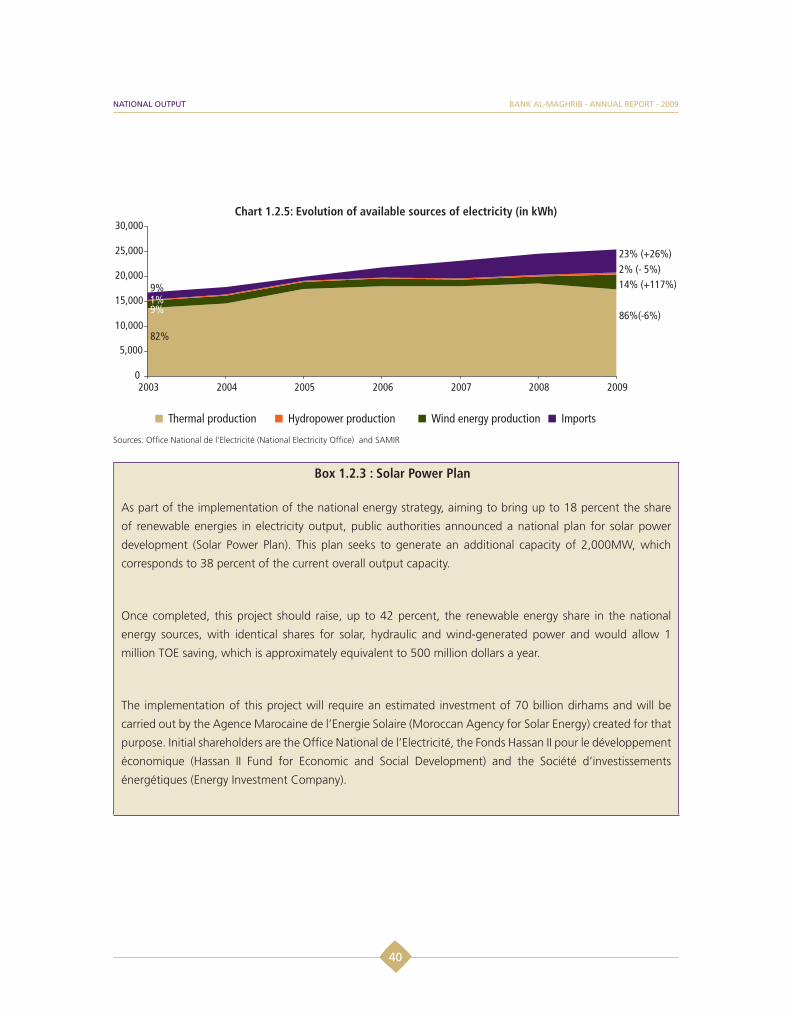
Chart 1.2.5: Evolution of available sources of electricity (in kWh)
Sources: Office National de l’Electricité (National Electricity Office) and SAMIR
Box 1.2.3 : Solar Power Plan
As part of the implementation of the national energy strategy, aiming to bring up to 18 percent the share
of renewable energies in electricity output, public authorities announced a national plan for solar power
development (Solar Power Plan). This plan seeks to generate an additional capacity of 2,000MW, which
corresponds to 38 percent of the current overall output capacity.
Once completed, this project should raise, up to 42 percent, the renewable energy share in the national
energy sources, with identical shares for solar, hydraulic and wind-generated power and would allow 1
million TOE saving, which is approximately equivalent to 500 million dollars a year.
The implementation of this project will require an estimated investment of 70 billion dirhams and will be
carried out by the Agence Marocaine de l’Energie Solaire (Moroccan Agency for Solar Energy) created for that
purpose. Initial shareholders are the Office National de l’Electricité, the Fonds Hassan II pour le développement
économique (Hassan II Fund for Economic and Social Development) and the Société d’investissements
énergétiques (Energy Investment Company).
40
BANK AL-MAGHRIB - ANNUAL REPORT - 2009NATIONAL OUTPUT
1.2.3 Tertiary sector
Tertiary activities, which represent 56 percent of the overall value added, recorded a rise by 3.9 percent, a pace
similar to that of 2008. This expansion is due chiefly to the vigor of marketable services other than tourism.
Tourism
In a context marked by the degradation of the international economic situation, the main tourism indicators
recorded during 2009 diverging changes. Tourist flows grew 5.5 percent after 6.6 percent a year earlier, while
overnight stays in classified hotels dropped 1.4 percent, and occupancy rate fell from 45 percent to 41 percent.
Likewise, travel receipts amounting to 52.8 billion dirhams, fell 5 percent, after a drop by 5.3 percent in 2008.
In order to mitigate the cyclical international economic recession effects on tourism, public authorities pursued
their action through the action plan “CAP 2009” that aims to boost the main destinations of Morocco and
consolidate market shares. This plan aims particularly at diversifying foreign markets, developing domestic
tourism and preserving tourism investments’ vigor.
At the end of 2009, the number of foreign visitors -93 percent of whom are staying tourists- reached 4.6 million,
up 1.6 percent.
Arrivals from France, the main tourism-generating market with 73 percent of the overall foreigners’ flows, were
in quasi-stagnation, while Spanish and Italian tourists’ flows grew respectively by 8 percent and 8.9 percent.
Conversely, the number of German and English visitors dropped 2.6 percent and 7.9 percent respectively.
Concerning Arab and American visitors, their number grew respectively by 2.4 percent and 6.3 percent. In
parallel, arrivals of Moroccans residing abroad, which amounted to 4 million, rose 10.4 percent instead of 8.6
percent a year earlier.
41
BANK AL-MAGHRIB - ANNUAL REPORT - 2009NATIONAL OUTPUT

Chart 1.2.6: Changes in the number of European and Arab tourists
Source: Ministry of Tourism and Handicrafts
At 16.2 million, the number of overnight stays in classified hotels declined by 1 percent on the back of the 4.2
percent decrease in foreign tourists’ overnights, amounting to approximately 12.5 million. Accommodation
capacity was enhanced by nearly 12,000 new beds to reach 164,612 beds, due to the opening of two new
beach resorts. In this context, the occupancy rate fell again from 45 percent to 41 percent.
Transport and communication
The value added of transportation services grew 2.9 percent compared to 2.6 percent in 2008, owing to the
expansion of air travel, rail traffic and maritime traffic, while freight suffered from the weakness of foreign
exchanges.
Air traffic grew by 3.8 percent in 2009 to reach 13.5 million travelers, in spite of an unfavorable international
context. Similarly, rail traffic and maritime traffic rose by 7.5 percent and 5.5 percent with respectively 29.6
million and 4.2 million travelers.
Conversely, goods transportation activity pursued its decline in both maritime and rail transportations. Indeed,
national maritime traffic stood at 59.8 million tons, down 11.5 percent while goods rail transportation, at 4.1
42
BANK AL-MAGHRIB - ANNUAL REPORT - 2009NATIONAL OUTPUT

million tons, decreased by 18 percent due in particular to the drop in the activity of mining and phosphate
exportation.
Concerning the value added of communication services, its growth pace slowed down substantially, from 8.7
percent to 2.8 percent, reflecting the impact of prices drop, especially at the international level. By the end of
2009, the number of cell phone subscribers reached 25.3 million, up 10.9 percent, raising penetration rate to
approximately 81.2 percent, up by 7 percentage points. Fixed telephony market grew 17.6 percent with an
overall number of subscribers at 3.5 million. In parallel, the overall number of internet subscribers attained 1.2
million, up 56.8 percent compared to 43.9 percent in 2008.
Chart 1.2.7: Change in the number of fixed phone and cell phone subscribers (In thousands)
Source: ANRT (National Agency of Telecommunications Regulation).
Commerce and other services
Commercial activities, which represent 12.4 percent of the overall value added, increased by 3.5 percent
compared to 4.5 percent in 2008. Conversely, the value added of financial activities dropped in one year from
3.9 percent to 1.1 percent.
43
BANK AL-MAGHRIB - ANNUAL REPORT - 2009NATIONAL OUTPUT

1.3 Labor market
The labor market again improved in 2009, as national unemployment rate fell from 9.6 percent in 2008 to 9.1
percent, despite the marked deceleration observed in various sectors. At the same time, wage costs increased,
notably following the second readjustment of the minimum wage whereas the pace of growth of apparent labor
productivity declined significantly.
1.3.1 Activity and employment indicators
The labor force aged 15 years and above, at 11.31 million persons, increased 0.4 percent compared to 1.1
percent in 2008, reflecting a 0.7 percent increase in urban labor force and near stagnation in rural areas. Labor
force participation rate slightly dropped from 50.6 percent in 2008 to 49.9 percent.
Employed labor force rose around 1 percent with an increase of 1.7 percent in urban areas and 0.1 percent in
rural areas. Net job creation reached 95,100 employments of which 92 percent in urban areas. This trend covers
the creation of 113,900 gainful jobs of which 91 percent in urban areas and a loss of 18,800 unpaid jobs.
Chart 1.3.1: Annual change in unemployment rate and labor force
BANK AL-MAGHRIB - ANNUAL REPORT - 2009
44

The sectors of building and public works as well as those of services were the only job providers in 2009, with
respective shares of 44 percent and 56 percent of the overall new jobs. In spite of the recessionary effects of the
slump in demand, particularly from abroad, the creation of jobs in both sectors saw only a slight slowdown, as
its growth rate decreased from 7.7 percent to 6.9 percent in the sector of building and public works and from
2.8 percent to 2.1 percent in services between 2008 and 2009. However, the other sectors registered a loss of
45,700 jobs, of which 87 percent in the industrial sector. The value added of the latter dropped for the first time
since 1996, recording a loss of 39,700 jobs, i.e. a decrease of 3 percent in the employed workforce compared
to a 3 percent increase in 2008.
Chart 1.3.2: Change in value added and volume of employment
Source: High Commission for Planning
Overall, the employment rate fell to 45.3 percent from 45.8 percent in 2008 and 46 percent in 2007, due to the
higher increase of total population aged 15 years and above compared to the employed labor force. By place
of residence, the urban and rural employment rates decreased 0.3 percentage point and 0.5 percentage point,
respectively, to 37.9 percent and 56.1 percent. The share of self-employment reached 41.8 percent, slightly
lower than that of 2008.
45
BANK AL-MAGHRIB - ANNUAL REPORT - 2009LABOR MARKET
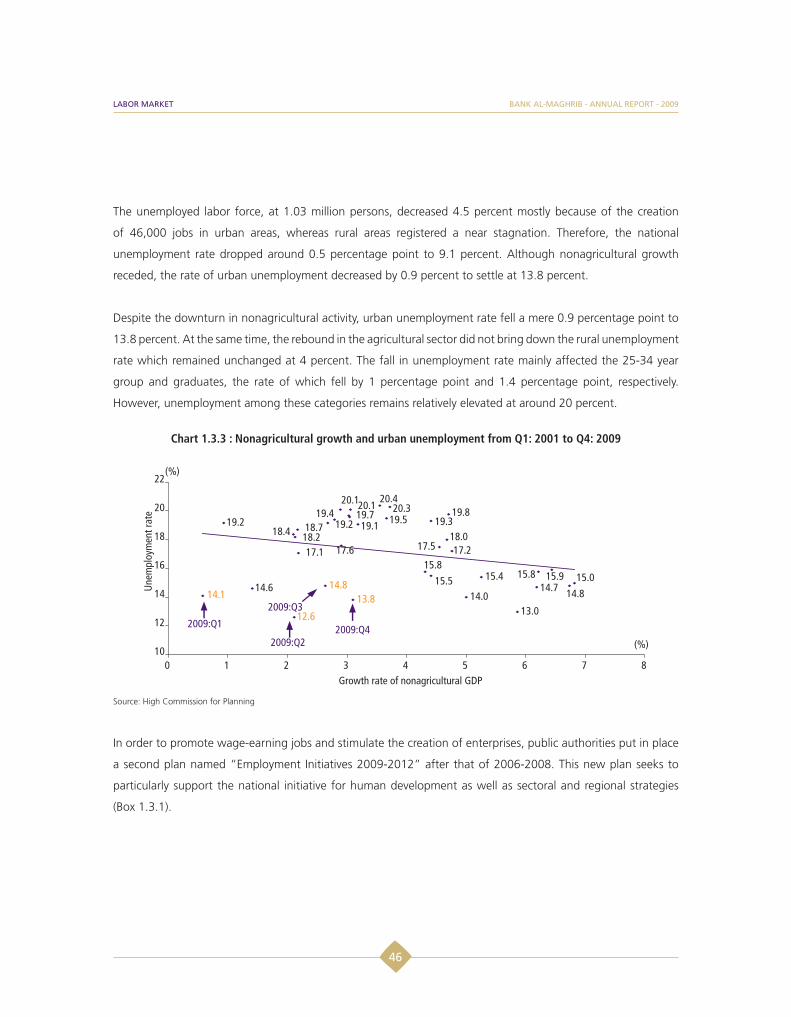
The unemployed labor force, at 1.03 million persons, decreased 4.5 percent mostly because of the creation
of 46,000 jobs in urban areas, whereas rural areas registered a near stagnation. Therefore, the national
unemployment rate dropped around 0.5 percentage point to 9.1 percent. Although nonagricultural growth
receded, the rate of urban unemployment decreased by 0.9 percent to settle at 13.8 percent.
Despite the downturn in nonagricultural activity, urban unemployment rate fell a mere 0.9 percentage point to
13.8 percent. At the same time, the rebound in the agricultural sector did not bring down the rural unemployment
rate which remained unchanged at 4 percent. The fall in unemployment rate mainly affected the 25-34 year
group and graduates, the rate of which fell by 1 percentage point and 1.4 percentage point, respectively.
However, unemployment among these categories remains relatively elevated at around 20 percent.
Chart 1.3.3 : Nonagricultural growth and urban unemployment from Q1: 2001 to Q4: 2009
Source: High Commission for Planning
In order to promote wage-earning jobs and stimulate the creation of enterprises, public authorities put in place
a second plan named “Employment Initiatives 2009-2012” after that of 2006-2008. This new plan seeks to
particularly support the national initiative for human development as well as sectoral and regional strategies
(Box 1.3.1).
46
BANK AL-MAGHRIB - ANNUAL REPORT - 2009LABOR MARKET

1.3.2 Costs and labor productivity
The index of apparent labor productivity in nonagricultural activities, measured through the nonagricultural GDP/
urban employed labor force ratio, grew by 0.4 percent from 1.3 percent in 2008 and 2.6 percent on average
over the last five years. This deceleration is mainly attributable to divergent trends of nonagricultural added
value and urban employment. Whereas secondary and tertiary sectors grew by -0.7 percent and 3 percent,
respectively, job market indicators showed an increase of around 1.7 percent in urban employment.
In the meantime, following the second minimum wage adjustment on July 1, 2009, the minimum hourly wage
in industry, trade and liberal professions increased 5 percent in nominal terms to 10.64 dirhams, from 10.14
dirhams.
Chart 1.3.4: Quarterly minimum wage in nominal and real terms
Source: Ministry of Labor, and BAM calculations
Against this backdrop, the relative unit labor cost (RULC) continued the upward trend that began in 2008 with
an average quarterly growth of 3.1 percent in 2009 (Box 1.3.2). Accordingly, RULC in Morocco was 2.4 percent,
2.2 percent and 0.6 percent higher than in Poland, South Korea and France, respectively. However, it was slightly
lower than in Italy, Hungary and Czech Republic.
47
BANK AL-MAGHRIB - ANNUAL REPORT - 2009LABOR MARKET

Chart 1.3.5 : Change in unit labor cost and apparent labor productivity (Base 2000)
Source: DataStream, and BAM calculations
Chart 1.3.6 : Morocco’s competitiveness cost
Box 1.3.1 : Outcome of the second plan«Employment Initiative 2009-2012»
their own businesses. It enabled the creation of 1,012 enterprises in 2009, i.e. 44 percent of enterprises
created since 2007, generating 8,000 new jobs.
holders. It managed to integrate 172,000 job seekers over the 2006-2009 period, 30 percent of whom in
2009.
78 percent of the 2012 target.
48
BANK AL-MAGHRIB - ANNUAL REPORT - 2009LABOR MARKET

Box 1.3.2 : Assessment of the manufacturing sector’s unit labor cost
As part of the work led by Bank Al-Maghrib to examine and monitor Morocco’s external competitiveness,
the Central Bank estimated the relative unit labor cost in manufacturing which reflects the country’s relative
position compared to that of its partners and competitors. The RULC was assessed on the basis of the unit
labor cost of partners and competitors weighted by their shares in Moroccan exports. The results show that
after an annual average drop of 6 percent in 1996-2000, Morocco’s RULC has registered an increase starting
from 2001 which has speeded up as of late 2007.
Chart B1.3.2.1 : Manufacturing sector relative unit labor cost in Morocco, in US dollars(1993:Q1 – 2009:Q4)
Source: Datastream, and BAM calculations
The rise in the Moroccan manufacturing RULC was marked by lower productivity than many emerging
countries. Indeed, productivity in Morocco is far below the level recorded in Greece, Hungary, Poland and
Bulgaria.Chart B1.3.2.2 : Average growth rate of relative unit labor cost and productivity (1999-2008)
Source: Datastream, and BAM calculations
49
BANK AL-MAGHRIB - ANNUAL REPORT - 2009LABOR MARKET

1.4 Demand
The exceptional contraction of economic activity worldwide, particularly in Morocco’s main European partners,
led to the decline of foreign demand. It also contributed to the slowdown of domestic demand, through
the drop in current transfers flows and foreign direct investments. Although exports of goods and services
decreased by 13.1 percent, the negative contribution of the net foreign demand to GDP growth came down to
1.9 percentage points compared with 2.9 points in 2008, due to a substantial decline in imports. Concerning
the components of domestic demand, household consumption increased by 4.0 percent instead of 6.0 percent,
while private investment recorded a marked slowdown. However, the growth of public consumption and
investment accelerated from one year to the next. All things considered, domestic demand rose by 4.5 percent
at current prices and by 5.2 percent in real terms, contributing 6.8 percentage points to the overall growth,
which was at 4.9 percent.
Chart 1.4.1: Contribution of demand aggregates to GDP growth, in percentage points
Sources: High Commission for Planning
(*) provisional data
BANK AL-MAGHRIB - ANNUAL REPORT - 2009
50

1.4.1 Consumption
Domestic final consumption reached 552 billion dirhams in nominal terms, up 6.4 percent, contributing 4.2
percentage points to the overall growth, compared to 4.4 points in 2008. Its share in the gross national
disposable income rose to 70.8 percent compared to 69.6 percent a year earlier, while marginal propensity to
consume, as a ratio to the GDP, remained at 0.7, which is the average level observed during the last five years.
Concerning households’ consumption, which represents 76 percent of domestic consumption, it grew in nominal
terms by 4.7 percent compared to 11.2 percent in 2008 and its contribution to growth stood at 2.3 percentage
points in 2009. Despite the drop in income from nonagricultural activities and in net revenues and transfers from
abroad, consumption remained robust thanks to better agricultural revenues, higher wages and a bigger share
of paid jobs. Besides, low inflation contributed to preserve household’s purchasing power. Final consumption of
public administration grew by 12 percent compared to 5.3 percent a year earlier, in connection with the rise in
workforce charges and expenditure for goods and services.
Chart 1.4.2: Change of final consumption of households and general government (at current prices)
Sources: High Commission for Planning
(*) provisional data
51
BANK AL-MAGHRIB - ANNUAL REPORT - 2009DEMAND

1.4.2 Investment
At 226 billion dirhams in nominal terms, the gross fixed capital formation remained at the same level registered
the previous year. In real terms, it grew by 2.5 percent compared to 11.5 percent in 2008, contributing 0.8
percentage points to overall growth. This development covers a dynamic trend in public investment and a
slowdown in private investment which was substantially impacted by the knock-on effects of the international
crisis, particularly the decline of the output capacity utilization, and a drop of foreign direct investments.
Given the positive change in inventories estimated at 38.8 billion dirhams, overall investment reached 264.8
billion dirhams, which means a quasi-stagnation in nominal terms, after it rose by 31.2 percent the previous
year. Its contribution to growth fell from 4.1 percentage points in 2008 to 2.6 in 2009 and gross investment
ratio attained 30.7 percent.
Chart 1.4.3: Change of investment and gross investment rate
Sources: High Commission for Planning
(*) provisional data
1.4.3 National saving
The gross national disposable income grew to 780 billion dirhams, up 4.6 percent, compared to 10.9 percent
in 2008, due notably to the drop of net revenues and transfers from abroad. National saving rose by only 0.6
52
BANK AL-MAGHRIB - ANNUAL REPORT - 2009DEMAND
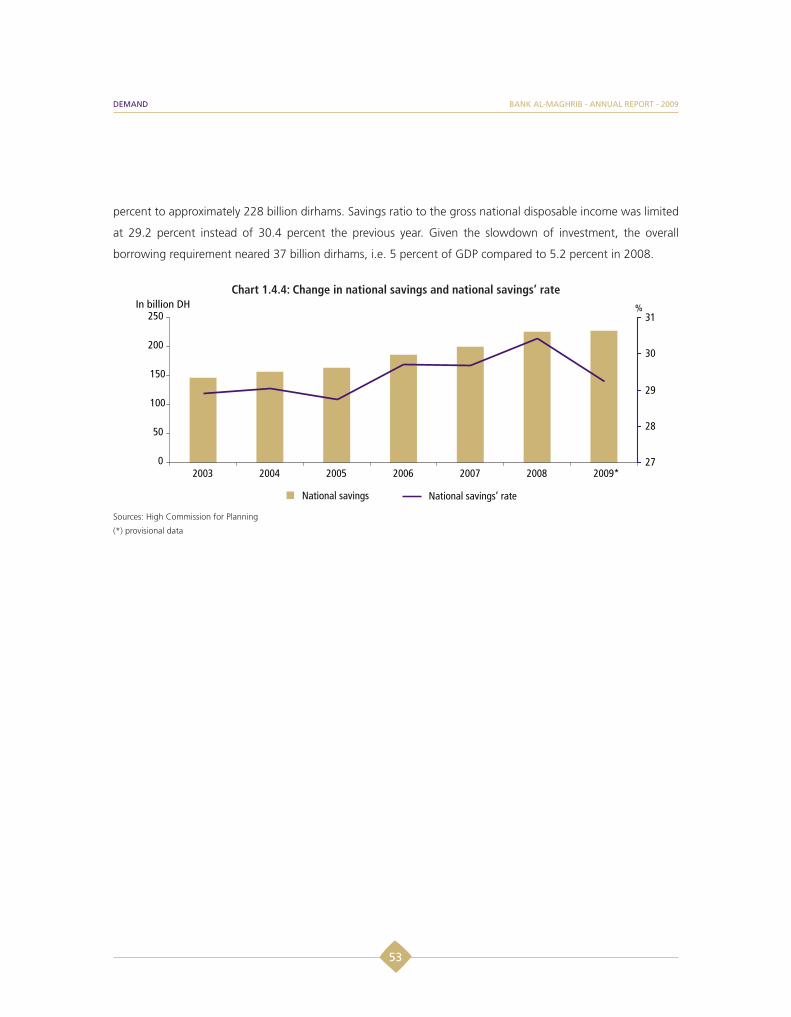
percent to approximately 228 billion dirhams. Savings ratio to the gross national disposable income was limited
at 29.2 percent instead of 30.4 percent the previous year. Given the slowdown of investment, the overall
borrowing requirement neared 37 billion dirhams, i.e. 5 percent of GDP compared to 5.2 percent in 2008.
Chart 1.4.4: Change in national savings and national savings’ rate
Sources: High Commission for Planning
(*) provisional data
53
BANK AL-MAGHRIB - ANNUAL REPORT - 2009DEMAND

1.5!Economic and financial flows
In 2009, the borrowing requirement of the economy reached almost 37 billion dirhams because of general
government deficit and the gap between the private sector’s investment expenditure and its savings. As foreign
investments and loans failed to fully meet this requirement, the net foreign assets were marked down for the
second consecutive year.
1.5.1 Nonfinancial transactions
Gross national disposable income (GNDI) grew by nearly 5 percent to 780 billion dirhams. Consumption totaled
552 billion dirhams, whereas the national saving increased by a mere 0.6 percent to 228 billion dirhams. The ratio
of savings to the GNDI therefore fell from 30.4 percent to 29.2 percent. However, given the sharp slowdown
in total investment, up only 0.9 percent from 31.2 percent in 2008, the overall borrowing requirement of the
economy did not decline markedly, reaching nearly 37 billion dirhams, down from 37.4 billion in 2008.
1.5.2 Financial transactions
Overall, the monetary financing of the economy slowed in 2009, compared to rates seen during the last three
years. On other channels of financing, the financial sector and general government again registered a positive
net flow, while net private investment fell from one year to the other.
General government
General government deficit reached 15.9 billion dirhams in 2009, compared with a 3.1 billion surplus in 2008,
mostly because of the decline in tax revenues and the rise in investment expenditures. 69 percent of this deficit
was financed by external loans and 31 percent by the domestic market, mainly through Treasury bills.
BANK AL-MAGHRIB - ANNUAL REPORT - 2009
54

Private sector
Given the slowdown in consumption and investment expenditure, the private sector’s borrowing requirement
fell from 40 billion dirhams to 21 billion. Net investments of private individuals and businesses on the domestic
market declined 8 billion dirhams.
Net flows of bank credit to the private sector fell sharply compared to last year, from 104.6 to 54.9 billion
dirhams, while the change in deposits with banks totaled 20.7 billion. As a consequence, the monetary financing
of the private sector stood at 34.2 billion. Regarding nonmonetary investments, institutional savings were at
23.8 billion dirhams and net subscriptions to UCITS amounted to 10.9 billion, compared with 7.9 billion of net
repurchases in 2008. In contrast, net investments in Treasury bills fell from 5.3 billion in 2008 to nearly 800
million in 2009.
The external financing of the private sector totaled 18.4 billion, including 11.1 billion of net direct investment
and 7.3 billion of commercial loans.
Financial sector
Banking sector
In 2009, credit institutions registered a net flow of 4.7 billion dirhams vis-à-vis other resident sectors. They
distributed 56 billion of loans to the private sector and financial institutions, and increased their portfolio of
Treasury bills by 4.4 billion. Given the 38.1 billion of monetary balances held by other sectors, the monetary
financing of the economy by credit institutions stood at 18.3 billion. On the capital markets, credit institutions
collected 13.6 billion, mainly in the form of certificates of deposit. Net foreign assets fell 7 billion, after declining
11 billion in 2008.
BANK AL-MAGHRIB - ANNUAL REPORT - 2009
55
ECONOMIC AND FINANCIAL FLOWS

Nonbanking financial sector
Comprising mainly insurance companies, pension funds, provident companies and mutual funds, the sector
collected 23.8 billion dirhams as institutional savings and 14.8 billion dirhams in mutual fund shares. It financed
the private sector through the purchase of stocks and bonds, the Government through the purchase of Treasury
bills and the banking sector through increased deposits. In total, the financial sector, excluding credit institutions,
mobilized a net 8.8 billion dirhams in 2009.
Rest of the world
Nonfinancial transactions resulted in a deficit vis-à-vis the rest of the world of about 37 billion dirhams. External
financial flows were up, from 15.9 to 31.1 billion dirhams, covering a 4.6 billion drop in direct investment and a
19.8 billion increase in external borrowing. Despite the growth in capital flows, financing the deficit vis-à-vis the
rest of the world again led to a decline in foreign reserves.
56
BANK AL-MAGHRIB - ANNUAL REPORT - 2009BANK AL-MAGHRIB - ANNUAL REPORT - 2009ECONOMIC AND FINANCIAL FLOWS

1.6 Inflation
After reaching 3.7 percent in 2008, headline inflation measured by the change in the consumer price index (CPI)
fell significantly to 1.0 percent in 2009, below the average of 1.9 percent observed during the 1997-2008 period.
Core inflation, which excludes volatile food and regulated goods, was down from 4.5 percent to 0.7 percent, the
lowest level ever recorded in the last twenty years.
The decrease in inflation is mainly related to the decline in international commodity prices and the ease in
demand pressures from partner countries. The change in the prices for tradables and nontradables reflects the
significant drop in world prices of energy commodities and staple food as a factor in the downward adjustment
of inflation in 2009. Therefore, inflation of tradable goods stood at 0.3 percent, from 5.6 percent in 2008. The
decline in inflation affected, to a lesser extent, nontradable goods whose prices fell from 1.9 percent in 2008 to
1.7 percent in 2009.
The transmission of lower commodity prices was more reflected in production costs. The producer price index
for the manufacturing industry indeed lost 15.3 percent, compared with a rise of 18.2 percent a year earlier. The
downturn affected both the refining and coking industry and the nonrefining manufacturing industries.
1.6.1 Consumer price index
The consumer price index increased 1 percent, down from 3.7 percent a year earlier. The slowdown in inflation is
attributable to the decline in international commodity prices, particularly staple food prices whose transmission
to consumer prices was largely driven by the moderation of demand pressure. Under these conditions, the
easing of inflationary pressures was more reflected in the change in core inflation that fell from 4.5 percent to
0.7 percent.
The decline was particularly marked in the prices of staple food which, after contributing 2.1 percentage points
to inflation in 2008, contributed a negative 0.5 point in 2009. The largest decreases were observed in the prices
for cereal-based products, which fell 5.2 percent, compared to an increase of 15.2 percent in 2008, and oils that
were down 3.3 percent compared to an increase of 24.8 percent.
BANK AL-MAGHRIB - ANNUAL REPORT - 2009
57
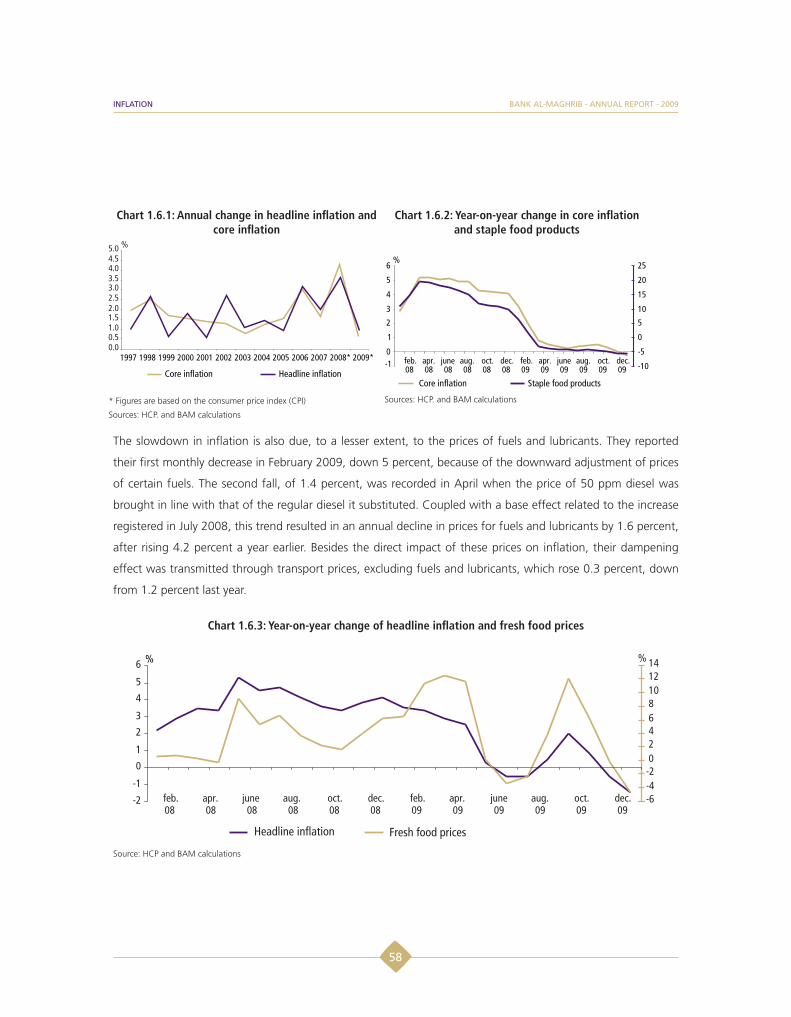
Chart 1.6.1: Annual change in headline inflation and core inflation
Chart 1.6.2: Year-on-year change in core inflation and staple food products
* Figures are based on the consumer price index (CPI)
Sources: HCP. and BAM calculations
Sources: HCP. and BAM calculations
The slowdown in inflation is also due, to a lesser extent, to the prices of fuels and lubricants. They reported
their first monthly decrease in February 2009, down 5 percent, because of the downward adjustment of prices
of certain fuels. The second fall, of 1.4 percent, was recorded in April when the price of 50 ppm diesel was
brought in line with that of the regular diesel it substituted. Coupled with a base effect related to the increase
registered in July 2008, this trend resulted in an annual decline in prices for fuels and lubricants by 1.6 percent,
after rising 4.2 percent a year earlier. Besides the direct impact of these prices on inflation, their dampening
effect was transmitted through transport prices, excluding fuels and lubricants, which rose 0.3 percent, down
from 1.2 percent last year.
Chart 1.6.3: Year-on-year change of headline inflation and fresh food prices
Source: HCP and BAM calculations
58
BANK AL-MAGHRIB - ANNUAL REPORT - 2009INFLATION

The magnitude of the decline in inflation in 2009 was offset by higher prices for fresh produce. Indeed, the
increasing number and importance of adverse supply shocks resulted in a significant increase in the prices of
these products that positively contributed 0.8 percentage point to inflation. During the year, they experienced
a sustained month-to-month rise between February and April, because of the impact of weather conditions
on the supply of vegetables. As a result of the seasonal increase observed during the month of Ramadan -this
year worsened by the supply problems of certain products-, the rise in fresh produce prices again accelerated in
August and September, before a downward adjustment took place in the fourth quarter.
Table 1.6.1: Major items of the consumer price index
(Base 100 in 2006)
Groups of productsWeights year-on-year variation %
in % 2008 2009
Consumer price index, including: 100 3.7 1.0
Items not included in core inflation 32.9 2.3 1.6
- Food products 12.1 4.4 3.1
- Fuels and lubricants 2.4 4.2 -1.6
- Administered prices, except fuels and lubricants 18.4 0.6 0.9
Core inflation 67.1 4.5 0.7
- Food products included in core inflation 26.1 9.0 -0.1
- Clothing items and shoes 3.9 1.8 0.9
- Housing, water, gas, electricity and other fuels(1) 7.0 1.8 1.6
- Furniture, housewares and routine household maintenance 4.9 1.5 1.9
- Health(1) 0.1 1.2 0.8
- Transportation (1) 7.0 1.2 0.3
- Communications 3.5 -1.6 -4.5
- Leusure and culture 2.2 -0.7 -0.5
- Education 3.9 3.2 5.4
- Restaurants and hotels 2.9 2.9 1.8 - Miscellaneous goods and services 5.5 2.1 2.1
(1) Excluding administered goods
Sources: HCP, and BAM calculations
59
BANK AL-MAGHRIB - ANNUAL REPORT - 2009INFLATION

Chart 1.6.4: Contribution of major headings to headline inflation (in percentage points)
* Figures are based on the CPI
** This heading corresponded to “private transportation” before 2008
Sources: HCP, and BAM calculations
60
BANK AL-MAGHRIB - ANNUAL REPORT - 2009INFLATION

Box 1.6.1: The new consumer price index (CPI)
The High Commission for Planning (HCP) released in December 2009 the new Consumer Price Index (CPI),
which replaced the Cost of Living Index (CLI). The main differences between the CPI (base 100 in 2006) and
the CLI (base 100 in 1989) relate to the target population, geographical coverage, the weighting pattern, the
method of calculation and the basket of products.
Target population: The new index covers all the urban population, contrary to the CLI which was limited to
an urban population with «medium living conditions». The widening of the target population will extend the
CPI coverage to all socio-economic classes.
Geographic coverage: The CPI covers a wider geographical area, comprising 17 cities instead of 11, namely
Agadir, Casablanca, Fez, Kenitra, Marrakech, Oujda, Rabat, Tetuan, Meknes, Tangier, Laayoune, Al-Hoceima,
Settat, Beni Mellal, Safi, Guelmim, and Dakhla.
Weights: CPI weights are based on data from the national household consumption and spending survey of
2001, and the household income and standard of living survey of 2007.
Method of calculation: The HCP uses the chain Laspeyres which calculates the price indexes in each of the 17
cities at the different levels of the nomenclature, before aggregating them into a single national price index.
Unlike the CLI where all cities had the same weighting pattern, the CPI has a weighting pattern specific to
each city.
New products: In order to better reflect the change in the consumption habits of the target population, about
a hundred of new goods and services, accounting for 6.5 percent of the overall index, have been included in
the new basket (e.g. cell phone, higher education tuition fees, etc.)
Under the new system for the classification of goods and services which is modeled after that of the United
Nations Statistical Commission, the adopted nomenclature divides household expenditure into 12 divisions,
41 groups, 88 classes, 112 sections, 478 products and 1,067 varieties.
61
BANK AL-MAGHRIB - ANNUAL REPORT - 2009INFLATION

Prices of goods and services1
The breakdown of the CPI basket into goods and services shows that the deceleration in inflation mainly affected
goods, as the prices of services grew at a rate similar to last year.
Chart 1.6.5: Annual change in the prices of goods and services
* Figures are based on the CPI
Sources: HCP, and BAM calculations
Prices of processed goods, excluding fuels and lubricants, were down 0.2 percent, compared to a 5.5 percent
increase in the previous year. This was due to the transmission of declining international food prices to domestic
prices for oil and cereal-based products. In contrast, prices for unprocessed goods, consisting mostly of fresh
food, rose 4.2 percent in 2009 instead of 3.1 percent in 2008. Prices of services increased 1.3 percent, almost
similar to the 1.2 percent recorded in the previous year. Overall, prices of goods contributed 0.6 percentage
point to inflation, from 3.2 percentage points in 2008, while services’ contribution was limited to 0.4 percentage
point.
1 The breakdown of goods and services was revised based on the structure of the new consumer price index, while maintaining the same breakdown principle applied before.
62
BANK AL-MAGHRIB - ANNUAL REPORT - 2009INFLATION
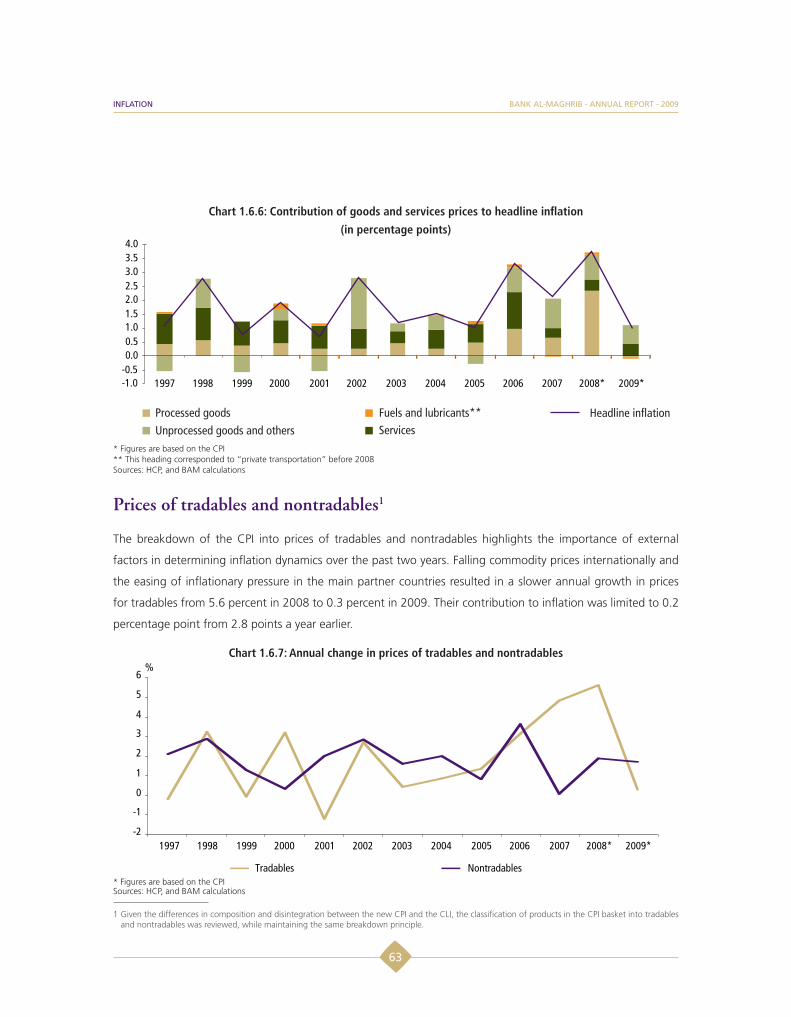
Chart 1.6.6: Contribution of goods and services prices to headline inflation (in percentage points)
* Figures are based on the CPI ** This heading corresponded to “private transportation” before 2008Sources: HCP, and BAM calculations
Prices of tradables and nontradables1
The breakdown of the CPI into prices of tradables and nontradables highlights the importance of external
factors in determining inflation dynamics over the past two years. Falling commodity prices internationally and
the easing of inflationary pressure in the main partner countries resulted in a slower annual growth in prices
for tradables from 5.6 percent in 2008 to 0.3 percent in 2009. Their contribution to inflation was limited to 0.2
percentage point from 2.8 points a year earlier.
Chart 1.6.7: Annual change in prices of tradables and nontradables
* Figures are based on the CPI Sources: HCP, and BAM calculations
1 Given the differences in composition and disintegration between the new CPI and the CLI, the classification of products in the CPI basket into tradables and nontradables was reviewed, while maintaining the same breakdown principle.
63
BANK AL-MAGHRIB - ANNUAL REPORT - 2009INFLATION

Nontradables inflation was 1.7 percent in 2009 against 1.9 percent in 2008, and contributed 0.8 percentage
point to inflation. This is largely attributable to the second-round effects of falling prices of tradable goods, and
the continued easing of pressure from domestic demand that began at the end of the previous year. This slight
decline mainly reflects the less rapid growth in prices of transportation and catering services, as well as the
significant decrease in communication costs. Detailed analysis also indicates that the decrease of nontradables
inflation would have been more pronounced in the absence of the price rise in meat, up 3.9 percent from 3.5
percent in 2008, and education services, up 5.4 percent from 3.2 percent a year earlier.
Chart 1.6.8: Contribution of tradables’ and nontradables’ prices to headline inflation (in percentage points)
* Figures are based on the CPI
Sources: HCP, and BAM calculations
64
BANK AL-MAGHRIB - ANNUAL REPORT - 2009INFLATION

Box 1.6.2: World inflation in 2009
Global inflation decreased in 2009, after the record highs of 2008. This decline in inflation is attributable to
the sharp fall in the prices of energy and agricultural commodities which, in turn, significantly impacted the
“energy” and “food” components of the CPI basket. These two categories had pushed inflation up in 2008,
subsequent to the strong rise in the first half of the year.
Moreover, downward pressure on prices reflected, on the one hand, the increase in spare capacity due to the
contraction of economic activity, and on the other, significant base effects related to commodity prices. These
played a key role in maintaining global inflation at low levels and even negative in some countries in 2009,
given the high commodity prices in 2008.
Chart B 1.6.2.1: Change in inflation by group of countries (Year-on-year)
Chart B 1.6.2.2: Price index of energy and nonenergy commodity (in level. base 100=2000)
Sources: IMF and HCP Source: World Bank
Indeed, many advanced countries experienced negative inflation, in particular the United States and some
euro area countries. Consumer prices grew at an annual rate of minus 0.3 percent in the U.S. and 0.3
percent in the euro area. In contrast, inflation averaged 5.2 percent in all emerging countries. The drop in
inflation mainly in the major partner countries passed through to domestic prices in Morocco via the prices
of tradables.
The trend in global inflation also reflected the trend of economic activity. Following the contraction observed
in the first quarter 2009, global growth turned positive in the second, third and fourth quarters of the year.
The slight recovery in economic activity was accompanied by a rebound in global inflation starting from
August 2009.
65
BANK AL-MAGHRIB - ANNUAL REPORT - 2009INFLATION

1.6.2 Manufacturing producer prices
The producer price index for the manufacturing industry declined 15.3 percent in 2009 after an 18.2 percent
increase in 2008. This is due to falling international commodity prices and the weakening U.S. dollar. This trend
mainly reflects the change in the producer prices for “coking and refining” and “chemical” industries which
fell 33.6 percent and 30.2 percent in 2009, respectively, after increasing by 32.2 percent and 52.5 percent in
2008. The contribution of price changes in these two industries to the fall in the general index is estimated at
15 percentage points, while they accounted for 85 percent of its rise in 2008.
Similarly, the prices in the “food industry” and “metal industry” trended down in 2009, but at less rapid rates
of 0.4 percent and 9.3 percent, respectively, compared to an increase in 2008 by 8.8 percent and 5.3 percent.
Overall, prices in these two sectors contributed 0.4 percentage point to the decline in the producer price index
for manufacturing.
Chart 1.6.9: Annual change in the contribution of prices of major headings to the producer price index for the
manufacturing industries(In percentage points)
Chart 1.6.10: Annual change in the main producer price indexes for the manufacturing
industries
Source: HCP. and BAM calculations
Source: HCP
The change in international commodity prices did not affect production costs in the “textile” and the “clothing
and fur” industries, which are more impacted by changes in wages. The latter are a dominant cost factor for
these labor intensive industries. In 2009, producer prices in the «textile industry» remained unchanged, while
they had edged down 0.3 percent in 2008. Meanwhile, prices in the clothing and fur industry increased 0.7
percent from 0.1 percent in 2008.
66
BANK AL-MAGHRIB - ANNUAL REPORT - 2009INFLATION

Table 1.6.2: Producer price index for the manufacturing industries (Base 100 in 1997)
Change in % Weigthtsin % 2007 2008 2009
Manufacturing industries excluding oil refining 86.7 +1.8 +13.2 -7.7
Including: Food industries 28.9 -0.1 +8.8 -0.4
Chemical industries 13.1 +5.7 +52.5 -30.2
Textile industry 6.5 -1.0 -0.3 0.0
Clothing industry 6.7 -0.6 +0.1 +0.7
Oil refining 13.3 +1.8 +32.2 -33.6
General index 100 +1.8 +18.2 -15.3 Source: HCP
67
BANK AL-MAGHRIB - ANNUAL REPORT - 2009INFLATION

1.7 External commercial and financial relations
The repercussions of the global economic crisis, which appeared starting from the second half of 2008,
significantly intensified during the first six months of 2009. They were passed on to the national economy
through exporting activities, tourism and remittances by Moroccans residing abroad, as well as investment
flows. Against this background, the negative balance of current transactions1 with abroad reached 5 percent
of GDP in 2009, compared to 5.2 percent one year earlier and an average surplus of 2.4 percent from 2001
through 2007.
Despite the large current account deficit and considering the capital and financial transactions account surplus,
net foreign assets decreased by 7 billion dirhams against 11 billion in 2008. Foreign exchange reserves made up
nearly 7.6 months of goods and services’ imports, instead of 7 months in 2008 and an annual average of 9.4
months from 2001 through 2007.
The data available for 2008 indicate a negative net external financial position totaling 265 billion dirhams or
38.5 percent of GDP, instead of 222.5 billion in 2007 or 36.1 percent of GDP. This deterioration is due to the
continued increase of liabilities for foreign direct investments and public debt, as well as to the decline in foreign
exchange reserves.
1.7.1 Balance of payments
Goods and services
The structurally negative commercial balance2 decreased by 10 percent in 2009, to 153.2 billion dirhams or 20.8
percent of GDP, compared to 24.7 percent in 2008 and an annual average close to 14 percent between 2001
and 2007. Exports having registered a stronger decrease than imports, the import-export coverage declined
significantly, from 47.8 percent to 42.2 percent within one year. As to the economy’s openness rate, it was 51.7
percent compared to 70 percent in 2008.
1 See table A 7.6
2 See tables A 7.1 to 5
BANK AL-MAGHRIB - ANNUAL REPORT - 2009
68

Chart 1.7.1: Development of trade balance
At 265.2 billion dirhams (CIF), imports decreased by 18.7 percent, a fall accounted for by all groups of products
against a backdrop of declining prices at world level, which pushed import prices down.
Chart 1.7.2: Import price index
At 54.2 billion dirhams, the energy bill decreased by 25.5 percent, with its share in total exports down from 22.3
percent to 20.4 percent. The decline was particularly perceptible for crude oil purchases, down 44.1 percent to
17.2 billion, dragged by a 35.7 percent drop in the average price of the ton and a 13 percent fall in imported
69
BANK AL-MAGHRIB - ANNUAL REPORT - 2009EXTERNAL COMMERCIAL AND FINANCIAL RELATIONS

quantities. Similarly, gas oil and fuel oil imports, which were estimated at 15.7 billion, dipped 11.1 percent, in
connection with a 35.2 percent decrease in prices, while quantities increased by 37.2 percent.
Chart 1.7.3: Breakdown of imports per usage groupChart 1.7.4: Contribution of usage groups to
imports development
Meanwhile, imports of food products, which stood at 24.3 billion dirhams, were down 23.9 percent. At 5.5
billion dirhams, wheat imports registered a fall of 55.9 percent, which covers a decrease in quantities and prices
alike, by 41.5 percent and 24.6 percent respectively.
Purchases of raw products, totaling 13.6 billion dirhams, dipped by half approximately, mainly as a result of the
strong decrease in the price of unprocessed sulfur, the import value of which went down from 11.3 billion to
1.2 billion dirhams.
At 53.6 billion dirhams, imports of semi-finished products decreased by 22.8 percent, in connection with a 48.3
percent fall in the purchases of iron and steel, the prices of which were down 46.4 percent, and with the decline
in the imports of chemical products and plastic materials, by 33.6 percent and 21.7 percent, respectively.
Similarly, at 66.8 billion dirhams, imports of capital goods fell 6.8 percent, mainly as a result of the decrease in
imports of electrical wires and cables as well as industrial vehicles, by 47 percent and 20.2 percent, respectively.
As to consumer goods imports, which came to 52.7 billion dirhams, they declined by 1.6 percent, following the
70
BANK AL-MAGHRIB - ANNUAL REPORT - 2009EXTERNAL COMMERCIAL AND FINANCIAL RELATIONS
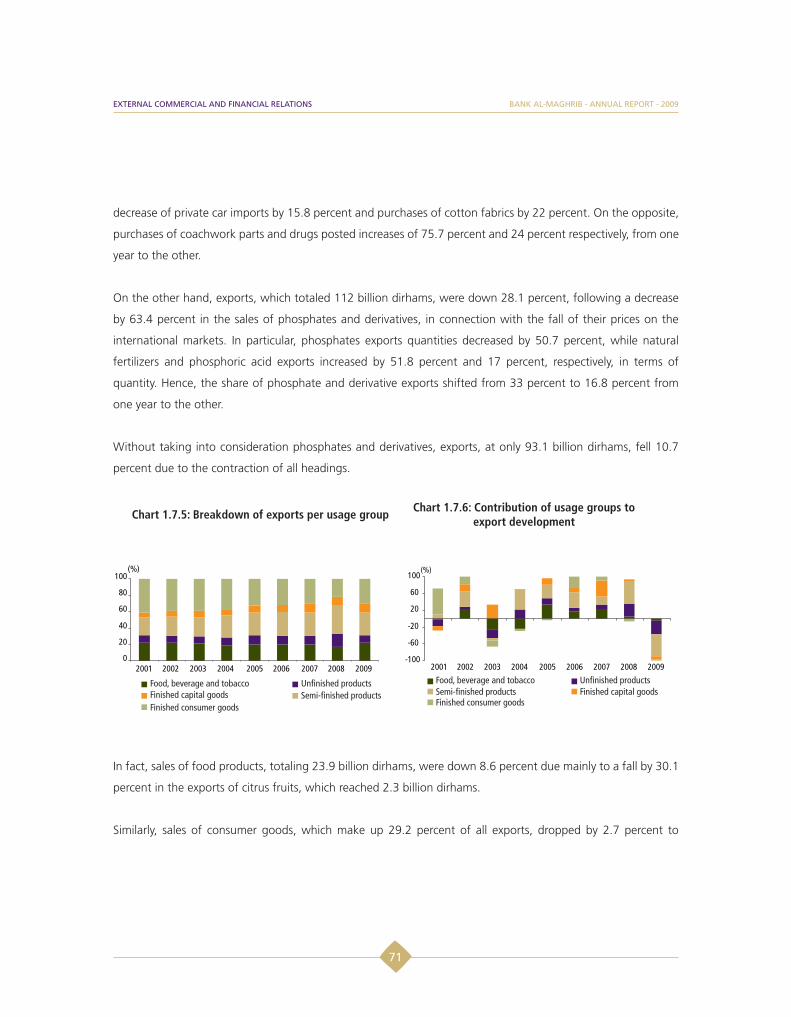
decrease of private car imports by 15.8 percent and purchases of cotton fabrics by 22 percent. On the opposite,
purchases of coachwork parts and drugs posted increases of 75.7 percent and 24 percent respectively, from one
year to the other.
On the other hand, exports, which totaled 112 billion dirhams, were down 28.1 percent, following a decrease
by 63.4 percent in the sales of phosphates and derivatives, in connection with the fall of their prices on the
international markets. In particular, phosphates exports quantities decreased by 50.7 percent, while natural
fertilizers and phosphoric acid exports increased by 51.8 percent and 17 percent, respectively, in terms of
quantity. Hence, the share of phosphate and derivative exports shifted from 33 percent to 16.8 percent from
one year to the other.
Without taking into consideration phosphates and derivatives, exports, at only 93.1 billion dirhams, fell 10.7
percent due to the contraction of all headings.
Chart 1.7.5: Breakdown of exports per usage group Chart 1.7.6: Contribution of usage groups to export development
In fact, sales of food products, totaling 23.9 billion dirhams, were down 8.6 percent due mainly to a fall by 30.1
percent in the exports of citrus fruits, which reached 2.3 billion dirhams.
Similarly, sales of consumer goods, which make up 29.2 percent of all exports, dropped by 2.7 percent to
71
BANK AL-MAGHRIB - ANNUAL REPORT - 2009EXTERNAL COMMERCIAL AND FINANCIAL RELATIONS

32.7 billion dirhams. This trend mainly translates the decline in textile products sales, in connection with the
downswing in foreign demand, the sales of ready-made clothes and hosiery items having decreased by 6.2
percent and 3 percent, respectively. On the opposite, shoes exports gained 8.1 percent while exports of private
cars posted a high increase.
In turn, the exports of capital goods, which reached 12.2 billion dirhams, decreased by 21.2 percent, mainly
following the contraction of the exports of electrical wires and cables.
On the services side, tourism revenues, totaling 52.8 billion dirhams, fell 4.9 percent compared to 5.3 percent
in 2008, dragged by the slowing economic activity in the main source countries. Expenditure having reached
8.8 billion, the travel balance amounted to 44 billion dirhams, compared to 47.1 billion dirhams a year ago.
Concerning transports’ negative balance, at 1.8 billion dirhams, it worsened by 42.2 percent, whereas the
surplus of communications was 12.5 percent up.
Chart 1.7.7: Development of travel receipts and remittances by Moroccans residing abroad
72
BANK AL-MAGHRIB - ANNUAL REPORT - 2009EXTERNAL COMMERCIAL AND FINANCIAL RELATIONS

Income and current transfers
The net outflows of capital income amounted to 7.4 billion dirhams, compared to 4.1 billion dirhams in 2008.
The negative balance of private income, up from 6.7 billion dirhams to 9.4 billion, increased by 40.6 percent, due
to a 33.4 percent rise in outflows relating to the returns of foreign investments in Morocco.
The yield of public investments abroad decreased by 7.7 percent, to only 6.9 billion dirhams, following the drop
of foreign exchange reserves and international interest rates. Public debt interest payments remained almost
stable at 4.8 billion dirhams.
In parallel, revenues from private current transfers, totaling 56.6 billion dirham, were down 5.1 percent, due
to the decline of remittances by Moroccans residing abroad, from 53.1 billion dirhams to 50.2 billion. These
transfers came from the euro area (79 percent), Gulf countries (8.7 percent) and the United States (4.7 percent).
Revenues from public transfers dropped from 9.6 billion dirhams to 3.6 billion, down 62.4 percent from one
year to the next.
Chart 1.7.8: Development of current account balance
Overall, the current account deficit reached 36.8 billion dirhams, or 5 percent of GDP, at almost the same level
as in 2008.
73
BANK AL-MAGHRIB - ANNUAL REPORT - 2009EXTERNAL COMMERCIAL AND FINANCIAL RELATIONS

Capital and financial transactions account
The capital and financial transactions account showed a surplus balance of 38.2 billion, instead of 27.6 billion in
2008, mainly in response to a higher surplus in transactions made by the public sector.
Box 1.7.1: New classification of foreign liabilities
In line with the sixth edition of the Balance of Payments Manual, the IMF requested that all allocations of
SDR be reclassified within foreign liabilities, including a 5.8 billion-dirham allocation of SDR for Morocco in
2009. Besides, at the methodological level, foreign liabilities, for the year 2009, were reclassified within the
heading “Other investments”.
Transactions by the public sector in fact posted a surplus of 18.9 billion dirhams, instead of 9.3 billion dirhams a
year before, in connection with a 24 percent rise in mobilized loans, worth 28 billion dirhams, and a 31 percent
decline in debt redemption expenses, down to 9.1 billion. Borrowings, mainly from multilateral donors and
lenders and the Paris Club, were allocated to the financing of investment projects and structural reforms. Against
this background, the outstanding public external debt amounted to 152.2 billion dirhams, or 20.7 percent
of GDP instead of 19.5 percent the year before. The overall debt burden dropped 22.8 percent to 14 billion
dirhams, or 5 percent of current revenues, compared with 5.4 percent a year earlier.
Chart 1.7.9: Development of drawings, redemptions and outstanding external public debt as % of GDP
74
BANK AL-MAGHRIB - ANNUAL REPORT - 2009EXTERNAL COMMERCIAL AND FINANCIAL RELATIONS

As to foreign loans and investments, they posted a surplus of 13.5 billion dirhams, compared with 20.8 billion
a year before. Revenues dropped by 24.5 percent, mainly as a result of a 27.4 percent fall in direct investments,
down to 20.3 billion. These investments were executed by France (37 percent), Kuwait (14.9 percent) and
Spain (8.3 percent), and concerned the sectors of real-estate, banks and tourism, with respective shares of
28.9 percent, 19.5 percent and 15.2 percent. By the same token, portfolio investments, at 3.2 billion dirhams,
decreased by 32.4 percent from one year to the next. On the other hand, expenditure, which amounted to 13.1
billion, decreased by 9.4 percent, in connection with a 72.5 percent drop in private debt redemption.
The negative balance of Moroccan loans and investments abroad decreased significantly, from 4.6 billion
dirhams to 2.4 billion, in response to a 23.4 percent fall in expenses and a 38 percent rise in receipts. Portfolio
investments by residents abroad declined by 50.2 percent while sales markedly increased, from 25.5 million
dirhams to 971.4 million.
Chart 1.7.10: Breakdown of foreign direct investments per sector
In turn, the surplus balance of commercial loans substantially improved, from 764 million dirhams to 2.2 billion,
particularly due to the decline of expenses by 11.5 percent, while receipts almost stabilized.
75
BANK AL-MAGHRIB - ANNUAL REPORT - 2009EXTERNAL COMMERCIAL AND FINANCIAL RELATIONS

1.7.2 International investment position
In 20081, the stock of financial assets and liabilities with the rest of the world, as represented in the international
investment position, showed a net debtor position of 265 billion dirhams, or 38.5 percent of GDP, as compared
with 36.1 percent in 2007. This deterioration was mainly attributable to the increased net debtor position of
direct investments and other investments2, as well as to a decline in the stock of reserve assets.
Box 1.7.2: The international investment position
A main part of external accounts, the international investment position has been elaborated by the Foreign
Exchange Office since 2002. It depicts, at a given date, the stock of an economy’s financial assets and liabilities
vis-à-vis the rest of the world, taking into account the impact, on the existing stocks, of the financial flows
registered by the balance of payments as well as of other factors such as changes in prices and exchange
rates. It is composed of four headings: direct investments, portfolio investments, other investments and
reserve assets.
Table 1.7.1: Development of the international investment position (In billions of dirhams)
Headings 2006 2007 2008
Assets Liabilities Balance Assets Liabilities Balance Assets Liabilities Balance
Direct investments 8.9 253.2 -244.3 10.3 297.8 -287.5 13.8 319.0 -305.2
Portfolio investments 1.5 17.8 -16.3 7.1 25.3 -18.2 8.3 26.0 -17.7
Other investments 13.2 140.7 -127.5 14.7 149.9 -135.2 14.5 165.5 -151.0
Reserve assets 199.9 - 199.9 218.4 - 218.4 208.9 - 208.9
Net position 223.5 411.7 -188.2 250.5 473.0 -222.5 245.5 510.5 -265.0Source: Foreign Exchange Office
Assets
Standing at 245.5 billion, the outstanding financial assets held by residents dropped 2 percent, mainly in
connection with a decline in reserve assets which account for 85.1 percent of them. The latter fell 4.4 percent
under the effect of a 4.6 percent decrease in currency holdings, down to 202.7 billion dirhams.1 The data relating to the international investment position, which are prepared by the Foreign Exchange Office, are published six months after the closing
date of the financial year.
2 See table A 7.7
76
BANK AL-MAGHRIB - ANNUAL REPORT - 2009EXTERNAL COMMERCIAL AND FINANCIAL RELATIONS
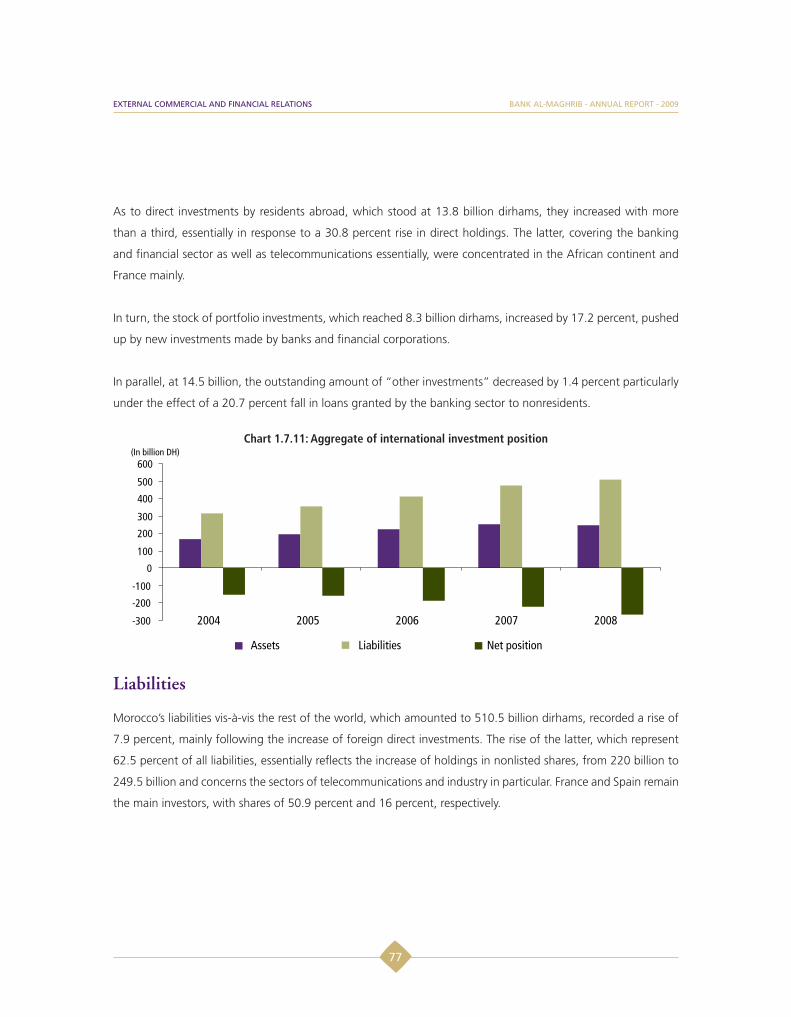
As to direct investments by residents abroad, which stood at 13.8 billion dirhams, they increased with more
than a third, essentially in response to a 30.8 percent rise in direct holdings. The latter, covering the banking
and financial sector as well as telecommunications essentially, were concentrated in the African continent and
France mainly.
In turn, the stock of portfolio investments, which reached 8.3 billion dirhams, increased by 17.2 percent, pushed
up by new investments made by banks and financial corporations.
In parallel, at 14.5 billion, the outstanding amount of “other investments” decreased by 1.4 percent particularly
under the effect of a 20.7 percent fall in loans granted by the banking sector to nonresidents.
Chart 1.7.11: Aggregate of international investment position
Liabilities
Morocco’s liabilities vis-à-vis the rest of the world, which amounted to 510.5 billion dirhams, recorded a rise of
7.9 percent, mainly following the increase of foreign direct investments. The rise of the latter, which represent
62.5 percent of all liabilities, essentially reflects the increase of holdings in nonlisted shares, from 220 billion to
249.5 billion and concerns the sectors of telecommunications and industry in particular. France and Spain remain
the main investors, with shares of 50.9 percent and 16 percent, respectively.
77
BANK AL-MAGHRIB - ANNUAL REPORT - 2009EXTERNAL COMMERCIAL AND FINANCIAL RELATIONS
The increase of “other investments”, the stock of which is estimated at 165.5 billion dirhams, is largely attributable
to a 9.8 percent surge in the outstanding public external debt which amounted to 134 billion dirhams, or 19.5
percent of GDP. The outstanding private external debt1 moved from 7 billion dirhams down to 6.5 billion.
In parallel, the stock of liabilities for portfolio investments, which stood at 26 billion dirhams, increased by 2.8
percent, in connection with the rise in both listed and non-listed securities.
Box 1.7.3: Main measures adopted in 2009 in connection with the settlement of commercial and financial transactions with abroad
The year 2009 was marked by the introduction of new liberalization measures aiming at simplifying and
relaxing the commercial transactions regulations, as well as travel allowances:
-Business trip allowances are now granted in a single or several installments, not exceeding 60,000
dirhams for companies coming under the Moroccan law and micro-credit associations or state-approved
associations. For natural persons practicing professions, this allowance is capped at 30,000 dirhams.
-The new provisions of the regime governing settlements between Morocco and abroad have extended
the possibility to hold accounts in dirhams or “special accounts” to other nonresident foreign entities.
They also provide for the introduction of new methods for the payment of foreign banknotes in foreign
currency accounts and foreign accounts in convertible dirhams and draw a distinction between accounts
in convertible dirhams held by the foreign correspondents of Moroccan banks and those open in the name
of customers.
-The redefinition, for the sea transport regime, of the regulatory framework relative to the consignment of
containers by shipping agents and the regulation of passengers sea transport. As to the goods and services
import regime, sums collected from sales within the frame of shows are now freely transferable.
-The upper limit for noncommercial exports has been increased from 3,000 to 10,000 while the ceiling for
samples intended for exporters’ foreign customers has been raised from 10,000 to 20,000.
-Companies holding contracts abroad have been permitted to transfer up to 20 percent of the contract’s
value in order to cover preliminary expenses. They are also allowed to open accounts with banks for the
execution of these contracts, pending the approval of the Foreign Exchange Office.
1 Excluding loans between affiliated parties, advances in current accounts and commercial loans
78
BANK AL-MAGHRIB - ANNUAL REPORT - 2009EXTERNAL COMMERCIAL AND FINANCIAL RELATIONS
1.8 Public finance
The execution of the 2009 Finance Act took place in a context of slowing growth in many nonagricultural
activities. Impacted also by the new tax adjustments, particularly with regard to corporate tax and income tax,
revenues fell to 23 percent of GDP, following the record expansion registered over the last two years1. Conversely,
despite the strong decline in subsidization costs, overall expenditure increased owing to the economy stimulus
efforts through the fostering of investment spending.
These developments led to a fiscal deficit of 15.9 billion or 2.2 percent of GDP, compared to a surplus of
0.4 percent in 2008 and 0.1 percent of GDP in 2007. Nonetheless, the process of reducing the Treasury’s
indebtedness rate compared to GDP continued in 2009 as this rate stood at 46.9 percent compared to 47.2
percent in 2008.
1.8.1 2009 Finance Act
The 2009 Finance Act was based on a real growth rate at 5.8 percent, an inflation rate at 2.9 percent, an oil price
of 100 dollars a barrel and a euro-dollar exchange rate at 1.4. Fiscal deficit, excluding privatization receipts, was
expected to stand at 3.3 percent of GDP instead of 3.5 percent in the 2008 Finance Act, as current receipts and
overall expenditures are expected to increase by respectively 22.1 percent and 20.2 percent.
The growth in overall expenditures was projected to result from higher subsidization costs and equipment
expenses. Indeed, oil and cereal prices forecasts on the international markets suggested a rise by 87.8 percent
in subsidization costs, while equipment spending was expected to grow by 19.3 percent, in line with the
continuation of big road and railway infrastructure projects, as well as in the water sector. In turn, personnel
expenses were expected to rise by 12.9 percent.
Conversely, the improvement in current receipts was expected to be driven by a 22.3 percent growth in tax
revenues, while nontax revenues, excluding privatization, were likely to increase by 24.7 percent owing to the
45.1 percent growth in monopoly receipts.
1 See statistical appendices A8.1 to 3
BANK AL-MAGHRIB - ANNUAL REPORT - 2009
79

In addition, the 2009 Finance Act included a number of tax adjustments that, as a continuation of the ongoing
process for many years now, concerned corporate tax, income tax, value added tax as well as customs duties tax.
Box 1.8.1: Main tax measures adopted in the 2009 Finance Act
The main measures adopted in terms of income tax concern adjusting the tax scale by raising the tax
exemption level from 24,000 to 28,000 dirhams, modifying all intermediate brackets and corresponding
rates and reducing the marginal rate from 42 percent to 40 percent for all incomes above 150,000 dirhams
instead of 120,000 dirhams previously. In addition, it was decided to raise, on the one hand, the amount
of the discount for family costs from 180 dirhams to 360 dirhams per dependent, while not exceeding a
maximum of 6 persons, and on the other hand, to raise the discount rate for professional expenses for
employees from 17 percent to 20 percent while not exceeding 28,000 dirhams.
With regard to corporate tax, for SMEs which during the year 2009 increase their capital through
contribution in cash or the partner’s current accounts, the Finance Act enacted a 20 percent decrease in the
tax rate applied to the amount of the capital increase.
The Finance Act also comprises measures common to both income tax and corporate tax. Indeed, the
tax exemption of agricultural incomes from these two taxes was renewed until December 31, 2013. The
50 percent tax deduction for real-estate developers that build 1,500 apartments in the framework of
agreements signed with the State was extended as well.
In line with the VAT reform, the main measures adopted concerned exempting anti-cancer and antiviral
drugs of this tax, as well as raising the tax rate from 7 percent to 10 percent for turnpike highway. In
addition, in order to harmonize the liability thresholds in terms of VAT and income tax, the VAT liability
threshold was raised from 180,000 to 500,000 dirhams of turnover.
Concerning customs duties tax, tariffs reduction continued standing at 35 percent in 2009, before they
reach, in 2012, the maximum rate of 25 percent.
80
BANK AL-MAGHRIB - ANNUAL REPORT - 2009PUBLIC FINANCE

1.8.2 Execution of 2009 Finance Act
The 2009 fiscal year recorded a deficit of 15.9 billion dirhams or 2.2 percent of GDP, compared to a surplus at
0.4 percent of GDP in 2008. This is due to a 7 percent drop in current receipts as a result of falling tax revenues,
while overall expenditures grew 2.4 percent, driven by the 22.8 percent rise in equipment spending. The latter
was covered up to 80 percent by a public saving amounting to more than 38 billion or 5.2 percent of GDP.
Table 1.8.1 :Treasury expenditure and receipts
2008* in % of GDP 2009 in % of GDP
Current receipts 204,675 29.7 190,525 25.9
Tax receipts 185,651 27.0 169,008 23.0
Of which: - Direct taxes 81,827 11.9 71,580 9.7
of which: Corporate tax 46,290 6.7 43,532 5.9
Indirect taxes 33,312 4.8 25,803 3.5
- Indirect taxes 79,943 11.6 76,146 10.3
Value added tax 61,250 8.9 56,516 7.7
Domestic consumer taxes 18,693 2.7 19,630 2.7
- Customs duties 13,706 2.0 11,830 1.6
Nontax receipts 16,269 2.4 18,302 2.5
Receipts of some Treasury special accounts 2,755 0.4 3,216 0.4
Price support Fund 521 0.1 560 0.1
Roads special Fund 2,234 0.3 2,656 0.4
Overall expenditure 201,605 29.3 206,459 28.0
Current expenditure 157,036 22.8 152,090 20.7
Current expenditure excluding subsidization 125,586 18.2 139,302 18.9
Goods and services 107,355 15.6 121,828 16.5
of which: employees 70,315 10.2 75,264 10.2
81
BANK AL-MAGHRIB - ANNUAL REPORT - 2009PUBLIC FINANCE

2008* in % of GDP 2009 in % of GDP
Debt service 18,231 2.6 17,474 2.4
Domestic 15,389 2.2 14,613 2.0
External 2,842 0.4 2,861 0.4
Subsidization 31,450 4.6 12,788 1.7
Including Price Support Fund 544 0.1 594 0.1
Transfers to local governments 18,375 2.7 16,955 2.3
Current balance 47,639 6.9 38,435 5.2
Investment spending 37,740 5.5 46,361 6.3
Of which Roads Special Fund 2,195 0.3 2,567 0.4
Balance of other Treasury special accounts -6,829 -1.0 -8,008 -1.1
Overall surplus or deficit 3,070 0.4 -15,934 -2.2
Primary balance 21,301 3.1 1,541 0.2
Change in arrears -1,992 -0.3 -4,063 -0.6
Financing requirements or surplus 1,078 0.2 -19,997 -2.7
Domestic financing -12,160 -1.8 7,289 1.0
External financing 11,082 1.6 12,708 1.7
Drawings 20,551 3.0 17,663 2.4
Amortization -9,469 -1.4 -4,955 -0.7
Privatization 0 0 *Revised figures
Treasury current receipts
Following a period of ongoing growth since 2003, culminating in a record rise in 2008, current receipts
dropped 7 percent in 2009 to stand at 190.5 billion. This drop is mainly the result of a 9 percent decrease in tax
receipts which, including the VAT transferred to local governments, stood at 169 billion, that is a tax burden at
23 percent compared to 27 percent in the preceding year.
82
BANK AL-MAGHRIB - ANNUAL REPORT - 2009PUBLIC FINANCE

Chart 1.8.1 : Treasury current receipts
Direct taxes which fell by 12.5 percent generated 71.6 billion, representing nearly 42 percent of total tax receipts
compared to 44 percent a year earlier. This drop reflects the adjustment of rates and brackets on income tax,
the base effect related to two consecutive years of strong growth and slowing nonagricultural activities. Indeed,
income tax revenues shrank by 22.5 percent to 25.8 billon, while corporate tax receipts, at 43.5 billion, dropped
6 percent.
Indirect tax revenues fell at a less significant pace, 4.8 percent, to stand at 76.1 billion. VAT revenues, which
represent 75 percent of these indirect taxes, dropped 7.7 percent to stand at 56.6 billion. Reflecting mainly
the impact of slowing domestic demand, this development covers a drop by 8 percent in import VAT and 7.3
percent in domestic VAT. Conversely, revenues from consumer domestic tax, amounting to 19.6 billion, grew by
5 percent, in line with the increase in levies on energy products.
As a result of the joint effect of slowing imports and the on-going dismantling of tariffs, customs duties
receipts -amounting to 11.8 billion- fell by 13.7 percent. Likewise, registration and stamp fees, that generated
9.5 billion in revenues, dropped 7.1 percent as a result of falling real-estate transactions. As to nontax revenues,
at 18.3 billion, they grew by 12.5 percent due to the 35 percent growth in State monopoly and exploitations
receipts.
83
BANK AL-MAGHRIB - ANNUAL REPORT - 2009PUBLIC FINANCE

Treasury expenditure
Despite the strong decline in subsidization costs, Treasury overall expenditures, standing at 206.5 billion, saw
a limited increase by 2.4 percent, owing to the rise both in equipment and operating expenses. In a context of
falling prices of international oil and basic products, subsidization costs registered a marked slowdown this year,
after reaching a peak in 2008. Accordingly, they dropped from 31.5 billion to 12.8 billion, 7.9 percent of which
are accounted for by oil products and 4.9 billion by basic products.
Chart 1.8.2 : Treasury overall expenditure
Conversely, operating expenditures, at 121.8 billion, grew by 13.5 percent due to a 7 percent rise in the wage
bill, reaching nearly 75.3 billion or 10.2 percent of GDP, as a result of the wage adjustments adopted in the
framework of the social dialogue and the net creation of 10,000 jobs. Similarly, other services and goods
expenditures rose by 25.7 percent to 46.6 billion dirhams.
84
BANK AL-MAGHRIB - ANNUAL REPORT - 2009PUBLIC FINANCE

Chart 1.8.3 : Wage bill
Chart 1.8.4 : Subsidization costs
As to debt interest burden, it stood at 17.5 billion, down 4.2 percent, which covers a 5 percent drop in domestic
debt interests, linked to a decline in the Treasury’s financing average cost, and an almost stable reimbursement
of external debt interests.
85
BANK AL-MAGHRIB - ANNUAL REPORT - 2009PUBLIC FINANCE

Chart 1.8.5 : Public saving
In this context, public saving stood at 38.4 billion dirhams or 5.2 percent of GDP compared to 47.6 billion or
6.9 percent of GDP in 2008. Taking into account equipment spending at 46.4 billion, up 22.8 percent and the
negative balance of the Treasury’s special accounts at 8 billion, the Treasury’s expenditure and receipts showed
a deficit at 15.9 billion, or 2.2 percent of GDP, compared to a surplus of 0.4 percent of GDP a year earlier. As
to the primary surplus, it dropped significantly, barely representing more than 0.2 percent of GDP. Following the
payment of arrears amounting to 4.1 billion, the cash deficit stood at 20 billion dirhams, or 2.7 percent of GDP,
compared to a 1.1 billion surplus a year earlier.
Chart 1.8.6 : Change in the primary balance and the Treasury’s indebtedness
86
BANK AL-MAGHRIB - ANNUAL REPORT - 2009PUBLIC FINANCE
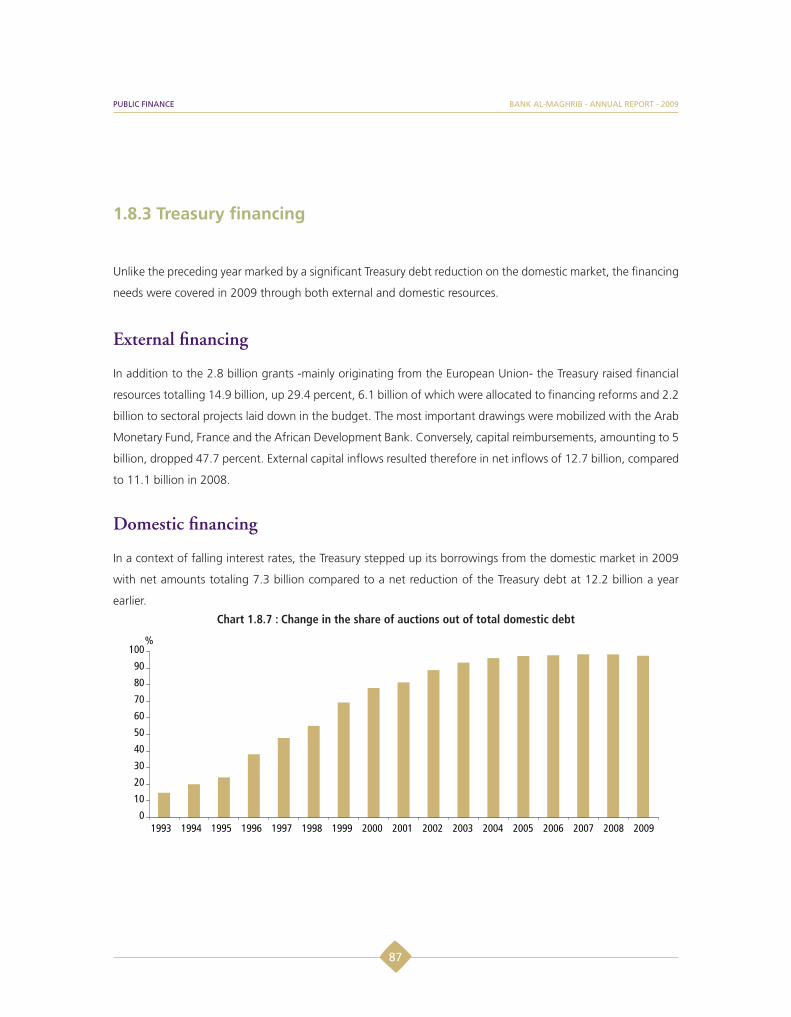
1.8.3 Treasury financing
Unlike the preceding year marked by a significant Treasury debt reduction on the domestic market, the financing
needs were covered in 2009 through both external and domestic resources.
External financing
In addition to the 2.8 billion grants -mainly originating from the European Union- the Treasury raised financial
resources totalling 14.9 billion, up 29.4 percent, 6.1 billion of which were allocated to financing reforms and 2.2
billion to sectoral projects laid down in the budget. The most important drawings were mobilized with the Arab
Monetary Fund, France and the African Development Bank. Conversely, capital reimbursements, amounting to 5
billion, dropped 47.7 percent. External capital inflows resulted therefore in net inflows of 12.7 billion, compared
to 11.1 billion in 2008.
Domestic financing
In a context of falling interest rates, the Treasury stepped up its borrowings from the domestic market in 2009
with net amounts totaling 7.3 billion compared to a net reduction of the Treasury debt at 12.2 billion a year
earlier.
Chart 1.8.7 : Change in the share of auctions out of total domestic debt
87
BANK AL-MAGHRIB - ANNUAL REPORT - 2009PUBLIC FINANCE

Focusing mainly on short and medium-term maturities, Treasury bills on the auctions’ market stood at
72.9 billion, while net borrowings1 reached 5.3 billion, compared to net reimbursements of 6.9 billion in 2008.
The volume of net purchases by insurance and provident companies stood at 12.9 billion while banks’ purchases
came to 7.1 billion. In contrast, mutual funds and the Caisse de Dépôt et de Gestion (CDG) (Deposit and
Management Fund) reduced their Treasury bills portfolio by 9.3 billion and 7 billion, respectively. The remainder
in the Treasury’s financing needs was covered through its financial channels.
1.8.4 Public debt
Meeting the financing needs of the Treasury as well as the increase in foreign borrowings of some state
companies led to a rise by 7.3 percent in the outstanding public debt2 which reached 419.3 billion dirhams, or
57 percent of GDP. The direct debt of the Treasury, up 6.1 percent in 2009 following a 1.3 percent drop in the
preceding year, stood at 345.1 billion dirhams and represented 46.9 percent of GDP, compared to 47.2 percent
of GDP a year earlier (Box 1.8.2).
Chart 1.8.8 : Public debt
1 Net borrowings refer to the positive difference between the new bills issued by the Treasury and the reimbursements made during the year. When this difference is negative, the term used is net reimbursements.
2 Refers to the total amount of the Treasury’s domestic and external debt and the guaranteed external debt.
88
BANK AL-MAGHRIB - ANNUAL REPORT - 2009PUBLIC FINANCE

The outstanding Treasury domestic debt increased year-on-year by 9.3 billion to stand at 266.4 billion,
representing 77.2 percent of the overall direct debt and 36.2 percent of GDP, compared to 79 percent and 37.3
percent respectively in 2008. The outstanding amount of Treasury bills issued by auction, up 2.1 percent, stood
at nearly 258 billion. 32 percent of this amount is held by insurance and provident companies, 27 percent by
banks and 18 percent by mutual funds.
Box 1.8.2: Medium-term sustainability of the Treasury’s indebtedness
Bank Al-Maghrib has put in place analyses models of fiscal sustainability in order to assess the impact of the various options and decisions in terms of fiscal policy on the debt and the overall and primary balances.
Simulations were carried out for the period 2010-2019, taking into account data in the 2010 Finance Act and the recent trends both nationally and internationally. Sustainability assessment is conducted on the basis of fiscal adjustment, estimated by the difference between the effective primary balance and the debt primary balance stabilizer, as well as by the trend in the debt ratio.
The simulation rests on the principle of keeping the implicit fiscal discipline, corresponding to a 3 percent GDP deficit, and assumes a GDP growth close to 5 percent for the analysis period and the absence of privatization receipts as of 2014. The spending trend is expected to stay lower than the long-term trend, while revenues level, in terms of GDP, is expected to be higher compared to its long-term trend (the last 10 years) by 0.6 point of GDP.
Results show a slight increase in the debt ratio compared to GDP, followed by a slight correction as of 2012. The Treasury’s debt ratio in percentage of GDP would then drop from 46.9 percent in 2009 to 46.5 percent in 2019. The primary average balance necessary for the stabilization of debt compared to GDP at its 2009 level is -0.44 percent. The gap between this debt stabilizer balance and the primary balance resulting from the projections indicates an average value of 0.54 percent, suggesting that the Treasury debt remains sustainable over the forecast period, taken into account the assumptions adopted.
Chart B1.8.2.1 : Direct public debt in % of GDP
89
BANK AL-MAGHRIB - ANNUAL REPORT - 2009PUBLIC FINANCE
As to the average cost of the Treasury domestic debt, it dropped year-on-year from 5.35 percent to 5.10 percent
on the back of lower interest rates on the auctions’ market. As to the structure change by residual maturity, long
term bills recorded a drop from 49 percent to 43 percent out of the overall outstanding amount while short term
bills grew from 24 percent to 29 percent. In turn, medium-term maturities grew from 27 percent to 28 percent1.
As to the public external debt stock, up 14.3 percent, it reached 152.9 billion or 20.8 percent of GDP, half of
which is accounted for by the guaranteed foreign debt. The Treasury’s direct external indebtedness stood at 78.7
billion dirhams, or 10 billion dollars, representing 22.8 percent of the Treasury’s indebtedness and 10.7 percent
of GDP, compared to 21 percent and 9.9 percent respectively in 2008.
1 Since March 2007, the Treasury has not issued any bills with maturities exceeding five years.
90
BANK AL-MAGHRIB - ANNUAL REPORT - 2009PUBLIC FINANCE

1.9 Monetary policy
In 2009, monetary policy was run amid stronger effects of world crisis on the national economy, especially during
the first semester. The fall of international commodity prices and inflation in partner countries, combined with
sluggish global demand, heavily impacted on inflation development in Morocco, pushing it down to 1 percent
this year compared to 3.7 percent in 2008. Core inflation moved from 4.5 percent in 2008 to 0.7 percent, its
20-year low.
This sharp decline in inflation and the moderating medium-run inflationary risks were the main determinants
of monetary policy decisions in 2009. Against this backdrop, the Bank Board cut its key rate by 25 basis points
during its meeting of March and kept it unchanged for the remainder of the year.
The gradual reduction of the required reserve ratio, started in December 2007, went on in 2009. The Board,
noting the scale and persistence of the liquidity squeeze on the money market and viewing the projected
development of liquidity autonomous factors, reduced the required reserve ratio twice, from 12 percent to 10
percent, and then to 8 percent starting from October 1, 2009.
At the operational level, Bank Al-Maghrib carried on with its policy aiming to regulate the money market, mainly
through liquidity injection by means of 7-day advances at auctions, the purpose being to maintain the interbank
rate close to the key rate.
1.9.1 Monetary policy decisions
On the whole, the year 2009 was marked by a notable decline in headline inflation and core inflation compared
to a year before. They even dipped below their 1.9 percent average observed from 1997 to 2008. This is mainly
due to a downturn in international demand for Moroccan products, the continued transmission of the fall in
world commodity prices to domestic ones, especially for tradables, as well as to the reduction of pressures
exerted by domestic demand and monetary conditions.
BANK AL-MAGHRIB - ANNUAL REPORT - 2009
91

Besides, as a result of the moderating medium-term inflationary risks, inflation’s consensual forecast was marked
down during the first three meetings of the Bank Board. The inflation rate projected for the end of the six-
quarter horizon moved from 2.6 percent in the Monetary Policy Report (MPR) of March to 2 percent in the
edition of September. Considering the uplift in international economic activity, starting from the third quarter
of 2009, as well as the expected transmission of the hike in international prices to domestic ones, the inflation
rate foreseen in the MPR of December was revised up to 2.5 percent, a level still in line with medium-term price
stability.
Against this background and while staying extremely vigilant about the development of inflationary risk factors,
the Bank Board cut 25 basis points off its key rate in its meeting of March 24, 2009, bringing it down to 3.25
percent, a level kept unchanged during the rest of the year.
Table 1.9.1 : Monetary policy decisions since 2006
Liquidity-withdrawal rate Key rate Monetary reserve rate
2006
Q1
Q2
Q3
Q4 Increase from 2.5% to 2.75%
2007
Q1
Q2
Q3
Q4 Decrease from 16.5% to 15%
2008
Q1
Q2
Q3 Increase from 3.25% to 3.50%
Q4 Decrease from 15% to 12%
2009
Q1 Decrease from 3.50% to 3.25%
Q2 Decrease from 12% to 10%
Q3 Decrease from 10% to 8%
Q4
In parallel, and considering the durability of banks liquidity crunch, Bank Al-Maghrib carried on the lowering of
the monetary reserve rate, started in December 2007. A total liquidity of about 17.9 billion dirhams was thus
injected as a result of this ratio’s decrease to 12 percent in the meeting of December 23, 2008 and to 10 percent
on June 16, 2009 and then to 8 percent on October 1, 2009.
92
BANK AL-MAGHRIB - ANNUAL REPORT - 2009MONETARY POLICY

Chart 1.9.1: BAM monetary reserve rate
93
BANK AL-MAGHRIB - ANNUAL REPORT - 2009MONETARY POLICY

Box 1.9.1: Evaluation of the inflation forecast in 2009
The collapse of food and energy commodity prices worldwide as well as the extent to which it passed on
to domestic consumer prices were the main reasons for the decline of inflation in 2009. Thus, viewing the
projected easing of inflationary pressures and the downtrend in internal and external risks surrounding the
central forecast amid a deteriorating international environment and a slower domestic demand, the Bank
Board decided, in its meeting of March 24, to decrease the key rate by 25 basis points to 3.25 percent.
The registered figures confirmed the consensual forecasts of Bank Al-Maghrib for the year 2009, about a
slowdown in inflation.
The mean absolute deviation was 0.7 percentage point in 2009, taking into account a foreseen rate of 1.7
percent against a realized one of 1 percent. This difference is due to the higher-than-expected decrease
in staple food and oil prices as well as to the stronger-than-projected fall in both foreign demand and the
resulting output capacity utilization rate. As to quarterly forecasts, their evaluation indicates wider gaps, of
up to 2.5 percentage points for the fourth quarter. Most of these differences stem from the strong volatility
of fresh produce in 2009, following the multiplication of offer shocks, especially climate-related ones.
Chart B 1.9.1: Gap between the consensual forecast and the realized rate of inflation (In percentage points)
94
BANK AL-MAGHRIB - ANNUAL REPORT - 2009MONETARY POLICY

1.9.2 Operational aspects of monetary policy
In 2009, the monetary policy was carried out against a background of a 6.7 billion-dirham increase in banks
liquidity crunch compared to the year before, which brought the shortage up to 17.7 billion dirhams. This
reflects the contraction of the structural liquidity position1 of banks which was down -from one year to the next
and according to end-of-week averages- from 43.7 billion dirhams to 22.8 billion in 2009. However, this deficit
would have been larger had the monetary reserve ratio not been lowered twice, bringing the monetary reserve
down by 14.6 billion to only 40.5 billion dirhams.
1 The structural liquidity position of banks (SLPB) corresponds to the net effect of liquidity’s autonomous factors on banks treasuries. It is calculated as follows: SLPB = Bank Al-Maghrib’s net foreign assets + Treasury’s net position + other net factors – notes and coins in circulation
95
BANK AL-MAGHRIB - ANNUAL REPORT - 2009MONETARY POLICY

Chart 1.9.2: Liquidity position and the reserve requirements amount (In billions of dirhams)
In order to keep the interbank rate close to the key rate, liquidity was mainly managed on the money market
through 7-day advances at auction.
As to developments during the year, banks cash holdings showed an average deficit of 13.9 billion dirhams
during the first five months of the year. This situation essentially resulted from the Treasury’s improved net
position, as well as from the fall of Bank Al-Maghrib’s net foreign assets, itself due to the contraction of travel
receipts, remittances by Moroccans residing abroad and direct foreign investment flows. During this period,
Bank Al-Maghrib principally intervened through 7-day advances at auction and injected an average 13 billion
dirhams, at 3.50 percent between January and March, and at 3.25 percent subsequently. Thus, the interbank
overnight rate was 3.31 percent on average.
Chart 1.9.3: Liquidity position and the monetary reserve amount (end-of-week averages, in billions of dirhams)
Chart 1.9.4: Impact of autonomous factors (end-of-week averages, in billions of dirhams)
96
BANK AL-MAGHRIB - ANNUAL REPORT - 2009MONETARY POLICY

Between June and September, banks refinancing requirements further intensified, to an average 21.9 billion
dirhams, pushed up by the contracting exchange reserves of the Bank and increasing currency in circulation.
To ease pressures on the interbank rate in this period, Bank Al-Maghrib raised the volume of its interventions
mainly through 7-day advances at auction at 3.25 percent, to 21.3 billion dirhams. Consequently, the interbank
rate averaged 3.18 percent.
As a result of the decreased monetary reserve ratio, in force starting from October, banks’ liquidity requirement
dropped to 18.3 billion dirhams during the last quarter of the year. In parallel, the Bank adjusted the volume of
its interventions, to 17.1 billion dirhams on average during this period, thus maintaining the market balanced at
a level close to the key rate.
Chart 1.9.5: Bank Al-Maghrib interventions (end-of-week data, in billions of dirhams)
1.9.3 Interest rates
The lowering of the key rate to 3.25 percent, as decided by the Bank Board in March 2009, influenced the
development of short-term interest rates which trended downwards overall compared to the year before.
During the first quarter of the year, the interbank overnight rate evolved around an average 3.40 percent, a level
close to the key rate of 3.50 percent. From April through November, it trended downwards overall, declining to
97
BANK AL-MAGHRIB - ANNUAL REPORT - 2009MONETARY POLICY

3.18 percent on average. This fall translates the effects of the decision, taken by the Board at the end of the first
quarter, to cut the key rate by 25 basis points. In December, the interbank rate rose slightly higher than the key
rate, to a daily average of 3.35 percent.
Over the year 2009, the interbank overnight rate averaged 3.26 percent, down 11 basis points compared to
2008. Its volatility remained almost stable compared to a year before, while the standard deviation was 0.27.
Chart 1.9.6: Trend of average weighted rate on the interbank market (daily data)
In line with variations in the interbank rate, interest rates on short-term Treasury bills trended downwards on
the whole in 2009. The latter’s yields on the primary market dropped significantly in the second quarter before
stabilizing during the rest of the year. Rates on medium-term Treasury bills showed the same trend, except in
the last quarter when they posted a relatively significant upturn. As to the secondary market, short-term rates
remained almost stable during the last half of 2009 after falling significantly in the second quarter, whereas
medium-term rates rose at year-end.
98
BANK AL-MAGHRIB - ANNUAL REPORT - 2009MONETARY POLICY

Table 1.9.2: Rates on Treasury bills on the primary market*
Average 06 Average 07 Average 08 09:Q1 09:Q2 09:Q3 09:Q4 Average 09
Short-term rates
21 days - - - 3.48 - - - 3.48
13 weeks 2.60 3.24 3.52 3.58 3.26 3.25 3.25 3.33
26 weeks 2.70 3.27 3.68 3.65 3.31 3.27 3.28 3.38
52 weeks 3.03 3.20 3.63 3.75 3.35 3.33 3.37 3.45Medium and long-term rates
2 years 3.17 3.38 3.68 3.90 3.44 3.48 3.57 3.60
5 years 3.61 3.57 3.86 4.05 3.69 3.68 3.74 3.79
10 years 4.10 3.40 - - - - - -
15 years 4.54 3.65 - - - - - -
20 years 4.87 3.81 - - - - - -
30 years 3.98 3.98 - - - - - -
(*) Arithmetic means
Like 2008, the year 2009 was marked by the absence of long-term Treasury issues. On the secondary market,
rates decreased in the second quarter, then posted a slight increase, particularly in the last quarter of the
year mainly on the back of higher demand, transactors having sought to increase their portfolio’s maturity by
acquiring long-term securities.
Table 1.9.3: Rates on Treasury bills on the secondary market*
Average 06 Average 07 Average 08 09:Q1 09:Q2 09:Q3 09:Q4 Average 09
Short-term rates
13 weeks 2.67 3.21 3.51 3.62 3.30 3.26 3.26 3.36
26 weeks 2.76 3.24 3.57 3.65 3.34 3.28 3.29 3.39
52 weeks 2.94 3.27 3.68 3.76 3.41 3.35 3.38 3.48
Medium and long-term rates
2 years 3.15 3.34 3.79 3.87 3.52 3.48 3.54 3.60
5 years 3.59 3.54 4.03 4.06 3.69 3.71 3.77 3.81
10 years 4.09 3.79 4.33 4.33 4.00 4.03 4.08 4.11
15 years 4.55 3.97 4.59 4.66 4.57 4.34 4.37 4.48
20 years 4.87 4.04 4.64 4.65 4.43 4.45 4.46 4.50
30 years 4.90 4.09 4.45 4.48 4.51 4.50 4.52 4.50
(*) Arithmetic means
99
BANK AL-MAGHRIB - ANNUAL REPORT - 2009MONETARY POLICY

Chart 1.9.7: Rates on short-term Treasury bills on the secondary market
Chart 1.9.8: Rates on medium and long-term Treasury bills on the secondary market
The lowering of rates on Treasury bills in 2009 did not impact the yield of savings accounts, due to the six-month
timelag stipulated by the indexation mechanism. The minimum rate on passbook accounts with banks1 rose to
3.20 percent, up 9 basis points compared to a year before, while the minimum rate on passbook accounts with
the Caisse d’épargne nationale2 (National Savings Fund) stabilized at 1.95 percent .
Table 1.9.4: Minimum rates on passbook accounts
2006 2007 2008 2009
Rate on passbook accounts with banks 2.53 2.45 3.11 3.20
Rate on passbook accounts with the Caisse d’épargne nationale 1.68 1.23 1.95 1.95
As to the borrowing rates applied by banks, their development overall reflected the lagged effect of the key
rate’s decrease decided at the beginning of the year. After the exceptional surge registered in 2008, the return
on time deposits adjusted downwards in 2009, the weighted average rate on 6-month and 12-month deposits
having fallen back to 3.66 percent on average, compared to 3.80 percent a year before. The development
during the year shows a sharper decline in rates on 6-month deposits. The latter went on falling as of the second
quarter of 2009, while rates on 12-month deposits went down in the third quarter before stabilizing in the rest
of the year.
1 The minimum rate on passbook accounts with banks is index-linked to the weighted average rate of the 52-week Treasury bills, issued at auction in the preceding semester, reduced by 50 basis points.
2 The minimum rate on passbook accounts with the Caisse d’épargne nationale is index-linked to the weighted average rate of the 5-year Treasury bills, issued at auction in the preceding semester, reduced by 200 basis points.
100
BANK AL-MAGHRIB - ANNUAL REPORT - 2009MONETARY POLICY
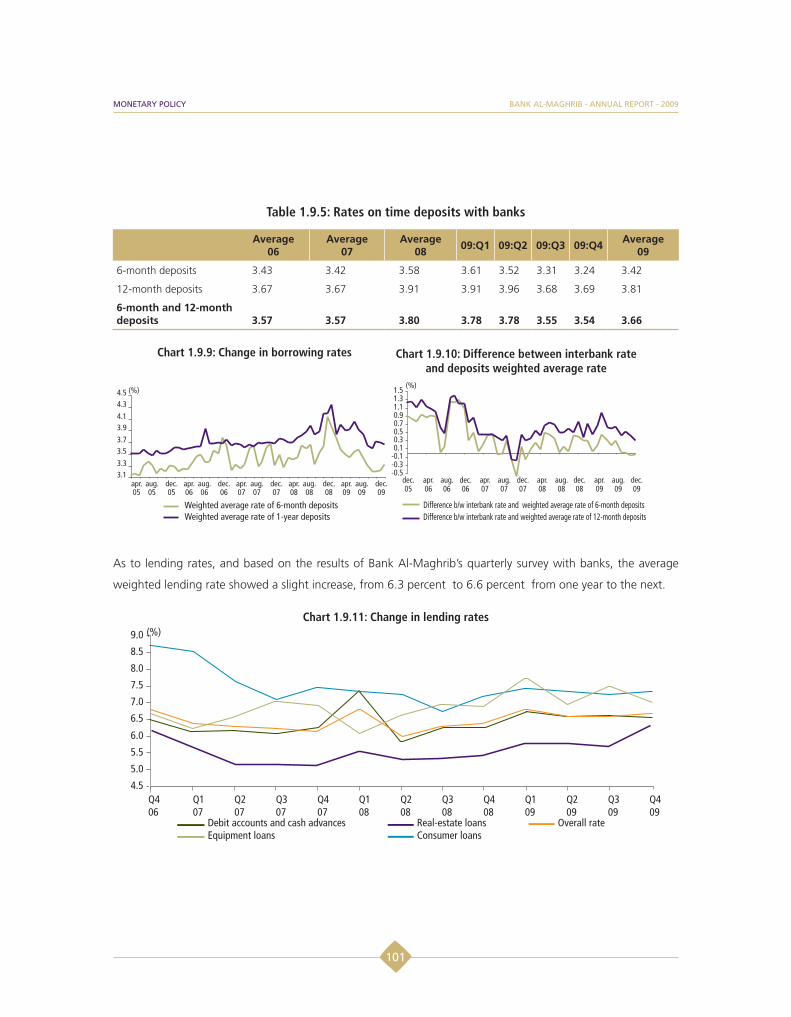
Table 1.9.5: Rates on time deposits with banks
Average
06Average
07Average
08 09:Q1 09:Q2 09:Q3 09:Q4 Average 09
6-month deposits 3.43 3.42 3.58 3.61 3.52 3.31 3.24 3.42
12-month deposits 3.67 3.67 3.91 3.91 3.96 3.68 3.69 3.81
6-month and 12-month deposits 3.57 3.57 3.80 3.78 3.78 3.55 3.54 3.66
Chart 1.9.9: Change in borrowing rates Chart 1.9.10: Difference between interbank rate and deposits weighted average rate
As to lending rates, and based on the results of Bank Al-Maghrib’s quarterly survey with banks, the average
weighted lending rate showed a slight increase, from 6.3 percent to 6.6 percent from one year to the next.
Chart 1.9.11: Change in lending rates
101
BANK AL-MAGHRIB - ANNUAL REPORT - 2009MONETARY POLICY

The development of the weighted average rate for loans covers varying paces of growth depending on loan
types. Rates on cash loans and consumer loans did not change significantly during the last nine months of the
year, after increasing in the first quarter to levels higher than in 2008. With regard to rates on equipment loans,
more influenced by the borrower’s size and the loan’s maturity date, their variations were relatively more marked
during the year. Finally, rates on real-estate loans increased considerably in the fourth quarter, which contributed
to bringing them close to other rates.
Table 1.9.6: Change in lending rates 2008 2009
Q1 Q2 Q3 Q4 Q1 Q2 Q3 Q4
Debit accounts and cash advances 7.43 5.89 6.30 6.29 6.78 6.61 6.65 6.58
Equipment loans 6.01 6.59 6.93 6.83 7.67 6.88 7.46 6.97
Real-estate loans 5.50 5.24 5.31 5.36 5.75 5.75 5.61 6.29
Consumer loans 7.27 7.22 6.66 7.14 7.38 7.29 7.22 7.30
Overall rate 6.76 5.96 6.25 6.33 6.73 6.52 6.53 6.63
Source: BAM quarterly survey with banks
1.9.4 Exchange rate 1
Against a backdrop of unstable international financial markets, the American dollar in 2009 rose on average
against the pound sterling and the euro and depreciated against the Japanese yen. In these conditions, the
dirham posted an average annual increase of 11.6 percent against the pound sterling and 0.9 percent against
the euro. On the other hand, it fell 4.4 percent and 14.7 percent against the dollar and the yen, respectively.
1 See statistical appendix A.9.1
102
BANK AL-MAGHRIB - ANNUAL REPORT - 2009MONETARY POLICY

Chart 1.9.12: Transfer exchange rate (monthly average)
Chart 1.9.13: Dirham nominal and real effective exchange rates (Base 100 in 2000*)
Despite the scope of changes in the dirham’s bilateral exchange rates against some currencies, the nominal
effective exchange rate appreciated only slightly in 2009. Based on Bank Al-Maghrib calculations, the dirham’s
effective exchange rate gained 2.4 percent on average over the year, in real and in nominal terms alike. The
similarity of trends in the national currency’s real and nominal values mainly reflects the absence of significant
changes in the price differential between Morocco and its main partner countries.
103
BANK AL-MAGHRIB - ANNUAL REPORT - 2009MONETARY POLICY

1.10 Money, loans and liquid investments1
At the end of 2009, the annual growth of M3 again slowed down to 4.6 percent compared to an increase of
10.8 percent in 2008 and a 13.1 percent rise on average over the last five years.
The moderate pace of money creation in 2009 is mainly attributable to the impact of the slowdown in credit
growth and the decrease in net foreign assets which declined for the second year in a row, down 3.6 percent
compared to 5.3 percent a year earlier. At the same time, the annual growth of loans fell from 22.9 percent
to 9.4 percent, a pace which is however comparable to the average observed before the 2007-2008 period of
exceptional increases. Net claims on the Government increased 6 percent during the year under review.
After two years of decline, liquid investment aggregates improved in 2009 owing to the appreciation of
liquidation values of money market and bond UCITS securities.
1.10.1 M3 aggregate
The growth of money supply in 2009 primarily reflected slowing bank loans’ growth coupled with the decreasing
nonagricultural growth, as well as the effect of negative shocks on net foreign assets. After nearly stagnating in
2008, net claims on the Government, which were volatile, posted an increase.
After a 10.4 percent increase year-on-year during the first quarter, M3 growth gradually decreased until the
end of the year, falling to 6.7 percent on average during the last nine months due to the net foreign assets’
contraction and the moderate growth of loans. In December, money supply grew by a mere 4.6 percent, in part
reflecting a base effect connected to the considerable expansion of M3 during the same month of the previous
year.
1 See statistical appendices: Tables A10.1 to A10.20
104
BANK AL-MAGHRIB - ANNUAL REPORT - 2009 MONEY, LOANS AND LIQUID INVESTMENTS
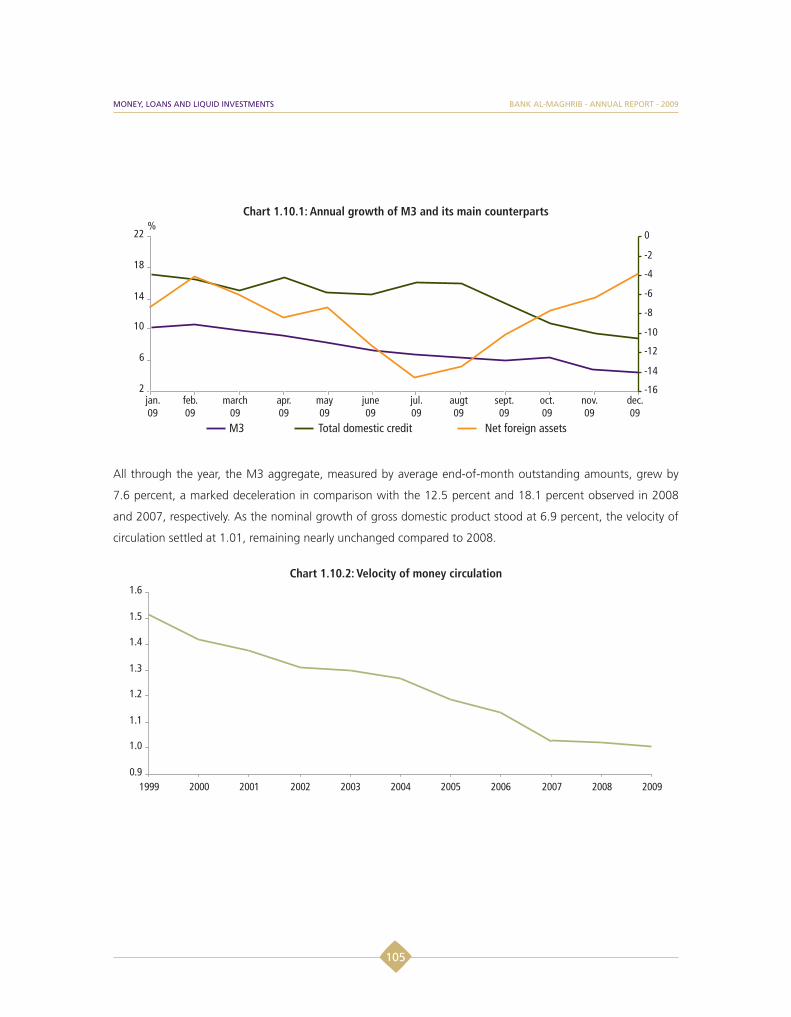
Chart 1.10.1: Annual growth of M3 and its main counterparts
All through the year, the M3 aggregate, measured by average end-of-month outstanding amounts, grew by
7.6 percent, a marked deceleration in comparison with the 12.5 percent and 18.1 percent observed in 2008
and 2007, respectively. As the nominal growth of gross domestic product stood at 6.9 percent, the velocity of
circulation settled at 1.01, remaining nearly unchanged compared to 2008.
Chart 1.10.2: Velocity of money circulation
105
BANK AL-MAGHRIB - ANNUAL REPORT - 2009 MONEY, LOANS AND LIQUID INVESTMENTS
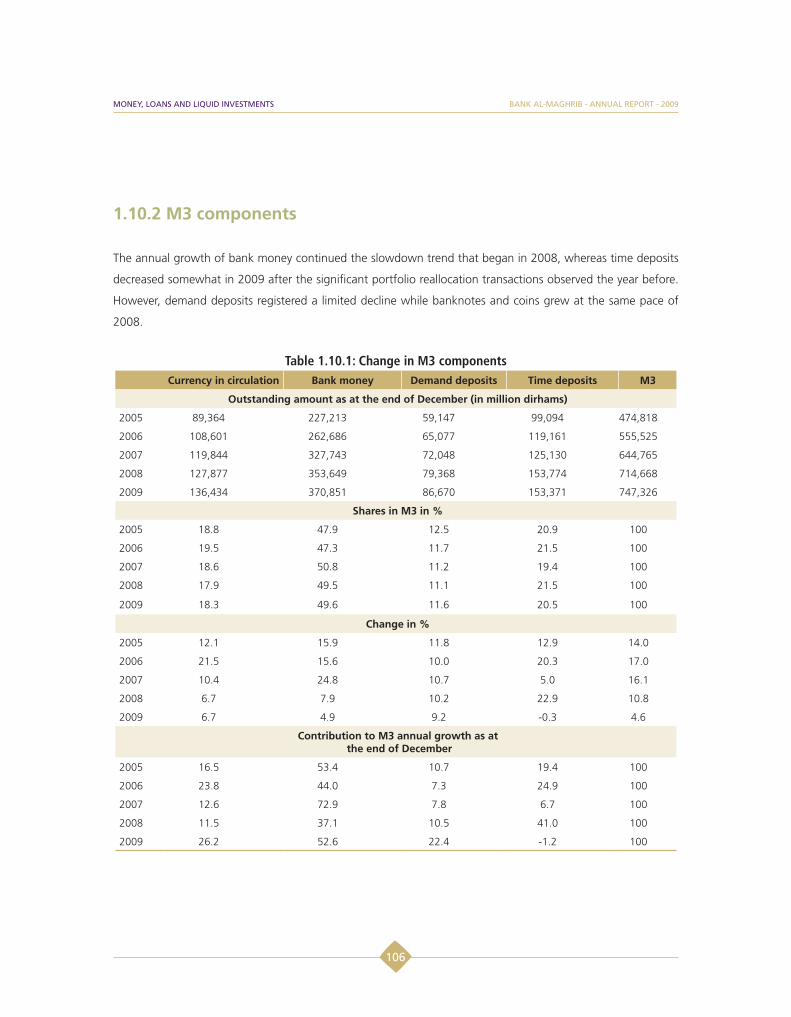
1.10.2 M3 components
The annual growth of bank money continued the slowdown trend that began in 2008, whereas time deposits
decreased somewhat in 2009 after the significant portfolio reallocation transactions observed the year before.
However, demand deposits registered a limited decline while banknotes and coins grew at the same pace of
2008.
Table 1.10.1: Change in M3 components Currency in circulation Bank money Demand deposits Time deposits M3
Outstanding amount as at the end of December (in million dirhams)
2005 89,364 227,213 59,147 99,094 474,818
2006 108,601 262,686 65,077 119,161 555,525
2007 119,844 327,743 72,048 125,130 644,765
2008 127,877 353,649 79,368 153,774 714,668
2009 136,434 370,851 86,670 153,371 747,326
Shares in M3 in %
2005 18.8 47.9 12.5 20.9 100
2006 19.5 47.3 11.7 21.5 100
2007 18.6 50.8 11.2 19.4 100
2008 17.9 49.5 11.1 21.5 100
2009 18.3 49.6 11.6 20.5 100
Change in %
2005 12.1 15.9 11.8 12.9 14.0
2006 21.5 15.6 10.0 20.3 17.0
2007 10.4 24.8 10.7 5.0 16.1
2008 6.7 7.9 10.2 22.9 10.8
2009 6.7 4.9 9.2 -0.3 4.6
Contribution to M3 annual growth as at the end of December
2005 16.5 53.4 10.7 19.4 100
2006 23.8 44.0 7.3 24.9 100
2007 12.6 72.9 7.8 6.7 100
2008 11.5 37.1 10.5 41.0 100
2009 26.2 52.6 22.4 -1.2 100
106
BANK AL-MAGHRIB - ANNUAL REPORT - 2009 MONEY, LOANS AND LIQUID INVESTMENTS

Currency in circulation
Currency in circulation increased at an annual rate of 6.7 percent, a pace similar to that observed at the end of
the previous year. Overall, its intra-annual trend remained in line with its seasonal profile. After a decline in the
first quarter, banknotes and coins gradually expanded in the second quarter and then rose substantially in July in
connection with the summer period. During the rest of the year, currency in circulation did not change markedly,
except in November during which it registered the most important increase, in conjunction with the celebration
of the Eid Al Adha (Feast of the Sacrifice).
Chart 1.10.3: Change in the currency in circulation in 2009
Bank money
Bank money continued to decelerate for the second year in a row as its annual growth was limited to 4.9 percent
from 7.9 percent in 2008. The weak constitution of demand deposits by nonfinancial agents would be mainly
attributable to the slowdown in the nonagricultural sector as well as to the decline of transactions on the stock
market.
107
BANK AL-MAGHRIB - ANNUAL REPORT - 2009 MONEY, LOANS AND LIQUID INVESTMENTS

Chart 1.10.4: Annual growth of bank money and nonagricultural GDP in % (mobile average over
four quarters)
Chart 1.10.5: Bank money and volume of transactions on the stock market (mobile
average over four quarters)
Like the previous year, seasonal factors largely determined the intra-annual evolution of bank money. Following a
downward adjustment in January, the monthly growth of bank money accelerated in March, June and December
owing to the constitution of downpayments by businesses for corporate tax payments. There were also increases
in June and July, especially under the effect of household demand deposits’ increase during this period.
Chart 1.10.6: Change in bank money
108
BANK AL-MAGHRIB - ANNUAL REPORT - 2009 MONEY, LOANS AND LIQUID INVESTMENTS

Demand deposits
Demand deposits grew 9.2 percent compared with 10.2 percent in 2008 and 10.5 percent on average over the
last five years. Their structure is still dominated by passbook accounts representing 82.7 percent while the share
of passbook accounts with the Caisse d’épargne nationale (National Savings Fund) stood at 17.3 percent.
Table 1.10.2: Change in demand deposits
Outstanding amounts in million dirhams
End 2007 End 2008 End 2009
Outstanding amount
Outstanding amount
Change in %
Outstanding amount
Change in %
Total demand deposits 72,048 79,368 10.2 86,669 9.2
Passbook accounts with banks 58,967 65,251 10.7 71,590 9.7
Passbook accounts with the Caisse d'épargne nationale 13,081 14,117 7.9 15,079 6.8
Structure of demand deposits in %
Passbook accounts with banks 81.8 82.2 82.6
Passbook accounts with the Caisse d'épargne nationale 18.2 17.8 17.4
Time deposits
Consecutively to a 22.9 percent increase in 2008, time deposits remained unchanged in 2009, even falling 0.3
percent at the end of the year, the first decline since 2002. Their intra-annual evolution covers two different
periods, characterized by divergent behaviors of nonfinancial agents. Despite the decrease in their interest rates,
time deposits during the first nine months of the year remained slightly higher than the level observed at the
end of 2008, mainly through the increase of private individuals’ deposits. These deposits registered a slight
contraction in the fourth quarter, notably due to the decrease in public sector’s time deposits, as well as the
arbitrage of other nonfinancial agents to the benefit of UCITS securities.
109
BANK AL-MAGHRIB - ANNUAL REPORT - 2009 MONEY, LOANS AND LIQUID INVESTMENTS

Chart 1.10.7: Annual change in nonfinancial agents’ time deposits and UCITS securities
Chart 1.10.8: Change in public sector time deposits in 2009
1.10.3 Credit and other sources of money creation
The contribution of loans to money creation remains significant, despite the moderate growth from one year to
the next. The contribution of net claims on the Government increased from one year-end to the other, while net
foreign assets negatively impacted M3 growth.
Chart 1.10.9: Main counterparts’ contribution to M3 annual growth
110
BANK AL-MAGHRIB - ANNUAL REPORT - 2009 MONEY, LOANS AND LIQUID INVESTMENTS

Table 1.10.3: Change in money supply counterparts
End 2007 End 2008 End 2009
Outstanding amount
Outstanding amount
Change in %
Outstanding amount
Change in %
Net foreign assets (I) 207,476 196,453 -5.3 189,387 -3.6
Overall domestic credit
A. Claims on Government 79,771 80,621 1.1 85,569 6.1
B. Lending to the private sector 436,285 536,200 22.9 585,317 9.2
C. Counterparts of assets with the Caisse d’épargne nationale 13,081 14,117 7.9 15,079 6.8
Total (A+B+C) 529,137 630,938 19.2 685,901 8.7
To be deducted: Nonmonetary resources 64,303 83,606 30.0 85,495 2.3
Domestic lending of a monetary nature (II) 464,834 547,332 17.7 600,470 9.7
Total of counterparts (I+II) 672,310 743,785 10.6 789,857 6.2
Balance of various items -27,545 -29,117 5.7 -42,531 46.1
M3 aggregate 644,765 714,668 10.8 747,326 4.6
Credit1
Credit activity remained strong in 2009 despite the marked slowdown in its growth rate from 22.9 percent to 9.2
percent. The downward trend affected both bank loans as well as those distributed by finance companies. Bank
loans indeed increased 9.4 percent, down from 22.9 percent in 2008, while loans granted by finance companies
rose only 7.7 percent instead of 17.1 percent a year ago. The slowdown in bank lending in 2009 largely reflects a
downward adjustment toward its average trend before the period of exceptional growth. Nonperforming loans
shrank somewhat from a year-end to the other, standing at 5.5 percent of total outstanding amount of loans,
from 6 percent in 2008.
Bank lending
The overall outstanding amount of loans distributed by banks increased 9.4 percent to 568 billion dirhams, up
1 Restated figures, different from those of monetary statistics.
111
BANK AL-MAGHRIB - ANNUAL REPORT - 2009 MONEY, LOANS AND LIQUID INVESTMENTS
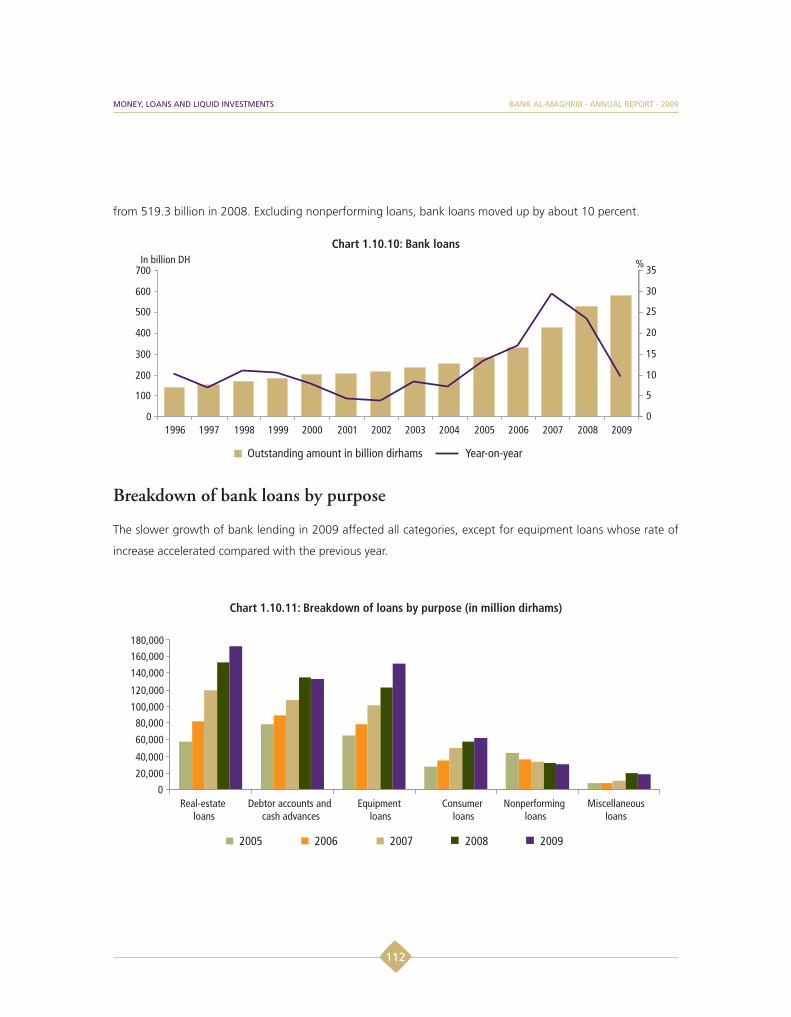
from 519.3 billion in 2008. Excluding nonperforming loans, bank loans moved up by about 10 percent.
Chart 1.10.10: Bank loans
Breakdown of bank loans by purpose
The slower growth of bank lending in 2009 affected all categories, except for equipment loans whose rate of
increase accelerated compared with the previous year.
Chart 1.10.11: Breakdown of loans by purpose (in million dirhams)
112
BANK AL-MAGHRIB - ANNUAL REPORT - 2009 MONEY, LOANS AND LIQUID INVESTMENTS

The slowdown was most noticeable in real-estate loans, whose growth rate fell from 27.6 percent in 2008 to
13.2 percent, particularly in relation to the decline in real estate transactions in 2009. At 173 billion dirhams at
the end of December, real-estate loans accounted for nearly 30.5 percent of total bank loans.
Moreover, cash advances registered a decline of 2.8 percent to 130 billion dirhams, compared to an increase of
24.6 percent in 2008. Consumer loans, which have experienced strong rises in recent years, slowed down to 7.2
percent, as growth in household consumption slackened.
Equipment loans, despite the slowdown in economic activity, were up 25.1 percent in 2009 to 153.5 billion,
reflecting the momentum in investment.
Nonperforming loans continued the downward trend observed since 2005, albeit at a less rapid rate than in 2008,
down 0.6 percent instead of 6.4 percent to 31 billion dirhams in 2009. The coverage ratio of nonperforming
loans in the entire banking system went down from 75.3 percent to 74.1 percent from one year to another.
Except for state banks, that rate declined more sharply from 82 percent in 2008 to 77.1 percent in 2009.
Chart 1.10.12: Change in NPL and their share in bank loans
113
BANK AL-MAGHRIB - ANNUAL REPORT - 2009 MONEY, LOANS AND LIQUID INVESTMENTS

Breakdown of bank loans by term
At nearly 320 billion dirhams or 56.3 percent of total bank loans, medium and long-term loans increased by
14.9 percent, in connection with the development of equipment and real-estate loans. This rate confirms the
continued process of lengthening maturities that began in 2005. Short-term loans amounted to 217 billion
dirhams, up only 3.5 percent from 20.4 percent a year earlier.
Chart 1.10.13: Breakdown of bank loans by term (in million dirhams)
Breakdown of bank loans by sector
Annual growth of loans to secondary and tertiary sectors fell from 23.4 percent to 10 percent, mostly because
of the slowdown in nonagricultural growth, while loans to the primary sector declined 7.8 percent, reflecting
the continued reduction of their share in total bank loans since 2004.
114
BANK AL-MAGHRIB - ANNUAL REPORT - 2009 MONEY, LOANS AND LIQUID INVESTMENTS

Chart 1.10.14: Sectoral breakdown of bank loans (in million dirhams)
Loans to the services sector in 2009 amounted to 364.5 billion dirhams, up only 8.4 percent after 23 percent
in 2008. These loans were primarily intended for households and financial activities, with respective shares of
43 percent and 19.4 percent of all credits granted to the sector. Loans to the trade industry rose 8.7 percent to
36.8 billion, while those granted to hotels grew 36.7 percent. Lending to the activities of transportation and
communication increased a mere 2.5 percent from 7.1 percent a year earlier.
Credit to the secondary sector reached 184 billion dirhams, up 13.6 percent, lower than the 24.1 percent
increase achieved in 2008. This development mainly reflects the slowdown in loans to the manufacturing sector,
up 11.7 percent from 15.8 percent last December, and the 3.3 percent drop in loans to the energy and water
sector. Meanwhile, loans to the extractive industry, which had increased sharply in 2008 following the granting
of a 6.9 billion dirhams loan to the Office Chérifien des Phosphates (OCP) (Phosphates Office), grew this year by
only 0.2 percent. However, credit to the construction industry and the public works sector rose by 23 percent in
2009, comparable to the rate recorded one year earlier.
Loans to the primary sector posted a decline of 7.8 percent compared to 2008, to 19.4 billion dirhams. This
contraction primarily reflects the 32.6 percent decline in loans to the fisheries sector and to a lesser extent the
3 percent fall in those to agriculture.
115
BANK AL-MAGHRIB - ANNUAL REPORT - 2009 MONEY, LOANS AND LIQUID INVESTMENTS

Loans distributed by finance companies
After rising 17.1 percent in 2008, the total outstanding amount of loans granted by finance companies grew
by only 9.9 percent to nearly 80 billion dirhams. These loans continue to be provided mainly by consumer loan
companies and leasing companies which accounted for 51.5 percent and 45.2 percent, respectively.
Chart 1.10.15: Growth of loans distributed by consumer loan companies and leasing companies
Chart 1.10.16: Loans distributed by finance companies (in million dirhams)
Lending by consumer loan companies, which reached 41 billion dirhams in 2009, rose 7.1 percent down
from 14.8 percent one year ago, because of the deceleration in the growth rate of household consumption.
Meanwhile, loans granted by leasing companies totaled 36 billion dirhams, up 13.5 percent from 19.3 percent
in 2008.
Loans granted by factoring companies registered a slight increase from last year, amounting to 2.2 billion
dirhams at the end of 2009. Lastly, lending by surety companies increased markedly to 2.3 billion dirhams, in
which commitments by signature represented more than 2 billion.
Breakdown of loans by economic agents
Corporations and private individuals still represent the main beneficiaries of loans from credit institutions, with
respective shares of 57.7 percent and 33.1 percent. Loans to corporations grew by 11.3 percent instead of 23.3
percent in 2008. The increase in loans to individuals fell from 14.6 percent to 12.4 percent, mainly in connection
116
BANK AL-MAGHRIB - ANNUAL REPORT - 2009 MONEY, LOANS AND LIQUID INVESTMENTS

with the slowdown in housing and consumer loans. Lending to individual entrepreneurs remained almost stable
compared to the previous year, at 38.6 billion dirhams. Loans to local governments and the general government
increased 3.7 percent to 16.2 billion dirhams.
Chart 1.10.17: Breakdown of bank loans by economic agent
Microcredit
Microcredit activity in 2009 reversed the upward trend observed in recent years. Indeed, outstanding loans
from the 13 microcredit associations totaled 4.8 billion dirhams, down 16 percent from the previous year.
Nonperforming loans rose 2 percent to nearly 307 million in 2009, and their provisioning stood at 59 percent
from 68 percent in 2008.
At the same time, the number of microcredit borrowers shrank from 1,247,359 to 916,861 customers in 2009,
with 49 percent of women from 54 percent in 2008.
The process of strengthening the regulatory framework governing microcredit activity continued in 2009 with
the adoption of the Directive on Governance in Microfinance Institutions. This text specifies, in particular, rules
relating to the role of board and management, and provides for a system of internal control to monitor and
control risks.
117
BANK AL-MAGHRIB - ANNUAL REPORT - 2009 MONEY, LOANS AND LIQUID INVESTMENTS
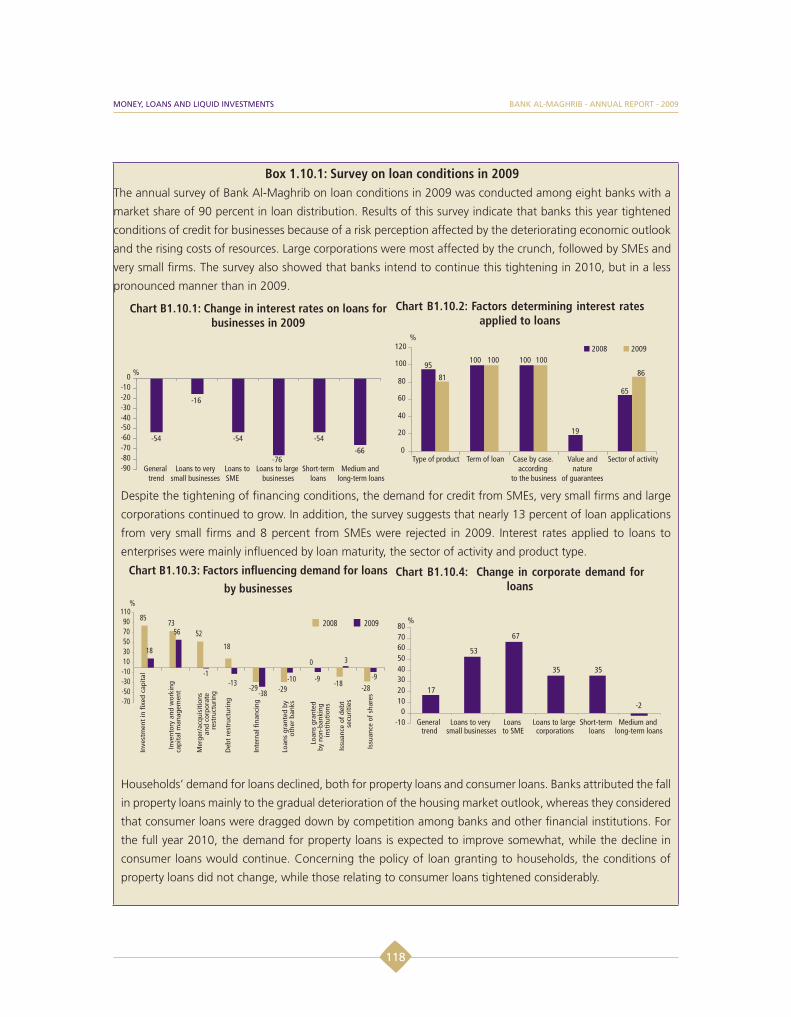
Box 1.10.1: Survey on loan conditions in 2009The annual survey of Bank Al-Maghrib on loan conditions in 2009 was conducted among eight banks with a
market share of 90 percent in loan distribution. Results of this survey indicate that banks this year tightened
conditions of credit for businesses because of a risk perception affected by the deteriorating economic outlook
and the rising costs of resources. Large corporations were most affected by the crunch, followed by SMEs and
very small firms. The survey also showed that banks intend to continue this tightening in 2010, but in a less
pronounced manner than in 2009.
Chart B1.10.1: Change in interest rates on loans for businesses in 2009
Chart B1.10.2: Factors determining interest rates applied to loans
Despite the tightening of financing conditions, the demand for credit from SMEs, very small firms and large
corporations continued to grow. In addition, the survey suggests that nearly 13 percent of loan applications
from very small firms and 8 percent from SMEs were rejected in 2009. Interest rates applied to loans to
enterprises were mainly influenced by loan maturity, the sector of activity and product type.
Chart B1.10.3: Factors influencing demand for loans by businesses
Chart B1.10.4: Change in corporate demand for loans
Households’ demand for loans declined, both for property loans and consumer loans. Banks attributed the fall
in property loans mainly to the gradual deterioration of the housing market outlook, whereas they considered
that consumer loans were dragged down by competition among banks and other financial institutions. For
the full year 2010, the demand for property loans is expected to improve somewhat, while the decline in
consumer loans would continue. Concerning the policy of loan granting to households, the conditions of
property loans did not change, while those relating to consumer loans tightened considerably.
118
BANK AL-MAGHRIB - ANNUAL REPORT - 2009 MONEY, LOANS AND LIQUID INVESTMENTS
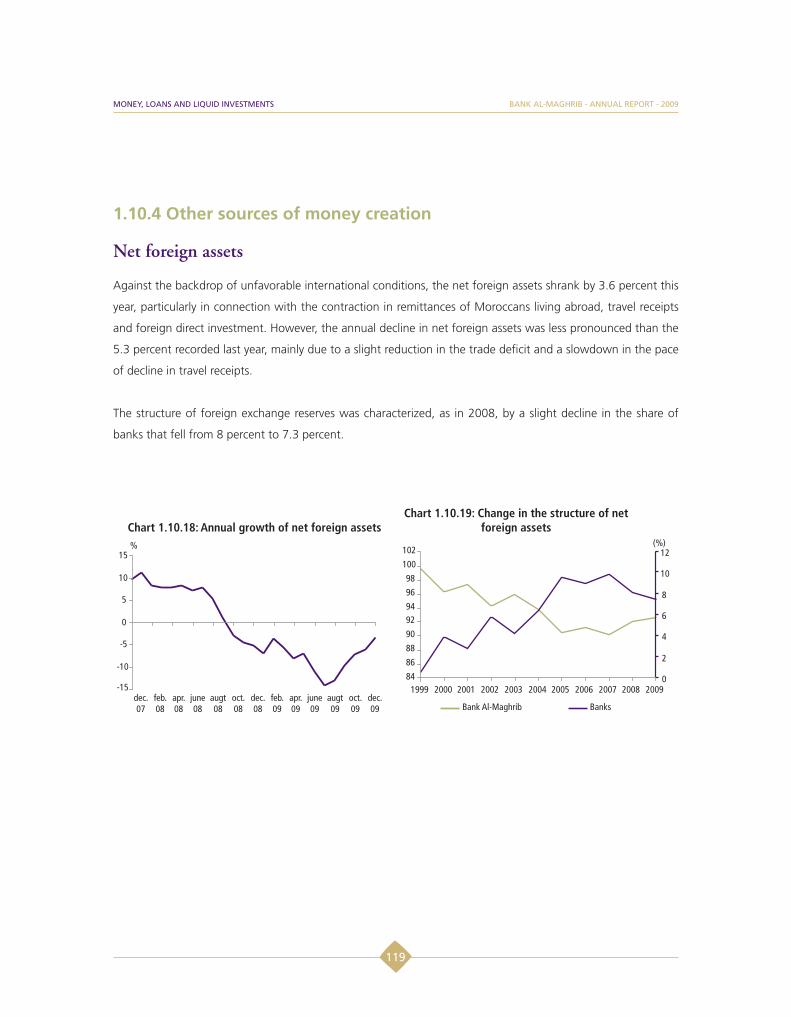
1.10.4 Other sources of money creation
Net foreign assets
Against the backdrop of unfavorable international conditions, the net foreign assets shrank by 3.6 percent this
year, particularly in connection with the contraction in remittances of Moroccans living abroad, travel receipts
and foreign direct investment. However, the annual decline in net foreign assets was less pronounced than the
5.3 percent recorded last year, mainly due to a slight reduction in the trade deficit and a slowdown in the pace
of decline in travel receipts.
The structure of foreign exchange reserves was characterized, as in 2008, by a slight decline in the share of
banks that fell from 8 percent to 7.3 percent.
Chart 1.10.18: Annual growth of net foreign assetsChart 1.10.19: Change in the structure of net
foreign assets
119
BANK AL-MAGHRIB - ANNUAL REPORT - 2009 MONEY, LOANS AND LIQUID INVESTMENTS
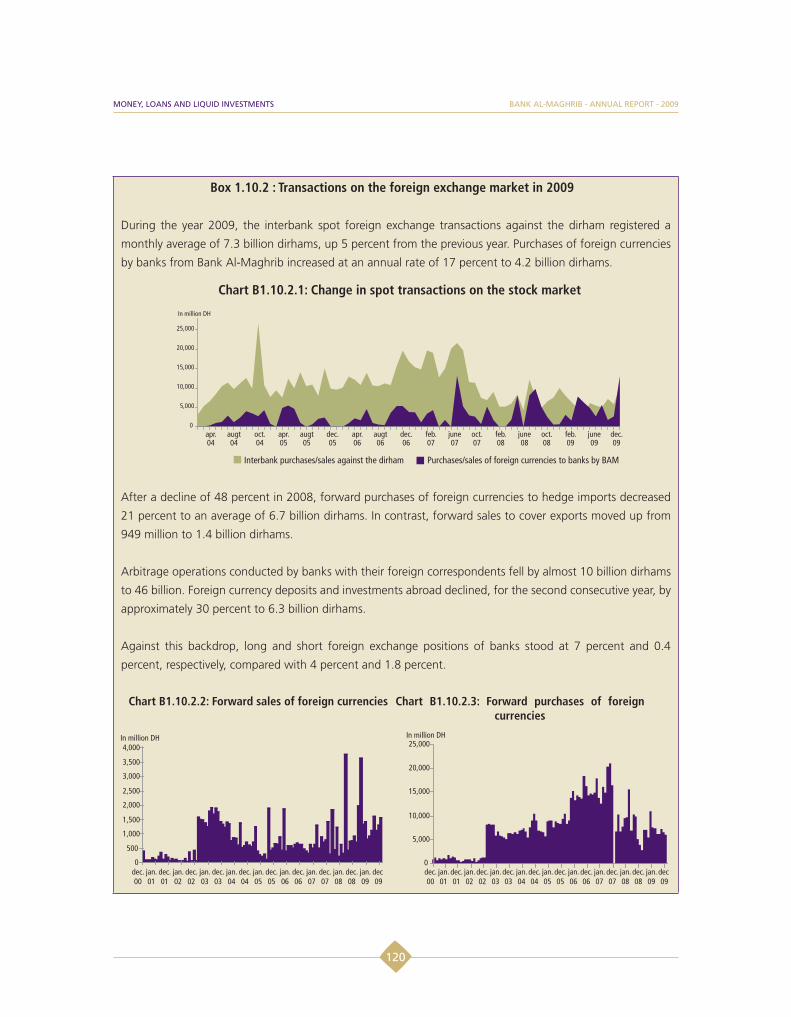
Box 1.10.2 : Transactions on the foreign exchange market in 2009
During the year 2009, the interbank spot foreign exchange transactions against the dirham registered a
monthly average of 7.3 billion dirhams, up 5 percent from the previous year. Purchases of foreign currencies
by banks from Bank Al-Maghrib increased at an annual rate of 17 percent to 4.2 billion dirhams.
Chart B1.10.2.1: Change in spot transactions on the stock market
After a decline of 48 percent in 2008, forward purchases of foreign currencies to hedge imports decreased
21 percent to an average of 6.7 billion dirhams. In contrast, forward sales to cover exports moved up from
949 million to 1.4 billion dirhams.
Arbitrage operations conducted by banks with their foreign correspondents fell by almost 10 billion dirhams
to 46 billion. Foreign currency deposits and investments abroad declined, for the second consecutive year, by
approximately 30 percent to 6.3 billion dirhams.
Against this backdrop, long and short foreign exchange positions of banks stood at 7 percent and 0.4
percent, respectively, compared with 4 percent and 1.8 percent.
Chart B1.10.2.2: Forward sales of foreign currencies Chart B1.10.2.3: Forward purchases of foreign currencies
120
BANK AL-MAGHRIB - ANNUAL REPORT - 2009 MONEY, LOANS AND LIQUID INVESTMENTS
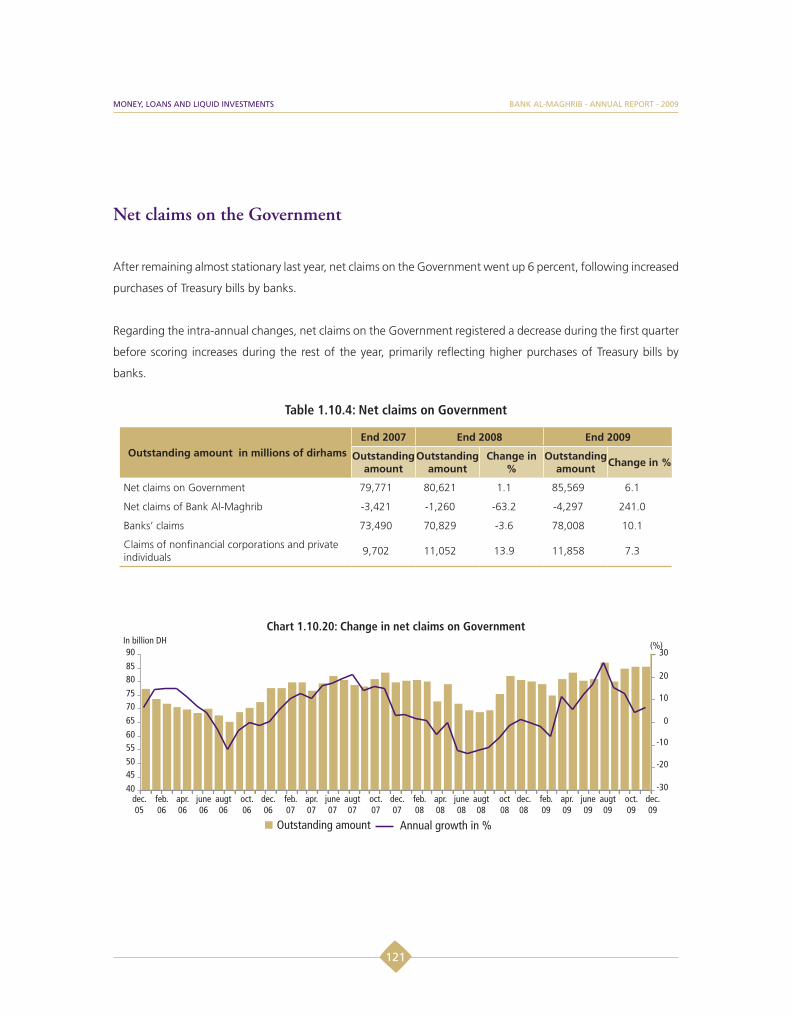
Net claims on the Government
After remaining almost stationary last year, net claims on the Government went up 6 percent, following increased
purchases of Treasury bills by banks.
Regarding the intra-annual changes, net claims on the Government registered a decrease during the first quarter
before scoring increases during the rest of the year, primarily reflecting higher purchases of Treasury bills by
banks.
Table 1.10.4: Net claims on Government
Outstanding amount in millions of dirhamsEnd 2007 End 2008 End 2009
Outstanding amount
Outstanding amount
Change in %
Outstanding amount Change in %
Net claims on Government 79,771 80,621 1.1 85,569 6.1
Net claims of Bank Al-Maghrib -3,421 -1,260 -63.2 -4,297 241.0
Banks’ claims 73,490 70,829 -3.6 78,008 10.1
Claims of nonfinancial corporations and private individuals 9,702 11,052 13.9 11,858 7.3
Chart 1.10.20: Change in net claims on Government
121
BANK AL-MAGHRIB - ANNUAL REPORT - 2009 MONEY, LOANS AND LIQUID INVESTMENTS

1.10.5 Liquid investment aggregates
The outstanding amount of liquid investment aggregates, which primarily includes UCITS securities held by
nonfinancial agents, improved markedly in 2009 after two years of decline, increasing at annual rate of 27
percent to 54.4 billion dirhams. This growth is in large part related to the upturn in demand from nonfinancial
corporations, supported by rising yields on bond and money market UCITS.
Table 1.10.5: Liquid investment aggregates
Outstanding amount in millions of dirhams
End 2007 End 2008 End 2009
Outstanding amount
Outstanding amount Change in % Outstanding
amount Change in %
LI 1 aggregate 717 1,025 43.0 1,823 77.9
LI 2 aggregate 19,412 20,512 5.7 24,669 20.3
LI 3 aggregate 22,642 16,526 - 27.0 23,719 43.5
LI 4 aggregate 7,966 4,804 - 39.7 4,238 -11.8
Total LI 50,737 42,867 - 15.5 54,449 27.0
LI1 aggregate
Made up of Treasury bonds and other negotiable debt securities, the outstanding amount LI1 aggregate rose
to 1.8 billion dirhams, due to increased purchases of Treasury bonds by private individuals and nonfinancial
corporations.
Table 1.10.6: Change in LI aggregate
Outstanding amount in dirhams End 2006 End 2007 End 2008 End 2009
Treasury bills 3,855 620 365 1,427
Commercial papers 0 0 405 0
Bonds issued by finance companies 492 97 30 20
Securities of contractual UCITS - - 225 376
Total LI 1 4,347 717 1,025 1,823
122
BANK AL-MAGHRIB - ANNUAL REPORT - 2009 MONEY, LOANS AND LIQUID INVESTMENTS

Securities of money market UCITS: LI2 aggregate
The growth rate of money market UCITS securities -included under the LI2 aggregate- accelerated to 20.3 percent
from 5.7 percent, bringing the outstanding amount to 24.7 billion dirhams. During the first seven months of
the year, the latter has hovered around the level reached in December 2008, before trending upward until
November, in conjunction with the fall in time deposits during the same period. In December, the LI2 aggregate
registered a sharp decline, mostly because of the one-time adjustments of nonfinancial agents’ portfolios.
Chart 1.10.21: Annual change in nonfinancial agents’ securities in money market UCITS
Securities of bond UCITS: LI3 aggregate
At the end of fiscal 2009, the outstanding amount of LI3 aggregate, which consists of securities issued by
bond UCITS, totaled 23.7 billion dirhams, up 43.5 percent, reflecting increasing demand from nonfinancial
corporations and the impact of reduced rates on medium and long-term Treasury bonds compared to 2008. LI3
aggregate grew almost steadily in 2009, with the exception of December which registered a rise in redemptions.
123
BANK AL-MAGHRIB - ANNUAL REPORT - 2009 MONEY, LOANS AND LIQUID INVESTMENTS
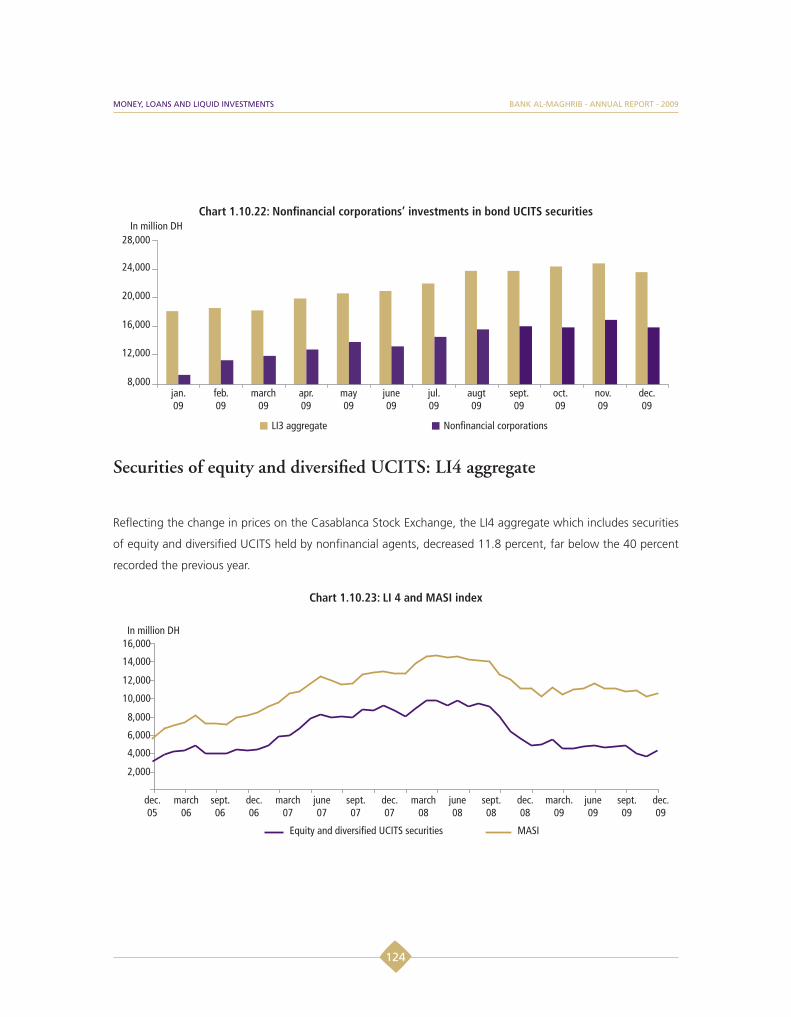
Chart 1.10.22: Nonfinancial corporations’ investments in bond UCITS securities
Securities of equity and diversified UCITS: LI4 aggregate
Reflecting the change in prices on the Casablanca Stock Exchange, the LI4 aggregate which includes securities
of equity and diversified UCITS held by nonfinancial agents, decreased 11.8 percent, far below the 40 percent
recorded the previous year.
Chart 1.10.23: LI 4 and MASI index
124
BANK AL-MAGHRIB - ANNUAL REPORT - 2009 MONEY, LOANS AND LIQUID INVESTMENTS

Liquidity of the economy
The growth in the economy’s liquidity -composed of M3 and the total liquid investment aggregates captured
through the average monthly outstanding amounts- slowed for the second consecutive year, from 11.2 percent
in 2008 to 7.1 percent. Given a 6.9 percent growth in the GDP at current prices, the liquidity ratio of the
economy remained almost unchanged at 105.4 percent.
Chart 1.10.24: Change in the liquidity of the economy
Table 1.10.7: Liquidity ratio of the economy (in %)
2005 2006 2007 2008 2009*
M3/GDP 84.1 87.9 97.3 97.9 98.6
M3/GNDI 78.0 81.3 89.3 90.5 93.1
Total liquidity/GDP 92.0 96.8 105.7 105.1 105.4
Total liquidity/GNDI 85.3 89.4 97.0 97.2 99.5
*Provisional data
125
BANK AL-MAGHRIB - ANNUAL REPORT - 2009 MONEY, LOANS AND LIQUID INVESTMENTS

1.11 The Stock market, Private dept and Asset management
In 2009, capital markets activity recorded a decrease -although at a lower pace- of stock indexes as well as a
reduction in the issuance of negotiable debt securities, especially certificates of deposits. As to bond loans, they
remained buoyant while net assets under management by UCITS increased.
1.11.1 The stock marketThe downward trend of share prices continued for the second year in a row. Indeed, following the 13 percent
drop in 2008, MASI and MADEX indexes fell 4.9 percent and 6.6 percent respectively in 20091 (See Box 1.11.1).
Analysis of sectoral indexes shows diverging trends in 2009. Distribution and telecommunications sectors
registered a drop by more than 12 percent, while real-estate, building and construction materials sectors fell
respectively 10.3 percent and nearly 8 percent. The banking and finance companies sectors also reported a
disappointing performance at respectively 2.7 percent and 7 percent. Conversely, the drinks index almost
doubled year-on-year, while the mining sector index rose 52.3 percent. The agri-business and chemicals indexes
also reported rises at respectively 24.6 percent and 4.2 percent.
Chart 1.11.1: Sectoral indexes (in %)
Source: Casablanca stock exchange
1 See Table A11.4
126
BANK AL-MAGHRIB - ANNUAL REPORT - 2009THE STOCK MARKET, PRIVATE DEPT AND ASSET MANAGEMENT
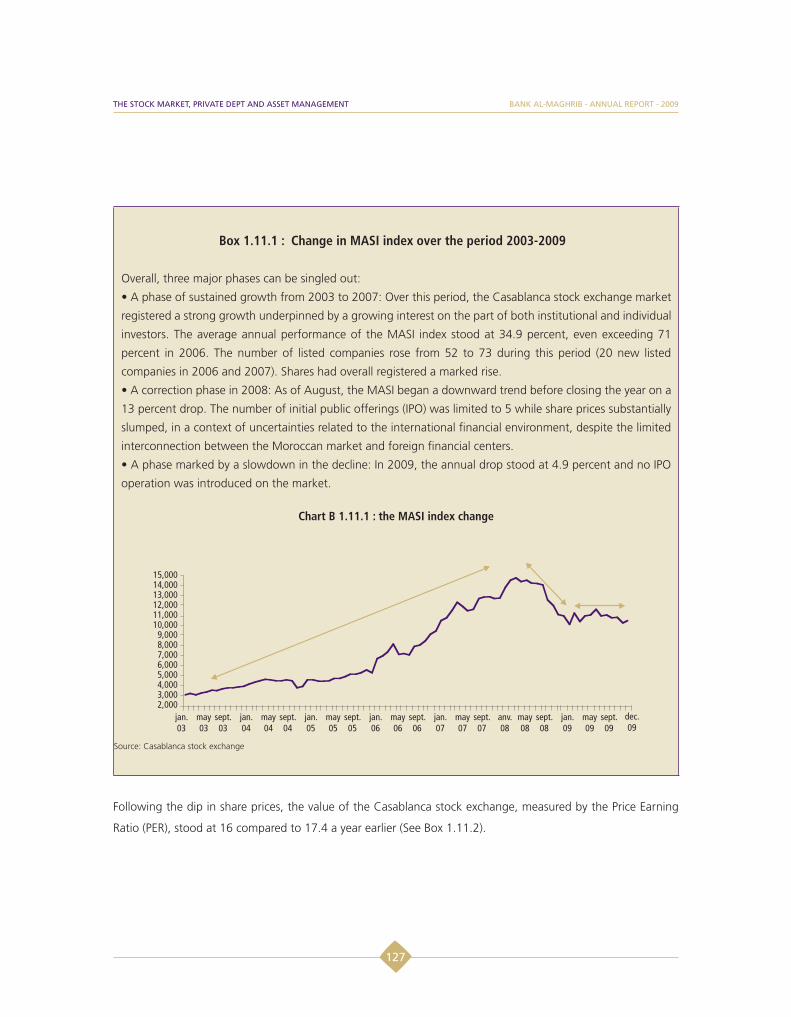
Box 1.11.1 : Change in MASI index over the period 2003-2009
Overall, three major phases can be singled out:
registered a strong growth underpinned by a growing interest on the part of both institutional and individual
investors. The average annual performance of the MASI index stood at 34.9 percent, even exceeding 71
percent in 2006. The number of listed companies rose from 52 to 73 during this period (20 new listed
companies in 2006 and 2007). Shares had overall registered a marked rise.
13 percent drop. The number of initial public offerings (IPO) was limited to 5 while share prices substantially
slumped, in a context of uncertainties related to the international financial environment, despite the limited
interconnection between the Moroccan market and foreign financial centers.
operation was introduced on the market.
Chart B 1.11.1 : the MASI index change
Source: Casablanca stock exchange
Following the dip in share prices, the value of the Casablanca stock exchange, measured by the Price Earning
Ratio (PER), stood at 16 compared to 17.4 a year earlier (See Box 1.11.2).
127
THE STOCK MARKET, PRIVATE DEPT AND ASSET MANAGEMENT BANK AL-MAGHRIB - ANNUAL REPORT - 2009
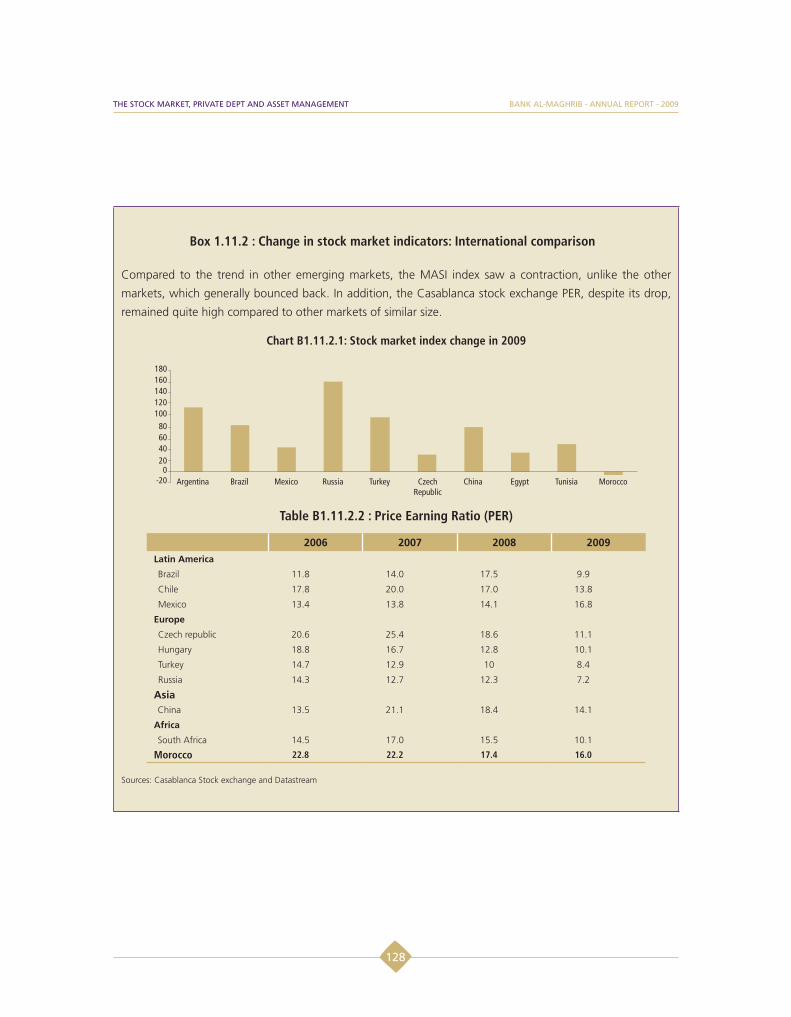
Box 1.11.2 : Change in stock market indicators: International comparison
Compared to the trend in other emerging markets, the MASI index saw a contraction, unlike the other
markets, which generally bounced back. In addition, the Casablanca stock exchange PER, despite its drop,
remained quite high compared to other markets of similar size.
Chart B1.11.2.1: Stock market index change in 2009
Table B1.11.2.2 : Price Earning Ratio (PER)
2006 2007 2008 2009Latin America
Brazil 11.8 14.0 17.5 9.9
Chile 17.8 20.0 17.0 13.8
Mexico 13.4 13.8 14.1 16.8
Europe
Czech republic 20.6 25.4 18.6 11.1
Hungary 18.8 16.7 12.8 10.1
Turkey 14.7 12.9 10 8.4
Russia 14.3 12.7 12.3 7.2
AsiaChina 13.5 21.1 18.4 14.1
Africa
South Africa 14.5 17.0 15.5 10.1
Morocco 22.8 22.2 17.4 16.0
Sources: Casablanca Stock exchange and Datastream
128
BANK AL-MAGHRIB - ANNUAL REPORT - 2009THE STOCK MARKET, PRIVATE DEPT AND ASSET MANAGEMENT

Chart B1.11.2.2 : Market capitalization ratio/ GDP (in %)
Sources: Casablanca Stock exchange and Datastream
At 508.9 billion, market capitalization dropped for the second year in a row, albeit at a less pronounced pace,
by 4.3 percent compared to 9.3 percent in 2008. This decrease is attributed solely to the dip in share prices,
while the number of listed companies remained unchanged. As to capital increase operations, they grew from
5.8 billion to 6.4 billion from one year to the next. The absence of IPO’s and the weak volume of capital increase
operations reflect the limited contribution of the stock exchange in the financing of the economy.
The volume of transactions, amounting to 144.4 billion dirhams, fell 40.8 percent after the 32.1 percent decrease
in 2008. This trend led to a drop in the liquidity ratio which edged down from 16.6 percent to 10.7 percent. In
addition, scalping operations carried out by investors as part of their portfolio readjustments were lower in 2009,
being limited to 36.8 billion dirhams compared to 59.1 billion in 2008. By segment, the central market which
drained more than 60 percent of the overall volume in 2009 continued to attract the majority of operations
amounting to 71.9 billion dirhams.
Concerning the profitability of stock market investments, the dividends distributed by listed companies continued
their upward trend to reach 21.2 billion, compared to 19.5 billion in 2008, raising therefore the overall average
return rate to 4.2 percent instead of 3.7 percent in 2008.
129
THE STOCK MARKET, PRIVATE DEPT AND ASSET MANAGEMENT BANK AL-MAGHRIB - ANNUAL REPORT - 2009

Foreign investments in listed shares dropped in turn 6.45 percent to stand at 145 billion dirhams. This decrease
is due to the depreciation of securities composing foreign investors’ portfolios. As to the share of foreign
investments in market capitalization, it slightly decreased from 26.8 percent in 2008 to 26 percent on the back
of the poor performance of the shares’ portfolios held by foreigners which was more important compared to
the stock market index in 2009. Excluding strategic stakes, the share of foreign capital in listed securities, while
increasing slightly, remained low as it represented only 2.5 percent of market capitalization compared to 2.3
percent in 2008.
1.11.2 Negotiable debt securities
After reaching nearly 39 billion dirhams in 2008, gross issuance of negotiable debt securities dropped 22.5
percent in 2009 to stand at 30.1 billion dirham. This decrease is mainly attributable to the decline in new
issues of certificates of deposits which fell from 30 billion in 2008 to 20.6 billion dirhams in 2009. Similarly, the
issuance of commercial paper fell to 3.5 billion compared to 7.7 billion. As to the issuance of finance company
bonds, it registered a marked increase to stand at 6 billion dirhams in 2009 against 1.1 billion in 2008. Since
repayments stood at 21.5 billion dirhams, the outstanding amount of negotiable debt securities rose from 31.8
billion in 2008 to 42.7 billion dirhams in 20091.
Interest rates applied to these securities changed differently according to each instrument. For certificates of
deposits, rates on the most frequent maturity, that is the 2-year certificates, varied between 3.60 percent and
4.55 percent compared to 4.15 percent and 4.70 percent. Concerning finance company bonds, rates on 3-year
maturity securities ranged between 4.20 percent and 4.75 percent against 4.15 percent and 4.61 percent. As
to commercial paper, rates on 3-month maturities ranged between 3.64 percent and 4.60 percent compared to
3.90 percent and 4.40 percent.
1 See Table A11.5
130
BANK AL-MAGHRIB - ANNUAL REPORT - 2009THE STOCK MARKET, PRIVATE DEPT AND ASSET MANAGEMENT
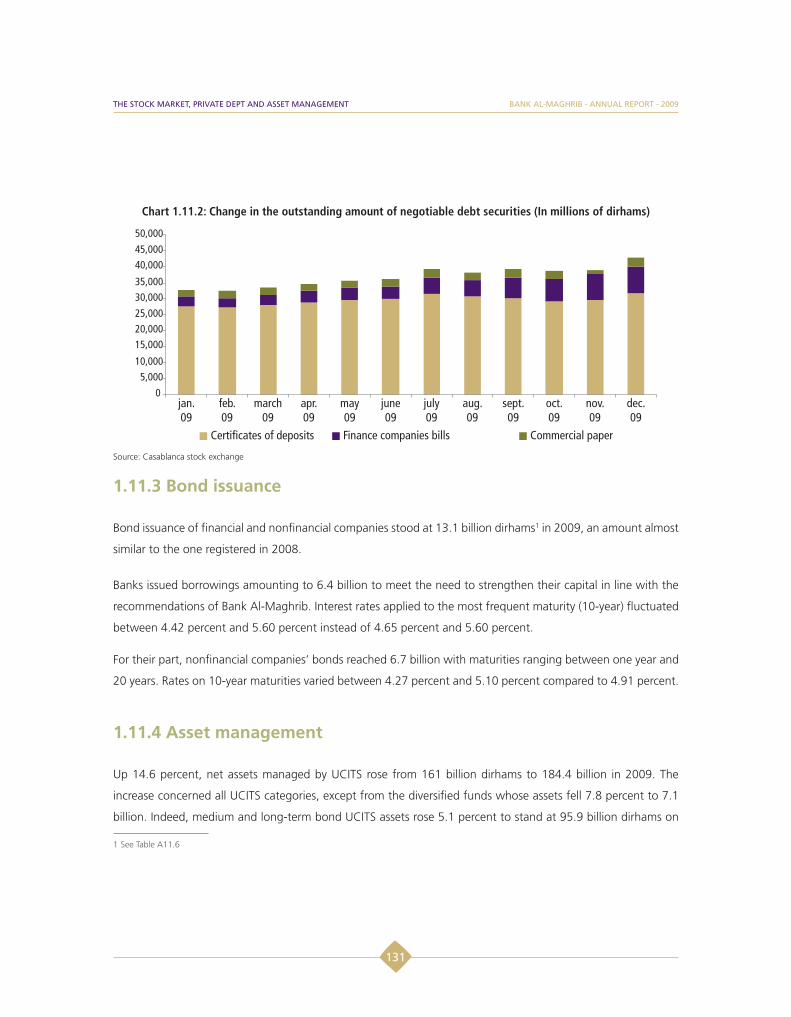
Chart 1.11.2: Change in the outstanding amount of negotiable debt securities (In millions of dirhams)
Source: Casablanca stock exchange
1.11.3 Bond issuance
Bond issuance of financial and nonfinancial companies stood at 13.1 billion dirhams1 in 2009, an amount almost
similar to the one registered in 2008.
Banks issued borrowings amounting to 6.4 billion to meet the need to strengthen their capital in line with the
recommendations of Bank Al-Maghrib. Interest rates applied to the most frequent maturity (10-year) fluctuated
between 4.42 percent and 5.60 percent instead of 4.65 percent and 5.60 percent.
For their part, nonfinancial companies’ bonds reached 6.7 billion with maturities ranging between one year and
20 years. Rates on 10-year maturities varied between 4.27 percent and 5.10 percent compared to 4.91 percent.
1.11.4 Asset management
Up 14.6 percent, net assets managed by UCITS rose from 161 billion dirhams to 184.4 billion in 2009. The
increase concerned all UCITS categories, except from the diversified funds whose assets fell 7.8 percent to 7.1
billion. Indeed, medium and long-term bond UCITS assets rose 5.1 percent to stand at 95.9 billion dirhams on
1 See Table A11.6
131
THE STOCK MARKET, PRIVATE DEPT AND ASSET MANAGEMENT BANK AL-MAGHRIB - ANNUAL REPORT - 2009

the back of the drop in interest rates on the Treasury’s medium and long-term issues compared to 2008, while
short-term bond funds assets rose nearly 65 percent to stand at 7.8 billion. In turn, contractual UCITS and money
market UCITS respectively grew 73.8 percent and 29.8 percent. As to equity UCITS, their assets reached 20.6
billion, growing by around 25 percent; thus highlighting a diversification of their investments.
Chart 1.11.3 : UCITS net assets
Source: Transferable Securities Ethics Board
The number of UCITS rose from 260 in 2008 to 294 in 2009 following the creation of 34 new funds, a third of
which are bond UCITS. As per legal structure, these UCITS are divided into 249 mutual funds and 45 investment
companies with variable capital. Medium and long-term bond UCITS, totaling 117, are still dominant and
represent nearly 40 percent of the total.
The breakdown of net assets by UCITS category shows that medium and long-term bond UCITS still hold
a dominant share, even though it fell from 56.7 percent to 52 percent. The net assets of equity funds and
diversified funds also decreased to 11.2 percent and 3.8 percent respectively compared to 15 percent and 4.7
percent, whereas money market UCITS rose year-on-year from 25.2 percent to 28.6 percent.
The amount of UCITS securities held by financial companies increased from 118.7 billion to 131.2 billion
dirhams, representing 71.2 percent of the total. Such growth results from the marked increase in assets held
132
BANK AL-MAGHRIB - ANNUAL REPORT - 2009THE STOCK MARKET, PRIVATE DEPT AND ASSET MANAGEMENT

by pension and provident institutions and, to a lesser degree, assets held by banks. Similarly, the share of assets
held by nonfinancial businesses increased to represent 20 percent instead of 15.6 percent in the preceding year.
Conversely, resident natural persons held only 8.3 percent from 10.1 percent the year before while the share of
nonresident natural and legal persons remained almost stable at 0.5 percent.
The share of UCITS net assets in national saving rose to more than 80 percent, up from 75.6 percent in 2008,
while its ratio to GDP increased from 23.4 percent to 25 percent.
Box 1.11.3 : Major regulatory measures introduced in 2009
The Casablanca stock market initiated an overhaul of its Statutes in order to introduce as of April 2009
a governance model based on a Board of Directors and executive management, in replacement of the
Supervisory Board and the management board model adopted since 2000.
In addition, the Securities Board approved seven circulars related to the:
- Publication and dissemination of financial information by legal persons going public: These procedures were
modified in line with the recent change in the regulatory environment and with international practices.
- Prudential rules governing UCITS activity: The new provisions aim at harmonizing the calculation methods
of the prudential ratios applicable to UCITS as well as controlling the risk related to the composition of UCITS
assets.
- Classification of UCITS: The new provisions define and specify the determination mode of investment
strategies of UCITS and also identify the special treatment of repurchase operations in light of the classification
rules in force.
- Disclosure obligation by UCITS management companies: This circular aims in particular at incorporating the
new disclosure obligations concerning the investment operations abroad as well as some specific provisions
in terms of advertising communication.
- Documents and information to be addressed by the Stock exchange management company to the Securities
Board.
- The management charges of UCITS.
- The fee UCITS has to pay to the Securities Board.
133
THE STOCK MARKET, PRIVATE DEPT AND ASSET MANAGEMENT BANK AL-MAGHRIB - ANNUAL REPORT - 2009


PART 2
BANK ACTIVITIES

Highlights of 2009
Following is the fourth edition of the activity report of the Bank as a corporation. It goes back over the Bank’s
annual activity, in the context of the independence it enjoys by virtue of the law and considering its fundamental
missions, namely: preserving price stability, seeing to the soundness and solidity of the banking system and
ensuring the secure operation of payment systems and means. The report also presents the Bank’s medium-
term priorities, in light of the internal and external economic and financial changes calling for reactivity and
adaptability.
First, 2009 coincided with the celebration of the 50th anniversary of the Bank. This event was commemorated
internally as well as with external partners, with openness and sharing as key-words. It was also the occasion to
take stock of the bank’s main achievements.
the launching of the dirham as the national currency, the establishment of Dar As-Sikkah and the adoption
of a banking act which defined a unified legal framework for all credit institutions and reinforced the bank’s
regulatory powers. This law was completed by the overhaul of the Bank’s statutes, aimed at better clarifying its
missions.
the banking act. The new statutes vested the Bank with a clear mandate for the formulation and implementation
of monetary policy, and larger prerogatives in banking regulation and supervision. In conformity with the
amended statutes, the Bank has become responsible for the supervision of payment systems and means and the
improvement of their security.
resources and competences. New operational and management processes were set up, following international
standards, which permitted the Bank to become ISO-9001 certified for all its activities and processes.
as the numismatic and artistic heritage of Morocco. These efforts were crowned with the edification of a new
museum.
BANK AL-MAGHRIB - ANNUAL REPORT - 2009
137
BANK ACTIVITIES

The year 2009 was also marked by the completion of the second strategic plan (2007-2009), at the end of which
considerable advances were achieved. In terms of functioning and management modes, the Bank adopted good
governance practices, improved the quality and efficiency of its processes, upgraded its internal control systems,
and modernized and optimized its human resources management. Thanks to these wide-ranging reforms, the
Bank developed its monetary policy and banking supervision frameworks, in line with the international standards
and practices, and set up a framework for the monitoring of payment systems and means.
In accordance with the priorities defined in the three-year plan, progress achieved in 2009 in terms of the Bank’s
fundamental missions allowed both consolidating the achievements of the two preceding years and giving
special attention to the domestic knock-effects of the international economic and financial crisis. The response
and vigilance measures adopted by the Bank in this regard include:
and the information mechanisms underlying its decisions, mainly through a better understanding of monetary
policy transmission mechanisms and a refined range of real and financial indicators. The Bank also endeavored
to enhance the transparency and communication around its monetary policy decisions, in order to improve their
credibility and make them more understandable for the public.
functioning of the banking system, to allow it to develop and effectively play its role in financing the economy.
Hence, as part of the actions conducted in 2008, the Bank carried on the reinforcement of the regulatory
framework of credit institutions and the preventive mechanism for risk detection. It also intensified coordination
with the other regulatory authorities in order to coherently ensure the stability of the national financial system.
the contractual framework for payment systems and the completion of the paperless exchange of securities.
The setting-up of the Credit Bureau, which was operational as of October, was one of the major achievements
of the year as far as financial information is concerned. By centralizing information regarding granted loans,
this entity will allow credit institutions to better manage risks and will also help improve the access of small and
medium-sized enterprises to credit.
138
BANK AL-MAGHRIB - ANNUAL REPORT - 2009BANK ACTIVITIES

Finally, in 2009 the Bank started the examination of the priorities of the 2010-2012 strategic plan. Based on
a long-term vision, the Bank made a diagnosis of the threats posed and opportunities offered by its external
environment, taking into account its internal strengths and weaknesses alike. This analysis brought out key
factors likely to allow the Bank to consolidate its image as a center of rigor, transparency and modernity, and
also to contribute, in the most efficient way, to the economic and social development of the country. The
orientations set, taking into consideration the Bank’s fundamental missions, reflect the effort needed in order to
adapt and take up the challenges of the future. The latter ensue from the acceleration of regionalization and the
formulation of sector-based policies, the commercial and financial integration of Morocco into the international
economy in a post-crisis context, the regional positioning of the Moroccan financial system and from financial
inclusion. The Bank therefore has to shore up its governance system, make its resource management more
efficient while improving the working environment in order to further professional development.
BANK AL-MAGHRIB - ANNUAL REPORT - 2009
139
BANK ACTIVITIES
Box 2.1 : From 1959 through 2009: highlightsSeveral dates have marked the history and development process of the Bank from 1959 through 2009:
1959: Creation, on July 1st, of the “Banque du Maroc” which replaced the «Banque d’Etat du Maroc». By so
doing, Morocco recovered its monetary sovereignty.
On October 17, the Moroccan dirham was established.
1967: Adoption, in April, of the Banking Act and the parallel consolidation of the role devolved upon the
Bank, by virtue of its statutes, in terms of banking supervision.
1987: Creation in March of Dar As-Sikkah, the industrial unit in charge of banknotes manufacturing and
coins minting.
Adoption, as of April, of the denomination “Bank Al-Maghrib” in all languages.
1993: Adoption in July of a new Banking Act, which set up a unified legal framework for all credit institutions.
It also enlarged the scope of consultation, adopted measures aiming at better protecting customers’ interests,
and reinforced the Bank’s powers in regulating and supervising the activities of credit institutions.
Amendment in October of the Bank’s statutes, in order to better define its missions, especially with regard to
monetary policy, and endow its administration and management bodies with more autonomy.
2002: Creation, in June, of the Currency Museum. Thanks to the large collection it houses, the Museum goes
back over the history of the monetary art, thus enriching the museum scene.
2006: Amendment of the Bank’s statutes, with a clear mission as to the formulation and implementation of
monetary policy and larger powers in banking regulation and supervision. By virtue of the statutes, the Bank
has also become legally in charge of supervising and securing payment systems and means and has been
endowed the form of a public legal entity.
140
BANK AL-MAGHRIB - ANNUAL REPORT - 2009BANK ACTIVITIES

2.1 Governance
2.1.1 Governance structure
2.1.1.1 Administration, management and control bodies
The Bank has several administration and management bodies: the Bank Board, the Governor and the
Management Committee.
The Bank Board is made up of the Governor, the vice-Governor or Director General and six members appointed
by the Prime Minister, three of whom are proposed by the Governor from among people renown for their
monetary, financial and economic expertise. These members, who are appointed for a six-year renewable
mandate, are subject to the incompatibility rule that guarantees their independence and impartiality. To this
end, they are not allowed to have any position of responsibility in credit or financial institutions or in the general
government. The Ministry of Finance is represented by the Treasury and External Finance Director who does not
take part in voting on monetary policy decisions.
The Bank Board sets the objectives of monetary policy, defines the characteristics of banknotes and coins issued
by the Bank, and takes decisions about circulating them and drawing them from circulation.
In addition, the Board is in charge of the Bank’s administration. In this regard, it defines the general investment
rules for foreign exchange reserves, decides on the investment of the Bank’s equity capital, approves its budget
and accounts, and takes decisions on the distribution of the net income.
The Governor runs and manages the Bank. He chairs the Board and keeps it informed about the implementation
of monetary policy and the management of foreign exchange reserves, and sees to the enforcement of its
decisions.
The Management Committee, chaired by the Governor, meets monthly to examine issues relating to the Bank’s
internal management and the progress report of the ongoing projects scheduled in the strategic plan mainly.
BANK AL-MAGHRIB - ANNUAL REPORT - 2009
141
BANK ACTIVITIES

Three entities are in charge of the Bank’s control: the Government Representative, the statutory auditor and the
Court of Auditors.
The Government Representative is appointed by virtue of a royal decree from among the top-ranking civil
servants of the Ministry of Finance and is responsible for controlling the Bank’s activities, on behalf of the
Government and in the name of the Finance Minister. He attends the Board’s meetings in an advisory capacity.
Appointed by the Board, the statutory auditor examines the Bank’s accounts annually, certifies that they give a
fair view of its assets, financial situation and results, and evaluates its internal control mechanism.
Being subject to the control of the Court of Auditors, the Bank is required to provide it, each year, with its
accounts and those of the social welfare body of its staff as well as with extracts from the Board minutes relating
to its budget and assets, along with the auditors’ reports.
142
BANK AL-MAGHRIB - ANNUAL REPORT - 2009BANK ACTIVITIES
2.1.1.2 Organization and activity steering
As at end-December 2009, the Bank was made of fifteen units, including seven core business units and eight
support units, following the reorganization that took place in June, in order to better adapt this structure to the
institution’s missions.
The activities of the Bank are steered by standing committees set up by a directive of the Governor and cross-
sectoral committees responsible for managing and monitoring projects.
BANK AL-MAGHRIB - ANNUAL REPORT - 2009
143
BANK ACTIVITIES

The Governor
The Director General
Risk PreventionDivision
Internal AuditDivision
AUDIT AND RISK PREVENTIONDEPARTMENT
MONETARY OPERATIONS
AND EXCHANGEDEPARTMENT
Front-OfficeDivision
Control and Risk
ManagementDivision
Back-OfficeDivision
Money and Exchange MarketsDivision
Payment Systems
and Means Division
General ServicesDivision
PurchasingDivision Real Estate Division
LOGISTICSDEPARTMENT
BANKING SUPERVISIONDEPARTMENT
Regulation and Licensing
Division
Accounting and Banking
StudiesDivision
Credit Institutions and Similar
Bodies Off-site Inspection
Division
On-site Inspection
Division
Social Management
Division
TrainingDivision
Human Resources
DevelopmentDivision
Jobs and Competence Frameworks
Division
Staff AdministrationDivision
HUMAN RESOURCESDEPARTMENT
ECONOMICS AND INTERNATIONAL
RELATIONSDEPARTMENT
Monetary and Financial Studies
Division
StatisticsDivision
Economic StudiesDivision
International Relations
Division
AccountingDivision
ManagementControl Division Budget Division
FINANCIALDEPARTMENT
DAR AS-SIKAHDEPARTMENT
Central FundDivision
Banknotes andCoins Division
Secure Documents
Service
Quality and Money Control
Division
Engineering and
MaintenanceDivision
Resources Management
Division
Infrastructure and Production
Division
Studies and Development
Division
OrganizationDivision
ORGANIZATION AND
INFORMATION SYSTEMS
DEPARTMENT
NETWORK AND CORPORATE RELATIONSDEPARTMENT
NetworkDivision
Division of Central
InformationBureaus
Anti-Money Laundering
CentralService
Litigation and General Affairs
Service
Banking and Financial Law
Service
Institutional andSocial Law Service
LEGAL AFFAIRSDIVISION
CURRENCY MUSEUMDIVISION
Studies Service CollectionsService
Coordination and CulturalAction Service
Control Service
Internal Communication
ServicePress Service
Service of Institutional
Communication and Relations with
the Public
COMMUNICATIONDIVISION
RESEARCHDIVISION
Modelling and Macroeconomic Forecasts Service
Monetary Policy Research
Service
Financial Research
Service
ControlService
TechnicalService
OperationsService Engineering Service
SECURITYDIVISION
144
BANK AL-MAGHRIB - ANNUAL REPORT - 2009BANK ACTIVITIES

2.1.2 Strategic planning
In 2004, the Bank adopted the strategic planning approach, which has since then set continued improvement
as an objective.
The second strategic plan 2007-2009 was elaborated following the amendment of the statutes and the banking
act which endow the Bank with a larger autonomy in the formulation and implementation of monetary policy
and give it wider powers in banking supervision and the oversight of payment systems.
Based on the achievements of the 2004-2006 strategic plan, the priority of which was to provide the Bank with
all the means necessary to successfully accomplish its missions and ensure its transition to a modern central
bank, the 2007-2009 strategic plan defined three major strategic orientations:
mechanisms in order to ensure a general monitoring of the financial system, the development of a prudential
mechanism for the early detection of risks and vulnerability sources in the banking system, and the secured
functioning of payment systems;
At the end of 2009, the objectives defined in the plan’s orientations were met overall.
The Bank thus aligned its monetary policy and banking supervision frameworks with the international standards
and practices. Important progress was achieved in the oversight and security of payment systems and means.
As part of the forward-looking approach adopted with regard to financial stability-related challenges, the Bank
took many initiatives, mainly within the Coordinating Committee for the Financial Sector Supervisory Bodies, in
order to ensure the adoption of the best practices aiming at countering the development of systemic risks. The
Bank also launched actions for the setting-up of a macro-prudential surveillance framework and led a stress test.
BANK AL-MAGHRIB - ANNUAL REPORT - 2009
145
BANK ACTIVITIES

These modernization efforts come within the framework of total quality management, which was crowned with
an ISO-9001 certification for all of the Bank’s processes in March 2009.
As part of the ongoing reforms and to meet the major challenges of the coming years, the 2010-2012 strategic
plan has been defined as marking transition from the consolidation of the Bank’s position to enhancing its
performance.
The Bank, in conformity with the new approach adopted for the preparation of this plan and within a long-term
vision, made a strategic diagnosis based on the analysis of the threats posed and opportunities offered by its
external environment and comparing them with its external strengths and weaknesses. This analysis turned out
very rewarding and shed light on the key success factors likely to allow the Bank to consolidate its image as a
center of rigor, transparency and modernity in order to better fulfill its mission.
Box 2.1.1: 2010-2012 strategic orientations1-Developing monetary policy so that it contributes to a successful integration of Morocco into the world
economy;
2-Reinforcing banking supervision and developing the financial stability-related function;
3-Working for the development of financial services;
4-Carrying on the development of payment systems and means taking into account technology and risk
evolution;
5-Adapting the work of the Bank’s network to the development of its missions;
6-Consolidating governance in view of the best standards and consolidating the Bank’s image based on
transparency, conformity and integrity, within a sustainable development approach;
7-Encouraging professional development and a rewarding working environment, and targeting the efficiency
in the management of resources and the quality of services offered.
146
BANK AL-MAGHRIB - ANNUAL REPORT - 2009BANK ACTIVITIES
Box 2.1.2: Main 2007-2009 strategic projects ERP information system The ERP information system, named “Indimaj”, allows the firm to coordinate all the activities of its support
functions around a unique and common database. The system became operational in January 2010 and
covers many functional aspects, including the budget, accounting, procurement, fixed assets and stocks.
Budget: Budgetary control is now automated and managing entities have become accountable, as to the
follow-up of their budget’s execution. This provides real-time, rapid, coherent and reliable information.
Accounting: the system’s innovations in terms of accounting management are:
-The adoption of a flexible accounting key which allows segment-based management of accounting,
analytical and budget information;
-Distinction between individual accounting and general accounting, thus re-centering accounting on its core
business;
-Implementing a multi-diverse “supplier” and “client” accounting;
-Shifting from a cash-basis accounting to an accrual-basis accounting.
Fixed assets: fixed asset management under the ERP provides users with an exhaustive and centralized
statement of the Bank’s assets. This statement is updated in real time, according to sale and purchase
transactions. The ERP does also away with the manual adjustments between the results of accounting and
those of fixed asset management.
Procurement: Under the ERP, procurement is realized and managed automatically and in real time through:
-Traceability and reliability, with the integration of all the procurement process from the expression of needs
to accounting and the supplier’s settlement;
-Rapid and reactive processing of the whole cycle of the order, from reception to invoicing,
-A better command of restocking management;
-The setting-up of a reference system for suppliers and integrated and shared items.
Inventory: The ERP guarantees real-time cohesion between procurement and values, through the central
basis and the integration of the whole processes “Budget, accounting, procurement, sale, inventories and
fixed assets”. Inventory and value management therefore becomes simplified, secure and more efficient.
Reform of the Pension FundThe reform of the Pension Fund included the setting-up of an appropriate governance framework, the
elaboration of an actuarial balance sheet and the outsourcing of the financial management of a big part of
the fund’s assets as of October 2009.
Finalization of the setting-up of a management control systemThe key business indicators were gradually generalized to all activities. In addition to budget optimization
through the decentralization and accountability of resource management, management control through an
ABC (activity-based costing) analytical accounting system- provides all entities with cost indicators allowing
them to optimize the use of resources and to identify means to reduce expenses and increase productivity.
BANK AL-MAGHRIB - ANNUAL REPORT - 2009
147
BANK ACTIVITIES

2.1.3 Ethics
As far as ethics are concerned, 2009 was marked by the organization of several awareness actions about the
code of ethics, which was adopted in 2005 and has been enriched since then by a series of sub-principles.
Awareness actions mainly targeted newly hired staff and the Bank’s branches personnel. To allow the ethics
culture to take root and become fully adopted by the staff, two innovations were introduced this year, namely
the adoption of a new pedagogical approach, based on the illustrated presentation of the code of ethics, and
the presentation of the code’s provisions and clauses in dialectal Arabic.
Furthermore, a new communication strategy was adopted concerning ethics. It aims to preserve the main asset
of the Bank, namely credibility, by encouraging the entire staff to implement the most rigorous ethics’ standards
in their relations with colleagues, suppliers and partners.
In parallel, compliance to the code was monitored to make sure the staff is correctly implementing some of
its provisions, notably with regard to reporting requirements (conflicts of interest, gifts and stock holdings for
employees having sensitive functions).
2.1.4 Internal control system
The Bank’s internal control system, which is inspired from the COSO1 reference system, is centered on the
principle of decentralisation and the accountability of operational entities in the setting-up and follow-up of
risk control and monitoring systems inherent to their activities. Like the aforesaid reference system, the Bank’s
internal control system is based on five components: the control environment, risk assessment, control activities,
information and communication system and steering system.
The 2009 report on the internal control system, which was submitted to the Bank Board, underlined the positive
evolution of all its components. These improvements mainly have to do with the Bank Board’s increasing
involvement in steering the said system; the positive impact of the major projects initiated by the Bank in
2004; a generally appropriate separation between the functions of operation launching, implementation and
control; and the consolidation of ethics and the development of practices promoting upward and downward
1 Committee of Sponsoring Organizations of the Treadway Commission
148
BANK AL-MAGHRIB - ANNUAL REPORT - 2009BANK ACTIVITIES
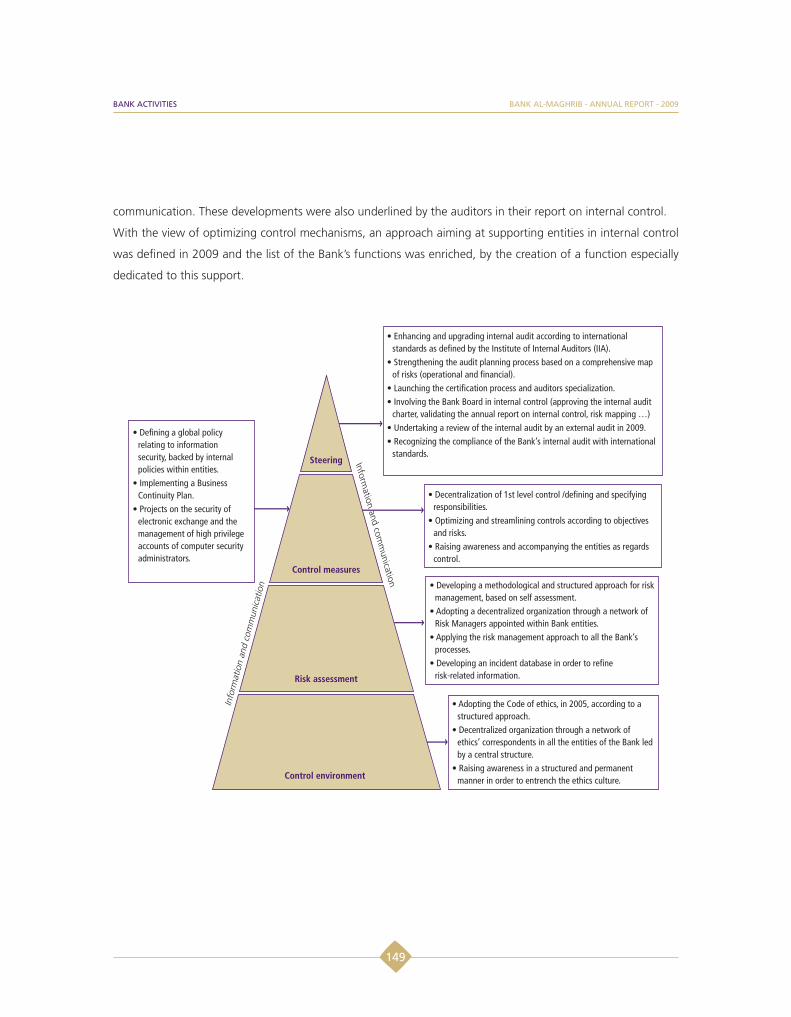
communication. These developments were also underlined by the auditors in their report on internal control.
With the view of optimizing control mechanisms, an approach aiming at supporting entities in internal control
was defined in 2009 and the list of the Bank’s functions was enriched, by the creation of a function especially
dedicated to this support.
BANK AL-MAGHRIB - ANNUAL REPORT - 2009
149
BANK ACTIVITIES

2.1.4.1 Risk management
With regard to risk prevention, 2009 was marked by the implementation of the operational risk control and
analysis (MARIO) to the new process map issued from the quality management system, thus enhancing synergy
between the two systems. Based on the experience acquired since 2005, MARIO was implemented in all
processes and covered both central entities and the Bank’s network. Furthermore, in order to better refine risk-
related information, a new “top-down” approach, based on the identification of the most critical risks, was
adopted.
Founded on an organization that involves both risk managers and process leaders, a comprehensive map of
operational risks was developed and put at the disposal of the Governor and the Bank’s management, as a
support tool for strategic decision-making. The main risks mentioned therein were identified, assessed and
covered by action plans designed to control them. As a result, 51 specific risks were identified at the Bank’s
network level, for which action plans were elaborated in consultation with the concerned central entities.
Moreover, the Bank reinforced its presence at the international level through its active participation in the
International Operational Risk Working Group, to which it adhered in 2007. At the same time, it provided
assistance to some African central banks in the management of operational risks.
2.1.4.2 Internal audit
The year 2009 was marked by the end of the first 2005-2009 audit cycle which virtually covered all of the Bank’s
core business and support activities. Overall, nearly 80 missions were conducted during this cycle.
150
BANK AL-MAGHRIB - ANNUAL REPORT - 2009BANK ACTIVITIES
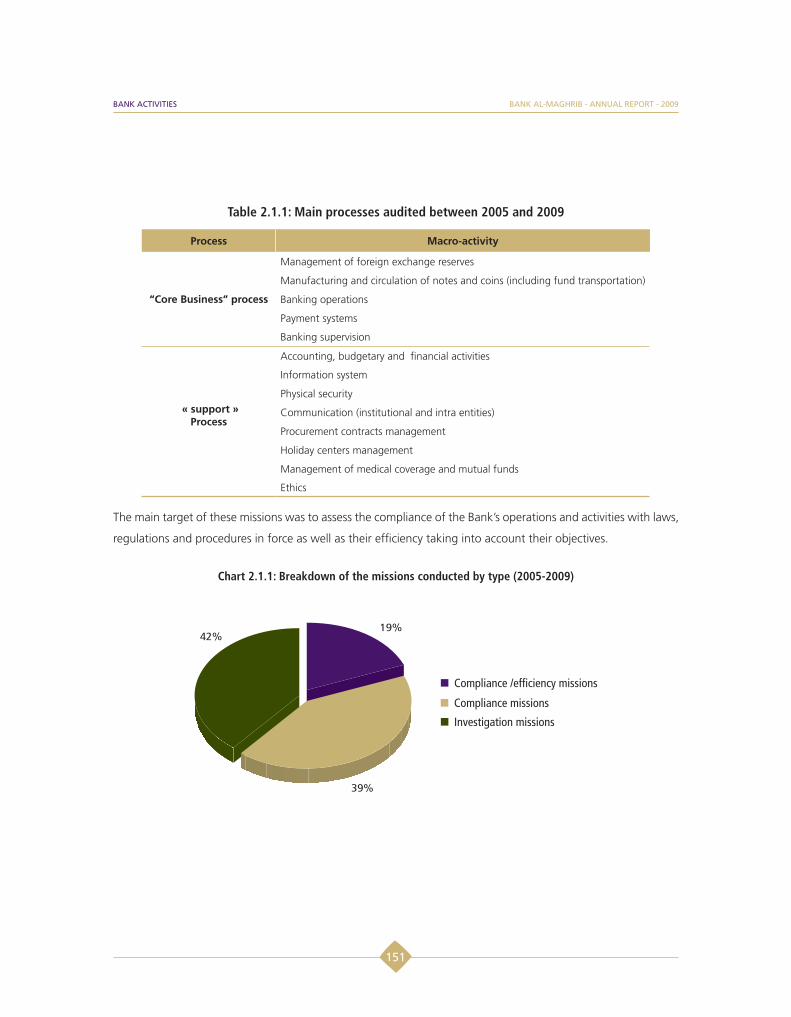
Table 2.1.1: Main processes audited between 2005 and 2009
Process Macro-activity
“Core Business” process
Management of foreign exchange reserves
Manufacturing and circulation of notes and coins (including fund transportation)
Banking operations
Payment systems
Banking supervision
« support »Process
Accounting, budgetary and financial activities
Information system
Physical security
Communication (institutional and intra entities)
Procurement contracts management
Holiday centers management
Management of medical coverage and mutual funds
Ethics
The main target of these missions was to assess the compliance of the Bank’s operations and activities with laws,
regulations and procedures in force as well as their efficiency taking into account their objectives.
Chart 2.1.1: Breakdown of the missions conducted by type (2005-2009)
BANK AL-MAGHRIB - ANNUAL REPORT - 2009
151
BANK ACTIVITIES

In 2009, the Bank completed the upgrading process of internal audit. Launched in 2004 as part of the Bank’s
first strategic plan, this alignment with the international standards for the professional internal audit as defined
by the Institute of Internal Auditors (IIA), allowed in particular the repositioning of internal audit at the structural
and functional levels, the reinforcement of its means and skills and the adoption of a rigorous methodology and
a risk-based approach both for audit missions’ planning and implementation.
The upgrading of the internal audit was crowned with an external assessment carried out in 2009 by an
independent office that was selected following an international open tender. As part of the continuous
improvement of the auditing process, this assessment covered the compliance of the Bank’s internal audit
activity with the international standards as enacted by the IIA. At the end of the assessment, the Bank’s internal
audit was recognized conform to said standards.
Moreover, on the occasion of the celebration of its 50th anniversary, the Bank organized the second annual
conference of Internal audit directors French-speaking countries’ central banks, the first edition of which was
held in Paris in 2008. 24 delegations of central banks from Africa, North America, Asia and Europe participated
in this conference. Themes discussed included the evolution of internal audit’s role in central banks in the
context of rapid changes and increasingly demanding requirements, namely the financial crisis and its impact on
internal audit, the concept of continued audit and its implementation in central banks, and the impact of quality
certification on the internal audit process.
2.1.4.3 Information security
In 2009, the project for the Information Security Management System, inspired by ISO 27001 standard, was
launched. In the continuity of the constant improvement, the Bank aims, through this project, to acquire the
organization, procedures and means necessary for a full control of information security-related risks.
In addition to valuing and improving the measures taken to protect the Bank’s assets (information, software,
hardware, staff, services, etc.) and third party assets (clients, partners, etc), this project provides an organizing
framework for all security-related actions or projects launched in the Bank since 2005, particularly internal policy
applications of the Overall Information Security Policy, the Business Continuity Plan, the securing of information
and electronic exchanges (PKI) and the follow-up of actions regarding highly privileged accounts.
152
BANK AL-MAGHRIB - ANNUAL REPORT - 2009BANK ACTIVITIES
2.1.4.4. Business Continuity Plan
The Business Continuity Plan was set up in the Bank to cope with operational disruptions which could interrupt
activity as a result of a major disaster like fire, floods or pandemic. It aims at preventing any interruption of
the Bank’s statutory missions, by planning the continuity of operation in the most critical services in terms of
emergency procedures and solutions.
The Business Continuity Plan includes a plan for crisis management, plans for the continuity of entities’ operations,
a plan for IT continuity and a plan for maintaining an operational condition. After defining the business continuity
strategy in 2008, the implementation of the continuity measures and solutions that match most to the Bank’s
specificities was carried out in 2009, particularly for the processes deemed critical (management of foreign
exchange reserves, payment systems, notes and coins, and secured documents).
Box 2.1.3: Main instruments in the information security system implemented in 2009
PKI system for securing information and electronic exchangesThe PKI system aims at putting in place at the Bank the organization and the infrastructure for issuing
electronic certificates in order particularly to ensure information confidentiality and integrity, control risks
related to access and exchange of information (authentication, electronic signature ,etc.). and help comply
with legal obligations and the best practices in terms of data protection. The infrastructure was implemented
in 2009 and its deployment to the different Bank applications will spread over the period 2010-2012.
Monitoring the High Privilege Accounts Actions (MHPAA)High privilege accounts are accounts which manage information systems and have elevated rights in terms
of access and processing of information stored in these systems. MHPAA would contribute to the security
of Bank’s information systems through a monitoring solution of the High Privilege Account Actions in order,
notably, to minimize the risk of improper handling or unauthorized change in the systems or authorizations.
In 2009, the project was deployed on the Windows operating system of the Bank.
BANK AL-MAGHRIB - ANNUAL REPORT - 2009
153
BANK ACTIVITIES

2.1.5 Quality management and compliance
2.1.5.1 Quality management system
The quality management system (QMS) initiated at the Bank in 2006 was awarded ISO 9001 certification for all
activities and processes in March 2009.
The year 2009 was characterized by maintaining the QMS, mainly through internal quality auditing of fourteen
out of twenty-six processes, operational steering meetings and process reviews, implementing actions related
to the sensitive issues highlighted during the certification audit, adopting measures related to potential
improvements ensuing from the QMS review, and conducting an overall review of the QMS in October.
The follow-up audit was carried out in November according to ISO 9001: 2008, following which the certification
of the Bank was renewed.
2.1.5.2 Integrated management system
As Bank Al-Maghrib has already undertaken several actions for environmental protection, safety and occupational
health, mainly with regard to its activities in Dar As-Sikkah, the Bank, in the context of developing its quality
approach, started in 2009 the building-up of an integrated management system: Quality, occupational health
and safety, and the environment.
The Bank looks forward to developing its system in line with other referential standards like environmental
management (ISO 14001) and occupational health and safety management system (OHSAS 18001). Such an
endeavor would allow the Bank to boost the progress made in terms of environment, occupational health and
safety, upgrade its activities in keeping with international standards, and embark on a sustainable development
path.
154
BANK AL-MAGHRIB - ANNUAL REPORT - 2009BANK ACTIVITIES

2.1.5.3 Internal anti-money laundering system
Over the year 2009, the Bank continued to strengthen its internal anti-money laundering system so as to cover
the whole of its intervention scope and to better protect its network from any unlawful usage.
On the regulatory front, the Bank elaborated and published the procedures related in particular to handling
watch-lists of persons involved in the financing of terrorism and alerts issued upon screening customers’
identification information.
Likewise, an ex-ante monitoring procedure laying out the identification rules of the Bank’s occasional customers
and the control of their identity in relation to the watch lists was prepared.
Procedures governing the collection and centralization process of Bank customers’ data and providing them to
operating units were also generalized to the entire Bank’s network.
Prior to the implementation of the IT tool aimed at providing assistance in customers’ behavioral analysis as
well as accounts and operations control, ex-post monitoring and operational rules of this tool were elaborated.
On the technical side, the Bank deployed the IT tool related to filtering the identification elements of customers
across its network. The same mechanism was extended to the SWIFT platform so as to cover the entire operational
perimeter.
Accordingly, since April 2009, the Bank’s network carries out automatic identity checks of all its occasional
customers in relation to the watch lists. These controls are also applicable to its usual customers, on the basis of
a regular scanning of the databases containing information on this category of customers.
Concerning the implementation project of an IT tool which assists in customers’ behavioral analysis, all the
prerequisites were met and its deployment is scheduled for the second quarter of 2010.
BANK AL-MAGHRIB - ANNUAL REPORT - 2009
155
BANK ACTIVITIES

As to training, which is an important pillar in the fight against money laundering and terrorism financing, the
Bank organized over the year 2009 nine training programs which benefited 113 employees. These trainings,
which focused on aspects related to ex-ante and ex-post control procedures and IT assistance tools, are expected
to continue for a three-year period in line with a strategy that identifies the target population and the adequate
training kits.
As part of the implementation of the technical assistance program laid out in the twinning agreement between
Morocco and the European Union on the fight against money laundering and terrorism financing, the Bank
staff participated in 13 training sessions, provided by international experts to the benefit of compliance officers
working in banking and financial sectors.
On top of the so-called “on-site” trainings and those given by relays at the Bank’s network, an “e-learning”
training program was developed. Its deployment in the near future will allow a better coverage of the involved
target population.
In addition, awareness and business intelligence efforts were exerted through the preparation and publication of
an annual report which outlines the recent national and international developments related to the fight against
money laundering and the financing of terrorism.
As to regional cooperation, the Bank participated in the Ninth and Tenth Plenary Meetings of the Middle East
and North Africa Financial Action Task Force (MENA FATF), held in Bahrain and Lebanon, respectively, as well as
in the workgroups ensuing from these meetings.
156
BANK AL-MAGHRIB - ANNUAL REPORT - 2009BANK ACTIVITIES

Box 2.1.4 Decisions taken by the Financial Intelligence Processing Unit (FIPU) in 2009
By virtue of the Law No 43-05 on the fight against money laundering and Decree No 2-08-572 of December
24, 2008 promulgating the creation of the Unit, the FIPU adopted on September 24, 2009, two decisions
concerning some categories of persons subject to this law, in completion of the national relevant legal texts.
Decision No. 1/109 of September 24, 2009 on the minimum amounts for due diligence. This Decision sets
50,000 dirhams as the minimum amount for operations concerning which financial institutions should
trigger the identification process of occasional customers, and completes the legal definition of the complex
operations by setting the third criteria related to the amount, which is 50,000 dirhams.
Decision No. 2/09 of September 24, 2009 on declarations for suspicion. This Decision sets the declaration
for suspicion model and the terms for its transmission to the FIPU, as well as the accreditation process of FIPU
correspondents with the parties subject to this law.
In order to ensure the compliance and adequacy of its internal mechanism with its own specificities, the Bank
commissioned an internal audit which would highlight the potential deficiencies of this mechanism and set up
appropriate action plans.
Finally, at the institutional level, the Bank put in place an internal committee for the fight against money
laundering and terrorism financing, entrusted with defining the Bank’s strategy, setting its risk prevention and
control policies, and monitoring their implementation.
2.1.6 Resources
2.1.6.1 Human resources 2.1.6.1.1 The Bank’s staff
By the end of 2009, the Bank’s working staff totaled 2,633 employees, composed up to 63 percent of males and
37 percent of females. 66 percent of them work at the Central Administration -29 percent in the manufacturing
BANK AL-MAGHRIB - ANNUAL REPORT - 2009
157
BANK ACTIVITIES

of notes and coins-and 34 percent in the Bank’s network. The average age is 41 years and the average seniority
is 14 years. The breakdown of the Bank’s staff by business fields shows that 63 percent are assigned to the core
business fields while 37 percent work in the support areas.
Chart 2.1.2: Staff by field of activity Chart 2.1.3: Staff by gender
Chart 2.1.4: Staff by age bracket
2.1.6.1.2 Implementation of the new human resources management mechanisms
In continuation of the projects initiated last year, the implementation process of the new human resources
management systems was still ongoing.
158
BANK AL-MAGHRIB - ANNUAL REPORT - 2009BANK ACTIVITIES

The identification of skills profile was generalized to all functions occupied at the Bank. Individual skills profiles
allowed defining clear development axes so as to bridge the potential gap between the skill required and
those acquired by staff. A consolidation of skills’ development objectives was carried out and included in the
identification process of training needs.
As to the new professional assessment system launched in 2008, the Bank introduced for the first time, during
the 2009 professional assessment campaign, the fixing of skills’ development objectives.
The mobility management process was boosted with a view to enriching professional trajectories by diversifying
experiences, offering everybody opportunities for professional and personal progress and constantly improving
the position/skills matching. A job database was thus prepared and disseminated to all the staff, covering 131
published positions (corresponding to 70 functions). Over the year 2009, 25 mobility committees were held, 128
employees benefited from functional mobility and 27 from geographic mobility.
In addition, training sessions were organized to the benefit of all Bank managers so as to strengthen their
managerial skills and accompany them in their new HR outreach role. These actions follow the training sessions
related to professional assessment organized last year and focussed on themes related to the every-day concerns
of managers and the Bank’s working environment (team building, managerial communication, conducting
meetings, time management and project- mode management, etc.).
The new salary-increase system and attribution of individual variable bonus and collective variable bonus system
was implemented for the first time this year. The system highlights the contribution of the employee and his
performance, based on the annual assessment results.
In addition, the human resource information system was enriched by the incorporation of seven new modules.
They concern the management of the collective variable bonus, promotions and career management, the ex
post evaluation of training sessions, recruitment and mobility management, the decentralized entry of the
variable salary elements, skills management and self-service. Besides simplifying administrative management,
this last module offers to managers and staff alike the opportunity to have access to wide-varied information
on human resources.
BANK AL-MAGHRIB - ANNUAL REPORT - 2009
159
BANK ACTIVITIES
2.1.6.1.3 Training
Individual training needs, as formulated by the Bank staff during the annual assessment interviews, together
with the annual consultations with the Bank’s departments, were both taken into account in drafting the training
program of 2009. The analysis and aggregation efforts of all training needs have also taken into consideration
the strategic objectives and the different projects carried out by the departments.
In 2009, the Bank organized 224 training courses, broken down into 268 sessions, taking place in the Madinat
Al Irfane Training Center, intercompany or abroad.
The 2009 training program included new themes covering core and support business areas, with 123 and 101
themes respectively, as well as training sessions to accompany the different on-going projects at the Bank. 2248
employees benefited from these trainings, a third of them from the Bank’s network.
2.1.6.2 Information systems
The year 2009 saw the completion of several projects related to information systems, notably:
against money laundering and the financing of terrorism.;
individual skills, assessment of skill levels, management of promotions and social management related to the
payroll.
As to infrastructure projects, the main achievements of 2009 included in particular:
processes based on the ITIL model, and the installation of a centralized solution for platforms supervision;
160
BANK AL-MAGHRIB - ANNUAL REPORT - 2009BANK ACTIVITIES

so as to deploy it in 2010 and integrate the first services;
implementation of the segment related to monitoring administration actions under the Windows operational
systems.
2.2 Bank missions
2.2.1 Monetary policy
The Bank pursued in 2009 its strategy of strengthening the monetary policy analytical framework. The latter
is based on an in-depth assessment of the economic condition, inflation and economic growth forecasts and
medium-term inflationary risks. Concurrently, the Bank continued to enhance the transparency of its monetary
policy decisions and facilitate its understanding by the public.
2.2.1.1 Analytical framework
The deepening of the assessment framework of risks on price stability continued in 2009 both on the analytical
and forecasting levels. The Bank gave special importance to strengthening monitoring and analysis indicators
related to the real and financial spheres.
Concerning the real sphere indicators, the progress made focused on deepening the understanding of inflation
dynamics, strengthening the forward-looking analysis of the national economy and analyzing the impact of
the international economic situation on Moroccan economy, in view notably of its synchronization with the
economic cycle in the main partner countries. The actions carried out focused on:
composed of quarterly SARIMA, P-Star and VARX models’ was enriched by introducing five new models, two of
them statistical (Markov regime model and SCARMA model) and three models inspired by the economic theory
(VAR, Bayesian VAR and the hybrid-expectations Philips curve based-model);
BANK AL-MAGHRIB - ANNUAL REPORT - 2009
161
BANK ACTIVITIES

allows to trace the interrelationships between the four sectors of the Moroccan economy and make medium-
term forecasts, while ensuring accounting and behavior coherence between the different variables;1 implemented by the Bank in 2008, with, on the one
hand, the introduction of 10-day agro climatic data and extending the used variables, and on the other the
development of a new forecasting model of the agricultural value added, which is currently on a testing stage.
advanced indicators of the economic situation. These indicators synthesize the information contained in
a number of economic variables and contribute thereby to the analysis and forecasting of sectoral activity
fluctuations. These indicators highlight nonagricultural activities as well as the industry, building and public
works, and energy and mining sectors;
especially in the phosphate and tourism sectors, in relation with the particularly deteriorated international
economic situation since 2008;
indicators which synthesize information contained in a mix of economic variables, considered relevant for
following-up and analyzing the trends in household final consumption and gross fixed capital formation;
which takes into account the various determining factors of the Treasury indebtedness on the medium-term;
of payments accounts;
forecasting model on the short term and the estimation of the relative labor unit cost indicator2 , which highlights
Morocco’s cost competitiveness compared to the main partner countries and competitors;
advanced composite index of partner countries3, developed on the basis of the cyclical component of the
advanced composite indicators of partner countries 4, weighted by the share of these countries in Morocco’s
total exports. In addition, a weighted unemployment indicator of Morocco’s partner countries was developed,
based on the unemployment rate in the main partner countries, weighted by the share of these countries in the
remittances of Moroccans living abroad.
1 The forecasting of cereal production implemented in 2008 comprises three models: an econometric spatial model, a model based on the detection of similar crop years and a model based on the computation of a rainfall indicator (See Box No 1.1 in the Monetary Policy Report of March 2009, available at the Bank website : www.bkam.ma).
2 The methodology related to this indicator is explained in Box No. 2.1 of the Monetary Policy Report of December 2009.
3 The methodology related to this indicator is presented in Box No 3.1 of the Monetary Policy Report of December 2009.
4 The methodology related to this indicator is presented in a box in the Monthly Business Survey of October 2009.
162
BANK AL-MAGHRIB - ANNUAL REPORT - 2009BANK ACTIVITIES

As to monetary and financial conditions, the studies conducted in 2009 aimed at strengthening the analytical
framework of inflationary pressures of monetary origin and better understanding the impact of assets prices’
fluctuation on inflation, especially real estate assets. The completed studies focused on:
price index (REPI)1 , which represents an important tool for the assessment of inflationary risks of monetary
origin;
exchange rate and interest rate;
and elaborating a new estimation of the equilibrium real exchange rate.
Concurrently, the efforts concerning the reform of monetary statistics, launched in 2008, continued in 2009
and its deployment by the Bank is expected to take place in June 2010. The objective of the new methodology
is to ensure the coherence of monetary statistics with data related to other macro statistic categories, so as to
facilitate their comparability on the international scene.
As part of a medium-term vision, the decisions taken by the Bank in its strategic plan 2010-2012 in order
to upgrade its monetary policy framework, introduce the necessary changes likely to secure the successful
integration of Morocco into the global economy.
1 The first edition of the REPI was published for the first time simultaneously on the website of the Bank and the Agence Nationale de la Conservation Foncière, du Cadastre et de la Cartographie – ANCFCC (National Land Registry and Cartography Agency) on March 15, 2010 as well as the reference document describing its methodology and uses.
BANK AL-MAGHRIB - ANNUAL REPORT - 2009
163
BANK ACTIVITIES
Box 2.2.1 Monetary policy in the strategic plan 2010-2012
The strategic aim set for monetary policy, under the 2010-2012 Plan, is to upgrade it with a view to
contributing to a successful integration of Morocco into the global economy. Six objectives were identified
to this purpose, namely:
Objective 1 Strengthening monetary policy transparency and credibility.
Objective 2 Adjusting the institutional, analytic and operational framework.
Objective 3 Boosting the process of consultation between the Central Bank and state authorities on flow
liberalization.
Objective 4 Working toward the deepening of markets.
Objective 5 Strengthening regional cooperation and playing a more active role in international institutions.
Objective 6 Adapting foreign exchange reserves management to the challenges induced by opening up to
the outside world.
2.2.1.2 Transparency
Concerning transparency, which is tantamount to independence in terms of monetary policy, the Bank continued
to improve its outreach to the public, increase the content and frequency of its communication, and facilitate a
greater opening up to its environment.
The Bank reinforced the quality of dialogue with the different economic policy players, economic operators and
the media. The press conference held at the end of the Bank Board quarterly meetings still represents the main
communication tool in term of monetary policy.
Concurrently, the Bank reduced the publishing time of monetary policy reports on the Bank’s website, bringing
it in 2009 to at most three hours following the Board meeting from 2 days in 2008 and 10 days in 2007. In
addition, it kept holding quarterly meetings with banking professionals in order to better explain and justify the
monetary policy decisions taken and also listen to bankers’ proposals.
The Bank also began in 2009 to publish the methodologies underlying the preparation of its new analysis and
forecasting tools.
164
BANK AL-MAGHRIB - ANNUAL REPORT - 2009BANK ACTIVITIES
2.2.1.3 Information system
The information system underlying the analytical framework of monetary policy was reinforced in 2009, by
enlarging the scope of the Monetary, Economic and Financial Series Database (BSMEF). To meet the new
requirements, more than 2900 series were added to the BSMEF.
In 2009, data collection and processing was fully integrated in the quality management system of the Bank and
became subject to a regular monitoring mechanism in order to detect non-conformities and prepare corrective
and/or preventive action plans. Accordingly, a “listening” system was put in place in order to measure users’
satisfaction.
In order to respond to external requests for information, the Bank launched a publishing process of the statistical
series on its website.
Strengthening the information mechanism of the Bank led to the conclusion of two agreements with external
partners in 2009:
Cartographie – ANCFCC (National Land Registry and Cartography Agency) for the elaboration of the REPI;
provide the Bank with 10-day weather data, allowing it to improve its forecasting tools of the crop output.
Finally, in order to maximize the internal use of data and information prepared for monetary policy purposes, the
Bank continued its efforts intended to formalize and automatize information processing.
2.2.2 Supervision and financial stability
2.2.2.1 Accounting and prudential regulation
In 2009, the Bank’s efforts focused on consolidating the regulatory framework governing credit institutions
and similar bodies. New rules were fixed for credit institutions in order to classify defaulting counterparties with
BANK AL-MAGHRIB - ANNUAL REPORT - 2009
165
BANK ACTIVITIES

the prospect of applying the advanced approaches of Basel II. The Bank submitted the draft text relative to the
implementation of these approaches for review by the banking industry. It also issued a directive on the minimal
rules governing the stress tests conducted by credit institutions, in order to assess their resilience to financial
shocks.
With a view to reinforcing governance within micro-credit associations, the Bank issued a directive defining rules
to be observed in this regard. They mainly identify the mission and operation methods of the administration
and management bodies of these institutions, while putting emphasis on their role in communication and
transparency.
The Bank also examined, in consultation with the banking industry, the impact of changes in IFRS1 and IASB 2,
in the light of the lessons drawn from the international financial crisis. In this regard, the Bank is working to
establish a harmonized framework for a new prudential and accounting reporting, called “Common Reporting”
and “FINREP” (Financial Reporting), in order to disseminate among banks the best practices relating to regulatory
information disclosure.
2.2.2.2 Control activities
The Bank’s mission relative to the supervision of credit institutions and similar bodies is carried out through
offsite and onsite inspections.
At end-December 2009, the Bank’s supervision activity was covering 85 credit institutions, including 18 banks,
36 finance companies, 6 offshore banks, 13 micro-credit associations, 9 funds transfer companies, the Caisse
Centrale de Garantie (Central Guarantee Fund), the Caisse de Dépôt et de Gestion (Deposit and Management
Fund) and the financial services of Barid Al-Maghrib (Moroccan Post Office).
Within the framework of offsite supervision, the credit institutions’ rating aid system (Système d’aide à la notation
des établissements de crédit – SANEC), created earlier, constituted a central tool as it helped conduct deep and
structured analyses of the individual situation of credit institutions and banking groups. These quantitative 1 International Financial Reporting Standards
2 International Accounting Standards Board
166
BANK AL-MAGHRIB - ANNUAL REPORT - 2009BANK ACTIVITIES

and qualitative analyses covered credit, market, operational, concentration, liquidity and interest rate risks.
The quantitative assessment is completed by a qualitative evaluation of internal control and risk management
mechanisms as well as by a balance between banks’ equity and the strategies set up by the concerned
institutions. Designed both for risk management and prevention, this system has structured the relation with
credit institutions and paved the way for fruitful exchanges with their managers and audit committees about
areas requiring corrective actions.
Onsite supervision consists in inspections conducted at credit institutions according to a prior timetable which
depends on risk areas. In 2009, 16 inspections were carried out at credit institutions and similar bodies, including
10 general missions and 6 cross-sectoral and specific missions.
Cross-sectoral missions mainly covered the study of mechanisms set up by credit institutions in order to
manage liquidity, interest rate and operational risks, the surveillance of banks’ branches abroad and anti-money
laundering.
Specific inspections focused on the evaluation of credit institutions’ exposures to the sectors mostly affected by
the international financial crisis.
2.2.2.3 Financial stability
Drawing on the teachings of the international financial crisis, the Bank reinforced the macro-prudential
surveillance framework. The December meeting of the Coordinating Committee was marked by the first-ever
participation of the Finance Ministry’s Department of Treasury and External Finance. The stress test conducted
during this meeting showed the effectiveness of the coordination mechanisms used by regulatory authorities.
It led to an action plan aiming at further formalizing this coordination and introducing reforms to consolidate
the systemic risk management tool. On the other hand, the Bank continued to improve its macro-prudential
surveillance tools, especially financial soundness indicators and sensitivity stress tests, and made an in-depth
analysis of the risks considered to be systemic.
BANK AL-MAGHRIB - ANNUAL REPORT - 2009
167
BANK ACTIVITIES

2.2.2.4 Credit institutions/customer relation
The Bank carried on with its actions aiming at developing financial services. In this regard, it accompanied banks
that implemented bancarization policies targeting low-income categories, while using innovative solutions based
on new technologies. The year 2009 was particularly marked by the effective start of the banking mediation
tool which works toward the amicable settlement of conflicts1 arising between credit institutions and their
customers.
On the other hand, the Bank- in consultation with the banking industry- launched a new action program aiming
at accelerating the development of financial services. This program aspires to improve the legibility of bank
statements and to set up a series of instruments, including a free basic service, an index of financial service prices
and a financial education program for the public.
2.2.3 Research
In 2009, research activity at the Bank was marked by the adoption of a program aiming at deepening the
scientific foundation underlying the conduct of the Banks’ fundamental missions. Actions conducted in this
regard were aiming at accompanying the realization of the strategic orientations relative mainly to monetary
policy and financial stability.
In the field of monetary policy, the Dynamic Stochastic General Equilibrium model was developed in order to
analyze the monetary policy transmission channels. A calibrated version of this model was achieved and other
extensions and improvements are planned to allow the model to better meet the Bank’s needs in terms of
analysis and simulation.
Research in the field of financial stability centered on increasing the analytical capacities in terms of risk modeling
and measuring, mainly through the development of quantitative models. Work accomplished with regard to the
modeling of systemic banking risks were crowned in 2009 with the elaboration of a model for systemic credit
risk.
1 The mediator intervenes to resolve conflicts relative to the management of demand, time and passbook accounts as well as to payment means, provided that these disputes are not brought before courts. The decisions of the mediator are binding for the credit institution when the amount in question is less or equal to 100,000 dirhams. However, the customer is free to accept or refuse the decision.
168
BANK AL-MAGHRIB - ANNUAL REPORT - 2009BANK ACTIVITIES

In parallel, efforts were extended with the aim of creating and consolidating partnerships with the academic
circles in order to help develop a real culture of research in Morocco in areas linked to the Bank’s fundamental
missions.
2.2.4 Systems and means of payment
2.2.4.1 Systems of payment
In 2009, the systems of payment witnessed two major events: the setting-up of the contractual framework for
payment systems’ monitoring and the completion of the paperless exchange of securities.
The contractual framework set up by the Bank, in collaboration with all participants in the payment systems,
defines the rules of good governance, transparency, security, prevention, and risk control as well as the business
continuity that managers are bound to respect. Modalities of the payment systems’ monitoring mission, as
defined in this agreement, include three aspects:
payment systems manager should abide by;
in force and ensuring that managers respect their commitments defined in the above-mentioned agreement;
In parallel, the generalization of the remote clearing system to all exchanged means of payment continued in
2009, through the deployment of the paperless exchange of debit advices via the Moroccan Interbank Remote
Clearing System (SIMT).
Regarding the payment means oversight, the Bank pursued its efforts to ensure that banks’ electronic money
system complies with the international standards, and to supervise the new generation of payment means.
2.2.4.2 Notes and coins
The Bank produces, issues and recycles banknotes and coins. It supplies the national economy with banknotes
and coins, and ensures the quality of their circulation.
BANK AL-MAGHRIB - ANNUAL REPORT - 2009
169
BANK ACTIVITIES

In 2009, the Bank produced 490 million new banknotes, compared to 402 million in 2008, up 22 percent.
In parallel, coins production stood at 113 million units in 2009, compared to 77.8 million coins in 2008, a 45
percent increase from one year to the next.
Chart 2.2.1: Production of new banknotes Chart 2.2.2: Production of new coins (In millions of coins)
At the end of December 2009, currency in circulation attained 143.1 billion dirhams, up by 6.2 percent compared
to 2008. In fact, the number of banknotes in circulation increased by 4.9 percent, while the quantity of coins
rose by 4.6 percent.
Chart 2.2.3: Monthly change of currency circulation
170
BANK AL-MAGHRIB - ANNUAL REPORT - 2009BANK ACTIVITIES

Concerning the structure of banknotes in circulation, the share of 200-dirham and 20-dirham denominations
rose from 41 percent to 43 percent and from 7 percent to 8 percent, respectively, year-on-year. Conversely,
100-dirham and 50-dirham denominations dropped from 46 percent to 44 percent and from 5 percent to
4 percent, respectively. As for the 10-dirham denomination, it stood at 1 percent. In terms of volume, coins’
circulation is mostly dominated by 1-dirham, !-dirham, 20-cent and 5-cent denominations with respective
shares of 25 percent, 15 percent, 15 percent, 19 percent, and 12 percent, thus constituting around 86 percent
of the coins in circulation. Compared to the previous year, shares in volume of all types of coins remained
unchanged.
Chart 2.2.4 Breakdown of banknotes in circulation per denomination
Chart 2.2.5 Breakdown of coins in circulation per denomination
During 2009, banknotes’ withdrawals from the Bank’s branches rose by 6.2 percent, compared to 2008, to
stand at 941 million units. On the other hand, coins’ withdrawals, at 124 million units, increased by 17 percent
compared to 2008. In terms of banknotes withdrawals from the Bank’s network, all the denominations recorded
an upward trend, rising by 3.4 percent for the 200-dirham denomination, 10 percent for the 100-dirham
denomination, 2.8 percent for the 50-dirham denomination and 3.3 percent for the 20-dirham denomination.
The number of banknotes deposited at the Bank’s branches increased by 14.8 percent to reach 817 million
banknotes. Deposits of valid banknotes by the private sorting centers reached 75 million denominations during
2009 compared to 118 million in 2008. This decrease is due to the rise in recycled banknotes, owing to the
important increase of bank branches and ATMs in 2009.
BANK AL-MAGHRIB - ANNUAL REPORT - 2009
171
BANK ACTIVITIES

Analysis of coins’ movements at the Bank’s network confirms the presence of a continuing pressure on the
1-dirham and !-dirham denominations. Indeed, their withdrawals increased, respectively, to 28.5 million and
19.5 million units while deposits stood at 2.5 million and 3.7 million denominations.
The overall volume of coins deposits at the Bank’s branches rose by 40.5 percent in 2009 and recorded
positive variations of 42 percent, 32 percent, 122 percent, 59.8 percent, and 12.5 percent, respectively, in the
denominations of 10 dirhams, 5 dirhams, 2 dirhams, 1 dirham and ! dirham. Conversely, 20-cent, 10-cent,
5-cent and 1-cent denominations recorded downward variations of 90 percent, 56 percent, 3 percent, and 33
percent, respectively.
In the Bank’s branches, cash outflows in 2009 concerned 123.7 billion dirhams of banknotes, while cash inflows
reached 115.3 billion dirhams, thus recording a surplus of outflows over inflows by around 8.4 billion dirhams
compared to 9.2 billion dirhams in the previous year. Such a surplus was recorded in the branches of Agadir,
Al-Hoceima, Beni-Mellal, Laâyoune, Meknes, Ouarzazate, Rabat, Safi, Tangiers, and Taza.
Table 2.2.1: Cash flows in the Bank’s branches(In thousand dirhams)
Branches Inflows Outflows Surplus
Agadir 11,147,504 12,539,506 1,392,002
Al-Hoceima 1,440,401 2,087,682 647,281
Beni mellal 1,784,327 3,717,400 1,933,073
Casablanca 24,372,623 22,958,433 -1,414,190
Laâyoune 995,082 2,164,280 1,169,198
El jadida 2,205,859 1,432,060 -773,799
Fez 13,067,843 8,091,999 -4,975,844
Kenitra 4,049,490 2,922,969 -1,126,521
Larache 920,090 845,912 -74,178
Marrakech 15,195,205 13,811,445 -1,383,760
Meknes 6,871,447 7,878,568 1,007,121
Nador 5,067,305 4,215,239 -852,066
Ouarzazate 408,695 1,840,555 1,431,860
Oujda 4,306,851 5,470,288 1,163,437
Rabat 8,671,069 18,275,193 9,604,124
Safi 2,026,591 2,555,647 529,056
Settat 1,073,301 886,499 -186,802
Tangiers 7,798,026 9,051,947 1,253,921
Taza 935,731 1,740,973 805,242
Tetouan 3,018,708 1,242,653 -1,776,055
Surplus (outflows-inflows) 115,356,148 123,729,248 8,373,100
172
BANK AL-MAGHRIB - ANNUAL REPORT - 2009BANK ACTIVITIES

In 2009, deposits of banknotes at the Bank’s branches, which amounted to 817 million notes, induced sorting
operations of 628 million units, all denominations combined. As a consequence, 282 million denominations
were definitely withdrawn, as their condition no longer complied with the required quality standards.
The sorting of 100-dirham and 200-dirham banknotes decreased by 7 percent in 2009 to 540 million from 581
million processed banknotes. This decrease is mainly attributed to the difficulties faced in processing damaged
banknotes received from the private sorting centers, accounting for 27 percent of all processed banknotes. As
regards the branches, the volume of processed banknotes reached 88 million units, composed mainly of 50 and
20-dirham denominations.
Chart 2.2.6: Change in deposits and banknotes to be sorted
Banknotes sorted by the private sorting centers stood at 759 million banknotes in 2009, all denominations
combined. These banknotes were divided as follows: 374 million recycled banknotes, 75 million valid banknotes
deposited at the Bank’s branches, and 310 million banknotes removed from circulation.
Regarding foreign banknotes, their purchase decreased by 4.8 percent compared to 2008, while their sales
saw no considerable change. Consequently, net purchases stood at 44.2 billion dirhams, down by 5 percent
compared to their level in 2008.
BANK AL-MAGHRIB - ANNUAL REPORT - 2009
173
BANK ACTIVITIES
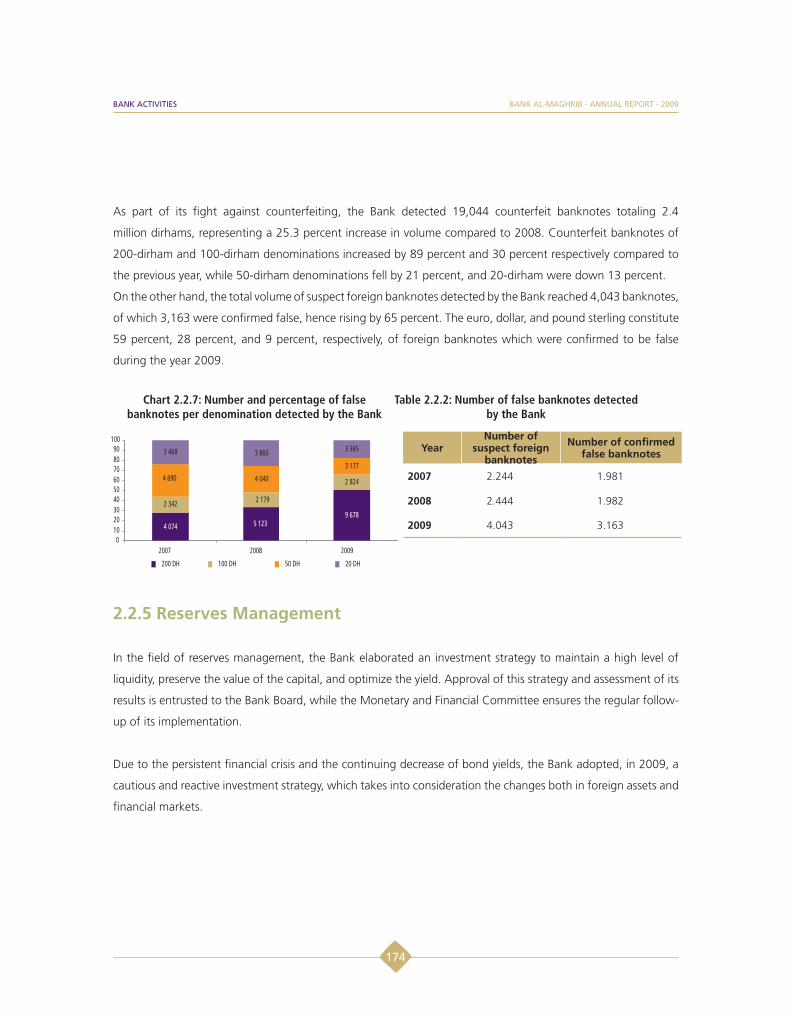
As part of its fight against counterfeiting, the Bank detected 19,044 counterfeit banknotes totaling 2.4
million dirhams, representing a 25.3 percent increase in volume compared to 2008. Counterfeit banknotes of
200-dirham and 100-dirham denominations increased by 89 percent and 30 percent respectively compared to
the previous year, while 50-dirham denominations fell by 21 percent, and 20-dirham were down 13 percent.
On the other hand, the total volume of suspect foreign banknotes detected by the Bank reached 4,043 banknotes,
of which 3,163 were confirmed false, hence rising by 65 percent. The euro, dollar, and pound sterling constitute
59 percent, 28 percent, and 9 percent, respectively, of foreign banknotes which were confirmed to be false
during the year 2009.
Chart 2.2.7: Number and percentage of false banknotes per denomination detected by the Bank
Table 2.2.2: Number of false banknotes detected by the Bank
YearNumber of
suspect foreign banknotes
Number of confirmed false banknotes
2007 2.244 1.981
2008 2.444 1.982
2009 4.043 3.163
2.2.5 Reserves Management
In the field of reserves management, the Bank elaborated an investment strategy to maintain a high level of
liquidity, preserve the value of the capital, and optimize the yield. Approval of this strategy and assessment of its
results is entrusted to the Bank Board, while the Monetary and Financial Committee ensures the regular follow-
up of its implementation.
Due to the persistent financial crisis and the continuing decrease of bond yields, the Bank adopted, in 2009, a
cautious and reactive investment strategy, which takes into consideration the changes both in foreign assets and
financial markets.
174
BANK AL-MAGHRIB - ANNUAL REPORT - 2009BANK ACTIVITIES

However, owing to the normalization of the financial conditions at the end of the year, the Bank removed some
restrictions to allow the reintegration of certain banks as eligible counterparties for deposit operations, namely
unsecure ones. In parallel, new indicators for the measurement of the yields’ efficiency have been introduced to
ensure a better monitoring of the overall risk.
In continuation of the strategy adopted in 2008, the pace of investments was accelerated at the start of the year
2009, in anticipation of the low rates expected in the second half of the year. The Bank also gave preference to
acquiring AAA quasi-sovereign assets and reducing its exposure to monetary investments.
Eventually, this strategy allowed the overall yield of the foreign exchange reserves to be greater than expected.
2.2.6 Financial information
In 2009, the Bank achieved considerable progress in terms of financial information, with the set up of the Credit
Bureau, and the deployment of its decision-support information system.
2.2.6.1 Central information registries
The central information registries’ project consists of a revamp of all the information registers managed by the
Bank through a single database which allows harmonizing the data. The project is centered on two axes:
2.2.6.1.1 Credit Bureau
In order to provide credit institutions with centralized information on the loans granted to their customers, the
Bank engaged in a process of delegating its central risk registry.
BANK AL-MAGHRIB - ANNUAL REPORT - 2009
175
BANK ACTIVITIES

To this end, the Bank set down the regulatory framework governing the implementation of this mandate and
launched an international call for tenders, following which Experian International, renowned for its expertise
in the field, was selected. Thanks to its know-how, Experian International created a limited company under the
Moroccan law named Experian Services Maroc, whose shareholding includes other Moroccan financial players.
The credit bureau centralizes loan contracts declared by credit institutions, processes the information contained
in these declarations, and in turn, issues creditworthiness reports to these institutions allowing them to make a
better assessment of loan requests made by their customers.
To ensure the appropriate conditions for the functioning of the credit bureau, the Bank made it mandatory for
credit institutions to feed its database and consult it. Similarly, the Bank saw to the security of exchanges through
meeting all the prerequisites and engagements, notably those relating to the platform’s technical architecture,
data security and confidentiality, the specifications relating to the supply and trustworthiness of data, consultation
and restitution of credit worthiness reports as well as the aspects linked to corporate governance.
The completion of this project allowed the Bank to organize, in cooperation with the International Finance
Corporation and the Arab Monetary Fund, study visits in Rabat to the benefit of delegations from the central
banks of Lebanon, Algeria and the Central Bank of West African States, interested in the Moroccan experience
of delegating its central risk registry.
On the back of the close monitoring by the Bank of the feeding process of the central risk registry and the
adherence of lending institutions to the system, the credit bureau set up a database comprising, at the end of
2009, 2.3 million loan contracts, up 166 percent compared to March of the same year. The chart below retraces
the development of the contracts sent to the credit bureau since its inception in March 2009.
176
BANK AL-MAGHRIB - ANNUAL REPORT - 2009BANK ACTIVITIES

Chart 2.2.8: Development of the number of contracts sent to the credit bureau between March and December 2009
Following the stabilization of the feeding mechanism, the consultation service began in October so as to provide
lending institutions with creditworthiness reports necessary for the assessment of credit risk.
Chart 2.2.9: Development of the consultations between October and December 2009
BANK AL-MAGHRIB - ANNUAL REPORT - 2009
177
BANK ACTIVITIES

2.2.6.1.2 Activity of the Default Registry
The year 2009 was marked by the adherence of Caixa, Banco Sabadell and CDG Capital to the Default Registry.
In comparison to the preceding year, data flows processed by the default registry illustrate the following changes:
percent, respectively;
Table 2.2.3: Change in data flows processed by the Default Registry
Year/number (in thousands) 2007 2008 2009 Variation(%)2008/2007
Variation (%)2009/2008
Default declarations 296.7 302.7 336.5 2 11
Default cancellations 8.2 5.0 5.5 -39 11
Default settlements 115.5 111.9 106.3 -3 -5
Overdue defaults 37.2 172.1 202.6 363 18
Information requests 981.2 1,208.2 1,351.7 23 12
Legal bans on the issuing of checks 86.0 128.0 111.0 49 -13
In addition, outreach efforts aimed at the public enabled to collect 3,399 requests, whose processing resulted in:
In order to continue the development of central information registries, four steps were adopted in the strategic
plan 2010-2012:
178
BANK AL-MAGHRIB - ANNUAL REPORT - 2009BANK ACTIVITIES

Central Information Registry;
2.2.6.2 Decision-support system
Launched by the Bank in 2009, the project aims at making significant productivity gains in connection with
reducing the search time for information, ensuring a greater autonomy to users, building on the efforts exerted
in terms of data processing and reliability and finally unifying the practices of Bank departments as concerns
restitution. This project was divided into two segments: The deployment of the decision-support system tools
and the creation of the centralized Bank data warehouse.
2.2.6.2.1 The deployment of the decision-support system tools
The Bank opted for the SAS platform which has the advantage of being an integrated solution. The decision-
support platform of the Bank is composed of the decision–support engine of SAS, around which tools shall
be installed with the goal of implementing activities such as reporting, statements preparation, design and
development of the main leading indicators, surveys management, statistical analyses a well as data processing
and the questioning of operational databases. In addition, a data extraction, transformation and supplying tool
will be implemented in order to industrialize the feed process of the monetary, economic and financial series
database and the central data warehouse, based on several data sources.
2.2.6.2.2 The creation of the centralized Bank data warehouse
The second phase of the project aims at developing the centralized Bank data warehouse on a pilot perimeter
composed of business indicators.
In parallel, a platform will be put in place in order to guarantee an integrated management of all the survey
phases conducted by the Bank. A database rich with the appropriate indicators relating to all the surveys will be
made available to Bank departments.
BANK AL-MAGHRIB - ANNUAL REPORT - 2009
179
BANK ACTIVITIES

The pilot perimeter of the restitution project also includes the development of a module for the management of
data flows, notably the traceability of indicators, reports and data disseminated to outside partners or published
at the Bank’s website.
The implementation of the project started in September 2009 and will be completed in 2010.
2.3 Openness and outreach
2.3.1 Relationship with the Treasury
In line with the modernization of its activities, the Bank started the dematerialization of bids submitted by banks
during Treasury-bill auctions and refinancing operations with Bank Al-Maghrib, by equipping itself with a reliable
and secure IT system for the management and processing of such operations.
This system is composed of three modules: the first one concerns monetary policy operations, the second bears
on instruments relating to issuing operations as well as repurchase and swap operations of T-bill while a third
module consists of enabling the management of Treasury loans and borrowings on the interbank market. To
optimize management, several training and awareness programs to the benefit of market players were carried
out by the Bank so as to enable them further their knowledge of the system and introduce the organizational
and technical developments relating to access requirements.
The deployment of the “Teletransmission” system started effectively in July for monetary policy operations bids
and T-bill auctions. The implementation of the modules relating to loans and borrowings by the Treasury on the
market is scheduled for early 2010.
2.3.2 National network of the Bank
The Bank’s network, composed of two subsidiaries and eighteen branches, saw no changes as to its location
in 2009. The development of its activities, however, continued through several modernization actions. The
progress made concerned in particular the mechanization of currency, the anchoring of the quality approach,
the control of operational risks and the strengthening of security measures.
180
BANK AL-MAGHRIB - ANNUAL REPORT - 2009BANK ACTIVITIES

2.3.2.1 Strengthening the currency system
The improved quantity and quality of currency processing and packaging machines allowed a greater speed in
the processing of operations, while improving staff working conditions. The number of machines, all categories
included, grew progressively to 814 units in 2009 from 415 units in 2004.
2.3.2.2 Strengthening security measures in branches
The effectiveness of the security system was further reinforced with the generalization and the equipment of the
entire network, in 2009, with digital video surveillance and recording systems, in addition to the metal detector
tools installed previously.
2.3.2.3 Quality and customer satisfaction
In line with the outreach strategy toward customers and the large public, the Banks’ network which is considered
to be the main contact point was equipped with reception units to guide customers and provide them with
information relating to the Bank’s missions. A modern system for the management of waiting queues was
previously installed in the Rabat and Casablanca subsidiaries.
In addition, the appropriation of the quality approach allowed sustaining the improvement dynamism through
the reporting of information issued from the meetings held with institutional customers and other partners, the
processing of customer complaints and the closer monitoring and progress of activities.
2.3.2.4 Supervising private sorting centers’ activity
In the context of its supervision system ensuing from delegating the sorting activity to the managing companies
of private sorting centers, the Bank mobilized its resources from the Casablanca and Tangiers subsidiaries which
carried out 21 investigations with private sorting centers.
BANK AL-MAGHRIB - ANNUAL REPORT - 2009
181
BANK ACTIVITIES

The Bank also inquired about the current status of the machines used by these centers, the efficiency of their
security apparatus and the respect of the rules and regulations in place for the processing of funds.
2.3.3 Communication
As part of an overall internal and external communication strategy, the Bank reinforced and diversified its
information channels in 2009, with the aim of consolidating its outreach and communication strategy. At the
center of its preoccupations was also the development of partnerships and sharing.
The Bank stepped up efforts to improve public understanding of its decisions. Press conferences are thus held
within the same day as the Board meeting, in order to explain monetary policy decisions. The Monetary Policy
Report, which is drawn up in preparation for the Board meetings, has since 2009 been handed forthwith to
journalists attending the press conference.
As regards its internet website, which is the main communication medium, the Bank is continuously working
to improve it in order to provide the public with updated, diversified and increasingly structured information.
The editing and publication process, which targets the large public, was completed in 2009 with new information
notes, two of which cover the means and systems of payment and anti-money laundering respectively. It also
includes and with many information tools which are distributed through the Bank’s subsidiaries and branches.
On the other hand and in order to make the staff more involved and better informed, the Bank continued in 2009
to develop internal communication tools. Three issues of the internal newsletter “Infobam” were published,
underlying the major projects carried out by the Bank. Several manuals and projects were also realized to this
end. A meeting was held at the end of the year to take stock of the past year’s achievements and discuss the
new orientations and challenges.
In line with the openness it adopts, transparency is defined as the prior objective of the Bank’s communication
policy. The 2010-2012 strategic plan still includes among its major orientations the consolidation and
improvement of the information and communication processes relating to its missions and decisions. To
this end, the Bank set among its main objectives supporting the development of relations with institutional
182
BANK AL-MAGHRIB - ANNUAL REPORT - 2009BANK ACTIVITIES

partners, encouraging financial education and supporting the reinforcement of the governance framework and
sustainable development policy. Another major axis of the communication strategy is to shed light on and share
the Bank’s heritage.
The fiftieth anniversary of the Bank in 2009 was celebrated with a rich and diversified program. Openness and
sharing were the keywords of all the celebrations and events held in-house or outside the Bank in commemoration
of this great occasion.
Box 2.3.1: Major events organized in commemoration of the Bank’s fiftieth anniversary
The commemoration of the fiftieth anniversary of the Bank was marked by the organization of many events:
March 17: A ceremony was held in which the Bank was given ISO 9001 certification for all its activities.
April through December: Guided tours in Dar As-Sikkah for the staff children.
May 4-6: Organization of an international seminar on banking supervision in collaboration with the Toronto
Centre and the Autorité des Marchés Financiers of Quebec.
May 26: Edition of a book on the architectural heritage of the Bank.
May 29: Organization in Marrakech of an international symposium on “The role of central banks and the IMF
in financial crisis detection and management: lessons from the recent experience”, with the participation-
among others- of the International Monetary Fund, the European Central Bank, the Arab Monetary Fund, the
Central Bank of Central African States as well as the governors of many central banks.
July 3: Organization of a reception in honor of the Bank’s staff in all of its sites.
October 1: Issue of a commemorative banknote with a face value of 50 dirhams. An international competition
was organized for the conception of this banknote, as well as of a postage stamp and a commemorative
coin issued on this occasion.
October 28-30: Organization of the Second Edition of the Annual Conference of the Heads of Internal Audit
in the Central Banks of French-speaking Countries, with the participation of 25 delegations from the central
banks of Africa, North America, Asia and Europe.
November: Organization of a painting competition for the staff children on the theme of the Bank’s fiftieth
anniversary.
December 11: Organization of a Staff Day at the Bank’s Professional Training Center.
BANK AL-MAGHRIB - ANNUAL REPORT - 2009
183
BANK ACTIVITIES

2.3.4 Currency Museum
Many cultural events were organized on the occasion of the fiftieth anniversary.
A museum was built on a 2,000 m" area that hosts:
including pre-monetary instruments, ancient currencies and Moroccan banknotes;
applications aiming at providing visitors with a clear and didactic overview of the central bank’s business,
The staging-design and museum configuration of the site is modern, based mainly on images and interactive,
pedagogical elements. The museum addresses the large public and offers several levels of information-processing.
It hosts permanent and temporary exhibition areas, pedagogical workshops, a shop and an auditorium. The shop
offers the visitors about forty different items linked to Museum-related areas (publications, commemorative
currencies and banknotes withdrawn from circulation, numismatic and publicity items). The Museum will be
open to the public as of May 18, 2010 which coincides with the International Museum Day.
The collection and processing of the Bank’s historical archives went on, through classification works that covered
378,000 archive documents from the Banque de France, BNP Paribas, the Moroccan National Library and the
Nantes Diplomatic Archives Center.
The Bank also carried on with its policy aiming at enriching and enlarging its numismatic and artistic heritage
namely with the acquisition of the works of famous Moroccan and orientalist painters and of extremely rare
specimen and proofs of Moroccan banknotes.
184
BANK AL-MAGHRIB - ANNUAL REPORT - 2009BANK ACTIVITIES

2.3.5 International cooperation
In 2009, the Bank participated in several international events, namely:
April in Washington and in October in Istanbul;
Dhabi in September;
financial crisis and its impact on economies”.
International cooperation was further reinforced in 2009, with the traditional partners of Morocco as well
as with other institutions having expressed their desire to benefit from its expertise. As part of the annual
cooperation programs, three actions were carried out with the Banque de France, five with the Financial Services
Volunteer Corps and four with the Central Bank of Central African States.
In parallel, the Bank organized many activities, consisting of study tours and assistance visits for the benefit of
the Central Bank of Mauritania, the Central Bank of Libya, the Central Bank of Guinea, the Central Bank of West
African States, the Central Bank of Lebanon, the National Bank of Albania and the National Bank of Poland.
In 2009, the Bank signed a cooperation agreement in the field of bank control, information exchange and
general cooperation with the Central Bank of West African States.
BANK AL-MAGHRIB - ANNUAL REPORT - 2009
185
BANK ACTIVITIES


PART 3
FINANCIAL STATEMENTS OF BANK AL-MAGHRIB


Balance sheet
1. Balance sheet as at the end of December 2009
(After allocation of profits)
ASSETS (In thousands of dirhams) Notes Dec 31, 2008 Dec 31, 2009
Holdings and investments in gold 1 4,962,457 6,152,625
Holdings and investments in foreign currency 2 178,350,705 172,317,841
- Holdings and investments held in foreign banks 26,469,032 37,461,701
- Foreign Treasury bills and similar securities 136,700,006 128,081,155
- Other holdings in foreign currency 15,181,667 6,774,985
Holding in international financial institutions 3 1,468,018 7,307,701
- I.M.F. subscription-Reserve tranche 1,054,717 1,053,778
- Special Drawing Rights holdings 156,037 5,999,775
- Subscription to the Arab Monetary Fund 257,264 254,149
Lending to the Government - -
- Conventional advances - -
- Overdraft facilities advances - -
- Other facilities - -
Claims on Moroccan credit institutions and similar ones 4 15,014,783 17,034,139
- Securities received under repurchase agreements - -
- Advances to the banks 15,000,000 17,000,631
- Other claims on Moroccan credit institutions and similar ones 14,783 33,508
Treasury bills - Open market operations 3,068,950 -
Other assets 5 11,748,462 12,822,901
- Sundry debtors 7,070,561 7,979,124
- Other miscellaneous assets 4,677,901 4,843,777
Fixed assets 6 2,530,705 2,796,030
- Fixed assets 2,530,705 2,796,030
Total assets 217,144,080 218,431,238
BANK AL-MAGHRIB - ANNUAL REPORT - 2009
189

Liabilities(In thousands of dirhams) Notes Dec 31, 2008 Dec 31, 2009
Banknotes and coins in circulation 7 134,771,581 143,139,225
- Banknotes 132,691,292 140,937,548
- Coins 2,080,289 2,201,677
Liabilities in gold and in foreign currency 8 2,432,466 2,895,116
- Liabilities in gold
- Liabilities in foreign currency 2,432,466 2,895,116
Liabilities in convertible dirhams 9 196,176 210,403
- Liabilities to international financial institutions 184,390 197,112
- Other liabilities 11,786 13,291
Deposits and liabilities in dirham 10 59,630,039 44,261,285
Current account of the Treasury 1,458,154 3,809,646
Deposits and liabilities to Moroccan banks 52,946,150 37,294,962
. Current accounts 52,946,150 37,294,962
. Liquidity-withdrawal accounts
. Deposit facility accounts
Deposits of general government and public institutions 3,583,063 1,194,821
Other accounts 1,642,672 1,961,856
Other liabilities 11 13,524,121 15,473,844
Allocations of Special Drawing Rights 12 1,068,834 6,918,045
Equity capital and the like 13 5,520,863 5,533,320
- Equity capital 500,000 500,000
- Reserves 5,001,340 5,001,340
- Other equity capital and similar ones 19,523 31,980
Total liabilities 217,144,080 218,431,238
190
BANK AL-MAGHRIB - ANNUAL REPORT - 2009
190
FINANCIAL STATEMENTS

2. Profit and loss statement
Revenues(in thousands of dirhams) Dec 31, 2008 Dec 31, 2009
Interests earned on holdings and investments in gold and foreign currency 6,582,353 5,048,010
Interests earned on lending to the Government - -
Interests earned on claims on Moroccan credit institutions and similar ones 506,974 587,428
Other interests earned 9,568 8,017
Commissions earned 303,112 307,324
Other financial revenues 1,401,478 1,065,648
Sales of produced goods and services 62,287 65,453
Miscellaneous revenues 15,592 18,225
Reversal of amortization 2,374 -
Reversal of provisions 1,023,040 471,291
Noncurrent revenues 1,014 234,342
Total revenues 9,907,792 7,805,738
Expenses(in thousands of dirhams) Dec 31, 2008 Dec 31, 2009
Interests paid on liabilities in gold and foreign currency 34,987 9,355
Interests paid on liabilities in convertible dirham - -
Interests paid on deposits and liabilities in dirham 721,757 459,828
Commissions paid 25,323 24,678
Other financial expenses 429,925 414,982
Staff expenses 912,688 924,697
Purchase of materials and supplies 160,677 175,353
Other external expenses 126,885 206,752
Amortization and provisions expenses 1,092,849 811,108
Noncurrent expenses 153,439 218,132
Corporate taxes 2,343,980 1,776,996
Total expenses 6,002,510 5,021,881
Income 3,905,282 2,783,857
BANK AL-MAGHRIB - ANNUAL REPORT - 2009
191 191
FINANCIAL STATEMENTS
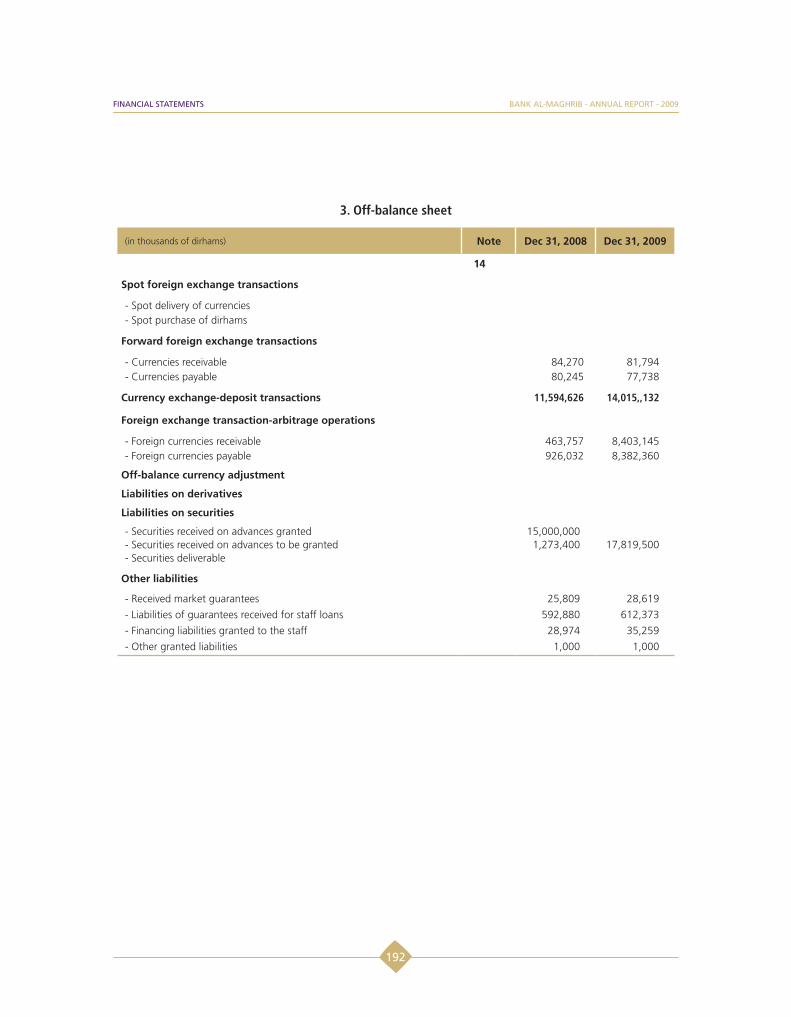
3. Off-balance sheet
(in thousands of dirhams) Note Dec 31, 2008 Dec 31, 2009
14
Spot foreign exchange transactions
- Spot delivery of currencies- Spot purchase of dirhams
Forward foreign exchange transactions
- Currencies receivable- Currencies payable
84,27080,245
81,79477,738
Currency exchange-deposit transactions 11,594,626 14,015,,132
Foreign exchange transaction-arbitrage operations
- Foreign currencies receivable- Foreign currencies payable
463,757926,032
8,403,1458,382,360
Off-balance currency adjustment
Liabilities on derivatives
Liabilities on securities
- Securities received on advances granted- Securities received on advances to be granted- Securities deliverable
15,000,0001,273,400 17,819,500
Other liabilities
- Received market guarantees- Liabilities of guarantees received for staff loans- Financing liabilities granted to the staff- Other granted liabilities
25,809592,88028,9741,000
28,619612,37335,2591,000
192
BANK AL-MAGHRIB - ANNUAL REPORT - 2009
192
FINANCIAL STATEMENTS

3.1 Bank Al-Maghrib balance sheet
Analysis of the Bank’s balance sheet changes reveals, year-on-year, the combined effect of foreign assets’
continuing decrease, the IMF’s Special Drawing Rights allocation, and the repeated monetary reserve rate
reduction.
Overall, the diverging differences in the main sections of the balance sheet were generally offset. Consequently,
the balance sheet total increased by 0.6 percent, and reached 218,431 million dirhams at the end of 2009.
3.1.1 ASSETSChart 3.1.1: Breakdown of assets items
Assets and investments in gold
Assets and investments in gold reached 6,153 million dirhams, up by 1,190 million or 24 percent. This increase
has exclusively resulted from the rise of the gold ounce price from 882.05 dollars to 1,096.97 dollars. As for the
gold stock, it almost stabilized at 708,662,438 gold ounces.
Assets and investments in foreign currency
At 172,318 million dirhams, i.e. almost 79 percent of the Bank’s assets, holdings and investments in foreign
currency shrank by 6,033 million dirhams, equal to 3.4 percent, compared to 3.6 percent in 2008. This change is
essentially due to the decline of travel receipts and of transfers of Moroccans residing abroad. The Bank’s foreign
currency assets are mainly invested in debentures.
BANK AL-MAGHRIB - ANNUAL REPORT - 2009
193 193
FINANCIAL STATEMENTS

Assets with international financial institutions
These assets grew by 5,840 million to attain 7,308 million dirhams, owing to the IMF general and special
allocations, whose global amount equaled 475.7 million SDR.
SDR allocations lead to increasing gross foreign reserves. However, on a net basis, the latter were not affected as
these allocations induced the rise of the Bank’s assets and liabilities, by the same proportions.
Claims on Moroccan credit institutions and similar ones
Reflecting the importance of liquidity injection operations carried out via 7-day advances, year-end to year-end
claims rose from 15,015 to 17,034 million dirhams.
Treasury bills - open market operations
At the end of December 2009, Treasury bills portfolio shows a zero balance, as a result of the maturity of all its
assets.
It is worth mentioning that further to the payment of conventional advances by the Treasury, Bank Al-Maghrib
subscribed, in 2006 and 2007, Treasury bills of a total value of 5,500 million dirhams.
Other assets
At the end of 2009, the other assets, composed mainly of sundry debtor accounts and equalization and cash
accounts, rose to 12,823 million, compared to 11,748 million dirhams the year before.
Fixed assets
Fixed assets, which include tangible and intangible fixed assets, fixed loans, equity securities and similar ones,
grew by 265 million dirhams at the end of 2009, equal to 10.5 percent, particularly due to the increase of
investments in operating tangible assets.
194
BANK AL-MAGHRIB - ANNUAL REPORT - 2009
194
FINANCIAL STATEMENTS

3.1.2 LIABILITIES
Chart 3.1.2: Breakdown of liabilities items
Banknotes and coins in circulation
At the end of December 2009, banknotes and coins in circulation rose by 8,368 million dirhams, or 6.2 percent,
to reach 143,139 million dirhams, thus at a lower pace compared to the last three years. On the contrary, the
share of banknotes and coins in the Bank’s total liabilities is continuously increasing, as it reached almost two
thirds in 2009.
Liabilities in gold and foreign currency
These liabilities rose by 463 million, equal to 19 percent, to attain 2,895 million dirhams, owing to the increase
of the Bank’s commitments to nonresidents.
Liabilities in convertible dirhams
The total of this item reached 210 million dirhams, up by 7.3 percent, mainly due to the increase of the Bank’s
commitments towards international financial institutions, further to the SDR appreciation.
Deposits and liabilities in dirhams
In 2009, deposits and liabilities in dirhams fell by 25.8 percent, and therefore stood at 44,261 million dirhams.
This fall mainly translated the decrease of the banks’ current account deposits, by around 30 percent, as a result
of the monetary reserve rate cut to 10 percent in June and 8 percent in September.
BANK AL-MAGHRIB - ANNUAL REPORT - 2009
195 195
FINANCIAL STATEMENTS

Other liabilities
The «other liabilities» item, which reached 15,474 million dirhams, rose by 1,950 million, or 14.4 percent, mainly
as a result of the growth of the foreign exchange reserves’ revaluation account.
Special Drawing Rights allocations
SDR allocations went up from 1,069 million to 6,918 million dirhams. This rise has exclusively resulted from
the general and special allocations granted by the IMF to Morocco on August 28 and September 9, 2009,
respectively.
Equity capital and the like
At the end of the year 2009, equity capital and the like reached 5,533 million dirhams, as the Bank’s capital
remained unchanged at 500 million dirhams.
3.2 Profit and loss account
At 2,784 million dirhams, the net income of the Bank decreased by 28,7 percent after having recorded major
increases during the last three years. However, this decrease, which resulted from the 21.2 percent fall in
revenues, was offset by the 16.3 percent decrease in expenses.
Chart 3.2.1: Change in revenues, expenses, and in the net result
196
BANK AL-MAGHRIB - ANNUAL REPORT - 2009
196
FINANCIAL STATEMENTS

3.2.1 RevenuesChart 3.2.2: Breakdown of profit items
The Bank’s revenues, which reached 7,806 million dirhams, dropped by 2,102 million, equal to 21.2 percent
compared to their level recorded in 2008. This drop has mainly resulted from the decrease of revenues from
investments in foreign currency, which constitute around four fifths of the Bank’s revenues.
Hence, interests received on holdings and investments in gold and foreign currency dropped by 23.3 percent
to reach 5,048 million dirhams. This change has resulted from the contraction of the exchange reserves volume
and from the fall of interest rates.
On the other hand, and further to the increasing recourse of banks to the Central Bank financing, interests
received on claims to credit institutions and the like increased by about 16 percent to reach 587 million dirhams,
of which 7-day advances constitute 551 million.
BANK AL-MAGHRIB - ANNUAL REPORT - 2009
197 197
FINANCIAL STATEMENTS

Other financial revenues, which primarily consisted of gains generated by foreign currency transactions, fell
by 336 million -i.e. 24 percent- to attain 1,066 million dirhams, year-end to year-end. This evolution involves
a decrease of unrealized gains in management authorizations and an increase in the gains realized in foreign
investment securities disposal.
Furthermore, the transfer of provisions settled at 471 million dirhams, down by around 54 percent, mainly due
to the appreciation of the values of foreign securities held by the Bank.
Chart 3.2.3: Breakdown of loss items
At the end of the year 2009, overall expenses of the Bank broke with the upward trends registered since 2003
and dropped from 6,002 million to 5,022 million dirhams. Excluding corporate taxes, these expenses settled
at 3,245 millions, down by 413.6 million (or 11.3 percent), mainly as a result of the decrease observed both
in interests paid for deposits and commitments in dirhams and in the depreciation and provisions allowances.
198
BANK AL-MAGHRIB - ANNUAL REPORT - 2009
198
FINANCIAL STATEMENTS
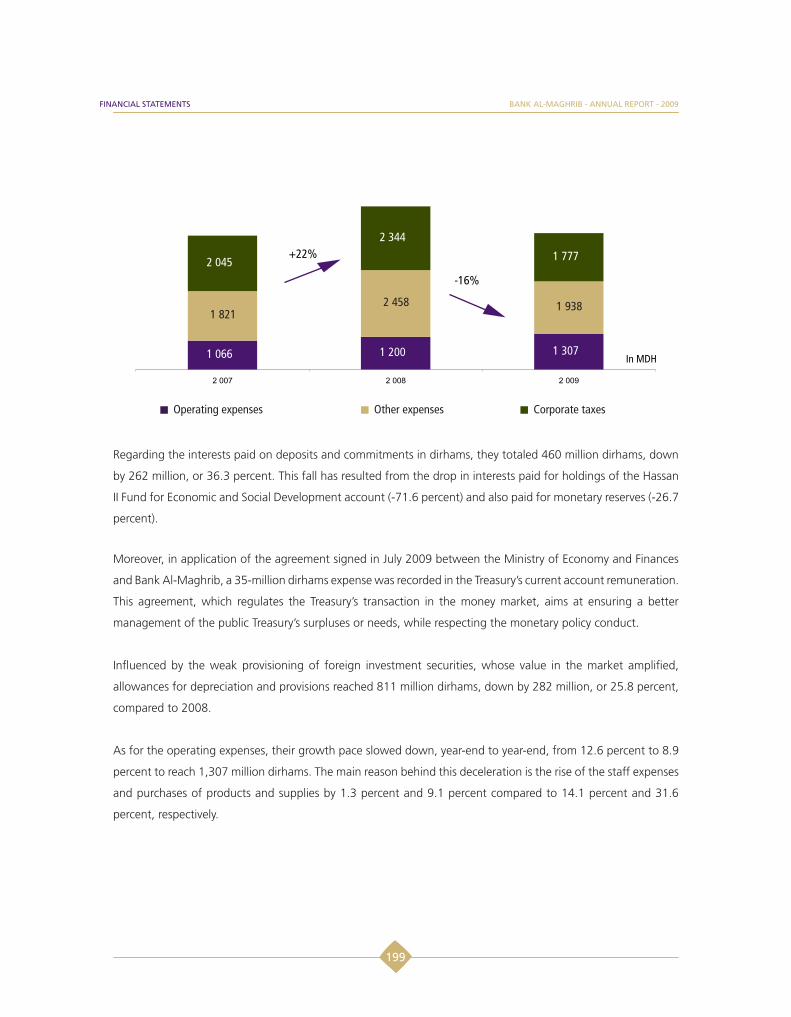
Regarding the interests paid on deposits and commitments in dirhams, they totaled 460 million dirhams, down
by 262 million, or 36.3 percent. This fall has resulted from the drop in interests paid for holdings of the Hassan
II Fund for Economic and Social Development account (-71.6 percent) and also paid for monetary reserves (-26.7
percent).
Moreover, in application of the agreement signed in July 2009 between the Ministry of Economy and Finances
and Bank Al-Maghrib, a 35-million dirhams expense was recorded in the Treasury’s current account remuneration.
This agreement, which regulates the Treasury’s transaction in the money market, aims at ensuring a better
management of the public Treasury’s surpluses or needs, while respecting the monetary policy conduct.
Influenced by the weak provisioning of foreign investment securities, whose value in the market amplified,
allowances for depreciation and provisions reached 811 million dirhams, down by 282 million, or 25.8 percent,
compared to 2008.
As for the operating expenses, their growth pace slowed down, year-end to year-end, from 12.6 percent to 8.9
percent to reach 1,307 million dirhams. The main reason behind this deceleration is the rise of the staff expenses
and purchases of products and supplies by 1.3 percent and 9.1 percent compared to 14.1 percent and 31.6
percent, respectively.
BANK AL-MAGHRIB - ANNUAL REPORT - 2009
199 199
FINANCIAL STATEMENTS
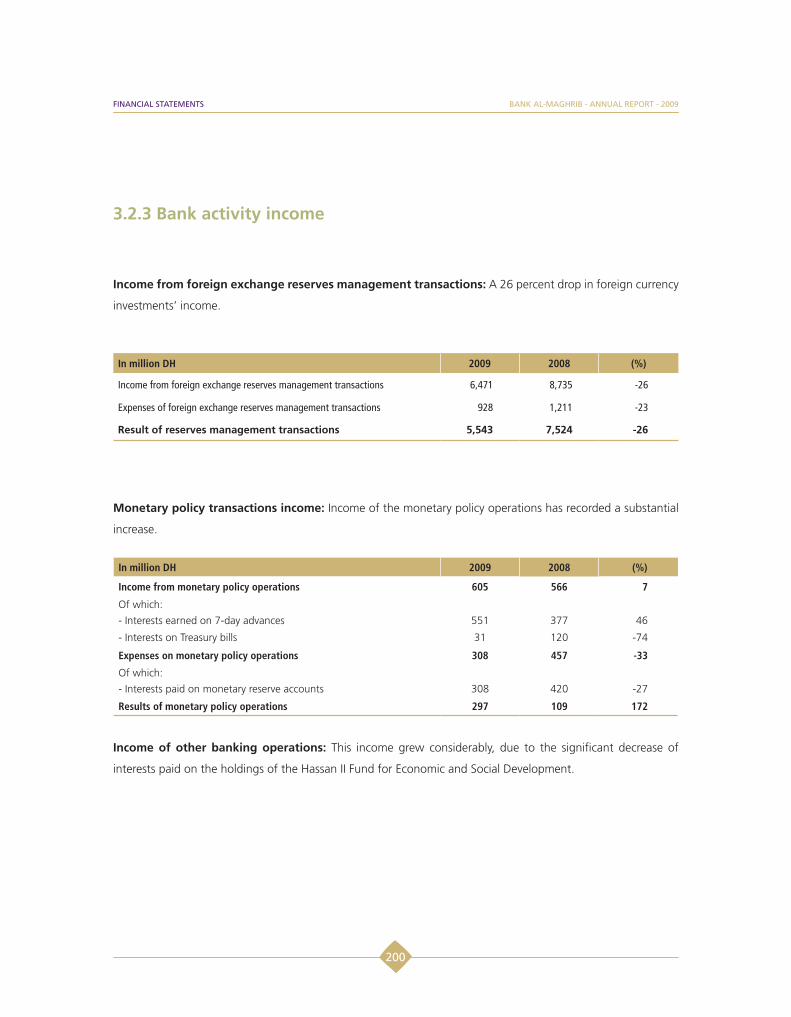
3.2.3 Bank activity income
Income from foreign exchange reserves management transactions: A 26 percent drop in foreign currency
investments’ income.
In million DH 2009 2008 (%)
Income from foreign exchange reserves management transactions 6,471 8,735 -26
Expenses of foreign exchange reserves management transactions 928 1,211 -23
Result of reserves management transactions 5,543 7,524 -26
Monetary policy transactions income: Income of the monetary policy operations has recorded a substantial
increase.
In million DH 2009 2008 (%)
Income from monetary policy operations 605 566 7
Of which: - Interests earned on 7-day advances 551 377 46
- Interests on Treasury bills 31 120 -74
Expenses on monetary policy operations 308 457 -33
Of which: - Interests paid on monetary reserve accounts 308 420 -27
Results of monetary policy operations 297 109 172
Income of other banking operations: This income grew considerably, due to the significant decrease of
interests paid on the holdings of the Hassan II Fund for Economic and Social Development.
200
BANK AL-MAGHRIB - ANNUAL REPORT - 2009
200
FINANCIAL STATEMENTS
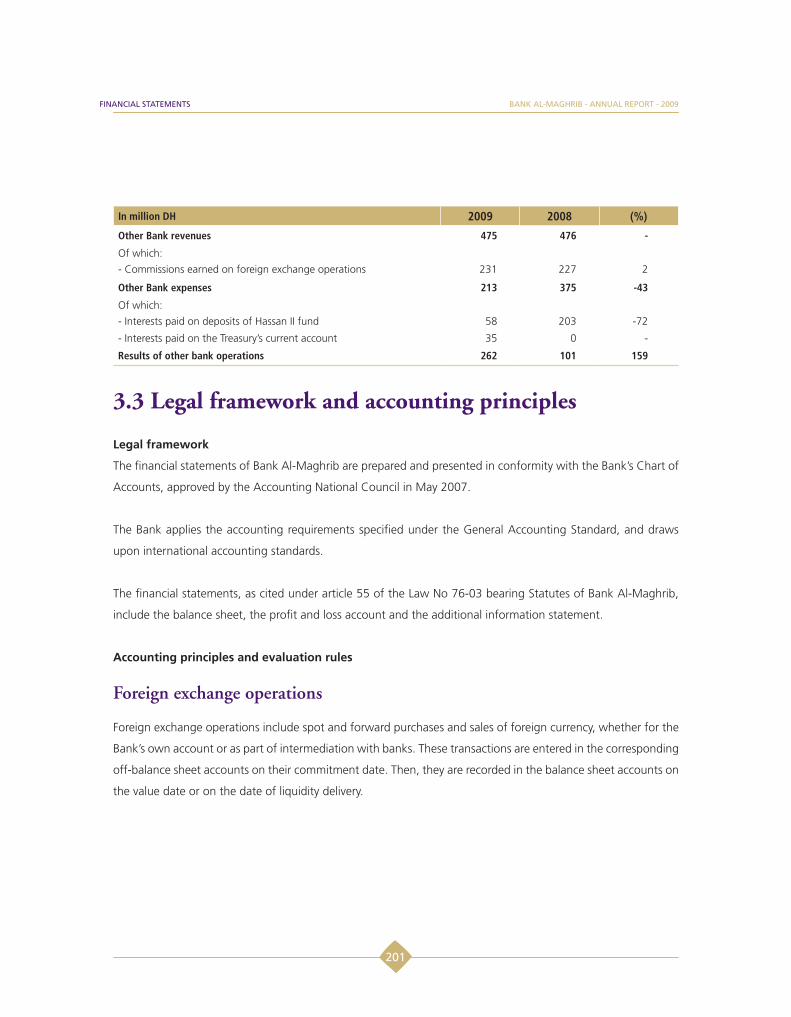
In million DH 2009 2008 (%)
Other Bank revenues 475 476 -
Of which: - Commissions earned on foreign exchange operations 231 227 2
Other Bank expenses 213 375 -43
Of which: - Interests paid on deposits of Hassan II fund 58 203 -72
- Interests paid on the Treasury’s current account 35 0 -
Results of other bank operations 262 101 159
3.3 Legal framework and accounting principles
Legal framework
The financial statements of Bank Al-Maghrib are prepared and presented in conformity with the Bank’s Chart of
Accounts, approved by the Accounting National Council in May 2007.
The Bank applies the accounting requirements specified under the General Accounting Standard, and draws
upon international accounting standards.
The financial statements, as cited under article 55 of the Law No 76-03 bearing Statutes of Bank Al-Maghrib,
include the balance sheet, the profit and loss account and the additional information statement.
Accounting principles and evaluation rules
Foreign exchange operations
Foreign exchange operations include spot and forward purchases and sales of foreign currency, whether for the
Bank’s own account or as part of intermediation with banks. These transactions are entered in the corresponding
off-balance sheet accounts on their commitment date. Then, they are recorded in the balance sheet accounts on
the value date or on the date of liquidity delivery.
BANK AL-MAGHRIB - ANNUAL REPORT - 2009
201 201
FINANCIAL STATEMENTS

Assets and liabilities in gold and in foreign currency
Assets and liabilities in foreign currency are converted into dirhams based on the exchange rate of foreign
currencies on the closing date of the fiscal year.
Profits and losses resulting from this revaluation are entered in the account of exchange reserves evaluation
posted in the liabilities of the Bank’s balance sheet, in accordance with the provisions of the convention governing
this account, and which was concluded between Bank Al-Maghrib and the Government on December 29, 2006.
This convention sets the minimum threshold of 2.5 percent of BAM’s net foreign assets, at which the balance
of this account shall be maintained, and provides for a mechanism for allocation of provision to, or withdrawal
from, this account in cases of deficit or surplus compared to the required minimum. Revenues and expenses are
converted at the exchange rate on the date of the transaction.
Securities
The securities acquired as part of the management of exchange reserves are treated according to the purpose
for which they are held: portfolio of transaction, portfolio of securities held-for-sale, or investment portfolio.
- Transaction portfolio: It consists of securities purchased with the intention to re-sell them within a short
deadline not exceeding six months. They are recorded, right from the start, at their purchase price, including
costs and, if need be, accrued coupons. Gains and losses resulting from the monthly evaluation of these securities
at the market price are entered in the corresponding profit and loss accounts.
At the end of 2009, Bank Al-Maghrib holds no transaction security in its portfolio.
- Portfolio of held-for-sale securities: It consists of securities purchased with the intention of being held for
more than six months. Their recording comes as follows:
be, accrued coupons.
amortized over the duration for these securities holding.
202
BANK AL-MAGHRIB - ANNUAL REPORT - 2009
202
FINANCIAL STATEMENTS

and the market value of these securities are subjected to depreciation provisions. On the contrary, unrealized
gains are not entered in accounts.
It is worth reminding that in 2008, the Bank came up with a sub-category in its investment securities to include
short-term securities with pre-computed interests. These securities are recorded at their purchase price including
interests. Pre-computed interests are spread over the life of securities and are entered in the revenue accounts
at the end of each month.
- Investment portfolio: It consists of securities acquired with the intention of being held until maturity.
on a straight-line basis over the remaining life of the securities.
Other assets in foreign currencies
The Bank holds a portfolio of securities denominated in euro and in US dollar. The management of that portfolio,
of which an important part has been closed in 2009, is delegated to foreign authorized agents.
These securities are recorded at their market value. In fact, they are initially recorded at their purchase price; the
gains or losses recognized at the end of each month are entered in the appropriate profit and loss accounts.
Tangible and intangible fixed assets are recorded at their purchase cost
They are posted on the assets side of the balance sheet at a net value representing their acquisition cost minus
depreciations accumulated.
Fixed assets are depreciated according to the straight-line method, depending on the estimated duration of use
of the goods, and by applying the depreciation rate in vigor.
BANK AL-MAGHRIB - ANNUAL REPORT - 2009
203 203
FINANCIAL STATEMENTS

The depreciation life retained according to the nature of each fixed asset is as follows:
Financial fixed assets
Shareholdings in Moroccan and foreign financial institutions are entered in the assets side of the balance sheet
for their net value representing their acquisition cost minus the provisions set up at the closing date. These
shareholdings are evaluated at the end of the fiscal year according to the method of the net asset value, based
on the financial statements of the preceding year.
Inventories
Inventories are composed of:
Consumable materials and supplies are recorded in the balance sheet at their purchase price, minus the provisions
for their depreciation at the closing date.
Raw materials are recorded in the balance sheet at their purchase price plus the handling costs, and minus the
provisions for their depreciation.
In-process inventory and finished goods are recorded in the balance sheet at their production cost, minus the
provisions for their depreciation.
Commemorative coins are evaluated at their sale price.
204
BANK AL-MAGHRIB - ANNUAL REPORT - 2009
204
FINANCIAL STATEMENTS

3.4 Information on the balance sheet items
Note 1: Assets and investments in gold
Gold assets include those deposited in Morocco and abroad. Since the end of 2006, gold assets are evaluated
Note 2: Assets and investments in foreign currency
This item presents the equivalent in dirhams of assets in convertible foreign currencies. The latter are held in the
form of sight deposits, time deposits and foreign securities.
Note 3: Assets with international financial institutions
This item includes:
-The subscription to the IMF Reserve Tranche composed of the fraction of Morocco’s quota in the capital of
the IMF, paid by Bank Al-Maghrib.
The amount of Morocco’s subscription to the IMF is of 588.20 million SDR, of which:
million SDR (equal to 186 million dirhams). This amount, corresponding to the mobilized reserve tranche, is
registered in account No. 1, opened in the name of the IMF on the Bank’s books.
portion of the aforementioned quota.
The subscription to the IMF Reserve Tranche can be mobilized in case of need. It is included in Bank Al-Maghrib’s
foreign exchange reserves.
- SDR assets: This account records Bank Al-Maghrib’s assets with the IMF. It records, in the debit side, SDR
purchase transactions by the Bank and the remuneration paid by IMF, and in the credit side, payments of
commissions on SDR allocations and reimbursement of Morocco’s borrowings.
These available funds are remunerated by the IMF on a quarterly basis.
BANK AL-MAGHRIB - ANNUAL REPORT - 2009
205 205
FINANCIAL STATEMENTS

-AMF subscription: This account represents the fraction paid by the Bank for the subscription paid up in
currency in the capital of the AMF.
Morocco’s participation in this institution amounts to 27.55 million Arab dinars, divided between Bank Al-
Maghrib and the Treasury:
Maghrib books. The share paid by the latter amounts to 150 thousand Arab dinars (5.6 million dirhams)
Bank (254.15 million dirhams);
incorporation of reserves, which took place in 2005.
Note 4: Claims on Moroccan credit institutions and similar ones
This item comprises refi-nancing operations of credit institutions as part of the monetary policy conduct.
Note 5: Other assets
This item includes primarily:
years, expenses recognized in advance, and revenues due, making it possible to attach to each financial year the
revenues and expenses relevant thereto as well as any other debtor amount pending equalization;
Note 6: Fixed assets
This entry includes:
206
BANK AL-MAGHRIB - ANNUAL REPORT - 2009
206
FINANCIAL STATEMENTS

Note 7: Banknotes and coins in circulation
This entry covers the difference between banknotes and coins issued by the Bank and those deposited with the
Bank.
Note 8: Liabilities in gold and foreign currency
This entry mainly comprises currency deposits of Moroccan banks, foreign banks and nonresidents.
Note 9: Liabilities in convertible dirhams
This entry includes the Bank’s liabilities in convertible dirhams towards foreign banks, international financial
institutions (IMF, AMF, IBRD) and nonresidents. Account No.1 of the IMF represents the major component of this
entry. The deposits of this account as well as those of Account No.2 of the IMF are readjusted annually to take
into account the fluctuation of the dirham relative to SDR.
Note 10: Deposits and liabilities in dirhams
This entry includes:
rate at the end of 2009, is 8 percent, remunerated at 0.75 percent per year;
remunerated at the rates of 7-day advances, minus 50 basis points.
Note 11: Other liabilities
This entry includes:
and contributions to provident funds and institutions for social security pending settlement;
paid and expenses recognized in advance, making it possible to attach to each financial year the revenues and
BANK AL-MAGHRIB - ANNUAL REPORT - 2009
207 207
FINANCIAL STATEMENTS
expenses relevant thereto as well as any other debtor amount pending settlement;
presented for payment;
with operations executed during the financial year and that will most likely be realized. The provisions set in
2009 concern the tax risk, litigations and paid leaves;
of holdings and liabilities in gold and in foreign currency, based on the year-end average exchange rates, in
conformity with the provisions of the agreement signed between Bank Al-Maghrib and the State. The credit
balance of this account can neither be posted in the revenues of the financial year, nor distributed or allocated
to any other usage.
Note 12: Special Drawing Rights allocations
This entry corresponds to the value in dirhams of the amounts for SDR allocations granted by the IMF to
Morocco as a member country. Commissions are paid by the Bank, on a quarterly basis, on these allocations.
Note 13: Equity capital and the like
This item includes:
Note 14: Off-balance sheet
The Bank keeps record of off-balance sheet liabilities. The accounts on the off-balance sheet are registered to
debit when the liabilities materialize on maturity or in case of realization by a debit on the balance sheet, and to
credit side in the opposite case.
The off-balance sheet liability includes liabilities in foreign currency, liabilities on securities and other liabilities.
208
BANK AL-MAGHRIB - ANNUAL REPORT - 2009
208
FINANCIAL STATEMENTS

3.5 STATUTORY AUDIT REPORT
FISCAL YEAR ENDED: DECEMBER 31, 2009
In accordance with our assignment as statutory auditors by the Bank’s Board, we have audited the accompanying
financial statements including the balance sheet, the profit and loss account and the attached disclosures here
attached of BANK AL MAGHRIB for the year ended December 31, 2009, which show a net equity of 5,532,463
thousands of Moroccan dirhams included a net profit of 2,783,857 thousands of Moroccan dirhams.
Management’s Responsability
Management is responsible for the preparation and fair presentation of these financials statements, in accordance
with generally accepted accounting principles and standards in Morocco. This responsibility includes: designing,
implementing and maintaining internal control relevant to the preparation of the financial statements that are
free from material misstatement and making accounting estimates that are reasonable in the circumstances.
Auditor’s Responsibility
Our responsibility is to express an opinion on the financial statement based on our audit. We conducted our
audit in accordance with generally accepted auditing standards in Morocco. Those standards require that we
comply with ethical requirements and plan and perform the audit to obtain reasonable assurance about whether
the financial statements are free from material misstatement.
An audit involves performing procedures to obtain audit evidence about the amounts and disclosures in the
financial statements. The procedures selected depend on the auditor’s judgment, including the assessment of
the risk of material misstatement of the financial statements. In making those risk assessments, the auditor
considers internal control relevant to the Entity’s preparation of the financial statements in order to design audit
procedures that are appropriate in the circumstances but not for the purpose of expressing an opinion on the
effectiveness of the Entity’s internal control. An audit also includes evaluating the appropriateness of accounting
BANK AL-MAGHRIB - ANNUAL REPORT - 2009
209

policies used and the reasonableness of accounting estimates made by management, as well as evaluating the
overall financial statements presentation.
We believe that the audit evidence that we have obtained is sufficient and appropriate to provide a reasonable
basis for our audit opinion.
Opinion on the financial statements
We certify that the financial statements mentioned in the first paragraph show, in all material aspects, a fair view
of the results of the operations for the year ended as well as of the financial situation and the assets of BANK
AL MAGHRIB on December 31, 2009, in accordance with generally accepted accounting principles in Morocco.
Without disputing the above opinion, we would note that assets and liabilities in gold and currencies have been
assessed according to the principles provided in the statement A1 of the attached disclosures.
Specific Procedures and Disclosures
We have notably ensured the correspondence of the information provided in the management report with the
Bank’s financial statements.
210
BANK AL-MAGHRIB - ANNUAL REPORT - 2009
210
STATUTORY AUDIT REPORT

3.6 Approval by the Bank Board
In compliance with article 55 of Law No 76-03 bearing Statutes of Bank Al-Maghrib, the financial statements
are hereby submitted by the Governor for approval by the Board.
At its meeting on March 30th, 2010, after having taken cognizance of the statutory auditor’s opinion on the
sincerity of the financial statements and their conformity with the information given in the Bank’s management
report, the Board approved the financial statements of the fiscal year 2009 and the distribution of the net
income.
BANK AL-MAGHRIB - ANNUAL REPORT - 2009
211

APPENDICES


TABLE A1 MAIN INDICATORS OF THE ECONOMY(1)
Amounts in billions of dirhams 2007 2008 2009Percentage changes
20082007
20092008
National accounts
- Gross domestic product at constant prices (growth in%) . Agricultural Added value . Non-agricultural Added value- Gross domestic product at current prices . Agricultural Added value . Non-agricultural Added value - Gross national disposable income - Final national consumption- Gross fixed capital formation- National gross saving- Investment ratio (GFCF/GDP) in %- Saving ratio (as % of GNDI)
2.7-20.8
6.0616.368.7
477.0671.6472.2192.6199.431.229.7
5.616.34.1
688.883.0
536.7745.2518.5227.5226.633.030.4
4.930.61.0
736.2100.9553.6779.7551.7226.1228.030.729.2
11.820.712.510.99.8
18.113.7
6.921.63.24.66.4
-0.60.6
Unemployment rate in % 9.8 9.6 9.1Prices
- Consumer price index Including : Foodstuffs- Underlying inflation
102.5104.5101.4
106.3111.9105.9
107.4113.0106.6
3.77.14.5
1.01.00.7
External accounts
- Total exports- Total imports- Total trade deficit- Balance of Travel- Balance of current transfers- Current account balancet- Current account balance as % of GDP- Oustanding foreign public debt- Foreign public debt as % of GDP
123.7259.7
-136.051.562.94.1
-0.1122.019.8
155.7326.0
-170.347.167.6
-35.9-5.2
133.619.5
112.0265.2
-153.244.058.4
-36.8-5.0
152.220.7
25.925.525.2-8.57.5
--
9.6-
-28.1-18.7-10.0
-6.6-13.6
2.5-
13.9-
Exchange rate(2)
- Dirhams per 1 Euro 11.359 11.246 11.316 1.0 -0.6
- Dirhams per 1 US dollar 7.7132 8.0983 7.8602 -4.8 3.0
Public finance(3)
- Ordinary balance- Investment expenditure- Budget balance- Budget balance as % of GDP- Outstanding amount of the domestic debt- Outstanding amount of the domestic debt as % of GDP
34.828.21.00.2
263.842.8
47.638.23.10.4
257.137.3
38.446.4
-15.9-2.2
266.436.2
36.835.5
-2.5
-19.321.5
3.6
Money
- Aggregate M1- Money supply (M3)- Net foreign assets- Claims on Government- Claims on the private sector
447.6644.8207.579.8
436.3
481.5714.7196.580.6
536.2
507.3747.3189.485.6
585.3
7.610.8-5.31.1
22.9
5.34.6
-3.66.19.1
(1) The changes and ratios were calculated on the basis of the amounts in millions.
(2) The end of year.
(3) Excluding privatization receipts.
214

TABLE A2.1 GROSS DOMESTIC PRODUCT CHANGES (1998 : 100)
(At last year prices) (In percentage)
2009*2008200720062005Branches of activity
29.0
30.6
12.2
-4.7
-23.8
0.9
-70.7
3.5
3.4
3.9
3.5
-1.2
2.8
2.8
3.7
7.6
5.0
4.6
4.9
16.6
16.3
19.0
3.6
-5.9
2.1
-5.8
5.9
9.4
4.1
4.5
0.8
2.6
8.7
3.9
3.9
5.7
5.0
5.6
-20.0
-20.8
-10.1
6.6
9.1
3.8
41.9
5.8
11.7
6.1
2.5
4.1
8.4
10.4
8.5
2.4
1.8
10.6
2.7
21.1
25.3
-19.3
4.8
1.6
3.8
-32.7
6.9
8.7
5.2
4.6
8.7
5.2
10.4
5.3
3.2
7.4
10.8
7.8
-11.1
-13.5
21.2
4.9
7.4
4.5
19.0
7.7
6.1
6.3
4.0
7.8
9.5
5.4
7.4
4.8
3.0
2.4
3.0
Primary sector
Agriculture
Fishing
Secondary sector
Mining
Industry (excluding oil refining)
Oil refining and energy products
Elecricity and water
Building and public works
Tertiary sector (1)
Commerce
Hotels and restaurants
Transports
Postal and telecommunications services
Other services (2)
General government and social security
Added value to the base prices
Tax on products net of subsidies
Gross domestic product
(1) Including non-market services provided by the general government.(2) Financial and insurance activities, Services to businesses and personal services, Education, health and social action, Fictitions branch.(*) PreliminarySource : High Commission for Planning (National accounting department)
215

TABLE A2.2 GROSS DOMESTIC PRODUCT BY BRANCH OF ACTIVITY (1998 : 100)
(At current prices) (In millions of dirhams)
2009*2008200720062005Branches of activity
107 183
100 890
6 293
186 742
16 925
104 004
1 084
18 953
45 776
360 540
72 054
16 775
25 795
22 097
164 959
58 860
654 465
81 741
736 206
90 690
82 969
7 721
187 866
45 121
86 996
963
16 123
38 663
341 076
70 597
16 278
23 897
21 365
154 939
54 000
619 632
69 211
688 843
74 928
68 716
6 212
149 052
13 155
82 074
841
15 749
37 233
321 713
65 058
16 294
23 264
19 887
145 300
51 910
545 693
70 561
616 254
87 482
81 147
6 335
141 927
10 534
82 498
1 296
14 687
32 912
288 539
60 956
13 265
18 357
18 134
127 163
50 664
517 948
59 396
577 344
69 565
62 932
6 633
133 749
8 994
77 166
1 484
14 583
31 522
270 642
56 454
12 963
17 961
16 561
118 786
47 917
473 956
53 723
527 679
Primary sector
Agriculture
Fishing
Secondary sector
Mining
Industry (excluding oil refining)
Oil refining and energy products
Elecricity and water
Building and public works
Tertiary sector (1)
Commerce
Hotels and restaurants
Transports
Postal and telecommunications services
Other services (2)
General government and social security
Added value to the base prices
Tax on products net of subsidies
Gross domestic product
(1) Including non-market services provided by the general government.(2) Financial and insurance activities, Services to businesses and personal services, Education, health and social action, Fictitions branch.(*) PreliminarySource : High Commission for Planning (National accounting department)
216

TABLE A2.3 CEREALS
Crop year 2008-2009 Crop year 2007-2008
Yield(quintals
per hectare)
Production(1000
tonnes)
Area(1000
hectares)
Yield(quintals
per hectare)
Production(1000
tonnes)
Area(1000
hectares)
21.621.017.3
43 384 20 330 37 860
2 009 969
2 183
13.113.46.25.5
25 29512 40013 532
1 200
1 930
928
2 181
219
Principal cereals
Soft wheat
Hard wheat
Barley
Maïs
10.0 52 427 5 258Total
Source : Ministry of Agriculture and Sea Fisheries (Programming and Economic Affairs Department)
TABLE A2.4 PULSE CROPS
Crop year 2008-2009 Crop year 2007-2008
Yield(quintals
per hectare)
Production(1000
tonnes)
Area(1000
hectares)
Yield(quintals
per hectare)
Production(1000
tonnes)
Area(1000
hectares)
8.56.47.16.64.6
1 530 521 276 232 193
180 81 39 35 42
6.05.54.12.74.9
1 090 381 156 94
239
182 69 38 35 49
Broad beansChick peasGreen peasLentilsOther leguminous vegetables
7.32 7523775.31 960373Total
Source : Ministry of Agriculture and Sea Fisheries (Programming and Economic Affairs Department)
TABLE A2 5 MARKET GARDEN CROPS
Oct 2008 to Sept 2009Oct 2007 to Sept 2008
Yield(quintals
per hectare)
Production(1000
tonnes)
Area(1000
hectares)
Yield(quintals
per hectare)
Production(1000
tonnes)
Area(1000
hectares)
23.8
55.4 135.2 21.3 42.0
5 581.4
1 749.2838.0159.5751.8
234.7
31.66.27.5
17.9
23.4
53.4 130.6 22.0 40.2
5 203.0
1 710.0810.0165.0735.0
222.0
32.06.27.5
18.3
Vegetable crops of season
PrimeursTomatoes PotatoesOther fruits vegetables
27.57 330.6266.3 27.26 913.0254.0Total
Source : Ministry of Agriculture and Sea Fisheries (Strategy and statistics Department)
217

TABLE A2.6 CITRUS FRUITS(thousands of tonnes)
Oct. 2006 à Sept. 2007 Oct. 2007 à Sept. 2008 Oct. 2008 à Sept. 2009
Production Exportation Production Exportation Production Exportation
OrangesClementinesMiscellaneous
660336289
265 201 117
732337169
296184102
715353211
163181139
Total 1 285 583 1 238 582 1 279 482
Source : Ministry of Agriculture and Sea Fisheries. (Strategy and statistics Department)
TABLE A2.7 BEET CROPS
Harvestedareas
(hectares)
Crops(tonnes)
Yield(tonnes
per hectare)
Crop year 2007-2008
GharbLoukkosTadlaDoukkalaMoulouya
11 578 7 460
11 651 20 576 5 815
582 966 402 000 618 8491 011 597 310 406
50.453.953.149.253.4
Total 57 080 2 925 818 51.3
Crop year 2008-2009
GharbLoukkosTadlaDoukkalaMoulouya
11 250 6 500
13 500 18 900 5 140
332 000 163 000 672 0001 264 000 268 000
29.525.149.866.952.1
Total 55 290 2 699 000 48.8
(*) Data provided by the Ministry of Industry Trade and new Technologies Source : Ministry of Agriculture and Sea Fisheries (Strategy and statistics Department)
218
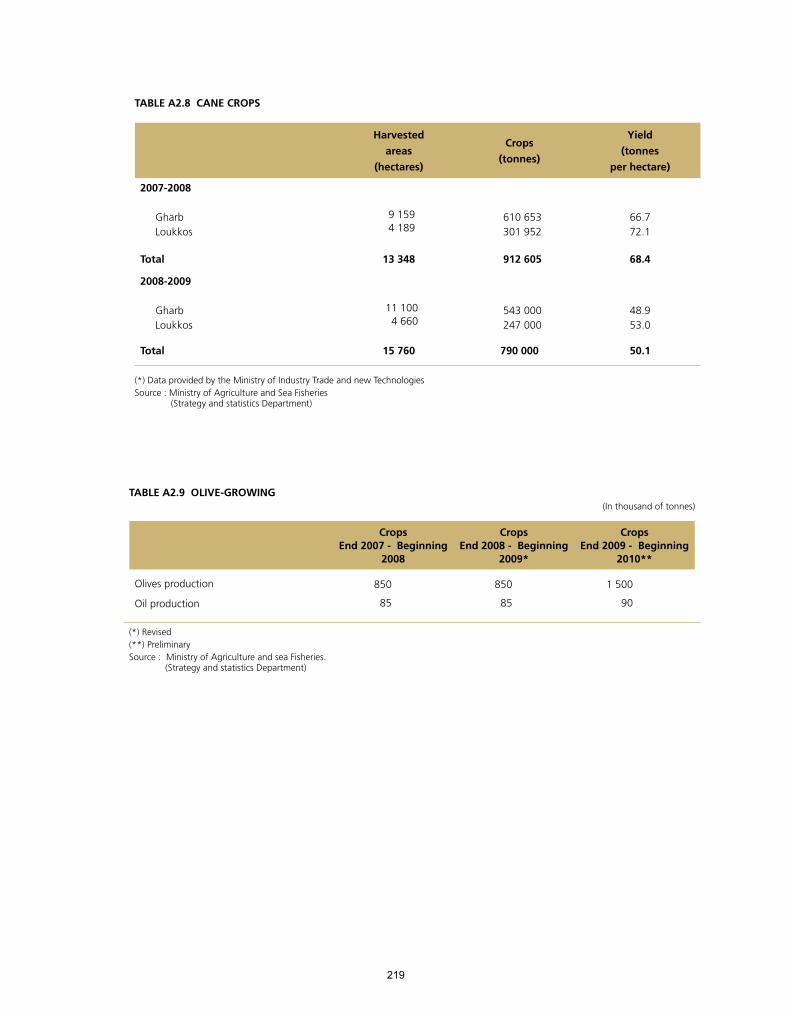
TABLE A2.8 CANE CROPS
Harvestedareas
(hectares)
Crops (tonnes)
Yield(tonnes
per hectare)
2007-2008
GharbLoukkos
9 159 4 189
610 653 301 952
66.772.1
Total 13 348 912 605 68.4
2008-2009
GharbLoukkos
11 100 4 660
543 000 247 000
48.953.0
Total 15 760 790 000 50.1
(*) Data provided by the Ministry of Industry Trade and new TechnologiesSource : Ministry of Agriculture and Sea Fisheries (Strategy and statistics Department)
TABLE A2.9 OLIVE-GROWING(In thousand of tonnes)
CropsEnd 2007 - Beginning
2008
CropsEnd 2008 - Beginning
2009*
CropsEnd 2009 - Beginning
2010**
Olives production
Oil production
850
85
850
85
1 500
90
(*) Revised(**) Preliminary Source : Ministry of Agriculture and sea Fisheries. (Strategy and statistics Department)
219
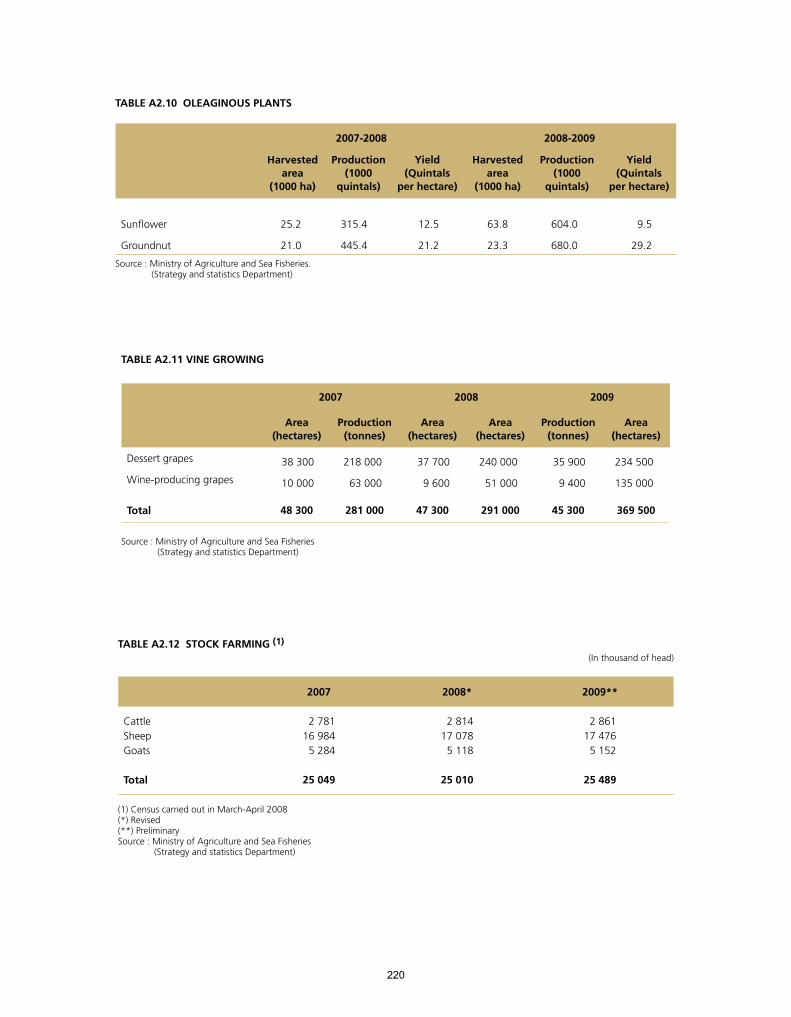
TABLE A2.10 OLEAGINOUS PLANTS
2007-2008 2008-2009
Harvestedarea
(1000 ha)
Production(1000
quintals)
Yield(Quintals
per hectare)
Harvestedarea
(1000 ha)
Production(1000
quintals)
Yield(Quintals
per hectare)
Sunflower
Groundnut
25.2
21.0
315.4
445.4
12.5
21.2
63.8
23.3
604.0
680.0
9.5
29.2
Source : Ministry of Agriculture and Sea Fisheries. (Strategy and statistics Department)
TABLE A2.11 VINE GROWING
2007 2008 2009
Area(hectares)
Production(tonnes)
Area(hectares)
Area(hectares)
Production(tonnes)
Area(hectares)
Dessert grapes
Wine-producing grapes
38 300
10 000
218 000
63 000
37 700
9 600
240 000
51 000
35 900
9 400
234 500
135 000
Total 48 300 281 000 47 300 291 000 45 300 369 500
Source : Ministry of Agriculture and Sea Fisheries (Strategy and statistics Department)
TABLE A2.12 STOCK FARMING (1)
(In thousand of head)
2007 2008* 2009**
CattleSheepGoats
2 78116 984 5 284
2 81417 078 5 118
2 86117 476 5 152
Total 25 049 25 010 25 489
(1) Census carried out in March-April 2008 (*) Revised(**) PreliminarySource : Ministry of Agriculture and Sea Fisheries (Strategy and statistics Department)
220

TABLE A2.14 SEA FISHERIES(In thousands of tonnes)
2009**2008*
1 208.0141.0
1 067.0362.0690.0109.0344.0237.0524.2145.6104.3143.4130.9
1 055.1112.1943.0323.1607.0123.0260.0224.0485.3141.097.0
145.9101.4
ProductionDeep-sea fishing
Coastal fishingConsumption of fresh productsProcessing
Canned fish Fish meal and fish oilFreezing
ExportationFresh and freezed fishCrustaceans and molluscsCanned fishFish meal and fish oil
(*) Revised(**) PreliminarySources : - Production : Ministry of Agriculture and Sea Fisherie et National office of Fisheries - Exports : Foreign Exchange Control Office
TABLE A2.13 MEAT SUPPLIED FOR CONSUMPTION(In thousands of tonnes)
2007 2008* 2009**
Red meatCattle SheepGoatsOther et offal
White meat
388. 0170. 0120. 0 22. 0 76. 0
420. 0
400. 0180. 0121. 0 22. 0 77. 0
490. 0
425. 0----
490. 0
(*) Revised(**) Preliminary(-) Non disponibleSource : Ministry of Agriculture and Sea Fisheries (Cattle breeding Department)
221

TABLE A2.15 INDEX OF MINERAL PRODUCTION(100: 1998)
Percentage changes
20092008
2009**2008*2007
-1.9
3.2
1.9
3.3
-14.1
-29.1
137.4
57.1
57.7
57.1
126.5
79.7
140.0
55.3
56.6
55.3
147.2
112.5
134.6
56.4
59.7
56.5
149.3
122.0
Overall index
Metallic ores
of which :
Minerais de fer
Minerais de métaux non ferreux
Other non-metallic ores
of which :
Phosphates
(*) Revised(**) PreliminarySource : High Commission for Planning (Department of Statistics)
TABLE A2.16 ENERGY BALANCE(In thousands of tonnes oil equivalent T.O.E)
2009**2008*2007
%Total%Total%Total
10014 974.810014 583.110013 634.3Consumption
22.73 405.625.23 676.228.13 836.6- Coal
60.72.8
9 085.0414.2
61.52.8
8 962.0405.8
59.13.0
8 059.2411.2
- Petroleum products - Gaz naturel
- Hydro-electricity wind powerpower13.82 070.010.61 539.09.71 327.4 electricity and imported electricity
Of which :100819.0100374.7100379.6Domestic products
6.2
93.8
50.5
768.5
15.7
84.3
59.0
315.7
19.0
81.0
72.1
307.5
- Oil and natural gas- Hydro-electricity and wind power electricity
14 155.814 208.413 254.8Deficit
94.597.497.2As a percentage of overall -
consumption
(*) Revised(**) Preliminary Source : Ministry of Energy and Mining and High Commission for Planning
(Department of Statistics)
222

TABLE A2.17 ENERGY PRODUCTION
Percentage changes20092008
2009**2008*2007
Extraction activity3.6
-17.69.341.2
9.050.0
11.161.0
Crude oil production (1 000 t)Natural gas production ( millions m3)
Processing activity
-20.6
3.3
(-2.0)
4 271.2
20 387.1
(12 806.1)
5 378.8
19 742.5
(13 072.6)
6 038.9
19 101.6
(13 062.0)
Refineries production (1 000 t) (1)
Net electricity production (millions kWh)
Of which : Concession electricity (thermic and wind power)
(*) Revised(**) Preliminary(1) Excluding non energy oil products (bitumen and lubricants) Sources : Ministry of Energy and Mining and National Electricity Office
TABLE A2.18 ENERGY PRODUCTION EXPRESSED IN TONNES OIL EQUIVALENT (TOE)
2009**2008*In thousands ofTonnes Oil Equivalent
(TOE) StructurePercentage
changesQuantitiesStructure Percentage
changesQuantities
100.0-8.99 572100.0-4.510 512Total production (1)
44.655.4
-20.63.3
4 2715 301
51.248.8
-10.93.4
5 3795 133
Of which :Refined petroleum (2)
Electricity
(*) Revised(**) Preliminary(1) Total output of energy calculated from data provided by the Ministry of Energy and Mining and the National Electricity Office
on the basis of a conversion coefficient of 0.26 TOE per 1000 kWh for electricity(2) Excluding non-energy products (bitumen and lubricants)
223

TABLE A2.19 TOTAL ENERGY CONSUMPTION
Percentage changes 20092008
2009**2008*2007
1.49 0858 9628 059Petroleum products (1 000 t)
6.45 3305 0084 664- Light distillate
6.40.47.2
2.23.0
-5.2-11.4-12.1-10.7
500490
4 340
1 8951 730
1651 860
969891
470488
4 050
1 8541 680
1742 1001 102
998
417484
3 763
1 7661 596
1711 628
735893
. Super petrol
. Planes kerosene
.Gas-oil
- Liquefied gas. Butane. Propane
- Fuel-oil. Quantities used for electricity production. Other
-7.45 1605 5705 813Coal (1 000 t)
-8.2-3.7
4 1201 040
4 4901 080
4 8131 000
. Quantities used for electricity producetion
. Other
2.1545534541Natural gas ( millions m3)
-0.4482484480of which : Tahaddart’s consumption
3.422 38421 63820 502Electricity O.N.E. (millions kWh)
8.54 6224 2613 507of which : external contribution
(*) Revised(**) PreliminarySources : Ministry of Energy and Mining and National Electricity Office
TABLE A2.20 FINAL ENERGY CONSUMPTION (1)
2009**2008*In thousands of Tonnes Oil
Equivalent (TOE)Structure
Percentagechanges
Quantities StructurePercentage
changes
Quantities
1003.414 6081006.414 124Final energy consumption (2)
55.0
(29.6)39.8
4.7
4.1
(8.8)3.4
-3.7
8 102
(4 326)5 820
686
55.1
(28.1)39.85.0
6.8
(6.7)5.58.0
7 785
(3 975)5 626
713
Petroleum productsof which :(Gas oil)
Electricity Coal
(1)Final energy consumption is equal to primary consumption less energy products consumed by the National Electricity Office (2) Final energy consumption is calculated on the basis of data provided by the Ministry of Energy and Mining and the National Electricity Office (ONE) on the basis of a conversion coefficient of 0.26 TOE per 1000 kWh for electricity and 0.66 TOE per tonne for coal (*) Revised(**) Preliminary
224

TABLE A2.21 INDICES OF MANUFACTURING PRODUCTION
(1998 : 100)
Percentage changes
200920082007Weighting 2009
2008
2008
2007
2.64.2144.0140.4134.7230Food industries
2.06.9
4.05.6
141.8162.3
139.0151.8
133.6143.7
20525
. Staple foods
. Manufactured tobacco
-0.5-0.7129.0129.7130.5209Textiles and leather industries
-0.90.0
-4.3
-2.61.0
-8.4
115.5141.091.9
116.6141.096.0
119.7139.6104.8
65126
17
. Textile industry products
. Clothing goods and furs
. Leather, travel goods and footwear
-1.43.5157.9160.0154.7363Chemical and parachemical industries
-7.7-0.4-0.6
-19.82.5
-1.5-0.5
5.9-2.9-0.61.33.5
13.55.2
111.8228.8161.6103.8142.3236.4172.9
121.1229.7162.6129.4138.8240.1173.7
114.3236.5163.5127.7134.1211.5165.1
9311841
1551990
. woodwork products. Paper and cardboard. Editing products, printed or reproduced products. Coking, refining, and nuclear industries products. Chemical products. Rubber or plastic products. Other mineral non-metal products
1.40.1196.3193.5193.3160Mechanical and metallurgical industries
3.34.2
-8.9-0.7-5.51.8
-7.12.7
11.71.84.48.1
201.4197.2160.3219.0147.0187.2
195.0189.2175.9220.5155.5183.9
210.0184.3157.5216.5149.0170.1
534915276
11
. Met al products. Metal works products. Machinery and equipement. Car industry products. Other transport equipement. Furniture, miscellaneous industries
-0.81.4188.1189.7187.138Electrical and electronic industries
-1.30.2
-1.6
1.60.4
5.2
173.6224.2
204.8
175.9223.7
208.2
173.1222.7
197.9
2710
1
. Electrical machines
. Radio, Television and communication equipement
. Mediacl, precision, optics and clock making material
0.22.1156.0155.7152.51 000Total manufacturing industries
Source : High Commission for Planning
225

TABLE A2.22 TOURIST ARRIVALS
Percentage changes
20092008
200920082007
+1.64 612 3114 541 7754 324 231I - Foreign tourists
+1.9
+1.7
-0.5+8.0-2.6-7.9+8.9
+1.7
+6.3
+9.4-2.6
+11.9+5.4+0.0
+11.5+1.9
-22.1
-3.2
4 292 958
3 414 920
1 699 201 642 817 174 384 252 945 177 915
209 153
214 692
121 14454 7898 077
117 489135 766104 88464 65031 404
319 353
4 211 855
3 359 117
1 707 055595 279179 037274 762163 315
205 746
201 915
110 77856 2317 219
111 463135 82094 08663 41840 290
329 920
4 030 898
3 218 188
1 605 503540 186159 844338 304160 047
188 727
196 154
109 07950 8028 189
101 875122 75084 16960 76058 275
293 333
A. On-shore
European Union countriesOf which :
. France . Spain . Germany . United Kingdom . Italy
Other European countries
AmericaOf which :
. United States
. Canada
. ArgentinaMiddle East (*)
MaghrebOther African countriesAsia Other countries
B. Off-shore (cruising)
+10.44 048 2793 666 7843 376 719II -Moroccans resident abroad
+5.58 660 5908 208 5597 700 950Total
(*) Including Egypt.Source : Ministry of Tourism and of Handicraft
226

TABL
E A
2.23
IN
DEX
OF
IND
UST
RIA
L PR
OD
UCE
R PR
ICES
(*)
(199
7 : 1
00)
Perc
enta
ge c
hang
es
2009
Ann
ual
aver
age
2008
Wei
ghti
ng
%20
0920
08A
nnua
lav
erag
e4t
h qu
arte
r3r
d q
uart
er2n
d qu
arte
r1s
t qu
arte
r20
0820
07
-0.4 0.0
0.0
0.7
3.9
0.9
-2.2 1.2
-33.
6-3
0.2
-2.0 3.8
-9.3
-5.2
-1.3 1.3
0.0
0.4
0.8
-1.5 1.5
8.8
0.0
-0.3 0.1
4.0
1.5
3.1
0.3
32.2
52.5 2.5
1.2
5.3
8.1
-1.3 1.3
0.0
0.4
0.6
1.2
1.7
117.
911
6.1
94.9
94.6
107.
010
9.4
89.0
97.5
224.
613
9.9
102.
912
1.9
130.
611
3.7
88.4
121.
892
.810
3.6
102.
710
3.8
120.
3
117.
711
6.1
95.8
94.4
107.
011
0.1
86.1
98.3
257.
512
4.9
101.
312
2.7
126.
611
1.1
88.0
122.
492
.8 1
03.6
103.
210
2.5
120.
5
118.
311
6.1
95.1
94.6
107.
010
9.2
86.4
97.5
249.
012
5.0
102.
212
2.7
125.
811
3.4
88.0
122.
492
.8 1
03.6
103.
110
2.5
120.
4
117.
711
6.1
94.0
94.7
107.
010
9.2
89.5
97.5
212.
812
4.4
103.
412
2.7
126.
611
4.1
88.6
121.
392
.8 1
03.6
102.
510
2.5
120.
3
118.
011
6.1
94.6
94.7
107.
010
9.2
94.1
96.7
179.
218
5.5
104.
611
9.4
143.
211
6.2
89.0
121.
292
.810
3.5
101.
810
7.6
120.
2
118.
411
6.1
94.9
94.0
103.
010
8.5
91.1
96.4
338.
320
0.4
105.
011
7.5
144.
012
0.0
89.6
120.
392
.810
3.2
101.
810
5.3
118.
5
28.9
3.1
6.5
6.7
1.6
1.8
2.6
1.4
13.3
13.1
2.0
5.9
3.2
3.0
0.9
2.0
0.5
0.1
2.5
0.1
0.9
Food
indu
strie
sTo
bacc
o in
dust
ryTe
xtile
indu
stry
Clo
thin
g in
dust
ryLe
athe
r and
foot
wea
r W
ood
and
woo
d pr
oduc
ts
Pape
r and
car
dboa
rdPr
intin
g an
d pu
blish
ing
Oil
refin
ing
Che
mic
al in
dust
ry
Rubb
er a
nd p
last
ic p
rodu
cts
Oth
er n
on-m
etal
lic m
iner
al p
rodu
cts
Basic
met
al in
dust
ry
Met
alw
orki
ngM
achi
nery
and
equ
ipm
ent
Elec
tric
al m
achi
nery
and
equ
ipm
ent
Radi
o, te
levi
sion
and
com
mun
icat
ion
equi
pmen
tM
edia
l, pr
ecisi
on, o
ptic
al a
nd w
atch
-mak
ing
inst
rum
ents
Car
indu
stry
Oth
er tr
ansp
ort e
quip
men
tFu
rnitu
re a
nd m
iscel
lane
ous
man
ufac
ture
s
-15.
318
.213
0.1
132.
213
1.3
126.
313
0.5
153.
510
0G
ener
al in
dex
(*) P
rices
exc
ludi
ng ta
xes
and
ex w
orks
.So
urce
: H
igh
com
miss
ion
for p
lann
ing
( Dep
artm
ent o
f sta
tistic
ts)
227

TABL
E A
3.1
IND
ICA
TORS
OF
EMPL
OY
MEN
T A
ND
UN
EMPL
OY
MEN
T(P
opul
atio
n in
thou
sand
s an
d ra
tes
in p
erce
ntag
e)
Tota
l R
ural
are
asU
rban
are
as
Chan
ges
inab
solu
te
valu
e 20
09/2
008(
2)
2009
2008
Chan
ges
inab
solu
te
valu
e20
09/2
008(
2)
2009
2008
Chan
ges
inab
solu
te
valu
e 20
09/2
008(
2)
2009
2008
337
.031
514
31 1
777.
013
455
13 4
48 3
30.0
18 0
5917
729
Tota
l pop
ulat
ion
412
.822
683
22 2
70 1
69.5
9 31
29
143
243
.313
369
13 1
26Po
pula
tion
age
d 15
yea
rs a
nd o
ver
47.0
11 3
1411
267
5.0
5 3
98 5
393
42.
05
916
5 87
4La
bour
for
ce a
ged
15 y
ears
and
ove
r
96.0
-49.
010
285
1 02
910
189
1 07
8 8
.0-3
.05
184
214
5 17
621
7 8
8.0
- 46.
05
101
815
5 01
386
1O
f whi
ch :
- Em
ploy
ed- U
nem
ploy
ed
- 0.7
49.9
50.6
- 0.6
58.4
59.
0 -
0.7
44.0
44.7
Act
ivit
y ra
te (1
)
- 0.5
9.1
9.6
-0.1
4.0
4.0
- 0.9
13.8
14.7
Une
mpl
oym
ent
rate
-0.5
-0.3
-0.3
- 0.8
0.2
-0.1
-0.3
-1.3
9.0
9.5
18.0
12.7
5.4
1.9
4.4
17.
2
9.5
9.8
18.3
13.5
5.2
2.0
4.7
18.5
-0.1
-0.1
0.0
- 0.4
0.7
0.0
0.0
0.8
5.0
1.7
8.7
3.9
2.4
0.9
2.5
11.8
5.1
1.8
8.7
4.3
1.7
0.9
2.6
12.2
- 0.9
- 0.5
0.0
- 1.0
- 0.3
- 0.2
- 0.6
- 1.4
12.1
19.8
31.8
19.2 7.4
2.9
7.7
18.6
13.0
20.3
31.8
20.2 7.7
3.1
8.3
20.0
Men
Wom
en
15 to
24
year
s25
to 3
4 ye
ars
35 to
44
year
s45
yea
rs a
nd o
ver
With
out a
ny d
iplo
ma
With
dip
lom
a
(1) L
abou
r for
ce a
ged
15 a
nd o
ver a
s a
perc
enta
ge o
f the
tota
l pop
ulat
ion
aged
15
and
over
(2
) For
rate
s th
is is
a ch
ange
in p
erce
ntag
e po
ints
So
urce
: H
igh
Com
miss
ion
for P
lann
ing
(Dep
artm
ent o
f Sta
tistic
s)
228
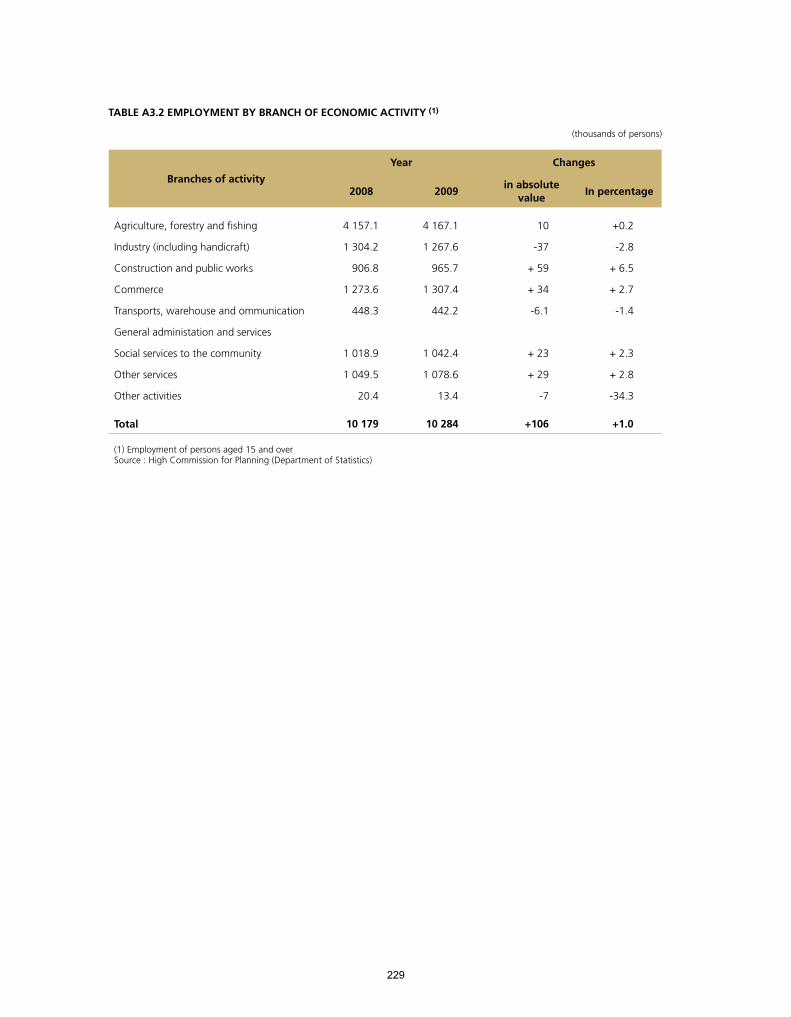
TABLE A3.2 EMPLOYMENT BY BRANCH OF ECONOMIC ACTIVITY (1)
(thousands of persons)
ChangesYearBranches of activity
In percentagein absolute
value 20092008
+0.2
-2.8
+ 6.5
+ 2.7
-1.4
+ 2.3
+ 2.8
-34.3
10
-37
+ 59
+ 34
-6.1
+ 23
+ 29
-7
4 167.1
1 267.6
965.7
1 307.4
442.2
1 042.4
1 078.6
13.4
4 157.1
1 304.2
906.8
1 273.6
448.3
1 018.9
1 049.5
20.4
Agriculture, forestry and fishing
Industry (including handicraft)
Construction and public works
Commerce
Transports, warehouse and ommunication
General administation and services
Social services to the community
Other services
Other activities
+1.0 +10610 28410 179Total
(1) Employment of persons aged 15 and overSource : High Commission for Planning (Department of Statistics)
229
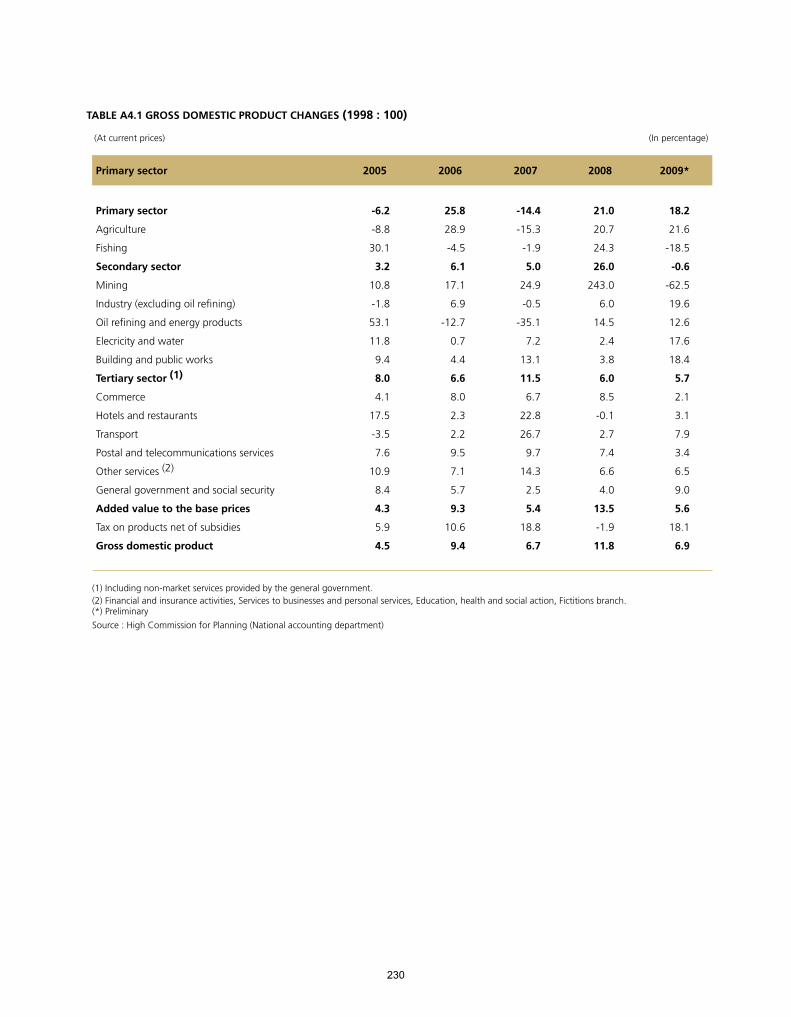
TABLE A4.1 GROSS DOMESTIC PRODUCT CHANGES (1998 : 100)
(At current prices) (In percentage)
2009*2008200720062005Primary sector
18.2
21.6
-18.5
-0.6
-62.5
19.6
12.6
17.6
18.4
5.7
2.1
3.1
7.9
3.4
6.5
9.0
5.6
18.1
6.9
21.0
20.7
24.3
26.0
243.0
6.0
14.5
2.4
3.8
6.0
8.5
-0.1
2.7
7.4
6.6
4.0
13.5
-1.9
11.8
-14.4
-15.3
-1.9
5.0
24.9
-0.5
-35.1
7.2
13.1
11.5
6.7
22.8
26.7
9.7
14.3
2.5
5.4
18.8
6.7
25.8
28.9
-4.5
6.1
17.1
6.9
-12.7
0.7
4.4
6.6
8.0
2.3
2.2
9.5
7.1
5.7
9.3
10.6
9.4
-6.2
-8.8
30.1
3.2
10.8
-1.8
53.1
11.8
9.4
8.0
4.1
17.5
-3.5
7.6
10.9
8.4
4.3
5.9
4.5
Primary sector
Agriculture
Fishing
Secondary sector
Mining
Industry (excluding oil refining)
Oil refining and energy products
Elecricity and water
Building and public works
Tertiary sector (1)
Commerce
Hotels and restaurants
Transport
Postal and telecommunications services
Other services (2)
General government and social security
Added value to the base prices
Tax on products net of subsidies
Gross domestic product
(1) Including non-market services provided by the general government.(2) Financial and insurance activities, Services to businesses and personal services, Education, health and social action, Fictitions branch.(*) PreliminarySource : High Commission for Planning (National accounting department)
230
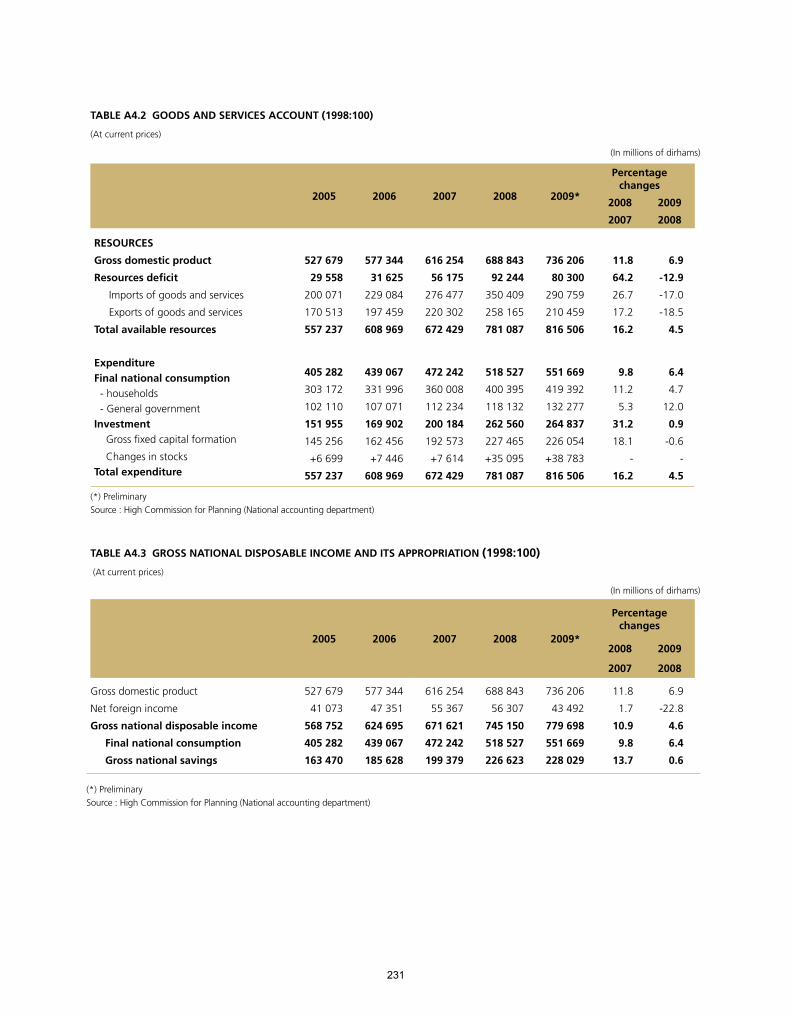
TABLE A4.2 GOODS AND SERVICES ACCOUNT (1998:100)
(At current prices)
(In millions of dirhams)
Percentage changes
2009*2008200720062005 20092008
20082007
6.9
-12.9
-17.0
-18.5
4.5
11.8
64.2
26.7
17.2
16.2
736 206
80 300
290 759
210 459
816 506
688 843
92 244
350 409
258 165
781 087
616 254
56 175
276 477
220 302
672 429
577 344
31 625
229 084
197 459
608 969
527 679
29 558
200 071
170 513
557 237
RESOURCES
Gross domestic product
Resources deficit
Imports of goods and services
Exports of goods and services
Total available resources
6.4
4.7
12.0
0.9
-0.6
-
4.5
9.8
11.2
5.3
31.2
18.1
-
16.2
551 669
419 392
132 277
264 837
226 054
+38 783
816 506
518 527
400 395
118 132
262 560
227 465
+35 095
781 087
472 242
360 008
112 234
200 184
192 573
+7 614
672 429
439 067
331 996
107 071
169 902
162 456
+7 446
608 969
405 282
303 172
102 110
151 955
145 256
+6 699
557 237
Expenditure Final national consumption - households - General governmentInvestment Gross fixed capital formation
Changes in stocksTotal expenditure
(*) PreliminarySource : High Commission for Planning (National accounting department)
TABLE A4.3 GROSS NATIONAL DISPOSABLE INCOME AND ITS APPROPRIATION (1998:100) (At current prices)
(In millions of dirhams)
Percentage changes
2009*2008200720062005
20092008
20082007
6.9
-22.8
4.6
6.4
0.6
11.8
1.7
10.9
9.8
13.7
736 206
43 492
779 698
551 669
228 029
688 843
56 307
745 150
518 527
226 623
616 254
55 367
671 621
472 242
199 379
577 344
47 351
624 695
439 067
185 628
527 679
41 073
568 752
405 282
163 470
Gross domestic product
Net foreign income
Gross national disposable income
Final national consumption
Gross national savings
(*) PreliminarySource : High Commission for Planning (National accounting department)
231

TABLE A4.4 INVESTMENT AND SAVINGS (1998:100) (At current prices) (In millions of dirhams)
Variations en %
2009*200820072006200520092008
20082007
0.6
-73.3
-
0.9
-0.6
-
-
0.9
13.7
-42.3
-
31.2
18.1
-
-
31.2
228 029
-4
36 812
264 837
226 054
+38 783
-
264 837
226 623
-15
35 952
262 560
227 465
+35 095
-
262 560
199 379
-26
834
200 187
192 573
+7 614
-
200 187
185 628
-81
-
185 547
162 456
+7 446
15 645
185 547
163 470
-50
-
163 420
145 256
+6 699
11 465
163 420
Gross national savings
Net capital transfers received
Financing requirement
Total resources
Gross fixed capital formation
Changes in stocks
Financing capacity
Total expenditure
(*) Preliminary Source : High Commission for Planning (National accounting department)
232

TABLE A5 ECONOMIC AND FINANCIAL FLOWS IN 2009(At current prices in billions of dirhams)
Rest of the world
national economySector
financial sectorPrivate sector
Public sector
Economy Non bankingsector
Bankingsector
Transactions
-210.46290.76-43.49
589.17-391.57-179.69-38.78
190.53-160.10-46.36
-779.70551.67226.0538.78
210.46-290.76
43.49
Gross national disposable incomeConsumptionGross fixed capital formationChanges in inventoriesGoods and services exportsGoods and services importsNet income and transfers from abroad
36.81-20.87-15.93Banlance of non financial operations
-8.82-16.35
1.87-18.22
-4.70-18.32-56.4438.12
7.7734.1854.88
-20.71
5.750.49
-0.310.81
Domestic financing- Monetary
. Domestic lending
. Money supply
7.5313.62-26.415.26- Non monetary: collection and investments
23.80-0.04
-16.2314.77
-17.16-12.70-2.68-1.75-7.48-6.36
-4.43
18.05-3.9016.2913.042.620.635.66
-23.80-0.79
-1.82-10.87
0.87-0.310.061.121.826.36
5.260.00
. Institutional saving. Treasury bills. Privatization. Private investments
- UCITS- Negotiable debt securities
. Certificats of deposits
. Bonds of finance companies
. Treasury bills- Private bonds - Shares
-38.20-7.06
7.067.06
18.4312.71Foreign financing - Monetary
-1.75-5.31
1.755.31
. Changes in net foreign assets of commercial banks
. Changes in net foreign assets of Bank Al-Maghrib
-31.14 18.4312.71- Non monetary
-11.09-20.05
-38.20
-8.822.36
11.097.34
26.20
0.0012.71
18.46
. Direct investments
. Net foreign borrowing
Balance of financial operations
-1.39-8.822.365.332.53Statistic differences
Source : Bank Al-Maghrib.
233

TABL
E A
6 C
ON
SUM
ER P
RICE
IND
EX (1
) (1
00 :
2006
)
Non
-foo
d pr
oduc
tsFo
od p
rodu
cts
Gen
eral
inde
xCa
tego
ryVa
riou
s go
ods
and
serv
ices
Rest
aura
nts
and
hote
lsEd
ucat
ion
Leis
ure
and
cult
ure
Com
mun
icat
ions
Tran
spor
tH
ealt
h
Furn
itur
e,
hous
ehol
d it
ems
and
rout
ine
hous
ehol
d m
aint
enan
ce
Hou
sing
, w
ater
, gas
, el
ectr
icit
y an
d ot
her
fuel
s
Clot
hes
and
shoe
sO
vera
ll
Alc
ohol
ic
beve
rage
s,
toba
cco
and
narc
otic
s
Food
and
so
ft d
rink
sO
vera
ll
5.5
2.9
3.9
2.2
3.5
11.4
5.5
4.9
14.8
3.9
58.5
2.2
39.3
41.5
100
Wei
ght
101.
710
2.2
102.
410
2.8
102.
810
2.9
102.
910
3.6
103.
710
3.8
103.
810
4.0
104.
410
4.5
104.
610
4.9
105.
210
5.2
105.
210
5.2
105.
510
5.6
105.
810
6.0
102.
510
4.1
104.
210
4.7
104.
610
4.9
105.
210
5.2
105.
210
5.1
105.
110
5.3
105.
610
5.4
105.
510
5.6
106.
010
6.3
106.
910
6.9
107.
510
7.8
107.
810
7.9
102.
710
2.7
102.
710
2.7
102.
710
2.7
102.
710
2.7
108.
610
9.1
109.
110
9.1
109.
110
9.1
109.
110
9.1
109.
110
9.1
109.
110
9.1
113.
111
3.3
113.
311
3.3
99.2
98.8
98.6
98.4
98.2
98.1
98.0
98.0
98.2
98.3
98.1
98.3
98.3
98.2
98.3
97.9
97.8
97.8
97.7
97.3
97.3
97.5
98.0
97.7
96.6
96.6
95.8
95.8
95.8
95.8
95.8
95.8
95.0
94.9
95.1
94.8
92.6
92.6
92.6
90.9
90.9
91.0
91.0
91.0
90.9
90.9
90.9
90.9
101.
910
2.1
102.
310
2.3
102.
310
2.4
103.
910
4.0
103.
710
3.7
103.
710
3.7
104.
110
2.8
102.
710
2.8
102.
810
3.0
103.
110
3.1
103.
310
3.4
103.
410
3.3
100.
810
0.8
100.
910
0.9
100.
910
0.9
100.
910
1.2
101.
210
1.2
101.
210
1.2
101.
310
1.5
101.
610
1.6
101.
610
1.6
101.
610
1.6
102.
410
2.5
102.
610
2.6
102.
710
2.5
102.
510
2.8
103.
010
3.2
103.
410
3.6
103.
610
3.9
104.
610
4.9
105.
110
5.2
105.
210
5.3
105.
310
5.3
105.
410
5.4
105.
410
5.5
105.
610
5.5
102.
310
2.4
102.
610
2.7
102.
910
3.1
103.
110
3.2
103.
310
3.3
103.
310
3.4
103.
510
3.5
103.
610
3.7
103.
810
3.8
103.
910
3.9
104.
010
4.0
104.
110
4.2
102.
210
2.6
102.
810
2.8
102.
810
2.8
102.
610
2.6
102.
910
3.0
103.
310
3.5
103.
810
3.8
103.
610
3.7
103.
710
3.5
103.
610
3.3
104.
010
4.1
104.
210
4.3
101.
610
1.8
101.
910
2.0
102.
110
2.2
102.
510
2.6
103.
010
3.0
103.
110
3.2
103.
310
3.0
103.
110
3.0
103.
110
3.2
103.
210
3.2
103.
710
3.8
103.
910
3.9
102.
110
2.1
102.
110
2.1
102.
110
2.1
102.
110
7.8
108.
310
8.3
108.
310
8.3
108.
310
8.3
108.
310
8.1
108.
210
8.2
108.
210
8.2
108.
210
8.2
108.
210
8.2
106.
710
7.3
110.
111
2.3
113.
811
2.5
112.
611
3.6
114.
811
4.7
113.
811
5.1
113.
011
4.0
115.
411
6.9
112.
410
9.1
109.
611
3.7
118.
911
5.6
111.
110
9.9
106.
510
7.0
109.
711
1.8
113.
211
2.0
112.
111
3.3
114.
511
4.4
113.
511
4.7
112.
811
3.7
115.
011
6.4
112.
210
9.1
109.
511
3.4
118.
311
5.2
110.
910
9.8
103.
610
410
5.1
106
106.
710
6.2
106.
410
710
7.7
107.
710
7.5
108
107.
210
7.4
108
108.
610
6.9
105.
610
5.8
107.
410
9.8
108.
510
6.8
106.
3
2008
Janu
ary
Fe
brua
ryM
arch
Apr
ilM
ayJu
ne July
A
ugus
tSe
ptem
ber
Oct
ober
Nov
embe
rD
écem
ber
2009
Janu
ary
Fe
brua
ryM
arch
Apr
ilM
ayJu
ne July
A
ugus
tSe
ptem
ber
Oct
ober
Nov
embe
rD
ecem
ber
(1) T
he c
onsu
mer
pric
e in
dex
has
repl
aced
the
cost
of l
ivin
g in
dex
as fr
om N
ovem
ber 2
009.
Sour
ce :
Hig
h C
omm
issio
n fo
r Pla
nnon
g (S
tatis
tics
Dep
artm
ent)
234
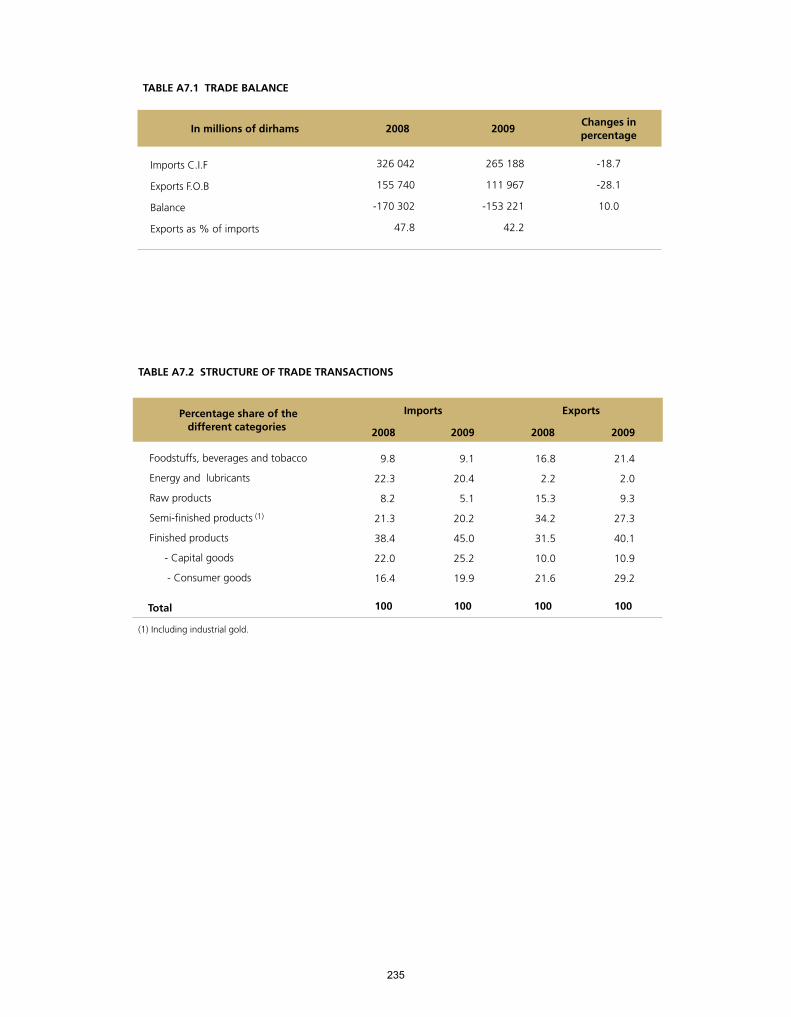
TABLE A7.1 TRADE BALANCE
Changes inpercentage
20092008In millions of dirhams
-18.7
-28.1
10.0
265 188
111 967
-153 221
42.2
326 042
155 740
-170 302
47.8
Imports C.I.F
Exports F.O.B
Balance
Exports as % of imports
TABLE A7.2 STRUCTURE OF TRADE TRANSACTIONS
Exports ImportsPercentage share of thedifferent categories 2009200820092008
21.4
2.0
9.3
27.3
40.1
10.9
29.2
16.8
2.2
15.3
34.2
31.5
10.0
21.6
9.1
20.4
5.1
20.2
45.0
25.2
19.9
9.8
22.3
8.2
21.3
38.4
22.0
16.4
Foodstuffs, beverages and tobacco
Energy and lubricants
Raw products
Semi-finished products (1)
Finished products
- Capital goods
- Consumer goods
100100100100Total
(1) Including industrial gold.
235
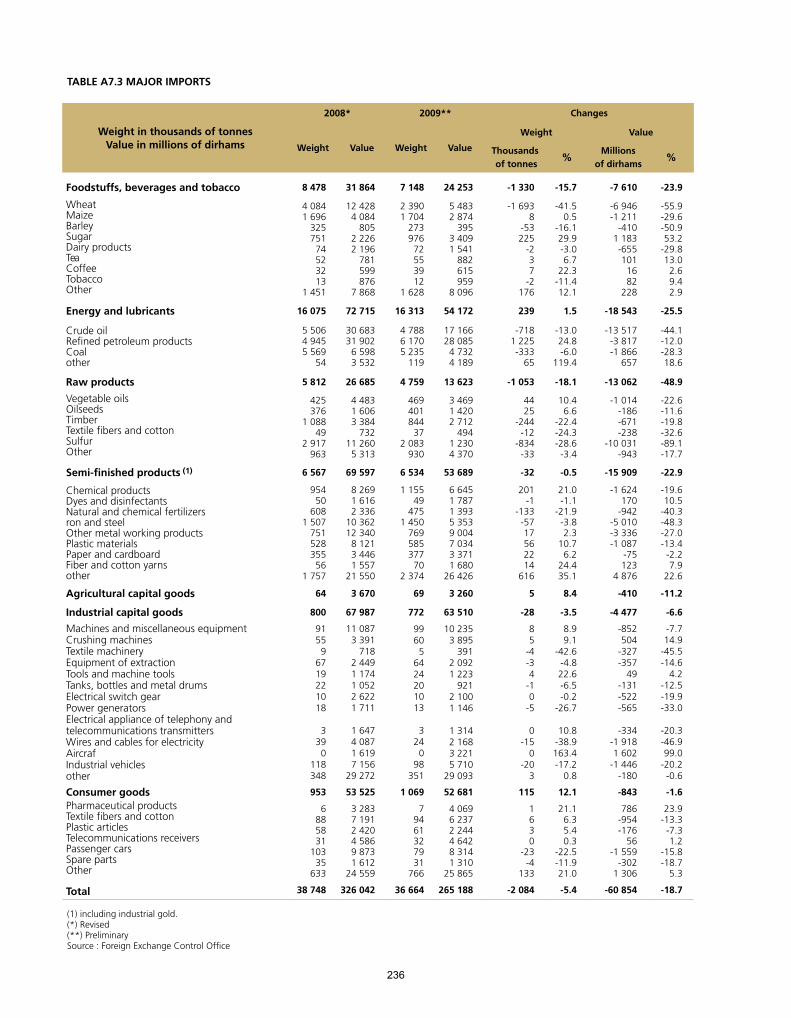
TABLE A7.3 MAJOR IMPORTS
Changes2009**2008*
Weight in thousands of tonnesValue in millions of dirhams
ValueWeight
ValueWeightValueWeight%
Millions of dirhams
%Thousands of tonnes
-23.9-7 610-15.7-1 33024 2537 14831 8648 478Foodstuffs, beverages and tobacco
-55.9-29.6-50.953.2
-29.813.0
2.69.42.9
-6 946-1 211
-4101 183-655101
1682
228
-41.50.5
-16.129.9-3.06.7
22.3-11.412.1
-1 6938
-53225
-237
-2176
5 4832 874
3953 4091 541
882615959
8 096
2 3901 704
273976
72553912
1 628
12 4284 084
8052 2262 196
781599876
7 868
4 0841 696
325751
74523213
1 451
WheatMaize Barley Sugar Dairy productsTeaCoffeeTobaccoOther
-25.5-18 5431.523954 17216 31372 71516 075Energy and lubricants
-44.1-12.0-28.318.6
-13 517-3 817-1 866
657
-13.024.8-6.0
119.4
-7181 225-333
65
17 16628 085
4 7324 189
4 7886 1705 235
119
30 68331 902
6 5983 532
5 5064 9455 569
54
Crude oilRefined petroleum productsCoalother
-48.9-13 062-18.1-1 05313 6234 75926 6855 812Raw products
-22.6-11.6-19.8-32.6-89.1-17.7
-1 014-186-671-238
-10 031-943
10.46.6
-22.4-24.3-28.6
-3.4
4425
-244-12
-834-33
3 4691 4202 712
4941 2304 370
469401844
372 083
930
4 4831 6063 384
73211 260
5 313
425376
1 08849
2 917963
Vegetable oils OilseedsTimberTextile fibers and cottonSulfurOther
-22.9-15 909-0.5-3253 6896 53469 5976 567Semi-finished products (1)
-19.610.5
-40.3-48.3-27.0-13.4
-2.27.9
22.6
-1 624170
-942-5 010-3 336-1 087
-75123
4 876
21.0-1.1
-21.9-3.82.3
10.76.2
24.435.1
201-1
-133-5717562214
616
6 6451 7871 3935 3539 0047 0343 3711 680
26 426
1 15549
4751 450
769585377
702 374
8 2691 6162 336
10 36212 340
8 1213 4461 557
21 550
95450
6081 507
751528355
561 757
Chemical productsDyes and disinfectantsNatural and chemical fertilizersron and steelOther metal working productsPlastic materialsPaper and cardboardFiber and cotton yarnsother
-11.2-4108.453 260693 67064Agricultural capital goods
-6.6-4 477-3.5-2863 51077267 987800Industrial capital goods-7.714.9
-45.5-14.6
4.2-12.5-19.9-33.0
-20.3-46.999.0
-20.2-0.6
-852504
-327-357
49-131-522-565
-334-1 9181 602
-1 446-180
8.99.1
-42.6-4.822.6-6.5-0.2
-26.7
10.8-38.9163.4-17.2
0.8
85
-4-34
-10
-5
0-15
0-20
3
10 2353 895
3912 0921 223
9212 1001 146
1 3142 1683 2215 710
29 093
9960
56424201013
324
098
351
11 0873 391
7182 4491 1741 0522 6221 711
1 6474 0871 6197 156
29 272
9155
96719221018
339
0118348
Machines and miscellaneous equipmentCrushing machinesTextile machineryEquipment of extractionTools and machine toolsTanks, bottles and metal drumsElectrical switch gearPower generatorsElectrical appliance of telephony andtelecommunications transmittersWires and cables for electricityAircraf Industrial vehiclesother
-1.6-84312.111552 6811 06953 525953Consumer goods23.9
-13.3-7.31.2
-15.8-18.7
5.3
786-954-176
56-1 559
-3021 306
21.16.35.40.3
-22.5-11.921.0
1630
-23-4
133
4 0696 2372 2444 6428 3141 310
25 865
79461327931
766
3 2837 1912 4204 5869 8731 612
24 559
6885831
10335
633
Pharmaceutical productsTextile fibers and cotton Plastic articlesTelecommunications receiversPassenger carsSpare partsOther
-18.7-60 854-5.4-2 084265 18836 664326 04238 748Total
(1) including industrial gold.(*) Revised(**) PreliminarySource : Foreign Exchange Control Office
236

TABLE A7.4 MAJOR EXPORTS
Changes 2009**2008**
Wheight in thousands of tonnesValue in millions of dirhams
ValueWeightValueWeightValueWeight
%Millions
of dirhams%
Thousands of tonnes
-8.6-2 257-15.4-33423 9401 84126 1982 175Foodstuffs beverages and tobacco
-30.1-5.7
-24.2-21.6-3.87.0
-7.138.22.8
-970-127-416
-1 197-80317
-118201133
-33.8-17.3-24.7
7.53.2
-1.7-4.219.3-8.0
-206-70-44
75
-2-415
-35
2 2572 0911 3024 3402 0294 8421 543
7284 809
4023331341041461438891
399
3 2272 2191 7185 5372 1094 5241 661
5264 677
60840317897
1411469276
434
Citrus fruitsEarly vegetablesFresh fruitsCrustaceans molluscs and shellfishFresh fishCanned fishCanned fruits and vegetablesFish meal Other
-32.3-1 08424.41202 2686083 351489Energy and lubricants
-0.8 -1916.8322 3652262 384194Raw animal and vegetable products
-7.0-2.0
-12.6-6.7
-45.8119.8
0.1-16.3
-7-8
-41-12-22241
--170
7.524.5-7.5-5.3
-37.633.89.3
17.9
-21-1-
-32-
12
9641528116226
44368
874
4108151485
81
10342332217448
20268
1 044
487161764
69
Olive oilPaper pulpPlants and flowersAgar-agarCorkBowelsSeaweedOther
-62.6-13 396-46.6-6 7057 9927 69821 38714 403Raw mineral products
-70.8-37.115.3
-82.0-14.7
-12 520-118105
-567-296
-50.7-17.235.8
-76.7-27.4
-5 900-1924
-158-652
5 163199788124
1 717
5 744919048
1 726
17 684317683691
2 013
11 64411066
2062 378
Phosphates Zinc oreLead and copper oresScrap of cast iron and steelother ores
-42.8-22 80621.084630 5124 86453 3194 018Semi-finished products (1)
-64.8-48.5-13.7-21.0-7.6
-47.3-10.0
-14 788-5 313
-613-318-15
-540-1 218
17.051.8
-51.6-41.9
6.2-29.0-21.9
278780
-3-16
--36
-157
8 0425 6323 8731 197
187602
10 979
1 9072 285
3221
88558
22 83110 9464 4861 515
2021 142
12 198
1 6291 505
6371
125715
Phosphoric acidNatural and chemical fertilizers Electronic devices (transistors)Unwrought lead and silverHides and skinsiron sheetsOther
-21.2-3 289-11.1-1212 2199315 508105Capital goods
349.7-34.6-41.846.02.7
18-56
-3 711305156
98.5-57.6-22.446.2-8.4
--
-124
-3
23105
5 175969
5 947
--
421437
5161
8 886664
5 792
-1
549
40
Rubber productsElectronic under-systems Wires and cables for electricityindustrial vehiclesother
-2.7-923-8.1-1932 67021733 593236Consumer goods
-6.2-3.08.1
-12.8-31.2-47.916.3
-1 171-199174-10
-146-327756
-14.321.3-2.5
-14.2-43.1-6.0
-13.2
-9800
-30
-14
17 7526 4602 316
67324355
5 395
554711144
94
18 9246 6592 142
77470682
4 639
653912174
108
ClothingHosieryShoes CarpetsFiber and cotton fabricsSpare partsother
-28.1-43 773-28.1-6 072111 96715 548155 74021 620Total
(1) including industrial gold (*) Revised(**) PreliminarySource : Foreign Exchange Control Office
237
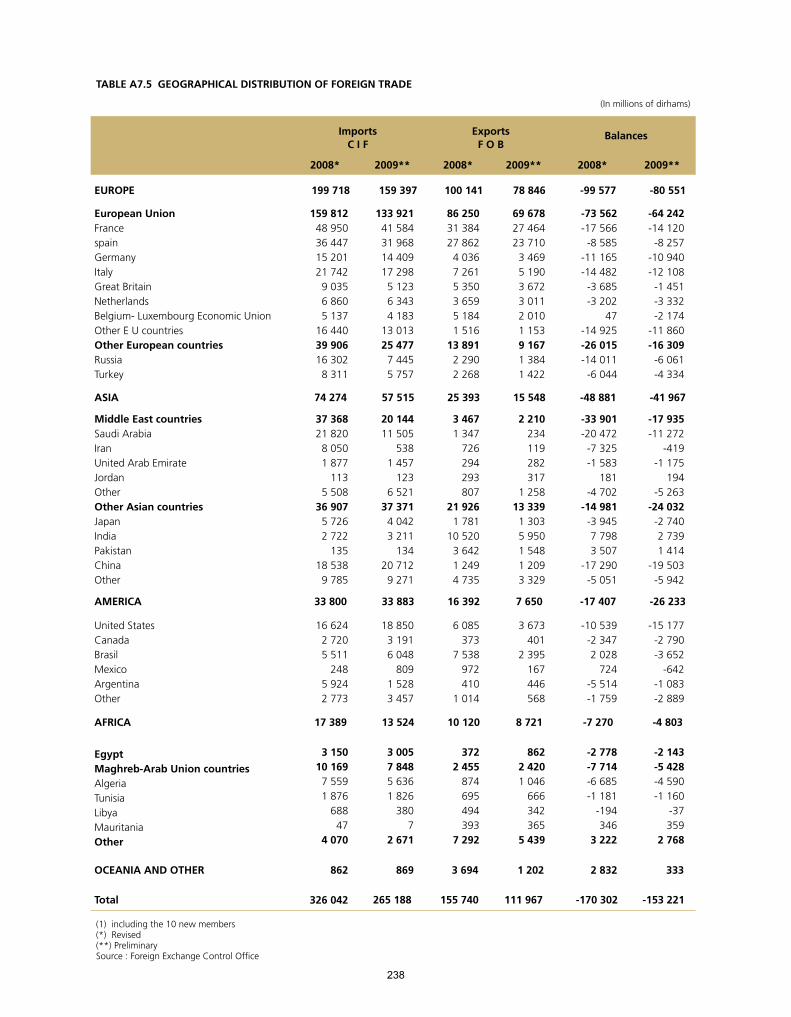
TABLE A7.5 GEOGRAPHICAL DISTRIBUTION OF FOREIGN TRADE
(In millions of dirhams)
BalancesExportsF O B
ImportsC I F
2009**2008*2009**2008*2009**2008*
-80 551-99 57778 846100 141159 397199 718EUROPE
-64 242-14 120-8 257
-10 940-12 108-1 451-3 332-2 174
-11 860-16 309-6 061-4 334
-73 562-17 566-8 585
-11 165-14 482-3 685-3 202
47-14 925-26 015-14 011-6 044
69 67827 46423 7103 4695 1903 6723 0112 0101 1539 1671 3841 422
86 25031 38427 8624 0367 2615 3503 6595 1841 516
13 8912 2902 268
133 92141 58431 96814 40917 2985 1236 3434 183
13 01325 4777 4455 757
159 81248 95036 44715 20121 7429 0356 8605 137
16 44039 90616 3028 311
European UnionFrancespainGermanyItalyGreat BritainNetherlandsBelgium- Luxembourg Economic UnionOther E U countriesOther European countriesRussia Turkey
-41 967-48 88115 54825 39357 51574 274ASIA
-17 935-11 272
-419-1 175
194-5 263
-24 032-2 7402 7391 414
-19 503-5 942
-33 901-20 472-7 325-1 583
181-4 702
-14 981-3 9457 7983 507
-17 290-5 051
2 210234119282317
1 25813 3391 3035 9501 5481 2093 329
3 4671 347
726294293807
21 9261 781
10 5203 6421 2494 735
20 14411 505
5381 457
1236 521
37 3714 0423 211
13420 7129 271
37 36821 8208 0501 877
1135 508
36 9075 7262 722
13518 5389 785
Middle East countriesSaudi ArabiaIranUnited Arab EmirateJordanOther Other Asian countriesJapan IndiaPakistan ChinaOther
-26 233-17 4077 65016 39233 88333 800AMERICA
-15 177-2 790-3 652
-642-1 083-2 889
-10 539-2 3472 028
724-5 514-1 759
3 673401
2 395167446568
6 085373
7 538972410
1 014
18 8503 1916 048
8091 5283 457
16 6242 7205 511
2485 9242 773
United States Canada Brasil MexicoArgentina Other
-4 803-7 2708 72110 12013 52417 389AFRICA
-2 143-5 428-4 590-1 160
-37359
2 768
-2 778-7 714-6 685-1 181
-194346
3 222
8622 4201 046
666342365
5 439
3722 455
874695494393
7 292
3 0057 8485 6361 826
3807
2 671
3 15010 1697 5591 876
68847
4 070
EgyptMaghreb-Arab Union countriesAlgeriaTunisiaLibyaMauritaniaOther
333 2 832 1 202 3 694869862OCEANIA AND OTHER
-153 221 -170 302111 967 155 740265 188326 042Total
(1) including the 10 new members (*) Revised(**) PreliminarySource : Foreign Exchange Control Office
238

TABLE A7.6 BALANCE OF PAYMENTS
(In millions of dirhams)
2009**2008*
NetDebitCreditNetDebitCredit
-36 808.0316 443.5279 635.5-35 936.7372 506.4336 569.7A.CURRENT ACCOUNT
-133 332.2-153 583.8
19 780.0471.6
45 426.8-1 804.544 001.44 757.6
-21.6-551.2
7 436.5-8 391.4
-7 351.5-9 403.02 051.5
58 448.93 003.0
55 445.9
245 299.1225 623.019 569.4
106.7
54 605.618 717.28 822.7
684.51 475.1
574.712 356.211 975.2
14 775.99 951.24 824.7
1762.9614.6
1148.3
111 966.972 039.239 349.4
578.3
100 032.416 912.752 824.15 442.11 453.5
23.519 792.73 583.8
7 424.4548.2
6 876.2
60 211.83 617.6
56 594.2
-150 963.3-167 688.0
14 624.62 100.1
51 474.8-1 269.447 087.94 228.9-153.7-308.0
5 741.0-3 851.9
-4 069.8-6 689.12 619.3
67 621.69 011.5
58 610.1
306 703.2282 121.124 463.7
118.4
51 878.520 542.08 462.9
713.01 035.3
330.212 519.68 275.5
12 291.17 460.84 830.3
1 633.6599.8
1 033.8
155 739.9114 433.139 088.32 218.5
103 353.319 272.655 550.84 941.9
881.622.2
18 260.64 423.6
8 221.3771.7
7 449.6
69 255.29 611. 359 643.9
Goods- General merchandise- Goods for processing - Goods procured in ports by carriers
Services- Transportation- Travel- Communication services- Insurance services- Royalties and license fees- Other business services - Government services N.I.E
Income- Private investment income - Income on public investment and debt
Unrequited transfers- Public- Private
38 205.938 354.176 560.027 620.946 791.374 412.2B. CAPITAL AND FINANCIAL ACCOUNT
-3.6-3.6
38 209.519 318.12 249.5
13 516.7-2 425.35 977.2
18 891.418 891.4
6.96.9
38 347.229 203.511 163.113 111.14 929.3
-9 143.79 143.7
3.33.3
76 556.748 521.613 412.626 627.82 504.05 977.2
28 035.128 035.1
-15.4-15.4
27 636.318 287.1
763.920 824.9-4 618.61 316.99 349.29 349.2
24.124.1
46 767.233 510.012 611.314 465.76 433.0
-13 257.213 257.2
8.78.7
74 403.551 797.113 375.235 290.61 814.41 316.9
22 606.422 606.4
1. Capital account - Transfert of capital
2. Financial account
Private sector- Commercial credits- Foreign loans and investments in Morocco- Moroccan loans and investments abroad- Currency and depositsPublic sector- loans
-2 981.52 981.5--3 162.63 162.6-C. STATISTICAL DISCREPANCY
-1 583.6357 779.1356 195.5-11 478.4422 460.3410 981.9TOTAL
N.I.E : not included elsewhere(*) Revised(**) PreliminarySource : Foreign Exchange Control Office
239

TABL
E A
7.7
IN
TERN
ATI
ON
AL
INV
ESTM
ENT
POSI
TIO
N
Net
pos
itio
n 20
08N
et p
osit
ion
2007
2008
2007
(in m
illio
ns o
f di
rham
s) C
hang
es%
Chan
ges
in v
alue
N
et P
osit
ion
Liab
iliti
esA
sset
sN
et P
osit
ion
Liab
iliti
esA
sset
s
6.2
33.
4 7
.1 6
.5- 0
.2- 2
.7 1
7.2
2.8
0.5
2 8
88.3
11.
6 2
.4 1
0.3
4.1
- 88.
5 1
2.8
17.
7- 3
0.6
28.
4 5
.4- 5
9.7
- 48.
2
- 69.
9 2
2.9
4.0
52.
5 4
.2- 4
.4 8
.6- 3
6.6
1.2
- 4.6
19.
1
-17
696.
9 3
446
.0-2
1 14
2.9
-17
721.
1 2
4.2
495
.7 1
214
.0- 7
18.3
- 99.
3 5
95.0
-15
742.
3-5
2.2
-12
673.
7-2
724
.0-2
289
.5-7
660
.2-9
499
.0 1
838
.8-3
045
.1- 1
91.0
- 874
.6- 3
33.5
-541
.1-1
979
.5
-213
.0-1
766
.5 2
8.7
-9 5
23.6
391
.0-9
0.0
13.
0-9
837
.6
-42
467.
1
-305
215
.113
759
.6-3
18 9
74.7
-289
883
.3-1
5 33
1.8
-17
717.
18
277.
9-2
5 99
5.0
-18
332.
761
5.6
-150
984
.7-2
248
.8-1
35 6
82.6
-68
670.
029
7.2
-67
309.
8-6
3 14
1.0
-4 1
68.8
-13
768.
9-3
727
.059
0.7
357.
7
233.
0-1
0 63
2.6
-5 5
00.0
-5 1
32.6
715.
620
8 90
8.6
4 96
2.0
156.
01
055.
020
2 73
5.6
-265
008
.3
318
974.
7
318
974.
730
2 45
0.2
16 5
24.5
25 9
95.0
25 9
95.0
25 9
95.0
165
482.
810
654
.814
0 46
8.4
68 6
70.0
3 49
4.5
68 3
03.9
63 1
41.0
5 16
2.9
14 3
59.6
3 72
7.0
10 6
32.6
5 50
0.0
5 13
2.6
510
452.
5
13 7
59.6
13 7
59.6
12 5
66.9
1 19
2.7
8 27
7.9
8 27
7.9
7 66
2.3
615.
614
498
.18
406.
04
785.
8
3 79
1.7
994.
1
994.
159
0.7
590.
735
7.7
233.
0
715.
620
8 90
8.6
4 96
2.0
156.
01
055.
020
2 73
5.6
245
444.
2
-287
518
.210
313
.6-2
97 8
31.8
-272
162
.2-1
5 35
6.0
-18
212.
87
063.
9-2
5 27
6.7
-18
233.
420
.6-1
35 2
42.4
-2 1
96.6
-123
008
.9-6
5 94
6.0
2 58
6.7
-59
649.
6-5
3 64
2.0
-6 0
07.6
-10
723.
8-3
536
.01
465.
369
1.2
774.
1-8
653
.1-5
287
.0
-3 3
66.1
686.
921
8 43
2.2
4 57
1.0
246.
01
042.
021
2 57
3.2
-222
541
.2
297
831.
8
297
831.
828
1 76
9.9
16 0
61.9
25 2
76.7
25 2
76.7
25 2
29.1
47.6
149
946.
48
712.
612
9 04
4.7
65 9
46.0
2 45
5.0
60 6
43.7
53 6
42.0
7 00
1.7
12 1
89.1
3 53
6.0
8 65
3.1
5 28
7.0
3 36
6.1
473
054.
9
10 3
13.6
10 3
13.6
9 60
7.7
705.
97
063.
97
063.
9
6 99
5.7
68.2
14 7
04.0
6 51
6.0
6 03
5.8
5 04
1.7
994.
1
994.
11
465.
3
1 46
5.3
691.
2
774.
1
686.
921
8 43
2.2
4 57
1.0
246.
01
042.
021
2 57
3.2
250
513.
7
Dir
ect
Inve
stm
ents
Mor
occa
n in
vest
men
ts a
broa
dFo
reig
n in
vest
men
ts in
Mor
occo
Eq
uity
cap
ital
Oth
er c
apita
lPo
rtfo
lio In
vest
men
ts
Fore
ign
secu
ritie
sM
oroc
can
secu
ritie
Shar
es a
nd o
ther
equ
ity s
ecur
ities
Bond
s an
d ot
her d
ebt s
ecur
ities
Oth
er In
vest
men
tsC
omm
erci
al c
redi
tsLo
ans
Gen
eral
gov
ernm
ent
Bank
sO
ther
sec
tors
- Pub
lic s
ecto
r- P
rivat
e se
ctor
Not
es, c
oins
and
dep
osits
Mon
etar
y au
thor
ities
(lia
bilit
ies)
Oth
er s
ecto
rs- P
ublic
sec
tor
- Pr
ivat
e se
ctor
(inc
ludi
ng re
siden
ts fo
reig
n c
urre
ncy
acco
unts
)Ba
nks
- Non
-Res
iden
ts’ a
ccou
nts
in c
onve
rtib
le
dirh
ams
- Oth
er li
abili
ties
Oth
er a
sset
sRe
serv
e as
sets
Mon
etar
y go
ldSp
ecia
l dra
win
g rig
hts
IMF
rese
rve
posit
ion
Fore
ign
curr
ency
Net
inte
rnat
iona
l inv
estm
ent
posi
tion
Sour
ce :
Fore
ign
Exch
ange
Offi
ce
240
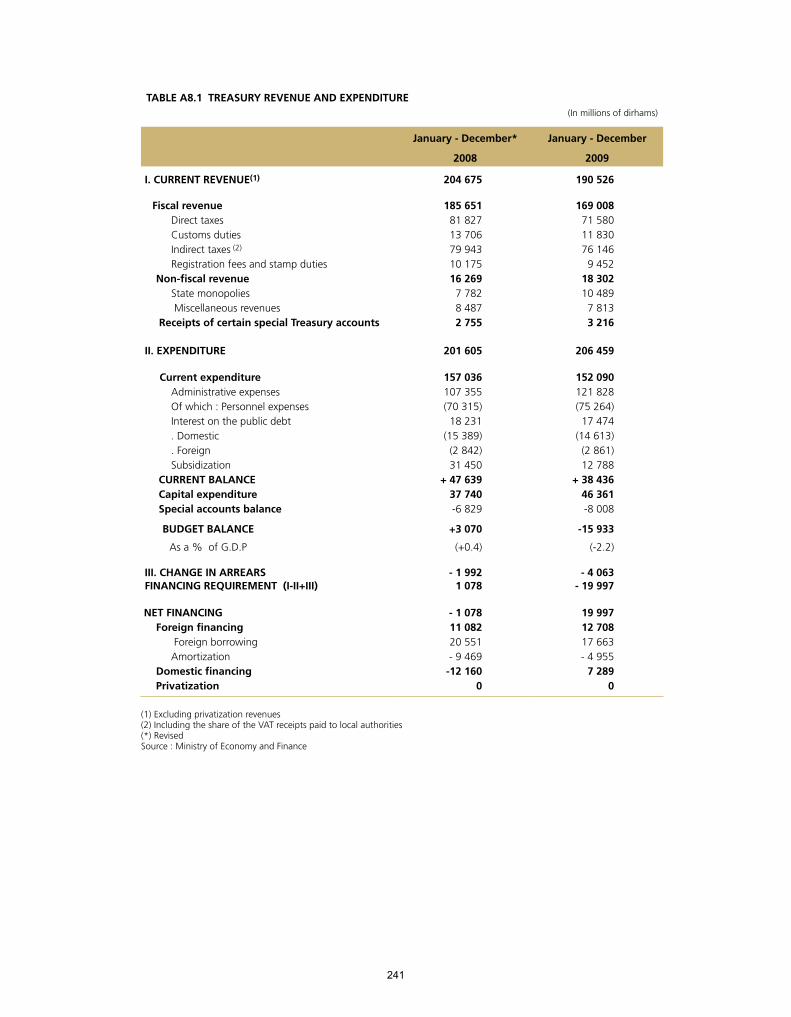
TABLE A8.1 TREASURY REVENUE AND EXPENDITURE(In millions of dirhams)
January - DecemberJanuary - December*
20092008
190 526204 675I. CURRENT REVENUE(1)
169 008 71 580 11 830 76 146 9 452 18 302 10 489 7 813 3 216
185 651 81 827 13 706 79 943 10 175 16 269 7 782 8 487 2 755
Fiscal revenueDirect taxesCustoms dutiesIndirect taxes (2)
Registration fees and stamp dutiesNon-fiscal revenue
State monopolies Miscellaneous revenues
Receipts of certain special Treasury accounts
206 459 201 605II. EXPENDITURE
152 090121 828(75 264)17 474
(14 613)(2 861)12 788
+ 38 43646 361-8 008
157 036 107 355 (70 315) 18 231
(15 389) (2 842) 31 450
+ 47 639 37 740
-6 829
Current expenditureAdministrative expensesOf which : Personnel expensesInterest on the public debt . Domestic . ForeignSubsidization
CURRENT BALANCE Capital expenditure Special accounts balance
-15 933 +3 070 BUDGET BALANCE
(-2.2)(+0.4) As a % of G.D.P
- 4 063- 19 997
- 1 992 1 078
III. CHANGE IN ARREARSFINANCING REQUIREMENT (I-II+III)
19 997 12 70817 663- 4 955
7 2890
- 1 078 11 08220 551- 9 469-12 160
0
NET FINANCINGForeign financing
Foreign borrowingAmortization
Domestic financingPrivatization
(1) Excluding privatization revenues (2) Including the share of the VAT receipts paid to local authorities (*) Revised Source : Ministry of Economy and Finance
241

TABLE A8.2 TREASURY CURRENT REVENUE (In millions of dirhams)
Percentage change
January - December2009
January - December*2008
-9.0169 008185 651FISCAL REVENUE
-12.5
-6.0
-22.5
0.9
-13.7
-4.7
-7.7
(-7.3)
(-8.0)
5.0
10.0
-1.7
-1.3
-7.1
71 580
43 532
25 803
2 245
11 830
76 146
56 515
(23 921)
(32 594)
19 630
11 708
6 865
1 057
9 452
81 827
46 290
33 312
2 225
13 706
79 943
61 250
(25 817)
(35 433)
18 693
10 639
6 983
1 071
10 175
Direct taxes
Corporation tax
Income tax
Other direct taxes
Customs duties
Indirect taxes
Value added tax (V.A.T)
- Domestic
- Imports
Domestic taxes on consumption
- Petroleum products
- Tobacco products
- Other domestic taxes
Registration fees and stamp duties
12.518 30216 269NON-FISCAL REVENUE
34.8-7.9
10 489 7 813
7 782 8 487
MonopoliesMiscellaneous revenues
16.7 3 216 2 755RECEIPTS OF CERTAIN SPECIAL TREASURY ACCOUNTS
-6.9190 526204 675TOTAL CURRENT REVENUE (1)
(1) Excluding privatization revenues(*) RevisedSource : Ministry of Economy and Finance
242
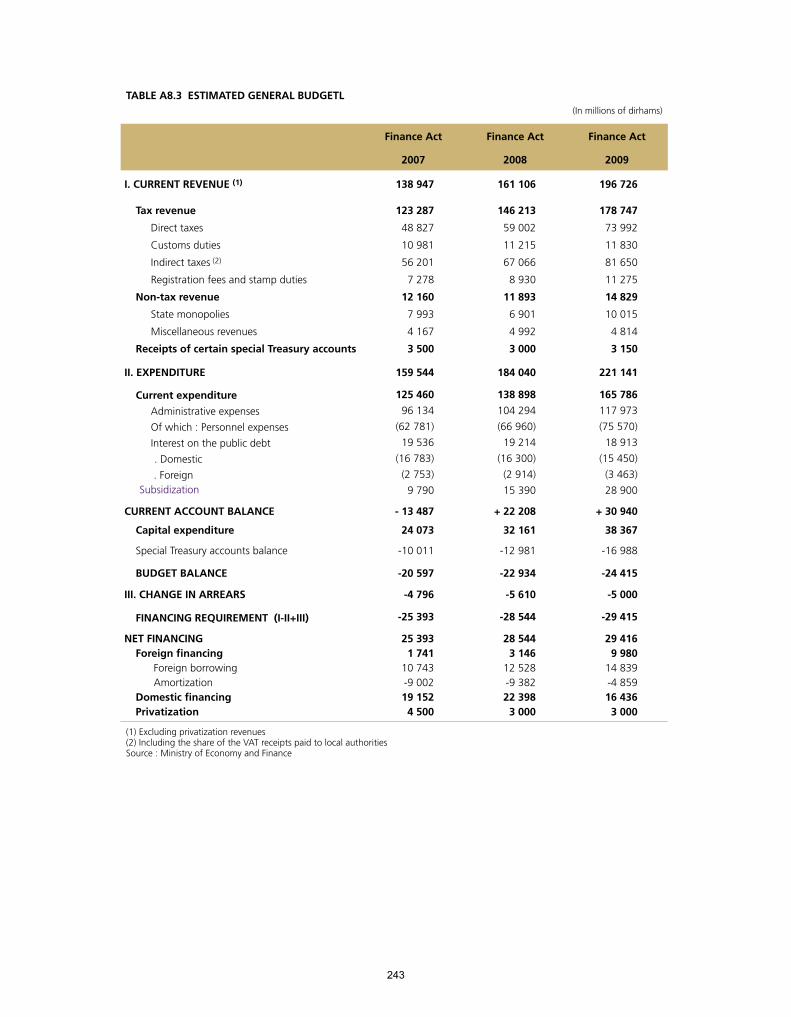
TABLE A8.3 ESTIMATED GENERAL BUDGETL(In millions of dirhams)
Finance ActFinance ActFinance Act
200920082007
196 726161 106138 947I. CURRENT REVENUE (1)
178 747
73 992
11 830
81 650
11 275
14 829
10 015
4 814
3 150
146 213
59 002
11 215
67 066
8 930
11 893
6 901
4 992
3 000
123 287
48 827
10 981
56 201
7 278
12 160
7 993
4 167
3 500
Tax revenue
Direct taxes
Customs duties
Indirect taxes (2)
Registration fees and stamp duties
Non-tax revenue
State monopolies
Miscellaneous revenues
Receipts of certain special Treasury accounts
221 141184 040159 544II. EXPENDITURE
165 786117 973(75 570)18 913
(15 450)(3 463)28 900
138 898104 294(66 960)19 214
(16 300)(2 914)15 390
125 46096 134
(62 781)19 536
(16 783)(2 753)9 790
Current expenditureAdministrative expensesOf which : Personnel expensesInterest on the public debt
. Domestic . Foreign
Subsidization
+ 30 940+ 22 208- 13 487CURRENT ACCOUNT BALANCE
38 36732 16124 073Capital expenditure
-16 988-12 981-10 011Special Treasury accounts balance
-24 415-22 934-20 597BUDGET BALANCE
-5 000-5 610-4 796III. CHANGE IN ARREARS
-29 415-28 544-25 393FINANCING REQUIREMENT (I-II+III)
29 4169 980
14 839-4 85916 4363 000
28 5443 146
12 528-9 38222 3983 000
25 3931 741
10 743-9 00219 1524 500
NET FINANCINGForeign financing
Foreign borrowing Amortization
Domestic financingPrivatization
(1) Excluding privatization revenues (2) Including the share of the VAT receipts paid to local authorities Source : Ministry of Economy and Finance
243

TABL
E A
9.1
Mai
n fo
reig
n ex
chan
ge r
ates
quo
ted
by t
he B
ank
Al-M
aghr
ib- R
ates
of t
he tr
anfe
r pay
men
ts -
2009
2008
End
of p
erio
dA
nnua
lav
erag
eD
ec.
Nov
.O
ct.
Sept
.A
ugus
tJu
lyJu
neM
ayA
pril
Mar
chFe
b.Ja
n.D
ec.
Ann
ual
aver
age
11.2
5011
.282
11.3
5011
.361
11.4
3011
.334
11.4
0211
.308
11.3
7611
.266
11.3
3311
.244
11.3
1211
.242
11.3
0911
.241
11.3
0911
.117
11.1
8411
.127
11.1
9411
.018
11.0
8411
.057
11.1
2311
.212
11.2
8011
.348
Ach
atVe
nte
1 eu
ro -
EUR
8.08
467.
8366
7.88
377.
5652
7.61
077.
6595
7.70
567.
7485
7.79
507.
8919
7.93
937.
9653
8.01
327.
9737
8.02
167.
9756
8.02
358.
3999
8.45
048.
3660
8.41
638.
7375
8.79
008.
6054
8.65
718.
0740
8.12
257.
7503
Ach
atVe
nte
1 U
.S. d
olla
r -
USD
7.11
217.
4652
7.51
007.
1549
7.19
797.
0899
7.13
257.
1842
7.22
737.
1430
7.18
597.
3464
7.39
056.
9060
6.94
757.
2611
7.30
477.
0372
7.07
956.
6484
6.68
846.
8910
6.93
246.
9620
7.00
396.
6153
6.65
517.
2810
Ach
atVe
nte
1 Ca
nadi
an d
olla
r -
CA
D
12.6
3212
.703
12.7
8012
.462
12.5
3712
.652
12.7
2812
.385
12.4
6012
.793
12.8
7013
.138
13.2
1713
.193
13.2
7312
.843
12.9
2012
.374
12.4
4811
.961
12.0
3312
.345
12.4
1912
.277
12.3
5111
.779
11.8
5014
.286
Ach
atVe
nte
1 Po
und
ster
ling
- G
B
7.46
017.
6043
7.65
007.
5381
7.58
347.
4917
7.53
677.
4451
7.48
987.
4305
7.47
517.
3460
7.39
027.
3681
7.41
237.
4361
7.48
087.
3693
7.41
367.
3534
7.39
767.
4476
7.49
237.
4226
7.46
727.
5338
7.57
917.
1554
Ach
atVe
nte
1 S
wis
s fr
anc
- C
HF
8.63
678.
4560
8.50
688.
7424
8.79
498.
4111
8.46
168.
6426
8.69
458.
4632
8.51
408.
3551
8.40
538.
2921
8.34
208.
3318
8.38
188.
5408
8.59
228.
5129
8.56
408.
9827
9.03
679.
5994
9.65
718.
8945
8.94
807.
5399
Ach
atVe
nte
100.
Jap
anes
e ye
ns -
PY
Sour
ce :
Bank
Al-M
aghr
ib.
244

TABL
E A
9.2
DEV
ELO
PMEN
T O
F TH
E EX
CHA
NG
E M
ARK
ET A
CTIV
ITY
(In
mill
ions
of d
irham
s)
Ann
ual
aver
age
2009
2009
Ann
ual
aver
age
2008
Tota
ux m
ensu
els
Dec
.N
ov.
Oct
.Se
pt.
Aug
ust
July
June
May
Apr
ilM
arch
Fev.
Janv
.
Spot
ope
rati
ons
5 67
2.1
45 7
21.1
6 26
9.6
2.8
4 20
8.2
7 36
6.0
45 3
75.0
9 48
5.9
0.0
13 1
17.0
3 18
8.0
29 1
70.0
7 57
5.1
0.0
2 64
3.0
4 29
0.0
41 5
86.0
7 94
5.6
0.0
1 77
3.0
1 98
7.0
45 0
90.0
3 79
1.0
0.0
5 59
6.0
5 51
7.3
35 7
15.9
7 55
6.1
0.0
2 67
4.0
6 15
3.0
51 5
94.0
7 62
0.5
0.0
4 82
0.0
2 88
8.0
41 7
60.0
6 45
4.2
0.0
6 26
2.0
4 71
7.0
57 7
96.0
5 77
8.0
0.0
7 78
7.0
6 36
7.0
53 5
59.0
8 48
0.1
0.0
1 59
9.0
8 02
5.0
40 8
44.0
4 14
7.1
0.0
3 08
2.0
10 0
25.0
45 5
01.0
3 50
6.2
33.0
582.
0
7 54
2.0
60 6
62.0
2 89
5.0
0.0
563.
0
6 91
6.5
55 8
57.5
8 94
1.5
0.0
3 63
9.4
Inte
rban
k sa
le/p
urch
ase
oper
atio
ns
agai
nst t
he d
irham
Cur
renc
y-ag
ains
t-cu
rren
cy s
ale/
purc
hase
ope
ratio
ns w
ith fo
reig
n
corr
espo
ndan
ts
Cur
renc
y in
vest
men
ts a
broa
d
Cur
renc
y pu
rcha
se b
y BA
M
from
the
bank
sC
urre
ncy
sale
by
BAM
to th
e ba
nks
Forw
ard
oper
atio
ns
6 73
4.8
1 44
0.5
5 97
7.5
1 54
0.9
6 54
1.2
1 27
9.9
7 24
4.9
1 11
4.3
6 25
5.7
1 59
9.4
6 16
1.3
1 10
3.1
7 45
7.5
893.
7
7 66
9.3
784.
8
11 0
33.2
1 40
9.8
5 53
7.0
1 29
5.7
7 05
2.8
3 62
8.2
7 10
0.6
1 94
0.2
2 78
6.8
696.
3
8 54
6.0
948.
9
Forw
ard
purc
hase
of c
urre
ncy
by
bank
s cu
stom
ers
(impo
rt c
over
age)
Forw
ard
sale
of c
urre
ncy
by b
anks
cu
stom
ers
(exp
ort c
over
)
Sour
ce :
Bank
Al-M
aghr
ib.
245

TABL
E A
9.3
BA
NK
LIQ
UID
ITY
DEV
ELO
PMEN
TS
Mon
thly
Out
stan
ding
am
ount
s 2
009
(1)
Dec
. 200
8(In
mill
ions
of
dirh
ams)
Dec
.N
ov.
Oct
.Se
pt.
Aug
ust
July
June
May
Apr
ilM
arch
Feb.
Jan.
Out
stan
ding
amou
nts
143
568
-6 4
0117
1 11
8-9
086
12 0
6431
066
-19
002
19 0
00
19 0
0019
000 0 0 0 0 0 0 0
143
023
-5 2
1617
0 77
3-7
526
15 0
0830
953
-15
945
15 5
63
15 5
6315
563 0 0 0 0 0 0 0
140
738
-7 4
8317
1 70
9-7
794
15 6
9335
639
-19
946
16 6
00
16 6
0016
600 0 0 0 0 0 0 0
141
865
-6 4
9117
1 97
8-7
631
15 9
9138
196
-22
205
21 5
01
21 5
0121
501 0 0 0 0 0 0 0
142
770
-4 7
6817
1 68
8-7
839
16 3
1137
608
-21
296
21 7
50
21 7
5021
750 0 0 0 0 0 0 0
138
664
-6 3
5516
9 83
9-7
702
17 1
1939
388
-22
270
21 4
01
21 4
0121
401 0 0 0 0 0 0 0
134
733
-5 5
9017
1 12
0-8
410
22 3
8744
169
-21
781
20 6
25
20 1
5020
150 0 0 0 0
475
475 0
133
152
-3 6
7017
8 07
1-9
750
31 4
9945
392
-13
893
15 0
00
15 0
0015
000 0 0 0 0 0 0 0
132
789
-9 6
8817
9 19
3-1
0 58
8
26 1
2845
064
-18
935
16 7
50
16 7
5016
750 0 0 0 0 0 0 0
133
903
-7 2
6218
2 42
7-9
891
31 3
7245
098
-13
726
12 0
00
12 0
0012
000 0 0 0 0 0 0 0
132
642
-4 4
3318
3 72
1-1
2 87
4
33 7
7145
605
-11
834
12 0
00
12 0
0012
000 0 0 0 0 0 0 0
134
025
-873
182
122
-11
109
36 1
1547
252
-11
136
9 20
0
9 20
09
200 0 0 0 0 0 0 0
135
766
-1 4
8618
0 21
6-7
418
35 5
4653
882
-18
336
20 8
08
20 3
3320
333 0 0 0 0
475
475 0
Not
es a
nd c
oin
Trea
sury
’s ne
t pos
ition
(2)
Bank
Al-M
aghr
ib n
et fo
reig
n ex
chan
ge h
oldi
ngs
Oth
er fa
ctor
s
Bank
’s s
truc
tura
l liq
uidi
ty p
osit
ion(
3)
Rese
rve
requ
irem
ent
Surp
lus
or li
quid
ity
requ
irem
ent
Bank
Al-M
aghr
ib m
oney
mar
ket
inte
rven
tion
s
Faci
litie
s on
Ban
k A
l-Mag
hrib
's in
itia
tive
- 7-d
ays
adva
nce
on c
all f
or te
nder
s (4)
- 7-d
ays
liqui
dity
-with
draw
als
on c
all f
or te
nder
s (4
)
- Ope
n m
arke
t ope
ratio
ns (5
)
- For
eign
exc
hang
e sw
aps
(5)
- Rep
urch
ase
agre
emen
t (5)
Faci
litie
s on
ban
k's
init
iati
ve- 2
4-ho
ur a
dvan
ces
(6)
- 24-
hour
dep
osit
faci
lity
(6)
(1) M
onth
ly o
usta
ndin
g am
ount
s ca
lcul
ated
on
the
basis
of e
nd-o
f-w
eek
aver
ages
(2) T
he T
reas
ury’
s ne
t pos
ition
is th
e di
ffer
ence
bet
wee
n, o
n th
e on
e ha
nd, t
he to
tal o
f adv
ance
s gr
ante
d to
the
Trea
sury
and
the
trea
sury
bon
ds -
open
mar
ket t
rans
actio
ns h
eld
by B
ank
Al-M
aghr
ib, a
nd o
n th
e ot
her
hand
, the
tota
l of a
ccou
nts
of th
e Tr
easu
ry a
nd H
assa
n II
Fund
for e
cono
mic
and
soc
ial d
evel
opm
ent
As
the
new
sta
tute
s of
Ban
k A
l-Mag
hrib
rest
ricte
s fin
anci
al a
ssist
ance
to th
e st
ate
to c
ash
faci
litie
s, th
e TN
P is
part
icul
arity
influ
ence
d by
mov
emen
ts a
t the
leve
l of t
he T
reas
ury’
s ac
coun
t and
that
of H
assa
n II
fund
for e
cono
mic
and
soc
ial d
evel
opm
ent
(3) B
ank’
s st
ruct
ural
liqu
idity
pos
ition
is th
e ne
t eff
ect o
f aut
onom
ous
fact
ors
on b
ank
trea
surie
s It
is c
alcu
late
d as
follo
ws
:
BSLP
= N
et fo
reig
n as
sets
of B
ank
Al-M
aghr
ib +
Tre
asur
y’s
net p
ositi
on +
Oth
er n
et fa
ctor
s - n
otes
and
coi
ns in
circ
ulat
ion
(4) 7
-day
adv
ance
s an
d w
ithdr
awal
s on
cal
ls fo
r ten
ders
are
the
mai
n in
terv
entio
n in
stru
men
ts o
f Ban
k A
l-Mag
hrib
in th
e in
terb
ank
mar
ket
(5) I
t con
cern
s fin
e-tu
rnin
g in
stru
men
ts
(6) T
he ra
tes
of 2
4-ho
ur a
dvan
ces
and
depo
sit fa
cilit
ies,
on
bank
’s in
itiat
ive,
repr
esen
t res
pect
ivel
y th
e hi
gher
and
low
er li
mits
of t
he in
terb
ank
fluct
uatio
n ra
tes
Sour
ce :
Bank
Al-M
aghr
ib
246

TABLE A9 4 BANK AL-MAGHRIB'S INTERVENTIONS ON THE MONEY MARKET(In millions of dirhams)
Total
Facility on bank's initiativeFacility on Bank Al-Maghrib’s initiative
2009(Daily average of
the week)24-hours deposit facility
24-hours advances
Repurchase agreement
Foreign exchange
swaps
Openmarket
Liquiditywithdraws
7-days advances
on calls for tenders
15 00010 000
-11 00010 00012 00012 0009 000
15 0006 000
18 45716 00012 00017 00019 00017 00014 00014 00013 00013 00015 00020 00020 29123 60021 81419 00022 00023 00023 00019 00020 00025 00021 00025 00020 00017 00022 00025 00022 00022 00014 00016 00013 00010 0009 000
14 00019 10720 00019 00023 00016 00018 000
----------------------------------------------------
---------------------- - -
814.3---------------------------
----- -----
4 457-----------
3 291.4 - - ---------------------------
----------------------------------------------------
- - - - - - - - - - - - - - - - - - - - - - - - - - - - - - - - - - - - - - - - - - - - --
107.1 - - - - -
----------------------------------------------------
15 00010 000
-11 00010 00012 00012 000
9 00015 000
6 00014 00016 00012 00017 00019 00017 00014 00014 00013 00013 00015 00020 00017 00023 60021 00019 00022 00023 00023 00019 00020 00025 00021 00025 00020 00017 00022 00025 00022 00022 00014 00016 00013 00010 000
9 00014 00019 00020 00019 00023 00016 00018 000
1st to 7 january 08 to 14 january15 to 21 january 22 to 28 january 29 january to 04 february05 to 11 february12 to 18 february19 to 25 february26 february to 04 march05 to 11 march12 to 18 march19 to 25 march26 march au 1st april02 to 08 april09 to 15 april16 to 22 april 23 to 29 april 30 april to 06 may07 to 13 may14 to 20 may21 to 27 may28 may to 03 june04 to 10 june11 to 17 june18 to 24 june25 june to 1er july02 to 8 july 09 to 15 july16 to 22 july23 to 29 july 30 july to 5 august06 to 12 august13 to 19 august20 to 26 august 27 august to 2 september03 to 9 september10 to 16 september17 to 23 september24 to 30 september1er to 07 october 08 to 14 october 15 to 21 october 22 au 28 october 29 october to 04 november 05 to 11 november 12 to 18 november19 to 25 november 26 november to 02 december03 to 09 december 10 to 16 december 17 to 23 december 24 to 30 december
16 736-15.7149.0-2.1-16 569Moyenne
Source : Bank Al-Maghrib
247

TABLE A9.5 MONEY MARKET RATES (Percent per annum)
Interbank market rateBank Al-Maghrib’s intervention rate
2009Month
endMonthly average
24-hoursdepositfacility
24-hours advances
Liquiditywithdrawals(on call for
tenders)
7-days adva nces(on call for
tenders)
3.503.283.263.373.253.313.313.253.263.253.303.50
3.463.293.453.253.083.293.253.003.193.203.283.35
2.252.252.442.252.252.252.252.252.252.252.252.25
4.254.254.444.254.254.254.254.254.254.254.254.25
2.752.752.752.752.752.752.752.752.752.752.752.75
3.503.503.443.253.253.253.253.253.253.253.253.25
January FebruaryMarch (*)
AprilMayJuneJulyAugustSeptemberOctoberNovemberDecember
(*) Bank AL-Maghrib board decided to cut the key rate to 3.25 percent on march 24th 2009 .Source : Bank Al-Maghrib
TABLE A9.6 INTEREST RATES OF DEPOSITS WITH BANKS (Per cent per annum)
2009 2008
July - DecemberJanuary - juneJuly- DecemberJanuary - june
not remunerated3.11 (minimum)
Free rate
not remunerated3.29 (minimum)
Free rate
not remunerated3.10 (minimum)
Free rate
not remunerated3.11 (minimum)
Free rate
Deposits with banksSight depositsSavings accountsOther accounts
((1) Since january 2005, the minimum rate on savings books has been equal to the weighted average rate on the 52-week Treasury bills issued by tender during the previous half year minus 50 basis points.
Source : Bank Al-Maghrib
TABLE A9.7 INTEREST RATES OF DEPOSITS WITH THE NATIONAL SAVINGS FUND (Per cent per annum)
July - Dec. 2009Jan. - june 2009July - Dec. 2008Jan. - june 2008 Période
1.902.001.902.00National Savings Fund books (1)
(1) Since July 2006, the remuneration rate of deposits and savings accounts with the National Savings Fund is equal to the average rate of 5-year treasury bills issued by tender during the previous half year minus 200 basis points instead of 250 before.
Source : Bank Al-Maghrib
248

TABLE A9.8 WEIGHTED AVERAGE INTEREST RATE OF TIME ACCOUNTS AND FIXED-TERM BILLS (Percent per annum)
6 and 12-month deposits weighted average
interest rate
12- month deposits weighted average
interest rates
6-month deposits weighted average
interest rate2009
3.79
3.85
3.71
3.72
3.87
3.74
3.68
3.53
3.45
3.55
3.51
3.56
3.83
4.00
3.89
3.91
4.05
3.91
3.83
3.63
3.59
3.72
3.69
3.66
3.76
3.58
3.48
3.43
3.54
3.58
3.42
3.30
3.20
3.20
3.21
3.32
January
February
March
April
May
June
July
August
September
October
November
December
(*) Weighted interest rateSource : Bank Al-Maghrib
249

TABL
E A
9.9
WEI
GH
TED
AV
ERA
GE
RATE
S O
F TR
EASU
RY B
ILLS
ISSU
ED B
Y T
END
ER
(Pe
rcen
t per
ann
um)
30-y
ears
bill
s20
-yea
rs b
ills
15-y
ears
bill
s10
-yea
rs b
ills
5-ye
ars
bills
2-ye
ars
bills
52-w
eeks
bill
s26
-wee
ks b
ills
13-w
eeks
bill
sA
nnée
s
2008
- - - - - - - - - - - -
- - - - - - - - - - - -
- - - - - - - - - - - -
- - - - - - - - - - - -
-3.
863.
82 - - - - -3.
75 - -3.
99
- -3.
68 - - - - - - - - -
3.68
3.63
3.57
3.53 - - - -
3.51
3.86
3.85
3.82
3.76
3.55
3.45 - -
3.43 - - -
3.84 -
3.74
3.69
3.47 -
3.43
3.40
3.40
3.40
3.40
3.45
3.70 -
3.68
Janu
ary
Febr
uary
Mar
chA
pril
May
June
July
Aug
ust
Sept
embe
rO
ctob
erN
ovem
ber
Dec
embe
r
2009
- - - - - - - - - - - -
- - - - - - - - - - - -
- - - - - - - - - - - -
- - - - - - - - - - - -
4.07
4.07
4.01
3.76
3.66
3.66 -
3.68 -
3.69
3.78 -
3.95
3.92
3.84 -
3.38 - -
3.49
3.47
3.53
3.58
3.60
3.79
3.74
3.72 -
3.35
3.36
3.35
3.35
3.29
3.31
3.40
3.41
3.71
3.66
3.58
3.34 -
3.34
3.28
3.26 -
3.28
3.28 -
3.65 -
3.50
3.29
3.26 -
3.25
3.24 -
3.24
3.25 -
Janu
ary
Febr
uary
Mar
chA
pril
May
June
July
Aug
ust
Sept
embe
rO
ctob
erN
ovem
ber
Dec
embe
r
250
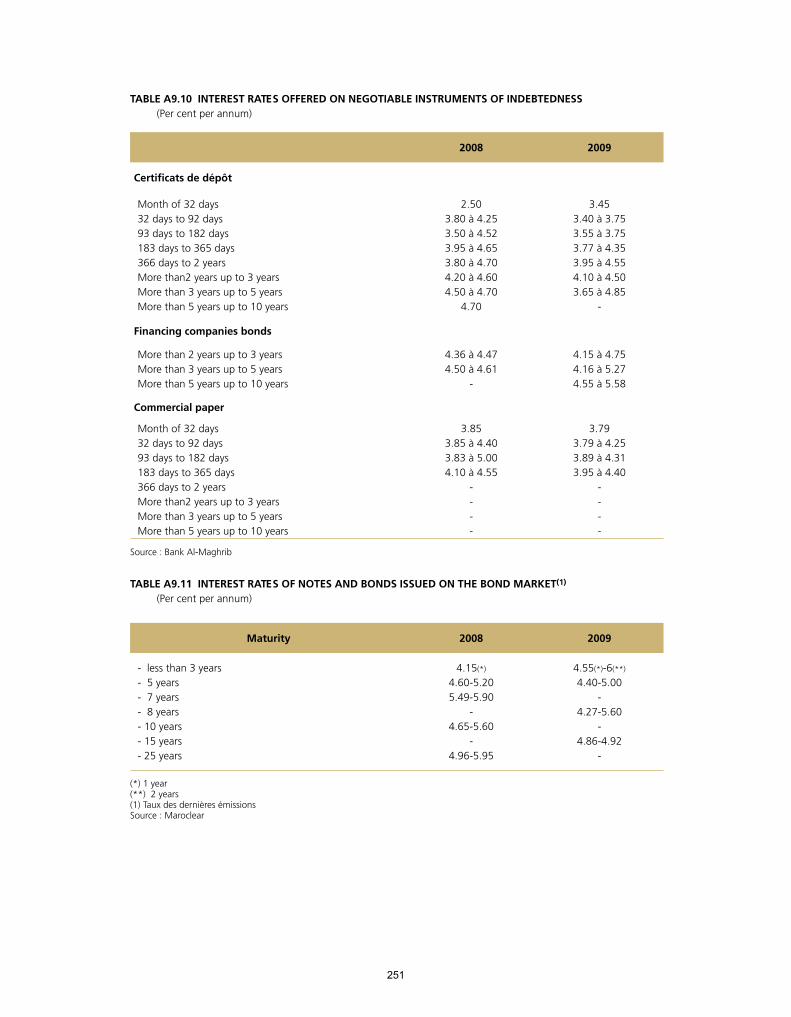
TABLE A9.10 INTEREST RATES OFFERED ON NEGOTIABLE INSTRUMENTS OF INDEBTEDNESS (Per cent per annum)
20092008
Certificats de dépôt
3.453.40 à 3.753.55 à 3.753.77 à 4.353.95 à 4.554.10 à 4.503.65 à 4.85
-
2.503.80 à 4.253.50 à 4.523.95 à 4.653.80 à 4.704.20 à 4.604.50 à 4.70
4.70
Month of 32 days32 days to 92 days93 days to 182 days183 days to 365 days366 days to 2 yearsMore than2 years up to 3 yearsMore than 3 years up to 5 yearsMore than 5 years up to 10 years
Financing companies bonds
4.15 à 4.754.16 à 5.274.55 à 5.58
4.36 à 4.474.50 à 4.61
-
More than 2 years up to 3 yearsMore than 3 years up to 5 yearsMore than 5 years up to 10 years
Commercial paper
3.793.79 à 4.253.89 à 4.313.95 à 4.40
----
3.853.85 à 4.403.83 à 5.004.10 à 4.55
----
Month of 32 days32 days to 92 days93 days to 182 days183 days to 365 days366 days to 2 yearsMore than2 years up to 3 yearsMore than 3 years up to 5 yearsMore than 5 years up to 10 years
Source : Bank Al-Maghrib
TABLE A9.11 INTEREST RATES OF NOTES AND BONDS ISSUED ON THE BOND MARKET(1)
(Per cent per annum)
20092008Maturity
4.55(*)-6(**)
4.40-5.00-
4.27-5.60-
4.86-4.92-
4.15(*)
4.60-5.205.49-5.90
-4.65-5.60
-4.96-5.95
- less than 3 years- 5 years- 7 years- 8 years- 10 years- 15 years- 25 years
(*) 1 year (**) 2 years(1) Taux des dernières émissionsSource : Maroclear
251
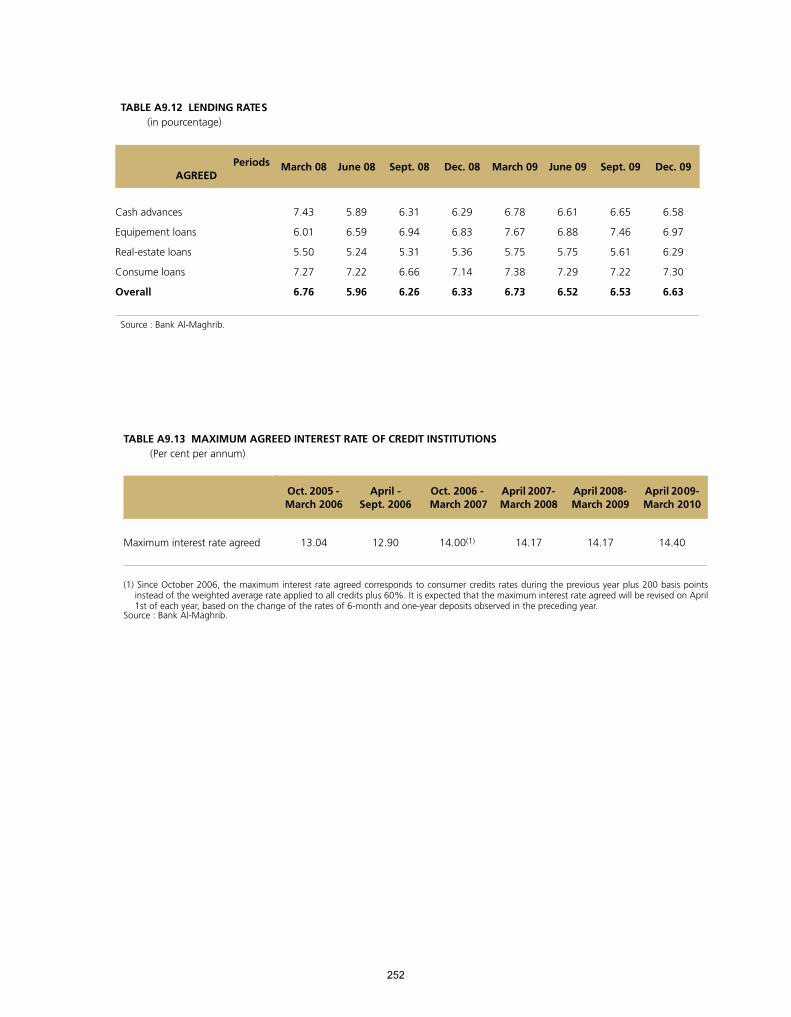
TABLE A9.12 LENDING RATES (in pourcentage)
Dec. 09Sept. 09June 09March 09Dec. 08Sept. 08June 08March 08Periods AGREED
6.58
6.97
6.29
7.30
6.63
6.65
7.46
5.61
7.22
6.53
6.61
6.88
5.75
7.29
6.52
6.78
7.67
5.75
7.38
6.73
6.29
6.83
5.36
7.14
6.33
6.31
6.94
5.31
6.66
6.26
5.89
6.59
5.24
7.22
5.96
7.43
6.01
5.50
7.27
6.76
Cash advances
Equipement loans
Real-estate loans
Consume loans
Overall
Source : Bank Al-Maghrib.
TABLE A9.13 MAXIMUM AGREED INTEREST RATE OF CREDIT INSTITUTIONS (Per cent per annum)
April 2009- March 2010
April 2008- March 2009
April 2007- March 2008
Oct. 2006 - March 2007
April - Sept. 2006
Oct. 2005 - March 2006
14.4014.1714.1714.00(1)12.9013.04Maximum interest rate agreed
(1) Since October 2006, the maximum interest rate agreed corresponds to consumer credits rates during the previous year plus 200 basis points instead of the weighted average rate applied to all credits plus 60%. It is expected that the maximum interest rate agreed will be revised on April 1st of each year, based on the change of the rates of 6-month and one-year deposits observed in the preceding year.
Source : Bank Al-Maghrib.
252

TABLE A10.1 MONEY AGGREGATE(In millions of dirhams)
End of December 2009End of December 2008
Components Annual ChangesAmounts
Annual ChangesAmounts
%Amounts%Amounts
6.7
4.9
5.3
8 557
17 202
25 759
136 434
370 851
507 285
6.7
7.9
7.6
8 033
25 906
33 939
127 877
353 649
481 526
Notes and coins
Bank money
Total M1
9.2
5.9
7 301
33 060
86 669
593 954
10.2
7.9
7 320
41 259
79 368
560 894
Sight deposits (M2 - M1)
Total Total
-0.3
4.6
-403
32 657
153 371
747 325
22.9
10.8
28 644
69 903
153 774
714 668
Time deposits (M3 - M2)
Total M3
Source : Bank Al-Maghrib
TABLE A10.2 LIQUID INVESTMENT AGGREGATES (1)
(In millions of dirhams)
End of December 2009End of December 2008
Components Annual ChangesAmounts
Annual ChangesAmounts
%Amounts%Amounts
77.9
20.3
43.5
-11.8
27.0
798
4 157
7 193
-566
11 582
1 823
24 669
23 719
4 238
54 449
43.0
5.7
-27.0
-39.7
-15.5
308
1 100
-6 116
-3 162
-7 870
1 025
20 512
16 526
4 804
42 867
Aggregate LI 1
Aggregate LI 2
Aggregate LI 3
Aggregate LI 4
Total PL
(1) Subscriptions of individuals and non-financial enterprises Source : Bank Al-Maghrib
253
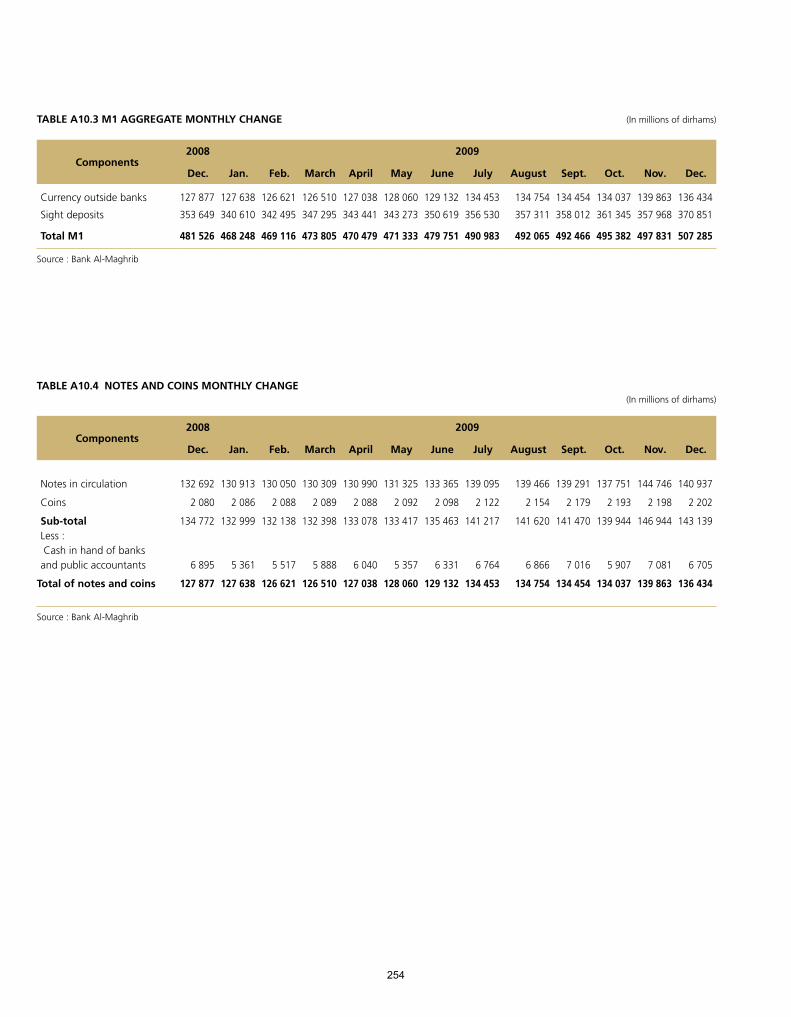
TABLE A10.3 M1 AGGREGATE MONTHLY CHANGE (In millions of dirhams)
20092008Components
Dec.Nov.Oct.Sept.AugustJulyJuneMayAprilMarchFeb.Jan.Dec.
136 434
370 851
507 285
139 863
357 968
497 831
134 037
361 345
495 382
134 454
358 012
492 466
134 754
357 311
492 065
134 453
356 530
490 983
129 132
350 619
479 751
128 060
343 273
471 333
127 038
343 441
470 479
126 510
347 295
473 805
126 621
342 495
469 116
127 638
340 610
468 248
127 877
353 649
481 526
Currency outside banks
Sight deposits
Total M1
Source : Bank Al-Maghrib
TABLE A10.4 NOTES AND COINS MONTHLY CHANGE(In millions of dirhams)
20092008Components
Dec.Nov.Oct.Sept.AugustJulyJuneMayAprilMarchFeb.Jan.Dec.
140 937
2 202
143 139
6 705
136 434
144 746
2 198
146 944
7 081
139 863
137 751
2 193
139 944
5 907
134 037
139 291
2 179
141 470
7 016
134 454
139 466
2 154
141 620
6 866
134 754
139 095
2 122
141 217
6 764
134 453
133 365
2 098
135 463
6 331
129 132
131 325
2 092
133 417
5 357
128 060
130 990
2 088
133 078
6 040
127 038
130 309
2 089
132 398
5 888
126 510
130 050
2 088
132 138
5 517
126 621
130 913
2 086
132 999
5 361
127 638
132 692
2 080
134 772
6 895
127 877
Notes in circulation
Coins
Sub-totalLess : Cash in hand of banksand public accountants
Total of notes and coins
Source : Bank Al-Maghrib
254
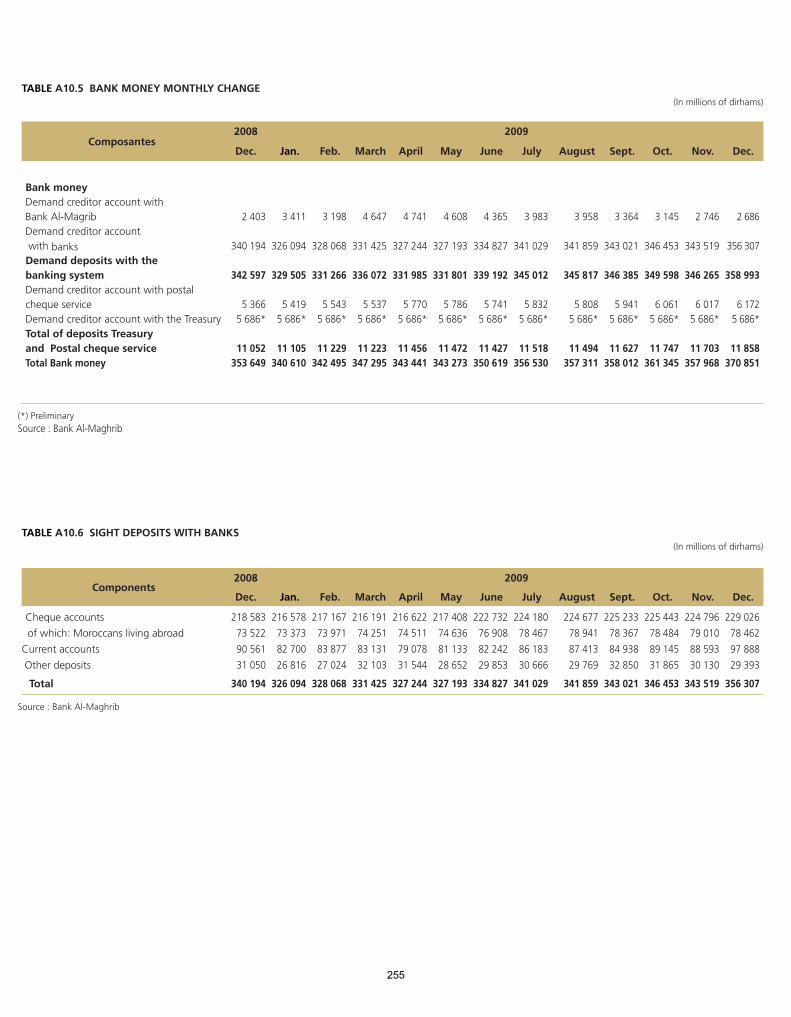
TABLE A10.5 BANK MONEY MONTHLY CHANGE(In millions of dirhams)
20092008Composantes
Dec.Nov.Oct.Sept.AugustJulyJuneMayAprilMarchFeb.Jan.Dec.
2 686
356 307
358 993
6 1725 686*
11 858 370 851
2 746
343 519
346 265
6 0175 686*
11 703357 968
3 145
346 453
349 598
6 0615 686*
11 747361 345
3 364
343 021
346 385
5 9415 686*
11 627358 012
3 958
341 859
345 817
5 8085 686*
11 494357 311
3 983
341 029
345 012
5 8325 686*
11 518356 530
4 365
334 827
339 192
5 7415 686*
11 427350 619
4 608
327 193
331 801
5 7865 686*
11 472343 273
4 741
327 244
331 985
5 7705 686*
11 456343 441
4 647
331 425
336 072
5 5375 686*
11 223347 295
3 198
328 068
331 266
5 5435 686*
11 229342 495
3 411
326 094
329 505
5 4195 686*
11 105340 610
2 403
340 194
342 597
5 3665 686*
11 052353 649
Bank moneyDemand creditor account with Bank Al-MagribDemand creditor account with banks Demand deposits with thebanking systemDemand creditor account with postal cheque serviceDemand creditor account with the TreasuryTotal of deposits Treasuryand Postal cheque service Total Bank money
(*) PreliminarySource : Bank Al-Maghrib
TABLE A10.6 SIGHT DEPOSITS WITH BANKS(In millions of dirhams)
20092008Components
Dec.Nov.Oct.Sept.AugustJulyJuneMayAprilMarchFeb.Jan.Dec.
229 02678 46297 88829 393
356 307
224 79679 01088 59330 130
343 519
225 44378 48489 14531 865
346 453
225 23378 36784 93832 850
343 021
224 67778 94187 41329 769
341 859
224 18078 46786 18330 666
341 029
222 73276 90882 24229 853
334 827
217 40874 63681 13328 652
327 193
216 62274 51179 07831 544
327 244
216 19174 25183 13132 103
331 425
217 16773 97183 87727 024
328 068
216 57873 37382 70026 816
326 094
218 58373 52290 56131 050
340 194
Cheque accounts of which: Moroccans living abroadCurrent accounts Other deposits
Total
Source : Bank Al-Maghrib
255

TABLE A10.7 AGGREGATE M2 AND AGGREGATE M3 MONTHLY CHANGE(In millions of dirhams)
20092008Components
Dec.Nov.Oct.Sept.AugustJulyJuneMayAprilMarchFeb.Jan.Dec.
507 28586 66971 590
15 079593 954153 371
396152 975
43 741)747 325
497 83185 74670 833
14 913583 577150 205
396149 809
42 888)733 782
495 38285 60470 654
14 950580 986151 389
481150 908
(42 385)732 375
492 46684 95170 086
14 865577 417159 327
484158 843
(41 820)736 744
492 06584 21169 424
14 787576 276158 492
484158 008
(40 946)734 768
490 98383 42468 747
14 677574 407160 598
484160 114
(40 454)735 005
479 75182 61968 038
14 581562 370163 051
484162 567
(41 058)725 421
471 33382 41167 833
14 578553 744160 913
484160 429
(42 540)714 657
470 47982 29967 719
14 580552 778160 130
484159 646
(41 276)712 908
473 80581 66667 125
14 541555 471159 628
435159 193
(41 913)715 099
469 11680 81666 546
14 270549 932161 045
538160 507
(41 792)710 977
468 24880 26866 056
14 212548 516158 856
538158 318
(41 893)707 372
481 52679 36865 251
14 117560 894153 774
501153 273
(41 299)714 668
Aggregate M1Sight deposits (M2-M1) . Passbooks account with banks . Saving books with the National Savings Fund Aggregate M2Time deposits (M3-M2). Certificates of deposit (1)
. Time accounts and fixed-term billsOf which : Moroccans living abroadAggregate M3
(1) Subscriptions of individuals and non-financial enterprises
Source : Bank Al-Maghrib
TABLE A10.8 LIQUID INVESTMENT AGGREGATES(1)
(In millions of dirhams)
20092008Components
Dec.Nov.Oct.Sept.AugustJulyJuneMayAprilMarchFeb.Jan.Dec.
1 427-
20
3761 823
24 66924 669
23 719 23 719
4 238 4 23854 449
1 820-
20
3362 176
27 78327 783
24 877 24 877
3 591 3 59158 427
1 438405
20
3162 179
26 21826 218
24 384 24 384
3 926 3 92656 707
1 868405
20
2352 528
21 35921 359
23 855 23 855
4 784 4 78452 526
2 208405
30
2342 877
20 26620 266
23 883 23 883
4 673 4 67351 699
254405
30
234923
17 85417 854
22 132 22 132
4 551 4 55145 460
1 234405
30
2331 902
19 61919 619
21 074 21 074
4 714 4 71447 309
1 266405
30
2321 933
22 49522 495
20 700 20 700
4 6204 620
49 748
2 000405
30
2322 667
19 81319 813
20 070 20 070
4 438 4 43846 988
765405
30
2301 430
21 02521 025
18 355 18 355
4 513 4 51345 323
865405
30
2291 529
21 60721 607
18 609 18 609
5 417 5 41747 162
892405
30
2381 565
21 30621 306
18 263 18 263
4 957 4 95746 091
365405
30
2251 025
20 51220 512
16 52616 526
4 8044 804
42 867
Aggregate LI 1. Negociable Treasury bills Commercial papers .Bills issued by the financing
companies. Securities issued by Contractual (UCITS) (2)
Total Aggregate LI 1Aggregate LI 2. Securities issued by monetary (UCITS) (3)
Total Aggregate LI 2Aggregate LI 3. Securities issued by bond (short,medium and long term) UCITSTotal Aggregate LI 3Aggregate LI 4. Securities issued by share
UCITS and diversified UCITSTotal Aggregate LI 4Total Aggregate LI
(1) Subscriptions of individuals and non-financial enterprises(2) According to article 5 of the decision issued by the Minister of Finance and privatisation under n° 167-07 on August 24, 2007, « Contractual UCITS » are UCITS where the institution in charge of managing the common investment funds or the variable capital investment companies, are committed, by virtue of a contract, to achieve a concrete result in terms of performance and /or guarantee of the invested amount. In return of this guarantee, the institution in charge of management of the common investment fund, or the variable capital investment company, may require the subscriber to provide a commitment on the invested amount and/or the period of UCITS securities’ holding by the latter(3) According to article 4 of the Minister of Finance and Privatisation decision number 2062-04 of Decembre 6, 2004, the Monetary UCITS are those of which global assets, at the exception of “Monetary UCITS” and liquidity, are permanently invested in debt securities.Moreover, at least 50 percent of the said are permanently placed in debt securities of an initial or residual maturity less than one yearSource : Bank Al-Maghrib
256

TABLE A10.9 COUNTERPARTS OF M3 AGGREGATE (In millions of dirhams)
End of december 2009End of december 2008
Components annuels changesAmounts
annuels changesAmounts
%Amounts%Amounts
-2.9-11.2-3.6
241.010.1
7.36.1
-5.89.39.2
6.8
8.7
-5 314-1 752-7 066
-3 0377 179
8064 948
-37249 48949 117
962
55 027
175 48313 904
189 387
-4 29778 008
11 85885 569
6 032579 285585 317
15 079
685 965
-3.5-22.5-5.3
-63.2-3.6
13.91.1
-6.123.422.9
7.9
19.2
-6 487-4 536
-11 023
2 161-2 661
1 350850
-416100 33199 915
1 036
101 801
180 79715 656
196 453
-1 26070 829
11 05280 621
6 404529 796536 200
14 117
630 938
Net foreign assets (1)
. Bank Al-Maghrib . banks Total (I)
Total domestic lending
A. Claims on government(1)
. Claims on Bank Al-Maghrib
. Claims on banks.
. Claims of individuals and
nonfinancial corporations(2)
Sub-total
B. Lending to the economy (1) . Loans of Bank Al-Maghrib. Loans of banks(3)
Sub-total
C. Counterpart of savings books with the National Savings Fund (4)
Total (A+B+C)
2.3
9.7
6.2
4.6
1 889
53 138
46 072
-13 415
32 657
85 495
600 470
789 857
-42 532
747 325
30.0
17.7
10.6
10.8
19 303
82 498
71 475
-1 572
69 903
83 606
547 332
743 785
-29 117
714 668
Less : Banking system’s non monetary resources (5) (6)
Domestic credit of a monetary nature (II)
Total counterparts (I+II)
Other items Balances (7)
Total Aggregate M 3
(1) See details on the components of net foreign assets. claims on government and claims on the private sector. in Appendices XII-11. XII-12 and XII-13 respectively
(2) Counterpart of deposits with the Treasury and the Postal cheque Service. recorded as sight deposits(3) Including lending to public institutions(4) The resources collected by the National Savings Fund are deposited with the Deposit and Management Fund They cannot
be broken down according to claims on government and claims on the private sector(5) Domestic and external loans contracted by the banks (see bank’liabilities in Appendix XIV-1)(6) Amount by which the equity base (capital and reserves) exceeds the total of fixed assets and the portfolio of shareholding(7) Amount by wich the other liability item of the banking system exceed the other items of its assets
Source : Bank Al-Maghrib
257

TABLE A10.10 MONTHLY DEVELOPMENT OF M3 COUNTERPARTS (In millions of dirhams)
20092008Components
Dec.Nov.Oct.Sept.AugustJulyJuneMayAprilMarchFeb.Jan.Dec.
175 483 13 904189 387
174 094 12 465186 559
173 980 15 566189 546
173 574 16 876190 450
175 658 15 689191 347
173 288 15 562188 850
171 539 15 630187 169
175 916 17 099193 015
180 934 11 886192 820
183 253 13 964197 217
183 695 14 989198 684
183 132 12 854195 986
180 797 15 656196 453
Net foreign assets. Bank Al-Maghrib. Banks
Total (I)
-4 29778 008
11 85885 569
6 032579 285585 317
15 079
685 965
-6 09779 790
11 70385 396
6 032571 631577 663
14 913
677 972
- 1 73174 873
11 74784 889
6 047568 637574 684
14 950
674 523
-6 778 75 346
11 62780 195
6 042566 895572 937
14 865
667 997
-4 517 80 103
11 49487 080
6 043559 272565 315
14 787
667 182
- 4 288 73 628
11 51880 858
6 048562 258568 306
14 677
663 841
- 5 422 74 287
11 42780 292
6 052554 142560 194
14 581
655 067
-4 476 76 326
11 47283 322
6 052540 050546 102
14 578
644 002
- 4 79574 451
11 45681 112
6 013536 779542 792
14 580
638 484
- 10 60374 321
11 22374 941
5 013532 650537 663
14 541
627 145
- 4 073 72 148
11 22979 304
6 413525 064531 477
14 270
625 051
-838 69 915
11 10580 182
6 414522 180528 594
14 212
622 988
-1 260 70 829
11 05280 621
6 404529 796536 200
14 117
630 938
Total domestic lendingA. Claims on government. Net claims of the bank Al-Maghrib. Claims of banks. Claims of individuals and nonfinancial corporations
Sub-total
B. Claims on the private sector . Bank Al-Maghrib. Banks
Sub-total
C. Counterpart of savingsbooks with the NationalSaving Fund
Total (A+B+C)
85 495
17 430
28 136
39 929
600 470
789 857
-42 532
747 325
86 521
17 779
28 706
40 036
591 451
778 010
-44 228
733 782
88 697
19 498
28 514
40 685
585 826
775 372
-42 997
732 375
87 722
18 290
28 497
40 935
580 275
770 725
-33 981
736 744
86 902
18 116
28 053
40 733
580 280
771 627
36 859
734 768
82 745
14 116
27 908
40 721
581 096
769 946
-34 941
735 005
87 160
17 876
28 700
40 584
567 907
755 076
-29 655
725 421
83 418
19 886
28 186
35 346
560 584
753 599
-38 942
714 657
80 918
17 078
28 307
35 533
557 566
750 386
-37 478
712 908
78 529
16 162
27 972
34 395
548 616
745 833
-30 734
715 099
78 719
17 776
27 551
33 392
546 332
745 016
-34 039
710 977
78 823
19 726
27 319
31 778
544 165
740 151
-32 779
707 372
83 606
17 012
29 841
36 753
547 332
743 785
-29 117
714 668
Less : Banking system’s non monetary resources . Bank’s borrowing Bank’s
borrowing. Provisions constitued by
the banks. Bank Al-Maghrib and banks
net capital and reservesDOMESTIC CREDIT OF A MONETARY NATURE (II)
TOTAL COUNTERPARTS (I+II)
Miscellaneous items balance
Aggregate M 3
Source : Bank Al-Maghrib
258

TABL
E A
10.1
1 N
ET F
ORE
IGN
ASS
ETS
MO
NTH
LY C
HA
NG
E
(I
n m
illio
ns o
f dirh
ams)
2009
2008
Com
pone
nts
Dec
.N
ov.
Oct
.Se
pt.
Aug
ust
July
June
May
Apr
ilM
arch
Feb.
Jan.
Dec
.
6 15
317
2 31
86
000
1 05
418
5 52
5
197
6 91
82
927
10
042
175
483
20 0
90
6 18
6
13 9
04
189
387
6 30
217
0 52
75
963
1 04
618
3 83
8
188
6 85
92
697
9 7
44
174
094
21 9
71
9 50
6
12 4
65
186
559
5 68
717
1 00
25
962
1 04
618
3 69
7
189
6 85
72
671
9 7
17
173
980
23 8
64
8 29
8
15 5
66
189
546
5 51
417
0 79
36
010
1 05
318
3 37
0
189
6 91
32
694
9 7
96
173
574
22 6
11
5 73
5
16 8
76
190
450
5 36
017
3 09
85
559
1 05
918
5 07
6
189
6 46
72
762
9 4
18
175
658
21 1
93
5 50
4
15 6
89
191
347
5 30
217
0 75
615
41
060
177
272
192
1 06
32
729
3 9
84
173
288
22 0
59
6 49
7
15 5
62
188
850
5 33
216
8 86
815
41
060
175
414
195
1 06
42
616
3 8
75
171
539
21 0
66
5 43
6
15 6
30
187
169
5 50
917
2 99
815
31
058
179
718
195
1 06
12
546
3 8
02
175
916
21 9
52
4 85
3
17 0
99
193
015
5 30
717
8 13
115
71
065
184
660
177
1 08
12
468
3 7
26
180
934
17 9
93
6 10
7
11 8
86
192
820
5 46
118
0 31
2 1
561
060
186
989
177
1 07
52
484
3 7
36
183
253
19 1
31
5 16
7
13 9
64
197
217
5 85
918
0 39
0 1
601
082
187
491
178
1 10
22
516
3 7
96
183
695
20 0
44
5
055
14 9
89
198
684
5 61
618
0 08
3 1
611
085
186
945
178
1 10
62
529
3 8
13
183
132
19 2
72
6 41
8
12 8
54
195
986
4 96
217
8 35
115
61
055
184
524
184
1 06
92
474
3 7
27
180
797
21 1
56
5 50
0
15 6
56
196
453
A. G
ross
for
eign
ass
ets
of
the
Ban
k A
l-Mag
hrib
. Ass
et in
gol
d. A
sset
s in
conv
ertib
le c
urre
ncie
s. S
pecia
l dra
win
g rig
hts h
oldi
ngs
. IM
F su
bscr
iptio
n-re
serv
e tra
nche
Sub-
tota
l
B. F
orei
gn li
abili
ties
of
the
Bank
Al-M
aghr
ib. C
redi
t fro
m in
tern
atio
nal
o
rgan
izat
ions
. S
pecia
l dra
win
g rig
hts
allo
catio
ns (1
)
. Oth
er li
abili
ties
Sub-
tota
lI.
Tota
l net
for
eign
as
sets
of
the
Ban
k A
l-Mag
hrib
(A-B
)
C. G
ross
for
eign
ass
ets
of
bank
s (2
) D
. Ext
erna
l lia
bilit
ies
of b
anks
(3)
II. T
otal
net
for
eign
ass
ets
of b
anks
(C-D
)
Tota
l net
for
eign
asse
ts (I
+II)
(1) S
DR
allo
catio
ns w
ere
recl
assifi
ed u
nder
ext
erna
l lia
bilit
ies.
Thi
s ch
ange
in a
ccou
ntin
g se
eks
to h
arm
oniz
e m
onet
ary
stat
istic
s w
ith th
e m
etho
dolo
gy re
com
men
ded
by th
e six
th e
ditio
n of
the
Bala
nce
of P
aym
ents
Man
ual.
(2) T
hese
are
fore
ign
curr
ency
ass
ets
of b
anks
and
thei
r for
eign
cur
renc
y de
posit
s w
ith th
eir f
orei
gn c
orre
spon
dent
s.Ba
nk's
fore
ign
curr
ency
dep
osits
with
Ban
k A
l-Mag
hrib
, w
hich
are
cla
ims
on a
resid
ent i
nstit
utio
n, a
re e
xclu
ded
from
thei
r for
eign
ass
ets.
(3) T
here
are
mai
nly
fore
ign
corr
espo
nden
t's c
redi
t acc
ount
s w
ith b
anks
and
non
-res
iden
t's d
eman
d an
d tim
e cr
edit
acco
unts
. So
urce
: Ba
nk A
l-Mag
hrib
.
259

TABLE A10.12 MONTHLY CHANGES CLAIMS ON GOVERNMENT(In millions of dirhams)
20092008Components
Dec.Nov.Oct.Sept.AugustJulyJuneMayAprilMarchFeb.Jan.Dec.
--
230
4 067-4 297
--4 297
77 707
30178 008
11 858 11 858
85 569
--
217
5 880-6 097
--6 097
79 538
25279 790
11 703 11 703
85 396
--
281
1 450-1 731
--1 731
74 594
27974 873
11 747 11 747
84 889
--
244
6 534-6 778
--6 778
75 050
29675 346
11 627 11 627
80 195
--
228
5 310-5 538
1 021-4 517
79 808
29580 103
11 494 11 494
87 080
--
262
5 045-5 307
1 019-4 288
73 121
50773 628
11 518 11 518
80 858
--
265
6 173-6 438
1 016-5 422
74 043
24474 287
11 427 11 427
80 292
- -
245
5 244-5 489
1 013-4 476
75 952
37476 326
11 472 11 472
83 322
--
223
5 583-5 806
1 011-4 795
74 072
37974 451
11 456 11 456
81 112
--
224
11 387-11 611
1 008-10 603
74 047
27474 321
11 223 11 223
74 941
--
235
5 356-5 591
1 518-4 073
71 880
26872 148
11 22911 229
79 304
--
292
3 623-3 915
3 077-838
69 598
31769 915
11 105 11 105
80 182
--
214
4 115-4 329
3 069-1 260
70 663
16670 829
11 052 11 052
80 621
I. Claims of Bank Al-MaghribA. Claims due to Bank
Al-Maghrib. Cash facilities (1)
Gross total. Less :
Notes and coins with public accountantsCurrent account of the treasury and the FHADES
Net totalB. Treasury bills purchased
on the secondary marketSub-total (I)
II. Claims of banks . Portfolio of public securities . Banks'deposits with Treasury
and Postal cheque serviceSub-total (II)
III. Claims of individuals andnon-financial enterprises
. Counterpart of depositswith Postal cheque service and Treasury
Sub-total (III)
Total claims ongovernment (I+II+III)
(1) Article 27 of the statuts of Bank-AL-Maghrib, taking effect as from February 2006, stipulates that the central bank can offer financial loans to the state only as a cash facility limited to 5 percent of tax revenues for the precedent year, remunerated at the prime rate for refinancing banks, and who usage may not exceed 120 days, continued or not during one financial yearSource : Bank Al-Maghrib
260

TABLE A10.13 CLAIMS ON THE PRIVATE SECTOR(In millions of dirhams)
20092008Components
Dec.Nov.Oct.Sept.AugustJulyJuneMayAprilMarchFeb.Jan.Dec.
516 061140 056125 077172 296 29 810
17 83330 989
52 72351 834
889
10 501
579 285
6 032
585 317
508 817141 633119 631170 769 29 680
15 92231 182
51 47050 556
914
11 344
571 631
6 032
577 663
505 935142 769118 273169 224 29 414
15 61430 641
51 50050 706
794
11 202
568 637
6 047
574 684
506 051144 912116 415168 103 29 167
16 86330 591
52 51251 822
690
8 332
566 895
6 042
572 937
499 416144 270113 375167 231 28 996
15 38130 163
52 75352 273
480
7 103
559 272
6 043
565 315
500 979147 728111 971166 755 28 727
15 91429 884
52 46651 986
480
8 813
562 258
6 048
568 306
492 772142 575110 880164 249 28 124
17 12729 817
54 10853 638
470
7 262
554 142
6 052
560 194
479 759135 550109 906161 251 27 504
16 43129 117
53 166 52 850
316
7 125
540 050
6 052
546 102
476 863135 657109 781158 910 27 087
15 97229 456
52 95152 635
316
6 965
536 779
6 013
542 792
472 939140 010104 735158 097 26 360
15 05228 685
52 99152 675
316
6 720
532 650
5 013
537 663
465 649139 071101 293155 105 25 828
14 89929 453
52 52552 192
333
6 890
525 064
6 413
531 477
460 255136 112
98 100153 857 25 431
17 43329 322
52 89252 359
533
9 033
522 180
6 414
528 594
467 736141 451
96 888152 811 25 086
20 32431 176
52 23251 580
652
9 828
529 796
6 404
536 200
A. Lending to enterprises and individuals (1)
. Debtor accounts andcash advance
. Equipment loans
. Real estate loans
. Consumer loans
. Miscellaneous claims on costumers. Non performing loans (2)
B. Lending to financingcompanies
. Credit
. Financing companies securitiesheld by banks
C. Banks' portfolio ofinvestment securities (3)
I. Total bank's claims onthe private sector (A+B+C)
II. Bank Al-Maghrib's loans
Total (I+II)
(1) Including lending to the public institutions(2) Pre-doubtful claims, doubtful claims and compromised claims(3) Non-banking enterprises securities subscribed for by banksSource : Bank Al-Maghrib
261

TABL
E A
10.1
4 M
ON
ETA
RY A
ND
LIQ
UID
INV
ESTM
ENT
AG
GRE
GA
TES
1984
-200
9(In
mill
ions
de
dirh
ams)
Liqu
id in
vest
men
t ag
greg
ate
M3 =
M2
+ Ti
me
Sigh
t
Agg
rega
te M
3
Out
stan
ding
am
ount
s at
end
Dec
embe
rIL
4(6
)LI
3(5
)LI
2(4
)LI
1(3
)Ti
me
Sigh
t (2
)
M2
= M1
+Si
ght
depo
sits
Agg
rega
te M
2
Tota
lSi
ght
depo
sits
(1)
Tota
lA
ggre
gate
M1
Ban
mon
eyN
otes
and
co
ins
359
2 64
16
229
9 61
210
308
13 4
8515
739
14 5
0415
564
16 8
3721
849
22 9
1825
074
25 5
8634
232
39 3
5127
356
32 9
5339
782
36 2
6840
996
41 0
4257
829
50 7
3742
867
54 4
49
- - - - - - - - - - - 81
696
3 05
76
590
5 42
33
214
1 93
61
247
1 75
22
408
3 06
95
854
7 96
64
804
4 23
8
- - - - - - - - - - - -22
02
708
9 15
418
630
12 7
2217
111
29 6
9626
423
22 1
1023
065
35 9
4222
642
16 5
2623
719
- - - - - - - - - - - - - - - - - - - -11
478
9 36
911
686
19 4
1220
512
24 6
69
359
2 64
16
229
9 61
210
308
13 4
8515
739
14 5
0415
564
16 8
3721
849
22 9
1023
158
19 8
2118
488
15 2
9811
420
13 9
068
839
8 09
35
000
5 53
94
347
717
1 02
51
823
51 1
9260
316
70 0
6677
097
88 6
8810
0 03
211
9 03
213
9 86
215
3 06
316
5 72
318
3 33
319
8 25
621
1 54
223
0 96
424
4 90
926
9 98
629
3 12
533
4 39
235
5 88
438
6 69
741
6 43
047
4 81
855
5 52
564
4 76
571
4 66
874
7 32
5
11 3
7314
416
15 8
5116
485
18 8
6721
441
24 8
8331
190
37 4
6743
986
47 4
6452
494
57 2
8364
121
65 1
1469
389
76 2
8184
294
83 3
3787
360
87 7
4199
094
119
161
125
130
153
774
153
371
39 8
1945
900
54 2
1560
612
69 8
2178
591
94 1
4910
8 67
211
5 59
612
1 73
713
5 86
914
5 76
215
4 25
916
6 84
317
9 79
520
0 59
721
6 84
425
0 09
827
2 54
729
9 33
732
8 68
937
5 72
443
6 36
451
9 63
556
0 89
459
3 95
4
2 74
43
136
4 16
05
891
7 57
39
317
11 4
9114
051
14 9
1315
959
18 6
8521
279
23 4
6625
983
29 5
2333
069
35 2
4039
581
43 0
9747
843
52 9
1859
147
65 0
7772
048
79 3
6886
669
37 0
7542
764
50 0
5554
721
62 2
4869
274
82 6
5894
621
100
683
105
778
117
184
124
483
130
793
140
860
150
272
167
528
181
604
210
517
229
450
251
494
275
771
316
577
371
287
447
587
481
526
507
285
22 3
0526
570
31 3
6134
718
40 3
3544
460
53 1
1560
352
64 9
3968
576
76 1
6381
329
84 3
4692
198
99 6
2811
0 81
512
3 09
414
4 08
715
9 52
217
6 24
719
6 05
622
7 21
326
2 68
632
7 74
335
3 64
937
0 85
1
14 7
7016
194
18 6
9420
003
21 9
1324
814
29 5
4334
269
35 7
4437
202
41 0
2143
154
46 4
4748
662
50 6
4456
713
58 5
1066
430
69 9
2875
247
79 7
1589
364
108
601
119
844
127
877
136
434
1984
1985
1986
1987
1988
1989
1990
1991
1992
1993
1994
1995
1996
1997
1998
1999
2000
2001
2002
2003
2004
2005
2006
2007
2008
2009
(1)
Dep
osit
book
s w
ith b
anks
and
sav
ings
boo
ks w
ith th
e N
atio
nal S
avin
gs F
und.
(2)
Tim
e ac
coun
ts a
nd fi
xed-
term
bill
s w
ith b
anks
and
cer
tifica
tes
of d
epos
it su
bscr
ibed
by
indi
vidu
els
and
non
finan
cial
entr
epris
es(3
) Six
-mon
th o
ver-
the-
coun
ter T
reas
ury
bills
and
neg
otia
ble
debt
sec
uriti
es (T
reas
ury
bills
, bill
s of
the
finan
cing
com
pani
es a
nd c
omm
erci
al p
aper
s)
sub
scrib
ed fo
r by
indi
vidu
als
and
non-
finan
cial
ent
erpr
ises
(4) S
ecur
ities
issu
ed b
y m
onet
ary
UC
ITS
and
subs
crib
ed fo
r by
indi
vidu
als
and
non-
finan
cial
ent
erpr
ises.
(5)
Sec
uriti
es is
sued
by
bond
UC
ITS
and
subs
crib
ed fo
r by
indi
vidu
als
and
non-
finan
cial
ent
erpr
ises.
(6)
Secu
ritie
s iss
ued
by d
iver
sified
and
sha
re U
CIT
S an
d su
bscr
ibed
for b
y in
divi
dual
s an
d no
n-fin
anci
al e
nter
prise
sSo
urce
: Ba
nk A
l-Mag
hrib
.
262

TABL
E A
10.1
5 C
OU
NTE
RPA
RTS
OF
M3
1984
-200
9
(In m
illio
ns o
f dirh
ams)
Bala
ncin
g it
ems
othe
rs (3
)
Tota
l Cou
nter
par
of M
3(I+
II)
Dom
esti
c cr
edit
of
a m
onet
ary
natu
r
Net
for
eign
ass
ets
Out
stan
ding
amou
nts
at
dece
mbe
rTo
tal
(II)
Less
Bank
ing
syst
em's
non
mon
etar
yre
sour
ces
Tota
l(A
+B+C
)
Tota
l dom
esti
c le
ndin
g
Coun
terp
arof
ass
ets
wit
hN
atio
nal
Savi
ngs
Fund
(C)(2
)
Clai
ms
on t
he p
riva
te s
ecto
rCl
aim
s on
gov
ernm
ent
Tota
l (B
)ba
nks
Bank
Al-
Mag
hrib
Tota
l(A
)In
divi
dual
s an
d no
n fi
nani
al
ente
rpri
ses(
1)
bank
sBa
nkA
l-M
aghr
ib
Tota
l(I)
bank
sBa
nkA
l-M
aghr
ib
-1 4
96-1
708
-2 5
98-1
843
-1 6
42-2
201
-1 4
74-3
414
-4 4
62-3
329
-4 2
19-2
744
-4 6
11-6
887
-9 1
21-5
345
-3 0
99-8
510
-9 0
53-1
4 65
5-1
5 22
0-1
2 22
3-1
3 10
2-2
7 54
5-2
9 11
7-4
2 53
2
52 6
8862
024
72 6
6478
940
90 3
3010
2 23
312
0 50
614
3 27
615
7 52
516
9 05
218
7 55
220
1 00
021
6 15
323
7 85
125
4 03
027
5 33
129
6 22
434
2 90
236
4 93
740
1 35
243
1 65
048
7 04
156
8 62
767
2 31
074
3 78
578
9 85
7
52 3
1860
915
70 9
7775
727
85 7
8498
145
103
294
118
204
125
431
131
417
146
500
168
226
180
773
197
202
211
004
216
240
241
973
241
387
254
591
274
593
287
643
322
275
378
949
464
834
547
332
600
470
10 5
2312
219
15 2
8517
750
21 0
1122
703
27 4
8332
144
40 3
0145
480
48 0
7249
854
54 1
7253
144
54 7
2158
611
58 5
3460
875
60 0
1158
506
57 1
1457
801
50 0
0764
303
83 6
0685
495
62 8
4173
134
86 2
6293
477
106
795
120
848
130
777
150
348
165
732
176
897
194
572
218
080
234
945
250
346
265
725
274
851
300
507
302
262
314
602
333
099
344
757
380
076
428
956
529
137
630
938
685
965
719
780
897
1 05
31
236
1 42
81
663
1 91
72
150
2 34
22
754
3 29
23
866
4 55
35
330
5 72
16
208
6 57
67
312
8 19
69
349
10 5
7211
702
13 0
8114
117
15 0
79
36 2
3242
390
48 3
6852
423
58 4
4466
117
77 8
1494
695
106
080
111
792
122
103
136
601
149
442
159
424
175
885
193
097
208
024
216
951
226
221
246
008
262
743
292
029
339
598
436
285
536
200
585
317
34 5
5739
311
43 1
8446
588
52 4
1159
418
71 0
0087
850
99 0
7910
4 74
711
4 79
612
8 98
214
2 05
615
2 02
916
8 49
518
5 90
520
0 55
320
8 64
721
6 47
423
4 53
125
1 44
128
4 33
333
2 08
242
9 46
552
9 79
657
9 28
5
1 67
53
079
5 18
45
835
6 03
36
699
6 81
46
845
7 00
17
045
7 30
77
619
7 38
67
395
7 39
07
192
7 47
18
304
9 74
711
477
11 3
027
696
7 51
66
820
6 40
46
032
25 8
9029
964
36 9
9740
001
47 1
1553
303
51 3
0053
736
57 5
0262
763
69 7
1578
187
81 6
3786
369
84 5
1076
033
86 2
7578
735
81 0
6978
895
72 6
6577
475
77 6
5679
771
80 6
2185
569
1 92
62
028
2 30
12
925
4 34
74
988
5 20
86
274
6 15
16
532
6 78
36
789
8 03
28
073
6 65
27
711
8 17
28
285
8 35
88
599
8 60
99
312
9 18
89
702
11 0
5211
858
13 1
0717
888
25 1
3828
277
32 6
9037
701
34 5
7535
346
41 4
2746
295
54 7
4752
908
54 8
4758
616
58 6
1454
917
61 7
2973
161
76 9
2377
123
72 0
3375
391
77 2
5973
490
70 8
2978
008
10 8
5710
048
9 55
88
799
10 0
7810
614
11 5
1712
116
9 92
49
936
8 18
518
490
18 7
5819
680
19 2
4413
405
16 3
74-2
711
-4 2
12-6
827
-7 9
77-7
228
-8 7
91-3
421
-1 2
60-4
297
370
1 10
91
687
3 21
34
546
4 08
817
212
25 0
7232
094
37 6
3541
052
32 7
7435
380
40 6
4943
026
59 0
9154
251
101
515
110
346
126
759
144
007
164
766
189
678
207
476
196
453
189
387
70 137
-18
228
254
137
612
637
590
735
299
426
166
294
316
207
2 03
42
685
6 29
05
110
9 04
015
672
16 7
8820
192
15 6
5613
904
300
972
1 70
52
985
4 29
23
951
16 6
0024
435
31 5
0436
900
40 7
5332
348
35 2
1440
355
42 7
1058
884
52 2
1798
830
104
056
121
649
134
967
149
094
172
890
187
284
180
797
175
483
1984
1985
1986
1987
1988
1989
1990
1991
1992
1993
1994
1995
1996
1997
1998
1999
2000
2001
2002
2003
2004
2005
2006
2007
2008
2009
(1) C
ount
erpa
rt o
f dep
osits
with
the
Trea
sury
and
the
Post
al c
hequ
e se
rvic
e, re
cord
ed a
s no
tes
and
coin
s(2
) The
reso
urce
s co
llect
ed b
y th
e N
atio
nal S
avin
gs F
und
are
depo
sited
with
the
Dep
osit
and
Man
agem
ent F
und
(CD
G).
Thes
e re
sour
ces
can'
t be
split
up
into
cla
ims
on g
over
nmen
t and
cla
ims
on th
e pr
ivat
e se
ctor
.
(3) A
mou
nt b
y w
hich
the
othe
r lia
bilit
ies
of th
e ba
nkin
g sy
stem
exc
eed
the
othe
r ite
ms
of it
s as
sets
.So
urce
: Ba
nk A
l-Mag
hrib
.
263
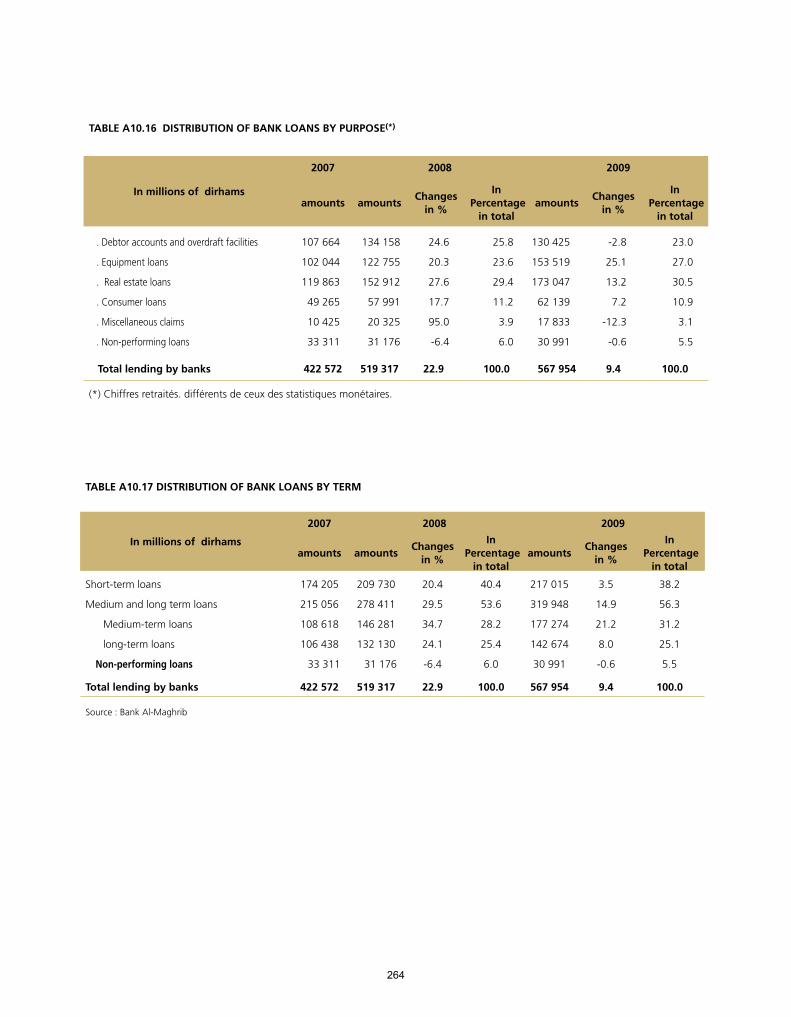
TABLE A10.16 DISTRIBUTION OF BANK LOANS BY PURPOSE(*)
200920082007
In millions of dirhams In Percentage
in total
Changes in %
amountsIn
Percentage in total
Changes in %
amountsamounts
23.0
27.0
30.5
10.9
3.1
5.5
-2.8
25.1
13.2
7.2
-12.3
-0.6
130 425
153 519
173 047
62 139
17 833
30 991
25.8
23.6
29.4
11.2
3.9
6.0
24.6
20.3
27.6
17.7
95.0
-6.4
134 158
122 755
152 912
57 991
20 325
31 176
107 664
102 044
119 863
49 265
10 425
33 311
. Debtor accounts and overdraft facilities
. Equipment loans
. Real estate loans
. Consumer loans
. Miscellaneous claims
. Non-performing loans
100.09.4567 954100.022.9519 317422 572 Total lending by banks
(*) Chiffres retraités. différents de ceux des statistiques monétaires.
TABLE A10.17 DISTRIBUTION OF BANK LOANS BY TERM
200920082007
In millions of dirhams In Percentage
in total
Changes in %
amountsIn
Percentage in total
Changes in %
amountsamounts
38.2
56.3
31.2
25.1
5.5
3.5
14.9
21.2
8.0
-0.6
217 015
319 948
177 274
142 674
30 991
40.4
53.6
28.2
25.4
6.0
20.4
29.5
34.7
24.1
-6.4
209 730
278 411
146 281
132 130
31 176
174 205
215 056
108 618
106 438
33 311
Short-term loans
Medium and long term loans
Medium-term loans
long-term loans
Non-performing loans
100.09.4567 954100.022.9519 317422 572Total lending by banks
Source : Bank Al-Maghrib
264

TABLE A10.18 DISTRIBUTION OF BANK LOANS BY SECTOR
200920082007
In millions of dirhams In Percentage
in total
Changes in %
amountsIn
Percentage in total
Changes in %
amountsamounts
3.4
3.0
0.4
32.4
2.6
2.9
12.9
14.1
64.2
3.3
4.3
6.5
12.5
27.6
10.1
-7.8
-3.0
-32.6
13.6
0.2
-3.3
11.7
23.0
8.4
36.7
2.5
8.7
3.7
13.9
-3.3
19 418
17 136
2 282
184 063
14 564
16 453
72 987
80 059
364 473
18 616
24 155
36 760
70 784
156 714
57 444
4.1
3.4
0.7
31.2
2.8
3.3
12.6
12.5
64.8
2.6
4.5
6.5
13.1
26.5
11.4
12.6
13.8
6.8
24.1
251.7
1.5
15.8
22.3
23.0
39.6
7.1
23.6
13.2
14.6
75.5
21 059
17 674
3 385
161 989
14 530
17 009
65 369
65 081
336 269
13 618
23 557
33 823
68 273
137 594
59 404
18 705
15 536
3 169
130 558
4 131
16 765
56 453
53 209
273 310
9 753
21 987
27 364
60 308
120 050
33 848
primary sector
Agriculture
Fisheries
Secondary Sector
extractive Industries
Energy and water
Manufacturing Industries
Building and public works
Tertiary sector
Hotel industry
Transport and communications
Trade
financial Activities
Households
Other services
100.09.4567 954100.022.9519 317422 572Total lending by banks
265

TABLE A10.19 CREDIT DISTRIBUES PAR LES SOCIETES DE FINANCEMENT
200920082007
In millions of dirhams In Percentage
in total
Changes in %
amountsIn
Percentage in total
Changes in %
amountsamounts
51.5
45.2
0.3
2.8
0.3
0.0
7.1
13.5
-10.9
4.4
100.9
36.8
41 131
36 111
205
2 198
235
26
52.8
43.8
0.3
2.9
0.2
0.0
14.8
19.3
15.6
42.6
-51.7
-58.7
38 387
31 819
230
2 106
117
19
33 435
26 668
199
1 477
242
46
Consumer loan companies
Leasing companies
Real estate loan companies
Factoring companies
Surety companies(*)
Payement means managements
companies
100.09.979 906100.017.172 67862 067Totallending by finance companies
(*) Surety companies have granted loans by signature for a total amount of 1.1 billion dirhams in 2007 and of 1.3 billion in 2008
Source : Bank Al-Maghrib
TABLE A10.20 DISTRIBUTION OF CREDIT INSTITUTIONS LENDING BY ECONOMIC AGENT
20092008*2007
In millions of dirhams In Percentage
in total
Changes in %
amountsIn
Percentage in total
Changes in %
amountsamounts
57.7
6.5
33.1
2.7
11.3
0.2
12.4
3.7
345 307
38 618
197 845
16 197
57.4
7.1
32.6
2.9
23.3
53.7
14.6
24.6
310 157
38 544
175 981
15 617
251 464
25 083
153 496
12 529
Companies
individual entrepreneurs
Private individuals
Local governements and
administrations publics
100.010.7597 967100.022.1540 299442 572Total lending by banks
(*) Revised
266

TABL
E A
10.2
1 C
HA
NG
E IN
TH
E IN
TERB
AN
K M
ARK
ET
(In m
illio
ns o
f dirh
ams)
2009
2008
Ave
rage
Dec
.N
ov.
Oct
.Se
pt.
Aug
July
June
May
Apr
ilM
arch
Feb.
Jan.
Ave
rage
4 44
9.6
2 73
9.9
3 35
8.4
2 41
1.4
3 42
9.0
1 62
5.7
3 60
6.3
2 57
4.8
4 56
9.1
2 70
0.1
4 79
1.2
3 75
1.7
5 05
2.6
3 51
5.6
6 76
0.1
3 01
6.4
4 48
8.0
2 60
9.5
3 52
5.4
2 22
7.6
2 76
0.8
2 05
0.9
4 78
2.1
2 65
8.8
6 27
2.0
3 73
6.8
3 77
7.3
2 96
4.3
aver
ge o
utst
andi
ng a
mou
nts
Ave
rage
exc
hang
ed v
olum
e
Sour
ce :
Bank
Al-M
aghr
ib.
TABL
E A
10.2
2 S
UBS
CRIP
TIO
NS
TO T
REA
SURY
BIL
LS B
Y T
END
ER(In
mill
ions
of d
irham
s)
2009
Tota
lM
atur
ity
Tota
lD
ec.
Nov
.O
ct.
Sept
.A
ugJu
lyJu
neM
ayA
pril
Mar
chFe
b.Ja
n.20
08
3 50
0.00
2 65
0.00
8 82
6.90
34 9
03.2
0
49 8
80.1
0
11 9
93.0
0
11 0
38.0
0
23 0
31.0
0
0.0
72 9
11.1
3 40
0.0
3 40
0.0
500.
0
500.
0
0.0
3 90
0.0
500.
0
1 05
0.0
7 25
0.0
8 80
0.0
4 32
7.0
2 48
7.0
6 81
4.0
0.0
15 6
14.0
300.
0
550.
0
2 29
0.0
3 14
0.0
636.
0
1 45
1.0
2 08
7.0
0.0
5 22
7.0
1 30
0.0
1 30
0.0
780.
0
780.
0
0.0
2 08
0.0
500.
0
1 30
0.0
1 36
5.0
3 16
5.0
100.
0
200.
0
300.
0
0.0
3 46
5.0
300.
0
1 00
0.0
4 71
0.0
6 01
0.0
0.0
0.0
6 01
0.0
176.
9
3 35
1.3
3 52
8.2
100.
0
100.
0
0.0
3 62
8.2
600.
0
2 39
1.0
2 99
1.0
1 90
0.0
3 00
0.0
4 90
0.0
0.0
7 89
1.0
200.
0
100.
0
300.
0
100.
0
100.
0
0.0
400.
0
3 50
0.0
150.
0
450.
0
1 00
0.0
5 10
0.0
600.
0
2 00
0.0
2 60
0.0
0.0
7 70
0.0
1 60
0.0
2 24
6.0
3 84
6.0
2 35
0.0
1 20
0.0
3 55
0.0
0.0
7 39
6.0
100.
0
2 60
0.0
5 59
9.9
8 29
9.9
800.
0
500.
0
1 30
0.0
0.0
9 59
9.9
9 53
7.7
4 53
8.9
29 8
42.4
43 9
19.0
100.
0
2 45
0.0
2 55
0.0
0.0
46 4
69.0
21 D
ays
13 W
eeks
26 W
eeks
52 W
eeks
Tota
l sho
rt-t
erm
(I)
2 ye
ars
5 ye
ars
Tota
l moy
en t
erm
e (II
)
10 y
ears
15 y
ears
20 y
ears
30 y
ears
Tota
l lon
g te
rm (I
II)
Tota
l (I+
II+III
)
Sour
ce :
Bank
Al-M
aghr
ib
267

TABL
E A
11.1
OU
TSTA
ND
ING
TO
TRE
ASU
RY B
ILLS
BY
TEN
DER
(In m
illio
ns o
f dirh
ams)
2009
2008
Mat
urit
ésTo
tal
Oth
erU
CITS
Insu
ranc
e co
mpa
nies
and
pe
nsio
n in
stit
utio
ns
C.D
.G. (
1)Ba
nks
Tota
lO
ther
UCI
TS
Insu
ranc
e co
mpa
nies
and
pe
nsio
n in
stit
utio
ns
C.D
.G. (
1)Ba
nks
800
3 90
0
54 2
46
0 30
11 6
84
690
2 9
19
8 3
33
13 159
20 4
03
0 0
200
97 792
13
626
1 15
1
1 92
6
31 8
54
0
180
13 2
76
1 14
9
1 45
7
3 72
6
0 31
5 1
79
0 0
789
2
258
8 88
4
13 W
eeks
26 W
eeks
52 W
EEKS
58 9
46 1
1 71
4 1
1 94
1 2
0 57
520
0 1
4 51
534
931
13
456
6 3
325
210
789
9 14
4To
tal s
hort
-ter
m (I
)
11 9
93
29 4
36
349
9 77
9
2 0
40
5 11
1
5 6
13
8 65
8
0
144
3 9
91
5 74
4
6 69
9
41 5
01
1 7
44
9 56
4
2 06
9
8 68
4
1 23
8
16 7
94
579
1 3
26
1 0
69
5 13
3
2 ye
ars
5 ye
ars
41 4
2910
128
7 15
114
271
144
9 73
548
200
11 3
0810
753
18 0
321
905
6 20
2To
tal m
oyen
ter
me
(II)
64 5
89
71 6
08
18 7
91
2 57
5
10 8
42
9 89
9
360 0
17 5
69
16 3
52
5 49
3
1 45
3
23 0
72
23 4
29
8 1
56 109
3 4
29
12
695
290
196
9 67
8
9 2
33
4 4
91
818
71 3
90
76 7
91
18 7
91
2 57
4
8 99
4
8 29
1
490
79
22
903
14
945
8 8
51
1 9
98
21 1
69
24 7
66
7 4
42 387
5 2
05
15
886
150 0
13 1
19
12
903
1 8
58
110
10 y
ears
15 y
ears
20 y
ears
30 y
ears
157
563
21
101
40
867
54
765
16
609
24
220
169
546
17
854
48
697
53
764
21
241
27
990
Tota
l lon
g-te
rm (I
II)
257
937
42 9
4359
960
89 6
1116
953
48 4
6925
2 67
742
618
65 7
8277
006
23 9
3543
336
Tota
l (I+
II+III
)
(1) E
xclu
ding
the
outs
tand
ing
amou
nt o
f the
trea
sury
bill
s of
the
prov
iden
t ins
titut
ions
adm
inist
red
by th
e de
posit
and
man
agem
ent f
und.
So
urce
: Ba
nk A
l-Mag
hrib
.
268

TABLE A11.2 STOCK EXCHANGES INDICATORS
MADEX (**)MASI (*)Market capitalisation(In millions of dirhams)
Volume of transactions
(In millions of dirhams)
Period
3 693.023 323.082 512.693 174.563 522.384 358.877 743.81
10 464.34
11 423.8211 995.5612 138.1111 878.7111 984.7411 715.0711 667.8211 543.2110 261.819 841.279 147.289 061.02
8 325.699 228.968 525.928 986.129 030.129 527.458 954.288 996.458 718.838 751.268 265.208 464.47
3 995.27 3 568.682 980.443 943.514 521.985 539.139 479.45
12 694.97
13 809.7914 481.5414 684.1314 387.7914 516.9714 191.0714 134.6913 990.6212 487.7011 977.5311 119.2810 984.29
10 133.3211 209.3710 402.0910 937.9111 024.3711 588.5510 971.6611 048.7310 765.3910 775.7610 208.4510 443.81
114 881104 74087 175
115 507206 517252 326417 092586 328
640 602671 527679 339668 411677 860660 756670 033662 496598 601579 964543 578531 750
496 883544 634508 460530 503526 446553 908528 877532 431521 737524 911498 944508 893
6 832.5 5 009.7 9 545.6
11 388.8 30 004.4 48 041.3 36 528.1 137 479.4
23 770.5 22 885.1 21 017.6 15 062.5 13 526.1 12 614.9 22 086.7 6 938.5
14 735.9 18 943.1 13 493.9 59 089.8
16 798.116 826.612 507.98 594.16 242.2
10 833.210 469.64 984.16 612.86 013.27 747.7
36 791.2
2000 December2001 December2002 December2003 December2004 December2005 December2006 December2007 December 2008 January
February March April May June July August September October November December
2009 January February March April May June July August September October November December
(*) With effect from January 1st, 2002, the general stock exchange index (IGB) was replaced by the Moroccan All Shares Index (MASI), which covers all quoted shares and takes as its base December 31st, 1991 = 1000.(**) MADEX, created in 2002, is composed of the most liquid securities and has as basis 1000 on December 31st, 1991.Source : Casablanca stock exchange.
269

TA
BLE
A11
3 O
UTS
TAN
DIN
G A
MO
UN
TS O
F N
EGO
TIA
BLE
DEB
T SE
CURI
TIES
(by
cate
gory
of i
nitia
l sub
crip
tions
) (In
mill
ions
of d
irham
s)
2009
2008
Secu
riti
es t
ypes
Tota
lO
ther
UCI
TS
Insu
ranc
e co
mpa
nies
an
d pe
nsio
n in
stit
utio
ns
Cred
itin
stit
utio
nsan
d CD
GTo
tal
Oth
erU
CITS
Insu
ranc
e co
mpa
nies
an
d pe
nsio
n in
stit
utio
ns
Cred
itin
stit
utio
nsan
d CD
G
31
528
8 4
50
2 6
84
816 20 0
17
951
3 3
15
2 6
64
6 1
70 205 0
6 5
91
4 9
10 20
26 4
71
3 52
8
1 82
5
497 30 405
7 34
4
737
1 17
0
2 05
2 70 0
16 5
78
2 69
1
250
Cer
tifica
tes
of d
epos
it
Bills
of fi
nanc
ing
com
pani
es
Com
mer
cial
pap
er
42
662
836
23
930
6 3
75 1
1 52
131
824
932
9 25
12
122
19 5
19To
tal (
I+II+
III)
Sour
ce :
Bank
Al-M
aghr
ib
270

TABLE A11.4 BOND ISSUANCES
Issuer Date MaturityRate
(in %)
Volume issued
(In millions of DH)
Financial corporations SGMB March 10 years 5.60 377.3
SGMB March 10 years 4.84 680.7
SGMB March 10 years 5.60 842
BCP April 7 years 5.00 1 500
BMCE June Perpetinty 5.30 50
BMCE June Perpetinty 4.51 950
Attijariwafa Bank June 10 years 5.00 710
Attijariwafa Bank June 10 years 4.42 290
Attijariwafa Bank December 7 years 4.76 1 000
Non Financial corporations Autoroutes du Maroc February 10 years 4.70 400
Autoroutes du Maroc july 10 years 4.27 640
Autoroutes du Maroc july 20 years 4.86 860
Autoroutes du Maroc November 10 years 4.38 1 180
Autoroutes du Maroc November 20 years 4.92 320
SNI August 10 years 5.10 1 500
Addoha August 1 year 4.55 1 500
CMT September 5 years 4.40 250
Distra October 2 years 6.00 50
271

TABLE OF CONTENTS

Table of contents Page
INTRODUCTION ......................................................................................................................................................................... 3
PART 1. ECONOMIC, MONETARY AND FINANCIAL SITUATION
1.1 International environment. . . . . . . . . . . . . . . . . . . . . . . . . . . . . . . . . . . . . . . . . . . . . . . . . . . . . . . . . . . . . . . . . . . . . . . . . . . . . . . . . . . . . . . . . 13
1.1.1 Global economic trends in 2009 .........................................................................................................14
1.1.2 International trade and balance of payments .....................................................................................18
1.1.3 Major economic policy measures ......................................................................................................19
1.1.4 Financial and commodity markets .......................................................................................................22
1.1.5 International financial markets ...........................................................................................................23
1.1.6 International commodity markets .......................................................................................................26
1.1.7 International Financial Architecture ....................................................................................................28
1.2 National output ......................................................................................................................31
1.2.1 Primary sector .....................................................................................................................................32
1.2.2 Secondary sector .................................................................................................................................35
1.2.3 Tertiary sector ......................................................................................................................................41
1.3 Job market ...................................................................................................................................44
1.3.1 Activity and employment indicators ....................................................................................................44
1.3.2 Costs and labor productivity ...............................................................................................................47
1.4 Demand ........................................................................................................................................50
1.4.1 Consumption .......................................................................................................................................51
1.4.2 Investment ..........................................................................................................................................52
1.4.3 National saving ...................................................................................................................................52
1.5 Economic and financial flows .........................................................................................54
1.5.1 Nonfinancial transactions ...................................................................................................................54
1.5.2 Financial transactions..........................................................................................................................54
1.6 Inflation ........................................................................................................................................57
1.6.1 Consumer price index..........................................................................................................................57
1.6.2 Manufacturing producer prices ..........................................................................................................66
1.7 External commercial and financial relations ........................................................68
1.7.1 Balance of payments ..........................................................................................................................68
1.7.2 International investment position ......................................................................................................76
1.8 Public finance............................................................................................................................79
274

1.8.1 2009 Finance Act .................................................................................................................................79
1.8.2 Execution of 2009 Finance Act ............................................................................................................81
1.8.3 Treasury financing ...............................................................................................................................87
1.8.4 Public debt ..........................................................................................................................................88
1.9 Monetary policy ......................................................................................................................91
1.9.1 Monetary policy decisions ..................................................................................................................91
1.9.2 Operational aspects of monetary policy ..............................................................................................95
1.9.3 Interest rates ......................................................................................................................................97
1.9.4 Exchange rate ..................................................................................................................................102
1.10 Money, loans and liquid investments ..................................................................104
1.10.1 M3 aggregate ................................................................................................................................104
1.10.2 M3 components ..............................................................................................................................106
1.10.3 Credit and other sources of money creation....................................................................................110
1.10.4 Other sources of money creation ....................................................................................................119
1.10.5 Liquid investment aggregates ........................................................................................................122
1.11 The Stock market, Private dept and Asset management ...........................126
1.11.1 The stock market .............................................................................................................................126
1.11.2 Negotiable debt securities...............................................................................................................130
1.11.3 Bond issuance .................................................................................................................................131
1.11.4 Asset management .........................................................................................................................131
PART 2. BANK ACTIVITIES
2.1 Governance ...............................................................................................................................141
2.1.1 Governance structure ........................................................................................................................141
2.1.2 Strategic planning ............................................................................................................................145
2.1.3 Ethics ................................................................................................................................................148
2.1.4 Internal control system......................................................................................................................148
2.1.5 Quality management and compliance ...............................................................................................154
2.1.6 Resources ..........................................................................................................................................157
2.2 Bank missions .........................................................................................................................161
2.2.1 Monetary policy ................................................................................................................................161
2.2.2 Supervision and financial stability ....................................................................................................165
2.2.3 Research ...........................................................................................................................................168
2.2.5 Reserves Management .....................................................................................................................174
2.2.6 Financial information ........................................................................................................................175
275
2.3 Openness and outreach .....................................................................................................180
2.3.1 Relationship with the Treasury ..........................................................................................................180
2.3.2 National network of the Bank ...........................................................................................................180
2.3.3 Communication ................................................................................................................................182
2.3.4 Currency Museum .............................................................................................................................184
2.3.5 International cooperation ................................................................................................................185
PART 3. FINANCIAL STATEMENTS OF BANK AL-MAGHRIB3.1 Bank Al-Maghrib balance sheet .................................................................................................................193
3.2 Profit and loss statement ..........................................................................................................................196
3.3 Legal framework and accounting principles ..............................................................................................201
3.4 Information on the balance sheet items ...................................................................................................205
3.5 Statutory audit report ................................................................................................................................209
3.6 Approval by the Bank Board ......................................................................................................................211
LIST OF CHARTS
Chart 1.1.1 : Quarterly profile of growth ......................................................................................................15
Chart 1.1.2 : Evolution of weighted GDP and weighted unemployment rate in main partner countries .......16
Chart 1.1.3 : Inflation trend in the world ......................................................................................................17
Chart 1.1.4: ECB and FED key rates trend .....................................................................................................21
Chart 1.1.5 : ECB and FED real interest rates trend .......................................................................................21
Chart 1.1.6 : Change in the world’s stock market indexes ............................................................................23
Chart 1.1.7 : Change of the OIS-Libor and TED2 spreads .............................................................................24
Chart 1.1.8 : Change of CDS premiums for 5-year sovereign debts
(in basis points) and of public debt in some countries of the euro area ....................................25
Chart 1.1.9 : Credit trend in the United States and in the euro area .............................................................25
Chart 1.1.10 : Trend of the main international currencies’ exchange rates .....................................................26
Chart 1.1.11 : Change of energy and nonenergy commodity price indexes ...................................................27
Chart 1.1.12 : Trend of the prices of phosphates and their derivatives ............................................................28
Chart 1.2.1 : Absolute contribution of economic sectors to GDP growth ......................................................32
Chart 1.2.2 : Main vegetable crops ...............................................................................................................33
Chart 1.2.3 : Changes in crude phosphate production and exports, in volume .............................................38
Chart 1.2.4 : Evolution of national output of electricity and refined oil products ..........................................39
Chart 1.2.5 : Evolution of available sources of electricity ..............................................................................40
Chart 1.2.6 : Changes in the number of European and Arab tourists ............................................................42
Chart 1.2.7 : Change in the number of fixed phone and cell phone subscribers ..........................................43
Chart 1.3.1 : Annual change in unemployment rate and labor force ............................................................44
Chart 1.3.2 : Change in value added and volume of employment .................................................................45
Chart 1.3.3 : Nonagricultural growth and urban unemployment from Q1: 2001 to Q4: 2009 .......................46
276

Chart 1.3.4 : Quarterly minimum wage in nominal and real terms ...............................................................47
Chart 1.3.5 : Change in unit labor cost and apparent labor productivity .....................................................48
Chart 1.3.6 : Morocco’s competitiveness cost ...............................................................................................48
Chart B1.3.2.1 : Manufacturing sector relative unit labor cost in Morocco, in US dollars ..................................49
Chart B1.3.2.2 : Average growth rate of relative unit labor cost and productivity (1999-2008) .......................49
Chart 1.4.1 : Contribution of demand aggregates to GDP growth, in percentage points ..............................50
Chart 1.4.2 : Change of final consumption of households and general government ...................................51
Chart 1.4.3 : Change of investment and gross investment rate ....................................................................52
Chart 1.4.4 : Change in national savings and national savings’ rate ............................................................53
Chart 1.6.1 : Annual change in headline inflation and core inflation ............................................................58
Chart 1.6.2 : Year-on-year change in core inflation and staple food products...............................................58
Chart 1.6.3 : Year-on-year change of headline inflation and fresh food prices ..............................................58
Chart 1.6.4 : Contribution of major headings to headline inflation ..............................................................60
Chart 1.6.5 : Annual change in the prices of goods and services ..................................................................62
Chart 1.6.6 : Contribution of goods and services prices to headline inflation ..............................................63
Chart 1.6.7 : Annual change in prices of tradables and nontradables ...........................................................63
Chart 1.6.8 : Contribution of tradables’ and nontradables’ prices to headline inflation ...............................64
Chart B 1.6.2.1: Change in inflation by group of countries ................................................................................65
Chart B 1.6.2.2: Price index of energy and nonenergy commodity ....................................................................65
Chart 1.6.9 : Annual change in the contribution of prices of major headings
to the producer price index for the manufacturing industries ....................................................66
Chart 1.6.10 : Annual change in the main producer price indexes for the manufacturing industries ..............66
Chart 1.7.1 : Development of trade balance .................................................................................................69
Chart 1.7.2 : Import price index ...................................................................................................................69
Chart 1.7.3 : Breakdown of imports per usage group ...................................................................................70
Chart 1.7.4 : Contribution of usage groups to imports development ............................................................70
Chart 1.7.5 : Breakdown of exports per usage group ...................................................................................71
Chart 1.7.6 : Contribution of usage groups to export development ..............................................................71
Chart 1.7.7 : Development of travel receipts and remittances by Moroccans residing abroad .....................72
Chart 1.7.8 : Development of current account balance .................................................................................73
Chart 1.7.9 : Development of drawings, redemptions and outstanding external public debt as % of GDP ..74
Chart 1.7.10 : Breakdown of foreign direct investments per sector ................................................................75
Chart 1.7.11 : Aggregate of international investment position .......................................................................77
Chart 1.8.1 : Treasury current receipts .........................................................................................................83
Chart 1.8.2 : Treasury overall expenditure ....................................................................................................84
Chart 1.8.3 : Wage bill ..................................................................................................................................85
Chart 1.8.4 : Subsidization costs ...................................................................................................................85
Chart 1.8.5 : Public saving ............................................................................................................................86
Chart 1.8.6 : Change in the primary balance and the Treasury’s indebtedness .............................................86
Chart 1.8.7 : Change in the share of auctions out of total domestic debt ....................................................87
Chart 1.8.8 : Public debt ...............................................................................................................................88
Chart B1.8.2.1 : Direct public debt in % of GDP ................................................................................................89
Chart 1.9.1 : BAM monetary reserve rate .....................................................................................................93
Chart B 1.9.1 : Gap between the consensual forecast and the realized rate of inflation .................................94
277

Chart 1.9.2 : Liquidity position and the reserve requirements amount .....................................................96
Chart 1.9.3 : Liquidity position and the monetary reserve amount ...........................................................96
Chart 1.9.4 : Impact of autonomous factors (end-of-week averages, in billions of dirhams) .....................96
Chart 1.9.5 : Bank Al-Maghrib interventions (end-of-week data, in billions of dirhams) ...........................97
Chart 1.9.6 : Trend of average weighted rate on the interbank market ......................................................98
Chart 1.9.7 : Rates on short-term Treasury bills on the secondary market ..............................................100
Chart 1.9.8 : Rates on medium and long-term Treasury bills on the secondary market ............................100
Chart 1.9.9 : Change in borrowing rates ..................................................................................................101
Chart 1.9.10 : Difference between interbank rate and deposits weighted average rate ...........................101
Chart 1.9.11 : Change in lending rates ......................................................................................................101
Chart 1.9.12 : Transfer exchange rate ........................................................................................................103
Chart 1.9.13 : Dirham nominal and real effective exchange rates .............................................................103
Chart 1.10.1 : Annual growth of M3 and its main counterparts ................................................................105
Chart 1.10.2 : Velocity of money circulation...............................................................................................105
Chart 1.10.3 : Change in the currency in circulation in 2009 .....................................................................107
Chart 1.10.4 : Annual growth of bank money and nonagricultural GDP ..................................................108
Chart 1.10.5 : Bank money and volume of transactions on the stock market ...........................................108
Chart 1.10.6 : Change in bank money .......................................................................................................108
Chart 1.10.7 : Annual change in nonfinancial agents’ time deposits and UCITS securities ........................110
Chart 1.10.8 : Change in public sector time deposits in 2009 ....................................................................110
Chart 1.10.9 : Main counterparts’ contribution to M3 annual growth .......................................................110
Chart 1.10.10 : Bank loans ..........................................................................................................................112
Chart 1.10.11 : Breakdown of loans by purpose ..........................................................................................112
Chart 1.10.12 : Change in NPL and their share in bank loans ......................................................................113
Chart 1.10.13 : Breakdown of bank loans by term ......................................................................................114
Chart 1.10.14 : Sectoral breakdown of bank loans ......................................................................................115
Chart 1.10.15 : Growth of loans distributed by consumer loan companies and leasing companies .............116
Chart 1.10.16 : Loans distributed by finance companies ..............................................................................116
Chart 1.10.17 : Breakdown of bank loans by economic agent ..................................................................117
Chart B1.10.1 : Change in interest rates on loans for businesses in 2009 ....................................................118
Chart B1.10.2 : Factors determining interest rates applied to loans ............................................................118
Chart B1.10.3 : Factors influencing demand for loans by businesses ..........................................................118
Chart B1.10.4 : Change in corporate demand for loans ..............................................................................118
Chart 1.10.18 : Annual growth of net foreign assets ...................................................................................119
Chart 1.10.19 : Change in the structure of net foreign assets .....................................................................119
Chart B1.10.2.1 : Change in spot transactions on the stock market................................................................120
Chart B1.10.2.2 : Forward sales of foreign currencies .....................................................................................120
Chart B1.10.2.3 : Forward purchases of foreign currencies ............................................................................120
Chart 1.10.20 : Change in net claims on Government .................................................................................121
Chart 1.10.21 : Annual change in nonfinancial agents’ securities in money market UCITS ..........................123
Chart 1.10.22 : Nonfinancial corporations’ investments in bond UCITS securities .......................................124
Chart 1.10.23 : LI 4 and MASI index ............................................................................................................124
Chart 1.10.24 : Change in the liquidity of the economy ..............................................................................125
Chart 1.11.1 : Sectoral indexes .................................................................................................................126
Chart B 1.11.1 : the MASI index change .......................................................................................................127
278

Chart B1.11.2.1 : Stock market index change in 2009 ....................................................................................128
Chart B1.11.2.2 : Market capitalization ratio/ GDP .........................................................................................129
Chart 1.11.2 : Change in the outstanding amount of negotiable debt securities .......................................131
Chart 1.11.3 : UCITS net assets ..................................................................................................................132
Chart 2.1.1 : Breakdown of the missions conducted by type (2005-2009) ...............................................151
Chart 2.1.2 : Staff by field of activity .......................................................................................................158
Chart 2.1.3 : Staff by gender ....................................................................................................................158
Chart 2.1.4 : Staff by age bracket ............................................................................................................158
Chart 2.2.1 : Production of new banknotes .............................................................................................170
Chart 2.2.2 : Production of new coins .....................................................................................................170
Chart 2.2.3 : Monthly change of currency circulation ..............................................................................170
Chart 2.2.4 :Breakdown of banknotes in circulation per denomination ...................................................171
Chart 2.2.5 :Breakdown of coins in circulation per denomination ...........................................................171
Chart 2.2.6 : Change in deposits and banknotes to be sorted .................................................................173
Chart 2.2.7 : Number and percentage of false banknotes per denomination detected by the Bank ........174
Chart 2.2.8 : Development of the number of contracts sent to the credit bureau
between March and December 2009 ....................................................................................177
Chart 2.2.9 : Development of the consultations between October and December 2009 ..........................177
Chart 3.1.1 : Breakdown of assets items.................................................................................................193
Chart 3.1.2 : Breakdown of liabilities items ............................................................................................195
Chart 3.2.1 : Change in revenues, expenses, and in the net result .........................................................196
Chart 3.2.2 : Breakdown of profit items ..................................................................................................197
Chart 3.2.3 : Breakdown of loss items ....................................................................................................198
LIST OF TABLES
Table 1.1.1 : World GDP growth trend, in % .............................................................................................14
Table 1.1.2 : Current account of the balance of payment per regions and countries of the world .............19
Table 1.2.1 : Changes in average yearly indexes of industrial production, in % ........................................36
Table 1.6.1 : Major items of the consumer price index ..............................................................................59
Table 1.6.2 : Producer price index for the manufacturing industries ......................................................... 67
Table 1.7.1 : Development of the international investment position ........................................................76
Table 1.8.1 : Treasury expenditure and receipts .........................................................................................81
Table 1.9.1 : Monetary policy decisions since 2006 ...................................................................................92
Table 1.9.2 : Rates on Treasury bills on the primary market .......................................................................99
Table 1.9.3 : Rates on Treasury bills on the secondary market ...................................................................99
Table 1.9.4 : Minimum rates on passbook accounts ...............................................................................100
Table 1.9.5 : Rates on time deposits with banks ......................................................................................101
Table 1.9.6 : Change in lending rates ......................................................................................................102
Table 1.10.1 : Change in M3 components ................................................................................................106
Table 1.10.2 : Change in demand deposits ................................................................................................109
Table 1.10.3 : Change in money supply counterparts ................................................................................111
Table 1.10.4 : Net claims on Government ..................................................................................................121
Table 1.10.5 : Liquid investment aggregates ............................................................................................122
Table 1.10.6 : Change in LI aggregate Table .............................................................................................122
Table 1.10.7 : Liquidity ratio of the economy ............................................................................................125
Table B1.11.2.2 : Price Earning Ratio (PER) ....................................................................................................128
279

Table 2.1.1 : Main processes audited between 2005 and 2009 ...............................................................151
Table 2.2.1 : Cash flows in the Bank’s branches ......................................................................................172
Table 2.2.2 : Number of false banknotes detected by the Bank ...............................................................174
Table 2.2.3 : Change in data flows processed by the Default Registry .....................................................178
LIST OF BOXES
Box 1.1.1 : Proposals of the Basel Committee on Banking Supervision to strengthen
the global banking sector ......................................................................................................30
Box 1.2.1 : Green Morocco Plan .............................................................................................................34
Box 1.2.2 : National Pact for Industrial Emergence: Agreement 2009-2015 ...........................................36
Box 1.2.3 : Solar Power Plan ...................................................................................................................40
Box 1.3.1 : Outcome of the second plan «Employment Initiative 2009-2012» ......................................48
Box 1.3.2 : Assessment of the manufacturing sector’s unit labor cost ...................................................49
Box 1.6.1 : The new consumer price index (CPI) .....................................................................................61
Box 1.6.2 : World inflation in 2009 .........................................................................................................65
Box 1.7.1 : New classification of foreign liabilities ................................................................................74
Box 1.7.2 : The international investment position ..................................................................................76
Box 1.7.3 : Main measures adopted in 2009 in connection with the settlement
of commercial and financial transactions with abroad ..........................................................78
Box 1.8.1 : Main tax measures adopted in the 2009 Finance Act ...........................................................80
Box 1.8.2 : Medium-term sustainability of the Treasury’s indebtedness ..................................................89
Box 1.9.1 : Evaluation of the inflation forecast in 2009 ..........................................................................94
Box 1.10.1 : Survey on loan conditions in 2009 ......................................................................................118
Box 1.10.2 : Transactions on the foreign exchange market in 2009 ........................................................120
Box 1.11.1 : Change in MASI index over the period 2003-2009 .............................................................127
Box 1.11.2 : Change in stock market indicators: International comparison ...........................................128
Box 1.11.3 : Major regulatory measures introduced in 2009 ..................................................................133
Box 2.1 : From 1959 through 2009: highlights ...................................................................................140
Box 2.1.1 : 2010-2012 strategic orientations ........................................................................................146
Box 2.1.2 : Main 2007-2009 strategic projects ....................................................................................147
Box 2.1.3 : Main instruments in the information security system implemented in 2009 .......................153
Box 2.1.4 : Decisions taken by the Financial Intelligence Processing Unit (FIPU) in 2009 .....................157
Box 2.2.1 : Monetary policy in the strategic plan 2010-2012 ...............................................................164
Box 2.3.1 : Major events organized in commemoration of the Bank’s fiftieth anniversary ...................183
LIST OF STATISTICAL APPENDICES
Table a1 main indicators of the economy .......................................................................................................215
NATIONAL OUTPUTTable A1.2.1 : Gross domestic product changes (1998 : 100) ....................................................................216
Table A1.2.2 : Gross domestic product by branch of activity (1998 : 100) ..................................................217
Table A1.2.3 : Cereals .................................................................................................................................218
Table A1.2.4 : Pulse crops...........................................................................................................................218
Table A1.2 5 : Market garden crops ..........................................................................................................218
280

Table A1.2.6 : Citrus fruits ..........................................................................................................................219
Table A1.2.7 : Beet crops ............................................................................................................................219
Table A1.2.8 : Cane crops ..........................................................................................................................220
Table A1.2.9 : Olive-growing ......................................................................................................................220
Table A1.2.10 : Oleaginous plants ................................................................................................................221
Table A1.2.11 : Vine growing........................................................................................................................221
Table A1.2.12 : Stock farming .....................................................................................................................221
Table A1.2.13 : Meat supplied for consumption ...........................................................................................222
Table A1.2.14 : Sea fisheries .........................................................................................................................222
Table A1.2.15 : Index of mineral production.................................................................................................223
Table A1.2.16 : Energy balance ....................................................................................................................223
Table A1.a2.17 : Energy production ...............................................................................................................224
Table A1.2.18 : Energy production expressed in tonnes oil equivalent ........................................................224
Table A1.2.19 : Total energy consumption ....................................................................................................225
Table A1.2.20 : Final energy consumption ...................................................................................................225
Table A1.2.21 : Indices of manufacturing production ...................................................................................226
Table A1.2.22 : Tourist arrivals ......................................................................................................................227
Table A1.2.23 : Index of industrial producer prices ......................................................................................228
LABOR MARKETTable A1.3.1 : Indicators of employment and unemployment ....................................................................229
Table A1.3.2 : Employment by branch of economic activity .......................................................................230
Table A1.4.1 : Gross domestic product changes (1998 : 100) .....................................................................231
Table A1.4.2 : Goods and services account (1998:100) ..............................................................................232
Table A1.4.3 : Gross national disposable income and its appropriation (1998:100) ...................................232
Table A1.4.4 : Investment and savings (1998:100) .....................................................................................233
ECONOMIC AND FINANCIAL FLOWSTable A1.5 : Economic and financial flows in 2009 .................................................................................234
INFLATIONTable A1.6 : Consumer price index .........................................................................................................235
EXTERNAL COMMERCIAL AND FINANCIAL RELATIONSTable A1.7.1 : Trade balance .......................................................................................................................236
Table A1.7.2 : Structure of trade transactions ............................................................................................236
Table A1.7.3 : Major imports ......................................................................................................................237
Table A1.7.4 : Major exports ......................................................................................................................238
Table A1.7.5 : Geographical distribution of foreign trade ...........................................................................239
Table A1.7.6 : Balance of payments ...........................................................................................................240
Table A1.7.7 : International investment position .......................................................................................241
PUBLIC FINANCETable A1.8.1 : Treasury revenue and expenditure .......................................................................................242
Table A1.8.2 : Treasury current revenue .....................................................................................................243
Table A1.8.3 : Estimated general budgetl ...................................................................................................244
281

MONETARY POLICYTable A1.9.1 : Main foreign exchange rates quoted by the bank al-maghrib .............................................245
Table A1.9.2 : Development of the exchange market activity .....................................................................246
Table A1.9.3 : Bank liquidity developments ................................................................................................247
Table A1.9 4 : bank al-maghrib’s interventions on the money market ........................................................248
Table A1.9.5 : Money market rates .............................................................................................................249
Table A1.9.6 : Interest rates of deposits with banks ...................................................................................249
Table A1.9.7 : Interest rates of deposits with the national savings fund ...................................................249
Table A1.9.8 : Weighted average interest rate of time accounts and fixed-term bills .................................250
Table A1.9.9 : Weighted average rates of treasury bills issued by tender ..................................................251
Table A1.9.10 : Interest rates offered on negotiable instruments of indebtedness .......................................252
Table A1.9.11 : Interest rates of notes and bonds issued on the bond market .............................................252
Table A1.9.12 : Lending rates .......................................................................................................................253
Table A1.9.13 : Maximum agreed interest rate of credit institutions ............................................................253
MONEY, LOANS AND LIQUID INVESTMENTSTable A1.10.1 : Money aggregate ................................................................................................................254
Table A1.10.2 : Liquid investment aggregates .............................................................................................254
Table A1.10.3 : M1 aggregate monthly change ............................................................................................255
Table A1.10.4 : Notes and coins monthly change ........................................................................................255
Table A1.10.5 : Bank money monthly change ..............................................................................................256
Table A1.10.6 : Sight deposits with banks ....................................................................................................256
Table A1.10.7 : Aggregate M2 and aggregate M3 monthly change .............................................................257
Table A1.10.8 : Liquid investment aggregates ..............................................................................................257
Table A1.10.9 : Counterparts of M3 aggregate ..........................................................................................258
Table A1.10.10 : Monthly development of M3 counterparts ..........................................................................259
Table A1.10.11 : Net foreign assets monthly change .....................................................................................260
Table A1.10.12 : Monthly changes claims on government ..............................................................................261
Table A1.10.13 : Claims on the private sector .................................................................................................262
Table A1.10.14 : Monetary and liquid investment aggregates 1984-2009 ......................................................263
Table A1.10.15 : Counterparts of M3 1984-2009 ............................................................................................264
Table A1.10.16 : Distribution of bank loans by purpose ..................................................................................265
Table A1.10.17 : Distribution of bank loans by term ........................................................................................265
Table A1.10.18 : Distribution of bank loans by sector .....................................................................................266
Table A1.10.19 : Credit distribues par les societes de financement.................................................................267
Table A1.10.20 : Distribution of credit institutions lending by economic agent ..............................................267
Table A1.10.21 : Change in the interbank market ...........................................................................................268
Table A1.10.22 : Subscriptions to treasury bills by tender ...............................................................................268
THE STOCK MARKET, PRIVATE DEPT AND ASSET MANAGEMENTTable A1.11.1 : Outstanding to treasury bills by tender ...............................................................................269
Table A1.11.2 : Stock exchanges indicators ..................................................................................................270
Table A1.11 3 : Outstanding amounts of negotiable debt securities ............................................................271
Table A1.11.4 : Bond issuances ....................................................................................................................272
282


Legal deposit : 2010 MO 1755I S B N : 9981 - 873 - 57 - 5
I S S N : 1114 - 4114