Embed Size (px)
Citation preview

DTU FoodNational Food Institute
Annual Report on Zoonosesin Denmark 2020
Annual Report on Zoonoses in Denmark 2020
Edited by:Channie Kahl PetersenNational Food InstituteTechnical University of Denmark
Luise Müller and Mia TorpdahlStatens Serum Institut
This is an official publication from the National Food Institute, Technical University of Denmark, the Danish Veterinary and Food Administration, and Statens Serum Institut.
Text and tables may be cited and reprinted only with reference to this report.
Suggested citation:Anonymous, 2021. Annual Report on Zoonoses in Denmark 2020, National Food Institute, Technical University of Denmark.
Reprints can be ordered from:National Food InstituteTechnical University of DenmarkKemitorvetBuilding 204DK - 2800 Kgs. LyngbyDenmarkPhone: +45 35 88 64 20E-mail: [email protected]
Layout: Channie Kahl Petersen Photos: Colourbox Printing: www.STEPPRINTPOWER.dk
1. edition
ISSN: 1600-3837
The report is also available at:www.food.dtu.dk
Contents
Introduction . . . . . . . . . . . . . . . . . . . . . . . . . . . . . . . . . . . . . . . . . . . . . . . . . . . . . . . . . . . . . . . . . . . . . . . . . . 4
1. Food- and waterborne outbreaks . . . . . . . . . . . . . . . . . . . . . . . . . . . . . . . . . . . . . . . . . . . . 6
2. Burden of foodborne diseases in Denmark . . . . . . . . . . . . . . . . . . . . . . . . . . . . . . . . 10
3. Foodborne bacterial pathogens in a time with covid-19 restrictions 13
4. SARS-CoV-2 in farmed Danish mink . . . . . . . . . . . . . . . . . . . . . . . . . . . . . . . . . . . . . . 16
5. Vectorborne zoonoses . . . . . . . . . . . . . . . . . . . . . . . . . . . . . . . . . . . . . . . . . . . . . . . . . . . . . . . 23
6. International topics . . . . . . . . . . . . . . . . . . . . . . . . . . . . . . . . . . . . . . . . . . . . . . . . . . . . . . . . . . 25
7. Danish participation in the One Health European Joint Programme . . . 27 8. Surveillance and control programmes . . . . . . . . . . . . . . . . . . . . . . . . . . . . . . . . . . . . . 30 8.1 Surveillance of human disease 8.2 Outbreaks of zoonotic gastrointestinal infections 8.3 Surveillance and control of animals and animal products 8.4 Official testing of zoonotic pathogens in foodstuffs
Appendix . . . . . . . . . . . . . . . . . . . . . . . . . . . . . . . . . . . . . . . . . . . . . . . . . . . . . . . . . . . . . . . . . . . . . . . 34 Human disease and outbreak data . . . . . . . . . . . . . . . . . . . . . . . . . . . . . . . . . . . . . . . . . . . . . 34 Monitoring and surveillance data . . . . . . . . . . . . . . . . . . . . . . . . . . . . . . . . . . . . . . . . . . . . . . . 37 Monitoring and surveillance programmes . . . . . . . . . . . . . . . . . . . . . . . . . . . . . . . . . . . . . . . 51 Population and slaughter data . . . . . . . . . . . . . . . . . . . . . . . . . . . . . . . . . . . . . . . . . . . . . . . . . 59 List of figures and tables . . . . . . . . . . . . . . . . . . . . . . . . . . . . . . . . . . . . . . . . . . . . . . . . . . . . . . 60

The Annual Report on Zoonoses presents a summary of the trends and sources of zoonotic infections in humans and animals, as well as the occurrence of zoonotic agents in food and feeding stuffs in Denmark in 2020. Greenland and the Faroe Islands are not represented. The report is based on data collected according to the Zoonoses Directive 2003/99/EC, supplemented by data obtained from national surveillance and control programmes as well as data from relevant research projects. Corrections to the data may occur after publication resulting in minor changes in the presentation of historical data in the following year’s report. The report is also available at www.food.dtu.dk.
Campylobacter continued to be the most common bacte-rial foodborne illness, with 3,742 confirmed human cases in 2020. One national and two regional outbreaks of Campylobacter were reported; one large outbreak on the Island of Bornholm involved 161 cases, the probable cause was a specific brand of pasteurised milk.
Salmonella resulted in 614 laboratory-confirmed human infections and this was almost reduced by half compared to 2019. The decrease was mainly seen in sporadic travel-related cases and can be explained by the travel restrictions implemented to limit the spread of covid-19.
Foodborne outbreaks In total, 35 foodborne outbreaks with 1,190 patients were reported in 2020. This is a decrease compared to 2019, where 51 outbreaks were reported. The decrease is mainly due to a decrease in regional/local outbreaks where 19 where registered in 2020 compared to 33 in 2019.
Previously norovirus has been the most common cause of foodborne outbreaks, however in 2020, pathogens associated with point-source outbreaks, such as norovirus, decreased. This decrease was likely influenced by the general restrictions on gatherings, closed restaurants and increased hygiene focus during the covid-19 pandemic.
The largest outbreak of Salmonella in 2020 was a national outbreak of Salmonella Strathcona with 25 registered cases. Imported tomatoes were suspected to be the cause based on interviews, but also due to a prior outbreak in Denmark in 2011 associated with imported small tomatoes. Trace-back investigation of the tomatoes could however not point out a common producer.
An unprecedented canteen outbreak caused by Enterocytozoon bieneusi, affected 77 employees of a Danish company. E. bieneusi is a type of microsporidia, a microorganism rarely detected in Denmark and with no outbreaks previously registered in Denmark. The source of the outbreak was a lunch box in the company canteen, however a specific food item could not be pointed out.
Burden of foodborne diseases in DenmarkBurden of disease studies can help enable policy makers and other stakeholders carry out risk management, as they provide a ranking of diseases according to their overall health impact in the population.When correcting for underreporting and underdiagnosing, it is estimated that nearly 59,000 cases of campylobacteriosis occurred in Denmark in 2019, which is more than tenfold the notified number from the same year (5,389). Campylobacter was therefore not only the most common bacterial foodborne illness in 2019, it was also the one with the greatest overall health impact, with an estimated loss of 1,691 healthy life years.
The impact of covid-19 restrictions on foodborne bacterial pathogensFor Campylobacter, Salmonella and Shiga toxin–producing Escherichia coli (STEC) a decrease, ranging from -29% to -45%, in registered human cases was observed from 2019 to 2020.
A slight decrease of registered cases of Campylobacter, Salmonella, STEC and Yersinia enterocolitica was seen in March-April 2020, when the first national lock-down was implemented due to the covid-19 epidemic. During the lock-down restaurants, schools and several work places were closed and international travel was restricted. Access to health care was open, however, Danes were less likely to visit their general practitioner and it is possible that the decrease in registered cases of foodborne pathogens were affected by less samples taken due to this change in behaviour.
The general decrease in total number of Campylobacter, Salmonella and STEC cases throughout 2020 is to a large extend explained by the sizeable decrease in travel-associated cases for all three pathogens, due to the travel restrictions implemented during the covid-19 epidemic.
IntroductionIntroduction
ANNUAL REPORT ON ZOONOSES IN DENMARK 20204

5 ANNUAL REPORT ON ZOONOSES IN DENMARK 2020
SARS-CoV-2 in farmed Danish minkIn June 2020, the first outbreaks of SARS-CoV-2 in farmed mink were reported in Denmark. From June to December 2020, SARS-CoV-2 infected mink on 290 mink farms, constituting 24% of the Danish mink production. In the same period, efforts in surveillance, protective measures and culling strategy were made in the attempt to contain the spread of the virus.
The infection of farmed mink was associated with a substantial occupational risk, and followed by widespread infection of the human population with the mink as-sociated lineage B.1.1.298, and a higher percentage of human cases where found in areas with a high density of mink farms. On the 4th of November 2020, the Danish Prime Minister announced that all Danish mink should be culled. After culling of almost all Danish farmed mink was accomplished (by the end of November 2020) the mink associated linage B.1.1.298 gradually disappeared among the human cases, and the last human case caused by B.1.1.298 was observed in mid-January 2021.
Vectorborne zoonosesIn 2020, a study explored the potential of flies as a me-chanical vector of livestock-associated Methicillin-resist-ant Staphylococcus aureus (LA-MRSA). The study found that an average of 27% of house flies and 7% of stable flies carried live LA-MRSA in a concentration high enough to be detected by culture at the laboratory. Many flies re-mained positive for live bacteria for 48 hours after being removed from the farm and it was estimated that 65.2% of all residential addresses were situated within three kilometres of a pig farm. The high average contamination rates on flies in an LA-MRSA affected Danish pig farm, combined with the long survival time of the bacteria of both fly species, and the short distances between pig farms and most human addresses suggest that flies may be able to transport live LA-MRSA bacteria to the major-ity of human residential addresses in Denmark.
International travel with companion animals as well as import and adoption of dogs from abroad remains a constant risk of introducing new tick species and diseases to Denmark. In 2020, a brown dog tick (Rhipicephalus sanguineus) was found on a dog returning from a vacation with its owners in Spain. This species of tick may carry zoonotic Rickettsia species. Another tick known to habour zoonotic diseases, the exotic meadow tick (Dermacentor reticulatus), is continuously being reported on dogs in Den-mark and dogs that have never been outside Denmark are being diagnosed with the severe infection of Babesia canis.
Danish participation in the One Health European Joint ProgrammeDenmark is a well-known frontrunner in the field of One Health, with the “Annual Report on Zoonoses in Den-mark” as one of many good examples of collaboration across sectors.
The One Health European Joint Programme (One Health EJP) is an ongoing international partnership between public health, animal health and food safety institutes across Europe.
The One Health EJP Consortium has 44 partners from 22 countries across Europe and its main focus is to strengthen collaboration and improve prepared-ness by means of projects and activities in the fields of foodborne zoonoses, antimicrobial resistance (AMR) and emerging threats. Denmark is strongly represented in the One Health EJP Consortium by two partners, the National Food Institute at the Technical University of Denmark (DTU Food) and Statens Serum Institut (SSI). The Danish partner institutes participate in 22 of the 30 Joint Re-search Projects and Joint Integrative Projects. For nine of the projects (30% of all) one of the two Danish partners holds leadership.
The Salmonella source account The Salmonella source account is not included in this years report. This is mainly due to technical challenges associated with data management. When the Salmonella source account is finished, it will be available as an online appendix (https://www.food.dtu.dk/-/media/institutter/foedevareinstituttet/publikationer/pub-2021/Appendix-Trends-and-sources-in-human-salmonellosis-2020).

ANNUAL REPORT ON ZOONOSES IN DENMARK 20206
1. Food- and waterborne outbreaksBy the Central Outbreak Management Group
Food- and waterborne outbreaks in Denmark are reported in the Food- and Waterborne Outbreak Database (FUD). Appen-dix table A3 list the outbreaks that occurred in 2020. Figure 1.1 shows the relative distribution of these outbreaks by the different causative agents. Household outbreaks and clusters not verified as common source foodborne outbreaks are excluded. Outbreak investigation procedures in Denmark are described in Chapter 8.
In 2020, 35 foodborne outbreaks were reported in FUD and the total number of persons affected by foodborne outbreaks was 1,190 with an average of 34 persons per outbreak (range 2-200). This is a decrease from 2019, where 51 outbreaks were registered. The decrease is mainly due to a decrease in regional/local outbreaks where 19 where registered in 2020 compared to 33 in 2019. Figure 1.2 shows the foodborne outbreaks by pathogen in 2020 compared to the previous four years. Pathogens commonly associated with point-source outbreaks such as norovirus, Clostridium perfringens and Bacillus cereus decreased in 2020 compared to 2019. In 2020, 6 norovirus outbreaks were registered compared to 19 outbreaks in 2019, and it was in particular the absence of outbreaks related to
infected kitchen staff affecting this decrease (Table 1.1). The number of Salmonella outbreaks – which are primarily national – have been stable with 10 in 2020 compared to 9 in 2019. Please note that the number of Salmonella outbreaks for previous years before 2019 also include travel-related outbreaks and therefore is higher. The general restrictions on gatherings, closed restaurants and increased hygiene focus during the covid-19 pandemic has likely influenced the number of local point-source outbreaks, whereas it does not seem to have affected the number of national outbreaks to the same degree. Sixteen outbreaks were national out-breaks of which six were part of international outbreaks. In comparison, 18 national outbreaks were registered in 2019.
1.1 Norovirus outbreaksFrom the end of 2019 and during the first months of 2020 a range of local norovirus outbreaks were reported to the Danish Veterinary and Food Administration (DVFA) after consumption of oysters. A large investigation was initiated and the outbreaks were grouped in two investigations (FUD1838 and FUD1846). In all, 393 cases of gastroenteri-tis compatible with norovirus were related to this outbreak
Figure 1.1. Aetiology of the 35 foodborne disease outbreaks reported in the Food- and waterborne Outbreak Database (FUD), 2020. Percentage of total outbreaks indicated in brackets
a) Including the monophasic S. Typhimurium variant (S. 1,4,[5],12:i:-).
Source: Food- and waterborne Outbreak Database (FUD)
Campylobacter (8.6%)
Clostridium perfringens (5.7%)
Enterocytozoon bieneusi (2.9%)
Hepatitis A (5.7%)
Norovirus (17.1%)
Unknown (2.9%)Lectins (8.6%)
L. monocytogenes (8.6%)
Shigella sonnei (2.9%)
STEC (2.9%)
Yersinia enterocolitica (5.7%)
S. Typhimurium domesticª (14.3%)
Other Salmonella serotypes - domestic (14.3%)

7 ANNUAL REPORT ON ZOONOSES IN DENMARK 2020
(271 of these cases were reported in the beginning of the outbreak period in 2019). Investigation pointed out oysters from France to be the source of a European outbreak. The French authorities reported that they had experienced a contamination in the harvesting areas due to heavy rains.
1.2 Salmonella outbreaksIn 2020, ten Salmonella outbreaks were identified as genetically closely related by whole genome sequencing (WGS). Five of the ten outbreaks were caused by Salmonella Typhimurium or the monophasic variant (S. 1,4,[5],12:i:-). The sources of these outbreaks were not revealed – primar-ily due to a small number of cases per outbreak (< 10 cases).
The largest national outbreak of Salmonella in 2020 was due to Salmonella Strathcona ST2559#1 (FUD1883). In total, 25 cases were registered from May to July 2020. There were 21 female and four male patients, aged 3-95 years old with a median age of 63 years. Imported tomatoes were suspected to be the cause of this outbreak based on the interviews, but also due to a prior outbreak in Denmark in 2011 (FUD1112) with this rare serotype that was found to be associated with imported small tomatoes. However, trace-back investigation of the tomatoes could not point out a common producer.
A point source outbreak of Salmonella Kottbus ST1669#1 occurred in a restaurant in the Copenhagen area in June 2020 (FUD 1879). In total, 36 patients were registered in the outbreak of which 14 were laboratory-con-firmed. A cohort study among the guests at the restaurant pointed at a pea purée as the likely source. The suspicion
was cross-contamination of the purée in combination with inadequate temperature on a hot summer day.
1.3 Campylobacter outbreaksDuring the national holiday of Pentecost in May 2020, an unusually high number of Campylobacter cases were report-ed by the hospital on the island of Bornholm (FUD1875). In total, 161 cases were identified within a week, ages ranged from 0 to 97 years and 97 (60%) cases were male. Of 64 isolates analysed with WGS, 55 were genetically closely related and identified as Campylobacter jejuni type ST50#8. Hypothesis-generating interviews and a matched case-control study showed that cases were more likely to have consumed a particular brand of milk from a local milk producer (‘Brand A’). ‘Brand A’ milk also presented a positive dose- and frequency-response association. Coli-form bacteria contamination was furthermore detected in a pasteurised milk sample from ‘Brand A’ dairy producer. In conclusion, epidemiological and microbiological findings suggested ‘Brand A’ pasteurised milk as a probable source for this Campylobacter outbreak on Bornholm.
A long-lasting national outbreak of Campylobacter with a total of 20 Campylobacter jejuni ST50#11 cases, geneti-cally closely related by WGS, were registered from July to December 2020 (FUD1907). Campylobacter jejuni, match-ing the outbreak strain, was detected in five food isolates from Danish-produced chicken and the dates of positive batches matched the occurrence of the human cases. The conclusion of the outbreak was that Danish-produced chicken was the likely source of the outbreak.
Table 1.1. Norovirus outbreaks per route of transmission based on number of cases or number of outbreaks, 2018-2020
2020 2019 2018
Transmission route/source No. of outbreaks
No. of persons ill
No. of outbreaks
No. of persons ill
No. of outbreaks
No. of persons ill
Ill kitchen staff or healthy carrier of virus among kitchen staff
2 109 12 691 10 408
Kitchen staff tending to ill persons at home before entering the kitchen
2 158 2 80 1 30
Ill person/guest attending a buffet 0 0 2 89 4 193Seafood (oysters) 2 122a 3 72 4 146Frozen raspberries 0 0 0 0 1 50
Leafy greens / lettuce 0 0 0 0 1 12
Total 6 389 19 932 21 839
a) One of the two outbreaks in 2020 (FUD1838) consisted of 286 cases of which 271 cases were additionally registered in 2019.
Source: Food- and waterborne Outbreak Database (FUD)

ANNUAL REPORT ON ZOONOSES IN DENMARK 20208
1.4 Other outbreaks of interestIn August-September an outbreak of Shigella sonnei oc-curred in the Capital Region of Denmark (FUD1893). The outbreak was notified from local clinical departments and from the mandatory clinical notification system. Simulta-neously, several enquiries were directed to the DVFA and Statens Serum Institut (SSI) from hosts of social events where a large share of the participants had fallen ill fol-lowing the event. In total, 44 persons had a positive fecal sample and were linked to this outbreak (either by a sample culture-positive for S. sonnei or an ipaH PCR-positive sample indicating an infection with Shigella). In addition to the iden-tified cases, another approx. 60 persons fell ill after having participated in one of five point-source events. The age of the cases ranged from ten months to 75 years (median age 30 years). Thirty (68%) of the laboratory-confirmed cases were women and 14 men. A total of 13 (30%) persons were admitted to hospital. The investigation showed that the source of infection was likely from imported fresh mint sold in greengrocers/bazars. Trace-back was challenged due to a lack of invoices for purchases of mint among the involved
greengrocers/bazars. In March 2020 the German public health authorities
launched an urgent inquiry of an outbreak of hepatitis A genotype IB. In Denmark, initially three cases were identical with matching sequences and an investigation was initiated (FUD1877). In all, 19 Danish cases were registered from May to November. The cases were 10 female and nine male aged 17- 78 years (median age 35 years). Despite thorough interviews of cases the source was not identified.
Three small outbreaks of Listeria was identified in 2020. One was caused by Listeria monocytogenes, ST394#1 (FUD1910), where two Danish cases from November were related to an international outbreak. The source of the out-break were pointed out to be smoked trout from a Danish manufacturer. L. monocytogenes was found in food isolates from this manufacturer and WGS showed that they were identical to the Listeria type found in the patients. Another Listeria outbreak, caused by L. monocytogenes ST451#2, linked to hot-smoked fish products where the outbreak was solved combining findings in food and comparing with hu-man isolates by WGS, was investigated in June (FUD1890).
Figure 1.2. Number of foodborne outbreaks reported in Denmark by pathogen, 2016-2020
0
5
10
15
20
25
30
Bac
illus
cer
eus
Cam
pylo
bact
er
Clos
trid
ium
per
frin
gens
Hep
atit
is A
His
tam
in
L. m
onoc
ytog
enes
Lect
ines
Nor
oviru
s
Salm
onel
laª
Sapo
viru
s
Shig
ella
Stap
hylo
cocc
us a
ureu
s
STEC
Yers
inia
ent
eroc
olit
ica
Unk
now
n/ot
her
2016 2017 2018 2019 2020
a) Note for Salmonella that travel-related outbreaks were not included in 2019 and 2020.
Source: Food- and waterborne Outbreak Database (FUD)

9 ANNUAL REPORT ON ZOONOSES IN DENMARK 2020
First foodborne outbreak of Enterocytozoon bieneusi in Denmark
By the Central Outbreak Management Group
On November 23, 2020 the Danish Veterinary and Food Administration (DVFA) was informed about an outbreak of diarrhoeal disease in 77 employees of a company in Denmark (FUD1904). A foodborne outbreak was suspected from the canteen at the company. Stool samples were negative for the common gastrointestinal bacteria and viruses analy-sed at the local Clinical Microbiological Departments. Additional stool samples were collected from patients and analy-sed by Statens Serum Institut (SSI) to investigate for parasites. On December 1, Enterocytozoon bieneusi (E. bieneusi) was identified in stool samples.
E. bieneusi is a type of microsporidia. Microsporidia is a group of single-celled, spore-forming obligate intracellular organisms, which are rarely reported to cause disease in humans due to the lack of diagnostic testing. Most cases have been reported in immunocompromised individuals including AIDS patients.
An electronic questionnaire was sent to all employees at the company. Overall, 195 employees completed the questi-onnaire, and 52 (27%) were defined as cases based on their symptoms. The median age of the cases was 45 years, and approximately two thirds of the cases were male. Dates of symptom onset ranged from November 5, 2020 to December 12, 2020, with a peak on November 14-15, 2020. The incubation period ranged between 7-10 days with most cases occurring on day 10 post infection. Diarrhoea (90%), abdominal pain (78%), fatigue (83%) and nausea (71%) were the most commonly reported symptoms. About 81% of cases self-reported a duration of illness of up to 14 days. Half of the eight confirmed cases with E. bieneusi, who responded to the questionnaire, reported having been ill for 22 days or more. The survey showed that employees who attended lunch on November 4, 2020 at the canteen had a significantly higher risk of being a case. The results pointed at a specific lunch box with various open sandwiches, however, it was not possible to differentiate the risk of the various ingredients as they were served in the same lunch box and a specific food item could not be pointed out.
Stool samples from 15 cases were positive for E. bieneusi, however not all responded to the questionnaire.
In conclusion, this outbreak highlights the need to include E. bieneusi in the panel of pathogens to be tested for in stool samples during foodborne outbreaks. In particular, this is relevant in samples from patients who exhibit a longer incubation period and/or longer duration of illness, which would rule out most of viral and bacterial sources.
This was a long-lasting outbreak with two cases from 2020 and two cases in 2014. The source was hot-smoked fish from a local smokehouse. The last Listeria outbreak occurred in December 2020 and was caused by L. monocytogenes ST7#7 (FUD1914). This was a national outbreak with four cases, the investigation did not reveal a source.
An unprecedented canteen outbreak in November was caused by Enterocytozoon bieneusi which is a microorgan-ism rarely detected in Denmark and with no outbreaks previ-ously registered in Denmark (FUD1904). Further description of the outbreak can be found in the text box below.
1.4 References1. Stensvold R, Nielsen HV, Müller L, Vestergaard LS. (2020).
Sygdomsudbrud med mikrosporidier. Epi-nyt week 51-52/2020, https://www.ssi.dk/aktuelt/nyhedsbreve/epi-nyt/2020/uge-52a---2020 (In Danish).
2. Voss S, Müller L, Torpdahl M, Schjørring S, Pedersen AF, Munch NSM. Udbrud af shigellose i Danmark, august-september 2020. Epi-nyt week 41/2020, https://www.ssi.dk/aktuelt/nyhedsbreve/epi-nyt/2020/uge-41---2020 (In Danish).
ANNUAL REPORT ON ZOONOSES IN DENMARK 202010
At the National Food Institute, Technical University of Denmark we regularly estimate the burden of a range of foodborne diseases caused by microbial agents and chemi-cal hazards. These estimates are used to rank diseases in Denmark according to their overall health impact in the population, and ultimately to inform policy makers in the area of food and health.
2.1 Total incidence of disease by foodborne patho-gens
It is widely recognised that cases of foodborne infections are underreported, and that for many pathogens the true incidence of disease in the population is unknown. The gap between the true number of cases caused by contaminated foods and what is captured by public health surveillance is explained by the process of diagnosing and reporting a foodborne illness: not all individuals visit the doctor, not all doctors request a sample to be sent for laboratory diagnosis, and not all pathogens are included in the labora-tory- identification list. This gap is larger for diseases with mild and short-duration symptoms, and smaller for severe diseases or infections that particularly affect vulnerable groups of society, as these are more likely to be diagnosed and reported. To address knowledge gaps, we estimate the true number of cases of different foodborne diseases in the population. The detailed methodology is described in Pires et al., 2019 [1].
2.2 Disability Adjusted Life Years (DALYs)To be able to compare diseases with different causes, inci-dence and symptoms, we apply a harmonised health metric that assesses the impact of diseases in terms of incidence, severity, duration, and mortality. DALYs are the sum of years lived with disability (YLD), and the years of life lost due to premature death caused by the disease (YLL) [2].
2.3 Burden of disease of six foodborne pathogens in Denmark
We estimated the burden of disease caused by six foodborne pathogens in Denmark in 2019: the enteric bacteria Campy-lobacter, Salmonella, Shiga toxin–producing Escherichia coli (STEC), Yersinia enterocolitica, hepatitis A and the invasive bacteria Listeria monocytogenes.
The enteric bacteria cause mild-to-severe gastroen-teritis, and may lead to severe sequelae or death. Possible sequelae include active arthritis (ReA) and irritable bowel
syndrome (IBS) for Salmonella, Campylobacter and Y. en-terocolitica, Guillian–Barré syndrome for Campylobacter, and hemolytic uremic syndrome (HUS) and end-stage renal disease for STEC. Infection with L. monocytogenes can cause mild disease in otherwise healthy people, manifesting with usually mild and self-limiting gastroenteritis. However, in high-risk groups such as the elderly, immunocompromised or in fetuses and neonates (in utero infection), infection can be invasive and lead to severe clinical disease, manifesting as sepsis, meningitis or encephalitis, spontaneous abortion, and death [3]. We included only the invasive form of listeriosis.
2.3.1 MethodsTo estimate the foodborne burden for all pathogens in 2019, we 1) estimated the incidence and mortality of each, 2) es-timated the disease burden of all health outcomes of each pathogen in terms of DALYs, and 3) calculated the fraction of this burden that was attributed to foods, as described by Pires et al., 2019 [1].
Incidence and mortalityWe applied different approaches to each pathogen to esti-mate the total incidence of disease and mortality dependent on available data.
To adjust for underdiagnosing and underreporting of enteric bacterial infections, we reconstructed the surveil-lance pyramid as described by Haagsma et al., 2012 [4]. The model consists of a set of parameters that were based on data collected through a population-based telephone survey conducted in 2009 [5].
Invasive listeriosis is a severe illness, and thus we as-sumed that all cases in the population were diagnosed and notified through the public health surveillance system. Age and gender-specific incidence of listeriosis in 2019 was collected from the National Listeria Surveillance database (available at http://www.ssi.dk/data). Under Danish surveil-lance, pregnancy-associated infections are notified as a single case (the woman), fetal loss or still-born babies are thus not recorded.
DALY calculationDALYs are the sum of years lived with disability (YLD), and the years of life lost (YLL) due to premature death caused by a disease [6]. For each disease, we combined the estimated incidence of each health outcome with disability weights previously collected [7] with duration of disease and life
2. Burden of foodborne diseases in DenmarkBy Sara Monteiro Pires ([email protected])
11 ANNUAL REPORT ON ZOONOSES IN DENMARK 2020
expectancy statistics as published by Denmark Statistics (available at www.statbank.dk/HISB8) to estimate YLD. To estimate YLL, we combined the estimated mortality with standard expected YLL. To estimate the associated uncertainty, we applied a stochastic model using the DALY calculator interface developed in R (http://daly.cbra.be/). More details available at Pires et al., 2019 [1].
Attribution to foodsTo estimate the burden of disease that was due to consump-tion of contaminated foods, we applied the attributable food-borne proportions to the total disease burden, previously estimated by Hald et al., 2016 [8]. This study conducted a global expert elicitation, with expert panels representing different world regions and groups of hazards, to estimate attribution proportions for foodborne, environmental, direct contact, or person-to-person transmission. Because estimates were not produced at a national level, we applied estimates for the subregion that includes Denmark (WHO subregion EUR-A). For simplification purposes, we multiplied point estimates without accounting for uncertainty range of neither of the parameters.
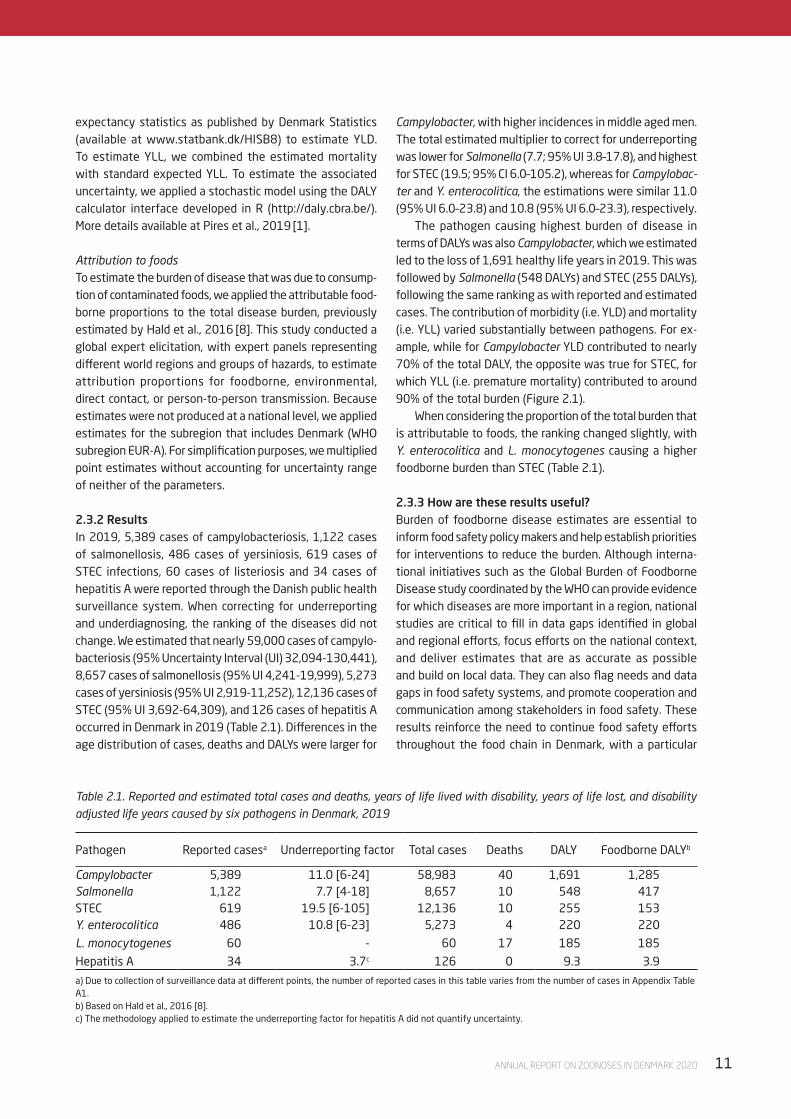
2.3.2 ResultsIn 2019, 5,389 cases of campylobacteriosis, 1,122 cases of salmonellosis, 486 cases of yersiniosis, 619 cases of STEC infections, 60 cases of listeriosis and 34 cases of hepatitis A were reported through the Danish public health surveillance system. When correcting for underreporting and underdiagnosing, the ranking of the diseases did not change. We estimated that nearly 59,000 cases of campylo-bacteriosis (95% Uncertainty Interval (UI) 32,094-130,441), 8,657 cases of salmonellosis (95% UI 4,241-19,999), 5,273 cases of yersiniosis (95% UI 2,919-11,252), 12,136 cases of STEC (95% UI 3,692-64,309), and 126 cases of hepatitis A occurred in Denmark in 2019 (Table 2.1). Differences in the age distribution of cases, deaths and DALYs were larger for
Campylobacter, with higher incidences in middle aged men. The total estimated multiplier to correct for underreporting was lower for Salmonella (7.7; 95% UI 3.8–17.8), and highest for STEC (19.5; 95% CI 6.0–105.2), whereas for Campylobac-ter and Y. enterocolitica, the estimations were similar 11.0 (95% UI 6.0–23.8) and 10.8 (95% UI 6.0–23.3), respectively.
The pathogen causing highest burden of disease in terms of DALYs was also Campylobacter, which we estimated led to the loss of 1,691 healthy life years in 2019. This was followed by Salmonella (548 DALYs) and STEC (255 DALYs), following the same ranking as with reported and estimated cases. The contribution of morbidity (i.e. YLD) and mortality (i.e. YLL) varied substantially between pathogens. For ex-ample, while for Campylobacter YLD contributed to nearly 70% of the total DALY, the opposite was true for STEC, for which YLL (i.e. premature mortality) contributed to around 90% of the total burden (Figure 2.1).
When considering the proportion of the total burden that is attributable to foods, the ranking changed slightly, with Y. enterocolitica and L. monocytogenes causing a higher foodborne burden than STEC (Table 2.1).
2.3.3 How are these results useful?Burden of foodborne disease estimates are essential to inform food safety policy makers and help establish priorities for interventions to reduce the burden. Although interna-tional initiatives such as the Global Burden of Foodborne Disease study coordinated by the WHO can provide evidence for which diseases are more important in a region, national studies are critical to fill in data gaps identified in global and regional efforts, focus efforts on the national context, and deliver estimates that are as accurate as possible and build on local data. They can also flag needs and data gaps in food safety systems, and promote cooperation and communication among stakeholders in food safety. These results reinforce the need to continue food safety efforts throughout the food chain in Denmark, with a particular
Pathogen Reported casesa Underreporting factor Total cases Deaths DALY Foodborne DALYb
Campylobacter 5,389 11.0 [6-24] 58,983 40 1,691 1,285Salmonella 1,122 7.7 [4-18] 8,657 10 548 417STEC 619 19.5 [6-105] 12,136 10 255 153Y. enterocolitica 486 10.8 [6-23] 5,273 4 220 220
L. monocytogenes 60 - 60 17 185 185
Hepatitis A 34 3.7c 126 0 9.3 3.9
Table 2.1. Reported and estimated total cases and deaths, years of life lived with disability, years of life lost, and disability adjusted life years caused by six pathogens in Denmark, 2019
a) Due to collection of surveillance data at different points, the number of reported cases in this table varies from the number of cases in Appendix Table A1.b) Based on Hald et al., 2016 [8].c) The methodology applied to estimate the underreporting factor for hepatitis A did not quantify uncertainty.

ANNUAL REPORT ON ZOONOSES IN DENMARK 202012
focus on reducing the incidence of Campylobacter infec-tions. If presented regularly, they can help monitor trends in foodborne disease burden and the impact of implemented food safety interventions.
2.4 References1. Pires SM, Jakobsen LS, Ellis-Iversen J, Pessoa J, Ethelberg
S. (2019). Burden of Disease Estimates of Seven Patho-gens Commonly Transmitted Through Foods in Denmark, 2017. Foodborne Pathog Dis. 2020 May;17(5):322-339. doi: 10.1089/fpd.2019.2705. Epub 2019 Nov 22.
2. Murray CJL. (1994). Quantifying the burden of disease: The technical basis for disability-adjusted life years. Bull World Health Organ 1994;72(3):429–445.
3. Jensen AK, Björkman JT, Ethelberg S, Kiil K, Kemp M, Nielsen EM. (2016). Molecular Typing and Epidemiol-ogy of Human Listeriosis Cases, Denmark, 2002-2012. Emerg Infect Dis. 2016;22(4):625-633. doi:10.3201/eid2204.150998.
4. Haagsma JA, Geenen PL, Ethelberg S, Fetsch A, Hansdot-ter F, Jansen , Korsgaard H, O’Brien SJ, Scavia G, Spitznagel H, et al. (2012). Community incidence of pathogen-specific gastroenteritis: reconstructing the surveillance pyramid for seven pathogens in seven European Union member states. Epidemiol Infect. 2013;141(8):1625-1639. doi:10.1017/S0950268812002166. Epub 2012 Sep 27.
5. Müller L, Korsgaard H, Ethelberg S. (2011). Burden of acute gastrointestinal illness in Denmark 2009: a pop-ulation-based telephone survey. Epidemiol Infect 2012 Feb;140(2):290-8. doi: 10.1017/S0950268811000471. Epub 2011 Apr 7.
6. Devleesschauwer B, Havelaar AH, Maertens De Noord-hout C, et al. (2014) DALY calculation in practice (2014) A stepwise approach. Int J Public Health. 2014;59(3):571-574. doi:10.1007/s00038-014-0553-y.
7. Salomon JA, Haagsma JA, Davis A, et al. (2015). Disability weights for the Global Burden of Disease 2013 study. Lancet Glob Heal. 2015;3(11):e712-e723. doi:10.1016/S2214-109X(15)00069-8.
8. Hald T, Aspinall W, Devleesschauwer B, et al. (2016). World Health Organization estimates of the relative contribu-tions of food to the burden of disease due to selected foodborne hazards: A structured expert elicitation. PLoS One. 2016;11(1):e0145839. Published 2016 Jan 19. doi:10.1371/journal.pone.0145839.
Figure 2.1. Total disability adjusted life years (DALYs) and contribution of years of life lost due to disability (YLD) and years of life lost due to premature death (YLL) of six foodborne pathogens in Denmark, 2019
a) Note for hepatitis A, that the value for YLD is not visible in the figure because of the relativly low value.
0 500 1000 1500
Hepatitis Aª
L. monocytogenes
Y. enterocolítica
STEC
Salmonella
Campylobacter
YLD YLL

13 ANNUAL REPORT ON ZOONOSES IN DENMARK 2020
3.1 Trend in foodborne bacterial pathogens 2018-2020All laboratory-confirmed human cases due to foodborne bacterial pathogens are recorded in the Register of Enteric Pathogens maintained at Statens Serum Institut (SSI) and set up for surveillance to follow trends and detect outbreaks. The numbers of human cases registered with the most common foodborne bacterial pathogens, Campylobacter (jejuni and coli), Salmonella, Shiga toxin–producing Escherichia coli (STEC) and Yersinia enterocolitica varies over the last three years with a decline in total number of cases for STEC, Salmonella and Campylobacter in 2020 (Figure 3.1).
The number of Campylobacter cases increased from 2018 to 2019 (Figure 3.1) and this was mainly due to one large outbreak in 2019 [1]. From 2019 to 2020 the number of cases decreased by 31% from 5,389 to 3,742 cases (Table 3.1). For STEC, a similar pattern was seen, an increase of cases from 2018 to 2019 (Figure 3.1) caused by a change in diagnostics [1] and a decrease of 29% from 630 in 2019 to 448 cases in 2020 (Table 3.1). The decline seen in the number of Salmonella cases was even larger. The total number of Salmonella cases had been quite stable in the years 2018 and 2019 with 1,168 and 1,120 cases (Appendix Table A1). The number decreased in 2020 to 614 cases, a decrease of 45% from 2019 to
3. Foodborne bacterial pathogens in a year with covid-19 restrictionsBy Mia Torpdahl ([email protected]) and Luise Müller
2020 (Table 3.1). Finally, the number of Y. enterocolitica cases has been relatively stable between 2018 and 2020 (Figure 3.1) and the only pathogen, where a 10% increase from 2019 to 2020 was registered (Table 3.1).
3.2 Trend in foodborne pathogens 2018-20, based on travel status of casesThe comparison within each species of human infections acquired domestically or with unknown travel status display the same general seasonal patterns from 2018 to 2020 (Figure 3.2). A small drop in cases of all four pathogens were seen in spring 2020 in contrast to 2018 and 2019 (Figure 3.2). The number of Campylobacter cases with domestic or unknown travel status have been stable over the three year period (Figure 3.2) and with a decrease of 11% from 2019 to 2020 (Table 3.1). Lower levels of Salmonella infections acquired domestically or with unknown travel status are apparent in 2020 in comparison to 2018 and 2019 (Figure 3.2) with a decrease of 24% from 2019 to 2020 (Table 3.1). The numbers seems to catch up with the previous years (Figure 3.2), with a peak in July 2020 due to a domestic outbreak of Salmonella Strathcona including 25 cases (see chapter 1). Due to diagnostic differences from mid-2019 when diagnosing STEC infections, it is difficult to follow the trends over the three years. It is apparent
Figure 3.1. Number of cases of the four most common foodborne bacterial pathogens in Denmark, 2018-2020
0
1000
2000
3000
4000
5000
6000
Yersiniaenterocolitica
STEC Salmonella Campylobacterjejuni/coli
2018 2019 2020
Source: Statens Serum Institut

ANNUAL REPORT ON ZOONOSES IN DENMARK 202014
though, that the number of cases declined dramatically in the summer 2020 when compared to the summer 2019 (Figure 3.2). Overall, the number of STEC cases domestic or with unknown travel status declined with 20% from 2019 to 2020 (Table 3.1). The number of infections caused by Y. enterocolitica are very similar over the three years (Figure 3.2). The only deviations from this being a top in the beginning of 2018 (Figure 3.2) caused by diagnostic differences at the clinical laboratories and the peak in March 2019 caused by an outbreak [1]. In contrast to the other pathogens, the number of cases with domestic or unknown travel status increased with 19% (Table 3.1).
Comparing the whole period and the four pathogens,
there are large pathogen-specific deviations in the number of cases related to travel (Figure 3.3). In 2019, travel-related foodborne infections accounts for a larger percentage of Campylobacter (28%) and Salmonella cases (42%) in comparison to STEC (13%) and Y. enterocolitica (16%) (Table 3.1). The comparison within each pathogen of travel-associated cases display the same general seasonal patterns from 2018 to 2019 (Figure 3.3). A common trend for all four pathogens is the dramatic decline in travel-related cases from spring 2020 (Figure 3.3). This decline resulted in a lower percentage of travel-related cases in 2020, ranging from 2% (STEC) to 20% (Salmonella) of the total number that year (Table 3.1). When comparing the number of travel-related cases
Figure 3.2. Number of cases diagnosed with the four most common bacterial foodborne pathogens in Denmark, acquired domestically or with unknown travel status, 2018-2020
Source: Statens Serum Institut
2019 2020 Change from 2019 to 2020
Pathogen Total Domestic/unknown Travel Total Domestic/
unknown Travel Total Domestic/unknown Travel
Campylobacter jejuni/coli 5,389 3,855 (72%) 1,534 (28%) 3,742 3,421 (91%) 321 (9%) -31% -11% -79%
Salmonella 1,120 646 (58%) 474 (42%) 614 490 (80%) 124 (20%) -45% -24% -74%
STEC 630 549 (87%) 81 (13%) 448 440 (98%) 8 (2%) -29% -20% -90%
Yersinia enterocolitica 374 316 (84%) 58 (16%) 413 375 (91%) 38 (9%) 10% 19% -34%
Table 3.1. Number of cases including information on travel status and percentage change, 2019-2020
0
100
200
300
400
500
600
Jan. Feb. Mar. Apr. May June July Aug. Sep. Oct. Nov. Dec.
Campylobacter jejuni/coli cases
0
10
20
30
40
50
60
70
80
90
Jan. Feb. Mar. Apr. May June July Aug. Sep. Oct. Nov. Dec.
Salmonella cases
0
20
40
60
80
100
Jan. Feb. Mar. Apr. May June July Aug. Sep. Oct. Nov. Dec.
STEC cases
202020192018
0
10
20
30
40
50
60
70
80
90
Jan. Feb. Mar. Apr. May June July Aug. Sep. Oct. Nov. Dec.
Yersinia enterocolitica cases

15 ANNUAL REPORT ON ZOONOSES IN DENMARK 2020
from 2019 to 2020, Y. enterocolitica decreased by 34%, whereas the decrease of the other three pathogens ranged from 74% to 90% (Table 3.1).
3.3 Discussion of the impact of covid-19 restrictions on foodborne pathogens 2018-20A slight decrease in registered cases of Campylobacter, Salmonella, STEC and Y. enterocolitica was seen in March-April 2020, when the first national lock-down was implemented due to the covid-19 epidemic. During the lock-down restaurants, schools and several work places were closed and international travel was restricted. Access to health care was open, however, Danes were less likely to visit their general practitioner and it is possible that the decrease in registered cases of foodborne pathogens were affected by less samples taken due to this change in behaviour.
The general decrease in total number of Campylobacter, Salmonella and STEC cases throughout 2020 is to a large extend explained by the sizeable decrease in travel-associated cases for all three pathogens, due to the travel restrictions implemented during the covid-19 epidemic. The domestic cases and cases where travel is unknown follow the same seasonal trends from previous years although with decreasing
number of cases. The decline, although significantly smaller than for travel-related cases, indicates that the general restrictions on gatherings, closed restaurants and increased hygiene focus imposed nationally in 2020 due to covid-19, also had an impact on the total number of cases.
In contrast to the decline in cases with Campylobacter, Salmonella and STEC, the number of Y. enterocolitica cases was stable between 2019 and 2020. Travel-associated Y. enterocolitica infections are quite rare and hardly no decline was seen due to the travel restrictions imposed. Further explanation could be that outbreaks of Y. enterocolitica often are caused by exposure to common food items consumed at home and not in specific settings and therefore restrictions implemented in 2020, due to covid-19, has had limited impact.
3.4 References1. Anonymous 2020, Annual Report on Zoonoses in
Denmark 2019, National Food Institute, Technical University of Denmark.
Figure 3.3. Number of travel-associated cases diagnosed with the four most common bacterial foodborne pathogens in Den-mark, 2018 -2020
Source: Statens Serum Institut
202020192018
0
50
100
150
200
250
300
Jan. Feb. Mar. Apr. May June July Aug. Sep. Oct. Nov. Dec.
Campylobacter jejuni/coli cases
0
10
20
30
40
50
60
70
80
Jan. Feb. Mar. Apr. May June July Aug. Sep. Oct. Nov. Dec.
Salmonella cases
0
2
4
6
8
10
12
14
16
18
Jan. Feb. Mar. Apr. May June July Aug. Sep. Oct. Nov. Dec.
STEC cases
0
2
4
6
8
10
12
14
16
Jan. Feb. Mar. Apr. May June July Aug. Sep. Oct. Nov. Dec.
Yersinia enterocolitica cases
ANNUAL REPORT ON ZOONOSES IN DENMARK 202016
4. SARS-CoV-2 in farmed Danish mink
By Anette Boklund ([email protected]), Thomas Bruun Rasmussen, Helle Daugaard Larsen, Tine Dalby and Kåre Mølbak
Natural infections with SARS-CoV-2 (severe acute respira-tory syndrome coronavirus 2) have been observed in dif-ferent species, such as pet dogs and cats and wild felids in zoos [1]. However, until now, mink (Neovison vison) is the only farmed animal, in which natural infection has been observed.
In April 2020, outbreaks of SARS-CoV-2 in farmed mink were reported from the Netherlands. In June 2020, the first Danish outbreaks were reported, followed by out-
breaks reported in France, Greece, Italy, Lithuania, Spain, Sweden, USA, and Canada [1].
Before 2020, Denmark was the world’s largest pro-ducer of mink fur with more than 1,100 mink farms and 17 million mink, leading to a yearly production of 12-13 million pelts. An additional 12 million skins from other countries were each year sold at the auctions at Copenha-gen FUR. In total, corresponding to a value of €700 million
[2].
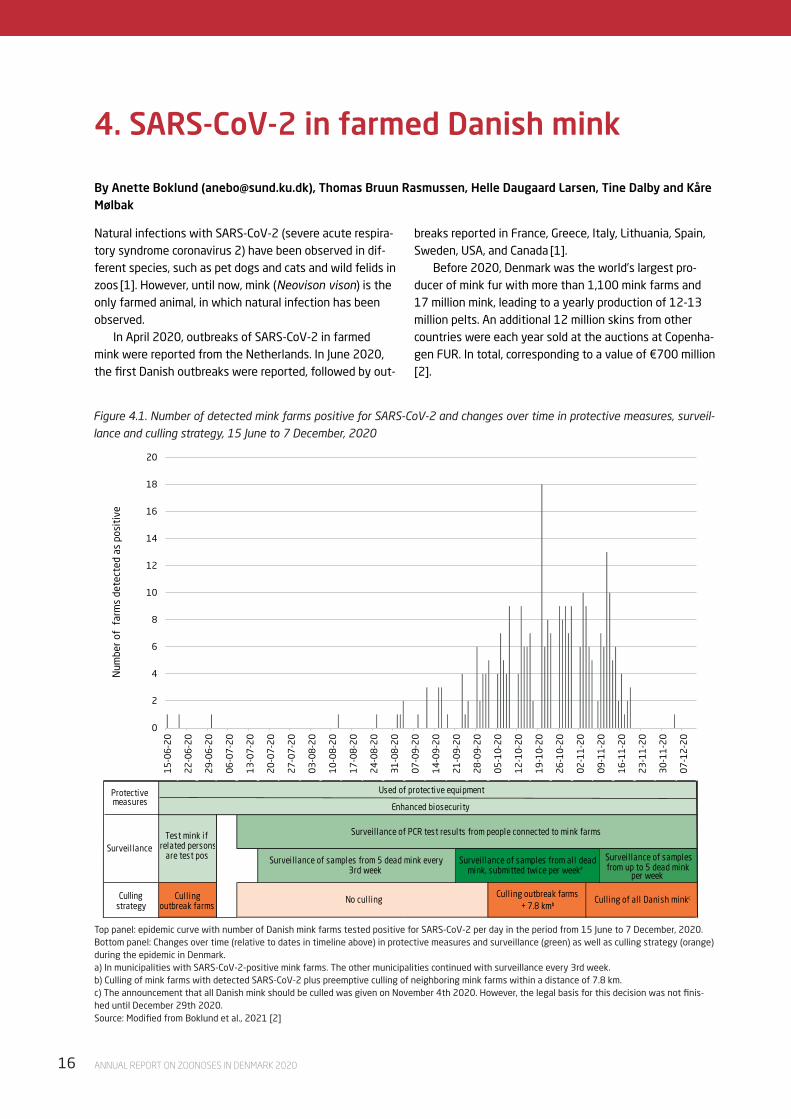
Figure 4.1. Number of detected mink farms positive for SARS-CoV-2 and changes over time in protective measures, surveil-lance and culling strategy, 15 June to 7 December, 2020
Top panel: epidemic curve with number of Danish mink farms tested positive for SARS-CoV-2 per day in the period from 15 June to 7 December, 2020. Bottom panel: Changes over time (relative to dates in timeline above) in protective measures and surveillance (green) as well as culling strategy (orange) during the epidemic in Denmark. a) In municipalities with SARS-CoV-2-positive mink farms. The other municipalities continued with surveillance every 3rd week.b) Culling of mink farms with detected SARS-CoV-2 plus preemptive culling of neighboring mink farms within a distance of 7.8 km.c) The announcement that all Danish mink should be culled was given on November 4th 2020. However, the legal basis for this decision was not finis-hed until December 29th 2020.
0
2
4
6
8
10
12
14
16
18
20
15
-06
-20
22
-06
-20
29
-06
-20
06
-07
-20
13
-07
-20
20
-07
-20
27
-07
-20
03
-08
-20
10
-08
-20
17
-08
-20
24
-08
-20
31
-08
-20
07
-09
-20
14
-09
-20
21
-09
-20
28
-09
-20
05
-10
-20
12
-10
-20
19
-10
-20
26
-10
-20
02
-11
-20
09
-11
-20
16
-11
-20
23
-11
-20
30
-11
-20
07
-12
-20
Num
ber
of f
arm
s de
tect
ed a
s po
siti
ve
Culling strategy
Protective measures
SurveillanceTest mink if
related persons are test pos
Culling outbreak farms + 7.8 kmb
Used of protective equipment
Enhanced biosecurity
Culling outbreak farms
Culling of all Danish minkc
Surveillance of samples from up to 5 dead mink
per week
Surveillance of PCR test results from people connected to mink farms
Surveillance of samples from 5 dead mink every 3rd week
Surveillance of samples from all dead mink, submitted twice per weekª
No cullingCullingstrategy
Source: Modified from Boklund et al., 2021 [2]

17 ANNUAL REPORT ON ZOONOSES IN DENMARK 2020
4.1 Description of the epidemic in minkThe first Danish outbreak of SARS-CoV-2 was confirmed on 15 June 2020, in a farm in the Northern part of Jutland. Shortly after, SARS-CoV-2 was detected in an additio-nal two farms in Northern Jutland, one in the same and another in a neighboring municipality. In all three farms, suspicion was raised as a result of persons directly or indirectly related to the farms testing positive for SARS-CoV-2. On these three farms, all mink were culled shortly after detection of SARS-CoV-2.
In two of these first three infected farms, the pre-valence of PCR-positive and seropositive animals were already high at the time of detection [3]. On the third of these farms, the prevalence of PCR-positive as well as seropositive animals was low at the first sampling date, with a steep increase within the next few days [3] reflec-ting a rapid spread of SARS-CoV-2 among farmed mink.
In the end of June, mink from 125 randomly selected Danish mink farms were tested for SARS-CoV-2, all with negative results [2]. Following, infection with SARS-CoV-2 in animals was made notifiable and a surveillance pro-gramme for mink farms was initiated [4]. Clinical signs in mink should be notified to the Danish Veterinary and Food Administration (DVFA). Furthermore, if persons related to mink farms tested positive for SARS-CoV-2, the farm would be put under suspicion, and follow-up testing initiated. Additionally, all mink farmers should every third week sample five recently dead mink by throat swabs and send to the laboratory for analyses, and mink farmers were encouraged to be tested on a weekly basis.
During the following 6 weeks, no further outbreaks were detected (Figure 4.1). However, on 12 August, SARS-CoV-2 was detected in the fourth Danish mink farm in Northern Jutland. From August to September 28, another 30 outbreak farms were detected, still within the same two muncipalities. From September 29, outbreaks started occurring in neighboring municipalities and from October 6, SARS-CoV-2 was more widespread in Jutland. In the period from August until October 8, mink on out-break farms were not culled [2]. On October 2, when 69 farms were either detected positive or under suspicion of SARS-CoV-2, the Danish government decided that mink on all SARS-CoV-2 positive farms and in zones of 7.8 km around the infected farms should be culled [5]. However, new outbreaks still occurred over the next month, and by November 4, 230 farms spread over 20 municipalities in Jutland were either tested positive or under suspicion for SARS-CoV-2. At this date, it was announced from the Da-nish Prime Minister that all Danish mink should be culled. Subsequently, it was decided that mink farming would not be allowed in Denmark until 2022 [6]. By the end of 2020, nearly all Danish mink were culled, with only two farms remaining. These two were culled in early 2021. In total,
SARS-CoV-2 was detected in 290 mink farms.
4.2 Clinical signs and test results in positive mink in farmsIn one third of the outbreak farms, suspicion was raised based on clinical signs in mink, and 10% of the suspicions were raised based on tracing contacts from infected farms. Furthermore, in 24% of the farms, suspicion was raised based on tracing from persons tested positive for SARS-CoV-2, and in 32% of the farms suspicion was raised as a result of testing of dead mink in the “early warning” system.
In 30% of infected farms, no clinical signs were ob-served among the mink. When clinical signs were present, they were most often unspecific, e.g., reduced feed intake (54%), respiratory symptoms (31%) and nasal symptoms (discharge 25%, sneezing 23%) [2]. However, mortality increased in 63% of the farms. The increased mortality was observed for approximately 10 days and peaked at a daily mortality rate of 0.14% (5-95-percentile: 0.11-1.9%) in the farms where detailed mortality data were available. For comparison, the normal mortality is 1-4 animals per month on an average farm of size 10,000 mink [1]. The median duration of clinical signs, including increased mor-tality, was 11 days. Only a few farms experienced clinical signs for more than 20 days [2].
Overall, the virus- and seroprevalence were high in infected farms at the time of sampling. In 65% of all sampled farms, the virus-prevalence among the 30 samp-led animals was 100% at the first sampling date, while in farms without observation of clinical signs, 45% had a 100% virus-prevalence. Among 160 farms, where blood samples were collected at the first sampling date, 69% had a seroprevalence of 100% at the first sampling date. Furthermore, most often the virus-prevalence had decre-ased to the second sampling date. Together, these results indicate that either farms were detected late after virus had been introduced, or that a fast virus spread occurred in the farms [2]. In one farm, only 12.5% tested mink were virus-positive at the first sampling date, while four days later at the second sampling date, 96% of the tested mink were virus-positive, indicating a very fast spread within the farms.
4.3 SARS-CoV-2 in the environment and other animals
Environmental contamination on the infected farms was investigated by testing of air samples, feed, hair and water. Air samples were collected from 19 different farms, of which seven tested positive for SARS-CoV-2 [2]. The samples were collected at different locations within the farms and with varying distances to mink. Most of the positive samples were collected within one metre from
ANNUAL REPORT ON ZOONOSES IN DENMARK 202018
infected mink and none of the samples collected further than three metres away were positive [2].
Feed from feed containers on infected farms as well as samples from feed batches from suppliers and feed trucks were all tested negative for virus. Mink hair and bedding material collected from e.g., cages were tested positive for virus and a few water samples from the roof ridge and gutters on an infected farm were found positive for SARS-CoV-2 [2]. A swab from the foot of a seagull found dead within an infected farm was also found posi-tive by PCR, but no internal swabs from the seagull were positive for SARS-CoV-2 [2].
Wildlife carnivores in areas with infected mink farms were investigated to provide knowledge about SARS-CoV-2 in wild predators. From October 2020 to the end of November 2020, a wide range of wildlife carnivores, including red foxes (Vulpes vulpes), badgers (Meles meles), least weasels (Mustela nivalis), European polecats (Mustela putorius), otters (Lutra lutra), beech martens (Martes fonia) and racoon dogs (Nyctereutes procynoides) were tested for SARS-CoV-2. Furthermore, samples from feral mink and stray cats were also collected and tested. All samples from wildlife species, feral mink and stray cats tested negative for virus [2]. In some infected mink farms, dogs and cats residing within the fence tested positive for SARS-CoV-2 and/or antibodies to the virus [2].
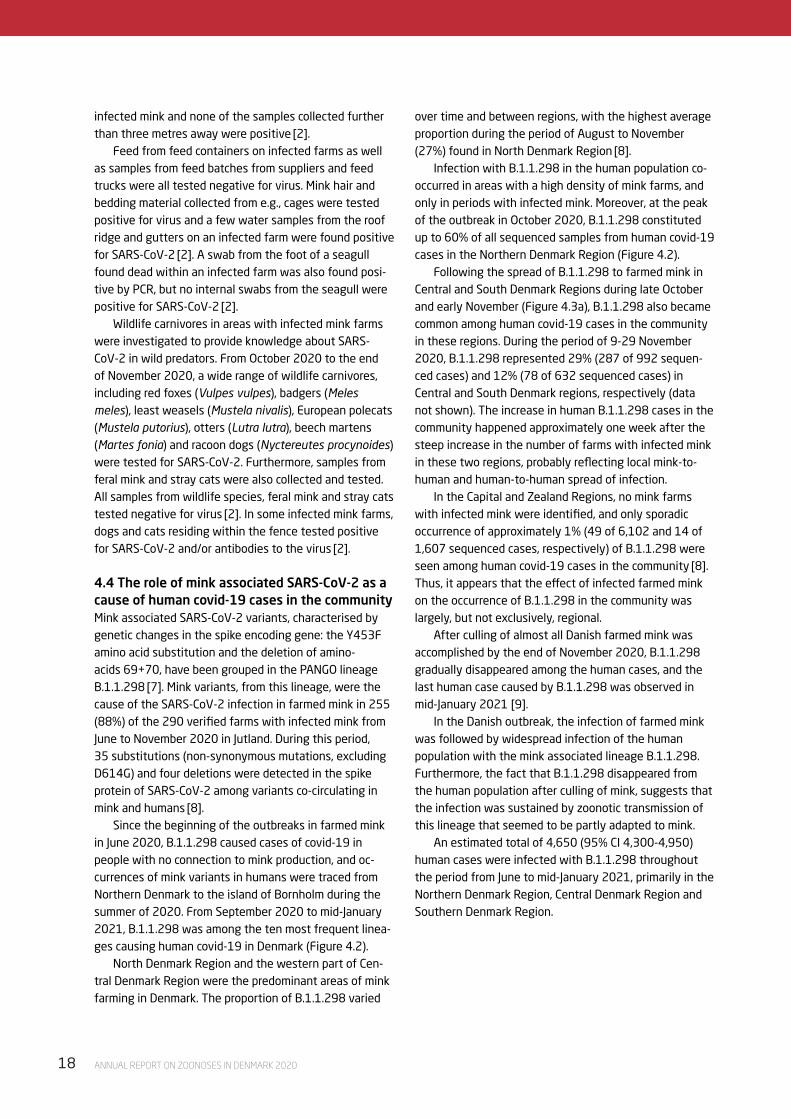
4.4 The role of mink associated SARS-CoV-2 as a cause of human covid-19 cases in the communityMink associated SARS-CoV-2 variants, characterised by genetic changes in the spike encoding gene: the Y453F amino acid substitution and the deletion of amino-acids 69+70, have been grouped in the PANGO lineage B.1.1.298 [7]. Mink variants, from this lineage, were the cause of the SARS-CoV-2 infection in farmed mink in 255 (88%) of the 290 verified farms with infected mink from June to November 2020 in Jutland. During this period, 35 substitutions (non-synonymous mutations, excluding D614G) and four deletions were detected in the spike protein of SARS-CoV-2 among variants co-circulating in mink and humans [8].
Since the beginning of the outbreaks in farmed mink in June 2020, B.1.1.298 caused cases of covid-19 in people with no connection to mink production, and oc-currences of mink variants in humans were traced from Northern Denmark to the island of Bornholm during the summer of 2020. From September 2020 to mid-January 2021, B.1.1.298 was among the ten most frequent linea-ges causing human covid-19 in Denmark (Figure 4.2).
North Denmark Region and the western part of Cen-tral Denmark Region were the predominant areas of mink farming in Denmark. The proportion of B.1.1.298 varied
over time and between regions, with the highest average proportion during the period of August to November (27%) found in North Denmark Region [8].
Infection with B.1.1.298 in the human population co-occurred in areas with a high density of mink farms, and only in periods with infected mink. Moreover, at the peak of the outbreak in October 2020, B.1.1.298 constituted up to 60% of all sequenced samples from human covid-19 cases in the Northern Denmark Region (Figure 4.2).
Following the spread of B.1.1.298 to farmed mink in Central and South Denmark Regions during late October and early November (Figure 4.3a), B.1.1.298 also became common among human covid-19 cases in the community in these regions. During the period of 9-29 November 2020, B.1.1.298 represented 29% (287 of 992 sequen-ced cases) and 12% (78 of 632 sequenced cases) in Central and South Denmark regions, respectively (data not shown). The increase in human B.1.1.298 cases in the community happened approximately one week after the steep increase in the number of farms with infected mink in these two regions, probably reflecting local mink-to-human and human-to-human spread of infection.
In the Capital and Zealand Regions, no mink farms with infected mink were identified, and only sporadic occurrence of approximately 1% (49 of 6,102 and 14 of 1,607 sequenced cases, respectively) of B.1.1.298 were seen among human covid-19 cases in the community [8]. Thus, it appears that the effect of infected farmed mink on the occurrence of B.1.1.298 in the community was largely, but not exclusively, regional.
After culling of almost all Danish farmed mink was accomplished by the end of November 2020, B.1.1.298 gradually disappeared among the human cases, and the last human case caused by B.1.1.298 was observed in mid-January 2021 [9].
In the Danish outbreak, the infection of farmed mink was followed by widespread infection of the human population with the mink associated lineage B.1.1.298. Furthermore, the fact that B.1.1.298 disappeared from the human population after culling of mink, suggests that the infection was sustained by zoonotic transmission of this lineage that seemed to be partly adapted to mink.
An estimated total of 4,650 (95% CI 4,300-4,950) human cases were infected with B.1.1.298 throughout the period from June to mid-January 2021, primarily in the Northern Denmark Region, Central Denmark Region and Southern Denmark Region.
19 ANNUAL REPORT ON ZOONOSES IN DENMARK 2020
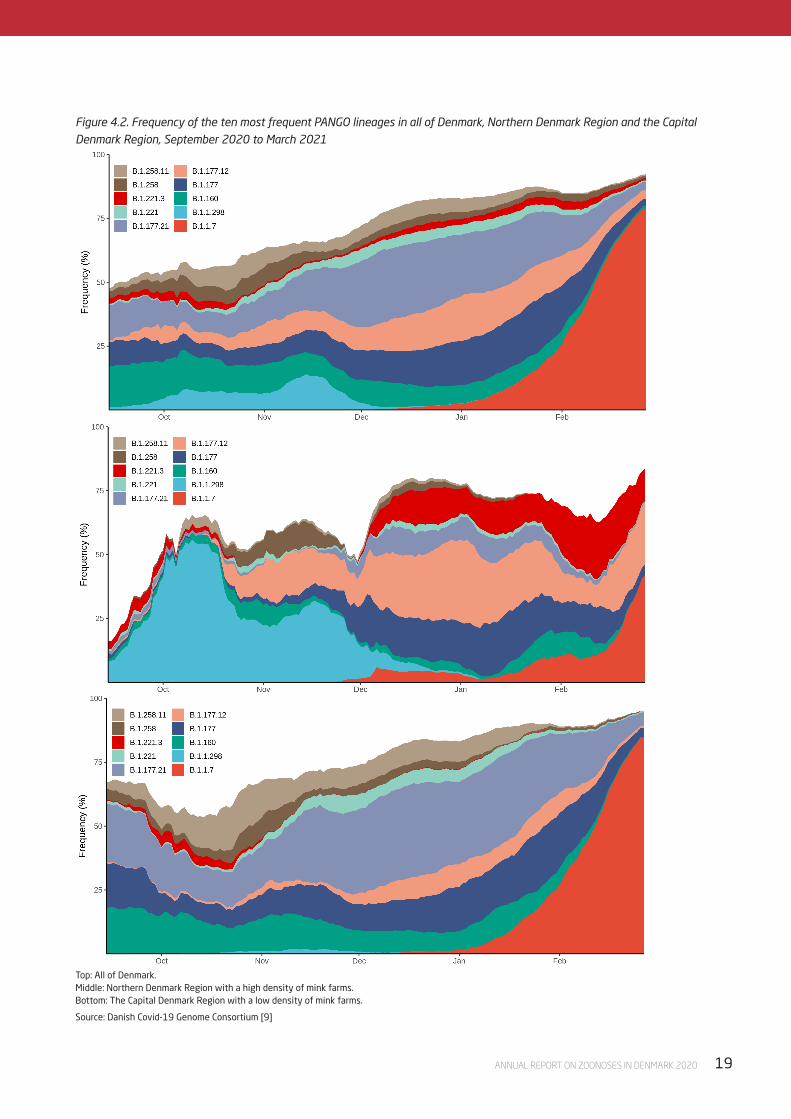
Figure 4.2. Frequency of the ten most frequent PANGO lineages in all of Denmark, Northern Denmark Region and the Capital Denmark Region, September 2020 to March 2021
Top: All of Denmark.Middle: Northern Denmark Region with a high density of mink farms. Bottom: The Capital Denmark Region with a low density of mink farms.
Source: Danish Covid-19 Genome Consortium [9]

ANNUAL REPORT ON ZOONOSES IN DENMARK 202020
4.5 The occupational risk related to mink contact in areas with SARS-CoV-2 in farmed minkConfirmed human cases of SARS-CoV-2 (Figure 4.3b) were linked to a list of addresses of mink farms and mink farm owners (Figure 4.3a), thereby identify-ing human cases residing on mink farms, production sites and at the residence of mink farm owners. In
total, 3,319 people were identified as connected to mink production. However, employees with residence elsewhere were not identified, and could therefore not be included [8].
A close relationship was found between the geographical distribution of farms with SARS-CoV-2 positive mink and covid-19 among people connected
Figure 4.3 a and b. Cumulative percentage of farms with SARS-CoV-2 positive mink (a) and people identified as connected to mink farms that tested PCR-positive for SARS-CoV-2 (b), by province, Denmark, June–December 2020
Source: Danish Veterinary and Food Administration
Source: Statens Serum Institut
9% (21/237)
18% (71/385)
13% (8/60)
47% (190/401)
0% (0/106)
24% (290/1189)
0%
5%
10%
15%
20%
25%
30%
35%
40%
45%
50%
07
-06
-20
20
14
-06
-20
20
21
-06
-20
20
28
-06
-20
20
05
-07
-20
20
12
-07
-20
20
19
-07
-20
20
26
-07
-20
20
02
-08
-20
20
09
-08
-20
20
16
-08
-20
20
23
-08
-20
20
30
-08
-20
20
06
-09
-20
20
13
-09
-20
20
20
-09
-20
20
27
-09
-20
20
04
-10
-20
20
11
-10
-20
20
18
-10
-20
20
25
-10
-20
20
01
-11
-20
20
08
-11
-20
20
15
-11
-20
20
22
-11
-20
20
29
-11
-20
20
06
-12
-20
20
13
-12
-20
20
20
-12
-20
20
27
-12
-20
20
03
-01
-20
21
Min
k fa
rms
wit
h co
nfirm
ed S
AR
S-Co
V-2
inf
ecte
d m
ink,
cum
ulat
ed
South Jutland West Jutland East Jutland North Jutland Other All
a
13% (89/680)
21% (212/1033)
12% (22/177)
30% (324/1092)
3% (9/337)
20% (656/3319)
0%
5%
10%
15%
20%
25%
30%
35%
07
-06
-20
20
14
-06
-20
20
21
-06
-20
20
28
-06
-20
20
05
-07
-20
20
12
-07
-20
20
19
-07
-20
20
26
-07
-20
20
02
-08
-20
20
09
-08
-20
20
16
-08
-20
20
23
-08
-20
20
30
-08
-20
20
06
-09
-20
20
13
-09
-20
20
20
-09
-20
20
27
-09
-20
20
04
-10
-20
20
11
-10
-20
20
18
-10
-20
20
25
-10
-20
20
01
-11
-20
20
08
-11
-20
20
15
-11
-20
20
22
-11
-20
20
29
-11
-20
20
06
-12
-20
20
13
-12
-20
20
20
-12
-20
20
27
-12
-20
20
03
-01
-20
21
covi
d-1
9 c
ases
am
ong
peop
le c
onne
cted
to
min
k fa
rms,
cum
ulat
ed
South Jutland West Jutland East Jutland North Jutland Other All
b

21 ANNUAL REPORT ON ZOONOSES IN DENMARK 2020
to mink farms during the period of 10 August to 29 November 2020 (Figure 4.4) [8].
Overall, from June to end of November 2020, 656 of 3,319 people registered as connected to mink production in Denmark (20%) were tested PCR-positive for SARS-CoV-2 (Figure 4.3b). In areas with infected mink, the cumulative proportion of covid-19 in people connected to mink production was higher than for any other group of occupation in the Danish society during the entire pandemic (15 April 2021: health sector 7.1% (34,354 of 481,345 people), hotel and restaurants 7.5% (5,846 of 78,404 people) [10]). In provinces with no observation of SARS-CoV-2 infected mink, the cumulative incidence among people connected to mink production was con-siderably lower (3%, 9 of 337), and stable throughout the outbreak (Figure 4.3b). In the province of Northern Jutland, 30% (324 of 1,092) of people connected to mink production were tested positive for SARS-CoV-2 by PCR in 2020. The majority were infected during October and
November 2020 (Figure 4.3b). In the province of West Jutland, 21% (212 of 1,033) were tested PCR-positive for SARS-CoV-2 during the same period, with the majority of cases from 1-22 November. In the provinces of South and East Jutland, 13% (89 of 680) and 12% (22 of 177) of people connected to mink production were tested positive for covid-19 by PCR, respectively. Also in these provinces, the majority of cases were detected from 1-22 November (Figure 4.3b).
As the authorities culled mink from farms with a positive SARS-CoV-2 status, mink farmers, their staff and family members were restricted to handle and cull SARS-CoV-2 free mink. Apparently, a considerable oc-cupational risk was connected to the culling of mink from supposedly SARS-CoV-2 free farms, as a total of 311 (9%) of 3,319 people registered as connected to mink produc-tion were tested positive within a period of three weeks, 2-22 November 2020, when the main culling of mink took place. For comparison, 0.4% of the general population was
Figure 4.4. Proportion by municipality of (A) farms with SARS-CoV-2-positive mink among mink farms and (B) covid-19 cases among people identified as connected to mink farms, Denmark, 10 August–29 November 2020
Q1: 4−12%
Q2: 12.1−20%
Q3: 20.1−39%
Q4: 39.1−67%
Proportion of infected mink farms − from 10/08/2020 to 29/11/2020
Q1: 4−15%
Q2: 15.1−21%
Q3: 21.1−26%
Q4: 26.1−50%
Proportion of human cases with known relation to mink production − from 10/08/2020 to 29/11/2020
Q1-4: quartile percent range; SARS-CoV-2: severe acute respiratory syndrome coronavirus 2A The three farms with SARS-CoV-2-infected mink in June were incidentally detected. During July the ad-hoc surveillance became operationalB As representatives for the occupational risk
Note: Only data from 10 August onwards, which were collected once the surveillance was in place are included in the figure.To maintain patient confidentiality, the municipalities of Læsø and Frederikshavn, and the municipalities of Silkeborg and Ikast –Brande, were merged. In the municipalities of Egedal and Stevns (within Zealand), only a few people were connected to mink production, and therefore the one and four positive samples, respectively, constituted large proportions of this group of people.
Source: Larsen et al., 2021 [8]. The original shapefile of Danish municipalities is from the Database of Global Administrative Areas, GADM (www.gadm.org), version 2.5, July 2015

ANNUAL REPORT ON ZOONOSES IN DENMARK 202022
infected in the same period (SSI, unpublished). Of the 311 infected, 215 were connected to farms with a negative SARS-CoV-2 status, and 96 were connected to farms with a confirmed SARS-CoV-2 infection in mink. This further suggest that undetected infection of mink from suppo-sedly SARS-CoV-2 free farms was taking place during this period, and it is likely that more than the confirmed 290 farms housed SARS-CoV-2 infected mink by November 2020. Furthermore, during the pelting season covid-19 outbreaks were detected on eight pelting facilities, including 402 workers. Phylogenetic analyses of these outbreaks are pending.
There was a rapid spread of infection between mink farms in West, South and East Jutland in the beginning of November (Figure 4.3a). Infected farms were typically detected at a late stage in the course of infection within the individual farms, and clinical signs were often lacking or unspecific [2]. Thus, a rapid silent dissemination would have allowed infected mink to go unnoticed for a short period of time and be infectious to humans handling the animals in this period.
In conclusion, a large susceptible population of farmed mink constitutes a risk of a massive ongoing viral pro-pagation and further adaptations, spilling back into the human population. The detection of spill back into the human population and to other mink farms depends on a high frequency of testing and on characterisation of virus types detected in both mink and humans, with particular focus on people connected to mink production.
The Danish experience was unique due to the magnitude and density of the Danish mink production in 2020. However, infected mink on one farm was enough to cause human infection in the community. Fortunately, the B.1.1.298 lineage in the Danish 2020 outbreak seemed to be primarily adapted to mink, as the spread among hu-mans decreased as the number of farmed mink decreased.
The Danish experience calls for an international and coordinated One Health approach to SARS-CoV-2 infection of farmed mink.
This chapter was made in collaboration between Statens Serum Institut and The University of Copenhagen.
4.5 References1. European Food Safety Authority and European Centre
for Disease Prevention and Control, Boklund A, Gortá-zar C, Pasquali P, Roberts H, Nielsen SS, Stahl K, Stege-man A, Baldinelli F, Broglia A, Van Der Stede Y, Adl-hoch C, Alm E, Melidou A and Mirinaviciute G. (2021). Scientific Opinion on the monitoring of SARS-CoV-2 infection in mustelids. EFSA Journal 2021;19(3):6459, 68 pp. https://doi.org/10.2903/j.efsa.2021.6459.
2. Boklund A, Hammer AS, Quaade ML, Rasmussen TB, Lohse L, Strandbygaard B, Jørgensen CS, Olesen AS, Hjerpe FB, Petersen HH, Jensen TK, et al. (2021) SARS-CoV-2 in Danish Mink Farms: Course of the Epidemic and a Descriptive Analysis of the Outbreaks in 2020. Animals 2021, 11, 164. https://doi.org/10.3390/ani11010164.
3. Hammer A, Quaade M, Rasmussen T, Fonager J, Rasmussen M, Mundbjerg K, et al. (2020) SARS-CoV-2 Transmission between Mink (Neovison vison) and Humans, Denmark. Emerg Infect Dis. 2021;27(2):547-551. https://dx.doi.org/10.3201/eid2702.203794.
4. Ministerial Order No. 1172 of 17/07/2020, https://www.retsinformation.dk/eli/lta/2020/1172 (in Danish).
5. Ministerial Order No. 1455 of 8/10/2020, https://www.retsinformation.dk/eli/lta/2020/1455 (in Danish).
6. Press conference 04/11/2020, https://www.stm.dk/presse/pressemoedearkiv/pressemoede-den-4-novem-ber-2020/ (in Danish).
7. PANGO lineage B.1.1.298, https://cov-lineages.org/lineages/lineage_B.1.1.298.html.
8. Larsen HD, Fonager J, Lomholt FK, Dalby T, Benedetti G, Kristensen B, Urth TR, Rasmussen M, Lassaunière R, Rasmussen TB, Strandbygaard B, Lohse L, Chaine M, Møller KL, Berthelsen AN, Nørgaard SK, Sönksen UW, Boklund AE, Hammer AS, Belsham GJ, Krause TG, Mortensen S, Bøtner A, Fomsgaard A, Mølbak K. (2021). Preliminary report of an outbreak of SARS-CoV-2 in mink and mink farmers associated with community spread, Denmark, June to November 2020. Euro Surveill. 2021;26(5):pii=2100009. https://doi.org/10.2807/1560-7917.ES.2021.26.5.210009.
9. Danish Covid-19 Genome Consortium, https://www.covid19genomics.dk/home.
10. Statens Serum Institut (2020). COVID-19 – branche- og arbejdsmarkedstilknytning, https://files.ssi.dk/covid19/brancher/alle/ansatte-alle-brancher-covid-19-uge15-ps93 (in Danish).

23 ANNUAL REPORT ON ZOONOSES IN DENMARK 2020
5. Vectorborne zoonoses
By René Bødker ([email protected]), Erika Thorhauge-Thejll, Lene Jung Kjær, Jonno Jorn Stelder and Anette Boklund
The Danish Veterinary Consortium at the University of Copenhagen monitors vectors and vectorborne diseases in Denmark on behalf of the Danish Veterinary and Food Administration. The surveillance focuses on endemic vectors but also screens for exotic vectors. Mosquitoes and biting midges in Denmark have been monitored weekly during the vector season since 2011 and 2012, respectively. Mechani-cal vectors (Tabanidae and other flies) and tick vectors have been monitored regularly since 2017. Surveillance data are continuously updated at www.myggetal.dk.
5.1 Low risk of West Nile virus in the cold summer of 2020The vector season 2020 was affected by an unusually cold July. The number of mosquitoes were relatively low during summer and after July the populations were delayed and also peaked later than usual as a result of the cold July. Especially the important bridge vector for West Nile virus Culex modestus was affected by the low temperatures and was completely absent at several previously identified breeding sites. This species was first discovered in Denmark in 2013 around the Køge Bay area just south of Copenhagen
[1]. The Køge bay area remains the most northern breeding site for C. modestus in Europe. The northern distribution of C. modestus is expected to be largely driven by the cool climate and the dramatic decline in the abundance of this species in the cooler 2020 supports this hypothesis. C. modestus is considered one of the most important potential vectors of diseases in Denmark as it is able to transmit West Nile virus from wild birds (the natural reservoir for the virus) to humans and horses, as it bites both birds and mammals. In 2020 a new Culex species C. territans was identified in Denmark by our vector surveillance. C. territans is prob-ably the most harmless mosquito species in Denmark as it predominantly bites frogs. However, identifying adult mosquitoes of this species proves the ability of the vector surveillance programme to collect and identify rare and new mosquito species. This is important because a key objective of the vector surveillance programme is to be able to detect and report invasive exotic mosquito species.
5.2 Potential zoonotic LA-MRSA risk from vectors In recent years the zoonotic livestock-associated form of Methicillin-resistant Staphylococcus aureus (LA-MRSA) has been rapidly spreading between pig farms in Denmark, but epidemiological simulation spread models are unable to
explain the entire observed spread [2]. LA-MRSA has also spread to humans, but the majority of infections concern people living in rural areas often without direct contact to pigs on farms [3]. Flies are often carriers of bacteria, and they may sometimes be important mechanical vectors of specific pathogens because the flies actively target a new host the pathogen may be transmitted to. Moreover, flies are often attracted to wounds and other susceptible surfaces on the host. This ability of the vector to actively identify target hosts and land in a wound suggests that flies could be vectors of LA-MRSA in rural areas of Denmark. To explore this, we did a series of repeated experiments with naturally LA-MRSA contaminated house flies (Musca domestica) and stable flies (Stomoxys calcitrans). Both species were col-lected in an LA-MRSA affected Danish pig farm and brought to the laboratory. The survival of the LA-MRSA on batches of both species of flies was then measured daily by cultur-ing surface extracts of the flies on a selective medium. On average, 27% of the house flies carried live LA-MRSA in a concentration high enough to be detected by culture when they arrived at the laboratory. Only 7% of the stable flies tested positive at arrival at the laboratory, but both contamination rates were high for a vectorborne infection. While contamination rates rapidly dropped in both species within the first 24 hours, many flies remained positive for live bacteria for 48 hours after being removed from the farm [4]. To estimate the potential for spread we calculated the distance between 99.1% of all known residential addresses in Denmark (n = 2,057,350) and found that 65.2% of the resi-dential addresses were situated within three kilometres of a pig farm. This short distance, can in theory, easily be covered by a fly within 48 hours, corresponding to the survival time of the LA-MRSA. The high average contamination rates on flies in an LA-MRSA affected Danish pig farm, the long sur-vival time of the bacteria of both fly species, and the short distances between pig farms and most human addresses suggest that flies may be able to transport live LA-MRSA bacteria to the majority of human residential addresses in Denmark [4]. The study indicates that flies escaping from contaminated stables are able to locate and land on most humans in Denmark. However, the study did not determine how infectious the contaminated flies are to humans. Im-portantly, it is not known to what degree the flies are able to transmit the LA-MRSA to humans, and the contamination rates on Danish flies outside pig farms remains unknown.

ANNUAL REPORT ON ZOONOSES IN DENMARK 202024
5.3 Emerging ticks and tick borne pathogens in Denmark The only endemic tick species of zoonotic importance in Denmark is the castor bean tick (Ixodes ricinus), but in recent years new species of ticks have been sporadically recorded. In 2018 the large Mediterranean Hyalomma tick was discovered on animals and humans in Denmark and the neighbouring countries [5]. Here in 2020 the brown dog tick (Rhipicephalus sanguineus) was reported to the vector surveillance programme by a veterinarian who found the tick on a dog returning from a vacation with its owners in Spain (Figure 5.1). The tick transmits a number of important diseases in dogs, but it may also carry zoonotic Rickettsia species. International travel with companion animals and import and adoption of dogs from abroad remains a constant risk of introducing new tick species and diseases to Denmark. Also the exotic meadow tick (Dermacentor reticulatus) is now continuously being reported on dogs in Denmark (Figure 5.2), and dogs that have never been outside Denmark are being diagnosed with the severe infection of Babesia canis. B. canis is carried by D. reticulatus, but not by the endemic I. ricinus tick. Meadow ticks has been shown to harbour a number of zoonotic pathogens not found in endemic ticks. One of these zoonotic pathogens, Rickettsia raoultii, was previously identified in introduced meadow ticks in Denmark [6]. Despite continuously screening for meadow ticks in B. canis outbreak areas, we have not been able to locate any ex-otic questing meadow ticks in nature anywhere in Denmark.
5.4 References1. Bødker R, Klitgard K, Byriel DB, Kristensen B. (2014).
Establishment of the West Nile virus vector, Culex mod-estus, in a residential area in Denmark. J Vector Ecol. 2014;39(2):1-3. doi:10.1111/jvec.12121.
2. Schulz J, Boklund A, Toft N, Halasa T. (2018). Drivers for Livestock-Associated Methicillin-Resistant Staphylococ-cus Aureus Spread among Danish Pig Herds - A Simulation Study. Sci Rep. 2018;8(1):16962. Published 2018 Nov 16. doi:10.1038/s41598-018-34951-1.
3. Anker JCH, Koch A, Ethelberg S, Mølbak K, Larsen L, Jepsen MR. (2018) Distance to pig farms as risk fac-tor for community-onset livestock-associated MRSA CC398 infection in persons without known contact to pig farms—A nationwide study. Zoonoses Public Health. 2018;65(3):352-360. doi:10.1111/zph.12441.
4. Stelder JJ, Kjær LJ, Jensen LB, Boklund AE, Denwood M, Carlsen M, Bødker R. (2021) Livestock-associated MRSA survival on house flies (Musca domestica) and stable flies (Stomoxys calcitrans) after removal from a Danish pig farm. Sci Rep. 2021;11(1).3527. https://doi.org/10.1038/s41598-021-83228-7.
5. Anonymous (2019). Annual Report on Zoonoses in Den-mark 2018. National Food Institute, Technical University of Denmark.
6. Schou KK, Chriél M, Isbrand A, Jensen TK & Bødker R. (2017) Identification of Dermacentor reticulatus Ticks Carrying Rickettsia raoultii on Migrating Jackal, Den-mark. Emerg Infec Dis. 23(12), 2072-2074. https://doi.org/10.3201/eid2312.170919.
Figure 5.1. New exotic tick species are now continuously being reported from Denmark. A brown dog tick (Rhipicephalus sanguineus) introduced to Denmark with a Boston terrier returning from a vacation in Spain (left). A meadow tick (Derma-centor reticulatus) removed from a dog recently infected with Babesia canis in Southern Denmark (right)
Photo: Erika Thorhauge-Thejll

25 ANNUAL REPORT ON ZOONOSES IN DENMARK 2020
6.1 EU targetsHarmonised regulation on targets and surveillance in the poultry production has been laid down by the Commission.An overview is presented in Appendix Table A23.
According to Regulation (EC) No 1190/2012, the EU tar-get for Salmonella in breeding and fattening turkey flocks is 1% positive for S. Typhimurium or S. Enteritidis. In Denmark, no turkey flocks were positive with S. Typhimurium or S. Enteritidis in 2020 (Appendix Table A8).
In breeding flocks of Gallus gallus, Regulation (EC) No 200/2010 lays down a target of maximum 1% adult flocks positive for S. Typhimurium including the monophasic S. 1,4,[5],12:i:- variant, S. Enteritidis, S. Hadar, S. Infantis and S. Virchow. In the legislation no distinction is made between breeding flocks from the table egg and broiler production lines. In Denmark, two breeding flocks were positive for target serovars in 2020 with S. Typhimurium and S. Ente-ritidis (Appendix Table A5 and A7). Thereby, 0.8% of the breeding flocks of G. gallus in Denmark were positive for target serovars.
Regulation (EC) No 517/2011 lays down targets for the reduction of Salmonella in laying flocks. The targets are Member State specific and are set either as an annual
10-40% reduction of positive adult flocks dependent on the prevalence of adult flocks in the Member State the previous year or a maximum of 2% adult flocks positive. For Denmark, the target is a maximum of 2% adult flocks positive for S. Typhimurium including the monophasic S. 1,4,[5],12:i:- variant and S. Enteritidis. The prevalence in Denmark has been below 2% since 2004, except for 2018, where 2.2% of flocks were found positive with target serovars. In 2020 the prevalence was 1.2%, as five flocks were positive with target serovars (Appendix Table A5).
In broiler flocks of G. gallus, Regulation (EC) No 200/2012 lays down a target at a maximum of 1% flocks positive for S. Enteritidis and S. Typhimurium including the monophasic S. 1,4,[5],12:i:- variant. Denmark has had intensive Salmonella control programmes since the 90’s and the target of 1% was reached in 2000. In 2020, 0.2% of broiler flocks was positive with target serovars (Appendix Table A7).
6. International topics
By Pernille Charlotte Tillisch ([email protected])
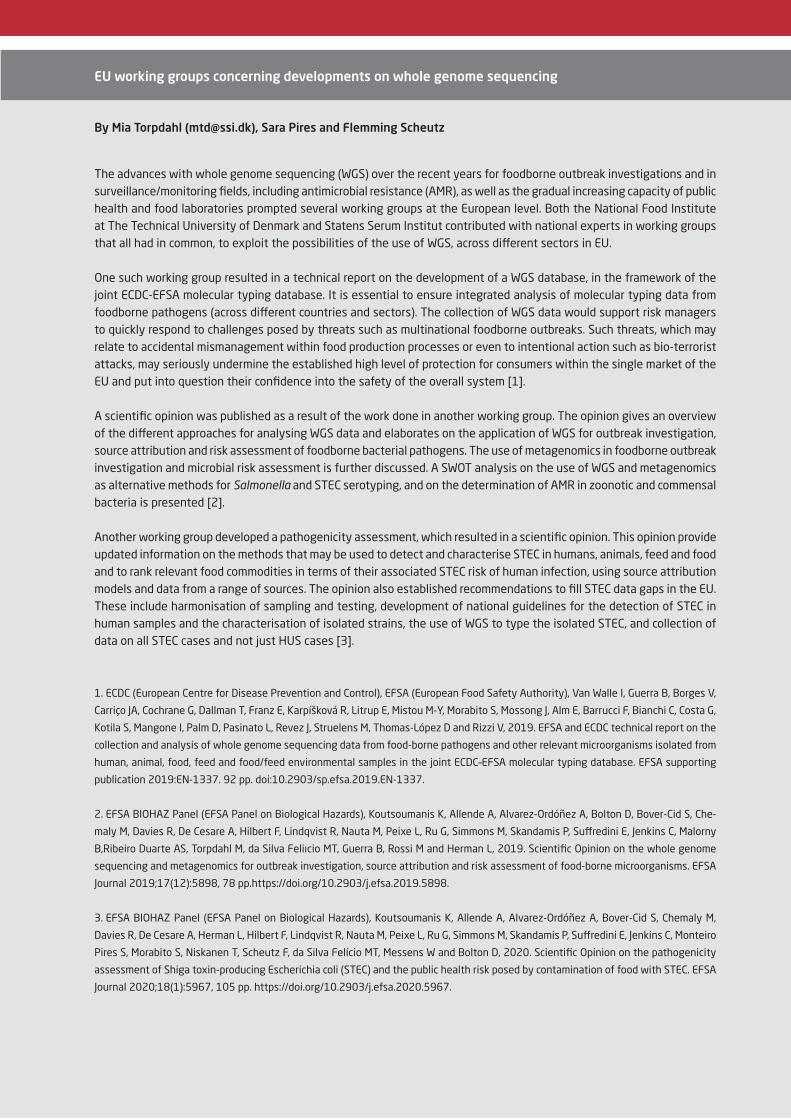
ANNUAL REPORT ON ZOONOSES IN DENMARK 202026
1 EU working groups concerning developments on whole genome sequencing
The advances with whole genome sequencing (WGS) over the recent years for foodborne outbreak investigations and in surveillance/monitoring fields, including antimicrobial resistance (AMR), as well as the gradual increasing capacity of public health and food laboratories prompted several working groups at the European level. Both the National Food Institute at The Technical University of Denmark and Statens Serum Institut contributed with national experts in working groups that all had in common, to exploit the possibilities of the use of WGS, across different sectors in EU.
One such working group resulted in a technical report on the development of a WGS database, in the framework of the joint ECDC-EFSA molecular typing database. It is essential to ensure integrated analysis of molecular typing data from foodborne pathogens (across different countries and sectors). The collection of WGS data would support risk managers to quickly respond to challenges posed by threats such as multinational foodborne outbreaks. Such threats, which may relate to accidental mismanagement within food production processes or even to intentional action such as bio-terrorist attacks, may seriously undermine the established high level of protection for consumers within the single market of the EU and put into question their confidence into the safety of the overall system [1].
A scientific opinion was published as a result of the work done in another working group. The opinion gives an overview of the different approaches for analysing WGS data and elaborates on the application of WGS for outbreak investigation, source attribution and risk assessment of foodborne bacterial pathogens. The use of metagenomics in foodborne outbreak investigation and microbial risk assessment is further discussed. A SWOT analysis on the use of WGS and metagenomics as alternative methods for Salmonella and STEC serotyping, and on the determination of AMR in zoonotic and commensal bacteria is presented [2].
Another working group developed a pathogenicity assessment, which resulted in a scientific opinion. This opinion provide updated information on the methods that may be used to detect and characterise STEC in humans, animals, feed and food and to rank relevant food commodities in terms of their associated STEC risk of human infection, using source attribution models and data from a range of sources. The opinion also established recommendations to fill STEC data gaps in the EU. These include harmonisation of sampling and testing, development of national guidelines for the detection of STEC in human samples and the characterisation of isolated strains, the use of WGS to type the isolated STEC, and collection of data on all STEC cases and not just HUS cases [3].
1. ECDC (European Centre for Disease Prevention and Control), EFSA (European Food Safety Authority), Van Walle I, Guerra B, Borges V,
Carriço JA, Cochrane G, Dallman T, Franz E, Karpíšková R, Litrup E, Mistou M-Y, Morabito S, Mossong J, Alm E, Barrucci F, Bianchi C, Costa G,
Kotila S, Mangone I, Palm D, Pasinato L, Revez J, Struelens M, Thomas-López D and Rizzi V, 2019. EFSA and ECDC technical report on the
collection and analysis of whole genome sequencing data from food-borne pathogens and other relevant microorganisms isolated from
human, animal, food, feed and food/feed environmental samples in the joint ECDC–EFSA molecular typing database. EFSA supporting
publication 2019:EN-1337. 92 pp. doi:10.2903/sp.efsa.2019.EN-1337.
2. EFSA BIOHAZ Panel (EFSA Panel on Biological Hazards), Koutsoumanis K, Allende A, Alvarez-Ordóñez A, Bolton D, Bover-Cid S, Che-
maly M, Davies R, De Cesare A, Hilbert F, Lindqvist R, Nauta M, Peixe L, Ru G, Simmons M, Skandamis P, Suffredini E, Jenkins C, Malorny
B,Ribeiro Duarte AS, Torpdahl M, da Silva Feliıcio MT, Guerra B, Rossi M and Herman L, 2019. Scientific Opinion on the whole genome
sequencing and metagenomics for outbreak investigation, source attribution and risk assessment of food-borne microorganisms. EFSA
Journal 2019;17(12):5898, 78 pp.https://doi.org/10.2903/j.efsa.2019.5898.
3. EFSA BIOHAZ Panel (EFSA Panel on Biological Hazards), Koutsoumanis K, Allende A, Alvarez-Ordóñez A, Bover-Cid S, Chemaly M,
Davies R, De Cesare A, Herman L, Hilbert F, Lindqvist R, Nauta M, Peixe L, Ru G, Simmons M, Skandamis P, Suffredini E, Jenkins C, Monteiro
Pires S, Morabito S, Niskanen T, Scheutz F, da Silva Felício MT, Messens W and Bolton D, 2020. Scientific Opinion on the pathogenicity
assessment of Shiga toxin-producing Escherichia coli (STEC) and the public health risk posed by contamination of food with STEC. EFSA
Journal 2020;18(1):5967, 105 pp. https://doi.org/10.2903/j.efsa.2020.5967.
By Mia Torpdahl ([email protected]), Sara Pires and Flemming Scheutz

27 ANNUAL REPORT ON ZOONOSES IN DENMARK 2020
7. Danish participation in the One Health European Joint Programme
By Pikka Jokelainen ([email protected])
The One Health concept - that the health of humans, animals and the environment are closely connected - is acknowledged and embraced at the global level by the tripartite partners; World Health Organization (WHO), the Food and Agriculture Organization of the United Nations (FAO) and the World Organisation for Animal Health (OIE), and at European level by the European Food Safety Author-ity (EFSA) and the European Centre for Disease Prevention and Control (ECDC). One Health is inherently international, and international partnerships between institutes can en-able and support collaboration across the different fields related to One Health.
7.1 Landmark partnership One Health European Joint ProgrammeThe One Health European Joint Programme (One Health EJP) is an ongoing international partnership between pub-lic health, animal health and food safety institutes across Europe. Denmark is strongly represented in the One Health EJP Consortium by two partners, the National Food Institute at the Technical University of Denmark (DTU Food) and Statens Serum Institut (SSI).
Launched in January 2018, the One Health EJP now has 44 partners from 22 countries across Europe. Its main focus is to strengthen collaboration and improve preparedness by means of projects and activities in the fields of foodborne zoonoses, antimicrobial resistance (AMR) and emerging threats. The Danish partner institutes participate in 22 out of the altogether 30 Joint Research Projects and Joint Integrative Projects (Table 7.1). Nine of the projects (30% of all) are led by one of the two Danish partners. Furthermore, the Danish partner institutes host the Annual Scientific Meeting of the One Health EJP in 2021.
SSI is represented in the Project Management Team of the One Health EJP, with a Deputy Leader of two major Work Packages: Coordination of the Joint Research Projects, and Science-to-Policy Translation to Stakeholders. The One Health EJP has particular focus on science-to-policy activities with stakeholders across the fields related to One Health, including national ministries, European stakehold-ers (ECDC, EFSA, European Environment Agency (EEA), and European Medicines Agency (EMA)) and global stakeholders (FAO, OIE, WHO Regional Office for Europe), for immediate and long-term impact.
7.2 Three Joint Integrative Projects coordinated by Danish partnersCARE develops new One Health concepts for External Quality Assurance (EQA) schemes for laboratories, refer-ence materials, and quality and availability of demographic data. In 2020, a mapping review was conducted, identifying EQAs offered to the National Reference Laboratories for zoonotic bacterial agents and AMR. The aim is to develop new EQA schemes that can be used across sectors to evalu-ate the capacity to manage foodborne problems from a One Health perspective. The project also aims to provide insight to availability and quality of strain collections and of the demographic data, including those for food production and consumption. A set of zoonotic agents were selected for EUROpanelOH, a reference database of strains and ge-nomes for quality control in food safety and public health protection across sectors.
OH-Harmony-CAP collects information on current capa-bilities, capacities and interoperability at both the National Reference Laboratory and the primary diagnostic level. Quantitative description of current and best practices is followed by development of harmonised protocols for foodborne pathogens across the One Health sectors. During 2020, a pilot survey was conducted as the first step to the development of a benchmarking OHLabCap instrument for surveying One Health laboratory interoperability, capac-ity, adaptability and performance. The project also issued a technical report on practices for sampling and testing for Shiga toxin-producing E. coli (STEC), Enterotoxigenic Escherichia coli (ETEC), Cryptosporidium as well as AMR in Salmonella and Campylobacter, and collected related laboratory protocols across the sectors.
MATRIX works to advance the implementation of One Health Surveillance (OHS) in practice, by building on existing resources, adding value to them and creating synergies. The project encompasses four hazard-specific tracks: Campylo-bacter, Salmonella, Listeria and emerging threats, including AMR. During 2020, MATRIX collaborated with the ORION project on an inventory of surveillance systems across the sectors, and described the commonalities and differences of the various operational frameworks. The inventory pro-vides a foundation for the development of best-practice

ANNUAL REPORT ON ZOONOSES IN DENMARK 202028
Table 7.1. Participation and leadership of Joint Integrative Projects and Joint Research Projects of the One Health EJP by the two Danish partner institutes, 2018-2022 National Food Institute Statens Serum Institut
Joint Integrative Projects of One Health EJP
CARECross-sectoral framework for quality Assurance Resources for countries in the European Union
Leader and participant Participant
MATRIXConnecting dimensions in One-Health surveillance
Participant Leader and participant
OH-Harmony-CAPOne Health Harmonisation of Protocols for the Detection of Foodborne Pathogens and AMR Determinant
Leader and participant
ORIONOne health suRveillance Initiative on harmOnization of data collection and interpretatioN
Participant Participant
COHESIVEOne Health Structure In Europe
Participant
Joint Research Projects of One Health EJP
DiSCoVerDiscovering the sources of Salmonella, Campylobacter, VTEC and antimicrobial resistance
Leader and participant Participant
BeOneBuilding Integrative Tools for One Health Surveillance
Participant Leader and participant
TOXOSOURCESToxoplasma gondii sources quantified
Participant Leader and participant
AIR-SAMPLEAir-sampling, A Low-Cost Screening Tool in Biosecured Broiler Production
Leader and participant
MAD-VirMetagenomic Array Detection of emerging Virus in EU
Leader and participant
TELE-VirPoint-of-incidence toolbox for emerging virus threats
Leader and participant
FARMEDFast Antimicrobial Resistance and Mobile-Element Detection using metagenomics for animal and human on-site tests
Participant Participant
FULL-FORCEFull-length sequencing for an enhanced EFFORT to map and understand drivers and reser-voirs of antimicrobial resistance
Participant Participant
IMPARTImproving phenotypic Antimicrobial Resistance Testing by development of sensitive scree-ning assays for emerging resistances, and setting missing ECOFFs
Participant Participant
MedVetKlebsKlebsiella pneumoniae: from ecology to source attribution and transmission control
Participant Participant
NOVANovel approaches for design and evaluation of cost-effective surveillance across the food chain
Participant Participant
LISTADAPTAdaptive traits of Listeria monocytogenes to its diverse ecological niches
Participant
RADARRisk and Disease burden of Antimicrobial Resistance
Participant
ADONISAssessing Determinants of the Non-Decreasing Incidence of Salmonella
Participant
FED-AMRThe role of free extracellular DNA in dissemination of antimicrobial resistance over ecosystem boundaries along the food/feed chain
Participant
MEmEMulti-centre study on Echinococcus multilocularis and Echinococcus granulosus s.l. in Europe: development and harmonisation of diagnostic methods in the food chain
Participant
PARADISEParasite Detection, Isolation and Evaluation
Participant
Source: One Health EJP

29 ANNUAL REPORT ON ZOONOSES IN DENMARK 2020
OHS guidelines and a roadmap to OHS. Another key aim is to share surveillance inputs and outputs across sectors, providing digital integration centres for decision-making. Moreover, MATRIX develops a benchmarking EUEpiCap tool for performance monitoring and evaluation of OHS.
7.3 Six Joint Integrative Projects coordinated by Danish partnersDiSCoVeR addresses the challenges of source attribution using an interdisciplinary One Health approach. As there is no gold standard for source attribution, DiSCoVeR uses a comprehensive approach applying several different meth-odologies and models in a comparative fashion. The project not only evaluates and advances existing methods, but also explores and develops novel approaches for source attribu-tion. The source attribution estimates target three bacterial pathogens (Salmonella, Campylobacter, and STEC) and AMR.
BeOne works to develop an integrated surveillance dashboard in which molecular and epidemiological data for foodborne pathogens can be analysed, visualised and interpreted interactively by experts across disciplines and sectors. During 2020, the goal to develop a decentralised system for collaborative outbreak surveillance and investi-gation crystallised into an architecture for the platform and a model for data exchange. A literature review of factors impacting outbreak detection was undertaken. The project evaluated data sharing practices across countries, and defined a meta-data schema and a preliminary ontology implementation plan.
TOXOSOURCES investigates the relative contributions of the different sources of Toxoplasma gondii infection us-ing multidisciplinary approaches. In 2020, TOXOSOURCES started the collection of data and building of a quantita-tive microbiological risk assessment model for T. gondii. A literature review supported the selection of a method to detect T. gondii oocysts in fresh produce, for a multicentre study. The project also explores serology for detecting T. gondii infections caused by oocysts. An unprecedented effort of whole genome sequencing of T. gondii isolates was used to identify polymorphic marker regions for the establishment of a new typing method to detect within-genotype variation.
AIR-SAMPLE, which finished in December 2020, inves-tigated air sampling as a low-cost method for detection of Campylobacter in broiler production. The studies dem-onstrated that the likelihood of detecting Campylobacter using air sampling and real-time PCR quadrupled compared to the traditional swab and culture methods. As a result, air sampling could be especially useful for assessing the
cleanliness of poultry houses before introducing new chicks for production. The benefit of a European-wide validation of the approach was that it showed that even for low-prevalence situations, air sampling and real-time PCR were as effective as culture.
MAD-Vir was the first One Health EJP project to finish, in December 2019. The project optimised and validated a metagenomics microarray, the Pan-Virus-Array, to improve fast detection of viruses, including all known virus species and identification of novel virus types or strains belonging to currently known virus families. During the project, the microarray was adapted to use in several laboratories, and it was shown to be able to correctly identify a vast majority of PCR-confirmed positive samples with a known viral content.
TELE-Vir focuses on developing a toolbox for identification and characterisation of emerging virus threats for humans, domestic animals and wildlife. Field-deployable point-of-care approach and direct upload of genomic, phenotypic and epidemiological data into a user-friendly bioinformatics toolkit are combined for fast identification and characterisa-tion of new emerging virus threats. The covid-19 pandemic has had a positive impact on the TELE-Vir project and many of the experiences and challenges will be useful for the development of the toolbox, which will help to control outbreaks of new emerging viruses in the future.
7.4 SustainabilityThe One Health EJP projects will all finish by the end of 2022, but the collaborations, the networks and the trust built will carry longer.
7.5 References1. Brown HL, Passey JL, Getino M, Pursley I, Basu P, Horton
DL, La Ragione RM. (2020). The One Health European Joint Programme (OHEJP), 2018-2022: an exemplary One Health initiative. J Med Microbiol. 69(8): 1037-1039. DOI: 10.1099/jmm.0.001228.
2. One Health European Joint Programme https://one-healthejp.eu/; projects: https://onehealthejp.eu/pro-jects/.
Source: One Health EJP

ANNUAL REPORT ON ZOONOSES IN DENMARK 202030
8. Surveillance and control programmes
Figure 8.1. Overview of the monitor-ing and outbreak investigation net-work for reporting infectious patho-gens in humans, animals, foodstuffs and feedstuffs in Denmark, 2020
The collaboration on zoonoses between national and regional authorities, the industry and non-governmental organisations in Denmark is presented in Figure 8.1. An overview of the notifiable and non-notifiable human and animal diseases, presented in this report, is provided in Appendix Table A24 and Table A25, respectively, including reference to the relevant legislation.
8.1 Surveillance of human diseaseInformation on human cases due to zoonotic pathogens pre-sented in this report is extracted from the Danish Microbiol-ogy Database (MiBa) or reported to Statens Serum Institut (SSI) through different channels depending on the disease:
• Notifiable through the laboratory surveillance system: Salmonella, Campylobacter, Yersinia, Shiga toxin-pro-ducing E. coli (STEC) and Listeria.
• Individually notifiable zoonotic pathogens: Chlamydia psittacci (ornithosis), Leptospira (Weils disease), Myco-bacterium, Bovine Spongiform Encephalopathy (BSE) prions (var. Creutzfeldt-Jakob Disease), Shiga toxin-pro-ducing E. coli (STEC) and Lyssavirus (rabies).
• Non-notifiable zoonotic pathogens: Brucella.
In Denmark, the physicians report individually notifiable zoonotic diseases to the Danish Patient Safety Authority and SSI. Physicians send specimens from suspected cases to one of the clinical microbiology laboratories depending on the geographical region. A copy of the results of the diagnostic analysis from regional clinical microbiology labo-ratory is transmitted to MiBa. All cases of infections with laboratory notifiable pathogens are collected in the Register of Enteric Pathogens maintained by SSI. Campylobacter, Salmonella and Yersinia cases are extracted from MiBa and STEC and Listeria are reported to SSI directly from the clinical microbiology laboratories. Furthermore, all Salmo-nella and STEC and a subset of Yersinia and Campylobacter isolates are sent to SSI for further characterisation and the results are recorded in the Register of Enteric Pathogens. Cases are reported as episodes, i.e. each patient-infectious agent combination is only recorded once in any six-month period. Overviews of results from the Register of Enteric Pathogens are presented as follows:
• All laboratory-confirmed human cases are presented in Appendix Table A1.
• STEC O-group distribution in humans is presented in Ap-pendix Table A2.
• The Salmonella serovar distribution is presented in Ap-pendix Table A4.
Industry
Statens Serum Institut (SSI)
Danish Health AuthorityGeneral Practioners
& Hospitals
Clinical Microbiology
Ministry of HealthMinistry of Food, Agriculture and Fisheries of Denmark
Danish Veterinary and Food Administration
Central OutbreakManagement Group
Tecnical University of DenmarkNational Food Institute
Ministry of Higher Education and Science
Non-governmental Organisation
The municipalities
Danish Patient Safety Authotity

31 ANNUAL REPORT ON ZOONOSES IN DENMARK 2020
_____________________________________________________________________________________________________________________________________a) The Danish Veterinary and Food Administration (DVFA) is one authority that operates from more locations throughout the country. To be able to distinguish the locations the terms DVFA is used synonymous with the location in Glostrup and Food Inspection Unit followed by the location synonymous with the location in question.
8.2 Outbreaks of zoonotic gastrointestinal infectionsIn Denmark, local and regional foodborne outbreaks are typically investigated by the Food Inspection Unit in col-laboration with the Public Health Medical Officers at the Danish Patient Safety Authority, and the regional clinical microbiology laboratories. National outbreaks are investi-gated by SSI, the National Food Institute at the Technical University of Denmark (DTU Food) and the Danish Vet-erinary and Food Administration (DVFA) in collaboration. These institutions may also aid in the investigation of regional or local outbreaks. Representatives from these institutions meet regularly in the Central Outbreak Man-agement Group to discuss surveillance results, compare the reported occurrence of zoonotic agents in animals, food and feedstuffs with that in humans, and coordinate the investigation of outbreaks. The formal responsibility of investigating food or waterborne outbreaks is cur-rently divided between three ministries based on the outbreak source: the Ministry of Health for infectious diseases; the Ministry of Food, Agriculture and Fisher-ies for foodborne and animal related diseases, and the Ministry of Environment for legislators responsibility with the municipalities responsible for outbreaks of diseases related to supply of tap water.
Outbreaks may be detected in various ways. Clusters of cases may be noted in the local clinical laboratory or identified at SSI through the laboratory surveillance system of gastrointestinal bacterial infections through subtyping of bacterial isolates from patients. Food han-dlers are obliged to contact the DVFA if the food they served are suspected to have caused illness. Individuals who experience illness related to food intake in settings such as restaurants or work place cafeterias may report these incidents directly to the Food Inspection Unit. General practitioners and hospitals are obliged to report all suspected food- and waterborne infections to the Danish Patient Safety Authority and to SSI.
A list of verified outbreaks (not including house-hold outbreaks) reported to the Food- and waterborne Outbreak Database are presented in Appendix Table A3 and some of the outbreaks from 2020 are outlined in Chapter 1.
8.3 Surveillance and control of animals and animal productsIn Denmark, action plans and programmes on zoonoses have been in place for more than 25 years. The first plan targeted Salmonella in the broiler production and was developed as a response to an increase in the number of human cases related to eating chicken meat. Since then, plans have been developed for Salmonella in pigs and pork, Salmonella in layers (eggs), Campylobacter in broil-ers and S. Dublin in cattle and beef.
All plans have been outlined in cooperation between industry, research institutes and authorities, and are followed by a technical working group and a steering committee. This ensures progress, that new knowledge is incorporated in the plans, and an assessment of achieve-ment of targets.
At EU level, harmonised surveillance programmes and common targets have been set for the broiler and laying egg production. An overview on the status on the targets can be seen in Table A23.
Salmonella surveillance and control programmes for poultry, pigs and cattle are presented in Appendix Tables A26-31. Sample analysis is performed at the DVFA labo-ratory for all isolates, except poultry. For poultry, samples are analysed at Eurofins Laboratory, where Salmonella isolates also are serotyped, and the isolates are sent to the DVFA for testing of antimicrobial resistance. An overview of the methods used for subtyping is presented in Appendix Table A32.
Overviews of results from surveillance and control of Salmonella are presented as follows:
• Results from the table egg production are presented in Appendix Tables A5-A6.
• Results from the broiler production are presented in Appendix Tables A4 and A7.
• Results from the duck and turkey productions are pre-sented in Appendix Tables A4 and A8.
• Results from the pig production are presented in Ap-pendix Tables A4, A11 and Figures A1-A3.
• Results from the cattle production are presented in Appendix Tables A4, A12-A13 and Figure A4.
• Results from the rendering plants are presented in Appendix Table A14.
• Results from the feed production are presented in Ap-pendix Tables A15-A16.

ANNUAL REPORT ON ZOONOSES IN DENMARK 202032
Overviews of results from monitoring and control of Campylobacter are presented as follows:
• Results from the broiler production are presented in Ap-pendix Tables A9-A10.
Pig and cattle carcases are screened for Mycobacterium and Echinococcus during meat inspection at the slaughterhouse. Although swine kept under controlled housing conditions in Denmark are exempted from examination for Trichinella at slaughter, all slaughter pigs, sows and boars are still examined at slaughter. Free range pigs, horses, wild game (e.g. wild boar) and other species susceptible to Trichinella must still be tested. In addition, boars and bulls are tested for Brucella and bulls are tested for Mycobacterium at se-men collection centres. All positive results for notifiable infectious diseases are reported to the DVFA. Results are presented in Appendix Table A11-A12.
Results from the surveillance for Bovine Spongiform Encephalopathy (BSE) in cattle, and Transmissible Spongi-form Encephalopathy (TSE) in sheep/goat are presented in Appendix Tables A20-A21.
8.4 Official testing of zoonotic pathogens in foodstuffsIn Denmark, control of zoonotic microorganisms in food-stuffs is mainly carried out as projects which are coor-dinated at the central level of the DVFA. Sampling and testing are carried out with the following purposes:
• To verify that food business operators comply with microbiological criteria laid down in the legislation.
• To verify the microbiological safety of food for which no microbiological criteria are laid down at EU Commu-nity level.
• To monitor the effect of established risk management procedures in order to evaluate if these provide the desired results or need to be reconsidered.
• To generate data for the preparation of risk profiles and risk assessments to support microbial risk man-agement
• To discover emerging problems with microbiological contaminants.
Appendix Table A22 provides information on the centrally coordinated studies conducted in 2020.
For further information, consult the website of the DVFA, www.foedevarestyrelsen.dk (in Danish).

33 ANNUAL REPORT ON ZOONOSES IN DENMARK 2020
1
Table 8.1. Top 10 Salmonella serotypes in humans and information about travel abroad, 2019-2020
2020Number of patients (%)
% of patientsa infected Abroadb Domestically 2019
Number of patients (%)
% of patientsa infected Abroadb Domestically
Enteritidis 118 (19.2) 51.1 48.9 Enteritidis 310 (27.7) 79.7 20.3
1,4,[5],12:i:- 86 (14.0) 9.4 90.6 1,4,[5],12:i:- 184 (16.4) 33.0 67.0
Typhimurium 63 (10.3) 19.1 46.6 Typhimurium 88( 7.9) 53.4 46.6
Dublin 33 (5.4) 0.0 100.0 Coeln 30 (2.7) 23.5 76.5
Strathcona 27 (4.4) 0.0 100.0 Stanley 25 (2.2) 72.2 27.8
Kottbus 24 (3.9) 15,8 84.2 Paratyphi B var. Java 24 (2,1) 84.2 15.8
Coeln 17 (2.8) 7.7 92.3 Dublin 24 (2.1) 0.0 100.0
Newport 17 (2.8) 30.8 69.2 Infantis 22 (2.0) 47.1 52.9
Stanley 16 (2.6) 66.7 33.3 Newport 22 (2.0) 31.3 68.7
Kasenyi 12 (2.0) 0.0 100.0 Derby 21 (1.9) 28.6 71.4
Other serotypes 201 (32.7) 33.8 66.2 Other serotypes 281 (25.1) 72.7 27.3
Total 614 28.1 71.9 Total 1,120 64.1 35.9
a) Patients with unknown travel information (28.2% of all paitents in 2020 and 34.0% in 2019) were excluded from the percent calculations.b) Infected abroad is defined as travel abroad in a seven-day period prior to disease onset.Source: Statens Serum Institut
Figure 8.2. Monthly distribution of S. Enteritidis and S. Typhimurium incl. the monophasic variant S. 1,4,[5],12:i:- cases, 2017-2020
In 2020, Statens Serum Institut extracted all registered Salmonella cases including the available travel information from the Danish Microbiology Database (MiBa) that receives copies of reports from all Danish departments of clinical microbiology. This information was complemented with information from interviews performed by Statens Serum Institut of some of the Salmonella cases. Travel information was available from 71.8% of the Salmonella cases in 2020. A significant decrease of cases with known travel history was seen from 64.1% in 2019 to 28.1% in 2020 (Table 8.1). This was mostly caused by the travel restrictions implemented due to covid-19, see also chapter 3. The proportion of travel-related cases varied greatly between the different serotypes, hence 51.1% of the S. Enteritidis cases, 9.4% of the monophasic S. Typhimurium (S. 1,4,[5],12:i:-) cases and 33.8% of cases with other serotypes were infected abroad (Figure 8.2).
Where do we acquire Salmonella infections? By Mia Torpdahl ([email protected])
Source: Statens Serum Institut
0
20
40
60
80
2017 2018 2019 2020
Num
ber o
f hu
man
cas
es
S. Typhimurium and monophasic S. 1,4,[5],12:i:-
Domestic
Travel
Domestic outbreak related cases
Travel related outbreak cases Travel status unknown
0
20
40
60
80
2017 2018 2019 2020
Num
ber o
f hu
man
cas
es
S. Enteritidis

ANNUAL REPORT ON ZOONOSES IN DENMARK 202034
Appendix
Table A1. Zoonoses in humans, number of laboratory-confirmed cases, 2015-2020
Human disease and outbreak data
a) Not notifiable, hence the incidence cannot be calculated.b) Data presented are from one laboratory (Statens Serum Institut) only, representing a proportion of the Danish population. The proportion of the
population represented varies from year to year, thus results from different years are not comparable. Testing for these pathogens is carried out only if specifically requested on the submission form.
c) Notifiable.d) Including the monophasic variant of S. Typhimurium (S. 1,4,[5],12:i:-).e) Includes also only notified cases.f) A subset, of Yersinia enterocolitica (40.4%) was isolated and sent from the local clinical departments to SSI for surveillance. Characterisation disclosed 49.0% (102 isolates) being apathogenic biotype 1a, and these are excluded from the total number for 2020.
Source: Statens Serum Institut
Incidence per 100,000 inhabitants
Reported no. of cases
Zoonotic pathogen 2020 2020 2019 2018 2017 2016 2015
Bacteria
Brucella abortus/melitensisa,b - 1 7 3 3 3 6
Campylobacter coli/jejunic,e 64.2 3,742 5,389 4,546 4,257 4,677 4,348
Chlamydia psittacic 0.5 27 32 16 14 24 25
Leptospira spp.c 0.2 14 14 19 22 10 5
Listeria monocytogenesc 0.7 43 62 47 58 39 43
Mycobacterium bovisc 0 0 0 1 2 2 1
Salmonella totalc,e 10.5 614 1,120 1,168 1,067 1,074 925
S. Enteritidisc,e 2.0 117 310 268 226 246 258
S. Typhimuriumc,d 2.6 149 272 306 290 320 233
Other serotypesc 5.2 302 449 594 551 508 434
STEC totalc,e 7.7 448 630 495 346 269 228
O157 0.7 39 60 43 50 37 33
Other O-groups or non-typeable 3.4 198 359 259 215 204 195
Yersinia enterocolitica totalc,e,f 7.1 413 374 366 354 573 539
Yersinia enterocolitica (Biotype 2,3 and 4) 1.8 106 139 - - - -
Viruses
Lyssavirusc 0 0 0 0 0 0 0

35 ANNUAL REPORT ON ZOONOSES IN DENMARK 2020
Appendix
Table A3. Food- and waterborne disease outbreaks reported in the Food- and waterborne Outbreak Database (FUD) (n=35), 2020
Pathogena No. of patients
Patients labora-tory confirmed Setting Source FUD
no.e
Campylobacter jejuni, ST50#8 161 161 Regional Pasteurised milk 1875
Campylobacter jejuni, ST50#10 18 18 Regional Unknown 1887Campylobacter jejuni, ST50#11 20 20 National Chicken breast and
whole chicken1907
Clostridium perfringens 5 - Retail delicates-sen
Stew with tenderloin and mashed potatoes
1868
Clostridium perfringens 40 - Catering Lasagne 1924
Enterocytozoon bieneusi 77 15 Company canteen Composite meal 1904
Hepatitis A, 1A 3 3 International Unknown 1895
Hepatitis A, 1B 19 19 International Unknown 1877
Lectins 3 - Restaurant Fresh salad with pre-cooked red kidney beans
1876
Lectins 5 - Canteen Red kidney beans and white horse beans
1878
Lectins 47 - Canteen or work-place catering
Frozen pre-cooked beans 1874
Listeria monocytogenes, ST7#7 4 4 National Unknown 1914
Listeria monocytogenes, ST394#1 2 2 International Hot-smoked trout 1910
Listeria monocytogenes, ST451#2 2 2 Regional Hot-smoked fish produ-cts
1890b
Norovirus 40 - Take-away Rice used for sushi 1915
Norovirus 59 - Canteen Buffet meals 1843
Norovirus 69 1 Conference center
Mixed food 1885
Norovirus 99 - Restaurant Meat balls in curry sauce with rice
1920
Continued on the next page
Table A2. STEC O-group distribution in humansa, 2020
O-group Number of episodes
Proportion of total (%) O-group Number of
episodesProportion of total (%)
O157 39 8.7 O8 7 1.6
O146 23 5.1 O54 7 1.6
O103 16 3.6 O145 7 1.6
O128 11 2.5 O117 6 1.3
O26 11 2.5 O2 6 1.3O55 10 2.2 O125 5 1.1
O91 10 2.2 Other 61 13.6
O27 9 2.0 Not verifiedb 37 8.3
O63 9 2.0 Notificationc 174 38.8
Continued in the next column Total 448
a) All O-groups that resulted in five or more episodes are listed.b) Cases sent for verification at SSI but not possible to verify and/or determine O-group.c) Cases not sent for verification at SSI and/or only notified through the clinical notification system.
Source: Statens Serum Institut

ANNUAL REPORT ON ZOONOSES IN DENMARK 202036
Appendix
Note: (imp)= imported product. a) ST= Sequence Type.b) FUD1890: This outbreak has two additional cases in 2014.c) FUD1838: In total this outbreak consisted of 286 cases of which 271 cases were additionally registered in 2019.d) FUD1908: This outbreak has two additional cases in 2021.e) Additional outbreak cases in 2020 to outbreaks reported previous years: FUD1782: 3 cases; FUD1797: 1 case; FUD1816: 19 cases; FUD1817: 3 cases.
Source: Food- and waterborne Outbreak Database (FUD)
Table A3. Food- and waterborne disease outbreaks reported in the Food- and waterborne Outbreak Database (FUD) (n=35), 2020 (Continued from previous page)
Pathogena No. of patients
Patients labora-tory confirmed Setting Source FUD
no.e
Norovirus 107 - International Raw oysters 1846
Norovirus 15 - International Raw oysters 1838c
Salmonella Coeln, ST1955#5 6 6 Regional Unknown 1909
Salmonella Dublin, ST10#22 7 7 National Unknown 1908d
Salmonella Kasenyi, ST4546#1 12 12 National Unknown 1888
Salmonella Kottbus, ST1669#1 36 15 Restaurant Unknown 1879
Salmonella Strathcona, ST2559#1 25 25 International Unknown 1883
Salmonella Typhimurium, ST36#6 7 7 National Unknown 1898
Salmonella Typhimurium, ST19#60
4 4 Private party Unknown 1913
Salmonella 4,[5],12:i.-, ST34#25 6 6 National Unknown 1901
Salmonella 4,[5],12:i.-, ST34#123 9 9 National Unknown 1900
Salmonella 4,[5],12:i.-, ST34#127 9 9 National Unknown 1899
Shigella sonnei 44 44 National Fresh mint (imp) 1893
STEC O55:H7 ST335#1 8 8 National Unknown 1911
Unknown 14 - Local Water 1937
Yersinia enterocolitica, ST18#1 200 15 Football camp Pasta 1881
Yersinia enterocolitica, ST23#1 8 8 Regional Fresh spinach 1873
Total 1,190 420

37 ANNUAL REPORT ON ZOONOSES IN DENMARK 2020
Appendix
Table A4. Top 15 (humans) serotype distribution (%) of Salmonella from humans, animals, carcases, Danish and imported meat, 2020. N=number of culture positive unitsa
a) One isolate per serotype per unit is included, thus the number of isolates may exceed the number of units. b) Sampling of pork carcases at slaughterhouses according to the surveillance programme (Table A31).c) Sampling of beef carcases at slaughterhouses according to the surveillance programme (Table A30). d) Sampling of production flocks prior to slaughter according to surveillance programmes (Tables A27). e) Centrally coordinated study (see section 8.4 and Table A22 for more information).f) Six batches positive with 9 Salmonella isolates.g) Of the 49.5% positive with "Other" serotypes, 74% were positive ved S. Derby.
Source: Danish Veterinary and Food Administration and Statens Serum Institut
Monitoring and surveillance data
Human Porkb Beefc Broilerd Layerd Ducke Imported meat (batches)
cases batches batches flocks flocks batches Porke Beefe Broilere Ducke
N=614 N=101 N=11 N=13 N=8 N=1 N=34 N=3 N=9f N=10Enteritidis 19.2 - - 7.7 33.3 - - - 22.2 30.0
O:4,5,12; H:i:- 14.0 42.6 - 15.4 16.7 - 55.9 - - -
Typhimurium 10.3 7.9 - 23.1 - - 23.5 - - 20.0
Dublin 5.4 - 81.8 - - - - 100 - -
Strathcona 4.4 - - - - - - - - -
Kottbus 3.9 - - - - - - - - 20.0
Coeln 2.8 - - - - - - - - -
Newport 2.8 - - 7.7 - 100 - - 11.1 -
Stanley 2.6 - - - - - - - - -
Kasenyi 2.0 - - - - - - - - -
Agona 1.6 - - - - - - - - -
Thompson 1.5 - - - - - - - - -
Paratyphi B var. Java 1.3 - - - - - - - - -
Saintpaul 1.1 - - - - - - - - -
Bovismorbificans 1.0 - - - - - - - - -
Other 18.7 49.5g 9.1 46.2 50.0 - 20.6 - 66.7 30.0
Unknown 7.5 - 9.1 - - - - - - -
Total 100 100 100 100 100 100 100 100 100 100

ANNUAL REPORT ON ZOONOSES IN DENMARK 202038
Appendix
Table A6. Occurrence of Salmonella in the table egg layer flocks sorted by type of production, 2010-2020
a) S. 4,5,12:i:- (2), S. Enteritidis (1).b) S. Enteritidis (1). c) S. 4,5,12:i:- (1) ,S. Ajiobo (2), S. Infantis (1).
Source: Danish Agriculture and Food Council, and Danish Veterinary and Food Administration
Deep litter Free range Organic Cage
N Positive N Positive N Positive N Positive
2010 117 0 45 2 136 1 157 5
2011 109 0 40 0 130 1 131 1
2012 101 0 37 1 136 1 131 1
2013 108 0 37 1 137 3 94 0
2014 97 0 30 0 125 1 95 1
2015 108 0 29 0 172 0 86 0
2016 125 1 31 0 196 1 74 1
2017 126 0 42 1 217 2 61 0
2018 139 4 46 1 227 4 42 3
2019 135 1 34 2 220 5 22 0
2020 151 3a 40 1b 216 4c 25 0
Table A5. Occurrence of Salmonella in the table egg productiona, 2010-2020
Rearing periodb (parent flocks)
Adult periodc
(parent flocks) Pullet-rearing flocks Table egg layer flocks
N Positive N Positive N Positive N Positive
2010 15 0 9 0 225 0 455 8
2011 8 0 9 0 195 0 410 2
2012 9 0 8 0 197 1 359 3
2013 10 0 7 0 173 0 373 4
2014 22 0 8 0 150 0 347 2
2015 15 0 8 0 123 0 344 0
2016 15 0 10 0 132 0 426 3
2017 7 0 8 1 138 1 446 3
2018 7 0 6 0 124 1 454 12
2019 7 0 6 0 101 0 411 8
2020 8 0 9 0 134 0 432 8d
a) See Tables A26 and A28 for description of the surveillance programmes.b) Salmonella was not detected in grandparent flocks during rearing period (1 flocks).c) Salmonella was not detected in grandparent flocks during adult period (4 flocks).d) S. 4,5,12:i:- (3), S. Ajiobo (2) S. Enteritidis (2), S. Infantis (1).
Source: Danish Agriculture and Food Council, and Danish Veterinary and Food Administration

39 ANNUAL REPORT ON ZOONOSES IN DENMARK 2020
Appendix
Table A7. Occurrence of Salmonella in the broiler productiona, 2010-2020
a) See Tables A26-A27 for description of the surveillance programmes. b) Salmonella was not detected in grandparent flocks during rearing period (8 flocks).c) Salmonella was not detected in grandparent flocks during adult period (9 flocks).d) From 2008, meat from all AM positive flocks are heat treated at slaughter. Sampling is now carried out as verification of the AM results of the
negative flocks.e) S. Enteritidis (1), S. Typhimurium (1).f) S. 4,5,12:i:- (2), S. 4,12:i:- (1), S. Aarhus (1), , S. Derby (4), S. Enteritidis (1), S. Newport (1), S. Stourbridge (1), S. Typhimurium (2).
Source: Danish Agriculture and Food Council, and Danish Veterinary and Food Administration
Rearing periodb (parent flocks)
Adult periodc
(parent flocks) Broiler flocks Slaughterhoused (flocks/batches)
N Positive N Positive N Positive N Positive
2010 126 0 200 5 3,773 43 346 1
2011 114 0 213 0 3,795 47 306 0
2012 123 0 183 0 3,448 27 368 0
2013 128 0 152 1 3,498 34 288 0
2014 121 2 131 3 3,470 26 277 4
2015 91 0 289 1 3,631 23 148 0
2016 184 0 182 3 3,606 21 203 1
2017 170 2 250 1 4,290 25 259 0
2018 184 1 149 1 4,245 35 249 1
2019 210 0 137 1 4,012 12 254 0
2020 357 0 217 2e 3,604 13f 231 0
a) See Table A29 for description of the surveillance programme for turkey flocks. The major turkey slaugh-terhouse in Denmark closed down in 2004. Therefore, most commercially reared turkey flocks are transported abroad for slaughter.
b) The increase in number of tested flocks is primarily based on a change of registration.
Source: Danish Veterinary and Food Administration
Turkey flocksa
N Positive
2010 24 1
2011 38 1
2012 23 0
2013 56 3
2014 10 0
2015 80 1
2016 76 0
2017 24 1
2018 13 0
2019 85b 0
2020 198 0
Table A8. Occurrence of Salmonella in turkey flocks, 2010-2020

ANNUAL REPORT ON ZOONOSES IN DENMARK 202040
Appendix
Table A9. Occurrence of Campylobacter in broiler flocks, 2010-2020a
a) See Table A27 for description of the surveillance programmes. In 2014 the sampling method changed from boot swabs collected in the stable 7-10 days before slaughter to cloacal swabs at slaughter according to Danish Order no. 1512 of 13/12/2013.
b) In 2018, additional sampling of neck skin began at the slaughterhouses according to Regulation (EC) 2073/2005, see Table A27 for further description.c) Percent positive samples >1000 cfu/g.
Source: Danish Agriculture and Food Council
Sock samples at farm Cloacal swabs at slaughter Neck skin samples at slaughterb
N (Flocks) % pos N (Flocks) % pos N (Batches) % posc
2010 3,132 16.5 - - - -
2011 3,379 14.4 - - - -
2012 3,376 11.6 - - - -
2013 3,508 13.1 - - - -
2014 - - 3,474 27.7 - -
2015 - - 3,274 19.6 - -
2016 - - 3,184 20.8 - -
2017 - - 3,316 16.6 - -
2018 - - 3,411 24.6 1,120 9.7
2019 - - 3,327 22.7 1,063 7.4
2020 - - 3,189 20.2 985 7.0
Table A10. Occurrence of Campylobacter in non-heat treated chilled broiler meat samples at slaughter and retaila, 2014-2020
At slaughterb At retail
Denmark Denmark Import
N (samples) % pos N (samples) % posc N (samples) % posc
2014 Conventional 927 25.7 - - - -
Organic/free-range 108 75.0 - - - -
2015 Conventional 960 20.1 - - - -
Organic/free-range 115 78.2 - - - -
2016 Conventional 999 21.3 1,339 12.8 232 37.9
Organic/free-range 117 87.2 93 71.0 245 78.8
2017 Conventional 1,258 25.0 - - - -
Organic/free-range 203 79.0 - - - -
2018 Conventional 1,250 31.0 - - - -
Organic/free-range 199 91.0 - - - -
2019 Conventional 1,248 32.6 697 12.4 28 36.1
Organic/free-range 123 68.3 155 31.6 28 82.1
2020 Conventional 1,224 25.8 436 15.2 64 67.3
Organic/free-range 95 49.5 192 34.4 - -
a) Centrally coordinated studies (see Table A22 and section 8.4 for description). Limit of quantification: 10 cfu/g. b) Leg-skin samples. c) The prevalence is calculated as a mean of quarterly prevalences, except organic/free-range results.
Source: National Food Institute and Danish Veterinary and Food Administation

41 ANNUAL REPORT ON ZOONOSES IN DENMARK 2020
Appendix
Figure A2. Serological surveillance of Salmonella in slaughter pigsa, 2015-2020. Percentage of seropositive meat juice samples (first sample per herd per month)
a) For more information about the surveillance programme, see Table A31.
Source: Danish Agriculture and Food Council
Figure A1. Serological surveillance of Salmonella in breeding and multiplying pigsa based on monthly testing of blood samples, 2015-2020
a) For more information about the surveillance programme, see Table A31.
Source: Danish Agriculture and Food Council
0
3
6
9
12
15
18
2015 2016 2017 2018 2019 2020
% p
osit
ive
slau
ghte
r pig
s
% positive % positive, moving avg. for 12 month
0
2
4
6
8
2015 2016 2017 2018 2019 2020
% p
osit
ive
bree
ding
-and
m
ulti
plyi
ng p
igs
% positive % positive, moving avg. for 12 month

ANNUAL REPORT ON ZOONOSES IN DENMARK 202042
Appendix
Figure A3. Salmonella in pork, monitored at slaughterhousesa, 2015-2020
Table A11. Occurrence of zoonotic pathogens in pigs and pork in Denmark, 2020
Herds Animals/Samples
Zoonotic pathogen N Pos N Pos % pos
At slaughterhouse (slaughter pigs)
Salmonella spp.a,b 5,504 182g - - -
Salmonella spp.a,c (slaughtering >30,000 pigs/year) - - 18,670 - 0.9h
Salmonella spp.a,c (slaughtering 1,000 or more and less than 30,000 pigs/year) - - 95 - 0
Salmonella spp.a,d - - - - -
Trichinella spp.e - - 16,822,421 0 -
Mycobacterium spp.f - - 17,509,438i 0 -
Echinococcus granulosis/multilocularisf 17,509,438i 0 -
a) See Table A31 for description of the Salmonella surveillance programme. b) Data are from December 2020. Slaughter pig herds monitored using serological testing of meat juice samples collected at slaughter. c) Swab samples from 4 designated areas after 12 hours chilling (4x100cm2).d) Caecum samples are randomly collected from slaughter pigs at slaughter. No samples were collected in 2020.e) Samples collected from slaughter pigs at slaughter were examined using the method described in Regulation (EU) 2015/1375. In 2014, an amendment
to EU regulation (EC) No 2075/2005 came into force stating that slaughter pigs, sows and boars kept under ”controlled housing conditions” in Denmark are extempted testing for Trichinella. Free range pigs must be tested for Trichinella.
f) Slaughter pigs were examined by meat inspectors at slaughter.g) Includes herds belonging to Salmonella level 2 and 3 only (See Table A31). h) When estimating the prevalence of Salmonella, both the loss of sensitivity and the probability of more than one sample being positive in each pool are
taken into consideration. A conversion factor has been determined on the basis of comparative studies, as described in Annual Report 2001.i) Includes sows and boars slaughtered.
Source: Danish Veterinary and Food Administration, National Veterinary Institute and National Food Institute, Technical University of Denmark
a) For more information about the surveillance programme, see Table A31.
Source: Danish Veterinary and Food Administration
0.0
0.5
1.0
1.5
2.0
2.5
3.0
2015 2016 2017 2018 2019 2020
% p
osit
ive
sam
ples
% positive % positive, moving avg. for 12 month

43 ANNUAL REPORT ON ZOONOSES IN DENMARK 2020
Appendix
Table A12. Occurrence of zoonotic pathogens in cattle and beef in Denmark, 2020
a) Denmark has been declared officially brucellosis free since 1979. The last outbreak was recorded in 1962. 5-8 ml blood samples were analysed using either the SAT or CFT methods. In addition 34 aborted fetuses were tested, none were positive.
b) Denmark has been declared officially tuberculosis free since 1980. The last case of TB in cattle was diagnosed in 1988. c) Analysis using the intradermal tuberculin test. Including samples from bulls (examined at pre-entry, every year, and prior to release from semen col-
lection centres) and samples collected in connection with export.d) Swab samples from 4 designated areas after 12 hours chilling (4x100cm2) e) See Table A30 for description of the surveillance programme. f) Slaughtered cattle were examined by the meat inspectors at slaughter. g) When estimating the prevalence of Salmonella, both the loss of sensitivity and the probability of more than one sample being positive in each pool are
taken into consideration. A conversion factor has been determined on the basis of comparative studies, as described in Annual Report 2001.
Source: Danish Veterinary and Food Administration, National Veterinary Institute, and National Food Institute, Technical University of Denmark
Animals/Samples
Zoonotic pathogen N Pos % pos
At farm
Brucella spp.a 1,177 0 -
Mycobacterium bovisb, c 1,800 0 -
At slaughterhouse
Salmonella spp.d,e(slaughtering >=7,500 cattle/year) 6,840 - 0.3g
Salmonella spp.d,e (slaughtering 250 or more and 7,500 or less cattle/year) 231 - 0
Mycobacterium spp.b, f 448,100 0 -
Echinococcusus granulosis/multilocularisf 448,100 0 -
Figure A4. Salmonella in beef, monitored at slaughterhousesa, 2015-2020
a) For more information about the surveillance programme, see Table A30.
Source: Danish Veterinary and Food Administration
0.0
0.2
0.4
0.6
0.8
1.0
2015 2016 2017 2018 2019 2020
% p
osit
ive
sam
ples
% positive % positive, moving avg. for 12 month
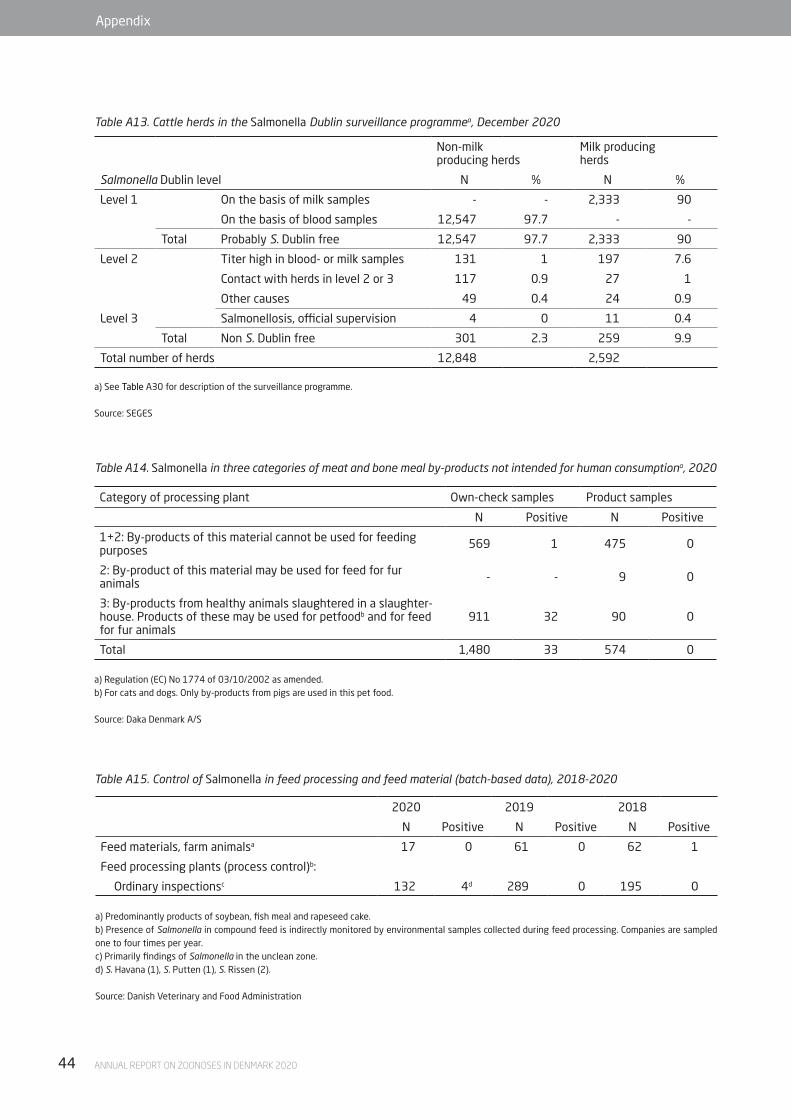
ANNUAL REPORT ON ZOONOSES IN DENMARK 202044
Appendix
Table A13. Cattle herds in the Salmonella Dublin surveillance programmea, December 2020
Non-milk producing herds
Milk producing herds
Salmonella Dublin level N % N %
Level 1 On the basis of milk samples - - 2,333 90
On the basis of blood samples 12,547 97.7 - -
Total Probably S. Dublin free 12,547 97.7 2,333 90
Level 2 Titer high in blood- or milk samples 131 1 197 7.6
Contact with herds in level 2 or 3 117 0.9 27 1
Other causes 49 0.4 24 0.9
Level 3 Salmonellosis, official supervision 4 0 11 0.4
Total Non S. Dublin free 301 2.3 259 9.9
Total number of herds 12,848 2,592
a) See Table A30 for description of the surveillance programme.
Source: SEGES
Table A14. Salmonella in three categories of meat and bone meal by-products not intended for human consumptiona, 2020
Category of processing plant Own-check samples Product samples
N Positive N Positive
1+2: By-products of this material cannot be used for feeding purposes 569 1 475 0
2: By-product of this material may be used for feed for fur animals - - 9 0
3: By-products from healthy animals slaughtered in a slaughter-house. Products of these may be used for petfoodb and for feed for fur animals
911 32 90 0
Total 1,480 33 574 0
a) Regulation (EC) No 1774 of 03/10/2002 as amended.b) For cats and dogs. Only by-products from pigs are used in this pet food.
Source: Daka Denmark A/S
Table A15. Control of Salmonella in feed processing and feed material (batch-based data), 2018-2020
2020 2019 2018
N Positive N Positive N Positive
Feed materials, farm animalsa 17 0 61 0 62 1
Feed processing plants (process control)b:
Ordinary inspectionsc 132 4d 289 0 195 0
a) Predominantly products of soybean, fish meal and rapeseed cake. b) Presence of Salmonella in compound feed is indirectly monitored by environmental samples collected during feed processing. Companies are sampled one to four times per year.c) Primarily findings of Salmonella in the unclean zone. d) S. Havana (1), S. Putten (1), S. Rissen (2).
Source: Danish Veterinary and Food Administration

45 ANNUAL REPORT ON ZOONOSES IN DENMARK 2020
Appendix
2020 2019 2018
N Positive N Positive N Positive
Compound feed, farm animals 2,253 9d 1,918 1 1,534 0
Feed materials, farm animalsa 2,300 32e 2,432 31 1,734 22
Feed processing plants (process control):
Ordinary inspections - clean zoneb 8,252 31f 7,531 4 8,018 7
Ordinary inspections - unclean zoneb 1,239 34g 1,257 25 1,231 26
Transport vehicles, clean zone/hygiene samplesc 1,082 1h 1,121 1 1,141 0
Transport vehicles, unclean zone/hygiene samplesc 219 4i 346 3 165 4
Table A16. Feed business operators own sampling of Salmonella in compound feeds, feed processing and feed material (batch-based data), 2018-2020
Note: Data are from one feed and grain trade organisation only, representing a proportion of feed at the Danish market. a) Predominantly products of soy (e.g. soybean meal) but also products of rape (e.g. rapeseed cake) and sunflower (e.g. sunflower meal).b) Presence of Salmonella in compound feed is indirectly monitored by environmental samples collected during feed processing.c) Samples from transport vehicles (hygiene samples) prior to loading of feed compounds.d) S. Falkensee (8), S. Ohio (1).e) S. Dessau (1), Salmonella spp. (6), S. Infantis (7), S. Jerusalem (8), S. Aarhus (1), S. Havana (1), S. Ruiru (1), S. Agona (1), S. Dublin (1), S. Livingstone (2), S. Mbandaka (3).f) S. Idikan (1), S. Senftenberg (1), S. Mbandaka (1), S. Falkensee (27), Salmonella spp. (1).g) S. Putten (2), S. Rissen (6), S. 23:d:- (1), S. Falkensee (20), S. Mbandaka (2), Salmonella spp. (3).h) S. Tennesee (1).i) S. Putten (1), S. Rissen (3).
Source: Danish Veterinary and Food Administration and the feed business operators
Table A17. Listeria monocytogenes in Danish and non-Danish produced ready-to-eat (RTE) foodsa, 2020
Samples analysed by a qualitative methodb
Samples analysed by a quantitative method
Batches Batches
Food category Sampling place N Positive N Positivec
Danish Fish and fishery products, RTEd Processing plant 6 0 5 0
Infant formula, RTEd Processing plant 4 0 - -
Products made from pork, RTEd Processing plant 2 2 2 0
Vegetables, RTEd Processing plant 1 0 1 0
Non-Danish Crustaceans, RTEd Border inspection - - 12 0
Processing plant - - 20 0
Fish and fishery products, RTEd Border inspection - - 1 0
Molluscan shellfish, RTEd Border inspection - - 3 0
Total 13 2 44 0
a) Samples are collected by the local food control offices according to EU Regulation (EC) No 2073/2005.b) Listeria monocytogenes present in a 25 g sample of the product.c) Levels > 10 cfu/g.d) Ready-to-eat.e) Samples from Canada, Chile, China, Greenland, USA and Vietnam.
Source: Danish Veterinary and Food Administration

ANNUAL REPORT ON ZOONOSES IN DENMARK 202046
Appendix
Danish Non-Danishb
Food category Sampling place N Positive N Positive
Escolar Border inspection - - 1 0
Herring in dressing Processing plant 2 0 - -
Herring Border inspection - - 3 0
Processing plant - - 2 0
Mackerel Border inspection - - 6 1c
Processing plant 4 0 8 0
Sardines Border inspection - - 3 0
Tuna Border inspection - - 1 0
Total 6 0 24 1
Table A18. Histamine in batches of Danish and non-Danish fish productsa, 2020
a) Samples are collected by the local food control offices according to EU Regulation (EC) No 2073/2005.
b) Samples from Greenland, Indonesia, Ireland, Morocco, Netherland, Norway, Poland, Spain and Vietnam. c) The findigs of histamine did not exceed the limits according to EU Regulation (EC) No 2073/2005.
Source: Danish Veterinary and Food Administration
Danish Non-Danishb
Food category Sampling place N Positive N Positive
Molluscan shellfish, intended to be cooked Processing plant - - 15 0
Products made from beef, intended to be cooked
Border inspection - - 5 0
Processing plant 5 0 - -
Products made from pork, intended to be cooked
Border inspection - - 15 0
Processing plant 115 3d - -
Products made from poultry, intended to be cooked
Processing plant 10 0 - -
Products made from turkey, intended to be cooked
Processing plant 5 0 - -
Crusteaceans, RTEc Border inspection - - 46 0
Processing plant - - 99 0
Molluscan shellfish, RTEc Border inspection - - 15 0
Products made from poultry, RTEc Processing plant - - 5 0
Infant formula, dried Border inspection 60 0 - -
Total 195 3 200 0
Table A19. Salmonella in Danish and non-Danish produced food itemsa, 2020
a) Samples are collected by the local food control offices according to EU Regulation (EC) No 2073/2005. b) Samples are from Brazil, Canada, Chile, China, Greenland, Hungary, Mexico, Thailand and Vietnam.c) Ready-to-eat.d) Two out of three positive samples were from the same batch.
Source: Danish Veterinary and Food Administration
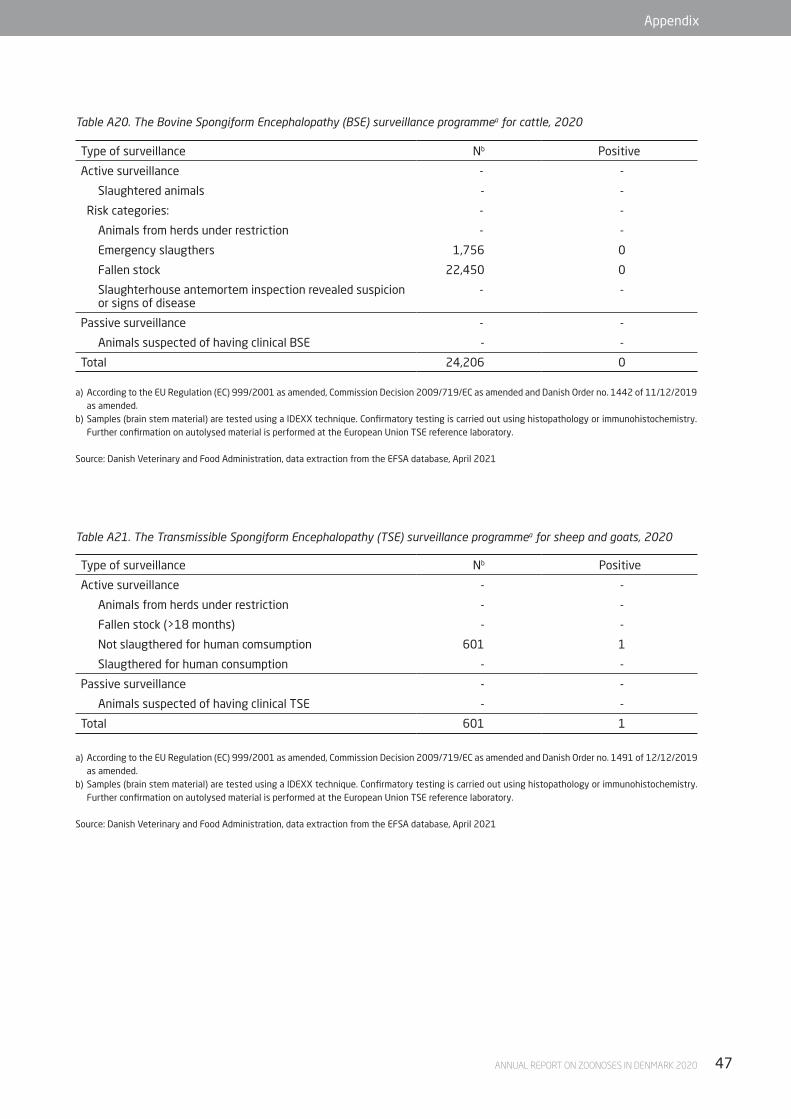
47 ANNUAL REPORT ON ZOONOSES IN DENMARK 2020
Appendix
Table A20. The Bovine Spongiform Encephalopathy (BSE) surveillance programmea for cattle, 2020
a) According to the EU Regulation (EC) 999/2001 as amended, Commission Decision 2009/719/EC as amended and Danish Order no. 1442 of 11/12/2019 as amended.
b) Samples (brain stem material) are tested using a IDEXX technique. Confirmatory testing is carried out using histopathology or immunohistochemistry. Further confirmation on autolysed material is performed at the European Union TSE reference laboratory.
Source: Danish Veterinary and Food Administration, data extraction from the EFSA database, April 2021
Type of surveillance Nb Positive
Active surveillance - -
Slaughtered animals - -
Risk categories: - -
Animals from herds under restriction - -
Emergency slaugthers 1,756 0
Fallen stock 22,450 0
Slaughterhouse antemortem inspection revealed suspicion or signs of disease
- -
Passive surveillance - -
Animals suspected of having clinical BSE - -
Total 24,206 0
Table A21. The Transmissible Spongiform Encephalopathy (TSE) surveillance programmea for sheep and goats, 2020
Type of surveillance Nb Positive
Active surveillance - -
Animals from herds under restriction - -
Fallen stock (>18 months) - -
Not slaugthered for human comsumption 601 1
Slaugthered for human consumption - -
Passive surveillance - -
Animals suspected of having clinical TSE - -
Total 601 1
a) According to the EU Regulation (EC) 999/2001 as amended, Commission Decision 2009/719/EC as amended and Danish Order no. 1491 of 12/12/2019 as amended.
b) Samples (brain stem material) are tested using a IDEXX technique. Confirmatory testing is carried out using histopathology or immunohistochemistry. Further confirmation on autolysed material is performed at the European Union TSE reference laboratory.
Source: Danish Veterinary and Food Administration, data extraction from the EFSA database, April 2021

ANNUAL REPORT ON ZOONOSES IN DENMARK 202048
Appendix
Title of project No. of planned samples Pathogen surveyed Further information
BU microbiology - slaughterhouses 50 Various Not published
Campylobacter in minced beef - surveillance 250 Campylobacter spp. To be publisheda
Campylobacter spp. in fresh, chilled Danish broiler meat at slaughterhouses (conventio-nal)
1,250Campylobacter spp. Appendix Table 10
Campylobacter spp. in fresh, chilled Danish and imported broiler meat 1,000 Campylobacter spp. To be publisheda
Campylobacter - contamination at slaughter 500 Campylobacter spp. To be publisheda
DANMAP - antibiotic resistance in poultry, pork and cattle 165
E. coli, Campylobacter spp., Salmonella spp., ESBL, AmpC, carbapenemase-producing E. coli
To be published in the DANMAP 2020 report
DANMAP and EU surveillance of antibiotic resistance in broiler, pork and cattle meat at retail (caecum samples)
660E. coli, Campylobacter spp., ESBL, AmpC, carbapenemase-producing E. coli
To be published in the DANMAP 2020 report
EU surveillance of antibiotic resistance in retail 660 ESBL, AmpC, carbapenemasepro-
ducing E. coliTo be publisheda
Export - USA environmental samples 100 Listeria monocytogens Not published
Export - USA swab 468 Salmonella spp. Not published
Import - Intensified control of Brazilian beef and poultry meat 5 Salmonella spp., Listeria monocy-
togenesAppendix Table 17 and 19
Import - Microbiologic control of fish, fish products and bivale molluscan shellfish from 3rd. countries
140Listeria monoctogenes, Salmo-nella spp.
Appendix Table 17 and 19
Import - Microbiologic control of some fish-products from Greenland 10 Listeria monoctogenes, Salmo-
nella spp.Appendix Table 17 and 19
Import - Microbiological control of food of animal origin, excluding fish 25 Listeria monoctogenes, Salmo-
nella spp.Appendix Table 17 and 19
Import - Special control microbiology - not animal Reg. (669/2009) 100 Various To be publisheda
Listeria monocytogenes, Salmonella spp., Escherichia coli and staphylococci in fishpro-ducts from Greenland
100Listeria monocytogenes, Sal-monella spp., Escherichia coli, staphylococci
To be publisheda
Listeria in mixed salads 300 Listeria monocytogenes To be publisheda
Listeria in the production environment 400 Listeria monocytogenes To be publisheda
Listeria WGS of isolates from official samples and follow-up on outbreaks 120 Listeria monocytogenes To be publisheda
Microbiologic classification of mussel produc-tion areas in Denmark 60 Salmonella spp., Escherichia
coliTo be publisheda
Part 1: Minced meat - wholesale 450 According to Reg. 2073/2005 To be publisheda
Part 2: Prepared meat - wholesale 450 According to Reg. 2073/2005 To be publisheda
Part 3: Ready-to-eat meat products - whole-sale
300 According to Reg. 2073/2005 To be publisheda
Part 6: Fish and fish products - wholesale 250 According to Reg. 2073/2005 To be publisheda
Continued on the next page
Table A22. Centrally coordinated studies conducted in 2020

49 ANNUAL REPORT ON ZOONOSES IN DENMARK 2020
Appendix
Title of project No. of planned samples Pathogen surveyed Further information
Part 9: Listeria monocytogenes Ready-to-eat foods intended for infants and ready-to-eat foods for special medical purposes
240 Listeria monocytogenes To be publisheda
Norovirus in samples of oysters from Danish production sites 20 Norovirus, E.coli To be published in
Cefas
Salmonella in imported pork and beef and in duck meat
700 Salmonella spp. To be publisheda
Salmonella in fresh ckicken meat 600 Salmonella spp. To be publisheda
Salmonella in feed materials from feed companies
60 Salmonella spp. Appendix Table A15
Salmonella in intratraded shell eggs retail 25 Salmonella spp. To be publisheda
Salmonella in intratraded shell eggs whole-sale
25 Salmonella spp. To be publisheda
Salmonella process samples from feed companies
280 Salmonella spp. Appendix Table A15
Salmonella spp. and Escherichia coli in raw frozen scallops from Greenland
25 Salmonella spp., Escherichia coli
To be publisheda
Salmonella in pork meat at cutting plant 200 Salmonella spp. To be publisheda
Table A22. Centrally coordinated studies conducted in 2020 (Continued from previous page)
a) Results will be published on the DVFA website www.foedevarestyrelsen.dk (in Danish).
Source: Danish Veterinary and Food Administration

ANNUAL REPORT ON ZOONOSES IN DENMARK 202050
Appendix
Table A23. Status on targets for Campylobacter and Salmonella, 2020
National Action Plans Target Status
Campylobacter in broilers 2018-2021Flocks at farm Maintaining low prevalence in flocks of
17.3%The prevelance in flocks in 2020 was 20.2% (Table A9)
Fresh meat at slaughterhouse Reduction of the relative human risk (RR) by 50% compared to the level in 2013a
A reduction in relative risk of 25% was obtained in 2020 compared to 2013
Salmonella in poultryb
Laying hen flocks of Gallus gallus
Initially eradication, later a reduction strategy in the table egg production
8 positive flocks (0.2%) (Table A5-A6) Eggs from positive flocks are destroy-ed or heat treated
Carcases at slaughterhouse Initially eradication, later a reduction strategy in the broiler productionZero-tolerance in Danish broiler meat.
0 positive batches (Table A7) Positive batches are heat treated
Salmonella in pigs 2014-2017
Carcases at slaughterhouse Max. 1% Salmonella at carcase level 0.9% (Table A11)
Salmonella Dublin in cattle 2017-2020Herds at farm Eradication of S. Dublin in all herds, i.e.
all herds in level 1c9.9% of milk-producing herds and 2.3% of non-milk producing herds are in level 2 or 3 (December, 2020) (Table A13)
EU Regulations
Regulation (EC) No. 1190/2012Breeding and fattening turkey flocks
Max. 1% positive for S. Enteritidis and S. Typhimuriumd
No fattening flocks positive with tar-get serovars (N=198) (Table A8)
Regulation (EC) No. 200/2010 Breeding flocks of Gallus gallus
Max. 1% adult flocks positive for S. Typhimuriumd, S. Enteritidis, S. Hadar, S. Infantis and S. Virchow
0.8% (2 flocks)e (Table A5 and A7)
Regulation (EC) No. 1168/2006
Laying hen flocks of Gallus gallus
MS specific targets, for Denmark:Max. 2% adult flocks positive for S. Typhimuriumd and S. Enteritidis
1.2% (5 flocks) positive with target serovars (Table A5)
Regulation (EC) No. 646/2007
Broiler flocks of Gallus gallus Max. 1% positive S. Typhimuriumd and S. Enteritidis
0.2% (6 flocks) positive with target serovars (Table A7)
a) 2013 is agreed as the baseline since 2012 data are not compareable with data from 2013 and onwards due to a nessessary improvent in the data collection.b) Supplementary to EU-regulations.c) See Table A30 for explanation of the herd levels.d) Including the monophasic variant of S. Typhimurium (S. 1,4,[5],12:i:-).e) One flock positive for S. Hadar.
Source: Danish Veterinary and Food Administration

51 ANNUAL REPORT ON ZOONOSES IN DENMARK 2020
Appendix
Monitoring and surveillance programmes
Table A24. Overview of notifiable and non-notifiable human diseases presented in this report, 2020
a) Danish Order no. 277 of 14/04/2000. Cases must be notified to Statens Serum Institut.b) The regional microbiological laboratories report confirmed cases.c) The physician report individually notifiable infections.d) The laboratories voluntarily report confirmed cases.
Source: Statens Serum Institut
Pathogen Notifiable Notification route
Bacteria
Brucella spp. no -
Campylobacter spp. 1979a Laboratoryb
Chlamydophila psittaci (Ornithosis) 1980a Physicianc
Listeria monocytogenes 1993a Physician
Leptospira spp. 1980a Physician
Mycobacterium bovis/ tuberculosis 1905a Physician (and laboratoryd)
Coxiella burnetii no -
Salmonella spp. 1979a Laboratory
STEC 2000a Physician and laboratory
Yersinia enterocolitica 1979a Laboratory
Parasites
Cryptosporidium spp. no -
Echinococcus multilocularis no -
Echinococcus granulosus no -
Trichinella spp. no -
Viruses
Lyssavirus (Rabies) 1964a Physician (via telephone)
Prions
BSE/Creutzfeld Jacob 1997a Physician

ANNUAL REPORT ON ZOONOSES IN DENMARK 202052
Appendix
Pathogen Notifiable EU legislation Danish legislation
Bacteria
Brucella spp. 1920a
Cattle OBF in 1979b Decision 2003/467/EC Order no 305 of 3/5/2000
Sheep and goats ObmF in 1995c Decision 2003/467/EC Order no. 739 of 21/8/2001
Pigs No cases since 1999 Directive 2003/99/EC Order no. 575 of 29/5/2018
Campylobacter spp. no - -
Chlamydophila psittaci - - -
Birds and poultry 1920 - Order no. 575 of 30/5/2017
Listeria monocytogenes no - -
Leptospira spp. (only in production animals)
2003 - Order no. 532 of 25/5/2018
Mycobacterium bovis/tu-berculosis
1920a -
Cattle OTF in 1980d Decision 2003/467/EC Order no. 1417 of 11/12/2007(Order no. 1079 of 6/10/2014)
Coxiella burnetii 2005 - Order no. 532 of 25/5/2018
Salmonella spp. 1993e
Cattle - Order no. 1687 of 18/12/2018
Swine - Order no. 1426 of 30/11/2018
Eggs for consumption - Order no. 1422 of 30/11/2018
Hatching eggs - Order no. 1423 of 30/11/2018
Poultry for slaugther - Order no. 1273 of 30/11/2018
STEC no - -
Yersinia enterocolitica no - -
Parasites
Cryptosporidium spp. no - -
Echinococcus multilocularis 2004 Directive 2004/41/EC Order no. 532 of 25/5/2018
Echinococcus granulosus 1993 Directive 2004/41/EC Order no. 532 of 25/5/2018
Trichinella spp. 1920a Regulation (EU) 2015/1375 Order no. 1714 of 15/12/2015
Viruses
Lyssavirus (Rabies) 1920 - Order no. 330 of 14/04/2011
Prions
TSE
Sheep and goats yes Regulation 999/2001/EC (as amended)
Order no. 1491 of 12/12/2019
BSE
Cattle yesf Regulation 999/2001/EC (as amended)
Order no. 1442 of 11/12/2019
Table A25. Overview of notifiable and non-notifiable animal diseases presented in this report, 2020
a) Clinical cases, observations during the meat inspection at the slaughterhouse, positive blood samples or finding of agents are notifiable. b) Officially Brucellosis Free (OBF) according to Council Directive 64/432/EC as amended and Commision Decision 2003/467/EC. No cases in since 1962. c) Officially Brucella melitensis Free (ObmF) according to Council Directive 91/68/EC and Commision Decision 2003/467/EC. The disease has never been
detected in sheep or goat.d) Officially Tuberculosis Free (OTF) according to Council Directive 64/432/EC as amended and Regulation (EC) No 1226/2002, and Commission Decision
2003/467/EC. No cases in since 1988 or in deer since 1994.e) Only clinical cases notifiable.f) Denmark was recognized as a country with neglible risk for BSE at World Organisation for Animal Health (OIE) general session in May 2011.
Source: Danish Veterinary and Food Administration
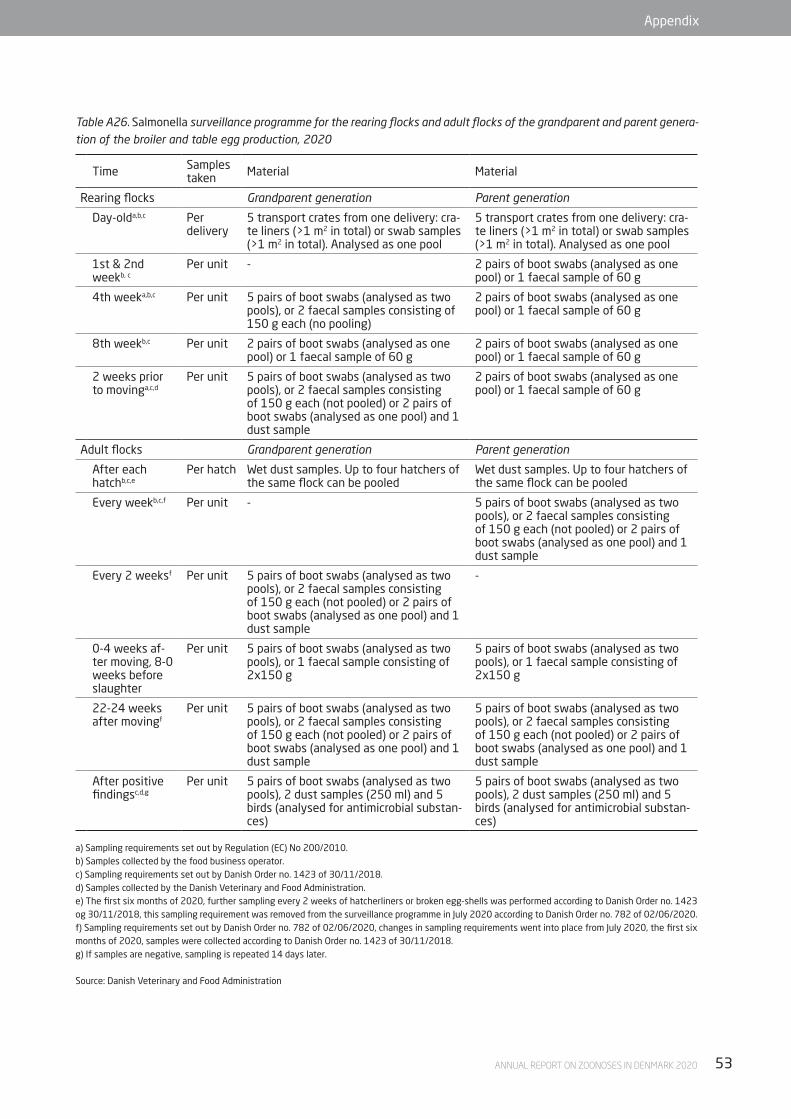
53 ANNUAL REPORT ON ZOONOSES IN DENMARK 2020
Appendix
Time Samples taken Material Material
Rearing flocks Grandparent generation Parent generation
Day-olda,b,c Per delivery
5 transport crates from one delivery: cra-te liners (>1 m2 in total) or swab samples (>1 m2 in total). Analysed as one pool
5 transport crates from one delivery: cra-te liners (>1 m2 in total) or swab samples (>1 m2 in total). Analysed as one pool
1st & 2nd weekb, c
Per unit - 2 pairs of boot swabs (analysed as one pool) or 1 faecal sample of 60 g
4th weeka,b,c Per unit 5 pairs of boot swabs (analysed as two pools), or 2 faecal samples consisting of 150 g each (no pooling)
2 pairs of boot swabs (analysed as one pool) or 1 faecal sample of 60 g
8th weekb,c Per unit 2 pairs of boot swabs (analysed as one pool) or 1 faecal sample of 60 g
2 pairs of boot swabs (analysed as one pool) or 1 faecal sample of 60 g
2 weeks prior to movinga,c,d
Per unit 5 pairs of boot swabs (analysed as two pools), or 2 faecal samples consisting of 150 g each (not pooled) or 2 pairs of boot swabs (analysed as one pool) and 1 dust sample
2 pairs of boot swabs (analysed as one pool) or 1 faecal sample of 60 g
Adult flocks Grandparent generation Parent generation
After each hatchb,c,e
Per hatch Wet dust samples. Up to four hatchers of the same flock can be pooled
Wet dust samples. Up to four hatchers of the same flock can be pooled
Every weekb,c,f Per unit - 5 pairs of boot swabs (analysed as two pools), or 2 faecal samples consisting of 150 g each (not pooled) or 2 pairs of boot swabs (analysed as one pool) and 1 dust sample
Every 2 weeksf Per unit 5 pairs of boot swabs (analysed as two pools), or 2 faecal samples consisting of 150 g each (not pooled) or 2 pairs of boot swabs (analysed as one pool) and 1 dust sample
-
0-4 weeks af-ter moving, 8-0 weeks before slaughter
Per unit 5 pairs of boot swabs (analysed as two pools), or 1 faecal sample consisting of 2x150 g
5 pairs of boot swabs (analysed as two pools), or 1 faecal sample consisting of 2x150 g
22-24 weeks after movingf
Per unit 5 pairs of boot swabs (analysed as two pools), or 2 faecal samples consisting of 150 g each (not pooled) or 2 pairs of boot swabs (analysed as one pool) and 1 dust sample
5 pairs of boot swabs (analysed as two pools), or 2 faecal samples consisting of 150 g each (not pooled) or 2 pairs of boot swabs (analysed as one pool) and 1 dust sample
After positive findingsc,d,g
Per unit 5 pairs of boot swabs (analysed as two pools), 2 dust samples (250 ml) and 5 birds (analysed for antimicrobial substan-ces)
5 pairs of boot swabs (analysed as two pools), 2 dust samples (250 ml) and 5 birds (analysed for antimicrobial substan-ces)
Table A26. Salmonella surveillance programme for the rearing flocks and adult flocks of the grandparent and parent genera-tion of the broiler and table egg production, 2020
a) Sampling requirements set out by Regulation (EC) No 200/2010.b) Samples collected by the food business operator.c) Sampling requirements set out by Danish Order no. 1423 of 30/11/2018.d) Samples collected by the Danish Veterinary and Food Administration.e) The first six months of 2020, further sampling every 2 weeks of hatcherliners or broken egg-shells was performed according to Danish Order no. 1423 og 30/11/2018, this sampling requirement was removed from the surveillance programme in July 2020 according to Danish Order no. 782 of 02/06/2020.f) Sampling requirements set out by Danish Order no. 782 of 02/06/2020, changes in sampling requirements went into place from July 2020, the first six months of 2020, samples were collected according to Danish Order no. 1423 of 30/11/2018.g) If samples are negative, sampling is repeated 14 days later.
Source: Danish Veterinary and Food Administration

ANNUAL REPORT ON ZOONOSES IN DENMARK 202054
Appendix
Table A27. Salmonella and Campylobacter surveillance programme for the broiler flocks, 2020
Time Samples taken Material
Salmonella
15 - 21 days before slaughtera,b,c Per flock 5 pairs of boot swabs
7 - 10 days before slaughterd,e Per flock 5 pairs of boot swabs
After slaughterb,d,f Per batch From slaughterhouses slaughtering 1,000 chickens or hens per day or more: 300 neck skin samples of 1 gram, pooled into subsamples of 60 gram from one batch per week. From slaughterhouses slaughtering less than 1,000 chickens or hens per day: 15 neck skin samples of approx. 10 gram pooled into 5 subsamples of 25 gram from one batch every fifth day of slaughter
Campylobacter
After slaughterb,d Per flock 12 cloacal swabs from 24 animals, analysed in one poolg,h
After slaughterb,f Per batch From slaughterhouses slaughtering 1,000,000 chickens or more per year: 15 neck skin samples of approx 10 gram, pooled into five subsamples of 25 gram from one batch per week. From slaughterhouses slaughtering less than 1,000,000 chickens per year and more than 10,000: 15 neck skin samples of approx. 10 gram pooled into 5 subsamples of 25 gram from one batch every tenth day of slaughter
a) Sampling requirements set out by Regulation (EC) 200/2012.b) Samples collected by the food business operator.c) Once a year, one pair of socks is collected by the Danish Veterinary and Food Administration. d) Sampling requirements set out by Danish Order no. 1424 of 30/11/2018. e) Samples are collected by a representative of the slaughterhouse, laboratorium or the Danish Veterinary and Food Administration.f) Sampling requirements set out by Regulation (EC) 2073/2005. g) For flocks to be slaughtered outside Denmark, 1 pair of boot swabs is collected by the owner 10 days before slaughter at the latest.h) If the flock is slaughtered over several days, the last batch is sampled.
Source: Danish Veterinary and Food Administration

55 ANNUAL REPORT ON ZOONOSES IN DENMARK 2020
Appendix
Table A28. Salmonella surveillance programme for the pullet-rearing, table egg layer and barnyard/hobby flocks in the table egg production, 2020
a) Sampling requirements set out by Danish Order no. 1422 of 30/11/2018.b) Samples collected by the food business operator.c) Samples collected by the Danish Veterinary and Food Administration.d) According to Regulation (EC) 2160/2003 sample collection must be carried out every 15 weeks as a minimum.e) Voluntary for hobby flocks.f) For flocks with 30 birds or less: No testing if only delivered to a well-known circle of users, who are informed about the fact that no Salmonella control was performed.g) If samples are negative, sampling is repeated 14 days later.
Source: Danish Veterinary and Food Administration
Time Samples taken Material
Pullet-rearing
Day-olda,b Per delivery 5 transport crates from one delivery: Crate liner (> 1 m2 in total) or swab samples (> 1 m2 in total) (Analysed as one pool)
4 weeks olda,b Per flock 5 pairs of boot swabs (analysed as two pools) or 5 faecal samples of 60 gram
2 weeks before movinga,c Per flock 5 pairs of boot swabs (analysed as two pooled samples) or 5 faecal samples of 60 gram. 60 blood samples (serology)
Table egg layers (Production for certified packing stations)
24 weeks olda,c Per flock 2 pairs of boot swabs (analysed as one pool) or 1 faecal sample consisting of 2x150 g. 250 ml (100 g) dust or a dust sample by a cloth of min. 900 cm2
Every 2 weeks from age 20 weeksa,b,d,
Per flock 2 pairs of boot swabs (analysed as one pool) or 1 faecal sample consisting of 2x150 g.
After positive serological findingsc Per flock 5 pairs of boot swabs (analysed as two pools) or 5 faecal samples consisting of 60 gram each
After positive findings of other serotypes than S. Enteritidis, S. Hadar, S. Infantis, S. Virchow or S. Typhimurium including the monop-hasic variant S. 1,4,[5],12:i:-c
Per flock 5 pairs of boot swabs (analysed as two pool) or 5 faecal samples consisting of 60 gram each, 2 dust samples (250 ml) and 5 birds (analysed for antimicrobial substances)g
Barnyard and hobby flockse
Every 18 weeksa,b,f Per flock Egg samples (serology)

ANNUAL REPORT ON ZOONOSES IN DENMARK 202056
Appendix
Table A29. Salmonella surveillance programme for the turkey flocks, 2020
Time Samples taken Material
Turkey production
Max. 21 days before slaughtera,b Per flock 2 pairs of boot swabs. Analysed individually
Table A30. Salmonella surveillance programmea for the cattle production, 2020
No. of samples Samples taken Purpose/Comment
Milk producing herds
4 samples distributed over 18 months
Bulk tank samples Calculation of herd levelb
Non-milk producing herds
1 sample every 3 months at slaughterc
Blood samples Calculation of herd levelb
1 sample every 6 months in farms with only heifer herds
Blood samples Calculation of herd levelb
4-8 samples depending on herd sized
Blood samples Consecutive negative samples required for level 1d
Beef carcases at the slaughterhouse
5 samples daily, pooled into one analysis
Swab samples from 4 designated areas after 12 hours chilling (4x100cm2)
Slaughterhouses slaughtering 7.500 or more cattle per year
5 samples every second month, analysed individually
Swab samples from 4 designated areas after 12 hours chilling (4x100cm2)
Slaughterhouses slaughtering 2.500 or more and less than 7.500 cattle per year
5 samples every 6th month, analysed individually
Swab samples from 4 designated areas after 12 hours chilling (4x100cm2)
Slaughterhouses slaughtering 250 or more and less than 2.500 cattle per year
No sampling Slaughterhouses slaughtering less than 250 cattle per year
a) Danish Order no. 1494 of 13/12/2019 as amended. In 2013 and 2014, the programme for eradication of Salmonella Dublin from the Danish cattle production was intensified. This implies compulsory eradication in Level 2 and 3 herds.
b) Herd levels based on serological testing (blood and milk): Level 1: Herd assumed free of infection based on bulk milk samples (milk producing herd) or blood samples (non-milk
producing herd). Level 2: Herd not assumed free of infection. Level 3: Herd infected based on culture and clinical signs or bacteriological findings in the intensified sampling.c) No samples are taken, if the herd has been tested for S. Dublin within the last 3 months. d) Number of samples equals total number of animals in the herd minus 2 (max. 8 animals, min. 4 animals).
Source: Danish Veterinary and Food Administration and SEGES
a) Sampling requirements set out by Regulation (EC) 1190/2012 and Danish Order no. 1424 of 30/11/2018. b) Samples collected by the food business operator or the local food control offices.
Source: Danish Veterinary and Food Administration
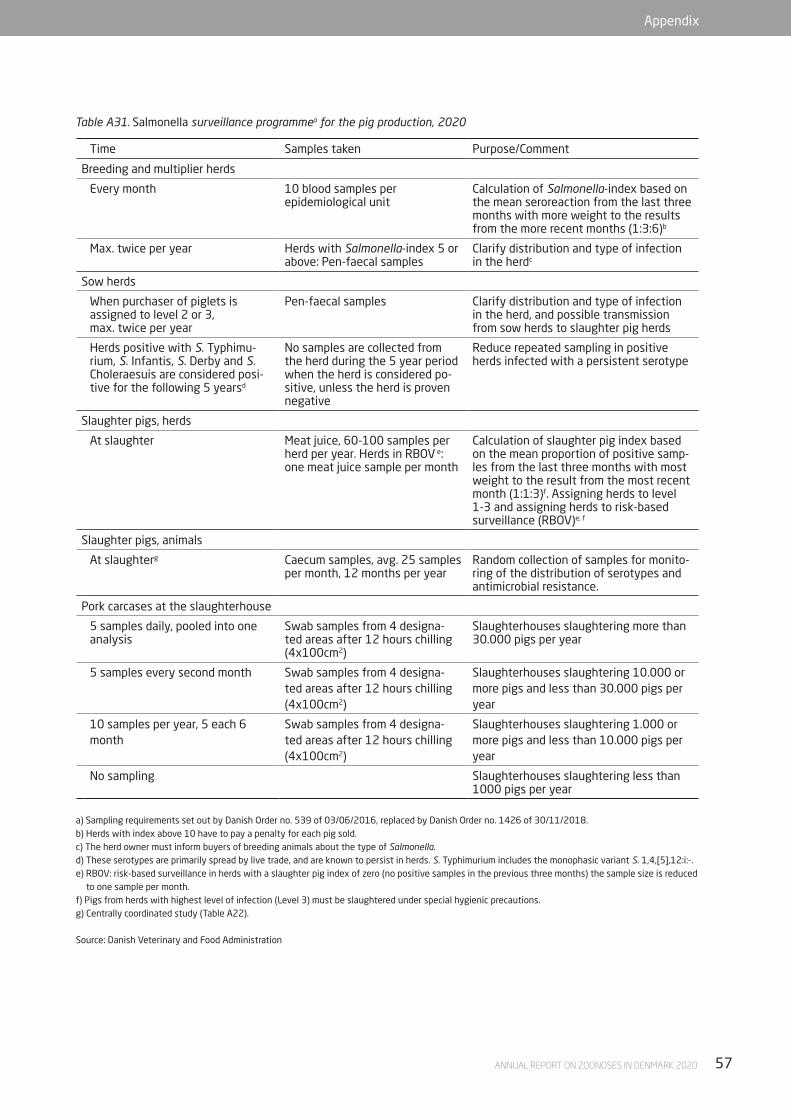
57 ANNUAL REPORT ON ZOONOSES IN DENMARK 2020
Appendix
Table A31. Salmonella surveillance programmea for the pig production, 2020
a) Sampling requirements set out by Danish Order no. 539 of 03/06/2016, replaced by Danish Order no. 1426 of 30/11/2018.b) Herds with index above 10 have to pay a penalty for each pig sold. c) The herd owner must inform buyers of breeding animals about the type of Salmonella. d) These serotypes are primarily spread by live trade, and are known to persist in herds. S. Typhimurium includes the monophasic variant S. 1,4,[5],12:i:-.e) RBOV: risk-based surveillance in herds with a slaughter pig index of zero (no positive samples in the previous three months) the sample size is reduced
to one sample per month.f) Pigs from herds with highest level of infection (Level 3) must be slaughtered under special hygienic precautions. g) Centrally coordinated study (Table A22).
Source: Danish Veterinary and Food Administration
Time Samples taken Purpose/Comment
Breeding and multiplier herds
Every month 10 blood samples per epidemiological unit
Calculation of Salmonella-index based on the mean seroreaction from the last threemonths with more weight to the results from the more recent months (1:3:6)b
Max. twice per year Herds with Salmonella-index 5 or above: Pen-faecal samples
Clarify distribution and type of infection in the herdc
Sow herds
When purchaser of piglets is assigned to level 2 or 3, max. twice per year
Pen-faecal samples Clarify distribution and type of infection in the herd, and possible transmission from sow herds to slaughter pig herds
Herds positive with S. Typhimu-rium, S. Infantis, S. Derby and S. Choleraesuis are considered posi-tive for the following 5 yearsd
No samples are collected from the herd during the 5 year period when the herd is considered po-sitive, unless the herd is proven negative
Reduce repeated sampling in positive herds infected with a persistent serotype
Slaughter pigs, herds
At slaughter Meat juice, 60-100 samples per herd per year. Herds in RBOV e: one meat juice sample per month
Calculation of slaughter pig index based on the mean proportion of positive samp-les from the last three months with most weight to the result from the most recent month (1:1:3)f. Assigning herds to level 1-3 and assigning herds to risk-based surveillance (RBOV)e, f
Slaughter pigs, animals
At slaughterg Caecum samples, avg. 25 samples per month, 12 months per year
Random collection of samples for monito-ring of the distribution of serotypes and antimicrobial resistance.
Pork carcases at the slaughterhouse
5 samples daily, pooled into one analysis
Swab samples from 4 designa-ted areas after 12 hours chilling (4x100cm2)
Slaughterhouses slaughtering more than 30.000 pigs per year
5 samples every second month Swab samples from 4 designa-ted areas after 12 hours chilling (4x100cm2)
Slaughterhouses slaughtering 10.000 or more pigs and less than 30.000 pigs per year
10 samples per year, 5 each 6 month
Swab samples from 4 designa-ted areas after 12 hours chilling (4x100cm2)
Slaughterhouses slaughtering 1.000 or more pigs and less than 10.000 pigs per year
No sampling Slaughterhouses slaughtering less than 1000 pigs per year

ANNUAL REPORT ON ZOONOSES IN DENMARK 202058
Appendix
Table A32. Typing methods used in the surveillance of foodborne pathogens in Denmark, 2020
Methods Human Food Animal
Salmonella enterica
Serotyping All isolates (mainly WGS) All isolates (by WGS) All isolates (by WGS)
Antimicrobial resistance testing
All Salmonella except S. Enteritidis
Almost all isolates Isolates for DANMAP and EFSA
MLVA In relation to International outbreak
None None
WGS All isolates All isolates All isolates
Campylobacter coli/jejuni
Antimicrobial resistance testing
Isolates from 4 districts for DANMAP surveillance
Isolates for DANMAP and EFSA
Isolates for DANMAP and EFSA
WGS Subset representing 10-15% of isolates
Few (isolates from chilled chicken meat)
None
STEC
Serotyping All isolates (mainly WGS) All isolates (by PCR & WGS) All O157 isolates
Virulence profile All isolates (mainly WGS) All isolates (by PCR & WGS) All O157 isolates
WGS All isolates All isolates None
Listeria
WGS All isolates Selected isolates (ST typing and outbreak investigations)
None
Yersinia enterocolitica
Serotyping All pathogenic isolates sent to SSI
None None
WGS Outbreaks investigations, research
None None
Source: Statens Serum Institut and the Laboratory of the Danish Veterinary and Food Administration

59 ANNUAL REPORT ON ZOONOSES IN DENMARK 2020
Appendix
Population and slaughter data
Table A33. Human population, 2020
Source: Statistics Denmark, 1 July 2020
Age groups (years) Males Females Total
0-4 159,041 150,486 309,527
5-14 328,545 311,977 640,522
15-24 367,137 350,803 717,940
25-44 734,553 715,292 1,449,845
45-64 770,431 769,690 1,540,121
65+ 537,949 629,433 1,167,382
Total 2,897,656 2,927,681 5,825,337
Table A34. Number of establishments, livestock and animals slaughtered, 2020
Source: Statistics Denmark and Danish Veterinary and Food Administration - the Central Husbandry Register, May 2021 and 1 July 2019
No. of establishments Livestock (capacity) Number slaughtered
Slaughter pigs 7,345 13,350,704 17,509,438
Cattle 16,101 1,505,474 448,100
Broilers 267 19,867,245 103,351,300
Layers (excl. barnyard) 183 5,079,691 -
Turkeys 29 327,588 5,400
Sheep & lambs 6,211 143,080 72,500
Goats 2,980 19,744 -
Horses - - 918
Table A35. Number of establishments, flocks and livestock capacity in the broiler production, 2020
Source: Danish Veterinary and Food Administration, March 2021
No. of establishments No. of flocks Livestock (capacity)
Rearing period (grandparent) 2 10 50,000
Adult period (grandparent) 3 9 82,500
Rearing period (parent) 21 96 764,310
Adult period (parent) 48 140 1,127,300
Hatcheries 5 0 0
Broilers 267 609 19,867,245
Table A36 Number of establishments, flocks and livestock capacity in the table egg production, 2020
Source: Danish Veterinary and Food Administration, March 2021
No. of establishments No. of flocks Livestock (capacity)
Rearing period (grandparent) 2 2 47,500
Adult period (grandparent) 2 7 75,000
Rearing period (parent) 4 6 31,710
Adult period (parent) 8 9 63,050
Hatcheries 7 0 0
Pullet-rearing 44 65 1,217,049
Layers (excl. barnyard) 183 294 5,079,691

ANNUAL REPORT ON ZOONOSES IN DENMARK 202060
Appendix
List of Figures
Figure 1.1 Aetiology of the 35 foodborne disease outbreaks reported in the Food- and waterborne Outbreak Data-base (FUD), 2020. Percentage of total outbreaks indicated in brackets
Figure 1.2 Number of foodborne outbreaks reported in Denmark by pathogen, 2016-2020
Figure 2.1 Total disability adjusted life years (DALYs) and contribution of years of life lost due to disability (YLD) and years of life lost due to premature death (YLL) of six foodborne pathogens in Denmark, 2019
Figure 3.1 Number of cases of the four most common foodborne bacterial pathogens in Denmark, 2018-2020
Figure 3.2 Number of cases diagnosed with the four most common bacterial foodborne pathogens in Denmark, aquired domestically or with unknown travel status, 2018-2020
Figure 3.3 Number of travel associated caeses diagnosed with the four most common bacterial foodborne patho-gens in Denmark, 2018-2020
Figure 4.1 Number of detected mink farms positive for SARS-CoV-2 and changes over time in protective measures, surveillance and culling strategy, 15 June to 7 December, 2020.
Figure 4.2 Frequency of the ten most frequent PANGO lineages in all of Denmark, Northern Denmark Region and the Capital Denmark Region, September 2020 to March 2021
Figure 4.3ab Cumulative percentage of farms with SARS-CoV-2 positive mink (a) and people identified as connected to mink farms that tested PCR-positive for SARS-CoV-2 (b), by province, Denmark, June–December 2020
Figure 4.4 Cumulative percentage of farms with SARS-CoV-2 positive mink (a) and people identified as connected to mink farms that tested PCR-positive for SARS-CoV-2 (b), by province, Denmark, June–December 2020
Figure 5.1 In 2019, record high TBE virus prevalence was found in ticks in an emerging hot spot close to a public playground in Denmark
Figure 8.1 Overview of the monitoring and outbreak investigation network for reporting infectious pathogens in humans, animals, foodstuffs and feedstuffs in Denmark, 2020
Figure 8.2 Monthly distribution of S. Enteritidis and S. Typhimurium including the monophasic S. 1,4,[5],12:i:- ca-ses, 2017-2020
Figure A1 Serological surveillance of Salmonella in breeding and multiplying pigs based on monthly testinf of blood samples, 2015-2020
Figure A2 Serological surveillance of Salmonella in slaughter pigs, 2015-2020. Percentage of seropositive meat juice samples (first sample per herd per month)
Figure A3 Salmonella in pork, monitored at slaughterhouses, 2015-2020
Figure A4 Salmonella in beef, monitored at slaughterhouses, 2015-2020

61 ANNUAL REPORT ON ZOONOSES IN DENMARK 2020
Appendix
List of Tables
Table 1.1 Norovirus outbreaks per route of transmission based on number of cases or number of outbreaks, 2018-2020
Table 2.1 Reported and estimated total cases and deaths, years of life lived with disability, years of life lost, and disability adjusted life years caused by five pathogens i Denmark, 2019
Table 3.1 Number of cases including information on travel status and percentage change from 2019 to 2020
Table 7.1 Participation and leadership of Joint Integrative Projects and Joint Research Projects of the One Health EJP by the two Danish partner institutes, 2018-2022.
Table 8.1 Top 10 Salmonella serotypes in humans and information about travel abroad, 2019-2020
Table A1 Zoonoses in humans, number of laboratory-confirmed cases, 2015-2020
Table A2 STEC O-group distribution in humans, 2020
Table A3 Food- and waterborne disease outbreaks reported in the Food- and waterborne Outbreak Database (FUD) (n=35), 2020
Table A4 Top 15 (humans) serotype distribution (%) of Salmonella from humans, animals, carcases, Danish and imported meat, 2020
Table A5 Occurrence of Salmonella in the table egg production, 2010-2020
Table A6 Occurrence of Salmonella in the table egg layer flocks sorted by type of production, 2010-2020
Table A7 Occurrence of Salmonella in the broiler production, 2010-2020
Table A8 Occurrence of Salmonella in turkey flocks, 2010-2020
Table A9 Occurence of Campylobacter in broiler flocks, 2010-2020
Table A10 Occurrence of Campylobacter in non-heat treated broiler meat samples at slaughter and retail, 2014-2020
Table A11 Occurrence of zoonotic pathogens in pigs and pork in Denmark, 2020
Table A12 Occurrence of zoonotic pathogens in cattle and beef in Denmark, 2020
Table A13 Cattle herds in the Salmonella Dublin surveillance programme, December 2020
Table A14 Salmonella in three categories of meat and bone meal by-products not intended for human consump-tion, 2020
Table A15 Control of Salmonella in feed processing and feed material (batch-based data), 2018-2020
Table A16 Feed business operators own sampling of Salmonella in compound feeds, feed processing and feed material (batch-based data), 2018-2020
Table A17 Listeria monocytogenes in Danish produced ready-to-eat (RTE) foods, 2020
Table A18 Histamine in batches of Danish and non-Danish fish products, 2020
Table A19 Salmonella in batches of Danish and non-Danish produced food items, 2020
Table A20 The Bovine Spongiform Encephalopathy (BSE) surveillance programme for cattle, 2020
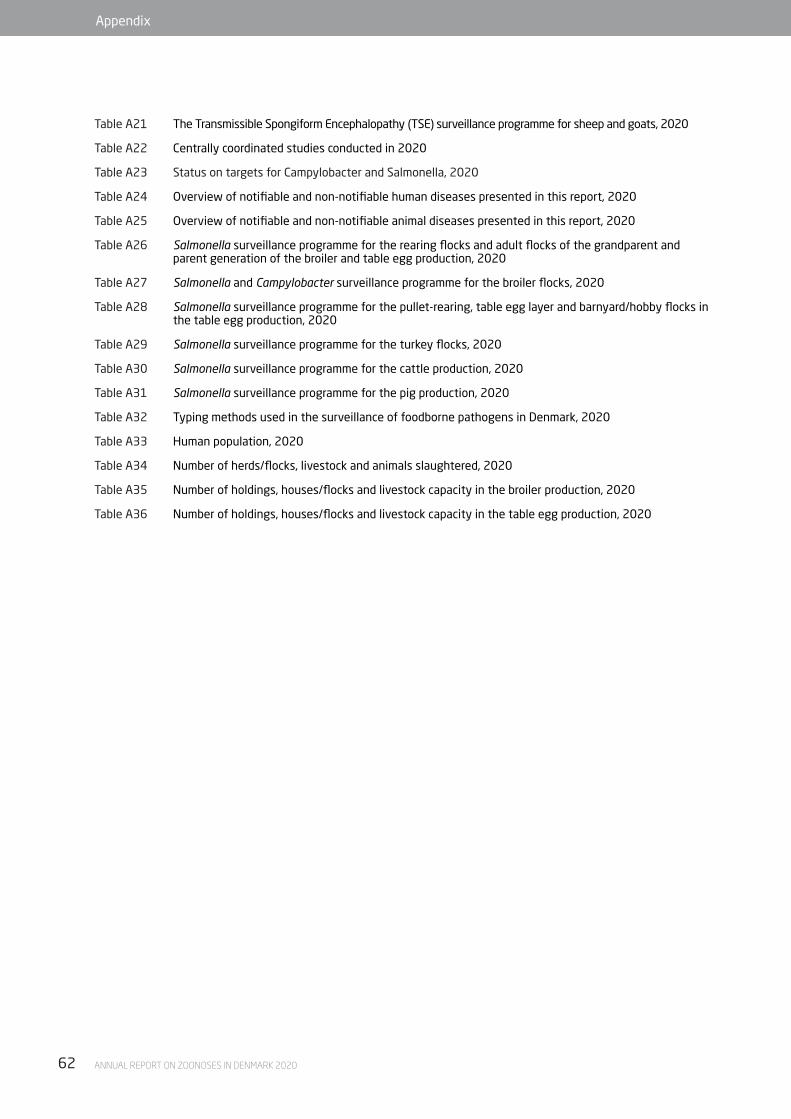
ANNUAL REPORT ON ZOONOSES IN DENMARK 202062
Appendix
Table A21 The Transmissible Spongiform Encephalopathy (TSE) surveillance programme for sheep and goats, 2020
Table A22 Centrally coordinated studies conducted in 2020
Table A23 Status on targets for Campylobacter and Salmonella, 2020
Table A24 Overview of notifiable and non-notifiable human diseases presented in this report, 2020
Table A25 Overview of notifiable and non-notifiable animal diseases presented in this report, 2020
Table A26 Salmonella surveillance programme for the rearing flocks and adult flocks of the grandparent and parent generation of the broiler and table egg production, 2020
Table A27 Salmonella and Campylobacter surveillance programme for the broiler flocks, 2020
Table A28 Salmonella surveillance programme for the pullet-rearing, table egg layer and barnyard/hobby flocks in the table egg production, 2020
Table A29 Salmonella surveillance programme for the turkey flocks, 2020
Table A30 Salmonella surveillance programme for the cattle production, 2020
Table A31 Salmonella surveillance programme for the pig production, 2020
Table A32 Typing methods used in the surveillance of foodborne pathogens in Denmark, 2020
Table A33 Human population, 2020
Table A34 Number of herds/flocks, livestock and animals slaughtered, 2020
Table A35 Number of holdings, houses/flocks and livestock capacity in the broiler production, 2020
Table A36 Number of holdings, houses/flocks and livestock capacity in the table egg production, 2020
63 ANNUAL REPORT ON ZOONOSES IN DENMARK 2020
Appendix
The Danish Veterinary and Food AdministrationStationsparken 31-33DK - 2600 GlostrupTel: +45 7227 6900E-mail: [email protected]
Danish Agriculture and Food CouncilAxelborg, Axeltorv 3DK - 1609 Copenhagen VTel: +45 3339 4000 E-mail: [email protected] www.lf.dk
National Food Institute Technical University of DenmarkKemitorvetBuilding 202DK - 2800 Kgs. LyngbyTel: +45 3588 7000E-mail: [email protected]
Statens Serum Institut Artillerivej 5DK - 2300 København STel: +45 3268 3268E-mail: [email protected]
Contributing institutions:

National Food InstituteTechnical University of DenmarkKemitorvet, Building 202DK - 2800 Kgs. Lyngby
T: 35 88 70 00F: 35 88 70 01www.food.dtu.dk
ISSN: 1600-3837