Embed Size (px)
Citation preview

Annual Reporton the Activities of
the RSMC Tokyo - Typhoon Center2016
Japan Meteorological Agency
TY Meranti09 UTC,13 September 2016

- i -
Annual Reporton the Activities of
the RSMC Tokyo - Typhoon Center2016
Japan Meteorological Agency
140
1626
1626
1625
1625
1624
1624
1623
1623
1622
1622
1621
16211620
1620
1619
1619
1618
1618
1617
1617
1616
1616
1615
1615
1614
1614
1613
1613
1612
1612
1611
1611
1610
1610
1609
1609
1608
1608
1607
1607
1606
1606
1605
1605
1604
1604
1603
1603
1602
1602
1601
1601

- ii -
Copyright (c) 2017 by the Japan Meteorological Agency (JMA). All rights reserved.
1) This publication, including the DVD, shall not be reproduced or be provided to any third party.2) The source shall be properly acknowledged in any work connected to this publication, including the DVD.
JMA accepts no liability for any direct and/or indirect loss or damage to the user caused by the use of the software, data or documents in this publication, including the DVD.

Table of Contents
Page Introduction Chapter 1 Operations at the RSMC Tokyo - Typhoon Center in 2016 1.1 Analysis 1 1.2 Forecasts 1 1.3 Provision of RSMC Products 2 1.4 WIS Global Information System Center Tokyo Server 4 1.5 RSMC Tokyo - Typhoon Center Website 4 1.6 Numerical Typhoon Prediction Website 5 1.7 Graphical Tropical Cyclone Advisory for SIGMET 5 Chapter 2 Major Activities of the RSMC Tokyo - Typhoon Center in 2016 2.1 Provision of RSMC Products 6 2.2 Publications 6 2.3 Typhoon Committee Attachment Training 7 2.4 Monitoring of Observational Data Availability 7 2.5 Other Activities in 2016 7 2.5.1 Reduction of Forecast Circle Radii 7 2.5.2 Update of Numerical Typhoon Prediction Website 8 Chapter 3 Summary of the 2016 Typhoon Season 3.1 Atmospheric and Oceanographic Conditions in the Tropics 10 3.2 Tropical Cyclones in 2016 11 Chapter 4 Verification of Forecasts in 2016 4.1 Verification of Operational Forecasts 14 4.1.1 Center Position 14 4.1.2 Central Pressure and Maximum Wind Speed 17 4.2 Verification of Numerical Model (GSM, TEPS) 18 4.2.1 GSM Prediction 18 4.2.2 TEPS Prediction 21 4.3 Verification of Storm Surge Prediction 23 4.3.1 Deterministic Prediction 24 4.3.2 Multi-scenario Prediction 25

Appendices 1 RSMC Tropical Cyclone Best Track Data in 2016 29 2 Monthly Tracks of Tropical Cyclones in 2016 33 3 Errors of Track and Intensity Forecasts for Each Tropical Cyclone in 2016 41 4 Monthly and Annual Frequencies of Tropical Cyclones 47 5 Code Forms of RSMC Products 49 6 Specification of JMA’s NWP models (GSM, TEPS) 55 7 Products on WIS GISC Tokyo Server 59 8 Products on NTP website 63 9 User’s Guide to the DVD 65 Tropical Cyclones in 2016 (only PDF in DVD) DVD for Annual Report 2016

Introduction
The RSMC Tokyo - Typhoon Center (referred to here as the Center) is a Regional Specialized
Meteorological Centre (RSMC) that carries out specialized activities in analysis, tracking and forecasting of western North Pacific tropical cyclones (TCs) within the framework of the World Weather Watch (WWW) Programme of the World Meteorological Organization (WMO). The Center was established at the headquarters of the Japan Meteorological Agency (JMA) in July 1989 following a designation by the WMO Executive Council at its 40th session (Geneva, June 1988).
The Center conducts the following operations on a routine basis: (1) Preparation of information on the formation, movement and development of TCs and associated
meteorological phenomena (2) Preparation of information on synoptic-scale atmospheric situations that affect the behavior of
TCs (3) Provision of the above information to National Meteorological Services (NMSs), and in
particular to ESCAP/WMO Typhoon Committee Members, in appropriate formats for operational processing
In addition to the routine services outlined above, the Center distributes a series of reports entitled
Annual Report on the Activities of the RSMC Tokyo - Typhoon Center as operational references for the NMSs concerned. The reports summarize the activities of the Center and review the TCs of the preceding year.
In this issue covering 2016, Chapter 1 outlines routine operations performed at the Center and its
operational products, while Chapter 2 reports on its major activities in 2016. Chapter 3 describes atmospheric and oceanic conditions in the tropics and notes the highlights of TC activity in 2016. Chapter 4 presents verification statistics relating to operational forecasts, results of JMA’s numerical weather prediction (NWP) models, and storm surge prediction. Best track data for 2016 TCs are shown in table and chart form in the appendices. All relevant text, tables, charts and appendices are included on the DVD provided with this report.
The DVD contains hourly cloud images of all 2016 TCs of TS intensity or higher within the Center’s
area of responsibility. Also included is the necessary viewer software, which features various functions for analyzing satellite imagery (such as image animations) and facilitates efficient post-analysis of TCs and their environments. A setup program and a user manual for the software are included on the DVD. Appendix 9 gives an outline of the DVD and instructions on using the software.

1
Chapter 1
Operations at the RSMC Tokyo - Typhoon Center in 2016 The Center’s area of responsibility covers the western North Pacific and the South China Sea (0° –
60°N, 100° – 180°E) including marginal seas and adjacent land areas (Figure 1.1). The Center carries out analysis and forecasting in relation to tropical cyclones (TCs) in the area and also provides the relevant National Meteorological Services (NMSs) with RSMC products via the Global Telecommunication System (GTS), the Aeronautical Fixed Telecommunication Network (AFTN), the Internet and other media.
1.1 Analysis TC analysis is performed eight times a day at 00, 03, 06, 09, 12, 15, 18 and 21 UTC, and begins with
determination of the TC’s center position. Cloud images from the Himawari-8 are the principal source for this determination, especially for TCs migrating over data-sparse ocean areas. Information on the TC’s direction and speed of movement is extracted primarily from six-hourly displacement vectors of the center position.
The central pressure of TCs is determined mainly from the CI number, which is derived from
satellite imagery using the Dvorak method. The CI number also gives the maximum sustained wind speed in the vicinity of the center. The radii of circles representing winds with speeds of more than 30 and 50 knots are determined mainly from surface observation, ASCAT observation and low-level cloud motion winds (LCW) derived from cloud motion vectors of satellite images in the vicinity of the TC.
1.2 Forecasts
As a primary basis for TC track forecasts, JMA implements NWP using the Global Spectral Model
(GSM) and the Typhoon Ensemble Prediction System (TEPS). The GSM (TL959L100; upgraded on 18 March, 2014) has a horizontal resolution of approximately 20 km and 100 vertical layers, while TEPS (TL479L60; operational as of 11 March 2014) has 25 members with a horizontal resolution of approximately 40 km and 60 vertical layers. Using mainly TEPS, JMA extended its TC track forecast up to five days ahead as of April 2009. Further details and recent model improvements are detailed in Appendix 6. In relation to TC intensity, central pressure and maximum sustained wind speeds are forecasted using results of NWP models, guidance model based on climatology and persistence, and the Dvorak method.
Figure 1.1 Area of responsibility of the RSMC Tokyo - Typhoon Center

2
A probability circle shows the range into which the center of a TC is expected to move with 70% probability at each validation time. The radius of the circle for all forecast times is statistically determined according to the direction and speed of TC movement based on the results of recent TC track forecast verification. In addition, those for 96- and 120-hour forecasts are statistically determined according to the confidence level based on the cumulative ensemble spread calculated using TEPS.
1.3 Provision of RSMC Products
The Center prepares and distributes the RSMC bulletins listed below via the GTS and the AFTN
when: - a TC of tropical storm (TS) intensity or higher exists in the Center’s area of responsibility - a TC is expected to reach or exceed TS intensity in the area within 24 hours RSMC products are continually issued while any TC of TS intensity or higher exists in the Center’s
area of responsibility. Appendix 5 denotes the code forms of the bulletins.
(1) RSMC Tropical Cyclone Advisory (WTPQ20-25 RJTD: via GTS) The RSMC Tropical Cyclone Advisory is issued eight times a day after observations made at 00, 03,
06, 09, 12, 15, 18 and 21 UTC, and reports the following elements in analysis, and in 24-, 48- and 72-hour forecasts for TCs:
Analysis Center position Accuracy of center position determination Direction and speed of movement Central pressure Maximum sustained wind speed (10-minute average) Maximum gust wind speed Radii of wind areas over 50 and 30 knots 24-, 48- and 72-hour Center position and radius of probability circle forecasts Direction and speed of movement Central pressure Maximum sustained wind speed (10-minute average) Maximum gust wind speed
(2) RSMC Tropical Cyclone Advisory for Five-day Track Forecast (WTPQ50-55 RJTD: via GTS) The RSMC Tropical Cyclone Advisory for Five-day Track Forecast is issued four times a day after
observations made at 00, 06, 12 and 18UTC, and reports the following elements in analysis and in 24-, 48-, 72-, 96- and 120-hour forecasts for TCs:
Analysis Center position Accuracy of center position determination Direction and speed of movement Central pressure Maximum sustained wind speed (10-minute average) Maximum gust wind speed Radii of wind areas over 50 and 30 knots

3
24-, 48- and 72-hour Center position and radius of probability circle forecasts Direction and speed of movement Central pressure Maximum sustained wind speed (10-minute average) Maximum gust wind speed 96- and 120-hour Center position and radius of probability circle forecasts Direction and speed of movement
(3) RSMC Guidance for Forecast (FXPQ20-25 RJTD: via GTS) The RSMC Guidance for Forecast reports the results of predictions made by the GSM; which is run
four times a day with initial analyses at 00, 06, 12 and 18 UTC. The guidance presents six-hourly GSM predictions for TCs up to 84 hours ahead and TEPS mean six-hourly predictions up to 132 hours ahead, and reports the following elements:
NWP prediction (T = 06 to 84 or 132) Center position Central pressure* Maximum sustained wind speed* * Predictions of these parameters are given as deviations from those at the initial time.
(4) SAREP (IUCC10 RJTD: via GTS) The SAREP in BUFR format reports on the results of TC analysis including intensity information
(i.e., the CI number) based on the Dvorak method. It is issued 30 minutes to an hour after observations made at 00, 03, 06, 09, 12, 15, 18 and 21 UTC, and reports the following elements:
Himawari-8 Center position imagery analysis Accuracy of center position determination Direction and speed of movement Mean diameter of overcast cloud Apparent past 24-hour change in intensity** Dvorak Intensity (CI, T, DT, MET, PT number) ** Cloud pattern type of the DT number** Trend of past 24-hour change** Cloud pattern type of the PT number** Type of the final T-number** ** Reported only at 00, 06, 12 and 18 UTC BUFR/CREX templates for translation into table-driven code forms are provided on the WMO
website at http://www.wmo.int/pages/prog/www/WMOCodes.html
(5) RSMC Prognostic Reasoning (WTPQ30-35 RJTD: via GTS) The RSMC Prognostic Reasoning report provides brief reasoning for TC forecasts, and is issued at
00 and 06 UTC following the issuance of the RSMC Tropical Cyclone Advisory. In the bulletin, general comments on the forecasting method, the synoptic situation such as the subtropical ridge, the movement and intensity of the TC as well as relevant remarks are given in plain language.
4
(6) RSMC Tropical Cyclone Best Track (AXPQ20 RJTD: via GTS)
The RSMC Tropical Cyclone Best Track report provides post-analysis data on TCs of TS intensity or
higher. It reports the center position, the central pressure and the maximum sustained wind speed. The best track for each TC is usually finalized one and a half months after the termination of related issuance of the above RSMC bulletins.
(7) Tropical Cyclone Advisory for SIGMET (FKPQ30-35 RJTD: via AFTN)
As a Tropical Cyclone Advisory Centre (TCAC) within the framework of the International Civil
Aviation Organization (ICAO), the Center provides Tropical Cyclone Advisory (TCA) for SIGMET to Meteorological Watch Offices (MWOs) in order to support their preparations of SIGMET information on TCs. These advisories include the following elements in analysis and in 6-, 12-, 18- and 24-hour forecasts:
Analysis Center position Direction and speed of movement Central pressure Maximum sustained wind speed (10-minute average) Forecast Center position Maximum sustained wind speed (10-minute average)
1.4 WIS Global Information System Center Tokyo Server As designated at the Sixteenth WMO Congress in June 2011, the Center introduced Data Collection
or Production Center (DCPC) service under the Global Information System Center (GISC) Tokyo for the WMO Information System (WIS) in August 2011. It provides NWP products such as data on predicted fields in grid-point-value (GPV) form and observational values through WIS Data Discovery, Access and Retrieval (DAR) via a new GISC Tokyo server (http://www.wis-jma.go.jp/). GSM products with resolution of 0.5 and 0.25 degrees (surface layer) and JMA SATAID Service (http://www.wis-jma.go.jp/cms/sataid/) are also available from the server through WIS DAR. All products available via the new server are listed in Appendix 7.
1.5 RSMC Tokyo - Typhoon Center Website The RSMC Tokyo - Typhoon Center Website provides TC advisories on a real-time basis and a wide
variety of products including TC analysis archives, technical reviews and annual reports on the Center’s activities at http://www.jma.go.jp/jma/jma-eng/jma-center/rsmc-hp-pub-eg/RSMC_HP.htm. Since 12 November 2012, the website has provided experimental TC advisory information in Common Alert Protocol (CAP) format.

5
1.6 Numerical Typhoon Prediction Website Since 1 October 2004, the Center has operated the Numerical Typhoon Prediction (NTP) website
(https://tynwp-web.kishou.go.jp/) to assist the NMSs of Typhoon Committee Members in improving their TC forecasting and warning services. The site provides TC track predictions and weather maps of deterministic NWP models from nine centers (BoM (Australia), CMA (China), CMC (Canada), DWD (Germany), ECMWF, KMA (Republic of Korea), NCEP (USA), UKMO (UK) and JMA), ensemble TC track predictions of ensemble NWP models from four centers (ECMWF, UKMO, NCEP and JMA) and a wide variety of products including the results of the Center’s TC analysis, upper-air analysis, ocean analysis, storm surge and wave height forecasting. All products available on the website are listed in Appendix 8.
1.7 Graphical Tropical Cyclone Advisory for SIGMET
In August 2015, the Center started providing graphical Tropical Cyclone Advisory (TCA) in addition
to text-format TCA in its role as the ICAO TCAC. Graphical TCA shows not only the text-format TCA information but also the horizontal extent of cumulonimbus cloud and cloud top height associated with TCs potentially affecting aviation safety. It is provided through the website where the specifications and text-format TCA are also available (http://www.data.jma.go.jp/fcd/tca/data/index.html). This website is linked from the NTP website, and graphical TCA is also dispatched to World Area Forecast Centres (WAFCs).

6
Chapter 2
Major Activities of the RSMC Tokyo - Typhoon Center in 2016 2.1 Provision of RSMC Products
The Center provides operational products for tropical cyclone (TC) forecasting to NMSs via the GTS,
the AFTN and other networks. Monthly and annual totals of products issued in 2016 are listed in Table 2.1.
2.2 Publications In March 2016, the 18th issue of the RSMC Technical Review was issued with the following areas of
focus: 1. Development of a product based on consensus between Dvorak and AMSU tropical cyclone
central pressure estimates at JMA 2. Tropical Cyclone Central Pressure Estimation Using Doppler Radar Observations at JMA In December 2016, the Center published the Annual Report on the Activities of the RSMC Tokyo -
Typhoon Center 2015. Both publications are available on the Center’s website at http://www.jma.go.jp/jma/jma-eng/jma-center/rsmc-hp-pub-eg/RSMC_HP.htm.
Table 2.1 Monthly and annual totals of products issued by the RSMC Tokyo - Typhoon Center in 2016
Product Jan Feb Mar Apr May Jun Jul Aug Sep Oct Nov Dec Total
IUCC10 0 0 0 0 0 14 102 314 250 239 101 51 1071
WTPQ20-25 0 0 0 0 0 28 119 352 284 286 127 55 1251
WTPQ30-35 0 0 0 0 0 8 28 86 71 71 31 14 309
WTPQ50-55 0 0 0 0 0 0 22 80 70 62 14 17 265
FXPQ20-25 0 0 0 0 0 28 116 346 278 282 124 54 1228
FKPQ30-35 0 0 0 0 0 14 58 173 139 141 62 27 614
AXPQ20 2 0 0 0 0 0 0 2 9 6 5 3 27
Notes:
IUCC10 RJTD SAREP (BUFR format)WTPQ20-25 RJTD RSMC Tropical Cyclone AdvisoryWTPQ30-35 RJTD RSMC Prognostic ReasoningWTPQ50-55 RJTD RSMC Tropical Cyclone Advisory for five-day track forecast FXPQ20-25 RJTD RSMC Guidance for ForecastFKPQ30-35 RJTD Tropical Cyclone Advisory for SIGMETAXPQ20 RJTD RSMC Tropical Cyclone Best Track

7
2.3 Typhoon Committee Attachment Training The 16th Typhoon Committee Attachment Training 2016 course was held at JMA Headquarters from
15 to 26 August 2016. The Center has organized Typhoon Committee Attachment Training courses every year since 2001
with the support of the WMO Tropical Cyclone Programme and the Typhoon Committee in order to advance the tropical cyclone forecasting capacity of Committee Members. Forecasters from the Panel on Tropical Cyclones (PTC) have also been invited since 2015 to enhance training collaboration between PTC and the Typhoon Committee. The 2016 attendees were Mr. Thatsana Chanvilay from Lao PDR, Ms. Shelly Jo Igpuara Ignacio from the Philippines, Ms. Ton Thi Thao from Vietnam, Mr. Nasser Said Abdullah Al Ismaili from Oman, Mr. Habib Rehmat from Pakistan, and Mr. Ponna Handi Chaminda De Silva from Sri Lanka.
The training focused on imparting practical knowledge and skills relating to operational tropical
cyclone analysis and forecasting via lectures and exercises using the Satellite Analysis and Viewer Program (SATAID). The course covered a range of subjects including Dvorak analysis, interpretation of microwave data, quantitative precipitation estimation, quantitative precipitation forecasting and storm surge forecasting. All attendees gave presentations to help JMA staff understand the current status of their meteorological and hydrological services. In 2016, two-day sessions on warning coordination were introduced, with focus on how to determine warning thresholds using disaster statistics and meteorological datasets based on a past tropical cyclone event in Japan.
2.4 Monitoring of Observational Data Availability
The Center carried out regular monitoring of information exchanges for enhanced TC observation in
accordance with the standard procedures stipulated in Section 6.2, Chapter 6 of The Typhoon Committee Operational Manual (TOM) - Meteorological Component (WMO/TD-No. 196). Monitoring for the period from 1 November, 2015, to 31 October, 2016, was conducted for two tropical cyclones:
1. TY Chaba (1618), from 12UTC 30 September to 12UTC 5 October 2016 2. TY Haima (1622), from 15UTC 16 October to 15UTC 21 October 2016 The results were distributed to all Typhoon Committee Members in March 2017, and are also
available on the WIS GISC Tokyo server at http://www.wis-jma.go.jp/monitoring/data/monitoring/.
2.5 Other Activities in 2016
2.5.1 Reduction of Forecast Circle Radii Based on TC track forecast improvements made in recent years via NWP model enhancement and
other forecast techniques, the Center reduced the radius of forecast circles in its official forecasts by 20 – 40% (depending on TC direction and speed) in June 2016, starting with TY Nepartak (1601). This change addresses the issue of over-dispersiveness of warning areas.

8
The size of forecast circles is determined so that forecast track falls within the circles in a probability of about 70%. Based on the forecast results from 2011-2015, sizes of forecast circles were reviewed for all the forecast times (3, 6, 9, 12, 15, 18, 21, 24, 48, 72, 96 and 120 hours). For those for all forecast times, more than one sizes are defined based on the speed and direction of movement. Furthermore, for those for the forecast times of 96 and 120 hours, more types of circles are used depending on the forecast reliability estimated by the results of the JMA’s TEPS for each typhoon. Changes in forecast circle size in typhoons with two directions are shown in Figure 2.1.
2.5.2 Update of Numerical Typhoon Prediction Website On 15 June and 23 August 2016, the Center started providing new products on the NTP website.
These include:
(1) TC Activity Prediction (15 June) The Center provides two- and five-day TC Activity Prediction Maps for its area of responsibility
using the ensembles of ECMWF and UKMO and a related consensus. An example is shown in Figure 2.2. The maps display TC activity based on the probability that a TC will be present within a 300-km radius of a certain location during a particular forecast time window. The products are expected to help forecasters identify and monitor areas where a TC could form within two- and five-day periods. TC activity prediction maps of other NWP centers are also displayed if the necessary NWP data are provided to the Center.
(2) TC Track Ensembles of ECMWF, NCEP and UKMO (15 June) TC track predictions of ECMWF, NCEP and UKMO ensemble systems are provided, in addition to
JMA’s TEPS, to help forecasters to develop TC track forecast scenarios in consideration of related uncertainty.
(3) Weighted Consensus of Satellite TC Intensity Estimates (15 June) Weighted consensus of TC intensity estimates based on the Dvorak technique and warm-core
intensity as observed by the Advanced Microwave Sounding Unit-A (AMSU-A) of NOAA and the MetOp series of polar-orbiting satellites are available. These estimates have higher accuracy than those made using the Dvorak technique, giving additional reliable information that helps forecasters estimate TC intensity.
Figure 2.1 (left) changes in forecast circle size with northwestward movement; blue: old circles; black: new circles. The figure shows forecasts for TY Chan-hom (1509) with an initial time of 18 UTC on 4 July 2015. (right) changes in forecast circle size with northeastward movement; blue: old circles; black: new circles. The figure shows forecasts for TY Vongfong (1419) with an initial time of 18UTC on 11 October 2014.

9
(4) Detailed History Log of Dvorak Analysis (15 June) Detailed logs of Dvorak analysis, including data on Cloud Pattern, DT, MET, PT, Final-T and CI, are
provided to help forecasters understand the Center’s TC intensity estimates.
(5) Multi-scenario Storm Surge Prediction (15 June) Multi-scenario storm surge prediction is now operational. This new product provides storm surge
predictions based on the Center’s official advisory and five additional tropical cyclone track scenarios derived from JMA’s TEPS using cluster analysis. As storm surge prediction is sensitive to tropical cyclone track scenarios, the product will help forecasters to estimate the uncertainty of storm surge prediction with consideration of track forecast errors.
(6) Ensemble Ocean Wave Prediction (23 August)
Ensemble mean / 3rd quantile / maximum wave heights, probability of wave heights over 2, 3, 4, 5 and 6 m, and ensemble spread information are available along with boxplot data and information on exceeding probability at selected stations. These products are based on JMA’s global Wave Ensemble System (WENS), which began operation on 8 June 2016, and cover most of the globe with 1.25-degree grid resolution. The model is run once a day at 12 UTC and predicts ocean wave conditions up to 264 hours ahead with 27 members. The products will help to clarify maritime/coastal risk from waves with a lead time in the range of a week.
Figure 2.2 Two-day (left) and five-day (right) TC Activity Prediction Maps made using the ensembles of ECMWF (middle) and UKMO (bottom), and related consensus (top) with an initial time of 00 UTC on 8 August 2016

10
Chapter 3
Summary of the 2016 Typhoon Season In 2016, 26 TCs of tropical storm (TS) intensity or higher formed over the western North Pacific and
the South China Sea. This is close to the climatological normal* frequency of 25.6. Among these 26 TCs, 13 reached typhoon (TY) intensity, 6 reached severe tropical storm (STS) intensity and 7 reached TS intensity (Table 3.1).
* Climatological normal is based on data for the period from 1981 to 2010.
3.1 Atmospheric and Oceanographic Conditions in the Tropics The El Niño event that started in summer 2014 and peaked in winter 2015/2016 ended in spring
2016. Consequently, zero-to-negative sea surface temperature (SST) anomalies became obscure in the tropical western North Pacific in late spring and then turned positive. Meanwhile, positive SST anomalies prevailed during 2016 over the South China Sea. In the Indian Ocean, positive SST anomalies were clearly seen until early summer.
Table 3.1 List of tropical cyclones reaching TS intensity or higher in 2016
(UTC) lat (N) long (E) (hPa) (kt)TY Nepartak (1601) 030000 Jul - 090600 Jul 060600 19.5 128.4 900 110TS Lupit (1602) 231800 Jul - 241800 Jul 231800 28.9 157.1 1000 40STS Mirinae (1603) 260600 Jul - 280600 Jul 271200 19.9 106.7 980 55STS Nida (1604) 300600 Jul - 021200 Aug 310600 18.2 122.3 975 60STS Omais (1605) 040000 Aug - 091800 Aug 060600 24.9 147.7 975 60TS Conson (1606) 090000 Aug - 150000 Aug 130600 31.6 154.3 985 45STS Chanthu (1607) 131800 Aug - 171800 Aug 160000 31.6 142.5 980 55TS Dianmu (1608) 171800 Aug - 191200 Aug 181800 20.5 108.2 980 40TY Mindulle (1609) 190600 Aug - 230300 Aug 211800 33.1 139.4 975 65TY Lionrock (1610) 211200 Aug - 301500 Aug 280600 27.7 137.9 940 90TS Kompasu (1611) 200000 Aug - 211800 Aug 200000 32.9 147.3 994 35TY Namtheun (1612) 010000 Sep - 041800 Sep 021800 28.5 130.6 955 70TS Malou (1613) 060600 Sep - 070000 Sep 060600 27.6 126.8 1000 40TY Meranti (1614) 100600 Sep - 151200 Sep 131200 20.4 122.9 890 120TS Rai (1615) 121800 Sep - 130600 Sep 121800 15.5 108.9 996 35TY Malakas (1616) 121800 Sep - 201200 Sep 161800 23.0 123.1 930 95TY Megi (1617) 231800 Sep - 281200 Sep 270000 23.3 123.3 945 85TY Chaba (1618) 290600 Sep - 051200 Oct 030900 25.4 126.9 905 115STS Aere (1619) 051800 Oct - 100000 Oct 071800 21.2 115.9 975 60TY Songda (1620) 081200 Oct - 130600 Oct 111800 30.3 148.9 925 100TY Sarika (1621) 131800 Oct - 190600 Oct 151800 15.8 121.8 935 95TY Haima (1622) 150000 Oct - 211800 Oct 181800 16.0 127.5 900 115TY Meari (1623) 030000 Nov - 070600 Nov 051200 18.3 140.7 960 75TS Ma-on (1624) 100000 Nov - 120000 Nov 100000 16.9 156.9 1002 35STS Tokage (1625) 251200 Nov - 280000 Nov 260000 13.2 118.7 992 50TY Nock-ten (1626) 211800 Dec - 271800 Dec 240600 13.3 128.2 915 105
Tropical Cyclone Duration (UTC) Minimum Central Pressure Max Wind(TS or higher)
11
The positive SST anomalies and associated enhanced convective activity in the Indian Ocean may have contributed to suppressed convective activity and lower-level anticyclonic circulation anomalies over the tropical western North Pacific and the South China Sea until early summer. After late summer, convective activity was generally enhanced over the tropical western North Pacific and the South China Sea.
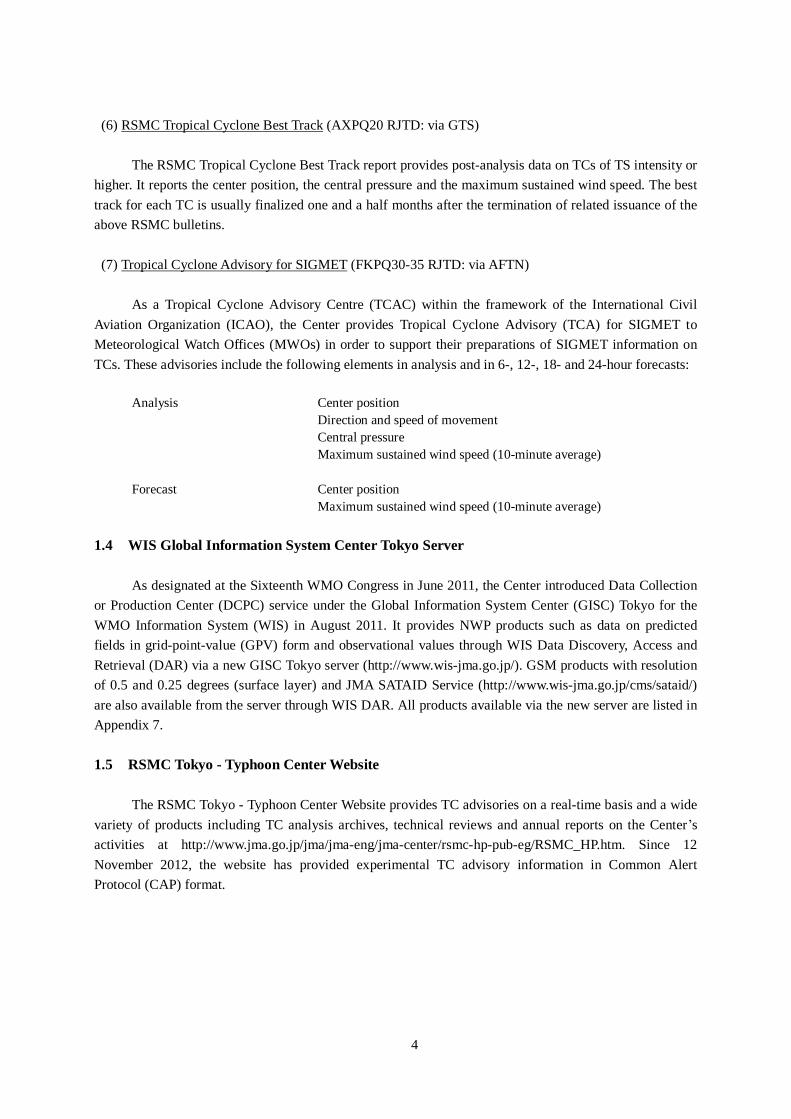
Figure 3.1 shows monthly mean streamline anomalies at 200 and 850 hPa, Outgoing Longwave
Radiation (OLR) anomalies (a lower OLR corresponds to stronger convective activity) and the tracks of TCs that formed in August 2016 when convective activity was enhanced from the South China Sea to the seas east of the Philippines in association with the positive SST anomalies in the area. In association with the northward meandering of the westerly jet stream near the Kamchatka Peninsula, an upper-level trough also formed in the central Pacific. From this, several upper-level lows were cut off and migrated westward. These conditions may have contributed to enhanced convective activity in the area of 20 - 30˚N to the southeast of Japan. It can be seen that seven named TCs formed in the area of 20 - 30˚N corresponding to strong convective activity, and six of them formed between 140 and 170˚E in line with particular areas of stronger convective activity.
To highlight atmospheric and oceanographic conditions, charts showing monthly mean SST
anomalies for the western North Pacific and the South China Sea, monthly mean streamlines at 850 and 200 hPa and OLRs and related anomalies for the months from January to December are included on the DVD provided with this report.
3.2 Tropical Cyclones in 2016 A total of 26 named TCs formed over the western North Pacific and the South China Sea in 2016.
Monthly and the climatological normal numbers of TC formations are shown in Figure 3.2, and the tracks of the 26 TCs are shown in Figure 3.3. Figure 3.4 shows the genesis points of the 26 TCs (dots) and related frequency distribution for past years (1951 – 2015).
Figure 3.1 Monthly mean streamline anomalies at 200 hPa (lines with arrows) (left) and 850 hPa (lines with arrows) and OLR anomalies (shading) (right) for August 2016. The tracks of the seven named TCs that formed in August are superimposed onto both figures.

12
The first named TC of 2016 formed on 3 July, which is the second latest formation of the annual first named TC since 1951 when the Center began keeping TC statistics. This late formation reflects suppressed convective activity over the tropics in the western North Pacific and the South China Sea until June, as seen in post-El Niño years such as 1998, 1973 and 1983. From August, monthly numbers of TC formations exceeded the climatological normal reflecting stronger convective activity in the area of 20 - 30˚N, 140 - 170˚E in August and in the western half of the western North Pacific and the South China Sea from September to December. The monthly and annual frequencies of named TCs forming since 1951 are detailed in Appendix 4.
The mean genesis point of the 26 named TCs forming in 2016 was at 18.0˚N and 136.5˚E, showing a
northward deviation from the climatological normal (16.2˚N and 136.7˚E). The mean genesis point of named TCs forming in summer (June to August) was 20.8˚N and 138.6˚E, showing a northeastward deviation from the climatological normal (18.4˚N and 135.9˚E), whereas that of named TCs forming in autumn (September to November) was 16.5˚N and 134.5˚E, showing a westward deviation from the climatological normal (15.9˚N and 137.8˚E). The summer deviation corresponds to the large number of named TCs forming in the area of 20 - 30˚N, 140 - 170˚E in August, while the autumn deviation corresponds to stronger convective activity in the western half of the western North Pacific and the South China Sea.
The mean TC duration** was 4.2 days, which is shorter than the climatological normal (5.3 days).
This reflects the northeastward deviation of the mean genesis point of named TCs forming in summer as compared to the climatological normal, causing increased proximity to a lower SST area, and the westward deviation of the mean genesis point in autumn, causing increased proximity to the continent.
** TC duration is defined as the period during which a TC remains at TS intensity or higher. Detailed descriptions of each TC forming in 2016 are included on the DVD provided with this
report. Figure 3.2 Monthly number of TC formations for 2016 compared to the climatological normal
0
1
2
3
4
5
6
7
8
1 2 3 4 5 6 7 8 9 10 11 12
number
month
2016 Average (1981-2010)

13
Figure 3.4 Genesis points of the 26 TCs forming in 2016 (dots) and related frequency distribution for 1951 – 2015 (lines)
Figure 3.3 Tracks of the 26 named TCs forming in 2016. TC tracks for those with an intensity of TS or higher are shown.

14
Chapter 4
Verification of Forecasts in 2016
4.1 Verification of Operational Forecasts Operational forecasts for the 26 TCs of TS intensity or higher that formed in 2016 were verified
using RSMC TC best track data. The verified elements were forecasts of the center position (up to five days ahead), central pressure and maximum sustained wind (up to three days ahead). The position and intensity errors of operational forecasts for each TC forming in 2016 are indicated in Appendix 3.
4.1.1 Center Position Figure 4.1 shows annual mean errors in TC track forecasts covering periods of 24 hours (since 1982),
48 hours (since 1989), 72 hours (since 1997), 96 hours and 120 hours (since 2009). It shows that operational TC track forecasts have steadily improved since 1982. The errors in 2016 were 79, 142, 243, 316 and 442 km for 24-, 48-, 72-, 96- and 120-hour forecasts, respectively, all of which were greater than the corresponding figures for 2015. This is partially attributed to the fact that the number of readily forecastable TCs moving with constant direction and speed over a long duration in 2016 was lower than in 2015.
The details of errors for each TC forming in 2016 are summarized in Table 4.1. The forecasts for
Chanthu (1607), which moved northward over the sea around Japan and hit Hokkaido Island, and Meari (1623), which moved northeastward over the sea west of the Mariana Islands, were characterized by large errors. The 96- and 120-hour forecasts for Conson (1606), which moved north-northwestward east of Japan, also showed large errors, while forecasts for Omais (1605) and Nock-ten (1626) exhibited relatively small errors.
Figure 4.1 Annual mean position errors in 24-, 48-, 72-, 96- and 120-hour operational track forecasts

15
The position errors were also compared with those determined using the persistency (PER) method*. The ratios of EO (i.e., the position errors of operational forecasts) to EP (the position errors of PER method forecasts) as percentages are also shown in Table 4.1. An EO/EP value smaller/greater than 100% indicates that the operational forecast was better/worse than the PER method forecast. The annual mean EO/EP ratios for 24-, 48-, 72-, 96- and 120-hour forecasts in 2016 were 32% (36% in 2015), 26% (27%), 26% (24%), 23% (25%) and 24% (26%), respectively. Figure 4.2 shows a histogram of 24-hour forecast position errors. About 89% (91% in 2015) of 24-hour forecasts, 92% (97%) of 48-hour forecasts, 91% (97%) of 72-hour forecasts, 86% (93%) of 96-hour forecasts and 72% (83%) of 120-hour forecasts had errors of less than 150, 300, 450, 500 and 600 km, respectively.
* The PER method is based on the assumption that a TC holds the same movement throughout the forecast period, and linear extrapolation for the latest 12-hour track of the TC is applied to create TC track forecasts. Position errors
with the PER method are used to evaluate the relative performance of operational forecasts and model predictions. Table 4.2 presents the mean hitting ratios and radii of 70% probability circles** provided in
operational forecasts for each TC forming in 2016. The term hitting ratio here is used to describe the ratio of the number of 70% probability circles within which the actual TC center fell to the total number of circles. The annual mean radius of circles provided in 24-hour position forecasts was 112 km (140 km in 2015), and their hitting ratio was 78% (89%). The corresponding values for 48-hour forecasts were 207 km (242 km in 2015) and 79% (93%), those for 72-hour forecasts were 290 km (355 km in 2015) and 79% (94%), those for 96-hour forecasts were 409 km (450 km in 2015) and 78% (88%), and those for 120-hour forecasts were 510 km (573 km in 2015) and 69% (83%). The annual mean radii of circles for all forecast times in 2016 were smaller than in 2015 and their hitting ratios were smaller, partially reflecting the review and reduction of probability circle radii in June 2016.
** Probability circle: a circular range in which a TC is expected to be located with a probability of 70% at each
forecast time
Table 4.1 Mean position errors of 24-, 48-, 72-, 96- and 120-hour operational forecasts for each TC forming in 2016. S.D., EO, EP, and EO/EP represent the standard deviation of operational forecast position error, the operational forecast position error, the position error with the PER method and the ratio of EO to EP, respectively.
Mean S.D. Num. EO/EP Mean S.D. Num. EO/EP Mean S.D. Num EO/EP Mean S.D. Num EO/EP Mean S.D. Num EO/EP(km) (km) (%) (km) (km) (%) (km) (km) (%) (km) (km) (%) (km) (km) (%)
TY Nepartak (1601) 60 45 21 35 92 49 17 22 156 52 13 22 327 94 9 35 508 127 5 40TS Lupit (1602) - - 0 - - - 0 - - - 0 - - - 0 - - - 0 -STS Mirinae (1603) 71 53 4 16 - - 0 - - - 0 - - - 0 - - - 0 -STS Nida (1604) 68 25 9 40 133 33 4 31 - - 0 - - - 0 - - - 0 -STS Omais (1605) 76 48 19 28 141 72 15 37 214 66 10 30 124 62 6 11 144 26 2 8TS Conson (1606) 108 52 20 37 145 74 16 19 187 82 12 15 492 105 8 32 907 102 4 44STS Chanthu (1607) 168 54 12 42 330 99 8 39 792 74 4 86 - - 0 - - - 0 -TS Dianmu (1608) 52 30 3 67 - - 0 - - - 0 - - - 0 - - - 0 -TY Mindulle (1609) 90 74 12 19 212 75 8 40 388 141 4 31 - - 0 - - - 0 -TY Lionrock (1610) 102 58 33 43 165 106 29 30 225 118 25 21 267 118 21 17 449 96 17 24TS Kompasu (1611) 141 60 3 11 - - 0 - - - 0 - - - 0 - - - 0 -TY Namtheun (1612) 48 21 11 30 51 27 7 9 340 94 3 16 - - 0 - - - 0 -TS Malou (1613) - - 0 - - - 0 - - - 0 - - - 0 - - - 0 -TY Meranti (1614) 63 31 17 58 138 95 13 69 169 108 9 52 214 29 5 58 302 0 1 -TS Rai (1615) - - 0 - - - 0 - - - 0 - - - 0 - - - 0 -TY Malakas (1616) 73 44 27 42 174 113 23 33 275 150 19 28 385 174 15 26 506 216 11 24TY Megi (1617) 73 16 15 55 111 30 11 47 160 37 7 42 167 44 3 26 - - 0 -TY Chaba (1618) 65 38 21 23 110 48 17 18 222 66 13 26 424 79 9 32 651 128 5 17STS Aere (1619) 98 39 13 45 203 63 9 29 312 31 5 18 514 0 1 - - - 0 -TY Songda (1620) 64 32 15 14 120 44 11 9 310 54 7 15 782 92 3 23 - - 0 -TY Sarika (1621) 30 13 18 17 104 33 14 19 168 46 10 24 197 37 6 23 220 26 2 -TY Haima (1622) 52 28 23 26 87 46 19 23 128 47 15 23 178 30 11 20 220 36 7 19TY Meari (1623) 137 99 13 36 297 198 9 46 1000 114 5 103 2066 0 1 - - - 0 -TS Ma-on (1624) 136 66 4 28 - - 0 - - - 0 - - - 0 - - - 0 -STS Tokage (1625) 72 30 6 19 65 19 2 - - - 0 - - - 0 - - - 0 -TY Nock-ten (1626) 58 42 20 30 85 55 16 22 103 41 12 17 127 47 8 12 115 65 4 13
79 55 339 32 142 101 248 26 243 192 173 26 316 242 106 23 442 232 58 24
96-hour Forecast 120-hour Forecast
Annual Mean (Total)
Tropical Cyclone 24-hour Forecast 48-hour Forecast 72-hour Forecast

16
Table 4.2 Mean hitting ratios (%) and radii (km) of 70% probability circles provided in 24-, 48-, 72-, 96- and 120-hour operational forecasts for each TC forming in 2016
Figure 4.2 Histogram of 24-hour forecast position errors in 2016 (Histograms for 48-, 72-, 96- and 120-hour forecasts are included on the DVD provided with this report).
0 20 40 60 80 100 120 140
550- 600
500- 550
450- 500
400- 450
350- 400
300- 350
250- 300
200- 250
150- 200
100- 150
50- 100
0- 50
Error (km)
Number of Cases
Ratio Num. Radius Ratio Num. Radius Ratio Num. Radius Ratio Num. Radius Ratio Num. Radius(%) (km) (%) (km) (%) (km) (%) (km) (%) (km)
TY Nepartak (1601) 86 21 104 100 17 197 100 13 254 100 9 424 40 5 500TS Lupit (1602) - 0 - - 0 - - 0 - - 0 - - 0 -STS Mirinae (1603) 75 4 93 - 0 - - 0 - - 0 - - 0 -STS Nida (1604) 100 9 119 100 4 204 - 0 - - 0 - - 0 -STS Omais (1605) 79 19 117 67 15 214 90 10 298 100 6 330 100 2 602TS Conson (1606) 60 20 113 75 16 200 75 12 267 13 8 350 0 4 468STS Chanthu (1607) 17 12 119 13 8 212 0 4 245 - 0 - - 0 -TS Dianmu (1608) 100 3 130 - 0 - - 0 - - 0 - - 0 -TY Mindulle (1609) 92 12 139 63 8 232 25 4 296 - 0 - - 0 -TY Lionrock (1610) 64 33 119 66 29 224 80 25 348 81 21 462 82 17 536TS Kompasu (1611) 67 3 136 - 0 - - 0 - - 0 - - 0 -TY Namtheun (1612) 100 11 96 100 7 188 67 3 377 - 0 - - 0 -TS Malou (1613) - 0 - - 0 - - 0 - - 0 - - 0 -TY Meranti (1614) 82 17 108 69 13 197 78 9 251 100 5 444 100 1 648TS Rai (1615) - 0 - - 0 - - 0 - - 0 - - 0 -TY Malakas (1616) 81 27 116 70 23 207 58 19 292 80 15 499 64 11 583TY Megi (1617) 100 15 110 100 11 204 100 7 257 100 3 315 - 0 -TY Chaba (1618) 86 21 115 100 17 224 92 13 339 56 9 469 20 5 602STS Aere (1619) 46 13 101 33 9 179 20 5 256 0 1 315 - 0 -TY Songda (1620) 80 15 121 91 11 230 100 7 368 0 3 482 - 0 -TY Sarika (1621) 100 18 100 93 14 188 100 10 248 100 6 315 100 2 370TY Haima (1622) 96 23 109 100 19 202 100 15 259 100 11 315 100 7 370TY Meari (1623) 54 13 115 44 9 222 0 5 285 0 1 444 - 0 -TS Ma-on (1624) 50 4 134 - 0 - - 0 - - 0 - - 0 -STS Tokage (1625) 83 6 105 100 2 204 - 0 - - 0 - - 0 -TY Nock-ten (1626) 85 20 102 100 16 185 100 12 247 100 8 326 100 4 370
78 339 112 79 248 207 79 173 290 78 106 409 69 58 510
96-hour Forecast 120-hour Forecast
Annual Mean (Total)
Tropical Cyclone 24-hour Forecast 48-hour Forecast 72-hour Forecast

17
4.1.2 Central Pressure and Maximum Wind Speed Table 4.3 gives the root mean square errors (RMSEs) of 24-, 48- and 72-hour operational central
pressure forecasts for each TC forming in 2016. RMSE data for maximum wind speed forecasts are included on the DVD provided with this report. The annual mean RMSEs of central pressure and maximum wind speed for 24-hour forecasts were 14.6 hPa (13.7 hPa in 2015) and 6.5 m/s (5.9 m/s). For 48-hour forecasts, the corresponding values were 21.5 hPa (19.1 hPa in 2015) and 8.9 m/s (8.2 m/s), while those for 72-hour forecasts were 23.4 hPa (21.2 hPa in 2015) and 10.0 m/s (9.0 m/s).
Figure 4.3 shows a histogram of maximum wind speed errors for 24-hour forecasts. Approximately
46% (47% in 2015) of 24-hour forecasts had errors of less than ±3.75 m/s, with figures of ±6.25 m/s for 51% (56%) of 48-hour forecasts and ±6.25 m/s for 52% (47%) of 72-hour forecasts.
Table 4.3 Mean intensity errors of 24-, 48- and 72-hour operational central pressure forecasts for each TC forming in 2016
Error RMSE Num. Error RM SE Num. Error RM SE Num.(hPa) (hPa) (hPa) (hPa) (hPa) (hPa)
TY Nepartak (1601) 7.4 20.5 21 15.2 35.8 17 16.4 45.8 13TS Lupit (1602) - - 0 - - 0 - - 0STS Mirinae (1603) 8.8 10.2 4 - - 0 - - 0STS Nida (1604) -11.1 15.5 9 -26.2 27.0 4 - - 0STS Omais (1605) -3.6 7.6 19 -8.7 11.4 15 -15.0 15.2 10TS Conson (1606) -5.9 9.9 20 -13.7 17.5 16 -19.2 21.6 12STS Chanthu (1607) 2.2 5.7 12 -1.1 6.1 8 -4.7 8.8 4TS Dianmu (1608) 3.3 5.8 3 - - 0 - - 0TY Mindulle (1609) 0.3 5.0 12 2.6 5.9 8 -1.7 2.7 4TY Lionrock (1610) -4.5 10.4 33 -6.8 15.5 29 -4.1 13.2 25TS Kompasu (1611) -3.3 3.8 3 - - 0 - - 0TY Namtheun (1612) -5.5 17.2 11 -9.3 20.8 7 -6.7 8.5 3TS Malou (1613) - - 0 - - 0 - - 0TY Meranti (1614) 3.8 23.2 17 6.1 35.6 13 -1.8 37.6 9TS Rai (1615) - - 0 - - 0 - - 0TY Malakas (1616) -0.9 9.4 27 1.7 7.4 23 8.9 15.4 19TY Megi (1617) -14.1 19.7 15 -13.6 20.2 11 -5.7 9.6 7TY Chaba (1618) 7.9 20.1 21 15.0 23.0 17 15.0 22.5 13STS Aere (1619) -6.5 12.9 13 -14.4 21.6 9 -21.0 21.1 5TY Songda (1620) 17.3 22.1 15 27.3 30.9 11 20.0 25.5 7TY Sarika (1621) -7.4 13.9 18 -11.7 21.1 14 -20.9 26.4 10TY Haima (1622) 0.6 9.0 23 -0.4 13.7 19 -3.5 17.8 15TY Meari (1623) 1.5 13.0 13 8.9 18.4 9 12.0 12.6 5TS Ma-on (1624) -4.0 4.0 4 - - 0 - - 0STS Tokage (1625) -3.7 4.4 6 -5.0 5.1 2 - - 0TY Nock-ten (1626) 6.8 19.2 20 16.5 29.1 16 16.2 29.8 12
-0.3 14.6 339 0.4 21.5 248 0.1 23.4 173
Tropical Cyclone 24-hour Forecast 48-hour Forecast 72-hour Forecast
Annual Mean (Total)

18
4.2 Verification of Numerical Models (GSM, TEPS) The Global Spectral Model (GSM) and the Typhoon Ensemble Prediction System (TEPS) provide
primary information for use by JMA forecasters in making operational TC track and intensity forecasts. The details of GSM and TEPS and information on recent related improvements are given in Appendix 6. GSM and TEPS predictions were verified with RSMC TC best track data and predictions using the persistency (PER) method. All TC forecast verifications were conducted for both systems.
4.2.1 GSM Prediction
1) Center Position
GSM annual mean position errors observed since 1997 are presented in Figure 4.4. In 2016, the
annual mean errors for 30-, 54- and 78-hour* predictions were 107 km (109 km in 2015), 190 km (173 km) and 301 km (256 km), respectively. The mean position errors of 18-, 30-, 42-, 54-, 66- and 78-hour predictions for each TC are given in Table 4.4.
* 30-, 54- and 78-hour GSM predictions are used as primary information by forecasters creating 24-, 48- and 72-hour operational forecasts, respectively.
0 10 20 30 40 50 60 70
18.75 - 21.2516.25 - 18.7513.75 - 16.2511.25 - 13.758.75 - 11.256.25 - 8.753.75 - 6.251.25 - 3.75-1.25 - 1.25-3.75 - -1.25-6.25 - -3.75-8.75 - -6.25-11.25 - -8.75-13.75 - -11.25-16.25 - -13.75-18.75 - -16.25-21.25 - -18.75
Number of Cases
Error (m/s)
Figure 4.3 Histogram of 24-hour forecast maximum wind speed errors in 2016 (Histograms for 48-, 72-, 96- and 120-hour forecasts are included on the DVD provided with this report).

19
Table 4.4 GSM mean position errors (km) for each TC forming in 2016. The number of samples is given in parentheses.
Figure 4.4 GSM annual mean position errors since 1997
TY NEPARTAK (1601) 71.9 (25) 127.7 (23) 187.8 (21) 244.7 (19) 289.3 (17) 333.3 (15)
TS LUPIT (1602) 153.0 (5) 228.8 (3) 298.1 (1) - (-) - (-) - (-)
STS MIRINAE (1603) 110.4 (7) 59.1 (4) 55.5 (2) - (-) - (-) - (-)
STS NIDA (1604) 80.7 (15) 113.3 (13) 157.1 (11) 232.5 (9) 319.5 (7) 415.2 (5)
STS OMAIS (1605) 119.1 (23) 140.4 (21) 172.2 (19) 221.5 (17) 265.8 (15) 301.4 (13)
TS CONSON (1606) 97.6 (24) 128.0 (22) 160.5 (20) 172.2 (18) 210.1 (16) 264.8 (14)
STS CHANTHU (1607) 130.8 (19) 186.3 (17) 254.9 (15) 357.0 (13) 546.5 (11) 797.6 (9)
TS DIANMU (1608) 88.4 (10) 93.7 (8) 179.0 (6) 188.4 (3) 295.2 (1) - (-)
TY MINDULLE (1609) 135.1 (17) 202.1 (15) 233.3 (13) 296.2 (10) 431.7 (8) 316.9 (6)
TY LIONROCK (1610) 59.9 (52) 89.6 (50) 131.1 (48) 166.6 (46) 190.4 (44) 219.6 (42)
TS KOMPASU (1611) 105.6 (6) 204.5 (4) 231.6 (2) 227.6 (1) - (-) - (-)
TY NAMTHEUN (1612) 51.3 (16) 63.6 (14) 72.5 (12) 92.3 (10) 193.9 (8) 363.9 (6)
TS MALOU (1613) 95.9 (5) 165.3 (3) 301.6 (1) - (-) - (-) - (-)
TY MERANTI (1614) 63.0 (20) 106.8 (18) 161.9 (16) 223.5 (14) 256.5 (12) 266.5 (10)
TS RAI (1615) 107.8 (5) 199.3 (3) 333.5 (1) - (-) - (-) - (-)
TY MALAKAS (1616) 54.9 (31) 93.6 (29) 146.4 (27) 226.0 (25) 319.0 (23) 402.7 (21)
TY MEGI (1617) 63.4 (20) 80.6 (18) 89.0 (16) 101.0 (14) 121.0 (12) 136.0 (10)
TY CHABA (1618) 74.4 (34) 91.6 (31) 126.3 (29) 170.7 (27) 223.0 (25) 283.8 (23)
STS AERE (1619) 78.3 (18) 116.4 (16) 159.3 (14) 187.3 (12) 209.9 (10) 264.0 (8)
TY SONGDA (1620) 51.8 (34) 92.8 (32) 138.3 (30) 169.6 (28) 207.6 (26) 242.5 (24)
TY SARIKA (1621) 45.4 (23) 61.5 (21) 98.3 (19) 136.2 (17) 192.3 (15) 258.1 (13)
TY HAIMA (1622) 60.9 (26) 85.4 (24) 99.4 (22) 125.7 (20) 152.3 (18) 159.1 (16)
TY MEARI (1623) 108.3 (24) 149.3 (22) 221.6 (20) 349.0 (17) 514.9 (15) 721.2 (13)
TS MA-ON (1624) 118.5 (10) 104.6 (6) 135.6 (4) 180.3 (2) - (-) - (-)
STS TOKAGE (1625) 61.3 (11) 68.1 (9) 85.8 (7) 157.0 (5) 278.1 (3) 434.6 (1)
TY NOCK-TEN (1626) 42.7 (23) 48.3 (21) 55.9 (19) 65.0 (17) 71.2 (15) 82.2 (13)
77.3 (503) 107.3 (447) 145.5 (395) 190.1 (344) 247.1 (301) 301.2 (262)
T=54 T=66 T=78Tropical Cyclone
Annual Mean (Total)
T=18 T=30 T=42

20
Table 4.5 shows relative GSM performance compared with results obtained using the PER method. In this comparison, TCs were classified into the three life stages of before, during and after recurvature. The definition of the stages is based on the direction of movement of each TC at individual prediction times. The table indicates that GSM results outperformed those of the PER method throughout the forecast period beyond 18 hours from the initial time, and that the ratios of error reduction for the GSM compared to the PER method were about 55% (44% in 2015), 64% (56%), 68% (65%) and 69% (67%) for 18-, 30-, 54- and 78-hour predictions, respectively.
About 78% (78% in 2015) of 30-hour predictions had errors of less than 150 km, while 83% (89%) of 54-hour predictions had errors of less than 300 km, and 85% (89%) of 78-hour predictions had errors of less than 450 km. Histograms showing the position errors of 30-, 54- and 78-hour predictions are included on the DVD provided with this report.
2) Central Pressure and Maximum Wind Speed The mean errors of 30-, 54- and 78-hour GSM central pressure predictions in 2016 were +14.7 hPa
(+13.7 hPa in 2015), +16.5 hPa (+14.0 hPa) and +16.5 hPa (+14.0 hPa), respectively. Their root mean square errors (RMSEs) were 24.4 hPa (24.0 hPa in 2015) for 30-hour predictions, 27.6 hPa (26.2 hPa) for 54-hour predictions and 30.6 hPa (28.3 hPa) for 78-hour predictions. The biases for 30-, 54- and 78-hour maximum wind speed predictions were -8.0 m/s (-8.1 m/s in 2015) with a RMSE of 11.5 m/s (11.7 m/s), -8.4 m/s (-7.8 m/s) with a RMSE of 13.2 m/s (12.9 m/s) and -8.1 m/s (-7.5 m/s) with a RMSE of 14.4 m/s (13.9 m/s), respectively.
Figure 4.5 shows histograms of central pressure errors and maximum wind speed errors in 30-hour GSM predictions. It can be seen that the GSM has a small positive bias for central pressure prediction (left) and tends to underestimate the wind speed of TCs (right). This underestimation occurs because the model’s current horizontal resolution (about 20 km) is not fine enough to produce the TC core structure, especially when the TC is intense and small.
Table 4.5 Mean position errors (km) of GSM and PER method predictions for the 26 TCs forming in 2016 in the stages before, during and after recurvature. The number of samples is given in parentheses. IMPROV is the ratio of error reductions in GSM results to those observed using the PER method.
TIME MODEL
T=18 GSM 70.6 (284) 82.1 (106) 89.7 (113) 77.3 (503)PER 149.0 (284) 177.9 (106) 223.5 (113) 171.9 (503)IMPROV 52.7 % 53.9 % 59.9 % 55.0 %
T=30 GSM 93.6 (244) 123.8 (99) 123.7 (104) 107.3 (447)PER 242.9 (244) 318.5 (99) 408.5 (104) 298.2 (447)IMPROV 61.5 % 61.1 % 69.7 % 64.0 %
T=42 GSM 125.0 (206) 163.4 (93) 172.0 (96) 145.5 (395)PER 346.6 (206) 467.9 (93) 600.9 (96) 437.0 (395)IMPROV 63.9 % 65.1 % 71.4 % 66.7 %
T=54 GSM 158.1 (171) 213.3 (84) 229.7 (89) 190.1 (344)PER 473.2 (171) 641.1 (84) 811.6 (89) 601.7 (344)IMPROV 66.6 % 66.7 % 71.7 % 68.4 %
T=66 GSM 196.9 (141) 256.6 (75) 322.1 (85) 247.1 (301)PER 585.7 (141) 863.4 (75) 1066.3 (85) 790.6 (301)IMPROV 66.4 % 70.3 % 69.8 % 68.7 %
T=78 GSM 236.5 (117) 295.6 (65) 400.2 (80) 301.2 (262)PER 710.0 (117) 1041.5 (65) 1339.1 (80) 984.3 (262)IMPROV 66.7 % 71.6 % 70.1 % 69.4 %
Before During After All

21
4.2.2 TEPS Prediction
1) Ensemble mean center position TEPS annual mean position errors observed since 2008 are presented in Figure 4.6. In 2016, the
mean position errors of TEPS ensemble mean forecasts for 30-, 54-, 78-, 102- and 126-hour predictions for each TC are given in Table 4.6. The annual means of ensemble mean position errors for 30-, 54-, 78-, 102- and 126-hour predictions were 112 km (107 km with the GSM), 199 km (190 km), 307 km (301 km), 405 km and 528 km, respectively.
0 10 20 30 40 50 60
-17.5
-15.0
-12.5
-10.0
-7.5
-5.0
-2.5
0
+2.5
+5.0
+7.5
+10.0
+12.5
+15.0
+17.5
Number of Cases
Error(m/s)
30-hour GSM Predictions
for Maximum Sustained Wind
0 20 40 60 80 100
-40
-35
-30
-25
-20
-15
-10
-5
0
+5
+10
+15
+20
+25
+30
+35
+40
Number of Cases
Error(hPa)
30-hour GSM Predictions
for Central Pressure
Figure 4.5 Error distribution of GSM 30-hour intensity predictions in 2016. The figure on the left shows error distribution for central pressure, while the one on the right shows that for maximum wind speed (the error distributions of 54- and 78-hour predictions are included on the DVD provided with this report).
Figure 4.6 TEPS annual mean position errors since 2008
0
100
200
300
400
500
600
700
800
2008 2009 2010 2011 2012 2013 2014 2015 2016
Error (km) 126 hour
102 hour
78 hour
54 hour
30 hour
22
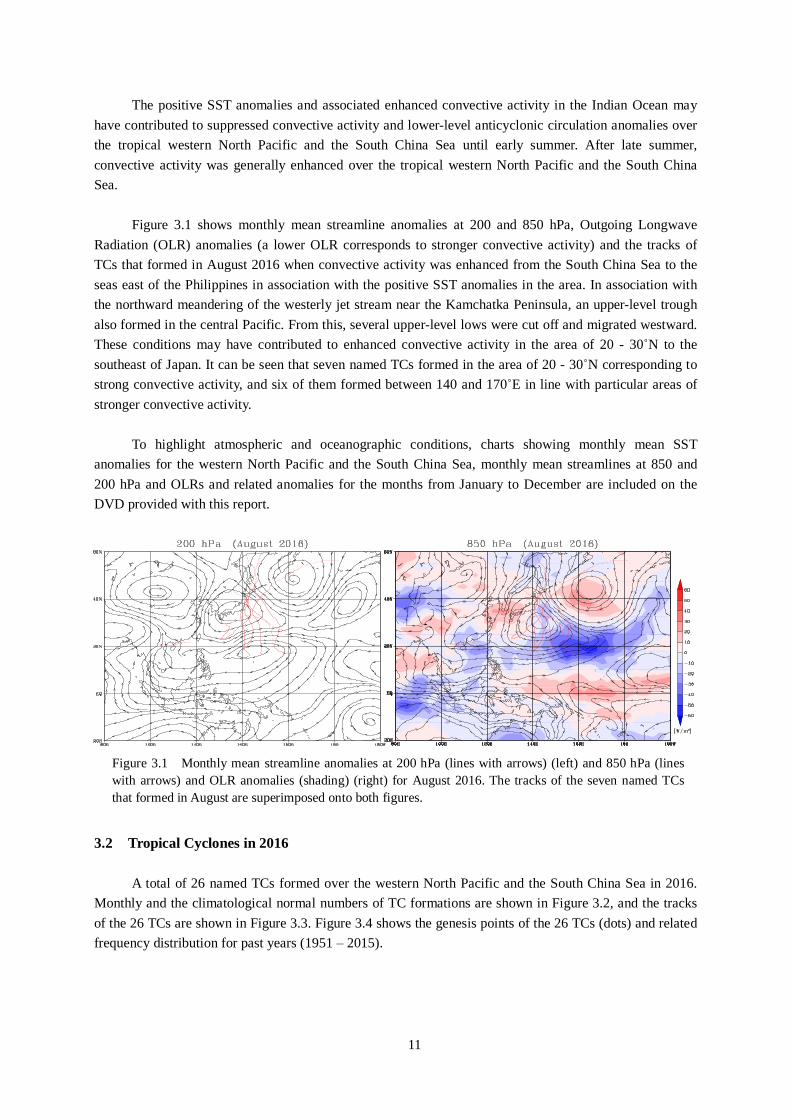
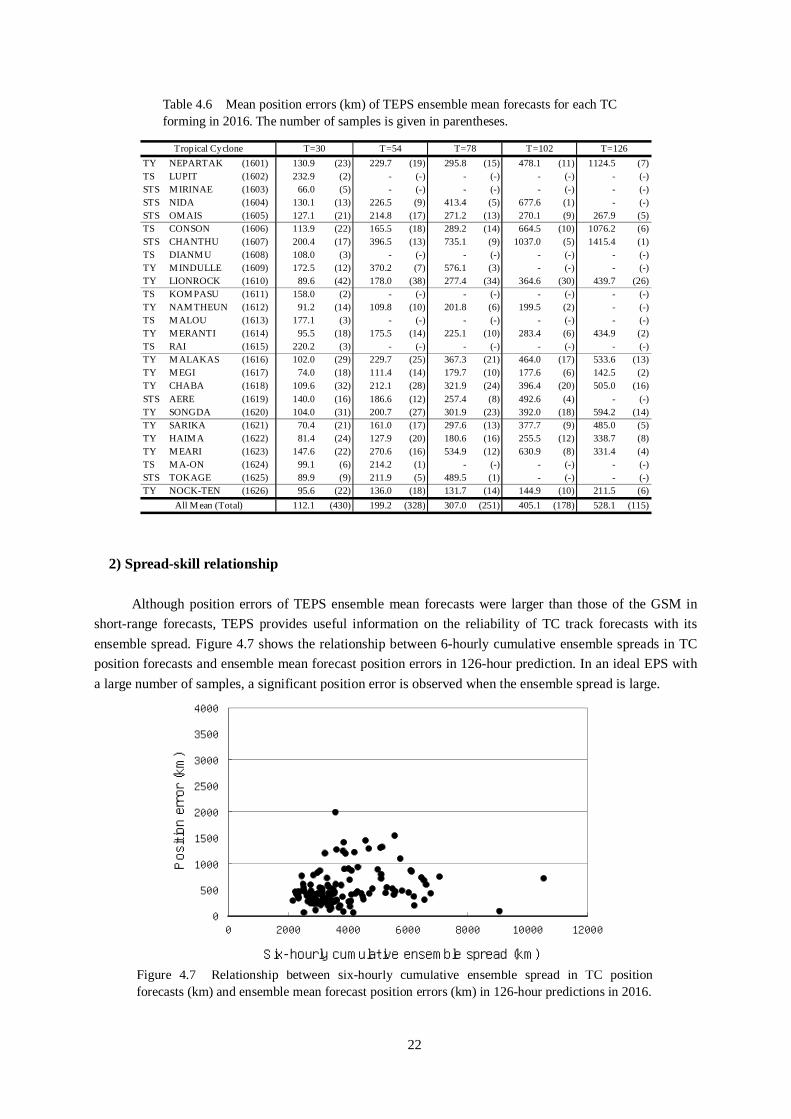
2) Spread-skill relationship Although position errors of TEPS ensemble mean forecasts were larger than those of the GSM in
short-range forecasts, TEPS provides useful information on the reliability of TC track forecasts with its ensemble spread. Figure 4.7 shows the relationship between 6-hourly cumulative ensemble spreads in TC position forecasts and ensemble mean forecast position errors in 126-hour prediction. In an ideal EPS with a large number of samples, a significant position error is observed when the ensemble spread is large.
Table 4.6 Mean position errors (km) of TEPS ensemble mean forecasts for each TC forming in 2016. The number of samples is given in parentheses.
Figure 4.7 Relationship between six-hourly cumulative ensemble spread in TC position forecasts (km) and ensemble mean forecast position errors (km) in 126-hour predictions in 2016.
TY NEPARTAK (1601) 130.9 (23) 229.7 (19) 295.8 (15) 478.1 (11) 1124.5 (7)TS LUPIT (1602) 232.9 (2) - (-) - (-) - (-) - (-)STS M IRINAE (1603) 66.0 (5) - (-) - (-) - (-) - (-)STS NIDA (1604) 130.1 (13) 226.5 (9) 413.4 (5) 677.6 (1) - (-)STS OM AIS (1605) 127.1 (21) 214.8 (17) 271.2 (13) 270.1 (9) 267.9 (5)TS CONSON (1606) 113.9 (22) 165.5 (18) 289.2 (14) 664.5 (10) 1076.2 (6)STS CHANTHU (1607) 200.4 (17) 396.5 (13) 735.1 (9) 1037.0 (5) 1415.4 (1)TS DIANM U (1608) 108.0 (3) - (-) - (-) - (-) - (-)TY M INDULLE (1609) 172.5 (12) 370.2 (7) 576.1 (3) - (-) - (-)TY LIONROCK (1610) 89.6 (42) 178.0 (38) 277.4 (34) 364.6 (30) 439.7 (26)TS KOM PASU (1611) 158.0 (2) - (-) - (-) - (-) - (-)TY NAM THEUN (1612) 91.2 (14) 109.8 (10) 201.8 (6) 199.5 (2) - (-)TS M ALOU (1613) 177.1 (3) - (-) - (-) - (-) - (-)TY M ERANTI (1614) 95.5 (18) 175.5 (14) 225.1 (10) 283.4 (6) 434.9 (2)TS RAI (1615) 220.2 (3) - (-) - (-) - (-) - (-)TY M ALAKAS (1616) 102.0 (29) 229.7 (25) 367.3 (21) 464.0 (17) 533.6 (13)TY M EGI (1617) 74.0 (18) 111.4 (14) 179.7 (10) 177.6 (6) 142.5 (2)TY CHABA (1618) 109.6 (32) 212.1 (28) 321.9 (24) 396.4 (20) 505.0 (16)STS AERE (1619) 140.0 (16) 186.6 (12) 257.4 (8) 492.6 (4) - (-)TY SONGDA (1620) 104.0 (31) 200.7 (27) 301.9 (23) 392.0 (18) 594.2 (14)TY SARIKA (1621) 70.4 (21) 161.0 (17) 297.6 (13) 377.7 (9) 485.0 (5)TY HAIM A (1622) 81.4 (24) 127.9 (20) 180.6 (16) 255.5 (12) 338.7 (8)TY M EARI (1623) 147.6 (22) 270.6 (16) 534.9 (12) 630.9 (8) 331.4 (4)TS M A-ON (1624) 99.1 (6) 214.2 (1) - (-) - (-) - (-)STS TOKAGE (1625) 89.9 (9) 211.9 (5) 489.5 (1) - (-) - (-)TY NOCK-TEN (1626) 95.6 (22) 136.0 (18) 131.7 (14) 144.9 (10) 211.5 (6)
112.1 (430) 199.2 (328) 307.0 (251) 405.1 (178) 528.1 (115)
T=102 T=126
All M ean (Total)
Tropical Cyclone T=30 T=54 T=78
0
500
1000
1500
2000
2500
3000
3500
4000
0 2000 4000 6000 8000 10000 12000
Position error (km)
Six-hourly cumulative ensemble spread (km)

23
To add reliability information to TC track forecasts, JMA has introduced a reliability index in which the categories A, B and C represent the highest, middle and lowest levels of reliability, respectively. The index is based on the six-hourly cumulative ensemble spread at each forecast time. The category levels were set from the results of the pre-operational running of TEPS so that the category frequencies are 40%, 40% and 20%, respectively. Table 4.7 shows ensemble mean forecast errors classified with the reliability index. Theoretically, mean position errors with higher reliability should be smaller than those with lower reliability throughout forecast times with sufficient samples in an ideal EPS. However, B shows larger errors than C in 2016 TC track forecasts. Consequently, TEPS needs to be improved to enable the provision of better reliability information on TC track forecasts.
4.3 Verification of Storm Surge Prediction Storm surge predictions have been provided since 2011 via the Numerical Typhoon Prediction
website to Typhoon Committee Members within the framework of the Storm Surge Watch Scheme (SSWS) (for details of the storm surge model, refer to Hasegawa et al. (2012) on the RSMC Tokyo - Typhoon Center website). Verification of deterministic storm surge prediction was conducted on data from eight stations (Table 4.8) for which tide observation information is provided on the University of Hawaii Sea Level Center (UHSLC) database website (http://uhslc.soest.hawaii.edu/data/?fd) for all typhoons in 2016. Hourly hindcast data (from FT = -5 to FT = 0) and forecast data (from FT = 1 to FT = 72) were compared with observation data.
In addition, a multi-scenario prediction method was incorporated into the model in June 2016 to support the provision of more useful risk management information (Hasegawa et al., 2017). Verification of multi-scenario predictions was conducted on data from a station in Hong Kong for STS Nida (1604) and TY Meranti (1614).
Station Member 1 Quarry Bay QB Hong Kong 2 Langkawi LK Malaysia 3 Legaspi Port LG Philippines 4 Manila South Harbor ML Philippines 5 Subic Bay SB Philippines 6 Apra Harbor AP U.S.A. 7 Qui Nhon QN Viet Nam 8 Vung Tau VT Viet Nam
Table 4.7 Ensemble mean forecast position errors (km) in 2016 classified with six-hourly cumulative ensemble spread at each forecast time. The number of samples is given in parentheses.
Table 4.8 Stations used for verification
T=30 101.2 (232) 119.0 (176) 158.8 (49)T=54 183.4 (189) 239.3 (121) 214.7 (47)T=78 258.8 (147) 377.1 (94) 366.6 (31)T=102 329.9 (116) 524.9 (66) 482.6 (16)T=126 432.1 (80) 701.7 (40) 553.1 (12)
A B CReliability Index
Time

24
4.3.1 Deterministic Prediction No significant storm surges were observed at any of the eight stations in 2016 (Table 4.9). Figure 4.8
shows a scatter diagram of model storm surges (hindcast and forecast) against observation data. The root mean square errors (RMSEs; unit: m) were 0.086 (hindcast) and 0.088 (forecast), and the correlations were 0.37 and 0.34, respectively. Forecast data tended to overestimate storm surges because the typhoon bogus, which expresses wind and pressure fields based on parametric TC modeling, does not incorporate consideration of structural changes and wind mitigation caused by land topography.
Table 4.9 Maximum storm surges observed at the eight stations for each TC forming in 2016 (unit: m)
T1601 T1602 T1603 T1604 T1605 T1606 T1607 T1608 T1609 T1610QB 0.15 -0.05 -0.03 0.51 0.01 0.08 0.15 0.22 0.1 0.34LKLG 0.09 0.09 0.07 0.15 0.1 0.14 0.12 0.07 0.15 0.15ML 0.17 -0.03 0.01 0.12 0.09 0.16 0.21 0.14 0.13 0.15SB 0.08 0.03 0.03 0.12 0.07 0.11 0.15 0.1 0.09 0.11AP 0.1 0.08 0.08 0.13 0.1 0.16 0.18 0.19 0.16 0.15QN 0.05 0.01 0.09 0.15 0.11 0.08 0.04 0.01 0.06 0.13VT 0.22 0.24 0.24 0.27 0.19 0.1 0.05 0.08 0.08 0.16
T1611 T1612 T1613 T1614 T1615 T1616 T1617 T1618 T1619 T1620QB 0.05 0.22 0.1 0.35 0.23 0.35 0.27 0.12 0.24 0.26LKLG 0.15 0.13 0.13 0.16 0.15 0.17 0.19 0.18 0.15 0.15ML 0.11 0.16 0.05 0.13 0.07 0.13 0.19 0.15 0.13 0.12SB 0.09 0.07 0.04 0.09 0.07 0.1 0.12 0.08 0.1 0.11AP 0.15 0.11 0.08 0.13 0.08 0.11 0.12 0.11 0.14 0.14QN -0.02 0.06 -0.03 0.08 0.07 0.16 0.12 0.03 0.02 0.12VT 0.06 0.22 0.08 0.08 -0.06 0.15 0.17 0.11 0.01 0.11
T1621 T1622 T1623 T1624 T1625 T1626QB 0.35 0.44 0.2 0.15 0.28 0.32LK 0.08 0.06 -0.07 0.02 0.14LG 0.2 0.18 0.15 0.09 0.14 0.23ML 0.3 0.38 0.1 0.09 0.12SB 0.15 0.22 0.1 0.04 0.15 0.14AP 0.18 0.19 0.21 0.16 0.12 0.2QN 0.17 0.18 0.35 0.14 0.16VT 0.2 0.17 0.22 0.06 0.25 0.14
Figure 4.8 Scatter diagram of model storm surges against observation data from the eight stations for all TCs forming in 2016 (left: hindcast; right: forecast)

25
4.3.2 Multi-scenario Prediction STS Nida (1604) hit the southern coast of China in August 2016 with a maximum wind speed of 30
m/s and a minimum pressure of 975 hPa. Storm surges are a concern along the wide, shallow sea area off the Chinese coast because the phenomenon is particularly intensified there. Figure 4.9 shows the analysis track and the predicted tracks (official and five selected ones) for Nida with the initial time of 24 hours before it landed. The official forecast track had the most westerly course, passing near Hong Kong and threatening the area. In reality, Nida landed on eastern Hong Kong with a track similar to that of scenario 2. The maximum storm tide and surge for Quarry Bay in Hong Kong in the official forecast were 4.04 m and 1.85 m, and those of scenario 2 were 2.87 m and 0.66 m, respectively (Figure 4.10). The values of scenario 2 correspond closely to the observation (2.93 m and 0.64 m).
Figure 4.9 Analysis track (left) and predicted tracks (right) for Nida In the figure on the right, colored lines show the five selected tracks and the bold black line shows the official JMA forecast.
Figure 4.10 Time-series representation of storm tide and astronomical tide (top), storm surge, sea level pressure and surface wind (bottom) for Quarry Bay (Hong Kong) Squares show hourly observations provided by HKO (Hong Kong Observatory).

26
Figure 4.11 shows another example of multi-scenario prediction. For TY Meranti (1614), the TC
tracks of the five scenarios showed large variations. The map of maximum storm surges among all scenarios during the forecast time indicates the probability of high storm surges around wide areas along the southern coast of China. Multi-scenario prediction is especially valid for risk management in uncertain situations.
[Reference] Hasegawa.H., N.Kohno, and H.Hayashibara, 2012: JMA’s Storm Surge Prediction for the WMO Storm
Surge Watch Scheme (SSWS). RSMC Tokyo-Typhoon Center Technical Review, 14, 13-24. Hasegawa.H, N.Kohno, M.Higaki, and M.Itoh, 2017: Upgrade of JMA’s Storm Surge Prediction for WMO
Storm Surge Watch Scheme (SSWS). RSMC Tokyo-Typhoon Center Technical Review, 19, 26-34.
Figure 4.11 Predicted tracks (black line: official forecast; colored lines: five selected tracks). The figure on the right shows storm surge distribution maxima for all scenarios during the forecast time for Meranti.

Appendices
Appendix 1 RSMC Tropical Cyclone Best Track Data in 2016 29
Appendix 2 Monthly Tracks of Tropical Cyclones in 2016 33
Appendix 3 Errors of Track and Intensity Forecasts for Each Tropical Cyclone in 2016 41
Appendix 4 Monthly and Annual Frequencies of Tropical Cyclones 47
Appendix 5 Code Forms of RSMC Products 49
Appendix 6 Specification of JMA’s NWP Models (GSM, TEPS) 55
Appendix 7 Products on WIS GISC Tokyo Server 59
Appendix 8 Products on NTP website 63
Appendix 9 User’s Guide to the DVD 65

Appendix 1RSMC Tropical Cyclone Best Track Data in 2016
Central Max CI Grade Central Max CI Grade Central Max CI Gradepressure wind num. pressure wind num. pressure wind num.
Lat (N) Lon (E) (hPa) (kt) Lat (N) Lon (E) (hPa) (kt) Lat (N) Lon (E) (hPa) (kt)
Jul. 02/12 8.3 145.1 1006 - 1.0 TD Jul. 29/12 11.7 127.1 1002 - 0.5 TD Aug. 07/12 18.8 163.0 1010 - 0.0 TD02/18 8.6 145.0 1004 - 1.5 TD 29/18 12.7 127.3 1002 - 1.0 TD 07/18 18.0 162.0 1008 - 0.0 TD03/00 8.9 144.9 1002 35 2.0 TS 30/00 14.1 126.5 1002 - 1.5 TD 08/00 17.4 161.7 1008 - 0.5 TD03/06 9.2 144.8 1002 35 2.0 TS 30/06 15.5 125.8 998 35 2.0 TS 08/06 17.1 161.4 1006 - 1.0 TD03/12 10.0 144.4 1000 35 2.5 TS 30/12 16.4 124.4 994 40 2.5 TS 08/12 17.0 160.8 1006 - 1.5 TD03/18 10.9 143.9 996 40 3.0 TS 30/18 16.9 123.8 990 45 3.0 TS 08/18 17.0 160.1 1002 - 1.5 TD04/00 11.9 142.6 996 40 3.0 TS 31/00 17.5 123.1 985 50 3.5 STS 09/00 16.9 159.3 1000 35 2.0 TS04/06 12.8 141.1 994 45 3.0 TS 31/06 18.2 122.3 975 60 4.0 STS 09/06 16.8 158.7 996 40 2.0 TS04/12 13.5 139.6 990 50 4.0 STS 31/12 18.8 121.2 975 60 3.5 STS 09/12 17.0 157.8 990 45 2.5 TS04/18 14.5 138.2 980 60 4.5 STS 31/18 19.5 120.1 980 55 3.0 STS 09/18 17.7 156.9 990 45 2.5 TS05/00 15.3 136.6 965 65 4.5 TY Aug. 01/00 20.1 118.9 980 55 3.0 STS 10/00 18.0 156.0 990 45 2.5 TS05/06 16.3 135.1 955 75 5.0 TY 01/06 21.4 117.5 980 55 3.0 STS 10/06 18.6 155.1 990 45 2.5 TS05/12 17.1 133.5 940 85 6.0 TY 01/12 21.9 116.0 980 55 3.0 STS 10/12 18.9 154.4 990 45 2.5 TS05/18 18.0 131.9 925 95 6.5 TY 01/18 22.5 114.8 980 50 3.0 STS 10/18 19.6 154.0 990 45 2.5 TS06/00 18.7 130.1 915 100 7.0 TY 02/00 22.8 113.5 985 45 2.5 TS 11/00 20.0 153.6 990 45 2.5 TS06/06 19.5 128.4 900 110 7.5 TY 02/06 23.4 112.0 990 35 2.5 TS 11/06 20.5 154.0 990 45 2.5 TS06/12 20.1 127.0 900 110 7.5 TY 02/12 23.9 110.8 994 - 2.0 TD 11/12 21.9 154.3 990 45 2.5 TS06/18 20.7 125.6 900 110 7.5 TY 02/18 24.3 109.4 996 - 1.5 TD 11/18 23.5 155.0 990 45 2.5 TS07/00 21.3 124.3 900 110 7.5 TY 03/00 25.0 107.9 998 - 1.0 TD 12/00 25.2 155.5 990 45 2.5 TS07/06 21.6 123.4 900 110 7.5 TY 03/06 Dissip. 12/06 26.2 155.7 990 40 2.5 TS07/12 22.0 122.6 900 110 7.0 TY 12/12 28.0 156.4 990 40 2.5 TS07/18 22.4 121.7 920 90 6.5 TY 12/18 28.9 156.6 990 40 2.5 TS08/00 22.6 120.6 950 75 5.5 TY Central Max CI Grade 13/00 29.9 155.5 990 40 2.5 TS08/06 23.2 120.1 975 65 5.5 TY pressure wind num. 13/06 31.6 154.3 985 45 2.5 TS08/12 23.2 119.9 985 50 4.5 STS Lat (N) Lon (E) (hPa) (kt) 13/12 32.6 153.1 985 45 2.0 TS08/18 23.4 119.8 985 45 4.5 TS 13/18 33.9 152.2 985 45 2.0 TS09/00 24.3 118.8 992 35 4.0 TS 14/00 35.7 151.1 985 45 2.0 TS09/06 24.8 118.5 994 - 3.5 TD Aug. 02/12 16.7 148.8 1004 - - TD 14/06 38.1 149.5 985 45 2.0 TS09/12 25.4 117.9 996 - 3.0 TD 02/18 16.7 148.2 1002 - - TD 14/12 40.2 148.0 990 40 2.0 TS09/18 25.9 117.2 996 - - TD 03/00 16.9 147.8 1004 - - TD 14/18 42.1 145.9 990 40 1.5 TS10/00 26.4 116.7 998 - - TD 03/06 17.6 147.8 1002 - 0.0 TD 14/23 43.3 145.5 988 40 - TS10/06 Dissip. 03/12 17.8 148.1 1002 - 0.5 TD 15/00 43.6 145.6 990 - 1.5 L
03/18 18.1 148.3 1000 - 0.5 TD 15/06 46.3 145.4 992 - - L04/00 18.4 148.5 998 35 1.0 TS 15/12 48.8 146.1 996 - - L
Central Max CI Grade 04/06 18.8 148.5 998 35 1.5 TS 15/18 53.2 145.2 996 - - Lpressure wind num. 04/12 19.2 148.5 998 35 1.5 TS 16/00 56.1 142.6 996 - - L
Lat (N) Lon (E) (hPa) (kt) 04/18 19.8 148.4 996 35 2.0 TS 16/06 57.2 142.0 998 - - L05/00 20.7 148.1 992 40 2.0 TS 16/12 58.7 143.1 1000 - - L05/06 21.7 147.9 990 45 2.0 TS 16/18 Dissip.
Jul. 22/18 24.6 151.5 1004 - 0.5 TD 05/12 22.5 147.8 985 50 2.5 STS23/00 25.3 152.3 1004 - 1.0 TD 05/18 23.3 147.8 980 55 2.5 STS23/06 26.4 154.0 1004 - 1.5 TD 06/00 24.2 147.8 980 55 3.0 STS Central Max CI Grade23/12 27.4 155.3 1004 - 1.5 TD 06/06 24.9 147.7 975 60 3.0 STS pressure wind num.23/18 28.9 157.1 1000 35 2.0 TS 06/12 26.1 147.7 975 60 3.0 STS Lat (N) Lon (E) (hPa) (kt)24/00 31.0 158.5 1000 40 2.0 TS 06/18 27.3 147.5 975 60 3.0 STS24/06 33.0 159.3 1000 40 2.0 TS 07/00 28.6 147.3 975 60 3.0 STS24/12 35.0 159.5 1000 40 2.0 TS 07/06 30.0 146.9 975 60 3.0 STS Aug. 12/00 16.0 137.6 1002 - 0.0 TD24/18 37.2 159.5 1000 - 2.0 L 07/12 31.3 146.3 980 55 3.0 STS 12/06 16.3 138.0 1002 - 0.0 TD25/00 40.3 159.3 1004 - - L 07/18 32.5 145.3 980 55 2.5 STS 12/12 16.8 138.6 1002 - 0.0 TD25/06 44.1 157.4 1008 - - L 08/00 33.5 144.5 980 55 2.5 STS 12/18 17.2 139.4 1002 - 0.0 TD25/12 45.6 156.5 1010 - - L 08/06 34.5 144.3 980 50 2.5 STS 13/00 17.7 139.9 1002 - 0.5 TD25/18 47.0 155.5 1012 - - L 08/12 35.7 144.5 980 50 2.5 STS 13/06 18.8 140.7 1000 - 1.0 TD26/00 47.5 153.7 1014 - - L 08/18 36.8 145.1 980 50 2.5 STS 13/12 19.8 141.9 1000 - 1.5 TD26/06 48.4 152.1 1014 - - L 09/00 37.9 145.9 980 50 2.0 STS 13/18 20.9 142.9 994 35 2.0 TS26/12 Dissip. 09/06 40.2 147.4 980 50 2.0 STS 14/00 22.0 143.6 994 35 2.5 TS
09/12 42.0 148.8 985 45 1.5 TS 14/06 23.4 144.2 992 40 2.5 TS09/18 44.1 151.7 984 - 1.5 L 14/12 24.6 144.5 990 45 3.0 TS
Central Max CI Grade 10/00 46.2 152.5 988 - - L 14/18 25.7 144.8 985 50 3.0 STSpressure wind num. 10/06 48.1 156.2 988 - - L 15/00 27.1 145.0 985 50 3.0 STS
Lat (N) Lon (E) (hPa) (kt) 10/12 50.0 159.8 986 - - L 15/06 28.1 144.5 985 50 3.0 STS10/18 51.9 162.8 986 - - L 15/12 29.4 143.8 985 45 2.5 TS11/00 53.5 165.5 984 - - L 15/18 30.5 143.0 985 45 2.5 TS
Jul. 25/12 17.2 114.7 1006 - 1.0 TD 11/06 54.9 169.1 984 - - L 16/00 31.6 142.5 980 50 2.5 STS25/18 17.3 113.9 1004 - 1.5 TD 11/12 55.6 172.5 984 - - L 16/06 33.4 141.4 980 50 2.5 STS26/00 18.1 113.0 1002 - 2.0 TD 11/18 56.1 174.6 984 - - L 16/12 34.4 141.0 980 50 2.5 STS26/06 18.5 112.0 998 40 2.5 TS 12/00 56.3 177.1 986 - - L 16/18 35.8 141.2 980 50 2.5 STS26/12 18.5 110.8 996 40 2.5 TS 12/06 56.4 181.8 988 - - Out 17/00 37.8 141.7 980 55 2.5 STS26/18 18.9 109.7 996 40 2.5 TS 17/03 39.0 142.2 980 55 - STS27/00 19.7 108.6 998 35 2.0 TS 17/06 40.8 142.7 980 55 2.5 STS27/06 19.8 107.3 990 45 2.5 TS 17/08 41.8 143.0 980 55 - STS27/12 19.9 106.7 980 55 3.0 STS 17/09 42.3 143.1 980 55 - STS27/18 20.2 106.2 985 45 3.0 TS 17/12 44.3 143.1 984 55 2.5 STS28/00 20.6 105.6 996 35 2.5 TS 17/18 47.7 144.6 984 - - L28/06 21.2 105.0 1000 - 2.0 TD 18/00 51.2 145.3 982 - - L28/12 22.0 104.9 1004 - 1.5 TD 18/06 54.6 146.7 980 - - L28/18 1.0 Dissip. 18/12 58.1 147.6 982 - - L
18/18 60.7 149.1 986 - - Out
(UTC) position (UTC) position (UTC) positionDate/Time Center Date/Time Center Date/Time Center
Omais (1605)
Date/Time Center(UTC) position
Lupit (1602)
Nepartak (1601) Nida (1604) Conson (1606)
Date/Time Center(UTC) position
(UTC) position
Mirinae (1603)
Date/Time Center(UTC) position
Chanthu (1607)
Date/Time Center

Central Max CI Grade Central Max CI Grade Central Max CI Gradepressure wind num. pressure wind num. pressure wind num.
Lat (N) Lon (E) (hPa) (kt) Lat (N) Lon (E) (hPa) (kt) Lat (N) Lon (E) (hPa) (kt)
Aug. 15/06 21.7 117.0 996 - - TD Aug. 17/00 26.4 159.1 996 - 0.5 TD Aug. 31/00 21.1 123.2 1002 - 0.5 TD15/12 21.7 116.3 996 - - TD 17/06 27.0 157.0 996 - 0.5 TD 31/06 21.3 124.4 1002 - 1.0 TD15/18 21.7 115.4 996 - - TD 17/12 27.4 155.4 996 - 1.0 TD 31/12 22.0 125.8 1002 - 1.5 TD16/00 21.8 114.7 996 - - TD 17/18 28.3 153.6 996 - 0.5 TD 31/18 23.0 126.9 1000 - 2.0 TD16/06 21.7 114.0 994 - - TD 18/00 29.3 152.0 996 - 0.5 TD Sep. 01/00 23.8 127.7 998 35 2.5 TS16/12 21.6 113.5 994 - - TD 18/06 30.4 150.4 996 - 0.5 TD 01/06 24.4 129.0 994 45 3.0 TS16/18 21.5 113.3 992 - - TD 18/12 31.4 148.6 996 - 0.5 TD 01/12 25.0 130.2 985 55 3.5 STS17/00 21.5 113.2 992 - 0.0 TD 18/18 32.2 146.8 996 - 0.5 TD 01/15 25.3 130.5 985 55 - STS17/06 21.5 113.1 992 - 0.5 TD 19/00 32.9 144.9 996 - 0.5 TD 01/18 25.7 130.6 975 60 4.0 STS17/12 21.4 112.9 990 - 1.0 TD 19/06 33.1 142.8 996 - 0.5 TD 01/21 26.1 130.7 975 60 - STS17/18 21.1 112.2 985 35 1.5 TS 19/12 33.1 141.3 996 - 0.5 TD 02/00 26.4 130.8 970 65 4.0 TY18/00 20.9 111.3 985 35 1.5 TS 19/18 32.3 139.7 996 - 0.5 TD 02/03 26.8 130.8 970 65 - TY18/06 20.8 110.3 985 35 1.5 TS 20/00 31.5 138.5 996 - 0.5 TD 02/06 27.2 130.8 965 70 4.5 TY18/12 20.5 109.2 985 35 2.0 TS 20/06 31.0 137.6 996 - 1.0 TD 02/09 27.5 130.8 965 70 - TY18/18 20.5 108.2 980 40 2.0 TS 20/12 30.5 136.7 996 - 1.5 TD 02/12 27.8 130.8 965 70 4.5 TY19/00 20.5 107.3 980 40 2.0 TS 20/18 30.1 135.5 996 - 1.5 TD 02/15 28.1 130.7 960 70 - TY19/06 20.6 106.4 980 40 2.0 TS 21/00 29.8 134.3 996 - 1.5 TD 02/18 28.5 130.6 955 70 5.0 TY19/12 20.8 104.8 990 - 1.5 TD 21/06 29.5 133.7 996 - 2.0 TD 02/21 28.9 130.5 955 70 - TY19/18 21.2 102.5 994 - 1.0 TD 21/12 29.2 133.3 992 35 2.0 TS 03/00 29.3 130.3 955 70 5.0 TY20/00 Dissip. 21/18 28.8 133.2 990 40 2.5 TS 03/03 29.7 130.2 955 70 - TY
22/00 28.8 133.4 990 40 2.5 TS 03/06 30.0 130.1 960 65 5.0 TY22/06 28.7 133.7 990 40 2.5 TS 03/09 30.3 130.0 960 65 - TY
Central Max CI Grade 22/12 28.5 134.1 990 40 2.5 TS 03/12 30.5 129.9 965 60 4.5 STSpressure wind num. 22/18 28.2 134.3 990 45 3.0 TS 03/15 30.7 129.9 970 60 - STS
Lat (N) Lon (E) (hPa) (kt) 23/00 28.0 134.4 985 50 3.5 STS 03/18 31.0 129.8 975 55 4.0 STS23/06 27.3 134.2 980 55 3.5 STS 03/21 31.2 129.7 980 55 - STS23/12 26.6 134.0 975 60 4.5 STS 04/00 31.4 129.6 985 50 3.5 STS
Aug. 17/00 15.3 138.9 1002 - - TD 23/18 25.8 133.3 965 70 4.5 TY 04/03 31.6 129.6 990 50 - STS17/06 15.2 139.9 998 - - TD 24/00 25.3 132.8 960 75 4.5 TY 04/06 31.8 129.6 992 45 3.0 TS17/12 15.2 140.7 998 - 0.5 TD 24/06 24.8 132.3 950 80 5.5 TY 04/09 32.1 129.6 994 45 - TS17/18 15.1 141.3 996 - 0.5 TD 24/12 24.4 131.8 950 80 5.5 TY 04/12 32.4 129.6 998 40 3.0 TS18/00 15.2 142.0 996 - 1.0 TD 24/18 23.9 131.4 945 85 5.5 TY 04/15 32.7 129.7 1000 35 - TS18/06 15.6 142.8 996 - 0.5 TD 25/00 23.6 131.1 945 85 5.5 TY 04/16 32.8 129.7 1000 35 - TS18/12 16.1 143.1 996 - 1.0 TD 25/06 23.5 130.9 945 85 5.5 TY 04/18 33.1 129.8 1004 - 2.5 TD18/18 16.6 143.1 996 - 1.5 TD 25/12 23.5 130.8 945 85 5.5 TY 04/21 33.5 129.9 1006 - - TD19/00 17.2 142.5 996 - 2.0 TD 25/18 23.1 130.5 945 85 5.5 TY 05/00 33.9 130.2 1008 - 2.0 TD19/06 17.8 141.8 994 35 2.0 TS 26/00 23.2 131.0 945 85 5.5 TY 05/06 34.8 131.0 1008 - - TD19/12 18.7 140.9 994 35 2.0 TS 26/06 23.1 131.3 945 85 5.5 TY 05/12 35.9 132.3 1008 - - TD19/18 19.4 140.6 992 40 2.0 TS 26/12 23.2 132.1 950 80 5.0 TY 05/18 Dissip.20/00 20.4 140.8 992 40 2.5 TS 26/18 23.5 132.5 950 80 5.0 TY20/06 22.1 141.0 990 45 2.5 TS 27/00 23.7 133.1 945 85 5.5 TY20/12 24.4 141.1 985 50 2.5 STS 27/06 24.0 133.9 945 85 5.5 TY Central Max CI Grade20/18 26.2 140.8 985 50 2.5 STS 27/12 24.5 134.6 945 85 5.5 TY pressure wind num.21/00 28.0 140.6 985 50 2.5 STS 27/18 25.1 135.6 945 85 5.5 TY Lat (N) Lon (E) (hPa) (kt)21/06 29.8 139.9 985 50 2.5 STS 28/00 26 137 945 85 5.5 TY21/12 31.5 139.5 980 55 2.5 STS 28/06 27.7 137.9 940 90 6.0 TY21/15 32.3 139.2 980 55 - STS 28/12 28.5 138.8 940 90 6.0 TY Sep. 05/12 24.8 124.8 1006 - 1.0 TD21/18 33.1 139.4 975 65 2.5 TY 28/18 29.4 140.5 940 90 6.0 TY 05/18 25.2 124.8 1004 - 1.5 TD21/21 33.8 139.3 975 65 - TY 29/00 30.4 141.7 945 85 5.5 TY 06/00 26.4 125.8 1002 - 1.5 TD22/00 34.2 139.5 975 65 3.0 TY 29/06 31.3 142.7 950 80 5.0 TY 06/06 27.6 126.8 1000 40 1.5 TS22/03 34.8 139.8 975 65 - TY 29/12 32.3 143.4 960 75 4.5 TY 06/12 28.3 128.1 1002 40 1.5 TS22/06 35.9 140.0 980 60 3.0 STS 29/18 34.0 143.6 965 70 4.0 TY 06/18 29.0 129.1 1000 40 1.5 TS22/09 36.6 140.3 985 55 - STS 29/21 34.8 143.4 965 70 - TY 07/00 29.2 130.3 1002 - 1.5 TD22/12 37.8 140.8 990 55 2.5 STS 30/00 35.6 143.0 965 65 3.5 TY 07/06 29.1 132.1 1002 - 1.5 TD22/15 38.9 141.1 990 55 - STS 30/03 36.6 142.4 965 65 - TY 07/12 1.5 Dissip.22/18 40.4 141.9 992 50 2.0 STS 30/06 37.8 142.2 965 65 3.0 TY22/20 41.8 142.3 992 50 - STS 30/08 38.8 142.0 965 65 - TY22/21 42.4 142.6 992 50 - STS 30/09 39.3 141.7 970 60 - STS Central Max CI Grade23/00 43.6 143.8 992 50 - STS 30/12 41.3 140.0 972 60 2.5 STS pressure wind num.23/03 45.1 145.3 992 - - L 30/15 42.0 138.0 976 - - L Lat (N) Lon (E) (hPa) (kt)23/06 Dissip. 30/18 43.9 135.7 980 - - L
31/00 Dissip.Sep. 09/12 13.7 141.7 1004 - 1.0 TD
09/18 14.0 141.2 1004 - 1.5 TDCentral Max CI Grade 10/00 14.4 140.2 1004 - 2.0 TDpressure wind num. 10/06 14.8 139.2 1000 35 2.5 TS
Lat (N) Lon (E) (hPa) (kt) 10/12 15.3 137.9 998 35 2.5 TS10/18 16.0 136.9 990 45 3.0 TS11/00 16.4 135.7 980 55 3.5 STS
Aug. 18/12 22.3 152.8 998 - 0.5 TD 11/06 16.7 134.5 970 65 4.0 TY18/18 24.1 153.4 996 - 0.5 TD 11/12 17.4 133.2 950 80 5.0 TY19/00 25.7 152.8 996 - 1.0 TD 11/18 17.6 131.7 940 85 5.5 TY19/06 27.4 152.2 996 - 1.0 TD 12/00 18.0 130.4 930 95 6.0 TY19/12 29.5 151.5 996 - 1.5 TD 12/06 18.3 129.4 920 100 6.5 TY19/18 31.8 149.3 996 - 1.5 TD 12/12 18.9 128.2 910 105 7.0 TY20/00 32.9 147.3 994 35 2.0 TS 12/18 19.3 126.7 910 105 7.0 TY20/06 34.3 145.7 994 35 2.0 TS 13/00 19.6 125.5 900 115 7.5 TY20/12 36.3 143.7 994 35 2.0 TS 13/06 20.2 124.1 900 115 7.5 TY20/18 37.8 142.8 996 35 2.0 TS 13/12 20.4 122.9 890 120 8.0 TY21/00 38.8 142.9 996 35 2.0 TS 13/18 20.9 121.8 900 115 8.0 TY21/06 40.6 142.9 996 35 2.0 TS 14/00 21.6 120.8 910 105 8.0 TY21/12 42.5 143.9 1000 35 1.5 TS 14/06 22.5 119.8 930 90 7.0 TY21/14 42.9 144.1 1002 35 - TS 14/12 23.5 118.9 940 85 6.5 TY21/18 45.0 145.0 1002 - 1.0 L 14/18 24.4 118.3 965 70 6.5 TY22/00 46.8 145.8 1002 - - L 15/00 25.2 117.7 980 55 5.5 STS22/06 48.2 147.0 1002 - - L 15/06 26.1 116.9 996 45 5.0 TS22/12 Dissip. 15/12 27.0 117.1 1002 - 5.0 TD
15/18 28.1 117.5 1004 - - TD16/00 30.2 118.9 1004 - - TD16/06 31.6 120.1 1004 - - L16/12 32.7 121.5 1004 - - L16/18 33.7 123.4 1004 - - L17/00 33.5 123.8 1004 - - L17/06 33.3 124.4 1004 - - L17/12 33.2 125.2 1006 - - L17/18 Dissip.
Date/Time Center Date/Time Center Date/Time Center(UTC) position (UTC) position (UTC) position
Mindulle (1609)
Date/Time Center(UTC) position
Malou (1613)
Dianmu (1608) Lionrock (1610) Namtheun (1612)
Date/Time Center(UTC) position
(UTC) position
Kompasu (1611)
Date/Time Center(UTC) position
Meranti (1614)
Date/Time Center

Central Max CI Grade Central Max CI Grade Central Max CI Gradepressure wind num. pressure wind num. pressure wind num.
Lat (N) Lon (E) (hPa) (kt) Lat (N) Lon (E) (hPa) (kt) Lat (N) Lon (E) (hPa) (kt)
Sep. 11/06 12.3 114.3 1002 - 0.5 TD Sep. 22/18 15.4 141.1 1002 - 0.5 TD Sep. 24/18 14.9 164.6 1008 - - TD11/12 12.7 113.9 1002 - 1.0 TD 23/00 15.7 140.6 1000 - 0.5 TD 25/00 14.5 163.4 1008 - - TD11/18 13.2 113.2 1002 - 1.0 TD 23/06 16.0 139.7 1000 - 1.0 TD 25/06 14.7 162.2 1008 - - TD12/00 13.7 112.1 1002 - 1.5 TD 23/12 16.4 138.8 998 - 1.5 TD 25/12 15.1 161.0 1008 - 0.5 TD12/06 14.4 111.0 1002 - 1.5 TD 23/18 16.9 137.6 994 35 2.0 TS 25/18 15.6 160.0 1008 - 0.5 TD12/12 14.9 109.9 1000 - 1.5 TD 24/00 17.5 136.5 990 40 2.5 TS 26/00 15.9 159.0 1008 - 1.0 TD12/18 15.5 108.9 996 35 2.0 TS 24/06 18.3 135.3 980 45 3.0 TS 26/06 15.9 158.0 1008 - 1.0 TD13/00 15.9 107.3 996 35 2.0 TS 24/12 18.7 133.9 975 55 3.5 STS 26/12 15.8 156.2 1008 - 1.0 TD13/06 16.0 105.9 998 - 1.5 TD 24/18 19.0 132.9 970 65 4.0 TY 26/18 15.3 154.5 1008 - 1.0 TD13/12 16.0 104.7 1000 - - TD 25/00 19.5 131.6 970 65 4.0 TY 27/00 14.6 153.3 1008 - 1.5 TD13/18 16.1 103.5 1004 - - TD 25/06 19.9 130.3 970 65 4.0 TY 27/06 14.4 152.0 1006 - 2.0 TD14/00 Dissip. 25/12 20.2 129.3 970 65 4.0 TY 27/12 14.3 151.0 1004 - 2.0 TD
25/18 20.6 128.2 970 65 4.0 TY 27/18 14.3 149.8 1004 - 2.0 TD26/00 20.8 127.3 970 65 4.0 TY 28/00 14.4 148.1 1004 - 2.0 TD
Central Max CI Grade 26/06 21.4 126.2 960 70 4.5 TY 28/06 14.4 146.5 1004 - 2.0 TDpressure wind num. 26/09 21.6 125.9 960 70 - TY 28/12 14.5 145.5 1004 - 2.0 TD
Lat (N) Lon (E) (hPa) (kt) 26/12 21.9 125.3 960 70 4.5 TY 28/18 14.4 144.4 1002 - 2.0 TD26/15 22.2 124.8 960 70 - TY 29/00 14.3 143.4 1002 - 2.0 TD26/18 22.5 124.4 950 80 5.0 TY 29/06 13.7 141.8 1000 35 2.0 TS
Sep. 11/18 12.5 144.8 1006 - 0.5 TD 26/21 22.8 123.7 950 80 - TY 29/12 13.5 140.5 1000 35 2.5 TS12/00 12.8 143.1 1008 - 1.0 TD 27/00 23.3 123.3 945 85 5.5 TY 29/18 13.4 139.2 992 45 3.0 TS12/06 13.2 141.9 1006 - 1.5 TD 27/03 23.7 122.5 945 85 - TY 30/00 13.8 138.1 990 50 3.0 STS12/12 13.5 140.8 1006 - 1.5 TD 27/06 24.1 121.6 950 80 5.5 TY 30/06 14.3 137.4 990 50 3.0 STS12/18 13.8 139.4 1000 35 2.0 TS 27/09 23.8 120.9 960 75 - TY 30/12 14.8 136.7 990 50 3.0 STS13/00 14.2 138.1 996 40 2.5 TS 27/12 23.9 120.6 965 65 5.5 TY 30/18 15.4 136.0 985 55 3.5 STS13/06 14.5 137.0 990 45 3.0 TS 27/18 24.4 119.6 975 55 5.0 STS Oct. 01/00 16.1 135.2 985 55 3.5 STS13/12 14.7 135.9 990 45 3.0 TS 28/00 25.0 118.1 985 45 4.5 TS 01/06 16.8 134.4 980 60 4.0 STS13/18 15.0 134.6 985 55 3.5 STS 28/06 25.3 117.0 990 35 4.0 TS 01/12 17.6 133.4 970 70 4.5 TY14/00 15.4 133.4 975 65 4.0 TY 28/12 25.4 116.7 994 - 3.5 TD 01/18 18.5 132.6 955 80 5.0 TY14/06 15.8 132.2 965 70 4.5 TY 28/18 25.6 116.6 998 - - TD 02/00 19.7 131.5 935 95 6.0 TY14/12 16.3 131.2 965 70 4.5 TY 29/00 25.9 116.5 1002 - - TD 02/06 20.8 130.4 935 95 6.0 TY14/18 16.7 130.0 965 70 4.5 TY 29/06 26.5 117.2 1002 - - TD 02/12 21.8 129.2 935 95 6.0 TY15/00 16.9 128.8 965 70 4.5 TY 29/12 Dissip. 02/18 22.8 128.3 935 95 6.0 TY15/06 17.5 127.7 950 80 5.0 TY 02/21 23.3 127.9 935 95 - TY15/12 18.4 126.7 940 85 5.5 TY 03/00 23.8 127.6 925 100 6.5 TY15/18 19.2 125.7 940 85 5.5 TY 03/03 24.5 127.3 925 100 - TY16/00 20.1 124.7 940 85 5.5 TY 03/06 24.9 127.0 915 110 7.0 TY16/06 21.1 123.9 940 85 5.5 TY 03/09 25.4 126.9 905 115 - TY16/09 21.5 123.7 940 85 - TY 03/12 25.8 126.8 905 115 7.5 TY16/12 22.1 123.4 940 85 5.5 TY 03/15 26.2 126.6 905 115 - TY16/15 22.5 123.1 940 85 - TY 03/18 26.8 126.4 910 110 7.5 TY16/18 23.0 123.1 930 95 5.5 TY 03/21 27.3 126.3 920 100 - TY16/21 23.6 123.0 930 95 - TY 04/00 27.9 126.2 925 95 7.5 TY17/00 24.1 123.0 930 95 5.5 TY 04/03 28.5 126.1 925 95 - TY17/03 24.7 122.9 930 95 - TY 04/06 29.4 126.0 940 85 7.5 TY17/06 25.3 122.8 940 90 5.5 TY 04/09 30.2 125.9 950 80 - TY17/09 25.6 122.7 940 90 - TY 04/12 31.0 126.0 950 80 7.0 TY17/12 25.9 122.7 950 80 5.0 TY 04/15 31.7 126.3 960 75 - TY17/18 26.3 122.8 950 80 5.0 TY 04/18 32.7 126.6 965 70 6.0 TY18/00 26.9 123.5 950 80 5.0 TY 04/21 33.3 127.2 965 70 - TY18/06 27.4 124.2 950 80 5.0 TY 05/00 34.4 128.1 970 65 5.5 TY18/12 28.0 125.1 945 85 5.5 TY 05/03 35.4 129.4 985 55 - STS18/18 28.7 126.1 940 95 6.0 TY 05/06 36.1 131.1 990 50 5.0 STS19/00 29.4 127.1 940 95 6.0 TY 05/09 37.3 133.8 992 45 - TS19/03 29.7 127.6 940 95 - TY 05/12 38.7 136.7 996 - 4.5 L19/06 30.2 128.3 940 95 6.0 TY 05/18 39.4 143.4 998 - - L19/09 30.5 129.1 940 95 - TY 06/00 41.1 148.8 992 - - L19/12 30.8 129.7 950 80 5.0 TY 06/06 41.8 153.5 988 - - L19/15 31.1 130.5 955 75 - TY 06/12 42.9 158.7 984 - - L19/18 31.6 131.5 960 75 5.0 TY 06/18 44.2 164.2 980 - - L19/21 32.2 132.5 960 75 - TY 07/00 45.7 170.0 972 - - L20/00 32.9 133.4 965 70 4.5 TY 07/06 47.8 175.1 960 - - L20/02 33.3 134.1 970 70 - TY 07/12 50.2 179.2 956 - - L20/03 33.5 134.6 970 65 - TY 07/18 52.0 182.4 956 - - Out20/04 33.7 135.1 980 55 - STS20/06 34.3 136.1 985 50 4.0 STS20/08 34.9 136.8 992 45 - TS Central Max CI Grade20/09 34.8 137.1 992 45 - TS pressure wind num.20/12 34.5 138.1 1006 - 3.5 L Lat (N) Lon (E) (hPa) (kt)20/18 Dissip.
Oct. 04/12 19.2 130.0 1004 - 1.0 TD04/18 19.2 127.8 1002 - 1.5 TD05/00 19.0 126.5 1004 - 1.5 TD05/06 18.9 125.5 1004 - 1.5 TD05/12 19.5 123.8 1002 - 1.5 TD05/18 20.1 122.1 998 35 1.5 TS06/00 20.6 120.5 998 35 1.5 TS06/06 20.7 119.0 998 35 1.5 TS06/12 20.6 117.8 994 40 2.0 TS06/18 20.6 117.2 994 40 2.0 TS07/00 20.4 116.4 992 40 2.5 TS07/06 20.7 116.0 985 50 3.0 STS07/12 21.0 115.9 980 55 3.5 STS07/18 21.2 115.9 975 60 3.5 STS08/00 21.3 116.1 980 55 3.5 STS08/06 21.3 116.3 985 50 3.5 STS08/12 21.6 116.9 990 45 3.5 TS08/18 21.8 117.2 992 40 3.5 TS09/00 21.6 117.4 996 40 3.0 TS09/06 21.3 117.8 996 40 3.0 TS09/12 21.6 117.9 998 35 2.5 TS09/18 21.8 117.9 998 35 2.5 TS10/00 22.1 118.0 1004 - 2.0 TD10/06 Dissip.
Date/Time Center Date/Time Center
Rai (1615) Megi (1617) Chaba (1618)
Date/Time Center(UTC) position
Date/Time Center(UTC) position (UTC) position (UTC) position
Malakas (1616)
Date/Time Center(UTC) position
Aere (1619)

Central Max CI Grade Central Max CI Grade Central Max CI Gradepressure wind num. pressure wind num. pressure wind num.
Lat (N) Lon (E) (hPa) (kt) Lat (N) Lon (E) (hPa) (kt) Lat (N) Lon (E) (hPa) (kt)
Oct. 03/18 16.4 180.5 1008 - - Out Oct. 14/12 7.4 144.5 1004 - 1.0 TD Nov. 08/18 12.8 161.4 1008 - 1.0 TD04/00 16.5 178.8 1008 - 0.5 TD 14/18 8.2 143.6 1004 - 1.5 TD 09/00 13.4 160.4 1006 - 1.0 TD04/06 16.4 177.6 1006 - 0.5 TD 15/00 8.8 142.9 1000 35 2.0 TS 09/06 14.6 159.7 1006 - 1.5 TD04/12 16.6 176.7 1006 - 0.0 TD 15/06 9.1 142.1 996 40 2.5 TS 09/12 15.8 158.5 1006 - 1.5 TD04/18 17.3 175.9 1006 - 0.5 TD 15/12 9.5 140.7 992 45 2.5 TS 09/18 16.3 157.7 1002 - 1.5 TD05/00 18.0 174.7 1008 - 1.0 TD 15/18 9.7 140.0 985 50 3.0 STS 10/00 16.9 156.9 1002 35 1.5 TS05/06 18.1 173.1 1008 - 0.5 TD 16/00 9.9 139.6 980 55 3.5 STS 10/06 17.3 155.9 1002 35 2.0 TS05/12 18.0 171.5 1008 - 0.5 TD 16/06 10.4 139.1 975 65 4.0 TY 10/12 17.5 154.5 1002 35 2.0 TS05/18 17.9 170.3 1006 - 0.5 TD 16/12 11.3 138.7 970 70 4.5 TY 10/18 17.9 153.5 1002 35 2.0 TS06/00 17.9 168.7 1008 - 0.5 TD 16/18 12.3 137.8 960 80 5.0 TY 11/00 18.3 152.3 1002 35 2.5 TS06/06 18.0 167.0 1006 - 0.5 TD 17/00 12.9 136.7 955 85 5.0 TY 11/06 19.1 150.9 1002 35 2.5 TS06/12 18.0 165.5 1008 - 0.5 TD 17/06 13.4 135.5 950 90 5.0 TY 11/12 19.9 148.1 1004 35 2.5 TS06/18 18.1 164.4 1008 - 0.5 TD 17/12 13.8 134.5 945 95 5.5 TY 11/18 20.7 146.8 1004 35 2.5 TS07/00 18.2 163.4 1008 - 1.0 TD 17/18 14.4 133.3 925 100 6.5 TY 12/00 20.8 145.5 1006 - 2.5 TD07/06 18.6 161.8 1006 - 1.0 TD 18/00 14.9 132.1 925 100 6.5 TY 12/06 21.6 144.7 1008 - 2.5 TD07/12 18.9 160.4 1006 - 1.5 TD 18/06 15.4 130.7 915 105 6.5 TY 12/12 21.4 143.4 1012 - - TD07/18 19.2 158.7 1006 - 1.5 TD 18/12 15.6 129.1 910 110 7.0 TY 12/18 21.4 142.4 1010 - - TD08/00 19.3 157.3 1004 - 1.5 TD 18/18 16.0 127.5 900 115 7.0 TY 13/00 21.3 141.4 1014 - - TD08/06 19.5 155.8 1002 - 2.0 TD 19/00 16.1 126.0 900 115 7.0 TY 13/06 Dissip.08/12 19.9 154.4 1000 35 2.5 TS 19/06 16.7 124.7 900 115 7.0 TY08/18 20.6 152.7 1000 35 2.5 TS 19/12 17.3 123.1 915 100 6.5 TY09/00 21.2 151.3 1000 35 3.0 TS 19/18 17.7 121.5 940 90 5.5 TY Central Max CI Grade09/06 22.1 150.0 996 40 3.5 TS 20/00 18.4 120.1 945 80 5.0 TY pressure wind num.09/12 23.2 148.5 990 45 3.5 TS 20/06 19.0 118.8 950 75 5.0 TY Lat (N) Lon (E) (hPa) (kt)09/18 24.0 147.3 980 55 4.0 STS 20/12 19.8 117.4 960 70 4.5 TY10/00 24.7 146.4 970 65 4.5 TY 20/18 20.6 116.6 960 70 4.5 TY10/06 25.5 145.9 955 80 5.0 TY 21/00 22.1 115.6 970 60 4.5 STS Nov. 24/00 9.7 126.8 1006 - 1.5 TD10/12 26.3 145.8 940 90 6.0 TY 21/06 23.2 115.1 980 45 4.0 TS 24/06 10.4 125.5 1004 - 1.5 TD10/18 27.2 145.8 930 95 6.0 TY 21/12 24.3 114.7 992 35 3.5 TS 24/12 10.8 124.3 1002 - 1.5 TD11/00 27.8 146.0 935 90 6.0 TY 21/18 25.9 115.5 998 - 3.0 TD 24/18 11.0 123.2 1000 - 1.5 TD11/06 28.5 146.7 935 90 6.0 TY 22/00 27.4 116.4 1004 - - L 25/00 11.4 122.5 1000 - 2.0 TD11/12 29.2 147.5 930 95 6.0 TY 22/06 28.9 119.4 1004 - - L 25/06 11.5 121.3 1000 - 2.0 TD11/18 30.3 148.9 925 100 6.5 TY 22/12 30.2 121.4 1004 - - L 25/12 11.7 120.7 998 35 2.5 TS12/00 31.3 151.0 925 100 6.5 TY 22/18 30.5 123.1 1004 - - L 25/18 12.6 119.9 994 45 3.0 TS12/06 32.6 153.7 935 90 6.5 TY 23/00 29.9 126.1 1002 - - L 26/00 13.2 118.7 992 50 3.5 STS12/12 33.9 156.8 945 85 5.5 TY 23/06 29.4 129.3 1002 - - L 26/06 13.8 117.7 994 45 3.5 TS12/18 35.8 161.1 955 75 5.0 TY 23/12 29.4 133.5 1002 - - L 26/12 14.3 117.4 994 45 3.5 TS13/00 38.1 166.3 970 65 4.5 TY 23/18 29.5 136.6 1000 - - L 26/18 14.8 117.3 994 45 3.5 TS13/06 40.3 171.1 988 - 4.0 L 24/00 29.2 140.2 1002 - - L 27/00 15.7 117.6 994 45 3.5 TS13/12 41.7 176.5 992 - - L 24/06 28.9 142.5 1002 - - L 27/06 16.4 118.0 994 45 3.5 TS13/18 42.1 183.6 996 - - Out 24/12 28.7 145.2 1006 - - L 27/12 16.8 118.2 994 45 3.5 TS
24/18 28.3 147.1 1008 - - L 27/18 17.0 118.5 1000 35 3.0 TS25/00 27.5 146.0 1012 - - L 28/00 17.1 118.7 1006 - 2.5 TD
Central Max CI Grade 25/06 26.7 144.9 1010 - L 28/06 Dissip.pressure wind num. 25/12 26.9 144.7 1012 - L
Lat (N) Lon (E) (hPa) (kt) 25/18 27.1 144.4 1012 - L26/00 27.3 145.0 1014 - L Central Max CI Grade26/06 27.8 145.4 1012 - L pressure wind num.
Oct. 13/00 12.9 129.4 1004 - 0.5 TD 26/12 Dissip. Lat (N) Lon (E) (hPa) (kt)13/06 13.1 128.9 1004 - 1.0 TD13/12 13.3 128.1 1002 - 1.5 TD Central Max CI Grade13/18 13.5 127.3 998 35 2.0 TS pressure wind num. Dec. 20/12 6.2 144.5 1004 - 1.0 TD14/00 13.6 126.7 994 40 2.5 TS Lat (N) Lon (E) (hPa) (kt) 20/18 6.2 143.4 1004 - 1.5 TD14/06 13.7 126.3 990 45 3.0 TS 21/00 6.3 142.4 1004 - 1.5 TD14/12 13.8 125.9 980 55 3.5 STS 21/06 6.4 141.7 1002 - 1.5 TD14/18 14.0 125.4 980 55 3.5 STS Oct. 30/18 10.1 146.9 1004 - 0.5 TD 21/12 6.8 140.9 1004 - 1.5 TD15/00 14.3 124.6 970 65 4.0 TY 31/00 10.5 146.2 1004 - 0.5 TD 21/18 7.8 140.0 998 35 2.0 TS15/06 14.7 123.9 955 80 5.0 TY 31/06 10.5 145.2 1002 - 1.0 TD 22/00 8.6 139.1 994 40 2.5 TS15/12 15.1 123.0 950 85 5.5 TY 31/12 10.3 144.1 1002 - 1.5 TD 22/06 9.4 137.8 994 40 2.5 TS15/18 15.8 121.8 935 95 6.0 TY 31/18 10.3 143.5 1002 - 1.5 TD 22/12 10.2 136.3 992 45 3.0 TS16/00 16.2 119.8 965 75 5.0 TY Nov. 01/00 10.5 142.5 1002 - 1.5 TD 22/18 11.1 134.8 985 55 3.5 STS16/06 16.6 118.4 965 70 4.5 TY 01/06 10.9 141.6 1000 - 2.0 TD 23/00 11.7 133.3 985 55 3.5 STS16/12 16.8 117.2 970 65 4.0 TY 01/12 11.7 139.9 1000 - 2.0 TD 23/06 11.9 132.1 970 70 4.5 TY16/18 16.8 115.5 970 65 4.0 TY 01/18 11.8 138.7 1000 - 2.0 TD 23/12 12.6 131.0 955 80 5.0 TY17/00 17.0 114.3 970 60 3.5 STS 02/00 12.3 138.1 1000 - 2.0 TD 23/18 13.0 129.9 950 85 5.5 TY17/06 17.4 113.1 970 60 3.5 STS 02/06 12.6 137.8 1000 - 2.0 TD 24/00 13.1 128.9 935 95 6.0 TY17/12 17.6 112.3 970 60 3.5 STS 02/12 12.9 137.6 1000 - 2.0 TD 24/06 13.3 128.2 915 105 7.0 TY17/18 18.0 111.5 970 60 3.5 STS 02/18 13.1 137.4 998 - 2.0 TD 24/12 13.4 127.5 915 105 7.0 TY18/00 18.6 110.7 970 60 3.5 STS 03/00 13.3 137.3 996 35 2.5 TS 24/18 13.6 126.7 915 105 7.0 TY18/06 19.1 110.0 975 55 3.0 STS 03/06 13.7 137.3 996 35 2.5 TS 25/00 13.5 126.0 915 105 7.0 TY18/12 19.7 109.3 985 45 2.5 TS 03/12 14.0 137.4 996 35 2.5 TS 25/06 13.5 125.1 925 100 6.5 TY18/18 20.3 108.8 990 40 2.0 TS 03/18 14.3 137.9 992 40 3.0 TS 25/12 13.5 124.0 925 100 6.5 TY19/00 21.0 108.4 994 35 1.5 TS 04/00 15.0 138.8 990 45 3.0 TS 25/18 13.5 122.8 950 85 5.5 TY19/06 21.7 108.1 996 - 1.0 TD 04/06 15.6 139.1 985 55 3.0 STS 26/00 13.6 121.4 950 85 5.5 TY19/12 22.0 108.0 1000 - 0.5 TD 04/12 16.2 139.3 985 55 3.5 STS 26/06 14.1 119.7 970 70 4.5 TY19/18 22.4 108.0 1004 - - TD 04/18 16.8 139.4 975 60 4.0 STS 26/12 14.4 118.4 970 70 4.5 TY20/00 Dissip. 05/00 17.2 139.9 970 65 5.0 TY 26/18 14.8 117.0 975 65 4.0 TY
05/06 17.5 140.3 965 70 5.0 TY 27/00 15.0 116.3 980 60 3.5 STS05/12 18.3 140.7 960 75 5.0 TY 27/06 14.7 116.0 985 50 3.0 STS05/18 18.6 141.8 960 75 5.0 TY 27/12 14.2 115.5 996 40 2.5 TS06/00 19.5 142.5 960 75 5.0 TY 27/18 13.3 114.7 1004 - 2.0 TD06/06 20.7 143.6 960 75 5.0 TY 28/00 13.0 113.3 1006 - 1.5 TD06/12 22.2 144.8 960 75 5.0 TY 28/06 11.9 112.3 1006 - 1.0 TD06/18 24.3 146.1 965 70 5.0 TY 28/12 11.2 111.4 1008 - - TD07/00 27.3 147.0 970 65 5.0 TY 28/18 Dissip.07/06 28.3 147.5 976 - 5.0 L07/12 28.8 148.0 980 - 4.5 L07/18 29.2 149.1 984 - - L08/00 30.6 150.5 988 - - L08/06 31.9 152.2 992 - - L08/12 33.3 154.6 996 - - L08/18 34.9 157.1 998 - - L09/00 36.5 161.0 1000 - - L09/06 37.7 163.0 1002 - - L09/12 38.4 164.0 1002 - - L09/18 39.0 165.5 1004 - - L10/00 Dissip.
Date/Time Center Date/Time Center Date/Time Center
Songda (1620) Haima (1622) Ma-on (1624)
Date/Time Center(UTC) position
(UTC) position (UTC) position (UTC) position
Nock-ten (1626)Date/Time Center(UTC) position
Meari (1623)
Tokage (1625)
Date/Time Center(UTC) position
Sarika (1621) Date/Time Center(UTC) position

Appendix 2
Monthly Tracks of Tropical Cyclones in 2016


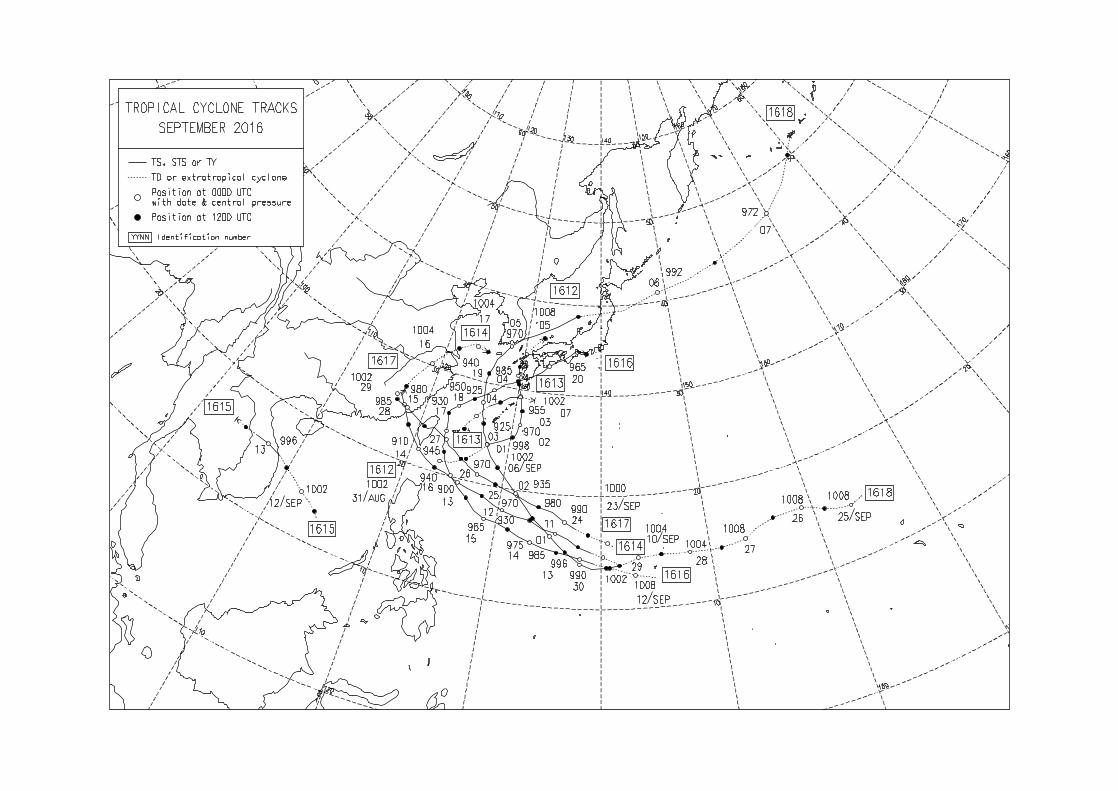


Appendix 3Errors of Track and Intensity Forecasts for Each Tropical Cyclone in 2016
T=00 =24 =48 =72 =96 =120 T=24 =48 =72 T=24 =48 =72 T=00 =24 =48 =72 =96 =120 T=24 =48 =72 T=24 =48 =72
Jul. 03/00 22 79 34 67 123 330 0 20 60 5 -10 -35 Jul. 30/06 86 87 10 -1003/06 0 40 21 57 215 383 -2 25 70 0 -15 -40 30/12 24 81 184 5 -15 -5 1503/12 11 46 90 170 317 642 0 35 60 -5 -25 -35 30/18 22 33 138 -10 -30 10 3003/18 25 44 78 178 365 616 5 45 55 -5 -30 -35 31/00 15 25 93 -15 -30 15 3004/00 34 58 77 129 319 570 15 40 45 -10 -20 -25 31/06 11 100 117 -15 -30 15 4004/06 31 43 77 124 383 25 55 40 -20 -30 -20 31/12 21 78 -15 1504/12 25 168 204 151 376 30 55 40 -15 -30 -20 31/18 10 91 -20 2504/18 0 164 178 166 423 35 45 15 -20 -25 5 Aug. 01/00 0 54 -25 3005/00 11 134 137 248 424 35 40 -15 -15 -20 20 01/06 15 60 -15 2505/06 11 95 94 213 40 25 -40 -20 -10 30 01/12 005/12 11 11 64 193 30 25 -50 -15 -10 45 01/18 1005/18 0 10 49 189 20 0 -40 -5 15 40 02/00 1006/00 11 15 91 147 10 -15 -27 0 20 35 02/06 006/06 10 22 57 0 -35 5 2006/12 0 30 89 5 -40 -5 30 mean 17 68 133 -- -- -- -11 -26 -- 13 29 --06/18 0 35 167 -10 -35 10 35 sample 13 9 4 0 0 0 9 4 0 9 4 007/00 10 64 67 -10 -27 0 3507/06 0 24 -15 1007/12 0 57 -25 2507/18 0 84 -15 20 T=00 =24 =48 =72 =96 =120 T=24 =48 =72 T=24 =48 =7208/00 0 42 -17 2508/06 1508/12 63 Aug. 04/00 158 79 168 2 5 -5 -1008/18 53 04/06 0 31 15 179 167 170 -5 0 -10 0 -5 009/00 23 04/12 15 15 40 169 104 118 0 0 -15 -5 -5 5
04/18 130 24 30 123 46 5 0 -15 -10 -5 5mean 15 60 92 156 327 508 7 15 16 -2 -4 -3 05/00 114 49 101 212 52 5 0 -15 -10 -5 5
sample 25 21 17 13 9 5 21 17 13 21 17 13 05/06 62 63 121 173 160 5 -5 -15 -10 -5 1005/12 22 35 200 256 214 0 -15 -15 -5 5 1005/18 0 30 212 178 0 -15 -15 0 10 1506/00 23 51 200 194 0 -15 -15 0 10 15
T=00 =24 =48 =72 =96 =120 T=24 =48 =72 T=24 =48 =72 06/06 35 135 233 351 0 -15 -15 0 15 1506/12 30 176 213 302 -15 -15 -20 10 15 2006/18 22 167 192 -15 -15 10 15
Jul. 23/18 53 07/00 15 146 128 -15 -15 10 1524/00 0 07/06 22 102 191 -10 -10 10 1024/06 0 07/12 15 48 75 -10 -15 10 1524/12 0 07/18 29 66 -10 10
08/00 24 72 0 5mean 13 -- -- -- -- -- -- -- -- -- -- -- 08/06 35 98 0 5
sample 4 0 0 0 0 0 0 0 0 0 0 0 08/12 54 55 -5 1008/18 10709/00 11009/06 34
T=00 =24 =48 =72 =96 =120 T=24 =48 =72 T=24 =48 =72 09/12 74
mean 49 76 141 214 124 144 -4 -9 -15 2 5 10Jul. 26/06 21 157 6 -5 sample 23 19 15 10 6 2 19 15 10 19 15 10
26/12 35 64 16 -1526/18 22 53 11 -527/00 25 10 2 027/06 2427/12 1027/18 1528/00 15
mean 21 71 -- -- -- -- 9 -- -- -6 -- --sample 8 4 0 0 0 0 4 0 0 4 0 0
Date/Time Center Position (km) Central Pressure (hPa) Max. Wind (kt)(UTC)
STS Mirinae (1603)
Date/Time Center Position (km) Central Pressure (hPa) Max. Wind (kt)(UTC)
TS Lupit (1602)
Date/Time Center Position (km) Central Pressure (hPa) Max. Wind (kt)(UTC)
STS Omais (1605)
Central Pressure (hPa) Max. Wind (kt)(UTC) (UTC)
TY Nepartak (1601) STS Nida (1604)
Date/Time Center Position (km) Central Pressure (hPa) Max. Wind (kt) Date/Time Center Position (km)

T=00 =24 =48 =72 =96 =120 T=24 =48 =72 T=24 =48 =72 T=00 =24 =48 =72 =96 =120 T=24 =48 =72 T=24 =48 =72
Aug. 09/00 35 11 94 224 384 833 -10 -20 -30 15 25 35 Aug. 19/06 0 310 379 223 0 0 0 -5 -5 -1009/06 0 54 109 157 419 826 -5 -20 -30 10 25 40 19/12 0 125 214 321 7 5 -5 -10 -10 -1009/12 34 95 143 190 478 1079 -5 -20 -30 10 25 40 19/18 22 117 156 404 0 10 0 -5 -20 -1509/18 22 183 89 325 358 893 -5 -20 -30 10 25 40 20/00 30 83 156 606 0 10 -2 0 -15 -1010/00 0 175 84 229 434 -15 -25 -25 20 25 30 20/06 52 88 239 0 5 0 -1010/06 0 143 119 255 609 -15 -25 -20 20 30 25 20/12 80 83 236 0 -5 0 -510/12 0 67 275 235 632 -15 -25 -20 20 30 25 20/18 15 44 204 5 -2 -10 -510/18 0 59 294 247 624 -15 -25 -20 20 30 25 21/00 15 86 112 10 -2 -15 -511/00 22 101 284 178 -20 -25 -10 20 30 15 21/06 0 55 0 -511/06 0 128 226 116 -15 -10 -5 20 15 10 21/12 19 49 -5 -511/12 0 187 96 61 -10 -5 -5 15 10 10 21/18 0 25 -7 011/18 33 204 119 27 -5 -5 -5 10 10 10 22/00 9 20 -7 012/00 24 151 105 -5 0 10 5 22/06 012/06 0 88 97 0 5 5 0 22/12 012/12 50 86 93 5 0 0 5 22/18 3412/18 108 95 101 5 0 0 5 23/00 013/00 40 69 5 013/06 0 125 5 0 mean 17 90 212 388 -- -- 0 3 -2 -5 -9 -1113/12 0 85 0 5 sample 16 12 8 4 0 0 12 8 4 12 8 413/18 0 44 2 014/00 014/06 2614/12 0 T=00 =24 =48 =72 =96 =120 T=24 =48 =72 T=24 =48 =7214/18 27
mean 18 108 145 187 492 907 -6 -14 -19 11 18 25 Aug. 21/12 24 90 223 395 461 443 -5 0 15 10 -5 -10sample 24 20 16 12 8 4 20 16 12 20 16 12 21/18 10 141 273 458 532 424 -5 10 20 5 -15 -15
22/00 31 157 323 498 506 413 -5 10 15 5 -10 -1022/06 41 155 324 429 413 374 0 20 15 0 -15 -1022/12 15 135 340 375 300 367 5 20 15 -5 -15 -10
T=00 =24 =48 =72 =96 =120 T=24 =48 =72 T=24 =48 =72 22/18 37 150 284 314 214 494 5 15 5 -10 -15 -523/00 11 195 323 268 262 491 15 10 10 -10 -5 -523/06 15 248 331 271 240 677 25 10 10 -15 -5 -5
Aug. 13/18 183 241 400 735 0 -15 -15 0 15 15 23/12 33 240 307 220 175 511 10 0 -10 -5 0 1014/00 108 250 389 714 0 0 -5 0 5 5 23/18 35 167 258 145 214 661 5 -5 -15 -5 0 1014/06 42 212 481 900 -5 -5 -5 5 10 5 24/00 0 183 198 132 220 279 0 -10 -10 0 5 514/12 59 223 411 820 -5 0 6 10 5 -10 24/06 0 143 171 194 236 382 -5 -15 -15 5 15 1514/18 56 128 214 -5 0 10 5 24/12 0 61 113 158 201 423 -5 -20 -15 5 20 1515/00 11 112 207 0 5 5 -5 24/18 0 131 73 181 312 464 -10 -20 -15 10 20 1515/06 24 178 315 5 5 0 -5 25/00 11 70 63 120 173 399 -15 -25 -15 15 20 1515/12 10 113 224 5 1 0 -5 25/06 0 59 98 187 172 405 -15 -25 -10 15 20 1015/18 31 91 5 0 25/12 10 69 107 125 133 425 -20 -25 -10 20 20 1016/00 31 151 10 -10 25/18 0 70 129 179 143 -20 -25 -5 20 20 516/06 48 207 10 -10 26/00 0 61 110 154 154 -15 -25 -5 15 20 516/12 11 116 6 -10 26/06 10 78 148 130 181 -15 -15 -10 10 10 1016/18 14 26/12 11 51 107 80 370 -10 -5 -15 5 0 517/00 11 26/18 11 64 112 108 -10 -5 -20 5 0 1017/06 0 27/00 0 55 73 117 -10 -10 -20 5 5 1517/12 34 27/06 10 98 36 141 -5 -10 -10 0 5 10
27/12 0 49 50 245 -5 -15 -7 0 5 5mean 42 168 330 792 -- -- 2 -1 -5 0 3 4 27/18 0 45 14 -5 -20 0 10
sample 16 12 8 4 0 0 12 8 4 12 8 4 28/00 0 40 38 -5 -10 0 528/06 10 58 58 0 0 0 028/12 0 87 114 -10 -7 5 528/18 0 78 -10 5
T=00 =24 =48 =72 =96 =120 T=24 =48 =72 T=24 =48 =72 29/00 10 21 -5 529/06 11 56 0 529/12 11 58 -2 5
Aug. 17/18 46 94 10 -5 29/18 7218/00 15 31 0 5 30/00 2918/06 0 30 0 5 30/06 2118/12 30 30/12 018/18 7419/00 57 mean 13 102 165 225 267 449 -4 -7 -4 4 4 419/06 15 sample 37 33 29 25 21 17 33 29 25 33 29 25
mean 34 52 -- -- -- -- 3 -- -- 2 -- --sample 7 3 0 0 0 0 3 0 0 3 0 0
Date/Time Center Position (km) Central Pressure (hPa) Max. Wind (kt)(UTC)
TS Dianmu (1608)
Date/Time Center Position (km) Central Pressure (hPa) Max. Wind (kt)(UTC)
STS Chanthu (1607)
Date/Time Center Position (km) Central Pressure (hPa) Max. Wind (kt)(UTC)
TY Lionrock (1610)
Central Pressure (hPa) Max. Wind (kt)(UTC) (UTC)
TS Conson (1606) TY Mindulle (1609)
Date/Time Center Position (km) Central Pressure (hPa) Max. Wind (kt) Date/Time Center Position (km)

T=00 =24 =48 =72 =96 =120 T=24 =48 =72 T=24 =48 =72 T=00 =24 =48 =72 =96 =120 T=24 =48 =72 T=24 =48 =72
Aug. 20/00 22 211 -2 0 Sep. 12/18 3120/06 0 147 -2 0 13/00 2520/12 0 64 -6 020/18 44 mean 28 -- -- -- -- -- -- -- -- -- -- --21/00 0 sample 2 0 0 0 0 0 0 0 0 0 0 021/06 021/12 0
mean 9 141 -- -- -- -- -3 -- -- 0 -- -- T=00 =24 =48 =72 =96 =120 T=24 =48 =72 T=24 =48 =72sample 7 3 0 0 0 0 3 0 0 3 0 0
Sep. 12/18 25 68 144 236 252 401 5 10 25 -5 -5 -10T=00 =24 =48 =72 =96 =120 T=24 =48 =72 T=24 =48 =72 13/00 0 57 175 216 227 409 10 5 25 -10 0 -10
13/06 0 91 172 201 404 650 10 10 10 -10 -5 -513/12 44 55 167 270 469 763 0 5 5 5 0 0
Sep. 01/00 10 75 89 443 15 20 0 -15 -10 0 13/18 0 92 204 368 567 841 -10 0 15 10 5 -1001/06 15 45 56 362 15 10 -7 -15 0 5 14/00 24 105 200 346 410 452 -20 0 15 15 5 -1001/12 15 53 11 215 0 0 -13 0 10 10 14/06 11 89 124 177 415 391 -10 0 10 10 5 -1001/18 11 56 69 10 -10 0 15 14/12 0 67 94 153 329 270 0 0 0 5 5 002/00 0 22 48 5 -25 5 25 14/18 0 25 24 78 147 131 0 10 0 5 -5 002/06 11 39 15 0 -27 10 25 15/00 0 33 54 111 145 466 0 10 0 5 -5 002/12 15 15 65 -5 -33 15 30 15/06 11 15 32 119 316 791 -5 -5 0 5 0 002/18 10 44 -15 15 15/12 0 15 49 125 234 -15 -5 20 10 5 -2003/00 11 73 -25 20 15/18 0 30 63 177 445 -5 -5 25 0 5 -3003/06 11 80 -27 25 16/00 0 15 60 278 632 5 -5 25 -5 0 -3003/12 10 29 -33 25 16/06 0 46 80 323 786 -5 -5 20 0 0 -2503/18 0 16/12 0 52 176 462 -15 0 5 10 0 -504/00 0 16/18 0 40 191 421 -15 0 -10 10 -10 504/06 0 17/00 0 60 228 530 -5 15 0 5 -20 004/12 22 17/06 11 73 285 643 -5 15 -20 5 -20 20
17/12 0 122 373 10 0 -10 0mean 9 48 51 340 -- -- -5 -9 -7 8 14 5 17/18 15 189 432 15 -10 -20 5
sample 15 11 7 3 0 0 11 7 3 11 7 3 18/00 11 126 288 15 5 -20 -518/06 0 137 382 10 -10 -15 1018/12 0 49 0 0
T=00 =24 =48 =72 =96 =120 T=24 =48 =72 T=24 =48 =72 18/18 0 86 5 -519/00 0 91 5 -1019/06 0 157 -5 0
Sep. 06/06 56 19/12 006/12 60 19/18 1106/18 15 20/00 0
20/06 0mean 44 -- -- -- -- -- -- -- -- -- -- --
sample 3 0 0 0 0 0 0 0 0 0 0 0 mean 5 73 174 275 385 506 -1 2 9 0 -1 -7sample 31 27 23 19 15 11 27 23 19 27 23 19
T=00 =24 =48 =72 =96 =120 T=24 =48 =72 T=24 =48 =72
T=00 =24 =48 =72 =96 =120 T=24 =48 =72 T=24 =48 =72Sep. 10/06 0 15 39 115 176 302 10 35 35 -10 -20 -25
10/12 54 40 57 99 198 30 45 45 -25 -25 -3010/18 24 35 79 102 257 30 40 30 -20 -25 -25 Sep. 23/18 25 74 105 144 217 5 -15 -5 0 15 1011/00 11 25 79 100 235 35 45 20 -25 -30 -15 24/00 11 85 162 238 110 -10 -20 -5 10 20 511/06 0 54 70 113 202 30 30 10 -20 -20 -5 24/06 0 67 135 178 172 -20 -35 10 20 30 -1011/12 0 24 43 88 15 30 -5 -10 -20 5 24/12 11 83 141 144 -30 -35 -5 25 30 511/18 15 25 46 179 10 20 -35 -5 -15 20 24/18 54 84 125 120 -30 -25 -15 25 20 1512/00 0 70 126 322 15 5 -50 -10 0 40 25/00 44 66 131 132 -35 -20 -15 30 15 2012/06 0 70 183 405 10 -15 -66 -5 15 50 25/06 0 73 113 161 -35 15 -5 30 -10 1512/12 0 57 261 10 -15 0 15 25/12 0 83 62 -25 5 25 -512/18 0 84 300 10 -45 -5 25 25/18 11 85 69 -15 -5 15 513/00 0 84 255 0 -60 5 35 26/00 15 79 78 -5 -10 5 1013/06 0 126 261 -20 -36 20 20 26/06 0 99 105 -10 -5 10 513/12 0 89 -20 20 26/12 0 62 5 -513/18 0 101 -30 25 26/18 21 42 -5 514/00 0 100 -40 35 27/00 15 35 -5 1014/06 0 78 -31 20 27/06 11 78 4 1014/12 0 27/12 2014/18 0 27/18 015/00 0 28/00 015/06 10 28/06 30
mean 5 63 138 169 214 302 4 6 -2 -1 -3 2 mean 14 73 111 160 167 -- -14 -14 -6 14 12 9sample 21 17 13 9 5 1 17 13 9 17 13 9 sample 19 15 11 7 3 0 15 11 7 15 11 7
Date/Time Center Position (km) Central Pressure (hPa) Max. Wind (kt)(UTC)
TY Megi (1617)
Date/Time Center Position (km) Central Pressure (hPa) Max. Wind (kt)(UTC)
TY Meranti (1614)
Date/Time Center Position (km) Central Pressure (hPa) Max. Wind (kt)(UTC)
TS Malou (1613)
Date/Time Center Position (km) Central Pressure (hPa) Max. Wind (kt)(UTC)
TY Namtheun (1612)
Date/Time Center Position (km) Central Pressure (hPa) Max. Wind (kt)(UTC)
TY Malakas (1616)
Central Pressure (hPa) Max. Wind (kt)(UTC) (UTC)
TS Kompasu (1611) TS Rai (1615)
Date/Time Center Position (km) Central Pressure (hPa) Max. Wind (kt) Date/Time Center Position (km)

T=00 =24 =48 =72 =96 =120 T=24 =48 =72 T=24 =48 =72 T=00 =24 =48 =72 =96 =120 T=24 =48 =72 T=24 =48 =72
Sep. 29/06 141 171 143 147 334 831 0 -5 20 0 5 -15 Oct. 08/12 11 70 156 222 670 0 35 35 5 -25 -2029/12 0 123 157 176 354 697 0 5 20 0 -5 -15 08/18 22 106 188 257 779 10 45 40 -5 -30 -2529/18 0 57 134 201 437 623 -5 5 5 5 -5 -5 09/00 35 105 157 282 895 20 40 35 -15 -25 -2530/00 60 31 81 141 504 669 -25 5 5 20 -5 -5 09/06 15 97 156 369 30 35 20 -25 -20 -1030/06 89 46 44 149 362 435 -10 15 35 10 -10 -25 09/12 10 83 112 345 40 40 10 -30 -25 -530/12 0 90 101 267 540 10 35 45 -10 -25 -30 09/18 15 102 128 376 40 40 0 -25 -25 530/18 0 113 101 280 482 20 25 40 -15 -15 -25 10/00 0 89 116 320 25 25 0 -15 -20 5
Oct. 01/00 21 79 115 326 487 40 30 25 -30 -20 -10 10/06 0 56 131 15 20 -5 -1001/06 32 61 102 292 314 35 35 10 -25 -25 0 10/12 10 22 75 5 10 -5 -501/12 0 53 151 287 20 45 5 -15 -30 0 10/18 0 22 63 20 10 -15 -501/18 0 56 177 234 15 40 -5 -10 -25 5 11/00 0 24 34 30 0 -25 002/00 0 102 198 264 15 20 0 -10 -10 5 11/06 0 24 20 -1502/06 0 87 155 126 25 15 -10 -20 -5 10 11/12 0 48 10 -1002/12 0 32 66 35 5 -25 0 11/18 10 33 0 002/18 0 60 58 30 0 -20 0 12/00 9 71 -5 503/00 0 24 35 10 0 0 0 12/06 1503/06 0 24 45 -5 -20 10 15 12/12 903/12 0 36 0 5 12/18 1803/18 15 22 -10 10 13/00 4404/00 15 29 -15 1504/06 0 70 -20 20 mean 12 64 120 310 782 -- 17 27 20 -12 -17 -1104/12 15 sample 19 15 11 7 3 0 15 11 7 15 11 704/18 905/00 005/06 24
T=00 =24 =48 =72 =96 =120 T=24 =48 =72 T=24 =48 =72mean 17 65 110 222 424 651 8 15 15 -4 -9 -8
sample 25 21 17 13 9 5 21 17 13 21 17 13Oct. 13/18 49 15 132 247 231 246 5 35 -5 0 -25 10
14/00 22 11 184 200 176 194 0 -10 -5 5 5 1514/06 34 22 132 159 145 0 5 -15 0 0 20
T=00 =24 =48 =72 =96 =120 T=24 =48 =72 T=24 =48 =72 14/12 15 46 144 161 200 0 0 -15 0 5 2014/18 39 31 72 116 175 15 -10 -10 -10 10 1515/00 34 44 68 119 256 10 0 -10 -15 10 15
Oct. 05/18 67 46 129 335 514 -2 10 -17 5 -10 20 15/06 0 11 79 102 5 -10 -15 -5 15 2006/00 0 57 94 264 0 5 -21 5 -5 20 15/12 0 46 78 154 -5 -15 -40 5 20 4006/06 15 46 152 288 0 -5 -21 0 10 25 15/18 11 31 90 187 -10 -25 -45 10 25 4506/12 33 59 182 325 5 -10 -23 -5 15 30 16/00 24 35 79 233 -15 -25 -49 20 25 5006/18 30 89 235 348 10 -12 -23 -10 15 25 16/06 11 46 123 -25 -30 25 3007/00 0 101 221 5 -16 -5 15 16/12 11 22 109 -25 -35 25 3507/06 25 109 274 -10 -26 10 25 16/18 0 11 84 -25 -30 25 3507/12 21 156 274 -25 -38 30 45 17/00 0 46 78 -20 -14 25 2507/18 24 165 267 -27 -38 35 45 17/06 0 11 -10 2008/00 0 114 -16 15 17/12 0 38 -10 1508/06 15 116 -16 15 17/18 0 39 -10 1508/12 11 70 -2 5 18/00 25 39 -14 2008/18 46 144 -6 5 18/06 3909/00 30 18/12 009/06 41 18/18 3309/12 22 19/00 2109/18 15
mean 17 30 104 168 197 220 -7 -12 -21 10 15 25mean 23 98 203 312 514 -- -6 -14 -21 8 17 24 sample 22 18 14 10 6 2 18 14 10 18 14 10
sample 17 13 9 5 1 0 13 9 5 13 9 5
Date/Time Center Position (km) Central Pressure (hPa) Max. Wind (kt)(UTC)
STS Aere (1619)
Date/Time Center Position (km) Central Pressure (hPa) Max. Wind (kt)(UTC)
TY Sarika (1621)
Central Pressure (hPa) Max. Wind (kt)(UTC) (UTC)
TY Chaba (1618) TY Songda (1620)
Date/Time Center Position (km) Central Pressure (hPa) Max. Wind (kt) Date/Time Center Position (km)

T=00 =24 =48 =72 =96 =120 T=24 =48 =72 T=24 =48 =72 T=00 =24 =48 =72 =96 =120 T=24 =48 =72 T=24 =48 =72
Oct. 15/00 184 111 46 89 144 180 5 -5 10 0 0 -5 Nov. 25/12 44 58 46 0 -4 -5 015/06 40 112 70 78 205 276 5 0 20 -5 -5 -10 25/18 93 110 85 -4 -6 0 515/12 49 64 15 55 171 228 10 5 15 -10 -10 -10 26/00 11 34 -4 015/18 0 45 15 86 171 192 10 15 15 -10 -10 -10 26/06 11 40 -4 516/00 0 35 24 86 149 256 0 0 15 -5 0 -10 26/12 22 84 -2 016/06 0 22 11 78 120 176 -5 10 15 -5 -5 -10 26/18 24 104 -8 1016/12 11 15 78 149 191 235 -5 15 0 -5 -10 5 27/00 2216/18 0 24 99 160 170 5 20 -25 -5 -15 15 27/06 1117/00 11 0 107 141 199 0 15 -5 0 -10 10 27/12 6717/06 16 15 107 134 207 10 15 -15 -5 -10 20 27/18 4617/12 0 44 109 147 225 10 0 -15 -10 5 1017/18 0 44 96 122 10 -30 -5 -5 20 5 mean 35 72 65 -- -- -- -4 -5 -- 2 3 --18/00 11 58 103 220 10 5 -15 -5 0 15 sample 10 6 2 0 0 0 6 2 0 6 2 018/06 0 55 100 192 10 0 -25 -5 5 3018/12 0 63 115 178 -15 -10 -37 15 10 4018/18 11 49 89 -25 -10 10 1019/00 0 57 172 0 -15 5 15 T=00 =24 =48 =72 =96 =120 T=24 =48 =72 T=24 =48 =7219/06 0 68 167 0 -25 5 3019/12 11 59 137 -5 -12 5 2019/18 11 57 0 5 Dec. 21/18 25 86 99 113 140 56 9 40 75 -10 -35 -5520/00 0 105 0 5 22/00 0 60 64 119 124 56 7 45 45 -5 -30 -2520/06 11 70 -10 20 22/06 11 22 46 76 49 137 20 60 35 -15 -35 -2020/12 0 35 -7 15 22/12 25 46 11 33 133 212 20 40 30 -15 -25 -2020/18 0 22/18 24 40 55 58 177 20 40 15 -15 -25 -1021/00 0 23/00 16 39 0 93 207 20 35 15 -15 -20 -1021/06 0 23/06 11 11 22 108 92 40 25 5 -25 -15 -521/12 10 23/12 0 16 55 127 89 35 25 5 -20 -15 -10
23/18 0 16 86 202 30 5 0 -15 -5 -5mean 14 52 87 128 178 220 1 0 -3 0 2 6 24/00 0 16 76 141 10 0 -5 -10 -5 0
sample 27 23 19 15 11 7 23 19 15 23 19 15 24/06 0 22 113 89 10 -5 -10 -10 0 1024/12 0 22 175 82 10 -5 -16 -10 0 1524/18 0 45 195 -5 -5 -5 025/00 0 76 161 0 -5 -10 0
T=00 =24 =48 =72 =96 =120 T=24 =48 =72 T=24 =48 =72 25/06 0 131 123 -15 -10 0 1025/12 0 144 74 -25 -21 5 2025/18 0 152 -20 10
Nov. 03/00 16 330 628 1068 2066 2 15 15 -5 -15 -15 26/00 0 76 -15 1003/06 24 303 547 1083 7 20 15 -15 -20 -15 26/06 15 70 -5 503/12 15 280 484 1005 7 25 15 -15 -25 -15 26/12 0 64 -11 1003/18 108 139 244 779 17 25 10 -20 -25 -10 26/18 004/00 140 154 291 1065 22 25 5 -25 -25 -5 27/00 2104/06 0 119 94 10 5 -10 -5 27/06 004/12 0 62 74 15 -5 -15 0 27/12 004/18 0 68 84 5 -10 -5 505/00 35 35 226 -5 -20 0 15 mean 6 58 85 103 127 115 7 17 16 -7 -11 -1105/06 15 25 -10 5 sample 24 20 16 12 8 4 20 16 12 20 16 1205/12 0 61 -15 1005/18 24 90 -20 1506/00 0 113 -15 1506/06 006/12 006/18 007/00 22
mean 24 137 297 1000 2066 -- 2 9 12 -5 -11 -12sample 17 13 9 5 1 0 13 9 5 13 9 5
T=00 =24 =48 =72 =96 =120 T=24 =48 =72 T=24 =48 =72
Nov. 10/00 11 185 -4 010/06 48 183 -4 010/12 54 25 -4 010/18 57 152 -4 011/00 4611/06 2411/12 25711/18 221
mean 90 136 -- -- -- -- -4 -- -- 0 -- --sample 8 4 0 0 0 0 4 0 0 4 0 0
Date/Time Center Position (km) Central Pressure (hPa) Max. Wind (kt)(UTC)
TS Ma-on (1624)
Date/Time Center Position (km) Central Pressure (hPa) Max. Wind (kt)(UTC)
TY Meari (1623)
Date/Time Center Position (km) Central Pressure (hPa) Max. Wind (kt)(UTC)
TY Nock-ten (1626)
Central Pressure (hPa) Max. Wind (kt)(UTC) (UTC)
TY Haima (1622) STS Tokage (1625)
Date/Time Center Position (km) Central Pressure (hPa) Max. Wind (kt) Date/Time Center Position (km)

Monthly and annual frequencies of tropical cyclones that attained TS intensity or higherin the western North Pacific and the South China Sea for 1951 - 2016
Year Jan Feb Mar Apr May Jun Jul Aug Sep Oct Nov Dec Total19501951 1 1 2 1 1 3 3 2 4 1 2 211952 3 3 5 3 6 3 4 271953 1 1 2 1 6 3 5 3 1 231954 1 1 1 5 5 4 3 1 211955 1 1 1 1 2 7 6 4 3 1 1 281956 1 2 1 2 5 6 1 4 1 231957 2 1 1 1 1 4 5 4 3 221958 1 1 1 4 7 5 5 3 2 2 311959 1 1 1 2 5 5 4 2 2 231960 1 1 3 3 10 3 4 1 1 271961 1 1 2 3 4 6 6 4 1 1 291962 1 1 2 5 8 4 5 3 1 301963 1 4 4 3 5 4 3 241964 2 2 7 5 6 5 6 1 341965 2 1 1 1 2 3 5 6 7 2 2 321966 1 2 1 4 10 9 5 2 1 351967 1 2 1 1 1 7 9 9 4 3 1 391968 1 1 1 3 8 3 5 5 271969 1 1 1 3 4 3 3 2 1 191970 1 2 3 6 5 5 4 261971 1 1 3 4 2 8 5 6 4 2 361972 1 1 3 7 5 4 5 3 2 311973 7 5 2 4 3 211974 1 1 1 1 4 4 5 5 4 4 2 321975 1 2 4 5 5 3 1 211976 1 1 2 2 2 4 4 5 1 1 2 251977 1 1 3 3 5 5 1 2 211978 1 1 3 4 8 5 4 4 301979 1 1 1 2 4 2 6 3 2 2 241980 1 4 1 4 2 6 4 1 1 241981 1 2 3 4 8 4 2 3 2 291982 3 1 3 3 5 5 3 1 1 251983 1 3 5 2 5 5 2 231984 2 5 5 4 7 3 1 271985 2 1 3 1 8 5 4 1 2 271986 1 1 2 2 4 4 3 5 4 3 291987 1 1 2 4 4 6 2 2 1 231988 1 1 3 2 8 8 5 2 1 311989 1 1 2 2 7 5 6 4 3 1 321990 1 1 1 3 4 6 4 4 4 1 291991 2 1 1 1 4 5 6 3 6 291992 1 1 2 4 8 5 7 3 311993 1 1 4 7 6 4 2 3 281994 1 1 2 7 9 8 6 2 361995 1 1 2 6 5 6 1 1 231996 1 1 2 6 5 6 2 2 1 261997 2 3 3 4 6 4 3 2 1 281998 1 3 5 2 3 2 161999 2 1 4 6 6 2 1 222000 2 5 6 5 2 2 1 232001 1 2 5 6 5 3 1 3 262002 1 1 1 3 5 6 4 2 2 1 262003 1 1 2 2 2 5 3 3 2 212004 1 2 5 2 8 3 3 3 2 292005 1 1 1 1 5 5 5 2 2 232006 1 2 2 7 3 4 2 2 232007 1 1 3 4 5 6 4 242008 1 4 1 2 4 4 2 3 1 222009 2 2 2 5 7 3 1 222010 1 2 5 4 2 142011 2 3 4 3 7 1 1 212012 1 1 4 4 5 3 5 1 1 252013 1 1 4 3 6 8 6 2 312014 2 1 2 2 5 1 5 2 1 2 232015 1 1 2 1 2 2 3 4 5 4 1 1 272016 4 7 7 4 3 1 26
Normal1981-2010 0.3 0.1 0.3 0.6 1.1 1.7 3.6 5.8 4.9 3.6 2.3 1.2 25.6
Appendix 4Monthly and Annual Frequencies of Tropical Cyclones
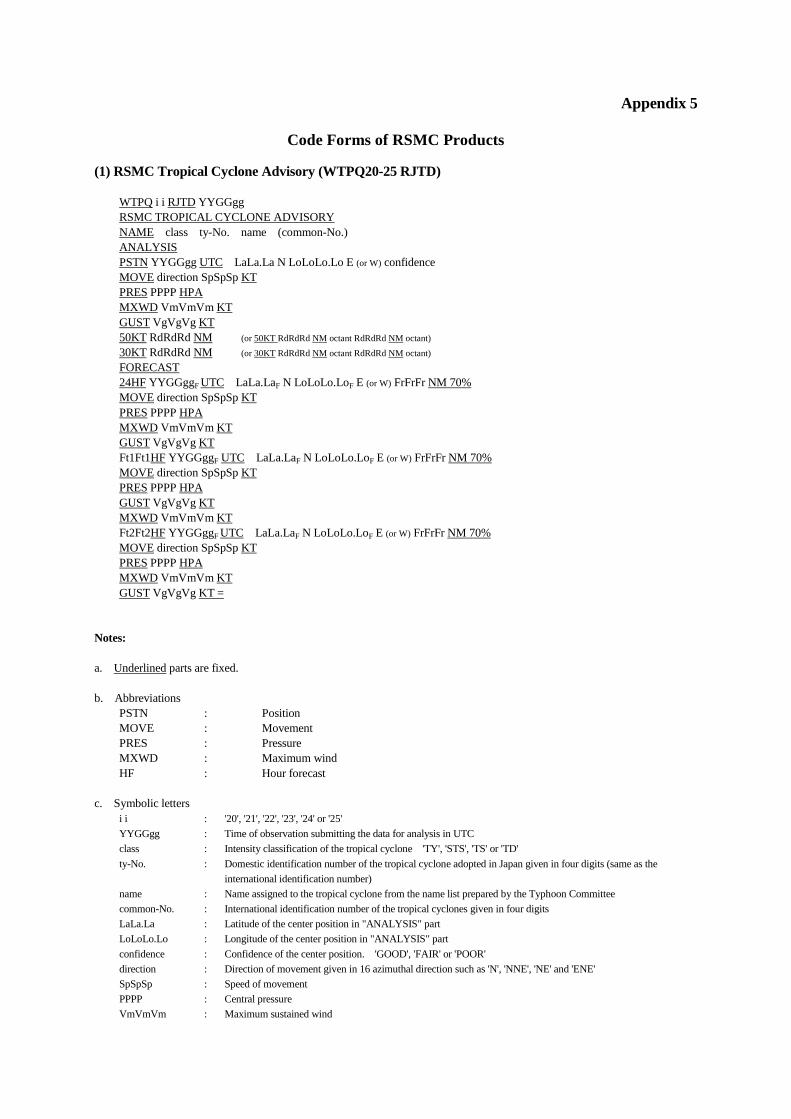
Appendix 5
Code Forms of RSMC Products (1) RSMC Tropical Cyclone Advisory (WTPQ20-25 RJTD) WTPQ i i RJTD YYGGgg RSMC TROPICAL CYCLONE ADVISORY NAME class ty-No. name (common-No.) ANALYSIS PSTN YYGGgg UTC LaLa.La N LoLoLo.Lo E (or W) confidence MOVE direction SpSpSp KT PRES PPPP HPA MXWD VmVmVm KT GUST VgVgVg KT 50KT RdRdRd NM (or 50KT RdRdRd NM octant RdRdRd NM octant) 30KT RdRdRd NM (or 30KT RdRdRd NM octant RdRdRd NM octant) FORECAST 24HF YYGGggF UTC LaLa.LaF N LoLoLo.LoF E (or W) FrFrFr NM 70% MOVE direction SpSpSp KT PRES PPPP HPA MXWD VmVmVm KT GUST VgVgVg KT Ft1Ft1HF YYGGggF UTC LaLa.LaF N LoLoLo.LoF E (or W) FrFrFr NM 70% MOVE direction SpSpSp KT PRES PPPP HPA GUST VgVgVg KT MXWD VmVmVm KT Ft2Ft2HF YYGGggF UTC LaLa.LaF N LoLoLo.LoF E (or W) FrFrFr NM 70% MOVE direction SpSpSp KT PRES PPPP HPA MXWD VmVmVm KT GUST VgVgVg KT = Notes: a. Underlined parts are fixed. b. Abbreviations PSTN : Position MOVE : Movement PRES : Pressure MXWD : Maximum wind HF : Hour forecast c. Symbolic letters i i : '20', '21', '22', '23', '24' or '25' YYGGgg : Time of observation submitting the data for analysis in UTC class : Intensity classification of the tropical cyclone 'TY', 'STS', 'TS' or 'TD' ty-No. : Domestic identification number of the tropical cyclone adopted in Japan given in four digits (same as the international identification number) name : Name assigned to the tropical cyclone from the name list prepared by the Typhoon Committee common-No. : International identification number of the tropical cyclones given in four digits LaLa.La : Latitude of the center position in "ANALYSIS" part LoLoLo.Lo : Longitude of the center position in "ANALYSIS" part confidence : Confidence of the center position. 'GOOD', 'FAIR' or 'POOR' direction : Direction of movement given in 16 azimuthal direction such as 'N', 'NNE', 'NE' and 'ENE' SpSpSp : Speed of movement PPPP : Central pressure VmVmVm : Maximum sustained wind

VgVgVg : Maximum gust wind RdRdRd : Radii of 30knots and 50knots wind octant : Eccentric distribution of wind given in 8 azimuthal direction such as 'NORTH', 'NORTHEAST' and 'EAST' Ft1Ft1 : 48 (00, 06, 12 and 18 UTC) or 45 (03, 09, 15 and 21 UTC) Ft2Ft2 : 72 (00, 06, 12 and 18 UTC) or 69 (03, 09, 15 and 21 UTC) YYGGggF : Time in UTC on which the forecast is valid LaLa.LaF : Latitude of the center of 70% probability circle in "FORECAST" part LoLoLo.LoF : Longitude of the center of 70% probability circle in "FORECAST" part FrFrFr : Radius of 70% probability circle d. MOVE is optionally described as 'ALMOST STATIONARY' or '(direction) SLOWLY', depending on the speed of movement. Example: WTPQ20 RJTD 150000 RSMC TROPICAL CYCLONE ADVISORY NAME STS 0320 NEPARTAK (0320) ANALYSIS PSTN 150000UTC 12.6N 117.8E FAIR MOVE WNW 13KT PRES 980HPA MXWD 055KT GUST 080KT 50KT 40NM 30KT 240NM NORTHEAST 160NM SOUTHWEST FORECAST 24HF 160000UTC 14.7N 113.7E 110NM 70% MOVE WNW 11KT PRES 965HPA MXWD 070KT GUST 100KT 48HF 170000UTC 16.0N 111.0E 170NM 70% MOVE WNW 07KT PRES 970HPA MXWD 065KT GUST 095KT 72HF 180000UTC 19.5N 110.0E 250NM 70% MOVE NNW 09KT PRES 985HPA MXWD 050KT GUST 070KT = (2) RSMC Tropical Cyclone Advisory for Five-day Track Forecast (WTPQ50-55 RJTD) WTPQ i i RJTD YYGGgg RSMC TROPICAL CYCLONE ADVISORY NAME class ty-No. name (common-No.) ANALYSIS PSTN YYGGgg UTC LaLa.La N LoLoLo.Lo E (or W) confidence MOVE direction SpSpSp KT PRES PPPP HPA MXWD VmVmVm KT GUST VgVgVg KT 50KT RdRdRd NM (or 50KT RdRdRd NM octant RdRdRd NM octant) 30KT RdRdRd NM (or 30KT RdRdRd NM octant RdRdRd NM octant) FORECAST 24HF YYGGggF UTC LaLa.LaF N LoLoLo.LoF E (or W) FrFrFr NM 70% MOVE direction SpSpSp KT PRES PPPP HPA MXWD VmVmVm KT GUST VgVgVg KT 48HF YYGGggF UTC LaLa.LaF N LoLoLo.LoF E (or W) FrFrFr NM 70% MOVE direction SpSpSp KT PRES PPPP HPA GUST VgVgVg KT MXWD VmVmVm KT 72HF YYGGggF UTC LaLa.LaF N LoLoLo.LoF E (or W) FrFrFr NM 70%

MOVE direction SpSpSp KT PRES PPPP HPA MXWD VmVmVm KT GUST VgVgVg KT 96HF YYGGggF UTC LaLa.LaF N LoLoLo.LoF E (or W) FrFrFr NM 70% MOVE direction SpSpSp KT 120HF YYGGggF UTC LaLa.LaF N LoLoLo.LoF E (or W) FrFrFr NM 70% MOVE direction SpSpSp KT= Notes: a. Underlined parts are fixed. b. Abbreviations and symbolic letters are the same as those used in RSMC Tropical Cyclone Advisory (WTPQ20-25 RJTD). Example: WTPQ50 RJTD 060000 RSMC TROPICAL CYCLONE ADVISORY NAME TY 0908 MORAKOT (0908) ANALYSIS PSTN 060000UTC 23.4N 128.3E FAIR MOVE WNW 09KT PRES 960HPA MXWD 075KT GUST 105KT 50KT 80NM 30KT 350NM SOUTH 300NM NORTH FORECAST 24HF 070000UTC 24.0N 123.9E 70NM 70% MOVE W 10KT PRES 925HPA MXWD 090KT GUST 130KT 48HF 080000UTC 25.3N 121.8E 110NM 70% MOVE WNW 06KT PRES 950HPA MXWD 080KT GUST 115KT 72HF 090000UTC 26.5N 119.7E 160NM 70% MOVE WNW 06KT PRES 970HPA MXWD 065KT GUST 095KT 96HF 100000UTC 28.0N 118.8E 240NM 70% MOVE NNW SLOWLY 120HF 110000UTC 29.6N 118.2E 375NM 70% MOVE NNW SLOWLY = (3) RSMC Guidance for Forecast (FXPQ20-25 RJTD) FXPQ i i RJTD YYGGgg RSMC GUIDANCE FOR FORECAST NAME class ty-No. name (common-No.) PSTN YYGGgg UTC LaLa.La N LoLoLo.Lo E (or W) PRES PPPP HPA MXWD WWW KT FORECAST BY GLOBAL MODEL TIME PSTN PRES MXWD (CHANGE FROM T=0) T=06 LaLa.La N LoLoLo.Lo E (or W) appp HPA awww KT T=12 LaLa.La N LoLoLo.Lo E (or W) appp HPA awww KT T=18 LaLa.La N LoLoLo.Lo E (or W) appp HPA awww KT : T=84 LaLa.La N LoLoLo.Lo E (or W) appp HPA awww KT=

Notes: a. Underlined parts are fixed. b. Symbolic letters i i : '20', '21', '22', '23', '24' or '25' YYGGgg : Initial time of the model in UTC class : Intensity classification of the tropical cyclone 'T', 'STS', 'TS' or 'TD' PPPP : Central pressure in hPa WWW : Maximum wind speed in knots a : Sign of ppp and www ( +, - or blank ) ppp : Absolute value of change in central pressure from T=0, in hPa www : Absolute value of change in maximum wind speed from T=0, in knots Example: FXPQ20 RJTD 180600 RSMC GUIDANCE FOR FORECAST NAME TY 0001DAMREY (0001) PSTN 180000UTC 15.2N 126.3E PRES 905HPA MXWD 105KT FORECAST BY GLOBAL MODEL TIME PSTN PRES MXWD (CHANGE FROM T=0) T=06 15.4N 125.8E +018HPA -008KT T=12 15.5N 125.6E +011HPA -011KT T=18 15.8N 125.7E +027HPA -028KT : : T=84 20.7N 128.8E +021HPA -022KT= (4) RSMC Prognostic Reasoning (WTPQ30-35 RJTD) Example: WTPQ30 RJTD 180000 RSMC TROPICAL CYCLONE PROGNOSTIC REASONING REASONING NO. 9 FOR TY 0001 DAMREY (0001) 1.GENERAL COMMENTS REASONING OF PROGNOSIS THIS TIME IS SIMILAR TO PREVIOUS ONE. POSITION FORECAST IS MAINLY BASED ON NWP AND PERSISTENCY. 2.SYNOPTIC SITUATION SUBTROPICAL RIDGE WILL NOT CHANGE ITS LOCATION AND STRENGTH FOR THE NEXT 24 HOURS. 3.MOTION FORECAST POSITION ACCURACY AT 180000 UTC IS GOOD. TY WILL DECELERATE FOR THE NEXT 12 HOURS. TY WILL RECURVE WITHIN 60 HOURS FROM 180000 UTC. TY WILL MOVE WEST FOR THE NEXT 12 HOURS THEN MOVE GRADUALLY TO WEST-NORTHWEST. 4.INTENSITY FORECAST TY WILL KEEP PRESENT INTENSITY FOR NEXT 24 HOURS. FI-NUMBER WILL BE 7.0 AFTER 24 HOURS.= (5) Tropical Cyclone Advisory for SIGMET (FKPQ30-35 RJTD) FKPQ i i RJTD YYGGgg TC ADVISORY DTG: yyyymmdd/time Z TCAC: TOKYO TC: name NR: number PSN: N LaLa.LaLa E LoLoLo.LoLo MOV: direction SpSpSp KT C: PPPP HPA MAX WIND: WWW KT FCST PSN +6HR: YY/GGgg Z NLaLa.LaLa ELoLoLo.LoLo* FCST MAX WIND +6HR: WWW KT*

FCST PSN +12HR: YY/GGgg Z NLaLa.LaLa ELoLoLo.LoLo FCST MAX WIND +12HR: WWW KT FCST PSN +18HR: YY/GGgg Z NLaLa.LaLa ELoLoLo.LoLo* FCST MAX WIND +18HR: YY/GGgg Z NLaLa.LaLa ELoLoLo.LoLo* FCST PSN +24HR: YY/GGgg Z N LaLa.LaLa E LoLoLo.LoLo FCST MAX WIND +24HR: WWW KT RMK: NIL = NXT MSG: yyyymmdd/time Z * 6 hour and 18 hour forecasts are added from 22 May 2008. Notes: a. Underlined parts are fixed. b. Abbreviations DTG : Date and time TCAC : Tropical Cyclone Advisory Centre TC : Tropical Cyclone NR : Number PSN : Position MOV : Movement C : Central pressure MAX WIND : Maximum wind FCST : Forecast RMK : Remarks NXT MSG : Next message c. Symbolic letters i i : '30', '31', '32', '33', '34' or '35' YYGGgg : Date(YY), hour(GG) and minute(gg) in UTC (Using “Z”) yyyymmdd/time : Year(yyyy), month(mm), date(dd), hour and minute (time) in UTC (Using “Z”) name : Name assigned to the tropical cyclone by RSMC Tokyo-Typhoon Center Number : Advisory number (starting with “01” for each cyclone) LaLa.LaLa : Latitude of the center position LoLoLo.LoLo : Longitude of the center position direction : Direction of movement given in 16 azimuthal direction such as 'N', 'NNE', 'NE' and 'ENE' SpSpSp : Speed of movement. “SLW” for less than 3 kt “STNR” for less than 1 kt. PPPP : Central pressure WWW : Maximum sustained wind Example: FKPQ30 RJTD 271200 TC ADVISORY DTG: 20080927/1200Z TCAC: TOKYO TC: JANGMI NR: 15 PSN: N2120 E12425 MOV: NW 13KT C: 910HPA MAX WIND: 115KT FCST PSN +6HR: 27/1800Z N2200 E12330 FCST MAX WIND +6HR: 115KT FCST PSN +12HR: 28/0000Z N2240 E12250 FCST MAX WIND +12HR: 115KT FCST PSN +18HR: 28/0600Z N2340 E12205 FCST MAX WIND +18HR: 95KT FCST PSN +24HR: 28/1200Z N2440 E12105 FCST MAX WIND +24HR: 80KT RMK: NIL NXT MSG: 20080927/1800Z =

(6) RSMC Tropical Cyclone Best Track (AXPQ20 RJTD) AXPQ20 RJTD YYGGgg RSMC TROPICAL CYCLONE BEST TRACK NAME ty-No. name (common-No.) PERIOD FROM MMMDDTTUTC TO MMMDDTTUTC DDTT LaLa.LaN LoLoLo.LoE PPPHPA WWWKT DDTT LaLa.LaN LoLoLo.LoE PPPHPA WWWKT DDTT LaLa.LaN LoLoLo.LoE PPPHPA WWWKT DDTT LaLa.LaN LoLoLo.LoE PPPHPA WWWKT : : DDTT LaLa.LaN LoLoLo.LoE PPPHPA WWWKT DDTT LaLa.LaN LoLoLo.LoE PPPHPA WWWKT REMARKS1) TD FORMATION AT MMMDDTTUTC FROM TD TO TS AT MMMDDTTUTC : : DISSIPATION AT MMMDDTTUTC= Notes: a. Underlined parts are fixed. b. 1) REMARKS is given optionally. c. Symbolic letters MMM : Month in UTC given such as 'JAN' and 'FEB' DD : Date in UTC TT : Hour in UTC PPP : Central pressure WWW : Maximum wind speed Example: AXPQ20 RJTD 020600 RSMC TROPICAL CYCLONE BEST TRACK NAME 0001 DAMREY (0001) PERIOD FROM OCT1300UTC TO OCT2618UTC 1300 10.8N 155.5E 1008HPA //KT 1306 10.9N 153.6E 1006HPA //KT 1312 11.1N 151.5E 1004HPA //KT 1318 11.5N 149.8E 1002HPA //KT 1400 11.9N 148.5E 1000HPA //KT 1406 12.0N 146.8E 998HPA 35KT : : 1712 14.6N 129.5E 905HPA 105KT 1718 14.7N 128.3E 905HPA 105KT : : 2612 32.6N 154.0E 1000HPA //KT 2618 33.8N 157.4E 1010HPA //KT REMARKS TD FORMATION AT OCT1300UTC FROM TD TO TS AT OCT1406UTC FROM TS TO STS AT OCT1512UTC FROM STS TO TY AT OCT1600UTC FROM TY TO STS AT OCT2100UTC FROM STS TO TS AT OCT2112UTC FROM TS TO L AT OCT2506UTC DISSIPATION AT OCT2700UTC=

Appendix 6
Specifications of JMA’s NWP Models (GSM, TEPS)
The Global Spectral Model (GSM) and the Typhoon Ensemble Prediction System (TEPS) are used in JMA as a primary basis for TC forecasts. GSM (TL959L100) has about 20 km horizontal resolution and 100 vertical layers. Details on the GSM are found in Yonehara et al. (2014). TEPS (TL479L60) has 25 members with approximately 40 km horizontal resolution and 60 vertical layers. Details on the TEPS are found in Kyouda and Higaki (2015). A singular vector (SV) method is employed for the initial perturbation setup. The stochastic physics scheme (Buizza et al. 1999) is also introduced in consideration of model uncertainties associated with physical parameterizations. The general specifications of GSM and TEPS are summarized in Table 6.1.
Table 6.1 Specifications of GSM and TEPS
NWP Models GSM (Global Spectral Model), TL959L100
TEPS (Typhoon Ensemble Prediction System), TL479L60
Resolution 20 km, 100 layers (Top: 0.01hPa) 40 km, 60 layers (Top: 0.1hPa) Area Global Global Method for initial value
Global Data Assimilation System (4DVAR) Outer resolution: TL959L100 Inner resolution: TL319L100 Window: Init-3h to Init + 3h
Unperturbed condition: Truncated GSM initial condition Initial perturbation: SV-based perturbation Ensemble size: 25 (24 perturbed members and 1 control member) SV target areas: Northwestern Pacific (20N -60N, 100E -180) and vicinities of up to 3 TCs in the Typhoon Center’s area of responsibility (e.g. Figure 6.1)
Forecast time (and initials)
84h (00, 06, 18 UTC) 264h (12 UTC)
132h (00, 06, 12, 18 UTC)
Operational as from
18 March 2014 11 March 2014 (de facto from T1404)
[Recent upgrades on GSM and the Global Data Assimilation System and TEPS] GSM:
- Parameterization schemes including land surface processes, deep convection, cloud, radiation and sea ice were revised. (March 2016).
Global Data Assimilation System: - Quality Control for Himawari-8 AMV was revised, and assimilation of
GRACE-B/BlackJack radio occultation data was enabled (December 2016). - The typhoon bogus scheme was revised (September 2016).

- Assimilation of GPM Microwave Imager (GMI) data was started (March 2016). - Assimilation of Himawari-8 AMV and CSR data was started (March 2016).
TEPS is an ensemble prediction system used mainly for TC track forecasts up to five days
ahead. Two SV calculations are introduced into the system to efficiently capture the uncertainty of TC track forecasts. One produces SVs with a spatial target area fixed on the Northwestern Pacific (20N - 60N, 100E - 180), and the other produces SVs whose spatial target area can be moved within a 750 km radius of a predicted TC’s position in one-day forecasting. Up to three movable areas can be configured for different TCs at one initial time. If more than three TCs are present in the area of responsibility, three are selected in the order of concern as prioritized by the RSMC Tokyo – Typhoon Center. Figure 6.1 shows an example of SV spatial target areas. At this initial time, there were three TCs in the area. Figure 6.2 shows an example of TEPS forecast tracks for PHANFONE (TY1418). In this case, the forecasted TC track of the control member showed that the typhoon would hit both Nansei Islands (southwestern islands off Kyushu) and Kyushu (southernmost of the four main islands of Japan). In addition, ensemble TC tracks suggested that there would be widespread probabilities of not only typhoon hitting but also typhoon passing by off the Pacific. As a result, some TC tracks were close to the best track during the period. Figure 6.1 Example of SV spatial target areas of TEPS (Initial time: 00UTC 27 September 2011). The
large thick rectangle shows the fixed area and the circles show the three movable areas which are set
around a predicted TC’s position. Filled circles and triangles show TCs’ central positions at the initial
time and in one-day forecasting, respectively. Gray contours show the initial sea level pressure of each
member.
T1117 NESAT
T1119 NALGAE T1118 HAITANG

Figure 6.2 Example of TEPS forecast track (Initial time: 12UTC 30 September 2014). Black and blue
lines denote TC best track and forecast track of control member respectively. Red, dark orange, orange,
yellow and green lines show TC forecast tracks of all perturbed members up to 48, 72, 96, 120 and 132
hours, respectively.
[References] Buizza, R., M. Miller, and T. N. Palmer, 1999: Stochastic representation of model uncertainties in
the ECMWF Ensemble Prediction System. Quart. J. Roy. Meteor. Soc., 125, 2887–2908. Kyouda, M. and M. Higaki, 2015: Upgrade of JMA's Typhoon Ensemble Prediction System, RSMC
Tokyo-Typhoon Center Technical Review, 17-1, p.13. http://www.jma.go.jp/jma/jma-eng/jma-center/rsmc-hp-pub-eg/techrev/text17-1.pdf
Yonehara, H., M. Ujiie, T. Kanehama, R. Sekiguchi and Y. Hayashi, 2014: Upgrade of JMA's Operational NWP Global Model, CAS/JSC WGNE Res. Activ. Atmos. Oceanic Modell., 44, 06.19-06.20.

Appendix 7
Products on WIS GISC Tokyo server (Available at http://www.wis-jma.go.jp/cms/)
NWP products (GSM and EPS)
Model GSM GSM GSM
Area and resolution Whole globe, 1.25°×1.25° 20°S–60°N, 60°E–160°W
1.25°×1.25° Whole globe, 2.5°×2.5°
Levels and elements
10 hPa: Z, U, V, T 20 hPa: Z, U, V, T 30 hPa: Z, U, V, T 50 hPa: Z, U, V, T 70 hPa: Z, U, V, T
100 hPa: Z, U, V, T 150 hPa: Z, U, V, T 200 hPa: Z, U, V, T, ψ, χ 250 hPa: Z, U, V, T 300 hPa: Z, U, V, T, H, ω 400 hPa: Z, U, V, T, H, ω 500 hPa: Z, U, V, T, H, ω, ζ 600 hPa: Z, U, V, T, H, ω 700 hPa: Z, U, V, T, H, ω 850 hPa: Z, U, V, T, H, ω, ψ, χ 925 hPa: Z, U, V, T, H, ω
1000 hPa: Z, U, V, T, H, ω Surface: P, U, V, T, H, R†
10 hPa: Z, U, V, T 20 hPa: Z, U, V, T 30 hPa: Z, U, V, T 50 hPa: Z, U, V, T 70 hPa: Z, U, V, T
100 hPa: Z, U, V, T 150 hPa: Z, U, V, T 200 hPa: Z§, U§, V§, T§, ψ, χ 250 hPa: Z, U, V, T 300 hPa: Z, U, V, T, D 400 hPa: Z, U, V, T, D 500 hPa: Z§, U§, V§, T§, D§, ζ 700 hPa: Z§, U§, V§, T§, D§, ω 850 hPa: Z§, U§, V§, T§, D§, ω, ψ, χ 925 hPa: Z, U, V, T, D, ω
1000 hPa: Z, U, V, T, D Surface: P¶, U¶, V¶, T¶, D¶, R¶
10 hPa: Z*, U*, V*, T* 20 hPa: Z*, U*, V*, T* 30 hPa: Z°, U°, V°, T° 50 hPa: Z°, U°, V°, T° 70 hPa: Z°, U°, V°, T°
100 hPa: Z°, U°, V°, T° 150 hPa: Z*, U*, V*, T* 200 hPa: Z, U, V, T 250 hPa: Z°, U°, V°, T° 300 hPa: Z, U, V, T, D*‡ 400 hPa: Z*, U*, V*, T*, D*‡ 500 hPa: Z, U, V, T, D*‡ 700 hPa: Z, U, V, T, D 850 hPa: Z, U, V, T, D
1000 hPa: Z, U*, V*, T*, D*‡ Surface: P, U, V, T, D*‡, R†
Forecast hours
0–84 every 6 hours and 96–192 every 12 hours † Except analysis
0–84 (every 6 hours) § 96–192 (every 24 hours) for 12UTC initial ¶ 90–192 (every 6 hours) for 12UTC initial
0–72 every 24 hours and 96–192 every 24 hours for 12UTC ° 0–120 for 12UTC † Except analysis * Analysis only
Initial times 00, 06, 12, 18UTC 00, 06, 12, 18UTC 00UTC and 12UTC
‡ 00UTC only
Model One-week EPS Area and resolution Whole globe, 2.5°×2.5°
Levels and elements
250 hPa: µU, σU, µV, σV 500 hPa: µZ, σZ 850 hPa: µU, σU, µV, σV, µT, σT
1000 hPa: µZ, σZ Surface: µP, σP
Forecast hours 0–192 every 12 hours Initial times 00, 12UTC
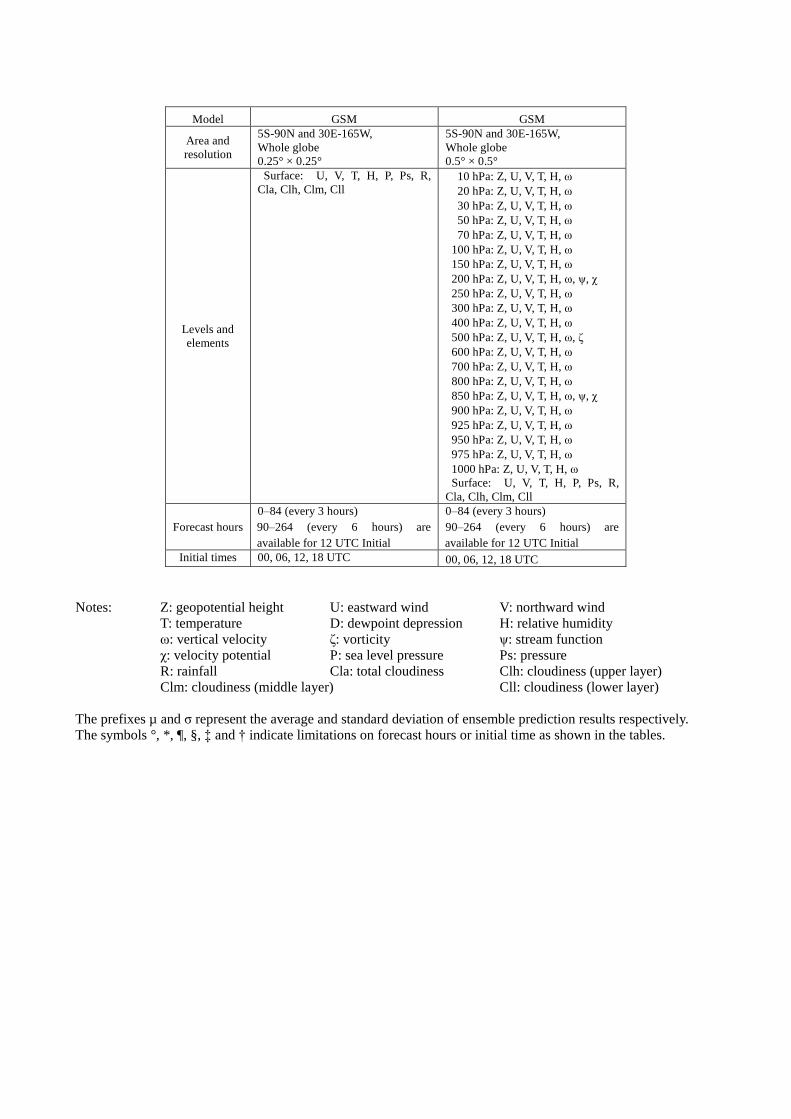
Model GSM GSM
Area and resolution
5S-90N and 30E-165W, Whole globe 0.25° × 0.25°
5S-90N and 30E-165W, Whole globe 0.5° × 0.5°
Levels and elements
Surface: U, V, T, H, P, Ps, R, Cla, Clh, Clm, Cll
10 hPa: Z, U, V, T, H, ω 20 hPa: Z, U, V, T, H, ω 30 hPa: Z, U, V, T, H, ω 50 hPa: Z, U, V, T, H, ω 70 hPa: Z, U, V, T, H, ω
100 hPa: Z, U, V, T, H, ω 150 hPa: Z, U, V, T, H, ω 200 hPa: Z, U, V, T, H, ω, ψ, χ 250 hPa: Z, U, V, T, H, ω 300 hPa: Z, U, V, T, H, ω 400 hPa: Z, U, V, T, H, ω 500 hPa: Z, U, V, T, H, ω, ζ 600 hPa: Z, U, V, T, H, ω 700 hPa: Z, U, V, T, H, ω 800 hPa: Z, U, V, T, H, ω 850 hPa: Z, U, V, T, H, ω, ψ, χ 900 hPa: Z, U, V, T, H, ω 925 hPa: Z, U, V, T, H, ω 950 hPa: Z, U, V, T, H, ω 975 hPa: Z, U, V, T, H, ω 1000 hPa: Z, U, V, T, H, ω Surface: U, V, T, H, P, Ps, R,
Cla, Clh, Clm, Cll
Forecast hours 0–84 (every 3 hours) 90–264 (every 6 hours) are available for 12 UTC Initial
0–84 (every 3 hours) 90–264 (every 6 hours) are available for 12 UTC Initial
Initial times 00, 06, 12, 18 UTC 00, 06, 12, 18 UTC Notes: Z: geopotential height U: eastward wind V: northward wind T: temperature D: dewpoint depression H: relative humidity ω: vertical velocity ζ: vorticity ψ: stream function χ: velocity potential P: sea level pressure Ps: pressure R: rainfall Cla: total cloudiness Clh: cloudiness (upper layer) Clm: cloudiness (middle layer) Cll: cloudiness (lower layer) The prefixes µ and σ represent the average and standard deviation of ensemble prediction results respectively. The symbols °, *, ¶, §, ‡ and † indicate limitations on forecast hours or initial time as shown in the tables.

Other products Data Contents / frequency (initial time)
Satellite products
High density atmospheric motion vectors (BUFR) Himawari-8 (VIS, IR, WVx3: every hour), 60S-60N, 90E-170W Clear Sky Radiance (CSR) data (BUFR)
Himawari-8 radiances and brightness temperatures averaged over cloud-free pixels: every hour
Tropical cyclone Information
Tropical cyclone related information (BUFR) • tropical cyclone analysis data (00, 06, 12 and 18 UTC)
Wave data
Global Wave Model (GRIB2) • significant wave height • prevailing wave period • wave direction Forecast hours: 0–84 every 6 hours (00, 06 and 18UTC) 0–84 every 6 hours and 96-192 every 12 hours (12 UTC)
Observational data
(a) Surface data (TAC/TDCF) SYNOP, SHIP, BUOY: Mostly 4 times a day (b) Upper-air data (TAC/TDCF) TEMP (parts A-D), PILOT (parts A-D): Mostly twice a day
SATAID service
(a) Satellite imagery (SATAID) Himawari-8 (b) Observation data (SATAID)
SYNOP, SHIP, METAR, TEMP (A, B) and ASCAT sea-surface wind (c) NWP products (SATAID)
GSM (Available at http://www.wis-jma.go.jp/cms/sataid/)

Appendix 8
Products on NTP website List of products provided on the Numerical Typhoon Prediction (NTP) website:
https://tynwp-web.kishou.go.jp/
Products Frequency Details
Observation/Analysis
TC Analysis At least 4 times/day
Results and historical logs of the Center’s TC analysis conducted using satellite images (Conventional Dvorak analysis and Early-stage Dvorak analysis)
Satellite Microwave Products
TC snapshot images Warm-core-based TC intensity estimates Weighted consensus TC intensity estimates made using Dvorak
analysis and satellite microwave warm-core-based intensity estimates
Upper-Air Analysis 4 times/day Upper-air analysis based on GSM initial field data
- Streamlines at 850 and 200 hPa - Vertical wind shear between 200 and 850 hPa
Ocean Analysis Once/day Sea surface temperature and difference from 24 hours ago Tropical cyclone heat potential and difference from 24 hours ago
Forecasting/NWP
TC Track Prediction 4 times/day
TC track prediction of deterministic NWP models from nine centers (BoM, CMA, CMC, DWD, ECMWF, KMA, NCEP, UKMO and JMA) and a related consensus
TC track prediction of ensemble NWP models from four centers (ECMWF, NCEP, UKMO and JMA)
NWP Weather Maps Twice/day
Mean sea level pressure and 500 hPa Geopotential height (up to 72 hours at 00 UTC, up to 168 hours at 12 UTC) of deterministic NWP models from nine centers (BoM, CMA, CMC, DWD, ECMWF, KMA, NCEP, UKMO and JMA)
TC Activity Prediction Twice/day
Two- and five-day TC activity prediction maps based on ensemble NWP models from two centers (ECMWF and UKMO) and a related consensus
Storm Surge/Waves
Storm Surge Forecasts 4 times/day
Distribution maps of storm surges for the Center’s TC track forecast and each of five TC track forecasts selected from TEPS ensemble members, and the maximum storm surge among these six TC track forecasts (up to 72 hours ahead)
Time-series storm surge forecast charts for the Center’s TC track forecast and each of five TC track forecasts selected from TEPS ensemble members (up to 72 hours ahead)
Wave Height Forecasts 4 times/day
Distribution maps of ensemble mean wave height, maximum wave height, probability of exceeding various wave heights and ensemble spread based on global Wave EPS Model (up to 264 hours ahead)
Time-series charts of ensemble mean wave height with ensemble spread information and probability of exceeding various wave heights based on global Wave EPS Model (up to 264 hours ahead)

Appendix 9
User’s Guide to the DVD
Preface This DVD contains all the texts, tables and charts of the RSMC Annual Report 2016 along with satellite images of the tropical cyclones that attained TS intensity or higher in the western North Pacific and the South China Sea in 2016. This document is a brief user's guide on how to use the DVD, which was mastered in ISO-9660 format. Directory and File layout [Root] |------TopMenu.html (start menu html page) |------Readme.txt (brief explanation of the DVD) |------SATAIDmanual.pdf (user manual for the satellite image viewer) |------Annual_Report |---Text (text of Annual Report 2016 in PDF) |---Figure (figures in PDF) |---Table (tables in PDF) |---Appendix (appendices for MS Word, Excel and PDF) |------Best_Track |---E_BST_2016.txt (best track data for 2016) |---E_BST_201607.txt (best track data for TCs generated in July 2016)
: |---E_BST_201612.txt (best track data for TCs generated in December 2016) |------SATAID |---Gmslpd.exe (viewer; tropical cyclone version in English for 32-bit OS) |---Gsetup.exe (setup program for 32-bit OS) |---Gmslpd64.exe (viewer; tropical cyclone version in English for 64-bit OS) |---Gsetup64.exe (setup program for 64-bit OS) |------Satellite_Images |---T1601 (hourly satellite image data for T1601) |---T1602 (hourly satellite image data for T1602)
: |---T1626 (hourly satellite image data for T1626)

How to use the DVD The start menu shown when the DVD is inserted or the TopMenu.html file is clicked contains links titled Annual Report 2016, SATAID Installation for 32-bit OS/64-bit OS, Satellite Images and About this DVD. Click the link or the file name of the content you wish to see and follow the instructions on the display. Hardware/OS requirements for using the DVD: Hardware : PC/AT compatible OS : Microsoft Windows XP or later < Annual Report 2016> Annual Report 2016 is provided in two formats as PDF files and MS Word/Excel files. - PDF files: Click Annual Report 2016 to open the text in PDF. If you cannot open it, download Adobe Reader from Adobe’s website (http://www.adobe.com/). Adobe Reader (or Adobe Acrobat) is required to view PDF files. - MS Word/Excel files: The original figures and tables prepared with Microsoft Word or Excel are contained in the Annual Report folder of the DVD. < SATAID Installation > - Installation of the program for displaying satellite images Click SATAID Installation for 32-bit OS/64-bit OS to run the setup program (Gsetup.exe for 32-bit OS/Gsetup64.exe for 64-bit OS) for the satellite image viewer (SATAID). Follow the instructions to install SATAID (Gmslpd.exe for 32-bit OS/Gmslpd64.exe for 64-bit OS). < Satellite Images > - Displaying satellite images After installing SATAID, click Satellite Images in Internet Explorer or Firefox to launch SATAID and display a list of tropical cyclones occurring in 2016 in the selection window. Choose and click a tropical cyclone from the list to see hourly satellite images of it. You can also display the track of the tropical cyclone superimposed onto the satellite image and measure its intensity using the Dvorak method. - User manual for the viewer Besides the above features, the viewer has many other useful functions. See the User Manual (SATAIDmanual.pdf) for further details on its use.

- Explanation of satellite image data Satellite : Himawari-8
Period : From the TD formation to the time of dissipation Images : Infrared images (00 to 23 UTC) Visible images (
00 to 12 and 17 to 23 UTC) Range : 40 degrees in both latitude and longitude (The image window moves to follow the track of the tropical cyclone so that its center remains in the middle of the window.) Time interval : Hourly Resolution : 0.05 degrees in both latitude and longitude Compression of file : Compressed using the compress.exe command of Microsoft Windows < About this DVD > Click About this DVD to open the Readme.txt file.

Microsoft Windows is a registered trademark of Microsoft Corporation in the United States and other countries. Adobe and Acrobat Reader are trademarks of Adobe Systems Incorporated.
For further information, please contact:
RSMC Tokyo - Typhoon Center Forecast Division Forecast Department Japan Meteorological Agency 1-3-4 Otemachi, Chiyoda-ku, Tokyo 100-8122, Japan FAX: +81-3-3211-8303 E-mail: [email protected]

Tropical Cyclones in 2016

NEPARTAK (1601)
NEPARTAK formed as a tropical depression (TD) around the Caroline Islands at 12 UTC on 02 July 2016.
After moving northwestward, it was upgraded to tropical storm (TS) intensity over the same waters 12
hours later. Keeping its northwestward track, NEPARTAK was upgraded to typhoon (TY) intensity over the
sea east of the Philippines at 00 UTC on 05 July and reached its peak intensity with maximum sustained
winds of 110 kt and a central pressure of 900 hPa south of Okinawa Island at 06 UTC on the next day.
Keeping its northwestward track, NEPARTAK hit Taiwan Island with weakening its intensity rapidly. After
it entered the Taiwan Strait, NEPARTAK hit southeast coast of China with TS intensity after 00 UTC on 09
July. Moving northwestward, NEPARTAK weakened to TD intensity in southern part of China 6 hours later.
NEPARTAK dissipated there at 06 UTC on 10 July.
[Circle] 6 hourly position [Circle with number] Position at 00UTC Number: Day [TC grade] TY STS TS TD or L

LUPIT (1602)
LUPIT formed as a tropical depression (TD) around Minamitorishima at 18 UTC on 22 July 2016 and
moved northeastward. After upgrading to tropical storm (TS) intensity northeast of the same island at 18
UTC on 23 July and gradually turning northward, LUPIT reached its peak intensity with maximum
sustained winds of 40 kt and a central pressure of 1000 hPa around far off east of Japan at 00 UTC on the
next day. LUPIT transformed into an extratropical cyclone there at 18 UTC on 24 July. It gradually turned
north-northwestward and dissipated around the Kuril Islands at 12 UTC on 26 July.
[Circle] 6 hourly position [Circle with number] Position at 00UTC Number: Day [TC grade] TY STS TS TD or L

MIRINAE (1603)
MIRINAE formed as a tropical depression (TD) over the South China Sea at 12 UTC on 25 July 2016.
After moving west-northwestward, it was upgraded to tropical storm (TS) intensity over the sea east of
Hainan Island at 06 UTC on the next day. Keeping its west-northwestward track, MIRINAE crossed
Hainan Island with TS intensity. It was upgraded to severe tropical storm (STS) intensity and reached its
peak intensity with maximum sustained winds of 55 kt and a central pressure of 980 hPa in the Gulf of
Tonkin at 12 UTC on 27 July. After crossing the coast line of Viet Nam, MIRINAE weakened to TD
intensity in northern part of the county on 06 UTC on 28 July and dissipated there 12 hours later.
[Circle] 6 hourly position [Circle with number] Position at 00UTC Number: Day [TC grade] TY STS TS TD or L

NIDA (1604)
NIDA formed as a tropical depression (TD) east of the Philippines at 12 UTC on 29 July 2016 and moved
northward. After gradually turning northwestward, it upgraded to tropical storm (TS) intensity over the
same waters at 06 UTC the next day. After turned west-northwestward, NIDA upgraded to severe tropical
storm (STS) intensity around Luzon Island at 00 UTC on 31 July and reached its peak intensity with
maximum sustained winds of 60 kt and a central pressure of 975 hPa 6 hours later. After hitting the
southern part of China with TS intensity early on 02 August, it weakened to TD intensity in the same area
12 UTC on the same day. NIDA dissipated in the southern part of China at 06 UTC on 03 August.
[Circle] 6 hourly position [Circle with number] Position at 00UTC Number: Day [TC grade] TY STS TS TD or L

OMAIS (1605)
OMAIS formed as a tropical depression (TD) around the sea east of the Northern Mariana Islands at 12
UTC on 2 August 2016. After moving northward, it upgraded to tropical storm (TS) intensity over the same
waters at 00 UTC on 4 August. Keeping its northward track, OMAIS reached its peak intensity with
maximum sustained winds of 60 kt and a central pressure of 975 hPa around the Ogasawara Islands at 06
UTC on 6 August. Turning north-eastward, OMAIS transformed into an extratropical cyclone far east of
Hokkaido at 18 UTC on 9 August. It crossed longitude 180 degrees east over the Bering Sea before 06
UTC on 12 August.
[Circle] 6 hourly position [Circle with number] Position at 00UTC Number: Day [TC grade] TY STS TS TD or L
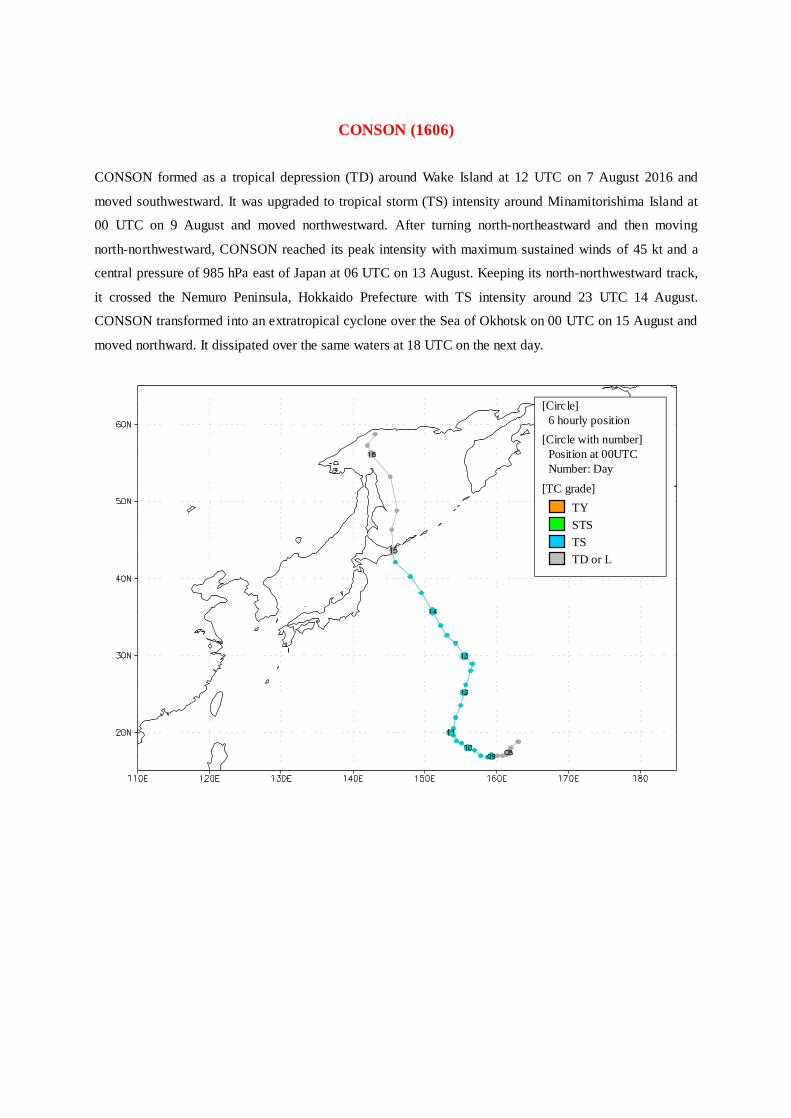
CONSON (1606)
CONSON formed as a tropical depression (TD) around Wake Island at 12 UTC on 7 August 2016 and
moved southwestward. It was upgraded to tropical storm (TS) intensity around Minamitorishima Island at
00 UTC on 9 August and moved northwestward. After turning north-northeastward and then moving
north-northwestward, CONSON reached its peak intensity with maximum sustained winds of 45 kt and a
central pressure of 985 hPa east of Japan at 06 UTC on 13 August. Keeping its north-northwestward track,
it crossed the Nemuro Peninsula, Hokkaido Prefecture with TS intensity around 23 UTC 14 August.
CONSON transformed into an extratropical cyclone over the Sea of Okhotsk on 00 UTC on 15 August and
moved northward. It dissipated over the same waters at 18 UTC on the next day.
[Circle] 6 hourly position [Circle with number] Position at 00UTC Number: Day [TC grade] TY STS TS TD or L

CHANTHU (1607)
CHANTHU formed as a tropical depression (TD) around the sea west of the Northern Mariana Islands at
00 UTC on 12 August 2016. After moving northeastward, it upgraded to tropical storm (TS) intensity over
the same waters at 18 UTC on the next day. Keeping its northward track, CHANTHU was upgraded to
severe tropical storm (STS) intensity around the Ogasawara Islands at 18 UTC on 14 August. Turning
northwestward and then northward, CHANTHU reached its peak intensity with maximum sustained winds
of 55 kt and a central pressure of 980 hPa off the eastern coast of the Tohoku Region at 00 UTC on 17
August. Keeping its northward track, CHANTHU landed on around Cape Erimo, Hokkaido Prefecture
around 0830UTC on 17 August. CHANTHU transformed into an extratropical cyclone around the Sakhalin
Island at 18 UTC on the same day. It crossed latitude 60 degrees north over the Sea of Okhotsk at 18 UTC
on 18 August.
[Circle] 6 hourly position [Circle with number] Position at 00UTC Number: Day [TC grade] TY STS TS TD or L

DIANMU (1608)
DIANMU formed as a tropical depression (TD) around the Taiwan Strait at 06 UTC on 15 August 2016.
After moving westward, it was upgraded to tropical storm (TS) intensity over the South China Sea at 18
UTC on 17 August. Keeping its westward track, DIANMU reached its peak intensity with maximum
sustained winds of 40 kt and a central pressure of 980 hPa in the Gulf of Tongking 24 hours later. After
hitting the northern part of Viet Nam with TS intensity early on 19 August, it weakened to TD intensity
there at 12 UTC on the same day and dissipated around Myanmar 00 UTC on 20 August.
[Circle] 6 hourly position [Circle with number] Position at 00UTC Number: Day [TC grade] TY STS TS TD or L

MINDULLE (1609)
MINDULLE formed as a tropical depression (TD) around the sea west of the Northern Mariana Islands at
00 UTC on 17 August 2016, and moved eastward and then northwestward. It was upgraded to tropical
storm (TS) intensity over the same waters at 06 UTC on 19 August and moved northward. MINDULLE
was upgraded to typhoon (TY) intensity and reached its peak intensity with maximum sustained winds of
65 kt and a central pressure of 975 hPa around Hachijojima Island at 18 UTC on 21 August. MINDULLE
made landfall on Tateyama City, Chiba Prefecture around 0330 UTC 22 August and moved
north-northeastward. After travelling over the eastern and northern part of Japan, it landed on again central
part of Hidaka District, Hokkaido Prefecture before 21 UTC on that day. MINDULLE transformed into an
extratropical cyclone over the Sea of Okhotsk at 03 UTC on 23 August and dissipated three hours later.
[Circle] 6 hourly position [Circle with number] Position at 00UTC Number: Day [TC grade] TY STS TS TD or L

LIONROCK (1610)
LIONROCK formed as a tropical depression (TD) around the sea east-northeast of Minamitorishima Island
at 00 UTC on 17 August 2016 and moved west-northwestward. After turning and decelerating
southwestward, it was upgraded to tropical storm (TS) intensity south of Shikoku Island at 12 UTC on 21
August. After LIONROCK sharply turned southeastward and then gradually turned southwestward again, it
was upgraded to typhoon (TY) intensity east of Minamidaitojima Island at 18 UTC on 23 August.
LIONROCK kept its southwestward track and sharply turned eastward south of Minamidaitojima Island at
18 UTC on 25 August. It accelerated northeastward and reached its peak intensity with maximum sustained
winds of 90 kt and a central pressure of 940 hPa west of Chichijima Island at 06 UTC on 28 August. After
gradually turning north-northwestward, LIONROCK made landfall on Ofunato City, Iwate Prefecture with
TY intensity around 0830 UTC on 30 August and moved northwestward. It transformed into an
extratropical cyclone over the Sea of Japan at 15 UTC on 30 August and dissipated there nine hours later.
[Circle] 6 hourly position [Circle with number] Position at 00UTC Number: Day [TC grade] TY STS TS TD or L

KOMPASU (1611)
KOMPASU formed as a tropical depression (TD) around Minamitorishima Island at 12 UTC on 18 August
2016 and moved northward. Gradually turning northwestward, it was upgraded to tropical storm (TS)
intensity and reached its peak intensity with maximum sustained winds of 35 kt and a central pressure of
994 hPa east of Japan at 00 UTC on 20 August. After turning north-northeastward, KOMPASU made
landfall on Kushiro City, Hokkaido Prefecture with TS intensity after 1400 UTC on 21 August. It entered
the Sea of Okhotsk and transformed into an extratropical cyclone on 18 UTC on that day. KOMPASU
dissipated there at 12 UTC on 22 August.
[Circle] 6 hourly position [Circle with number] Position at 00UTC Number: Day [TC grade] TY STS TS TD or L

NAMTHEUN (1612)
NAMTHEUN formed as a tropical depression (TD) around the Luzon Strait at 00 UTC on 31 August 2016.
Moving northeastward, it was upgraded to tropical storm (TS) intensity south of Okinawa Island at 00 UTC
on 01 September. After NAMTHEUN turned northward, it reached its peak intensity with maximum
sustained winds of 70 kt and a central pressure of 955 hPa east of Amami-Osima Island at 18 UTC on the
next day. Keeping its northward track, NAMTHEUN made landfall on around Nagasaki City, Nagasaki
Prefecture after 16 UTC on 4 September, and weakened to TD intensity 2 hours later. Turning
northeastward, NAMTHEUN dissipated over the Sea of Japan at 18 UTC on the next day.
[Circle] 6 hourly position [Circle with number] Position at 00UTC Number: Day [TC grade] TY STS TS TD or L

MALOU (1613)
MALOU formed as a tropical depression (TD) around Miyakojima Island at 12 UTC on 05 September
2016. Moving northeastward, it was upgraded to tropical storm (TS) intensity and reached its peak intensity
with maximum sustained winds of 40 kt and a central pressure of 1000 hPa north of Kumejima Island at 06
UTC on 06 September. Gradually turning eastward, MALOU weakened to TD intensity south of
Yakushima Island at 00 UTC on 07 September, and it dissipated south of Kyushu Island 12 hours later.
[Circle] 6 hourly position [Circle with number] Position at 00UTC Number: Day [TC grade] TY STS TS TD or L

MERANTI (1614)
MERANTI formed as a tropical depression (TD) around the sea west of the Northern Mariana Islands at 12
UTC on 9 September 2016, and moved west-northwestward. It was upgraded to tropical storm (TS)
intensity over the same waters at 06 UTC on 10 September and kept its west-northwestward track.
MERANTI was upgraded to typhoon (TY) intensity over the same waters at 06 UTC on 11 September, and
reached its peak intensity with maximum sustained winds of 120 kt and a central pressure of 890 hPa north
of Luzon Island at 12 UTC on 13 September. After gradually turning northwestward, it hit southeast of
China with TY intensity late on 14 September. After turning north-northeastward, it weakened to TD
intensity in the same area at 12 UTC on 15 September. MERANTI transformed into an extratropical
cyclone around the mouth of Yangtze River at 06 UTC on 16 September and dissipated around Jeju Island
at 18 UTC on the next day.
[Circle] 6 hourly position [Circle with number] Position at 00UTC Number: Day [TC grade] TY STS TS TD or L

RAI (1615)
RAI formed as a tropical depression (TD) over the South China Sea at 06 UTC on 11 September 2016.
After moving northwestward, it was upgraded to tropical storm (TS) intensity and reached its peak intensity
with maximum sustained winds of 35 kt and a central pressure of 996 hPa off the coast of Viet Nam on
18UTC on 12 September. After turning westward and hitting the central part of Viet Nam with TS intensity
late on the same day, RAI weakened to TD intensity in Laos at 06 UTC on 13 September and dissipated in
Thailand 18 hours later.
[Circle] 6 hourly position [Circle with number] Position at 00UTC Number: Day [TC grade] TY STS TS TD or L

MALAKAS (1616)
MALAKAS formed as a tropical depression (TD) over the waters south of Guam Island at 18 UTC on 11
September 2016. Moving west-northwestward, it was upgraded to tropical storm (TS) intensity west of the
Northern Mariana Islands at 18 UTC on the next day. Keeping its west-northwestward track, MALAKAS
was upgraded to typhoon (TY) intensity east of the Philippines at 00 UTC on 14 September. Gradually
turning northward, MALAKAS reached its peak intensity with maximum sustained winds of 95 kt and a
central pressure of 930 hPa south of Yonagunijima Island at 18 UTC on 16 September. After entering the
East China Sea, it turned northeastward and weakened its intensity slightly. MALAKAS developed again
and reached its second peak intensity with maximum sustained winds of 95 kt and a central pressure of 940
hPa over the same waters at 18 UTC on 18 September. Keeping its northeastward track, MALAKAS made
landfall on the Osumi Peninsula, Kagoshima Prefecture with TY intensity after 15 UTC on 19 September.
Weakening its intensity rapidly, MALAKAS made landfall again on around Tanabe City in Wakayama
Prefecture with severe tropical storm (STS) intensity around 0430 UTC, and then made landfall again
around Tokoname City in Aichi Prefecture with TS intensity after 08 UTC on 20 September. It transformed
into an extratropical cyclone off the coast of the Tokai region at 12 UTC on that day and dissipated 6 hours
later.
[Circle] 6 hourly position [Circle with number] Position at 00UTC Number: Day [TC grade] TY STS TS TD or L

MEGI (1617)
MEGI formed as a tropical depression (TD) over the sea west of the Northern Mariana Islands at 18 UTC
on 22 September 2016. After moving northwestward, it was upgraded to tropical storm (TS) intensity over
the same waters 24 hours later. Keeping its northwestward track, MEGI was upgraded to typhoon (TY)
intensity over the sea east of the Philippines at 18 UTC on 24 September. MEGI reached its peak intensity
with maximum sustained winds of 85 kt and a central pressure of 945 hPa southwest of Ishigakijima Island
at 00 UTC on 27 September and hit Taiwan Island with weakening its intensity on the same day. After
entering the Taiwan Strait, MEGI hit southeast coast of China with TS intensity before 00 UTC on 28
September. Moving northwestward, it weakened to TD intensity in southern part of China 12 hours later.
MEGI turned northeastward and dissipated at 12 UTC on 29 September.
[Circle] 6 hourly position [Circle with number] Position at 00UTC Number: Day [TC grade] TY STS TS TD or L

CHABA (1618)
CHABA formed as a tropical depression (TD) southwest of Wake Island at 18 UTC on 24 September 2016.
After moving westward, it was upgraded to tropical storm (TS) intensity around the sea west of Guam
Island at 06 UTC on 29 September. Turning northwestward, CHABA was upgraded to typhoon (TY)
intensity around the sea far east of the Philippines at 12 UTC on 01 October, and reached its peak intensity
with maximum sustained winds of 115 kt and a central pressure of 905 hPa southwest of Okinawa Island at
09 UTC on 03 October. After gradually turning northeastward, CHABA transformed into an extratropical
cyclone around Noto Peninsula at 12 UTC on 05 October. It moved east-northeastward and crossed
longitude 180 degrees east over the sea around the Aleutian Islands before 18 UTC on 7 October.
[Circle] 6 hourly position [Circle with number] Position at 00UTC Number: Day [TC grade] TY STS TS TD or L

AERE (1619)
AERE formed as a tropical depression (TD) south of Okinawa Island at 12 UTC on 4 October 2016, and
moved westward. It was upgraded to tropical storm (TS) intensity south of Taiwan Island at 18 UTC on 5
October and kept its west-northwestward track. AERE was upgraded to severe tropical storm (STS)
intensity over the South China Sea at 06 UTC on 7 October, and reached its peak intensity with maximum
sustained winds of 60 kt and a central pressure of 975 hPa over the same waters at 18 UTC on 7 October.
Remaining almost stationary, it weakened to TD intensity at 00 UTC on 10 October, and dissipated over the
same waters at 06 UTC on 10 October.
[Circle] 6 hourly position [Circle with number] Position at 00UTC Number: Day [TC grade] TY STS TS TD or L

SONGDA (1620)
SONGDA crossed longitude 180 degrees east with tropical depression (TD) intensity over the sea northeast
of the Marshall Islands after 18 UTC on 3 October 2016 and entered the western North Pacific. After
moving west-northwestward, it was upgraded to tropical storm (TS) intensity south of Minamitorishima
Island at 12 UTC on 8 October. Turning in a clockwise direction, SONGDA was upgraded typhoon (TY)
intensity east of the Ogasawara Islands at 00 UTC on 10 October, and reached its peak intensity with
maximum sustained winds of 100 kt and a central pressure of 925 hPa east of the Izu Islands on 18 UTC
the next day. Keeping its northeastward track, SONGDA transformed into an extratropical cyclone around
sea south of the Aleutian Islands at 06 UTC on 13 October and crossed longitude 180 degrees east after 12
UTC the same day.
[Circle] 6 hourly position [Circle with number] Position at 00UTC Number: Day [TC grade] TY STS TS TD or L

SARIKA (1621)
SARIKA formed as a tropical depression (TD) over the sea east of the Philippines at 00 UTC on 13
October 2016. Moving west-northwestward, it was upgraded to tropical storm (TS) intensity over the same
waters at 18 UTC on that day. Keeping its west-northwestward track, SARIKA was upgraded to typhoon
(TY) intensity around the Philippines at 00 UTC on 15 October. And then SARIKA reached its peak
intensity with maximum sustained winds of 95 kt and a central pressure of 935 hPa around Luzon Island at
18 UTC on that day just before hitting Luzon Island. After entering the South China Sea, SARIKA
gradually turned northwestward with weakening its intensity and crossed Hainan Island early on 18
October. It was downgraded to TD intensity near the border of China and Viet Nam at 06UTC on the next
day and dissipated in the southern China 18 hours later.
[Circle] 6 hourly position [Circle with number] Position at 00UTC Number: Day [TC grade] TY STS TS TD or L

HAIMA (1622) HAIMA formed as a tropical depression (TD) around the Caroline Islands at 12 UTC on 14 October 2016.
Moving west-northwestward, it was upgraded to tropical storm (TS) intensity over the same waters 12
hours later. Moving northwestward, HAIMA was upgraded to typhoon (TY) intensity over the same waters
at 06 UTC on 16 October and reached its peak intensity with maximum sustained winds of 115 kt and a
central pressure of 900 hPa around sea east of the Philippines at 18 UTC on 18 October. After Moving
west-northwestward, it hit Luzon Island with TY intensity the next day and entered the South China Sea.
Turning northwestward, HAIMA hit the southern part of China and it was downgraded to tropical storm
(TS) intensity at 06 UTC on 21 October. HAIMA weakened to TD intensity around southern part of China
at 18 UTC on 21 October and transformed into an extratropical cyclone 6 hours later. After gradually
turning eastward and entering the East China Sea, it moved to south of Japan and dissipated around sea east
of the Ogasawara Islands at 12UTC on 26 October.
[Circle] 6 hourly position [Circle with number] Position at 00UTC Number: Day [TC grade] TY STS TS TD or L

MEARI (1623)
MEARI formed as a tropical depression (TD) over the sea around the Caroline Islands at 18 UTC on 30
October 2016 and moved west-northwestward. Gradually turning northeastward, it was upgraded to
tropical storm (TS) intensity west of the Mariana Islands at 00 UTC on 3 November. It reached its peak
intensity with maximum sustained winds of 75 kt and a central pressure of 960 hPa south of the Ogasawara
Islands at 12 UTC on 5 November. MEARI accelerated northeastward and transformed into an extratropical
cyclone east of the Ogasawara Islands at 06 UTC on 7 November. MEARI kept its northeastward track and
dissipated far east of Japan at 00 UTC on 10 November.
[Circle] 6 hourly position [Circle with number] Position at 00UTC Number: Day [TC grade] TY STS TS TD or L

MA-ON (1624)
MA-ON formed as a tropical depression (TD) around the Marshall Islands at 18 UTC on 8 November 2016
and moved northwestward. It was upgraded to tropical storm (TS) intensity and reached its peak intensity
with maximum sustained winds of 35 kt and a central pressure of 1002 hPa around the Mariana Islands at
00 UTC on 10 November, and turned west-northwestward. MA-ON weakened to TD intensity around the
Northern Mariana Islands at 00 UTC on 12 November and dissipated around the Ogasawara Islands at 06
UTC the next day.
[Circle] 6 hourly position [Circle with number] Position at 00UTC Number: Day [TC grade] TY STS TS TD or L

TOKAGE (1625)
TOKAGE formed as a tropical depression (TD) over the sea northeast of Mindanao Island at 00 UTC on 24
November 2016 and moved west-northwestward. After hitting the middle of the Philippines, it was
upgraded to tropical storm (TS) intensity south of Mindoro Island at 12 UTC the next day. TOKAGE
turned northwestward and reached its peak intensity with maximum sustained winds of 50 kt and a central
pressure of 992 hPa west of Mindoro Island at 00 UTC on 26 November. After turning north-northeastward,
it weakened to TD intensity west of Luzon Island at 00 UTC on 28 November and dissipated there 6 hours
later.
[Circle] 6 hourly position [Circle with number] Position at 00UTC Number: Day [TC grade] TY STS TS TD or L

NOCK-TEN (1626)
NOCK-TEN formed as a tropical depression (TD) over the sea around the Caroline Islands at 12 UTC on
20 December 2016. Moving northwestward, it was upgraded to tropical storm (TS) intensity over the sea
southeast of the Yap Islands at 18 UTC on the next day. Gradually turning westward, it was upgraded to
typhoon (TY) intensity over the sea far east of the Philippines at 06 UTC on 23 December. Keeping its
westward track, NOCK-TEN developed rapidly and reached its peak intensity with maximum sustained
winds of 105 kt and a central pressure of 915 hPa over the sea east of the Philippines at 06 UTC on 24
December, and then hit Luzon Island with TY intensity late on the next day. Entering the South China Sea
and turning southwestward, it was downgraded to TD intensity at 18UTC on 27 December. It dissipated
over the same waters at 18UTC on the next day.
[Circle] 6 hourly position [Circle with number] Position at 00UTC Number: Day [TC grade] TY STS TS TD or L