Embed Size (px)
Citation preview
| 1
ANNUAL REPORT ON
EMPLOYMENT EQUITY IN THE
PUBLIC SERVICE
2013/2014
| 2
TABLE OF CONTENT
ABBREVIATIONS 3
FOREWORD 4
1. Introduction 6
2. South Africa’s Demography 8
3. Public Service Demography (as at March 2014) 9
3.1 Representation by race 9
3.2 Representation per Province by race and gender 11
3.3 Representation by race by salary levels and gender 13
4. Representation by age 14
5. Representation of people with disabilities 15
6. Representation of women at SMS 25
7. Public Service Trends of representation of people with disabilities, youth and
women (at SMS) in the past 20 years
29
8. Conclusion 32
9. Recommendations 34
10. References 35
Annexure A: Compliance with meeting of equity targets per department as at 31 March 2014
36

| 3
ABBREVIATIONS
AU African Union
DG Director General
DPSA Department of Public Service and Administration
EAP Economically Active Population
HOD Head of Department
MMS Middle Management Service
NDP National Development Plan
PERSAL Personnel Salary system
PS Public Service
SADC Southern African Development Communities
SMS Senior Management Service
STATSSA Statistics South Africa
UNCRPD United Nations Convention on the Rights of Persons with Disabilities
WPTPS White Paper on the Transformation of the Public Service, 1995

| 4
FOREWORD
This Annual Report on Employment Equity in the Public Service 2013/14 is presented at a very
important time in the history of our country as we celebrate 20 years of democracy; 18 years since
the enactment of the South African Constitution, 16 years since the promulgation of the
Employment Equity Act and 60 years since the adoption of the Women’s Charter in 1954. The
Constitution as we know, confers and protects the rights of all citizens and also identifies the
principles and values that should characterise Public Administration while the Employment Equity
Act outlaws discrimination and promotes equality in the workplace. It is on the basis of these
frameworks and other instruments discussed in this report that the Department of Public Service
and Administration (DPSA) monitors and reports on the achievement of employment equity in the
Public Service as part of the institutional transformation agenda.
This report provides extensive data on the representation of the Public Service Workforce in terms
of age, disability, gender, race in all salary levels, and for women across all levels and at SMS levels.
Included also in the report is a summary of trends on the representation of youth, people with
disabilities and women over the past 20 years. The representation of both people with disabilities
across all levels of the Public Service and women at SMS although gradually improving and not at the
set equity targets levels, shows an upward trend, while the representation of youth shows a
downward trend. The latter is a cause for concern as youth employment is one of the priorities of
government and an important part of the future Public Service cohort. My hope is that our next
report is not only going to show an improvement in the achievement of employment equity targets
but will reflect 100% compliance.
In the previous annual report, 13 departments had met the 50% employment equity target for
women at SMS, and 16 departments had met the 2% equity target for people with disabilities. This
year, I am happy to report that these numbers have increased to 19 for women at SMS and 25 for
people with disabilities. Departments with representation below 30% have decreased from 26 to 24
and those at below 1% for disability have also decreased from 81 to 73. It is not a very big
improvement, but it is encouraging to see that the trajectory is positive and moving towards our
goal. For this reason, I would like to urge departments that have representation of 40-49% for
women at SMS and 1-1.9% for people with disabilities to implement their remedial plans agreed to
with the DPSA as well as strategies that will assist them to meet the targets in the new financial year.
This is important because the DPSA will be reporting progress in this regard to Cabinet in 2015.

| 5
I was also very pleased to see that some departments have met both targets. I would like to
congratulate and encourage these departments to maintain this standard and to help others to
achieve our goals. For those departments that have met one target, apply the lessons learned in that
achievement to achieve the other target.
In conclusion, I hope that this report affirms departments that are compliant and encourage and
inspires those that are not, to do better. I also hope that you will all find this report a useful planning
tool for transformation and empowerment programmes as you move forward so that the Public
Service can become not only a true reflection of our country, but an employer of choice for all
citizens, especially women and people with disabilities.
| 6
1. INTRODUCTION
The employment equity programme of the Public Service is informed by the principles governing
public administration as enshrined in Section 195(1) of the Constitution of the Republic of South
Africa in particular Principle (i) which states that "Public Administration must be broadly
representative of the South African people, with employment and personnel management practices
based on ability, objectivity, fairness and the need to redress the imbalances of the past to achieve
broad representation". Most of the plans and programmes of the Department of Public Service and
Administration (DPSA) are aimed at giving effect to this principle. As early as 1954, the women of
South Africa were not happy with their subordinate position and this is clearly articulated in article 2
of the Women’s Charter which calls for “The right to full opportunities for employment with equal
pay and possibilities of promotion in all spheres of work”
This report gives an account of progress made by national and provincial departments in creating a
Public Service that is representative of the people of South Africa, through the implementation of
policies that lead to the increased employment of blacks, women and people with disabilities.
It is also worth noting that this report coincides with 16 years of the implementation of the
Employment Equity Act No 55 of 1998 which sought to achieve equity in the workplace by:-
promoting equal opportunity and fair treatment in employment through the elimination of
unfair discrimination; and
Implementing affirmative action measures to redress the disadvantages in employment
experienced by designated groups, to ensure their equitable representation in all
occupational categories and levels.
Employment equity targets used in this report derive from Cabinet decisions taken at various times
and the White Paper on the Transformation of the Public Service (WPTSPS) that asserted that Black
people, women and people with disabilities were the groups most adversely affected by
discrimination in the Public Service prior to 1994. To address this matter, Section 10.6 of the WPTPS
introduced the use of the following equity targets: 50% representation of black people in
management, at least 30% of all new recruits at management level should be women and for both
these targets to be met by 1999. To address the issue of disability, a target of 2% employment of
people with disabilities across all levels of the Public Service and for this target to be achieved by
2005. These targets were set as minimum requirements for national departments and provincial
administrations only. By the year 1999 the racial target for the representation of blacks in
| 7
management was met, but the target for the representation of women at 30% and 2% target for
people with disabilities were not met. The target for women was subsequently met in 2005, but the
disability target was and still remains unattained. In 2007, Cabinet revised the gender target from
30% to 50%, in line with other national, regional, continental and international treaties. This target
was to be met by March 2009. For disability, the target of 2% was retained and the target date was
moved to March 2010. In November 2012, the DPSA presented a report to Cabinet wherein the
department reported on the equity targets, challenges experienced by departments in meeting the
targets and recommendations for Cabinet's consideration. Cabinet retained the equity targets and
set the target date for both to the end of 2014.
Besides the domestic legislation and Cabinet decisions stated above in support of Gender parity,
South Africa is a signatory to the following regional and international treaties that advocate for
gender parity: the SADC Protocol on Gender and Development, which contains a gender parity
clause and for this to be achieved by 2015. This Protocol was adopted by the SADC Heads of State in
August 2008, and South Africa ratified it in 2011. Article 12 on Representation in the Protocol states
that : ‘States Parties shall endeavour that, by 2015, at least 50% of decision-making positions in the
public and private sector bodies are held by women including the use of affirmative action measures
as provided for in Article 5”.
Furthermore, Article 13 states that: “States Parties shall ensure the equal participation of women
and men in decision-making by putting in place policies, strategies and programmes for: (a) building
the capacity of women to participate effectively through leadership and gender sensitivity training
and mentoring; (b) providing support structures for women in decision-making positions; (c) the
establishment and strengthening of structures to enhance gender mainstreaming; and (d) changing
discriminatory attitudes and norms of decision-making structures and procedures”.
South Africa adopted the African Union Heads of States’ Solemn Declaration on Gender Equality in
Africa in 2004
On the 15th December 1995, South Africa ratified the Convention on the Elimination of all forms of
Discrimination against Women (CEDAW). The Convention provides the basis for realizing equality
between women and men through ensuring women's equal access to, and equal opportunities in,
political and public life including the right to vote and to stand for election as well as education,
health and employment.
| 8
In the case of disability, South Africa ratified the United Nations Convention on the Rights of Persons
with Disabilities (UNCRPD) on 30 November 2007. The convention places various obligations on
governments and in this respect; Article 27-1 (g) on work and employment says "employ persons
with disabilities in the public sector”.
This report illustrates performance by departments in meeting equity targets using the following
indices or dimensions: race, age, salary levels, gender and disability. There will also be a reflection of
trends over the past 20 years. All the data used in this report is extracted from PERSAL as at 31
March 2014, unless otherwise stated.
2. SOUTH AFRICA’S DEMOGRAPHY
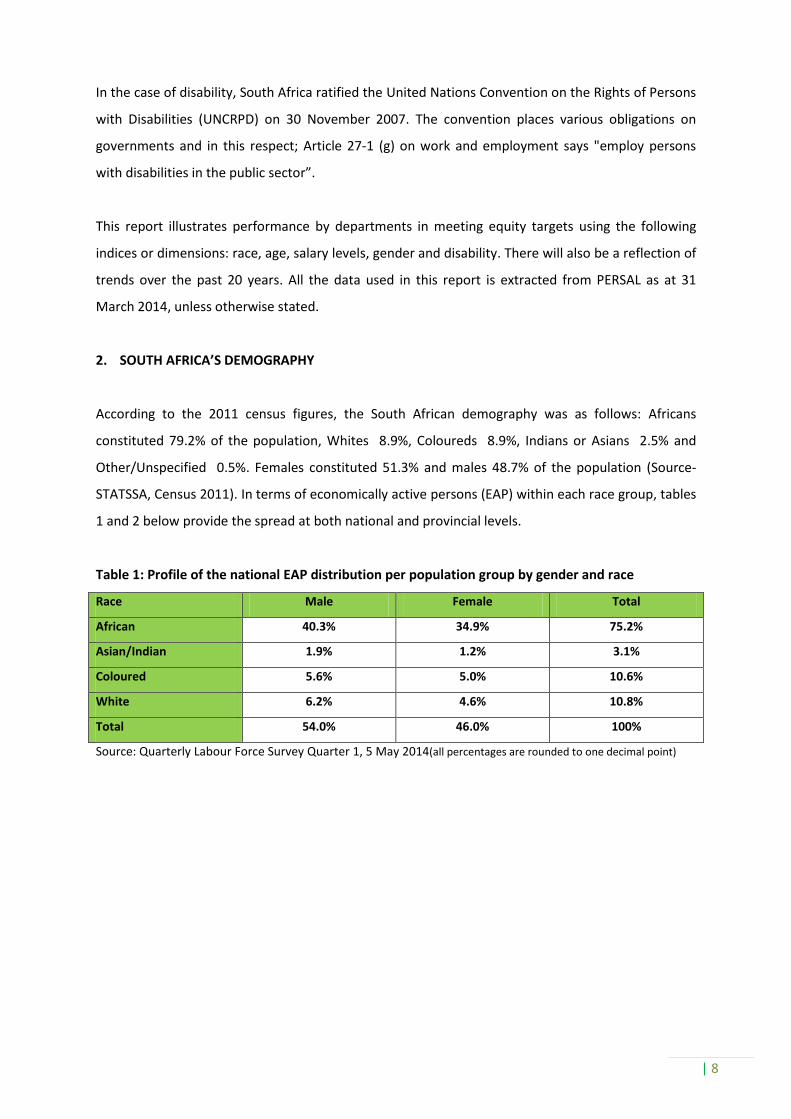
According to the 2011 census figures, the South African demography was as follows: Africans
constituted 79.2% of the population, Whites 8.9%, Coloureds 8.9%, Indians or Asians 2.5% and
Other/Unspecified 0.5%. Females constituted 51.3% and males 48.7% of the population (Source-
STATSSA, Census 2011). In terms of economically active persons (EAP) within each race group, tables
1 and 2 below provide the spread at both national and provincial levels.
Table 1: Profile of the national EAP distribution per population group by gender and race
Race Male Female Total
African 40.3% 34.9% 75.2%
Asian/Indian 1.9% 1.2% 3.1%
Coloured 5.6% 5.0% 10.6%
White 6.2% 4.6% 10.8%
Total 54.0% 46.0% 100%
Source: Quarterly Labour Force Survey Quarter 1, 5 May 2014(all percentages are rounded to one decimal point)

| 9
Table 2: Profile of the EAP distribution per province by gender and race
Province Population Group and Gender
Eastern Cape GENDER African Coloured Asian/Indian White TOTAL
Male 39.6% 7.3% 0.4% 5.1% 52.4%
Female 37.3% 6.2% 0.1% 4.0% 47.6%
TOTAL 76.9% 13.5% 0.5% 9.1% 100.0%
Free State Male 47.8% 1.1% 0.2% 5.3% 54.4%
Female 24.8% 15.8% 0.1% 4.1% 44.8%
TOTAL 72.6% 16.9% 0.3% 9.4% 100.0%
Gauteng Male 41.2% 1.8% 1.7% 9.9% 54.6%
Female 35.0% 1.5% 1.1% 7.8% 45.4%
TOTAL 76.2% 3.3% 2.8% 17.7% 100.0%
KwaZulu Natal Male 42.6% 1.1% 6.4% 2.7% 52.8%
Female 39.9% 1.0% 4.2% 2.1% 47.2%
TOTAL 82.5% 2.1% 10.6% 4.8% 100.0%
Limpopo Male 50.3% 0.4% 0.5% 1.8% 53.0%
Female 45.1% 0.4% 0.3% 1.3% 47.1%
TOTAL 92.4% 0.8% 0.8% 3.1% 100.0%
Mpumalanga Male 49.9% 0.4% 0.9% 4.6% 55.8%
Female 40.9% 0.4% 0.3% 2.5% 44.1%
TOTAL 90.8% 0.8% 1.2% 7.1% 100.0%
North West Male 54.9% 0.7% 0.2% 3.5% 59.3%
Female 36.9% 0.7% 0.1% 3.0% 40.7%
TOTAL 91.8% 1.4% 0.3% 6.5% 100.0%
Northern Cape Male 30.6% 19.1% 0.2% 5.3% 55.2%
Female 24.8% 15.8% 0.1% 4.1% 44.8%
TOTAL 55.4% 34.9% 0.3% 9.4% 100.0%
Western Cape Male 16.2% 27.4% 0.2% 8.7% 52.5%
Female 15.0% 25.0% 0.1% 7.3% 47.4%
TOTAL 31.2% 52.4% 0.3% 16.0% 100.0%
Source: Statistics South Africa, (Quarterly Labour Force Survey 1, 5 May 2014) (all percentages are rounded to
one decimal point)
3. PUBLIC SERVICE DEMOGRAPHY (as at March 2014):
3.1 REPRESENTATION BY RACE
There were 1 326 320 employees in the Public Service as at March 2014; Africans were 1 051 470
(79.3%), Asians 43 102 (3.2%), Coloureds were 111 180(8.4%), Whites 117 914 (8.9%) and 2 654
(0.2%) classified as unknown. The representation of the four racial groups corresponds with their
national demography figures. In terms of the need to transform the Public Service in a way that it
reflects the national demographics, this ideal has been reached at a racial level.

| 10
A further disaggregation of the Public Service shows that out of the 1 326 320 officials, there were
764 424 (57.6%) females and 561 896 (42.4%) males. African females were more than African males
at 58% and 42% respectively; for Asians, the female/male ratio was 52% to 48%; Coloureds 57% to
43% with Whites at 60% to 40%.The Public Service has more women than men across all racial
groups (see figure 2).
Figure 1: Representation by gender and race
Table 3: Representation per province by race and gender
Gender and Race
Province Unknown
Female African
Female Asian
Female Coloured
Female White
Male African
Male Asian
Male Coloured
Male White
Total
Eastern Cape 194 84140 350 6182 4450 34691 293 3064 1885 135,249
Free State 34 32204 38 1198 5529 19894 44 613 2227 61,781
Gauteng 606 89345 2564 3137 16221 40923 1059 1339 5013 160,207
Kwazulu-Natal 471 116984 12132 2030 4508 54432 6516 733 1808 199,614
Limpopo 137 69908 81 78 1374 45458 72 39 596 117,743
Mpumalanga 337 43909 197 241 3302 24880 163 91 1229 74,349
National D 617 115357 6132 13045 19765 193432 12167 21227 28567 410,309
North West 67 36759 164 605 3371 18843 138 297 1136 61,380
Northern Cape
48 7100 71 6044 1923 4270 67 3644 689 23,856
Western Cape 143 12810 503 30943 9730 6131 351 16630 4591 81,832
Grand-Total 2654 608516 22232 63503 70173 442954 20870 47677 47741 1,326,320
Level 00: Temporary employment, more especially Adult Basic Education teachers.
0%
10%
20%
30%
40%
50%
60%
70%
African Asian Coloured White
Female
Male

| 11
3.2 REPRESENTATION PER PROVINCE BY RACE AND GENDER
Eastern Cape Province
In the Eastern Cape Province, there were 135 249 officials with Africans at 118 831 (88%), Asians 643
(0.5%), Coloureds 9 246 (6.8%), Whites 6 335 (4.6%) and 194 (0.1%) classified as unknown. There
were 95 122 (70%) females and 39 933 males (30%) 194 are classified as unknown- making females
the largest group of employees in this province, the EAP for women is 47.6%.
Free State
There were 61781 employees of which 52098 (84%) were Africans, Asians 82 (0.1%), Coloureds 1811
(3%), Whites 7756 (13%) and 34 (0.1%) classified as unknown. There were 38969 (64%) females and
22778 (36%) males, 34 are classified as unknown. Again, females outnumber males by far, but their
EAP was 44.8%.
Gauteng
There were 160207 employees of which Africans were 130268 (81.3%), Asians 3623 (2%), Coloureds
4476 (3%), Whites 21234 (13.3%) and 606 (0.4%) classified as unknown. There were 111267 (70%)
females and 48334 (30%) males, 606 were classified as unknown. Here also, females outnumber
males by far, but the female EAP was 45.4%.
KwaZulu-Natal
There were 199614 employees of which Africans were 171416 (86%), Asians 18648 (9.3%),
Coloureds 2763 (1.4%, Whites 6316 (3.2%) and 471 (0.2%) classified as unknown. There were
135654 (68%) females and 63489 (32%) males, 471 were classified as unknown. Females are once
again far more than males, but their EAP was 47.2%.
Limpopo
There were 117743 of which Africans were 115366 (98%), Asians 153 (0.1%), Coloureds 117 (0.1%),
Whites 1970 1.7%) and 137 (0.1%) were classified as unknown. There were 71441 (61%) females and
46165 males (39%), 137 were classified as unknown. Females are more than males, but the
provincial EAP for females was 47.1%.
Mpumalanga
There were 74349 employees. Of which Africans were 68789 (92.5%), Asians 360 (0.5%), Coloureds
332 (0.4%), Whites 4531 (6.1%) and 337 (0.5%) classified as unknown. There were 47649 (64%)
| 12
females and 26363 males (36%), 337 were classified as unknown and here too, Females are more
than males, and their provincial EAP was 44.1%.
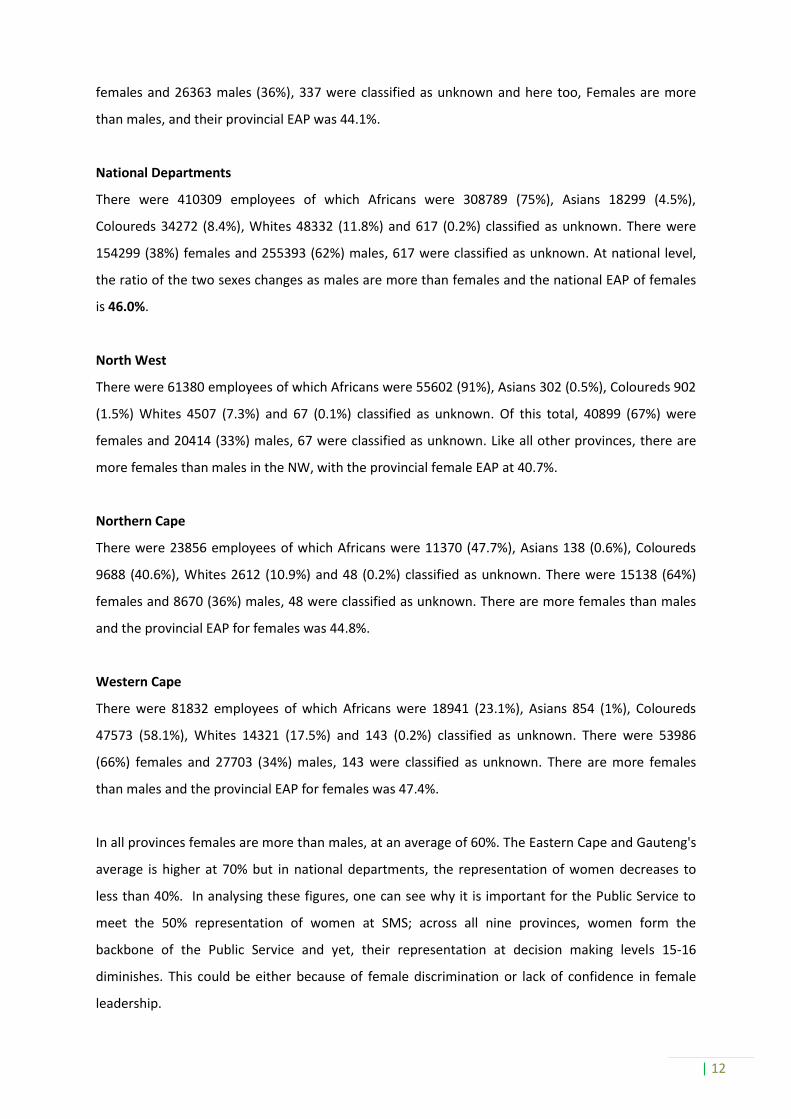
National Departments
There were 410309 employees of which Africans were 308789 (75%), Asians 18299 (4.5%),
Coloureds 34272 (8.4%), Whites 48332 (11.8%) and 617 (0.2%) classified as unknown. There were
154299 (38%) females and 255393 (62%) males, 617 were classified as unknown. At national level,
the ratio of the two sexes changes as males are more than females and the national EAP of females
is 46.0%.
North West
There were 61380 employees of which Africans were 55602 (91%), Asians 302 (0.5%), Coloureds 902
(1.5%) Whites 4507 (7.3%) and 67 (0.1%) classified as unknown. Of this total, 40899 (67%) were
females and 20414 (33%) males, 67 were classified as unknown. Like all other provinces, there are
more females than males in the NW, with the provincial female EAP at 40.7%.
Northern Cape
There were 23856 employees of which Africans were 11370 (47.7%), Asians 138 (0.6%), Coloureds
9688 (40.6%), Whites 2612 (10.9%) and 48 (0.2%) classified as unknown. There were 15138 (64%)
females and 8670 (36%) males, 48 were classified as unknown. There are more females than males
and the provincial EAP for females was 44.8%.
Western Cape
There were 81832 employees of which Africans were 18941 (23.1%), Asians 854 (1%), Coloureds
47573 (58.1%), Whites 14321 (17.5%) and 143 (0.2%) classified as unknown. There were 53986
(66%) females and 27703 (34%) males, 143 were classified as unknown. There are more females
than males and the provincial EAP for females was 47.4%.
In all provinces females are more than males, at an average of 60%. The Eastern Cape and Gauteng's
average is higher at 70% but in national departments, the representation of women decreases to
less than 40%. In analysing these figures, one can see why it is important for the Public Service to
meet the 50% representation of women at SMS; across all nine provinces, women form the
backbone of the Public Service and yet, their representation at decision making levels 15-16
diminishes. This could be either because of female discrimination or lack of confidence in female
leadership.

| 13
3.3 REPRESENTATION BY RACE, SALARY LEVELS AND GENDER
The representation of women of all racial groups is higher from levels 001 to level 10 with the
pattern changing in favour of men , from level 11 up to 16; that is, male representation is higher
than that of women as you move up the decision making ladder. This dimension highlights where
the gender parity blockage begins; although there is 57.6% of women in the Public Service, they are
concentrated at the lower levels where earnings and power to influence decisions are equally less.
This pattern could also indicate that it is easier for women to be recruited at entry levels than at
higher levels, or that although it is easier for women to enter the Public Service at lower levels; it is
harder for them to be promoted to higher levels than their male counterparts. This is an area of
concern that needs to be analysed and understood in order to develop appropriate and targeted
interventions. If skills gaps are identified as a problem for example, how does the National School of
Government respond? Or what policy gaps allow this to happen? Are the affirmative action
programmes not rigorous enough?
1 Level 00: Temporary employment, more especially Adult Basic Education teachers

| 14
Table 4: Representation by salary level, race and gender
Gender and Race
Salary Level - Notch
Unknown Female African
Female Asian
Female Coloured
Female White
Total Male African
Male Asian
Male Coloured
Male White
Total Grand Total
00 72 1293 0 11 37 1341 271 1 6 14 292 1,705
01 166 18588 249 1712 251 20800 8440 105 1274 237 10056 31,022
02 126 35411 763 2369 363 38906 31318 855 2186 403 34762 73,794
03 384 59477 615 4912 854 65858 41759 839 3866 751 47215 113,457
04 99 30574 296 2729 843 34442 17636 362 1804 444 20246 54,787
05 522 92971 2423 11485 5648 112527 77350 2066 8346 1961 89723 202,772
06 163 64170 2361 8253 7673 82457 57525 2577 5465 2572 68139 150,759
07 733 147267 5355 13423 20498 53537 75306 3290 6590 6340 91526 278,802
08 70 62830 2377 6808 10292 82307 59708 3495 8093 13350 84646 167,023
09 101 55962 3645 7214 12093 78914 33301 2796 4989 7236 48322 127,337
10 96 22956 1747 2628 5673 33004 15753 1574 1896 5303 24526 57,626
11 68 8771 1063 1032 2749 13615 11864 1105 1640 3949 18558 32,241
12 39 4942 790 535 1833 8100 7325 946 881 2742 11894 20,033
13 9 2300 361 258 863 3782 3588 486 397 1229 5700 9,491
14 3 692 106 96 315 1209 1142 164 171 584 2061 3,273
15 2 231 69 29 143 472 463 178 52 372 1065 1,539
16 1 81 12 9 45 147 205 31 21 254 511 659
Grand-Total
2654 608516 22232 63503 70173 764424 442954 20870 47677 47741 559242 1,326,320
Level 00: Temporary employment, more especially Adult Basic Education teachers.
There are more women in the lower salary levels, but from level 11 men’s representation is higher
than that of women. This high representation of women at lower salary levels and low
representation from salary level 11 is noted in all racial groups. This means that men of all racial
groups have more advantages of representation at higher salary levels than their female
counterparts.
4. REPRESENTATION BY AGE
The graph in figure 3 below shows the age spread in the Public Service. Currently, there is a higher
concentration of officials in the higher age bracket than the lower end. Compared to the national
age demographics of SA, there should be more young people than is currently the case. This graph
becomes more worrying when read with Figure 22 of this report which shows that in the year 2000,
youth constituted 37% of the Public Service workforce. This figure now (March 2014) stands at 26%;

| 15
Figure 21 also shows that there has been a year on year gradual decline of youth employment in the
Public Service from 2000 to March 2013. This decline was highlighted to Cabinet for noting during
the presentation of the 2011-12 report. Middle-aged employees are more than the number of young
people and this raises a concern as this is the group that is in senior positions and is approaching
retirement age; if the number of youths in the Public Service across all levels is not increased and
sustained, there is likely to be a leadership vacuum as older employees retire. Currently, youths
constitute 5.6% of the SMS cohort
Figure 2: Representation by age
Figure 3 Representation by age and gender
The graph above shows that there are more women represented in all age groups except in the 70-
85+ bracket and this is very significant because these employees are mostly judges, retired
professors and special advisors to Ministers and the President and Deputy. That there is an unequal
representation of women in this category of employment means that women who manage to reach
the top do not necessarily enjoy the same prestige as men on retirement. When they retire, they
0.00%
2.00%
4.00%
6.00%
8.00%
10.00%
12.00%
14.00%
16.00%
18.00%
15
to
19
20
-24
25
-29
30
-34
35
-39
40
-44
45
-49
50
-54
55
-59
60
-64
65
-69
70
-74
75
-79
80
-84
85
+
Un
kno
wn
Representation by age
0% 10% 20% 30% 40% 50% 60% 70% 80% 90%
100%
Female
Male

| 16
have less access to prestigious posts and one could argue that the average woman in the Public
Service retires poorer than their male counterpart. These positions also include prestigious advisory
bodies in Africa such as the Elders, Eminent persons in the continent all consist of men and this
supports what the graph above illustrates.
5. REPRESENTATION OF PEOPLE WITH DISABILITIES (as at March 2014)
Out of the 1 326 320 Public Service Workforce, people with disabilities were 7 237 of which Africans
constitute 4 757 (66%); Asians 235 (3%); Coloureds 574 (8%) and Whites 1 671 (23%). These figures
show that in the case of people with disabilities, the representation of Africans is lower than their
demography while the representation of Whites is higher than their demography. Only the
representation of Asians and Coloureds corresponds with their demographics. This anomaly with the
demographics of Africans and Whites within the disabled employees group is not surprising because
until recently, not many disabled African people were able to access education, training and skills
development opportunities that would enable them to find employment in the Public Service or
even in the open labour market. Most of these training opportunities and facilities, some of which
were state subsidised were more readily available to Whites- hence their higher representation in
the workplace.
This phenomenon repeats itself in the private sector too as has been highlighted by the Commission
for Employment Equity 14th Annual Report of 2013-14 under Chapter 5: Analysis of Employment
Equity Reports Received in 2013 "White representation is the highest among people with disabilities
at the Top Management level in almost all provinces". The challenge for the Public Service is to
ensure that employment equity targets for disability are met as government is the custodian of
transformation policies and legal frameworks and must take the lead in the implementation.

| 17
Figure 4: Representation of people with disabilities by race
Figure 5: Representation of people with disabilities by gender and race
Asian and White women have the highest representation at 48% each followed by African women
with disabilities at 46% and Coloured employees with the lowest representation of women with
disabilities at 41%. Of note though is the fact that Coloured males have the highest representation
of all groups in this category of employees. These statistics also illustrate an additional
challenge/barrier for females with disabilities which is that, although females are in the majority in
the Public Service at 57%, this does not apply to disabled women who experience access to
employment as still difficult. While the disability sector in general struggles with access to
employment, for women it is more so.
African , 66%
Asian, 3%
Coloured, 8%
White, 23%
0%
10%
20%
30%
40%
50%
60%
African Asian Coloured White
Female
Male
| 18
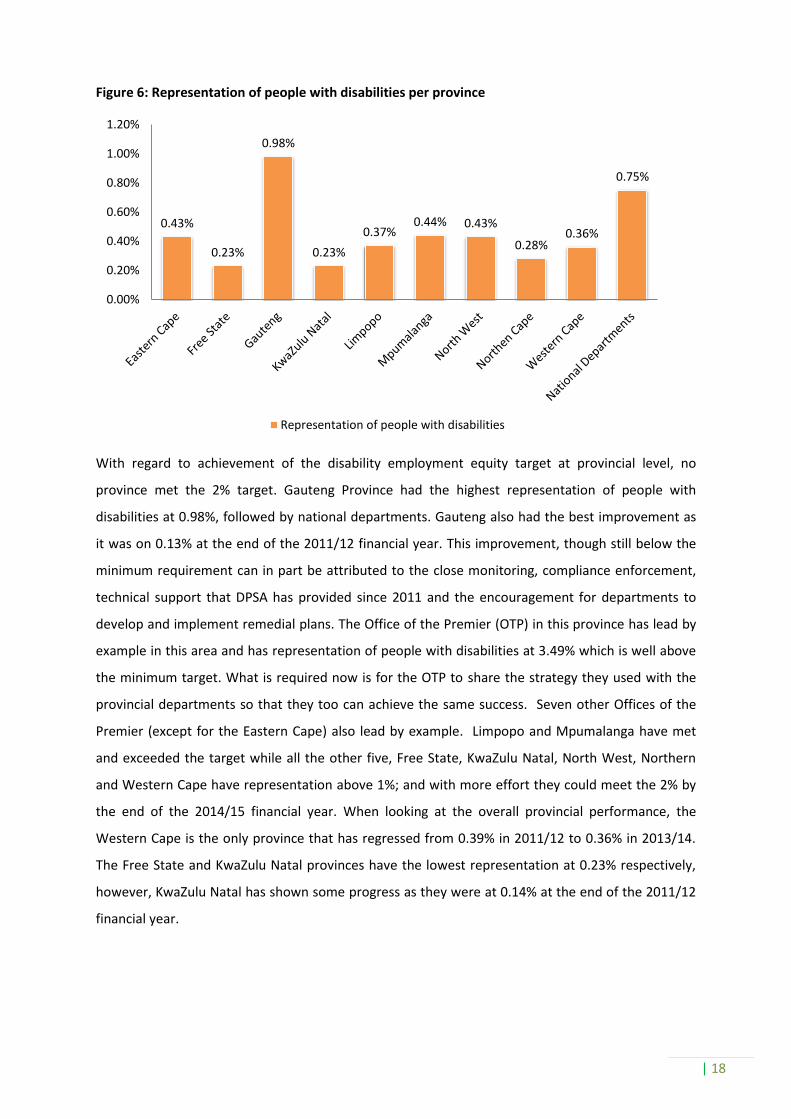
Figure 6: Representation of people with disabilities per province
With regard to achievement of the disability employment equity target at provincial level, no
province met the 2% target. Gauteng Province had the highest representation of people with
disabilities at 0.98%, followed by national departments. Gauteng also had the best improvement as
it was on 0.13% at the end of the 2011/12 financial year. This improvement, though still below the
minimum requirement can in part be attributed to the close monitoring, compliance enforcement,
technical support that DPSA has provided since 2011 and the encouragement for departments to
develop and implement remedial plans. The Office of the Premier (OTP) in this province has lead by
example in this area and has representation of people with disabilities at 3.49% which is well above
the minimum target. What is required now is for the OTP to share the strategy they used with the
provincial departments so that they too can achieve the same success. Seven other Offices of the
Premier (except for the Eastern Cape) also lead by example. Limpopo and Mpumalanga have met
and exceeded the target while all the other five, Free State, KwaZulu Natal, North West, Northern
and Western Cape have representation above 1%; and with more effort they could meet the 2% by
the end of the 2014/15 financial year. When looking at the overall provincial performance, the
Western Cape is the only province that has regressed from 0.39% in 2011/12 to 0.36% in 2013/14.
The Free State and KwaZulu Natal provinces have the lowest representation at 0.23% respectively,
however, KwaZulu Natal has shown some progress as they were at 0.14% at the end of the 2011/12
financial year.
0.43%
0.23%
0.98%
0.23%
0.37% 0.44% 0.43%
0.28% 0.36%
0.75%
0.00%
0.20%
0.40%
0.60%
0.80%
1.00%
1.20%
Representation of people with disabilities
| 19
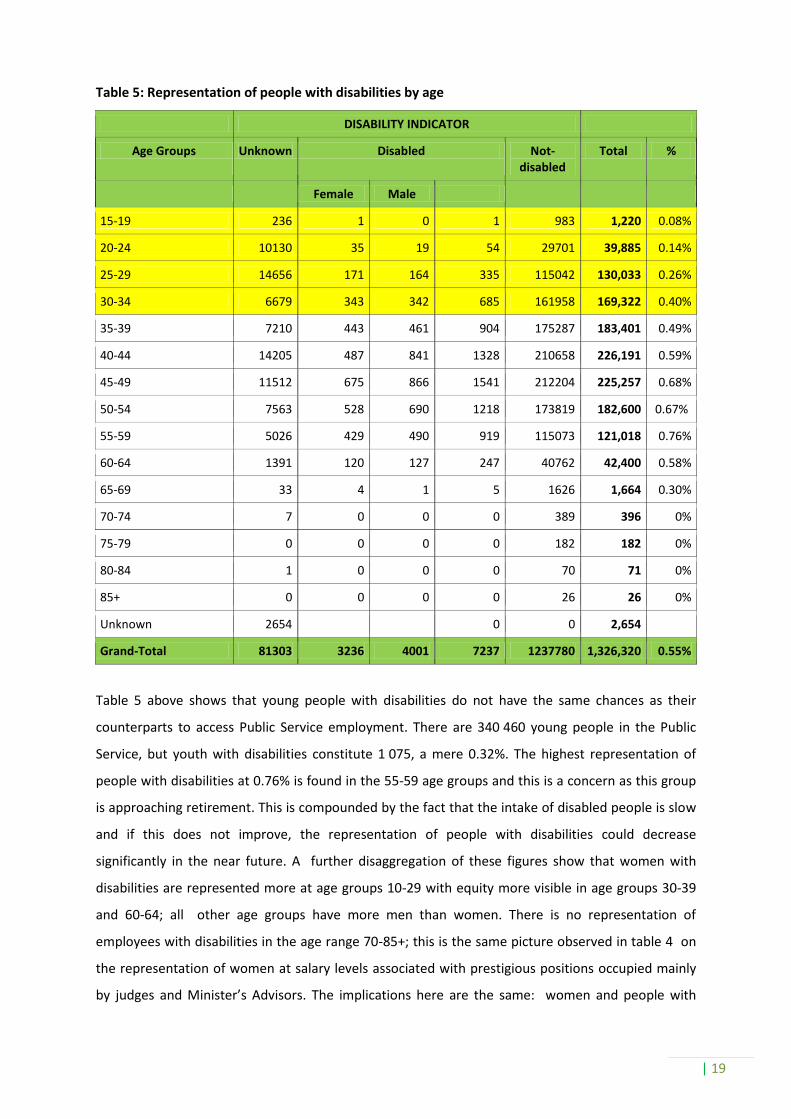
Table 5: Representation of people with disabilities by age
DISABILITY INDICATOR
Age Groups Unknown Disabled Not-disabled
Total %
Female Male
15-19 236 1 0 1 983 1,220 0.08%
20-24 10130 35 19 54 29701 39,885 0.14%
25-29 14656 171 164 335 115042 130,033 0.26%
30-34 6679 343 342 685 161958 169,322 0.40%
35-39 7210 443 461 904 175287 183,401 0.49%
40-44 14205 487 841 1328 210658 226,191 0.59%
45-49 11512 675 866 1541 212204 225,257 0.68%
50-54 7563 528 690 1218 173819 182,600 0.67%
55-59 5026 429 490 919 115073 121,018 0.76%
60-64 1391 120 127 247 40762 42,400 0.58%
65-69 33 4 1 5 1626 1,664 0.30%
70-74 7 0 0 0 389 396 0%
75-79 0 0 0 0 182 182 0%
80-84 1 0 0 0 70 71 0%
85+ 0 0 0 0 26 26 0%
Unknown 2654 0 0 2,654
Grand-Total 81303 3236 4001 7237 1237780 1,326,320 0.55%
Table 5 above shows that young people with disabilities do not have the same chances as their
counterparts to access Public Service employment. There are 340 460 young people in the Public
Service, but youth with disabilities constitute 1 075, a mere 0.32%. The highest representation of
people with disabilities at 0.76% is found in the 55-59 age groups and this is a concern as this group
is approaching retirement. This is compounded by the fact that the intake of disabled people is slow
and if this does not improve, the representation of people with disabilities could decrease
significantly in the near future. A further disaggregation of these figures show that women with
disabilities are represented more at age groups 10-29 with equity more visible in age groups 30-39
and 60-64; all other age groups have more men than women. There is no representation of
employees with disabilities in the age range 70-85+; this is the same picture observed in table 4 on
the representation of women at salary levels associated with prestigious positions occupied mainly
by judges and Minister’s Advisors. The implications here are the same: women and people with

| 20
disabilities are not equally represented as men without disabilities at this level when they reach
retirement. One could argue that they are discriminated against and deprived of opportunities to
continue to enjoy a good quality of life post retirement- even if they qualified.
Table 6: Representation of people with disabilities per salary level
DISABILITY INDICATOR
Salary Level - Notch Unknown Disabled Not-disabled Total %
00 72 0 1633 1,705 0%
01 252 41 30729 31,022 0.13%
02 8613 281 64900 73,794 0.38%
03 4192 476 108789 113,457 0.42%
04 459 398 53930 54,787 0.73%
05 10076 1182 191514 202,772 0.58%
06 20943 863 128953 150,759 0.57%
07 16764 1237 260801 278,802 0.44%
08 8490 1211 157322 167,023 0.73%
09 4788 786 121763 127,337 0.62%
10 3876 287 53463 57,626 0.50%
11 2364 201 29676 32,241 0.62%
12 214 154 19665 20,033 0.77%
13 133 80 9278 9,491 0.84%
14 55 28 3190 3,273 0.86%
15 9 10 1520 1,539 0.65%
16 3 2 654 659 0.30%
Grand-Total 81303 7237 1237780 1,326,320 0.55%
Level 00: Temporary employment, more especially Adult Basic Education teachers.
The table above shows that representation of people with disabilities is above 0.70% at levels 04, 08,
12, 13 and 14. This trend shows that the recruitment of people with disabilities at entry levels is low.
At levels 13 and 14 the percentage increases to 0.84% and 0.86% respectively which is the highest
and very encouraging as it means disabled people are not only employed at low levels and if the
recruitment pace was to be increased fast enough for the Public Service to reach the 2% target,
people with disabilities would be appointed across all levels of the service. The performance of
Limpopo Province in this regard is impressive as they have met the 2% target for levels 13-16.
Throughout the Public Service, there are only two people with disabilities at level 16.
| 21
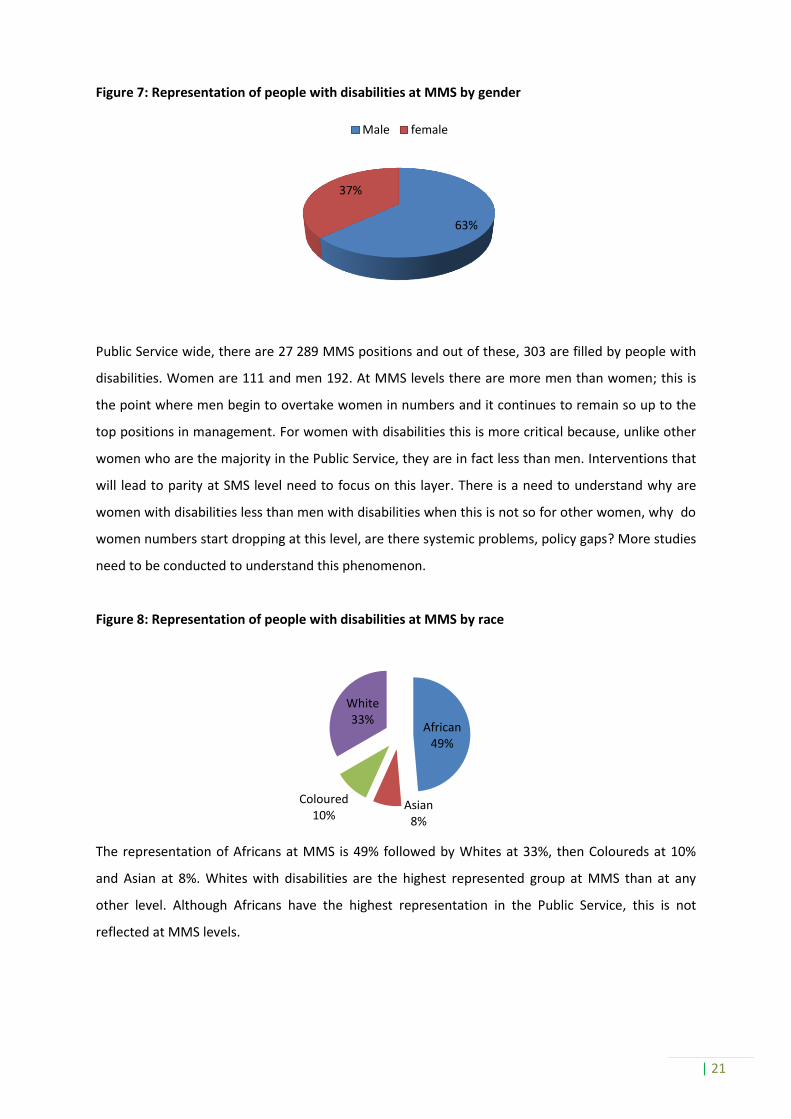
Figure 7: Representation of people with disabilities at MMS by gender
Public Service wide, there are 27 289 MMS positions and out of these, 303 are filled by people with
disabilities. Women are 111 and men 192. At MMS levels there are more men than women; this is
the point where men begin to overtake women in numbers and it continues to remain so up to the
top positions in management. For women with disabilities this is more critical because, unlike other
women who are the majority in the Public Service, they are in fact less than men. Interventions that
will lead to parity at SMS level need to focus on this layer. There is a need to understand why are
women with disabilities less than men with disabilities when this is not so for other women, why do
women numbers start dropping at this level, are there systemic problems, policy gaps? More studies
need to be conducted to understand this phenomenon.
Figure 8: Representation of people with disabilities at MMS by race
The representation of Africans at MMS is 49% followed by Whites at 33%, then Coloureds at 10%
and Asian at 8%. Whites with disabilities are the highest represented group at MMS than at any
other level. Although Africans have the highest representation in the Public Service, this is not
reflected at MMS levels.
63%
37%
Male female
African 49%
Asian 8%
Coloured 10%
White 33%

| 22
Figure 9: Representation of people with disabilities at SMS by gender
During this reporting period, there were 9 368 SMS positions of which, 102 were filled by people
with disabilities consisting of 31 women and 71 men. Men with disabilities enjoy more
representation at SMS than their women counterparts at 70/30 which correlates with the overall
representation of women and men without disabilities at SMS. Again, gender disparity in this group
is evident; women with disabilities do not have the same opportunities as men with disabilities.
Figure 10: Representation of people with disabilities at SMS by race
Africans with disabilities are 53%, followed by Whites at 32%, then Asians at 9% and lastly Coloureds
at 6%. The graph above may seem to suggest that there are more Africans than any other race group
with disabilities at SMS; truth about it is that the figure does not correlate with the population size
or percentage in relation to the entire workforce. Whites with disabilities form 30% of the SMS
workforce- a very high figure that shows that White people with disabilities have a better chance of
getting appointed at or promoted to SMS levels.
Female
Male
0%
10%
20%
30%
40%
50%
60%
African Asian Coloured White
Representation of people with disabilities at SMS by race

| 23
Figure 11: Representation of people with disabilities at SMS by race and gender
Only Coloured employees with disabilities are equally represented at SMS levels, while White and
African men with disabilities are the highest at 79% and 70% respectively which makes the
representation of their counterparts 21% and 30% respectively. Asian men with disabilities are
represented at 56%, higher than their female counterparts. This also shows that a White man has a
better chance than any man in other race groups of getting appointed or promoted to SMS.
Figure 12: Representation of people with disabilities at all levels of SMS
The highest representation of employees with disabilities is found at level 13, followed by level 14,
then 15 and there is no employee with disabilities at DG level.
0%
10%
20%
30%
40%
50%
60%
70%
80%
African Asian Coloured White
Women
Men
72%
19%
9% 0%
13 14 15 16

| 24
Table 7: Representation of people with disabilities at SMS by age
Age Groups Disabled Not-disabled Total %
25-29 0 45 45 0%
30-34 0 478 478 0%
35-39 6 1360 1,366 0.44%
40-44 18 1931 1,949 0.92%
45-49 30 1979 2,009 1.49%
50-54 17 1751 1,768 0.96%
55-59 16 1188 1,204 1.35%
60-64 13 462 475 2.74%
65-69 2 55 57 3.51%
70-74 0 12 12 0%
75-79 0 5 5 0%
Grand-Total 102 (1.09%) 9266 9,368 %
In the youth category 25-34 there is no employee with disability and the highest representation
which has even surpassed the 2% minimum target is in age groups 65-69 at 3.51%; followed by 60-
64 at 2.74%. This either reflects that employees with disabilities find it difficult to get appointed or
promoted at a young age whereas there are 523 young people at SMS; or the Public Service is only
willing to recruit older people with disabilities and it’s easier for them to get promoted.
Table 8: Representation of people with disabilities at SMS per province
Province Disabled Not-disabled Total %
Eastern Cape 11 659 670 1.6%
Free State 1 327 328 0.3%
Gauteng 5 731 736 0.7%
KZN-Natal 3 571 574 0.5%
Limpopo 10 480 490 2%
Mpumalanga 6 325 331 1.8%
National Department 58 5226 5,284 1.1%
North West 4 312 316 1.2%
Northern Cape 2 252 254 0.8%
Western Cape 2 383 385 0.5%
Grand-Total 102 (1.09%) 9266 9,368
Mpumalanga, the Eastern Cape and Limpopo provinces have the highest number of employees with
disabilities at SMS levels. Limpopo has met the 2% target at this level.
| 25
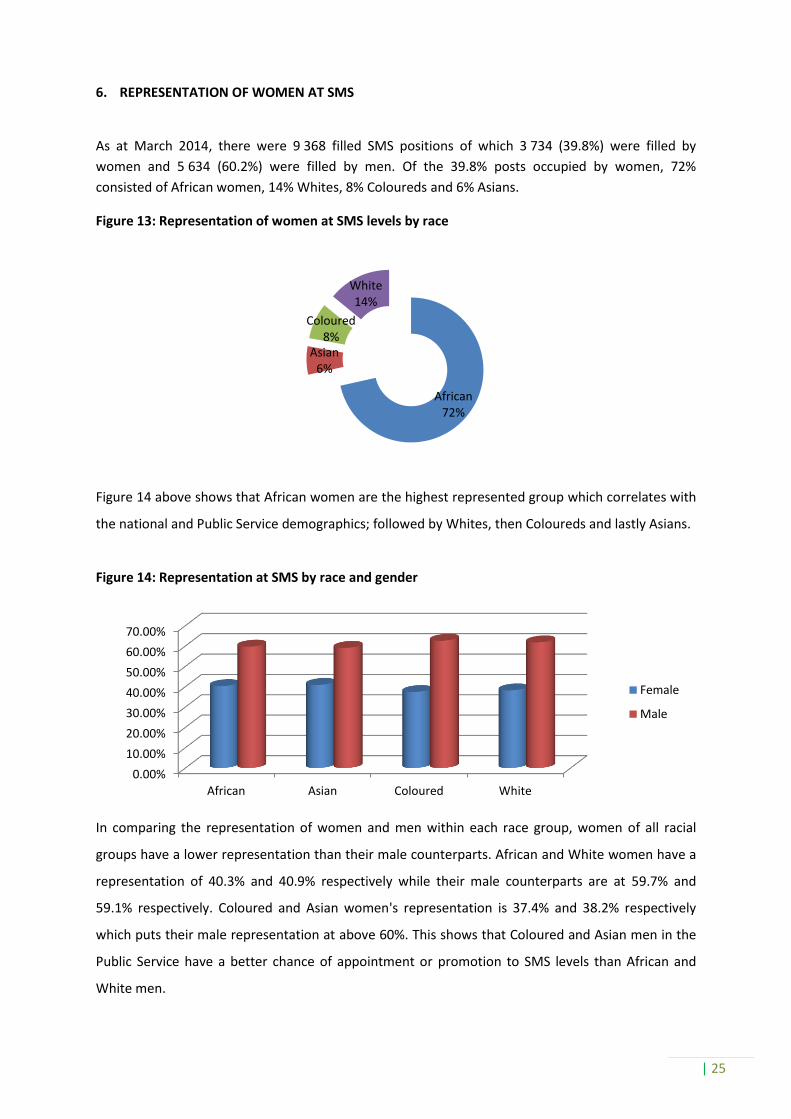
6. REPRESENTATION OF WOMEN AT SMS
As at March 2014, there were 9 368 filled SMS positions of which 3 734 (39.8%) were filled by
women and 5 634 (60.2%) were filled by men. Of the 39.8% posts occupied by women, 72%
consisted of African women, 14% Whites, 8% Coloureds and 6% Asians.
Figure 13: Representation of women at SMS levels by race
Figure 14 above shows that African women are the highest represented group which correlates with
the national and Public Service demographics; followed by Whites, then Coloureds and lastly Asians.
Figure 14: Representation at SMS by race and gender
In comparing the representation of women and men within each race group, women of all racial
groups have a lower representation than their male counterparts. African and White women have a
representation of 40.3% and 40.9% respectively while their male counterparts are at 59.7% and
59.1% respectively. Coloured and Asian women's representation is 37.4% and 38.2% respectively
which puts their male representation at above 60%. This shows that Coloured and Asian men in the
Public Service have a better chance of appointment or promotion to SMS levels than African and
White men.
African 72%
Asian 6%
Coloured 8%
White 14%
0.00%
10.00%
20.00%
30.00%
40.00%
50.00%
60.00%
70.00%
African Asian Coloured White
Female
Male

| 26
Figure 15: Representation at SMS per salary level by race
Africans are the highest represented racial group at all levels of SMS, followed by Whites, then
Coloured and Asians. The highest representation of Africans is at DG level which is above 70%.
Asians have the highest representation at levels 14 and 15; Coloureds at 14 Whites level 13.
Figure 16: Representation of women at SMS per salary levels by race
African and White women are represented more at level 13, but the representation declines from
level 14-16. Asian women are represented more at levels 13 and 15 and lower in level 14 and very
low at level 16. Coloured women are represented more at the first three levels, but lower at level 16.
0%
10%
20%
30%
40%
50%
60%
70%
80%
African Asian Coloured White
13
14
15
16
0%
5%
10%
15%
20%
25%
30%
African Asian
Coloured
White
13
14
15
16

| 27
Figure 17: Representation of women per SMS salary level by gender
Figure 18 above shows that males have a high representation in all levels of SMS at an average of
above 60%, with the highest at level 16 which is above 70%. Figure 19 below further illustrates the
gap that exists at DG level between men and women.
Figure 18
0%
10%
20%
30%
40%
50%
60%
70%
80%
13 14 15 16
Famale
Male
0%
50%
100%
16
26%
74%
Women Men

| 28
Table 9: Representation of women at SMS per province and gender
Province Female Male Total % Ranking
Eastern Cape 256 414 670 38.2% 5
Free State 102 226 328 31.1% 10
Gauteng 322 414 736 43.7% 1
KZN-Natal 232 342 574 40.4% 3
Limpopo 196 294 490 40% 4
Mpumalanga 119 212 331 35.9% 7
National Department 2166 3118 5,284 40.9% 2
North West 112 204 316 35.4% 8
Northern Cape 88 166 254 34.6% 9
Western Cape 141 244 385 36.6% 6
Grand-Total 3734 5634 9,368 100.00%
Good progress was noted in Gauteng, KwaZulu Natal, Limpopo and national departments with
women at above 40%. The lowest representation of women at SMS was found in the Free State and
similarly, this is the province with the highest number of departments with representation of women
at SMS below 30% (see Annexure A). This is a serious concern which will have to be addressed and
monitored.
Table 10: Representation of women at SMS by age, race and gender
Male Female
Age Groups White Asian Coloured African White Asian Coloured African Male Total Female Total Total
25-29 2 1 0 16 2 1 2 21 19 26 45
30-34 22 16 11 175 15 22 15 202 224 254 478
35-39 44 31 35 563 39 53 43 558 673 693 1,366
40-44 93 59 99 872 115 65 64 582 1,123 826 1,949
45-49 147 75 142 903 117 51 80 494 1,267 742 2,009
50-54 165 88 120 760 108 28 47 452 1,133 635 1,768
55-59 219 62 58 481 76 13 32 263 820 384 1,204
60-64 118 13 24 166 38 7 10 99 321 154 475
65-69 14 2 1 22 5 1 0 12 39 18 57
70-74 4 1 0 5 0 0 0 2 10 2 12
75-79 1 0 0 4 0 0 0 0 5 0 5
Grand-Total 829 348 490 3967 515 241 293 2685 5,634 3,734 9,368
| 29
In the age group of 25-34 there are 523 employees at SMS, and this only comprises 5.6% of the total
SMS cohort. There are more women than men in the youth category. Whites and Africans are
represented in high numbers in the youth category. The highest number of employees at SMS is
found in the age group 45-64. It should be recalled that earlier in this report there was mention of
the attrition rate of youths at SMS; if you consider that factor and the concentration of SMS in the
45-64 age cohort, the need to manage this well to avoid a future leadership vacuum becomes
important.
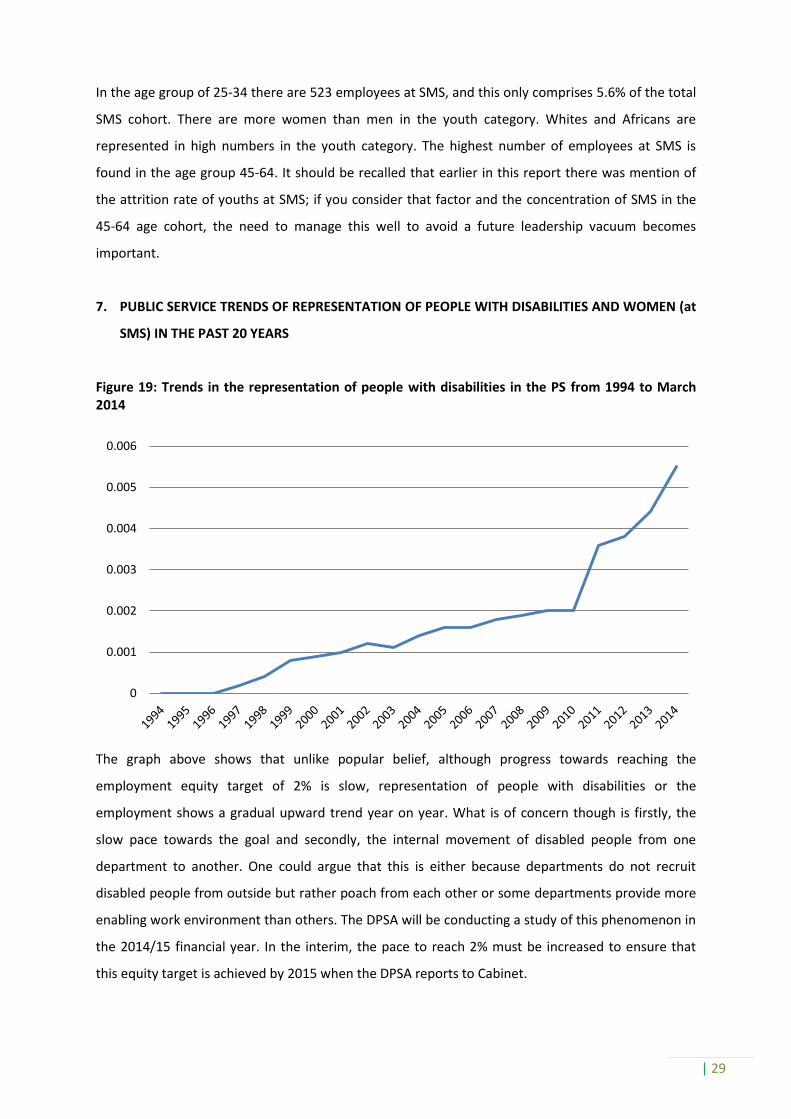
7. PUBLIC SERVICE TRENDS OF REPRESENTATION OF PEOPLE WITH DISABILITIES AND WOMEN (at
SMS) IN THE PAST 20 YEARS
Figure 19: Trends in the representation of people with disabilities in the PS from 1994 to March 2014
The graph above shows that unlike popular belief, although progress towards reaching the
employment equity target of 2% is slow, representation of people with disabilities or the
employment shows a gradual upward trend year on year. What is of concern though is firstly, the
slow pace towards the goal and secondly, the internal movement of disabled people from one
department to another. One could argue that this is either because departments do not recruit
disabled people from outside but rather poach from each other or some departments provide more
enabling work environment than others. The DPSA will be conducting a study of this phenomenon in
the 2014/15 financial year. In the interim, the pace to reach 2% must be increased to ensure that
this equity target is achieved by 2015 when the DPSA reports to Cabinet.
0
0.001
0.002
0.003
0.004
0.005
0.006

| 30
Figure 20: Distribution of women within the Senior Management in the PS from 1995 till 2013
The graph above provides an almost similar pattern with a better pace than with disability. Between
1995 and 2013, the number of women at SMS has gradually increased as the male trajectory has
declined to close the gap towards parity. It is important that this upward trajectory is increased to
ensure that parity is reached by 2015 when the DPSA has to report progress to Cabinet. So far,
nineteen (19) departments have met the 50% equity targets while 57 have representation between
40-49%. A total of 54 departments have representation between 30-39% while 24 departments have
representation of women below 30% (See Annexure A for details). There are more departments
closer to reaching parity than those 27 departments which are below 30%; this makes the
achievement of parity by 2015 possible!
8% 13%
17% 20%
24% 29%
33% 35% 37% 40%
92% 87%
83% 80%
76% 71%
67% 65% 63% 60%
0%
10%
20%
30%
40%
50%
60%
70%
80%
90%
100%
1995 1997 1999 2001 2003 2005 2007 2009 2011 2013
% d
istr
ibu
tio
n b
y ge
nd
er in
th
e se
nio
r m
anag
eme
nt
Women
Male

| 31
Figure 21: Representation of youth March 2000-March 2014
Because youth representation in the Public Service was not recorded before 2000, the figure above
reflects this dimension over fourteen years. Unlike trends for the representation of women and
people with disabilities that show increases yearly, the representation of youth shows a decline that
is concerning and in need of attention. The DPSA will be conducting a study during the 2014/15
financial year to understand why the Public Service is losing young people across all levels. The study
will then inform strategies to be developed to arrest the leadership pipeline leaks.
Table 11: Compliance with equity targets per province as at 31 March 2014
TRENDS EC FS GP KZN LMP MPU NAT NW NC WC TOTAL
Number of departments that met the 50% target 1 0 4 3 1 2 5 1 0 2 19
Number of departments between 40-49% 5 3 7 3 8 1 25 2 3 0 57
Number of departments between 30-39% 3 3 3 8 2 4 10 8 5 8 54
Number of departments below 30% 4 6 0 0 1 5 0 1 4 3 24
Number of departments that met the 2% target 1 1 2 0 3 3 9 4 1 1 25
Number of departments between 1-1.9% 5 2 4 6 4 7 14 3 5 6 56
Number of departments below 1% 7 9 8 8 5 2 17 5 6 6 73
The DPSA is encouraged by progress made by departments in the efforts towards reaching gender
parity- the goal is within reach. Nineteen departments have met the 50% equity targets while 57
have representation between 40-49%. A total of 54 departments have representation between 30-
39% while 24 departments have representation of women below 30% (See Annexure A for details).
A total of 25 departments have met the 2% target for the representation of people with disabilities;
56 departments have representation between 1-1.9% and 73 have representation below 1% (See
37% 34%
30% 29% 27% 27% 27% 27% 27% 28% 28% 28% 27% 26% 26%
2000 2001 2002 2003 2004 2005 2006 2007 2008 2009 2010 2011 2012 2013 2014
Series 1

| 32
Annexure A for details). Again, the DPSA is encouraged by the number of departments that are
working very hard to achieve this equity goal and we are confident that this goal will be achieved in
2015.
More encouraging are those departments doing well in both equity targets. These are departments
that have either met both targets and those that have representation between 40-49% and between
1-1.9%. In the Eastern Cape they are three ; Gauteng three, KwaZulu Natal three, Limpopo five,
Mpumalanga two, national departments 19, North West two, the Northern Cape two and one in the
Western Cape.
In total, 39 departments are on the right track and four have met both the 2% and 50% targets.
These are; National Department of Women, Children and People with Disabilities and PALAMA
(currently know as National School of Government); Limpopo Department of Public Works; and
North West Department of Economic Development, Environment and Tourism. These are our good
practice models that are applauded and for other departments to learn from. (See Annexure A for
details). It is also worth mentioning that the National School of Government (PALAMA) is the only
department that has maintained both targets since 2011/12.
There are departments that are either doing well on the representation of women at SMS, but not
on the representation of people with disabilities or vice versa. Others achieve the targets one year
and drop in the next year- this often happens when departments did not consciously address the
equity target that is on track, but got there by coincidence. This has been noticed over the past three
years from departments that met either of the targets, but within a year had regressed to below
50%, but maintained the 2% target. Such departments are: Government Communications
Information System who in the 2011/2012 met and exceeded the 50%, but in 2013/14 found
themselves at 44.9%, The National Department of Tourism was also above 50% in 2011/12, but in
2013/14 they are at 48.4%.
Another observation made is that departments that are doing well with equity targets, also do well
in areas such as creating an enabling environment. The National Department of Tourism,
Department of Science and Technology, Department of Home Affairs, Department of Trade and
Industry and the North West Department of Economic Development, Environment and Tourism, are
some of the few that have been providing reasonable accommodation for women and people with
disabilities.

| 33
8. CONCLUSION
The Public Service is committed to meeting equity targets as shown by the development of various
policies to create an enabling environment, but achieving the goals of gender parity and 2%
employment equity for disabled people has still not happened. After 20 years of democracy, the
equitable representation of people with disabilities has not been achieved- their representation is
just slightly above half a percentage point (0.55%) of the required 2% minimum target. The Public
Service needs to close the 1.45% gap by the end of 2015.
The representation of women at SMS improved annually by a percentage point and is currently at
39.8%. Although the parity target has not been reached, signs are encouraging because at this point,
nineteen (19) departments have met the 50% equity targets while 57 have representation between
40-49%. A total of 54 departments have representation between 30-39% while 24 departments have
representation of women below 30%. The DPSA will be monitoring departments closely and
ensuring that there is compliance. The achievement of this goal is not only key to transformation of
the Public Service, it is also key to the implementation of the National Development Plan to build an
effective and efficient Public Service: “To build a skilled and professional public service, we need to
attract talented people from a diverse range of backgrounds” (NDP, p 372). Women and people with
disabilities bring this diversity that the Public Service can benefit from.
At the end of March 2012 the representation of women and men in the Public Service was 760 501
(57.29%) women and 567 047 (42.71%) men. This number increased to 764 424 (57.6%) women and
561 896 (42.4%) men. At the end of the 2011/12 financial year there were 8 434 filled SMS positions
of which 3 220 (38.1%) were women and 5 214 (61.8%) men and at the end of the 2013/14 financial
year, there were 9 368 SMS positions of which 3734 (39.8%) were women and 5 634 (60.2%) were
men. The concentration of women at entry level raised last year has not changed.

| 34
Figure 22: Representation by gender in the PS Figure 23: Representation by gender at SMS
Figure 23 above summarises the reflection throughout the report on the high number of women in
the Public Service, but in figure 24, the number of women at SMS levels is very low.
On the question of youth employment, the declining representation of youth in the Public Service is
a cause for concern. For a country that has a large percentage of young people in the population,
this must be reflected in the workplace, including the Public Service. This report has shown that at
SMS level, there is a high percentage of middle aged to pre-retirement officials who when coupled
with the decline of youths at this level could in the medium to long term pose a serious leadership
risk in the Public Service. Youth employment will not only prevent a leadership vacuum, but could
improve the efficiency and efficacy of government as young people could bring in energy, positivity
and innovation which the Public Service needs to deliver service to the citizens.
Some of the systems, practices and processes of the Public Service need young minds as envisaged
by the NDP; “At the top, recruitment and management should be based on experience and
expertise, while at junior levels, the state needs to focus on producing the skills and expertise that
will be necessary for future public service cohorts” (NDP, p 365-366). It further states that; “To
improve capacity and performance, we need a strategy that will not only attract young people with
potential, but also retain them by developing their skills and sustaining their morale” (p272-273).
9. RECOMMENDATIONS
9.1 One of the decisions made by Cabinet at the presentation of the 2011/12 annual report was for
HODs to be held accountable for meeting equity targets in their departments during their
performance assessment. To implement this decision, the DPSA included this recommendation
in the review of PMDS for HODs; this process was delayed and to date, this decision has not
been officially implemented. This outstanding task will be implemented this year;
Male employees in the PS
42.4%
Female employees in the PS
57.6%
Male employees at SMS Levels
60.2%
Female employees at SMS Levels
39.8%

| 35
9.2 The Portfolio Committee on Public Service and Administration will be requested to include
accounting for equity targets in meetings they have with DGs and HODs from this financial year;
9.3 HODs whose departments do not achieve 50% representation of women at SMS and 2%
representation of people with disabilities must develop and continuously implement remedial
plans until the employment equity targets are met;
9.4 If a department has not met their targets, vacancies in departments should be filled in a way
that assists them to reach their targets;
9.5 Implementation of affirmative action programmes should be a priority until targets are met;
9.6 The National School of Government to include transformation in the induction programme
REFERENCES
14 Commission for Employment Equity Annual Report 2013-14
Convention on the Elimination of all forms of Discrimination against Women
National Development Plan
Republic of South Africa Constitution (Act 108 of 1996): Pretoria: Government Printers
Republic of South Africa Employment Equity Act No. 55 of 1998. Pretoria: Government
Printers
SADC Protocol on Gender and Development
Solemn Declaration on Gender Equality in Africa, adopted in 2004
Statistics South Africa (2013) Quarterly Labour Force Survey, Quarter 3, Pretoria
The Presidency (2012) National Development Plan-Vision 2030, Pretoria
United Nations Convention on the Rights of Persons with Disabilities
| 36
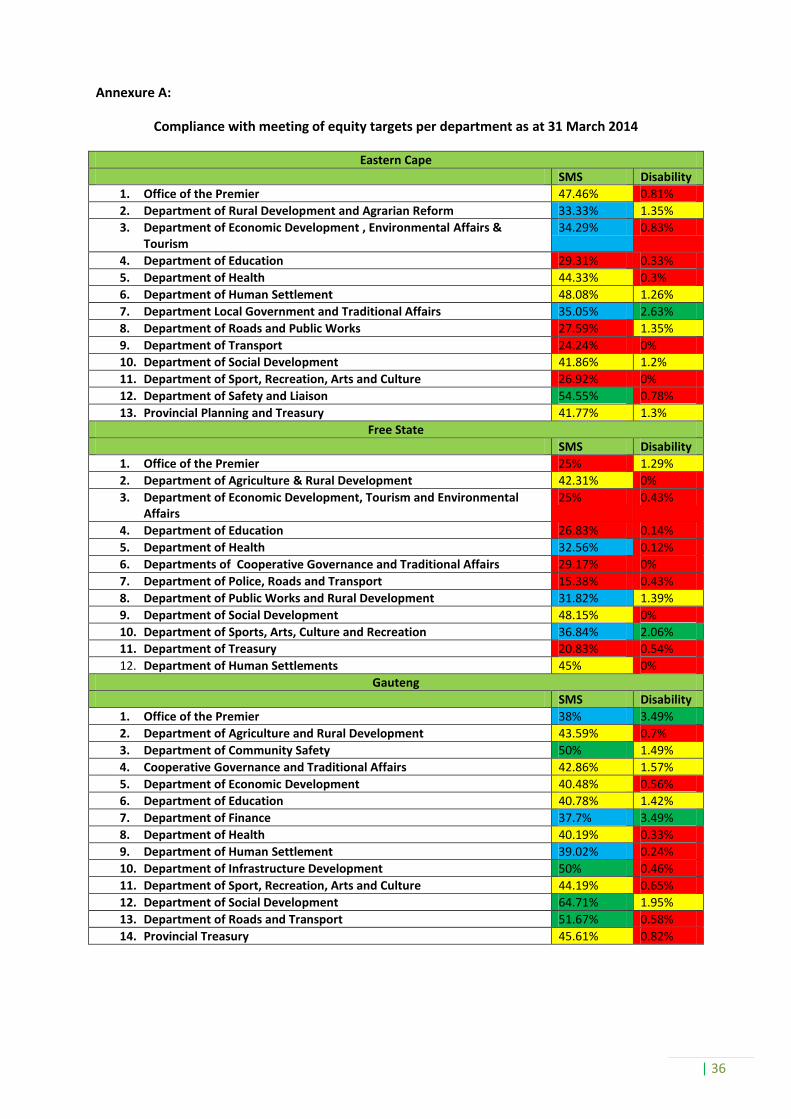
Annexure A:
Compliance with meeting of equity targets per department as at 31 March 2014
Eastern Cape
SMS Disability
1. Office of the Premier 47.46% 0.81%
2. Department of Rural Development and Agrarian Reform 33.33% 1.35%
3. Department of Economic Development , Environmental Affairs & Tourism
34.29% 0.83%
4. Department of Education 29.31% 0.33%
5. Department of Health 44.33% 0.3%
6. Department of Human Settlement 48.08% 1.26%
7. Department Local Government and Traditional Affairs 35.05% 2.63%
8. Department of Roads and Public Works 27.59% 1.35%
9. Department of Transport 24.24% 0%
10. Department of Social Development 41.86% 1.2%
11. Department of Sport, Recreation, Arts and Culture 26.92% 0%
12. Department of Safety and Liaison 54.55% 0.78%
13. Provincial Planning and Treasury 41.77% 1.3%
Free State
SMS Disability
1. Office of the Premier 25% 1.29%
2. Department of Agriculture & Rural Development 42.31% 0%
3. Department of Economic Development, Tourism and Environmental Affairs
25% 0.43%
4. Department of Education 26.83% 0.14%
5. Department of Health 32.56% 0.12%
6. Departments of Cooperative Governance and Traditional Affairs 29.17% 0%
7. Department of Police, Roads and Transport 15.38% 0.43%
8. Department of Public Works and Rural Development 31.82% 1.39%
9. Department of Social Development 48.15% 0%
10. Department of Sports, Arts, Culture and Recreation 36.84% 2.06%
11. Department of Treasury 20.83% 0.54%
12. Department of Human Settlements 45% 0%
Gauteng
SMS Disability
1. Office of the Premier 38% 3.49%
2. Department of Agriculture and Rural Development 43.59% 0.7%
3. Department of Community Safety 50% 1.49%
4. Cooperative Governance and Traditional Affairs 42.86% 1.57%
5. Department of Economic Development 40.48% 0.56%
6. Department of Education 40.78% 1.42%
7. Department of Finance 37.7% 3.49%
8. Department of Health 40.19% 0.33%
9. Department of Human Settlement 39.02% 0.24%
10. Department of Infrastructure Development 50% 0.46%
11. Department of Sport, Recreation, Arts and Culture 44.19% 0.65%
12. Department of Social Development 64.71% 1.95%
13. Department of Roads and Transport 51.67% 0.58%
14. Provincial Treasury 45.61% 0.82%
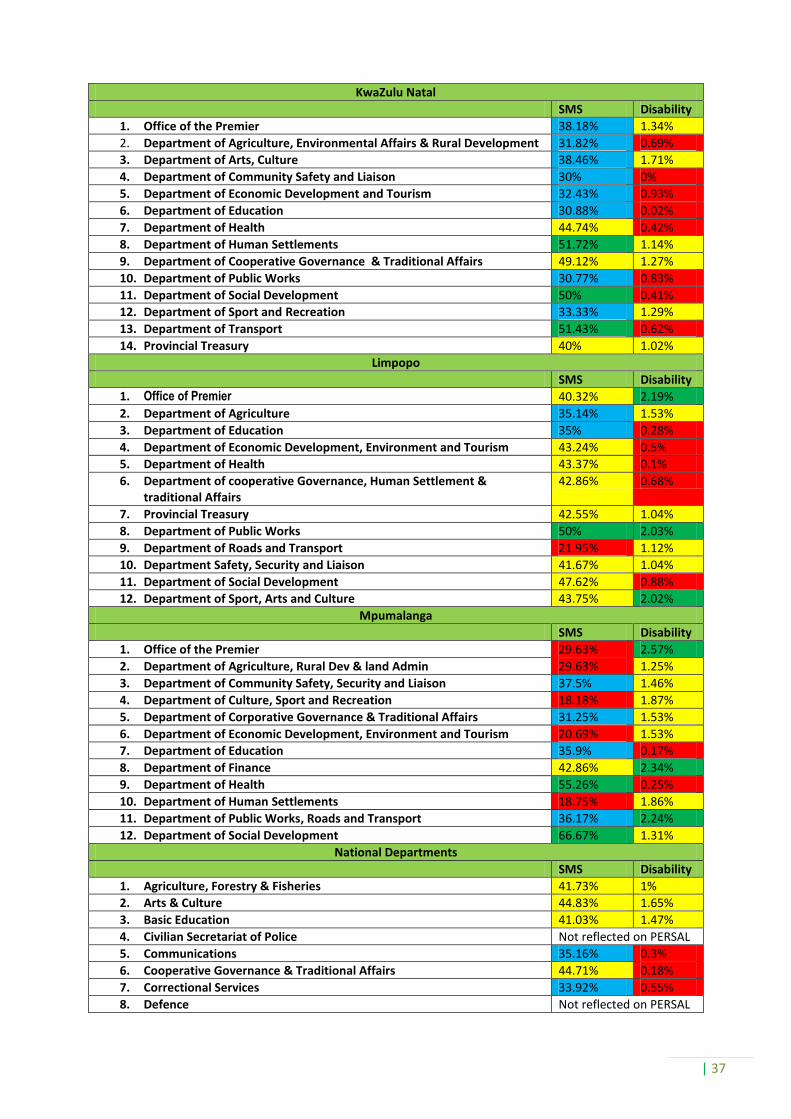
| 37
KwaZulu Natal
SMS Disability
1. Office of the Premier 38.18% 1.34%
2. Department of Agriculture, Environmental Affairs & Rural Development 31.82% 0.69%
3. Department of Arts, Culture 38.46% 1.71%
4. Department of Community Safety and Liaison 30% 0%
5. Department of Economic Development and Tourism 32.43% 0.93%
6. Department of Education 30.88% 0.02%
7. Department of Health 44.74% 0.42%
8. Department of Human Settlements 51.72% 1.14%
9. Department of Cooperative Governance & Traditional Affairs 49.12% 1.27%
10. Department of Public Works 30.77% 0.83%
11. Department of Social Development 50% 0.41%
12. Department of Sport and Recreation 33.33% 1.29%
13. Department of Transport 51.43% 0.62%
14. Provincial Treasury 40% 1.02%
Limpopo
SMS Disability
1. Office of Premier 40.32% 2.19%
2. Department of Agriculture 35.14% 1.53%
3. Department of Education 35% 0.28%
4. Department of Economic Development, Environment and Tourism 43.24% 0.5%
5. Department of Health 43.37% 0.1%
6. Department of cooperative Governance, Human Settlement & traditional Affairs
42.86% 0.68%
7. Provincial Treasury 42.55% 1.04%
8. Department of Public Works 50% 2.03%
9. Department of Roads and Transport 21.95% 1.12%
10. Department Safety, Security and Liaison 41.67% 1.04%
11. Department of Social Development 47.62% 0.88%
12. Department of Sport, Arts and Culture 43.75% 2.02%
Mpumalanga
SMS Disability
1. Office of the Premier 29.63% 2.57%
2. Department of Agriculture, Rural Dev & land Admin 29.63% 1.25%
3. Department of Community Safety, Security and Liaison 37.5% 1.46%
4. Department of Culture, Sport and Recreation 18.18% 1.87%
5. Department of Corporative Governance & Traditional Affairs 31.25% 1.53%
6. Department of Economic Development, Environment and Tourism 20.69% 1.53%
7. Department of Education 35.9% 0.17%
8. Department of Finance 42.86% 2.34%
9. Department of Health 55.26% 0.25%
10. Department of Human Settlements 18.75% 1.86%
11. Department of Public Works, Roads and Transport 36.17% 2.24%
12. Department of Social Development 66.67% 1.31%
National Departments
SMS Disability
1. Agriculture, Forestry & Fisheries 41.73% 1%
2. Arts & Culture 44.83% 1.65%
3. Basic Education 41.03% 1.47%
4. Civilian Secretariat of Police Not reflected on PERSAL
5. Communications 35.16% 0.3%
6. Cooperative Governance & Traditional Affairs 44.71% 0.18%
7. Correctional Services 33.92% 0.55%
8. Defence Not reflected on PERSAL
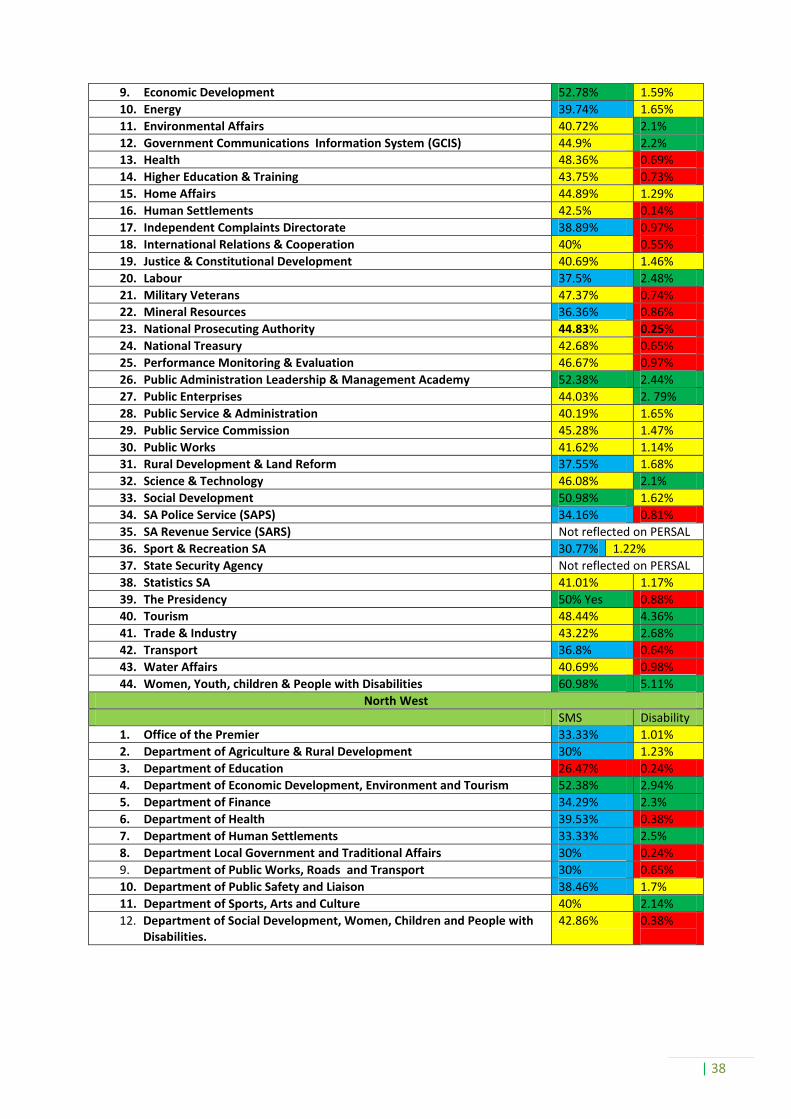
| 38
9. Economic Development 52.78% 1.59%
10. Energy 39.74% 1.65%
11. Environmental Affairs 40.72% 2.1%
12. Government Communications Information System (GCIS) 44.9% 2.2%
13. Health 48.36% 0.69%
14. Higher Education & Training 43.75% 0.73%
15. Home Affairs 44.89% 1.29%
16. Human Settlements 42.5% 0.14%
17. Independent Complaints Directorate 38.89% 0.97%
18. International Relations & Cooperation 40% 0.55%
19. Justice & Constitutional Development 40.69% 1.46%
20. Labour 37.5% 2.48%
21. Military Veterans 47.37% 0.74%
22. Mineral Resources 36.36% 0.86%
23. National Prosecuting Authority 44.83% 0.25%
24. National Treasury 42.68% 0.65%
25. Performance Monitoring & Evaluation 46.67% 0.97%
26. Public Administration Leadership & Management Academy 52.38% 2.44%
27. Public Enterprises 44.03% 2. 79%
28. Public Service & Administration 40.19% 1.65%
29. Public Service Commission 45.28% 1.47%
30. Public Works 41.62% 1.14%
31. Rural Development & Land Reform 37.55% 1.68%
32. Science & Technology 46.08% 2.1%
33. Social Development 50.98% 1.62%
34. SA Police Service (SAPS) 34.16% 0.81%
35. SA Revenue Service (SARS) Not reflected on PERSAL
36. Sport & Recreation SA 30.77% 1.22%
37. State Security Agency Not reflected on PERSAL
38. Statistics SA 41.01% 1.17%
39. The Presidency 50% Yes 0.88%
40. Tourism 48.44% 4.36%
41. Trade & Industry 43.22% 2.68%
42. Transport 36.8% 0.64%
43. Water Affairs 40.69% 0.98%
44. Women, Youth, children & People with Disabilities 60.98% 5.11%
North West
SMS Disability
1. Office of the Premier 33.33% 1.01%
2. Department of Agriculture & Rural Development 30% 1.23%
3. Department of Education 26.47% 0.24%
4. Department of Economic Development, Environment and Tourism 52.38% 2.94%
5. Department of Finance 34.29% 2.3%
6. Department of Health 39.53% 0.38%
7. Department of Human Settlements 33.33% 2.5%
8. Department Local Government and Traditional Affairs 30% 0.24%
9. Department of Public Works, Roads and Transport 30% 0.65%
10. Department of Public Safety and Liaison 38.46% 1.7%
11. Department of Sports, Arts and Culture 40% 2.14%
12. Department of Social Development, Women, Children and People with Disabilities.
42.86% 0.38%
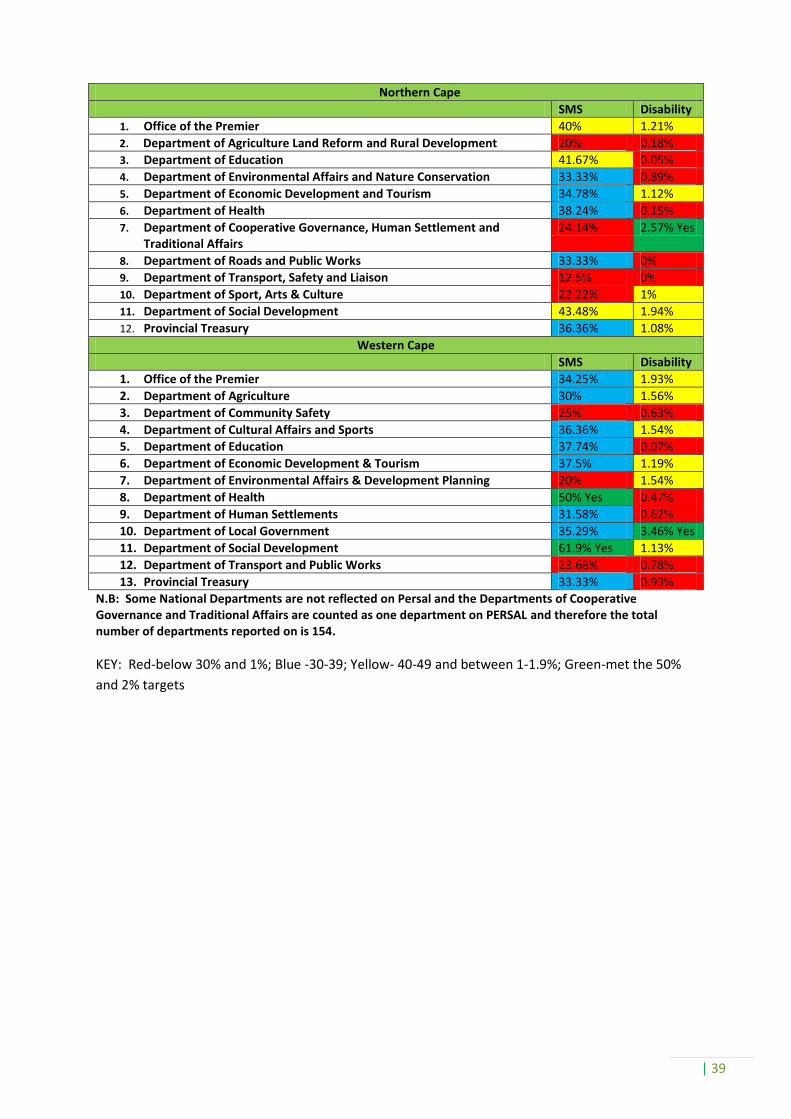
| 39
Northern Cape
SMS Disability
1. Office of the Premier 40% 1.21%
2. Department of Agriculture Land Reform and Rural Development 20% 0.18%
3. Department of Education 41.67% 0.05%
4. Department of Environmental Affairs and Nature Conservation 33.33% 0.89%
5. Department of Economic Development and Tourism 34.78% 1.12%
6. Department of Health 38.24% 0.15%
7. Department of Cooperative Governance, Human Settlement and Traditional Affairs
24.14% 2.57% Yes
8. Department of Roads and Public Works 33.33% 0%
9. Department of Transport, Safety and Liaison 12.5% 0%
10. Department of Sport, Arts & Culture 22.22% 1%
11. Department of Social Development 43.48% 1.94%
12. Provincial Treasury 36.36% 1.08%
Western Cape
SMS Disability
1. Office of the Premier 34.25% 1.93%
2. Department of Agriculture 30% 1.56%
3. Department of Community Safety 25% 0.63%
4. Department of Cultural Affairs and Sports 36.36% 1.54%
5. Department of Education 37.74% 0.07%
6. Department of Economic Development & Tourism 37.5% 1.19%
7. Department of Environmental Affairs & Development Planning 20% 1.54%
8. Department of Health 50% Yes 0.47%
9. Department of Human Settlements 31.58% 0.62%
10. Department of Local Government 35.29% 3.46% Yes
11. Department of Social Development 61.9% Yes 1.13%
12. Department of Transport and Public Works 23.68% 0.78%
13. Provincial Treasury 33.33% 0.93%
N.B: Some National Departments are not reflected on Persal and the Departments of Cooperative Governance and Traditional Affairs are counted as one department on PERSAL and therefore the total number of departments reported on is 154.
KEY: Red-below 30% and 1%; Blue -30-39; Yellow- 40-49 and between 1-1.9%; Green-met the 50%
and 2% targets