Embed Size (px)
Citation preview
ANNUAL REPORT OF THE DEPARTMENT OF BASIC EDUCATION
FOR 2011/12 Presentation to the Portfolio Committee on
Basic Education
10 OCTOBER 2012
1
PART 1Background – The role of the DBE
PART 2Overview of the service delivery environment and context
PART 3Programme Performance
PART 4Conditional Grants, Provincial Budget Monitoring and Support
PART 5Annual Financial Statements
2
Presentation Outline
PART 1 : Background – organisational
context
3
Background – Organisational context
Legislative mandate • The National Education Policy Act (Act 27 of 1996) (NEPA) inscribes into
law the policies for the national system of education, the legislative and monitoring responsibilities of the Minister of Education, as well as the formal relations between national and provincial authorities.
• It laid the foundation for the establishment of the Council of Education Ministers (CEM), as well as the Heads of Education Departments Committee (HEDCOM), as inter-governmental forums that would collaborate in the development of a new education system.
• NEPA therefore makes provision for the formulation of national policy in general, and further education and training policies for, inter alia, curriculum, assessment, language and quality assurance.
• NEPA embodies the principle of cooperative governance, elaborated upon in Schedule Three of the Constitution.
4
Understanding Annual Report in terms of the role of the DBE
• DBE’s Statutory role is to :– formulate policy, norms and standards; and – monitor and evaluate policy implementation and impact.
• Informed by system performance, it has become increasingly necessary that the DBE performs a more active steering role as well as a more direct role in supporting implementation.
• Various mechanisms have been introduced to do this, such as: – Stronger performance monitoring an evaluation (by DBE, NT, DPME and AG);– Direct interventions such as Workbooks, ANA and ASIDI;– Fiscal measures (e.g. conditional grants);– Monthly provicial budget monitoring reports; – Clear signalling of priorities through the The Action Plan to 2014 (introduced in
2010/11) –The first ever Sector Plan aimed at providing more robust mechanisms for steering the education system;
– Quarterly meetings by the Minister with District Managers; and– The creation of the Planning, Delivery and Oversight Unit.
5
PART 2 : Overview of the service delivery environment
6
Overview of the service delivery environment for 2011/12• During 2011/12, the service delivery environment of the education sector
included 12 283 875 learners in ordinary public and independent schools, who attended 25 851 schools and were served by 420 608 educators.
• On 2 March 2011, the National Cabinet decided to intervene in the Eastern Cape Education Department , in terms of section 100 (1)(b) of the Constitution.
• On 5 December 2011, Cabinet announced a section 100 (1)(b) intervention of the National Government in the Limpopo Education Department.
• The interventions in the Eastern Cape and Limpopo focused on a number of issues including:– Financial and supply chain management;– Failure to deal with excess teachers;– Overexpenditure; and– The non-delivery of learning and teaching materials.
• This placed considerable strain on the DBE’s institutional capacity and required a re-engineering of the work of the DBE.
7
Overview of the service delivery environment for 2011/12
• For the reporting period, the DBE continued to consolidate the advances it had made to improve learner performance in the basic education sector through the following strategic interventions:– Focusing on Teachers, Textbooks and Time (3Ts);– Issuing and implementation of the CAPS;– Planning and preparing for the ANA;– Expanding the workbooks programme; and– Improving infrastructure to maximise learner performance.
• Key systemic improvements were consolidated around these strategic interventions for the period 2011/12 anchored by the Action Plan to 2014 and the Delivery Agreement.
8
ACCESS : Key findings from 2011 General Household Survey (GHS) Report
• 85% of 5-yr olds attend educational institutions (from 39% in 2002).
• 99% of 7 – 15 yr olds attend educational institutions.
• 93% of 16 yr olds attend educational institutions.
• 86% of 17 yr olds attend educational institutions.
• 74% of 18 yr olds attend educational institutions but 26% do not. (of those that do not attend 35% have completed Grade 12).
9
PART 3 : Programme Performance
10
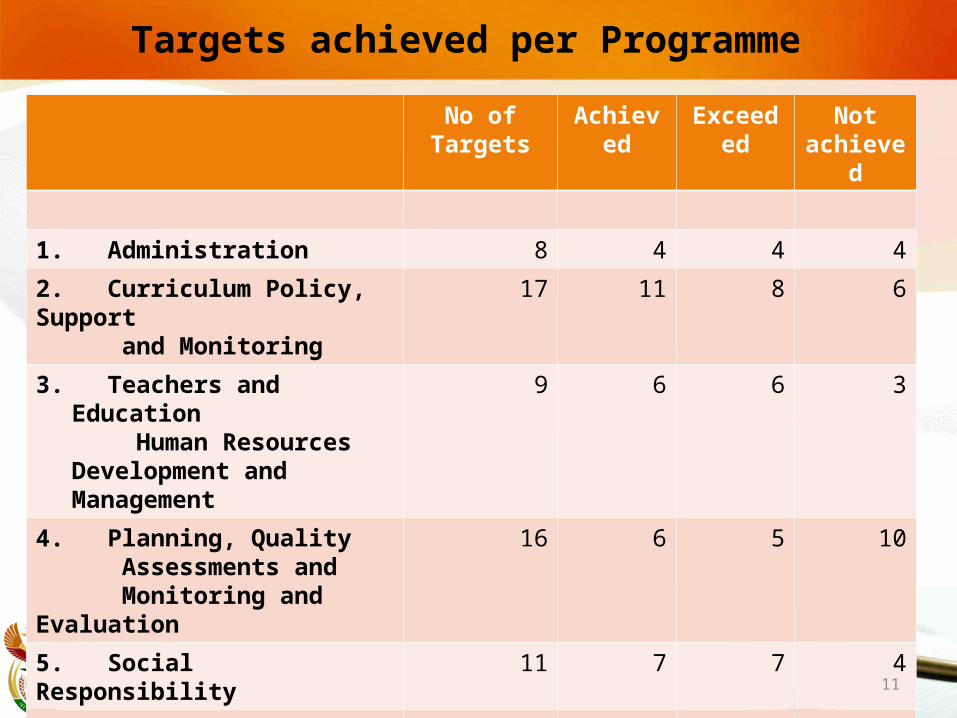
Targets achieved per Programme
No of Targets Achieved Exceeded Not achieved
1. Administration 8 4 4 4
2. Curriculum Policy, Support and Monitoring
17 11 8 6
3. Teachers and Education Human Resources Development
and Management
9 6 6 3
4. Planning, Quality Assessments and Monitoring and Evaluation
16 6 5 10
5. Social Responsibility 11 7 7 4
TOTAL 61 34 (56%) 30 (49%) 27 (44%)
11
Highlights and achievements
Policy area - Human resource management (P 1)• The DBE completed its internal reconfiguration process in order to meet its
strategic intent. The new organisational structure was fully implemented on 25 November 2011 and the PERSAL system has been updated accordingly.
• Appointments were made in the key posts of Chief Financial Officer, Deputy Directors-General for Finance and Administration; as well as for Planning, Information and Assessments.
• In response to natural attrition at middle and senior management level, the Department put in place a development plan to address the issues related to careerpathing and succession planning. To this end, 264 officials attended courses during the financial year for professional and personal development.
• 47 officials attended induction programmes for new entrants in the Department, while 63 internships were implemented for unemployed graduates.
12
Highlights and achievements
Policy area : Human resource management (P 1)• There were two key resignations, namely, the CEO of the National
Education Evaluation and Development Unit (NEEDU) and the Head of the Planning and Delivery Oversight Unit.
• The past year was a relatively peaceful one, with the absence of strikes on the labour front.
13
Highlights and achievementsPOLICY AREA: Curriculum implementation and development (P 2)• The Curriculum and Assessment Policy Statements (CAPS) comprise of a
single, comprehensive and concise policy document, which will incrementally replace the current Subject and Learning Area Statements, Learning Programme Guidelines and Subject Assessment Guidelines for all the subjects listed in the National Curriculum Statement (NCS): Grades R - 12.
• The CAPS were approved by the Minister by the issuing of Government Gazette No. 34600 on 12 September 2011.
• A total number of 2 591 subject advisors were trained in the implementation of CAPS during this cycle.
• Implementation of CAPS commenced with Grades R-3 and 10 in 2012.
14
Highlights and achievementsPOLICY AREA : Curriculum implementation and development (P 2)• In preparation for the implementation of CAPS in Grades 4-6 in 2013, all
district officials responsible for teacher training and support in these grades were orientated to the changes in the CAPS Subject Statements. This took place from 6 February until 25 March 2012.
• The Eastern Cape orientation programme, was scheduled to be done in May 2012.
• A total of 968 district officials were taken through the orientation programme in the Intermediate Phase.
• The DBE identified subject advisors from different provinces to establish a National Training Team (NTT) to assist with the Grade 11 CAPS orientation. The orientation started with a dry-run, on 6-8 February 2012, in preparation for the actual orientation. The Grade 11 CAPS orientation for officials was conducted in February 2012 and March 2012.
15
Highlights and achievementsPOLICY AREA : Curriculum implementation and development (P 2)Initiatives to improve teaching and learning included :• CAPS documents were distributed to schools and districts.• Question and Answer booklets were distributed to schools.• Self-Study Guides in selected subjects were distributed to schools.• Support materials on Thutong were transferred to CDs and distributed to
schools.• Support for the implementation of CAPS in the Foundation Phase was
provided using the Foundation Phase DVD on good practice. • Assessment in Grades 7-9 was strengthened with the provision of
Assessment Item Banks that teachers will use either for assessment or to model their own school-based assessment.
• An additional 3 500 Assessment Item Bank files were printed and distributed to schools offering the Senior Phase.
16
Highlights and achievementsPOLICY AREA : LTSM (P 2)• In 2011, a total of 23 million Grades R-6 (Volume 1 and 2) Language and
Mathematics workbooks were printed and delivered to 18 854 public primary schools in nine provinces.
• In 2012, schools were informed about the distribution of workbooks in an effort to improve the delivery process. Grade R-9 workbooks were distributed to all targeted schools and offices.
• Proof of deliveries for all Volume 1 and Volume 2 workbooks was provided as follows by the service provider and verified by an external auditor for payment:– 98.74% of Grade R-9 Volume 1 workbooks as per the order ;– 97.25% of Grade 1-9 Volume 2 workbooks as per order; and– 97.36% of FET schools Physical Science and Mathematics supplementary textbooks as per
order.
• The Grades 1-3 and Grade 10 National Catalogue of Textbooks aligned with the CAPS was developed and released to the provinces.
17
Highlights and achievementsPOLICY AREA : LTSM (P 2)In addition, the following developments also contributed to increasing access of learners to a wide range of media:
– A Framework for the LTSM Policy was developed.– Draft specifications for each subject and grade for the minimum school bag
were developed. – The process towards the development of the National Catalogue of Textbooks
for Grades 4-6 and Grade 11 got off the ground.– A reading and literacy activity guide for schools to use during National Book
Week was developed.– Some 2 600 schools were provided with library books in the official languages,
so as to support classroom libraries.– The National Guidelines for School Library and Information Services (NGSLIS)
to schools were released.– A National Guidelines for School Library and Information Services
implementation plan was developed in collaboration with the provinces.
18
Highlights and achievementsPOLICY AREA : e-Education (P 2)• The Telkom Masters Services Agreement was signed on 27 March 2012 for Phase
1 which is the implementation of the Connectivity Plan. This initiative will provide connectivity to 1 650 schools for a period of 3 years. The agreement will also see the development of an educational virtual private network (VPN) hosted by Telkom, as well as access to Britannica by all selected schools.
• Nine provincial ICT Resource Centres, with the required infrastructure (45 laptops and interactive whiteboards and an LCD screen), in the Proof of Concept districts were established in various provinces. The Western Cape and KwaZulu Natal are in the final stages of renovations and will be completed by 31 May 2012.
• www.digitalclassroom.co.za was developed to connect the nine centres and the 180 selected Mathematics and Science schools. The website provides support to teachers and also serves as a content repository for teacher professional development material. Mindset, Intel and Microsoft made their content available in support of the initiative.
19
Highlights and achievements
POLICY AREA : e-Education (P 2)For the period under review an additional:• 3 942 educators were using and applying ICT in their
classrooms.• 22 159 educators attended ICT training courses.• 2 266 schools were connected to ICT infrastructure and
services.
20
Highlights and achievements
POLICY AREA : Assessments – ANA (P 2 & P 4)• The first cycle of ANA was written in February 2011. Following the
finalisation of the official ANA Report in June 2011, work started on improving the utility of the data, aimed at an improvement in teaching and learning, and accountability for learner performance within the system.
• In preparation for the next cycle of ANA, the process of test development commenced in July 2011. Test development was preceded by the development of appropriate test blueprints.
• Test developers then developed draft tests for Grades 1-6 and these were submitted for moderation. Two sets of each test in Literacy/Language and Numeracy/Mathematics were completed.
• ANA exemplars were developed and released to support preparation for the second cycle of ANA was written in September 2012.
21
Highlights and achievementsPOLICY AREA : Assessments – NSC (P 2 & P 4)• The results of the 2011 NSC examinations indicated that there had been an
overall improvement of learner performance from 67.8% in 2010 to 70.2% in 2011. This subsequently increased to 72.7% after the release of the March 2012 supplementary examination results.
• The number of learners who qualified to enter a Bachelor’s programme came to 120 767 in 2011.
• Given the importance of Physical Science and Mathematics, ambitious targets were set for these subject. The number of passes in Mathematics came to 104 033 and to 96 441 in Physical Science. The number of candidates who sat for the matriculation examination in 2011 came to 496 090 compared to 537 543 in 2010 - a decrease of 41 453. The decreased enrolment contributed to the lower achievement against predetermined targets.
• An international benchmarking of the 2010 NSC question papers revealed that the standard of the NSC question papers compare favourably to those of international bodies.
22
Highlights and achievements
POLICY AREA : Assessments – NSC (P 2 & P 4)• A detailed Technical Report on the 2011 NSC examinations was developed
and distributed to all stakeholders. A diagnostic report based on the NSC examination results, which articulated the weaknesses in the key subjects, with proposed remedial programmes was compiled. This was distributed to PEDs and schools to support teaching and learning in those key subjects.
23
Highlights and achievementsPOLICY AREA : Special needs education (P 2)• The DBE successfully coordinated the development of a South African Sign
Language curriculum for Grades R-12. • English and Afrikaans workbooks for numeracy and literacy were adapted to Braille
in Grades1-4. • The Inclusive Education Strategy was developed and used to contribute to the
development of the National Strategy on Learner Attainment Framework.• The Guidelines for Responding to Learner Diversity formed part of the CAPS
orientation programme for the Intermediate Phase and Grades 10 and 11.• No training by the DBE took place on the identification and support of special
needs. This was due to the prioritisation of the implementation of the CAPS in 2012. The 2011/12 financial year was specifically set aside for the refinement and finalisation of the Screening, Identification, Assessment and Support (SIAS) tool, which is going to be used for training and for the implementation of White Paper 6.
• The framework for the refinement of SIAS was developed in November 2011. The rewriting of SIAS took place in January 2012.
24
Highlights and achievements
POLICY AREA : Teacher Development (P 3)• The Integrated Strategic Planning Framework for Teacher Education and
Development which provides a comprehensive plan for teacher recruitment, initial teacher education, induction and lifelong teacher development, was launched by the Ministers of Basic Education and Higher Education and Training.
• The provision of training programmes to teachers is the function of the PEDs, and the DBE plays a coordinating role. Orientation for the introduction of CAPS to 90 000 Foundation Phase and 60 000 Grade 10 teachers was co-ordinated in conjunction with PEDs.
• Further, teacher development programmes were co-ordinated with provincial departments in targeted priority areas with 184 207 teachers in response to improving the professionalism, teaching skills and subject knowledge of teachers throughout their careers [Action Plan to 2014: Goal 16].
25
Highlights and achievementsPOLICY AREA : Teacher Development (P 3)• A collaboration programme with teacher unions was initiated and an
agreement with the PEDs of KwaZulu-Natal and Mpumalanga was reached for the orientation of teachers. A reported 21 306 teachers participated in CAPS orientation as part of this collaboration programme.
• The National Teacher Awards gala was successfully hosted in conjunction with provincial education departments. The event was broadcast to viewers on SABC 2 and attended by 1 000 high profile guests. The awards recognised and substantial prizes and certificates were presented to 75 teachers at the national event, 216 teachers at provincial functions and 3 000 teachers at regional and district events.
26
Highlights and achievements
POLICY AREA : Teacher supply and utilisation (P 3)• As at the end of December 2011, 1 822 (76%) of the 2010 graduates had
been appointed and, of these, 1 496 (82%) were 30 years and younger in January 2011. This percentage is slightly higher than in 2010, when the reported placement rate was 72%.
• Number of qualified teachers aged 30 and below entering the public service as teachers for the first time during the past year; the overall target of 6 200 was exceeded with the appointment of 7 744 teachers for the 2011/12 financial year. This augurs well for attracting a new group of young motivated and appropriately trained teachers into the teaching profession each year [Action Plan to 2014 : Goal 14].
• The target of 8 517 Funza Lushaka Bursaries for 2011/12 was exceeded by 216 bursaries, with a cumulative total of 8 733 bursaries being awarded in 2011.
27
Highlights and achievements
POLICY AREA : Teacher supply and utilisation (P 3)• During the period under review, the Department developed a post-
provisioning model that will assist provinces and schools to generate the staff establishment for schools. Training was provided to the provinces on how to utilise the model.
• 65% of learners are in classes with no more than 45 learners. This is evidence of classroom backlogs that persist.
28
Highlights and achievements
POLICY AREA : School Management (P 3)• A total of 1 485 principals participated in the Advanced Certificate in
Education programme for 2011.• A total of 8 407 schools were visited in all provinces for the purpose of
monitoring the quality of IQMS implementation, school effectiveness as well as district engagement with the school. These visits included 5 080 follow-up visits and visits to 1 359 underperforming secondary schools. During these visits, the lessons of 1 446 educators were observed and support provided where necessary.
• Quality Teaching and Learning Campaign (QLTC) committees were established in more than 3 000 schools. These committees were tasked with protecting teacher contact time and consolidating learning.
29
Highlights and achievements
POLICY AREA : School Governance (P 3)• In March 2012, SGB Elections were held throughout the
country. The full participation of parents through SGB platforms contributed towards making learning a societal issue and also promoted good governance in schools.
POLICY AREA : Partnerships and community participation (P 5)• The successful national launch of the NEDLAC Accord on Basic
Education and Partnerships with Schools was held in Butterworth, Eastern Cape on 2 October 2011.
• The recorded number of schools that benefitted from private partnerships was 477.
30
Highlights and achievements
POLICY AREA : School funding (P 4)• A request aimed at securing additional funding for implementing an
amended funding model within the revised Grade R policy framework was made to the National Treasury (NT) and approved for the expansion of Grade R in the 2013/14 and 2014/15 periods.
• A funding request was made to the NT to ensure PEDs will be able to fund all no-fee schools at the same level and to offer certain fee charging schools the option to be voluntarily declared and funded as no-fee schools. Funding has consequently been made available by the National Treasury for the equalisation of the allocation to no-fee schools in the 2013/14 and 2014/15 periods.
• Amendments to the National Norms and Standards for School Funding by updating the national table of targets for the school allocation for 2012/13 have been approved and gazetted.
31
Highlights and achievementsPOLICY AREA : School funding (P 4)• An advertisement was placed through the GCIS, in newspapers as part of a
media campaign aimed at emphasising when parents qualify to be automatically exempted from the payment of school fees. Input was provided for a pamphlet on school fees and exemption to be placed on the Department’s website.
• For the 2011 academic year, approximately 78% of learners in public schools were accommodated in more than 20 000 no-fee schools.
• For the 2012 academic year, the national target allocation, which caters for non-personnel and non-capital expenditure in schools, was increased to R960 per learner for schools in Quintile 1, while the no-fee threshold, which is applicable to schools in Quintile 2 and Quintile 3, was set at R880 per learner.
32
Highlights and achievements
POLICY AREA : School Infrastructure (P 4)• A human resources strategy to address capacity constraints with regards to
infrastructure in PEDs was developed. An amount of R10 million has been allocated to each province to address the capacity constraints.
• The guidelines for planning for school infrastructure and for boarding facilities were concluded and approved by the CEM.
• The standardised designs and cost model were developed and approved. A guideline on school infrastructure maintenance was developed.
• Short-term technical assistance support was appointed to assess infrastructure plans and to assist provinces with long-term infrastructure planning.
• Education Infrastructure Grant (EIG): At the end of March 2012, PEDs had spent 93% or R5.254 million of the adjusted grant of R5.678 million.
33
Highlights and achievementsPOLICY AREA : School Infrastructure (P 4) There has been some progress in addressing school infrastructure issues
since the commencement of implementation of the Accelerated School Improvement and Development Initiative (ASIDI). During the 2011/12 financial year, the following infrastructure projects were implemented: 1 648 classrooms; 316 sanitation blocks; water supply to 63 schools; electricity supply to 540 schools and fencing of 96 schools. However, delivery on school infrastructure remains challenging. Some of the challenges experienced include the following:– Substantial variances exist in the cost of building schools across provinces, which is
compounded by a lack of uniformity in provincial planning, budgeting, design, procurement processes and implementation procedures to meet infrastructural targets.
– The competency of contractors and consultants, the dispersed nature of the projects, a myriad of small contracts that have to be managed, inadequate project management and few quality assurance staff members contribute to the slow pace of infrastructure provisioning.
– On-going maintenance and operations are not receiving adequate funding and attention, thus contributing to the increasing deterioration of existing infrastructure.
34
Highlights and achievements
POLICY AREA : District development (P 3)• The DBE has quarterly engagements with district directors to advocate
their contribution to the outputs of Action Plan to 2014: Towards the realisation of schooling 2025.
• The Department identified the need for more research and guidelines on the role of districts. The Guidelines on the organisation, roles and responsibilities of education districts were published for comment and will be finalised after careful consideration of the responses received.
• These guidelines express a national vision for education districts in the transformation of the education system; they determine a standard nomenclature for district offices and personnel and provides a normative guideline for the management and operation of district offices, including the support they render to schools.
• The PDOU supported the 15 underperforming districts located as follows: 11 in Eastern Cape; 1 in KwaZulu-Natal; 1 in Mpumalanga, 1 in Northern Cape and 1 in Limpopo.
35
Highlights and achievementsPOLICY AREA : Legal and legislative services (P 1)• The DBE received 37 court cases in the period under review and managed to
successfully resolve 22 of these. The remaining 15 cases are still in progress. In some cases, the judgments delivered by courts of law were in favour of the Minister or the Department, while other cases were settled out of court.
• Four pieces of legislation were drafted. The pieces that have been passed as law are (i) the Basic Education Laws Amendment Act, 2011 (Act No. 15 of 2011), which was finalised and signed into law on 15 December 2011; and (ii) the Regulations Relating to the Prohibition of the Payment of Unauthorised Remuneration or the Giving of Financial Benefit or Benefit in Kind to Certain State Employees , which was signed into law on 23 December 2011.
• The National Education Evaluation and Development Unit (NEEDU) Bill, 2011, has already been published for comments and been adapted to accommodate comments that had merit.
• The "Pregnancy Regulations" have not been finalised and are subject to amendments to SASA.
36

Highlights and achievementsPOLICY AREA : International relations (P 1)• The process of drafting a bilateral agreement between the Republic of South Africa and the
People’s Republic of China, pertaining to cooperation in the field of basic education was completed.
• An agreement was reached with the Japan International Cooperation Agency for provision of a specialist in Mathematics to support DBE’s processes of curriculum development for the Foundation and Intermediate Phases. The specialist assumed duty on 23 March 2012, and will serve for a period of two years.
• From 24 October to 10 November 2011, the Minister led a delegation to the United Nations Educational, Scientific and Cultural Organisation’s (UNESCO) 36th General Conference in Paris. The Department is the leading department in the South African National Commission for UNESCO.
• The drafting of a Memorandum of Understanding around co-operation in the field of English Language between the Government of the Republic of South Africa and the Government of the United Kingdom of Great Britain and Northern Ireland has been completed and is awaiting input from the Department of Justice and Constitutional Development.
37
Highlights and achievementsPOLICY AREA : Adult literacy (P 2)Kha Ri Gude Mass Literacy Campaign• A total of 39 562 volunteer educators (including 176 blind educators, assisted
by 161 sighted assistants) were employed on short-term contracts. • By the end of the financial year, R253.8 million was paid out in stipends to the
volunteer educators.• A total of 3 671 volunteer supervisors were appointed on short-term contracts.• All volunteer educators received the necessary materials, stationery and
administrative forms. A total of 2 822 652 workbooks were supplied to 660 924 learners.
• Out of the total number of learners enrolled, 95% of the learner assessment portfolios had been completed and returned to the campaign's warehouse by the end of March 2012. Of these, 44 000 were moderated by SAQA and a high rate of marking accuracy was established. The SAQA report is available to affirm the release of results.
38
Highlights, achievements and challengesPOLICY AREA : Learner well-being (P 5)• 8 850 208 Learners in 21 013 Quintile 1 – 3 primary and secondary schools
were provided with nutritious meals daily.• 256 268 learners in quintile 1 primary schools underwent health screening.• 902 279 Learning and Teaching Support Material on sexual and
reproductive health were delivered to schools.• 18 039 educators were trained to implement sexual and reproductive
health programmes for learners.• 235 schools participated in the Care and Support for Teaching and
Learning pilot programme.• 9 745 public ordinary schools participated in school sport leagues.• 8 871 public ordinary schools were linked to their local police station.
39
Highlights, achievements and challengesPOLICY AREA : Learner well-being (P 5)• The “Values in Action” training manual, which infuses constitutional values
and human rights into school governance, was developed during the period under review. The manual formed part of the training of newly appointed SGB and RCL members.
• The Curriculum and Assessment Policy incorporated the Bill of Responsibility (BOR). The BOR is explicitly entrenched in the Life Orientation Curriculum under the sub-section “Rights and Responsibilities”.
• The Department conducted comprehensive research that was utilised in developing an evidence-based social cohesion toolkit. The toolkit is a practical guide to school communities on how to bridge the gap between schools and their host communities, in a bid to improve the quality of teaching and learning.
40
PART 4 : CONDITIONAL GRANTS, PROVINCIAL BUDGET
MONITORING & SUPPORT
41
42
Conditional Grants• Five conditional grants were allocated to the Department during the period
under review:1. HIV and Aids Life Skills Programme2. National School Nutrition Programme (NSNP)3. Dinaledi Schools4. Technical Secondary Schools Recapitalisation5. Education Infrastructure Grant (EIG)
• In addition to the conditional grants, the Department received an allocation for School Infrastructure Backlogs Indirect Grant, amounting to R700 million.
• Before conditional grants funds were transferred to the provinces, the Department ensured that all the requirements of the Division of Revenue Act (DORA), 2011, were met.
Highlights and achievementsHIV and AIDS• Advocacy: A total of 291 582 learners and educators and 462 108 parents
and other key stakeholders were reached in terms of awareness campaigns.• Peer education: 13 210 learners were reached through functional peer
education programmes; 10 250 learners through curriculum-based learner pregnancy and learner retention programmes; 74 317 learners through training on the prevention of drug and substance use.
• Training and development: 2 796 educators were trained as master trainers to integrate the Life Skills Programme into the curriculum.
• Care and support: Some 6 400 educators and support staff were trained as SchoolBased Support Teams (SBSTs).
• Learning and Teaching Support Materials (LTSM): A total of 1 230 691 sets of LTSM were distributed to 13 480 primary and secondary schools.
• Monitoring and Support: A total of 8 168 selected schools were reached through monitoring and support visits.
43
ChallengesHIV and AIDS• Late approval of tender specifications in North West and the Western Cape
to conduct training activities.• Delayed payment of invoices for activities that had been conducted in
Limpopo had an impact on the final spending of the grant.• Utilisation of the conditional grant funds for non-grant related activities in
Gauteng impacted negatively on the implementation of the programme.
44
Highlights and achievements
NSNP• The programme was extended to Quintile 3 secondary schools from April
2011, increasing the number of secondary schools covered to 4 805.• Vegetable gardens in schools increased from 5 964 to 7 156 at the end of
March 2012.• A total of 53 workshops were conducted on meal planning and preparation
(28), sustainable food production (22) and financial management (3).• Partnership with the Tiger Brands Foundation supports schools in Gauteng,
Limpopo, KwaZulu-Natal and Western Cape.
45
Highlights, achievements and challenges
Dinaledi• Supplied Mathematics, Physical Science, Life Science, Agricultural Science
and English textbooks and study guides.• Supplied mobile science laboratories and other equipment.• Provided teacher training in Mathematics and Physical Science.• Supplied audio-visual equipment, computers, software and ICT
laboratories. • Provided mathematics kits.• Challenges included the late submissions of the monthly, quarterly, annual
reports and business plans by provinces.
46
Highlights, achievements challengesTechnical Secondary School Recapitalisation• 23 out of 42 new workshops were built to support technical subject
offerings.• 198 out of 247 existing workshops were refurbished, upgraded and re-
designed to comply with safety laws and regulations, and minimum industry standards.
• Equipment, machinery and tools were bought, delivered and installed at 174 out of 215 projected workshops.
• 554 out of 558 technical school teachers were trained in subject content delivery and new practical teaching methodologies.
• Challenges include the following:– delays in the development and approval of tender specifications;– Irregular monitoring, collection of data and reporting resulted in the absence of
information to detect early warning signals for underperformance;– late approval of provincial and school business plans.
47
Highlights, achievements and challengesEducation Infrastructure Grant• In total 39 090 projects were completed, including the following:
– 131 ablution facilities;– 721 new or additional classrooms;– 49 Specialised classrooms;– 50 provided with water;– 420 mobile classrooms; and– 33 526 square metres of fencing.
• Challenges include the following:– Insufficient capacity to deliver infrastructure;– lack of adequate reporting and monitoring mechanisms;– large number of projects are at retention;– Poor adoption of best practice approaches and methodologies for infrastructure
planning; and– Lack of capacity to maintain a school infrastructure database.
48
Provincial budget and monitoring• A Budget Standards Exercise for the Medium Term Expenditure Framework
(MTEF) period was undertaken throughout all the nine PEDs to analyse and evaluate the 2012 MTEF budget.
• The focus was on the following aspects: evaluation of the 2011/12 spending performance including conditional grants, the funding of personnel expenditure and the progress on the implementation of audit action plan to address matters raised by the Auditor-General in 2010/11.
• The PEDs monthly expenditure reports were collected, consolidated and analysed.
• Financial management support was provided to the intervention teams in Limpopo and the Eastern Cape.
• Policy compliance with basic administrative and financial prescripts still problematic
49
Challenges
50
• Institutional • Policy compliance• Coordination and management• Budget pressures especially related to
Compensation of Employees• Backlogs
51
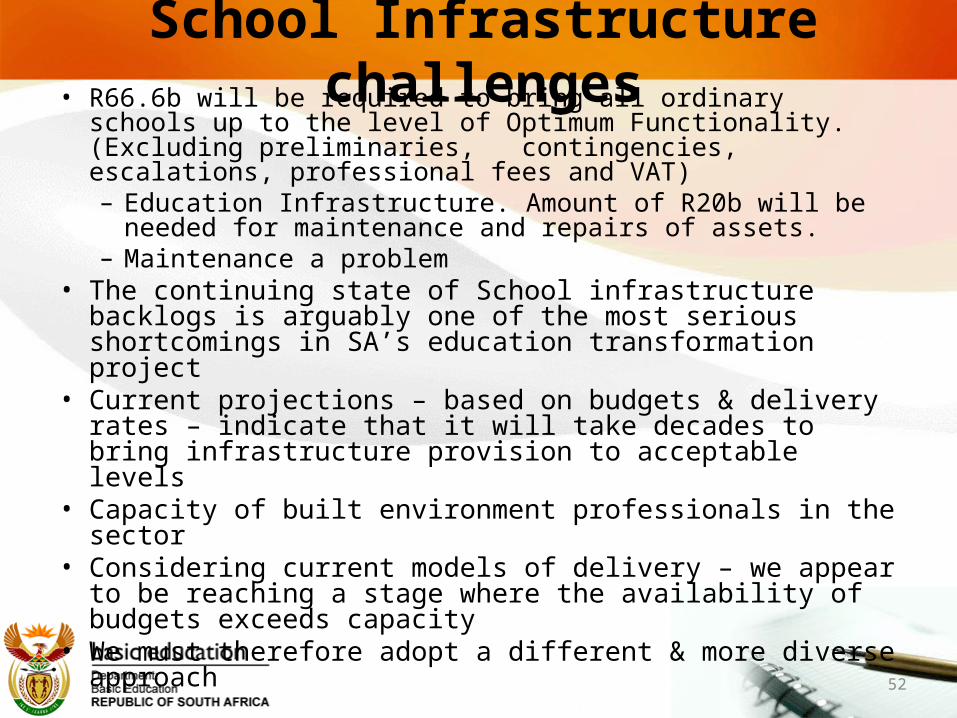
School Infrastructure challenges• R66.6b will be required to bring all ordinary schools up to the
level of Optimum Functionality. (Excluding preliminaries, contingencies, escalations, professional fees and VAT)– Education Infrastructure. Amount of R20b will be needed for
maintenance and repairs of assets.– Maintenance a problem
• The continuing state of School infrastructure backlogs is arguably one of the most serious shortcomings in SA’s education transformation project
• Current projections – based on budgets & delivery rates – indicate that it will take decades to bring infrastructure provision to acceptable levels
• Capacity of built environment professionals in the sector• Considering current models of delivery – we appear to be
reaching a stage where the availability of budgets exceeds capacity
• We must therefore adopt a different & more diverse approach52
PART 5 : ANNUAL FINANCIAL STATEMENTS
53
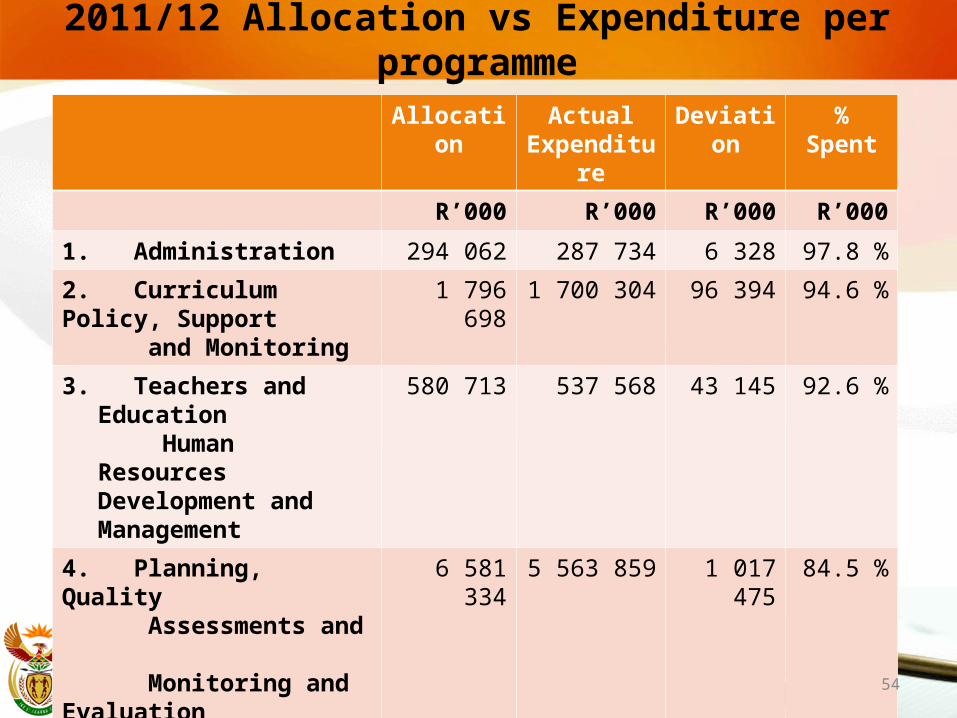
2011/12 Allocation vs Expenditure per programme
Allocation Actual Expenditure
Deviation % Spent
R’000 R’000 R’000 R’000
1. Administration 294 062 287 734 6 328 97.8 %
2. Curriculum Policy, Support and Monitoring
1 796 698 1 700 304 96 394 94.6 %
3. Teachers and Education Human Resources
Development and Management
580 713 537 568 43 145 92.6 %
4. Planning, Quality Assessments and Monitoring and Evaluation
6 581 334 5 563 859 1 017 475 84.5 %
5. Social Responsibility 4 827 659 4 811 449 16 210 99.6 %
TOTAL 14 080 466 12 900 914 1 179 552 91.6 %
54
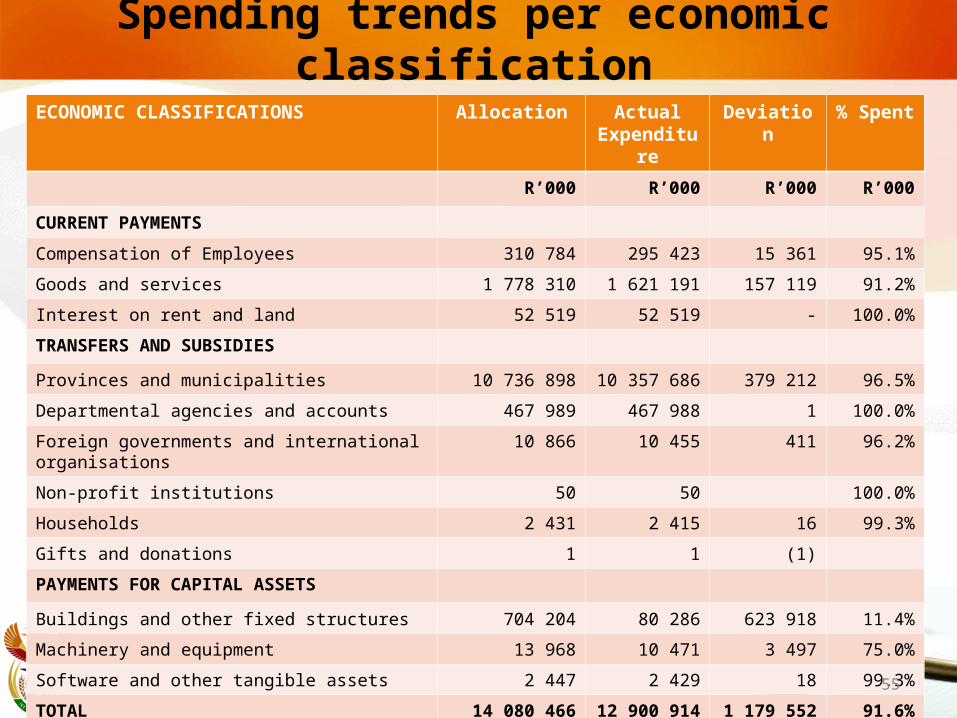
Spending trends per economic classificationECONOMIC CLASSIFICATIONS Allocation Actual
ExpenditureDeviation % Spent
R’000 R’000 R’000 R’000
CURRENT PAYMENTS
Compensation of Employees 310 784 295 423 15 361 95.1%
Goods and services 1 778 310 1 621 191 157 119 91.2%
Interest on rent and land 52 519 52 519 - 100.0%
TRANSFERS AND SUBSIDIES
Provinces and municipalities 10 736 898 10 357 686 379 212 96.5%
Departmental agencies and accounts 467 989 467 988 1 100.0%
Foreign governments and international organisations 10 866 10 455 411 96.2%
Non-profit institutions 50 50 100.0%
Households 2 431 2 415 16 99.3%
Gifts and donations 1 1 (1)
PAYMENTS FOR CAPITAL ASSETS
Buildings and other fixed structures 704 204 80 286 623 918 11.4%
Machinery and equipment 13 968 10 471 3 497 75.0%
Software and other tangible assets 2 447 2 429 18 99.3%
TOTAL 14 080 466 12 900 914 1 179 552 91.6%55
REASONS FOR DEVIATION
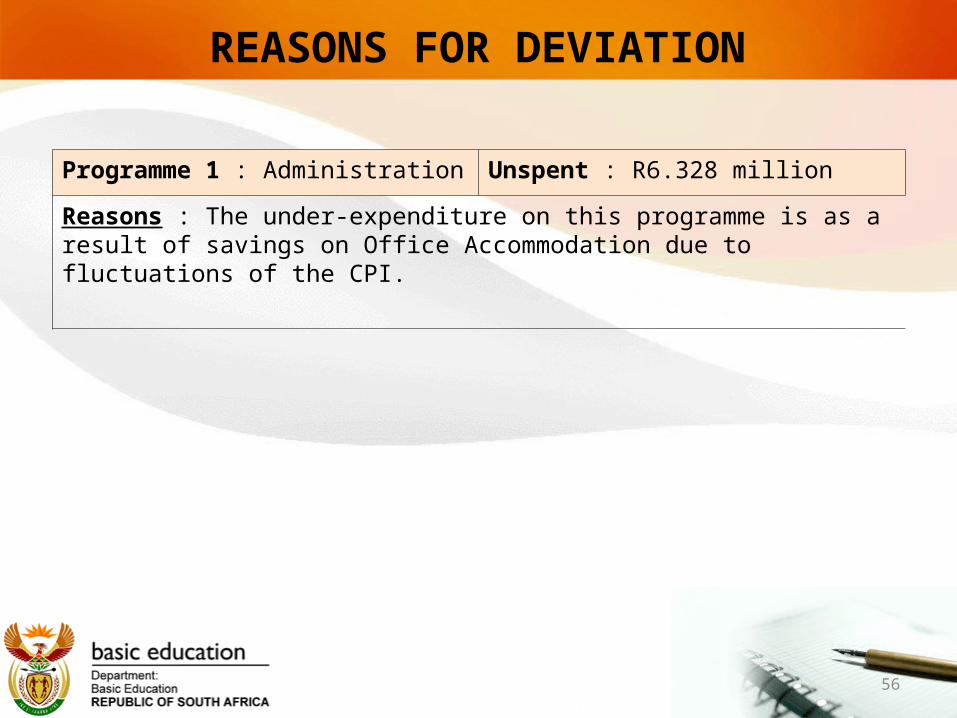
Programme 1 : Administration Unspent : R6.328 million
Reasons : The under-expenditure on this programme is as a result of savings on Office Accommodation due to fluctuations of the CPI.
56
57
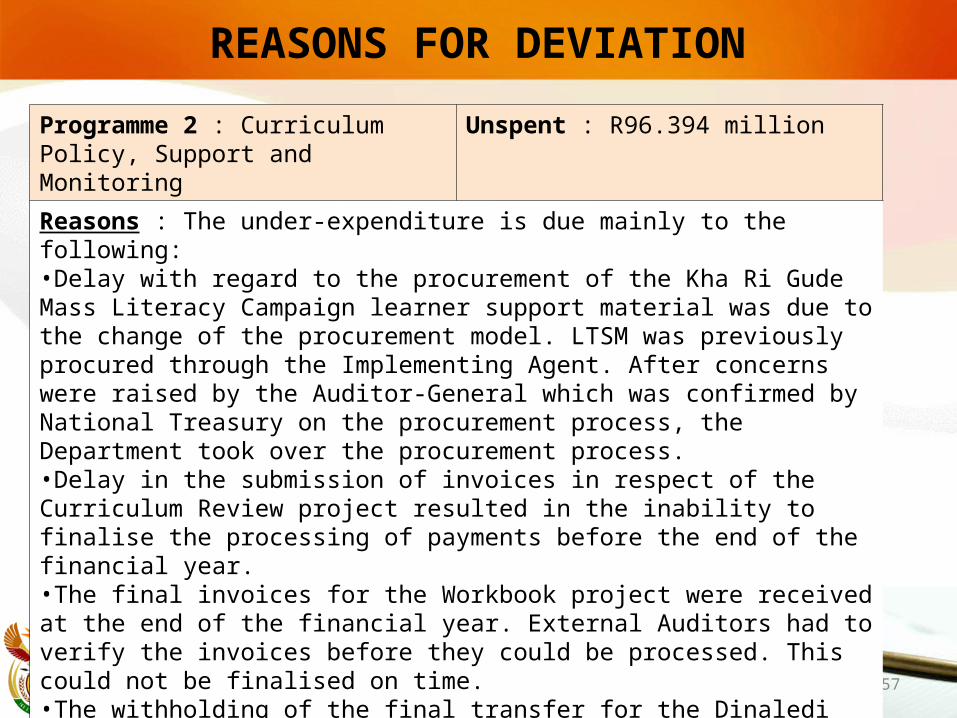
Programme 2 : Curriculum Policy, Support and Monitoring
Unspent : R96.394 million
Reasons : The under-expenditure is due mainly to the following:•Delay with regard to the procurement of the Kha Ri Gude Mass Literacy Campaign learner support material was due to the change of the procurement model. LTSM was previously procured through the Implementing Agent. After concerns were raised by the Auditor-General which was confirmed by National Treasury on the procurement process, the Department took over the procurement process. •Delay in the submission of invoices in respect of the Curriculum Review project resulted in the inability to finalise the processing of payments before the end of the financial year.•The final invoices for the Workbook project were received at the end of the financial year. External Auditors had to verify the invoices before they could be processed. This could not be finalised on time. •The withholding of the final transfer for the Dinaledi Schools conditional grant to Limpopo due to low spending.
REASONS FOR DEVIATION
REASONS FOR DEVIATION
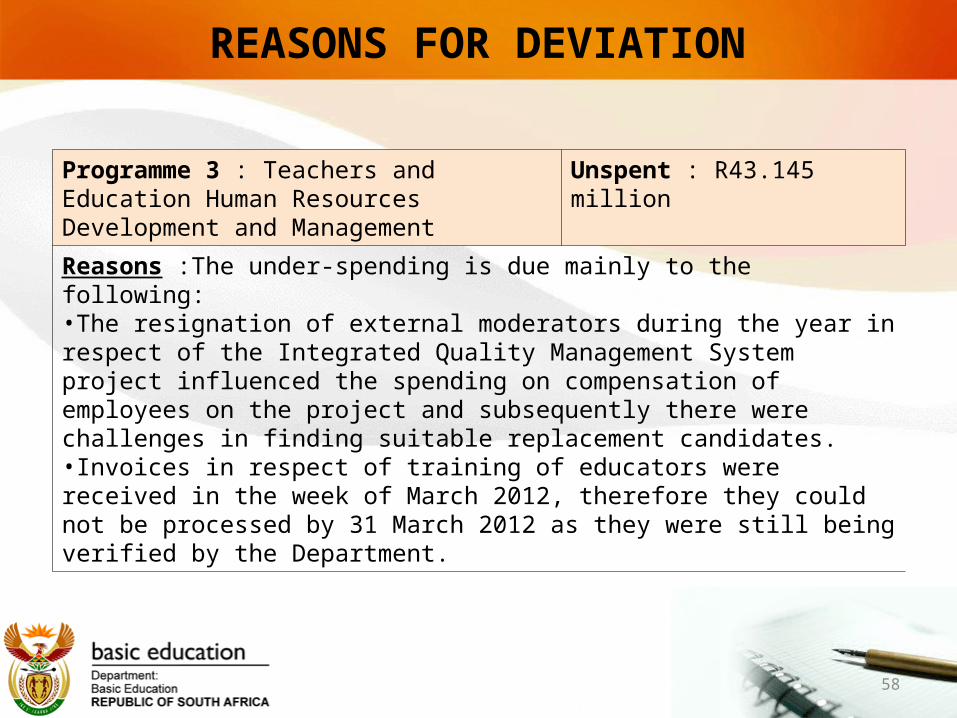
Programme 3 : Teachers and Education Human Resources Development and Management
Unspent : R43.145 million
Reasons :The under-spending is due mainly to the following:•The resignation of external moderators during the year in respect of the Integrated Quality Management System project influenced the spending on compensation of employees on the project and subsequently there were challenges in finding suitable replacement candidates.•Invoices in respect of training of educators were received in the week of March 2012, therefore they could not be processed by 31 March 2012 as they were still being verified by the Department.
58
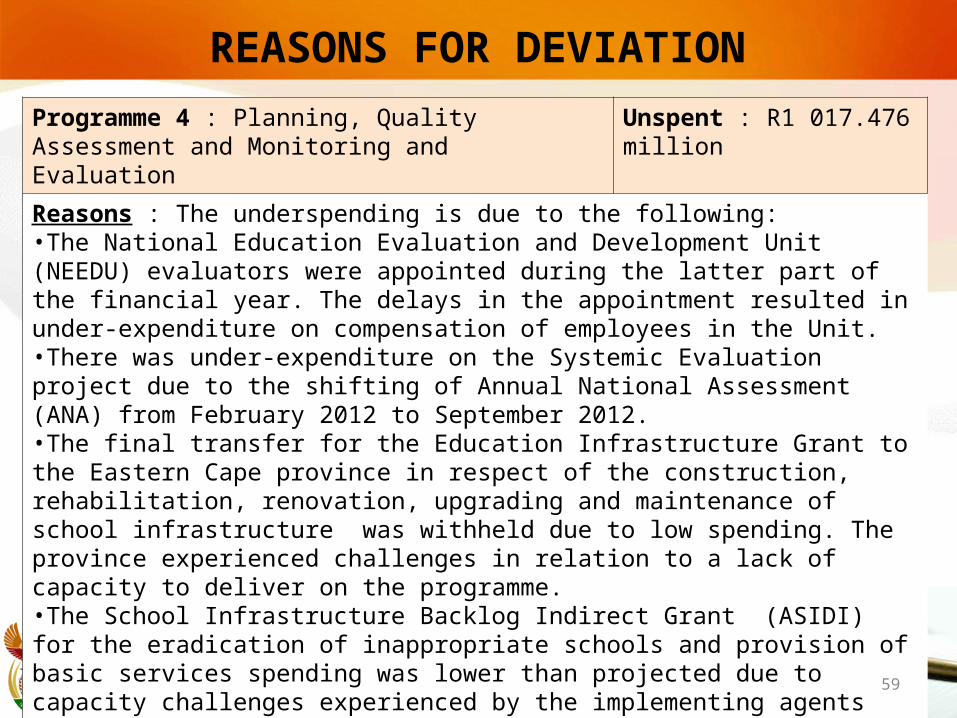
REASONS FOR DEVIATIONProgramme 4 : Planning, Quality Assessment and Monitoring and Evaluation
Unspent : R1 017.476 million
Reasons : The underspending is due to the following:•The National Education Evaluation and Development Unit (NEEDU) evaluators were appointed during the latter part of the financial year. The delays in the appointment resulted in under-expenditure on compensation of employees in the Unit.•There was under-expenditure on the Systemic Evaluation project due to the shifting of Annual National Assessment (ANA) from February 2012 to September 2012.•The final transfer for the Education Infrastructure Grant to the Eastern Cape province in respect of the construction, rehabilitation, renovation, upgrading and maintenance of school infrastructure was withheld due to low spending. The province experienced challenges in relation to a lack of capacity to deliver on the programme. •The School Infrastructure Backlog Indirect Grant (ASIDI) for the eradication of inappropriate schools and provision of basic services spending was lower than projected due to capacity challenges experienced by the implementing agents and contractors. This had an impact on the implementation of approved projects.
59
ASIDI CHALLENGES IN 2011/12
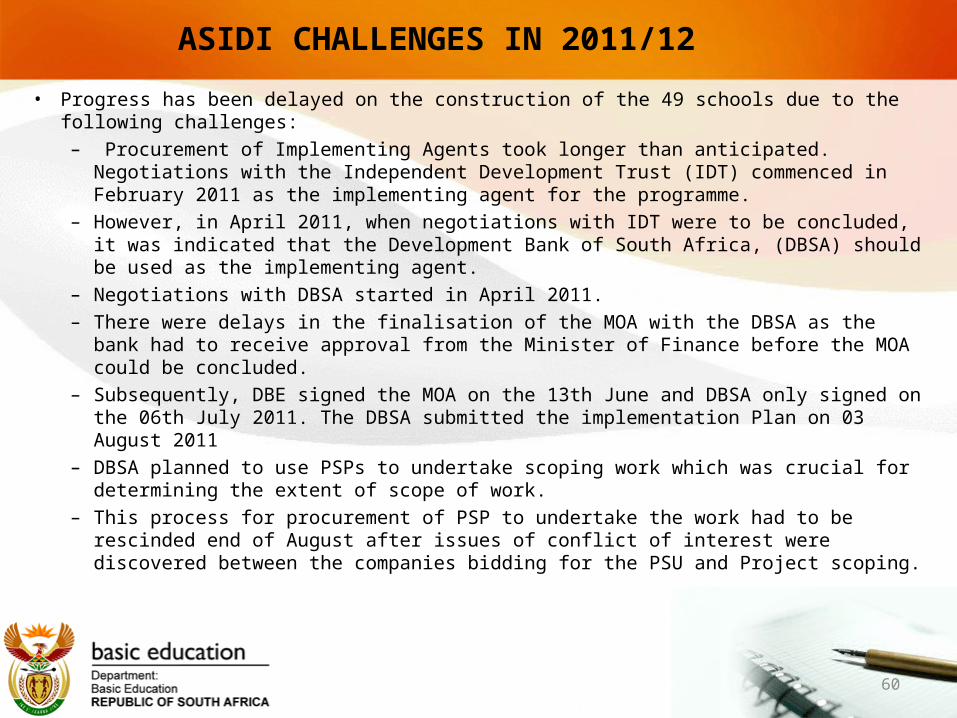
• Progress has been delayed on the construction of the 49 schools due to the following challenges:– Procurement of Implementing Agents took longer than anticipated. Negotiations with
the Independent Development Trust (IDT) commenced in February 2011 as the implementing agent for the programme.
– However, in April 2011, when negotiations with IDT were to be concluded, it was indicated that the Development Bank of South Africa, (DBSA) should be used as the implementing agent.
– Negotiations with DBSA started in April 2011. – There were delays in the finalisation of the MOA with the DBSA as the bank had to
receive approval from the Minister of Finance before the MOA could be concluded. – Subsequently, DBE signed the MOA on the 13th June and DBSA only signed on the 06th
July 2011. The DBSA submitted the implementation Plan on 03 August 2011– DBSA planned to use PSPs to undertake scoping work which was crucial for determining
the extent of scope of work. – This process for procurement of PSP to undertake the work had to be rescinded end of
August after issues of conflict of interest were discovered between the companies bidding for the PSU and Project scoping.
60
ASIDI CHALLENGES IN 2011/12
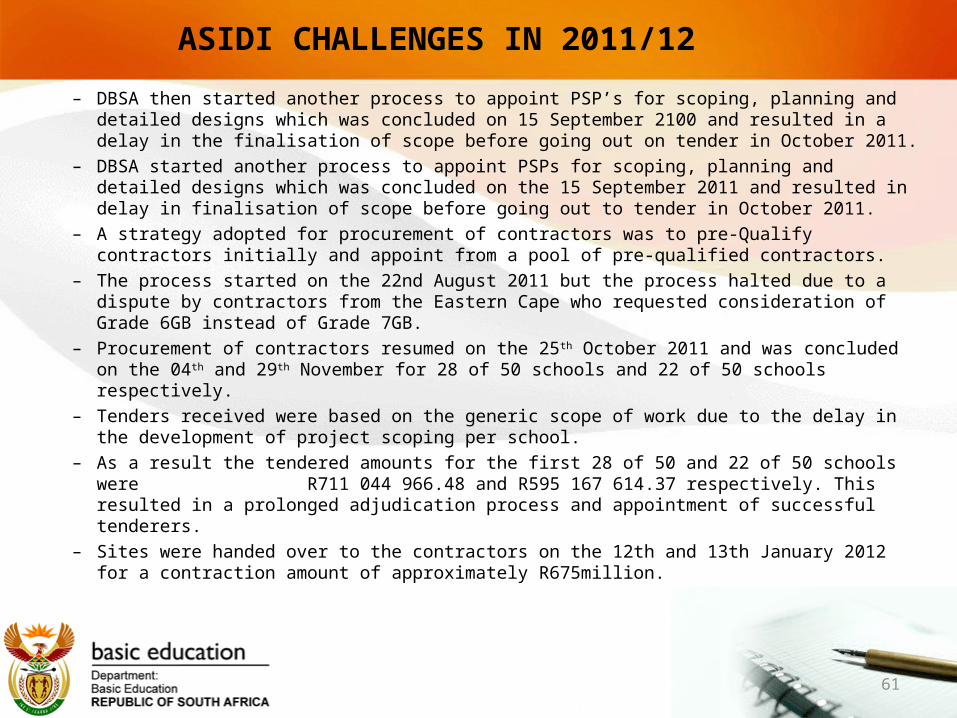
– DBSA then started another process to appoint PSP’s for scoping, planning and detailed designs which was concluded on 15 September 2100 and resulted in a delay in the finalisation of scope before going out on tender in October 2011.
– DBSA started another process to appoint PSPs for scoping, planning and detailed designs which was concluded on the 15 September 2011 and resulted in delay in finalisation of scope before going out to tender in October 2011.
– A strategy adopted for procurement of contractors was to pre-Qualify contractors initially and appoint from a pool of pre-qualified contractors.
– The process started on the 22nd August 2011 but the process halted due to a dispute by contractors from the Eastern Cape who requested consideration of Grade 6GB instead of Grade 7GB.
– Procurement of contractors resumed on the 25th October 2011 and was concluded on the 04th and 29th November for 28 of 50 schools and 22 of 50 schools respectively.
– Tenders received were based on the generic scope of work due to the delay in the development of project scoping per school.
– As a result the tendered amounts for the first 28 of 50 and 22 of 50 schools were R711 044 966.48 and R595 167 614.37 respectively. This resulted in a prolonged adjudication process and appointment of successful tenderers.
– Sites were handed over to the contractors on the 12th and 13th January 2012 for a contraction amount of approximately R675million.
61
RISKS AND MITIGATIONS FOR IMPLEMENTATION
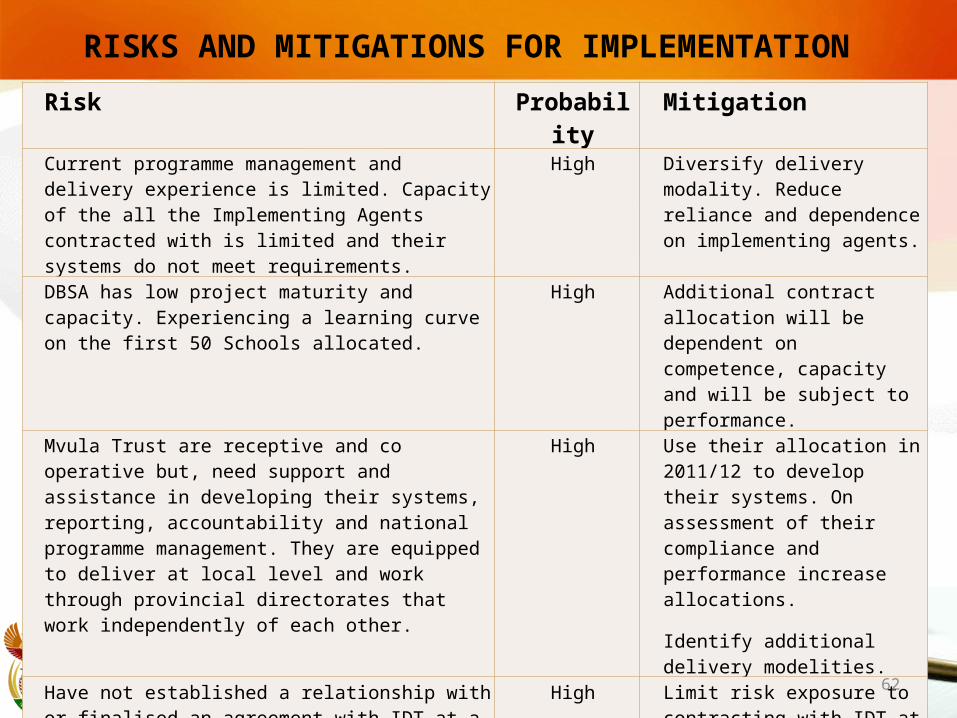
Risk Probability MitigationCurrent programme management and delivery experience is limited. Capacity of the all the Implementing Agents contracted with is limited and their systems do not meet requirements.
High Diversify delivery modality. Reduce reliance and dependence on implementing agents.
DBSA has low project maturity and capacity. Experiencing a learning curve on the first 50 Schools allocated.
High Additional contract allocation will be dependent on competence, capacity and will be subject to performance.
Mvula Trust are receptive and co operative but, need support and assistance in developing their systems, reporting, accountability and national programme management. They are equipped to deliver at local level and work through provincial directorates that work independently of each other.
High Use their allocation in 2011/12 to develop their systems. On assessment of their compliance and performance increase allocations.
Identify additional delivery modelities.
Have not established a relationship with or finalised an agreement with IDT at a national level. Performance between different provinces has been observed to be variable. They demonstrated an ability to deliver for PEDs in selected provinces (Gauteng, North West, Limpopo).
High Limit risk exposure to contracting with IDT at a provincial level. It will contain risk on allocations to one province and also slow release of work package in relation to performance.
62
RISKS AND MITIGATIONS FOR IMPLEMENTATION
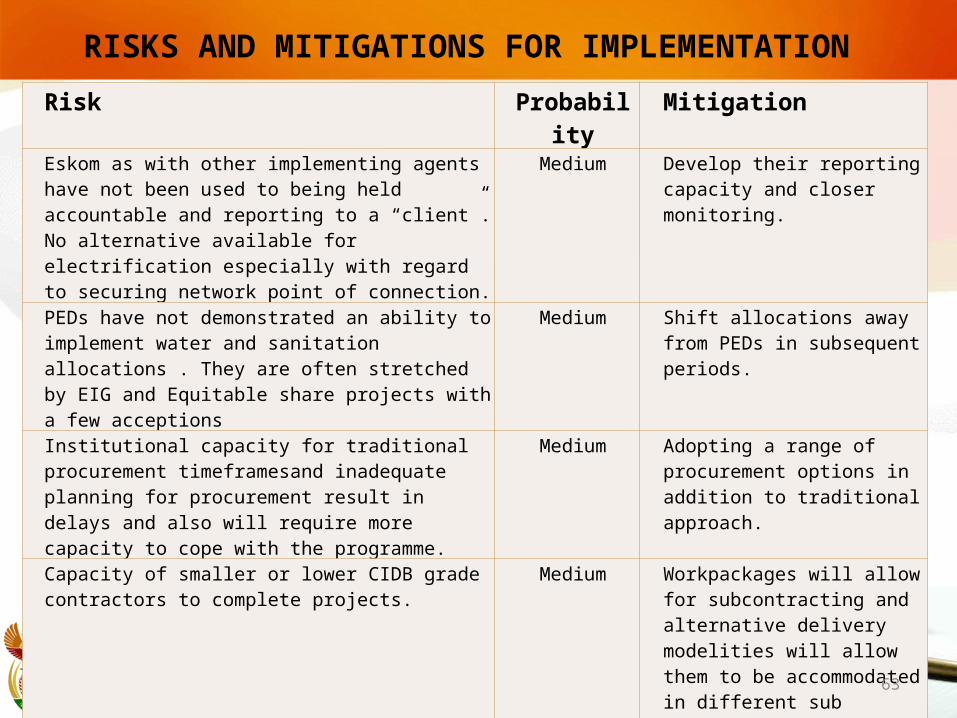
Risk Probability MitigationEskom as with other implementing agents have not been used to being held accountable and reporting to a “client”. No alternative available for electrification especially with regard to securing network point of connection.
Medium Develop their reporting capacity and closer monitoring.
PEDs have not demonstrated an ability to implement water and sanitation allocations . They are often stretched by EIG and Equitable share projects with a few acceptions
Medium Shift allocations away from PEDs in subsequent periods.
Institutional capacity for traditional procurement timeframesand inadequate planning for procurement result in delays and also will require more capacity to cope with the programme.
Medium Adopting a range of procurement options in addition to traditional approach.
Capacity of smaller or lower CIDB grade contractors to complete projects.
Medium Workpackages will allow for subcontracting and alternative delivery modelities will allow them to be accommodated in different sub programmes.
The range of Schedule 2 (Major Public Entities e.g DBSA, IDT, ESKOM, ect.), implementing agents limited and they cannot be relied upon.
High Expanding the range of delivery agents to reduce reliance on implementing agents.
63
64
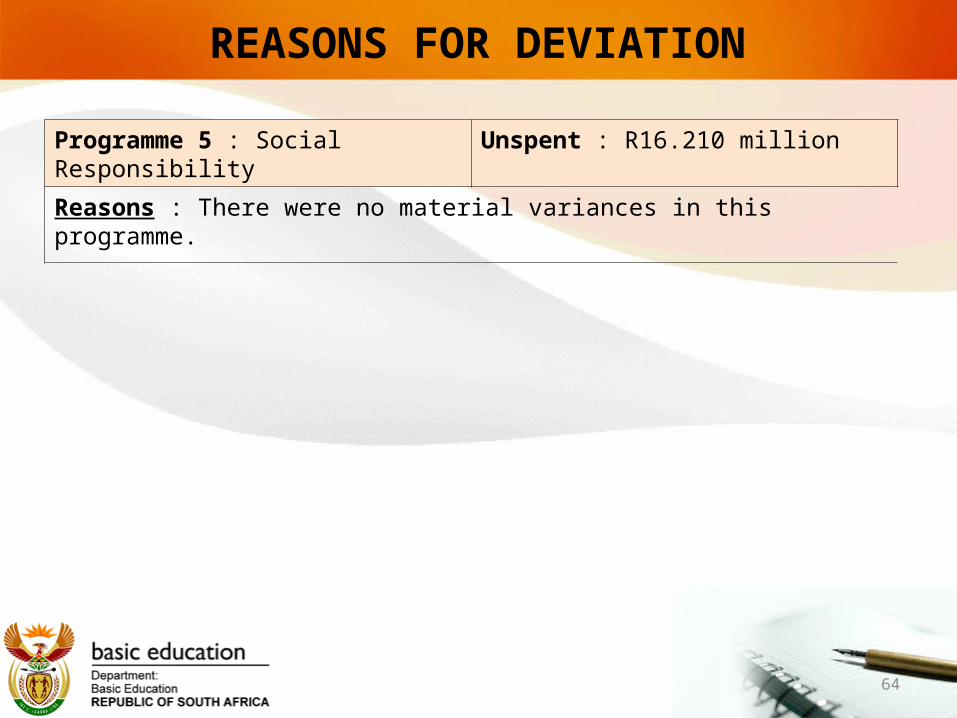
Programme 5 : Social Responsibility Unspent : R16.210 million
Reasons : There were no material variances in this programme.
REASONS FOR DEVIATION
AUDITOR-GENERAL REPORT
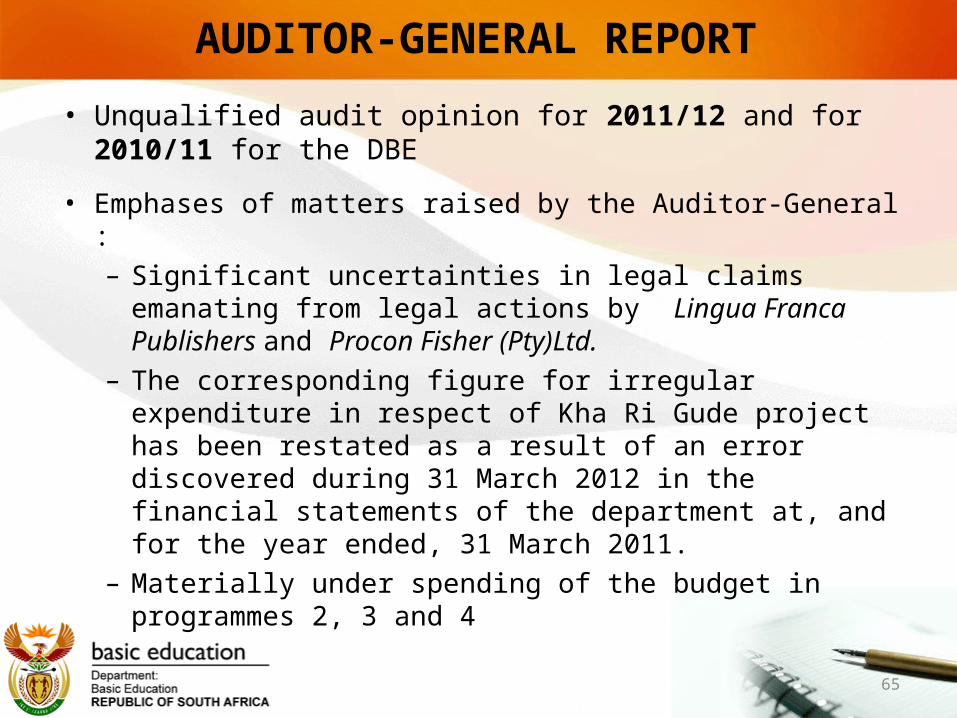
• Unqualified audit opinion for 2011/12 and for 2010/11 for the DBE
• Emphases of matters raised by the Auditor-General :– Significant uncertainties in legal claims emanating from legal
actions by Lingua Franca Publishers and Procon Fisher (Pty)Ltd.
– The corresponding figure for irregular expenditure in respect of Kha Ri Gude project has been restated as a result of an error discovered during 31 March 2012 in the financial statements of the department at, and for the year ended, 31 March 2011.
– Materially under spending of the budget in programmes 2, 3 and 4
65
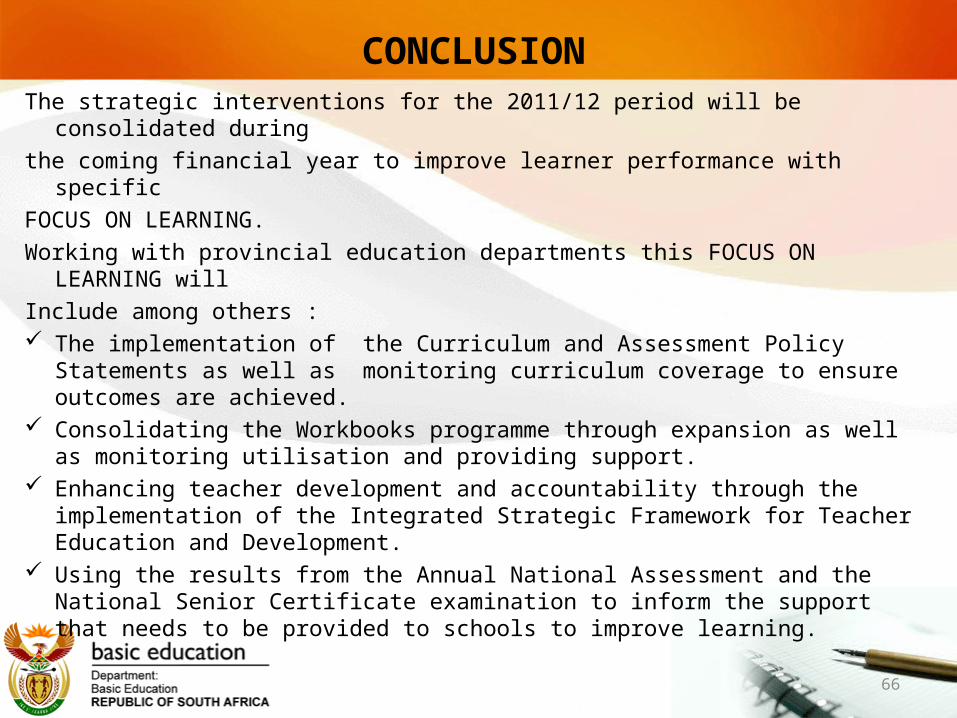
CONCLUSIONThe strategic interventions for the 2011/12 period will be consolidated during the coming financial year to improve learner performance with specific FOCUS ON LEARNING.Working with provincial education departments this FOCUS ON LEARNING will Include among others : The implementation of the Curriculum and Assessment Policy Statements as
well as monitoring curriculum coverage to ensure outcomes are achieved. Consolidating the Workbooks programme through expansion as well as
monitoring utilisation and providing support. Enhancing teacher development and accountability through the
implementation of the Integrated Strategic Framework for Teacher Education and Development.
Using the results from the Annual National Assessment and the National Senior Certificate examination to inform the support that needs to be provided to schools to improve learning.
66
Thank you
67