Embed Size (px)
Citation preview

FINANCIAL INCLUSION SECRETARIATCENTRAL BANK OF NIGERIA
2017 ANNUAL REPORTNATIONAL FINANCIAL INCLUSION
STRATEGY IMPLEMENTATION
2017 ANNUAL REPORTNATIONAL FINANCIAL INCLUSION
STRATEGY IMPLEMENTATION
JULY 2018

STAKEHOLDER INSTITUTIONS
PROVIDERS:
ENABLERS:
SUPPORTING INSTITUTIONS:

The Annual Report on the National Financial Inclusion Strategy Implementation is a
compendium of statistical analysis, reviews of periodic returns from stakeholders, desk
research on local and international developments, discussions and review meetings.
The Financial Inclusion Secretariat acknowledges the immense contributions of all
stakeholders whose input, involvement, and participation have helped in the publication of
this Report.
It is our sincere hope that the report would kindle greater commitment by stakeholders to
achieve the National Financial Inclusion Strategy target of a 20 per cent adult nancial
exclusion rate in Nigeria by the year 2020.
Editorial Board:
· Mrs. Temitope Akin-Fadeyi
· Mr. Joseph A. Attah
· Mr. Olayinka A. Peter
· Mr. Stephen Ambore
Mr. George Ogudu
Mr. Uzosike U. Jonathan
Dr. Nurudeen A. Zauro
Mr. Emeka M. Okoye
Mr. Maxmillian C. Belonwu
Ms. Sophia O. Abu·
Mr. Hilary D. Ewubor
Ms. Peterburs Teresa
ACKNOWLEDGMENTS
32017 Annual Report National Financial Inclusion Strategy Implementation

The Nigerian National Financial Inclusion Strategy (NFIS) was launched on October 23, 2012. The aim was
to reduce the percentage of adult Nigerians who do not have access to nancial services from 46.3 per cent
in 2010 to 20 per cent in 2020. In addition, the strategy stipulates that 70 per cent of those to be included in
the nancial system by 2020 should be in the formal sector.
The Strategy is implemented through a wide range of stakeholders and the implementation monitored
through Governing Committees, as shown below:
Figure A: Governing Structure of NFIS
T h e N a t i o n a l F i n a n c i a l
Inclusion Steering Committee,
chaired by the Central Bank of
N i g e r i a ( C B N ) G o v e r n o r,
comprises the Heads of relevant
Ministries, Departments and
Agencies (MDAs) , Indust ry
Associations, Regulators and
Technical Advisory companies. It
provides high-level policy and
s t ra teg ic d i rec t ion fo r the
implementation process. The
National Financial Inclusion
Technical Committee, chaired
by the CBN Deputy Governor, Financial System Stability, comprises CBN Directors as well as equivalents
within relevant Ministries, Departments and Agencies, Industry Associations, Regulators and Technical
Advisory companies. It provides technical support and validates data supplied on nancial inclusion. The
Technical Committee carries out its operational activities through Working Groups – Products,
Channels, Financial Literacy and Special Interventions Working Groups: The Working Groups
develop and implement annual work plans in order to achieve the dened nancial inclusion targets by 2020
and monitor implementation of the strategy.
The Financial Inclusion Secretariat
The Financial Inclusion Secretariat is a
Un i t w i th in the CBN, wh ich was
established to run the day-to-day
coordination, data management and
reporting on the National Financial
Inclusion Strategy implementation
process. It comprises three key ofces,
the Strategy Coordination Ofce, the Data
Management Ofce and the Digital
F i n a n c i a l S e r v i c e s P r o g r a m m e
Management Unit.
ABOUT THE NATIONAL FINANCIAL INCLUSION STRATEGY
Figure B: FIS organogram
2017 Annual Report National Financial Inclusion Strategy Implementation4

TABLE OF CONTENTS
FOREWORD
EXECUTIVE SUMMARY
1.0 INTRODUCTION
1.1 Why Financial Inclusion?
2.0 IMPLEMENTATION ENVIRONMENT
2.1 Macroeconomic Environment
2.2 Banking Sector
2.3 Micronance Bank Sector
2.4 E-Payments Sector
2.5 Insurance Sector
2.6 Pension Sector
2.7
Capital Market Sector
3.0 STAKEHOLDER ACTIVITIES
3.1 National Financial Inclusion Steering Committee (NFIST)
3.2 National Financial Inclusion Technical Committee (NFITC)
3.3 Working Groups
3.3.1 Channels Working Group (FICWG):
3.3.2 Financial Literacy Working Group (FLWG):
3.3.3 Financial Inclusion Products Working Group (FIPWG):
3.3.4 Special Interventions Working Group (FISIWG):
3.4 The National Financial Inclusion Secretariat
3.5 Activities Of Financial Service Providers
3.5.1 Bankers’ Committee
3.5.2 The National Association of Micronance Banks (NAMB)
3.5.3 The Nigerian Insurers Association (NIA)
3.5.4 The Association of non-Bank Micronance Institutions (ANMFIN)
3.5.5 The Bank of Industry (BOI)
3.6 Activities of Enablers
3.6.1 The Nigeria Deposit Insurance Corporation (NDIC)
8
12
23
23
25
25
26
28
28
31
33
34
35
35
36
36
36
36
36
37
37
38
38
38
38
38
39
39
39

3.6.5 The Nigerian Postal Service (NIPOST)
3.6.6 The National Identity Management Commission (NIMC)
3.6.7 The Securities and Exchange Commission (SEC)
3.6.8 The Nigerian Stock Exchange (NSE)
3.6.9 The Federal Ministry of Youths and Sports Development
3.6.10 The Federal Ministry of Education
3.6.11 Central Bank of Nigeria
3.7 Supporting Institutions
3.7.1 Alliance for Financial Inclusion (AFI)
3.7.2 Bill & Melinda Gates Foundation
3.7.3 Enhancing Financial Innovation and Access
3.7.4 Deutsche Gesellschaft fuer Internationale Zusammenarbeit (GIZ)
4.0 STRATEGY IMPLEMENTATION PROGRES
4.1 Overall Financial Inclusion Rate
4.2 Product Indicators
4.2.1 Banking
4.2.2 Electronic Payments and Savings
4.2.3 Credit
4.3 Insurance
4.3.1 Key activities in 2017
4.3.2 Status and Trend Analysis as at 2017
4.3.3 Key Issues and Future Outlook
4.4 Pension
4.4.1 Key activities in 2017
4.4.2 Status and Trend Analysis as at 2017
4.4.3 Key Issues and Future Outlook
3.6.2 The National Insurance Commission (NAICOM)
3.6.3 The Nigerian Communications Commission (NCC)
3.6.4 The National Pension Commission (PenCom)
4.5 Channel Indicators
4.5.1 Key activities in 2017
4.5.2 Status and Trend Analysis as at 2017
4.5.3 Key Issues and Future Outlook
4.6 Enablers
4.6.1 KYC ID
40
40
40
40
41
41
41
42
42
42
42
43
48
48
49
49
50
58
60
60
60
60
60
60
62
39
39
39
62
62
63
65
66
66
60

5.0 MID - TERM REVIEW OF THE NATIONAL FI STRATEGY
5.1 Introduction
5.2 The Need for a Revised National Financial Inclusion Strategy
5.3 Socio - economic Context and Technology Landscape
5.4 Mid - term Strategy Review
5.5 Governance and Approach
5.6 Key Findings
5.7 Five Most Excluded Groups
5.8 Critical Priorities for NFIS Refresh
5.9
Outlook for NFIS Refresh in 2018
LIST OF FIGURES
71
71
71
72
73
74
75
75
76
77
84
LIST OF TABLES
LIST OF ABBREVIATIONS
85
86
REFERENCES
82

The year, 2017 witnessed increasingly sustained efforts of stakeholders to accelerate progress towards the
20% exclusion rate by the year 2020.
Against the background of on exclusion rate of 41.6 percent in 2016 as per the survey results of the
Enhancing Financial Innovation and Access (EFInA) Access to Finance Survey in Nigeria in 2016, the need
to double efforts has become apparent. The Central Bank of Nigeria and indeed all the implementing
stakeholders demonstrated strong commitment to innovate new ways of increasing the speed towards the
2020 target.
One of the key steps taken is the review of the Strategy document, to reect current realities, take advantage
of opportunities and re-prioritize activities to create room for concentration on aspects that hold the greatest
promise in terms of inclusion impact. The conclusion of this exercise in 2018, will redene roles and
responsibilities and provide the impetus for greater commitment by stakeholders.
In 2017, considerable progress was made in the implementation of the National Identity Management
Framework, informal sector Pension, micro insurance, agent banking guidelines, nancial literacy
framework, Consumer Protection Framework amongst others. Also during the year, the Steering Committee
approved the framework for state-level implementation of the National Financial Inclusion Strategy at state
levels under the auspices of the Financial Inclusion State Steering Committee (FISSCO). The arrangement is
expected to bring nancial inclusion closer to the grassroots and nationally spread impact, thereby
improving the performance level.
The evolution of Digital Financial Services (DFS) has been proven globally to be a disruptive force in
signicantly improving uptake of nancial services, as it reduces cost to serve and acts as a convenient way
of carrying out nancial transactions, without the burden of physically travelling to a nancial institution.
Exploring the potentials of DFS therefore remains at the top of the priority list to support improved access to
nance in Nigeria.
In view of our commitment to our nation and the global community, I wish to call on stakeholders to double
their efforts particularly in the prioritized areas which will be the outcome of the ongoing review of the
Strategy.
I wish to therefore present the 2017 Annual report on the National
Financial Inclusion Strategy implementation for public use.
Thank you.
Godwin I. EmeeleGovernor, Central Bank of NigeriaChairman, National nancial Inclusion Steering Committee
FOREWORD
2017 Annual Report National Financial Inclusion Strategy Implementation8
STATUS OF FINANCIAL INCLUSION IN NIGERIA
56.3m
% of adult population that has or uses financialproducts from formal or informal financialinstitutions
Financial Inclusion Rate
Financial Inclusion Rate Formal Financial Inclusion Rate
% of adult population that has or uses financialproducts from formal financial institutions
46.9m
VALUE AS AT 2016
49% 57%70%
Product Indicators
58%70%80%
Electronic Payments & Savings Credit
27.2m
28%56%
70%
% of adult population having a BankVerification Number (BVN)
2%29%
40%
1.7mN
N
Insurance Pensions
% of adult population covered by a regulated insurance policy
2%25%
40%
1.7m 7.6m
% of adult population registered with a regulated pension scheme
8%26%
40%
adults adults
adults adults
adults adults
2016TARGET
2020TARGET
LEGEND
% of adult population having borrowed or paid back a loan through a regulated financial institution over last 12 months
Based on the 2016 Biennial Access to Financial Services in Nigeria Survey by EFInA. Statistics will be updated for 2018
a b

STATUS OF FINANCIAL INCLUSION IN NIGERIA
Channels Indicators
Enabler Indicators
% of adult population having a NIN
National Identification Number (NIN) Know Your Customer (KYC) Tier 1 ID
% of adult population having a mobile phoneAs a proxy for percentage of people eligible for a tier 1 account
58.3m
60%67%
100%
15%67%
100%
14.6m
No. of Commercial Bank Branches per 100,000 Adults
No. of Microfinance Bank Branches per 100,000 Adults
No. of Automated Teller Machines (ATMs) per 100,000 Adults
No. of Point-of-Sale (PoS) Devices per 100,000 Adults No. of Agents per 100,000 Adults
5,446
5.6 7.5 7.6
2,1972.3 4.6 5.0
17,440
18.0
46.259.6
112,847
116.3
524.1
850.0
18,228
18.837.2
62.0
adults adults
branches branches ATMs
PoS Devices agents
VALUE AS AT 2016
2016TARGET
2020TARGET
LEGEND
Based on Industry Data as at December 2017
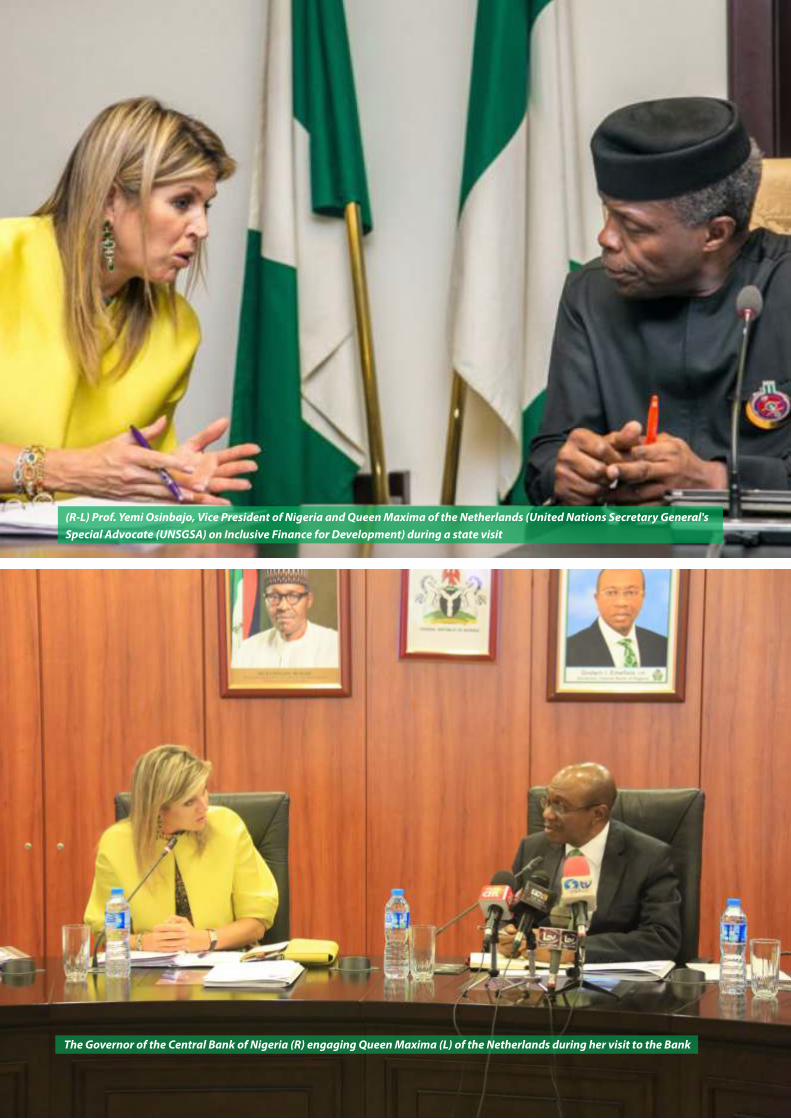
The Governor of the Central Bank of Nigeria (R) engaging Queen Maxima (L) of the Netherlands during her visit to the Bank
(R-L) Prof. Yemi Osinbajo, Vice President of Nigeria and Queen Maxima of the Netherlands (United Nations Secretary General's Special Advocate (UNSGSA) on Inclusive Finance for Development) during a state visit

Nigeria launched its own National Financial Inclusion Strategy (NFIS) in October, 2012. The
overarching objective of the strategy is to reduce the number of Nigerian adults without access
to formal nancial services to 20% by 2020 from the base line gure of 46.3% in 2010.
The strategy is being implemented by a wide range of stakeholders and managed by a
Governing Committee through a streamlined governance structure. The structure consist of a
National Financial Inclusion Secretariat that oversees the day-to-day monitoring of the Strategy
implementation; National Financial Inclusion Working Groups that implement specic actions
to achieve objective of the strategy; a Technical Committee who recommends the approval of
technical outputs for the consideration of the Steering Committee - which has overall
accountability for the NFIS. One of the key milestones achieved in 2017 was the approval of a
State level steering committee. The Financial Inclusion State Steering Committee (FISSCO) was
recently added to the governance structure to further deepen strategy implementation at the
state level; FISSCO reports to the Technical Committee. This annual publication seeks to report
the progress on implementation of the strategy in 2017.
rdThe 2017 report which is the 3 edition of this publication has few changes from the previous
edition based on feedback received and need to focus on higher-priority activities in the
strategy implementation landscape. There was a straight swap of two chapters; Chapter 3 of
previous report which used to be “Strategy Implementation Progress” is now Chapter 4 while
the Chapter covering “Stakeholder Activities” is now Chapter 3. A new Chapter 5 - Mid-Term
Review of the National Financial Inclusion Strategy - has been added to this year's report to
highlight key initiatives of 2017.
Importance of Financial Inclusion to the Nigerian Economy
The Nigerian economy contracted for ve consecutive quarters and only experienced ndsluggishly positive growth in real GDP in 2 quarter 2017. To sustain this growth, the Nigerian
government view Financial Inclusion as a critical foundation for economic recovery and growth.
The government believes in the capability of Financial Inclusion to drive economic growth and
development; hence endorsed Financial Inclusion as a major component of the country's
national economic development agenda. To buttress this point, while receiving the UN
Secretary-General's Special Advocate for Inclusive Finance for Development (UNSGSA),
Queen Maxima of Netherland, in Abuja, Nigeria in November 2017, the Vice President of
Nigeria, Prof. Yemi Osinbanjo stated that: “Financial Inclusion is absolutely important for us as
an economy. We need to be able to ensure that all of our people, wherever they live, no matter
how far away they are can be reached with nancial products”.
The same was point was further reinforced during bilateral discussions between the visiting
UNSGSA and the Nigerian Central Bank Governor, Godwin Emeele. What is more, a report
published by Mckinsey Global institute also showed that Digital Financial Inclusion can
provides potential economic benets to Nigeria by boosting GDP up to 12.4% by 2025;
mobilize new deposits to a tune of about USD 36 million; create about 3 million new jobs;
reduce government leakages annually by USD 2 billion; and add about 46 million people to the
inclusion bracket. It is against this back drop of these postulations that we present the progress
report of the implementation of the National Financial Inclusion strategy for 2017.
EXECUTIVE SUMMARY
Financial
Inclusion is
absolutely
important for us as
an economy. We
need to be able to
ensure that all of
our people,
wherever they live,
no matter how far
away they are can
be reached with
nancial productsProf. Yemi Osinbajo,
Vice President, Federal
Republic of Nigeria”
“
One of the key
milestones of
2017 was the
approval of a State-
level Steering
Committee:
Financial Inclusion
State Steering
Committee
(FISSCO).
Recently, FISSCO
was also added to
the governance
structure to further
deepen strategy
implementation at
the state level
“
”2017 Annual Report National Financial Inclusion Strategy Implementation12

Global numbers are improving but local numbers are not
One of the major highlights of Financial Inclusion in 2017 is the reduction in the number of
unbanked by 515 million globally according to data released by the World Bank. The World
Bank Global Findex 2017 report showed that the total number of globally excluded has
reduced from 2 billion based on the 2014 Global Findex data to 1.7 billion based on the 2017
data. The Global Findex 2017 also reported a 7% increase in account ownership up to 69%
from 62% in 2014. Digital technology and mobile money are the most promising tools used to
close Financial Inclusion gaps across the globe, with 52% of adults globally using the digital
platform to send and receive payment - an increase of 10% from 2014.
Notwithstanding global progress, account ownership in Nigeria has plummeted by 4
percentage points to 40% in 2017 compared to 44% in the 2014 report. This trend is in tandem
with the EFInA 2016 survey report on Access to nance which shows that no interim target was
achieved in 2016.
The fragile macroeconomic environment in the previous year coupled with the slow Financial
Inclusion growth rate in 2016 meant that concerted effort is required from all Financial Inclusion
stakeholders in Nigeria. This is in order to quickly reverse the trend and stand a realistic chance
of achieving 80% inclusion rate at the project terminal date of 2020.
Mild Improvements in Macroeconomic environment and Financial Market Results
The macroeconomic environment in 2017 showed better promise than that of the preceding
year. This was largely due to the intervention of the CBN in the Agricultural sector through the
Anchor Borrower Programme, increased oil receipt by the Nigerian government, scal
stimulus, as well as the improved business environment.
The recovery of crude oil price at the local and international market also meant an improvement
in performance with an overall balance of payments surplus of 3.3% of GDP, as against a decit
of 0.2% of GDP in 2016. This was further strengthened by the sustained reform in the foreign
exchange market which resulted in the accumulation of external reserve and a more stable
Naira/US Dollar exchange rate.
The structure of the Nigerian nancial sector remained largely unchanged in 2017, although
one more bank was granted license - making it a total of 27 licensed banks. In the same year,
total asset of the banking sector grew by 9.4% compared to the preceding year. Micronance
Banks (MFBs) also grew from 999 in 2016 to1008 in the period under review.
E-payment experienced impressive growth during the year under review with an increase in
volume and value by 43.2% and 37.6% respectively. On the other hand, the volume and value of
cheques cleared nationwide maintained a declining trend as it fell by 7.7% and 6.9%
respectively.
The insurance sector recorded a 14% growth in gross premium and 1.7% in terms of claims
paid by Insurance companies, during the year under review.
The total annual contributions made into the Contributory Pension Scheme (CPS) during the
year grew by 25.12% when compared to the contributions made in 2016.
In the capital Market, the number of listed securities increased from 247 in 2016 to 261 in 2017.
The aggregate market capitalisation of the 261 listed securities rose, signicantly, by 41.6% to
N22,917.9 billion, compared with the level in 2016.
Mild improvements were evident in all sectors of the Financial Market in 2017, compared to
2016. This has provided the necessary conditions for stakeholders to implement initiatives to
Other key
stakeholder
achievements in
2017 include… the
release of the
Micro-Insurance
and the
Bancassurance
guidelines by the
National Insurance
Commission
(NAICOM) to
further improve
uptake of
insurance in the
country
“
”
132017 Annual Report National Financial Inclusion Strategy Implementation

drive the objective of Financial Inclusion.
Further details of the macroeconomic environment and Financial Market in Nigeria during the
period under review are provided in section 2.0 of this document.
A Strategic Change to the Governance Structure
In order to deepen the implementation of Financial Inclusion at the States level, the National
Financial Inclusion Steering Committee (NFISC) approved the implementation of a Financial
Inclusion States Steering Committee (FISSCO) in all 36 states of the Federation and the Federal
Capital Territory, Abuja.
Also, during the year under review, in order to leverage on the potential of Digital Financial
Services to accelerate the objective of Financial Inclusion, the Digital Financial Services
Program Management Unit of the Secretariat became functional upon resumption of a key staff
of the units.
Key Stakeholder Activities and Achievements
At the National Financial Inclusion Steering Committee level, the two major initiatives that were
approved include; the review of the existing National Financial Inclusion Strategy and
development of a revised strategy through a refresh project; and approval for the setup of
FISSCOs.
During the period under review, the National Financial Inclusion Technical Committee (NFITC)
approved the change of membership status of some institutions from observers to full member
status of NFITC. The committee also approved collaborations between key institutional
stakeholders to improve Bank Verication Number (BVN) enrollments.
Some key achievements at the Working Group level include:
Ÿ Promoting the active role of Nigerian Postal Services (NIPOST) in agent banking.
Ÿ Development and infusion of Financial Literacy Curriculum into the National Education
Curricula.
Ÿ Participation of key member institutions in the National Youth Service Corps (NYSC)
Peer Educator Programme - an initiative designed to leverage on NYSC members to
drive Financial Literacy.
Ÿ Development of new strategies to onboard the nancially excluded by Jaiz Bank and
other Non-Interest Finance Institutions.
Ÿ Aggressive efforts to scale up the disbursement of 2% Micro, Small and Medium
Enterprises Development Fund (MSMEDF) to People living With Disabilities (PWDs).
During the same period, the Secretariat hosted a knowledge exchange programme for seven
(7) member countries of the Alliance of Financial Inclusion (AFI) network. The secretariat also
hosted the United Nations Secretary General's Special Advocate (UNSGSA) on Inclusive
Finance for Development - Queen Maxima of the Netherlands. In her role as the UNSGSA, she
visited Nigeria to ascertain progress of the NFIS implementation.
Other key stakeholder achievements in 2017 include the establishment of the Agri-Business
Small and Medium Enterprises Investment Scheme (AGSMEIS) by the Bankers' Committee to
promote SMEs in agri-business; and the release of the Micro-Insurance and the
Bancassurance guidelines by the National Insurance Commission (NAICOM) to further drive
uptake of insurance activities in the country.
Detail achievement of stakeholders is further provided in section 3 of this document.
2017 Annual Report National Financial Inclusion Strategy Implementation14

23.6%
28.0% 31.3%
Payment
Savings
Credit
Insurance
Pensions
% of adult popula�on having a payment product with a formal financial ins�tu�on
% of adult popula�on having a savings product with a formal financial ins�tu�on
% of adult popula�on having borrowed or paid back a loan through a regulated financial ins�tu�on over the last 12 months
% of adult popula�on covered by a regulated insurance policy
% of adult popula�on registered with a regulated pension scheme
Definition of Indicator
Defi
nition
of Pro
xy Ind
icat
or
% o
f ad
ult
po
pu
la�
on
hav
ing
Ban
k V
erifi
ca�
on
Nu
mb
ers
Baseline
2010
Actual
2014
Actual
2015
Actual2016
Actual2017
Target2017
% Achieved
2017
Trend2016 -17
StatusTarget2020
22%
24%
2%
1%
5%
N/A
1.5%
1.1%
7.0%
6.8%6.4m
Adults
(1.4m Adults)
3%*
1%*
7.5%
1.8%
1.8%
7.9%
(22.6m Adults)
(27.2m Adults)
(31.0m Adults)
(1.0m Adults)
(6.6m Adults)
(7.2m Adults)
(1.7m Adults)
(1.7m Adults)
(7.6m Adults)
5.4%5.4m
Adults
1.1%1.15m Adults
8.4%(8.4m
Adults)
31.6%
28.6%
29.2%
(31.3m Adults)
(28.4m Adults)
(29.0m Adults)
59.8%
49.2%(48.8m Adults)
(59.3m Adults)
52.3%
63.6%
17.1%
3.8%
28.8%
40%
40%
40%
(42.3m Adults)
(42.3m Adults)
(42.3m Adults)
70%
60%(63.5m Adults)
(74.1m Adults)
23.6%
(22.6m Adults)
(27.2m Adults)
28.0%
(31.0m Adults)
31.3%
*for these years, supply-side data was not available therefore the demand-side figure for the preceding year was used as a proxy.
Figure C: Status of the Product Key Performance Indicators
152017 Annual Report National Financial Inclusion Strategy Implementation
How close are we to the target?
The primary data source for measuring the demand side of progress of Financial Inclusion in
Nigeria is the bi-annual Access to Finance Services survey data by Enhancing Financial
Innovation and Access (EFInA). The last survey was conducted in 2016 and the ndings were
reported in the 2016 annual report which shows that no interim target for 2016 was achieved.
The next round of survey would take place in 2018. On the supply side however, the CBN and
other institutional regulators provide the relevant data for measurement.
Data from the World Bank Global Findex for 2017 provides some insight into Financial Inclusion
progress in Nigeria in 2017. The data shows that ownership of an account with a nancial
institution or a mobile money provider in Nigeria dropped by 4 percentage points from 44% in
2016 to 40% in 2017. The 2017 Findex report further highlights the issues observed in the mid-
term review of the NFIS strategy. For instance, the gender gap in account ownership widened
by 24 percentage points with 51% men owning an account compared to 27% women.
The product performance indicator for 2017 shows that even though the interim target for 2017
across all products were not achieved there was considerable progress in 2017 compared to
the previous year. Figure 2.0 below provides an overview of the 2017 products status.
The number of POS channel and Agents deployed in the year under review trended upwards in
2017, albeit below expected target, the remaining channels either trended downwards or
remained unchanged. This trend might not be unconnected with increased dependence on
Digital Financial Services (DFS) and Agency Banking; and less dependence on traditional
channels like physical bank branches and ATMs.
One of the key enablers for DFS and indeed Financial Inclusion is a means of identication. The
target for Nigerian adult population for National Identication Number (NIN) was 74.8 million;
however, only about 27.7 million Nigerian adult have NIN in 2017. Enrolment for Bank
Verication Number (BVN) which serves as a means of identication for the Banking sector in
Nigeria has grown to about 30 million. Efforts are ongoing by the National Identication
Management Commission (NIMC) to harmonize the various identication databases for better
efciency and results.
b
c
e

Overall, progress towards achieving the NFIS targets has fallen short of the annualized targets
in the year under review.
We are hoping that concerted efforts and policy initiatives rolled out in 2017 will yield more
positive outcomes in subsequent years starting from 2018.
Details of progress measurement against target are further described in section 4 of this report.
National Financial Inclusion Strategy Review and Refresh
With the terminal date to meet the Financial Inclusion target just 3 years away, drastic measures
need to be put in place to improve the chances of meeting the target, considering the changes
to certain socio-economic variables and the implementation landscape since 2012. The 2012
Strategy document also made provision for a mid-term review after the rst 4 years of
implementation.
To that effect, the project for the mid-term review and refresh of the 2012 NFIS strategy was
approved in 2017.
The strategy mid-term review was a backward-looking assessment of the 2012 NFIS based on
a comprehensive review of existing research; reports and databases; and extensive
stakeholder engagement; while the strategy refresh is a forward-looking process that seeks to
apply lessons learned from the review phase to the development of a new strategy.
The ndings of the mid-term review phase of the project were approved in 2017.
Key ndings of the mid-term review include:
I. That no interim targets were achieved as at December 2016, although exclusion rate had
dropped to 41.6% in 2016 from 46.3% in 2012.
II. That ve target demographic groups were excluded at especially high rates and
accounted for major exclusion gaps: Gender (Women 46.5%) Urban - rural (52.2%),
Age (Youth 18 – 25year, 53.3%), Regional (Northwest 70% and Northeast 62%, the two
regions account for 56.6% of overall exclusion) and Formality (MSMEs).
III. Reasons behind the unusually high exclusion rates for these groups ranged from
religious and cultural barriers to uptake of nancial products, difculties in protably
extending nancial services to them, high (and worsening) levels of unemployment,
security challenges in specic regions of the country and continuing high levels of
informality in the economy.
Based on these ndings, the review came up with the following critical themes to scale up
achievement in the Financial Inclusion targets as outlined in three steps:
I. Step 1 - Focus on building foundations: creating a controlled and enabling
environment for innovation to thrive, whilst assuring overall nancial system stability;
enhancing private sector understanding and interest in Financial Inclusion objectives;
expanding Agent networks; and accelerating issuance of the national identity number to
all citizens.
II. Step 2 - Unlocking high potential models: comprising Digital Financial Services (DFS)
and Community lending models through Micronance.
III. Step 3 - Broadening and deepening inclusion: investments in tailored savings and credit
products, accelerating digitization of government payments, including social transfers
and Government to Persons (G2P), Persons to Government (P2G) and Financial and
Digital literacy.
Overall,
progress
towards achieving
the NFIS targets
has fallen short of
the annualized
targets in the year
under review.
We are hoping that
concerted efforts
and policy
initiatives rolled
out in 2017 will
yield more positive
outcomes in
subsequent years
starting from
2018
“
”
2017 Annual Report National Financial Inclusion Strategy Implementation16

Though interim targets for 2017 were largely not met and certain socio-economic variables in
the implementation landscape remains a challenge, the ongoing collaboration within
stakeholders, the implementation of FISSCO, growth in DFS and the work on the revised
strategy makes us optimistic that when the EFInA Access to nancial services survey for 2018 is
conducted better progress would have been made towards the achievement of the Financial
Inclusion target of 80% exclusion rate by 2020.
As succinctly captured by the Governor of the Central Bank of Nigeria during the visit of Queen
Maxima of the Netherlands in her capacity as the UNSGSA, to ascertain the progress of
Financial Inclusion in Nigeria, “Our target is to bridge the 20 percent exclusion rate by
2020…we need to work on propagating digital nancial services as simple, exible and easy
alternative channels for reaching our remote areas and rural hinterland”. We intend to focus
more on DFS in achieving the set target.
Our target is to
bridge the 20
percent exclusion
rate by 2020…we
need to work on
propagating digital
nancial services
as simple, exible
and easy
alternative
channels for
reaching our
remote areas and
rural hinterland
“
”Table A: Implementation Status of Key Initiatives as at December 2017
172017 Annual Report National Financial Inclusion Strategy Implementation
Status Implementation Area
Initiative
Completed
Governance
Arrangement
The Steering Committee approved the setting up and inauguration of
Financial Inclusion State Steering Committee in all 36 States and the FCT.
Insurance
The National Insurance Commission released revised guidelines for
Microinsurance operations in Nigeria. The Takaful Guidelines was also
released and two stand-alone operators were licensed.
Establishment
of DFS PMU
The CBN established a programme Management Unit for Digital
Financial Services.
National
Identity
The National Identity Management Commission (NIMC) completed and
released 5 (ve) gazzetted regulations in support of the Federal
Government’s policy on National Identity.
Capital Market
The Securities and Exchange Commission completed its Capital Market
Strategy Document, providing the strategic foundation for deepening
nancial inclusion in the capital market.
Consumer
Protection
The Nigeria Deposit Insurance Corporation extended deposit insurance
to subscribers of mobile money products.
Financial
Literacy
The Central Bank of Nigeria approved the National Financial Literacy
Framework as well as the results of the National Financial Literacy
Baseline Survey.
On Track
Payments
1. The Central Bank of Nigeria issued license to 2 new Super Agents;
2. BVN enrolment extended to Micronance Bank customers.
3. CBN and NCC signed a Memorandum of
Understanding (MoU) to enhance payment systems and drafted a
regulatory framework on the use of Unstructured Supplementary Service
Data (USSD)
Credit
As at December 2017, the NCR recorded a total of 22,744 nancial
statements valued at N511.35 billion secured with 29,060 various types of
movable assets from 106,637 debtors.
Insurance The CBN released the Bancassurance guidelines in March 2017 in addition to NAICOM’s guidelines.
Pensions A draft Micro Pension Guideline for the informal sector and self-employed was under review as at December, 2017
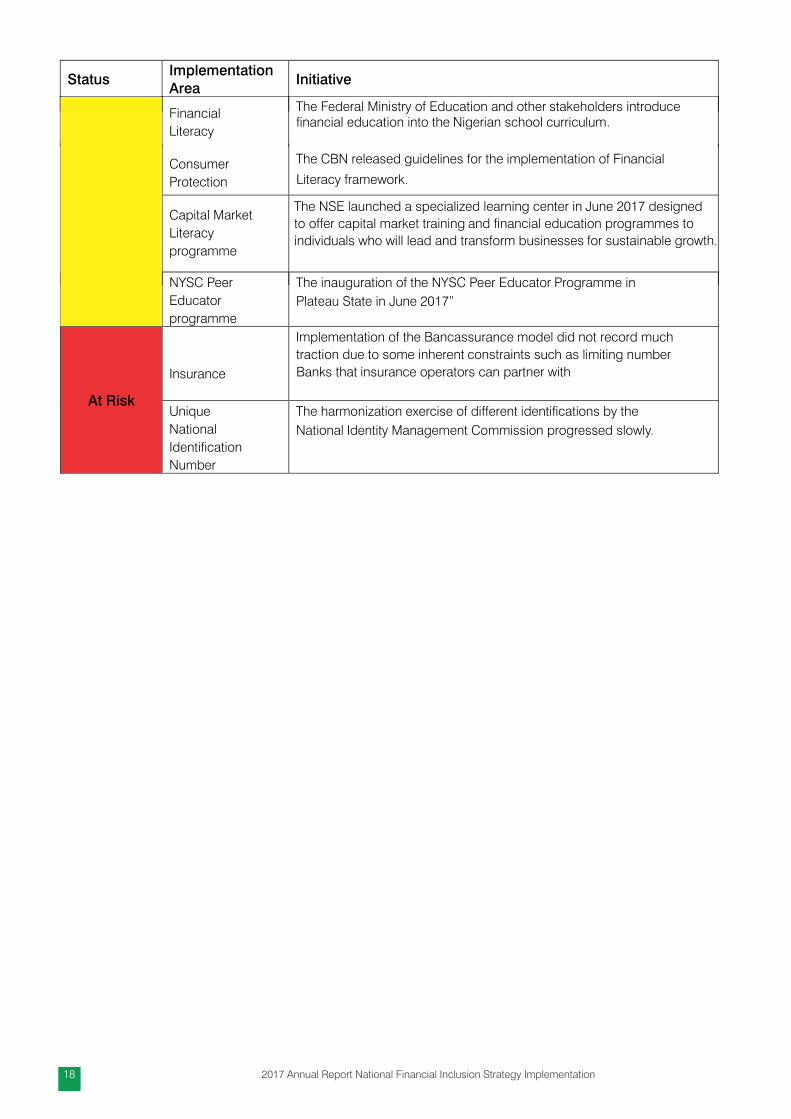
Status Implementation Area
Initiative
Financial
Literacy
The Federal Ministry of Education and other stakeholders introduce nancial education into the Nigerian school curriculum.
Consumer
Protection
The CBN released guidelines for the implementation of Financial
Literacy framework.
Capital Market
Literacy
programme
The NSE launched a specialized learning center in June 2017 designed
to offer capital market training and nancial education programmes to
individuals who will lead and transform businesses for sustainable growth.
NYSC Peer
Educator
programme
The inauguration of the NYSC Peer Educator Programme in
Plateau State in June 2017”
At Risk
Insurance
Implementation of the Bancassurance model did not record much
traction due to some inherent constraints such as limiting number
Banks that insurance operators can partner with
Unique
National
Identication
Number
The harmonization exercise of different identications by the
National Identity Management Commission progressed slowly.
2017 Annual Report National Financial Inclusion Strategy Implementation18

Notes
aThe adult nancial inclusion rate includes any adult who falls under one of the three nancial access strands “Banked”, “Other
Formal” and “Informal Only”, measured by EFInA in its biennial Access to Financial Services in Nigeria Survey. The formal adult
nancial inclusion rate includes any adult who falls under one of the two nancial access strands “Banked” and Other Formal”. The
denitions of the nancial access strands are as follows: Banked: Adults who have access to or use a deposit money bank in addition
to having/using a traditional banking product, including ATM (debit) card, credit card, savings account, current account, xed deposit
account, mortgage, overdraft, loan from a bank, or no-interest banking product, including indirect access. Formal Other: Adults who
have access to or use other formal institutions and nancial products not supplied by deposit money banks, including insurance
companies, micronance banks, pension schemes, mobile money operators or shares. It also includes remittances (through formal
channels); including indirect access. Informal Only: Adults who do not have any banked or formal other products but have access to
or use only informal services and products. This includes savings clubs/pools, esusu, ajo, or money lenders; as well as remittances
(through informal channels such as via a transport service or recharge card); Financially Excluded: Adults not in the “banked”, Formal
Other”, or “Informal only” categories, even though the person may be using or have access to any of the following: loan/gift from
friends or family and loan from employers, as well as remittances via a friend/family member.
bFigures on this charts are based on EFInA Access to Financial Services Survey (A2F) 2016 as the survey was not conducted in 2017.
cAdult population estimated from the 2006 EFInA A2F.
dBVN data sourced from the Nigerian Interbank Settlement System Plc. The Bank Verication Number (BVN) was introduced by the
CBN in collaboration with commercial banks in February 2014 to ensure unique biometric identication across commercial banks in
Nigeria. The BVN was made a mandatory requirement for any customer who would like to open and use a commercial bank account
in October 2015. Therefore, the indicator is used as a proxy for the % of the adult population having a commercial bank account,
which serves as a payments and savings product, as it can be used to make payments and save. The 2010 baseline value was based
on a different denition and is therefore not directly comparable.eNote that the 2017 gure of insurance penetration was computed based on industry data supplied by insurance companies only.
Special schemes such as the NHIS and NSITF gures though higher but are not included. Premiums for these later schemes is paid
directly by employers and the employees may not use the cover even when the event occurs because he/she may not be aware or
have little knowledge of the insurance cover.
192017 Annual Report National Financial Inclusion Strategy Implementation
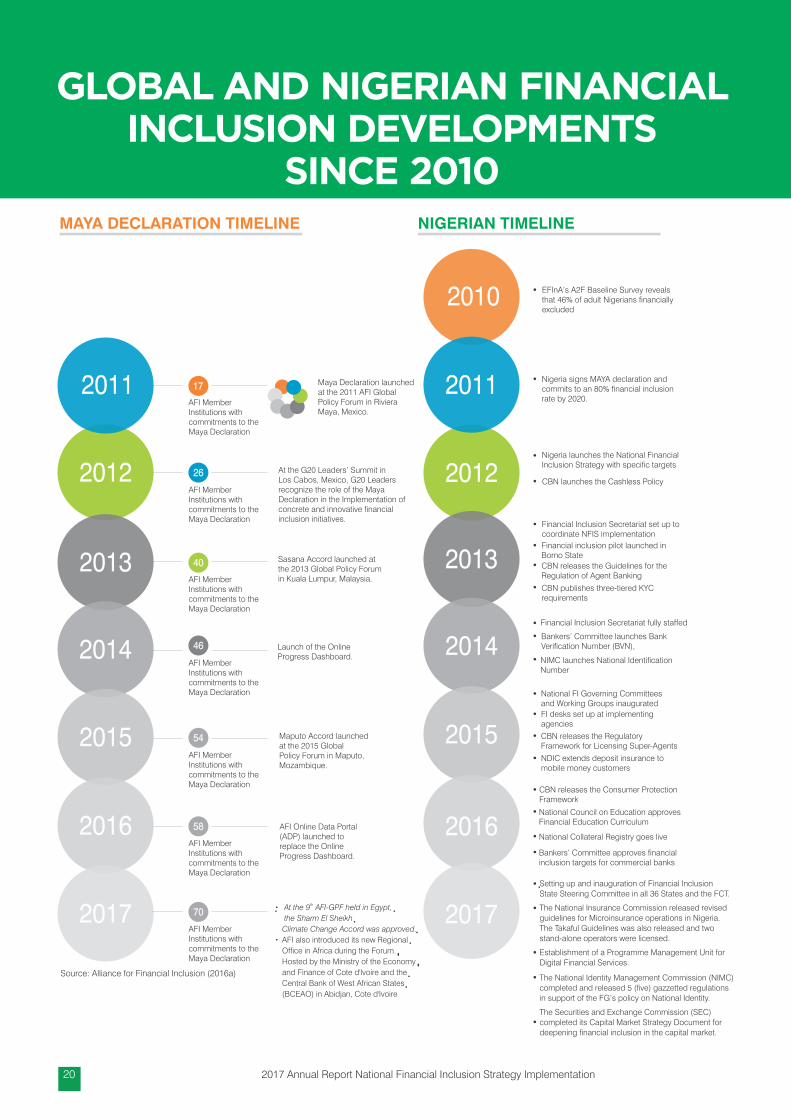
GLOBAL AND NIGERIAN FINANCIAL INCLUSION DEVELOPMENTS
SINCE 2010MAYA DECLARATION TIMELINE
Maya Declaration launchedat the 2011 AFI GlobalPolicy Forum in RivieraMaya, Mexico.
At the G20 Leaders’ Summit in Los Cabos, Mexico, G20 Leaders recognize the role of the Maya Declaration in the Implementation of concrete and innovative nancial inclusion initiatives.
Sasana Accord launched atthe 2013 Global Policy Forumin Kuala Lumpur, Malaysia.
Launch of the OnlineProgress Dashboard.
Maputo Accord launchedat the 2015 GlobalPolicy Forum in Maputo,Mozambique.
AFI Online Data Portal(ADP) launched toreplace the OnlineProgress Dashboard.
AFI MemberInstitutions withcommitments to theMaya Declaration
AFI MemberInstitutions withcommitments to theMaya Declaration
AFI MemberInstitutions withcommitments to theMaya Declaration
AFI MemberInstitutions withcommitments to theMaya Declaration
AFI MemberInstitutions withcommitments to theMaya Declaration
AFI MemberInstitutions withcommitments to theMaya Declaration
17
2012
40
46
54
58
26
2011
2012
2013
2014
2015
2010
NIGERIAN TIMELINE
2016
Nigeria launches the National FinancialInclusion Strategy with specic targets
Financial Inclusion Secretariat set up tocoordinate NFIS implementation
Financial Inclusion Secretariat fully staffed
National FI Governing Committees and Working Groups inaugurated
CBN releases the Consumer ProtectionFramework
EFInA’s A2F Baseline Survey revealsthat 46% of adult Nigerians nancially excluded
Nigeria signs MAYA declaration andcommits to an 80% nancial inclusion rate by 2020.
CBN launches the Cashless Policy
Financial inclusion pilot launched in Borno State
Bankers’ Committee launches BankVerication Number (BVN),
FI desks set up at implementing agencies
National Council on Education approvesFinancial Education Curriculum
Source: Alliance for Financial Inclusion (2016a)
CBN releases the Guidelines for the Regulation of Agent Banking
CBN publishes three-tiered KYC requirements
NDIC extends deposit insurance to mobile money customers
National Collateral Registry goes live
Bankers’ Committee approves nancialinclusion targets for commercial banks
NIMC launches National Identication Number
CBN releases the Regulatory Framework for Licensing Super-Agents
2017
2011
2013
2014
2015
2016
2017th
· At the 9 AFI-GPF held in Egypt,
the Sharm El Sheikh
Climate Change Accord was approved.
· AFI also introduced its new Regional
Ofce in Africa during the Forum.
Hosted by the Ministry of the Economy
and Finance of Cote d'Ivoire and the
Central Bank of West African States
(BCEAO) in Abidjan, Cote d'Ivoire
70
AFI MemberInstitutions withcommitments to theMaya Declaration
Setting up and inauguration of Financial Inclusion State Steering Committee in all 36 States and the FCT.
The National Insurance Commission released revised guidelines for Microinsurance operations in Nigeria. The Takaful Guidelines was also released and two stand-alone operators were licensed.
Establishment of a Programme Management Unit for Digital Financial Services.
The National Identity Management Commission (NIMC) completed and released 5 (ve) gazzetted regulations in support of the FG’s policy on National Identity.
The Securities and Exchange Commission (SEC) completed its Capital Market Strategy Document for deepening nancial inclusion in the capital market.
2017 Annual Report National Financial Inclusion Strategy Implementation20

Payment of Utility Bills
RemittancesInitiate Domestic Remittance
05 06 07
Credit Indicators
03
76.3%
2.7%
2.8%
18.1%
Form
al
Sources
Inform
al
Bank
Family &
Frien
ds
Percentage of Nigerian Adults Who Borrow
33.0%
Savings in a Financial Institution
02
Percentage of Adult Nigerians that Save
40.7%
0.7%
22.1%
36.5%
Bank
Othe
r Form
al
Inform
al
@Ho
me
68.0%
Account Ownership in Nigeria by Gender
01
Total Account Ownership
30.0%
46.3%
Fem
ale
M
ale
38.3%
Digital Payment Indicators
04
2%
Of the 16% Aware Adult Population are aware of Mobile Money
Percentage of Adults Aware of Mobile Money
16.0%
Percentage of Adults Who Paid Utility Bills
32.0%
Percentage of Domestic Remittance (by the Poorest 40%)
25.0%
4%Of the 32% Above Paid their Utility Bills Using Mobile Phone
16.0%Throug
h Mo
bile
Phon
es
Throug
h Fin
ancia
l Institutio
ns
20.0%
Percentage of Remittance
51.0%
1.0%
Throug
h Mo
ney
Tran
sfer
Throug
h Fin
ancia
l Institutio
ns
29.0%
On Nigeria
TRILLION$4.2 in new deposits
BILLION1.6 newly formally nancially
included adults
THE POTENTIAL IMPACT OF DIGITAL FINANCIAL SERVICES BY 2025
On Emerging Countries
6% GDP boost by 2025TRILLION $3.7
MILLION95 new jobs TRILLION$2.1
in new credit
BILLION$110 annual reduction in
government leakage
Source: Global Findex 2017: Further Analysis on Nigeria
Source: McKinsey Global Institute Report on Digital Finance for All (2016)

(L-R) Dr. Obiageli Ezekwesili, Queen Maxima of the Netherlands (United Nations Secretary General's Special Advocate (UNSGSA) on Inclusive Finance for Development), Emir of Kano, Alhaji Sanusi Lamido II and Mrs Maryam Uwais Special Adviser to the President for Social Protection Plan at an EFInA Financial Inclusion Workshop
Queen Maxima of the Netherlands (UNSGSA on Inclusive Finance for Development), presenting a keynote address on ‘The Transformative Power of Financial Inclusion’ at an EFInA Financial Inclusion Workshop
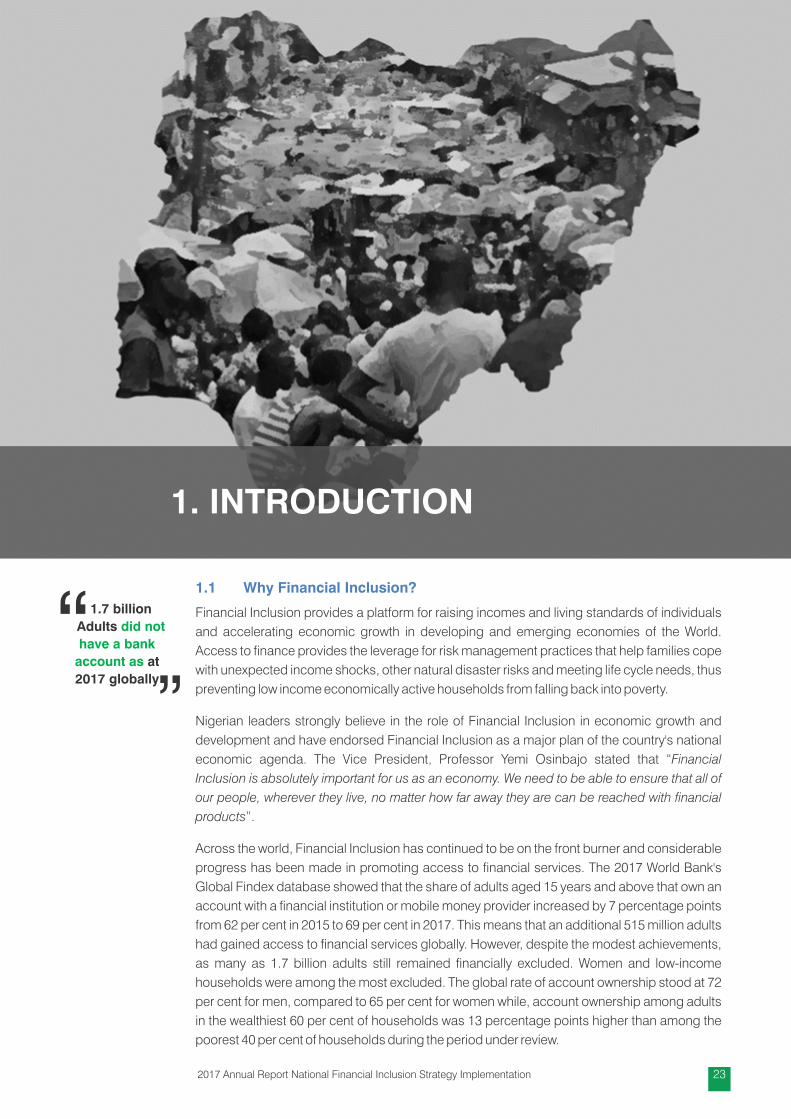
1.1 Why Financial Inclusion?
Financial Inclusion provides a platform for raising incomes and living standards of individuals
and accelerating economic growth in developing and emerging economies of the World.
Access to nance provides the leverage for risk management practices that help families cope
with unexpected income shocks, other natural disaster risks and meeting life cycle needs, thus
preventing low income economically active households from falling back into poverty.
Nigerian leaders strongly believe in the role of Financial Inclusion in economic growth and
development and have endorsed Financial Inclusion as a major plan of the country's national
economic agenda. The Vice President, Professor Yemi Osinbajo stated that “Financial
Inclusion is absolutely important for us as an economy. We need to be able to ensure that all of
our people, wherever they live, no matter how far away they are can be reached with nancial
products”.
Across the world, Financial Inclusion has continued to be on the front burner and considerable
progress has been made in promoting access to nancial services. The 2017 World Bank's
Global Findex database showed that the share of adults aged 15 years and above that own an
account with a nancial institution or mobile money provider increased by 7 percentage points
from 62 per cent in 2015 to 69 per cent in 2017. This means that an additional 515 million adults
had gained access to nancial services globally. However, despite the modest achievements,
as many as 1.7 billion adults still remained nancially excluded. Women and low-income
households were among the most excluded. The global rate of account ownership stood at 72
per cent for men, compared to 65 per cent for women while, account ownership among adults
in the wealthiest 60 per cent of households was 13 percentage points higher than among the
poorest 40 per cent of households during the period under review.
1.7 billion
Adults did not
have a bank
account as at
2017 globally
“”
1. INTRODUCTION
232017 Annual Report National Financial Inclusion Strategy Implementation

Digital technology and mobile money are the most promising tools to address these prevailing
gaps across the globe. About 52 per cent of adults globally have sent or received digital
payments in the past year, which represents an increase of 10 percentage points from the 42
per cent registered in 2014.
In Nigeria, 2017 was an important year for Financial Inclusion. Even though information from
the World Bank's Global Findex database revealed a decrease in account ownership from 44
per cent in 2014 to 40 per cent in 2017, a lot happened in the nancial inclusion sphere. The
review process of the National Financial Inclusion Strategy (NFIS) commenced during the year
with the aim of re-focusing all efforts towards achieving the 80 per cent nancial inclusion rate
by 2020. Moreover, activities such as the continued enrollment of Nigerians into the National
Identication Number (NIN) Scheme and the expansion of Bank Verication Number Scheme
(BVN) laid the foundation for additional progress.
As we advance towards 2020, there is need for accelerated implementation process in order to
achieve the targeted 80 per cent inclusion rate. This Annual Report provides detailed
information on the activities of nancial inclusion stakeholders and the implementation
progress achieved in 2017.
Chapter two of the report provides information on the implementation environment for the
period under review, while chapter three details the activities of different stakeholders. Chapter
four presents the data on the strategy implementation progress while chapter ve provides key
ndings from the review of the NFIS which was launched in 2012. Chapter 6 concludes the
report with recommendations and outlook for 2018.
The global rate
of account
ownership stood
at 72 per cent for
men, compared
to 65 per cent for
women while,
account
ownership
among adults in
the wealthiest 60
per cent of
households was
13 percentage
points higher
than among the
poorest 40 per
cent of
households
during the period
under review.
“
”
2017 Annual Report National Financial Inclusion Strategy Implementation24
Presentation of Peer Educator Jacket to the Honourable Minister of Youths and Sports Development, Barr. Solomon Dalung as part of the Flag-off Ceremony of the Peer Educator Programme

This chapter describes the implementation environment of the National Financial Inclusion
Strategy in 2017. It examines the macroeconomic environment as well as analyses relevant
sub-sectors of the Nigerian nancial industry.
2.1 Macroeconomic Environment
The economy witnessed a mild recovery from recession in 2017. This was attributed largely to
increased agricultural output enabled by CBN interventions, improved crude oil receipts, scal
stimulus, as well as, improved business environment witnessed during the year. Data from the
National Bureau of Statistics (NBS) showed that the real Gross Domestic Product (GDP),
measured at 2010 constant basic prices, grew by 0.83 per cent, in contrast to the contraction of
1.58 per cent in 2016. Growth was driven by the Agriculture, Industry and Construction sectors,
which contributed 0.84, 0.38 and 0.04 per cent to GDP growth in 2017 (see Figure 2.1.1).
-15.00
-10.00
-5.00
0.00
5.00
10.00
15.00
20.00
2013 2014 2015 2016 2017
Agriculture Industry Construc�on Trade Services Total GDP Non-oil GDP
Figure 2.1.1: Sectoral Growth Rates of GDP at 2010 Constant Basic Prices, 2013 to 2017 (%)
Source: National Bureau of Statistics (NBS)
Growth was
driven by the
Agriculture,
Industry and
Construction
sectors, which
contributed 0.84,
0.38 and 0.04 per
cent to GDP
growth in 2017
“
”
252017 Annual Report National Financial Inclusion Strategy Implementation
2. IMPLEMENTATION ENVIRONMENT

As in the year 2016 where sector recorded the fastest growth rate of 4.11 per cent of the GDP,
the agricultural sector grew by 3.45 per cent in 2017 compared with the Industry and
Construction sectors. While the Industry sector grew by 2.14 per cent of the GDP, Construction
sector grew by 1.00 per cent in the same year 2017. However, Trade and Services sectors
contracted by 1.05 and 0.67 per cent, respectively.
At end-December 2017, the year-on-year headline ination stood at 15.37 per cent, indicating a
decline of 3.18 percentage points below the level at end-December 2016. The rate remained
above the benchmark single-digit rate in 2017, although it maintained a declining trend
throughout the year. The gradual decline in inationary pressures was attributed to the effect of
sustained interventions by the CBN in the foreign exchange market which moderated the
exchange rate pass-through effect to domestic prices, among others.
0
0.5
1
1.5
2
0.0
5.0
10.0
15.0
20.0
Jan Feb Mar Apr May Jun Jul Aug Sept Oct Nov Dec
Ra
tes
(p
er
ce
nt)
Mo
nth-
on-
Mo
nth
Ra
tes (
pe
r c
en
t)
Year-on-Year 12 MMA Month-on-Month (Right Axis)
Figure 2.1.2: Trend of Ination rates, 2017
Source: National Bureau of Statistics (2017)
At end-
December 2017,
the year-on-year
headline ination
stood at 15.37 per
cent, indicating a
decline of 3.18
percentage points
below the level at
end-December
2016.
“
”
The external sector recorded an improved performance with an overall balance of payment
surplus of ₦3,737.37 billion or 3.3 per cent of GDP, as against a decit of 0.2 per cent of GDP in
2016. The improved performance was driven mainly, as a result of the recovery in crude oil price
at the international market, domestic production, and the sustained reforms in the foreign
exchange market, which resulted in the accumulation of external reserves. The sustained
interventions and policy reforms of the CBN at the foreign exchange market, particularly the
introduction of weekly sales of foreign exchange for invisible transactions, special window for
small and medium enterprises (SMEs), and the establishment of the Investors' and Exporters'
(I&E) window, stabilised the exchange rate during the review period. Consequently, the
average ofcial exchange rate of the naira to the US dollar was stable at N305.79/US$ in the
review period. The BDC segment of the foreign exchange market witnessed increased
pressure at the beginning of the year as it opened with a depreciation at ₦493.29/US$ in
January 2017, from N455 in December 2016 but was contained with the resumption of foreign
exchange sales to that segment by the Bank which led to an appreciation to ₦366.25/US$,
₦365.61/US$, ₦362.21/US$, and ₦362.83/US$, in June, August, October and December
2017, respectively.
The gradual
decline in
inationary
pressures was
attributed to the
effect of
sustained
interventions by
the CBN in the
foreign exchange
market which
moderated the
exchange rate
pass-through
effect to domestic
prices, among
others.
“
”2.2 Banking Sector
“Available data indicates that total assets of the banking sector increased by 9.4 per cent to
reach N35.1 trillion at end-December 2017 from N32.1 trillion at end-December 2016.”The
structure of the Nigerian nancial sector remained unchanged in 2017 although the number of
licensed banks increased to 27, from 26 in 2016. The licensed banks comprise 21 commercial
banks, ve (5) merchant banks and one (1) non-interest bank. The number of bank branches,
decreased to 5,450 from 5,571 in 2016.
2017 Annual Report National Financial Inclusion Strategy Implementation26

Available data
indicates that
total assets of the
banking sector
increased by 9.4
per cent to reach
N35.1 trillion at
end-December
2017 from N32.1
trillion at end-
December 2016.
“
”
Indicator 2013 2014 20152 20163 20173
Reserves 4 3,794,118.56 5,522,612.24 5,097,605.47 4,997,153.93 7,613,040.67
Aggregate Credit (Net)
12,207,717.51 16,437,093.55 18,091,452.53 21,296,805.72 20,232,569.71
Loans and Advances
6,677,225.03 12,175,750.47 12,262,502.40 15,075,607.96 14,777,941.92
Total Assets 24,468,368.48 27,581,647.55 28,369,031.69 32,130,449.38 35,146,836.65
Total Deposit Liabilities
13,825,188.77 15,234,775.34 17,343,986.35 18,521,914.63 19,384,722.34
Demand Deposits
5,169,063.97 4,668,215.23 5,885,856.53 6,201,688.88 6,419,662.10
Time, Savings & Foreign Currencies Deposits
8,656,124.80 10,566,560.11 11,458,129.82 12,320,225.75 12,965,060.24
Foreign Assets (Net)
1,614,722.37 969,549.18 107,999.86 359,006.47 386,144.46
Credit from Central Bank
262,170.55 224,581.43 732,244.52 992,267.90 1,003,885.20
Capital Accounts
3,915,405.55 4,269,522.17 5,051,419.96 5,684,981.50 5,966,426.80
Capital & Reserves
2,649,166.02 2,963,361.18 3,470,957.43 3,745,131.39 3,451,298.49
Other Provisions 1,266,239.52 1,306,160.99 1,580,462.52 1,939,850.12 2,515,128.31
Table 2.2.1: Statistics of the Banking Sector (DMBs), in million Naira
Source: Central Bank of Nigeria (2017)
In the Other Financial Institutions (OFIs) sub-sector, there were 4,870 licensed institutions at
end-December 2017, compared with the 4,242 institutions in 2016. This comprised seven (7)
Development Finance Institutions (DFIs), thirty-four (34) Primary Mortgage Banks (PMBs), one
thousand and eight (1,008) Micronance Banks (MFBs), eighty-one (81)Finance Companies
(FCs) and three thousand seven hundred and forty (3,740) Bureau-de-Change (BDCs)
operators. The increase was as a result of new OFI licenses granted during the year to ve
hundred and eleven (511) BDCs, twenty eight (28) MFBs, four (4) FCs and one (1) DFI. Also,
one (1) DFI in liquidation was delisted while eighty-two (82) BDCs, which did not meet the
deadline for recapitalization in 2014, were reinstated to the functional group of BDCs, following
their successful recapitalization during the year.
Available data indicates that total assets of the banking sector increased by 9.4 per cent to
reach N35.1 trillion at end-December 2017 from N32.1 trillion at end-December 2016. Total
deposit liabilities grew by 4.7 per cent from N18.5 trillion at end-December 2016 to N19.4 trillion
by end-December 2017. On the other hand, loans and advances decreased by 2.0 per cent
from N15.1 trillion at end-December 2016 to N14.8 trillion at end-December 2017.
Credit from the Central Bank increased by 1.2 per cent from N992.3 billion by end-December
2016 to N1.0 trillion at end-December 2017, while net foreign assets grew marginally from
N359.0 billion to N386.1 billion (see Table 2.1).
2 Revised 3 Provisional 4 Includes CBN bills held by Deposit Money Banks
272017 Annual Report National Financial Inclusion Strategy Implementation

2.3 Micronance Bank Sector
The number of micronance banks (MFBs) stood at 1,008 at end-December 2017, compared
with 999 MFBs at end-December 2016. This comprised 8 National, 132 State and 868 Unit
MFBs. Provisional data revealed that total assets of MFBs grew by 20.63 per cent to N393.55
billion at end-December 2017, compared with N326.22 billion at end-December 2016. Net
loans and advances also increased by 7.0 per cent to N190.49 billion at end-December 2017,
compared with N178.01 billion at end-December 2016, while deposit liabilities increased by
21.6 per cent to N182.01 billion in 2017. Capital and Reserves also increased by 15.9 per cent,
to N90.25 billion at end-December 2017, compared with N77.87 billion at end-December 2016.
Table 2.3.1: Selected Statistics of Micronance Sector
Source: Central Bank of Nigeria (2017)
2.4 e-Payments Sector
The volume and value of payment on different channels (comprising ATM, PoS, Mobile and
Internet) rose by 43.2 and 37.6 per cent to 1,023.6 million and N9,134.0 billion, respectively,
compared with 715.1 million and N6,636.4 billion recorded in the preceding year. The rise in
e-payment transactions was attributed to increased consumer condence and awareness
in the use of the e-payment channels.
Figure 2.4.1: Volume of Electronic Payments (Million), 2015 - 2017 Figure 2.4.2: Value of Electronic Payments (Billion), 2015 - 2017
Source: Central Bank of Nigeria (2017), Nigeria Inter-Bank Settlement System (2017)
2017 Annual Report National Financial Inclusion Strategy Implementation28

A breakdown of selected e-payment transaction channels for 2017 (comprising ATM, PoS,
Mobile and Internet), indicated that the ATM channel remained the most patronised,
accounting for 78.2 per cent, followed by PoS terminals and mobile payments with 14.3 and 4.7
per cent, respectively. The web (internet) was the least patronised, accounting for 2.8 per cent
of the total. In terms of value, the ATM accounted for 70.5 per cent, PoS, 15.4 per cent; mobile
channels, 12.1 per cent; and web (internet), 2.0 per cent.
Figure 2.4.3: Classication of e-Money Products by Volume, 2017, (Per cent)
Source: Central Bank of Nigeria (2017), Nigeria Inter-Bank Settlement System (2017)
Tables 2.4.1 and 2.4.2 provide further insight into the trend of the volume and value of the
specic electronic transaction channels from 2013 to 2017.
More comprehensively, in terms of volume of electronic transactions, ATMs remained the most
frequently used electronic channel in 2017 with 800.5 million transactions being the most
dominant channel with a share of 54.2 per cent of total electronic transactions. This was closely
followed by NIP which recorded 370.9 million transactions with a share of 25.1 per cent
compared to 154.5 million transactions recorded the preceding year (see Table 2.4.1).Others
were POS, mobile money, Remita, NEFT and internet banking which had respective shares of
9.9, 3.2, 2.7, 2.1, and 2.0 per cent. Similarly, other less dominant channels such as NAPS, e-
Bills Pay, Central Pay and M-Cash had respective shares of 0.8, 0.06, 0.03 and 0.01 per cent
respectively.
In terms of growth in the use of these channels, the ve fastest growing channels in 2017 were
Central Pay, NAPS, NIP, POS and Internet banking e-transaction channels which grew by 434.3,
200.1, 140.0, 129.6 and 105.8 per cent respectively compared to their growth rates in the
previous year. Others were ATM, NEFT, Remita and Mobile money channels which grew by
35.6, 22.7, 3.8 and 1.6 per cent respectively. E-bills Pay recorded a negative growth of 11.8 per
cent in 2017 compared to 2016.
ATM channel
remained the
most patronised,
accounting for
78.2 per cent,
followed by PoS
terminals and
mobile payments
with 14.3 and 4.7
per cent,
respectively.
“
”
292017 Annual Report National Financial Inclusion Strategy Implementation

Transaction Channels
2013 2014 2015 2016 2017
Growth Rate
2016-2017
ATM
295,416,724
400,269,140
433,695,748
590,238,934
800,549,099
35.63%
79.71%
74.05%
67.65%
62.91%
54.15%
NIP
17,112,158
40,829,854
71,223,545
154,504,034
370,870,672
140.04%
4.62%
7.55%
11.11%
16.47%
25.08%
PoS
9,418,427
20,817,423
33,720,933
63,715,203
146,267,156
129.56%
2.54%
3.85%
5.26%
6.79%
9.89%
Mobile Money
15,930,181
27,744,797
43,933,362
47,053,252
47,804,561
1.60%
4.30%
5.13%
6.85%
5.02%
3.23%
Remita
15,029,627
19,417,371
38,249,886
39,706,264
3.81%
2.78%
3.03%
4.08%
2.69%
NEFT
29,834,317
29,690,765
28,935,605
25,292,938
31,034,624
22.70%
8.05%
5.49%
4.51%
2.70%
2.10%
Internet Banking
2,900,473
5,567,436
7,981,361
14,088,247
28,991,097
105.78%
0.78%
1.03%
1.24%
1.50%
1.96%
NAPS
936,667
3,965,212
11,900,008
200.11%
0.15%
0.42%
0.80%
e-Bills Pay
557
593,579
1,208,556
1,026,886
905,941
-11.78%
0.00%
0.11%
0.19%
0.11%
0.06%
Central Pay
1,384
66,031
70,239
375,356
434.40%
0.00%
0.01%
0.01%
0.03%
m-Cash
77,832
0.01%
Total
370,612,837
540,544,005
641,119,179
938,204,831
1,478,482,610
57.59%
100.00%
100.00%
100.00%
100.00%
100.00%
Table 2.4.1: Volume (Number) of Electronic Transactions, 2013 to 2017, by Electronic Transaction Channel
Source: Central Bank of Nigeria (2017), Nigeria Inter-Bank Settlement System (2017)
In terms of nominal value of electronic transactions, NIP remained the channel through which
transactions with the highest value in Naira were made in 2017. The value of NIP transactions
increased by 47.0 per cent from N38.2 trillion in 2016 to N56.2 trillion in 2017, which resulted in a
share of NIP in the total value of electronic transactions of 56.6 per cent in 2017 (see Table
2.4.2). NEFT was the channel with the second highest value in 2017 at N14.9 trillion but
maintained declining relevance since 2012 as its share in total value of transactions declined
steadily to 15.1 per cent in 2017 down from 18.0 per cent and 50.6 per cent in 2016 and 2013
respectively. The sum of N13.5 trillion was also transacted on Remita platform in 2017
representing a share of 14 per cent in 2017 compared to a higher share of 15 per cent achieved
in the preceding year.
2017 Annual Report National Financial Inclusion Strategy Implementation30

Transaction Channel
2013 2014 2015 2016 2017 Growth Rate
2016-2017
NIP 10,849 19,921 25,541 38,215 56,166 47%
38.20% 45.43% 50.96% 55.34% 56.57%
NEFT 14,368 14,564 13,087 12,455 14,946 20%
50.59% 33.21% 26.11% 18.04% 15.05%
Remita 0 4,914 6,223 10,652 13,529 27%
0 11% 12% 15% 14%
ATM 2,831 3,682 3,972 4,988 6,438 29%
9.97% 8.40% 7.92% 7.22% 6.48%
PoS
161
312
449
759
1,410
86%
0.57%
0.71%
0.90%
1.10%
1.42%
Mobile Money
143
339
442
757
1,102
46%
0.50%
0.77%
0.88%
1.10%
1.11%
NAPS
0
0
99
754
4,960
558%
0%
0%
0%
1%
5%
E-Bills Pay
0
44
217
339
551
63%
0.0%
0.1%
0.4%
0.5%
0.6%
Internet Banking
47
74
92
132
185
40%
0.17%
0.17%
0.18%
0.19%
0.19%
Central Pay
0
0
0
1
5
400%
0%
0%
0%
0%
0%
m-Cash
0
0.6
0%
0%
0%
0%
0%
Total
28,399
43,850
50,122
69,052
99,293
44%
100%
100%
100%
100%
100%
Table 2.4.2: Nominal Value of Electronic Transactions, 2013-2017, by Electronic Transaction Channel (Billion Naira)
Source: Central Bank of Nigeria (2017), Nigeria Inter-Bank Settlement System ((2017)
The volume and value of cheques cleared nationwide maintained a declining trend as it fell by
7.7 per cent and 6.9 per cent to 10.8 million and N5.4 trillion, respectively, compared with 11.7
million and N5.8 trillion in 2016. This was attributed to increased adoption of e-payment
channels.
2.5 Insurance Sector
The gross premium of the Insurance industry stood at N371.8 billion at end-December 2017,
compared to N326.1 billion in 2016 representing a growth of 14.0 per cent during the year
under review. Within the sector, growth in gross premium was witnessed in both sub-sectors
which comprise Non-life (General) and Life Insurance as the premium in the non-life sub-sector
grew by 4.61 per cent while the life sub-sector grew by 29.3 per cent during the period. The
respective shares of the non-life and life gross premium of the total industry gross premium
amounted to 56.7 and 43.3 per cent, respectively, in 2017 (see Table 2.5.1).
Claims worth
N148.3 billion
was paid out in
2017 compared to
N145.8 billion
paid out in 2016.
“”
312017 Annual Report National Financial Inclusion Strategy Implementation

Year Non-Life Gross
Premium (N Million)
Life Gross Premium
(N Million)
Industry Gross
Premium (N Million)
Growth Rate of
Industry Gross Premium
(Year on Year)
2009 153,127.12 36,833.33 189,960.45 -
2010 157,336.81 43,039.17 200,375.98 5.5%
2011 175,756.76 57,996.13 233,752.89 16.7%
2012 193,493.25 64,909.06 258,402.30 10.5%
2013 196,008.76 80,520.24 276,529.00 7.0%
2014 195,887.85 85,952.58 281,840.43 1.9%
2015 198,389.16 90,952.32 289,341.48 2.7%
2016 201,547.68 124,566.34 326,114.02 12.7%
2017 210,772.49 161,068.12 371,840.61 14.0
5Table 2.5.1: Industry Gross Premium by Insurance Type and Growth Rate, 2009 to 2017
Source: Returns from the National Insurance Commission (Year of publication)
In terms of claims paid by Insurance companies during the year, the companies paid out claims
worth N148.3 billion in 2017 compared to N145.8 billion paid out in 2016. This represented a
growth of 1.7 per cent compared to the rate recorded in 2016. The marginal growth recorded
during the period could be attributed to the decline in aggregate demand that occasioned the
recession experienced by the country during the year and lag effects from the recovery in the
second quarter of 2017 (see Table 2.5.2).
5 Please note that 2017 data is provisional; 2015 and 2016 data have been updated from the 2016 Annual Report.
Year Non-Life Gross Claims
(N Million)
(Claims Ratio)7
Life Gross Claims (N Million)
(Claims Ratio)
Industry Gross Premium (N Million)
(Claims Ratio)
Growth Rate of Industry Claims
Paid (Year on
Year)
2009 49,498.93
(32.3%)
12,470.22
(33.9%)
61,969.15
(32.6%)
-
2010 37,589.56
(23.9%)
16,225.79
(37.7%)
53,815.35
(26.9%)
-13.2%
2011 26,792.14
(15.2%)
20,815.60
(35.9%)
47,607.74
(20.4%)
-11.5%
2012 55,717.15
(28.8%)
23,405.43
(36.1%)
79,122.58
(30.6%)
66.2%
2013 71,602.78
(36.5%)
35,701.76
(44.3%)
107,304.54
(38.8%)
35.7%
2014 65,555.70
(33.5%)
33,601.00
(39.0%)
99,156.70
(35.2%)
-7.5%
2015 65,971.92
(33.3%)
45,197.37
(49.7%)
111,169.29
(38.4%)
12.1%
2016 78,574.56
(39.0%)
67,263.78
(54.0%)
145,838.34
(44.7%)
31.1%
2017 88,522.11
(42.0%)
59,822.99
(37.1%)
148,345.10
(39.9%)
1.7%
6Table 2.5.2: Industry Gross Claims Paid, by Insurance Type, and Growth Rate, 2009 to 2017
Source: Returns from the National Insurance Commission (2017)
6 Please note that 2017 data is provisional.
2017 Annual Report National Financial Inclusion Strategy Implementation32

7 The claims ratio is dened as the share of gross claims paid of gross premium income.
2.6 Pension Sector
The total annual contributions made into the Contributory Pension Scheme (CPS) by
employees and employers from both, the public and private sectors, amounted to N610.84
billion in 2017. This represent an increase of 25.12 per cent compared to the contributions
made in 2016. The increase was due to the rise in both public and private sector contributions,
which grew by 13.84 per cent and 34.84 percent respectively from the preceding year. The
growth in the contributions saw the private sector grow 21 percentage points more than the
public-sector contributions. (see Table 2.6.1).
The total annual
contributions
made into the
Contributory
Pension Scheme
(CPS) by
employees and
employers from
both, the public
and private
sectors,
amounted to
N610.84 billion in
2017.
“
”
Year Public Sector
Contributions
Private Sector
Contributions
Total Contributions Growth Rate of
Contributions
(Year on Year)
2004 15.60 - 15.60 -
2005 34.68 - 34.68 122.3%
2006 37.38 23.03 60.41 74.2%
2007 80.63 68.34 148.97 146.6%
2008 99.28 80.81 180.09 20.9%
2009 137.10 91.21 228.31 26.8%
2010 162.46 103.03 265.49 16.3%
2011 228.92 119.53 348.45 31.2%
2012 331.14 174.43 505.57 45.1%
2013 278.50 225.42 503.92 -0.3%
2014 237.76 343.97 581.73 15.4%
2015 200.05 358.91 558.96 -3.9%
2016 225.86 262.33 488.20 -12.7%
2017 257.11 353.73 610.84 25.12%
Total 2,326.47 2,204.74 4,531.22
Table 2.6.1: Annual Pension Contributions from 2004 to 2017, by Sector, in Billion Naira
Source: National Pension Commission (2017)
332017 Annual Report National Financial Inclusion Strategy Implementation

2.7 Capital Market Sector
Major capital market indicators were bullish in 2017, as major market indicators trended
upward, generally. This was largely attributed to the signicant rebound in investment activities
due to the gradual recovery in the domestic economy, including return to positive output
growth, declining ination, growing external reserves and modest improvement in foreign
exchange supply, thereby spurring greater foreign portfolio inow.
The number of listed securities increased from 247 in 2016 to 261 in 2017, while the number of
listed companies fell to 167 from 170 at end-December 2016. Furthermore, the number of listed
bonds and Exchange Traded Funds (ETF) rose to 80 and 9, respectively, at end-December
2017, while the number of listed equities fell to 172 from 175 at end-December 2016.
The aggregate market capitalisation of the 261 listed securities rose, signicantly, by 41.6 per
cent to N22,917.9 billion, compared with the level in 2016. This reected appreciable increases
in the value of securities across different asset classes (equities and debt), due to the persisting
bullish sentiments. (see Table 2.7.1).
The aggregate
market
capitalisation of
the 261 listed
securities rose,
signicantly, by
41.6 per cent to
N22,917.9 billion,
compared with
the level in 2016.
“
”
Indicator 2013 2014 2015 2016 2017
Number of Listed Securities 254 253 257 247 261
Volume of Stocks Traded (Turnover Volume) (Billion)
267.3 108.5 92.9 95.8 100.3
Value of Stocks Traded (Turnover Value) (Billion Naira)
2,350.9 1,338.6 950.4 575.7 1,273.2
Value of Stocks Traded/GDP (%) 2.9 1.5 1.0 0.6
Total Market Capitalisation (Billion Naira)
19,077.4 16,875.1 17,003.4 16,185.7 22,917.9
Of which: Banking Sector (Billion Naira)
2,939.9 2,367.0 1,447.6 1,905.4 3,292.2
Total Market Capitalisation/GDP (%) 23.5 19.0 18.0 16.0 20.1
Of which: Banking Sector/GDP (%) 3.6 2.7 1.5 1.9 2.9
Banking Sector Capitalisation/
Market Capitalisation (%)
15.4 14.0 8.5 11.8 14.4
Annual Turnover Volume/Value of
Stock (%)
11.4 8.1 9.8 16.6 7.9
Annual Turnover Value/Total Market Capitalisation (%)
12.3 7.9 5.6 3.5 5.6
NSE Value Index (1984=100) 41,329.2 34,657.2 28,642.3 26,874.6 38,243.2
Table 2.7.1: Indicators of Capital Market Developments in the Nigerian Stock Exchange, 2013 to 2017
Source: Securities & Exchange Commission (2017)
Overall, key macroeconomic indicators recorded modest improvements in 2017 compared to
2016, which improved the prospects of achieving nancial inclusion targets as contained in the
NFIS. Within this mild economic recovery condition in the year, the NFIS stakeholders
continued to implement scheduled activities. The next two chapters of this report present an
account of the various activities carried out by stakeholders in the various subsectors and
describes how the outcomes of such activities impacted on relevant key performance
indicators.
2017 Annual Report National Financial Inclusion Strategy Implementation34

This chapter provides insight into the governance arrangement for nancial inclusion and
outlines the activities of key nancial inclusion stakeholders in Nigeria.
Implementing nancial inclusion policies, schemes and interventions, requires the
commitment of stakeholders. The stakeholders are broadly classied into three (3) categories
as follows:
I. Providers: Institutions that provide nancial products and services, their partner
infrastructure and technology providers.
II. Enablers: Institutions responsible for setting regulations and policies with
regards to nancial inclusion. These are mainly regulators and public institutions.
III. Supporting Institutions: Institutions that can provide technical and funding
assistance that enhance nancial inclusion in Nigeria.
The stakeholders met regularly during the year under review under various governance
committee platforms and on ad-hoc basis. The meetings presented an opportunity for
reviewing and monitoring their activities and providing report to the public on the status of
Financial Inclusion in Nigeria.
3.1 National Financial Inclusion Steering Committee (NFISC)
The Committee held two meetings in June and December, 2017. At the meeting held in June,
the Committee approved the conduct of a review and refresh of the NFIS after ve (5) years of
implementation. It established an interagency taskforce to provide technical input into the
review and refresh process. Upon completion of the rst phase, the Committee approved the
reviewed document at its meeting in December 2017, in preparation for the second phase (the
refresh of the Strategy) in 2018.
Also, at the meeting held in December, the Committee considered and approved a proposal to
inaugurate a State Level Implementation Framework, including the establishment of Financial
Inclusion State Steering Committees (FISSCOs) across all 36 States and the Federal Capital
Territory (FCT). The FISSCOs aim to drive improved uptake of nancial products and services
352017 Annual Report National Financial Inclusion Strategy Implementation
3. STAKEHOLDER ACTIVITIES

at the grassroots level by enhancing the engagement of stakeholders in each of the 36 states
and the FCT, and offering solutions to challenges related to achieving nancial inclusion
peculiar to individual states.
3.2 National Financial Inclusion Technical Committee (NFITC)
The Committee held meetings in April, June, September and November, totaling four (4) in
2017.
The key achievements of the Committee included the endorsement of collaborations between
the Bank of Industry (BOI), the Nigeria Inter-Bank Settlement System (NIBSS) and other
nancial institutions on scaling up the Bank Verication Number (BVN) registration for
beneciaries of micro loans under the Government Enterprise and Empowerment Program
(GEEP).
Furthermore, in recognition of the critical role played by emerging stakeholders in the nancial
inclusion space in Nigeria, the Committee recommended to upgrade the membership status of
the following observer institutions to full members: National Health Insurance Scheme (NHIS), 8Nigeria Social Insurance Trust Fund (NSITF), NIBSS, Innovectives LLC , Interswitch Financial
9Inclusion Services (IFIS), Committee of e-Banking Industry Heads (CeBIH), National Co-
operative Financing Agency of Nigeria (CFAN) and the Small and Medium Enterprises
Development Agency (SMEDAN).
3.3 Working Groups
The four working groups dened and implemented their respective annual work plans. Their
meetings held in April, June, September and November 2017. The major achievements of each
group were as follows:
3.3.1 Channels Working Group (FICWG): Notable achievements by member institutions
of the Working Group included: promoting the active role of the Nigerian Postal
Services (NIPOST) in agent banking, supported the commissioning of a study on the
high Unstructured Supplementary Service Data (USSD) cost for Mobile Money
Operators (MMOs) by Nigerian Communications Commission (NCC), amongst
others.
3.3.2 Financial Literacy Working Group (FLWG): Notable achievements by member
institutions of the Working Group included: the development and infusion of Financial
Literacy Curriculum into the National Education Curricula and completion of the
Teachers' Guide by the Federal Ministry of Education, participation of member
institutions in the National Youth Service Corps (NYSC) Peer Educator Programme,
amongst others.
3.3.3 Financial Inclusion Products Working Group (FIPWG): Notable achievements by
member institutions of the Working Group included: the development of new
strategies to onboard the nancially excluded by Jaiz Bank and other Non-Interest
Finance Institutions, the introduction of Employee Contribution Scheme (ECS) to
enhance nancial inclusion by NSITF, amongst other things.
NFISTC
considered and
approved a
proposal to
inaugurate a
State Level
Implementation
Framework,
including the
establishment of
Financial
Inclusion State
Steering
Committees
(FISSCOs) across
all 36 States and
the Federal
Capital Territory
(FCT).
“
”
8 This is a Super Agent
9 This is a Super Agent
2017 Annual Report National Financial Inclusion Strategy Implementation36

3.3.4 Special Interventions Working Group (FISIWG): Notable achievements by
member institutions of the Working Group included: the inauguration of the NYSC Peer
Educator Programme in Plateau State in June 2017, aggressive efforts to scale up the
disbursement of 2 per cent Micro, Small and Medium Enterprises Development Fund
(MSMEDF) to People living With Disabilities (PWDs), amongst others.
3.4 The National Financial Inclusion Secretariat
In fullling its mandate to run the day-to-day coordination, data management and reporting on
the NFIS implementation process, the Secretariat engaged in a range of activities, amongst
which were:
Ÿ Establishment of Digital Financial Services Programme Management Unit: In
view of the importance of Digital Financial Services to overcome traditional nancial
inclusion barriers, the ofce set up a DFS Programme unit. The unit, charged with the
responsibility of coordinating initiatives in the DFS ecosystem, became operational in
2017.
Ÿ Performance Monitoring Review: During the period under review, the Secretariat
commenced monitoring of targets set for deposit money banks in 2016. Similarly, the
Secretariat collaborated with micronance banks to set annual targets towards the
implementation of the NFIS.
Ÿ Knowledge Exchange Programme: The Secretariat hosted a knowledge exchange
Programme for seven (7) member countries (Bhutan, Seychelles, Mozambique, Sierra
Leone, Lesotho, Cote Devoir and BCEO) of the Alliance for Financial Inclusion (AFI)
network to understudy Nigeria's nancial inclusion strategy and implementation efforts.
The inauguration
of the NYSC
Financial
Inclusion Peer
Educator
Programme in
Plateau State in
June 2017
“”Table 3.3.1: Chairpersons and Vice Chairpersons of the Four National Financial Inclusion Working Groups
Working Group Outgoing Member Institution Elect Member Institution
Channels
Chairperson:
Branch Operations
Department, CBN
Vice Chairperson: Fund Managers’
Association of Nigeria (FMAN)
Chairperson:
Fund Managers’
Association of Nigeria (FMAN)
Vice Chairperson: Banking &
Payments System Department,
CBN
Chairperson:
Nigeria Deposit
Insurance Corporation (NDIC)
Vice Chairperson: Association of
Licensed Mobile Payment Operators
(ALMPO)
Chairperson:
Nigeria Deposit
Insurance Corporation (NDIC)
Vice Chairperson:
Association
of Licensed Mobile Payment
Operators (ALMPO)
Special Interventions
Chairperson:
Special Adviser to the
Governor of Central Bank of Nigeria
on Sustainable Banking
Vice Chairperson: Theseabilities Ltd
Chairperson:
Enhancing
Financial Innovation & Access
(EFInA)
Vice Chairperson: Bank of
Industry (BOI)
Financial Literacy Chairperson: Consumer Protection Department, CBN
Vice Chairperson: Federal Ministry of Finance
372017 Annual Report National Financial Inclusion Strategy Implementation
Product

Ÿ Visit of the United Nations Secretary General's Special Advocate (UNSGSA) for
Inclusive Finance for Development, Queen Maxima of the Netherlands: In her
role as the UNSGSA, Queen Maxima visited Nigeria to ascertain progress of the NFIS
implementation in November, 2017. She accordingly held various consultations with
members of the public and private sector to discuss strategies for accelerating the
pace of implementation of the Strategy and achieving the 2020 target.
3.5 Activities of Financial Service Providers
3.5.1 Bankers' Committee
Some of the activities of the Bankers' Committee towards the implementation of the Strategy
include:
· Establishment of the Agri-business Small and Medium Enterprises Investment stScheme: At its 331 meeting held in February 2017, the committee approved the
establishment of the Agri-Business Small and Medium Enterprises Investment Scheme.
The scheme is aimed at supporting the Federal Government's efforts to promote SMEs in
agri-business as a vehicle for sustainable economic development and employment
generation.
· Financial Literacy Programmes
The Committee participated actively in the following global initiatives:
Ÿ 2017 Global Money Week Celebration: The Global Money Week is an annual
nancial awareness campaign embarked upon by countries across the world with
the aim of inspiring children and young people to learn about nancial literacy and
entrepreneurship. In March, 2017, the Committee encouraged nancial institutions
to participate in the GMW and mentored over 88,000 children across the country on
nancial literacy matters.
Ÿ 2017 World Savings Day Celebration: The Committee sensitized a total of 62,003
students as part of the World Savings Day Celebrations with 2,000 new bank
accounts opened by some of the participants.
3.5.2 The National Association of Micronance Banks (NAMB)
As an umbrella body for micronance banks in Nigeria, comprising of over nine hundred
member institutions, NAMB as at December 2017, actively encouraged members to innovate
and engage in sustainable micronance practices that guarantee nancial inclusion and
wealth creation for the economically active population.
3.5.3 The Nigerian Insurers Association (NIA)
In its 2017 Annual Micro Insurance Retreat, the NIA encouraged members to develop micro
insurance products that will address the needs of the people at the bottom of the pyramid.
3.5.4 The Association of non-Bank Micronance Institutions (ANMFIN)
In the period under review, the Association developed a consumer rights and feedback
mechanism for MFI's and extended its outreach by mentoring over one hundred and twenty
four (124) MFIs on how to expand their services and outreach. Moreover, ANMFIN created and
deployed a platform and database called AMFINCLOUD, which aims to drive digital nancial
service delivery within the sector. The association also partnered with NICON Insurance
Limited to increase uptake of insurance products and to provide credit, life and group life
insurance services to MFIs.
2017 Annual Report National Financial Inclusion Strategy Implementation38

3.5.5 The Bank of Industry (BOI)
In 2017, BOI offered the Government Enterprise and Empowerment Programme (GEEP), Micro
Enterprise Loans (for farmers, traders etc.), on-lending for MFBs, youth specic loan products
such as the Youth Entrepreneurship Support Program (YES), Graduate Entrepreneurship Fund
(GEF), gender specic loan products such as the Business Fund for Women (BUDFOW) and
the National Women Empowerment Fund (NAWEF) on behalf of the Federal Ministry of Women
Affairs and Social Development.
Notably, the Government Enterprise and Empowerment Programme (GEEP) fully kicked off in
2017 and as at December, 2017, loans of about N11.26 billion had been disbursed to 205,863
beneciaries in all 36 States of the Federation and the FCT. About 57 per cent of the
beneciaries were women entrepreneurs.
3.6 Activities of Enablers
Activities of key enablers involved in the implementation of nancial inclusion in Nigeria are
highlighted below:
3.6.1 The Nigeria Deposit Insurance Corporation (NDIC)
In the period under review, NDIC extended the Deposit Insurance protection to Non-Interest
Banks, and pass-through deposit insurance for subscribers of mobile money.
To date, NDIC had reimbursed a cumulative sum of N53.03 million, N6.79billion and
N2.86billion to customers of closed insured PMBs, DMBs and MFBs, respectively. The total
sum of N95.89billion has been reimbursed to uninsured depositors of DMBs.
3.6.2 The National Insurance Commission (NAICOM)
Key activities undertaken by NAICOM during the year under review include:
Ÿ Micro insurance: The guideline for the operation of micro insurance in Nigeria was
released and a window created for operators to transit to full-edged micro insurance
companies.
Ÿ Takaful Insurance: The guideline for Takaful insurance was released and licenses were
granted to the two stand-alone operators (Jaiz Bank Ltd. and Noor Takaful).
Ÿ Bancassurance Guidelines: Bancassurance guideline was released in 2017 to allow
insurance companies partner with two (2) commercial banks (and vice versa) and to
extend insurance products/services to the underserved segments of the population.
3.6.3 The Nigerian Communications Commission (NCC)
In 2017, a joint Committee comprising the Commission and the Central Bank of Nigeria (CBN)
was established to determine the optimum role of Mobile Network Operators (MNOs) in
extending nancial services to low income segments through mobile phones.
The NCC sustained its commitment to ensure that a high level of service delivery, security
assurance of networks, information and data protection was achieved during the period.
Likewise it ensured that MNOs complied with the interoperability provisions in their service
delivery to all MMOs. In 2017, the total number of GSM subscribers stood at 237,414,619 at end
2017.
3.6.4 The National Pension Commission (PenCom)
During the period under review, PenCom engaged in a range of activities to spread awareness
and literacy on pension initiatives. The Commission produced and aired multiple public
enlightenment programmes, which included school teaching initiatives for staff to impart
The total
number of GSM
subscribers stood
at 237,414,619 at
end 2017.
“”
392017 Annual Report National Financial Inclusion Strategy Implementation

knowledge on primary and secondary school students. PenCom also donated essential
learning materials to charity organizations.
Furthermore, the Commission extended the use of pension fund investments as allowable
securities to Non-Interest Capital Market Products (NICMP). This was achieved by amending
the regulation on investment of pension fund assets in April 2017, to allow for investments in
Sharia compliant nancial instruments, such as Sukuk.
Moreover, PenCom started partnerships with universities in all the six geopolitical zones to
incorporate pension programmes into the curriculum. The universities are University of
Maiduguri (North East), Ahmadu Bello University, Zaria (North West), University of Abuja (North
Central), University of Nigeria Nsukka (South East), University of Lagos (South West), and
University of Port Harcourt (South South).
Towards the end of the year, the Commission concluded the pension industry baseline survey.
It is expected that ndings from the survey would be shared with relevant stakeholders in 2018
and used to drive nancial inclusion in Nigeria.
3.6.5 The Nigerian Postal Service (NIPOST)
In 2017, NIPOST deployed agency banking platforms for MFBs, DMBs and non-bank nancial
institutions. It also launched an agency banking scheme in post ofces across twelve (12)
States of the Federation and extended NIPOST locations used in rendering mobile money
services in Rivers and Bayelsa States.
As at end 2017, NIPOST's connection to the National Central Switch (NCS) was almost
completed. In addition, the Service was certied as an International Money Transfer Operator
(IMTO) by the CBN. It also signed MOUs with ve (5) additional MMOs and commenced the
process of obtaining a license with the CBN to become a super-agent.
3.6.6 The National Identity Management Commission (NIMC)
During the year under review, the Commission published ve (5) gazetted regulations. These
are: (i) Mandatory Use of the NIN Regulations, 2017; (ii) Nigeria Biometrics Standard
Regulations, 2017; (iii) Registration of Persons and Contents of the National Identity Database
Regulations, 2017; (iv) Access to Register Information in the National Identity Database
Regulations, 2017; and (v) Licensing of the Frontend Services of the National Identity
Management Commission Regulations, 2017.
3.6.7 The Securities and Exchange Commission (SEC)
The SEC, in collaboration with Bwari and Kuje Area Councils and the University of Abuja
organized sensitization campaigns on nancial inclusion. The campaigns, which were
supported by key nancial sector stakeholders like CBN, NDIC, PenCom, NIAICOM, Federal 10Ministry of Youth and Sport Development among others, reached 659 people.
In addition, the Commission completed its Capital Market Strategy Document, providing the
strategic foundation for deepening nancial inclusion in the capital market.
3.6.8 The Nigerian Stock Exchange (NSE)
In 2017, the NSE intensied efforts to improve capital market literacy by embarking on the
following activities:
Ÿ 2017 Essay Competition: The NSE recorded approximately 10,100 entries for the
2017 edition of the Annual Essay Competition. Also, in collaboration with an
10 Securities and Exchange Commission (2017)
PenCom started
partnerships
with universities
in all six
geopolitical
zones to
incorporate
pension
programmes into
the curriculum.
“
”
2017 Annual Report National Financial Inclusion Strategy Implementation40

implementing partner, Mind the Gap, the Exchange engaged over 23,000 students
through school activations.
Ÿ 2017 Global Money Week: The Exchange directly imparted approximately 4,127
students across different schools with information on nancial literacy, savings,
investing, creating livelihood, and gaining employment.
Ÿ The Nigerian Stock Exchange x-Academy: The NSE launched a specialized
learning center in June 2017 designed to offer capital market training and nancial
education programmes to individuals who will lead and transform businesses for
sustainable growth. The programmes cut across knowledge needs of Nigerians.
3.6.9 The Federal Ministry of Youths and Sports Development
The Ministry in conjunction with CBN, the National Youth Service Corps (NYSC) and several
stakeholders agged off a sensitization drive through the National Peer Group Educator
Programme (NAPGEP) on Financial Inclusion for volunteer corps members in June 2017 in
Plateau State. The Programme leveraged on the number and spread of the NYSC corps
members in the six geo-political zones of the country to expand nancial inclusion knowledge
to their host communities.
As at December 2017, the programme had trained 1,988 volunteer National Youth Service Corp
members.
3.6.10 The Federal Ministry of Education
In 2017, the Federal Ministry of Education worked in partnership with the CBN and other key
stakeholders to introduce financial education into the Nigerian school curriculum. The main
objective of the project was to include nancial education topics into the basic and senior
secondary school curricula in order to enable youths to make informed and effective decisions
with their nancial resources.
The project involved four (4) major phases including the development of a stand-alone
Financial Education Curriculum (FEC), the presentation of the FEC to the approving bodies, the
introduction of FEC into the basic and senior secondary school curricula through relevant
carrier subjects, and the development of teachers' guides.
3.6.11 Central Bank of Nigeria
Key nancial inclusion activities initiated by the CBN in 2017 include:
Ÿ Increase in the number of MFBs from 980 in 2016 to 1008 in 2017
Ÿ Development of the Financial Education Strategy
Ÿ Development of the Financial Education Curriculum
Ÿ Targeted nancial literacy training for MSMEs and farmers
Ÿ The establishment of various policies, schemes and interventions to support improved
access to credit including;
Ÿ Secured Transaction and National Collateral Registry Bill
Ÿ Nigeria Bulk Electricity Trading (NBET) Payment Assurance Facility
Ÿ Accelerated Agriculture Development Scheme
Ÿ Agribusiness/Small and Medium Enterprise Investment Scheme (AGSMEIS)
Ÿ Push for appropriate pricing of USSD and drafting of a USSD framework at CBN
Ÿ Issuance of license to two new super-agents operators
Ÿ Review of minimum capital requirements for the mobile money operators to N2 billion
Ÿ BVN enrolment for MMOs
The
inauguration of
the NYSC
Financial
Inclusion Peer
Educator
Programme in
Plateau State in
June 2017
“
”
412017 Annual Report National Financial Inclusion Strategy Implementation

Ÿ Issuance of Bancassurance guidelines by the Bank in March 2017 in addition to the
NAICOM guidelines.
Ÿ Engagement with banks to ensure the completeness of returns received including the
branch post code to capture the GPS coordinates of each branch.
Ÿ Engagements and sensitization of Nigerians on cashless policy in markets, schools, on
TV and radio, as well as through social media.
Ÿ GoG granted approval to establish gender-desk dedicated to gender related issues in
the CBN.
3.7 Supporting Institutions
3.7.1 Alliance for Financial Inclusion (AFI)
The AFI network held its Annual Global Policy Forum (GPF) in Sharm El Sheikh, Egypt, in
September 2017, which was attended by over 500 AFI members from policy making and
regulatory institutions. The Forum resulted in an accord on nancial inclusion, climate change
and green nance, which commits members to work together to identify, understand and
implement nancial inclusion policies that have positive outcomes for the environment.
One of the key recommendations from the Forum, which has been adopted by the CBN, is to
enhance access to nance for women. An approval to include gender as a major plank of the
NFIS implementation and to establish a special desk dedicated to gender related issues in the
CBN was granted in 2017.
3.7.2 Bill & Melinda Gates Foundation
In 2017, the Gates foundation supported the review and on-going refresh of the NFIS. The
revised document will guide stakeholders' efforts in working towards the nancial inclusion
targets for 2020.
Furthermore, the Foundation focused on promoting digital nancial services as a means of
improving nancial inclusion in Nigeria. In this context, the Foundation hosted a workshop for
NCC and CBN to enhance cooperation regarding mobile money. The Foundation further
supported the Nigeria Financial Maps project, which aims at updating the geographical map of
nancial access points across the country.
3.7.3 Enhancing Financial Innovation and Access
As a supporting institution, EFInA was involved in three key nancial inclusion activities in the
year 2017:
Ÿ A comparative study on micro insurance: the institution commissioned a study on
micro insurance in South Africa, Ghana, Zambia, Namibia, Pakistan and Kenya to
identify ways to promote sustainability of the micro insurance sector in Nigeria. The
study highlighted the need to use multiple channels to target customers to drive the
uptake of micro insurance products and claried that simplied processes for
registration, administration and processing would encourage customers to take up
digital micro insurance products.
Ÿ Innovation grant: EFInA launched their innovation grant request for proposals (RFP-8)
with a window for proposals focused on fostering new approaches to expand the
uptake and usage of digital nancial services by low income populations in Nigeria.
Ÿ Workshop on the role of Government in driving nancial inclusion in Nigeria:
The event involved presentations on the landscape of nancial access in Nigeria; the
2017 Annual Report National Financial Inclusion Strategy Implementation42

transformative power of nancial inclusion driving nancial inclusion in Nigeria; and,
key insights on the nancial prole of women. The workshop highlighted the critical role
of the Nigerian Government in promoting nancial inclusion by providing an enabling
environment to support access to nance for the entire value chain.
3.7.4 Deutsche Gesellschaft fuer Internationale Zusammenarbeit (GIZ)
In 2017, GIZ worked together with the Federal Ministry of Youth and Sports and the CBN to
develop monitoring logbooks for NYSC ofcials to supervise volunteer youth corp members
under the Peer Educator Programme. In addition, GIZ supported the programme by printing
and distributing log books across various states as well as organizing a workshop for NYSC
schedule ofcers to refresh their knowledge on the initiative and use of monitoring logbooks.
The cohesion between providers, enablers and supporting institutions working together
through governing committees to advance nancial inclusion in Nigeria bodes well for the
implementation of the NFIS target of 80 per cent by 2020. The following chapter will provide
additional insight into the progress towards this target.
(L-R) Dr Alfred Hannig, Executive Director Alliance for Financial Inclusion (AFI) with Mrs Temitope Akin-Fadeyi (Head, CBN Financial Inclusion Secretariat)

STAKEHOLDER ACTIVITIESIN 2017
National Financial Inclusion TechnicalCommittee
4 National Financial Inclusion Working Groups
National Financial Inclusion Secretariat
Channels Product Special Interventions Financial Literacy
Chairperson Vice Chairperson Chairperson Vice Chairperson Chairperson Vice Chairperson Chairperson Vice Chairperson
Fund Managers' Association of
Nigeria
Banking & Payments System Department,
CBN
National Financial Inclusion SteeringCommittee
Nigeria Deposit Insurance Corpo-
ration
Association of Licensed Mobile
Payment Operators
Enhancing Financial
Innovation & Access
Bank of Industry
Enablers Supporting Institutions
Providers Enablers Supporting Institutions Providers Enablers
Supporting Institutions Providers Enablers
Supporting Institutions Providers
Enablers: Institutions responsible for setting enabling regulations and policies on nancial inclusion
Supporting Institutions: Institutions of fer ing technical assistance in the implementation of the Strategy
Consumer Protection
Department, CBN
Federal Ministryof Finance
Providers: Institutions providing products and services as wel l as infrastructure and technology to support the implementation of the Strategy
AFI held its annual Global Policy Forum in Egypt. The GPF came up with the Sham El Sheikh Accord on Financial Inclusion, Climate Change and Green Finance.
BMGF supported the review and refresh of the National Financial Inclusion Strategy. Similarly, the Foundation supported the development of a Nigeria Financial Services Maps project.
EFInA supported a number of research efforts (including innovation grants) in support of advancing nancial inclusion.
The GIZ supported the NYSC Peer Educator Programme by developing and distributing monitoring logbooks.
The Bankers Committee supported the establishment of the Agri-business Small and Medium Enterprises Investment Scheme.
The Bankers Commit tee act ive ly participated in the 2017 Global Money week and the World Savings Dar celebrations
The National Association of Micronance Banks supported the Bank Verication Number initiative.
T h e A s s o c i a t i o n o f N o n - B a n k Micronance Institutions developed a c o n s u m e r r i g h t s a n d f e e d b a c k mechanism for MFIs. The Association also deployed the ANMFIN Cloud database for its members.
The Bank of Industry (BOI) implemented the Government En te rp r i se and Empowerment Programme (GEEP).
The NDIC extended the Deposit Insurance protection to non-interest Banks, and pass-through deposit insurance for subscribers of mobile money.
NAICOM release the Microinsurance guidelines, Takaful insurance guidelines and licensed 2 stand-alone operators, and the Bancassurance Guidelines was also released.
The NCC ensure that MNOs complied with the interoperability provisions n their service delivery to all MMOs.
NIPOST deployed agency banking platforms for MFBs, DMBs and non-bank nancial institutions.
NIMC published 5 gazzetted regulations in support of National ID for citizens.
The Federal Ministry of Youth and Sport Development agged off a sensitization through the National Peer Group Educator Programme on Financial Inclusion.

CBN Financial Inclusion delegation with staff of Heritage Bank aftera progress review meeting
CBN Financial Inclusion delegation with the Executive Governor of Kwara State, His Excellency— Mr. Abdulfatah Ahmed
CBN Financial Inclusion delegation with the Executive Governor of Enugu State, His Excellency— Mr. Lawrence Ifeanyi Ugwuanyi
CBN Financial Inclusion delegation with staff of Fidelity Bank aftera progress review meeting
CBN Financial Inclusion delegation with staff of Diamond Bank at a product launch ceremony
CBN Financial Inclusion delegation with staff of FCMB aftera progress review meeting
CBN Financial Inclusion delegation with staff of Hasal Micro�nance Bank after a progress review meeting

Working Group Executives at the 10th Technical Committee Meeting The Kogi State CBN Branch Controller delivering his welcome address at a Financial Inclusion Strategy Implementation Update session
CBN Financial Inclusion Delegate Engaging with FSPs (South-East)
A cross section of participants at the engagement section with FSPs South West
Plenary session at a working group meetingPresentation of the Working Group Gap Analysis by FIS data analyst
A cross section of participants at the engagement section with FSPs North East

Knowledge Exchange Programmes facilitated by the CBN Financial Inclusion Secretariat for Various Stakeholders

4. STRATEGY IMPLEMENTATION
PROGRESS The year 2017 marked an important milestone for nancial inclusion in Nigeria, as the 2012
National Financial Inclusion Strategy (NFIS) was reviewed, and a refreshed strategy is
expected for 2018. This chapter provides a progress update on the achievement of the targets
of the strategy with respect to product, channel, and enabler indicators.
4.1 Overall Financial Inclusion Rate
The primary data source to gauge overall nancial inclusion rates has been the Access to
Financial Services in Nigeria Survey, a nationally representative survey which is carried out
every two years by the Enhancing Financial Innovation and Access (EFInA). The last round of
data collection happened in 2016, and as such there were no data on nancial inclusion rates
from EFInA in 2017. Results from the 2016 Survey showed a constant formal adult nancial
inclusion rate of 48.6 per cent between 2014 and 2016, while the overall adult nancial inclusion
rate, which includes adults who use formal and informal nancial services decreased by 2.1
percentage points from 60.5 to 58.4 per cent during the same period (see Figure 4.1.1).
11Figure 4.1.1: Financial Access Strands and Adult Population Estimates, 2010 to 2016
Source: EFInA (2010, 2012, 2014, 2016)
2017 Annual Report National Financial Inclusion Strategy Implementation48

11 The denitions of the nancial access strands are as follows: Banked: Adults who have access to or use a deposit
money bank in addition to having/using a traditional banking product, including ATM card, credit card, savings
account, current account, xed deposit account, mortgage, overdraft, loan from a bank, or no-interest banking
product; including indirect access; Formal Other: Adults who have access to or use other formal institutions and
nancial products not supplied by deposit money banks, including insurance companies, micronance banks,
pension schemes, mobile money operators or shares. It also includes remittances (through formal channels);
including indirect access; Informal Only: Adults who do not have any banked or formal other products, but have access
to or use only informal services and products. This includes savings clubs/pools, esusu, ajo, or moneylenders; as well
as remittances (through informal channels such as via a transport service or recharge card); Financially Excluded:
Adults not in the “banked”, “formal other” or “informal only” categories, even though the person may be using or have
access to any of the following: loan/gift from friends or family and loan from employers, as well as remittances via a
friend/family member.
Furthermore, the recently published World Bank report on nancial inclusion; the Global Findex
2017, showed that ownership of an account with a nancial institution or a mobile money
provider in Nigeria stood at 40 per cent in 2017, which represented a decrease from 44 per cent
account ownership in 2014 (gure 4.1.2). The gender gap in account ownership widened by 24
percentage points, as 51 per cent of men owned an account, while only 27 per cent of women
owned an account. Meanwhile, it has to be noted that a direct comparison to EFInA data is not 12possible due to differences in certain denitions , the Global Findex database provides
insights into the trend of nancial inclusion in Nigeria since the last round of data collection In
2014.
Figure 4.1.2: Ownership of an account at a nancial institution or with a mobile money provider, percentage of adults aged 15+,
2011 to 2017
Source: World Bank, Global Findex Database (2017)
4.2 Product Indicators
4.2.1 Banking
The NFIS dened key performance indicators for ve formal nancial products: electronic
payments, savings, credit, insurance, and pensions. Key Product performance indicators aim
at tracking the percentage of adult Nigerians who own and use the dened nancial products.
Table 4.1 shows the progress made on the indicators as at 2017. The 2017 target was not
achieved for payments, savings, and pensions, even though the trend towards target
achievement was positive. The percentage of adult Nigerians that had access to payment
services maintained a progressive trend in 2015, 2016 and 2017 by 23.6, 28.0 and 31.3 per
cent, respectively. However, the 31.3 per cent recorded in 2017 was below the 59.8 percent that
was targeted for the year. The savings target was estimated based on the number bank
accounts attached to a unique Bank Verication Number (BVN). In the absence of
The 2017
target was not
achieved for
payments,
savings, and
pensions, even
though the trend
towards target
achievement was
positive.
“
”
492017 Annual Report National Financial Inclusion Strategy Implementation

comprehensive data, the progress towards achievement of the credit and insurance target
could not be measured for 2017.
12 First, the denition of a nancial institution under Global Findex includes a “bank or another type of formal, regulated
nancial institution, such as a credit union, a cooperative, or a micronance institution” (World Bank, 2018, p. 17) and
therefore does not fully match any of EFInA's nancial access strands. Moreover, the Global Findex denes adults as
persons aged 15 years and above, while EFInA considers all persons aged 18 years and above as adults.
4.2.2 Electronic Payments and Savings
4.2.2.1 Key initiatives in 2017
Throughout 2017, Bank Verication Number (BVN) enrollment for customers of nancial
institutions was expanded to include customers of micronance banks and other nancial
institutions. Initially, institutions were required to enroll their customers on or before July 31,
2017, a deadline that was later extended to December 31 2017. Customers without a BVN were
unable to make withdrawals from their accounts past this date.
4.2.2.2 Status and Trend Analysis as at 2017
As at end-December 2017, 31.4 million people had been registered with a unique BVN, out of
which 31.0 million were adults aged 18 years and above. This segment represented 31.3 per cent
of the adult population, which constituted an increase by three percentage points over the 28.0
per cent of adult Nigerians with a BVN in December 2016. Despite the increase, the 2017 targets
for formal payments and savings products of 59.8 per cent and 49.2 per cent were not met.
Figure 4.2.2 below provides an overview of the estimated percentage of the adult population
that had a bank account with a Deposit Money Bank (DMB) or a Micronance Bank (MFB),
(using the adult population with a BVN as a proxy) by geopolitical zone as at December 2017.
An analysis of the data showed that in the previous year, the South West geopolitical zone of the
country was far ahead of other zones in BVN registration, with 50.9 per cent of adults (11.1
million adults) enrolled. The North Central, South South, and South East geopolitical zones
As at end-
December 2017,
31.4 million
people had been
registered with a
unique BVN, out
of which 31.0
million were
adults aged 18
years and above.
“
”
Figure 4.2.1: Status of the Product Key Performance Indicators
23.6%
28.0% 31.3%
Payment
Savings
Credit
Insurance
Pensions
% of adult popula�on having a payment product with a formal financial ins�tu�on
% of adult popula�on having a savings product with a formal financial ins�tu�on
% of adult popula�on having borrowed or paid back a loan through a regulated financial ins�tu�on over the last 12 months
% of adult popula�on covered by a regulated insurance policy
% of adult popula�on registered with a regulated pension scheme
Definition of Indicator
Defi
nitio
n o
f Pro
xy
Indic
ator
% o
f ad
ult
po
pu
la�
on
hav
ing
Ban
k V
erifi
ca�
on
Nu
mb
ers
Baseline
2010
Actual
2014
Actual
2015
Actual2016
Actual2017
Target2017
% Achieved
2017
Trend2016 -17
StatusTarget2020
22%
24%
2%
1%
5%
N/A
1.5%
1.1%
7.0%
6.8%6.4m
Adults
(1.4m Adults)
3%*
1%*
7.5%
1.8%
1.8%
7.9%
(22.6m Adults)
(27.2m Adults)
(31.0m Adults)
(1.0m Adults)
(6.6m Adults)
(7.2m Adults)
(1.7m Adults)
(1.7m Adults)
(7.6m Adults)
5.4%5.4m
Adults
1.1%1.15m Adults
8.4%(8.4m
Adults)
31.6%
28.6%
29.2%
(31.3m Adults)
(28.4m Adults)
(29.0m Adults)
59.8%
49.2%(48.8m Adults)
(59.3m Adults)
52.3%
63.6%
17.1%
3.8%
28.8%
40%
40%
40%
(42.3m Adults)
(42.3m Adults)
(42.3m Adults)
70%
60%(63.5m Adults)
(74.1m Adults)
23.6%
(22.6m Adults)
(27.2m Adults)
28.0%
(31.0m Adults)
31.3%
*for these years, supply-side data was not available therefore the demand-side figure for the preceding year was used as a proxy.
b
c
e
2017 Annual Report National Financial Inclusion Strategy Implementation50

followed with 36.5 per cent (5.1 million adults), 34.6 per cent (4.2 million adults), and 34.4 per
cent (5.5 million adults), respectively. BVN enrollment has been least advanced in the North
West and North East with penetration rates of 16.1 per cent (3.6 million adults) and 15.4 per
cent (1.9 million adults) respectively.
Figure 4.2.2: Estimated Percentage of Adult Population with a BVN and Number of Adults enrolled with a BVN, by Geopolitical Zone,
2017
Source: Nigeria Inter-Bank
Settlement System, EFInA
(2010, 2016)
An analysis of the distribution of BVN holders by gender (see gure 4.2.3) showed that almost
60 per cent of adults that enrolled with a BVN were men, while 40 per cent were women. This
share corresponded with a similar gender split in previous years. The low registration of women
in the North Eastern and North Western states was the main cause of the gender disparity, as
women were less than one third of total BVN holders in these areas.
Figure 4.2.3: BVN holders by gender, 2017
Source: Nigeria Inter-Bank Settlement System (2017)
Figure 4.2.4 below provides an overview of the distribution of BVN holders by age in 2016 and
2017. It shows that the bulk of BVN holders were between 18 and 45 years of age. The age
group of 18 to 25 years, recorded a total of 1.5 million new BVN enrollments in 2017 compared
with 2016 and this leap was higher than that recorded by other age groups in the period.
512017 Annual Report National Financial Inclusion Strategy Implementation

Figure 4.2.4: BVN Holders by Age, 2016 and 2017, in million
Source: Nigeria Inter-Bank Settlement System (2017)
Analyzing the distribution of BVN holders by age as a proportion of the total population in the
same age group provides further insights. Figure 4.2.5 shows that despite the increase in
registration of Nigerians aged between 18 and 25 years, the share of Nigerians with a BVN in
this age group stands at only 27 per cent, which is lower than for the age groups 26-33 years
(42%) and 34-45 years and 46-55 years (both 38%). The group of above 65 year olds contains
an even lower share of BVN holders at 17 per cent.
Figure 4.2.5: Share of population with a BVN by Age, 2016 and 2017
Source: Nigeria Inter-Bank Settlement System (2017); National Population Commission (2017)
13The number of adult nancial inclusion-related deposit accounts amounted to a total of 129.53 million in 2017. A total of
124.35 million accounts were individual accounts and 119.78 million, corporate accounts.
13 Financial inclusion-related deposit accounts include mobile money accounts, current and savings deposit accounts
at DMBs and current, voluntary savings, mandatory deposit and other deposit accounts at MFBs. Fixed deposit and
domiciliary accounts were not included as anyone who has any of these two types of accounts was assumed to have
one of the other deposit accounts already. Indeed, out of the 23,072 adult Nigerians who were interviewed in EFInA
(2016), no respondent indicated that he had a xed deposit account, but no current or savings account.
2017 Annual Report National Financial Inclusion Strategy Implementation52

2017
No. of Registered Financial Inclusion-related Deposit Accounts 14
No. of Corporate
and Individual (Non-
corporate) Accounts
No. of Individual
(Non-corporate)
Accounts
No. of Individua l
(Non-corporate)
Accounts registered
with Adults
Commercial Banks 15 95.57 90.54 86.27
Micronance Banks 16 13.81 13.68 13.62
Mobile Money Operators 20.15 20.13 19.89
Total 129.53 124.35 119.78
Table 4.2.1: Number of Financial Inclusion-related Deposit Accounts as at December 2017, by Institution Type, in Million
Source: Central Bank of Nigeria (2017)
In comparison to 2016, the number of individual (non-corporate) deposit accounts increased
from 105.7 million in 2016 to 119.8 million in 2017 (13%). Figure 4.2.6 shows that the majority of
individual deposit accounts remained with DMBs, (86.3 million or 72%) followed by MMOs
(19.9 million or 17%) and MFBs (13.6 million or 11%) as at December 2017.
Figure 4.2.6: Number of Individual (non-corporate) Deposit Accounts by Type of Institutions, 2016 to 2017, in Million
Source: Central Bank of Nigeria (2017)
14 Financial inclusion-related deposit accounts include mobile money accounts, current and savings deposit accounts
at commercial banks and current, voluntary savings, mandatory deposit and other deposit accounts at micronance
banks. Fixed deposit and domiciliary accounts were not included as anyone who has any of these two types of
accounts was assumed to have one of the other deposit accounts already. Indeed, out of the 23,072 adult Nigerians
who were interviewed in EFInA (2016), no respondent indicated that he had a xed deposit account, but no current or
savings account.15 Note that joint/group accounts at commercial banks were captured as account registrations. This means that, for
instance, a joint account which was registered with two people was captured as two accounts16 Data on accounts at micronance banks is based on returns from 69 per cent of all MFBs and represents therefore a
conservative estimate.
Figure 4.2.7 shows the number and percentage of active individual deposit accounts at
commercial banks, micronance banks and MMOs. In this context, an active account is
dened as “an account which has been used at least once in the last twelve months for a 17customer-initiated transaction” . The gure shows that 73 per cent of all individual deposit
accounts with DMBs had been used within the period January to December, 2017 while for
MMOs and MFBs only 29 percent and 23 percent of the account were used.
17 Central Bank of Nigeria (2017)
532017 Annual Report National Financial Inclusion Strategy Implementation

Figure 4.2.7: Share of Active and Inactive Individual Deposit Accounts, by Type of Institution, 2017
Source: Central Bank of Nigeria (2017)
A further analysis of the accounts on the basis of Tiered Know-Your-Customer (KYC)
requirement (gure 4.2.8) revealed that Tier 3 accounts were the predominant type of account
at deposit money banks (75%) and, to a lesser degree, at micronance banks (60%). For
MMOs, the share of tier 3 accounts was signicantly lower at 11 per cent. This could explain the
high level of inactive mobile money accounts, as customers might open the account without
the intention of using it.
Figure 4.2.8: Share of Individual Deposit Accounts, by KYC Tier, 2017
Source: Central Bank of Nigeria (2017)
2017 Annual Report National Financial Inclusion Strategy Implementation54

A deeper analysis of mobile money users based on EFinA's 2016 survey data reveals that the
current system of digital nancial services is not reaching the un-served and under-served. As
shown in gure 4.10 below, the users of mobile money services tend to have access to banks
and live in urban areas. The graph (Banking Status) shows that 100 per cent of mobile money
users also have an account with a DMB. Furthermore, the graph (Urban – rural) shows that
mobile money users live disproportionately often in urban areas, 82 per cent of them are city
dwellers.
In addition, mobile money users are more priviledged than the average Nigerian regarding their
levels of education and wealth. The graph (Education levels) shows that not a single mobile
money user has an education level below 'secondary incomplete', while the share among the
total population with these education level was 43 per cent. Moreover, the share of mobile
money users with a university and post-univeristy degree was as high as 74 per cent, while the
share is only 16 per cent for the overall Nigerian adult population. Lastly, the graph on the
bottom right hand side shows the primary material used for the walls in respondents' houses.
This serves as a proxy for respondents' wealth, where cement or concrete walls indicate more
wealth compared to other materials. It can be seen that among the overall Nigerian population,
34 per cent live in houses with mud walls and 63 per cent live in houses with cement or concrete
walls. Amongst mobile money users, no more than 0.9 per cent live in houses with mud walls,
while 98.5 per cent live in houses with cement or concrete walls, indicating that they tend to be
richer than the average Nigerian.
The share of
mobile money
users with a
university and
post-univeristy
degree was as
high as 74 per
cent, while the
share is only 16
per cent for the
overall Nigerian
adult population.
“
” Figure 4.2.9: Analysis of Mobile Money Users in Comparison to the Total Population
552017 Annual Report National Financial Inclusion Strategy Implementation

Source: EFinA (2016)
4.2.2.3 Key issues and Future Outlook
Survey data from the World Bank's Global Findex 2017 Database gives insight into the reasons
that inhibit people from using bank accounts (see gure 4.2.10). Insufcient funds was the
most frequently cited response at 64 per cent, followed by long distance to nancial institutions
(19%), and lack of necessary documentation (18%). These ndings correspond largely to the
results of EFInA's 2016 survey, in which the most prevalent reasons for not using banks were
irregular income (23.1%), not having a job (14.3%) and living or working too far away from
banks (14.3%). Analyzing these reasons separately is necessary to develop feasible strategies
to address them.
The primary material used for the walls in respondents' houses
served as a proxy for respondents' wealth
2017 Annual Report National Financial Inclusion Strategy Implementation56

Figure 4.2.10: Reasons for not having an account, percentage of respondents without a nancial institution account, age 15+, 2017
Source: World Bank, Global
Findex (2017)
The fact that income-related reasons were the primary factors inhibiting Nigerians from using
savings accounts emphasizes the need for business models that are tailored to low-income
households. This includes product design that takes into account small and potentially
irregular savings as well as distribution channels that accommodate low-income customers.
Another important reason for not using accounts was long distance to nancial institutions. The
most promising way to address this issue is pooling efforts to promote Digital Financial
Services (DFS). Due to their low capital expenditure per access point and their possibility to 18reach remote areas in a cost-effective way , DFS will be the key to unlocking access to nancial
services beyond urban centers. Creating a regulatory environment that enables DFS to gain
traction is an essential part of this journey.
The analysis of current mobile money users show, however, that the current DFS system is not
reaching the nancially excluded. Data on the level of nancial access, education, urban or
rural living pattterns, and wealth show the priviledged status of mobile money users. While early
adopters of new technologies are often the relatively better-off and more priviledged, it has to
be ensured that both the products and the channels to deliver DFS are modeled in an inclusive
way. Only if products appeal to low-income households and the distribution channels reach
them, can mobile money be converted from an additional feature for the banked into a tool that
drives nancial inclusion.
Attention also needs to be paid to the high levels of account dormancy. This holds true
especially for accounts with MFBs and MMOs, where merely 23 per cent and 29 per cent of
customers, respectively, made a transaction within the past 12 months.
Insufcient
funds was the
most frequently
cited response at
64 per cent,
followed by long
distance to
nancial
institutions (19%),
and lack of
necessary
documentation
(18%).
“
”The analysis of
current mobile
money users
show, however,
that the current
DFS system is not
reaching the
nancially
excluded.
“
”18 An IFC study found that for micronance institutions, the operational costs for transactions with agents were around
25 per cent cheaper than for conducting a branch transaction. (IFC and MasterCard Foundation: Turning MFI Digital
Strategies into Reality)
572017 Annual Report National Financial Inclusion Strategy Implementation

4.2.3 Credit
4.2.3.1 Key Initiatives in 2017
The CBN rolled out the Anchor Borrower's Programme, in all 36 States as well as the Federal
Capital Territory. The programme covered rice, maize, cassava, wheat, soya beans, sh, and
poultry, cotton, cattle and groundnuts. As at December 31, 2017, over N81 billion had been
disbursed to 366,465 beneciaries across the participating states and through 18 nancial
institutions and 405,119 hectares in cultivation.
Also, the Bank disbursed over N95 billion through 16 participating DMBs to 199,785
beneciaries under the Micro, Small, and Medium Enterprises Development Fund (MSMEDF).
The National Collateral Registry (NCR) commenced operations in May, 2016 to facilitate
access to nance for micro, small and medium enterprises through the registration of movable
assets that could be used as collateral to obtain loans from nancial institutions. Financial
institutions comprising deposit money banks, micronance banks, development nance
institutions, merchant banks, and non-bank nancial institutions have registered and are
utilizing the portal to advance credit to individuals and businesses in the country. As at
December 2017, the NCR recorded a total of 22,744 nancial statements valued at N511.35
billion secured with 29,060 various types of movable assets from 106,637 debtors. As at end-
2017, a total N563.11 billion worth of loan have been granted by the nancial institutions to
borrowers out of which N26.36 billion went to women borrowers.
The Youth Entrepreneurship Development Programme (YEDP) was created on March 15, 2016
to support the youth entrepreneurs between the ages of 18 to 35. As at December 31, 2017,
over N206 million had been disbursed to 82 beneciaries in two banks namely, Heritage and
Sterling Bank. Thirty two (32) people beneted from over N82 million disbursed through
Heritage Bank, while 50 people beneted from over N123 million disbursed through Sterling
Bank.
4.2.3.2 Status and Trend Analysis as at 2017
EFInA's 2016 Access to Financial Services survey showed that 1.8 per cent of the adult
population had borrowed from a formal nancial institution over the past 12 months. In
absence of data for 2017, the progress cannot be ultimately qualied. However, it seems
unlikely that the 2017 target of 31.6 per cent credit penetration was achieved.
As at December
31, 2017, over
N81 billion had
been disbursed to
366,465
beneciaries
across the
participating
states and
through 18
nancial
institutions and
405,119 hectares
in cultivation.
“
”
Table 4.2.2: Number of Credit Accounts as at December 2017, by Institution Type, in Million
2017
No. of Registered Credit Accounts
No. of Corporate and
Individual (non-
corporate) Accounts
No. of Individual
Accounts
No. of Individual
(adult) Accounts
Commercial Banks19 2.34 1.79 1.76
Micronance Banks
3.72
3.71
3.70
Total
6.06
5.50
5.46
Source: Central Bank of Nigeria (2017)
Note that joint/group accounts at commercial banks were captured as account registrations. This means thata joint account registered with two people was captured as two accounts.
2017 Annual Report National Financial Inclusion Strategy Implementation58

In terms of credit accounts, there were 6.06 million accounts at DMBs and MFBs as at
December 2017. Out of the 6.06 million accounts, an estimated 5.50 million were individual
(non-corporate) accounts, while an estimated 5.46 million individual credit accounts were
registered with adults (see Table 4.2.2.). Relative to the adult population, there were 5.5 credit
accounts registered with adults per 100 adults as at December 2017, which constituted a slight
decrease compared to the 5.7 credit accounts per 100 adults registered as at December 2016.
Figure 4.2.11 shows that the number of individual credit accounts with adults had remained
constant between 2016 and 2017. However, the number of credit accounts per person had
declined due to continued population growth. It can also be seen that around two thirds of
credit accounts were held at MFBs. This is opposed to the distribution of deposit accounts, as
no more than 11 per cent of all deposit accounts (see gure 4.2.8) are held at MFBs.
In terms of
credit accounts,
there were 6.06
million accounts
at DMBs and
MFBs as at
December 2017.
“”
Figure 4.2.11: Number of adult individual credit accounts by type of nancial institution: 2016 to 2017
Source: Central Bank of
Nigeria (2017)
4.2.3.3 Key issues and Future Outlook
The number of credit accounts remained constant in 2017 relative to the previous year.
However, the number of accounts per person declined due to population growth. This trend is
worrisome, especially given the fact that a lot of work is needed to achieve the target of 40 per
cent credit penetration by 2020.
One striking feature about the credit sector is the dominance of MFBs. In 2017, 68 per cent of all
credit accounts were with MFBs, as opposed to 11 per cent of deposit accounts. This
mismatch indicates that while MFBs are the channel that connects customers with credit
products at the largest scale, they face constraints to expand their lending operations. Liquidity
of the micronance industry is an issue that will have to be addressed to make an impact in
extending access to credit.
One striking
feature about
the credit sector
is the dominance
of MFBs.
“”
592017 Annual Report National Financial Inclusion Strategy Implementation

4.3 Insurance
4.3.1 Key activities in 2017
The release of the Bancassurance guidelines by NAICOM and CBN in March 2017 marked an
important step for the insurance industry. Following the referral model, the guidelines allowed
insurers to partner with up to two banks that refer their customers to the insurer. This allows
insurance companies to tap into the established customer network of banks and drive
insurance penetration, while banks receive a commission for every new policyholder.
4.3.2 Status and Trend Analysis as at 2017
Due to lack of unique identication of customers across insurance companies and government
programmes, such as the Nigeria Social Insurance Trust Fund (NSITF) and the National Health
Insurance Scheme (NHIS), no consolidated supply-side estimate was available as at
December 2017. However, data from the National Insurance Commission showed that 43 out
of 58 insurance companies reported 1.15 million personal insurance policies as at December
2017. This was an increase of 3 per cent from 1.12 million policies in December 2016. Data from
the NSITF showed that out of 6.8 million Nigerians who were registered with NSITF as at
December 2017, only 0.1 million were covered by the scheme; also at least one contribution
had been made over the past 12 months. These 0.1 million represented 2 per cent of those
registered in NSITF and about 0.1 per cent of the Nigerian adult population.
4.3.3 Key Issues and Future Outlook
Low penetration rates over the years have shown that conventional insurance products are
unable to bridge the insurance gap. Promoting micro-insurance is crucial to achieving the
target of 40 per cent insurance penetration. The micro insurance guidelines, which are
expected to be released in 2018, will play a crucial role in this regard. In addition, products need
to be affordable for the mass market and easily understandable and distributed through
channels that can reach large numbers of customers.
The release
of the
Bancassurance
guidelines by
NAICOM and
CBN in March
2017 marked an
important step for
the insurance
industry.
“
”
Promoting
micro-insurance
is crucial to
achieving the
target of 40 per
cent insurance
penetration.
“” 4.4 Pension
4.4.1 Key activities in 2017
In 2017, PenCom engaged in a range of activities in order to spread awareness on pensions,
which included the production and distribution of public enlightenment programmes and
partnership with universities from all six geopolitical zones. Furthermore, in an important step
towards increased inclusivity, PenCom extended pension fund investments to include non-
interest capital market products as allowable securities.
A draft Micro Pension Guideline for the informal sector and self-employed was under review as
at December, 2017. Moreover, PenCom conducted a Pension Industry Baseline Survey on the
level of customer satisfaction and literacy regarding pensions.
4.4.2 Status and Trend Analysis as at 2017
From 2016 to 2017 the share of adult Nigerians who were contributing to a regulated pension
scheme increased from 7.9 per cent to 8.4 per cent. As gure 4.14 shows, these numbers fall
short of the target set in the NFIS, which is 29.2 per cent for 2017. In absolute terms, 7.9 million
Nigerians were contributing to a regulated pension system, an increase of 9.7 per cent from the
7.2 million adults contributing in 2016.
In absolute
terms, 7.9
million Nigerians
were contributing
to a regulated
pension system,
an increase of 9.7
per cent from the
7.2 million adults
contributing in
2016.
“
” 2017 Annual Report National Financial Inclusion Strategy Implementation60
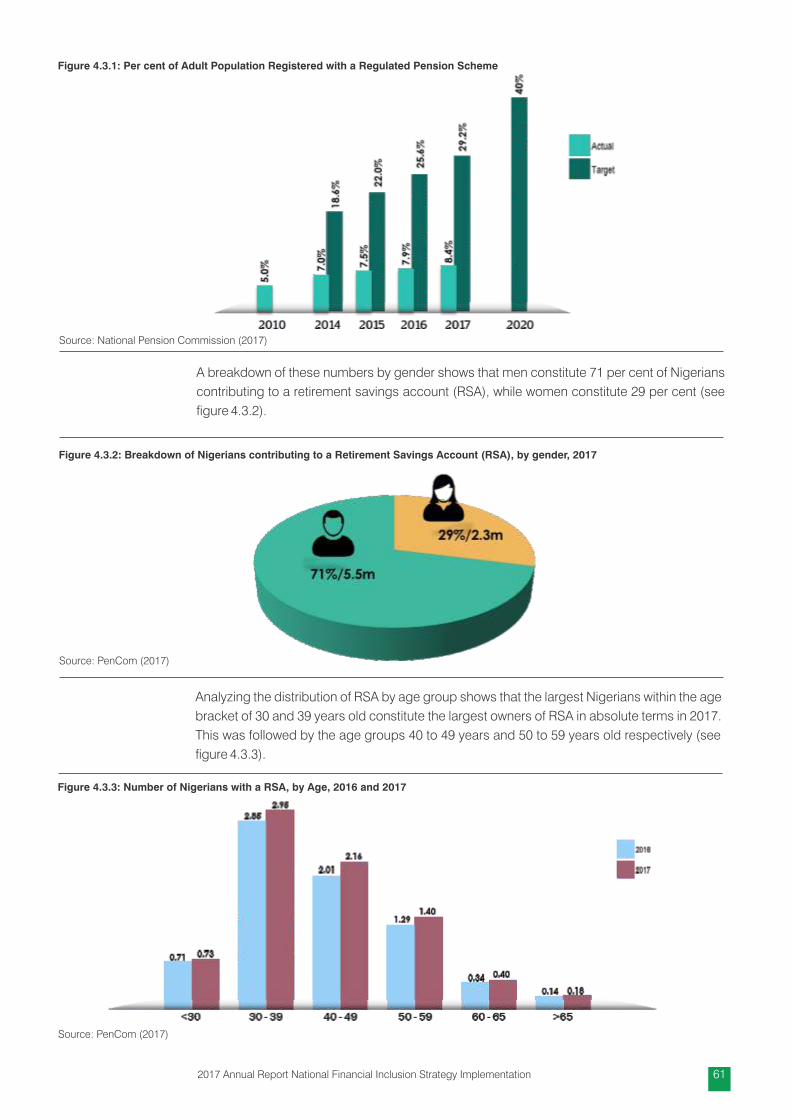
Source: National Pension Commission (2017)
A breakdown of these numbers by gender shows that men constitute 71 per cent of Nigerians
contributing to a retirement savings account (RSA), while women constitute 29 per cent (see
gure 4.3.2).
Figure 4.3.2: Breakdown of Nigerians contributing to a Retirement Savings Account (RSA), by gender, 2017
Source: PenCom (2017)
Analyzing the distribution of RSA by age group shows that the largest Nigerians within the age
bracket of 30 and 39 years old constitute the largest owners of RSA in absolute terms in 2017.
This was followed by the age groups 40 to 49 years and 50 to 59 years old respectively (see
gure 4.3.3).
Figure 4.3.3: Number of Nigerians with a RSA, by Age, 2016 and 2017
Source: PenCom (2017)
Figure 4.3.1: Per cent of Adult Population Registered with a Regulated Pension Scheme
612017 Annual Report National Financial Inclusion Strategy Implementation

Conversely, in relative terms, it can be observed that the age group 50 to 59 years old has the
highest share of RSA holders at 18 per cent (see gure 4.3.4). This is followed by the group
aged 40 to 49 years (15%) and 30 to 39 years (14%).
Figure 4.3.4: Share of Nigerians with a RSA, by Age, 2016 and 2017
Source: PenCom (2017), National Population Commission (2017)
4.4.3 Key Issues and Future Outlook
As at end of 2017, the draft Micro Pension Guideline was yet to be released. Publishing the
guideline will be an essential step towards closing the gap between actual pension
contributors and the product target of 40 per cent by 2020. There will also be need for sustained
awareness creation on the importance of pensions and the windows for participating in it.
4.5 Channel Indicators
Long distance to nancial access points – dened as points where cash-in and cash-out
transactions can be performed – is one key barrier to nancial inclusion. In order to address this
issue, the National Financial Inclusion Strategy dened ve channels key performance
indicators.
4.5.1 Key activities in 2017
In an effort to strengthen the delivery of digital nancial services, the CBN engaged in a range of
activities in 2017. The Bank issued three new super-agent licenses, which allowed the licensed
entities to sub-contract individual agents on behalf of nancial institutions, while maintaining
the ultimate responsibility for the agents. The additional licenses will contribute to the
expansion of the mobile money agent network.
The CBN also granted an Approval in Principle (AIP) for super-agent licenses to Mobile Network
Operators (MNO) that incorporated a Special Purpose Vehicle (SPV) for the provision of
nancial services. The super-agents are expected to complement the efforts of the MMOs in
extending nancial services to the unbanked at a minimal cost.
Efforts to increase the attractiveness of mobile money accounts include CBN's proposal to
introduce interest earnings on mobile money accounts. This would constitute a signicant
incentive for using mobile money accounts as a means to accumulate savings. Moreover,
balance and transfer limits for mobile money wallets have been reviewed and Tier 1 mobile
money accounts have been exempted from BVN enrollment to further enhance ease of use of
mobile money in Nigeria.
There will also
be need for
sustained
awareness
creation on the
importance of
pensions and the
windows for
participating in it.
“
” Efforts to
increase the
attractiveness of
mobile money
accounts include
CBN's proposal to
introduce interest
earnings on
mobile money
accounts.
“
”
2017 Annual Report National Financial Inclusion Strategy Implementation62

In order to facilitate the improved provision of digital nancial services, CBN and NCC signed a
Memorandum of Understanding (MoU) to enhance payment systems and drafted a regulatory
framework on the use of Unstructured Supplementary Service Data (USSD). The framework
seeks to establish the rules and risk-mitigation considerations when implementing USSD for
nancial services due to the advent of mobile payments, m-commerce, m-banking and other
nancial transactions based on mobile telephony.
4.5.2 Status and Trend Analysis as at 2017
Table 4.5.1 and gure 4.5.1 show the status and trend of the channel key performance
indicators.
Table 4.5.1: Status of the Channel Key Performance Indicators as at December 2017
Source: Central Bank of Nigeria (2017); Interswitch (2017); NIBSS (2017)
The number of DMB branches per 100,000 adults stood at 5.5 as at December 2017. This
represented a decrease of 2 per cent from 5.6 DMB branches per 100,000 adults as at
December 2016, even though in absolute numbers there was an increase in DMB branches
from 5,446 branches in 2016 to 5,470 branches in 2017. Target achievement of the 2017 target
of 7.5 branches per 100,000 adults stood at 73 per cent.
The number of MFB branches per 100,000 adults remained constant in 2017 at 2.3 branches
per 100,000 adults. In absolute terms, there was a slight increase in the number of MFB
branches from 2,197 to 2,231; 49 per cent of the 2017 target of 4.7 micronance branches was
achieved.
The number of ATMs per 100,000 adults increased slightly to 18.2 in 2017 from 18.0 in 2016.
The absolute number of ATMs also saw an increase from 17,440 ATMs in 2016 to 18,060 ATMs
in 2017. Despite this positive trend, only 37 per cent of the 2017 target of 49.5 ATMs per 100,000 20adults was achieved .
20 Report from Banking and Payment Systems Department, Central Bank of Nigeria (2017)
18.8%(18,228Agents)
632017 Annual Report National Financial Inclusion Strategy Implementation

Figure 4.5.1: Status of the Channel Key Performance Indicators as at 2014, 2015, 2016 and 2017
Source: Central Bank of Nigeria (2017); Interswitch (2017); NIBSS (2017)
The number of PoS devices stood at 153.0 per 100,000 adults. This constituted an increase
from 116.3 PoS devices per 100,000 adults in 2016. In absolute terms, the number of PoS
devices increased from 112,847 in 2016 to 151,786 in 2017. The target achievement for 2017
(605.6 PoS devices per 100,000 adults) stood at 25 per cent.
The number of agents per 100,000 adults, using the number of agents registered on CBN's
agent database per 100,000 adults as a proxy, stood at 28.2 in 2017. This shows a
considerable jump from 18.8 agents per 100,000 adults as at December 2016 (see gure
4.5.2). In absolute terms, the number of agents increased from 18,228 agents in 2016 to 27,978
agents 2017. To put these numbers into context, it has to be taken into account that the agent
database registers both active and inactive agents. The share of active agents is estimated to 21be around 23 per cent of total agents, where active is dened as those having made at least
one transaction within the past month. This adjustment reduces the number of mobile money
agents per 100,000 adults to 6.5.
21 Estimates are based on data provided by 19 mobile money operators, representing 83 per cent of the total industry.
2017 Annual Report National Financial Inclusion Strategy Implementation64

Figure 4.5.2: Number of mobile money agents per 100,000 adults
Source: Central Bank of Nigeria (2017)
The geographical dispersion of nancial access points showed that deposit money bank
branches and mobile money agents were distributed unequally across Nigeria. The South
West geopolitical zone has by far the largest amount of access points with 2.3 commercial
bank branches and 24 mobile money agents per 100,000 adults. North Central and South-
South followed with 0.9 bank branches and 9.7 mobile money agents per 100,000 adults and
0.9 bank branches and 5.18 mobile money agents per 100,000 adults, respectively. In the
North West geopolitical zone there were 0.6 deposit money bank branches and 6.39 mobile
money agents per 100,000 adults, while South East with 0.6 deposit money bank branches and
4.7 mobile money agents per 100,000 adults. The least served geopolitical zone was North
East with 0.3 deposit money bank branches and 2.37 mobile money agents per 100,000
adults.
4.5.3 Key Issues and Future Outlook
Stagnant and declining trends in the number of traditional channels, such as bank branches
and ATMs are indicative of an overall trend in the industry, as nancial institutions are de-
emphasizing traditional branches due to unsustainably high costs. Instead, the focus is shifting
towards technological solutions, especially digital nancial services (DFS), and agency
banking. This shift represents an opportunity for nancial inclusion, as DFS has the potential to
cost-effectively serve areas that were excluded due to their remoteness, poor infrastructure, or
low population density. However, so far, this opportunity is not fully harnessed.
As the analysis above has shown, the current DFS ecosystem is not reaching the nancially
excluded. Rather than being a tool to drive nancial inclusion, it is an add-on feature for those
who are already banked. Developing products that appeal to low-income customers and
building an agent network that distributes these products beyond the major urban centers will
be crucial to harness the nancial inclusion potential of DFS.
While the number of mobile money agents has increased signicantly in the previous year, the
large share of inactive agents constitutes an obstacle towards greater uptake of DFS. As agent
inactivity is likely to be a consequence of limited nancial incentives, the current remuneration
model for agents should be reviewed, including regulations such as the xed fees agents can
charge for cash-in cash-out transactions.
The South West
geopolitical
zone has by far
the largest
amount of access
points with 2.3
commercial bank
branches and 24
mobile money
agents per
100,000 adults.
“
”
652017 Annual Report National Financial Inclusion Strategy Implementation

4.6 Enablers
4.6.1 KYC ID
4.6.1.1 Key activities in 2017
Throughout 2017, the National Identity Management Commission (NIMC) continued
enrollment efforts for the National Identication Number (NIN) as well as the harmonization and
integration of identity databases.
Table 4.6.1: Status of the Enabler Key Performance Indicators as at 2017
Source: NIMC (2017), EFInA (2014, 2016
4.6.1.2 Status and Trend Analysis as at 2017
As shown in Table 4.6.1 above, the share of adult Nigerians having a NIN increased to 27.9 per
cent or 27.7 million adults in absolute terms. This constitutes a signicant increase compared
to the 15.1 per cent and 14.6 million adults registered by the end of 2016 (see Figure 4.20). The
achievements in 2017 amounted to only 37 per cent of the target value of 75.4 per cent or 74.8
million adult Nigerians that had a NIN in 2017.
Figure 4.6.1: Per cent of Adult Population having a National Identication Number (NIN)
Source for acutals: National Identity Management Commission
Analyzing the distribution of NIN holders by gender shows that the majority of NIN holders were
men, as they accounted for 60 per cent of all NIN holders, totaling 16.7 million adults as against,
while 40 per cent or 11.2 million for the female gender (see gure 4.6.3).
2017 Annual Report National Financial Inclusion Strategy Implementation66

Figure 4.6.2: Distribution of Nigerians with a National Identication Number (NIN) by Gender, 2017
Source: National Identity Management Commission
Also, most NIN holders were aged between 34 and 45 years old which accounted for 8.22
million people (see Figure 4.6.4), followed by age 26 and 33 years which recorded 7.74 million.
Ages 18-25 recorded 4.52 million, 46 -55 recorded 3.96 million and ages above 55 recorded
3.25 million.
Figure 4.6.3: Distribution of Nigerians with a National Identication Number (NIN) by Age, in Million, 2016 and 2017
Source: National Identity Management Commission (2017)
Figure 4.6.4: Share of population with a NIN, by Age, 2016 and 2017
Source: National Identity Management Commission (2017), National Population Commission (2006)
672017 Annual Report National Financial Inclusion Strategy Implementation

4.6.1.3 Key Issues and Future Outlook
Enrollment of the adult population for the NIN continued throughout 2017. Further efforts will be
needed in the upcoming years to create a strong identication system, which builds on the
foundation for nancial inclusion.
There is the need to give more attention to young Nigerians as the analysis has shown that the
share of NIN holders aged between 18 and 25 years at 14.7 per cent is signicantly lower than
that for other age groups. This coincides with the low nancial inclusion rates for Nigerian
youths and offers a compelling explanation. Additional attention on youths in enrolling
Nigerians for NIN will be necessary to promote equitable access to nancial services.
Overall, the progress towards achieving the NFIS targets has fallen short of the annualized
targets in the year under review. Product, channels, and enabler targets were not met. For
instance, only 31.3 per cent of adults had access to payments and savings products, while the
targets for 2017 were 59.8 per cent and 49.2 per cent respectively. Nonetheless, commendable
activities took place, such as the continued enrollment of customers of nancial institutions in
the BVN scheme and the continued capturing of NIN. Moreover, commendable regulations
were issued, such as the Bancassurance guidelines released by nd CBN, which will contribute
towards progress in the future. The next chapter will conclude the overall activities and
progress in more detail.
Only 31.3 per
cent of adults
had access to
payments and
savings products,
while the targets
for 2017 were
59.8 per cent and
49.2 per cent
respectively.
“
”
Mrs Temitope Akin-Fadeyi, Head, CBN-FIS presenting a Stakeholder Report at the 10th National Financial Inclusion Technical Committee meeting
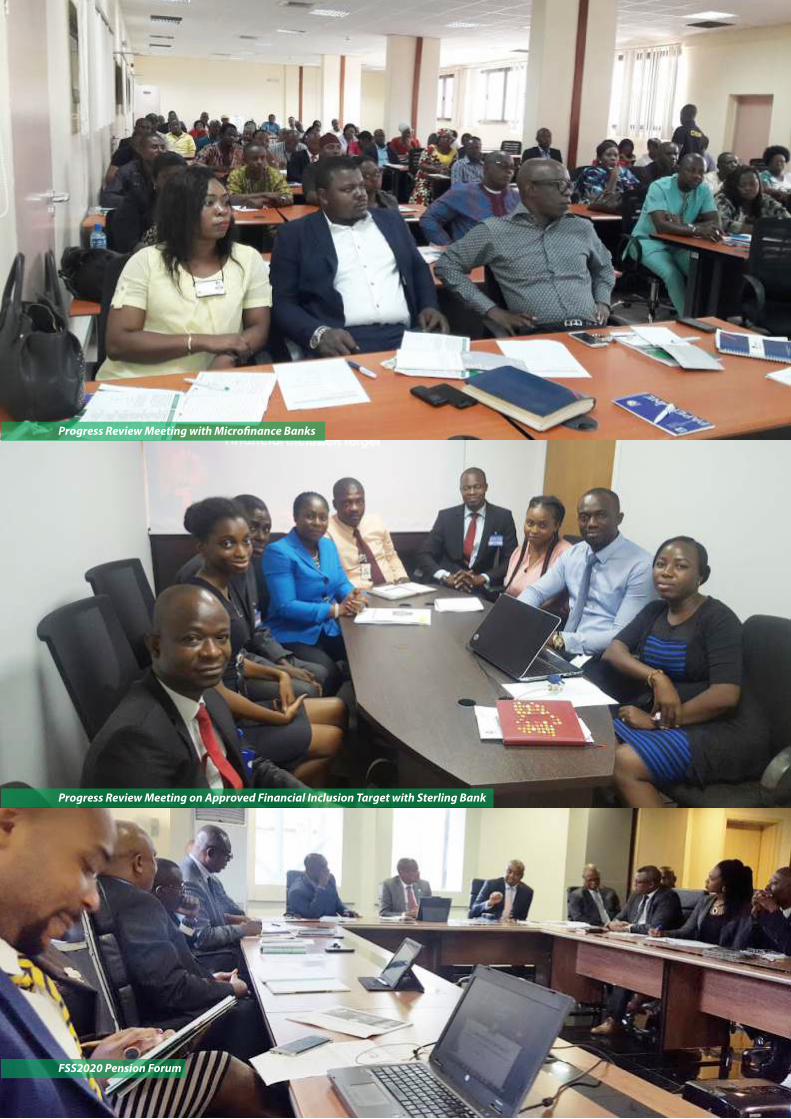
Progress Review Meeting with Micro�nance Banks
Progress Review Meeting on Approved Financial Inclusion Target with Sterling Bank
FSS2020 Pension Forum

Financial Inclusion delegates during a visit to Nigeria Inter-Bank Settlement System
CBN Financial Inclusion delegates after with participants at the people living with disability (PWD) pre-disbursement workshop

5.1 Introduction
Since its launch in 2012, the Nigerian National Financial Inclusion strategy has served as a
veritable platform for harnessing stakeholder efforts towards the attainment of nancial
inclusion objective in Nigeria. Sections 3 and 4 of this report provided insight into stakeholder
activities and their consequential impact on Financial Inclusion in year 2017. Halfway into the
2012 strategy a backward review of the progress of implementation has become necessary.
This need became more ostensible given the rapid changes in the socio-economic and
technology landscape. Thankfully, the need for a mid-term review was envisaged during the
development of the 2012 strategy and captured as a key activity in the 2012 strategy.
It was against this backdrop that in 2017 a project was commissioned to review and refresh the
existing strategy. The two-phase process comprises a backward review of the implementation
of the current strategy and a development of a refreshed strategy. The Mid-Term Review phase
of the strategy was completed and approved by the National Financial inclusion Steering
committee in December 2017, while the Refresh phase would be conducted in 2018.
The focus of this chapter is to describe the process and ndings of the Mid-Term Strategy
Review phase of the project, while setting the tone for the Refresh phase in year 2018.
5.2 The Need for a Revised NFIS
The 2012 Nigerian National Financial Inclusion strategy (NFIS) sets out to achieve 70% formal
nancial inclusion and 80% total nancial inclusion by 2020. The strategy sought to achieve
70% payment penetration, 60% savings penetration, 40% pension penetration and 40%
insurance penetration alongside other specic targets and implementation actions. Based on
the data obtained from EFInA Access to Financial Services survey of 2016, no interim target
was achieved in 2016. Based on the 2016 data, nancial inclusion in Nigeria stood at 58.4% of
96 Million Nigerian adults. Figure 5.1 below shows the distribution of the ndings of the survey.
5. MID-TERM REVIEW OF THE
NATIONAL FINANCIAL
INCLUSION STRATEGY
712017 Annual Report National Financial Inclusion Strategy Implementation

Figure 5.2.1: Overview of the Financial Inclusion Situation in Nigeria in 2016
Source: EFInA Access to Financial Services in Nigeria survey, 2016
5.3 Socio-economic Context and Technology Landscape
Since the launch of the strategy in 2012, Nigeria's macroeconomic and security context has
weakened, presenting a challenging environment for nancial inclusion to thrive. Furthermore,
the 2012 strategy did not fully leverage on the capability of Digital Financial services in spite of
high mobile penetration rate in Nigeria.
Nigeria has a high youth population, adding to other factors like high poverty and
unemployment rates provide a highly challenging nancial inclusion context even prior to the
recession in 2016. More so, the declining oil revenue from year 2014 has negatively impacted
economic activities and household consumption and has also led to ination that has reduced
purchasing power. Unemployment and reduced disposable income also affected economic
activities at the base of the pyramid.
The insurgency in the North Eastern part of Nigeria led some nancial institutions to close
shops. Some in the region kept away from banks for security reasons. The security situation
also put pressure on the Northwest due to migration of displaced persons.
Nigeria has a very high mobile penetration rate. 75% of the population use a mobile phone.
Consumer behaviour is also tending towards digital nancial services as the value of electronic
transaction increased 2.7 times since 2012. This growth has been driven by introduction of the
cashless policy in some states and the resulting increase in digital banking investments by
nancial services providers.
While the 2012 NFIS laid out a plan to address identied gaps and other nancial inclusion
needs, progress against the nancial inclusion strategy has been mixed. Of the 70
recommendations dened in the strategy, few were completed highlighting the need to
prioritise.
In summary, the reasons for reviewing the strategy in Nigeria are multi-fold, they include;
Ÿ The original strategy included a provision that the document would be reviewed and
refreshed at the mid-point of the strategy.
Ÿ Nigeria is a member of the Maya Declaration Initiative and an early adopter of some
best practices in nancial inclusion. These best practices call for a routine review and
2017 Annual Report National Financial Inclusion Strategy Implementation72

refresh of strategy documents. As of 2016, 30 countries had developed a National
Financial Inclusion Strategy, with additional 23 countries being in the process of
formulating a NFIS. Nigeria is one of many Maya Declaration initiative members
recognising the need to refresh its strategy in light of changing country context and to
incorporate up-to-date best practices.
Ÿ Nigeria lags behind NFIS 2012 nancial inclusion targets, and several gaps have been
observed in the strategy around the need to (i) strengthen coordination with states; (ii)
incorporate women, disadvantaged groups, MSMEs and geographical variations; and
(iii) develop a practical monitoring and evaluation (M&E) approach and the need to
leverage on the changes in emerging technological landscape.
Ÿ Much has changed in the Nigerian context since the original document was written,
especially with regard to the economy, security and technology. New lessons and
priorities have been identied since the inception of the document. These changes and
insights need to be reected in Nigeria's strategy to more adequately address nancial
inclusion.
To address the aforementioned challenges there was a need to assess performance of the
existing strategy (2012-2017) to understand the implementation progress so far, determine
whether interventions were on course to meet goals and identify approaches and key issues.
The Mid-term Strategy Review was meant to address these needs.
5.4 Mid-term Strategy Review
The strategy review was a backward-looking assessment of the 2012 NFIS based on a
comprehensive review of existing research, reports and databases and extensive stakeholder
engagements (see 5.2 for strategy review methodology). The review aimed to understand the
current state of nancial inclusion in Nigeria and determine the barriers to achieving broader
inclusion. Past approaches to resolving the barriers were examined for lessons they might offer
for the refresh phase. The barriers to nancial inclusion were also assessed to prioritise those
most critically in need of being addressed in order to drive the inclusion agenda.
Figure 5.4.1:
NFIS 2012 review
methodology
732017 Annual Report National Financial Inclusion Strategy Implementation

5.5 Governance and Approach
To carry out the review, the services of a consulting rm, Dalberg Global Development Advisors
was engaged. A governance structure was then put in place to conduct the review. The
governance structure was as shown in Table 5.5.1.
Table 5.5.1: Mid-Term Review Governance Structure
Project
Structure
Financial Inclusion Steering Committee (FISC) and Financial Inclusion
Technical Committee (FITC) provide guidance and strategic direction at regular
meetings.
Core Team: A smaller team comprised of key members of relevant department in the
Central Bank of Nigeria. The team meets once every month to review and provide input to
ongoing work.
Shadow Team: Comprised of three members of the Financial Inclusion Secretariat. They work very closely with the consultant on the project.
Stakeholder
Engagement
Inter-Agency Taskforce: The taskforce incorporates representation from a broad
range of stakeholder groups, including Government Ministries, Agencies and
Departments. It also includes representation from industry association, technical
advisors and civil societies.
Other stakeholders as deemed necessary during the project.
The mid-term review phase evaluated NFIS impact and lessons learned through analysis, desk
review and stakeholder conversations as shown in the project activity chart in gure 5.3. The
gure also shows deliverables at each stage.
Figure 5.5.1: Mid-Term Project Activity Chart.
Mid-termreview
Phase 1: Kick-off andincep�on report
2 weeks
Phase 2: Progress andlessons discovery
3 weeks 1.5 weeks
Phase 3: Preliminaryinsights and working
session
1.5 weeks
Phase 4: Synthesisand finaliza�on of
Review report
Ac�vi�es and Analyses
Conduct kickoff
conversa�ons
Prepare detailed research
approach and
methodology
Review exis�ng materials
Conduct research into
current context and
changes since last strategy
Iden�fy contribu�ons
required from
stakeholders
Iden�fy key interviewees
Dra� incep�on and work
program report
Conduct desk research and
analysis to understand
progress against targets
Review current M&E
framework
Assess approaches to date
and extract lessons
Review best prac�ces from
other FI strategies in other
countries, drawing on
previous Dalberg work
Conduct interviews in
Nigeria with relevant
stakeholders
Conduct working sessions
with selected stakeholders
Extract key insights from
interview data and
combine with desk
research to synthesize
progress of the current FI
strategy and iden�fy gaps
Assess the trajectory to
2020
Develop list of preliminary
findings
Conduct working session
with to assess preliminary
findings of the mid-term
review
Key deliverables
Synthesize findings and
feedback from the
workshop
Ar�culate high level
recommenda�ons of
changes needed
Dra� and present
preliminary report
Begin work on the Refresh
while wai�ng for
comments
Finalize report based on
comments
Incep�on report
List of interviewees
Preliminary findings:
progress and gaps
Working session
Preliminary Review
report
Final Review report
2017 Annual Report National Financial Inclusion Strategy Implementation74

5.6 Key Findings of the Review Exercise
The mid-term review revealed some barriers that are hindering the attainment of the nancial
inclusion strategy objective in Nigeria. These barriers were classied into thematic areas which
include;
Ÿ Insufcient agent network to allow expansion of nancial services to rural areas
Ÿ Lack of National ID limiting many to tier 1 accounts
Ÿ Digital Financial services not realizing its full potential in Nigeria
Ÿ Only few products are tailored for the excluded groups (women, youth, northerners and
rural dwellers) etc.
These barriers were further classied into barrier only government could address and barriers
that others could address.
5.7 Five Most Excluded Groups
Further analysis of nancially excluded Nigerians reveals ve groups that were
disproportionately excluded: women, rural dwellers, youth, people living in North-East and
North-West Nigeria and MSMEs (see Figure 5.4). While data is not readily available on access
to nancial services for persons with disability, qualitative information suggests that they were
also disproportionately excluded. Reasons behind the unusually high exclusion rates for these
groups include cultural barriers to uptake of nancial products, difculties in protably serving
excluded groups with nancial services, high (and worsening) levels of unemployment,
security challenges in specic regions of the country and continuing high levels of informality in
the economy.
Gender gap
1
Urban-rural gap
2
Age gap
3
Regional gap
4
Formality gap
5
51%
49%
male
Adult popula�on
femaleThere are ~47 million female adults in Nigeria, represen�ng nearly half of the adult popula�on
Financial inclusion rates are lower among women than men. However, informal inclusion is higher for women than men
61%
39%urban
rural
Adult popula�on
~60m Nigerian adults live in rural areas, while just ~37m live in urban areas
Financial inclusion rates are much lower in rural areas than in urban areas , However informal inclusion is higher in rural than urban areas
74%
26%
Others
Adult popula�on
18-25 ~26m youth aged 18-25 in Nigeria, and ~31m aged 25-35
The 18-25 group is the least included age group – at~47% total and ~38% formal inclusion
65%
23%
Others
Adult popula�on
12%North East
North West ~34 million adults live in North West and North East Nigeria, represen�ng 35% of the adult popula�on
Only ~33% of adults in the North East and North West (combined) are financially included
Formal Informal Excluded
48.6% 9.8% 41.6%
Men 54.5% 8.7%
Total
10.9%
36.8%
42.6% 46.5%Women
52.2%
48.6%
34.7%
Urban
41.6%
13.1%
71.3%
9.8%Total
Rural
4.3%
Excluded
24.4%
Formal Informal
53.5%
9.8%Total
37.6% 8.9%
Formal Informal
41.6%
Excluded
48.6%
18-25
Formal Informal
Total 9.8% 41.6%48.6%
North East 25.0% 14.0%
Excluded
62.0%
North West 24.0% 6.0% 70.0%
There are ~37 million MSMEs, and ~60 million Nigerians are employed in the MSME sector
Financial inclusion is thought to be lower for MSMEs than larger businesses *
Target group and size (total adult popula�on of 96.4m as of 2016)
Financial inclusion situa�on (na�onal total inclusion 58% ; formal inclusion 49%)
Note: *Quan�ta�ve data about SME inclusion is not readily available
Source: EFinA Access to Financial Services in Nigeria 2016 Survey.
Figure 5.7.1: Five target demographic groups excluded at especially high rates
752017 Annual Report National Financial Inclusion Strategy Implementation

5.8 Critical Priorities for NFIS Refresh
One major challenge that was identied in the 2012 strategy was the lack of prioritization of the
70 identied recommendations. In the mid-term review, five priority actions emerged as most
crucial to increasing nancial inclusion in Nigeria, in terms of their potential to address the most
signicant barriers: these include;
1. Create a conducive environment for the expansion of DFS. DFS has proven to be
a low-cost approach to reaching unserved and underserved customers; across the
world, advancement of DFS goes hand in hand with nancial inclusion improvements.
2. Enable the rapid growth of agent networks with nationwide reach.
Agents—particularly CICO agents—act as the entry point for nancial inclusion and
facilitate the crucial conversion between cash and digital money.
3. Reduce KYC hurdles to opening and operating a bank account.
4. Create an environment conducive to serving the most excluded, so that
inclusion efforts do not focus solely on the 'lowest hanging fruit' (and thereby increase
inequality).
225. Drive adoption of cashless payment channels, particularly in G2P and P2G
payments, in order to (a) establish trust by leading by example, (b) provide a sufcient
load volume to drive the business case for building and growing distribution networks
(particularly agent networks) and (c) have in place a forcing mechanism to include
large numbers of unserved and underserved people.
To achieve its nancial inclusion goals, Nigeria needs to address these priorities in three broad
steps. The steps taken to achieve the identied priority are detailed in Figure 5.5. The steps are:
Ÿ Step 1: Building foundations
Ÿ Step 2: Unlock high potential models
Ÿ Step 3: Broadening and deepening inclusion.
22 Person to government (P2G) and government to person (G2P) payments.
Figure 5.8.1: Three steps to address high priority themes.
2017 Annual Report National Financial Inclusion Strategy Implementation76

The ndings of the mid-term review were approved by both the FITC and FISC in 2017, paving
the way for the commencement of the second phase of the project which is a refresh in 2018.
5.9 Outlook for NFIS Refresh in 2018
The refreshed strategy will be developed in early 2018 and will incorporate lessons learned
from the review phase of the project namely:
• Need for prioritization: Honing on the most critical barriers and highest potential
solutions;
• Alignment to stakeholder incentives: Identifying solutions that are consistent
with the interests of key stakeholders, including private sector players, that are
politically feasible;
• Adaptability: Designing for exibility in the case of shocks and changes in the
country context;
• Openness to innovation: Following an approach that allows piloting in
controlled environments, such as a regulatory sandbox;
• Inclusion of global best practices: Ensuring that strategy draws insights from
international frameworks and success stories that can be adapted to the local
context.
The efforts of the Financial Inclusion Stakeholders in Nigeria cannot be over-emphasised. This
is hinged on their obvious commitment to enhance access to nance by the adult population
throughout the country. We are condent that the refreshed strategy will also foster more
effective collaboration with all the stakeholders towards achievable targets and put Nigeria
back on track to achieve 80% nancial inclusion rate by year 2020.
2017 Annual Report National Financial Inclusion Strategy Implementation72A cross section of members of the Technical Committee Inter-Agency Taskforce on Nigerian Financial Inclusion Strategy NFIS Review

Nigerian Financial Inclusion Strategy (NFIS) Review: Inter-Agency Taskforce Workshop

WAY FORWARD
out of 10 Nigeriansfinancially included by 20208
North West
70%
47%
53.5%Exclusion
Exclusion
Exclusion
MSMEs
LOWER
Inclusion
Gen
der G
ap
Reg
iona
l Gap
Age
Gap
Regional G
apF
orm
ality
Gap
Step I: Building Foundation
Step II: Unlocking High Potential Models
Step III: Broadening and Deepening Inclusion
61%
Exclusion
� Regulatory and policy environment
� Private Sector understanding and interest
� Agent networks
� National Identity
� Digital financial services
� Community lending (MFI and MFB models)
� FSP investment in tailored savings and credit products
� P2G, G2P and digital payments ecosystems
� Financial and digital literacyH
igh
pri
ori
ty t
he
me
s
High
prio
rity the
me
s
Fiv
e M
ost
Exc
lud
ed
Gro
up
s

Appendix 2: Selected Disaggregated Financial Inclusion Data as at December 2017
61 Data is provisional
Count of Bank Verication Number (BVN) registration as at December 2017
Count of Adult Nigerians who have a National Identity Number (NIN) as at December 2017
Female
Male
Total
Female
Male Total
ABIA STATE
407,508
494,741
902,249
109,159
124,350
233,509
ADAMAWA STATE
114,740
262,091
376,831 207,095 327,772
534,867
AKWA IBOM STATE
305,026
387,000
692,026 160,936 195,459
356,395
ANAMBRA STATE
595,063
697,832
1,292,895 330,318 304,821
635,139
BAUCHI STATE
114,733
260,077
374,810
137,887
241,085
378,972
BAYELSA STATE
111,644
161,450
273,094
85,743
113,783
199,526
BENUE STATE
223,634
388,245
611,879
133,295
213,875
347,170
BORNO STATE
124,002
256,648
380,650
39,494
108,004
147,498
CROSS RIVER STATE
222,877
300,374
523,251
108,147
145,177
253,324
DELTA STATE
552,891
711,937
1,264,828
279,276
315,871
595,147
EBONYI STATE
127,349
170,668
298,017
96,331
120,063
216,394
EDO STATE
499,811
633,565
1,133,376
182,049
224,307
406,356
EKITI STATE
176,263
191,733
367,996
164,794
145,996
310,790
ENUGU STATE
402,184
463,091
865,275
142,184
149,285
291,469
FCT
555,530
962,953
1,518,483
4,996,423
8,015,757
13,012,180
GOMBE STATE
77,790
187,128
264,918
177,006
276,504
453,510
IMO STATE
398,996
475,868
874,864
170,768
168,497
339,265
JIGAWA STATE
50,288
183,649
233,937
67,326
202,136
269,462
KADUNA STATE
427,502
714,296
1,141,798
365,290
468,693
833,983
KANO STATE
259,262
707,442
966,704
202,619
537,876
740,495
KATSINA STATE
109,857
267,004
376,861
80,137
187,445
267,582
KEBBI STATE
65,422
229,129
294,551
122,895
220,098
342,993
KOGI STATE
213,314
311,255
524,569
224,811
265,054
489,865
KWARA STATE
269,556
349,751
619,307
163,114
223,992
387,106
LAGOS STATE
2,568,784
3,646,536
6,215,320
422,750
575,868
998,618
NASARAWA STATE
201,592
314,485
516,077
105,858
160,268
266,126
NIGER STATE
220,068
427,384
647,452
128,344
226,760
355,104
OGUN STATE
634,951
786,051
1,421,002
226,411
280,616
507,027
ONDO STATE
332,951
416,415
749,366
235,142
228,460
463,602
OSUN STATE
344,742
401,423
746,165
239,766
248,482
488,248
OYO STATE
701,921
859,407
1,561,328
278,834
330,980
609,814
PLATEAU STATE
270,243
401,143
671,386
209,400
223,565
432,965
RIVERS STATE
680,478
968,737
1,649,215
188,569
258,551
447,120
SOKOTO STATE
81,477
258,502
339,979
96,455
282,178
378,633
TARABA STATE
92,587
186,473
279,060
125,164
213,213
338,377
YOBE STATE
73,710
125,846
199,556
73,953
141,671
215,624
ZAMFARA STATE
70,060
172,533
242,593
133,828
229,612
363,440
NIGERIA (TOTAL)
12,678,806
18,732,862
31,411,668 11,211,571 16,696,124
27,907,695
2017 Annual Report National Financial Inclusion Strategy Implementation80
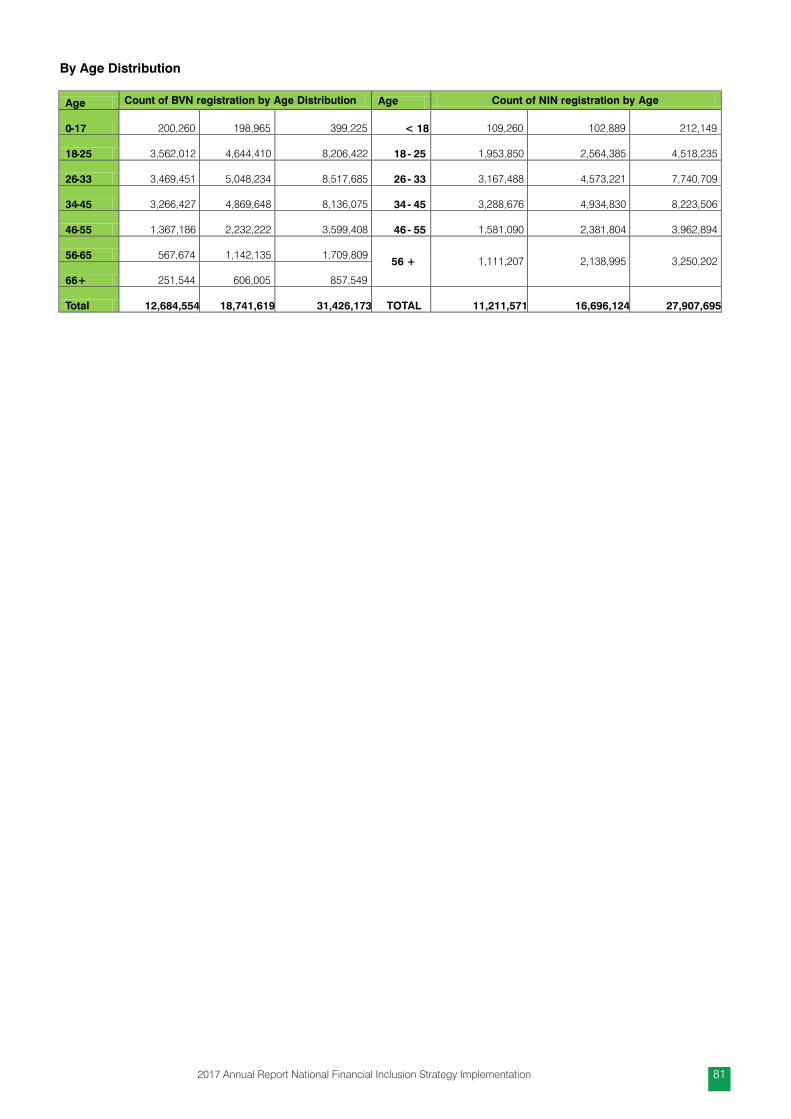
By Age Distribution
Age
Count of BVN registration by Age Distribution
Age
Count of NIN registration by Age
0-17
200,260
198,965
399,225 < 18
109,260
102,889
212,149
18-25
3,562,012
4,644,410
8,206,422
18 -
25
1,953,850 2,564,385
4,518,235
26-33
3,469,451
5,048,234
8,517,685
26 -
33
3,167,488
4,573,221
7,740,709
34-45
3,266,427
4,869,648
8,136,075
34 -
45
3,288,676
4,934,830
8,223,506
46-55
1,367,186
2,232,222
3,599,408
46 -
55
1,581,090
2,381,804
3,962,894
56-65
567,674
1,142,135
1,709,809
56 +
1,111,207
2,138,995
3,250,202
66+
251,544
606,005
857,549
Total 12,684,554 18,741,619 31,426,173 TOTAL 11,211,571 16,696,124 27,907,695
812017 Annual Report National Financial Inclusion Strategy Implementation
Asli Demirgüç-Kunt, Leora Klapper, Dorothe Singer, Saniya Ansar, Jake Hess, 2017. World Bank Global Findex:
Measuring Financial Inclusion and the Fintech Revolution. Published by the World Bank Group.
Beck, Thorsten; Demirgüç-Kunt, Asli and Levine, Ross, 2007. “Finance, Inequality and the Poor”, 26 January.
Central Bank of Nigeria Annual Reports
Cull, Robert; Ehrbeck, Tilman; Holle, Nina, 2014. “Financial Inclusion and Development: Recent Impact Evidence”,
29 April, 2014 – as published by CGAP.
EFInA (Enhancing Financial Innovation and Access), 2016 Access to Financial Services Survey, assessed from
www.ena.org.ng
Jain Amit, Zubenko Olga Carotenuto, George, A progressive approach to nancial inclusion, MasterCard Advisors,
October 2014.
McKinsey Global Institute, 2016, Digital Finance For All: Powering Inclusive Growth in Emerging Economies.
Osinbajo Yemi (Vice President Federal Republic of Nigeria), quoted in Guardian Newspaper 02 November 2017:
https://guardian.ng/news/nigeria/national/nancial-inclusion-key-to-growth-of-nigerias-economy-says-
osinbajo/
Susie Lonie,2017. Turning M Digital Strategies Into Reality, A report based on information collected from nine Sub-
Saharan MFIs during four rounds of eld visits 2014-2017: Cameroon – Advans: DRC – FINCA:
Madagascar – Acces Banque / Microcred: Nigeria – AB Micronance Bank / LAPO Micronance Bank:
Rwanda – Urwego Bank: Senegal – Microcred: Tanzania – Access Bank. The study was supported by IFC
and Mastercard Foundation.
Dalberg Global Development Advisers, CBN - Mid-term Review Report of the NFIS (2017)
REFERENCES
Alliance for Financial Inclusion (AFI). 2016a. “Maya Declaration: Turning Commitments into Action.” Available at:
http://www.a-global.org/sites/default/les/publications/2016-08/FS-Maya-A5-digital.pdf. Accessed in June 2017.
Alliance for Financial Inclusion (AFI). 2016b. “2016 Maya Declaration Progress Report: Celebrating Five Years of
Advancing Global Financial Inclusion.” Available at: http://www.a-global.org/sites/default/les/publications/2016-
08/2016%20Maya%20Progress%20Report-2.pdf. Accessed in June 2017.
Alliance for Financial Inclusion (AFI). 2017. “2016 AFI Annual Report: Making Financial Services More Accessible to the
World's Unbanked.” Available at: http://www.a-global.org/sites/default/les/publications/2017-
05/2016%20AFI%20Annual%20Report.pdf. Accessed in July 2017.
Bill & Melinda Gates Foundation and McKinsey & Company (2016). “Accelerating mobile payments in Nigeria:
Preliminary report”. May 2016.
Brune, L., Gine, X., Goldberg, J. and D. Yang. 2015. “Facilitating Savings for Agriculture: Field Experimental Evidence
from Malawi”. NBER Working Paper Series No. 20946.
Central Bank of Nigeria (CBN). 2012. “National Financial Inclusion Strategy.” Abuja, October, 2012.
Demirguc-Kunt, A., Klapper, L., Singer, D., and P. Van Oudheusden. 2015. “The Global Findex Database 2014:
Measuring Financial Inclusion around the World.” Policy Research Working Paper WPS7255. World Bank Group.
April 2015.
Enhancing Financial Innovation and Access (EFInA). 2010. “EFInA Access to Financial Services in Nigeria 2010 Survey
– Key Findings.” Available at: http://www.ena.org.ng/assets/Documents/EFInAAccess-to-Financial-Services-in-
Nigeria-2010-surveyKey-Findings.pdf?phpMyAdmin=%2CWvBxPNpx0z2BcKe8h2UcHJI%2CXb. Accessed in
June 2017.
Enhancing Financial Innovation and Access (EFInA). 2014. “EFInA Access to Financial Services in Nigeria 2014 Survey.”
Key Findings available at: http://www.ena.org.ng/assets/ResearchDocuments/A2F-2014-Docs/Updated/EFInA-
Access-to-Financial-Services-in-Nigeria-2014-Survey-Key-FindingswebsiteFINAL.pdf. Accessed in June 2017.
Enhancing Financial Innovation and Access (EFInA). 2016. “EFInA Access to Financial Services in Nigeria 2016 Survey.”
Key Findings available at: . Accessed in http://www.ena.org.ng/assets/A2F/2016/Key-Findings-A2F-2016.pdf
May 2017.
InterMedia. 2016. “Nigeria: Wave 3 Report FII Tracker Survey”. April 2016. Available at:
nclusion.org/uploads/le/reports/InterMedia%20FII%20Nigeria%20W3%20%2030%20April%202016.pdf.
Accessed in June 2017.
Jack, W. and T. Suri (2014). “Risk Sharing and Transaction Costs: Evidence from Kenya's Mobile Money Revoluation”.
American Economic Review. Vol. 104. No. 1. pp. 183-223.
2017 Annual Report National Financial Inclusion Strategy Implementation82

Janzen, S.A. and M.R. Carter. 2013. “After the Drought: The Impact of Microinsurance on Consumption Smoothing and
Asset Protection”. NBER Working Paper Series No. 19702.
Karlan, D., Osei, R., Osei-Akoto, I. and C. Udry. 2014. “Agricultural Decisions after Relaxing Credit and Risk Constraints”.
The Quarterly Journal of Economics. Vol. 129. No. 2. pp. 597-652.
Manyika, J., Lund, S., Singer, M., White, O., and C. Berry. 2016. “Digital Finance for All: Powering Inclusive Growth in
Emerging Economies.” McKinsey Global Institute. September 2016.
Prina, S. 2015. “Banking the Poor via Savings Accounts: Evidence from a Field Experiment”. Journal of Development
Economics. Vol. 115, No. C. pp. 16-31.
Sahay, Ratna; Cihak, Martin; N'Diaye, Papa; Barajas, Adolfo; Mitra, Srobona; Kyobe, Annette; Mooi, Yen Nian; and
Seyed Reza Youse. (2015). “Financial Inclusion: Can It Meet Multiple Macroeconomic Goals?” IMF Staff
Discussion Note SDN/15/17. September 2015.
Villasenor, J., West, D.M., and R. Lewis. 2016. “The 2016 Brookings Financial and Digital Inclusion Project Report”. The
Brookings Institution. August 2016. Available at: https://www.brookings.edu/research/the-2016-brookings-
nancial-and-digital-inclusion-project-report/#NG. Accessed in June 2017.
832017 Annual Report National Financial Inclusion Strategy Implementation

LIST OF FIGURES
2017 Annual Report National Financial Inclusion Strategy Implementation84
Figure A: Governing Structure of NFIS ...........................................................................................................................4
Figure B: FIS organogram .............................................................................................................................................. 4
Figure C: Status of the Product Key Performance Indicators....................................................................................... 15
Figure 2.1.1: Sectoral Growth Rates of GDP at 2010 CBPrices, 2013-2017 (%).......................................................... 25
Figure 2.1.2: Trend of Ination rates, 2017....................................................................................................................26
Figure 2.4.1: Volume of Electronic Payments (Million), 2015 - 2017 ............................................................................ 28
Figure 2.4.2: Value of Electronic Payments (N’ Billion), 2015 - 2017 ........................................................................... 28
Figure 2.4.3: Classication of e-Money Products by Volume, 2017, (Per cent) ........................................................... 30
Figure 4.1.1: Financial Access Strands &Adult Population Estimates, 2010-2016 .................................................... . 48
Figure 4.1.2: Ownership of A/c nancial institution aged 15+, 2011 to 2017 ............................................................. 50
Figure 4.2.1: Status of the Product Key Performance Indicators.................................................................................. 50
Figure 4.2.2: Estimated % with a BVN and No enrolled with a BVN, .......................................................................... . 51
Figure 4.2.3: BVN holders by gender, 2017 ................................................................................................................ . 51
Figure 4.2.4: BVN Holders by Age, 2016 and 2017, in million .................................................................................... .52
Figure 4.2.5: Share of population with a BVN by Age, 2016 and 2017 ....................................................................... .52
Figure 4.2.6: Deposit Accounts by Type of Institutions, 2016-2017, ........................................................................... .53
Figure 4.2.7: Share of Active and Inactive Individual Deposit Accounts, .................................................................... 54
Figure 4.2.8: Share of Individual Deposit Accounts, by KYC Tier, 2017 ..................................................................... . 54
Figure 4.2.9: Analysis of MM Users to the Total Population .........................................................................................55
Figure 4.2.10: Reasons for not having an account, age 15+, 2017 ............................................................................ 57
Figure 4.2.11: Number of adult individual credit accounts 2016-2017 ........................................................................ 59
Figure 4.3.1: % of Adult Population With Regulated Pension Scheme ........................................................................ 61
Figure 4.3.2: Breakdown of Nigerians contributing to RSA by gender, 2017 ............................................................. . 61
Figure 4.3.3: Number of Nigerians with a RSA, by Age, 2016 and 2017 .................................................................... .61
Figure 4.3.4: Share of Nigerians with a RSA, by Age, 2016 and 2017 ....................................................................... . 62
Figure 4.5.1: Status of the Channel Key Performance Indicators ............................................................................... .64
Figure 4.5.2: Number of mobile money agents per 100,000 adults ........................................................................... .65
Figure 4.6.1: % of Adult Population with NIN Number ................................................................................................ .66
Figure 4.6.2: Distribution of Nigerians with NIN by Gender, 2017 .............................................................................. . 67
Figure 4.6.3: Distribution of Nigerians with NIN by Age,2016 and 2017 ..................................................................... 67
Figure 4.6.4: Share of population with a NIN, by Age, 2016 and 2017 ...................................................................... .67
Figure 5.2.1: Overview of the Financial Inclusion Situation in Nigeria in 2016 ............................................................72
Figure 5.5.1: Mid-Term Project Activity Chart ...............................................................................................................74
Figure 5.7.1: Five target demographic groups excluded at especially high rates ......................................................75
Figure 5.8.1: Three steps to address high priority themes ..........................................................................................76

LIST OF TABLES
852017 Annual Report National Financial Inclusion Strategy Implementation
Table A: Implementation Status of Key Initiatives as at December 2017 .....................................................................17
Table 2.2.1: Statistics of the Banking Sector (DMBs), in million Naira ......................................................................... 27
Table 2.3.1: Selected Statistics of Micronance Sector ............................................................................................... 28
Table 2.4.1: Volume of eTransactions, 2013 to 2017, by eChannel ............................................................................. 31
Table 2.4.2: Nominal Value of eTransactions, 2013 to 2017, by eChannel .................................................................. 32
Table 2.5.1: Industry Gross Premium by Insurance 2009 to 2017 ............................................................................... 32
Table 2.5:2 Industry Gross Claims Paid, by Insurance 2009 to 2016 .......................................................................... 32
Table 2.6.1: Annual Pension Contributions from 2004 to 2017, ................................................................................... 33
Table 2.7.1: Capital Market Indicators Developments in the NSE, 2013 to 2017 ........................................................ 34
Table 3.3.1: Chairpersons and Vice Chairpersons of the Four National Financial Inclusion Working Groups ............37
Table 4.2.1: Number of FI-related Deposit a/c as at Dec 2017 .................................................................................... 53
Table 4.2.2: Number of Credit a/c Dec 2017, by Institution Type, in Million ................................................................. 62
Table 4.5.1: Channel Key Performance Indicators as at Dec 2017 .............................................................................. 63
Table 4.6.1: Status of the Enabler Key Performance Indicators as at 2017 ................................................................. 66
Table 5.5.1: Mid-Term Review Governance Structure .................................................................................................. 74

LIST OF ABBREVIATIONS
Abbreviation Full MeaningAlliance For Financial Inclusion
Agribusiness Small And Medium Enterprise Investment Scheme
Approval In Principle
Association Of Non-Bank Micronance Institutions
Automated Teller Machines
Business to government payments
Bill and Melinda Gates Foundation
Bank Of Industry
Base of pyramid
Banking And Payment System Department
Bank Verication Number
Central Bank of Nigeria
Committee of e-banking industry heads
Cooperative Financing Agency Of Nigeria
Contributory Pension Scheme
Digital Financial Services
Deposit Money Banks
Employee Contribution Scheme
Entrepreneurship Development Centers
Enhancing Financial Innovation and Access
Financial Education Curriculum
Financial Inclusion
Financial Technology Companies
Financial Inclusion Product Working Group
Financial Inclusion Secretariat
Financial Inclusion Steering Committee
Financial Inclusion State Steering Committee
Financial Inclusion Technical Committee
AFI
AGSMEIS
AIP
ANMFIN
ATM
B2G
BMGF
BOI
BoP
BPSD
BVN
CBN
CeBIH
CFAN
CPS
DFS
DMBs
ECS
EDCs
EFinA
FEC
FI
FINTECH
FIPWG
FIS
FISC
FISSCO
FITC
FLWG
FMBN
FSP
G2B
G2P
GDP
GEEP
GoN
GPF
GPZ
GWP
IATF
IFC
IFIS
IFSB
IMTO
KPI
KYC
Financial Literacy Working Group
Federal Mortgage Bank Of Nigeria
Financial Services Provider
Government to Business Payments
Government to Public Payments
Gross Domestic Product
Government Enterprise and Empowerment Program
Government of Nigeria
Global Policy Forum
Geopolitical Zone
Gross Written Premium
Interagency Taskforce
International Finance Cooperation
Inters witch Financial Inclusion Services
Islamic Finance Service Board
International Money Transfer Operation
Key Performance Indicator
Know Your Customer
2017 Annual Report National Financial Inclusion Strategy Implementation86

LBS
M&E
MDAs
MFBs
MFI
MMOs
MNOs
MSME
MSMEDF
NAICOM
NAPGEP
NBS
NCC
NCR
NDIC
NFBI
NFIS
NGOs
NHIS
NIA
NIBSS
NICMP
NIN
NIPOST
NSE
NSITF
NYSC
PAT
PENCOM
PENOP
PoS
PWD
RSA
SEC
SMEDAN
SPV
UNSGSA
USSD
YEDP
Lagos Business School
Monitoring and Evaluation
Ministries Departments And Agencies
Micronance Banks
Micronance Institutions
Mobile Money Operators
Mobile Network Operators
Micro, Small and Medium Enterprises
Micro Small Medium Enterprise Development Fund
National Insurance Commission
National Peer Group Educator
National Bureau of Statistics
Nigerian Communications Commission National Collateral Registry
Nigeria Deposit Insurance Corporation
Non-bank Financial Institution
National Financial Inclusion Stra0tegy
Non-Governmental Organization
National Health Insurance Scheme
Nigerian Insurance Association
Nigerian Inter-Bank Settlement System
Non-Interest Capital Market Products
National Identity Numbers
Nigerian Postal Services
Nigerian Stock Exchange
Nigerian Social Insurance Trust Fund
National Youth Service Corp
Prot After Tax
National Pension Commission
Pension Fund Operators Association
Point of Sale
People With Disabilities
Retirement Saving Account
Securities And Exchange Commission
Small And Medium Enterprise Development Agency
Special Purpose Vehicle
United Nation Secretary General Special Advocate
Unstructured Supplementary Service Data
Youth Entrepreneurship Development Program
872017 Annual Report National Financial Inclusion Strategy Implementation

For further enquiries, please contact:Head, Financial Inclusion SecretariatCentral Bank of NigeriaPlot 33, Abubakar Tafawa Balewa WayCentral Business District,Cadastral Zone, Abuja,Federal Capital TerritoryTelephone: 0946237625Email: [email protected]