Embed Size (px)
Citation preview
ANNUAL REPORT NOVEMBER 30, 2015NYSE SYMBOL: BIF
Distribution PolicyNovember 30, 2015
Boulder Growth & Income Fund, Inc. (the “Fund”), acting pursuant to a Securities and Exchange Commission exemptive order and with the approval of the Fund’s Board of Directors (the “Board”), has adopted a plan, consistent with its investment objectives and policies to support a level distribution of income, capital gains and/or return of capital (the “Plan”). In accordance with the Plan, the Fund began distributing $0.033 per share on a monthly basis in November 2015. The fixed amount distributed per share is subject to change at the discretion of the Fund’s Board. Under the Plan, the Fund will typically distribute most or all of its available investment income to its stockholders, consistent with its primary investment objectives and as required by the Internal Revenue Code of 1986, as amended (the “Code”). The Fund may also distribute long term capital gains and short term capital gains and return capital to stockholders in order to maintain a level distribution. Please refer to Note 10 on pages 29 and 30 for the distributions made during this period. Each monthly distribution to stockholders is expected to be at the fixed amount established by the Board, except for extraordinary distributions and potential distribution rate increases or decreases to enable the Fund to comply with the distribution requirements imposed by the Code. Stockholders should not draw any conclusions about the Fund’s investment performance from the amount of these distributions or from the terms of the Plan. The Fund’s total return performance on net asset value is presented in its financial highlights table. The Board may amend, suspend or terminate the Fund’s Plan without prior notice if it deems such action to be in the best interest of the Fund or its stockholders. The suspension or termination of the Plan could have the effect of creating a trading discount (if the Fund’s stock is trading at or above net asset value) or widening an existing trading discount. The Fund is subject to risks that could have an adverse impact on its ability to maintain level distributions. Examples of potential risks include, but are not limited to, economic downturns impacting the markets, investments in foreign securities, foreign currency fluctuations and changes in the Code. Please refer to the Fund’s prospectus for a more complete description of its risks.
Boulder Growth & Income Fund, Inc. Table of Contents
Annual Report | November 30, 2015 1
Letter from the Advisers .................................................................................................. 2
Financial Data .................................................................................................................. 6
Consolidated Portfolio of Investments ........................................................................... 7
Consolidated Statement of Assets & Liabilities ............................................................ 12
Consolidated Statement of Operations ........................................................................ 13
Consolidated Statements of Changes in Net Assets ..................................................... 14
Consolidated Statement of Cash Flows ........................................................................ 15
Consolidated Financial Highlights ................................................................................. 16
Notes to Consolidated Financial Statements ................................................................ 19
Report of Independent Registered Public Accounting Firm .......................................... 37
Additional Information ................................................................................................. 38
Summary of Dividend Reinvestment Plan ..................................................................... 41
Directors & Officers ....................................................................................................... 43
Boulder Growth & Income Fund, Inc. Letter from the Advisers November 30, 2015 (Unaudited)
2 www.boulderfunds.net
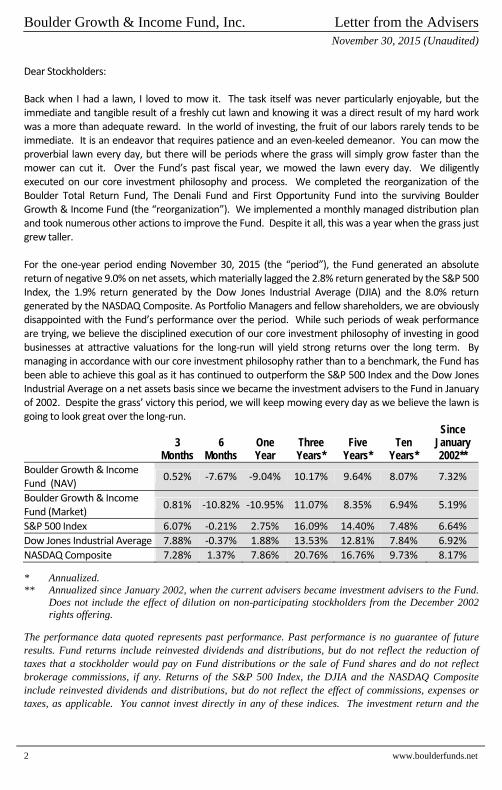
Dear Stockholders: Back when I had a lawn, I loved to mow it. The task itself was never particularly enjoyable, but the immediate and tangible result of a freshly cut lawn and knowing it was a direct result of my hard work was a more than adequate reward. In the world of investing, the fruit of our labors rarely tends to be immediate. It is an endeavor that requires patience and an even‐keeled demeanor. You can mow the proverbial lawn every day, but there will be periods where the grass will simply grow faster than the mower can cut it. Over the Fund’s past fiscal year, we mowed the lawn every day. We diligently executed on our core investment philosophy and process. We completed the reorganization of the Boulder Total Return Fund, The Denali Fund and First Opportunity Fund into the surviving Boulder Growth & Income Fund (the “reorganization”). We implemented a monthly managed distribution plan and took numerous other actions to improve the Fund. Despite it all, this was a year when the grass just grew taller. For the one‐year period ending November 30, 2015 (the “period”), the Fund generated an absolute return of negative 9.0% on net assets, which materially lagged the 2.8% return generated by the S&P 500 Index, the 1.9% return generated by the Dow Jones Industrial Average (DJIA) and the 8.0% return generated by the NASDAQ Composite. As Portfolio Managers and fellow shareholders, we are obviously disappointed with the Fund’s performance over the period. While such periods of weak performance are trying, we believe the disciplined execution of our core investment philosophy of investing in good businesses at attractive valuations for the long‐run will yield strong returns over the long term. By managing in accordance with our core investment philosophy rather than to a benchmark, the Fund has been able to achieve this goal as it has continued to outperform the S&P 500 Index and the Dow Jones Industrial Average on a net assets basis since we became the investment advisers to the Fund in January of 2002. Despite the grass’ victory this period, we will keep mowing every day as we believe the lawn is going to look great over the long‐run.
3
Months 6
Months One Year
Three Years*
Five Years*
Ten Years*
Since January 2002**
Boulder Growth & Income Fund (NAV)
0.52% ‐7.67% ‐9.04% 10.17% 9.64% 8.07% 7.32%
Boulder Growth & Income Fund (Market)
0.81% ‐10.82% ‐10.95% 11.07% 8.35% 6.94% 5.19%
S&P 500 Index 6.07% ‐0.21% 2.75% 16.09% 14.40% 7.48% 6.64%
Dow Jones Industrial Average 7.88% ‐0.37% 1.88% 13.53% 12.81% 7.84% 6.92%
NASDAQ Composite 7.28% 1.37% 7.86% 20.76% 16.76% 9.73% 8.17%
* Annualized. ** Annualized since January 2002, when the current advisers became investment advisers to the Fund.
Does not include the effect of dilution on non-participating stockholders from the December 2002 rights offering.
The performance data quoted represents past performance. Past performance is no guarantee of future results. Fund returns include reinvested dividends and distributions, but do not reflect the reduction of taxes that a stockholder would pay on Fund distributions or the sale of Fund shares and do not reflect brokerage commissions, if any. Returns of the S&P 500 Index, the DJIA and the NASDAQ Composite include reinvested dividends and distributions, but do not reflect the effect of commissions, expenses or taxes, as applicable. You cannot invest directly in any of these indices. The investment return and the
Boulder Growth & Income Fund, Inc. Letter from the Advisers November 30, 2015 (Unaudited)
Annual Report | November 30, 2015 3
principal value of an investment will fluctuate and shares, if sold, may be worth more or less than their original cost. Current performance may be lower or higher than the performance data quoted. Drilling further down into the numbers, the Fund’s negative absolute performance for the period was primarily driven by a few of the Fund’s larger positions. Chief among these was the Fund’s combined position in the Class A and Class B shares of Berkshire Hathaway, Inc. (Berkshire Hathaway), which was the Fund’s largest position accounting for ~26.8% of total assets as of November 30, 2015. Due to its large weighting in the portfolio, Berkshire Hathaway’s performance will obviously have a dramatic impact on the Fund’s overall performance for good or ill. Over the long‐run, the Fund’s ownership of Berkshire Hathaway has definitely been for the good. Unfortunately for the current period it was for the ill as Berkshire Hathaway’s Class A and Class B shares generated total returns of negative 8.6% and negative 8.7% for the period, respectively. While Berkshire Hathaway was a major detractor to performance for the period, our underlying investment thesis has not changed. We believe it is an exceptional company that is well‐run and its shares trade at an attractive valuation currently. The Fund’s performance was also negatively impacted by some of its other larger positions in Wal‐Mart Stores Inc. (Wal‐Mart), Freeport‐McMoRan Inc., Caterpillar Inc. (Caterpillar), Chevron Corporation (Chevron) and YUM! Brands, Inc. as each of these positions generated negative returns over the period. While a decline in stock prices is obviously not great for short‐term performance, it does provide the opportunity to buy additional shares in companies that we believe have good long‐term return potential at lower prices. This was the case this period as we took advantage of the decline in the share prices of Wal‐Mart, Caterpillar and Chevron to opportunistically add to each position. In regards to the Berkshire Hathaway position, there are often two concerns expressed about it that I would like to address. The first being the Fund is overly exposed to the specific risk of a single business by having such a high concentration of the portfolio invested in a single company. We believe this is a valid concern and one that we take seriously. In the case of Berkshire Hathaway, we effectively view it as a holding company that owns whole or partial interests in a diverse array of businesses. As a result, we believe the issues related to the Fund holding such a concentrated position are partially mitigated by the underlying diversity of the businesses that comprise Berkshire Hathaway. The second concern is related to Warren Buffett. Specifically, what will happen to the stock of Berkshire Hathaway when Mr. Buffett eventually relinquishes his role at the company? We sincerely hope and wish that Mr. Buffett will continue in his role for many, many years to come, but it is an eventuality for which we still must prepare. I cannot predict the future, but when that day comes I believe it is reasonable to assume the stock will initially decline. Assuming Berkshire Hathaway is still a large part of the Fund’s holdings at that time, such a decline would obviously have a negative impact on the Fund’s overall performance. If this is indeed the case, how do we as investors prepare for it? The answer is simple. We do what we do every day and remain disciplined to our investment process and make rational investment decisions based on facts, not emotions. As part of our research and monitoring processes, we regularly calculate and update our estimates of intrinsic value for each of the Fund’s holdings. In the case of Berkshire Hathaway, we base our estimate of intrinsic value solely on the investments and underlying businesses already in place at Berkshire Hathaway. We do not assume any benefit from future investments capable of generating above market returns due to Mr. Buffett’s perceived investment acumen. As a result, our estimate of Berkshire Hathaway’s intrinsic value already effectively assigns zero value to the presence of Mr. Buffett and his prodigious investment skill. Our belief that the shares of Berkshire Hathaway currently trade at an
Boulder Growth & Income Fund, Inc. Letter from the Advisers November 30, 2015 (Unaudited)
4 www.boulderfunds.net
attractive valuation is based on this estimate of intrinsic value. When Mr. Buffett departs Berkshire Hathaway, the investment world will debate whether Berkshire Hathaway is Berkshire Hathaway without Warren Buffett, while we will continue to do what we always do and make investment decisions based on price versus value. While we are on the topic of price versus value, let us discuss the discount of the Fund’s share price relative to its net asset value (the “discount”). In my last letter, I wrote of the work we did to develop a general blueprint that we believed would help drive a reduction in the discount. Over the last few years we have diligently delivered upon this blueprint. We implemented changes to the Fund’s website to provide clearer and more concise insight into the Fund, the Advisers and our investment philosophy and process. We have worked to improve the quality of our communications with shareholders. We have worked to streamline portfolio construction. We completed the reorganization, which we believe addressed many of the potential reasons for the discount as detailed more fully in my last letter. We sought to improve disclosure about the Fund’s holdings by moving to daily Net Asset Value reporting and monthly portfolio holdings reporting. Finally, we were happy to announce in November of this year that the Fund’s Board approved a monthly managed distribution plan. In other words, we have been very busy. Unfortunately, we also are extremely frustrated as the discount persists despite all of our efforts. We believe the actions we have taken over the last couple of years have made the Fund a considerably better investment product. In comparison to just a few years ago, today’s Fund benefits from its dramatically larger size, improved secondary liquidity, a lower management fee, a lower total expense ratio, better portfolio construction, increased portfolio disclosure and the new monthly managed distribution program. Considering all of these improvements, we believe it is rational to assume the discount would have narrowed. Instead the discount has actually widened from approximately 17.6% as of February 29, 2012 to approximately 21.7% as of November 30, 2015. To be blunt and true to my Texas roots, it don’t make a lick of sense. We fully believe the discount continues to be unreasonable and undeserved. When the above improvements are combined with the fact that the Fund is comprised of investments in well‐run, attractive businesses that generally trade at attractive valuations, we believe the Fund’s discount should at least trade more in‐line with comparable equity focused closed‐end Funds. As part of our ongoing efforts to address the discount, we will continue to communicate this message to the market to help it understand the underlying story that we believe supports a reduction of the discount. We are proud of everything that we have accomplished over the past few years and believe, over time, the discount will favorably reflect the improvements that have been made to the Fund. We also believe the Fund is well positioned to perform favorably over the long‐run. These beliefs are not just backed by our words, but by our money as Stewart, Joel and I are proud to be fellow shareholders. As always, I look forward to writing you again soon and I would like to wish you all the best in the New Year.
Boulder Growth & Income Fund, Inc. Letter from the Advisers November 30, 2015 (Unaudited)
Annual Report | November 30, 2015 5
Sincerely,
Brendon Fischer, CFA Portfolio Manager December 14, 2015 The views and opinions in the preceding commentary are as of the date of this letter and are subject to change at any time. This material represents an assessment of the market environment at a specific point in time, should not be relied upon as investment advice and is not intended to predict or depict performance of any investment. Portfolio weightings and other figures in the foregoing commentary are provided as of period-end, unless otherwise stated.
Note to Stockholders on the Fund’s Discount. As most stockholders are aware, the Fund’s shares presently trade at a significant discount to net asset value. The Fund’s board of directors is aware of this, monitors the discount and periodically reviews the limited options available to mitigate the discount. In addition, there are several factors affecting the Fund’s discount over which the board and management have little control. In the end, the market sets the Fund’s share price. For long‐term stockholders of a closed‐end fund, we believe the Fund’s discount should only be one of many factors taken into consideration at the time of your investment decision.
Note to Stockholders on Leverage. The Fund is currently leveraged through a credit facility. The Fund may utilize leverage to seek to enhance the returns for its stockholders over the long‐term; however, this objective may not be achieved in all interest rate environments. Leverage creates certain risks for stockholders, including the likelihood of greater volatility of the Fund’s NAV and market price. There are certain risks associated with borrowing through a line of credit, including, but not limited to risks associated with purchasing securities on margin. In addition, borrowing through a line of credit subjects the Fund to contractual restrictions on its operations and requires the Fund to maintain certain asset coverage ratios on its outstanding indebtedness.
Note to Stockholders on Concentration of Investments. The Fund's investment advisers feel it is important that stockholders be aware that the Fund is concentrated in a small number of positions. Concentrating investments in a fewer number of securities may involve a degree of risk that is greater than a fund which has less concentrated investments spread out over a greater number of securities.
Boulder Growth & Income Fund, Inc. Financial Data November 30, 2015 (Unaudited)
6 www.boulderfunds.net
Per Share of Common Stock Net Asset
Value Market Price
Dividend Paid
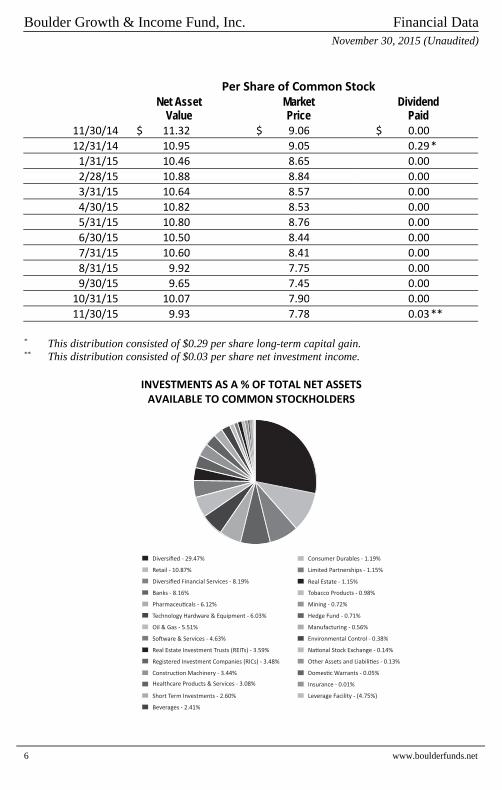
11/30/14 $ 11.32 $ 9.06 $ 0.00 12/31/14 10.95 9.05 0.29 * 1/31/15 10.46 8.65 0.00 2/28/15 10.88 8.84 0.00 3/31/15 10.64 8.57 0.00 4/30/15 10.82 8.53 0.00 5/31/15 10.80 8.76 0.00 6/30/15 10.50 8.44 0.00 7/31/15 10.60 8.41 0.00 8/31/15 9.92 7.75 0.00 9/30/15 9.65 7.45 0.00 10/31/15 10.07 7.90 0.00 11/30/15 9.93 7.78 0.03 **
* This distribution consisted of $0.29 per share long-term capital gain. ** This distribution consisted of $0.03 per share net investment income.
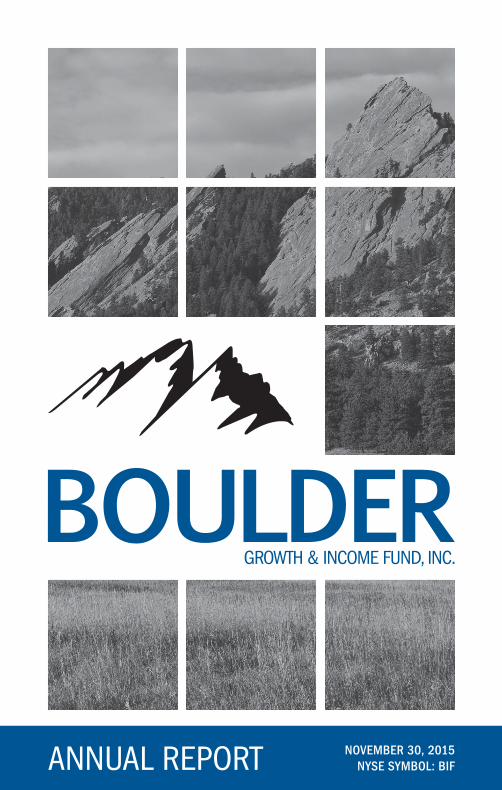
INVESTMENTS AS A % OF TOTAL NET ASSETS AVAILABLE TO COMMON STOCKHOLDERS
Registered Investment Companies (RICs) - 3.48%
Insurance
Warrants
Other Assets and Liabilities
National Stock Exchange
Environmental Control
Manufacturing
Hedge Fund
Mining
Tobacco Products
Real Estate
Limited Partnerships
Consumer Durables
Beverages
Short Term Investments
Healthcare Products & Services
Construction Machinery
Registered Investment Companies (RICs)
Real Estate Investment Trusts (REITs)
Software & Services
Oil & Gas
Technology Hardware & Equipment
Pharmaceuticals
Banks
Diversified Financial Services
Retail
Diversified
Domes�c Warrants - 0.05%
Other Assets and Liabili�es - 0.13%
Diversified Financial Services - 8.19%
Manufacturing - 0.56%
Na�onal Stock Exchange - 0.14%
Limited Partnerships - 1.15%
Consumer Durables - 1.19%
Real Estate Investment Trusts (REITs) - 3.59%
Oil & Gas - 5.51%
Construc�on Machinery - 3.44%
Tobacco Products - 0.98%
Technology Hardware & Equipment - 6.03%
Real Estate - 1.15%
Pharmaceu�cals - 6.12%
Short Term Investments - 2.60%
Diversified - 29.47%
Healthcare Products & Services - 3.08%
Beverages - 2.41%
Banks - 8.16%
Retail - 10.87%
So�ware & Services - 4.63%
Leverage Facility - (4.75%)
Mining - 0.72%
Hedge Fund - 0.71%
Environmental Control - 0.38%
Insurance - 0.01%
Boulder Growth & Income Fund, Inc. Consolidated Portfolio of Investments November 30, 2015
Annual Report | November 30, 2015 7
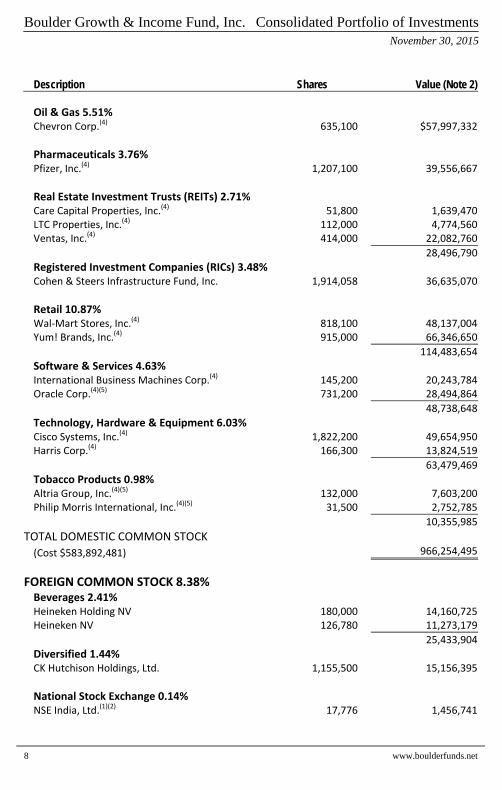
Description Shares Value (Note 2)
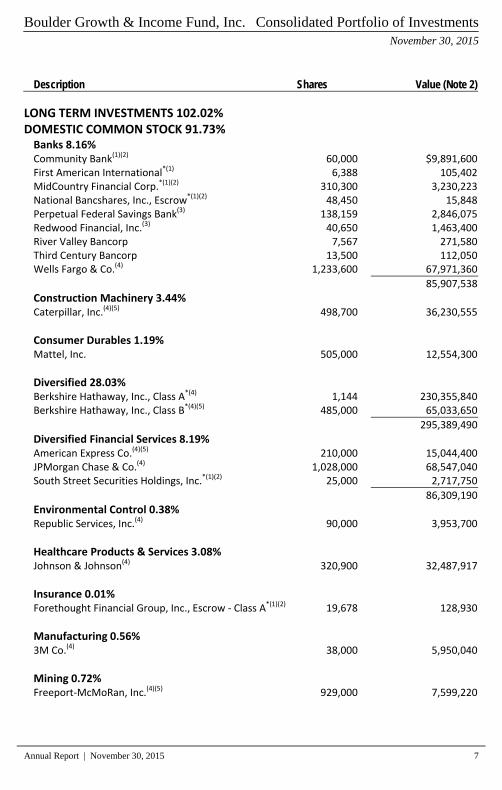
LONG TERM INVESTMENTS 102.02% DOMESTIC COMMON STOCK 91.73% Banks 8.16% Community Bank(1)(2) 60,000 $9,891,600 First American International*(1) 6,388 105,402 MidCountry Financial Corp.*(1)(2) 310,300 3,230,223 National Bancshares, Inc., Escrow*(1)(2) 48,450 15,848 Perpetual Federal Savings Bank(3) 138,159 2,846,075 Redwood Financial, Inc.(3) 40,650 1,463,400 River Valley Bancorp 7,567 271,580 Third Century Bancorp 13,500 112,050 Wells Fargo & Co.(4) 1,233,600 67,971,360
85,907,538
Construction Machinery 3.44% Caterpillar, Inc.(4)(5) 498,700 36,230,555
Consumer Durables 1.19% Mattel, Inc. 505,000 12,554,300
Diversified 28.03% Berkshire Hathaway, Inc., Class A*(4) 1,144 230,355,840 Berkshire Hathaway, Inc., Class B*(4)(5) 485,000 65,033,650
295,389,490
Diversified Financial Services 8.19% American Express Co.(4)(5) 210,000 15,044,400 JPMorgan Chase & Co.(4) 1,028,000 68,547,040 South Street Securities Holdings, Inc.*(1)(2) 25,000 2,717,750
86,309,190
Environmental Control 0.38% Republic Services, Inc.(4) 90,000 3,953,700
Healthcare Products & Services 3.08% Johnson & Johnson(4) 320,900 32,487,917
Insurance 0.01% Forethought Financial Group, Inc., Escrow ‐ Class A*(1)(2) 19,678 128,930
Manufacturing 0.56% 3M Co.(4) 38,000 5,950,040
Mining 0.72% Freeport‐McMoRan, Inc.(4)(5) 929,000 7,599,220
Boulder Growth & Income Fund, Inc. Consolidated Portfolio of Investments November 30, 2015
8 www.boulderfunds.net
Description Shares Value (Note 2)
Oil & Gas 5.51% Chevron Corp.(4) 635,100 $57,997,332
Pharmaceuticals 3.76% Pfizer, Inc.(4) 1,207,100 39,556,667
Real Estate Investment Trusts (REITs) 2.71% Care Capital Properties, Inc.(4) 51,800 1,639,470 LTC Properties, Inc.(4) 112,000 4,774,560 Ventas, Inc.(4) 414,000 22,082,760
28,496,790
Registered Investment Companies (RICs) 3.48% Cohen & Steers Infrastructure Fund, Inc. 1,914,058 36,635,070
Retail 10.87% Wal‐Mart Stores, Inc.(4) 818,100 48,137,004 Yum! Brands, Inc.(4) 915,000 66,346,650
114,483,654
Software & Services 4.63% International Business Machines Corp.(4) 145,200 20,243,784 Oracle Corp.(4)(5) 731,200 28,494,864
48,738,648
Technology, Hardware & Equipment 6.03% Cisco Systems, Inc.(4) 1,822,200 49,654,950 Harris Corp.(4) 166,300 13,824,519
63,479,469
Tobacco Products 0.98% Altria Group, Inc.(4)(5) 132,000 7,603,200 Philip Morris International, Inc.(4)(5) 31,500 2,752,785
10,355,985
TOTAL DOMESTIC COMMON STOCK
(Cost $583,892,481) 966,254,495
FOREIGN COMMON STOCK 8.38% Beverages 2.41% Heineken Holding NV 180,000 14,160,725 Heineken NV 126,780 11,273,179
25,433,904
Diversified 1.44% CK Hutchison Holdings, Ltd. 1,155,500 15,156,395
National Stock Exchange 0.14% NSE India, Ltd.(1)(2) 17,776 1,456,741
Boulder Growth & Income Fund, Inc. Consolidated Portfolio of Investments November 30, 2015
Annual Report | November 30, 2015 9
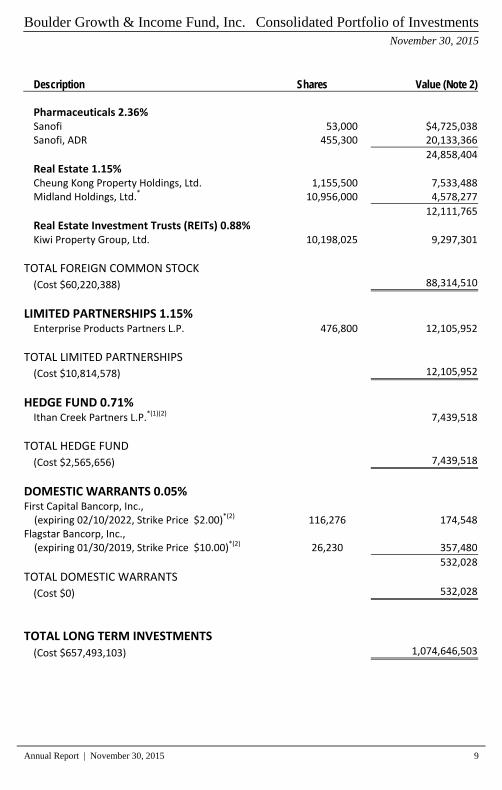
Description Shares Value (Note 2)
Pharmaceuticals 2.36% Sanofi 53,000 $4,725,038 Sanofi, ADR 455,300 20,133,366
24,858,404
Real Estate 1.15% Cheung Kong Property Holdings, Ltd. 1,155,500 7,533,488 Midland Holdings, Ltd.* 10,956,000 4,578,277
12,111,765
Real Estate Investment Trusts (REITs) 0.88% Kiwi Property Group, Ltd. 10,198,025 9,297,301
TOTAL FOREIGN COMMON STOCK
(Cost $60,220,388) 88,314,510
LIMITED PARTNERSHIPS 1.15% Enterprise Products Partners L.P. 476,800 12,105,952
TOTAL LIMITED PARTNERSHIPS
(Cost $10,814,578) 12,105,952
HEDGE FUND 0.71% Ithan Creek Partners L.P.*(1)(2) 7,439,518
TOTAL HEDGE FUND
(Cost $2,565,656) 7,439,518
DOMESTIC WARRANTS 0.05% First Capital Bancorp, Inc., (expiring 02/10/2022, Strike Price $2.00)*(2) 116,276 174,548 Flagstar Bancorp, Inc., (expiring 01/30/2019, Strike Price $10.00)*(2) 26,230 357,480
532,028
TOTAL DOMESTIC WARRANTS
(Cost $0) 532,028
TOTAL LONG TERM INVESTMENTS (Cost $657,493,103) 1,074,646,503
Boulder Growth & Income Fund, Inc. Consolidated Portfolio of Investments November 30, 2015
10 www.boulderfunds.net
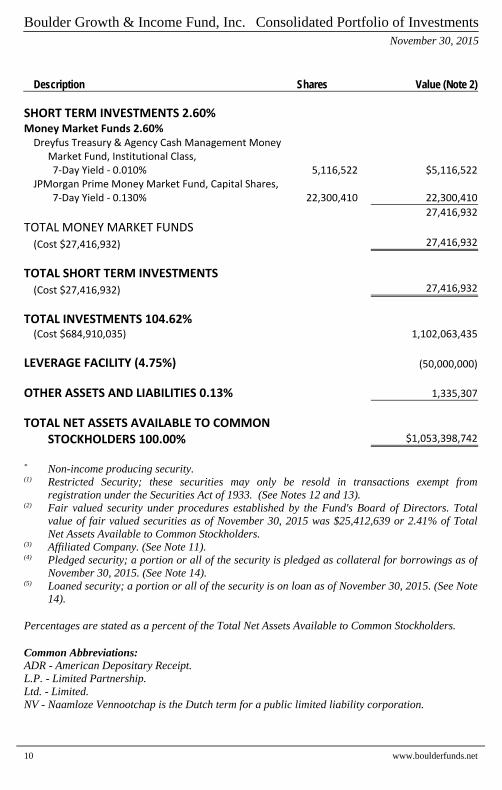
Description Shares Value (Note 2)
SHORT TERM INVESTMENTS 2.60% Money Market Funds 2.60% Dreyfus Treasury & Agency Cash Management Money
Market Fund, Institutional Class, 7‐Day Yield ‐ 0.010% 5,116,522 $5,116,522
JPMorgan Prime Money Market Fund, Capital Shares, 7‐Day Yield ‐ 0.130% 22,300,410 22,300,410
27,416,932
TOTAL MONEY MARKET FUNDS
(Cost $27,416,932) 27,416,932
TOTAL SHORT TERM INVESTMENTS
(Cost $27,416,932) 27,416,932
TOTAL INVESTMENTS 104.62% (Cost $684,910,035) 1,102,063,435
LEVERAGE FACILITY (4.75%) (50,000,000)
OTHER ASSETS AND LIABILITIES 0.13% 1,335,307
TOTAL NET ASSETS AVAILABLE TO COMMON STOCKHOLDERS 100.00% $1,053,398,742
* Non-income producing security. (1) Restricted Security; these securities may only be resold in transactions exempt from
registration under the Securities Act of 1933. (See Notes 12 and 13). (2) Fair valued security under procedures established by the Fund's Board of Directors. Total
value of fair valued securities as of November 30, 2015 was $25,412,639 or 2.41% of Total Net Assets Available to Common Stockholders.
(3) Affiliated Company. (See Note 11). (4) Pledged security; a portion or all of the security is pledged as collateral for borrowings as of
November 30, 2015. (See Note 14). (5) Loaned security; a portion or all of the security is on loan as of November 30, 2015. (See Note
14). Percentages are stated as a percent of the Total Net Assets Available to Common Stockholders. Common Abbreviations: ADR - American Depositary Receipt. L.P. - Limited Partnership. Ltd. - Limited. NV - Naamloze Vennootchap is the Dutch term for a public limited liability corporation.
Boulder Growth & Income Fund, Inc. Consolidated Portfolio of Investments November 30, 2015
Annual Report | November 30, 2015 11
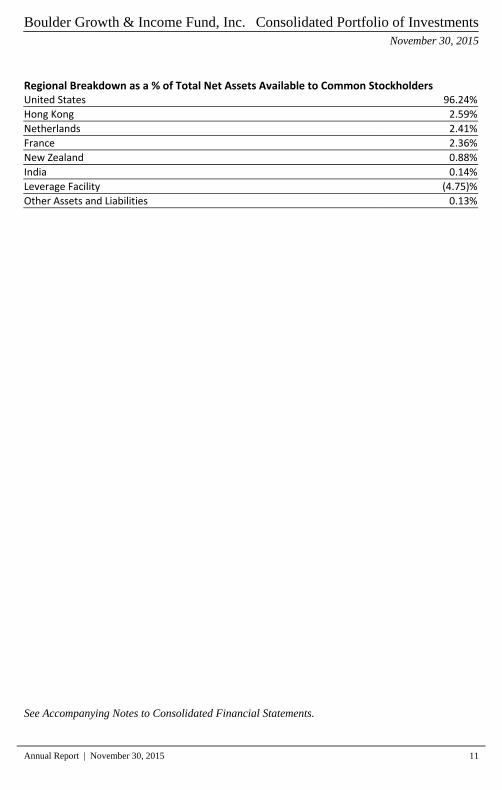
Regional Breakdown as a % of Total Net Assets Available to Common Stockholders United States 96.24%
Hong Kong 2.59%
Netherlands 2.41%
France 2.36%
New Zealand 0.88%
India 0.14%
Leverage Facility (4.75)%
Other Assets and Liabilities 0.13%
See Accompanying Notes to Consolidated Financial Statements.
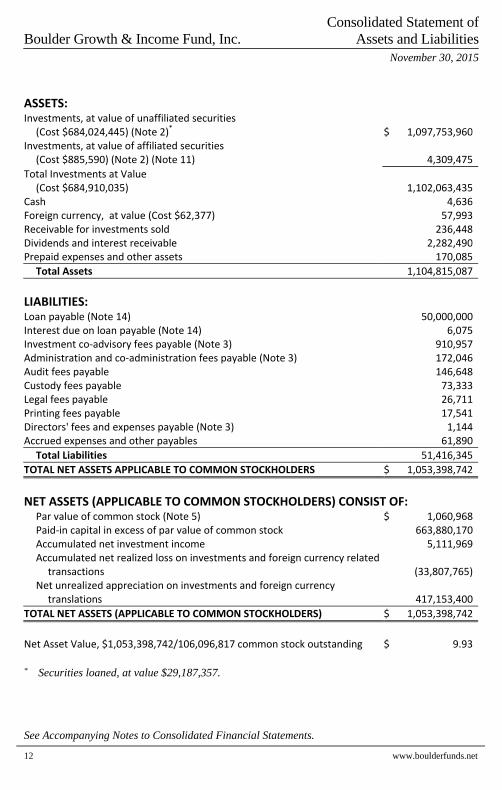
Consolidated Statement of Boulder Growth & Income Fund, Inc. Assets and Liabilities
November 30, 2015
See Accompanying Notes to Consolidated Financial Statements.
12 www.boulderfunds.net
ASSETS: Investments, at value of unaffiliated securities
(Cost $684,024,445) (Note 2)* $ 1,097,753,960 Investments, at value of affiliated securities
(Cost $885,590) (Note 2) (Note 11) 4,309,475 Total Investments at Value
(Cost $684,910,035) 1,102,063,435 Cash 4,636 Foreign currency, at value (Cost $62,377) 57,993 Receivable for investments sold 236,448 Dividends and interest receivable 2,282,490 Prepaid expenses and other assets 170,085
Total Assets 1,104,815,087
LIABILITIES: Loan payable (Note 14) 50,000,000 Interest due on loan payable (Note 14) 6,075 Investment co‐advisory fees payable (Note 3) 910,957 Administration and co‐administration fees payable (Note 3) 172,046 Audit fees payable 146,648 Custody fees payable 73,333 Legal fees payable 26,711 Printing fees payable 17,541 Directors' fees and expenses payable (Note 3) 1,144 Accrued expenses and other payables 61,890
Total Liabilities 51,416,345 TOTAL NET ASSETS APPLICABLE TO COMMON STOCKHOLDERS $ 1,053,398,742
NET ASSETS (APPLICABLE TO COMMON STOCKHOLDERS) CONSIST OF: Par value of common stock (Note 5) $ 1,060,968 Paid‐in capital in excess of par value of common stock 663,880,170 Accumulated net investment income 5,111,969 Accumulated net realized loss on investments and foreign currency related
transactions (33,807,765) Net unrealized appreciation on investments and foreign currency
translations 417,153,400 TOTAL NET ASSETS (APPLICABLE TO COMMON STOCKHOLDERS) $ 1,053,398,742 Net Asset Value, $1,053,398,742/106,096,817 common stock outstanding $ 9.93 * Securities loaned, at value $29,187,357.
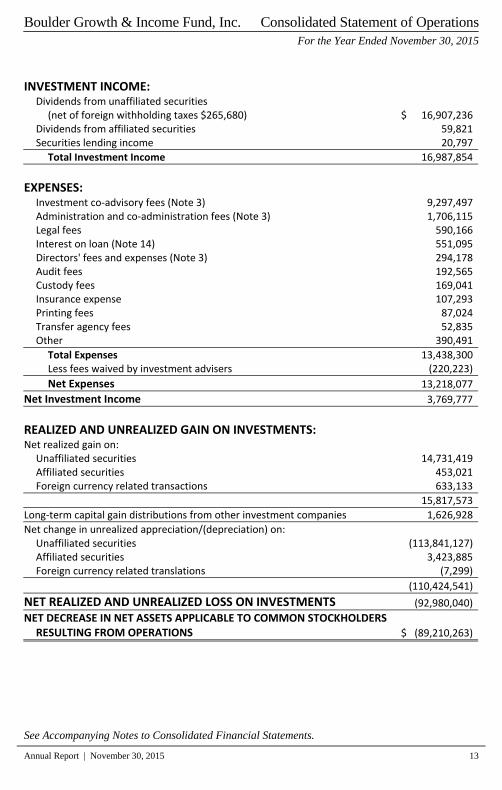
Boulder Growth & Income Fund, Inc. Consolidated Statement of Operations For the Year Ended November 30, 2015
See Accompanying Notes to Consolidated Financial Statements.
Annual Report | November 30, 2015 13
INVESTMENT INCOME: Dividends from unaffiliated securities
(net of foreign withholding taxes $265,680) $ 16,907,236 Dividends from affiliated securities 59,821 Securities lending income 20,797
Total Investment Income 16,987,854
EXPENSES: Investment co‐advisory fees (Note 3) 9,297,497 Administration and co‐administration fees (Note 3) 1,706,115 Legal fees 590,166 Interest on loan (Note 14) 551,095 Directors' fees and expenses (Note 3) 294,178 Audit fees 192,565 Custody fees 169,041 Insurance expense 107,293 Printing fees 87,024 Transfer agency fees 52,835 Other 390,491
Total Expenses 13,438,300 Less fees waived by investment advisers (220,223) Net Expenses 13,218,077
Net Investment Income 3,769,777
REALIZED AND UNREALIZED GAIN ON INVESTMENTS: Net realized gain on:
Unaffiliated securities 14,731,419 Affiliated securities 453,021 Foreign currency related transactions 633,133
15,817,573 Long‐term capital gain distributions from other investment companies 1,626,928 Net change in unrealized appreciation/(depreciation) on:
Unaffiliated securities (113,841,127) Affiliated securities 3,423,885 Foreign currency related translations (7,299)
(110,424,541) NET REALIZED AND UNREALIZED LOSS ON INVESTMENTS (92,980,040) NET DECREASE IN NET ASSETS APPLICABLE TO COMMON STOCKHOLDERS RESULTING FROM OPERATIONS $ (89,210,263)
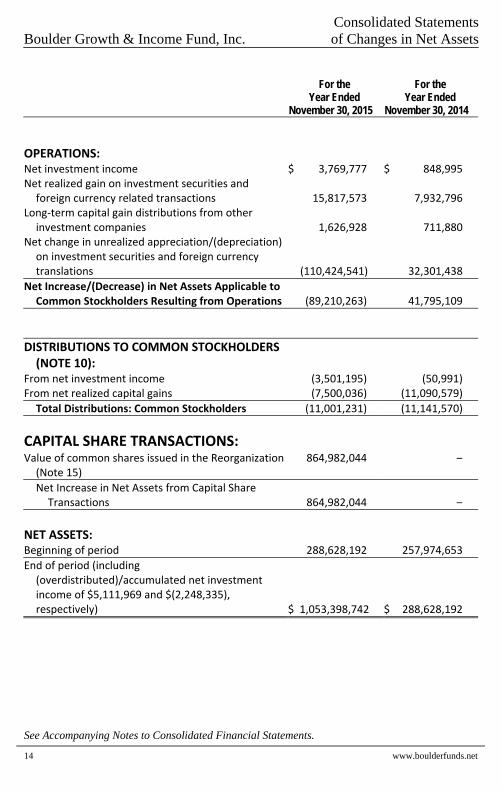
Consolidated Statements Boulder Growth & Income Fund, Inc. of Changes in Net Assets
See Accompanying Notes to Consolidated Financial Statements.
14 www.boulderfunds.net
For the Year Ended
November 30, 2015
For the Year Ended
November 30, 2014
OPERATIONS: Net investment income $ 3,769,777 $ 848,995 Net realized gain on investment securities and foreign currency related transactions 15,817,573 7,932,796
Long‐term capital gain distributions from other investment companies 1,626,928 711,880
Net change in unrealized appreciation/(depreciation) on investment securities and foreign currency translations (110,424,541) 32,301,438
Net Increase/(Decrease) in Net Assets Applicable to Common Stockholders Resulting from Operations (89,210,263) 41,795,109
DISTRIBUTIONS TO COMMON STOCKHOLDERS (NOTE 10):
From net investment income (3,501,195) (50,991) From net realized capital gains (7,500,036) (11,090,579) Total Distributions: Common Stockholders (11,001,231) (11,141,570)
CAPITAL SHARE TRANSACTIONS: Value of common shares issued in the Reorganization 864,982,044 – (Note 15)
Net Increase in Net Assets from Capital Share Transactions 864,982,044 –
NET ASSETS: Beginning of period 288,628,192 257,974,653 End of period (including (overdistributed)/accumulated net investment income of $5,111,969 and $(2,248,335), respectively) $ 1,053,398,742 $ 288,628,192
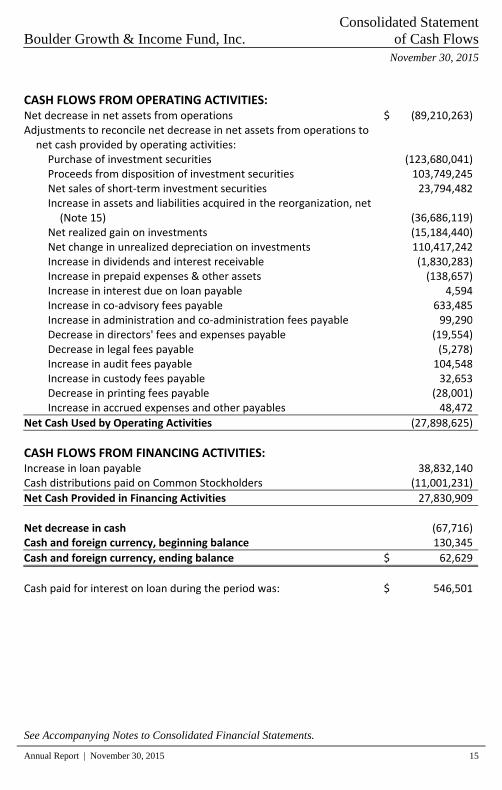
Consolidated Statement Boulder Growth & Income Fund, Inc. of Cash Flows
November 30, 2015
See Accompanying Notes to Consolidated Financial Statements.
Annual Report | November 30, 2015 15
CASH FLOWS FROM OPERATING ACTIVITIES:
Net decrease in net assets from operations $ (89,210,263) Adjustments to reconcile net decrease in net assets from operations to net cash provided by operating activities: Purchase of investment securities (123,680,041) Proceeds from disposition of investment securities 103,749,245 Net sales of short‐term investment securities 23,794,482 Increase in assets and liabilities acquired in the reorganization, net (Note 15) (36,686,119)
Net realized gain on investments (15,184,440) Net change in unrealized depreciation on investments 110,417,242 Increase in dividends and interest receivable (1,830,283) Increase in prepaid expenses & other assets (138,657) Increase in interest due on loan payable 4,594 Increase in co‐advisory fees payable 633,485 Increase in administration and co‐administration fees payable 99,290 Decrease in directors' fees and expenses payable (19,554) Decrease in legal fees payable (5,278) Increase in audit fees payable 104,548 Increase in custody fees payable 32,653 Decrease in printing fees payable (28,001) Increase in accrued expenses and other payables 48,472
Net Cash Used by Operating Activities (27,898,625)
CASH FLOWS FROM FINANCING ACTIVITIES:
Increase in loan payable 38,832,140 Cash distributions paid on Common Stockholders (11,001,231) Net Cash Provided in Financing Activities 27,830,909 Net decrease in cash (67,716) Cash and foreign currency, beginning balance 130,345 Cash and foreign currency, ending balance $ 62,629
Cash paid for interest on loan during the period was: $ 546,501
Boulder Growth & Income Fund, Inc. Consolidated Financial Highlights
16 www.boulderfunds.net
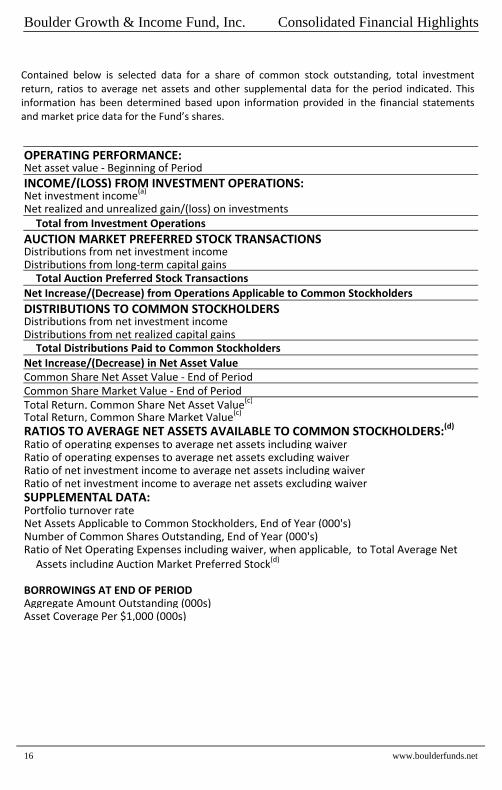
OPERATING PERFORMANCE:Net asset value ‐ Beginning of Period
INCOME/(LOSS) FROM INVESTMENT OPERATIONS:Net investment income(a) Net realized and unrealized gain/(loss) on investmentsTotal from Investment Operations
AUCTION MARKET PREFERRED STOCK TRANSACTIONSDistributions from net investment incomeDistributions from long‐term capital gainsTotal Auction Preferred Stock Transactions
Net Increase/(Decrease) from Operations Applicable to Common Stockholders
DISTRIBUTIONS TO COMMON STOCKHOLDERSDistributions from net investment incomeDistributions from net realized capital gainsTotal Distributions Paid to Common Stockholders
Net Increase/(Decrease) in Net Asset ValueCommon Share Net Asset Value ‐ End of PeriodCommon Share Market Value ‐ End of PeriodTotal Return, Common Share Net Asset Value(c)
Total Return, Common Share Market Value(c)
RATIOS TO AVERAGE NET ASSETS AVAILABLE TO COMMON STOCKHOLDERS:(d) Ratio of operating expenses to average net assets including waiverRatio of operating expenses to average net assets excluding waiverRatio of net investment income to average net assets including waiverRatio of net investment income to average net assets excluding waiverSUPPLEMENTAL DATA: Portfolio turnover rate Net Assets Applicable to Common Stockholders, End of Year (000's)Number of Common Shares Outstanding, End of Year (000's)Ratio of Net Operating Expenses including waiver, when applicable, to Total Average Net Assets including Auction Market Preferred Stock(d)
BORROWINGS AT END OF PERIODAggregate Amount Outstanding (000s)Asset Coverage Per $1,000 (000s)
Contained below is selected data for a share of common stock outstanding, total investment return, ratios to average net assets and other supplemental data for the period indicated. This information has been determined based upon information provided in the financial statements and market price data for the Fund’s shares.
Boulder Growth & Income Fund, Inc. Consolidated Financial Highlights
See Accompanying Notes to Consolidated Financial Statements.
Annual Report | November 30, 2015 17
For the Year Ended November
30, 2015
For the YearEnded
November 30, 2014
For the YearEnded
November 30, 2013
For the YearEnded
November 30, 2012
For the YearEnded
November 30, 2011
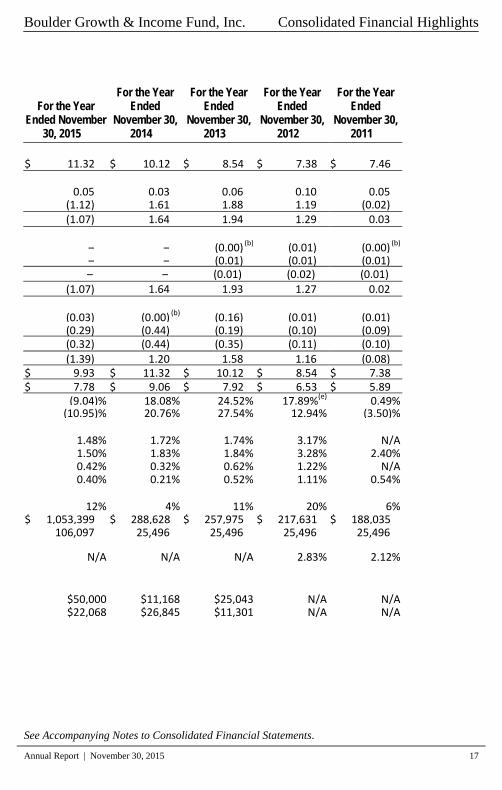
$ 11.32 $ 10.12 $ 8.54 $ 7.38 $ 7.46 0.05 0.03 0.06 0.10 0.05 (1.12) 1.61 1.88 1.19 (0.02) (1.07) 1.64 1.94 1.29 0.03
– – (0.00) (b) (0.01) (0.00) (b)
– – (0.01) (0.01) (0.01) – – (0.01) (0.02) (0.01) (1.07) 1.64 1.93 1.27 0.02
(0.03) (0.00) (b) (0.16) (0.01) (0.01) (0.29) (0.44) (0.19) (0.10) (0.09) (0.32) (0.44) (0.35) (0.11) (0.10) (1.39) 1.20 1.58 1.16 (0.08)$ 9.93 $ 11.32 $ 10.12 $ 8.54 $ 7.38$ 7.78 $ 9.06 $ 7.92 $ 6.53 $ 5.89
(9.04)% 18.08% 24.52% 17.89%(e) 0.49%(10.95)% 20.76% 27.54% 12.94% (3.50)%
1.48% 1.72% 1.74% 3.17% N/A 1.50% 1.83% 1.84% 3.28% 2.40%0.42% 0.32% 0.62% 1.22% N/A 0.40% 0.21% 0.52% 1.11% 0.54%
12% 4% 11% 20% 6%
$ 1,053,399 $ 288,628 $ 257,975 $ 217,631 $ 188,035 106,097 25,496 25,496 25,496 25,496
N/A N/A N/A 2.83% 2.12%
$50,000 $11,168 $25,043 N/A N/A $22,068 $26,845 $11,301 N/A N/A
Boulder Growth & Income Fund, Inc. Consolidated Financial Highlights
See Accompanying Notes to Consolidated Financial Statements.
18 www.boulderfunds.net
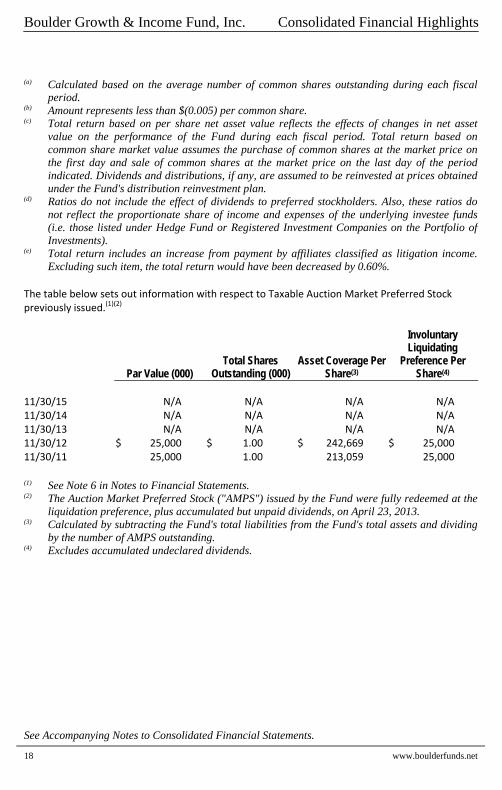
(a) Calculated based on the average number of common shares outstanding during each fiscal
period. (b) Amount represents less than $(0.005) per common share. (c) Total return based on per share net asset value reflects the effects of changes in net asset
value on the performance of the Fund during each fiscal period. Total return based on common share market value assumes the purchase of common shares at the market price on the first day and sale of common shares at the market price on the last day of the period indicated. Dividends and distributions, if any, are assumed to be reinvested at prices obtained under the Fund's distribution reinvestment plan.
(d) Ratios do not include the effect of dividends to preferred stockholders. Also, these ratios do not reflect the proportionate share of income and expenses of the underlying investee funds (i.e. those listed under Hedge Fund or Registered Investment Companies on the Portfolio of Investments).
(e) Total return includes an increase from payment by affiliates classified as litigation income. Excluding such item, the total return would have been decreased by 0.60%.
The table below sets out information with respect to Taxable Auction Market Preferred Stock previously issued.(1)(2)
Par Value (000) Total Shares
Outstanding (000) Asset Coverage Per
Share(3)
Involuntary Liquidating
Preference Per Share(4)
11/30/15 N/A N/A N/A N/A 11/30/14 N/A N/A N/A N/A 11/30/13 N/A N/A N/A N/A 11/30/12 $ 25,000 $ 1.00 $ 242,669 $ 25,000 11/30/11 25,000 1.00 213,059 25,000 (1) See Note 6 in Notes to Financial Statements. (2) The Auction Market Preferred Stock ("AMPS") issued by the Fund were fully redeemed at the
liquidation preference, plus accumulated but unpaid dividends, on April 23, 2013. (3) Calculated by subtracting the Fund's total liabilities from the Fund's total assets and dividing
by the number of AMPS outstanding. (4) Excludes accumulated undeclared dividends.
Notes to Consolidated Boulder Growth & Income Fund, Inc. Financial Statements
November 30, 2015
Annual Report | November 30, 2015 19
NOTE 1. FUND ORGANIZATION Boulder Growth & Income Fund, Inc. (the “Fund” or “BIF”), is a non‐diversified, closed‐end management company organized as a Maryland corporation and is registered with the Securities and Exchange Commission (“SEC”) under the Investment Company Act of 1940, as amended (the “1940 Act”). The Fund is considered an investment company for financial reporting purposes under generally accepted accounting principles in the United States of America (“GAAP”). On March 20, 2015 (the “Reorganization Date”), Boulder Total Return Fund, Inc. (“BTF”), The Denali Fund Inc. (“DNY”) and First Opportunity Fund, Inc. (“FOFI” and, together with BTF and DNY, the “Acquired Funds”) reorganized into the Fund (the “Reorganization”), pursuant to a certain Agreement and Plan of Reorganization. Details of the Reorganization are further described in Note 15 ‐ Fund Reorganization.
NOTE 2. SIGNIFICANT ACCOUNTING POLICIES The following is a summary of significant accounting policies followed by the Fund in the preparation of its financial statements. The preparation of financial statements is in accordance with GAAP, which requires management to make estimates and assumptions that affect the reported amounts and disclosures in the financial statements. Actual results could differ from those estimates.
Basis for Consolidation: The accompanying consolidated financial statements include the account of FOFI 1, Ltd. (the “Subsidiary”) a wholly‐owned subsidiary of the Fund, organized under the laws of the Cayman Islands. In accordance with the Agreement and Plan of Reorganization, the ownership of the Subsidiary was transferred from FOFI to the Fund on the Reorganization Date. FOFI 1, Ltd. contains cash and accruals for expenses related to the Subsidiary. The net assets of FOFI 1, Ltd. as of November 30, 2015 represented 0.00% of the Fund’s consolidated total net assets as the Subsidiary distributed all of its assets to the Fund on November 2, 2015.
Portfolio Valuation: Equity securities for which market quotations are readily available (including securities listed on national securities exchanges and those traded over‐the‐counter) are valued based on the last sales price at the close of the applicable exchange. If such equity securities were not traded on the valuation date, but market quotations are readily available, they are valued at the bid price provided by an independent pricing service or by principal market makers. Equity securities traded on NASDAQ are valued at the NASDAQ Official Closing Price. Debt securities are valued at the mean between the closing bid and asked prices, or based on a matrix system which utilizes information (such as credit ratings, yields and maturities) from independent pricing services, principal market makers, or other independent sources. Money market mutual funds are valued at their net asset value. Short‐term securities which mature in more than 60 days are valued at current market quotations. Short‐term securities which mature in 60 days or less are valued at amortized cost, which approximates fair value. The Fund’s Board of Directors (the “Board”) has delegated to the Valuation Committee, the responsibility of determining the fair value of any security or financial instrument owned by the Fund for which market quotations are not readily available or where the pricing agent or market maker
Notes to Consolidated Boulder Growth & Income Fund, Inc. Financial Statements
November 30, 2015
20 www.boulderfunds.net
does not provide a valuation or methodology, or provides a valuation or methodology that, in the judgment of the Valuation Committee, does not represent fair value (“Fair Value Securities”). The Valuation Committee uses a third‐party pricing consultant to assist the committee in analyzing, developing, applying and documenting a methodology with respect to certain Fair Value Securities. The Valuation Committee and the valuation consultant, as appropriate, use valuation techniques that utilize both observable and unobservable inputs. In such circumstances, the Valuation Committee is responsible for (i) identifying Fair Value Securities, (ii) analyzing each Fair Value Security and developing, applying and documenting a methodology for valuing Fair Value Securities, and (iii) periodically reviewing the appropriateness and accuracy of the methods used in valuing Fair Value Securities. The appointment of any officer or employee of the advisers or Fund to the Valuation Committee shall be promptly reported to the Board and ratified by the Board at its next regularly scheduled meeting. The Valuation Committee is responsible for reporting to the Board, on a quarterly basis, valuations and certain findings with respect to the Fair Value Securities. Such valuations and findings are reviewed by the entire Board on a quarterly basis. The Consolidated Portfolio of Investments includes investments valued at $25,412,639 (2.41% of total net assets), whose fair values have been estimated by management in the absence of readily determinable fair values. Due to the inherent uncertainty of the valuation of these investments, these values may differ from the values that would have been used had a ready market for these investments existed and the differences could be material. The Fund’s investment in an unregistered pooled investment vehicle (“Hedge Fund”) is valued, as a practical expedient, at the most recent net asset value determined by the Hedge Fund manager according to such manager’s policies and procedures based on valuation information reasonably available to the Hedge Fund manager at that time; provided, however, that the Valuation Committee may consider whether it is appropriate, in light of relevant circumstances, to adjust such valuation in accordance with the Fund’s valuation procedures. If the Hedge Fund does not report a value to the Fund on a timely basis, the fair value of the Hedge Fund shall be based on the most recent value reported by the Hedge Fund, as well as any other relevant information available at the time the Fund values its portfolio. The frequency and timing of receiving valuations for the Hedge Fund investment is subject to change at any time, without notice to investors, at the discretion of the Hedge Fund manager or the Fund. For valuation purposes, the last quoted prices of non‐U.S. equity securities may be adjusted under certain circumstances described below. If the Valuation Committee determines that developments between the close of a foreign market and the close of the New York Stock Exchange (“NYSE”) will, in its judgment, materially affect the value of some or all of the Fund’s portfolio securities, the responsible Valuation Committee may adjust the previous closing prices to reflect what it believes to be the fair value of the securities as of the close of the NYSE. In deciding whether it is necessary to adjust closing prices to reflect fair value, the Valuation Committee reviews a variety of factors, including developments in foreign markets, the performance of U.S. securities markets, and the performance of instruments trading in U.S. markets that represent foreign securities and baskets of foreign securities. The Valuation Committee may also fair value securities in other situations, such as when a particular foreign market is closed but the U.S. market is open. The Valuation Committee may use outside pricing services to provide it with closing prices. The Valuation Committee may consider whether it is appropriate, in light of relevant circumstances, to adjust such valuation in accordance with the Fund’s valuation procedures. The Valuation Committee cannot predict how often it will use
Notes to Consolidated Boulder Growth & Income Fund, Inc. Financial Statements
November 30, 2015
Annual Report | November 30, 2015 21
closing prices and how often it will determine it necessary to adjust those prices to reflect fair value. If the Valuation Committee adjusts prices, the Valuation Committee will periodically compare closing prices, the next day’s opening prices in the same markets and those adjusted prices as a means of evaluating its security valuation process. Various inputs are used to determine the value of the Fund's investments. Observable inputs are inputs that reflect the assumptions market participants would use based on market data obtained from sources independent of the reporting entity. Unobservable inputs are inputs that reflect the reporting entity’s own assumptions based on the best information available in the circumstances. These inputs are summarized in the three broad levels listed below. Level 1 — Unadjusted quoted prices in active markets for identical investments Level 2 — Significant observable inputs (including quoted prices for similar investments, interest
rates, prepayment speeds, credit risk, etc.) Level 3 — Significant unobservable inputs (including the Fund’s own assumptions in determining
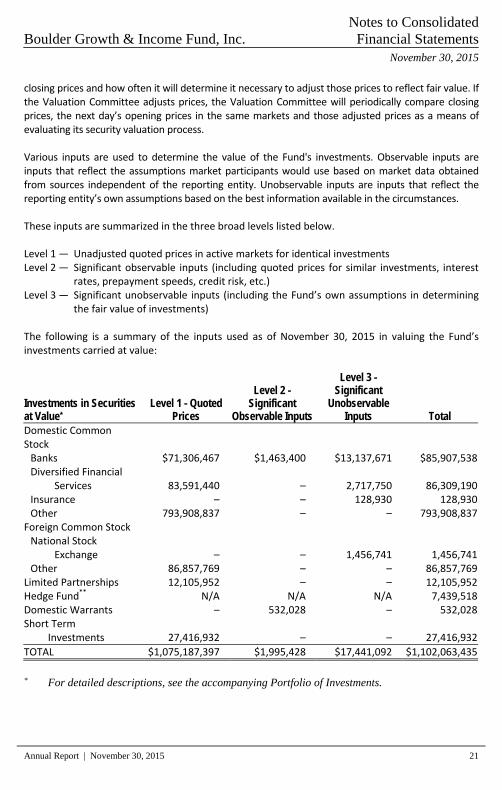
the fair value of investments) The following is a summary of the inputs used as of November 30, 2015 in valuing the Fund’s investments carried at value:
Investments in Securities at Value*
Level 1 - Quoted Prices
Level 2 - Significant
Observable Inputs
Level 3 - Significant
Unobservable Inputs Total
Domestic Common Stock Banks $71,306,467 $1,463,400 $13,137,671 $85,907,538 Diversified Financial
Services 83,591,440 – 2,717,750 86,309,190 Insurance – – 128,930 128,930 Other 793,908,837 – – 793,908,837
Foreign Common Stock National Stock
Exchange – – 1,456,741 1,456,741 Other 86,857,769 – – 86,857,769
Limited Partnerships 12,105,952 – – 12,105,952 Hedge Fund** N/A N/A N/A 7,439,518 Domestic Warrants – 532,028 – 532,028 Short Term
Investments 27,416,932 – – 27,416,932
TOTAL $1,075,187,397 $1,995,428 $17,441,092 $1,102,063,435
* For detailed descriptions, see the accompanying Portfolio of Investments.
Notes to Consolidated Boulder Growth & Income Fund, Inc. Financial Statements
November 30, 2015
22 www.boulderfunds.net
** In accordance with Subtopic 820-10, certain investments that are measured at fair value using the net asset value per share (or its equivalent) as a practical expedient have not been classified in the fair value hierarchy. The fair value amounts presented in this table are intended to permit reconciliation of the fair value hierarchy to the amounts presented in the Statement of Assets and Liabilities.
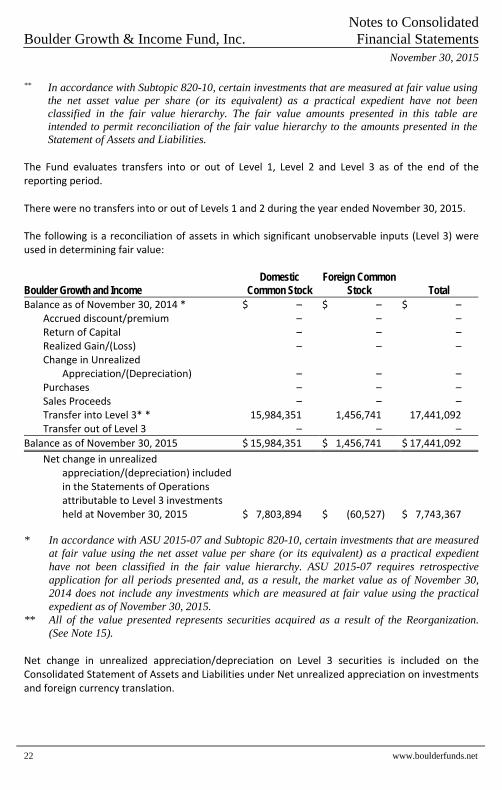
The Fund evaluates transfers into or out of Level 1, Level 2 and Level 3 as of the end of the reporting period. There were no transfers into or out of Levels 1 and 2 during the year ended November 30, 2015. The following is a reconciliation of assets in which significant unobservable inputs (Level 3) were used in determining fair value:
Boulder Growth and Income Domestic
Common Stock Foreign Common
Stock Total Balance as of November 30, 2014 * $ – $ – $ –
Accrued discount/premium – – – Return of Capital – – – Realized Gain/(Loss) – – – Change in Unrealized
Appreciation/(Depreciation) – – – Purchases – – – Sales Proceeds – – – Transfer into Level 3* * 15,984,351 1,456,741 17,441,092 Transfer out of Level 3 – – –
Balance as of November 30, 2015 $ 15,984,351 $ 1,456,741 $ 17,441,092
Net change in unrealized appreciation/(depreciation) included in the Statements of Operations attributable to Level 3 investments held at November 30, 2015 $ 7,803,894 $ (60,527) $ 7,743,367
* In accordance with ASU 2015-07 and Subtopic 820-10, certain investments that are measured
at fair value using the net asset value per share (or its equivalent) as a practical expedient have not been classified in the fair value hierarchy. ASU 2015-07 requires retrospective application for all periods presented and, as a result, the market value as of November 30, 2014 does not include any investments which are measured at fair value using the practical expedient as of November 30, 2015.
** All of the value presented represents securities acquired as a result of the Reorganization. (See Note 15).
Net change in unrealized appreciation/depreciation on Level 3 securities is included on the Consolidated Statement of Assets and Liabilities under Net unrealized appreciation on investments and foreign currency translation.
Notes to Consolidated Boulder Growth & Income Fund, Inc. Financial Statements
November 30, 2015
Annual Report | November 30, 2015 23
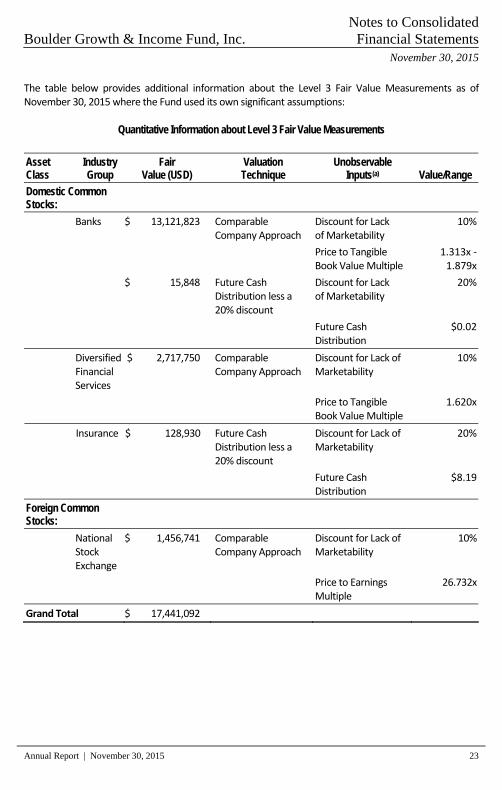
The table below provides additional information about the Level 3 Fair Value Measurements as of November 30, 2015 where the Fund used its own significant assumptions:
Quantitative Information about Level 3 Fair Value Measurements
Asset Class
Industry Group
Fair Value (USD)
Valuation Technique
Unobservable Inputs(a) Value/Range
Domestic Common Stocks:
Banks $ 13,121,823 Comparable Company Approach
Discount for Lack of Marketability
10%
Price to Tangible Book Value Multiple
1.313x ‐ 1.879x
$ 15,848 Future Cash Distribution less a 20% discount
Discount for Lack of Marketability
20%
Future Cash Distribution
$0.02
Diversified Financial Services
$ 2,717,750 Comparable Company Approach
Discount for Lack of Marketability
10%
Price to Tangible Book Value Multiple
1.620x
Insurance $ 128,930 Future Cash Distribution less a 20% discount
Discount for Lack of Marketability
20%
Future Cash Distribution
$8.19
Foreign Common Stocks:
National Stock Exchange
$ 1,456,741 Comparable Company Approach
Discount for Lack of Marketability
10%
Price to Earnings Multiple
26.732x
Grand Total $ 17,441,092
Notes to Consolidated Boulder Growth & Income Fund, Inc. Financial Statements
November 30, 2015
24 www.boulderfunds.net
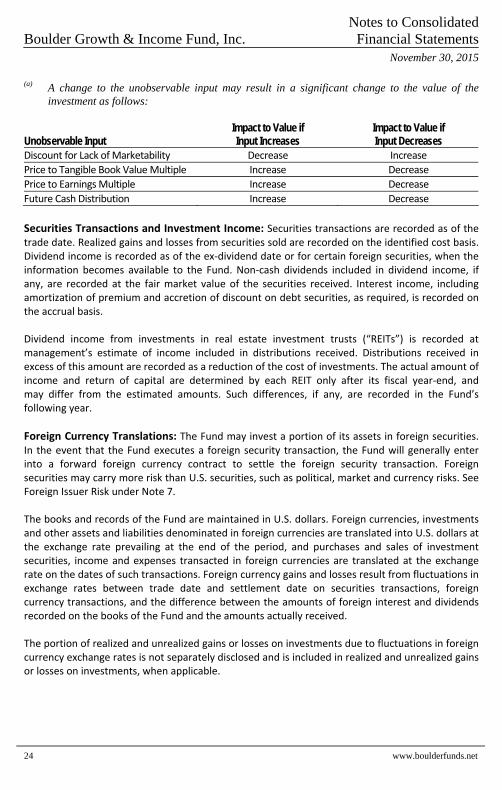
(a) A change to the unobservable input may result in a significant change to the value of the investment as follows:
Unobservable Input Impact to Value if Input Increases
Impact to Value if Input Decreases
Discount for Lack of Marketability Decrease Increase
Price to Tangible Book Value Multiple Increase Decrease
Price to Earnings Multiple Increase Decrease
Future Cash Distribution Increase Decrease
Securities Transactions and Investment Income: Securities transactions are recorded as of the trade date. Realized gains and losses from securities sold are recorded on the identified cost basis. Dividend income is recorded as of the ex‐dividend date or for certain foreign securities, when the information becomes available to the Fund. Non‐cash dividends included in dividend income, if any, are recorded at the fair market value of the securities received. Interest income, including amortization of premium and accretion of discount on debt securities, as required, is recorded on the accrual basis. Dividend income from investments in real estate investment trusts (“REITs”) is recorded at management’s estimate of income included in distributions received. Distributions received in excess of this amount are recorded as a reduction of the cost of investments. The actual amount of income and return of capital are determined by each REIT only after its fiscal year‐end, and may differ from the estimated amounts. Such differences, if any, are recorded in the Fund’s following year.
Foreign Currency Translations: The Fund may invest a portion of its assets in foreign securities. In the event that the Fund executes a foreign security transaction, the Fund will generally enter into a forward foreign currency contract to settle the foreign security transaction. Foreign securities may carry more risk than U.S. securities, such as political, market and currency risks. See Foreign Issuer Risk under Note 7. The books and records of the Fund are maintained in U.S. dollars. Foreign currencies, investments and other assets and liabilities denominated in foreign currencies are translated into U.S. dollars at the exchange rate prevailing at the end of the period, and purchases and sales of investment securities, income and expenses transacted in foreign currencies are translated at the exchange rate on the dates of such transactions. Foreign currency gains and losses result from fluctuations in exchange rates between trade date and settlement date on securities transactions, foreign currency transactions, and the difference between the amounts of foreign interest and dividends recorded on the books of the Fund and the amounts actually received. The portion of realized and unrealized gains or losses on investments due to fluctuations in foreign currency exchange rates is not separately disclosed and is included in realized and unrealized gains or losses on investments, when applicable.
Notes to Consolidated Boulder Growth & Income Fund, Inc. Financial Statements
November 30, 2015
Annual Report | November 30, 2015 25
Dividends and Distributions to Stockholders: It is the Fund’s policy to distribute substantially all net investment income and net realized gains to stockholders and to otherwise qualify as a regulated investment company under provisions of the Internal Revenue Code. The stockholders of Auction Market Preferred Stock were previously entitled to receive cumulative cash dividends as declared by the Fund’s Board. Distributions to stockholders are recorded on the ex‐dividend date. Any net realized short‐term capital gains will be distributed to stockholders at least annually. Any net realized long‐term capital gains may be distributed to stockholders at least annually or may be retained by the Fund as determined by the Fund’s Board. Capital gains retained by the Fund are subject to tax at the corporate tax rate. Subject to the Fund qualifying as a registered investment company, any taxes paid by the Fund on such net realized long‐term gains may be used by the Fund’s stockholders as a credit against their own tax liabilities.
Indemnifications: Like many other companies, the Fund’s organizational documents provide that its officers and directors are indemnified against certain liabilities arising out of the performance of their duties to the Fund. In addition, both in some of its principal service contracts and in the normal course of its business, the Fund enters into contracts that provide indemnifications to other parties for certain types of losses or liabilities. The Fund’s maximum exposure under these arrangements is unknown as this could involve future claims against the Fund.
Federal Income Tax: For federal income tax purposes, the Fund currently qualifies, and intends to remain qualified as a regulated investment company under the provisions of Subchapter M of the Internal Revenue Code of 1986, as amended, by distributing substantially all of its earnings to its stockholders. Accordingly, no provision for federal income or excise taxes has been made. Income and capital gain distributions are determined and characterized in accordance with income tax regulations, which may differ from U.S. GAAP. These differences are primarily due to differing treatments of income and gains on various investment securities held by the Fund, timing differences and differing characterization of distributions made by the Fund as a whole. During the year ended November 30, 2015, the Fund did not have a liability for any unrecognized tax benefits. The Fund files U.S. federal, state, and local tax returns as required. The Fund’s tax returns are subject to examination by the relevant tax authorities until expiration of the applicable statute of limitations which is generally three years after the filing of the tax return for federal purposes and four years for most state returns. Tax returns for open years have incorporated no uncertain tax positions that require a provision for income taxes.
NOTE 3. ADVISORY FEES, ADMINISTRATION FEES AND OTHER AGREEMENTS Boulder Investment Advisers, L.L.C. (“BIA”) and Stewart Investment Advisers (“SIA”) served as co‐investment advisers to the Fund until the Reorganization Date. Through the Reorganization Date, the Fund paid BIA and SIA a monthly fee (the “Advisory Fee”) at an annual rate of 1.25% of the value of the Fund’s average monthly total net assets plus the principal amount of leverage, if any (“Net Assets”). Effective December 1, 2011, BIA and SIA agreed to waive 0.10% of the Advisory Fee such that the Advisory Fee would be calculated at the annual rate of 1.15% of Net Assets. The fee waiver agreement had a one‐year term and was renewable annually. BIA and SIA renewed the fee waiver for an additional one year term as of December 1, 2013. Effective December 1, 2014, BIA
Notes to Consolidated Boulder Growth & Income Fund, Inc. Financial Statements
November 30, 2015
26 www.boulderfunds.net
and SIA agreed to reduce the advisory fee for the Fund to a flat rate of 1.00% (i.e. 1.25% contractual rate less a 0.25% waiver) through the effectiveness of the Reorganization. After the Reorganization took place on March 20, 2015, Rocky Mountain Advisers, LLC (“RMA”) replaced BIA as co‐investment adviser to the Fund (together with SIA, the “Advisers”). The Fund pays the Advisers an Advisory Fee at an annual rate of 1.00% of the value of the Fund’s Net Assets. The waiver agreement was terminated on the Reorganization Date. For the year ended November 30, 2015, the Fund made net cash payments for advisory fees to SIA in the amount of $2,395,571, including $130,414 incurred by the Acquired Funds. For the period of December 1, 2014 to March 20, 2015 the Fund made net cash payments for advisory fees to BIA of $910,931, including $251,164 incurred by the Acquired Funds. For the period of March 21, 2015 to November 30, 2015 the Fund made net cash payment for advisory fees to RMA of $6,275,781, including $140,078 incurred by the Acquired Funds. Stewart West Indies Trading Company, Ltd. is a Barbados international business company doing business as Stewart Investment Advisers. The equity owner of SIA is the Stewart West Indies Trust. RMA is owned by the Susan L. Ciciora Trust (the “SLC Trust”), which is also a stockholder of the Fund. SIA, BIA and RMA are considered “affiliated persons”, as that term is defined in the 1940 Act, of the Fund and Fund Administrative Services, LLC (“FAS”). Prior to October 1, 2013, SIA and BIA received 75% and 25%, respectively, of the Advisory Fee. From October 1, 2013 through the Reorganization Date SIA and BIA received 25% and 75%, respectively, of the Advisory Fee. Effective March 21, 2015, RMA receives 75% of the fees earned by the Advisers and SIA receives 25% of the fees earned by the Advisers. FAS serves as the Fund’s co‐administrator. Under the Administration Agreement, FAS provides certain administrative and executive management services to the Fund. The Fund pays FAS a monthly fee, calculated at an annual rate of 0.20% of the value of the Fund’s Net Assets up to $100 million, and 0.15% of the Fund’s Net Assets over $100 million. Notwithstanding, FAS has agreed to cap the Fund’s total administration costs at 0.30% (including administration, co‐administration, transfer agent and custodian fees). As such, FAS has agreed to waive a portion of its fee based on Net Assets should the total monthly administration expenses exceed 0.30%. As the Fund’s total monthly administration costs did not exceed 0.30% during the year ended November 30, 2015, there was no fee waiver for that period. Prior to December 17, 2015, the equity owners of FAS were Evergreen Atlantic, LLC (“EALLC”) and the Lola Brown Trust No. 1B. As of December 17, 2015, with the dissolution of EALLC, the equity owners of FAS are the Lola Brown Trust No. 1B, the SLC Trust and the Stewart West Indies Trust. As BIA, SIA, RMA and FAS are considered affiliates of the Fund, as that term is defined in the 1940 Act, agreements between the Fund and those entities are considered affiliated transactions. ALPS Fund Services, Inc. (“ALPS”) serves as the Fund’s co‐administrator. As compensation for its services, ALPS receives certain out‐of‐pocket expenses and asset‐based fees, which are accrued daily and paid monthly. Through the Reorganization Date, fees paid to ALPS were calculated based on combined Net Assets of the Fund, BTF, DNY, and FOFI (the “Fund Group”). After the Reorganization Date, fees paid to ALPS were calculated based on the Net Assets of the Fund. In addition, ALPS received a fee for administration services related to FOFI 1, Ltd.
Notes to Consolidated Boulder Growth & Income Fund, Inc. Financial Statements
November 30, 2015
Annual Report | November 30, 2015 27
No persons (other than the Independent Directors) currently receive compensation from the Fund for acting as a director or officer; however, officers of the Fund may also be officers or employees of the Advisers or FAS and may receive compensation in such capacities. Before the Reorganization, the Fund paid each member of the Board (a “Director”) who was not a director, officer, employee, or affiliate of BIA, SIA, FAS, or any of their affiliates a fee of $8,000 per annum, plus $3,000 for each in‐person meeting, $500 for each audit committee meeting, $500 for each nominating committee meeting, and $500 for each telephonic meeting of the Board. The lead independent director of the Board received an additional $1,000 for attending each regular quarterly meeting of the Board. The chairman of the audit committee received an additional $1,000 for attending each regular meeting of the audit committee. After the Reorganization, the Fund pays each Director who is not a director, officer, employee, or affiliate of the Advisers, FAS, or any of their affiliates a fee of $40,000 per annum, plus $5,000 for each in‐person meeting, $3,000 for each audit committee meeting, $1,000 for each nominating committee meeting and $1,000 for each telephonic meeting of the Board. The lead independent director of the Board receives an additional $3,125 for attending each regular quarterly meeting of the Board. The chairman of the audit committee receives an additional $3,000 for attending each regular meeting of the audit committee. The Fund will also reimburse all non‐interested Directors for travel and out‐of‐pocket expenses incurred in connection with such meetings. Bank of New York Mellon (“BNY Mellon”) serves as the Fund’s custodian. Computershare Shareowner Services (“Computershare”) serves as the Fund’s common stock servicing agent, dividend‐paying agent and registrar. As compensation for BNY Mellon’s and Computershare’s services, the Fund pays each a monthly fee plus certain out‐of‐pocket expenses.
NOTE 4. SECURITIES TRANSACTIONS Purchases and sales of securities, excluding short term securities during the year ended November 30, 2015 were $123,680,041 and $103,746,607 respectively.
NOTE 5. CAPITAL At November 30, 2015, 249,990,000 of $0.01 par value common stock (the “Common Stock”) were authorized, of which 106,096,817 were outstanding. Transactions in Common Stock were as follows: For the Year Ended
November 30, 2015 For the Year Ended November 30, 2014
Common Stock outstanding ‐ beginning of period 25,495,585 25,495,585 Shares issued in the Reorganization (Note 15) 80,601,232 –
Common Stock outstanding ‐ end of period 106,096,817 25,495,585
Notes to Consolidated Boulder Growth & Income Fund, Inc. Financial Statements
November 30, 2015
28 www.boulderfunds.net
NOTE 6. TAXABLE AUCTION MARKET PREFERRED STOCK The Fund’s Articles of Incorporation authorize the issuance of up to 1,000 shares of $0.01 par value Auction Market Preferred Stock. On October 17, 2005, the Fund issued 1,000 AMPS. AMPS are senior to Common Stock and result in the financial leveraging of the Common Stock. Such leveraging tends to magnify both the risks and opportunities to common stockholders. Dividends on the AMPS are cumulative. The Fund’s AMPS had a liquidation preference of $25,000 per share plus any accumulated unpaid dividends, whether or not earned or declared by the Fund and had no mandatory retirement date. On April 23, 2013 all outstanding AMPS issued by the Fund were redeemed at the liquidation preference plus accumulated but unpaid dividends. The Fund obtained alternative financing to provide new funding in order to redeem the AMPS and provide leverage to the Fund going forward. See Note 14 ‐ Line of Credit and Securities Lending, for further information on the borrowing facility used by the Fund during the year ended, and as of, November 30, 2015.
NOTE 7. PORTFOLIO INVESTMENTS AND CONCENTRATION Under normal market conditions, the Fund intends to invest at least 80% of its net assets in common stocks. Common stocks include dividend‐paying closed‐end funds and REITs. The portion of the Fund’s assets that are not invested in common stocks may be invested in fixed income securities and cash equivalents. The term “fixed income securities” includes bonds, U.S. Government securities, notes, bills, debentures, preferred stocks, convertible securities, bank debt obligations, repurchase agreements and short‐term money market obligations.
Concentration Risk: The Fund operates as a “non‐diversified” investment company, as defined in the 1940 Act. As a result of being “non‐diversified” with respect to 50% of the Fund’s portfolio, the Fund must limit the portion of its assets invested in the securities of a single issuer to 5%, measured at the time of purchase. In addition, no single investment can exceed 25% of the Fund’s total assets at the time of purchase. A more concentrated portfolio may cause the Fund’s net asset value to be more volatile and thus may subject stockholders to more risk. Thus, the volatility of the Fund’s net asset value and its performance in general, depends disproportionately more on the performance of a smaller number of holdings than that of a more diversified fund. As a result, the Fund is subject to a greater risk of loss than a fund that diversifies its investments more broadly. As of November 30, 2015, the Fund held more than 25% of its assets in Berkshire Hathaway, Inc. In addition to market appreciation of the issuer since the time of purchase, the Fund acquired additional interest in Berkshire Hathaway, Inc. due to the Reorganization. After the Reorganization was completed, shares held of the issuer were liquidated to bring the concentration to 25%. Concentration of the Berkshire Hathaway, Inc. position was a direct result of market appreciation since the time each of the funds in the Fund Group purchased the security.
Notes to Consolidated Boulder Growth & Income Fund, Inc. Financial Statements
November 30, 2015
Annual Report | November 30, 2015 29
Foreign Issuer Risk: Investment in non‐U.S. issuers may involve unique risks compared to investing in securities of U.S. issuers. These risks may include, but are not limited to: (i) less information about non‐U.S. issuers or markets may be available due to less rigorous disclosure, accounting standards or regulatory practices; (ii) many non‐U.S. markets are smaller, less liquid and more volatile thus, in a changing market, the Advisers may not be able to sell the Fund’s portfolio securities at times, in amounts and at prices they consider reasonable; (iii) currency exchange rates or controls may adversely affect the value of the Fund’s investments; (iv) the economies of non‐U.S. countries may grow at slower rates than expected or may experience downturns or recessions; and, (v) withholdings and other non‐U.S. taxes may decrease the Fund’s return.
Changes in Investment Policies: On November 14, 2014, stockholders of the Fund approved a proposal to eliminate the Fund’s fundamental investment policy that limits the Fund’s ability to invest more than 4% of its total assets in any single issuer which became effective immediately.
NOTE 8. SIGNIFICANT STOCKHOLDERS On November 30, 2015, trusts and other entities and individuals affiliated with Stewart R. Horejsi and the Horejsi family owned 45,444,844 shares of Common Stock of the Fund, representing approximately 42.83% of the total Common Stock outstanding. Stewart R. Horejsi is the Chief Investment Officer of RMA and SIA and is a portfolio manager of the Fund. Entities affiliated with Mr. Horejsi and the Horejsi family also own SIA, RMA and FAS.
NOTE 9. SHARE REPURCHASES AND REDEMPTIONS In accordance with Section 23(c) of the 1940 Act and the rules promulgated thereunder, the Fund may from time to time effect repurchases and/or redemptions of its Common Stock. For the years ended November 30, 2015 and November 30, 2014 the Fund did not repurchase any of its Common Stock.
NOTE 10. TAX BASIS DISTRIBUTIONS AND TAX BASIS INFORMATION As determined on November 30, 2015, permanent differences resulting primarily from different book and tax accounting for the tax‐free merger, partnership investments, and certain other investments were reclassified at fiscal year‐end. These reclassifications had no effect on net increase in net assets resulting from operations, net assets applicable to common stockholders or net asset value per common share outstanding. Permanent book and tax basis differences of $7,091,722, $(53,512,144) and $46,420,422 were reclassified at November 30, 2015 among accumulated net investment income, accumulated net realized gains/losses on investments and paid‐in capital, respectively, for the Fund.
Notes to Consolidated Boulder Growth & Income Fund, Inc. Financial Statements
November 30, 2015
30 www.boulderfunds.net
The character of distributions paid on a tax basis during the year ending November 30, 2015 is as follows: Distributions paid from: Ordinary Income $ 3,501,195 Long‐term Capital Gain 7,500,036 $ 11,001,231 The character of distributions paid on a tax basis during the year ending November 30, 2014 is as follows: Distributions paid from: Ordinary Income $ 452,485 Long‐term Capital Gain 10,689,085 $ 11,141,570 The Fund acquired unused pre‐enactment capital loss carryovers from FOFI of $9,191,039 expiring March 31, 2017 and $35,618,163 expiring March 31, 2018. The Fund also acquired unused post‐enactment capital loss carryovers from FOFI of $6,967,304. As of November 30, 2015, the Fund has unused pre‐enactment capital loss carryovers available for tax purposes expiring in 2016 and 2017, totaling $7,052,057 and $35,618,163, respectively. Capital loss carryovers used during the period were $9,106,286. On November 30, 2015, based on cost of $685,774,896 for federal income tax purposes, aggregate gross unrealized appreciation for all securities in which there is an excess of value over tax cost was $471,601,412, aggregate gross unrealized depreciation for all securities in which there is an excess of tax cost over value was $55,312,873 resulting in net unrealized appreciation of $416,288,539. As of November 30, 2015, the components of distributable earnings on a tax basis were as follows: Undistributed Ordinary Income $ 8,282,263 Accumulated Long‐term Capital Gain 9,683,691 Unrealized Appreciation 416,288,539 Cumulative Effect of Other Timing Differences (45,796,889) Total $ 388,457,604 The difference between book and tax basis distributable earnings is attributable primarily to temporary differences related to mark to market of passive foreign investment companies and partnership book and tax differences.
Notes to Consolidated Boulder Growth & Income Fund, Inc. Financial Statements
November 30, 2015
Annual Report | November 30, 2015 31
NOTE 11. TRANSACTIONS WITH AFFILIATED COMPANIES Transactions during the period with companies in which the Fund owned at least 5% of the voting securities were as follows:
Name of Affiliate Perpetual Federal
Savings Bank Redwood Financial,
Inc. Total Beginning Share Balance as of
November 30, 2014 – – – Transfer due to Reorganization* 165,930 40,650 206,580 Purchases – – – Sales 27,771 – 27,771 Ending Share balance as of
November 30, 2015 138,159 40,650 178,809 Dividend Income $ 59,821 – $ 59,821 Realized Gains $ 453,021 – $ 453,021
Value as of November 30, 2015 $ 2,846,075 $ 1,463,400 $ 4,309,475
* Acquired shares as a result of the Reorganization (Note 15). NOTE 12. RESTRICTED SECURITIES As of November 30, 2015, investments in securities included issues that are considered restricted. Restricted securities are often purchased in private placement transactions, are not registered under the Securities Act of 1933, may have contractual restrictions on resale, and may be valued under methods approved by the Board as reflecting fair value.
Notes to Consolidated Boulder Growth & Income Fund, Inc. Financial Statements
November 30, 2015
32 www.boulderfunds.net
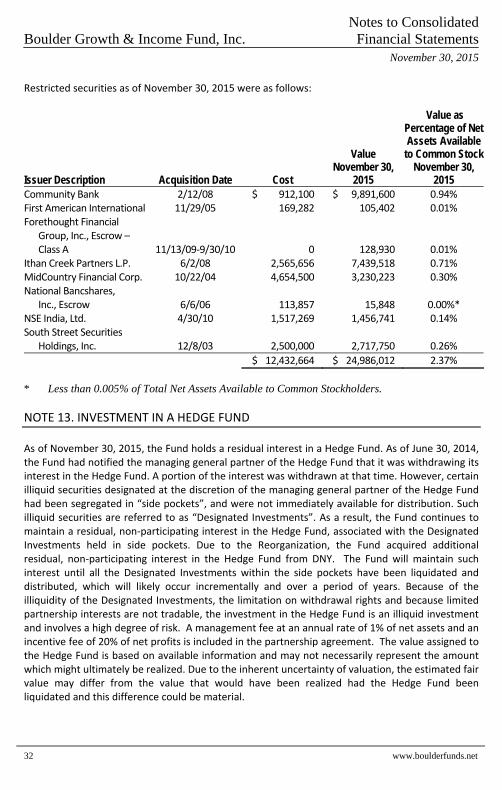
Restricted securities as of November 30, 2015 were as follows:
Issuer Description Acquisition Date Cost
Value November 30,
2015
Value as Percentage of Net Assets Available
to Common Stock November 30,
2015 Community Bank 2/12/08 $ 912,100 $ 9,891,600 0.94% First American International 11/29/05 169,282 105,402 0.01% Forethought Financial
Group, Inc., Escrow – Class A 11/13/09‐9/30/10 0 128,930 0.01%
Ithan Creek Partners L.P. 6/2/08 2,565,656 7,439,518 0.71% MidCountry Financial Corp. 10/22/04 4,654,500 3,230,223 0.30% National Bancshares,
Inc., Escrow 6/6/06 113,857 15,848 0.00%* NSE India, Ltd. 4/30/10 1,517,269 1,456,741 0.14% South Street Securities
Holdings, Inc. 12/8/03 2,500,000 2,717,750 0.26%
$ 12,432,664 $ 24,986,012 2.37%
* Less than 0.005% of Total Net Assets Available to Common Stockholders.
NOTE 13. INVESTMENT IN A HEDGE FUND As of November 30, 2015, the Fund holds a residual interest in a Hedge Fund. As of June 30, 2014, the Fund had notified the managing general partner of the Hedge Fund that it was withdrawing its interest in the Hedge Fund. A portion of the interest was withdrawn at that time. However, certain illiquid securities designated at the discretion of the managing general partner of the Hedge Fund had been segregated in “side pockets”, and were not immediately available for distribution. Such illiquid securities are referred to as “Designated Investments”. As a result, the Fund continues to maintain a residual, non‐participating interest in the Hedge Fund, associated with the Designated Investments held in side pockets. Due to the Reorganization, the Fund acquired additional residual, non‐participating interest in the Hedge Fund from DNY. The Fund will maintain such interest until all the Designated Investments within the side pockets have been liquidated and distributed, which will likely occur incrementally and over a period of years. Because of the illiquidity of the Designated Investments, the limitation on withdrawal rights and because limited partnership interests are not tradable, the investment in the Hedge Fund is an illiquid investment and involves a high degree of risk. A management fee at an annual rate of 1% of net assets and an incentive fee of 20% of net profits is included in the partnership agreement. The value assigned to the Hedge Fund is based on available information and may not necessarily represent the amount which might ultimately be realized. Due to the inherent uncertainty of valuation, the estimated fair value may differ from the value that would have been realized had the Hedge Fund been liquidated and this difference could be material.
Notes to Consolidated Boulder Growth & Income Fund, Inc. Financial Statements
November 30, 2015
Annual Report | November 30, 2015 33
NOTE 14. LINE OF CREDIT AND SECURITIES LENDING On March 19, 2013 the Fund entered into a financing package that includes a Committed Facility Agreement (the “Credit Agreement”) with BNP Paribas Prime Brokerage, Inc. (“BNP”) that allowed the Fund to borrow up to $50,000,000 (“Initial Maximum Commitment”) and a Lending Agreement, as defined below. On March 20, 2015, pursuant to the Reorganization, BIF amended the Credit Agreement with BNP Paribas to borrow up to a limit of $172,000,000. The Credit Agreement was amended again on August 1, 2015, reducing the maximum borrowing amount to $55,000,000. Borrowings under the Credit Agreement are secured by assets of the Fund that are held by the Fund’s custodian in a separate account (the “Pledged Collateral”). Under the terms of the Credit Agreement, BNP was permitted in its discretion, with 270 calendar days advance notice (the “Notice Period”), to reduce or call the entire Initial Maximum Commitment. Interest on the borrowing was charged at the one month LIBOR (London Inter‐bank Offered Rate) plus 0.80% on the amount borrowed, until the August 1, 2015 amendment when it was changed to one month LIBOR plus 0.85%. Under the terms of the August 1, 2015 amendment to the Credit Agreement, the Fund must pay a commitment fee of 0.60% on the excess unused financing which exceeds 90% of the maximum borrowing amount. For the year ended November 30, 2015, the average amount borrowed under the Credit Agreement and the average interest rate for the amount borrowed were $53,556,784 and 1.00%, respectively. Due to the short term nature of the Credit Agreement, face value approximates fair value at November 30, 2015. This fair value is based on Level 2 inputs under the three‐tier fair valuation hierarchy (see Note 2). As of November 30, 2015, the amount of such outstanding borrowings was $50,000,000. The interest rate applicable to the borrowings on November 30, 2015 was 1.09%. As of November 30, 2015, the amount of Pledged Collateral was $370,808,225. Securities pledged as collateral are notated on the Consolidated Portfolio of Investments. The Lending Agreement is a separate side‐agreement between the Fund and BNP pursuant to which BNP may borrow a portion of the Pledged Collateral (the “Lent Securities”) in an amount not to exceed the outstanding borrowings owed by the Fund to BNP under the Credit Agreement. The Lending Agreement is intended to permit the Fund to reduce the cost of its borrowings under the Credit Agreement. BNP has the ability to reregister the Lent Securities in its own name or in another name other than the Fund to pledge, re‐pledge, sell, lend or otherwise transfer or use the collateral with all attendant rights of ownership. The Fund may designate any security within the Pledged Collateral as ineligible to be a Lent Security, provided there are eligible securities within the Pledged Collateral in an amount equal to the outstanding borrowing owed by the Fund. During the period in which the Lent Securities are outstanding, BNP must remit payment to the Fund equal to the amount of all dividends, interest or other distributions earned or made by the Lent Securities. The Fund receives income from BNP based on the value of the Lent Securities. This income is recorded as Securities lending income on the Consolidated Statement of Operations. Under the terms of the Lending Agreement, the Lent Securities are marked to market daily, and if the value of the Lent Securities exceeds the value of the then‐outstanding borrowings owed by the Fund to BNP under the Credit Agreement (the “Current Borrowings”), BNP must, on that day, either (1) return Lent Securities to the Fund’s custodian in an amount sufficient to cause the value of the outstanding Lent Securities to equal the Current Borrowings; or (2) post cash collateral with
Notes to Consolidated Boulder Growth & Income Fund, Inc. Financial Statements
November 30, 2015
34 www.boulderfunds.net
the Fund’s custodian equal to the difference between the value of the Lent Securities and the value of the Current Borrowings. If BNP fails to perform either of these actions as required, the Fund will recall securities, as discussed below, in an amount sufficient to cause the value of the outstanding Lent Securities to equal the Current Borrowings. The Fund can recall any of the Lent Securities and BNP shall, to the extent commercially possible, return such security or equivalent security to the Fund’s custodian no later than three business days after such request. If the Fund recalls a Lent Security pursuant to the Lending Agreement, and BNP fails to return the Lent Securities or equivalent securities in a timely fashion, BNP shall remain liable to the Fund’s custodian for the ultimate delivery of such Lent Securities, or equivalent securities, and for any buy‐in costs that the executing broker for the sales transaction may impose with respect to the failure to deliver. The Fund shall also have the right to apply and set‐off an amount equal to one hundred percent (100%) of the then‐current fair market value of such Lent Securities against the Current Borrowings. As of November 30, 2015, the value of securities on loan was $29,187,357. As the Fund has the ability to offset the fair value of any Lent Securities not returned from BNP against an equal amount of Current Borrowings outstanding, the Fund had no net exposure from the Lending Agreement as of November 30, 2015. The Board has approved the Credit Agreement and the Lending Agreement. No violations of the Credit Agreement or the Lending Agreement occurred during the year ended November 30, 2015.
NOTE 15. FUND REORGANIZATION The Reorganization was approved by the Boards of Directors of the Fund and the Acquired Funds on November 4, 2013 and by the stockholders of the Fund and the Acquired Funds on November 14, 2014. The Reorganization combined four Funds that had similar investment objectives, policies and risk profiles to achieve certain economies of scale, enhanced liquidity and other operational efficiencies for the Funds and their stockholders. In addition, the Funds had overlaps in advisory personnel and portfolio management. Pursuant to that certain Agreement and Plan of Reorganization, dated as of March 5, 2015, the Fund acquired all of the assets and liabilities of the Acquired Funds in exchange for common shares of the Fund. Stockholders of the Acquired Funds became stockholders of the Fund. Fractional shares were paid in cash. The Reorganization qualified as a U.S. tax‐free reorganization under the Internal Revenue Code for U.S. federal income tax purposes.
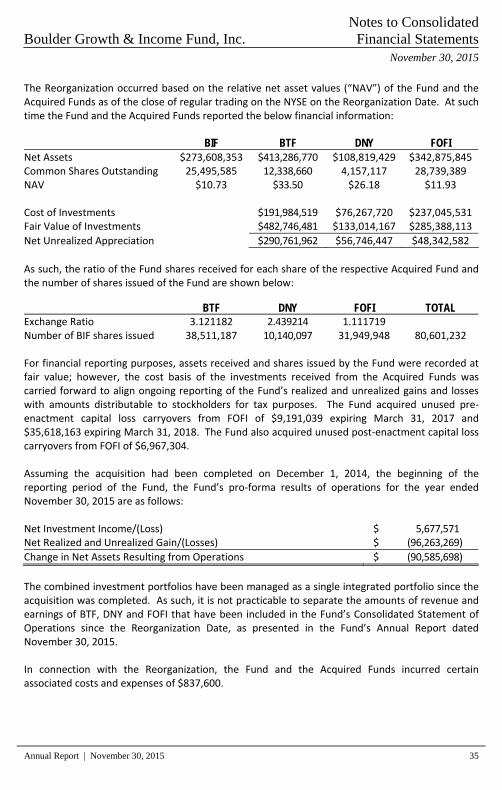
Notes to Consolidated Boulder Growth & Income Fund, Inc. Financial Statements
November 30, 2015
Annual Report | November 30, 2015 35
The Reorganization occurred based on the relative net asset values (“NAV”) of the Fund and the Acquired Funds as of the close of regular trading on the NYSE on the Reorganization Date. At such time the Fund and the Acquired Funds reported the below financial information: BIF BTF DNY FOFI Net Assets $273,608,353 $413,286,770 $108,819,429 $342,875,845 Common Shares Outstanding 25,495,585 12,338,660 4,157,117 28,739,389 NAV $10.73 $33.50 $26.18 $11.93 Cost of Investments $191,984,519 $76,267,720 $237,045,531 Fair Value of Investments $482,746,481 $133,014,167 $285,388,113
Net Unrealized Appreciation $290,761,962 $56,746,447 $48,342,582
As such, the ratio of the Fund shares received for each share of the respective Acquired Fund and the number of shares issued of the Fund are shown below:
BTF DNY FOFI TOTAL Exchange Ratio 3.121182 2.439214 1.111719 Number of BIF shares issued 38,511,187 10,140,097 31,949,948 80,601,232 For financial reporting purposes, assets received and shares issued by the Fund were recorded at fair value; however, the cost basis of the investments received from the Acquired Funds was carried forward to align ongoing reporting of the Fund’s realized and unrealized gains and losses with amounts distributable to stockholders for tax purposes. The Fund acquired unused pre‐enactment capital loss carryovers from FOFI of $9,191,039 expiring March 31, 2017 and $35,618,163 expiring March 31, 2018. The Fund also acquired unused post‐enactment capital loss carryovers from FOFI of $6,967,304. Assuming the acquisition had been completed on December 1, 2014, the beginning of the reporting period of the Fund, the Fund’s pro‐forma results of operations for the year ended November 30, 2015 are as follows: Net Investment Income/(Loss) $ 5,677,571 Net Realized and Unrealized Gain/(Losses) $ (96,263,269)
Change in Net Assets Resulting from Operations $ (90,585,698)
The combined investment portfolios have been managed as a single integrated portfolio since the acquisition was completed. As such, it is not practicable to separate the amounts of revenue and earnings of BTF, DNY and FOFI that have been included in the Fund’s Consolidated Statement of Operations since the Reorganization Date, as presented in the Fund’s Annual Report dated November 30, 2015. In connection with the Reorganization, the Fund and the Acquired Funds incurred certain associated costs and expenses of $837,600.
Notes to Consolidated Boulder Growth & Income Fund, Inc. Financial Statements
November 30, 2015
36 www.boulderfunds.net
NOTE 16. SUBSEQUENT EVENTS
Stockholder Distributions: On December 31, 2015 the Fund paid a distribution of $0.1225 per share to stockholders of record as of December 24, 2015. The distribution was inclusive of the $0.033 per share monthly managed distribution payment. On January 12, 2016, the Fund declared the regularly scheduled monthly distribution of $0.033 to stockholders of record as of January 22, 2016.
17. RECENT ACCOUNTING PRONOUNCEMENTS
In May 2015, the Financial Accounting Standards Board ("FASB") issued Accounting Standards Update (“ASU”) 2015‐07, “Disclosures for Investments in Certain Entities that Calculate Net Asset Value Per Share (or its Equivalent).” This is an update to Accounting Standards Codification Topic 820, Fair Value Measurement. ASU 2015‐07 removes the requirement to categorize within the fair value hierarchy investments for which fair value is measured at net asset value per share (or its equivalent) using the practical expedient.
ASU 2015‐07 is effective for annual reporting periods beginning on or after December 15, 2015, and interim periods within those annual periods, with retrospective application for all periods presented. Management has elected to early adopt ASU 2015‐07, and the disclosures in Note 2 are presented accordingly.
Report of Independent Registered Boulder Growth & Income Fund, Inc. Public Accounting Firm
Annual Report | November 30, 2015 37
To the Stockholders and Board of Directors of Boulder Growth & Income Fund, Inc.: We have audited the accompanying consolidated statement of assets and liabilities of Boulder Growth & Income Fund, Inc. (the “Fund”), including the consolidated portfolio of investments, as of November 30, 2015, and the related consolidated statements of operations and cash flows for the year then ended, the consolidated statements of changes in net assets for each of the two years in the period then ended, and the financial highlights for each of the five years in the period then ended. These financial statements and financial highlights are the responsibility of the Fund’s management. Our responsibility is to express an opinion on these financial statements and financial highlights based on our audits. We conducted our audits in accordance with the standards of the Public Company Accounting Oversight Board (United States). Those standards require that we plan and perform the audit to obtain reasonable assurance about whether the financial statements and financial highlights are free of material misstatement. The Fund is not required to have, nor were we engaged to perform, an audit of its internal control over financial reporting. Our audits included consideration of internal control over financial reporting as a basis for designing audit procedures that are appropriate in the circumstances, but not for the purpose of expressing an opinion on the effectiveness of the Fund’s internal control over financial reporting. Accordingly, we express no such opinion. An audit also includes examining, on a test basis, evidence supporting the amounts and disclosures in the financial statements, assessing the accounting principles used and significant estimates made by management, as well as evaluating the overall financial statement presentation. Our procedures included confirmation of securities owned as of November 30, 2015, by correspondence with the custodian and hedge fund manager. We believe that our audits provide a reasonable basis for our opinion. In our opinion, such consolidated financial statements and financial highlights referred to above present fairly, in all material respects, the financial position of Boulder Growth & Income Fund, Inc. as of November 30, 2015, the results of its operations and its cash flows for the year then ended, the changes in its net assets for each of the two years in the period then ended, and the financial highlights for each of the five years in the period then ended, in conformity with accounting principles generally accepted in the United States of America. DELOITTE & TOUCHE LLP Denver, Colorado January 29, 2016
Boulder Growth & Income Fund, Inc. Additional Information November 30, 2015 (Unaudited)
38 www.boulderfunds.net
PORTFOLIO INFORMATION The Fund files its complete schedule of portfolio holdings with the SEC for the first and third quarters of each fiscal year on Form N‐Q. The Fund’s Forms N‐Q are available (i) on the Fund’s website at www.boulderfunds.net; (ii) on the SEC’s website at www.sec.gov; or (iii) for review and copying at the SEC’s Public Reference Room (“PRR”) in Washington, DC. Information regarding the operation of the PRR may be obtained by calling 1‐800‐SEC‐0330. PROXY VOTING The policies and procedures used by the Fund to determine how to vote proxies relating to portfolio securities held by the Fund are available, without charge, (i) on the Fund’s website located at www.boulderfunds.net, (ii) on the SEC’s website at www.sec.gov, or (iii) by calling toll‐free (877) 561‐7914. Information regarding how the Fund voted proxies relating to portfolio securities during the most recent twelve‐month period ended June 30 is available at www.sec.gov. SENIOR OFFICER CODE OF ETHICS The Fund files a copy of its code of ethics that applies to its principal executive officer, principal financial officer or controller, or persons performing similar functions (the “Senior Officer Code of Ethics”), with the SEC as an exhibit to its annual report on Form N‐CSR. The Fund’s Senior Officer Code of Ethics is available on the Fund’s website located at www.boulderfunds.net. PRIVACY STATEMENT Pursuant to SEC Regulation S‐P (Privacy of Consumer Financial Information) the Board established the following policy regarding information about the Fund’s stockholders. We consider all stockholder data to be private and confidential, and we hold ourselves to the highest standards in its safekeeping and use. General Statement. The Fund may collect nonpublic information (e.g., your name, address, email address, Social Security Number, Fund holdings (collectively, “Personal Information”)) about stockholders from transactions in Fund shares. The Fund will not release Personal Information about current or former stockholders (except as permitted by law) unless one of the following conditions is met: (i) we receive your prior written consent; (ii) we believe the recipient to be you or your authorized representative; (iii) to service or support the business functions of the Fund (as explained in more detail below), or (iv) we are required by law to release Personal Information to the recipient. The Fund has not and will not in the future give or sell Personal Information about its current or former stockholders to any company, individual, or group (except as permitted by law) and as otherwise provided in this policy. In the future, the Fund may make certain electronic services available to its stockholders and may solicit your email address and contact you by email, telephone or U.S. mail regarding the availability of such services. The Fund may also contact stockholders by email, telephone or U.S. mail in connection with these services, such as to confirm enrollment in electronic stockholder communications or to update your Personal Information. In no event will the Fund transmit your Personal Information via email without your consent.
Boulder Growth & Income Fund, Inc. Additional Information November 30, 2015 (Unaudited)
Annual Report | November 30, 2015 39
Use of Personal Information. The Fund will only use Personal Information (i) as necessary to service or maintain stockholder accounts in the ordinary course of business and (ii) to support business functions of the Fund and its affiliated businesses. This means that the Fund may share certain Personal Information, only as permitted by law, with affiliated businesses of the Fund, and that such information may be used for non‐Fund‐related solicitation. When Personal Information is shared with the Fund’s business affiliates, the Fund may do so without providing you the option of preventing these types of disclosures as permitted by law. Safeguards Regarding Personal Information. Internally, we also restrict access to Personal Information to those who have a specific need for the records. We maintain physical, electronic, and procedural safeguards that comply with federal standards to guard Personal Information. Any doubts about the confidentiality of Personal Information, as required by law, are resolved in favor of confidentiality. NOTICE TO STOCKHOLDERS
The Fund designates the following as a percentage of taxable ordinary income distributions, or up to the maximum amount allowable, for the calendar year ended December 31, 2014: Qualified Dividend Income: 100.00% Dividend Received Deduction: 100.00% In early 2015, if applicable, stockholders of record received this information for the distributions paid to them by the Funds during the calendar year 2014 via Form 1099. The Funds will notify stockholders in early 2016 of amounts paid to them by the Funds, if any, during the calendar year 2015. Pursuant to Section 852(b)(3) of the Internal Revenue Code, the Fund designated $7,500,036 as long‐term capital gain dividends. SECTION 19(A) NOTICES The following table sets forth the estimated amount of the sources of distribution for purposes of Section 19 of the Investment Company Act of 1940, as amended, and the related rules adopted thereunder. The Fund estimates the following percentages, of the total distribution amount per share, attributable to (i) current and prior fiscal year net investment income, (ii) net realized short‐term capital gain, (iii) net realized long‐term capital gain and (iv) return of capital or other capital source as a percentage of the total distribution amount. These percentages are disclosed for the fiscal year‐to‐date cumulative distribution amount per share for the Fund. The amounts and sources of distributions reported in these 19(a) notices are only estimates and not for tax reporting purposes. The actual amounts and sources of the amounts for tax reporting purposes will depend upon the Fund’s investment experience during the remainder of its fiscal year and may be subject to changes based on tax regulations. The Fund will send you a Form 1099‐DIV for the calendar year that will tell you how to report these distributions for federal income tax purposes.
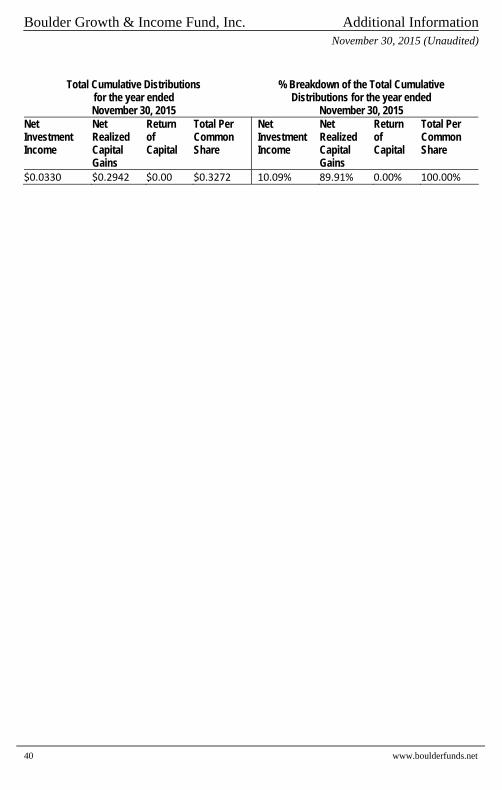
Boulder Growth & Income Fund, Inc. Additional Information November 30, 2015 (Unaudited)
40 www.boulderfunds.net
Total Cumulative Distributions
for the year ended November 30, 2015
% Breakdown of the Total Cumulative Distributions for the year ended
November 30, 2015 Net Investment Income
Net Realized Capital Gains
Return of Capital
Total Per Common Share
Net Investment Income
Net Realized Capital Gains
Return of Capital
Total Per Common Share
$0.0330 $0.2942 $0.00 $0.3272 10.09% 89.91% 0.00% 100.00%
Summary of Dividend Boulder Growth & Income Fund, Inc. Reinvestment Plan
November 30, 2015 (Unaudited)
Annual Report | November 30, 2015 41
Registered holders (“Common Stockholders”) of common shares (the “Common Shares”) are automatically enrolled (the “Participants”) in the Fund’s Dividend Reinvestment Plan (the “Plan”) whereupon all distributions of income, capital gains or managed distributions (“Distributions”) are automatically reinvested in additional Common Shares. Common Stockholders who elect to not participate in the Plan will receive all distributions in cash paid by check in U.S. dollars mailed directly to the stockholders of record (or if the shares are held in street name or other nominee name, then the nominee) by the custodian, as dividend disbursing agent. Computershare Shareowner Services (the “Agent”) serves as Agent for each Participant in administering the Plan. After the Fund declares a Distribution, if (1) the net asset value per Common Share is equal to or less than the market price per Common Share plus estimated brokerage commissions on the payment date for a Distribution, Participants will be issued Common Shares at the higher of net asset value per Common Share or 95% of the market price per Common Share on the payment date; or if (2) the net asset value per Common Share exceeds the market price plus estimated brokerage commissions on the payment date for a Distribution, the Agent shall apply the amount of such Distribution to purchase Common Shares on the open market and Participants will receive the equivalent in Common Shares valued at the weighted average market price (including brokerage commissions) determined as of the time of the purchase (generally, following the payment date of the Distribution). If, before the Agent has completed its purchases, the market price plus estimated brokerage commissions exceeds the net asset value of the Common Shares as of the payment date, the purchase price paid by the Agent may exceed the net asset value of the Common Shares, resulting in the acquisition of fewer Common Shares than if such Distribution had been paid in Common Shares issued by the Fund. If the Agent is unable to invest the full Distribution amount in purchases in the open market or if the market discount shifts to a market premium during the purchase period then the Agent may cease making purchases in the open market the instant the Agent is notified of a market premium and may invest the uninvested portion of the Distribution in newly issued Common Shares at the net asset value per Common Share at the close of business provided that, if the net asset value is less than or equal to 95% of the then current market price per Common Share, the dollar amount of the Distribution will be divided by 95% of the market price on the payment date. The Fund will not issue Common Shares under the Plan below net asset value. There is no charge to Participants for reinvesting Distributions, except for certain brokerage commissions, as described below. The Agent’s fees for the handling of the reinvestment of Distributions will be paid by the Fund. There will be no brokerage commissions charged with respect to shares issued directly by the Fund. However, each Participant will pay a pro rata share of brokerage commissions incurred with respect to the Agent’s open market purchase in connection with the reinvestment of Distributions. The automatic reinvestment of Distributions will not relieve Participants of any federal income tax that may be payable on such Distributions. The Fund reserves the right to amend or terminate the Plan upon 90 days’ written notice to Common Stockholders of the Fund.

Summary of Dividend Boulder Growth & Income Fund, Inc. Reinvestment Plan
November 30, 2015 (Unaudited)
42 www.boulderfunds.net
Participants in the Plan may (i) request a certificate, (ii) request to sell their shares, or (iii) withdraw from the Plan upon written notice to the Agent or by telephone in accordance with the specific procedures and will receive certificates for whole Common Shares and cash for fractional Common Shares. All correspondence concerning the Plan should be directed to the Agent, Computershare, P.O. Box 30170, College Station, TX, 77842‐3170. To receive a full copy of the Fund’s Dividend Reinvestment Plan, please contact the Agent at 1‐866‐228‐4853.
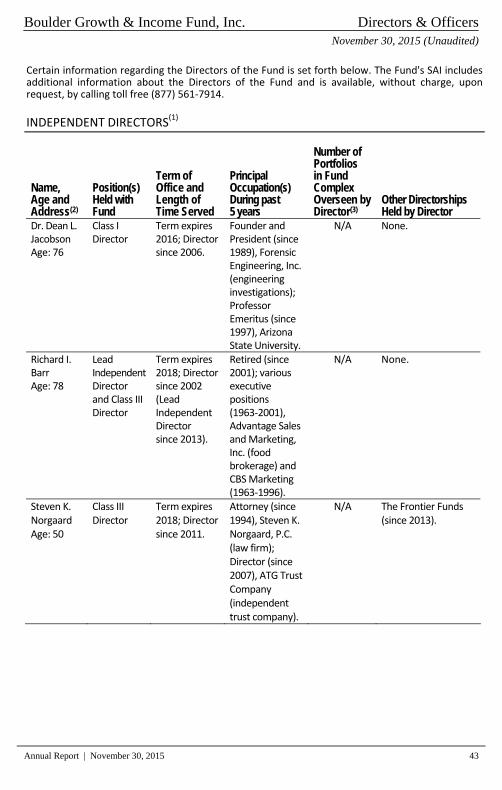
Boulder Growth & Income Fund, Inc. Directors & Officers November 30, 2015 (Unaudited)
Annual Report | November 30, 2015 43
Certain information regarding the Directors of the Fund is set forth below. The Fund's SAI includes additional information about the Directors of the Fund and is available, without charge, upon request, by calling toll free (877) 561‐7914.
INDEPENDENT DIRECTORS(1)
Name, Age and Address(2)
Position(s) Held with Fund
Term of Office and Length of Time Served
Principal Occupation(s) During past 5 years
Number of Portfolios in Fund Complex
Overseen by Director(3)
Other Directorships Held by Director
Dr. Dean L. Jacobson Age: 76
Class I Director
Term expires 2016; Director since 2006.
Founder and President (since 1989), Forensic Engineering, Inc. (engineering investigations); Professor Emeritus (since 1997), Arizona State University.
N/A None.
Richard I. Barr Age: 78
Lead Independent Director and Class III Director
Term expires 2018; Director since 2002 (Lead Independent Director since 2013).
Retired (since 2001); various executive positions (1963‐2001), Advantage Sales and Marketing, Inc. (food brokerage) and CBS Marketing (1963‐1996).
N/A None.
Steven K. Norgaard Age: 50
Class III Director
Term expires 2018; Director since 2011.
Attorney (since 1994), Steven K. Norgaard, P.C. (law firm); Director (since 2007), ATG Trust Company (independent trust company).
N/A The Frontier Funds (since 2013).
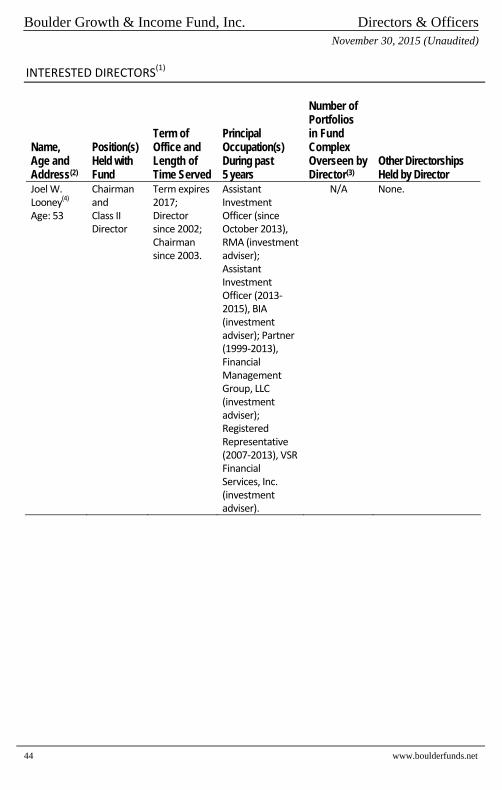
Boulder Growth & Income Fund, Inc. Directors & Officers November 30, 2015 (Unaudited)
44 www.boulderfunds.net
INTERESTED DIRECTORS(1)
Name, Age and Address(2)
Position(s) Held with Fund
Term of Office and Length of Time Served
Principal Occupation(s) During past 5 years
Number of Portfolios in Fund Complex
Overseen by Director(3)
Other Directorships Held by Director
Joel W. Looney(4) Age: 53
Chairman and Class II Director
Term expires 2017; Director since 2002; Chairman since 2003.
Assistant Investment Officer (since October 2013), RMA (investment adviser); Assistant Investment Officer (2013‐2015), BIA (investment adviser); Partner (1999‐2013), Financial Management Group, LLC (investment adviser); Registered Representative (2007‐2013), VSR Financial Services, Inc. (investment adviser).
N/A None.
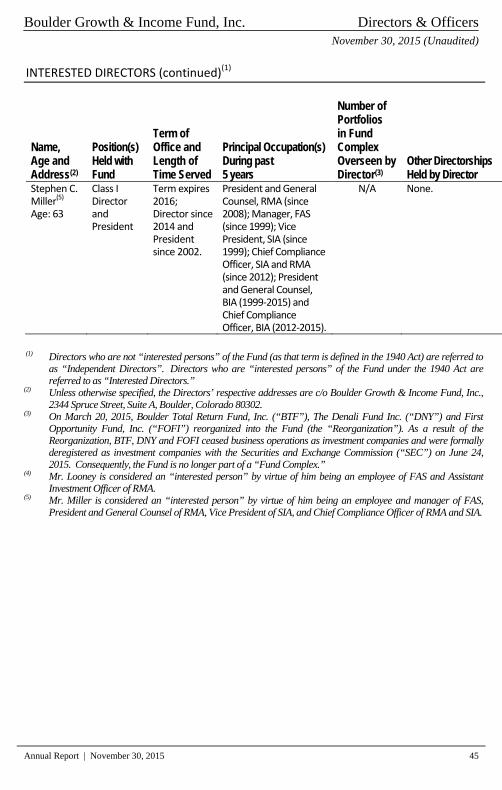
Boulder Growth & Income Fund, Inc. Directors & Officers November 30, 2015 (Unaudited)
Annual Report | November 30, 2015 45
INTERESTED DIRECTORS (continued)(1)
Name, Age and Address(2)
Position(s) Held with Fund
Term of Office and Length of Time Served
Principal Occupation(s) During past 5 years
Number of Portfolios in Fund Complex
Overseen by Director(3)
Other Directorships Held by Director
Stephen C. Miller(5) Age: 63
Class I Director and President
Term expires 2016; Director since 2014 and President since 2002.
President and General Counsel, RMA (since 2008); Manager, FAS (since 1999); Vice President, SIA (since 1999); Chief Compliance Officer, SIA and RMA (since 2012); President and General Counsel, BIA (1999‐2015) and Chief Compliance Officer, BIA (2012‐2015).
N/A None.
(1) Directors who are not “interested persons” of the Fund (as that term is defined in the 1940 Act) are referred to
as “Independent Directors”. Directors who are “interested persons” of the Fund under the 1940 Act are referred to as “Interested Directors.”
(2) Unless otherwise specified, the Directors’ respective addresses are c/o Boulder Growth & Income Fund, Inc., 2344 Spruce Street, Suite A, Boulder, Colorado 80302.
(3) On March 20, 2015, Boulder Total Return Fund, Inc. (“BTF”), The Denali Fund Inc. (“DNY”) and First Opportunity Fund, Inc. (“FOFI”) reorganized into the Fund (the “Reorganization”). As a result of the Reorganization, BTF, DNY and FOFI ceased business operations as investment companies and were formally deregistered as investment companies with the Securities and Exchange Commission (“SEC”) on June 24, 2015. Consequently, the Fund is no longer part of a “Fund Complex.”
(4) Mr. Looney is considered an “interested person” by virtue of him being an employee of FAS and Assistant Investment Officer of RMA.
(5) Mr. Miller is considered an “interested person” by virtue of him being an employee and manager of FAS, President and General Counsel of RMA, Vice President of SIA, and Chief Compliance Officer of RMA and SIA.
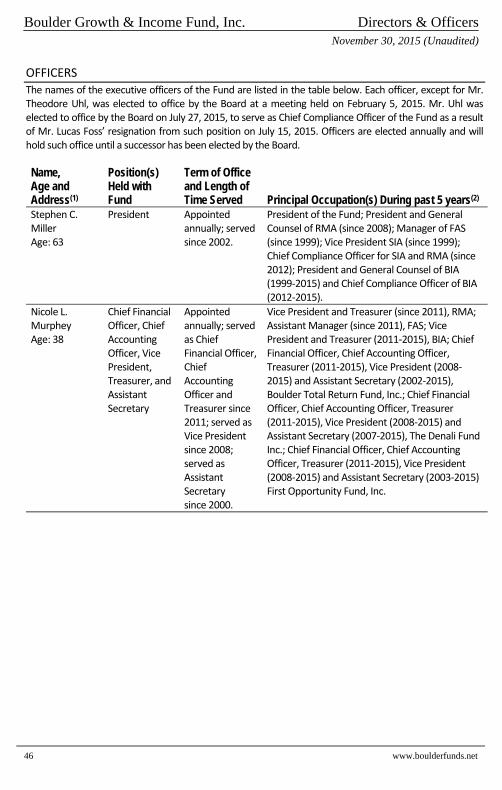
Boulder Growth & Income Fund, Inc. Directors & Officers November 30, 2015 (Unaudited)
46 www.boulderfunds.net
OFFICERS The names of the executive officers of the Fund are listed in the table below. Each officer, except for Mr. Theodore Uhl, was elected to office by the Board at a meeting held on February 5, 2015. Mr. Uhl was elected to office by the Board on July 27, 2015, to serve as Chief Compliance Officer of the Fund as a result of Mr. Lucas Foss’ resignation from such position on July 15, 2015. Officers are elected annually and will hold such office until a successor has been elected by the Board. Name, Age and Address(1)
Position(s) Held with Fund
Term of Office and Length of Time Served Principal Occupation(s) During past 5 years(2)
Stephen C. Miller Age: 63
President Appointed annually; served since 2002.
President of the Fund; President and General Counsel of RMA (since 2008); Manager of FAS (since 1999); Vice President SIA (since 1999); Chief Compliance Officer for SIA and RMA (since 2012); President and General Counsel of BIA (1999‐2015) and Chief Compliance Officer of BIA (2012‐2015).
Nicole L. Murphey Age: 38
Chief Financial Officer, Chief Accounting Officer, Vice President, Treasurer, and Assistant Secretary
Appointed annually; served as Chief Financial Officer, Chief Accounting Officer and Treasurer since 2011; served as Vice President since 2008; served as Assistant Secretary since 2000.
Vice President and Treasurer (since 2011), RMA; Assistant Manager (since 2011), FAS; Vice President and Treasurer (2011‐2015), BIA; Chief Financial Officer, Chief Accounting Officer, Treasurer (2011‐2015), Vice President (2008‐2015) and Assistant Secretary (2002‐2015), Boulder Total Return Fund, Inc.; Chief Financial Officer, Chief Accounting Officer, Treasurer (2011‐2015), Vice President (2008‐2015) and Assistant Secretary (2007‐2015), The Denali Fund Inc.; Chief Financial Officer, Chief Accounting Officer, Treasurer (2011‐2015), Vice President (2008‐2015) and Assistant Secretary (2003‐2015) First Opportunity Fund, Inc.
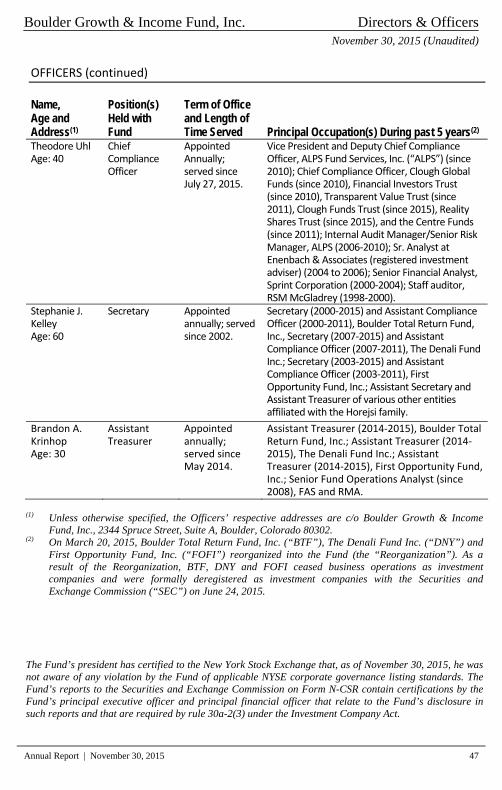
Boulder Growth & Income Fund, Inc. Directors & Officers November 30, 2015 (Unaudited)
Annual Report | November 30, 2015 47
OFFICERS (continued)
Name, Age and Address(1)
Position(s) Held with Fund
Term of Office and Length of Time Served Principal Occupation(s) During past 5 years(2)
Theodore Uhl Age: 40
Chief Compliance Officer
Appointed Annually; served since July 27, 2015.
Vice President and Deputy Chief Compliance Officer, ALPS Fund Services, Inc. (“ALPS”) (since 2010); Chief Compliance Officer, Clough Global Funds (since 2010), Financial Investors Trust (since 2010), Transparent Value Trust (since 2011), Clough Funds Trust (since 2015), Reality Shares Trust (since 2015), and the Centre Funds (since 2011); Internal Audit Manager/Senior Risk Manager, ALPS (2006‐2010); Sr. Analyst at Enenbach & Associates (registered investment adviser) (2004 to 2006); Senior Financial Analyst, Sprint Corporation (2000‐2004); Staff auditor, RSM McGladrey (1998‐2000).
Stephanie J. Kelley Age: 60
Secretary Appointed annually; served since 2002.
Secretary (2000‐2015) and Assistant Compliance Officer (2000‐2011), Boulder Total Return Fund, Inc., Secretary (2007‐2015) and Assistant Compliance Officer (2007‐2011), The Denali Fund Inc.; Secretary (2003‐2015) and Assistant Compliance Officer (2003‐2011), First Opportunity Fund, Inc.; Assistant Secretary and Assistant Treasurer of various other entities affiliated with the Horejsi family.
Brandon A. Krinhop Age: 30
Assistant Treasurer
Appointed annually; served since May 2014.
Assistant Treasurer (2014‐2015), Boulder Total Return Fund, Inc.; Assistant Treasurer (2014‐2015), The Denali Fund Inc.; Assistant Treasurer (2014‐2015), First Opportunity Fund, Inc.; Senior Fund Operations Analyst (since 2008), FAS and RMA.
(1) Unless otherwise specified, the Officers’ respective addresses are c/o Boulder Growth & Income
Fund, Inc., 2344 Spruce Street, Suite A, Boulder, Colorado 80302. (2) On March 20, 2015, Boulder Total Return Fund, Inc. (“BTF”), The Denali Fund Inc. (“DNY”) and
First Opportunity Fund, Inc. (“FOFI”) reorganized into the Fund (the “Reorganization”). As a result of the Reorganization, BTF, DNY and FOFI ceased business operations as investment companies and were formally deregistered as investment companies with the Securities and Exchange Commission (“SEC”) on June 24, 2015.
The Fund’s president has certified to the New York Stock Exchange that, as of November 30, 2015, he was not aware of any violation by the Fund of applicable NYSE corporate governance listing standards. The Fund’s reports to the Securities and Exchange Commission on Form N-CSR contain certifications by the Fund’s principal executive officer and principal financial officer that relate to the Fund’s disclosure in such reports and that are required by rule 30a-2(3) under the Investment Company Act.

The views expressed in this report and the information about the Fund’s portfolio holdings are for the period covered by this report and are subject to change thereafter.
Statistics and projections in this report are derived from sources deemed to be reliable but cannot be regarded as a representation of future results of the Fund. This report is prepared for the general information of stockholders and is not a prospectus, circular or representation intended for use in the purchase or sale of shares of the Fund or of any securities mentioned in this report.
www.boulderfunds.net
DIRECTORS Richard I. Barr Dr. Dean L. Jacobson Joel W. Looney Stephen C. Miller Steven K. Norgaard
CO-INVESTMENT Stewart Investment Advisers ADVISERS Rocky Mountain Advisers, LLC 2344 Spruce Street, Suite A Boulder, CO 80302
CO-ADMINISTRATOR Fund Administrative Services, LLC 2344 Spruce Street, Suite A Boulder, CO 80302
CO-ADMINISTRATOR ALPS Fund Services, Inc. 1290 Broadway, Suite 1100 Denver, CO 80203
CUSTODIAN Bank of New York Mellon One Wall Street New York, NY 10286
STOCK TRANSFER Computershare AGENT 480 Washington Blvd. Jersey City, NJ 07310
INDEPENDENT Deloitte & Touche LLP REGISTERED PUBLIC 555 17th Street, Suite 3600 ACCOUNTING FIRM Denver, CO 80202
LEGAL COUNSEL Paul Hastings, LLP 515 South Flower Street Twenty-Fifth Floor Los Angeles, CA 90071
BOULDER GROWTH &
INCOME FUND, INC.
c/o Com
putershare480 W
ashington Blvd.
Jersey City, N
J 07310