Embed Size (px)
Citation preview
ANNUAL REPORT
For the year ended: 31 March 2017
Network Waitaki Limited Annual Report for the year ended 31 March 2017 1 | P a g e
CONTENTS
Directory 2
Annual Review 3
Directors’ Report 6
Company Trend Statement 9
Directors’ Responsibility Statement 10
FINANCIAL STATEMENTS
Statement of Comprehensive Income 11
Statement of Changes in Equity 11
Statement of Financial Position 12
Statement of Cash Flows 13
Notes to the Financial Statements 14
Statement of Service Performance 30
Auditors Report 32

Network Waitaki Limited Annual Report for the year ended 31 March 2017 2 | P a g e
DIRECTORY
WAITAKI POWER TRUST
DIRECTORS: TRUSTEES:
Mrs. C. M. Kearney (Chairman) Dr. H. F. Brookes (Chairman)
Mr. D. Atkinson Mr. A. J. Brady
Mr. C. J. Dennison Mr. J. Clements
Mr. D. A. Ruddenklau Mr. H. J. Tonkin
Mr. J. D. Walker Mr. J. Webster
Mr. A. J. Wood
SOLICITORS: AUDITORS:
Berry & Co., Eden Street Nathan Wylie
Oamaru PricewaterhouseCoopers
Christchurch
ON BEHALF OF The Auditor-General
REGISTERED OFFICE:
10 Chelmer Street, Oamaru
CHIEF EXECUTIVE PRINCIPAL BANKERS
Mr. G. B. Clark ANZ, The Octagon, Dunedin

Network Waitaki Limited Annual Report for the year ended 31 March 2017 3 | P a g e
ANNUAL REVIEW
Message from Chairman and Chief Executive
Introduction It is with pleasure that we present the 2017 Network Waitaki Annual Report. The Annual Report provides the opportunity for the Company to report on its performance during the past year and highlight influences that potentially will impact on electricity distribution businesses through emerging technologies and regulatory reviews. From a regulatory perspective, we have embarked on a distribution price structure review. Our Industry is changing with new and exciting technologies entering the market. Network Waitaki intends to stay informed with developments that will impact our network and consumers, ensuring our prices reflect the service we provide and the expectations of our community. The Transmission Pricing methodology guidelines, currently being developed by the Electricity Authority, have the potential for impact on our tariffs to consumers. We have fully communicated our concerns to the Electricity Authority through the submission process. Progress has also been made in terms of signing up retailers to our new Use of System Agreement. The Electricity Authority is of the view that Default Distribution Agreements are necessary and we will be monitoring developments in that arena. Our intention is to work co-operatively with the Electricity Authority on developing standardised agreements. Our two-yearly customer engagement survey has been conducted and we are pleased to note that our community rated us highly in terms of provision of a reliable service. An upgrade of the Company’s logo has been undertaken to increase the visibility of the Company in the community.
Ownership Network Waitaki is owned by the Waitaki Power Trust which holds the shares in Network Waitaki for the benefit of the electricity consumers in the wider Waitaki District. The Company’s mission statement is to support the economic growth and wellbeing of the community it serves. It is necessary to ensure that the Company has sufficient capital to meet the increased demand for electricity in our region. Income comes from our distribution charges and capital contributions made by developers. Surplus revenues are returned to consumers by way of an annual discount. The Inland Revenue Department is currently scrutinising and reviewing the treatment of discounts as a reduction in revenue and therefore, a deduction for tax purposes. The Electricity Networks Association, of which we are a member, has strongly submitted on this review on behalf of our industry. Network Waitaki’s Board of Directors has a positive and constructive relationship with the Waitaki Power Trust. The Board reports on the performance of the Company, quarterly, to the Trust followed by opportunities for Directors and Trustees to discuss Company matters as required. Health and Safety of our staff and the public is imperative for Network Waitaki. Continuous improvement is expected and monitored. We have a strong focus on the provision of risk reduction processes, appropriate Personal Protection Equipment, training and equipment to ensure staff have the competencies and processes to safely perform in the workplace. The Health and Safety at Work Act 2015 has necessitated a review of all procedures. One of these has been the practice of working Live Line. This practice is seen by the Company as not meeting the requirements of the “Act to take all practical steps to eliminate the risk” and has ceased, unless the alternative creates a greater risk. The health and safety statistics show the Company had 2 Lost Time Incidents in the 2016/17 year and had a safety measure of 3.31 per 200,000 hours’ work. We are very proud of our staff and their continuous improvement in health and safety practices. Across our company, from field staff to board, there is a positive engagement in managing risk to protect others.
Network Performance The decision to work predominantly with de-energised lines, has resulted in increased planned disruptions on the Network and is reflected in the increase in customer minutes lost, as measured by System Average Incident Duration Index (SAIDI). The Company is investigating opportunities of minimising these disruptions and the SAIDI measure, by strategic use of generators, in the short term, and longer term, through Network design.
Clare Kearney Graham B. Clark
Network Waitaki Limited Annual Report for the year ended 31 March 2017 4 | P a g e
ANNUAL REVIEW (CONTINUED)
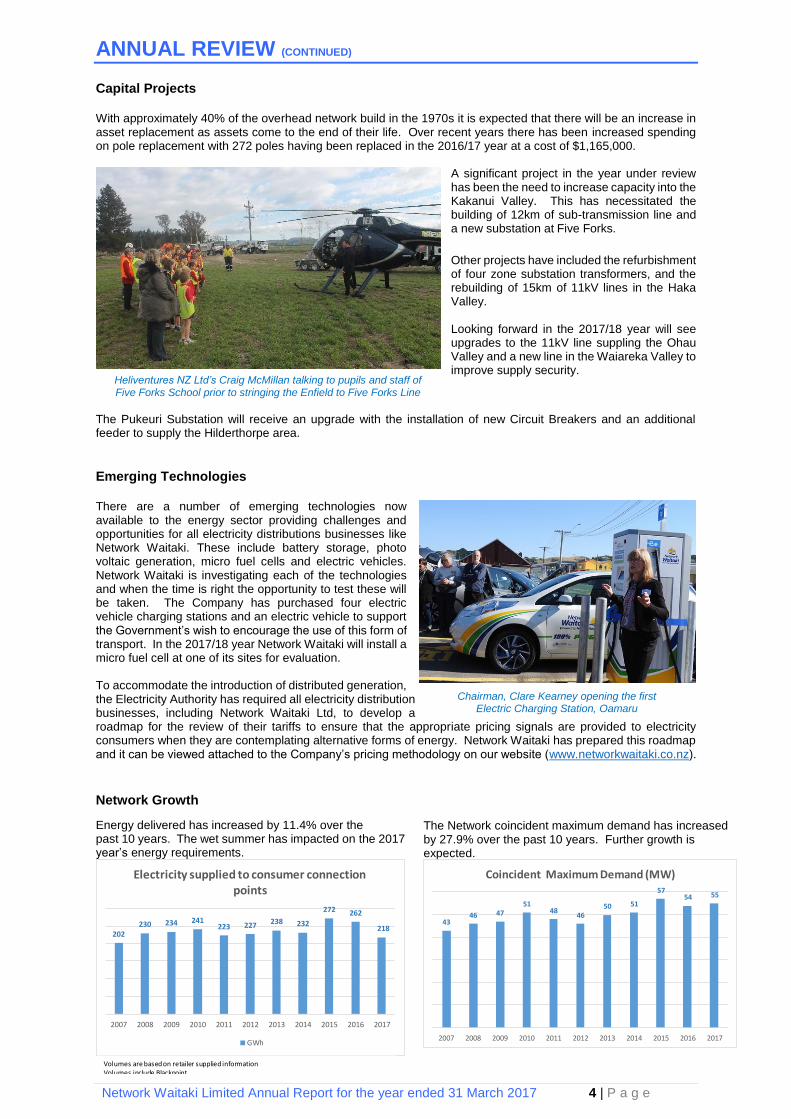
Capital Projects With approximately 40% of the overhead network build in the 1970s it is expected that there will be an increase in asset replacement as assets come to the end of their life. Over recent years there has been increased spending on pole replacement with 272 poles having been replaced in the 2016/17 year at a cost of $1,165,000.
A significant project in the year under review has been the need to increase capacity into the Kakanui Valley. This has necessitated the building of 12km of sub-transmission line and a new substation at Five Forks.
Other projects have included the refurbishment of four zone substation transformers, and the rebuilding of 15km of 11kV lines in the Haka Valley. Looking forward in the 2017/18 year will see upgrades to the 11kV line suppling the Ohau Valley and a new line in the Waiareka Valley to improve supply security.
The Pukeuri Substation will receive an upgrade with the installation of new Circuit Breakers and an additional feeder to supply the Hilderthorpe area.
Emerging Technologies There are a number of emerging technologies now available to the energy sector providing challenges and opportunities for all electricity distributions businesses like Network Waitaki. These include battery storage, photo voltaic generation, micro fuel cells and electric vehicles. Network Waitaki is investigating each of the technologies and when the time is right the opportunity to test these will be taken. The Company has purchased four electric vehicle charging stations and an electric vehicle to support the Government’s wish to encourage the use of this form of transport. In the 2017/18 year Network Waitaki will install a micro fuel cell at one of its sites for evaluation. To accommodate the introduction of distributed generation, the Electricity Authority has required all electricity distribution businesses, including Network Waitaki Ltd, to develop a roadmap for the review of their tariffs to ensure that the appropriate pricing signals are provided to electricity consumers when they are contemplating alternative forms of energy. Network Waitaki has prepared this roadmap and it can be viewed attached to the Company’s pricing methodology on our website (www.networkwaitaki.co.nz).
Network Growth
Heliventures NZ Ltd’s Craig McMillan talking to pupils and staff of Five Forks School prior to stringing the Enfield to Five Forks Line
Chairman, Clare Kearney opening the first Electric Charging Station, Oamaru
The Network coincident maximum demand has increased by 27.9% over the past 10 years. Further growth is expected.
4346 47
5148
4650 51
5754 55
2007 2008 2009 2010 2011 2012 2013 2014 2015 2016 2017
Coincident Maximum Demand (MW)
Energy delivered has increased by 11.4% over the past 10 years. The wet summer has impacted on the 2017 year’s energy requirements.
202230 234 241
223 227 238 232
272 262
218
2007 2008 2009 2010 2011 2012 2013 2014 2015 2016 2017
Electricity supplied to consumer connection points
GWh
Volumes are based on retailer supplied informationVolumes include Blackpoint
Network Waitaki Limited Annual Report for the year ended 31 March 2017 5 | P a g e
ANNUAL REVIEW (CONTINUED)
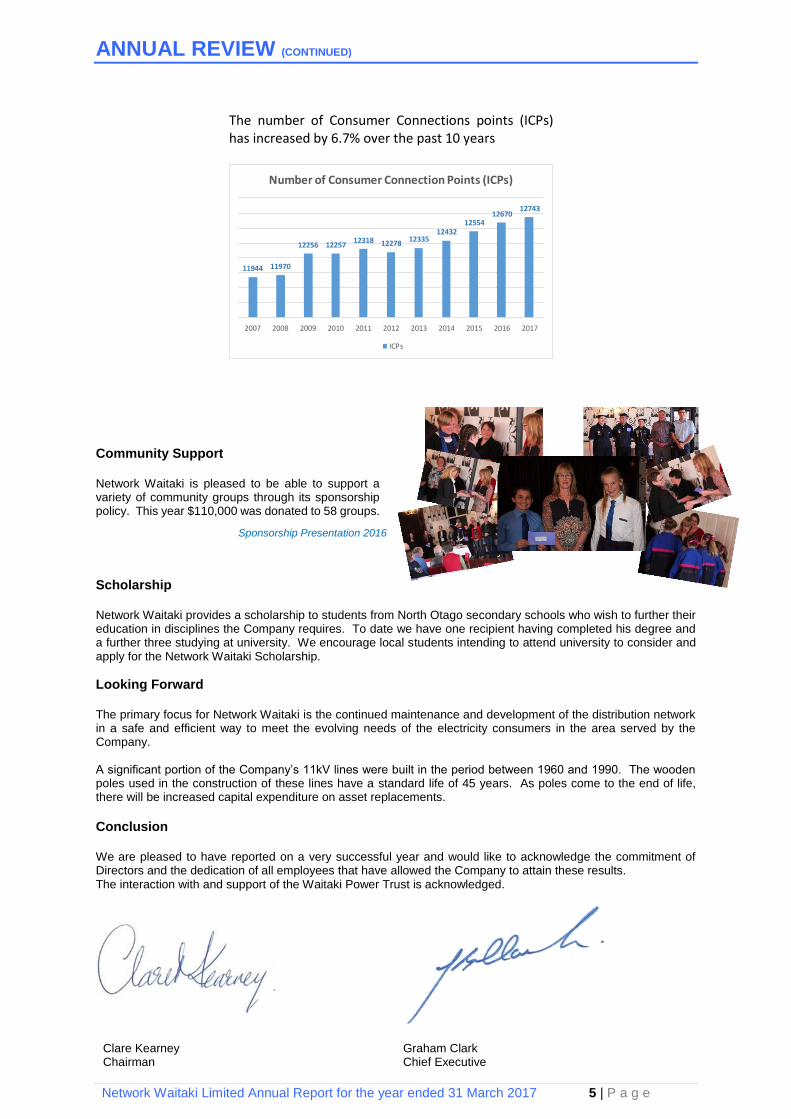
Community Support Network Waitaki is pleased to be able to support a variety of community groups through its sponsorship policy. This year $110,000 was donated to 58 groups.
Scholarship Network Waitaki provides a scholarship to students from North Otago secondary schools who wish to further their education in disciplines the Company requires. To date we have one recipient having completed his degree and a further three studying at university. We encourage local students intending to attend university to consider and apply for the Network Waitaki Scholarship.
Looking Forward The primary focus for Network Waitaki is the continued maintenance and development of the distribution network in a safe and efficient way to meet the evolving needs of the electricity consumers in the area served by the Company. A significant portion of the Company’s 11kV lines were built in the period between 1960 and 1990. The wooden poles used in the construction of these lines have a standard life of 45 years. As poles come to the end of life, there will be increased capital expenditure on asset replacements.
Conclusion We are pleased to have reported on a very successful year and would like to acknowledge the commitment of Directors and the dedication of all employees that have allowed the Company to attain these results. The interaction with and support of the Waitaki Power Trust is acknowledged.
Clare Kearney Graham Clark Chairman Chief Executive
Sponsorship Presentation 2016
The number of Consumer Connections points (ICPs) has increased by 6.7% over the past 10 years
11944 11970
12256 1225712318 12278
1233512432
1255412670
12743
2007 2008 2009 2010 2011 2012 2013 2014 2015 2016 2017
Number of Consumer Connection Points (ICPs)
ICPs

Network Waitaki Limited Annual Report for the year ended 31 March 2017 6 | P a g e
DIRECTORS’ REPORT
DIRECTORS' INTERESTS The following Directors of Network Waitaki Limited have declared interests in identified entities as shareholder and/or director. The
declaration serves as notice that the Director may benefit from any transactions between Network Waitaki Limited and the identified
entities.
Clare Kearney (Chairman) Clare has been a member of the board since 2005 and Chairman from July 2008. Currently she is Chairman of Sport Otago, Chairman of Waitaki Safer Community Trust, a Director of South Port New Zealand Ltd, a Director of Awarua Holdings Ltd and a Trustee of KP & CM Kearney Family Trust.
Derek Atkinson Derek has been a Director since June 2011.
John Walker John has been a Director since June 2005. He is a Director/Shareholder of Mighty Mix Dog Food Limited.
Chris Dennison Chris has been a Director since June 2013. He is a Director of Dennison Farms Limited, Chairman of Tracmap Aviation Ltd, Chairman of Tracmap Holdings Ltd, Chairman of Tracmap NZ Ltd, a Director of Farmlands Co-operative, a Director of the Waitaki Irrigators Collective and an advisor to the board of the Lower Waitaki Irrigation Company.
David Ruddenklau David joined the board in July 2011. He is a Director and Shareholder of Newhaven Farms Limited, and Carhill Limited, a Trustee for Pukeraro Trust and Otago/Southland Child Cancer Foundation and a Shareholder of North Otago Irrigation Company.
Tony Wood Tony joined the board in July 2012. He is a Director and Shareholder of A J Wood Chartered Accountants Ltd, A J Wood Trustees Ltd (also Trustee to various Clients’ Family Trusts) and Mackismith Properties Ltd, and a Trustee of Wood Family Trust. Tony is the Chairman of North Otago Search and Rescue.
Back row: Derek Atkinson, Tony Wood and David Ruddenklau.
Seated: Chris Dennison, Clare Kearney (chairman) and John Walker
Network Waitaki Limited Annual Report for the year ended 31 March 2017 7 | P a g e
DIRECTORS’ REPORT (CONTINUED)
GENERAL DISCLOSURES PRINCIPAL ACTIVITIES The principal activity of Network Waitaki Limited is ownership of its electricity distribution network.
REVIEW OF OPERATIONS The Operating Revenue (before customer discount) was $22,781,957 (2016 $23,795,848) for the year.
Operating Profit before Taxation is $4,643,626 (2016 $7,260,360)
SHARE CAPTIAL Total issued and paid up capital as at 31 March 2017 was 14,000,000 Ordinary Fully-Paid Shares. There has been
no movement in Share Capital during the year.
USE OF COMPANY INFORMATION There were no notices from Directors of Network Waitaki Limited or a Director of a related body corporate
requesting to use company information received in their capacity as Directors which would not otherwise have
been available to them.
DIVIDENDS No dividend was declared for the 2017 year. (2016 Nil)
DISCOUNT A discount (excluding GST) of $1,740,810 has been paid to Customers (2016 $1,767,952).
DONATIONS The company made donations totaling $109,540 in the year (2016 $78,586).
CORPORATE GOVERNANCE Network Waitaki Limited operates under a set of corporate governance principles designed to ensure the Company
is effectively managed.
Board of Directors
The Board is the governing body of the company and currently has six members. The Board is appointed by the
shareholders to oversee the management of the Company and is responsible for all corporate governance matters.
The Board endeavors to ensure that the activities undertaken are carried out in the best interests of all
shareholders, while respecting the right of other stakeholders. The Board formally met eleven times during the
financial year.
Responsibilities
The Board is responsible for the management, supervision, regulatory compliance, health and safety, and direction
of the Company. This incorporates the long-term strategic financial plan, strategic initiatives, budgets and the
policy framework. The Board has developed and maintains clear policies which define the individual and collective
responsibilities of the Board and management.
Network Waitaki Limited Annual Report for the year ended 31 March 2017 8 | P a g e
DIRECTORS’ REPORT (CONTINUED)
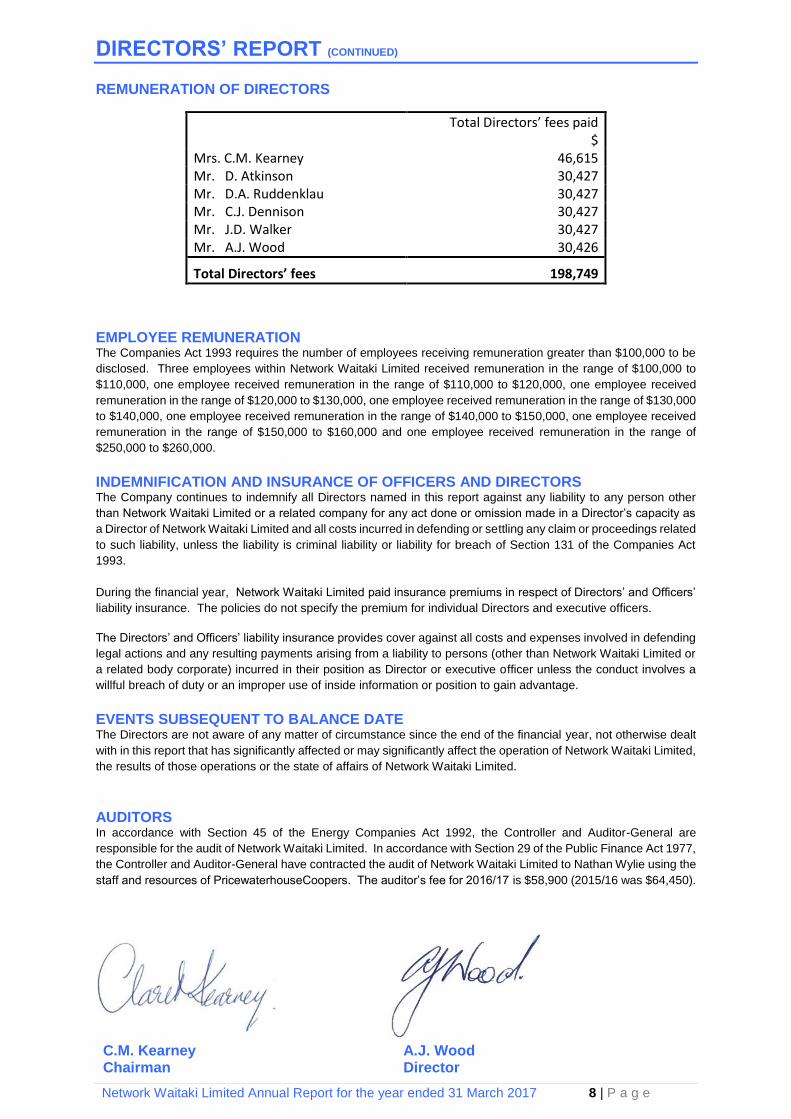
REMUNERATION OF DIRECTORS
Total Directors’ fees paid $ Mrs. C.M. Kearney 46,615 Mr. D. Atkinson 30,427 Mr. D.A. Ruddenklau 30,427 Mr. C.J. Dennison 30,427 Mr. J.D. Walker 30,427 Mr. A.J. Wood 30,426
Total Directors’ fees 198,749
EMPLOYEE REMUNERATION The Companies Act 1993 requires the number of employees receiving remuneration greater than $100,000 to be
disclosed. Three employees within Network Waitaki Limited received remuneration in the range of $100,000 to
$110,000, one employee received remuneration in the range of $110,000 to $120,000, one employee received
remuneration in the range of $120,000 to $130,000, one employee received remuneration in the range of $130,000
to $140,000, one employee received remuneration in the range of $140,000 to $150,000, one employee received
remuneration in the range of $150,000 to $160,000 and one employee received remuneration in the range of
$250,000 to $260,000.
INDEMNIFICATION AND INSURANCE OF OFFICERS AND DIRECTORS The Company continues to indemnify all Directors named in this report against any liability to any person other
than Network Waitaki Limited or a related company for any act done or omission made in a Director’s capacity as
a Director of Network Waitaki Limited and all costs incurred in defending or settling any claim or proceedings related
to such liability, unless the liability is criminal liability or liability for breach of Section 131 of the Companies Act
1993.
During the financial year, Network Waitaki Limited paid insurance premiums in respect of Directors’ and Officers’
liability insurance. The policies do not specify the premium for individual Directors and executive officers.
The Directors’ and Officers’ liability insurance provides cover against all costs and expenses involved in defending
legal actions and any resulting payments arising from a liability to persons (other than Network Waitaki Limited or
a related body corporate) incurred in their position as Director or executive officer unless the conduct involves a
willful breach of duty or an improper use of inside information or position to gain advantage.
EVENTS SUBSEQUENT TO BALANCE DATE The Directors are not aware of any matter of circumstance since the end of the financial year, not otherwise dealt
with in this report that has significantly affected or may significantly affect the operation of Network Waitaki Limited,
the results of those operations or the state of affairs of Network Waitaki Limited.
AUDITORS In accordance with Section 45 of the Energy Companies Act 1992, the Controller and Auditor-General are
responsible for the audit of Network Waitaki Limited. In accordance with Section 29 of the Public Finance Act 1977,
the Controller and Auditor-General have contracted the audit of Network Waitaki Limited to Nathan Wylie using the
staff and resources of PricewaterhouseCoopers. The auditor’s fee for 2016/17 is $58,900 (2015/16 was $64,450).
C.M. Kearney A.J. Wood Chairman Director
Network Waitaki Limited Annual Report for the year ended 31 March 2017 9 | P a g e
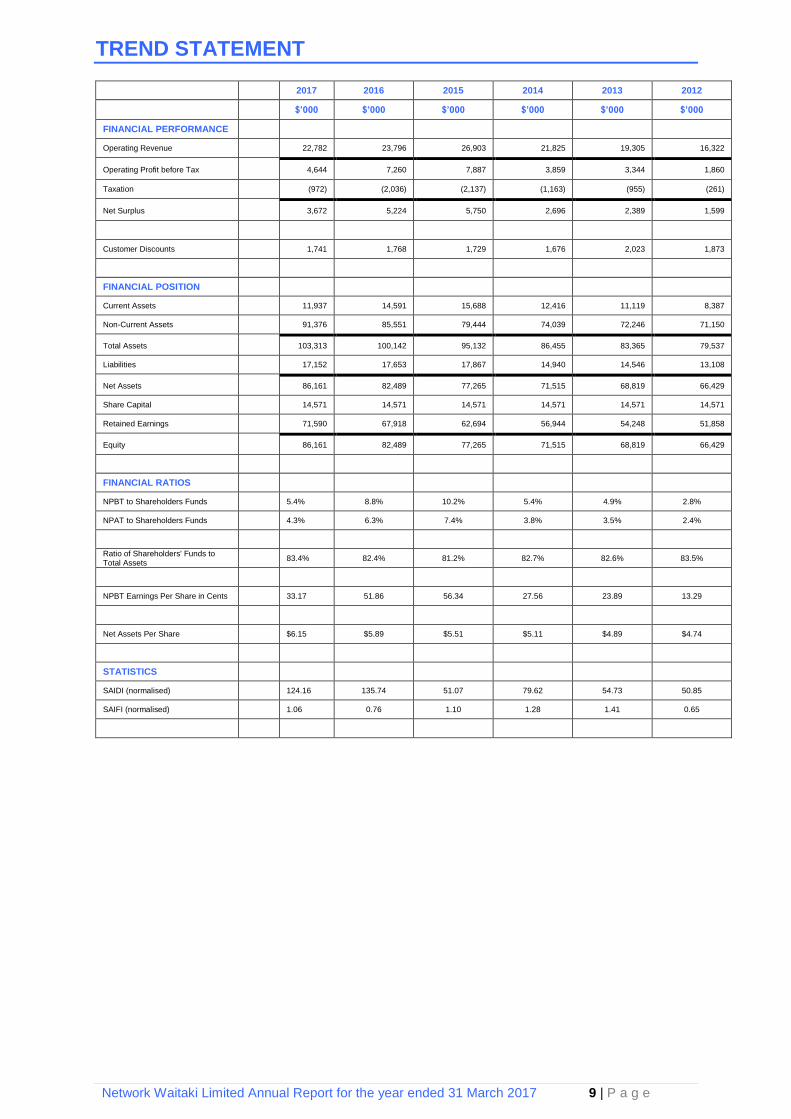
TREND STATEMENT
2017 2016 2015 2014 2013 2012
$’000 $’000 $’000 $’000 $’000 $’000
FINANCIAL PERFORMANCE
Operating Revenue 22,782 23,796 26,903 21,825 19,305 16,322
Operating Profit before Tax 4,644 7,260 7,887 3,859 3,344 1,860
Taxation (972) (2,036) (2,137) (1,163) (955) (261)
Net Surplus 3,672 5,224 5,750 2,696 2,389 1,599
Customer Discounts 1,741 1,768 1,729 1,676 2,023 1,873
FINANCIAL POSITION
Current Assets 11,937 14,591 15,688 12,416 11,119 8,387
Non-Current Assets 91,376 85,551 79,444 74,039 72,246 71,150
Total Assets 103,313 100,142 95,132 86,455 83,365 79,537
Liabilities 17,152 17,653 17,867 14,940 14,546 13,108
Net Assets 86,161 82,489 77,265 71,515 68,819 66,429
Share Capital 14,571 14,571 14,571 14,571 14,571 14,571
Retained Earnings 71,590 67,918 62,694 56,944 54,248 51,858
Equity 86,161 82,489 77,265 71,515 68,819 66,429
FINANCIAL RATIOS
NPBT to Shareholders Funds 5.4% 8.8% 10.2% 5.4% 4.9% 2.8%
NPAT to Shareholders Funds 4.3% 6.3% 7.4% 3.8% 3.5% 2.4%
Ratio of Shareholders' Funds to Total Assets
83.4% 82.4% 81.2% 82.7% 82.6% 83.5%
NPBT Earnings Per Share in Cents 33.17 51.86 56.34 27.56 23.89 13.29
Net Assets Per Share $6.15 $5.89 $5.51 $5.11 $4.89 $4.74
STATISTICS
SAIDI (normalised) 124.16 135.74 51.07 79.62 54.73 50.85
SAIFI (normalised) 1.06 0.76 1.10 1.28 1.41 0.65
Network Waitaki Limited Annual Report for the year ended 31 March 2017 10 | P a g e
DIRECTORS’ RESPONSIBILITY STATEMENT
The Directors are responsible for ensuring that the financial statements give a true and fair view of the financial
position of Network Waitaki Limited as at 31 March 2017 and its financial performance and cash flows for the year
ended on that date.
The Directors consider that the financial statements of Network Waitaki Limited have been prepared using
appropriate accounting policies consistently applied and supported by reasonable judgements and estimates and
that all relevant reporting and accounting standards have been followed.
The Directors believe that proper accounting records have been kept which enable, with reasonable accuracy, the
determination of the financial position of Network Waitaki Limited and facilitate compliance of the financial
statements with the Financial Reporting Act 2013.
The Directors consider they have taken adequate steps to safeguard the assets of Network Waitaki Limited and to
prevent and detect fraud and other irregularities.
The Directors have pleasure in presenting the Financial Statements of Network Waitaki Limited for the year ended
31 March 2017.
The Board of Directors of Network Waitaki Limited authorises these Financial Statements for issue on 29 May
2017.
For and on behalf of the Board of Directors
C.M. Kearney A.J. Wood Chairman Director
Network Waitaki Limited Annual Report for the year ended 31 March 2017 11 | P a g e
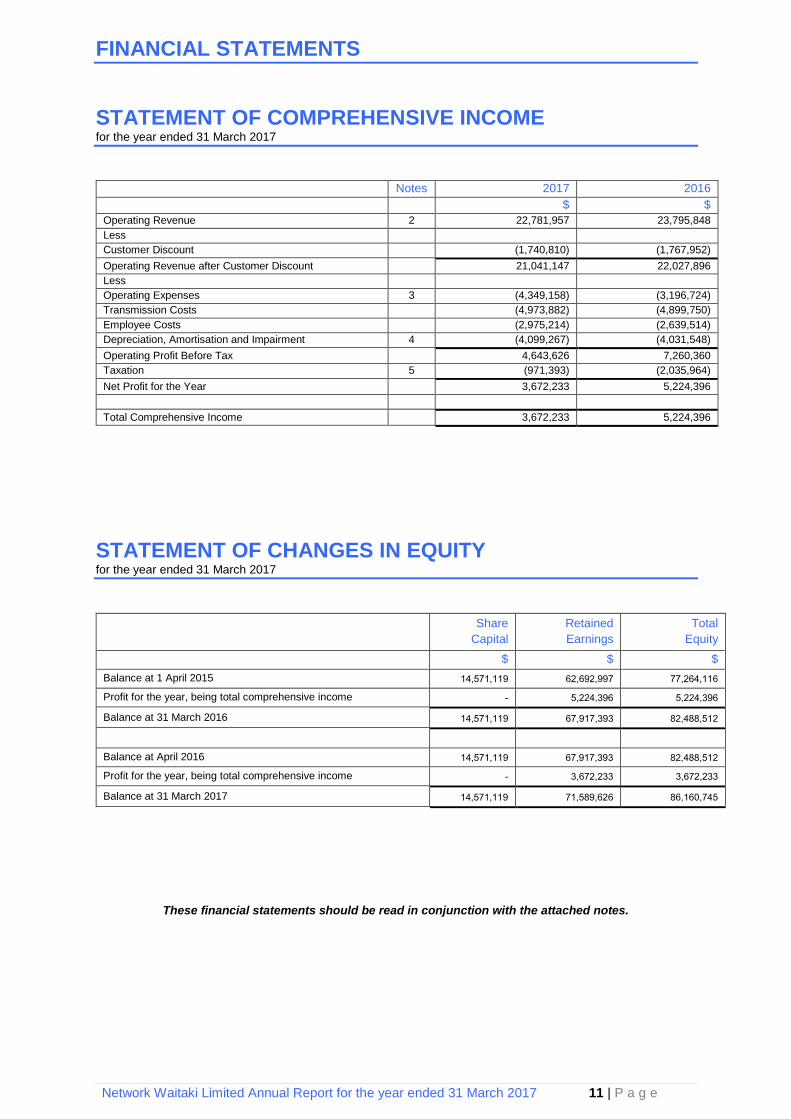
FINANCIAL STATEMENTS
STATEMENT OF COMPREHENSIVE INCOME for the year ended 31 March 2017
Notes 2017 2016
$ $
Operating Revenue 2 22,781,957 23,795,848
Less
Customer Discount (1,740,810) (1,767,952)
Operating Revenue after Customer Discount 21,041,147 22,027,896
Less
Operating Expenses 3 (4,349,158) (3,196,724)
Transmission Costs (4,973,882) (4,899,750)
Employee Costs (2,975,214) (2,639,514)
Depreciation, Amortisation and Impairment 4 (4,099,267) (4,031,548)
Operating Profit Before Tax 4,643,626 7,260,360
Taxation 5 (971,393) (2,035,964)
Net Profit for the Year 3,672,233 5,224,396
Total Comprehensive Income 3,672,233 5,224,396
STATEMENT OF CHANGES IN EQUITY for the year ended 31 March 2017
Share
Capital
Retained
Earnings
Total
Equity
$ $ $
Balance at 1 April 2015 14,571,119 62,692,997 77,264,116 Profit for the year, being total comprehensive income - 5,224,396 5,224,396 Balance at 31 March 2016 14,571,119 67,917,393 82,488,512
Balance at April 2016 14,571,119 67,917,393 82,488,512 Profit for the year, being total comprehensive income - 3,672,233 3,672,233 Balance at 31 March 2017 14,571,119 71,589,626 86,160,745
These financial statements should be read in conjunction with the attached notes.
Network Waitaki Limited Annual Report for the year ended 31 March 2017 12 | P a g e
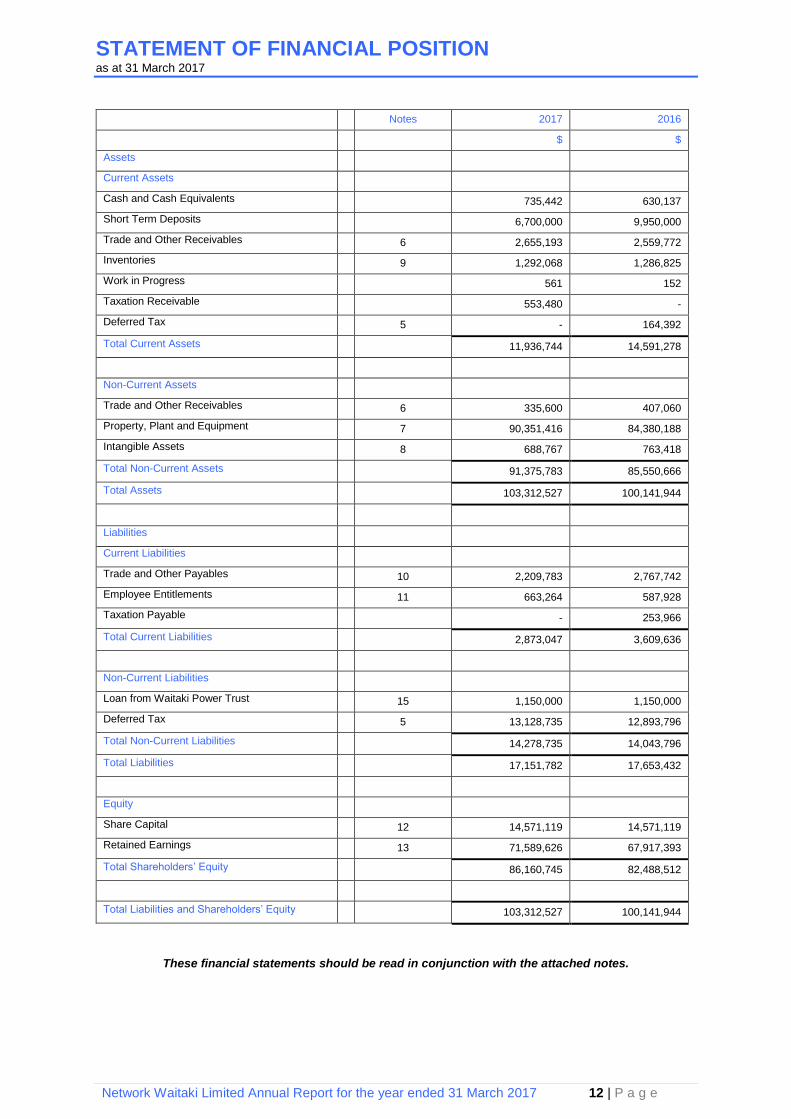
STATEMENT OF FINANCIAL POSITION as at 31 March 2017
Notes 2017 2016
$ $
Assets
Current Assets
Cash and Cash Equivalents 735,442 630,137
Short Term Deposits 6,700,000 9,950,000
Trade and Other Receivables 6 2,655,193 2,559,772
Inventories 9 1,292,068 1,286,825
Work in Progress 561 152
Taxation Receivable 553,480 -
Deferred Tax 5 - 164,392
Total Current Assets 11,936,744 14,591,278
Non-Current Assets
Trade and Other Receivables 6 335,600 407,060
Property, Plant and Equipment 7 90,351,416 84,380,188
Intangible Assets 8 688,767 763,418
Total Non-Current Assets 91,375,783 85,550,666
Total Assets 103,312,527 100,141,944
Liabilities
Current Liabilities
Trade and Other Payables 10 2,209,783 2,767,742
Employee Entitlements 11 663,264 587,928
Taxation Payable - 253,966
Total Current Liabilities 2,873,047 3,609,636
Non-Current Liabilities
Loan from Waitaki Power Trust 15 1,150,000 1,150,000
Deferred Tax 5 13,128,735 12,893,796
Total Non-Current Liabilities 14,278,735 14,043,796
Total Liabilities 17,151,782 17,653,432
Equity
Share Capital 12 14,571,119 14,571,119
Retained Earnings 13 71,589,626 67,917,393
Total Shareholders’ Equity 86,160,745 82,488,512
Total Liabilities and Shareholders’ Equity 103,312,527 100,141,944
These financial statements should be read in conjunction with the attached notes.
Network Waitaki Limited Annual Report for the year ended 31 March 2017 13 | P a g e
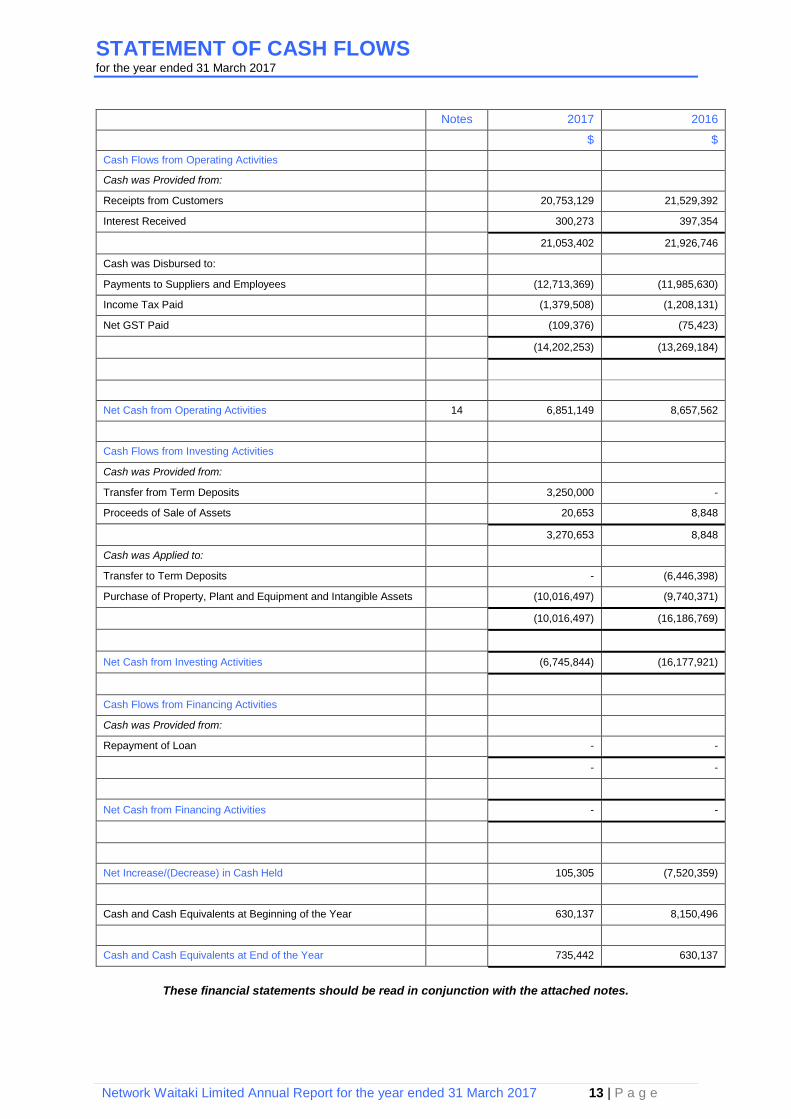
STATEMENT OF CASH FLOWS for the year ended 31 March 2017
Notes 2017 2016
$ $
Cash Flows from Operating Activities
Cash was Provided from:
Receipts from Customers 20,753,129 21,529,392
Interest Received 300,273 397,354
21,053,402 21,926,746
Cash was Disbursed to:
Payments to Suppliers and Employees (12,713,369) (11,985,630)
Income Tax Paid (1,379,508) (1,208,131)
Net GST Paid (109,376) (75,423)
(14,202,253) (13,269,184)
Net Cash from Operating Activities 14 6,851,149 8,657,562
Cash Flows from Investing Activities
Cash was Provided from:
Transfer from Term Deposits 3,250,000 -
Proceeds of Sale of Assets 20,653 8,848
3,270,653 8,848
Cash was Applied to:
Transfer to Term Deposits - (6,446,398)
Purchase of Property, Plant and Equipment and Intangible Assets (10,016,497) (9,740,371)
(10,016,497) (16,186,769)
Net Cash from Investing Activities (6,745,844) (16,177,921)
Cash Flows from Financing Activities
Cash was Provided from:
Repayment of Loan - -
- -
Net Cash from Financing Activities - -
Net Increase/(Decrease) in Cash Held 105,305 (7,520,359)
Cash and Cash Equivalents at Beginning of the Year 630,137 8,150,496
Cash and Cash Equivalents at End of the Year 735,442 630,137
These financial statements should be read in conjunction with the attached notes.
Network Waitaki Limited Annual Report for the year ended 31 March 2017 14 | P a g e
NOTES TO THE FINANCIAL STATEMENTS
1 SIGNIFICANT ACCOUNTING POLICIES
ENTITY REPORTING
Network Waitaki Limited is a consumer trust-owned electricity distribution network operator in North Otago. The
Company’s registered office is 10 Chelmer Street, Oamaru, New Zealand.
PARENT TRUST
The parent trust is the Waitaki Power Trust. GENERAL INFORMATION
Network Waitaki Limited is a limited liability company incorporated and domiciled in New Zealand.
STATEMENT OF COMPLIANCE WITH NZ IFRS Basis of Preparation
The financial statements have been prepared in accordance with Generally Accepted Accounting Practice in New
Zealand (NZ GAAP). They comply with New Zealand equivalents to International Financial Reporting Standards
(NZ IFRS) as applicable for profit-oriented entities.
The company is eligible and has elected to report in accordance with Tier 2 for-profit accounting standards, NZ
IFRS Reduced Disclosure Regime (NZ IFRS RDR) on the basis that the company has no public accountability and
is not a large public sector nonprofit entity.
In adopting NZ IFRS RDR, the company has taken a number of disclosure concessions.
DATE OF ISSUE FOR THE FINANCIAL STATEMENTS
These financial statements have been approved for issue by the Board of Directors on 29 May 2017. The entity’s owners do not have the power to amend the financial statements after its issue. PROFIT-ORIENTED ENTITY
The Company is a profit-oriented entity for the purpose of complying with NZ IFRS.
STATUTORY BASE
Network Waitaki Limited is:
• a New Zealand registered company under the Companies Act 1993,
• an energy company as defined in the Energy Companies Act 1992.
The financial statements have been prepared in accordance with the requirements of the Financial Reporting Act
2013, the Companies Act 1993 and the Energy Companies Act 1992.
FUNCTIONAL AND PRESENTATION CURRENCY
The Company’s financial statements are presented in whole New Zealand dollars, which is the Company’s
functional and presentation currency.
MEASUREMENT BASE
The financial statements have been prepared on the historical cost basis, and its modification by the revaluation of
certain assets as identified in specific accounting policies below. Accounting policies adopted and applied ensure
that the resulting financial information satisfies the concepts of relevance and reliability, thereby ensuring that the
substance of the underlying transactions or other events are reported.
CRITICAL ACCOUNTING ESTIMATES AND JUDGMENTS IN APPLYING THE ENTITY’S ACCOUNTING
POLICIES
The preparation of financial statements in conformity with NZ IFRS requires management to make certain critical
accounting estimates and judgments that affect the application of policies and the reported amount of assets,
liabilities, income and expenses. The estimates and associated assumptions have been based on historical
experience and other factors that are believed to be reasonable in the circumstances.
These estimates and judgments form the basis for the carrying values of assets and liabilities where these are not
readily apparent from other sources. Actual results may differ from these estimates.
Network Waitaki Limited Annual Report for the year ended 31 March 2017 15 | P a g e
NOTES TO THE FINANCIAL STATEMENTS (CONTINUED) 1 SIGNIFICANT ACCOUNTING POLICIES (CONTINUED)
Estimates and underlying judgments are regularly reviewed. Any changes to estimates are recognised in the period
if the change affects that period, or in future periods if the change also affects future periods.
In the process of applying the Company’s accounting policies, management has made the following estimates and
judgments that have had the most significant impact on the amounts recognised in these financial statements.
Network reticulation assets
Network reticulation assets are depreciated at the rates provided by the ODV handbook issued by the Commerce
Commission in 2004. These rates are considered a reasonable estimate of useful lives.
Easements
Easements are recorded at cost.
GOODS AND SERVICES TAX (GST)
The Statement of Comprehensive Income and Statement of Cash Flows have been prepared so that all
components are stated exclusive of GST. All items in the Statement of Financial Position are stated net of GST,
with the exception of receivables and payables.
REVENUE
Sale of goods
Revenue from the sale of goods is recognised in the Statement of Comprehensive Income when the significant
risks and rewards of ownership have been transferred to the consumer. No revenue is recognised if there are
significant uncertainties regarding recovery of the consideration due, associated costs or the possible return of
goods, or where there is continuing management involvement with the goods.
Services supplied
Revenue from the sale of services is recognised in the Statement of Comprehensive Income when it is probable
that the economic benefits associated with the transaction will flow to the company. No revenue from services
supplied is recognised when the stage of completion of the transaction cannot be measured reliably or the amount
of revenue from the transaction cannot be reliably measured.
Investment income
• Interest is recognised using the effective interest method.
• Dividends are recognised when the right to receive payment is established.
• Rental income is recognised on an accrual basis in accordance with the substance of the relevant
agreements.
Lease income
Revenues from operating leases are recognised on a straight line basis over the period between rental reviews.
Customer contributions
Contributions from customers in relation to the construction of new lines for the network are accounted for as
income in the year in which the Company completes the actual work.
Construction Contracts
Revenue from construction contracts is recognised by reference to the recoverable cost incurred during the period
plus the percentage of fees earned.
When a loss is expected to occur, it is recognised immediately.
Network Waitaki Limited Annual Report for the year ended 31 March 2017 16 | P a g e
NOTES TO THE FINANCIAL STATEMENTS (CONTINUED) 1 SIGNIFICANT ACCOUNTING POLICIES (CONTINUED)
INCOME TAX
Income tax expense in relation to the profit or loss for the period comprises current tax and deferred tax.
Current tax is the amount of income tax payable on the taxable profit from the current year, plus any adjustments
to income tax payable in respect of the prior year. Current tax is calculated using rates that have been enacted or
substantially enacted by balance date.
Deferred tax is the amount of income tax payable or receivable in future periods in respect of temporary differences
and unused tax losses. Temporary differences are differences between the carrying amount of assets and liabilities
in the financial statements and the corresponding tax bases used in the computation of taxable profit.
Deferred income tax assets are recognised to the extent that it is probable that future taxable profit will be available
against which the temporary differences can be utilised.
Deferred income tax is provided on temporary differences arising on investments in associates, except where the
timing of the reversal of the temporary difference is controlled by the Company and it is probable that the temporary
difference will not reverse in the foreseeable future.
CAPITAL AND OPERATING EXPENDITURE
Capital expenditure relates to expenditure incurred in the creation of a new asset and expenditure incurred on
existing reticulation system assets to the extent the system is enhanced.
Operating expenditure relates to expenditure incurred in maintaining and operating the property, plant and
equipment and investment properties of the Company.
DIVIDENDS
Provision is made for the amount of any dividend declared on or before the end of the financial year but not
distributed at balance date. Distribution of dividends to the Company shareholders is recognised as a liability in the
Company’s financial statements in the period in which the dividends are approved by the Board of Directors.
CASH AND CASH EQUIVALENTS
Cash and Cash Equivalents include cash on hand, deposits held at call with financial institutions, other short-term,
highly liquid investments with original maturities of three months or less that are readily convertible to known
amounts of cash and which are subject to an insignificant risk of changes in value, and bank overdrafts.
CURRENT INVESTMENTS
Current investments comprise cash deposits held with financial institutions with an original maturity greater than
three months and less than twelve months.
HELD FOR SALE ASSETS
An asset is classified as ‘held for sale’ if its carrying amount will be recovered principally through a sale rather than
continuing use. On classification, as ‘held for sale’, assets are recognised at the lower of carrying amount and fair
value less costs to sell. Impairment losses on initial classification as ‘held for sale’ are included in the Statement of
Comprehensive Income.
WORK IN PROGRESS
Work in progress is stated at actual direct costs incurred, less non-recoverable amounts.
Network Waitaki Limited Annual Report for the year ended 31 March 2017 17 | P a g e
NOTES TO THE FINANCIAL STATEMENTS (CONTINUED) 1 SIGNIFICANT ACCOUNTING POLICIES (CONTINUED)
CAPITAL RISK MANAGEMENT
The Company’s objective when managing capital, which comprises share capital plus retained earnings, is to
safeguard the ability to continue as a going concern and to provide acceptable returns to shareholders.
The Company is not subject to any externally imposed capital requirements.
In order to maintain or adjust the capital structure, the Company may adjust the amount of discount paid to
customers.
TRADE RECEIVABLES
Trade receivables are recognised initially at fair value and subsequently measured at amortised cost, less provision
for impairment. A provision for impairment of trade receivables is established when there is objective evidence that
the Company will not be able to collect all amounts due according to the original terms of the receivables. The
amount of the provision is the difference between the assets’ carrying amount and realisable value. The amount of
the provision is recognised in the Statement of Comprehensive Income.
PROPERTY, PLANT AND EQUIPMENT
Property, plant and equipment comprise mainly buildings, land, meters and relays, and office equipment. Buildings,
meters and relays purchased prior to the adoption of NZ IFRS, 1 April 2006, are shown at ‘deemed cost’ less
subsequent depreciation and impairment write-down. Land purchased prior to 1 April 2006 is shown at deemed
cost.
Property, Plant and Equipment acquired subsequent to the adoption of ‘deemed cost’, after 1 April 2006, is
recorded at the value of the consideration given to acquire the assets, plus the value of other directly attributable
costs which have been incurred in bringing the assets to the location and condition necessary for their intended
service, less subsequent depreciation and impairment write-down.
Network Reticulation Assets comprises mainly Low Voltage, 11kV, 33kV and LV conductor and associated
transformers and substations. Reticulation assets are shown at deemed cost less subsequent depreciation and
impairment write-down.
Network Reticulation Assets acquired subsequent to the adoption of ‘deemed cost’ are recorded at the value of
the consideration given to acquire the assets and the value of other directly attributable costs which have been
incurred in bringing the assets to the location and condition necessary for their intended service less subsequent
depreciation and impairment write-down.
Capital Contributions are amortised over 10 years.
Easements Assets sited on easements will normally be renewed at the end of their economic life in the same
location in which they are currently housed. On this basis, the easement itself has an indefinite life. Annually,
easements are tested for signs of impairment.
Contracting Equipment comprises mainly plant and equipment used in the construction and repair of network
reticulation systems. Items are recorded at the value of the consideration given to acquire the assets and the value
of directly attributable costs which have been incurred in bringing the assets to the location and condition necessary
for their intended service less subsequent depreciation and impairment write-down.
Depreciation of Property, Plant and Equipment Depreciation is provided on all property, plant and equipment,
other than freehold land, at rates that will allocate the assets’ cost or valuation, to their residual values, over their
estimated lives. All network reticulation system assets and contracting equipment assets are depreciated on a
straight line basis; other assets are depreciated using both straight line and diminishing value.
Network Waitaki Limited Annual Report for the year ended 31 March 2017 18 | P a g e
NOTES TO THE FINANCIAL STATEMENTS (CONTINUED) 1 SIGNIFICANT ACCOUNTING POLICIES (CONTINUED)
Depreciation of Property, Plant and Equipment (continued)
The following depreciation rates have been used:
Item Depreciation rate
Contracting Equipment 6.0% to 30.0%
Distribution System 1.4% to 10.0%
Fibre Network 7.0%
Freehold Buildings 1.25% to 2.5%
Motor Vehicles 13.5% to 26.0%
Plant and Equipment 5.0% to 80.0%
Office Furniture and Equipment 8.0% to 40.0%
Gains and losses on disposal of property, plant and equipment are taken into account in determining the operating
result for the year.
INTANGIBLE ASSETS
Intangible Assets consist solely of computer software, which is recorded at the value of the consideration given to
acquire the assets plus the value of other directly attributable costs which have been incurred in bringing the assets
to the location and condition necessary for their intended service.
Amortisation of intangible assets is provided for at rates that will allocate the assets’ cost or valuation, to their
residual values, over their estimated lives. All intangible assets are amortised on a straight line basis.
Intangible assets are carried at cost less accumulated amortisation.
The following amortisation rates have been used:
Item Amortisation rate
Computer Software 15% to 48%
IMPAIRMENT
Assets that have an indefinite useful life, for example easements, are not subject to depreciation and are tested
annually for impairment. Assets that are subject to depreciation or amortisation are reviewed for impairment
whenever events or changes in circumstances indicate that the carrying amount may not be recoverable. An
impairment loss is recognised for the amount by which the asset’s carrying amount exceeds its recoverable amount.
The recoverable amount is the higher of an asset’s fair value less cost to sell and value in use. For the purpose of
assessing impairment, assets are grouped at the lowest levels for which there are separately identifiable cash flows
(cash-generating units). Non-financial assets that have suffered impairment are reviewed for possible reversal of
the impairment at each reporting date.
INVENTORIES
Inventories are valued at the lower of cost and net realisable value, with additional allowance for obsolescence
where necessary. The cost of finished goods comprises direct materials and, where applicable, direct labour and
other direct variable costs incurred in order to bring inventories to their present location and condition. Costs are
assigned to individual items of inventory on a weighted average cost basis.
BORROWING COSTS
Borrowing costs for assets are capitalised when the construction period of qualifying assets is greater than nine
months. The capitalisation rate used to determine the amount of borrowing costs eligible for capitalisation is the
current cost of borrowing from financial markets.
BORROWINGS
Borrowings are initially measured at fair value plus transaction costs.
Borrowings are classified as current liabilities unless the Company has an unconditional right to defer settlement
of the liability for at least 12 months after the balance date.
Any difference between the proceeds (net of transaction costs) and the redemption amount is recognised in the
Statement of Comprehensive Income over the period of the borrowings, using the effective interest method.
FINANCIAL ASSETS
The only financial assets that the Company has are loans and receivables. Purchases and sales of financial assets
are accounted for at trade date.
Network Waitaki Limited Annual Report for the year ended 31 March 2017 19 | P a g e
NOTES TO THE FINANCIAL STATEMENTS (CONTINUED) 1 SIGNIFICANT ACCOUNTING POLICIES (CONTINUED)
Loans and receivables
Loans and receivables are non-derivative financial assets with fixed or determinable payments that are not quoted
in an active market. They are included in current assets, except for maturities greater than 12 months after the
balance sheet date. These are classified as non-current assets. The Company’s loans and receivables comprise
‘trade and receivables’, current investments and cash and cash equivalents in the Statement of Financial Position.
FINANCIAL RISK MANAGEMENT
Risk management is carried out by management under policies approved by the Board of Directors. Management
identifies and evaluates relevant financial risks and acts to manage these risks where possible within the
parameters set out by the board of directors. The board provides written principles for overall risk management, as
well as policies covering specific areas, such as foreign exchange risk and credit risk.
Market risk
(i) Foreign exchange risk
The Company’s revenue is entirely denominated in New Zealand dollars and it has limited currency exposure in
the foreseeable future. The Company may from time to time purchase assets denominated in foreign currency.
Board approval is required for foreign currency-denominated contracts valued above a specified threshold, together
with a recommendation on the manner in which the foreign currency exposure is to be managed, which may include
the use of foreign exchange contracts.
(ii) Cash flow and fair value interest rate risk
Apart from a loan from the Waitaki Power Trust, the Company has no interest risk from long-term borrowing. The
loan from the shareholder is an unsecured loan with interest charged at a commercial rate. Board approval is
required for borrowings, together with a recommendation on the manner in which the interest rate risk is to be
managed.
Credit risk
Credit risk is managed by the Company under policy approved by the board. Credit risk arises from cash and cash
equivalents and deposits with banks, as well as credit exposure to customers, including outstanding receivables
and committed transactions. For banks and financial institutions, only independent parties with a minimum
Standard and Poor’s rating of BBB for long-term investments and A-2 for short-term investment, or financial
institutions that provide well-supported first ranking security, are acceptable. Investments with banks and financial
institutions are limited to a term of no more than 24 months and no more than $3 million or 25% of current
investments, whichever is the greater, in any one institution. Credit risk associated with trade receivables is limited
through electricity retailer invoicing for line and metering charges rather than individual consumer invoicing for line
and metering charges. Credit risk is also limited in trade receivables by the requirement of a minimum of 50%
deposit of the total cost of new connections before work is started.
Liquidity risk
Cash flow forecasting is performed in the operating entities of the Company. The Company monitors its rolling
forecast liquidity requirements to ensure it has sufficient cash to meet operational needs while maintaining sufficient
headroom at all times. Such financial forecasting takes into consideration the Company’s debt financing plans and
compliance with the Statement of Corporate Intent.
Surplus cash held by the operating entities over and above the balance required for working capital management
is invested in interest-bearing call accounts and term deposits.
Note 18 analyses the Company’s non-derivative financial liabilities and net-settled derivative financial liabilities into
relevant maturity groupings based on the remaining period, at the statement of financial position date to the
contractual maturity date. Derivative financial liabilities are included in the analyses if their contractual maturities
are essential for an understanding of timing of the cash flows. The amounts disclosed in the table are contractual
undiscounted cash flows.
Fair value estimation
The fair value of financial assets and liabilities must be estimated for recognition and measurement and for
disclosure purposes.
The fair value for any financial instruments that are not traded in an active market is determined using valuation
techniques. The Company uses a variety of methods and makes assumptions that are based on market conditions
existing at each balance date.
Network Waitaki Limited Annual Report for the year ended 31 March 2017 20 | P a g e
NOTES TO THE FINANCIAL STATEMENTS (CONTINUED) 1 SIGNIFICANT ACCOUNTING POLICIES (CONTINUED)
FOREIGN CURRENCY TRANSACTIONS
Transactions denominated in foreign currencies are translated into the reporting currency using the exchange rate
in effect at the transaction date. Foreign currency monetary items at balance date are translated at the exchange
rate in effect at the balance date. Non-monetary assets and liabilities carried at fair value that are denominated in
foreign currencies are translated at the rates ruling at the date when the fair value is determined.
Exchange differences on foreign currency balances are recognised in the Statement of Comprehensive Income in
the period that they occur.
TRADE AND OTHER PAYABLES
Trade and Other Payables are recognised when the Company becomes obliged to make future payments resulting
from the purchase of goods and services. Trade and Other Payables are recognised at fair value.
PROVISIONS
Provisions are recognised when the Company has a present legal or constructive obligation as a result of past
events, it is more likely than not that an outflow of resources will be required to settle the obligation, and the amount
has been reliably estimated. Provisions are not recognised for future operating losses.
Where there are a number of similar obligations, the likelihood that an outflow will be required in settlement is
determined by considering the class of obligations as a whole. A provision is recognised even if the likelihood of
an outflow with respect to any one item included in the same class of obligations may be small.
EMPLOYEE ENTITLEMENTS
Wages, salaries and annual leave
Employee Entitlements to salaries, wages and annual leave are recognised when they accrue to employees.
Sick and special leave
Employee Entitlements to sick and special leave are recognised when taken by employees. A provision is made
for the additional amount that the Company expects to pay as a result of unused sick or special leave that has
accumulated at balance date.
Long service leave
Long service leave is not recognised in the first 10 years of service. After 10 years of service an allowance is made
of 1/5 per year towards long service leave entitlement. This allowance is then discounted back to current value.
Employees are entitled to long service leave after serving for 15 years
SHARE CAPITAL
Ordinary shares are classified as equity.
Incremental costs directly attributable to the issue of new shares are shown in equity as a deduction, net of tax,
from the proceeds.
LEASES
Operating Leases
Leases in which a significant portion of the risks and rewards of ownership are retained by the lessor are classified
as operating leases. Payments made under operating leases (net of any incentives received from the lessor) are
charged to the profit and loss component of the statements of comprehensive income on a straight-line basis over
the period of the lease.
Finance Leases
The Company is the Lessor
Assets leased to third parties under operating leases are included in property, plant and equipment in the Statement
of Financial Position. They are depreciated over their expected useful lives on a basis consistent with similar owned
property, plant and equipment. Rental income (net of incentives given to lessees) is recognised on a straight-line
basis over the lessee term.
The Company is the Lessee
Leases in which the Company has substantially all the risks and rewards of ownership are classified as finance
leases. Finance leases are capitalised at the lease’s inception at the lower of the fair value of the leased asset and
the present value of the minimum lease payments. Each lease payment is allocated between the liability and
finance charges so as to achieve a constant rate on the finance balance outstanding.
Network Waitaki Limited Annual Report for the year ended 31 March 2017 21 | P a g e
NOTES TO THE FINANCIAL STATEMENTS (CONTINUED) 1 SIGNIFICANT ACCOUNTING POLICIES (CONTINUED)
The corresponding rental obligations, net of finance charges, are included in other long term payables. The interest
element of the finance cost is charged to the Statement of Comprehensive Income over the lease period so as to
produce a constant periodic rate of interest on the remaining balance of the liability for each period. Property, plant
and equipment acquired under a finance lease are depreciated over the shorter of the asset’s useful life and the
lease term.
CHANGES IN ACCOUNTING POLICY AND DISCLOSURES
New and amended standards adopted by the company
There are no changes in 2016/17.
New Standards and interpretations not yet adopted
A number of new standards and amendments to standards and interpretations are effective for annual periods
beginning after 1 April 2016, and have not been applied in preparing these financial statements. None of these are
expected to have a significant effect on the financial statements of the Company, except the following set out below:
NZ IFRS 9: Financial Instruments
NZ IFRS 9, ‘Financial instruments’, addresses the classification, measurement and recognition of financial assets
and financial liabilities. The complete version of NZ IFRS 9 was issued in September 2014. It replaces the guidance
in NZ IAS 39 that relates to the classification and measurement of financial instruments. NZ IFRS 9 retains but
simplifies the mixed measurement model and establishes three primary measurement categories for financial
assets: amortised cost, fair value through other comprehensive income and fair value through profit or loss. The
basis of classification depends on the entity’s business model and the contractual cash flow characteristics of the
financial asset. Investments in equity instruments are required to be measured at fair value through profit or loss
with the irrevocable option at inception to present changes in fair value in other comprehensive income not
recycling. There is now a new expected credit losses model that replaces the incurred loss impairment model used
in NZ IAS 39. For financial liabilities there were no changes to classification and measurement except for the
recognition of changes in own credit risk in other comprehensive income, for liabilities designated at fair value
through profit or loss. NZ IFRS 9 relaxes the requirements for hedge effectiveness by replacing the bright line
hedge effectiveness tests. It requires an economic relationship between the hedged item and hedging instrument
and for the ‘hedged ratio’ to be the same as the one management actually use for risk management purposes.
Contemporaneous documentation is still required but beginning on or after 1 January 2018. Early adoption is
permitted. The company intends to adopt NZ IFRS 9 on its effective date and has yet to assess its full impact.
NZ IFRS 15: Revenue from contracts with customers, (effective for annual periods beginning on or after 1
January 2018)
NZ IFRS 15 addresses recognition of revenue from contracts with customers. It replaces the current revenue
recognition guidance in IAS 18 Revenue and IAS 11 Construction contracts and is applicable to all entities with
revenue. It sets out a 5 step model for revenue recognition to depict the transfer of promised goods or services to
customers in an amount that reflects the consideration to which the entity expects to be entitled in exchange for
those goods or services. The Company has yet to assess IFRS 15's full impact. The Company will apply this
standard from 1 April 2018.
NZ IFRS 16: Leases
NZ IFRS 16, “Leases’ replaces the current guidance in NZ IAS 17. Under NZ IFRS 16, a contract is, or contains, a
lease if the contract conveys the right to control the use of an identified asset for a period of time in exchange for
consideration. Under NZ IAS 17, a lessee was required to make a distinction between a finance lease (on balance
sheet) and an operating lease (off balance sheet). NZ IFRS 16 now requires a lessee to recognise a lease liability
reflecting future lease payments and a right-of-use asset for virtually all lease contracts. Included is an optional
exemption for certain short-term leases and leases of low-value assets; however, this exemption can only be
applied by lessees.
For lessors, the accounting for leases under NZ IFRS 16 is almost the same as NZ IAS 17. However, because the
guidance on the definition of a lease has been updated (as well as the guidance on the combination and separation
of contracts), lessors will also be affected by the new standard.
The standard is effective for accounting periods beginning on or after 1 January 2019. Early adoption is permitted
but only in conjunction with NZ IFRS 15, 'Revenue from Contracts with Customers.
The company intends to adopt NZ IFRS 16 on its effective date and has yet to assess its full impact.
Prior Year Comparatives
Prior year comparatives have been restated where necessary in line with current year reporting.
Network Waitaki Limited Annual Report for the year ended 31 March 2017 22 | P a g e
NOTES TO THE FINANCIAL STATEMENTS (CONTINUED)
2017 2016
$ $
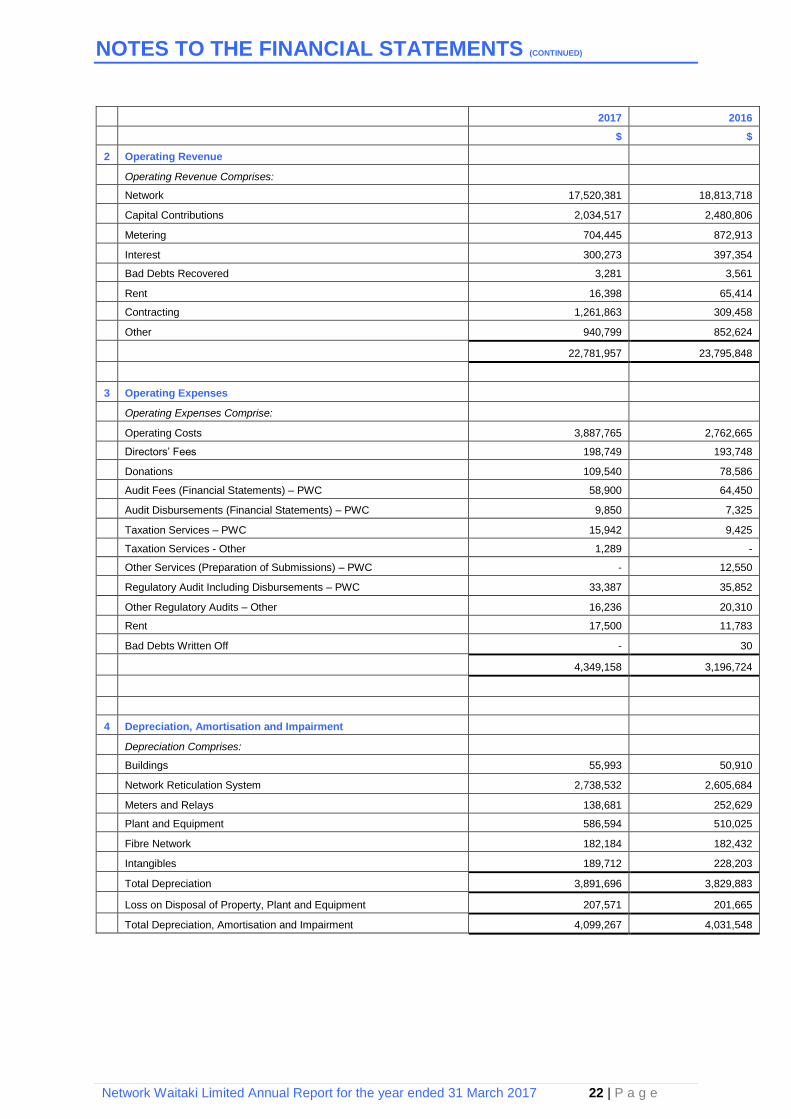
2 Operating Revenue
Operating Revenue Comprises:
Network 17,520,381 18,813,718
Capital Contributions 2,034,517 2,480,806
Metering 704,445 872,913
Interest 300,273 397,354
Bad Debts Recovered 3,281 3,561
Rent 16,398 65,414
Contracting 1,261,863 309,458
Other 940,799 852,624
22,781,957 23,795,848
3 Operating Expenses
Operating Expenses Comprise:
Operating Costs 3,887,765 2,762,665
Directors’ Fees 198,749 193,748
Donations 109,540 78,586
Audit Fees (Financial Statements) – PWC 58,900 64,450
Audit Disbursements (Financial Statements) – PWC 9,850 7,325
Taxation Services – PWC 15,942 9,425
Taxation Services - Other 1,289 -
Other Services (Preparation of Submissions) – PWC - 12,550
Regulatory Audit Including Disbursements – PWC 33,387 35,852
Other Regulatory Audits – Other 16,236 20,310
Rent 17,500 11,783
Bad Debts Written Off - 30
4,349,158 3,196,724
4 Depreciation, Amortisation and Impairment
Depreciation Comprises:
Buildings 55,993 50,910
Network Reticulation System 2,738,532 2,605,684
Meters and Relays 138,681 252,629
Plant and Equipment 586,594 510,025
Fibre Network 182,184 182,432
Intangibles 189,712 228,203
Total Depreciation 3,891,696 3,829,883
Loss on Disposal of Property, Plant and Equipment 207,571 201,665
Total Depreciation, Amortisation and Impairment 4,099,267 4,031,548
Network Waitaki Limited Annual Report for the year ended 31 March 2017 23 | P a g e
NOTES TO THE FINANCIAL STATEMENTS (CONTINUED)
2017 2016
$ $
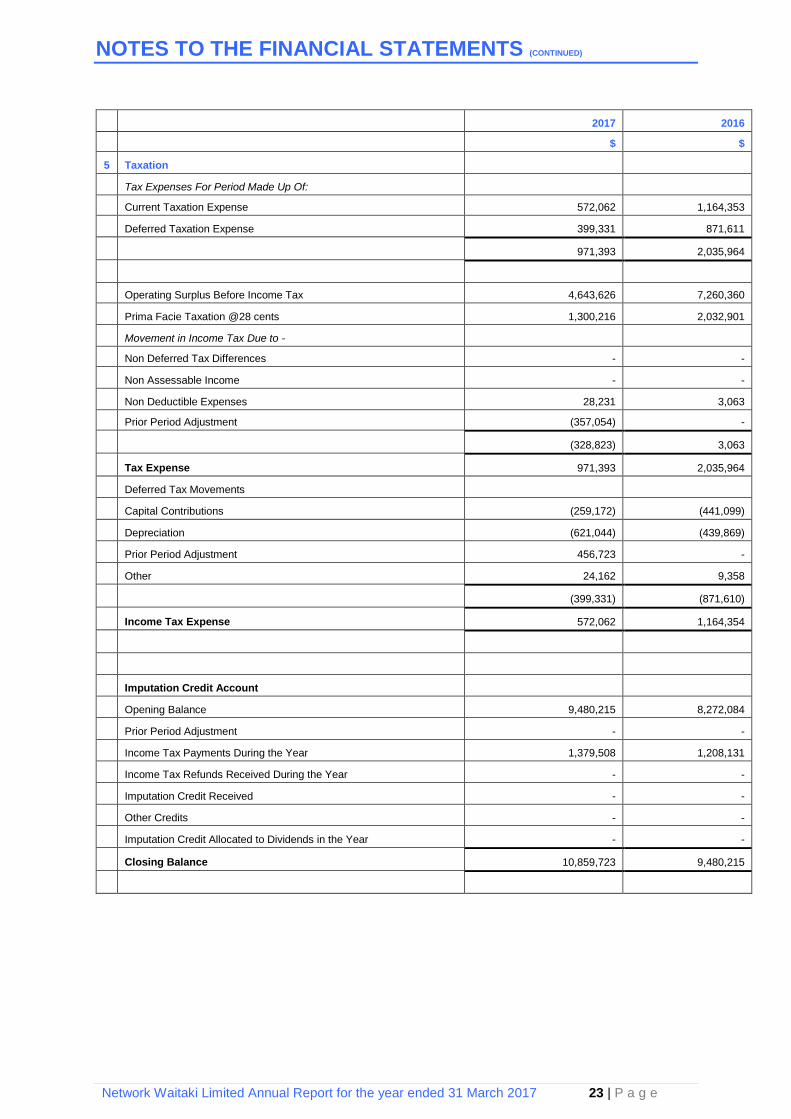
5 Taxation
Tax Expenses For Period Made Up Of:
Current Taxation Expense 572,062 1,164,353
Deferred Taxation Expense 399,331 871,611
971,393 2,035,964
Operating Surplus Before Income Tax 4,643,626 7,260,360
Prima Facie Taxation @28 cents 1,300,216 2,032,901
Movement in Income Tax Due to -
Non Deferred Tax Differences - -
Non Assessable Income - -
Non Deductible Expenses 28,231 3,063
Prior Period Adjustment (357,054) -
(328,823) 3,063
Tax Expense 971,393 2,035,964
Deferred Tax Movements
Capital Contributions (259,172) (441,099)
Depreciation (621,044) (439,869)
Prior Period Adjustment 456,723 -
Other 24,162 9,358
(399,331) (871,610)
Income Tax Expense 572,062 1,164,354
Imputation Credit Account
Opening Balance 9,480,215 8,272,084
Prior Period Adjustment - -
Income Tax Payments During the Year 1,379,508 1,208,131
Income Tax Refunds Received During the Year - -
Imputation Credit Received - -
Other Credits - -
Imputation Credit Allocated to Dividends in the Year - -
Closing Balance 10,859,723 9,480,215
Network Waitaki Limited Annual Report for the year ended 31 March 2017 24 | P a g e
NOTES TO THE FINANCIAL STATEMENTS (CONTINUED)
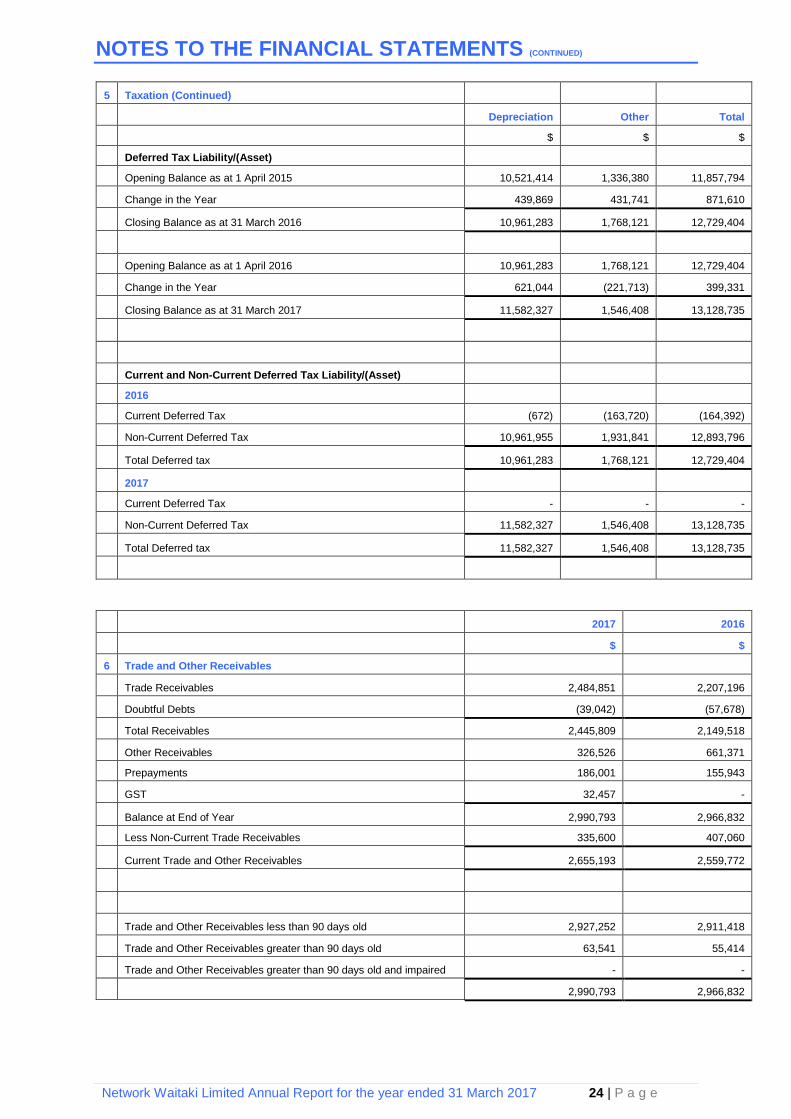
5 Taxation (Continued)
Depreciation Other Total
$ $ $
Deferred Tax Liability/(Asset)
Opening Balance as at 1 April 2015 10,521,414 1,336,380 11,857,794
Change in the Year 439,869 431,741 871,610
Closing Balance as at 31 March 2016 10,961,283 1,768,121 12,729,404
Opening Balance as at 1 April 2016 10,961,283 1,768,121 12,729,404
Change in the Year 621,044 (221,713) 399,331
Closing Balance as at 31 March 2017 11,582,327 1,546,408 13,128,735
Current and Non-Current Deferred Tax Liability/(Asset)
2016
Current Deferred Tax (672) (163,720) (164,392)
Non-Current Deferred Tax 10,961,955 1,931,841 12,893,796
Total Deferred tax 10,961,283 1,768,121 12,729,404
2017
Current Deferred Tax - - -
Non-Current Deferred Tax 11,582,327 1,546,408 13,128,735
Total Deferred tax 11,582,327 1,546,408 13,128,735
2017 2016
$ $
6 Trade and Other Receivables
Trade Receivables 2,484,851 2,207,196
Doubtful Debts (39,042) (57,678)
Total Receivables 2,445,809 2,149,518
Other Receivables 326,526 661,371
Prepayments 186,001 155,943
GST 32,457 -
Balance at End of Year 2,990,793 2,966,832
Less Non-Current Trade Receivables 335,600 407,060
Current Trade and Other Receivables 2,655,193 2,559,772
Trade and Other Receivables less than 90 days old 2,927,252 2,911,418
Trade and Other Receivables greater than 90 days old 63,541 55,414
Trade and Other Receivables greater than 90 days old and impaired - -
2,990,793 2,966,832
Network Waitaki Limited Annual Report for the year ended 31 March 2017 25 | P a g e
NOTES TO THE FINANCIAL STATEMENTS (CONTINUED)
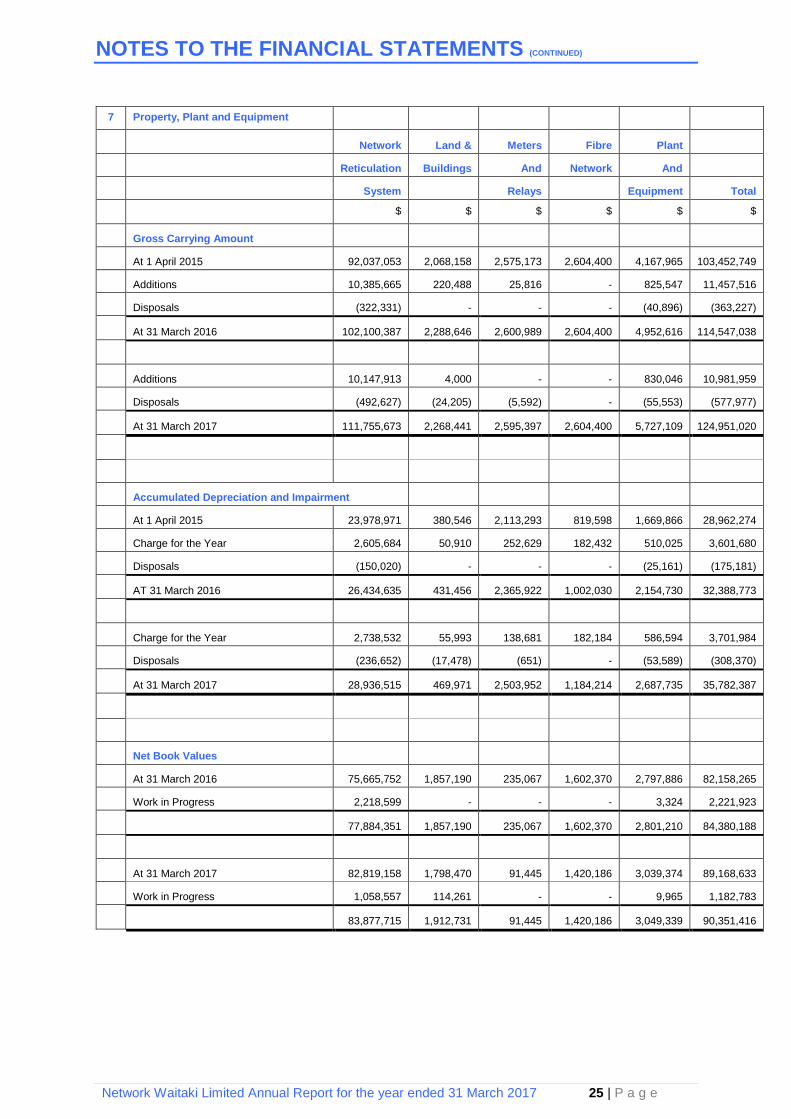
7 Property, Plant and Equipment
Network Land & Meters Fibre Plant
Reticulation Buildings And Network And
System Relays Equipment Total
$ $ $ $ $ $
Gross Carrying Amount
At 1 April 2015 92,037,053 2,068,158 2,575,173 2,604,400 4,167,965 103,452,749
Additions 10,385,665 220,488 25,816 - 825,547 11,457,516
Disposals (322,331) - - - (40,896) (363,227)
At 31 March 2016 102,100,387 2,288,646 2,600,989 2,604,400 4,952,616 114,547,038
Additions 10,147,913 4,000 - - 830,046 10,981,959
Disposals (492,627) (24,205) (5,592) - (55,553) (577,977)
At 31 March 2017 111,755,673 2,268,441 2,595,397 2,604,400 5,727,109 124,951,020
Accumulated Depreciation and Impairment
At 1 April 2015 23,978,971 380,546 2,113,293 819,598 1,669,866 28,962,274
Charge for the Year 2,605,684 50,910 252,629 182,432 510,025 3,601,680
Disposals (150,020) - - - (25,161) (175,181)
AT 31 March 2016 26,434,635 431,456 2,365,922 1,002,030 2,154,730 32,388,773
Charge for the Year 2,738,532 55,993 138,681 182,184 586,594 3,701,984
Disposals (236,652) (17,478) (651) - (53,589) (308,370)
At 31 March 2017 28,936,515 469,971 2,503,952 1,184,214 2,687,735 35,782,387
Net Book Values
At 31 March 2016 75,665,752 1,857,190 235,067 1,602,370 2,797,886 82,158,265
Work in Progress 2,218,599 - - - 3,324 2,221,923
77,884,351 1,857,190 235,067 1,602,370 2,801,210 84,380,188
At 31 March 2017 82,819,158 1,798,470 91,445 1,420,186 3,039,374 89,168,633
Work in Progress 1,058,557 114,261 - - 9,965 1,182,783
83,877,715 1,912,731 91,445 1,420,186 3,049,339 90,351,416
Network Waitaki Limited Annual Report for the year ended 31 March 2017 26 | P a g e
NOTES TO THE FINANCIAL STATEMENTS (CONTINUED)
2017 2016
$ $
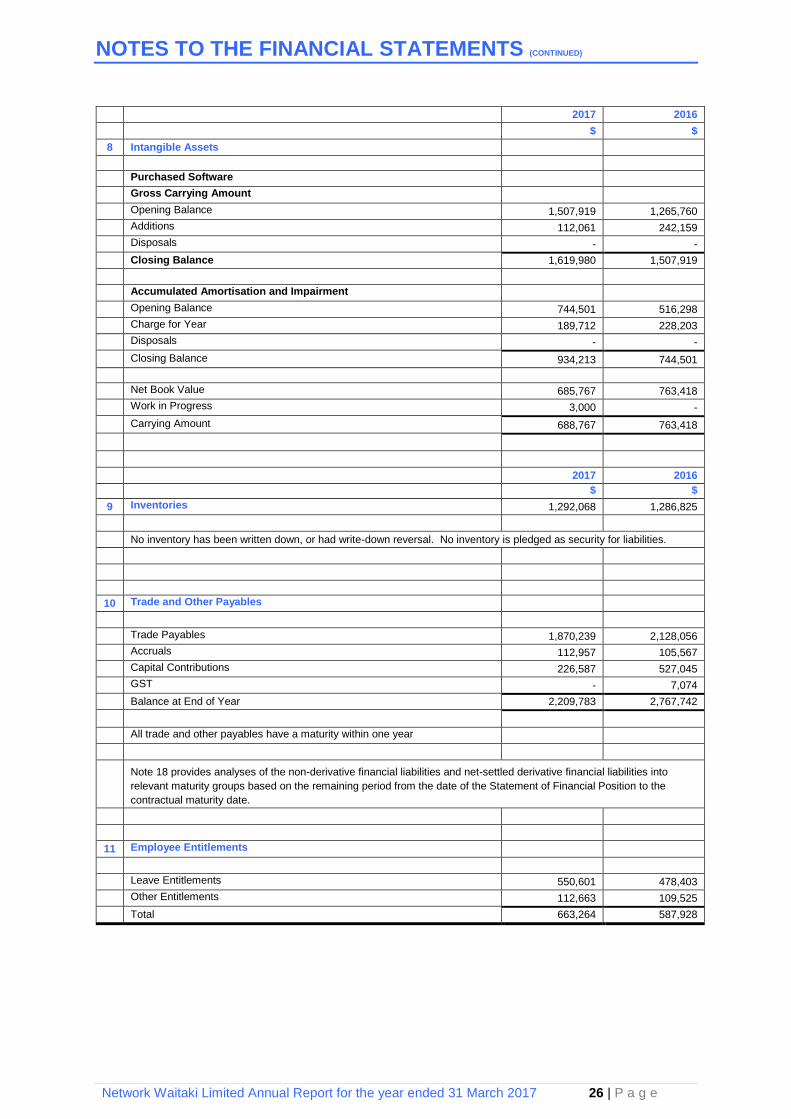
8 Intangible Assets
Purchased Software
Gross Carrying Amount
Opening Balance 1,507,919 1,265,760
Additions 112,061 242,159
Disposals - -
Closing Balance 1,619,980 1,507,919
Accumulated Amortisation and Impairment
Opening Balance 744,501 516,298
Charge for Year 189,712 228,203
Disposals - -
Closing Balance 934,213 744,501
Net Book Value 685,767 763,418
Work in Progress 3,000 -
Carrying Amount 688,767 763,418
2017 2016
$ $
9 Inventories 1,292,068 1,286,825
No inventory has been written down, or had write-down reversal. No inventory is pledged as security for liabilities.
10 Trade and Other Payables
Trade Payables 1,870,239 2,128,056
Accruals 112,957 105,567
Capital Contributions 226,587 527,045
GST - 7,074
Balance at End of Year 2,209,783 2,767,742
All trade and other payables have a maturity within one year
Note 18 provides analyses of the non-derivative financial liabilities and net-settled derivative financial liabilities into
relevant maturity groups based on the remaining period from the date of the Statement of Financial Position to the
contractual maturity date.
11 Employee Entitlements
Leave Entitlements 550,601 478,403
Other Entitlements 112,663 109,525
Total 663,264 587,928
Network Waitaki Limited Annual Report for the year ended 31 March 2017 27 | P a g e
NOTES TO THE FINANCIAL STATEMENTS (CONTINUED)
2017 2016
$ $
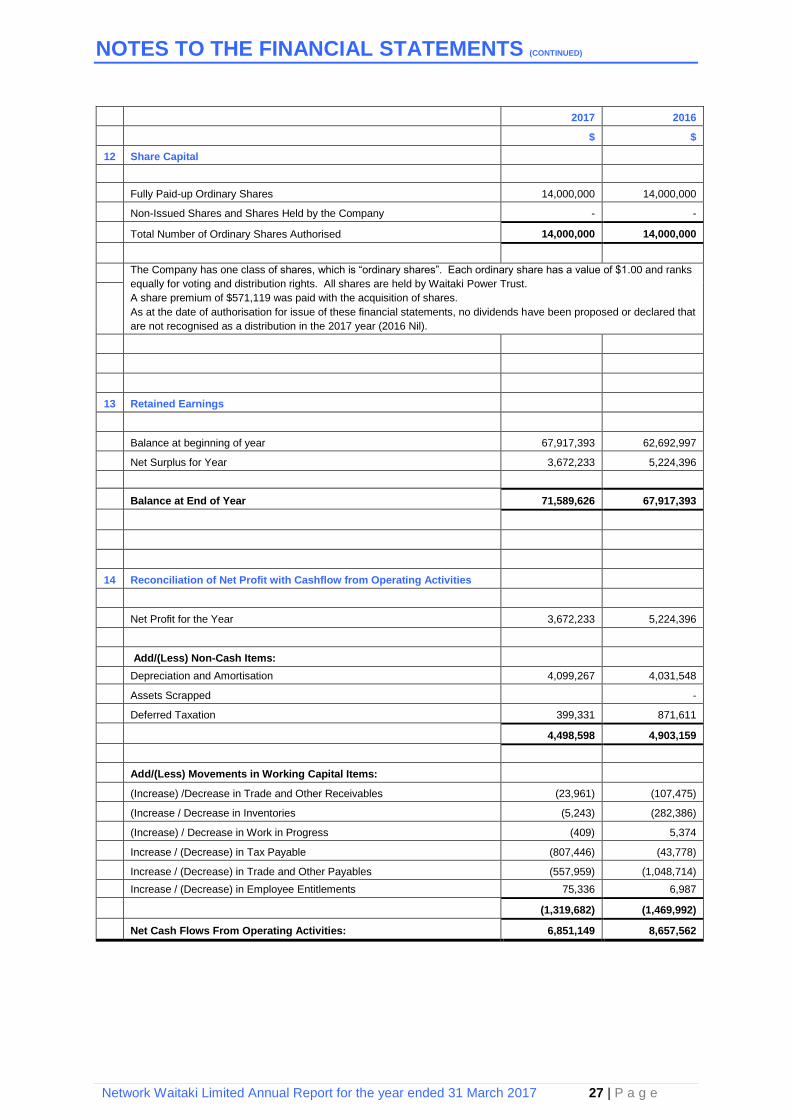
12 Share Capital
Fully Paid-up Ordinary Shares 14,000,000 14,000,000
Non-Issued Shares and Shares Held by the Company - -
Total Number of Ordinary Shares Authorised 14,000,000 14,000,000
The Company has one class of shares, which is “ordinary shares”. Each ordinary share has a value of $1.00 and ranks
equally for voting and distribution rights. All shares are held by Waitaki Power Trust.
A share premium of $571,119 was paid with the acquisition of shares.
As at the date of authorisation for issue of these financial statements, no dividends have been proposed or declared that
are not recognised as a distribution in the 2017 year (2016 Nil).
13 Retained Earnings
Balance at beginning of year 67,917,393 62,692,997
Net Surplus for Year 3,672,233 5,224,396
Balance at End of Year 71,589,626 67,917,393
14 Reconciliation of Net Profit with Cashflow from Operating Activities
Net Profit for the Year 3,672,233 5,224,396
Add/(Less) Non-Cash Items:
Depreciation and Amortisation 4,099,267 4,031,548
Assets Scrapped -
Deferred Taxation 399,331 871,611
4,498,598 4,903,159
Add/(Less) Movements in Working Capital Items:
(Increase) /Decrease in Trade and Other Receivables (23,961) (107,475)
(Increase / Decrease in Inventories (5,243) (282,386)
(Increase) / Decrease in Work in Progress (409) 5,374
Increase / (Decrease) in Tax Payable (807,446) (43,778)
Increase / (Decrease) in Trade and Other Payables (557,959) (1,048,714)
Increase / (Decrease) in Employee Entitlements 75,336 6,987
(1,319,682) (1,469,992)
Net Cash Flows From Operating Activities: 6,851,149 8,657,562
Network Waitaki Limited Annual Report for the year ended 31 March 2017 28 | P a g e
NOTES TO THE FINANCIAL STATEMENTS (CONTINUED)
2017 2016
$ $
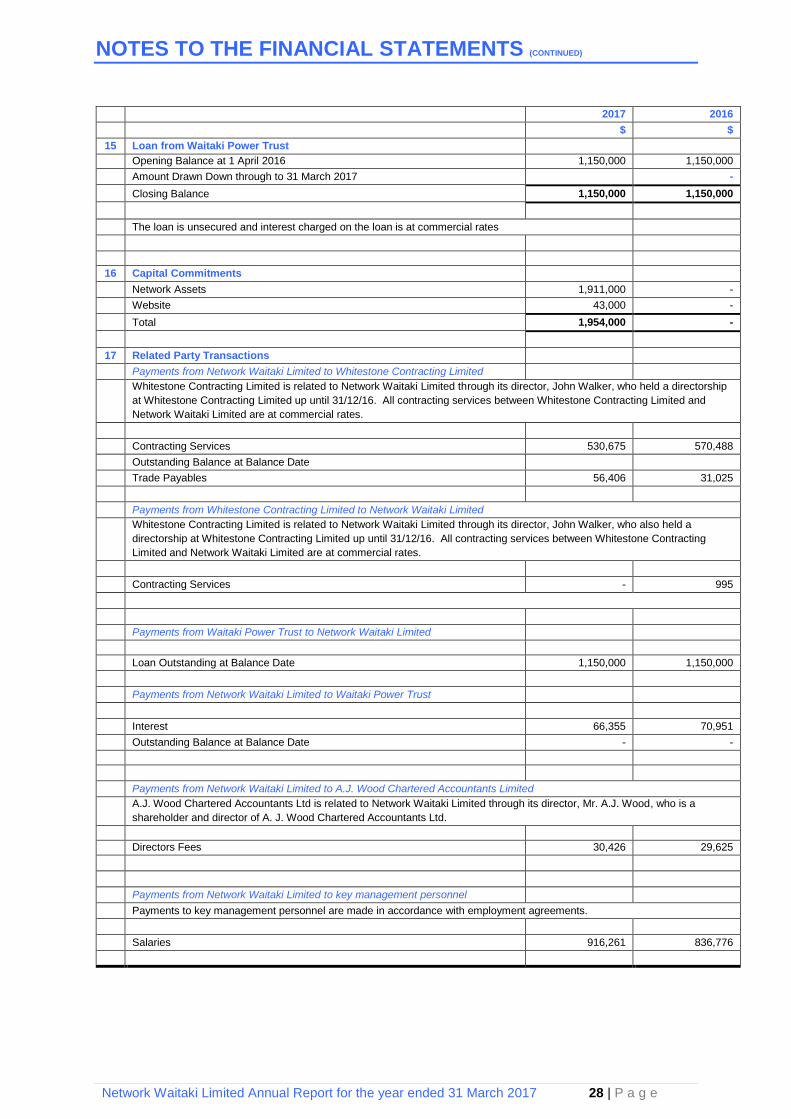
15 Loan from Waitaki Power Trust
Opening Balance at 1 April 2016 1,150,000 1,150,000
Amount Drawn Down through to 31 March 2017 -
Closing Balance 1,150,000 1,150,000
The loan is unsecured and interest charged on the loan is at commercial rates
16 Capital Commitments
Network Assets 1,911,000 -
Website 43,000 -
Total 1,954,000 -
17 Related Party Transactions
Payments from Network Waitaki Limited to Whitestone Contracting Limited
Whitestone Contracting Limited is related to Network Waitaki Limited through its director, John Walker, who held a directorship
at Whitestone Contracting Limited up until 31/12/16. All contracting services between Whitestone Contracting Limited and
Network Waitaki Limited are at commercial rates.
Contracting Services 530,675 570,488
Outstanding Balance at Balance Date
Trade Payables 56,406 31,025
Payments from Whitestone Contracting Limited to Network Waitaki Limited
Whitestone Contracting Limited is related to Network Waitaki Limited through its director, John Walker, who also held a
directorship at Whitestone Contracting Limited up until 31/12/16. All contracting services between Whitestone Contracting
Limited and Network Waitaki Limited are at commercial rates.
Contracting Services - 995
Payments from Waitaki Power Trust to Network Waitaki Limited
Loan Outstanding at Balance Date 1,150,000 1,150,000
Payments from Network Waitaki Limited to Waitaki Power Trust
Interest 66,355 70,951
Outstanding Balance at Balance Date - -
Payments from Network Waitaki Limited to A.J. Wood Chartered Accountants Limited
A.J. Wood Chartered Accountants Ltd is related to Network Waitaki Limited through its director, Mr. A.J. Wood, who is a
shareholder and director of A. J. Wood Chartered Accountants Ltd.
Directors Fees 30,426 29,625
Payments from Network Waitaki Limited to key management personnel
Payments to key management personnel are made in accordance with employment agreements.
Salaries 916,261 836,776
Network Waitaki Limited Annual Report for the year ended 31 March 2017 29 | P a g e
NOTES TO THE FINANCIAL STATEMENTS (CONTINUED)
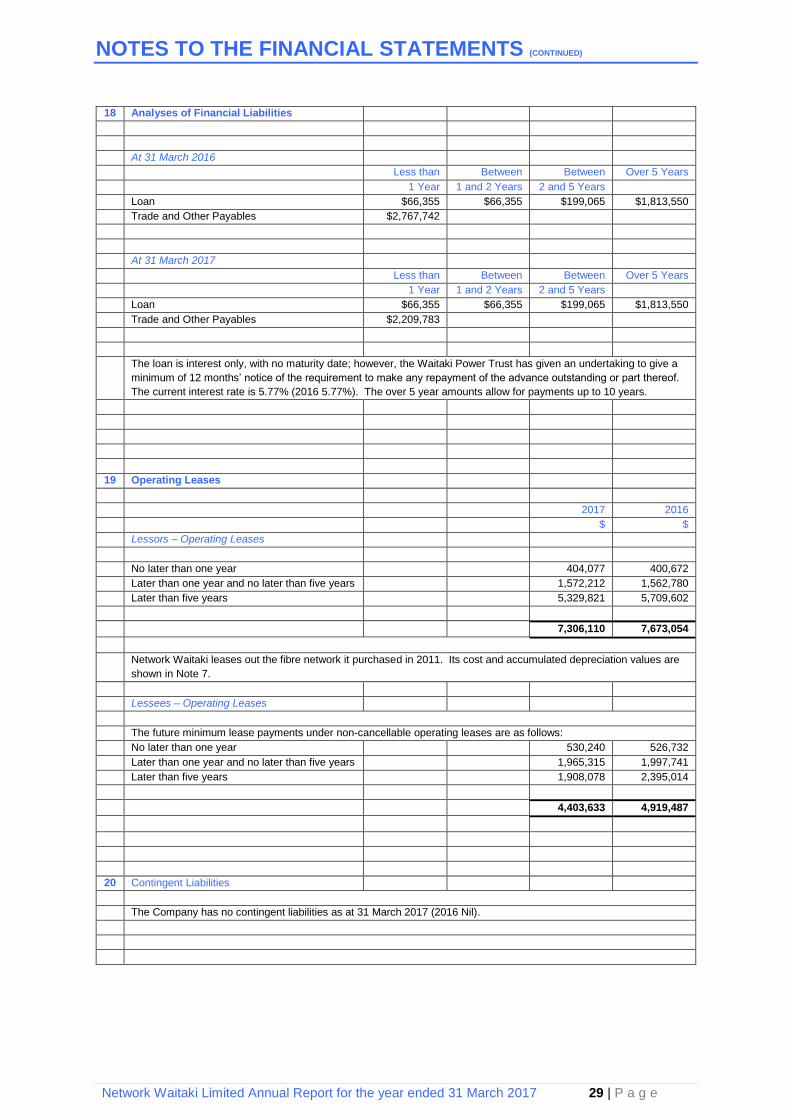
18 Analyses of Financial Liabilities
At 31 March 2016
Less than Between Between Over 5 Years
1 Year 1 and 2 Years 2 and 5 Years
Loan $66,355 $66,355 $199,065 $1,813,550
Trade and Other Payables $2,767,742
At 31 March 2017
Less than Between Between Over 5 Years
1 Year 1 and 2 Years 2 and 5 Years
Loan $66,355 $66,355 $199,065 $1,813,550
Trade and Other Payables $2,209,783
The loan is interest only, with no maturity date; however, the Waitaki Power Trust has given an undertaking to give a
minimum of 12 months’ notice of the requirement to make any repayment of the advance outstanding or part thereof.
The current interest rate is 5.77% (2016 5.77%). The over 5 year amounts allow for payments up to 10 years.
19 Operating Leases
2017 2016
$ $
Lessors – Operating Leases
No later than one year 404,077 400,672
Later than one year and no later than five years 1,572,212 1,562,780
Later than five years 5,329,821 5,709,602
7,306,110 7,673,054
Network Waitaki leases out the fibre network it purchased in 2011. Its cost and accumulated depreciation values are
shown in Note 7.
Lessees – Operating Leases
The future minimum lease payments under non-cancellable operating leases are as follows:
No later than one year 530,240 526,732
Later than one year and no later than five years 1,965,315 1,997,741
Later than five years 1,908,078 2,395,014
4,403,633 4,919,487
20 Contingent Liabilities
The Company has no contingent liabilities as at 31 March 2017 (2016 Nil).
Network Waitaki Limited Annual Report for the year ended 31 March 2017 30 | P a g e
STATEMENT OF SERVICE PERFORMANCE
Performance targets, as set out in the Statement of Corporate Intent (SCI) approved by Directors
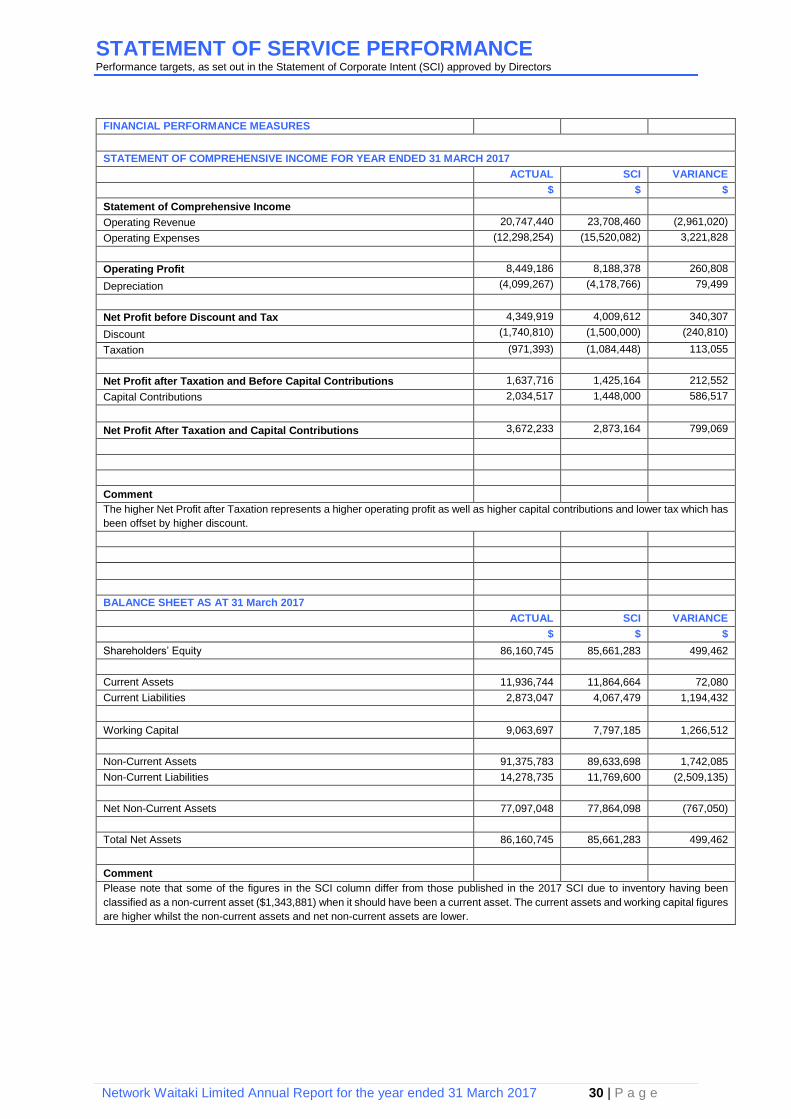
FINANCIAL PERFORMANCE MEASURES
STATEMENT OF COMPREHENSIVE INCOME FOR YEAR ENDED 31 MARCH 2017
ACTUAL SCI VARIANCE
$ $ $
Statement of Comprehensive Income
Operating Revenue 20,747,440 23,708,460 (2,961,020)
Operating Expenses (12,298,254) (15,520,082) 3,221,828
Operating Profit 8,449,186 8,188,378 260,808
Depreciation (4,099,267) (4,178,766) 79,499
Net Profit before Discount and Tax 4,349,919 4,009,612 340,307
Discount (1,740,810) (1,500,000) (240,810)
Taxation (971,393) (1,084,448) 113,055
Net Profit after Taxation and Before Capital Contributions 1,637,716 1,425,164 212,552
Capital Contributions 2,034,517 1,448,000 586,517
Net Profit After Taxation and Capital Contributions 3,672,233 2,873,164 799,069
Comment
The higher Net Profit after Taxation represents a higher operating profit as well as higher capital contributions and lower tax which has
been offset by higher discount.
BALANCE SHEET AS AT 31 March 2017
ACTUAL SCI VARIANCE
$ $ $
Shareholders’ Equity 86,160,745 85,661,283 499,462
Current Assets 11,936,744 11,864,664 72,080
Current Liabilities 2,873,047 4,067,479 1,194,432
Working Capital 9,063,697 7,797,185 1,266,512
Non-Current Assets 91,375,783 89,633,698 1,742,085
Non-Current Liabilities 14,278,735 11,769,600 (2,509,135)
Net Non-Current Assets 77,097,048 77,864,098 (767,050)
Total Net Assets 86,160,745 85,661,283 499,462
Comment
Please note that some of the figures in the SCI column differ from those published in the 2017 SCI due to inventory having been
classified as a non-current asset ($1,343,881) when it should have been a current asset. The current assets and working capital figures
are higher whilst the non-current assets and net non-current assets are lower.
Network Waitaki Limited Annual Report for the year ended 31 March 2017 31 | P a g e
STATEMENT OF SERVICE PERFORMANCE (CONTINUED)
Performance targets, as set out in the Statement of Corporate Intent (SCI) approved by Directors
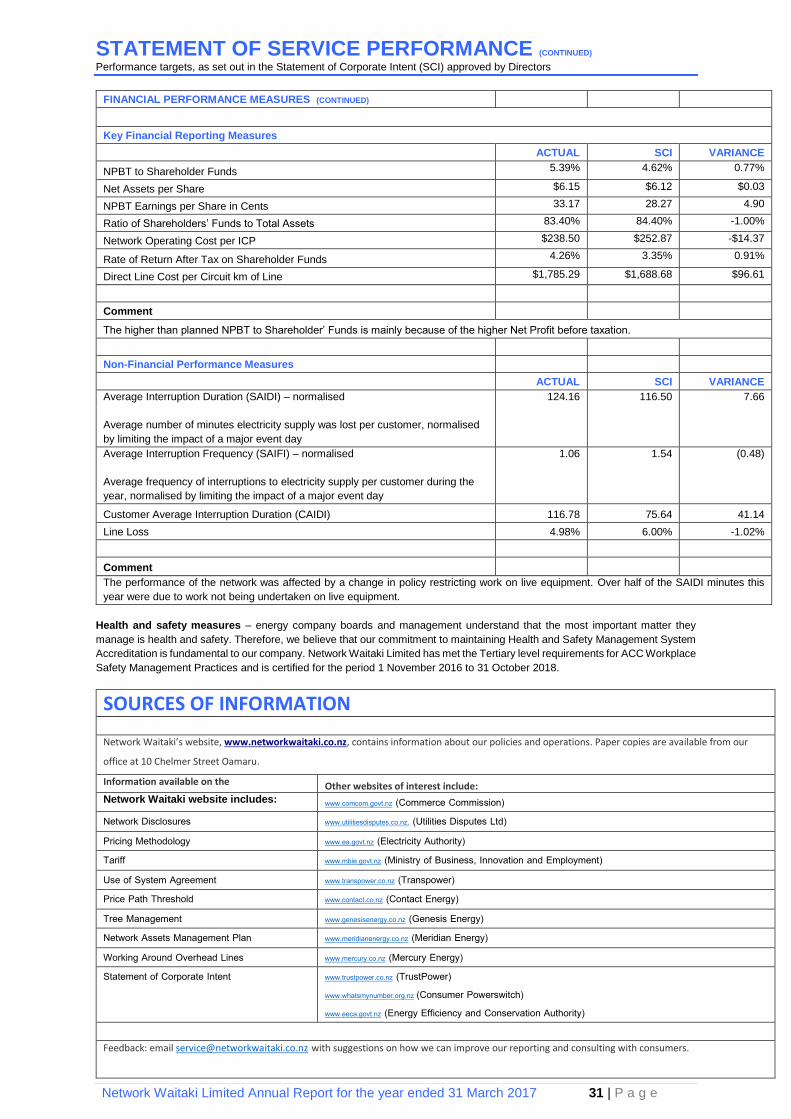
FINANCIAL PERFORMANCE MEASURES (CONTINUED)
Key Financial Reporting Measures
ACTUAL SCI VARIANCE
NPBT to Shareholder Funds 5.39% 4.62% 0.77%
Net Assets per Share $6.15 $6.12 $0.03
NPBT Earnings per Share in Cents 33.17 28.27 4.90
Ratio of Shareholders’ Funds to Total Assets 83.40% 84.40% -1.00%
Network Operating Cost per ICP $238.50 $252.87 -$14.37
Rate of Return After Tax on Shareholder Funds 4.26% 3.35% 0.91%
Direct Line Cost per Circuit km of Line $1,785.29 $1,688.68 $96.61
Comment
The higher than planned NPBT to Shareholder’ Funds is mainly because of the higher Net Profit before taxation.
Non-Financial Performance Measures
ACTUAL SCI VARIANCE
Average Interruption Duration (SAIDI) – normalised
Average number of minutes electricity supply was lost per customer, normalised
by limiting the impact of a major event day
124.16 116.50 7.66
Average Interruption Frequency (SAIFI) – normalised
Average frequency of interruptions to electricity supply per customer during the
year, normalised by limiting the impact of a major event day
1.06 1.54 (0.48)
Customer Average Interruption Duration (CAIDI) 116.78 75.64 41.14
Line Loss 4.98% 6.00% -1.02%
Comment
The performance of the network was affected by a change in policy restricting work on live equipment. Over half of the SAIDI minutes this
year were due to work not being undertaken on live equipment.
Health and safety measures – energy company boards and management understand that the most important matter they
manage is health and safety. Therefore, we believe that our commitment to maintaining Health and Safety Management System
Accreditation is fundamental to our company. Network Waitaki Limited has met the Tertiary level requirements for ACC Workplace
Safety Management Practices and is certified for the period 1 November 2016 to 31 October 2018.
SOURCES OF INFORMATION Network Waitaki’s website, www.networkwaitaki.co.nz, contains information about our policies and operations. Paper copies are available from our
office at 10 Chelmer Street Oamaru.
Information available on the Other websites of interest include: Network Waitaki website includes: www.comcom.govt.nz (Commerce Commission) Network Disclosures www.utilitiesdisputes.co.nz. (Utilities Disputes Ltd) Pricing Methodology www.ea.govt.nz (Electricity Authority) Tariff www.mbie.govt.nz (Ministry of Business, Innovation and Employment) Use of System Agreement www.transpower.co.nz (Transpower) Price Path Threshold www.contact.co.nz (Contact Energy) Tree Management www.genesisenergy.co.nz (Genesis Energy) Network Assets Management Plan www.meridianenergy.co.nz (Meridian Energy) Working Around Overhead Lines www.mercury.co.nz (Mercury Energy) Statement of Corporate Intent www.trustpower.co.nz (TrustPower)
www.whatsmynumber.org.nz (Consumer Powerswitch) www.eeca.govt.nz (Energy Efficiency and Conservation Authority)
Feedback: email [email protected] with suggestions on how we can improve our reporting and consulting with consumers.
Network Waitaki Limited Annual Report for the year ended 31 March 2017 32 | P a g e
INDEPENDENT AUDITORS REPORT
Network Waitaki Limited Annual Report for the year ended 31 March 2017 33 | P a g e
INDEPENDENT AUDITORS REPORT
Network Waitaki Limited Annual Report for the year ended 31 March 2017 34 | P a g e
INDEPENDENT AUDITORS REPORT
Network Waitaki Limited Annual Report for the year ended 31 March 2017 35 | P a g e
INDEPENDENT AUDITORS REPORT
Network Waitaki Limited Annual Report for the year ended 31 March 2017 36 | P a g e
INDEPENDENT AUDITORS REPORT
Network Waitaki Limited Annual Report for the year ended 31 March 2017 37 | P a g e
DIRECTORY
Network Waitaki Limited Office
10 Chelmer Street
P O Box 147
Oamaru 9444
Phone: (03) 433 0065
Fax: (03) 434 8845
Freephone: 0800440 220
Email: [email protected]
Executive Team, Network Waitaki Limited
Chief Executive Officer Graham B. Clark
Managers
- Health & Safety Neil McBride
- Network David Paterson
- Contracting Derek McGee
- Finance Brett Dixon
- Planning & Asset Tod Trotman
- Regulatory Analyst Cornel van Basten
www.networkwaitaki.co.nz