Embed Size (px)
Citation preview

ird.govt.nz
B–23
AnnualReport
2015

Crown Copyright © 2015
This work is licensed under the Creative Commons Attribution 3.0 New Zealand licence. In essence, you are free to copy, distribute and adapt the work, as long as you attribute the work to the Crown and abide by the other licence terms. To view a copy of this licence, visit
creativecommons.org
Please note that no departmental or governmental emblem, logo or Coat of Arms may be used in any way that infringes any provision of the Flags, Emblems, and Names Protection Act 1981.
legislation.govt.nz
Attribution to the Crown should be in written form and not by reproduction of any such emblem, logo or Coat of Arms.
ISSN 1176-6654 (Print)
ISSN 2230-4053 (Online)
ird.govt.nz
Presented to the House of Representatives pursuant to the Public Finance Act 1989 and the Tax Administration Act 1994.

ANNUAL REPORT 2015 1
About Inland Revenue 7
Delivering and improving our core business 11
Contributing to the Government’s priorities 23
Business Transformation 31
Organisational health 35
Our performance 43
Measuring our performance 57
Departmental financial statements 93
Non-departmental financial schedules 125
Audit Report 145
Additional information 149
Contents

2 ANNUAL REPORT 2015
From the Commissioner
A year of making tax simpler
As Commissioner I’m enormously proud of how much Inland Revenue has achieved for the people of New Zealand. This year’s Annual Report reflects many of the improvements you’ll notice next time you look for information online, file a return or claim a refund. We’re making the business of tax and entitlements simpler, more open and more certain for customers and businesses across New Zealand.
Easier for customers
Our Business Transformation will completely change how people interact with the revenue system in future. And as we prepare for transformation, we’re making it easier every day for businesses and individuals, through continuous improvement and innovation.
More people are doing a lot more online. During the year we improved our website and myIR online services, and made it easier to register and find information. Since August customers have been able to activate their new myIR account instantly via text. Customers are embracing new digital opportunities – last year 67% of returns and almost 83% of payments were done online. Our mobile app that lets small businesses do GST on the go, developed through crowd-sourcing and research, is hugely popular.
Going digital gives customers increased certainty. But if they need to call us we’re answering more calls and answering them faster: 75% of our 3.24 million calls received last year were answered in less than two minutes. Voice ID, with 1.5 million customers registered, and automatic call-back makes the process even smoother.
These changes and more contribute to Better Public Services, making it simpler and more seamless for New Zealanders to deal with Government. We’re working with many other agencies on a range of projects from sharing information that supports customers to joint service delivery. Businesses are noticing the difference: a recent survey reported a 23% reduction in the effort of dealing with Inland Revenue.
Getting it right
Our new Compliance Model helps us understand customers better and tailor our approaches to respond to different customer behaviours and needs. We want
to help people get it right from the start, make tax simpler and more certain, and help more people avoid debt.
For the first time in five years, Inland Revenue’s overdue debt total has reduced. We’ve done this by contacting businesses and individuals upfront to prevent them getting into debt, following up fast with effective arrangements to manage any debts, and recognising that some debt costs more than it’s worth to collect.
The vast majority of student loan debt is owed by borrowers now living overseas, and much child support debt is owed by liable parents living in Australia. We’ve used innovative campaigns to successfully reach these customers and recover debt. Our student loan campaign was a gold-medal winner in communications awards.
We also reduced overdue tax returns by 21.5% last year, finalising 1.45 million overdue returns and reducing the number outstanding to the lowest level in five years.
We also take further action to ensure everyone pays the tax they should. During the year we tackled the hidden economy, property tax compliance and aggressive tax planning, with an excellent rate of return on each. We also had some outstanding wins in the courts.
Reforming child support
A significant project during the year was changing the child support system to better reflect how families live since child support was introduced in 1992. After earlier public consultation, the first changes took effect on 1 April 2015, with the second stage to come in April 2016.
In preparation we contacted thousands of parents who pay or receive child support to make sure they understood the changes and were well-prepared for their impacts. We used social media and texts as well as more traditional channels. 68,000 visitors used our online calculator to work out how changes could affect them.

ANNUAL REPORT 2015 3
Future Inland Revenue – Business Transformation
Implementing our Business Transformation programme is one of our three strategic priorities for 2014–18. I’m excited to see preparation for changes that will create a modern tax administration by 2023, now coming to fruition.
It’s critical we have the right people helping us develop and implement transformation. After an intensive selection process we appointed Accenture and Fast Enterprises, along with several New Zealand-based supporting companies, to work alongside us. We also completed high-level design for all four transformation stages taking place over the next eight to 10 years and started detailed design of the first stage expected to start next year.
We’re involving stakeholders across all areas, with four advisory panels providing a wide range of advice and opinions. Quality assurance reviews from external organisations who make sure we’re spending taxpayers’ funds wisely, have all been positive.
We asked New Zealanders for their thoughts on the tax system of the future through two significant Government consultations during the year. These received great engagement from the public and tax community, with more than 900 comments online and over 90 written submissions.
Conclusion
It’s a privilege to be Commissioner of Inland Revenue. Alongside great customer service delivered every day this organisation provides advice to Government on tax and social policy; and contributes to solving international tax issues.
This year we helped make New Zealand an even better place to live and work in many ways - including collecting $59.7 billion of tax revenue that helps fund services to benefit all New Zealanders.
I’m proud of our people who are committed to making a difference in people’s lives and adding value every day. As we look forward to next year’s challenges I am confident Inland Revenue has the people, skills and innovation to meet the future.
Naomi FergusonCommissioner of Inland Revenue

4 ANNUAL REPORT 2015
Highlights
KIWISAVER MEMBERSHIP REACHED
2.5MILLION
WE NOW HAVE 1.5 MILLION CUSTOMERS
REGISTERED WITH VOICE ID
MOBILE APPLICATION LAUNCHED FOR APPLE PRODUCTS – SMALL TO MEDIUM ENTERPRISES CAN NOW MANAGE THEIR
GST ON THEIR SMARTPHONES
OVERDUE DEBT CASES HAVE DECREASED BY
16%(67,000)
THIS IS THE FIRST TIME IN
five yearsTHAT WE HAVE BEEN ABLE TO
REDUCE THE TOTAL AMOUNT OF OVERDUE DEBT
WE COLLECTED
$59.7BILLION OF TAX REVENUE FOR
THE GOVERNMENT
WE PAID
$3.4 BILLION IN WORKING FOR
FAMILIES TAX CREDITS, KIWISAVER, PAID PARENTAL LEAVE PAYMENTS AND PAYROLL SUBSIDY
WE TRANSFERRED
$4.8BILLION OF KIWISAVER
CONTRIBUTIONS TO PROVIDERS
BUSINESSES WHOSE MOST RECENT INTERACTION WITH GOVERNMENT WAS WITH INLAND REVENUE REPORTED A
23%REDUCTION IN EFFORT OF DEALING WITH US,
IN THE LATEST BUSINESS REFERENCE GROUP SURVEY
$

ANNUAL REPORT 2015 5
INLAND REVENUE IS THE FIRST AGENCY TO REACH
five stars IN THE ENERGY EFFICIENCY
AND CONSERVATION AUTHORITY (EECA) ONE2FIVE
ENERGY MANAGEMENT RATING
EECA LOOKED AT OUR ENERGY USAGE AND HOW WELL WE DEMONSTRATE CORPORATE
COMMITMENT, TARGETS AND PERFORMANCE INDICATORS, PLANS, AND ACCOUNTABILITY TO ENERGY MANAGEMENT. OUR FIVE STAR
RATING IS AN IMPROVEMENT FROM OUR FOUR STAR RATING IN NOVEMBER 2013.
OUR BUSINESS TRANSFORMATION PROGRAMME ACHIEVED ALL ITS MILESTONES AND
WAS UNDER BUDGET
CHILD SUPPORT REFORMS PHASE ONE COMPLETED AND IMPLEMENTED
SUCCESSFULLY
SIGNIFICANTLY CONTRIBUTED TO THE GOVERNMENT’S RESULT 10 TARGET OF “AN AVERAGE OF 70% OF NEW
ZEALANDERS’ MOST COMMON TRANSACTIONS WITH GOVERNMENT WILL BE COMPLETED IN A DIGITAL
ENVIRONMENT” WITH
88%OF INDIVIDUALS FILING
THEIR TAX RETURNS ELECTRONICALLY AND JUST OVER
81% PAYING INDIVIDUAL TAX ELECTRONICALLY
CONTINUED INCREASE IN CUSTOMERS’ USE OF DIGITAL
SERVICES. WE RECEIVED
67.4%OF RETURNS ELECTRONICALLY,
UP FROM 59.8% LAST YEAR
WE ACHIEVED
91%OF OUR SERVICE PERFORMANCE
TARGETS COMPARED TO 85% LAST YEAR
82.5%OF PAYMENTS ELECTRONICALLY COMPARED TO 74.2% LAST YEAR
$
Tax return

6 ANNUAL REPORT 2015
01About
Inland Revenue
ANNUAL REPORT 2015 7

8 ANNUAL REPORT 2015
About us
Outcomes
Inland Revenue contributes to the economic and social wellbeing of New Zealand by collecting and distributing money. New Zealanders pay tax to and may get money from the Government. We are accountable to the Minister of Revenue.
Inland Revenue’s success is reflected in two outcomes:
• Revenue is available to fund government programmes through people meeting payment obligations of their own accord.
• People receive payments they are entitled to, enabling them to participate in society.
Strategic intentions
Our strategic intentions set out in our Statement of Intent 2014–18 are to:
• Deliver and improve our core business
• Contribute to the Government’s priorities
• Implement our transformation change agenda.
We are working on these three areas to ensure that we deliver for our customers today and transform for tomorrow.
Why paying tax matters
In 2014–15, Inland Revenue collected $59.7 billion in tax revenue, which is around 80% of the money government uses to pay for services that all New Zealanders benefit from, including healthcare, education and policing.
In 2014–15 the Crown expected to spend the following:
Our tax system
An effective tax and social policy system comprises good policy settings plus good administration. A well-functioning tax system supports a more competitive and productive economy and helps the Government achieve its fiscal, economic and social objectives.
Most of New Zealand’s tax revenue is from three main sources:
• Personal income
• Company income
• GST.
These three main tax types have broad bases, allowing substantial amounts of tax to be collected at modest tax rates.
Scope of operations In the tax year ended March 20141:
Individuals—about 1.08 million individuals filed annual tax returns
Employers—about 196,000 employers filed almost 2.1 million employer monthly schedules with PAYE deductions for employees
Companies—392,000 company tax returns were filed
GST filers—631,000 registered customers filed 3.0 million GST returns.
We also manage or share the administration of:
Working for Families Tax Credits—we distributed, with the Ministry of Social Development, $2.4 billion in entitlements to support working families.
Child support—we collected $463 million from 174,000 liable parents who pay child support and distributed $265 million to parents who are main carers of children. The balance is collected for the Government as an off-set for custodial families supported through the benefit system.
* includes $291 million for forecasted new operating spending and ($875) million top down expense adjustment which are not included in graph
Where taxes go – Total Crown expenses $73,107 million*
Forecast 2015 $million
Social security and welfareHealthEducationCore government servicesFinance costsLaw and order
Transport and communications
Economic and industrial servicesDefenceHeritage, culture and recreationPrimary servicesOtherEnvironmental protectionGSF pension expensesHousing and community development
23,954
15,065
12,827
4,816
3,883
3,486
2,217
2,215
1,984
770
700
543
510
395
326

01
Executive Leadership Team
From left to right:
Greg James, Deputy Commissioner Change
Giles Southwell, Chief Financial Officer
Mary Craig, Deputy Commissioner Corporate Integrity & Assurance
Mike Cunnington, Deputy Commissioner Information, Intelligence & Communications
Naomi Ferguson, Commissioner
Martin Smith, Chief Tax Counsel
Jeanie Truell, Chief People Officer
Arlene White, Deputy Commissioner Service Delivery
Myles Ward, Chief Technology Officer
Struan Little, Deputy Commissioner Policy & Strategy
ANNUAL REPORT 2015 9
Our operating budgetOur operating expenditure for the 2014–15 year was $704.2 million, an increase of $3.7 million over the prior year. Expenditure for 2015–16 is forecast to be $764.9 million, an increase of $60.7 million. Most of the forecast increase relates to expenditure on our Business Transformation programme.
KiwiSaver—we administer the scheme by collecting contributions and transferring them to scheme providers for investment. At 30 June 2015 there were 2.5 million people enrolled in KiwiSaver. We distributed $4.8 billion to scheme providers.
Student loans—we jointly administer this programme with the Ministries of Education and Social Development (StudyLink). We had 728,000 student loan borrowers and collected $1.1 billion in repayments.
Paid parental leave—we make payments, for the Ministry of Business, Innovation and Employment, to parents who take leave from their job or business to care for a baby. We made $180 million in payments to 27,500 parents.
12015 figures not available

10 ANNUAL REPORT 2015

02Delivering and improving our
core business
ANNUAL REPORT 2015 11

12 ANNUAL REPORT 2015
We aim to make it easy for our customers to manage their own tax and social policy obligations and entitlements by providing information, assistance and tools so they can do it themselves.
We are enabling our customers to do more online. It is part of our strategy to save our customers and Inland Revenue time and money. Completing their tax and social policy obligations online also helps customers get it right the first time and means we do not have to contact customers to check the information provided is accurate. Over the past year the number of people who have started to file online and use our online tools has increased. The number of returns we received electronically increased by 8.3 percentage points since last year compared to a 4.4 percentage point increase the previous year.
Customers are able to register for a myIR account to manage their own tax and social policy affairs. To make things easier for our customers, we have updated myIR and introduced more online documents to provide access to statements, notices and letters electronically. We made eDocuments available to customers in April 2015. This fits with the objectives of the Government’s Better Public Services Result 9 and 10 goals covered on page 27.
Customers expect to be able to interact with us using all their digital devices.
In January 2015, we launched our new free mobile application myIR on Apple products. This enables small to medium enterprises to manage their GST through their smartphones.
We recognise that our website is the first place most people go when they want to find out information so we work hard to make sure it is the best it can be. We also publish instructional videos on our YouTube channel InlandRevenueNZ. We are continually improving our website and YouTube information to make sure customers are able to find the information they need. One of the improvements we made was to add transcripts of our introductory videos written in Korean and traditional and simplified Chinese to reflect the changing needs of our customers. These are in addition to information in English, Māori and New Zealand Sign Language already available.
Another example of improvements we have made to our website is the employer superannuation contribution tax (ESCT) tool. Customers told us that ESCT was hard to understand so we created an educational tool in July 2014 to help employers. The tool explained what ESCT was and how to calculate, file and pay ESCT. This has been used over 163,000 times.
Our work to make tax easier to understand on our website was recognised again. In December, ird.govt.nz won the ESET NetGuide best Government website award for the eighth time in nine years.
Digital services
02
Phone calls
We aim to make sure our customers can get the answers to all their questions online. However, if customers cannot find the answer they need online then most will call us. When people do call, we are answering more phone calls and answering them faster.
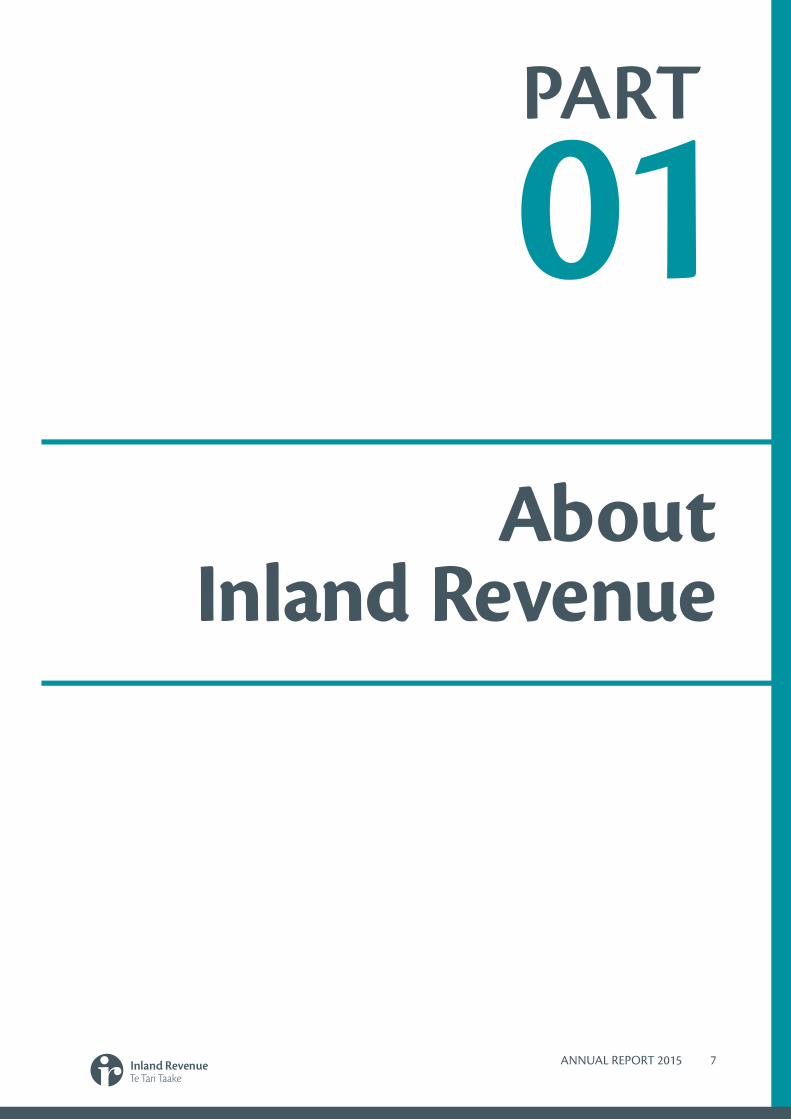
We answered 3.24 million calls this year, which was 96.5% of calls received. Overall the number of calls we answered was similar to last year but our contact centres received 4% (141,000) fewer calls this year than last year.
Reducing the time it takes for us to answer customers’ telephone calls improves their experience and satisfaction. This is why we aim to answer calls as quickly as possible. We answered 75% of our customers’ calls within two minutes.
We managed our calls more effectively by directing calls to staff with the best skills to help and by offering our customers call-back options including the opportunity to book a time for us to call them back when they are free. We have also reduced the number of phone calls that are related to follow-up contact by improving how quickly we get back to people.
We introduced Voice ID in November 2011 as a way to recognise people and remove the need for us to ask questions to confirm that we are talking to the right people. This saves the customer time and enables us to answer calls faster. People register with Voice ID once then use the system each time they call.
Tax agents
Some of our customers choose not to manage their own taxes, but instead use tax agents. Tax agents are a key customer group for us. A tax agent is a person who prepares the returns of income required to be filed for 10 or more taxpayers.
We have been working with tax agents to continue to make things easier.
An example of the changes we made to help tax agents was creating new correspondence guidelines for any requests they send to us. These explain what information needs to be provided so the request can be considered or the return processed as quickly as possible.
We also updated the Tips for Faster Processing page on the tax agent section of our website to improve accuracy and reduce common errors when they are filing returns.
Tax agents also told us that linking Inland Revenue client information with their systems was an issue. In March 2015 we made changes to myIR where tax agents link and delink clients and they can now do this easily for new customers or if a customer chooses to no longer use a tax agent.
Tax agents’ overall satisfaction with us showed statistically significant improvement from 89% satisfied and 69% very satisfied in 2013–14 to 92% satisfied and 78% very satisfied this year.
COVERAGE 2014–15 ACTUAL OUR TARGET
Minimum percentage of attempted calls that we answer 96.5% 75%TIME
Minimum percentage of telephone calls answered within two minutes 75% 75% At the end of June 2015,
1.5 million people were registered for Voice ID. Inland Revenue has one of the world’s highest rates of enrolment for voice recognition services.
ANNUAL REPORT 2015 13

14 ANNUAL REPORT 2015
Returns
Returns are the way in which customers give us their tax information for the year. We aim to be more proactive by letting customers know their returns are due before issues arise. This proactive approach is working.
The number of outstanding returns was down 21.5% at the end of June 2015, to reach the lowest number in the last five years. This reflects an ongoing reduction and we had about 234,000 fewer returns outstanding at 30 June 2015 than at 1 July 2014.
We are encouraging as many customers as possible to use our online channels to file their returns.
Making payments
Our proactive approach of letting people know their obligations before their payments are due is also supported by Budget 2012 and 2014 funded projects which improved our predictive modelling capability. These projects looked at how we can identify patterns of compliance and engage with customers before issues arise.
When customers need to make payments, we are making it easier for them to pay electronically. This also makes it easier for us to process payments faster.
To help our customers know all the ways they can pay electronically, we developed a 45-second video on the Make a payment page of our website. We have also made the payment page responsive and easy to use on mobile devices. Around 20% of customers visit our payment page using a mobile device.
We removed the option for cheque payments at Westpac. Now that Westpac only receives cash or EFTPOS payments, we have seen a large reduction in exceptions. Exceptions are payments that cannot be processed or that are missing information like IRD numbers. In December 2014, we had 21 payments which could not be processed. These exceptions were worth $10,000. This compares with 5,400 exceptions worth $56 million in December 2013. During January and February 2015 we had one exception each month and by March we had no exceptions.
For customers who want to pay over the counter at Westpac, we introduced barcodes on payment slips in June 2015. The barcode aims to reduce time and errors for these transactions.
Predictive modelling helps us change customer behaviour before issues arise
Our work on the probability of GST returns being filed shows we can reliably predict customers who are highly unlikely to file GST returns on time. We have changed our processes based on our findings.
This has already resulted in a reduction of more than 98,000 outstanding GST returns during the past year. In the future, we will be able to take a more proactive approach for these customers and contact them before any potential GST filing issues arise.
We had 82.5% of payments made electronically compared to 74.2% in 2013–14 and 70% in 2012–13.
$
2012–13 2013–14 2014–15
INCOME TAX 84.1% 86.9% 88.8%
GST 47.6% 54.9% 64.0%
EMPLOYER MONTHLY SCHEDULES 41.3% 49.6% 60.0%
Electronic returns by tax type
YEAR % GST RETURNS RECEIVED ELECTRONICALLY
% OF GST CUSTOMERS FILING ELECTRONICALLY
30 June 2013 47.6% 44.9%
30 June 2014 54.9% 50.6%
30 June 2015 64.0% 62.5%
GST return

ANNUAL REPORT 2015 15
02
Social policy programmes
We have an important role in administering social policy programmes, often in conjunction with other government agencies. During the year we made changes to our child support, paid parental leave, and KiwiSaver systems to implement Government policy changes.
Child support changes
Inland Revenue collects and distributes child support payments for about 200,000 children whose parents do not live together.
The Government recognised that things have changed for families since child support was first introduced in 1992. After significant public consultation, extensive changes were made to the scheme to better reflect family life today. These changes come into effect in two stages on 1 April 2015 and 1 April 2016.
The first stage went live on 1 April 2015 and changed the way child support was calculated. The calculation moved from focusing on the liable parent’s income to the cost of ongoing care of the child by:
• taking into account the cost of raising children
• taking into account the income of both parents
• recognising lower levels of shared and regular care provided for each child.
To ensure the liable and receiving parents knew how the changes would affect them, we contacted them via either mail, phone, text messaging or email to ensure we had the correct information about their situation and to help them understand the changes.
As part of the changes we developed two new calculators and made them available on our website to help parents work out how the changes would affect them. Since going live in September 2014, the
calculators have had 68,000 visits.
We used social media as a new way to improve engagement with some of our child support customers and also contacted parents through our normal communication channels. We undertook our first question and answer session on Facebook on the privately-run Child Support NZ Facebook page. During the session we had 139 participants in a one-hour discussion, received over 200 questions and had over 680 comments made. We also had over 10,000 views of the Facebook page during the session.
An additional change we made is that parents who received child support payments from more than one liable parent can now see who made the payment.
Changes to paid parental leave
We make paid parental leave payments for the Ministry of Business, Innovation and Employment (MBIE), to parents who take leave from their job or business to care for a baby. We are responsible for ensuring people receive their correct entitlements.
On 1 April 2015 paid parental leave was extended from 14 to 16 weeks. From 1 April 2016 this will be extended to 18 weeks. Also from 1 April 2015, the parental tax credit increased from $150 to $220 a week and the payment period was extended from eight weeks to 10 weeks.
KiwiSaver
Inland Revenue administers members’ KiwiSaver contributions through the PAYE system. We do this by collecting contributions and transferring them to scheme providers for investment.
Through Budget 2015, changes were made to KiwiSaver. The KiwiSaver Budget Measures Act enacted on 27 May 2015 removed the KiwiSaver $1,000 kick-start payment to help contain the cost of the scheme to taxpayers.
Removing the kick-start payment for
One of our outcomes is to ensure people receive payments they are entitled to, enabling them to participate in society.
In the 2014–15 financial year we collected $463 million from 174,000 liable parents and distributed $265 million to receiving caregivers. This is an increase of 3% in payment collection.
16 ANNUAL REPORT 2015
future enrolments will save over $500 million over the next four years.
In March, we got excellent feedback from an Australian research company SuperRatings for the role we play in administering KiwiSaver. Their assessment also recognised our role is critical in maintaining the efficiency of the system and the overall cost-effectiveness of KiwiSaver schemes in comparison to other countries’ retirement systems.
In April 2015, KiwiSaver membership hit a significant milestone of 2.5 million people.
Improving compliance
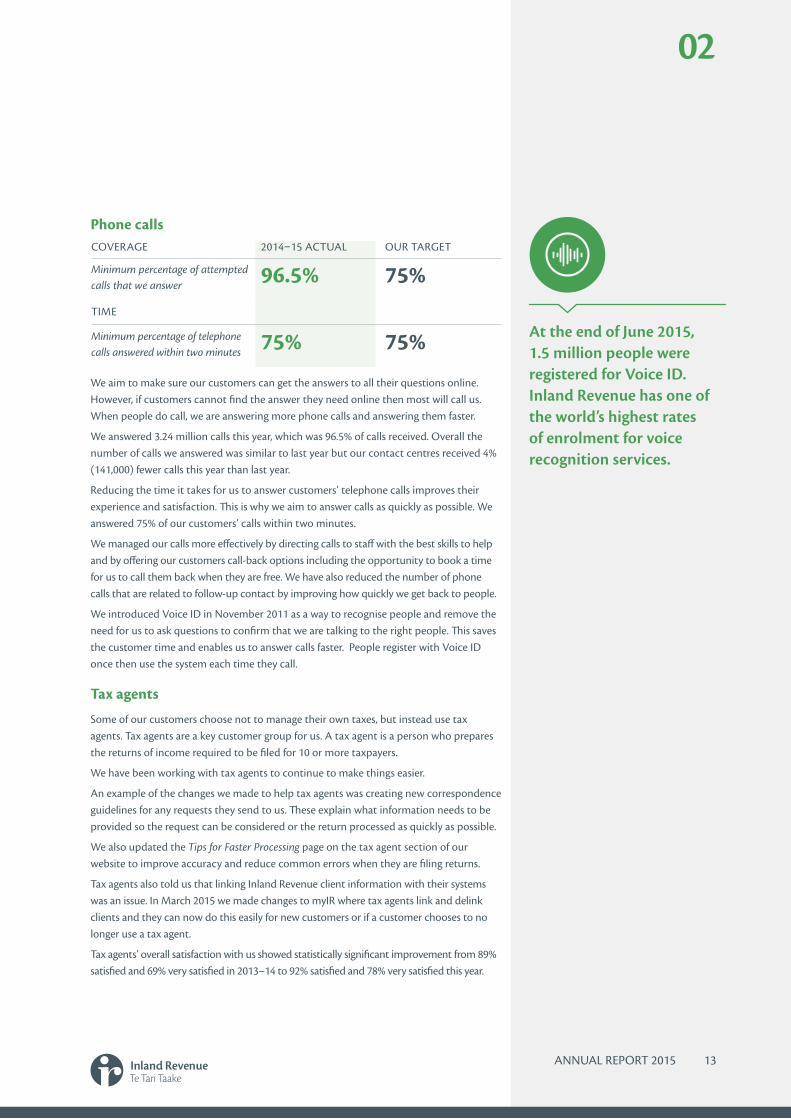
A key aspect of our core business is helping to maximise voluntary compliance. We assist customers who are willing to meet their compliance obligations but are unaware or uncertain about how to do so. Influencing voluntary compliance, targeting inadvertent non-compliance by providing information, assistance and tools, and detecting and deterring deliberate non-compliance are part of our core activities.
Understanding and influencing customer behaviour
We aim to make it easy for people to understand their obligations and entitlements. In our Statement of Intent 2014–18 we said we would redesign our compliance model so it reflects a more comprehensive range of the factors influencing customer behaviour.
We launched our new compliance model in March 2015. The new model places greater emphasis on understanding our customers, their lifecycles and perspectives. We want to give our customers certainty with the least number of interactions. We also want our customers to be able to get it right first time. We have worked with customers, tax agents, private providers and other government departments to design solutions that fit tax and social policy obligations around customers’ needs, and we will continue to do this. The impacts of changes on customers will also be assessed to ensure we understand how they influence and affect compliance and the customer experience.
Dealing with non-compliance
The majority of our customers file and pay on time, but New Zealanders need to have confidence that we take action when people or businesses do not pay. This encourages compliance and maintains confidence in our tax system. We use a range of tools to identify areas of non-compliance and evaluate the most appropriate response, including investigations of the tax affairs of individuals and businesses. We have focused our efforts on specific areas of non-compliance such as aggressive tax planning, property and the hidden economy and received further funding in Budget 2015 to expand our investigations activity in these areas.
At the core of our new compliance model are the three factors that form customer behaviour – capability, motivation and opportunity.Capability is how well customers can meet their obligations and access their entitlements. It includes their knowledge of rules that apply to them, their access to tools and assistance, and their ability to understand.
Motivation is about the factors that create the willingness to comply and then actually follow through and do it. Motivation includes both social and personal norms.
Opportunity is about how easy it is for a customer to comply or not to comply with their obligations or access their entitlements.
CAPABILITY M
OTIV
ATIO
N
OPPORTUNITY
CUSTOMER

ANNUAL REPORT 2015 17
02
If our investigation detects a discrepancy, a difference between the tax position filed by a taxpayer and the position determined by our investigations, we issue a new assessment and may charge penalties and interest. This year we identified discrepancies of $1.23 billion. The overall return on investment for our investigation activity was $7.52:$1 (target $7.00:$1).
Aggressive tax planning
A small number of people try to avoid paying the tax they should, reduce the amount they should be paying or increase their entitlement to social benefits. They use inappropriate or unlawful tax structures and this is called aggressive tax planning. We match information from different sources to identify potential aggressive tax planning structures and schemes.
Our work to counter aggressive tax planning contributed $336.9 million toward the total discrepancies result. Of this, $191.1 million came from examining complex finance and trust losses. This produced a return on investment of $34.10:$1 (target $11.60:$1). We resolved the last optional convertible notes cases after the settlement with Alesco New Zealand in 2014. This contributed $64.3 million to this year’s discrepancies. This year we have worked on cases
New Zealand has a voluntary compliance approach to tax. This is an environment dependent on an open, honest and transparent tax system where there are high levels of mutual trust and understanding between customers and the revenue agency.
OUR MODEL FOR
facilitatingcompliance
OUR NEW COMPLIANCE MODEL
The movable wheels show we use a range of approaches that change depending on our customers. The more we understand customer needs and behaviours, the better we can tailor our actions so people pay the taxes and get the entitlements they should.
A thinking tool to help us understand customers better so we can work pro-actively and tailor approaches to make compliance easier.>
> Customer centred: Customers are at the centre of our thinking surrounded by context that affects their behaviour.
> Behaviour wheel: we consider the three factors that form customer behaviour so we can tailor our approaches to facilitate compliance.
> Principles wheel: five key principles guide how we work with customers to build compliance. We apply a mix of these in different ways, depending on our role and the customers we work with.
> Activity wheel: whatever our job in IR, we have a role in making sure people pay the taxes and get the entitlements they should. We use different activities to facilitate compliance depending on our customers.
EDUCATE DESIGN LEGISLATE COLLABORATE
ANALYSE
SER
VICE
E
NFO
RCE
Make it easy to comply
and difficult not to
C
APABILITY MO
TIVA
TION
OPPORTUNITY
Understand and involve the customer and stakeholders
CUSTOMER
Build compliance right from the start
Influence norms
Provide certainty
18 ANNUAL REPORT 2015
involving the use of mandatory convertible notes, which led to discrepancies of $91.8 million.
Since we received multi-year funding to work on aggressive tax planning in Budget 2012, we have assessed revenue of $811.1 million. We will use Budget 2015 funding to continue addressing emerging risks such as high-income individuals, in particular high-income new immigrants.
Non-compliance in the property sector
We have continued to focus on identifying property speculation, particularly in Auckland and Christchurch. This focus includes examining residential property sales and new developments to ensure that speculators and developers are paying the correct amount of tax. We have found discrepancies during the year of $67.1 million. The return on investment was $9.97:$1 (target $6.80:$1).
To help clarify the tax position we delivered presentations to different industry groups on this topic. We aim to educate people about how to deal with GST on a property and property investment. We will use funding from Budget 2015 to expand customer education and increase our focus on this sector.
Hidden economy
People operate in the hidden economy by intentionally not declaring or accurately reporting transactions. We focused on higher-risk sectors such as hospitality and construction. We identified discrepancies of $146 million in the hidden economy. Of this, $45 million (target $44 million) came from Budget 2010-funded work, a return on investment of $5.21:$1 (target $5.00:$1). As a last resort we prosecute to recover funds from taxpayers operating in the hidden economy.
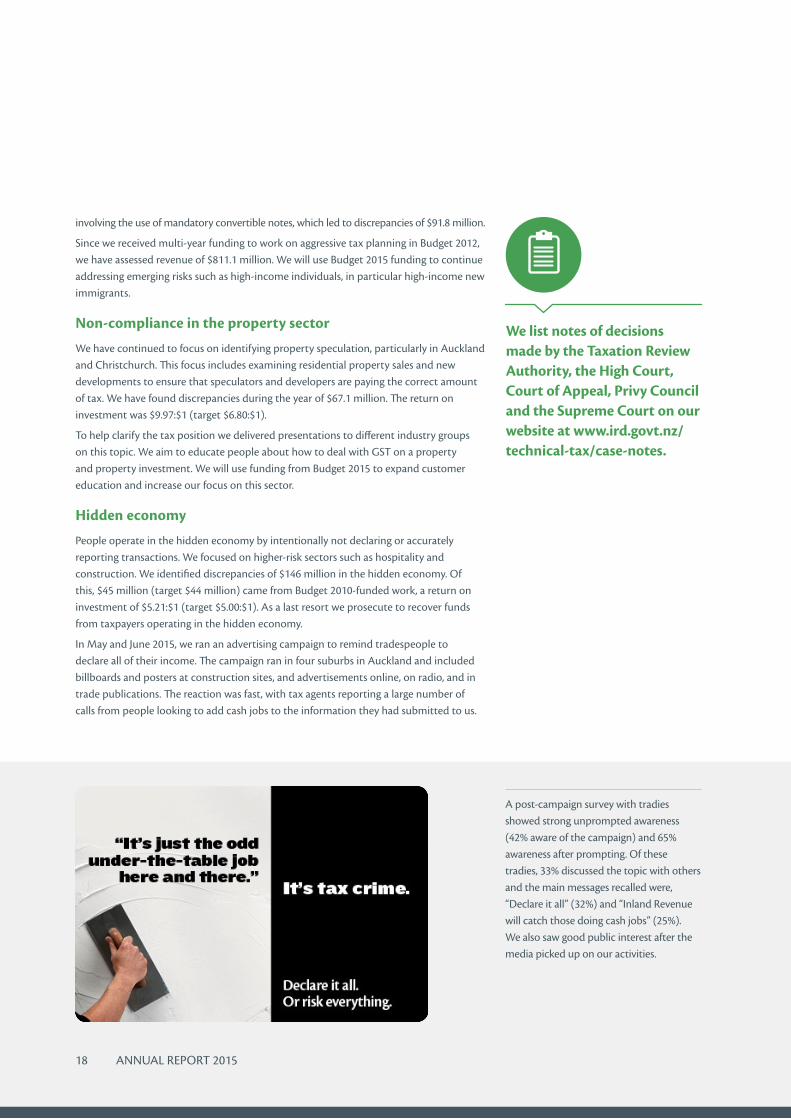
In May and June 2015, we ran an advertising campaign to remind tradespeople to declare all of their income. The campaign ran in four suburbs in Auckland and included billboards and posters at construction sites, and advertisements online, on radio, and in trade publications. The reaction was fast, with tax agents reporting a large number of calls from people looking to add cash jobs to the information they had submitted to us.
We list notes of decisions made by the Taxation Review Authority, the High Court, Court of Appeal, Privy Council and the Supreme Court on our website at www.ird.govt.nz/technical-tax/case-notes.
A post-campaign survey with tradies showed strong unprompted awareness (42% aware of the campaign) and 65% awareness after prompting. Of these tradies, 33% discussed the topic with others and the main messages recalled were, “Declare it all” (32%) and “Inland Revenue will catch those doing cash jobs” (25%). We also saw good public interest after the media picked up on our activities.

02
ANNUAL REPORT 2015 19
Clarifying tax law in cases where there are different interpretations
When interpretation of the law is not clear we provide certainty by providing binding rulings on specific transactions, public rulings and statements and disputes reviews. However in some cases we may need to clarify tax law by taking cases to court. The court will decide on the correct interpretation and create a precedent.
In June 2015, our appeal to the Court of Appeal against Trustpower was successful. Trustpower had claimed tax deductions on the costs of getting resource consents for new power generation projects, arguing that these costs were revenue expenses.
We believed these were capital costs and therefore not deductible. In 2013 the High Court agreed with Trustpower and we appealed this judgement. The Court of Appeal found that Trustpower’s spending on resource consents was capital expenditure and that Trustpower was not entitled to the deductions it had claimed.
Trustpower has been granted leave to appeal. Clarifying this question will help us and our customers have certainty over how these expenses should be dealt with.
Litigation against non-compliance
Over a decade of litigation came closer to conclusion in April 2015 when the High Court struck out the remaining 77 Trinity tax challenges. This case, a significant tax avoidance scheme, has been subject to a large number of court proceedings since the Supreme Court found in Inland Revenue’s favour in the 2008 Ben Nevis case.
Prosecutions
We completed 67 prosecutions for tax evasion or knowledge offences. This compares with 74 last year. The decrease was related to the timing of cases before the courts. At 30 June 2015, 79 such cases were pending. There were 89 cases pending at the same time last year.
Tax law is complicated. We need to interpret and apply the law correctly and give our customers certainty on areas of tax law.
So we have teams of legal experts spread across Inland Revenue whose research and consultation provide us and our customers with reliable technical advice.
We provide public rulings, interpretation statements and interpretation guidelines, which clarify difficult areas of tax law, give our customers certainty and help them comply. We also research and analyse technical tax issues that come from private or product ruling applications.
www.ird.govt.nz/technical-tax
20 ANNUAL REPORT 2015
Managing debt
We want people to pay on time to prevent them getting into debt. Our debt strategy sets out our long-term goals for debt, which are:
• minimise what becomes debt
• maximise what is collected
• deal appropriately with what cannot be collected.
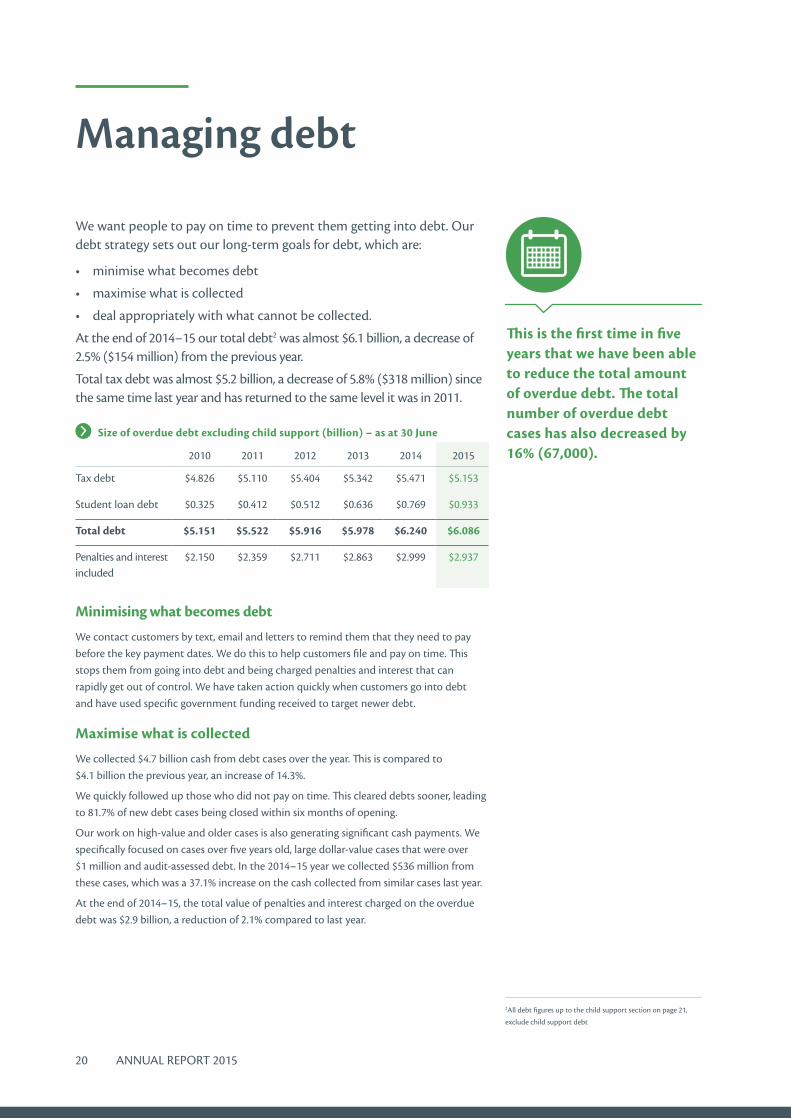
At the end of 2014–15 our total debt2 was almost $6.1 billion, a decrease of 2.5% ($154 million) from the previous year.
Total tax debt was almost $5.2 billion, a decrease of 5.8% ($318 million) since the same time last year and has returned to the same level it was in 2011.
This is the first time in five years that we have been able to reduce the total amount of overdue debt. The total number of overdue debt cases has also decreased by 16% (67,000).
Minimising what becomes debt
We contact customers by text, email and letters to remind them that they need to pay before the key payment dates. We do this to help customers file and pay on time. This stops them from going into debt and being charged penalties and interest that can rapidly get out of control. We have taken action quickly when customers go into debt and have used specific government funding received to target newer debt.
Maximise what is collected
We collected $4.7 billion cash from debt cases over the year. This is compared to $4.1 billion the previous year, an increase of 14.3%.
We quickly followed up those who did not pay on time. This cleared debts sooner, leading to 81.7% of new debt cases being closed within six months of opening.
Our work on high-value and older cases is also generating significant cash payments. We specifically focused on cases over five years old, large dollar-value cases that were over $1 million and audit-assessed debt. In the 2014–15 year we collected $536 million from these cases, which was a 37.1% increase on the cash collected from similar cases last year.
At the end of 2014–15, the total value of penalties and interest charged on the overdue debt was $2.9 billion, a reduction of 2.1% compared to last year.
2010 2011 2012 2013 2014 2015
Tax debt $4.826 $5.110 $5.404 $5.342 $5.471 $5.153
Student loan debt $0.325 $0.412 $0.512 $0.636 $0.769 $0.933
Total debt $5.151 $5.522 $5.916 $5.978 $6.240 $6.086
Penalties and interest included
$2.150 $2.359 $2.711 $2.863 $2.999 $2.937
Size of overdue debt excluding child support (billion) – as at 30 June
2All debt figures up to the child support section on page 21,
exclude child support debt

ANNUAL REPORT 2015 21
02
Deal appropriately with what cannot be collected
New Zealanders expect us to take action against those that do not pay their fair share of tax. In the most severe cases we will take legal action against people who refuse to pay their debt. It is rare, but we can ask for people to be arrested if they refuse to pay.
Where necessary we have made decisions over the year to write off debt that would cost more to collect than the cost of the debt.
Child support debt
Child support debt is $3.3 billion, 79% ($2.6 billion) of which is penalties.
Of the total child support debt, around $827 million is owed by liable parents living in Australia, and is mostly in the form of penalties. In accordance with our agreement with the Australian Department of Human Services they collected $50.2 million from these parents on our behalf. A further $778 million is owed by those living in other parts of the world. The remaining $1,671 million debt is owed by liable parents living in New Zealand.
For child support, over the last year there were 56 cases where the lack of action by the liable parent justified Inland Revenue to seek an arrest warrant. We have only been required to execute one arrest warrant. All other cases were able to be resolved by simply having the possibility of a warrant being executed. The total debt relating to the 56 cases amounted to $11.7 million.
Budget 2014 provided us with additional funding to help improve child support compliance. We are beginning to see positive outcomes from our activities in this area, including more debt cases being closed within 12 months of opening and a reduction in the total number of debtors at the end of the year. Early work has included an education campaign to new child support customers on their obligations, particularly taking into account the child support reform changes, ensuring they understand their obligations to help them get it right from the start. This initiative aims to progressively increase the amount of debt repaid over a five-year period with early work resulting in an extra $1.5 million recovered from liable parents.
2010 2011 2012 2013 2014 2015
Debt value $1.990 $2.335 $2.452 $2.781 $3.047 $3.276
Penalties included $1.430 $1.743 $1.818 $2.109 $2.372 $2.605
Size of overdue child support debt (billion) – as at 30 June
22 ANNUAL REPORT 2015
Student loan debt
We jointly administer student loans with the Ministry of Education and Ministry of Social Development (MSD), through StudyLink.
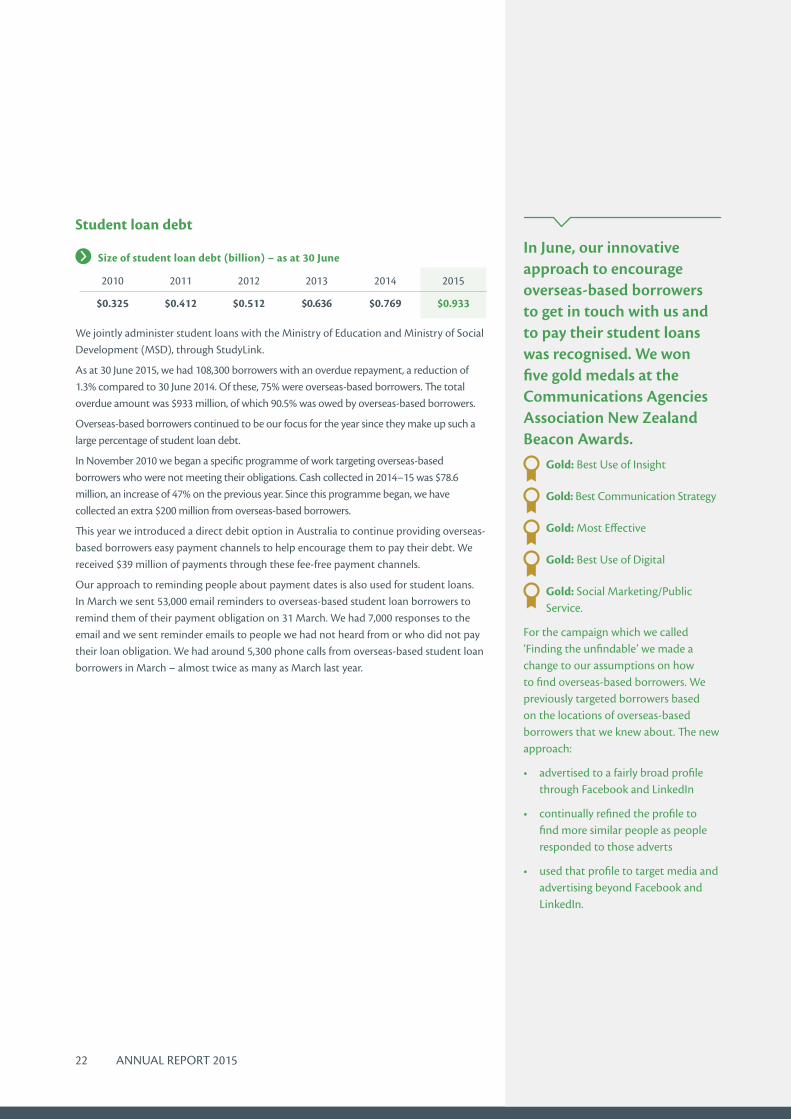
As at 30 June 2015, we had 108,300 borrowers with an overdue repayment, a reduction of 1.3% compared to 30 June 2014. Of these, 75% were overseas-based borrowers. The total overdue amount was $933 million, of which 90.5% was owed by overseas-based borrowers.
Overseas-based borrowers continued to be our focus for the year since they make up such a large percentage of student loan debt.
In November 2010 we began a specific programme of work targeting overseas-based borrowers who were not meeting their obligations. Cash collected in 2014–15 was $78.6 million, an increase of 47% on the previous year. Since this programme began, we have collected an extra $200 million from overseas-based borrowers.
This year we introduced a direct debit option in Australia to continue providing overseas-based borrowers easy payment channels to help encourage them to pay their debt. We received $39 million of payments through these fee-free payment channels.
Our approach to reminding people about payment dates is also used for student loans. In March we sent 53,000 email reminders to overseas-based student loan borrowers to remind them of their payment obligation on 31 March. We had 7,000 responses to the email and we sent reminder emails to people we had not heard from or who did not pay their loan obligation. We had around 5,300 phone calls from overseas-based student loan borrowers in March – almost twice as many as March last year.
In June, our innovative approach to encourage overseas-based borrowers to get in touch with us and to pay their student loans was recognised. We won five gold medals at the Communications Agencies Association New Zealand Beacon Awards.
Gold: Best Use of Insight
Gold: Best Communication Strategy
Gold: Most Effective
Gold: Best Use of Digital
Gold: Social Marketing/Public Service.
For the campaign which we called ‘Finding the unfindable’ we made a change to our assumptions on how to find overseas-based borrowers. We previously targeted borrowers based on the locations of overseas-based borrowers that we knew about. The new approach:
• advertised to a fairly broad profile through Facebook and LinkedIn
• continually refined the profile to find more similar people as people responded to those adverts
• used that profile to target media and advertising beyond Facebook and LinkedIn.
2010 2011 2012 2013 2014 2015
$0.325 $0.412 $0.512 $0.636 $0.769 $0.933
Size of student loan debt (billion) – as at 30 June

03Contributing to
the Government’s priorities
ANNUAL REPORT 2015 23
24 ANNUAL REPORT 2015
Responsibly manage the Government’s finances
Inland Revenue collected $59.7 billion tax revenue and transferred $4.8 billion of KiwiSaver contributions to providers. Total payments for the year ended 30 June 2015 for social policy entitlements were $3.4 billion. Social policy entitlements include Working for Families Tax Credits, KiwiSaver, Paid Parental Leave Payments and Payroll Subsidy. We also managed a departmental budget of $727 million.
Full finance details are covered in parts eight and nine.
We have a responsibility as a government agency to contribute to the Government’s priorities.
These are to:
• responsibly manage the Government’s finances
• build a more competitive and productive economy
• deliver Better Public Services within tight fiscal constraints
• rebuild Canterbury.
We participate in a range of all-of-government activities, collaborate with other agencies to reduce costs, improve efficiency and effectiveness.
Along with the Government’s priorities, we also continued to work on the
Government’s tax policy work programme which was updated and released by the Minister of Revenue on 13 March 2015. This programme focused on three main areas:
• Business Transformation and Better Public Services
• International tax reform and contributing to international efforts to counter base erosion and profit shifting (BEPS)
• Continuing improvement and enhancements to tax and social policy settings to keep the tax system well maintained.
ANNUAL REPORT 2015 25
03
Build a more competitive and productive economy
Inland Revenue contributed to building a more productive economy through legislation changes. These changes are designed to ensure New Zealand is an attractive place to do business. We also want to strengthen tax rules to ensure overseas companies pay their fair share of tax in New Zealand. The Government’s tax policy work programme focuses on improving tax and social policy settings and participating in the global response to the problem of tax base erosion and profit shifting.
Our work to enhance tax and social policy settings
An important part of our approach to the development and review of tax policy is public consultation. This provides transparency of our policy-making process and allows us to listen and respond to New Zealanders, tax professionals and associations.
During the year we asked for public feedback on:
• an officials’ issues paper, Related parties debt remission, released on 24 February 2015. This asked for feedback on proposed changes to make the tax rules on this more certain and fairer.
• a discussion document, Simplifying the tax collection for employee share schemes, released in April 2015. Public feedback helped shape proposals introduced in the Taxation (Transformation: First Phase Simplification and Other Measures) Bill in June 2015, which will allow employers to choose to withhold tax on an employee’s behalf as part of their PAYE return.
• detailed design proposals for the new bright-line test announced in Budget 2015 released on 29 June 2015. The proposal clarifies whether or not gains on the sale of residential property bought and sold within two years are taxable. Feedback helped shape legislation planned for introduction in September 2015.
Legislation
To improve the economic environment for businesses and New Zealanders we provided policy analysis and options to the Government to change legislation. We focused on three main bills during the year.
The Taxation (Annual Rates for 2015–16, Research and Development, and Remedial Matters) Bill introduced on 26 February 2015 contains proposals to reflect the Government’s Business Growth Agenda emphasising the importance of innovation to help grow New Zealand’s economy. The bill removes some distortions relating to Research and Development to encourage businesses to invest in these activities. It also clarified the GST rules for bodies corporate.
The KiwiSaver HomeStart Bill enacted on 31 March 2015 implemented part of the Government’s support package for first home buyers, allowing eligible KiwiSaver members to access more of their KiwiSaver funds to purchase their first home. It also clarified and corrected the tax rules for payments made under the Veterans’ Support Act 2014.
New rules to strengthen the property tax rules were introduced in the Taxation (Land Information and Offshore Persons Information) Bill on 22 June 2015. The proposed rules will require domestic and overseas buyers and sellers of property to provide their IRD number at the time of the property transfer and the equivalent tax identification number for people resident in another country.
26 ANNUAL REPORT 2015
Overseas residents will have to provide a New Zealand bank account number to obtain an IRD number for properties bought on or after 1 October 2015. The IRD number requirement will not apply to New Zealand individuals buying or selling their main home, unless they are selling their third main home in a two-year period.
International tax reforms and base erosion and profit shifting
As outlined in our Statement of Intent 2014–18 we are participating in the Organisation for Economic Co-operation and Development (OECD) led response to the global problem of base erosion and profit shifting, where multinational organisations take advantage of the interaction between the tax rules of different countries to pay little or no tax. We continue to work on projects to strengthen domestic rules on international tax.
We continued to work with the OECD and the G20 forum of countries on implementing an Automatic Exchange of Financial Account Information, a global automatic exchange of information to counter tax evasion.
Over the year we worked on the taxation of cross-border purchasing of services and intangibles, low-value goods and digital downloads. This work aligns with the OECD’s draft guidelines to develop rules to tax consumption fairly.
On 1 January 2015 the Convention on Mutual Administrative Assistance in Tax Matters came into effect for New Zealand. This lets us seek assistance from other tax authorities to discover evasion and pursue tax debt overseas.
An issues paper, NRWT: Related party and branch lending, which explores options to clarify the non-resident withholding rules to help ensure that non-resident investors pay an appropriate amount of tax, was released in May 2015.
Our tax treaty negotiations with other jurisdictions continued, with China completed in July 2014, Korea in April 2015 and Norway in June 2015.
A new tax treaty between New Zealand and Canada came into force in June 2015, replacing the 1980 treaty with a more modern agreement.
Foreign Account Tax Compliance Act
As outlined in our Statement of Intent 2014–18, we need to implement legislative change to help New Zealand’s financial institutions to meet Foreign Account Tax Compliance Act (FATCA) obligations. This legislation requires New Zealand financial institutions to give United States authorities details of accounts held by American citizens, tax residents and others.
In July 2014, New Zealand was granted more favourable terms from the United States Government as part of the FATCA intergovernmental agreement signed between New Zealand and the United States. Implementing Inland Revenue’s obligations set out in the agreement is on track. We started collecting information from New Zealand financial institutions from April 2015. We will start forwarding the information to the United States Government’s Internal Revenue Service in 2015–16.
We are making good progress in working with significant enterprises and multinational companies operating in New Zealand and across different countries to identify and address potential risk before non-compliance occurs. Our work with these taxpayers can result in advance pricing agreements (APAs) which represent a more co-operative approach to addressing transfer pricing compliance. We completed 15 APAs this year. This is the best mechanism to achieve certainty for multinationals in their international associated-party dealings as they involve complex issues such as restructuring arrangements and intellectual property transfers.

ANNUAL REPORT 2015 27
03
Deliver Better Public Services within tight fiscal constraints
We play an important role in improving services for New Zealanders and continue to play a key role in:
• the Better Public Services programme
• the delivery of the Government’s ICT Strategy
• all-of-government services
• other cross-agency initiatives.
Our Business Transformation programme, outlined in part four, contributes to the Government’s goal of making it easier for customers to interact with government and delivering a significant reduction in the effort of dealing with government.
We are working closely with other government agencies to deliver the innovative and effective public services that government and our customers expect. We are working to link more of our customer services with those of other government agencies to provide a seamless service. More cross-agency information sharing will be balanced against the need to protect customer privacy and the integrity of the tax system.
In line with Government’s ICT Strategy, we are also using all-of-government services where they are available and where they fit with our Business Transformation programme.
Working with the Ministry of Business, Innovation and Employment (MBIE) and other participating agencies, we have helped to develop the Result 9 roadmap and worked on key initiatives such as the New Zealand Business Number (NZBN). We have also delivered products and services that support Result 9’s intent of improving interaction with government for businesses
including eGST, more digital delivery, a myIR application, online business videos and simplified Tools for business web pages.
We have continued to focus on the digitisation of key processes for individuals and businesses to make it easier to interact with government. We contribute to the Result 10 target of “an average of 70% of New Zealanders’ most common transactions with government will be completed in a digital environment” with over 88% of individuals filing their tax returns electronically and just over 81% paying individual tax electronically.
The Department of Internal Affairs (DIA) digitised the process for applying for an IRD number as part of the birth registration process and this will also contribute to this target.
We are working with the Ministry of Social Development (MSD) to understand if it is possible and practical to share one voice biometric service for customers interacting with multiple agencies. Initial results saw 84% of customers saying they thought sharing one voice identification service across several government agencies would be useful, while 51% of customers surveyed gave consent to their voiceprint and information being shared with MSD.
We have now completed our first year of running a shared financial management information system with DIA. As part of this service we have successfully provided accounts receivable, accounts payable and bank reconciliations for both organisations. We have refined the system during the year and are working with DIA on enhancing the system and processes in the future.
We continue to work with the Property Management Centre of Expertise (PMCoE) and to join with other agencies to lease accommodation, where it makes sense to do so.3
The Better Public Services result areas we contribute to are:
• Result 7: Reduce total crime rate
• Result 9: New Zealand businesses have a one-stop online shop for all government advice and support they need to run and grow their business
• Result 10: New Zealanders can complete their transactions with government easily in a digital environment.
3Hosted by MSD, PMCoE leads and assists agencies in
meeting the goals set by Government for the efficient and
effective management of the property owned or leased by 61
government agencies.

28 ANNUAL REPORT 2015
Information sharing
The Government has increasingly recognised that information is an asset which, under certain circumstances, should be shared across government to support collective outcomes for New Zealand. We continue to work with other government agencies to enable more effective information sharing between government agencies and with third parties by helping to simplify the management and control of agency data.
New Zealanders expect us to responsibly manage their details and only share information between agencies when it is appropriate.
We have Approved Information Sharing Agreements (AISA) in place with DIA and New Zealand Police. Reports of sharing that we have done under these agreements can be found on pages 154 to 156. Full details of the agreements are on our website www.ird.govt.nz/aboutir/agreements.
We contribute to Result 7 through an AISA with New Zealand Police. This allows Inland Revenue to share certain personal information with New Zealand Police for the purpose of prevention, detection, investigation or providing evidence of serious crime. We also participate in the Whole-of-Government Gangs Action Plan, a multi-agency approach to reducing the harm caused by gangs, involving intelligence gathering and a range of prevention and enforcement activities.
Over 2014–15, we have continued to enable more effective information sharing between government agencies. This has included:
• working on the development of possible future information sharing initiatives with MSD and the Accident Compensation Corporation (ACC)
• working with MBIE and Worksafe to share information for the enforcement of employment standards as a result of changes to workplace legislation
• participating in cross-agency forums such as the privacy reform group, data futures forums, Government Chief Information Officer information management groups, and Government Chief Privacy Officer leadership forums and working groups.
Our sharing arrangements are supported by our new Information Management Strategy. The strategy enables effective administration of information and helps us to build and manage our intellectual property. This will improve information management capability through collective ownership of information management and simplified guidelines supported by fit for purpose IT capability.
Government Information and Communication Technology Strategy
Inland Revenue’s Information and Communication Technology (ICT) strategy and roadmaps reflect the Government ICT Strategy’s focus on using information and technology to deliver better services to New Zealanders. By 2017, the aim is to enable individuals and businesses to connect with government services through digital channels, joined-up services and technology that will function across agencies.
We already use a number of all-of-government services. One example is Storage as a Service provided through Datacom New Zealand. This approach means that we no longer have to physically manage storage ourselves. By using the all-of-government data storage service we have access to more capacity, flexibility and improved performance at less cost.
Businesses are already noticing the differences we are making. The latest results of the business reference group survey looking at effort of dealing with government and how government agencies compare with the private sector show overall a 16% reduction in effort with dealing with government. For businesses whose most recent interaction with government was with Inland Revenue, the survey showed there was a 23% reduction in effort. The key reasons businesses listed for the improvement were:
• ease of filing returns led by the implementation of online GST filing and increased uptake of other online services
• ease of contacting Inland Revenue, with businesses finding it easy to get through to services and dealing with helpful Inland Revenue staff.
ANNUAL REPORT 2015 29
03
Contributing to other all-of-government services
We are involved in other all-of-government activities. We will continue to work with other agencies to identify where we could adopt new and improved processes and services used elsewhere in the public sector.
Procurement
We are participating in the Government’s new streamlined procurement rules, which have changed the way government does business with suppliers by making agencies’ procurement practices more consistent and business-friendly. The new rules promote a value for money approach to procurement, which means that rather than just getting the lowest price, we consider total cost of ownership and other benefits.
We have a long-term strategy to ‘buy not build’ for our Business Transformation programme. To make it easier for small businesses to engage with Inland Revenue, we developed the Business Transformation Approved Panel in October 2014, which covers a number of the professional services our Business Transformation programme
is likely to need on a recurring basis. This panel is open and allows suppliers to register their interest at any time.
Inland Revenue is committed to using collaborative procurement opportunities such as all-of-government, collaborative and syndicated procurement contracts. We have signed up to a number of these in the past 12 months and are leading the syndicated waste management contract.
All-of-government banking services
The state sector’s banking contract with Westpac has been in place for more than 20 years. During this time the banking requirements of government have changed considerably. We are working with Treasury and MBIE who are leading an all-of-government solution to meet the Government’s current and future banking needs. This solution will provide access to economies of scale, better value for money, process efficiencies and better interaction for financial payments between government, business and taxpayers.

30 ANNUAL REPORT 2015
Rebuild Canterbury
Understanding the impact of adverse events and the characteristics of the rebuild workforce
Inland Revenue has sponsored research projects to understand the impact of the earthquakes on SMEs in Canterbury and the characteristics of the Christchurch rebuild workforce. The research has provided insight into SME compliance, debt and employment and the compliance issues associated with the rebuild workforce. The effect of the rebuild on SME GST in different industries and sectors has also been evaluated. These insights are now informing our initiatives in Canterbury.
Providing joined-up government services in Christchurch
We continued to work with the Canterbury Earthquake Recovery Authority (CERA) and other agencies in various forums to support the overall reconstruction effort. This included planning for the Public Sector Precinct and exploring opportunities to co-locate 1,600 public servants from 17 agencies in four new CBD locations from late 2015. We continue to operate and learn from co-location in the New Zealand Government site in Durham Street and work with other agencies to investigate opportunities for cross-government collaboration.
Supporting our people in Canterbury
We provided additional support and wellbeing initiatives for our own Christchurch workforce and other government agencies supporting the Government sector in Christchurch. This included chairing the Public Sector Organisational Resilience Team and contributing to the Greater Christchurch Psychosocial Recovery Committee and work programme.
Improving compliance in Canterbury
We have focused on mitigating and addressing the compliance risks from the $40 billion rebuild. This included working alongside funding distributors, including all major insurance companies and government, to gain assurance in the integrity of their systems and identify any areas of risk. We have continued our compliance focus on identified high-risk sectors, including construction, hospitality and property. We have also provided support to the wider community with educational activities to help customers get it right from the start.
Inland Revenue research has confirmed on-time GST filing and payments have improved in Canterbury since the low point in the 2011 tax year when the earthquakes occurred.
While the proportion of Canterbury small and medium enterprises (SME) in debt spiked at the time of the earthquakes, it has improved since then, with Canterbury SMEs making up a smaller proportion of SMEs in debt nationally than they did in 2011.

04Business
Transformation
ANNUAL REPORT 2015 31

32 ANNUAL REPORT 2015
Business Transformation
Business Transformation is a multi-year, multi-stage change programme that will help us become the modern world-class revenue organisation that is set out in our vision IR for the future. Over the year we got closer to realising this vision.
We are currently managing a range of tax and social policy products on an ageing system and business model. Over the years our role has expanded from solely collecting tax in a paper world, to today where we manage the collection and payments of tax and a range of other services like student loans, child support and KiwiSaver. Adding these social policy products and services to 30 year old technology has resulted in complexity.
Our tax administration needs to catch up and be fit for 21st century needs.
Technology is rapidly advancing, our customers’ lives are busier than ever and businesses want to spend less time on compliance. New Zealand is becoming more diverse and customers want and expect us to interact with them in a digital world.
Modernising our systems and processes will also enable the Government to implement policy more quickly.
The Business Transformation programme consistently met its milestones and spent less than its budget throughout the year.
How we are changing
Our Business Transformation programme is being delivered in four customer-focused stages over eight to 10 years.
High-level design of the four stages has been completed and the detailed design of stage one has begun. We anticipate that the detailed business case will be completed and submitted to the Government for approval by March 2016. Once approved, implementation of stage one will begin. We have delivered some visible, early improvements to our digital services, including improving myIR and making improvements to our website.
This year we focused on designing the foundations for our future revenue system. The design phase began in January 2015, and covers high-level design for stages one to four of the programme, and detailed design for Stage 1: Enabling secure digital services. The design and digital services business case outlining the approach to design and the funding, was approved by Cabinet on 17 November 2014.
We have a regular programme of independent quality assurance reviews to continually check that what we are doing is the best way to do it. Over the year we had a Deloitte review and the Gateway Review in September 2014, KPMG Independent Quality Assurance and Technical Quality Assurance completed in December 2014 and a review from the Office of the Auditor General in April 2015. All were positive and support the way we are transforming and the quality of our processes. Results of the reviews are available on www.ird.govt.nz/transformation.
Cabinet approval and legislative changes
Changes proposed in the Taxation (Transformation: First Phase Simplification and Other Measures) Bill introduced on 30 June 2015 pave the way for modernising and simplifying the tax administration system by removing some current legislative obstacles.
They include:
• proposals to allow earlier tax refunds on personal tax summaries that meet the automatic refund threshold
• reforming the way we are able to communicate with our customers by providing modern rules to support electronic communication in the same way as paper communications
• measures to allow us to share certain information with other agencies when it makes customers’ lives easier.
Choosing design and core software partners
We spent most of the year completing very careful procurement processes to select partners to help us design the next stage of Business Transformation and a software provider to supply the technological core of our future system.
We chose Accenture and two local providers to help us with design. External quality assurance checks found the

ANNUAL REPORT 2015 33
“ The programme has been set up to succeed, and is suitably prepared to begin the design phase, while being aware of the considerable challenge of sustaining the good progress thus far.”
KPMG Independent Quality Assurance and Technical Quality Assurance review, December 2014
04
procurement process that we used was sound and fair.
Accenture joined Inland Revenue in January 2015 and has been helping us with the high-level design of the four stages of the Business Transformation programme. We have developed blueprints outlining our future system.
In June 2015 we announced Fast Enterprises (FAST) as our preferred Commercial Off-the-Shelf (COTS) software vendor. COTS software will form the technological core of our future system. FAST started working with us on the detailed design in August 2015.
To help us prepare for the changes, we have engaged a range of local providers including Optimation, ThinkPlace, Assurity Consulting and Tenzing along with Accenture and FAST.
Stakeholder engagement
A large part of what we are doing is engaging with stakeholders and seeking their input on designing New Zealand’s future tax system.
Discussions continued during the year with GST and payroll software developers on options for how they can better interact with our core systems and reduce compliance costs for businesses. We also met and presented to a wide range of groups including:
• financial services and accounting industry bodies
• software developers
• industry groups including Federated Farmers and Business New Zealand
• social service groups such as Age Concern and Citizens Advice Bureau.
We have set up three key reference groups to help us.
The Taxpayers’ Simplification Panel was created to give New Zealanders a voice in simplifying, modernising and transforming the way we pay tax.
The Transformation Reference Group provides us insights and perspectives from businesses, individuals and the tax community to inform our Business Transformation programme. Members have extensive experience across a broad range of sectors and represent diverse communities.
Our ICT Reference Group provides an independent voice and sounding board on our Business Transformation programme. It is an opportunity for ICT professionals to contribute individual perspectives and experience on the impact of our Business Transformation programme on business and the community.
Public consultation
Improving the customer experience and making it easier and simpler for our customers will require significant policy-related work over the life of the Business Transformation programme.
We ran two significant public consultations asking New Zealanders for their feedback on our Business Transformation and explored options designed to modernise and simplify the tax system. The Minister of Revenue launched both on 31 March 2015.
Making Tax Simpler – A Government Green paper on Tax Administration set out the policy direction for modernising and simplifying the tax administration. This consultation ran until 29 May 2015.
Making Tax Simpler – A Government discussion document on Better Digital Services asked for feedback on approaches to encourage customers to move to better digital services and any barriers that currently prevent them from doing so. This consultation closed on 5 May 2015.
More than 900 online comments and over 90 written submissions were received on the proposals. This was a significantly higher number of responses than we expected. Detailed feedback on these consultations will be published on our website when it is collated.

34 ANNUAL REPORT 2015
Cabinet confirmed a programme roadmap to deliver Business Transformation in a number of steps, enabling the Government to make investment choices throughout the life of the programme:
Enabling secure digital services – to enable the majority of customers to self-manage and reduce businesses’ compliance burden in fulfilling their PAYE obligations.
STAGE 1
Streamline social policy delivery – this will improve the delivery of the social policies that Inland Revenue administers.
STAGE 3
Complete delivery of the future revenue system – this will include transitioning any remaining tax and social policies to a new platform and decommissioning technical platforms that are no longer required.
STAGE 4
Streamline income and business tax processes – this will leverage the foundations delivered in the previous stage and further reduce businesses’ compliance burden to fulfil their tax obligations.
STAGE 2

Organisational health
ANNUAL REPORT 2015 35
05
36 ANNUAL REPORT 2015
Health and Safety
A range of activities have started to ensure Inland Revenue is compliant and has strategies in place that will effectively transition the organisation to the new Health and Safety legislation, which comes into effect 4 April 2016.
We are currently working to bring our health and safety-related policies, processes and systems into line with the requirements of the new legislation. Our activities include exploring a health and safety governance reporting structure that will provide our governance group with regular information on health and safety risks and mitigation and ensuring people including managers and health and safety committees receive education and increased visibility of the legislation.
Organisational health
It is important that we effectively manage our people, our assets and the risks to our business so that we can achieve our strategic intentions.
Governance
To ensure our governance system continues to meet the needs of our transforming organisation, we introduced changes to our governance system in May 2015. The governance system will ensure robust and timely governance of our strategy, investment and performance activities, focusing on transformation, but also ensuring we are meeting the needs of today. Membership across the system is a mix of our Inland Revenue Executive Leadership Team, senior leaders and external members where appropriate.
Preparing our people for change
Changing and streamlining the way we deliver our services, mainly through greater use of digital and online services, will have an impact on our people. As we move towards greater application of technology and streamlined processes, we will make changes to our workforce. To prepare for this, we are designing frameworks and systems to help reshape our organisational capability.
We have updated our workforce strategy to help us identify what we need to do to deliver our strategic intentions. This has supported work on our organisation’s culture and our leadership strategy.
Change leadership and capability
Effective change leadership is essential to lead our people through Business Transformation. We need leaders to be more agile, adaptable and open to new ways of working.
We have revised our leadership framework and are currently redesigning our leadership programmes to reflect this.
Our people leadership strategy includes:
• embedding this leadership framework
• renewing our development programmes for leaders
• encouraging leadership collaboration
• further developing our leadership skill set.
This work aligns with the State Services leadership strategy and Leadership Success Profile (LSP). Our leadership framework identifies those things from the LSP which are important for us to focus on at this time and describes some of the fundamental shifts we are looking for in our leaders as we progress through our transformation journey.
In line with the introduction of talent management across the state sector, Inland Revenue has implemented a talent management approach for senior leaders, to be extended to other leadership levels in the future.
Culture
Inland Revenue wants productive and engaged employees, and a work environment that features strong leadership, innovation, clear accountability and sound risk management.
In June 2015, we completed a baseline culture survey of a sample of 600 employees. This survey was designed to give us some benchmark measures around our culture and will help us understand the shifts we need to make in order to get us to our desired future culture.

05
ANNUAL REPORT 2015 37
OUR PEOPLE PROFILE AS AT JUNE 2014
HEADCOUNT 5788
AVERAGE AGE
42.9 years
FTE 5640.89FULL TIME 91%PART TIME 9%PERMANENT 98%FIXED TERM 2%
FEMALE
STAFF OVERALL 64%PEOPLE LEADERS 54%MANAGERS 46%
MALE
STAFF OVERALL 36%PEOPLE LEADERS 46%MANAGERS 54%
TOTAL TURNOVER*
ANNUALISED 10%AVERAGE LENGTH
OF SERVICE* 11.1 years
NEW HIRES 743EXITS 663
UNPLANNED TURNOVER*
ANNUALISED 8.6%
!
OUR PEOPLE PROFILE AS AT JUNE 2015
HEADCOUNT 5820
AVERAGE AGE
43.0 years
FTE 5679.37FULL TIME 91%PART TIME 9%PERMANENT 98%FIXED TERM 2%
FEMALE
STAFF OVERALL 64%PEOPLE LEADERS 55%MANAGERS 46%
MALE
STAFF OVERALL 36%PEOPLE LEADERS 45%MANAGERS 54%
TOTAL TURNOVER*
ANNUALISED 10.6%AVERAGE LENGTH
OF SERVICE* 11.3years
NEW HIRES 737EXITS 675
UNPLANNED TURNOVER*
ANNUALISED 10%
!
*Permanent staff only

38 ANNUAL REPORT 2015
A new multi-union collective agreement
Three unions represent our employees:
• Public Service Association (PSA)
• Taxpro
• National Union of Public Employees (NUPE).
All union agreements ran out this year – PSA and Taxpro in February 2015 and NUPE in May 2015. A new multi-union collective agreement was ratified by PSA and Taxpro members in June 2015, effective from July 2015. We have been bargaining with NUPE and reached an agreement in July 2015.
Non-union members who are in positions covered by the collective agreements were offered a change to their terms and conditions.
SSC Integrity and Conduct Survey
The most recent State Services Commission (SSC) Integrity and Conduct Survey confirmed that we are performing extremely well, and in some important areas exceptionally well, compared with other survey participants, particularly around integrity, leadership, our processes and the working environment.
The Commissioner established a working group with representatives from Inland Revenue, the PSA and Taxpro to look at areas from the survey which required some focus:
• bullying in the workplace
• change management
• visible leadership
• clarity around promotions and appointments.
The primary focus of recommendations made by the working group related to the way Inland Revenue manages bullying in the workplace. The majority of changes will occur as a result of work
currently underway to update our Human Resources policies and guidance.
Diversity at Inland RevenueOur diversity and inclusion policy reflects our commitment to attracting and retaining a diverse range of people who bring different perspectives, experiences and skills. The insight gained in understanding the facets of diversity gives us a better appreciation of the challenges that some of our customers have when interacting with us. The diversity of thought and culture also make Inland Revenue a vibrant place to work.
New Zealand’s population is changing, with increasing migration and an ageing population. As we understand these population changes, we will respond by developing the capabilities, skills and organisational culture required to meet customer needs.
Our staff diversity networks, including women, Māori and Pacific networks, continue to support their members and wider community interests through regular meetings, mentoring and training opportunities. They promote cultural events across Inland Revenue such as Māori Language Week and various Pacific language weeks. The positive benefit of diversity in practice also spreads to our customers – even in simple things like learning to pronounce customers’ names correctly.
Tiriti o Waitangi / Responsiveness to Māori
Inland Revenue’s customer charter sets out our commitment to work in ways consistent with the spirit of the Treaty of Waitangi and that we acknowledge people’s individual, specific and cultural needs. During the year, we formalised a new relationship agreement between the Public Service Association’s Inland Revenue’s Māori Rūnanga and our Responsiveness to Māori team. This agreement established a new working
Celebrating diversity
An environmental scan last year showed that the workforce at the Penrose Contact Centre is representative of the Auckland population. It found 29% of people identified as New Zealand European, 28% Indian, 24% Pacific Islander, 8% Māori and others were European, Chinese, Korean and from the Philippines. Representatives of the different cultures meet regularly to come up with ideas for events to create a fun environment and embrace the diversity of the teams.
ANNUAL REPORT 2015 39
05
group called Te Manu Taupua, which has a focus on areas of common interest and concern for our Māori staff.
Security incidents
We are committed to keeping our people safe. We monitor and record security incidents and continually assess our workplaces to ensure that we minimise risks and concerns so that our staff feel safe. We review any process after any incident and will change a process if a threat profile is changed.
For example, in early April we received a security threat. The threat was via a phone call and involved our Tauranga and Wellington offices. We informed staff of the threat and we worked quickly to ensure security was provided to mitigate the risk and provide a safer environment for our staff.
Inland Revenue reviewed the recommendations that came out of the independent review of MSD’s physical safety environment following the tragic shooting of three of their staff members in Ashburton in September 2014.
We raise security awareness using a number of communication mechanisms:
• proactive poster campaigns throughout the year supported by self-help tools readily available on the intranet
• mandatory on-line learning modules
• event triggered communication using our intranet.
Business Continuity PlanWe have continued to review, refine and exercise our Business Continuity Plans and Crisis Management arrangements to ensure that critical processes can
continue to function during and after business disruptions. The benefit of this preparation was demonstrated in an effective organisational response to a fire at our Auckland contact centre. Full telephone services were restored within 48 hours.
Risk management
Risk management is an important part of Inland Revenue’s governance and internal control environment.
We ensure Inland Revenue’s approach to risk management reflects good practice and supports risk-based decision-making across all levels of the organisation.
We are continuing to improve our practices to provide greater clarity to our decision-making processes.
We have a mature Enterprise Risk Management Framework that is used to identify and manage risk as we:
• deliver our core business
• implement projects and programmes
• consider risks to achievement of our strategic objectives.
We use the concept of risk champions embedded within business groups to further improve our risk management maturity.
We continue to use a Three Lines of Assurance model to enhance clarity regarding risks and controls and help improve the effectiveness of the internal control environment. Our Internal Audit plan and use of third party assurance providers ensures that there is an appropriate level of independent assurance.
Our Risk and Assurance Committee meets formally on a quarterly basis. All members are independent.
Privacy
We are committed to ensuring our customers privacy is protected. Any personal information customers do provide to us will be kept for as long as necessary to achieve the purpose we collected it for. If personal information becomes part of Inland Revenue records, we will retain the information in accordance with Inland Revenue policy on retention of Inland Revenue records.
Full details of privacy breaches are outlined on page 156.

40 ANNUAL REPORT 2015
ENTERPRISE RISK OUR MITIGATIONS INCLUDE THE FOLLOWING ACTIONS:
We fail to balance all-of-government strategies effectively with the delivery of our core business leading to sub-optimal outcomes
• We will align our long-term planning with the Government’s Better Public Services goals.
• We will participate in all-of-government steering groups to understand and anticipate impending public sector changes.
We are unable to source sufficient government funding to deliver our Business Transformation programme
• Our four-year and 10-year plans will make a compelling case for the investment we need to implement changes.
• We will present rigorous, well-considered business cases for government funding that set out the costs and benefits of proposed spending.
• Our Investment Board will provide strong governance oversight of our Business Transformation programme investments.
Natural hazards such as earthquakes disrupt delivery of critical services
• We will identify and assess potential business impacts and regularly review our response plans, which include business impact assessments, business continuity plans, disaster recovery plans and business continuity emergency management procedures.
We don’t have enough experienced and qualified people to deliver the Business Transformation programme and other programmes
• We will develop and implement strategies to promote workforce capability, employment relations, leadership and workplace culture.
The expanding availability of our information in digital form to others reduces our ability to control that information
• We will ensure our security policies, procedures and standards are strong and enforced.
• We will develop and monitor information-sharing protocols.
• We will align our protocols with government security and privacy standards.
• We will continue to review staff training and awareness.
• We will continue to assess our security processes and performance.
Individuals and organisations represent themselves as Inland Revenue, affecting the integrity of the tax system
• We will keep our security incident database up to date.
• We will monitor social media and internet sites for signs of security breaches.
• We will respond rapidly to reports of misrepresentation.
• We will develop communications strategies to alert the public to scams.
Outdated technology and unsupported software result in systems failures that affect delivery of critical services
• We will continue to invest in stabilising our IT systems.
• We will invest in the upgrade of some key systems and applications.
• We will increasingly buy technology services, rather than buy technology for in-house operation.

ANNUAL REPORT 2015 41
05
ENTERPRISE RISK OUR MITIGATIONS INCLUDE THE FOLLOWING ACTIONS:
Ineffective or incomplete delivery of the Business Transformation programme reduces our ability to meet government revenue forecasts
• We will continue to work towards reaching our target operating model.
• Our governance boards will monitor progress of the Business Transformation programme.
• Our management will coordinate and report on progress of the Business Transformation programme.
Ineffective or incomplete delivery of the Business Transformation programme reduces our ability to implement government policy
• We will continue to work towards reaching our target operating model.
• Our governance boards will monitor progress of the Business Transformation programme.
• Our management will coordinate and report on progress of the Business Transformation programme.
Confidence among customers and stakeholders in our ability to protect their data as a result of information-sharing with government agencies results in a drop in voluntary compliance
• We will ensure our security policies, procedures and standards are strong.
• We will develop and monitor information-sharing protocols.
• We will align our protocols with government security and privacy standards.
• We will continue to review staff training and awareness.
• We will align our security processes with other agencies and continuously monitor performance.
A downturn in the world’s economy affects New Zealand’s ability to fund and deliver government priorities
• We will continuously identify and monitor changes in overseas economic trends through research and forecasting.
The changing customer profile affects voluntary compliance
• We will monitor and report on the effect of changes to the customer base.
• We will use research and planning to develop tailored responses to customer base changes.
We lose the trust and confidence of stakeholders by not recognising or understanding how their expectations change
• We will continue to work closely with the Ministers’ offices.
• The Executive Leadership Team will engage closely with key stakeholders.
• We will monitor and respond to changes in the integrity of the tax system.
• We will monitor and respond to emerging trends in policy and strategy.
• We will take part in forums with our key stakeholders.
Complex international transactions affect our ability to collect revenue
• We are members of the OECD and work with overseas tax administrations to identify changes to practices.
• We are joint advisors with the Treasury in developing policy and strategies to work on complex international practices.

42 ANNUAL REPORT 2015

Our performance
ANNUAL REPORT 2015 43
06

44 ANNUAL REPORT 2015
Our outcomes
Inland Revenue contributes to the economic and social wellbeing of New Zealand by collecting and distributing money. New Zealanders pay tax to and may get money from the Government. We are accountable to the Minister of Revenue.
Inland Revenue’s success is reflected in two outcomes:
• Revenue is available to fund government programmes through people meeting payment obligations of their own accord.
• People receive payments they are entitled to, enabling them to participate in society.
In 2014–15 we collected $60.6 billion of revenue to fund government programmes.
We collected $59.7 billion of this from tax. Direct (or income) taxation, for example individuals’ income tax or corporate income tax, accounts for 73.3% of tax revenue. GST accounts for 26.1%. For full details refer to pages 126 to 127.
OTHER$3.9b
CORP$10.9b
GST$15.6b
IND$29.4bTAX REVENUE
$59.7b
$3.5bfrom 2013–14
OTHER$86.3m
CHILD SUPPORT$197.0m
OTHER REVENUE
$887.5m
INTEREST UNWIND
STUDENT LOANS
$604.2m
$17.5mfrom 2013–14
We also manage or share administration of several social policy entitlements and payments. The key programmes we administer are:
$4.8b KiwiSaver payments transferred to
scheme providers
$2.4b Working for Families Tax Credits
entitlements distributed
$1.1b student loan payments collected
$463m child support payments collected $265m child support entitlements distributed*
$180m paid parental leave entitlements distributed
*The balance is collected for the Government as an off-set for custodial families supported through
the benefit system.
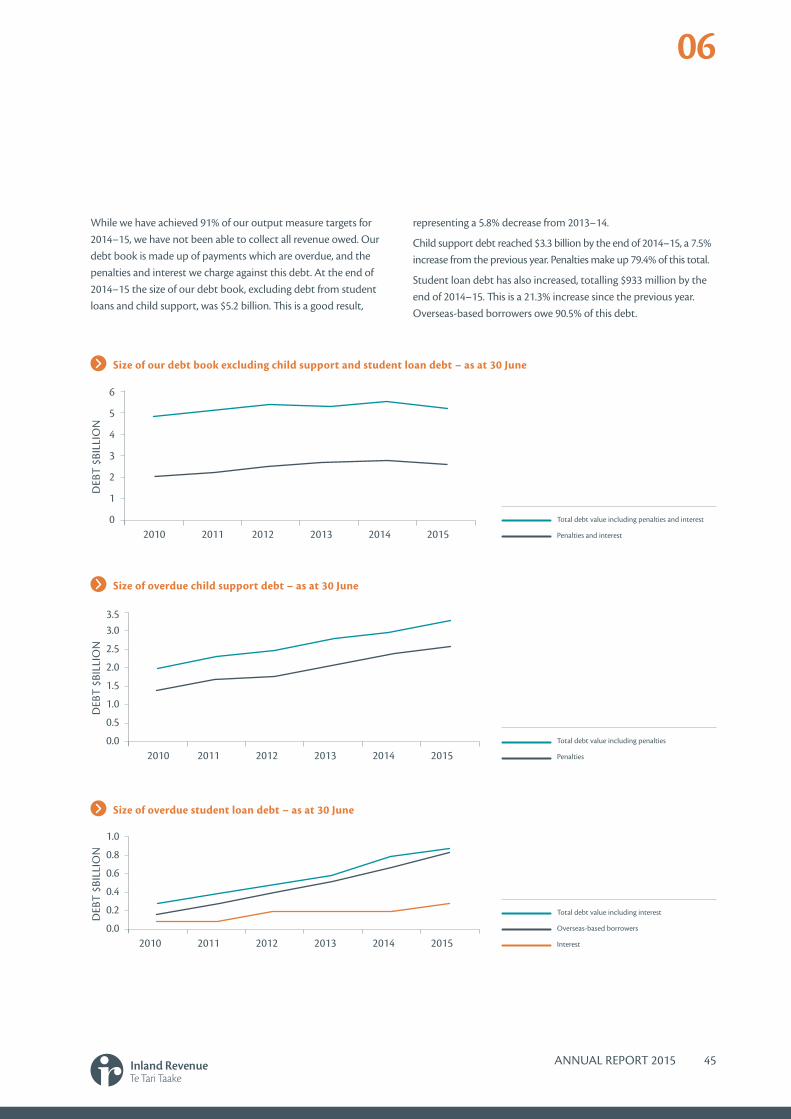
ANNUAL REPORT 2015 45
06
While we have achieved 91% of our output measure targets for 2014–15, we have not been able to collect all revenue owed. Our debt book is made up of payments which are overdue, and the penalties and interest we charge against this debt. At the end of 2014–15 the size of our debt book, excluding debt from student loans and child support, was $5.2 billion. This is a good result,
representing a 5.8% decrease from 2013–14.
Child support debt reached $3.3 billion by the end of 2014–15, a 7.5% increase from the previous year. Penalties make up 79.4% of this total.
Student loan debt has also increased, totalling $933 million by the end of 2014–15. This is a 21.3% increase since the previous year. Overseas-based borrowers owe 90.5% of this debt.
Size of our debt book excluding child support and student loan debt – as at 30 June
6
5
4
3
2
1
02010
DEB
T $B
ILLI
ON
2011 2012 2013 2014 2015 Total debt value including penalties and interest
Penalties and interest
Size of overdue child support debt – as at 30 June
3.5 3.0
2.5
2.0
1.5
1.0
0.5
0.02010
DEB
T $B
ILLI
ON
2011 2012 2013 2014 2015 Total debt value including penalties
Penalties
Total debt value including interest
Overseas-based borrowers
Interest
Size of overdue student loan debt – as at 30 June
1.0
0.8
0.6
0.4
0.2
0.02010
DEB
T $B
ILLI
ON
2011 2012 2013 2014 2015
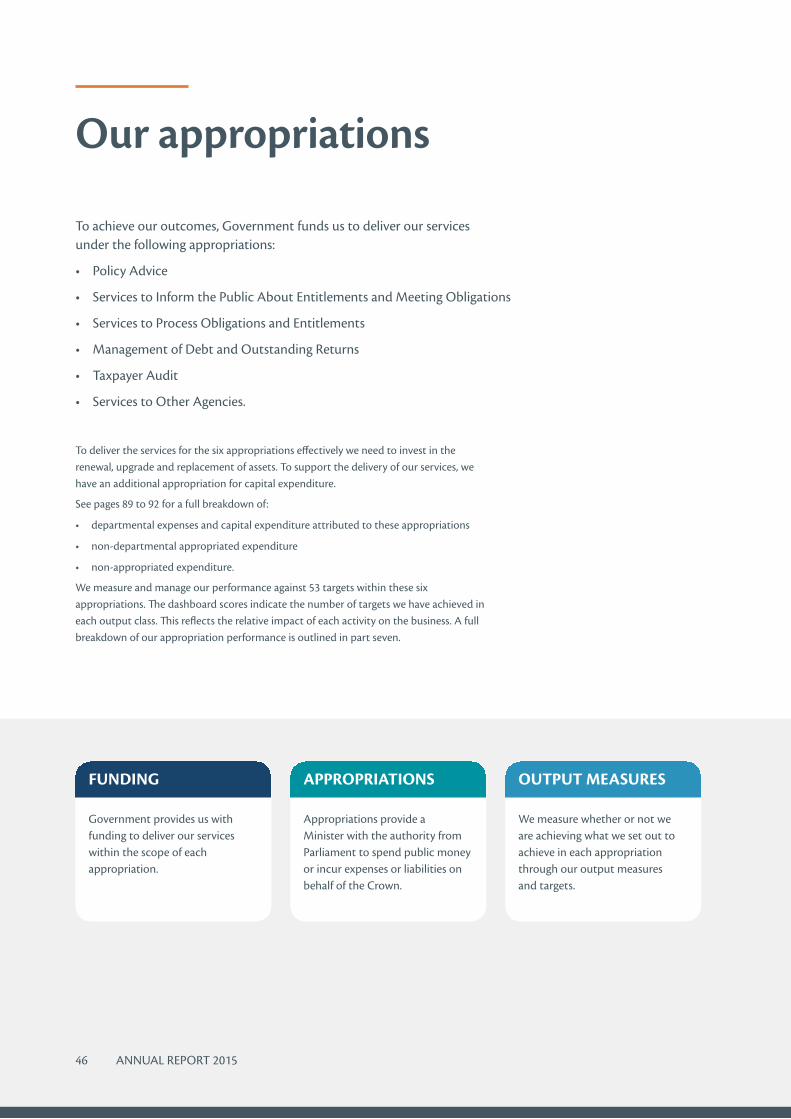
46 ANNUAL REPORT 2015
Our appropriations
To achieve our outcomes, Government funds us to deliver our services under the following appropriations:
• Policy Advice
• Services to Inform the Public About Entitlements and Meeting Obligations
• Services to Process Obligations and Entitlements
• Management of Debt and Outstanding Returns
• Taxpayer Audit
• Services to Other Agencies.
To deliver the services for the six appropriations effectively we need to invest in the renewal, upgrade and replacement of assets. To support the delivery of our services, we have an additional appropriation for capital expenditure.
See pages 89 to 92 for a full breakdown of:
• departmental expenses and capital expenditure attributed to these appropriations
• non-departmental appropriated expenditure
• non-appropriated expenditure.
We measure and manage our performance against 53 targets within these six appropriations. The dashboard scores indicate the number of targets we have achieved in each output class. This reflects the relative impact of each activity on the business. A full breakdown of our appropriation performance is outlined in part seven.
FUNDING
Government provides us with funding to deliver our services within the scope of each appropriation.
APPROPRIATIONS
Appropriations provide a Minister with the authority from Parliament to spend public money or incur expenses or liabilities on behalf of the Crown.
OUTPUT MEASURES
We measure whether or not we are achieving what we set out to achieve in each appropriation through our output measures and targets.

ANNUAL REPORT 2015 47
06
Policy AdviceAchieved 1 target out of 31Services to Inform the Public About Entitlements and Meeting ObligationsAchieved 15 targets out of 16
2Services to Process Obligations and EntitlementsAchieved 14 targets out of 15
3Management of Debt and Outstanding ReturnsAchieved 9 targets out of 9
4Taxpayer AuditAchieved 8 targets out of 85Services to Other AgenciesAchieved 1 target out of 26
33%
94%
93%
100%
100%
50%
Performance Targets Achieved2014–15
91%

48 ANNUAL REPORT 2015
Providing value for money
Government expects us to provide the best value for money from public funds. We have to ensure our services are delivered in a cost-effective and efficient way. We carefully consider the relationship between our resources, outputs and impacts to ensure we stay focused on delivering value for money. Three elements contribute to this:
• Effectiveness—operating in a way that achieves our outcomes
• Efficiency—producing more for the same or less
• Economy—getting and using our resources as economically as possible.
We have made a number of changes to our processes to ensure we deliver our services in the best way possible within the limits of our funding, which may not always be visible to our customers.
Effectively managing peak season
Our peak season, when we have very high contact volumes, runs between April and August. Most of the people who contact us want information about how certain tax and social policy rules work and apply to them. These high volumes can translate into very long wait times.
To make things easier for our customers, we improved our internal planning processes, increased use of our online channels and continued to improve our communication with our customers and our working relationship with tax agents.
We opened the Personal Tax Summary (PTS) annual run to tax intermediaries 28 hours earlier than last year, allowing us to confirm earlier, the 264,000 returns they filed. Getting these out sooner relieved pressure on our systems and allowed better service for individual customers logging into myIR to confirm their PTS. The core PTS annual run was completed ahead of time and we achieved our target for calls answered within two minutes for the year. This also resulted in fewer customer calls to manage.
Operational efficiency
Our operational teams have achieved considerable savings in the form of greater efficiencies in servicing our customers. This has created additional capacity, which has been reinvested to help us improve performance and deliver additional change effectively, such as the first phase of the changes to child support.
We use a number of tools to automate basic repetitive tasks that do not need any decision-making or real input from our people. This enables our people to focus more on tasks that require real decision-making or customer engagement, with the overall outcome being that we can provide an improved and faster service to customers.
We continued to improve processes to ensure we deliver the value for money the public and Government expects. The efficiencies driven by our operations management programme in customer-facing areas enabled us to do just over 450,000 hours more work this year. We estimate that this extra capacity is equivalent to a cost of $12.2 million. Since the programme started in March 2011, it has produced capacity savings equivalent to $32.5 million, $4.7 million above the target. To achieve further efficiency gains we are taking an enterprise-wide continuous improvement approach.
We have been developing our continuous improvement capability and while this is focused on improving our performance to the customer, it is also helping to prepare our people
Our FIRST database which holds all tax and social policy customer information is three terabytes in size. It is the single largest Unisys database of its type in the world.
ANNUAL REPORT 2015 49
06
System back-ups that used to take six hours are now completed in three hours.
for the transformation of our business. We will extend our continuous improvement programme across the organisation to a number of our support services in 2015–16.
Economy – saving on postage and printing costs
This year we spent $16 million on print and postage. By giving customers access to their details online, we aim to reduce these costs.
Because more of our customers are filing online we stopped providing prepaid envelopes for Employer Monthly Schedules (EMS) in November 2014. In 2012–13 the cost to send envelopes was about $840,000. In 2014–15 the cost was around $200,000 and for the 2015–16 year, it is expected that the annual cost will be reduced to $40,000.
Maintaining our computer systems and infrastructure
While we prepare to make a large investment in a new core system through our Business Transformation programme we are also investing in our existing systems where it is sensible to do so. We still need to meet government and customer expectations for better, smarter and more cost-effective systems and support the stability of our ICT environment while we transform.
Our ICT Strategy and Roadmaps guide our activities to deliver safe and secure digital services to our customers. The strategy will drive the future rationalisation, consolidation and simplification of our ICT environment and is closely linked to our Business Transformation objectives and the Government’s overall ICT Strategy.
Our mainframe platform houses the core FIRST business systems, all our customers’ data, including their return, payment, entitlement and transaction activity. In 2012 Cabinet approved a business case for us to replace the existing platform which was approaching end of life.
There was considerable risk attached to this move. We spent nearly a year planning and testing to get this right, which included moving the planned cut-over date from May 2014 to November 2014 in order to ensure that our peak business periods were not affected.
In November 2014 we successfully transitioned to a new mainframe platform service. With the new mainframe in place, run by Unisys New Zealand, we can accelerate our digital growth and support our goal to make it easier and faster for customers to do business with us.
We have since seen significant performance improvements for both our external customers submitting their tax returns and accessing our online services and our internal staff members accessing the system. For example system back-ups that used to take six hours can now be completed in three hours and the time to complete the annual PTS run reduced from 27 hours to seven hours and was able to be completed over a weekend. This meant that intermediaries were able to process refunds much more quickly and customers received their refund days earlier than previous years.
We continued to update and upgrade our existing systems and infrastructure to ensure they support a high level of stability and reliability for our customers. Examples include:
• upgrading the underlying ICT environment for our electronic document storage and retrieval system
• moving our legacy printing platform to XPression
• upgrading the software components and replacing the underlying hardware in our contact centres and our telephone environment.
In May we were ranked as number two in CIO Magazine’s top 100 companies and government agencies across New Zealand – an acknowledgement of the complex technology planning and support we provide to collect and distribute revenue and social policy payments for New Zealand.
2
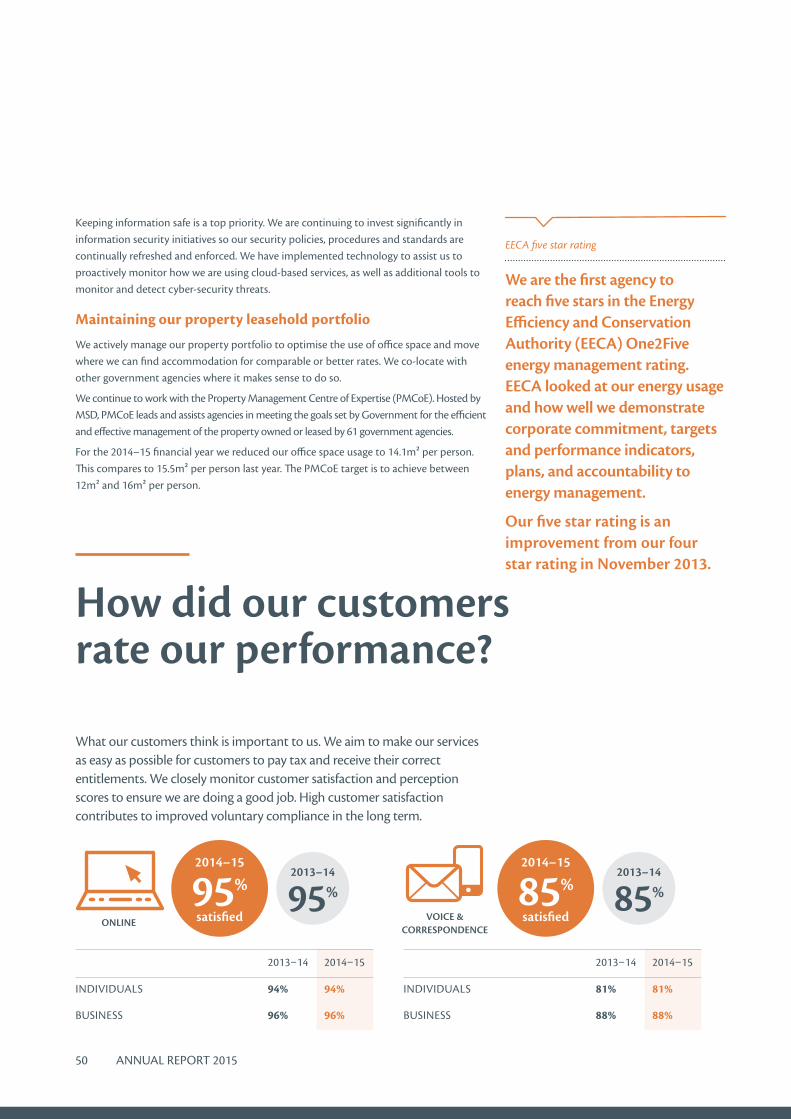
50 ANNUAL REPORT 2015
Keeping information safe is a top priority. We are continuing to invest significantly in information security initiatives so our security policies, procedures and standards are continually refreshed and enforced. We have implemented technology to assist us to proactively monitor how we are using cloud-based services, as well as additional tools to monitor and detect cyber-security threats.
Maintaining our property leasehold portfolio
We actively manage our property portfolio to optimise the use of office space and move where we can find accommodation for comparable or better rates. We co-locate with other government agencies where it makes sense to do so.
We continue to work with the Property Management Centre of Expertise (PMCoE). Hosted by MSD, PMCoE leads and assists agencies in meeting the goals set by Government for the efficient and effective management of the property owned or leased by 61 government agencies.
For the 2014–15 financial year we reduced our office space usage to 14.1m² per person. This compares to 15.5m² per person last year. The PMCoE target is to achieve between 12m² and 16m² per person.
EECA five star rating
We are the first agency to reach five stars in the Energy Efficiency and Conservation Authority (EECA) One2Five energy management rating. EECA looked at our energy usage and how well we demonstrate corporate commitment, targets and performance indicators, plans, and accountability to energy management.
Our five star rating is an improvement from our four star rating in November 2013.
How did our customers rate our performance?
What our customers think is important to us. We aim to make our services as easy as possible for customers to pay tax and receive their correct entitlements. We closely monitor customer satisfaction and perception scores to ensure we are doing a good job. High customer satisfaction contributes to improved voluntary compliance in the long term.
2013–14 2014–15
INDIVIDUALS 94% 94%
BUSINESS 96% 96%
2013–14 2014–15
INDIVIDUALS 81% 81%
BUSINESS 88% 88%
ONLINE
2014–15
95%
satisfied
2013–14
95%VOICE &
CORRESPONDENCE
2014–15
85%
satisfied
2013–14
85%

ANNUAL REPORT 2015 51
06
Overall customer satisfaction scores have remained stable in 2014–15, with the same results for online and voice and correspondence services as measured in 2013–14. Tax agents showed a statistically significant change in overall satisfaction for voice and correspondence services, with 92% satisfied (up 3.4% from 2013–14) and 78% very satisfied (up 13.0% from 2013–14), which can be attributed to an improvement in satisfaction with accessibility and perceived ease of access to our services. However, due to the weighting of results based on the sample size of customer groups surveyed, this does not result in an increase in Business and Overall satisfaction scores.
Tax revenue is used by government to pay for services we all use. In 2014–15,
97% of our customers recognised that paying tax contributes to New Zealand society. Between 2009–10 and 2014–15, the proportion of customers who resent paying tax dropped from 46% to 41%.
For our customers to trust us and believe in the integrity of the tax system it is important they believe we do a good job in collecting taxes and paying entitlements. From 2010–11 to 2012–13, the proportion of customers who were confident that Inland Revenue did a good job was stable at 92%. In recent years this has increased, reaching 94% in 2014–15.
There were also increases in the proportions of customers who agreed that they accessed Inland Revenue easily, from 81% in 2012–13 to 87% in 2014–15.
Looking at 4-5 out of 5 ratings, or customers who were very satisfied, there were improvements in customers’ perceptions for all indicators in 2014–15 compared to 2013–14. Increases of at least 3 percentage points in the proportions of customers who rated 4-5 out of 5 were seen for the following indicators:
• Confidence that Inland Revenue does a good job
• Inland Revenue can easily be accessed
• Information is treated confidentially
• Inland Revenue treats people fairly
• Inland Revenue makes it easy to get it right.
Resent paying tax
Proportions of all customers who agreed (3-5 of 5) that they resent paying tax: 2009–10 to 2014–15
47%
46%
45%
44%
43%
42%
41%
40%2009–10 2010–11 2011–12 2012–13 2013–14 2014–15
Paying tax contributes to NZ
Confidence IR does a good job
Easily access IR
Proportions of all customers who agreed (3-5 of 5) that Inland Revenue can easily be accessed, and that paying tax contributes to NZ society: 2009–10 to 2014–15
100%
95%
90%
85%
80%
75%
70%2009–10 2010–11 2011–12 2012–13 2013–14 2014–15
52 ANNUAL REPORT 2015
How we compare to other tax authorities
The OECD compares tax authorities around the world on various measures every three years. The latest OECD survey published, Tax Administration 2015: Comparative Information on OECD and Other Advanced and Emerging Economies, compares results from 2013 provided by tax authorities.
We were among a group of 13 revenue bodies reporting IT costs over 15% of total expenditure. In 2013 our IT expenditure was 18.3% of our total expenditure. The OECD observed that this group generally performed favourably on performance-related measures such as e-filing and payment, administrative costs as a percentage of GDP and average staffing numbers.
Our year-end debt to total revenue collected ratio of 9.2% was the same as the OECD median and slightly below Australia and Canada. Our cost of collection (85 cents to collect $100) also compared favourably with other countries, though it is difficult to compare different countries on this measure as they have different tax rates and there is no single method for calculating this result.
Our impacts
We want our activities and interventions to improve customer compliance behaviour. We use 14 impact indicators and four contextual indicators, grouped under five Impact Statements, to measure our progress. We have set targets to be achieved by 2017–18, which take into account our strategic intentions (including transformation goals), our operating environment (including government priorities), the economy, our resources and customer expectations.

ANNUAL REPORT 2015 53
06
More customers claim their correct
entitlements
More customers pay and file
information on time
The behaviour of non-compliant
customers improves
More customers register and report
accurate information when required
More customers are able to self-manage
Our impacts
Achieving our impact indicator targets will contribute to us achieving our long-term outcomes.
To view the full set of impact indicator results and targets, please see pages 84 to 88.
More customers pay and file information on timeOn-time filing and paying compliance and customer satisfaction and perception levels remained high.
The behaviour of non-compliant customers improvesWe continue to improve our results, collecting debt quicker and identifying older debt, which cannot be collected, as uncollectable. The high level of penalties and interest as a proportion
of total debt, and high levels of uncollectable debt unable to be dealt with are limited by appropriations for write-off. The end of this year sees a smaller debt book with less cases on hand which shows the debt book moving in the right direction.
More customers are able to self-manageThis year we reached our 2018 target of ‘80% or more of customers find it easy to comply’. We are only 2% away from achieving our 2018 target of ‘85% or more of customers are aware of their obligations and entitlements’.
More customers register and report accurate information when requiredThe results show improvements in the accuracy of submitted returns, driven by lower error rates for individual income tax returns submitted electronically.
More customers claim their correct entitlementsSocial policy-related compliance levels remained stable. This year we achieved our 2018 target of ‘75% or more of child support assessments are collected’.
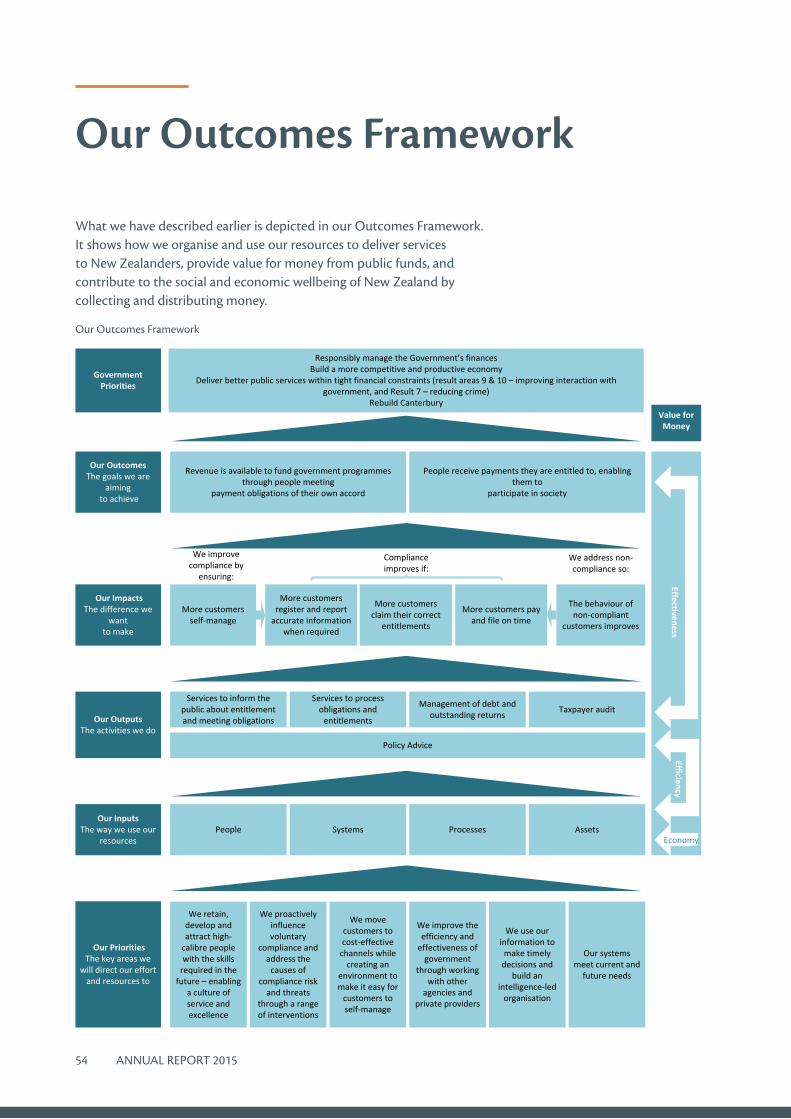
54 ANNUAL REPORT 2015
Our Outcomes Framework
What we have described earlier is depicted in our Outcomes Framework. It shows how we organise and use our resources to deliver services to New Zealanders, provide value for money from public funds, and contribute to the social and economic wellbeing of New Zealand by collecting and distributing money.
Our Outcomes Framework
Our OutcomesThe goals we are
aiming to achieve
Revenue is available to fund government programmes through people meeting
payment obligations of their own accord
People receive payments they are entitled to, enabling them to
participate in society
Our ImpactsThe difference we
want to make
More customers self-manage
More customers register and report
accurate information when required
More customers claim their correct
entitlements
More customers pay and file on time
The behaviour of non-compliant
customers improves
Our OutputsThe activities we do
Services to inform the public about entitlement and meeting obligations
Services to process obligations and
entitlements
Management of debt and outstanding returns
Taxpayer audit
Policy Advice
Our InputsThe way we use our
resourcesPeople Systems Assets
Our PrioritiesThe key areas we
will direct our effort and resources to
We retain, develop and attract high-
calibre people with the skills
required in the future – enabling
a culture of service and excellence
Processes
EffectivenessEfficiency
Economy
Value for Money
We improve compliance by
ensuring:
We address non-compliance so:
Compliance improves if:
Government Priorities
Responsibly manage the Government’s financesBuild a more competitive and productive economy
Deliver better public services within tight financial constraints (result areas 9 & 10 – improving interaction with government, and Result 7 – reducing crime)
Rebuild Canterbury
We proactively influence voluntary
compliance and address the
causes of compliance risk
and threats through a range of interventions
We move customers to cost-effective
channels while creating an
environment to make it easy for
customers to self-manage
We improve the efficiency and
effectiveness of government
through working with other
agencies and private providers
We use our information to
make timely decisions and
build an intelligence-led
organisation
Our systems meet current and
future needs

ANNUAL REPORT 2015 55
What we are here for
We contribute to the economic and social wellbeing of New Zealand by collecting and distributing money
What we want to be
A world-class revenue organisation recognised for service and excellence
· Trust and integrity
· Valuing people
· Innovating to make a difference
· Working together
What’s important to us in how we work
Strategic objectives
1. Grow voluntary compliance by making it easier for people to get it right
2. Reduce customer compliance costs
3. Make Government policy changes faster and more cost-effectively
How we’ll do this
Link our systems across the government and private sector
Fit revenue processes into customers’ broader lives
Make more intelligent use of information
What we’ll do
Replace our computer system
Become truly digital
Upskill our people and change the ways we work
IR for the future also required us to change to overcome our challenges and meet our transformation goals.
As our change has become more tangible, we have sharpened our objectives, clarified how we’ll achieve them and what we’ll do differently. That sharper focus is summarised in Our Change Story - why and how IR is changing.
Improving information
security
Rationalising and consolidating applications
Providing an agile and adaptive set
of capabilities
Taking a service-centric
approach
Providing greater self-
management
Being highly-automated and event-driven
Enabling a wider service delivery
ecosystem
Adopting agile, responsive
design
Enabling greater outreach
Tailoring services & channels
Embedding a customer-centric
approach
Delivering One Way of Working
Supporting Our People
to Achieve
Future State Organisation
Extending the digital border
Driving Enterprise Excellence
Future State Policy and Legislation
Embracing richer data sources
Embedding right-time insights
Enhancing Enterprise Tools
and Systems
Streamlining delivery and operations across
an ecosystem of trusted partners
Extracting actionable insights
Providing seamless data flows
Enhancing risk based tolerance to technology
failure
Continuously learning from
feedback
Customer Experience
Core Tax & Social Policy
Enterprise Support Services
Organisation Design
Policy and Legislation
Technology
Intelligence Led
We are reviewing our Outcomes Framework in 2015–16 to ensure it remains fit for purpose and allows us to tell the clear performance story of how we will continue to deliver today while achieving our strategic objectives. Our updated framework will be included in our next Statement of Intent.
Designing our future
The mission, vision and values of IR for the future continue to guide us:
06
Our Direction

Measuring our performance
56 ANNUAL REPORT 2015

Measuring our performance
ANNUAL REPORT 2015 57
07
58 ANNUAL REPORT 2015
Statement of Responsibility
In terms of the Public Finance Act 1989 I am responsible, as Chief Executive of Inland Revenue, for the preparation of the department’s financial statements and end of year performance information, and for the judgements made in them. I am also responsible for the preparation of the department’s forecast financial statements including the appropriateness of the underlying assumptions and all other required disclosures.
I have the responsibility for establishing a system of internal control designed to provide reasonable assurance as to the integrity and reliability of financial reporting and the accuracy of our end of year performance information.
In my opinion, these financial statements fairly reflect the financial position and operations of the department for the year ended 30 June 2015 and the forecast financial statements reflect the financial position and operations of the department for the year ending 30 June 2016 based on Government decisions and information as at 28 April 2015.
Naomi FergusonChief Executive and Commissioner of Inland Revenue 29 September 2015
Countersigned by:
Giles SouthwellChief Financial Officer 29 September 2015
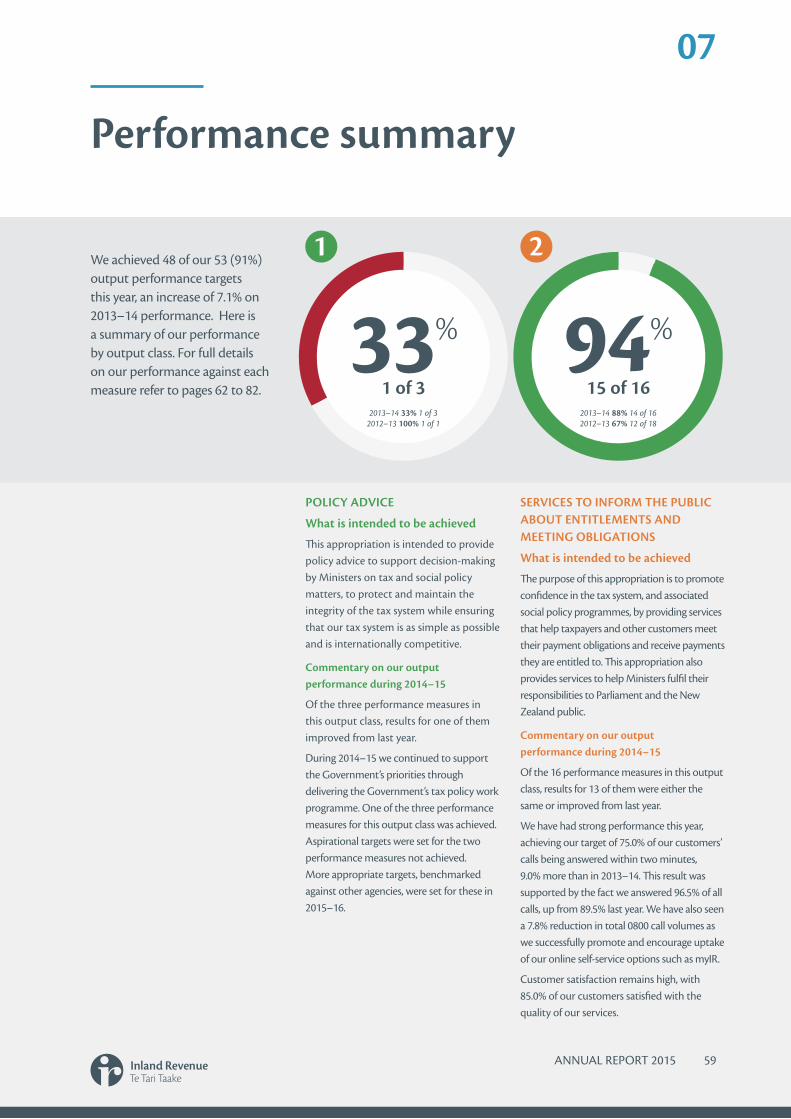
07
ANNUAL REPORT 2015 59
Performance summary
SERVICES TO INFORM THE PUBLIC ABOUT ENTITLEMENTS AND MEETING OBLIGATIONS
What is intended to be achieved
The purpose of this appropriation is to promote confidence in the tax system, and associated social policy programmes, by providing services that help taxpayers and other customers meet their payment obligations and receive payments they are entitled to. This appropriation also provides services to help Ministers fulfil their responsibilities to Parliament and the New Zealand public.
Commentary on our output performance during 2014–15
Of the 16 performance measures in this output class, results for 13 of them were either the same or improved from last year.
We have had strong performance this year, achieving our target of 75.0% of our customers’ calls being answered within two minutes, 9.0% more than in 2013–14. This result was supported by the fact we answered 96.5% of all calls, up from 89.5% last year. We have also seen a 7.8% reduction in total 0800 call volumes as we successfully promote and encourage uptake of our online self-service options such as myIR.
Customer satisfaction remains high, with 85.0% of our customers satisfied with the quality of our services.
94%
15 of 162013–14 88% 14 of 16 2012–13 67% 12 of 18
2
POLICY ADVICE
What is intended to be achieved
This appropriation is intended to provide policy advice to support decision-making by Ministers on tax and social policy matters, to protect and maintain the integrity of the tax system while ensuring that our tax system is as simple as possible and is internationally competitive.
Commentary on our output performance during 2014–15
Of the three performance measures in this output class, results for one of them improved from last year.
During 2014–15 we continued to support the Government’s priorities through delivering the Government’s tax policy work programme. One of the three performance measures for this output class was achieved. Aspirational targets were set for the two performance measures not achieved. More appropriate targets, benchmarked against other agencies, were set for these in 2015–16.
33%
1 of 32013–14 33% 1 of 3
2012–13 100% 1 of 1
1We achieved 48 of our 53 (91%) output performance targets this year, an increase of 7.1% on 2013–14 performance. Here is a summary of our performance by output class. For full details on our performance against each measure refer to pages 62 to 82.
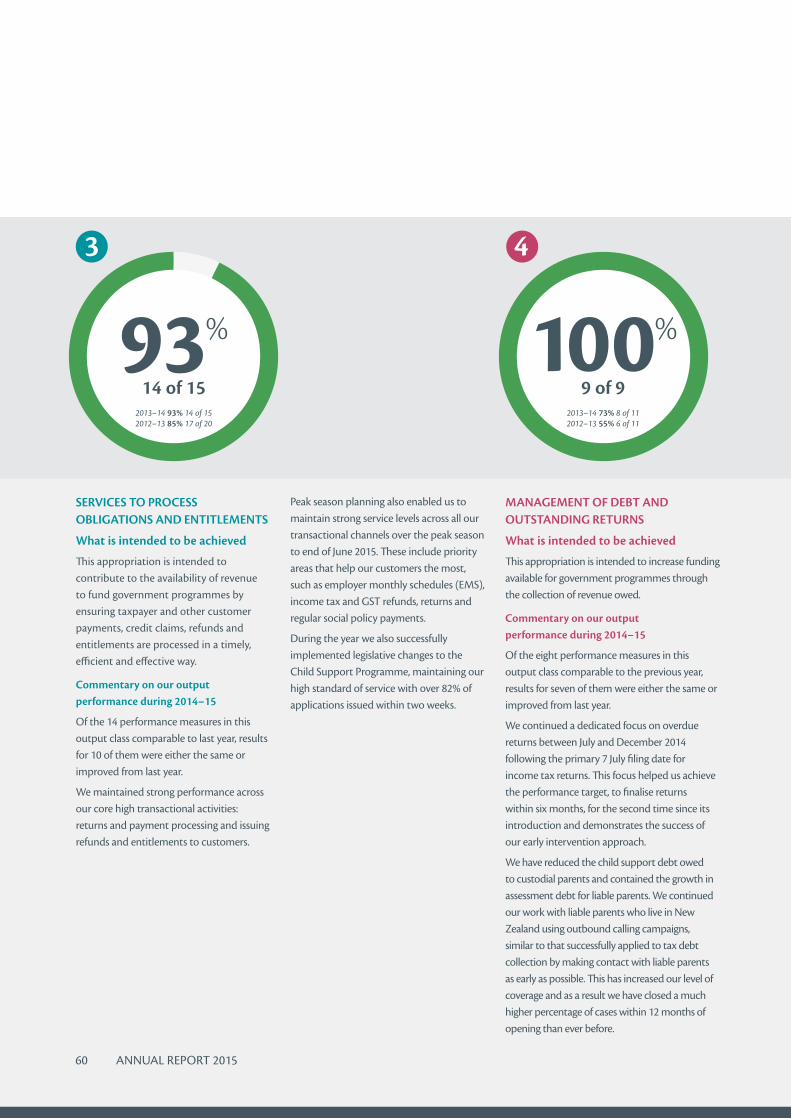
60 ANNUAL REPORT 2015
SERVICES TO PROCESS OBLIGATIONS AND ENTITLEMENTS
What is intended to be achieved
This appropriation is intended to contribute to the availability of revenue to fund government programmes by ensuring taxpayer and other customer payments, credit claims, refunds and entitlements are processed in a timely, efficient and effective way.
Commentary on our output performance during 2014–15
Of the 14 performance measures in this output class comparable to last year, results for 10 of them were either the same or improved from last year.
We maintained strong performance across our core high transactional activities: returns and payment processing and issuing refunds and entitlements to customers.
3
93%
14 of 152013–14 93% 14 of 15 2012–13 85% 17 of 20
MANAGEMENT OF DEBT AND OUTSTANDING RETURNS
What is intended to be achieved
This appropriation is intended to increase funding available for government programmes through the collection of revenue owed.
Commentary on our output performance during 2014–15
Of the eight performance measures in this output class comparable to the previous year, results for seven of them were either the same or improved from last year.
We continued a dedicated focus on overdue returns between July and December 2014 following the primary 7 July filing date for income tax returns. This focus helped us achieve the performance target, to finalise returns within six months, for the second time since its introduction and demonstrates the success of our early intervention approach.
We have reduced the child support debt owed to custodial parents and contained the growth in assessment debt for liable parents. We continued our work with liable parents who live in New Zealand using outbound calling campaigns, similar to that successfully applied to tax debt collection by making contact with liable parents as early as possible. This has increased our level of coverage and as a result we have closed a much higher percentage of cases within 12 months of opening than ever before.
100%
9 of 92013–14 73% 8 of 11 2012–13 55% 6 of 11
4
Peak season planning also enabled us to maintain strong service levels across all our transactional channels over the peak season to end of June 2015. These include priority areas that help our customers the most, such as employer monthly schedules (EMS), income tax and GST refunds, returns and regular social policy payments.
During the year we also successfully implemented legislative changes to the Child Support Programme, maintaining our high standard of service with over 82% of applications issued within two weeks.
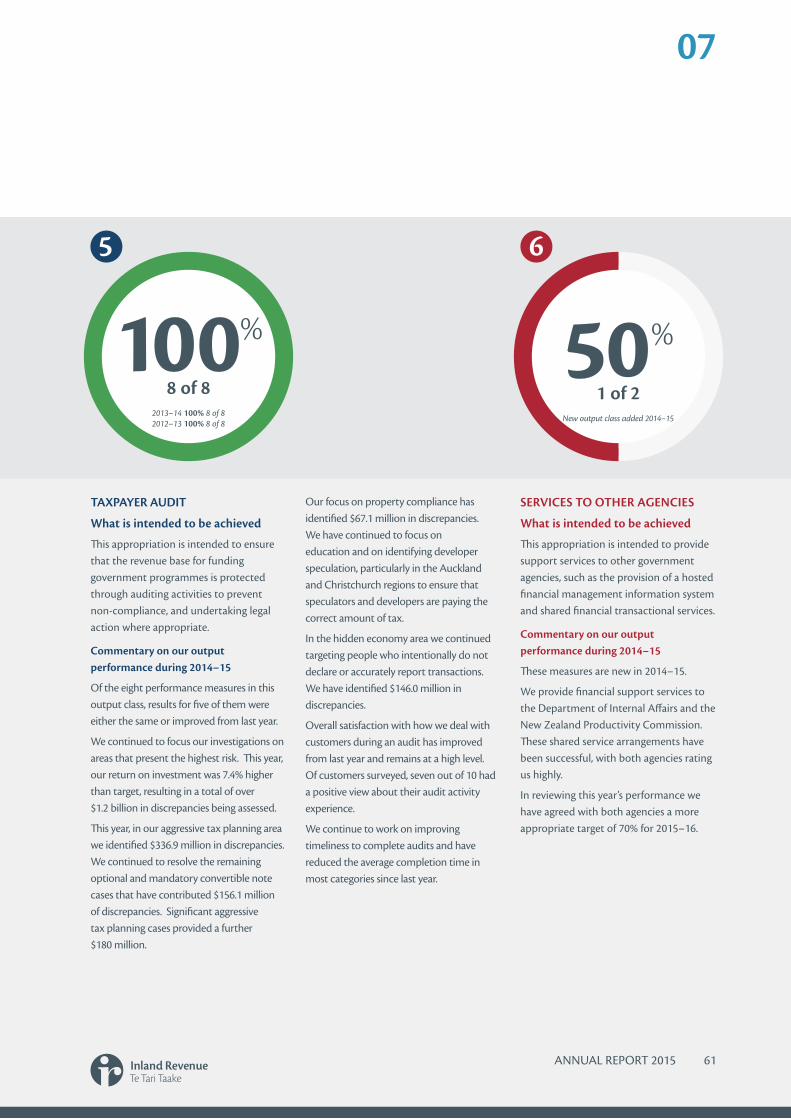
07
ANNUAL REPORT 2015 61
65
50%
1 of 2New output class added 2014–15
100%
8 of 82013–14 100% 8 of 8 2012–13 100% 8 of 8
TAXPAYER AUDIT
What is intended to be achieved
This appropriation is intended to ensure that the revenue base for funding government programmes is protected through auditing activities to prevent non-compliance, and undertaking legal action where appropriate.
Commentary on our output performance during 2014–15
Of the eight performance measures in this output class, results for five of them were either the same or improved from last year.
We continued to focus our investigations on areas that present the highest risk. This year, our return on investment was 7.4% higher than target, resulting in a total of over $1.2 billion in discrepancies being assessed.
This year, in our aggressive tax planning area we identified $336.9 million in discrepancies. We continued to resolve the remaining optional and mandatory convertible note cases that have contributed $156.1 million of discrepancies. Significant aggressive tax planning cases provided a further $180 million.
Our focus on property compliance has identified $67.1 million in discrepancies. We have continued to focus on education and on identifying developer speculation, particularly in the Auckland and Christchurch regions to ensure that speculators and developers are paying the correct amount of tax.
In the hidden economy area we continued targeting people who intentionally do not declare or accurately report transactions. We have identified $146.0 million in discrepancies.
Overall satisfaction with how we deal with customers during an audit has improved from last year and remains at a high level. Of customers surveyed, seven out of 10 had a positive view about their audit activity experience.
We continue to work on improving timeliness to complete audits and have reduced the average completion time in most categories since last year.
SERVICES TO OTHER AGENCIES
What is intended to be achieved
This appropriation is intended to provide support services to other government agencies, such as the provision of a hosted financial management information system and shared financial transactional services.
Commentary on our output performance during 2014–15
These measures are new in 2014–15.
We provide financial support services to the Department of Internal Affairs and the New Zealand Productivity Commission. These shared service arrangements have been successful, with both agencies rating us highly.
In reviewing this year’s performance we have agreed with both agencies a more appropriate target of 70% for 2015–16.

62 ANNUAL REPORT 2015
Reporting our performanceFOR THE YEAR ENDED 30 JUNE 2015
The following parts provide detailed reporting on our performance against our targets. Where a performance measure is expressed in terms of a range of characteristics that the output should meet, the result is reported as ‘achieved’ or ‘not achieved’ (eg, see Departmental Output Expense 5).
Comparative performance data
Where appropriate, we have included comparative performance information against the activity forecasts and performance measures for the previous year (2013–14 actual). We have not included comparative performance information for new performance measures, or where there has been a change in the performance measure or measurement methodology that make the results not comparable. These are indicated by ‘n/a’.
Activity forecasts
Where appropriate, we have included forecasts of expected customer demand for our services that provide context for our results. Significant variation from the forecast figures can influence the achievement of the targets set for our performance measures.
Review of 2014–15 output performance measures and targets
As in previous years, we reviewed our output measures before the start of the new financial year. The purpose of this review was to:
• create or update measures to reflect changes in our business
• remove items that were not true measures of our performance.
Of the 53 measures from 2013–14, we removed two and added two. There are 49 measures comparable with last year. Our performance improved for 29 of these measures (59%), remained the same for seven measures (14%) and deteriorated for 13 measures (27%). For seven (54%) of the 13 measures where performance deteriorated, the change in performance between years was less than 5%.
We have provided comments for:
• key activity forecasts where actual demand was outside the expected range
• performance measures that were not achieved
• performance measures with a positive variance greater than 10%.
Some performance measures are calculated using a sample of the customer population. We have marked these performance measures with a hash mark (#).
All target and forecast figures in pages 63 to 82 are not subject to audit.
Performance context
Each appropriation contributes to achieving Inland Revenue’s long-term outcomes:
• Revenue is available to fund government programmes through people meeting payment obligations of their own accord
• People receive payments they are entitled to, enabling them to participate in society.
We have included information to give context to the performance achieved. For each output expense we have included a summary of the impacts we believe it contributes to. Further information about our Outcomes Framework can be found in part six. This forms part of the overall performance picture and should be read in conjunction with the activity forecasts and narrative in the other parts of this report. Our non-financial performance targets for the coming year are also included, and provide context to this year’s results. Full details of our 2015–16 performance measures and targets can be found in Performance measures and targets 2015–16 on our website.
More customers are able to self-manage
More customers register and report accurate information when required
More customers claim their correct entitlements
More customers pay and file information on time
The behaviour of non-compliant customers improves
Key

ANNUAL REPORT 2015 63
07
1 Departmental Output Expense 1: Policy Advice
Description
This appropriation is limited to the provision of advice (including second opinion advice and contributions to policy advice led by other agencies) to support decision-making by Ministers on government policy matters.
Contributes to Impact Statements:
Providing policy advice services protects and maintains the integrity of the tax system while ensuring that our tax system is as simple as possible and is internationally competitive.
Financial performance
OUTPUT STATEMENT FOR THE YEAR ENDED 30 JUNE 2015
2013–14 2014–15 2014–15 2014–15 2015–16Actual Unaudited Unaudited Actual Unaudited
budget revised forecastbudget
$000 $000 $000 $000 $000
Revenue
Crown 8,166 8,051 9,151 9,151 8,000
Other 6 2 2 10 2
Total revenue 8,172 8,053 9,153 9,161 8,002
Expenses
Annual appropriations 8,118 8,053 9,153 8,128 8,002
Total expenses 8,118 8,053 9,153 8,128 8,002
Net surplus/(deficit) 54 – – 1,033 –
Output 1.1 Policy advice in relation to tax and social policy
Description
This output involves:
• advising on all aspects of tax policy and social policy measures that interact with the tax system
• developing tax and social policy in line with the Generic Tax Policy Process
• drafting tax legislation for introduction in the House of Representatives and assisting its passage through the House of Representatives
• negotiating and maintaining New Zealand’s network of double tax agreements with other countries
• forecasting future tax and non-tax Crown revenue receipts and disbursements for the government
• analysing revenue implications of changes in tax and social policy.

64 ANNUAL REPORT 2015
Performance measures
All targets are unaudited.
2 Departmental Output Expense 2: Services to Inform the Public About Entitlements and Meeting Obligations
Description
The scope of this appropriation is limited to:
• providing information and assistance to customers on the application of the law
• responding to customer enquiries about tax and social support programmes
• adjudication on behalf of the Commissioner on proposed taxpayer assessments
• providing binding rulings and other statements on the interpretation and application of the law administered by Inland Revenue
• provision of services to Ministers to enable them to discharge their portfolio (other than policy decision-making responsibilities).
Contributes to Impact Statements:
Providing customers with relevant information and advice, certainty in relation to the application of the law, and a choice in how they engage with us ensures that customers are aware of and understand their obligations and entitlements. This means more customers can self-manage.
Minimum percentage of policy advice papers that meet quality standards
Although we did not achieve our target this year, the result has improved from 73% in 2013–14 to 83%. The target for 2015–16 is set at 75% to align our target with other agencies which provide policy advice. Areas identified for improvement will be implemented next year, including more consistent analysis of the impacts of proposals, and greater attention to risk and risk management.
2013–14 Actual
2014–15 Target 90%
2015–16 Target
73.0% 83.0% 75%
Minimum percentage of ministerial satisfaction for policy advice
Performance is assessed by a survey completed by the Minister of Revenue. On review the appropriate target for this measure has been deemed to be 80%, which is consistent with other agencies that provide policy advice.
2013–14 Actual
2014–15 Target 95%
2015–16 Target
87.0% 78.3% 80%
Maximum average cost per hour of producing policy advice outputs
The result for 2014–15 of $132.88 was less than the target set of $150. The target was based on our best estimate of the cost per hour of providing policy advice. Our forecast for the year end was revised to a cost per hour of $115, in line with the results from previous years. However, when the measure was calculated this year less time was attributed to direct policy work, resulting in the maximum cost per hour being above our forecast. This measure is still relatively new, and further work is required on how to more accurately forecast the result.
2013–14 Actual
2014–15 Target $150
2015–16 Target
$112.62 $132.88 $115

ANNUAL REPORT 2015 65
07
Financial performance
OUTPUT STATEMENT FOR THE YEAR ENDED 30 JUNE 2015
2013–14 2014–15 2014–15 2014–15 2015–16Actual Unaudited Unaudited Actual Unaudited
budget revised forecastbudget
$000 $000 $000 $000 $000
Revenue
Crown 265,591 249,846 251,694 251,694 249,297
Other 1,245 1,461 1,461 1,151 1,461
Total revenue 266,836 251,307 253,155 252,845 250,758
Expenses
Annual appropriations 248,037 251,307 253,155 245,816 250,758
Total expenses 248,037 251,307 253,155 245,816 250,758
Net surplus/(deficit) 18,799 – – 7,029 –
Core service costs
Output 2.1 Information services
Description
This output involves responding to customer enquiries on tax and social support programmes (including child support and KiwiSaver) through electronic channels, correspondence, telephone, personal appointments, actively providing advice through a range of communication approaches delivered in the community and through our complaints management service.
* These figures are unaudited.
$31.10Target*: $40.00 2013–14 $33.00
Cost per contact 2013–14 Actual*
2014–15 Actual*
2014–15 Target*
Telephone $29.88 $30.41 $36.00
Counter $64.89 $22.65 $65.00
Correspondence $37.80 $35.81 $45.00
AVERAGE COST PER CUSTOMER-INITIATED CONTACT
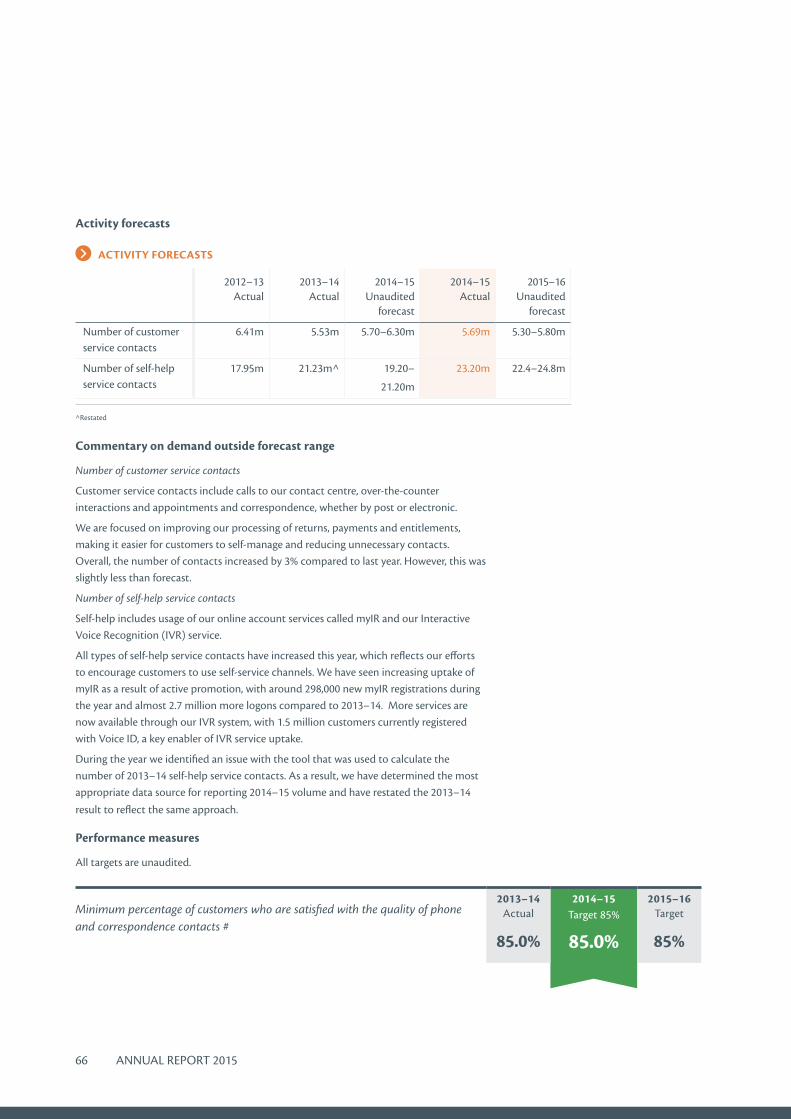
66 ANNUAL REPORT 2015
ACTIVITY FORECASTS
2012–13 Actual
2013–14 Actual
2014–15 Unaudited
forecast
2014–15 Actual
2015–16 Unaudited
forecast
Number of customer service contacts
6.41m 5.53m 5.70–6.30m 5.69m 5.30–5.80m
Number of self-help service contacts
17.95m 21.23m^ 19.20–
21.20m
23.20m 22.4–24.8m
Activity forecasts
^Restated
Commentary on demand outside forecast range
Number of customer service contacts
Customer service contacts include calls to our contact centre, over-the-counter interactions and appointments and correspondence, whether by post or electronic.
We are focused on improving our processing of returns, payments and entitlements, making it easier for customers to self-manage and reducing unnecessary contacts. Overall, the number of contacts increased by 3% compared to last year. However, this was slightly less than forecast.
Number of self-help service contacts
Self-help includes usage of our online account services called myIR and our Interactive Voice Recognition (IVR) service.
All types of self-help service contacts have increased this year, which reflects our efforts to encourage customers to use self-service channels. We have seen increasing uptake of myIR as a result of active promotion, with around 298,000 new myIR registrations during the year and almost 2.7 million more logons compared to 2013–14. More services are now available through our IVR system, with 1.5 million customers currently registered with Voice ID, a key enabler of IVR service uptake.
During the year we identified an issue with the tool that was used to calculate the number of 2013–14 self-help service contacts. As a result, we have determined the most appropriate data source for reporting 2014–15 volume and have restated the 2013–14 result to reflect the same approach.
Performance measures
All targets are unaudited.
Minimum percentage of customers who are satisfied with the quality of phone and correspondence contacts #
2013–14 Actual
2014–15 Target 85%
2015–16 Target
85.0% 85.0% 85%
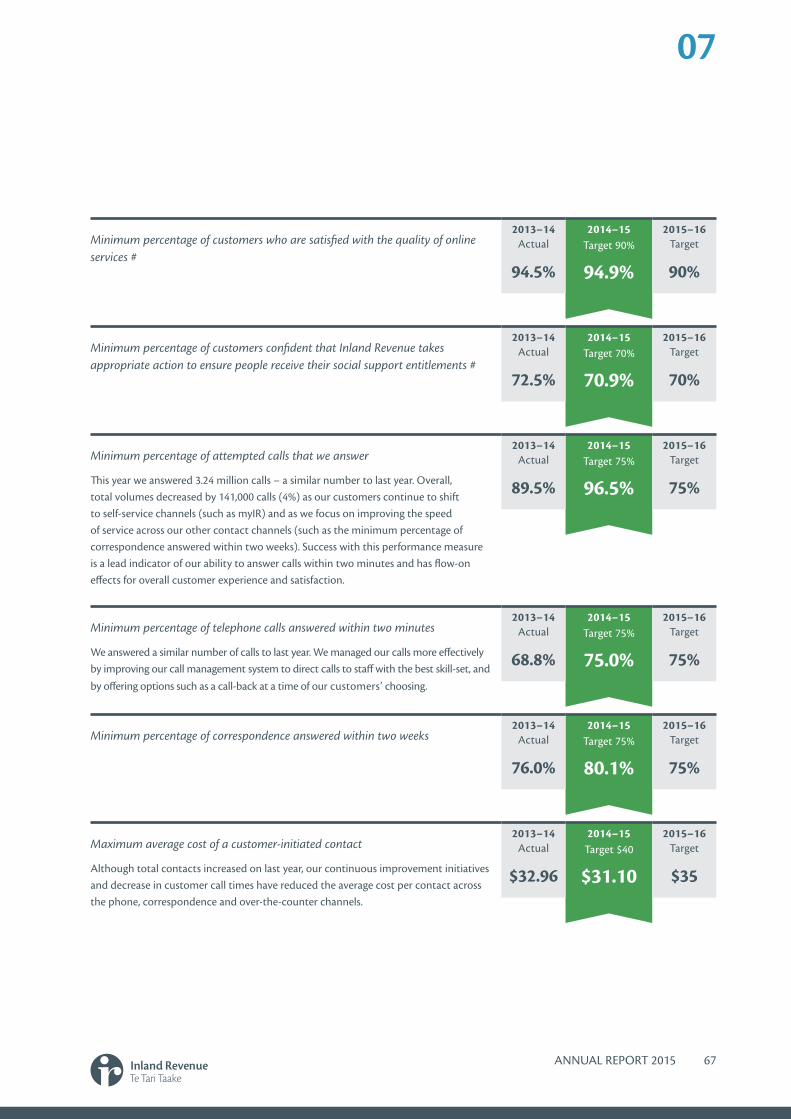
ANNUAL REPORT 2015 67
07
Minimum percentage of customers who are satisfied with the quality of online services #
2013–14 Actual
2014–15 Target 90%
2015–16 Target
94.5% 94.9% 90%
Minimum percentage of customers confident that Inland Revenue takes appropriate action to ensure people receive their social support entitlements #
2013–14 Actual
2014–15 Target 70%
2015–16 Target
72.5% 70.9% 70%
Minimum percentage of attempted calls that we answer
This year we answered 3.24 million calls – a similar number to last year. Overall, total volumes decreased by 141,000 calls (4%) as our customers continue to shift to self-service channels (such as myIR) and as we focus on improving the speed of service across our other contact channels (such as the minimum percentage of correspondence answered within two weeks). Success with this performance measure is a lead indicator of our ability to answer calls within two minutes and has flow-on effects for overall customer experience and satisfaction.
2013–14 Actual
2014–15 Target 75%
2015–16 Target
89.5% 96.5% 75%
Minimum percentage of telephone calls answered within two minutes
We answered a similar number of calls to last year. We managed our calls more effectively by improving our call management system to direct calls to staff with the best skill-set, and by offering options such as a call-back at a time of our customers’ choosing.
2013–14 Actual
2014–15 Target 75%
2015–16 Target
68.8% 75.0% 75%
Maximum average cost of a customer-initiated contact
Although total contacts increased on last year, our continuous improvement initiatives and decrease in customer call times have reduced the average cost per contact across the phone, correspondence and over-the-counter channels.
2013–14 Actual
2014–15 Target $40
2015–16 Target
$32.96 $31.10 $35
Minimum percentage of correspondence answered within two weeks 2013–14
Actual2014–15
Target 75%2015–16
Target
76.0% 80.1% 75%

68 ANNUAL REPORT 2015
Percentage of all rulings reports, adjudication reports, public items and technical correspondence or advice that meet the applicable purpose, logic, alternatives, consultation and practicality standards
2013–14 Actual
2014–15 Target 100%
2015–16 Target
100% 100% 100%
Output 2.2 Adjudication and rulings
Description
This output involves:
Adjudication
• providing a technical review of existing taxation disputes referred to the Adjudication Unit
• issuing an adjudication report (or other formal communication of conclusions) to the parties concerned
• directing the issuing, where required, of an assessment consistent with the conclusions of the technical review.
Taxpayer Rulings
• considering applications for and providing binding private and product rulings, and financial arrangement determinations.
Public Rulings
• preparing and issuing binding public rulings
• developing and publishing non-binding statements on the Commissioner’s view of the law administered by Inland Revenue eg, interpretation statements and interpretation guidelines
• considering applications for and providing taxpayer-specific depreciation determinations
• preparing and publishing depreciation and other determinations eg, livestock valuations
• considering and responding to technical correspondence.
Commentary on significant positive variances
This year we maintained a strong performance across all areas, reflecting our continuing focus on delivery and our ability to better forecast and meet customer demand resulting in more effective scheduling of our work programme. During the period we further developed the capability to balance work across business units, with a number of business areas contributing directly to the high quantity of public items finalised during the period. Our continuous improvement initiatives have contributed to this and the other positive variances achieved over 2014–15.
Performance measures
All targets are unaudited.

ANNUAL REPORT 2015 69
07
Minimum number of published or finalised public items that give the Commissioner’s interpretation of the law
2013–14 Actual
2014–15 Target 25
2015–16 Target
27 40 25
Minimum percentage of adjudication cases completed within three months of receipt 2013–14
Actual2014–15
Target 90%2015–16
Target
98.2% 97.2% 90%
Minimum percentage of taxpayer ruling applications that have a draft ruling completed within three months of receipt
2013–14 Actual
2014–15 Target 90%
2015–16 Target
100% 100% 90%
Minimum percentage of non-qualifying ruling applications that have a draft ruling completed within six months of receipt
2013–14 Actual
2014–15 Target 90%
2015–16 Target
100% 100% 90%
Minimum percentage of public items (including relevant public consultation), completed within 18 months of allocation
2013–14 Actual
2014–15 Target 90%
2015–16 Target
92.0% 94.3% 90%
Minimum percentage of submissions by the applicant on any draft ruling responded to within one month of receipt
2013–14 Actual
2014–15 Target 90%
2015–16 Target
97.9% 100% 90%
Output 2.3 Government and Executive Services
Description
This output involves all activities associated with ministerial services, including responding to ministerial correspondence and parliamentary questions. It includes all tax, child support, student loan, KiwiSaver and family assistance ministerial correspondence and supply of information.

70 ANNUAL REPORT 2015
Minimum percentage of ministerial correspondence responded to within 10 days
We received and dealt with more Official Information Act (OIA) requests and ministerial reports than expected. Although these OIAs and ministerial reports are not included in the measure, we gave these a higher priority than other ministerial correspondence in a number of cases.
2013–14 Actual
2014–15 Target 95%
2015–16 Target
92.7% 87.0% 95%
Percentage of parliamentary questions responded to within required timeframes2013–14
Actual2014–15
Target 100%2015–16
Target
100% 100% 100%
Performance measures
All targets are unaudited.
3 Departmental Output Expense 3: Services to Process Obligations and Entitlements
Description
The scope of this appropriation covers:
• registering taxpayers
• making tax assessments
• assessing child support liabilities including providing a readily accessible inexpensive process for reviewing assessments
• receiving and making payments to customers
• processing applications and payments for social support programmes
• collection of ACC Earners’ levies
• supplying information to other government agencies
• accounting and reporting the collection of Crown revenue.
Contributes to Impact Statements:
Accurate, timely, complete and efficient processing of notices, statements and social policy entitlements increases customers’ confidence in the tax system. When customers have confidence in the tax system they are more likely to self-manage their compliance obligations.

ANNUAL REPORT 2015 71
07
Financial performance
OUTPUT STATEMENT FOR THE YEAR ENDED 30 JUNE 2015
2013–14 2014–15 2014–15 2014–15 2015–16Actual Unaudited Unaudited Actual Unaudited
budget revised forecastbudget
$000 $000 $000 $000 $000
Revenue
Crown 137,696 119,575 112,510 112,510 104,737
Other 20,590 20,997 20,997 20,652 20,997
Total revenue 158,286 140,572 133,507 133,162 125,734
Expenses
Annual appropriations 144,965 140,572 133,507 127,612 125,734
Total expenses 144,965 140,572 133,507 127,612 125,734
Net surplus/(deficit) 13,321 – – 5,550 –
Core service costs
Output 3.1 Registrations, applications and processing
Description
This output involves processing all registrations, applications and assessments for the tax and social policy programmes we administer.
$3.48Target*: $5.00 2013–14 $3.95
Cost per return processed 2013–14 Actual*
2014–15 Actual*
2014–15 Target*
Income tax $4.92 $4.32 $6.50
GST $1.34 $1.03 $2.00
Employer monthly schedules
$5.14 $4.56 $7.75
AVERAGE COST PER RETURN PROCESSED
* These figures are unaudited.
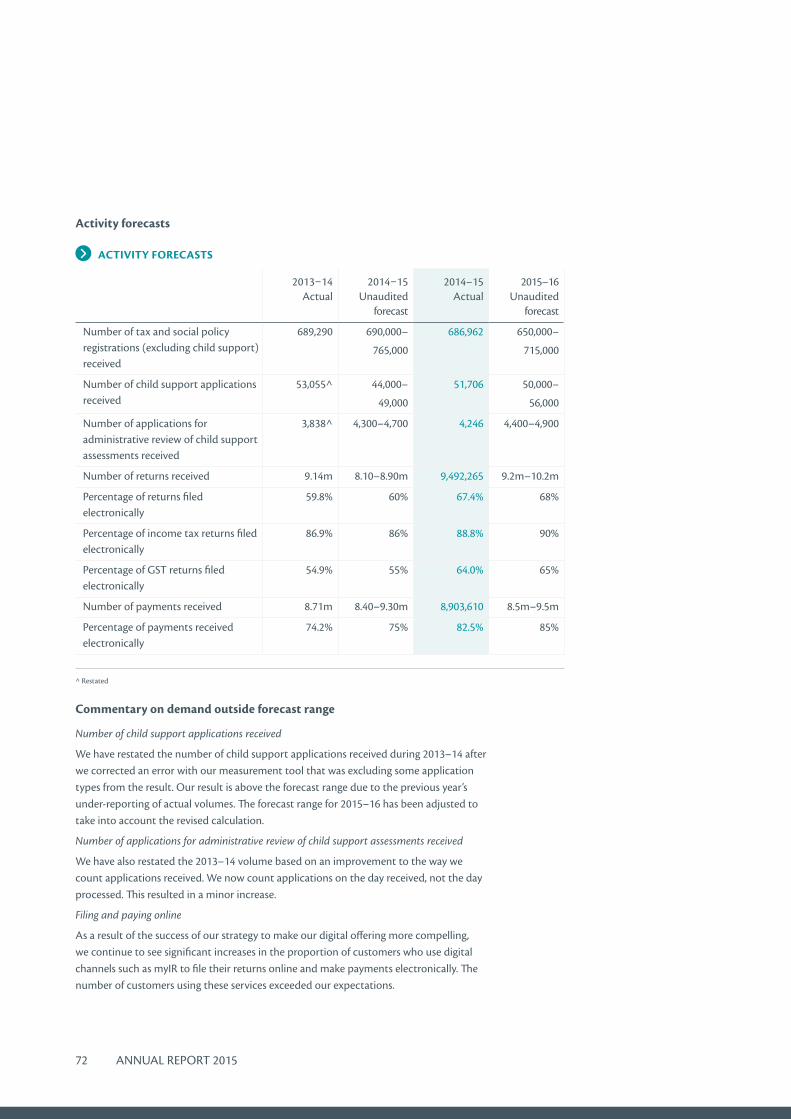
72 ANNUAL REPORT 2015
Activity forecasts
ACTIVITY FORECASTS
2013–14 Actual
2014–15 Unaudited
forecast
2014–15 Actual
2015–16 Unaudited
forecast
Number of tax and social policy registrations (excluding child support) received
689,290 690,000–
765,000
686,962 650,000–
715,000
Number of child support applications received
53,055^ 44,000–
49,000
51,706 50,000–
56,000
Number of applications for administrative review of child support assessments received
3,838^ 4,300–4,700 4,246 4,400–4,900
Number of returns received 9.14m 8.10–8.90m 9,492,265 9.2m–10.2m
Percentage of returns filed electronically
59.8% 60% 67.4% 68%
Percentage of income tax returns filed electronically
86.9% 86% 88.8% 90%
Percentage of GST returns filed electronically
54.9% 55% 64.0% 65%
Number of payments received 8.71m 8.40–9.30m 8,903,610 8.5m–9.5m
Percentage of payments received electronically
74.2% 75% 82.5% 85%
^ Restated
Commentary on demand outside forecast range
Number of child support applications received
We have restated the number of child support applications received during 2013–14 after we corrected an error with our measurement tool that was excluding some application types from the result. Our result is above the forecast range due to the previous year’s under-reporting of actual volumes. The forecast range for 2015–16 has been adjusted to take into account the revised calculation.
Number of applications for administrative review of child support assessments received
We have also restated the 2013–14 volume based on an improvement to the way we count applications received. We now count applications on the day received, not the day processed. This resulted in a minor increase.
Filing and paying online
As a result of the success of our strategy to make our digital offering more compelling, we continue to see significant increases in the proportion of customers who use digital channels such as myIR to file their returns online and make payments electronically. The number of customers using these services exceeded our expectations.

ANNUAL REPORT 2015 73
07
Performance measures
All targets are unaudited.
Minimum percentage of income tax returns finalised within four weeks 2013–14
Actual2014–15
Target 90%2015–16
Target
94.6% 95.5% 90%
Minimum percentage of GST returns finalised within three weeks2013–14
Actual2014–15
Target 95%2015–16
Target
99.6% 99.2% 95%
Minimum percentage of employer monthly schedule employee deductions finalised within four weeks
2013–14 Actual
2014–15 Target 95%
2015–16 Target
99.7% 99.8% 95%
Minimum percentage of social policy and tax registrations processed within five working days
During the year, an IT issue led to approximately 77,500 KiwiSaver registrations being held and not released for processing. This issue has been investigated and resolved primarily through ensuring issues are escalated appropriately. Excluding this one-off issue, we achieved a processing result of 88.3% for the year.
2013–14 Actual
2014–15 Target 85%
2015–16 Target
89.6% 80.5% 85%
Minimum percentage of payments banked on the day of receipt2013–14
Actual2014–15
Target 99%2015–16
Target
99.3% 99.4% 99%
Minimum percentage of payments correctly processed to customers’ accounts2013–14
Actual2014–15
Target 99.5%2015–16
Target
99.8% 100% 99.5%

74 ANNUAL REPORT 2015
Maximum average cost of processing income tax returns, GST returns and employer monthly schedules
Although the total number of returns has increased this year, the cost of processing each return continues to decline as more of our customers file their returns online. In 2014–15, 67.4% of all returns were filed electronically, compared to 59.8% last year.
2013–14 Actual
2014–15 Target $5
2015–16 Target
$3.95 $3.48 $5
Minimum percentage of notices and statements produced without error #2013–14
Actual2014–15
Target 98.5%2015–16
Target
99.4% 99.4% 98.5%
Minimum percentage of Income Tax refunds issued within six weeks2013–14
Actual2014–15
Target 85%2015–16
Target
90.2% 91.5% 85%
Minimum percentage of GST refunds issued within four weeks2013–14
Actual2014–15
Target 95%2015–16
Target
97.8% 97.2% 95%
Minimum percentage of tax credit claim payments made within three weeks2013–14
Actual2014–15
Target 90%2015–16
Target
96.1% 96.9% 90%
Output 3.2 Statements, notices, refunds and payments
Description
This output involves:
• issuing statements, notices, rebates and refunds
• receiving and banking payments.
It covers all the tax and social policy programmes that we administer.
Performance measures
All targets are unaudited.
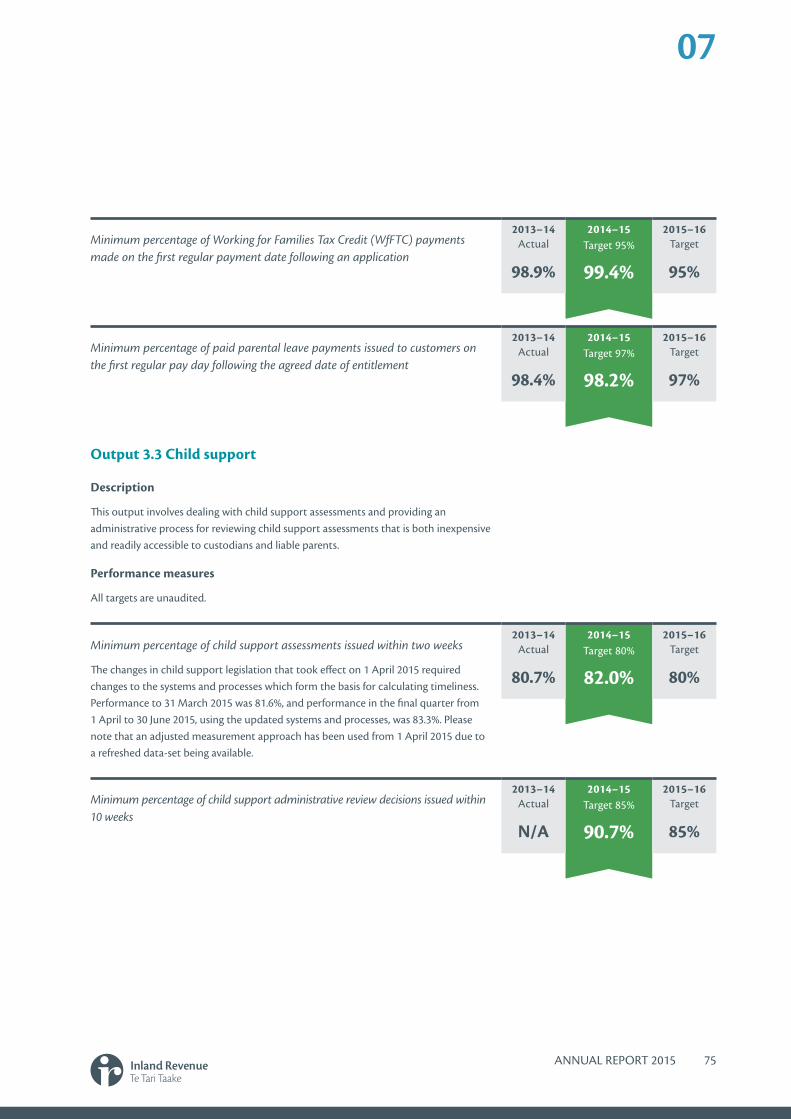
ANNUAL REPORT 2015 75
07
Minimum percentage of Working for Families Tax Credit (WfFTC) payments made on the first regular payment date following an application
2013–14 Actual
2014–15 Target 95%
2015–16 Target
98.9% 99.4% 95%
Minimum percentage of child support administrative review decisions issued within 10 weeks
2013–14 Actual
2014–15 Target 85%
2015–16 Target
N/A 90.7% 85%
Minimum percentage of child support assessments issued within two weeks
The changes in child support legislation that took effect on 1 April 2015 required changes to the systems and processes which form the basis for calculating timeliness. Performance to 31 March 2015 was 81.6%, and performance in the final quarter from 1 April to 30 June 2015, using the updated systems and processes, was 83.3%. Please note that an adjusted measurement approach has been used from 1 April 2015 due to a refreshed data-set being available.
2013–14 Actual
2014–15 Target 80%
2015–16 Target
80.7% 82.0% 80%
Minimum percentage of paid parental leave payments issued to customers on the first regular pay day following the agreed date of entitlement
2013–14 Actual
2014–15 Target 97%
2015–16 Target
98.4% 98.2% 97%
Output 3.3 Child support
Description
This output involves dealing with child support assessments and providing an administrative process for reviewing child support assessments that is both inexpensive and readily accessible to custodians and liable parents.
Performance measures
All targets are unaudited.

76 ANNUAL REPORT 2015
4 Departmental Output Expense 4: Management of Debt and Outstanding Returns
Description
The scope of this appropriation covers taking action where returns are outstanding and where payments are overdue, including providing people with assistance on the actions they need to take to meet their obligations. This includes collection on behalf of other agencies and external parties.
Contributes to Impact Statements:
We apply a tailored approach to our interventions based on our Prevent, Assist, Recover and Enforce model (PARE). This model is designed to take into account past compliance behaviour together with current circumstances. By attempting to prevent people and businesses from missing filing and payment dates in the first instance, we are able to be more effective at following up quickly on those who do not file and pay on time.
Financial performance
OUTPUT STATEMENT FOR THE YEAR ENDED 30 JUNE 2015
2013–14 2014–15 2014–15 2014–15 2015–16Actual Unaudited Unaudited Actual Unaudited
budget revised forecastbudget
$000 $000 $000 $000 $000
Revenue
Crown 134,788 140,297 148,501 148,501 143,207
Other 1,859 2,962 2,962 2,171 2,962
Total revenue 136,647 143,259 151,463 150,672 146,169
Expenses
Annual appropriations 132,610 143,259 151,463 148,033 146,169
Total expenses 132,610 143,259 151,463 148,033 146,169
Net surplus/(deficit) 4,037 – – 2,639 –
Budget-funded Initiative
2013–14 Unaudited ROI actual
2014–15 Unaudited ROI actual
2014–15 Unaudited ROI target
Early debt $13.79 $18.91 $8.20
Ageing debt $11.45 $11.19 $5.50
Unfiled returns $19.64 $16.40 $4.00
Additional funding received from Government for initiatives
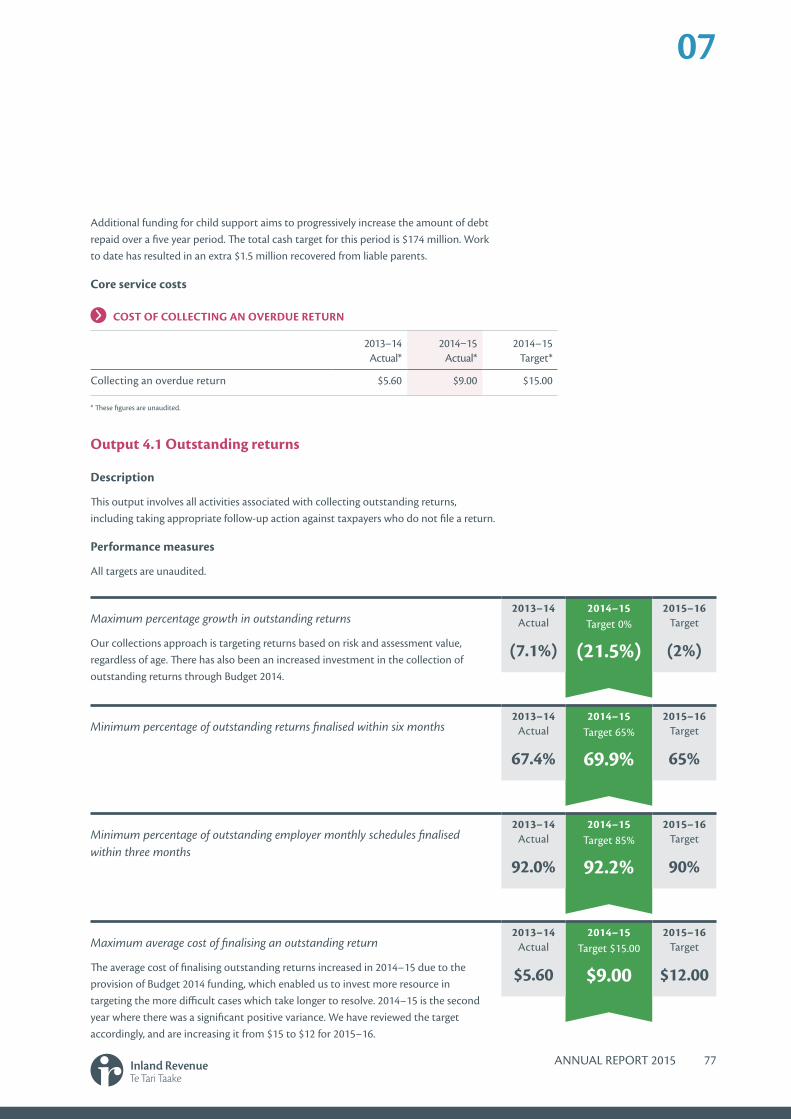
ANNUAL REPORT 2015 77
07
Additional funding for child support aims to progressively increase the amount of debt repaid over a five year period. The total cash target for this period is $174 million. Work to date has resulted in an extra $1.5 million recovered from liable parents.
Core service costs
Output 4.1 Outstanding returns
Description
This output involves all activities associated with collecting outstanding returns, including taking appropriate follow-up action against taxpayers who do not file a return.
Performance measures
All targets are unaudited.
Maximum percentage growth in outstanding returns
Our collections approach is targeting returns based on risk and assessment value, regardless of age. There has also been an increased investment in the collection of outstanding returns through Budget 2014.
2013–14 Actual
2014–15 Target 0%
2015–16 Target
(7.1%) (21.5%) (2%)
Minimum percentage of outstanding returns finalised within six months2013–14
Actual2014–15
Target 65%2015–16
Target
67.4% 69.9% 65%
Minimum percentage of outstanding employer monthly schedules finalised within three months
2013–14 Actual
2014–15 Target 85%
2015–16 Target
92.0% 92.2% 90%
Maximum average cost of finalising an outstanding return
The average cost of finalising outstanding returns increased in 2014–15 due to the provision of Budget 2014 funding, which enabled us to invest more resource in targeting the more difficult cases which take longer to resolve. 2014–15 is the second year where there was a significant positive variance. We have reviewed the target accordingly, and are increasing it from $15 to $12 for 2015–16.
2013–14 Actual
2014–15 Target $15.00
2015–16 Target
$5.60 $9.00 $12.00
COST OF COLLECTING AN OVERDUE RETURN
2013–14 Actual*
2014–15 Actual*
2014–15 Target*
Collecting an overdue return $5.60 $9.00 $15.00
* These figures are unaudited.
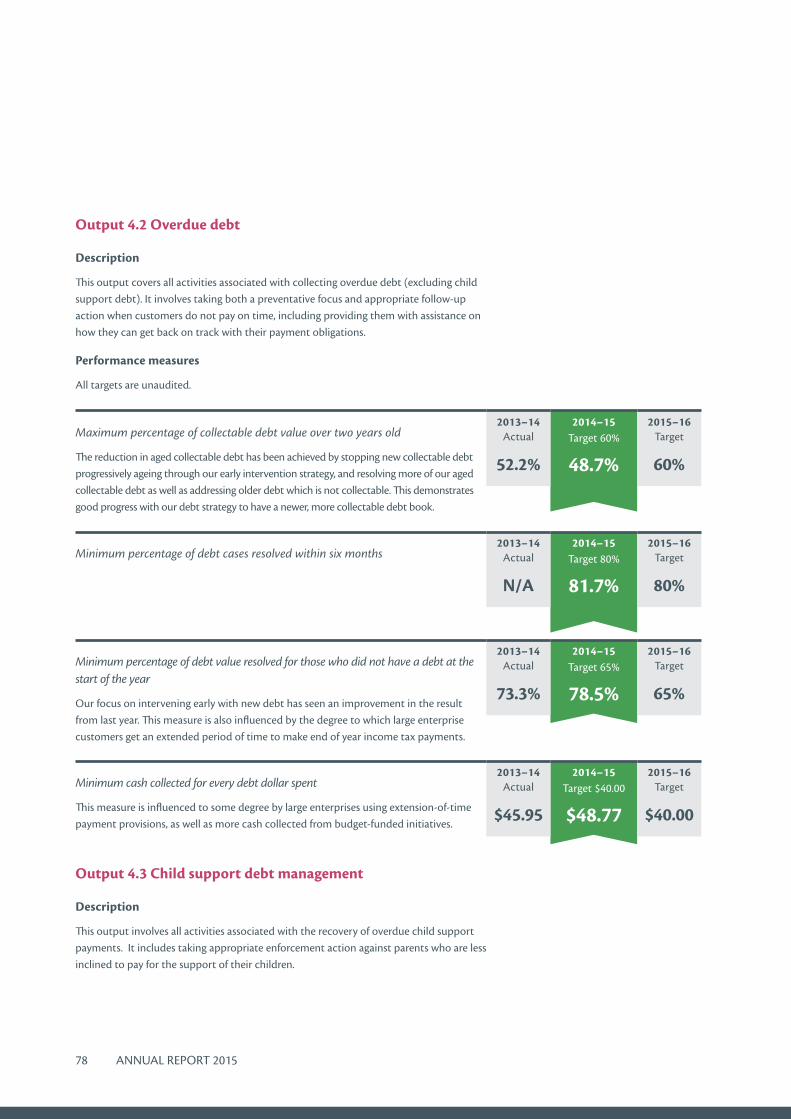
78 ANNUAL REPORT 2015
Maximum percentage of collectable debt value over two years old
The reduction in aged collectable debt has been achieved by stopping new collectable debt progressively ageing through our early intervention strategy, and resolving more of our aged collectable debt as well as addressing older debt which is not collectable. This demonstrates good progress with our debt strategy to have a newer, more collectable debt book.
2013–14 Actual
2014–15 Target 60%
2015–16 Target
52.2% 48.7% 60%
Minimum percentage of debt cases resolved within six months2013–14
Actual2014–15
Target 80%2015–16
Target
N/A 81.7% 80%
Minimum percentage of debt value resolved for those who did not have a debt at the start of the year
Our focus on intervening early with new debt has seen an improvement in the result from last year. This measure is also influenced by the degree to which large enterprise customers get an extended period of time to make end of year income tax payments.
2013–14 Actual
2014–15 Target 65%
2015–16 Target
73.3% 78.5% 65%
Minimum cash collected for every debt dollar spent
This measure is influenced to some degree by large enterprises using extension-of-time payment provisions, as well as more cash collected from budget-funded initiatives.
2013–14 Actual
2014–15 Target $40.00
2015–16 Target
$45.95 $48.77 $40.00
Output 4.2 Overdue debt
Description
This output covers all activities associated with collecting overdue debt (excluding child support debt). It involves taking both a preventative focus and appropriate follow-up action when customers do not pay on time, including providing them with assistance on how they can get back on track with their payment obligations.
Performance measures
All targets are unaudited.
Output 4.3 Child support debt management
Description
This output involves all activities associated with the recovery of overdue child support payments. It includes taking appropriate enforcement action against parents who are less inclined to pay for the support of their children.

ANNUAL REPORT 2015 79
07
Performance measures
All targets are unaudited.
Minimum percentage of NZ paying parent child support debt cases resolved within 12 months
2013–14 Actual
2014–15 Target 75%
2015–16 Target
75.5% 79.5% 75%
5 Departmental Output Expense 5: Taxpayer Audit
Description
This output is limited to:
• identifying risks to revenue and designing and undertaking audit activities accordingly
• managing litigation of disputed tax cases.
Contributes to Impact Statements:
We use intelligence analysis to target our compliance activities to customers who are non-compliant or at risk of non-compliance. This creates an environment where customers expect us to detect non-compliance and are deterred from providing inaccurate information. It also protects the revenue base and provides certainty to customers in relation to the application of the law.
We also use our compliance activities to educate customers who are unaware of their obligations and help them get it right. We only use enforcement action where necessary. This ensures that the behaviour of non-compliant customers improves. Consequently, more customers pay and file information on time in the future.
Financial performance
OUTPUT STATEMENT FOR THE YEAR ENDED 30 JUNE 2015
2013–14 2014–15 2014–15 2014–15 2015–16Actual Unaudited Unaudited Actual Unaudited
budget revised forecastbudget
$000 $000 $000 $000 $000
Revenue
Crown 171,597 165,866 176,794 176,794 175,903
Other 434 265 265 326 265
Total revenue 172,031 166,131 177,059 177,120 176,168
Expenses
Annual appropriations 165,269 166,131 177,059 172,017 176,168
Total expenses 165,269 166,131 177,059 172,017 176,168
Net surplus/(deficit) 6,762 – – 5,103 –

80 ANNUAL REPORT 2015
Minimum percentage of cases completed that are correct, complete, clear and appropriately referenced #
2013–14 Actual
2014–15 Target 90%
2015–16 Target
95.1% 96.6% 90%
Minimum percentage of audited customers who are satisfied with their experience #
This year, we surveyed audited customers once per quarter rather than in previous years when we have measured customer satisfaction by annual survey. Overall, the level of customer satisfaction has improved from last year and remains at a high level. We have increased the target for 2015–16.
2013–14 Actual
2014–15 Target 65%
2015–16 Target
74.4% 76.2% 70%
Minimum percentage of customers confident that Inland Revenue takes appropriate action against those who do not comply #
2013–14 Actual
2014–15 Target 75%
2015–16 Target
77.1% 75.0% 75%
Minimum percentage of audits that result in a material discrepancy 2013–14
Actual2014–15
Target 75%2015–16
Target
79.2% 80.3% 75%
Budget-funded initiative 2013–14 Unaudited ROI actual
2014–15 Unaudited ROI actual
2014–15 Unaudited ROI target
Hidden Economy $5.51 $5.21 $5.00
Aggressive Tax Planning $62.43 $34.10 $11.60
Fraud $3.74 $3.09 $3.10
Additional funding received from Government for initiatives
Output 5.1 Taxpayer audit
Description
This output involves the auditing of taxpayers including individuals, small to medium businesses and larger businesses. It includes audits of duties and non-residents.
Performance measures
All targets are unaudited.
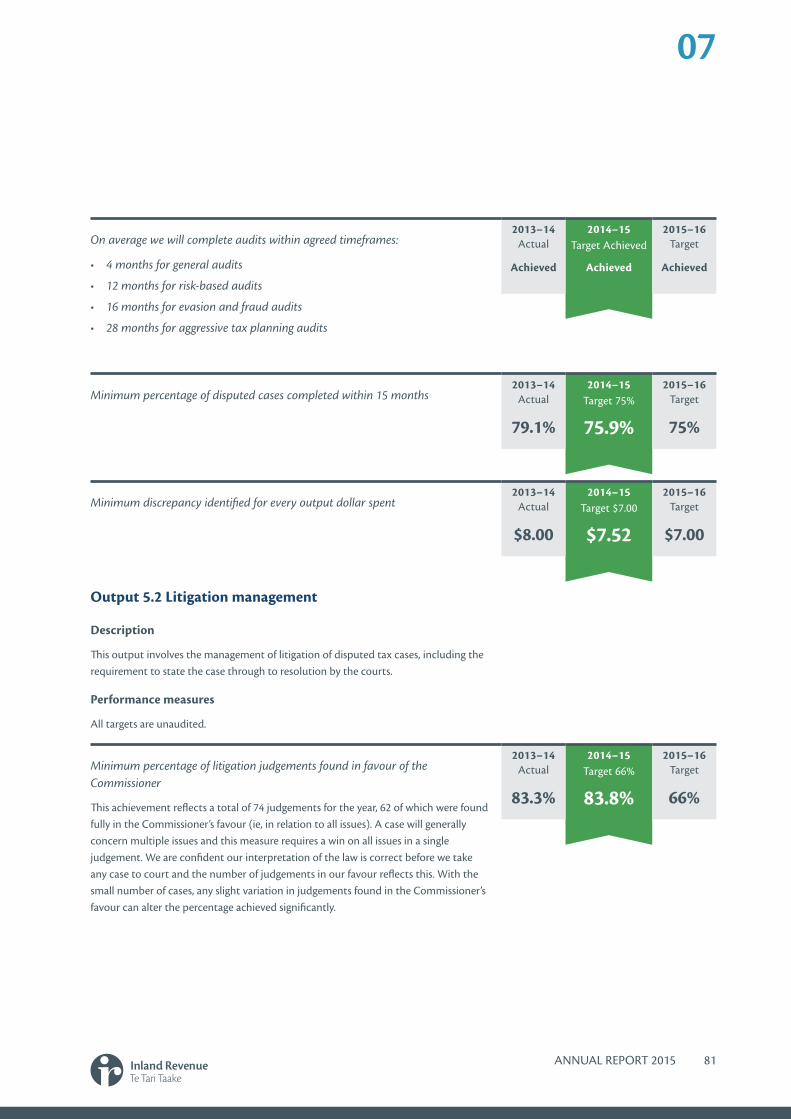
ANNUAL REPORT 2015 81
07
On average we will complete audits within agreed timeframes:
• 4 months for general audits
• 12 months for risk-based audits
• 16 months for evasion and fraud audits
• 28 months for aggressive tax planning audits
2013–14 Actual
2014–15 Target Achieved
2015–16 Target
Achieved Achieved Achieved
Minimum percentage of disputed cases completed within 15 months 2013–14
Actual2014–15
Target 75%2015–16
Target
79.1% 75.9% 75%
Minimum discrepancy identified for every output dollar spent2013–14
Actual2014–15
Target $7.002015–16
Target
$8.00 $7.52 $7.00
Minimum percentage of litigation judgements found in favour of the Commissioner
This achievement reflects a total of 74 judgements for the year, 62 of which were found fully in the Commissioner’s favour (ie, in relation to all issues). A case will generally concern multiple issues and this measure requires a win on all issues in a single judgement. We are confident our interpretation of the law is correct before we take any case to court and the number of judgements in our favour reflects this. With the small number of cases, any slight variation in judgements found in the Commissioner’s favour can alter the percentage achieved significantly.
2013–14 Actual
2014–15 Target 66%
2015–16 Target
83.3% 83.8% 66%
Output 5.2 Litigation management
Description
This output involves the management of litigation of disputed tax cases, including the requirement to state the case through to resolution by the courts.
Performance measures
All targets are unaudited.

82 ANNUAL REPORT 2015
Minimum percentage of satisfaction of the New Zealand Productivity Commission for services provided
2013–14 Actual
2014–15 Target 95%
2015–16 Target
N/A 98.0% 70%
Minimum percentage of satisfaction of the Department of Internal Affairs for services provided
This was the first year a measure and target has been set for this appropriation. The target of 95% was set prior to the completion of a measurement methodology. The result of 80% satisfaction from the Department of Internal Affairs reflects a high level of satisfaction with the services provided based on the measurement methodology. The target for the 2015–16 financial year has been set at 70%.
2013–14 Actual
2014–15 Target 95%
2015–16 Target
N/A 80.0% 70%
6 Departmental Output Expense 6: Services to Other Agencies
Description
This output is limited to the provision of services by Inland Revenue to other agencies, where those services are not within the scope of another departmental output expense appropriation in Vote Revenue.
Contributes to Impact Statements: N/A
Financial performance
OUTPUT STATEMENT FOR THE YEAR ENDED 30 JUNE 2015
2013–14 2014–15 2014–15 2014–15 2015–16Actual Unaudited Unaudited Actual Unaudited
budget revised forecastbudget
$000 $000 $000 $000 $000
Revenue
Crown – – – – –
Other 555 3,060 3,060 2,396 3,060
Total revenue 555 3,060 3,060 2,396 3,060
Expenses
Annual appropriations 555 3,060 3,060 2,394 3,060
Total expenses 555 3,060 3,060 2,394 3,060
Net surplus/(deficit) – – – 2 –
Performance measures
All targets are unaudited.

ANNUAL REPORT 2015 83
07
Departmental Capital Expenditure and Capital Injections
Description
The scope of this appropriation is limited to the purchase or development of assets by and for the use of the Inland Revenue Department, as authorised by section 24(1) of the Public Finance Act 1989.
Contributes to Impact Statements:
This appropriation is intended to invest in the renewal, upgrade and redesign of assets that support the delivery of the Department’s services. This includes enhancements to support child support scheme reform and the commencement of the transformation programme including detailed design of strategic initiatives and progressing core foundational and tactical requirements.
Financial performance
For details of departmental capital expenditure incurred against appropriations please refer to the ‘Statement of Budgeted and Actual Expenses and Capital Expenditure Incurred Against Appropriations’, in the ‘Departmental capital expenditure’ lines ‘Property, plant and equipment’, ‘Intangible assets’ and ‘Total departmental capital expenditure’ on page 89.
For details of departmental capital injections please refer to page 90.
Commentary on performance information
Expenditure supports the delivery of our output performance measures in accordance with our capital asset management priorities.
Deliver infrastructure that will support transformation
Our investment profile changed due to the timing of our investment in business transformation foundational technology.
Maintain and improve business infrastructure
The assumptions we made around the investment required to maintain and improve our business infrastructure and the technology needed for us to transform changed during the year. Our investment profile changed due to the timing of our investment in business transformation foundational technology.
Performance measures
All targets are unaudited.
2014–15 Target 40% 20% 40%
2014–15 Actual 41% 1% 58%
2015–16 Target 10% 60% 30%
Implement government policy initiatives
Deliver infrastructure that will support transformation
Maintain and improve business infrastructure

84 ANNUAL REPORT 2015
Our impact indicators Full details of our impact indicators are listed below.
More customers are able to self-manage
Factors that influenced target setting: this impact is key to enabling improved customer compliance and cost-effectiveness in a fiscally constrained environment. We only include results for the contextual indicator under this impact ‘customer compliance costs are minimised’ when the data is less than two years old. The survey that this indicator uses was last undertaken in 2009 and results were included in the 2011 Annual Report.
% of customers who are aware of their obligations and entitlements increases 83%
YE June 201583% YE June 2014
By June 2018Increase to
85%
or more
% of customers who find it easy to comply increases 82%
YE June 201580% YE June 2014
By June 2018Increase to
80%
or more
More customers register and report accurate information when required
Factors that influenced target setting: this impact is key to improving customer self-management, reducing unneccessary contacts and improving end-to-end planning.
% of returns filed without errors increases 88%
July 2014 – March 201587% July 2013 – March 2014
By June 2018Increase to
88%
or more

07
ANNUAL REPORT 2015 85
% of applications submitted without errors increases 89%
YE June 201590% YE June 2014
By June 2018Increase to
90%
or more
% of correct student loan deductions for New Zealand-based borrowers is maintained
99%
July 2014 – March 201599% July 2013 –
March 2014
By June 2018Maintain at
98%
or more
Employer registrations follow an appropriate trend We report on this indicator to provide additional contextual information. Employers’ correlation is between the number of employers who register for PAYE and the percentage of the labour force that is employed (from the Statistics New Zealand Household Labour Force Survey).
Correlation
95.6%
YE June 2015Correlation 98%
YE June 2014
N/A (contextual)
GST assessed to consumer spending follows an appropriate trend We report on this indicator to provide additional contextual information. This measure highlights a link between consumers’ spending and the amount of GST assessed, showing the completeness of information provided by GST customers. No target has been set because this is an indicator that is beyond our influence.
Correlation
98%
YE March 2015Correlation 98% YE March 2014
N/A (contextual)
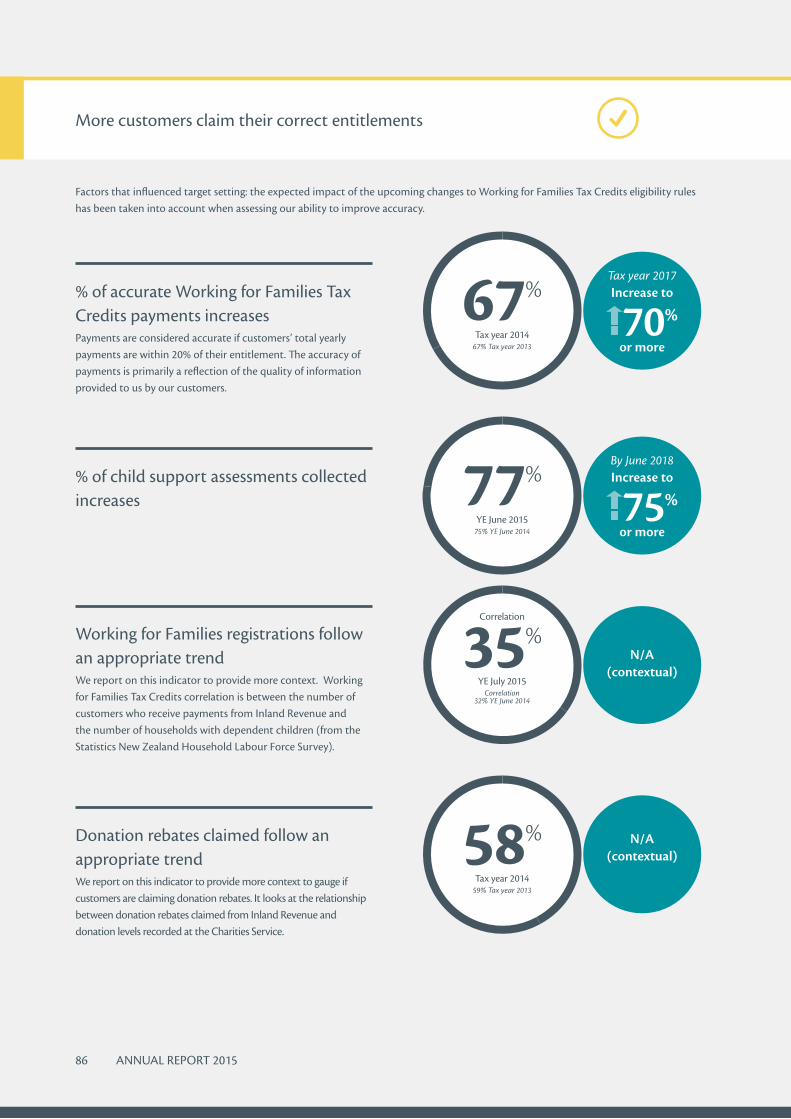
86 ANNUAL REPORT 2015
More customers claim their correct entitlements
Factors that influenced target setting: the expected impact of the upcoming changes to Working for Families Tax Credits eligibility rules has been taken into account when assessing our ability to improve accuracy.
% of accurate Working for Families Tax Credits payments increases Payments are considered accurate if customers’ total yearly payments are within 20% of their entitlement. The accuracy of payments is primarily a reflection of the quality of information provided to us by our customers.
67%
Tax year 201467% Tax year 2013
Tax year 2017Increase to
70%
or more
% of child support assessments collected increases 77%
YE June 201575% YE June 2014
By June 2018Increase to
75%
or more
Working for Families registrations follow an appropriate trendWe report on this indicator to provide more context. Working for Families Tax Credits correlation is between the number of customers who receive payments from Inland Revenue and the number of households with dependent children (from the Statistics New Zealand Household Labour Force Survey).
Correlation
35%
YE July 2015Correlation
32% YE June 2014
N/A (contextual)
Donation rebates claimed follow an appropriate trendWe report on this indicator to provide more context to gauge if customers are claiming donation rebates. It looks at the relationship between donation rebates claimed from Inland Revenue and donation levels recorded at the Charities Service.
58%
Tax year 201459% Tax year 2013
N/A (contextual)

07
ANNUAL REPORT 2015 87
More customers pay and file information on time
Factors that influenced target setting: this impact is a key compliance driver and consequently stretch targets are appropriate.
% of returns filed on time is maintained 83%
Tax year 201483% Tax year 2013
Tax year 2017 Maintain at
83%
or more
% of payments made by customers on time is maintained 86%
Tax year 201486% Tax year 2013
Tax year 2017 Maintain at
86%
or more
% of child support assessments paid on time increases 67%
YE June 201565% YE June 2014
By June 2018Increase to
68%
or more
The behaviour of non-compliant customers improves
Factors that influenced target setting: the economic environment is a significant factor in debt performance. Maintaining or making small improvements will be challenging.
The compliance behaviour of customers who received an audit intervention improves
77%
YE June 201586% YE June 2014
By June 2018Increase to
85%
or more

88 ANNUAL REPORT 2015
% of collectable debt to total debt increases 57%
YE June 201562% YE June 2014
By June 2018Increase to
65%
or more
% of collectable debt recovered increases 15%
YE June 201513% YE June 2014
By June 2018Increase to
13%
or more
% of collectable debt to revenue assessed decreases
5.8%
YE June 20156.8% YE June 2014
By June 2018Decrease to
6.0%
or less

ANNUAL REPORT 2015 89
07
Appropriation Statements
The following statements report information about the expenses and capital expenditure incurred against each appropriation administered by Inland Revenue for the year ended 30 June 2015.
STATEMENT OF BUDGETED AND ACTUAL EXPENSES AND CAPITAL EXPENDITURE INCURRED AGAINST APPROPRIATIONS FOR THE YEAR ENDED 30 JUNE 2015
2013–14 2014–15 2014–15 2014–15 2015–16Expenditure1 Unaudited Unaudited Expenditure1 Unaudited
budget revised forecastbudget2
$000 $000 $000 $000 $000
Vote: Revenue
Output expenses
Policy advice 8,118 8,053 9,153 8,128 8,002
Services to inform the public about entitlements and meeting obligations
248,037 251,307 253,155 245,816 250,758
Services to process obligations and entitlements 144,965 140,572 133,507 127,612 125,734
Management of debt and outstanding returns 132,610 143,259 151,463 148,033 146,169
Taxpayer audit 165,269 166,131 177,059 172,017 176,168
Total departmental output expenses1 698,999 709,322 724,337 701,606 706,831
Services to other agencies RDA3 555 3,060 3,060 2,394 3,060
Total output expenses 699,554 712,382 727,397 704,000 709,891
Other expenses
Transformation – – – – 55,000
Administration and use of another departments appropriations
973 – 244 244 –
Total other expenses 973 – 244 244 55,000
Total expenditure 700,527 712,382 727,641 704,244 764,891
Departmental capital expenditure
Property, plant and equipment 15,564 20,000 4,000 3,678 10,000
Intangible assets 29,127 42,336 29,000 28,710 95,000
Total departmental capital expenditure 44,691 62,336 33,000 32,388 105,000
1 Excludes remeasurement of ($1,999,000), (2013–14: $641,000).2 The Revised Budget figures for 2014–15 are those included in The Supplementary Estimates of Appropriations and Supporting Information for the year ending 30 June 2015.
3 Revenue-dependent appropriation (RDA). The amount of a RDA is limited to the amount of revenue earned.
The budget, revised budget and forecast figures have been prepared in accordance with NZ GAAP, using accounting policies that are consistent with those adopted in preparing the departmental financial statements in part eight.

90 ANNUAL REPORT 2015
Explanations of significant variances against budget are detailed in Note 25 of the departmental financial statements in part eight.
All of the 2014–15 performance information for each appropriation administered by Inland Revenue has been reported within part seven, Measuring our performance.
STATEMENT OF EXPENSES AND CAPITAL EXPENDITURE INCURRED WITHOUT, OR IN EXCESS OF, APPROPRIATION OR OTHER AUTHORITY FOR THE YEAR ENDED 30 JUNE 2015
In the 2014–15 financial year there were no instances of:
• expenses and capital expenditure incurred in excess of appropriation (2013–14: $nil)
• expenses and capital expenditure incurred without appropriation or other authority, or outside the scope or period of appropriation (2013–14: $nil).
STATEMENT OF DEPARTMENTAL CAPITAL INJECTIONS FOR THE YEAR ENDED 30 JUNE 2015
2013–14 2014–15 2014–15Actual capital Actual capital Unaudited
injections injections revisedbudget
$000 $000 $000
Vote: Revenue
Capital injections 5,329 3,572 3,572
Inland Revenue has not received any capital injections during the year without, or in excess of, authority (2013–14: $nil).

ANNUAL REPORT 2015 91
07
STATEMENT OF NON-DEPARTMENTAL APPROPRIATIONS FOR THE YEAR ENDED 30 JUNE 2015
2013–14 2014–15 2014–15 2014–15 2015–16Actual Unaudited Unaudited Actual Unaudited
budget revised forecastbudget7
$000 $000 $000 $000 $000
Vote: Revenue1
Benefits and other unrequited expenses
Child support payments PLA 241,595 267,000 263,000 265,078 276,000
Child tax credit PLA 1,835 1,300 1,300 1,298 1,100
Family tax credit PLA 1,965,263 1,934,000 1,857,000 1,854,048 1,837,000
In-work tax credit PLA 533,266 494,000 512,000 511,186 529,000
KiwiSaver: Fee subsidy (11) – – (8) –
KiwiSaver: Interest 7,294 13,000 13,000 8,413 15,000
KiwiSaver: Kick-start payment 227,772 171,000 231,000 218,364 –
KiwiSaver: Tax credit 569,163 643,000 643,000 629,297 705,000
Minimum family tax credit PLA 14,275 13,000 16,000 15,975 16,000
Paid parental leave payments 164,5042 176,000 189,000 180,286 233,000
Parental tax credit PLA 17,640 19,000 21,000 20,967 31,000
Payroll subsidy PLA 3,129 4,000 4,100 3,945 5,100
Research and development tax credit (3,952) – – – –
Total benefits and other unrequited expenses 3,741,773 3,735,300 3,750,400 3,708,849 3,648,200
Borrowing expenses
Adverse event interest PLA 12 10 20 (1) 10
Environmental restoration account interest PLA 1,636 2,000 2,000 1,634 2,000
Income equalisation interest PLA 7,260 7,000 15,000 3,543 15,000
Total borrowing expenses 8,908 9,010 17,020 5,176 17,010
Other expenses
Bad debt write-offs 930,158 – – – –
Impairment of debt3 94,9026 – – – –
Impairment of debt and debt write-offs4 – 1,162,098 1,180,356 860,829 1,179,224
Impairment of debt relating to child support –6 – – – –
Impairment of debt relating to student loans5 41,000 100,000 282,000 152,000 100,000
Initial fair value write-down relating to student loans 629,539 668,000 622,844 601,665 646,000
Total other expenses 1,695,599 1,930,098 2,085,200 1,614,494 1,925,224
Total appropriations 5,446,280 5,674,408 5,852,620 5,328,519 5,590,434
1 PLA refers to appropriations established under a permanent legislative authority.2 Historically Inland Revenue had made paid parental leave payments on the basis they had PLA. During 2013–14 it was identified they
did not have PLA. Refer to the Statement of Unappropriated Expenditure for details.3 Impairment of debt relates to general tax, Working for Families Tax Credits and KiwiSaver debt.
92 ANNUAL REPORT 2015
4 Impairment of debt and debt write-offs is a new appropriation combining both bad debt write-offs and impairment of debt, effective from 1 July 2014.
5 Excludes remeasurement of $117 million (2013–14 ($29) million). Macroeconomic changes are classified as a remeasurement, as defined in the Public Finance Act 1989. The Schedule of Non-departmental Expenditure includes remeasurement adjustments in the impairment figure. However, the Statement of Non-departmental Appropriations excludes remeasurement adjustments. The remeasurement relates to changes in the macroeconomic assumptions used for the valuation of the receivable.
6 These numbers are restated due to the transition to the new PBE accounting standards. Refer to Note 9 of the non-departmental financial schedules in part nine for details.
7 The revised budget figures for 2014–15 are those included in The Supplementary Estimates of Appropriations and Supporting Information for the year ending 30 June 2015.
All of the non-departmental appropriations administered by the Department are exempt from the requirements to report end-of-year performance information, under section 15D of the Public Finance Act 1989.
The budget, revised budget and forecast figures have been prepared in accordance with NZ GAAP, using accounting policies that are consistent with those adopted in preparing the non-departmental financial schedules in part nine.
For a full understanding of the Crown’s financial position and the results of its operations, refer to the Financial Statements of the Government of New Zealand for the Year Ended 30 June 2015.
STATEMENT OF NON-DEPARTMENTAL UNAPPROPRIATED EXPENDITURE
In the 2014–15 financial year:
• There were no instances of expenditure incurred outside of appropriation (2013–14: $nil).
• There were no instances of expenditure incurred in excess of appropriation (2013–14: $67.689 million).

Departmental financial statements
ANNUAL REPORT 2015 93
08
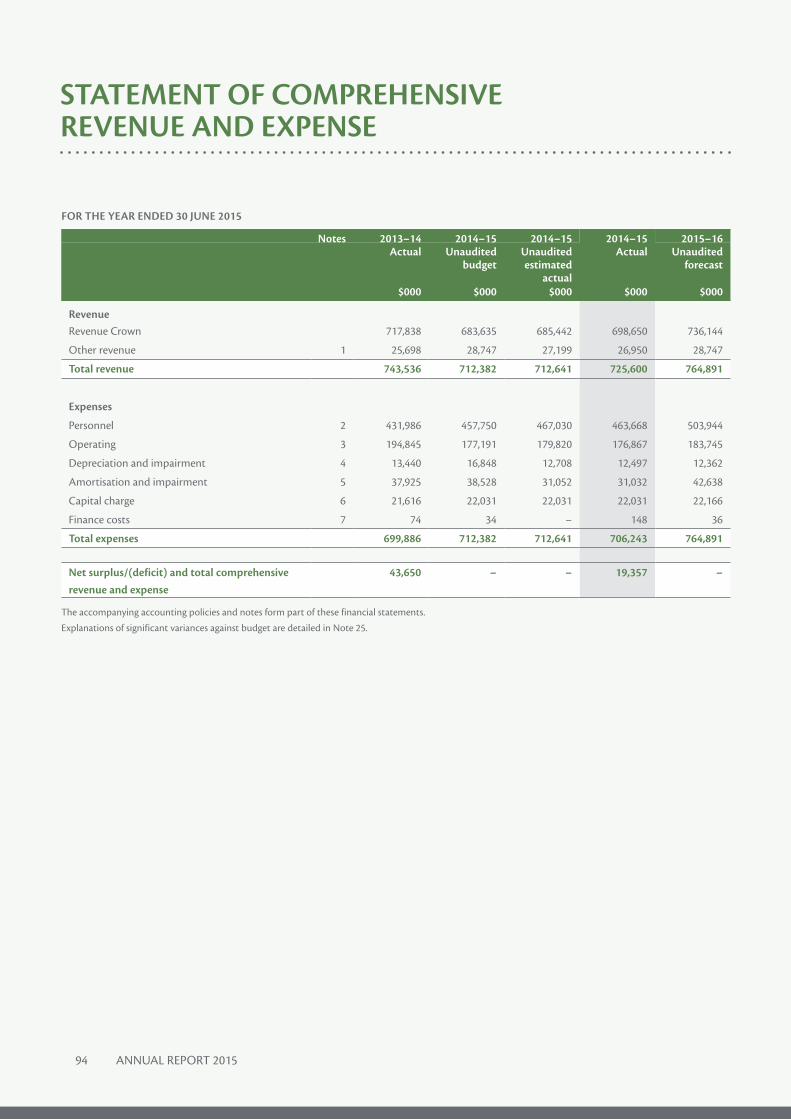
94 ANNUAL REPORT 2015
STATEMENT OF COMPREHENSIVE REVENUE AND EXPENSE
FOR THE YEAR ENDED 30 JUNE 2015
Notes 2013–14 2014–15 2014–15 2014–15 2015–16Actual Unaudited Unaudited Actual Unaudited
budget estimated forecast actual
$000 $000 $000 $000 $000
Revenue Revenue Crown 717,838 683,635 685,442 698,650 736,144
Other revenue 1 25,698 28,747 27,199 26,950 28,747
Total revenue 743,536 712,382 712,641 725,600 764,891
Expenses
Personnel 2 431,986 457,750 467,030 463,668 503,944
Operating 3 194,845 177,191 179,820 176,867 183,745
Depreciation and impairment 4 13,440 16,848 12,708 12,497 12,362
Amortisation and impairment 5 37,925 38,528 31,052 31,032 42,638
Capital charge 6 21,616 22,031 22,031 22,031 22,166
Finance costs 7 74 34 – 148 36
Total expenses 699,886 712,382 712,641 706,243 764,891
Net surplus/(deficit) and total comprehensive revenue and expense
43,650 – – 19,357 –
The accompanying accounting policies and notes form part of these financial statements.
Explanations of significant variances against budget are detailed in Note 25.

ANNUAL REPORT 2015 95
08
STATEMENT OF CHANGES IN TAXPAYERS’ FUNDS
FOR THE YEAR ENDED 30 JUNE 2015
Notes 2013–14 2014–15 2014–15 2014–15 2015–16Actual Unaudited Unaudited Actual Unaudited
budget estimated forecast actual
$000 $000 $000 $000 $000
Balance at start of year 270,343 275,393 275,393 275,392 277,093Total comprehensive revenue and expense 43,650 – – 19,357 –
Repayment of surplus to the Crown 8 (43,651) – – (19,357) –
Capital injection 5,329 2,336 3,572 3,572 2,480
Capital withdrawal (279) – (1,872) (1,872) (34)
Balance at end of year 275,392 277,729 277,093 277,092 279,539
The accompanying accounting policies and notes form part of these financial statements.

96 ANNUAL REPORT 2015
STATEMENT OF FINANCIAL POSITION
AS AT 30 JUNE 2015
Notes 2013–14 2014–15 2014–15 2014–15 2015–16Actual Unaudited Unaudited Actual Unaudited
budget estimated forecast actual
$000 $000 $000 $000 $000
Taxpayers' funds Taxpayers' funds 275,392 277,729 277,093 277,092 279,539Total taxpayers' funds 275,392 277,729 277,093 277,092 279,539
Represented by:
Current assets Cash and cash equivalents 30,643 12,000 12,000 20,679 12,000
Debtor Crown 238,430 195,502 227,558 245,557 160,342
Debtors and prepayments 9 16,811 15,422 12,407 15,471 11,922
Inventories held for distribution 10 879 1,000 851 873 800
Total current assets 286,763 223,924 252,816 282,580 185,064
Non-current assets Prepayments 9 834 66 795 328 42
Property, plant and equipment 4 55,450 59,176 46,330 45,689 43,968
Intangible assets 5 107,853 113,487 105,449 105,186 157,811
Total non-current assets 164,137 172,729 152,574 151,203 201,821
Total assets 450,900 396,653 405,390 433,783 386,885
Current liabilitiesCreditors and other payables 11 44,303 33,200 37,418 37,090 33,200
Surplus payable to the Crown 8 43,651 – – 19,357 –
Employee entitlements 12 47,931 43,815 50,889 58,345 36,500
Provision for other liabilities 13 53 – 53 90 174
Derivative financial instruments 14 1 – – – –
Finance leases 15 386 274 420 707 172
Other financial liabilities 16 183 205 271 275 176
Total current liabilities 136,508 77,494 89,051 115,864 70,222
Non-current liabilities Employee entitlements 12 36,626 39,948 37,091 38,807 35,700
Provision for other liabilities 13 912 851 1,007 397 912
Finance leases 15 593 12 172 487 –
Other financial liabilities 16 869 619 976 1,136 512
Total non-current liabilities 39,000 41,430 39,246 40,827 37,124
Total liabilities 175,508 118,924 128,297 156,691 107,346
Net assets 275,392 277,729 277,093 277,092 279,539
The accompanying accounting policies and notes form part of these financial statements. Explanations of significant variances against budget are detailed in Note 25.
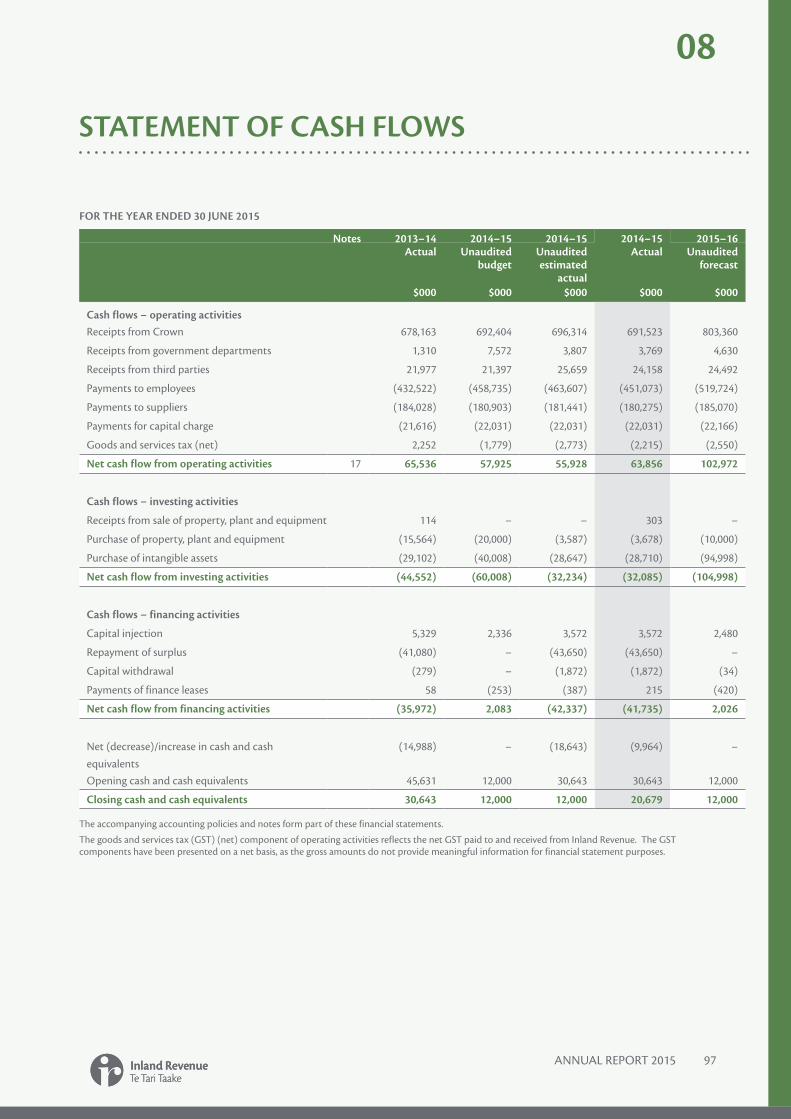
ANNUAL REPORT 2015 97
08
STATEMENT OF CASH FLOWS
FOR THE YEAR ENDED 30 JUNE 2015
Notes 2013–14 2014–15 2014–15 2014–15 2015–16Actual Unaudited Unaudited Actual Unaudited
budget estimated forecast actual
$000 $000 $000 $000 $000
Cash flows − operating activities Receipts from Crown 678,163 692,404 696,314 691,523 803,360
Receipts from government departments 1,310 7,572 3,807 3,769 4,630
Receipts from third parties 21,977 21,397 25,659 24,158 24,492
Payments to employees (432,522) (458,735) (463,607) (451,073) (519,724)
Payments to suppliers (184,028) (180,903) (181,441) (180,275) (185,070)
Payments for capital charge (21,616) (22,031) (22,031) (22,031) (22,166)
Goods and services tax (net) 2,252 (1,779) (2,773) (2,215) (2,550)
Net cash flow from operating activities 17 65,536 57,925 55,928 63,856 102,972
Cash flows − investing activities
Receipts from sale of property, plant and equipment 114 – – 303 –
Purchase of property, plant and equipment (15,564) (20,000) (3,587) (3,678) (10,000)
Purchase of intangible assets (29,102) (40,008) (28,647) (28,710) (94,998)
Net cash flow from investing activities (44,552) (60,008) (32,234) (32,085) (104,998)
Cash flows − financing activities
Capital injection 5,329 2,336 3,572 3,572 2,480
Repayment of surplus (41,080) – (43,650) (43,650) –
Capital withdrawal (279) – (1,872) (1,872) (34)
Payments of finance leases 58 (253) (387) 215 (420)
Net cash flow from financing activities (35,972) 2,083 (42,337) (41,735) 2,026
Net (decrease)/increase in cash and cash equivalents
(14,988) – (18,643) (9,964) –
Opening cash and cash equivalents 45,631 12,000 30,643 30,643 12,000
Closing cash and cash equivalents 30,643 12,000 12,000 20,679 12,000
The accompanying accounting policies and notes form part of these financial statements.
The goods and services tax (GST) (net) component of operating activities reflects the net GST paid to and received from Inland Revenue. The GST components have been presented on a net basis, as the gross amounts do not provide meaningful information for financial statement purposes.
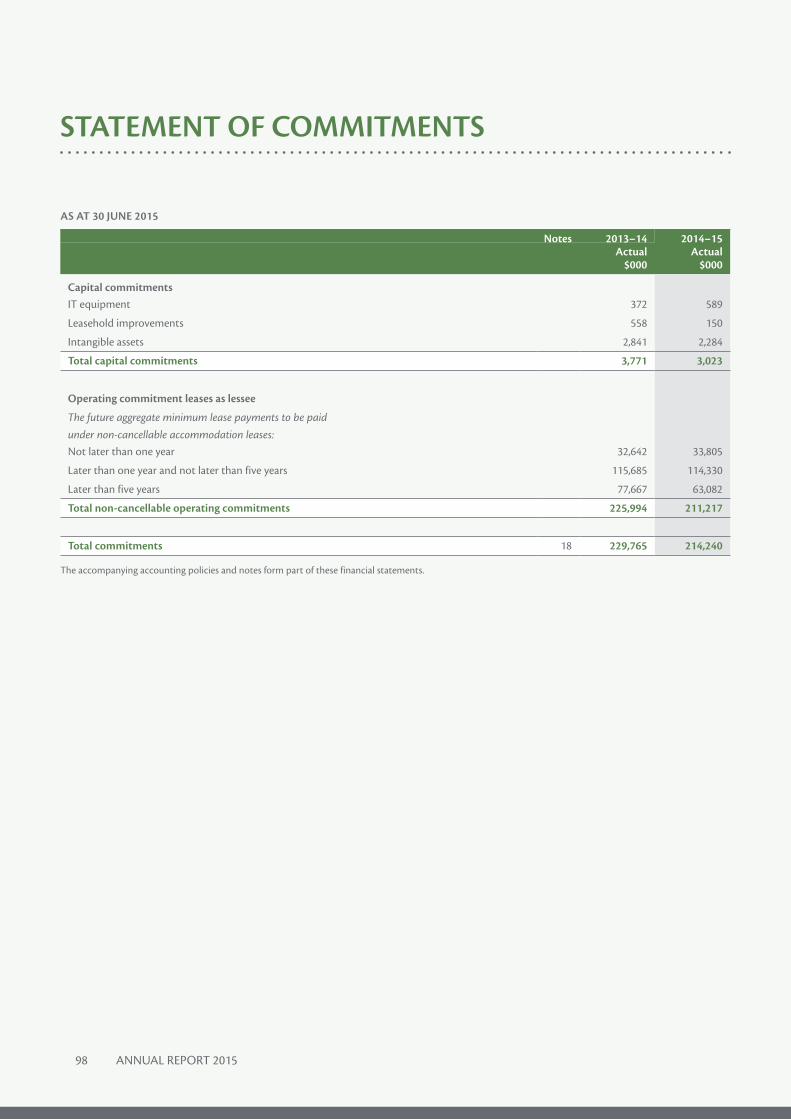
98 ANNUAL REPORT 2015
STATEMENT OF COMMITMENTS
AS AT 30 JUNE 2015
Notes 2013–14 2014–15 Actual Actual
$000 $000
Capital commitmentsIT equipment 372 589
Leasehold improvements 558 150
Intangible assets 2,841 2,284
Total capital commitments 3,771 3,023
Operating commitment leases as lessee
The future aggregate minimum lease payments to be paid under non-cancellable accommodation leases:Not later than one year 32,642 33,805
Later than one year and not later than five years 115,685 114,330
Later than five years 77,667 63,082
Total non-cancellable operating commitments 225,994 211,217
Total commitments 18 229,765 214,240
The accompanying accounting policies and notes form part of these financial statements.
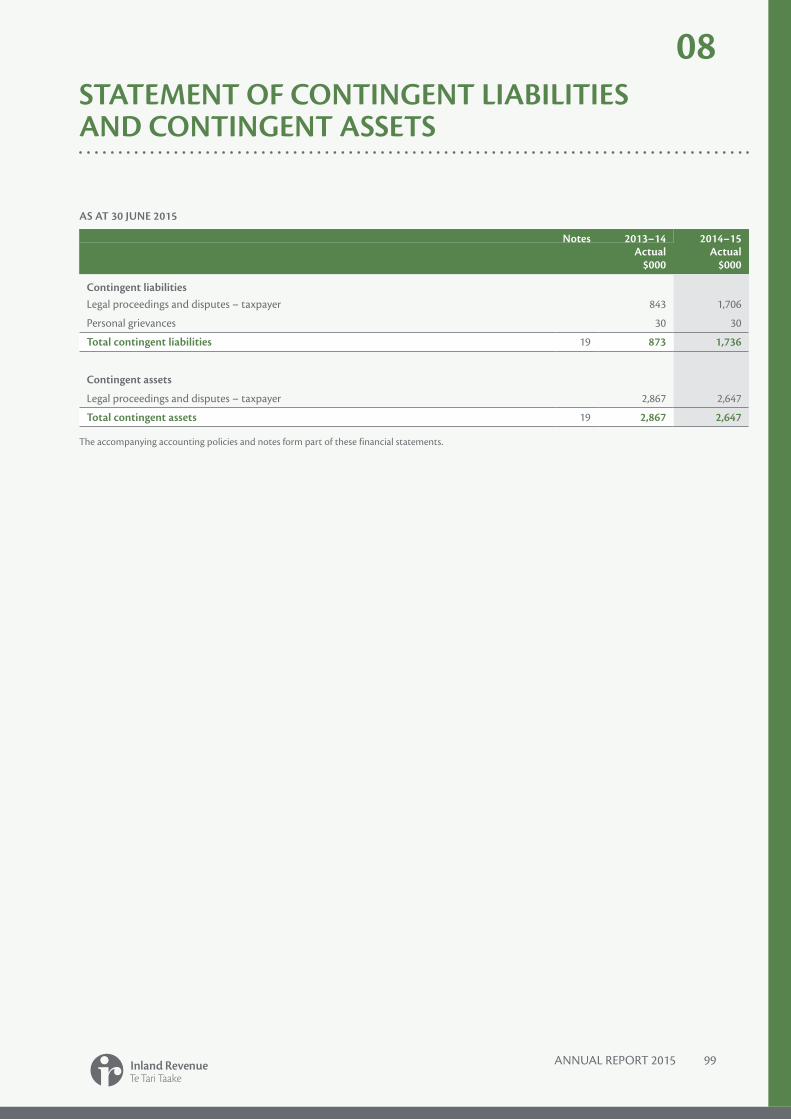
ANNUAL REPORT 2015 99
08STATEMENT OF CONTINGENT LIABILITIES AND CONTINGENT ASSETS
AS AT 30 JUNE 2015
Notes 2013–14 2014–15 Actual Actual
$000 $000
Contingent liabilitiesLegal proceedings and disputes – taxpayer 843 1,706
Personal grievances 30 30
Total contingent liabilities 19 873 1,736
Contingent assets
Legal proceedings and disputes – taxpayer 2,867 2,647
Total contingent assets 19 2,867 2,647
The accompanying accounting policies and notes form part of these financial statements.

100 ANNUAL REPORT 2015
STATEMENT OF ACCOUNTING POLICIES
These financial statements are for the year ended 30 June 2015 and include forecast financial statements for the year ending 30 June 2016. The statements have been combined to provide a single view of budget, actual and forecast information.
References to the financial statements incorporate the financial statements and the forecast financial statements, unless otherwise stated.
REPORTING ENTITY
Inland Revenue is a government department as defined by section 2 of the Public Finance Act (PFA) 1989 and is domiciled and operates in New Zealand. The relevant legislation governing Inland Revenue’s operations is the PFA 1989. It is a wholly owned entity of the Crown whose primary objective is to provide services to the public rather than making a financial return. Accordingly, Inland Revenue has designated itself as a Public Benefit Entity (PBE) for financial reporting purposes.
REPORTING PERIODThe reporting period for these financial statements is for the year ended 30 June 2015. The forecast financial statements are for the year ending 30 June 2016.
The financial statements were authorised for issue by the Chief Executive of Inland Revenue on 29 September 2015.
STATEMENT OF COMPLIANCE
The financial statements have been prepared in accordance with the requirements of the PFA 1989, which includes the requirement to comply with New Zealand generally accepted accounting practice (NZ GAAP), and Treasury Instructions.
In May 2013, the External Reporting Board issued a new suite of PBE accounting standards for application by public sector entities for reporting periods beginning on or after 1 July 2014. Inland Revenue has applied the new suite of Tier 1 PBE accounting standards in preparing the 30 June 2015 financial statements.
These financial statements are the first financial statements presented in accordance with the new Tier 1 PBE accounting standards. There are no material adjustments arising on transition to the new Tier 1 PBE accounting standards.
BASIS OF PREPARATION
The financial statements have been prepared on a going concern basis, and the accounting policies set out below have been applied consistently to all periods presented in these financial statements.
These financial statements have been prepared on a historical cost basis, unless otherwise stated. The accrual basis of accounting has been used, unless otherwise stated.
These financial statements are presented in New Zealand dollars, and all values are rounded to the nearest thousand dollars ($000). The functional currency of Inland Revenue is New Zealand dollars.
STANDARDS ISSUED AND NOT EARLY ADOPTED
There are no new relevant standards and interpretations issued this year and Inland Revenue has not early adopted any new standards and interpretations.
ESTIMATIONS AND JUDGEMENTS
In preparing these financial statements, judgements, estimates and assumptions have been made concerning the future. These estimates and their associated assumptions may differ from the subsequent actual results. Estimates and assumptions are continually evaluated and are based on experience and other factors, including expectations of future events that are believed to be reasonable under the circumstances. Revisions to accounting estimates are recognised in the period the estimate is revised in if the revision affects only that period, or in the period of the revision and future periods if the revision affects both current and future periods.
The estimates and assumptions that have a significant risk of causing a material adjustment to the carrying amount of assets and liabilities within the next financial year are related to retiring and long-service leave liabilities.
An analysis is provided in Note12 of the exposure in relation to estimates and uncertainties surrounding retiring and long-service leave liabilities.
Finance leasesDetermining whether a lease agreement is a finance lease or an operating lease requires judgement as to whether the agreement transfers substantially all the risks and rewards of ownership to Inland Revenue. Judgement is required on various aspects that include, but are not limited to, the fair value of the leased asset, the economic life of the leased asset, whether or not to include renewal options in the lease term, and determining an appropriate discount rate to calculate the present value of the minimum lease payments. Classification as a finance lease means the asset is recognised in the Statement of Financial Position as property, plant, and equipment, whereas with an operating lease no such asset is recognised.
Inland Revenue has exercised its judgement on the appropriate classification of equipment leases, and has determined that one of these arrangements included a finance lease.
ANNUAL REPORT 2015 101
08
ACCOUNTING POLICIES
The following accounting policies, which materially affect the measurement of financial results, financial position, and output statements within part seven, Measuring our performance have been applied.
Budget and forecast figuresThe budget figures for 2014–15 are those included in The Estimates of Appropriations for the year ending 30 June 2015.
The estimated actual figures for 2014–15 and the forecast figures for 2015–16 are those included in The Estimates of Appropriations for the year ending 30 June 2016. The estimated actual figures represent forecasts submitted to Treasury based on all Government decisions and assumptions as at 28 April 2015.
It is not intended that the forecast financial statements will be updated subsequent to presentation.
The budget, estimated actual and forecast figures have been prepared in accordance with NZ GAAP, using accounting policies that are consistent with those adopted in preparing these financial statements.
GSTAll items in the financial statements, and appropriation statements, are stated exclusive of GST, except for debtor Crown, net debtors and accounts payable, which are stated on a GST-inclusive basis. Where GST is not recoverable as input tax, it is recognised as part of the related asset or expense.
The net amount of GST owing to or from Inland Revenue at balance date, being the difference between output GST and input GST, is included in creditors and other payables or debtors and prepayments in the Statement of Financial Position.
The net GST paid to or received from Inland Revenue, including the GST relating to investing and financing activities, is classified as an operating cash flow in the Statement of Cash Flows.
Commitments and contingencies are disclosed exclusive of GST.
Income taxGovernment departments are exempt from income tax as public authorities, so accordingly, no charge for income tax has been provided for.
RevenueRevenue is measured at the fair value of consideration received or receivable.
Revenue is recognised as follows:
Revenue Crown
Revenue Crown transactions are considered to be non-exchange transactions.
Revenue Crown is measured based on Inland Revenue’s funding entitlement for the reporting period. The funding entitlement is established by Parliament when it passes the Appropriation
Acts for the financial year. The amount of revenue recognised takes into account any amendments to appropriations approved in the Appropriation (Supplementary Estimates) Act for the year and certain other unconditional funding adjustments formally approved prior to balance date.
There are no conditions attached to the funding from the Crown. However, Inland Revenue can incur expenses only within the scope and limits of its appropriations.
The fair value of Revenue Crown has been determined to be equivalent to the funding entitlement.
Other revenueOther revenue transactions as outlined below are considered to be exchange transactions.
Sale of services
Sale of services are recognised in the accounting period the services are provided in, by reference to completion of specific transactions, assessed on the basis of actual services provided as a proportion of the total services to be provided.
Revenue from recoveries
Revenue from recoveries is recognised as revenue when earned.
Sub-leases
Rental revenue from sub-leased property is recognised in the surplus or deficit on a straight-line basis over the term of the lease.
Insurance proceeds
Insurance claim proceeds are recognised as revenue when the claim has been accepted by the insurer or when receipt of the insurance proceeds is considered virtually certain. The insurance proceeds will be disclosed as a contingent asset if the receipt is only probable.
Capital chargeThe capital charge is recognised as an expense in the period to which the charge relates.
Foreign currency transactions, hedge accounting, and hedging activities Inland Revenue’s activities expose it primarily to risks of changes in foreign exchange rates. Foreign currency transactions (including those for which forward exchange contracts are held) are translated into New Zealand dollars using the spot exchange rates at the dates of the transactions. Foreign exchange gains and losses resulting from the settlement of such transactions and from the translation at year end exchange rates of monetary assets and liabilities denominated in foreign currencies are recognised in the surplus or deficit.
For certain commitments Inland Revenue uses derivative financial instruments (primarily, foreign currency forward exchange contracts) to mitigate its risks associated with
102 ANNUAL REPORT 2015
foreign currency fluctuations. The use of financial derivatives is governed by Inland Revenue’s foreign exchange policy, which provides written principles on the use of financial derivatives consistent with Inland Revenue’s risk management strategy.
Inland Revenue does not hold or issue derivative financial instruments for trading purposes. It also has not adopted hedge accounting.
Derivative financial instrumentsDerivative financial instruments are recognised at fair value on the date a derivative contract is entered into and subsequently at fair value at each balance date. They are reported as either assets or liabilities, depending on whether the derivative is in a net gain or net loss position, respectively. The fair value gains or losses on derivatives are recognised in the surplus or deficit. Foreign currency forward exchange contracts are classified as derivative financial instruments.
Foreign currency forward exchange contracts are classified as current if the contract is due for settlement within 12 months of balance date. Otherwise the full fair value is classified as non-current.
Debtors and receivablesAccounts receivable and other debtors transactions are considered to be exchange transactions. Debtor Crown transactions are considered to be non-exchange transactions.
Debtors and receivables are non-derivative financial assets with fixed or determinable payments that are not quoted in an active market. They are recognised initially at fair value plus transaction costs and subsequently measured at amortised cost using the effective interest rate method. Debtors and receivables issued with durations of less than 12 months are recognised at their nominal value, unless the effect of discounting is material.
Impairment of receivables
Allowances for estimated irrecoverable amounts are recognised when there is objective evidence that Inland Revenue will not be able to collect all amounts due according to the original terms of the receivable. Significant financial difficulties of the debtor, probability that the debtor will enter into bankruptcy, and default in payments are considered indicators that the debtor is impaired.
The amount of the provision is the difference between the asset’s carrying amount and the estimated amount expected to be collected. The carrying amount of the asset is reduced through the use of an allowance account, and the amount of the impairment loss is recognised in the surplus or deficit.
Cash and cash equivalentsCash and cash equivalents include all cash held in the bank accounts. All cash held in bank accounts is held in on demand accounts and no interest is payable to Inland Revenue.
Inland Revenue is only permitted to expend its cash and cash equivalents within the scope and limits of its appropriations.
Inventories held for distributionInventories held for distribution comprise forms, booklets and returns held for distribution to the public at no or nominal consideration in the ordinary course of operations.
Inventories held for distribution for public benefit purposes are carried at cost, calculated using the first-in, first-out (FIFO) cost method, adjusted where applicable for any loss of service potential. The cost of inventories includes all costs of purchase, costs of conversion and other costs incurred in bringing the inventories to their present location and condition. Where inventories are acquired through a non-exchange transaction, the cost is deemed to be the fair value at the date of acquisition.
The carrying amount is recognised as an expense in the period in which the goods are distributed. The amount of any write-down for the loss of service potential is recognised in the surplus or deficit in the period the write-down occurs.
Property, plant and equipmentInland Revenue has operational assets that include IT equipment, furniture and office equipment, motor vehicles, and leasehold improvements. The capitalisation thresholds are:
• IT equipment – desktop all computers and laptops
• IT equipment – other $2,000 and over (or $20,000 for bulk purchased IT equipment)
• Furniture and office equipment $2,000 and over (or $20,000 for bulk purchased furniture)
• Motor vehicles $2,000 and over
• Leasehold improvements $20,000 and over
Property, plant and equipment are shown at historical cost, less accumulated depreciation and impairment losses. Historical cost is the value of consideration given to acquire or create the asset and any directly attributable costs of bringing the asset to working condition for its intended use.
Additions
The cost of an item of property, plant and equipment is recognised as an asset if it is probable that future economic benefits or service potential associated with the item will flow to Inland Revenue and the cost of the item can be measured reliably. In most instances, an item of property, plant and equipment is recognised at its cost. Where an asset is acquired through a non-exchange transaction, it is recognised at fair value as at the date of acquisition.
ANNUAL REPORT 2015 103
08
Subsequent costs
Subsequent costs are included in the asset’s carrying amount or recognised as a separate asset, as appropriate, only when it is probable that future economic benefits or service potential associated with the item will flow to Inland Revenue and the cost of the item can be measured reliably. All repairs and maintenance are recognised in the surplus or deficit during the financial period in which they are incurred.
Depreciation
Depreciation is provided on a straight-line basis on all property, plant and equipment, other than assets under construction. The rate of depreciation will write off the cost of the asset to the estimated residual value over the useful life of the asset. The useful life of major classes of assets have been estimated as follows:
• IT equipment 3 to 6 years
• Furniture and office equipment 5 to 7 years
• Motor vehicles 5 to 7 years
• Leasehold improvements up to 10 years
All property, plant and equipment other than motor vehicles are assumed to have no residual value. Motor vehicles are assumed to have a 20% residual value.
The cost of leasehold improvements is capitalised and depreciated over the unexpired period of the lease, or the estimated remaining useful life of the improvements, whichever is shorter, up to a maximum of 10 years.
Assets under construction are recognised at cost less impairment and are not depreciated. The total cost of a capital project is transferred to the appropriate asset class on its completion and then depreciated.
The assets’ residual values and useful lives are reviewed, and adjusted if appropriate, at each balance date.
Disposals
Gains and losses on disposals are determined by comparing proceeds with the carrying amount. These are recognised on a net basis in the surplus or deficit.
Intangible assetsInland Revenue has intangible assets in the form of internally generated intangible assets and software licenses.
Additions
Intangible assets are initially recorded at cost. Inland Revenue only has intangible assets with finite useful lives. The two main categories are: internally generated intangible assets and software licences.
a) Internally generated intangible assets
The cost of internally generated intangible assets represents expenditure incurred in the development phase of the asset only.
There are two types of internally generated intangible assets: computer software developed and business processes.
The cost of computer software developed comprises direct labour, material purchased and an appropriate portion of relevant overheads. These costs are directly associated with the development of identifiable and unique software controlled by Inland Revenue, and will generate future economic benefits.
Expenditure on development activities where research findings are applied to a plan or design for new or substantially improved business processes, is capitalised if the business process is technically and commercially feasible and Inland Revenue has sufficient resources to complete development. Other development expenditure as part of a new or improved business process is recognised in the surplus or deficit as an expense as incurred.
Expenditure incurred on research of an internally generated intangible asset is expensed when it is incurred. Where the research phase cannot be distinguished from the development phase, the expenditure is expensed when it is incurred.
Costs associated with maintaining internally generated computer software are recognised as an expense when incurred. Costs of configuring and customising Commercial Off-the-Shelf (COTS) software are capitalised.
Costs associated with ongoing development and maintenance of Inland Revenue’s existing websites are recognised as an expense in the surplus or deficit when incurred.
Staff training costs are recognised as an expense in the surplus or deficit when incurred.
b) Software licences
Intangible assets acquired by Inland Revenue such as computer software licences are stated at cost less accumulated amortisation and impairment losses. Acquired computer software licences are capitalised on the basis of costs incurred to acquire and bring to use the specific software.
Costs associated with maintaining computer software licences are recognised as an expense when incurred.
The capitalisation thresholds for intangible assets are:
• Internally generated intangible assets $50,000 and over
• Software licences $5,000 and over
Subsequent cost
The cost of intangible assets with finite lives is subsequently recorded at cost less any amortisation and impairment losses.
Amortisation
The carrying value of an intangible asset with a finite life is amortised on a straight-line basis over its estimated useful life. Amortisation begins when the asset is available for use and ceases at the date that the asset is de-recognised. The amortisation charge for each period is recognised in the surplus or deficit.

104 ANNUAL REPORT 2015
The useful lives of major classes of intangible assets have been estimated as follows:
• Internally generated intangible assets 5 to 10 years
• Software licences 5 to 10 years
Assets under construction are recognised at cost less impairment and are not amortised. The total cost of a capital project is transferred to the appropriate asset class on its completion and then amortised.
De-recognition
The gain or loss arising from the de-recognition of an intangible asset is recognised in the surplus or deficit when the asset is de-recognised.
Impairment of non-cash generating property, plant and equipment and intangible assetsInland Revenue does not hold any cash generating assets. Assets are considered cash generating where their primary objective is to generate a commercial return.
Property, plant and equipment and intangible assets that have a finite useful life are reviewed for impairment whenever events or changes in circumstances indicate that the carrying amount may not be recoverable. Property, plant and equipment and intangible assets including assets under construction are also reviewed annually for impairment at each balance date.
An impairment loss is recognised for the amount by which the asset’s carrying amount exceeds its recoverable service amount. The recoverable service amount is the higher of an asset’s fair value less costs to sell and value in use.
Value in use is the present value of the asset’s remaining service potential. Value in use is determined based on either a depreciated replacement cost approach, restoration cost approach, or a service units approach. The most appropriate approach used depends on the nature of the impairment and the availability of information.
If an asset’s carrying amount exceeds its recoverable service amount, the asset is considered to be impaired and is written down to the recoverable service amount. The impairment loss is recognised in the surplus or deficit.
The reversal of an impairment loss is also recognised in the surplus or deficit.
Financial liabilities Financial liabilities measured at amortised cost are recognised initially at fair value less transaction costs and subsequently measured at amortised cost using the effective interest rate method. Included in this category are creditors and other payables, finance leases and leasing incentives. Financial liabilities entered into with durations of less than 12 months are recognised at their nominal value, unless the effect of discounting is material. Creditors and other payables are recognised at their nominal value as the effect of discounting is immaterial.
Leases A lease is classified as a finance lease if it transfers substantially all the risks and rewards of ownership of an asset, whether or not title is eventually transferred. A lease is classified as an operating lease if it does not transfer substantially all the risks and rewards incidental to the ownership of an asset.
Operating leases
Rentals payable under operating leases are recognised as an expense on a straight-line basis over the term of the relevant lease. Lease incentives received as an incentive to enter into an operating lease are also recognised evenly over the term of the lease as a reduction in the rental expense.
Contractual arrangements considered to be operating leases have been recognised during the reporting period.
Finance leases
At the commencement of the lease term, finance leases are recognised as assets and liabilities in the Statement of Financial Position at the lower of the fair value of the leased item or the present value of the minimum lease payments.
The finance charge is charged to the surplus or deficit over the lease period so as to produce a constant periodic rate of interest on the remaining balance of the liability.
The amount recognised as an asset is depreciated over its useful life. If there is no certainty as to whether Inland Revenue will obtain ownership at the end of the lease term, the asset is fully depreciated over the shorter of the lease term and its useful life.
Contractual arrangements considered to be finance leases have been recognised during the reporting period.
Employee entitlements
Short-term entitlements
Employee entitlements that Inland Revenue expects to be settled within 12 months of balance date are measured at nominal values based on accrued entitlements at current rates of pay. These include salaries and wages accrued up to balance date, annual leave and time off in lieu earned up to but not yet taken at balance date, retiring, long-service leave and sick leave entitlements expected to be settled within 12 months.
Inland Revenue recognises a liability for sick leave to the extent that absences in the coming year are expected to be greater than the sick leave entitlements earned in the coming year. The amount is calculated based on the unused sick leave entitlement that can be carried forward at balance date, to the extent that Inland Revenue anticipates it will be used by staff to cover those future absences.
Inland Revenue recognises a liability and an expense for bonuses where it is contractually obliged to pay them, or where a past practice has created a constructive obligation and a reliable estimate of the obligation can be made.
ANNUAL REPORT 2015 105
08
Long-term entitlements
Employee entitlements that are payable beyond 12 months such as long-service leave and retiring leave have been calculated on an actuarial basis.
The actuarial calculations for long-service leave and retiring leave liabilities are based on:
• Employee contractual entitlements
• Years of service accrued to balance date and years remaining to entitlement
• Present value of the estimated future cash outflows using an applicable discount rate and salary inflation rate.
Sick leave, annual leave, and vested long-service leave are classified as a current liability. Non-vested long-service leave and retiring leave liabilities expected to be settled within 12 months of balance date are classified as a current liability. All other employee entitlements are classified as a non-current liability.
Superannuation schemes
Obligations for contributions to the Inland Revenue Superannuation Scheme, State Sector Retirement Savings Scheme, KiwiSaver, and the Government Superannuation Fund are accounted for as defined contribution schemes and are recognised as an expense in the surplus or deficit as they are incurred.
Termination benefits
Termination benefits are payable when an employee’s employment contract is terminated before their normal retirement or when an employee accepts voluntary redundancy in exchange for these benefits. Inland Revenue recognises the expenditure in the surplus or deficit when it is demonstrably committed to either terminate the employment of current employees, according to a detailed formal plan without the possibility of withdrawal, or as a result of an offer for voluntary redundancy.
Termination benefits to be settled within 12 months are reported at the amount expected to be paid, otherwise they are reported as the present value of the estimated future cash outflows.
ProvisionsInland Revenue recognises a provision for future expenditure of uncertain amounts or timing where there is a present obligation (either legal or constructive) as a result of a past event, and it is probable that expenditure will be required to settle the obligation, and a reliable estimate can be made of the amount of the obligation. Provisions are not recognised for net deficits from future operating activities.
Provisions are recorded at the best estimate of the expenditure required to settle the obligation. Provisions to be settled beyond 12 months are recorded at their present value and are discounted using market yields on government bonds at balance date with terms to maturity that match, as closely as possible, the estimated timing of the future cash flows. The increase in
the provision due to the passage of time is recognised as an interest expense and is included in finance costs.
A provision for onerous contracts is recognised when the expected benefits or service potential to be derived from a contract are lower than the unavoidable cost of meeting the obligations under the contract.
The provision is measured at the present value of the lower of the expected cost of terminating the contract and the expected net costs of continuing with the contract.
Taxpayers’ fundsThis is the Crown’s net investment in Inland Revenue. It is measured as the difference between total assets and total liabilities. Taxpayers’ funds are disaggregated and classified into a number of components:
• Capital injection
• Capital withdrawal
• Repayment of surplus to the Crown.
Statement of Cash FlowsCash and cash equivalents mean cash balances in bank accounts.
Operating activities include cash received from all revenue sources of Inland Revenue, and cash payments made for the supply of goods and services.
Investing activities are those activities relating to the acquisition and disposal of non-current assets.
Financing activities comprise capital injections by, or repayment of capital to, the Crown.
Commitments Expenses and liabilities yet to be incurred on non-cancellable contracts that have been entered into on or before balance date are disclosed as commitments to the extent that they are unperformed obligations. Information on non-cancellable capital and lease commitments is reported in the Statement of Commitments. Cancellable capital commitments that have penalty or exit costs explicit in the agreement on exercising that option to cancel are reported in the Statement of Commitments at the lower of the remaining contractual commitment and the value of those penalty or exit costs (i.e. the minimum future payments).
Contingent liabilities and assetsContingent liabilities and assets are recorded in the Statement of Contingent Liabilities and Contingent Assets at the point at which the contingency is evident. Contingent liabilities are disclosed if the possibility that they will crystallise is not remote. Contingent assets are disclosed if it is probable that the benefits will be realised. Insurance claim proceeds are disclosed as a contingent asset if the receipt of the insurance proceeds is probable.
106 ANNUAL REPORT 2015
Cost allocationsInland Revenue uses an integrated cost allocation process to derive the cost of its outputs. This process involves the initial costing of business processes followed by the full costing of outputs.
Business processes represent Inland Revenue’s key functional activities. These business processes are used to capture direct costs.
Direct personnel costs are charged to business processes based on actual hours and standard activity rates. Other related direct costs including depreciation, are allocated to business processes based on planned hours or relevant activity drivers.
Premises lease costs are charged to business processes based on headcount or relevant activities.
Other indirect costs and corporate overheads that cannot be attributed directly to a business process are apportioned to outputs based on planned business process activity allocation to outputs.
There have been no material changes in cost allocation policies since the date of the last audited financial statements.
ComparativesCertain comparative information has been reclassified, where required, to conform with the current year’s presentation.
CHANGES IN ACCOUNTING POLICIES
For the preparation of the Department’s financial statements, forecast financial statements and output statements within part seven, Measuring our performance as at 30 June 2015 there have been no changes in accounting policies and cost allocation policies since the date of the last audited financial statements. All policies have been applied on a basis consistent with the previous year.
FORECAST FINANCIAL STATEMENTS
The forecast financial statements have been prepared in accordance with the PFA 1989.
The purpose of the forecast financial statements is to facilitate Parliament’s consideration of appropriations for, and planned performance of, the department. These forecast financial statements may not be appropriate for other purposes.
The forecast financial statements have been prepared in accordance with the accounting policies detailed above. Additional accounting policies relating to the forecasts are set out below.
The forecast financial statements comply with NZ GAAP and have been prepared in accordance with PBE Financial Reporting Standard 42 Prospective Financial Statements.
The forecast financial statements are not subject to audit.
Forecast policiesThe forecasts have been compiled on the basis of existing government policies and ministerial expectations at the time the statements were finalised and reflect all government decisions and circumstances as at 28 April 2015. It is not intended that the forecast financial statements will be updated subsequent to presentation. The main assumptions are as follows:
• The Department’s main activities will remain substantially the same as for the previous year.
• Operating costs are based on historical experience. The general historical pattern is expected to continue.
• Estimated year-end information for 2014–15 is used as the opening position for the 2015–16 forecasts.
Variations to forecastThe actual financial results for the forecast period covered are likely to vary from the information presented in these forecasts. Factors that may lead to a material difference between information in these forecast financial statements and the actual reported results include:
• Changes to the budget through initiatives approved by Cabinet
• Technical adjustments to the budget including transfers between financial years
• The timing of expenditure relating to significant programmes and projects.
Any changes to budgets during 2015–16 will be incorporated into The Supplementary Estimates of Appropriations for the year ending 30 June 2016.

ANNUAL REPORT 2015 107
08
NOTE 1: OTHER REVENUE
2013–14 2014–15 2014–15 2015–16Actual Unaudited Actual Unaudited
budget forecast $000 $000 $000 $000
Accident Compensation Corporation (ACC) – agency fees 20,500 20,500 20,500 20,500
Support services to other government agencies 555 3,060 2,396 3,060
Court costs recovery 2,081 2,828 2,124 2,828
Revenue from rulings 1,061 1,088 865 1,088
Rental revenue from sub-leases 475 1,100 794 1,257
Services on behalf of other government agencies 1,009 – 244 –
Supply of information to other agencies 13 170 13 13
Net gains on disposal of property, plant and equipment 1 – 1 –
Insurance proceeds – – 1 –Other 3 1 12 1
Total other revenue 25,698 28,747 26,950 28,747
NOTE 2: PERSONNEL
2013–14 2014–15 2014–15 2015–16Actual Unaudited Actual Unaudited
budget forecast $000 $000 $000 $000
Salaries and wages 371,178 395,310 388,272 409,770
Contractors and temporary staff 37,489 39,926 45,328 70,203
Employer contributions to defined contribution plans 11,745 11,952 12,181 12,790
Retiring, long-service and sick leave 242 3,000 5,109 3,000
Terminating benefits 1,926 2,051 1,995 2,106
ACC levies 1,536 1,714 1,653 2,036
Annual leave 1,114 759 1,585 1,589
Bonuses 258 275 223 235
Other 6,498 2,763 7,322 2,215Total personnel 431,986 457,750 463,668 503,944
NOTES TO THE FINANCIAL STATEMENTS

108 ANNUAL REPORT 2015
NOTE 3: OPERATING
2013–14 2014–15 2014–15 2015–16Actual Unaudited Actual Unaudited
budget forecast $000 $000 $000 $000
Information technology costs 50,545 50,312 52,093 55,556
Accommodation lease rentals 31,471 33,280 32,315 34,355
Printing and postage 17,943 18,623 16,304 17,122
Communication 15,845 15,404 14,025 14,136
Consultants 23,348 13,763 10,513 12,051
Travel and transport 9,027 7,905 9,198 9,305
Premises costs 9,505 8,120 8,109 8,868
Staff development 6,882 6,860 7,689 7,934
Legal expenses 8,568 8,642 6,404 6,937
Office supplies 3,604 3,435 3,963 4,189
Bank fees 3,400 3,241 2,849 2,953
Advertising and publicity 1,881 2,086 2,035 2,109
Equipment maintenance 1,780 1,297 1,734 1,789
Audit fees for audit of the financial statements 1,033 1,100 1,033 1,100
Disbursements for audit of the financial statements 20 – 46 –
Fees to Audit NZ for other services 30 – – –
Net loss on disposal of property, plant and equipment 87 8 639 –
Net loss on disposal of intangible assets 478 – 344 –
Inc/(Dec) in provision for onerous leases – – 488 (52)
Inc/(Dec) in provision for debt impairment 8 9 9 3
Realised foreign exchange losses 2,310 106 135 121
Bad debts written off 10 – 6 –
Other operating expenses 7,070 3,000 6,936 5,269
Total operating 194,845 177,191 176,867 183,745

ANNUAL REPORT 2015 109
08
NOTE 4: PROPERTY, PLANT AND EQUIPMENT BY CATEGORY
IT equipment Furniture and office
equipment
Motor vehicles
Leasehold improvements
Assets under construction
– leasehold
Total
$000 $000 $000 $000 $000 $000
CostBalance as at 1 July 2014 56,671 30,724 4,595 62,011 1,406 155,407Additions by purchase 2,121 596 236 938 48 3,939Other movements1 – – – (684) – (684)Transfers between category – – – 1,362 (1,347) 15Disposals (5,329) (4) (1,120) (3,573) – (10,026)Balance as at 30 June 2015 53,463 31,316 3,711 60,054 107 148,651
Accumulated depreciation and impairment losses
Balance as at 1 July 2014 47,232 23,528 1,508 27,689 – 99,957Depreciation charge – expensed 4,399 2,188 477 5,413 – 12,477Depreciation charge – capitalised2 1 (9) – – – (8)Impairment losses – – – – 20 20Transfers between category – – – – – –Disposals (4,812) (1) (735) (3,936) – (9,484)Balance as at 30 June 2015 46,820 25,706 1,250 29,166 20 102,962
Carrying amount as at 30 June 2015 6,643 5,610 2,461 30,888 87 45,689
Unaudited forecast carrying amount at 30 June 2016
6,558 4,251 2,293 30,769 97 43,968
CostBalance as at 1 July 2013 65,621 29,298 4,904 53,003 4,334 157,160Additions by purchase 4,935 1,437 – 8,388 184 14,944Other movements1 – – – (175) – (175)Transfers between category 25 – – 3,905 (3,112) 818Disposals (13,910) (11) (309) (3,110) – (17,340)Balance as at 30 June 2014 56,671 30,724 4,595 62,011 1,406 155,407
Accumulated depreciation and impairment lossesBalance as at 1 July 2013 54,952 21,190 1,123 26,343 – 103,608Depreciation charge – expensed 6,100 2,638 547 4,455 – 13,740Depreciation charge – capitalised 2 12 11 – – – 23Impairment losses – (300) – – – (300)Transfers between category – – – – – –Disposals (13,832) (11) (162) (3,109) – (17,114)Balance as at 30 June 2014 47,232 23,528 1,508 27,689 – 99,957
Carrying amount as at 30 June 2014 9,439 7,196 3,087 34,322 1,406 55,450
There is no restriction over the title of Inland Revenue’s property, plant and equipment, nor is any property, plant and equipment pledged as security for liabilities.
1 This relates to the addition/reduction of lease make-good costs on leased buildings. 2 The depreciation charge for existing assets that are used in the development of intangible assets.
Finance leases – Inland Revenue has entered into an agreement for the provision of telecommunications services that includes embedded finance leases. The net carrying amount of these finance leases within the IT equipment category is $1,117,000 (2013–14: $935,000).

110 ANNUAL REPORT 2015
NOTE 5: INTANGIBLE ASSETS BY CATEGORY
Internally generated intangible
assets
Software licences
Assets under construction – intangibles
Total
$000 $000 $000 $000
Cost
Balance as at 1 July 2014 478,867 125,803 30,027 634,697
Additions by purchase – 5,984 – 5,984
Additions internally developed 11,058 – 11,704 22,762
Transfers between category 21,715 – (21,730) (15)
Disposals (1,100) (17,222) (146) (18,468)
Balance as at 30 June 2015 510,540 114,565 19,855 644,960
Accumulated amortisation and impairment losses
Balance as at 1 July 2014 413,151 107,450 6,243 526,844
Amortisation charge – expensed 22,227 7,422 – 29,649
Amortisation charge – capitalised 1 17 – – 17
Impairment losses – – 1,383 1,383
Transfers between category 2,519 – (2,519) –
Disposals (1,100) (17,019) – (18,119)
Balance as at 30 June 2015 436,814 97,853 5,107 539,774
Carrying amount as at 30 June 2015 73,726 16,712 14,748 105,186
Unaudited forecast carrying amount at 30 June 2016
80,612 25,073 52,126 157,811
Cost
Balance as at 1 July 2013 465,001 124,343 26,517 615,861
Additions by purchase – 5,445 – 5,445
Additions internally developed 6,826 – 17,706 24,532
Transfers between category 13,009 369 (14,196) (818)
Disposals (5,969) (4,354) – (10,323)
Balance as at 30 June 2014 478,867 125,803 30,027 634,697
Accumulated amortisation and impairment losses
Balance as at 1 July 2013 391,152 102,989 4,594 498,735
Amortisation charge – expensed 27,938 8,338 – 36,276
Amortisation charge – capitalised 1 32 – – 32
Impairment losses – – 1,649 1,649
Transfers between category – – – –
Disposals (5,971) (3,877) – (9,848)
Balance as at 30 June 2014 413,151 107,450 6,243 526,844
Carrying amount as at 30 June 2014 65,716 18,353 23,784 107,853
There is no restriction over the title of Inland Revenue’s intangible assets, nor are any intangible assets pledged as security for liabilities.1 Refers to the amortisation charge for existing assets that are utilised in the development of intangible assets.

ANNUAL REPORT 2015 111
08
Internally generated intangible assets include the following items and carrying amounts: FIRST technology environment $30,378,000, Child Support Reform $22,490,000, student loans $19,478,000, KiwiSaver $1,380,000 (2013–14: FIRST technology environment $35,922,000, student loans $25,207,000, KiwiSaver $4,587,000). The amortisation period for these intangible assets ranges from 5–10 years.
Software licences include the following items and carrying amounts: FIRST technology environment $15,884,000, KiwiSaver $669,000, Child Support Reform $159,000 (2013–14: FIRST technology environment $17,379,000, KiwiSaver $974,000). The amortisation period for these intangible assets ranges from 5–10 years.
NOTE 6: CAPITAL CHARGE
Inland Revenue pays a capital charge to the Crown on taxpayers’ funds as at 30 June and 31 December each year. The capital charge rate for the year ended 30 June 2015 was 8.0% per annum (2013–14: 8.0%, forecast 2015–16: 8.0%).
NOTE 7: FINANCE COSTS
2013–14 2014–15Actual Actual
$000 $000
Interest on finance leases 74 148
Total finance costs 74 148 NOTE 8: SURPLUS PAYABLE TO THE CROWN
2013–14 2014–15Actual Actual
$000 $000
Net surplus/(deficit) 43,650 19,357Add unrealised losses/(gains) in relation to forward foreign exchange contracts 1 –
Total surplus payable to the Crown 43,651 19,357

112 ANNUAL REPORT 2015
NOTE 9: DEBTORS AND PREPAYMENTS
2013–14 2014–15 Actual Actual
$000 $000
Current assets – exchange transactions
Debtors
Accounts receivable 5,098 4,368
Less provision for impairment (8) (14)
Other debtors 474 232
Net debtors 5,564 4,586
Prepayments 11,247 10,885
Total current assets 16,811 15,471
Non-current assets – exchange transactionsPrepayments 834 328
Total non-current assets 834 328
Total debtors and prepayments – exchange transactions 17,645 15,799
Given their short-term nature, the carrying value of accounts receivable and other debtors approximates their fair value.
Overdue receivables have been assessed for impairment and appropriate provisions applied, as detailed below:
Gross debtors Impairment Net debtorsactual actual actual
$000 $000 $000
2014–15
Not past due 4,339 – 4,339
Past due 1 to 30 days 55 – 55
Past due 31 to 60 days 63 – 63
Past due 61 to 90 days 27 – 27
Past due > 90 days 116 (14) 102Total 4,600 (14) 4,586
2013–14
Not past due 3,061 – 3,061
Past due 1 to 30 days 2,107 – 2,107
Past due 31 to 60 days 299 – 299
Past due 61 to 90 days 26 – 26
Past due > 90 days 79 (8) 71 Total 5,572 (8) 5,564
The provision for impairment has been calculated based on expected losses for Inland Revenue’s debtors. Expected losses have been determined based on a review of each debtor.
Movements in the provision for impairment are as follows:
2013–14 2014–15Actual Actual
$000 $000
Opening balance (9) (8)
Additional provisions made during the year (8) (9)
Unused amounts reversed – –
Receivables written off during the year 9 3Closing balance (8) (14)
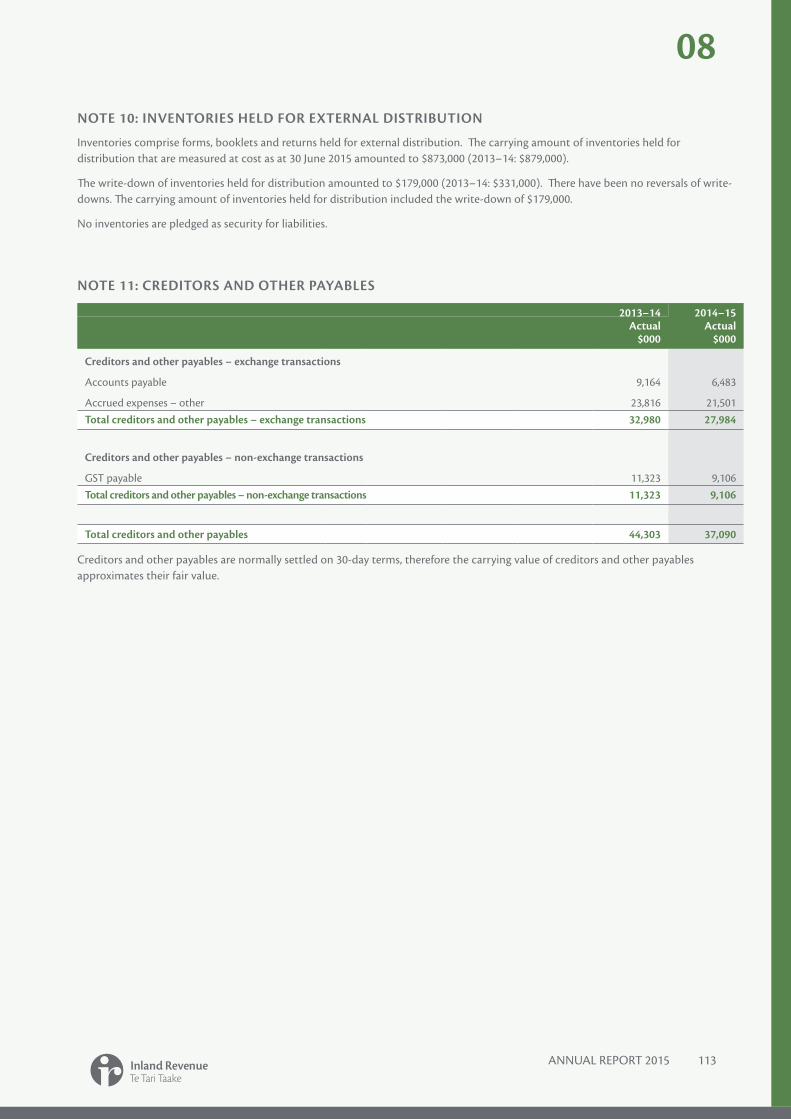
ANNUAL REPORT 2015 113
08
NOTE 10: INVENTORIES HELD FOR EXTERNAL DISTRIBUTION
Inventories comprise forms, booklets and returns held for external distribution. The carrying amount of inventories held for distribution that are measured at cost as at 30 June 2015 amounted to $873,000 (2013–14: $879,000).
The write-down of inventories held for distribution amounted to $179,000 (2013–14: $331,000). There have been no reversals of write-downs. The carrying amount of inventories held for distribution included the write-down of $179,000.
No inventories are pledged as security for liabilities.
NOTE 11: CREDITORS AND OTHER PAYABLES
2013–14 2014–15Actual Actual
$000 $000
Creditors and other payables – exchange transactions
Accounts payable 9,164 6,483
Accrued expenses – other 23,816 21,501Total creditors and other payables – exchange transactions 32,980 27,984
Creditors and other payables – non-exchange transactions
GST payable 11,323 9,106Total creditors and other payables – non-exchange transactions 11,323 9,106
Total creditors and other payables 44,303 37,090
Creditors and other payables are normally settled on 30-day terms, therefore the carrying value of creditors and other payables approximates their fair value.

114 ANNUAL REPORT 2015
NOTE 12: EMPLOYEE ENTITLEMENTS
2013–14 2014–15Actual Actual
$000 $000
Current liabilities – exchange transactions
Annual leave 25,139 26,332
Accrued salaries and wages 14,180 22,542
Retiring leave 1,539 1,801
Long-service leave 1,007 1,348
Sick leave 1,138 1,140
Terminating benefits 886 941
Time off in lieu 10 3Total current liabilities – exchange transactions 43,899 54,107
Current liabilities – non-exchange transactions
PAYE payable 4,032 4,238Total current liabilities – non-exchange transactions 4,032 4,238
Total current liabilities 47,931 58,345
Non-current liabilities – exchange transactions
Retiring leave 28,971 30,764
Long-service leave 7,655 8,043Total non-current liabilities – exchange transactions 36,626 38,807
Total non-current liabilities 36,626 38,807
Total employee entitlements 84,557 97,152
The present value of retiring and long-service leave obligations depend on a number of factors that are determined on an actuarial basis by an independent actuary using a number of assumptions. Two key assumptions used in calculating these liabilities are the discount rate and salary inflation. Any changes in these assumptions will impact on the carrying amount of the liabilities.
The discount rates used by the independent actuary for the retiring and long-service leave valuations are based on Treasury published forward rates at 30 June 2015. The forward rates are derived from New Zealand government bonds. The long-term salary inflation assumption is based on Treasury published rates at 30 June 2015 and after obtaining advice from the independent actuary. The long-term salary inflation assumption used was 3.0% (2013–14: 3.5%).
In 2014–15 there was a general decrease in Treasury published forward discount rates. The impact of the forward discount rate movement was to increase the carrying amounts of the retiring leave liability by $1,578,000 and the long-service leave liability by $421,000.
The following table provides a sensitivity analysis for the key assumptions:
Discount rate Salary inflation – 1.0% + 1.0% – 1.0% + 1.0%
$000 $000 $000 $000
Retiring leave 1,776 (1,589) (1,722) 1,895
Long-service leave 489 (432) (474) 527
Movements in the provision for terminating benefits are as follows:
2013–14 2014–15Actual Actual
$000 $000
Opening balance 2,410 886
Additional provisions made 1,907 1,995
Amounts used (3,431) (1,940)
Unused amounts reversed – –
Closing balance 886 941
The closing 2014–15 provision is expected to be fully utilised in the 2015–16 year.
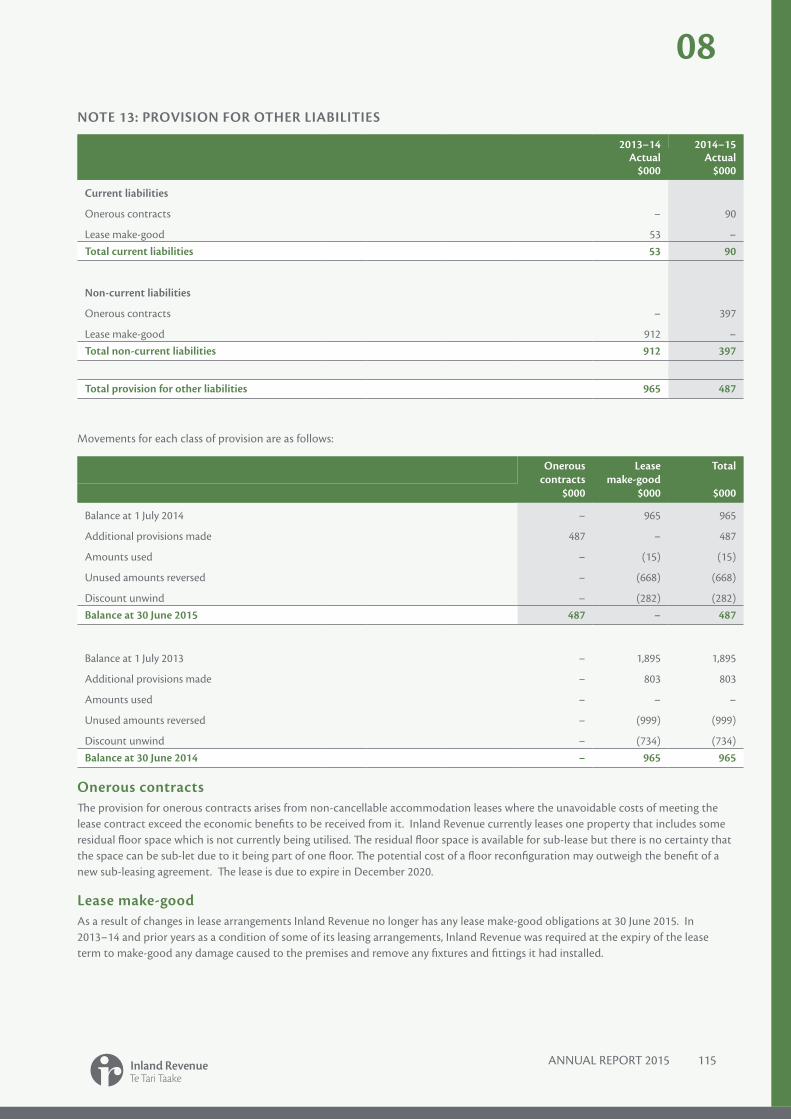
ANNUAL REPORT 2015 115
08
NOTE 13: PROVISION FOR OTHER LIABILITIES
2013–14 2014–15Actual Actual
$000 $000
Current liabilities
Onerous contracts – 90
Lease make-good 53 –Total current liabilities 53 90
Non-current liabilities
Onerous contracts – 397
Lease make-good 912 –Total non-current liabilities 912 397
Total provision for other liabilities 965 487
Movements for each class of provision are as follows:
Onerous Lease Totalcontracts make-good
$000 $000 $000
Balance at 1 July 2014 – 965 965
Additional provisions made 487 – 487
Amounts used – (15) (15)
Unused amounts reversed – (668) (668)
Discount unwind – (282) (282)Balance at 30 June 2015 487 – 487
Balance at 1 July 2013 – 1,895 1,895
Additional provisions made – 803 803
Amounts used – – –
Unused amounts reversed – (999) (999)
Discount unwind – (734) (734) Balance at 30 June 2014 – 965 965
Onerous contractsThe provision for onerous contracts arises from non-cancellable accommodation leases where the unavoidable costs of meeting the lease contract exceed the economic benefits to be received from it. Inland Revenue currently leases one property that includes some residual floor space which is not currently being utilised. The residual floor space is available for sub-lease but there is no certainty that the space can be sub-let due to it being part of one floor. The potential cost of a floor reconfiguration may outweigh the benefit of a new sub-leasing agreement. The lease is due to expire in December 2020.
Lease make-goodAs a result of changes in lease arrangements Inland Revenue no longer has any lease make-good obligations at 30 June 2015. In 2013–14 and prior years as a condition of some of its leasing arrangements, Inland Revenue was required at the expiry of the lease term to make-good any damage caused to the premises and remove any fixtures and fittings it had installed.

116 ANNUAL REPORT 2015
NOTE 14: DERIVATIVE FINANCIAL INSTRUMENTS
To hedge its currency risk, Inland Revenue enters into foreign currency forward exchange contracts with the New Zealand Debt Management Office (NZDMO).
The notional principal amount of outstanding forward exchange contract derivatives as at 30 June 2015 was NZ $nil (2013–14: NZ $95,146). The prior year contracts consisted of the purchase of US $82,720 and the unrealised loss on the forward exchange contract derivative was NZ $728 at 30 June 2014.
The fair value of forward exchange contracts entered into during the financial year was determined by reference to published price quotations in an active market.
NOTE 15: FINANCE LEASES
2013–14 2014–15Actual Actual
$000 $000
Total minimum lease payments payable
Not later than one year 456 788
Later than one year and not later than five years 637 513
Later than five years – –Total minimum lease payments 1,093 1,301
Future finance charges (114) (107)Present value of minimum lease payments 979 1,194
Present value of minimum lease payments payable
Not later than one year 386 707
Later than one year and not later than five years 593 487
Later than five years – –
Total present value of minimum lease payments 979 1,194
Represented by:
Current 386 707
Non-current 593 487
Total finance leases 979 1,194
Inland Revenue has entered into an agreement for the provision of telecommunications services that includes embedded finance leases. The leased items are included within the net carrying amount of IT equipment (refer Note 4).
Inland Revenue has no rights of renewal and no option to purchase the assets at the end of the lease term.
There are no restrictions placed on Inland Revenue by any of the finance leasing arrangements.
Finance lease liabilities are effectively secured, as the rights to the leased assets reverts to the lessor in the event of default in payment.
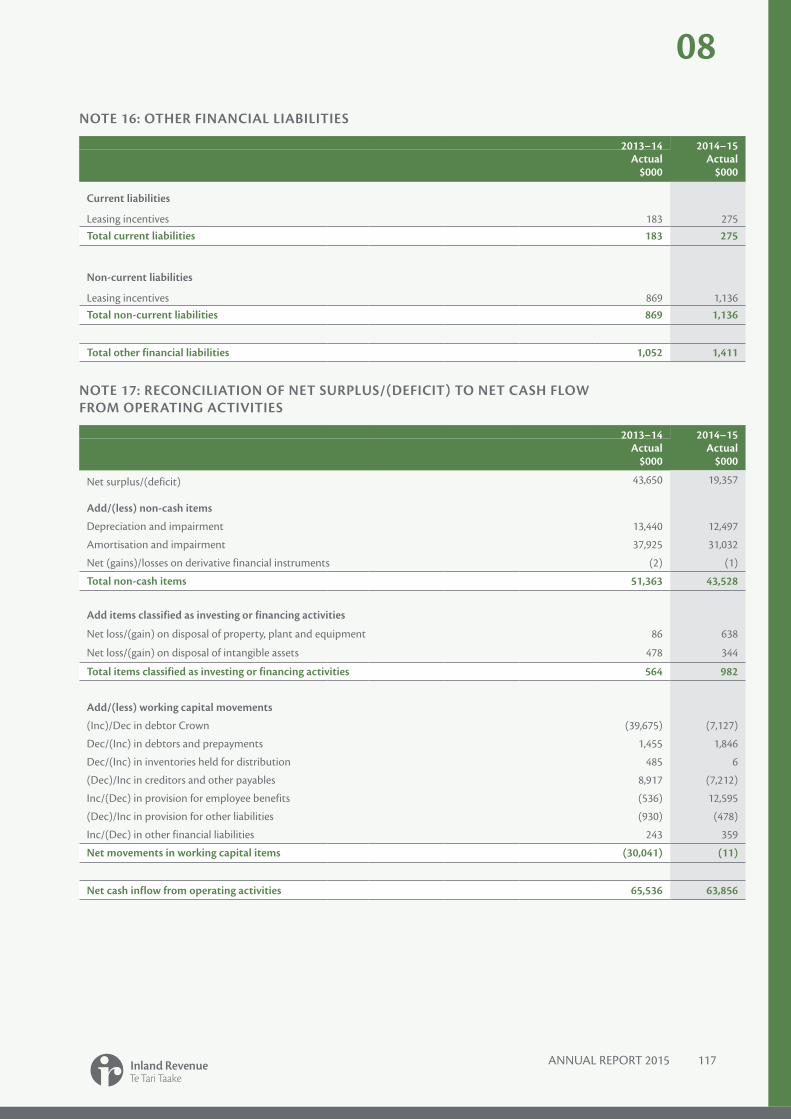
ANNUAL REPORT 2015 117
08
NOTE 16: OTHER FINANCIAL LIABILITIES
2013–14 2014–15Actual Actual
$000 $000
Current liabilities
Leasing incentives 183 275Total current liabilities 183 275
Non-current liabilities
Leasing incentives 869 1,136Total non-current liabilities 869 1,136
Total other financial liabilities 1,052 1,411
NOTE 17: RECONCILIATION OF NET SURPLUS/(DEFICIT) TO NET CASH FLOW FROM OPERATING ACTIVITIES
2013–14 2014–15Actual Actual
$000 $000
Net surplus/(deficit) 43,650 19,357
Add/(less) non-cash items
Depreciation and impairment 13,440 12,497
Amortisation and impairment 37,925 31,032
Net (gains)/losses on derivative financial instruments (2) (1)
Total non-cash items 51,363 43,528
Add items classified as investing or financing activities
Net loss/(gain) on disposal of property, plant and equipment 86 638
Net loss/(gain) on disposal of intangible assets 478 344
Total items classified as investing or financing activities 564 982
Add/(less) working capital movements
(Inc)/Dec in debtor Crown (39,675) (7,127)
Dec/(Inc) in debtors and prepayments 1,455 1,846
Dec/(Inc) in inventories held for distribution 485 6
(Dec)/Inc in creditors and other payables 8,917 (7,212)
Inc/(Dec) in provision for employee benefits (536) 12,595
(Dec)/Inc in provision for other liabilities (930) (478)
Inc/(Dec) in other financial liabilities 243 359
Net movements in working capital items (30,041) (11)
Net cash inflow from operating activities 65,536 63,856

118 ANNUAL REPORT 2015
NOTE 18: COMMITMENTS
Capital commitmentsCapital commitments are the aggregate amount of capital expenditure contracted for the acquisition of property, plant and equipment and intangible assets that have not been paid for or recognised as a liability at balance date.
Operating commitmentsOperating commitments for non-cancellable accommodation leases relate to Inland Revenue’s long-term leases on its premises at many locations throughout New Zealand. The annual lease payments are reviewed regularly, and the amounts disclosed as future commitments are based on current rental rates. These commitments also include office space vacated by Inland Revenue as a result of organisational restructuring and sub-leasing. Provision has been made in the financial statements for the expected net expenses for the duration of these leases.
The total minimum future sub-lease payments expected to be received under non-cancellable sub-leases at balance date is $13,632,426 (2013–14: $12,294,537). The increase is mainly due to an upcoming establishment of a co-located building in Tauranga with another government agency. The co-location is expected to take place in the 2016–17 financial year.
Inland Revenue’s non-cancellable operating leases have varying terms, escalation clauses and renewal rights. There are no restrictions placed on Inland Revenue by any of its leasing arrangements.
NOTE 19: CONTINGENT LIABILITIES AND CONTINGENT ASSETS
Contingent liabilities
Legal proceedings and disputes – taxpayer
This contingent liability relates to potential claims against Inland Revenue for court costs associated with tax disputes and other legal proceedings being taken through the courts against taxpayers. It only relates to court costs; the actual revenue (tax) under dispute is recognised as a non-departmental contingency (refer to part nine, Schedule of Non-departmental Contingent Liabilities and Contingent Assets).
The expected value of the contingent liability is calculated using an outcome probability model that weighs the total potential liability against outcome probabilities.
The contingent liability as at 2014–15 (excluding court costs recoverable) was $1,706,058 (2013–14: $843,283).
Legal proceedings and disputes – departmental
This contingent liability relates to disputes such as claims made by departmental suppliers.
Personal grievances
Personal grievances represent amounts claimed by employees for alleged breaches of contract against Inland Revenue.
Contingent assets
Legal proceedings and disputes – taxpayer
This contingent asset relates to potential court costs recoverable by Inland Revenue for court costs associated with tax disputes and other legal proceedings being taken through the courts against taxpayers. It only relates to court costs; the actual revenue (tax) under dispute is recognised as a non-departmental contingency (refer to part nine, Schedule of Non-departmental Contingent Liabilities and Contingent Assets).
The expected value of the contingent asset is calculated using an outcome probability model that weighs the total potential court costs recoverable against outcome probabilities.
The contingent asset as at 2014–15 was $2,646,669 (2013–14: $2,867,162).

ANNUAL REPORT 2015 119
08
NOTE 20: RELATED PARTY TRANSACTIONS AND KEY MANAGEMENT PERSONNEL
Inland Revenue is a wholly owned entity of the Crown. The government significantly influences the role of Inland Revenue as well as being its major source of revenue.
Related party disclosures have not been made for transactions with related parties that are within a normal supplier or client/recipient relationship on terms and conditions no more or less favourable than those that it is reasonable to expect that Inland Revenue would have adopted in dealing with the party at arm’s length in the same circumstances. Further, transactions with other government agencies (for example, government departments and Crown entities) are not disclosed as related party transactions when they are consistent with the normal operating arrangements between government agencies and undertaken on the normal terms and conditions for such transactions.
Inland Revenue has no related party transactions that are required to be disclosed in 2014–15 (2013–14: $nil).
Remuneration to key management personnelThe remuneration of key management personnel during the year was as follows:
2013–14 2014–15Actual Actual
Leadership team, including the Chief Executive
Remuneration and other benefits $3,334,000 $3,526,000
Full-time equivalents 10 10
Key management personnel comprise the Minister of Revenue, the Commissioner, five Deputy Commissioners, Chief Tax Counsel, Chief Financial Officer, Chief Technology Officer, Chief People Officer and those formally acting in those positions during the financial year. The Commissioner’s remuneration is determined and paid by the State Services Commission.
The above key management personnel disclosure excludes the Minister of Revenue. The Minister’s remuneration and other benefits are set out by the remuneration authority, are not received only for his role as a member of key management personnel of Inland Revenue and are not paid by Inland Revenue.

120 ANNUAL REPORT 2015
NOTE 21: FINANCIAL INSTRUMENTS – CATEGORIES OF FINANCIAL INSTRUMENTS
The carrying amounts of financial assets and financial liabilities in each of the financial instrument categories are as follows:
Notes 2013–14 2014–15 Actual Actual
$000 $000
Debtors and receivablesCash and cash equivalents 30,643 20,679
Debtor Crown 238,430 245,557
Net debtors 9 5,564 4,586
Total debtors and receivables 274,637 270,822
Fair value through surplus or deficit
Derivative financial instrument liabilities 14 1 –
Total fair value through surplus or deficit 1 –
Financial liabilities measured at amortised costCreditors and other payables 11 32,980 27,984
Finance lease liabilities 15 979 1,194
Other financial liabilities 16 1,052 1,411
Total financial liabilities measured at amortised cost 35,011 30,589
NOTE 22: FINANCIAL INSTRUMENTS – FAIR VALUE HIERARCHY DISCLOSURES
For those instruments recognised at fair value in the Statement of Financial Position, fair values are determined according to the following hierarchy:
• Quoted market price (level 1) – Financial instruments with quoted prices for identical instruments in active markets.
• Valuation technique using observable inputs (level 2) – Financial instruments with quoted prices for similar instruments in active markets or quoted prices for identical or similar instruments in inactive markets and financial instruments valued using models where all significant inputs are observable.
• Valuation techniques with significant non-observable inputs (level 3) – Financial instruments valued using models where one or more significant inputs are not observable.
The following table analyses the basis of the valuation of classes of financial instruments measured at fair value in the Statement of Financial Position.
Valuation TechniqueQuoted market Observable Significant non - Total
price inputs observable inputs$000 $000 $000 $000
2014–15
Financial liabilities
Foreign exchange derivatives – – – –
2013–14
Financial liabilities
Foreign exchange derivatives – 1 – 1
There were no transfers between the different levels of the fair value hierarchy.
ANNUAL REPORT 2015 121
08
NOTE 23: FINANCIAL INSTRUMENTS – FINANCIAL INSTRUMENT RISKS
Inland Revenue’s activities expose it to a variety of financial instrument risks, including market risk, credit risk, and liquidity risk. Inland Revenue has a series of policies to manage the risks associated with financial instruments and seeks to minimise exposure from financial instruments. These policies do not allow any transactions that are speculative in nature to be entered into.
Market risk
Currency risk
The risk that the fair value or future cash flows of a financial instrument will fluctuate because of changes in foreign exchange rates is called currency risk.
Because Inland Revenue purchases fixed assets and services from overseas suppliers it is exposed to currency risk arising from various currency exposures, primarily for the United States and Australian dollars. Currency risk arises from future purchases of fixed assets and services which are denominated in a foreign currency.
Inland Revenue has policies in place to manage the risks associated with financial instruments and, being risk averse, seeks to minimise exposure from its treasury activities.
Under its foreign exchange policy, Inland Revenue enters into foreign currency forward exchange contracts to manage foreign exchange exposures when single foreign exchange transactions exceed NZ $100,000, or the transaction exposure for an individual currency exceeds NZ $100,000. This policy has been approved by Treasury and is in line with the requirements of Treasury’s Guidelines for the Management of Crown and Departmental Foreign Exchange Exposure.
Interest rate risk
Interest rate risk is the risk that the fair value of a financial instrument will fluctuate or, the cash flows from a financial instrument will fluctuate, due to changes in market interest rates.
Inland Revenue has no interest-bearing financial instruments so it has no exposure to interest rate risk.
Credit riskThe risk that a third party will default on its obligations to Inland Revenue, causing a loss to be incurred is called credit risk. In the normal course of its business, credit risk from debtors and receivables is concentrated with the Crown and other government agencies.
The carrying amount of financial assets recognised in the Statement of Financial Position best represents Inland Revenue’s maximum exposure to credit risk at balance date.
Inland Revenue does not require any collateral, security, or other credit enhancements to support financial instruments with financial institutions that it deals with, because these entities have high credit ratings. Westpac is Inland Revenue’s main bank and has a Standard and Poor’s credit rating of AA–. Inland Revenue enters into foreign currency transactions with the NZDMO (Standard and Poor’s credit rating of AA). For its other financial instruments, Inland Revenue does not have significant concentrations of credit risk.
The carrying amount of financial assets that would otherwise be past due or impaired whose terms have been renegotiated is not material.
Liquidity riskLiquidity risk is the risk that Inland Revenue will encounter difficulty raising liquid funds to meet commitments as they fall due.
As all but an insignificant proportion of funds come from the New Zealand Government and cash is drawn down on a fortnightly basis, Inland Revenue does not have significant liquidity risk. In meeting its liquidity requirements, Inland Revenue closely monitors its forecast cash requirements with expected cash drawdowns from the NZDMO. Inland Revenue maintains a target level of available cash to meet liquidity requirements.

122 ANNUAL REPORT 2015
Contractual maturity analysis of financial liabilities, excluding derivatives
The table below analyses Inland Revenue’s financial liabilities that will be settled, based on the remaining period at balance date to the contractual maturity date. The amounts disclosed are the contractual undiscounted cash flows.
Notes Carrying Contractual Up to 1 year 1 to 5 years Over 5 years Totalamount cash flows
$000 $000 $000 $000 $000 $000
2014–15 Creditors and other payables 11 27,984 27,984 27,984 – – 27,984
Finance lease liabilities 15 1,194 1,093 456 637 – 1,093
Other financial liabilities 16 1,411 1,144 275 604 265 1,144
Closing balance 30,589 30,221 28,715 1,241 265 30,221
2013–14
Creditors and other payables 11 32,980 32,980 32,980 – – 32,980
Finance lease liabilities 15 979 1,028 441 587 – 1,028
Other financial liabilities 16 1,052 861 183 489 189 861
Closing balance 35,011 34,869 33,604 1,076 189 34,869
Contractual maturity analysis of derivative financial instrument liabilities
The table below analyses Inland Revenue’s forward exchange contract derivatives into relevant maturity groupings based on the remaining period at balance date to the contractual maturity date. The amounts disclosed are the contractual undiscounted cash flows.
Notes Liability Asset carrying Contractual Less than 6 6–12 1–2 yearscarrying amount cash flows months monthsamount NZD NZD NZD NZD
$000 $000 $000 $000 $000 $000
2014–15 Gross settled forward foreign exchange contracts
14 – – – – – –
–Outflow – – – – – –
–Inflow – – – – – –
– – – – – –
2013–14
Gross settled forward foreign exchange contracts
14 1 – – – – –
–Outflow – – 95 95 – –
–Inflow – – – – – –
1 – 95 95 – –
The following provides a sensitivity analysis for the key assumptions:
At 30 June 2015, if the NZ dollar had strengthened by 5% against the US dollar, with all other variables held constant, the surplus for the year would have been $1,083 (2013–14: $4,769) higher. At 30 June 2015, if the NZ dollar had weakened by 5% against the US dollar, with all other variables held constant, the surplus for the year would have been $1,198 (2013–14: $5,271) lower. This movement is attributable to the translation of US dollar-denominated creditors.
At 30 June 2015, if the NZ dollar had strengthened by 5% against the Australian dollar, with all other variables held constant, the surplus for the year would have been $16,131 (2013–14: $8,232) higher. At 30 June 2015, if the NZ dollar had weakened by 5% against the Australian dollar, with all other variables held constant, the surplus for the year would have been $17,829 (2013–14: $9,098) lower. This movement is attributable to the translation of Australian dollar-denominated creditors.
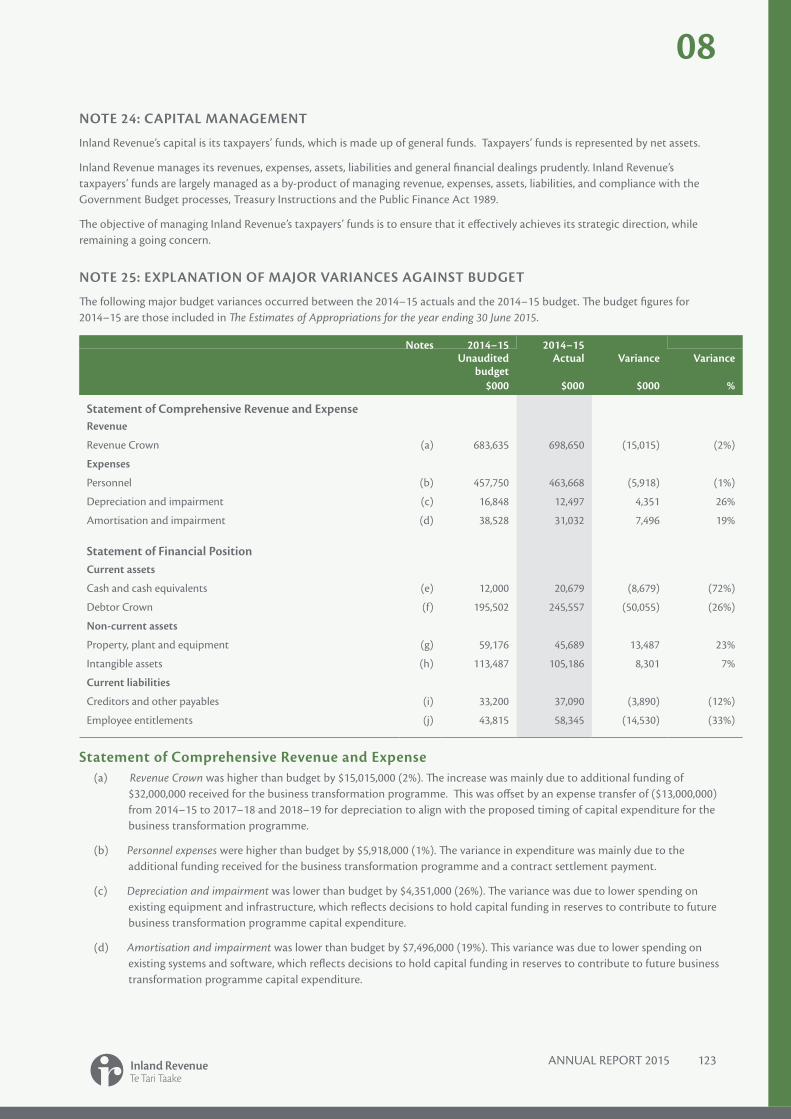
ANNUAL REPORT 2015 123
08
NOTE 24: CAPITAL MANAGEMENT
Inland Revenue’s capital is its taxpayers’ funds, which is made up of general funds. Taxpayers’ funds is represented by net assets.
Inland Revenue manages its revenues, expenses, assets, liabilities and general financial dealings prudently. Inland Revenue’s taxpayers’ funds are largely managed as a by-product of managing revenue, expenses, assets, liabilities, and compliance with the Government Budget processes, Treasury Instructions and the Public Finance Act 1989.
The objective of managing Inland Revenue’s taxpayers’ funds is to ensure that it effectively achieves its strategic direction, while remaining a going concern.
NOTE 25: EXPLANATION OF MAJOR VARIANCES AGAINST BUDGET
The following major budget variances occurred between the 2014–15 actuals and the 2014–15 budget. The budget figures for 2014–15 are those included in The Estimates of Appropriations for the year ending 30 June 2015.
Notes 2014–15 2014–15 Unaudited Actual Variance Variance budget
$000 $000 $000 %
Statement of Comprehensive Revenue and Expense
Revenue
Revenue Crown (a) 683,635 698,650 (15,015) (2%)
Expenses
Personnel (b) 457,750 463,668 (5,918) (1%)
Depreciation and impairment (c) 16,848 12,497 4,351 26%
Amortisation and impairment (d) 38,528 31,032 7,496 19%
Statement of Financial PositionCurrent assets
Cash and cash equivalents (e) 12,000 20,679 (8,679) (72%)
Debtor Crown (f) 195,502 245,557 (50,055) (26%)
Non-current assets
Property, plant and equipment (g) 59,176 45,689 13,487 23%
Intangible assets (h) 113,487 105,186 8,301 7%
Current liabilities
Creditors and other payables (i) 33,200 37,090 (3,890) (12%)
Employee entitlements (j) 43,815 58,345 (14,530) (33%)
Statement of Comprehensive Revenue and Expense(a) Revenue Crown was higher than budget by $15,015,000 (2%). The increase was mainly due to additional funding of
$32,000,000 received for the business transformation programme. This was offset by an expense transfer of ($13,000,000) from 2014–15 to 2017–18 and 2018–19 for depreciation to align with the proposed timing of capital expenditure for the business transformation programme.
(b) Personnel expenses were higher than budget by $5,918,000 (1%). The variance in expenditure was mainly due to the additional funding received for the business transformation programme and a contract settlement payment.
(c) Depreciation and impairment was lower than budget by $4,351,000 (26%). The variance was due to lower spending on existing equipment and infrastructure, which reflects decisions to hold capital funding in reserves to contribute to future business transformation programme capital expenditure.
(d) Amortisation and impairment was lower than budget by $7,496,000 (19%). This variance was due to lower spending on existing systems and software, which reflects decisions to hold capital funding in reserves to contribute to future business transformation programme capital expenditure.

124 ANNUAL REPORT 2015
Statement of Financial Position(e) Cash and cash equivalents were higher than budget by $8,679,000 (72%). This was due to holding cash for salaries and
wages that were paid on 1 July 2015.
(f) Debtor Crown was higher than budget by $50,055,000 (26%). This variance was mainly due to $13,487,000 of underspending in property, plant and equipment, $8,301,000 of underspending in intangible assets, and the net surplus for 2014–15 of $19,357,000 that will be repaid to the Crown.
(g) & (h) Non-current assets were lower than budget by $21,788,000 (13%). The variance in non-current assets mainly reflects a reduction in the capital expenditure during the year. Capital expenditure on existing systems and infrastructure has been reduced, with capital funding held in reserves to contribute to future business transformation programme capital expenditure.
(i) Creditors and other payables were higher than budget by $3,890,000 (12%). This was due to the timing of trade payables and a higher than forecast GST liability.
(j) Employee entitlements were higher than budget by $14,530,000 (33%). This was mainly due to a contract settlement payment and macroeconomic changes in the actuarial valuations for retiring and long-service leave in 2014–15.
NOTE 26: EVENTS AFTER BALANCE DATE
No events have occurred between the balance date and date of signing these financial statements that materially affect the actual results within these financial statements.
Non-departmental financial schedules
ANNUAL REPORT 2015 125
09
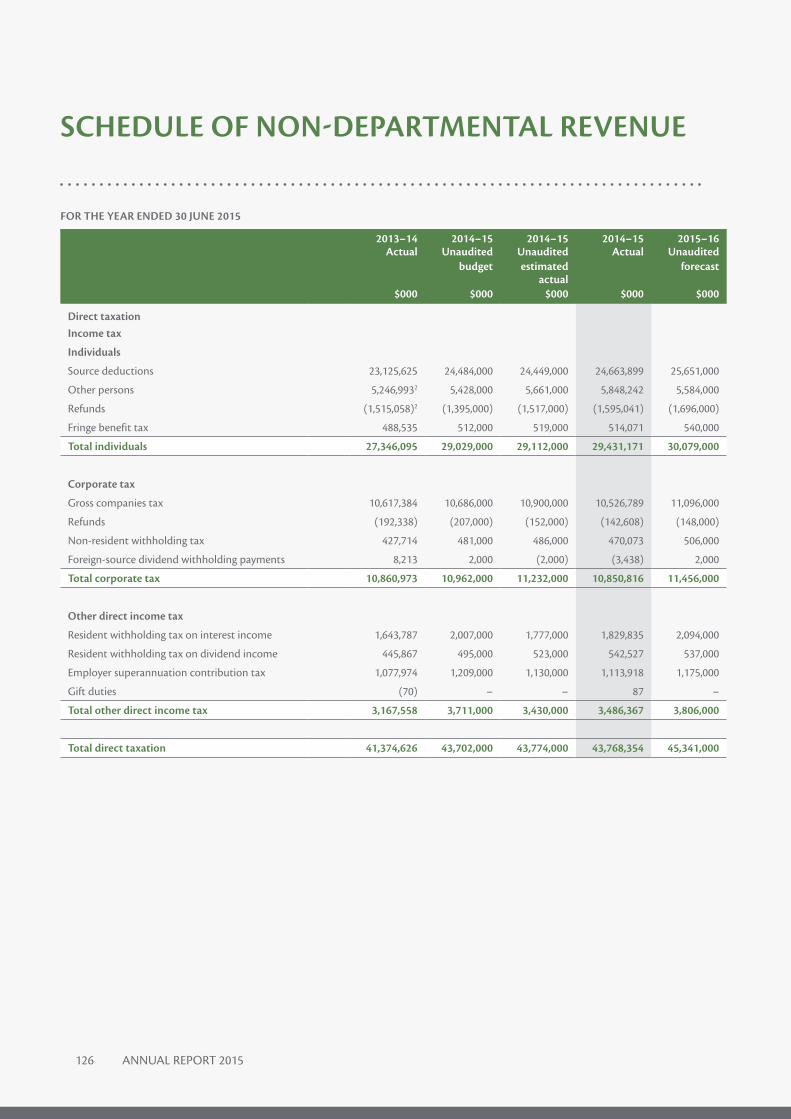
126 ANNUAL REPORT 2015
SCHEDULE OF NON-DEPARTMENTAL REVENUE
FOR THE YEAR ENDED 30 JUNE 2015
2013–14 2014–15 2014–15 2014–15 2015–16Actual Unaudited
budgetUnaudited estimated
Actual Unaudited forecast
actual $000 $000 $000 $000 $000
Direct taxation Income tax
Individuals
Source deductions 23,125,625 24,484,000 24,449,000 24,663,899 25,651,000
Other persons 5,246,9932 5,428,000 5,661,000 5,848,242 5,584,000
Refunds (1,515,058)2 (1,395,000) (1,517,000) (1,595,041) (1,696,000)
Fringe benefit tax 488,535 512,000 519,000 514,071 540,000
Total individuals 27,346,095 29,029,000 29,112,000 29,431,171 30,079,000
Corporate tax
Gross companies tax 10,617,384 10,686,000 10,900,000 10,526,789 11,096,000
Refunds (192,338) (207,000) (152,000) (142,608) (148,000)
Non-resident withholding tax 427,714 481,000 486,000 470,073 506,000
Foreign-source dividend withholding payments 8,213 2,000 (2,000) (3,438) 2,000
Total corporate tax 10,860,973 10,962,000 11,232,000 10,850,816 11,456,000
Other direct income tax
Resident withholding tax on interest income 1,643,787 2,007,000 1,777,000 1,829,835 2,094,000
Resident withholding tax on dividend income 445,867 495,000 523,000 542,527 537,000
Employer superannuation contribution tax 1,077,974 1,209,000 1,130,000 1,113,918 1,175,000
Gift duties (70) – – 87 –
Total other direct income tax 3,167,558 3,711,000 3,430,000 3,486,367 3,806,000
Total direct taxation 41,374,626 43,702,000 43,774,000 43,768,354 45,341,000

ANNUAL REPORT 2015 127
09
SCHEDULE OF NON-DEPARTMENTAL REVENUE (CONTINUED)
FOR THE YEAR ENDED 30 JUNE 2015
2013–14 2014–15 2014–15 2014–15 2015–16Actual Unaudited
budgetUnaudited estimated
Actual Unaudited forecast
actual $000 $000 $000 $000 $000
Indirect taxation Goods and services tax
Gross goods and services tax 25,751,108 27,946,000 26,878,000 26,566,080 28,378,000
Refunds (11,191,411) (11,632,000) (11,312,000) (10,954,126) (11,949,000)
Total goods and services tax 14,559,697 16,314,000 15,566,000 15,611,954 16,429,000
Other indirect taxation
Cheque duties1 2,464 – – 312 –
Approved issuer levy 90,522 90,000 93,000 100,075 92,000
Gaming duties 266,814 267,000 262,000 264,364 270,000
Other indirect taxation 2,709 5,000 5,000 2,480 5,000
Total other indirect taxation 362,509 362,000 360,000 367,231 367,000
Total indirect taxation 14,922,206 16,676,000 15,926,000 15,979,185 16,796,000
Total taxation 56,296,832 60,378,000 59,700,000 59,747,539 62,137,000
Other revenue
Child support 204,6742 229,620 187,350 196,985 200,250
Interest unwind – student loans 579,318 601,000 596,000 604,175 605,000
Other revenue 86,059 92,000 76,000 86,341 78,000
Total other revenue 870,051 922,620 859,350 887,501 883,250
Total operating revenue 57,166,883 61,300,620 60,559,350 60,635,040 63,020,250
1 Cheque duties were abolished from 1 July 2014.
2 These numbers are restated due to the transition to the new PBE accounting standards. Refer to Note 9 for details.
The accompanying accounting policies and notes form part of these financial schedules.
For a full understanding of the Crown’s financial position and the results of its operations, refer to the Financial Statements of the Government of New Zealand for the Year Ended 30 June 2015.

128 ANNUAL REPORT 2015
SCHEDULE OF NON-DEPARTMENTAL EXPENDITURE
FOR THE YEAR ENDED 30 JUNE 2015
2013–14 2014–15 2014–15 2014–15 2015–16Actual Unaudited Unaudited Actual Unaudited
budget estimated forecastactual
$000 $000 $000 $000 $000
Benefits and other unrequited expenses
Child tax credit 1,835 1,300 1,300 1,298 1,100
Family tax credit 1,965,263 1,934,000 1,857,000 1,854,048 1,837,000
In-work tax credit 533,266 494,000 512,000 511,186 529,000
KiwiSaver: Fee subsidy (11) – – (8) –
KiwiSaver: Interest 7,294 13,000 13,000 8,413 15,000
KiwiSaver: Kick-start payment 227,772 171,000 226,000 218,364 –
KiwiSaver: Tax credit 569,163 643,000 643,000 629,297 705,000
Minimum family tax credit 14,275 13,000 16,000 15,975 16,000
Paid parental leave payments 164,504 176,000 184,000 180,286 233,000
Parental tax credit 17,640 19,000 21,000 20,967 31,000
Payroll subsidy 3,129 4,000 4,100 3,945 5,100
Research and development tax credit (3,952) – – – –
Total benefits and other unrequited expenses 3,500,178 3,468,300 3,477,400 3,443,771 3,372,200
Borrowing expenses
Adverse event interest 12 10 20 (1) 10
Environmental restoration account interest 1,636 2,000 2,000 1,634 2,000
Income equalisation interest 7,260 7,000 15,000 3,543 15,000
Total borrowing expenses 8,908 9,010 17,020 5,176 17,010
Other expenses
Impairment of debt and debt write-offs1 1,025,0602 1,162,098 875,972 860,829 1,179,224
Impairment of debt relating to child support –2 – – – –
Impairment of debt relating to student loans 12,000 100,000 253,000 269,000 100,000
Initial fair value write-down relating to student loans 629,539 668,000 606,000 601,665 646,000
Total other expenses 1,666,599 1,930,098 1,734,972 1,731,494 1,925,224
Total expenditure 5,175,685 5,407,408 5,229,392 5,180,441 5,314,434 1 Impairment of debt and debt write-offs relates to general tax, Working for Families Tax Credits and KiwiSaver debt.2 These numbers are restated due to the transition to the new PBE accounting standards. Refer to Note 9 for details.
The accompanying accounting policies and notes form part of these financial schedules.
For a full understanding of the Crown’s financial position and the results of its operations, refer to the Financial Statements of the Government of New Zealand for the Year Ended 30 June 2015.
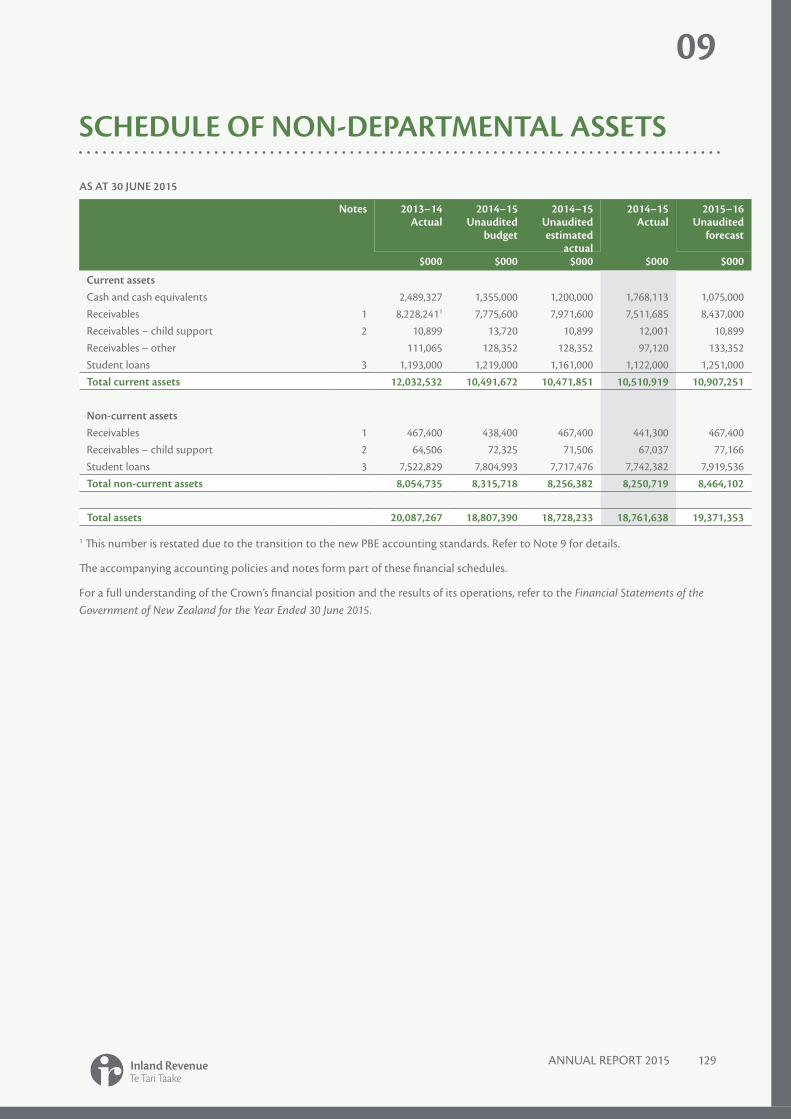
ANNUAL REPORT 2015 129
09
SCHEDULE OF NON-DEPARTMENTAL ASSETS
AS AT 30 JUNE 2015
Notes 2013–14 2014–15 2014–15 2014–15 2015–16Actual Unaudited Unaudited Actual Unaudited
budget estimated forecastactual
$000 $000 $000 $000 $000
Current assetsCash and cash equivalents 2,489,327 1,355,000 1,200,000 1,768,113 1,075,000Receivables 1 8,228,2411 7,775,600 7,971,600 7,511,685 8,437,000Receivables – child support 2 10,899 13,720 10,899 12,001 10,899Receivables – other 111,065 128,352 128,352 97,120 133,352Student loans 3 1,193,000 1,219,000 1,161,000 1,122,000 1,251,000Total current assets 12,032,532 10,491,672 10,471,851 10,510,919 10,907,251
Non-current assetsReceivables 1 467,400 438,400 467,400 441,300 467,400Receivables – child support 2 64,506 72,325 71,506 67,037 77,166Student loans 3 7,522,829 7,804,993 7,717,476 7,742,382 7,919,536Total non-current assets 8,054,735 8,315,718 8,256,382 8,250,719 8,464,102
Total assets 20,087,267 18,807,390 18,728,233 18,761,638 19,371,353
1 This number is restated due to the transition to the new PBE accounting standards. Refer to Note 9 for details.
The accompanying accounting policies and notes form part of these financial schedules.
For a full understanding of the Crown’s financial position and the results of its operations, refer to the Financial Statements of the Government of New Zealand for the Year Ended 30 June 2015.

130 ANNUAL REPORT 2015
SCHEDULE OF NON-DEPARTMENTAL LIABILITIES
AS AT 30 JUNE 2015
Notes 2013–14 2014–15 2014–15 2014–15 2015–16Actual Unaudited Unaudited Actual Unaudited
budget estimated forecastactual
$000 $000 $000 $000 $000
Current liabilitiesPayables and provisionsChild support 37,359 30,096 37,359 42,752 37,359Refundables and payables 4 4,489,2451 4,404,794 4,381,975 4,311,622 4,749,799Unclaimed monies 5 13,818 12,475 13,818 14,859 13,818Total current liabilities 4,540,422 4,447,365 4,433,152 4,369,233 4,800,976
Non-current liabilitiesReserve schemes 6 245,937 294,968 429,437 339,279 362,437Total non-current liabilities 245,937 294,968 429,437 339,279 362,437
Total liabilities 4,786,359 4,742,333 4,862,589 4,708,512 5,163,413
1 This number is restated due to the transition to the new PBE accounting standards. Refer to Note 9 for details.
The accompanying accounting policies and notes form part of these financial schedules.
For a full understanding of the Crown’s financial position and the results of its operations, refer to the Financial Statements of the Government of New Zealand for the Year Ended 30 June 2015.

ANNUAL REPORT 2015 131
09
SCHEDULE OF NON-DEPARTMENTAL MOVEMENTS BETWEEN DEPARTMENTS
FOR THE YEAR ENDED 30 JUNE 2015
2013–14 2014–15 2014–15 2014–15 2015–16Actual Unaudited Unaudited Actual Unaudited
budget estimated forecastactual
$000 $000 $000 $000 $000
Opening balance 14,956,5441 14,568,802 15,300,908 15,300,908 13,865,644
Net result from operating activities 51,991,1982 55,893,212 55,329,958 55,454,599 57,705,816
Asset transfer between departments – Ministry of Social Development – student loans
1,521,537 1,597,153 1,539,647 1,528,794 1,594,060
New Zealand Debt Management Office (53,168,371) (58,014,490) (58,519,420) (58,231,175) (58,967,990)
Other – 20,380 214,551 – 10,410
Closing balance 15,300,908 14,065,057 13,865,644 14,053,126 14,207,940
1 This number is restated due to the transition to the new PBE accounting standards. Refer to Note 9 for details.2 This number is restated due to the flow-on effect from the Schedule of Non-departmental Revenue and the Schedule of Non-departmental Expenditure on the transition to the new PBE accounting standards. Refer to Note 9 for details.
The accompanying accounting policies and notes form part of these financial schedules.
For a full understanding of the Crown’s financial position and the results of its operations, refer to the Financial Statements of the Government of New Zealand for the Year Ended 30 June 2015.
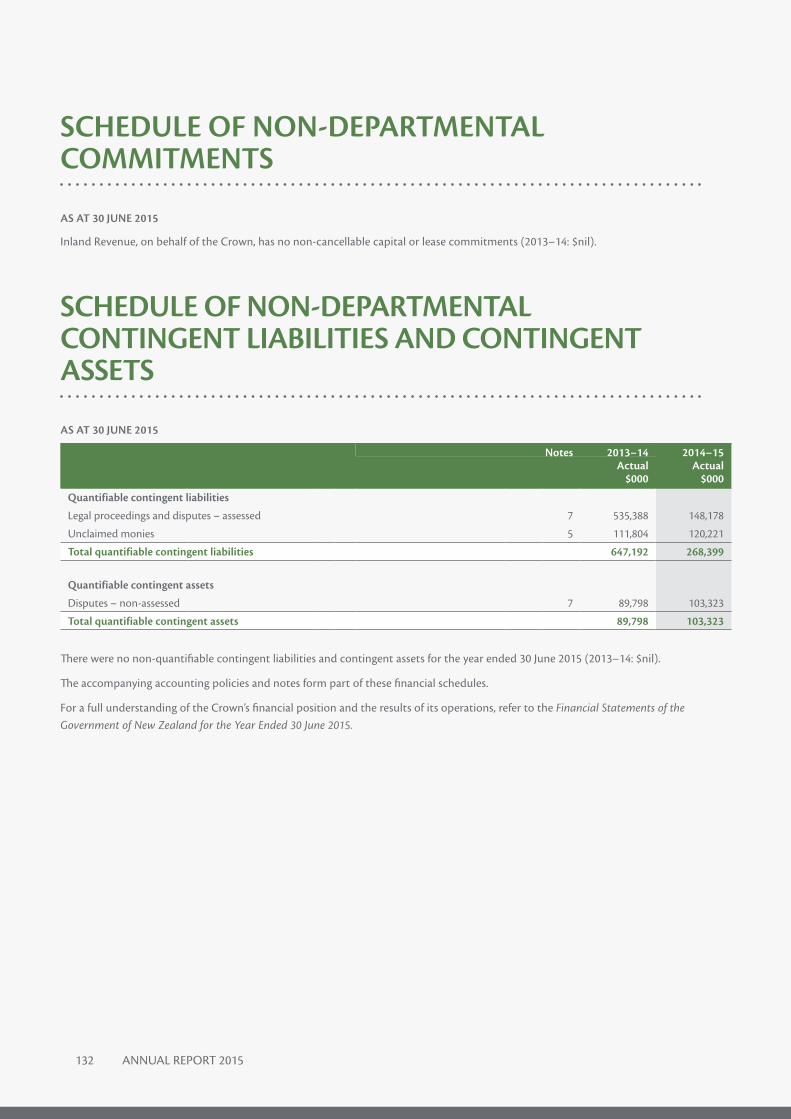
132 ANNUAL REPORT 2015
SCHEDULE OF NON-DEPARTMENTAL COMMITMENTS
AS AT 30 JUNE 2015
Inland Revenue, on behalf of the Crown, has no non-cancellable capital or lease commitments (2013–14: $nil).
SCHEDULE OF NON-DEPARTMENTAL CONTINGENT LIABILITIES AND CONTINGENT ASSETS
AS AT 30 JUNE 2015
Notes 2013–14 2014–15Actual Actual
$000 $000
Quantifiable contingent liabilities
Legal proceedings and disputes – assessed 7 535,388 148,178
Unclaimed monies 5 111,804 120,221
Total quantifiable contingent liabilities 647,192 268,399
Quantifiable contingent assets
Disputes – non-assessed 7 89,798 103,323
Total quantifiable contingent assets 89,798 103,323
There were no non-quantifiable contingent liabilities and contingent assets for the year ended 30 June 2015 (2013–14: $nil).
The accompanying accounting policies and notes form part of these financial schedules.
For a full understanding of the Crown’s financial position and the results of its operations, refer to the Financial Statements of the Government of New Zealand for the Year Ended 30 June 2015.

ANNUAL REPORT 2015 133
09
SCHEDULE OF NON-DEPARTMENTAL TRUST MONEY
FOR THE YEAR ENDED 30 JUNE 2015
2013–14 2014–15 2014–15 2014–15Actual Contributions Distributions Actual
$000 $000 $000 $000
Child support
Child support trust account 17,394 260,880 (262,075) 16,199
Reciprocal child support agreement trust account 397 12,546 (12,504) 439
Total child support 17,791 273,426 (274,579) 16,638
KiwiSaver
KiwiSaver returned transactions trust account 44 102 – 146
Total KiwiSaver 44 102 – 146
Total trust money 17,835 273,528 (274,579) 16,784
The child support trust accounts were established in accordance with sections 139 and 140 of the Child Support Act 1991. Inland Revenue administers these trust accounts for amounts collected from liable parents and the subsequent child support payments that are paid to the custodial parents.
The KiwiSaver trust account was established in accordance with section 74(4) of the KiwiSaver Act 2006. Inland Revenue administers this account to hold money deposited with the Crown from KiwiSaver scheme providers, primarily for refunds and payments made in error, pending the completion of the financial transaction.
The accompanying accounting policies and notes form part of these financial schedules.
For a full understanding of the Crown’s financial position and the results of its operations, refer to the Financial Statements of the Government of New Zealand for the Year Ended 30 June 2015.

134 ANNUAL REPORT 2015
STATEMENT OF ACCOUNTING POLICIES
These financial schedules are for the year ended 30 June 2015 and include forecast financial schedules for the year ending 30 June 2016. The schedules have been combined to provide a single view of actual, budget and forecast information.
References to the financial schedules incorporate the financial schedules and forecast financial schedules, unless otherwise stated.
REPORTING ENTITY
These non-departmental financial schedules present financial information on public funds managed by Inland Revenue on behalf of the Crown.
These non-departmental balances are consolidated into the Financial Statements of the Government of New Zealand for the Year Ended 30 June 2015. For a full understanding of the Crown’s financial position, results of operations, and cash flows for the year, refer to the Financial Statements of the Government of New Zealand for the Year Ended 30 June 2015.
REPORTING PERIOD
The reporting period for these financial schedules is for the year ended 30 June 2015. The forecast financial schedules are for the year ending 30 June 2016.
The financial schedules were authorised for issue by the Chief Executive of Inland Revenue on 29 September 2015.
BASIS OF PREPARATION
The accounting policies set out below have been applied consistently to all periods presented in these financial schedules.
These financial schedules have been prepared on a historical cost basis, unless otherwise stated. The accrual basis of accounting has been used, unless otherwise stated.
These financial schedules are presented in New Zealand dollars, and all values are rounded to the nearest thousand dollars ($000). The functional currency of Inland Revenue is New Zealand dollars.
These financial schedules are the first prepared in accordance with the new Tier 1 Public Benefit Entity (PBE) accounting standards. The material adjustments arising on transition are explained in Note 9.
There are no other new relevant standards and interpretations issued this year and Inland Revenue has not early adopted any new standards and interpretations.
CRITICAL ACCOUNTING ESTIMATES
The estimates and assumptions that have a significant risk of causing a material adjustment to the carrying amounts of receivables and payables within the next financial year are referred to below:
Income taxIncome tax is recognised on an accruals basis in the period the taxable event occurs. It is deemed to accrue evenly over the period to which it relates.
Where income tax returns have not been filed for the relevant period, accrued income tax revenue receivable or payable has been estimated based on current provisional assessments or prior year terminal assessments. The outcome of income tax revenue and refunds is not known with certainty until income tax returns for the period have been filed. This occurs sometime after the publication of the annual report, usually in the next accounting period.
The measurement of the income tax accruals requires significant estimates where terminal tax assessments are not yet available for the period. Key features of the estimation used are as follows:
• Where taxpayers subject to the provisional tax regime have not yet filed a terminal tax assessment for the period, provisional tax assessments are accrued.
• Where taxpayers have made payments to Inland Revenue but have not submitted a provisional tax assessment for the period, their credit balance is accrued as revenue. Payments into the tax pool are not captured by this approach.
• For individual taxpayers not subject to provisional tax, an estimate is made of the tax revenues receivable and refundable based on prior year returns adjusted for current year experience. This is a new estimate for 2014–15.
• For company taxpayers not subject to provisional tax for the current year, revenue is recognised on an assessment basis, i.e. no estimate of tax revenue is accrued in the period of the taxable event. This is because a reliable estimate cannot be made in the period of the taxable event.
Other critical accounting estimatesMaterial estimates and assumptions impact on receivables, student loan debt and refundables and payables. See Notes 1, 3 and 4 for more information on these.
ACCOUNTING POLICIES
The following accounting policies, which materially affect the measurement of financial results and financial position, have been applied.

ANNUAL REPORT 2015 135
09
Budget and forecast figuresThe budget figures for 2014–15 are those included in The Estimates of Appropriations for the year ending 30 June 2015.
The estimated actual figures for 2014–15 and the forecast figures for 2015–16 are those included in The Estimates of Appropriations for the year ending 30 June 2016. The estimated actual figures represent forecasts submitted to the Treasury based on all Government decisions and assumptions as at 28 April 2015.
The budget, estimated actual and forecast figures have been prepared in accordance with NZ GAAP, using accounting policies that are consistent with those adopted in preparing these financial schedules.
Revenue
Operating revenue
The payment of tax in itself, does not entitle a taxpayer to an equivalent value of services or benefits, because there is no direct relationship between paying tax and receiving Crown services and transfers, that is, tax revenue is a non-exchange transaction.
Tax revenue is recognised when a taxable event has occurred, the tax revenue can be reliably measured and it is probable that economic benefits will flow to the Crown. The taxable event is defined as follows:
Tax type Taxable activity
Income tax The earning of assessable income during the taxation period by the taxpayer.
Goods and services tax The purchase or sale of taxable goods and services during the taxation period.
The New Zealand tax system is predicated on self-assessment where taxpayers are expected to understand the tax laws and comply with them. This has an impact on the completeness of tax revenues when taxpayers fail to comply with tax laws, for example, if they do not report all of their income. Inland Revenue has implemented systems and controls in order to detect and correct situations where taxpayers are not complying with the various acts it administers. These systems and controls include performing audits of taxpayer records where determined necessary by Inland Revenue. Such procedures cannot be expected to identify all sources of unreported income or other cases of non-compliance with tax laws. Inland Revenue is unable to estimate the amount of unreported tax.
Interest unwind – student loans
Interest unwind on student loans is accrued using the effective interest rate method. The effective interest rate exactly discounts estimated future cash receipts through the expected
life of the financial asset to that asset’s net carrying amount. Effective interest rates are assigned to new lending each year on a ‘year of lending’ basis.
ExpensesExpenses are recognised in the period to which they relate.
Cash and cash equivalentsCash and cash equivalents include cash on hand, cash in transit and funds held in bank accounts administered by Inland Revenue.
ReceivablesReceivables include taxes and Working for Families Tax Credits (and any penalties and interest associated with these activities) and exclude student loans and child support debt.
Receivables are initially assessed at nominal value, that is, the receivable reflects the amount of tax owed or Working for Families Tax Credits payable. The nominal value of receivables at recognition does not materially differ from their fair value at that point, taking into consideration the effects of uncollectability and discounting of future cashflows to present value.
Receivables are subsequently adjusted for penalties and interest as they are charged, and tested for impairment annually. Interest and penalties charged on receivables are presented as revenue in the Schedule of Non-departmental Revenue.
Allowances for estimated irrecoverable amounts are recognised when there is objective evidence that the asset is impaired. Impairment movements are recognised in the Schedule of Non-departmental Expenditure. Impairment losses can be reversed where there is evidence that the impaired value of the asset has increased.
Financial models have been constructed for Inland Revenue to calculate the impairment of Crown debt. These models apply a number of assumptions on future repayment behaviour as well as economic assumptions such as the discount rate and inflation.
Receivables – child supportChild support receivables consist of penalties applied when a non-custodial parent is in default. These receivables are initially recognised at fair value and are assessed annually for impairment.
Financial instruments
Financial assets
Student loans
Student loans are designated as loans and receivables under PBE IPSAS 29 Financial Instruments: Recognition and Measurement. Student loans are recognised initially at fair value, plus transaction costs, and subsequently measured at amortised cost using the effective interest rate method, and adjusted for impairment movements. Fair value on initial recognition of student loans is determined by projecting

136 ANNUAL REPORT 2015
forward expected repayments and discounting them back at an appropriate discount rate. The difference between the amount lent and the fair value on initial recognition is expensed on initial recognition. The subsequent measurement at amortised cost is determined using the effective interest rate calculated at initial recognition. This rate is used to spread the Crown’s interest income across the life of the loan and determines the loan’s carrying value at each reporting date.
Allowances for estimated irrecoverable amounts are recognised when there is objective evidence that Inland Revenue will not be able to collect all amounts due according to the original terms of the receivables. Impairment losses are incurred if, and only if, there is objective evidence of impairment as a result of one or more events that occurred after the initial recognition of the loan and a loss event has an impact on the estimated future cash flows of the loan that can be reliably measured. The amount of the provision is the difference between the asset’s carrying amount and estimated impaired value. The impairment losses are recognised in the Schedule of Non-departmental Expenditure.
Impairment losses can be reversed where there is evidence that the impaired value of the financial asset has increased.
Actuarial models have been constructed by a third party to calculate the impairment of student loan debt. Refer to Note 3 for more information on this model.
Financial liabilities
Financial liabilities entered into with a duration of less than 12 months are recognised at their nominal value, unless the effect of discounting is material.
Contingent liabilities and assetsContingent liabilities and assets are recorded in the Schedule of Non-departmental Contingent Liabilities and Contingent Assets at the point at which the contingency is evident. Contingent liabilities are disclosed if the possibility that they will crystallise is not remote. Contingent assets are disclosed if it is probable that the benefits will be realised.
ComparativesWhen presentation or classification of items in the financial schedules is amended or accounting policies are changed, comparative figures have been restated to ensure consistency with the current period, unless it is impracticable to do so. Note 9 shows the adjustments to comparatives arising on transition to the new PBE accounting standards.
FORECAST FINANCIAL SCHEDULES
The forecast financial schedules have been prepared in accordance with the Public Finance Act 1989.
The purpose of the forecast financial schedules is to facilitate Parliament’s consideration of appropriations for, and planned performance of, the department. These forecast financial schedules may not be appropriate for other purposes.
The forecast financial schedules have been prepared in accordance with the accounting policies detailed above. Additional accounting policies relating to the forecasts are set out below.
The forecast financial schedules comply with NZ GAAP and have been prepared in accordance with PBE IPSAS 42 Prospective Financial Statements.
The forecast financial schedules are not subject to audit.
Forecast policiesThe forecasts have been compiled on the basis of existing government policies and ministerial expectations at the time the schedules were finalised and reflect all government decisions and circumstances as at 28 April 2015.
The key assumptions in the preparation of the forecasts include:
• Tax revenue: tax policy changes enacted and announced by the Government will take place as planned and will affect tax revenue and receipts as calculated and agreed between Inland Revenue and the Treasury.
• Student loans: the carrying value of student loans is based on a valuation model adapted to reflect current student loans policy. As such, the carrying value over the forecast period is sensitive to changes in a number of underlying assumptions, including future income levels, repayment behaviour and macroeconomic factors such as inflation and discount rates used to determine the effective interest rate for new borrowers. Any change in these assumptions would affect the present fiscal forecast.
For other key fiscal forecast assumptions, refer to the Budget Economic and Fiscal Update 2015.
Variations to forecastThe actual financial results for the forecast period covered are likely to vary from the information presented in these forecasts. Factors that may lead to a material difference between information in these forecast financial schedules and the actual reported results include:
• Changes to the Budget through initiatives or legislation approved by Cabinet
• Macroeconomics impacting revenue, expenditure and debt levels
• The timing of taxpayer’s filing and payment of returns
• The timing of taxpayer refund and credit claims
• Outcomes of the disputes process including litigation.
Any changes to budgets during 2015–16 will be incorporated into The Supplementary Estimates of Appropriations for the year ending 30 June 2016.

ANNUAL REPORT 2015 137
09
NOTES TO THE FINANCIAL SCHEDULES
NOTE 1: RECEIVABLES
Receivables include taxes and Working for Families Tax Credits and exclude student loans and child support debt.
The recoverable amount of receivables is calculated by forecasting the expected repayments based on analysis of historical debt data, deducting an estimate of service costs and then discounting using an appropriate rate. If the recoverable amount of the portfolio is less than the carrying amount, the carrying amount is reduced to the recoverable amount. Alternatively, if the recoverable amount is more, the carrying amount is increased.
Tax pooling funds held in Crown bank accounts have been netted off against receivables. These funds have been deposited by a commercial intermediary and allow taxpayers to pool tax payments to reduce their use-of-money-interest exposure. Underpayments and overpayments are offset within the same pool. We estimate that the majority of pooling funds relate to income accruals already included in not yet due receivables.
2013–14 2014–15Actual Actual
$000 $000
Receivables
Gross receivables 13,162,0762 12,145,147
Impairment receivables (4,466,435)2 (4,192,162)
Carrying value receivables 8,695,641 7,952,985
Current and non-current apportionment
Receivables – current 8,228,2412 7,511,685
Receivables – non-current 467,400 441,300
Carrying value receivables 8,695,641 7,952,985
Ageing profile of receivables – gross
Not due 7,691,3702 6,992,052
Past due1
Less than 6 months 930,766 974,747
6 – 12 months 389,436 336,826
1 – 2 years 719,193 679,751
Greater than 2 years 3,431,311 3,161,771
Total past due 5,470,706 5,153,095
Total receivables – gross 13,162,076 12,145,147
% Past due 42% 42%
Receivables – impairment
Opening balance 4,371,533 4,466,435
Impairment losses recognised 1,025,0602 860,829
Amounts written off as uncollectable (930,158) (1,135,102)
Closing balance 4,466,435 4,192,162
1 Figures are based on debt elements (a specific tax type and time period for which a debt is due). They are not comparable with the figures in the Additional Information section, which are based on debt cases (one debt case can have one or more debt elements) and also include overdue student loan debt.
2 These numbers are restated due to the transition to the new PBE accounting standards. Refer to Note 9 for details.
Receivables are classified as past due when any outstanding revenue is not paid by the taxpayer’s due date. Due dates will vary, depending on the type of revenue outstanding (e.g. income tax, GST, KiwiSaver) and the taxpayer’s balance date. Past due debt includes debt collected under instalment, debt under dispute, default assessments and debts of taxpayers who are bankrupt,
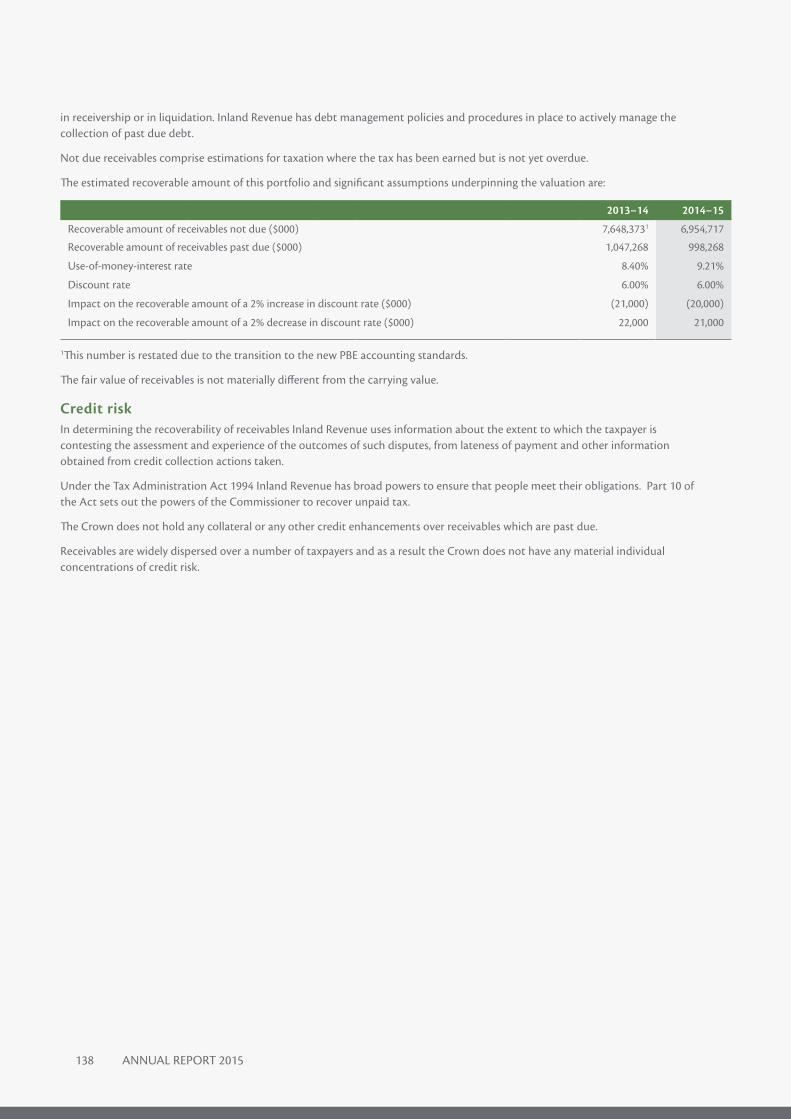
138 ANNUAL REPORT 2015
in receivership or in liquidation. Inland Revenue has debt management policies and procedures in place to actively manage the collection of past due debt.
Not due receivables comprise estimations for taxation where the tax has been earned but is not yet overdue.
The estimated recoverable amount of this portfolio and significant assumptions underpinning the valuation are:
2013–14 2014–15
Recoverable amount of receivables not due ($000) 7,648,3731 6,954,717
Recoverable amount of receivables past due ($000) 1,047,268 998,268
Use-of-money-interest rate 8.40% 9.21%
Discount rate 6.00% 6.00%
Impact on the recoverable amount of a 2% increase in discount rate ($000) (21,000) (20,000)
Impact on the recoverable amount of a 2% decrease in discount rate ($000) 22,000 21,000
1This number is restated due to the transition to the new PBE accounting standards.
The fair value of receivables is not materially different from the carrying value.
Credit riskIn determining the recoverability of receivables Inland Revenue uses information about the extent to which the taxpayer is contesting the assessment and experience of the outcomes of such disputes, from lateness of payment and other information obtained from credit collection actions taken.
Under the Tax Administration Act 1994 Inland Revenue has broad powers to ensure that people meet their obligations. Part 10 of the Act sets out the powers of the Commissioner to recover unpaid tax.
The Crown does not hold any collateral or any other credit enhancements over receivables which are past due.
Receivables are widely dispersed over a number of taxpayers and as a result the Crown does not have any material individual concentrations of credit risk.

ANNUAL REPORT 2015 139
09
NOTE 2: RECEIVABLES – CHILD SUPPORT
The Crown collects monies from liable parents and remits this to custodial parents. The child support receivable represents penalties which have been incurred as a result of the under-payment of the debt, and in the main, relates to penalties imposed on liable parents who default on their payments.
Child support penalties grow exponentially due to their compounding nature. The recovery of debt is challenging and 97% of child support debt is written down at initial recognition as it is not expected to be collected. There are limited provisions under child support legislation to remit penalties. The non-recoverability of penalties has been allowed for in the initial fair value write-down figure. At year end the fair value of the outstanding debt is also tested for impairment.
The concentration of credit risk is limited and this is not a risk that is actively managed. The Crown does not hold any collateral or other credit enhancements over these receivables.
2013–14 2014–15Actual Actual
$000 $000
Receivables – child support
Gross receivables 2,372,026 2,605,488
Impairment receivables (2,296,621) (2,526,450)
Total receivables – child support 75,405 79,038
Current and non-current apportionment
Receivables – current 10,899 12,001
Receivables – non-current 64,506 67,037
Carrying value receivables 75,405 79,038
Ageing profile of receivables – gross
Not due – –
Past due
Less than 12 months 267,192 240,285
1 – 2 years 296,558 267,192
Greater than 2 years 1,808,276 2,098,011
Total past due 2,372,026 2,605,488
Total receivables – gross 2,372,026 2,605,488
% Past due 100% 100%
Impairment of receivables – child support
Opening balance 2,041,986 2,296,621
Initial write-down to fair value1 350,991 338,070
Impairment losses recognised during the year – –
Amounts written off as uncollectable (96,356) (108,241)
Impairment losses reversed – –
Closing balance 2,296,621 2,526,450
1This is to comply with the new PBE accounting standards. Refer to Note 9 for details.
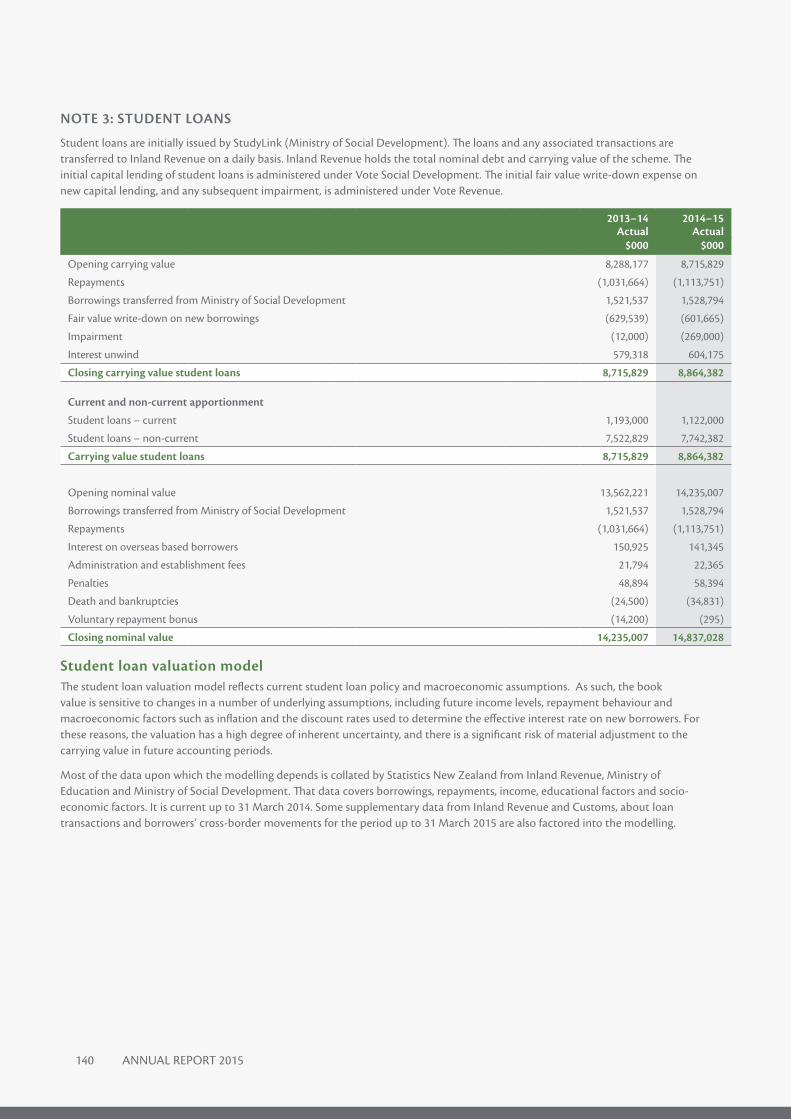
140 ANNUAL REPORT 2015
NOTE 3: STUDENT LOANS
Student loans are initially issued by StudyLink (Ministry of Social Development). The loans and any associated transactions are transferred to Inland Revenue on a daily basis. Inland Revenue holds the total nominal debt and carrying value of the scheme. The initial capital lending of student loans is administered under Vote Social Development. The initial fair value write-down expense on new capital lending, and any subsequent impairment, is administered under Vote Revenue.
2013–14 2014–15Actual Actual
$000 $000
Opening carrying value 8,288,177 8,715,829
Repayments (1,031,664) (1,113,751)
Borrowings transferred from Ministry of Social Development 1,521,537 1,528,794
Fair value write-down on new borrowings (629,539) (601,665)
Impairment (12,000) (269,000)
Interest unwind 579,318 604,175
Closing carrying value student loans 8,715,829 8,864,382
Current and non-current apportionment
Student loans – current 1,193,000 1,122,000
Student loans – non-current 7,522,829 7,742,382
Carrying value student loans 8,715,829 8,864,382
Opening nominal value 13,562,221 14,235,007
Borrowings transferred from Ministry of Social Development 1,521,537 1,528,794
Repayments (1,031,664) (1,113,751)
Interest on overseas based borrowers 150,925 141,345
Administration and establishment fees 21,794 22,365
Penalties 48,894 58,394
Death and bankruptcies (24,500) (34,831)
Voluntary repayment bonus (14,200) (295)
Closing nominal value 14,235,007 14,837,028
Student loan valuation modelThe student loan valuation model reflects current student loan policy and macroeconomic assumptions. As such, the book value is sensitive to changes in a number of underlying assumptions, including future income levels, repayment behaviour and macroeconomic factors such as inflation and the discount rates used to determine the effective interest rate on new borrowers. For these reasons, the valuation has a high degree of inherent uncertainty, and there is a significant risk of material adjustment to the carrying value in future accounting periods.
Most of the data upon which the modelling depends is collated by Statistics New Zealand from Inland Revenue, Ministry of Education and Ministry of Social Development. That data covers borrowings, repayments, income, educational factors and socio-economic factors. It is current up to 31 March 2014. Some supplementary data from Inland Revenue and Customs, about loan transactions and borrowers’ cross-border movements for the period up to 31 March 2015 are also factored into the modelling.
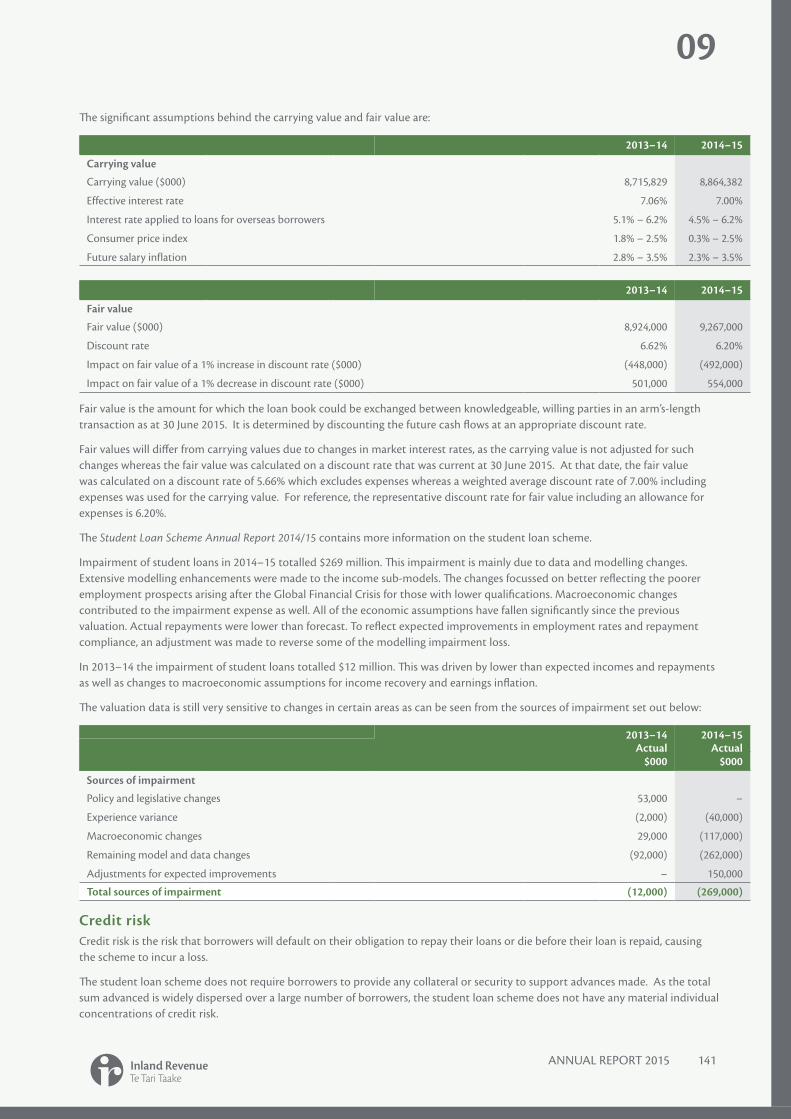
ANNUAL REPORT 2015 141
09
The significant assumptions behind the carrying value and fair value are:
2013–14 2014–15
Carrying value
Carrying value ($000) 8,715,829 8,864,382
Effective interest rate 7.06% 7.00%
Interest rate applied to loans for overseas borrowers 5.1% – 6.2% 4.5% – 6.2%
Consumer price index 1.8% – 2.5% 0.3% – 2.5%
Future salary inflation 2.8% – 3.5% 2.3% – 3.5%
2013–14 2014–15
Fair value
Fair value ($000) 8,924,000 9,267,000
Discount rate 6.62% 6.20%
Impact on fair value of a 1% increase in discount rate ($000) (448,000) (492,000)
Impact on fair value of a 1% decrease in discount rate ($000) 501,000 554,000
Fair value is the amount for which the loan book could be exchanged between knowledgeable, willing parties in an arm’s-length transaction as at 30 June 2015. It is determined by discounting the future cash flows at an appropriate discount rate.
Fair values will differ from carrying values due to changes in market interest rates, as the carrying value is not adjusted for such changes whereas the fair value was calculated on a discount rate that was current at 30 June 2015. At that date, the fair value was calculated on a discount rate of 5.66% which excludes expenses whereas a weighted average discount rate of 7.00% including expenses was used for the carrying value. For reference, the representative discount rate for fair value including an allowance for expenses is 6.20%.
The Student Loan Scheme Annual Report 2014/15 contains more information on the student loan scheme.
Impairment of student loans in 2014–15 totalled $269 million. This impairment is mainly due to data and modelling changes. Extensive modelling enhancements were made to the income sub-models. The changes focussed on better reflecting the poorer employment prospects arising after the Global Financial Crisis for those with lower qualifications. Macroeconomic changes contributed to the impairment expense as well. All of the economic assumptions have fallen significantly since the previous valuation. Actual repayments were lower than forecast. To reflect expected improvements in employment rates and repayment compliance, an adjustment was made to reverse some of the modelling impairment loss.
In 2013–14 the impairment of student loans totalled $12 million. This was driven by lower than expected incomes and repayments as well as changes to macroeconomic assumptions for income recovery and earnings inflation.
The valuation data is still very sensitive to changes in certain areas as can be seen from the sources of impairment set out below:
2013–14 2014–15Actual Actual
$000 $000
Sources of impairment
Policy and legislative changes 53,000 –
Experience variance (2,000) (40,000)
Macroeconomic changes 29,000 (117,000)
Remaining model and data changes (92,000) (262,000)
Adjustments for expected improvements – 150,000
Total sources of impairment (12,000) (269,000)
Credit riskCredit risk is the risk that borrowers will default on their obligation to repay their loans or die before their loan is repaid, causing the scheme to incur a loss.
The student loan scheme does not require borrowers to provide any collateral or security to support advances made. As the total sum advanced is widely dispersed over a large number of borrowers, the student loan scheme does not have any material individual concentrations of credit risk.

142 ANNUAL REPORT 2015
The credit risk is reduced by collection of compulsory repayments through the tax system.
Interest rate riskInterest rate risk is the risk that the value of financial instruments will fluctuate due to changes in interest rates. Changes could impact on the Government’s return on loans advanced. The interest rate and the interest write-off provisions attached to student loans are set by the Government.
NOTE 4: REFUNDABLES AND PAYABLES
Refundables and payables are recognised at their nominal value as they are due within 12 months. The nominal value is considered to approximate their fair value.
Taxes refundable represent refunds due to taxpayers. Refunds are issued to taxpayers once account and refund reviews are complete.
2013–14 2014–15Actual Actual
$000 $000
KiwiSaver payable 943,133 917,020
Paid parental leave payable 6,659 7,894
Taxes refundable 3,539,4531 3,386,708
Total refundables and payables 4,489,245 4,311,622
1 These numbers are restated due to the transition to the new PBE accounting standards. Refer to Note 9 for details.
NOTE 5: UNCLAIMED MONIES
Under the Unclaimed Money Act 1971, entities (e.g. financial institutions, insurance companies) hand over money not claimed after six years to Inland Revenue. The funds are repaid to the entitled owner on proof of identification.
NOTE 6: RESERVE SCHEMES
2013–14 2014–15Actual Actual
$000 $000
Adverse event income equalisation 2 133
Environmental restoration 54,927 54,926
Income equalisation 191,008 284,220
Total reserve schemes 245,937 339,279
The adverse event income equalisation scheme operates in addition to the income equalisation scheme. Deposits earn interest at a rate of 6.5% per annum from the date of receipt until the deposit is refunded. Deposits can be withdrawn immediately, but are transferred to the main income equalisation account if not withdrawn within 12 months of the deposit.
The environmental restoration account allows businesses to set aside money to cover restoration costs for monitoring, avoiding, remedying or mitigating the detrimental environmental effects which may occur in later years. Interest is calculated at a rate of 3% per annum and is payable from the day after the deposit is made until the day before a refund is made. Refunds will be made when the environmental restoration costs are incurred.
The income equalisation scheme allows taxpayers in the farming, fishing and forestry industries to make payments during the year by way of income equalisation deposits. Interest paid at a rate of 3% per annum will apply where a deposit is left in the scheme for a period of 12 months or more.
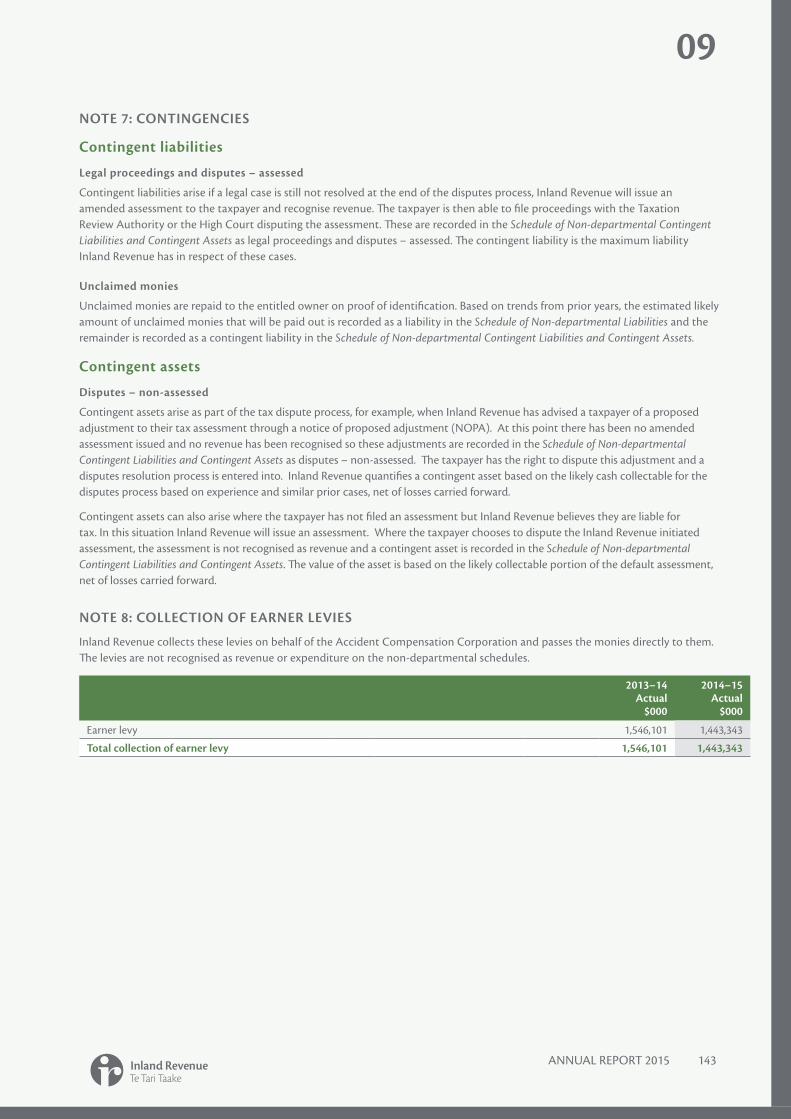
ANNUAL REPORT 2015 143
09
NOTE 7: CONTINGENCIES
Contingent liabilities
Legal proceedings and disputes – assessed
Contingent liabilities arise if a legal case is still not resolved at the end of the disputes process, Inland Revenue will issue an amended assessment to the taxpayer and recognise revenue. The taxpayer is then able to file proceedings with the Taxation Review Authority or the High Court disputing the assessment. These are recorded in the Schedule of Non-departmental Contingent Liabilities and Contingent Assets as legal proceedings and disputes – assessed. The contingent liability is the maximum liability Inland Revenue has in respect of these cases.
Unclaimed monies
Unclaimed monies are repaid to the entitled owner on proof of identification. Based on trends from prior years, the estimated likely amount of unclaimed monies that will be paid out is recorded as a liability in the Schedule of Non-departmental Liabilities and the remainder is recorded as a contingent liability in the Schedule of Non-departmental Contingent Liabilities and Contingent Assets.
Contingent assets
Disputes – non-assessed
Contingent assets arise as part of the tax dispute process, for example, when Inland Revenue has advised a taxpayer of a proposed adjustment to their tax assessment through a notice of proposed adjustment (NOPA). At this point there has been no amended assessment issued and no revenue has been recognised so these adjustments are recorded in the Schedule of Non-departmental Contingent Liabilities and Contingent Assets as disputes – non-assessed. The taxpayer has the right to dispute this adjustment and a disputes resolution process is entered into. Inland Revenue quantifies a contingent asset based on the likely cash collectable for the disputes process based on experience and similar prior cases, net of losses carried forward.
Contingent assets can also arise where the taxpayer has not filed an assessment but Inland Revenue believes they are liable for tax. In this situation Inland Revenue will issue an assessment. Where the taxpayer chooses to dispute the Inland Revenue initiated assessment, the assessment is not recognised as revenue and a contingent asset is recorded in the Schedule of Non-departmental Contingent Liabilities and Contingent Assets. The value of the asset is based on the likely collectable portion of the default assessment, net of losses carried forward.
NOTE 8: COLLECTION OF EARNER LEVIES
Inland Revenue collects these levies on behalf of the Accident Compensation Corporation and passes the monies directly to them. The levies are not recognised as revenue or expenditure on the non-departmental schedules.
2013–14 2014–15Actual Actual
$000 $000
Earner levy 1,546,101 1,443,343
Total collection of earner levy 1,546,101 1,443,343
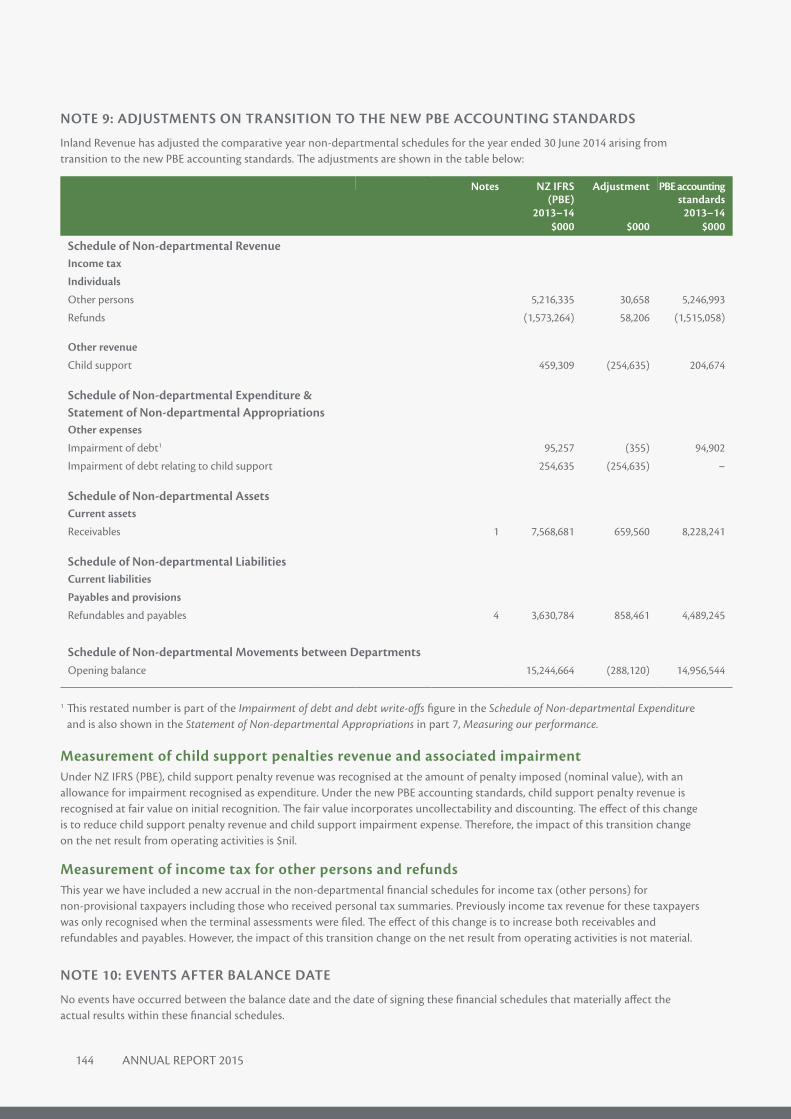
144 ANNUAL REPORT 2015
NOTE 9: ADJUSTMENTS ON TRANSITION TO THE NEW PBE ACCOUNTING STANDARDS
Inland Revenue has adjusted the comparative year non-departmental schedules for the year ended 30 June 2014 arising from transition to the new PBE accounting standards. The adjustments are shown in the table below:
Notes NZ IFRS Adjustment PBE accounting(PBE) standards
2013–14 2013–14 $000 $000 $000
Schedule of Non-departmental RevenueIncome tax
Individuals
Other persons 5,216,335 30,658 5,246,993
Refunds (1,573,264) 58,206 (1,515,058)
Other revenue
Child support 459,309 (254,635) 204,674
Schedule of Non-departmental Expenditure & Statement of Non-departmental AppropriationsOther expenses
Impairment of debt1 95,257 (355) 94,902
Impairment of debt relating to child support 254,635 (254,635) –
Schedule of Non-departmental AssetsCurrent assets
Receivables 1 7,568,681 659,560 8,228,241
Schedule of Non-departmental LiabilitiesCurrent liabilities
Payables and provisions
Refundables and payables 4 3,630,784 858,461 4,489,245
Schedule of Non-departmental Movements between DepartmentsOpening balance 15,244,664 (288,120) 14,956,544
1 This restated number is part of the Impairment of debt and debt write-offs figure in the Schedule of Non-departmental Expenditure and is also shown in the Statement of Non-departmental Appropriations in part 7, Measuring our performance.
Measurement of child support penalties revenue and associated impairment Under NZ IFRS (PBE), child support penalty revenue was recognised at the amount of penalty imposed (nominal value), with an allowance for impairment recognised as expenditure. Under the new PBE accounting standards, child support penalty revenue is recognised at fair value on initial recognition. The fair value incorporates uncollectability and discounting. The effect of this change is to reduce child support penalty revenue and child support impairment expense. Therefore, the impact of this transition change on the net result from operating activities is $nil.
Measurement of income tax for other persons and refunds This year we have included a new accrual in the non-departmental financial schedules for income tax (other persons) for non-provisional taxpayers including those who received personal tax summaries. Previously income tax revenue for these taxpayers was only recognised when the terminal assessments were filed. The effect of this change is to increase both receivables and refundables and payables. However, the impact of this transition change on the net result from operating activities is not material.
NOTE 10: EVENTS AFTER BALANCE DATE
No events have occurred between the balance date and the date of signing these financial schedules that materially affect the actual results within these financial schedules.
Audit Report
ANNUAL REPORT 2015 145
10
146 ANNUAL REPORT 2015
INDEPENDENT AUDITOR’S REPORTTo the readers of Inland Revenue’s annual report for the year ended 30 June 2015The Auditor-General is the auditor of Inland Revenue (the Department). The Auditor-General has appointed me, Ajay Sharma, using the staff and resources of Audit New Zealand, to carry out the audit on her behalf of:
• the financial statements of the Department on pages 94 to 124, that comprise the statement of financial position, statement of commitments, statement of contingent liabilities and contingent assets as at 30 June 2015, the statement of comprehensive revenue and expense, statement of changes in taxpayers’ funds, and statement of cash flows for the year ended on that date and the notes to the financial statements that include accounting policies and other explanatory information;
• the performance information prepared by the Department for the year ended 30 June 2015 on pages 59 to 88;
• the statements of expenses and capital expenditure of the Department for the year ended 30 June 2015 on pages 89 to 92; and
• the schedules of non-departmental activities which are managed by the Department on behalf of the Crown on pages 126 to 144 that comprise:
• the schedules of assets, liabilities, contingent liabilities and assets, commitments, expenditure, revenue, and movements between departments for the year ended 30 June 2015;
• the schedule of trust monies for the year ended 30 June 2015; and
• the notes to the schedules that include accounting policies and other explanatory information.
Opinion
In our opinion:
• the financial statements of the Department:
• present fairly, in all material respects:
• its financial position as at 30 June 2015; and
• its financial performance and cash flows for the year ended on that date;
• comply with generally accepted accounting practice in New Zealand and have been prepared in accordance with Public Benefit Entity Reporting Standards.
• the performance information of the Department:
• presents fairly, in all material respects, for the year ended 30 June 2015:
• what has been achieved with the appropriation; and
• the actual expenses or capital expenditure incurred compared with the appropriated or forecast expenses or capital expenditure;
• complies with generally accepted accounting practice in New Zealand.
• the statements of expenses and capital expenditure of the Department on pages 89 to 92 are presented fairly, in all material respects, in accordance with the requirements of section 45A of the Public Finance Act 1989.
• the schedules of non-departmental activities which are managed by the Department on behalf of the Crown on pages 126 to 144 present fairly, in all material respects, in accordance with the Treasury Instructions:
• the assets, liabilities, contingent liabilities and assets, commitments, expenditure, revenue, and movements between departments for the year ended 30 June 2015; and
• the schedule of trust monies for the year ended 30 June 2015.
ANNUAL REPORT 2015 147
10
Our audit was completed on 29 September 2015. This is the date at which our opinion is expressed.
The basis of our opinion is explained below. In addition, we outline the responsibilities of the Chief Executive and our responsibilities, and we explain our independence.
Basis of opinionWe carried out our audit in accordance with the Auditor-General’s Auditing Standards, which incorporate the International Standards on Auditing (New Zealand). Those standards require that we comply with ethical requirements and plan and carry out our audit to obtain reasonable assurance about whether the information we audited is free from material misstatement.
Material misstatements are differences or omissions of amounts and disclosures that, in our judgement, are likely to influence readers’ overall understanding of the information we audited. If we had found material misstatements that were not corrected, we would have referred to them in our opinion.
An audit involves carrying out procedures to obtain audit evidence about the amounts and disclosures in the information we audited. The procedures selected depend on our judgement, including our assessment of risks of material misstatement of the information we audited, whether due to fraud or error. In making those risk assessments, we consider internal control relevant to the Department’s preparation of the information we audited in order to design audit procedures that are appropriate in the circumstances, but not for the purpose of expressing an opinion on the effectiveness of the Department’s internal control.
An audit also involves evaluating:
• the appropriateness of accounting policies used and whether they have been consistently applied;
• the reasonableness of the significant accounting estimates and judgements made by the Chief Executive;
• the appropriateness of the reported performance information within the Department’s framework for reporting performance;
• the adequacy of the disclosures in the information we audited; and
• the overall presentation of the information we audited.
We did not examine every transaction, nor do we guarantee complete accuracy of the information we audited. Also, we did not evaluate the security and controls over the electronic publication of the information we audited.
We believe we have obtained sufficient and appropriate audit evidence to provide a basis for our audit opinion.
Responsibilities of the Chief ExecutiveThe Chief Executive is responsible for preparing:
• financial statements that present fairly the Department’s financial position, financial performance, and its cash flows, and that comply with generally accepted accounting practice in New Zealand.
• performance information that presents fairly what has been achieved with each appropriation, the expenditure incurred as compared with expenditure expected to be incurred, and that complies with generally accepted accounting practice in New Zealand.
• statements of expenses and capital expenditure of the Department, that are presented fairly, in accordance with the requirements of the Public Finance Act 1989.
• schedules of non-departmental activities, in accordance with the Treasury Instructions, that present fairly those activities managed by the Department on behalf of the Crown.
The Chief Executive’s responsibilities arise from the Public Finance Act 1989.
The Chief Executive is responsible for such internal control as is determined is necessary to ensure that the annual report is free from material misstatement, whether due to fraud or error. The Chief Executive is also responsible for the publication of the annual report, whether in printed or electronic form.

148 ANNUAL REPORT 2015
Responsibilities of the AuditorWe are responsible for expressing an independent opinion on the information we are required to audit, and reporting that opinion to you based on our audit. Our responsibility arises from the Public Audit Act 2001.
IndependenceWhen carrying out the audit, we followed the independence requirements of the Auditor-General, which incorporate the independence requirements of the External Reporting Board.
Other than the audit, we have no relationship with or interests in the Department.
Ajay Sharma
Audit New Zealand On behalf of the Auditor-General Wellington, New Zealand

Additional information
ANNUAL REPORT 2015 149
11
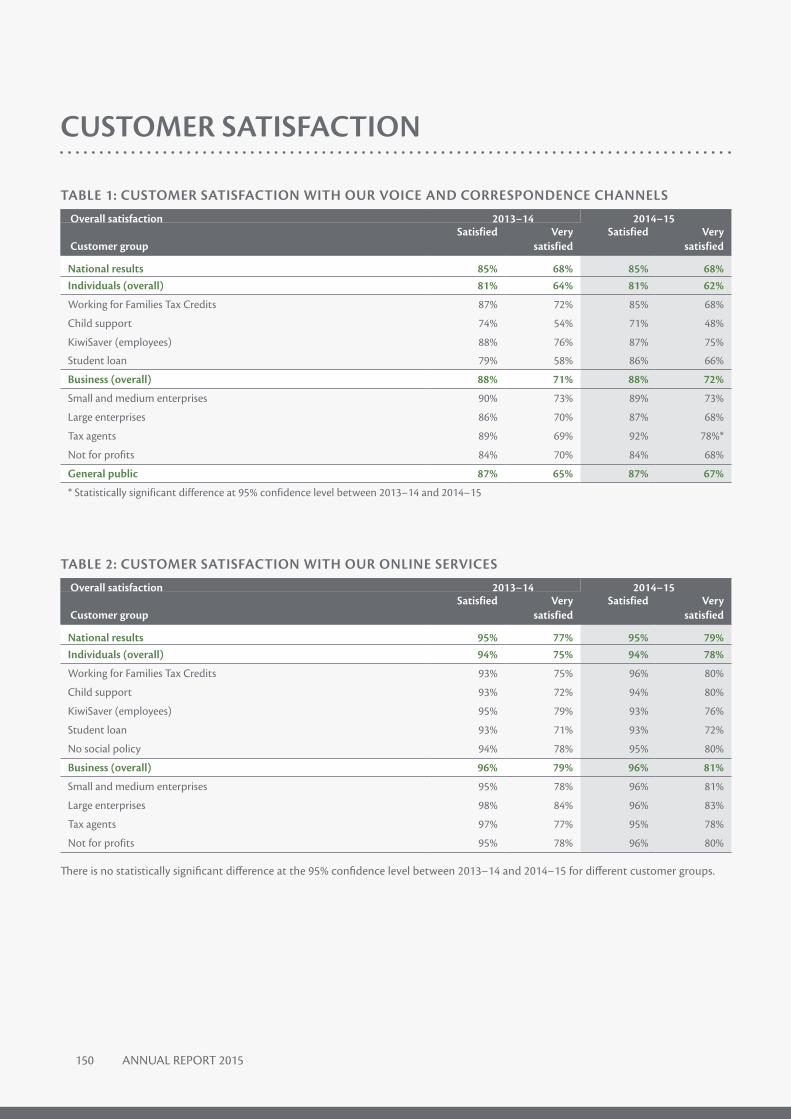
150 ANNUAL REPORT 2015
CUSTOMER SATISFACTION
TABLE 1: CUSTOMER SATISFACTION WITH OUR VOICE AND CORRESPONDENCE CHANNELS
Overall satisfaction 2013–14 2014–15Satisfied Very Satisfied Very
Customer group satisfied satisfied
National results 85% 68% 85% 68%Individuals (overall) 81% 64% 81% 62%
Working for Families Tax Credits 87% 72% 85% 68%
Child support 74% 54% 71% 48%
KiwiSaver (employees) 88% 76% 87% 75%
Student loan 79% 58% 86% 66%
Business (overall) 88% 71% 88% 72%
Small and medium enterprises 90% 73% 89% 73%
Large enterprises 86% 70% 87% 68%
Tax agents 89% 69% 92% 78%*
Not for profits 84% 70% 84% 68%
General public 87% 65% 87% 67%
* Statistically significant difference at 95% confidence level between 2013–14 and 2014–15
TABLE 2: CUSTOMER SATISFACTION WITH OUR ONLINE SERVICES
Overall satisfaction 2013–14 2014–15Satisfied Very Satisfied Very
Customer group satisfied satisfied
National results 95% 77% 95% 79%Individuals (overall) 94% 75% 94% 78%
Working for Families Tax Credits 93% 75% 96% 80%
Child support 93% 72% 94% 80%
KiwiSaver (employees) 95% 79% 93% 76%
Student loan 93% 71% 93% 72%
No social policy 94% 78% 95% 80%
Business (overall) 96% 79% 96% 81%
Small and medium enterprises 95% 78% 96% 81%
Large enterprises 98% 84% 96% 83%
Tax agents 97% 77% 95% 78%
Not for profits 95% 78% 96% 80%
There is no statistically significant difference at the 95% confidence level between 2013–14 and 2014–15 for different customer groups.
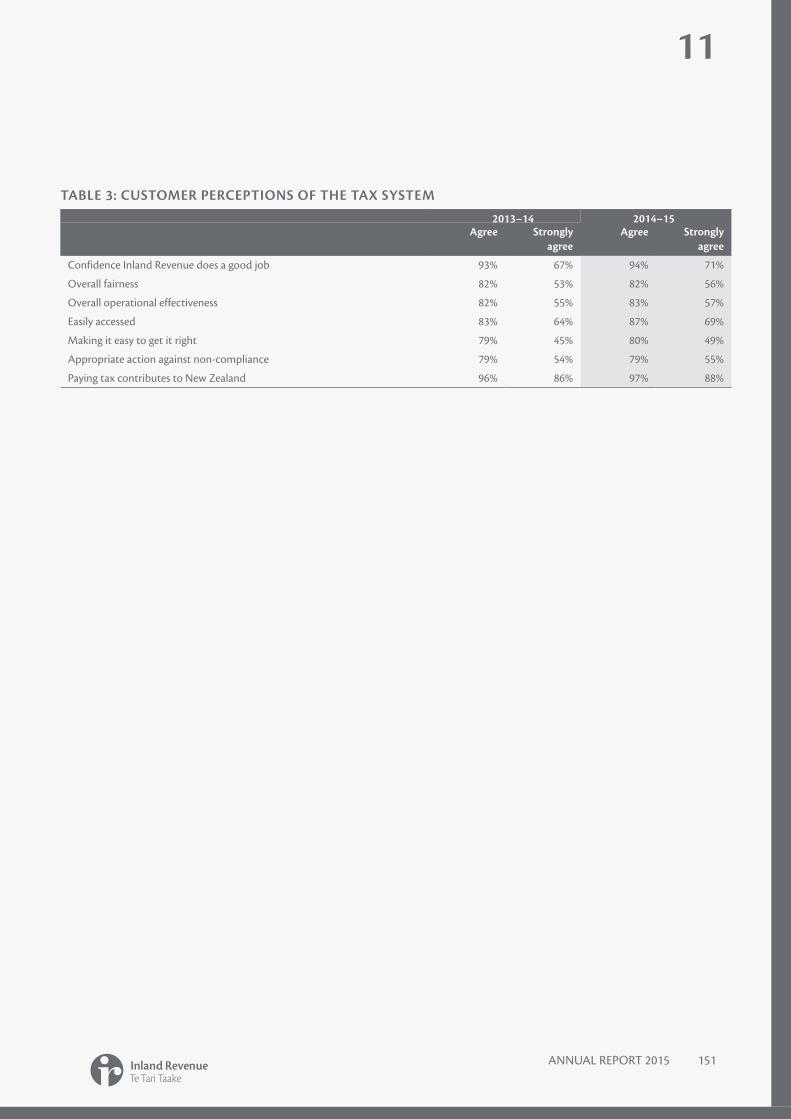
ANNUAL REPORT 2015 151
11
TABLE 3: CUSTOMER PERCEPTIONS OF THE TAX SYSTEM
2013–14 2014–15Agree Strongly Agree Strongly
agree agree
Confidence Inland Revenue does a good job 93% 67% 94% 71%
Overall fairness 82% 53% 82% 56%
Overall operational effectiveness 82% 55% 83% 57%
Easily accessed 83% 64% 87% 69%
Making it easy to get it right 79% 45% 80% 49%
Appropriate action against non-compliance 79% 54% 79% 55%
Paying tax contributes to New Zealand 96% 86% 97% 88%

152 ANNUAL REPORT 2015
DEBT TABLES
TABLE 4: COMPOSITION OF OUR DEBT PORTFOLIO AT 30 JUNE ($ MILLIONS)
Debt type 2011 2012 2013 2014 2015 One-year One-yearchange change (%)
Debt under instalments $1,146.6 $1,176.3 $1,230.2 $1,228.2 $1,085.4 ($142.8) (11.6%)
Other collectable debt $2,663.5 $2,582.7 $2,561.5 $2,621.6 $2,367.0 ($254.6) (9.7%)
Tax Collectable debt* $3,810.2 $3,759.0 $3,791.7 $3,849.8 $3,452.4 ($397.4) (10.3%)
Tax Non-Collectable debt** $1,711.9 $2,157.4 $2,186.4 $2,390.3 $2,633.8 $243.4 10.2%
Total Debt $5,522.1 $5,916.4 $5,978.2 $6,240.1 $6,086.1 ($154.0) (2.5%)
WfFTC $275.1 $320.8 $371.8 $406.6 $334.8 ($71.8) (17.7%)
GST $1,908.5 $1,947.2 $1,873.9 $1,775.5 $1,527.5 ($248.0) (14.0%)
Income tax $2,207.8 $2,372.4 $2,365.7 $2,519.6 $2,653.0 $133.5 5.3%
KiwiSaver $19.8 $21.5 $22.5 $33.3 $29.4 ($4.0) (11.9%)
Other tax $76.6 $100.1 $121.6 $121.8 $115.9 ($5.9) (4.9%)
PAYE $622.6 $642.1 $586.8 $613.9 $492.4 ($121.4) (19.8%)
Student loan $411.7 $512.3 $635.9 $769.4 $933.0 $163.6 21.3%
Total $5,522.1 $5,916.4 $5,978.2 $6,240.1 $6,086.1 ($154.0) (2.5%)
Tax Penalties & Interest $2,359.0 $2,711.3 $2,862.6 $2,998.5 $2,936.7 ($61.9) (2.1%)
Penalties and Interest % 42.7% 45.8% 47.9% 48.1% 48.3%
Customers in debt (total cases) 389,947 408,605 436,298 435,360 367,864 (67,496) (15.5%)
Annual debt change (%) 7.2% 7.1% 1.0% 4.4% (2.5%)
Notes
* Collectable debt: debt cases where the assessment value is overdue and collections activity is in progress. This activity includes instalment arrangements, deduction notices, cases linked to legal actions and other manual or automatic actions.
**Non-Collectable debt: debt cases where the assessed value is pending or in dispute and we are unable to proceed with collection activity at present. This includes cases:
• linked to investigations
• linked to objections
• pending write-off action
• with limited or no collection activity due to insolvency.
TABLE 5: AGE OF DEBT AT 30 JUNE ($ MILLIONS)
Tax debt by age 2011 2012 2013 2014 2015 One-year One-yearchange change (%)
<1 year $1,377.7 $1,254.7 $1,245.5 $1,298.9 $1,333.4 $34.5 2.7%
1–2 year $1,387.7 $1,079.1 $901.9 $936.7 $809.1 ($127.6) (13.6%)
2–5 year $1,787.7 $2,310.9 $2,304.8 $2,204.6 $1,928.3 ($276.4) (12.5%)
5–10 year $653.9 $793.5 $992.4 $1,126.5 $1,170.4 $43.9 3.9%
10 year+ $315.1 $478.1 $533.6 $673.4 $845.0 $171.6 25.5%
Total $5,522.1 $5,916.4 $5,978.2 $6,240.1 $6,086.1 ($154.0) (2.5%)

ANNUAL REPORT 2015 153
11
CORE SERVICES COSTS
We track the cost of providing our core services, such as answering telephone queries and processing tax returns. Table six compares those costs with targets and the previous year’s results. We are encouraging people and businesses to do as much as they can online to lower the number of phone calls and items of correspondence we receive.
TABLE 6: COST INDICATORS
Indicator 2013–14 2014–15 2014–15Actual Actual Target
Cost per telephone contact $29.88 $30.41 $36.00
Cost per correspondence contact $37.80 $35.81 $45.00
Cost per counter contact $64.89 $22.65 $65.00
Average cost per customer initiated contact $33.00 $31.10 $40.00
Cost per income tax return processed $4.92 $4.32 $6.50
Cost per GST return processed $1.34 $1.03 $2.00
Cost per employer monthly schedule processed $5.14 $4.56 $7.75
Average cost per return processed $3.95 $3.48 $5.00
Cost of collecting an overdue return $5.60 $9.00 $15.00
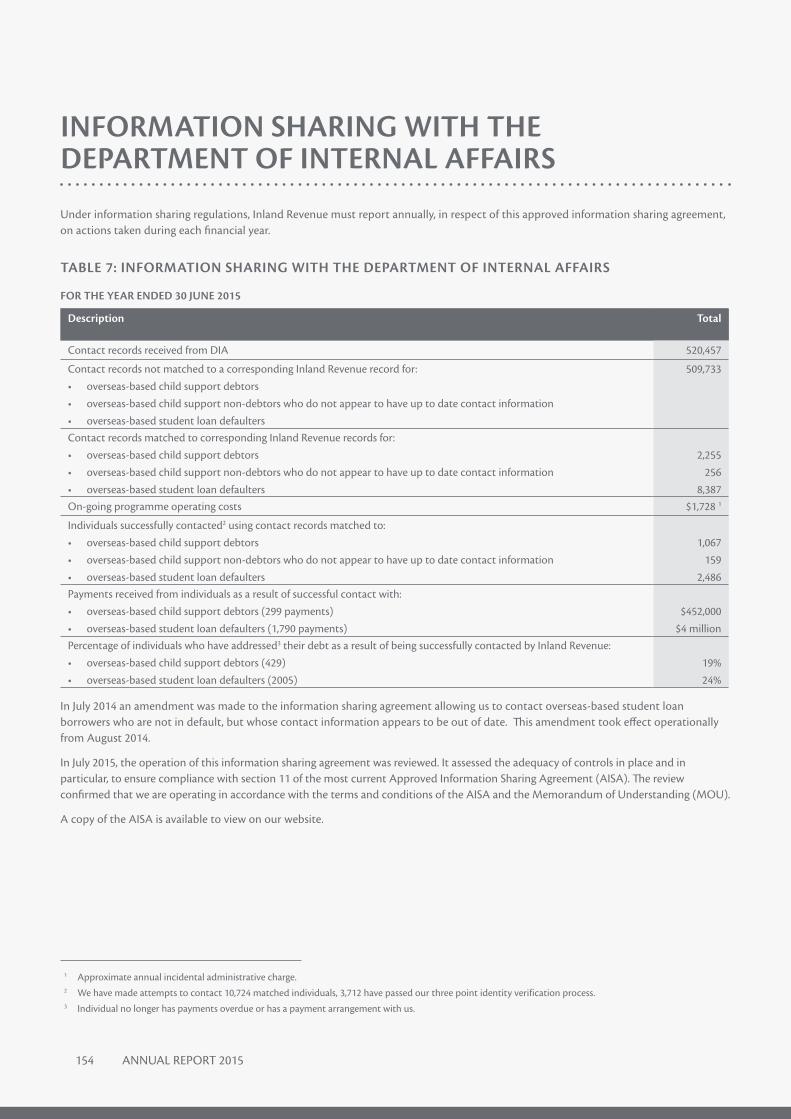
154 ANNUAL REPORT 2015
INFORMATION SHARING WITH THE DEPARTMENT OF INTERNAL AFFAIRS
Under information sharing regulations, Inland Revenue must report annually, in respect of this approved information sharing agreement, on actions taken during each financial year.
TABLE 7: INFORMATION SHARING WITH THE DEPARTMENT OF INTERNAL AFFAIRS
FOR THE YEAR ENDED 30 JUNE 2015
Description Total
Contact records received from DIA 520,457
Contact records not matched to a corresponding Inland Revenue record for:• overseas-based child support debtors• overseas-based child support non-debtors who do not appear to have up to date contact information• overseas-based student loan defaulters
509,733
Contact records matched to corresponding Inland Revenue records for:• overseas-based child support debtors• overseas-based child support non-debtors who do not appear to have up to date contact information • overseas-based student loan defaulters
2,255
256 8,387
On-going programme operating costs $1,728 1
Individuals successfully contacted2 using contact records matched to:• overseas-based child support debtors• overseas-based child support non-debtors who do not appear to have up to date contact information • overseas-based student loan defaulters
1,067
159 2,486
Payments received from individuals as a result of successful contact with:• overseas-based child support debtors (299 payments)• overseas-based student loan defaulters (1,790 payments)
$452,000$4 million
Percentage of individuals who have addressed3 their debt as a result of being successfully contacted by Inland Revenue:• overseas-based child support debtors (429)• overseas-based student loan defaulters (2005)
19% 24%
In July 2014 an amendment was made to the information sharing agreement allowing us to contact overseas-based student loan borrowers who are not in default, but whose contact information appears to be out of date. This amendment took effect operationally from August 2014.
In July 2015, the operation of this information sharing agreement was reviewed. It assessed the adequacy of controls in place and in particular, to ensure compliance with section 11 of the most current Approved Information Sharing Agreement (AISA). The review confirmed that we are operating in accordance with the terms and conditions of the AISA and the Memorandum of Understanding (MOU).
A copy of the AISA is available to view on our website.
1 Approximate annual incidental administrative charge.2 We have made attempts to contact 10,724 matched individuals, 3,712 have passed our three point identity verification process.3 Individual no longer has payments overdue or has a payment arrangement with us.
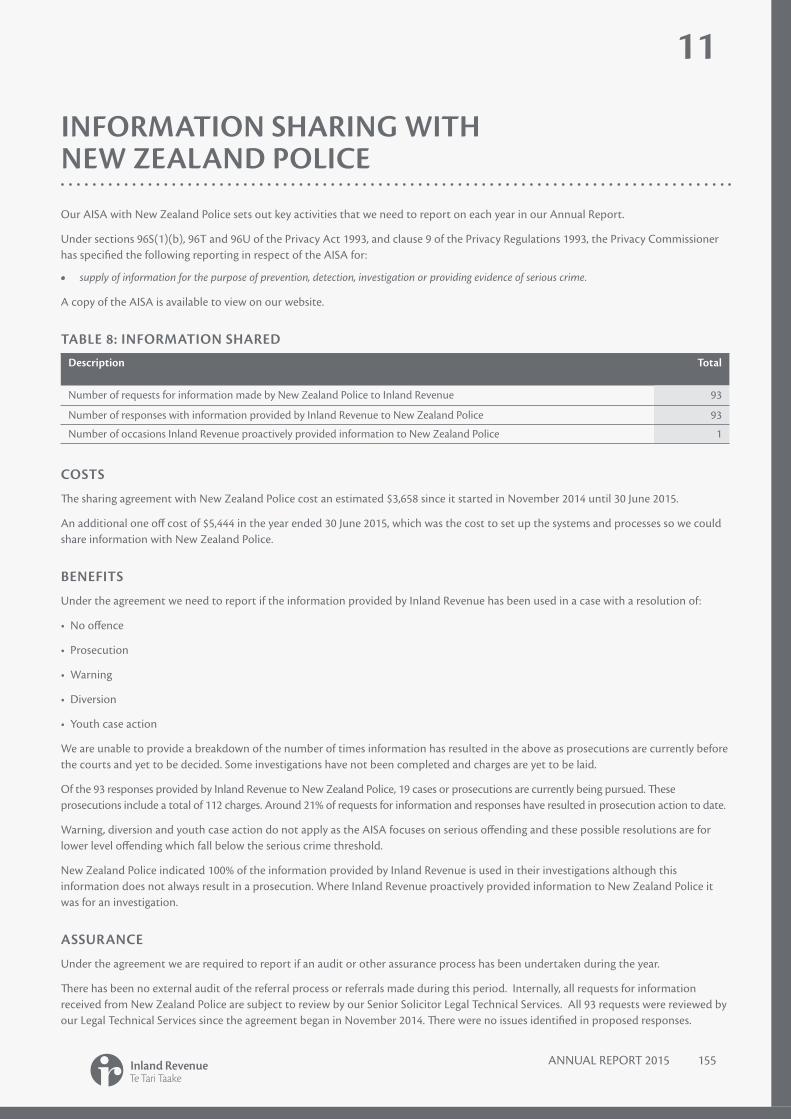
ANNUAL REPORT 2015 155
11
INFORMATION SHARING WITH NEW ZEALAND POLICE
Our AISA with New Zealand Police sets out key activities that we need to report on each year in our Annual Report.
Under sections 96S(1)(b), 96T and 96U of the Privacy Act 1993, and clause 9 of the Privacy Regulations 1993, the Privacy Commissioner has specified the following reporting in respect of the AISA for:
• supply of information for the purpose of prevention, detection, investigation or providing evidence of serious crime.
A copy of the AISA is available to view on our website.
TABLE 8: INFORMATION SHARED
Description Total
Number of requests for information made by New Zealand Police to Inland Revenue 93
Number of responses with information provided by Inland Revenue to New Zealand Police 93
Number of occasions Inland Revenue proactively provided information to New Zealand Police 1
COSTS
The sharing agreement with New Zealand Police cost an estimated $3,658 since it started in November 2014 until 30 June 2015.
An additional one off cost of $5,444 in the year ended 30 June 2015, which was the cost to set up the systems and processes so we could share information with New Zealand Police.
BENEFITS
Under the agreement we need to report if the information provided by Inland Revenue has been used in a case with a resolution of:
• No offence
• Prosecution
• Warning
• Diversion
• Youth case action
We are unable to provide a breakdown of the number of times information has resulted in the above as prosecutions are currently before the courts and yet to be decided. Some investigations have not been completed and charges are yet to be laid.
Of the 93 responses provided by Inland Revenue to New Zealand Police, 19 cases or prosecutions are currently being pursued. These prosecutions include a total of 112 charges. Around 21% of requests for information and responses have resulted in prosecution action to date.
Warning, diversion and youth case action do not apply as the AISA focuses on serious offending and these possible resolutions are for lower level offending which fall below the serious crime threshold.
New Zealand Police indicated 100% of the information provided by Inland Revenue is used in their investigations although this information does not always result in a prosecution. Where Inland Revenue proactively provided information to New Zealand Police it was for an investigation.
ASSURANCE
Under the agreement we are required to report if an audit or other assurance process has been undertaken during the year.
There has been no external audit of the referral process or referrals made during this period. Internally, all requests for information received from New Zealand Police are subject to review by our Senior Solicitor Legal Technical Services. All 93 requests were reviewed by our Legal Technical Services since the agreement began in November 2014. There were no issues identified in proposed responses.

156 ANNUAL REPORT 2015
One proactive release of information by Inland Revenue to New Zealand Police was reviewed by a Senior Solicitor and also by the Manager Legal Technical Services. The information was considered appropriate for release within the intent of AISA.
AMENDMENTS
Under the agreement we need to report details of any amendments made to the agreement since the Order in Council came into force.
The original agreement was amended on 16 March 2015 to clarify that Inland Revenue may share with New Zealand Police both current and previous personal information held, and added that information about liabilities can be shared.
The amendment also permits that, in addition to using SEEMail to share personal information, Inland Revenue may share personal information with New Zealand Police by other means, for example by permitting New Zealand Police to physically access Inland Revenue premises to examine, copy and/or remove personal information and reasonable steps will be taken by the parties to maintain security during this process.
PRIVACY BREACHES
Inland Revenue processes more than 25 million transactions and pieces of correspondence every year. When dealing with that volume and level of information, occasionally mistakes will occur. Of the breaches identified for the 2014–15 year no individual was harmed by the incident.
We take privacy very seriously and reporting incidents that may amount to a privacy breach are encouraged. This has resulted in reporting incidents that do not involve personal information, but are still important to be aware of. Inland Revenue recognises the importance of protecting information and reporting incidents identifies where processes can be strengthened or more awareness is required.
In the 2014–15 financial year 323 incidents were reported to our Incident Management team and of those a potential 223 incidents involved personal information. This compares to 287 in 2013–14. The remainder either involved entity information or were not considered a breach at all. For example generic forms being sent to the wrong address so no personal information was involved.
Further analysis of the incidents found that 214 were actual privacy breaches where personal information was inadvertently disclosed, or an address was not accurate. This is compared to 241 for 2013–14. Sending information to the wrong address including postal, email or fax accounted for 35% of incidents. These are logged as a privacy breach as they indicate address information is not accurate, although do not necessarily also result in information being disclosed. Of the incidents, 43% involved the disclosure of information.
Only eight per cent of breaches were considered to be potentially significant in that more than 10 individuals were affected or the information disclosed was considered to be sensitive. However, none of the breaches recorded resulted in harm or adverse consequences to any individual.
The main cause of breaches is through staff error when manually handling correspondence. Each incident is investigated and we look at how to reduce staff errors by a continuous improvement focus which includes reviewing handling processes, educating staff and regular performance reporting.
TABLE 9: INSTANCES OF PRIVACY BREACHES INVOLVING PERSONAL INFORMATION
Detail Number of affected people
Certificates for resident withholding tax on interest were detached from a return and sent to the incorrect person
49
KiwiSaver information was sent to the wrong provider 71
Two incidents when tax agent email addresses were visible (rather than being blind carbon copied) 110
Mail merge email system failure resulted in incorrect information being sent to the wrong customers 132
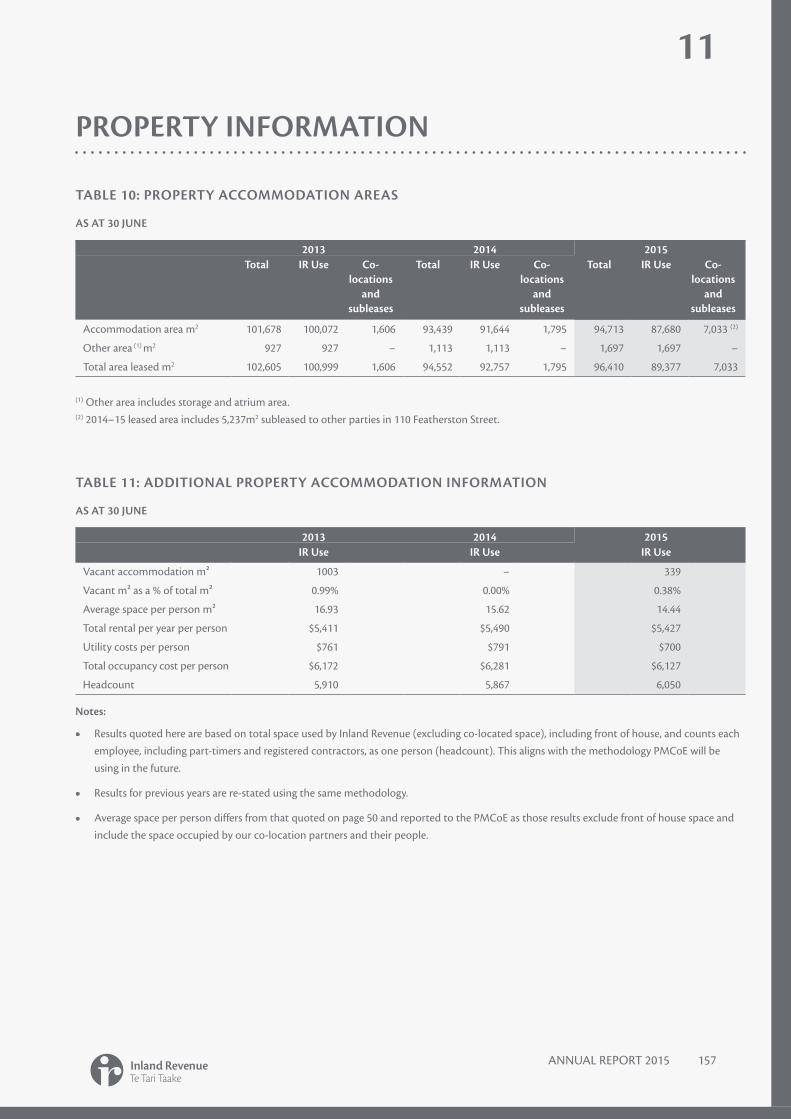
ANNUAL REPORT 2015 157
11
PROPERTY INFORMATION
TABLE 10: PROPERTY ACCOMMODATION AREAS
AS AT 30 JUNE
2013 2014 2015Total IR Use Co-
locations and
subleases
Total IR Use Co-locations
and subleases
Total IR Use Co-locations
and subleases
Accommodation area m2 101,678 100,072 1,606 93,439 91,644 1,795 94,713 87,680 7,033 (2)
Other area (1) m2 927 927 – 1,113 1,113 – 1,697 1,697 –
Total area leased m2 102,605 100,999 1,606 94,552 92,757 1,795 96,410 89,377 7,033
(1) Other area includes storage and atrium area. (2) 2014–15 leased area includes 5,237m2 subleased to other parties in 110 Featherston Street.
TABLE 11: ADDITIONAL PROPERTY ACCOMMODATION INFORMATION
AS AT 30 JUNE
2013 2014 2015IR Use IR Use IR Use
Vacant accommodation m² 1003 – 339
Vacant m² as a % of total m² 0.99% 0.00% 0.38%
Average space per person m² 16.93 15.62 14.44
Total rental per year per person $5,411 $5,490 $5,427
Utility costs per person $761 $791 $700
Total occupancy cost per person $6,172 $6,281 $6,127
Headcount 5,910 5,867 6,050
Notes:
• Results quoted here are based on total space used by Inland Revenue (excluding co-located space), including front of house, and counts each employee, including part-timers and registered contractors, as one person (headcount). This aligns with the methodology PMCoE will be using in the future.
• Results for previous years are re-stated using the same methodology.
• Average space per person differs from that quoted on page 50 and reported to the PMCoE as those results exclude front of house space and include the space occupied by our co-location partners and their people.

158 ANNUAL REPORT 2015
TABLE 12: HISTORICAL EXPENDITURE ON CONSULTANTS AND CONTRACTORS
2012–13Actual
2013–14Actual
2014–15Actual
Total expenditure on consultants and contractors ($000) 52,907 59,191 55,643
% of total operating expenditure 8.1% 8.5% 7.9%
% of total capital and operating expenditure 7.5% 7.9% 7.5%
TABLE 13: EXPENDITURE ON CONSULTANTS AND CONTRACTORS
2012–13Actual
$000
2013–14Actual
$000
2014–15Actual
$000
Information technology 17,882 20,481 20,597
Specialist advice and project management 29,151 31,436 28,205
HR and change management services 778 2,225 2,332
Tax issues 669 1,179 1,340
Property 2,074 2,023 1,258
Research 1,113 1,325 880
Communications 343 123 654
Other 897 399 377
Total 52,907 59,191 55,643
EVALUATING OUR WORK PROGRAMMES
We measure our effectiveness through evaluating our work programmes and contributions to revenue and social policy outcomes. The findings help to inform government policy decisions and continuous improvement processes.
We completed and commenced evaluations for four key programmes.
The final stage of the KiwiSaver evaluation that began in 2007, involved publishing reports on the impact of KiwiSaver on savings behaviour and impact on living standards in retirement.
We began the first stage of a multi-year evaluation of the impact of Child Support Reforms by collecting baseline information that will be used as the basis of comparing future findings. We also completed the design of evaluations of Inland Revenue’s debt strategy and of the programme to reduce participation in the hidden economy.

ANNUAL REPORT 2015 159
11
DELEGATION OF AUTHORITY
In accordance with section 41(2C) of the State Sector Act 1988 we need to report when the Commissioner delegates their authority.
During the year the Commissioner of Inland Revenue delegated her authority to Hon. Todd McClay, Minister of Revenue for the purpose of signing the OECD’s Multilateral Competent Authority Agreement on Automatic Exchange of Financial Account Information. This was done at a ceremony held in Paris on 3 June 2015.
The agreement was signed by Ministers from the countries involved at a ceremony held in the margins of this year’s OECD Ministerial Council Meeting.
Signing the agreement is a necessary step in New Zealand’s implementation of the new global Standard for Automatic Exchange of Financial Account Information in Tax Matters which is generally referred to as AEOI. It required agreement by the competent authorities in the jurisdictions involved.
New Zealand’s tax treaties all designate the Commissioner as the New Zealand competent authority. Accordingly, it was necessary for the Commissioner to delegate her authority for the Minister to sign the agreement.

160 ANNUAL REPORT 2015


ird.govt.nz


![Inland Revenue Act, No. 10 of 2006 Tax_Documents... · Inland Revenue Act, No. 10 of 2006 [Incorporating Amendments up to 30th April 2014] Department of Inland Revenue. i . Table](https://img.pdfslide.us/doc/110x75/6043c6879e27e213f25b2e6b/inland-revenue-act-no-10-of-taxdocuments-inland-revenue-act-no-10-of-2006.jpg)