Embed Size (px)
Citation preview
1
Hambledon State School
2016 ANNUAL REPORT
Queensland State School Reporting
Inspiring minds. Creating opportunities. Shaping Queensland’s future. Every student succeeding. State Schools Strategy 2016-2020
Department of Education and Training
2
Contact Information
Postal address: PO Box 849 Edmonton 4869
Phone: (07) 4040 8666
Fax: (07) 4040 8600
Email: [email protected]
Webpages: Additional reporting information pertaining to Queensland state schools is located on the My School website and the Queensland Government data website.
Contact Person: Mr Ross Kubler
3
School Overview
Hambledon is a co-educational state school in the southern corridor of Cairns, providing a quality education for students from Prep to Yr.6. The school has a good reputation in the community and has recently benefited from some major capital works projects providing modern and engaging 21st century learning facilities. Prep students are provided with engaging learning experiences drawn from the Early Years Curriculum Guidelines and the Australian Curriculum. High quality and engaging learning experiences for primary students are drawn from the Australian Curriculum for each key learning area. The school offers a variety of distinctive programs to cater for individual student's talents and interests. These include Senior and Junior Choirs, Instrumental Music, after school sporting activities, school camps and Sports. Classroom teaching programs are balanced and innovative but never lose sight of the foundations of English, Mathematics and Science. Parents are encouraged to be actively involved in the school, with a vibrant P&C Association fostering cohesion within the school community and providing additional resources. Our school’s value of Be Respectful, Be a Learner, Be Safe and Be Resilient are embedded across our school as part of our Positive Behaviour for Learning (PBL) Framework. Our school mission is “to value support and champion every child”.
Principal’s Foreward
Introduction
Every year, State Schools across Queensland issue an Annual Report. This report identifies the growth, development and performance of Hambledon State School in 2016. It provides insights into our school’s improvement agenda, program development, teaching and learning improvements, community partnerships and the goals and standards achieved by every student. Our community is proud of the standards being attained by our students in all key learning areas in all year levels. In partnership with our community, Hambledon State School is committed to developing active, compassionate and lifelong learners. Integral to our philosophy is the development of inquiring, knowledgeable and caring young citizens who respect their own and other cultures
School Progress towards its goals in 2016
The school’s improvement focus for 2016 was strategically planned and identified in the school’s Annual Implementation Plan 2016 and the Strategic Plan 2016 - 2019. The improvement foci included improve teaching and learning outcomes for all children in English and Math, develop a positive learning culture across the school, as well as fostering better community engagement: The following are some of the strategies and initiatives that were consolidated and embedded during 2016:
Whole School Support Learning Resources were transformed to maximise available resources to embed a coaching and mentoring model focusing on enhancing the individual skills and capabilities of all teachers
Extension programs and strategies were initiated to extend students identified as capable of performing in the upper 2 bands of NAPLAN
Established a Reading and Writing Team (RAW Team) to ensure the embedding of a consistent whole school approach to the teaching of reading and writing
All teachers successfully engaged in the Annual Personal Development Plan process aligning personal goals for development to the Australian Professional Standards for Teachers
Establishment of the Student Engagement & Welfare Team (SEW Team) to support the individual needs of children and to assist teacher in developing strategies within the classroom to support learning and engagement
Embedded the Positive Rewards Program (with support from the P&C) as an integral element of the PBL Framework resulting in more than 85% of the children at our school achieving either Bronze, Silver or Gold levels of behaviour
4
Implementation of Systems aimed at improving Teaching & Learning and embedding Positive Behaviour for Learning
Implementation of the Investing for Success (I4S) Plan – providing explicit intervention for children in the early years and improving teacher practice through a combination of coaching and mentoring
Continued embedding of Quality Schools Inclusive Leadership Action Plan to ensure that school culture and practices meet the expectations of the Disability Standards
Continuing to enhance the strong partnership between the school, P&C and community
Embedding the Annual Review Process to support the development of teacher’s practice in conjunction with the Developing Performance Framework
Increased the percentage of children who achieve a C or higher in English as a result of a sharp and narrow focus on improving Reading and Wriiting
Improvement in Year 3 and 5 NAPLAN results with regards to National Minimum Standards, Mean Scale Score and Upper 2 Bands as a result of the sharp and narrow focus on improving Reading and Writing
Future Outlook
In 2017, Hambledon State School will continue to focus on improving children’s skills in Reading, Writing and Numeracy. The school will continue to consistently embed Positive Behaviour for Learning Framework strategies across the school as well health and well-being. The 2017 improvement agenda also includes:
Continued embedding of the Australian Curriculum through collaborative planning, pre and post moderation and deconstructing the Achievement Standards
Continuing to embed best practice teaching strategies to improve the outcomes for all students in literacy and numeracy, focusing on differentiated teaching
Develop, implement and commence embedding a consistent school-wide approach to the teaching of mathematics
Consolidating and embedding the consistent school-wide approach to PBL
Review and promote the Positive Rewards Program celebrating the children’s behaviour level achievements
Develop and implement a school wide approach to the teaching of Coding
Align professional development and school resources are targeted to facilitate improvement on the school focuses
Continue to embed a whole school approach to differentiation and inclusion to support every child’s learning
Continue actively engage with and seek input from a wide variety of school stakeholders
Investigate and consult school stakeholders in implementing an equitable system that allows all children to fully utilise ipads / tablets to develop 21st century learners
5
Our School at a Glance
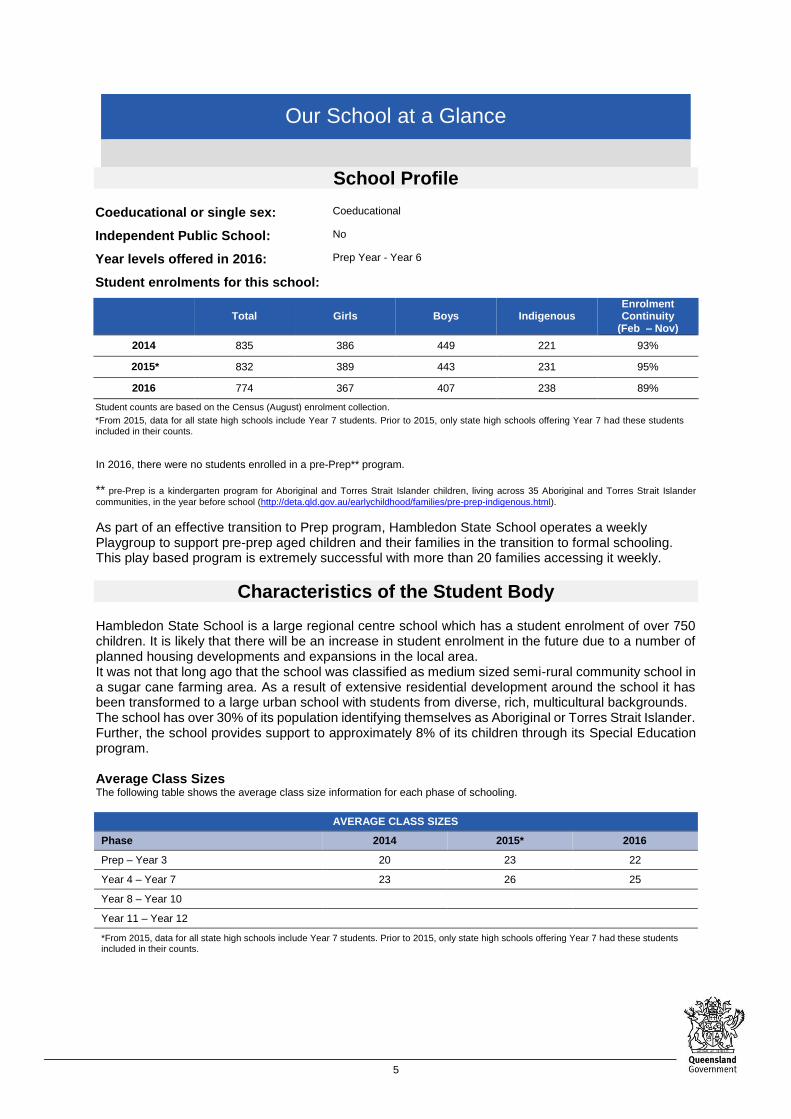
School Profile
Coeducational or single sex: Coeducational
Independent Public School: No
Year levels offered in 2016: Prep Year - Year 6
Student enrolments for this school:
Total Girls Boys Indigenous
Enrolment Continuity
(Feb – Nov)
2014 835 386 449 221 93%
2015* 832 389 443 231 95%
2016 774 367 407 238 89%
Student counts are based on the Census (August) enrolment collection.
*From 2015, data for all state high schools include Year 7 students. Prior to 2015, only state high schools offering Year 7 had these students included in their counts.
In 2016, there were no students enrolled in a pre-Prep** program.
** pre-Prep is a kindergarten program for Aboriginal and Torres Strait Islander children, living across 35 Aboriginal and Torres Strait Islander
communities, in the year before school (http://deta.qld.gov.au/earlychildhood/families/pre-prep-indigenous.html).
As part of an effective transition to Prep program, Hambledon State School operates a weekly Playgroup to support pre-prep aged children and their families in the transition to formal schooling. This play based program is extremely successful with more than 20 families accessing it weekly.
Characteristics of the Student Body
Hambledon State School is a large regional centre school which has a student enrolment of over 750 children. It is likely that there will be an increase in student enrolment in the future due to a number of planned housing developments and expansions in the local area. It was not that long ago that the school was classified as medium sized semi-rural community school in a sugar cane farming area. As a result of extensive residential development around the school it has been transformed to a large urban school with students from diverse, rich, multicultural backgrounds. The school has over 30% of its population identifying themselves as Aboriginal or Torres Strait Islander. Further, the school provides support to approximately 8% of its children through its Special Education program. Average Class Sizes The following table shows the average class size information for each phase of schooling.
AVERAGE CLASS SIZES
Phase 2014 2015* 2016
Prep – Year 3 20 23 22
Year 4 – Year 7 23 26 25
Year 8 – Year 10
Year 11 – Year 12
*From 2015, data for all state high schools include Year 7 students. Prior to 2015, only state high schools offering Year 7 had these students included in their counts.
6
Curriculum Delivery
Our Approach to Curriculum Delivery Our approach to curriculum delivery at Hambledon State School focuses on the effective teaching of literacy and numeracy skills in English and Mathematics, and integration of these core skills into other key learning areas. Our school has a sharp focus on improving reading, writing and numeracy skills of all children and effectively tracks individual student progress in these areas. The school delivers the Australian Curriculum for the mandated Key Learning Areas and the Essential Learnings for the remaining learning areas. At Hambledon State School, C2C has been adopted and adapted in most key learning areas (KLA’s), especially English, Math, History, Geography and Science. Hambledon State School has high expectations for every child and challenges them to achieve to the best of their ability. Learning is led learning through the use of consistent language, strong routines and structure. The Explicit Teaching Model of ‘I DO, WE DO, YOU DO’ enables all children to be actively engaged in the teaching and learning process. The following programs are delivered at our school to enhance children’s social, emotional and academic learning: • Targeted teaching in all year levels that track the progress of students and teach from ‘where
the individual child is at’ • Individual Curriculum Plans for children who have been identified as requiring differentiated
curriculum to support or extend their learning • Learning Support programs in reading and writing for children • Social Learning programs for children who require support to meet their social or emotional
needs • Whole class programs that support the social and emotional needs of all children • ICAS English, Writing, Spelling, Mathematics, Science and Computer competitions • LOTE (Japanese) for children in Years 5 & 6 • • Instrumental Music program, school cluster Band and Choirs • Emphasis on the use of digital technologies in teaching • Computers accessible in each classroom as well as a pod of 56 laptops in the school
computer lab • Participation in District Interschool competitions and festivals (Readers Cup, Trinity Bay
Writers festival etc.) • Participation in community challenges and competitions (Mount Sheridan Plaza Spelling Bee) • School Chaplaincy program to support health and well-being of children and families. Co-curricular Activities Hambledon State School offers a range of extra curricula activities. In 2016 these activities included: • Junior & Senior Choir • After school AusKick & NRL programs • After school Tennis program • Participation in the Edmonton RSL Sub-branch - ANZAC Day Ceremony • Inter-school sporting teams including Rugby League, AFL, Marlin Coast Netball • Athletics and Cross Country team • Beginning swimmers program for children in Years 1 - 2 • Premiers Readers Challenge • Mount Sheridan Plaza Spelling Bee • Calanna Speaking competition • Readers Cup • Indigenous Leadership Camp • Year 6 School Camp • Literature & Musical Camps • Student Council • Resource Centre Assistants • Book Week and Under 8s week activities • Arts Council performances • Gala Sports Day • Discos run by the P&C
7
How Information and Communication Technologies are used to Assist Learning Hambledon State School has a large computer lab containing 56 laptops computers (sufficient to allow 2 classes of children to use computers at any one time). Computers and tablet devices are also located in the library and in classrooms. Our schools ICT program develops students’ ICT and information literacy skills through learning and assessment activities. Computers are used in classrooms by students to complete learning assessment tasks in all key learning areas. Children use online content and services to support their learning. The school employs a computer technician (4 days a week) to ensure school technology resources are maintained in effective working order. All classrooms use interactive white boards to support teachers in the delivery of the Australian Curriculum. Our philosophy with regards to the use of ICTs is that the technology must be accessible, enhances teaching and learning, and engages to learners.
Social Climate
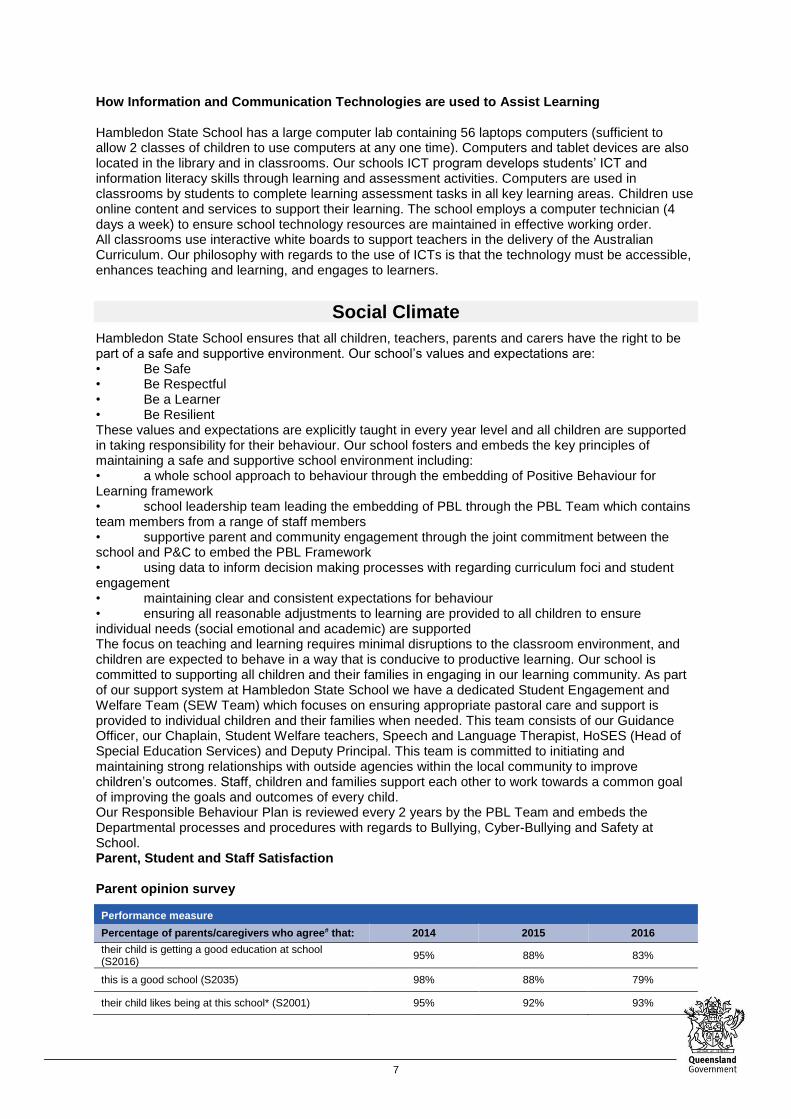
Hambledon State School ensures that all children, teachers, parents and carers have the right to be part of a safe and supportive environment. Our school’s values and expectations are: • Be Safe • Be Respectful • Be a Learner • Be Resilient These values and expectations are explicitly taught in every year level and all children are supported in taking responsibility for their behaviour. Our school fosters and embeds the key principles of maintaining a safe and supportive school environment including: • a whole school approach to behaviour through the embedding of Positive Behaviour for Learning framework • school leadership team leading the embedding of PBL through the PBL Team which contains team members from a range of staff members • supportive parent and community engagement through the joint commitment between the school and P&C to embed the PBL Framework • using data to inform decision making processes with regarding curriculum foci and student engagement • maintaining clear and consistent expectations for behaviour • ensuring all reasonable adjustments to learning are provided to all children to ensure individual needs (social emotional and academic) are supported The focus on teaching and learning requires minimal disruptions to the classroom environment, and children are expected to behave in a way that is conducive to productive learning. Our school is committed to supporting all children and their families in engaging in our learning community. As part of our support system at Hambledon State School we have a dedicated Student Engagement and Welfare Team (SEW Team) which focuses on ensuring appropriate pastoral care and support is provided to individual children and their families when needed. This team consists of our Guidance Officer, our Chaplain, Student Welfare teachers, Speech and Language Therapist, HoSES (Head of Special Education Services) and Deputy Principal. This team is committed to initiating and maintaining strong relationships with outside agencies within the local community to improve children’s outcomes. Staff, children and families support each other to work towards a common goal of improving the goals and outcomes of every child. Our Responsible Behaviour Plan is reviewed every 2 years by the PBL Team and embeds the Departmental processes and procedures with regards to Bullying, Cyber-Bullying and Safety at School. Parent, Student and Staff Satisfaction Parent opinion survey
Performance measure
Percentage of parents/caregivers who agree# that: 2014 2015 2016
their child is getting a good education at school (S2016)
95% 88% 83%
this is a good school (S2035) 98% 88% 79%
their child likes being at this school* (S2001) 95% 92% 93%
8
Performance measure
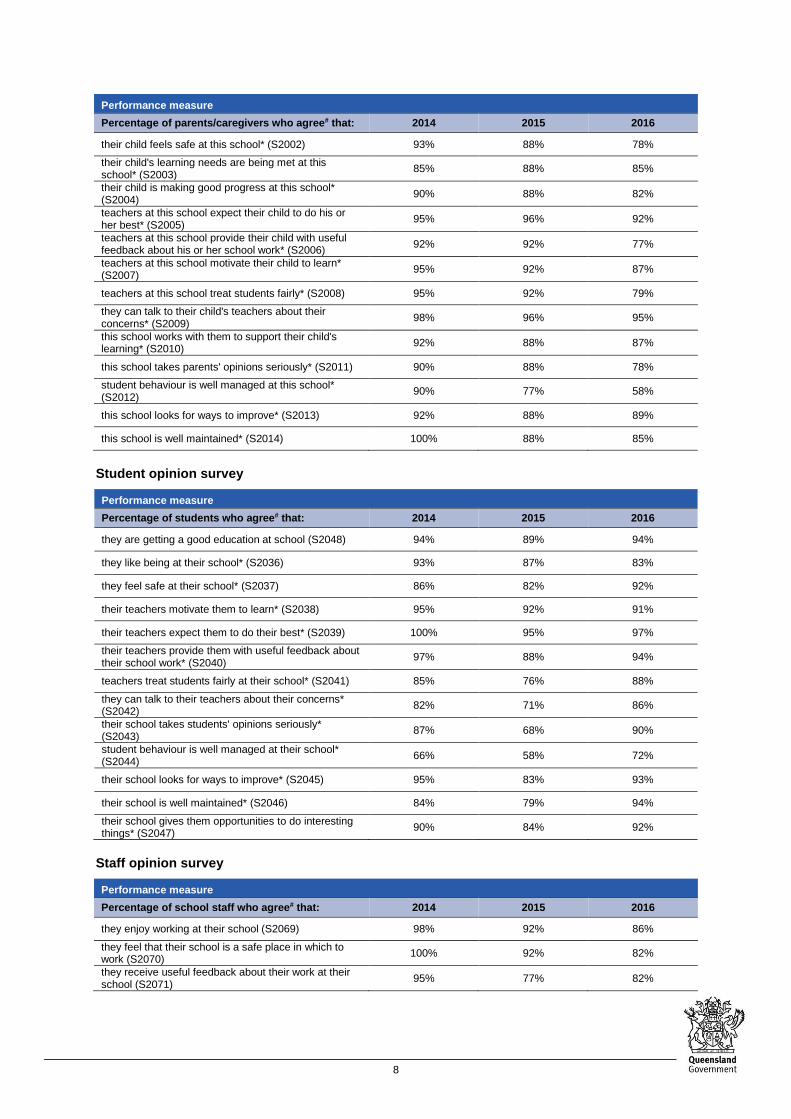
Percentage of parents/caregivers who agree# that: 2014 2015 2016
their child feels safe at this school* (S2002) 93% 88% 78%
their child's learning needs are being met at this school* (S2003)
85% 88% 85%
their child is making good progress at this school* (S2004)
90% 88% 82%
teachers at this school expect their child to do his or her best* (S2005)
95% 96% 92%
teachers at this school provide their child with useful feedback about his or her school work* (S2006)
92% 92% 77%
teachers at this school motivate their child to learn* (S2007)
95% 92% 87%
teachers at this school treat students fairly* (S2008) 95% 92% 79%
they can talk to their child's teachers about their concerns* (S2009)
98% 96% 95%
this school works with them to support their child's learning* (S2010)
92% 88% 87%
this school takes parents' opinions seriously* (S2011) 90% 88% 78%
student behaviour is well managed at this school* (S2012)
90% 77% 58%
this school looks for ways to improve* (S2013) 92% 88% 89%
this school is well maintained* (S2014) 100% 88% 85%
Student opinion survey
Performance measure
Percentage of students who agree# that: 2014 2015 2016
they are getting a good education at school (S2048) 94% 89% 94%
they like being at their school* (S2036) 93% 87% 83%
they feel safe at their school* (S2037) 86% 82% 92%
their teachers motivate them to learn* (S2038) 95% 92% 91%
their teachers expect them to do their best* (S2039) 100% 95% 97%
their teachers provide them with useful feedback about their school work* (S2040)
97% 88% 94%
teachers treat students fairly at their school* (S2041) 85% 76% 88%
they can talk to their teachers about their concerns* (S2042)
82% 71% 86%
their school takes students' opinions seriously* (S2043)
87% 68% 90%
student behaviour is well managed at their school* (S2044)
66% 58% 72%
their school looks for ways to improve* (S2045) 95% 83% 93%
their school is well maintained* (S2046) 84% 79% 94%
their school gives them opportunities to do interesting things* (S2047)
90% 84% 92%
Staff opinion survey
Performance measure
Percentage of school staff who agree# that: 2014 2015 2016
they enjoy working at their school (S2069) 98% 92% 86%
they feel that their school is a safe place in which to work (S2070)
100% 92% 82%
they receive useful feedback about their work at their school (S2071)
95% 77% 82%
9
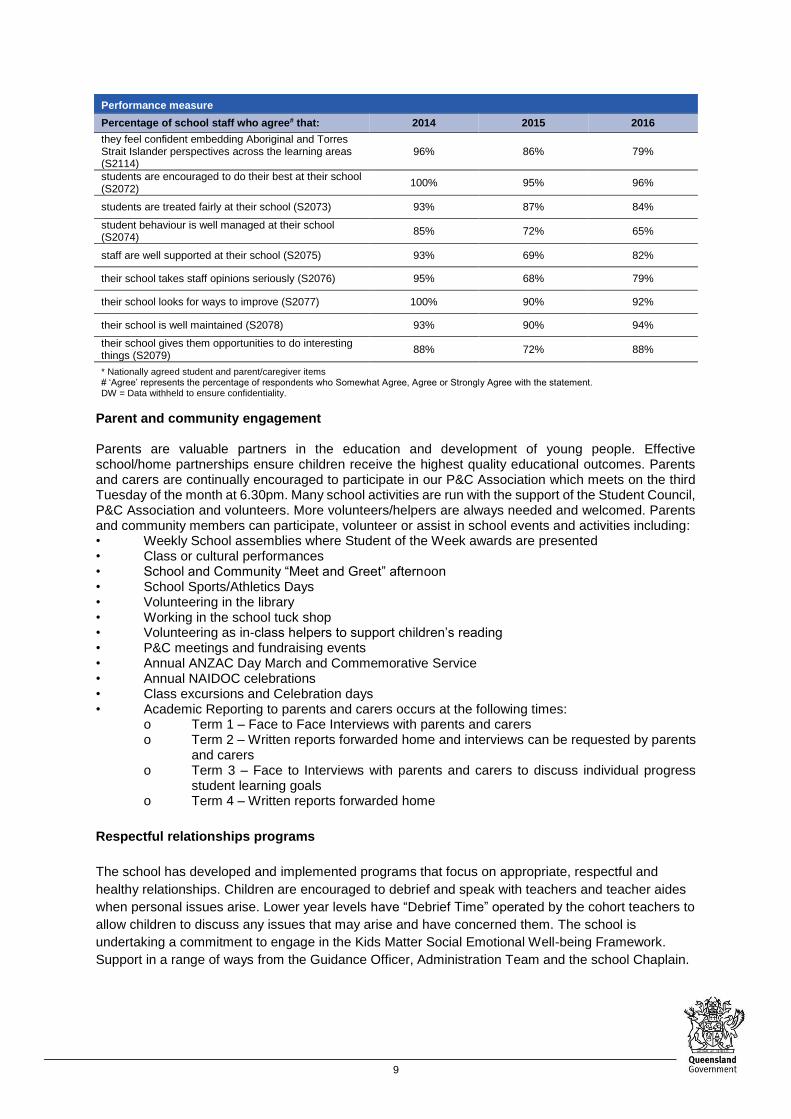
Performance measure
Percentage of school staff who agree# that: 2014 2015 2016
they feel confident embedding Aboriginal and Torres Strait Islander perspectives across the learning areas (S2114)
96% 86% 79%
students are encouraged to do their best at their school (S2072)
100% 95% 96%
students are treated fairly at their school (S2073) 93% 87% 84%
student behaviour is well managed at their school (S2074)
85% 72% 65%
staff are well supported at their school (S2075) 93% 69% 82%
their school takes staff opinions seriously (S2076) 95% 68% 79%
their school looks for ways to improve (S2077) 100% 90% 92%
their school is well maintained (S2078) 93% 90% 94%
their school gives them opportunities to do interesting things (S2079)
88% 72% 88%
* Nationally agreed student and parent/caregiver items # ‘Agree’ represents the percentage of respondents who Somewhat Agree, Agree or Strongly Agree with the statement. DW = Data withheld to ensure confidentiality.
Parent and community engagement Parents are valuable partners in the education and development of young people. Effective school/home partnerships ensure children receive the highest quality educational outcomes. Parents and carers are continually encouraged to participate in our P&C Association which meets on the third Tuesday of the month at 6.30pm. Many school activities are run with the support of the Student Council, P&C Association and volunteers. More volunteers/helpers are always needed and welcomed. Parents and community members can participate, volunteer or assist in school events and activities including: • Weekly School assemblies where Student of the Week awards are presented • Class or cultural performances • School and Community “Meet and Greet” afternoon • School Sports/Athletics Days • Volunteering in the library • Working in the school tuck shop • Volunteering as in-class helpers to support children’s reading • P&C meetings and fundraising events • Annual ANZAC Day March and Commemorative Service • Annual NAIDOC celebrations • Class excursions and Celebration days • Academic Reporting to parents and carers occurs at the following times:
o Term 1 – Face to Face Interviews with parents and carers o Term 2 – Written reports forwarded home and interviews can be requested by parents
and carers o Term 3 – Face to Interviews with parents and carers to discuss individual progress
student learning goals o Term 4 – Written reports forwarded home
Respectful relationships programs
The school has developed and implemented programs that focus on appropriate, respectful and
healthy relationships. Children are encouraged to debrief and speak with teachers and teacher aides
when personal issues arise. Lower year levels have “Debrief Time” operated by the cohort teachers to
allow children to discuss any issues that may arise and have concerned them. The school is
undertaking a commitment to engage in the Kids Matter Social Emotional Well-being Framework.
Support in a range of ways from the Guidance Officer, Administration Team and the school Chaplain.
10
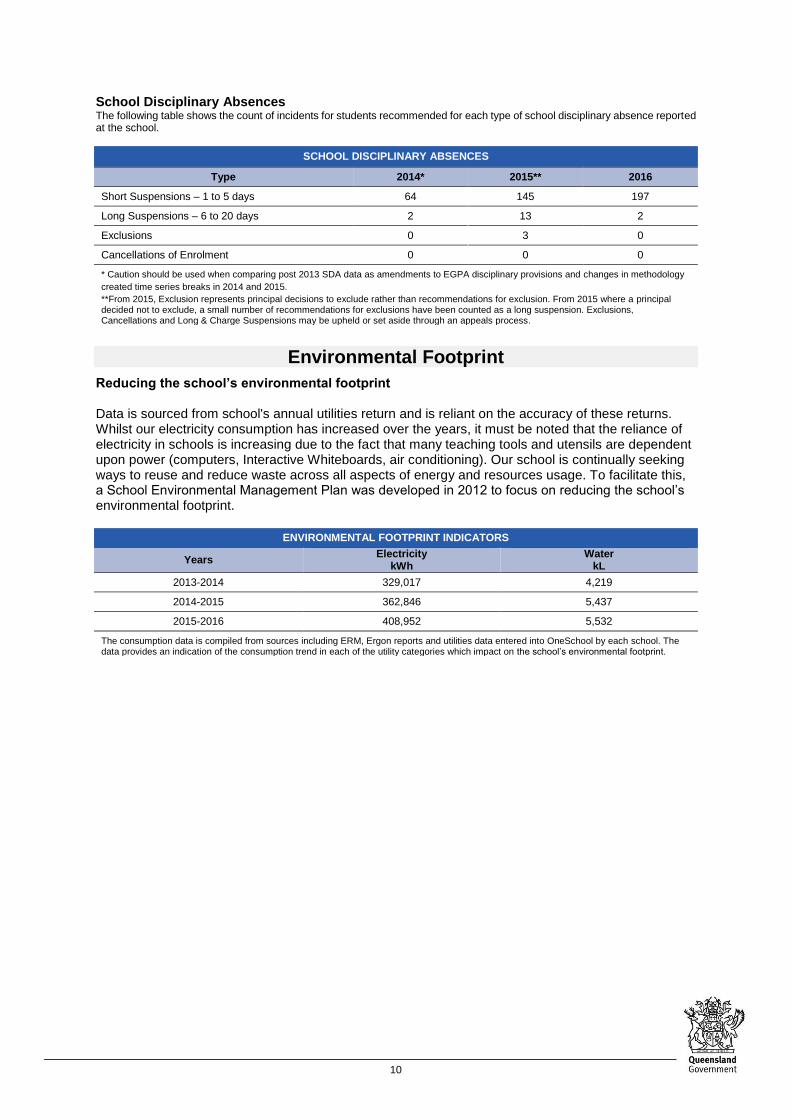
School Disciplinary Absences The following table shows the count of incidents for students recommended for each type of school disciplinary absence reported at the school.
SCHOOL DISCIPLINARY ABSENCES
Type 2014* 2015** 2016
Short Suspensions – 1 to 5 days 64 145 197
Long Suspensions – 6 to 20 days 2 13 2
Exclusions 0 3 0
Cancellations of Enrolment 0 0 0
* Caution should be used when comparing post 2013 SDA data as amendments to EGPA disciplinary provisions and changes in methodology
created time series breaks in 2014 and 2015.
**From 2015, Exclusion represents principal decisions to exclude rather than recommendations for exclusion. From 2015 where a principal decided not to exclude, a small number of recommendations for exclusions have been counted as a long suspension. Exclusions, Cancellations and Long & Charge Suspensions may be upheld or set aside through an appeals process.
Environmental Footprint
Reducing the school’s environmental footprint Data is sourced from school's annual utilities return and is reliant on the accuracy of these returns. Whilst our electricity consumption has increased over the years, it must be noted that the reliance of electricity in schools is increasing due to the fact that many teaching tools and utensils are dependent upon power (computers, Interactive Whiteboards, air conditioning). Our school is continually seeking ways to reuse and reduce waste across all aspects of energy and resources usage. To facilitate this, a School Environmental Management Plan was developed in 2012 to focus on reducing the school’s environmental footprint.
ENVIRONMENTAL FOOTPRINT INDICATORS
Years Electricity
kWh Water
kL
2013-2014 329,017 4,219
2014-2015 362,846 5,437
2015-2016 408,952 5,532
The consumption data is compiled from sources including ERM, Ergon reports and utilities data entered into OneSchool by each school. The data provides an indication of the consumption trend in each of the utility categories which impact on the school’s environmental footprint.
11
School Funding
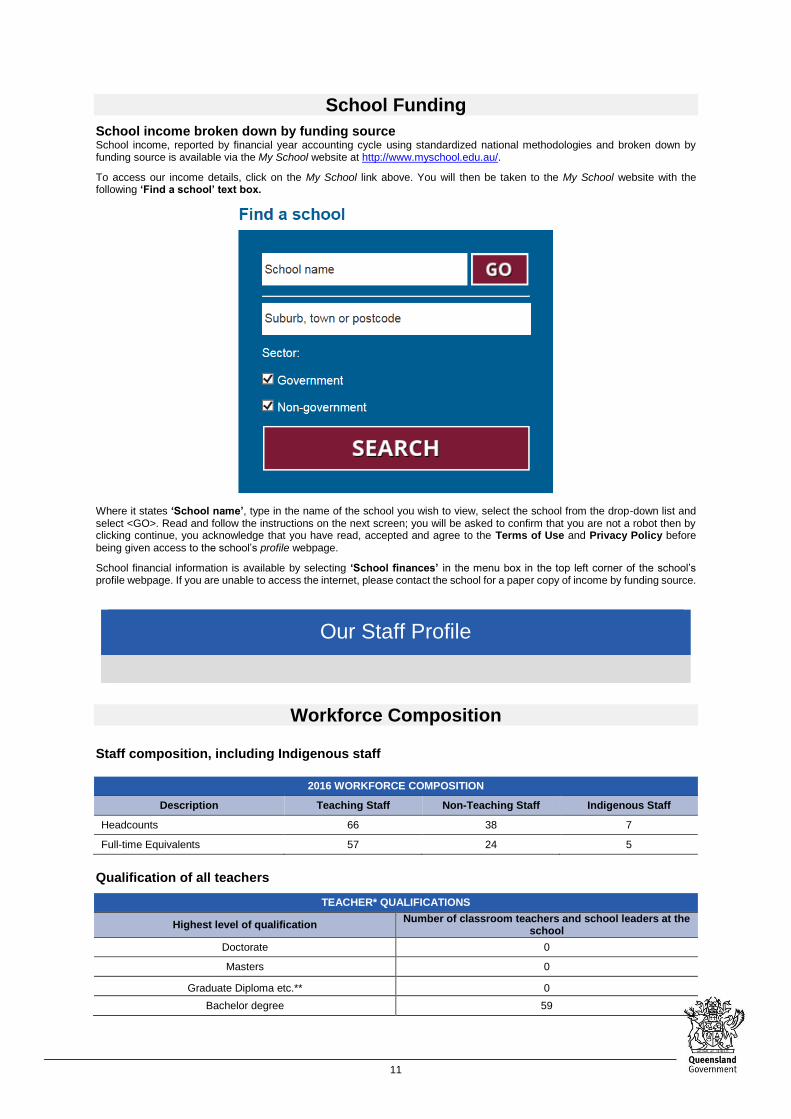
School income broken down by funding source School income, reported by financial year accounting cycle using standardized national methodologies and broken down by funding source is available via the My School website at http://www.myschool.edu.au/.
To access our income details, click on the My School link above. You will then be taken to the My School website with the following ‘Find a school’ text box.
Where it states ‘School name’, type in the name of the school you wish to view, select the school from the drop-down list and select <GO>. Read and follow the instructions on the next screen; you will be asked to confirm that you are not a robot then by clicking continue, you acknowledge that you have read, accepted and agree to the Terms of Use and Privacy Policy before being given access to the school’s profile webpage.
School financial information is available by selecting ‘School finances’ in the menu box in the top left corner of the school’s profile webpage. If you are unable to access the internet, please contact the school for a paper copy of income by funding source.
Our Staff Profile
Workforce Composition
Staff composition, including Indigenous staff
2016 WORKFORCE COMPOSITION
Description Teaching Staff Non-Teaching Staff Indigenous Staff
Headcounts 66 38 7
Full-time Equivalents 57 24 5
Qualification of all teachers
TEACHER* QUALIFICATIONS
Highest level of qualification Number of classroom teachers and school leaders at the
school
Doctorate 0
Masters 0
Graduate Diploma etc.** 0
Bachelor degree 59
12
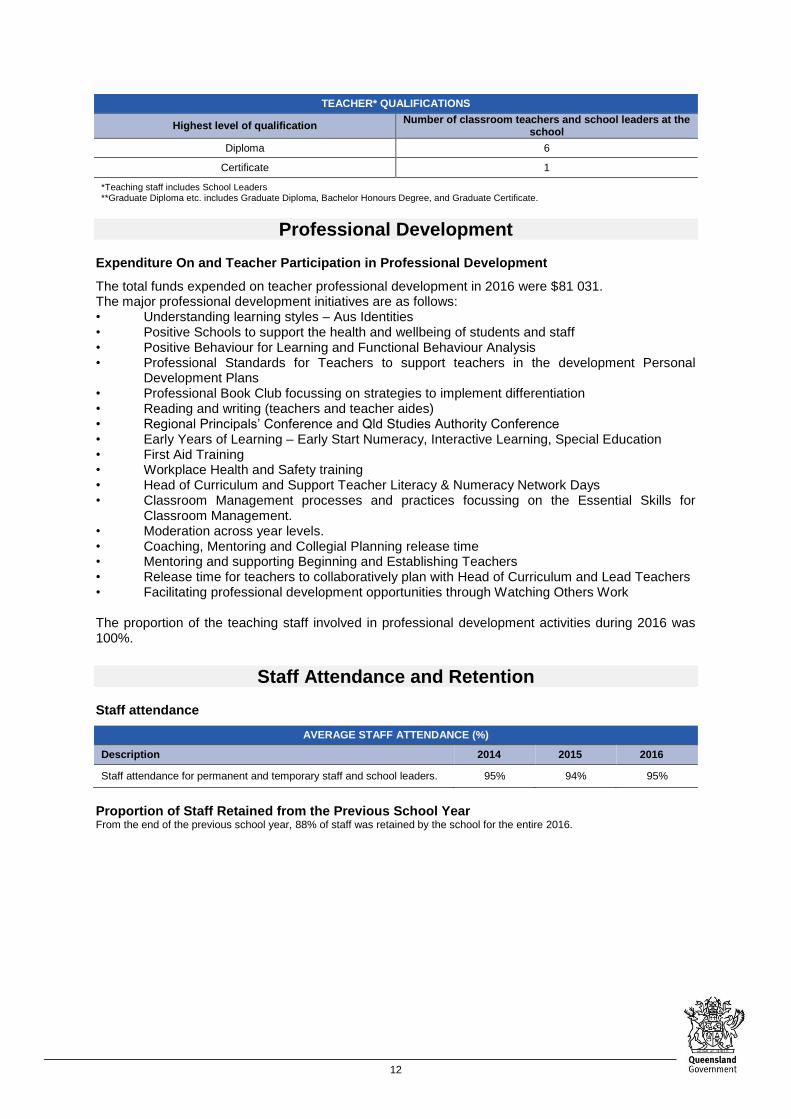
TEACHER* QUALIFICATIONS
Highest level of qualification Number of classroom teachers and school leaders at the
school
Diploma 6
Certificate 1
*Teaching staff includes School Leaders **Graduate Diploma etc. includes Graduate Diploma, Bachelor Honours Degree, and Graduate Certificate.
Professional Development Expenditure On and Teacher Participation in Professional Development
The total funds expended on teacher professional development in 2016 were $81 031. The major professional development initiatives are as follows: • Understanding learning styles – Aus Identities • Positive Schools to support the health and wellbeing of students and staff • Positive Behaviour for Learning and Functional Behaviour Analysis • Professional Standards for Teachers to support teachers in the development Personal
Development Plans • Professional Book Club focussing on strategies to implement differentiation • Reading and writing (teachers and teacher aides) • Regional Principals’ Conference and Qld Studies Authority Conference • Early Years of Learning – Early Start Numeracy, Interactive Learning, Special Education • First Aid Training • Workplace Health and Safety training • Head of Curriculum and Support Teacher Literacy & Numeracy Network Days • Classroom Management processes and practices focussing on the Essential Skills for
Classroom Management. • Moderation across year levels. • Coaching, Mentoring and Collegial Planning release time • Mentoring and supporting Beginning and Establishing Teachers • Release time for teachers to collaboratively plan with Head of Curriculum and Lead Teachers • Facilitating professional development opportunities through Watching Others Work The proportion of the teaching staff involved in professional development activities during 2016 was 100%.
Staff Attendance and Retention Staff attendance
AVERAGE STAFF ATTENDANCE (%)
Description 2014 2015 2016
Staff attendance for permanent and temporary staff and school leaders. 95% 94% 95%
Proportion of Staff Retained from the Previous School Year From the end of the previous school year, 88% of staff was retained by the school for the entire 2016.
13
Performance of Our Students
Key Student Outcomes
Student Attendance
Student attendance
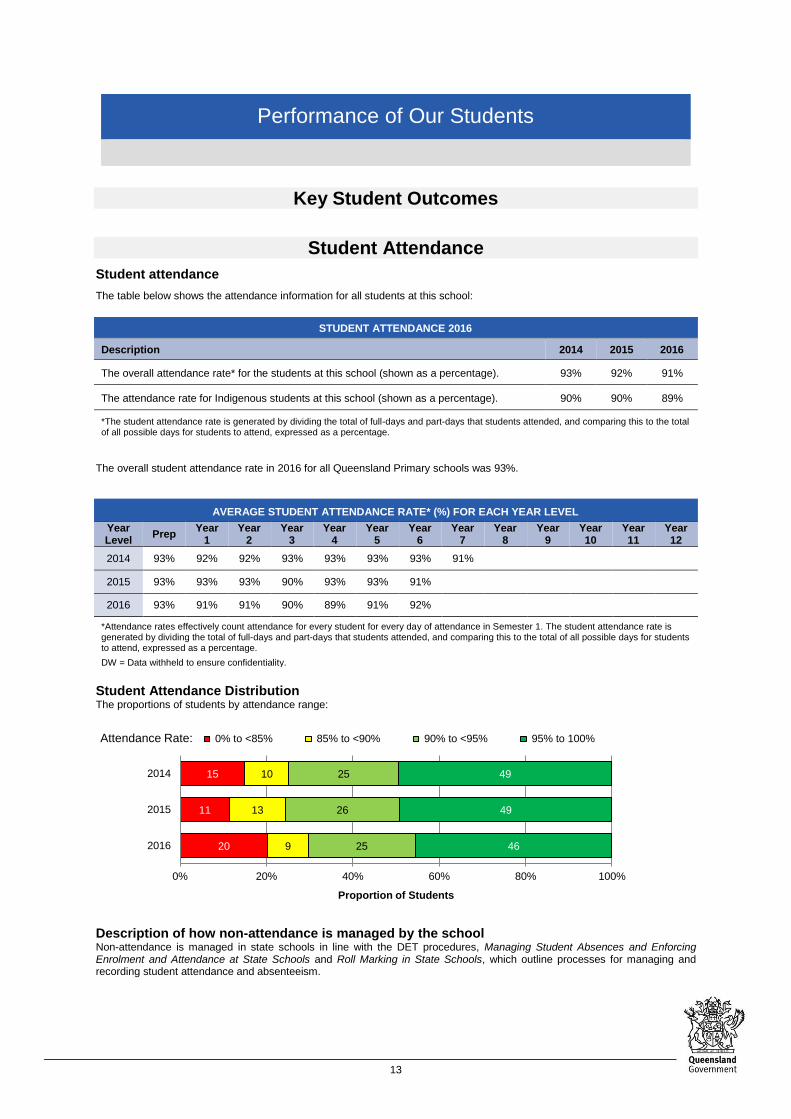
The table below shows the attendance information for all students at this school:
STUDENT ATTENDANCE 2016
Description 2014 2015 2016
The overall attendance rate* for the students at this school (shown as a percentage). 93% 92% 91%
The attendance rate for Indigenous students at this school (shown as a percentage). 90% 90% 89%
*The student attendance rate is generated by dividing the total of full-days and part-days that students attended, and comparing this to the total of all possible days for students to attend, expressed as a percentage.
The overall student attendance rate in 2016 for all Queensland Primary schools was 93%.
AVERAGE STUDENT ATTENDANCE RATE* (%) FOR EACH YEAR LEVEL
Year Level
Prep Year
1 Year
2 Year
3 Year
4 Year
5 Year
6 Year
7 Year
8 Year
9 Year 10
Year 11
Year 12
2014 93% 92% 92% 93% 93% 93% 93% 91%
2015 93% 93% 93% 90% 93% 93% 91%
2016 93% 91% 91% 90% 89% 91% 92%
*Attendance rates effectively count attendance for every student for every day of attendance in Semester 1. The student attendance rate is generated by dividing the total of full-days and part-days that students attended, and comparing this to the total of all possible days for students to attend, expressed as a percentage.
DW = Data withheld to ensure confidentiality.
Student Attendance Distribution The proportions of students by attendance range:
Description of how non-attendance is managed by the school Non-attendance is managed in state schools in line with the DET procedures, Managing Student Absences and Enforcing Enrolment and Attendance at State Schools and Roll Marking in State Schools, which outline processes for managing and recording student attendance and absenteeism.
20
11
15
9
13
10
25
26
25
46
49
49
0% 20% 40% 60% 80% 100%
2016
2015
2014
Proportion of Students
Attendance Rate: 0% to <85% 85% to <90% 90% to <95% 95% to 100%
14
Non-attendance is managed in state schools in line with the DET procedures, Managing Student Absences and Enforcing Enrolment and Attendance at State Schools and Roll Marking in State Schools, which outline processes for managing and recording student attendance and absenteeism. Teachers mark rolls electronically in the morning and afternoon. Teachers and administrative staff informally follow up student absences with students and parents by requesting notes and making phone calls. Administrators follow up with parents and students by investigating issues affecting attendance, identifying support options if needed, and following procedures identified in the Department flowchart “Managing Unexplained Absences”. In term 3 of 2016 the school commenced daily SMS notification of parents and carers as to the unexplained absences of children from school. This is delivered in accordance with the recommended Departmental processes and procedures. For persistent truancy or absenteeism, administrators follow procedures identified in the Department flowchart “Process for Persistent Truancy or Absenteeism for Children of Compulsory School Age”. Administrators manage ‘at risk’ attendance and target those students with irregular attendance including early leavers and late arrivals. Hambledon State School consistently articulates the key message that ‘Every Day Counts” to our school community.
NAPLAN
Our reading, writing, spelling, grammar and punctuation, and numeracy results for the Years 3, 5, 7 and 9 are available via the My School website at http://www.myschool.edu.au/.
To access our NAPLAN results, click on the My School link above. You will then be taken to the My School website with the
following ‘Find a school’ text box.
Where it states ‘School name’, type in the name of the school you wish to view, select the school from the drop-down list and select <GO>. Read and follow the instructions on the next screen; you will be asked to confirm that you are not a robot then by clicking continue, you acknowledge that you have read, accepted and agree to the Terms of Use and Privacy Policy before being given access to the school’s profile webpage.
School NAPLAN information is available by selecting ‘NAPLAN’ in the menu box in the top left corner of the school’s profile webpage. If you are unable to access the internet, please contact the school for a paper copy of our school’s NAPLAN results.