Embed Size (px)
Citation preview
Departmental Guide
Guide for the
Preparation of the
Annual Report
For the year ended 31 March 2012

The Annual Report Guide 2011/12
2
Main Contents
A BACKGROUND .............................................................................................................. 3
B LEGISLATION ................................................................................................................ 4
C THE ANNUAL REPORT ................................................................................................. 6
D PROVINCIAL DEPARTMENTS .................................................................................... 52
i) WITH CUSTOMISED PERFORMANCE MEASURES ................................................. 52
ii) WITHOUT CUSTOMISED PERFORMANCE MEASURES ........................................ 52
ANNEXURE A…………………………………………………………………………………...53

The Annual Report Guide 2011/12
3
A BACKGROUND
The purpose of this Annual Report Guide is to provide minimum requirements of information that must
be included in a National or Provincial Department’s Annual Report. The Annual Report provides
information of performance against plans and budgets.
Adherence to the format of this guide will enhance departments’ coverage of all aspects pertaining to
the departments’ activities and financial performance, and will promote ease of reference and
comparison for users of the Annual Report. The guide is congruent to other frameworks issued for
national and provincial departments such as the Framework for Strategic Plans and Annual
Performance Plans, Framework for Managing Programme Performance Information and the
Departmental Financial Reporting Framework Guide.
In line with the Transfer of Functions – Financial Accounting and Reporting Guide, new departments
that have fully completed the organisational approval process, including obtaining approval for the
new establishment, function shifts and the new budget programme structures from the Department of
Public Service and Administration (DPSA) and the National Treasury respectively, will have to report
separately on activities of the financial year in the annual report.
Departments must note that the guide provides guidance on the non-financial information
requirements of the Annual Report. In other words, the guidance is on all sections of the Annual
Report except the Annual Financial Statements section. The Annual Financial Statements section is
dealt with in a separate guide, namely the Departmental Financial Reporting Framework Guide, that
can be obtained from the Office of the Accountant-General (OAG) website. It is imperative that any
narrative or figures in the non-financial information part of the Annual Report correspond with
information reported in the Annual Financial Statements.
The following must be noted:
The areas written in italics and in the colour red must be updated accordingly,
Additional relevant information can be provided at the department’s discretion,
Where necessary, pictures, graphs and diagrams can be added to enhance the information,
The sequence of information to be reported on must not be changed, even if additional
information is provided,
A reporting requirement that is included in the guide that is not applicable to the department can
be excluded from the annual report,
Departments must exercise due care when spending to produce an annual report,
The annual report, including the information on predetermined objectives must be submitted to
the AGSA by 31 May.

The Annual Report Guide 2011/12
4
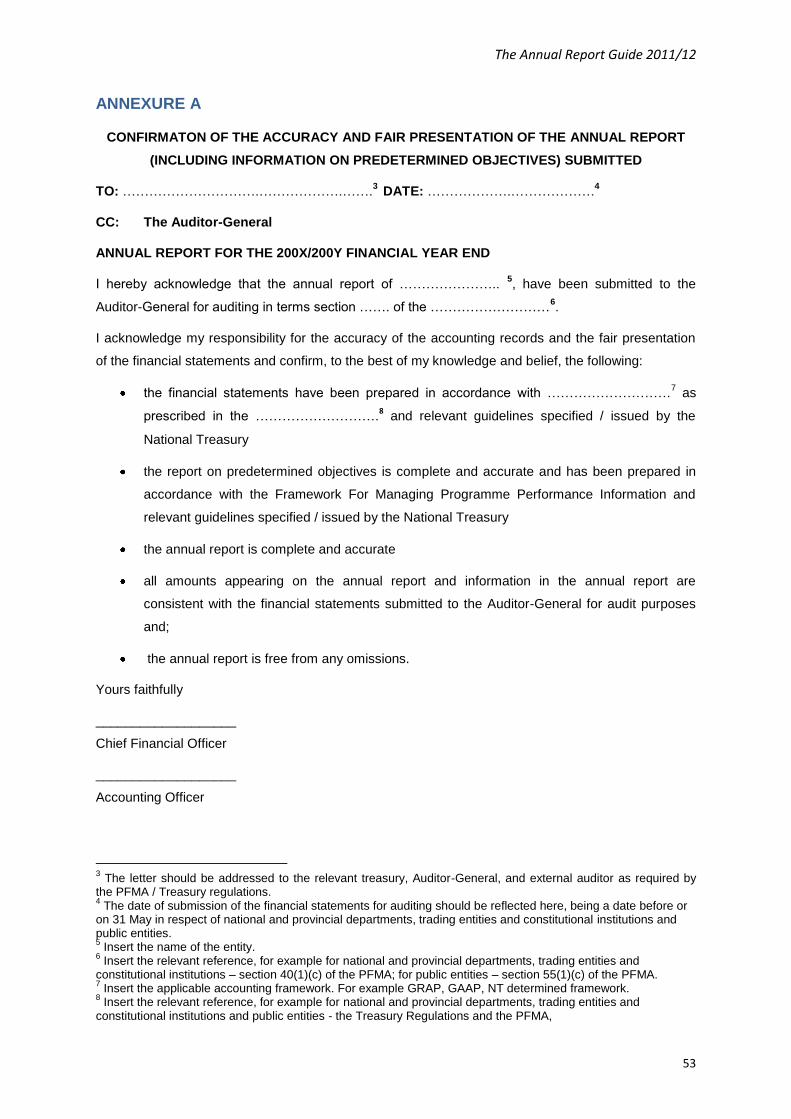
Submission of the annual report to the Auditor-General (AGSA):
The annual report must be submitted to the Auditor-General by 31 May 2011. The Auditor–General will
review the contents of the annual report to ensure that the content of the annual report is consistent with
the annual financial statements. A confirmation letter must be completed by the Accounting Officer to
accept responsibility for the accuracy and fair presentation of the Annual Report including the information
on predetermined objectives submitted to the AGSA and relevant treasury, and confirms that the Annual
Report conforms to certain set guidelines. A copy of this letter is attached to this guide. It is the same
letter as the one included in Chapter 1 of the Departmental Financial Reporting Framework Guide.
B LEGISLATION
Section 40 of the PFMA and chapter 18 of the Treasury Regulations set out the legal requirements for
departments’ annual reports.
PFMA
40. Accounting officers’ reporting responsibilities
(1) The accounting officer of a department, trading entity or constitutional institution-
(d) must submit within five months of the end of a financial year to the relevant treasury and, in the
case of a department or trading entity, also to the executive authority responsible for that
department or trading entity-
(i) an annual report on the activities of that department, trading entity or constitutional
institution during that financial year;
(3) The annual report and audited financial statements referred to in subsection (1)(d) must-
(a) fairly present the state of affairs of the department trading entity or constitutional institution, its
business , its financial results, its performance against predetermined objectives and its financial
position as at the end of the financial year concerned; and
(b) include particulars of-
(i) any material losses through criminal conduct, and any unauthorised expenditure, irregular
expenditure and fruitless and wasteful expenditure, that occurred during the financial year;
(ii) any criminal or disciplinary steps taken as a result of such losses, unauthorised
expenditure, irregular expenditure and fruitless and wasteful expenditure;
(iii) any material losses recovered or written off; and
(iv) any other matters that may be prescribed.
The Annual Report Guide 2011/12
5
Treasury Regulations
18.3 Contents of annual reports [Section 40(1)(d) of the PFMA]
18.3.1 In preparing the annual report of an institution, the accounting officer must –
(a) in the case of a department or trading entity, comply with the requirements prescribed in Chapter
1, Part III J of the Public Service Regulations, 2001;
(c) include information on transfers and subsidies per organisation for the entire financial year as well
as a report on compliance with section 38(1)(j) of the Act;
(d) include all information required in terms of the annual Division of Revenue Act;
(e) include any additional information required by Parliament or the provincial legislature;
(f) report on the use of foreign aid assistance, detailing the source and intended use of the assistance
(including the value of any aid-in-kind in rand), performance information on the institution’s use of the
assistance, and any pending applications for assistance;
(g) a report from the audit committee as required by paragraph 3.1.13; and
(h) include information on the management of PPP agreements as required by paragraph 16.7.1(f).
18.4 Additional annual reporting requirements for departments controlling trading entities, and
public entities
18.4.1 A department’s annual report must include a list of trading and/or public entities; controlled by
or reporting to the department or responsible executive authority, together with –
(a) an indication of the legislation under which the trading and/or public entity was established;
(b) a statement of the functions of each trading and/or public entity; (c) the accountability
arrangements established between the accounting officer or executive authority and the management
of the trading and/or public entity; and
(d) significant achievements in relation to outputs of a trading and/or public entity.

The Annual Report Guide 2011/12
6
C THE ANNUAL REPORT
Cover page
The Department to use format desired by the Department for the cover page.
COVER PAGE
(Department’s own format)

The Annual Report Guide 2011/12
7
Submitting the Annual Report to the Minister
The following serves as an example of wording that may be included by the department as indication of
submitting the annual report to its executive authority.
NAME OF DEPARTMENT
Annual Report
2011/12
(Mr/Mrs/Miss/Dr/Prof Name of Minister)
Minister of (Name of Department)
I have the honour of submitting the Annual Report of the (Name of Department) for the period 1 April
2011 to 31 March 2012.
(Signature of Accounting Officer)
_________________________________________
(Name of Accounting Officer)
(Date of Submission)

The Annual Report Guide 2011/12
8
DEPARTMENT OF XXXXXX
VOTE XX
2011/12 ANNUAL REPORT
Contents
1. GENERAL INFORMATION .......................................................................................................... 10
Vision, Mission and Values ................................................................................................................ 10
Organisational Structure .................................................................................................................... 11
Legislative Mandate ............................................................................................................................ 11
Entities Reporting to the Minister ..................................................................................................... 11
Minister’s/MEC’s Statement ............................................................................................................... 12
Deputy Minister’s Statement .............................................................................................................. 12
Accounting Officer’s Overview .......................................................................................................... 12
2. INFORMATION ON PREDETERMINED OBJECTIVES .............................................................. 13
2.1 Overall Performance .......................................................................................................... 14
2.1.1 Voted Funds .................................................................................................................... 14
2.1.2 Aim of vote ....................................................................................................................... 14
2.1.3 Strategic Outcome Oriented Goals .............................................................................. 14
2.1.4 Overview of the service delivery environment for 2011/12 ...................................... 15
2.1.5 Overview of the organisational environment for 2011/12 ......................................... 15
2.1.6 Key policy developments and legislative changes .................................................... 16
2.1.7 Departmental revenue, expenditure, and other specific topics ............................... 16
2.1.8 Departmental expenditure ............................................................................................. 17
2.1.9 Transfer payments (if applicable) ................................................................................ 17
2.1.10 Public Entities ................................................................................................................. 18
2.1.11 Conditional grants and earmarked funds .................................................................... 18
2.1.12 Capital investment, maintenance and asset management plan ............................. 20

The Annual Report Guide 2011/12
9
2.2 Programme Performance .................................................................................................. 22
Programme 1: Administration ....................................................................................................... 22
Programme 2: XXXXXXXXXXXXX.............................................................................................. 23
Programme 3: XXXXXXXXXXXXX.............................................................................................. 23
Programme 4: XXXXXXXXXXXXX.............................................................................................. 23
3. ANNUAL FINANCIAL STATEMENTS ......................................................................................... 24
Report of the Audit Committee ..................................................................................................... 24
Report of the Accounting Officer(s) ............................................................................................. 24
Report of the Auditor-General ...................................................................................................... 24
Appropriation Statement ............................................................................................................... 24
Notes to the Appropriation Statement ......................................................................................... 24
Statement of Financial Performance ........................................................................................... 24
Statement of Financial Position ................................................................................................... 24
Statement of changes in Net Assets ........................................................................................... 24
Cash Flow Statement .................................................................................................................... 24
Statement of Accounting Policies and Related Matters ........................................................... 24
Notes to the Annual Financial Statements (including Accounting Policies) .......................... 24
Disclosure notes to the Annual Financial Statements .............................................................. 24
Annexures (Unaudited supplementary schedules) ................................................................... 24
Annual Financial Statements of other entities (if applicable)................................................... 24
4. HUMAN RESOURCE MANAGEMENT ........................................................................................ 25
5. OTHER INFORMATION ............................................................................................................... 51
Acronyms ......................................................................................................................................... 51
List of contact details ..................................................................................................................... 51
Additional information .................................................................................................................... 51
The Annual Report Guide 2011/12
10
1. GENERAL INFORMATION
Vision, Mission and Values
Vision
A vision is an inspiring picture of a preferred future. It is not time-bound and serves as a foundation for all
policy development and planning, including Strategic Planning. It should be specific to the institution but
linked to the overall vision of a particular sector or cluster.
(The department must state the Vision of the Department.)
Mission
A mission statement sets out the reason for an institution’s existence based on its legislative mandates,
functions and responsibilities. The mission should succinctly identify what the institution does, why and
for whom. In the budget documentation, the stated mission of the department should be the same as the
Vote aim.
(The department must state the Mission of the Department.)
Values
Values identify the principles for the conduct of the institution in carrying out its mission. Institutional
values are derived in conjunction with the institution’s mission. These values should define a citizen-
oriented approach for producing and delivering government services in line with the Batho Pele
principles.
(The department must state the Values of the Department.)

The Annual Report Guide 2011/12
11
Organisational Structure
The organisational structure must include details of the Minister, Deputy Minister/s, Director
General/Head of Department and Deputy Director-Generals (or equivalent). Pictures may be added to
the organisational structure.
(The Department must provide its organisational structure.)
Legislative Mandate
The legislative mandate refers to the legislation that governs the existence of the department and its
operations. There is an overarching mandate for the existence of each department. There is also
legislation that is not entity-specific but governs other departments in the cluster, province or/and national
sphere of government. An example of non-entity-specific legislation is the PFMA.
(The department must state:
Its legislative mandate stating the actual legislation reference starting with the “overarching
mandate” ,
Non-entity-specific legislation, and,
List of all legislation tabled in parliament during 2011/12 financial year.
Entities Reporting to the Minister
The department must provide information on any other entities that report to its executive authority. The
information is meaningful as it provides details of entities related to the department. The information
furnished in this section should correlate with information provided in the related party transactions
disclosure note to the financial statements.
The department may elect to provide details about the name, legislation and nature of the business of the entity reporting to its executive authority in tabular format (example provided below) or in narrative format.
The Annual Report Guide 2011/12
12
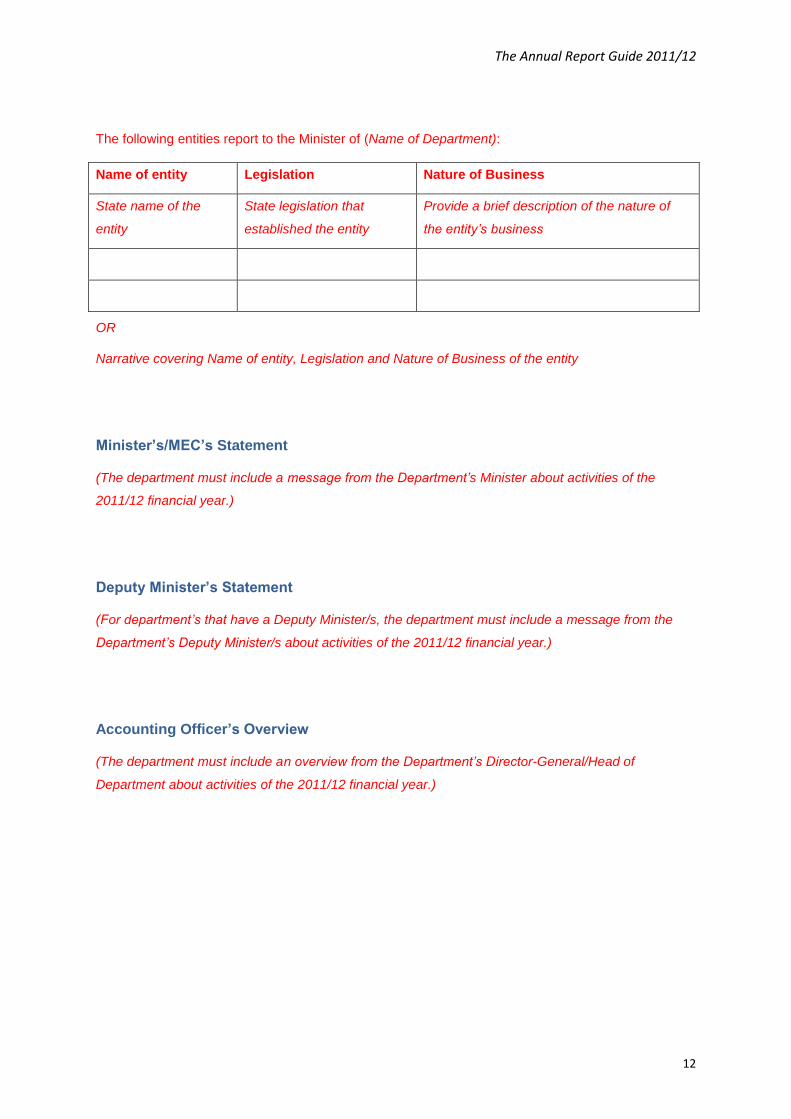
The following entities report to the Minister of (Name of Department):
Name of entity Legislation Nature of Business
State name of the
entity
State legislation that
established the entity
Provide a brief description of the nature of
the entity’s business
OR
Narrative covering Name of entity, Legislation and Nature of Business of the entity
Minister’s/MEC’s Statement
(The department must include a message from the Department’s Minister about activities of the
2011/12 financial year.)
Deputy Minister’s Statement
(For department’s that have a Deputy Minister/s, the department must include a message from the
Department’s Deputy Minister/s about activities of the 2011/12 financial year.)
Accounting Officer’s Overview
(The department must include an overview from the Department’s Director-General/Head of
Department about activities of the 2011/12 financial year.)

The Annual Report Guide 2011/12
13
2. INFORMATION ON PREDETERMINED OBJECTIVES
The guidance provided in this section is based on Framework for Strategic Plans and Annual
Performance Plans and Framework for Managing Programme Performance Information which are
available on the National Treasury website.
Any input or clarification required should be directed to:-
National Departments
Euody Mogaswa
Budget Office, National Treasury
Euody. [email protected]
Provincial Departments
Edeshri Moodley
Intergovernmental Relations (IGR), National Treasury
Performance information, (i.e. information on predetermined objectives), is key to effective
management planning, budgeting, implementation, monitoring, evaluation and reporting. Measuring
performance ensures that policy, planning, budgeting and reporting are aligned in order to achieve
improved service delivery. Performance information indicates how well an institution is meeting its
aims and objectives, and which policies and processes are working. Making the best use of available
data and knowledge is crucial for improving the execution of government's mandate.
Performance information also facilitates effective accountability, enabling legislators, members of the
public and other interested parties to track progress of government activities, identify the scope for
improvement and better understand the issues involved.
The performance information reported in the annual report enables parliament, provincial legislatures
and the public to track government performance, and to hold it accountable. Performance information
also needs to be available to managers at each stage of the planning, budgeting and reporting cycle
so that they can adopt a results-based approach to managing service delivery. This approach
emphasises planning and managing with a focus on desired results, and managing inputs and
activities to achieve these results.
Departments must ensure that there is alignment in terms of the strategic objectives and its
associated targets between the Strategic Plans, Annual Performance Plans and budget documents.
The programme performance must clearly report on the department’s performance against service

The Annual Report Guide 2011/12
14
delivery objectives and targets as identified in the Strategic Plans, Annual Performance Plans1 and
budget documents.
2.1 Overall Performance
Departments should customise the framework and the content to reflect their own specific
circumstances.
2.1.1 Voted Funds
Main
Appropriation
R’000
Adjusted
Appropriation
R’000
Actual
Amount Spent
R’000
(Over)/Under Expenditure
R’000
(Appropriated amount
as per ENE for
National Departments
and Estimates of
Provincial Revenue
and Expenditure)
(Adjusted appropriation
as per National
/Provincial Adjustment
Appropriation Act)
(Total Expenditure
which as per
Statement of Financial
Performance)
( The difference
between Adjusted
Appropriation and Actual
Amount Spent)
Responsible Minister/
MEC
Minister of (title of responsible Minister/MEC to be completed by the relevant
department)
Administering Dept Department of (name of relevant department to be included)
Accounting Officer Director-General of/Head of Department (title of responsible Accounting
Officer to be completed by the relevant department)
2.1.2 Aim of vote
Each department should describe the main aim of its vote. The aim of the vote described here should
be supportive of the mission statement as stated in the annual report. Additional information may be
included to expand on the mission, provided this information is in no way contrary to the mission
statement.
2.1.3 Strategic Outcome Oriented Goals
Each department should reflect their strategic outcome oriented goals as reflected in the Strategic
Plan.
1 Applicable to Provincial Departments from 1 April 2010. National Departments will only be required to submit
Annual Performance Plans in 2011/12.

The Annual Report Guide 2011/12
15
2.1.4 Overview of the service delivery environment for 2011/12
In order to assist users of the annual report to gain an understanding of the challenges, successes
and other factors that might impact on a department’s performance, it is necessary to provide the
users with an overview of the context within which the department operated and sought to implement
its Strategic Plans and Annual Performance Plans.
A department should seek to give a balanced overview of the environment in which it operated during
the past year and not merely focus on factors that might be offered as ‘mitigating circumstances’ to
support the department’s delivery record.
The overview should include:
commentary on the department’s overall performance, outlining its key outputs, particularly
relating to services rendered directly to the public. The department should list all the key services
that it renders to the public, and provide relevant information on each such service, for example,
how many people used that service during the financial year, how many people were turned away
or could not be served and what was the quality of that service,
commentary on the problems encountered by the department when providing the relevant
services, and what corrective steps were/are to be taken in dealing with such problems,
explanations/reasons for any additions to or virement between the main appropriation allocations,
a report on any rollovers from the previous financial year, and
a description of any significant developments, external to the department, that may have impacted
either on the demand for the department’s services or on the department’s ability to deliver those
services.
The department must also highlight significant achievements with regard to the 12 outcomes
announced by the Department of Performance Monitoring and Evaluation. This is only applicable to
departments that directly contribute to the achievement of one or more of the 12 outcomes. A
department that does not directly contribute to any of the 12 outcomes must highlight significant
achievements with regard to its own outcome(s).
2.1.5 Overview of the organisational environment for 2011/12
The annual report should provide readers with an understanding of the organisational challenges and
successes experienced by the department in the year under review.
The aim of this ‘overview of the organisational environment’ is to provide a description of any
significant developments internal to the department that may have impacted on the department’s
ability to deliver on its Strategic Plan and Annual Performance Plan. For example:
The Annual Report Guide 2011/12
16
the resignation and/or appointment of key personnel such as the Accounting Officer or the Chief
Financial Officers,
a strike by significant portions of the personnel employed by the department, or,
restructuring efforts, significant system failures or cases of corruption.
Given that these are factors internal to the department and therefore ostensibly within the
department’s control, it would be expected that the department gives some indication of any
measures that were adopted to mitigate the impact of these events on service delivery.
2.1.6 Key policy developments and legislative changes
The department should describe any major changes to relevant policies or legislation that may have
effected its operations during the period under review or for future financial periods.
2.1.7 Departmental revenue, expenditure, and other specific topics
Collection of departmental revenue
Departments must describe in some detail how they have delivered on the plans for collecting
departmental revenue. Where a department has under-performed, it should give reasons and
indicate what measures were taken during the course of the year to keep on target, and what future
measures will be taken to try and rectify the under-performance. Where it exceeded its target, the
department should provide reasons for the better than anticipated performance.
The department can also use this section to report on new measures instituted during the course of
the year to raise additional revenue or to ensure more efficient/effective collection.
Where there were sales of capital assets, reasons for such a sale must be provided.

The Annual Report Guide 2011/12
17
The table below should be used to provide a breakdown of the sources of revenue:
2008/09
Actual
2009/10
Actual
2010/11
Actual
2011/12
Target
2011/12
Actual
%
deviation
from
target
Tax revenue
(Specify)
Non-tax revenue
(Specify)
Sales of capital assets
(specify)
Financial transactions
(Recovery of loans and
advances)
TOTAL
DEPARTMENTAL
RECEIPTS
Amounts in the 2010/11 Actual and 2011/12 Actual columns above must agree to the note of
Departmental Revenue in the Annual Financial Statements.
2.1.8 Departmental expenditure
The primary aim of the departmental expenditure section is to explore how actual expenditure differed
from planned expenditure and how this may have impacted on service delivery. The secondary aim is
to provide the department with an opportunity to report on measures that were adopted to improve the
economy and efficiency of spending on each programme.
2.1.9 Transfer payments (if applicable)
The transfer payments section provides for funds that have been transferred to other institutions,
provinces, municipalities, public entities, business enterprises and individuals and, therefore, does not

The Annual Report Guide 2011/12
18
constitute final expenditure by the department. Public entities however receive sizeable transfer
payments from government and are often the front-line providers of services. It is therefore important
to understand the impact of these services on the community. Departments are requested to provide
a narrative on the services provided by these entities as well as a summary of all transfers to entities.
Most important, the department must assess the actual amount spent by such entities (excluding
individuals or social grant payments), and indicate when a full spending report can be provided (in the
next annual report). Departments must also comment on monthly monitoring systems or the lack
thereof to monitor spending on such transfers. If such monitoring did take place, departments must
provide details of difficulties experienced and what steps (if any) were taken to rectify such difficulties.
2.1.10 Public Entities
This section must provide a narrative of the significant achievements of targets for each trading and/or
public entity that has received transfer payments from the oversight department for the 2011/2012
financial year. Any other deliverables by the trading and/or public entity can also be stated here.
The narrative must also briefly provide a synopsis on how the achievement of targets has contributed
towards achieving the department’s outcomes which will invariably impact on the strategic priorities of
government.
Legislation
s38(1)(j)
(PFMA)
Departments are further requested to provide a summary report on the institution’s compliance with section 38(1)(j) of the PFMA which requires the accounting officer of the transferring department to ensure that “before transferring any funds to an entity within or outside government
must obtain written assurance from the entity that the entity implements effective
efficient and transparent financial management and internal control systems
or,
if such written assurance is not or cannot be given
render the transfer of the funds subject to conditions and remedial measures requiring the entity to establish and implement effective
efficient and transparent financial management and internal control systems.”
2.1.11 Conditional grants and earmarked funds
These grants were introduced in 1998/99 to support national priorities, particularly in the social
services sector. They enable national priorities to be provided for in the budgets of other spheres of
government. They are viewed as part of voted funds.

The Annual Report Guide 2011/12
19
(Further details regarding conditional grants must be given in note 1 to the annual financial
statements.)
The Division of Revenue Act 1 of 2011 (DORA) requires that annual reports and financial statements
of the transferring and receiving departments must also include information on conditional grants set
out in schedules 4, 5, 6 and 7 of the Act.
Section 13(1) and (2) of DORA outlines information that should be included in the annual reports of
the transferring national offices. Section 13(3) and (4) of DORA outlines information that should be
included in the annual reports and financial statements of the receiving provincial departments and
municipalities.
In order to comply with this requirement, the annual report of the transferring department should
include the following information on conditional grants transferred:
Overview of departmental grants, types of grants, total allocations, transfer trends. A summary of
all grants should be provided in the annexures to the Annual Financial Statements,
Outline of the purpose and expected outputs for each grant,
Explanation of whether transfers were made as scheduled, into the accredited accounts for the
receiving spheres. In situations where payments were either delayed (failure to pay according to
the payment schedule) or withheld (non-transfers) explain the reasons and the extent to which the
department complied with the relevant sections of DORA,
Indication whether any portion of the grant was retained at the national department for
administration costs. Briefly describe the nature of the administration costs,
Analysis of spending trends for each grant, indicating the extent to which the department
monitored compliance with the conditions of the grant. Highlighting specific areas in which
compliance fell short of requirements and steps taken in situations where a province or
municipality failed to comply,
Indication of the extent to which the outputs were achieved, providing a comparative analysis of
provincial performance against their targets. Where performance fell short of expectations outline
the reasons and measures taken to improve performance in the coming years if the grant is
continuing,
An overall assessment of compliance with the DORA, both by the department and the receiving
spheres, and explain any measures taken in a situation where there was non-compliance.
The receiving department should include the following information in the annual report on conditional
grants received:
An overview of grants received, including types and total amount received,
An indication of the total amount of actual expenditure on all allocations,

The Annual Report Guide 2011/12
20
Confirmation that all transfers were deposited into the accredited bank account of the Provincial
Treasury,
An indication of the extent to which the objectives were achieved, with a comparative analysis of
provincial performance against targets. Where performance fell short of expectations, outline the
reasons and measures taken to improve performance in the coming years if the grant is
continuing.
An overall assessment of compliance with the Act, and an explanation of any measures taken in
situations where there was non-compliance.
2.1.12 Capital investment, maintenance and asset management plan
Departments are required to develop a capital investment and asset management plan. The
Estimates of Provincial Revenue and Expenditure should be used as a guide for provincial
departments to report on capital projects, while the ENE should be used for national departments to
report on the capital investment, asset management and maintenance within departments.
Capital investment
The following information must be provided with regard to the department’s capital investment
programme:
Building projects that are currently in progress (list projects) and when are they expected to be
completed,
Plans to close down or down-grade any current facilities,
The current maintenance backlog and how the department plans to deal with such over the
Medium Term Expenditure Framework (MTEF) period,
Developments relating to the above that are expected to impact on the department’s current
expenditure.
Asset Management
Departments are required to provide an overview of the fixed and significant movable assets under
the control of the department. The following information should be included:
Details as to how asset holdings have changed over the period under review, including
information on disposals, scrapping and loss due to theft,
Measures taken to ensure that the department’s asset register remained up-to-date during the
period under review,
The current state of the department’s capital stock, for example what percentage is in good, fair or
bad condition,

The Annual Report Guide 2011/12
21
Major maintenance projects that have been undertaken during the period under review,
Facilities that were closed down or down-graded during the period under review,
Projects that will be carried forward to the forthcoming financial year,
New projects that will commence in the forthcoming financial year,
Processes in place for the tendering of projects.
The Government Immovable Asset Management Act (GIAMA) has been promulgated. It promotes the
sound management of the immovable assets that national and provincial departments use or control.
It makes a distinction between users and custodians. The intention is for Accounting Officers of user
or custodian departments to be accountable for the use of immovable assets as prescribed by the
PFMA and the GIAMA. The User Immovable Asset Management Plan (UAMP) ensures the following:
Accountable, fair and transparent management of immovable assets,
Effective, efficient and economic use of immovable assets,
Reduced overall cost of service delivery,
Reduced demand for new immovable assets.
The UAMP for each government department must inform the budget allocation process in terms of the
annual performance plans of the Department. The UAMPs relate to the accommodation requirements
and current utilization of immovable assets by National Government Departments and some
agencies, aligned to their strategic objectives and Strategic Plans.
Refer to Government Immovable Asset Management Act, 2007 (GIAMA)
Maintenance
Departments must provide details of expenditure on normal maintenance of property assets during
the period under review as far as applicable to the department. (The National Treasury’s Asset
Management Guidelines should also be used as a guide when reporting on capital assets.) The
details should include the following:
How the actual expenditure compares to what the department planned to spend on maintenance.
Whether the expenditure is more or less than the property industry norms.
Progress made in addressing the maintenance backlog during the period under review, for
example, has the backlog grown or become smaller? Is the rate of progress according to plan? If
not why not, and what measures were taken to keep on track?

The Annual Report Guide 2011/12
22
2.2 Programme Performance
The activities of the (Name of Department) are organized in the following programmes:
Programme 1: Administration
Programme 2: XXXXXXXXXXXXXXX (Department to state name of Programme)
Programme 3: XXXXXXXXXXXXXXX (Department to state name of Programme)
Programme 4: XXXXXXXXXXXXXXX (Department to state name of Programme)
Etc (Department to list all the programmes of the Department)
Programme 1: Administration
Purpose: (Department to describe the purpose of the programme)
Strategic Objectives: (Department to describe the strategic objectives relating to the programme)
Performance indicators and targets: This section must provide a narrative of the significant
achievements of targets of each programme/ sub-programme for the 2011/2012 financial year. The
narrative must also provide a synopsis on how the achievement of targets has contributed towards
achieving the department’s outcomes, which will invariably impact on the strategic priorities of
government.
In the table below, departments should report on performance indicators and targets for each
programme or every sub-programme under each Programme2 as specified in the ENE and Annual
Performance Plan (APP) for both national and provincial departments.
2 Departments have an option to provide details at programme or sub-programme level. Ideally, details should be
provided at sub-programme level as information at sub-programme level is more comprehensive.

The Annual Report Guide 2011/12
23
The following table should be completed to complement the narrative above:
Sub-programme/programme: (Name of sub-programme/programme)
Performance Indicator Baseline
(Actual
Output)
2010/11
Actual Performance against Target Reason for
Variance Target (2011 /12) Actual(2011/12)
Measures performance in relation to inputs, activities, outputs, outcomes and impacts.
Level of performance, based on previous year’s performance
Express a specific level of performance that the institution, programme or individual is aiming to achieve within a given time period.
The actual service that was delivered by the department
Reasons for variance between the actual performance and the target. Where relevant, this prompts a department to determine corrective measures.
Changes to planned targets: The department must provide reasons per performance
measure/indicator if the targets have been changed in-year.
Programme 2: XXXXXXXXXXXXX
(Department to refer to Programme 1 above for guidance)
Programme 3: XXXXXXXXXXXXX
(Department to refer to Programme 1 above for guidance)
Programme 4: XXXXXXXXXXXXX
(Department to refer to Programme 1 above for guidance)
Etc (Department to list and report on all the programmes of the Department)

The Annual Report Guide 2011/12
24
3. ANNUAL FINANCIAL STATEMENTS
The Framework and Guidance on the Annual Financial Statements, (except the Report of the Auditor-
General), is on the OAG website: http://oag.treasury.gov.za
> Publications
> Annual Financial Statements
> For Prov. And Nat. Departments
> For fin. Year ending 31-03-2012
> Preparation guide
In addition to the Preparation Guide (the Departmental Financial Reporting Framework Guide) in
Chapter format, the Specimen Annual Financial Statements for National and Provincial Departments
is published on the OAG website.
The Annual Financial Statements in the Annual Report must consist of the items listed below:
Report of the Audit Committee
Report of the Accounting Officer(s)
Report of the Auditor-General
Appropriation Statement
Notes to the Appropriation Statement
Statement of Financial Performance
Statement of Financial Position
Statement of changes in Net Assets
Cash Flow Statement
Statement of Accounting Policies and Related Matters
Notes to the Annual Financial Statements (including Accounting Policies)
Disclosure notes to the Annual Financial Statements
Annexures (Unaudited supplementary schedules)
Annual Financial Statements of other entities (if applicable)
Some departments have entities that are small in size and activity. It is recommended that the
department publishes such entities’ financial statements in the department’s annual report.

The Annual Report Guide 2011/12
25
4. HUMAN RESOURCE MANAGEMENT
The statistics and information published in the Human Resources Management part of the annual
report are required in terms of Chapter 1, Part III J.3 of the Public Service Regulations, 2002 and
have been prescribed by the Minister for the Public Service and Administration for all departments
within the Public Service.
The tables were obtained from Department of Public Service and Administration (DPSA). Any input or
clarification required should be directed to:-
Ledule Bosch
Department of Public Service and Administration
For a detailed description and explanation of the terminology used in this section of the report, please
consult the publication from the DPSA entitled ‘A guide to understanding the oversight report of
departmental annual reports’. A copy of the guide is available from all departments or can be
accessed from the DPSA website (www.dpsa.gov.za ).
Service delivery
All departments are required to develop a Service Delivery Improvement (SDI) Plan. The following
tables reflect the components of the SDI plan as well as progress made in the implementation of the
plans.
Table 1.1 – Main services provided and standards
Main services Actual
customers Potential
customers Standard of
service
Actual achievement
against standards
Table 1.2 – Consultation arrangements with customers
Type of arrangement Actual Customers Potential Customers
Actual achievements

The Annual Report Guide 2011/12
26
Table 1.3 – Service delivery access strategy
Access Strategy Actual achievements
Table 1.4 – Service information tool
Types of information tool Actual achievements
Table 1.5 – Complaints mechanism
Complaints Mechanism Actual achievements

The Annual Report Guide 2011/12
27
Expenditure
Departments budget in terms of clearly defined programmes. The following tables summarise final
audited expenditure by programme (Table 2.1) and by salary bands (Table 2.2). In particular, it
provides an indication of the amount spent on personnel costs in terms of each of the programmes or
salary bands within the department.
TABLE 2.1 – Personnel costs by programme, 2011/12
Programme Total
Expenditure (R’000)
Personnel Expenditure
(R’000)
Training Expenditu
re
(R’000)
Professional and
Special Services (R’000)
Personnel cost as a percent of total
expenditure
Average personnel cost per employee
(R’000)
Total
TABLE 2.2 – Personnel costs by salary bands, 2011/12
Salary bands Personnel
Expenditure (R’000)
% of total personnel cost
Average personnel cost per employee
(R’000)
Lower skilled (Levels 1-2)
Skilled (Levels 3-5)
Highly skilled production (Levels 6-8)
Highly skilled supervision (Levels 9-12)
Senior management (Levels 13-16)
Total

The Annual Report Guide 2011/12
28
The following tables provide a summary per programme (Table 2.3) and salary bands (Table 2.4), of
expenditure incurred as a result of salaries, overtime, home owners allowance and medical
assistance. In each case, the table provides an indication of the percentage of the personnel budget
that was used for these items.
TABLE 2.3 – Salaries, Overtime, Home Owners Allowance and Medical Assistance by
programme, 2011/12
Programme Salaries Overtime Home Owners
Allowance Medical Assistance
Amount (R’000)
Salaries as a %
of personnel cost
Amount (R’000)
Overtime as a %
of personnel cost
Amount (R’000)
HOA as a % of
personnel cost
Amount (R’000)
Medical Assistance as a % of
personnel cost
Total
TABLE 2.4 – Salaries, Overtime, Home Owners Allowance and Medical Assistance by salary
bands, 2011/12
Salary Bands
Salaries Overtime Home Owners
Allowance Medical Assistance
Amount (R’000)
Salaries as a %
of personnel cost
Amount (R’000)
Overtime as a % of
personnel cost
Amount (R’000)
HOA as a % of
personnel cost
Amount (R’000)
Medical Assistance as a
% of personnel cost
Lower skilled
(Levels 1-2)
Skilled (Levels 3-5)
Highly skilled production
(Levels 6-8)
Highly skilled supervision
(Levels 9-12)
Senior management (Levels 13-16)
Total

The Annual Report Guide 2011/12
29
Employment and vacancies
The following tables summarise the number of posts on the establishment, the number of employees,
the vacancy rate, and whether there are any staff that are additional to the establishment. This
information is presented in terms of three key variables: - programme (Table 3.1), salary band (Table
3.2) and critical occupations (Table 3.3). Departments have identified critical occupations that need to
be monitored. Table 3.3 provides establishment and vacancy information for the key critical
occupations of the department.
The vacancy rate reflects the percentage of posts that are not filled.
TABLE 3.1 – Employment and vacancies by programme, 31 March 2012
Programme Number of
posts Number of posts filled
Vacancy Rate Number of posts filled
additional to the establishment
Total
TABLE 3.2 – Employment and vacancies by salary bands, 31 March 2012
Salary band Number of
posts Number of posts filled
Vacancy Rate Number of posts filled
additional to the establishment
Lower skilled (Levels 1-2)
Skilled
(Levels 3-5)
Highly skilled production
(Levels 6-8)
Highly skilled supervision (Levels 9-12)
Senior management (Levels 13-16)
TABLE 3.3 – Employment and vacancies by critical occupation, 31 March 2012
Critical occupations
Number of posts
Number of posts filled
Vacancy Rate Number of posts
filled additional to the establishment
Total

The Annual Report Guide 2011/12
30
The information in each case reflects the situation as at 31 March 2012. For an indication of changes
in staffing patterns over the year under review, please refer to section 5 of this report.
Job evaluation
The Public Service Regulations, 1999 introduced job evaluation as a way of ensuring that work of
equal value is remunerated equally. Within a nationally determined framework, executing authorities
may evaluate or re-evaluate any job in his or her organisation. In terms of the Regulations all
vacancies on salary levels 9 and higher must be evaluated before they are filled. This was
complemented by a decision by the Minister for the Public Service and Administration that all SMS
jobs must be evaluated before 31 December 2002.
The following table (Table 4.1) summarises the number of jobs that were evaluated during the year
under review. The table also provides statistics on the number of posts that were upgraded or
downgraded.
TABLE 4.1 – Job Evaluation, 1 April 2011 to 31 March 2012
Salary band Numbe
r of posts
Number of Jobs Evaluate
d
% of posts
evaluated by salary
bands
Posts Upgraded Posts
downgraded
Number
% of posts
evaluated
Number
% of posts
evaluated
Lower skilled (Levels 1-2)
Skilled (Levels 3-5)
Highly skilled production
(Levels 6-8)
Highly skilled supervision
(Levels 9-12)
Senior Management Service Band A
Senior Management Service Band B
Senior Management Service Band C
Senior Management Service Band D
Total

The Annual Report Guide 2011/12
31
The following table provides a summary of the number of employees whose salary positions were
upgraded due to their posts being upgraded. The number of employees might differ from the number
of posts upgraded since not all employees are automatically absorbed into the new posts and some of
the posts upgraded could also be vacant.
TABLE 4.2 – Profile of employees whose salary positions were upgraded due to their posts
being upgraded, 1 April 2011 to 31 March 2012
Beneficiaries African Asian Coloured White Total
Female
Male
Total
Employees with a disability
The following table summarises the number of cases where remuneration levels exceeded the grade
determined by job evaluation. Reasons for the deviation are provided in each case.
TABLE 4.3 – Employees whose salary level exceed the grade determined by job evaluation, 1
April 2011 to 31 March 2012 (in terms of PSR 1.V.C.3)
Occupation Number of employees
Job evaluation
level
Remuneration level
Reason for deviation
Total Number of Employees whose salaries exceeded the level determined by job evaluation in 2011/12
Percentage of total employment
Table 4.4 summarises the beneficiaries of the above in terms of race, gender, and disability.
TABLE 4.4 – Profile of employees whose salary level exceed the grade determined by job
evaluation, 1 April 2011 to 31 March 2012 (in terms of PSR 1.V.C.3)
Beneficiaries African Asian Coloured White Total
Female
Male
Total
Employees with a disability

The Annual Report Guide 2011/12
32
[If there were no cases where the remuneration bands exceeded the grade determined by job
evaluation, use the following table as TABLE 4.3]
Total Number of Employees whose salaries exceeded the grades determined by job
evaluation in 2011/12 None
Employment changes
This section provides information on changes in employment over the financial year.
Turnover rates provide an indication of trends in the employment profile of the department. The
following tables provide a summary of turnover rates by salary band (Table 5.1) and by critical
occupations (Table 5.2). (These "critical occupations" should be the same as those listed in Table
3.3).
TABLE 5.1 – Annual turnover rates by salary band for the period 1 April 2011 to 31 March 2012
Salary Band
Number of employees per band as on 1 April
2011
Appointments and transfers
into the department
Terminations and transfers
out of the department
Turnover rate
Lower skilled (Levels 1-2)
Skilled (Levels 3-5)
Highly skilled production(Levels 6-8)
Highly skilled supervision(Levels 9-12)
Senior Management Service Band A
Senior Management Service Band B
Senior Management Service Band C
Senior Management Service Band D
Total
The Annual Report Guide 2011/12
33
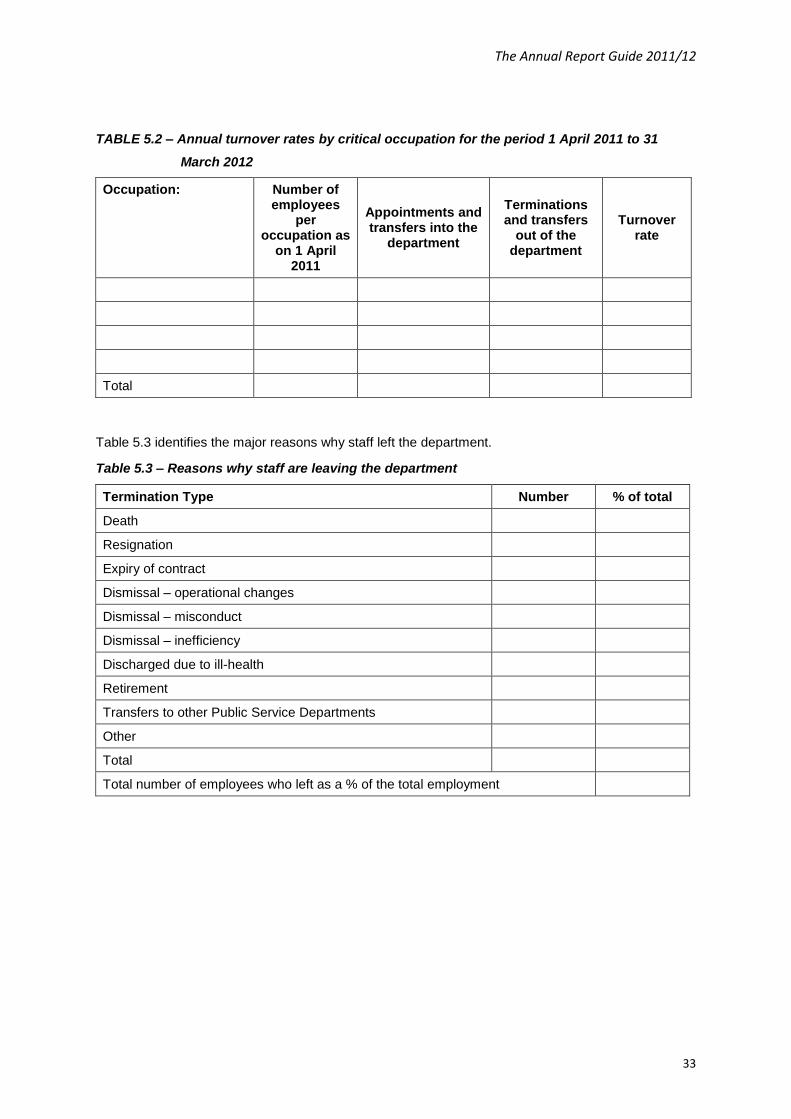
TABLE 5.2 – Annual turnover rates by critical occupation for the period 1 April 2011 to 31
March 2012
Occupation: Number of employees
per occupation as
on 1 April 2011
Appointments and transfers into the
department
Terminations and transfers
out of the department
Turnover rate
Total
Table 5.3 identifies the major reasons why staff left the department.
Table 5.3 – Reasons why staff are leaving the department
Termination Type Number % of total
Death
Resignation
Expiry of contract
Dismissal – operational changes
Dismissal – misconduct
Dismissal – inefficiency
Discharged due to ill-health
Retirement
Transfers to other Public Service Departments
Other
Total
Total number of employees who left as a % of the total employment

The Annual Report Guide 2011/12
34
Table 5.4 – Promotions by critical occupation
Occupation Employees as at 1 April
2011
Promotions to
another salary level
Salary level promotions
as a % of employees
by occupation
Progressions to another
notch within a salary level
Notch progressions as a % of employees
by occupation
Total
Table 5.5 – Promotions by salary band
Salary Band Employees 1 April
2011
Promotions to
another salary level
Salary bands promotions
as a % of employees by
salary level
Progressions to another notch within
a salary level
Notch progressions as a % of employees by salary
band
Lower skilled (Levels 1-2)
Skilled (Levels 3-5)
Highly skilled production (Levels 6-8)
Highly skilled supervision (Levels9-12)
Senior management (Levels13-16)
Total

The Annual Report Guide 2011/12
35
Employment equity
The tables in this section are based on the formats prescribed by the Employment Equity Act, 55 of
1998.
6.1 – Total number of employees (including employees with disabilities) in each of the
following occupational categories as on 31 March 2012
Occupational categories (SASCO)
Male Female
African Coloured Indian White African Coloured Indian White Total
Legislators, senior officials and managers
Professionals
Technicians and associate professionals
Clerks
Service and sales workers
Skilled agriculture and fishery workers
Craft and related trades workers
Plant and machine operators and assemblers
Elementary occupations
Total
Employees with disabilities
6.2 – Total number of employees (including employees with disabilities) in each of the
following occupational bands as on 31 March 2012
Occupational Bands
Male Female
African Coloured Indian White African Coloured Indian White Total
Top Management(L15-L16)
Senior Management(L13-L14)
Professionally

The Annual Report Guide 2011/12
36
qualified and experienced specialists and mid-management
Skilled technical and academically qualified workers, junior management, supervisors, foreman and superintendents
Semi-skilled and discretionary decision making
Unskilled and defined decision making
Total
6.3 – Recruitment for the period 1 April 2011 to 31 March 2012
Occupational Bands
Male Female
African Coloured Indian White African Coloured Indian White Total
Top Management
Senior Management
Professionally qualified and experienced specialists and mid-management
Skilled technical and academically qualified workers, junior management, supervisors, foreman and superintendents
Semi-skilled and discretionary decision making
Unskilled and defined decision making
Total
Employees with disabilities

The Annual Report Guide 2011/12
37
6.4 – Promotions for the period 1 April 2011 to 31 March 2012
Occupational Bands
Male Female
African Coloured Indian White African Coloured Indian White Total
Top Management
Senior Management
Professionally qualified and experienced specialists and mid-management
Skilled technical and academically qualified workers, junior management, supervisors, foreman and superintendents
Semi-skilled and discretionary decision making
Unskilled and defined decision making
Total
Employees with disabilities
6.5 – Terminations for the period 1 April 2011 to 31 March 2012
Occupational Bands
Male Female
African Coloured Indian White African Coloured Indian White Total
Top Management
Senior Management
Professionally qualified and experienced specialists and mid-management
Skilled technical and academically qualified workers, junior management, supervisors, foreman and superintendents

The Annual Report Guide 2011/12
38
Semi-skilled and discretionary decision making
Unskilled and defined decision making
Total
Employees with disabilities
6.6 – Disciplinary action for the period 1 April 2011 to 31 March 2012
Male Female
African Coloured Indian White African Coloured Indian White Total
Disciplinary action
6.7 – Skills development for the period 1 April 2011 to 31 March 2012
Occupational categories
Male Female
African Coloured Indian White African Coloured Indian White Total
Legislators, senior officials and managers
Professionals
Technicians and associate professionals
Clerks
Service and sales workers
Skilled agriculture and fishery workers
Craft and related trades workers
Plant and machine operators and assemblers
Elementary occupations
Total
Employees with disabilities

The Annual Report Guide 2011/12
39
Performance rewards
To encourage good performance, the department has granted the following performance rewards
during the year under review. The information is presented in terms of race, gender, and disability
(Table 6.1), salary bands (table 6.2) and critical occupations (Table 6.3).
TABLE 7.1 – Performance Rewards by race, gender, and disability, 1 April 2011 to 31 March
2012
Gender & Race Beneficiary Profile Cost
Number of
beneficiaries
Total number of employees in
group
% of total within group
Cost (R’000) Average cost
per employee
African
Male
Female
Asian
Male
Female
Coloured
Male
Female
White
Male
Female
Employees with a disability
Total
TABLE 7.2 – Performance Rewards by salary bands for personnel below Senior Management
Service, 1 April 2011 to 31 March 2012
Salary Bands Beneficiary Profile Cost
Number of beneficiaries
Number of employees
% of total
within salary bands
Total Cost (R’000)
Average cost per
employee
Total cost as a % of the total
personnel expenditure
Lower skilled (Levels 1-2)
Skilled (Levels 3-5)
Highly skilled
The Annual Report Guide 2011/12
40
production (Levels 6-8)
Highly skilled supervision (Levels 9-12)
Total
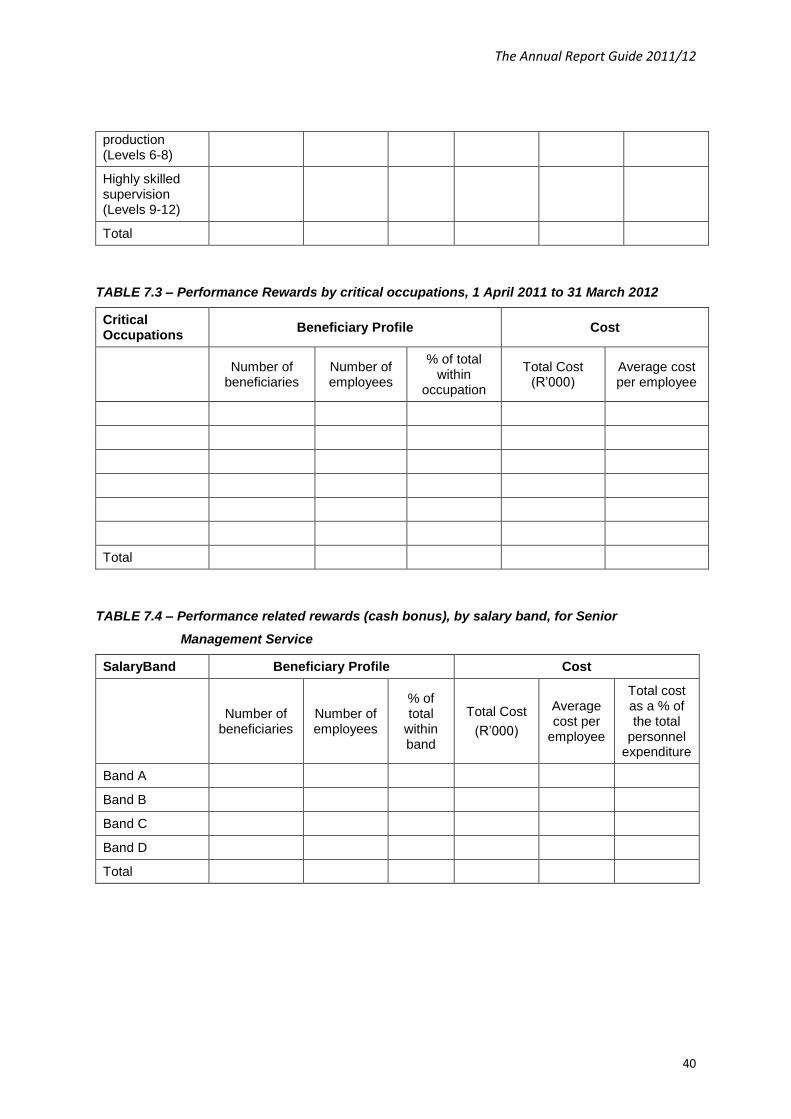
TABLE 7.3 – Performance Rewards by critical occupations, 1 April 2011 to 31 March 2012
Critical Occupations
Beneficiary Profile Cost
Number of
beneficiaries Number of employees
% of total within
occupation
Total Cost (R’000)
Average cost per employee
Total
TABLE 7.4 – Performance related rewards (cash bonus), by salary band, for Senior
Management Service
SalaryBand Beneficiary Profile Cost
Number of beneficiaries
Number of employees
% of total
within band
Total Cost
(R’000)
Average cost per
employee
Total cost as a % of the total
personnel expenditure
Band A
Band B
Band C
Band D
Total
The Annual Report Guide 2011/12
41
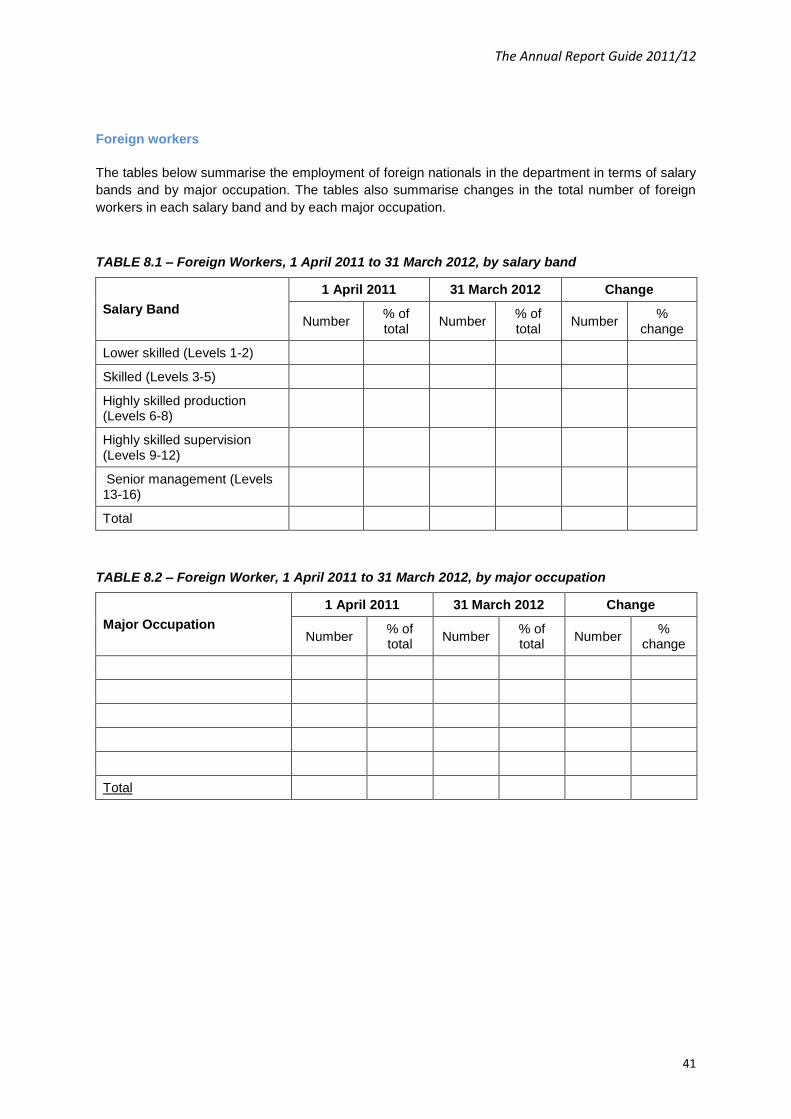
Foreign workers
The tables below summarise the employment of foreign nationals in the department in terms of salary
bands and by major occupation. The tables also summarise changes in the total number of foreign
workers in each salary band and by each major occupation.
TABLE 8.1 – Foreign Workers, 1 April 2011 to 31 March 2012, by salary band
Salary Band
1 April 2011 31 March 2012 Change
Number % of total
Number % of total
Number %
change
Lower skilled (Levels 1-2)
Skilled (Levels 3-5)
Highly skilled production (Levels 6-8)
Highly skilled supervision (Levels 9-12)
Senior management (Levels 13-16)
Total
TABLE 8.2 – Foreign Worker, 1 April 2011 to 31 March 2012, by major occupation
Major Occupation
1 April 2011 31 March 2012 Change
Number % of total
Number % of total
Number %
change
Total

The Annual Report Guide 2011/12
42
Leave utilisation for the period 1 January 2011 to 31 December 2011
The Public Service Commission identified the need for careful monitoring of sick leave within the
public service. The following tables provide an indication of the use of sick leave (Table 9.1) and
disability leave (Table 9.2). In both cases, the estimated cost of the leave is also provided.
TABLE 9.1 – Sick leave, 1 January 2011 to 31 December 2011
Salary Band Total days
% days with
medical certificatio
n
Number of Employee
s using sick leave
% of total employees using
sick leave
Average days per employee
Estimated Cost (R’000)
Lower skilled (Levels 1-2)
Skilled (Levels 3-5)
Highly skilled production (Levels 6-8)
Highly skilled supervision (Levels9-12)
Senior management (Levels 13-16)
Total
TABLE 9.2 – Disability leave (temporary and permanent), 1 January 2011 to 31 December 2011
Salary Band Total days taken
% days with
medical certificatio
n
Number of Employee
s using disability
leave
% of total employee
s using disability
leave
Average days per employee
Estimated Cost (R’000)
Lower skilled (Levels 1-2)
Skilled (Levels 3-5)
Highly skilled production (Levels 6-8)
Highly skilled supervision (Levels 9-12)
Senior management (Levels 13-16)
Total

The Annual Report Guide 2011/12
43
Table 9.3 summarises the utilisation of annual leave. The wage agreement concluded with trade
unions in the PSCBC in 2000 requires management of annual leave to prevent high levels of accrued
leave being paid at the time of termination of service.
TABLE 9.3 – Annual Leave, 1 January 2011 to 31 December 2011
Salary Bands Total days taken Average per
employee
Lower skilled (Levels 1-2)
Skilled Levels 3-5)
Highly skilled production (Levels 6-8)
Highly skilled supervision(Levels 9-12)
Senior management (Levels 13-16)
Total
TABLE 9.4 – Capped leave, 1 January 2011 to 31 December 2011
Salary Bands Total days of capped leave
taken
Average number of days taken per employee
Average capped leave per
employee as at 31 December
2011
Lower skilled (Levels 1-2)
Skilled Levels 3-5)
Highly skilled production (Levels 6-8)
Highly skilled supervision(Levels 9-12)
Senior management (Levels 13-16)
Total
TABLE 9.5 – Leave payouts for the period 1 April 2011 to 31 March 2012
The following table summarises payments made to employees as a result of leave that was not taken.
REASON Total Amount
(R’000) Number of Employees
Average payment per
employee
Leave payout for 2011/12 due to non-utilisation of leave for the previous cycle
Capped leave payouts on termination of service for 2011/12
Current leave payout on termination of service for 2011/12
Total
The Annual Report Guide 2011/12
44
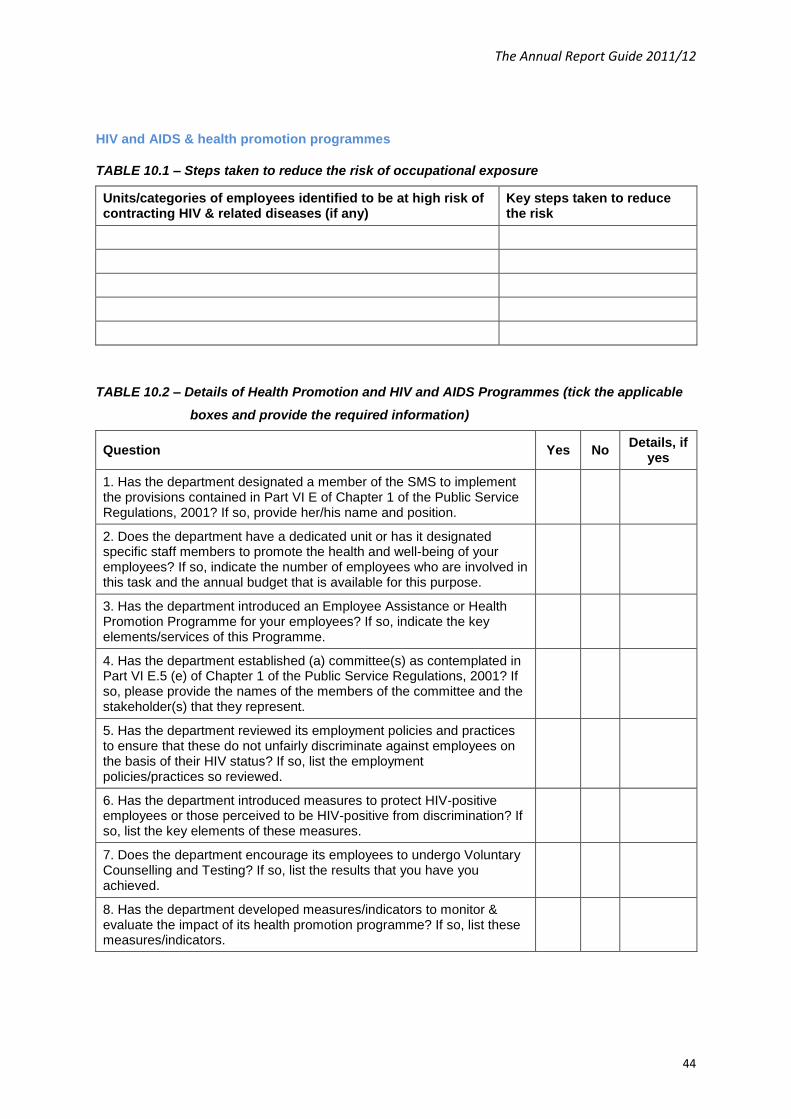
HIV and AIDS & health promotion programmes
TABLE 10.1 – Steps taken to reduce the risk of occupational exposure
Units/categories of employees identified to be at high risk of contracting HIV & related diseases (if any)
Key steps taken to reduce the risk
TABLE 10.2 – Details of Health Promotion and HIV and AIDS Programmes (tick the applicable
boxes and provide the required information)
Question Yes No Details, if
yes
1. Has the department designated a member of the SMS to implement the provisions contained in Part VI E of Chapter 1 of the Public Service Regulations, 2001? If so, provide her/his name and position.
2. Does the department have a dedicated unit or has it designated specific staff members to promote the health and well-being of your employees? If so, indicate the number of employees who are involved in this task and the annual budget that is available for this purpose.
3. Has the department introduced an Employee Assistance or Health Promotion Programme for your employees? If so, indicate the key elements/services of this Programme.
4. Has the department established (a) committee(s) as contemplated in Part VI E.5 (e) of Chapter 1 of the Public Service Regulations, 2001? If so, please provide the names of the members of the committee and the stakeholder(s) that they represent.
5. Has the department reviewed its employment policies and practices to ensure that these do not unfairly discriminate against employees on the basis of their HIV status? If so, list the employment policies/practices so reviewed.
6. Has the department introduced measures to protect HIV-positive employees or those perceived to be HIV-positive from discrimination? If so, list the key elements of these measures.
7. Does the department encourage its employees to undergo Voluntary Counselling and Testing? If so, list the results that you have you achieved.
8. Has the department developed measures/indicators to monitor & evaluate the impact of its health promotion programme? If so, list these measures/indicators.

The Annual Report Guide 2011/12
45
Labour relations
The following collective agreements were entered into with trade unions within the department.
TABLE 11.1 – Collective agreements, 1 April 2011 to 31 March 2012
Subject Matter Date
If there were no agreements, then use the following table
Total collective agreements None
The following table summarises the outcome of disciplinary hearings conducted within the department
for the year under review.
TABLE 11.2 – Misconduct and disciplinary hearings finalised, 1 April 2011 to 31 March 2012
Outcomes of disciplinary hearings Number % of total
Correctional counselling
Verbal warning
Written warning
Final written warning
Suspended without pay
Fine
Demotion
Dismissal
Not guilty
Case withdrawn
Total
If there were no disciplinary hearings, then use the following table
Disciplinary hearings – 2011/12 None
The Annual Report Guide 2011/12
46
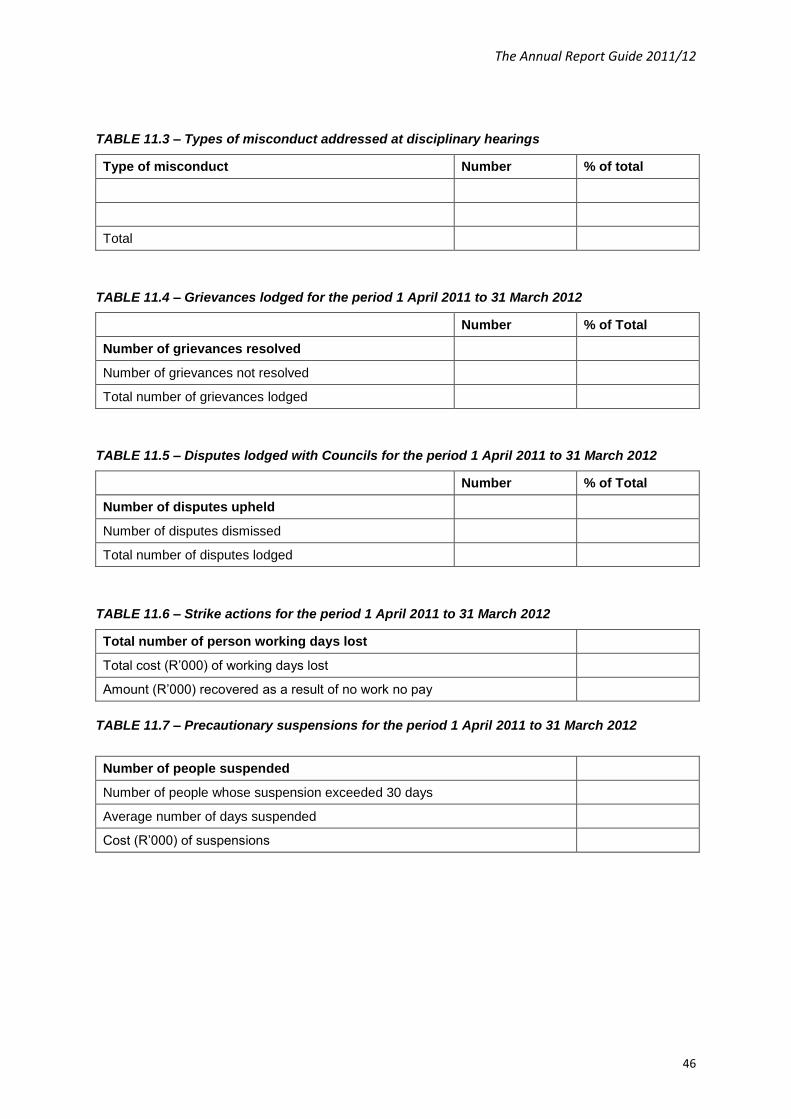
TABLE 11.3 – Types of misconduct addressed at disciplinary hearings
Type of misconduct Number % of total
Total
TABLE 11.4 – Grievances lodged for the period 1 April 2011 to 31 March 2012
Number % of Total
Number of grievances resolved
Number of grievances not resolved
Total number of grievances lodged
TABLE 11.5 – Disputes lodged with Councils for the period 1 April 2011 to 31 March 2012
Number % of Total
Number of disputes upheld
Number of disputes dismissed
Total number of disputes lodged
TABLE 11.6 – Strike actions for the period 1 April 2011 to 31 March 2012
Total number of person working days lost
Total cost (R’000) of working days lost
Amount (R’000) recovered as a result of no work no pay
TABLE 11.7 – Precautionary suspensions for the period 1 April 2011 to 31 March 2012
Number of people suspended
Number of people whose suspension exceeded 30 days
Average number of days suspended
Cost (R’000) of suspensions

The Annual Report Guide 2011/12
47
Skills development
This section highlights the efforts of the department with regard to skills development.
12.1 – Training needs identified 1 April 2011 to 31 March 2012
Occupational Categories
Gender
Number of employees as at 1
April 2011
Training needs identified at start of reporting period
Learnerships
Skills Programmes & other short
courses
Other forms
of training
Total
Legislators, senior officials and managers
Female
Male
Professionals Female
Male
Technicians and associate professionals
Female
Male
Clerks Female
Male
Service and sales workers
Female
Male
Skilled agriculture and fishery workers
Female
Male
Craft and related trades workers
Female
Male
Plant and machine operators and assemblers
Female
Male
Elementary occupations
Female
Male
Sub Total Female
Male
Total

The Annual Report Guide 2011/12
48
12.2 – Training provided 1 April 2011 to 31 March 2012
Occupational Categories
Gender
Number of employees
as at 1 April 2011
Training provided within the reporting period
Learnerships
Skills Programmes & other short
courses
Other forms
of training
Total
Legislators, senior officials and managers
Female
Male
Professionals Female
Male
Technicians and associate professionals
Female
Male
Clerks Female
Male
Service and sales workers
Female
Male
Skilled agriculture and fishery workers
Female
Male
Craft and related trades workers
Female
Male
Plant and machine operators and assemblers
Female
Male
Elementary occupations
Female
Male
Sub Total Female
Male
Total
Injury on duty
The following tables provide basic information on injury on duty.
TABLE 13.1 – Injury on duty, 1 April 2011 to 31 March 2012
Nature of injury on duty Number % of total
Required basic medical attention only
Temporary Total Disablement
Permanent Disablement

The Annual Report Guide 2011/12
49
Fatal
Total
Utilisation of consultants
Table 14.1 – Report on consultant appointments using appropriated funds
Project Title Total number of
consultants that worked on the project
Duration:
Work days
Contract value in
Rand
Total number of projects Total individual
consultants
Total duration:
Work days
Total contract value in Rand
Table 14.2 – Analysis of consultant appointments using appropriated funds, in terms of
Historically Disadvantaged Individuals (HDIs)
Project Title Percentage
ownership by HDI groups
Percentage management by
HDI groups
Number of Consultants from HDI groups that work on
the project
Table 14.3 – Report on consultant appointments using Donor funds
Project Title Total Number of
consultants that worked on the project
Duration:
Work days
Donor and Contract value in Rand
Total number of projects Total individual
consultants Total
duration: Total contract value
in Rand

The Annual Report Guide 2011/12
50
Work days
Table 14.4 – Analysis of consultant appointments using Donor funds, in terms of Historically
Disadvantaged Individuals (HDIs)
Project Title Percentage ownership by HDI groups
Percentage management by HDI groups
Number of Consultants from HDI groups that work on the project

The Annual Report Guide 2011/12
51
5. OTHER INFORMATION
Acronyms
(An alphabetic list of acronyms/abbreviations stating what each acronym/abbreviation stands for.)
List of contact details
(The department to provide a list of names and contact details of individuals within the department
that can be contacted by users of the department’s annual report)
Additional information
(Any information that the department deems relevant to users may be included in this section
provided it was not already included in the rest of the annual report. For example a Department may
deem it necessary to include a list of all key documents published on their website.)

The Annual Report Guide 2011/12
52
D PROVINCIAL DEPARTMENTS
i) WITH CUSTOMISED PERFORMANCE MEASURES
In alignment to information stated under 2.1 above, Provincial departments with customised
performance measures must report on their full set of customised performance measures in their
annual performance plans. The list of performance measures for customised provincial sectors which
needs to be report on for the 2011/12 financial year is available on the website of the OAG website in
an Excel format.
http://oag.treasury.gov.za
> Publications
> Annual Financial Statements
> For Prov. And Nat. Departments
> For fin. Year ending 31-03-2012
> Performance reports
Where the department is unable to do so either due of lack of data or because a measure was poorly
specified, this must be stated explicitly.
A department shall also articulate clear strategies to realise efficiency savings to meet the target set
and report on the efficiency savings. The order in which the department reports on performance
measures and targets must be exactly as presented in the strategic and annual performance plans.
This is to facilitate comparisons, and to ensure that none are left out. Where departments numbered
their performance measures in their annual performance plans, the same numbering system should
be used in their annual report.
ii) WITHOUT CUSTOMISED PERFORMANCE MEASURES
The order in which the department reports on performance measures and targets must be exactly as
presented in the annual performance plans. This is to facilitate comparisons, and to ensure that none
are left out. Where departments numbered their performance measures in their annual performance
plans, the same numbering system should be used in their annual report.
The Annual Report Guide 2011/12
53
ANNEXURE A
CONFIRMATON OF THE ACCURACY AND FAIR PRESENTATION OF THE ANNUAL REPORT
(INCLUDING INFORMATION ON PREDETERMINED OBJECTIVES) SUBMITTED
TO: ………………………….……………….…….3 DATE: ……………….……………….
4
CC: The Auditor-General
ANNUAL REPORT FOR THE 200X/200Y FINANCIAL YEAR END
I hereby acknowledge that the annual report of ………………….. 5, have been submitted to the
Auditor-General for auditing in terms section ……. of the ………………………6.
I acknowledge my responsibility for the accuracy of the accounting records and the fair presentation
of the financial statements and confirm, to the best of my knowledge and belief, the following:
the financial statements have been prepared in accordance with ……………………….7 as
prescribed in the ……………………….8 and relevant guidelines specified / issued by the
National Treasury
the report on predetermined objectives is complete and accurate and has been prepared in
accordance with the Framework For Managing Programme Performance Information and
relevant guidelines specified / issued by the National Treasury
the annual report is complete and accurate
all amounts appearing on the annual report and information in the annual report are
consistent with the financial statements submitted to the Auditor-General for audit purposes
and;
the annual report is free from any omissions.
Yours faithfully
___________________
Chief Financial Officer
___________________
Accounting Officer
3 The letter should be addressed to the relevant treasury, Auditor-General, and external auditor as required by
the PFMA / Treasury regulations. 4 The date of submission of the financial statements for auditing should be reflected here, being a date before or
on 31 May in respect of national and provincial departments, trading entities and constitutional institutions and public entities. 5 Insert the name of the entity.
6 Insert the relevant reference, for example for national and provincial departments, trading entities and
constitutional institutions – section 40(1)(c) of the PFMA; for public entities – section 55(1)(c) of the PFMA. 7 Insert the applicable accounting framework. For example GRAP, GAAP, NT determined framework.
8 Insert the relevant reference, for example for national and provincial departments, trading entities and
constitutional institutions and public entities - the Treasury Regulations and the PFMA,