Embed Size (px)
Citation preview

RC 113Unilever Nigeria Plc
& FINANCIAL STATEMENTS
2 180 REPORT
ANNUAL

Table of Content
1
Unilever Purpose and Values
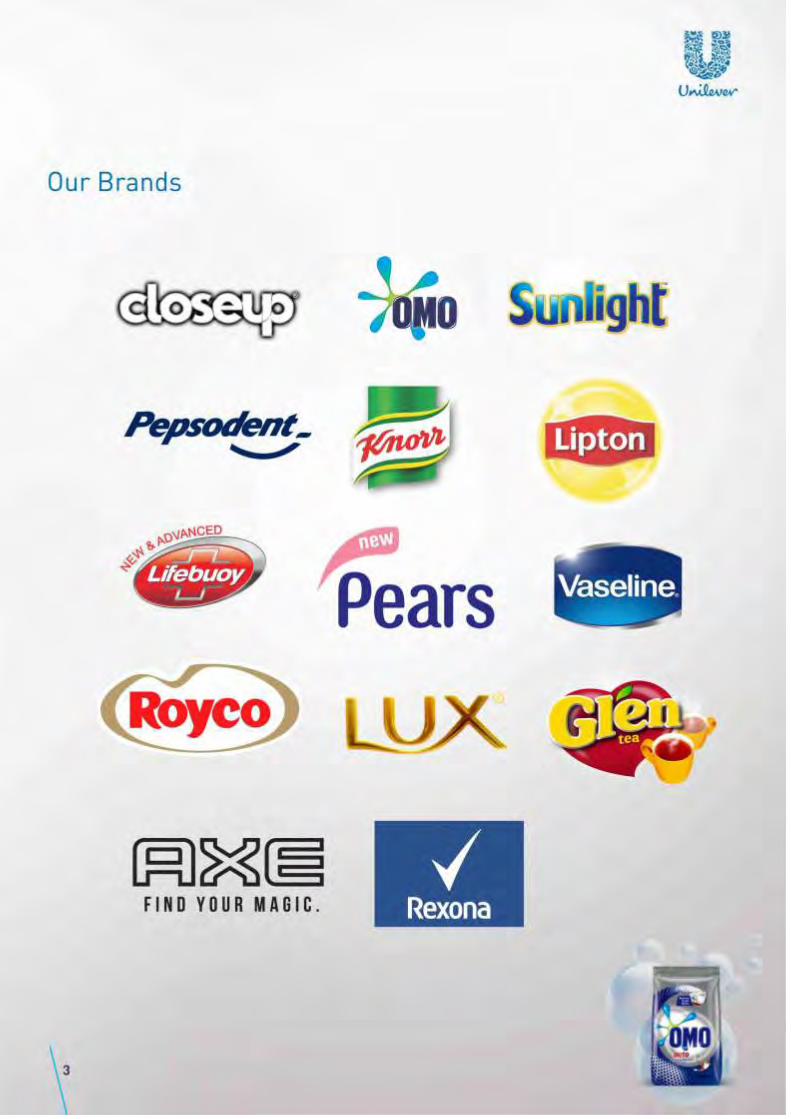
Our Brands
Corporate Profile
Board of Directors, Officers and other corporate information
Results at a glance
Notice of Annual General Meeting
Chairman’s Statement
Board Profile
Report of the Directors - including Corporate Governance Report and Sustainability Report
Statement of Directors' Responsibilities
Report of the Audit Committee
Report of the Independent Auditors to the Members
FINANCIAL STATEMENTS
Income Statement
Statement of Other Comprehensive Income
Statement of Financial Position
Statement of Changes in Equity
Statement of Cash Flows
Notes to the Financial Statements
OTHER NATIONAL DISCLOSURES
Value Added Statement
Five Year Financial Summary
SHAREHOLDERS’ INFORMATION
Unilever Share Capital History
Range Analysis as at December 31, 2018
Circular to Shareholders Seeking a General Mandate
E-Dividend Mandate Activation Form
Photo Gallery
Product Range
Proxy Form
2
5
6
7
9
11
18
26
45
46
47
53
54
52
56
57
58
117
118
119
121
124
128
120
140
3
122


Corporate Profile
5
Unilever Nigeria (the "Company") is where great people,
terrific brands and proud traditions converge, to meet and
satisfy the needs of people and families across Nigeria. We
anticipate the aspirations of our consumers and
customers, and respond creatively and competitively with
branded products and services that are good for them and
good for others.
Unilever Nigeria is a member of the Unilever Group, one of
the world's leading consumer goods companies whose
food, home and personal care brands are used by 2.5 billion
people all over the world on any given day. Unilever Nigeria
Plc. was established in 1923 as a soap manufacturing
company – West Africa Soap Company– by Lord
Leverhulme. It later became known as Lever Brothers
Nigeria. Today, it is the longest serving manufacturing
organization in Nigeria.
After a series of mergers and acquisitions, the Company
diversified into manufacturing and marketing of foods and
personal care products. These mergers and acquisitions
brought in Lipton Nigeria Limited in 1985, Cheesebrough
Industries Limited in 1988 and Unilever Nigeria Limited in
1996. The Company changed its name to Unilever Nigeria
Plc. in 2001 in line with the global strategic direction of the
business.
The Company was quoted on the Nigerian Stock Exchange
in 1973 and is a truly multi-local, multinational
organization with international and local brands in her
portfolio. The international brands include Close-Up
toothpaste, Pepsodent toothpaste, Lux beauty soap,
Lifebuoy soap, Rexona, Vaseline lotion and Vaseline
Petroleum Jelly in the Personal Care Unit of the business;
Glen Tea, Lipton Yellow Label Tea and Knorr bouillon cubes
in the Foods Unit; and Omo Multi-Active Detergent,
Sunlight washing powder, bar soap and dish washing liquid
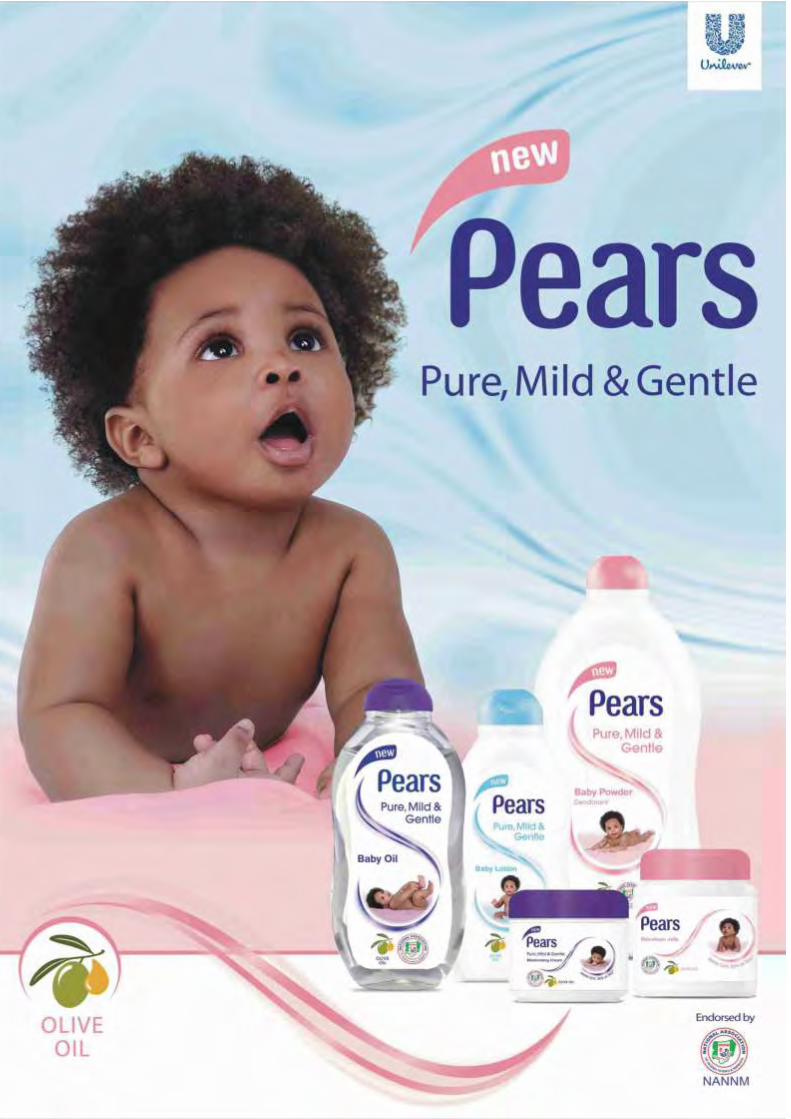
in the Home Care Unit. Other Regional and local jewels
include the Pears Baby Products range and Royco bouillon
cubes. The Company provides sources of income to tens of
thousands of Nigerians who are shareholders,
distributors, suppliers, service providers and employees.
Unilever believes in taking small everyday actions that can
make a big difference for consumers, the communities in
which it operates and the environment. A typical Unilever
employee has passion and commitment to win and
constantly looks for opportunity through insights to make a
difference.
Unilever subscribes to the highest standards of corporate
behaviour by being transparent in her dealings, fair in
competition, and law abiding. In a challenging operating
environment like Nigeria, the Company remains a pride in
the area of Corporate Governance by strictly adhering to
Unilever's Global Code of Business Principles (CoBP). The
company is also a socially responsible and responsive
organization. Unilever has delivered significant social
investments that have helped create a brighter future for
numerous Nigerians.
The Company has also leveraged its great brands to impact
lives positively. In line with the social mission of health and
hygiene, through brands like Knorr bouillon cubes,
Pepsodent and Lifebuoy, Unilever has organized various
outreach programmes that have enlightened Nigerians on
the health benefits of handwashing, brushing twice a day,
having iron fortified bouillon cubes and addressing iron
deficiency through behavioural change campaigns. The
Company has high growth aspirations, with a vision to grow
our business whilst decoupling our environmental
footprint from our growth and increasing our positive
social impact. An ambition which is consistent with our
long history of doing well by doing good.
Unilever Nigeria’s confidence in the Nigerian economy is
unwavering and will remain a major player in the country
by continually investing, developing capabilities and
growing brands that most suit the consumers’ needs.

Board of Directors, Officers and Other Corporate Information
Directors
6
His Majesty Nnaemeka A. Achebe CFR, MNI - Non-Executive Director and Chairman
Obi of Onitsha
Mr Yaw Nsarkoh (Ghanaian) - Managing Director
Mrs Abiola Alabi - Non Executive Director
Ammuna Lawan Ali, OON - Independent Non-Executive Director
Mr Felix Enwemadu - Executive Director
Mr Chika Nwobi - Non-Executive Director (Appointed w.e.f. 1 January 2018)
Mr Atedo N. A. Peterside, CON -Non-Executive Director
Mrs Adesola Sotande-Peters -Executive Director
Mr Mutiu Sunmonu, CON, FNSE - Independent Non-Executive Director
Mr James Todd (British) - Non-Executive Director (Resigned w.e.f. 31 December 2018)
General Counsel Ghana-Nigeria & Company Secretary
Mrs. Abidemi Ademola
Registered Office
1, Billings Way
Oregun
Ikeja, Lagos
Tel: 01 279 3000, +234 8039066000
Email: [email protected]
Company Registration Number
RC 113
Independent Auditor
KPMG Professional Services
KPMG Towers
Bishop Aboyade Cole Street
Victoria Island, Lagos
Registrar and Transfer Office
Greenwich Registrars and Data Solutions Ltd.
274, Murtala Muhammed Way
Alagomeji, Yaba, Lagos
Tel: 01-279 3161- 2 & 01 -813 1925
Email: [email protected]
Website: www.unilevernigeria.com

1
Results at a glance
7
Continuing operations
Revenue 92,899,969 85,193,369
Operating Profit 9,197,776 12,231,428
Profit before tax 12,621,908 10,595,995
Taxation (3,489,756) (3,526,251)
Profit from continuing operations 9,132,152 7,069,744
Discontinued operations
Profit from discontinued operations 1,419,988 380,341
Profit for the year 10,552,140 7,450,085
Capital employed 82,789,543 75,908,375
Capital expenditure 5,395,511 4,559,238
Depreciation of property, plant and equipment 2,672,245 4,099,064
Cash and cash equivalents 57,144,182 50,493,595
Earnings per share (Naira) 1.84 1.78
Earnings per share (Naira) - continuing operations 1.59 1.69
Net Assets per share (Naira) 14.41 13.21
NSE share price at 31 December 37.00 41.00
Ratio % Revenue
Operating costs 88% 86%
Operating profit 12% 14%
Profit after tax 11% 8%
The prior year corresponding figures have been restated to reflect the impact of discontinued operations
as a single amount in the income statement (Note 32 (i))
2017
N’000
2018
N’000
Notice of Annual General Meeting
9
NOTICE IS HEREBY GIVEN that the Ninety-fourth (94th)
Annual General Meeting of Unilever Nigeria Plc. will be
held at the Grand Banquet Hall, Civic Centre, Victoria
Island, Lagos on Thursday 9 May, 2019 at 10.00am for the
following purposes:
Ordinary business:
1. To lay before the Members, the Report of the Directors,
the Audited Financial Statements for the year ended 31
December, 2018 together with the Reports of the Audit
Committee and the Independent Auditors thereon.
2. To declare a Dividend
3. To elect/re-elect Directors.
4. To authorize the Directors to fix the remuneration of
the Independent Auditors.
5. To elect members of the Audit Committee.
Special business:
6. To fix the remuneration of the Directors.
7.
NOTES:
Proxy
A member of the company entitled to attend and vote is
entitled to appoint a proxy instead of him/her. A proxy need
not also be a member. A detachable Proxy Form is enclosed
and if it is to be valid for the purpose of the meeting, it must
be completed and deposited at the office of the Registrars,
To consider and if thought fit, pass the following
resolution as an ordinary resolution of the
Company:“That, pursuant to Rule 20.8 of the
Rulebook of the Nigerian Stock Exchange 2015:
Issuers Rule, a general mandate be and is hereby
given authorizing the Company during the 2018
financial year and up to the date of the next Annual
General Meeting, to procure goods, services and
financing and enter into such incidental transactions
necessary for its day to day operations from its
related parties or interested persons on normal
commercial terms consistent with the Company's
Transfer Pricing Policy. All transactions falling under
this category which were earlier entered into in 2018
prior to the date of this meeting are hereby ratified.”
Greenwich Registrars and Data Solutions Ltd. 274, Murtala
Muhammed Way, Alagomeji, Yaba, Lagos, not later than
forty-eight (48) hours before the time of the meeting.
Dividend warrants and closure of register
The Board has recommended dividend payment which if
approved, is payable less withholding tax. Dividend
warrants will be payable on Friday, 10 May 2019 to the
shareholders who are on the Company's Register of
Members at the close of business on Friday 12 April, 2019.
NOTICE is therefore given that the Register of Members
and Transfer books of the Company will be closed from
Monday 15 April, 2019 to Tuesday, 23 April, 2019 (both dates
inclusive) to enable the preparation of payment of the
dividend.
Nominations for the Audit Committee
The Audit Committee comprises of three (3) shareholders
and three (3) Directors. In accordance with Section 359 (5)
of the Companies and Allied Matters Act Cap. C20, Laws of
the Federation of Nigeria 2004, any shareholder may
nominate another shareholder as a member of the Audit
Committee by giving notice in writing of such nomination to
the Company Secretary at least twenty-one (21) days
before the date of the Annual General Meeting. The
Securities and Exchange Commission's Code of Corporate
Governance for public Companies stipulates that members
of the Audit Committee should have basic financial literacy
and should be able to read Financial Statements. We
therefore request that nominations be accompanied by a
copy of the nominee's curriculum vitae.
Unclaimed Dividends
Shareholders are hereby informed that several dividend
warrants have been returned to the Registrars as
unclaimed. Some Dividend warrants have neither been
presented to the Banks for payment nor to the registrar for
revalidation. A list of such unclaimed dividends will be
circulated with the Annual Reports and Financial
Statements. Members concerned are advised to contact

Notice of Annual General Meeting (continued)
10
the Registrars at Greenwich Registrars and Data Solutions
Ltd. 274, Murtala Muhammed Way, Alagomeji, Yaba, Lagos
Tel: 01 279 3161- 2 & 01 813 1925
E-Dividend/Bonus
Pursuant to the Directive of the Securities and Exchange
Commission, notice is hereby given to all shareholders to
open bank accounts, stockbroking accounts and CSCS
accounts for the purpose of e-dividend/bonus. A
detachable application form for e-dividend is attached to
enable shareholders furnish particulars of their accounts
to the Registrars as soon as possible.
Rights of Securities' Holders to ask Questions
Securities' Holders have a right to ask questions not only at
the Meeting, but also in writing prior to the Meeting and
such questions must be submitted to the Company via the
Company Secretary on or before Thursday 2 May, 2019.
Dated this 14 March, 2019
By order of the Board
Mrs. Abidemi Ademola
General Counsel GN & Company Secretary
FRC/2013/NBA/00000001646
Registered Office
1, Billings Way,
Oregun, Ikeja,
Lagos.

1
HIS MAJESTY NNAEMEKA A. ACHEBE CFR, MNI
Obi of Onitsha
Chairman’s Statement
‘The Company made good strides in its growth
strategy with results showing decent
performance on key financial and performance
indices. Turnover from continuing operations
grew by 9% from N85bn in 2017 to N92bn in 2018.
Earnings per share increased by 3% from N 1.78
per share in 2017 to N1.84 per share in 2018.
Profit After Tax from continuing operations
increased by 29% from N7.1bn in 2017 to N9.1bn
in 2018.’

12
Chairman’s Statement (continued)
Distinguished Shareholders, Fellow Board members,
representatives of Regulatory Bodies present, esteemed
ladies and gentlemen, it is with great pleasure that I
welcome you to the 94th Annual General Meeting of our
Company holding here in Lagos.
It is with mixed feelings that I present the Reports and
Financial Statements for the year ended 31 December,
2018 together with a review of the Company's performance
during the financial year. 2018 was an exceedingly
challenging year with tremendous pressure on the
Nigerian economic environment. However, I am pleased to
report that 2018 was another year of consistent revenue
growth and profitability for the Company, as the Company
recorded increased revenue growth combined with
profitability and cash flow delivery.
2018 Economic and Business Environment
The recovery of the Nigerian economy was slow in 2018,
with major indicators reflecting suboptimal performances.
The recovery was aided by improved stability in the macro
environment as the Central Bank of Nigeria continued to
pursue a relatively tight monetary policy stance in its effort
to curtail inflation, which effectively maintained liquidity
and stability in the foreign exchange market during the
year. Inflationary pressures returned towards the end of
the year after spiraling downwards from January to July.
The Consumer Price Index (CPI) was at 11.44 per cent
(year-on-year) in December, 2018, 16 basis points higher
than the rate recorded in the previous month (11.28
percent). Similarly, the Naira remained relatively stable at
the inter-bank foreign exchange market throughout the
year.
On the macroeconomic front, Nigeria maintained the
growth trajectory, which began in 2017, after exiting the
recession. In 2018, Nigeria's real Gross Domestic Product
(GDP) grew at an annual growth rate of 1.93 per cent,
compared to 0.82 per cent recorded in 2017, according to
the National Bureau of Statistics. For the oil sector, the real
2018 GDP growth stood at 1.14 per cent as against 4.69 per
cent recorded in 2017. The non-oil sector, on the other
hand, grew by 2 per cent in 2018, performing considerably
better than 0.47 per cent seen in 2017. The Manufacturing
sector grew at 24 % in 2018 and its contribution to real GDP
rose slightly from 9.18 per cent in 2017 to 9.20 per cent.
Nigeria's total public debt (external and domestic) rose
from $70.99 billion (N21.725 trillion) in 2017 to $73.21
billion (about N22.428 trillion), according to the Debt
Management Office. Despite the increase, Nigeria
remained at moderate risk of debt distress. In the third
quarter of 2018, the government issued an Eurobond of
$2.9 billion, which ushered in its new debt management
strategy of prioritizing foreign debt to mitigate the high
financing costs of domestic borrowing. Furthermore,
relatively strong oil receipts solidified the current account
surplus to an estimated 3.7% and bolstered improvements
in the terms of trade by about 13% in 2018 alone.
The Nigeria Stock Exchange equity market started the year
on a high, with the All Share Index (ASI) reaching a ten-year
peak of 45.092.83 in January, 2018, driven by the positive
performance of the ASI in 2017. Political risks, oil price
volatility and rising global yields resulted in the bearish
performance that saw the ASI and equity market
capitalization fall by 17.81 per cent and 13.8 per cent to
close at 31,430.50 and N11.73 trillion respectively, as at
December 31, 2018.
Results and performance
Notwithstanding the pressure and disruption in the
business operating landscape, Unilever Nigeria Plc's
fundamentals held strong in 2018. Our Company's
performance attests to the durability and resilience of the
Unilever brand. The Company made good strides in its
growth strategy with results showing decent performance
on key financial and performance indices. Turnover from
continuing operations grew by 9% from N85bn in 2017 to
N92bn in 2018. Earnings per share increased by 3% from N
1.78 per share in 2017 to N1.84 per share in 2018. Profit
After Tax from continuing operations increased by 29%
from N7.1bn in 2017 to N9.1bn in 2018. Clearly, the results
are, once again, a reflection of our Company's entrenched

Chairman’s Statement (continued)
13
values of creating a brighter future for our citizens through
brands that make them feel good, look good and get more
out of life.
In 2018, Unilever successfully completed the complex
disposal of the spreads business (Blue Band brand)
recording a one-off income of N1.42bn representing profit
from the disposal. Further, our Company stepped up
investments behind its brands, with significant spend on
innovations and continued digitization of its operations.
Our Company successfully launched Glen tea and OMO
auto wash powder, which enabled it to expand its offering to
citizens. Our Company raised its level of investment in
manufacturing capacity, upgraded its plant for better and
higher capacity, and drove efficiencies in all aspects of the
business. The resultant effect was overheads cost
reduction, streamlined administrative costs and return on
marketing investments which enabled us to invest in more
productive areas. The Board remains confident that our
Company's strategy is well placed to capture current and
emerging growth opportunities.
Dividends
Unilever Nigeria Plc. remains committed to delivering
returns to its valued shareholders. In line with the dividend
policy and subject to your approval the Board of Directors
h e re b y re c o m m e n d s a d i v i d e n d p a y o u t o f
N8,617,508,125.50 (Eight Billion, Six Hundred and
Seventeen Million, Five Hundred and Eight Thousand, One
Hundred and Twenty-Five Naira, Fifty Kobo) that is, N1.50k
gross per ordinary shares of 50k each. It is noteworthy that
this enhanced dividend payout against the 50k gross paid
last year, includes the benefit to shareholders from the
disposal of the spreads business.
The Board of Directors remains committed to the
implementation of electronic dividend and electronic
bonus payment system, aimed at reducing the incidence of
unclaimed dividend and share certificates. On behalf of the
Board, I request shareholders to complete the e-dividend
and e-bonus Application Form in the Annual Report and
Financial Statements and submit to the Registrars,
Greenwich Registrars and Data Solutions Limited.
Board
During the financial year ended 31 December, 2018, Mr.
James Todd resigned from the Board with effect from 31
December, 2018, having served as a Non-Executive
Director meritoriously for some years. Mr. Todd recently
took up a new appointment within the Unilever Group as
the Vice President Finance, North Africa, Middle East,
Turkey, Iran and Russia. On behalf of the Board,
Management and all shareholders of our esteemed
Company, I wish Mr. Todd every success in his new role.
Acknowledgements
Our Citizens are always at the centre of everything we do
and without them, we will not be in business. Accordingly,
special thanks go to our citizens for their unflinching love
and loyalty to our brands. Our appreciation goes to all our
employees whose collective efforts and dedication made it
possible for us to sustain our growth trajectory in 2018. We
also acknowledge with thanks the continued support of our
customers, bankers, suppliers and other service
providers. We acknowledge the unwavering confidence
and commitment of our esteemed shareholders. Finally, I
thank the Board and Management, whose exemplary
leadership ensure that Unilever remains focused on the
pursuit of offering brands with purpose to create a brighter
future for our citizens.
Future outlook
The Federal Government through the 2019 budget, seeks
to maintain the growth momentum in the Economic
Recovery and Growth Plan designed in 2017, to drive
macroeconomic stability and economic diversification. The
aggregate expenditure proposed for 2019 was N8.83
trillion, comprising capital expenditure of N2.03 trillion,
recurrent expenditure of N4.04 trillion, debt service of
N2.14 trillion, statutory transfers of N492 billion, and
sinking fund of N120 billion. The 2019 Federal Government

Chairman’s Statement (continued)
14
budget was predicated on projected crude oil production of
2.3 million barrels per day (mpd); crude oil price of US$60
per barrel; and an average exchange rate of N305/dollar.
The fiscal deficit was projected at N1.86 trillion or 1.3 per
cent of GDP to be financed partly by new borrowings
estimated at N1.65 trillion.
The Federal Government expects the economy, measured
by Gross Domestic Product (GDP) to grow by 3.02% in 2019,
up from 1.93 per cent in 2018. The International Monetary
Fund (IMF) and the World Bank, however, expect the
Nigerian economy to expand by only 2% and 2.2%
respectively.
I am pleased to share that Unilever's approach to business
in 2019 is to continue to drive growth that is profitable,
responsible, consistent and competitive. Unilever will
continue to focus on delivering strong results despite the
VUCA environment within which it operates. We will
therefore constantly monitor the local and global economic
environment, and appropriately apply pragmatic and
dynamic approaches to business execution. On our part,
we will continue to position ourselves to mine the
opportunities in all the markets in which we operate to
grow our earnings, improve profitability and deliver
returns to meet the expectations of our stakeholders who
rely on us every day to make sustainable living
commonplace.
Thank you for your continued support.
HIS MAJESTY NNAEMEKA A. ACHEBE CFR, MNI Obi of Onitsha
FRC/2013/NIM/00000001568


Board Profile
18
HIS MAJESTY NNAEMEKA A. ACHEBE CFR, MNI
– Non-Executive Director and Chairman
His Majesty Nnaemeka A. Achebe, Obi of Onitsha, had a 30-year
career with the Royal Dutch Shell Petroleum Group of
Companies in Nigeria and overseas. He is the past Chairman of
Diamond Bank PLC, past Chairman of Intafact Beverages Ltd.
(subsidiary of SAB Miller Plc.) and past Chancellor of Kogi State
University. He is the Chairman of the Board of International
Breweries Plc. (a subsidiary of AB-InBev, the global leading
brewer of beer and other beverages) and a non-executive
director of Coscharis Farms Limited. (a subsidiary of the
Coscharis Group).
He is also the Chairman of Anambra State Traditional Rulers
Council and Chancellor Ahmadu Bello University, Zaria. He was
educated at Stanford and Columbia Universities in the U.S.A.
and also attended the National Institute for Policy and Strategic
Studies, Kuru.
He was appointed to the Board of Unilever Nigeria Plc. in March
2003.
MR YAW NSARKOH (Ghanaian) - Managing Director
Yaw Nsarkoh is the Executive Vice President (EVP) of Unilever Ghana and Nigeria. Prior to this, he served as the Managing Director for Unilever Nigeria Plc. from 1st January, 2014 to 31st December, 2016 and Managing Director, Unilever East and Southern Africa, based in Kenya from 2010 to 2013. He was at one time the Strategic Assistant to the President and Unilever Leadership Executive Member for Asia, Africa, Central and Eastern Europe based in the United Kingdom and then Singapore.
He also served at various times in the past as Marketing Director and Executive Board member at Unilever Ghana Ltd. Mr. Nsarkoh holds a Honors Degree in Chemical Engineering from the University of Science and Technology, Kumasi, Ghana and a Post Graduate Diploma in Management from Henley Management College, United Kingdom. He represents Africa on the Unilever global Diversity and Inclusion board, and is a director of Changing Lives Endowment Fund (CLEF) in Ghana. Mr. Nsarkoh is a member of the Board of Advisors of the Lagos Business School and also sits on governing boards of industry associations and strategic Private Sector committees. He is a regular speaker on business issues and on matters of sustainable development.
He was appointed to the Board of Unilever Nigeria Plc. in January, 2014.

Board Profile
19
MR ATEDO N. A. PETERSIDE, CON – Non-Executive Director
AMMUNA LAWAN ALI, OON – Independent Non-Executive Director
Mr. Peterside (a Commander of the Order of the Niger) is the
Founder of Stanbic IBTC Bank Plc. He is also the Founder and
Chairman of ANAP Business Jets Limited and ANAP Foundation
as well as the Chairman of Cadbury Nigeria Plc.
He was the Chairman of the Committee that crafted the first
Corporate Governance Code for Public Companies in Nigeria
(published in October 2003). Mr. Peterside sits on the Boards of
Flour Mills of Nigeria Plc, Nigerian Breweries Plc (Heineken
Subsidiary), Standard Bank Group Limited, The Standard Bank
of South Africa Limited and Unilever Nigeria Plc. He is also the
Chairman of Endeavor High Impact Entrepreneurship Ltd/Gte as
well as the Alternate Vice Chairman (Private Sector) of the
Nigerian Industrial and Competitiveness Advisory Council,
which is chaired by the Vice President of the Federal Republic of
Nigeria.
He was appointed to the Board of Unilever Nigeria Plc. in
January 2008.
Ammuna Lawan Ali, a retired Federal Permanent Secretary,
commenced her Civil Service career in 1977 as a Planning
Officer in the Borno State Ministry of Lands and Survey,
Maiduguri, where she rose to the position of Permanent
Secretary. In 1995, Ammuna Lawan Ali transferred her services
to the Federal Civil Service as a director and served in the
Ministry of Women Affairs and Social Development and of
Finance. In January 2001, Ammuna Lawan Ali was appointed a
Permanent Secretary and served in various Ministries,
including those of Commerce, Petroleum Resources,
Transportation, Works, Environment, Housing and Urban
Development, amongst others.
She retired from service in December 2009. Ammuna Lawan Ali
is a proud recipient of a national honour, Order of Niger (OON)
and a member of the National Institute of Policy and Strategic
Studies (NIPSS) Kuru. She holds a BA (Hons) and Masters
Degree in Public Administration. She is an Independent Director
of Africa Prudential Registrars Plc. She was appointed to the
Board of Unilever Nigeria Plc. in December, 2015
.

Board Profile
20
MR MUTIU SUNMONU CON, FNSE
– Independent Non-Executive Director
Mutiu Sunmonu, CON graduated from the University of Lagos in
1977 with a first-class degree in Mathematics and Computer
Sciences. He joined Shell Petroleum Development Company of
Nigeria Limited (SPDC) in August 1978 and served in various
capacities in Nigeria, UK and the Netherlands. After 36 years of
meritorious service, Mr. Mutiu Sunmonu retired from Shell as
the Managing Director of SPDC, and Country Chair of Shell
Companies in Nigeria. Since his retirement, he continues to be
active in the Oil and Gas Industry.
He is currently the chairman of Petralon Energy Nigeria and the
chairman of San Leon Energy UK. He is the Chairman of Julius
Berger Nigeria Plc and the Chairman of Imperial Homes
Mortgage Bank.
He was appointed to the Board of Unilever Nigeria Plc. in
December, 2015.
.
Mrs Adesola Sotande-Peters holds a bachelor degree in
Business Administration and Economics from Richmond
College, The American International University in London, she
also has an MBA for finance professionals from Manchester
Business School. She is a Fellow of the Association of Certified
Chartered Accountants (FCCA) and member of the Institute of
Chartered Accountants of Nigeria (ICAN). Her career spans
about 23 years in various organizations such as British
Broadcasting Corporation (BBC), Informa Group UK, Openwave
Telecoms UK, Diageo Plc (Guinness Nigeria Plc, East African
Breweries Limited, and Guinness Cameroon SA) where she has
held various senior Finance roles. Adesola is a member of the
Institute of Directors, Nigeria, an Associate member of Women
in Management, Business & Public Services (WIMBIZ) and a
Fellow of the WIMBOARD Institute, a WIMBIZ/IE University,
Madrid Executive Education Programme for Women on Boards.
She was also a recipient of the 2017 CFO Awards (organised by
Instinct Wave Media) as the CFO of the year- FMCG Category.
Adesola is amiable and keen to nurture young professional
colleagues. Adesola is a non-executive director of Unilever
Ghana Ltd, and was appointed to the Board of Unilever Nigeria
Plc. in January 2015.
MRS ADESOLA SOTANDE-PETERS – Executive Director and Vice President Finance

21
Board Profile
21
MRS ABIOLA ALABI– Non-Executive Director
MR CHIKA NWOBI
– Non-Executive Director
Biola Alabi is the CEO of Biola Alabi Media, a dynamic
consultancy with expertise in film and television production, pay-
tv entertainment, digital television. They service governments,
content creators and the telecommunication industry. She is
also the founder of “Grooming for Greatness” a leadership
development and mentorship program for a new generation of
African leaders. Named one of the 20 Youngest Power Women in
Africa by Forbes Magazine (2012), a World Economic Forum
Young Global Leader (2012) and CNBC Africa's AABLA West
African Business Woman of the Year (2013), Yale World Fellow
(2014) for over five highly successful years, Biola Alabi held the
position of Managing Director for M-Net. Prior to this, she was
based in the United States where she was part of the executive
team at the children's television brand Sesame Street.
An alumni of the University of Cincinnati, Alabi has spent recent
years polishing her knowledge with Executive Education
Programs at Harvard University's Kennedy School of
Government and Yale University's Jackson Institute of Global
Affairs. She was appointed to the Board of Unilever Nigeria Plc. in
December, 2015.
Chika Nwobi is founder of Level 5 Lab (L5Lab)– a venture
development firm that has incubated several successful African
tech companies including Decagon - Nigeria's leading software
engineering institute, Babybliss - Nigeria's top omni-channel
platform for mom and baby products, Jobberman and Cheki.
Chika has led consulting engagements for Ford Foundation and
IFC on mobile money and micropayments technology in Nigeria.
Chika has a BA in Economics and a B.Sc. in Computer Science
and is in the MSc Software Engineering program at University of
Oxford. He also completed the Stanford University SEED
transformation program. Chika is passionate about education
and developing young people and has been invited to speak at
Wharton, NYU and Lagos Business School.
He has also served as judge for Federal Government of Nigeria’s
Entrepreneurship business plan competition and as a mentor
for the World Bank XL startup program. Chika is also a venture
partner in Rise Capital, an emerging-markets focused venture
capital firm. He was appointed to the Board of Unilever Nigeria
Plc. in January 2018.

Board Profile
22
MR FELIX ENWEMADU – Executive Director and Vice President Customer Development
MRS ABIDEMI ADEMOLA – General Counsel Ghana - Nigeria & Company Secretary
Mr Felix Enwemadu is the Vice President, Customer
Development. Prior to this position, he was the Head of
Customer Development and Customer Development Director,
General Trade respectively at Unilever Nigeria Plc, General
Manager at Diageo Brands Nigeria Ltd, Sales Director at
Nutricima Nig. Plc, Head of Sales Notore Chemicals Industries
Ltd and occupied Sales Management positions at Guinness and
Procter & Gamble.
He is an experienced business sales professional with over 20
years’ experience. He holds a Bachelor of Science Degree in
Geology from Nnamdi Azikiwe University, Awka, Anambra State.
He was appointed to the Board of Unilever Nigeria Plc. in
October, 2016.
Mrs Abidemi Ademola is a Corporate Counsel and Chartered
Secretary with experience spanning over 24 years of
Commercial Law and Corporate Governance practice in Nigeria
and West Africa. She is listed on the Legal 500 GC Powerlist:
Africa. Her forte is identifying existing and emerging legal and
corporate governance risks to business and providing innovative
solutions. Abidemi holds a Bachelor of Laws from the Obafemi
Awolowo University, Ile-Ife., a Master of Laws from the
University of Lagos, Akoka and an MBA Leadership from Walden
University, United States. She is a Fellow of the Institute of
Chartered Secretaries and Administrators of Nigeria and an
Associate of the United Kingdom equivalent. She is also a
member of the Nigerian Bar Association, the Society of
Corporate Governance and the Institute of Directors, Nigeria.
She is an Associate member of Women in Management,
Business & Public Services (WIMBIZ) and a Fellow of the
WIMBOARD Institute, a WIMBIZ/IE University, Madrid Executive
Education Programme for Women on Boards. Abidemi chairs
the Corporate Counsel Committee of the NBA Section on
Business Law. She is passionate about nurturing talents to
realise their leadership potential. She was appointed as
Company Secretary in January 2012.
.


Report of the Directors
Revenue
Operating profit
Profit before taxation
Taxation
Profit after tax
Other comprehensive income
Proposed dividend
24
The Directors submit their Report together with the
audited financial statements for the year ended 31
December 2018, which disclose the state of affairs of the
Company.
Incorporation
Unilever Nigeria Plc. is incorporated in Nigeria under the
Companies and Allied Matters Act (CAP C20) Laws of the
Federation of Nigeria, 2004 as a public limited liability
company, and is domiciled in Nigeria. The Company's
shares are listed on the Nigerian Stock Exchange (NSE).
Principal activities
The Company is principally involved in the manufacture
and marketing of foods & refreshments, home care and
beauty & personal care products. It has manufacturing
sites in Oregun, Lagos State and Agbara, Ogun State.
Results - Continued and Discontinued operations
The results for the year are summarized as follows:
N'000
95,244,403
11,342,178
14,852,723
(4,300,582)
10,552,141
120,268
8,617,508
Dividend
The Directors recommend to the shareholders, payment
of a dividend in respect of the year ended 31 December,
2018, of N8,617,508,126 that is, 1.50 Naira gross per
share which is payable on Friday, 10 May, 2019 subject to
the deduction of appropriate withholding tax.
.
Corporate Governance Report
Framework
Unilever Nigeria Plc. operates within a Corporate
Governance framework established on the following:
1 Companies and Allied Matters Act (Cap C20) LFN 2004
2 The Rule Book of the Nigerian Stock Exchange for the
time being in force
3 The Investment and Securities Act 2007
4 Securities and Exchange Commission (SEC) Rules for
the time being in force
5 The SEC Code of Corporate Governance for Public
Companies 2011 as ammended
6 The Memorandum and Articles of Association of
Unilever Nigeria Plc.
7 The Board Charter
8 The Unilever Code of Business Principles and Code
Policies
9 The Governance of Unilever Document
From the above, the Corporate Governance Policy of
Unilever Nigeria Plc can be summed up as follows:
a. We conduct our operations with honesty, integrity and
openness and with respect for the human rights and
interests of the employees.
b. We shall similarly respect the legitimate interests of
those with whom we have relationships.
c. As a Unilever Group company, we are required to comply
with the laws and regulations of the countries in which
we operate.
d. We conduct our operations in accordance with
internationally accepted principles of good corporate
governance. We will provide timely, regular and reliable
information on our activities, structure, financial
situation and performance to our shareholders and
other stakeholders.

Report of the Directors (continued)
25
His Majesty Nnaemeka A.
Achebe, CFR, MNI
Mr Yaw Nsarkoh
Mrs Abiola Alabi
Managing Director
Non-Executive Director
and Chairman
Ammuna Lawan Ali, OON Independent Non-Executive
Director
Mr Felix Enwemadu Executive Director
Mr Chika Nwobi Non-Executive Director
(appointed w.e.f. 1 January
2018
Mr Atedo N. A. Peterside, CON Non-Executive Director
Mrs Adesola Sotande-Peters Executive Director
Mr Mutiu Sunmonu, CON Independent Non-Executive
Director
Mr James Todd Non-Executive Director
(resigned w.e.f 31 December
2018)
Compliance with the above principles is an essential
element in our business success and all employees and
business partners of Unilever are mandated to comply with
the above principles.
During the year 2018, Unilever Nigeria Plc. complied with
all the mandatory provisions of the Securities and
Exchange Commission Code of Corporate Governance for
Public Companies 2011 together with the requirements of
other good corporate governance standards listed above.
Board composition
The Directors who held office during the year 2018 and up
to the date of this report are:
Non-Executive Director
Since the last Annual General Meeting, the following
Director resigned from the Board:
Mr James Todd - resigned from the Board with effect from
31 December, 2018.
Board responsibilities
The Board has the final responsibility for management,
direction and performance of the company and has the
powers, authorities and duties vested in it by the relevant
laws and regulations of the Federal Republic of Nigeria and
the Articles of Association of Unilever Nigeria Plc. The
Board has overall responsibility for the management of
risk and for reviewing the effectiveness of the internal
control and risk management system within the Company.
The Board has delegated to the Chief Executive
Officer/Managing Director all its powers, authorities and
discretions which relate to the day to day operations of
Unilever Nigeria Plc.
The powers, authorities and discretions exclusively within
the remit of the Board and which currently have not been
delegated include making or approving the following:
1 Structural and constitutional powers
- Alteration of Articles of Association
- Alteration of the capital of the Company
- Significant asset disposal
2 Governance
-
-
-
-
-
Convening of meetings of the shareholders of Unilever
Nigeria Plc. and the setting of the agenda thereof and
generally ensuring that a satisfactory dialogue with
shareholders takes place
Presentation of the annual report and financial
statements to shareholders
Reviewing and approving proposals from the
Governance/Remuneration Committee
Proposals to the general meetings of shareholders of
Unilever Nigeria Plc. on the Board remuneration
policy within the authority set by the general meeting
of shareholders
The review of the functioning of the Board and its
committees
Report of the Directors (continued)
26
Overall responsibility for compliance with all relevant
laws, regulations and Code of Corporate Governance.
The Operating Framework
Board appointment and evaluation process
Unilever Nigeria Plc. appoints Directors in line with its
Board recruitment process which devolves from its Code of
Business Principles and Code Policies relating to human
resources recruitment and the Governance of Unilever
document. The basic principle underlining the process of
recruitment of Directors in Unilever Nigeria Plc. are the
qualifications, ability and skills required for the role and
the ability to make visible and independent (as applicable)
contribution to the governance of Unilever Nigeria Plc. in
accordance with Unilever global, regional and local
strategy and the relevant local legal requirements.
The governance process in Unilever Nigeria Plc. provides
for the induction and training of Directors by virtue of which
Directors are taken through relevant and appropriate
training programmes which equip them for the role. In
accordance with its 70-20-10 principle Unilever believes
that a major part of training will happen through on-the-
role experience and exposure, 20% will happen through
relationship building and interaction with the right calibre
of people while the remaining 10% will result from formal
training.
In 2018, the Board went through a formal training session
on Key Provisions of The (Draft) Nigerian Code of
Corporate Governance 2018 and Practical Tips For Board
Effectiveness and Accountability which was facilitated by
Chief Olusegun Osunkeye CON, OFR, OON, DF.IOD, FCA of
Osunkeye & Associates.
Unilever Nigeria Plc. provides the right atmosphere for its
Directors to exhibit leadership and enhance their
capabilities. Unilever Nigeria Plc further provides relevant
governance information to its Directors and facilitates
circulation of essential governance documents to the
Board from time to time to keep them updated on legal,
regulatory and corporate governance trends.
-
-
The Board of Directors of Unilever Nigeria Plc. is evaluated
locally and at the Unilever Africa Cluster level on an annual
basis. The Board and individual Directors are
benchmarked against the requirements of the Unilever
Code of Business Principles, the Code Policies, the laws
and regulations of Nigeria, the SEC Code of Corporate
Governance and other relevant governance provisions. The
scope of evaluation covers compliance, contribution to the
Board agenda for the year, attendance at meetings, quality
of discussions at Board meetings, level of engagement
with government and the community, business
performance and entrepreneurial acumen.
In line with the Unilever Governance standards and in
compliance with the SEC Code of Corporate Governance,
the Board of Unilever Nigeria Plc. opted for an internal
evaluation exercise in respect of period ended 31
December, 2018 to review the performance of the Board,
individual Directors and Board Committees. The
Evaluation Report shows that Unilever’s governance
procedures and practices during the year ended 31
December 2018 were in compliance with the provisions of
applicable laws, regulations, corporate governance Code
and international best practices. Action points from the
Evaluation will be addressed in course of 2019.
Directors retiring by rotation
In accordance with Article 90 of the company's Articles of
Association, Mrs Abiola Alabi, Mr Felix Enwemadu and Mrs
Adesola Sotande-Peters will retire by rotation and being
eligible, offer themselves for re-election.
The profiles of all the three (3) Directors standing for re-
election are contained on pages 20 to 22 of this Annual
Report and Financial Statements.

Report of the Directors (continued)
28
Board committees
In line with the Code of Best Practices in Corporate
Governance, the Board of Directors works through the
following committees:
a. Executive Committee (Exco)
The Exco is a sub-committee of the Board and it is
empowered by the Board to take decisions on behalf of
the Board, which are necessary for the smooth day to
day operations of the Company.
The committee comprises the Executive Directors of
the Company. The following are currently members of
the committee:
i Mr Yaw Nsarkoh
-Managing Director & Executive Vice President
ii Mrs Adesola Sotande-Peters
-Executive Director & Vice President Finance
iii Mr Felix Enwemadu
-Executive Director & Vice President Customer
Development
b. Leadership Team (LT)
i Mr Yaw Nsarkoh
-Managing Director & Executive Vice President
ii Mr Stephane Achio
-Director, Planning
iii Mrs Abidemi Ademola
iv Mrs Bunmi Adeniba
-Director, Brand Building (Home Care) Ghana-Nigeria
v Mr Adeleye Adeniji
-Director, Customer Development
vi Mr Felix Enwemadu
-Vice President, Customer Development
vii Mrs Soromidayo George
-Director, Corporate Affairs & Sustainable Business
Ghana-Nigeria
viii Mrs Bolanle Kehinde-Lawal
-Marketing Lead Refreshment Ghana-Nigeria
ix Mr Katoch Kishore
-Director, Manufacturing
x Mr Thomas Mwanza
-Director, Procurement Operations West Africa
xi Mrs Eniola Onimole
-Director, Human Resources Ghana-Nigeria
xii Mr George Owusu-Ansah
-Director, Supply Chain Logistics
xiii Mr Dave Planson
-Director, Research & Development, West Africa
xiv Mr Siddharth Ramaswamy
-Vice President, Supply Chain West Africa
xv Mrs Adesola Sotande-Peters
-Vice-President, Finance Ghana-Nigeria
xvi Mrs Nsima Ogedi-Alakwe
-Marketing Director, Foods Ghana-Nigeria
The Leadership Team is constituted by the Executive
Directors and Senior Executives who occupy strategic
roles in the organization. This Leadership Team is
responsible for delivering the corporate targets of the
Company, establishing priorities, allocating
resources, and seeing to the operations of the
Company on a day to day basis. The Leadership Team is
chaired by the Managing Director/Chief Executive
Officer of the Company. Current members of the
leadership team are as follows:
-General Counsel Ghana-Nigeria & Company Secretary

Report of the Directors (continued)
29
d. The Governance, Remuneration and Risk
Management Committee
The Governance/Remuneration Committee comprises
solely of Non-Executive Directors.
i Mr Atedo N.A. Peterside, CON - Chairman
ii His Majesty Nnaemeka A. Achebe, MNI, CFR
iii Ammuna Lawan Ali, OON
iv Mr Mutiu Sunmonu, CON, FNSE
In 2018, all the above committees discharged their roles
creditably and in line with their terms of reference.
The Audit Committee, established in accordance with
the provisions of Section 359(4) of the Companies and
Allied Matters Act (CAP C20) Laws of the Federation of
Nigeria, 2004, is comprised of three (3) shareholders’
representa t i ves and three (3 ) D i rec tors’
representatives (two of whom are non–executive
Directors and the other an executive director (not
being the Finance Director). The chairman of the Audit
committee is one of the shareholders’ representatives.
During the year under review, the committee met four
(4) times.
The functions of the Audit Committee are governed by
the provisions of Section 359(6) of the Companies and
Allied Matters Act Cap 20 Laws of the Federation of
Nigeria 2004 and the SEC Code of Corporate
Governance for Public Companies 2011. The Members
of the Audit Committee and the Report of the Audit
Committee to the members are contained on page 46.
The Committee’s Terms of Reference are in line with
the SEC Code of Corporate Governance 2011.
Members of the Committee during the period ended
31 December, 2018 were:
c. The Audit Committee

Report of the Directors (continued)
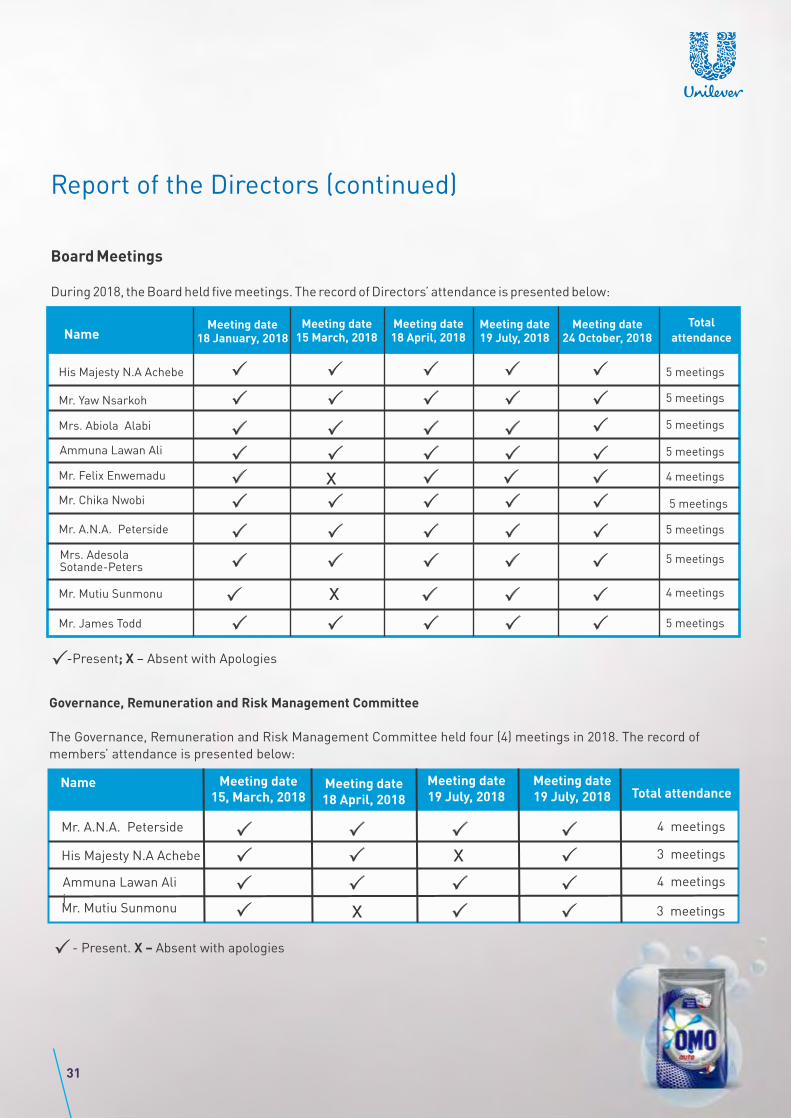
-Present; X – Absent with Apologies
His Majesty N.A Achebe 5 meetings
Mr. Yaw Nsarkoh
Mrs. Abiola Alabi
Ammuna Lawan Ali
Mr. Felix Enwemadu
Mr. Chika Nwobi
Mr. James Todd
4 meetings
5 meetings
Name 24 October, 2018
Total
attendanceMeeting date
19 July, 2018Meeting date
18 April, 2018Meeting date
15 March, 2018Meeting date
18 January, 2018Meeting date
5 meetings
5 meetings
Mr. A.N.A. Peterside
5 meetings
x
Mrs. Adesola Sotande-Peters
5 meetings
5 meetings
Mr. Mutiu Sunmonu x 4 meetings
5 meetings
Board Meetings
During 2018, the Board held five meetings. The record of Directors’ attendance is presented below:
Governance, Remuneration and Risk Management Committee
The Governance, Remuneration and Risk Management Committee held four (4) meetings in 2018. The record of
members’ attendance is presented below:
His Majesty N.A Achebe
Mr. A.N.A. Peterside
Mr. Mutiu Sunmonu
4 meetings
3 meetings
3 meetings
- Present. X – Absent with apologies
Name Meeting date15, March, 2018 18 April, 2018 19 July, 2018 Total attendance
Meeting date Meeting date
Ammuna Lawan Ali
i
4 meetings
19 July, 2018Meeting date
x
x
31
Report of the Directors (continued)
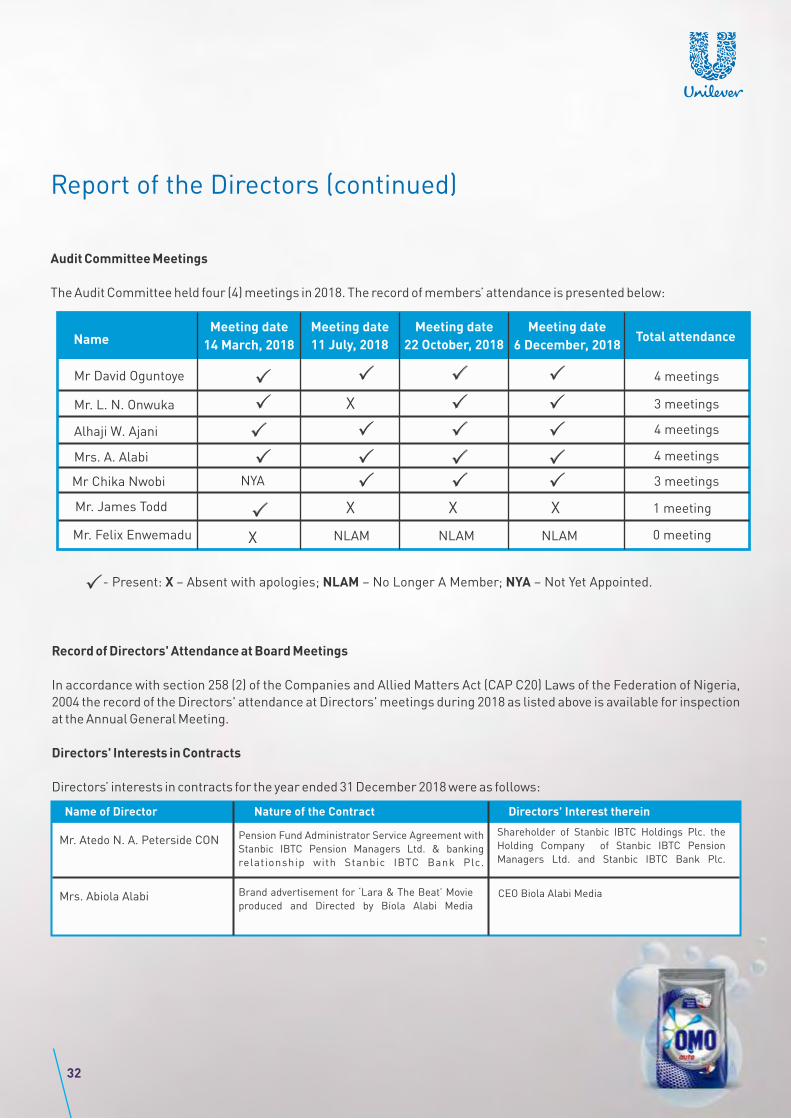
Audit Committee Meetings
The Audit Committee held four (4) meetings in 2018. The record of members’ attendance is presented below:
Mr. L. N. Onwuka
Mr. James Todd
Mr. Felix Enwemadu
3 meetings
3 meetings
4 meetings
4 meetings
- Present: X – Absent with apologies; NLAM – No Longer A Member; NYA – Not Yet Appointed.
NameMeeting date
14 March, 2018 11 July, 2018 22 October, 2018 6 December, 2018Total attendance
Meeting date Meeting date Meeting date
Mr David Oguntoye
Mr Chika Nwobi
Alhaji W. Ajani
Mrs. A. Alabi
4 meetings
1 meeting
Mr. Atedo N. A. Peterside CON Pension Fund Administrator Service Agreement with
Stanbic IBTC Pension Managers Ltd. & banking
relationship with Stanbic IBTC Bank Plc.
Shareholder of Stanbic IBTC Holdings Plc. the
Holding Company of Stanbic IBTC Pension
Managers Ltd. and Stanbic IBTC Bank Plc.
Mrs. Abiola Alabi Brand advertisement for ‘Lara & The Beat’ Movie
produced and Directed by Biola Alabi MediaCEO Biola Alabi Media
Record of Directors' Attendance at Board Meetings
In accordance with section 258 (2) of the Companies and Allied Matters Act (CAP C20) Laws of the Federation of Nigeria,
2004 the record of the Directors' attendance at Directors' meetings during 2018 as listed above is available for inspection
at the Annual General Meeting.
Directors' Interests in Contracts
Directors’ interests in contracts for the year ended 31 December 2018 were as follows:
Name of Director Nature of the Contract Directors' Interest therein
X
NYA
X X X
X NLAM NLAM NLAM 0 meeting
32

Report of the Directors (continued)
No other Director has notified the Company for the
purpose of section 277 of the Companies and Allied
Matters Act (CAP C20) Laws of the Federation of Nigeria
2004, of their direct or indirect interest in contracts or
proposed contracts with the Company during the year.
Directors' shareholding
The Register of Directors' interests in the share capital of
the Company will be open for inspection at the Annual
General Meeting.
The direct and indirect interest of Directors in the issued
share capital of the company as recorded in the Register of
Directors' Shareholdings and/or as notified by them for the
purposes of sections 275 and 276 of the Companies and
Allied Matters Act (CAP C20) Laws of the Federation of
Nigeria, 2004 and the listing requirements of the Nigerian
Stock Exchange are as follows:
Name of Director
His Majesty N. A. Achebe 55,976 55,976
Mr. Yaw Nsarkoh Nil Nil
Mrs. Abiola Alabi Nil Nil
Ammuna Lawan Ali Nil Nil
Mr. Felix Enwemadu Nil Nil
Mr. Chika Nwobi Nil Nil
Mr. Atedo N. A. Peterside-
Indirect (First ANAP
Domestic Trust) 2,500,000 2,577,831
Mrs. Adesola Sotande-Peters Nil Nil
Mr. Mutiu Sunmonu Nil Nil
Mr. James Todd Nil Nil
Number of
shares held at 31
December 2018
Number of
shares held at 31
December 2017
According to the register of members at 31 December
2018, the following shareholders of the Company held
more than 5% of the issued share capital of the
Company:
Unilever Overseas
Holdings B.V. Holland 3,210,405,278 55.08
Unilever Overseas
Holdings BV 689,743,643 12.01
Stanbic Nominees
Nigeria Ltd (Cummulative
Holding) 596,869,298 10.39
Immediate and Ultimate Parent Companies
Percentage
held%Shareholder Number
of shares
Unilever Overseas Holdings B.V. and Unilever Plc. United
Kingdom.
Share Dealing Policy
In accordance with the Post-Listings Rules of the Nigerian
Stock Exchange, Unilever Nigeria Plc. has in place a share
dealing policy which regulates securities transactions by
its Directors, Employees and other Insiders on terms
which are no less exacting than the required standard set
out in the Nigerian Stock Exchange Rules. The Policy and
Closed Periods are communicated periodically to drive
compliance. In respect of the year ended 31 December,
2018, the Directors of Unilever Nigeria Plc. hereby confirm
that:
1) A code of conduct regarding securities transactions
by all Directors has been adopted by the Company.
2) Specific enquiry of all Directors has been made
during the reporting period and there is no incidence
of non-compliance with the listing rules of the
Nigerian Stock Exchange, and Unilever Nigeria’s
code of conduct, regarding securities transactions by
Directors.
33

Report of the Directors (continued)
Complaints Management Policy Framework
In compliance with the Securities and Exchange
Commission Rule Relating to the Complaints Management
Framework of the Nigerian Capital Market (“SEC Rules”)
2018, Unilever Nigeria Plc. has further strengthened its
complaints management procedure. The Company has in
place a formal Complaints Management Policy by which
complaints arising from issues covered under the
Investment and Securities Act 2007 (ISA) are registered,
promptly resolved and quarterly submission of same is
made to the Nigerian Stock Exchange.
Unilever Code of Business Principles
Unilever Nigeria Plc. has zero tolerance for corruption and
unethical practices and mandates its employees and
business partners to adhere to all applicable laws and
regulations, the Unilever Code of Business Principles and
Code Policies. Unilever Code of Business Principles
(COBP) prescribes a uniform standard of conduct expected
of every Unilever operating company, employee and
business partner. The COBP covers matters such as
Obeying the law, Conflict of interest, Business integrity,
Business partners, Shareholders and public activities, Fair
Competition and Responsibility to our consumers. The
Code Policies further spell out the ‘must dos’ and ‘must
nots’ relating to each area under the COBP. Employees of
Unilever Nigeria Plc. go through periodic mandatory
trainings and Declarations and focused discussions to
reinforce the COBP standards and drive compliance.
Compliance with the COBP is mandatory and is monitored
at the highest level of leadership. Internal and external
confidential reporting media are available to encourage
reporting of breaches and sanctions are consistently
applied for these breaches. Unilever has a dedicated
Business Integrity (BI) organization which focuses on Code
compliance and related matters. The BI organization
provides an effective framework for prevention,
monitoring and enforcement. Unilever also makes it
mandatory for all its business partners to sign up to
compliance with its Responsible Business Partner Policy
or Responsible Sourcing Policy as may be applicable.
Employment Policy
At Unilever Nigeria, we strongly believe that to win in the
market place, we must win with people and through
people. This unwavering premise continues to guide us in
the way we work and culminates in our policies and
practices at every stage of our employment cycle. Thus, we
strive to remain an equal opportunity employer that is
passionate about diversity and inclusivity, mutual respect
as well as encouraging vibrant communication and
consultation between employees and the leadership team.
Our core values and Code of Business Principles define
what we stand for and the framework in which we do
business. These are values hinged on professional
integrity, attaining and maintaining a pioneering mindset
of innovation and continuous improvement, a
responsibility to make a positive impact in the society in
which we operate, and respect for all our stakeholders.
These non-negotiables together with our standards of
leadership define the kind of people that drive our
business; People who work from purpose for the good of
others, who always bring their best self (Personal Mastery)
and are constantly curious & courageous (Agility). In
addition to being People with a Passion for High
Performance, Consumer love, Good Business Acumen and
people who develop & magnify the power of people (Talent
Catalyst).
Talent Development
Our people are an essential part of our sustainable
competitive advantage in this ever increasingly connected
world. Therefore, our most trusted principle in creating
opportunities for development and connecting our
employees with those opportunities has continued to set
us apart within the Consumer Goods industry. While we
encourage employees to take ownership of their personal
development, we have robust technology enabled systems
in place to help them develop better leadership,
professional and general skills to enhance engagement
and productivity.
34

Report of the Directors (continued)
In addition, we amplified the focus on digital
transformation and skills by landing various initiatives to
prepare employees for the inevitable disruptions in the
world of work through technology. A few of these initiatives
are:
These and other related activities continue to create the
platform for our business leaders to engage with
employees and share their experiences, while giving career
coaching and mentoring to younger employees within the
organization.
Employee Engagement
We believe that helping our people find purpose and
balance in what they do creates the positive energy which is
critical to driving Unilever Nigeria in the desired direction.
In this regard, we deployed several initiatives to promote a
highly engaged and productive workforce and inspire a
sense of accountability and ownership. One initiative that
brought this to light was the wellbeing awareness drive
tagged “Thrive”. Thrive is geared towards the sustenance
of personal wellbeing and it equipped employees at every
level with the right information and support needed to
cultivate a healthy and balanced lifestyle.
Through this initiative, we encouraged all employees to
THRIVE while delivering business goals for the year using
the four (4) wellbeing thrusts;
Employer Branding
Our objective to attract the best talent was achieved in 2018
through series of initiatives including sustained
partnerships with reputable universities that had Unilever
hosting student competitions, career talks, seminars etc.
Through these forums Unilever was able to impact over
15,000 youths across the country with a compelling
message to keep dreaming and actively pursue those
dreams. This culminated in the 7th Edition of our flagship
IdeaTrophy Competition for University undergraduates.
The Grand Finale was taken to the next level as it brought
together over 500 youths who had the privilege of receiving
free vetting of CVs, Career Counselling, and an
inspirational panel discussion with carefully selected team
of bright young minds who have been able to provide
innovative solutions to local challenges. Our panelists
were Onyeka Akumah– Co-Founder and Chief Executive
Officer of Farmcrowdy, Otto Orondaam– Founder of
Slum2School and Bilkis Adebiyi-Abiola –General Manager
36
Connected World Programs for Marketers and Digital
Workshops in Partnership with Google and Facebook;
this aimed at unlocking the power of digital with some
of the great tools and partners that we have at our
disposal.
Introduction of Flex Experiences; This is focused on
giving employees an avenue to access different
learning experiences while unlocking capacity and
driving efficiency.
Digital Finance Week; This is an avenue to identify
opportunities for simplification of our processes
through technology.
b.
a.
c.
Physical Wellbeing- Through the Inhouse Annual
Medical Checkup tagged “Lamp Lighter” and through
partnerships wi th the Heal th Insurance
Organizations (HMOs).
Mental Wellbeing- Employee Assistance Program
(EAP) was made available to all employees and their
loved ones. This allows them to get free professional
counsel to personal and professional challenges.
Purposeful Wellbeing- Purpose workshops were run
for employees to help them discover their purpose.
This is with the understanding that employees with
purpose thrive and can unlock energy and growth in
the organization.
Emotional Wellbeing- Wellness tips shared weekly
via various communication channels to encourage
employees to celebrate their uniqueness and
individuality.
a.
b.
c.
d.
Report of the Directors (continued)
of the Lagos State Parks and Gardens Agency (LASPARK)
and Co-Founder of WeCyclers Nigeria Limited. The
competition produced two teams as winners, which in
addition to receiving fantastic prizes, represented Nigeria
at the regional rounds of the Unilever Africa Ideatrophy
competition in South Africa in February 2019.
Our activities and impact in 2018 were rewarded as
Unilever Nigeria was recognized and certified for
Excellence in Employee Conditions for the fifth time in a
row as No. 1 Top Employer in Nigeria and Top Employer in
Africa.
As we look forward, our thrust as Unilever Nigeria is to
amplify the potential of our employees and continue to
embed all our people related processes to achieve
sustainable business growth in 2019.
Safety, Health and Environmental Care (SHE) Policy
Unilever as a company has always placed esteem value on
the Safety, Health and Environment of our employees,
contractors, third party service providers and other
stakeholders. We continue to provide visible and inspiring
safety leadership to protect and enhance wellbeing of our
employees, contractors, visitors and third-party service
providers. Our Employees are safety conscious in all that
they do and have both individual and collective
responsibility in ensuring that their working environment
is safe at all times. This is achieved by ensuring weekly
behavioral safety audits (BSA) and monthly planned safety
inspections as the major drivers on all our sites and
regions.
In Unilever, we do all that is reasonably practicable to
prevent personal injury, we provide and maintain a healthy
and safe environment in all our operations. In the bid to
maintain the high level of safety awareness and educate
staff on occupational health issues, safety talks tagged
“Value Life Value Safety” are held across the sites/ offices
on a weekly basis across the business to continually
promote a culture of safety awareness. We conduct
monthly educational campaigns on topics relevant to
workplace, travel and home safety. We also engage with
regulatory agencies like the FRSC, Federal Fire Service to
collaborate with us in educating our employees and
contractors. In this way, we will continuously manage
occupational safety risk towards achieving our vision of
zero incident.
As part of the Company’s drive to promote healthy lifestyle
for employees, the Company provides 24-hour medical
services in clinic both at Agbara and Oregun, some of these
programs includes preventive Medicine through
Lamplighter where employees are encouraged to carry out
comprehensive health checks. Promotion of mental and
general wellbeing of our employees remain our top
priority.
The Company also provides canteens that serve nutritious
meals at subsidized rates for all workers in our
manufacturing sites. Special diets are also provided for
employees who may need such based on medical advice.
Additionally, there are long standing initiatives including
quarterly aerobic sessions and the free access to onsite
gymnasium by our employees.
We drive a community partnership with other
manufacturing colleagues to create a platform for
collaborative emergency preparedness and response. We
continue to aggressively implement waste reduction,
recycle and re-use, energy reduction, water consumption
reduction and rigorous “Zero Non-Hazardous Waste to
Landfill” initiatives in order to reduce our environmental
footprints and live up to our Unilever Sustainable Living
Plan.
Quality Policy
At Unilever we understand that the consumer is at the
heart of what we do every day. Our consumers expect a
great experience every time they use our products and
trust us to deliver it. Great quality is at the core of this trust.
Our business is built on our quality promise - it keeps our
consumers safe, builds stronger brands and is key to our
consumers.
37


Report of the Directors (continued)
We realize that one of the key factors that help consumers
make their choice is Quality. Product quality has always
been part of our brand promise and in a more demanding,
competitive and digitalized world we are poised to ensure
our brand reputation remains infallible. We aim at
delivering right first time all the time across our value
chain and have systems in place to ensure our product
development through to manufacturing and even
customers and suppliers all understand and know the role
they play in making this happen.
In meeting Quality objectives, we continue to continue to
work and engage closely with regulators to ensure
consistent compliance to local and global statutory
requirements. Our focus continues to be helping people
look good feel good and get more out of life.
Sustainability Report:
“Giving consumers reasons to feel good, look good and get
more out of life – Unilever Sustainable Living Plan”
Our strategy for sustainable business
Over 100 years ago, in 1885, our – William Lever – started
his own business making Sunlight soap. He was a social
entrepreneur who could see how selling low-cost branded
soap at a time when cholera and dysentery in Britain’s
Victorian slums were widespread could improve people’s
lives and grow his business. He brought hygiene to millions
of people who didn’t know about the existence of germs or
why hygiene was important, and he did it by setting an
inspiring purpose for his company: to make cleanliness
commonplace. He also used advertising to make
cleanliness the new social norm.
Today Unilever is a global company, with sales in nearly
every country in the world. We make many of the world’s
favourite brands and, every day, 2.5 billion people use
Unilever products to feel good, look good and get more out
of life. And we have kept faith with our purpose.
Across the world we face new and bigger challenges:
- nearly 800 million people are without access to safe
drinking water and over 2 billion without access to
proper sanitation
- more than 2 million children die each year from
preventable diarrhea disease
- 1 in 10 adults is obese while almost 1 billion go hungry
- climate change is causing extreme weather
condition and changes to the seasons
- over a billion people live in water-scarce areas
- demand for food is increasing to feed a growing
population.
At Unilever, we believe that we cannot wait for others to
solve these problems. Businesses and brands must be part
of the solution. But to do so, businesses will have to adopt a
different model of engagement to achieve a different set of
results as there is no room for ‘business as usual’ anymore.
Sustainable and equitable growth is the only acceptable
business model. So, in 2010, we launched the Unilever
Sustainable Living Plan, which is the blueprint for how we
conduct our business sustainably. In this model, we aim to
decouple our growth from our environmental impact while
increasing our positive social impact, driving profitable
growth for our brands, saving costs and fuelling innovation.
Our strategic vision is “to make sustainable living
commonplace” by doubling the size of our business while
reducing our environmental footprint and increasing our
positive social impact. To achieve this vision, we will:
• Help people take action to improve their health and
well-being.
• Enhance livelihoods.
• Decouple growth from the environmental footprint of
our products.
39
Report of the Directors (continued)
2018 in Review
Improved Health And Well-Being
Our brands are positioned to help Nigerians take the
actions they need to stay healthy and improve their
wellbeing. Our brands have strong programs which help to
address some of the specific challenges we face in the
country. In 2017, we had two key areas of intervention:
1. Knorr ‘Follow In My Green Food Steps’ Program
In Nigeria, almost one in two (49%) women of reproductive
age suffer from anaemia. 50% of these cases are caused by
a lack of iron in the body which is often diet-related; and
this condition, in severe cases, can cause tiredness and
dizziness.
As part of Unilever’s commitment, the Knorr ‘Follow In My
Green Food Steps’ program was launched in 2015 by Knorr
to help families access more iron from their diets. Unilever
has fortified its bouillon cubes with iron and iodine and
instituted a behaviour change program that teaches young
girls and their mums to get more iron out of everyday family
meals by adding commonly available green leafy
vegetables.
At the end of 2018, the ‘Follow In My Green Food Steps’
program had reached 320,000 mothers and daughters
through four-week behavioural change activations.
Through school and community events in rural areas
where the incidence of anaemia is prevalent, we educate
adolescent girls and their mothers on the importance of
cooking more nutritious meals through these steps. We
have since reached 320,000 mothers and young girls
directly in Ogun, Imo, Osun, Nasarawa, Benue, Kaduna,
Abuja and Kogi states and an additional 20 million indirectly
via our digital and social channels.
An impact evaluation report of the program, conducted by
the University of Ibadan, showed that 41% of program
participants had started adding leafy vegetables to their
stew at the end of the of the four-week program.
2. Pepsodent ‘Brush Day and Night’ Schools Program
We aim to tackle the widespread menace of poor oral
hygiene and tooth decay which affects children and adults
alike. In 2012, we launched the Pepsodent ‘Brush Day and
Night’ oral health campaign in 2012, to improve oral health
habits amongst Nigerian children.
Together with partners and relevant stakeholders in the
health sector, we bring a 21-day behavioral change
programme to primary schools to educate and motivate
kids to adopt good oral hygiene habits. By educating the
children on the essence of brushing day and night, we
encourage them to stay healthy, happy and lead a more
enjoyable and fulfilled life.
After eight years, the Oral Health Schools Programme has
directly reached over 5 million Nigerian children in
government primary schools across the country with our
message, our products, free educational materials and
behaviour change ambassadors.
Enhancing Livelihoods
Creating Women ‘Microprenuers’ at the Base of the
Pyramid
Global and local economic challenges, unemployment and
poverty have impacted the spending power of families
around the world. Reduced disposable incomes mean that
families must prioritize necessities and cannot invest in
health, wellbeing, and the basic requirements for a good
quality of life. The impact of this is particularly hard on
vulnerable groups such as women and children.
The ‘Shakti’ (Mbuli, Gbemiga, Tallapi) project is an initiative
that creates an opportunity for women to increase their
earnings and improve the quality of their lives. Gbemiga
registers, trains and provides women in rural communities
with capital to begin trading Unilever products to
households and small stores within their communities.
40


Report of the Directors (continued)
households and small stores within their communities.
Since its pilot in 2015 in Oyo, Ogun, Imo and Enugu State,
the project has expanded to even more states across the
country. At the end of 2018, we had empowered over 6000
women as micro-entrepreneurs. In addition, these women
have undertaken training in basic bookkeeping and
marketing and workshops on nutrition and hygiene
communication.
Protecting the Environment in which we Operate
Partnerships to Recycle Plastic Waste
From 2016, when we instituted a “zero waste to landfill”
agenda across all the company’s sites, we have since
awarded a grant to WeCyclers (which manages the
collection and recycling of plastic waste) to extend its waste
recovery program to more communities in Lagos and Ogun
State. This partnership will collect and recycle 6000 tons of
waste plastic from the environment over three years and
provide jobs and livelihoods to hundreds of participants in
the initiative.
We have also joined the Food & Beverage Recycling
Alliance of Nigeria to create synergies with other players
within our industry to jointly reduce the impact of our
plastic footprint on the environment.
These are in line with the company’s commitment to
continue to conserve the environment, as well as create
more job opportunities and promote entrepreneurship
amongst young Nigerians.
Future Outlook for 2019
The business case for growing a company sustainably is
compelling. Consumers expect it and retailers increasingly
demand it from their suppliers. It drives innovation and
market development. It saves money and avoids costs.
Also, it inspires the people who work for our business. This
is not just about doing good, it is also about doing well.
Even as our sustainability activities improve the lives and
wellbeing of those we serve; it is also an investment in the
growth and resilience of our business. These investments
ensure that we:
Achieve more growth
Sustainability is supporting growth by deepening brand
equity, driving sales and inspiring innovation. By the end of
2017, our sustainable living brands grew even faster than
they did in 2014, delivered 70% of our growth globally, and
grew 46% faster than the rest of the business.
Lower our costs
By cutting waste and reducing the use of energy, raw
materials and natural resources, we create efficiencies
and lower costs. Cost avoidance ultimately helps to
improve our margins.
Hedge our risks
Sustainable ways of doing business help us mitigate risk
across our operations. Operating sustainably helps us to
future proof our supply chain against the risks associated
with climate change and long-term sourcing of raw
materials.
Build more trust
Placing sustainability at the heart of our business model
strengthens our relationships with stakeholders and helps
us succeed as a business. It helps us maintain our value
and relevance to consumers while inspiring Unilever’s
current and future employees and this is why Unilever is
named number one graduate employer in 44 countries.
Secondary school scholarships
Donation of products to schools,
charity homes, corporate
Organizations etc
Corporate Social Responsibility
10,800
43,456Total
2018
N'000
2017
N'000
32,656
12,500
6,176
18,676
42
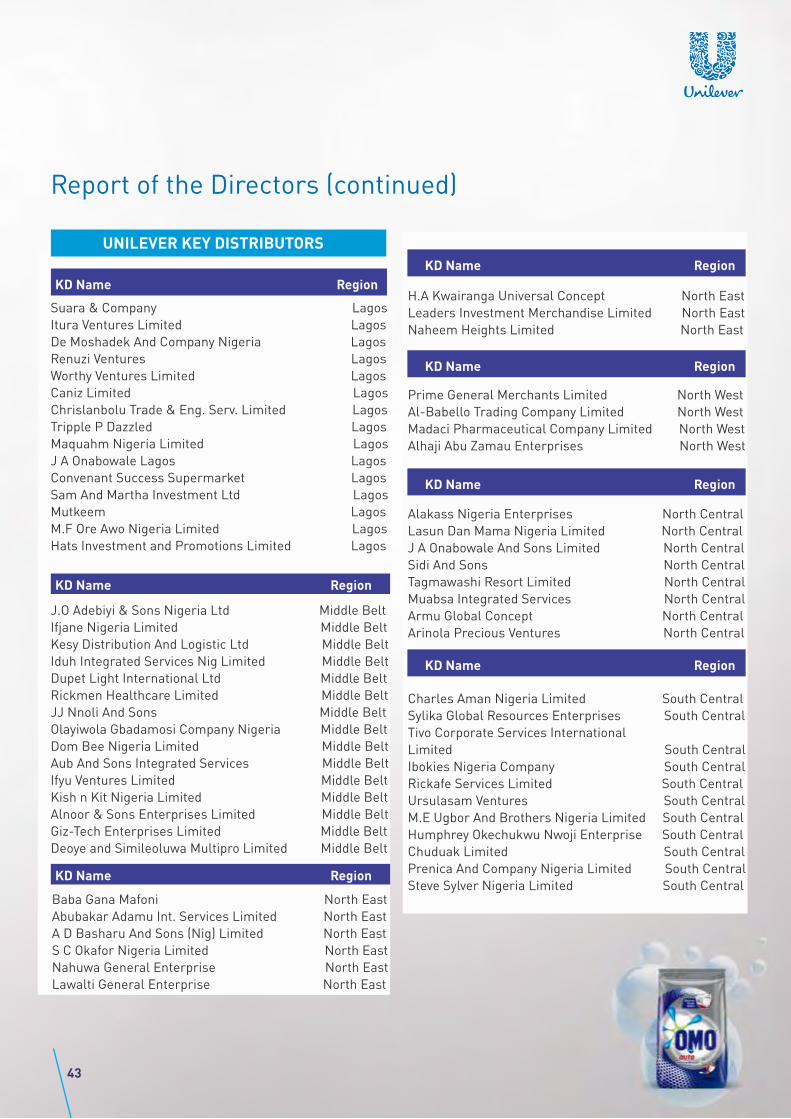
Report of the Directors (continued)
Suara & Company Lagos
Itura Ventures Limited Lagos
De Moshadek And Company Nigeria Lagos
Renuzi Ventures Lagos
Worthy Ventures Limited Lagos
Caniz Limited Lagos
Chrislanbolu Trade & Eng. Serv. Limited Lagos
Tripple P Dazzled Lagos
Maquahm Nigeria Limited Lagos
J A Onabowale Lagos Lagos
Convenant Success Supermarket Lagos
Sam And Martha Investment Ltd Lagos
Mutkeem Lagos
M.F Ore Awo Nigeria Limited Lagos
Hats Investment and Promotions Limited Lagos
Baba Gana Mafoni North East
Abubakar Adamu Int. Services Limited North East
A D Basharu And Sons (Nig) Limited North East
S C Okafor Nigeria Limited North East
Nahuwa General Enterprise North East
Lawalti General Enterprise North East
KD Name Region
KD Name Region
UNILEVER KEY DISTRIBUTORS
KD Name Region
J.O Adebiyi & Sons Nigeria Ltd Middle Belt
Ifjane Nigeria Limited Middle Belt
Kesy Distribution And Logistic Ltd Middle Belt
Iduh Integrated Services Nig Limited Middle Belt
Dupet Light International Ltd Middle Belt
Rickmen Healthcare Limited Middle Belt
JJ Nnoli And Sons Middle Belt
Olayiwola Gbadamosi Company Nigeria Middle Belt
Dom Bee Nigeria Limited Middle Belt
Aub And Sons Integrated Services Middle Belt
Ifyu Ventures Limited Middle Belt
Kish n Kit Nigeria Limited Middle Belt
Alnoor & Sons Enterprises Limited Middle Belt
Giz-Tech Enterprises Limited Middle Belt
Deoye and Simileoluwa Multipro Limited Middle Belt
KD Name Region
H.A Kwairanga Universal Concept North East
Leaders Investment Merchandise Limited North East
Naheem Heights Limited North East
Prime General Merchants Limited North West
Al-Babello Trading Company Limited North West
Madaci Pharmaceutical Company Limited North West
Alhaji Abu Zamau Enterprises North West
KD Name Region
KD Name Region
Alakass Nigeria Enterprises North Central
Lasun Dan Mama Nigeria Limited North Central
J A Onabowale And Sons Limited North Central
Sidi And Sons North Central
Tagmawashi Resort Limited North Central
Muabsa Integrated Services North Central
Armu Global Concept North Central
Arinola Precious Ventures North Central
KD Name Region
Charles Aman Nigeria Limited South Central
Sylika Global Resources Enterprises South Central
Tivo Corporate Services International
Limited South Central
Ibokies Nigeria Company South Central
Rickafe Services Limited South Central
Ursulasam Ventures South Central
M.E Ugbor And Brothers Nigeria Limited South Central
Humphrey Okechukwu Nwoji Enterprise South Central
Chuduak Limited South Central
Prenica And Company Nigeria Limited South Central
Steve Sylver Nigeria Limited South Central
43
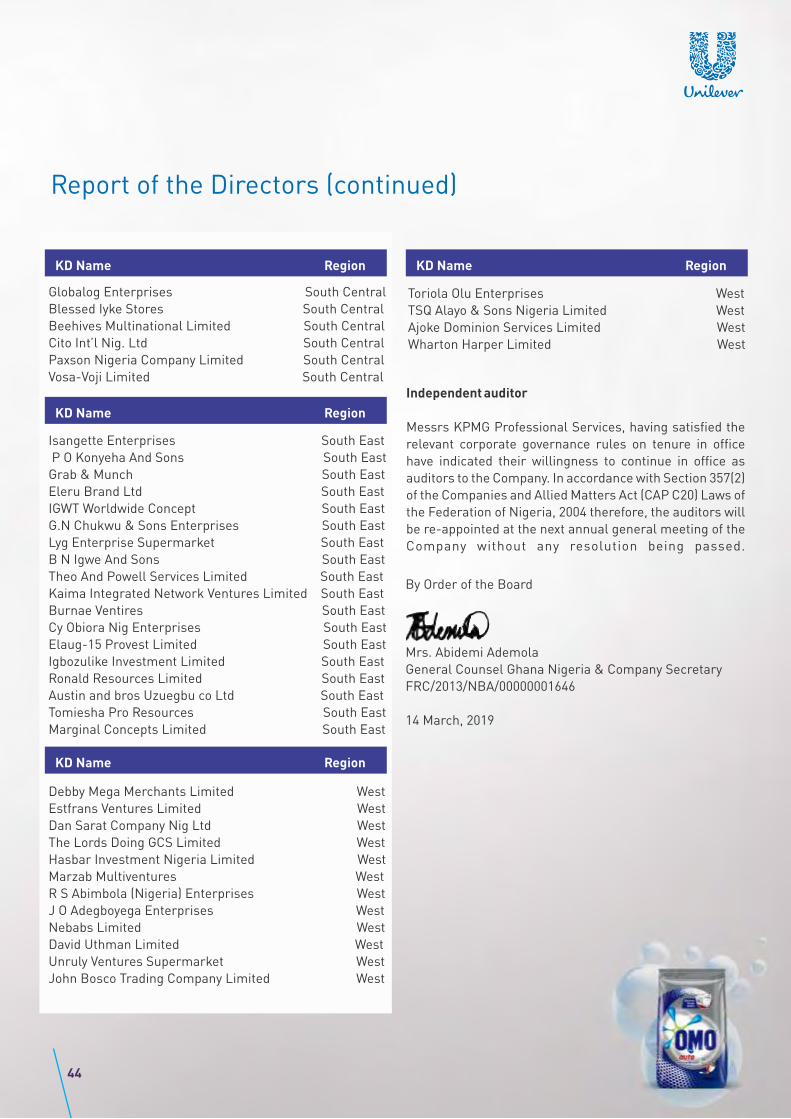
Report of the Directors (continued)
KD Name Region
Independent auditor
Messrs KPMG Professional Services, having satisfied the
relevant corporate governance rules on tenure in office
have indicated their willingness to continue in office as
auditors to the Company. In accordance with Section 357(2)
of the Companies and Allied Matters Act (CAP C20) Laws of
the Federation of Nigeria, 2004 therefore, the auditors will
be re-appointed at the next annual general meeting of the
Company without any resolution being passed.
By Order of the Board
Mrs. Abidemi Ademola
General Counsel Ghana Nigeria & Company Secretary
FRC/2013/NBA/00000001646
14 March, 2019
Globalog Enterprises South Central
Blessed Iyke Stores South Central
Beehives Multinational Limited South Central
Cito Int’l Nig. Ltd South Central
Paxson Nigeria Company Limited South Central
Vosa-Voji Limited South Central
KD Name Region
Isangette Enterprises South East
P O Konyeha And Sons South East
Grab & Munch South East
Eleru Brand Ltd South East
IGWT Worldwide Concept South East
G.N Chukwu & Sons Enterprises South East
Lyg Enterprise Supermarket South East
B N Igwe And Sons South East
Theo And Powell Services Limited South East
Kaima Integrated Network Ventures Limited South East
Burnae Ventires South East
Cy Obiora Nig Enterprises South East
Elaug-15 Provest Limited South East
Igbozulike Investment Limited South East
Ronald Resources Limited South East
Austin and bros Uzuegbu co Ltd South East
Tomiesha Pro Resources South East
Marginal Concepts Limited South East
KD Name Region
Debby Mega Merchants Limited West
Estfrans Ventures Limited West
Dan Sarat Company Nig Ltd West
The Lords Doing GCS Limited West
Hasbar Investment Nigeria Limited West
Marzab Multiventures West
R S Abimbola (Nigeria) Enterprises West
J O Adegboyega Enterprises West
Nebabs Limited West
David Uthman Limited West
Unruly Ventures Supermarket West
John Bosco Trading Company Limited West
Toriola Olu Enterprises West
TSQ Alayo & Sons Nigeria Limited West
Ajoke Dominion Services Limited West
Wharton Harper Limited West
KD Name Region
44

Adesola Sotande-Peters
Finance Director
FRC/2015/ICAN/00000010834
His Majesty N. A. Achebe CFR, mni
Chairman
FRC/2013/NIM/00000001568
Yaw Nsarkoh
Managing Director
FRC/2014/IODN/00000007035
14 March, 2019
SIGNED ON BEHALF OF THE BOARD OF
DIRECTORS BY:
Statement of Directors' responsibilities for the year ended 31 December 2018
The directors accept responsibility for the preparation of
the annual financial statements that give a true and fair
view in accordance with the International Financial
Reporting Standards and in the manner required by the
Companies and Allied Matters Act (Cap C.20) Laws of the
Federation on Nigeria, 2004 and the Financial Reporting
Council of Nigeria Act, 2011.
The directors further accept responsibility for maintaining
adequate accounting records as required by the Companies
and Allied Matters Act (Cap C.20) Laws of the Federation on
Nigeria, 2004 and for such internal control as the directors
determine is necessary to enable the preparation of
financial statements that are free from material
misstatement whether due to fraud or error.
The directors have made an assessment of the Company’s
ability to continue as a going concern and have no reason to
believe the Company will not remain a going concern in the
year ahead.
45
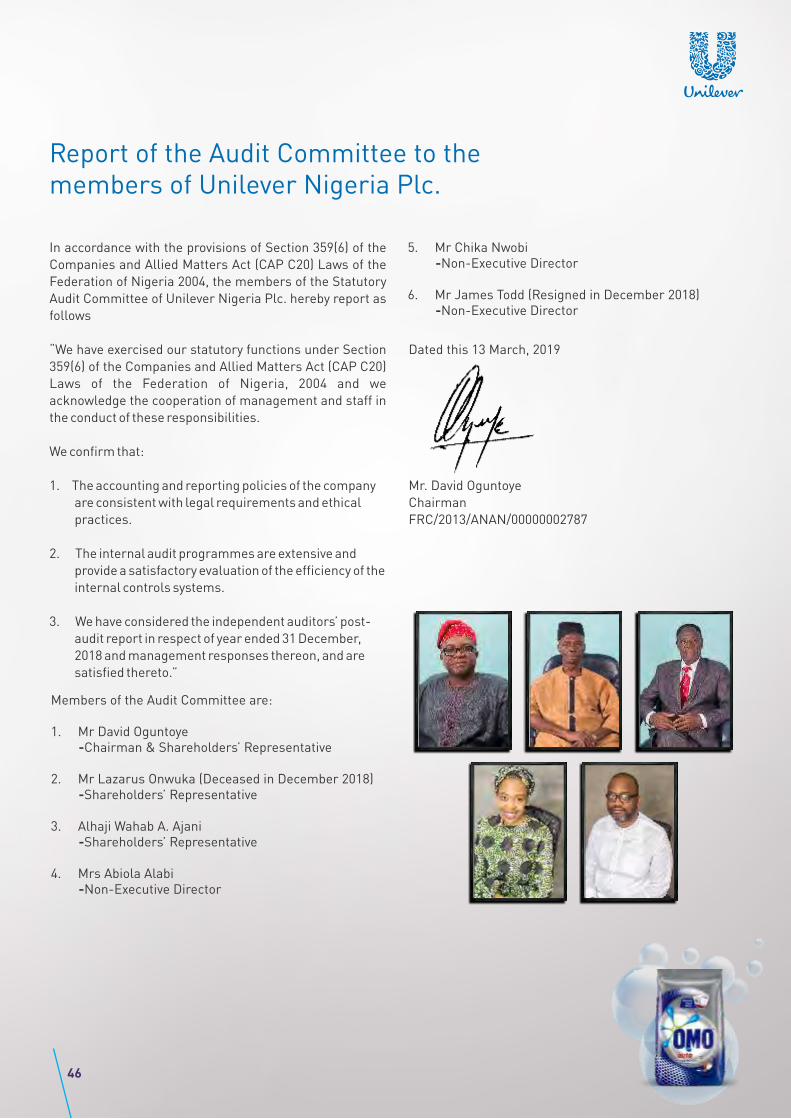
Report of the Audit Committee to the members of Unilever Nigeria Plc.
In accordance with the provisions of Section 359(6) of the
Companies and Allied Matters Act (CAP C20) Laws of the
Federation of Nigeria 2004, the members of the Statutory
Audit Committee of Unilever Nigeria Plc. hereby report as
follows
“We have exercised our statutory functions under Section
359(6) of the Companies and Allied Matters Act (CAP C20)
Laws of the Federation of Nigeria, 2004 and we
acknowledge the cooperation of management and staff in
the conduct of these responsibilities.
We confirm that:
1. The accounting and reporting policies of the company
are consistent with legal requirements and ethical
practices.
2. The internal audit programmes are extensive and
provide a satisfactory evaluation of the efficiency of the
internal controls systems.
3. We have considered the independent auditors’ post-
audit report in respect of year ended 31 December,
2018 and management responses thereon, and are
satisfied thereto.”
5. Mr Chika Nwobi -Non-Executive Director
6. Mr James Todd (Resigned in December 2018) -Non-Executive Director
Dated this 13 March, 2019
Mr. David Oguntoye
Chairman
FRC/2013/ANAN/00000002787
46
Members of the Audit Committee are: 1. Mr David Oguntoye -Chairman & Shareholders’ Representative
2. Mr Lazarus Onwuka (Deceased in December 2018) -Shareholders’ Representative
3. Alhaji Wahab A. Ajani -Shareholders’ Representative
4. Mrs Abiola Alabi -Non-Executive Director


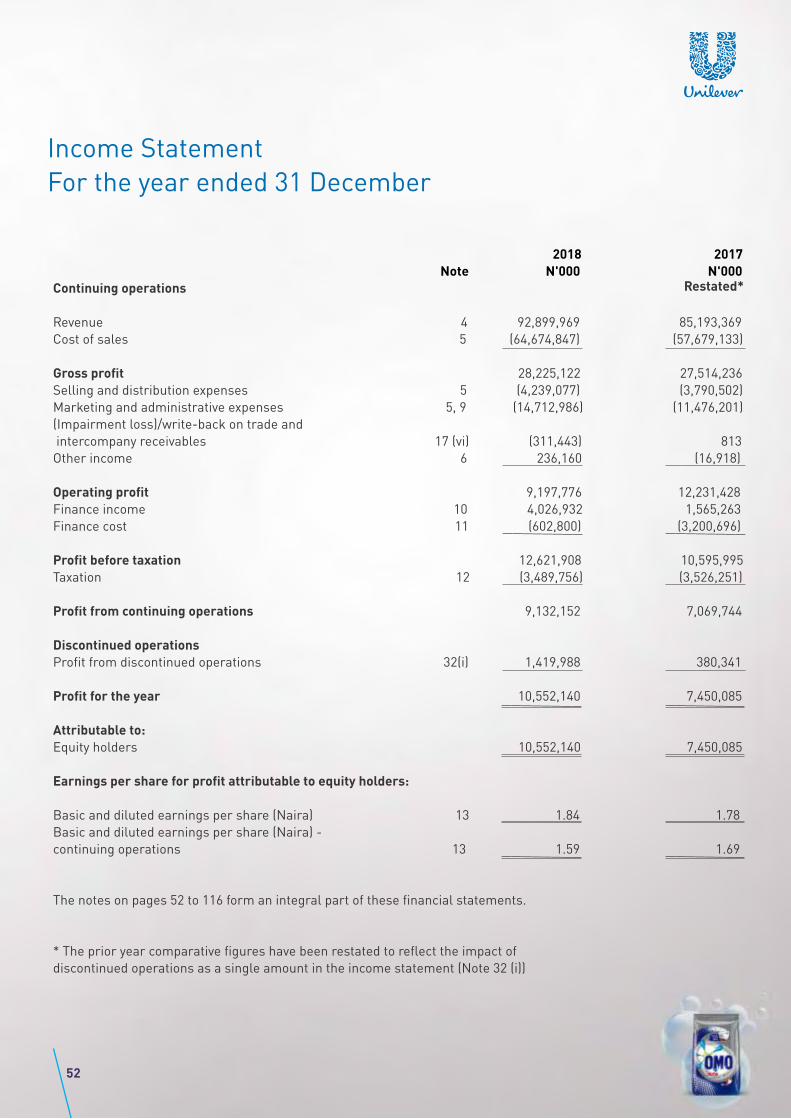
Income Statement
For the year ended 31 December
2018 2017
Note N'000 N'000
Continuing operations
Revenue 4 92,899,969 85,193,369
Cost of sales 5 (64,674,847) (57,679,133)
Gross profit 28,225,122 27,514,236
Selling and distribution expenses 5 (4,239,077) (3,790,502)
Marketing and administrative expenses 5, 9 (14,712,986) (11,476,201)
(Impairment loss)/write-back on trade and
intercompany receivables 17 (vi) (311,443) 813
Other income 6 236,160 (16,918)
Operating profit 9,197,776 12,231,428
Finance income 10 4,026,932 1,565,263
Finance cost 11 (602,800) (3,200,696)
Profit before taxation 12,621,908 10,595,995
Taxation 12 (3,489,756) (3,526,251)
Profit from continuing operations 9,132,152 7,069,744
Discontinued operations
Profit from discontinued operations 32(i) 1,419,988 380,341
Profit for the year 10,552,140 7,450,085
Attributable to:
Equity holders 10,552,140 7,450,085
Earnings per share for profit attributable to equity holders:
Basic and diluted earnings per share (Naira) 13 1.84 1.78
Basic and diluted earnings per share (Naira) -
continuing operations 13 1.59 1.69
The notes on pages 52 to 116 form an integral part of these financial statements.
* The prior year comparative figures have been restated to reflect the impact of
discontinued operations as a single amount in the income statement (Note 32 (i))
Restated*
52

Statement of Other Comprehensive Income
For the year ended 31 December
Note
2018
N’0002017
N’000
Profit for the year 10,552,140 7,450,085
Other Comprehensive Income
Items that will not be reclassified to the income statement:
Remeasurement of post employment benefit obligations 21(vi) 176,865 (1,000,252)
Tax effect 12 (56,597) 320,081
Total comprehensive income 10,672,408 6,769,914
Attributable to:
Equity holders 10,672,408 6,769,914
The notes on pages 52 to 116 form an integral part of these financial statements.
53
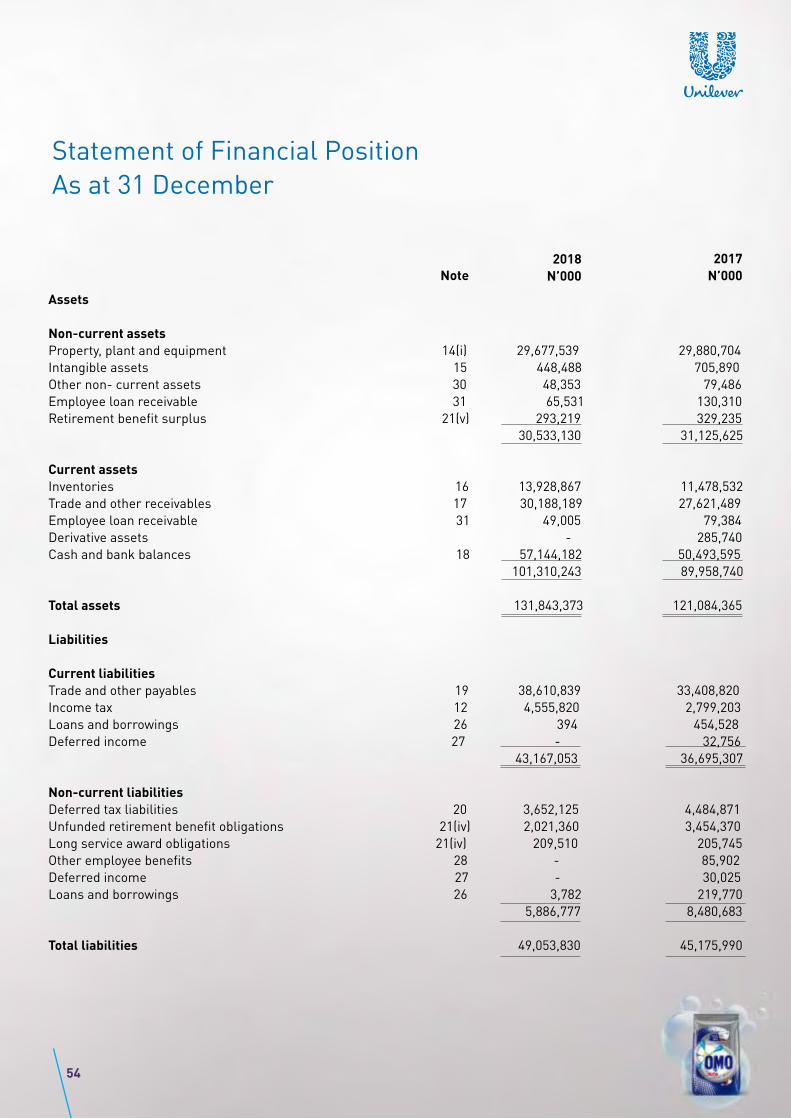
Statement of Financial Position
As at 31 December
2018
N’000
2017
N’000Note
Assets
Non-current assets
Property, plant and equipment 14(i) 29,677,539 29,880,704
Intangible assets 15 448,488 705,890
Other non- current assets 30 48,353 79,486
Employee loan receivable 31 65,531 130,310
Retirement benefit surplus 21(v) 293,219 329,235
30,533,130 31,125,625
Current assets
Inventories 16 13,928,867 11,478,532
Trade and other receivables 17 30,188,189 27,621,489
Employee loan receivable 31 49,005 79,384
Derivative assets - 285,740
Cash and bank balances 18 57,144,182 50,493,595
101,310,243 89,958,740
Total assets 131,843,373 121,084,365
Liabilities
Current liabilities
Trade and other payables 19 38,610,839 33,408,820
Income tax 12 4,555,820 2,799,203
Loans and borrowings 26 394 454,528
Deferred income 27 - 32,756
43,167,053 36,695,307
Non-current liabilities
Deferred tax liabilities 20 3,652,125 4,484,871
Unfunded retirement benefit obligations 21(iv) 2,021,360 3,454,370
Long service award obligations 21(iv) 209,510 205,745
Other employee benefits 28 - 85,902
Deferred income 27 - 30,025
Loans and borrowings 26 3,782 219,770
5,886,777 8,480,683
Total liabilities 49,053,830 45,175,990
54

Statement of Financial Position (continued)
As at 31 December
The notes on pages 58 to 116 form an integral part of these financial statements.
His Majesty N. A. Achebe CFR, MNI Yaw Nsarkoh Adesola Sotande-Peters
Chairman Managing Director Finance Director
FRC/2013/NIM/00000001568 FRC/2014/IODN/00000007035 FRC/2015/ICAN/00000010834
Equity
Ordinary share capital 29 2,872,503 2,872,503
Share premium 29 56,812,810 56,812,810
Retained earnings 23,104,230 16,223,062
Total equity 82,789,543 75,908,375
Total equity and liabilities 131,843,373 121,084,365
The financial statements on pages 52 to 118 were approved for issue by the Board of Directors on 15 March 2019 and
signed on its behalf by:
2018
N’000
2017
N’000Note
55
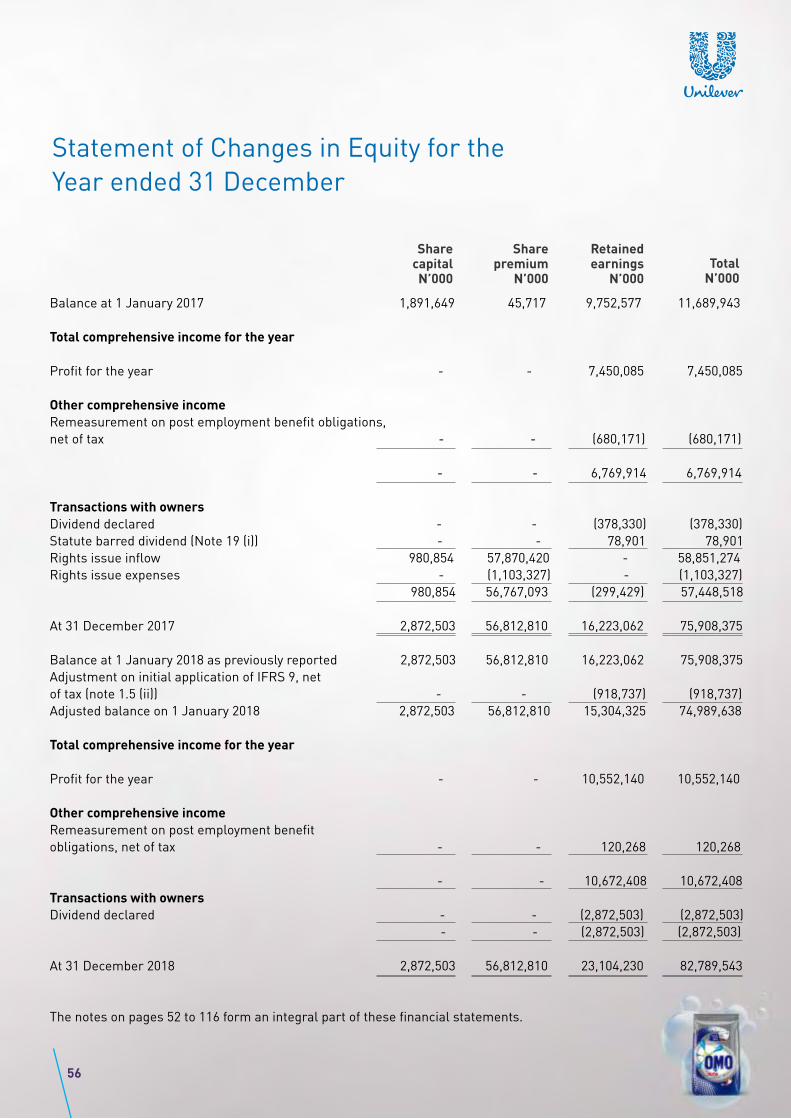
TotalN’000
Retainedearnings
N’000
Share premium
N’000
Share capitalN’000
Statement of Changes in Equity for the
Year ended 31 December
Balance at 1 January 2017 1,891,649 45,717 9,752,577 11,689,943
Total comprehensive income for the year
Profit for the year - - 7,450,085 7,450,085
Other comprehensive income
Remeasurement on post employment benefit obligations,
net of tax - - (680,171) (680,171)
- - 6,769,914 6,769,914
Transactions with owners
Dividend declared - - (378,330) (378,330)
Statute barred dividend (Note 19 (i)) - - 78,901 78,901
Rights issue inflow 980,854 57,870,420 - 58,851,274
Rights issue expenses - (1,103,327) - (1,103,327)
980,854 56,767,093 (299,429) 57,448,518
At 31 December 2017 2,872,503 56,812,810 16,223,062 75,908,375
Balance at 1 January 2018 as previously reported 2,872,503 56,812,810 16,223,062 75,908,375
Adjustment on initial application of IFRS 9, net
of tax (note 1.5 (ii)) - - (918,737) (918,737)
Adjusted balance on 1 January 2018 2,872,503 56,812,810 15,304,325 74,989,638
Total comprehensive income for the year
Profit for the year - - 10,552,140 10,552,140
Other comprehensive income
Remeasurement on post employment benefit
obligations, net of tax - - 120,268 120,268
- - 10,672,408 10,672,408
Transactions with owners
Dividend declared - - (2,872,503) (2,872,503)
- - (2,872,503) (2,872,503)
At 31 December 2018 2,872,503 56,812,810 23,104,230 82,789,543
The notes on pages 52 to 116 form an integral part of these financial statements.
56
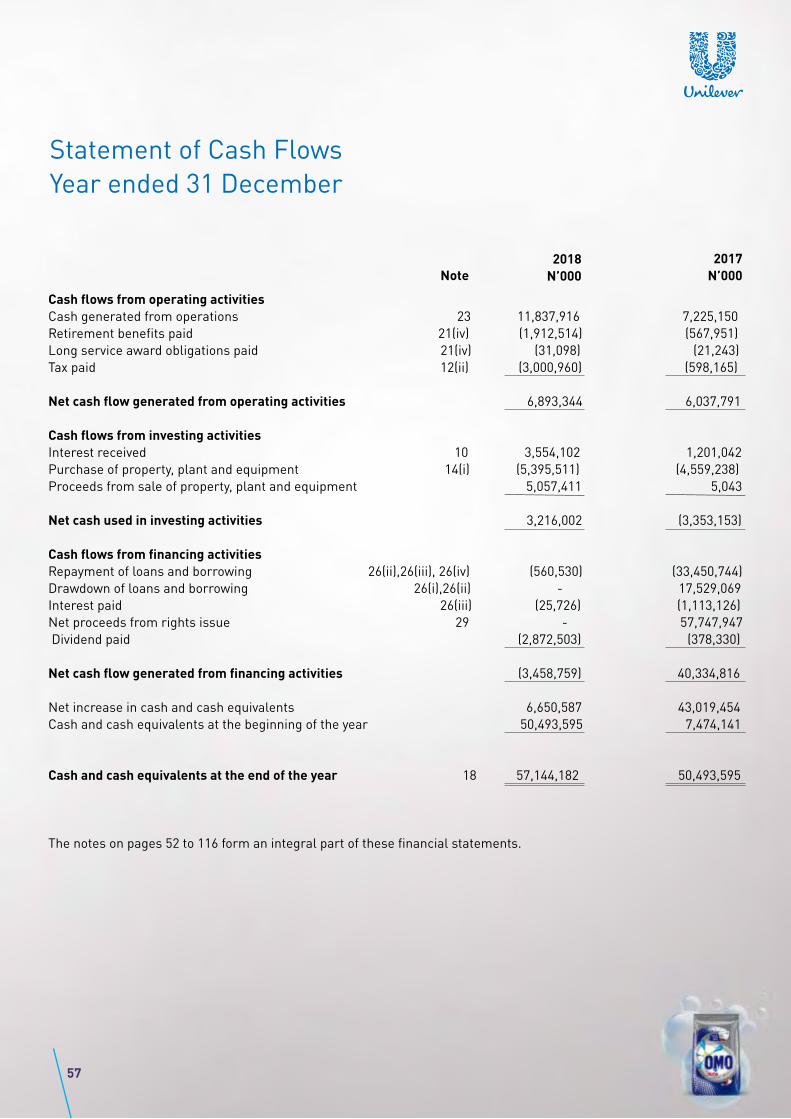
Statement of Cash Flows
Year ended 31 December
2018
N’000
2017
N’000Note
Cash flows from operating activities
Cash generated from operations 23 11,837,916 7,225,150
Retirement benefits paid 21(iv) (1,912,514) (567,951)
Long service award obligations paid 21(iv) (31,098) (21,243)
Tax paid 12(ii) (3,000,960) (598,165)
Net cash flow generated from operating activities 6,893,344 6,037,791
Cash flows from investing activities
Interest received 10 3,554,102 1,201,042
Purchase of property, plant and equipment 14(i) (5,395,511) (4,559,238)
Proceeds from sale of property, plant and equipment 5,057,411 5,043
Net cash used in investing activities 3,216,002 (3,353,153)
Cash flows from financing activities
Repayment of loans and borrowing 26(ii),26(iii), 26(iv) (560,530) (33,450,744)
Drawdown of loans and borrowing 26(i),26(ii) - 17,529,069
Interest paid 26(iii) (25,726) (1,113,126)
Net proceeds from rights issue 29 - 57,747,947
Dividend paid (2,872,503) (378,330)
Net cash flow generated from financing activities (3,458,759) 40,334,816
Net increase in cash and cash equivalents 6,650,587 43,019,454
Cash and cash equivalents at the beginning of the year 50,493,595 7,474,141
Cash and cash equivalents at the end of the year 18 57,144,182 50,493,595
The notes on pages 52 to 116 form an integral part of these financial statements.
57

1.
1.1
Notes to the financial statements
Summary of significant accounting policies
Basis of preparation
The financial statements of Unilever Nigeria Plc ("Unilever" or "the Company") have been prepared in accordance
with International Financial Reporting Standards (IFRS) as issued by the International Accounting Standards
Board. The financial statements have been prepared under the historical cost basis, except for the following items
which are measured on an alternative basis on each reporting date:
Items Measurement basis
Derivative financial instruments - Fair value
Inventories - Lower of cost and net realisable value
Liabilities for cash settled share based payment - Fair value
Non-derivative financial instruments - Initially at fair value and subsequently at
amortised cost using effective interest rate
Defined benefit obligation - Present value of the obligation
Plan asset of defined benefit obligation - Fair value
Functional and Presentation currency
The financial statements are presented in Nigerian Naira, which is the Company's functional and presentation
currency, rounded to the nearest thousand (N'000) unless otherwise indicated.
Going concern
Nothing has come to the attention of the directors to indicate that Unilever will not remain a going concern for at
least twelve months from the date of approval of these financial statements.
Standards issued but not yet effective
A number of standards are effective for annual periods beginning after 1 January 2019 and earlier application is
permitted; however, the Company has not early adopted the new or amended standards in preparing the
Company's financial statements.Of those standards that are not yet effective, IFRS 16 is expected to have a
material impact on the Company's financial statements in the period of initial recognition.
IFRS 16: Leases
On 13 January 2016 the IASB issued IFRS 16 Leases, completing the IASB’s project to improve the financial
reporting of leases. IFRS 16 replaces the previous leases standard, IAS 17 Leases, IFRIC 4 Determining whether
an arrangement contains a Lease, SIC-15 - Operating Leases -Incentive and SIC-27 - Evaluating the substance of
transactions involving the legal form of a Lease.
IFRS 16 sets out the principles for the recognition, measurement, presentation and disclosure of leases for both
parties to a contract, i.e. the customer (‘lessee’) and the supplier (‘lessor’). The standard defines a lease as a
contract that conveys to the customer (‘lessee’) the right to use an asset and a lease liability for a period of time in
exchange for consideration.There are recognition exemptions for short term leases and leases of low value
1.2
1.3
1.4
i
58
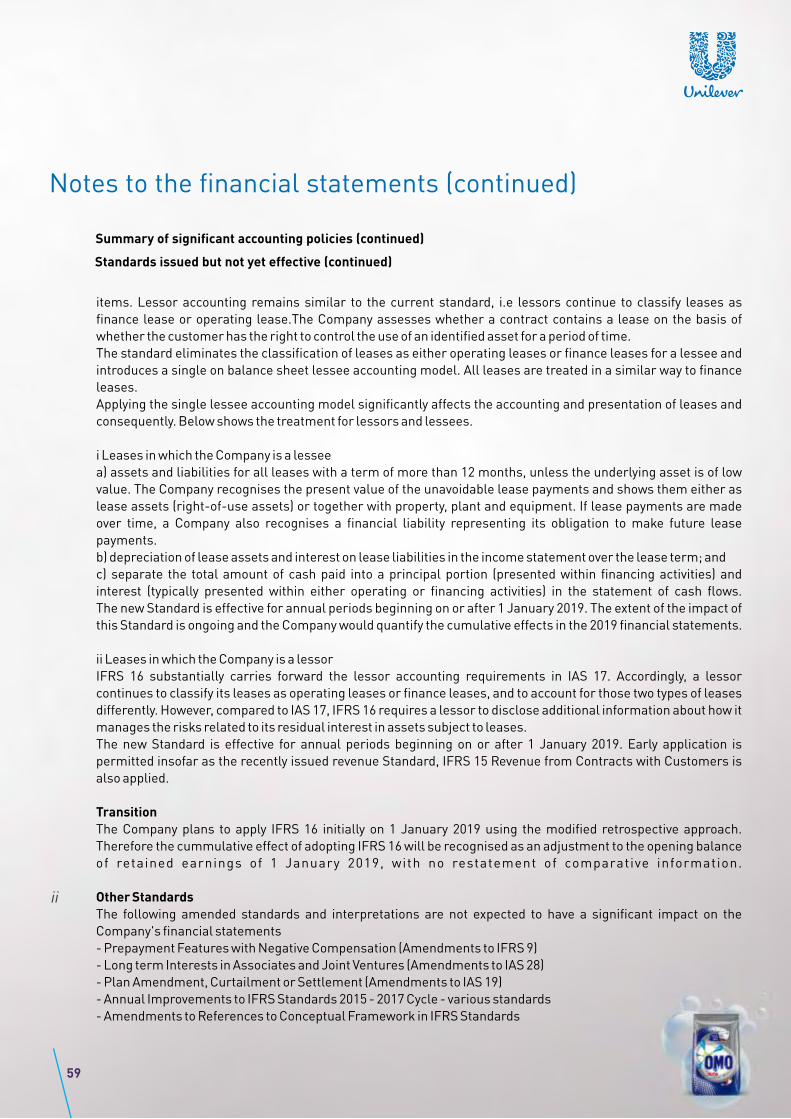
Summary of significant accounting policies (continued)
items. Lessor accounting remains similar to the current standard, i.e lessors continue to classify leases as
finance lease or operating lease.The Company assesses whether a contract contains a lease on the basis of
whether the customer has the right to control the use of an identified asset for a period of time.
The standard eliminates the classification of leases as either operating leases or finance leases for a lessee and
introduces a single on balance sheet lessee accounting model. All leases are treated in a similar way to finance
leases.
Applying the single lessee accounting model significantly affects the accounting and presentation of leases and
consequently. Below shows the treatment for lessors and lessees.
i Leases in which the Company is a lessee
a) assets and liabilities for all leases with a term of more than 12 months, unless the underlying asset is of low
value. The Company recognises the present value of the unavoidable lease payments and shows them either as
lease assets (right-of-use assets) or together with property, plant and equipment. If lease payments are made
over time, a Company also recognises a financial liability representing its obligation to make future lease
payments.
b) depreciation of lease assets and interest on lease liabilities in the income statement over the lease term; and
c) separate the total amount of cash paid into a principal portion (presented within financing activities) and
interest (typically presented within either operating or financing activities) in the statement of cash flows.
The new Standard is effective for annual periods beginning on or after 1 January 2019. The extent of the impact of
this Standard is ongoing and the Company would quantify the cumulative effects in the 2019 financial statements.
ii Leases in which the Company is a lessor
IFRS 16 substantially carries forward the lessor accounting requirements in IAS 17. Accordingly, a lessor
continues to classify its leases as operating leases or finance leases, and to account for those two types of leases
differently. However, compared to IAS 17, IFRS 16 requires a lessor to disclose additional information about how it
manages the risks related to its residual interest in assets subject to leases.
The new Standard is effective for annual periods beginning on or after 1 January 2019. Early application is
permitted insofar as the recently issued revenue Standard, IFRS 15 Revenue from Contracts with Customers is
also applied.
Transition
The Company plans to apply IFRS 16 initially on 1 January 2019 using the modified retrospective approach.
Therefore the cummulative effect of adopting IFRS 16 will be recognised as an adjustment to the opening balance
of retained earnings of 1 January 2019, with no restatement of comparative information.
Other Standards
The following amended standards and interpretations are not expected to have a significant impact on the
Company's financial statements
- Prepayment Features with Negative Compensation (Amendments to IFRS 9)
- Long term Interests in Associates and Joint Ventures (Amendments to IAS 28)
- Plan Amendment, Curtailment or Settlement (Amendments to IAS 19)
- Annual Improvements to IFRS Standards 2015 - 2017 Cycle - various standards
- Amendments to References to Conceptual Framework in IFRS Standards
ii
Notes to the financial statements (continued)
59
Standards issued but not yet effective (continued)
Notes to the financial statements (continued)
- IFRS 17 Insurance Contracts
- IFRIC 23 Uncertainty over Tax treatments
Changes in significant accounting policies
This is the first set of the Company's annual financial statements in which IFRS 15 - Revenue from Contracts with
Customers and IFRS 9 - Financial Instruments have been applied. Changes to significant accounting policies are
described in Note 1.5 The Company has adopted IFRS 15 (see (i) and IFRS 9 (see (ii) with effect from 1 January
2018. A number of other new standards are also effective from 1 January 2018 but they do not have a material
effect on the Company's financial statements
Due to the transition methods chosen by the Company in applying these standards, comparative information
throughout these financial statements have not been restated to reflect the requirements of the new standards,
except for the requirement to separately present impairment loss on trade and intercompany receivables in the
income statement.
The effect of initially applying these standards is mainly attributed to the following:
- deferred recognition of revenue from the sale of goods with a right of return
- an increase in impairment losses recognised on trade and intercompany receivables
IFRS 15: Revenue from Contracts with Customers
IFRS 15 establishes a comprehensive framework for determining whether, how much and when revenue is
recognised. It replaces existing revenue recognition guidance, including IAS 18, Revenue, IAS 11 Construction
Contracts and IFRIC 13 Customer Loyalty Programmes. Under IFRS 15, revenue is recognised when a customer
obtains control of the goods or services. The Company has adopted IFRS 15 using the cummulative effect method,
with the effect of initially applying this standard recognised at the date of initial application (i.e 1 January 2018).
Accordingly, the information presented for 2017 has not been restated, i.e it is presented as previously reported
under IAS 18. Additionally, the disclosure requirements in IFRS 15 have not generally been applied to comparative
information. There is no significant impact as a result of the transition to IFRS 15 on the Company's retained
earnings at 1 Jan 2018.
The following tables summarise the impacts of adopting IFRS 15 on the Company's statement of financial position
as at 31 December 2018 and its income statement and OCI for the year ended for each line of the line items
affected. There was no material impact on the Company's statement of cashflows for the year ended 31
December 2018.
1.5
i
60
Summary of significant accounting policies (continued)
Standards issued but not yet effective (continued)
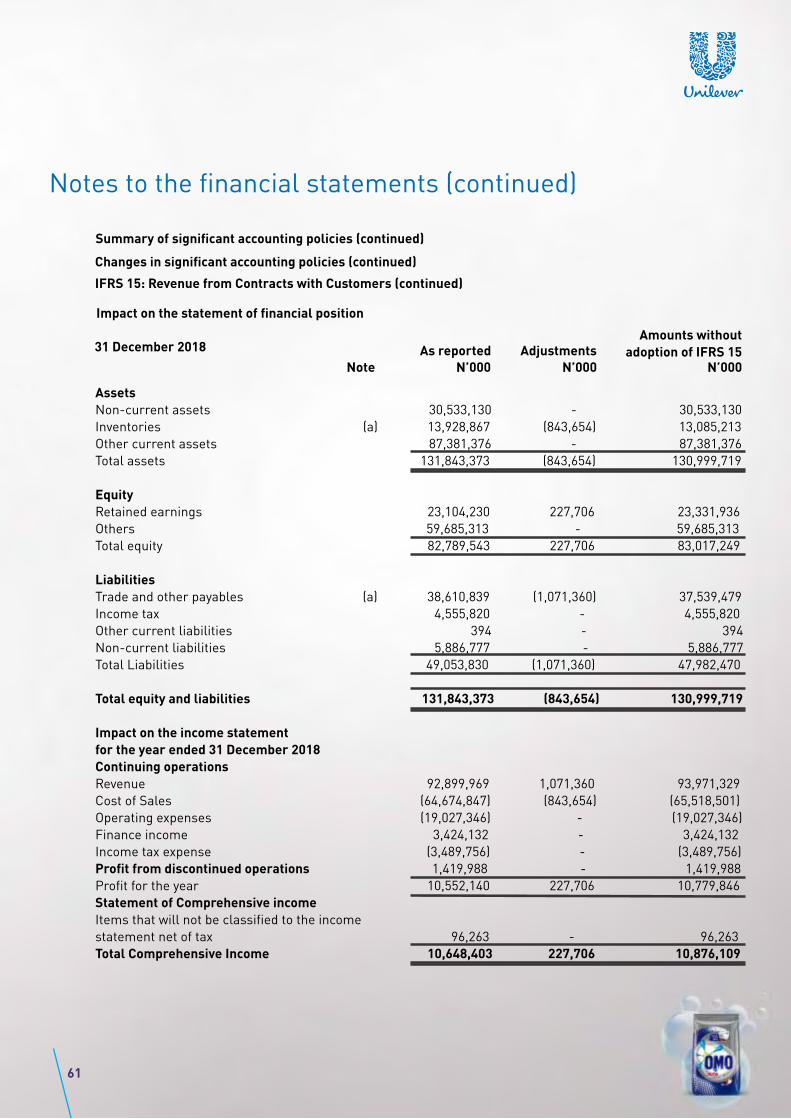
Assets
Non-current assets 30,533,130 - 30,533,130
Inventories (a) 13,928,867 (843,654) 13,085,213
Other current assets 87,381,376 - 87,381,376
Total assets 131,843,373 (843,654) 130,999,719
Equity
Retained earnings 23,104,230 227,706 23,331,936
Others 59,685,313 - 59,685,313
Total equity 82,789,543 227,706 83,017,249
Liabilities
Trade and other payables (a) 38,610,839 (1,071,360) 37,539,479
Income tax 4,555,820 - 4,555,820
Other current liabilities 394 - 394
Non-current liabilities 5,886,777 - 5,886,777
Total Liabilities 49,053,830 (1,071,360) 47,982,470
Total equity and liabilities 131,843,373 (843,654) 130,999,719
Impact on the income statement
for the year ended 31 December 2018
Continuing operations
Revenue 92,899,969 1,071,360 93,971,329
Cost of Sales (64,674,847) (843,654) (65,518,501)
Operating expenses (19,027,346) - (19,027,346)
Finance income 3,424,132 - 3,424,132
Income tax expense (3,489,756) - (3,489,756)
Profit from discontinued operations 1,419,988 - 1,419,988
Profit for the year 10,552,140 227,706 10,779,846
Statement of Comprehensive income
Items that will not be classified to the income
statement net of tax 96,263 - 96,263
Total Comprehensive Income 10,648,403 227,706 10,876,109
Amounts without
adoption of IFRS 15AdjustmentsAs reported
Impact on the statement of financial position
N’000 N’000 N’000Note
61
Notes to the financial statements (continued)
Summary of significant accounting policies (continued)
Changes in significant accounting policies (continued)
31 December 2018
IFRS 15: Revenue from Contracts with Customers (continued)
Under IAS 18, revenue was recognised when risks and rewards of ownership have been transferred to the
customer which is upon delivery of goods to customers. The Company has provisions in its sale agreement that
permits or obligates it to remove out of date products or permits the customer to return goods. Under IFRS 15,
revenue is recognised to the extent that it is highly probable that significant returns from cummulative revenue
recognised will not occur. Management is required to make a reasonable estimate of returns and to the extent to
which the Company is able to make a reasonable estimate of returns, revenue is adjusted for expected returns. In
these circumstances a new asset for the right to receive the returned goods, which is presented as part of
inventory is recognised. Also, a refund liability for the expected returns is recognised and presented as part of
trade payables
IFRS 9: Financial Instruments
In July 2014, the IASB issued the final version of IFRS 9 Financial Instruments which replaces IAS 39 Financial
Instruments: Recognition and Measurement. IFRS 9 sets out requirements for recognising and measuring
financial assets, financial liabilities and some contracts to buy or sell non-financial items. This standard replaces
IAS 39: Financial Instruments Recognition & Measurement
As a result of the adoption of IFRS 9, the Company has adopted consequential amendments to IAS 1 Presentation
of Financial Statements, which require impairment of financial assets to be presented in a separate line item in
the income statement and OCI. Previously, the Company's approach was to include the impairment of trade
receivables in administrative expenses. Consequently, the Company has reclassified impairment writeback
amounting to N0.8 million from administrative expenses to impairment loss on trade receivables in the income
statement and OCI for the year ended 31 December 2017.
Additionally, the Company has adopted consequential amendments of IFRS 7 Financial Instruments. Disclosures
that are applied to disclosures about 2018, but have not been generally applied to comparative information
The following table summarises the impact, net of tax of transition to IFRS 9 on the opening balance of retained
earnings
Retained earnings
Recognition of expected credit loss under IFRS 9 1,351,084
Related tax (Note 20 (432,347)
Impact at 1 January 2018 918,737
ii
(a)
Impact of
adopting IFRS 9 on
opening balance
N'000
62
Notes to the financial statements (continued)
Summary of significant accounting policies (continued)
Changes in significant accounting policies (continued)
IFRS 15: Revenue from Contracts with Customers (continued)
- Recognition and initial measurement
Trade receivables and debt securities issued are initially recognised when they originated. All other financial
assets and financial liabilities are initially recognised when the Company becomes a party to the contractual
provisions of the instrument.A financial asset (unless it is a trade receivable without significant financing
component) or financial liability is initially measured at fair value plus, for an item not at Fair Value through Profit
or Loss (FVTPL), transactions costs that are directly attributable to its acquisition or issue. A trade receivable
without a significant financing component is init ial ly measured at the transaction price.
- Classification and subsequent measurement
IFRS 9 contains three principal classification categories for financial assets: measured at amortised cost, Fair
Value through Other Comprehensive Income (FVOCI) and FVTPL. The classification of IFRS 9 is generally based on
the business model in which a financial asset is managed, and its contractual cash flow characteristics IFRS 9
eliminates the previous IAS 39 categories of held to maturity, loans and receivables and available for sale.
Financial assets are not reclassified subsequent to their initial recognition unless the Company changes its
business model for managing financial assets, in which case all affected financial assets are classified on the first
day of the first reporting period following the change in the business model.
IFRS 9 largely retains the existing requirements in IAS 39 for the classification and measurement of financial
liabilities. The adoption of IFRS 9 has not had a significant effect on the Company's accounting policies related to
financial liabilities. The effect of adopting IFRS 9 on the carrying amounts of financial assets as at 1 January 2018
relates solely to the new impairment requirements. The following table and the accompanying notes below
explain the original measurement categories under IAS 39 and the new measurement categories under IFRS 9 for
each class of the Company's financial assets and financial liabilities as at 1 January 2018.
Financial assets
Trade and other receivables Loans and trade
receivables Amortised cost 27,621,489 26,270,405
Employee loan receivable Loans and trade
receivables Amortised cost 209,694 209,694
Cash and cash equivalents Loans and
receivables Amortised cost 50,493,595 50,493,595
Total financial assets 78,324,778 76,973,694
New carrying
amount under
IFRS 9N'000
Original
carrying
amount under
IAS 39N'000
New
classification
under IFRS 9
Original
classification
under IAS 39Note
63
Notes to the financial statements (continued)
a
Summary of significant accounting policies (continued)
Changes in significant accounting policies (continued)
IFRS 9: Financial Instruments (continued)
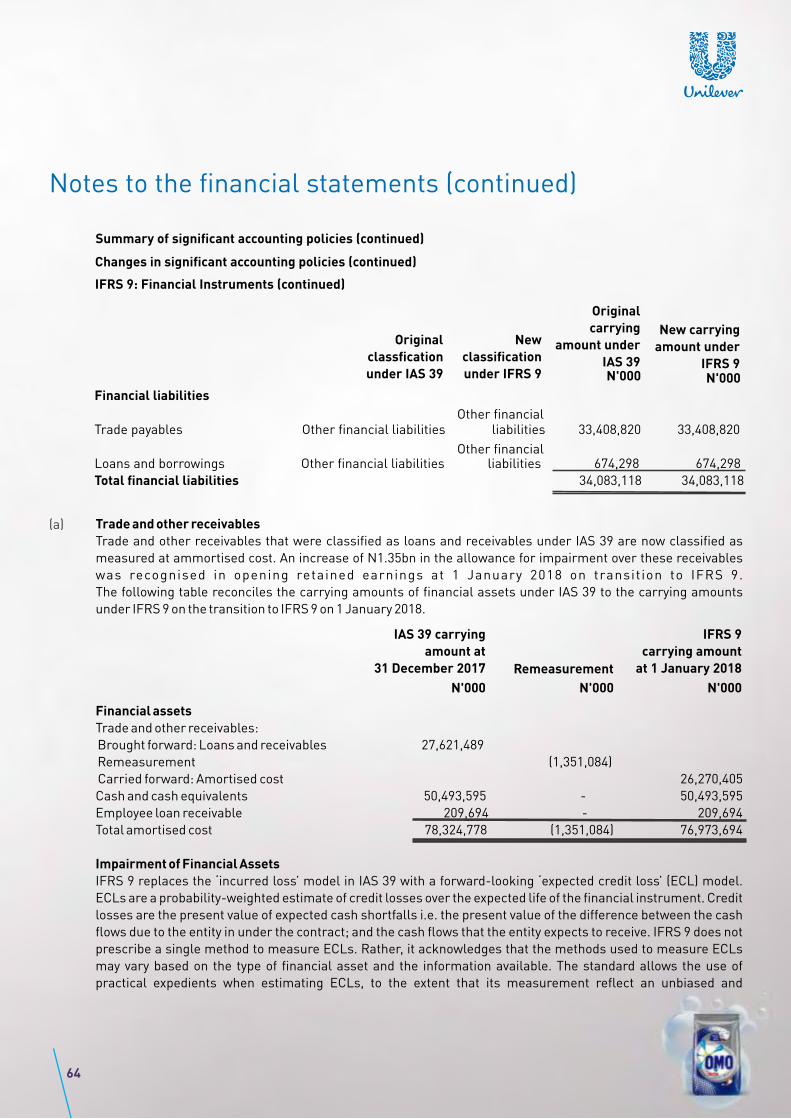
New carrying
amount under
IFRS 9N'000
Original
carrying
amount under
IAS 39N'000
New
classification
under IFRS 9
Original
classfication
under IAS 39
Financial liabilities
Trade payables Other financial liabilities liabilities 33,408,820 33,408,820
Loans and borrowings Other financial liabilities liabilities 674,298 674,298
Total financial liabilities 34,083,118 34,083,118
Other financial
Trade and other receivables
Trade and other receivables that were classified as loans and receivables under IAS 39 are now classified as
measured at ammortised cost. An increase of N1.35bn in the allowance for impairment over these receivables
was recognised in opening retained earnings at 1 January 2018 on transit ion to IFRS 9.
The following table reconciles the carrying amounts of financial assets under IAS 39 to the carrying amounts
under IFRS 9 on the transition to IFRS 9 on 1 January 2018.
Financial assets
Trade and other receivables:
Brought forward: Loans and receivables 27,621,489
Remeasurement (1,351,084)
Carried forward: Amortised cost 26,270,405
Cash and cash equivalents 50,493,595 - 50,493,595
Employee loan receivable 209,694 - 209,694
Total amortised cost 78,324,778 (1,351,084) 76,973,694
Impairment of Financial Assets
IFRS 9 replaces the ‘incurred loss’ model in IAS 39 with a forward-looking ‘expected credit loss’ (ECL) model.
ECLs are a probability-weighted estimate of credit losses over the expected life of the financial instrument. Credit
losses are the present value of expected cash shortfalls i.e. the present value of the difference between the cash
flows due to the entity in under the contract; and the cash flows that the entity expects to receive. IFRS 9 does not
prescribe a single method to measure ECLs. Rather, it acknowledges that the methods used to measure ECLs
may vary based on the type of financial asset and the information available. The standard allows the use of
practical expedients when estimating ECLs, to the extent that its measurement reflect an unbiased and
IFRS 9
carrying amount
at 1 January 2018
N'000
Remeasurement
IAS 39 carrying
amount at
31 December 2017
N'000N'000
64
Notes to the financial statements (continued)
Summary of significant accounting policies (continued)
Changes in significant accounting policies (continued)
(a)
Other financial
IFRS 9: Financial Instruments (continued)

probability weighted amount, time value of money and reasonable and supportable information that is available
without undue cost or effort. The standard contains a simplified approach that uses provision matrix to measure
lifetime ECLs for trade receivables, contract assets and lease receivables. For assets in the scope of IFRS 9
impairment model, impairment losses are generally expected to increase and become more volatile.
Trade and other receivables
The Company has applied the simplified model to estimate ECLs, adopting a provision matrix to determine the
lifetime ECLs for its trade and intercompany receivables. The provision matrix estimates ECLs on the basis of
historical default rates, adjusted for current and future economic conditions without undue cost and effort.
The estimation of ECL rates was based on the following parameters :
- 180 days was considered as the default point
- The probability of default risk parameters were calculated based on historical data
- The loss given default was calculated based on recovery rate observed from payment history of the key
distributors.
- Credit losses were adjusted by scalar factors to reflect differences between economic conditions during the
period over which the historical data was collected, current conditions and the Company's view of economic
conditions over the expected lives of the receivables.
Intercompany receivables
The estimation of ECL rates for intercompany receivables was based on the following parameters:
- Probability of default which is the average cummulative default rates for the related parties based on their risk
grading
- Exposure at default which is the total receivables due from the related parties as at 31 December 2018
- Loss given default which has been adjusted for the following:
- Recovery rate of a security with a similar risk grading as the related party receivables
- Credit enhancements such as letters of support from the parent company and letter of guarantee from the
related party
The Company has determined that the application of IFRS 9's impairment requirement at 1 January 2018 results
in an additional allowance for impairment as follows:
Loss allowance at 31 December 2017 under IAS 39 287,672
Additional impairment recognised on 1 January 2018 on:
- Trade and other receivables -
- Intercompany Receivables as at 31 December 2017 1,351,084
Loss allowance at 1 January 2018 under IFRS 9 1,638,756
The carrying amount of intercompany receivables is as follows:
Carrying amount as at 31 December 2017 under IAS 39 14,972,990
Additional impairment recognised on 1 January 2018 (1,351,084)
Carrying amount at 1 January 2018 under IFRS 9 13,621,906
N'000
N'000
65
Notes to the financial statements (continued)
Summary of significant accounting policies (continued)
Changes in significant accounting policies (continued)
Impairment of Financial Assets (continued)
Transition
The Company has used an exemption not to restate comparative information for prior periods with respect to the
classification and measurement (including impairment) requirements. Therefore, comparative periods have not
been restated. Differences in the carrying amount of financial instruments resulting from the adoption of IFRS 9
are recognised in opening retained earnings as at 1 January 2018. Accordingly the information presented for 2017
does not generally reflect the requirement of IFRS 9 but rather those of IAS 39.
Foreign currency translation
Transactions and balances
Foreign currency transactions are initially recorded at the rate of exchange at the date of the transaction.
Monetary assets and liabilities denominated in foreign currencies are translated at the functional currency spot
rates of exchange at the reporting date.
Non-monetary items that are measured in terms of historical cost in a foreign currency are translated using the
exchange rates at the dates of the initial transactions. Non-monetary items measured at fair value in a foreign
currency are translated using the exchange rates at the date when the fair value is determined. Foreign currency
differences are generally recognised in the income statement.
Discontinued operations
A discontinued operation is a component of the Company's business, the operations and cashflows of which can
be clearly distinguished from the rest of the Company and which:
- represents a major line of business or geographic area of operations
- is part of a single co-ordinated plan to dispose of a separate major line of business or geographic area of
operations; or
- is a subsidiary acquired exclusively with a view to resale
Classification as a discontinued operation occurs at the earlier of disposal or when the operation meets the
criteria to be classified as held for sale.
When an operation is classified as a discontinued operation, the comparative income statement is re-presented
as if the operation had been discontinued from the start of the comparative year.
Property, plant and equipment
Recognition and measurement
The cost of an item of property, plant and equipment is recognised as an asset if it is probable that future economic
benefits associated with the item will flow to the entity and the cost can be measured reliably. All property, plant
and equipment are stated in the statement of financial position at cost less accumulated depreciation and any
accumulated impairment losses. Cost includes expenditures that are directly attributable to the acquisition of the
asset. When significant parts of an item of property, plant and equipment have different useful lives, they are
accounted for as separate items (major components) of property, plant and equipment.
Any gain or loss on disposal of an item of property, plant and equipment is recognised in the income statement
1.5
(i)
1.7
(i)
1.6
66
Notes to the financial statements (continued)
Summary of significant accounting policies (continued)
Changes in significant accounting policies (continued)
Intercompany receivables (continued)

Subsequent costs
Subsequent costs are included in the asset’s carrying amount or recognised as a separate asset, as appropriate,
only when it is probable that future economic benefits associated with the item will flow to the Company and the
cost of the item can be measured reliably. The carrying amount of a replaced part is derecognised. All other
repairs and maintenance are charged to the income statement during the financial year in which they are
incurred.
Depreciation
The estimated depreciation rates of property, plant and equipment for current and comparative periods are as
follows:
Leasehold land - Nil
Buildings - 2.5%
Plant and machinery - 7%
Furniture and equipment - 7% - 25%
Motor vehicles - 25%
Depreciation is calculated to write off the cost of items of property, plant and equipment less their estimated
residual values using the straight-line method over their estimated useful lives and is generally recognized in the
income statement.
The capital work-in-progress represents buildings and plant and machinery under construction and other
property, plant and equipment not available for use in the manner intended by management.
Depreciation method, assets' residual values and useful lives are reviewed and adjusted if appropriate, at the end
of each reporting period.
Intangible assets
Computer software
Costs associated with maintaining computer software programmes are recognised as an expense as incurred.
Development costs that are directly attributable to the design and testing of identifiable and unique software
products controlled by the Company are recognised as intangible assets when the following criteria are met:
- it is technically and commercially feasible to complete the software product so that it will be available for use;-
- management intends to complete the software product and use or sell it;
- there is an ability to use or sell the software product;
- it can be demonstrated how the software product will generate probable future economic benefits;
- adequate technical, financial and other resources to complete the development of the software product are
available; and
- the expenditure attributable to the software product during its development can be reliably measured.
Directly attributable costs that are capitalised as part of the software product include the software development
employee costs and an appropriate portion of relevant overheads.
Other development expenditures that do not meet these criteria are recognised as an expense as incurred.
Development costs previously recognised as an expense are not recognised as an asset in a subsequent period.
(ii)
(iii)
1.8
67
Notes to the financial statements (continued)
Summary of significant accounting policies (continued)
Property, plant and equipment(continued)
Computer software development costs recognised as assets are amortised on a straight line basis in the income
statement over their estimated useful lives, which does not exceed eight and a half years. These costs are
measured at cost less accumulated amortisation and any accumulated impairment losses.
Amortisation method, assets' residual values and useful lives are reviewed and adjusted if appropriate, at the end
of each reporting period.
Impairment of non-financial assets
At each reporting period, the Company reviews the carrying amount of its non-financial assets (other than
inventories) to determine whether there is any indication of impairment. If any such indication exists, then the
assets recoverable amount is estimated.
An impairment loss is recognised for non-financial assets when the asset’s carrying amount exceeds its
recoverable amount. The recoverable amount is the higher of an asset’s fair value less costs to sell and value in
use. For the purposes of assessing impairment, assets are grouped at the lowest levels for which there are
separately identifiable cash flows (cash-generating units). An impairment loss is recognised if the carrying
amount of an asset or CGU exceeds its recoverable amount. Non-financial assets that suffered an impairment are
reviewed for possible reversal of the impairment at each reporting date.
Intangible assets not yet available for use are tested for impairment annually. Impairment losses are recognized
in the income statement. All other non-financial assets are assessed for indicators of impairment at the end of
each reporting period.
Financial instruments
Recognition and initial measurement
Financial instruments (i.e. financial assets and liabilities) are recognized when the Company becomes a party to
the contractual provisions of the instrument. A financial asset or financial liability is initially measured at fair
value plus, for an item not at FVTPL, transaction costs are directly attributable to its acquisition or issue. A trade
receivable without a significant financing component is initially measured at the transaction price.
Classification and subsequent measurement
Management determines the classification of its financial instruments at initial recognition.
Financial assets
Policy applicable before 1 January 2018
The Company classified its financial assets as loans and receivables. Loans and receivables are non-derivative
financial assets with fixed or determinable payments that are not quoted in an active market. They are included in
current assets, except for instruments with greater than twelve months after the end of the reporting period.
These are classified as non-current assets. The Company's loans and receivables comprise trade receivables,
employee loan receivables and other receivables in the statement of financial position.
1.9
1.10
1.10.1
1.10.2
(i)
68
Notes to the financial statements (continued)
Summary of significant accounting policies (continued)
Intangible assets (continued)
Loans and receivables are initially recognized at fair value. Transaction costs are added to the fair value of the
financial asset on initial recognition. Subsequently, loans and receivables are measured at amortized cost using
the effective interest method less an allowance for impairment.
Policy applicable from 1 January 2018
On initial recognition, a financial asset is classified as measured at: amortised cost; FVOCI - debt investment;
FVOCI - equity investment; or FVTPL.
Financial assets are not reclassified subsequent to their initial recognition unless the Company changes its
business model for managing financial assets, in which case all affected financial assets are reclassified on the
first day of the first reporting period following the change in the business model.
A financial asset is measured at amortised cost if it meets both of the following conditions and is not designated as
at FVTPL:
- it is held within a business model whose objective is to hold assets to collect contractual cashflows; and
- its contractual terms give rise on specified dates to cashflows that are solely payments of principal and interest
on the principal amount outstanding
Financial assets at FVTPL
Financial assets at amortised cost
These assets are subsequently measured at fair value. Net gains & losses including
any interest or dividend income are recognised in the income statement
These assets are subsequently measured at amortised cost using the effective interest
method. The amortised cost is reduced by impairment losses. Interest income, foreign
exchange gains and losses and impairment are recognised in the income statement.
Any gain or loss on derecognition is recognised in the income statement.
Debt investments at FVOCIThese assets are subsequently measured at fair value. Interest income calculated using
the effective interest method, foreign exchange gains and losses and impairment are
recognised in the income statement. Other net gains or losses are recognised in OCI.
On derecognition, gains and losses accumulated in OCI are reclassified to the income
statement.
These assets are subsequently measured at fair value. Dividends are recognised as income
in the income statement unless the dividend clearly represents a recovery of part of the
cost of the investment. Other net gains and losses are recognised in OCI and are never
reclassified to the income statement.
Equity investments at FVOCI
Financial assets - Subsequent measurement and gains and losses
All financial assets not classified as measured at amortised cost or FVOCI are measured at FVTPL. This includes
all derivative financial assets
Derivative financial instruments - Policy applicable from 1 January 2018
The Company holds derivative financial instruments to hedge its foreign currency and interest rate risk
exposures. Embedded derivatives are separated from the host contract and accounted for separately if the host
contract is not a financial asset and certain criteria are met.
Derivatives are initially measured at fair value. Subsequent to initial recognition, derivatives are
measured at fair value, and changes therein are generally recognised in the income statement.
(ii)
69
Notes to the financial statements (continued)
Summary of significant accounting policies (continued)
Financial Instruments (continued)
Policy applicable before 1 January 2018
The policy applied in the comparative information presented for 2017 is similar to that applied for 2018.
Financial liabilities - classification, subsequent measurement and gains and losses
Financial liabilities are classified as measured at amortised cost or FVTPL. The Company has classified its
financial liabilities at amortised cost and this includes trade payables, bank debt and other long-term debts.
Trade payables are initially recognized at fair value less any directly attributable transaction costs. Subsequently,
trade payables are measured at amortized cost using the effective interest method.
Interest-bearing bank loans and overdrafts are recorded at the proceeds received, net of direct issue costs.
Finance charges, including premiums payable on settlement or redemption and direct issue costs, are accounted
for on an amortised cost basis through the income statement using the effective interest method and are added to
the carrying amount of the instrument to the extent they are not settled in the period in which they arise. These are
classified as current liabilities if payment is due within twelve months. Otherwise, they are presented as non-
current liabilities.
Borrowing costs that are directly attributable to the acquisition, construction or production of a qualifying asset
are capitalised as part of the cost of that asset.
Derecognition
- Financial assets
Financial assets are derecognized when the contractual rights to receive cash flows from the assets have expired
or have been transferred and the Company has transferred substantially all risks and rewards of ownership of the
financial asset or the Company neither transfers nor retains substantially all of the risks and rewards of
ownership and it does not retain control of the financial asset
.
- Financial liabilities
Financial liabilities are derecognized when the obligation specified in the contract is discharged, cancelled or
expired. The Company also derecognises a financial liability when its terms are modified and the cashflows of the
modified liability are substantially different, in which case a new financial liability based on the modified terms is
recognised at fair value.
On derecognition of a financial liability, the difference between the carrying amount extinguished and the
consideration paid (including any non-cash assets transferred or liabilities assumed) is recognised in the income
statement.
Offsetting financial instruments
Financial assets and financial liabilities are offset and the net amount presented in the statement of financial
position when the Company has a legally enforceable right to offset the recognised amounts and
there is an intention to settle on a net basis or realise the asset and settle the liability simultaneously.
(iii)
(iv)
1.10.3
70
Notes to the financial statements (continued)
Summary of significant accounting policies (continued)
Classification and subsequent measurement (continued)
Impairment of financial assets
Financial assets
Policy applicable from 1 January 2018
The Company recognises loss allowances for ECLs on financial assets at amortised cost
The Company measures loss allowances at an amount equal to lifetime ECLs.
When determining whether the credit risk of a financial asset has increased significantly since initial recognition
and when estimating ECLs, the Company considers reasonable and supportable information that is relevant and
available without undue cost or effort. This includes both quantitative and qualitative information and analysis,
based on the Company's historical experience and informed credit assessment and including forward looking
information.
The Company assumes that the credit risk on a financial asset has increased significantly if it is more than 30 days
past due.
The Company considers a financial asset to be in default when:
- the borrower is unlikely to pay its credit obligations to the Company in full without recourse by the Company to
actions such as realising security (if any is held) or
- the financial asset is more than 180 days past due
Lifetime ECLs are the ECLs that result from all possible default events over the expected life of the financial asset
The Company considers intercompany receivables to have a lower credit risk when its credit risk rating is
equivalent to the globally understood definition of "investment grade".The maximum period considered when
estimating ECLs is the maximum contractual period over which the Company is exposed to credit risk.
Measurement of ECLs
ECLs are a probability-weighted estimate of credit losses. Credit losses are measured as the present value of all
cash shortfalls (i.e the difference between the cash flows due to the entity in accordance with the contract and the
cash flows that the Company expects to receive).
ECLs are discounted at the effective interest rate of the financial asset.
Credit- impaired financial assets
At each reporting date, the Company assesses whether financial assets carried at amortised cost are credit-
impaired. A financial asset is "credit impaired" when one or more events that have a detrimental impact on the
estimated future cash flows of the financial asset have occured.
Evidence that a financial asset is credit-impaired includes the following observable data:
- significant financial difficulty of the borrower or issuer;
- a breach of contract, such as a default or being more than 180 days past due
- the restructuring of a loan or advance by the Company on terms that the Company would not consider otherwise;
- it probable that the borrower will enter bankruptcy or other financial reorganisation; or
- the disappearance of an active market for that financial asset because of financial difficulties
71
Notes to the financial statements (continued)
Summary of significant accounting policies (continued)
1.11
Presentation of allowance for ECL in the statement of financial position
Loss allowances for financial assets measured at amortised cost are deducted from the gross carrying amount of
the assets
Write-off
The gross carrying amount of a financial asset is written off when the Company has no reasonable expectations of
recovering a financial asset in its entirety or a portion thereof. The Company individually makes an assessment
with respect to the timing and amount of write-off based on whether there is reasonable expectation of recovery.
The Company expects no significant recovery from the amount written off. However, financial assets that are
written off could still be subject to enforcement activities in order to comply with the Company's procedures for
recovery of amounts due.
Policy applicable before 1 January 2018
Unilever assesses at the end of each reporting period whether there is objective evidence that a financial asset or
group of financial assets is impaired. A financial asset or a group of financial assets is impaired and impairment
losses are incurred only if there is objective evidence of impairment as a result of one or more events that
occurred after the initial recognition of the asset (a ‘loss event’) and that loss event (or events) has an impact on
the estimated future cash flows of the financial asset or group of financial assets that can be reliably estimated.
The criteria that the Company uses to determine that there is objective evidence of an impairment loss include the
following:
- significant financial difficulty of the issuer or obligor;
- a breach of contract, such as a default or delinquency in interest or principal payments;
- The Company, for economic or legal reasons relating to the borrower’s financial difficulty, granting to the
borrower a concession that the lender would not otherwise consider;
- it becomes probable that the borrower will enter bankruptcy or other financial reorganisation;
- the disappearance of an active market for that financial asset because of financial difficulties; or
- observable data indicating that there is a measurable decrease in the estimated future cash flows from a
portfolio of financial assets since the initial recognition of those assets, although the decrease cannot yet be
identified with the individual financial assets in the portfolio, including:
- adverse changes in the payment status of borrowers in the portfolio; and
- national or local economic conditions that correlate with defaults on the assets in the portfolio.
Fair value measurement
Fair value is the price that would be received to sell an asset or paid to transfer a liability in an orderly transaction
between market participants at the measurement date. The fair value measurement is based on the presumption
that the transaction to sell the asset or transfer the liability takes place either:
- In the principal market for the asset or liability, or
- In the absence of a principal market, in the most advantageous market for the asset or liability.
All assets and liabilities for which fair value is measured or disclosed in the financial statements are categorised
within the fair value hierarchy, described as follows, based on the lowest level input that is significant to the fair
value measurement as a whole:
1.12
72
Notes to the financial statements (continued)
Summary of significant accounting policies (continued)
Impairment of financial assets (continued)
- Level 1 — Quoted (unadjusted) market prices in active markets for identical assets or liabilities
- Level 2 — Valuation techniques for which the lowest level input that is significant to the fair value measurement
is directly or indirectly observable
- Level 3 — Valuation techniques for which the lowest level input that is significant to the fair value measurement
is unobservable
Inventories
Inventories are measured at the lower of cost and estimated net realisable value less allowance for obsolete and
damaged inventories. A detailed review of slow moving and obsolete stocks is carried out on a monthly basis and
an allowance is booked based on a realistic estimate. Cost is based on standard costing that comprises direct
materials and where applicable, directs labour costs and those overheads that have been incurred in bringing the
inventories to their present location and condition. Cost of raw materials, work in progress and finished goods are
stated at standard cost while cost of engineering spares and other items of inventories is calculated using the
weighted average method. Standard cost is reviewed periodically to ensure it consistently approximates historical
cost. Net realisable value represents the estimated selling price less all estimated costs of selling expenses.
Cash and cash equivalents
Cash and cash equivalents in the statement of cash flows include cash at bank and in hand plus short-term
deposits less overdrafts and short-term working capital loans. Short-term deposits have a maturity of three
months or less from the date of acquisition, are readily convertible to cash and are subject to an insignificant risk
of change in value. Bank overdrafts are repayable on demand and form an integral part of the Company's cash
management.
Provisions
Provisions are measured at the present value of management’s best estimate of the expenditure required to settle
the present obligation at the reporting date. The present value is derived by discounting the expected future
cashflows at a pre-tax rate. The discount rate used to determine the present value reflects current market
assessments of the time value of money and the risks specific to the liability. The increase in the provision due to
the passage of time is recognised as finance cost.
Provisions are recognised when the Company has a present legal or constructive obligation as a result of a past
event, and it is probable that the Company will be required to settle that obligation and the amount has been
reliably estimated. Provisions for restructuring costs are recognised when the Company has a detailed formal
plan for the restructuring that has been communicated to affected parties. Provisions are not recognised for
future operating losses.
Income tax
The tax for the period comprises current and deferred tax. Tax is recognised in the income statement, except to the
extent that it relates to items recognised in other comprehensive income or directly in equity. In this case the tax is
recognised in other comprehensive income or directly in equity, respectively.
Current income tax
The tax currently payable is based on taxable profit for the year and any adjustment to tax payable or receivable in
1.13
1.14
1.15
1.16
(i)
73
Notes to the financial statements (continued)
Summary of significant accounting policies (continued)
Fair value measurement (continued)
respect of previous years. Taxable profit differs from net profit as reported in the income statement because it
excludes items of income or expense that are taxable or deductible in other years and it further excludes items
that are never taxable or deductible. The Company's liability for current tax is calculated using tax rates that have
been enacted or substantively enacted at the reporting date.
Deferred income tax
Deferred tax is the tax expected to be payable or recoverable on differences between the carrying amounts of
assets and liabilities in the financial statements and the corresponding tax bases used in the computation of
taxable profit, and is accounted for using the balance sheet liability method. Deferred tax liabilities are generally
recognised for all taxable temporary differences and deferred tax assets are recognised to the extent that it is
probable that taxable profits will be available against which deductible temporary differences can be utilised.
Such assets and liabilities are not recognised if the temporary difference arises from goodwill or from the initial
recognition (other than in a business combination) of other assets and liabilities in a transaction that affects
neither the tax profit nor the accounting profit.
The carrying amount of deferred tax assets is reviewed at each reporting date and reduced to the extent that it is
no longer probable that sufficient taxable profits will be available to allow all or part of the asset to be recovered.
Deferred tax is calculated at the tax rates that are expected to apply in the period when the liability is settled or the
asset is realised. Deferred tax is charged or credited to the income statement, except when it relates to items
charged or credited to equity, in which case the deferred tax is also dealt with in equity.
Deferred tax assets and liabilities are offset when there is a legally enforceable right to set off current tax assets
against current tax liabilities and when they relate to income taxes levied by the same taxation authority and the
Company intends to settle its current tax liabilities on a net basis.
Deferred tax assets and liabilities are presented as non-current in the statement of financial position.
Employee benefits
Post-employment benefit plans
The Company operates a defined contribution benefit scheme, an unfunded defined benefit service gratuity
scheme for its employees; and a funded post-employment benefit plan.
Defined contribution scheme
The Company operates a defined contribution plan in line with the Pension Reform Act 2014. The contributions
are recognised as employee benefit expenses when they are due. The Company has no further payment obligation
once the contributions have been paid. The contribution made towards securing the future benefits in the scheme
is as follows:
Staff Management staff Non-management
Employer 10% 10%
Employee 8% 10%
(ii)
1.17
(i)
(a)
74
Notes to the financial statements (continued)
Summary of significant accounting policies (continued)
Income tax (continued)

Defined benefit plans
The Company also operates both an unfunded defined benefit service gratuity scheme and a funded benefit plan.
The level of benefit provided is based on the length of service and terminal salary of the person entitled. The
defined benefit plan surplus or deficit in the statement of financial position comprises the total for each plan of the
fair value of plan assets less the present value of the defined benefit obligation (using a discount rate based on
federal government bonds in issue as at the reporting date).
The cost of defined benefit plans is determined using the projected unit credit method. The liability recognised in
the statement of financial position in respect of the unfunded defined benefit service gratuity scheme is the
present value of the defined benefit obligation at the reporting date. With respect to the funded benefit plan, the
related pension liability recognized in the statement of financial position is the present value of the defined benefit
obligation at the end of the reporting period less the fair value of plan assets.
Actuarial valuations for defined benefit plans are carried out annually. The discount rate applied in arriving at the
present value of the pension liability represents the market yield on government bonds at the calculation date and
reflects the duration of the liabilities of the benefit plan.
Actuarial gains and losses are recognized in full in the period in which they occur, in other comprehensive income
without recycling to the income statement in subsequent periods. Current service cost, the recognized element of
any past service cost and the net interest cost arising on the pension liability are included in the same line items in
the income statement as the related compensation cost.
Other long term employee benefits
The Company measures long term employee benefits using the same accounting policies for defined benefit
plans except for remeasurements which are recognised in income statement in the period in which they arise.
Share-based payment transaction - Cash-settled transactions
The cost of cash-settled transactions is measured initially at fair value at the grant date using a pricing model
similar to the 'projected unit credit method'. The fair value of the amount payable is recognised as an expense with
a corresponding increase in liabilities over the period during which the employees become unconditionally
entitled to payment. The liability is re-measured to fair value at each reporting date up to, and including the
settlement date, with changes in fair value recognised in employee benefits expense.
Short term employee benefits
Short term employee benefits are expensed as the related service is provided. A liability is recognised for the
amount expected to be paid if the company has a present legal or constructive obligation to pay this amount as a
result of past services provided by the employee and the obligation can be estimated reliably.
Revenue
Revenue is measured based on the consideration specified in a contract with a customer and excludes amounts
collected on behalf of third parties. The Company recognises revenue at a point in time when it transfers control
over a product or service to a customer. The Company initially applied IFRS 15 from 1 January 2018. The effect of
initially applying IFRS 15 is described in note 1.5 (i)
(ii)
(b)
( )c
1.18
(d)
75
Notes to the financial statements (continued)
Summary of significant accounting policies (continued)
Employee benefits (continued)
Revenue recognition under IFRS 15 (applicable from 1 January 2018)
The Company principally generates revenue from the sale and delivery of its products. The sale and delivery of
products are identified as one performance obligation and are not separately identifiable. The Company
recognises revenue when the customer takes possession of the goods. This usually occurs when the customer
signs the invoice. The amount of revenue is adjusted for expected returns, which are estimated based on the
historical data. In these circumstances, a refund liability and a right to recover returned goods assets are
recognised.
The right to recover returned goods asset is measured at the former carrying amount of the inventory less any
expected costs to recover goods. The refund liability is included in other payables (Note 19) and the right to receive
returned goods is included in inventory (Note 16).
The Company reviews its estimates of expected returns at each reporting date and updates the amounts of assets
and liability accordingly.
Revenue recognition under IAS 18 (applicable before 1 January 2018)
In the comparative period, revenue was measured at fair value of the consideration received or receivable.
Revenue from the sale of goods was recognised when:
- the significant risks and rewards of ownership had been transferred to the customer, -recovery of the
consideration was probable
- the associated costs and possible return of goods could be estimated reliably
- there was no continuing management involvement with the goods
- the amount of revenue could be measured reliably
See note 4 for details of revenue disaggregated by business category and geographical location
Leases
Leases in which a significant portion of the risks and rewards of ownership are retained by another party, the
lessor, are classified as operating leases. Payments, including prepayments, made under operating leases (net of
any incentives received from the lessor) are charged to the income statement on a straight-line basis over the
period of the lease.
All other leases are accounted for as finance leases. Finance leases relate to various leasehold land properties
which the Company holds the right to use for between 50 and 99 years. The Company has retained significant risks
and rewards over the use of these properties, including construction of its offices and factories, and is responsible
for maintaining the properties. The leasehold land were acquired under the Land Use Act, and payments were
made upfront. There are no annual lease repayments connected with these leases. Minimum lease payments
shall be apportioned between the finance charge and the reduction of the outstanding liability. The finance charge
shall be allocated to each period during the lease term so as to produce a constant periodic rate of interest on the
remaining balance of the liability. Contingent rents shall be charged as expenses in the periods in which they are
incurred.
1.19
76
Notes to the financial statements (continued)
Summary of significant accounting policies (continued)
Revenue (continued)
Dividend distribution
Dividend distribution to the Company’s shareholders is recognised as a liability in the financial statements in the
period in which the dividends are approved by the shareholders.
Finance income and finance cost
Finance income and finance costs are recognised using the effective interest rate method.
Finance income includes interest received or receivable on balances and deposits with banks, exchange
differences (excluding differences on payables to foreign suppliers which has been included in cost of sales) and
derivative gains on derivative financial assets.
Finance cost includes interest on borrowings, interest charge related to defined benefit plans, gains or losses
arising on the early settlement of debt, exchange difference on non-derivative financial assets and liabilities
(excluding differences on paybles to foreign suppliers which has been included in cost of sales) and derivative
losses on derivative financial liabilities.
Share capital
Ordinary shares are classified as equity. Incremental costs directly attributable to the issue of ordinary shares are
recognised as a deduction from equity, net of any tax effects.
Government grants
Grants from the government are recognised at their fair value where there is a reasonable assurance that the
grant will be received and the Company will comply with all attached conditions. Government grants relating to
costs are deferred and recognised in the income statement on a systematic basis over the period necessary to
match them with the costs that they are intended to compensate.
1.20
1.21
1.22
1.23
Financial risk management
Financial risk factors
The Company’s activities expose it to a variety of financial risks: market risk, credit risk and liquidity risk.
Unilever’s overall risk management programme focuses on the unpredictability of financial markets and seeks to
minimise potential adverse effects on Unilever’s financial performance.
Risk management is carried out by a Treasury Department under policies approved by Board of Directors.
Unilever's Treasury Department identifies, evaluates and manages financial risks in close co-operation with
Unilever’s operating units. The Board provides written principles for overall risk management, as well as written
policies covering specific areas, such as foreign exchange risk, credit risk, use of derivative financial instruments
and non-derivative financial instruments, and investment of excess liquidity. These policies are mostly Unilever
Global Policies adopted for local use.
2
2.1
77
Notes to the financial statements (continued)
Summary of significant accounting policies (continued)
Market risk
Market risk is the risk that changes in market prices – such as foreign exchange rates, interest rates and equity
prices – will affect the Company’s income or the value of its holdings of financial instruments. The objective of
market risk management is to manage and control market risk exposures within acceptable parameters, while
optimising the return.
Currency risk - Transactions in foreign currency
Unilever is exposed to foreign exchange risk arising from various currency exposures. The currencies in which
these transactions are primarily denominated are US dollars, Pound sterling, Euro and Rand. The currency risk is
the risk that the fair value of future cash flows of a financial instrument will fluctuate due to changes in foreign
exchange rates.
During the year, the Company explored foreign currency official instruments available in the market to settle
obligations denominated in foreign currencies and to manage foreign currency volatility. These include: Central
Bank of Nigeria (CBN) forwards and CBN interventions in the interbank market.
As a result, the Company’s transactions were settled at a range of rates during the year. As at year end the assets
and liabilities were translated using the NIFEX rate which represented the rate at which the future cash flows
represented by the balances could have been settled if those cash flows had occurred at year end.
At 31 December 2018, the unhedged financial assets and financial liabilities amounted to N6.4 billion (2017: N7
billion).
At 31 December 2018, if the Naira had weakened/strengthened by 81%* against key currencies (Euro and USD) to
which the Company is exposed to, with all other variables held constant, post-tax profit for the year would have
been N4.6 billion lower/higher.
At 31 December 2018, if the Naira had weakened/strengthened by 81%* against other currencies (GBP and ZAR)
to which the Company is exposed to, with all other variables held constant, post-tax profit for the year would have
been N112.3 million lower/higher.
*81% represents the 5 year average change in the conversion rate of key currencies to Naira.
During the year, the Company entered future contracts to hedge its currency risk with a maturity of less than 1
year from the reporting date. As at the reporting date, the amount of derivative gain recognised in the income
statement was nil (2017: N285.7m) (Note 10)
Cash flow and fair value interest rate risk
Unilever’s interest rate risk arises from bank overdrafts, bank loans and inter-company loans. Overdrafts issued
at variable rates expose Unilever to cash flow interest rate risk. Borrowings issued at fixed rates expose Unilever
to fair value interest rate risk.
Unilever analyses its interest rate exposure on a dynamic basis. Various scenarios are simulated taking into
consideration refinancing, renewal of existing positions and alternative financing. Based on these scenarios,
(a)
(i)
(ii)
78
Notes to the financial statements (continued)
Financial risk management (continued)
Financial risk factors (continued)

Unilever calculates the impact on profit and loss of a defined interest rate shift. For each simulation, the same
interest rate shift is used for all currencies. The scenarios are run only for liabilities that represent the major
interest-bearing positions.
The average interest rate on local short-term borrowings in 2018 was 19% (2017: 21.1%)
The following table shows the split in fixed rate exposures:
Fixed rate (bank loans) - Note 26 4,176 674,298
4,176 674,298
Credit risk
Credit risk is the risk of financial loss to the Company if a customer or a counterparty to a financial instrument
fails to meet its contractual obligations, and arises principally from the Company's receivables from customers
The carrying amounts of financial assets and contract assets represent the maximum credit exposure
Impairment losses on financial assets assets recognised in the income statement were as follows:
Impairment loss/(reversal) on trade and intercompany
receivables 311,443 (813)
Trade and other receivables
The Company's exposure to credit risk is influenced mainly by the individual characteristics of each customer.
However, management also considers the factors that may influence the credit risk of its customer base.
The Company's risk management committee has established a credit policy under which each new customer is
placed on a 3 month probation. Sales are made to these customers on a cash and carry basis during this period
after which each customer is analysed individually for credit worthiness before the Company's standard credit
and delivery terms and offered. The Company's review includes available financial information, industry
information and bank references. Credit limits are established for each customer and reviewed quarterly.
Concentration of credit risk with respect to trade receivables is limited, due to the Company’s customer base
being diverse. Credit terms for customers are determined on individual basis. Credit risk relating to trade
receivables is managed by reference to the customers' credit limit, inventory balance, cash position and
secondary sales to final consumers.
More than 70% of the Company's customers have been transacting with the Company for over four years and
none of these customers' balances have been written off or are credit-impaired at the reporting date. In
monitoring customer credit risk, customers are grouped according to their credit characteristics, distribution
channel, geographic location and trading history.
2018
N’000
2017
N’000
2018
N’000
2017
N’000
(b)
79
Notes to the financial statements (continued)
Financial risk management (continued)
Financial risk factors (continued)
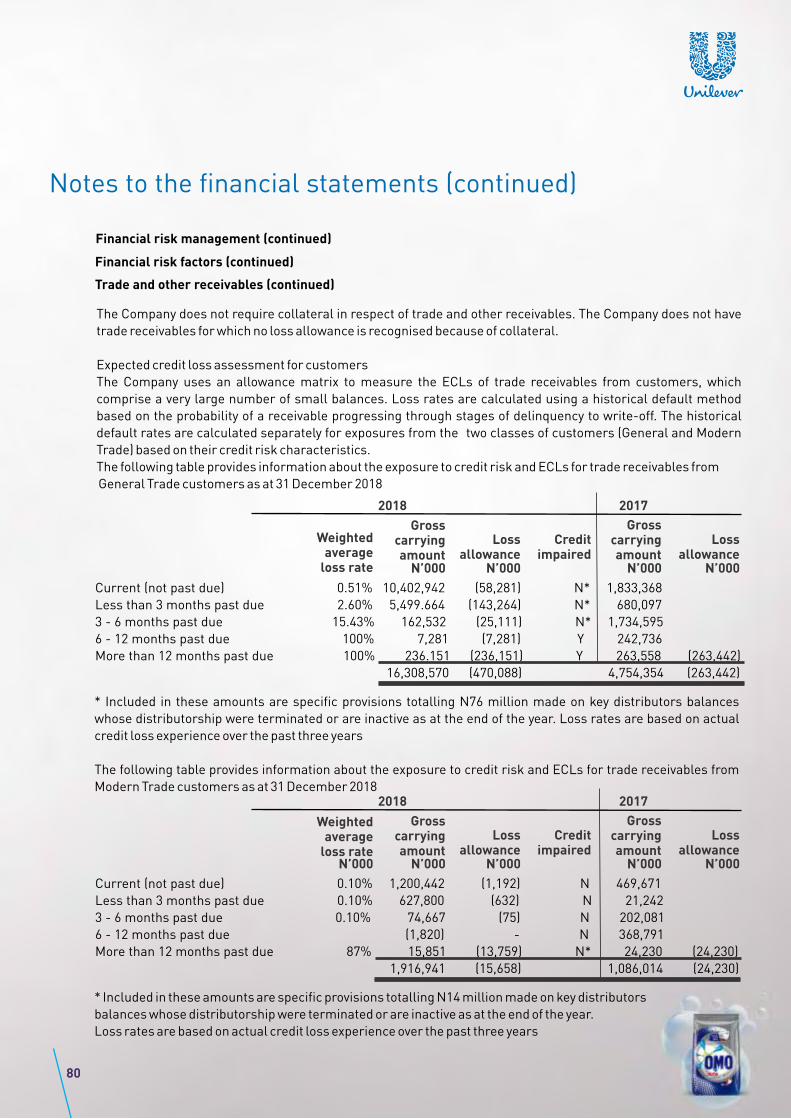
The Company does not require collateral in respect of trade and other receivables. The Company does not have
trade receivables for which no loss allowance is recognised because of collateral.
Expected credit loss assessment for customers
The Company uses an allowance matrix to measure the ECLs of trade receivables from customers, which
comprise a very large number of small balances. Loss rates are calculated using a historical default method
based on the probability of a receivable progressing through stages of delinquency to write-off. The historical
default rates are calculated separately for exposures from the two classes of customers (General and Modern
Trade) based on their credit risk characteristics.
The following table provides information about the exposure to credit risk and ECLs for trade receivables from
General Trade customers as at 31 December 2018
Loss allowance
N’000
Gross carrying amount
Credit impaired
Loss allowance
Grosscarryingamount
Weighted average
loss rate N’000N’000N’000
20172018
Current (not past due) 0.51% 10,402,942 (58,281) N* 1,833,368
Less than 3 months past due 2.60% 5,499.664 (143,264) N* 680,097
3 - 6 months past due 15.43% 162,532 (25,111) N* 1,734,595
6 - 12 months past due 100% 7,281 (7,281) Y 242,736
More than 12 months past due 100% 236.151 (236,151) Y 263,558 (263,442)
16,308,570 (470,088) 4,754,354 (263,442)
80
Notes to the financial statements (continued)
Financial risk management (continued)
Financial risk factors (continued)
Trade and other receivables (continued)
* Included in these amounts are specific provisions totalling N76 million made on key distributors balances
whose distributorship were terminated or are inactive as at the end of the year. Loss rates are based on actual
credit loss experience over the past three years
The following table provides information about the exposure to credit risk and ECLs for trade receivables from
Modern Trade customers as at 31 December 2018
Loss allowance
N’000
Gross carrying amount
Credit impaired
Loss allowance
Grosscarryingamount
Weighted average
loss rateN’000N’000N’000N’000
20172018
Current (not past due) 0.10% 1,200,442 (1,192) N 469,671
Less than 3 months past due 0.10% 627,800 (632) N 21,242
3 - 6 months past due 0.10% 74,667 (75) N 202,081
6 - 12 months past due (1,820) - N 368,791
More than 12 months past due 87% 15,851 (13,759) N* 24,230 (24,230)
1,916,941 (15,658) 1,086,014 (24,230)
* Included in these amounts are specific provisions totalling N14 million made on key distributors
balances whose distributorship were terminated or are inactive as at the end of the year.
Loss rates are based on actual credit loss experience over the past three years
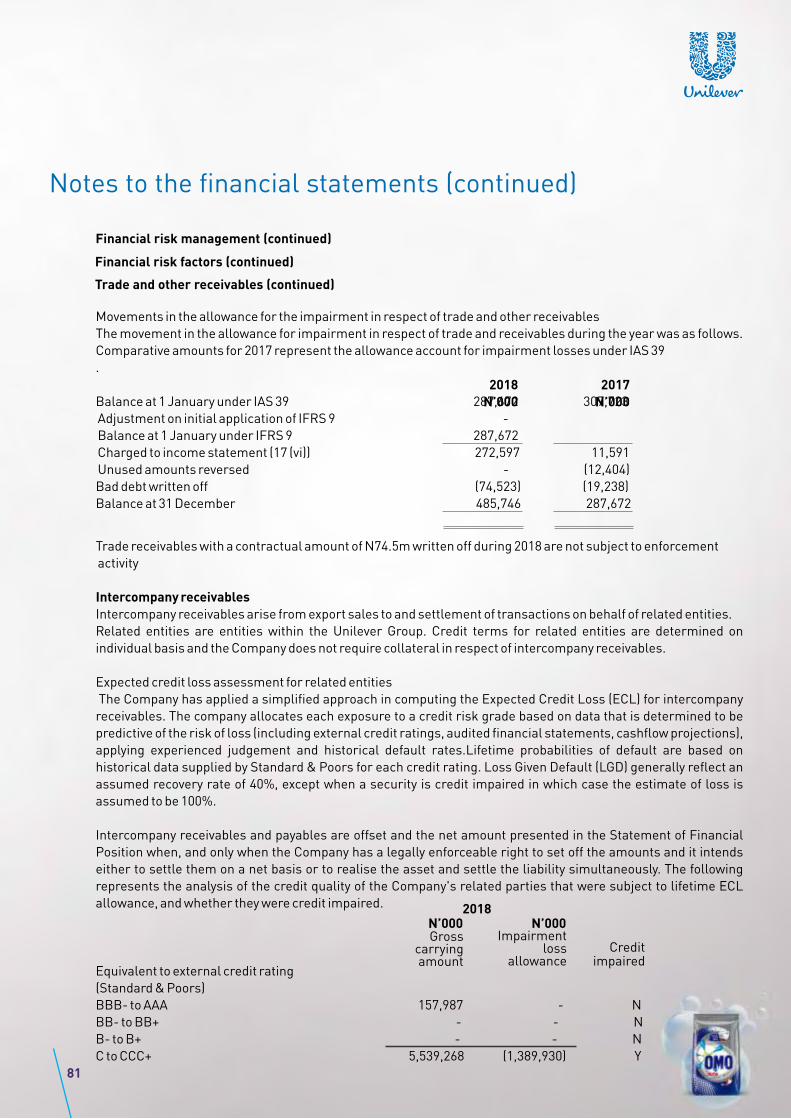
Trade receivables with a contractual amount of N74.5m written off during 2018 are not subject to enforcement
activity
Intercompany receivables
Intercompany receivables arise from export sales to and settlement of transactions on behalf of related entities.
Related entities are entities within the Unilever Group. Credit terms for related entities are determined on
individual basis and the Company does not require collateral in respect of intercompany receivables.
Expected credit loss assessment for related entities
The Company has applied a simplified approach in computing the Expected Credit Loss (ECL) for intercompany
receivables. The company allocates each exposure to a credit risk grade based on data that is determined to be
predictive of the risk of loss (including external credit ratings, audited financial statements, cashflow projections),
applying experienced judgement and historical default rates.Lifetime probabilities of default are based on
historical data supplied by Standard & Poors for each credit rating. Loss Given Default (LGD) generally reflect an
assumed recovery rate of 40%, except when a security is credit impaired in which case the estimate of loss is
assumed to be 100%.
Intercompany receivables and payables are offset and the net amount presented in the Statement of Financial
Position when, and only when the Company has a legally enforceable right to set off the amounts and it intends
either to settle them on a net basis or to realise the asset and settle the liability simultaneously. The following
represents the analysis of the credit quality of the Company's related parties that were subject to lifetime ECL
allowance, and whether they were credit impaired.
Equivalent to external credit rating
(Standard & Poors)
BBB- to AAA 157,987 - N
BB- to BB+ - - N
B- to B+ - - N
C to CCC+ 5,539,268 (1,389,930) Y
N’000
Credit impaired
Gross carrying amount
Impairment loss
allowance
N’0002018
81
Notes to the financial statements (continued)
Financial risk management (continued)
Financial risk factors (continued)
Trade and other receivables (continued)
Movements in the allowance for the impairment in respect of trade and other receivables
The movement in the allowance for impairment in respect of trade and receivables during the year was as follows.
Comparative amounts for 2017 represent the allowance account for impairment losses under IAS 39
.
Balance at 1 January under IAS 39 287,672 307,723
Adjustment on initial application of IFRS 9 -
Balance at 1 January under IFRS 9 287,672
Charged to income statement (17 (vi)) 272,597 11,591
Unused amounts reversed - (12,404)
Bad debt written off (74,523) (19,238)
Balance at 31 December 485,746 287,672
2018
N’000
2017
N’000
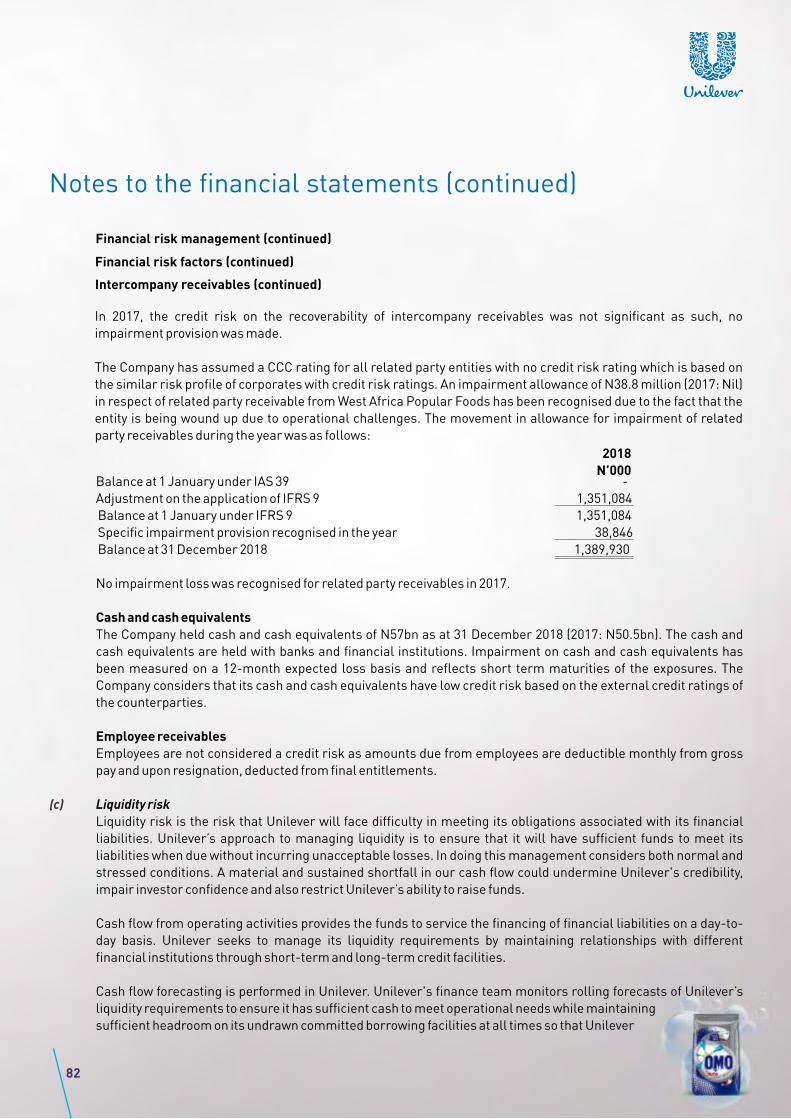
Balance at 1 January under IAS 39 -
Adjustment on the application of IFRS 9 1,351,084
Balance at 1 January under IFRS 9 1,351,084
Specific impairment provision recognised in the year 38,846
Balance at 31 December 2018 1,389,930
No impairment loss was recognised for related party receivables in 2017.
Cash and cash equivalents
The Company held cash and cash equivalents of N57bn as at 31 December 2018 (2017: N50.5bn). The cash and
cash equivalents are held with banks and financial institutions. Impairment on cash and cash equivalents has
been measured on a 12-month expected loss basis and reflects short term maturities of the exposures. The
Company considers that its cash and cash equivalents have low credit risk based on the external credit ratings of
the counterparties.
Employee receivables
Employees are not considered a credit risk as amounts due from employees are deductible monthly from gross
pay and upon resignation, deducted from final entitlements.
Liquidity risk
Liquidity risk is the risk that Unilever will face difficulty in meeting its obligations associated with its financial
liabilities. Unilever’s approach to managing liquidity is to ensure that it will have sufficient funds to meet its
liabilities when due without incurring unacceptable losses. In doing this management considers both normal and
stressed conditions. A material and sustained shortfall in our cash flow could undermine Unilever's credibility,
impair investor confidence and also restrict Unilever’s ability to raise funds.
Cash flow from operating activities provides the funds to service the financing of financial liabilities on a day-to-
day basis. Unilever seeks to manage its liquidity requirements by maintaining relationships with different
financial institutions through short-term and long-term credit facilities.
Cash flow forecasting is performed in Unilever. Unilever's finance team monitors rolling forecasts of Unilever’s
liquidity requirements to ensure it has sufficient cash to meet operational needs while maintaining
sufficient headroom on its undrawn committed borrowing facilities at all times so that Unilever
2018
N’000
( )c
82
Notes to the financial statements (continued)
Financial risk management (continued)
Financial risk factors (continued)
Intercompany receivables (continued)
In 2017, the credit risk on the recoverability of intercompany receivables was not significant as such, no
impairment provision was made.
The Company has assumed a CCC rating for all related party entities with no credit risk rating which is based on
the similar risk profile of corporates with credit risk ratings. An impairment allowance of N38.8 million (2017: Nil)
in respect of related party receivable from West Africa Popular Foods has been recognised due to the fact that the
entity is being wound up due to operational challenges. The movement in allowance for impairment of related
party receivables during the year was as follows:
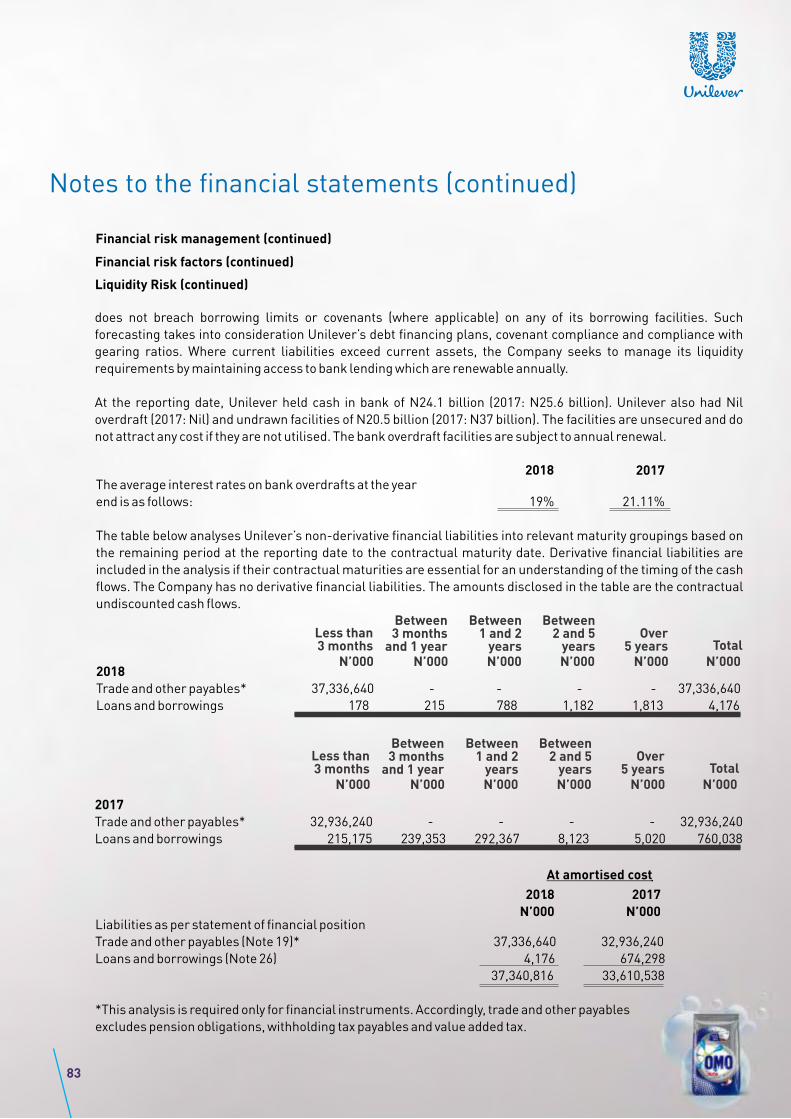
The average interest rates on bank overdrafts at the year
end is as follows: 19% 21.11%
The table below analyses Unilever’s non-derivative financial liabilities into relevant maturity groupings based on
the remaining period at the reporting date to the contractual maturity date. Derivative financial liabilities are
included in the analysis if their contractual maturities are essential for an understanding of the timing of the cash
flows. The Company has no derivative financial liabilities. The amounts disclosed in the table are the contractual
undiscounted cash flows.
2018 2017
Total
Between2 and 5
yearsOver
5 yearsN’000 N’000N’000N’000N’000N’000
Between1 and 2
years
Between3 months
and 1 yearLess than3 months
2018
Trade and other payables* 37,336,640 - - - - 37,336,640
Loans and borrowings 178 215 788 1,182 1,813 4,176
Total
Between2 and 5
yearsOver
5 yearsN’000 N’000N’000N’000N’000N’000
Between1 and 2
years
Between3 months
and 1 yearLess than3 months
2017
Trade and other payables* 32,936,240 - - - - 32,936,240
Loans and borrowings 215,175 239,353 292,367 8,123 5,020 760,038
Liabilities as per statement of financial position
Trade and other payables (Note 19)* 37,336,640 32,936,240
Loans and borrowings (Note 26) 4,176 674,298
37,340,816 33,610,538
*This analysis is required only for financial instruments. Accordingly, trade and other payables
excludes pension obligations, withholding tax payables and value added tax.
2018
N’000
2017
N’000
At amortised cost
83
Notes to the financial statements (continued)
Financial risk management (continued)
Financial risk factors (continued)
Liquidity Risk (continued)
does not breach borrowing limits or covenants (where applicable) on any of its borrowing facilities. Such
forecasting takes into consideration Unilever’s debt financing plans, covenant compliance and compliance with
gearing ratios. Where current liabilities exceed current assets, the Company seeks to manage its liquidity
requirements by maintaining access to bank lending which are renewable annually.
At the reporting date, Unilever held cash in bank of N24.1 billion (2017: N25.6 billion). Unilever also had Nil
overdraft (2017: Nil) and undrawn facilities of N20.5 billion (2017: N37 billion). The facilities are unsecured and do
not attract any cost if they are not utilised. The bank overdraft facilities are subject to annual renewal.
The gearing ratios at 31 December 2018 and 2017 were as follows:
Total liabilities 49,053,830 45,175,990
Total assets 131,843,373 121,084,365
Gearing ratio (%) 37% 37%
Critical accounting estimates and judgements
Estimates and accounting judgements are continually evaluated and are based on historical experience and other
factors, including expectations of future events that are believed to be reasonable under the circumstances.
The preparation of financial statements requires management to make judgements, estimates and assumptions
in the application of accounting policies that affect the reported amounts of assets, liabilities, income and
expenses. Actual results may differ from these estimates. Estimates and judgements are continuously evaluated
and are based on historical experience and other factors, including expectations of future events that are believed
to be reasonable. Revisions to accounting estimates are recognised in the period in which the estimate is revised
and in any future period affected.
Information about critical judgements in applying accounting policies, as well as estimates and assumptions that
have the most significant risk of causing a material adjustment to the carrying amounts of assets and liabilities
within the next financial year, are:
Retirement benefit and long service award obligations
The cost of retirement benefit and long service award obligations are determined using actuarial valuations. An
actuarial valuation involves making various assumptions which may differ from actual developments in the
future. These include the determination of the discount rate, future salary increases and mortality rates.
Due to the complexity of the valuation, the underlying assumptions and its long-term nature, a defined benefit
obligation is highly sensitive to changes in these assumptions. All assumptions are reviewed at each reporting
date.
2018
N’000
2017
N’000
3
(i)
84
Notes to the financial statements (continued)
Financial risk management (continued)
Financial risk factors (continued)
Capital risk management
Unilever’s objectives when managing capital are to safeguard Unilever’s ability to continue as a going concern in
order to provide returns for shareholders and benefits for other stakeholders and to maintain an optimal capital
structure to reduce the cost of capital.
In order to maintain or adjust the capital structure, Unilever may adjust the amount of dividends paid to
shareholders, return capital to shareholders, issue new shares or sell assets to reduce debt.
Consistent with others in the industry, Unilever monitors capital on the basis of the gearing ratio. This ratio is
calculated as total liabilities (non-current liabilities and current liabilities) over total assets (non-current assets
and current assets), based on balances reported in the statement of financial position.
2.1

Recognition and measurement of contingencies: key assumptions about the likelihood and magnitude of an
outflow of resources (Note 22).
Provision for Right of Return on Revenue (Note 4b)
Measurement of ECL allowance of trade and intercompany receivables (Note 17 (iii) and (vi))
Recognition and measurement of provisions and contingencies (Note 33)
(ii)
(iii)
(iv)
(v)
Segment reporting
The chief operating decision-maker has been identified as the Leadership Team (LT) of Unilever Nigeria Plc. The
Leadership Team reviews Unilever’s monthly financial and operational information in order to assess
performance and allocate resources. Management has determined the operating segments based on these
reports. The Leadership Team consider the business from Food Products category and Home and Personal Care
category.
Foods – including sales of tea and savoury products
Home and Personal Care – including sales of fabric care, household cleaning, skin care and oral care products.
There are no intersegmental sales and Nigeria is the Company's primary geographical segment as it comprises
98% of the Company's sales.
The Leadership Team assesses the performance based on operating profits for each operating segment that is
reviewed. Total financing (including interest income and expense), income taxes and retirement benefit
obligations are managed on an entity-wide basis and are not allocated to operating segments.
Total segment assets exclude tax related assets. These are included in the reconciliation to the total assets on the
Statement of financial position.
4a.
85
Notes to the financial statements (continued)
Critical accounting estimates and judgements (continued)
In determining the appropriate discount rate, management considers the interest rates of government bonds
with extrapolated maturities corresponding to the expected duration of the defined benefit obligation.
The mortality rate is based on the rates published in the A67/70 tables published jointly by the Institute and
Faculty of Actuaries in the UK.
Future salary increases are based on expected future inflation rates in Nigeria. Further details about the
assumptions are given in Note 21.
Total
N’000
Home and
Personal care
N’000
Food
products
N’0002018
Property, plant and equipment 14,211,601 15,465,938 29,677,539
Inventories 6,670,078 7,258,789 13,928,867
20,881,679 22,724,727 43,606,406
Other non-current assets 855,591
Cash and bank balances 57,144,182
Other current assets 30,237,194
Trade and other payables (38,610,839)
Income tax (4,555,820)
Deferred income -
Loans and borrowings (4,176)
Deferred tax liabilities (3,652,125)
Retirement benefit obligations (2,021,360)
Long service obligations (209,510)
Other employee benefits -
Net assets 82,789,543
Capital expenditure 2,583,733 2,811,778 5,395,511
Total
N’000
Home and
Personal care
N’000
Food
products
N’0002017
Revenue 37,283,202 47,910,167 85,193,369
Depreciation and amortisation 2,046,132 2,287,166 4,333,298
Segmental operating profit 5,352,844 6,878,584 12,231,428
Finance income 685,007 880,256 1,565,263
Finance cost (1,400,722) (1,799,974) (3,200,696)
Profit before taxation 10,595,995
86
Notes to the financial statements (continued)
Segment reporting (continued)
Total
N’000
Home and
Personal care
N’000
Food
products
N’000
Revenue 44,486,751 48,413,218 92,899,969
Depreciation and amortisation 1,402,912 1,526,735 2,929,647
Segmental operating profit 4,404,514 4,793,262 9,197,776
Finance income 1,928,366 2,098,566 4,026,932
Finance cost (288,661) (314,139) (602,800)
Profit before taxation 12,621,908
2018
Total
N’000
Home and
Personal care
N’000
Food
products
N’0002017
Property, plant and equipment 14,109,316 15,771,388 29,880,704
Inventories 5,420,027 6,058,505 11,478,532
19,529,343 21,829,893 41,359,236
Other non-current assets 1,244,921
Cash and bank balances 50,493,595
Other current assets 27,986,613
Trade and other payables (33,408,820)
Income tax (2,799,203)
Deferred income (62,781)
Loans and borrowings (674,298)
Deferred tax liabilities (4,484,871)
Retirement benefit obligations (3,454,370)
Long service obligations (205,745)
Other employee benefits (85,902)
Net assets 75,908,375
Capital expenditure 2,152,818 2,406,420 4,559,238
2018
N’000
2017
N’000
Revenue by geographical location of customers:
Domestic (within Nigeria) 91,216,481 83,497,196
Export (outside Nigeria) 1,683,488 1,696,173
92,899,969 85,193,369
The Company has 102 (2017: 98) key distributors, and no single key distributor accounted for more than 10% of the
Company's revenue.
All the Company's non-current assets are located in Nigeria.
Right of Return
In line with the adoption of IFRS 15, a refund liability of N1.1bn (2017: nil) has been recognised for the right to
return goods sold. Management has made an estimate based on historical trend of likely sales returns by
customers subsequent to year end. The amount of revenue recognised is adjusted for expected returns. A refund
liability (Note 19) and the right to recover returned goods asset have been recognised (Note 16)
4b
87
Notes to the financial statements (continued)
Segment reporting (continued)
Expenses by nature
The following items have been charged/(credited) in arriving at profit before tax:
Raw materials and consumables 50,127,989 42,824,285
Bought in products 4,649,860 5,041,494
Depreciation of property, plant and equipment (Note 14) 2,672,245 4,099,064
Amortisation of intangible assets (Note 15) 257,402 234,234
Staff costs (Note 8) 9,739,754 7,373,428
Brand and marketing (Note 9) 4,397,631 3,582,135
Royalties and Service Fees (Note 9) 2,422,901 2,240,062
Handling charges 3,477,885 3,790,502
Auditors' remuneration 26,047 25,310
Professional service fees 159,113 124,476
Utilities 1,011,971 954,250
Business travel expenses 609,810 448,601
IT costs 1,610,342 374,749
Consumer market research 400,875 455,669
Repairs and maintenance cost 1,368,031 980,799
Insurance 196,025 169,717
Donations 43,456 18,676
Trainings and meals 386,940 146,021
Office materials 68,633 62,364
Total cost of sales, selling and marketing, distribution and
administrative expenses 83,626,910 72,945,836
Analysed as:
Cost of sales 64,674,847 57,679,133
Selling and distribution expenses 4,239,077 3,790,502
Marketing and administrative expenses 14,712,986 11,476,201
83,626,910 72,945,836
Other income
Gain on sale of Aba factory 149,626 -
Gain/(Loss) on sale of property plant and equipment 10,264 (16,918)
TSA income (32 (ii)) 76,270 -
236,160 (16,918)
2018
N’000
2017
N’000
2018
N’000
2017
N’000
5
(a)
6
88
Notes to the financial statements (continued)

Compensation of key management personnel and directors
Key management personnel comprises the directors (executive and non-executive) and other key management
staff who are members of the Leadership Team.
Compensation to key management personnel was as follows:
Short term benefits
Non executive directors 57,457 43,495
Executive directors 648,046 394,190
Members of the Leadership team (excluding executive directors) 930,040 602,103
1,635,543 1,039,788
Post-employment benefits:
Executive directors 13,840 12,615
Members of the Leadership team (excluding executive directors) 31,580 28,101
45,420 40,716
The emoluments of the Chairman of Board of Directors 10,787 8,819
The emoluments of the highest paid director 330,107 219,513
Employee benefits expense
Salaries and wages 6,051,869 4,947,445
Pension contribution 512,353 85,173
Gratuity and Long service awards (Note 21(vi)) 265,925 286,658
Stakeholders scheme (Note 28) - 11,752
Other employee allowances 2,909,607 2,042,400
9,739,754 7,373,428
Other employee allowances include incentives, medical allowances, product packs and other benefits which are
consistent with industry practice.
The average number of persons, excluding executive directors, employed by Unilever during the year was as
follows:
Administration 215 102
Technical and production 758 840
Sales and marketing 201 206
1,174 1,148
2018
N’000
2017
N’000
2018
N’000
2017
N’000
2018
N’000
2017
N’000
2018
Number
2017
Number
7
(i)
(ii)
(iii)
(iv)
8
89
Notes to the financial statements (continued)

The table below shows the numbers of direct employees of Unilever excluding executive directors, other than
employees who discharged their duties wholly or mainly outside Nigeria and which fell within the bands stated.
1 - 250,000 2 3
250,001 - 500,0001 1 18
500,001 - 750,000 12 12
750,001 - 1,000,000 46 9
1,000,001 - 1,250,000 15 8
1,250,001 - 1,500,000 15 30
1,500,001 - 1,750,000 47 161
1,750,001 - 2,000,000 88 211
2,000,001 - 2,250,000 165 191
2,250,001 - 2,500,000 157 106
2,500,001 - 2,750,000 114 52
2,750,001 - 5,000,000 191 69
5,000,001 - 10,000,000 150 163
10,000,001 - 15,000,000 76 58
15,000,001 - 20,000,000 30 23
20,000,001 - 30,000,000 38 23
30,000,001 - 40,000,000 18 7
40,000,001 - 60,000,000 3 4
60,000,001 - 80,000,000 6 -
1,174 1,148
Marketing and administrative expenses
Brand and marketing 4,397,631 3,582,135
Overheads 7,892,454 5,654,004
Royalties and Service Fees (9(b)) 2,422,901 2,240,062
14,712,986 11,476,201
Unilever Nigeria Plc has Technology & Trademark agreements with Unilever Plc to manufacture, distribute and
market its international brands. In consideration for this, a royalty of 2% of net sales value and 0.5% of net sales
value is payable to Unilever Plc for technology and trademark licences respectively. (Note 25)
Also, Unilever Nigeria has a central support and management services agreement with Unilever Europe Business
Centre B.V (previously Unilever Plc) for the provision of corporate strategic direction, and expert advice/support on
legal, tax, finance, human resources and information technology matters. In consideration of this, a fee of 2% of
profit before tax is payable as service fees. (Note 25)
2018
Number
2017
NumberNN
2018
N’000
2017
N’000
9
(b)
90
Notes to the financial statements (continued)
Employee benefits expense (continued)
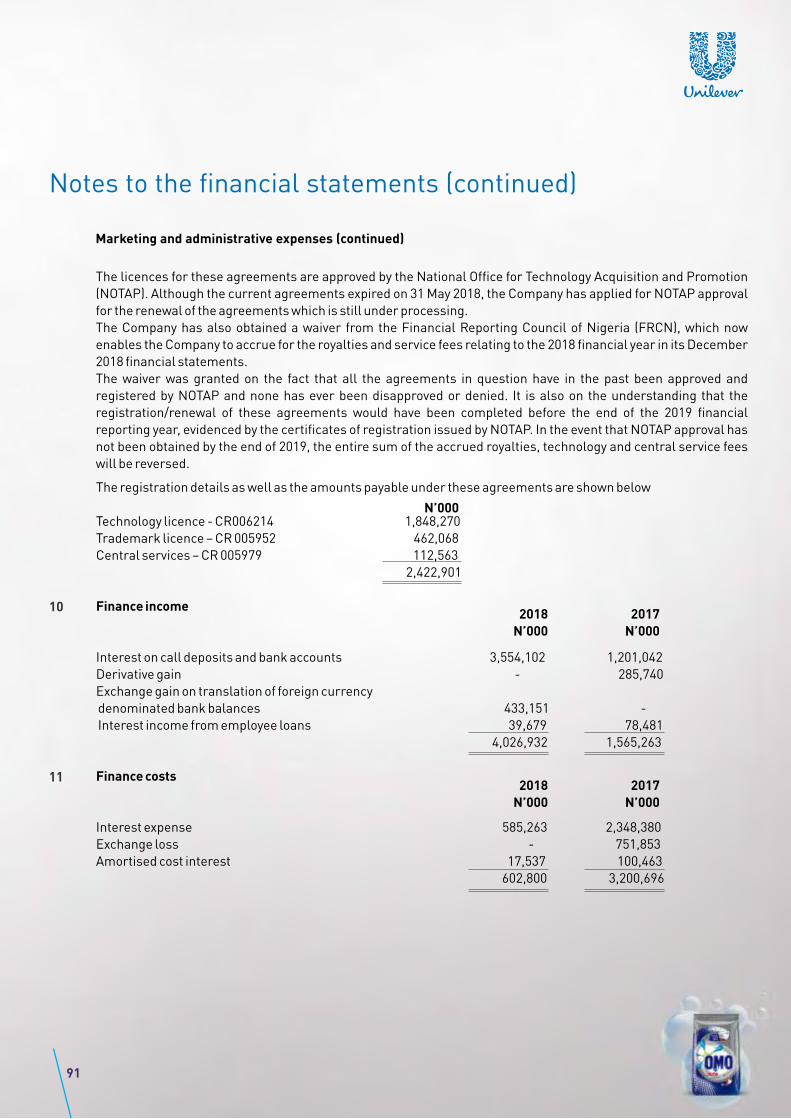
The licences for these agreements are approved by the National Office for Technology Acquisition and Promotion
(NOTAP). Although the current agreements expired on 31 May 2018, the Company has applied for NOTAP approval
for the renewal of the agreements which is still under processing.
The Company has also obtained a waiver from the Financial Reporting Council of Nigeria (FRCN), which now
enables the Company to accrue for the royalties and service fees relating to the 2018 financial year in its December
2018 financial statements.
The waiver was granted on the fact that all the agreements in question have in the past been approved and
registered by NOTAP and none has ever been disapproved or denied. It is also on the understanding that the
registration/renewal of these agreements would have been completed before the end of the 2019 financial
reporting year, evidenced by the certificates of registration issued by NOTAP. In the event that NOTAP approval has
not been obtained by the end of 2019, the entire sum of the accrued royalties, technology and central service fees
will be reversed.
The registration details as well as the amounts payable under these agreements are shown below
Technology licence - CR006214 1,848,270
Trademark licence – CR 005952 462,068
Central services – CR 005979 112,563
2,422,901
Finance income
Interest on call deposits and bank accounts 3,554,102 1,201,042
Derivative gain - 285,740
Exchange gain on translation of foreign currency
denominated bank balances 433,151 -
Interest income from employee loans 39,679 78,481
4,026,932 1,565,263
Finance costs
Interest expense 585,263 2,348,380
Exchange loss - 751,853
Amortised cost interest 17,537 100,463
602,800 3,200,696
N’000
2018
N’000
2017
N’000
2018
N’000
2017
N’000
10
11
91
Notes to the financial statements (continued)
Marketing and administrative expenses (continued)
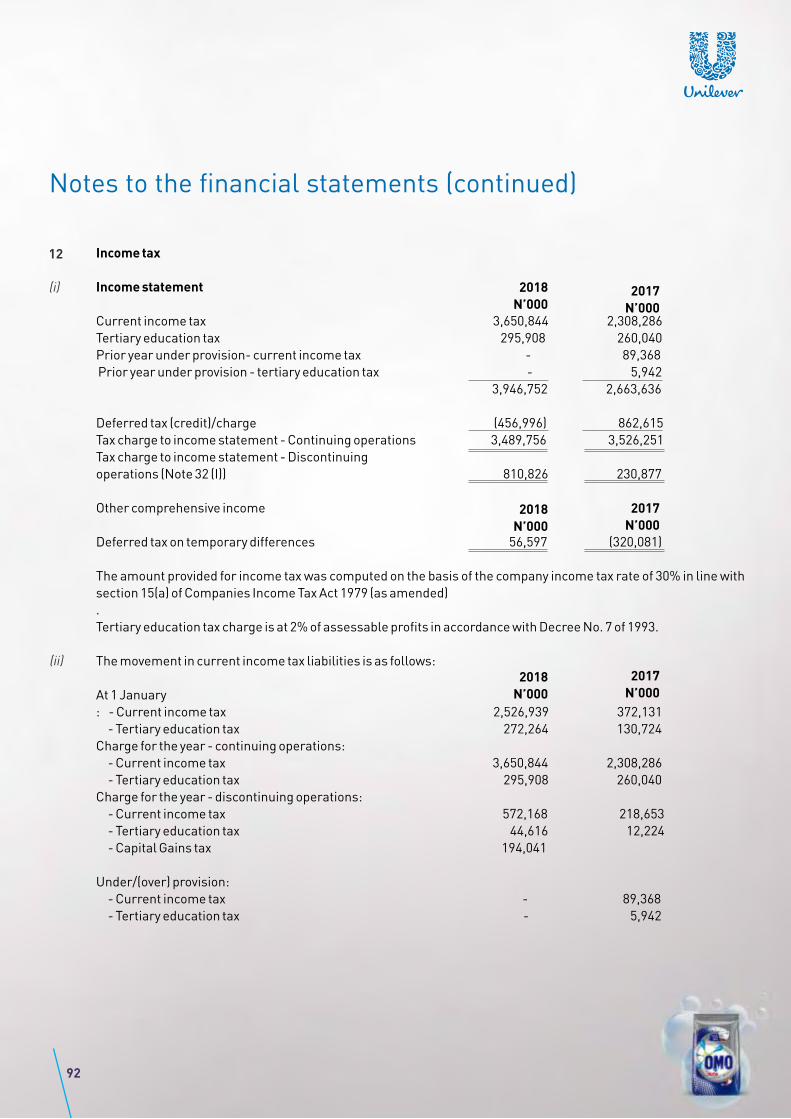
Income tax
Income statement
Current income tax 3,650,844 2,308,286
Tertiary education tax 295,908 260,040
Prior year under provision- current income tax - 89,368
Prior year under provision - tertiary education tax - 5,942
3,946,752 2,663,636
Deferred tax (credit)/charge (456,996) 862,615
Tax charge to income statement - Continuing operations 3,489,756 3,526,251
Tax charge to income statement - Discontinuing
operations (Note 32 (I)) 810,826 230,877
Other comprehensive income
Deferred tax on temporary differences 56,597 (320,081)
The amount provided for income tax was computed on the basis of the company income tax rate of 30% in line with
section 15(a) of Companies Income Tax Act 1979 (as amended)
.
Tertiary education tax charge is at 2% of assessable profits in accordance with Decree No. 7 of 1993.
The movement in current income tax liabilities is as follows:
At 1 January
: - Current income tax 2,526,939 372,131
- Tertiary education tax 272,264 130,724
Charge for the year - continuing operations:
- Current income tax 3,650,844 2,308,286
- Tertiary education tax 295,908 260,040
Charge for the year - discontinuing operations:
- Current income tax 572,168 218,653
- Tertiary education tax 44,616 12,224
- Capital Gains tax 194,041
Under/(over) provision:
- Current income tax - 89,368
- Tertiary education tax - 5,942
2018
N’0002017
N’000
2018
N’000
2017
N’000
2018
N’000
2017
N’000
12
(i)
(ii)
92
Notes to the financial statements (continued)
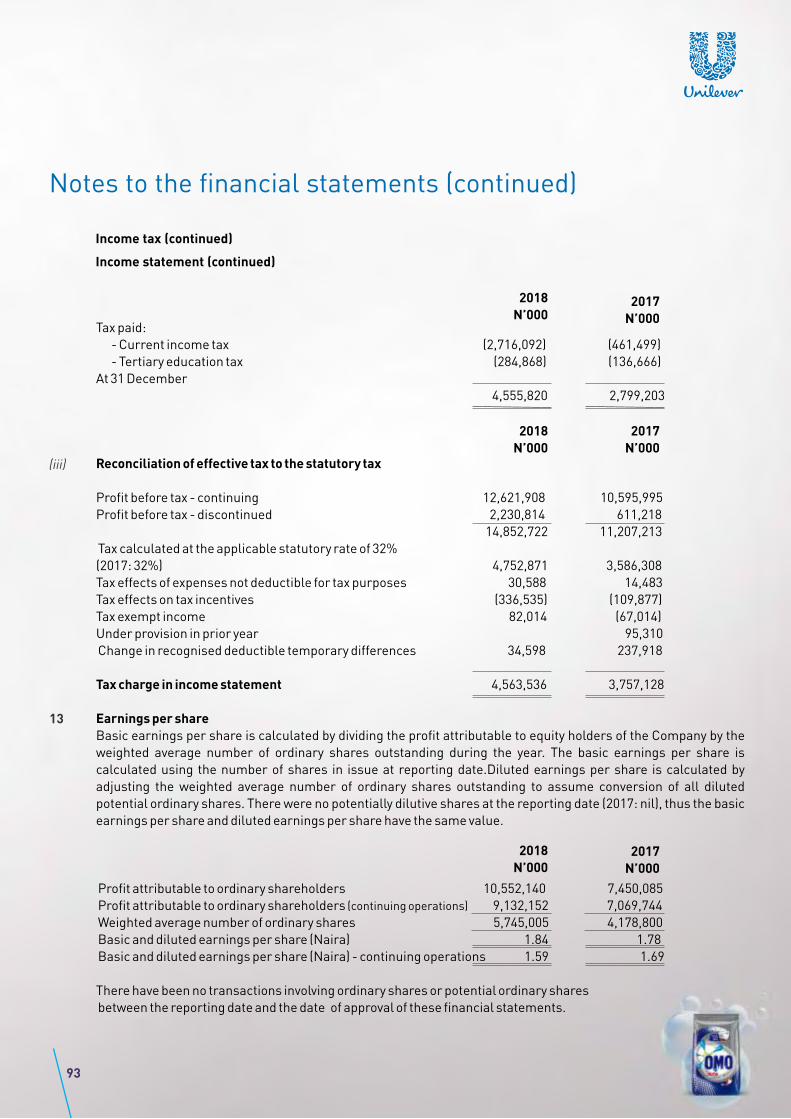
Tax paid:
- Current income tax (2,716,092) (461,499)
- Tertiary education tax (284,868) (136,666)
At 31 December
4,555,820 2,799,203
Reconciliation of effective tax to the statutory tax
Profit before tax - continuing 12,621,908 10,595,995
Profit before tax - discontinued 2,230,814 611,218
14,852,722 11,207,213
Tax calculated at the applicable statutory rate of 32%
(2017: 32%) 4,752,871 3,586,308
Tax effects of expenses not deductible for tax purposes 30,588 14,483
Tax effects on tax incentives (336,535) (109,877)
Tax exempt income 82,014 (67,014)
Under provision in prior year 95,310
Change in recognised deductible temporary differences 34,598 237,918
Tax charge in income statement 4,563,536 3,757,128
Earnings per share
Basic earnings per share is calculated by dividing the profit attributable to equity holders of the Company by the
weighted average number of ordinary shares outstanding during the year. The basic earnings per share is
calculated using the number of shares in issue at reporting date.Diluted earnings per share is calculated by
adjusting the weighted average number of ordinary shares outstanding to assume conversion of all diluted
potential ordinary shares. There were no potentially dilutive shares at the reporting date (2017: nil), thus the basic
earnings per share and diluted earnings per share have the same value.
Profit attributable to ordinary shareholders 10,552,140 7,450,085
Profit attributable to ordinary shareholders (continuing operations) 9,132,152 7,069,744
Weighted average number of ordinary shares 5,745,005 4,178,800
Basic and diluted earnings per share (Naira) 1.84 1.78
Basic and diluted earnings per share (Naira) - continuing operations 1.59 1.69
There have been no transactions involving ordinary shares or potential ordinary shares
between the reporting date and the date of approval of these financial statements.
2018
N’000
2017
N’000
2018
N’0002017
N’000
(iii)
13
2018
N’0002017
N’000
93
Notes to the financial statements (continued)
Income tax (continued)
Income statement (continued)
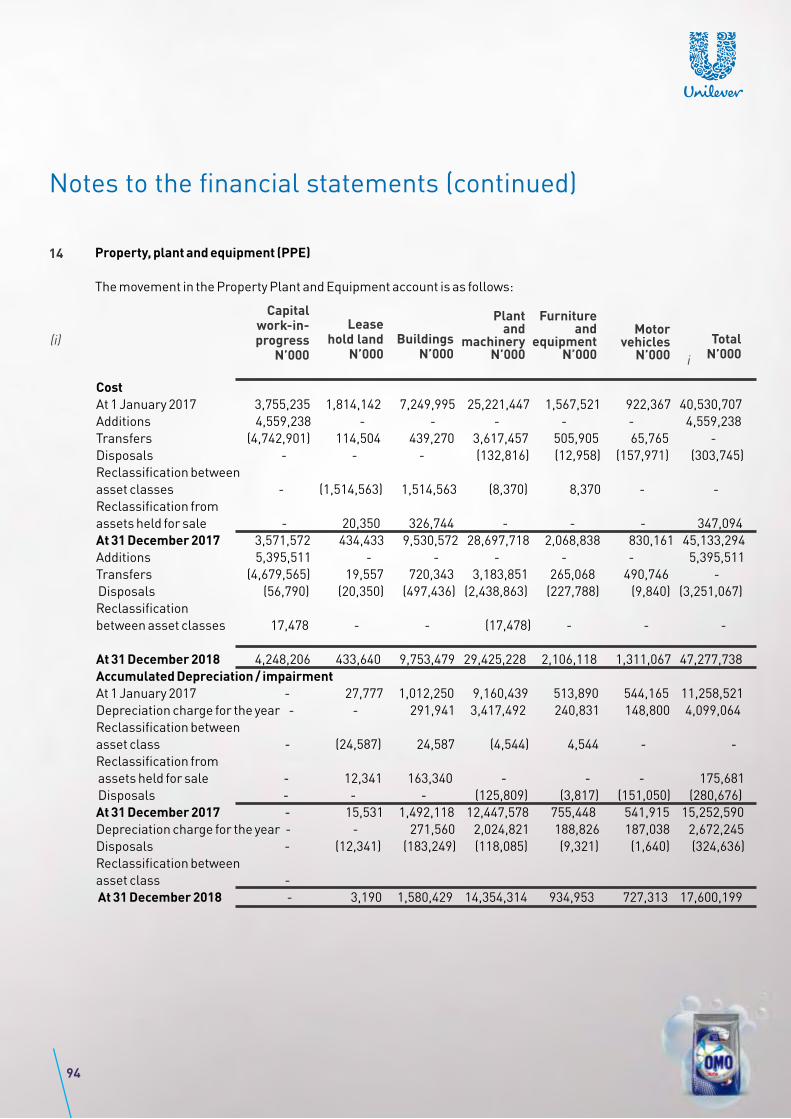
i
TotalN’000
Motor vehicles
N’000
Furnitureand
equipmentN’000
Plantand
machineryN’000
BuildingsN’000
Leasehold land
N’000
Capitalwork-in-progress
N’000
Property, plant and equipment (PPE)
The movement in the Property Plant and Equipment account is as follows:
Cost
At 1 January 2017 3,755,235 1,814,142 7,249,995 25,221,447 1,567,521 922,367 40,530,707
Additions 4,559,238 - - - - - 4,559,238
Transfers (4,742,901) 114,504 439,270 3,617,457 505,905 65,765 -
Disposals - - - (132,816) (12,958) (157,971) (303,745)
Reclassification between
asset classes - (1,514,563) 1,514,563 (8,370) 8,370 - -
Reclassification from
assets held for sale - 20,350 326,744 - - - 347,094
At 31 December 2017 3,571,572 434,433 9,530,572 28,697,718 2,068,838 830,161 45,133,294
Additions 5,395,511 - - - - - 5,395,511
Transfers (4,679,565) 19,557 720,343 3,183,851 265,068 490,746 -
Disposals (56,790) (20,350) (497,436) (2,438,863) (227,788) (9,840) (3,251,067)
Reclassification
between asset classes 17,478 - - (17,478) - - -
At 31 December 2018 4,248,206 433,640 9,753,479 29,425,228 2,106,118 1,311,067 47,277,738
Accumulated Depreciation / impairment
At 1 January 2017 - 27,777 1,012,250 9,160,439 513,890 544,165 11,258,521
Depreciation charge for the year - - 291,941 3,417,492 240,831 148,800 4,099,064
Reclassification between
asset class - (24,587) 24,587 (4,544) 4,544 - -
Reclassification from
assets held for sale - 12,341 163,340 - - - 175,681
Disposals - - - (125,809) (3,817) (151,050) (280,676)
At 31 December 2017 - 15,531 1,492,118 12,447,578 755,448 541,915 15,252,590
Depreciation charge for the year - - 271,560 2,024,821 188,826 187,038 2,672,245
Disposals - (12,341) (183,249) (118,085) (9,321) (1,640) (324,636)
Reclassification between
asset class -
At 31 December 2018 - 3,190 1,580,429 14,354,314 934,953 727,313 17,600,199
(i)
94
Notes to the financial statements (continued)
14

i
TotalN’000
Motor vehicles
N’000
Furnitureand
equipmentN’000
Plantand
machineryN’000
BuildingsN’000
Leasehold land
N’000
Capitalwork-in-progress
N’000
Net book value:
At 1 January 2017 3,755,235 1,786,365 6,237,745 16,061,008 1,053,631 378,202 29,272,186
At 31 December 2017 3,571,572 418,902 8,038,454 16,250,140 1,313,390 288,246 29,880,704
At 31 December 2018 4,248,206 430,450 8,173,050 15,070,914 1,171,165 583,754 29,677,539
Security
As at 31 December 2018, no item of property, plant and equipment was pledged as security for liabilities (2017: nil).
Capital work-in-progress
The capital work-in-progress of N4.2bn (2017: N3.6bn) represents buildings and plant and machinery under
construction and other property, plant and equipment not available for use in the manner intended by
management.
(ii)
(iii)
TotalN’000
Motor vehicles
N’000
Furnitureand
equipmentN’000
Plantand
machineryN’000
Landand
BuildingN’000
Capital work-in-progress 60,331 4,060,491 97,459 29,925 4,248,206
Capital commitments
Contractual commitments with respect to property, plant and equipment contracted for at the reporting date
but not recognised in the financial statements:
Capital commitments 2,035,862 1,458,778
2018
N’0002017
N’000
(iv)
95
Notes to the financial statements (continued)
Property, plant and equipment (PPE) (continued)
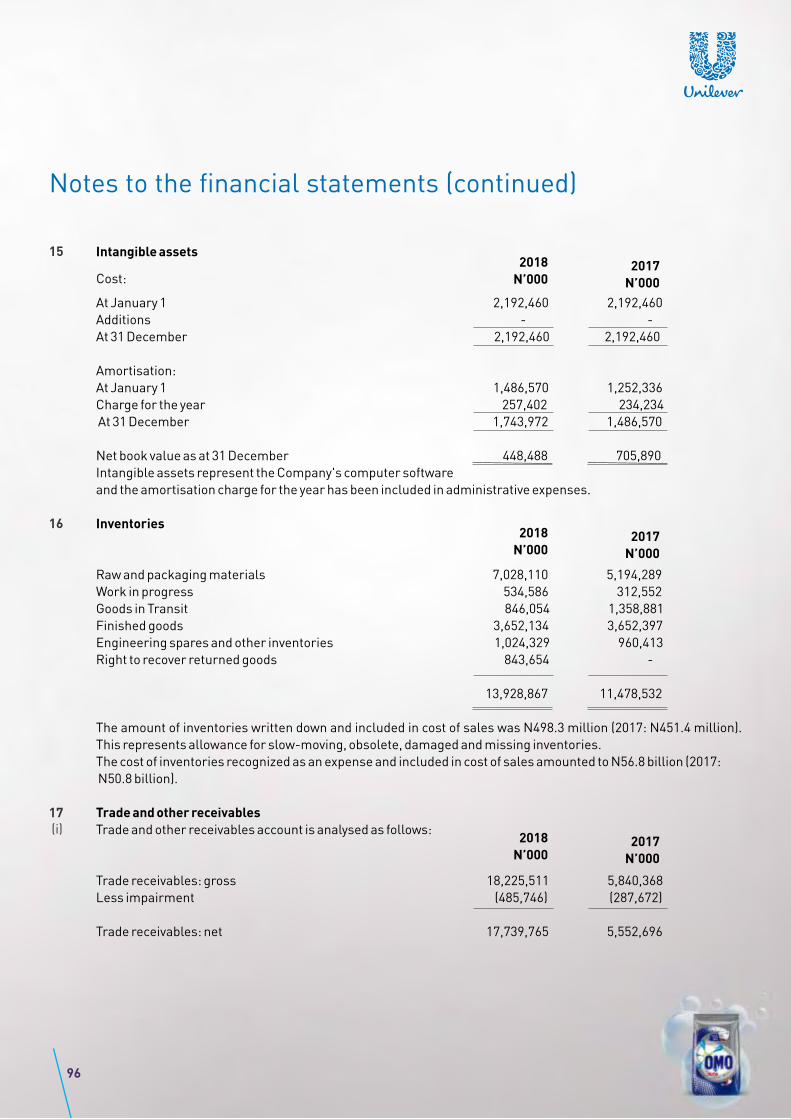
Intangible assets
At January 1 2,192,460 2,192,460
Additions - -
At 31 December 2,192,460 2,192,460
Amortisation:
At January 1 1,486,570 1,252,336
Charge for the year 257,402 234,234
At 31 December 1,743,972 1,486,570
Net book value as at 31 December 448,488 705,890
Intangible assets represent the Company's computer software
and the amortisation charge for the year has been included in administrative expenses.
Inventories
Raw and packaging materials 7,028,110 5,194,289
Work in progress 534,586 312,552
Goods in Transit 846,054 1,358,881
Finished goods 3,652,134 3,652,397
Engineering spares and other inventories 1,024,329 960,413
Right to recover returned goods 843,654 -
13,928,867 11,478,532
The amount of inventories written down and included in cost of sales was N498.3 million (2017: N451.4 million).
This represents allowance for slow-moving, obsolete, damaged and missing inventories.
The cost of inventories recognized as an expense and included in cost of sales amounted to N56.8 billion (2017:
N50.8 billion).
Trade and other receivables
Trade and other receivables account is analysed as follows:
Trade receivables: gross 18,225,511 5,840,368
Less impairment (485,746) (287,672)
Trade receivables: net 17,739,765 5,552,696
2018
N’0002017
N’000Cost:
2018
N’0002017
N’000
2018
N’0002017
N’000
15
16
17
96
Notes to the financial statements (continued)
(i)
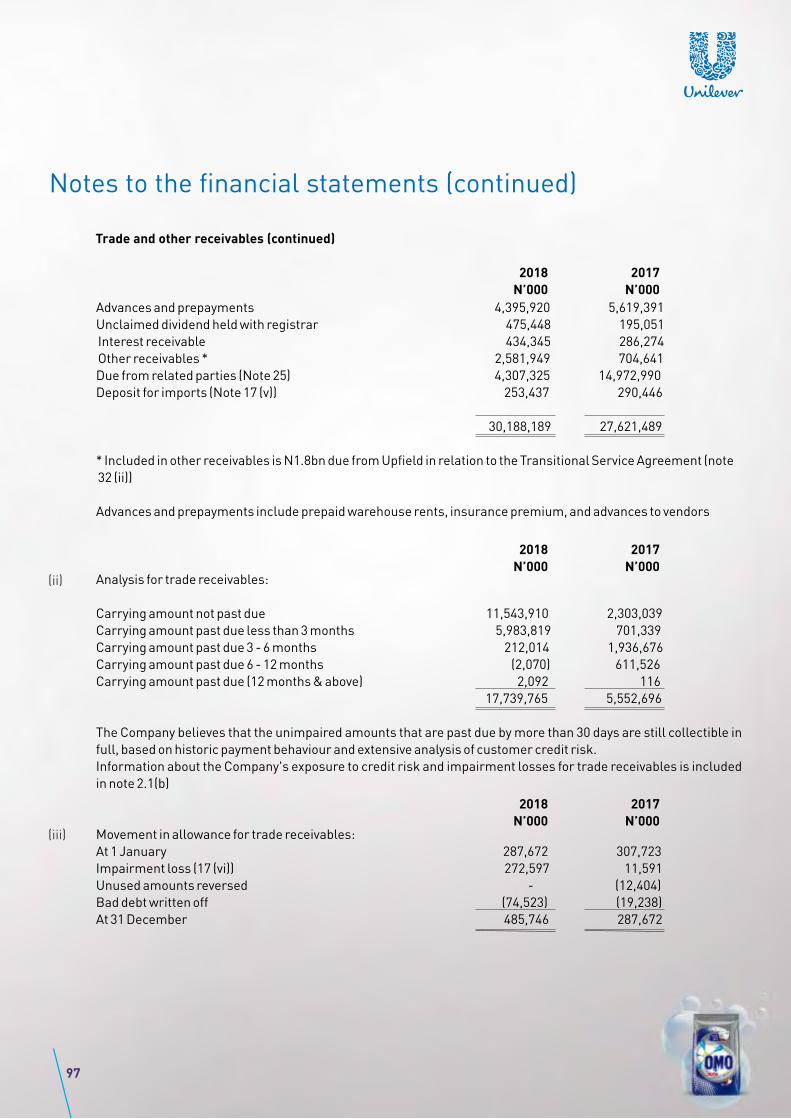
Advances and prepayments 4,395,920 5,619,391
Unclaimed dividend held with registrar 475,448 195,051
Interest receivable 434,345 286,274
Other receivables * 2,581,949 704,641
Due from related parties (Note 25) 4,307,325 14,972,990
Deposit for imports (Note 17 (v)) 253,437 290,446
30,188,189 27,621,489
* Included in other receivables is N1.8bn due from Upfield in relation to the Transitional Service Agreement (note
32 (ii))
Advances and prepayments include prepaid warehouse rents, insurance premium, and advances to vendors
Analysis for trade receivables:
Carrying amount not past due 11,543,910 2,303,039
Carrying amount past due less than 3 months 5,983,819 701,339
Carrying amount past due 3 - 6 months 212,014 1,936,676
Carrying amount past due 6 - 12 months (2,070) 611,526
Carrying amount past due (12 months & above) 2,092 116
17,739,765 5,552,696
The Company believes that the unimpaired amounts that are past due by more than 30 days are still collectible in
full, based on historic payment behaviour and extensive analysis of customer credit risk.
Information about the Company's exposure to credit risk and impairment losses for trade receivables is included
in note 2.1(b)
Movement in allowance for trade receivables:
At 1 January 287,672 307,723
Impairment loss (17 (vi)) 272,597 11,591
Unused amounts reversed - (12,404)
Bad debt written off (74,523) (19,238)
At 31 December 485,746 287,672
2018
N’000
2017
N’000
2018
N’000
2017
N’000
2018
N’000
2017
N’000
(ii)
(iii)
97
Notes to the financial statements (continued)
Trade and other receivables (continued)
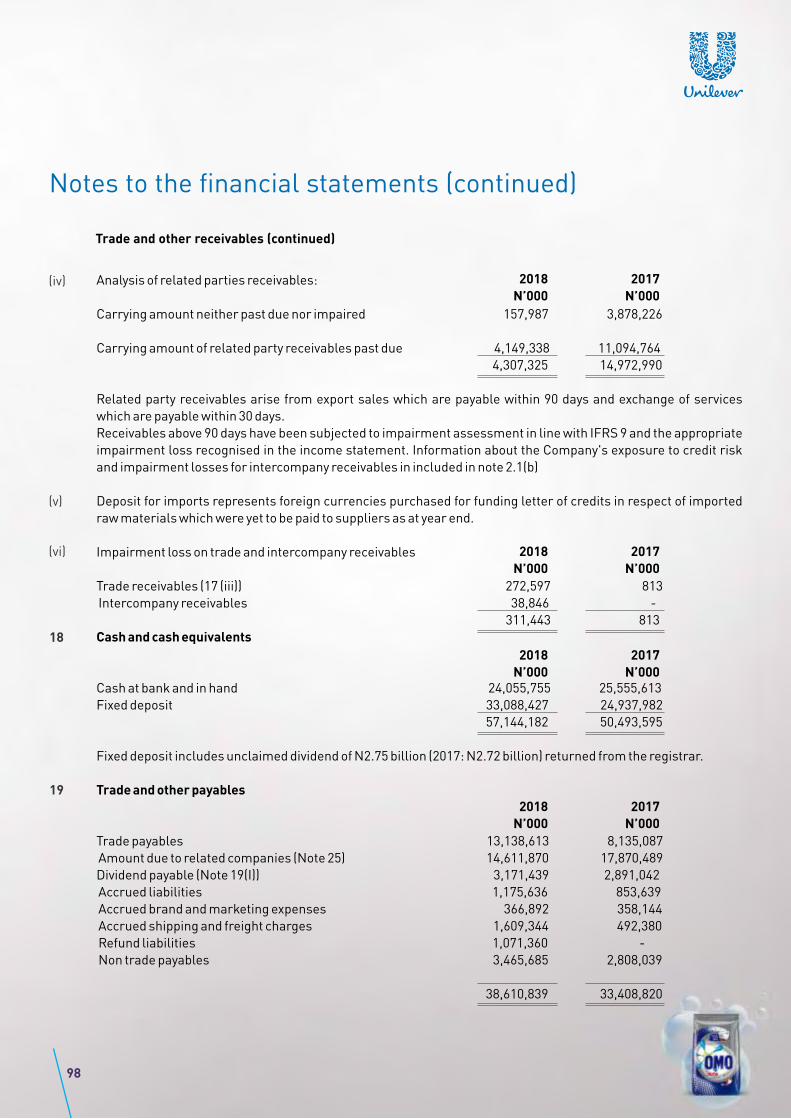
Analysis of related parties receivables:
Carrying amount neither past due nor impaired 157,987 3,878,226
Carrying amount of related party receivables past due 4,149,338 11,094,764
4,307,325 14,972,990
Related party receivables arise from export sales which are payable within 90 days and exchange of services
which are payable within 30 days.
Receivables above 90 days have been subjected to impairment assessment in line with IFRS 9 and the appropriate
impairment loss recognised in the income statement. Information about the Company's exposure to credit risk
and impairment losses for intercompany receivables in included in note 2.1(b)
Deposit for imports represents foreign currencies purchased for funding letter of credits in respect of imported
raw materials which were yet to be paid to suppliers as at year end.
Impairment loss on trade and intercompany receivables
Trade receivables (17 (iii)) 272,597 813
Intercompany receivables 38,846 -
311,443 813
Cash and cash equivalents
Cash at bank and in hand 24,055,755 25,555,613
Fixed deposit 33,088,427 24,937,982
57,144,182 50,493,595
Fixed deposit includes unclaimed dividend of N2.75 billion (2017: N2.72 billion) returned from the registrar.
Trade and other payables
Trade payables 13,138,613 8,135,087
Amount due to related companies (Note 25) 14,611,870 17,870,489
Dividend payable (Note 19(I)) 3,171,439 2,891,042
Accrued liabilities 1,175,636 853,639
Accrued brand and marketing expenses 366,892 358,144
Accrued shipping and freight charges 1,609,344 492,380
Refund liabilities 1,071,360 -
Non trade payables 3,465,685 2,808,039
38,610,839 33,408,820
2018
N’000
2017
N’000
2018
N’000
2017
N’000
2018
N’000
2017
N’000
2018
N’000
2017
N’000
(iv)
(v)
(vi)
18
19
98
Notes to the financial statements (continued)
Trade and other receivables (continued)

* Included in Non trade payables is N711m due to Upfield in relation to the TSA (Note 32 (ii))
Dividend payable
As at 1 January 2,891,042 2,990,997
Dividend declared 2,872,503 378,330
Dividend paid (2,872,503) (378,330)
Dividend unclaimed by shareholders 280,397 (21,054)
Statute barred dividend - (78,901)
As at 31 December 3,171,439 2,891,042
For the year ended 31 December 2018, the directors have proposed a dividend of N1.50 per share, amounting to
N8.6 billion which will be subject to the approval of the shareholders at the next Annual General Meeting.
Unclaimed dividend returned by the registrar is included in a fixed deposit account. In line with SEC rules, this
uncla imed d iv idend is not ava i lable to be used by the Company for i ts own bus iness .
As at 31 December 2018, N475 million (2017: N195 million) of the total dividend was held with the Company's
Registrar, GTL Registrars Limited
Deferred tax liabilities
Deferred income tax is calculated using the statutory income tax rate of 30% (2017: 30%). The movement on the
deferred tax account is as follows:
The movement in deferred tax is as follows:
Deferred tax liability:
At start of year 4,484,871 3,942,337
Changes during the year:
- (Credit)/Charge to income statement (Note 12) (456,996) 862,615
- Charge/(credit) to other comprehensive income 56,597 (320,081)
- Credit to retained earnings (432,347) -
At end of year 3,652,125 4,484,871
2018
N’000
2017
N’000
2018
N’000
2017
N’000
(i)
20
99
Notes to the financial statements (continued)
Trade and other payables (continued)
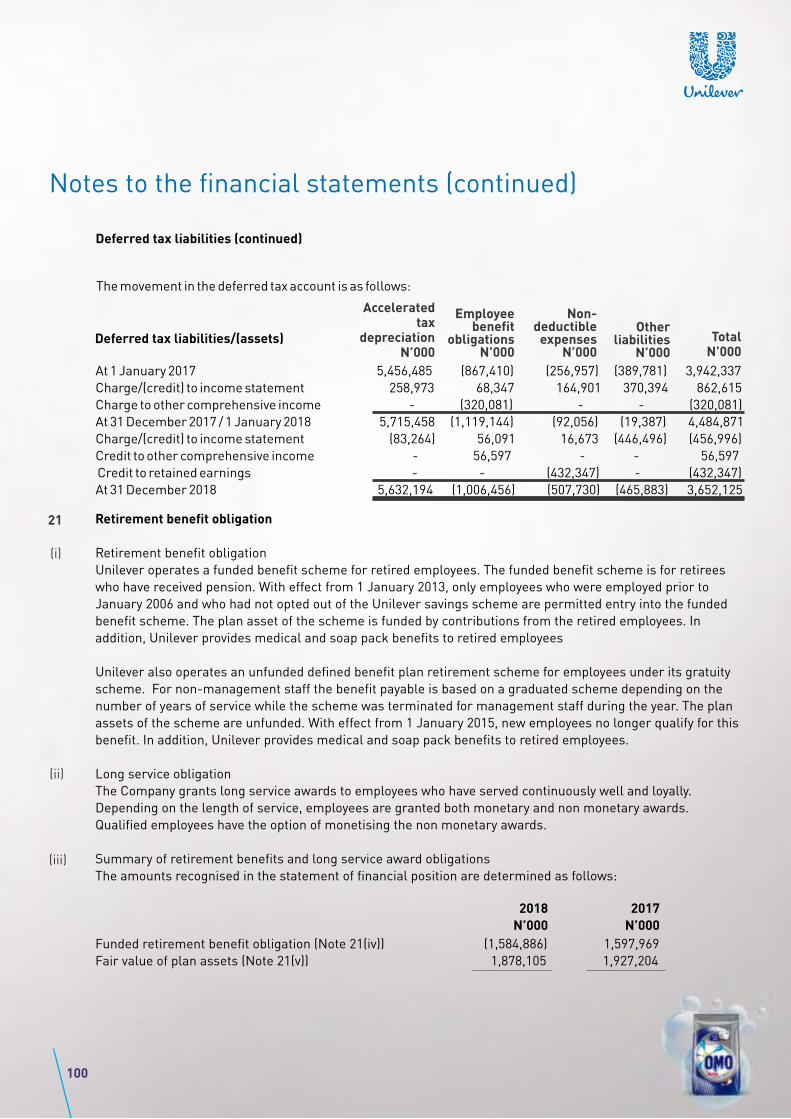
TotalN’000
Other liabilities
N’000
Non-deductible
expensesN’000
Employee benefit
obligationsN’000
Accelerated tax
depreciationN’000
The movement in the deferred tax account is as follows:
Deferred tax liabilities/(assets)
At 1 January 2017 5,456,485 (867,410) (256,957) (389,781) 3,942,337
Charge/(credit) to income statement 258,973 68,347 164,901 370,394 862,615
Charge to other comprehensive income - (320,081) - - (320,081)
At 31 December 2017 / 1 January 2018 5,715,458 (1,119,144) (92,056) (19,387) 4,484,871
Charge/(credit) to income statement (83,264) 56,091 16,673 (446,496) (456,996)
Credit to other comprehensive income - 56,597 - - 56,597
Credit to retained earnings - - (432,347) - (432,347)
At 31 December 2018 5,632,194 (1,006,456) (507,730) (465,883) 3,652,125
Retirement benefit obligation
Retirement benefit obligation
Unilever operates a funded benefit scheme for retired employees. The funded benefit scheme is for retirees
who have received pension. With effect from 1 January 2013, only employees who were employed prior to
January 2006 and who had not opted out of the Unilever savings scheme are permitted entry into the funded
benefit scheme. The plan asset of the scheme is funded by contributions from the retired employees. In
addition, Unilever provides medical and soap pack benefits to retired employees
Unilever also operates an unfunded defined benefit plan retirement scheme for employees under its gratuity
scheme. For non-management staff the benefit payable is based on a graduated scheme depending on the
number of years of service while the scheme was terminated for management staff during the year. The plan
assets of the scheme are unfunded. With effect from 1 January 2015, new employees no longer qualify for this
benefit. In addition, Unilever provides medical and soap pack benefits to retired employees.
Long service obligation
The Company grants long service awards to employees who have served continuously well and loyally.
Depending on the length of service, employees are granted both monetary and non monetary awards.
Qualified employees have the option of monetising the non monetary awards.
Summary of retirement benefits and long service award obligations
The amounts recognised in the statement of financial position are determined as follows:
Funded retirement benefit obligation (Note 21(iv)) (1,584,886) 1,597,969
Fair value of plan assets (Note 21(v)) 1,878,105 1,927,204
2018
N’000
2017
N’000
21
(i)
(ii)
(iii)
100
Notes to the financial statements (continued)
Deferred tax liabilities (continued)

Retirement benefit surplus 293,219 329,235
Unfunded retirement benefit obligations (Note 21(iv)) (2,021,360) (3,454,370)
Long service award obligations (Note 21(iv)) (209,510) (205,745)
Net liability in the statement of financial position (1,937,651) (3,330,880)
Reconciliation of change in liabilities
The movement in the obligations over the year is as follows:
2018
N’000
2017
N’000
(iv)
2018
N’000
2017
N’000
2018
N’000
2017
N’000
2018
N’000
2017
N’000
Long Service Award
Obligations
Unfunded Retirement
Benefit Obligations
Funded Retirement
Benefit Obligations
At 1 January (1,597,969) (1,237,335) (3,454,370) (2,613,267) (205,745) (181,166)
Included in income statement
Current service charge - - (257,719) (268,796) (30,680) (25,667)
Interest cost (205,705) (178,372) (458,204) (388,697) (26,657) (27,960)
Actuarial (losses)/gains
– change in assumptions - - - - 16,461 (17,701)
Actuarial gains – experience - - - - 6,013 25,506
(205,705) (178,372) (715,923) (657,493) (34,863) (45,822)
Included in OCI
Actuarial (losses)/gains – change
in assumptions 117,788 (132,946) 187,532 (379,529) - -
Actuarial (losses)/gains
– experience (177,342) (107,039) 48,887 (372,032) - -
(59,554) (239,985) 236,419 (751,561) - -
Others
Employer contributions - (221,087) - - - -
Benefits paid 278,342 278,810 1,912,514 567,951 31,098 21,243
278,342 57,723 1,912,514 567,951 31,098 21,243
At 31 December (1,584,886) (1,597,969) (2,021,360) (3,454,370) (209,510) (205,745)
101
Notes to the financial statements (continued)
Retirement benefit obligation (continued)
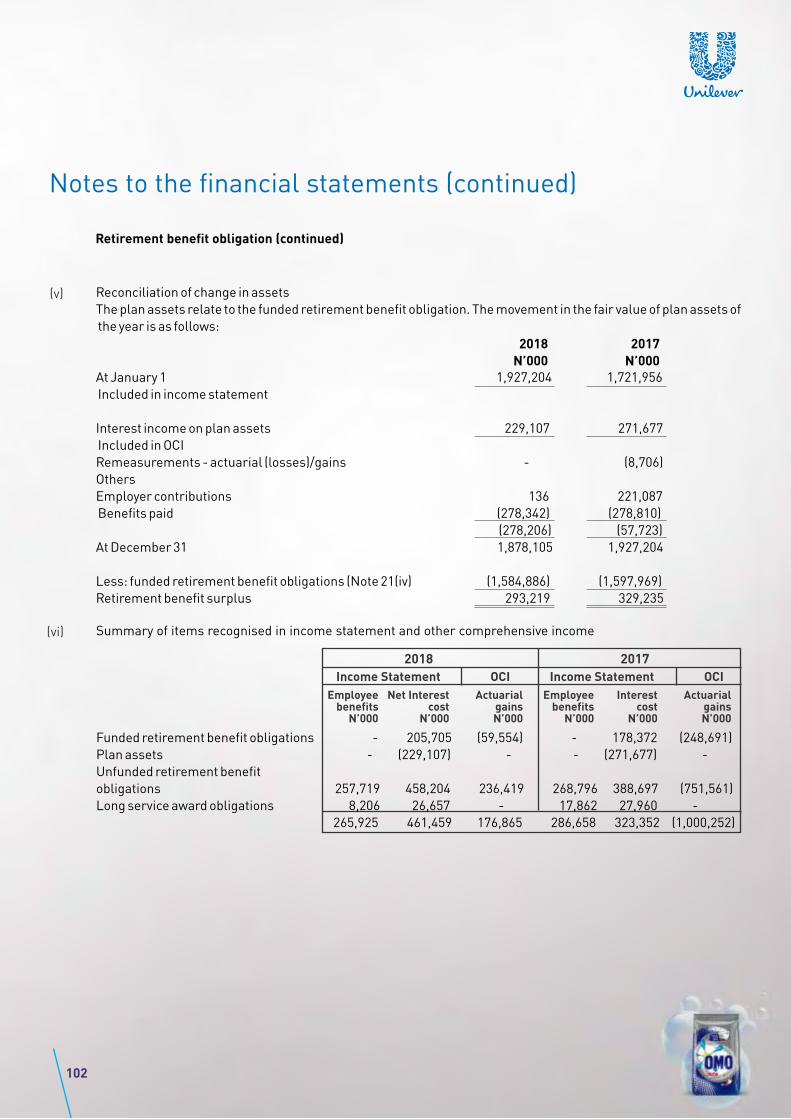
Reconciliation of change in assets
The plan assets relate to the funded retirement benefit obligation. The movement in the fair value of plan assets of
the year is as follows:
At January 1 1,927,204 1,721,956
Included in income statement
Interest income on plan assets 229,107 271,677
Included in OCI
Remeasurements - actuarial (losses)/gains - (8,706)
Others
Employer contributions 136 221,087
Benefits paid (278,342) (278,810)
(278,206) (57,723)
At December 31 1,878,105 1,927,204
Less: funded retirement benefit obligations (Note 21(iv) (1,584,886) (1,597,969)
Retirement benefit surplus 293,219 329,235
2018
N’000
2017
N’000
(v)
Summary of items recognised in income statement and other comprehensive income(vi)
20172018
Income Statement OCI Income Statement OCI
ActuarialgainsN’000
Interestcost
N’000
Employeebenefits
N’000
ActuarialgainsN’000
Net Interestcost
N’000
Employeebenefits
N’000
Funded retirement benefit obligations - 205,705 (59,554) - 178,372 (248,691)
Plan assets - (229,107) - - (271,677) -
Unfunded retirement benefit
obligations 257,719 458,204 236,419 268,796 388,697 (751,561)
Long service award obligations 8,206 26,657 - 17,862 27,960 -
265,925 461,459 176,865 286,658 323,352 (1,000,252)
102
Notes to the financial statements (continued)
Retirement benefit obligation (continued)
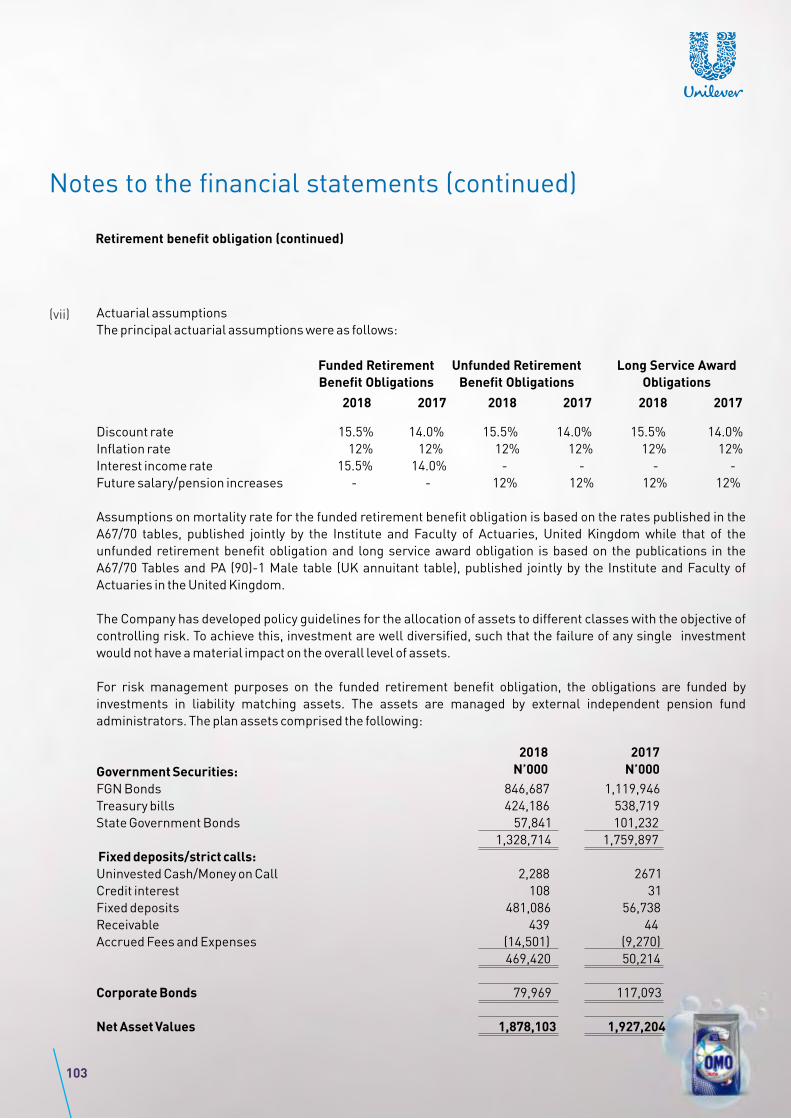
Actuarial assumptions
The principal actuarial assumptions were as follows:
Discount rate 15.5% 14.0% 15.5% 14.0% 15.5% 14.0%
Inflation rate 12% 12% 12% 12% 12% 12%
Interest income rate 15.5% 14.0% - - - -
Future salary/pension increases - - 12% 12% 12% 12%
Assumptions on mortality rate for the funded retirement benefit obligation is based on the rates published in the
A67/70 tables, published jointly by the Institute and Faculty of Actuaries, United Kingdom while that of the
unfunded retirement benefit obligation and long service award obligation is based on the publications in the
A67/70 Tables and PA (90)-1 Male table (UK annuitant table), published jointly by the Institute and Faculty of
Actuaries in the United Kingdom.
The Company has developed policy guidelines for the allocation of assets to different classes with the objective of
controlling risk. To achieve this, investment are well diversified, such that the failure of any single investment
would not have a material impact on the overall level of assets.
For risk management purposes on the funded retirement benefit obligation, the obligations are funded by
investments in liability matching assets. The assets are managed by external independent pension fund
administrators. The plan assets comprised the following:
Government Securities:
FGN Bonds 846,687 1,119,946
Treasury bills 424,186 538,719
State Government Bonds 57,841 101,232
1,328,714 1,759,897
Fixed deposits/strict calls:
Uninvested Cash/Money on Call 2,288 2671
Credit interest 108 31
Fixed deposits 481,086 56,738
Receivable 439 44
Accrued Fees and Expenses (14,501) (9,270)
469,420 50,214
Corporate Bonds 79,969 117,093
Net Asset Values 1,878,103 1,927,204
2018 20172018 20172018 2017
Long Service Award
Obligations
Unfunded Retirement
Benefit Obligations
Funded Retirement
Benefit Obligations
2018
N’000
2017
N’000
(vii)
103
Notes to the financial statements (continued)
Retirement benefit obligation (continued)

The expected return on plan assets is determined by considering the expected returns available on the assets
underlying the current investment policy. Expected yield on fixed interest investments are based on gross
redemption yields as at the end of the reporting period. Expected returns on government securities and quoted
securities reflect long-term real rates of return experienced in the respective markets.
Sensitivity analysis on liability as at 31 December 2018
A 1% change in assumed rates will result in the following balances to the retirement benefit scheme.(viii)
Base figures 1,623,471 - 300,524 - 1,584,887 -
Discount rate (-1%) 1,722,931 6% 317,244 6% 1,661,469 5%
Discount rate (+1%) 1,533,727 -6% 285,484 -5% 1,515,240 -4%
Salary/pension increase rate (-1%) 1,524,898 -6% - - - -
Salary/pension increase rate (+1%) 1,731,393 7% - - - -
Price escalation rate (-1%) - - 282,720 -6% - -
Price escalation rate (+1%) - - 320,152 7% - -
Mortality experience (-1 year) 1,623,217 0% 300,530 0% 1,604,347 1%
Mortality experience (+1 year) 1,623,749 0% 300,518 0% 1,564,657 - 1%
Impact (%)N’000
Unfunded Retirement Benefit Obligations Funded RetirementBenefit Obligations
Impact (%)N’000Impact (%)N’000
Gratuity Medical and Soap packs
Sensitivity analysis on liability as at 31 December 2017
Impact (%)N’000
Unfunded Retirement Benefit Obligations Funded RetirementBenefit Obligations
Impact (%)N’000Impact (%)N’000
Gratuity Medical and Soap packs
Base figures 3,191,757 - 397,888 - 1,237,335 -
Discount rate (-1%) 3,418,113 7% 420,091 6% 1,297,214 5%
Discount rate (+1%) 2,990,232 -6% 377,926 -5% 1,182,878 -4%
Salary/pension increase rate (-1%) 2,973,530 -7% - - - -
Salary/pension increase rate (+1%) 3,433,588 8% - - - -
Price escalation rate (-1%) - - 374,263 -4% - -
Price escalation rate (+1%) - - 423,947 4% - -
Mortality experience (-1 year) 3,190,213 0% 397,894 1% 1,222,712 -1%
Mortality experience (+1 year) 3,193,311 0% 397,880 -1% 1,251,403 1%
104
Notes to the financial statements (continued)
Retirement benefit obligation (continued)

Long Service Award Obligations- 2018
N'000 Impact (%)
Long Service Award Obligations- 2017
N'000 Impact (%)
Base figures 209,510
Discount Rate (-1%) 220,231 5%
Discount Rate (+1%) 199,700 -5%
Salary increase rate (-1%) 199,946 -5%
Salary increase rate (+1%) 219,852 5%
Price escalation rate (-1%) 207,909 -1%
Price escalation rate (+1%) 211,213 1%
Mortality experience (-1 year) 209,831 0%
Mortality experience (+1 year) 209,147 0%
205,745
216,966 5%
195,548 -5%
196,190 -5%
216,145 5%
203,869 -1%
207,748 1%
212,406 3%
198,521 -4%
Assumptions for sensitivity analysis
Discount rate (unfunded retirement benefit obligation and medical) 15.5% 14%
Discount rate (funded retirement benefit obligation) 15.5% 14%
Salary increase rate 12% 12%
Product/benefit inflation rate 12% 12%
The base figures used for the sensitivity analysis on liability is the unfunded retirement benefit obligation as at 31
December 2018 while the base figure for sensitivity analysis on service and interest cost is the projected net
period benefit cost for 2018.
The retirement benefits and long service award obligations are based upon independent actuarial valuation
conducted by Ernst and Young (O.O. Okpaise, FRC/2012/NAS/00000000738).
Operating leases
The Company leases a number of regional offices and residential accomodation under operating leases. The
leases typically run for a period of 1 to 2 years, with an option to renew the lease after that date
Future minimum lease payments
At 31 December, the future minimum lease payments under non-cancellable leases were payable as follows:
Less than 1 year 84,701 82,082
Between 1 and 5 years 17,779 9,274
Total 102,480 91,356
Base rates
2018
Base rates
2017
2018
N’000
2017
N’000
22
i
105
Notes to the financial statements (continued)
Retirement benefit obligation (continued)
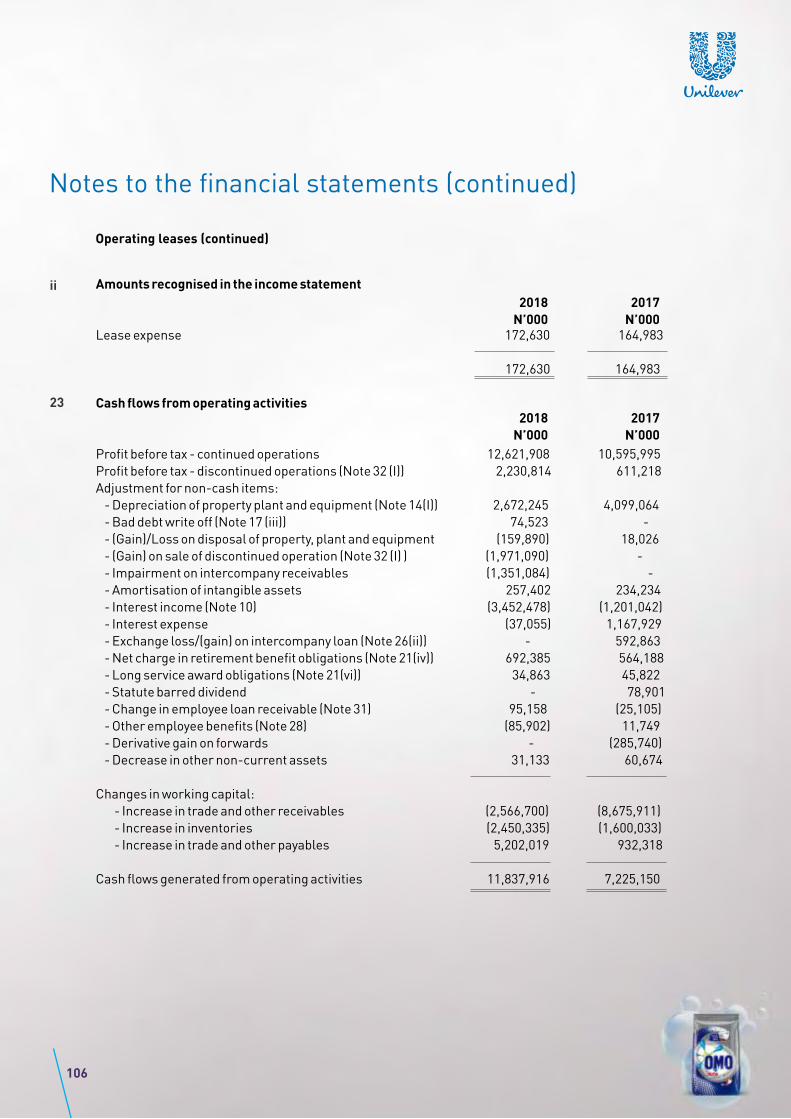
Amounts recognised in the income statement
Lease expense 172,630 164,983
172,630 164,983
Cash flows from operating activities
Profit before tax - continued operations 12,621,908 10,595,995
Profit before tax - discontinued operations (Note 32 (I)) 2,230,814 611,218
Adjustment for non-cash items:
- Depreciation of property plant and equipment (Note 14(I)) 2,672,245 4,099,064
- Bad debt write off (Note 17 (iii)) 74,523 -
- (Gain)/Loss on disposal of property, plant and equipment (159,890) 18,026
- (Gain) on sale of discontinued operation (Note 32 (I) ) (1,971,090) -
- Impairment on intercompany receivables (1,351,084) -
- Amortisation of intangible assets 257,402 234,234
- Interest income (Note 10) (3,452,478) (1,201,042)
- Interest expense (37,055) 1,167,929
- Exchange loss/(gain) on intercompany loan (Note 26(ii)) - 592,863
- Net charge in retirement benefit obligations (Note 21(iv)) 692,385 564,188
- Long service award obligations (Note 21(vi)) 34,863 45,822
- Statute barred dividend - 78,901
- Change in employee loan receivable (Note 31) 95,158 (25,105)
- Other employee benefits (Note 28) (85,902) 11,749
- Derivative gain on forwards - (285,740)
- Decrease in other non-current assets 31,133 60,674
Changes in working capital:
- Increase in trade and other receivables (2,566,700) (8,675,911)
- Increase in inventories (2,450,335) (1,600,033)
- Increase in trade and other payables 5,202,019 932,318
Cash flows generated from operating activities 11,837,916 7,225,150
2018
N’000
2017
N’000
2018
N’000
2017
N’000
ii
23
106
Notes to the financial statements (continued)
Operating leases (continued)
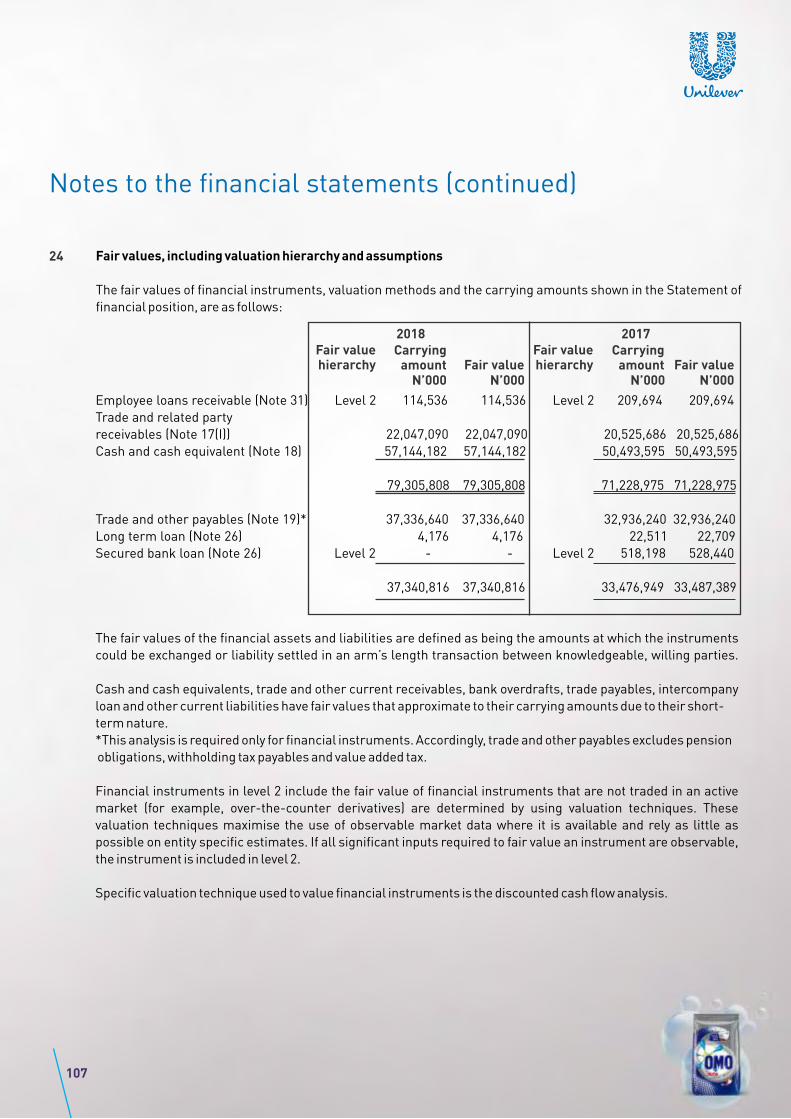
Fair values, including valuation hierarchy and assumptions
The fair values of financial instruments, valuation methods and the carrying amounts shown in the Statement of
financial position, are as follows:
N’000N’000N’000N’000Fair value
Carryingamount
Fair valuehierarchyFair value
Carryingamount
Fair valuehierarchy
2018 2017
Employee loans receivable (Note 31) Level 2 114,536 114,536 Level 2 209,694 209,694
Trade and related party
receivables (Note 17(I)) 22,047,090 22,047,090 20,525,686 20,525,686
Cash and cash equivalent (Note 18) 57,144,182 57,144,182 50,493,595 50,493,595
79,305,808 79,305,808 71,228,975 71,228,975
Trade and other payables (Note 19)* 37,336,640 37,336,640 32,936,240 32,936,240
Long term loan (Note 26) 4,176 4,176 22,511 22,709
Secured bank loan (Note 26) Level 2 - - Level 2 518,198 528,440
37,340,816 37,340,816 33,476,949 33,487,389
24
The fair values of the financial assets and liabilities are defined as being the amounts at which the instruments
could be exchanged or liability settled in an arm’s length transaction between knowledgeable, willing parties.
Cash and cash equivalents, trade and other current receivables, bank overdrafts, trade payables, intercompany
loan and other current liabilities have fair values that approximate to their carrying amounts due to their short-
term nature.
*This analysis is required only for financial instruments. Accordingly, trade and other payables excludes pension
obligations, withholding tax payables and value added tax.
Financial instruments in level 2 include the fair value of financial instruments that are not traded in an active
market (for example, over-the-counter derivatives) are determined by using valuation techniques. These
valuation techniques maximise the use of observable market data where it is available and rely as little as
possible on entity specific estimates. If all significant inputs required to fair value an instrument are observable,
the instrument is included in level 2.
Specific valuation technique used to value financial instruments is the discounted cash flow analysis.
107
Notes to the financial statements (continued)
Related party transactions
Unilever Nigeria Plc is controlled by Unilever Plc incorporated in the United Kingdom which is the ultimate party
and controlling party of Unilever Nigeria Plc. There are other companies that are related to Unilever Nigeria Plc
by virtue of their relationship to Unilever Plc (subsidiary) who is the ultimate controlling party.
The following transactions were carried out with related parties:
Trade mark and technology licences
Unilever Plc, United Kingdom has given Unilever Nigeria Plc exclusive right to the know-how, manufacture,
distribution and marketing of its international brands namely: Omo, Sunlight, Close-Up, Pepsodent, Vaseline,
Lux, Knorr, Royco, Lipton, Blue Band and Lifebouy in Nigeria. In consideration of this, a royalty of 2% of net sales
value and 0.5% of net sales value is payable by Unilever Nigeria Plc to Unilever Plc, United Kingdom for
Technology and Trade Mark licences respectively. The royalty payable under these agreements for the year is
N2,310 million (2017: N2,069 million).
These licenses have been approved by the National Office for Technology Acquisition and Promotion (NOTAP).
The certificate of registration, (Certificate No. CR005942 - Trademark License; Certificate No. CR006214 -
Technology License) are valid from 1 June 2015 to 31st May 2018. (see note 9(b)) Approved maximum amount
payable on these licenses per annum is N4,341 million.
Central support and management services
Unilever Nigeria Plc has a Management Services Agreement with Unilever Plc, United Kingdom for the provision
of corporate strategic direction, and expert advice/support on legal, tax, finance, human resources and
information technology matters.
Effective 1 June 2018, after an internal arrangement, the service provider was changed from Unilever Plc to
Unilever Europe Business Centre B.V.
In consideration of this agreement, a fee of 2% of profit before tax is payable by Unilever Nigeria Plc to Unilever
Plc/Unilever Europe Business Center B.V. The fee payable under this agreement in 2018 was N112.6 million
(2017: N112.6 million).
This license has been approved by the National Office for Technology Acquisition and Promotion (NOTAP). The
certificate of registration, Certificate No. CR005979, is valid from 1 June 2015 to 31st May 2018. (see note 9(b)).
Approved maximum amount payable on central services is N112.6 million.
25
(i)
(ii)
108
Notes to the financial statements (continued)
Sale of finished goods to related parties
Unilever Cote D'Ivoire 988,598 909,803
Unilever Ghana Ltd 694,890 786,371
1,683,488 1,696,174
Purchases of finished goods for resale from related parties
Unilever Ghana Limited 1,632,154 3,729,970
Unilever Asia Private Limited 78,670 -
Unilever South Africa (Pty) Limited 51,593 593,611
Unilever Gulf Free Zone Establishment 18,461 16,101
1,780,878 4,339,682
Outstanding related party balances as at 31 December were:
Receivables from related parties:
Unilever Cote D'Ivoire 5,457,650 7,814,098
Unilever Ghana Limited - 4,441,888
Other related parties (settlement of liabilities on behalf
of related entities) 239,605 2,717,004
Gross receivables 5,697,255 14,972,990
Less impairment (1,389,930) -
4,307,325 14,972,990
Payables to related parties:
Unilever UK Plc 2,423,562 3,346,150
Unilever Cote D'Ivoire 125,328 144,963
Unilever Ghana Limited 2,373,529 5,943,665
Unilever Asia Private 5,876,661 4,596,274
Unilever NV 2,394,533 1,943,904
Unilever Gulf Free Zone Establishment 333 10,938
Other related parties (settlement of liabilities on
behalf of the Company) 1,417,924 1,884,595
14,611,870 17,870,489
2018
N’000
2017
N’000
2018
N’000
2017
N’000
2018
N’000
2017
N’000
2018
N’000
2017
N’000
(iii)
(iv)
(v)
109
Notes to the financial statements (continued)
Related party transactions (continued)
During the year, there were no transactions between the Company and its key management personnel.
Compensation paid to key management personnel have been disclosed in Note 7.
Related party relationship
The nature of related party relationships with Unilever Nigeria Plc is as follows:
Related Party Nature of relationship
Unilever UK Plc Ultimate parent and controlling party
Unilever Cote D'Ivoire Fellow subsidiary
Unilever Ghana Limited Fellow subsidiary
Unilever Asia Private Fellow subsidiary
Unilever Finance International AG Fellow subsidiary
Unilever NV Immediate Parent
Unilever Market Development (Pty) Limited Fellow subsidiary
Unilever South Africa (Pty) Limited Fellow subsidiary
Unilever Gulf Free Zone Establishment Fellow subsidiary
Loans and borrowings
This note provides information about the contractual terms of the company's interest-bearing loans and
borrowing which are measured at amortised cost.
Current liability
Confirmed LC loan (Note 26(I)) - 133,589
Current portion of long term bank loan (Note 26(ii)) 394 4,684
Current portion of secured bank loan (Note 26(iii)) - 316,255
394 454,528
Non-current liability
Non-current portion of long term bank loan (Note 26(ii)) 3,782 17,827
Secured bank loan (Note 26(iii)) - 201,943
3,782 219,770
Total loans and borrowings 4,176 674,298
Confirmed LC
This represents confirmed LCs funded forward via the CBN retail SMIS as at the end of the year. It is payable upon
maturity of the forward contracts, usually 75 days. The average interest rate is 9% per annum.
2018
N’000
2017
N’000
(vi)
26
(I)
110
Notes to the financial statements (continued)
Related party transactions (continued)
Long term bank loan
Long term bank loan represents bank facilities obtained by the Company to fund housing loans extended to
employees. The facility is unsecured and is for a maximum period of ten years. Interest rate is charged at 21% per
annum. A portion of the outstanding principal amount is repaid annually.
The movement on the facility is as follows:
At 1 January 22,511 66,083
Repayments (18,335) (43,572)
At 31 December 4,176 22,511
Analysed as:
Current 394 4,684
Non current 3,782 17,827
4,176 22,511
2018
N’000
2017
N’000
(ii)
Secured bank loan
This represents the loan obtained from the Bank of Industry (BOI). The bank issued a loan of N5 billion to Unilever
at 10% for a period of six years ending 2019. Given that Unilever has adopted the settlement date accounting
policy, the amount recognised is the drawn down value of N1.4 billion. The loan is secured by the guarantee of the
Company's bankers and would be utilised to improve capital investment capacity.
The loan was initially recognised at its fair value by discounting the expected cash outflows and deducting the
applicable transaction costs. The difference between the present value at grant date and the original proceeds
has been recognised as deferred income in accordance with IAS 20 (Note 27).
The loan was settled during the year.
Opening amortised cost 518,198 702,748
Interest cost 25,726 133,219
543,924 835,967
Less repayment
Principal (518,198) (272,109)
Interest (25,726) (45,660)
Amortised closing balance - 518,198
2018
N’000
2017
N’000
(iii)
111
Notes to the financial statements (continued)
Loans and borrowings (continued)

Analysed as:
Current - 316,255
Non current - 201,943
- 518,198
The net interest charge on the BOI loan is as follows:
Interest expense 25,726 133,219
Amortisation of government grant (8,189) (32,756)
17,537 100,463
Import Finance Facility
This represents a facility line for the issuance of Letters of Credits to the Company's vendors for the purchase of
raw materials
Deferred income
The deferred income refers to the difference between the present value at grant date and the original proceeds
based on government grant obtained by Unilever through the N5 billion loan from the Bank of Industry. The loan is
at an interest rate of 10% which is below the market rate and therefore represents a government benefit. The
benefit is measured by the difference between the original loan proceeds and the present value of the loan at
grant date recognised in line with IAS 39. The benefit is recognised in interest expense to match the related cost in
accordance with IAS 20. The loan was paid up during the year and the outstanding deferred income recognised in
interest expense.
At 1 January 62,781 95,537
Amount recognised in interest expense (62,781) (32,756)
At 31 December - 62,781
Amount disclosed in the statement of financial is presented below:
Current liabilities - 32,756
Non-current liabilities - 30,025
- 62,781
2018
N’000
2017
N’000
2018
N’000
2017
N’000
2018
N’000
2017
N’000
2018
N’000
2017
N’000
(iv)
27
112
Notes to the financial statements (continued)
Loans and borrowings (continued)
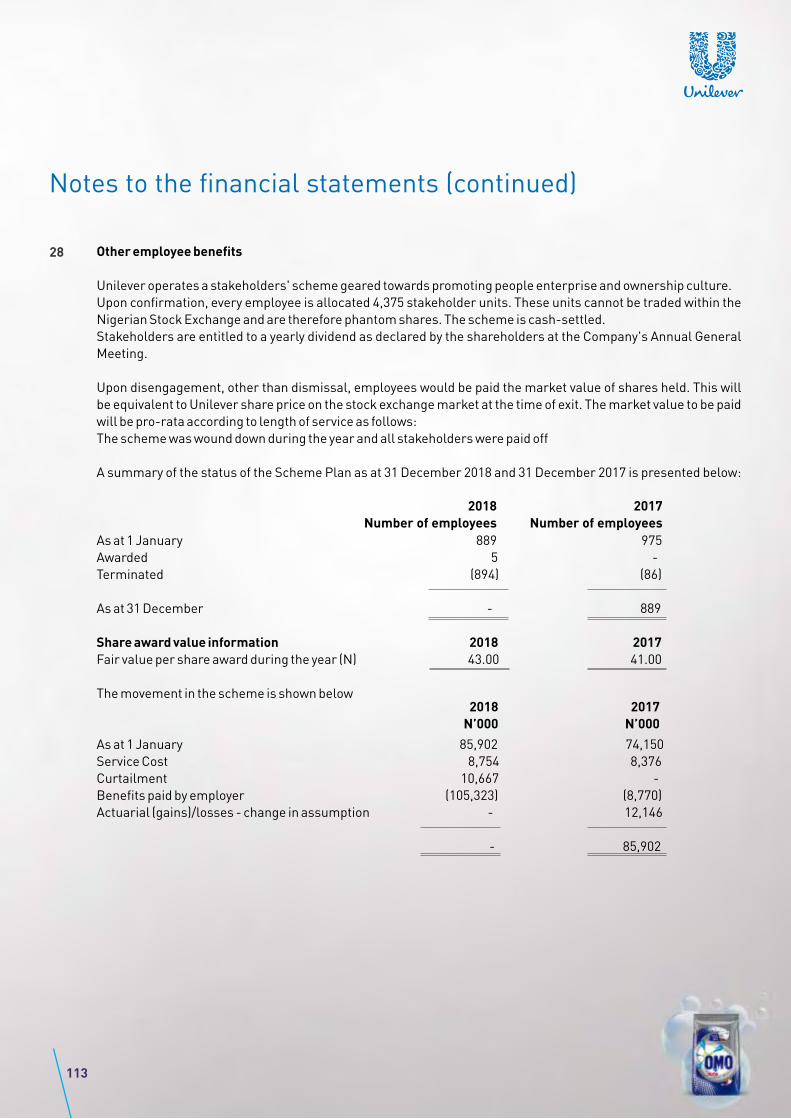
Other employee benefits
Unilever operates a stakeholders' scheme geared towards promoting people enterprise and ownership culture.
Upon confirmation, every employee is allocated 4,375 stakeholder units. These units cannot be traded within the
Nigerian Stock Exchange and are therefore phantom shares. The scheme is cash-settled.
Stakeholders are entitled to a yearly dividend as declared by the shareholders at the Company's Annual General
Meeting.
Upon disengagement, other than dismissal, employees would be paid the market value of shares held. This will
be equivalent to Unilever share price on the stock exchange market at the time of exit. The market value to be paid
will be pro-rata according to length of service as follows:
The scheme was wound down during the year and all stakeholders were paid off
A summary of the status of the Scheme Plan as at 31 December 2018 and 31 December 2017 is presented below:
As at 1 January 889 975
Awarded 5 -
Terminated (894) (86)
As at 31 December - 889
Share award value information 2018 2017
Fair value per share award during the year (N) 43.00 41.00
The movement in the scheme is shown below
As at 1 January 85,902 74,150
Service Cost 8,754 8,376
Curtailment 10,667 -
Benefits paid by employer (105,323) (8,770)
Actuarial (gains)/losses - change in assumption - 12,146
- 85,902
2018
Number of employees
2017
Number of employees
2018
N’000
2017
N’000
28
113
Notes to the financial statements (continued)

Amount recognised in non current liabilities is shown below:
Other employee benefits - 85,902
The share-based payments are based upon independent valuation conducted by Ernst and Young. (O.O. Okpaise
FRC/2012/NAS/00000000738)
Share capital and share premium
Balance as at 31 December 2017 and 31 December 2018 5,745,005 2,872,503 56,812,810
The authorised number of ordinary shares is 6,053,274,000 (2017:6,053,274,000) with a par value of 50kobo per
share. Of these, 5,745,005,417 (2017: 5,745,005,417) ordinary shares have been issued and fully paid.
Other non-current assets
Long term portion of employee loans 30,574 70,212
Long term portion of prepayments 17,779 9,274
Balance as at 31 December 48,353 79,486
Long term portion of employee loans include long term portion of loans provided to employees. The tenor of the
loans range from a period of 2 years to maximum period of 4 years
Employee loan receivable
Current portion of present value 49,005 79,384
Non-current portion of present value 65,531 130,310
114,536 209,694
This represents the fair value of interest free loans given to staff of Unilever Nigeria Plc. These are amortised
annually and recognised in the income statement as interest expense. They are also disclosed as part of the
employee benefit for the period. The terms are:
1) The fair value (i.e. present value of the future cash flow) of the loan is calculated using the market interest rate
of 22%
2) A monthly deduction is made from payroll over the tenor of the loan, which is between 4 and 5 years.
3) Terms of repayment are agreed with any staff who is exiting the business but has outstanding loan
receivables.
2018
N’000
2017
N’000
Share premium
N’000
Ordinary shares
N’000
Number ofordinary shares
(thousands)
2018
N’000
2017
N’000
2018
N’000
2017
N’000
29
30
31
114
Notes to the financial statements (continued)
Other employee benefits (continued)
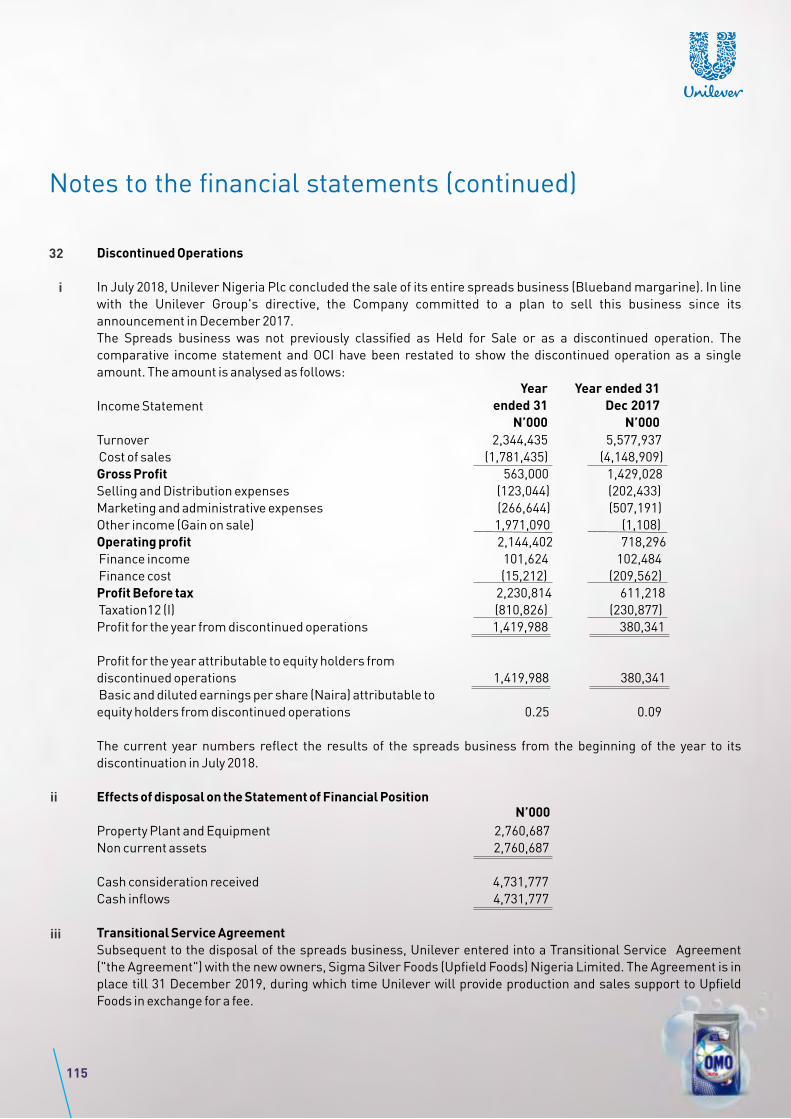
Discontinued Operations
In July 2018, Unilever Nigeria Plc concluded the sale of its entire spreads business (Blueband margarine). In line
with the Unilever Group's directive, the Company committed to a plan to sell this business since its
announcement in December 2017.
The Spreads business was not previously classified as Held for Sale or as a discontinued operation. The
comparative income statement and OCI have been restated to show the discontinued operation as a single
amount. The amount is analysed as follows:
Income Statement
Turnover 2,344,435 5,577,937
Cost of sales (1,781,435) (4,148,909)
Gross Profit 563,000 1,429,028
Selling and Distribution expenses (123,044) (202,433)
Marketing and administrative expenses (266,644) (507,191)
Other income (Gain on sale) 1,971,090 (1,108)
Operating profit 2,144,402 718,296
Finance income 101,624 102,484
Finance cost (15,212) (209,562)
Profit Before tax 2,230,814 611,218
Taxation12 (I) (810,826) (230,877)
Profit for the year from discontinued operations 1,419,988 380,341
Profit for the year attributable to equity holders from
discontinued operations 1,419,988 380,341
Basic and diluted earnings per share (Naira) attributable to
equity holders from discontinued operations 0.25 0.09
The current year numbers reflect the results of the spreads business from the beginning of the year to its
discontinuation in July 2018.
Effects of disposal on the Statement of Financial Position
Property Plant and Equipment 2,760,687
Non current assets 2,760,687
Cash consideration received 4,731,777
Cash inflows 4,731,777
Transitional Service Agreement
Subsequent to the disposal of the spreads business, Unilever entered into a Transitional Service Agreement
("the Agreement") with the new owners, Sigma Silver Foods (Upfield Foods) Nigeria Limited. The Agreement is in
place till 31 December 2019, during which time Unilever will provide production and sales support to Upfield
Foods in exchange for a fee.
Year ended 31
Dec 2017
N’000
Year
ended 31
N’000
N’000
32
ii
iii
115
Notes to the financial statements (continued)
Receivables from and payables due to Upfield in relation to this agreement are N1.8bn and N711m respectively.
Contingencies
The Company is involved in pending litigation arising in the ordinary course of business. Estimated contingent
liability as at 31 December 2018 is N492 million (2017: N221.6 million). The directors believe that the risk of
material claims crystallising against the Company from pending litigation is low.
Subsequent events
There are no significant subsequent events which could have had a material effect on the state of affairs of the
company as at 31 December 2018 that have not been adequately provided for or disclosed in the financial
statements.
33
34
116
Notes to the financial statements (continued)
Discontinued Operations (continued)
Transitional Service Agreement (continued)
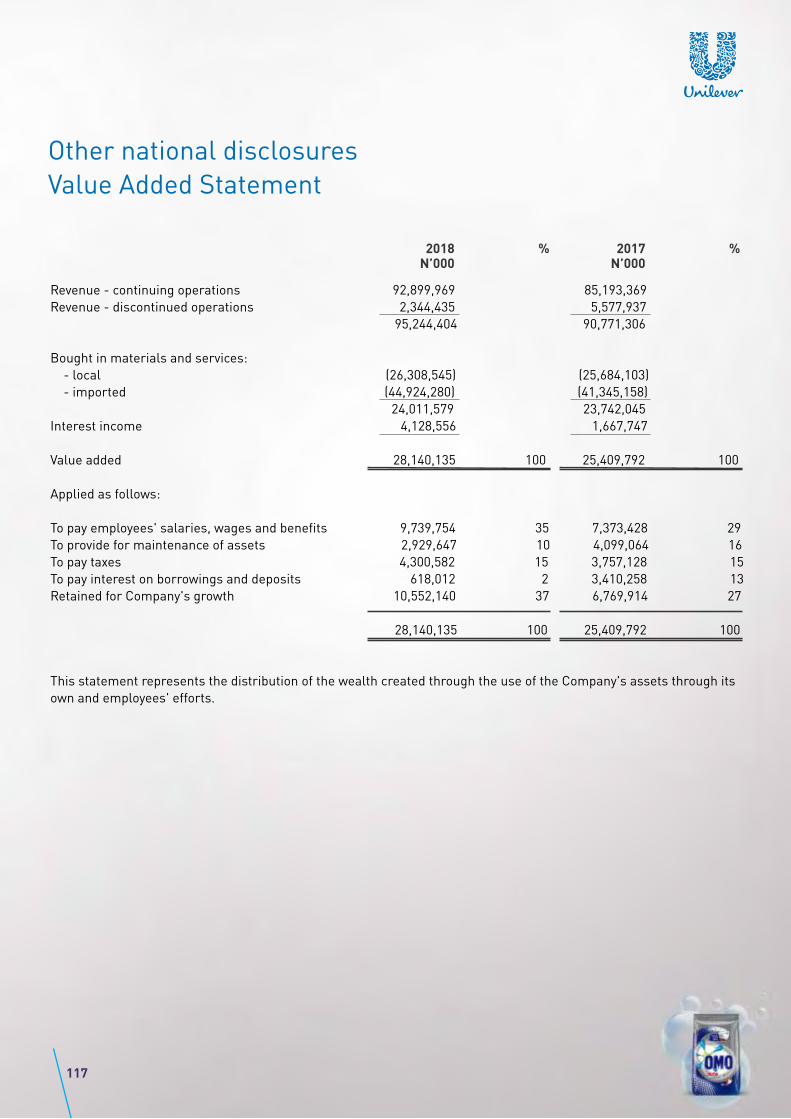
2017N’000
2018N’000
% %
Other national disclosures
Value Added Statement
Revenue - continuing operations 92,899,969 85,193,369
Revenue - discontinued operations 2,344,435 5,577,937
95,244,404 90,771,306
Bought in materials and services:
- local (26,308,545) (25,684,103)
- imported (44,924,280) (41,345,158)
24,011,579 23,742,045
Interest income 4,128,556 1,667,747
Value added 28,140,135 100 25,409,792 100
Applied as follows:
To pay employees' salaries, wages and benefits 9,739,754 35 7,373,428 29
To provide for maintenance of assets 2,929,647 10 4,099,064 16
To pay taxes 4,300,582 15 3,757,128 15
To pay interest on borrowings and deposits 618,012 2 3,410,258 13
Retained for Company's growth 10,552,140 37 6,769,914 27
28,140,135 100 25,409,792 100
This statement represents the distribution of the wealth created through the use of the Company's assets through its
own and employees' efforts.
117

Other national disclosures
Five Year Financial Summary
2015N’000
2015N’000
2016N’000
2017N’000
2018N’000
Financial performance
Revenue 95,244,404 90,771,306 69,777,061 59,221,748 55,754,309
Gross profit 28,788,122 28,943,264 20,296,041 21,047,500 20,170,293
Operating expenses (19,653,194) (15,975,515) (14,615,233) (16,485,316) (15,561,139)
Other (expenses)/income 2,207,250 (18,026) 124,237 77,506 5,590
Net finance cost 3,510,544 (1,742,511) (1,698,623) (2,868,627) (1,741,509)
Profit before taxation 14,852,722 11,207,213 4,106,422 1,771,063 2,873,235
Taxation (4,300,582) (3,757,128) (1,034,537) (578,697) (460,892)
Profit after Tax 10,552,140 7,450,085 3,071,885 1,192,366 2,412,343
Other comprehensive income 120,268 (680,171) 742,739 (430,004) 447,663
Total comprehensive income 10,672,408 6,769,914 3,814,624 762,362 2,860,006
Earnings per share
(Basic and diluted) - Naira 1.84 1.78 0.81 0.32 0.64
Capital employed
Share capital 2,872,503 2,872,503 1,891,649 1,891,649 1,891,649
Share premium 56,812,810 56,812,810 45,717 45,717 45,717
Reserves 23,104,230 16,223,062 9,752,577 6,065,887 5,541,442
Shareholders' funds 82,789,543 75,908,375 11,689,943 8,003,253 7,478,808
Employment of capital
Non-current assets 30,533,130 31,125,625 30,948,762 29,164,670 27,165,096
Net current assets/(liabilities) 58,143,190 53,263,433 (11,970,842) (13,689,839) (12,799,674)
Non-current liabilities (5,886,777) (8,480,683) (7,287,977) (7,471,578) (6,886,614)
82,789,543 75,908,375 11,689,943 8,003,253 7,478,808
Net assets per share (Naira) 14.41 18.17 3.09 2.12 1.98
* Includes continued and discontinued operations
118
*
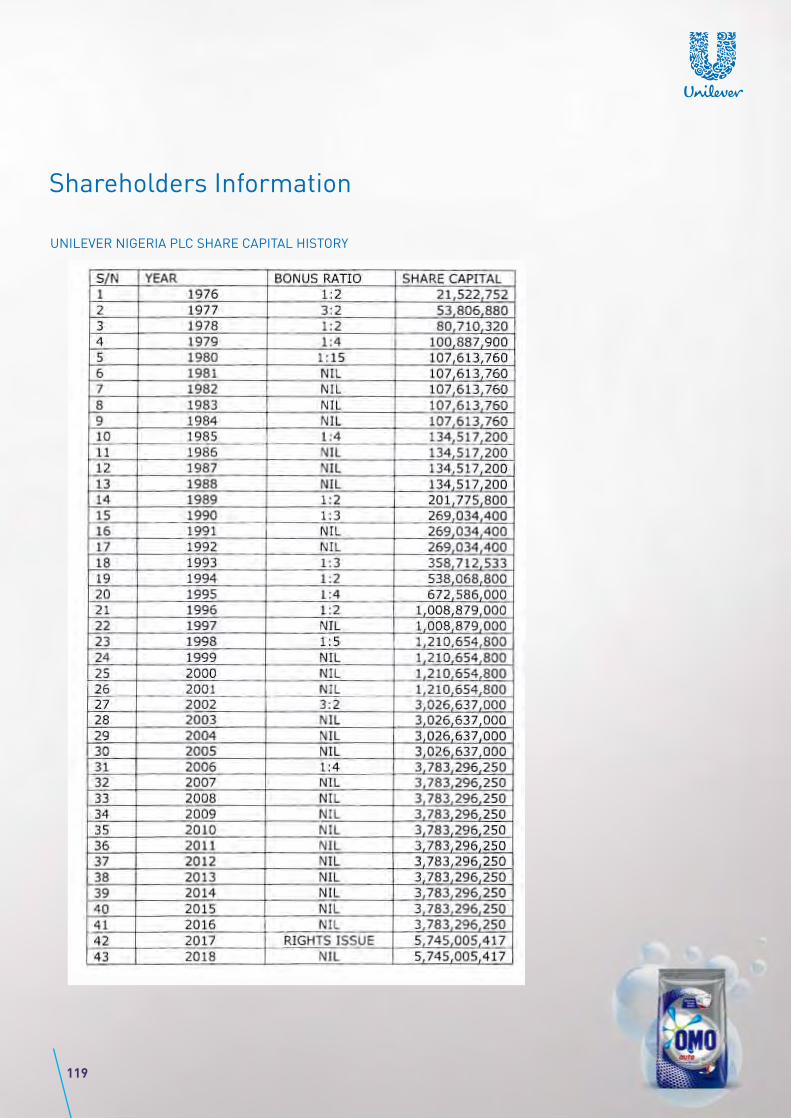
Shareholders Information
UNILEVER NIGERIA PLC SHARE CAPITAL HISTORY
119

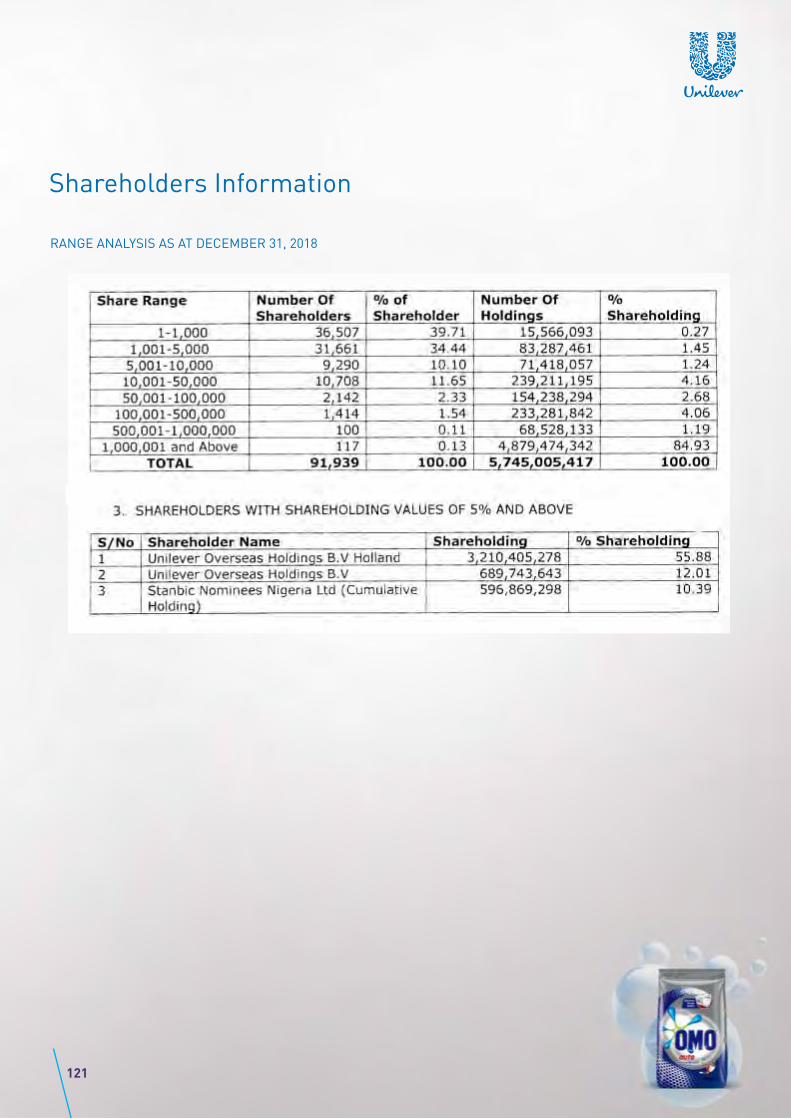
Shareholders Information
RANGE ANALYSIS AS AT DECEMBER 31, 2018
121

Circular to Shareholders Seeking a General Mandate Authorizing
Transactions with Related Parties of Value up to and more than
5% of Unilever Nigeria Plc. Net Tangible Assets
In accordance with Paragraph 6.0 of the Nigerian Stock
Exchange Rules Governing Transactions with Related
Parties or Interested Persons, Unilever Nigeria Plc.
hereby seeks a general mandate from shareholders in
general meeting, authorizing the Company to enter into
recurrent transactions necessary for its day to day
operations such as the purchase and sale of supplies and
materials and procurement of goods and services, with
its related parties to wit Unilever Overseas Holdings B.V.,
Unilever Plc, United Kingdom and other entities within
the Unilever Group, up to transactions of a value equal to
or more than 5% of Unilever Nigeria Plc's net tangible
assets.
The following information is hereby provided in respect of
the transactions for which the general mandate is
sought:
i. Class of interested persons with which the entity at
risk will be transacting:
a. Parent Company - Unilever Plc
b. Holding Company - Unilever NV
c. Other Companies within the Unilever Group
ii. Nature of transactions contemplated under the
mandate:
a. Import and export of raw materials and finished
goods
b. Import and export of materials
c. Services - Cross charges of pension costs,
international assignees costs and other services such as
Trademark License, Technology License, Central
Services and Financial Services.
iii. Rationale for, and benefit to the entity:
a. Access to Unilever logo and trade marks, up to
date technology and service expertise
b. Competitive sourcing prices through negotiated
transfer pricing
c. Seamless reconciliation of transactions and
balances on a line item level
d. Pro-active, managed dispute resolution process
e. Full transparency of all intercompany
differences
f. Enforced compliance with internal intercompany
processes and external regulations.
g. Ensures adequate monitoring of receivables and
payables
h. Reduced financial risk
I. Business continuity
iv. Methods or procedures for determining transaction
prices are based on the Company’s Transfer Pricing
methods as follows:
a. Comparable uncontrolled price
b. Resale price method
c. Cost plus method
d. Transactional net margin method
v. We have received Independent financial advisers'
opinion which confirmed that our transfer pricing
methods or procedures are sufficient to ensure that the
transactions shall be carried out on normal commercial
terms and shall not be prejudicial to the interests of
Unilever Nigeria Plc. and its minority shareholders.
vi. Unilever Nigeria Plc. shall obtain a fresh mandate
from the shareholders if the transfer pricing methods or
procedures become inappropriate.
vii. Unilever Overseas Holdings B.V. and/or Unilever Plc,
United Kingdom shall abstain and has undertaken to
ensure that its associates shall abstain from voting on the
Resolution approving the general mandate.
Dated this 15 March, 2019
By order of the Board
Mrs. Abidemi Ademola
Company Secretary and Legal Director Ghana-Nigeria
FRC/2013/NBA/00000001646
Registered Office
1, Billings Way,
Oregun, Ikeja,
Lagos.
122
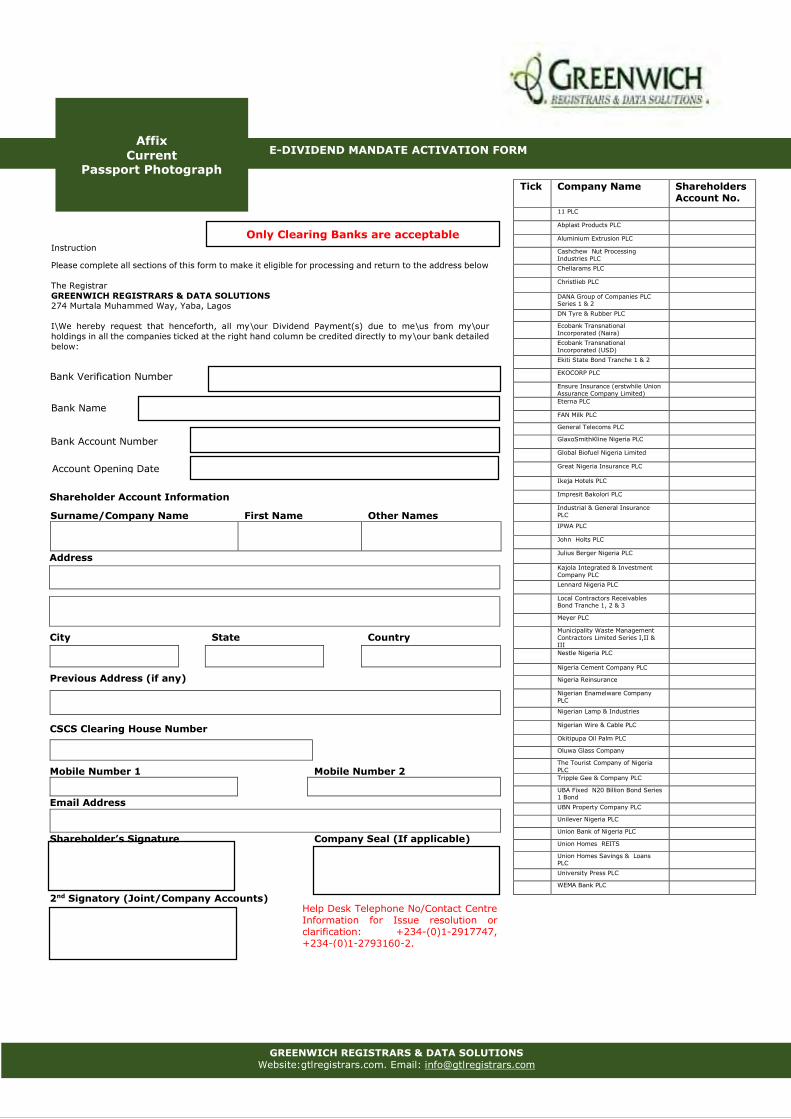


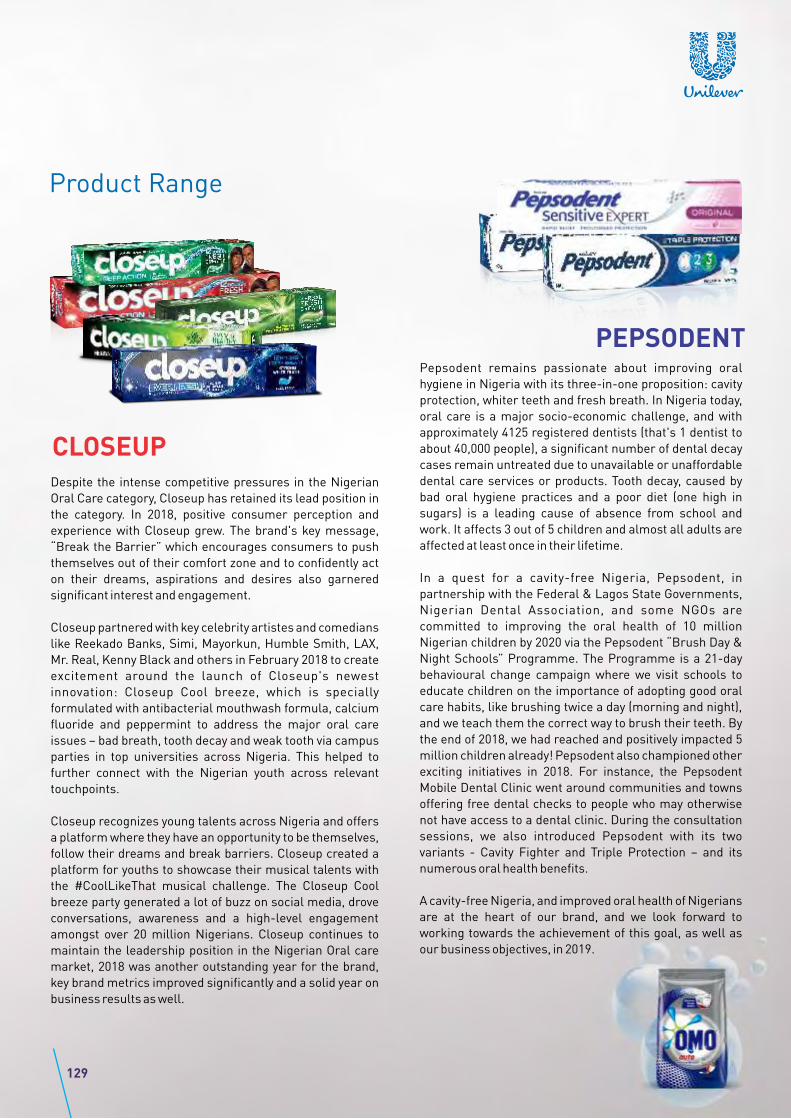
Product Range
CLOSEUP
PEPSODENTPepsodent remains passionate about improving oral
hygiene in Nigeria with its three-in-one proposition: cavity
protection, whiter teeth and fresh breath. In Nigeria today,
oral care is a major socio-economic challenge, and with
approximately 4125 registered dentists (that's 1 dentist to
about 40,000 people), a significant number of dental decay
cases remain untreated due to unavailable or unaffordable
dental care services or products. Tooth decay, caused by
bad oral hygiene practices and a poor diet (one high in
sugars) is a leading cause of absence from school and
work. It affects 3 out of 5 children and almost all adults are
affected at least once in their lifetime.
In a quest for a cavity-free Nigeria, Pepsodent, in
partnership with the Federal & Lagos State Governments,
Nigerian Dental Association, and some NGOs are
committed to improving the oral health of 10 million
Nigerian children by 2020 via the Pepsodent “Brush Day &
Night Schools” Programme. The Programme is a 21-day
behavioural change campaign where we visit schools to
educate children on the importance of adopting good oral
care habits, like brushing twice a day (morning and night),
and we teach them the correct way to brush their teeth. By
the end of 2018, we had reached and positively impacted 5
million children already! Pepsodent also championed other
exciting initiatives in 2018. For instance, the Pepsodent
Mobile Dental Clinic went around communities and towns
offering free dental checks to people who may otherwise
not have access to a dental clinic. During the consultation
sessions, we also introduced Pepsodent with its two
variants - Cavity Fighter and Triple Protection – and its
numerous oral health benefits.
A cavity-free Nigeria, and improved oral health of Nigerians
are at the heart of our brand, and we look forward to
working towards the achievement of this goal, as well as
our business objectives, in 2019.
Despite the intense competitive pressures in the Nigerian
Oral Care category, Closeup has retained its lead position in
the category. In 2018, positive consumer perception and
experience with Closeup grew. The brand's key message,
“Break the Barrier” which encourages consumers to push
themselves out of their comfort zone and to confidently act
on their dreams, aspirations and desires also garnered
significant interest and engagement.
Closeup partnered with key celebrity artistes and comedians
like Reekado Banks, Simi, Mayorkun, Humble Smith, LAX,
Mr. Real, Kenny Black and others in February 2018 to create
excitement around the launch of Closeup's newest
innovation: Closeup Cool breeze, which is specially
formulated with antibacterial mouthwash formula, calcium
fluoride and peppermint to address the major oral care
issues – bad breath, tooth decay and weak tooth via campus
parties in top universities across Nigeria. This helped to
further connect with the Nigerian youth across relevant
touchpoints.
Closeup recognizes young talents across Nigeria and offers
a platform where they have an opportunity to be themselves,
follow their dreams and break barriers. Closeup created a
platform for youths to showcase their musical talents with
the #CoolLikeThat musical challenge. The Closeup Cool
breeze party generated a lot of buzz on social media, drove
conversations, awareness and a high-level engagement
amongst over 20 million Nigerians. Closeup continues to
maintain the leadership position in the Nigerian Oral care
market, 2018 was another outstanding year for the brand,
key brand metrics improved significantly and a solid year on
business results as well.
129
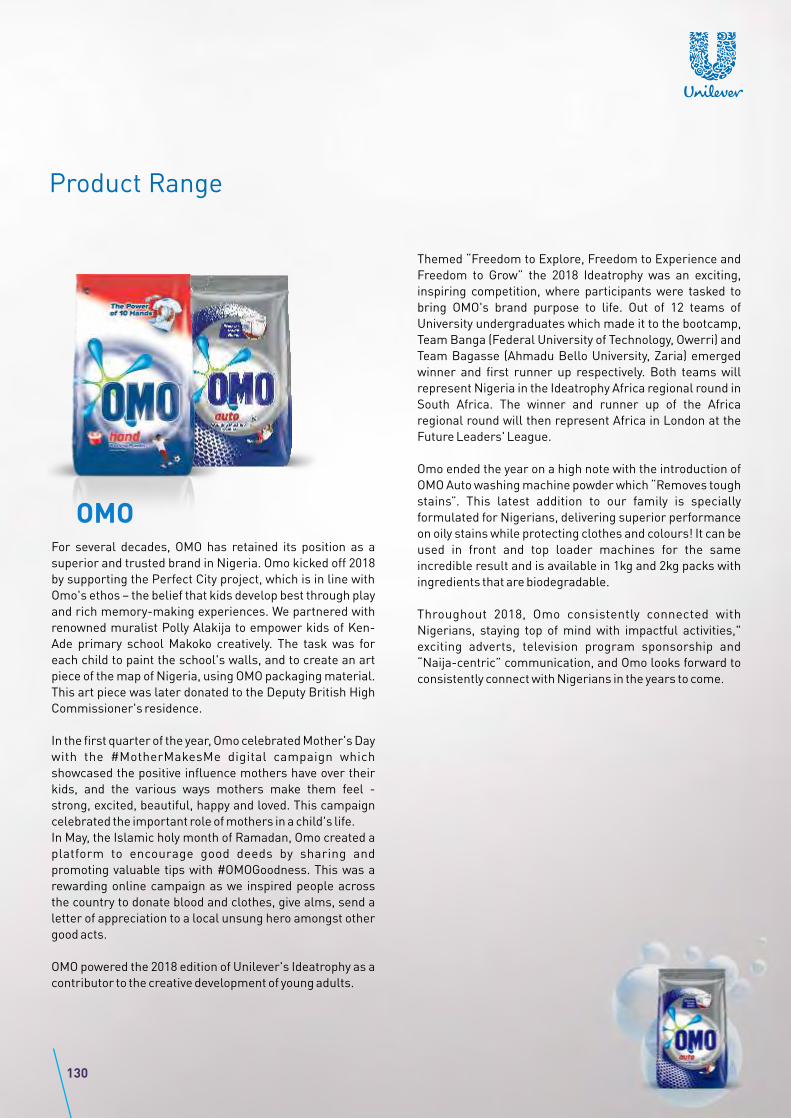
Product Range
For several decades, OMO has retained its position as a
superior and trusted brand in Nigeria. Omo kicked off 2018
by supporting the Perfect City project, which is in line with
Omo's ethos – the belief that kids develop best through play
and rich memory-making experiences. We partnered with
renowned muralist Polly Alakija to empower kids of Ken-
Ade primary school Makoko creatively. The task was for
each child to paint the school's walls, and to create an art
piece of the map of Nigeria, using OMO packaging material.
This art piece was later donated to the Deputy British High
Commissioner's residence.
In the first quarter of the year, Omo celebrated Mother's Day
with the #MotherMakesMe digital campaign which
showcased the positive influence mothers have over their
kids, and the various ways mothers make them feel -
strong, excited, beautiful, happy and loved. This campaign
celebrated the important role of mothers in a child's life.
In May, the Islamic holy month of Ramadan, Omo created a
platform to encourage good deeds by sharing and
promoting valuable tips with #OMOGoodness. This was a
rewarding online campaign as we inspired people across
the country to donate blood and clothes, give alms, send a
letter of appreciation to a local unsung hero amongst other
good acts.
OMO powered the 2018 edition of Unilever's Ideatrophy as a
contributor to the creative development of young adults.
Themed “Freedom to Explore, Freedom to Experience and
Freedom to Grow” the 2018 Ideatrophy was an exciting,
inspiring competition, where participants were tasked to
bring OMO's brand purpose to life. Out of 12 teams of
University undergraduates which made it to the bootcamp,
Team Banga (Federal University of Technology, Owerri) and
Team Bagasse (Ahmadu Bello University, Zaria) emerged
winner and first runner up respectively. Both teams will
represent Nigeria in the Ideatrophy Africa regional round in
South Africa. The winner and runner up of the Africa
regional round will then represent Africa in London at the
Future Leaders' League.
Omo ended the year on a high note with the introduction of
OMO Auto washing machine powder which “Removes tough
stains”. This latest addition to our family is specially
formulated for Nigerians, delivering superior performance
on oily stains while protecting clothes and colours! It can be
used in front and top loader machines for the same
incredible result and is available in 1kg and 2kg packs with
ingredients that are biodegradable.
Throughout 2018, Omo consistently connected with
Nigerians, staying top of mind with impactful activities,"
exciting adverts, television program sponsorship and
“Naija-centric” communication, and Omo looks forward to
consistently connect with Nigerians in the years to come.
130
OMO
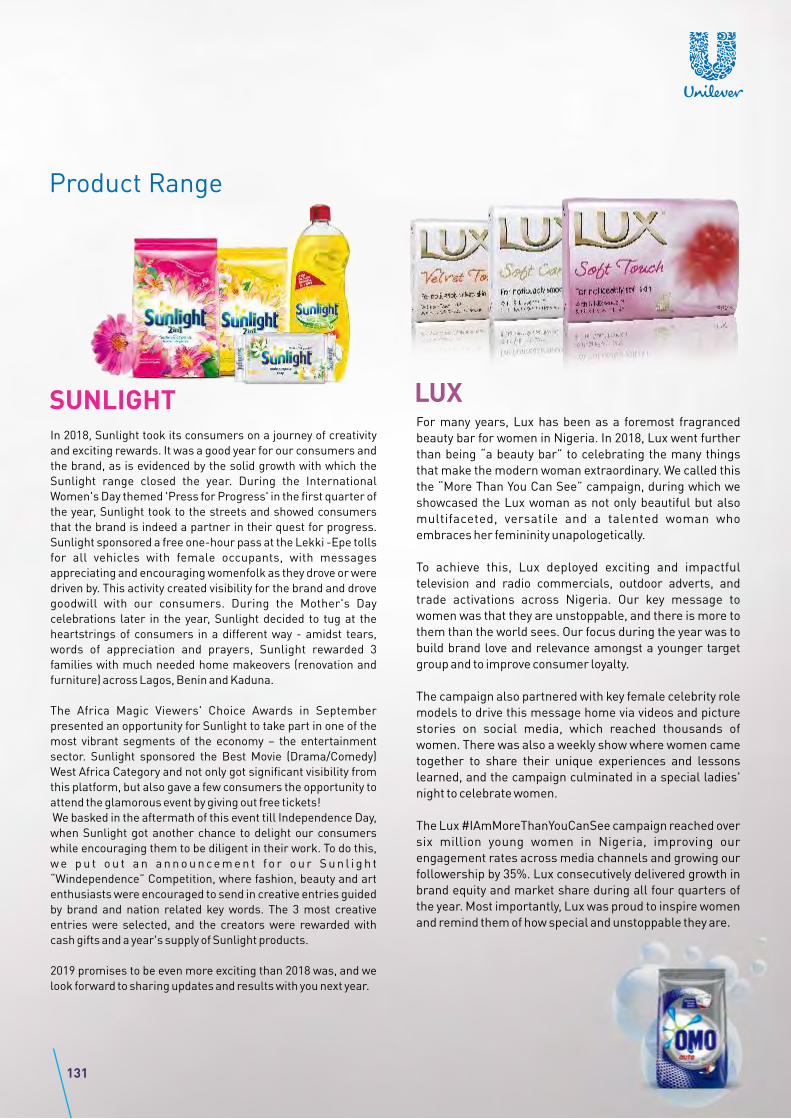
Product Range
LUXFor many years, Lux has been as a foremost fragranced
beauty bar for women in Nigeria. In 2018, Lux went further
than being “a beauty bar” to celebrating the many things
that make the modern woman extraordinary. We called this
the “More Than You Can See” campaign, during which we
showcased the Lux woman as not only beautiful but also
multifaceted, versatile and a talented woman who
embraces her femininity unapologetically.
To achieve this, Lux deployed exciting and impactful
television and radio commercials, outdoor adverts, and
trade activations across Nigeria. Our key message to
women was that they are unstoppable, and there is more to
them than the world sees. Our focus during the year was to
build brand love and relevance amongst a younger target
group and to improve consumer loyalty.
The campaign also partnered with key female celebrity role
models to drive this message home via videos and picture
stories on social media, which reached thousands of
women. There was also a weekly show where women came
together to share their unique experiences and lessons
learned, and the campaign culminated in a special ladies'
night to celebrate women.
The Lux #IAmMoreThanYouCanSee campaign reached over
six million young women in Nigeria, improving our
engagement rates across media channels and growing our
followership by 35%. Lux consecutively delivered growth in
brand equity and market share during all four quarters of
the year. Most importantly, Lux was proud to inspire women
and remind them of how special and unstoppable they are.
In 2018, Sunlight took its consumers on a journey of creativity
and exciting rewards. It was a good year for our consumers and
the brand, as is evidenced by the solid growth with which the
Sunlight range closed the year. During the International
Women's Day themed 'Press for Progress' in the first quarter of
the year, Sunlight took to the streets and showed consumers
that the brand is indeed a partner in their quest for progress.
Sunlight sponsored a free one-hour pass at the Lekki -Epe tolls
for all vehicles with female occupants, with messages
appreciating and encouraging womenfolk as they drove or were
driven by. This activity created visibility for the brand and drove
goodwill with our consumers. During the Mother's Day
celebrations later in the year, Sunlight decided to tug at the
heartstrings of consumers in a different way - amidst tears,
words of appreciation and prayers, Sunlight rewarded 3
families with much needed home makeovers (renovation and
furniture) across Lagos, Benin and Kaduna.
The Africa Magic Viewers' Choice Awards in September
presented an opportunity for Sunlight to take part in one of the
most vibrant segments of the economy – the entertainment
sector. Sunlight sponsored the Best Movie (Drama/Comedy)
West Africa Category and not only got significant visibility from
this platform, but also gave a few consumers the opportunity to
attend the glamorous event by giving out free tickets!
We basked in the aftermath of this event till Independence Day,
when Sunlight got another chance to delight our consumers
while encouraging them to be diligent in their work. To do this,
w e p u t o u t a n a n n o u n c e m e n t f o r o u r S u n l i g h t
“Windependence” Competition, where fashion, beauty and art
enthusiasts were encouraged to send in creative entries guided
by brand and nation related key words. The 3 most creative
entries were selected, and the creators were rewarded with
cash gifts and a year's supply of Sunlight products.
2019 promises to be even more exciting than 2018 was, and we
look forward to sharing updates and results with you next year.
SUNLIGHT
131
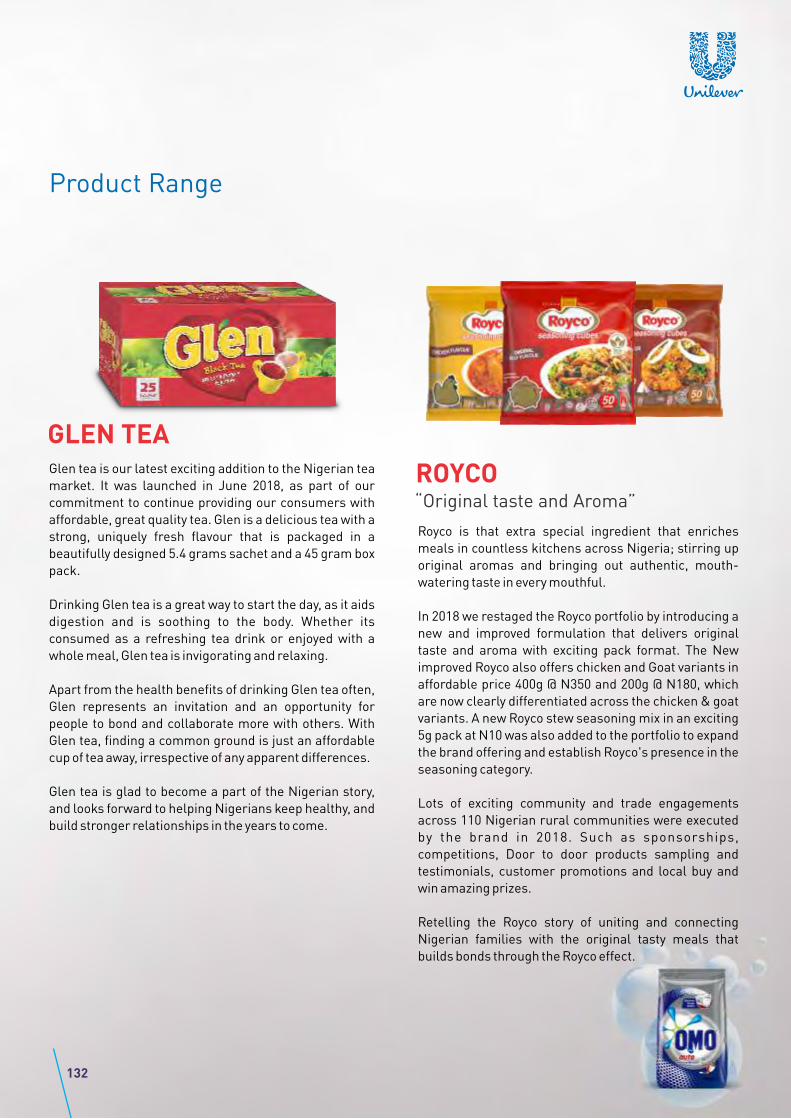
Product Range
GLEN TEA
ROYCO“Original taste and Aroma”
Royco is that extra special ingredient that enriches
meals in countless kitchens across Nigeria; stirring up
original aromas and bringing out authentic, mouth-
watering taste in every mouthful.
In 2018 we restaged the Royco portfolio by introducing a
new and improved formulation that delivers original
taste and aroma with exciting pack format. The New
improved Royco also offers chicken and Goat variants in
affordable price 400g @ N350 and 200g @ N180, which
are now clearly differentiated across the chicken & goat
variants. A new Royco stew seasoning mix in an exciting
5g pack at N10 was also added to the portfolio to expand
the brand offering and establish Royco's presence in the
seasoning category.
Lots of exciting community and trade engagements
across 110 Nigerian rural communities were executed
by the brand in 2018. Such as sponsorships,
competitions, Door to door products sampling and
testimonials, customer promotions and local buy and
win amazing prizes.
Retelling the Royco story of uniting and connecting
Nigerian families with the original tasty meals that
builds bonds through the Royco effect.
Glen tea is our latest exciting addition to the Nigerian tea
market. It was launched in June 2018, as part of our
commitment to continue providing our consumers with
affordable, great quality tea. Glen is a delicious tea with a
strong, uniquely fresh flavour that is packaged in a
beautifully designed 5.4 grams sachet and a 45 gram box
pack.
Drinking Glen tea is a great way to start the day, as it aids
digestion and is soothing to the body. Whether its
consumed as a refreshing tea drink or enjoyed with a
whole meal, Glen tea is invigorating and relaxing.
Apart from the health benefits of drinking Glen tea often,
Glen represents an invitation and an opportunity for
people to bond and collaborate more with others. With
Glen tea, finding a common ground is just an affordable
cup of tea away, irrespective of any apparent differences.
Glen tea is glad to become a part of the Nigerian story,
and looks forward to helping Nigerians keep healthy, and
build stronger relationships in the years to come.
132


Product Range
LIPTONOur Lipton Yellow Label tea is greatly loved by consumers
for its rich and nutritious flavor, and as a result, has retained
its position as the market leader in tea.
As our consumers are at the heart of our brand, Lipton has
championed several campaigns and initiatives (dubbed
“Lipton awakening moments”) that have positively impacted
the lives of our consumers. In 2018, we successfully reached
over 90,000 consumers across Nigeria.
During Ramadan, 85,000 Muslims in 10 key cities were given
free cups of Lipton tea and fruits to break their fast. Lipton
also collaborated with Hope for Life Initiative and God's
Wives (both NGOs), by asking consumers to partner with us
by buying a pack of Lipton, in order to help us reach 1,000
widows. With this initiative, we were able to give care packs
to 1,000 widows and we helped 100 of them start various
businesses, from small scale trading to fashion designing.
We called this initiative “Lipton reasons to smile” because
we strongly believe that everyone deserves to smile; even
those who are often forgotten.
In 2018, we also partnered with the African Artist
Foundation and Ake Festival. By both partnerships Lipton
helped give young, budding literary talents an opportunity to
share their creative work. This also helped other young
consumers reconnect with the importance and beauty of
literature over cups of tea.
Over the years, Lipton has continued to engage and evolve
with our consumers of all age groups, by being immersed in
their interests, and in 2019, Lipton looks forward to
enriching the lives of consumers by championing several
impactful Lipton awakening moments.
The power of looking and smelling pleasant cannot be
overstated, and for several years, Axe deodorant has
helped consumers smell their best, enabling them to
confidently live their lives and find what makes them
unique - we term this 'their magic'.
Building on the exciting Axe Party of 2017, we partnered
with Davido, one of Nigeria's big music artistes to
create further brand engagement with our consumers;
using the passion of music to drive brand equity with the
proposition ''Axe Find Your Magic''. We invited
individuals who had found their magic to send in their
entries, for a chance to win and attend an exclusive
party with Axe and Davido.
The 2018 Axe Party of the Year was an authentic,
thrilling event where young, energetic and creative
males showcased their magic; their uniqueness. Axe
celebrated those who had found their magic and
encouraged those who were still on their way.
Axe looks forward to more exciting engagements with
its consumers in 2019.
AXE
134
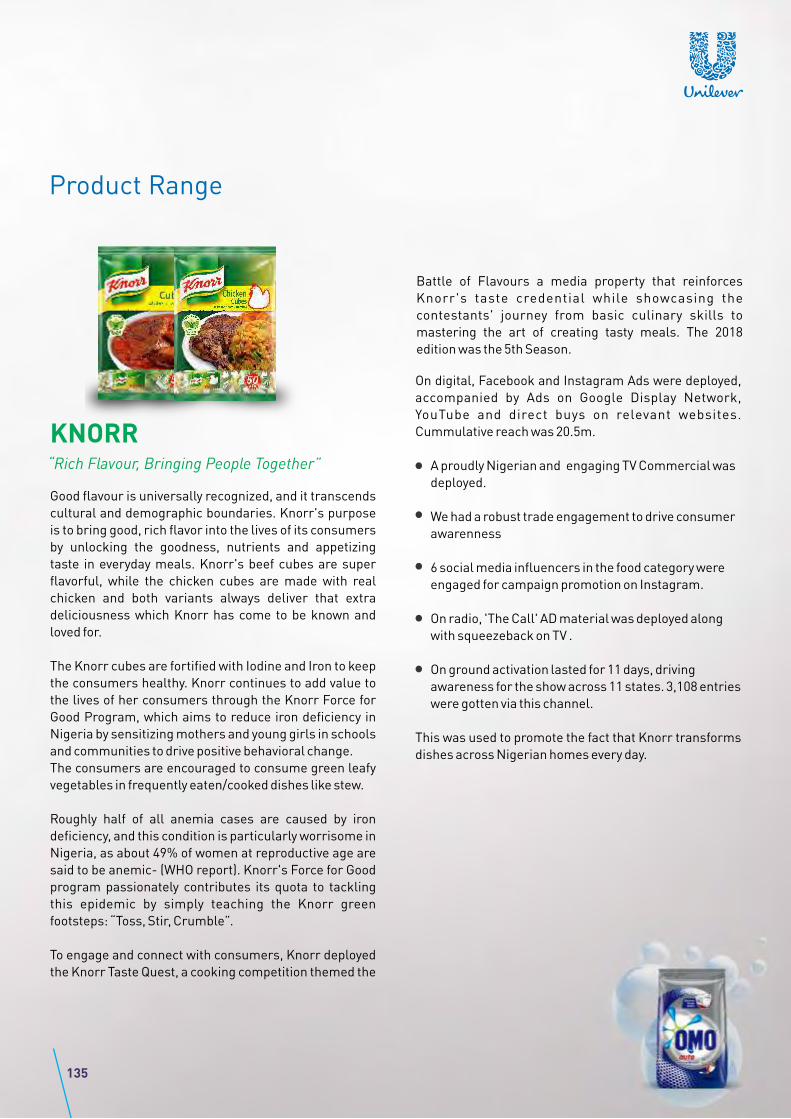
KNORR“Rich Flavour, Bringing People Together”
Good flavour is universally recognized, and it transcends
cultural and demographic boundaries. Knorr's purpose
is to bring good, rich flavor into the lives of its consumers
by unlocking the goodness, nutrients and appetizing
taste in everyday meals. Knorr's beef cubes are super
flavorful, while the chicken cubes are made with real
chicken and both variants always deliver that extra
deliciousness which Knorr has come to be known and
loved for.
The Knorr cubes are fortified with Iodine and Iron to keep
the consumers healthy. Knorr continues to add value to
the lives of her consumers through the Knorr Force for
Good Program, which aims to reduce iron deficiency in
Nigeria by sensitizing mothers and young girls in schools
and communities to drive positive behavioral change.
The consumers are encouraged to consume green leafy
vegetables in frequently eaten/cooked dishes like stew.
Roughly half of all anemia cases are caused by iron
deficiency, and this condition is particularly worrisome in
Nigeria, as about 49% of women at reproductive age are
said to be anemic- (WHO report). Knorr's Force for Good
program passionately contributes its quota to tackling
this epidemic by simply teaching the Knorr green
footsteps: “Toss, Stir, Crumble”.
To engage and connect with consumers, Knorr deployed
the Knorr Taste Quest, a cooking competition themed the
On digital, Facebook and Instagram Ads were deployed,
accompanied by Ads on Google Display Network,
YouTube and direct buys on relevant websites.
Cummulative reach was 20.5m.
A proudly Nigerian and engaging TV Commercial was
deployed.
We had a robust trade engagement to drive consumer
awarenness
6 social media influencers in the food category were
engaged for campaign promotion on Instagram.
On radio, 'The Call' AD material was deployed along
with squeezeback on TV .
On ground activation lasted for 11 days, driving
awareness for the show across 11 states. 3,108 entries
were gotten via this channel.
This was used to promote the fact that Knorr transforms
dishes across Nigerian homes every day.
Product Range
Battle of Flavours a media property that reinforces
Knorr's taste credential while showcasing the
contestants' journey from basic culinary skills to
mastering the art of creating tasty meals. The 2018
edition was the 5th Season.
135

Product Range
VASELINEPEARS
The Pears lotion, oil, cream, petroleum jelly and powder
are just right for babies' tender skin. They contain
carefully chosen, pure and mild ingredients, including
olive oil which is known to be a natural, mild skin
cleanser. In addition, the Pears perfume leaves babies
smelling fresh and throughout the day. Pears is gentle,
and promises rash-free skin, resulting in a comfortable,
cheerful baby
In 2018, Pears, in partnership with the Nigerian Nurses
and Midwives of Nigeria, carried out the Pears Hospital
Activation which was aimed at educating expectant and
new mothers on the benefits of moisturizing their babies
skin using Pears. We employed the services of Midwives
in 50 top maternal and childcare centres in Lagos, to
engage with the target audience and give out free
samples from the Pears range. Pears reached and
educated almost 500,000 women across several
channels (including social media), through this
Activation.
In 2019 and the years to come, Pears will continue to
deliver on its promise of consistently offering trusted,
quality baby care to Nigerian homes.
.
Vaseline Petroleum Jelly maintains its market share as
the number one Petroleum Jelly in Nigeria. The brand
has been around since the 1880s and Nigerians, and
people all over the world love and use it as a beauty and
natural healing staple.
In Nigeria, Vaseline Jelly is available in 3 tubs of its
original variant; 50ml, 250ml and 450ml.
In 2018, the Vaseline Lotion was relaunched in Nigeria
and we partnered with influencer Tobi Bakre of the Big
Brother Naija fame to launch the Vaseline For Men range
on social media. This drove consumer engagement with
the brand, and the relaunch received many positive
reviews.
Vaseline also executed the 'No Cracks' campaign which
reinforced the brand's purpose of delivering superior
moisturization benefit to prevent cracks and heal dry
skin.
In line with Unilever's mission to make sustainable living
common place, we recently modified the brand's
packaging material to reduce the amount of plastic use,
and we continue to research on techniques to reduce this
even further.
We look forward to a good 2019, with the healing power of
Vaseline.
136

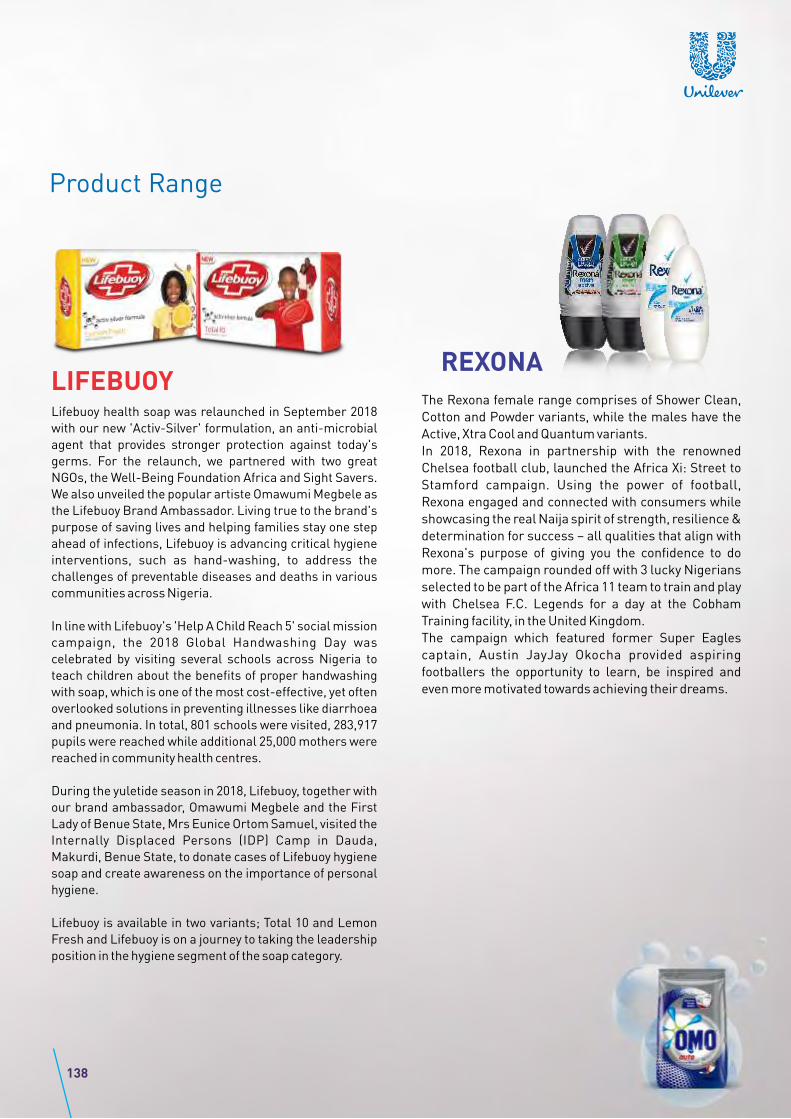
Product Range
LIFEBUOYLifebuoy health soap was relaunched in September 2018
with our new 'Activ-Silver' formulation, an anti-microbial
agent that provides stronger protection against today's
germs. For the relaunch, we partnered with two great
NGOs, the Well-Being Foundation Africa and Sight Savers.
We also unveiled the popular artiste Omawumi Megbele as
the Lifebuoy Brand Ambassador. Living true to the brand's
purpose of saving lives and helping families stay one step
ahead of infections, Lifebuoy is advancing critical hygiene
interventions, such as hand-washing, to address the
challenges of preventable diseases and deaths in various
communities across Nigeria.
In line with Lifebuoy's 'Help A Child Reach 5' social mission
campaign, the 2018 Global Handwashing Day was
celebrated by visiting several schools across Nigeria to
teach children about the benefits of proper handwashing
with soap, which is one of the most cost-effective, yet often
overlooked solutions in preventing illnesses like diarrhoea
and pneumonia. In total, 801 schools were visited, 283,917
pupils were reached while additional 25,000 mothers were
reached in community health centres.
During the yuletide season in 2018, Lifebuoy, together with
our brand ambassador, Omawumi Megbele and the First
Lady of Benue State, Mrs Eunice Ortom Samuel, visited the
Internally Displaced Persons (IDP) Camp in Dauda,
Makurdi, Benue State, to donate cases of Lifebuoy hygiene
soap and create awareness on the importance of personal
hygiene.
Lifebuoy is available in two variants; Total 10 and Lemon
Fresh and Lifebuoy is on a journey to taking the leadership
position in the hygiene segment of the soap category.
REXONA
The Rexona female range comprises of Shower Clean,
Cotton and Powder variants, while the males have the
Active, Xtra Cool and Quantum variants.
In 2018, Rexona in partnership with the renowned
Chelsea football club, launched the Africa Xi: Street to
Stamford campaign. Using the power of football,
Rexona engaged and connected with consumers while
showcasing the real Naija spirit of strength, resilience &
determination for success – all qualities that align with
Rexona's purpose of giving you the confidence to do
more. The campaign rounded off with 3 lucky Nigerians
selected to be part of the Africa 11 team to train and play
with Chelsea F.C. Legends for a day at the Cobham
Training facility, in the United Kingdom.
The campaign which featured former Super Eagles
captain, Austin JayJay Okocha provided aspiring
footballers the opportunity to learn, be inspired and
even more motivated towards achieving their dreams.
138

Notes
139

Notes
140
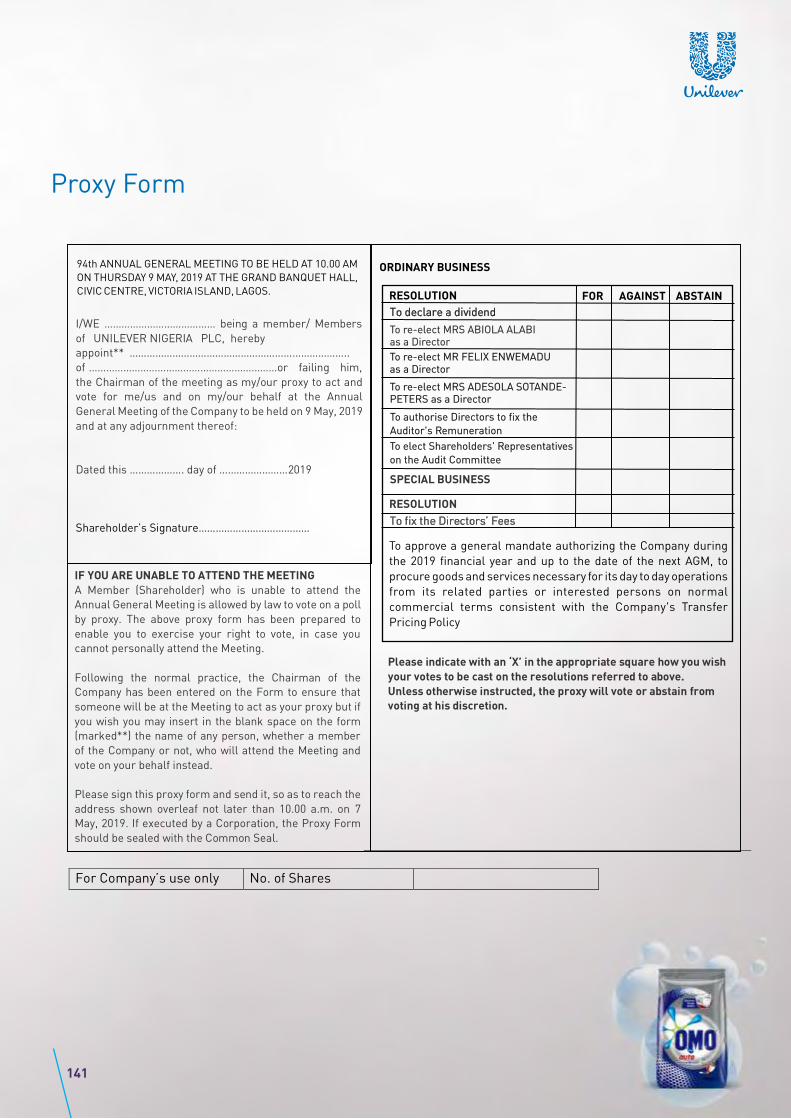
Proxy Form
141
To re-elect MRS ABIOLA ALABI as a Director
To re-elect MR FELIX ENWEMADU as a Director
94th ANNUAL GENERAL MEETING TO BE HELD AT 10.00 AM
ON THURSDAY 9 MAY, 2019 AT THE GRAND BANQUET HALL,
CIVIC CENTRE, VICTORIA ISLAND, LAGOS.
To re-elect MRS ADESOLA SOTANDE-PETERS as a Director
To authorise Directors to fix the
Auditor's Remuneration
To elect Shareholders' Representatives
on the Audit Committee
To approve a general mandate authorizing the Company during
the 2019 financial year and up to the date of the next AGM, to
procure goods and services necessary for its day to day operations
from its related parties or interested persons on normal
commercial terms consistent with the Company's Transfer
Pricing Policy

THE REGISTRAR
GREENWICH REGISTRARS & DATA SOLUTIONS,
274, MURTALA MUHAMMED WAY
ALAGOMEJI, YABA, LAGOS