Embed Size (px)
Citation preview

ANNUAL REPORT – GLASS AND CERAMIC INDUSTRY OF THE CZECH REPUBLIC - 2011
August 2012

Dear friends,
The Association of the Glass and Ceramic Industry of the Czech Republic issues the „Annual Report – Glass and Ceramic Industry of the Czech Republic – 2011“, where we would like to inform the public about the main economic indices of this industry in 2011, and also about development trends in the period from 2006 till 2011. A chapter dealing with the activities of the Association of the Glass and Ceramic Industry of the Czech Republic is also included in this Report.
The glass and ceramic industry is an export oriented branch. The balance of foreign trade of this industry was 19.790 bill. CZK in 2011. In spite of the inter-year decrease by 2.0 % it strengthened the balance of foreign trade of the whole Czech processing industry significantly.
In 2011 stimulation on foreign markets appeared and it projected favourably to export and also to companies economy. In spite of this fact, the year 2011 was not simple for companies of the glass and ceramic industry. According to the prediction of the Ministry of Finance, the present development of foreign and home economy does not give great expectations to significant improvement even in 2012.
The glass and ceramic industry reacts very sensitively to changes of economical and political development not only because of its export orientation but also due to its dependence on a number of following industrial branches utilizing its products. Companies still have to search ways how to orientate to the production with a high added value, how to strengthen the innovation in the production and in the management and commercial strategies.
I believe you will find interesting and usable information in our Annual Report.
Mr Petr Mazzolini
The President of the Association of the Glass and Ceramic Industry of the Czech Republic
President Ing. Petr Mazzolini
Vicepresidents
Ing. Radislav Feix, PhD., Ing. Petr Hübner, Ing. Jaroslav Seifrt
Board Ing. Petr Beránek, Ladislav Dvořák (od 30. 11. 2011), Mgr. Miloslav Hambálek (do 30. 11. 2011), Ing. Lubomír Hnilička, Ing. Jaroslav Hudera (do 19. 4. 2012), Mgr. Martin Kubát (od 24. 5. 2012),
Ing. Svatopluk Kudláč (do 24. 5. 2012), Ing. Milan Kucharčík (od 24. 5. 2012), Otakar Moťka (od 24. 5. 2012), Ing. Jan Pavliš (do 24. 5. 2012), Ing. Pavel Wurzel
Supervisory Board
předseda: Ing. Jiří Mašek Členové: Ing. Jiří Bělský, Doc. Ing. Stanislav Kasa, Csc.

CONTENT
Introduction
1. Association of the Glass and Ceramic Industry of the Czech Republic
2. Czech Product, guaranteed by the Association of the Glass and Ceramic Industry of the Czech
Republic
3. Structure of the glass and ceramic industry in the Czech Republic
4. Position of the glass and ceramic industry in the Czech Republic
5. Development of the glass and ceramic industry in the period from 2006 till 2011
6. Export and import according to production branches in the period from 2006 till 2011
INTRODUCTION
The Annual Report gives in its introduction part an overview on the position of the glass and
ceramic industry within the processing industry of the Czech Republic, its structure and development in the period from 2006 till 2011. An evaluation of the activities of the Association of the Glass and Ceramic Industry of the Czech Republic in the past period is a part of this Annual Report.
Data processed in the Annual Report are based on data of the Czech Statistical Office (valid at
the date of June 20, 2012). These data are completed with information gained from annual reports of the Association members.
Classification and terminology of the processing industry used in the Chapter “Position of the
glass and ceramic industry in the Czech Republic“ are taken from the Czech Statistical Office. Time development lines compared in the Chapter”Development of the glass and ceramic industry” are given for the period from 2006 till 2011.
The glass and ceramic industry is in the submitted Annual Report mostly investigated and described separately, i.e. in seven so-called groups. These groups are created by related glass and ceramic production activities as far as technology and marketing. This methodology corresponds to a method of the statistical statement in the Czech Republic.
• Flat glass (unfinished and finished flat glass)
• Container glass (bottles, preserve glass jars, other glass containers)
• Glass fibres (reinforcing/textile fibres, insulating glass fibres)
• Other glass (special glasses - laboratory and laboratory apparatus glass, tubing, glass TV components, technical spheres, glass industrial apparatuses, protective welding glass, optical glass, glass blocks, fashion jewellery glass, etc.) and lighting glass (chandeliers, lamps and their glass parts)
• Utility glass (drinking glass, glass for household, decorative glass, art glass, etc.)
• Household china and ceramics (china ware for household and decorative china, ceramic ware for household, decorative ceramics)
• Technical ceramics and sanitary ware (insulators, laboratory china, ceramic products for sanitary purposes, products for technical purposes)
The development in the rest groups created by the production of machinery, equipment and
services for the glass and ceramic industry, is not investigated in the Annual Report as the whole. From the point of view of the statistical statement the activities connected with this group are investigated in a number of other subsections of the processing industry, and so it is not possible to process and compare them, especially numerical data, reliably.

1. THE ASSOCIATION OF THE GLASS AND CERAMIC INDUSTRY OF THE CZECH REPUBLIC
The Association of the Glass and Ceramic Industry of the Czech Republic
The Association of the Glass and Ceramic Industry of the Czech Republic is a member of the Confederation of Industry of the Czech Republic (hereinafter Confederation) and a member of the Glass Alliance Europe.
The Association of the Glass and Ceramic Industry of the Czech Republic (hereinafter
Association) was established in 1990 as an interest group of producers of flat, container, technical, utility and lighting glass, glass and mineral fibres, household china, household ceramics and sanitary ware, trade companies, suppliers of machinery, machine and technological equipments and services, specialized schools, research institutes and publishers of specialized journals. Also the Czech Glass Society is the member of the Association. A separate part of this chapter is devoted to the Czech Glass Society.
The activities of the Association are focused, especially on the promotion, assertion and
defence of interests and demands in relation to the bodies of the state administration, on organizing a mutual cooperation of members in solution of common problems, on rational utilization of local raw material resources, on environmental problems solution, on ensuring collective negotiations with respective trade union and making collective bargains, on ensuring a database for strategic decisions of its members, on assistance in search of foreign partners, on coordination of research and development in the glass and ceramic industry in cooperation with specialized schools and workplaces, on expert and financial support in publishing specialized literature and journals, and also on solution of specialized education orientation.
Activities of the Association in 2011
The Association within the membership in the Confederation collaborated on fulfilling the Agenda 2010 on national level. As far as the promotion of interests directly connected with the glass and ceramic industry the Association cooperated with the Czech Glass Society, the Silicate Union and the Czech Union of Fashion Jewellery Producers. Within the European Union the Association worked together with the Comité Permanent des Industries du Verre Européenne (CPIV) on promotion of interests of the glass industry. The CPIV changed the organizational structure and name to the Glass Alliance Europe (hereinafter GAE) in November 2011.
The Association had 48 members at the date of December 31, 2011. The company REMAT,
s. r.o. became a new member in 2011. TRIMA, s.r.o. and AGC Liberec s.r.o. left the Association.
The activities of the Association in 2011 followed the activities in 2010. The development of economical situation forced the Association to look for new ways how to promote the interests of its members in the area of competitiveness, environment, energy savings and medial promotion. A great accent was put on the last mentioned activity - medial promotion - in 2011.

Promotion of competitiveness of the glass and ceramic industry
The aim was to promote the competitiveness of products of the glass and ceramic industry on inland and international markets.
The Chamber of Commerce realized a project Providing of common participation on
specialized foreign exhibitions and fairs. The Association enforced an inclusion of international exhibitions MAISON et OBJECT, Paris and AMBIENTE 2011, Frankfurt am Main to this project. The participation of companies in these fairs was endowed. For 2012 the fairs AMBIENTE 2012 and Glasstec 2012 are included.
The Association started to cooperate intensively with the Department of International
Competitiveness of the Ministry of Industry and Trade since June 2011. A material containing characteristics of the branch of the glass and ceramic industry was elaborated for the Department. A lot of questions were answered and more detailed information was given to the Department workers. In December based on information of the Association members, secretariat asked for including of international fairs with official Czech participation for fairs AMBIENTE 2013, Frankfurt am Main and Mir Stěkla 2013, Moscow.
The Association collaborated with the commercial department of the Czech Embassy in
Beijing, China on luxury utility glass presentation. On the suggestion of the Executive Board of the Association the general meeting of the
Association being held on May 10, 2011, decided to award a mark The Czech Product, guaranteed by the Association of the Glass and Ceramic Industry of the Czech Republic for the promotion of the competitiveness (see Chapter 2). Special rules (published on the Association www site) are given for awarding this mark and a commission of 5 members decide about its awarding.
The environment
The Association supposed an active cooperation within the Environment Committee of the CPIV. Due to limited capacity possibilities, its role was only passive; it was not possible to express and cooperate on the conception of management in various problems.
During 2011 changes in the management of the CPIV, nowadays the Glass Alliance Europe (GAE), appeared. Competences regarding the environment devolved on the appropriate producers associations (Glass for Europe, the European Container Glass Federation, the European Glass Fibre Producers Association, etc.) The transnational companies, the owners of companies in the Czech Republic too, are the members of these associations.
A representative of the Association is a member of the ENVI, the working group of the Confederation, where the bills are read and commented. Another representative of the Association is a member of specialized commission for secondary raw materials in the Ministry of Industry and Trade since January 2011. A priority aim is to solve problems of waste glass for recycling. Since November 2011 the representatives of the Association are members of the Technical group Glass
in the Ministry of Industry and Trade to the competence of which belongs the problem of Integrated Pollution Prevention and Control (IPPC) and the Document on Best Available Techniques (BREF). In June 2011 the Association organized a seminar on methodology and report for free granting of permits to the period 2013 till 2020. Mr. J. Tůma from the Department of Climate Changes in the Ministry of Industry and Trade gave his paper there.
Development, research and education
The Association supported the request of the Institute of Chemical Technology in Prague, Czech Technical University in Prague, Masaryk University in Brno and the Institute of Rock Structure and Mechanics of the Academy of Sciences of the Czech Republic together with a number of producers in the branch of glass and ceramic materials, for a grant project Centres of Competence. In spite of a very good elaboration and excellent assessments of opponents it has not been granted.
The Association cooperates with a consortium of the Confederation, Chamber of Commerce and TREXIMA, s.r.o. on the second stage of the National Qualification System (NSK 2) and the National System of Employment (NSPII). There were elaborated profession qualifications of craft activities of the production of utility glass and glass jewellery. It means glassmaker for hollow, pressed and technical glass; painter, engraver and glass cutter; glass melter; producer of metal and wooden moulds; producer of glass and metal fashion jewellery and Christmas decorations.
Also the glass machinery operator and type positions machine operator of blowing, press-and-blowing and pressing lines and lines for the production of rods and tubing was elaborated. Profession qualifications and jobs are located on the internet site www.nsk.cz and www.nsp.cz.
Labour law
Since July 1, 2011 the Collective agreement of higher degree to the period of 2011 till 2012 was enlarged to further employers with prevailing activities in the branch marked with codes of classification of economical activities (CZ-NACE) 23.1 production of glass and glass products, 23.41 production of ceramic and china products, mostly for household and decorative subjects, and 23.42 production of ceramic sanitary ware.
In the period from October 26, 2011 till February 13, 2012 proceeded the collective negotiation of higher degree between the Association and the Trade Union of Employees of Glass, Ceramic, Fashion Jewellery and China Industry (hereinafter Trade Union) on the Appendix to the Collective agreement of higher degree to the period of 2011 till 2012.
After very complicated negotiation the Appendix of the Collective agreement of higher degree was signed on February 14, 2012 by Mr. P. Mazzolini, President of the Association and by Dr. V. Kubinec, the Chairman of the Trade Union.
Promotion of the Association
A conception of medial promotion of the glass and ceramic industry has been prepared. According to this conception the promotion proceeded in 2011. The aim was to inform the public with production and the level of this branch and to contribute to entry of new qualified workers to companies and to draw young people to schools of all levels of education.
A Group for Public Relations has been established. In the Czech Radio 1 in the programme called Design, Architecture, Building Industry proceeded a serial about individual production branches of the glass industry. The website of the Association was newly processed with the aim to promote the Association members. On November 30, 2011 a meeting of the Association representatives with journalists proceeded. An agreement on partnership between the Association and the journal Sklář a keramik was signed. The Association was presented in the introduction part of the glass conference in Slovakia.
The Annual Report - Glass and Ceramic Industry of the Czech Republic - 2010 was located on the website of the Association. An extract from this report was published in Sklář a keramik in numbers 9-10 and 11-12. Further on, three issues of informational bulletin Střípky were issued.
The Czech Glass Society
The Czech Glass Society is a member of the International Commission on Glass (ICG) and the European Society of Glass Science and Technology (ESG).
The Czech Glass Society was originally established in 1946 as a glass section of the Czechoslovak Glass and Ceramic Society. In present form it exists after division of the Czech and Slovak Federal Republic in 1993 as the Czech Glass Society (hereinafter CGS).
The CGS is a voluntary organization associating individual and collective members from the production of glass, fashion jewellery and related branches.
Activities of the CGS in 2011
At the date of December 31, 2011 the CGS had totally 345 individual members, from them 62 members are in two subsidiaries and 59 in art section, and 20 collective members.
The CGS works in Technical Commissions of the ICG: TC 2 - Chemical Durability & Analysis, TC 3 - Basic Glass Science, TC 7 – Nucleation, Crystallisation & Glass-Ceramics, TC 13 - Environment, TC 14 - Gases in Glass, TC 19 - Glass Surface Diagnostics, TC 20 - Glasses for Optoelectronics, TC 21 - Modelling of Melting Processes, TC 23 - Education & Training in Glass
Science & Engineering, and TC 25 – Modelling of Glass Forming Processes.
Preparation of the 23rd International Glass Congress on Glass (July 1-5, 2013) in Prague started.
The CGS collaborates with the Deutsche Glastechnische Gesellschaft (DGG) and with the Slovak Glass Society. The delegace of the CGS participated on the 85th Annual Conference of the DGG in Saarbrücken in June.
On February 2011 the 16th traditional seminar of doctorands with the theme “Inorganic Non-Metallic Materials – processes, technologies, properties” was held. The organizer was the Institute of Glass and Ceramics of the Institute of Chemical Technology, Prague.
The 11th International Seminar on Furnace Design - Operation & Process Simulation and

related 3rd Glass Forming Simulation Workshop was held in June.
The CGS collaborates with the Foundation of Josef Viewegh in the project called Way of Glass – National Centre of Glass Art – Glassworks František in Sázava.
The CGS is a publisher of the journal Sklář a keramik. In 2011 it was the 61st year already and already the 88th year of Czech glass journal. There were published 6 issues with total number of more than 300 pages.
2. CZECH PRODUCT, GUARANTEED BY THE ASSOCIATION OF THE GLASS AND CERAMIC INDUSTRY OF THE CZECH REPUBLIC
The General meeting of the Association of the Glass and Ceramic Industry of the Czech
Republic (hereinafter Association) being held on May 10, 2011 decided about using a mark of glass and ceramic products for a support of competitiveness of products of the glass and ceramic industry of the Czech Republic Czech Product, guaranteed by the Association of the Glass and Ceramic Industry of the Czech Republic.
This mark was initiated by Český porcelán, a.s., Dubí and it has been decided about the possibility of this mark use not only for the members of the Association but also for non-members. This mark has an aim to give a possibility to inland and foreign customers to orientate better on market and to recognise the Czech product from other products or from their imitations. At the same time it clearly specifies Czech glass and ceramic products from products from other countries exchangeable thanks to shape, colour and, especially, due to not authorized mark. The Czech Product mark can use already: Crystalex CZ, s.r.o. for products of household assortment of crystal glass Krystalín with a trade mark “Sparkle” Crystal BOHEMIA, a.s. for products made of lead crystal 24 % PbO, incl. lighting and art glass Český porcelán, a.s. for household china with under-glaze cobalt decoration, the so called onion pattern; and household china with on-glaze decoration, decalcomania, in-glaze decoration and painting technique with gold, colour; figural and decorative china Further on, the group of companies – members of the AGC Group AGC Processing Teplice, a.s., the member of the AGC Group AGC Fenestra, a.s., the member of the AGC Group AGC Stod, s.r.o., the member of the AGC Group AGC Moravské Budějovice, a.s., the member of the AGC Group AGC Hradec Králové, a.s., the member of the AGC Group for insulation glasses sold with a trade mark Thermobel/Thermobel TG
Those interested in the mark Czech Product, guaranteed by the Association of the Glass and Ceramic Industry of the Czech Republic will find all necessary information in the internet site of the Association – www.askpcr.cz
3. STRUCTURE OF THE GLASS AND CERAMIC INDUSTRY IN THE CZECH REPUBLIC
The structure of the glass and ceramic industry of the Czech Republic is described below according to the division of individual production branches, as it is used in the following parts of this Annual Report. Companies profiling the branch through their economic importance and prestige are given in individual groups. Further on, also basic information on Czech producers of machinery and equipment and on companies providing services for the glass and ceramic industry and suppliers of basic raw materials, is given.
Flat glass
AGC Flat Glass Czech, a.s.: the key player in the area of flat glass production and processing
The only producer of a large-dimension flat glass in the Czech Republic is AGC Flat Glass Czech, a.s., a member of the AGC Group with the seat in Teplice. This company is at present the greatest producer of flat glass and its applications in Central and Eastern Europe. The 100 % owner of the company is Asahi Glass Co. Ltd., Japan.
The activities of AGC Flat Glass Czech, a.s. include the production of basic flat float glass, clear or with defined green tint. It is finished by further transformation to the so-called low-emission glasses controlling the light and energy flow, safety (laminated or toughened) glass, sound insulating glass, matt or painted glasses for exterior and interior applications and mirrors. By further treatment double or triplex insulating glass, bent building glasses, furniture glass, glass for solar technique and fire resistant glass, are produced. Beside float glass the company produces dozens of ornamental patterns of cast glass. The trade policy of the company is based on export to the countries of Central and Eastern Europe. The company production is applied also in world distribution channels of the AGC Group.
The activities of AGC Flat Glass Czech, a.s. are supported by distribution channels in the Czech Republic, Slovakia and Poland created by subsidiary companies for distribution of glass for the architecture and building industry. Through them the company is a supplier of important volumes of unfinished flat glass to processing companies.
Great volumes of flat glass are processed in the Czech Republic in the automotive division represented by AGC Automotive Czech, a.s. Chudeřice u Bíliny. This company is a part of world and European distribution channels of production and trade activities of Automotive Glass Company, Asahi Glass Co., Ltd., Japan. The main goal and vision is to be the most respected world supplier of all safety glasses for the automotive industry. AGC Automotive Europe Ltd. has its production activities in Belgium, France, Italy, Czech Republic, Hungary, Russia, Germany and Great Britain. It supplies more than 33 mill. windshields, rear windows, sidescreens and skylights made of safety automotive glass per year to all most significant automobile producers of the world.
In the Czech Republic there are many other companies processing flat glass for various specialized products. It is for instance SAINT-GOBAIN GLASS SOLUTION, s.r.o. (it appeared by a merger of Saint-Gobain SKLO ČR, spol. s r.o., Izolas, spol. s r.o. and VEHA, spol. s r.o. in 2010), production of insulating glasses, treatment of glass for the building industry and interiors; Saint-Gobain Sekurit ČR, spol. s r.o. Hořovice - production of glass for private cars; Pilkington Czech, spol. s r.o. Noviny pod Ralskem - production of glass for the building industry; Amirro, s.r.o. Čelákovice - production of mirrors and furniture glass; ERTL GLAS, s.r.o. Říčany - production of laminated safety glass, heat protective glass; WMA-Glass, s.r.o. Chrastava - production of insulating glass; Bepof, spol. s r.o., Hranice u Aše, processing of flat glass and mirrors, etc.
Beside the above mentioned companies there are also many wholesale companies trading with products and services regarding finished flat glass.
Container glass
The production of container glass includes beverage bottles and preserve glass jars made for the food industry (beer, wine, liquors, non-alcoholic drinks, mineral waters, fruit, etc.), and further on, glass containers for products of the chemical, pharmaceutical and cosmetic industries.
Dominant producers of container glass in the Czech Republic are O-I Manufacturing Czech Republic, a.s. with trading company O-I Sales and Distribution Czech Republic, s.r.o. Dubí u Teplic, members of the transnational group of companies Owens-Illinois, USA, and VETROPACK MORAVIA GLASS, a.s. Kyjov, a member of the transnational group Vetropack Holding AG, Switzerland. Both these companies have about 90 % of a market share of container glass in the Czech Republic and they have also important export shares in neighbouring countries within their transnational ownership and trade bonds.
Further on, there are producers of container glass, e.g. SKLÁRNY MORAVIA, a.s. Úsobrno and STÖLZLE UNION, s.r.o. Heřmanova Huť (the owner is STÖLZLE - OBERGLAS GmbH) in the Czech Republic.
Glass fibres and products made of
The only producer of glass textile fibres and products made of in the Czech Republic is SAINT-GOBAIN ADFORS CZ, s.r.o. Litomyšl (companies Saint-Gobain Vertex, s.r.o., VERTEX FABRICIS, s.r.o. and VERTEX GLASS MAT, s.r.o. changed their names on September 1, 2011), which is organizationally included to the sector of innovative materials of the group Saint-Gobain. As far as products it includes activities: “Vetrotex” and ADFORS CONSTRUCTION PRODUCTS EUROPE”. The term “CONSTRUCTION PRODUCTS” reflects the final utilization of company products.
The only Czech producer of thermal and sound insulation made of glass fibres in the form of mats and slabs (ROTAFLEX SUPER® trade mark) is Union Lesní Brána, a.s. Dubí u Teplic.
Insulation material based on glass wool in the form of slabs and rolls is produced by KNAUF INSULATION, spol. s r.o. Krupka u Teplic.

Utility glass
There are about thirty companies with more than 20 employees with the main production of utility glass. To the greatest belong Crystalex CZ, s.r.o. Nový Bor (machine made utility soda potassium glass), Crystal BOHEMIA, a.s. Poděbrady (lead crystal) and Crystalite Bohemia, a.s. Světlá nad Sázavou. Further on, there are many smaller companies with various assortments, e.g. art glass, cut lead crystal, utility glass decorated with painting, pen-and-ink drawing, staining, high enamel and engraving, handmade utility glass, historical replicas, off-hand glass, etc. For example: AJETO, s.r.o. Lindava, Rückl CRYSTAL, a.s. Nižbor, Blažek Glass, s.r.o. Poděbrady, CAESAR CRYSTAL BOHEMIAE, a.s. Světlá nad Sázavou, SKLÁRNA SLAVIA, s.r.o. Nový Bor, Královská Huť, s.r.o. Doksy, EGERMANN, s.r.o. Nový Bor, Bohemia Machine, s.r.o. Světlá nad Sázavou and a number of other companies.
Luxury handmade utility glass is produced by Moser, a.s. Karlovy Vary. The pressed-and-blown decorated utility and decorative glass is produced by Sklárna Heřmanova Huť, a.s.
KAVALIERGLASS, a.s. Sázava nad Sázavou is a producer of household cooking glass.
Other glass
Products included into this group of the glass industry are often (especially in abroad) called special glasses. It is a wide range of glass products with specifically defined properties having their customers mostly in other processing branches of industrial market. The assortment of this group in the Czech Republic is very wide. It includes technical, laboratory and laboratory apparatus glass, technical spheres, glass industrial apparatuses, protective welding glass, optical glass. Also the production of glass blocks, fashion jewellery semiproducts and lighting glass are included.
A dominant Czech producer of technical and laboratory glass, tubing and apparatus glass made of borosilicate glass is KAVALIERGLASS, a.s. Sázava. Technical and laboratory glass is also produced by TECHNOSKLO, s.r.o. Držkov, EXATHERM, s.r.o. Železný Brod (glass thermometers and densimeters), DETESK, s.r.o. Železný Brod (technical borosilicate glass), Vitrum, spol. s r.o. - Sklárna Janov, Janov nad Nisou and other smaller companies.
From the producers of optical glass can be stated EcoGlass, s.r.o. Jablonec nad Nisou, the producer of exactly pressed components of optical glass for electro-optical apparatuses and BOHEMIA OPTIK, s.r.o. Mařenice u České Lípy, the producer of optical components and systems.
VITRABLOK, k.s. Duchcov is the producer of glass blocks for the building industry.
Frits and glazes are made in MEFRIT spol. s r.o. Mělník and Glazura, spol. s r.o. Roudnice.
Production of fashion jewellery semiproducts is a subject of activities of many companies mostly in the north part of the Czech Republic in Jablonec region (Preciosa, a.s., Liglass, a.s., PAS JABLONEC, a.s.).
Lighting glass is produced by Sklárny Janštejn, s.r.o. and it is a supplementary assortment of

several smaller producers of utility and technical glass. A number of companies are engaged in the production of components for chandeliers and also in individual production of chandeliers, the most significant are, e.g. Preciosa, a.s., Liglass, a.s.
Household china and ceramics
The assortment of household china includes products intended for daily use to luxury products, e.g. luxury household china, household and decorative china, e.g. rose, onion pattern, and figural china.
Among significant china producers belong Thun 1794, a.s. Nová Role, Český porcelán, a.s. Dubí u Teplic, G-Benedikt, s.r.o. Karlovy Vary, LEANDER Porcelán Loučky, s.r.o. Nové Sedlo, König-Porzellan Sokolov, spol. s r. o., Sokolov, ELPOR-Rauschert, s.r.o. Krupka-Bohosudov and Starorolský porcelán Moritz Zdekauer, a.s. Karlovy Vary - Stará Role.
A great number of more specialized smaller companies produce household ceramics. The greatest are KERAMO Kožlany, v.d., and Keramika Krumvíř, spol. s r.o. Krumvíř. Ceramic tiles are made in KERAMIA, s.r.o. Znojmo.
Technical ceramics and sanitary ware
There are two dominant Czech producers of sanitary ware – LAUFEN CZ, s.r.o. (with producing facilities in Bechyně and Znojmo), a member of the Roca and Ideal Standard, s.r.o. Teplice. Both companies are strongly oriented to export and their market success is dependent in a great extent on the building industry boom in Europe.
The producers of technical china are Elektroporcelán, a.s. Louny with its assortment of insulators for the energy industry and Jizerská porcelánka, s.r.o. Desná v Jizerských horách producing also laboratory chinaware and china tubing.
From the producers of technical ceramics can be stated TECHNICKÁ KERAMIKA, a.s. Hradec Králové - production technical oxide ceramics for the electrotechnical industry, machinery and chemical industry, etc., KERAMTECH, spol. s r.o. Žacléř - production of foundry ceramics and technical china, and BRISK TÁBOR, a.s. - production spark and glow plugs for internal combustion engines and technical ceramics, HOFMAN CERAMIC CZ, s.r.o. Bělá nad Radbuzou - production of technical ceramics for foundries, ESTCOM CZ-oxidová keramika, a.s. Louny - production of refractory ceramics and ceramic tubes, HOB CerTec, spol. s r.o. Horní Bříza - production of technical ceramics.
Other mineral products
Aluminosilicate fibres resistant to high temperatures and insulating fibre products (wool, mats, shaped pieces, slabs) with Sibral trade mark used mainly in the construction of heat appliances are produced by UNIFRAX, s.r.o. Dubí u Teplic.
Fused basalt products (abrasion resistant and refractory materials with EUROR trade mark), abrasion resistant piping, and tiles for industry and interiors are produced in EUTIT, s.r.o., Stará Voda. This company is the only world producer of interior floor basalt tiles.
Furnaces/kilns, glass machinery and equipment, and special services for glass and ceramic industry
Nowadays, about forty or fifty independent companies produce and deliver glass furnaces, kilns, machinery and equipment, glass moulds and apparatuses for the glass and ceramic production, or carry out service, design and various specialized and consultancy work for this industry. These companies are of a different size and they have, of course, various ranges of their activities.
Among the companies with individual production and trade activities exceeding significantly the territory of the Czech Republic belong some producers of machinery and equipment, e.g. Sklostroj Turnov CZ, s.r.o. producing machines and equipment for automatic production of container glass. Further on, SKLOPAN LIBEREC, a.s. is a supplier of machinery for processing of flat glass, Sklářské stroje Znojmo, s.r.o. delivers various glass machinery equipments and TRIMA, s.r.o. Turnov delivers machinery and equipment for the production and processing of glass fibres.
Heat appliances and kilns for china and ceramics firing, as a complex and in greater amount, are designed and delivered by Realistic, a.s. Karlovy Vary, BVD PECE, s.r.o. Karlovy Vary, and LAC, s.r.o. Rajhrad. The company Elsklo, s.r.o. Desná v Jizerských horách designs and delivers equipment for small-scale electric melting of glass. Glass melting aggregates are designed and delivered by Teplotechna Prima, s.r.o. Teplice and PKI Sklopece Olomouc, s.r.o. Companies Glass Service, s.r.o. Vsetín and Dites, s.r.o. Teplice (automatized control systems for technological processes) have important activities in abroad in the area of design and control systems for glass melting aggregates and automatized systems of technological processes control, respectively. Gas-fired melting furnaces and auxiliary furnaces for hand production of glass are produced by EGT servis, s.r.o. Hradec Králové.
Producers and suppliers of cast iron and steel moulds for utility and lighting glass - Brnoform, s.r.o. Brno, and for container glass SKLOFORM, a.s. Suchdol nad Lužnicí - work predominantly on the level of services and deliveries for Czech producers. Further on, Desko, a.s. Desná v Jizerských horách delivers machinery and moulds for fashion jewellery production. Other producers of machinery for the production of glass are, e.g. FOR G, s.r.o. Teplice, and Bohemia Machine, s.r.o. Světlá nad Sázavou.
Quite a great group of companies and also a number of independent individuals are dealing with design of procedures and construction of machinery for mechanical working of glass (engraving, cutting, polishing), e.g. DIAS Turnov, s.r.o. and POLPUR, s.r.o. Turnov.
Raw materials for the glass and ceramic industry
A long tradition and the development of glass, china and ceramic production were determined, beside other factors, by an abundance of basic raw materials, i.e. sand, kaolin, feldspar and quartz.
High quality glass sands with extremely high content of SiO2 are outstanding for the glass industry and also for various utilizations in other branches. Sands are delivered in a moistened or dried form. In the Czech Republic, companies Provodínské písky, a.s. Provodín and Sklopísek Střeleč, a.s. Mladějov v Čechách mine and deliver these sands.
Mining and processing of kaolin is carried out by LB MINERALS, s.r.o. Horní Bříza, Sedlecký kaolin, a.s. Božičany and Kaolin Hlubany, a.s. Podbořany. LB MINERALS, s.r.o. is a supplier of ceramic kaolins intended for wall and floor tiles and sanitary ware, mixed kaolins for sanitary ware, paper mills kaolins and kaolins for glass fibres. Floated kaolin delivered by Sedlecký kaolin, a.s. is used, especially for china and ceramics. Kaolin Hlubany, a.s. delivers floated kaolins for ceramics.
Beside mining and processing of kaolins also mining and processing of feldspar is a part of the production of the LB MINERALS, s.r.o. Potassium feldspars are suitable for production of container and flat glass, glazes and china; soda-lime feldspars are suitable for the production of frits and enamels. Soda-potassium feldspars are applied as flux.
4. POSITION OF THE GLASS AND CERAMIC INDUSTRY IN THE CZECH REPUBLIC
The glass and ceramic industry is a traditional part of the processing industry in the Czech Republic.
The glass and ceramic industry is classified in the subcategory Production of other non-metallic mineral products according to the Classification of Economic Activities (NACE) used by the European Union.
The CZ-NACE 23 Production of other non-metallic mineral products put together productions of glass, ceramics and building materials of various types and utilization. Production of these commodities has a long tradition and a high level in the Czech Republic.
Classification of CZ-NACE activities is the following:
• Production of glass and glass products
• Production of refractory products
• Production of building materials from clay materials
• Production of other china and ceramic products
• Production of cement, lime and plaster
• Production of concrete, cement and plaster products
• Cutting, shaping and finishing of stones
• Production of abrasive materials and other non-metallic mineral products not stated elsewhere
Sections 23.1 and 23.4 from which: 23.41 Production of ceramic and china products, mostly for household and decorative products 23.42 Production of ceramic sanitary ware 23.43 Production of ceramic insulators and insulation accessories 23.44 Production of other technical ceramic products
represent the production of glass, glass products and production of other china and ceramic products which are a subject of evaluation of this Annual Report.
In the following tables the revenues without the value added tax (VAT) from the products and services sale, from sale of own products and services of industrial character (hereinafter revenues) and revenues without the VAT from the direct export (hereinafter direct export) of individual subcategories of the processing industry. Revenues and direct export are given in current prices. Their share within the Czech processing industry in 2011 is described by this method.
The revenues of the processing industry in the Czech Republic reached a value of 2790.80 bill. CZK in 2011 (in 2010 it was 2550.58 bill. CZK). In comparison with previous year the revenues of the processing industry increased by 9.4 %. The category Production of other non-metallic mineral products with revenues in amount of 96.39 bill. CZK shared on the revenues of the processing industry with 3.5 %.
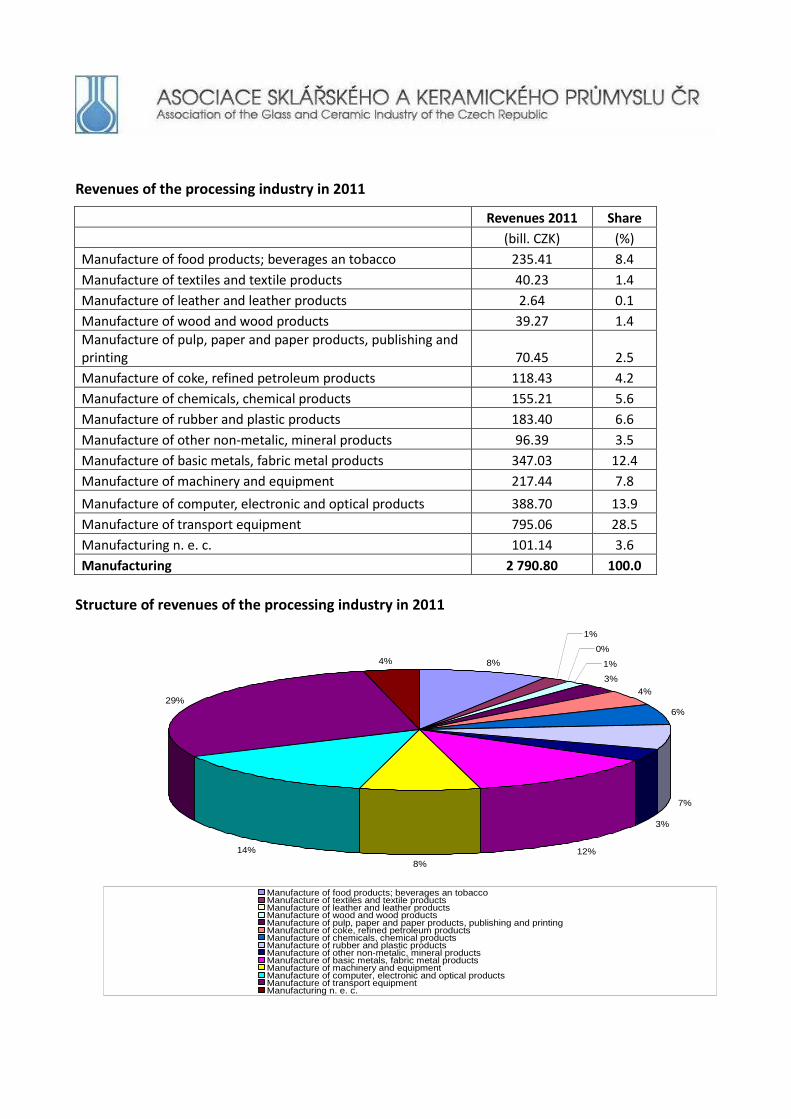
Revenues of the processing industry in 2011
Revenues 2011 Share
(bill. CZK) (%)
Manufacture of food products; beverages an tobacco 235.41 8.4
Manufacture of textiles and textile products 40.23 1.4
Manufacture of leather and leather products 2.64 0.1
Manufacture of wood and wood products 39.27 1.4
Manufacture of pulp, paper and paper products, publishing and printing 70.45 2.5
Manufacture of coke, refined petroleum products 118.43 4.2
Manufacture of chemicals, chemical products 155.21 5.6
Manufacture of rubber and plastic products 183.40 6.6
Manufacture of other non-metalic, mineral products 96.39 3.5
Manufacture of basic metals, fabric metal products 347.03 12.4
Manufacture of machinery and equipment 217.44 7.8
Manufacture of computer, electronic and optical products 388.70 13.9
Manufacture of transport equipment 795.06 28.5
Manufacturing n. e. c. 101.14 3.6
Manufacturing 2 790.80 100.0
Structure of revenues of the processing industry in 2011
8%
1%
0%
1%
3%
4%
6%
7%
3%
12%8%
14%
29%
4%
Manufacture of food products; beverages an tobaccoManufacture of textiles and textile productsManufacture of leather and leather productsManufacture of wood and wood productsManufacture of pulp, paper and paper products, publishing and printingManufacture of coke, refined petroleum productsManufacture of chemicals, chemical productsManufacture of rubber and plastic productsManufacture of other non-metalic, mineral productsManufacture of basic metals, fabric metal productsManufacture of machinery and equipmentManufacture of computer, electronic and optical productsManufacture of transport equipmentManufacturing n. e. c.
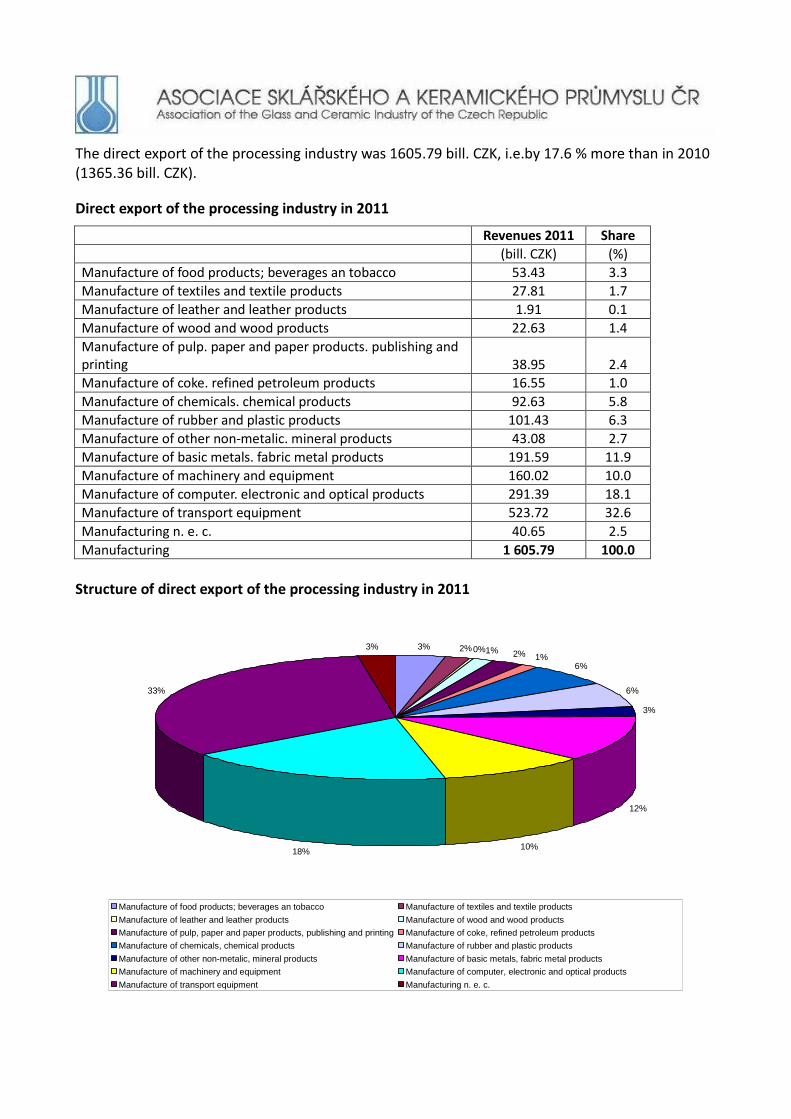
The direct export of the processing industry was 1605.79 bill. CZK, i.e.by 17.6 % more than in 2010 (1365.36 bill. CZK).
Direct export of the processing industry in 2011
Revenues 2011 Share
(bill. CZK) (%)
Manufacture of food products; beverages an tobacco 53.43 3.3
Manufacture of textiles and textile products 27.81 1.7
Manufacture of leather and leather products 1.91 0.1
Manufacture of wood and wood products 22.63 1.4
Manufacture of pulp. paper and paper products. publishing and printing 38.95 2.4 Manufacture of coke. refined petroleum products 16.55 1.0
Manufacture of chemicals. chemical products 92.63 5.8
Manufacture of rubber and plastic products 101.43 6.3
Manufacture of other non-metalic. mineral products 43.08 2.7
Manufacture of basic metals. fabric metal products 191.59 11.9
Manufacture of machinery and equipment 160.02 10.0
Manufacture of computer. electronic and optical products 291.39 18.1
Manufacture of transport equipment 523.72 32.6
Manufacturing n. e. c. 40.65 2.5
Manufacturing 1 605.79 100.0
Structure of direct export of the processing industry in 2011
3% 2%0%1% 2% 1%6%
6%
3%
12%
10%18%
33%
3%
Manufacture of food products; beverages an tobacco Manufacture of textiles and textile products
Manufacture of leather and leather products Manufacture of wood and wood products
Manufacture of pulp, paper and paper products, publishing and printing Manufacture of coke, refined petroleum products
Manufacture of chemicals, chemical products Manufacture of rubber and plastic products
Manufacture of other non-metalic, mineral products Manufacture of basic metals, fabric metal products
Manufacture of machinery and equipment Manufacture of computer, electronic and optical products
Manufacture of transport equipment Manufacturing n. e. c.
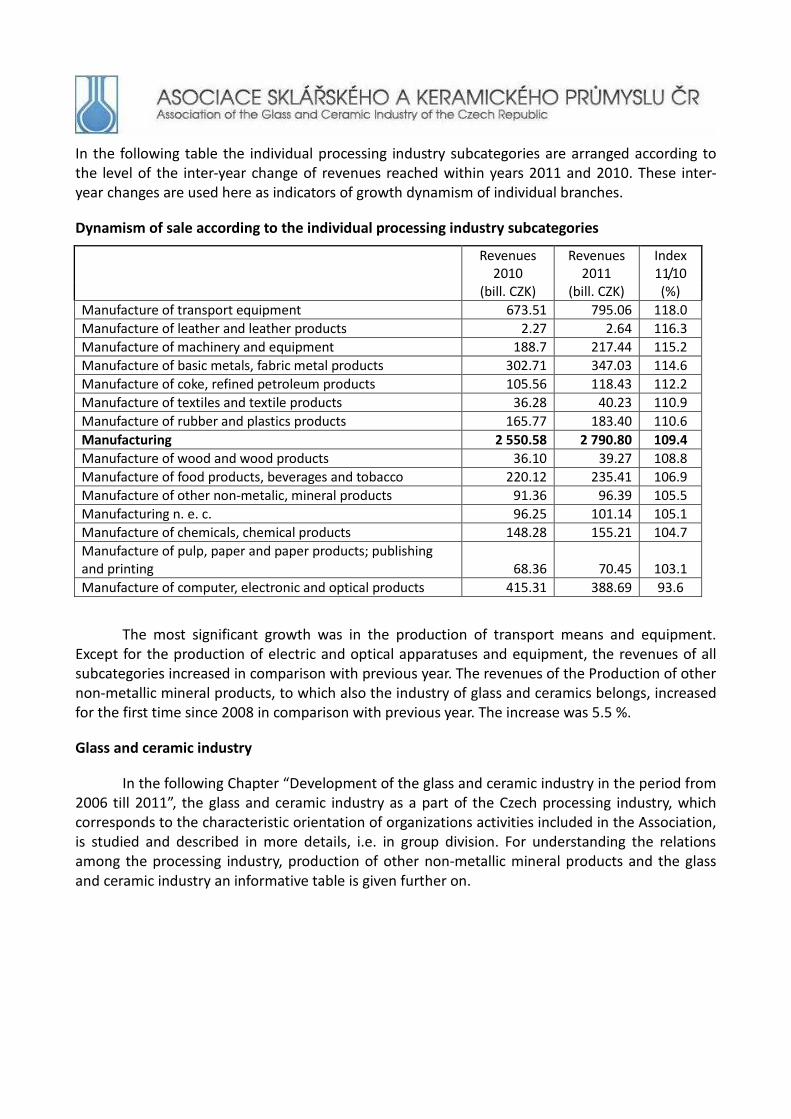
In the following table the individual processing industry subcategories are arranged according to the level of the inter-year change of revenues reached within years 2011 and 2010. These inter-year changes are used here as indicators of growth dynamism of individual branches.
Dynamism of sale according to the individual processing industry subcategories
Revenues
2010 Revenues
2011 Index 11/10
(bill. CZK) (bill. CZK) (%)
Manufacture of transport equipment 673.51 795.06 118.0
Manufacture of leather and leather products 2.27 2.64 116.3
Manufacture of machinery and equipment 188.7 217.44 115.2
Manufacture of basic metals, fabric metal products 302.71 347.03 114.6
Manufacture of coke, refined petroleum products 105.56 118.43 112.2
Manufacture of textiles and textile products 36.28 40.23 110.9
Manufacture of rubber and plastics products 165.77 183.40 110.6
Manufacturing 2 550.58 2 790.80 109.4
Manufacture of wood and wood products 36.10 39.27 108.8
Manufacture of food products, beverages and tobacco 220.12 235.41 106.9
Manufacture of other non-metalic, mineral products 91.36 96.39 105.5
Manufacturing n. e. c. 96.25 101.14 105.1
Manufacture of chemicals, chemical products 148.28 155.21 104.7
Manufacture of pulp, paper and paper products; publishing and printing 68.36 70.45 103.1
Manufacture of computer, electronic and optical products 415.31 388.69 93.6
The most significant growth was in the production of transport means and equipment. Except for the production of electric and optical apparatuses and equipment, the revenues of all subcategories increased in comparison with previous year. The revenues of the Production of other non-metallic mineral products, to which also the industry of glass and ceramics belongs, increased for the first time since 2008 in comparison with previous year. The increase was 5.5 %.
Glass and ceramic industry
In the following Chapter “Development of the glass and ceramic industry in the period from 2006 till 2011”, the glass and ceramic industry as a part of the Czech processing industry, which corresponds to the characteristic orientation of organizations activities included in the Association, is studied and described in more details, i.e. in group division. For understanding the relations among the processing industry, production of other non-metallic mineral products and the glass and ceramic industry an informative table is given further on.
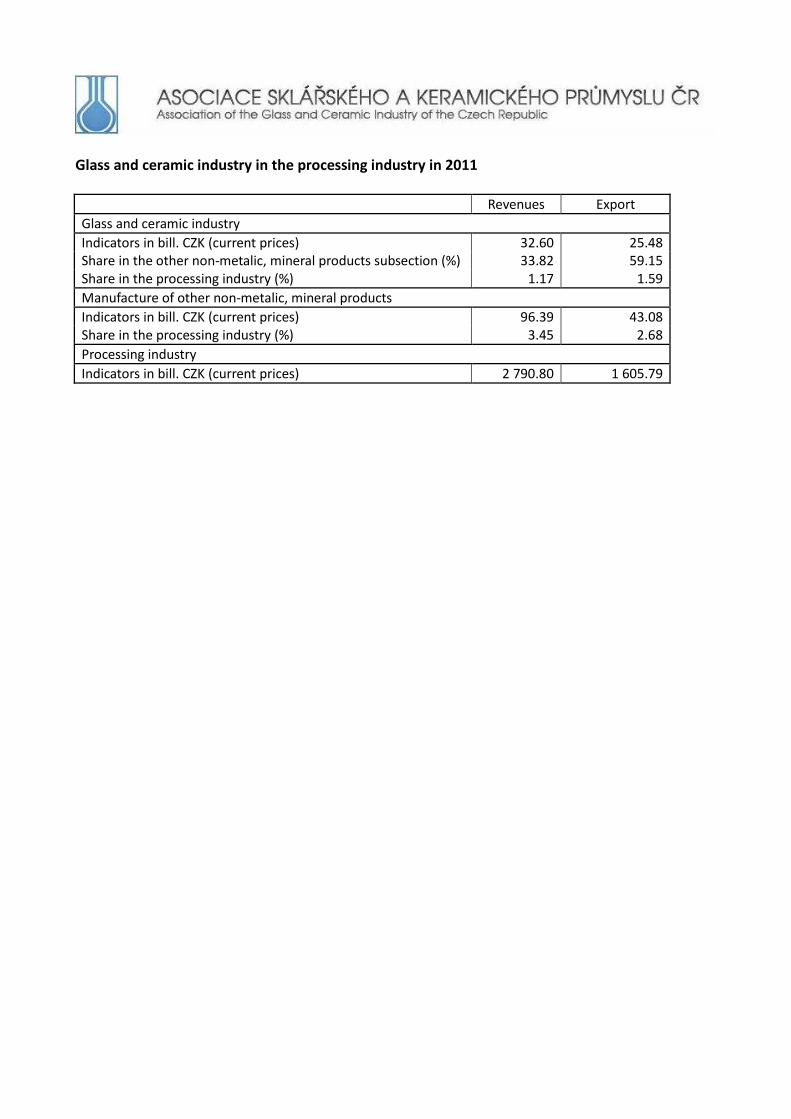
Glass and ceramic industry in the processing industry in 2011
Revenues Export
Glass and ceramic industry
Indicators in bill. CZK (current prices) 32.60 25.48 Share in the other non-metalic, mineral products subsection (%) 33.82 59.15 Share in the processing industry (%) 1.17 1.59
Manufacture of other non-metalic, mineral products
Indicators in bill. CZK (current prices) 96.39 43.08 Share in the processing industry (%) 3.45 2.68
Processing industry
Indicators in bill. CZK (current prices) 2 790.80 1 605.79

5. DEVELOPMENT OF THE GLASS AND CERAMIC INDUSTRY IN THE PERIOD FROM 2006 TILL 2011
In this part of the Annual Report characteristic values of the main production indices of the glass and ceramic industry of the Czech Republic in 2011 and in the period from 2006 till 2011 are recorded. In the context of real outer and inner background of the Czech Republic, based on these data, the aim is to analyze and describe the main trends of the development of economic indices of the glass and ceramic industry in above-mentioned years.
In the introduction of the glass and ceramic industry development analysis a survey of basic macroeconomic indices for the Czech Republic in the investigated period from 2006 till 2011 is given for understanding wide relations.
Main macroeconomic indices in the Czech Republic in the period from 2006 till 2011
2006 2007 2008 2009 2010 2011
Gross domestic product (GDP)
Average growth in %, current prices 7.0 5.7 3.1 -4.7 2.7 1.7
Average rate of inflation Average growth in % 2.5 2.8 6.3 1.0 1.5 1.9
Unemployment rate Average growth in % 8.13 6.62 5.44 7.98 9.01 8.57
Growth of average wages in % 4.0 4.3 1.4 2.3 0.7 0.5
Balance of trade bill CZK 39.8 86.1 67.8 149.5 124.5 191.4
CZK / EUR Average per year 28.34 27.76 24.94 26.45 25.29 24.59
CZK / USD Average per year 22.61 20.31 17.04 19.06 19.11 17.69
During the whole year 2011 the gross domestic product increased actually by 1.7 % in comparison with 2010 when the economy increased by 2.7 % compared with collapse by 4.7 % in 2009. According to the Czech Statistical Office (Development of Economy of the Czech Republic in 2011) the Czech economy decelerated step-by-step in each quarter of 2011. The main cause lay on inner background, because total seven tens of the Czech gross domestic product in actual and also nominal expression create expenditures to final consumption of households and government sector decreasing in each quarter. Also investments decreased during prevailing part of the year. The foreign trade became the only growth impulse in 2011.
Data and analyses given below were gathered and processed for the glass and ceramic industry as the area of the Czech processing industry corresponding to the characteristic orientation of companies associated in the Association. The selected method of the industrial development description comes out from investigation of data arranged in individual branches of the glass and ceramic industry. For the analysis of 2011 available statistical data of companies with more than 50 employees relevant to 20 June 2012, have been used.
Since 2008 the production is not stated by the Czech Statistical Office consistently in tonnes, but for instance in m2, pieces, kg, etc. Therefore, in comparison with previous reports, information about the production in weight units in individual production branches is not given in this report.
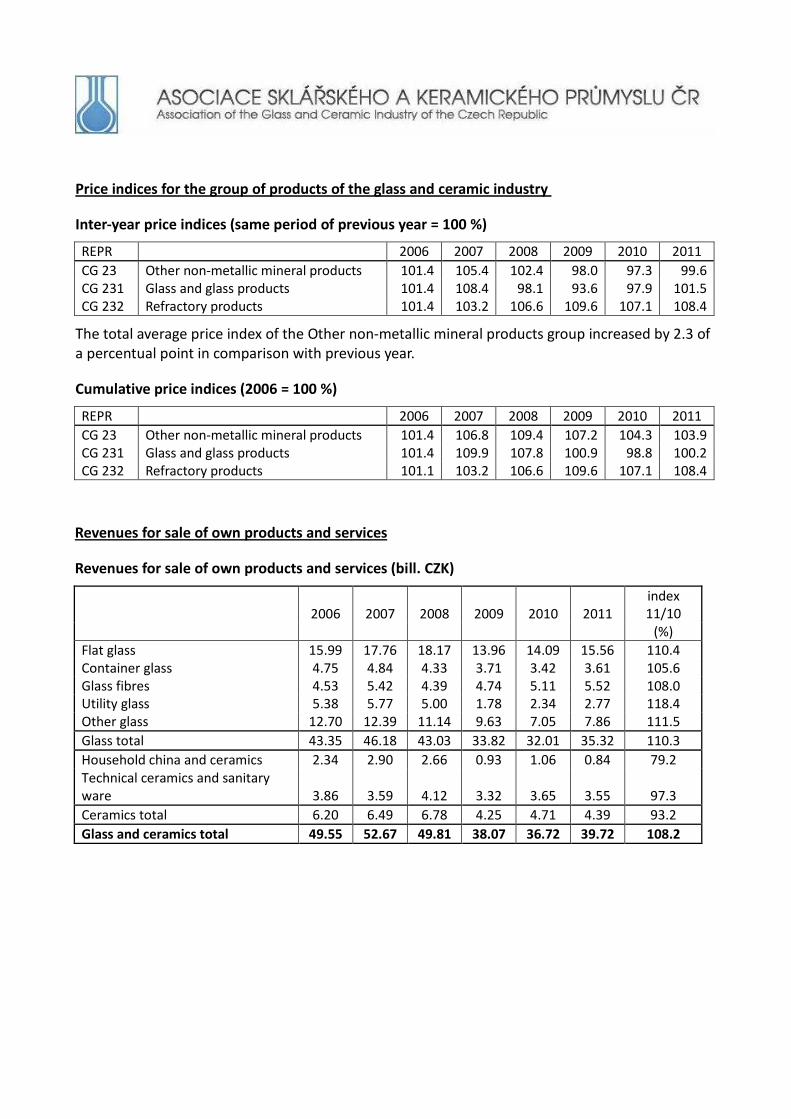
Price indices for the group of products of the glass and ceramic industry
Inter-year price indices (same period of previous year = 100 %)
REPR 2006 2007 2008 2009 2010 2011
CG 23 Other non-metallic mineral products 101.4 105.4 102.4 98.0 97.3 99.6 CG 231 Glass and glass products 101.4 108.4 98.1 93.6 97.9 101.5 CG 232 Refractory products 101.4 103.2 106.6 109.6 107.1 108.4
The total average price index of the Other non-metallic mineral products group increased by 2.3 of a percentual point in comparison with previous year.
Cumulative price indices (2006 = 100 %)
REPR 2006 2007 2008 2009 2010 2011
CG 23 Other non-metallic mineral products 101.4 106.8 109.4 107.2 104.3 103.9 CG 231 Glass and glass products 101.4 109.9 107.8 100.9 98.8 100.2 CG 232 Refractory products 101.1 103.2 106.6 109.6 107.1 108.4
Revenues for sale of own products and services
Revenues for sale of own products and services (bill. CZK)
2006 2007 2008 2009 2010 2011 index 11/10
(%)
Flat glass 15.99 17.76 18.17 13.96 14.09 15.56 110.4 Container glass 4.75 4.84 4.33 3.71 3.42 3.61 105.6 Glass fibres 4.53 5.42 4.39 4.74 5.11 5.52 108.0 Utility glass 5.38 5.77 5.00 1.78 2.34 2.77 118.4 Other glass 12.70 12.39 11.14 9.63 7.05 7.86 111.5
Glass total 43.35 46.18 43.03 33.82 32.01 35.32 110.3
Household china and ceramics 2.34 2.90 2.66 0.93 1.06 0.84 79.2 Technical ceramics and sanitary ware 3.86 3.59 4.12 3.32 3.65 3.55 97.3
Ceramics total 6.20 6.49 6.78 4.25 4.71 4.39 93.2
Glass and ceramics total 49.55 52.67 49.81 38.07 36.72 39.72 108.2
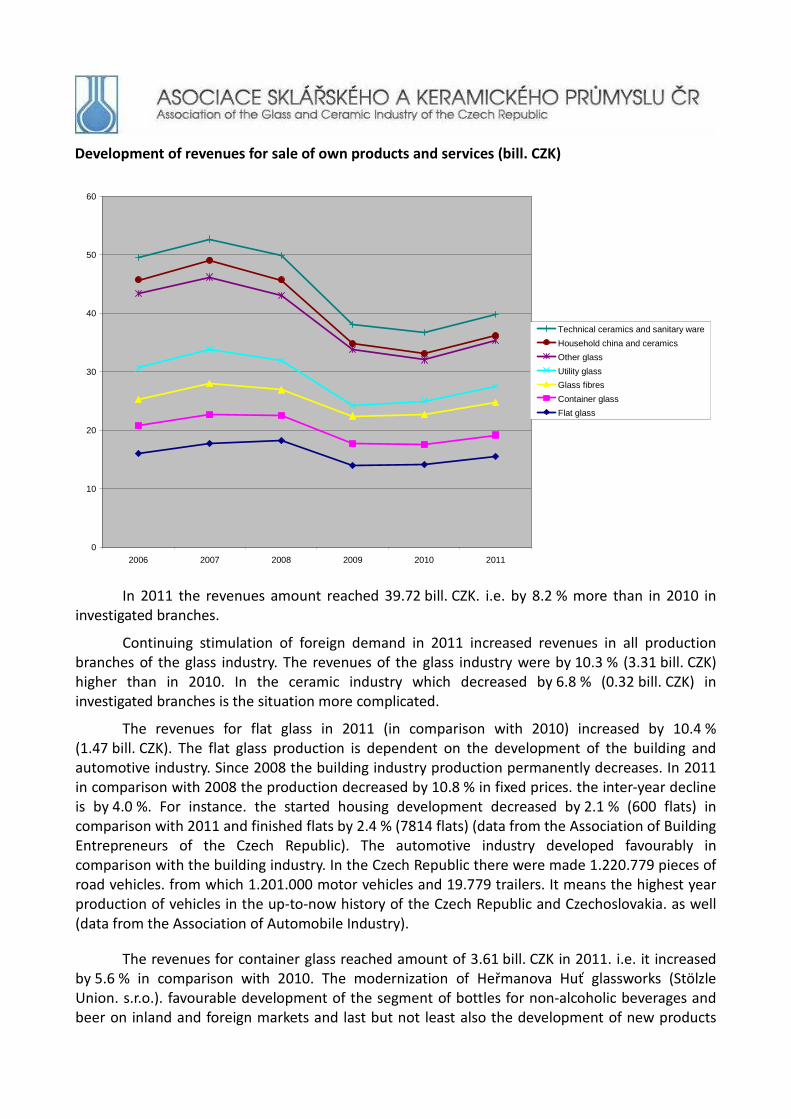
Development of revenues for sale of own products and services (bill. CZK)
0
10
20
30
40
50
60
2006 2007 2008 2009 2010 2011
Technical ceramics and sanitary ware
Household china and ceramics
Other glass
Utility glass
Glass fibres
Container glass
Flat glass
In 2011 the revenues amount reached 39.72 bill. CZK. i.e. by 8.2 % more than in 2010 in investigated branches.
Continuing stimulation of foreign demand in 2011 increased revenues in all production branches of the glass industry. The revenues of the glass industry were by 10.3 % (3.31 bill. CZK) higher than in 2010. In the ceramic industry which decreased by 6.8 % (0.32 bill. CZK) in investigated branches is the situation more complicated.
The revenues for flat glass in 2011 (in comparison with 2010) increased by 10.4 % (1.47 bill. CZK). The flat glass production is dependent on the development of the building and automotive industry. Since 2008 the building industry production permanently decreases. In 2011 in comparison with 2008 the production decreased by 10.8 % in fixed prices. the inter-year decline is by 4.0 %. For instance. the started housing development decreased by 2.1 % (600 flats) in comparison with 2011 and finished flats by 2.4 % (7814 flats) (data from the Association of Building Entrepreneurs of the Czech Republic). The automotive industry developed favourably in comparison with the building industry. In the Czech Republic there were made 1.220.779 pieces of road vehicles. from which 1.201.000 motor vehicles and 19.779 trailers. It means the highest year production of vehicles in the up-to-now history of the Czech Republic and Czechoslovakia. as well (data from the Association of Automobile Industry).
The revenues for container glass reached amount of 3.61 bill. CZK in 2011. i.e. it increased by 5.6 % in comparison with 2010. The modernization of Heřmanova Huť glassworks (Stölzle Union. s.r.o.). favourable development of the segment of bottles for non-alcoholic beverages and beer on inland and foreign markets and last but not least also the development of new products

with exclusive design. projected to the increase of revenues.
The revenues for glass fibres and products made of increased by 8.0 % (0.41 bill. CZK) in comparison with previous year. The revenues increase was influenced by the growth of European economy in 2011 and antidumping measures introduced for import of this assortment by the European Commission. On the other side the decline in the building industry in the Czech Republic projected negatively.
In comparison with previous year the revenues for utility glass increased by 18.4 % (0.43 bill. CZK). In 2011 the demand for this production branch assortment henceforth increased. In this branch very strong competitiveness exists. Companies have to face it by a high quality and originality of products.
The revenues for other glass increased in comparison with 2010 by 11.5 % (0.81 bill. CZK). This group includes a wide assortment of products (technical and laboratory glass. glass tiles and bricks. glass semiproducts for fashion jewellery. etc.). The demand for this production branch assortment is very unbalanced. In comparison with previous years the decline of demand for glass semiproducts for fashion jewellery decelerated very significantly (approximately 60 % of revenues of the other glass group). the demand for technical and laboratory glass and glass tiles and bricks increased.
The decrease of revenues for household china and ceramics by 20.8 % (0.22 bill. CZK) is a consequence of continuing decline of demand not only in the Czech Republic but also in abroad. The decrease of demand was also a cause of closing of the HAAS & CZJZEK company.
For technical ceramics and sanitary ware the revenues decreased by 2.7 % (0.10 bill. CZK). The revenues for sanitary ware increased by 0.21 bill. CZK. The decline of this products group is given by the decrease of revenues for technical ceramics (0.31 bill. CZK).
Workers
Average accounting number of workers (persons)
2006 2007 2008 2009 2010 2011 index 11/10
(%)
Flat glass 4 151 4 683 5 175 4 453 4 256 4 817 113.2 Container glass 1 233 1 198 1 150 1 143 1 202 1 247 103.7 Glass fibres 1 561 1 670 1 529 1 259 1 188 1 319 111.0 Utility glass 7 436 6 911 6 020 1 931 2 402 3 254 135.5 Other glass 13 364 12 865 10 206 7 447 5 361 6 340 118.3
Glass total 27 745 27 327 24 080 16 233 14 409 16 977 117.8
Household china and ceramics 4 234 4 136 3 749 1 751 1 900 1 571 82.7 Technical ceramics and sanitary ware 3 215 2 917 3 411 1 885 2 576 2 351 91.3
Ceramics total 7 449 7 053 7 160 3 636 4 476 3 922 87.6
Glass and ceramics total 35 194 34 380 31 240 19 869 18 885 20 899 110.7

Development of average accounting number of workers (persons)
0
2 000
4 000
6 000
8 000
10 000
12 000
14 000
16 000
2006 2007 2008 2009 2010 2011
Flat glass
Container glass
Glass fibres
Utility glass
Other glass
Household china and ceramics
Technical ceramics and sanitary ware
Total workers number in the glass and ceramic industry stated in 2011 in comparison with the previous year. increased by 2014 persons (by 10.7 %). from which it was by 17.8 % in the glass industry. in the ceramic industry it decreased by 12.4 %. The inter-year development of workers number in individual branches is different.
The workers number increasedin flat glass production is a consequence of the increase of workers number in shaping and processing of flat glass (by 117.5 %).
The workers number increased by 4 % in container glass production.
The workers number increased by 11.0 % in glass fibres production. It is a consequence of the increase of demand for the assortment of this production branch.
Together with the increase of the assortment of utility glass the workers number in utility glass production increased significantly (by 35.3 %).
The workers number increased (by 18.3 %) in other glass production in comparison with previous years.
The decrease of demand leading to limitation of production and redundancies of employees projects to the decline of workers number in household china and ceramics production.
Also the workers number in technical ceramics and sanitary ware decreased (by 8.7 %). It is caused by a fact that the workers number in technical ceramics production decreased by 31.6 %. On the other side it increased by 4.5 % in sanitary ware production.

Average month-wages
Average month-wages (CZK)
2006 2007 2008 2009 2010 2011 index 11/10
(%)
Flat glass 25 406 26 785 27 271 28 172 30 113 30 214 100.3 Container glass 23 028 25 035 26 875 27 007 27 896 28 332 101.6 Glass fibres 28 734 29 196 31 351 31 351 30 783 32 104 104.3 Utility glass 14 702 15 736 17 120 13 828 17 300 18 333 106.0 Other glass 17 043 17 798 19 745 20 223 21 979 22 175 100.9 Household china and ceramics 13 058 14 177 14 650 13 602 14 698 15 680 106.7 Technical ceramics and sanitary ware 19 496 21 314 21 472 23 863 22 566 24 207 107.3
Glass and ceramics total 18 008 19 276 20 794 22 364 23 495 24 160 102.8
Development of average month-wages (CZK)
0
5 000
10 000
15 000
20 000
25 000
30 000
35 000
2006 2007 2008 2009 2010 2011
Flat glass
Container glass
Glass fibres
Utility glass
Other glass
Household china and ceramics
Technical ceramics and sanitaryware
The inter-year development of average month-wages within 2011 and 2010 documents the economic situation of glass and ceramic industry companies.
The average wages grew in all branches in comparison with previous year.
More and more noticeable tendency in differentiation of wages among branches with mass
and full automatized productions (e.g. flat glass. glass fibres and container glass) and branches with more often changes (shorter production series) in the regime of automatized production lines and also a certain share of manual production. is continuing. Average wages reached in glass fibres and flat and container glass are high above the average wage of the Czech Republic (i.e. 24.319 CZK) (data from the Czech Statistical Office). The average wage reached in technical ceramics and sanitary ware is on the level of the average wage in the Czech Republic where the average wage in technical ceramics was 19.872 CZK and in sanitary ware 28.501 CZK. The height of the average wage in other glass is influenced by strengthening of more qualified work share (a group of technical glass productions) on one side. and low wages in the production of glass semiproducts for fashion jewellery on the other side. According to the development within the last three years it is noticeable that a qualified work is preferred in this branch. The average wages in utility glass and household china stay deeply below the average wage in the Czech Republic.
Productivity of labour
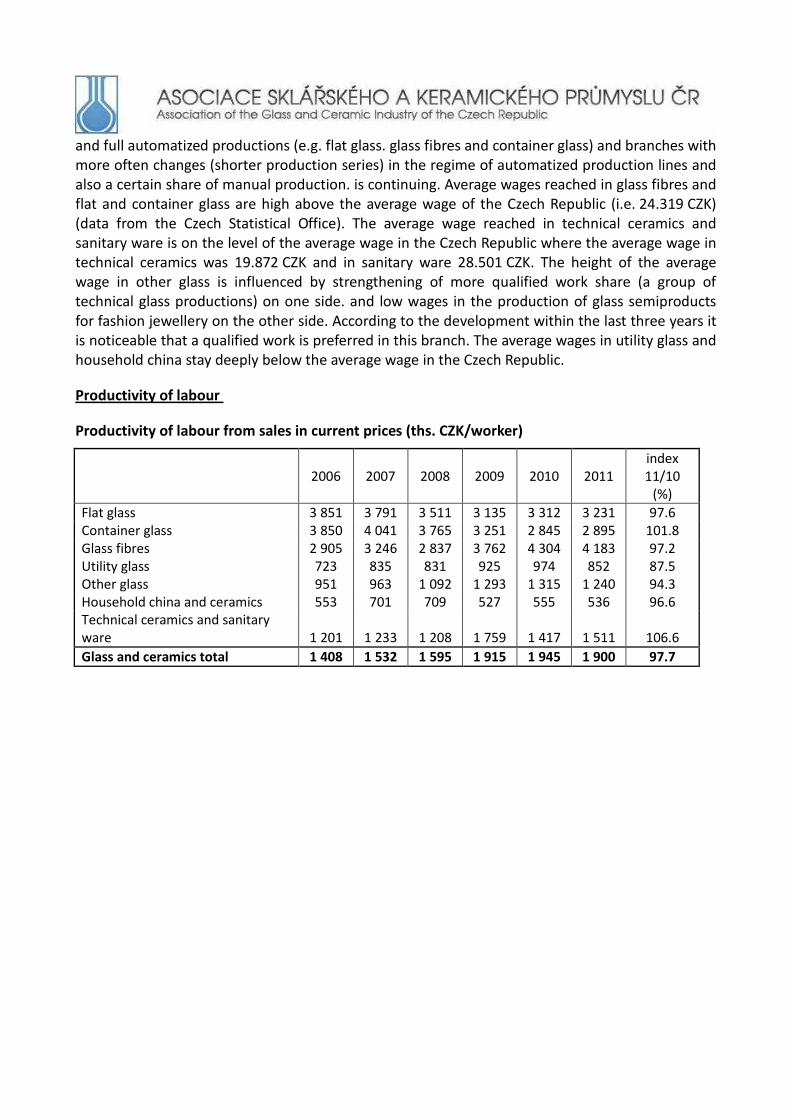
Productivity of labour from sales in current prices (ths. CZK/worker)
2006 2007 2008 2009 2010 2011 index 11/10
(%)
Flat glass 3 851 3 791 3 511 3 135 3 312 3 231 97.6 Container glass 3 850 4 041 3 765 3 251 2 845 2 895 101.8 Glass fibres 2 905 3 246 2 837 3 762 4 304 4 183 97.2 Utility glass 723 835 831 925 974 852 87.5 Other glass 951 963 1 092 1 293 1 315 1 240 94.3 Household china and ceramics 553 701 709 527 555 536 96.6 Technical ceramics and sanitary ware 1 201 1 233 1 208 1 759 1 417 1 511 106.6
Glass and ceramics total 1 408 1 532 1 595 1 915 1 945 1 900 97.7
Development of productivity of labour from sales in current prices (ths. CZK/worker)
0
500
1 000
1 500
2 000
2 500
3 000
3 500
4 000
4 500
5 000
2006 2007 2008 2009 2010 2011
Flat glass
Container glass
Glass fibres
Utility glass
Other glass
Household china and ceramics
Technical ceramics and sanitary ware
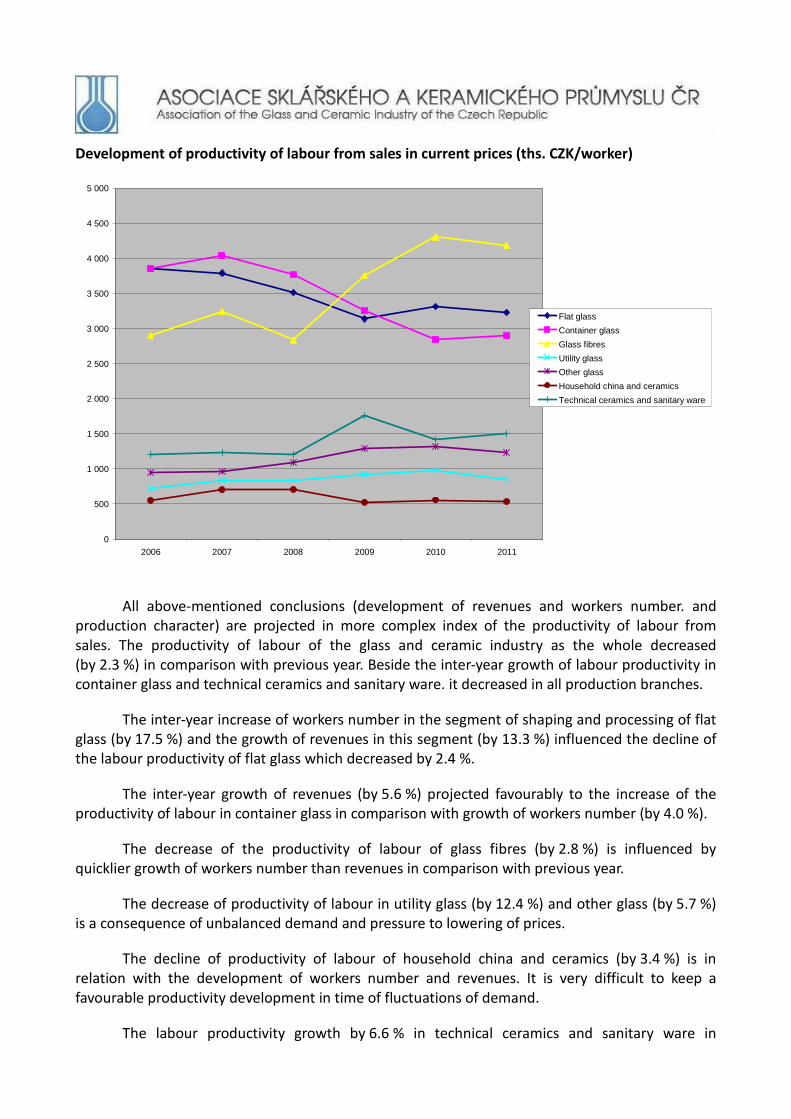
All above-mentioned conclusions (development of revenues and workers number. and production character) are projected in more complex index of the productivity of labour from sales. The productivity of labour of the glass and ceramic industry as the whole decreased (by 2.3 %) in comparison with previous year. Beside the inter-year growth of labour productivity in container glass and technical ceramics and sanitary ware. it decreased in all production branches.
The inter-year increase of workers number in the segment of shaping and processing of flat glass (by 17.5 %) and the growth of revenues in this segment (by 13.3 %) influenced the decline of the labour productivity of flat glass which decreased by 2.4 %.
The inter-year growth of revenues (by 5.6 %) projected favourably to the increase of the productivity of labour in container glass in comparison with growth of workers number (by 4.0 %).
The decrease of the productivity of labour of glass fibres (by 2.8 %) is influenced by quicklier growth of workers number than revenues in comparison with previous year.
The decrease of productivity of labour in utility glass (by 12.4 %) and other glass (by 5.7 %) is a consequence of unbalanced demand and pressure to lowering of prices.
The decline of productivity of labour of household china and ceramics (by 3.4 %) is in relation with the development of workers number and revenues. It is very difficult to keep a favourable productivity development in time of fluctuations of demand.
The labour productivity growth by 6.6 % in technical ceramics and sanitary ware in

investigated period was influenced especially by the growth of labour productivity of sanitary ware (by 5.2 %).
In relation to the growth of average wages to the productivity of labour in the glass and ceramic industry the difference was 5.1 of a percentual point.
Export
The export is further on stated in revenues from direct export in current prices (hereinafter direct export) and total export (direct export. indirect export).
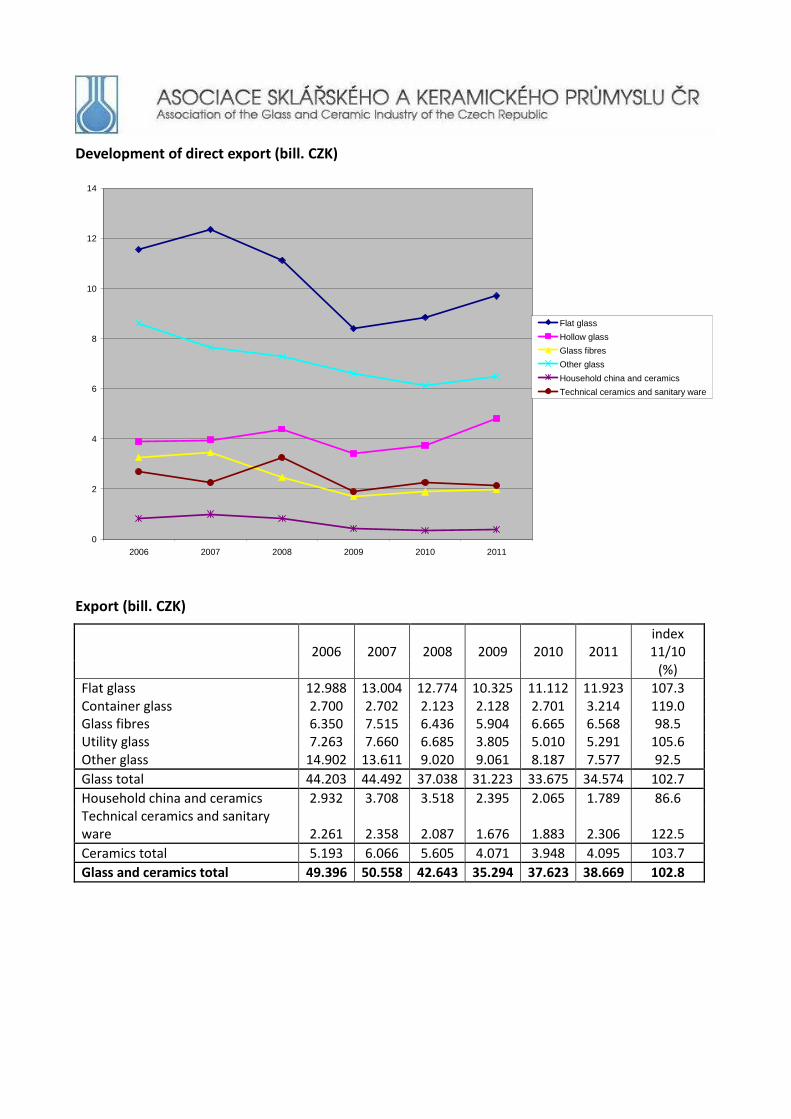
The development of direct export is given in the following table. The hollow glass production includes utility and container glass. Due to the statistical investigation it is not possible to divide hollow glass to above mentioned production branches.
Direct export (bill. CZK)
2006 2007 2008 2009 2010 2011 index 11/10
(%)
Flat glass 11.54 12.35 11.13 8.39 8.86 9.70 109.5 Hollow glass 3.89 3.95 4.39 3.41 3.75 4.82 128.5 Glass fibres 3.26 3.44 2.47 1.69 1.88 1.97 104.8 Other glass 8.62 7.63 7.28 6.62 6.14 6.48 105.5
Glass total 27.31 27.37 25.27 20.11 20.63 22.97 111.3
Household china and ceramics 0.81 1.00 0.82 0.43 0.36 0.37 102.8 Technical ceramics and sanitary ware 2.68 2.25 3.26 1.88 2.26 2.13 94.2
Ceramics total 3.49 3.25 4.08 2.31 2.62 2.50 95.4
Glass and ceramics total 30.80 30.62 29.35 22.42 23.25 25.47 109.5
Development of direct export (bill. CZK)
0
2
4
6
8
10
12
14
2006 2007 2008 2009 2010 2011
Flat glass
Hollow glass
Glass fibres
Other glass
Household china and ceramics
Technical ceramics and sanitary ware
Export (bill. CZK)
2006 2007 2008 2009 2010 2011 index 11/10
(%) Flat glass 12.988 13.004 12.774 10.325 11.112 11.923 107.3 Container glass 2.700 2.702 2.123 2.128 2.701 3.214 119.0 Glass fibres 6.350 7.515 6.436 5.904 6.665 6.568 98.5 Utility glass 7.263 7.660 6.685 3.805 5.010 5.291 105.6 Other glass 14.902 13.611 9.020 9.061 8.187 7.577 92.5
Glass total 44.203 44.492 37.038 31.223 33.675 34.574 102.7
Household china and ceramics 2.932 3.708 3.518 2.395 2.065 1.789 86.6 Technical ceramics and sanitary ware 2.261 2.358 2.087 1.676 1.883 2.306 122.5
Ceramics total 5.193 6.066 5.605 4.071 3.948 4.095 103.7
Glass and ceramics total 49.396 50.558 42.643 35.294 37.623 38.669 102.8
Development of export (bill. CZK)
0
2
4
6
8
10
12
14
16
2006 2007 2008 2009 2010 2011
Flat glass
Container glass
Glass fibres
Utility glass
Other glass
Household china and ceramics
Technical ceramics and sanitary ware
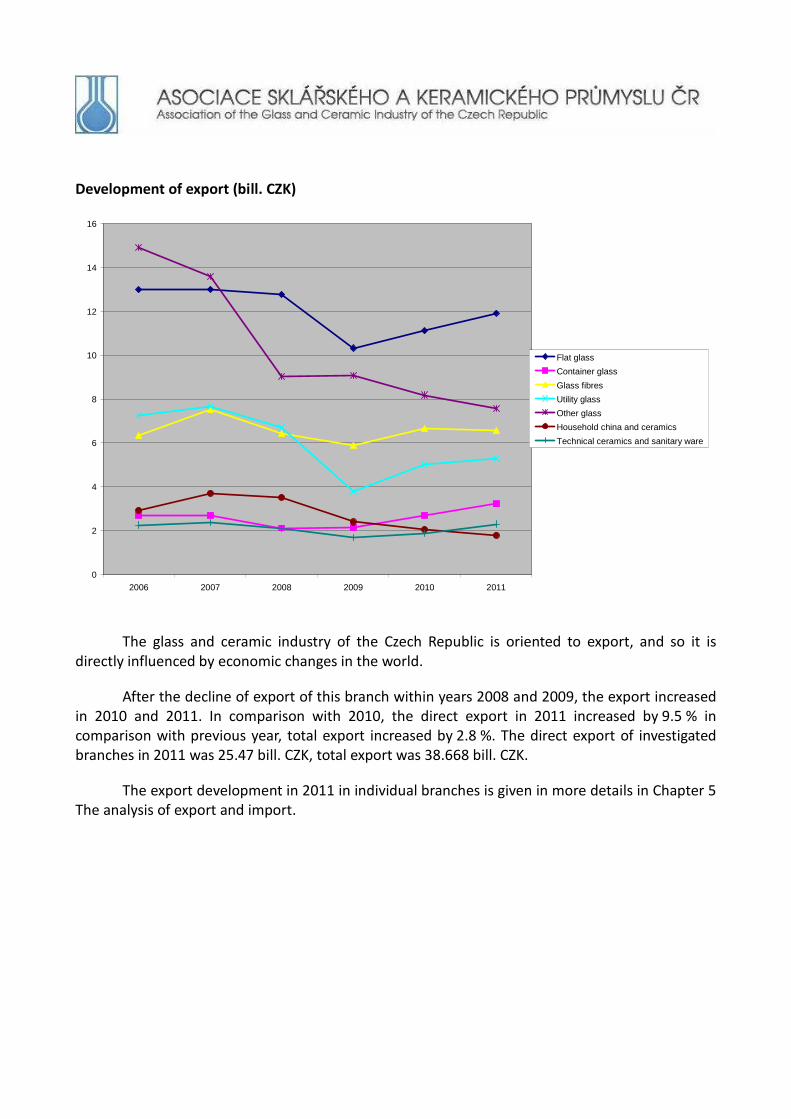
The glass and ceramic industry of the Czech Republic is oriented to export, and so it is directly influenced by economic changes in the world.
After the decline of export of this branch within years 2008 and 2009, the export increased in 2010 and 2011. In comparison with 2010, the direct export in 2011 increased by 9.5 % in comparison with previous year, total export increased by 2.8 %. The direct export of investigated branches in 2011 was 25.47 bill. CZK, total export was 38.668 bill. CZK.
The export development in 2011 in individual branches is given in more details in Chapter 5 The analysis of export and import.
Import
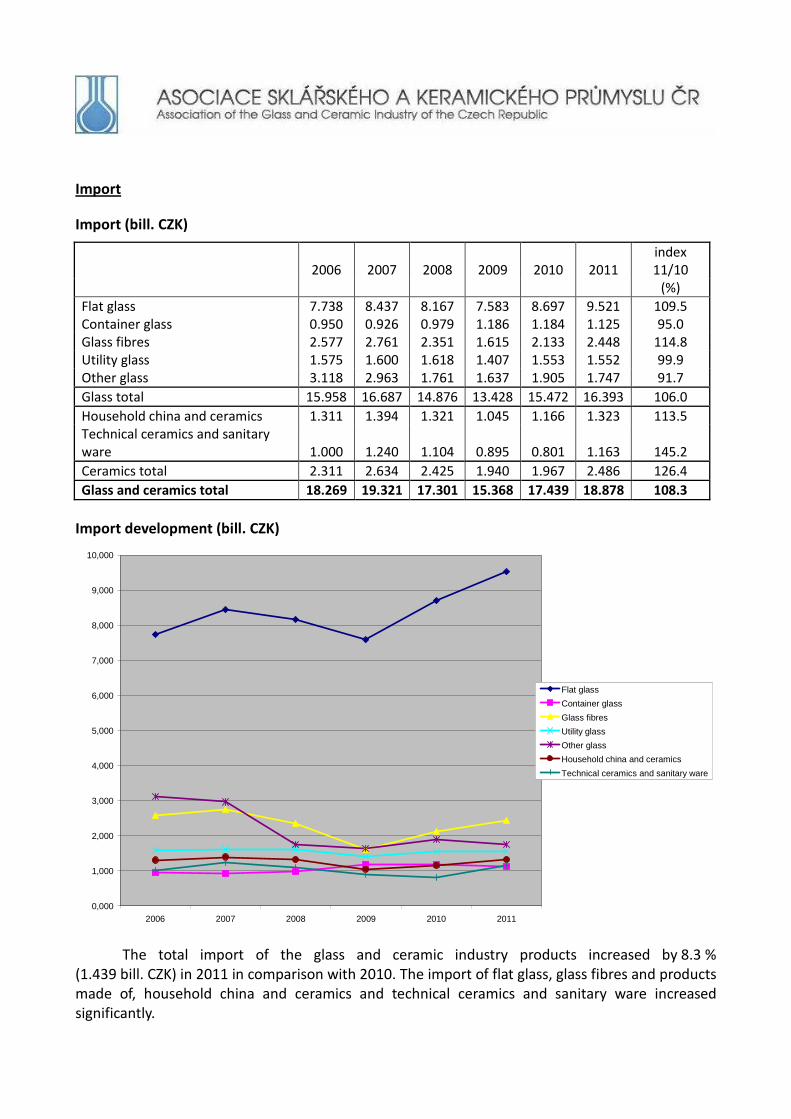
Import (bill. CZK)
2006 2007 2008 2009 2010 2011 index 11/10
(%)
Flat glass 7.738 8.437 8.167 7.583 8.697 9.521 109.5 Container glass 0.950 0.926 0.979 1.186 1.184 1.125 95.0 Glass fibres 2.577 2.761 2.351 1.615 2.133 2.448 114.8 Utility glass 1.575 1.600 1.618 1.407 1.553 1.552 99.9 Other glass 3.118 2.963 1.761 1.637 1.905 1.747 91.7
Glass total 15.958 16.687 14.876 13.428 15.472 16.393 106.0
Household china and ceramics 1.311 1.394 1.321 1.045 1.166 1.323 113.5 Technical ceramics and sanitary ware 1.000 1.240 1.104 0.895 0.801 1.163 145.2
Ceramics total 2.311 2.634 2.425 1.940 1.967 2.486 126.4
Glass and ceramics total 18.269 19.321 17.301 15.368 17.439 18.878 108.3
Import development (bill. CZK)
0,000
1,000
2,000
3,000
4,000
5,000
6,000
7,000
8,000
9,000
10,000
2006 2007 2008 2009 2010 2011
Flat glass
Container glass
Glass fibres
Utility glass
Other glass
Household china and ceramics
Technical ceramics and sanitary ware
The total import of the glass and ceramic industry products increased by 8.3 % (1.439 bill. CZK) in 2011 in comparison with 2010. The import of flat glass, glass fibres and products made of, household china and ceramics and technical ceramics and sanitary ware increased significantly.
The import development in individual production branches in 2011 is given in more details in Chapter 5 The analysis of export and import.
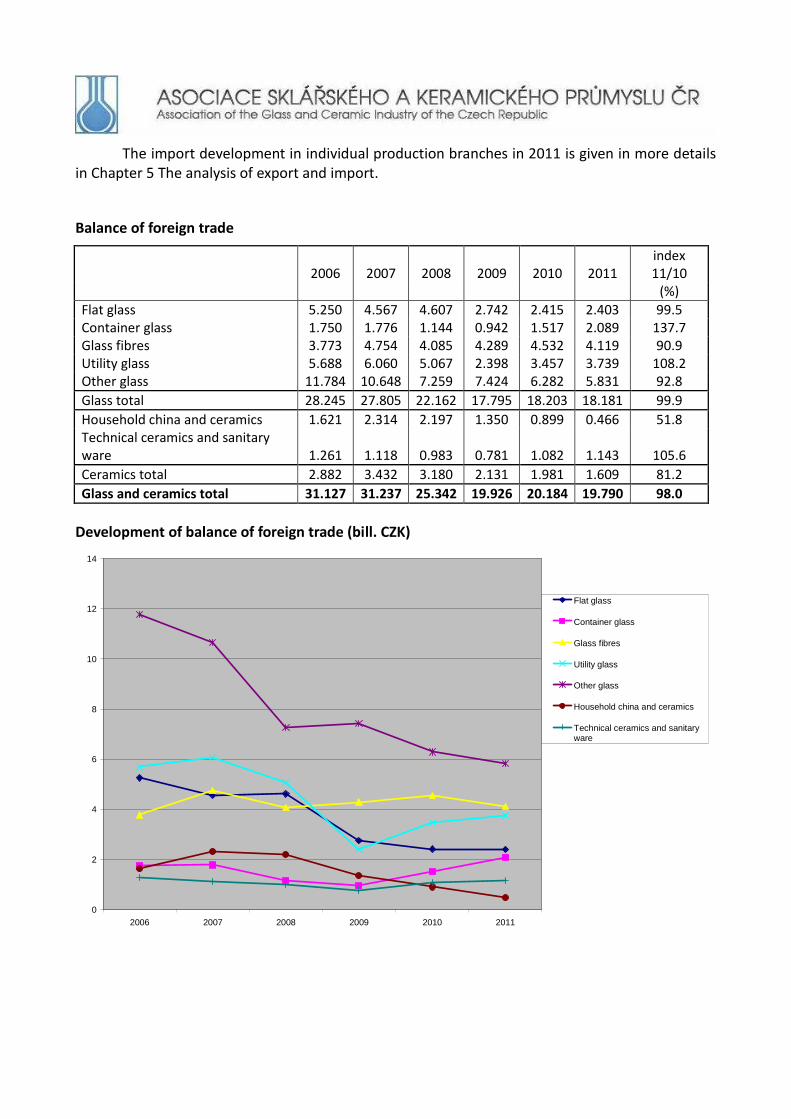
Balance of foreign trade
2006 2007 2008 2009 2010 2011 index 11/10
(%)
Flat glass 5.250 4.567 4.607 2.742 2.415 2.403 99.5 Container glass 1.750 1.776 1.144 0.942 1.517 2.089 137.7 Glass fibres 3.773 4.754 4.085 4.289 4.532 4.119 90.9 Utility glass 5.688 6.060 5.067 2.398 3.457 3.739 108.2 Other glass 11.784 10.648 7.259 7.424 6.282 5.831 92.8
Glass total 28.245 27.805 22.162 17.795 18.203 18.181 99.9
Household china and ceramics 1.621 2.314 2.197 1.350 0.899 0.466 51.8 Technical ceramics and sanitary ware 1.261 1.118 0.983 0.781 1.082 1.143 105.6
Ceramics total 2.882 3.432 3.180 2.131 1.981 1.609 81.2
Glass and ceramics total 31.127 31.237 25.342 19.926 20.184 19.790 98.0
Development of balance of foreign trade (bill. CZK)
0
2
4
6
8
10
12
14
2006 2007 2008 2009 2010 2011
Flat glass
Container glass
Glass fibres
Utility glass
Other glass
Household china and ceramics
Technical ceramics and sanitaryware

Structure of balance of foreign trade
12%
11%
21%
19%
29%
2% 6%
Flat glass
Container glass
Glass fibres
Utility glass
Other glass
Household china and ceramics
Technical ceramics and sanitary ware
The branches of the glass and ceramic industry in the investigated period from 2006 till 2011 always very notably contributed to the active balance of foreign trade of the whole processing industry of the Czech Republic. The values of the balance of foreign trade confirm important export orientation of this industry. The balance of foreign trade was 19.790 bill. CZK in 2011, it decreased by 2.0 % in 2010. The balance of foreign trade decline confirms quicklier growth of import of investigated production branches in comparison with their export.
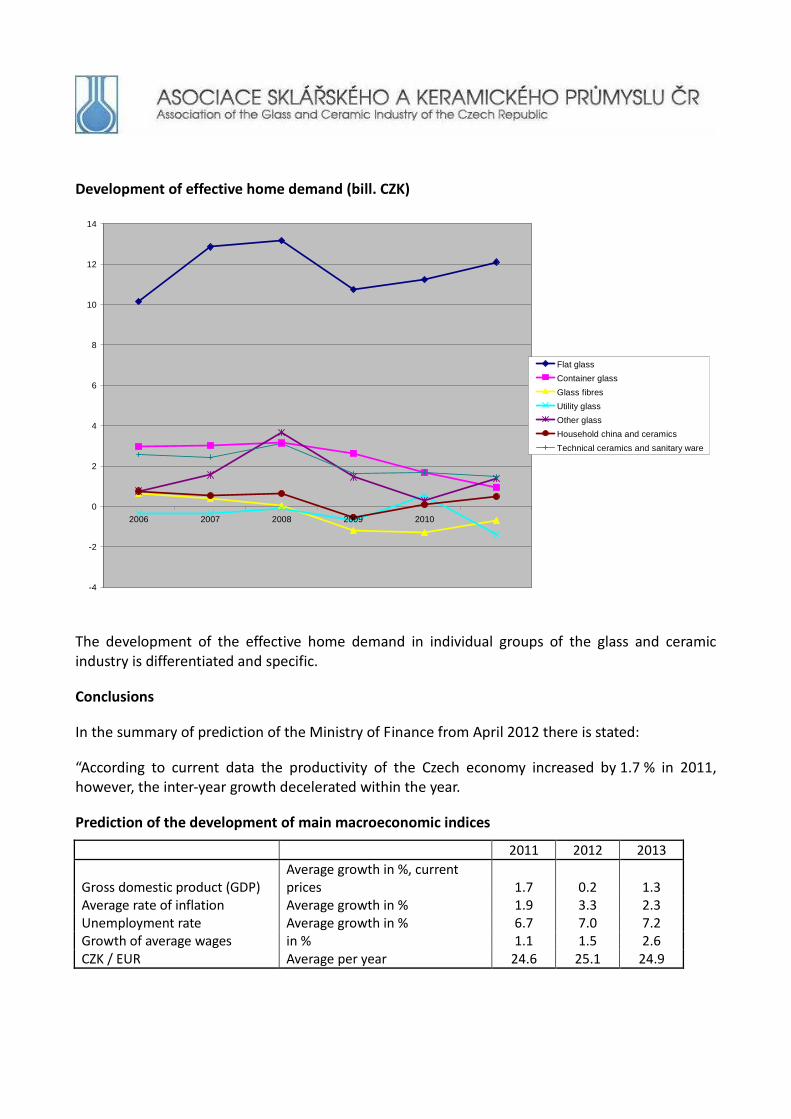
Effective home demand
The effective home demand index is defined by the formula:
(The revenues from industrial activities + Import – Export)
2006 2007 2008 2009 2010 2011
Flat glass 10.15 12.85 13.16 10.74 11.22 12.11 Container glass 2.96 3.03 3.14 2.63 1.68 0.96 Glass fibres 0.63 0.39 0.05 -1.20 -1.30 -0.69 Utility glass -0.35 -0.34 -0.12 -0.68 0.56 -1.40 Other glass 0.76 1.56 3.67 1.46 0.31 1.38 Household china and ceramics 0.76 0.53 0.65 -0.52 0.07 0.49 Technical ceramics and sanitary ware 2.57 2.45 3.12 1.61 1.70 1.47
Development of effective home demand (bill. CZK)
-4
-2
0
2
4
6
8
10
12
14
2006 2007 2008 2009 2010
Flat glass
Container glass
Glass fibres
Utility glass
Other glass
Household china and ceramics
Technical ceramics and sanitary ware
The development of the effective home demand in individual groups of the glass and ceramic industry is differentiated and specific.
Conclusions
In the summary of prediction of the Ministry of Finance from April 2012 there is stated:
“According to current data the productivity of the Czech economy increased by 1.7 % in 2011, however, the inter-year growth decelerated within the year.
Prediction of the development of main macroeconomic indices
2011 2012 2013
Gross domestic product (GDP) Average growth in %, current prices 1.7 0.2 1.3
Average rate of inflation Average growth in % 1.9 3.3 2.3 Unemployment rate Average growth in % 6.7 7.0 7.2 Growth of average wages in % 1.1 1.5 2.6 CZK / EUR Average per year 24.6 25.1 24.9

For 2012 it is expected a growth of consumer prices approximately 3.3 %, in 2013 the average rate of inflation should reach 2.3 %. The development of consumer prices will be significantly influenced by changes of the value added tax. The situation on labour market should reflect a slow growth of economy with high uncertainty as far as further development. The employment should decrease this year by 0.5 %, for 2013 it is expected its stagnation or a slow growth by 0.1 %.
The ratio of current account deficit of payment balance to the value added tax should stay on a sustainable level.
A certain calming in Euro zone having appeared thanks to finished restructuring of Greece debt and positive impacts of exceptional operations of European Central Bank, means lower risks for the future development for the Czech economy in a very short period. However, further escalation of problems in Euro zone cannot be completely eliminated and, therefore, also the possibility of transfer of eventual negative external shocks of the Czech economy.”
It is possible to say that the year 2011 was more successful for the glass and ceramic industry of the Czech Republic in comparison with previous years. According to the stated prediction the present development of foreign and inland economy does not give expectations to significant improvement in 2012. This development will be, however, for the glass and ceramic industry decisive. A permanently increasing competition from the countries of the Third World, and mainly from the Far East, belongs to uncertainties of future development, especially in Europe as the greatest export territory. This competition impacts with no exceptions all branches of the glass and ceramic industry investigated in this Annual Report.
For a favourable development of the glass and ceramic industry the above mentioned facts is not good information. The export orientation and dependence on a number of following industrial branches for which it delivers its products, makes it very vulnerable. For companies there is still the same necessity to search ways how to orientate to the production with a high added value, how to strengthen the innovation in the production and in the management and commercial strategies.

6. EXPORT AND IMPORT ACCORDING TO PRODUCTION BRANCHES IN THE PERIOD FROM 2006 TILL 2011
Export The export of the assortment of the glass and ceramic industry is investigated according to
the codes of the Customs Tariff, i.e. not only the direct export, but the total export from the Czech Republic.
Flat glass
The export of flat glass in 2011 reached an amount of 11,923.3 mill. CZK.
Export of flat glass according to the assortment
2006 2007 2008
Net Mill. CZK Share Net Mill. CZK Share Net Mill. CZK Share
( t ) (%) ( t ) (%) ( t ) (%)
Unfinished flat glass 255 942.2 3 623.5 27.9 223 759.0 3 752.8 28.9 306 985.4 4 021.2 31.5
Safety glass 112 730.9 7 590.2 58.4 112 843.5 7 188.2 55.3 116 309.5 6 605.5 51.7
Insulating units from several glass sheets 6 953.2 270.9 2.1 6 016.5 282.2 2.2 6 878.0 322.4 2.5
Glass mirrors and rear mirrors 62 615.1 1 503.5 11.6 62 774.5 1 780.9 13.7 56 544.8 1 825.1 14.3
Totally 438 241.4 12 988.1 100.0 405 393.5 13 004.1 100.0 486 717.7 12 774.2 100.0
2009 2010 2011
Net Mill. CZK Share Net Mill. CZK Share Net Mill. CZK Share
( t ) (%) ( t ) (%) ( t ) (%)
Unfinished flat glass 249 787.3 3 098.8 30.0 268 406.5 3 263.5 29.4 287 196.5 3 625.1 30.4
Safety glass 84 657.3 5 623.1 54.5 90 966.1 6 071.2 54.6 94 186.0 6 558.1 55.0
Insulating units from several glass sheets 7 593.9 341.7 3.3 10 377.2 361.4 3.3 7 997.2 326.9 2.7
Glass mirrors and rear mirrors 42 624.4 1 262.2 12.2 37 508.1 1 415.9 12.7 39 496.3 1 413.2 11.9
Totally 384 662.9 10 325.8 100.0 407 257.9 11 112.0 100.0 428 876.0 11 923.3 100.0
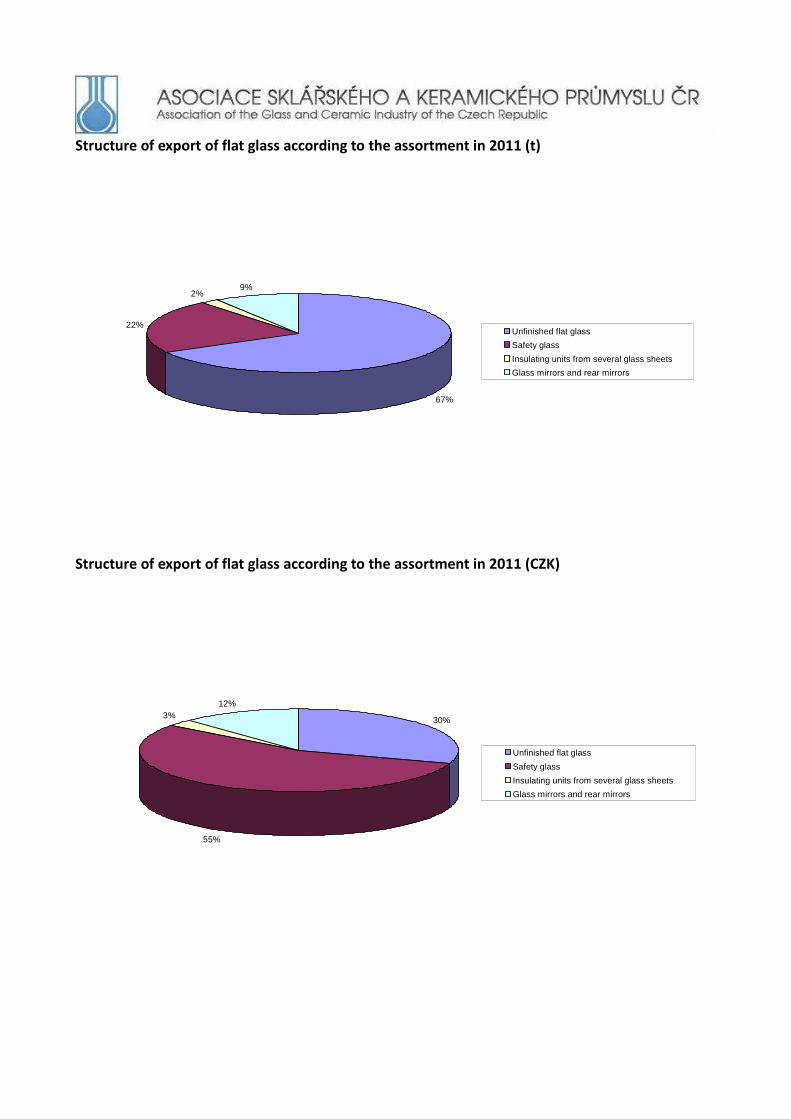
Structure of export of flat glass according to the assortment in 2011 (t)
67%
22%
2%9%
Unfinished flat glass
Safety glass
Insulating units from several glass sheets
Glass mirrors and rear mirrors
Structure of export of flat glass according to the assortment in 2011 (CZK)
30%
55%
3%12%
Unfinished flat glass
Safety glass
Insulating units from several glass sheets
Glass mirrors and rear mirrors
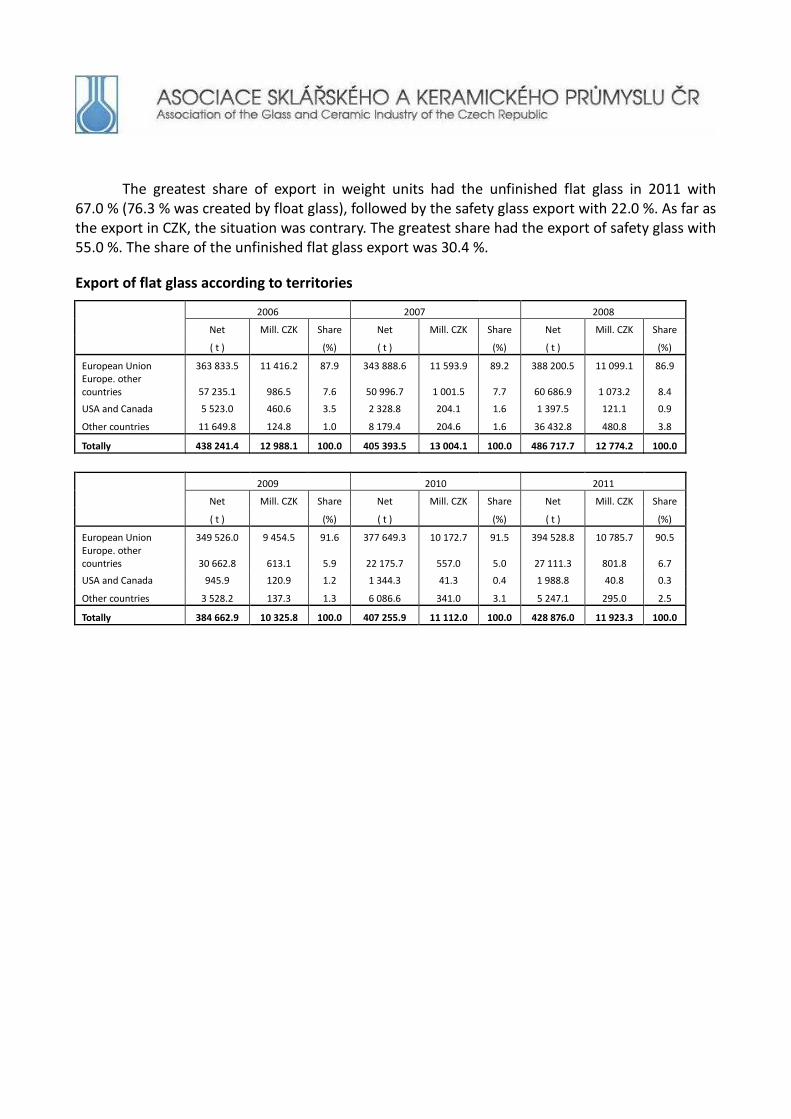
The greatest share of export in weight units had the unfinished flat glass in 2011 with 67.0 % (76.3 % was created by float glass), followed by the safety glass export with 22.0 %. As far as the export in CZK, the situation was contrary. The greatest share had the export of safety glass with 55.0 %. The share of the unfinished flat glass export was 30.4 %.
Export of flat glass according to territories
2006 2007 2008
Net Mill. CZK Share Net Mill. CZK Share Net Mill. CZK Share
( t ) (%) ( t ) (%) ( t ) (%)
European Union 363 833.5 11 416.2 87.9 343 888.6 11 593.9 89.2 388 200.5 11 099.1 86.9 Europe. other countries 57 235.1 986.5 7.6 50 996.7 1 001.5 7.7 60 686.9 1 073.2 8.4
USA and Canada 5 523.0 460.6 3.5 2 328.8 204.1 1.6 1 397.5 121.1 0.9
Other countries 11 649.8 124.8 1.0 8 179.4 204.6 1.6 36 432.8 480.8 3.8
Totally 438 241.4 12 988.1 100.0 405 393.5 13 004.1 100.0 486 717.7 12 774.2 100.0
2009 2010 2011
Net Mill. CZK Share Net Mill. CZK Share Net Mill. CZK Share
( t ) (%) ( t ) (%) ( t ) (%)
European Union 349 526.0 9 454.5 91.6 377 649.3 10 172.7 91.5 394 528.8 10 785.7 90.5 Europe. other countries 30 662.8 613.1 5.9 22 175.7 557.0 5.0 27 111.3 801.8 6.7
USA and Canada 945.9 120.9 1.2 1 344.3 41.3 0.4 1 988.8 40.8 0.3
Other countries 3 528.2 137.3 1.3 6 086.6 341.0 3.1 5 247.1 295.0 2.5
Totally 384 662.9 10 325.8 100.0 407 255.9 11 112.0 100.0 428 876.0 11 923.3 100.0

Structure of export of flat glass according to territories in 2011 (CZK)
91%
7% 0% 2%
European Union
Europe, other countries
USA and Canada
Other countries
A substantial part of flat glass export was directed to the European Union countries. In 2011 the share on export was 90.5 %. The greatest customers were Germany, Austria, Romania, Poland, Belgium, France, Hungary and Slovakia. The greatest customers out of the European Union were Russia, Ukraine, Serbia and Croatia.
The structure of export corresponds to the final use of the assortment of flat glass (mostly utilized in the building and automotive industries) and to the trade strategy of companies.

Container glass
Container glass export in 2011 was 3214.3 mill. CZK.
Export of container glass according to territories
2006 2007 2008
Net Mill. CZK Share Net Mill. CZK Share Net Mill. CZK Share
( t ) (%) ( t ) (%) ( t ) (%)
European Union 236 760,3 2 301,2 85,2 227 986,4 2 380,5 88,1 170 869,0 1 838,2 86,6 Europe, other countries 36 031,9 357,0 13,2 29 614,3 285,6 10,6 27 496,5 245,8 11,6
USA and Canada 187,0 4,3 0,2 456,7 9,0 0,3 615,5 14,4 0,7
Other countries 4 257,9 37,5 1,4 1 740,0 26,9 1,0 1 283,3 24,2 1,1
Totally 277 237,1 2 700,0 100,0 259 797,4 2 702,0 100,0 200 264,3 2 122,6 100,0
2009 2010 2011
Net Mill. CZK Share Net Mill. CZK Share Net Mill. CZK Share
( t ) (%) ( t ) (%) ( t ) (%)
European Union 153 244,9 1 744,4 82,0 258 449,2 2 358,9 87,3 288 752,6 2 797,0 87,0 Europe, other countries 31 581,1 340,3 16,0 27 600,9 300,1 11,1 31 980,9 354,7 11,0
USA and Canada 808,7 17,0 0,8 725,5 14,3 0,5 1 253,8 24,3 0,8
Other countries 1 191,1 26,2 1,2 1 307,3 27,7 1,0 1 856,3 38,3 1,2
Totally 186 825,8 2 127,9 100,0 288 082,9 2 701,0 100,0 323 843,6 3 214,3 100,0
Structure of export of container glass according to territories in 2011 (CZK)
87%
11%1% 1%
European Union
Europe, other countries
USA and Canada
Other countries

The export is determined by the character of use of a substantial part of container glass
assortment. It is not economical to deliver bottles and preserve jars to long distances. In 2011 87.0 % of export was intended to the European Union countries. The greatest customers were Germany, Poland, Slovakia, Austria, Italy and France. The 11.0 % of export was directed to other European countries. From these countries the greatest customers were Russia and Switzerland. Glass fibres and products made of
The export of glass fibres and products made of in 2011 was on the same level as in 2010, i.e. 6657.7 mill. CZK.
Export of glass fibres and products made of according to territories
2006 2007 2008
Net Mill. CZK Share Net Mill. CZK Share Net Mill. CZK Share
( t ) (%) ( t ) (%) ( t ) (%)
European Union 98 689.8 5 385.8 84.8 159 851.8 6 598.5 87.8 124 632.6 5 807.2 90.2 Europe. other countries 12 308.6 454.2 7.2 14 059.2 524.6 7.0 6 364.4 315.4 4.9
USA and Canada 2 631.1 128.1 2.0 2 102.2 92.7 1.2 1 359.7 56.8 0.9
Other countries 9 615.8 382.0 6.0 5 722.2 299.1 4.0 6 261.3 258.8 4.0
Totally 123 245.3 6 350.1 100.0 181 735.4 7 514.9 100.0 138 618.0 6 438.2 100.0
2009 2010 2011
Net Mill. CZK Share Net Mill. CZK Share Net Mill. CZK Share
( t ) (%) ( t ) (%) ( t ) (%)
European Union 127 780.5 5 387.2 91.2 152 659.9 6 065.9 91.0 142 284.1 5 953.7 89.4 Europe. other countries 5 141.6 224.9 3.8 6 681.7 240.5 3.6 5 358.6 234.4 3.5
USA and Canada 1 935.9 79.2 1.3 1 816.1 88.9 1.3 1 247.0 68.3 1.0
Other countries 4 079.6 212.6 3.6 5 281.3 269.9 4.0 5 265.7 401.3 6.0
Totally 138 937.6 5 903.9 100.0 166 439.0 6 665.2 100.0 154 155.4 6 657.7 100.0
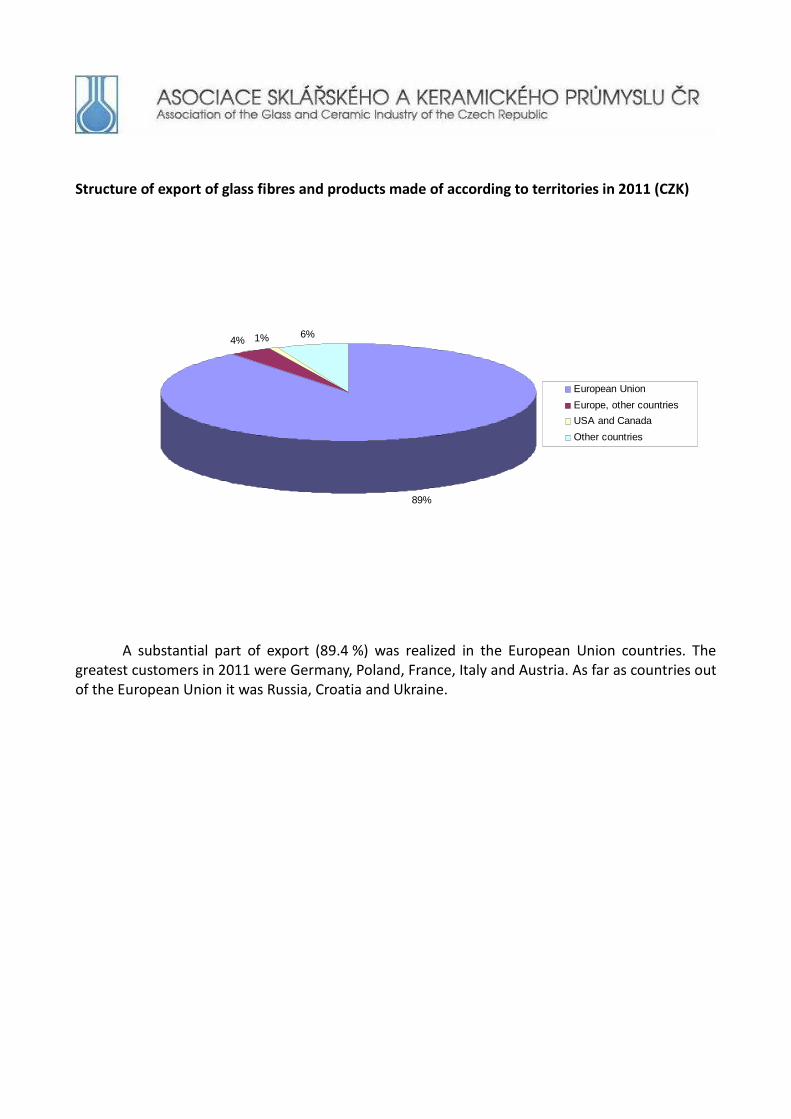
Structure of export of glass fibres and products made of according to territories in 2011 (CZK)
89%
4% 1% 6%
European Union
Europe, other countries
USA and Canada
Other countries
A substantial part of export (89.4 %) was realized in the European Union countries. The greatest customers in 2011 were Germany, Poland, France, Italy and Austria. As far as countries out of the European Union it was Russia, Croatia and Ukraine.
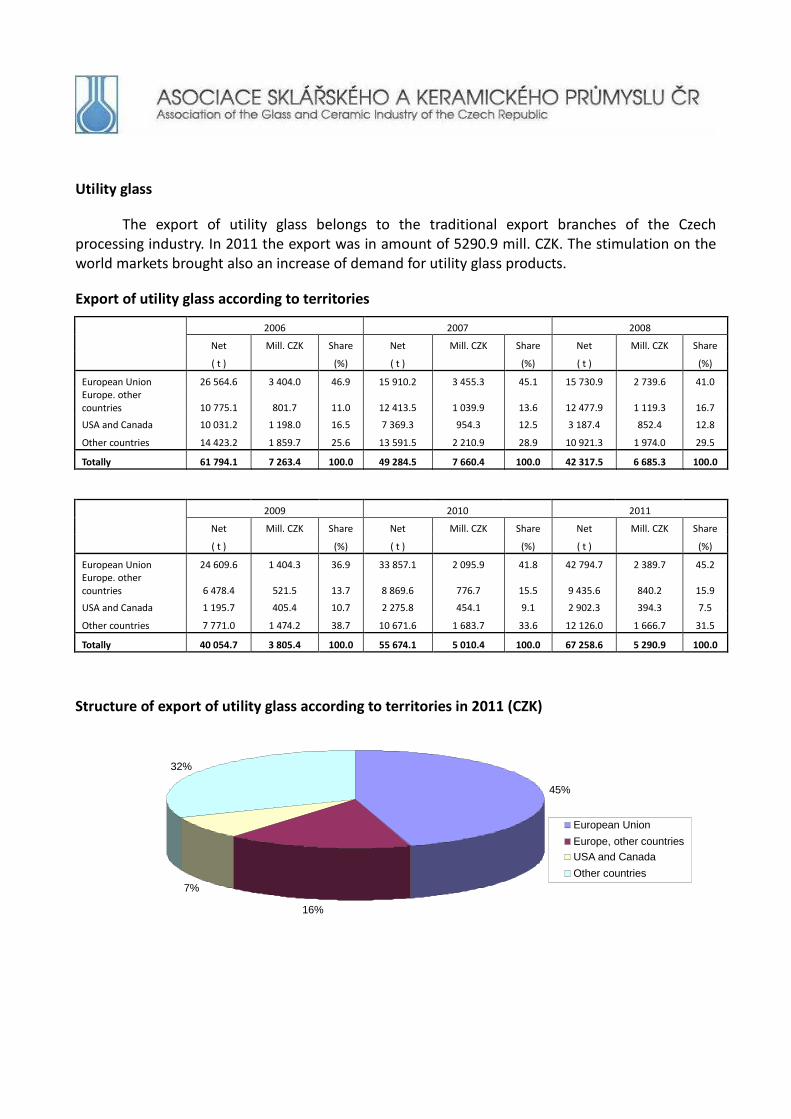
45%
16%
7%
32%
European Union
Europe, other countries
USA and Canada Other countries
Utility glass
The export of utility glass belongs to the traditional export branches of the Czech processing industry. In 2011 the export was in amount of 5290.9 mill. CZK. The stimulation on the world markets brought also an increase of demand for utility glass products.
Export of utility glass according to territories
2006 2007 2008
Net Mill. CZK Share Net Mill. CZK Share Net Mill. CZK Share
( t ) (%) ( t ) (%) ( t ) (%)
European Union 26 564.6 3 404.0 46.9 15 910.2 3 455.3 45.1 15 730.9 2 739.6 41.0 Europe. other countries 10 775.1 801.7 11.0 12 413.5 1 039.9 13.6 12 477.9 1 119.3 16.7
USA and Canada 10 031.2 1 198.0 16.5 7 369.3 954.3 12.5 3 187.4 852.4 12.8
Other countries 14 423.2 1 859.7 25.6 13 591.5 2 210.9 28.9 10 921.3 1 974.0 29.5
Totally 61 794.1 7 263.4 100.0 49 284.5 7 660.4 100.0 42 317.5 6 685.3 100.0
2009 2010 2011
Net Mill. CZK Share Net Mill. CZK Share Net Mill. CZK Share
( t ) (%) ( t ) (%) ( t ) (%)
European Union 24 609.6 1 404.3 36.9 33 857.1 2 095.9 41.8 42 794.7 2 389.7 45.2 Europe. other countries 6 478.4 521.5 13.7 8 869.6 776.7 15.5 9 435.6 840.2 15.9
USA and Canada 1 195.7 405.4 10.7 2 275.8 454.1 9.1 2 902.3 394.3 7.5
Other countries 7 771.0 1 474.2 38.7 10 671.6 1 683.7 33.6 12 126.0 1 666.7 31.5
Totally 40 054.7 3 805.4 100.0 55 674.1 5 010.4 100.0 67 258.6 5 290.9 100.0
Structure of export of utility glass according to territories in 2011 (CZK)
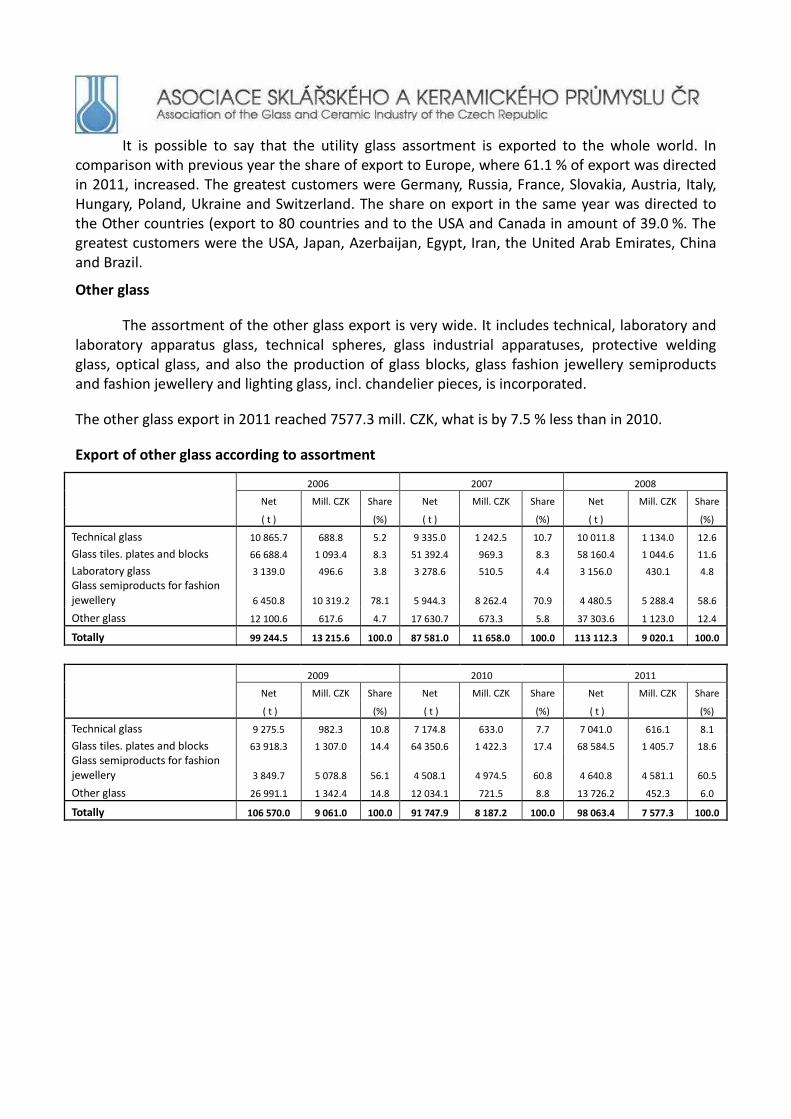
It is possible to say that the utility glass assortment is exported to the whole world. In comparison with previous year the share of export to Europe, where 61.1 % of export was directed in 2011, increased. The greatest customers were Germany, Russia, France, Slovakia, Austria, Italy, Hungary, Poland, Ukraine and Switzerland. The share on export in the same year was directed to the Other countries (export to 80 countries and to the USA and Canada in amount of 39.0 %. The greatest customers were the USA, Japan, Azerbaijan, Egypt, Iran, the United Arab Emirates, China and Brazil.
Other glass
The assortment of the other glass export is very wide. It includes technical, laboratory and laboratory apparatus glass, technical spheres, glass industrial apparatuses, protective welding glass, optical glass, and also the production of glass blocks, glass fashion jewellery semiproducts and fashion jewellery and lighting glass, incl. chandelier pieces, is incorporated.
The other glass export in 2011 reached 7577.3 mill. CZK, what is by 7.5 % less than in 2010.
Export of other glass according to assortment
2006 2007 2008
Net Mill. CZK Share Net Mill. CZK Share Net Mill. CZK Share
( t ) (%) ( t ) (%) ( t ) (%)
Technical glass 10 865.7 688.8 5.2 9 335.0 1 242.5 10.7 10 011.8 1 134.0 12.6
Glass tiles. plates and blocks 66 688.4 1 093.4 8.3 51 392.4 969.3 8.3 58 160.4 1 044.6 11.6
Laboratory glass 3 139.0 496.6 3.8 3 278.6 510.5 4.4 3 156.0 430.1 4.8
Glass semiproducts for fashion jewellery 6 450.8 10 319.2 78.1 5 944.3 8 262.4 70.9 4 480.5 5 288.4 58.6
Other glass 12 100.6 617.6 4.7 17 630.7 673.3 5.8 37 303.6 1 123.0 12.4
Totally 99 244.5 13 215.6 100.0 87 581.0 11 658.0 100.0 113 112.3 9 020.1 100.0
2009 2010 2011
Net Mill. CZK Share Net Mill. CZK Share Net Mill. CZK Share
( t ) (%) ( t ) (%) ( t ) (%)
Technical glass 9 275.5 982.3 10.8 7 174.8 633.0 7.7 7 041.0 616.1 8.1
Glass tiles. plates and blocks 63 918.3 1 307.0 14.4 64 350.6 1 422.3 17.4 68 584.5 1 405.7 18.6
Glass semiproducts for fashion jewellery 3 849.7 5 078.8 56.1 4 508.1 4 974.5 60.8 4 640.8 4 581.1 60.5
Other glass 26 991.1 1 342.4 14.8 12 034.1 721.5 8.8 13 726.2 452.3 6.0
Totally 106 570.0 9 061.0 100.0 91 747.9 8 187.2 100.0 98 063.4 7 577.3 100.0

8%
19%
7%
60%
6%
Technical glass
Glass tiles, plates and blocks
Laboratory glass
Glass semiproducts for fashion jewellery
Other glass
Structure of other glass export according to assortment in 2011 (CZK)
The greatest share with 60.4 % has the export of fashion jewellery and glass fashion jewellery semiproducts. The export of this assortment which is traditional in the Czech Republic, has been facing up still stronger and substantially cheaper competition from the Far East. In comparison with 2010 the share of glass tiles, plates and bricks and laboratory and technical glass increased. The export of glass semiproducts for jewellery and other glass ware decreased in comparison with previous year.
In the following table the export of other glass according to territories is given.
Export of other glass according to territories
2006 2007 2008
Net Mill. CZK Share Net Mill. CZK Share Net Mill. CZK Share
( t ) (%) ( t ) (%) ( t ) (%)
European Union 57 046.0 3 017.6 22.8 50 284.3 2 743.0 23.5 77 207.8 2 713.8 30.1 Europe. other countries 2 828.8 219.2 1.7 4 033.0 242.1 2.1 2 381.0 180.6 2.0
USA and Canada 9 787.2 1 162.4 8.8 7 728.7 816.9 7.0 5 534.1 628.9 7.0
Other countries 29 582.5 8 816.4 66.7 25 535.0 7 856.0 67.4 27 989.4 5 496.8 60.9
Totally 99 244.5 13 215.6 100.0 87 581.0 11 658.0 100.0 113 112.3 9 020.1 100.0
2009 2010 2011
Net Mill. CZK Share Net Mill. CZK Share Net Mill. CZK Share
( t ) (%) ( t ) (%) ( t ) (%)
European Union 67 557.4 3 322.7 36.7 54 630.7 2 738.0 33.4 53 911.4 2 781.4 36.7 Europe. other countries 1 960.6 141.7 1.6 3 783.1 259.5 3.2 3 646.0 244.1 3.2
USA and Canada 1 752.4 412.0 4.5 5 213.1 701.7 8.6 6 584.4 466.9 6.2
Other countries 35 299.7 5 184.6 57.2 28 121.0 4 488.0 54.8 33 921.6 4 084.9 53.9
Totally 106 570.1 9 061.0 100.0 91 747.9 8 187.2 100.0 98 063.4 7 577.3 100.0

Structure of export of other glass according to territories in 2011 (CZK)
In contrast with flat, container and fibre glass export, the most of the other glass export (60.1 %) is oriented to the countries out of Europe. In each group of products there is a different situation and it can differ according to orders every year. In 2011 the share of export of glass tiles, plates and blocks assortment (76.3 %) and laboratory glass (70.8 %) to the European Union prevailed. On the other side the export of glass semiproducts for fashion jewellery assortment (74.4 %) and technical glass (54.5 %) prevailed to the Other countries, including the USA and Canada.
The greatest customers in the European Union were Germany, Poland, Italy, France, Belgium, Austria and Romania, in the other European countries Russia, Ukraine, Switzerland and Norway. From the Other countries and the USA and Canada the greatest customers, mostly of fashion jewellery and glass semiproducts for fashion jewellery, were the United Arab Emirates, Hongkong, the USA, Mexico and Brazil.
Household china and ceramics
The household china export similarly as the utility glass export belongs to the traditional export branches of the Czech processing industry.
37%
3%6%
54%
European Union
Europe, other countries
USA and Canada Other countries

Export of household china and ceramics according to the assortment
2006 2007 2008
Net Mill. CZK Share Net Mill. CZK Share Net Mill. CZK Share
( t ) ( % ) (t ) ( % ) ( t ) ( % )
Household china 21 479.3 2 738.7 93.4 21 041.4 3 522.4 95.0 18 883.2 3 332.1 94.7
Household ceramics 2 179.8 91.4 3.1 1 996.5 91.8 2.5 2 157.0 108.6 3.1 Decorative and figural china and ceramics 755.8 102.1 3.5 641.0 94.1 2.5 478.8 77.4 2.2
Totally 24 414.9 2 932.2 100.0 23 678.9 3 708.3 100.0 21 519.0 3 518.1 100.0
2009 2010 2011
Net Mill. CZK Share Net Mill. CZK Share Net Mill. CZK Share
(t ) ( % ) (t ) ( % ) (t ) ( % )
Household china 11 245.0 2 253.8 94.1 20 826.3 1 899.5 92.0 13 466.4 1 551.6 86.7
Household ceramics 1 488.8 82.8 3.5 1 387.6 107.2 5.2 1 514.4 188.2 10.5 Decorative and figural china and ceramics 399.3 58.7 2.5 391.4 58.7 2.8 316.7 49.5 2.8
Totally 13 133.1 2 395.3 100.0 22 605.3 2 065.4 100.0 15 297.5 1 789.3 100.0
Structure of export of household china and ceramics according to the assortment in 2011 (CZK)
86%
11%3%
Household china
Household ceramics
Decorative and figural china and ceramics
In 2011 the export of household china and ceramics was totally 1789.3 mill. CZK. The export of household china shared with 86.7 % in the household china and ceramics group.
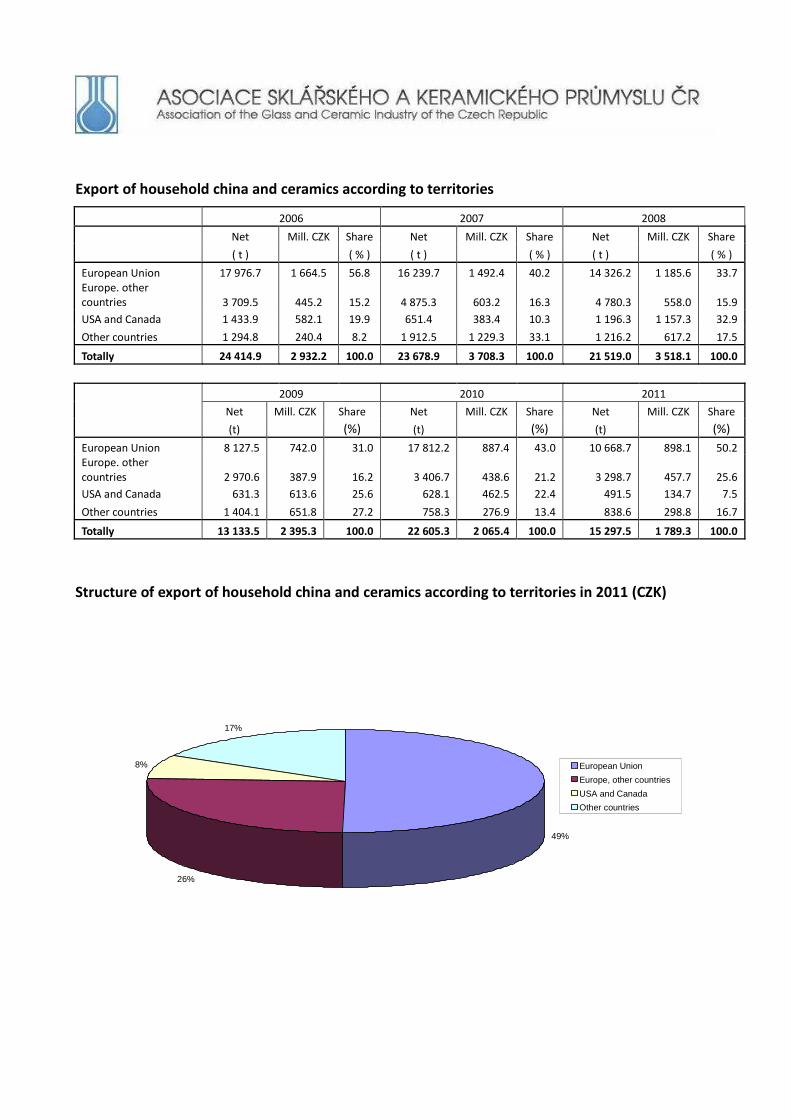
Export of household china and ceramics according to territories
2006 2007 2008
Net Mill. CZK Share Net Mill. CZK Share Net Mill. CZK Share
( t ) ( % ) ( t ) ( % ) ( t ) ( % )
European Union 17 976.7 1 664.5 56.8 16 239.7 1 492.4 40.2 14 326.2 1 185.6 33.7 Europe. other countries 3 709.5 445.2 15.2 4 875.3 603.2 16.3 4 780.3 558.0 15.9
USA and Canada 1 433.9 582.1 19.9 651.4 383.4 10.3 1 196.3 1 157.3 32.9
Other countries 1 294.8 240.4 8.2 1 912.5 1 229.3 33.1 1 216.2 617.2 17.5
Totally 24 414.9 2 932.2 100.0 23 678.9 3 708.3 100.0 21 519.0 3 518.1 100.0
2009 2010 2011
Net Mill. CZK Share Net Mill. CZK Share Net Mill. CZK Share
(t) (%) (t) (%) (t) (%)
European Union 8 127.5 742.0 31.0 17 812.2 887.4 43.0 10 668.7 898.1 50.2 Europe. other countries 2 970.6 387.9 16.2 3 406.7 438.6 21.2 3 298.7 457.7 25.6
USA and Canada 631.3 613.6 25.6 628.1 462.5 22.4 491.5 134.7 7.5
Other countries 1 404.1 651.8 27.2 758.3 276.9 13.4 838.6 298.8 16.7
Totally 13 133.5 2 395.3 100.0 22 605.3 2 065.4 100.0 15 297.5 1 789.3 100.0
Structure of export of household china and ceramics according to territories in 2011 (CZK)
49%
26%
8%
17%
European Union
Europe, other countries
USA and Canada
Other countries
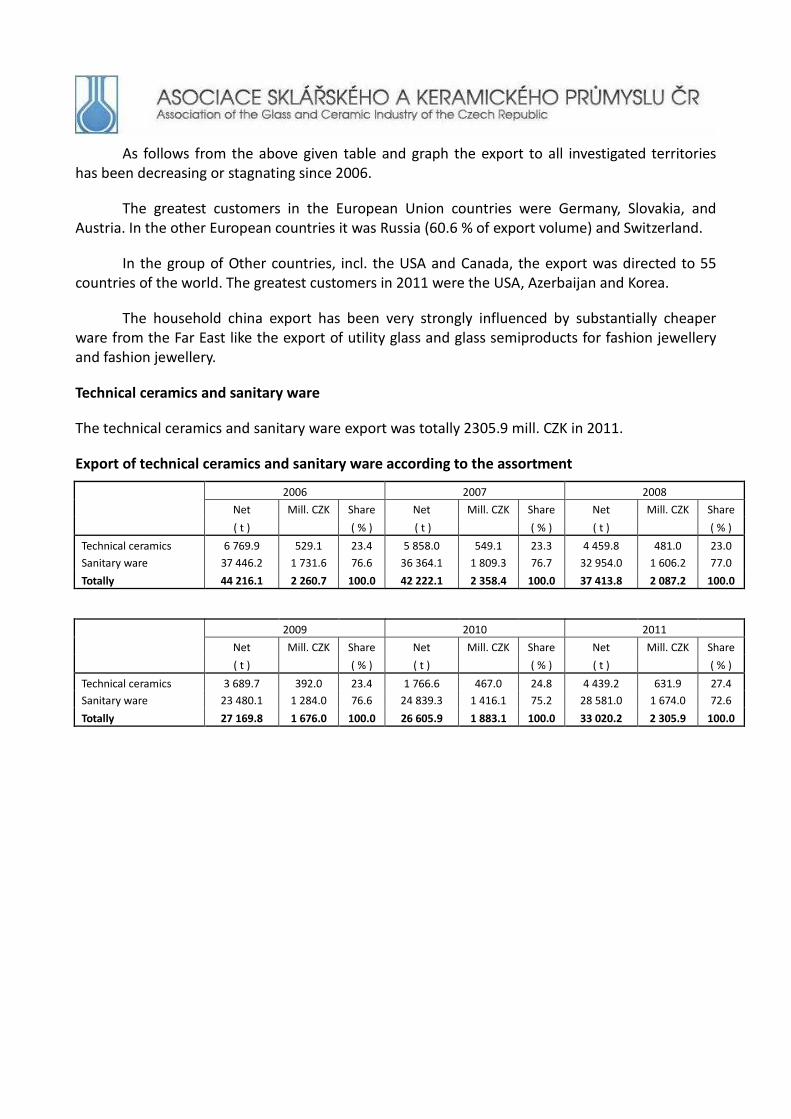
As follows from the above given table and graph the export to all investigated territories has been decreasing or stagnating since 2006.
The greatest customers in the European Union countries were Germany, Slovakia, and Austria. In the other European countries it was Russia (60.6 % of export volume) and Switzerland.
In the group of Other countries, incl. the USA and Canada, the export was directed to 55 countries of the world. The greatest customers in 2011 were the USA, Azerbaijan and Korea.
The household china export has been very strongly influenced by substantially cheaper ware from the Far East like the export of utility glass and glass semiproducts for fashion jewellery and fashion jewellery.
Technical ceramics and sanitary ware
The technical ceramics and sanitary ware export was totally 2305.9 mill. CZK in 2011.
Export of technical ceramics and sanitary ware according to the assortment
2006 2007 2008
Net Mill. CZK Share Net Mill. CZK Share Net Mill. CZK Share
( t ) ( % ) ( t ) ( % ) ( t ) ( % )
Technical ceramics 6 769.9 529.1 23.4 5 858.0 549.1 23.3 4 459.8 481.0 23.0
Sanitary ware 37 446.2 1 731.6 76.6 36 364.1 1 809.3 76.7 32 954.0 1 606.2 77.0
Totally 44 216.1 2 260.7 100.0 42 222.1 2 358.4 100.0 37 413.8 2 087.2 100.0
2009 2010 2011
Net Mill. CZK Share Net Mill. CZK Share Net Mill. CZK Share
( t ) ( % ) ( t ) ( % ) ( t ) ( % )
Technical ceramics 3 689.7 392.0 23.4 1 766.6 467.0 24.8 4 439.2 631.9 27.4
Sanitary ware 23 480.1 1 284.0 76.6 24 839.3 1 416.1 75.2 28 581.0 1 674.0 72.6
Totally 27 169.8 1 676.0 100.0 26 605.9 1 883.1 100.0 33 020.2 2 305.9 100.0

Structure of export of technical ceramics and sanitary ware according to the assortment in 2011 (CZK)
27%
73%
Technical ceramics
Sanitary ware
In 2011 the sanitary ware shared with 72.6 % and the technical ceramics with 27.4 % on export.
Export of technical ceramics and sanitary ware according to territories
2006 2007 2008
Net Mill. CZK Share Net
Mill. CZK Share Net Mill. CZK Share
( t ) ( % ) ( t ) ( % ) ( t ) ( % )
European Union 33 999.0 1 673.5 74.0 36 205.1 1 955.4 82.9 31 165.6 1 707.9 81.8 Europe. other countries 5 048.6 330.8 14.6 4 007.6 302.6 12.8 3 875.9 265.7 12.7
USA and Canada 46.4 5.1 0.2 11.4 3.7 0.2 56.6 10.3 0.5
Other countries 5 122.1 251.3 11.1 1 998.0 96.7 4.1 2 315.7 103.3 4.9
Totally 44 216.1 2 260.7 100.0 42 222.1 2 358.4 100.0 37 413.8 2 087.2 100.0
2009 2010 2011
Net Mill. CZK Share Net
Mill. CZK Share Net Mill. CZK Share
(t) (%) (t) (%) (t) (%)
European Union 23 490.1 1 415.0 84.4 22 520.0 1 554.7 82.6 28 132.9 1 907.0 82.7 Europe. other countries 1 807.1 145.0 8.7 2 291.2 218.3 11.6 3 106.7 261.4 11.3
USA and Canada 38.6 9.1 0.5 49.0 10.2 0.5 33.8 6.5 0.3
Other countries 1 834.0 106.9 6.4 1 744.7 99.9 5.3 1 746.8 131.0 5.7
Totally 27 169.8 1 676.0 100.0 26 604.9 1 883.1 100.0 33 020.2 2 305.9 100.0

Structure of export of technical ceramics and sanitary ware according to territories in 2011 (CZK)
83%
11%0% 6%
European Union
Europe, other countries
USA and Canada
Other countries
A substantial part of both assortments was exported to the countries of Europe. Sanitary ware shared on export to European countries with 94.0 % (with 82.7 % to the European Union), technical ceramics shared on the export with 93.0 % (79.8 % to the European Union). To the greatest customers of sanitary ware in Europe belong Germany, Austria, Great Britain, Slovakia, and Russia.

Import Flat glass
The import of flat glass assortment increased in 2011 by 9.5 % in comparison with 2010 and by 25.6 % compared with 2009.
Import of flat glass according to the assortment
2006 2007 2008
Net Mill. CZK Share Net Mill. CZK Share Net Mill. CZK Share
( t ) ( % ) ( t ) ( % ) ( t ) ( % )
Unfinished flat glass 226 460.6 3 253.7 42.0 222 740.9 3 696.7 43.8 214 016.8 3 224.1 39.6
Safety glass 42 271.1 3 193.1 41.3 44 980.6 3 298.7 39.1 70 951.0 3 420.6 42.0
Insulating units from several glass sheets 5 825.9 267.9 3.5 7 177.8 368.5 4.4 6 986.2 274.6 3.4
Glass mirrors and rear mirrors 13 317.8 1 023.6 13.2 14 347.9 1 073.1 12.7 9 590.0 1 229.4 15.1
Totally 287 875.4 7 738.3 100.0 289 247.2 8 437.0 100.0 301 544.0 8 148.7 100.0
2009 2010 2011
Net Mill. CZK Share Net Mill. CZK Share Net Mill. CZK Share
( t ) ( % ) ( t ) ( % ) ( t ) ( % )
Unfinished flat glass 216 320.6 2 803.2 37.0 229 192.8 2 952.7 33.9 320 056.1 3 543.3 37.2
Safety glass 54 101.2 3 210.7 42.3 80 260.5 3 867.6 44.5 91 371.4 4 030.8 42.3
Insulating units from several glass sheets 5 725.4 255.8 3.4 7 266.3 282.9 3.3 5 990.5 200.4 2.1
Glass mirrors and rear mirrors 10 199.5 1 312.9 17.3 7 951.6 1 594.3 18.3 8 762.3 1 746.2 18.3
Totally 286 346.7 7 582.6 100.0 324 671.2 8 697.5 100.0 426 180.3 9 520.7 100.0

Structure of import of flat glass according to the assortment in 2011 (t)
76%
21%
1% 2%
Unfinished flat glass
Safety glass
Insulating units from several glass sheets
Glass mirrors and rear mirrors
Structure of import of flat glass according to the assortment in 2011 (CZK)
37%
43%
2%
18%
Unfinished flat glass
Safety glass
Insulating units from several glass sheets
Glass mirrors and rear mirrors
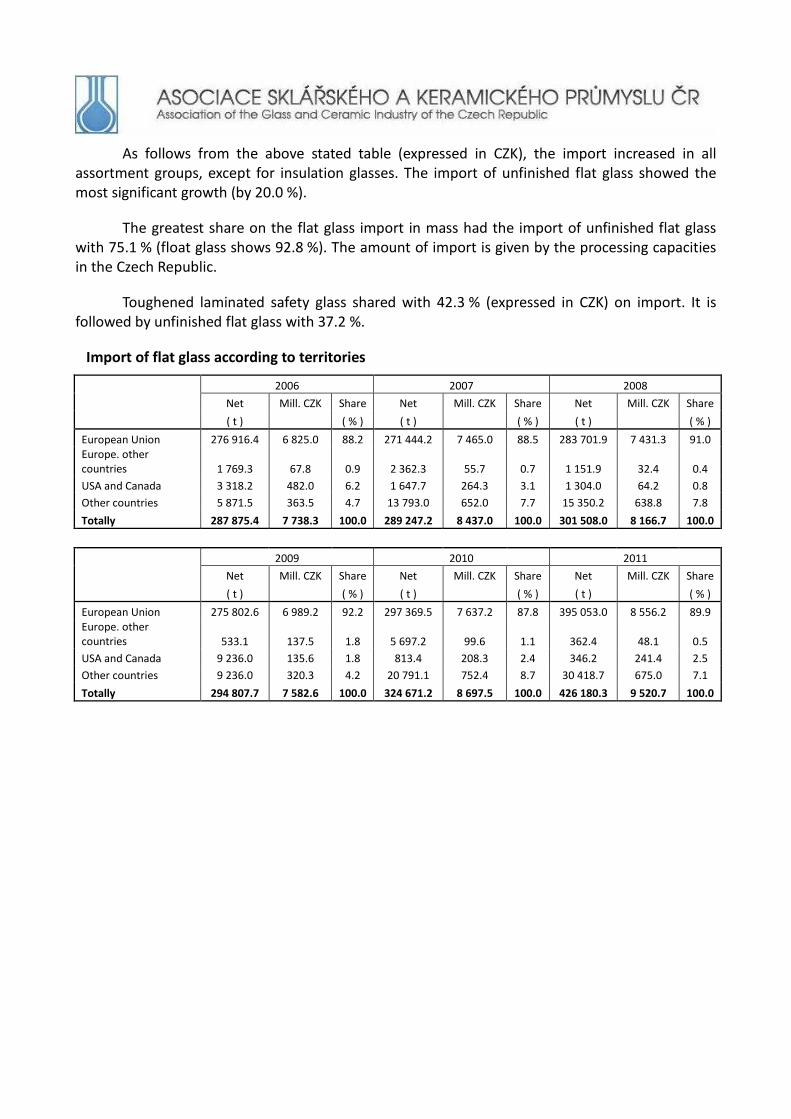
As follows from the above stated table (expressed in CZK), the import increased in all assortment groups, except for insulation glasses. The import of unfinished flat glass showed the most significant growth (by 20.0 %).
The greatest share on the flat glass import in mass had the import of unfinished flat glass with 75.1 % (float glass shows 92.8 %). The amount of import is given by the processing capacities in the Czech Republic.
Toughened laminated safety glass shared with 42.3 % (expressed in CZK) on import. It is followed by unfinished flat glass with 37.2 %.
Import of flat glass according to territories
2006 2007 2008
Net Mill. CZK Share Net Mill. CZK Share Net Mill. CZK Share
( t ) ( % ) ( t ) ( % ) ( t ) ( % )
European Union 276 916.4 6 825.0 88.2 271 444.2 7 465.0 88.5 283 701.9 7 431.3 91.0 Europe. other countries 1 769.3 67.8 0.9 2 362.3 55.7 0.7 1 151.9 32.4 0.4
USA and Canada 3 318.2 482.0 6.2 1 647.7 264.3 3.1 1 304.0 64.2 0.8
Other countries 5 871.5 363.5 4.7 13 793.0 652.0 7.7 15 350.2 638.8 7.8
Totally 287 875.4 7 738.3 100.0 289 247.2 8 437.0 100.0 301 508.0 8 166.7 100.0
2009 2010 2011
Net Mill. CZK Share Net Mill. CZK Share Net Mill. CZK Share
( t ) ( % ) ( t ) ( % ) ( t ) ( % )
European Union 275 802.6 6 989.2 92.2 297 369.5 7 637.2 87.8 395 053.0 8 556.2 89.9 Europe. other countries 533.1 137.5 1.8 5 697.2 99.6 1.1 362.4 48.1 0.5
USA and Canada 9 236.0 135.6 1.8 813.4 208.3 2.4 346.2 241.4 2.5
Other countries 9 236.0 320.3 4.2 20 791.1 752.4 8.7 30 418.7 675.0 7.1
Totally 294 807.7 7 582.6 100.0 324 671.2 8 697.5 100.0 426 180.3 9 520.7 100.0
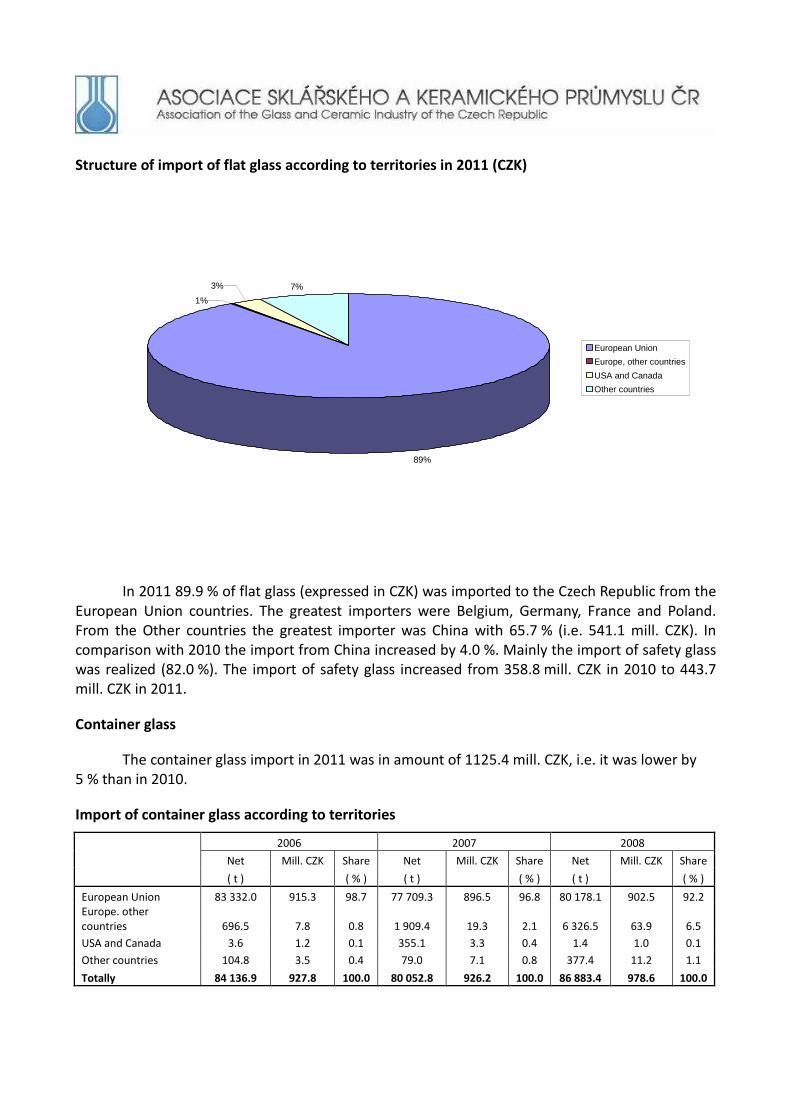
Structure of import of flat glass according to territories in 2011 (CZK)
89%
1%
3% 7%
European Union
Europe, other countries
USA and Canada
Other countries
In 2011 89.9 % of flat glass (expressed in CZK) was imported to the Czech Republic from the European Union countries. The greatest importers were Belgium, Germany, France and Poland. From the Other countries the greatest importer was China with 65.7 % (i.e. 541.1 mill. CZK). In comparison with 2010 the import from China increased by 4.0 %. Mainly the import of safety glass was realized (82.0 %). The import of safety glass increased from 358.8 mill. CZK in 2010 to 443.7 mill. CZK in 2011.
Container glass
The container glass import in 2011 was in amount of 1125.4 mill. CZK, i.e. it was lower by 5 % than in 2010.
Import of container glass according to territories
2006 2007 2008
Net Mill. CZK Share Net Mill. CZK Share Net Mill. CZK Share
( t ) ( % ) ( t ) ( % ) ( t ) ( % )
European Union 83 332.0 915.3 98.7 77 709.3 896.5 96.8 80 178.1 902.5 92.2 Europe. other countries 696.5 7.8 0.8 1 909.4 19.3 2.1 6 326.5 63.9 6.5
USA and Canada 3.6 1.2 0.1 355.1 3.3 0.4 1.4 1.0 0.1
Other countries 104.8 3.5 0.4 79.0 7.1 0.8 377.4 11.2 1.1
Totally 84 136.9 927.8 100.0 80 052.8 926.2 100.0 86 883.4 978.6 100.0
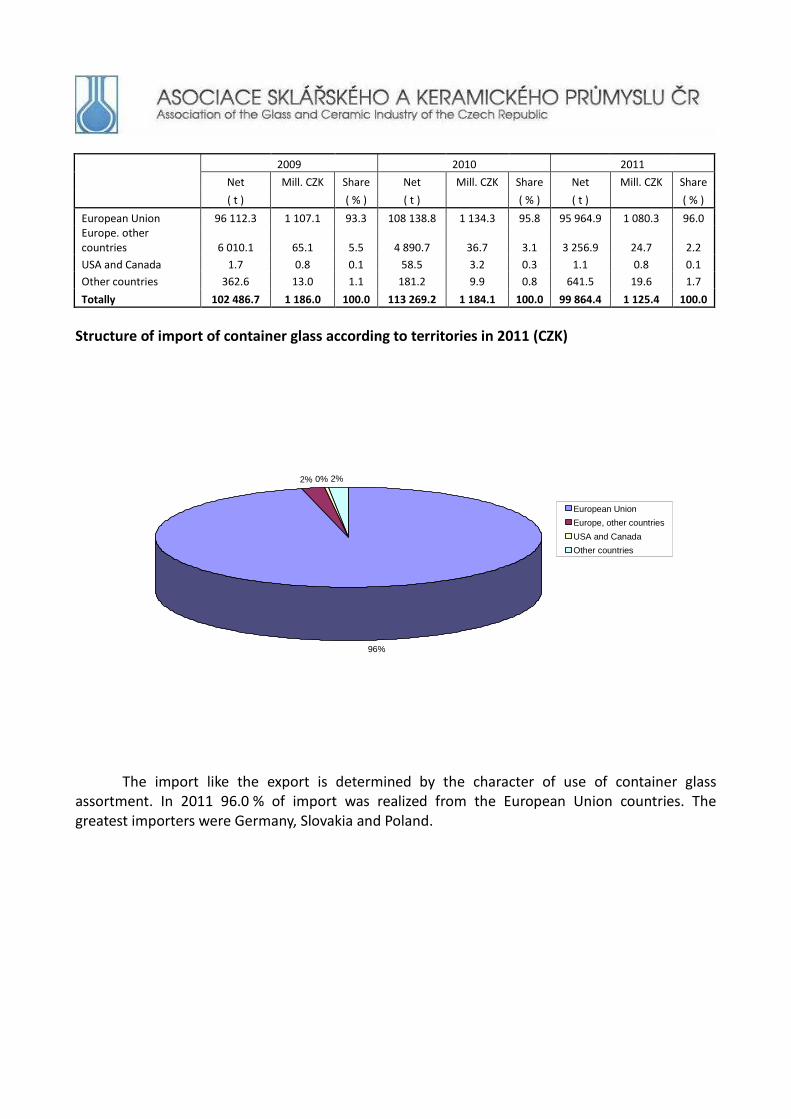
2009 2010 2011
Net Mill. CZK Share Net Mill. CZK Share Net Mill. CZK Share
( t ) ( % ) ( t ) ( % ) ( t ) ( % )
European Union 96 112.3 1 107.1 93.3 108 138.8 1 134.3 95.8 95 964.9 1 080.3 96.0 Europe. other countries 6 010.1 65.1 5.5 4 890.7 36.7 3.1 3 256.9 24.7 2.2
USA and Canada 1.7 0.8 0.1 58.5 3.2 0.3 1.1 0.8 0.1
Other countries 362.6 13.0 1.1 181.2 9.9 0.8 641.5 19.6 1.7
Totally 102 486.7 1 186.0 100.0 113 269.2 1 184.1 100.0 99 864.4 1 125.4 100.0
Structure of import of container glass according to territories in 2011 (CZK)
96%
2% 0% 2%
European Union
Europe, other countries
USA and Canada
Other countries
The import like the export is determined by the character of use of container glass assortment. In 2011 96.0 % of import was realized from the European Union countries. The greatest importers were Germany, Slovakia and Poland.

Glass fibres and products made of
The import of glass fibres and products made of to the Czech Republic was 2448.3 mill. CZK in 2011.
Import of glass fibres and products made of according to territories
2006 2007 2008
Net Mill. CZK Share Net
Mill. CZK Share Net Mill. CZK Share
( t ) ( % ) ( t ) ( % ) ( t ) ( % )
European Union 37 072.8 2 205.3 85.6 37 831.6 2 058.2 74.5 37 410.2 1 829.3 77.8 Europe. other countries 1 206.6 85.2 3.3 2 369.0 165.1 6.0 1 509.7 122.5 5.2
USA and Canada 417.2 126.7 4.9 557.3 133.5 4.8 511.7 101.4 4.3
Other countries 3 541.0 159.8 6.2 10 312.8 404.2 14.6 8 696.4 297.9 12.7
Totally 42 237.6 2 577.0 100.0 51 070.7 2 761.0 100.0 48 128.0 2 351.1 100.0
2009 2010 2011
Net Mill. CZK Share Net
Mill. CZK Share Net Mill. CZK Share
( t ) ( % ) ( t ) ( % ) ( t ) ( % )
European Union 29 377.8 1 201.5 74.4 35 831.1 1 467.3 68.8 44 036.3 1 534.8 62.7 Europe. other countries 3 679.0 118.9 7.4 6 513.2 192.6 9.0 1 163.5 53.4 2.2
USA and Canada 218.1 16.6 1.0 1 075.7 87.4 4.1 1 405.9 103.6 4.2
Other countries 7 270.1 278.2 17.2 10 638.4 386.0 18.1 19 906.1 756.5 30.9
Totally 40 545.0 1 615.2 100.0 54 058.4 2 133.3 100.0 66 511.8 2 448.3 100.0
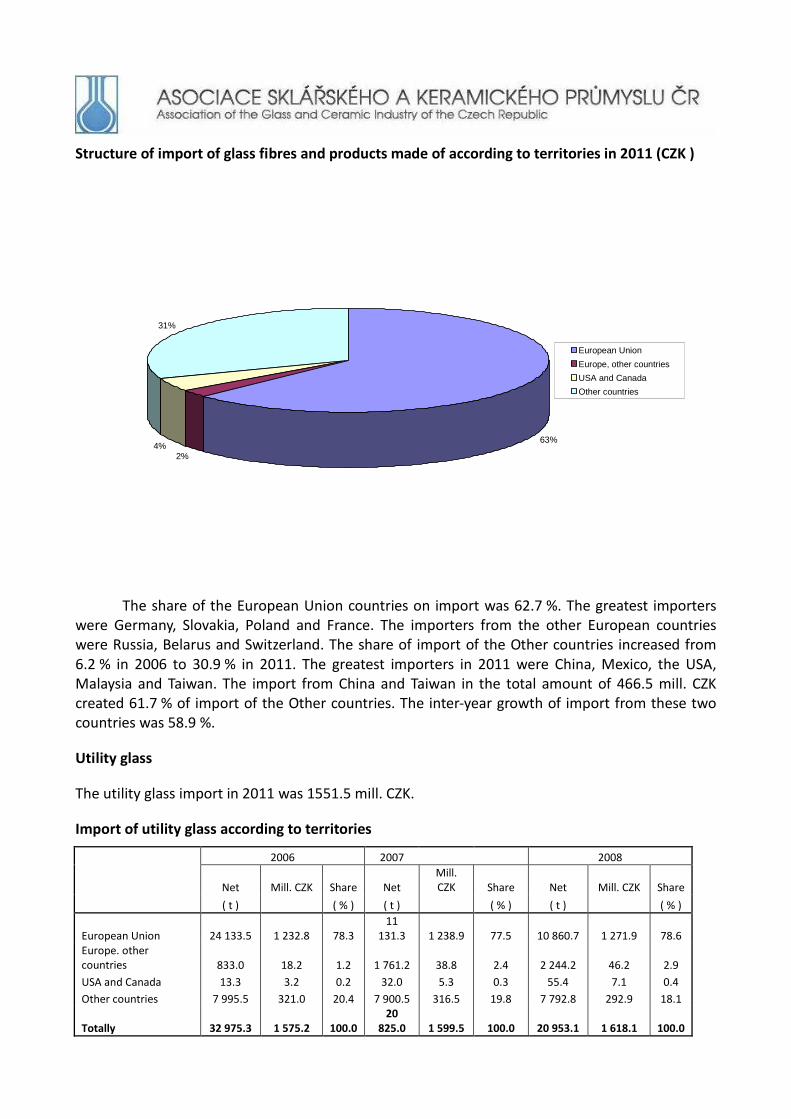
Structure of import of glass fibres and products made of according to territories in 2011 (CZK )
63%
2%4%
31%
European Union
Europe, other countries
USA and Canada
Other countries
The share of the European Union countries on import was 62.7 %. The greatest importers were Germany, Slovakia, Poland and France. The importers from the other European countries were Russia, Belarus and Switzerland. The share of import of the Other countries increased from 6.2 % in 2006 to 30.9 % in 2011. The greatest importers in 2011 were China, Mexico, the USA, Malaysia and Taiwan. The import from China and Taiwan in the total amount of 466.5 mill. CZK created 61.7 % of import of the Other countries. The inter-year growth of import from these two countries was 58.9 %.
Utility glass
The utility glass import in 2011 was 1551.5 mill. CZK.
Import of utility glass according to territories
2006 2007 2008
Net Mill. CZK Share Net Mill. CZK Share Net Mill. CZK Share
( t ) ( % ) ( t ) ( % ) ( t ) ( % )
European Union 24 133.5 1 232.8 78.3 11
131.3 1 238.9 77.5 10 860.7 1 271.9 78.6 Europe. other countries 833.0 18.2 1.2 1 761.2 38.8 2.4 2 244.2 46.2 2.9
USA and Canada 13.3 3.2 0.2 32.0 5.3 0.3 55.4 7.1 0.4
Other countries 7 995.5 321.0 20.4 7 900.5 316.5 19.8 7 792.8 292.9 18.1
Totally 32 975.3 1 575.2 100.0 20
825.0 1 599.5 100.0 20 953.1 1 618.1 100.0

2009 2010 2011
Net Mill. CZK Share Net Mill. CZK Share Net Mill. CZK Share
( t ) ( % ) ( t ) ( % ) ( t ) ( % )
European Union 20 017.5 1 081.8 76.9 24
038.6 1 071.7 69.0 42 883.0 1 150.7 74.2 Europe. other countries 1 485.4 31.0 2.2 1 142.9 28.0 1.8 1 107.6 26.9 1.7
USA and Canada 17.2 3.3 0.2 23.2 2.6 0.2 30.6 3.2 0.2
Other countries 7 996.4 291.0 20.7 11
656.9 450.4 29.0 10 358.1 370.7 23.9
Totally 29 516.5 1 407.1 100.0 36
861.6 1 552.7 100.0 54 379.3 1 551.5 100.0
Structure of import of utility glass according to territories in 2011 (CZK)
74%
2%
0%
24%
European Union
Europe, other countries
USA and Canada
Other countries
The greatest share of import (74.2 %) was realized from the European Union countries. The greatest importers were Germany, Slovakia, Poland, Italy, Bulgaria and France. From the Other countries (23.9 % of total import) the greatest importers in 2011 were China (235.4 mill. CZK) and Turkey (106.1 mill. CZK). Both these countries totally created 92.1 % of import from the Other countries.

Other glass
The import of other glass in 2011 was 1746.1 mill. CZK.
Import of other glass according to the assortment
2006 2007 2008
Net Mill. CZK Share Net Mill. CZK Share Net Mill. CZK Share
( t ) ( % ) ( t ) ( % ) ( t ) ( % )
Technical glass 34 679.1 1 148.8 36.8 11 809.3 539.8 18.2 1 791.0 263.0 14.9
Glass tiles. plates and blocks 13 456.0 292.4 9.4 10 205.0 319.7 10.8 12 303.4 376.0 21.3
Laboratory glass 162.3 47.6 1.5 225.0 54.6 1.8 246.1 56.0 3.2 Glass semiproducts for fashion jewellery 1 726.6 615.4 19.7 2 333.0 572.7 19.3 1 574.0 281.6 16.0
Other glass 77 123.0 1 014.1 32.5 83 749.7 1 476.1 49.8 85 889.9 784.7 44.6
Totally 127 147.0 3 118.3 100.0 108 322.0 2 962.9 100.0 101 804.4 1 761.3 100.0
2009 2010 2011
Net Mill. CZK Share Net Mill. CZK Share Net Mill. CZK Share
( t ) ( % ) ( t ) ( % ) ( t ) ( % )
Technical glass 1 428.7 140.2 8.6 1 917.0 232.7 12.2 2 057.8 245.1 14.0
Glass tiles. plates and blocks 8 650.2 275.8 16.8 8 069.5 284.8 14.9 6 664.2 230.4 13.2
Laboratory glass 2 988.3 60.4 3.7 1 892.6 73.0 3.8 502.1 76.4 4.4
Glass semiproducts for fashion jewellery 1 822.6 327.1 20.0 2 525.0 464.1 24.4 3 226.2 346.9 19.9
Other glass 97 409.6 833.8 50.9 102 766.8 850.5 44.6 157 324.0 847.9 48.5
Totally 112 299.4 1 637.3 100.0 117 170.9 1 905.1 100.0 169 774.3 1 746.7 100.0

Structure of import of other glass according to the assortment in 2011 (mill. CZK)
14%
13%
4%
20%
49%
Technical glass
Glass tiles, plates and blocks
Laboratory glass
Glass semiproducts for fashion jewellery
Other glass
In the following table the other glass import according to territories is given.
Import of other glass according to territories
2006 2007 2008
Net Mill. CZK Share Net Mill. CZK Share Net Mill. CZK Share
( t ) ( % ) ( t ) ( % ) ( t ) ( % )
European Union 107 192.0 2 264.5 72.6 96 117.2 2 084.5 70.4 94 318.8 1 371.2 77.9
Europe. other countries 819.7 56.6 1.8 690.3 84.9 2.9 256.0 36.9 2.1
USA and Canada 44.2 33.6 1.1 18.0 34.5 1.2 25.1 21.1 1.2
Other countries 19 091.1 763.6 24.5 11 496.5 759.0 25.6 7 204.5 332.1 18.9
Totally 127 147.0 3 118.3 100.0 108 322.0 2 962.9 100.0 101 804.4 1 761.3 100.0
2009 2010 2011
Net Mill. CZK Share Net Mill. CZK Share Net Mill. CZK Share
( t ) ( % ) ( t ) ( % ) ( t ) ( % )
European Union 107 923.4 1 298.3 79.3 106 632.9 1 487.9 78.1 138 606.8 1 221.9 70.0
Europe. other countries 81.0 15.3 0.9 2 730.4 24.0 1.3 24 218.6 52.7 3.0
USA and Canada 148.4 42.8 2.6 3 178.0 28.0 1.5 40.1 40.3 2.3
Other countries 4 146.6 280.9 17.2 4 629.6 365.2 19.2 6 908.8 431.8 24.7
Totally 112 299.4 1 637.3 100.0 117 170.9 1 905.1 100.0 169 774.3 1 746.7 100.0
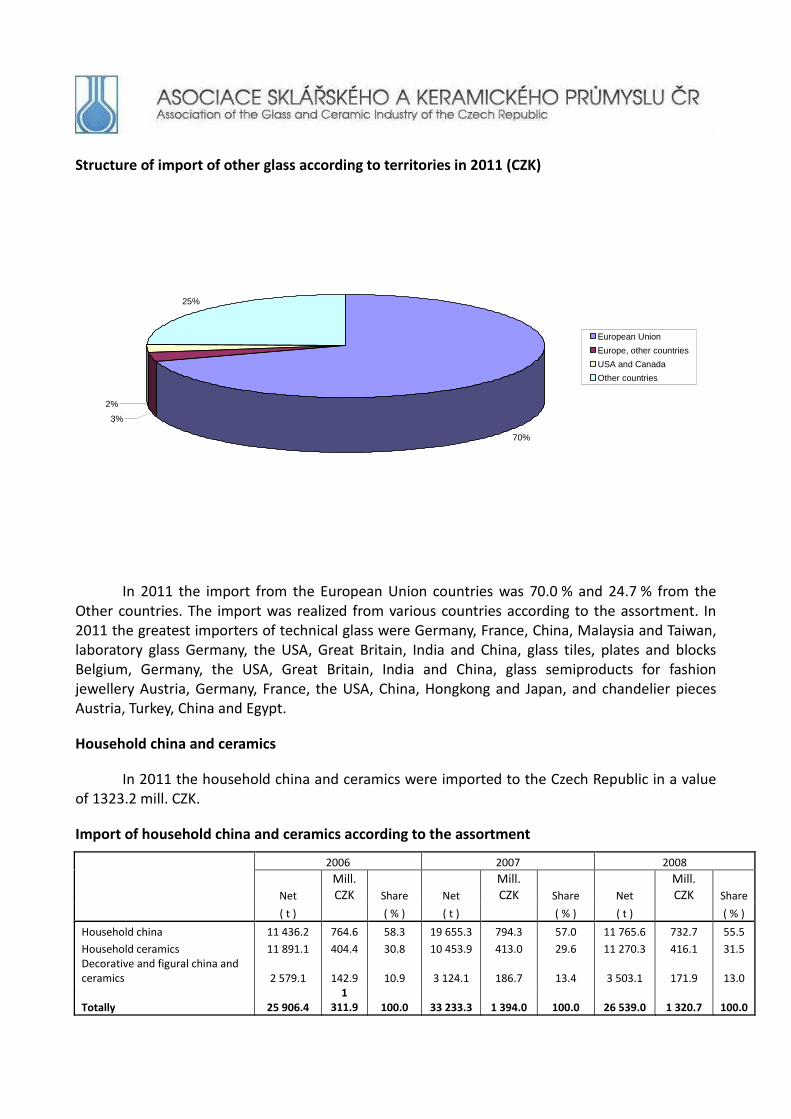
Structure of import of other glass according to territories in 2011 (CZK)
70%
3%
2%
25%
European Union
Europe, other countries
USA and Canada
Other countries
In 2011 the import from the European Union countries was 70.0 % and 24.7 % from the Other countries. The import was realized from various countries according to the assortment. In 2011 the greatest importers of technical glass were Germany, France, China, Malaysia and Taiwan, laboratory glass Germany, the USA, Great Britain, India and China, glass tiles, plates and blocks Belgium, Germany, the USA, Great Britain, India and China, glass semiproducts for fashion jewellery Austria, Germany, France, the USA, China, Hongkong and Japan, and chandelier pieces Austria, Turkey, China and Egypt.
Household china and ceramics
In 2011 the household china and ceramics were imported to the Czech Republic in a value of 1323.2 mill. CZK.
Import of household china and ceramics according to the assortment
2006 2007 2008
Net
Mill. CZK Share Net
Mill. CZK Share Net
Mill. CZK Share
( t ) ( % ) ( t ) ( % ) ( t ) ( % )
Household china 11 436.2 764.6 58.3 19 655.3 794.3 57.0 11 765.6 732.7 55.5
Household ceramics 11 891.1 404.4 30.8 10 453.9 413.0 29.6 11 270.3 416.1 31.5 Decorative and figural china and ceramics 2 579.1 142.9 10.9 3 124.1 186.7 13.4 3 503.1 171.9 13.0
Totally 25 906.4 1
311.9 100.0 33 233.3 1 394.0 100.0 26 539.0 1 320.7 100.0

2009 2010 2011
Net
Mill. CZK Share Net
Mill. CZK Share Net
Mill. CZK Share
( t ) ( % ) ( t ) ( % ) ( t ) ( % )
Household china 8 302.5 542.5 51.9 9 264.1 594.5 51.0 10 625.6 728.7 55.1
Household ceramics 8 094.9 342.3 32.8 10 461.3 405.3 34.8 8 712.4 415.3 31.4 Decorative and figural china and ceramics 3 050.7 159.8 15.3 3 534.0 166.3 14.3 3 249.4 179.2 13.5
Totally 19 448.1 1 044.6 100.0 23 259.4 1 166.1 100.0 22 587.4 1 323.2 100.0
Structure of import of household china and ceramics according to the assortment in 2011 (CZK)
55%31%
14%
Household china
Household ceramics
Decorative and figural china and ceramics
The household china shares with 55.1 %, household ceramics with 31.4 % and decorative and figural china and ceramics with 13.5 % on the import of this group assortment.
Import of household china and ceramics according to territories
2006 2007 2008
Net Mill. CZK Share Net Mill. CZK Share Net Mill. CZK Share
( t ) ( % ) ( t ) ( % ) ( t ) ( % )
European Union 12 664.6 855.3 65.2 19 178.8 850.5 61.0 10 610.9 741.0 56.1 Europe. other countries 657.4 25.8 2.0 509.4 12.2 0.9 421.7 11.2 0.8
USA and Canada 1.6 0.7 0.1 1.9 0.8 0.1 0.7 0.3 0.0
Other countries 12 582.8 430.1 32.8 13 543.2 530.5 38.1 15 505.7 568.2 43.0
Totally 25 906.4 1 311.9 100.0 33 233.3 1 394.0 100.0 26 539.0 1 320.7 100.0
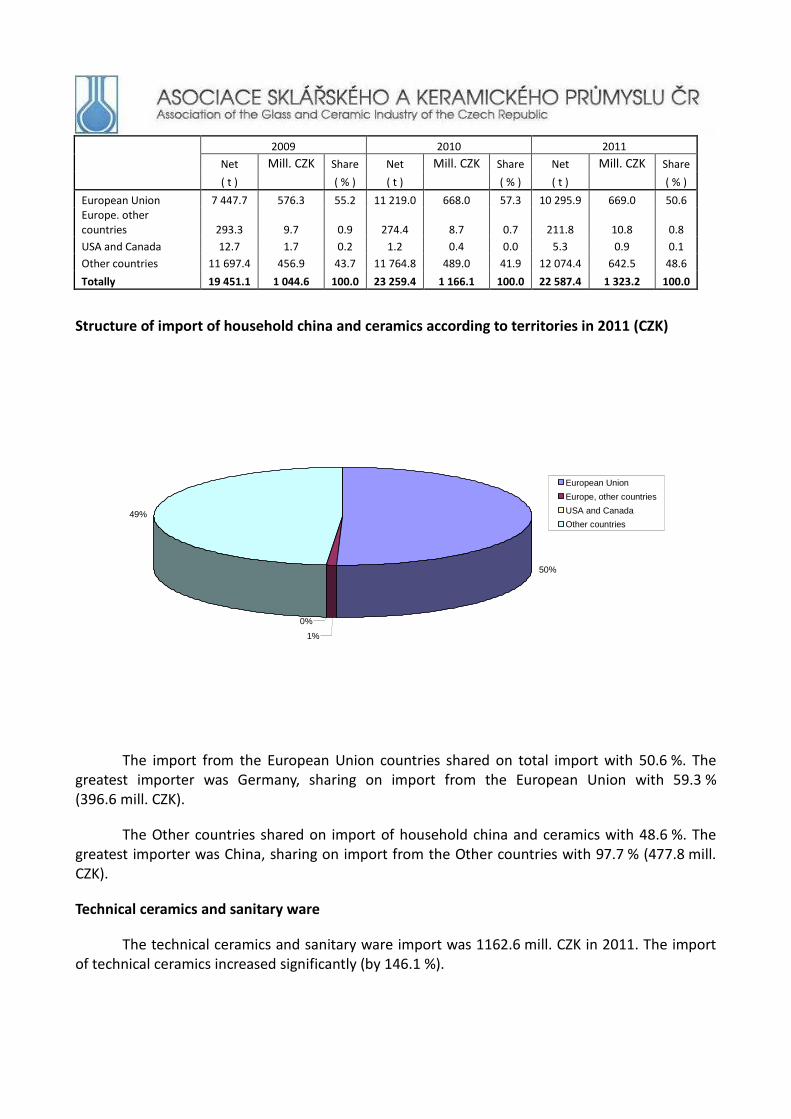
2009 2010 2011
Net Mill. CZK Share Net Mill. CZK Share Net Mill. CZK Share
( t ) ( % ) ( t ) ( % ) ( t ) ( % )
European Union 7 447.7 576.3 55.2 11 219.0 668.0 57.3 10 295.9 669.0 50.6 Europe. other countries 293.3 9.7 0.9 274.4 8.7 0.7 211.8 10.8 0.8
USA and Canada 12.7 1.7 0.2 1.2 0.4 0.0 5.3 0.9 0.1
Other countries 11 697.4 456.9 43.7 11 764.8 489.0 41.9 12 074.4 642.5 48.6
Totally 19 451.1 1 044.6 100.0 23 259.4 1 166.1 100.0 22 587.4 1 323.2 100.0
Structure of import of household china and ceramics according to territories in 2011 (CZK)
50%
1%
0%
49%
European Union
Europe, other countries
USA and Canada
Other countries
The import from the European Union countries shared on total import with 50.6 %. The greatest importer was Germany, sharing on import from the European Union with 59.3 % (396.6 mill. CZK).
The Other countries shared on import of household china and ceramics with 48.6 %. The greatest importer was China, sharing on import from the Other countries with 97.7 % (477.8 mill. CZK).
Technical ceramics and sanitary ware
The technical ceramics and sanitary ware import was 1162.6 mill. CZK in 2011. The import of technical ceramics increased significantly (by 146.1 %).
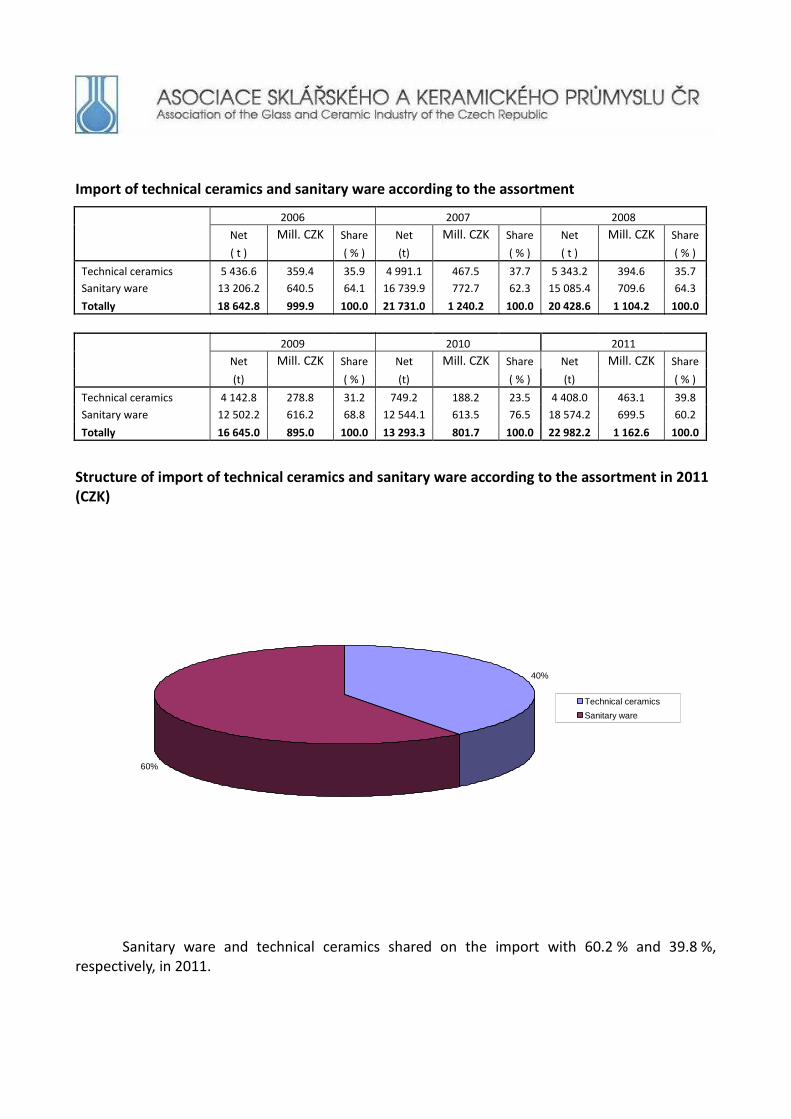
Import of technical ceramics and sanitary ware according to the assortment
2006 2007 2008
Net Mill. CZK Share Net Mill. CZK Share Net Mill. CZK Share
( t ) ( % ) (t) ( % ) ( t ) ( % )
Technical ceramics 5 436.6 359.4 35.9 4 991.1 467.5 37.7 5 343.2 394.6 35.7
Sanitary ware 13 206.2 640.5 64.1 16 739.9 772.7 62.3 15 085.4 709.6 64.3
Totally 18 642.8 999.9 100.0 21 731.0 1 240.2 100.0 20 428.6 1 104.2 100.0
2009 2010 2011
Net Mill. CZK Share Net Mill. CZK Share Net Mill. CZK Share
(t) ( % ) (t) ( % ) (t) ( % )
Technical ceramics 4 142.8 278.8 31.2 749.2 188.2 23.5 4 408.0 463.1 39.8
Sanitary ware 12 502.2 616.2 68.8 12 544.1 613.5 76.5 18 574.2 699.5 60.2
Totally 16 645.0 895.0 100.0 13 293.3 801.7 100.0 22 982.2 1 162.6 100.0
Structure of import of technical ceramics and sanitary ware according to the assortment in 2011 (CZK)
40%
60%
Technical ceramics
Sanitary ware
Sanitary ware and technical ceramics shared on the import with 60.2 % and 39.8 %, respectively, in 2011.

Import of technical ceramics and sanitary ware according to territories
2006 2007 2008
Net Mill. CZK Share Net Mill. CZK Share Net Mill. CZK Share
( t ) ( % ) ( t ) ( % ) ( t ) ( % )
European Union 14 492.2 830.9 83.1 15 797.5 994.0 80.1 14 455.3 851.6 77.1
Europe. other countries 377.6 44.3 4.4 490.6 89.0 7.2 909.1 60.7 5.5
USA and Canada 150.4 19.1 1.9 33.6 36.1 2.9 22.6 28.9 2.6
Other countries 3 622.6 105.6 10.6 5 409.3 121.1 9.8 5 041.6 163.0 14.8
Totally 18 642.8 999.9 100.0 21 731.0 1 240.2 100.0 20 428.6 1 104.2 100.0
2009 2010 2011
Net Mill. CZK Share Net Mill. CZK Share Net Mill. CZK Share
( t ) ( % ) ( t ) ( % ) ( t ) ( % )
European Union 10 965.9 605.1 67.6 8 124.9 594.5 74.2 16 844.1 905.4 77.9
Europe. other countries 772.7 36.0 4.0 1 340.8 53.8 6.7 1 141.4 51.4 4.4
USA and Canada 1.9 22.2 2.5 2.5 18.0 2.2 22.2 38.8 3.3
Other countries 5 174.5 231.7 25.9 3 792.1 135.4 16.9 4 974.5 167.0 14.4
Totally 16 915.0 895.0 100.0 13 260.3 801.7 100.0 22 982.2 1 162.6 100.0
Structure of import of technical ceramics and sanitary ware according to territories in 2011 (CZK)
79%
4%
3%
14%
European Union
Europe, other countries
USA and Canada
Other countries
In 2011 the import from the European Union countries shared on technical ceramics import with 77.9 %. The greatest importer was Germany. As far as sanitary ware the share of import from the European Union countries was 58.1 %. The greatest importers were Poland, Germany and Austria. The Other countries had the share 17.7 % on total import of sanitary ware. The greatest importers from the Other countries were China and Turkey.