Embed Size (px)
Citation preview

A N N U A L R E P O R T
2 0 1 4
1
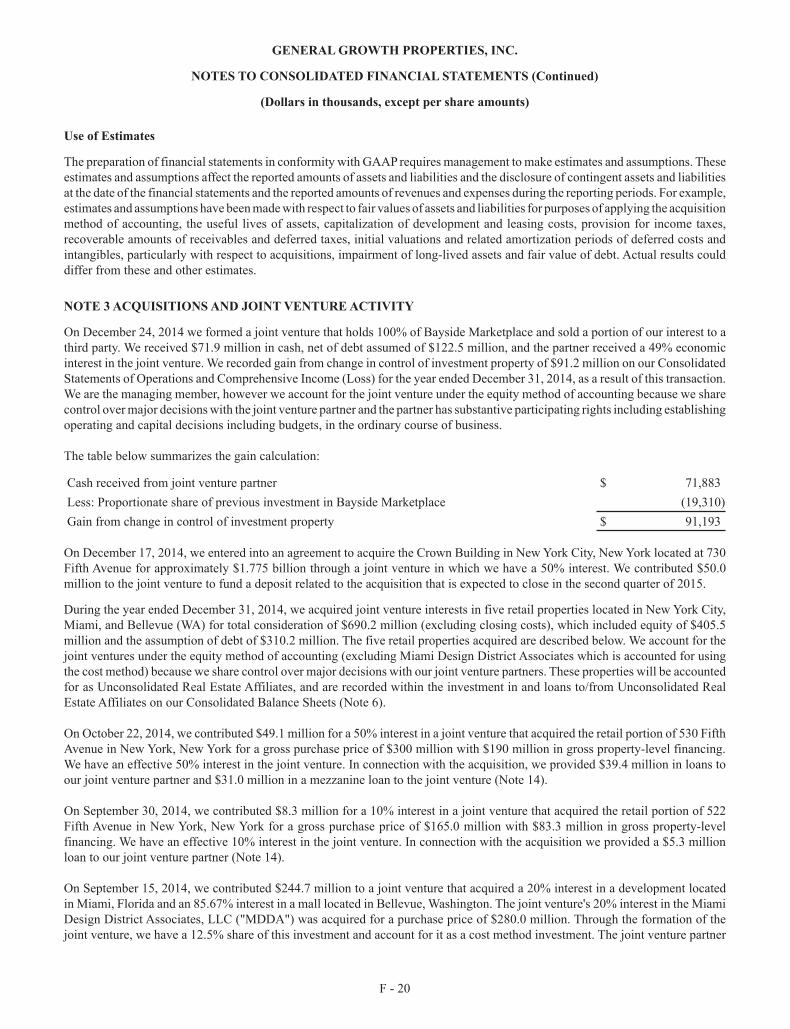
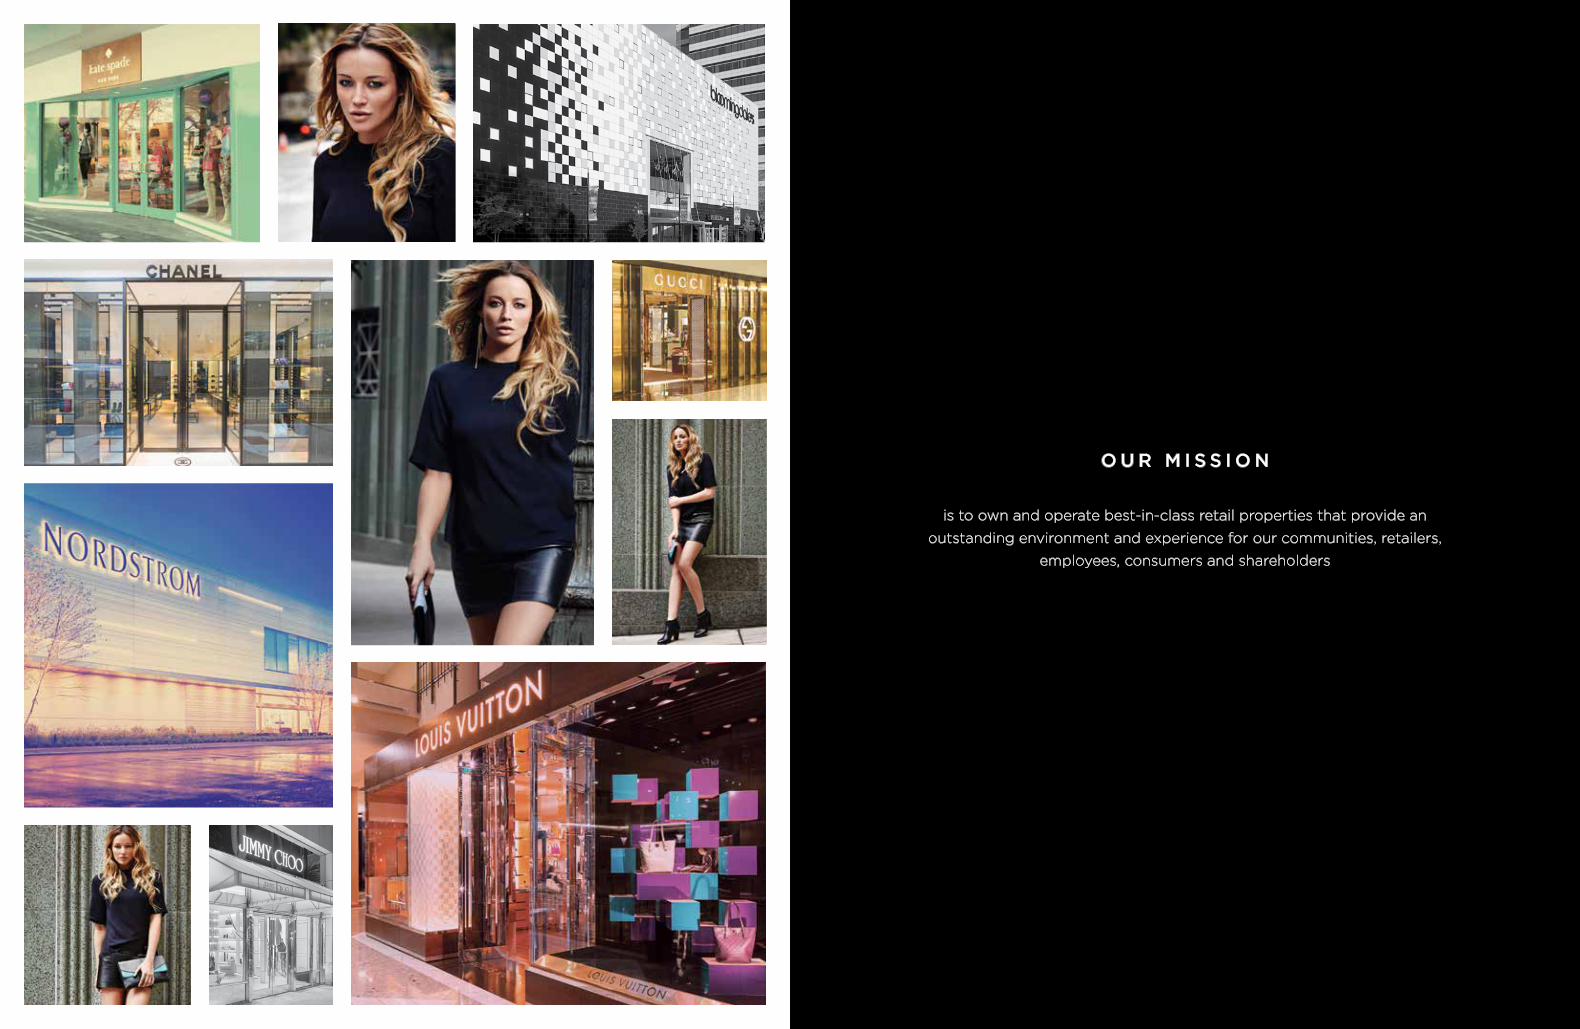
is to own and operate best-in-class retail properties that provide an
outstanding environment and experience for our communities, retailers,
employees, consumers and shareholders
O U R M I S S I O N
3
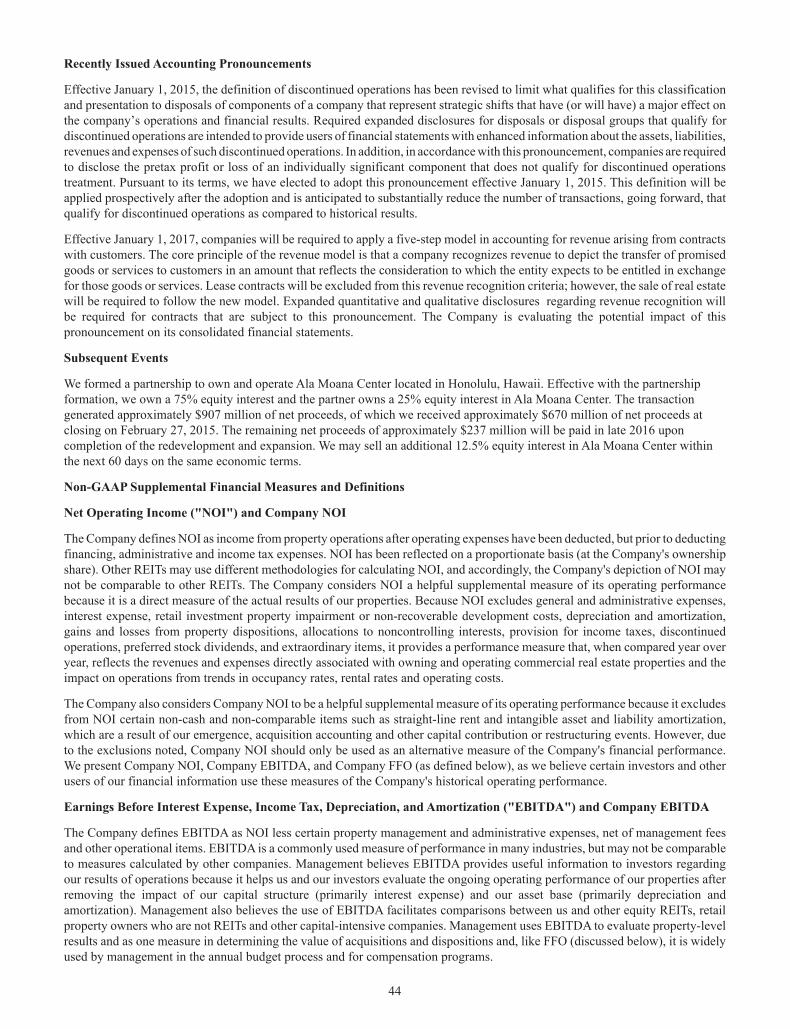
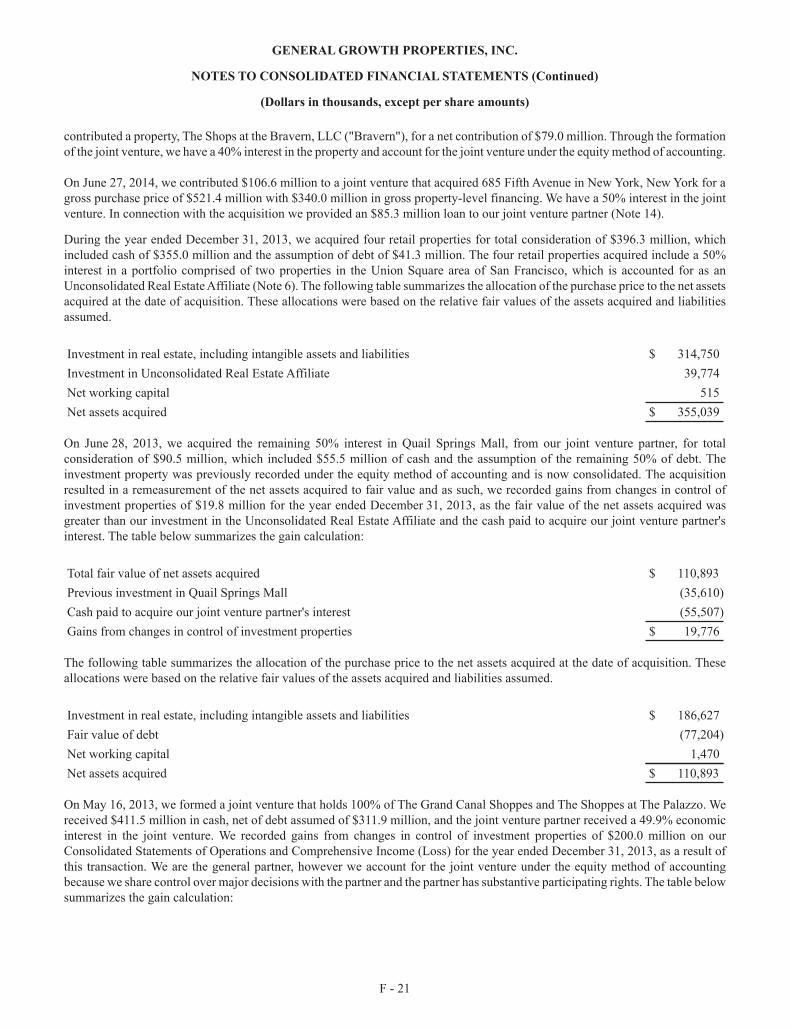
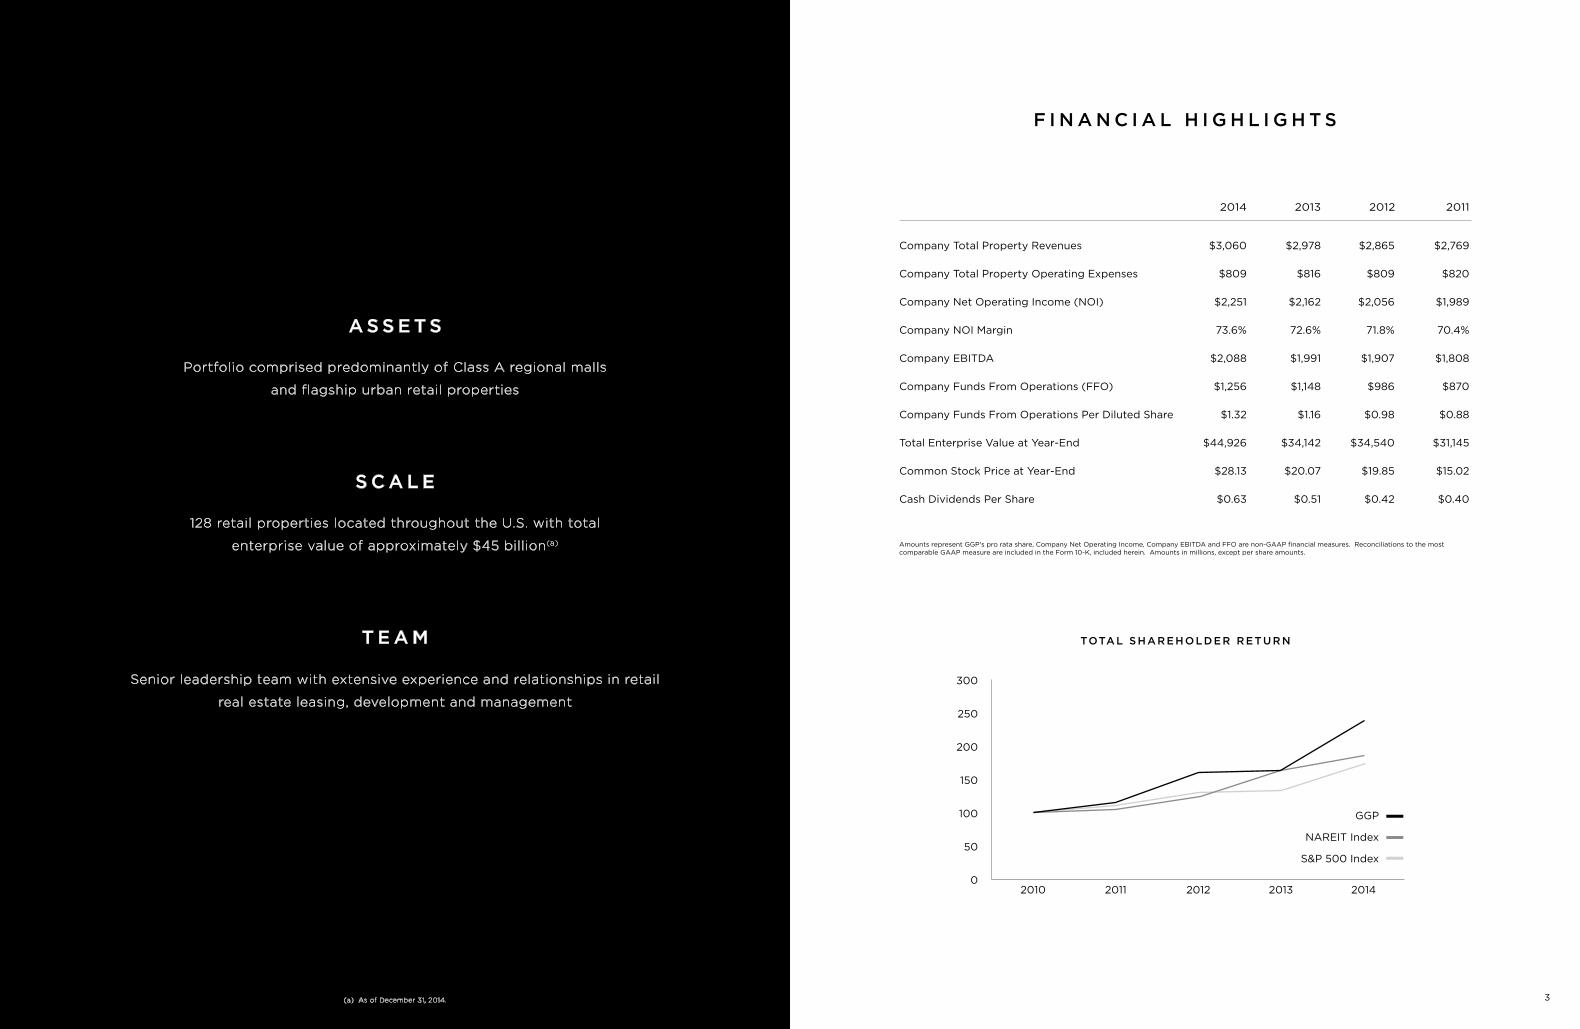
F I N A N C I A L H I G H L I G H T S
Company Total Property Revenues
Company Total Property Operating Expenses
Company Net Operating Income (NOI)
Company NOI Margin
Company EBITDA
Company Funds From Operations (FFO)
Company Funds From Operations Per Diluted Share
Total Enterprise Value at Year-End
Common Stock Price at Year-End
Cash Dividends Per Share
$3,060
$809
$2,251
73.6%
$2,088
$1,256
$1.32
$44,926
$28.13
$0.63
$2,978
$816
$2,162
72.6%
$1,991
$1,148
$1.16
$34,142
$20.07
$0.51
2014
Amounts represent GGP's pro rata share, Company Net Operating Income, Company EBITDA and FFO are non-GAAP financial measures. Reconciliations to the most comparable GAAP measure are included in the Form 10-K, included herein. Amounts in millions, except per share amounts.
$2,865
$809
$2,056
71.8%
$1,907
$986
$0.98
$34,540
$19.85
$0.42
$2,769
$820
$1,989
70.4%
$1,808
$870
$0.88
$31,145
$15.02
$0.40
2013 2012 2011
TOTAL SHAREHOLDER RETURN
GGP
NAREIT Index
S&P 500 Index
20142013201220112010
300
250
200
150
100
50
0
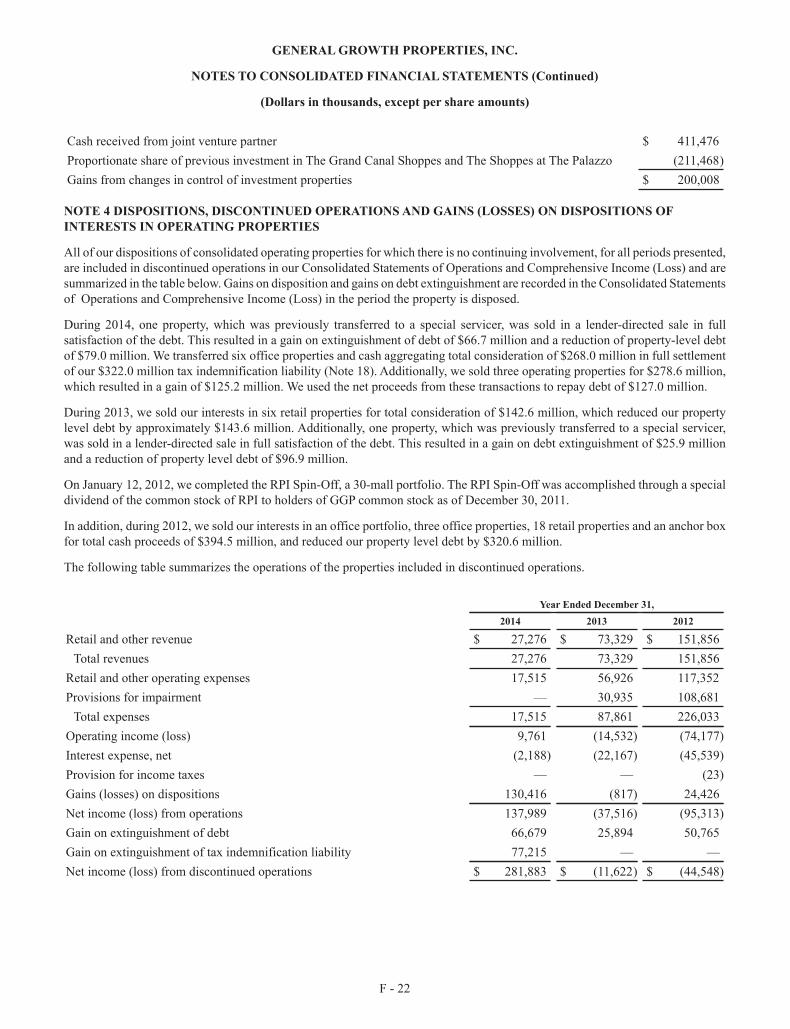
Portfolio comprised predominantly of Class A regional malls
and flagship urban retail properties
A S S E T S
128 retail properties located throughout the U.S. with total
enterprise value of approximately $45 billion(a)
S C A L E
Senior leadership team with extensive experience and relationships in retail
real estate leasing, development and management
T E A M
(a) As of December 31, 2014.
5
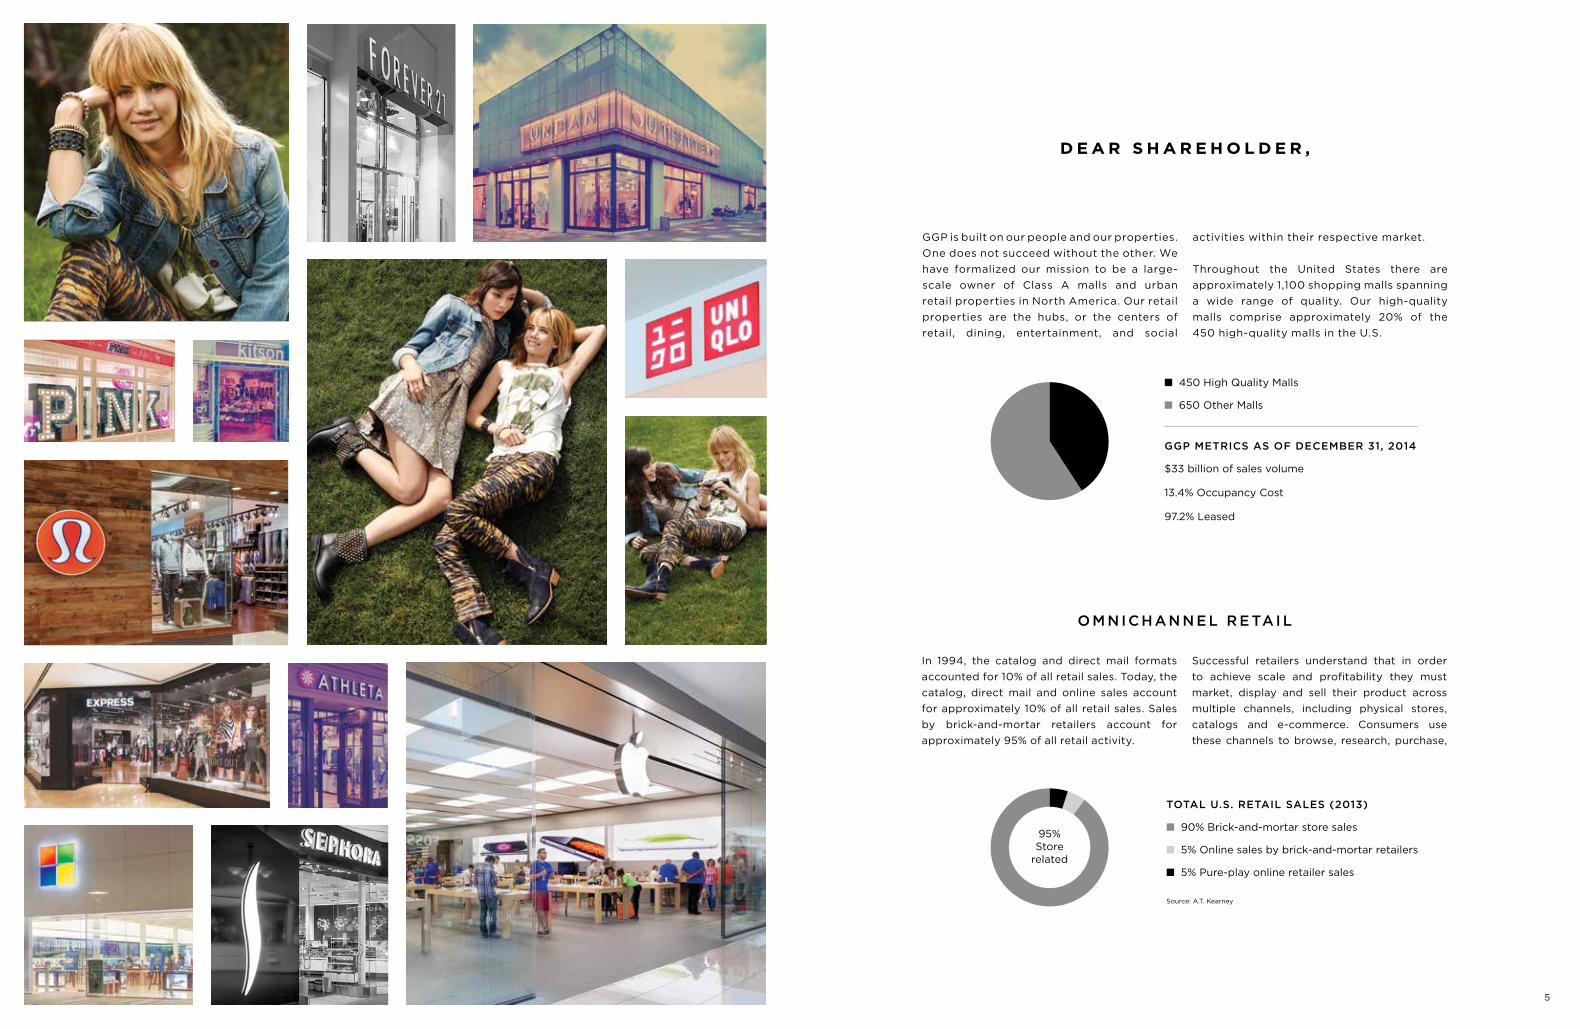
GGP is built on our people and our properties. One does not succeed without the other. We have formalized our mission to be a large-scale owner of Class A malls and urban retail properties in North America. Our retail properties are the hubs, or the centers of retail, dining, entertainment, and social
activities within their respective market.
Throughout the United States there are approximately 1,100 shopping malls spanning a wide range of quality. Our high-quality malls comprise approximately 20% of the 450 high-quality malls in the U.S.
D E A R S H A R E H O L D E R ,
GGP METRICS AS OF DECEMBER 31, 2014
$33 billion of sales volume
13.4% Occupancy Cost
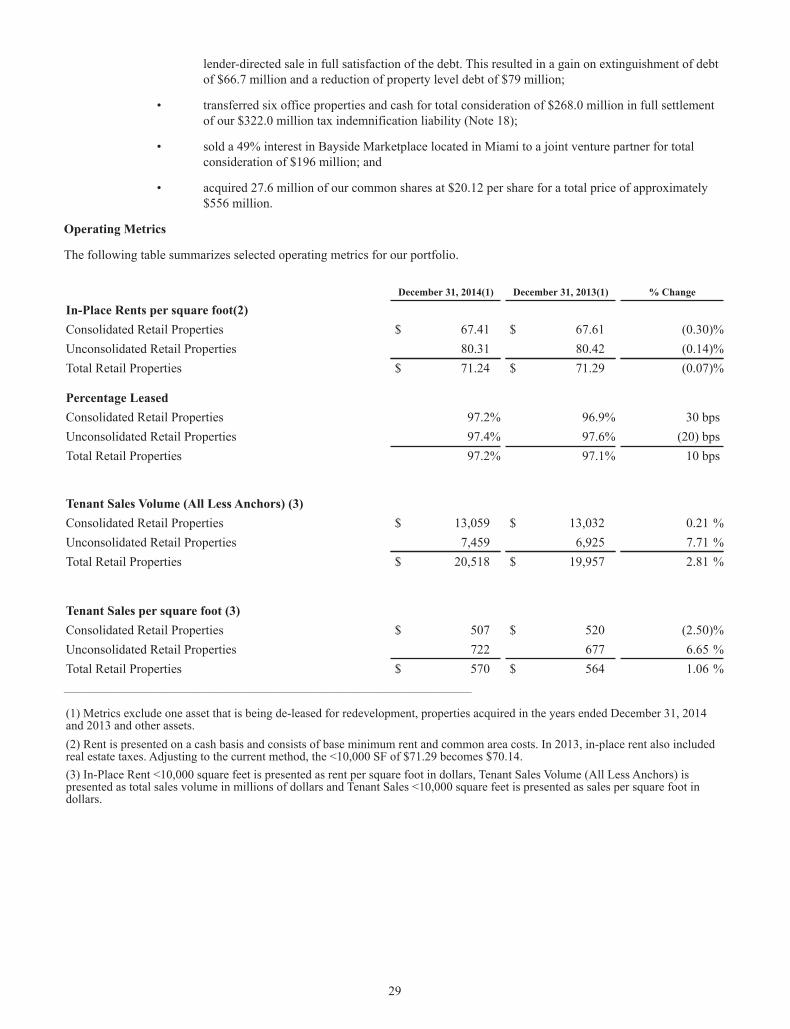
97.2% Leased
In 1994, the catalog and direct mail formats accounted for 10% of all retail sales. Today, the
catalog, direct mail and online sales account for approximately 10% of all retail sales. Sales by brick-and-mortar retailers account for approximately 95% of all retail activity.
Successful retailers understand that in order to achieve scale and profitability they must
market, display and sell their product across multiple channels, including physical stores, catalogs and e-commerce. Consumers use these channels to browse, research, purchase,
O M N I C H A N N E L R E TAI L
Source: A.T. Kearney
TOTAL U.S. RETAIL SALES (2013)
n 90% Brick-and-mortar store sales
n 5% Online sales by brick-and-mortar retailers
n 5% Pure-play online retailer sales
n 450 High Quality Malls
n 650 Other Malls
95% Store
related
take delivery and return, and so must the retailer to satisfy their customer. Removing barriers to buying spurs customers to purchase more.
The evolution of omnichannel commerce – seamlessly linking the physical store with the online store - has significantly benefitted those retailers that have embraced and implemented the technology. For example:
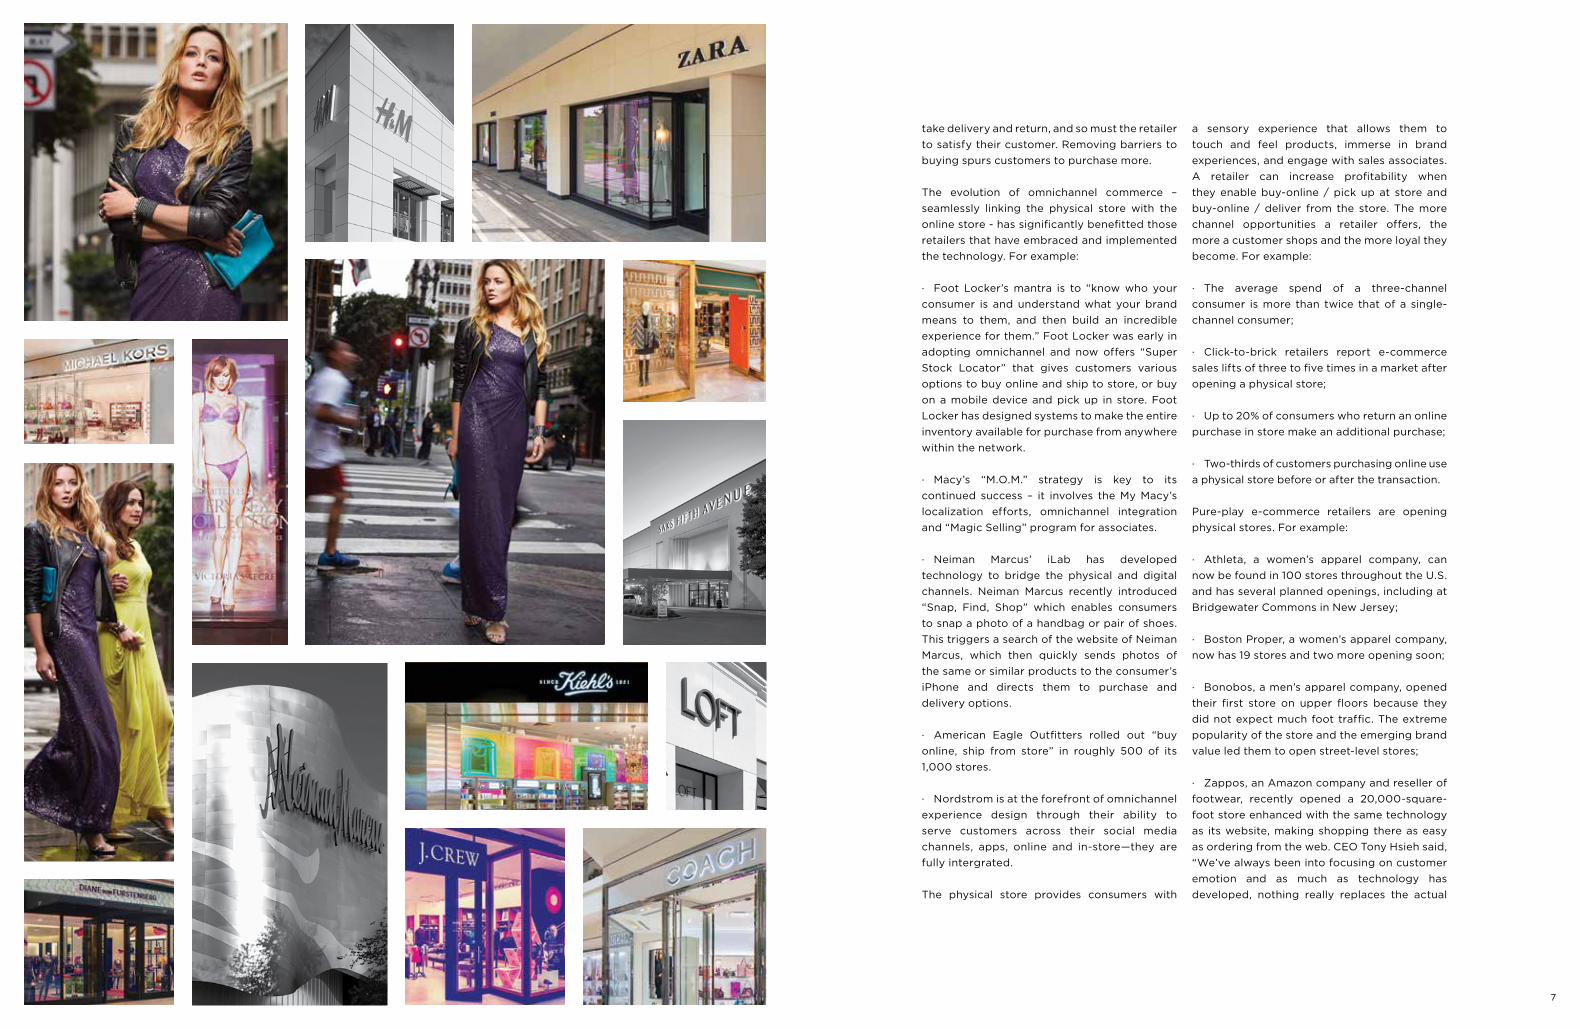
· Foot Locker’s mantra is to “know who your consumer is and understand what your brand means to them, and then build an incredible experience for them.” Foot Locker was early in adopting omnichannel and now offers “Super Stock Locator” that gives customers various options to buy online and ship to store, or buy on a mobile device and pick up in store. Foot Locker has designed systems to make the entire inventory available for purchase from anywhere within the network.
· Macy’s “M.O.M.” strategy is key to its continued success – it involves the My Macy’s localization efforts, omnichannel integration and “Magic Selling” program for associates.
· Neiman Marcus’ iLab has developed technology to bridge the physical and digital channels. Neiman Marcus recently introduced “Snap, Find, Shop” which enables consumers to snap a photo of a handbag or pair of shoes. This triggers a search of the website of Neiman Marcus, which then quickly sends photos of the same or similar products to the consumer’s iPhone and directs them to purchase and delivery options.
· American Eagle Outfitters rolled out “buy online, ship from store” in roughly 500 of its 1,000 stores.
· Nordstrom is at the forefront of omnichannel experience design through their ability to serve customers across their social media channels, apps, online and in-store—they are fully intergrated.
The physical store provides consumers with
a sensory experience that allows them to touch and feel products, immerse in brand experiences, and engage with sales associates. A retailer can increase profitability when they enable buy-online / pick up at store and buy-online / deliver from the store. The more channel opportunities a retailer offers, the more a customer shops and the more loyal they become. For example:
· The average spend of a three-channel consumer is more than twice that of a single-channel consumer;
· Click-to-brick retailers report e-commerce sales lifts of three to five times in a market after opening a physical store;
· Up to 20% of consumers who return an online purchase in store make an additional purchase;
· Two-thirds of customers purchasing online use a physical store before or after the transaction.
Pure-play e-commerce retailers are opening physical stores. For example:
· Athleta, a women’s apparel company, can now be found in 100 stores throughout the U.S. and has several planned openings, including at Bridgewater Commons in New Jersey;
· Boston Proper, a women’s apparel company, now has 19 stores and two more opening soon;
· Bonobos, a men’s apparel company, opened their first store on upper floors because they did not expect much foot traffic. The extreme popularity of the store and the emerging brand value led them to open street-level stores;
· Zappos, an Amazon company and reseller of footwear, recently opened a 20,000-square-foot store enhanced with the same technology as its website, making shopping there as easy as ordering from the web. CEO Tony Hsieh said, “We’ve always been into focusing on customer emotion and as much as technology has developed, nothing really replaces the actual
7
9
experience of being able to touch an item. That’s something they can do at the new store and see what it looks like matching with other different items”;
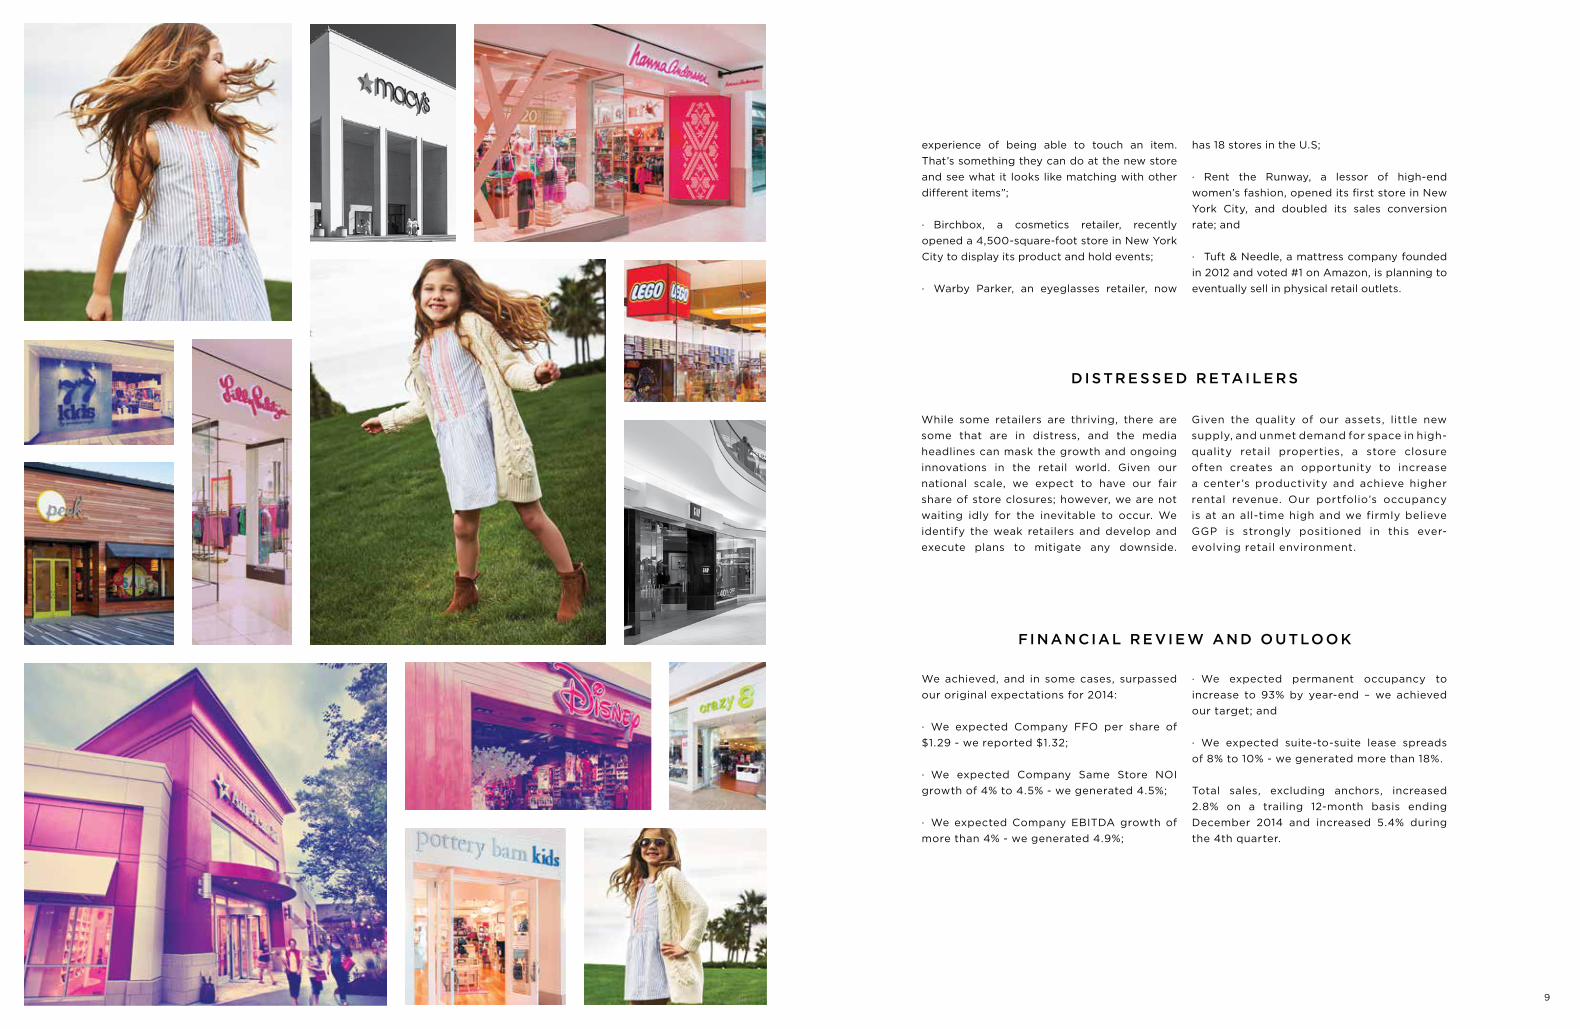
· Birchbox, a cosmetics retailer, recently opened a 4,500-square-foot store in New York City to display its product and hold events;
· Warby Parker, an eyeglasses retailer, now
has 18 stores in the U.S;
· Rent the Runway, a lessor of high-end women’s fashion, opened its first store in New York City, and doubled its sales conversion rate; and
· Tuft & Needle, a mattress company founded in 2012 and voted #1 on Amazon, is planning to eventually sell in physical retail outlets.
D I S TR E S S E D R E TA I LE R S
While some retailers are thriving, there are some that are in distress, and the media headlines can mask the growth and ongoing innovations in the retail world. Given our national scale, we expect to have our fair share of store closures; however, we are not waiting idly for the inevitable to occur. We identify the weak retailers and develop and execute plans to mitigate any downside.
Given the quality of our assets, little new supply, and unmet demand for space in high-quality retail properties, a store closure often creates an opportunity to increase a center’s productivity and achieve higher rental revenue. Our portfolio’s occupancy is at an all-time high and we firmly believe GGP is strongly positioned in this ever-evolving retail environment.
FI N A N CIA L R E VI E W A N D O U TLO O K
We achieved, and in some cases, surpassed our original expectations for 2014:
· We expected Company FFO per share of $1.29 - we reported $1.32;
· We expected Company Same Store NOI growth of 4% to 4.5% - we generated 4.5%;
· We expected Company EBITDA growth of more than 4% - we generated 4.9%;
· We expected permanent occupancy to increase to 93% by year-end – we achieved our target; and
· We expected suite-to-suite lease spreads of 8% to 10% - we generated more than 18%.
Total sales, excluding anchors, increased 2.8% on a trailing 12-month basis ending December 2014 and increased 5.4% during the 4th quarter.
11
Our outlook for 2014 was based on a strong conviction that high-quality retail properties, supported by a committed team of individuals, would continue to deliver strong results. Our results prove the premise.
In 2015, we expect GGP’s earnings growth will continue to be sourced organically from the following:
· Contractual rental increases of 2% to 3% annually;
· Leasing spreads of high-single digit to
low-double digits;
· Permanent occupancy stabilizing between 93.5% and 94% - we have achieved approx-imately 75% of our leasing target to date; and
· A portion of our $2 billion of development activities yielding 9% to 11% on cost upon stabilization coming online.
The combination of these sources, and our progress to date, provide us comfort in our growth expectations for 2015 and also achieving our longer-term goal of 4% to 5% annual EBITDA growth.
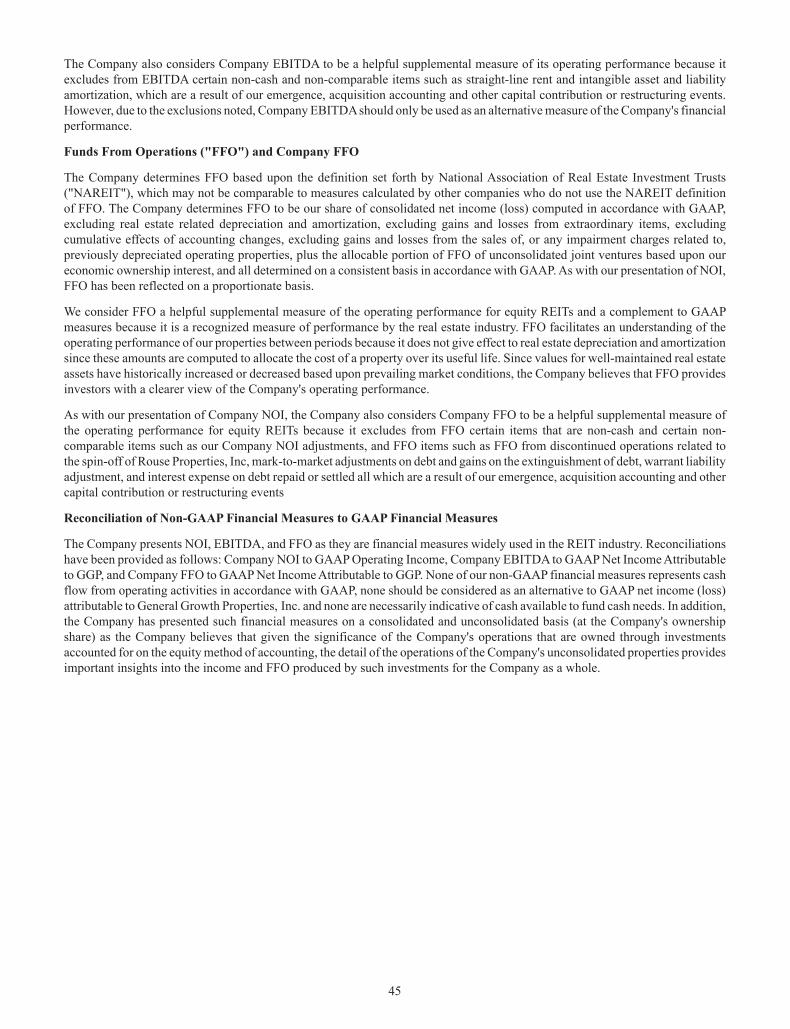
‘14‘11(b) ‘12
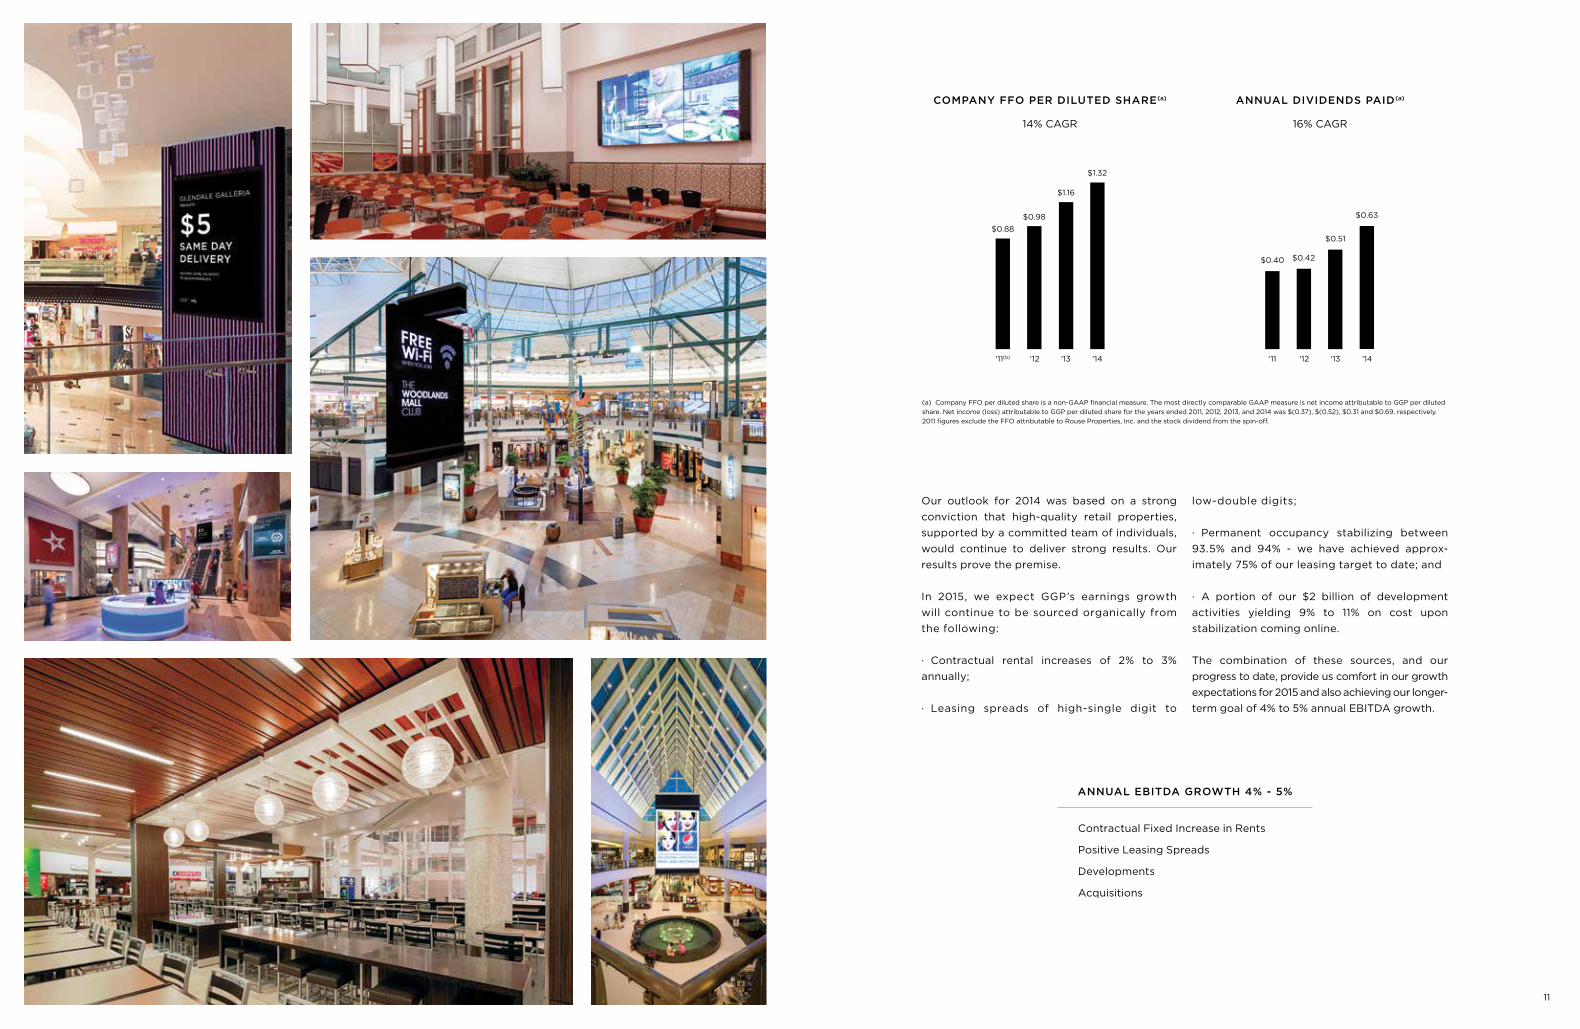
$0.88
$1.16
$1.32
COMPANY FFO PER DILUTED SHARE(a)
$0.40
$0.51
$0.63$0.98
‘13
$0.42
‘14‘11 ‘12 ‘13
ANNUAL DIVIDENDS PAID(a)
14% CAGR 16% CAGR
Contractual Fixed Increase in Rents
Positive Leasing Spreads
Developments
Acquisitions
ANNUAL EBITDA GROWTH 4% - 5%
(a) Company FFO per diluted share is a non-GAAP financial measure. The most directly comparable GAAP measure is net income attributable to GGP per diluted share. Net income (loss) attributable to GGP per diluted share for the years ended 2011, 2012, 2013, and 2014 was $(0.37), $(0.52), $0.31 and $0.69, respectively. 2011 figures exclude the FFO attributable to Rouse Properties, Inc. and the stock dividend from the spin-off.
13
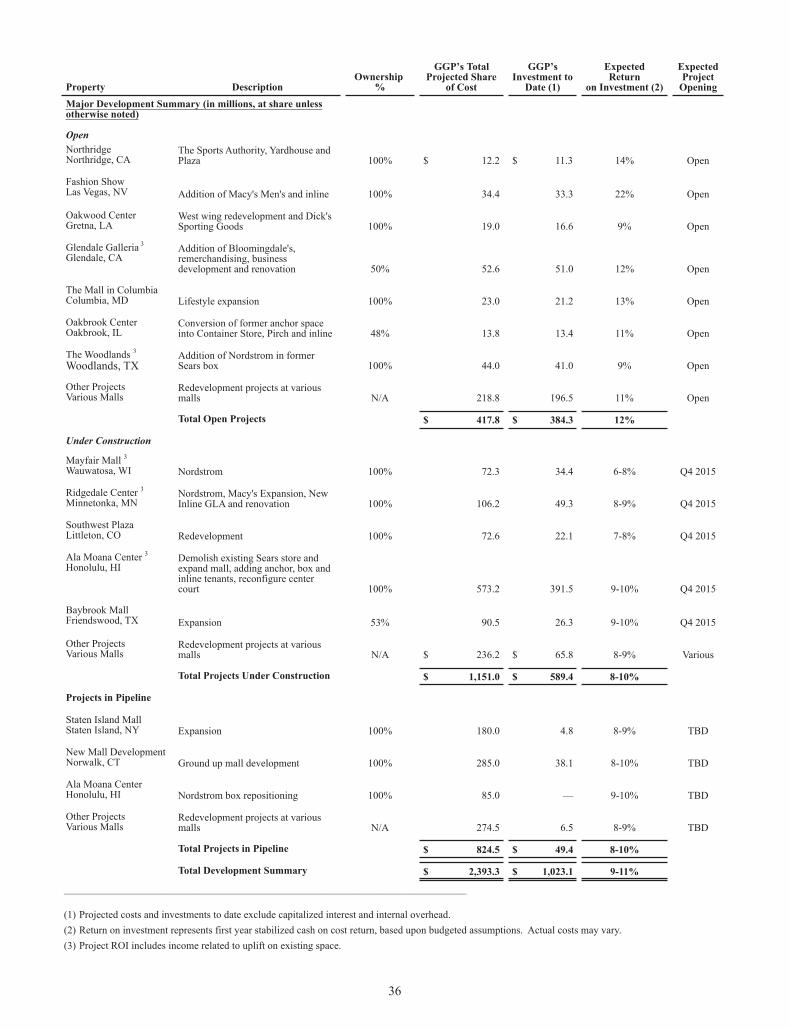
D E V E LO P M E NT S
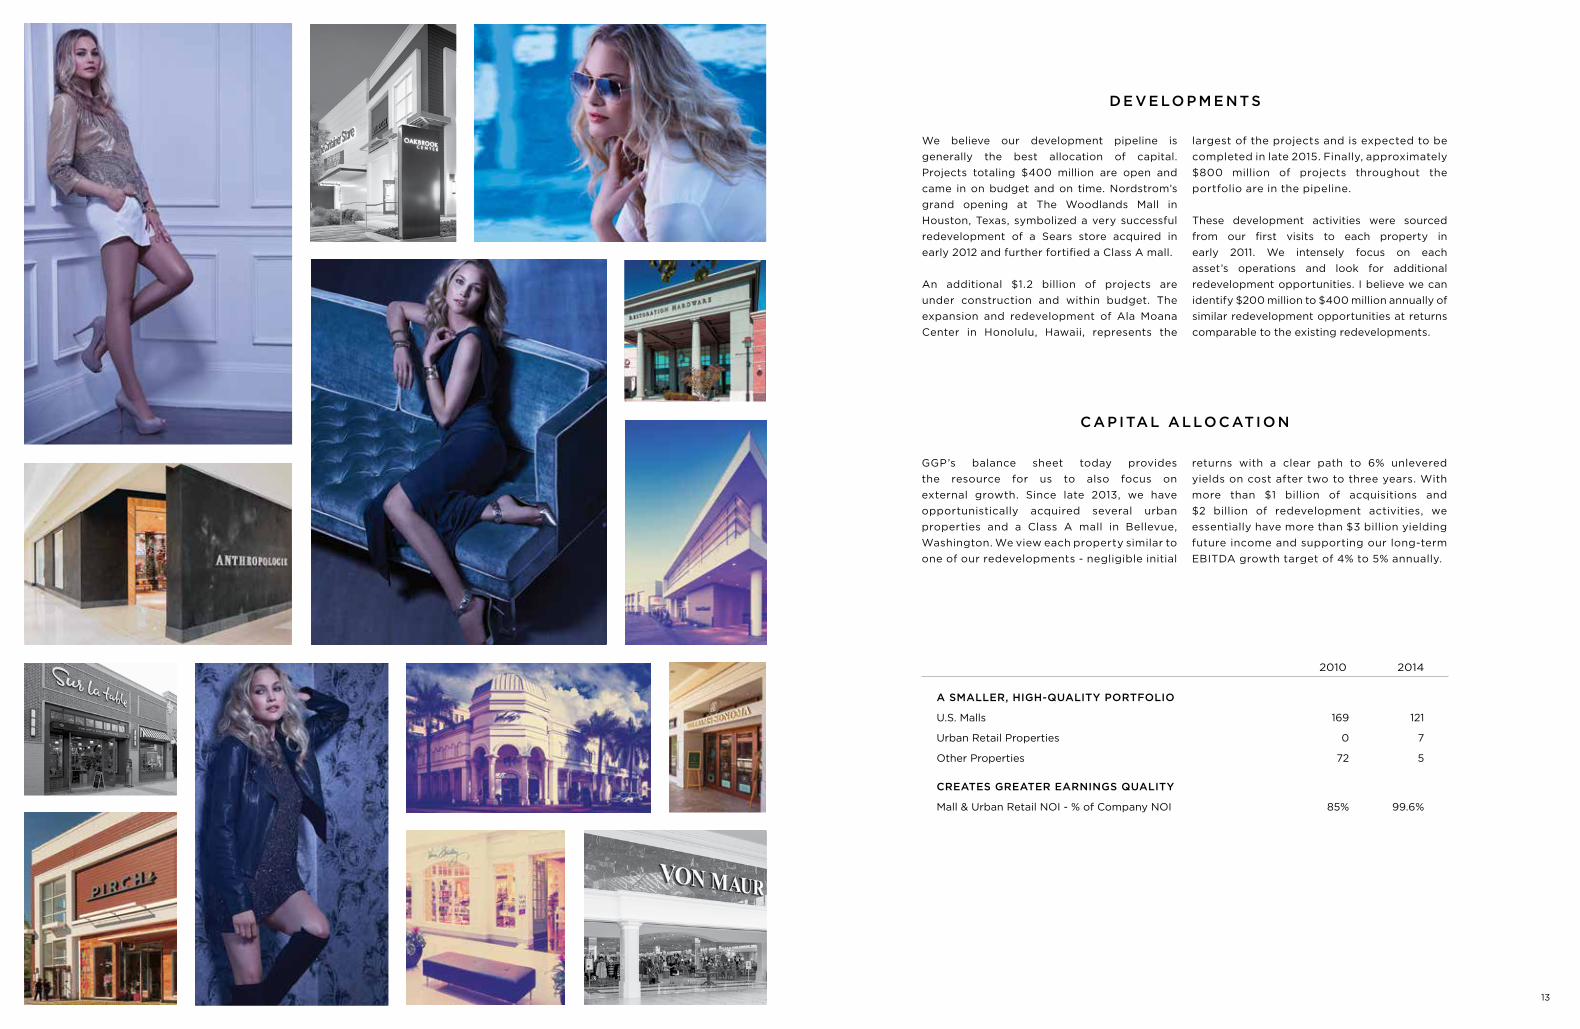
We believe our development pipeline is generally the best allocation of capital. Projects totaling $400 million are open and came in on budget and on time. Nordstrom’s grand opening at The Woodlands Mall in Houston, Texas, symbolized a very successful redevelopment of a Sears store acquired in early 2012 and further fortified a Class A mall.
An additional $1.2 billion of projects are under construction and within budget. The expansion and redevelopment of Ala Moana Center in Honolulu, Hawaii, represents the
largest of the projects and is expected to be completed in late 2015. Finally, approximately $800 million of projects throughout the portfolio are in the pipeline.
These development activities were sourced from our first visits to each property in early 2011. We intensely focus on each asset’s operations and look for additional redevelopment opportunities. I believe we can identify $200 million to $400 million annually of similar redevelopment opportunities at returns comparable to the existing redevelopments.
C A P ITA L A LLO C ATI O N
GGP’s balance sheet today provides the resource for us to also focus on external growth. Since late 2013, we have opportunistically acquired several urban properties and a Class A mall in Bellevue, Washington. We view each property similar to one of our redevelopments - negligible initial
returns with a clear path to 6% unlevered yields on cost after two to three years. With more than $1 billion of acquisitions and $2 billion of redevelopment activities, we essentially have more than $3 billion yielding future income and supporting our long-term EBITDA growth target of 4% to 5% annually.
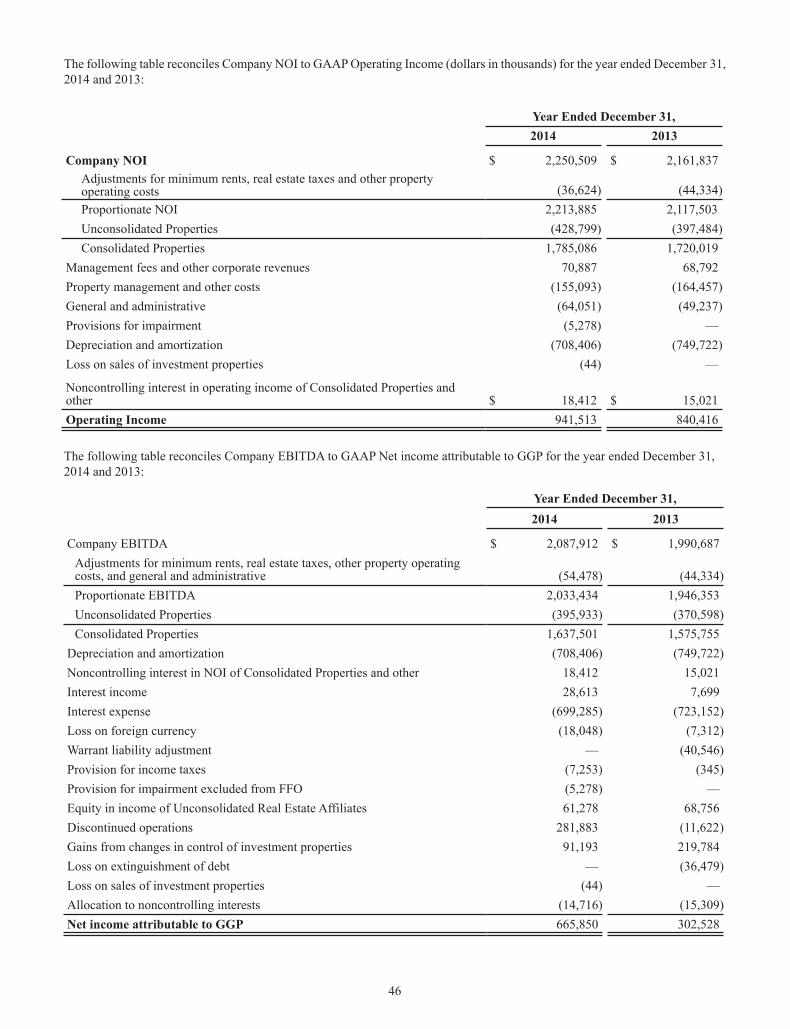
A SMALLER, HIGH-QUALITY PORTFOLIO
U.S. Malls
Urban Retail Properties
Other Properties
CREATES GREATER EARNINGS QUALITY
Mall & Urban Retail NOI - % of Company NOI
169
0
72
85%
121
7
5
99.6%
2010 2014
15
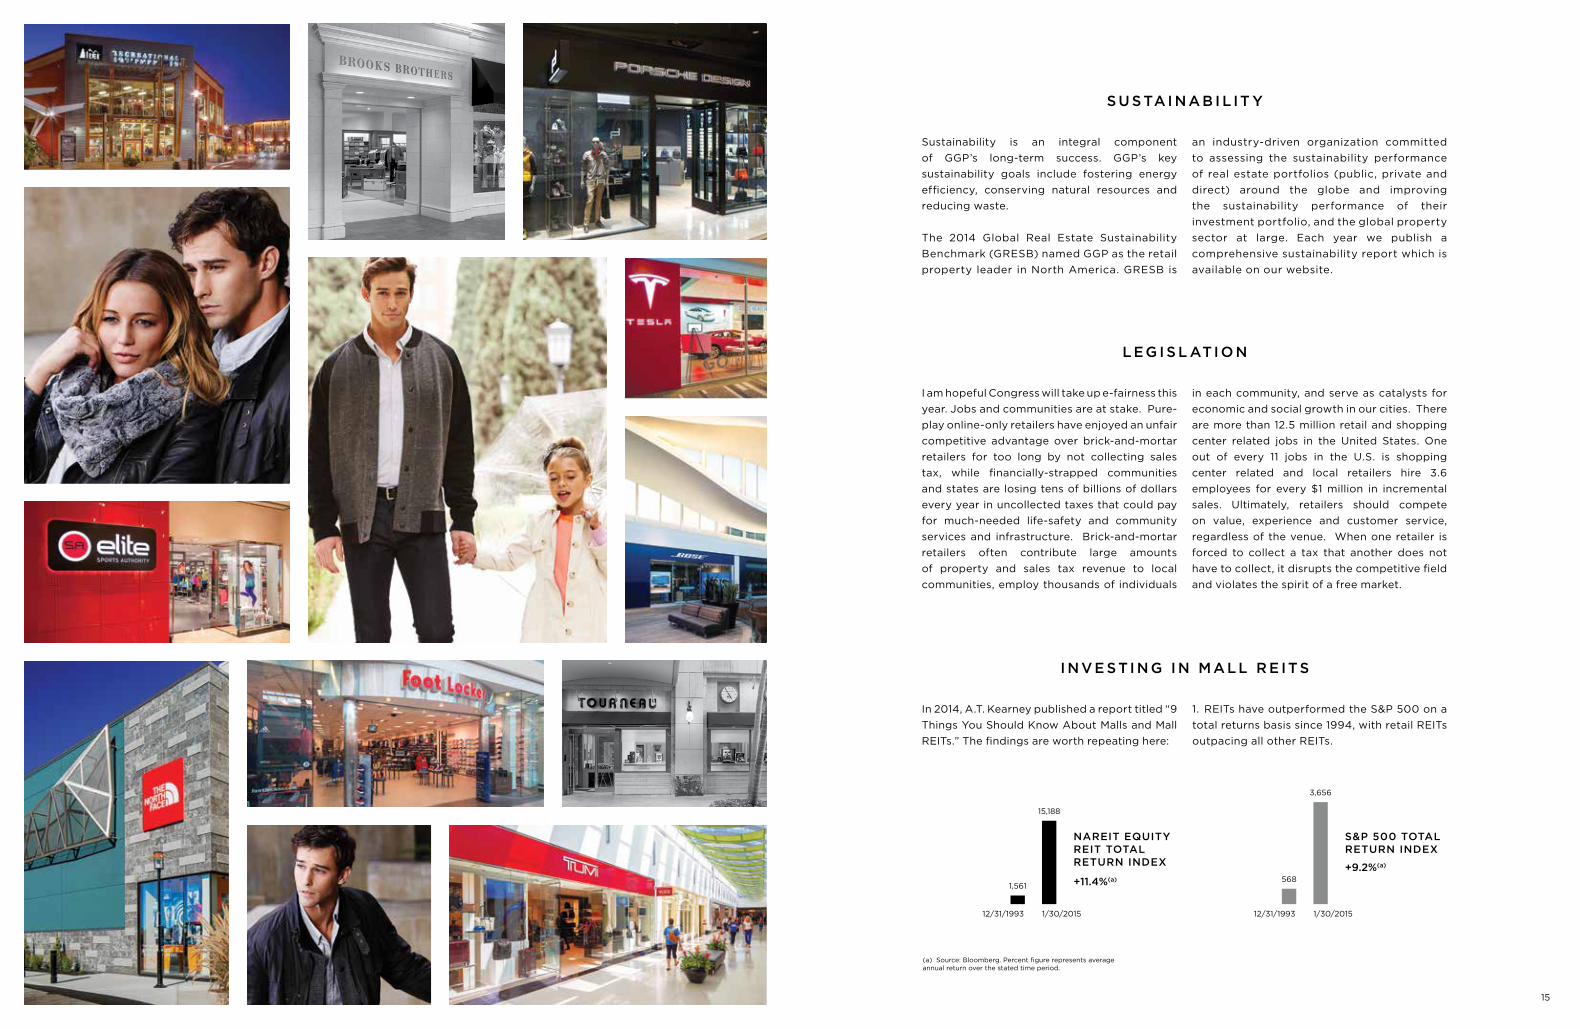
S U S TA I N A B I L IT Y
Sustainability is an integral component of GGP’s long-term success. GGP’s key sustainability goals include fostering energy efficiency, conserving natural resources and reducing waste.
The 2014 Global Real Estate Sustainability Benchmark (GRESB) named GGP as the retail property leader in North America. GRESB is
an industry-driven organization committed to assessing the sustainability performance of real estate portfolios (public, private and direct) around the globe and improving the sustainability performance of their investment portfolio, and the global property sector at large. Each year we publish a comprehensive sustainability report which is available on our website.
LEG I S L ATI O N
I am hopeful Congress will take up e-fairness this year. Jobs and communities are at stake. Pure-play online-only retailers have enjoyed an unfair competitive advantage over brick-and-mortar retailers for too long by not collecting sales tax, while financially-strapped communities and states are losing tens of billions of dollars every year in uncollected taxes that could pay for much-needed life-safety and community services and infrastructure. Brick-and-mortar retailers often contribute large amounts of property and sales tax revenue to local communities, employ thousands of individuals
in each community, and serve as catalysts for economic and social growth in our cities. There are more than 12.5 million retail and shopping center related jobs in the United States. One out of every 11 jobs in the U.S. is shopping center related and local retailers hire 3.6 employees for every $1 million in incremental sales. Ultimately, retailers should compete on value, experience and customer service, regardless of the venue. When one retailer is forced to collect a tax that another does not have to collect, it disrupts the competitive field and violates the spirit of a free market.
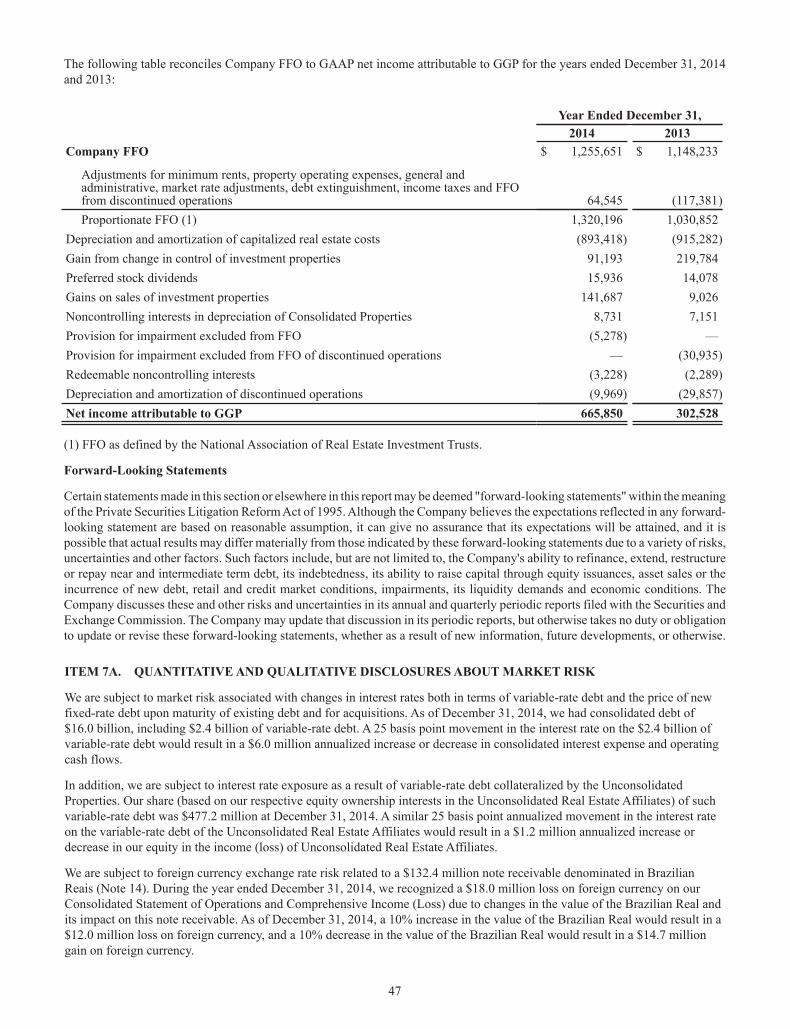
I N V E S TI N G I N M A LL R E IT S
In 2014, A.T. Kearney published a report titled “9 Things You Should Know About Malls and Mall REITs.” The findings are worth repeating here:
1. REITs have outperformed the S&P 500 on a total returns basis since 1994, with retail REITs outpacing all other REITs.
12/31/1993 1/30/2015
1,561
NAREIT EQUITY REIT TOTAL RETURN INDEX
568
15,188
3,656
S&P 500 TOTAL RETURN INDEX
+11.4%(a)
+9.2%(a)
(a) Source: Bloomberg. Percent figure represents average annual return over the stated time period.
12/31/1993 1/30/2015
17
Sandeep MathraniChief Executive Officer
Sincerely,
2. Mall REITs have displayed stability in dividends and cash-flow growth, with mall REIT adjusted funds from operations (AFFO) outgrowing S&P earnings by 40% over the past 10 years.
3. REITs have generated mostly positive returns during rising interest rate periods over the past 20 years. Mall REITs have also deleveraged since 2008 and have a laddered maturity debt schedule, better positioning them for future rising rates.
4. REITs are not correlated to the S&P 500 over the long run, making them potential candidates for investors with investment criteria that include broad diversification among asset classes.
5. Leasing supply and demand dynamics in the next few years are favorable for regional malls.
6. Digital is not a challenge, but an opportunity to supplement the stores to better engage today’s connected shoppers who prefer to interact with retailers through multiple channels.
7. Mall REITs are driven more by long-term discretionary consumer spending than the short-term performance volatility of retailers.
8. Faltering retailers are not new for mall REITs (for example, Montgomery Ward, JCP, Sears, Mervyns, W.T. Grant, Phar-Mor, and Jacobson Stores, among others). Malls have been able to adapt in the past by releasing vacated space and they continue to do so.
9. Published shopper traffic numbers may not truly represent the overall shopping activity that is occurring at malls.
CO N C LU S I O N
The GGP team of 1,800 people from Hawaii to Maine has embraced our mission of owning and operating best-in-class retail properties that provide an outstanding environment and experience for our communities, retailers, employees, consumers and shareholders. Achieving our mission is possible through the
commitment and belief from each of my GGP colleagues of our core values.
I thank each and every one of my colleagues for a fantastic 2014 and the bar is set high for us in 2015. Our results could not have been achieved if the team was not one.
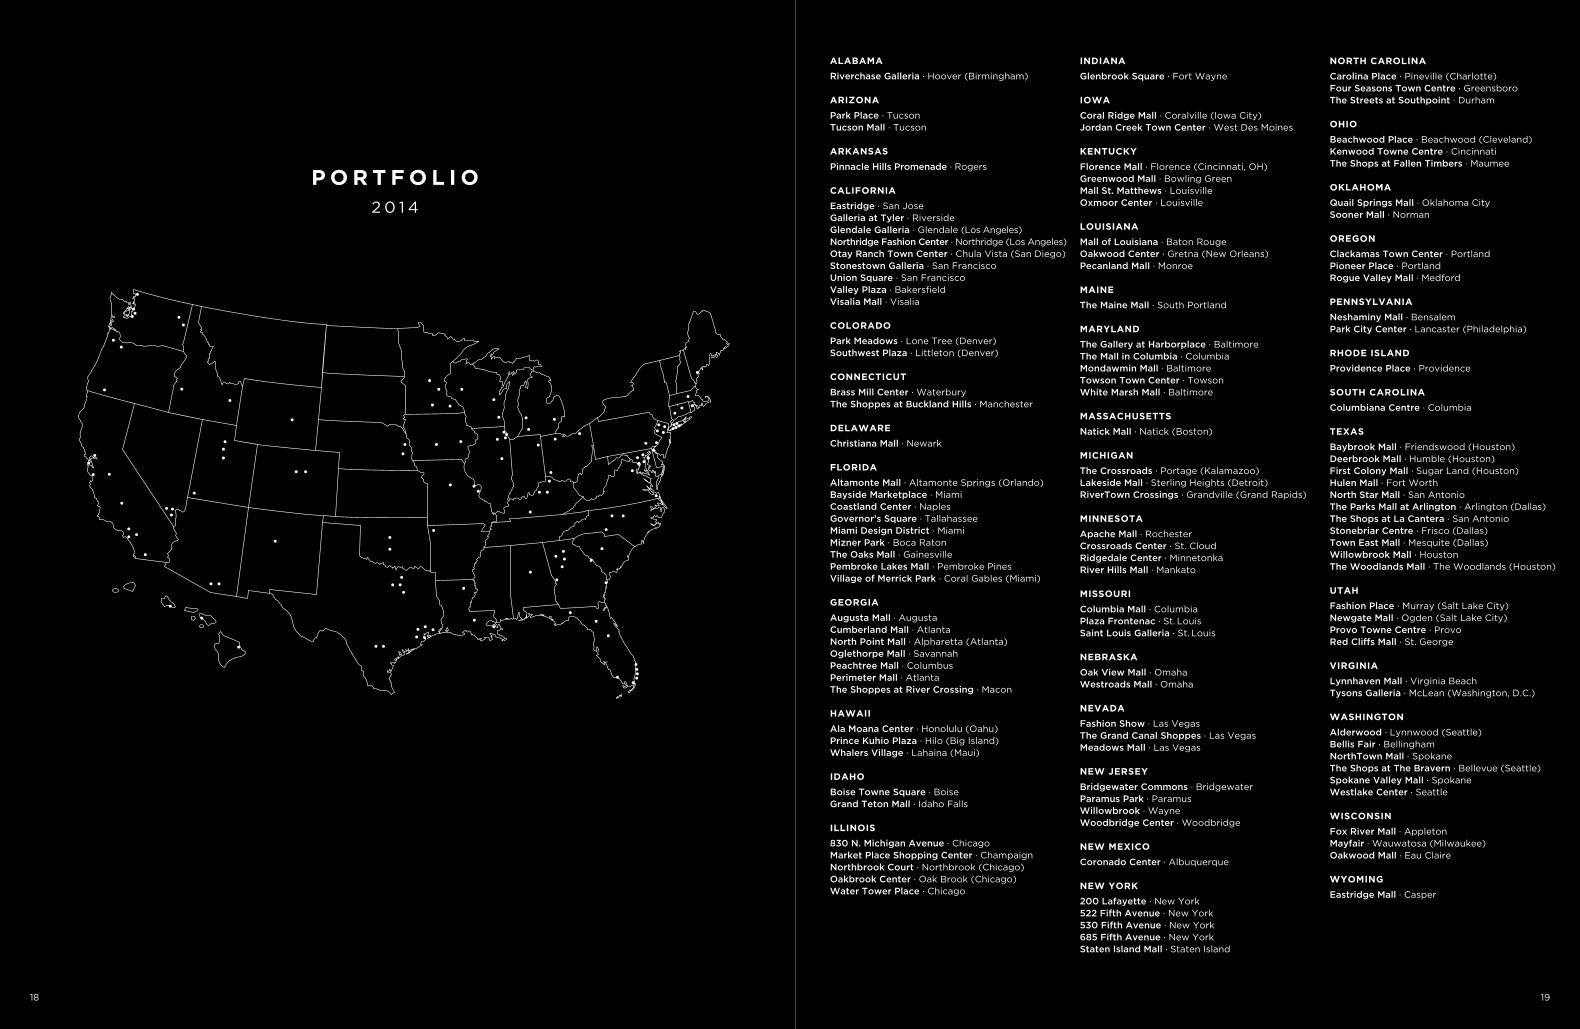
ALABAMA
Riverchase Galleria · Hoover (Birmingham)
ARIZONA
Park Place · TucsonTucson Mall · Tucson
ARKANSAS
Pinnacle Hills Promenade · Rogers
CALIFORNIA
Eastridge · San JoseGalleria at Tyler · RiversideGlendale Galleria · Glendale (Los Angeles)Northridge Fashion Center · Northridge (Los Angeles)Otay Ranch Town Center · Chula Vista (San Diego) Stonestown Galleria · San FranciscoUnion Square · San Francisco Valley Plaza · BakersfieldVisalia Mall · Visalia
COLORADO
Park Meadows · Lone Tree (Denver)Southwest Plaza · Littleton (Denver)
CONNECTICUT
Brass Mill Center · WaterburyThe Shoppes at Buckland Hills · Manchester
DELAWARE
Christiana Mall · Newark
FLORIDA
Altamonte Mall · Altamonte Springs (Orlando)Bayside Marketplace · MiamiCoastland Center · NaplesGovernor’s Square · TallahasseeMiami Design District · MiamiMizner Park · Boca RatonThe Oaks Mall · GainesvillePembroke Lakes Mall · Pembroke Pines Village of Merrick Park · Coral Gables (Miami)
GEORGIA
Augusta Mall · AugustaCumberland Mall · AtlantaNorth Point Mall · Alpharetta (Atlanta)Oglethorpe Mall · SavannahPeachtree Mall · ColumbusPerimeter Mall · Atlanta The Shoppes at River Crossing · Macon
HAWAII
Ala Moana Center · Honolulu (Oahu)Prince Kuhio Plaza · Hilo (Big Island)Whalers Village · Lahaina (Maui)
IDAHO
Boise Towne Square · BoiseGrand Teton Mall · Idaho Falls
ILLINOIS
830 N. Michigan Avenue · ChicagoMarket Place Shopping Center · ChampaignNorthbrook Court · Northbrook (Chicago)Oakbrook Center · Oak Brook (Chicago) Water Tower Place · Chicago
INDIANA
Glenbrook Square · Fort Wayne
IOWA
Coral Ridge Mall · Coralville (Iowa City)Jordan Creek Town Center · West Des Moines
KENTUCKY
Florence Mall · Florence (Cincinnati, OH)Greenwood Mall · Bowling GreenMall St. Matthews · LouisvilleOxmoor Center · Louisville
LOUISIANA
Mall of Louisiana · Baton RougeOakwood Center · Gretna (New Orleans)Pecanland Mall · Monroe
MAINE
The Maine Mall · South Portland
MARYLAND
The Gallery at Harborplace · Baltimore The Mall in Columbia · ColumbiaMondawmin Mall · BaltimoreTowson Town Center · TowsonWhite Marsh Mall · Baltimore
MASSACHUSETTS
Natick Mall · Natick (Boston)
MICHIGAN
The Crossroads · Portage (Kalamazoo)Lakeside Mall · Sterling Heights (Detroit)RiverTown Crossings · Grandville (Grand Rapids)
MINNESOTA
Apache Mall · RochesterCrossroads Center · St. CloudRidgedale Center · MinnetonkaRiver Hills Mall · Mankato
MISSOURI
Columbia Mall · ColumbiaPlaza Frontenac · St. LouisSaint Louis Galleria · St. Louis
NEBRASKA
Oak View Mall · OmahaWestroads Mall · Omaha
NEVADA
Fashion Show · Las VegasThe Grand Canal Shoppes · Las VegasMeadows Mall · Las Vegas
NEW JERSEY
Bridgewater Commons · BridgewaterParamus Park · ParamusWillowbrook · WayneWoodbridge Center · Woodbridge
NEW MEXICO
Coronado Center · Albuquerque
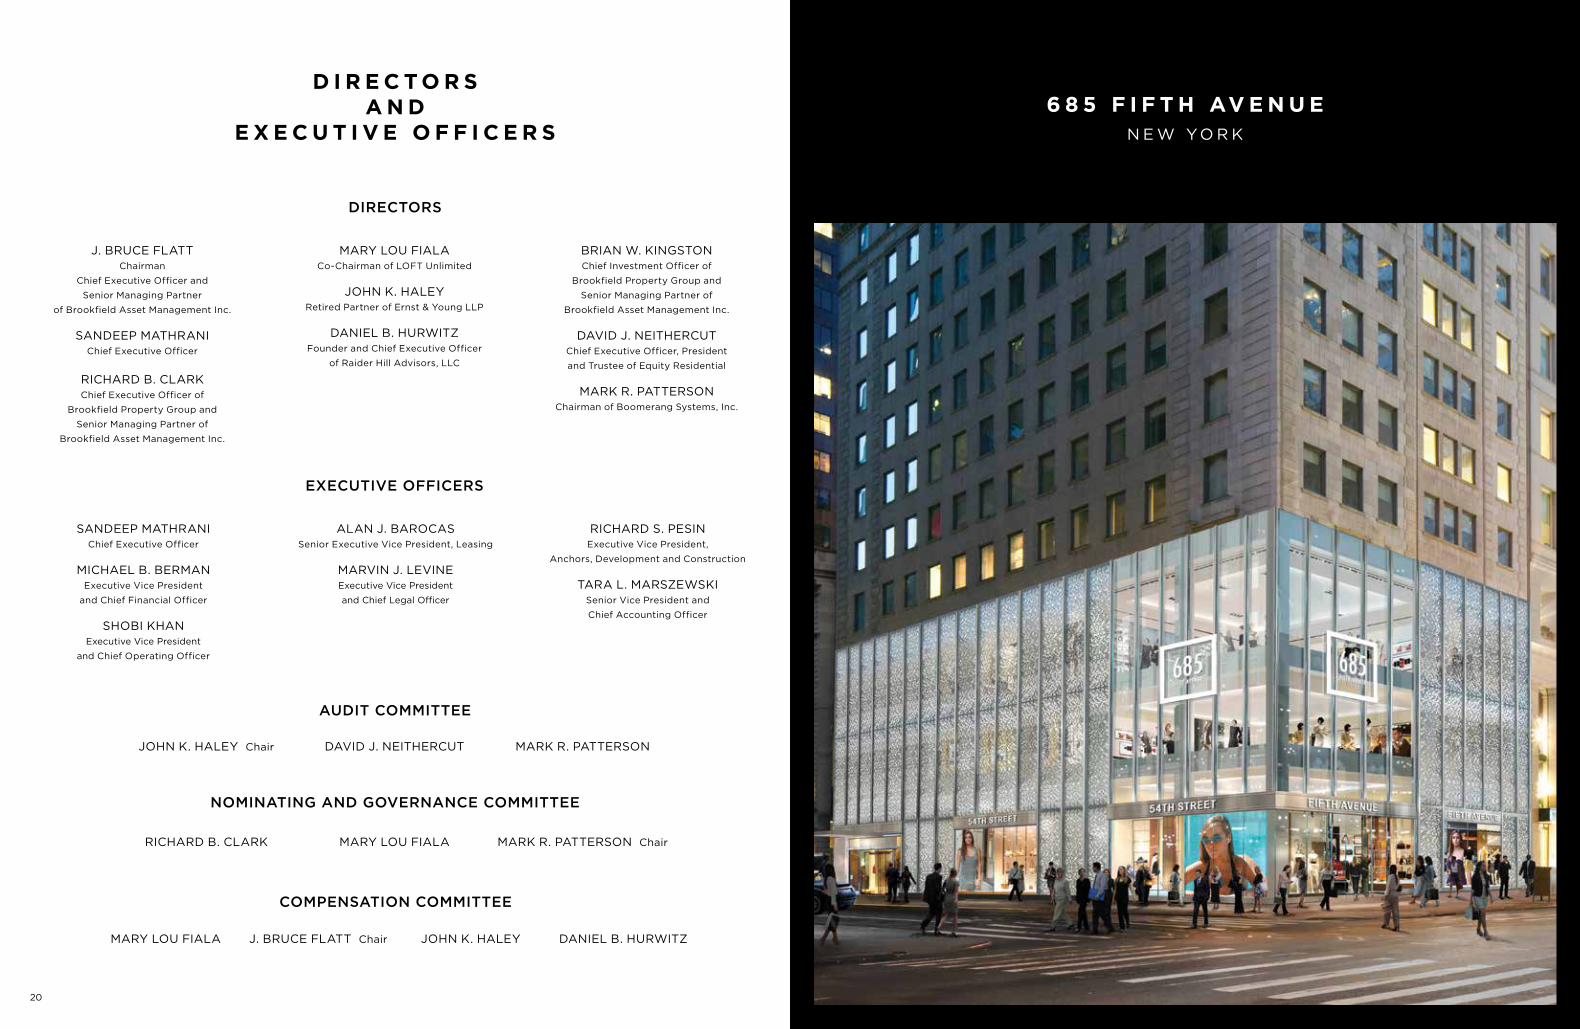
NEW YORK
200 Lafayette · New York522 Fifth Avenue · New York530 Fifth Avenue · New York685 Fifth Avenue · New YorkStaten Island Mall · Staten Island
NORTH CAROLINA
Carolina Place · Pineville (Charlotte)Four Seasons Town Centre · GreensboroThe Streets at Southpoint · Durham
OHIO
Beachwood Place · Beachwood (Cleveland)Kenwood Towne Centre · CincinnatiThe Shops at Fallen Timbers · Maumee
OKLAHOMA
Quail Springs Mall · Oklahoma CitySooner Mall · Norman
OREGON
Clackamas Town Center · PortlandPioneer Place · PortlandRogue Valley Mall · Medford
PENNSYLVANIA
Neshaminy Mall · BensalemPark City Center · Lancaster (Philadelphia)
RHODE ISLAND
Providence Place · Providence
SOUTH CAROLINA
Columbiana Centre · Columbia
TEXAS
Baybrook Mall · Friendswood (Houston)Deerbrook Mall · Humble (Houston)First Colony Mall · Sugar Land (Houston)Hulen Mall · Fort WorthNorth Star Mall · San AntonioThe Parks Mall at Arlington · Arlington (Dallas)The Shops at La Cantera · San AntonioStonebriar Centre · Frisco (Dallas)Town East Mall · Mesquite (Dallas)Willowbrook Mall · HoustonThe Woodlands Mall · The Woodlands (Houston)
UTAH
Fashion Place · Murray (Salt Lake City)Newgate Mall · Ogden (Salt Lake City)Provo Towne Centre · ProvoRed Cliffs Mall · St. George
VIRGINIA
Lynnhaven Mall · Virginia BeachTysons Galleria · McLean (Washington, D.C.)
WASHINGTON
Alderwood · Lynnwood (Seattle)Bellis Fair · BellinghamNorthTown Mall · SpokaneThe Shops at The Bravern · Bellevue (Seattle)Spokane Valley Mall · SpokaneWestlake Center · Seattle
WISCONSIN
Fox River Mall · AppletonMayfair · Wauwatosa (Milwaukee)Oakwood Mall · Eau Claire
WYOMING
Eastridge Mall · Casper
P O R T F O L I O
2 0 1 4
18 19
21 20
w
D I R E C T O R S A N D
E X E C U T I V E O F F I C E R S
J. BRUCE FLATT Chairman
Chief Executive Officer and
Senior Managing Partner
of Brookfield Asset Management Inc.
SANDEEP MATHRANI Chief Executive Officer
RICHARD B. CLARK
Chief Executive Officer of
Brookfield Property Group and
Senior Managing Partner of
Brookfield Asset Management Inc.
MARY LOU FIALA
Co-Chairman of LOFT Unlimited
JOHN K. HALEY
Retired Partner of Ernst & Young LLP
DANIEL B. HURWITZ
Founder and Chief Executive Officer
of Raider Hill Advisors, LLC
BRIAN W. KINGSTON
Chief Investment Officer of
Brookfield Property Group and
Senior Managing Partner of
Brookfield Asset Management Inc.
DAVID J. NEITHERCUT Chief Executive Officer, President
and Trustee of Equity Residential
MARK R. PATTERSON
Chairman of Boomerang Systems, Inc.
DIRECTORS
SANDEEP MATHRANI Chief Executive Officer
MICHAEL B. BERMAN
Executive Vice President
and Chief Financial Officer
SHOBI KHAN
Executive Vice President
and Chief Operating Officer
ALAN J. BAROCAS
Senior Executive Vice President, Leasing
MARVIN J. LEVINE Executive Vice President
and Chief Legal Officer
RICHARD S. PESIN
Executive Vice President,
Anchors, Development and Construction
TARA L. MARSZEWSKI Senior Vice President and
Chief Accounting Officer
EXECUTIVE OFFICERS
JOHN K. HALEY Chair DAVID J. NEITHERCUT MARK R. PATTERSON
AUDIT COMMITTEE
COMPENSATION COMMITTEE
MARY LOU FIALA J. BRUCE FLATT Chair JOHN K. HALEY DANIEL B. HURWITZ
NOMINATING AND GOVERNANCE COMMITTEE
RICHARD B. CLARK MARY LOU FIALA MARK R. PATTERSON Chair
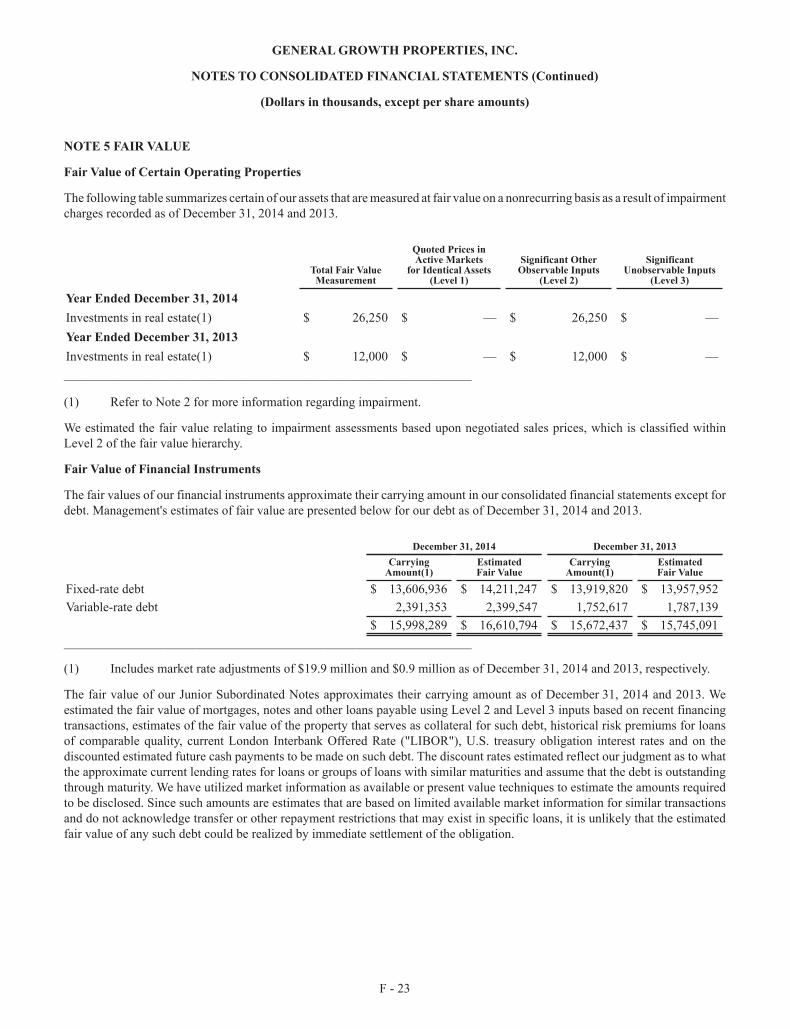
6 8 5 F I F T H AV E N U E N E W YO R K

22
CORPORATE OFFICE
General Growth Properties, Inc.110 N. Wacker Drive Chicago, IL 60606
(312) 960-5000www.ggp.com
INVESTOR RELATIONS
Kevin Berry, Vice [email protected]
(312) 960-5529
REGISTRAR AND TRANSFER AGENT AND SHAREHOLDER SERVICES DEPARTMENT
American Stock Transfer & Trust Company, LLC 6201 15th Avenue
Brooklyn, NY 11219 Phone: (866) 627-2643
TTY number: (866) 627-2643 Foreign Investor Line: (718) 921-8124
Email: [email protected]
INDEPENDENT REGISTERED PUBLIC ACCOUNTING FIRM
Deloitte & Touche LLP Chicago, Illinois
C O R P O R AT E I N F O R M AT I O N
HIGH PERFORMANCE
ATTITUDE
DO THE RIGHT THING
TOGETHER
OWN IT
C O R E VA L U E S