Embed Size (px)
Citation preview

Level 10 Export House22 Pitt Street SydneyNSW 2000 AustraliaT: +61 2 8273 5333
1800 093 724www.efic.gov.au
Ef ic A N N U A L R E P O R T
2017–2018
EFIC ANN
UAL REPO
RT 2017–2018

Data in this report may not sum due to rounding.
Requests for more information and enquiries should be addressed to:
Head of External Relations Level 10 Export House 22 Pitt Street Sydney NSW 2000
Telephone: +61 2 8273 5333 Email: [email protected]
© Efic 2018
All material presented in this document is provided under a Creative Commons Attribution 3.0 Australia (www.creativecommons.org/licenses/by/3.0/au) licence. To the extent that copyright subsists in a third party, permission will be required from the third party to reuse the material.
The document must be attributed as the Efic Annual Report 2017-2018.
Material used ‘as supplied’
Provided you have not modified or transformed the material in any way (including, for example, by changing the text; calculating percentage changes; graphing or charting data; or deriving new statistics from published statistics), Efic prefers the following attribution: Source: Efic.
Accessing this report online
An online version of this report is available on the Efic website www.efic.gov.au/annualreport


2 EFIC ANNUAL REPORT 2017–2018
WE WANT TO BE PART OF
AUSTRALIA’S EXPORT SUCCESS STORIES
The small, medium and large, the innovative and the everyday.
Our team works passionately to help Australian businesses finance their success. We share their ambitions, their
hopes and their visions.
Knowing that those who aspire to grow their business internationally are taking a huge leap,
we do our best to support them.
We find answers to problems, rather than reasons not to help. And we tailor delivery of our
finance solutions for each business and their specific deals.
All while providing expert guidance, support and connections they cannot find anywhere else.
We are driven by a genuine desire to help Australia’s best businesses promote Australia’s top products and
services to the world.
We are EficAnd we’re ready to provide the finance power
that Australian exporters need.

3
Efic at a glance 4
Highlights for 2017–18 10
Transaction highlights for 2017–18 12
Letter from the Chairman and Managing Director & CEO 14
Annual Performance Statement 19
Our clients 25
Our governing principles 28
Our risk management framework 51
Our Treasury 55
Table of facilities 58
Ten-year summary 82
Financial statements 85
Index of statutory reporting requirements 150
Abbreviations and acronyms 153
Company details 154
Contents

4 EFIC ANNUAL REPORT 2017–2018
Efic at a glance
The Export Finance and Insurance Corporation (Efic) is the Australian Government’s export credit agency. We were established under the Export Finance and Insurance Corporation Act 1991 (Efic Act) and are defined as a corporate Commonwealth entity under the Public Governance, Performance and Accountability Act 2013 (PGPA Act). Efic is part of the Department of Foreign Affairs and Trade (DFAT) portfolio of agencies, and reports to the Minister for Trade, Tourism and Investment (the Minister).
OUR PURPOSE Financing Australian businesses to take on the world.
OUR VISION To be Australia’s most innovative finance partner for international business success.
WHAT WE DOWe help build Australia’s export trade by providing Australian businesses with finance solutions to support their export growth.
We do this by:
working with banks and other financial institutions to provide financing support for export businesses
providing export finance solutions when the private market cannot
collaborating with Government agencies to promote our expertise and finance solutions.
We operate on a commercial basis. Our loans, guarantees, bonds and insurance products help Australian businesses:
secure export-related contracts in new markets
expand internationally
win export supply chain contracts
deliver on large offshore corporate or sovereign projects with significant Australian content.
We provide support to small, medium and large businesses across a range of industries – from manufacturing and defence to fashion and resources. This enables businesses to take on export opportunities that may not have been otherwise possible.
EXPORT CREDIT AGENCIES EXPLAINEDMost advanced countries worldwide have government-mandated export credit agencies (ECAs). Their purpose is to support and enable export trade for their country. Generally, ECAs provide government-backed finance solutions to businesses to help them grow exports.
Each export credit agency is given a mandate by its government outlining what support they are able to provide. This can include direct loans, guarantees and bonds, insurance products, and project and buyer finance.
The Berne Union is the leading global association for export credit agencies. Each year, the Berne Union holds meetings providing a forum for ECAs to learn from their peers and discuss future trends in export financing and global trade.
ECAs can also work together to provide finance solutions on large projects that involve their respective countries.

EFIC AT A GLANCE 5
EFIC AT A GLANCE
HOW WE FINANCE CUSTOMERSWe help customers with finance solutions which may involve:
LoansWe provide loans to Australian exporters to support export contracts, or to overseas buyers of Australian goods and services.
BondsWe offer bonds to help Australian companies with their security obligations under overseas contracts.
GuaranteesWe issue guarantees to an Australian exporter’s bank if the business cannot provide further security and the bank won’t extend additional finance.
InsuranceWe protect Australian exporters against the possibility of non-payment due to certain commercial and political risks.
We deliver our support in one of two ways – through our Commercial Account and/or the National Interest Account (see below).
Commercial Account Under the Commercial Account, Efic carries all risks as a corporate Commonwealth entity.
The Board is responsible for setting the strategy, risk appetite and risk tolerances.
We retain all margins and fees, and bear all risks and losses.
National Interest AccountUnder the National Interest Account, the Minister can direct Efic to support transactions that are in the national interest.
We can also refer transactions to the Minister for consideration. This might be due to the transaction’s size or the tenor of the transaction; or significant exposures to the country of export.
The Commonwealth receives all income on National Interest Account transactions. It also bears all risks and losses.
WHERE WE OPERATEWe are a national organisation with an on-the-ground presence across the country. This means that we can offer Australian exporters access to an influential network of businesses, financial stakeholders, partner associations and Government agencies – helping them achieve their global ambitions.
We are headquartered in Sydney, and we have employees located in Austrade’s interstate offices in Adelaide, Brisbane, Melbourne and Perth. Our Victorian and Queensland offices support exporters in Tasmania and the Northern Territory respectively.

6 EFIC ANNUAL REPORT 2017–2018
HOW WE BENEFIT AUSTRALIAOur activities add to the nation’s gross domestic product (GDP), boost people’s incomes and support local employment. Enabling Australian businesses to expand also stimulates companies in their supply chains. For example, a wine exporter might require additional domestic accounting services, irrigation equipment and glass bottles in its production processes. Determining the additional value created involves calculating these positive flow-on effects, which are offset against any increase in imports.
How we measure our impact:
In 2017-18 Efic’s facilities:
Supported
A$1.39bof export contracts
39%increase from last year
Contributed
A$1.15bof Australia’s GDP
41%increase from last year
Supported
7,600jobs in Australia
35%increase from last year
Export orders
Positive flow-on effects for Australian suppliers that feed into exports
+
Indirect effect on employment
Increased sales=
Positive effect on GDP+
Direct effect on employment
EFIC AT A GLANCE 7
EFIC AT A GLANCE
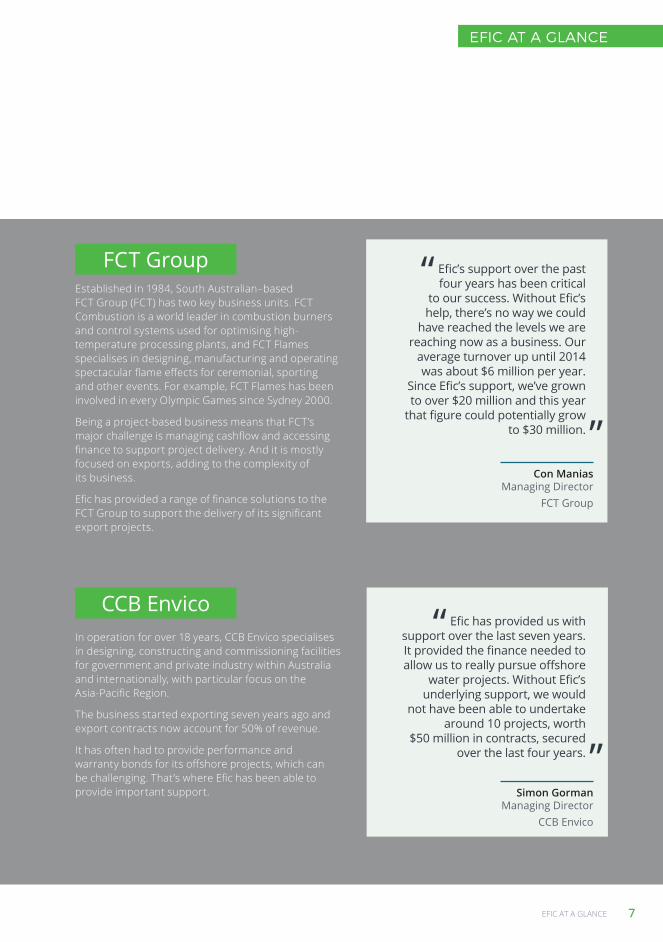
Established in 1984, South Australian–based FCT Group (FCT) has two key business units. FCT Combustion is a world leader in combustion burners and control systems used for optimising high-temperature processing plants, and FCT Flames specialises in designing, manufacturing and operating spectacular flame effects for ceremonial, sporting and other events. For example, FCT Flames has been involved in every Olympic Games since Sydney 2000.
Being a project-based business means that FCT’s major challenge is managing cashflow and accessing finance to support project delivery. And it is mostly focused on exports, adding to the complexity of its business.
Efic has provided a range of finance solutions to the FCT Group to support the delivery of its significant export projects.
In operation for over 18 years, CCB Envico specialises in designing, constructing and commissioning facilities for government and private industry within Australia and internationally, with particular focus on the Asia-Pacific Region.
The business started exporting seven years ago and export contracts now account for 50% of revenue.
It has often had to provide performance and warranty bonds for its offshore projects, which can be challenging. That’s where Efic has been able to provide important support.
FCT Group
CCB Envico
“ Efic’s support over the past four years has been critical
to our success. Without Efic’s help, there’s no way we could
have reached the levels we are reaching now as a business. Our
average turnover up until 2014 was about $6 million per year.
Since Efic’s support, we’ve grown to over $20 million and this year
that figure could potentially grow to $30 million.
“ Efic has provided us with support over the last seven years. It provided the finance needed to allow us to really pursue offshore
water projects. Without Efic’s underlying support, we would
not have been able to undertake around 10 projects, worth
$50 million in contracts, secured over the last four years.
Con Manias Managing Director
FCT Group
Simon Gorman Managing Director
CCB Envico
”
”

8 EFIC ANNUAL REPORT 2017–2018
OUR FUNCTIONSOur relevant functions under the Efic Act:
Facilitate and encourage Australian export trade by providing insurance and financial services and products to persons involved directly or indirectly in such trade.
Encourage banks and other financial institutions carrying on business in Australia to finance or assist in financing export-related transactions.
AN EXPANDING MANDATEMore support to Australian export businessesChanges to the Efic Act in September 2017 allow us to lend directly to more exporters – including tourism operators, online businesses, exporters of intellectual property and businesses engaged in overseas direct investment. We now also support a wider range of export projects, including onshore resource activities and related infrastructure. This change was in response to the growing difficulty resource projects faced when trying to obtain private market finance.
Working with our partnersWe continue to build partnerships with key industry groups and organisations, to align our finance offering with the export sector opportunities in each State and Territory, and to build awareness of our solutions. We engage with local industry, trade and export associations through events, marketing activities and seminars. This includes working with the Export Council of Australia, Austrade, Wine Australia, the Australian Tourism Export Council, DFAT and Tourism Australia.
Defence Export FacilityEfic has a long history of successfully providing financial support for Australian defence exports; however, there are limits to our ability to finance these exports. This may occur where a transaction is too large for Efic’s balance sheet, or we might already have significant exposures to a country or entity that prevent us from financing an otherwise commercially acceptable transaction.
The Government has established a 10-year A$3.8 billion Defence Export Facility, which enables Efic to refer applications for defence export finance to the National Interest Account if we are unable to use the Commercial Account. The facility amount is an upper limit for referrals, not additional funding for Efic.
Supporting the whole of GovernmentAs part of the Government’s broader Foreign Policy White Paper, we will continue to assist Australian businesses – including small and medium-sized enterprises (SMEs) – to access international markets through finance solutions, to support exports and investment overseas.
We also offer expertise to other Commonwealth entities and companies as a result of enhanced powers and other changes to the Efic Act.
This has included providing finance expertise and back-office assistance to the Northern Australia Infrastructure Facility (NAIF), and helping States and Territories involved with NAIF. We also support the Indigenous Entrepreneurs Capital Scheme (IECS) and the National Housing Finance and Investment Corporation (NHFIC), complementing their activities through service-level agreements.
Each Commonwealth entity we support is independent of Efic and is responsible for its own governance arrangements.
We work closely with DFAT, Austrade and other Government departments and agencies to provide expert insights and advice on export trade and finance. This is to ensure that Australian exporters receive benefits derived from every aspect of Government possible.
EFIC AT A GLANCE 9
EFIC AT A GLANCE
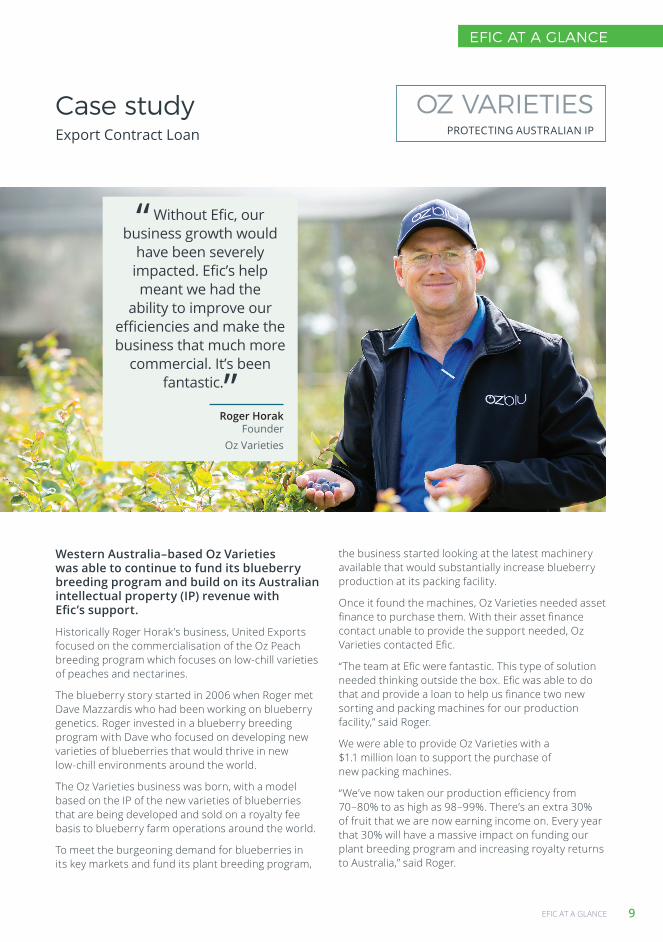
Case studyExport Contract Loan
OZ VARIETIESPROTECTING AUSTRALIAN IP
“ Without Efic, our business growth would
have been severely impacted. Efic’s help meant we had the
ability to improve our efficiencies and make the business that much more
commercial. It’s been fantastic.”
Roger Horak Founder
Oz Varieties
Western Australia–based Oz Varieties was able to continue to fund its blueberry breeding program and build on its Australian intellectual property (IP) revenue with Efic’s support.
Historically Roger Horak’s business, United Exports focused on the commercialisation of the Oz Peach breeding program which focuses on low-chill varieties of peaches and nectarines.
The blueberry story started in 2006 when Roger met Dave Mazzardis who had been working on blueberry genetics. Roger invested in a blueberry breeding program with Dave who focused on developing new varieties of blueberries that would thrive in new low-chill environments around the world.
The Oz Varieties business was born, with a model based on the IP of the new varieties of blueberries that are being developed and sold on a royalty fee basis to blueberry farm operations around the world.
To meet the burgeoning demand for blueberries in its key markets and fund its plant breeding program,
the business started looking at the latest machinery available that would substantially increase blueberry production at its packing facility.
Once it found the machines, Oz Varieties needed asset finance to purchase them. With their asset finance contact unable to provide the support needed, Oz Varieties contacted Efic.
“The team at Efic were fantastic. This type of solution needed thinking outside the box. Efic was able to do that and provide a loan to help us finance two new sorting and packing machines for our production facility,” said Roger.
We were able to provide Oz Varieties with a $1.1 million loan to support the purchase of new packing machines.
“We’ve now taken our production efficiency from 70–80% to as high as 98–99%. There’s an extra 30% of fruit that we are now earning income on. Every year that 30% will have a massive impact on funding our plant breeding program and increasing royalty returns to Australia,” said Roger.
10 EFIC ANNUAL REPORT 2017–2018
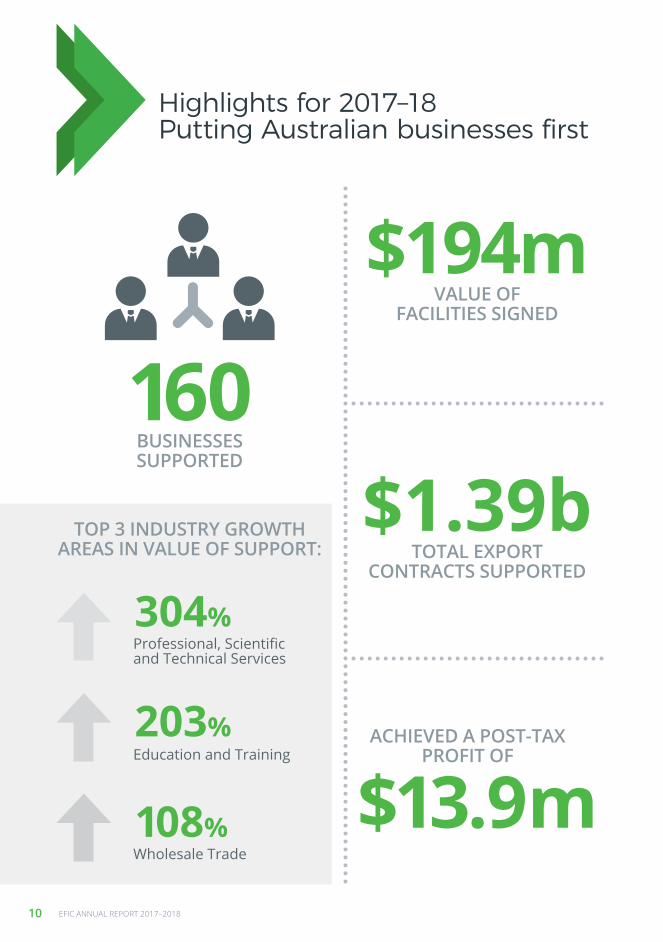
Highlights for 2017–18Putting Australian businesses first
TOP 3 INDUSTRY GROWTH
AREAS IN VALUE OF SUPPORT:
Professional, Scientific and Technical Services
304%
Education and Training203%
108%Wholesale Trade
160BUSINESSESSUPPORTED
ACHIEVED A POST-TAXPROFIT OF
$13.9m
$1.39bTOTAL EXPORT
CONTRACTS SUPPORTED
$194mVALUE OF
FACILITIES SIGNED
HIGHLIGHTS 11
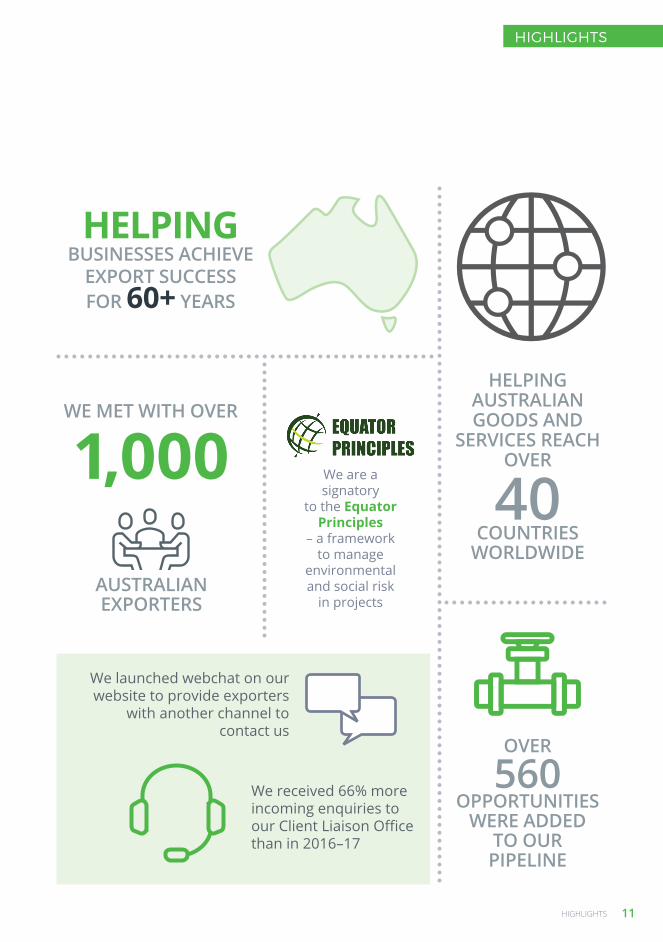
HIGHLIGHTS
1,000WE MET WITH OVER
AUSTRALIAN EXPORTERS
We are a signatory
to the Equator Principles
– a framework to manage
environmental and social risk
in projects
HELPINGBUSINESSES ACHIEVE
EXPORT SUCCESS FOR 60+ YEARS
We received 66% more incoming enquiries to our Client Liaison Office than in 2016–17
We launched webchat on our website to provide exporters
with another channel to contact us
HELPING AUSTRALIAN GOODS AND
SERVICES REACH OVER
40 COUNTRIES
WORLDWIDE
OVER
560 OPPORTUNITIES
WERE ADDED TO OUR PIPELINE
12 EFIC ANNUAL REPORT 2017–2018
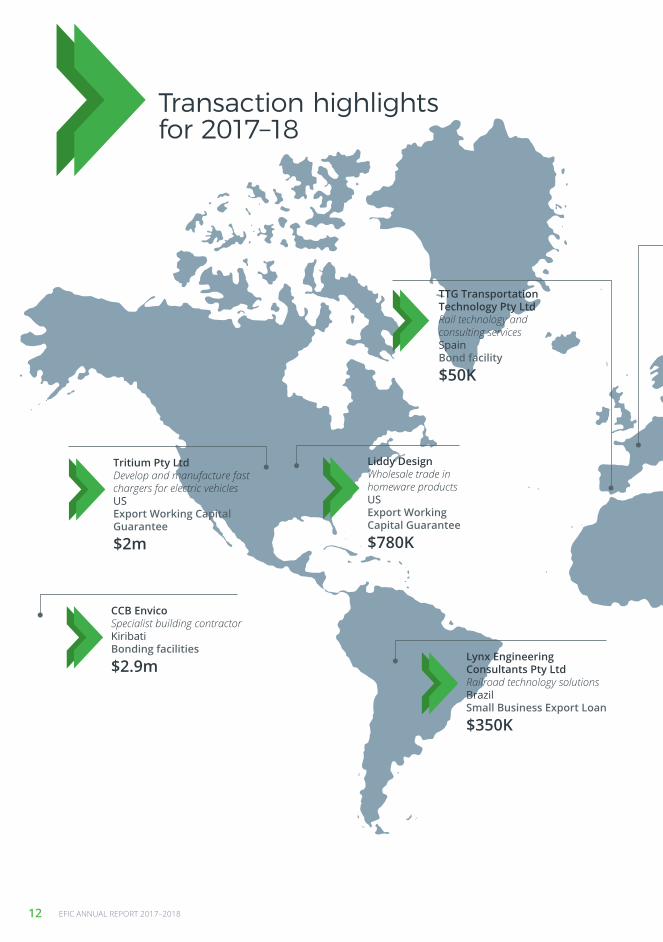
Transaction highlightsfor 2017–18
CCB Envico Specialist building contractor Kiribati Bonding facilities
$2.9m
Tritium Pty Ltd Develop and manufacture fast chargers for electric vehicles US Export Working Capital Guarantee
$2m
TTG Transportation Technology Pty Ltd Rail technology and consulting services Spain Bond facility
$50K
Liddy Design Wholesale trade in homeware products US Export Working Capital Guarantee
$780K
Lynx Engineering Consultants Pty Ltd Railroad technology solutions Brazil Small Business Export Loan
$350K

HIGHLIGHTS
HIGHLIGHTS 13
Gasco Pty Ltd Manufacturer of heat transfer and combustion products Egypt Bonding facilities
$600K
InnovAero Pty Ltd Aeronautical product development and manufacturing Australia (export supply chain) Export Contract Loan
$1.3m
Jet Engineering Manufacturer of custom-built machinery Mongolia Small Business Export Loan
$120K
Byrnecut Offshore Pty Ltd Underground mining contractor Saudi Arabia Direct loan
$9.9m
Status Awareness Systems Pty Ltd Vehicular safety, timing and tracking systems France Export Contract Loan
$650K
SRA International Business software solutions and environmental data management systems Singapore Export Contract Loan
$750K

14 EFIC ANNUAL REPORT 2017–2018
It is our privilege to present the Export Finance and Insurance Corporation (Efic) 2017–18 Annual Report. This report highlights our achievements as Australia’s export credit agency, financing Australian businesses to take on the world.
Our performance over the 2017–18 financial year has been a positive one and has contributed significantly to the activities of Australian exporters and the Australian export economy as a whole.
During the year, we provided $194 million in funding to 160 Australian businesses to help them expand their international operations. We are also proud to have contributed to Australia’s strong export trade growth through our support of around $1.4 billion in export contracts to businesses across a range of industries.
Pleasingly, we also met the majority of our business objectives for small and medium-sized enterprises (SMEs). This involved supporting 249 transactions, representing 98% of our total transaction value. As a result of strong private market appetite and delays in financing decisions by our customers, we fell short of our overall large transaction targets. However, a strong pipeline positions us well for the year ahead.
Our recent internal analysis on the value of Efic’s contribution to the Australian economy is also revealing. Results indicated that despite the lower amount of financing we provided this financial year, our contribution to both gross domestic product GDP and jobs supported increased significantly compared with the previous year. This is consistent with the greater value of exports supported and robust demand for Efic’s bonding facilities, which enabled Efic to support a larger value of export contracts for relatively small exposures. Efic’s focus on support of mining and professional services industries also drove the stronger GDP and jobs numbers, given the traditionally strong value added from professional services and the mining sector.
These are very positive results, illustrating how we contribute to the creation of jobs and economic prosperity across Australia.
Letter from the Chairman and Managing Director & CEO
James M. Millar AM Chairman
During the year, we provided $194 million in funding to 160 Australian businesses to help them expand their international operations. James M. Millar AM Chairman

LETTER FROM THE CHAIRMAN AND MANAGING DIRECTOR & CEO 15
LETTER FROM THE CHAIRMAN AND MANAGING DIRECTOR & CEO
A SHIFTING LANDSCAPE Efic operates as a counter-cyclical business. When credit availability in the private market is strong, the need for our support may decrease.
Australia’s banking sector was, over the year, active in funding projects that would traditionally be financed by export credit agencies. This is being driven primarily by higher liquidity and low interest rates.
In fact, data from the Berne Union indicates that sales volumes for new medium and long-term transactions are still at their lowest levels in the past 10 years, with the exception of 20161. This is despite a return to growth in most markets.
The global export credit agency landscape is also shifting. There is an increased focus on implementing more flexible and proactive lending to more broadly support Government trade policies.
In this context, our aim is to ensure we remain a relevant and sustainable organisation.
SUPPORTING OUR CUSTOMERS We are always looking to improve the way we support Australian exporters. The 2017–18 financial year was an important period for us to reassess our position in Australia’s business landscape. We focused on realigning to support the Government’s broad objectives to build Australia’s export trade and remove the barriers to finance that businesses typically face when seeking to grow on the world stage.
While our research shows that Australia’s export community has a strong awareness of Efic, we are aware that we can always do more to promote our offering. As such, we intensified our efforts to promote our capabilities to a broader range of businesses and industry sectors. This focus enhanced our role in promoting Australian exporters as well as contributed to our ongoing sustainability and profit objectives.
We also continued to work on simplifying our product offering, improving our online loan application platform and refining our internal processes. This is to ensure that our customers are provided with a seamless and efficient experience.
1. The BUlletin, March 2018 Edition, Berne Union, ‘2017 Year end data in review’.
We are pleased to report that 48% of our people leaders are women, up from 32% three years ago. This year, 60% of promotions were awarded to women. Swati Dave Managing Director and CEO
Swati Dave Managing Director and CEO

16 EFIC ANNUAL REPORT 2017–2018
WORKING WITH THE PRIVATE MARKET Developing strong relationships with the private market is fundamental to our ability to support Australia’s export businesses.
As the Government’s export credit agency, our mandate is to assist businesses in building capability to secure funding through the private market. Our solutions are designed to complement those of banks and other financial institutions. Often, our early involvement acts as a catalyst for private market engagement. This is a positive outcome for both us and for exporters.
Our Business Development team is actively engaged in managing relationships with financial institutions and procuring referrals. A good example of this is technology company Seeing Machines, which secured a large export order during the year with a Thailand-based transport logistics company. The order included delivering 8,000 units of its Guardian driver monitoring system. Considered too early stage for the private market, Seeing Machines was referred to us by a bank. We were able to provide a $2 million line of credit to the business to support contract delivery.
EXPANDING OUR SUPPORTIn 2017–18, the Government expanded our mandate to broaden the types of export businesses and industries that we are able to support.
The changes to the Efic Act and our Statement of Expectations allow us to lend more directly to tourism and online businesses, provide support for onshore resource projects and assist other Government entities.
SERVICE OFFERINGS TO OTHER AGENCIES We also finalised arrangements to provide support to the Indigenous Entrepreneurs Capital Scheme and the National Housing Finance and Investment Corporation. This adds to the back-office support we currently provide to the Northern Australia Infrastructure Facility.
SUPPORTING THE GOVERNMENT’S DEFENCE EXPORT STRATEGYWe are playing a central role in administering the Government’s new A$3.8 billion Defence Export Facility.
This facility provides confidence to Australia’s defence industry to identify and pursue new export opportunities knowing finance support is available when there is a market gap for defence finance.
With a strong history of supporting businesses in the defence sector and related supply chains, we are now able to refer transactions to the National Interest Account, particularly those that are too large for our balance sheet or where internal country prudential limits apply.

LETTER FROM THE CHAIRMAN AND MANAGING DIRECTOR & CEO 17
LETTER FROM THE CHAIRMAN AND MANAGING DIRECTOR & CEO
OUR PEOPLE AND CULTUREWe strive to create a culture where everyone is inspired to achieve their best and deliver great outcomes for our customers.
Over the last year, we have undertaken significant work to position Efic for ongoing success. We have developed a renewed purpose and vision, focused on building enterprise leadership and creating our OneEfic culture. This foundational work will create the environment, mindset and behaviours that will drive a more proactive and innovative approach to delivering on our strategy.
As a result of our commitment to diversity and inclusion, we are pleased to report that 48% of our people leaders are women, up from 32% three years ago. This year, 60% of promotions were awarded to women.
We are proud of our cultural diversity with 52% of employees from a non-English speaking background or with parents from a non-English speaking background.
We are building better relationships with Australia’s Indigenous community. Our new Reflect Reconciliation Plan, endorsed by Reconciliation Australia, reaffirms Efic’s commitment to promoting Aboriginal and Torres Strait Islander peoples by cultivating relationships and generating opportunities to work together.
Through education, awareness raising, and sponsorship of our diversity and inclusion initiatives, we will continue to move our organisation forward.
THE YEAR AHEADWe wish to thank and acknowledge our outgoing Board members, Nicholas Minogue and Justin Brown, for their valuable contribution to Efic.
The year ahead will be exciting. We are building a culture at Efic that will empower our people to do their best. Our pipeline of transactions is strong. And we are dedicated to putting our customers at the forefront of everything we do.
We look forward to supporting Australian businesses with the finance solutions they need to compete around the globe – and to make our nation and its people more prosperous.
Signed for and on behalf of the members of the Board, as the accountable authority of Efic, and being responsible for preparing and giving the Annual Report to Efic’s Minister in accordance with Section 46 of the PGPA Act.
James M. Millar AMChairman
Swati DaveManaging Director and CEO
21 September 2018

18 EFIC ANNUAL REPORT 2017–2018
Case studySmall Business Export Loan
“ I loved the online application process. I was amazed at the ease of it. At that time, it was really helpful to help with the reality of long payment terms in our industry.
I’m really glad that we’ve learned about Efic.”
BABE AUSTRALIABEAUTY PRODUCTS GOING GLOBAL
Kim Peirce Founder
Babe Australia
Efic’s Small Business Export Loan helped Victoria-based beauty product business Babe Australia (Babe) deliver on three purchase orders in the US and Mexico and continue to build brand presence overseas.
For Babe founder Kim Peirce, manufacturing her beauty products started off simple – at the kitchen bench. Having undertaken a cosmetics and chemistry course to ensure she knew what she was doing, Kim launched a range of basic products that she could manage.
Export was always part of the equation. With a limited market in Australia, Kim knew that overseas markets would factor into her business success.
The business invested heavily in getting into the US market due to the export growth opportunities, including attending major trade shows.
Today, exports make up around 70% of Babe’s revenue, with further growth in the business outlook. Securing two ongoing orders from two large US stores and after receiving a significant purchase order from
Mexico, Babe needed working capital to help with production and delivery, and the continuing strong push to build the brand in existing and new markets.
The business applied for our Small Business Export Loan. For small businesses, being able to access cash before you need to deliver on a purchase order means you have the financial support needed to deliver on your contract and continue to run and grow your business.
“I loved the online application process. I was amazed at the ease of it. At that time, it was really helpful to help with the reality of long payment terms in our industry. I’m really glad that we’ve learned about Efic,” said Kim.

ANNUAL PERFORMANCE STATEMENT 19
ANNUAL PERFORMANCE STATEMENT
Annual Performance Statement for the year ended 30 June 2018
INTRODUCTORY STATEMENTI, James M Millar, Chairman of the accountable authority, the Board of the Export Finance and Insurance Corporation (Efic), present the 2017–2018 Annual Performance Statement of Efic, as required under paragraph 39(1)(a) of the Public Governance, Performance and Accountability Act 2013 (PGPA Act). In my opinion, these Annual Performance Statements are based on properly maintained records, accurately reflect the performance of the entity, and comply with subsection 39(2) of the PGPA Act.
James M. Millar AM Chairman, Efic
OUR ROLEEfic’s primary role is to facilitate and encourage Australian export trade on a commercial basis. We do this by providing Australian businesses with finance solutions to support their export growth. Our primary focus is SMEs, larger transactions in emerging markets, or transactions that can crowd SMEs into the supply chain, as this is where the need for our support is greatest.
APPROACHThe performance criteria we report against are in our 2017–18 Corporate Plan (Plan).
These criteria have been organised according to the five key business performance objectives on the Commercial Account as set out in the Plan on page 16:
Objective 1: Between 200 and 250 SME transactions, valued between $150–$170 million supporting export contracts of between $730–$780 million (Table 1).
Objective 2: Between 2 and 10 Corporate, Sovereign and Project Finance transactions, valued between $270–$300 million supporting export contracts of between $380–$500 million (Table 2).
Objective 3: Pre-tax profit of $15.8 million and post-tax profit of $11.1 million (Table 3).
Objective 4: Risk-weighted assets growing to $3.66 billion (Table 4).
Objective 5: Capital available growing to $678 million,
assuming a 50% dividend payout ratio, giving a capital adequacy ratio of 18.5% (including A$200 million of callable capital) (Table 4).
ANALYSIS OF OUR OVERALL PERFORMANCE AGAINST OUR PLAN OBJECTIVESCommercial AccountIt has been a positive year for Efic overall with growth year on year for our SME business exceeding Plan and prior year. We also made a post-tax profit of $13.9 million ($11.6 million in 2016–17) and had a capital adequacy ratio of 25%, both of which exceeded Plan.
Our support for larger companies has been less than expected, in part due to strong private market appetite and delays in financing decisions by some of our customers. Changes to our Statement of Expectations, however, helped clarify market perceptions about our willingness to support larger corporate risks. Our updated Statement of Expectations has clearly outlined we can now support both large domestic and offshore projects. These changes have helped build a strong pipeline, which positions us well for the year ahead.
In aggregate (SME and Corporate, Sovereign and Project Finance), we provided 254 transactions (198 in 2016–17) during the year, valued at $194 million ($396 million in 2016–17), supporting 180 export contracts (170 in 2016–17), which supported nearly $1.4 billion of export contracts and overseas investments ($1.0 billion in 2016–17).
The following analysis of our overall performance should be read in conjunction with the rest of the Annual Report, and in particular, the Letter from the Chairman and Managing Director & CEO.
National Interest AccountIn 2017–18, we did not provide any facilities under the National Interest Account.

20 EFIC ANNUAL REPORT 2017–2018
RESULTS ON THE COMMERCIAL ACCOUNTTABLE 1: We substantially increased the value of export contracts supported, and fell within our
Plan transaction volume and value targets for SMEs.
Total new signings – SMEs
Performance criterion Result against performance criterion Corporate Plan 2017–18 source
200–250 in number of transactions 249 transactions Page 16, Column 4, Line 2 of table
175–225 in number of facilities 179 facilities Page 16, Column 4, Line 6 of table
$150-$170m in value of facilities $175.1m in value of facilities Page 16, Column 4, Line 10 of table
$730-$780m in value of supporting export contracts
$1.25b in value of supporting export contracts Page 16, Column 4, Line 14 of table
EXPLANATIONSME signings, as a proportion of total signings, dominate our activity and account for over 98% of all transactions by number and over 90% by value.
We provided 249 SME transactions during the year, equating to 179 facilities valued at $175.1 million supporting export contracts valued at $1.25 billion.
This included one SME transaction under our alliance arrangements with the Asian Development Bank, which will support Australian SMEs exporting to Bangladesh, Pakistan, Sri Lanka and Vietnam.
The Small Business Export Loan continues to provide benefit to Australian SMEs that require fast access to working capital. In 2017–18, we completed 83 transactions, an increase of 63% from the previous year.
ANNUAL PERFORMANCE STATEMENT 21
ANNUAL PERFORMANCE STATEMENT
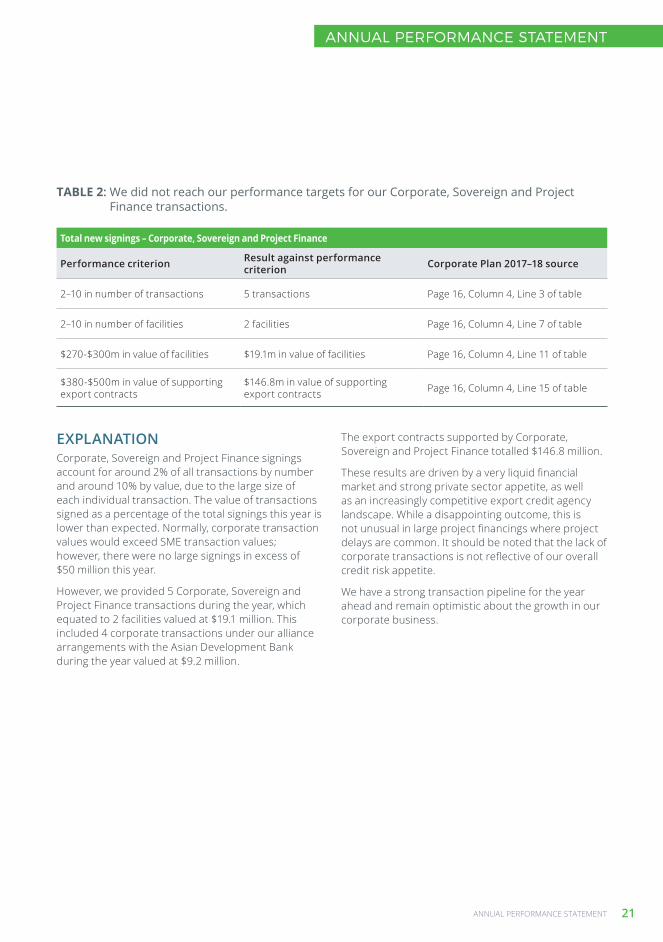
EXPLANATIONCorporate, Sovereign and Project Finance signings account for around 2% of all transactions by number and around 10% by value, due to the large size of each individual transaction. The value of transactions signed as a percentage of the total signings this year is lower than expected. Normally, corporate transaction values would exceed SME transaction values; however, there were no large signings in excess of $50 million this year.
However, we provided 5 Corporate, Sovereign and Project Finance transactions during the year, which equated to 2 facilities valued at $19.1 million. This included 4 corporate transactions under our alliance arrangements with the Asian Development Bank during the year valued at $9.2 million.
The export contracts supported by Corporate, Sovereign and Project Finance totalled $146.8 million.
These results are driven by a very liquid financial market and strong private sector appetite, as well as an increasingly competitive export credit agency landscape. While a disappointing outcome, this is not unusual in large project financings where project delays are common. It should be noted that the lack of corporate transactions is not reflective of our overall credit risk appetite.
We have a strong transaction pipeline for the year ahead and remain optimistic about the growth in our corporate business.
TABLE 2: We did not reach our performance targets for our Corporate, Sovereign and Project Finance transactions.
Total new signings – Corporate, Sovereign and Project Finance
Performance criterion Result against performance criterion Corporate Plan 2017–18 source
2–10 in number of transactions 5 transactions Page 16, Column 4, Line 3 of table
2–10 in number of facilities 2 facilities Page 16, Column 4, Line 7 of table
$270-$300m in value of facilities $19.1m in value of facilities Page 16, Column 4, Line 11 of table
$380-$500m in value of supporting export contracts
$146.8m in value of supporting export contracts Page 16, Column 4, Line 15 of table

22 EFIC ANNUAL REPORT 2017–2018
EXPLANATIONOur annual pre-tax profit was $19.8 million and post-tax profit was $13.9 million on the Commercial Account, which exceeded our Plan profit of $15.8 million pre-tax and $11.1 million post-tax.
Our profit during the year was underpinned by ongoing annuity income derived from fees and premium income on longer tenor transactions written in previous years. Profit was also supported by efficiency gains, which resulted in significantly lower costs, particularly from more targeted marketing and savings from our cloud-based strategy for information technology (IT).
We were also able to recover costs from supporting other Commonwealth entities. This was achieved without increasing Efic’s headcount and reflects in
part the efficiency gains derived from enhanced systems and more efficient processes over the last few years. However, it also reflects in part our ability to share fixed costs (premises, IT systems etc.) across a broader range of Commonwealth entities.
Our profit would have been even higher except for unrealised foreign exchange losses this year of $1.4 million compared to unrealised foreign exchange gains of $1.9 million in 2016–17.
During 2017–18, we continued to make allowance for payments to the Commonwealth covering a debt neutrality charge of $1.0 million, state equivalent taxes of $1.2 million and income tax equivalent payments of $5.9 million. In addition, we paid a dividend in December 2017 of $5.8 million, representing 50% of our 2016–17 profit.
TABLE 3: We exceeded our profit targets as a result of our support for exporters and efficiency measures.
Financial performance
Performance criterion Result against performance criterion Corporate Plan 2017–18 source
Achieve a pre-tax profit of $15.8m $19.8m Page 16, Column 4, Line 17 of table
Achieve a post-tax profit of $11.1m $13.9m Page 16, Column 4, Line 18 of table
ANNUAL PERFORMANCE STATEMENT 23
ANNUAL PERFORMANCE STATEMENT
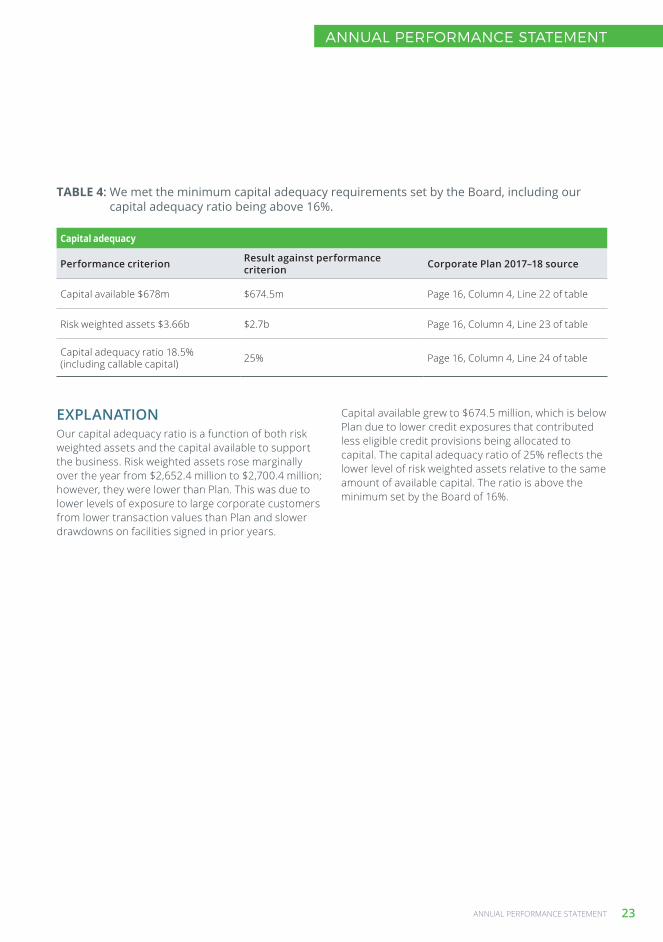
EXPLANATIONOur capital adequacy ratio is a function of both risk weighted assets and the capital available to support the business. Risk weighted assets rose marginally over the year from $2,652.4 million to $2,700.4 million; however, they were lower than Plan. This was due to lower levels of exposure to large corporate customers from lower transaction values than Plan and slower drawdowns on facilities signed in prior years.
Capital available grew to $674.5 million, which is below Plan due to lower credit exposures that contributed less eligible credit provisions being allocated to capital. The capital adequacy ratio of 25% reflects the lower level of risk weighted assets relative to the same amount of available capital. The ratio is above the minimum set by the Board of 16%.
TABLE 4: We met the minimum capital adequacy requirements set by the Board, including our capital adequacy ratio being above 16%.
Capital adequacy
Performance criterion Result against performance criterion Corporate Plan 2017–18 source
Capital available $678m $674.5m Page 16, Column 4, Line 22 of table
Risk weighted assets $3.66b $2.7b Page 16, Column 4, Line 23 of table
Capital adequacy ratio 18.5% (including callable capital) 25% Page 16, Column 4, Line 24 of table
24 EFIC ANNUAL REPORT 2017–2018
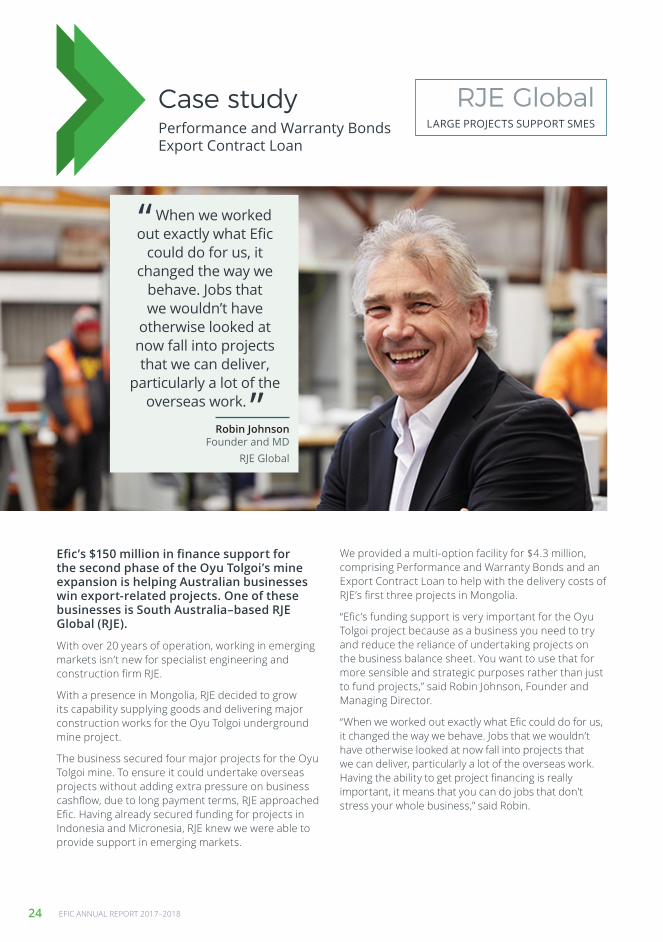
Case studyPerformance and Warranty Bonds Export Contract Loan
RJE GlobalLARGE PROJECTS SUPPORT SMES
“ When we worked out exactly what Efic
could do for us, it changed the way we
behave. Jobs that we wouldn’t have
otherwise looked at now fall into projects that we can deliver,
particularly a lot of the overseas work. ”
Robin JohnsonFounder and MD
RJE Global
Efic’s $150 million in finance support for the second phase of the Oyu Tolgoi’s mine expansion is helping Australian businesses win export-related projects. One of these businesses is South Australia–based RJE Global (RJE).
With over 20 years of operation, working in emerging markets isn’t new for specialist engineering and construction firm RJE.
With a presence in Mongolia, RJE decided to grow its capability supplying goods and delivering major construction works for the Oyu Tolgoi underground mine project.
The business secured four major projects for the Oyu Tolgoi mine. To ensure it could undertake overseas projects without adding extra pressure on business cashflow, due to long payment terms, RJE approached Efic. Having already secured funding for projects in Indonesia and Micronesia, RJE knew we were able to provide support in emerging markets.
We provided a multi-option facility for $4.3 million, comprising Performance and Warranty Bonds and an Export Contract Loan to help with the delivery costs of RJE’s first three projects in Mongolia.
“Efic’s funding support is very important for the Oyu Tolgoi project because as a business you need to try and reduce the reliance of undertaking projects on the business balance sheet. You want to use that for more sensible and strategic purposes rather than just to fund projects,” said Robin Johnson, Founder and Managing Director.
“When we worked out exactly what Efic could do for us, it changed the way we behave. Jobs that we wouldn’t have otherwise looked at now fall into projects that we can deliver, particularly a lot of the overseas work. Having the ability to get project financing is really important, it means that you can do jobs that don’t stress your whole business,” said Robin.

OUR CLIENTS 25
OUR CLIENTS
FIGURE 1: Commercial Account at 30 June 2018 – exposure by region
FIGURE 2: Commercial Account at 30 June 2018 – exposure by industry sector
COMMERCIAL ACCOUNT
Our total exposure under the Commercial Account at 30 June 2018 was $2.0 billion. This included loans, export finance guarantees (including funded export finance guarantees), medium-term insurances, bonds and rescheduled credit insurance.
At 30 June 2018, the average maturity of facilities outstanding was 1.9 years. This includes an average maturity of 0.9 years for SME exposures, and 5.7 years for larger corporate exposures.
Region Value ($m) Value (%)
Australia 874.8 43Asia 459.3 22North America 289.7 15Europe 209.4 10 Pacific 114.1 6 South America 76.1 4Middle East 0.6 0
Sector Value (A$m) Value (%)
Reinsurance 639.7 32Sovereign 357.9 18Mining – LNG 345.3 17Mining Commodities 212.7 10Financial & Insurance Services 150.0 7Transport, Postal & Warehousing 125.3 6Manufacturing 124.3 6Other 60.3 3Professional, Scientific & Technical Services 17.5 1
Our clients

26 EFIC ANNUAL REPORT 2017–2018
FIGURE 3: National Interest Account at 30 June 2018 – exposure by region
FIGURE 4: National Interest Account at 30 June 2018 – exposure by industry sector
NATIONAL INTEREST ACCOUNT
Our total exposure under the National Interest Account at 30 June 2018 was $610.1 million, largely comprising loans to sovereign countries or their agencies, and loans to natural resource projects in emerging markets.
Our largest exposure is the PNG LNG project, with exposure of US$201.6 million (A$272.7 million) at 30 June 2018.
Region Value ($m) Value (%)
Pacific 272.7 45Middle East 168.5 28Asia 149.2 24Australia 10.4 2South America 9.3 1
Sector Value ($m) Value (%)
Sovereign 317.7 52Mining – LNG 272.7 45Manufacturing 10.4 2Financial & Insurance Services 9.3 1

OUR CLIENTS 27
OUR CLIENTS
Case studySmall Business Export Loan
Fin Design + EffectsCREATIVE IMPACT IN ASIA
“ Efic was very important to our business and
became extraordinarily valuable when we had
a project that went over for a few months. The support allowed us to
cashflow our projects and continue to look for new
opportunities. ”Emma Daines
Group Managing DirectorFin Design + Effects
Efic’s Small Business Export Loan helped boutique design and special effects agency Fin Design + Effects (Fin Design) deliver on multiple large projects in China.
Group Managing Director Emma Daines started her career in the design and visual effects (VFX) industry more than 25 years ago.
When an opportunity arose to set up an editing facility in Sydney, Emma decided to take a different approach. She developed a boutique company that offered personalised design and VFX services that focused on creating an experience for customers.
“We started exporting pretty well from the start. I tapped into a lot of my American contacts from the beginning. It was a ‘slowly but surely’ process because I was concentrating on the local market as well,” said Emma.
“As we grew, Asia became more of an interest. Local talent in Asia was not as sophisticated as what we had to offer, so potential customers would come seeking Australian experts, due to proximity.”
Finding it difficult to secure finance support through the bank, due to lack of tangible security and being a services-based business, Fin Design needed an alternative solution to support the delivery of multiple contracts in China.
“When we were refinancing I was introduced to a broker and he brought up Efic and introduced us. That was three years ago,” said Emma.
Since then, Efic has provided the business with three Small Business Export Loans.
“Efic was very important to our business and became extraordinarily valuable when we had a project that went over for a few months. The support allowed us to cashflow our projects and continue to look for new opportunities,” said Emma.
With exports now accounting for more than half of business revenue, Emma is now focused on making Fin Design + Effects a global company, and has expansion plans in the pipeline.

28 EFIC ANNUAL REPORT 2017–2018
Our governing principles
OUR FINANCIAL OPERATIONSWe are self-funded and operate on a commercial basis. Our sources of income include the fees and risk premiums we receive from our customers, but we also earn interest on loans and investments that reflect the risk we take on. This includes the investment of our cash capital, reserves and working capital.
Since 1991, we have accumulated profits of $591.7 million and have paid normal dividends of $300.7 million. A dividend has not yet been agreed for 2017–18.
The Australian Government guarantees that all our creditors will receive payment from us. This guarantee has never been called.
$13.9mprofit in 2017–18 contributing to
$591.7maccumulated profits before
dividend payments since 1991
$5.8mdividend paid in 2017, based on 50%
of the profit in 2016–17 contributing to
$300.7mof normal dividend
paid since 1991
$1.0mdebt neutrality charge payable
in 2018 contributing to
$3.0mpaid under competitive neutrality
arrangements since 1 July 2015
$1.2mstate equivalent taxes payable
in 2018 contributing to
$3.7mpaid under competitive neutrality
arrangements since 1 July 2015
$5.9mincome tax equivalent charge of
30% payable in 2018 contributing to
$15.9mpaid under competitive neutrality
arrangements since 1 July 2015

OUR GOVERNING PRINCIPLES 29
OUR GOVERNING PRINCIPLES
OUR BOARDOur Board is responsible for managing the affairs of Efic. This includes determining strategy, defining risk appetite, monitoring performance and making recommendations to the Minister about dividends.
The Board met six times in 2017–18 and its membership is set out on pages 30–36.
The Board consists of the Managing Director, six Non-executive Directors and a Government member. The Non-executive Directors and Government member are appointed by the Minister. The Government member is the Secretary of DFAT (or their alternate).
OUR MINISTEROur Minister is Senator the Hon. Simon Birmingham, who was appointed on 28 August 2018 replacing the Hon. Mr Steven Ciobo MP. The Minister provides guidance to our independent Board through a Statement of Expectations. Our Board responds with a Statement of Intent, confirming how we will operate to meet those expectations.
The Minister may direct us in writing to perform our functions or exercise our powers in a certain way, if doing so is in the public interest. The Minister may also approve transactions on the National Interest Account. Details of Ministerial directions for the financial year ended 30 June 2018 are set out on pages 47–49.
The Board must keep the Minister informed about our operations and provide any information the Minister or the Minister for Finance may require. The Minister or Minister’s representative responds to questions from members of Federal Parliament about Efic, and to parliamentary orders relating to us. Our senior management team attends Senate Estimates hearings three times a year to answer questions, on behalf of the Minister, on Efic’s operations.
OUR PRIVACY OBLIGATIONSWe are partially exempt from freedom of information legislation but are subject to confidentiality obligations under the Efic Act. This recognises the requirement to keep confidential any commercial information that is obtained from Australian exporters and investors. As part of the Information Publication Scheme, we are required to make certain information public (for more details, visit our website).

30 EFIC ANNUAL REPORT 2017–2018
James M. Millar AMBCom, FCA, FAICD Chairman
Term of appointment 09/12/2014 to 08/12/2017 and 09/12/2017 to 08/12/2020
Independent, Non-executive member
James is the former CEO and Area Managing Partner of Ernst & Young in the Oceania region, and was a director of the Ernst & Young Global Board. His career prior to his leadership roles at
Ernst & Young was as a corporate reconstruction professional for large and small businesses, both within Australia and globally.
James is currently Chairman of the Forestry Corporation of NSW. He is a Non-executive Director of Mirvac Limited, Fairfax Media Limited and Macquarie Media Limited. He is the Chairman of The Vincent Fairfax Family Foundation.
Swati DaveBCom, GAICD, GAIST Managing Director and Chief Executive Officer
Appointed 3/07/2017
Executive member
Swati Dave is an experienced senior banking Executive and Non-executive Director with an established track record of successfully leading and growing complex businesses in Australia, the UK, Hong Kong and Singapore.
Swati has over 30 years of banking and finance experience across a number of sectors, including infrastructure, energy and utilities, renewable energy and property. She has held senior positions at National Australia Bank, Deutsche Bank, AMP, Henderson Global Investors, Bankers Trust and Westpac.
Swati currently serves on the boards of State Super and Asia Society Australia. She has served as a former director of Australian Hearing, Great Western Bancorp, Inc. (USA) and the NAB Wealth Responsible Entity Boards.
Swati holds a Bachelor of Commerce from the University of Newcastle and is a Graduate Member of the Australian Institute of Company Directors and the Australian Institute of Superannuation Trustees.
CURRENT BOARD MEMBERS

OUR GOVERNING PRINCIPLES 31
OUR GOVERNING PRINCIPLES
Jodie BakerBCom, GAICD, TFASFA Board member
Term of appointment 28/06/2018 to 27/06/2021
Independent, Non-executive member
Jodie is a Non-executive Director and consultant with 30+ years’ experience in investment banking and funds management. She is currently a Managing Partner of Blackhall & Pearl, a board governance and risk advisory firm, and is also on the board of Beyond Bank, the Advisory Board of Spaceship Superannuation, a superannuation fund for millennials, and is a member of the Credit Committee of social impact investor and B Corporation, Social Enterprise Finance Australia. She is also on the boards Finance
Executives Institute of Australia and performing arts group, Synergy & TaikOz.
Formerly CEO and Managing Director of a fintech business, Mòrgij Analtyics, Jodie has held senior executive risk roles at ANZ, Societe Generale and BT Financial Group. Earlier in her career, Jodie worked in frontline and risk roles at Westpac, Macquarie Bank and Bankers Trust Australia. She holds a Bachelor of Commerce from the University of Western Australia, and is a Trustee Fellow of Association of Superannuation Funds of Australia and a graduate of Australian Institute of Company Directors.
Lynda ChengBCom, LLB (Hons), GAICD Board member
Term of appointment 13/05/2016 to 12/05/2019
Independent, Non-executive member
Lynda Cheng is currently a Director of Corporate Development and Mergers and Acquisitions at Pratt Holdings and has held other senior executive roles for the Pratt Group since 2005, including CFO of Visy Industries. Previously, Lynda was in investment banking for a decade and worked for J.P.Morgan in their New York, San Francisco, Sydney and Melbourne offices.
She brings a broad commercial and international corporate finance perspective.
Lynda was Deputy Chair of South East Water and Chair of their Finance Audit and Risk Management Committee and is a current member of the Wesley College Council.
Lynda holds a Bachelor of Law (Honours) and Commerce degree, majoring in actuarial studies and economics from the University of Melbourne.

32 EFIC ANNUAL REPORT 2017–2018
Denise GoldsworthyBMet (Hons + University medal), FTSE, FAIM, GAICD Board member, Audit Committee member
Term of appointment 05/11/2014 to 08/12/2017 and 09/12/2017 to 08/12/2020
Independent, Non-executive member
Denise is the Founder of Alternate Futures Pty Ltd, a company that connects solutions to problems by addressing knowledge, cultural and system barriers. In practice, this means connecting Australia’s research organisations, tech start-ups and industry.
Prior to this, Denise worked as an executive for Rio Tinto, with roles including CCO Autonomous Haul Trucks, Managing Director of Dampier Salt and Managing Director HIsmelt. Denise started her career at BHP Steel Newcastle.
Denise is also Chair of ChemCentre WA, Chair of Minerals Research Institute WA (MRIWA), a non-executive director at Western Power and Leichardt Industrials, a member of Council and Chair of the Quality, Audit and Risk Committee of Edith Cowan University, a member of the Commercialisation Advisory Board for Curtin University and Chair of the Navy Clearance Diver Trust.
Among Denise’s honours is being named the 2010 Telstra Australian Business Woman of the Year.

OUR GOVERNING PRINCIPLES 33
OUR GOVERNING PRINCIPLES
Laura McBainBCom Board member, Audit Committee member
Term of appointment 09/12/2014 to 08/12/2017 and 09/12/2017 to 08/12/2020
Independent, Non-executive member
Laura McBain is the Managing Director of Longtable Group Ltd, a listed food and beverage company. This appointment was made in August 2017. Longtable Group owns an equity stake in Maggie Beer Products Pty Ltd, and is 100% owner of Bd Farm Paris Creek Pty Ltd, a biodynamic-, organic dairy based in the Adelaide Hills, South Australia, and St David Dairy Pty Ltd, a micro-dairy in the heart of Fitzroy, Melbourne.
Laura was formerly the CEO and Managing Director of Bellamy’s Australia Ltd from 2014 to 2017, prior to which she was CEO and General Manager since 2007.
During these years, Laura oversaw significant change, innovation and business growth including expansion into South East Asia and China.
Prior to joining Bellamy’s, Laura practised as an accountant and specialised in the areas of providing business advisory and taxation services to SMEs in both Sydney and Tasmania. Laura holds a Bachelor of Commerce, completed the IMD Leadership Challenge in 2013 and completed the IESE Business School, Wharton School and China Europe International Business School Global executive program in 2017.
In 2013, Laura was named as the Telstra Tasmanian Business Woman of the Year and she went on to be named Telstra Australian Business Woman of the Year (Corporate and Private).

34 EFIC ANNUAL REPORT 2017–2018
Rick SawersBoard member, Audit Committee Chair
Term of appointment 09/12/2014 to 08/12/2017 and 09/12/2017 to 08/12/2020
Independent, Non-executive member
Rick has over 44 years of commercial and international banking experience, leading large frontline businesses in Australia, Japan, United Kingdom, Hong Kong and the USA. Rick has served on NAB’s Group Executive Committee (2009–15), and Group Risk Committee (2005–2015). He has deep experience in treasury and balance sheet management, credit, market and operational risk, business administration and governance, financial markets (including capital markets, funding, liquidity, fixed income, money markets, FX and
interest rate risk management), infrastructure and project finance, and human resources.
Rick is a Director of the Australian Rural Leadership Foundation and previous board positions include Chairman and board member of the Australian Financial Markets Association, Chairman and director of Great Western Bancorp, Inc., and director of Clydesdale Bank PLC. He is a Fellow of the Financial Services Institute of Australasia, a graduate member of the Australian Institute of Company Directors and a life member of the Financial Markets Foundation for Children.
OUR GOVERNING PRINCIPLES 35
OUR GOVERNING PRINCIPLES
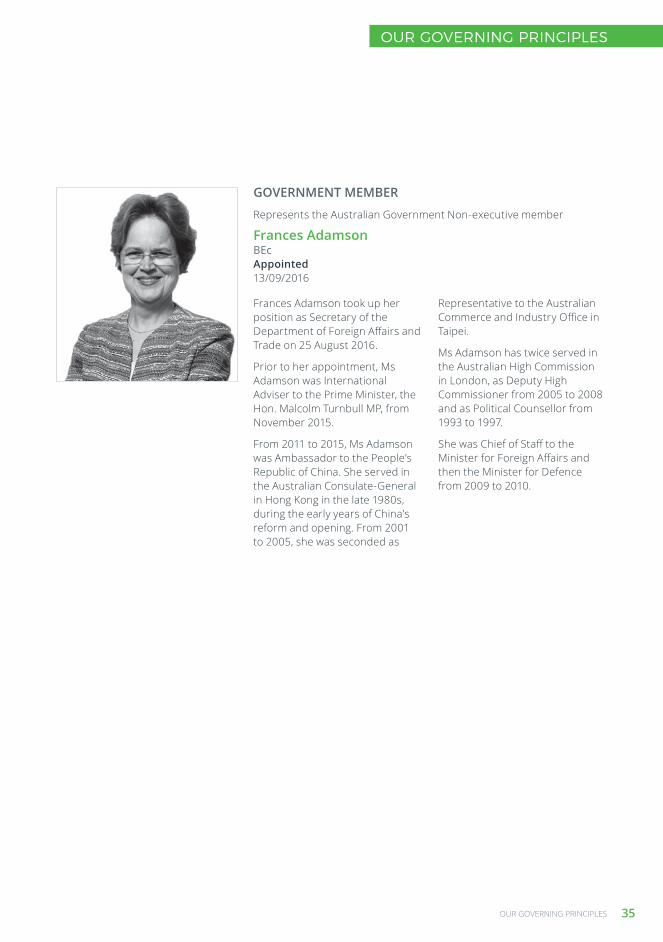
GOVERNMENT MEMBER
Represents the Australian Government Non-executive member
Frances AdamsonBEc Appointed 13/09/2016
Frances Adamson took up her position as Secretary of the Department of Foreign Affairs and Trade on 25 August 2016.
Prior to her appointment, Ms Adamson was International Adviser to the Prime Minister, the Hon. Malcolm Turnbull MP, from November 2015.
From 2011 to 2015, Ms Adamson was Ambassador to the People’s Republic of China. She served in the Australian Consulate-General in Hong Kong in the late 1980s, during the early years of China’s reform and opening. From 2001 to 2005, she was seconded as
Representative to the Australian Commerce and Industry Office in Taipei.
Ms Adamson has twice served in the Australian High Commission in London, as Deputy High Commissioner from 2005 to 2008 and as Political Counsellor from 1993 to 1997.
She was Chief of Staff to the Minister for Foreign Affairs and then the Minister for Defence from 2009 to 2010.

36 EFIC ANNUAL REPORT 2017–2018
ALTERNATE GOVERNMENT MEMBER
Christopher LangmanBA Appointed 04/04/2018
Mr Langman is responsible for the Trade, Investment and Business Engagement Group at the Department of Foreign Affairs and Trade, which includes:
Regional Trade Agreements Division
Investment and Economic Division
Office of Trade Negotiations
Europe and Latin America Division
State and Territory Offices.
Mr Langman acts as the alternate ex-officio Government member on the Efic Board.
Mr Langman was appointed as a Deputy Secretary in DFAT in
March 2018. Prior to that, he was Australia’s Ambassador to Iraq. Mr Langman earlier served as Ambassador to the OECD in Paris, as Deputy Head of Mission to the United Nations in Geneva, and in Washington and Buenos Aires. In Canberra, Mr Langman has held a number of senior positions, including as First Assistant Secretary, G20 Policy in the Department of the Prime Minister and Cabinet in the lead-up to and during Australia’s host year in 2014. He also led DFAT’s Trade and Economic Division and the Office of Trade Negotiations, and was Special Negotiator for Agriculture and Australian Ambassador for the Environment.

OUR GOVERNING PRINCIPLES 37
OUR GOVERNING PRINCIPLES
MEMBERS WHOSE TERM ENDED IN 2017-18
Nicholas MinogueMA, MBA Deputy Chairman, Audit Committee member
Term of appointment 09/12/2011 to 08/12/2014 and 09/12/2014 to 08/12/2017
Board attendance: 2 of 3 Audit Committee attendance: 1 of 2
Independent, Non-executive member
Justin BrownBEc Alternate Government member
Appointed 24/09/2015 to 21/05/2018
BOARD AND AUDIT COMMITTEEMr Millar AM, Ms Goldsworthy, Ms McBain and Mr Sawers were reappointed to the Board for a second term on 9 December 2017.
Mr Langman was appointed on 4 April 2018 as the alternate Government member following the appointment of Mr Brown as Australia’s Ambassador to Belgium, Luxembourg, the European Union and NATO.
Ms Baker was appointed to the Board on 28 June 2018 following the retirement of Mr Minogue from the Board on 8 December 2017.
TRANSACTIONS WITH BOARD MEMBERS AND RELATED ENTITIES OF BOARD MEMBERSDirectors have made appropriate disclosures in respect of transactions that Efic has undertaken where they may have, or may be perceived to have, a material personal interest.
DECLARED CONFLICTS AND POTENTIAL CONFLICTS OF INTERESTOur Board always ensures that a Board member does not participate in discussions where there is, or may be, a conflict between their own interests, those of Efic or one of our customers. We maintain a register, which is updated with the disclosed interests of all Board members.
Board meeting
Board member Attended Eligible to attend
James M. Millar (Chairman) 6 6
Swati Dave 5 6
Jodie Baker 0 0
Lynda Cheng 6 6
Denise Goldsworthy 6 6
Laura McBain 6 6
Rick Sawers 6 6Government member (or alternate) 4 6
Audit Committee meeting
Audit Committee member Attended Eligible to attend
Rick Sawers (Chair) 4 4
Denise Goldsworthy 4 4
Laura McBain 4 4
Board attendance Audit Committee attendance

38 EFIC ANNUAL REPORT 2017–2018
Case studyExport Line of Credit
“ This is the first time this company has ever had
any debt, because we’ve always been a start-up. It’s a sign of a company
maturing when they need to access facilities like the
one from Efic.”
SEEING MACHINESAUSTRALIAN TECH DRIVING GROWTH
James PalmerCEO
Seeing Machines
Efic’s Export Line of Credit gave technology business Seeing Machines the ability to deliver 8,000 units of the Guardian driver monitoring system to a Thailand-based transport logistics company.
Seeing Machines has gone from strength to strength since 2000, when the business was founded as part of an association with the Australia National University. Today, it is at the forefront of driver monitoring technology and has more than 200 staff and operations across the world; including in the US, the UK, South America, Europe and South East Asia.
The first real opportunity to commercialise the Seeing Machines technology came in 2007 as a result of the resources boom. The technology was originally used in heavy mining vehicles to monitor shift workers and reduce accidents and incidents. It was at this time that the organisation started exporting, taking advantage of opportunities in overseas markets, which were also benefiting from the growth in the mining sector.
In 2016, Seeing Machines turned their attention to coaches and commercial fleets. That led to the birth of their fleet business.
One of the key opportunities that the organisation was looking at was a landmark contract with Thai-based distributor Kiattana Transport in the fleet business. Seeing Machines won a contract to deliver 8,000 Guardian driver monitoring units and needed working capital to manage manufacturing and delivery.
Chief Financial Officer James Palmer said the company explored opportunities with its own and other banks. “Their answer to us was always that we were a little too early stage for them. And, in fact, one of the banks we were talking to did suggest Efic as an option.
“Efic really took the time to understand our business and to model the cashflow that worked with our distributors. In fact, some of the modelling we did as part of the due diligence actually helped us think through some of our cashflow planning,” said James.
We were able to provide Seeing Machines with a US$2 million Export Line of Credit facility. This was the company’s first step in expanding its relationship with Kiattana Transport and increasing the export capacity of the business.

OUR GOVERNING PRINCIPLES 39
OUR GOVERNING PRINCIPLES
Our people are central to everything we do, and are passionately committed to delivering innovative financing solutions for Australian exporters every day.
We encourage people in our organisation to think differently, collaborate effectively and actively challenge the status quo. We want to create a culture that:
fosters leadership empowerment and accountability
promotes inclusivity
values true diversity.
We want our people to be innovative and adaptive.
A key priority is to attract and retain outstanding talent. This enhances our ability to deliver successful business outcomes for our customers and boost Australia’s export trade as a whole.
Workforce profileTABLE 5: Number of full-time equivalent employees
TABLE 6: Workforce diversity
30 June 2018 30 June 2017 30 June 2016
Employees (excluding short term) 87.2 98.1 98.5
Short-term contract employees 6.6 4.6 6.6
Total 93.8 102.7 105.1
Classification Female Male Totalemployees NESB1 ATSI2 PWD3
Support 15 3 18 9 0 0
Technical 11 7 18 12 0 0
Middle management 16 24 40 25 0 0
Leadership 8 14 22 5 0 0
Total 50 48 98 51 0 0
1: NESB: Non–English speaking background (or with parents from a non–English speaking background)2: ATSI: Aboriginal or Torres Strait Islander background3: PWD: People with disability
OUR PEOPLE

40 EFIC ANNUAL REPORT 2017–2018
OUR PEOPLE: HIGHLIGHTS
Building cultureWe recognise the importance of workplace culture in attracting and retaining talent and driving our ongoing success. This year, we focused on building enterprise leadership and creating our OneEfic culture, which fosters leadership empowerment and accountability, and promotes diversity and inclusivity.
Nurturing leadersOur broader leadership team plays a key role in developing people and inspiring strong performance. To support them, we have invested in a 12-month program to build their coaching skills. This will provide a vital foundation as we work to create our desired culture.
Promoting gender equalityWe are making progress on improving the representation of women in our organisation resulting in targeted recruitment, talent development and flexible work initiatives. Women now make up 48% of our people leaders, up from 32% in 2015. This year, 60% of promotions were awarded to women, enriching our talent pipeline for the future. The number of women choosing to work flexibly rose by 4%.
Supporting reconciliationOur Reflect Reconciliation Action Plan is a roadmap to help our people understand Aboriginal and Torres Strait Islander cultures. Endorsed by Reconciliation Australia, its goal is to remove barriers to the employment of Aboriginal and Torres Strait Islander peoples.

OUR GOVERNING PRINCIPLES 41
OUR GOVERNING PRINCIPLES
WORK HEALTH AND SAFETYConsultationWe are committed to providing a positive and safe work environment.
Our Work Health and Safety Committee includes employee and management representatives who review our Health and Safety Management Arrangements annually.
Our Board Charter outlines our due diligence requirements under the Work Health and Safety Act 2011 (WHS Act). The Work Health and Safety Committee convenes before each Board meeting to assist the Board to fulfil its requirements.
Our Health and Safety Representative conducts workplace inspections before each Work Health and Safety Committee meeting. The Committee reviews the findings, and establishes an action plan to address any material issues and report these to the Board.
Risk managementWe take a pragmatic, risk-based approach to maintaining our work health and safety compliance framework and management practices. The Work Health and Safety Committee reviews our compliance requirements annually.
Our strong culture of incident notification and investigation includes reporting any accidents or ‘near misses’.
New employees participate in an in-depth induction program that includes a work health and safety overview with our Health and Safety Representative. We provide training on workplace behaviour as part of our ongoing compliance program. Our first aid officers also undergo regular training.
In an effort to ensure continued education in work health and safety, our Officers and key employees undertook additional training to increase awareness of legislative requirements and best practice.
International business travel has been identified as a risk that requires special monitoring. All employees travelling offshore are required to complete our certified traveller program. Employees also have access to 24/7 medical and security assistance for emergency and non-emergency situations while travelling overseas.
Employee physical and mental health is very important to us. We provide employees access to:
an Employee Assistance Program with confidential counselling services
executive health checks for senior employees and frequent overseas travellers
annual health and wellbeing program offerings, including workshops, activities and presentations by specialist health professionals.
Health and safety outcomesFor the period, we have not, in relation to work health and safety matters, been investigated, or received any notices. There were no ‘notifiable incidents’ under the WHS Act during 2017–18.
42 EFIC ANNUAL REPORT 2017–2018
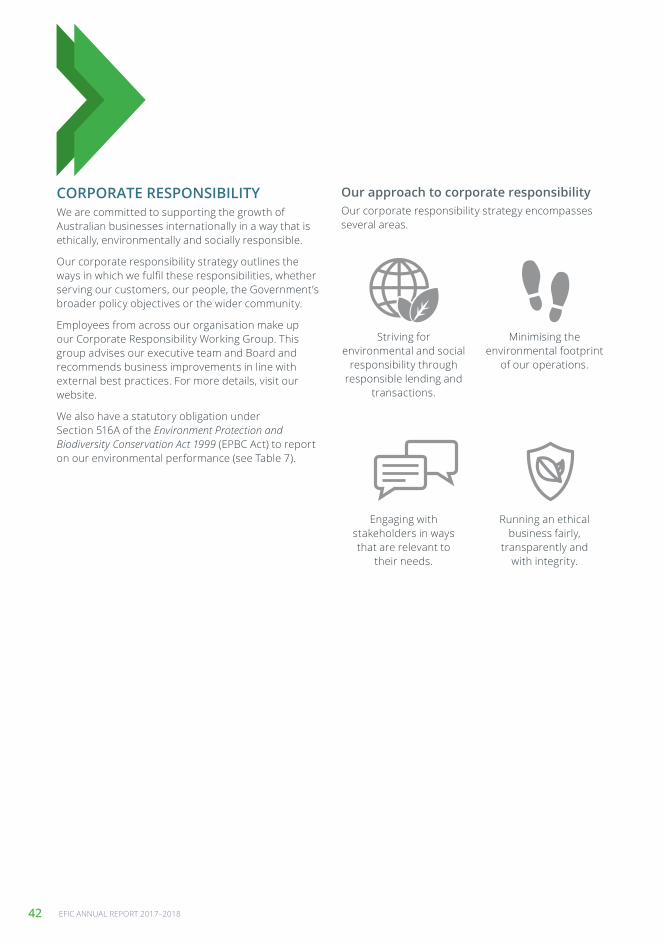
CORPORATE RESPONSIBILITYWe are committed to supporting the growth of Australian businesses internationally in a way that is ethically, environmentally and socially responsible.
Our corporate responsibility strategy outlines the ways in which we fulfil these responsibilities, whether serving our customers, our people, the Government’s broader policy objectives or the wider community.
Employees from across our organisation make up our Corporate Responsibility Working Group. This group advises our executive team and Board and recommends business improvements in line with external best practices. For more details, visit our website.
We also have a statutory obligation under Section 516A of the Environment Protection and Biodiversity Conservation Act 1999 (EPBC Act) to report on our environmental performance (see Table 7).
Striving for environmental and social
responsibility through responsible lending and
transactions.
Minimising the environmental footprint
of our operations.
Engaging with stakeholders in ways that are relevant to
their needs.
Running an ethical business fairly,
transparently and with integrity.
Our approach to corporate responsibilityOur corporate responsibility strategy encompasses several areas.

OUR GOVERNING PRINCIPLES 43
OUR GOVERNING PRINCIPLES
Our transaction processWe uphold the principles of ecologically sustainable development. We internally review our transactions on environmental and social grounds, based on policies and procedures that are available on our website.
We categorise new projects as:
Category A: transactions with potentially significantly adverse environmental or social impacts
Category C: transactions with minimal or no adverse environmental or social impacts
Category B: transactions with environmental or social impacts somewhere between categories A and C.
Table 7 summarises the number and type of assessments completed during 2017–18, and includes comparative data for the previous two financial years. However, this table does exclude transactions that only involve risk participation agreements associated with multilateral institutions. Those transactions are considered to always have low potential for environmental and social impact. Transactions under the National Interest Account are also excluded.
A full list of our transactions for 2017–18 is presented on pages 58–81, including information on location, industry type, sector, and the results of screening and classification. Our transaction process includes a commitment to periodically undertake an independent environmental and social review. The results of all completed reviews are available on our website.
We are a signatory to the Equator Principles. This risk management framework, adopted by financial institutions, helps signatories determine, assess and manage environmental and social risk in projects. It provides a minimum standard for due diligence and monitoring to support responsible risk decision making.
As a signatory, Efic is required to provide a progress report on our implementation and the number of project-related transactions that have reached financial close. We are also actively involved with the Equator Principles Association. For more information, visit our website.

44 EFIC ANNUAL REPORT 2017–2018
TABLE 7: Environmental and social review summary
YearEnvironmental and social impact category Existing project and
non-project potential impact
Category A Category B Category C Yes No
2017–18
All facilities 0 1 6 5 176
Project finance 0 0 0 Not applicable Not applicable
Project-related corporate loans 0 0 0 Not applicable Not applicable
2016–17
All facilities 0 0 5 1 128
Project finance 0 0 0 Not applicable Not applicable
Project-related corporate loans 0 0 0 Not applicable Not applicable
2015–16
All facilities 2 0 7 1 100
Project finance 1 0 0 Not applicable Not applicable
Project-related corporate loans 0 0 0 Not applicable Not applicable

OUR GOVERNING PRINCIPLES 45
OUR GOVERNING PRINCIPLES
Case studyExport Contract Loan
CalixREDUCING CO2 EMISSIONS
“ The role Efic has played is extremely valuable in ensuring this technology is able to be developed and ownership is retained within Australia, because
licensing that technology down the track will ultimately lead to licence revenues
flowing back in to Australia. ”Darren Charles
Chief Financial
OfficerCalix
With Efic’s support, NSW-based Calix is taking its innovative CO2 reduction and capture technology to Europe to reduce carbon emissions in the concrete and lime manufacture industries.
Australian innovation is making a real impact in reducing CO2 emissions globally – and that’s the driving force behind Calix.
The business developed a platform technology for the mass manufacturing of nano-active materials, but also found it is great for capturing the CO2 output in certain industries.
A breakthrough occurred when Calix successfully led the European Union (EU) Low Emissions Intensity Lime and Cement (LEILAC) research and innovation project, for which it received €12 million in EU funding.
The project will pilot Calix’s breakthrough CO2
separation technology, enabling Europe’s cement and lime industries to dramatically reduce CO2 emissions without a significant energy or capital penalty.
According to Calix’s Chief Financial Officer, Darren Charles, the cement industry is responsible for about 5% of global CO2 emissions. By using Calix technology, with very little additional capital cost to the manufacturing process, the cement industry can substantially reduce its CO2 emissions.
The pilot plant will be located in Lixhe, Belgium, where it is expected to begin operating in early 2019.
For a project of this size, Calix needed financial support to ensure it could maintain control of its IP.
“Efic’s support was critical for us as a technology company. We are cashflow positive, but we reinvest everything we do in research and development. You need a fair amount of working capital to fund a project of this size, but getting funding from typical banks can be difficult when you are a technology company.
“It’s made even more complicated when you’re dealing with an overseas contract and technology that is new and innovative,” said Darren.

46 EFIC ANNUAL REPORT 2017–2018
TABLE 8: Our environmental footprint
Parameter 2017–18 2016–17 2015–16
Energy use, megajoules/m2
Efic occupancya, electricity 377 383 396
Building servicesb, electricity 376 381 391
Building servicesb, gas 96 97 196
Water (sewage data not available)
Water, kilolitresc 5,382 5,500 5,749
Solid waste, tonnes
Comingle (recycled) 1.0 0.6 3.5
Cardboard (recycled) 10.0 13.9 14.2
Waste to landfill 78.0 74.8 53.4
Total waste 89.0 89.3 71.1
Business travel by our employees
Total domestic (million kilometres) 1.55 1.4 1.02
Total international (million kilometres) 0.82 0.99 1.43
Total (million kilometres) 2.37 2.39 2.45
(a): This figure represents Efic’s energy use only.(b): Building services are common facilities for all floors of Export House and include lighting to common areas, lifts, air conditioning and hot water. (c): This figure represents total usage by Export House.
Electricity and water use in Export House has been generally consistent over the past three years. We will continue to identify any methods to help minimise future use, including the use of alternate energy sources. Since 2014, we have sourced some of our electricity supply from green energy sources,
As of 30 June 2018, green energy sources accounted for 30% of Efic’s electricity supply.
Environmental footprintOne of our key priorities is to minimise our environmental footprint. Table 8 summarises the available information on our energy and water use, solid waste generation and business travel in 2017–18.
We occupy four floors of Export House, 22 Pitt Street, Sydney, and lease the remaining floors to tenants on standard commercial terms.
As of 30 June 2018, our building had a 4 star energy rating and a 3 star water rating under the National Australian Built Environment Rating System (NABERS).
OUR GOVERNING PRINCIPLES 47
OUR GOVERNING PRINCIPLES
including mini hydro, wind power, solar, biogas and biomass.
We continue to consider how to decrease waste generation and how to increase the proportion of waste we recycle.
Our employees flew 2.37 million kilometres during 2017–18. The majority of this travel was associated with due diligence and risk assessment of new transactions, or the management of existing transactions. Our travel kilometres, specifically from international travel, have decreased over the past three years, although domestic travel increased over the same period.
Indemnities and insuranceOur employees and Board members were indemnified during 2017–18, as were certain former employees and Board members, relating to liabilities and related legal costs incurred as officers of Efic. The scope of this indemnity is consistent with legislative requirements.
We also maintained and paid premiums for professional indemnity insurance and directors’ and officers’ liability insurance, including cover for certain legal costs. In total, we paid $135,822 in premiums during 2017–18. We did not pay out any amount in connection with Board member or employee indemnities during the year.
Judicial and administrative decisions and reviewsIn May 2018, the Minister sought a review by the Remuneration Tribunal of the remuneration of the Efic Board. The Tribunal, having considered the functions and responsibilities of the Board and comparable part-time officers of other similar Boards, supported an increase to the remuneration for all Efic Board members.
The Auditor-General provided his annual independent auditor’s report on our financial statements. The report was unmodified. This is discussed in the ‘Financial statements’ section on pages 85–149.
DIRECTIONS FROM THE MINISTERSection 9 Efic Act Under Section 9 of the Efic Act, the Minister can issue directions with respect to how we perform our functions or exercise our powers. We complied with each of the Section 9 directions referred to below during 2017–18.
During the year ended 30 June 2018, directions dated 4 July 2007 were in effect in relation to:
our continuing participation as part of the Australian Government’s negotiations in the Paris Club, the role of which is to find payment solutions for debtor nations
our compliance with Australia’s obligations under the OECD Arrangement on Officially Supported Export Credits
funding arrangements arising from the 2006 Efic Review.
National Housing Finance and Investment Corporation
On 8 May 2018, the Minister issued a direction under Section 9 of the Efic Act, instructing Efic to assist the Treasury in establishing and administering the National Housing Finance and Investment Corporation (NHFIC) and, upon its establishment, to assist NHFIC in its administration and operations, in accordance with Section 7(1)(dc) of the Efic Act.
Indigenous Entrepreneurs Capital Scheme
On 8 May 2018, the Minister issued a direction under Section 9 of the Efic Act, instructing Efic to assist the Department of the Prime Minister and Cabinet in establishing and managing the pilot Indigenous Entrepreneurs Capital Scheme, in accordance with Section 7(1)(dc) of the Efic Act.

48 EFIC ANNUAL REPORT 2017–2018
Uranium
A Section 9 direction in relation to uranium, dated 18 June 2014, was in effect during the year ended 30 June 2018. This direction states that Efic must not provide assistance for any transaction linked to uranium unless we are satisfied that any foreign countries relevant to the particular transaction:
are a party to the Treaty on the Non-Proliferation of Nuclear Weapons or have concluded a Nuclear Cooperation Agreement with Australia
have in force a safeguard agreement and an additional protocol on strengthened safeguards within the International Atomic Energy Agency.
We must also obtain a proliferation risk assessment from DFAT and be satisfied accordingly that the proliferation risk is acceptable.
Iran
A Section 9 direction in relation to trade with Iran, dated 15 February 2016, was in effect during the year ended 30 June 2018. This states that Efic shall resume facilitating and encouraging Australian export trade to Iran. However, we shall not provide services or perform functions in relation to a prohibited activity under the Autonomous Sanctions Regulations 2011 and the Charter of the United Nations (Sanctions – Iran) Regulations 2008.
Zimbabwe
A Section 9 direction in relation to Zimbabwe, dated 27 May 2009, was in effect during the year ended 30 June 2018. Under this direction:
all decisions regarding support for trade with, or investment in, Zimbabwe must be made by our Board
our Board must not approve any application prior to referring the matter to DFAT for determination
our Board must accept as decisive a determination by DFAT on the compliance or otherwise of an application with Australian autonomous sanctions in respect of Zimbabwe.
Democratic People’s Republic of Korea
A Section 9 direction in relation to the Democratic People’s Republic of Korea (DPRK), dated 19 July 2009, was in effect during the year ended 30 June 2018. This direction states that Efic must not:
accept an application from a person in respect of any transaction that relates to trade with, or investment in, the DPRK
provide any insurance or financial services or products or in any other way assist or facilitate any trade with, or investment in, the DPRK.
Australian Public Sector Workplace Bargaining Policy
A Section 9 direction in relation to new workplace bargaining arrangements for Commonwealth public sector employees, dated 26 May 2014, was in effect during the year ended 30 June 2018. This requires the adoption of the relevant policy covering the bargaining of new enterprise agreements across the Commonwealth public sector.
Cuba
A Section 9 direction relating to the 12 December 2015 Agreed Minutes between the Republic of Cuba and the Group of Creditors to Cuba, dated 22 March 2016, was in effect during the year ended 30 June 2018. This states that we are to exercise our powers and perform our functions in accordance with, and to give effect to, the parties’ agreement recorded in these Minutes.
Section 26 of the Efic Act Section 26 of the Efic Act permits the Minister to issue directions to us regarding circumstances in which applications are, or are not, to be referred to the Minister.
OUR GOVERNING PRINCIPLES 49
OUR GOVERNING PRINCIPLES
Defence Export Facility
On 15 January 2018, the Minister issued a Section 26 direction in relation to the Defence Export Facility. Under this direction, Efic must refer applications to the Minister – up to a maximum amount of US$3 billion over 10 years – that relate to the provision of financial support for Australian defence exports where:
Efic has identified a private finance market gap
we are unable to finance all or part of the transaction on our own Commercial Account
any necessary Defence Export Control export permit or in-principle approval has already been obtained
we have conducted due diligence for the application in the same manner as we would for a transaction on our own Commercial Account.
Section 29 of the Efic Act Section 29 of the Efic Act permits the Minister to issue directions to us regarding specified transactions on the National Interest Account. During the year ended 30 June 2018, a direction dated 4 July 2007 was in effect that set out facility terms for us to provide indemnities or guarantees up to an aggregate of $30 million in relation to contracts or proposed contracts.
Section 31 of the Efic Act Section 31 of the Efic Act permits the Minister to issue directions to us to reduce or reschedule any of our actual or contingent liability made under Part 5 (National Interest transactions) of the Efic Act. For more information, please refer to the ‘Financial matters’ section on page 56.
Section 55 of the Efic ActSection 55(2) of the Efic Act permits the Minister to issue directions to us regarding the payment of a dividend to the Commonwealth.
A dividend of $5.8 million was paid based on a direction from the Minister dated 19 September 2017 that 50% of the 2016–17 Commercial Account profit be paid as a dividend.
At the date of publication, the dividend for the year ended 30 June 2018 had not been determined.
Section 61A of the Efic ActSection 61A of the Efic Act permits the Minister to issue directions to us regarding the payment of a debt neutrality charge.
During the year ended 30 June 2018, a direction dated 18 June 2015 required Efic to pay a debt neutrality charge of 10 basis points on its cost of borrowing. The charge applies to new borrowings on all portfolios and existing debt that is rolled over or refinanced. The amount payable is $1.0 million.
Section 63A of the Efic ActSection 63A of the Efic Act permits the Minister to issue directions to us regarding tax equivalent payments. During the year ended 30 June 2018, a direction dated 18 June 2015 required Efic to pay a tax equivalent payment comprising:
a payment in lieu of Commonwealth income tax at 30% of accounting profits, and realised capital gains, with a capacity to carry forward any tax losses
a payment in lieu of NSW payroll tax levied on wages, allowance, bonuses, fringe benefits and superannuation, at rates and thresholds specified in the NSW Budget
a payment in lieu of NSW land tax, at rates and thresholds specified in the NSW Budget.
The amount payable in lieu of Commonwealth income tax is $5.9 million, the amount payable in lieu of NSW payroll tax is $0.9 million and the amount payable in lieu of NSW land tax is $0.3 million.

50 EFIC ANNUAL REPORT 2017–2018
Case studyExport Line of Credit
PIXIE ICE CREAMSWEET DEAL IN THE PACIFIC
“ Without Efic’s support it would be very difficult to grow and deliver on export contracts at the rate
that you can as a business. You do the
deal, you get these big contracts, but if you
can’t cashflow it you’re in big trouble.”
Justin ReisingerGlobal Business
Development ManagerPixie Ice Cream
Efic’s Export Line of Credit helped Toowoomba-based Pixie Ice Cream (Pixie) deliver on a significant export order into New Zealand.
Established in 1959, Pixie was Queensland’s alternative to the major brands of the day. Now with three generations of the family running the business, Pixie, the manufacturing arm of the business, has two well-known retail brands added to the mix – Home Ice Cream and Darling Downs Ice Cream Co. The business supports the local farming supply chain around Toowoomba.It only began exporting a couple of years ago: “We felt like we had a great product. We use fresh milk delivered daily from local farms around the Darling Downs, and we also have machine capacity,” said Justin Reisinger, Global Business Development Manager at Pixie.With exports growing in Asia, Pixie secured a significant contract a little closer to home. It was for a company in New Zealand and consisted of about 55, 40ft containers of ice cream. The high volume
represented a major uplift in Pixie’s production schedule.“The deal kept growing by the week and we realised that we needed funding to manage the cashflow. Barriers to entry are very minimal when you’re exporting to New Zealand. But an order of this size and volume adds real pressure on the business,” said Justin.Working with Pixie’s bank, Efic was able to provide a $1 million line of credit to help manufacture and deliver the New Zealand contract and support the business with other export deals over the year.“It was a very straightforward process when working with Efic. They were very supportive and worked with our bank as well. The bank saw it as a positive that Efic was coming in to support us. They thought it was great.
“Without Efic’s support it would be very difficult to grow and deliver on export contracts at the rate that you can as a business. You do the deal, you get these big contracts, but if you can’t cashflow it you’re in big trouble,” said Justin.
OUR RISK MANAGEMENT FRAMEWORK 51
OUR RISK MANAGEMENT FRAMEWORK
Our risk management framework
Risk management is a vital part of our business. We have developed an enterprise-wide Risk Management Framework that defines our core principles and the types of risks we face. Our Risk Management Framework is available on our website.
Our approach to risk management involves ensuring that the level and quality of capital is appropriate for our risk profile. Our Risk Appetite Statement* details our risk tolerance and sets appropriate limits on the risks we are willing to take.
We also operate based on a Risk Control Matrix.* This sets out each individual risk we face, as well as mitigation measures and the people responsible for managing certain risks. It also rates the likelihood and consequences of each risk event.
We review the Risk Control Matrix regularly to add new risks or identify changes to existing risks. This approach engenders a culture of risk awareness across our organisation.
Types of risks
REPUTATION RISK
STRATEGIC RISK
CREDIT RISK
COUNTRY RISK
MARKET RISK
OPERATIONAL ANDFINANCIAL RISK
Oversight of risk managementOur Risk Appetite Statement incorporates quantitative and qualitative measures to ensure effective monitoring and governance. Risk policies, tolerances and operational limits are set by our Board, the PGPA Act, and the Efic Act and Regulations.
These comprehensive arrangements highlight our commitment to continuously improving our risk management practices. Assessing and underwriting risk is central to our Risk Management Framework. All transactions we underwrite are reviewed by our Board, or by management as delegated by the Board. Country-related economic and political risks are assessed by a team of experts.
* Due to their commercial sensitivity, these documents are not made public.

52 EFIC ANNUAL REPORT 2017–2018
CORE PRINCIPLESOur risk management is built on a strong foundation.
ROLES AND RESPONSIBILITIESOur Board is responsible for setting the organisation’s risk strategy, including our risk appetite and tolerances.
The Board’s Audit Committee oversees all aspects of risk management and internal control. This includes reviewing our compliance activity, financial reporting and performance reporting; our audit program; and the adequacy of our accounting policies and procedures.
Our executive and senior management teams, led by our Managing Director and CEO, implement the Board’s risk strategy. This involves developing policies,
processes, procedures and controls to identify and manage risks across all our areas of activity, on a daily basis.
The Board also engages an independent auditor to review our risk management and internal controls. This service provider, currently Deloitte, reports to our Board via the Board Audit Committee and the executive team. It enjoys full access to our employees and company data when conducting these reviews.
The Australian National Audit Office and its appointed agent, currently KPMG, perform an independent review of our financial statements.
A commitment to our shared purpose, principles, values and Code of Conduct, all of which we review and renew periodically.
Strong policies and procedures, supported by robust systems and processes.
Strategies to recruit, develop and retain employees who have the required specialist skills.
Clear lines of responsibility and accountability for achieving set outcomes.
Rigorous control processes, including management reporting, supported by Board oversight and independent review.
A culture that anticipates and mitigates risks before they occur, and always seeks to learn and improve.
OUR RISK MANAGEMENT FRAMEWORK 53
OUR RISK MANAGEMENT FRAMEWORK
Role of committeesThe following internal committees support our risk management processes:
Credit Committee Examines large potential transactions Chaired by the Chief Credit Officer
Risk and Compliance Committee Examines, monitors and regulates
compliance risks Chaired by the Chief Risk Officer
Treasury Risk Review Committee Examines Treasury activities, limits, noteworthy
transactions and current issues Chaired by the Treasurer
Work Health and Safety Committee Examines all workplace risks and reports any
hazards or safety problems that may cause harm or injury to employees, contractors and visitors
Chaired by the Chief Operating Officer
CAPITAL MANAGEMENTOur Board is required to ensure that Efic’s capital and reserves at any time are sufficient, according to sound commercial principles, under Section 56 of the Efic Act. We are required to maintain sufficient capital and reserves to meet our likely liabilities and provide for the possibility of loan defaults.
The approach we apply is to set our own standards by drawing on the prudential standards set by the Australian Prudential Regulation Authority (APRA) and the Bank for International Settlements through the Basel Committee on Banking Supervision (Basel Committee).
The requirement to hold sufficient capital and reserves only relates to our Commercial Account activities. We hold no capital against the National Interest Account exposures, as the Australian Government bears these risks. For more information on our capital adequacy, see Note 21 of the ‘Financial statements’ section on pages 142–145.
CAPITAL ADEQUACYOur approach to assessing our organisation’s capital adequacy includes calculating two different capital adequacy ratios (see box below). The Board uses actual capital available (cash and callable) to set the risk tolerances for our counterparty and country exposure limits.
However, the Board also looks beyond capital adequacy ratios to determine the amount of capital required to prudently manage our business. Large exposures, concentration risks and potential currency movements all arise as a natural consequence of providing financing in a particular country or industry sector where the private market will not or cannot. These factors affect our business and necessitate the presence of extra capital as a buffer.
As of 30 June 2018, we had a cash capital balance of $474.5 million, comprising retained earnings, reserves and contributed equity. Our capital base also includes $200 million of callable (non-cash) capital.
Risk weighted assets remained stable over the year at $2.7 billion. Our capital adequacy ratio, including callable capital, is 25% (25.2% in 2017) and 17.6% (17.6% in 2017) on a cash capital basis. We have always maintained a buffer above the minimum 8% to reflect our risk concentrations and the counter-cyclical nature of our business.
Capital adequacy ratios
One capital adequacy ratio compares the amount of mandatory capital required by regulators – APRA and the Basel Committee – against the actual capital available (cash and callable). We add an allowance for concentration risk to regulatory capital to provide a proxy for economic capital. The latter denotes the best estimate of required capital that financial institutions use internally to manage their own risk.
The other capital adequacy ratio compares actual capital available with risk weighted assets (RWA). The Board requires cash capital to RWA to be higher than 8%; and higher than 16% if callable capital is included.

54 EFIC ANNUAL REPORT 2017–2018
LARGE EXPOSURESWe model our large exposure policy on the Basel and APRA guidelines. Australian banks are required to consult with APRA before committing to any aggregate exposures to non-government, non-bank counterparties exceeding 10% of their capital base.
APRA has also indicated a maximum exposure per non-bank counterparty (or related group of counterparties) of 25% of capital, but has emphasised that this is an upper limit. Only better-rated risks would be contemplated for these levels of exposures.
Our Board allows a small tolerance above these limits for foreign exchange movements, given the majority of our large exposures are in foreign currency against an Australian dollar capital base. The Board is also prepared to consider exceptional cases.
Under current delegations our Board must approve all transactions that involve commitments valued at over $50 million.
ALLOWANCES FOR RISKSAllowance for credit riskWhile it is never possible to know in advance the losses a financial institution will suffer in a particular year, we can forecast the average level of credit losses it can reasonably expect to experience. The Basel guidelines refer to such losses as ‘expected losses’.
Our approach is to take credit risk into account in the fair value calculation of all credit exposures, both on and off the balance sheet. We assess this in light of the expected losses over the life of facilities. Our current model takes into account the magnitude and nature of the exposures, their risk grading, the type of exposure and the maturity of the risk.
Periodically, we review our methodology and results against independent market sources to ensure consistency. When it is likely that a loan or debt will not be recovered in full due to a specific event, we do not use the model and instead determine an appropriate amount to set aside for expected loss. The allowance for credit risk also provides for possible loan defaults and potential claims in relation to off-balance-sheet facilities, such as export finance guarantees.
We do not make any collective provision for losses on National Interest Account facilities, as the Commonwealth reimburses us for such losses.
Allowance for derivative riskIt is standard practice within financial markets to value the credit risk component of derivative transactions. Different counterparties may value the same transaction differently, giving rise to valuation risk. Each year, we consult our external auditors on how to value our derivative exposures to recognise both credit and valuation risk. Valuation risk is calculated on all cross-currency transactions.
Residual marginWhen we value our loans and guarantees on a fair-value basis, we use a discounted cash flow methodology to calculate a valuation on day one for that particular transaction. The difference between the cash flow on day one and the net present value of the income stream (including an allowance for credit risk adjustment on that transaction) is termed ‘residual margin’. This includes other risk factors such as servicing costs and prepayment risk.
When these factors are included in the valuation, the day one profit equates to zero. The residual margin is then recognised over the life of the transaction.

OUR TREASURY 55
OUR TREASURY
Our Treasury
ACTIVITIESThe core function of our Treasury unit is to prudently raise funding at competitive rates. Treasury also manages the investment of our capital and reserves, as well as our other investment and liquidity portfolios.
These activities are carried out within a control framework approved by our Board and compliant with the Efic Act, the PGPA Act and associated approvals required by the Australian Government.
Our Treasury operates according to the following key principles:
we aim to minimise the cost of funding our loan assets for the Commercial Account and the National Interest Account
we seek to maximise the return on our investments, including funds that represent our equity, cash reserves and working capital
in transacting on wholesale markets, our Treasury unit manages credit risk within Board and management-approved limits, and does not trade speculatively
we use derivative products to minimise currency and interest rate risks.
See Note 19 of the ‘Financial statements’ section on pages 115–135 for further details about our financial exposure.
Handling currency exposureOur loans and rescheduled debts are mostly denominated in foreign currencies. As of 30 June 2018, 81.5% of our loans were denominated in US dollars and 3.5% were in Euros. Generally speaking, we convert income and expenses to Australian dollars when we receive or pay them.
Any currency exposure is subject to a Board-approved limit. To protect our assets and liabilities, we borrow in the same currency as our assets. Alternatively, we borrow in another currency and use cross-currency swaps and other foreign exchange instruments to manage currency risks. We also use interest rate swaps and forward rate agreements to substantially match the interest rate profiles of our liabilities with those of our loans.
Foreign exchange rates do affect our fair-value calculations, including the allowance for credit risk on the Commercial Account. This is because we do not hedge future income and expenses that are expected to be received and paid in foreign currencies.

56 EFIC ANNUAL REPORT 2017–2018
BORROWINGSWe borrow money to fund loans to exporters or buyers of Australian exports from either the Commercial Account or the National Interest Account.
Retaining this additional funding capacity is necessary to cover the possibility of borrower defaults. It also ensures we can pay our contingent liabilities, such as when banks call in our export finance guarantees.
We maintain a diversified funding capability with spare capacity. This ensures we have the strength and flexibility to accommodate financial market disruption, and enables us to pursue a range of pricing and risk management strategies.
The main borrowing instruments we currently use are medium-term notes issued in the capital markets, and Euro Commercial Paper.
We are authorised to raise funds from our approved commercial paper borrowing facility in advance of our loan funding needs. Our funding activity in 2017–18 included issuing short-term Euro Commercial Paper in Euros and US dollars, and short-term direct loans from banks. We also issued a A$130 million 10.5-year fixed rate bond, the proceeds of which were swapped into US dollars. We are generally able to borrow US dollars at margins below the benchmark London Inter-Bank Offered Rate (LIBOR).
INVESTMENTS AND LIQUIDITYThe investment approval issued by the Finance Minister under the PGPA Act requires our Treasury investments to be in entities rated AA– or better, or authorised deposit-taking institutions rated BBB– or better.
As at 30 June 2018, the face value of our investment and liquidity holdings on the Commercial Account was $1,246.9 million, comprising cash, bank deposits and investment securities. Of this amount:
$477.5 million represented cash capital and reserves
the remaining $769.4 million represented liquidity being held to maintain a minimum market presence, to reduce collateral posting risk or to refinance borrowings.
Our Treasury unit’s investments are treated from an accounting perspective as ‘available for sale’ and must be accounted for at fair market value. Any gains or losses are reflected through equity, not profit and loss. While our policy is to hold our investments to maturity, we can sell them if necessary.
FINANCIAL MATTERSRescheduling and debt forgivenessEfic has rescheduled debts owed by the Indonesian, Cuban and Iraqi governments in recent years. This has occurred pursuant to the Paris Club, a group of government creditors charged with finding coordinated and sustainable solutions to debtor nations’ payment difficulties. As at 30 June 2018, all previously rescheduled amounts had been paid on time, in line with various rescheduling agreements.
Indonesia
As at 30 June 2018, our rescheduled loans to the Indonesian Government were valued at $77.3 million on the National Interest Account and $2.9 million on the Commercial Account. The National Interest Account loans were predominantly loans supported by aid grants and approved under the now-discontinued Development Import Finance Facility. These loans have various maturities; the longest requires a final repayment in 2021. As at 30 June 2018, all rescheduled amounts had been paid on time, as set out in the rescheduling agreements.
On 8 July 2010, then Minister for Foreign Affairs and Trade issued a direction under Section 31 of the Efic Act requiring us to cancel up to $75 million in debt service owed by Indonesia. The final amount of $7.6 million was cancelled in 2017, which completed the debt forgiveness program.

OUR TREASURY 57
OUR TREASURY
Iraq
Between 1987 and 1992, we paid credit insurance claims, mostly from the National Interest Account, regarding non-payment by the Iraqi Government for exports from Australia.
These credit insurance claims were expensed as paid. The prevailing situation in Iraq following the claim payments had prevented us and the Australian Government from pursuing the recovery of this money. After the passage of United Nations Security Council Resolution 1546 and transfer of full sovereignty to the interim Iraqi Government, the Paris Club restructured the country’s external debt.
The Paris Club agreed to provide Iraq with 80% debt forgiveness in three stages. In May 2006, we signed a bilateral agreement with Iraq, which triggered 60% forgiveness under stages one and two of the debt-relief package. The third and final 20% stage of debt forgiveness was made in accordance with the last International Monetary Fund (IMF) Board review of Iraq’s three-year IMF Program, in December 2008. The remaining principal debt is to be repaid over 17 years until January 2028.
The rescheduled debt balance at 30 June 2018 is US$0.4 million on the Commercial Account and US$124.5 million on the National Interest Account. As at 30 June 2018, all rescheduled amounts have been paid on time as per the rescheduling agreements.
However, the current situation in Iraq and the continuing deterioration in the economic environment were assessed as posing a real threat to the reliability of future payments. Accordingly, in consultation with DFAT, we retain a 100% provision for impairment against the rescheduled debt.
Future payments from Iraq will only be recognised as income on receipt and booked as a recovery, consistent with current practice. Recoveries made during the year under this agreement resulted in $19.4 million taken up as income during 2017–18, on the National Interest Account.
Cuba
In the mid-1980s, we issued four National Interest Account loans to Banco Nacional de Cuba to support the sale of sugar cultivation and harvesting equipment. In December 2015, the Paris Club’s ‘Group of Creditors of Cuba’, which included Australia, agreed with Havana the terms upon which Cuba’s outstanding debt would be rescheduled. We executed a bilateral agreement with Cuba in late May 2016 on terms consistent with those established by the Paris Club creditors. The debt is to be repaid over 18 years. We received $0.2 million during 2017–18. The loans have had a 100% provision in place since the payments ceased, and this is maintained at 30 June 2018.
DIVIDENDSSection 55 of the Efic Act requires our Board to recommend in writing to the Minister that Efic pay a specified dividend, or not pay a dividend, to the Commonwealth for that financial year.
The Minister then either approves the recommendation or directs that we pay a different dividend.
We paid a dividend of $5.8 million in December 2017, based on a recommendation from the Board that 50% of the 2016–17 Commercial Account profit be paid as a dividend.
At the date of publication, the dividend for the year ended 30 June 2018 had not been determined.

58 EFIC ANNUAL REPORT 2017–2018
Table of facilities
Exporter/ investor/client
Industry of export
Goods/ services
Export destination
Integral to supply chain
Products/ transactions
Number of facilities
Amount ($A million equivalent)
Environmental/ social impact category (a)
3C Enterprise Holdings Ltd
Professional, Scientific and Technical Services
Professional, Scientific and Technical Services
Indonesia ELOC 1 0.25Low potential – note 3
A1 Dental Installations Pty Ltd
Professional, Scientific and Technical Services
Management and Related Consulting Services
India SBEL 1 0.16Low potential – note 3
A1 Dental Installations Pty Ltd
Professional, Scientific and Technical Services
Management and Related Consulting Services
India SBEL 1 0.10Low potential – note 3
ADB – Bank for Investment and Development of Vietnam (BIDV)
Wholesale TradeAgricultural Product Wholesaling
Vietnam RPA Existing facility 0.09
Low potential – note 2
ADB – Bank for Investment and Development of Vietnam (BIDV)
Wholesale TradeMineral, Metal and Chemical Wholesaling
Vietnam RPA 1 1.65Low potential – note 2
ADB – National Bank of Pakistan Wholesale Trade
Agricultural Product Wholesaling
Pakistan RPA Existing facility 0.09
Low potential – note 2
ADB – Vietnam Technological and Commercial Joint Stock Bank (Techcombank)
Wholesale TradeAgricultural Product Wholesaling
Vietnam RPA Existing facility 6.31
Low potential – note 2
ADB – Vietnam Technological and Commercial Joint Stock Bank (Techcombank)
Wholesale TradeAgricultural Product Wholesaling
Vietnam RPA Existing facility 1.17
Low potential – note 2
Allied Metal Recyclers Pty Ltd Wholesale Trade
Basic Non-Ferrous Metal Product Manufacturing
Australia Y EWCG Existing facility 0.50
Low potential – note 1
Altmore International Pty Ltd
Education and Training
Adult, Community and Other Education
China SBEL 1 0.35Low potential – note 3
AQ1 Systems Pty Ltd Manufacturing
Computer and Electronic Equipment Manufacturing
Ecuador SBEL 1 0.35Low potential – note 3
TABLE 9: Table of facilities

TABLE OF FACILITIES 59
TABLE OF FACILITIES
Exporter/ investor/client
Industry of export
Goods/ services
Export destination
Integral to supply chain
Products/ transactions
Number of facilities
Amount ($A million equivalent)
Environmental/ social impact category (a)
Aquatic Leisure Technologies Pty Ltd Manufacturing Polymer Product
ManufacturingNew Zealand SBEL 1 0.35
Low potential – note 3
Arterial Design Pty LtdProfessional, Scientific and Technical Services
Architectural, Engineering and Technical Services
Australia Y SBEL 1 0.12Low potential – note 3
Atkins Family Vineyards Pty Ltd Manufacturing Beverage
ManufacturingUnited Kingdom SBEL 1 0.12
Low potential – note 3
Atlantic (Aust) Pty Ltd MiningHeavy and Civil Engineering Construction
Australia Y Bond 1 1.32Low potential – note 1
Atlantic (Aust) Pty Ltd MiningHeavy and Civil Engineering Construction
Australia Y Bond Existing facility 1.32
Low potential – note 1
Aushang International Pty Ltd Wholesale Trade
Timber and Hardware Goods Wholesaling
China ELOC 1 0.98Low potential – note 1
Austin Wright Global Food Service Consultants Pty Ltd, trading as Global Hospitality Group
Accommodation and Food Services
Cafes, Restaurants and Takeaway Food Services
Taiwan Bond Existing facility 0.63
Low potential – note 1
Austin Wright Global Food Service Consultants Pty Ltd, trading as Global Hospitality Group
Accommodation and Food Services
Cafes, Restaurants and Takeaway Food Services
Taiwan ECL 1 0.25Low potential – note 1
Australian Beverage Contract Filling Pty Ltd Manufacturing Beverage
ManufacturingNew Zealand SBEL 1 0.11
Low potential – note 3
Australian Beverage Contract Filling Pty Ltd Manufacturing Beverage
ManufacturingNew Zealand SBEL 1 0.23
Low potential – note 3
Australian Beverage Contract Filling Pty Ltd Manufacturing Beverage
ManufacturingNew Zealand SBEL 1 0.04
Low potential – note 3

60 EFIC ANNUAL REPORT 2017–2018
Exporter/ investor/client
Industry of export
Goods/ services
Export destination
Integral to supply chain
Products/ transactions
Number of facilities
Amount ($A million equivalent)
Environmental/ social impact category (a)
Australian Business School Pty Limited
Education and Training
Adult, Community and Other Education
Philippines SBEL 1 0.08Low potential – note 3
Australian Mustard Oil Pty Ltd Manufacturing Oil and Fat
Manufacturing Japan ECL 1 0.41Low potential – note 1
Australian Organic Honey Company Pty Ltd
Manufacturing Food Product Manufacturing Various ELOC 1 0.30
Low potential – note 1
Austwine Viticulture Pty Ltd Wholesale Trade Beverage
Manufacturing Australia Y ECL 1 1.00Low potential – note 1
Ausworks (WA) Pty Ltd Education and Training
Adult, Community and Other Education
Singapore SBEL 1 0.30Low potential – note 3
Balance Utility Solutions Pty Ltd
Professional, Scientific and Technical Services
Architectural, Engineering and Technical Services
Micronesia Bond Existing facility 0.12
Low potential – note 1
Balance Utility Solutions Pty Ltd
Professional, Scientific and Technical Services
Architectural, Engineering and Technical Services
Micronesia Bond 1 0.94Low potential – note 1
Balance Utility Solutions Pty Ltd
Professional, Scientific and Technical Services
Architectural, Engineering and Technical Services
Micronesia Bond Existing facility 0.34
Low potential – note 1
Balance Utility Solutions Pty Ltd
Professional, Scientific and Technical Services
Architectural, Engineering and Technical Services
Micronesia Bond Existing facility 0.01
Low potential – note 1
BALTEC IES Pty LtdProfessional, Scientific and Technical Services
Architectural, Engineering and Technical Services
Vietnam Bond 1 0.12Low potential – note 1
BALTEC IES Pty LtdProfessional, Scientific and Technical Services
Architectural, Engineering and Technical Services
Vietnam Bond Existing facility 0.24
Low potential – note 1

TABLE OF FACILITIES 61
TABLE OF FACILITIES
Exporter/ investor/client
Industry of export
Goods/ services
Export destination
Integral to supply chain
Products/ transactions
Number of facilities
Amount ($A million equivalent)
Environmental/ social impact category (a)
Blaq Pty Ltd Manufacturing
Cleaning Compound and Toiletry Preparation Manufacturing
United States SBEL 1 0.25
Low potential – note 3
Blue Vault Digital Pty Ltd
Professional, Scientific and Technical Services
Computer System Design and Related Services
United States SBEL 1 0.14
Low potential – note 3
Boost Media Holdings Pty Ltd
Information Media and Tele-communications
Information Services Various EWCG-R 1 1.50
Low potential – note 1
Borghesi & Adam Publishers Pty Ltd
Information Media and Tele-communications
Newspaper, Periodical, Book and Directory Publishing
Various SBEL 1 0.03Low potential – note 1
Bottles Of Australia Pty Limited Manufacturing Polymer Product
Manufacturing Germany SBEL 1 0.09Low potential – note 3
Broadsource Australia Pty Ltd
Professional, Scientific and Technical Services
Computer System Design and Related Services
Various ELOC 1 0.10Low potential – note 1
Bycroft Consulting Pty Ltd
Professional, Scientific and Technical Services
Management and Related Consulting Services
Canada SBEL 1 0.25Low potential – note 3
Byrnecut Offshore Pty Ltd Mining Mining Support
ServicesSaudi Arabia Loan 1 9.94
Potential impacts - note 1
Byron Origins Pty Ltd Wholesale TradePharmaceutical and Toiletry Goods Wholesaling
Malaysia SBEL 1 0.03Low potential – note 3
Calix LimitedProfessional, Scientific and Technical Services
Architectural, Engineering and Technical Services
Belgium ECL 1 5.26 Category C
Can Ellgee Pty Ltd ConstructionHeavy and Civil Engineering Construction
Australia Y SBEL 1 0.09Low potential – note 3
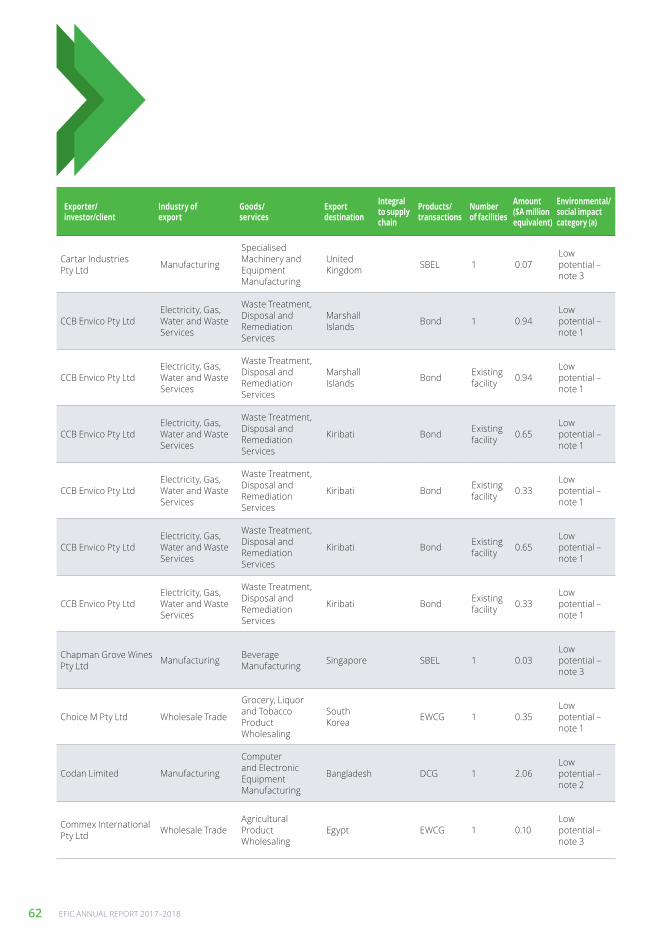
62 EFIC ANNUAL REPORT 2017–2018
Exporter/ investor/client
Industry of export
Goods/ services
Export destination
Integral to supply chain
Products/ transactions
Number of facilities
Amount ($A million equivalent)
Environmental/ social impact category (a)
Cartar Industries Pty Ltd Manufacturing
Specialised Machinery and Equipment Manufacturing
United Kingdom SBEL 1 0.07
Low potential – note 3
CCB Envico Pty LtdElectricity, Gas, Water and Waste Services
Waste Treatment, Disposal and Remediation Services
Marshall Islands Bond 1 0.94
Low potential – note 1
CCB Envico Pty LtdElectricity, Gas, Water and Waste Services
Waste Treatment, Disposal and Remediation Services
Marshall Islands Bond Existing
facility 0.94Low potential – note 1
CCB Envico Pty LtdElectricity, Gas, Water and Waste Services
Waste Treatment, Disposal and Remediation Services
Kiribati Bond Existing facility 0.65
Low potential – note 1
CCB Envico Pty LtdElectricity, Gas, Water and Waste Services
Waste Treatment, Disposal and Remediation Services
Kiribati Bond Existing facility 0.33
Low potential – note 1
CCB Envico Pty LtdElectricity, Gas, Water and Waste Services
Waste Treatment, Disposal and Remediation Services
Kiribati Bond Existing facility 0.65
Low potential – note 1
CCB Envico Pty LtdElectricity, Gas, Water and Waste Services
Waste Treatment, Disposal and Remediation Services
Kiribati Bond Existing facility 0.33
Low potential – note 1
Chapman Grove Wines Pty Ltd Manufacturing Beverage
Manufacturing Singapore SBEL 1 0.03Low potential – note 3
Choice M Pty Ltd Wholesale Trade
Grocery, Liquor and Tobacco Product Wholesaling
South Korea EWCG 1 0.35
Low potential – note 1
Codan Limited Manufacturing
Computer and Electronic Equipment Manufacturing
Bangladesh DCG 1 2.06Low potential – note 2
Commex International Pty Ltd Wholesale Trade
Agricultural Product Wholesaling
Egypt EWCG 1 0.10Low potential – note 3
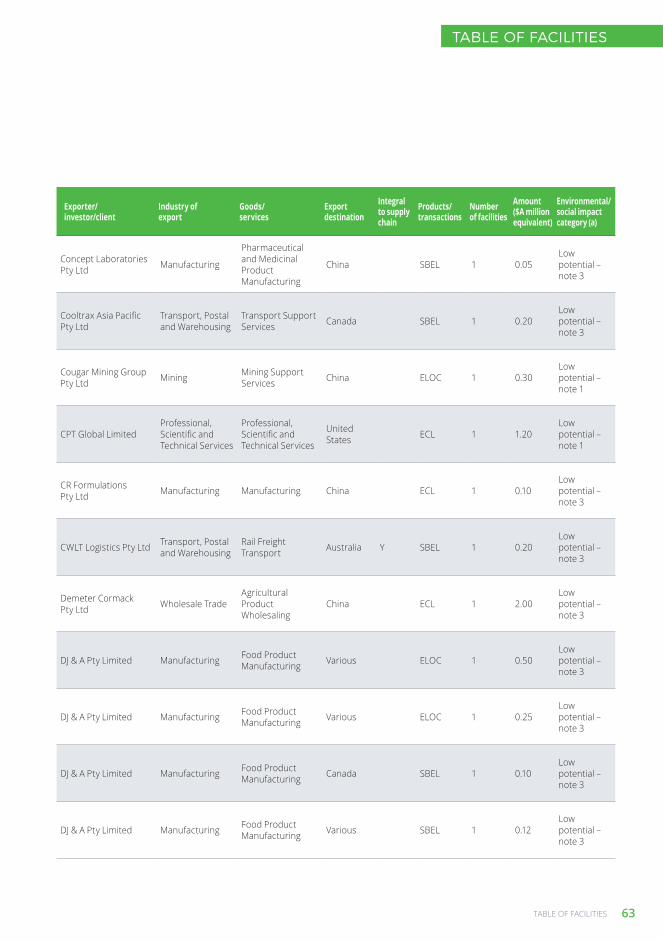
TABLE OF FACILITIES 63
TABLE OF FACILITIES
Exporter/ investor/client
Industry of export
Goods/ services
Export destination
Integral to supply chain
Products/ transactions
Number of facilities
Amount ($A million equivalent)
Environmental/ social impact category (a)
Concept Laboratories Pty Ltd Manufacturing
Pharmaceutical and Medicinal Product Manufacturing
China SBEL 1 0.05Low potential – note 3
Cooltrax Asia Pacific Pty Ltd
Transport, Postal and Warehousing
Transport Support Services Canada SBEL 1 0.20
Low potential – note 3
Cougar Mining Group Pty Ltd Mining Mining Support
Services China ELOC 1 0.30Low potential – note 1
CPT Global LimitedProfessional, Scientific and Technical Services
Professional, Scientific and Technical Services
United States ECL 1 1.20
Low potential – note 1
CR Formulations Pty Ltd Manufacturing Manufacturing China ECL 1 0.10
Low potential – note 3
CWLT Logistics Pty Ltd Transport, Postal and Warehousing
Rail Freight Transport Australia Y SBEL 1 0.20
Low potential – note 3
Demeter Cormack Pty Ltd Wholesale Trade
Agricultural Product Wholesaling
China ECL 1 2.00Low potential – note 3
DJ & A Pty Limited Manufacturing Food Product Manufacturing Various ELOC 1 0.50
Low potential – note 3
DJ & A Pty Limited Manufacturing Food Product Manufacturing Various ELOC 1 0.25
Low potential – note 3
DJ & A Pty Limited Manufacturing Food Product Manufacturing Canada SBEL 1 0.10
Low potential – note 3
DJ & A Pty Limited Manufacturing Food Product Manufacturing Various SBEL 1 0.12
Low potential – note 3

64 EFIC ANNUAL REPORT 2017–2018
Exporter/ investor/client
Industry of export
Goods/ services
Export destination
Integral to supply chain
Products/ transactions
Number of facilities
Amount ($A million equivalent)
Environmental/ social impact category (a)
Doncaster Australia Pty Ltd Wholesale Trade
Grocery, Liquor and Tobacco Product Wholesaling
Various ELOC 1 0.19Low potential – note 3
Doncaster Australia Pty Ltd Manufacturing Food Product
Manufacturing China SBEL 1 0.13Low potential – note 3
Elenium Automation Pty Ltd Manufacturing
Computer and Electronic Equipment Manufacturing
Various ELOC 1 0.25Low potential – note 3
Ellery Land Pty Limited ManufacturingClothing and Footwear Manufacturing
Various ECL 1 0.60Potential impacts - note 1
Enertion Boards Pty Ltd Manufacturing
Transport Equipment Manufacturing
United States SBEL 1 0.05
Low potential – note 3
EOS Defence Systems Pty Ltd Manufacturing
Specialised Machinery and Equipment Manufacturing
- Bond 1 41.57Low potential – note 1
Epichem Pty Ltd Manufacturing
Pharmaceutical and Medicinal Product Manufacturing
Various ECL 1 0.47Low potential – note 1
Evolution Systems For Training & Development Pty Ltd
Education and Training Tertiary Education Indonesia SBEL 1 0.03
Low potential – note 3
FCT Holdings Pty LtdProfessional, Scientific and Technical Services
Architectural, Engineering and Technical Services
China Bond 1 0.62Low potential – note 3
FCT Holdings Pty LtdProfessional, Scientific and Technical Services
Architectural, Engineering and Technical Services
China Bond Existing facility 0.25
Low potential – note 3
FCT Holdings Pty LtdProfessional, Scientific and Technical Services
Architectural, Engineering and Technical Services
Qatar ECL 1 0.90Potential impacts - note 1

TABLE OF FACILITIES 65
TABLE OF FACILITIES
Exporter/ investor/client
Industry of export
Goods/ services
Export destination
Integral to supply chain
Products/ transactions
Number of facilities
Amount ($A million equivalent)
Environmental/ social impact category (a)
FCT Holdings Pty LtdProfessional, Scientific and Technical Services
Architectural, Engineering and Technical Services
Qatar Bond Existing facility 0.36
Potential impacts - note 1
FCT Holdings Pty LtdProfessional, Scientific and Technical Services
Architectural, Engineering and Technical Services
Qatar Bond 1 0.36Potential impacts - note 1
FCT Holdings Pty LtdProfessional, Scientific and Technical Services
Architectural, Engineering and Technical Services
Malaysia Bond Existing facility 0.03
Low potential – note 1
FCT Holdings Pty LtdProfessional, Scientific and Technical Services
Architectural, Engineering and Technical Services
Malaysia Bond Existing facility 0.06
Low potential – note 1
FCT Holdings Pty LtdProfessional, Scientific and Technical Services
Architectural, Engineering and Technical Services
Turkey Bond Existing facility 0.38
Low potential – note 1
FCT Holdings Pty LtdProfessional, Scientific and Technical Services
Architectural, Engineering and Technical Services
Turkey Bond Existing facility 0.28
Low potential – note 1
FCT Holdings Pty LtdProfessional, Scientific and Technical Services
Architectural, Engineering and Technical Services
Algeria Bond Existing facility 0.17
Low potential – note 1
Ferguson Australia Pty Ltd Wholesale Trade
Grocery, Liquor and Tobacco Product Wholesaling
Various ECL 1 2.00Low potential – note 1
Fin Design and Effects Pty Ltd
Information Media and Tele-communications
Motion Picture and Video Activities China SBEL 1 0.12
Low potential – note 3
Finnigan Investments (Aust) Pty Limited
Information Media and Tele-communications
Internet Publishing and Broadcasting
United States ELOC 1 0.50
Low potential – note 1
Fortun8 International Trading Co Pty Limited Wholesale Trade
Grocery, Liquor and Tobacco Product Wholesaling
China SBEL 1 0.09Low potential – note 3

66 EFIC ANNUAL REPORT 2017–2018
Exporter/ investor/client
Industry of export
Goods/ services
Export destination
Integral to supply chain
Products/ transactions
Number of facilities
Amount ($A million equivalent)
Environmental/ social impact category (a)
Fridum Holdings Pty Ltd
Financial and Insurance Services
Auxiliary Finance and Investment Services
Various ECL 1 1.59Low potential – note 1
Gasco Pty Ltd ManufacturingMachinery and Equipment Manufacturing
United States Bond Existing
facility 0.47Low potential – note 1
Gasco Pty Ltd ManufacturingMachinery and Equipment Manufacturing
Egypt Bond 1 0.12Low potential – note 1
Gasco Pty Ltd ManufacturingMachinery and Equipment Manufacturing
Egypt Bond Existing facility 0.48
Low potential – note 1
GD Pork Pty Ltd Wholesale Trade Livestock Farming Australia Y ECL 1 1.10Low potential – note 1
Gentle Folk Wine Pty Ltd Wholesale Trade
Grocery, Liquor and Tobacco Product Wholesaling
Various Y SBEL 1 0.07Low potential – note 3
Geoscan Pty Ltd Mining Mining Support Services Chile SBEL 1 0.35
Low potential – note 3
Geovert Ground Engineering Pty Ltd Construction
Heavy and Civil Engineering Construction
United States Bond 1 0.53
Low potential – note 1
Gold Peg International Pty Limited Manufacturing
Specialised Machinery and Equipment Manufacturing
New Zealand Bond Existing
facility 0.07Low potential – note 1
Gold Peg International Pty Limited Manufacturing
Specialised Machinery and Equipment Manufacturing
Vietnam Bond 1 0.30Low potential – note 1
Grinding Equipment & Reline Support Pty Ltd
Professional, Scientific and Technical Services
Architectural, Engineering and Technical Services
Ghana ECL 1 0.15Low potential – note 1

TABLE OF FACILITIES 67
TABLE OF FACILITIES
Exporter/ investor/client
Industry of export
Goods/ services
Export destination
Integral to supply chain
Products/ transactions
Number of facilities
Amount ($A million equivalent)
Environmental/ social impact category (a)
Heirloom Vineyards Pty Ltd Manufacturing Beverage
Manufacturing Various SBEL 1 0.25Low potential – note 3
Heirloom Vineyards Pty Ltd Manufacturing Beverage
Manufacturing Various SBEL 1 0.25Low potential – note 3
Her the Label Pty Ltd Wholesale TradeTextile, Clothing and Footwear Wholesaling
Various SBEL 1 0.02Low potential – note 3
Her the Label Pty Ltd Wholesale TradeTextile, Clothing and Footwear Wholesaling
United States SBEL 1 0.02
Low potential – note 3
Industree Group Pty Ltd Wholesale Trade
Textile, Clothing and Footwear Wholesaling
Papua New Guinea SBEL 1 0.35
Low potential – note 3
Inflatable Packers International Pty Ltd Manufacturing
Specialised Machinery and Equipment Manufacturing
Various SBEL 1 0.19Low potential – note 3
InnovAero Pty LtdProfessional, Scientific and Technical Services
Architectural, Engineering and Technical Services
Australia Y ECL 1 1.30Low potential – note 1
Integrated Meat Solutions Pty Ltd Wholesale Trade
Grocery, Liquor and Tobacco Product Wholesaling
Various SBEL 1 0.30Low potential – note 3
Iris Practice Pty Ltd Manufacturing Manufacturing United States SBEL 1 0.05
Low potential – note 3
iVolve Pty LimitedInformation Media and Tele-communications
Data Processing, Web Hosting and Electronic Information Storage
United States ECL 1 0.30
Low potential – note 3
Laffers Lane Wine Pty Ltd Wholesale Trade
Grocery, Liquor and Tobacco Product Wholesaling
Various Y SBEL 1 0.11Low potential – note 3

68 EFIC ANNUAL REPORT 2017–2018
Exporter/ investor/client
Industry of export
Goods/ services
Export destination
Integral to supply chain
Products/ transactions
Number of facilities
Amount ($A million equivalent)
Environmental/ social impact category (a)
Latorre & Dutch Coffee Traders Pty Ltd Wholesale Trade
Agricultural Product Wholesaling
Various EWCG 1 0.50Low potential – note 1
Lee Mathews Workroom Pty Ltd ATF Mathews Family Trust
ManufacturingClothing and Footwear Manufacturing
Various SBEL 1 0.17Low potential – note 3
Leighton O’Brien Global Pty Ltd
Professional, Scientific and Technical Services
Architectural, Engineering and Technical Services
Various ECL 1 0.50Low potential – note 3
Leighton O’Brien Global Pty Ltd
Professional, Scientific and Technical Services
Architectural, Engineering and Technical Services
Various ODI 1 1.00Low potential – note 1
Liddy Design Pty Ltd Wholesale Trade
Furniture, Floor Covering and Other Goods Wholesaling
United States EWCG-R 1 0.78
Low potential – note 1
Linshank Vintners Pty Ltd Manufacturing Beverage
Manufacturing China SBEL 1 0.06Low potential – note 3
Lynx Engineering Consultants Pty Ltd
Transport, Postal and Warehousing
Rail Freight Transport Brazil SBEL 1 0.35
Low potential – note 3
Marine Engineering Consultants Pty Ltd Manufacturing
Transport Equipment Manufacturing
Fiji SBEL 1 0.23Low potential – note 3
Marque of Brands Pty Ltd Manufacturing
Cleaning Compound and Toiletry Preparation Manufacturing
United States ECL 1 1.05
Low potential – note 1
Marque of Brands Pty Ltd Manufacturing
Cleaning Compound and Toiletry Preparation Manufacturing
Various ELOC 1 2.00Low potential – note 1

TABLE OF FACILITIES 69
TABLE OF FACILITIES
Exporter/ investor/client
Industry of export
Goods/ services
Export destination
Integral to supply chain
Products/ transactions
Number of facilities
Amount ($A million equivalent)
Environmental/ social impact category (a)
Marque of Brands Pty Ltd Manufacturing
Cleaning Compound and Toiletry Preparation Manufacturing
United Kingdom SBEL 1 0.23
Low potential – note 3
Martinus Rail Pty Ltd Transport, Postal and Warehousing
Specialised Machinery and Equipment Manufacturing
Australia Y Bond Existing facility 0.19
Low potential – note 1
MCA Engineering Group Pty Ltd Mining Mining Support
Services Australia Y Bond 1 0.89Low potential – note 1
MCA Engineering Group Pty Ltd Mining Mining Support
Services Australia Y Bond Existing facility 0.32
Low potential – note 1
Meat Tender Pty Ltd Wholesale Trade
Grocery, Liquor and Tobacco Product Wholesaling
Morocco SBEL 1 0.11Low potential – note 3
MICROBRIC PTY LTDProfessional, Scientific and Technical Services
Management and Related Consulting Services
United States SBEL 1 0.13
Low potential – note 3
Microtec Engineering Group Pty Limited Manufacturing
Specialised Machinery and Equipment Manufacturing
Romania SBEL 1 0.15Low potential – note 3
Microtec Engineering Group Pty Limited Manufacturing
Machinery and Equipment Manufacturing
Saudi Arabia ECL 1 0.23
Low potential – note 3
Minemet Australasia Pty Ltd Wholesale Trade
Mineral, Metal and Chemical Wholesaling
Various EWCG 1 2.50Low potential – note 1
Minprovise International Pty Ltd Mining
Architectural, Engineering and Technical Services
Australia Y Bond Existing facility 0.23
Low potential – note 3
Minprovise International Pty Ltd Mining
Architectural, Engineering and Technical Services
Australia Y Bond 1 0.04Low potential – note 1

70 EFIC ANNUAL REPORT 2017–2018
Exporter/ investor/client
Industry of export
Goods/ services
Export destination
Integral to supply chain
Products/ transactions
Number of facilities
Amount ($A million equivalent)
Environmental/ social impact category (a)
Mitchell Operations Pty Ltd Mining Mining Support
Services Australia Y EWCG 1 2.60Low potential – note 1
Natural Water Solutions Pty Ltd
Electricity, Gas, Water and Waste Services
Water Supply, Sewerage and Drainage Services
Philippines SBEL 1 0.08Low potential – note 3
Neptune Sports Pty Ltd Manufacturing Textile
Manufacturing Various SBEL 1 0.06Low potential – note 3
Nicholas The Label Pty Ltd Manufacturing
Clothing and Footwear Manufacturing
Various ELOC 1 1.00Low potential – note 1
Nomad Tackle Pty Ltd Manufacturing Polymer Product Manufacturing
United States ELOC 1 0.35
Low potential – note 3
Nomad Tackle Pty Ltd Manufacturing Polymer Product Manufacturing
United States ECL 1 0.25
Low potential – note 3
NT Beverages Group Pty Ltd Manufacturing Beverage
ManufacturingSouth Korea ECL 1 0.03
Low potential – note 1
O1Distribution Pty Ltd Manufacturing Beverage Manufacturing Japan ECL 1 0.10
Low potential – note 3
Oasis Systems Pty LtdInformation Media and Tele-communications
Tele-communications Services
Malaysia SBEL 1 0.22Low potential – note 3
Ocean & Earth Australia Pty Ltd Wholesale Trade
Furniture, Floor Covering and Other Goods Wholesaling
Various EWCG 1 0.62Low potential – note 1
Oper8 Pty LtdInformation Media and Tele-communications
Data Processing, Web Hosting and Electronic Information Storage
Various SBEL 1 0.08Low potential – note 3

TABLE OF FACILITIES 71
TABLE OF FACILITIES
Exporter/ investor/client
Industry of export
Goods/ services
Export destination
Integral to supply chain
Products/ transactions
Number of facilities
Amount ($A million equivalent)
Environmental/ social impact category (a)
Ordital Pty LtdProfessional, Scientific and Technical Services
Professional, Scientific and Technical Services
United States ELOC 1 0.15
Low potential – note 3
Ostra Pty Ltd Manufacturing Beverage Manufacturing Various SBEL 1 0.15
Low potential – note 1
Oz Nature Pty Ltd Wholesale TradeGrocery, Liquor and Tobacco Product Wholesaling
South Korea EWCG-R Existing
facility 0.40 Low potential – note 3
Oz Nature Pty Ltd Wholesale TradeGrocery, Liquor and Tobacco Product Wholesaling
South Korea EWCG 1 0.20 Low potential
– note 3
Oz Varieties Pty Ltd Wholesale TradeGrocery, Liquor and Tobacco Product Wholesaling
Various ECL 1 1.13 Low potential – note 1
Pacific Welding Installations Pty Ltd Construction
Heavy and Civil Engineering Construction
Fiji SBEL 1 0.20 Low potential – note 3
Pakton Group Pty Ltd ManufacturingElectrical Equipment Manufacturing
South Africa SBEL 1 0.10 Low potential
– note 1
Pared Design Pty Ltd Manufacturing Manufacturing United States ELOC 1 0.08 Low potential
– note 1
Pared Design Pty Ltd Manufacturing Manufacturing Various SBEL 1 0.06 Low potential – note 3
Peerless Australia Pty Ltd Manufacturing
Pump, Compressor, Heating and Ventilation Equipment Manufacturing
India SBEL 1 0.22 Low potential – note 1
Pixie Ice Cream Pty Ltd Manufacturing Dairy Product Manufacturing Various ELOC 1 1.00 Low potential
– note 1

72 EFIC ANNUAL REPORT 2017–2018
Exporter/ investor/client
Industry of export
Goods/ services
Export destination
Integral to supply chain
Products/ transactions
Number of facilities
Amount ($A million equivalent)
Environmental/ social impact category (a)
Powerhouse Distribution Pty Ltd Mining
Machinery and Equipment Wholesaling
Australia Y EWCG 1 0.50 Category C
Precision Marketing Holdings Pty Ltd
Professional, Scientific and Technical Services
Market Research and Statistical Services
Indonesia ELOC 1 1.03 Low potential – note 3
Prior Industries Australia Pty Ltd
Professional, Scientific and Technical Services
Architectural, Engineering and Technical Services
Cuba ELOC 1 1.00 Low potential – note 1
Pronin Enterprises Pty Ltd Wholesale Trade
Furniture, Floor Covering and Other Goods Wholesaling
Various ELOC 1 0.50 Low potential – note 1
Pro-Test Pty Ltd Mining Mining Support Services Australia Y ECL 1 0.67
Low potential – note 1
Quickstep Holdings Ltd Manufacturing
Machinery and Equipment Manufacturing
United States ELOC 1 4.00
Low potential – note 1
Quickstep Holdings Ltd Manufacturing
Machinery and Equipment Manufacturing
United States ELOC-R Existing
facility 3.00Low potential – note 1
Radlink Pty Ltd MiningTele-communications Services
Australia Y Bond 1 0.10Low potential – note 1
Radlink Pty Ltd MiningTele-communications Services
Australia Y Bond Existing facility 0.10
Low potential – note 1
Red Herron Pty Ltd Manufacturing Beverage Manufacturing Norway SBEL 1 0.13
Low potential – note 3
Reeves International Pty Ltd Construction
Non-Residential Building Construction
Solomon Islands Bond Existing
facility 0.19Low potential – note 1

TABLE OF FACILITIES 73
TABLE OF FACILITIES
Exporter/ investor/client
Industry of export
Goods/ services
Export destination
Integral to supply chain
Products/ transactions
Number of facilities
Amount ($A million equivalent)
Environmental/ social impact category (a)
Reeves International Pty Ltd Construction
Non-Residential Building Construction
Kiribati Bond 1 0.52Low potential – note 1
Reeves International Pty Ltd Construction
Non-Residential Building Construction
Kiribati Bond Existing facility 0.26
Low potential – note 1
Reeves International Pty Ltd Construction
Non-Residential Building Construction
Kiribati Bond Existing facility 0.52
Low potential – note 1
Reeves International Pty Ltd Construction
Non-Residential Building Construction
Kiribati Bond Existing facility 0.26
Low potential – note 1
Rex Service Pty Ltd Wholesale Trade
Grocery, Liquor and Tobacco Product Wholesaling
China ELOC 1 0.45Low potential – note 1
Rhodes Project Services Pty Ltd Construction
Non-Residential Building Construction
Papua New Guinea Bond 1 1.63
Low potential – note 1
Rhodes Project Services Pty Ltd Construction
Non-Residential Building Construction
Papua New Guinea Bond Existing
facility 0.20Low potential – note 1
Rhodes Project Services Pty Ltd Construction
Non-Residential Building Construction
Papua New Guinea Bond Existing
facility 1.13Low potential – note 1
Rhodes Project Services Pty Ltd Construction
Non-Residential Building Construction
Papua New Guinea Bond Existing
facility 0.14Low potential – note 1
Rhodes Project Services Pty Ltd Construction
Non-Residential Building Construction
Papua New Guinea Bond Existing
facility 1.61Low potential – note 1
Rhodes Project Services Pty Ltd Construction
Non-Residential Building Construction
Papua New Guinea Bond Existing
facility 0.20Low potential – note 1
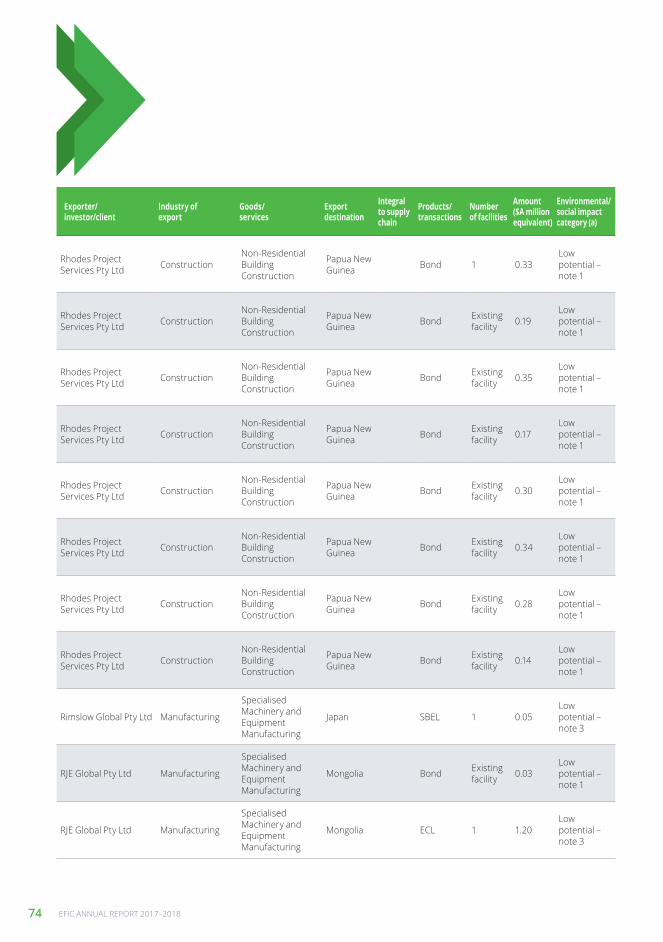
74 EFIC ANNUAL REPORT 2017–2018
Exporter/ investor/client
Industry of export
Goods/ services
Export destination
Integral to supply chain
Products/ transactions
Number of facilities
Amount ($A million equivalent)
Environmental/ social impact category (a)
Rhodes Project Services Pty Ltd Construction
Non-Residential Building Construction
Papua New Guinea Bond 1 0.33
Low potential – note 1
Rhodes Project Services Pty Ltd Construction
Non-Residential Building Construction
Papua New Guinea Bond Existing
facility 0.19Low potential – note 1
Rhodes Project Services Pty Ltd Construction
Non-Residential Building Construction
Papua New Guinea Bond Existing
facility 0.35Low potential – note 1
Rhodes Project Services Pty Ltd Construction
Non-Residential Building Construction
Papua New Guinea Bond Existing
facility 0.17Low potential – note 1
Rhodes Project Services Pty Ltd Construction
Non-Residential Building Construction
Papua New Guinea Bond Existing
facility 0.30Low potential – note 1
Rhodes Project Services Pty Ltd Construction
Non-Residential Building Construction
Papua New Guinea Bond Existing
facility 0.34Low potential – note 1
Rhodes Project Services Pty Ltd Construction
Non-Residential Building Construction
Papua New Guinea Bond Existing
facility 0.28Low potential – note 1
Rhodes Project Services Pty Ltd Construction
Non-Residential Building Construction
Papua New Guinea Bond Existing
facility 0.14Low potential – note 1
Rimslow Global Pty Ltd Manufacturing
Specialised Machinery and Equipment Manufacturing
Japan SBEL 1 0.05Low potential – note 3
RJE Global Pty Ltd Manufacturing
Specialised Machinery and Equipment Manufacturing
Mongolia Bond Existing facility 0.03
Low potential – note 1
RJE Global Pty Ltd Manufacturing
Specialised Machinery and Equipment Manufacturing
Mongolia ECL 1 1.20Low potential – note 3

TABLE OF FACILITIES 75
TABLE OF FACILITIES
Exporter/ investor/client
Industry of export
Goods/ services
Export destination
Integral to supply chain
Products/ transactions
Number of facilities
Amount ($A million equivalent)
Environmental/ social impact category (a)
RJE Global Pty Ltd Manufacturing
Specialised Machinery and Equipment Manufacturing
Mongolia Bond Existing facility 0.07
Low potential – note 1
RJE Global Pty Ltd Manufacturing
Specialised Machinery and Equipment Manufacturing
Mongolia Bond Existing facility 0.18
Low potential – note 1
RJE Global Pty Ltd Manufacturing
Specialised Machinery and Equipment Manufacturing
Mongolia Bond Existing facility 0.35
Low potential – note 1
RJE Global Pty Ltd Manufacturing
Specialised Machinery and Equipment Manufacturing
Mongolia Bond Existing facility 0.69
Low potential – note 1
RJE Global Pty Ltd Manufacturing
Specialised Machinery and Equipment Manufacturing
Mongolia Bond Existing facility 0.12
Low potential – note 1
RJE Global Pty Ltd Manufacturing
Specialised Machinery and Equipment Manufacturing
Mongolia Bond Existing facility 0.34
Low potential – note 1
RJE Global Pty Ltd Manufacturing
Specialised Machinery and Equipment Manufacturing
Mongolia ECL 1 3.20 Category C
RJE Global Pty Ltd Manufacturing
Specialised Machinery and Equipment Manufacturing
Micronesia Bond Existing facility 0.23
Low potential – note 1
S & E Engineering Pty Ltd Manufacturing
Specialised Machinery and Equipment Manufacturing
Australia Y SBEL 1 0.07Low potential – note 1
S & E Engineering Pty Ltd Manufacturing
Specialised Machinery and Equipment Manufacturing
Various Y SBEL 1 0.15Low potential – note 3
Savitas Wines Pty Ltd Manufacturing Beverage Manufacturing China SBEL 1 0.09
Low potential – note 3

76 EFIC ANNUAL REPORT 2017–2018
Exporter/ investor/client
Industry of export
Goods/ services
Export destination
Integral to supply chain
Products/ transactions
Number of facilities
Amount ($A million equivalent)
Environmental/ social impact category (a)
SD and CC Ritchings Pty Ltd as trustee for SD and CC Ritchings Family Trust
ManufacturingFabricated Metal Product Manufacturing
Mongolia SBEL 1 0.12Low potential – note 3
Seeing Machines Limited
Professional, Scientific and Technical Services
Computer System Design and Related Services
Thailand ELOC 1 2.50Low potential – note 1
Shapeshift Design Technologies Pty Ltd Manufacturing
Specialised Machinery and Equipment Manufacturing
Various ECL 1 0.45 Category C
Sila Australia Pty Ltd ManufacturingBasic Ferrous Metal Product Manufacturing
United Arab Emirates
SBEL 1 0.05Low potential – note 3
Sixth Avenue Group Pty Ltd Wholesale Trade
Pharmaceutical and Toiletry Goods Wholesaling
Australia Y ELOC 1 0.75Low potential – note 3
SRA Information Technology Pty Ltd
Professional, Scientific and Technical Services
Computer System Design and Related Services
Singapore ECL 1 0.75Low potential – note 1
StaminaLift International Limited Manufacturing
Transport Equipment Manufacturing
United Kingdom SBEL 1 0.08
Low potential – note 3
Status Awareness Systems Pty Ltd Manufacturing
Motor Vehicle and Motor Vehicle Part Manufacturing
France ECL 1 0.65Low potential – note 3
Steamwand International Pty Ltd Manufacturing
Specialised Machinery and Equipment Manufacturing
Various SBEL 1 0.04Low potential – note 3
Stoned Crystals Pty Ltd Wholesale Trade
Furniture, Floor Covering and Other Goods Wholesaling
United States SBEL 1 0.04
Low potential – note 3
Sun City Watersports Pty Ltd as Trustee for the Crocombe Family Discretionary Trust
Arts and Recreation Services
Amusement and Other Recreation Activities
Various ECL 1 0.58Low potential – note 1

TABLE OF FACILITIES 77
TABLE OF FACILITIES
Exporter/ investor/client
Industry of export
Goods/ services
Export destination
Integral to supply chain
Products/ transactions
Number of facilities
Amount ($A million equivalent)
Environmental/ social impact category (a)
Synergy Merchandising Pty Limited
Wholesale Trade
Furniture, Floor Covering and Other Goods Wholesaling
China SBEL 1 0.05Low potential – note 3
The Babe Destination Pty Ltd Wholesale Trade
Pharmaceutical and Toiletry Goods Wholesaling
United States SBEL 1 0.04
Low potential – note 3
The Beauty Chef Pty Ltd Wholesale Trade
Pharmaceutical and Toiletry Goods Wholesaling
United States SBEL 1 0.08
Low potential – note 3
The Beauty Chef Pty Ltd Wholesale Trade
Pharmaceutical and Toiletry Goods Wholesaling
United States SBEL 1 0.11
Low potential – note 3
The Creative Marketing Group Pty Ltd Wholesale Trade
Pharmaceutical and Toiletry Goods Wholesaling
Various ECL 1 3.00Low potential – note 1
The Ripe Bunch Pty Ltd Manufacturing Beverage
ManufacturingUnited States SBEL 1 0.05
Low potential – note 3
The Ripe Bunch Pty Ltd Manufacturing Beverage
Manufacturing Australia Y SBEL 1 0.17Low potential – note 3
Theatre Safe Australia Pty Ltd ATF The Theatre Safe Australia Unit Trust
Arts and Recreation Services
Creative and Performing Arts Activities
Australia Y ECL 1 0.50Low potential – note 1
Titeline Drilling Pty Ltd Mining Mining Support Services Ecuador EWCG 1 2.50 Category B
Trident RFID Pty Ltd Manufacturing
Computer and Electronic Equipment Manufacturing
United States SBEL 1 0.05
Low potential – note 3
Tritium Pty Ltd ManufacturingElectrical Equipment Manufacturing
United States EWCG 1 2.00
Low potential – note 1

78 EFIC ANNUAL REPORT 2017–2018
Exporter/ investor/client
Industry of export
Goods/ services
Export destination
Integral to supply chain
Products/ transactions
Number of facilities
Amount ($A million equivalent)
Environmental/ social impact category (a)
TTG Transportation Technology Pty Ltd
Professional, Scientific and Technical Services
Professional, Scientific and Technical Services
Spain Bond Existing facility 0.00
Low potential – note 3
TTG Transportation Technology Pty Ltd
Professional, Scientific and Technical Services
Professional, Scientific and Technical Services
Spain Bond 1 0.05Low potential – note 1
UAP Australia Pty LtdProfessional, Scientific and Technical Services
Architectural, Engineering and Technical Services
United States Bond 1 2.92
Low potential – note 1
United Wool Company Pty Ltd Wholesale Trade
Agricultural Product Wholesaling
Various EWCG-R Existing facility 1.00
Low potential – note 1
United Wool Company Pty Ltd Wholesale Trade
Agricultural Product Wholesaling
China EWCG 1 0.50Low potential – note 1
UON Pty Ltd Mining Mining Support Services Australia Y Bond Existing
facility 0.04Low potential – note 1
UON Pty Ltd Mining Mining Support Services Australia Y Bond Existing
facility 0.04Low potential – note 1
UON Pty Ltd Mining Mining Support Services Australia Y Bond Existing
facility 0.27Low potential – note 1
UON Pty Ltd Mining Mining Support Services Australia Y Bond Existing
facility 0.27Low potential – note 1
Vertiscope by Inverleigh Pty Ltd
Information Media and Tele-communications
Motion Picture and Video Activities France SBEL 1 0.48
Low potential – note 3
Vinsense Pty Ltd ATF Rossian Family Trust Wholesale Trade
Grocery, Liquor and Tobacco Product Wholesaling
United States ELOC 1 0.25
Low potential – note 3

TABLE OF FACILITIES 79
TABLE OF FACILITIES
Exporter/ investor/client
Industry of export
Goods/ services
Export destination
Integral to supply chain
Products/ transactions
Number of facilities
Amount ($A million equivalent)
Environmental/ social impact category (a)
Viottolo Pty Ltd Manufacturing Beverage Manufacturing
United Kingdom SBEL 1 0.11
Low potential – note 3
Virgin Green Olive Farm Pty Ltd
Agriculture, Forestry and Fishing
Crop Growing China SBEL 1 0.06Low potential – note 3
Vyta Buzz Pty Ltd Wholesale Trade
Furniture, Floor Covering and Other Goods Wholesaling
New Zealand SBEL 1 0.08
Low potential – note 3
Wax Converters Textiles Pty Ltd Manufacturing Textile Product
Manufacturing Various ECL 1 0.80Low potential – note 3
Web Profits Pty LtdProfessional, Scientific and Technical Services
Professional, Scientific and Technical Services
Various SBEL 1 0.35Low potential – note 3
Whittens Pty Ltd Mining Building Structure Services Australia Y Bond Existing
facility 1.22Low potential – note 1
Whittens Pty Ltd Mining Building Structure Services Australia Y Bond Existing
facility 0.61Low potential – note 1
Whittens Pty Ltd Mining Building Structure Services Australia Y Bond Existing
facility 0.18Low potential – note 1
Whittens Pty Ltd Mining Building Structure Services Australia Y Bond Existing
facility 0.18Low potential – note 1
Whittens Pty Ltd Mining Building Structure Services Australia Y Bond Existing
facility 2.08Low potential – note 1
Whittens Pty Ltd Mining Building Structure Services Australia Y Bond Existing
facility 2.08Low potential – note 1

80 EFIC ANNUAL REPORT 2017–2018
Exporter/ investor/client
Industry of export
Goods/ services
Export destination
Integral to supply chain
Products/ transactions
Number of facilities
Amount ($A million equivalent)
Environmental/ social impact category (a)
Whittens Pty Ltd Mining Building Structure Services Australia Y Bond Existing
facility 0.64Low potential – note 1
Whittens Pty Ltd Mining Building Structure Services Australia Y Bond Existing
facility 0.64Low potential – note 1
Whittens Pty Ltd Mining Building Structure Services Australia Y Bond Existing
facility 0.61Low potential – note 1
Whittens Pty Ltd Mining Building Structure Services Australia Y ECL 1 1.20 Category C
Whittens Pty Ltd Mining Building Structure Services Australia Y ECL Existing
facility 3.00 Category C
Wildbear Entertainment Pty Limited
Information Media and Tele-communications
Motion Picture and Video Activities Various ECL 1 0.60
Low potential – note 1
Wildbear Entertainment Pty Limited
Information Media and Tele-communications
Motion Picture and Video Activities Various ECL 1 0.60
Low potential – note 1
Winplus Australasia Pty Ltd Wholesale Trade
Furniture, Floor Covering and Other Goods Wholesaling
United States EWCG-R 1 2.26
Low potential – note 1
Worldpoly Pty Ltd ManufacturingMachinery and Equipment Manufacturing
Various ELOC Existing facility 0.38
Low potential – note 1
Worldpoly Pty Ltd ManufacturingMachinery and Equipment Manufacturing
Various ECL 1 0.08Low potential – note 1
Zinc Group Pty LtdProfessional, Scientific and Technical Services
Advertising Services Various ELOC 1 0.90
Low potential – note 1
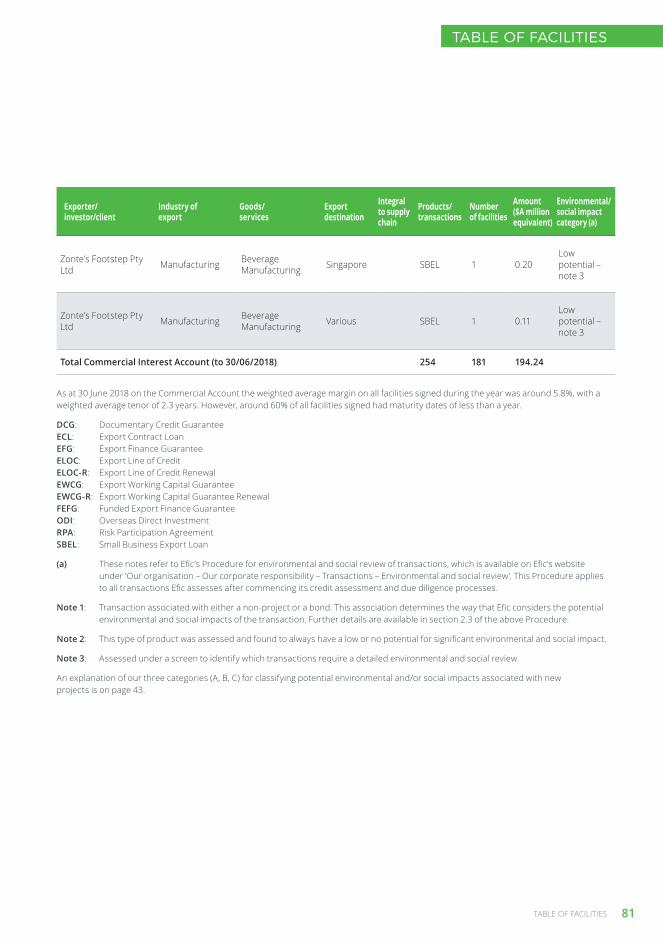
TABLE OF FACILITIES 81
TABLE OF FACILITIES
Exporter/ investor/client
Industry of export
Goods/ services
Export destination
Integral to supply chain
Products/ transactions
Number of facilities
Amount ($A million equivalent)
Environmental/ social impact category (a)
Zonte’s Footstep Pty Ltd Manufacturing Beverage
Manufacturing Singapore SBEL 1 0.20Low potential – note 3
Zonte’s Footstep Pty Ltd Manufacturing Beverage
Manufacturing Various SBEL 1 0.11Low potential – note 3
Total Commercial Interest Account (to 30/06/2018) 254 181 194.24
As at 30 June 2018 on the Commercial Account the weighted average margin on all facilities signed during the year was around 5.8%, with a weighted average tenor of 2.3 years. However, around 60% of all facilities signed had maturity dates of less than a year.
DCG: Documentary Credit Guarantee ECL: Export Contract Loan EFG: Export Finance Guarantee ELOC: Export Line of Credit ELOC-R: Export Line of Credit Renewal EWCG: Export Working Capital Guarantee EWCG-R: Export Working Capital Guarantee Renewal FEFG: Funded Export Finance Guarantee ODI: Overseas Direct Investment RPA: Risk Participation Agreement SBEL: Small Business Export Loan
(a) These notes refer to Efic’s Procedure for environmental and social review of transactions, which is available on Efic’s website under ‘Our organisation – Our corporate responsibility – Transactions – Environmental and social review‘. This Procedure applies to all transactions Efic assesses after commencing its credit assessment and due diligence processes.
Note 1: Transaction associated with either a non-project or a bond. This association determines the way that Efic considers the potential environmental and social impacts of the transaction. Further details are available in section 2.3 of the above Procedure.
Note 2: This type of product was assessed and found to always have a low or no potential for significant environmental and social impact.
Note 3: Assessed under a screen to identify which transactions require a detailed environmental and social review.
An explanation of our three categories (A, B, C) for classifying potential environmental and/or social impacts associated with new projects is on page 43.
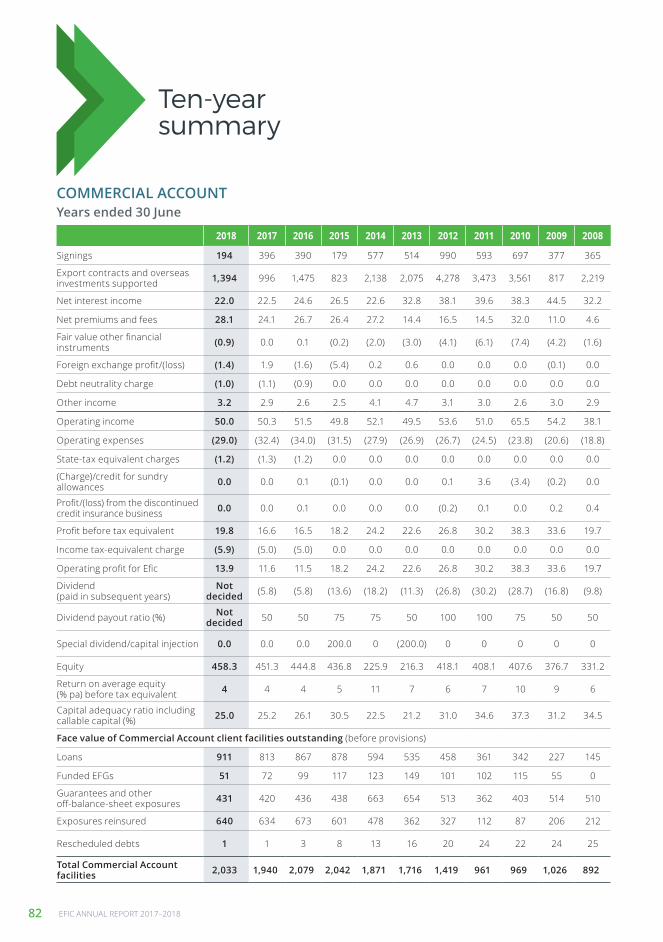
82 EFIC ANNUAL REPORT 2017–2018
Ten-year summary
COMMERCIAL ACCOUNTYears ended 30 June
2018 2017 2016 2015 2014 2013 2012 2011 2010 2009 2008
Signings 194 396 390 179 577 514 990 593 697 377 365
Export contracts and overseas investments supported 1,394 996 1,475 823 2,138 2,075 4,278 3,473 3,561 817 2,219
Net interest income 22.0 22.5 24.6 26.5 22.6 32.8 38.1 39.6 38.3 44.5 32.2
Net premiums and fees 28.1 24.1 26.7 26.4 27.2 14.4 16.5 14.5 32.0 11.0 4.6
Fair value other financial instruments (0.9) 0.0 0.1 (0.2) (2.0) (3.0) (4.1) (6.1) (7.4) (4.2) (1.6)
Foreign exchange profit/(loss) (1.4) 1.9 (1.6) (5.4) 0.2 0.6 0.0 0.0 0.0 (0.1) 0.0
Debt neutrality charge (1.0) (1.1) (0.9) 0.0 0.0 0.0 0.0 0.0 0.0 0.0 0.0
Other income 3.2 2.9 2.6 2.5 4.1 4.7 3.1 3.0 2.6 3.0 2.9
Operating income 50.0 50.3 51.5 49.8 52.1 49.5 53.6 51.0 65.5 54.2 38.1
Operating expenses (29.0) (32.4) (34.0) (31.5) (27.9) (26.9) (26.7) (24.5) (23.8) (20.6) (18.8)
State-tax equivalent charges (1.2) (1.3) (1.2) 0.0 0.0 0.0 0.0 0.0 0.0 0.0 0.0
(Charge)/credit for sundry allowances 0.0 0.0 0.1 (0.1) 0.0 0.0 0.1 3.6 (3.4) (0.2) 0.0
Profit/(loss) from the discontinued credit insurance business 0.0 0.0 0.1 0.0 0.0 0.0 (0.2) 0.1 0.0 0.2 0.4
Profit before tax equivalent 19.8 16.6 16.5 18.2 24.2 22.6 26.8 30.2 38.3 33.6 19.7
Income tax-equivalent charge (5.9) (5.0) (5.0) 0.0 0.0 0.0 0.0 0.0 0.0 0.0 0.0
Operating profit for Efic 13.9 11.6 11.5 18.2 24.2 22.6 26.8 30.2 38.3 33.6 19.7
Dividend (paid in subsequent years)
Not decided (5.8) (5.8) (13.6) (18.2) (11.3) (26.8) (30.2) (28.7) (16.8) (9.8)
Dividend payout ratio (%) Not decided 50 50 75 75 50 100 100 75 50 50
Special dividend/capital injection 0.0 0.0 0.0 200.0 0 (200.0) 0 0 0 0 0
Equity 458.3 451.3 444.8 436.8 225.9 216.3 418.1 408.1 407.6 376.7 331.2
Return on average equity (% pa) before tax equivalent 4 4 4 5 11 7 6 7 10 9 6
Capital adequacy ratio including callable capital (%) 25.0 25.2 26.1 30.5 22.5 21.2 31.0 34.6 37.3 31.2 34.5
Face value of Commercial Account client facilities outstanding (before provisions)
Loans 911 813 867 878 594 535 458 361 342 227 145
Funded EFGs 51 72 99 117 123 149 101 102 115 55 0
Guarantees and other off-balance-sheet exposures 431 420 436 438 663 654 513 362 403 514 510
Exposures reinsured 640 634 673 601 478 362 327 112 87 206 212
Rescheduled debts 1 1 3 8 13 16 20 24 22 24 25
Total Commercial Account facilities 2,033 1,940 2,079 2,042 1,871 1,716 1,419 961 969 1,026 892
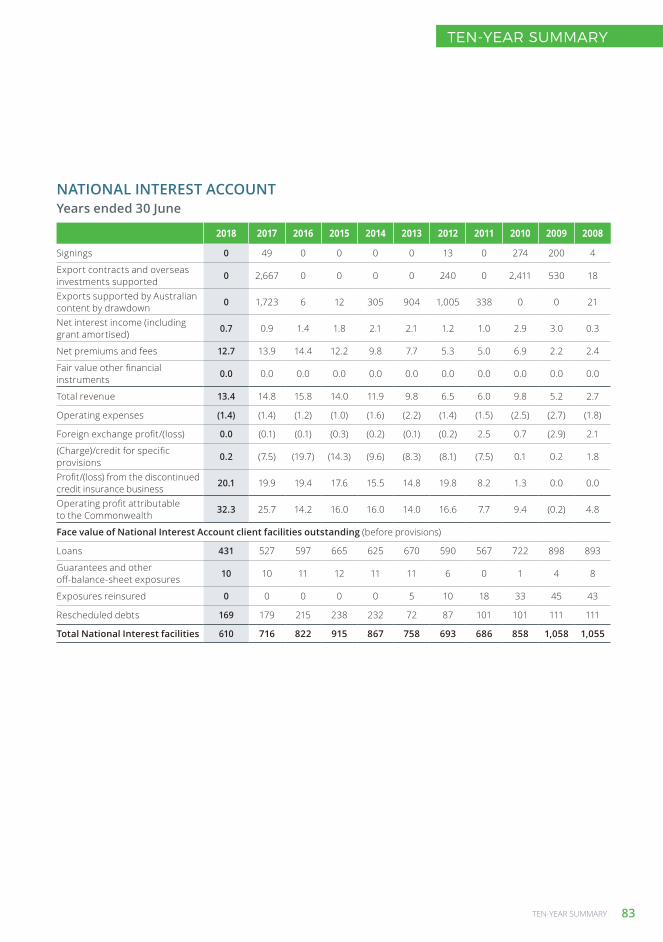
TEN-YEAR SUMMARY 83
TEN-YEAR SUMMARY
NATIONAL INTEREST ACCOUNTYears ended 30 June
2018 2017 2016 2015 2014 2013 2012 2011 2010 2009 2008
Signings 0 49 0 0 0 0 13 0 274 200 4
Export contracts and overseas investments supported 0 2,667 0 0 0 0 240 0 2,411 530 18
Exports supported by Australian content by drawdown 0 1,723 6 12 305 904 1,005 338 0 0 21
Net interest income (including grant amortised) 0.7 0.9 1.4 1.8 2.1 2.1 1.2 1.0 2.9 3.0 0.3
Net premiums and fees 12.7 13.9 14.4 12.2 9.8 7.7 5.3 5.0 6.9 2.2 2.4
Fair value other financial instruments 0.0 0.0 0.0 0.0 0.0 0.0 0.0 0.0 0.0 0.0 0.0
Total revenue 13.4 14.8 15.8 14.0 11.9 9.8 6.5 6.0 9.8 5.2 2.7
Operating expenses (1.4) (1.4) (1.2) (1.0) (1.6) (2.2) (1.4) (1.5) (2.5) (2.7) (1.8)
Foreign exchange profit/(loss) 0.0 (0.1) (0.1) (0.3) (0.2) (0.1) (0.2) 2.5 0.7 (2.9) 2.1
(Charge)/credit for specific provisions 0.2 (7.5) (19.7) (14.3) (9.6) (8.3) (8.1) (7.5) 0.1 0.2 1.8
Profit/(loss) from the discontinued credit insurance business 20.1 19.9 19.4 17.6 15.5 14.8 19.8 8.2 1.3 0.0 0.0
Operating profit attributable to the Commonwealth 32.3 25.7 14.2 16.0 16.0 14.0 16.6 7.7 9.4 (0.2) 4.8
Face value of National Interest Account client facilities outstanding (before provisions)
Loans 431 527 597 665 625 670 590 567 722 898 893
Guarantees and other off-balance-sheet exposures 10 10 11 12 11 11 6 0 1 4 8
Exposures reinsured 0 0 0 0 0 5 10 18 33 45 43
Rescheduled debts 169 179 215 238 232 72 87 101 101 111 111
Total National Interest facilities 610 716 822 915 867 758 693 686 858 1,058 1,055

84 EFIC ANNUAL REPORT 2017–2018
FINANCIAL STATEMENTS 85
FinancialStatements
Statement by Board members and Chief Financial Officer 86
Independent auditor’s report 87
Statement of comprehensive income 89
Statement of financial position 90
Statement of changes in equity 91
Cash flow statement 92
Notes to and forming part of the financial statements 94
Note 1: Summary of significant accounting policies 94
Note 2: Significant accounting judgements, estimates and assumptions 101
Note 3: Revenue and expenses 102
Note 4: Receivables from other financial institutions 104
Note 5: Amounts payable to the Commonwealth 105
Note 6: Available-for-sale investment securities 105
Note 7: Loans and receivables at amortised cost 106
Note 8: Loans and receivables designated at fair value through profit or loss 107
Note 9: Derivative financial instruments 108
Note 10: Property, plant and equipment 109
Note 11: Intangible assets 110
Note 12: Other assets 111
Note 13: Payables to other financial institutions 111
Note 14: Borrowings designated at fair value through profit or loss 111
Note 15: Guarantees designated at fair value through profit or loss 113
Note 16: Sundry provisions and allowances 113
Note 17: Other liabilities 113
Note 18: Contingencies and commitments 114
Note 19: Financial risk management 115
Note 20: Fair value of financial instruments 136
Note 21: Capital equivalent 142
Note 22: Remuneration of external auditors 146
Note 23: Related party disclosures 146
Note 24: Reconciliation of operating profit to net cash flows from operating activities 147
Note 25: Reconciliation of liabilities arising from financing activities 148
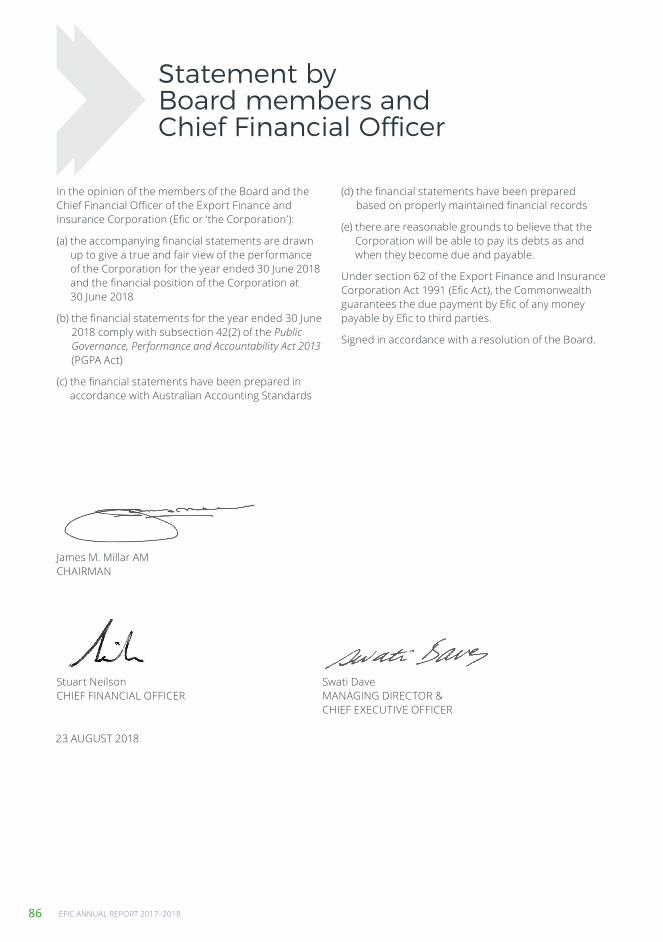
86 EFIC ANNUAL REPORT 2017–2018
Statement byBoard members and Chief Financial Officer
In the opinion of the members of the Board and the Chief Financial Officer of the Export Finance and Insurance Corporation (Efic or ‘the Corporation’):
(a) the accompanying financial statements are drawn up to give a true and fair view of the performance of the Corporation for the year ended 30 June 2018 and the financial position of the Corporation at 30 June 2018
(b) the financial statements for the year ended 30 June 2018 comply with subsection 42(2) of the Public Governance, Performance and Accountability Act 2013 (PGPA Act)
(c) the financial statements have been prepared in accordance with Australian Accounting Standards
(d) the financial statements have been prepared based on properly maintained financial records
(e) there are reasonable grounds to believe that the Corporation will be able to pay its debts as and when they become due and payable.
Under section 62 of the Export Finance and Insurance Corporation Act 1991 (Efic Act), the Commonwealth guarantees the due payment by Efic of any money payable by Efic to third parties.
Signed in accordance with a resolution of the Board.
James M. Millar AM CHAIRMAN
Stuart Neilson CHIEF FINANCIAL OFFICER
Swati Dave MANAGING DIRECTOR & CHIEF EXECUTIVE OFFICER
23 AUGUST 2018

FINANCIAL STATEMENTS 87
FINANCIAL STATEMENTS
Independentauditor’s report
GPO Box 707 CANBERRA ACT 260119 National Circuit BARTON ACTPhone (02) 6203 7300 Fax (02) 6203 7777
INDEPENDENT AUDITOR’S REPORT
To the Minister for Trade, Tourism and Investment
Opinion
In my opinion, the financial statements of the Export Finance and Insurance Corporation for the year ended 30 June 2018:
(a) comply with Australian Accounting Standards and the Public Governance, Performance and Accountability (Financial Reporting) Rule 2015; and
(b) present fairly the financial position of the Export Finance and Insurance Corporation as at 30 June 2018 and its financial performance and cash flows for the year then ended.
The financial statements of the Export Finance and Insurance Corporation, which I have audited,comprise the following statements as at 30 June 2018 and for the year then ended:
• Statement by the Board Members and Chief Financial Officer;• Statement of Comprehensive Income;• Statement of Financial Position; • Statement of Changes in Equity; • Cash Flow Statement; and• Notes to the financial statements, comprising a Summary of Significant Accounting Policies and
other explanatory information.
Basis for Opinion
I conducted my audit in accordance with the Australian National Audit Office Auditing Standards, which incorporate the Australian Auditing Standards. My responsibilities under those standards are further described in the Auditor’s Responsibilities for the Audit of the Financial Statements section of my report. I am independent of the Export Finance and Insurance Corporation in accordance with the relevant ethical requirements for financial statement audits conducted by the Auditor-General and his delegates.These include the relevant independence requirements of the Accounting Professional and Ethical Standards Board’s APES 110 Code of Ethics for Professional Accountants (the Code) to the extent that they are not in conflict with the Auditor-General Act 1997. I have also fulfilled my other responsibilities in accordance with the Code. I believe that the audit evidence I have obtained is sufficient and appropriate to provide a basis for my opinion.
Other Information
The Accountable Authority is responsible for the other information. The other information comprises the information included in the annual report for the year ended 30 June 2018 but does not include the financial statements and my auditor’s report thereon.
My opinion on the financial statements does not cover the other information and accordingly I do not express any form of assurance conclusion thereon.
In connection with my audit of the financial statements, my responsibility is to read the other information identified above and, in doing so, consider whether the other information is materially inconsistent with the financial statements or my knowledge obtained in the audit, or otherwise appears to be materially misstated.
If, based on the work I have performed, I conclude that there is a material misstatement of this other information, I am required to report that fact. I have nothing to report in this regard.

88 EFIC ANNUAL REPORT 2017–2018
Independentauditor’s report
Accountable Authority’s Responsibility for the Financial StatementsAs the Accountable Authority of the Export Finance and Insurance Corporation, the Board is responsible under the Public Governance, Performance and Accountability Act 2013 for the preparation and fair presentation of annual financial statements that comply with Australian Accounting Standards and the rules made under that Act. The Board is also responsible for such internal control as the Board determines is necessary to enable the preparation and fair presentation of financial statements that are free from material misstatement, whether due to fraud or error.
In preparing the financial statements, the Board is responsible for assessing the Export Finance and Insurance Corporation’s ability to continue as a going concern, taking into account whether the entity’s operations will cease as a result of an administrative restructure or for any other reason. The Board isalso responsible for disclosing, as applicable, matters related to going concern and using the going concern basis of accounting unless the assessment indicates that it is not appropriate.
Auditor’s Responsibilities for the Audit of the Financial Statements My objective is to obtain reasonable assurance about whether the financial statements as a whole are free from material misstatement, whether due to fraud or error, and to issue an auditor’s report that includes my opinion. Reasonable assurance is a high level of assurance, but is not a guarantee that an audit conducted in accordance with the Australian National Audit Office Auditing Standards will always detect a material misstatement when it exists. Misstatements can arise from fraud or error and are considered material if, individually or in the aggregate, they could reasonably be expected to influence the economic decisions of users taken on the basis of the financial statements.
As part of an audit in accordance with the Australian National Audit Office Auditing Standards, I exercise professional judgement and maintain professional scepticism throughout the audit. I also:
• identify and assess the risks of material misstatement of the financial statements, whether due to fraud or error, design and perform audit procedures responsive to those risks, and obtain audit evidence that is sufficient and appropriate to provide a basis for my opinion. The risk of not detecting a material misstatement resulting from fraud is higher than for one resulting from error, as fraud may involve collusion, forgery, intentional omissions, misrepresentations, or the override of internal control;
• obtain an understanding of internal control relevant to the audit in order to design audit procedures that are appropriate in the circumstances, but not for the purpose of expressing an opinion on the effectiveness of the entity’s internal control;
• evaluate the appropriateness of accounting policies used and the reasonableness of accounting estimates and related disclosures made by the Accountable Authority;
• conclude on the appropriateness of the Accountable Authority’s use of the going concern basis of accounting and, based on the audit evidence obtained, whether a material uncertainty exists related to events or conditions that may cast significant doubt on the entity’s ability to continue as a going concern. If I conclude that a material uncertainty exists, I am required to draw attention in my auditor’s report to the related disclosures in the financial statements or, if such disclosures are inadequate, to modify my opinion. My conclusions are based on the audit evidence obtained up to the date of my auditor’s report. However, future events or conditions may cause the entity to ceaseto continue as a going concern; and
• evaluate the overall presentation, structure and content of the financial statements, including the disclosures, and whether the financial statements represent the underlying transactions and events in a manner that achieves fair presentation.
I communicate with those charged with governance regarding, among other matters, the planned scope and timing of the audit and significant audit findings, including any significant deficiencies in internal control that I identify during my audit.
Australian National Audit Office
Clea Lewis
Executive Director
Delegate of the Auditor-General
Canberra
24 August 2018

FINANCIAL STATEMENTS 89
FINANCIAL STATEMENTS
Statement of comprehensive incomefor the year ended 30 June 2018
Commercial Account National Interest Account
Note
30 June 2018 $ m
30 June 2017
$ m
30 June 2018 $ m
30 June 2017
$ m
Interest income 3(i) 151.1 138.9 15.4 17.5
Interest expense 3(ii) (130.1) (117.5) (14.7) (16.6)
Net interest income 21.0 21.4 0.7 0.9
Fair value movement of third-party loans and guarantees 3(iii) 28.1 24.0 – –
Fair value movement of other financial instruments 3(iv) (0.9) – – –
Foreign exchange (loss)/gain (1.4) 1.9 – (0.1)
Other revenue 3(v) 3.2 3.0 32.8 33.8
Operating income 50.0 50.3 33.5 34.6
Operating expenses 3(vi) (29.0) (32.4) (1.4) (1.4)
State-tax equivalent charges 3(vii) (1.2) (1.3) – –
Net operating income 19.8 16.6 32.1 33.2
Net rescheduled loans and debt forgiveness 3(viii) – – 0.2 (7.5)
Profit before tax equivalent 19.8 16.6 32.3 25.7
Income tax-equivalent charge (5.9) (5.0) – –
Profit from ordinary activities 13.9 11.6 32.3 25.7
National Interest Account attributable directly to the Commonwealth – – (32.3) (25.7)
Net profit available to the Commonwealth 13.9 11.6 – –
Other comprehensive income
Items subject to subsequent reclassification to profit or loss:
Net fair value loss taken to equity on cash flow hedge (0.1) (0.3) – –
Net fair value (loss)/gain on available-for-sale investments (1.0) 1.0 – –
Total other comprehensive (loss)/income for the period (1.1) 0.7 – –
Total comprehensive income for the period available to the Commonwealth 12.8 12.3 – –
The accompanying notes form an integral part of the financial statements.
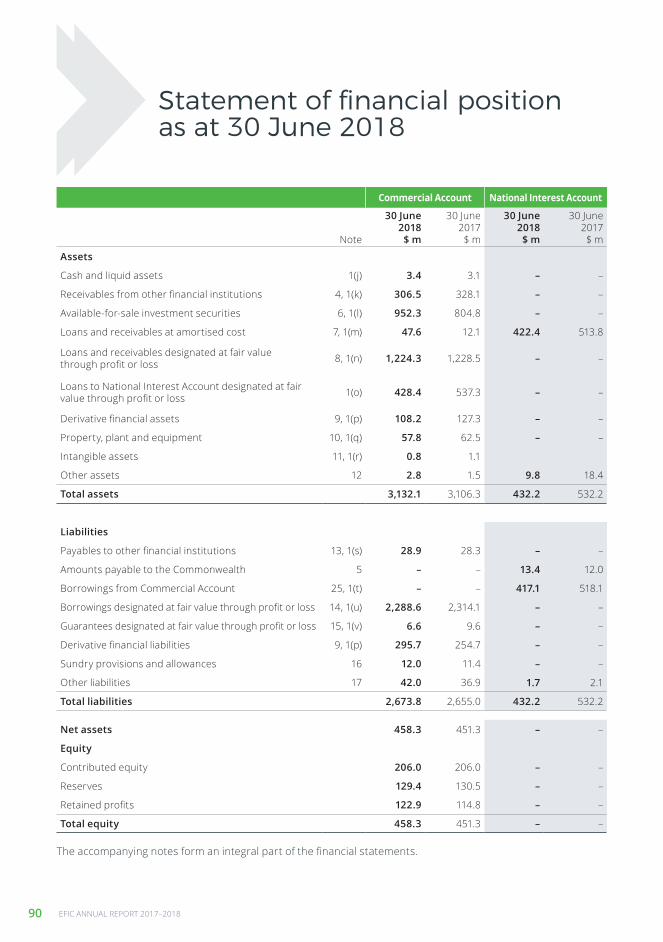
90 EFIC ANNUAL REPORT 2017–2018
Statement of financial positionas at 30 June 2018
Commercial Account National Interest Account
Note
30 June 2018 $ m
30 June 2017
$ m
30 June 2018 $ m
30 June 2017
$ m
Assets
Cash and liquid assets 1(j) 3.4 3.1 – –
Receivables from other financial institutions 4, 1(k) 306.5 328.1 – –
Available-for-sale investment securities 6, 1(l) 952.3 804.8 – –
Loans and receivables at amortised cost 7, 1(m) 47.6 12.1 422.4 513.8
Loans and receivables designated at fair value through profit or loss 8, 1(n) 1,224.3 1,228.5 – –
Loans to National Interest Account designated at fair value through profit or loss 1(o) 428.4 537.3 – –
Derivative financial assets 9, 1(p) 108.2 127.3 – –
Property, plant and equipment 10, 1(q) 57.8 62.5 – –
Intangible assets 11, 1(r) 0.8 1.1
Other assets 12 2.8 1.5 9.8 18.4
Total assets 3,132.1 3,106.3 432.2 532.2
Liabilities
Payables to other financial institutions 13, 1(s) 28.9 28.3 – –
Amounts payable to the Commonwealth 5 – – 13.4 12.0
Borrowings from Commercial Account 25, 1(t) – – 417.1 518.1
Borrowings designated at fair value through profit or loss 14, 1(u) 2,288.6 2,314.1 – –
Guarantees designated at fair value through profit or loss 15, 1(v) 6.6 9.6 – –
Derivative financial liabilities 9, 1(p) 295.7 254.7 – –
Sundry provisions and allowances 16 12.0 11.4 – –
Other liabilities 17 42.0 36.9 1.7 2.1
Total liabilities 2,673.8 2,655.0 432.2 532.2
Net assets 458.3 451.3 – –
Equity
Contributed equity 206.0 206.0 – –
Reserves 129.4 130.5 – –
Retained profits 122.9 114.8 – –
Total equity 458.3 451.3 – –
The accompanying notes form an integral part of the financial statements.

FINANCIAL STATEMENTS 91
FINANCIAL STATEMENTS
Statement of changes in equityfor the year ended 30 June 2018
Retained profits
Asset revaluation
reserves
Available-for-sale
investment reserve
Cash flow hedge
reserve (note 19)
Other reserves
Contributed equity
Total equity
Commercial Account $ m $ m $ m $ m $ m $ m $ m
Opening balance as at 30 June 2017 114.8 62.6 1.6 0.1 66.2 206.0 451.3
Comprehensive income
Other comprehensive income – – (1.0) (0.1) – – (1.1)
Profit for the period 13.9 – – – – – 13.9
Total comprehensive income 13.9 – (1.0) (0.1) – – 12.8
Transactions with the Commonwealth
Dividends paid 50% of 2016–17 profit (5.8) – – – – – (5.8)
Closing balance available to the Commonwealth 30 June 2018 122.9 62.6 0.6 – 66.2 206.0 458.3
Commercial Account
Opening balance as at 30 June 2016 109.0 62.6 0.6 0.4 66.2 206.0 444.8
Comprehensive income
Other comprehensive income – – 1.0 (0.3) – – 0.7
Profit for the period 11.6 – – – – – 11.6
Total comprehensive income 11.6 – 1.0 (0.3) – – 12.3
Transactions with the Commonwealth
Dividends paid 50% of 2015–16 profit (5.8) – – – – – (5.8)
Closing balance available to the Commonwealth 30 June 2017 114.8 62.6 1.6 0.1 66.2 206.0 451.3
The accompanying notes form an integral part of the financial statements.
The above tables are for the Commercial Account only as the National Interest Account holds no equity.
Contributed equity comprises of $6 million of capital advanced by the Commonwealth in November 1991 and an equity injection of $200 million paid in July 2014 that restored Efic’s capital base following a $200 million special dividend paid in June 2013.
In addition to the contributed equity, section 54 of the Efic Act provides for $200 million of callable capital from the Commonwealth, which to date has never been called.
Other reserves represent other net assets transferred from the Australian Trade Commission in November 1991.
As agreed with the Minister for Trade, Tourism and Investment (Minister), Efic paid a dividend for the year ended 30 June 2017 based on the recommendation from the Board that 50% of the 2016–17 profit be paid as a dividend and accordingly a dividend of $5.8 million was paid in December 2017.

92 EFIC ANNUAL REPORT 2017–2018
Cash flow statementfor the year ended 30 June 2018
Commercial Account National Interest Account
Note
30 June 2018 $ m
30 June 2017
$ m
30 June 2018 $ m
30 June 2017
$ m
Cash flows from operating activities
Inflows:
Premium and fees received* 43.5 39.0 11.5 13.1
Interest received 138.8 132.2 11.7 11.9
Insurance claim recoveries 0.1 0.1 19.5 29.6
Guarantees and associated costs recovered 0.2 0.5 – –
Sundry income* 3.4 3.1 – –
Rescheduled debt repayments – 2.6 0.2 12.3
Net repayments/(disbursements) of loans 122.0 124.7 123.8 46.0
Net decrease/(increase) in other debtors and prepayments 4.3 5.8 – –
Net decrease/(increase) in payables to the Commonwealth – – 0.7 (8.8)
Outflows:
Premiums paid to reinsurers (net of commissions) (9.0) (9.4) – –
Interest and other costs of finance paid (116.1) (109.5) (15.3) (17.6)
Guarantees called and associated costs (0.2) – – –
Payments to creditors and employees* (27.7) (29.5) – –
*Grossed up for Goods and Services Tax
Net cash from/(used by) operating activities 24 159.3 159.6 152.1 86.5
Cash flows from investing activities
Inflows:
Proceeds from available-for-sale investments 836.5 920.4 – –
Proceeds from sale of property, plant and equipment – 0.1 – –
Outflows:
Payments for available-for-sale investments (984.8) (853.2) – –
Payments for property, plant and equipment (0.1) (0.5) – –
Net cash from/(used by) investing activities (148.4) 66.8 – –

FINANCIAL STATEMENTS 93
FINANCIAL STATEMENTS
Commercial Account National Interest Account
Note
30 June 2018 $ m
30 June 2017
$ m
30 June 2018 $ m
30 June 2017
$ m
Cash flows from financing activities
Inflows:
Net proceeds/(repayments) of derivatives 25 12.1 (75.4) – –
Net proceeds/(repayments) of payables to other financial institutions 25 0.6 (15.1) – –
Receipts from the Commonwealth – – 1.3 9.1
Receipts from National Interest Account 1.3 1.5 – –
Receipts from Northern Australia Infrastructure Facility 1.7 1.4 – –
Outflows:
Net proceeds/(repayments) of other borrowings 25 (44.2) (82.7) (119.8) (59.7)
Dividend payments to the Commonwealth (5.8) (5.7) – –
Other payments to the Commonwealth (7.3) (7.1) (32.3) (34.4)
Payments to Commercial Account – – (1.3) (1.5)
Net cash from/(used by) financing activities (41.6) (183.1) (152.1) (86.5)
Net increase/(decrease) in cash equivalents held (30.7) 43.3 – –
Cash equivalents at beginning of financial year 331.2 291.4 – –
Net effects of exchange rate changes on cash equivalent balances held in foreign currencies 9.4 (3.5) – –
Cash equivalents at end of financial year 24 309.9 331.2 – –
The accompanying notes form an integral part of the financial statements.

94 EFIC ANNUAL REPORT 2017–2018
NOTE 1: SUMMARY OF SIGNIFICANT ACCOUNTING POLICIES Efic – the Export Finance and Insurance Corporation – is the Australian Government’s export credit agency. Efic was established under the Export Finance and Insurance Corporation Act 1991 (Efic Act) and is defined as a corporate Commonwealth entity under the Public Governance, Performance and Accountability Act 2013 (PGPA Act).
Efic is a specialist financier delivering finance solutions to Australian exporters – helping them win business, grow internationally and achieve export success.
Efic supports Australian export trade on a commercial basis and works directly with businesses and their banks to provide complementary financial support to Australian-based companies that are exporting, are involved in a global supply chain or want to grow internationally. Through loans, guarantees, bonds and insurance products, Efic helps Australian exporters and subcontractors take advantage of new contract opportunities that may not have been possible otherwise.
The continued existence of Efic in its present form is dependent on Government policy.
(a) Basis of preparation of the financial statements
The financial statements are general purpose financial statements and are required by section 42 of the PGPA Act.
The financial statements have been prepared in accordance with:
the Australian Accounting Standards and Interpretations issued by the Australian Accounting Standards Board that apply for the reporting period
Public Governance, Performance and Accountability (Financial Reporting) Rule 2015 (FRR).
The financial statements are presented in Australian dollars and amounts are rounded to the nearest $0.1 million unless otherwise stated.
Efic operates two separate accounts: (i) the Commercial Account and (ii) the National Interest
Account. The results of these accounts are reported separately in the financial statements.
i) Business undertaken on the Commercial Account
The majority of financial assets and liabilities on the Commercial Account are measured at fair value due to the way Efic uses derivatives to hedge risk. Changes in fair value are either taken through profit or loss or through equity. Some assets and liabilities, however, are accounted for on an amortised cost basis, typically because the transaction qualifies for hedge accounting or the transaction is short term and derivatives are not used to hedge the risk.
The Commercial Account operates on a for-profit basis and bears all the risks for those business activities undertaken under Part 4 of the Efic Act.
(ii) Business undertaken on the National Interest Account
All financial assets and liabilities on the National Interest Account are measured at amortised cost. Efic does not enter into derivative financial instruments (e.g. swaps, foreign exchange contracts or borrowings with embedded derivatives) on the National Interest Account.
The National Interest Account operates on an approval or direction from the Minister for Trade, Tourism and Investment (Minister) enabling Efic to undertake business activities under Part 5 of the Efic Act which the Minister considers to be in the ‘national interest’. Such activities may relate to a class of business which Efic is not authorised to undertake, or involve terms and conditions Efic would not accept in the normal course of business. Where the Minister directs Efic to undertake a business activity under Part 5 of the Efic Act, the credit risk is borne by the Commonwealth. The funding risk, however, is borne by the Commercial Account, and the Commercial Account is compensated for this funding risk by retaining the difference between the actual borrowing rate and an
Notes to and forming part of the financial statementsfor the year ended 30 June 2018

FINANCIAL STATEMENTS 95
FINANCIAL STATEMENTS
agreed benchmark rate for funding loans on the National Interest Account. Premium or other income derived from the business activity on the National Interest Account is paid to the Commonwealth.
The Commercial Account recovers from the Commonwealth the costs of administering business undertaken under Part 5 and recovers from the Commonwealth any losses incurred in respect of such business.
There is also a provision in the Efic Act which allows the Commercial Account to share part of a National Interest Account business activity. In such cases income and expenses are apportioned between the two accounts in accordance with the risk participation.
(b) New Australian Accounting Standards (AAS)
Consistent with government policy, no accounting standard has been adopted earlier than the application date as stated in the standard.
The adoption of new standards and amendments that came into effect for this financial year did not have a significant impact on the financial statements.
A number of new and revised Australian accounting standards apply to Efic’s financial statements in later years. Efic’s assessment of the main effects of these standards on its financial statements is set out below.
AASB 9 – Financial Instruments
AASB 9 contains new requirements for the classification, measurement and de-recognition of financial assets and liabilities. It will replace the corresponding AASB 139 Financial Instruments: Recognition and Measurement. Efic will apply the new standard in the 2018–19 financial year.
Efic will be reclassifying the available-for-sale investments as amortised costs as they are solely payments of principal and interest. Efic will elect not to restate comparatives as on a value of $952.3m there is a market value adjustment at 30th June 2018 of $0.6m. Currently there would be no need to raise any impairment on these investments as they are all with Australian
authorised deposit taking institutions rated BBB or better or with other financial institutions or foreign entities rated AA- or better.
Loans and receivables designated at fair value through profit or loss, Loans to National Interest Account designated at fair value through profit or loss, and Borrowings designated at fair value through profit or loss are designated at fair value as this significantly reduces the accounting mismatch that would otherwise arise from measuring the asset on a different basis from the derivatives that have been entered into to hedge their transactions. As such, Efic will continue to treat all these at fair value through profit and loss.
Under AASB 9 the impairment method has changed from incurred loss to expected loss for Loans and receivables at amortised cost. As at the 30th June 2018 this would not change the value of any of the loans and receivables held at amortised cost.
AASB 15 – Revenue from contracts with customer
AASB 15 establishes a comprehensive framework for determining whether, how much and when revenue is recognised. It replaces existing revenue recognition guidance, including AASB 118 Revenue. Efic will apply the new standard in the 2018–19 financial year.
There is no significant effect to the accounting results for Efic on the implementation of this standard.
(c) Recognition of income and expenses
Commercial Account income and expenses are recognised in the financial statements at fair value by applying market rates and using the valuation technique of discounted cash flows. All future income and expense to be received or paid is estimated based on actual disbursements and receipts or Efic’s best estimate of future disbursements and receipts. The future cash flows are discounted to their present value.
National Interest Account income and expenses are recognised in the financial statements as earned or incurred from the date of attachment of risk and are taken through profit or loss using the effective interest method.

96 EFIC ANNUAL REPORT 2017–2018
NOTE 1: SUMMARY OF SIGNIFICANT ACCOUNTING POLICIES (continued)
(d) Operating segments
The Corporation operates its specialist financing activities through a single business segment – Export Finance. Export Finance includes support for SME clients as well as larger corporate clients by providing them with loans, bonds, guarantees and insurance products.
(e) Unamortised grants
Unamortised grants income is comprised of funds previously provided from the Commonwealth’s overseas aid appropriations. The Commonwealth provided overseas aid funds under a mixed credit scheme to assist developing countries to undertake high-priority public sector projects. The mixed credit grant, which is administered by Efic on the National Interest Account, was blended with funding at commercial rates under Efic’s export finance facility to provide a ‘soft loan’ package to finance the project in the developing country and known as the Development Import Finance Facility.
The mixed credit grant is amortised over the life of the loan to cover the difference between Efic’s commercial borrowing costs and the concessional interest income earned on the loan using the effective interest method. The unamortised balance is included in the Balance Sheet of the National Interest Account as an offset to loan assets.
The Commonwealth discontinued the mixed credit scheme in 1996. The balances outstanding on these loans are shown in Note 7.
(f) Foreign currency
Transactions denominated in a foreign currency are converted at the exchange rate at the date of the transaction. Foreign currency receivables and payables at reporting date are translated at exchange rates prevailing at reporting date.
All exchange gains and losses are brought to account in determining profit or loss for the year.
The principal exchange rates affecting the balance sheet are the US dollar, the Euro, New Zealand dollar and the Japanese Yen. The relevant exchange rates used are:
Notes to and forming part of the financial statementsfor the year ended 30 June 2018
2018 2017
Average rates during year
US$ / A$ 0.7753 0.7540
Euro / A$ 0.6500 0.6918
NZD / A$ 1.0851 1.0587
JPY / A$ 85.567 82.237
Rates at 30 June
US$ / A$ 0.7391 0.7699
Euro / A$ 0.6344 0.6730
NZD / A$ 1.0903 1.0505
JPY / A$ 81.820 86.152

FINANCIAL STATEMENTS 97
FINANCIAL STATEMENTS
(g) Hedge accounting
Hedge accounting is only applied on transactions where the formal documentation and designation criteria has been met.
The purpose of cash flow hedges is to hedge the exposure to variability in interest rate movements that are attributable to future interest cash flows. The effective portion of the gain or loss on the hedging instrument is recognised directly in equity, while any ineffective portion of the hedge is recognised through profit or loss.
The purpose of fair value hedges is to hedge the exposure to variability in fair value movements that are attributable to future interest cash flows. The change in the fair value of the hedging instrument is recognised through profit or loss. Meanwhile, the change in the fair value of the hedged item attributable to the risk hedged is recognised as an adjustment to the carrying value of the hedged item and is also recognised through profit or loss.
Hedges are assessed for effectiveness each reporting period both retrospectively and prospectively. A hedge is regarded as highly effective if the changes in fair value or cash flows attributable to the hedged risk during the period for which the hedge is designated are expected to offset in a range of 80% to 125%.
(h) Taxation
Under section 63 of the Efic Act, Efic is not subject to income tax and a number of other taxes, however under section 63A, Efic is subject to tax-equivalent payments under competitive neutrality arrangements as outlined below.
Efic is also subject to Goods and Services Tax (GST) and Fringe Benefits Tax (FBT). Revenues, expenses and assets are recognised net of the amount of GST, except:
where the amount of GST incurred is not recoverable as an input tax credit from the Australian Taxation Office, it is recognised as part of the cost of acquisition of an asset or as part of an item of expense
the net amount of GST recoverable from, or payable to, the Australian Taxation Office is included as part of the receivables, payables or commitments.
(i) Competitive neutrality
The competitive neutrality arrangements impose a mandatory obligation on Efic to pay amounts as determined by the Minister each financial year.
Under section 61A of the Efic Act, Efic has been instructed by the Minister to pay a debt neutrality charge to the Commonwealth that consists of:
a payment of 10 basis points on Efic’s cost of borrowing, which applies to all new borrowings and to existing debt that is rolled over or refinanced.
Under section 63A of the Efic Act, Efic has been instructed by the Minister to pay to the Commonwealth a tax-equivalent payment that consists of:
a payment in lieu of Commonwealth income tax at 30% of accounting profits, and realised capital gains
a payment in lieu of New South Wales payroll tax
a payment in lieu of New South Wales land tax.
(j) Cash and liquid assets
Cash and liquid assets include cash on hand and bank account balances. Cash is recognised at its nominal amount as this is considered fair value.
(k) Receivables from other financial institutions
Receivables from other financial institutions include overnight deposits and short-term fixed deposits with banks and other financial institutions and are measured at amortised cost using the effective interest method, which is equivalent to fair value.
(l) Available-for-sale investment securities
Available-for-sale investment securities are those purchased with an intention of being held until maturity but can be sold if required. They are short-term, medium-term and long-term government, bank and other debt securities and include bonds, bills of exchange, commercial paper and certificates of deposit. Interest income is taken up using the effective interest method. They are carried at market value with changes in fair value recognised directly in equity unless they are part of a fair value hedge where, in that case, the changes in fair value that are due to future interest cash flows in an effective

98 EFIC ANNUAL REPORT 2017–2018
hedge are taken directly through profit or loss. For more detail on the valuation calculation refer to Note 20.
(m) Loans and receivables at amortised cost
On the Commercial Account, transactions that are recorded at amortised cost are floating rate loans and short-term loans where derivatives are not used to hedge the risk. As such the amortised value approximates their fair value.
On the National Interest Account, export finance loans and rescheduled credit insurance debts are carried at amortised cost. The recoverable amount is represented by the gross value of the outstanding balances, adjusted by specific provisions for impairment, deferred income, unearned premium, and unamortised grants – see Note 1(e). Unearned premiums and deferred income received in cash at the start of the loan are brought to income on an effective yield basis over the life of the loan by reducing the carrying amount. Interest income is recognised using the effective interest method. A loan or receivable is recognised as impaired when it is likely that the debt will not be recovered in full. In this instance a specific provision will be created for the impairment.
(n) Loans and receivables designated at fair value through profit or loss
Export finance loans and rescheduled credit insurance debts held on the Commercial Account are designated at fair value through profit or loss. They are designated at fair value as this designation significantly reduces the accounting mismatch that would otherwise arise from measuring the asset on a different basis from derivatives that have been entered into to hedge the transactions. Interest income through profit or loss is recorded using the effective interest method, which forms part of the fair value calculation. Movement in fair value for premium, reinsurance, residual margin, interest income and credit risk is recorded separately through profit or loss. For more detail on the fair value calculation refer to Note 20.
(o) Loans to National Interest Account designated at fair value through profit or loss
The Commercial Account funds the loans on the National Interest Account and this funding is recorded in the Commercial Account at fair value through profit or loss. For more detail on the fair value calculation refer to Note 20.
(p) Derivative financial instruments
Efic uses derivative financial instruments on the Commercial Account to manage exposures to interest rate and foreign exchange risk. These include foreign exchange contracts, interest rate and cross-currency swaps, and forward rate agreements. Derivatives are initially recognised at fair value on the date a derivative is entered into and are subsequently remeasured to their fair value at each reporting date. Derivatives are carried as assets when their fair value is positive (in the money) and as liabilities when their fair value is negative (out of the money). Any gains and losses arising from changes in the fair value of derivatives, except those that qualify for hedge accounting, are taken through profit or loss. For more detail on the fair value calculation refer to Note 20.
(q) Property, plant and equipment
Property, plant and equipment are revalued periodically to fair value to ensure that the carrying amounts of assets do not differ materially from the assets fair value at the reporting date.
The valuation of property, comprising land and buildings, is made by an independent registered valuer based on the net present value of future income expected to be generated from the land and buildings.
The valuation of plant and equipment is based on internal assessment by management to ensure that the carrying amounts do not differ materially from their fair value.
Revaluation increments are credited directly to the asset revaluation reserve and any subsequent decreases are written back against the asset revaluation reserve. On revaluation, the
Notes to and forming part of the financial statementsfor the year ended 30 June 2018
NOTE 1: SUMMARY OF SIGNIFICANT ACCOUNTING POLICIES (continued)

FINANCIAL STATEMENTS 99
FINANCIAL STATEMENTS
accumulated depreciation is eliminated against the gross carrying amount of the asset and the net amount restated to the revalued amount of the asset.
Property, plant and equipment, other than freehold land, is depreciated over their estimated useful economic lives using the straight-line method.
Depreciation rates remain the same as last year, and the rates used are as follows:
buildings 6.7% pa
computer equipment 33.3% pa
other plant and equipment 10.0–22.5% pa
The profit or loss on disposal of property, plant and equipment is taken into account in determining the result for the year.
(r) Intangible assets (software costs)
The identifiable and directly associated external and internal costs of acquiring and developing software are capitalised and recognised as an intangible asset where the software is controlled by the Corporation, and where it is probable that the future economic benefits will flow from its use over more than one year. Costs associated with maintaining the software are recognised as an expense as incurred.
Computer software and other intangible assets are stated at cost less amortisation and impairment losses, if any.
Capitalised software costs are amortised on a systematic basis, using the straight-line method over its useful life of five years.
(s) Payables to other financial institutions
Payables to other financial institutions are short-term borrowings with banks and other financial institutions and are measured using the effective interest method as this would be equivalent to their fair value. Included in payables to other financial institutions is a floating rate borrowing, which qualifies for hedge accounting.
(t) Borrowings from Commercial Account
The National Interest Account loans are funded from the Commercial Account at an agreed benchmark rate and these borrowings are recorded in the National Interest Account at an amount equal to the net proceeds received. Interest expense is recognised using the effective interest method.
(u) Borrowings designated at fair value through profit or loss
Commercial paper, medium-term notes, bonds and structured bonds (which may have embedded derivatives) are designated at fair value through profit or loss. They are designated at fair value as this designation significantly reduces the accounting mismatch that would otherwise arise from measuring the liability on a different basis from derivatives that have been entered into to hedge the transactions. Interest expense in the profit or loss is recorded using the effective interest method, which forms part of the fair value calculation, and movement in fair value is recorded separately through profit or loss. For more detail on the fair value calculation refer to Note 20.
(v) Guarantees designated at fair value through profit or loss
Guarantees, medium-term insurance, bonds and political risk insurance transactions are regarded as financial instruments under accounting standards. These are designated at fair value through profit or loss at inception. Subsequently, they are carried at their fair value with any movements transferred through profit or loss. For more detail on the fair value calculation refer to Note 20.
(w) Employee entitlements
Provisions for annual leave and long service leave have been established to provide for amounts expected to be paid to employees based on their entitlements. Where applicable, the entitlements take into account prior government service.
The provision for annual leave is based on the value of actual entitlements at reporting date. Long service leave is measured at the present value of expected future payments to be made in respect of services provided by employees up to the reporting

100 EFIC ANNUAL REPORT 2017–2018
date and discounted using appropriate market yields at reporting date.
Efic makes contributions to the Commonwealth Superannuation Scheme (CSS) and Public Sector Superannuation Scheme (PSS) and its obligation is limited to a required annual contribution as determined by the actuaries of the superannuation plans administered by the Commonwealth. Accordingly, the plans are accounted for by Efic as defined contribution plans. The liability for defined benefits are recognised in the financial statements of the Australian Government and are settled by the Australian Government in due course.
Efic staff can also be members of superannuation funds held outside the Australian Government. Efic makes employer contributions to these funds as per the Superannuation Guarantee Contribution rate. The liability for superannuation recognised as at 30 June represents outstanding contributions.
(x) Sundry creditors
Creditors and other liabilities are recognised when Efic becomes obliged to make future payments resulting from the purchase of goods or services.
(y) Cash flows
For the purpose of the cash flow statement cash equivalents include cash on hand and at bank, and deposits with financial institutions, to maintain liquidity.
(z) Contingencies and commitments – assets and liabilities
Where, as a result of past events, there is a possible asset or liability whose existence will be confirmed only by the occurrence or non-occurrence of one or more uncertain future events not wholly within the control of Efic, this will be disclosed as a contingent asset or contingent liability. When the inflow of economic benefits is probable, but not virtually certain, Efic will recognise the contingent asset. When the outflow of economic benefits is probable, Efic will recognise the contingent liability.
Commitments to provide financial facilities are contractually based. For loans and funded guarantees Efic has committed to lend a fixed amount and any undrawn amounts under these facilities are shown as commitments. For guarantees and bonds, Efic has committed to cover a fixed exposure and any undrawn amounts under these facilities are shown as commitments.
(aa) Events after the reporting period
There have been no material events occurring after the reporting period that impact these financial statements for the year ended 30 June 2018.
Notes to and forming part of the financial statementsfor the year ended 30 June 2018
NOTE 1: SUMMARY OF SIGNIFICANT ACCOUNTING POLICIES (continued)

FINANCIAL STATEMENTS 101
FINANCIAL STATEMENTS
NOTE 2: SIGNIFICANT ACCOUNTING JUDGEMENTS, ESTIMATES AND ASSUMPTIONS
In applying accounting policies, management continually evaluates judgements, estimates and assumptions based on experience and other factors, including expectations of future events, that may have an impact on the financial statements. All judgements, estimates and assumptions made are believed to be reasonable, based on the most current set of circumstances available to management. Actual results may differ from the judgements, estimates and assumptions. Significant judgements, estimates and assumptions made by management in the preparation of the financial statements are outlined below.
Impairment of available-for-sale investment securities
Efic holds a number of available-for-sale financial assets. A review of these assets has been undertaken for the year ended 30 June 2018, and it has been determined that no investment is considered to be impaired. On a portfolio basis there has been an appreciation in the value of the available-for-sale investments since purchase.
Plant and equipment
The valuation of plant and equipment is based on an internal assessment by management to ensure that the carrying amounts do not differ materially from their fair value.
An independent valuation of land and buildings was carried out in June 2016 by Mr Benjamin Masters AAPI, Registered Valuer No. 16930 and Mr Jonathan Petsalis AAPI, Registered Valuer No.12849 of CIVAS (NSW) Pty Limited. On a income approach and discounted cash flow analysis with reference to its highest and best use, the land and buildings were valued at $57,000,000.
Fair value of financial instruments
Where financial instruments have a price quoted in an active market, this is its fair value.
Where the fair value of financial instruments cannot be determined from active markets, they are determined using a variety of valuation techniques that include the use of mathematical models. The
inputs to these models are derived from observable market data where possible, but where observable market data are not available, judgement is required to establish fair values. The valuation of financial instruments is described in more detail in Note 20.
Significant accounting events on judgements, estimates and assumptions during the year
There have been no significant accounting events in the current financial year.

102 EFIC ANNUAL REPORT 2017–2018
Notes to and forming part of the financial statementsfor the year ended 30 June 2018
NOTE 3: REVENUE AND EXPENSES
Commercial Account National Interest Account
Note
30 June 2018 $ m
30 June 2017
$ m
30 June 2018 $ m
30 June 2017
$ m
(i) Interest income
Receivables from other financial institutions 2.8 2.3 – –
Available-for-sale investment securities 21.0 19.8 – –
Loans at amortised cost 0.1 0.2 15.4 17.5
Loans and receivables designated at fair value through profit or loss 29.0 23.9 – –
Loans to National Interest Account designated at fair value through profit or loss 14.5 16.1 – –
Derivative financial instruments receivable 83.7 76.6 – –
Total interest income 151.1 138.9 15.4 17.5
(ii) Interest expense
Payables to other financial institutions (0.8) (0.4) – –
Borrowings from Commercial Account – – (14.7) (16.6)
Borrowings at amortised cost (0.1) (0.1) – –
Borrowings designated at fair value through profit or loss (72.2) (68.5) – –
Derivative financial instruments payable (56.0) (47.4) – –
Debt neutrality charge (1.0) (1.1) – –
Total interest income (130.1) (117.5) (14.7) (16.6)
(iii) Fair value movement of third-party loans and guarantees
Net premium and fees 34.8 17.4 – –
Reinsurance (7.3) (2.5) – –
Interest 0.1 (1.3) – –
Credit risk 2.7 13.6 – –
Claims paid (0.2) – – –
Claims recovered 0.1 0.5 – –
Specific events (2.1) (3.7) – –
Total fair value movement of third-party loans and guarantees 28.1 24.0 – –
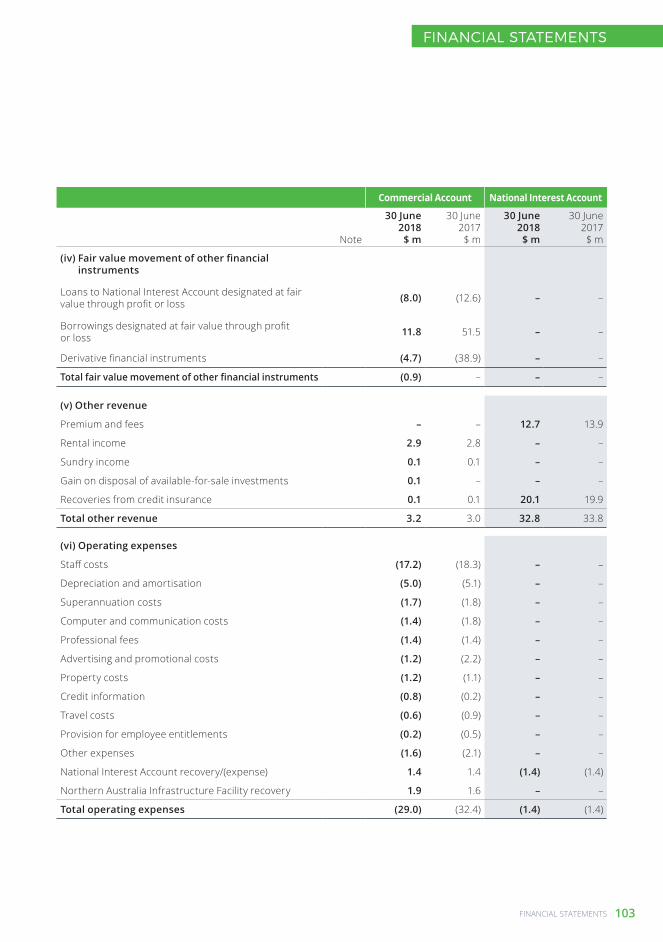
FINANCIAL STATEMENTS 103
FINANCIAL STATEMENTS
Commercial Account National Interest Account
Note
30 June 2018 $ m
30 June 2017
$ m
30 June 2018 $ m
30 June 2017
$ m
(iv) Fair value movement of other financial instruments
Loans to National Interest Account designated at fair value through profit or loss (8.0) (12.6) – –
Borrowings designated at fair value through profit or loss 11.8 51.5 – –
Derivative financial instruments (4.7) (38.9) – –
Total fair value movement of other financial instruments (0.9) – – –
(v) Other revenue
Premium and fees – – 12.7 13.9
Rental income 2.9 2.8 – –
Sundry income 0.1 0.1 – –
Gain on disposal of available-for-sale investments 0.1 – – –
Recoveries from credit insurance 0.1 0.1 20.1 19.9
Total other revenue 3.2 3.0 32.8 33.8
(vi) Operating expenses
Staff costs (17.2) (18.3) – –
Depreciation and amortisation (5.0) (5.1) – –
Superannuation costs (1.7) (1.8) – –
Computer and communication costs (1.4) (1.8) – –
Professional fees (1.4) (1.4) – –
Advertising and promotional costs (1.2) (2.2) – –
Property costs (1.2) (1.1) – –
Credit information (0.8) (0.2) – –
Travel costs (0.6) (0.9) – –
Provision for employee entitlements (0.2) (0.5) – –
Other expenses (1.6) (2.1) – –
National Interest Account recovery/(expense) 1.4 1.4 (1.4) (1.4)
Northern Australia Infrastructure Facility recovery 1.9 1.6 – –
Total operating expenses (29.0) (32.4) (1.4) (1.4)
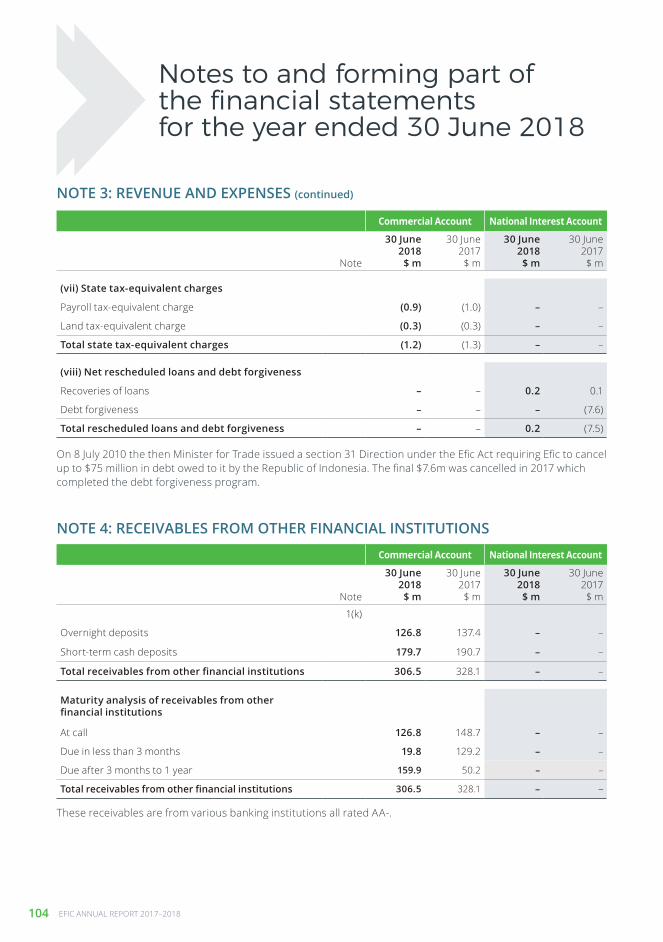
104 EFIC ANNUAL REPORT 2017–2018
Notes to and forming part of the financial statementsfor the year ended 30 June 2018
NOTE 3: REVENUE AND EXPENSES (continued)
Commercial Account National Interest Account
Note
30 June 2018 $ m
30 June 2017
$ m
30 June 2018 $ m
30 June 2017
$ m
(vii) State tax-equivalent charges
Payroll tax-equivalent charge (0.9) (1.0) – –
Land tax-equivalent charge (0.3) (0.3) – –
Total state tax-equivalent charges (1.2) (1.3) – –
(viii) Net rescheduled loans and debt forgiveness
Recoveries of loans – – 0.2 0.1
Debt forgiveness – – – (7.6)
Total rescheduled loans and debt forgiveness – – 0.2 (7.5)
NOTE 4: RECEIVABLES FROM OTHER FINANCIAL INSTITUTIONS
Commercial Account National Interest Account
Note
30 June 2018 $ m
30 June 2017
$ m
30 June 2018 $ m
30 June 2017
$ m
1(k)
Overnight deposits 126.8 137.4 – –
Short-term cash deposits 179.7 190.7 – –
Total receivables from other financial institutions 306.5 328.1 – –
Maturity analysis of receivables from other financial institutions
At call 126.8 148.7 – –
Due in less than 3 months 19.8 129.2 – –
Due after 3 months to 1 year 159.9 50.2 – –
Total receivables from other financial institutions 306.5 328.1 – –
These receivables are from various banking institutions all rated AA-.
On 8 July 2010 the then Minister for Trade issued a section 31 Direction under the Efic Act requiring Efic to cancel up to $75 million in debt owed to it by the Republic of Indonesia. The final $7.6m was cancelled in 2017 which completed the debt forgiveness program.

FINANCIAL STATEMENTS 105
FINANCIAL STATEMENTS
NOTE 6: AVAILABLE-FOR-SALE INVESTMENT SECURITIES
NOTE 5: AMOUNTS PAYABLE TO THE COMMONWEALTH
Commercial Account National Interest Account
Note
30 June 2018 $ m
30 June 2017
$ m
30 June 2018 $ m
30 June 2017
$ m
1(l)
Discount securities 392.6 189.1 – –
Floating rate notes 475.5 512.3 – –
Fixed rate bonds 84.2 103.4 – –
Total available-for-sale investment securities 952.3 804.8 – –
Maturity analysis of available-for-sale investment securities
Due in 3 months or less 265.3 34.9 – –
Due after 3 months to 1 year 384.2 370.7 – –
Due after 1 year to 5 years 302.8 399.2 – –
Total available-for-sale investment securities 952.3 804.8 – –
Refer to Note 19 for further information regarding credit risk and market risk.
Commercial Account National Interest Account
Note
30 June 2018 $ m
30 June 2017
$ m
30 June 2018 $ m
30 June 2017
$ m
Commonwealth opening balance payable – – 12.0 11.6
Net payments to the Commonwealth – – (30.9) (25.3)
Profit for the year on National Interest Account – – 32.3 25.7
Total amounts payable to the Commonwealth – – 13.4 12.0
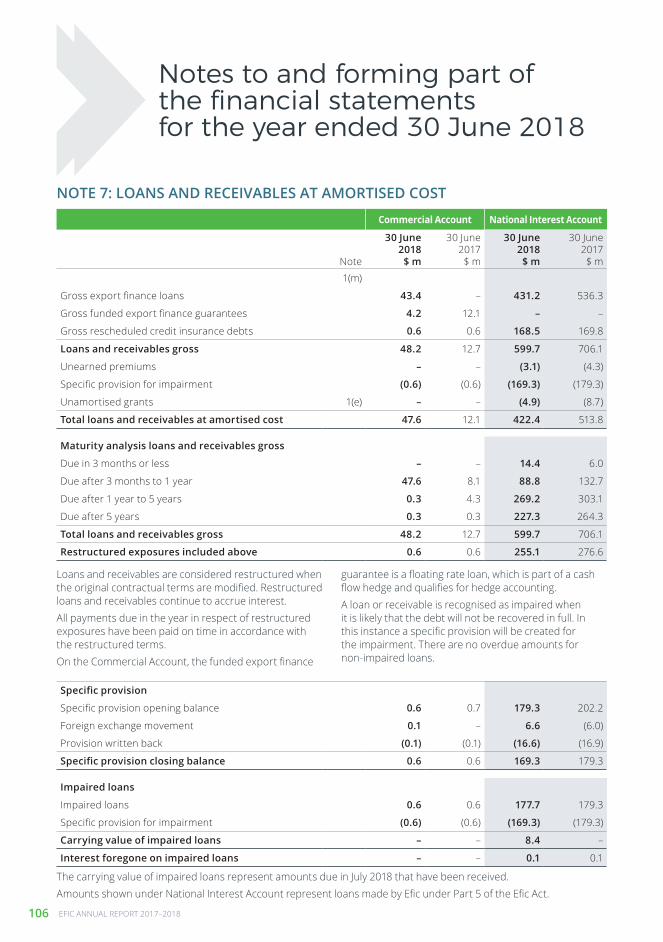
106 EFIC ANNUAL REPORT 2017–2018
Notes to and forming part of the financial statementsfor the year ended 30 June 2018
NOTE 7: LOANS AND RECEIVABLES AT AMORTISED COST
Commercial Account National Interest Account
Note
30 June 2018 $ m
30 June 2017
$ m
30 June 2018 $ m
30 June 2017
$ m
1(m)
Gross export finance loans 43.4 – 431.2 536.3
Gross funded export finance guarantees 4.2 12.1 – –
Gross rescheduled credit insurance debts 0.6 0.6 168.5 169.8
Loans and receivables gross 48.2 12.7 599.7 706.1
Unearned premiums – – (3.1) (4.3)
Specific provision for impairment (0.6) (0.6) (169.3) (179.3)
Unamortised grants 1(e) – – (4.9) (8.7)
Total loans and receivables at amortised cost 47.6 12.1 422.4 513.8
Maturity analysis loans and receivables gross
Due in 3 months or less – – 14.4 6.0
Due after 3 months to 1 year 47.6 8.1 88.8 132.7
Due after 1 year to 5 years 0.3 4.3 269.2 303.1
Due after 5 years 0.3 0.3 227.3 264.3
Total loans and receivables gross 48.2 12.7 599.7 706.1
Restructured exposures included above 0.6 0.6 255.1 276.6
Specific provision
Specific provision opening balance 0.6 0.7 179.3 202.2
Foreign exchange movement 0.1 – 6.6 (6.0)
Provision written back (0.1) (0.1) (16.6) (16.9)
Specific provision closing balance 0.6 0.6 169.3 179.3
Impaired loans
Impaired loans 0.6 0.6 177.7 179.3
Specific provision for impairment (0.6) (0.6) (169.3) (179.3)
Carrying value of impaired loans – – 8.4 –
Interest foregone on impaired loans – – 0.1 0.1
Loans and receivables are considered restructured when the original contractual terms are modified. Restructured loans and receivables continue to accrue interest.All payments due in the year in respect of restructured exposures have been paid on time in accordance with the restructured terms.On the Commercial Account, the funded export finance
guarantee is a floating rate loan, which is part of a cash flow hedge and qualifies for hedge accounting.A loan or receivable is recognised as impaired when it is likely that the debt will not be recovered in full. In this instance a specific provision will be created for the impairment. There are no overdue amounts for non-impaired loans.
The carrying value of impaired loans represent amounts due in July 2018 that have been received. Amounts shown under National Interest Account represent loans made by Efic under Part 5 of the Efic Act.

FINANCIAL STATEMENTS 107
FINANCIAL STATEMENTS
NOTE 8: LOANS AND RECEIVABLES DESIGNATED AT FAIR VALUE THROUGH PROFIT OR LOSS
Commercial Account National Interest Account
Note
30 June 2018 $ m
30 June 2017
$ m
30 June 2018 $ m
30 June 2017
$ m
Gross export finance loans 1,098.2 1,070.8 – –
Gross funded export finance guarantees 171.5 193.4 – –
Loans and receivables gross 1(n) 1,269.7 1,264.2 – –
Fair value net premium and fees 25.3 35.1 – –
Fair value interest income 3.8 2.8 – –
Fair value of credit risk (68.0) (70.0) – –
Fair value of specific events (6.5) (3.6) – –
Total loans and receivables at fair value 1,224.3 1,228.5 – –
Maturity analysis loans and receivables gross
Overdue 0.6 0.3 – –
Due in 3 months or less 133.8 29.6 – –
Due after 3 months to 1 year 40.6 114.5 – –
Due after 1 year to 5 years 636.3 637.2 – –
Due after 5 years 458.4 482.6 – –
Total loans and receivables gross 1,269.7 1,264.2 – –
Restructured exposures included above 6.9 6.3 – –
Maturity analysis of overdue loans and receivables gross
Less than 30 days – 0.1 – –
30 to 60 Days 0.6 – – –
Over 90 Days – 0.2 – –
Total overdue loans and receivables gross 0.6 0.3 – –
Loans and receivables are considered restructured when the original contractual terms are modified. Restructured loans and receivables continue to accrue interest.
All payments due in the year in respect of restructured exposures have been paid on time in accordance with the restructured terms.
The overdue amount of $0.6 million relates to nineteen SME export finance loans where payment was not received on time. For these overdue loans Efic has either received the payments in July or is working with the client to receive payment in full.
A loan or receivable is recognised as impaired when it is likely that the debt will not be recovered in full. In this instance a specific event will be created for the impairment.
Refer to Note 19 for further information regarding credit risk, including maximum exposures and market risk.
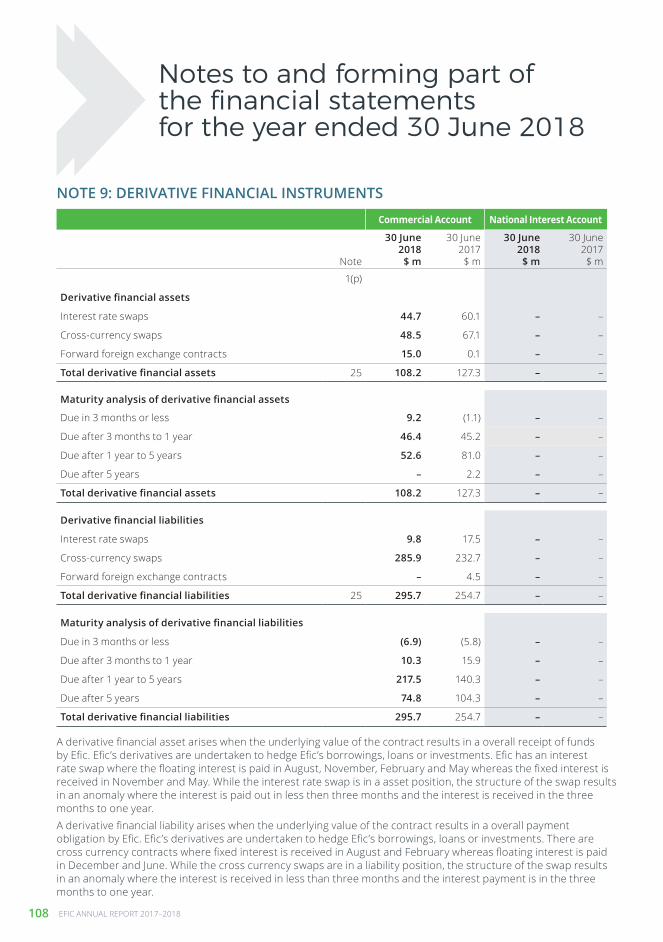
108 EFIC ANNUAL REPORT 2017–2018
Notes to and forming part of the financial statementsfor the year ended 30 June 2018
NOTE 9: DERIVATIVE FINANCIAL INSTRUMENTS
Commercial Account National Interest Account
Note
30 June 2018 $ m
30 June 2017
$ m
30 June 2018 $ m
30 June 2017
$ m
1(p)
Derivative financial assets
Interest rate swaps 44.7 60.1 – –
Cross-currency swaps 48.5 67.1 – –
Forward foreign exchange contracts 15.0 0.1 – –
Total derivative financial assets 25 108.2 127.3 – –
Maturity analysis of derivative financial assets
Due in 3 months or less 9.2 (1.1) – –
Due after 3 months to 1 year 46.4 45.2 – –
Due after 1 year to 5 years 52.6 81.0 – –
Due after 5 years – 2.2 – –
Total derivative financial assets 108.2 127.3 – –
Derivative financial liabilities
Interest rate swaps 9.8 17.5 – –
Cross-currency swaps 285.9 232.7 – –
Forward foreign exchange contracts – 4.5 – –
Total derivative financial liabilities 25 295.7 254.7 – –
Maturity analysis of derivative financial liabilities
Due in 3 months or less (6.9) (5.8) – –
Due after 3 months to 1 year 10.3 15.9 – –
Due after 1 year to 5 years 217.5 140.3 – –
Due after 5 years 74.8 104.3 – –
Total derivative financial liabilities 295.7 254.7 – –
A derivative financial asset arises when the underlying value of the contract results in a overall receipt of funds by Efic. Efic’s derivatives are undertaken to hedge Efic’s borrowings, loans or investments. Efic has an interest rate swap where the floating interest is paid in August, November, February and May whereas the fixed interest is received in November and May. While the interest rate swap is in a asset position, the structure of the swap results in an anomaly where the interest is paid out in less then three months and the interest is received in the three months to one year.A derivative financial liability arises when the underlying value of the contract results in a overall payment obligation by Efic. Efic’s derivatives are undertaken to hedge Efic’s borrowings, loans or investments. There are cross currency contracts where fixed interest is received in August and February whereas floating interest is paid in December and June. While the cross currency swaps are in a liability position, the structure of the swap results in an anomaly where the interest is received in less than three months and the interest payment is in the three months to one year.

FINANCIAL STATEMENTS 109
FINANCIAL STATEMENTS
NOTE 10: PROPERTY, PLANT AND EQUIPMENT
Commercial Account National Interest Account
Note
30 June 2018 $ m
30 June 2017
$ m
30 June 2018 $ m
30 June 2017
$ m
1(q)
Freehold land and building, at valuation 57.0 57.0 – –
Accumulated depreciation (5.8) (2.9) – –
Net book value – land and building 51.2 54.1 – –
Plant and equipment, at valuation 16.5 16.5 – –
Accumulated depreciation (9.9) (8.1) – –
Net book value – plant and equipment 6.6 8.4 – –
Total property, plant and equipment 57.8 62.5 – –
Land andbuildings
$ m
Plant andequipment
$ mTotal
$ m
Gross value
Balance as at 30 June 2017 57.0 16.5 73.5
Additions – 0.1 0.1
Disposals – (0.1) (0.1)
Gross value as at 30 June 2018 57.0 16.5 73.5
Accumulated depreciation
Balance as at 30 June 2017 (2.9) (8.1) (11.0)
Depreciation charged for assets held at 1 July 2017 (2.9) (1.8) (4.7)
Depreciation as at 30 June 2018 (5.8) (9.9) (15.7)
Net book value as at 1 July 2017 54.1 8.4 62.5
Net book value as at 30 June 2018 51.2 6.6 57.8
An independent valuation of land and buildings was carried out in June 2016 by Mr Benjamin Masters AAPI, Registered Valuer No. 16930 and Mr Jonathan Petsalis AAPI, Registered Valuer No.12849 of CIVAS (NSW) Pty Limited. On an income approach and discounted cash flow analysis with reference to its highest and best use, the land and buildings were valued at $57,000,000.

110 EFIC ANNUAL REPORT 2017–2018
Notes to and forming part of the financial statementsfor the year ended 30 June 2018
NOTE 10: PROPERTY, PLANT AND EQUIPMENT (continued)
Leased accommodation
Freehold land and buildings includes accommodation which has been leased to third parties. The valuation, accumulated depreciation and depreciation charge attributed to the leased space has been derived based on the floor area of the leased space.
The allocated valuation, accumulated depreciation, written-down value and depreciation expense of the leased space is based on a pro rata of floor space:
30 June 2018 $ m
30 June 2017
$ m
Leased accommodation
Freehold land and building, at valuation 39.0 39.0
Accumulated depreciation (4.0) (2.0)
Written-down value 35.0 37.0
Depreciation expense 2.0 2.0
NOTE 11: INTANGIBLE ASSETS
Commercial Account National Interest Account
Note
30 June 2018 $ m
30 June 2017
$ m
30 June 2018 $ m
30 June 2017
$ m
1(r)
Cost 1.5 1.5 – –
Accumulated amortisation and impairment (0.7) (0.4) – –
Net book value – intangible assets 0.8 1.1 – –
Intangible asset $ m
Gross value
Balance as at 30 June 2017 1.5
Gross value as at 30 June 2018 1.5
Accumulated amortisation and impairment losses
Balance as at 30 June 2017 (0.4)
Amortisation (0.3)
Amortisation and impairment as at 30 June 2018 (0.7)
Net book value as at 1 July 2017 1.1
Net book value as at 30 June 2018 0.8

FINANCIAL STATEMENTS 111
FINANCIAL STATEMENTS
NOTE 12: OTHER ASSETS
NOTE 14: BORROWINGS DESIGNATED AT FAIR VALUE THROUGH PROFIT OR LOSS
NOTE 13: PAYABLES TO OTHER FINANCIAL INSTITUTIONS
Commercial Account National Interest Account
Note
30 June 2018 $ m
30 June 2017
$ m
30 June 2018 $ m
30 June 2017
$ m
Accrued interest receivable – – 3.7 2.0
Sundry debtors and prepayments 2.8 1.5 6.1 16.4
Total other assets 2.8 1.5 9.8 18.4
Commercial Account National Interest Account
Note
30 June 2018 $ m
30 June 2017
$ m
30 June 2018 $ m
30 June 2017
$ m
1(u)
Borrowings 2,288.6 2,314.1 – –
Total borrowings at fair value 25 2,288.6 2,314.1 – –
Commercial Account National Interest Account
Note
30 June 2018 $ m
30 June 2017
$ m
30 June 2018 $ m
30 June 2017
$ m
1(s)
Short-term borrowings 24.7 16.2 – –
Floating rate borrowing* 4.2 12.1 – –
Total payables to other financial institutions 25 28.9 28.3 – –
Maturity analysis of payables to other financial institutions
At call 6.8 9.6 – –
Due in 3 months or less 17.9 6.6
Due after 3 months to 1 year 4.2 8.1 – –
Due after 1 year to 5 years – 4.0 – –
Total payables to other financial institutions 28.9 28.3 – –
*The floating rate borrowing is part of a cash flow hedge.
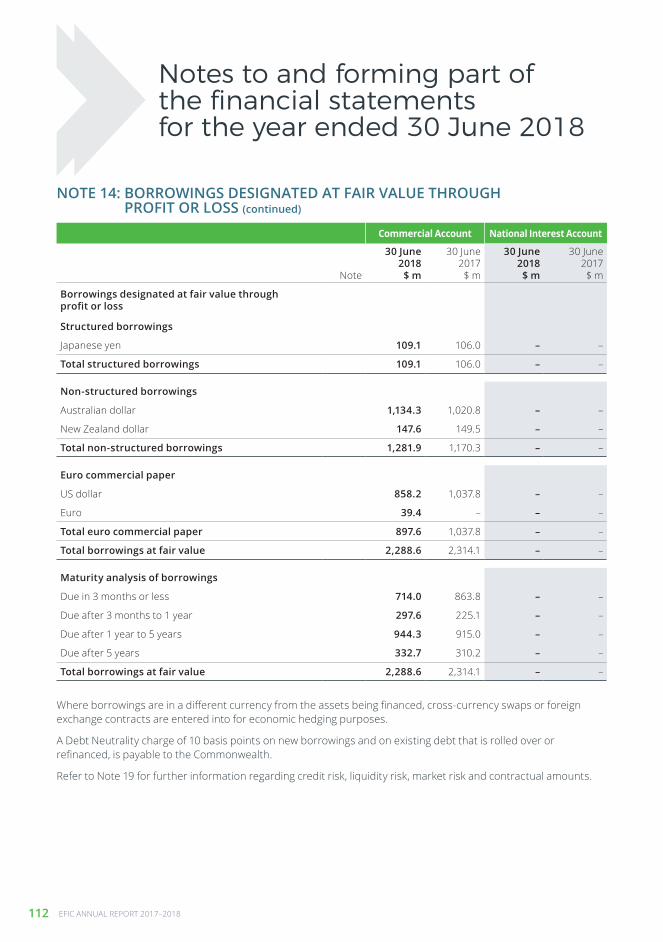
112 EFIC ANNUAL REPORT 2017–2018
Notes to and forming part of the financial statementsfor the year ended 30 June 2018
NOTE 14: BORROWINGS DESIGNATED AT FAIR VALUE THROUGH PROFIT OR LOSS (continued)
Commercial Account National Interest Account
Note
30 June 2018 $ m
30 June 2017
$ m
30 June 2018 $ m
30 June 2017
$ m
Borrowings designated at fair value through profit or loss
Structured borrowings
Japanese yen 109.1 106.0 – –
Total structured borrowings 109.1 106.0 – –
Non-structured borrowings
Australian dollar 1,134.3 1,020.8 – –
New Zealand dollar 147.6 149.5 – –
Total non-structured borrowings 1,281.9 1,170.3 – –
Euro commercial paper
US dollar 858.2 1,037.8 – –
Euro 39.4 – – –
Total euro commercial paper 897.6 1,037.8 – –
Total borrowings at fair value 2,288.6 2,314.1 – –
Maturity analysis of borrowings
Due in 3 months or less 714.0 863.8 – –
Due after 3 months to 1 year 297.6 225.1 – –
Due after 1 year to 5 years 944.3 915.0 – –
Due after 5 years 332.7 310.2 – –
Total borrowings at fair value 2,288.6 2,314.1 – –
Where borrowings are in a different currency from the assets being financed, cross-currency swaps or foreign exchange contracts are entered into for economic hedging purposes.
A Debt Neutrality charge of 10 basis points on new borrowings and on existing debt that is rolled over or refinanced, is payable to the Commonwealth.
Refer to Note 19 for further information regarding credit risk, liquidity risk, market risk and contractual amounts.

FINANCIAL STATEMENTS 113
FINANCIAL STATEMENTS
NOTE 15: GUARANTEES DESIGNATED AT FAIR VALUE THROUGH PROFIT OR LOSS
Commercial Account National Interest Account
Note
30 June 2018 $ m
30 June 2017
$ m
30 June 2018 $ m
30 June 2017
$ m
1(v)
Fair value of credit risk 10.6 8.4 – –
Fair value of specific events 1.4 2.3 – –
Fair value of net premium receivable (5.4) (1.1) – –
Total guarantees designated at fair value through profit or loss 6.6 9.6 – –
NOTE 16: SUNDRY PROVISIONS AND ALLOWANCES
NOTE 17: OTHER LIABILITIES
Commercial Account National Interest Account
Note
30 June 2018 $ m
30 June 2017
$ m
30 June 2018 $ m
30 June 2017
$ m
Employee entitlements 1(w) 3.9 4.1 – –
Provision for tax equivalent charges 8.1 7.3 – –
Total sundry provisions and allowances 12.0 11.4 – –
Commercial Account National Interest Account
Note
30 June 2018 $ m
30 June 2017
$ m
30 June 2018 $ m
30 June 2017
$ m
Sundry creditors 1(x) 42.0 36.9 – –
Interest payable – – 1.7 2.1
Total other liabilities 42.0 36.9 1.7 2.1
When it is likely that a guarantee will be called or a claim has been submitted but not yet paid, then a specific event will be recognised for the exposure that may be called or the claim that may be paid.
Refer to Note 19 for further information regarding credit risk, market risk and maximum exposures.
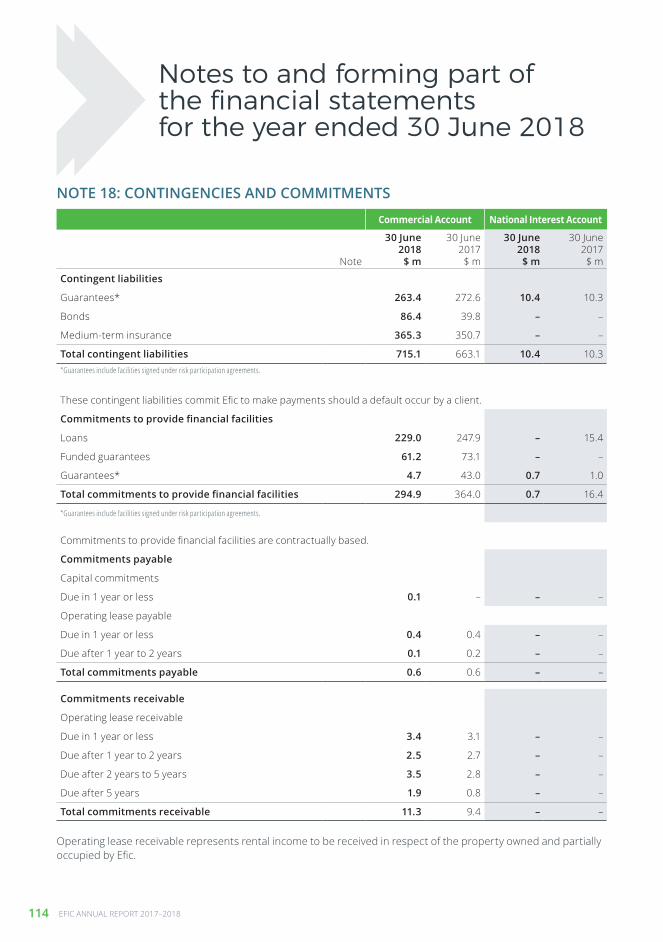
114 EFIC ANNUAL REPORT 2017–2018
Notes to and forming part of the financial statementsfor the year ended 30 June 2018
NOTE 18: CONTINGENCIES AND COMMITMENTS
Commercial Account National Interest Account
Note
30 June 2018 $ m
30 June 2017
$ m
30 June 2018 $ m
30 June 2017
$ m
Contingent liabilities
Guarantees* 263.4 272.6 10.4 10.3
Bonds 86.4 39.8 – –
Medium-term insurance 365.3 350.7 – –
Total contingent liabilities 715.1 663.1 10.4 10.3 *Guarantees include facilities signed under risk participation agreements.
These contingent liabilities commit Efic to make payments should a default occur by a client.
Commitments to provide financial facilities
Loans 229.0 247.9 – 15.4
Funded guarantees 61.2 73.1 – –
Guarantees* 4.7 43.0 0.7 1.0
Total commitments to provide financial facilities 294.9 364.0 0.7 16.4
*Guarantees include facilities signed under risk participation agreements.
Commitments to provide financial facilities are contractually based.
Commitments payable
Capital commitments
Due in 1 year or less 0.1 – – –
Operating lease payable
Due in 1 year or less 0.4 0.4 – –
Due after 1 year to 2 years 0.1 0.2 – –
Total commitments payable 0.6 0.6 – –
Commitments receivable
Operating lease receivable
Due in 1 year or less 3.4 3.1 – –
Due after 1 year to 2 years 2.5 2.7 – –
Due after 2 years to 5 years 3.5 2.8 – –
Due after 5 years 1.9 0.8 – –
Total commitments receivable 11.3 9.4 – –
Operating lease receivable represents rental income to be received in respect of the property owned and partially occupied by Efic.

FINANCIAL STATEMENTS 115
FINANCIAL STATEMENTS
NOTE 19: FINANCIAL RISK MANAGEMENT(i) General
As part of its normal operations, Efic enters into a variety of transactions, including loans, guarantees, medium-term insurance and bonds, which can be denominated in various currencies.
Efic enters into a number of financial derivative transactions on the Commercial Account to protect against interest rate, foreign exchange and funding risks associated with Efic’s normal operations, including funding the National Interest Account. Efic does not enter into derivative instruments for speculative or trading purposes. Derivative transactions include:
interest rate swaps and forward rate agreements which protect against interest rate movements where the interest rate basis of the borrowing is different from that of the required liability to fund assets. These contracts are used primarily to convert any fixed rate exposures into floating rate exposures
cross-currency swaps which protect Efic against interest rate and foreign exchange movements where the currency and interest rate of the borrowing is different from that of the required
liability to fund assets. These contracts are used primarily to convert the borrowing and interest payment into the same currency and type as the loan or investment
forward foreign exchange contracts which are used to protect against foreign exchange movements in investments, loans and borrowings.
Efic also conducts detailed stress testing, including examining the impact on the credit portfolio of slower economic growth in emerging markets and adverse movements in foreign exchange rates and commodity prices. Efic has previously entered into an option contract to mitigate to a degree credit losses across part of the portfolio.
(ii) Credit risk (a) Commercial Account exposures
Credit risk arises from the possibility of defaults by counterparties on contractual obligations, resulting in financial loss.
Exposures to credit risk for the Commercial Account are as follows:
Note30 June 2018
$ m30 June 2017
$ m
Credit risk exposures
Receivables from other financial institutions 4, 1(k) 306.5 328.1
Available-for-sale investment securities 6, 1(l) 952.3 804.8
Loans and receivables at amortised cost 7, 1(m) 47.6 12.1
Loans and receivables designated at fair value through profit or loss 8, 1(n) 1,224.3 1,228.5
Derivative financial assets 9, 1(p) 108.2 127.3
Total* 2,638.9 2,500.8
Contingent liabilities 18 715.1 663.1
Commitments 18 294.9 364.0
Total 1,010.0 1,027.1
Total credit risk exposure 3,648.9 3,527.9
* Cash and liquid assets, Loans to National Interest Account designated at fair value through profit or loss, Other assets, and Property, Plant and Equipment have not been included in the above table as there is no significant associated credit risk.
116 EFIC ANNUAL REPORT 2017–2018
> Exposures to treasury counterparties
Credit risk arising from Efic’s treasury activities through its investment portfolios and from interest rate and foreign exchange management is limited to Commonwealth and state or territory governments, authorised deposit-taking institutions rated BBB- or above and other entities with credit ratings the equivalent of AA- or above. However, if after purchase or a contracting counterparty subsequently falls below the minimum credit rating, management evaluates the risk and will decide on the applicable action, which may include selling the asset, novating the contract, holding the asset to maturity, or obtaining security through credit support annexures (CSAs).
Prudential controls set by the PGPA Act for the investment by Efic’s treasury of surplus monies are limited to:
(i) money with Authorised Deposit-taking Institutions (ADIs) in Australia rated BBB- or above
(ii) securities issued by or guaranteed by the Commonwealth, a State or Territory
(iii) money with other entities with credit ratings the equivalent of AA- or better
(iv) deposits with, or securities issued, by the above ADIs
(v) deposits with, or securities issued or guaranteed, by the above entities subject to:
(a) investments in ADIs with a rating lower than A- must not exceed 25% of Efic’s total investments
(b) investments in ADIs with a term longer than six months and a rating lower than A- must be able to be traded in the secondary market and must not exceed a term of three years
(c) investments in an individual ADI with a rating lower than A- must not exceed 10% of Efic’s total investments.
In addition to the PGPA Act requirements, the Board does not permit proprietary trading and in addition have set further controls for Efic’s treasury operations, which consist of:
(i) a cap on foreign exchange open positions
(ii) a cap on interest rate exposure to asset maturity
(iii) minimum levels for committed funding over the life of assets
(iv) a cap on the structured borrowing component of funding
(v) limits relating to individual counterparty exposures and terms
(vi) limits relating to portfolio exposures and terms
(vii) limits on investments in structured, multi credit entities
(viii) performance benchmarks relating to specific portfolios
(ix) derivative limits and a CSA collateral policy
All individual counterparty limits and sub-limits required by treasury are approved by the Treasurer, Chief Credit Officer and Chief Financial Officer and the usage against limits is monitored independently of treasury.
All limits set by the Board are monitored by management. The Board also sets triggers that require information to be notified to the Board. A treasury report, addressing prudential controls, risk, limits and triggers is submitted to the Board Audit meeting quarterly, which then reports to the Board. A treasury update is provided at each Board meeting.
Credit risk on treasury derivative transactions is mitigated by the fact that most of the contracts have a mutual 5 year right to break clause. In addition some contracts include a clause that allows the contract to be terminated if the counterparty rating falls below an agreed credit rating and some contracts also have Credit Support Annexes in operation where Efic receives collateral to offset the exposure.
Notes to and forming part of the financial statementsfor the year ended 30 June 2018
NOTE 19: FINANCIAL RISK MANAGEMENT (continued)

FINANCIAL STATEMENTS 117
FINANCIAL STATEMENTS
NOTE 19: FINANCIAL RISK MANAGEMENT (continued)
The tables below show treasury credit risk exposures by the current counterparty rating:
Note
30 June 2018 $ m
30 June 2017
$ m
Available-for-sale investment securities
Australian Authorised Deposit-taking Institutions
AA- 444.6 315.8
A+ 23.7 73.6
A 105.6 33.8
BBB+ 175.0 195.1
BBB 34.9 34.9
Other financial institutions or foreign entities
AA- 168.5 151.6
Exposure to credit risk of available-for-sale investment securities 6, 1(l) 952.3 804.8
Note
30 June 2018 $ m
30 June 2017
$ m
Derivative financial assets
Australian Authorised Deposit-taking Institutions
AA- 73.3 88.9
Other financial institutions or foreign entities
AA- 18.7 18.4
A+ * 2.5 15.0
A * 13.7 5.0
Exposure to credit risk for derivative financial assets 9, 1(p) 108.2 127.3
*At time of purchase all derivatives with other financial institutions or foreign entities were rated at AA- or better.
For treasury exposures there are no overdue or restructured amounts.

118 EFIC ANNUAL REPORT 2017–2018
NOTE 19: FINANCIAL RISK MANAGEMENT (continued)
> Exposures to clients
Efic’s principal exposure to credit risk arises from the financing and credit facilities extended to clients. On the Commercial Account, loans written off during the year or credit facilities called that were not subsequently recovered within the year were $0.3 million (2017: nil).
Gross exposures (before fair value adjustments) on each of the products offered on the Commercial Account are as follows:
Note
30 June 2018 $ m
30 June 2017
$ m
Gross exposures
Export finance loans 8, 1(n) 1,098.2 1,070.8
Funded export finance guarantees 8, 1(n) 171.5 193.4
Export finance loans at amortised cost 7 43.4 –
Funded export finance guarantees at amortised cost 7 4.2 12.1
Rescheduled credit insurance debts at amortised cost 7 0.6 0.6
Guarantees 18 263.4 272.6
Medium-term insurance 18 365.3 350.7
Bonds 18 86.4 39.8
Total gross exposures 2,033.0 1,940.0
Reinsured exposures included above 639.7 634.3
Notes to and forming part of the financial statementsfor the year ended 30 June 2018

FINANCIAL STATEMENTS 119
FINANCIAL STATEMENTS
NOTE 19: FINANCIAL RISK MANAGEMENT (continued)
Gross exposures are also monitored by country, and on the Commercial Account the country, exposures after reinsurance are as follows:
30 June 2018 $ m
30 June 2018
% of total
30 June 2017 $ m
30 June 2017
% of total
Country exposures
Australia* 874.8 43.0 735.5 37.9
Canada 243.5 12.0 233.8 12.1
Mongolia 135.3 6.7 129.9 6.7
China 127.4 6.3 122.8 6.3
Papua New Guinea 109.1 5.4 114.7 5.9
Japan 90.9 4.5 91.9 4.7
United Kingdom 75.3 3.7 73.4 3.8
Chile 67.6 3.3 81.2 4.2
Belgium 57.8 2.8 58.4 3.0
Malaysia 56.8 2.8 60.4 3.1
Bermuda 55.2 2.7 57.1 2.9
France 40.5 2.0 40.9 2.1
Sri Lanka 37.8 1.9 38.9 2.0
Russia 22.8 1.1 28.5 1.5
Turkey 12.1 0.6 20.9 1.1
Trinidad and Tobago 8.5 0.4 24.3 1.3
New Zealand 5.0 0.2 – –
Vietnam 4.7 0.2 10.8 0.6
Taiwan 3.5 0.2 3.5 0.2
Indonesia 2.9 0.1 10.2 0.5
Other 1.5 0.1 2.9 0.1
Total country exposures 2,033.0 100.0 1,940.0 100.0
Reinsured exposures included above 639.7 634.3
*Includes performance bonds and guarantees issued on behalf of Australian companies.

120 EFIC ANNUAL REPORT 2017–2018
NOTE 19: FINANCIAL RISK MANAGEMENT (continued)
Allowance for credit risk on the above gross exposures on the Commercial Account is as follows:
The movement in the allowance for credit risk on the Commercial Account is comprised of:
30 June 2018 $ m
30 June 2017
$ m
Allowance for credit risk by product
Export finance loans (64.6) (65.3)
Funded export finance guarantees (3.4) (4.8)
Guarantees (4.7) (7.1)
Medium-term insurance (0.3) (0.4)
Bonds (5.6) (0.8)
Allowance for credit risk closing balance (78.6) (78.4)
30 June 2018 $ m
30 June 2017
$ m
Allowance for credit risk for gross exposures
Allowance for credit risk opening balance (78.4) (94.8)
New exposures (14.3) (7.7)
Repayments 9.7 11.6
Change in risk grade (4.9) (1.6)
Change in term to maturity 10.0 8.9
Change in probability of default rates 2.6 0.6
Exchange rate movements (3.3) 4.6
Allowance for credit risk closing balance (78.6) (78.4)
Notes to and forming part of the financial statementsfor the year ended 30 June 2018
Efic employs a risk grading system to rank risks according to both the counterparty risk and the level of country risk inherent in the exposure. Efic also measures and monitors country, industry and counterparty concentration risk on the Commercial Account. Any significant concentration risk on the Commercial Account is taken into account in assessing the amount of capital which Efic requires to conduct its Commercial Account activities.

FINANCIAL STATEMENTS 121
FINANCIAL STATEMENTS
NOTE 19: FINANCIAL RISK MANAGEMENT (continued)
Efic uses nine broad categories of risk grade, with category 1 representing the lowest risk. Within categories 1 to 6 an outlook modifier is used of plus or minus if the counterparty is particularly strong or weak for that risk grade. The equivalent risk, based on Standards and Poor’s risk rating, is stated in brackets. The gross exposures (before fair value adjustments) for the Commercial Account after reinsurance under each category are as follows:
As part of its normal operations, Efic enters into a variety of transactions denominated in various currencies that give rise to contingent liabilities, including guarantees, medium-term insurance and bonds. The maximum exposure to credit risk is the maximum amount Efic would pay if called upon to do so. The exposure for the Commercial Account after reinsurance for each category is as follows:
Note
30 June 2018 $ m
30 June 2017
$ m
Gross exposures loans and receivables*
Risk category 1 (AA- to AAA) 218.5 174.6
Risk category 2 (A- to A+) 348.1 378.2
Risk category 3 (BBB- to BBB+) 245.5 278.4
Risk category 4 (BB- to BB+) 29.0 28.5
Risk category 5 (B- to B+) 116.5 117.5
Risk category 6 (CCC+) 351.2 296.3
Risk category 7 (C to CCC) 6.0 0.3
Risk category 8 Doubtful 2.5 2.5
Risk category 9 Impaired 0.6 0.6
Gross exposures loans and receivables 7, 8, 1(n) 1,317.9 1,276.9
*Risk category exposures for loans at amortised costs were disclosed in Note 7 in the prior year financial statements.
Note
30 June 2018 $ m
30 June 2017
$ m
Contingent liabilities*
Risk category 1 (AA- to AAA) 401.0 365.9
Risk category 2 (A- to A+) 160.6 124.7
Risk category 3 (BBB- to BBB+) 32.8 70.0
Risk category 5 (B- to B+) 38.7 54.5
Risk category 6 (CCC+) 80.3 46.6
Risk category 7 (C to CCC) 1.7 1.4
Total contingent liabilities 18 715.1 663.1
*There are no exposures in categories 4, 8 and 9.

122 EFIC ANNUAL REPORT 2017–2018
NOTE 19: FINANCIAL RISK MANAGEMENT (continued)
As part of its normal operations, Efic enters into a variety of transactions denominated in various currencies which give rise to contingent liabilities including guarantees, medium-term insurance, and bonds. The maximum exposure to credit risk is the maximum amount Efic would pay if called upon to do so. The exposure for the Commercial Account after reinsurance under each category are as follows:
Notes to and forming part of the financial statementsfor the year ended 30 June 2018
Note
30 June 2018 $ m
30 June 2017
$ m
Commitments*
Risk category 1 (AA- to AAA) 13.9 89.2
Risk category 2 (A- to A+) 37.0 50.2
Risk category 3 (BBB- to BBB+) 40.6 –
Risk category 5 (B- to B+) 1.8 2.2
Risk category 6 (CCC+) 201.6 222.4
Total commitments 18 294.9 364.0
*There are no exposures in categories 4,7,8 and 9.
> Retained sector exposure
The sectors that represent more than 15% of Efic’s Commercial Account retained exposure are the Sovereign and Mining LNG sector. At 30 June 2018, the exposure to the Sovereign sector accounted for $357.9 million, representing 17.6% of Efic’s total retained exposure (2017: $320.3 million, representing 16.5% of the total), and the exposure to the Mining LNG sector accounted for $345.3 million, representing 17.0% of Efic’s total retained exposure (2017: $371.5 million, representing 19.1% of the total).
> Reinsured exposure
To reduce Efic’s exposure to counterparties in the higher risk categories or to reduce concentration risk, Efic enters into contracts with reinsurers, including other export credit agencies. This will change the exposure from the counterparty in the higher risk categories to an exposure to the reinsurers, who will be in lower risk categories, or reduce concentration risk to a counterparty with the same or lower risk. As can be seen from the table below, Efic has reinsured exposures with counterparties in risk categories 2, 3, 4 and 6 to reinsurers in risk categories 1 or 2.
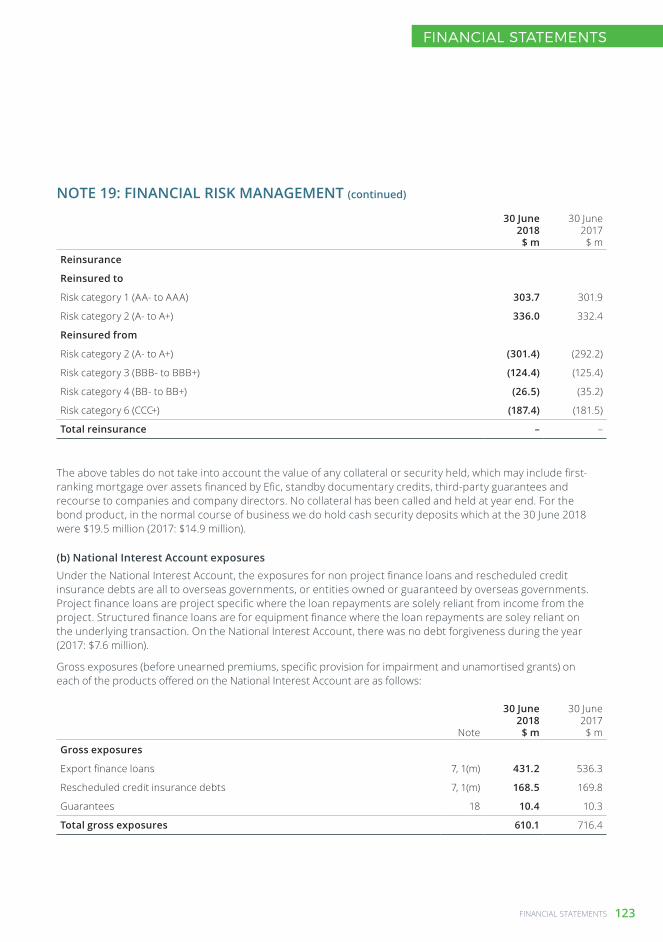
FINANCIAL STATEMENTS 123
FINANCIAL STATEMENTS
NOTE 19: FINANCIAL RISK MANAGEMENT (continued)
The above tables do not take into account the value of any collateral or security held, which may include first-ranking mortgage over assets financed by Efic, standby documentary credits, third-party guarantees and recourse to companies and company directors. No collateral has been called and held at year end. For the bond product, in the normal course of business we do hold cash security deposits which at the 30 June 2018 were $19.5 million (2017: $14.9 million).
(b) National Interest Account exposures
Under the National Interest Account, the exposures for non project finance loans and rescheduled credit insurance debts are all to overseas governments, or entities owned or guaranteed by overseas governments. Project finance loans are project specific where the loan repayments are solely reliant from income from the project. Structured finance loans are for equipment finance where the loan repayments are soley reliant on the underlying transaction. On the National Interest Account, there was no debt forgiveness during the year (2017: $7.6 million).
Gross exposures (before unearned premiums, specific provision for impairment and unamortised grants) on each of the products offered on the National Interest Account are as follows:
30 June 2018 $ m
30 June 2017
$ m
Reinsurance
Reinsured to
Risk category 1 (AA- to AAA) 303.7 301.9
Risk category 2 (A- to A+) 336.0 332.4
Reinsured from
Risk category 2 (A- to A+) (301.4) (292.2)
Risk category 3 (BBB- to BBB+) (124.4) (125.4)
Risk category 4 (BB- to BB+) (26.5) (35.2)
Risk category 6 (CCC+) (187.4) (181.5)
Total reinsurance – –
Note
30 June 2018 $ m
30 June 2017
$ m
Gross exposures
Export finance loans 7, 1(m) 431.2 536.3
Rescheduled credit insurance debts 7, 1(m) 168.5 169.8
Guarantees 18 10.4 10.3
Total gross exposures 610.1 716.4

124 EFIC ANNUAL REPORT 2017–2018
Notes to and forming part of the financial statementsfor the year ended 30 June 2018
NOTE 19: FINANCIAL RISK MANAGEMENT (continued)
Gross exposures are also monitored by country, and on the National Interest Account the country exposures are as follows:
30 June 2018 $ m
30 June 2018
% of total
30 June 2017 $ m
30 June 2017
% of total
Country exposures
Papua New Guinea 272.7 44.7 286.6 40.0
Iraq 168.5 27.6 169.8 23.7
Indonesia 144.8 23.8 197.8 27.6
Australia* 10.4 1.7 44.1 6.2
Cuba 9.3 1.5 9.5 1.3
China 4.4 0.7 8.6 1.2
Total country exposures 610.1 100.0 716.4 100.0
*Includes performance bonds and guarantees issued on behalf of Australian companies.
(c) Rescheduled debt exposures
Indonesia: At 30 June 2018, our rescheduled loans to the Indonesian Government were $77.3 million (2017: $97.3 million) on the National Interest Account and $2.9 million (2017: $2.7 million) on the Commercial Account. Scheduled payments from Indonesia due from December 1998 to December 2003 have been rescheduled on three occasions in the Paris Club of which one has been fully repaid. The two remaining rescheduled repayment schedules requires six-monthly payments until June 2019 and June 2021 respectively depending on the rescheduling agreement. As at 30 June 2018 all rescheduled amounts have been paid on time as per the rescheduling agreements.
Iraq: The rescheduled debt balance at 30 June 2018, is US$0.4 million (2017: US$0.5 million) on the Commercial Account and US$124.5 million (2017: USD$130.7 million) on the National Interest Account. At 30 June 2018, all rescheduled amounts have been paid on time as per the rescheduling agreements. However, the current situation in Iraq and the continuing deterioration in the economic environment were assessed as significantly impacting the likelihood of future payments. Accordingly, in consultation with DFAT, it was deemed appropriate to retain a 100% provision for impairment against the rescheduled debt and
this treatment will be reviewed on an annual basis. Therefore future payments from Iraq will only be recognised as income on receipt and booked as a recovery, consistent with current practice. Recoveries made during the year under this agreement were taken to income resulting in $19.4 million taken up as income during 2017-18 on the National Interest Account. These debts arose from credit insurance claims between 1987 and 1992 in respect of non-payment by the Iraqi Government on exports from Australia. These debts were subject to rescheduling with 80% debt forgiveness in three stages at the Paris Club. The repayment schedule for the remaining rescheduled amounts call for six-monthly payments until January 2028.
Cuba: At 30 June 2018, the rescheduled debt balance was $9.3 million (2017: $9.5 million), all rescheduled amounts have been paid on time as per the rescheduling agreements. Efic executed a bilateral agreement with Cuba in late May 2016 on terms consistent with those established by the Paris Club creditors. The debt is to be repaid over 18 years. The loans have had a 100% provision in place and this is maintained at 30 June 2018.

FINANCIAL STATEMENTS 125
FINANCIAL STATEMENTS
NOTE 19: FINANCIAL RISK MANAGEMENT (continued)
Contractual undiscounted principal and interest.
30 June 2018
3 months or less
$ m
3 months to 1 year
$ m
1 year to 5 years
$ m
Greater than 5 years
$ m
Undiscounted financial assets
Cash and liquid assets 3.4 – – –
Receivables from other financial institutions 146.6 159.9 – –
Available-for-sale investment securities 269.7 386.0 301.7 –
Loans and receivables at amortised cost – 47.7 0.3 0.3
Loans and receivables designated at fair value through profit or loss 137.3 66.7 722.6 495.1
Loans to National Interest Account designated at fair value through profit or loss 6.4 91.5 230.3 143.1
Derivative financial instruments receivable
Contractual amounts receivable 159.9 584.6 2,246.3 418.9
Total undiscounted financial assets 723.3 1,336.4 3,501.2 1,057.4
(iii) Liquidity risk
Prudent liquidity risk management on the Commercial Account is achieved by maintaining sufficient cash and marketable securities to meet any sudden shortfalls in the ability to fund Efic. Efic also has the explicit guarantee of the Commonwealth of Australia, which is rated AAA and therefore in normal markets there is no significant liquidity risk for Efic. Section 61 of the Efic Act states that “Efic must not borrow or raise money except under section 58 or 59”. Section 58 allows the Finance Minister, on behalf of the Commonwealth, to lend money to Efic, and section 59 allows Efic to borrow or raise money, subject to written approval of the Finance Minister. To date, Efic has funded its activities under section 59 and does not borrow
directly from the Commonwealth of Australia. Notwithstanding the above, Efic maintains a liquid investment portfolio.
On the National Interest Account all the cash flows on loans are matched with funding from the Commercial Account, and accordingly there is no liquidity risk on the National Interest Account.
The liquidity table below is based on estimated future cash flows for principal and interest and is not their fair value as is shown in the balance sheet. For the Commercial Account the contractual undiscounted amounts comprise principal and interest repayment obligations and are as follows:
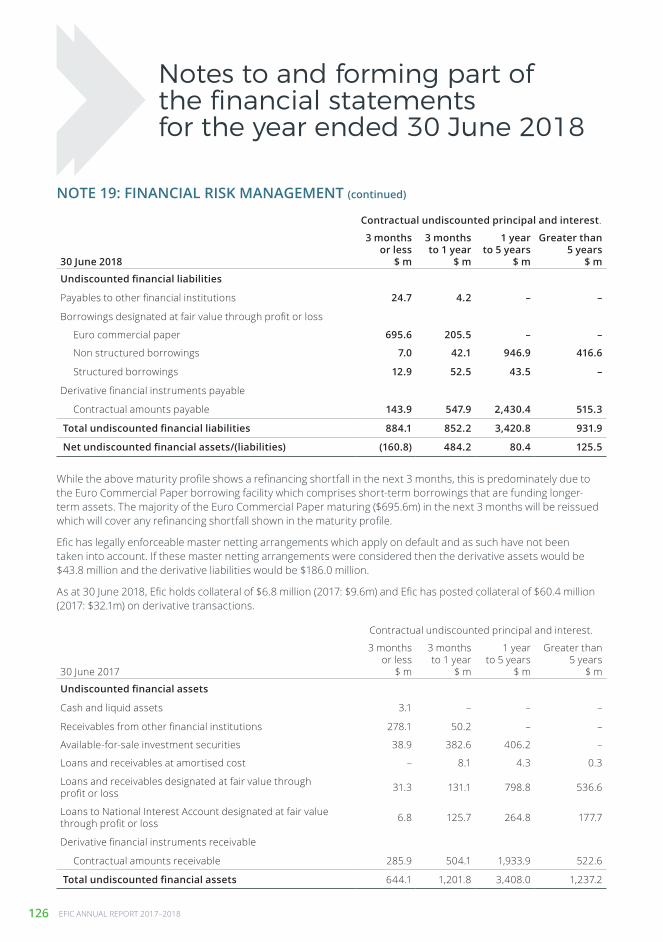
126 EFIC ANNUAL REPORT 2017–2018
NOTE 19: FINANCIAL RISK MANAGEMENT (continued)
Contractual undiscounted principal and interest.
30 June 2018
3 months or less
$ m
3 months to 1 year
$ m
1 year to 5 years
$ m
Greater than 5 years
$ m
Undiscounted financial liabilities
Payables to other financial institutions 24.7 4.2 – –
Borrowings designated at fair value through profit or loss
Euro commercial paper 695.6 205.5 – –
Non structured borrowings 7.0 42.1 946.9 416.6
Structured borrowings 12.9 52.5 43.5 –
Derivative financial instruments payable
Contractual amounts payable 143.9 547.9 2,430.4 515.3
Total undiscounted financial liabilities 884.1 852.2 3,420.8 931.9
Net undiscounted financial assets/(liabilities) (160.8) 484.2 80.4 125.5
Contractual undiscounted principal and interest.
30 June 2017
3 months or less
$ m
3 months to 1 year
$ m
1 year to 5 years
$ m
Greater than 5 years
$ m
Undiscounted financial assets
Cash and liquid assets 3.1 – – –
Receivables from other financial institutions 278.1 50.2 – –
Available-for-sale investment securities 38.9 382.6 406.2 –
Loans and receivables at amortised cost – 8.1 4.3 0.3
Loans and receivables designated at fair value through profit or loss 31.3 131.1 798.8 536.6
Loans to National Interest Account designated at fair value through profit or loss 6.8 125.7 264.8 177.7
Derivative financial instruments receivable
Contractual amounts receivable 285.9 504.1 1,933.9 522.6
Total undiscounted financial assets 644.1 1,201.8 3,408.0 1,237.2
While the above maturity profile shows a refinancing shortfall in the next 3 months, this is predominately due to the Euro Commercial Paper borrowing facility which comprises short-term borrowings that are funding longer-term assets. The majority of the Euro Commercial Paper maturing ($695.6m) in the next 3 months will be reissued which will cover any refinancing shortfall shown in the maturity profile.
Efic has legally enforceable master netting arrangements which apply on default and as such have not been taken into account. If these master netting arrangements were considered then the derivative assets would be $43.8 million and the derivative liabilities would be $186.0 million.
As at 30 June 2018, Efic holds collateral of $6.8 million (2017: $9.6m) and Efic has posted collateral of $60.4 million (2017: $32.1m) on derivative transactions.
Notes to and forming part of the financial statementsfor the year ended 30 June 2018

FINANCIAL STATEMENTS 127
FINANCIAL STATEMENTS
NOTE 19: FINANCIAL RISK MANAGEMENT (continued)
Contractual undiscounted principal and interest.
30 June 2017
3 months or less
$ m
3 months to 1 year
$ m
1 year to 5 years
$ m
Greater than 5 years
$ m
Undiscounted financial liabilities
Payables to other financial institutions 16.1 8.2 4.1 –
Borrowings designated at fair value through profit or loss
Euro commercial paper 857.3 194.8 – –
Non structured borrowings 7.0 30.0 866.1 377.2
Structured borrowings 0.6 1.6 103.3 –
Derivative financial instruments payable
Contractual amounts payable 281.3 474.8 1,984.4 624.4
Total undiscounted financial liabilities 1,162.3 709.4 2,957.9 1,001.6
Net undiscounted financial assets/(liabilities) (518.2) 492.4 450.1 235.6
(iv) Market risk (a) Interest rate risk
As Efic is involved in lending and borrowing activities, interest rate risks arise. Efic uses interest rate swaps, forward rate agreements and cross-currency swaps on the Commercial Account as the primary methods of reducing exposure to interest rate movements.
Efic’s policy is to minimise interest rate risk. If loans are not at floating rates, a fixed to floating rate swap is generally entered into from the time terms and conditions are agreed.
In certain circumstances cash flow hedges may be entered into to hedge the exposure to variability in interest rate movements that are attributable to future interest cash flows. At year end, Efic entered two cash flow hedge relationships using interest rate swaps as the hedging instrument, which require settlement of net interest receivable or payable every 180 days until October 2018. The underlying hedged items are loans classified as loans and receivables at amortised cost and borrowings classified as a payable to other financial institutions where the settlement date of interest coincides with the corresponding interest rate swap.
Movement in the cash flow hedge reserve is as follows:
30 June 2018 $ m
30 June 2017 $ m
Cash flow hedge reserve
Opening balance cash flow hedge reserve 0.1 0.4
Transferred to interest expense (0.1) (0.2)
Transferred to interest income 0.2 0.4
Net unrealised change in cash flow hedges (0.2) (0.5)
Closing balance cash flow hedge reserve – 0.1
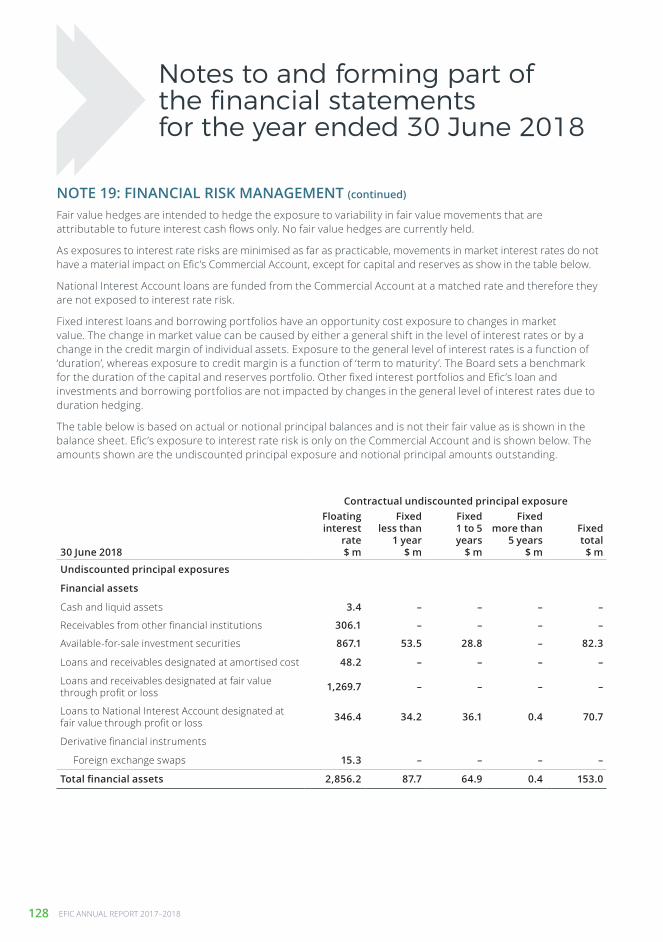
128 EFIC ANNUAL REPORT 2017–2018
NOTE 19: FINANCIAL RISK MANAGEMENT (continued)
Contractual undiscounted principal exposure
30 June 2018
Floating interest
rate $ m
Fixed less than
1 year $ m
Fixed 1 to 5 years
$ m
Fixed more than
5 years $ m
Fixed total
$ m
Undiscounted principal exposures
Financial assets
Cash and liquid assets 3.4 – – – –
Receivables from other financial institutions 306.1 – – – –
Available-for-sale investment securities 867.1 53.5 28.8 – 82.3
Loans and receivables designated at amortised cost 48.2 – – – –
Loans and receivables designated at fair value through profit or loss 1,269.7 – – – –
Loans to National Interest Account designated at fair value through profit or loss 346.4 34.2 36.1 0.4 70.7
Derivative financial instruments
Foreign exchange swaps 15.3 – – – –
Total financial assets 2,856.2 87.7 64.9 0.4 153.0
Notes to and forming part of the financial statementsfor the year ended 30 June 2018
Fair value hedges are intended to hedge the exposure to variability in fair value movements that are attributable to future interest cash flows only. No fair value hedges are currently held.
As exposures to interest rate risks are minimised as far as practicable, movements in market interest rates do not have a material impact on Efic’s Commercial Account, except for capital and reserves as show in the table below.
National Interest Account loans are funded from the Commercial Account at a matched rate and therefore they are not exposed to interest rate risk.
Fixed interest loans and borrowing portfolios have an opportunity cost exposure to changes in market value. The change in market value can be caused by either a general shift in the level of interest rates or by a change in the credit margin of individual assets. Exposure to the general level of interest rates is a function of ‘duration’, whereas exposure to credit margin is a function of ‘term to maturity’. The Board sets a benchmark for the duration of the capital and reserves portfolio. Other fixed interest portfolios and Efic’s loan and investments and borrowing portfolios are not impacted by changes in the general level of interest rates due to duration hedging.
The table below is based on actual or notional principal balances and is not their fair value as is shown in the balance sheet. Efic’s exposure to interest rate risk is only on the Commercial Account and is shown below. The amounts shown are the undiscounted principal exposure and notional principal amounts outstanding.

FINANCIAL STATEMENTS 129
FINANCIAL STATEMENTS
NOTE 19: FINANCIAL RISK MANAGEMENT (continued)
Contractual undiscounted principal exposure
30 June 2017
Floating interest
rate $ m
Fixed less than
1 year $ m
Fixed 1 to 5 years
$ m
Fixed more than
5 years $ m
Fixed total $ m
Undiscounted principal exposures
Financial assets
Cash and liquid assets 3.1 – – – –
Receivables from other financial institutions 327.5 – – – –
Available-for-sale investment securities 699.2 46.5 53.5 – 100.0
Loans and receivables designated at amortised cost 12.7 – – – –
Loans and receivables designated at fair value through profit or loss 1,255.0 9.2 – – 9.2
Loans to National Interest Account designated at fair value through profit or loss 411.0 39.3 67.1 0.7 107.1
Total financial assets 2,708.5 95.0 120.6 0.7 216.3
Contractual undiscounted principal exposure
30 June 2018
Floating interest
rate $ m
Fixed less than
1 year $ m
Fixed 1 to 5 years
$ m
Fixed more than
5 years $ m
Fixed total
$ m
Financial liabilities
Payables to other financial institutions 28.9 – – – –
Derivative financial instruments
Cross-currency swaps 968.0 – (331.3) (365.0) (696.3)
Interest rate swaps* 428.3 34.4 (463.1) 0.3 (428.4)
Borrowings designated at fair value through profit or loss 1,007.5 – 831.3 365.0 1,196.3
Other monetary liabilities 32.6 – – – –
Total financial liabilities 2,465.3 34.4 36.9 0.3 71.6
Interest exposures 390.9 53.3 28.0 0.1 81.4
Capital and reserves portfolio 395.7 53.5 28.8 – 82.3
Net interest exposures (4.8) (0.2) (0.8) 0.1 (0.9)
*Notional principal amounts.
The capital and reserves portfolio is the investment of Efic’s cash equity. The investment of these funds is exposed to interest rate movements and the tables below in the interest margin (duration) section show the sensitivity analysis of these investments to interest rate movements. The net interest exposure after these investments show that there is insignificant interest rate exposure in the rest of Efic’s assets and liabilities.
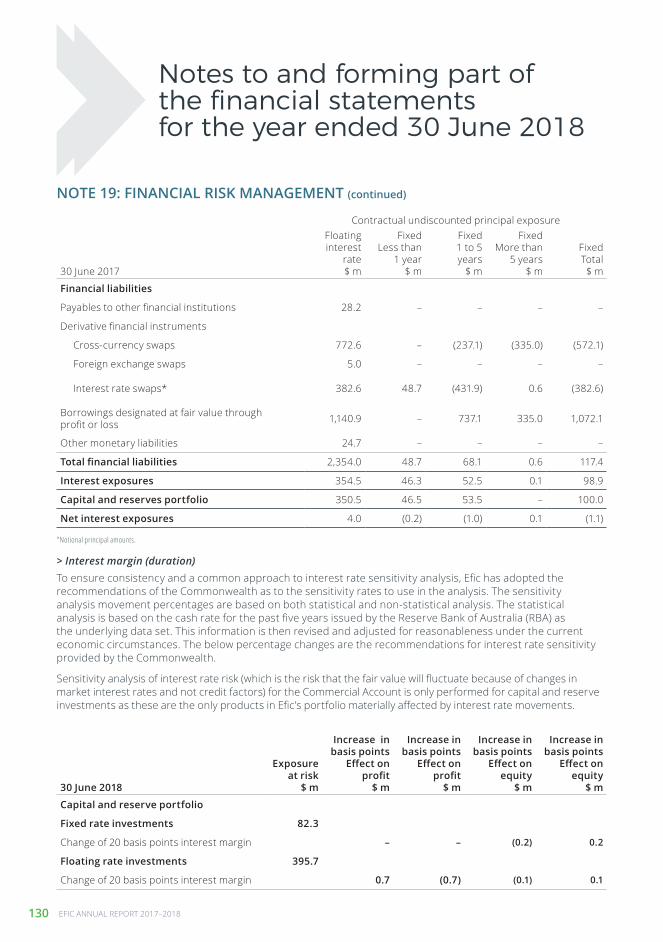
130 EFIC ANNUAL REPORT 2017–2018
NOTE 19: FINANCIAL RISK MANAGEMENT (continued)
Notes to and forming part of the financial statementsfor the year ended 30 June 2018
Contractual undiscounted principal exposure
30 June 2017
Floating interest
rate $ m
Fixed Less than
1 year $ m
Fixed 1 to 5 years
$ m
Fixed More than
5 years $ m
Fixed Total $ m
Financial liabilities
Payables to other financial institutions 28.2 – – – –
Derivative financial instruments
Cross-currency swaps 772.6 – (237.1) (335.0) (572.1)
Foreign exchange swaps 5.0 – – – –
Interest rate swaps* 382.6 48.7 (431.9) 0.6 (382.6)
Borrowings designated at fair value through profit or loss 1,140.9 – 737.1 335.0 1,072.1
Other monetary liabilities 24.7 – – – –
Total financial liabilities 2,354.0 48.7 68.1 0.6 117.4
Interest exposures 354.5 46.3 52.5 0.1 98.9
Capital and reserves portfolio 350.5 46.5 53.5 – 100.0
Net interest exposures 4.0 (0.2) (1.0) 0.1 (1.1)
*Notional principal amounts.
30 June 2018
Exposure at risk
$ m
Increase in basis points
Effect on profit
$ m
Increase in basis points
Effect on profit
$ m
Increase in basis points
Effect on equity
$ m
Increase in basis points
Effect on equity
$ m
Capital and reserve portfolio
Fixed rate investments 82.3
Change of 20 basis points interest margin – – (0.2) 0.2
Floating rate investments 395.7
Change of 20 basis points interest margin 0.7 (0.7) (0.1) 0.1
> Interest margin (duration)To ensure consistency and a common approach to interest rate sensitivity analysis, Efic has adopted the recommendations of the Commonwealth as to the sensitivity rates to use in the analysis. The sensitivity analysis movement percentages are based on both statistical and non-statistical analysis. The statistical analysis is based on the cash rate for the past five years issued by the Reserve Bank of Australia (RBA) as the underlying data set. This information is then revised and adjusted for reasonableness under the current economic circumstances. The below percentage changes are the recommendations for interest rate sensitivity provided by the Commonwealth.
Sensitivity analysis of interest rate risk (which is the risk that the fair value will fluctuate because of changes in market interest rates and not credit factors) for the Commercial Account is only performed for capital and reserve investments as these are the only products in Efic’s portfolio materially affected by interest rate movements.
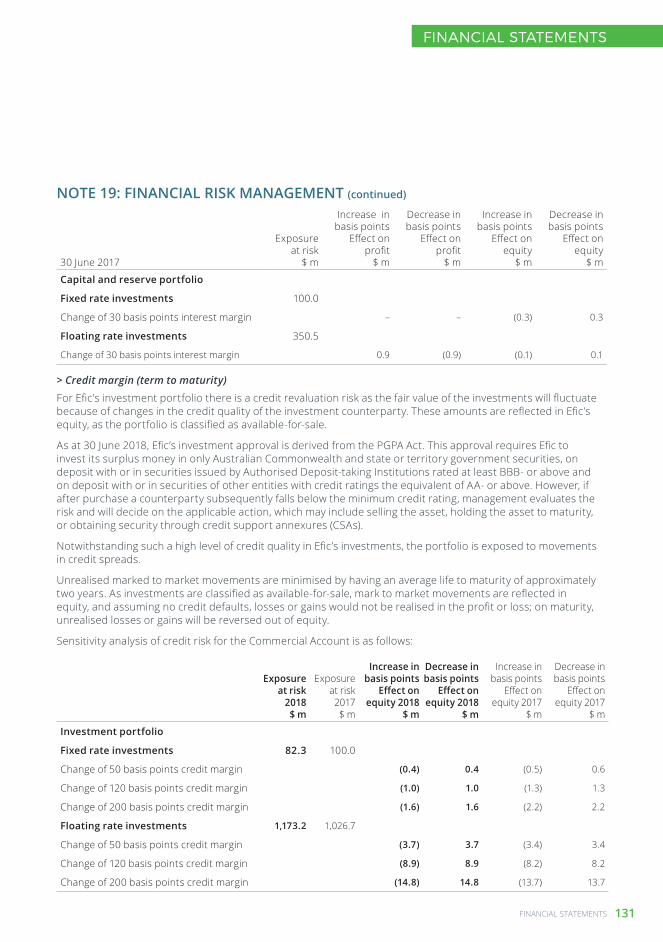
FINANCIAL STATEMENTS 131
FINANCIAL STATEMENTS
NOTE 19: FINANCIAL RISK MANAGEMENT (continued)
30 June 2017
Exposure at risk
$ m
Increase in basis points
Effect on profit
$ m
Decrease in basis points
Effect on profit
$ m
Increase in basis points
Effect on equity
$ m
Decrease in basis points
Effect on equity
$ m
Capital and reserve portfolio
Fixed rate investments 100.0
Change of 30 basis points interest margin – – (0.3) 0.3
Floating rate investments 350.5
Change of 30 basis points interest margin 0.9 (0.9) (0.1) 0.1
Exposure at risk
2018 $ m
Exposure at risk 2017 $ m
Increase in basis points
Effect on equity 2018
$ m
Decrease in basis points
Effect on equity 2018
$ m
Increase in basis points
Effect on equity 2017
$ m
Decrease in basis points
Effect on equity 2017
$ m
Investment portfolio
Fixed rate investments 82.3 100.0
Change of 50 basis points credit margin (0.4) 0.4 (0.5) 0.6
Change of 120 basis points credit margin (1.0) 1.0 (1.3) 1.3
Change of 200 basis points credit margin (1.6) 1.6 (2.2) 2.2
Floating rate investments 1,173.2 1,026.7
Change of 50 basis points credit margin (3.7) 3.7 (3.4) 3.4
Change of 120 basis points credit margin (8.9) 8.9 (8.2) 8.2
Change of 200 basis points credit margin (14.8) 14.8 (13.7) 13.7
> Credit margin (term to maturity)
For Efic’s investment portfolio there is a credit revaluation risk as the fair value of the investments will fluctuate because of changes in the credit quality of the investment counterparty. These amounts are reflected in Efic’s equity, as the portfolio is classified as available-for-sale.
As at 30 June 2018, Efic’s investment approval is derived from the PGPA Act. This approval requires Efic to invest its surplus money in only Australian Commonwealth and state or territory government securities, on deposit with or in securities issued by Authorised Deposit-taking Institutions rated at least BBB- or above and on deposit with or in securities of other entities with credit ratings the equivalent of AA- or above. However, if after purchase a counterparty subsequently falls below the minimum credit rating, management evaluates the risk and will decide on the applicable action, which may include selling the asset, holding the asset to maturity, or obtaining security through credit support annexures (CSAs).
Notwithstanding such a high level of credit quality in Efic’s investments, the portfolio is exposed to movements in credit spreads.
Unrealised marked to market movements are minimised by having an average life to maturity of approximately two years. As investments are classified as available-for-sale, mark to market movements are reflected in equity, and assuming no credit defaults, losses or gains would not be realised in the profit or loss; on maturity, unrealised losses or gains will be reversed out of equity.
Sensitivity analysis of credit risk for the Commercial Account is as follows:

132 EFIC ANNUAL REPORT 2017–2018
NOTE 19: FINANCIAL RISK MANAGEMENT (continued)
Notes to and forming part of the financial statementsfor the year ended 30 June 2018
Foreign currency fair value exposures
30 June 2018USD
A$ mEUR
A$ mNZD
A$ mJPY
A$ mOther A$ m
Financial assets exposure in foreign currencies
Cash and liquid assets – 0.8 0.3 0.1 0.9
Receivables from other financial institutions 228.9 31.5 – – –
Loans at amortised cost 4.2 43.4 – – –
Loans and receivables designated at fair value through profit or loss 1,030.5 2.4 – 2.2 –
Loans to National Interest Account designated at fair value through profit or loss 385.5 42.8 – – –
Derivative financial instruments receivable 608.4 (69.9) 111.7 108.9 –
Other assets 0.1 – – – –
Total financial assets exposure in foreign currencies 2,257.6 51.0 112.0 111.2 0.9
Financial liabilities exposure in foreign currencies
Payables to other financial institutions 12.7 7.1 – 2.2 –
Borrowings designated at fair value through profit or loss 858.2 39.4 147.6 109.1 –
Guarantees designated at fair value through profit or loss 4.2 1.0 – – (0.2)
Derivative financial instruments payable 1,408.6 3.8 (35.5) – –
Other liabilities 10.8 0.4 0.2 – 0.6
Total financial liabilities exposure in foreign currencies 2,294.5 51.7 112.3 111.3 0.4
Net foreign exchange exposures in foreign currencies (36.9) (0.7) (0.3) (0.1) 0.5
(b) Foreign exchange risk
Efic extends facilities in various currencies, principally in US dollars and Euros. Where the borrowing currency is different from the currency of the assets being funded, cross-currency swaps, or foreign exchange contracts are used to offset the exposure (before allowances and provisions).
The table below does not include any balances that are in AUD as they are not exposed to foreign currency movements. Foreign currency exposures for the Commercial Account in Australian dollar equivalents are:
As shown by the above table the net foreign exchange exposure as at 30 June 2018 is minimal in value for all currencies other than USD of $36.9 million. The imbalance in this currency is largely due to movements in credit risk provisioning.
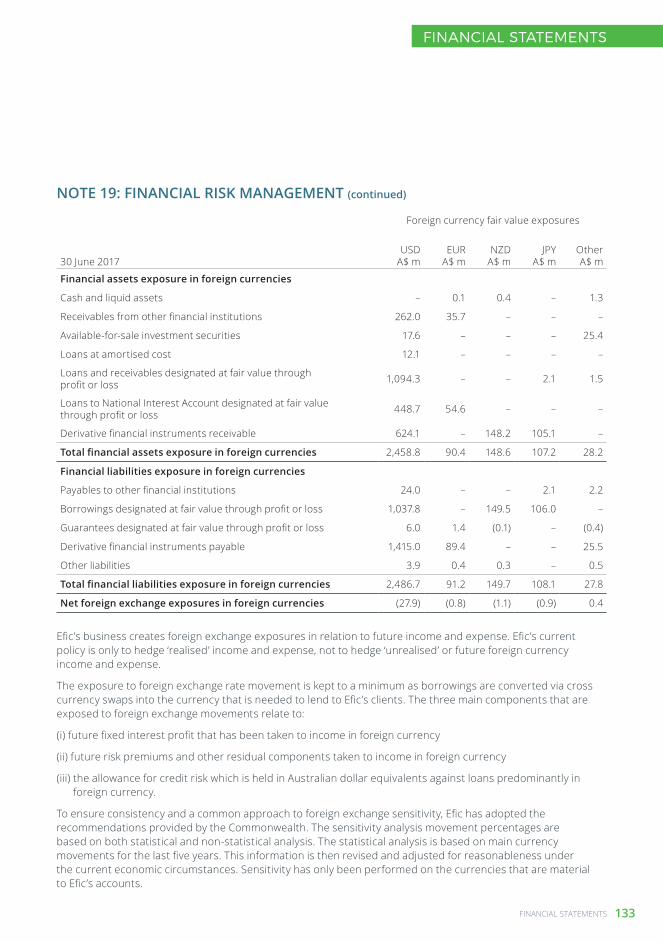
FINANCIAL STATEMENTS 133
FINANCIAL STATEMENTS
NOTE 19: FINANCIAL RISK MANAGEMENT (continued)
Foreign currency fair value exposures
30 June 2017USD
A$ mEUR
A$ mNZD
A$ mJPY
A$ mOther A$ m
Financial assets exposure in foreign currencies
Cash and liquid assets – 0.1 0.4 – 1.3
Receivables from other financial institutions 262.0 35.7 – – –
Available-for-sale investment securities 17.6 – – – 25.4
Loans at amortised cost 12.1 – – – –
Loans and receivables designated at fair value through profit or loss 1,094.3 – – 2.1 1.5
Loans to National Interest Account designated at fair value through profit or loss 448.7 54.6 – – –
Derivative financial instruments receivable 624.1 – 148.2 105.1 –
Total financial assets exposure in foreign currencies 2,458.8 90.4 148.6 107.2 28.2
Financial liabilities exposure in foreign currencies
Payables to other financial institutions 24.0 – – 2.1 2.2
Borrowings designated at fair value through profit or loss 1,037.8 – 149.5 106.0 –
Guarantees designated at fair value through profit or loss 6.0 1.4 (0.1) – (0.4)
Derivative financial instruments payable 1,415.0 89.4 – – 25.5
Other liabilities 3.9 0.4 0.3 – 0.5
Total financial liabilities exposure in foreign currencies 2,486.7 91.2 149.7 108.1 27.8
Net foreign exchange exposures in foreign currencies (27.9) (0.8) (1.1) (0.9) 0.4
Efic’s business creates foreign exchange exposures in relation to future income and expense. Efic’s current policy is only to hedge ‘realised’ income and expense, not to hedge ‘unrealised’ or future foreign currency income and expense.
The exposure to foreign exchange rate movement is kept to a minimum as borrowings are converted via cross currency swaps into the currency that is needed to lend to Efic’s clients. The three main components that are exposed to foreign exchange movements relate to:
(i) future fixed interest profit that has been taken to income in foreign currency
(ii) future risk premiums and other residual components taken to income in foreign currency
(iii) the allowance for credit risk which is held in Australian dollar equivalents against loans predominantly in foreign currency.
To ensure consistency and a common approach to foreign exchange sensitivity, Efic has adopted the recommendations provided by the Commonwealth. The sensitivity analysis movement percentages are based on both statistical and non-statistical analysis. The statistical analysis is based on main currency movements for the last five years. This information is then revised and adjusted for reasonableness under the current economic circumstances. Sensitivity has only been performed on the currencies that are material to Efic’s accounts.
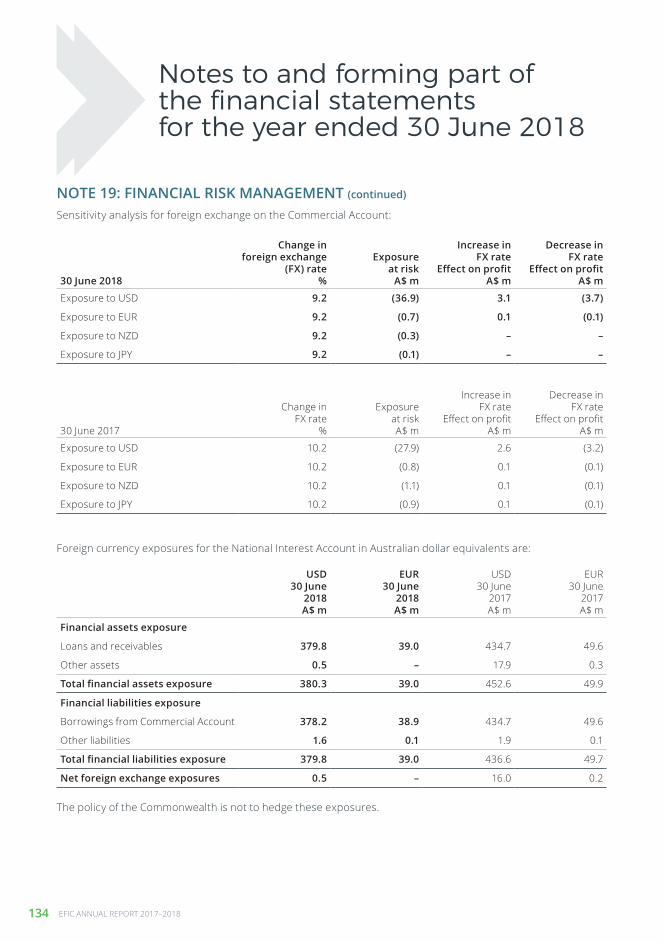
134 EFIC ANNUAL REPORT 2017–2018
NOTE 19: FINANCIAL RISK MANAGEMENT (continued)
30 June 2018
Change in foreign exchange
(FX) rate %
Exposure at risk
A$ m
Increase in FX rate
Effect on profit A$ m
Decrease in FX rate
Effect on profit A$ m
Exposure to USD 9.2 (36.9) 3.1 (3.7)
Exposure to EUR 9.2 (0.7) 0.1 (0.1)
Exposure to NZD 9.2 (0.3) – –
Exposure to JPY 9.2 (0.1) – –
USD 30 June
2018 A$ m
EUR 30 June
2018 A$ m
USD 30 June
2017 A$ m
EUR 30 June
2017 A$ m
Financial assets exposure
Loans and receivables 379.8 39.0 434.7 49.6
Other assets 0.5 – 17.9 0.3
Total financial assets exposure 380.3 39.0 452.6 49.9
Financial liabilities exposure
Borrowings from Commercial Account 378.2 38.9 434.7 49.6
Other liabilities 1.6 0.1 1.9 0.1
Total financial liabilities exposure 379.8 39.0 436.6 49.7
Net foreign exchange exposures 0.5 – 16.0 0.2
30 June 2017
Change in FX rate
%
Exposure at risk A$ m
Increase in FX rate
Effect on profit A$ m
Decrease in FX rate
Effect on profit A$ m
Exposure to USD 10.2 (27.9) 2.6 (3.2)
Exposure to EUR 10.2 (0.8) 0.1 (0.1)
Exposure to NZD 10.2 (1.1) 0.1 (0.1)
Exposure to JPY 10.2 (0.9) 0.1 (0.1)
Notes to and forming part of the financial statementsfor the year ended 30 June 2018
Sensitivity analysis for foreign exchange on the Commercial Account:
Foreign currency exposures for the National Interest Account in Australian dollar equivalents are:
The policy of the Commonwealth is not to hedge these exposures.

FINANCIAL STATEMENTS 135
FINANCIAL STATEMENTS
NOTE 19: FINANCIAL RISK MANAGEMENT (continued)
30 June 2018
Change in FX rate
%
Exposure at risk
A$ m
Increase in FX rate
Effect on profit A$ m
Decrease in FX rate
Effect on profit A$ m
Exposure to USD 9.2 0.5 – –
30 June 2017
Change in foreign exchange
(FX) rate %
Exposure at risk A$ m
Increase in FX rate
Effect on profit A$ m
Decrease in FX rate
Effect on profit A$ m
Exposure to USD 10.2 16.0 (1.5) 1.8
Sensitivity analysis for foreign exchange on the Commercial Account:

136 EFIC ANNUAL REPORT 2017–2018
NOTE 20: FAIR VALUE OF FINANCIAL INSTRUMENTS
Fair value exposures by hierarchy
30 June 2018Level 1
A$ mLevel 2
A$ mLevel 3
A$ mTotal A$ m
Financial assets
Loans and receivables designated at fair value through profit or loss – – 1,224.3 1,224.3
Loans to National Interest Account designated at fair value through profit or loss – 428.4 – 428.4
Interest rate swaps – 44.7 – 44.7
Cross-currency swaps – 37.5 11.0 48.5
Forward foreign exchange contracts – 15.0 – 15.0
Available-for-sale financial assets
Discount securities – 392.6 – 392.6
Floating rate notes – 390.1 85.4 475.5
Fixed rate bonds – 84.2 – 84.2
Total – 1,392.5 1,320.7 2,713.2
Financial liabilities
Borrowings designated at fair value through profit or loss – (2,179.5) (109.1) (2,288.6)
Guarantees designated at fair value through profit or loss – – (6.6) (6.6)
Interest rate swaps – (9.8) – (9.8)
Cross-currency swaps – (285.9) – (285.9)
Total – (2,475.2) (115.7) (2,590.9)
Notes to and forming part of the financial statementsfor the year ended 30 June 2018
(i) Determination of fair value hierarchy
Efic uses the following hierarchy for determining and disclosing the fair value of financial instruments by valuation technique:
Level 1: quoted (unadjusted) prices in active markets for identical assets or liabilities.
Level 2: techniques for which all inputs significantly affecting the recorded fair value are observable, either directly or indirectly.
Level 3: other techniques for which inputs significantly affecting the recorded fair value are not based on observable market data.
For assets and liabilities that are recognised in the financial statements on a recurring basis, Efic determines whether transfers have occurred between levels in the hierarchy by reassessing categorisation (based on the lowest level input that is significant to the fair value measurement as a whole) at the end of each reporting period.
The following table shows an analysis of financial instruments in the Commercial Account recorded at fair value by level of the fair value hierarchy:

FINANCIAL STATEMENTS 137
FINANCIAL STATEMENTS
NOTE 20: FAIR VALUE OF FINANCIAL INSTRUMENTS (continued)
Fair value exposures by hierarchy
30 June 2017Level 1
A$ mLevel 2
A$ mLevel 3
A$ mTotal A$ m
Financial assets
Loans and receivables designated at fair value through profit or loss – – 1,228.5 1,228.5
Loans to National Interest Account designated at fair value through profit or loss – 537.3 – 537.3
Interest rate swaps – 60.1 – 60.1
Cross-currency swaps – 55.5 11.6 67.1
Forward foreign exchange contracts – 0.1 – 0.1
Available-for-sale financial assets
Discount securities – 189.1 – 189.1
Floating rate notes – 469.2 43.1 512.3
Fixed rate bonds – 103.4 – 103.4
Total – 1,414.7 1,283.2 2,697.9
Financial liabilities
Borrowings designated at fair value through profit or loss – (2,208.1) (106.0) (2,314.1)
Guarantees designated at fair value through profit or loss – – (9.6) (9.6)
Interest rate swaps – (17.5) – (17.5)
Cross-currency swaps – (232.7) – (232.7)
Forward foreign exchange contracts – (4.5) – (4.5)
Total – (2,462.8) (115.6) (2,578.4)

138 EFIC ANNUAL REPORT 2017–2018
NOTE 20: FAIR VALUE OF FINANCIAL INSTRUMENTS (continued)
Notes to and forming part of the financial statementsfor the year ended 30 June 2018
The following table shows an analysis of movement in level 3 fair value hierarchy on the Commercial Account:
Movement in level 3 fair value exposures
At 1 July 2017 $ m
New deals $ m
Repayments $ m
Foreign exchange
$ m
Gain/(loss) through
equity $ m
Profit/(loss) deals
matured $ m
Profit/(loss) deals
existing $ m
At 30 June 2018 $ m
Level 3 Financial assets
Loans and receivables designated at fair value through profit or loss
1,228.5 186.7 (224.5) 44.6 – – (11.0) 1,224.3
Cross-currency swaps 11.6 – – 1.5 – – (2.1) 11.0
Available-for-sale financial assets
Floating rate notes 43.1 85.0 (43.0) – – (0.1) 0.4 85.4
1,283.2 271.7 (267.5) 46.1 – (0.1) (12.7) 1,320.7
Level 3 Financial liabilities
Borrowings designated at fair value through profit or loss
(106.0) – – (5.8) – – 2.7 (109.1)
Guarantees designated at fair value through profit or loss*
(9.6) – – 0.2 – – 2.8 (6.6)
(115.6) – – (5.6) – – 5.5 (115.7)
Total net level 3 1,167.6 271.7 (267.5) 40.5 – (0.1) (7.2) 1,205.0
*Guarantees are contingent liabilities and so the face value is not held in the statement of financial position.
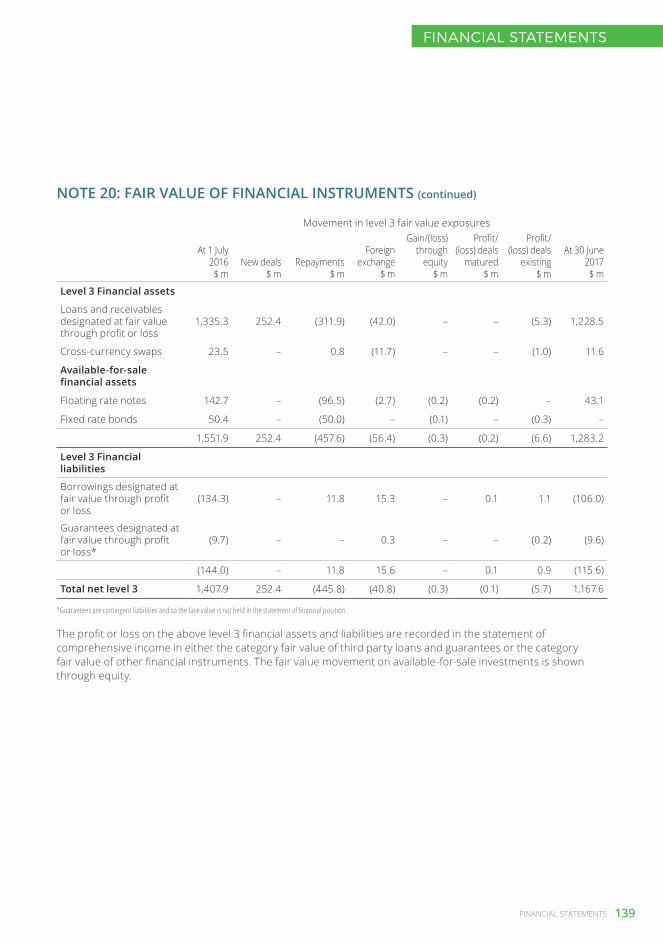
FINANCIAL STATEMENTS 139
FINANCIAL STATEMENTS
NOTE 20: FAIR VALUE OF FINANCIAL INSTRUMENTS (continued)
Movement in level 3 fair value exposures
At 1 July 2016 $ m
New deals $ m
Repayments $ m
Foreign exchange
$ m
Gain/(loss) through
equity $ m
Profit/(loss) deals
matured $ m
Profit/(loss) deals
existing $ m
At 30 June 2017 $ m
Level 3 Financial assets
Loans and receivables designated at fair value through profit or loss
1,335.3 252.4 (311.9) (42.0) – – (5.3) 1,228.5
Cross-currency swaps 23.5 – 0.8 (11.7) – – (1.0) 11.6
Available-for-sale financial assets
Floating rate notes 142.7 – (96.5) (2.7) (0.2) (0.2) – 43.1
Fixed rate bonds 50.4 – (50.0) – (0.1) – (0.3) –
1,551.9 252.4 (457.6) (56.4) (0.3) (0.2) (6.6) 1,283.2
Level 3 Financial liabilities
Borrowings designated at fair value through profit or loss
(134.3) – 11.8 15.3 – 0.1 1.1 (106.0)
Guarantees designated at fair value through profit or loss*
(9.7) – – 0.3 – – (0.2) (9.6)
(144.0) – 11.8 15.6 – 0.1 0.9 (115.6)
Total net level 3 1,407.9 252.4 (445.8) (40.8) (0.3) (0.1) (5.7) 1,167.6
*Guarantees are contingent liabilities and so the face value is not held in the statement of financial position.
The profit or loss on the above level 3 financial assets and liabilities are recorded in the statement of comprehensive income in either the category fair value of third party loans and guarantees or the category fair value of other financial instruments. The fair value movement on available-for-sale investments is shown through equity.

140 EFIC ANNUAL REPORT 2017–2018
NOTE 20: FAIR VALUE OF FINANCIAL INSTRUMENTS (continued)
Notes to and forming part of the financial statementsfor the year ended 30 June 2018
The following table shows the quantitative information of significant unobservable inputs for level 3 fair value exposures on the Commercial Account:
In order to determine reasonable alternative assumptions, the following model inputs were adjusted:
For both loans and receivables designated at fair value through profit or loss, and guarantees designated at fair value through profit or loss, the credit risk assumptions were adjusted. This involved adjusting the ratings modifier down by one notch (e.g. risk category 5 flat to 5 negative) across the entire portfolio, which is considered a reasonable alternative assumption.
Private placements, classified as available-for-sale investments, do not have a quoted market price, however a market rate is determined by calculating a yield. The yield includes an estimation for credit spreads which are determined by comparing the private issue to public issues of similar entities. The credit spreads were adjusted by 10 basis points as a reasonable alternative assumption.
For borrowings designated at fair value through profit or loss and cross currency swaps, the discount rate assumption was adjusted by 10 basis points, which is considered a reasonable alternative assumption.
(ii) Determination of fair value
The process for determination of fair value is regularly reviewed, and any changes recommended to the inputs used in the valuations are documented and submitted to the Audit Committee and then to the Board for approval if necessary. A summary paper is submitted to the Audit Committee and Board every year prior to the approval of the financial statements, which documents the accounting estimates used in fair value calculations including level 3 unobservable inputs.
The following is a description of the determination of fair value for financial instruments which are recorded at fair value using valuation techniques.
Sensitivity of level 3 fair value exposures
At 30 June 2018 $ m
Effect of reasonable alternative
assumptions $ m
At 30 June 2017 $ m
Effect of reasonable alternative
assumptions $ m
Level 3 Financial assets
Loans and receivables designated at fair value through profit or loss 1,224.3 (23.0) 1,228.5 (18.5)
Cross-currency swaps 11.0 0.1 11.6 0.2
Available-for-sale financial assets
Floating rate notes 85.4 (0.1) 43.1 –
Level 3 Financial liabilities
Borrowings designated at fair value through profit or loss (109.1) (0.3) (106.0) 0.2
Guarantees designated at fair value through profit or loss (6.6) (2.9) (9.6) (3.0)
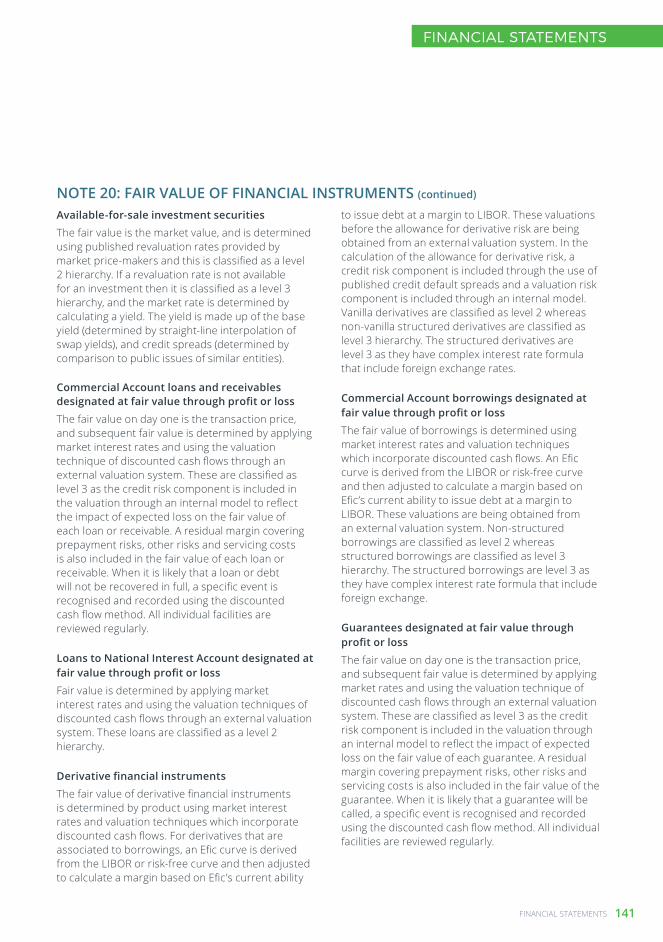
FINANCIAL STATEMENTS 141
FINANCIAL STATEMENTS
NOTE 20: FAIR VALUE OF FINANCIAL INSTRUMENTS (continued)
Available-for-sale investment securities
The fair value is the market value, and is determined using published revaluation rates provided by market price-makers and this is classified as a level 2 hierarchy. If a revaluation rate is not available for an investment then it is classified as a level 3 hierarchy, and the market rate is determined by calculating a yield. The yield is made up of the base yield (determined by straight-line interpolation of swap yields), and credit spreads (determined by comparison to public issues of similar entities).
Commercial Account loans and receivables designated at fair value through profit or loss
The fair value on day one is the transaction price, and subsequent fair value is determined by applying market interest rates and using the valuation technique of discounted cash flows through an external valuation system. These are classified as level 3 as the credit risk component is included in the valuation through an internal model to reflect the impact of expected loss on the fair value of each loan or receivable. A residual margin covering prepayment risks, other risks and servicing costs is also included in the fair value of each loan or receivable. When it is likely that a loan or debt will not be recovered in full, a specific event is recognised and recorded using the discounted cash flow method. All individual facilities are reviewed regularly.
Loans to National Interest Account designated at fair value through profit or loss
Fair value is determined by applying market interest rates and using the valuation techniques of discounted cash flows through an external valuation system. These loans are classified as a level 2 hierarchy.
Derivative financial instruments
The fair value of derivative financial instruments is determined by product using market interest rates and valuation techniques which incorporate discounted cash flows. For derivatives that are associated to borrowings, an Efic curve is derived from the LIBOR or risk-free curve and then adjusted to calculate a margin based on Efic’s current ability
to issue debt at a margin to LIBOR. These valuations before the allowance for derivative risk are being obtained from an external valuation system. In the calculation of the allowance for derivative risk, a credit risk component is included through the use of published credit default spreads and a valuation risk component is included through an internal model. Vanilla derivatives are classified as level 2 whereas non-vanilla structured derivatives are classified as level 3 hierarchy. The structured derivatives are level 3 as they have complex interest rate formula that include foreign exchange rates.
Commercial Account borrowings designated at fair value through profit or loss
The fair value of borrowings is determined using market interest rates and valuation techniques which incorporate discounted cash flows. An Efic curve is derived from the LIBOR or risk-free curve and then adjusted to calculate a margin based on Efic’s current ability to issue debt at a margin to LIBOR. These valuations are being obtained from an external valuation system. Non-structured borrowings are classified as level 2 whereas structured borrowings are classified as level 3 hierarchy. The structured borrowings are level 3 as they have complex interest rate formula that include foreign exchange.
Guarantees designated at fair value through profit or loss
The fair value on day one is the transaction price, and subsequent fair value is determined by applying market rates and using the valuation technique of discounted cash flows through an external valuation system. These are classified as level 3 as the credit risk component is included in the valuation through an internal model to reflect the impact of expected loss on the fair value of each guarantee. A residual margin covering prepayment risks, other risks and servicing costs is also included in the fair value of the guarantee. When it is likely that a guarantee will be called, a specific event is recognised and recorded using the discounted cash flow method. All individual facilities are reviewed regularly.

142 EFIC ANNUAL REPORT 2017–2018
Notes to and forming part of the financial statementsfor the year ended 30 June 2018
NOTE 21: CAPITAL EQUIVALENT
Commercial Account National Interest Account
30 June 2018 $ m
30 June 2017
$ m
30 June 2018 $ m
30 June 2017
$ m
Capital available
Equity at start of period 451.3 444.8 – –
Profit 13.9 11.6 – –
Net gain on cash flow hedges (0.1) (0.3) – –
Net gain/(loss) on available-for-sale investments (1.0) 1.0 – –
Dividend payable/paid (5.8) (5.8) – –
Equity at end of period 458.3 451.3 – –
Eligible allowance for credit risk in capital 16.2 15.9 – –
Efic capital 474.5 467.2 – –
Callable capital 200.0 200.0 – –
Capital available (including callable capital) 674.5 667.2 – –
Capital required
Export finance 156.3 154.2 – –
Treasury 32.6 30.7 – –
Other assets 5.0 5.6 – –
Operational capital 10.8 10.6 – –
Capital before concentration capital 204.7 201.1 – –
Concentration capital 148.9 159.6 – –
Total capital required 353.6 360.7 – –
Capital ratios
Risk weighted assets 2,700.4 2,652.4 – –
Capital adequacy ratio (excluding callable capital) 17.6% 17.6% – –
Capital adequacy ratio (including callable capital) 25.0% 25.2% – –

FINANCIAL STATEMENTS 143
FINANCIAL STATEMENTS
NOTE 21: CAPITAL EQUIVALENT (continued)
Commercial AccountCapital management
Efic considers capital from two perspectives:
the amount of regulatory capital required calculated under APRA/Basel prudential standards, and adding to regulatory capital an allowance for concentration risk to give a proxy for economic capital, compared to the actual capital available (cash and callable)
a capital adequacy ratio (CAR) assessing actual capital available against risk weighted assets (RWA), of which cash capital to RWA must be higher than 8% and including callable capital must be higher than 16%.
Actual capital available (cash and callable) is used by the Board as the base for setting risk tolerances for counterparty and country exposure limits.
It is imperative that given Efic’s mandate, the Board looks beyond capital adequacy ratios to determine the amount of capital required to prudently manage Efic’s business. Concentration risks, potential currency movements and large exposures all impact on Efic’s business, and capital is required as a buffer to these risks.
> Concentration risk
Efic needs a substantial amount of capital for concentration risk. Concentration risk is the ‘spread’ of outstanding obligors, or specifically, the level of diversity that exists across a bank’s loan portfolios and is not captured in typical capital adequacy calculations.
This creates a problem for Efic because concentration risks arise as a natural consequence of operating within the ‘market gap’ mandate. In other words, Efic by default, fills financing gaps that the private sector will not or cannot support, and those gaps may be in a particular industry or sector that creates concentration risk for Efic. The traditional capital adequacy ratios do not capture concentration risk.
Efic has defined concentration risk on large exposures as other risks in our model, and carries concentration capital (less the capital allocated on a risk weighted basis to that risk) based on the highest of:
100% of the largest individual maximum exposure (excluding reinsurers and central or local governments with internal rating 1 and 2); or
50% of the largest maximum country exposure (excluding internal credit rating 1 and 2); or
50% of the largest maximum industry exposure (except reinsurance and central or local governments).
The amount of capital that Efic has set aside for concentration capital risk at 30 June 2018 is $148.9 million, which is 50% of the maximum exposure to the mining LNG sector.
> Currency movement
Approximately 82% of Efic’s exposures are denominated in foreign currency, but actual capital available is denominated in AUD. This gives rise to a currency mismatch in that the numerator for capital adequacy purposes is fixed in AUD, but the denominator is in a foreign currency. Substantial movements in the exchange rate can therefore impact on capital adequacy and large exposure and country limits, even though the underlying credit exposure in foreign currency is unchanged.
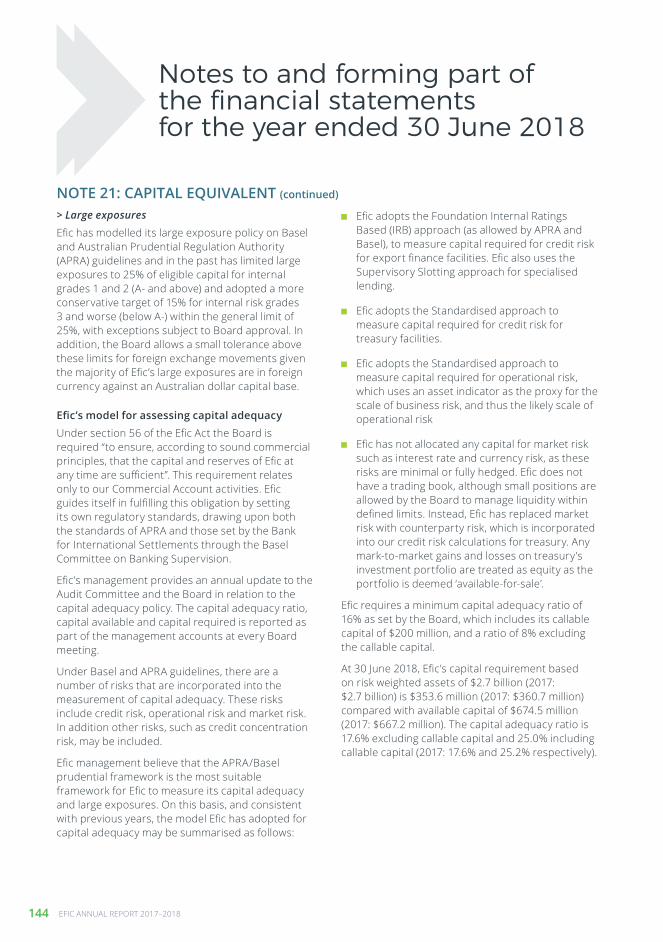
144 EFIC ANNUAL REPORT 2017–2018
> Large exposures
Efic has modelled its large exposure policy on Basel and Australian Prudential Regulation Authority (APRA) guidelines and in the past has limited large exposures to 25% of eligible capital for internal grades 1 and 2 (A- and above) and adopted a more conservative target of 15% for internal risk grades 3 and worse (below A-) within the general limit of 25%, with exceptions subject to Board approval. In addition, the Board allows a small tolerance above these limits for foreign exchange movements given the majority of Efic’s large exposures are in foreign currency against an Australian dollar capital base.
Efic’s model for assessing capital adequacy
Under section 56 of the Efic Act the Board is required “to ensure, according to sound commercial principles, that the capital and reserves of Efic at any time are sufficient”. This requirement relates only to our Commercial Account activities. Efic guides itself in fulfilling this obligation by setting its own regulatory standards, drawing upon both the standards of APRA and those set by the Bank for International Settlements through the Basel Committee on Banking Supervision.
Efic’s management provides an annual update to the Audit Committee and the Board in relation to the capital adequacy policy. The capital adequacy ratio, capital available and capital required is reported as part of the management accounts at every Board meeting.
Under Basel and APRA guidelines, there are a number of risks that are incorporated into the measurement of capital adequacy. These risks include credit risk, operational risk and market risk. In addition other risks, such as credit concentration risk, may be included.
Efic management believe that the APRA/Basel prudential framework is the most suitable framework for Efic to measure its capital adequacy and large exposures. On this basis, and consistent with previous years, the model Efic has adopted for capital adequacy may be summarised as follows:
Efic adopts the Foundation Internal Ratings Based (IRB) approach (as allowed by APRA and Basel), to measure capital required for credit risk for export finance facilities. Efic also uses the Supervisory Slotting approach for specialised lending.
Efic adopts the Standardised approach to measure capital required for credit risk for treasury facilities.
Efic adopts the Standardised approach to measure capital required for operational risk, which uses an asset indicator as the proxy for the scale of business risk, and thus the likely scale of operational risk
Efic has not allocated any capital for market risk such as interest rate and currency risk, as these risks are minimal or fully hedged. Efic does not have a trading book, although small positions are allowed by the Board to manage liquidity within defined limits. Instead, Efic has replaced market risk with counterparty risk, which is incorporated into our credit risk calculations for treasury. Any mark-to-market gains and losses on treasury’s investment portfolio are treated as equity as the portfolio is deemed ‘available-for-sale’.
Efic requires a minimum capital adequacy ratio of 16% as set by the Board, which includes its callable capital of $200 million, and a ratio of 8% excluding the callable capital.
At 30 June 2018, Efic’s capital requirement based on risk weighted assets of $2.7 billion (2017: $2.7 billion) is $353.6 million (2017: $360.7 million) compared with available capital of $674.5 million (2017: $667.2 million). The capital adequacy ratio is 17.6% excluding callable capital and 25.0% including callable capital (2017: 17.6% and 25.2% respectively).
Notes to and forming part of the financial statementsfor the year ended 30 June 2018
NOTE 21: CAPITAL EQUIVALENT (continued)

FINANCIAL STATEMENTS 145
FINANCIAL STATEMENTS
Efic’s risk based capital framework
Efic’s approach to risk management and capital management is based around assessing the level of, and appetite for, risk, and ensuring that the level and quality of capital is appropriate to that risk profile. Prudent practice also requires that capital management be forward-looking, having regard to changes in strategy, business plans and the operating environment, as well as changes in the type, amount and concentration of risk that might impact on the capital resources available.
Capital also supports Efic’s operations by providing a buffer to absorb unanticipated losses from its normal business activities. In the event cash capital is insufficient, the Board, in consultation with Government, may call additional cash capital, up to a prescribed amount. Efic is also supported by a Commonwealth guarantee that protects third parties from any financial loss in the event Efic cannot meet its obligations. This guarantee has never been called.
The Board treats Efic’s capital as equivalent to the regulatory capital under Basel and APRA guidelines and uses this as the basis for setting risk tolerances with regard to large exposures and capital adequacy. Changes to the Efic Act in 2013, which gave the Minister power under Section 55A(2) to direct Efic to pay specified dividends within a specific period, means Efic’s capital base may not meet the regulatory definition of capital.
When making this assessment, the Board is required to include as equity the $200 million of callable capital that is available from the Commonwealth in accordance with the provisions of section 54(8)(a) of the Efic Act.
National Interest Account
Efic holds no capital against the National Interest Account business on the basis that the risks are borne by the Commonwealth.
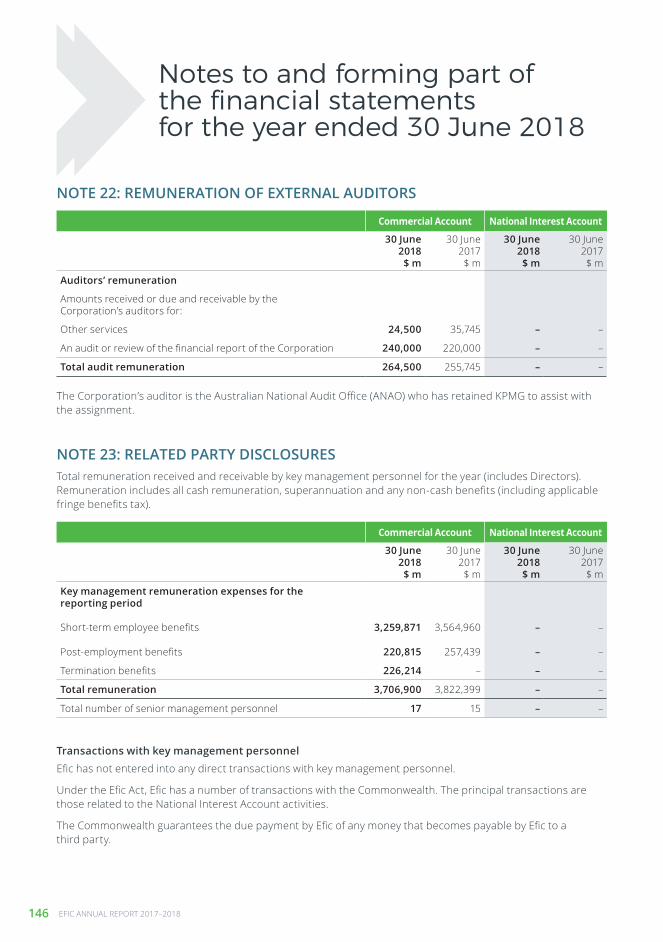
146 EFIC ANNUAL REPORT 2017–2018
NOTE 22: REMUNERATION OF EXTERNAL AUDITORS
NOTE 23: RELATED PARTY DISCLOSURES
Commercial Account National Interest Account
30 June 2018 $ m
30 June 2017
$ m
30 June 2018 $ m
30 June 2017
$ m
Auditors’ remuneration
Amounts received or due and receivable by the Corporation’s auditors for:
Other services 24,500 35,745 – –
An audit or review of the financial report of the Corporation 240,000 220,000 – –
Total audit remuneration 264,500 255,745 – –
Commercial Account National Interest Account
30 June 2018 $ m
30 June 2017
$ m
30 June 2018 $ m
30 June 2017
$ m
Key management remuneration expenses for the reporting period
Short-term employee benefits 3,259,871 3,564,960 – –
Post-employment benefits 220,815 257,439 – –
Termination benefits 226,214 – – –
Total remuneration 3,706,900 3,822,399 – –
Total number of senior management personnel 17 15 – –
The Corporation’s auditor is the Australian National Audit Office (ANAO) who has retained KPMG to assist with the assignment.
Transactions with key management personnel
Efic has not entered into any direct transactions with key management personnel.
Under the Efic Act, Efic has a number of transactions with the Commonwealth. The principal transactions are those related to the National Interest Account activities.
The Commonwealth guarantees the due payment by Efic of any money that becomes payable by Efic to a third party.
Total remuneration received and receivable by key management personnel for the year (includes Directors). Remuneration includes all cash remuneration, superannuation and any non-cash benefits (including applicable fringe benefits tax).
Notes to and forming part of the financial statementsfor the year ended 30 June 2018

FINANCIAL STATEMENTS 147
FINANCIAL STATEMENTS
NOTE 24: RECONCILIATION OF OPERATING PROFIT TO NET CASH FLOWS FROM OPERATING ACTIVITIES
Commercial Account National Interest Account
30 June 2018 $ m
30 June 2017
$ m
30 June 2018 $ m
30 June 2017
$ m
Operating profit from ordinary activities 13.9 11.6 32.3 25.7
Reclassification on non-cash items
Depreciation 5.0 5.1 – –
Employee entitlements 0.2 0.5 – –
Amortisation of deferred income – – (3.8) (5.3)
Credit risk movement (2.7) (13.6) – –
Foreign exchange (gains)/losses 1.4 (1.9) – 0.1
Unearned premium – – (0.4) (0.5)
Fair value movement of third-party loans and guarantees 6.4 15.9 – –
Fair value movement of other financial instruments 0.9 – – –
Specific provision 2.1 3.7 – 7.6
Provision for competitive neutrality charges 8.1 7.4 – –
Other (2.3) (2.2) – 0.6
Reclassification on cash items
Net movement in receivables/payables 4.3 5.8 – –
Net repayments of loan balances 122.0 124.7 123.8 46.0
Rescheduled debt repayments – 2.6 0.2 12.3
Net cash inflows/(outflows) from operating activities 159.3 159.6 152.1 86.5
Reconciliation of cash
Cash at end of financial year is reconciled to the related items in the Balance Sheet as follows:
Cash 3.4 3.1 – –
Receivables from other financial institutions 306.5 328.1 – –
Cash (including liquid funds) at end of financial year 309.9 331.2 – –
Financing facilities
Borrowing facilities available to Efic at end of financial year
Overdraft facilities 0.3 0.3 – –
Amount of facilities used – – – –
Amount of facilities unused 0.3 0.3 – –

148 EFIC ANNUAL REPORT 2017–2018
Commercial Account Notes
At 1 July 2017 $ m
Cash proceeds
$ m
Cash repayments
$ m
Net proceeds/ (repayments)
$ m
Fair value/ foreign
exchange $ m
At 30 June 2018 $ m
Derivative assets and liabilities
Derivative financial assets 9 127.3 608.6 (579.9) 28.7 (47.8) 108.2
Derivative financial liabilities 9 (254.7) 1,165.7 (1,182.3) (16.6) (24.4) (295.7)
(127.4) 1,774.3 (1,762.2) 12.1 (72.2) (187.5)
Payables to other financial institutions
Payables to other financial institutions 13 28.3 357.3 (356.7) 0.6 – 28.9
Borrowings designated at fair value through profit and loss
Structured borrowings 106.0 – – – 3.1 109.1
Non-structured borrowings 1,170.3 130.0 – 130.0 (18.4) 1,281.9
Euro commercial paper 1,037.8 3,506.7 (3,680.9) (174.2) 34.0 897.6
14 2,314.1 3,636.7 (3,680.9) (44.2) 18.7 2,288.6
National Interest Account
Borrowings from Commercial Account
Borrowings from Commercial Account 518.1 6.7 (126.5) (119.8) 18.8 417.1
NOTE 25: RECONCILIATION OF LIABILITIES ARISING FROM FINANCING ACTIVITIES
Notes to and forming part of the financial statementsfor the year ended 30 June 2018

FINANCIAL STATEMENTS 149
FINANCIAL STATEMENTS
NOTE 25: RECONCILIATION OF LIABILITIES ARISING FROM FINANCING ACTIVITIES (continued)
Commercial Account Notes
At 1 July 2016
$ m
Cash proceeds
$ m
Cash repayments
$ m
Net proceeds/ (repayments)
$ m
Fair value/ foreign
exchange $ m
At 30 June 2017 $ m
Derivative assets and liabilities
Derivative financial assets 9 185.9 924.2 (888.4) 35.8 (94.4) 127.3
Derivative financial liabilities 9 (374.9) 893.9 (1,005.1) (111.2) 231.4 (254.7)
(189.0) 1,818.1 (1,893.5) (75.4) 137.0 (127.4)
Payables to other financial institutions
Payables to other financial institutions 13 44.0 276.6 (291.7) (15.1) (0.6) 28.3
Borrowings designated at fair value through profit and loss
Structured borrowings 134.3 – (11.8) (11.8) (16.5) 106.0
Non-structured borrowings 1,389.8 – (200.0) (200.0) (19.5) 1,170.3
Euro commercial paper 967.1 4,430.3 (4,301.2) 129.1 (58.4) 1,037.8
14 2,491.2 4,430.3 (4,513.0) (82.7) (94.4) 2,314.1
National Interest Account
Borrowings from Commercial Account
Borrowings from Commercial Account 594.2 33.8 (93.5) (59.7) (16.4) 518.1

150 EFIC ANNUAL REPORT 2017–2018
Index of statutory reporting requirements
INDEX OF STATUTORY REPORTING REQUIREMENTSWe report in accordance with the requirements of the various acts and statutory instruments as set out in Table 10.
TABLE 10: Index of statutory reporting requirementsPart A: PGPA Act, Public Governance, Performance and Accountability Rule 2014
Section Subject Location Page
Public Governance, Performance and Accountability Act 2013
s.39 The Board must prepare annual performance statements. Annual Performance Statements 19–23
s.43
A copy of the annual financial statements and the Auditor-General’s report must be included in an annual report.
Independent auditor’s report Financial statements
87–88 89–149
s.46 The Board must prepare an annual report.
Report of operations Financial statements Auditor General’s report
1–152
Public Governance, Performance and Accountability Rule 2014
s.17BB
The Board must approve the annual report by a resolution of directors and signed by a director and include how and when approval was given.
Letter from the Chairman and Managing Director & CEO 14–17
s.17BE (a) – (b)
The annual report must detail Efic’s enabling legislation, its objects and functions and its purposes as set in its Corporate Plan.
Efic at a glance 4–9
s.17BE (c) – (f)
The annual report must detail the particulars of the responsible Minister and any directions given or policy orders applied during the financial year.
Efic at a glance Directions from the Minister
4–9 47–49
s.17BE(g) The annual report must include Efic’s Annual Performance Statements. Annual Performance Statement 19–23

INDEX OF STATUTORY REPORTING REQUIREMENTS 151
INDEX OF STATUTORY REPORTING REQUIREMENTS
Section Subject Location Page
s.17BE (h) – (i)
The annual report must detail any significant issues reported to the Minister. No issues reported –
s.17BE(j) The annual report must detail particulars of the Board. Our Board 29–37
s.17BE (k) – (l)
The annual report must detail particulars of Efic’s organisational structure.
Efic at a glance Where we operate
4–9 5
s.17BE (m) – (p)
The annual report must outline the main corporate governance practices. Our governing principles 28–50
s.17BE (q) – (s)
The annual report must detail any judicial and administrative decisions or reviews or reports having a significant effect on Efic.
Judicial and administrative decisions and reviews 47
s.17BE(t) The annual report must detail any indemnity applied during the financial year. Indemnities and insurance 47
s.17BE(u) The annual report must include an index of Efic’s statutory reporting requirements. Index of statutory reporting requirements 150–152
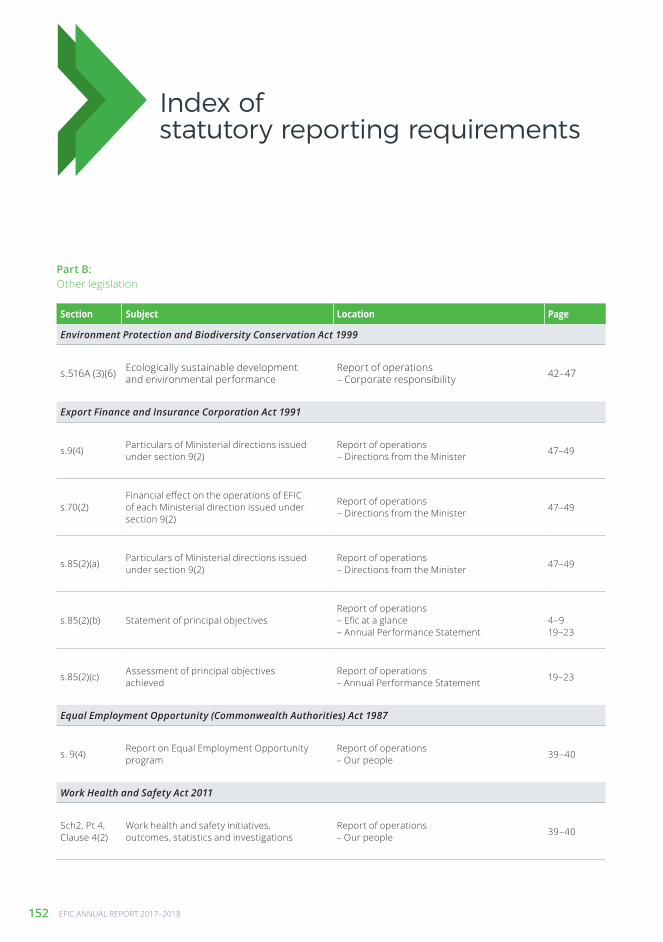
152 EFIC ANNUAL REPORT 2017–2018
Part B: Other legislation
Section Subject Location Page
Environment Protection and Biodiversity Conservation Act 1999
s.516A (3)(6) Ecologically sustainable development and environmental performance
Report of operations – Corporate responsibility 42–47
Export Finance and Insurance Corporation Act 1991
s.9(4) Particulars of Ministerial directions issued under section 9(2)
Report of operations – Directions from the Minister 47–49
s.70(2)Financial effect on the operations of EFIC of each Ministerial direction issued under section 9(2)
Report of operations – Directions from the Minister 47–49
s.85(2)(a) Particulars of Ministerial directions issued under section 9(2)
Report of operations – Directions from the Minister 47–49
s.85(2)(b) Statement of principal objectivesReport of operations – Efic at a glance – Annual Performance Statement
4–9 19–23
s.85(2)(c) Assessment of principal objectives achieved
Report of operations – Annual Performance Statement 19–23
Equal Employment Opportunity (Commonwealth Authorities) Act 1987
s. 9(4) Report on Equal Employment Opportunity program
Report of operations – Our people 39–40
Work Health and Safety Act 2011
Sch2, Pt 4, Clause 4(2)
Work health and safety initiatives, outcomes, statistics and investigations
Report of operations – Our people 39–40
Index of statutory reporting requirements
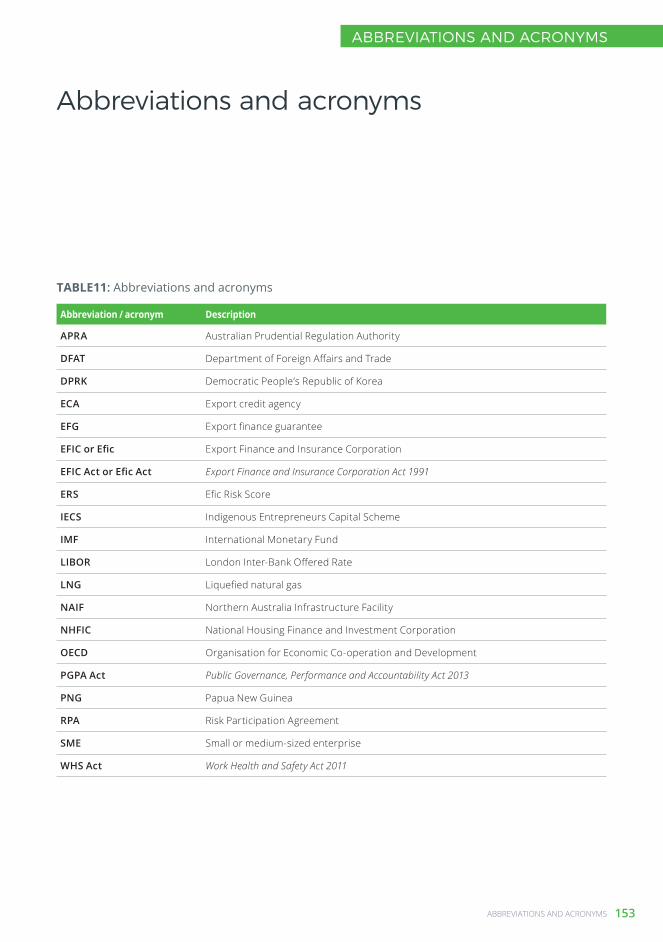
ABBREVIATIONS AND ACRONYMS 153
ABBREVIATIONS AND ACRONYMS
TABLE11: Abbreviations and acronyms
Abbreviation / acronym Description
APRA Australian Prudential Regulation Authority
DFAT Department of Foreign Affairs and Trade
DPRK Democratic People’s Republic of Korea
ECA Export credit agency
EFG Export finance guarantee
EFIC or Efic Export Finance and Insurance Corporation
EFIC Act or Efic Act Export Finance and Insurance Corporation Act 1991
ERS Efic Risk Score
IECS Indigenous Entrepreneurs Capital Scheme
IMF International Monetary Fund
LIBOR London Inter-Bank Offered Rate
LNG Liquefied natural gas
NAIF Northern Australia Infrastructure Facility
NHFIC National Housing Finance and Investment Corporation
OECD Organisation for Economic Co-operation and Development
PGPA Act Public Governance, Performance and Accountability Act 2013
PNG Papua New Guinea
RPA Risk Participation Agreement
SME Small or medium-sized enterprise
WHS Act Work Health and Safety Act 2011
Abbreviations and acronyms

154 EFIC ANNUAL REPORT 2017–2018
Company details
EXPORT FINANCE AND INSURANCE CORPORATIONContact Officer
Head of External Relations Level 10 Export House 22 Pitt Street Sydney NSW 2000
Tel: +61 2 8273 5333
Internet access
This document is available online at www.efic.gov.au/annualreport
Contact
General enquiries: +61 2 8273 5333 or 1800 887 588
Exporter enquiries: 1800 093 724
Email: [email protected]
Web: www.efic.gov.au
Offices
Sydney
Export House Level 10 22 Pitt St Sydney NSW 2000 T: + 61 2 8273 5333
Melbourne
c/- Austrade Level 3 60 Collins St Melbourne VIC 3000 T: +61 3 8060 4640
Brisbane
c/- Austrade Level 16 307 Queen St Brisbane QLD 4000 T: +61 7 3171 3345
Adelaide
c/- Austrade Level 5 131-139 Grenfell Adelaide SA 5000 T: +61 8 7070 6862
Perth
c/- Austrade Level 5 40 St Georges Tce Perth WA 6000 T: +61 8 6365 4102
© Efic 2018

Data in this report may not sum due to rounding.
Requests for more information and enquiries should be addressed to:
Head of External Relations Level 10 Export House 22 Pitt Street Sydney NSW 2000
Telephone: +61 2 8273 5333 Email: [email protected]
© Efic 2018
All material presented in this document is provided under a Creative Commons Attribution 3.0 Australia (www.creativecommons.org/licenses/by/3.0/au) licence. To the extent that copyright subsists in a third party, permission will be required from the third party to reuse the material.
The document must be attributed as the Efic Annual Report 2017-2018.
Material used ‘as supplied’
Provided you have not modified or transformed the material in any way (including, for example, by changing the text; calculating percentage changes; graphing or charting data; or deriving new statistics from published statistics), Efic prefers the following attribution: Source: Efic.
Accessing this report online
An online version of this report is available on the Efic website www.efic.gov.au/annualreport

Level 10 Export House22 Pitt Street SydneyNSW 2000 AustraliaT: +61 2 8273 5333
1800 093 724www.efic.gov.au
Ef ic A N N U A L R E P O R T
2017–2018
EFIC ANN
UAL REPO
RT 2017–2018