Embed Size (px)
Citation preview

Annual Report 2010-11
Touching Human Lives
Annual Report 2010-11
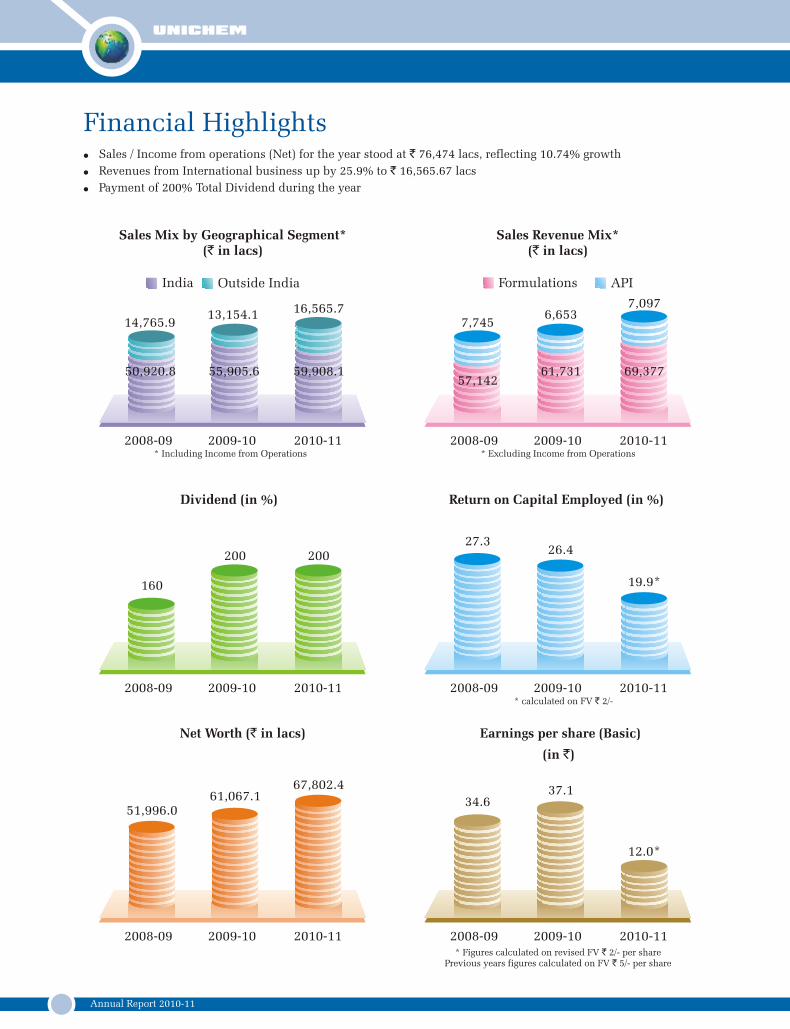
Financial Highlights! Sales / Income from operations (Net) for the year stood at ` 76,474 lacs, reflecting 10.74% growth
! Revenues from International business up by 25.9% to ` 16,565.67 lacs
! Payment of 200% Total Dividend during the year
2008-09 2009-10 2010-11
Dividend (in %) Return on Capital Employed (in %)
Net Worth (` in lacs) Earnings per share (Basic)
(in `)
2008-09 2009-10 2010-11
Formulations API
Sales Revenue Mix*(` in lacs)
* Excluding Income from Operations
Sales Mix by Geographical Segment*(` in lacs)
2008-09 2009-10 2010-11
India Outside India
* Including Income from Operations
16,565.7
59,908.1
13,154.1
55,905.6 50,920.8
14,765.9
7,097
69,377
6,653
61,73157,142
7,745
200200
160
2008-09 2009-10 2010-11
27.326.4
2008-09 2009-10 2010-11
51,996.061,067.1
67,802.4
19.9*
* calculated on FV ` 2/-
2008-09 2009-10 2010-11
34.6
12.0*
37.1
* Figures calculated on revised FV ` 2/- per sharePrevious years figures calculated on FV ` 5/- per share
01Annual Report 2010-11
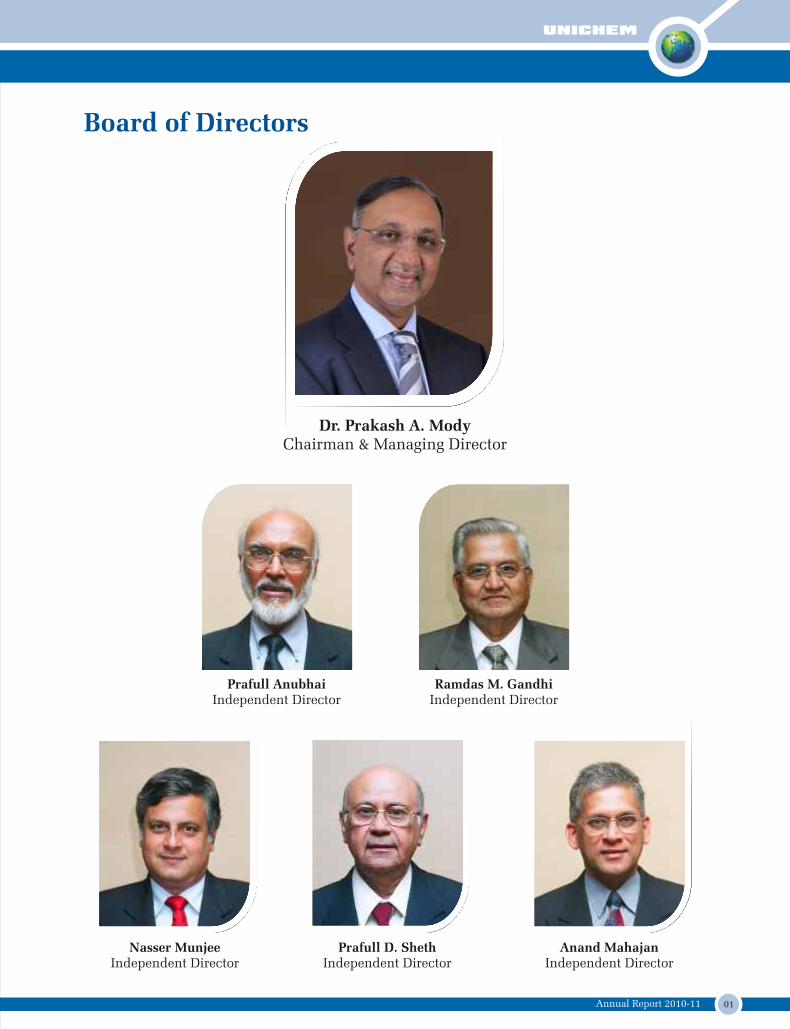
Board of Directors
Prafull AnubhaiIndependent Director
Ramdas M. GandhiIndependent Director
Prafull D. ShethIndependent Director
Nasser MunjeeIndependent Director
Anand MahajanIndependent Director
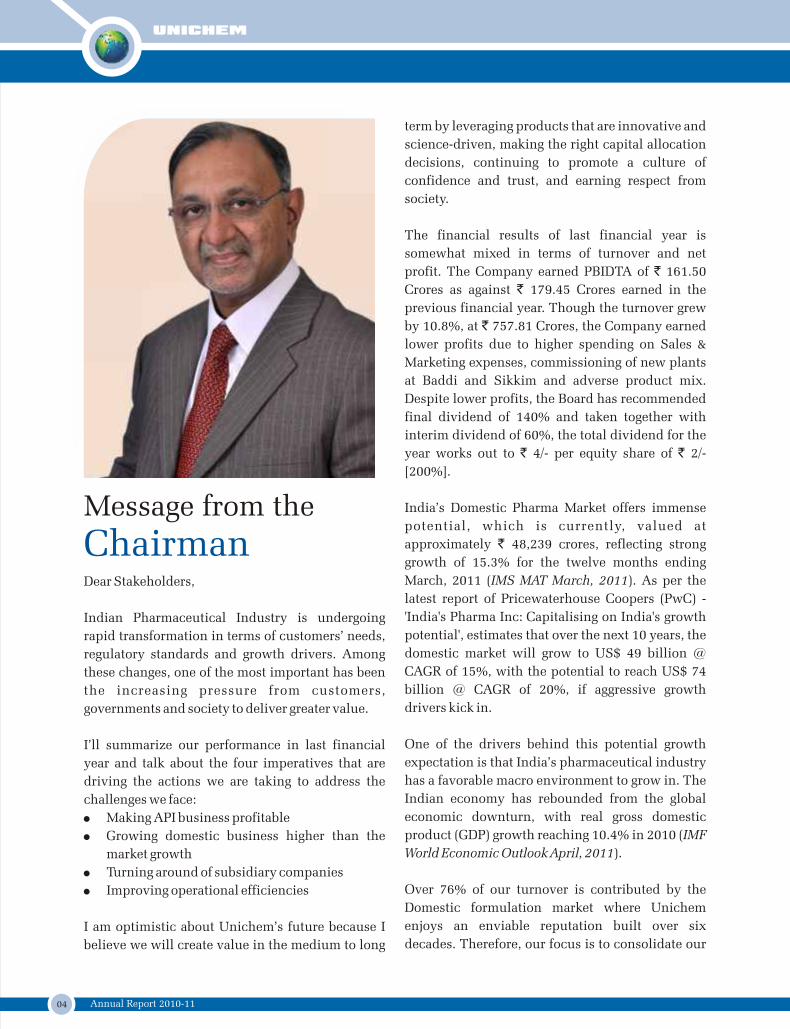
Dr. Prakash A. ModyChairman & Managing Director
02 Annual Report 2010-11
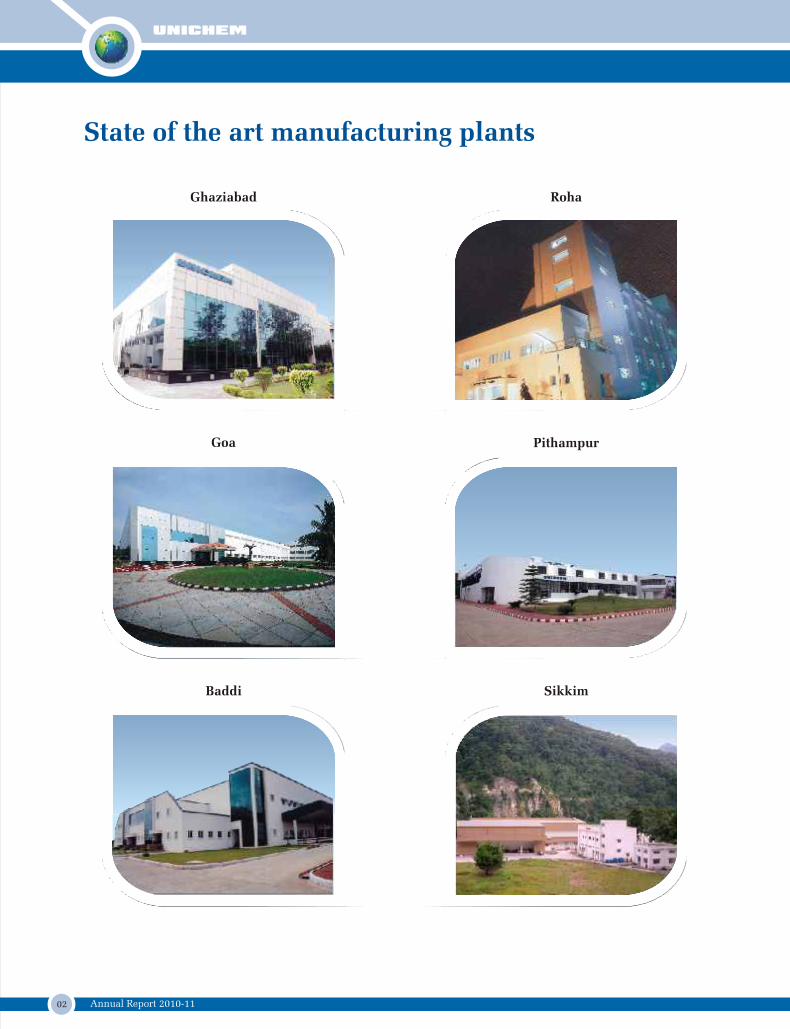
State of the art manufacturing plants
Ghaziabad
Goa
Baddi
Pithampur
Roha
Sikkim
03Annual Report 2010-11
Board Committees-Audit Committee Prafull Anubhai - Chairman
Ramdas Gandhi
Nasser Munjee
Shareholders’
Grievance Committee
Ramdas Gandhi - Chairman
Dr. Prakash A. Mody
-
Prafull D. Sheth - Chairman
Prafull Anubhai
Ramdas Gandhi
Compensation Committee -
Contents
Registered & Corporate OfficeUnichem Laboratories Limited
Unichem Bhavan, Prabhat Estate, Off. S. V. Road,
Jogeshwari (West), Mumbai - 400 102. Tel.: 022 66888333
Fax: 022 26794089/26784391• Website: www.unichemlabs.com
Company Secretary & Compliance OfficerK. Subharaman
Plant Locations
GHAZIABAD
C 31-32, Industrial Area,
Meerut Road, Ghaziabad - 201 003,
Uttar Pradesh
Formulation Plants API Plants
GOA
Plot No. 17 & 18,
Pilerne Industrial Estate,
Pilerne Bardez - 403 511,
Goa
PITHAMPUR
Plot No. 197, Sector –I,
Pithampur
District Dhar - 454 775,
Madhya Pradesh
BADDI
Bhatauli Kalan,
District Solan, Baddi - 173 205,
Himachal Pradesh
ROHA
99, MIDC Area, Roha,
District Raigad - 402 116,
Maharashtra
Registrar & Share Transfer AgentsLink Intime India Pvt. Ltd.
C-13, Pannalal Silk Mills Compound, LBS Marg,
Bhandup (West), Mumbai - 400 078.
Tel.: 022 25946970 • Fax: 022 25946969
Statutory AuditorsB. D. Jokhakar & Co.
Chartered Accountants
8, Ambalal Doshi Marg, Fort, Mumbai - 400 001.
SIKKIM
NH- 31A, Bagheykhola,
Majithar,
Rangpo, East Sikkim – 737 138.
Message from the Chairman. . . . . . . . . 4
Five-year Financial Highlights . . . . . . 8
Directors’ Report & Annexures . . . . . 10
Management’s Discussion & Analysis. . . . . . . . . . . . . . . . . . . . . . . . 17
Auditors’ Certificate on Corporate Governance . . . . . . . . . . . . . . . . . . . . . 21
Corporate Governance Report . . . . . . 22
Information for Shareholders . . . . . . . 29
Auditors’ Report on Standalone Financial Statements . . . . . . . . . . . . . 36
Standalone Financial Statements . . . 40
Consolidated Auditors' Report . . . . . . 67
Consolidated Financial Statements . . 68
Statement Pursuant to Section 212 & Summary of Subsidiary Financials . . 84
Notice . . . . . . . . . . . . . . . . . . . . . . . . . 85
Green Initiative in Corporate Governance . . . . . . . . . . . . . . . . . . . . . 88
Corporate Information
04 Annual Report 2010-11
term by leveraging products that are innovative and
science-driven, making the right capital allocation
decisions, continuing to promote a culture of
confidence and trust, and earning respect from
society.
The financial results of last financial year is
somewhat mixed in terms of turnover and net
profit. The Company earned PBIDTA of ` 161.50
Crores as against ` 179.45 Crores earned in the
previous financial year. Though the turnover grew
by 10.8%, at ` 757.81 Crores, the Company earned
lower profits due to higher spending on Sales &
Marketing expenses, commissioning of new plants
at Baddi and Sikkim and adverse product mix.
Despite lower profits, the Board has recommended
final dividend of 140% and taken together with
interim dividend of 60%, the total dividend for the
year works out to ` 4/- per equity share of ` 2/-
[200%].
India’s Domestic Pharma Market offers immense
potential, which is currently, valued at
approximately ` 48,239 crores, reflecting strong
growth of 15.3% for the twelve months ending
March, 2011 (IMS MAT March, 2011). As per the Dear Stakeholders,
latest report of Pricewaterhouse Coopers (PwC) -
'India's Pharma Inc: Capitalising on India's growth Indian Pharmaceutical Industry is undergoing
potential', estimates that over the next 10 years, the rapid transformation in terms of customers’ needs,
domestic market will grow to US$ 49 billion @ regulatory standards and growth drivers. Among
CAGR of 15%, with the potential to reach US$ 74 these changes, one of the most important has been
billion @ CAGR of 20%, if aggressive growth the increasing pressure from customers,
drivers kick in.governments and society to deliver greater value.
One of the drivers behind this potential growth I’ll summarize our performance in last financial
expectation is that India’s pharmaceutical industry year and talk about the four imperatives that are
has a favorable macro environment to grow in. The driving the actions we are taking to address the
Indian economy has rebounded from the global challenges we face:
economic downturn, with real gross domestic ! Making API business profitable
product (GDP) growth reaching 10.4% in 2010 (IMF ! Growing domestic business higher than the
World Economic Outlook April, 2011). market growth
! Turning around of subsidiary companies
Over 76% of our turnover is contributed by the ! Improving operational efficiencies
Domestic formulation market where Unichem
enjoys an enviable reputation built over six I am optimistic about Unichem’s future because I
decades. Therefore, our focus is to consolidate our believe we will create value in the medium to long
Message from the
Chairman
05Annual Report 2010-11
presence by expanding our product basket covering We have made significant investments in
more therapeutic segments, by deeper market manufacturing and research facilities over the last
penetration and expanding our reach to larger few years catering to both domestic and
number of customers. The growth potential for international market which makes Unichem the
Unichem is enormous considering the opportunity ideal partner for collaborative business.
that exists in unrepresented therapeutic segments. Contractual supplies will become one of the growth
areas for the Company to sweat manufacturing
As communicated to you last year, the Company assets more in the coming years.
continued its transformation initiatives to restore
momentum to its core business of domestic With regard to our global operations, Niche Generics,
formulations. These included portfol io our UK Subsidiary, had a difficult year and continued
prioritization and sales force alignment to improve to make losses. There are strategies in place to turn
the coverage of the existing portfolio, and around the operations during the current financial
strengthening a second tier of power brands. A new year. In US market we launched 5 products and the
division “Unifem” (Gynecology) was launched and same have been received well. During last financial
we will be hiring around 150 field personnel during year, we clocked total revenues of US$ 5.3 million.
this year to support this division. We had launched With more product filings and approvals in the
22 new products during last Financial Year and our pipeline, the foundation for substantial ramp up in
efforts are on to launch more in the current sales has been laid.
Financial Year to expand our product portfolio
covering various therapies. Our current focus on the API business is to make
reasonable profits. With US business slated for a
I am happy to inform that in cardiac market, take off, the API business support to the th th international business is expected to deliver Unichem jumped to 4 position this year from 6
desired results. In addition, new initiatives to position last year, thus adding the highest
expand customer base in new geographies should incremental value as per IMS. Unichem is the
drive growth in the coming years. undisputed leader in ARB segment of cardiac
market.
Our customers, business associates and
shareholders have reposed their faith in us. I am We have been investing continuously in upgrading
grateful to them for their continued confidence in and expanding our manufacturing and research
the management. I would also like to record my facilities at multiple locations. Our Sikkim plant,
sincere appreciation for the commitment of our which was commissioned during the year, is now
employees for their contribution. fully operational. Betalactum plant at Baddi, which
underwent modernization is now functional and
I fully recognize the complexity of the challenges has been recertified by MHRA. Cephalosporin plant
we face over the next several years and are prepared at Baddi is also fully ready for commercial
to address them by focusing on four imperatives exploitation. It is our endeavor to have this plant
that will allow us to distinguish ourselves from certified by USFDA. We have recently acquired
others, and we will continue to create superior additional land adjacent to our existing Goa Factory
value for all our stakeholders. and planning a major expansion to enhance tablet /
capsulation capacity from present 900 million to
Warm Regards2400 million units. The construction activities at
SEZ, Pithampur is expected to get over by the end of
Dr. Prakash A. Modythis financial year and immediately thereafter, we
Chairman & Managing Directorwill trigger for USFDA certifications.

06 Annual Report 2010-11
Top Brands
Group
®Serta ®RANX

07Annual Report 2010-11
Top Brands
®METRIDE 1
®allerfex *MYCLAV
08 Annual Report 2010-11
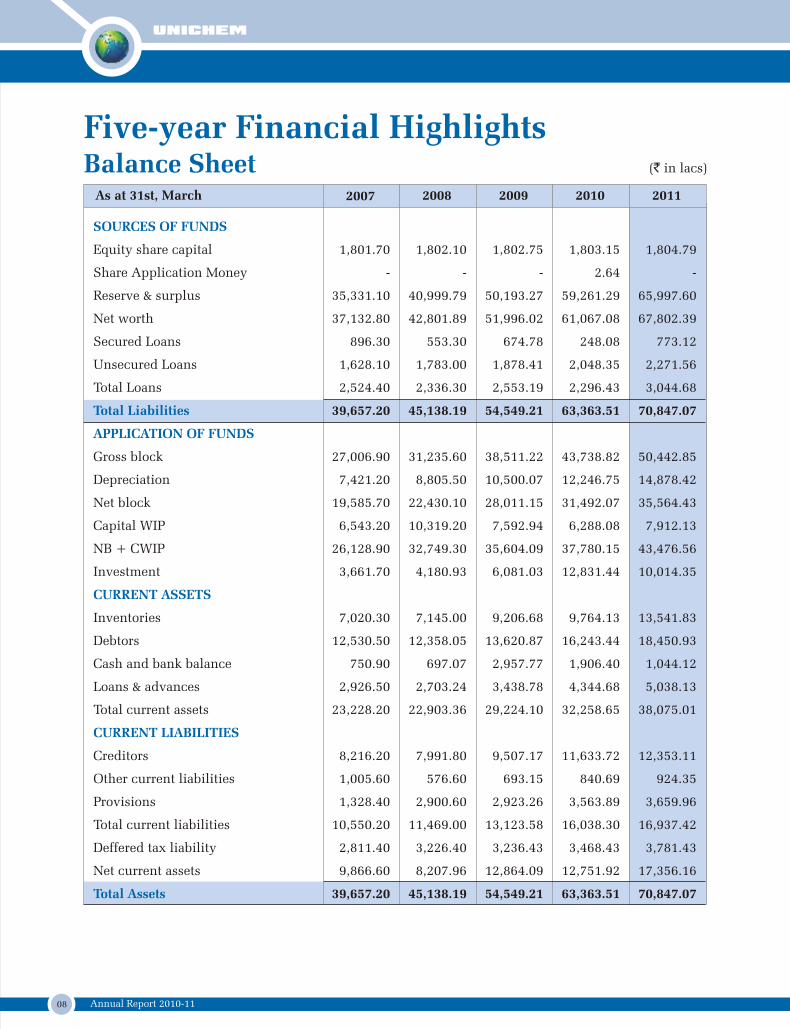
Balance Sheet (` in lacs)
Five-year Financial Highlights
SOURCES OF FUNDS
Total Liabilities
APPLICATION OF FUNDS
CURRENT ASSETS
CURRENT LIABILITIES
Total Assets
Equity share capital 1,801.70 1,802.10 1,802.75 1,803.15 1,804.79
Share Application Money - - - 2.64 -
Reserve & surplus 35,331.10 40,999.79 50,193.27 59,261.29 65,997.60
Net worth 37,132.80 42,801.89 51,996.02 61,067.08 67,802.39
Secured Loans 896.30 553.30 674.78 248.08 773.12
Unsecured Loans 1,628.10 1,783.00 1,878.41 2,048.35 2,271.56
Total Loans 2,524.40 2,336.30 2,553.19 2,296.43 3,044.68
39,657.20 45,138.19 54,549.21 63,363.51 70,847.07
Gross block 27,006.90 31,235.60 38,511.22 43,738.82 50,442.85
Depreciation 7,421.20 8,805.50 10,500.07 12,246.75 14,878.42
Net block 19,585.70 22,430.10 28,011.15 31,492.07 35,564.43
Capital WIP 6,543.20 10,319.20 7,592.94 6,288.08 7,912.13
NB + CWIP 26,128.90 32,749.30 35,604.09 37,780.15 43,476.56
Investment 3,661.70 4,180.93 6,081.03 12,831.44 10,014.35
Inventories 7,020.30 7,145.00 9,206.68 9,764.13 13,541.83
Debtors 12,530.50 12,358.05 13,620.87 16,243.44 18,450.93
Cash and bank balance 750.90 697.07 2,957.77 1,906.40 1,044.12
Loans & advances 2,926.50 2,703.24 3,438.78 4,344.68 5,038.13
Total current assets 23,228.20 22,903.36 29,224.10 32,258.65 38,075.01
Creditors 8,216.20 7,991.80 9,507.17 11,633.72 12,353.11
Other current liabilities 1,005.60 576.60 693.15 840.69 924.35
Provisions 1,328.40 2,900.60 2,923.26 3,563.89 3,659.96
Total current liabilities 10,550.20 11,469.00 13,123.58 16,038.30 16,937.42
Deffered tax liability 2,811.40 3,226.40 3,236.43 3,468.43 3,781.43
Net current assets 9,866.60 8,207.96 12,864.09 12,751.92 17,356.16
39,657.20 45,138.19 54,549.21 63,363.51 70,847.07
As at 31st, March 2007 2008 2009 2010 2011
09Annual Report 2010-11
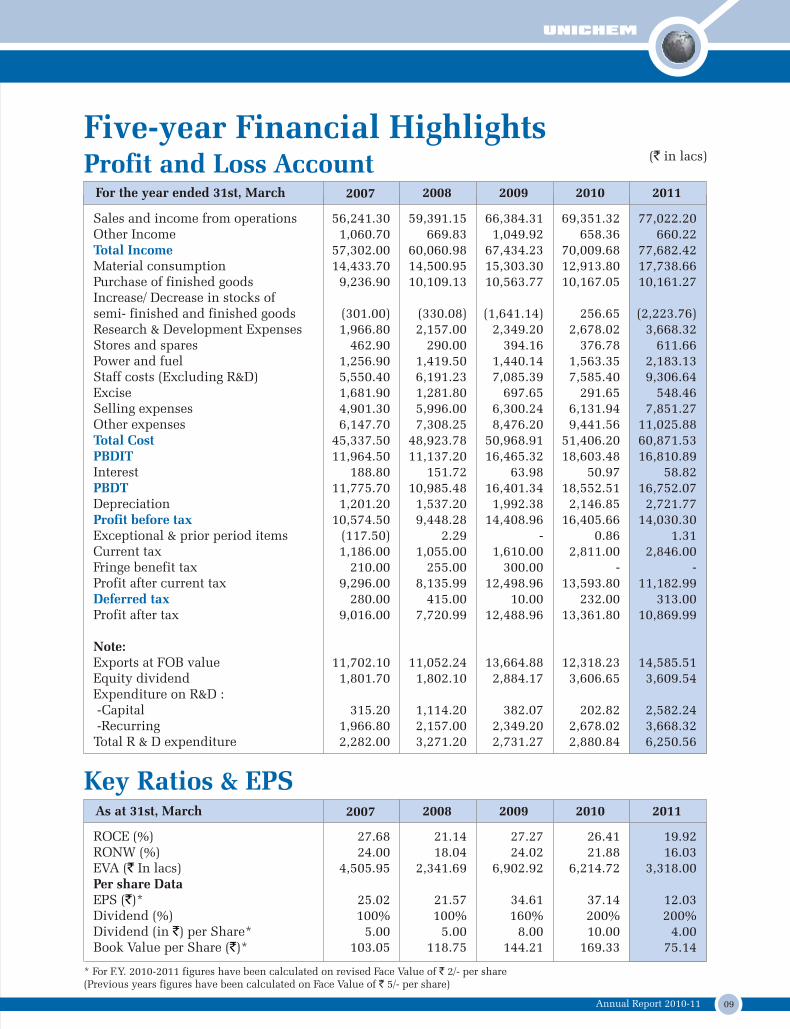
ROCE (%) 27.68 21.14 27.27 26.41 19.92RONW (%) 24.00 18.04 24.02 21.88 16.03EVA ( In lacs) 4,505.95 2,341.69 6,902.92 6,214.72 3,318.00Per share DataEPS ( )* 25.02 21.57 34.61 37.14 12.03Dividend (%) 100% 100% 160% 200% 200%Dividend (in ) per Share* 5.00 5.00 8.00 10.00 4.00Book Value per Share ( )* 103.05 118.75 144.21 169.33 75.14
`
`
``
Key Ratios & EPSAs at 31st, March 2007 2008 2009 2010 2011
For the year ended 31st, March 2007 2008 2009 2010 2011
Profit and Loss Account (` in lacs)
Five-year Financial Highlights
Sales and income from operations 56,241.30 59,391.15 66,384.31 69,351.32 77,022.20Other Income 1,060.70 669.83 1,049.92 658.36 660.22
57,302.00 60,060.98 67,434.23 70,009.68 77,682.42Material consumption 14,433.70 14,500.95 15,303.30 12,913.80 17,738.66Purchase of finished goods 9,236.90 10,109.13 10,563.77 10,167.05 10,161.27Increase/ Decrease in stocks of semi- finished and finished goods (301.00) (330.08) (1,641.14) 256.65 (2,223.76)Research & Development Expenses 1,966.80 2,157.00 2,349.20 2,678.02 3,668.32Stores and spares 462.90 290.00 394.16 376.78 611.66Power and fuel 1,256.90 1,419.50 1,440.14 1,563.35 2,183.13Staff costs (Excluding R&D) 5,550.40 6,191.23 7,085.39 7,585.40 9,306.64Excise 1,681.90 1,281.80 697.65 291.65 548.46Selling expenses 4,901.30 5,996.00 6,300.24 6,131.94 7,851.27Other expenses 6,147.70 7,308.25 8,476.20 9,441.56 11,025.88
45,337.50 48,923.78 50,968.91 51,406.20 60,871.53 11,964.50 11,137.20 16,465.32 18,603.48 16,810.89
Interest 188.80 151.72 63.98 50.97 58.82 11,775.70 10,985.48 16,401.34 18,552.51 16,752.07
Depreciation 1,201.20 1,537.20 1,992.38 2,146.85 2,721.77 10,574.50 9,448.28 14,408.96 16,405.66 14,030.30
Exceptional & prior period items (117.50) 2.29 - 0.86 1.31Current tax 1,186.00 1,055.00 1,610.00 2,811.00 2,846.00Fringe benefit tax 210.00 255.00 300.00 - -Profit after current tax 9,296.00 8,135.99 12,498.96 13,593.80 11,182.99
280.00 415.00 10.00 232.00 313.00Profit after tax 9,016.00 7,720.99 12,488.96 13,361.80 10,869.99
Note:Exports at FOB value 11,702.10 11,052.24 13,664.88 12,318.23 14,585.51Equity dividend 1,801.70 1,802.10 2,884.17 3,606.65 3,609.54Expenditure on R&D : -Capital 315.20 1,114.20 382.07 202.82 2,582.24 -Recurring 1,966.80 2,157.00 2,349.20 2,678.02 3,668.32Total R & D expenditure 2,282.00 3,271.20 2,731.27 2,880.84 6,250.56
Total Income
Total CostPBDIT
PBDT
Profit before tax
Deferred tax
* For F.Y. 2010-2011 figures have been calculated on revised Face Value of ` 2/- per share (Previous years figures have been calculated on Face Value of ` 5/- per share)
10 Annual Report 2010-11
Review of Operations annual general meeting it would take the total dividend During the year under review, Sales / Income from paid for the year to ` 4/- (200%) per equity share of ` 2/- operations (Net) increased to ̀ 76,473.74 Lacs in 2010-11 each fully paid-up.from ̀ 69,059.67 Lacs in 2009-10, registering a growth of
Sub-division of Face Value of Equity shares10.74 %. Consolidated Sales / Income from operations As you are aware during the year under review, face value of (Net) stood at ` 82,403.81 Lacs as compared to ` equity shares were sub-divided from ` 5/- each to ̀ 2/- each. 74,738.60 Lacs registering an increase of 10.26%.At present, the issued, subscribed and paid-up Share Capital
Appropriations of the Company stands at ̀ 180,494,000 Crores comprising of Your Company has transferred ` 1,500.00 Lacs to the 90,247,000 Equity Shares of ̀ 2/- each fully paid-up. General Reserve during the year under review. An
Scheme of Arrangement amount of ̀ 44,242 Lacs is proposed to be carried forward Your Board has considered and approved the valuation from the Profit & Loss Account.report, exchange ratio and the Scheme of Arrangement
Dividend between AVM Capital Services Private Limited, Chevy Your Company has consistently paid higher rate of dividend Capital Services Private Limited, PM Capital Services over all these years. Your Directors at their meeting held on Private Limited, Pranit Trading Private Limited and October 16, 2010, declared Interim Dividend of ̀ 1.20/- (60%) Viramrut Trading Private Limited and Unichem per equity share of ` 2/- each fully paid up (previous year: Laboratories Limited at its meeting held on May 14, 2011. total interim dividend declared and paid was ` 10/- (200%) The above mentioned Transferor Companies are
equity share of ` 5/- each fully paid up). The total interim companies through which the promoters of your
dividend payout for year 2010-11 (including dividend Company hold shares in Unichem Laboratories Ltd. The
distribution tax) was ` 1,262.67 Lacs. The above Interim proposed merger would help in consolidating and
Dividend declared and paid is to be confirmed by the streamlining the Promoter holding in your Company and
Members at the ensuing Annual General Meeting. bring long term stability in the holding structure of
Unichem without any change in the promoter holdings. Your Board of Directors at their meeting held on May 14,
2011 recommended ̀ 2.80 (140%) per equity share of ̀ 2/- The said Scheme shall be filed with the concerned High
each fully paid up. The register of members and share Court or such other competent authority and directions
transfer books shall remain closed from July 18, 2011 to would be sought for holding/dispensing with meeting of
July 22, 2011, both days inclusive. The Annual General the shareholders/creditors of your Company to give effect
Meeting of the Company is scheduled for July 28, 2011. If to the Scheme.
the final dividend is approved by the shareholders at the
Directors’ ReportDear Members,
thYour Directors have pleasure in presenting the 48 Annual Report on the business and operations of the Company for
the financial year ended March 31, 2011.
Financial Highlights
The table given below gives the financial highlights of the Company on Standalone basis for the year ended March 31,
2011 as compared to the previous financial year.
Sales/ Income from operations (Net) 76,473.74 69,059.67
Other Operating Income 660.22 658.36
Total Income 77,133.96 69,718.03
Profit before tax 14,030.30 16,405.66
Tax Expenses (Including deferred tax & Fringe Benefit tax) 3,159.00 3,043.00
Net profit from ordinary activities after tax but before Prior period items 10,871.30 13,362.66
Add/(less): Prior period Expenses (1.31) (0.86)
Add/(less): Excess/(Short) provision for taxation pertaining to previous years (20.21) 32.63
Net Profit for the period 10,849.78 13,394.43
Particulars 2011 2010
For the year ended March 31
(` in lacs)
Notes: Previous year’s figures have been regrouped/reclassified wherever necessary.
11Annual Report 2010-11
Employee Stock Options Scheme inspection at the registered office of your Company.During the year under review, 73,000 of ̀ 2/- options were
Review of Subsidiariesexercised and equivalent numbers of equity shares were Niche Generics Limitedallotted (on pari passu basis) under the Employees’ Stock Niche Generics Limited is a wholly-owned subsidiary of Option Scheme – 2008. your Company. It is engaged in manufacturing
formulations and dossier filing in European markets. It Details of Employees’ Stock Option Schemes, as required recorded sales of GBP 100.4 Lacs for the year ended March to be disclosed under Clause 12 of the SEBI (Employees of 31, 2011 as compared to GBP 104.1 Lacs for the previous Stock Option Scheme and Employees Stock Purchase) year ended March 31, 2010. The loss for the year ended Guidelines, 1999 are set out in the Annexure I to this March 31, 2011 stood at GBP 7.9 Lacs compared to the loss Report.of GBP 1.9 Lacs for the year ended March 31, 2010.
Management’s Discussion and AnalysisA detailed review on operations and performance of the Unichem Pharmaceuticals (USA) Inc.
Unichem Pharmaceuticals (USA) Inc., a wholly-owned Company and its business is given in the Management’s subsidiary of your Company in USA, has been set up for Discussion and Analysis, which forms part of this business development, filing of ANDA’s and exploring Annual Report.the opportunities for marketing alliances in North
Corporate Governance American markets. The subsidiary recorded sales of USD A detailed report on Corporate Governance forms part of 27.7 Lacs for the year ended March 31, 2011 and incurred this Annual Report. Your Company is in full compliance loss of USD 9.2 Lacs for the same period compared to the with the requirements and disclosures that have to be loss of USD 12.4 Lacs for the year ended March 31, 2010.made in this regard. The Auditors’ Certificate on
compliance with Corporate Governance requirements by Unichem Farmaceutica Do Brasil LtdaUnichem Farmaceutica Do Brasil Ltda., is a wholly-the Company is attached to the report on Corporate owned subsidiary of your Company in Brazil. This Governance.subsidiary has been set-up to own product registrations,
Information for Shareholders launch generic and branded generics products in the Additional information pertaining to shareholders like Brazilian market. Equity History, Dividend Payment History, Shareholding
pattern, etc. is provided in this Annual Report. The subsidiary plans to have marketing alliances for
promoting, warehousing and distribution. The entity Consolidated Financial Statements suffered a loss of Brazilian Reals 14.4 Lacs in the current In accordance with the Accounting Standards AS – 21 on year as against Brazilian Reals 9.3 Lacs during the Consolidated Financial Statements, your Directors previous year.provide the audited Consolidated Financial Statements
Unichem SA (Proprietary) Limitedin the Annual Report.
Unichem SA (Proprietary) Limited is a wholly-owned Notes on Subsidiaries subsidiary of your Company in South Africa. This Your Company has 4 (four) subsidiaries as on March 31, subsidiary has been set-up for business development and 2011. Your Company had applied to the Central to own product registrations. The subsidiary has registered Government for an exemption from attaching the Financial profit of SA Rand 58 in the current year as compared to Statements of its Subsidiaries, since the Audited profit of SA Rand 197 during the previous year. Consolidated Financial Statements are presented in the
Annual Report. Your Directors believe that the Directors’ Responsibility Statement
Consolidated Financial Statements present a full and fair In terms of section 217 (2AA) of the Companies Act, 1956,
view of the state of affairs of your Company as a whole. In your Directors confirm that:1. in preparation of annual accounts for the year terms of approval granted by the Central Government
ended March 31, 2011, the applicable accounting under Section 212(8) of Companies Act, 1956, financial standards have been followed along with proper statements pertaining to the subsidiaries have not been explanation relating to material departures, if any;attached with the Balance Sheet of the Company. However,
2. they have selected such accounting policies and for the benefit of the members, we have published a applied them consistently and made judgements summary of the financials of the subsidiaries in the Annual and estimates that are reasonable and prudent so as Report. The financial statements of subsidiaries, along-to give a true and fair view of the state of affairs of with related information and reports are available for
Directors’ Report
12 Annual Report 2010-11
the Company at the end of the financial year 2010- September, 2011 and the tentative date for filing these th11 and profit made by the Company for that period; reports is 24 September, 2011.
3. they have taken proper and sufficient care for the
maintenance of adequate accounting records in Energy, Research and Development, Technology
accordance with the provisions of this Act for Absorption, Foreign ExchangeThe particulars as prescribed under Clause (e) of Sub-safeguarding the assets of the Company and for section (1) of Section 217 of the Companies Act, 1956 preventing and detecting fraud and other read with the Companies (Disclosure of particulars in the irregularities;
4. they have prepared the annual accounts on a going Report of Board of Directors) Rule, 1988 are set out in
concern basis. Annexure II to this Report.
Credit Rating Particulars of EmployeesICRA has reaffirmed the A1+ rating for short-term debt Particulars of employees, as required under 217(2A) of
(including Commercial Paper) Programme of ̀ 1500 Lacs. the Companies Act, 1956 read with the Companies
The rating indicates highest safety, the prospect of timely (Particulars of Employees) Rules, 1975, as amended from
repayment of debt/obligation being the best. time to time, forms part of this Report. However in
pursuance of Section 219(1)(b)(iv) of the Act this report is Directors being sent to all shareholders of the Company, excluding By virtue of Section 255 of the Companies Act, 1956 and the aforesaid information and the said particulars are the Articles of Association of the Company, Mr. Prafull available at the Registered Office of the Company. The Anubhai and Mr. Ramdas Gandhi retire by rotation at the members interested in obtaining such particulars may ensuing Annual General Meeting. Attention of the write to the Secretarial Department at the Registered Members is invited to the relevant items in the Notice of Office of the Company.the Annual General Meeting for seeking their approval
for the aforesaid appointments. The information required Employee Relationsunder Clause 49 IV (G) of the Listing Agreement is given Relations with employees across all the offices and units
in the Notice of the Annual General Meeting. continued to be cordial throughout the year. Your Directors
place on record, their sincere appreciation of the Auditors significant contribution made by the employees at all levels The Statutory Auditors of the Company, M/s. B. D. through their dedication, hard work and commitment.Jokhakar & Co., retire at the conclusion of the ensuing
Annual General Meeting and are eligible for re- Quality and Environmentappointment. Your Company has received intimation to Your Company’s mission envisages a strong sense of
the effect that, proposed re-appointment, if made, would commitment to work towards being a caring
be within the prescribed limit under Section 224(1B) of pharmaceutical company, which will continuously strive
the Companies Act, 1956.They have confirmed their to enhance health through quality products. Your
willingness to accept office, if re-appointed. The Board Company aims to consistently provide products that
and Audit Committee recommend the re-appointment of meet customer as well as national and international
M/s. B.D. Jokhakar & Co. as Statutory Auditors of your regulatory requirements as may be applicable. It has been
Company for the financial year 2011-12. steadily raising the bar, setting higher goals for
environmental performance and enlarging the scope of Cost Auditors initiatives. The environmental policy of your Company Pursuant to Section 233B of the Companies Act, 1956, the emphasizes at being a caring company, which shall Central Government has prescribed Cost Audit of the protect and promote the environment by complying with Company’s Bulk Drugs and Formulations Division. The applicable environmental regulations and preventing Board of Directors of your Company has re-appointed Mr. pollution in all its operations. Y. R. Doshi, Cost Accountant, having membership no. To conserve water, the Company has devised various 3286, as the Cost Auditor to audit the cost accounts water savings methods which are monitored on day-to-relating to “Bulk Drugs” and “Formulations” for the day basis. In this direction, the Company has devised financial year ending 2011-12. The due date for filing rain-harvesting system at its Ghaziabad manufacturing Cost Audit Reports of the financial year 2009-10 for your unit. Your Company continues to strive for energy saving
thCompany was 27 September, 2010 and the reports were and conservation of natural resources.thfiled well within the due date i.e. on 24 September, 2010.
Corporate Social ResponsibilitySimilarly, the due date for filing Cost Audit Reports of the th Good governance demands adherence of social financial year 2010-11 for your Company is 27
Directors’ Report
13Annual Report 2010-11
responsibility coupled with creation of value in the larger contributing via endowments to educational institutions
interest of the general public. Your Company and its during his lifetime.
dedicated employees continue to contribute towards Plant Visitseveral worthwhile causes. Your Company aims to Your Company had organized a plant visit for the enhance the quality of life of the community in general shareholders to our Roha plant. The visit included and has a strong sense of social responsibility. The range information about the various functions and processes of our activities begins with organizing fire fighting drills, taking place at Roha plant. The visit was a grand success.blood donation camps in collaboration with Blood Banks,
facilitating plantation of trees, extending educational and Health & Safetyon-job training facilities and goes on to cover vocational Your Company assiduously endeavours to act in a guidance and supporting seminars in co-ordination with responsible manner to avoid causing any harm to the Universities, arranging spiritual upliftment programmes, health and for safety of its employees, contract personnel etc. The aim of these seminars and lectures is to increase and visitors. Health and Safety issues are addressed the intellectual wealth of employees, who in turn are systematically, effectively and proactively. Mock drills expected to go back and spread the knowledge to build a are conducted regularly for different emergency happy, peaceful and strong nation.situations for enhancing effectiveness of response plan.
To create awareness about the pollution generated by Your Company takes pride in providing various forms of motor vehicles, Unichem is rolling out a mandatory medical assistance to the families of its employees and check of Pollution Under Control (PUC) certificates of all also to all those living in surrounding villages. Periodic vehicles entering Company premises at Goa health checkups are carried out of all employees and manufacturing unit. As a part of Unichem’s regular training programmes are organised on safety and Environmental Awareness Drive, various programmes by precautionary measures. Fire fighting training programs eminent environmentalists are organized on a regular and first-aid training camps are organised regularly to basis for the benefit of the industrial community in educate workers and employees at our plant locations association with Goa University, Inspectorate of Factories and corporate office. Our Pithampur plant officials have & Boilers, Government of Goa and Green Triangle Society. developed a Safety Park at the plant where various types
of personal protective equipments, informative posters, As you are aware, our Company has undertaken a project fire extinguishers, etc are displayed for creating for Primary Health Centre in Village Taki-Pathar, Shahpur awareness towards safety among all employees. Taluka, Dist. Thane in the name of Mr. Amrut Mody,
founder of the Company. This Health Centre was Acknowledgementinaugurated in September last year and now shall cater to Your Directors acknowledge the support and wise medical needs of adiwasi population of Shapur taluka of counsel extended to the Company by analysts, bankers, Thane District. A dedicated team of doctors provide government agencies, shareholders, investors, suppliers, regular treatment to patients for TB, epilepsy and leprosy distributors, stockists and others associated with the at the Centre. During the financial year under review, the Company as its business partners. Your Directors also Centre organized 18 diagnostic, surgery and post acknowledges the trust reposed in the Company by operative camps at Taki, Andad and Shirval Villages of medical fraternity and patients. We look forward to Shapur. Free Cataract operations were carried out in having the same support in our mission to enhance Mumbai for 205 patients. Educational aid in the form of health through quality products.notebooks, compass boxes, biscuits, etc was provided to
around 1600 students from 20 schools. General Medical On behalf of the Board of Directors,
and Dental check up camp was organized in Khalapur For Unichem Laboratories Limited
district in Raigad. 180 students took advantage of the
camp. Dr. Prakash A. ModyChairman & Managing Director
Our Company has volunteered to be the chief donor to
Ahmedabad University School of Management which is Mumbai,
promoted by Ahmedabad Education Society. During the May 14, 2011year the Company donated a sum of ` 3 Crores to the
Management School. This donation is being given in the
memory of its founder Chairman Mr. Amrut Mody who
was a pioneer in Indian Pharma Industry and a visionary
Technocrat and who was instrumental in supporting and
Directors’ Report
14 Annual Report 2010-11
Annexure I to Directors’ ReportStatement pursuant to Clause 12 ‘Disclosure in the Director’s Report of SEBI(Employees’ Stock Option Scheme and Employees’ Stock Purchase Scheme) Guidelines, 1999
The details of the Stock Options as on March 31, 2011 are given here below:
* Options granted due to employees who are no longer associated with the Company** Options granted, exercised and outstanding as on March 31, 2011 stands augmented and exercise price stands reduced on account of the sub-division of the Face value of Equity share from ` 5/- to ` 2/- each
Particulars ESOP - 2004 ESOP – 2008
a. Options granted** 250,000 (in 2004-05) 125,000 (in 2008-09)500,000 (in 2005-06) 743,750 (in 2009-10)
b. The pricing formula @ ` 44/- per share of for @ ` 46/- per shareface value of ` 2/- eachgrants prior to 2004-05@ ` 105.42 per share forgrants made in 2005-06
c. Options vested 181,250 102,125d. Options exercised 179,000 73,000e. The total number of Shares arising 179,000 73,000
as a result of exercise of Optionsf. Options lapsed* 568,750 75,750g. Variation of terms of Options As per the notice of Nil
rd43 AGM.h. Money realised by exercise of Options ` 7,876,000 ` 3,358,000i. Total number of Options in force 2,250 29,125j. Employee wise detail of Options
granted during the year:(i) Senior manager personnel Nil Nil(ii) Any other employee who received Nil Nil
a grant in any one year of Options amounting to 5% or more of Options granted during the year.
(iii) Identified employees who were Nil Nilgranted options, during one year, equal to or exceeding 1% of the issued capital (excluding outstanding warrants and conversions) of the Company at the time of grant.
k. Diluted earnings per share (EPS) pursuant ` 11.95 ` 11.95to issue of shares on exercise of Options calculated in accordance with Accounting Standard (AS) 20 ‘Earnings per Share’.
l. Difference between employee compensation The Company has NAcost calculated as per intrinsic value of calculated the employee stock options and fair value of the options. compensation cost using Impact of the difference on profits and EPS. fair value of the options.
m. Weighted average exercise price and weighted For Options For Options For Options For Optionsaverage fair value of options whose exercise price granted on granted on granted on granted oneither equals or exceeds or is less than the 24.12.04 10.02.06 26.03.09 17.06.09market price of the stock:- Weighted average price (`) 110.0 264.0 115.0 115.0- Weighted average Fair value (`) 138.7 158.0 68.1 102.0
n. A description of the method and significant assumptions used during the year to estimate the fair values of options, including the following weighted average information:- Risk free interest rate 6.43% 6.9% 5.32% 4.62%- Expected life 5 years 5 years 5 years 5 years- Expected volatility 59.2% 36.89% 41.02% 41.23%- Expected dividends and 1.4% 1.1% 3.7% 3.8%- The price of the underlying share in the ` 209.75 ` 325.00 ` 160.05 ` 211.50
market at the time of option grant
15Annual Report 2010-11
Additional Information in terms of Section 217(1)(e) of the Companies Act, 1956, dealing withConservation of Energy, Research & Development and Technology Absorption & Foreign ExchangeEarning and Outgo forming part of Directors' Report as follows:-
Annexure II to Directors’ Report
A. CONSERVATION OF ENERGY
1. Measures taken
a. Additional capacitor banks installed at sub-stations.
b. Improved natural illumination done to reduce power consumption.
c. Replacement of existing lamps with lower wattage power saver lamps in Circuit Breaker assembly area.
d. Introduction of FRP blades on cooling towers.
e. Use of Energy saving luminaries for Lighting.
f. Introduction of timer for well water pump.
g. Use of 14 W CFL instead of tube lights for night lamp
h. Replacement of 36/40W conventional tube lights by 20W CFLs in office area
i. Introduction of efficient power factor controller to maintain power factor within 0.99 lag.
j. Reduce utilisation of compressor during shifts.
2. Impact of Measures undertaken
a. Optimisation of energy consumption
b. Savings in energy and fuel cost
c. Environment Protection
3. Power and Fuel Consumption
Particulars 2011 2010
Consumption per unit of production
In view of the varied nature of the products and packs, the compilation of accurate consumption per unit of production
is not feasible.
(a) ELECTRICITY
(i) Purchased Units (Lacs) 214.39 187.53
Total Amount (` in Lacs) 1104.85 915.05
Rate / Unit (`) 5.15 4.88
(ii) Own Generation
Through Diesel Generator Units (Lacs) 30.37 27.74
Units per litre of Diesel Oil 3.33 3.29
Cost per unit (`) 9.63 7.81
Through Steam Turbine / Generator N.A. N.A.
(b) COAL N.A. N.A.
(c) FURNACE OIL/HSD
Quantity (Kilo Litres) 1233.15 1,429.45
Total Amount (` in lacs) 375.44 343.17
Average Rate (`/Kilo Ltr.) 30.45 24.01
(d) OTHERS / INTERNAL GENERATION
Steam Purchased (M.T.) 6265.88 5,860.86
Total Amount (` in Lacs) 127.55 101.67
Average Rate (` per M.T.) 2035.64 1,734.67
For the year ended March 31,
16 Annual Report 2010-11
Annexure II to Directors’ Report
B. RESEARCH & DEVELOPMENT
1. Specific areas in which R&D is carried out by the Company
a. To undertake contract research with Generic & Research based pharmaceutical companies to develop
API’s and formulations.
b. Development of innovative as well as patentable routes of synthesis for API and Intermediates.
c. Development of a cost effective process for API’s and Intermediates.
d. Improvement in the quality & productivity
e. To contain the cost of products by innovation and improving the efficiency of the processes.
f. Formulation development of new dosage forms of generic API for domestic and international market.
g. Modified release formulation for domestic & international market.
h. Contract formulation development for NCEs for research based pharmaceutical companies.
i. Develop biosimilar products by following DNA recombinant technique and initiated work on
fermentation process for making API.
2. Benefits derived as a result of the above R&D
a. The above research has resulted in launching of new products at the right time in international as well as
domestic market in various therapeutic segments.
b. Products developed for the international market will result into increased business to the Company in
current and future years.
c. During the year, 9 patent applications were filed.
3. Future Plan of action
a. Undertake development of biosimilar products by using Recombinant DNA technique and monoclonal
antibodies.
b. Work has been initiated to synthesize polypeptides and a good progress is made during the year. This will
be taken further with new polypeptides of commercial value and human health issues.
c. Fermentation development work to make small molecule API.
d. Organization will continue to work on the therapeutic segments of
i. Anti-infective
ii. Cardiovascular
iii. Psychiatry and neurology
iv. Musculo-skeletal
v. Gastrointestinal
vi. Nutritional
vii. Anti -allergic
e. Develop cost effective processes for the existing molecules by reducing the overall cost by 10-20% for
selected APIs.
f. Development of new products for international business.
g. Development of modified drug delivery systems.
h. Undertake contract research work, in the area of synthesis of API and product dossiers.
i. Develop products and delivery systems through Biotechnology.
j. Improvements in quality of products and productivity.
k. Development of validated methods for the APIs, Intermediates and Impurities to meet the international
quality standards and also support regulatory requirements.
4. Expenditure on R&D
C. TECHNOLOGY ABSORPTION, ADAPTATION AND INNOVATION
The technologies developed by the research and development division of the Company has been commercialized
and adopted by the manufacturing facilities of the Company.
D. FOREIGN EXCHANGE EARNINGS AND OUTGO
The details of foreign exchange earnings and outgo are given in notes to accounts.
Particulars 2011 2010
a) Capital 2,582.24 202.82
b) Recurring
- at units approved by Department of Scientific & Industrial Research 3,668.32 2,678.02
- at others 385.32 296.52
c) Total 4,053.64 3,177.36
d) Total R&D expenditure as a percentage of Turnover 5.26% 4.58%
For the year ended March 31,(` in lacs)
17Annual Report 2010-11
Management's Discussion and AnalysisGLOBAL PHARMA MARKET (APIs) , f inished dosage formulat ions, bio–
The global pharmaceutical market is undergoing rapid pharmaceuticals and clinical services. The top five
transformation. As blockbuster drugs come off patent, destinations of Indian pharmaceutical products are the
there are fewer new chemical and biological entities in USA, Germany, Russia, the UK and China. The domestic
the pipeline to replace them. This is the outcome of pharma sector has also expanded in recent years.
declining R & D productivity and rising regulatory costs.
India's Domestic Pharma Market offers immense
As per the IMS Health forecast, divergent growth rates are potential, which is currently, valued at approximately Rs.
expected for developed and emerging markets in the year 48,239 Crores, reflecting strong growth of 15.3% for the
2011. The emerging markets are forecasted to grow at a twelve months ending March, 2011 (IMS MAT March,
15-17% in 2011, to US$170-180 billion. Many of these 2011). As per the latest report of Pricewaterhouse
markets are benefiting from greater government spending Coopers (PwC) - 'India's Pharma Inc: Capitalising on
on healthcare and broader public and private healthcare India's growth potential', estimates that over the next 10
funding, which is driving greater demand and access to years, the domestic market will grow to US$ 49 billion @
medicines. China, which is predicted to grow at 25-27% CAGR of 15%, with the potential to reach US$ 74 billion
to more than $50 billion next year, is now the world’s @ CAGR of 20%, if aggressive growth drivers kick in.
third-largest pharmaceutical market. The five major
European markets (Germany, France, Italy, Spain, and the One of the drivers behind this potential growth expectation
U.K.) collectively will grow at a 1-3% pace, as will is that India's pharmaceutical industry has a favorable
Canada. As per the forecast, U.S. will remain the single macro environment to grow in. The Indian economy has
largest pharmaceutical market, with 3-5% growth rebounded from the global economic downturn, with real
expected next year. gross domestic product (GDP) growth reaching 10.4% in
2010 (IMF World Economic Outlook April, 2011).
In 2011, products with sales of more than $30 billion are
expected to face the prospect of generic competition in The Indian Domestic Pharma industry is witnessing
the major developed markets. The full impact of patients trends such as acquisition activity, increased sales &
shifting to lower-cost generic alternatives for these marketing investment by domestic players, deeper
products, as well as other brands in their therapy classes, penetration into the tier I to tier VI and rural markets, and
mostly will be felt in 2012, due to the timing and expected growth in insurance coverage and innovation in
competitive intensity among generic entrants. healthcare delivery. Taken together, these trends are
leading to increased affordability of services to patients
The IMS Institute for Healthcare Informatics reported that and access to quality medical care. These trends, along
global spending for medicines will reach nearly $1.1 with the favorable macro environment will propel the
trillion by 2015, reflecting a slowing compound annual industry to the next level of growth.
growth rate of 3-6 percent over the next five years. This
compares with 6.2 percent annual growth over the past five The report highlights that presently around 67% of
years. Lower levels of spending growth for medicines in the India's population or 742 million people live in rural
U.S., the ongoing impact of patent expiries in developed areas, but rural markets contribute to only 17% of the
markets, continuing strong demand in emerging pharma overall pharma market's sales. Further, this low
markets, and policy-driven changes in several countries are penetration represents a huge opportunity for the
among the key factors that will influence future growth, pharmaceutical companies to expand in the rural
according to the IMS Institute's new study, The Global Use markets, which are expected to be the growth drivers for
of Medicines: Outlook Through 2015. the domestic pharma industry in the coming years.
INDIA UNICHEM’S PERFORMANCErd Financial HighlightsThe Indian pharmaceutical industry currently ranks 3
! Consolidated Sales / Income from operations (Net) in terms of volume of production (10% of global share) th stood at ` 82,403.81 Lacs as compared to ` 74,738.60 and 14 by value. Exports of pharmaceuticals have
Lacs in the previous financial year registering an consistently outstripped imports. India currently exports
increase of 10.26%.drug intermediates, active pharmaceutical ingredients
18 Annual Report 2010-11
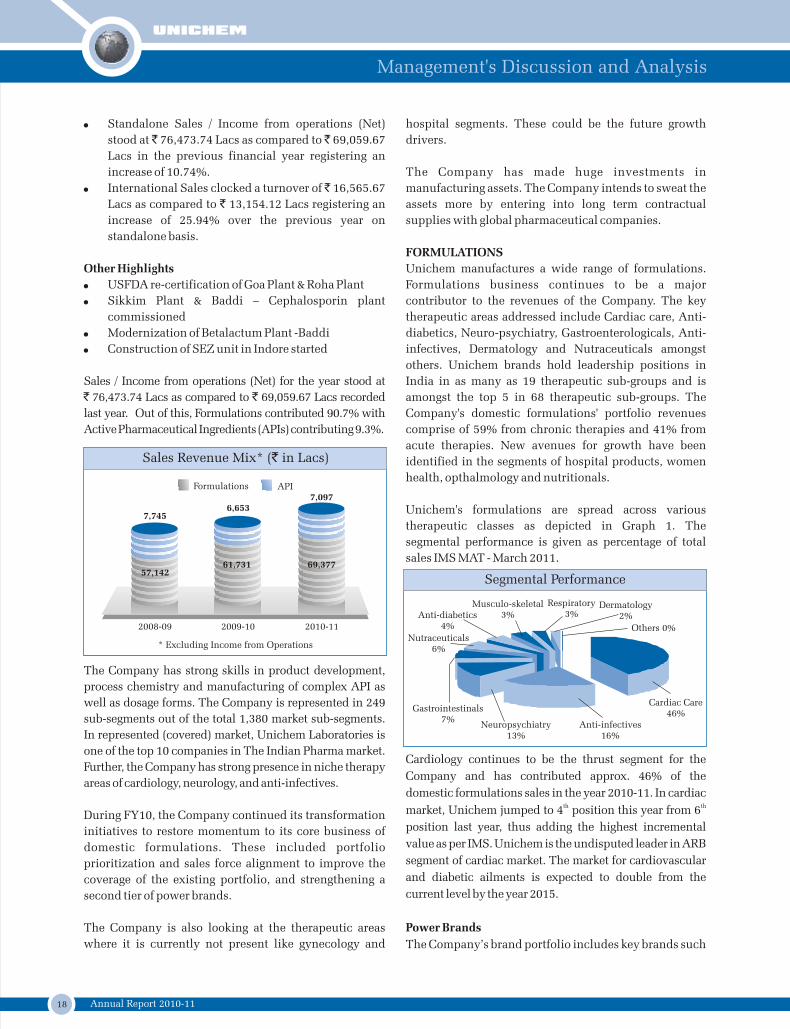
! Standalone Sales / Income from operations (Net) hospital segments. These could be the future growth
stood at ̀ 76,473.74 Lacs as compared to ̀ 69,059.67 drivers.
Lacs in the previous financial year registering an
increase of 10.74%. The Company has made huge investments in
! International Sales clocked a turnover of ̀ 16,565.67 manufacturing assets. The Company intends to sweat the
Lacs as compared to ` 13,154.12 Lacs registering an assets more by entering into long term contractual
increase of 25.94% over the previous year on supplies with global pharmaceutical companies.
standalone basis.
FORMULATIONS
Other Highlights Unichem manufactures a wide range of formulations.
! USFDA re-certification of Goa Plant & Roha Plant Formulations business continues to be a major
! Sikkim Plant & Baddi – Cephalosporin plant contributor to the revenues of the Company. The key
commissioned therapeutic areas addressed include Cardiac care, Anti-
! Modernization of Betalactum Plant -Baddi diabetics, Neuro-psychiatry, Gastroenterologicals, Anti-
! Construction of SEZ unit in Indore started infectives, Dermatology and Nutraceuticals amongst
others. Unichem brands hold leadership positions in
Sales / Income from operations (Net) for the year stood at India in as many as 19 therapeutic sub-groups and is
` 76,473.74 Lacs as compared to ` 69,059.67 Lacs recorded amongst the top 5 in 68 therapeutic sub-groups. The
last year. Out of this, Formulations contributed 90.7% with Company's domestic formulations' portfolio revenues
Active Pharmaceutical Ingredients (APIs) contributing 9.3%. comprise of 59% from chronic therapies and 41% from
acute therapies. New avenues for growth have been
identified in the segments of hospital products, women
health, opthalmology and nutritionals.
Unichem's formulations are spread across various
therapeutic classes as depicted in Graph 1. The
segmental performance is given as percentage of total
sales IMS MAT - March 2011.
The Company has strong skills in product development,
process chemistry and manufacturing of complex API as
well as dosage forms. The Company is represented in 249
sub-segments out of the total 1,380 market sub-segments.
In represented (covered) market, Unichem Laboratories is
one of the top 10 companies in The Indian Pharma market. Cardiology continues to be the thrust segment for the
Further, the Company has strong presence in niche therapy Company and has contributed approx. 46% of the
areas of cardiology, neurology, and anti-infectives. domestic formulations sales in the year 2010-11. In cardiac
th thmarket, Unichem jumped to 4 position this year from 6 During FY10, the Company continued its transformation position last year, thus adding the highest incremental initiatives to restore momentum to its core business of value as per IMS. Unichem is the undisputed leader in ARB domestic formulations. These included portfolio segment of cardiac market. The market for cardiovascular prioritization and sales force alignment to improve the and diabetic ailments is expected to double from the coverage of the existing portfolio, and strengthening a current level by the year 2015.second tier of power brands.
The Company is also looking at the therapeutic areas Power Brands
where it is currently not present like gynecology and The Company’s brand portfolio includes key brands such
Management's Discussion and Analysis
Segmental Performance
Dermatology2%
Cardiac Care46%
Respiratory3%
Musculo-skeletal3%
Nutraceuticals6%
Gastrointestinals7%
Neuropsychiatry13%
Anti-infectives16%
Anti-diabetics4% Others 0%
Sales Revenue Mix* (` in Lacs)
2008-09 2009-10 2010-11
Formulations API
* Excluding Income from Operations
6,653
61,73157,142
7,745
7,097
69,377
19Annual Report 2010-11
as Losar, Ampoxin, Trika, Olsar, TG-Tor, Unienzyme and which 9 have been approved and many more are at
Metride. The Company has strategies in place to grow its various stages of development. Unichem has already
brands in the chronic segments at a rapid rate. Three of launched five products in the US market.
our brands feature amongst the top 100 and five amongst
RESEARCH AND DEVELOPMENTthe top 300 brands of Indian Pharma as per IMS. The
R&D continues to be the focus area in view of the generic Company is taking efforts to strengthen its second tier
market opportunities. The Company relies upon an power brands by leveraging the brand equity of its
energetic, resourceful and competent R&D function flagship brands and increasing its market reach.
supporting existing products.
New Product launches
The Company has launched 22 new brands in various With more than 247 personnel engaged in the Chemical
therapeutic segments. 4 new brands were launched in R&D, Analytical R&D and Product Technology
Cardiac Care, 3 in Dermatology and 2 in Neuro- Development Centres [PTDC] in Mumbai & Goa and Bio
psychiatry amongst others. Science Research Centre in Goa, all efforts are directed
towards creating valuable Intellectual Property for the
Formulations Sales Internationally Company.
The Company has presence in over 20 countries across
the five continents. Unichem has four wholly owned The PTDC facility has a team of highly result-oriented
subsidiaries in UK, USA, Brazil & South Africa. Apart scientists leading the research efforts with expertise in a
from this, the Company has a network of distribution and wide range of areas including NCEs. It is a self-contained
marketing alliances in the CIS, Nepal, South-East Asian product development laboratory that meets current Good
region, Europe and Latin America. Manufacturing Practice (cGMP) requirements. It is fully
equipped to conduct pre-formulation studies, prototype
ACTIVE PHARMACEUTICAL INGREDIENTS (API) development, scale-up & optimization and technology
Unichem’s APIs and Intermediates are marketed both in transfer of oral solid dosage forms. In addition, the PTDC
the domestic as well as international regulated markets. has the capability to develop a platform technology
The objective of our API business is to contribute to the whereby different molecules can be processed for their
business performance of the Company through the controlled rate of release. With an ideal synergy of high-
marketing of APIs globally and to capture the Contractual end technology and superior expertise, PTDC is set to
Supplies opportunities in the API – Drug Intermediate’s play a pivotal role in Unichem’s R&D efforts.
business. Moreover, it also provides necessary vertical
integration to our Formulations business. The Product Technology Development Centre in Mumbai
has state of the art laboratory with capacity of developing
INTERNATIONAL BUSINESS novel drug delivery systems, platform therapeutic
Unichem is improving its success in international systems and other novel technologies. The Centre is
markets by way of new product launches, scientific already conducting contract research for generic product
CMEs & key doctor CRM activities. Our sales & development for regulated markets such as US, Canada,
managerial force is working to achieve higher market Europe etc.
share as well as customer mind-share in their respective
territories. In recent times, we executed various INFRASTRUCTURE
customer-focused activities to propel divisional growth. Over the years, the Company has undertaken expansion
plans and its fixed assets have doubled over the last five
The Company continues to focus on high value added years. Unichem has created world-class drug
generics. The Company is also leveraging its manufacturing facilities across India. The Company’s
manufacturing strengths to become partner of choice for manufacturing plants have been accredited by highly
supply of quality generic products. respected international regulatory bodies like the US
FDA, ISO, UK MHRA (earlier MCA), MCC (South Africa),
The Company has made 527 valid product registrations WHO (Geneva), TGA (Australia), ANVISA (Brazil).
across the world and more than 300 regulatory filings
such as DMFs, EDMFs, etc. It has filed 17 US ANDAs, of Unichem’s formulation facilities are located at
Management's Discussion and Analysis
20 Annual Report 2010-11
Ghaziabad, Baddi, Goa and Sikkim. The technology invited to visit our manufacturing facilities and interact
employed in these plants is in-house and automated to a with each other.
great extent. Formulations form the core of Unichem’s
pharma products business and are recognized for their Communication to employees across locations and field
has been a focus through channels like Unichem.com – high quality and effectiveness. The Company’s Sikkim
our corporate magazine. Unifest, the brand under which unit has commenced production in the current financial
various employee engagement initiatives are conducted, year.
has received acclaim from all employees.
The Company’s formulation facility at SEZ, Pithampur,
RISKS & CONCERNSMadhya Pradesh is expected to be commissioned by the
The Company has a Risk Management Policy in force to end of the current financial year. A major expansion at
review risk, mitigate risk and safeguard its interest. our Goa existing facility is underway for enhancing
tablet/capsule installed capacity from present 900 mio to
The primary and major concern of most of the Pharma 2400 mio on single shift basis. Contractual supplies will
companies are declining productivity of in-house R&D, become one of the thrust areas for the Company to sweat
patent expiration of number of block buster drugs, manufacturing assets more in the near future.
increasing legal and regulatory concern and pricing
issue. As a result, larger pharmaceutical companies are The API facilities are located in Roha and Pithampur. The
shifting to new business model with greater outsourcing Company’s facilities are designed to meet the highest
of discovery services, clinical research and global standards for API development with a focus on
manufacturing. complex APIs, controlled substances and APIs for
regulated markets, all of which are key to achieving the
The Company is concerned about the lack of clarity on Unichem’s strategic goals.
Government Drug Policy and pricing hurdles faced by the
INVESTMENTS pharmaceutical companies.
The investments made by your Company in all the
In order to protect products and consumers from subsidiaries are of long term need-based and of strategic
counterfeiting and diversion, the Company has entered nature and your management is confident of turning
into collaboration with PharmaSecure to add unique around the subsidiaries.
codes to some of its brands distributed nationally in
HUMAN RESOURCES India. These alphanumeric codes will be printed directly
onto the blister pack, medicine bottle or vial, or indeed Unichem employs over 3,600 employees who are vital to
onto a product's label. The unique identifier codes can be the growth of the Company. Several HR initiatives
texted by a consumer to a phone number that is printed encompassing development and engagement of
alongside the code. Within minutes, a message will be employees have been conducted in the past year.
sent from the Company back to the consumer to indicate Performance Enhancement & Development System
(PEDs) is in place whereby the performance of the whether or not the code is genuine. This will help
employees is appraised. As a part of our Talent strengthen our brand and differentiate our products from
Development strategy, we have conducted Development other brands.
Centres for the senior management team. We have also
OUTLOOK & THREATSconducted Management Development workshops for all
our Regional Managers under the aegis of UniLeap. ACE Growing the business exponentially would require
(Appreciation of Contributions & Excellence) Card investing in infrastructure, in people and consolidating
introduced by our HR team has gained momentum over our strengths. The Company is confident to create value
the years, which reaffirms the organizational values and by launching new products across therapeutic segments
strengthens the bonds amongst employees. Like ACE and making them power brands of the Company in their
Cards, Family Assimilation Programme, another respective segments. Our investments in Sikkim,
initiative of strengthening bonds between the employees Pithampur SEZ, expansions in Goa and restructuring in
and organization also continues with great affection and our sales portfolio are a testimony to our commitment to
pride. Under this programme, families of employees are growth.
Management's Discussion and Analysis
21Annual Report 2010-11
AUDITORS’ CERTIFICATE ON COMPLIANCE WITH THE CONDITIONS OF CORPORATE GOVERNANCE UNDER
CLAUSE 49 OF THE LISTING AGREEMENT
To,
The Members
Unichem Laboratories Limited
We have examined the compliance of conditions of Corporate Governance by Unichem Laboratories (the Company) for stthe year ended 31 March 2011 as stipulated in Clause 49 of the Listing Agreement of the Company with the stock
exchange(s) in India.
The compliance of conditions of Corporate Governance is the responsibility of the management. Our examination was
limited to a review of the procedures and implementation thereof, adopted by the Company for ensuring the
compliance with the conditions of Corporate Governance as stipulated in the said clause. It is neither an audit nor an
expression of opinion on the financial statements of the Company.
In our opinion and to the best of our information and according to the explanations given to us, and the representations
made by the directors and the management, we certify that the Company has complied with the conditions of
Corporate Governance as stipulated in Clause 49 of the above mentioned Listing Agreement.
We further state that such compliance is neither an assurance as to the future viability of the Company nor the
efficiency or effectiveness with which the management has conducted the affairs of the Company.
Corporate Governance Report
For B. D. Jokhakar & Co.
Chartered Accountants
Firm Registration No. 104345W
Raman Jokhakar
Partner
Membership No. 103241
Mumbai
May 14, 2011
22 Annual Report 2010-11
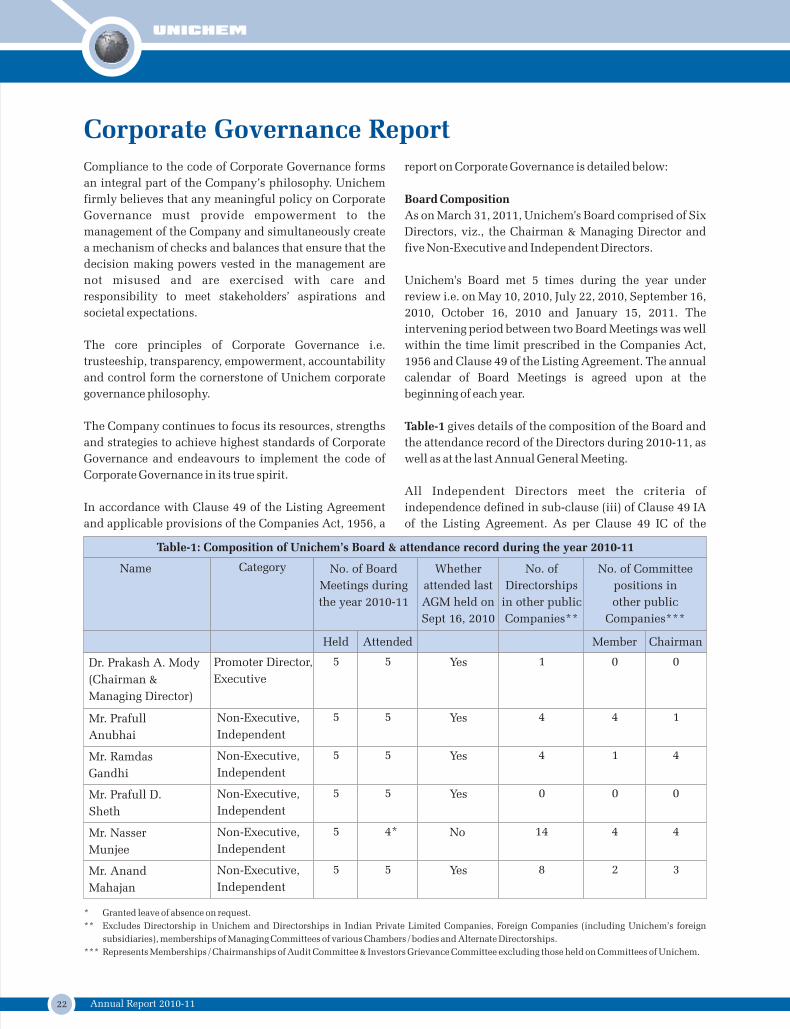
Corporate Governance ReportCompliance to the code of Corporate Governance forms report on Corporate Governance is detailed below:
an integral part of the Company’s philosophy. Unichem
Board Compositionfirmly believes that any meaningful policy on Corporate
As on March 31, 2011, Unichem's Board comprised of Six Governance must provide empowerment to the
Directors, viz., the Chairman & Managing Director and management of the Company and simultaneously create
five Non-Executive and Independent Directors. a mechanism of checks and balances that ensure that the
decision making powers vested in the management are
Unichem's Board met 5 times during the year under not misused and are exercised with care and
review i.e. on May 10, 2010, July 22, 2010, September 16, responsibility to meet stakeholders’ aspirations and
2010, October 16, 2010 and January 15, 2011. The societal expectations.
intervening period between two Board Meetings was well
within the time limit prescribed in the Companies Act, The core principles of Corporate Governance i.e.
1956 and Clause 49 of the Listing Agreement. The annual trusteeship, transparency, empowerment, accountability
calendar of Board Meetings is agreed upon at the and control form the cornerstone of Unichem corporate
beginning of each year. governance philosophy.
Table-1 gives details of the composition of the Board and The Company continues to focus its resources, strengths
the attendance record of the Directors during 2010-11, as and strategies to achieve highest standards of Corporate
well as at the last Annual General Meeting.Governance and endeavours to implement the code of
Corporate Governance in its true spirit.
All Independent Directors meet the criteria of
independence defined in sub-clause (iii) of Clause 49 IA In accordance with Clause 49 of the Listing Agreement
of the Listing Agreement. As per Clause 49 IC of the and applicable provisions of the Companies Act, 1956, a
Name No. of Committee
positions in
other public
Companies***
Member Chairman
0 0Dr. Prakash A. Mody
(Chairman &
Managing Director)
Mr. Prafull
Anubhai
4 1
Mr. Ramdas
Gandhi
1 4
Mr. Prafull D.
Sheth
0 0
Mr. Nasser
Munjee
4 4
Mr. Anand
Mahajan
No. of
Directorships
in other public
Companies**
1
4
4
0
14
Category No. of Board
Meetings during
the year 2010-11
Whether
attended last
AGM held on
Sept 16, 2010
Held Attended
Promoter Director,
Executive
5 5 Yes
Non-Executive,
Independent
5 5 Yes
Non-Executive,
Independent
5 5 Yes
Non-Executive,
Independent
5 5 Yes
Non-Executive,
Independent
5 4* No
Non-Executive,
Independent
5 5 Yes 8 2 3
* Granted leave of absence on request.
** Excludes Directorship in Unichem and Directorships in Indian Private Limited Companies, Foreign Companies (including Unichem’s foreign
subsidiaries), memberships of Managing Committees of various Chambers / bodies and Alternate Directorships.
*** Represents Memberships / Chairmanships of Audit Committee & Investors Grievance Committee excluding those held on Committees of Unichem.
Table-1: Composition of Unichem’s Board & attendance record during the year 2010-11
23Annual Report 2010-11
Corporate Governance Report
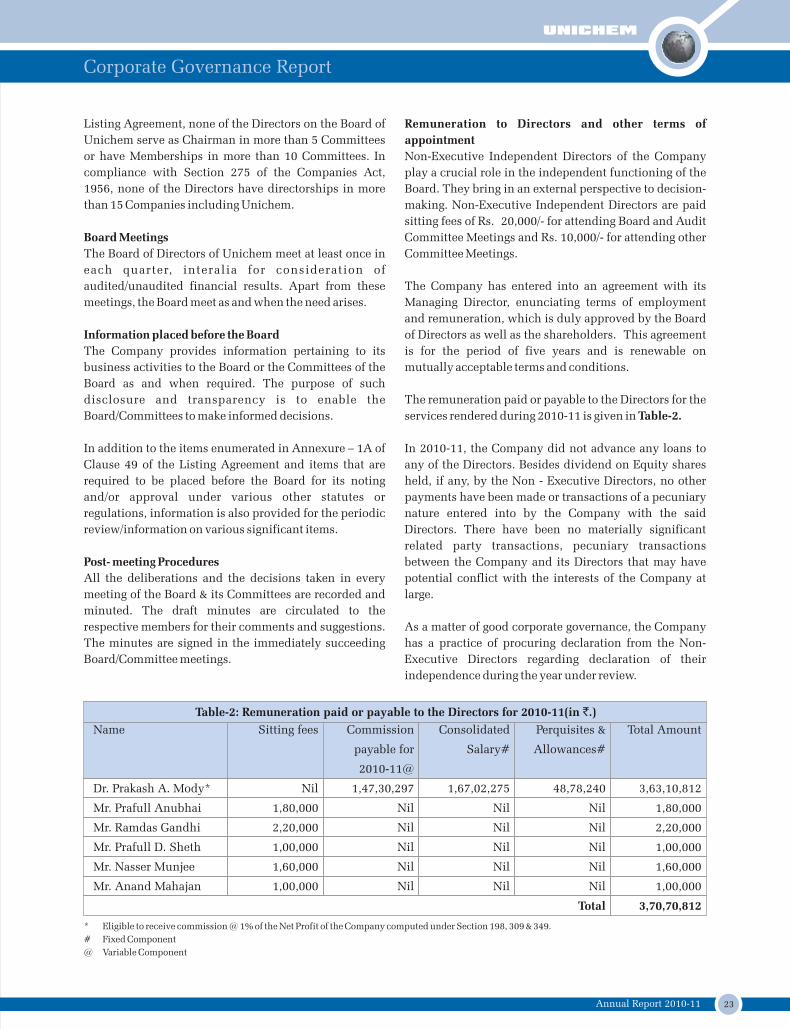
Remuneration to Directors and other terms of Listing Agreement, none of the Directors on the Board of
appointmentUnichem serve as Chairman in more than 5 Committees
Non-Executive Independent Directors of the Company or have Memberships in more than 10 Committees. In
play a crucial role in the independent functioning of the compliance with Section 275 of the Companies Act,
Board. They bring in an external perspective to decision-1956, none of the Directors have directorships in more
making. Non-Executive Independent Directors are paid than 15 Companies including Unichem.
sitting fees of Rs. 20,000/- for attending Board and Audit
Board Meetings Committee Meetings and Rs. 10,000/- for attending other
The Board of Directors of Unichem meet at least once in Committee Meetings.
each quarter, interalia for consideration of
audited/unaudited financial results. Apart from these The Company has entered into an agreement with its
meetings, the Board meet as and when the need arises. Managing Director, enunciating terms of employment
and remuneration, which is duly approved by the Board
Information placed before the Board of Directors as well as the shareholders. This agreement
The Company provides information pertaining to its is for the period of five years and is renewable on
business activities to the Board or the Committees of the mutually acceptable terms and conditions.
Board as and when required. The purpose of such
disclosure and transparency is to enable the The remuneration paid or payable to the Directors for the
Board/Committees to make informed decisions. services rendered during 2010-11 is given in Table-2.
In 2010-11, the Company did not advance any loans to In addition to the items enumerated in Annexure – 1A of
any of the Directors. Besides dividend on Equity shares Clause 49 of the Listing Agreement and items that are
held, if any, by the Non - Executive Directors, no other required to be placed before the Board for its noting
payments have been made or transactions of a pecuniary and/or approval under various other statutes or
nature entered into by the Company with the said regulations, information is also provided for the periodic
Directors. There have been no materially significant review/information on various significant items.
related party transactions, pecuniary transactions
Post- meeting Procedures between the Company and its Directors that may have
All the deliberations and the decisions taken in every potential conflict with the interests of the Company at
meeting of the Board & its Committees are recorded and large.
minuted. The draft minutes are circulated to the
respective members for their comments and suggestions. As a matter of good corporate governance, the Company
The minutes are signed in the immediately succeeding has a practice of procuring declaration from the Non-
Board/Committee meetings. Executive Directors regarding declaration of their
independence during the year under review.
Name Sitting fees Commission Consolidated Perquisites & Total Amount
payable for Salary# Allowances#
2010-11@
Dr. Prakash A. Mody* Nil 1,47,30,297 1,67,02,275 48,78,240 3,63,10,812
Mr. Prafull Anubhai 1,80,000 Nil Nil Nil 1,80,000
Mr. Ramdas Gandhi 2,20,000 Nil Nil Nil 2,20,000
Mr. Prafull D. Sheth 1,00,000 Nil Nil Nil 1,00,000
Mr. Nasser Munjee 1,60,000 Nil Nil Nil 1,60,000
Mr. Anand Mahajan 1,00,000 Nil Nil Nil 1,00,000
Total 3,70,70,812
* Eligible to receive commission @ 1% of the Net Profit of the Company computed under Section 198, 309 & 349.
# Fixed Component
@ Variable Component
Table-2: Remuneration paid or payable to the Directors for 2010-11(in `.)
24 Annual Report 2010-11
Corporate Governance Report
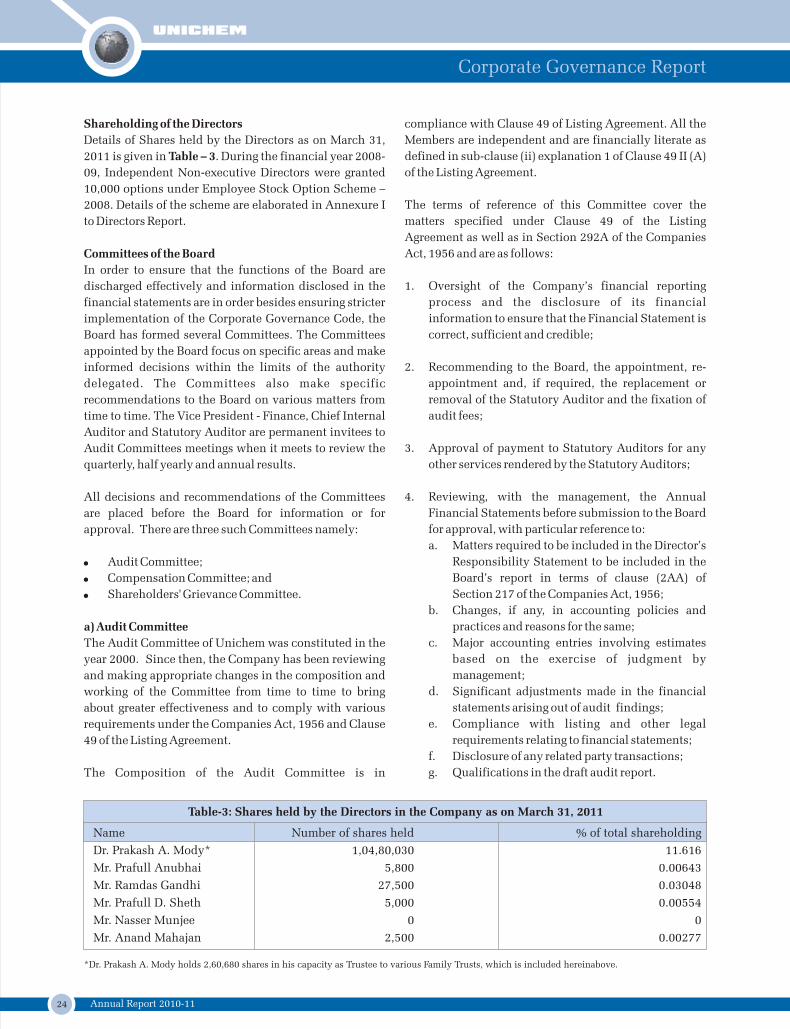
Name Number of shares held % of total shareholding
Dr. Prakash A. Mody* 1,04,80,030 11.616
Mr. Prafull Anubhai 5,800 0.00643
Mr. Ramdas Gandhi 27,500 0.03048
Mr. Prafull D. Sheth 5,000 0.00554
Mr. Nasser Munjee 0 0
Mr. Anand Mahajan 2,500 0.00277
Table-3: Shares held by the Directors in the Company as on March 31, 2011
Shareholding of the Directors compliance with Clause 49 of Listing Agreement. All the
Details of Shares held by the Directors as on March 31, Members are independent and are financially literate as
2011 is given in Table – 3. During the financial year 2008- defined in sub-clause (ii) explanation 1 of Clause 49 II (A)
09, Independent Non-executive Directors were granted of the Listing Agreement.
10,000 options under Employee Stock Option Scheme –
2008. Details of the scheme are elaborated in Annexure I The terms of reference of this Committee cover the
to Directors Report. matters specified under Clause 49 of the Listing
Agreement as well as in Section 292A of the Companies
Committees of the Board Act, 1956 and are as follows:
In order to ensure that the functions of the Board are
discharged effectively and information disclosed in the 1. Oversight of the Company’s financial reporting
financial statements are in order besides ensuring stricter process and the disclosure of its financial
implementation of the Corporate Governance Code, the information to ensure that the Financial Statement is
Board has formed several Committees. The Committees correct, sufficient and credible;
appointed by the Board focus on specific areas and make
informed decisions within the limits of the authority 2. Recommending to the Board, the appointment, re-
delegated. The Committees also make specific appointment and, if required, the replacement or
recommendations to the Board on various matters from removal of the Statutory Auditor and the fixation of
time to time. The Vice President - Finance, Chief Internal audit fees;
Auditor and Statutory Auditor are permanent invitees to
Audit Committees meetings when it meets to review the 3. Approval of payment to Statutory Auditors for any
quarterly, half yearly and annual results. other services rendered by the Statutory Auditors;
All decisions and recommendations of the Committees 4. Reviewing, with the management, the Annual
are placed before the Board for information or for Financial Statements before submission to the Board
approval. There are three such Committees namely: for approval, with particular reference to:
a. Matters required to be included in the Director’s
! Audit Committee; Responsibility Statement to be included in the
! Compensation Committee; and Board’s report in terms of clause (2AA) of
! Shareholders' Grievance Committee. Section 217 of the Companies Act, 1956;
b. Changes, if any, in accounting policies and
a) Audit Committee practices and reasons for the same;
The Audit Committee of Unichem was constituted in the c. Major accounting entries involving estimates
year 2000. Since then, the Company has been reviewing based on the exercise of judgment by
and making appropriate changes in the composition and management;
working of the Committee from time to time to bring d. Significant adjustments made in the financial
about greater effectiveness and to comply with various statements arising out of audit findings;
requirements under the Companies Act, 1956 and Clause e. Compliance with listing and other legal
49 of the Listing Agreement. requirements relating to financial statements;
f. Disclosure of any related party transactions;
The Composition of the Audit Committee is in g. Qualifications in the draft audit report.
*Dr. Prakash A. Mody holds 2,60,680 shares in his capacity as Trustee to various Family Trusts, which is included hereinabove.
25Annual Report 2010-11
Corporate Governance Report
5. Reviewing, with the management, the quarterly 12. To review the functioning of the Whistle Blower
financial statements before submission to the Board mechanism, in case the same is existing;
for approval;
13. Carrying out any other function as is mentioned in
5A. Reviewing, with the management, the statement of the terms of reference of the Audit Committee.
uses / application of funds raised through an issue
(public issue, rights issue, preferential issue, etc.), In addition to the above, the Audit Committee also
the statement of funds utilized for purposes other reviews the following information:
than those stated in the offer document / prospectus / 1. Management discussion and analysis of
notice and the report submitted by the monitoring financial condition and results of operations;
agency monitoring the utilisation of proceeds of a 2. Statement of significant related party
public or rights issue, and making appropriate transactions (as defined by the Audit
recommendations to the Board to take up steps in Committee), submitted by management;
this matter. 3. Management letters / letters of internal control
weaknesses issued by the Statutory Auditors;
6. Reviewing, with the management, performance of 4. Internal audit reports relating to internal control
Statutory and Internal Auditors, and adequacy of the weaknesses; and
internal control systems; 5. The appointment, removal and terms of
remuneration of the Chief Internal Auditor shall
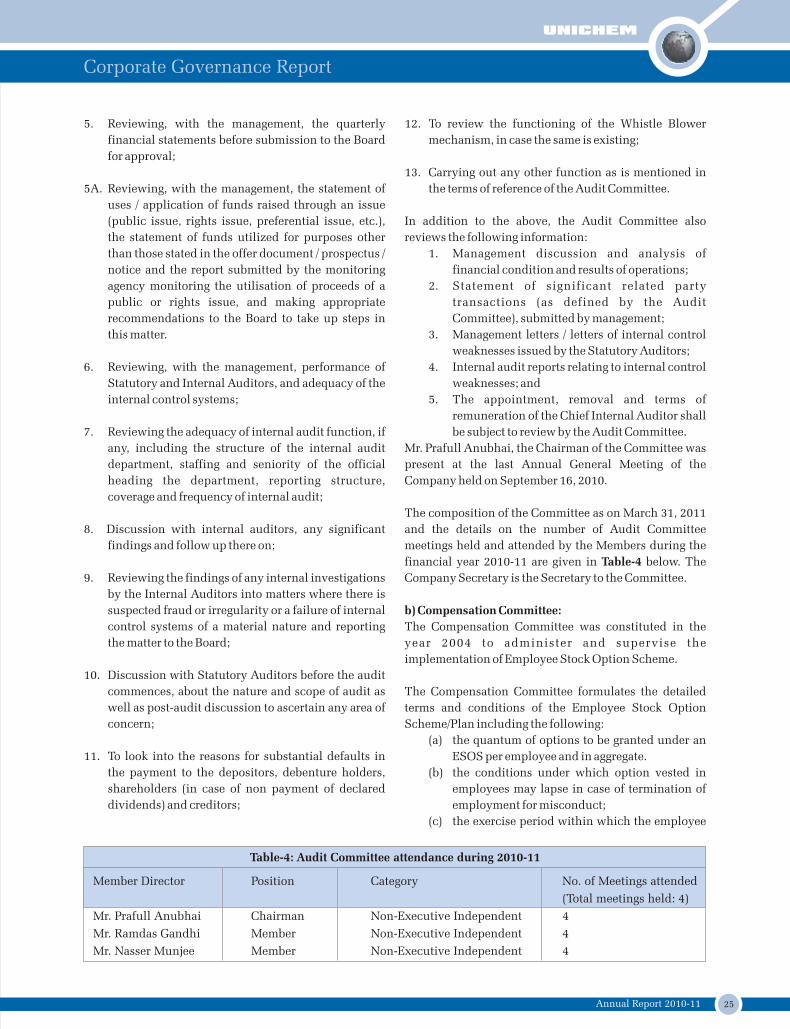
7. Reviewing the adequacy of internal audit function, if be subject to review by the Audit Committee.
any, including the structure of the internal audit Mr. Prafull Anubhai, the Chairman of the Committee was
department, staffing and seniority of the official present at the last Annual General Meeting of the
heading the department, reporting structure, Company held on September 16, 2010.
coverage and frequency of internal audit;
The composition of the Committee as on March 31, 2011
8. Discussion with internal auditors, any significant and the details on the number of Audit Committee
findings and follow up there on; meetings held and attended by the Members during the
financial year 2010-11 are given in Table-4 below. The
Company Secretary is the Secretary to the Committee. 9. Reviewing the findings of any internal investigations
by the Internal Auditors into matters where there is
b) Compensation Committee:suspected fraud or irregularity or a failure of internal
The Compensation Committee was constituted in the control systems of a material nature and reporting
year 2004 to administer and supervise the the matter to the Board;
implementation of Employee Stock Option Scheme.
10. Discussion with Statutory Auditors before the audit
The Compensation Committee formulates the detailed commences, about the nature and scope of audit as
terms and conditions of the Employee Stock Option well as post-audit discussion to ascertain any area of
Scheme/Plan including the following:concern;
(a) the quantum of options to be granted under an
ESOS per employee and in aggregate. 11. To look into the reasons for substantial defaults in
(b) the conditions under which option vested in the payment to the depositors, debenture holders,
employees may lapse in case of termination of shareholders (in case of non payment of declared
employment for misconduct; dividends) and creditors;
(c) the exercise period within which the employee
Member Director Position Category No. of Meetings attended
(Total meetings held: 4)
Mr. Prafull Anubhai Chairman Non-Executive Independent 4
Mr. Ramdas Gandhi Member Non-Executive Independent 4
Mr. Nasser Munjee Member Non-Executive Independent 4
Table-4: Audit Committee attendance during 2010-11
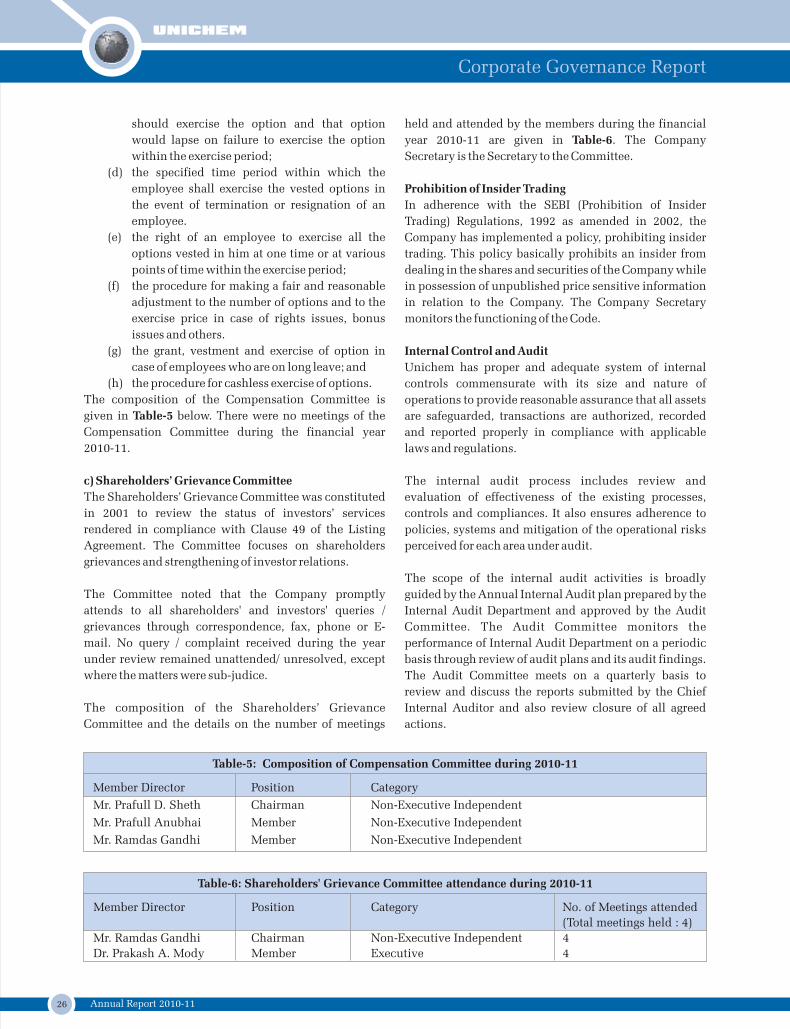
26 Annual Report 2010-11
Corporate Governance Report
should exercise the option and that option held and attended by the members during the financial
year 2010-11 are given in Table-6. The Company would lapse on failure to exercise the option
Secretary is the Secretary to the Committee. within the exercise period;
(d) the specified time period within which the
Prohibition of Insider Tradingemployee shall exercise the vested options in
In adherence with the SEBI (Prohibition of Insider the event of termination or resignation of an
Trading) Regulations, 1992 as amended in 2002, the employee.
Company has implemented a policy, prohibiting insider (e) the right of an employee to exercise all the
trading. This policy basically prohibits an insider from options vested in him at one time or at various
dealing in the shares and securities of the Company while points of time within the exercise period;
in possession of unpublished price sensitive information (f) the procedure for making a fair and reasonable
in relation to the Company. The Company Secretary adjustment to the number of options and to the
monitors the functioning of the Code. exercise price in case of rights issues, bonus
issues and others.
Internal Control and Audit(g) the grant, vestment and exercise of option in
Unichem has proper and adequate system of internal case of employees who are on long leave; and
controls commensurate with its size and nature of (h) the procedure for cashless exercise of options.
operations to provide reasonable assurance that all assets The composition of the Compensation Committee is
Table-5 are safeguarded, transactions are authorized, recorded given in below. There were no meetings of the
and reported properly in compliance with applicable Compensation Committee during the financial year
laws and regulations.2010-11.
c) Shareholders’ Grievance Committee The internal audit process includes review and
evaluation of effectiveness of the existing processes, The Shareholders’ Grievance Committee was constituted
controls and compliances. It also ensures adherence to in 2001 to review the status of investors’ services
policies, systems and mitigation of the operational risks rendered in compliance with Clause 49 of the Listing
perceived for each area under audit.Agreement. The Committee focuses on shareholders
grievances and strengthening of investor relations.
The scope of the internal audit activities is broadly
guided by the Annual Internal Audit plan prepared by the The Committee noted that the Company promptly
Internal Audit Department and approved by the Audit attends to all shareholders' and investors' queries /
Committee. The Audit Committee monitors the grievances through correspondence, fax, phone or E-
performance of Internal Audit Department on a periodic mail. No query / complaint received during the year
basis through review of audit plans and its audit findings. under review remained unattended/ unresolved, except
The Audit Committee meets on a quarterly basis to where the matters were sub-judice.
review and discuss the reports submitted by the Chief
Internal Auditor and also review closure of all agreed The composition of the Shareholders’ Grievance
actions.Committee and the details on the number of meetings
Member Director Position Category No. of Meetings attended
(Total meetings held : 4)
Mr. Ramdas Gandhi Chairman Non-Executive Independent 4
Dr. Prakash A. Mody Member Executive 4
Table-6: Shareholders' Grievance Committee attendance during 2010-11
Member Director Position Category
Mr. Prafull D. Sheth Chairman Non-Executive Independent
Mr. Prafull Anubhai Member Non-Executive Independent
Mr. Ramdas Gandhi Member Non-Executive Independent
Table-5: Composition of Compensation Committee during 2010-11
27Annual Report 2010-11
Corporate Governance Report
Review of Legal Compliance Reports the same to the management. These observations were
The Board periodically reviewed during the year, the then discussed at the Audit Committee and corrective
compliance reports in respect of the laws applicable to actions wherever required were carried out.
the Company as prepared and placed before the Board by
the Company Secretary. Audit fees
During the year, the Company paid ` 20.39 lacs plus out
Subsidiary Companies of pocket expenses to the Statutory Auditors of the
The Company has four 100% Foreign Subsidiaries as on Company as remuneration under various heads
March 31, 2011. During the year under review, Ministry of including Audit. Details of payment under other heads
Company Affairs had issued General Circular No. 2 /2011 are discussed in Schedule 18 of the financial statements.
dated February 8, 2011, granting general exemption to
companies which fulfil the certain conditions mentioned Auditors’ Certificate
The Company has complied with all the mandatory therein. Accordingly, Statement under Section 212 of
requirements of the code of corporate governance as Companies Act, 1956 and the information on the financials
stipulated under the Listing Agreement. The Company of subsidiaries appended to the Statement is given in this
has obtained a Certificate from its Statutory Auditors Annual Report. The financial statements of the Subsidiary
affirming such compliances. This Certificate is annexed Companies are available for inspection by the Members at
to this Report. the registered office of the Company during business hours
on any working day from 10.00 am to 1.00 pm.
General Body MeetingsthStatutory Auditors Date, Time and Venue of 48 AGM
For the financial year 2010-11, M/s. B.D. Jokhakar & Co. Date – July 28, 2011
audited the financial statements. While auditing the Time – 3.30 p.m.
operations of the Company the external auditors Venue – Hall of Culture, Nehru Centre, Dr. Annie Besant
recorded their observations and findings and forwarded Road, Worli, Mumbai – 400 018.
Time
Table-7: Details of the last 3 Annual General meetings
th47 2009-10 Hall of Culture, Nehru Centre,
Dr. Annie Besant Road, Worli,
Mumbai – 400 018.
3.30 pm 1. Alteration of Articles of
Association for sub-division of
face value of equity shares
2. Insertion of new object in
Memorandum of Associationth46 2008-09 Hall of Culture, Nehru Centre,
Dr. Annie Besant Road, Worli,
Mumbai – 400 018.
3.30 pm Appointment u/s 314(1B) of
Companies Act, 1956
th45 2007-08 Hall of Culture, Nehru Centre,
Dr. Annie Besant Road, Worli,
Mumbai – 400 018.
September 16,
2010
July 22, 2009
July 17, 2008 3.30 pm No Special resolutions were
passed at this meeting
AGM Year Venue Date Items of Special Resolution
passed at each meeting
Table-8: Resolutions passed during the financial year 2010-11 through postal ballot
Special Resolution No. 1 under Section 17 of the
Companies Act, 1956 for the approval of
insertion of New Object Clause in the
Memorandum of Association.
Particulars
262
forms
205,35,435
shares
In favour of the Resolution Against the Resolution
10
forms
1,60,382
shares
Special Resolution No. 2 under Section 149(2A)
of the Companies Act, 1956 for commencing
business embodied in the newly inserted sub-
clause 66 of Object Clause III, as and when
deemed fit by the Board of Directors.
247
forms
205,25,099
shares
11
forms
1,60,394
shares
28 Annual Report 2010-11
Corporate Governance Report
Resolutions passed during the financial year 2010-11 Code of Conduct
through postal ballot The Company has adopted a Code of Business Conduct &
In financial year 2010-11, 2(two) resolutions were passed Ethics applicable to all Directors and employees of the
through postal ballot conducted by the Company, details Company. The Code of Business Conduct & Ethics is
of which are given in the table below. The procedure for p o s t e d o n t h e C o m p a n y ’ s w e b s i t e i . e .
conducting Postal Ballot was carried out as notified in the www.unichemlabs.com for information of the
Companies (Passing of Resolution by Postal Ballot) rules, shareholders.
2001 and general circulars in this regard issued by the
Central Government. Mrs. Ragini Chokshi was appointed All Board members and senior management personnel
as Scrutinizer for conducting the postal ballot procedure, have affirmed compliance with the code for 2010-11. A
based on whose report the Company announced the declaration to this effect signed by our Chairman &
results of the postal ballot at Registered Office at 3.00 Managing Director is given below:
p.m. on November 29, 2010. The extract of results of
postal ballot, which were duly assented by requisite As provided under Clause 49 of the Listing Agreement
majority of the shareholders is given in Table-8. with the Stock Exchanges, I hereby confirm that the
Board of Directors and the Senior Management Personnel
Disclosure of information have confirmed compliance with the Code of Conduct
The Company has a well-established system to disclose and Ethics for the financial ended March 31, 2011.
relevant information to stakeholders, including
shareholders, analysts, suppliers, customers, employees Dr. Prakash A. Mody
and society at large. The primary sources of information Chairman & Managing Director
regarding the operations of the Company are available on
the co rpora t e webs i t e o f the Company -
www.unichemlabs.com. The Company has a separate Related party transactions
dedicated section ‘Investors’ where shareholders’ The Company’s major related party transactions are
information is available. Members are requested to access generally with its subsidiaries. The transactions are
‘Newsroom’ section for updated information. Apart from entered into based on consideration of various business
official new releases, code of conduct, the website also exigencies such as synergy of operations, sectoral
provides shareholding pattern of the Company. Annual specialization, etc. The details of related party
Report of last three years is available on the website in a transactions are discussed in detail in note no. 18 of
user-friendly and downloadable form. Schedule 18 to the financial statements of the Company.
The quarterly / half-yearly / annual / unaudited / audited CEO/CFO Certification under Clause 49 of the Listing
financial results of the Company are sent to the Stock Agreement
Exchanges immediately after they are approved by the As required under Clause 49 of the Listing Agreement,
Board of Directors. The quarterly results and annual certification from Dr. Prakash A. Mody, Chairman &
results of the Company are generally published in Managing Director and Mr. Rakesh Parikh, Vice President
Mumbai edition of Economic Times and Maharashtra – Finance was placed before the Board of Directors at its
Times. The Results for the quarter ended June 30, 2010, meeting held on May 14, 2011.
September 30, 2010, December 31, 2010 and March 31,
2011 are posted on the Company’s website Disclosure regarding re-appointment of Directors
Pursuant to provisions of Companies Act, 1956, Mr. www.unichemlabs.com
Prafull Anubhai and Mr. Ramdas Gandhi, Non-Executive
Directors, are liable to retire by rotation and offer All data required to be filed electronically pursuant to the
themselves for re-appointment. Their brief profiles and Listing Agreement with the Stock Exchanges, such as
particulars for re-appointment are given in the Notes to quarterly financial results, shareholding pattern, thquarterly report on Corporate Governance and corporate the Notice of 48 Annual General Meeting.
announcements are being regularly filed on Corporate
Fi l ing and Dissemina t ion Sys tem (CFDS) .
Shareholders/Investors can view the information by
visiting the website of CFDS www.corpfiling.co.in.
29Annual Report 2010-11
Financial Year
April 1 – March 31
Financial Calendar (Tentative)
Results for the Quarter Ending on Tentative date of declaration
June 30, 2011 Third week of July 2011
September 30, 2011 Third week of October 2011
December 31, 2011 Second week of January 2012
March 31, 2012 Second week of May 2012
Annual General Meeting for the year ended March 31, 2012 Second week of July 2012
Dividend Payment (if any) for the year ended March 31, 2012 Third week of July 2012
Date of Book Closure
July 18, 2011 to July 22, 2011 (both days inclusive)
Stock Exchanges on which shares are listed
The Bombay Stock Exchange Limited (BSE) National Stock Exchange of India Limited (NSE)thPhiroz Jeejeebhoy Towers, Exchange Plaza, 5 Floor,
Dalal Street, Plot No. C/1, G Block, Bandra-Kurla Complex,
Mumbai – 400 001. Bandra (East), Mumbai – 400 051.
Stock Codes
BSE 506690
NSE UNICHEMLAB
Reuters UNLB.BO
Bloomberg UL:IN
Company Registration Details
The Company is registered in the State of Maharashtra, India. The Corporate Identity Number (CIN) allotted to the
Company by the Ministry of Corporate Affairs (MCA) is L99999MH1962PLC012451.
International Securities Identification Number (ISIN) for NSDL & CDSL
ISIN is a unique identification number of traded scrip. The ISIN number of the equity shares of Unichem Laboratories
Ltd. is INE351A01035. The investors holding shares of the Company in the electronic mode are requested to mention
ISIN of the security in the Dematerialisation Request Form (‘DRF’) as well as in all debit/credit instructions to ensure
that the correct security is demated /delivered.
Listing Fees for 2011-12
The Listing fees for the year 2011-12, have been paid for all the above Stock Exchanges. The Company has complied
with all the applicable provisions of the Listing Agreement, SEBI regulations and guidelines and Companies Act, 1956
and there have been no strictures, penalties, fines, etc. levied on the Company during the financial year under review.
Custodian Fees for 2011-12
Pursuant to SEBI Circular No. MRD/DoP/SE/DEP/CIR – 4/2005 dated January 28, 2005, the Issuer companies are
required to pay custodial fees to the depositories with effect from April 1, 2005. Accordingly, the Company has paid
custodial fees for the year 2011-12 to National Securities Depository Limited and Central Depository Services (India)
Limited on the basis of number of beneficial accounts maintained by them as on March 31, 2011.
Information for Shareholders
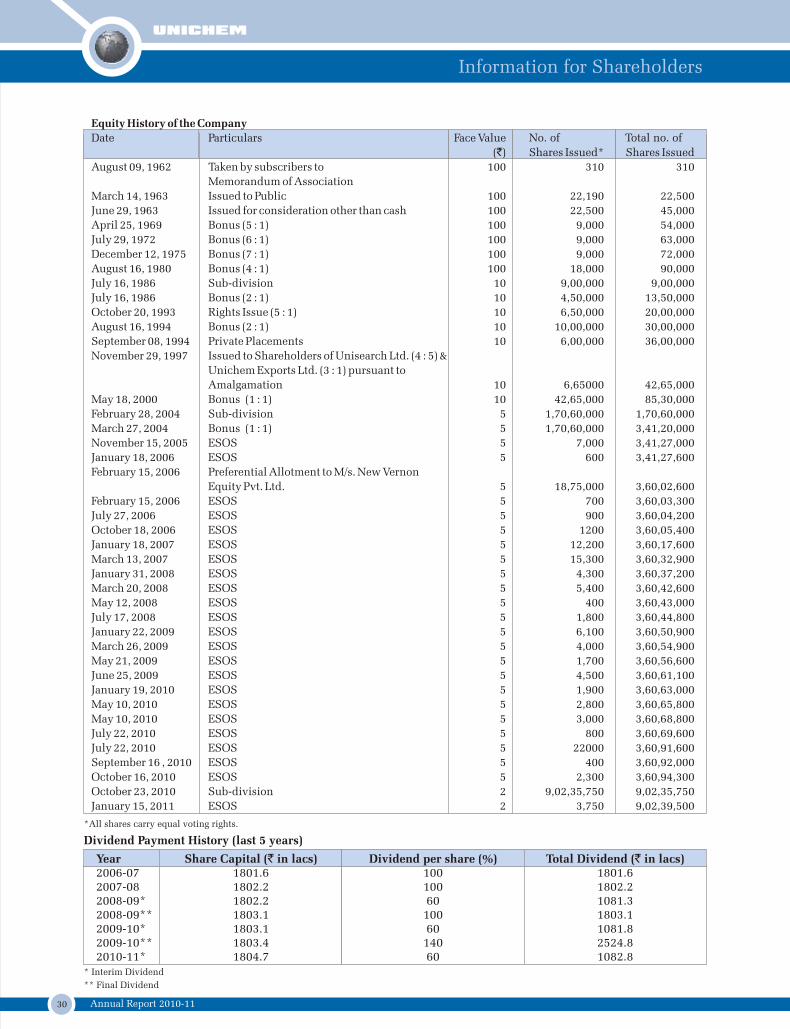
30 Annual Report 2010-11
Information for Shareholders
*All shares carry equal voting rights.
Dividend Payment History (last 5 years)
Year2006-072007-082008-09*2008-09**2009-10*2009-10**2010-11*
Share Capital (` in lacs)1801.61802.21802.21803.11803.11803.41804.7
Dividend per share (%)10010060
10060
14060
Total Dividend (` in lacs)1801.61802.21081.31803.11081.82524.81082.8
* Interim Dividend
** Final Dividend
Equity History of the Company
Date Particulars Face Value
(`) Shares Issued* Shares Issued
August 09, 1962 Taken by subscribers to 100 310 310
Memorandum of Association
March 14, 1963 Issued to Public 100 22,190 22,500
June 29, 1963 Issued for consideration other than cash 100 22,500 45,000
April 25, 1969 Bonus (5 : 1) 100 9,000 54,000
July 29, 1972 Bonus (6 : 1) 100 9,000 63,000
December 12, 1975 Bonus (7 : 1) 100 9,000 72,000
August 16, 1980 Bonus (4 : 1) 100 18,000 90,000
July 16, 1986 Sub-division 10 9,00,000 9,00,000
July 16, 1986 Bonus (2 : 1) 10 4,50,000 13,50,000
October 20, 1993 Rights Issue (5 : 1) 10 6,50,000 20,00,000
August 16, 1994 Bonus (2 : 1) 10 10,00,000 30,00,000
September 08, 1994 Private Placements 10 6,00,000 36,00,000
November 29, 1997 Issued to Shareholders of Unisearch Ltd. (4 : 5) &
Unichem Exports Ltd. (3 : 1) pursuant to
Amalgamation 10 6,65000 42,65,000
May 18, 2000 Bonus (1 : 1) 10 42,65,000 85,30,000
February 28, 2004 Sub-division 5 1,70,60,000 1,70,60,000
March 27, 2004 Bonus (1 : 1) 5 1,70,60,000 3,41,20,000
November 15, 2005 ESOS 5 7,000 3,41,27,000
January 18, 2006 ESOS 5 600 3,41,27,600
February 15, 2006 Preferential Allotment to M/s. New Vernon
Equity Pvt. Ltd. 5 18,75,000 3,60,02,600
February 15, 2006 ESOS 5 700 3,60,03,300
July 27, 2006 ESOS 5 900 3,60,04,200
October 18, 2006 ESOS 5 1200 3,60,05,400
January 18, 2007 ESOS 5 12,200 3,60,17,600
March 13, 2007 ESOS 5 15,300 3,60,32,900
January 31, 2008 ESOS 5 4,300 3,60,37,200
March 20, 2008 ESOS 5 5,400 3,60,42,600
May 12, 2008 ESOS 5 400 3,60,43,000
July 17, 2008 ESOS 5 1,800 3,60,44,800
January 22, 2009 ESOS 5 6,100 3,60,50,900
March 26, 2009 ESOS 5 4,000 3,60,54,900
May 21, 2009 ESOS 5 1,700 3,60,56,600
June 25, 2009 ESOS 5 4,500 3,60,61,100
January 19, 2010 ESOS 5 1,900 3,60,63,000
May 10, 2010 ESOS 5 2,800 3,60,65,800
May 10, 2010 ESOS 5 3,000 3,60,68,800
July 22, 2010 ESOS 5 800 3,60,69,600
July 22, 2010 ESOS 5 22000 3,60,91,600
September 16 , 2010 ESOS 5 400 3,60,92,000
October 16, 2010 ESOS 5 2,300 3,60,94,300
October 23, 2010 Sub-division 2 9,02,35,750 9,02,35,750
January 15, 2011 ESOS 2 3,750 9,02,39,500
No. of Total no. of
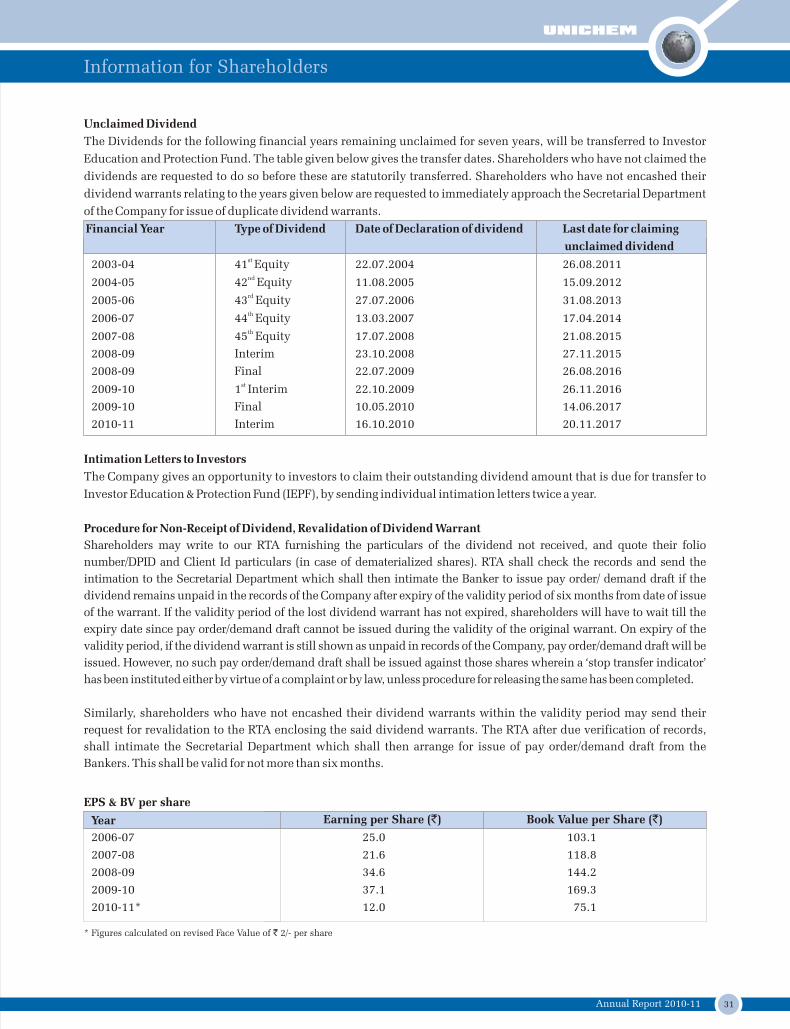
31Annual Report 2010-11
Information for Shareholders
Unclaimed Dividend
The Dividends for the following financial years remaining unclaimed for seven years, will be transferred to Investor
Education and Protection Fund. The table given below gives the transfer dates. Shareholders who have not claimed the
dividends are requested to do so before these are statutorily transferred. Shareholders who have not encashed their
dividend warrants relating to the years given below are requested to immediately approach the Secretarial Department
of the Company for issue of duplicate dividend warrants.
Financial Year Type of Dividend Date of Declaration of dividend Last date for claiming
unclaimed dividend st2003-04 41 Equity 22.07.2004 26.08.2011nd2004-05 42 Equity 11.08.2005 15.09.2012rd2005-06 43 Equity 27.07.2006 31.08.2013th2006-07 44 Equity 13.03.2007 17.04.2014th2007-08 45 Equity 17.07.2008 21.08.2015
2008-09 Interim 23.10.2008 27.11.2015
2008-09 Final 22.07.2009 26.08.2016st2009-10 1 Interim 22.10.2009 26.11.2016
2009-10 Final 10.05.2010 14.06.2017
2010-11 Interim 16.10.2010 20.11.2017
Intimation Letters to Investors
The Company gives an opportunity to investors to claim their outstanding dividend amount that is due for transfer to
Investor Education & Protection Fund (IEPF), by sending individual intimation letters twice a year.
Procedure for Non-Receipt of Dividend, Revalidation of Dividend Warrant
Shareholders may write to our RTA furnishing the particulars of the dividend not received, and quote their folio
number/DPID and Client Id particulars (in case of dematerialized shares). RTA shall check the records and send the
intimation to the Secretarial Department which shall then intimate the Banker to issue pay order/ demand draft if the
dividend remains unpaid in the records of the Company after expiry of the validity period of six months from date of issue
of the warrant. If the validity period of the lost dividend warrant has not expired, shareholders will have to wait till the
expiry date since pay order/demand draft cannot be issued during the validity of the original warrant. On expiry of the
validity period, if the dividend warrant is still shown as unpaid in records of the Company, pay order/demand draft will be
issued. However, no such pay order/demand draft shall be issued against those shares wherein a ‘stop transfer indicator’
has been instituted either by virtue of a complaint or by law, unless procedure for releasing the same has been completed.
Similarly, shareholders who have not encashed their dividend warrants within the validity period may send their
request for revalidation to the RTA enclosing the said dividend warrants. The RTA after due verification of records,
shall intimate the Secretarial Department which shall then arrange for issue of pay order/demand draft from the
Bankers. This shall be valid for not more than six months.
EPS & BV per share
2006-07 25.0 103.1
2007-08 21.6 118.8
2008-09 34.6 144.2
2009-10 37.1 169.3
2010-11* 12.0 75.1
Earning per Share (`) Book Value per Share (`)Year
* Figures calculated on revised Face Value of ` 2/- per share
32 Annual Report 2010-11
Information for Shareholders
Share Transfer System
In pursuance to the relevant provisions of the Companies Act, 1956 and the Listing Agreement, Share transfers are
registered and returned within a month from the date of receipt, subject to the documents being valid and complete in
all respects. Share certificates duly endorsed are issued or transferred to all those shareholders who opt to hold shares
in physical mode.
The Company has delegated the authority to approve shares received for transfer, to its RTA M/s. Link Intime India Pvt.
Ltd. Presently, the transfers of shares which are in physical form are completed by dispatching the certificates duly
transferred within a period of 15 days from the date of receipt of documents provided such documents are valid and
complete in all respects. The Company obtains from a Company Secretary in Practice, half-yearly certificate for
compliance with the share transfer formalities as required under Clause 47(c) of the Listing Agreement with Stock
Exchanges and files a copy of the certificate with the Stock Exchanges.
There are no legal proceedings pending against the Company before the Company Law Board in respect of dispute over
title to shares in which the Company has been made a party.
Investors Complaints
The Company has redressed all the complaints received from the investors and none were pending as on March 31,
2011. The Company has designated an e-mail ID exclusively for the purpose of registering complaints of investors, viz.,
[email protected]. Shareholders/Investors can send their complaints/grievances to the above e-mail ID and
the same will be attended to by the Secretarial Department.
Statutory Compliance
During the year under review, the Company has complied with all applicable provisions, filed all relevant returns or
forms and furnished all the relevant particulars or information as required under the Companies Act, 1956 and allied
acts, and rules, the regulations and guidelines issued by SEBI and the listing agreements. As regards the compliance of
the provisions of Clause 49 of the Listing Agreements by the Company, a certificate issued by M/s. B D. Jokhakar & Co.,
Statutory Auditors of the Company, is annexed elsewhere in this Annual Report.
NECS facility
Reserve Bank of India (RBI) has introduced National Electronic Clearing System (N-ECS) which aims at increasing
efficiency and simplification of the ECS process. RBI has also directed the member banks to update their systems and
information pertaining to the bank account numbers of their customers.
In view of the above, however, if the shares are held in dematerialized form, shareholder is advised to provide correct
bank account details and update the same so that N-ECS transfers to such accounts are not rejected due to incorrect
bank account details.
Non-resident shareholders
Non-resident shareholders are requested to immediately notify the following to the Company in respect of shares held
in physical form and to their DPs in respect of shares held in dematerialized form:-
! Indian address for sending all communications, if not provided so far;
! Change in their residential status on return to India for permanent settlement;
! Particulars of the Bank Account maintained with a bank in India, if not furnished earlier;
! RBI permission number with date to facilitate prompt credit of dividend in their Bank Accounts; and
! E-mail ID and fax number(s), if any.
General information
! In terms of the regulations of NSDL and CDSL, bank account details of beneficial owners of shares in demat form
will be printed on the dividend warrants as furnished by the Depository Partcipant. The Company will not
entertain requests for change of such bank details printed on their dividend warrants. In case of any changes in
your bank details, please inform to your DP now/immediately.
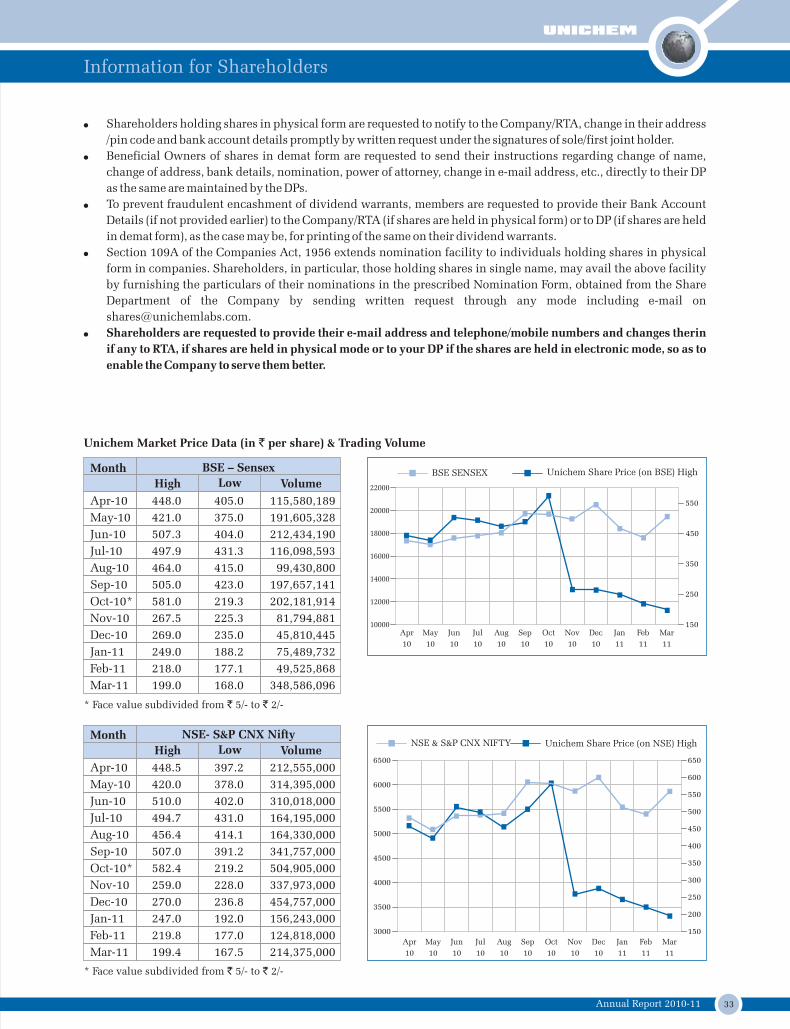
33Annual Report 2010-11
Information for Shareholders
! Shareholders holding shares in physical form are requested to notify to the Company/RTA, change in their address
/pin code and bank account details promptly by written request under the signatures of sole/first joint holder.
! Beneficial Owners of shares in demat form are requested to send their instructions regarding change of name,
change of address, bank details, nomination, power of attorney, change in e-mail address, etc., directly to their DP
as the same are maintained by the DPs.
! To prevent fraudulent encashment of dividend warrants, members are requested to provide their Bank Account
Details (if not provided earlier) to the Company/RTA (if shares are held in physical form) or to DP (if shares are held
in demat form), as the case may be, for printing of the same on their dividend warrants.
! Section 109A of the Companies Act, 1956 extends nomination facility to individuals holding shares in physical
form in companies. Shareholders, in particular, those holding shares in single name, may avail the above facility
by furnishing the particulars of their nominations in the prescribed Nomination Form, obtained from the Share
Department of the Company by sending written request through any mode including e-mail on
! Shareholders are requested to provide their e-mail address and telephone/mobile numbers and changes therin
if any to RTA, if shares are held in physical mode or to your DP if the shares are held in electronic mode, so as to
enable the Company to serve them better.
BSE – Sensex
448.0
421.0
507.3
497.9
464.0
505.0
581.0
267.5
269.0
249.0
218.0
199.0
405.0
375.0
404.0
431.3
415.0
423.0
219.3
225.3
235.0
188.2
177.1
168.0
High Low Volume
115,580,189
191,605,328
212,434,190
116,098,593
99,430,800
197,657,141
202,181,914
81,794,881
45,810,445
75,489,732
49,525,868
348,586,096
Month
Apr-10
May-10
Jun-10
Jul-10
Aug-10
Sep-10
Oct-10*
Nov-10
Dec-10
Jan-11
Feb-11
Mar-11
Apr
10
May
10
Jun
10
Jul
10
Aug
10
Sep
10
Oct
10
Nov
10
Dec
10
Jan
11
Feb
11
Mar
11
15010000
14000
16000
18000
12000
Unichem Share Price (on BSE) HighBSE SENSEX
Unichem Market Price Data (in ` per share) & Trading Volume
3000
3500
4000
4500
5500
150
300
250
400
500
550
650
Unichem Share Price (on NSE) HighNSE & S&P CNX NIFTY
5000
NSE- S&P CNX Nifty
448.5
420.0
510.0
494.7
456.4
507.0
582.4
259.0
270.0
247.0
219.8
199.4
397.2
378.0
402.0
431.0
414.1
391.2
219.2
228.0
236.8
192.0
177.0
167.5
High Low Volume
212,555,000
314,395,000
310,018,000
164,195,000
164,330,000
341,757,000
504,905,000
337,973,000
454,757,000
156,243,000
124,818,000
214,375,000
Month
Apr-10
May-10
Jun-10
Jul-10
Aug-10
Sep-10
Oct-10*
Nov-10
Dec-10
Jan-11
Feb-11
Mar-11
20000
22000
250
550
350
450
Apr
10
May
10
Jun
10
Jul
10
Aug
10
Sep
10
Oct
10
Nov
10
Dec
10
Jan
11
Feb
11
Mar
11
6000
6500
600
450
350
200
* Face value subdivided from ` 5/- to ` 2/-
* Face value subdivided from ` 5/- to ` 2/-
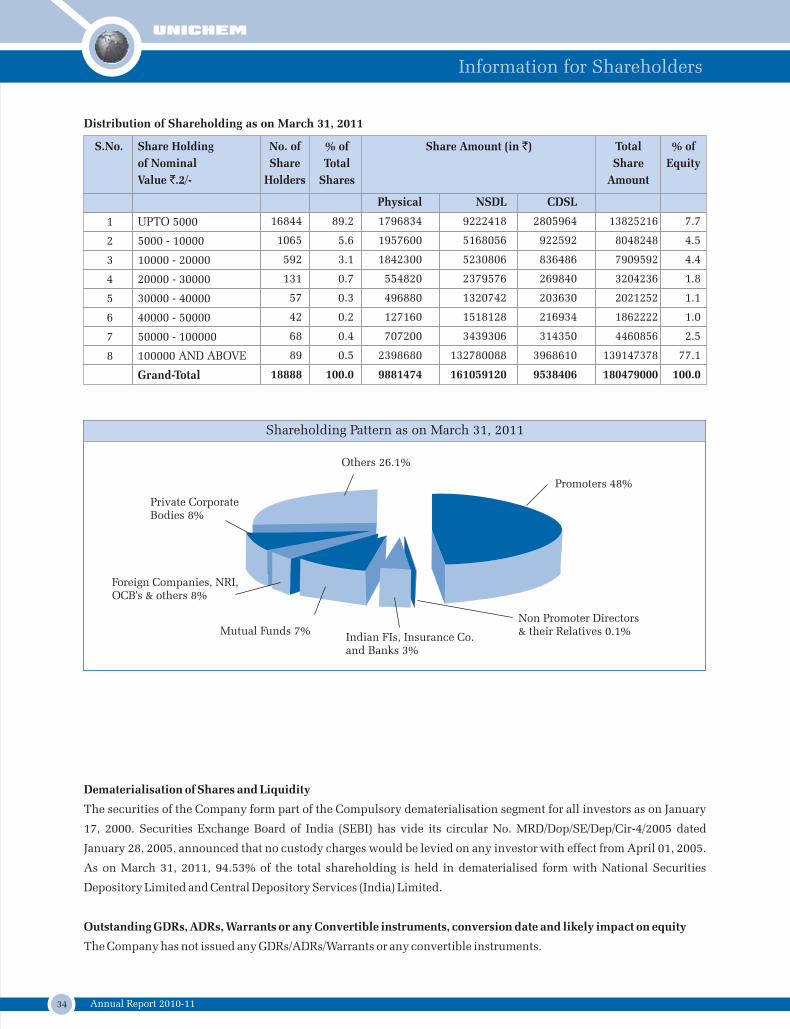
34 Annual Report 2010-11
Information for Shareholders
Promoters 48%
Non Promoter Directors & their Relatives 0.1%
Indian FIs, Insurance Co.and Banks 3%
Mutual Funds 7%
Foreign Companies, NRI, OCB's & others 8%
Private Corporate Bodies 8%
Others 26.1%
Shareholding Pattern as on March 31, 2011
Dematerialisation of Shares and Liquidity
The securities of the Company form part of the Compulsory dematerialisation segment for all investors as on January
17, 2000. Securities Exchange Board of India (SEBI) has vide its circular No. MRD/Dop/SE/Dep/Cir-4/2005 dated
January 28, 2005, announced that no custody charges would be levied on any investor with effect from April 01, 2005.
As on March 31, 2011, 94.53% of the total shareholding is held in dematerialised form with National Securities
Depository Limited and Central Depository Services (India) Limited.
Outstanding GDRs, ADRs, Warrants or any Convertible instruments, conversion date and likely impact on equity
The Company has not issued any GDRs/ADRs/Warrants or any convertible instruments.
Distribution of Shareholding as on March 31, 2011
UPTO 5000
5000 - 10000
10000 - 20000
20000 - 30000
30000 - 40000
40000 - 50000
50000 - 100000
100000 AND ABOVE
Grand-Total
16844
1065
592
131
57
42
68
89
18888
Share Holding
of Nominal
Value `.2/-
89.2
5.6
3.1
0.7
0.3
0.2
0.4
0.5
100.0
% of
Total
Shares
No. of
Share
Holders
13825216
8048248
7909592
3204236
2021252
1862222
4460856
139147378
180479000
Total
Share
Amount
7.7
4.5
4.4
1.8
1.1
1.0
2.5
77.1
100.0
1
2
3
4
5
6
7
8
Physical
1796834
1957600
1842300
554820
496880
127160
707200
2398680
9881474
NSDL
9222418
5168056
5230806
2379576
1320742
1518128
3439306
132780088
161059120
CDSL
2805964
922592
836486
269840
203630
216934
314350
3968610
9538406
% of
Equity
S.No. Share Amount (in `)
35Annual Report 2010-11
Information for Shareholders
Address for correspondence
Registered & Corporate Office For Secretarial matters
Unichem Bhavan, Prabhat Estate, Mr. Dilip Bhor / Ms. Radhika Shenoy
Off. S. V. Road, Jogeshwari (West), Unichem Bhavan, Prabhat Estate,
Mumbai – 400 102 Off. S. V. Road, Jogeshwari (West), Mumbai – 400 102
Tel: 022 66888333, Fax: 022 2679 4089 Tel: 022 66888439/478
Website: www.unichemlabs.com Email: [email protected],
Registrar and Shares Transfer Agents (RTA)
Link Intime India Pvt. Ltd.
C-13, Pannalal Silk Mills Compound, LBS Marg, Bhandup (West), Mumbai - 400 078.
Tel.: 022 2594 6970, Fax: 022 2594 6969
Subsidiaries Locations
Niche Generics Ltd. (U.K.) Unichem Farmaceutica Do Brasil Ltda (Brazil)
1, The Cam Centre Avenida Sete De Setembro 1564
Wilbury Way CEP-09912-010
Hitchin Hertfordshire, SG4 0TW Diadema-São Paulo,
UK Brasil
TEL: +44 [0] 1462 633804 TEL: +55 11 3845 7025
FAX: + 55 11 3845 7114
Unichem Pharmaceuticals (USA), Inc. Unichem S.A. (Pty) Ltd. (South Africa) st201, West Passaic Street Adrina Building, 1 Floor,
Ste 403 32-34, Klinkenberg Road,
Rochelle Park, Van Der Hoff Park
NJ 07662 Potchefstroom, USAP.O.Box - 20434
Noordbrug
TEL: 001-201-2260240 TEL: (+2718)-2974055 / 0823361954
FAX: 001-201-2260241 FAX: (+2718)-2974059
Representative Offices of the Company around the world
Russia Ghana
Bolshaya Yakimanka Str. P O Box 3368,
31/18, Moscow Accra. Ghana.
Russia West Africa
TEL: 007-499-2302380 TEL: 00-233-21-684183/665625(FAX)
Email: [email protected] Cell-00-233-243-323349
Country Business Executive – Mr. Narendra Kumar
Email: [email protected]
Ukraine
8, Strutinskogo, Apt No. 15,
Kiev 01014, Ukraine
Telefax: 00-380-44 5024550
00-380-44 5024590,
Cell: 00-380-67-2304247
Country Business Manager - Dr. Rajith Puthen
Email: [email protected]
36 Annual Report 2010-11
Auditors’ Report
1. We have audited the attached balance sheet of Unichem Laboratories Limited as at 31st March, 2011, the
profit & loss account and also the cash flow statement for the year ended on that date annexed thereto.
These financial statements are the responsibility of the Company’s management. Our responsibility is to
express an opinion on these financial statements based on our audit.
2. We conducted our audit in accordance with the auditing standards generally accepted in India. Those
Standards require that we plan and perform the audit to obtain reasonable assurance about whether the
financial statements are free of material misstatement. An audit includes examining on a test basis,
evidence supporting the amounts and disclosures in the financial statements. An audit also includes
assessing the accounting principles used and significant estimates made by the management, as well as
evaluating the overall financial statements presentation. We believe that our audit provides a reasonable
basis for our opinion.
3. As required by the Companies (Auditor’s Report) Order, 2003 (as amended) (‘the order’) issued by the
Central Government of India in terms of sub-section (4A) of section 227 of the Companies Act, 1956, we
enclose in the Annexure a statement on the matters specified in paragraph 4 & 5 of the said order.
4. Further to our comments in the Annexure referred to in paragraph 3 above, we report that:
(a) We have obtained all the information and explanations which to the best of our knowledge
and belief were necessary for the purposes of our audit;
(b) In our opinion, proper books of account as required by law have been kept by the Company
so far as appears from our examination of those books;
(c) The balance sheet, profit and loss account and cash flow statement dealt with by this report are in
agreement with the books of account;
(d) In our opinion the balance sheet, profit and loss account and cash flow statement dealt with by this
report comply with the accounting standards referred to in sub -section (3C) of section 211 of the
Companies Act, 1956.
(e) On the basis of the written representations received from the directors, as on 31st March, 2011 and
taken on record by the Board of Directors, we report that none of the directors is disqualified as on st31 March, 2011 from being appointed as a director in terms of clause (g) of sub-section (1) of section
274 of the Companies Act, 1956.
(f) In our opinion and to the best of our information and according to the explanations given to us, the
said financial statements, read with the notes thereon give the information required by the
Companies Act, 1956 in the manner so required and give a true and fair view in conformity with
the accounting principles generally accepted in India:
sti) in the case of the balance sheet of the state of affairs of the Company as at 31 March, 2011;
ii) in the case of the profit and loss account, of the profit for the year ended on that date; and
iii) in the case of cash flow statement, of the cash flows for the year ended on that date.
Auditors’ Report to the Members of Unichem Laboratories Limited
For B. D. Jokhakar & Co.
Chartered Accountants
Firm Registration No. 104345W
Raman Jokhakar
Partner
Membership No. 103241
Mumbai
May 14, 2011
37Annual Report 2010-11
Auditors’ Report
Annexure referred to in paragraph 3 of our report of even date
1. (a) The Company has maintained proper records showing full particulars including quantitative details and
situation of fixed assets.
(b) As explained to us, some of the fixed assets of the Company have been physically verified during the
year by the management in accordance with a phased program of verification designed to cover all
assets over a period of three years, which in our opinion, is reasonable having regard to the size of the
Company and the nature of its assets. The discrepancies noticed on such verification were not material
and have been properly dealt with in the books of account.
(c) The fixed assets disposed off during the year, in our opinion, do not constitute a substantial part of the
fixed assets of the Company and such disposal has, not affected the going concern status of the
Company.
2. (a) As explained to us, the inventories have been physically verified during the year by the management.
The intervals at which the inventories have been verified are, in our opinion, reasonable in relation to
the size of the Company and the nature of its business;
(b) In our opinion and according to the information and explanations given to us, the procedures of
physical verification of inventories followed by the management were reasonable and adequate in
relation to the size of the Company and the nature of the business.
(c) The Company is maintaining proper records of inventory and no material discrepancies were noticed on
physical verification.
3. (a) As informed, the Company has not granted any Loans, secured or unsecured to companies, firms or
other parties covered in the register maintained under section 301 of the Companies Act, 1956.
Accordingly, sub clause (b), (c) and (d) are not applicable.
(e) The Company has not taken any loans, secured or unsecured from companies, firms or other parties
covered in the register maintained under section 301 of the Companies Act, 1956. Consequently, sub
clauses (e), (f) and (g) are not applicable.
4. In our opinion, and according to the information and explanation given to us, there is an adequate internal
control system commensurate with the size of the Company and the nature of its business for the purchase of
inventory and fixed assets and for the sale of goods and services. In our opinion and according to the
information and explanations given to us, there is no continuing failure to correct major weaknesses in such
internal control systems.
5. (a) To the best of our knowledge and belief and according to information and explanations given to us and
on examination of records the particulars of contracts or arrangements referred to in section 301 of the
Companies Act, 1956 have been entered in the register maintained under that section.
(b) In our opinion and according to the information and explanations given to us, transactions made in
pursuance of such contracts or arrangements are specialised in nature and comparable prices are not
always determinable and the prices charged are prima facie reasonable.
38 Annual Report 2010-11
Auditors’ Report
6. In our opinion, and according to the information and explanations given to us, the Company has complied
with the provisions of section 58A, 58AA or any relevant provisions of the Companies Act, 1956 and the
rules framed there under and the directives issued by the Reserve Bank of India, where applicable, with
regard to the deposits accepted from the public. We have been informed that no order has been passed by
Company Law Board or National Company Law Tribunal or Reserve Bank of India or any Court or any
other Tribunal.
7. In our opinion, the internal audit system is commensurate with the size of the Company and the nature of its
business.
8. We have broadly reviewed the books of account and records maintained by the Company pursuant to the
rules made by the Central Government for the maintenance of cost records under section 209 (1) (d) of the
Companies Act, 1956 relating to the manufacture of Bulk drugs and pharmaceutical specialties and are of the
opinion that, prima facie, the prescribed accounts and records have been maintained. We have, however, not
made a detailed examination of the said records with a view to determine whether they are accurate or
complete.
9. (a) The Company is regular in depositing undisputed statutory dues payable in respect of provident fund,
investor education and protection fund, employees state insurance, income-tax, sales-tax, wealth tax,
custom duty, excise duty, cess and any other material statutory dues with the appropriate authorities
during the year. There were no undisputed statutory dues as mentioned above in arrears as at 31st
March, 2011 for a period of more than six months from the date they became payable.
(b) According to the information & explanations given to us, the dues in respect of Excise duty and Service
tax and Provident Fund that have not been deposited with the appropriate authorities on account of
dispute and the forum where the disputes are pending as on 31st March, 2011 are as given below:
10. The Company does not have any accumulated losses at the end of the financial year and it has not incurred
any cash losses in the current or in the immediately preceding financial year.
11. According to the information and explanations given to us the Company has not defaulted in repayment of
dues to banks and financial institutions.
Name of the
Statutes
Nature of
the dues
Amount
(` in lacs)
Forum where
dispute is pending Period to which
it relates
Central Excise
Act, 1944
Penalty 11.61 Appellate Tribunal
(CESTAT), Northen Bench,
New Delhi
2003-04
Provident Fund
& Misc. Prov.
Act, 1952
Dues under
Provident
Fund
1.75 Regional Provident Fund
Commissioner, Indore
2005-06
Central Excise
Act, 1944
Cenvat Credit
of Service Tax
43.13 Commissioner (Appeals),
Central Exise & Customs,
Indore
2005-06 to
2010-11
39Annual Report 2010-11
Auditors’ Report
For B. D. Jokhakar & Co.
Chartered Accountants
Firm Registration No. 104345W
Raman Jokhakar
Partner
Membership No. 103241
Mumbai
May 14, 2011
12. According to the information and explanations given to us the Company has not granted loans and advances
on the basis of security by way of pledge of shares, debentures and other securities. Therefore, the provisions
of clause 4(xii) of the order are not applicable to the Company.
13. The company is not a chit fund or a nidhi mutual benefit fund /society. Therefore, the provisions of clause
4(xiii) of the order are not applicable to the Company.
14. As informed to us, the Company is not dealing in or trading in shares, securities, debentures and other
investments. Accordingly the provisions of clause 4(xiv) of the order are not applicable to the Company.
15. In our opinion, the terms and conditions on which the Company has given guarantee for loans taken by
others from banks or financial institutions are not prejudicial to the interest of the Company.
16. To the best of our knowledge and belief and according to the information and explanations given to us the
Company did not have any term loans outstanding during the year.
17. According to the cash flow statement and other records examined by us and the information and explanations
given to us, on an overall basis, funds raised on short term basis, have prima facie, not been used during the
year for long term investments.
18. According to the information and explanations given to us no preferential allotment of shares has been made
by the Company to companies, firms or other parties listed in the register maintained under section 301 of the
Companies Act, 1956.
19. The Company has not issued any secured debentures and accordingly the provisions of clause 4(xix) of the
order are not applicable.
20. The Company has not raised any money through a public issue during the year.
21. To the best of our knowledge and belief and according to the information and explanations given to us, no
material fraud on or by the company has been noticed or reported during the course of our audit.
40 Annual Report 2010-11
Balance Sheet
Balance SheetPrevious YearCurrent YearSchedule
Schedules 1 to 18 form an integral part of accounts.
As per our report of even date attached For B. D. Jokhakar & Co.Chartered Accountants
For and on behalf of the Board of Directors
Raman Jokhakar Partner
Rakesh ParikhVice President Finance
K. SubharamanVice President - Legal & Company Secretary
Dr. Prakash A. ModyChairman & Managing Director
Prafull AnubhaiDirector
MumbaiMay 14, 2011
As at 31st March, 2011(` in lacs)
SOURCES OF FUNDS
APPLICATION OF FUNDS
Shareholders' FundShare Capital 1 1,804.79 1,803.15Share Application Money - 2.64Reserves and Surplus 2 65,997.60 59,261.29
67,802.39 61,067.08
Loan FundsSecured Loans 3 773.12 248.08 Unsecured Loans 4 2,271.56 2,048.35
3,044.68 2,296.43
Deferred Tax Liability 3,781.43 3,468.43
Total 74,628.50 66,831.94
Fixed AssetsGross Block 5 50,442.85 43,738.82 Less: Accumulated Depreciation 14,878.42 12,246.75Net Block 35,564.43 31,492.07Capital Work in Progress 7,912.13 6,288.08
43,476.56 37,780.15Investments 6 10,014.35 12,831.44
Current Assets, Loans and AdvancesInventories 7 13,541.83 9,764.13Sundry Debtors 8 18,450.93 16,243.44Cash and Bank Balances 9 1,044.12 1,906.40Loans and Advances 10 5,038.13 4,344.68
38,075.01 32,258.65Less: Current Liabilities and ProvisionsCurrent Liabilities 11 13,277.46 12,474.41 Provisions 12 3,659.96 3,563.89
16,937.42 16,038.30Net Current Assets 21,137.59 16,220.35
Total 74,628.50 66,831.94Significant Accounting Policies / Notes to Accounts 18
41Annual Report 2010-11
Profit & Loss Account
INCOME
EXPENDITURE
PROFIT BEFORE TAX
PROVISION FOR TAXATION
NET PROFIT AFTER TAX
APPROPRIATIONS
Sales / Income from operations (Gross) 13 77,022.20 69,351.32Less: Excise duty 548.46 291.65Sales / Income from operations (Net) 76,473.74 69,059.67Other Income 14 660.22 658.36Total 77,133.96 69,718.03
Manufacturing, selling and administrative expenses 15 56,654.75 48,436.53Research & Development expenses 16 3,668.32 2,678.02Interest 17 58.82 50.97Depreciation including Amortisation 5 2,721.77 2,146.85Total 63,103.66 53,312.37
14,030.30 16,405.66
Less: Current Tax (including Wealth tax) 2,846.00 2,811.00 Deferred Tax 313.00 232.00
10,871.30 13,362.66Add / (Less): Prior Period items (1.31) (0.86)Add / (Less): Excess/(Short) provision for taxation pertaining to previous years (20.21) 32.63Add: Balance Brought Forward 39,091.69 31,407.11Amount available for Appropriation 49,941.47 44,801.54
Proposed Dividend 2,526.71 -Interim Dividend (Refer Note 23 of schedule 18) 1,082.83 3,606.65Tax on Proposed Dividend 409.89 -Tax on Interim Dividend (Refer Note 23 of schedule 18) 179.84 603.20Transfer to General Reserve 1,500.00 1,500.00Surplus Carried to Balance Sheet 44,242.20 39,091.69Total 49,941.47 44,801.54
Basic Earnings per share of ` 2/- (Pr Yr ` 2/-) each (in `) 12.03 14.86 Diluted Earnings per share of ` 2/- (Pr Yr ` 2/-) each (in `) 11.95 14.77 Significant Accounting Policies / Notes to Accounts 18
Profit & Loss Account
Schedule
Schedules 1 to 18 form an integral part of accounts.
Current Year Previous Year
For the year ended 31st March, 2011(` in lacs)
As per our report of even date attached For B. D. Jokhakar & Co.Chartered Accountants
For and on behalf of the Board of Directors
Raman Jokhakar Partner
Rakesh ParikhVice President Finance
K. SubharamanVice President - Legal & Company Secretary
Dr. Prakash A. ModyChairman & Managing Director
Prafull AnubhaiDirector
MumbaiMay 14, 2011
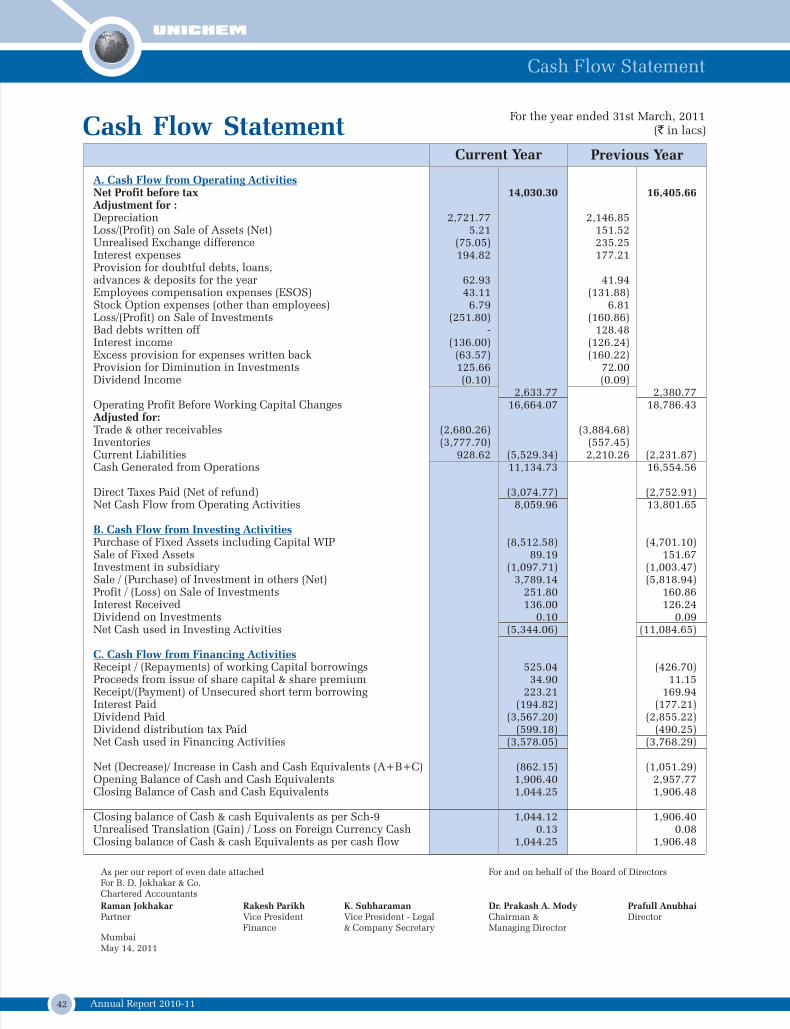
42 Annual Report 2010-11
As per our report of even date attached For B. D. Jokhakar & Co.Chartered Accountants
For and on behalf of the Board of Directors
Raman Jokhakar Partner
Rakesh ParikhVice President Finance
K. SubharamanVice President - Legal & Company Secretary
Dr. Prakash A. ModyChairman & Managing Director
Prafull AnubhaiDirector
MumbaiMay 14, 2011
Cash Flow StatementFor the year ended 31st March, 2011
(` in lacs)
A. Cash Flow from Operating Activities
B. Cash Flow from Investing Activities
C. Cash Flow from Financing Activities
Net Profit before tax 14,030.30 16,405.66Adjustment for :Depreciation 2,721.77 2,146.85Loss/(Profit) on Sale of Assets (Net) 5.21 151.52Unrealised Exchange difference (75.05) 235.25Interest expenses 194.82 177.21Provision for doubtful debts, loans, advances & deposits for the year 62.93 41.94Employees compensation expenses (ESOS) 43.11 (131.88)Stock Option expenses (other than employees) 6.79 6.81Loss/(Profit) on Sale of Investments (251.80) (160.86)Bad debts written off - 128.48Interest income (136.00) (126.24)Excess provision for expenses written back (63.57) (160.22)Provision for Diminution in Investments 125.66 72.00Dividend Income (0.10) (0.09)
2,633.77 2,380.77Operating Profit Before Working Capital Changes 16,664.07 18,786.43Adjusted for:Trade & other receivables (2,680.26) (3,884.68)Inventories (3,777.70) (557.45)Current Liabilities 928.62 (5,529.34) 2,210.26 (2,231.87)Cash Generated from Operations 11,134.73 16,554.56
Direct Taxes Paid (Net of refund) (3,074.77) (2,752.91)Net Cash Flow from Operating Activities 8,059.96 13,801.65
Purchase of Fixed Assets including Capital WIP (8,512.58) (4,701.10)Sale of Fixed Assets 89.19 151.67Investment in subsidiary (1,097.71) (1,003.47)Sale / (Purchase) of Investment in others (Net) 3,789.14 (5,818.94)Profit / (Loss) on Sale of Investments 251.80 160.86Interest Received 136.00 126.24Dividend on Investments 0.10 0.09Net Cash used in Investing Activities (5,344.06) (11,084.65)
Receipt / (Repayments) of working Capital borrowings 525.04 (426.70)Proceeds from issue of share capital & share premium 34.90 11.15Receipt/(Payment) of Unsecured short term borrowing 223.21 169.94Interest Paid (194.82) (177.21)Dividend Paid (3,567.20) (2,855.22)Dividend distribution tax Paid (599.18) (490.25)Net Cash used in Financing Activities (3,578.05) (3,768.29)
Net (Decrease)/ Increase in Cash and Cash Equivalents (A+B+C) (862.15) (1,051.29)Opening Balance of Cash and Cash Equivalents 1,906.40 2,957.77Closing Balance of Cash and Cash Equivalents 1,044.25 1,906.48
Closing balance of Cash & cash Equivalents as per Sch-9 1,044.12 1,906.40Unrealised Translation (Gain) / Loss on Foreign Currency Cash 0.13 0.08Closing balance of Cash & cash Equivalents as per cash flow 1,044.25 1,906.48
Previous YearCurrent Year
Cash Flow Statement
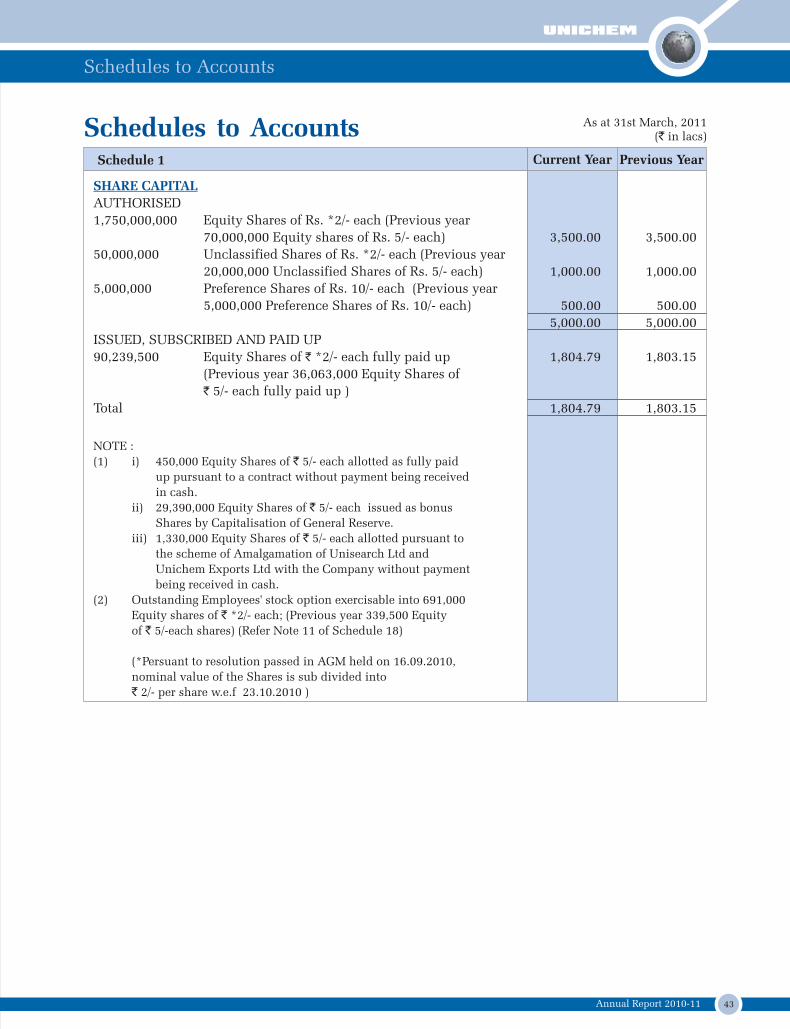
43Annual Report 2010-11
Schedules to Accounts
Schedules to Accounts As at 31st March, 2011( in lacs)`
SHARE CAPITAL
AUTHORISED
1,750,000,000 Equity Shares of Rs. *2/- each (Previous year
70,000,000 Equity shares of Rs. 5/- each) 3,500.00 3,500.00
50,000,000 Unclassified Shares of Rs. *2/- each (Previous year
20,000,000 Unclassified Shares of Rs. 5/- each) 1,000.00 1,000.00
5,000,000 Preference Shares of Rs. 10/- each (Previous year
5,000,000 Preference Shares of Rs. 10/- each) 500.00 500.00
5,000.00 5,000.00
ISSUED, SUBSCRIBED AND PAID UP
90,239,500 Equity Shares of ` *2/- each fully paid up 1,804.79 1,803.15
(Previous year 36,063,000 Equity Shares of
` 5/- each fully paid up )
Total 1,804.79 1,803.15
Schedule 1 Current Year Previous Year
NOTE :
(1) i) 450,000 Equity Shares of ` 5/- each allotted as fully paid
up pursuant to a contract without payment being received
in cash.
ii) 29,390,000 Equity Shares of ` 5/- each issued as bonus
Shares by Capitalisation of General Reserve.
iii) 1,330,000 Equity Shares of ` 5/- each allotted pursuant to
the scheme of Amalgamation of Unisearch Ltd and
Unichem Exports Ltd with the Company without payment
being received in cash.
(2) Outstanding Employees' stock option exercisable into 691,000
Equity shares of ` *2/- each; (Previous year 339,500 Equity
of ` 5/-each shares) (Refer Note 11 of Schedule 18)
(*Persuant to resolution passed in AGM held on 16.09.2010,
nominal value of the Shares is sub divided into
` 2/- per share w.e.f 23.10.2010 )
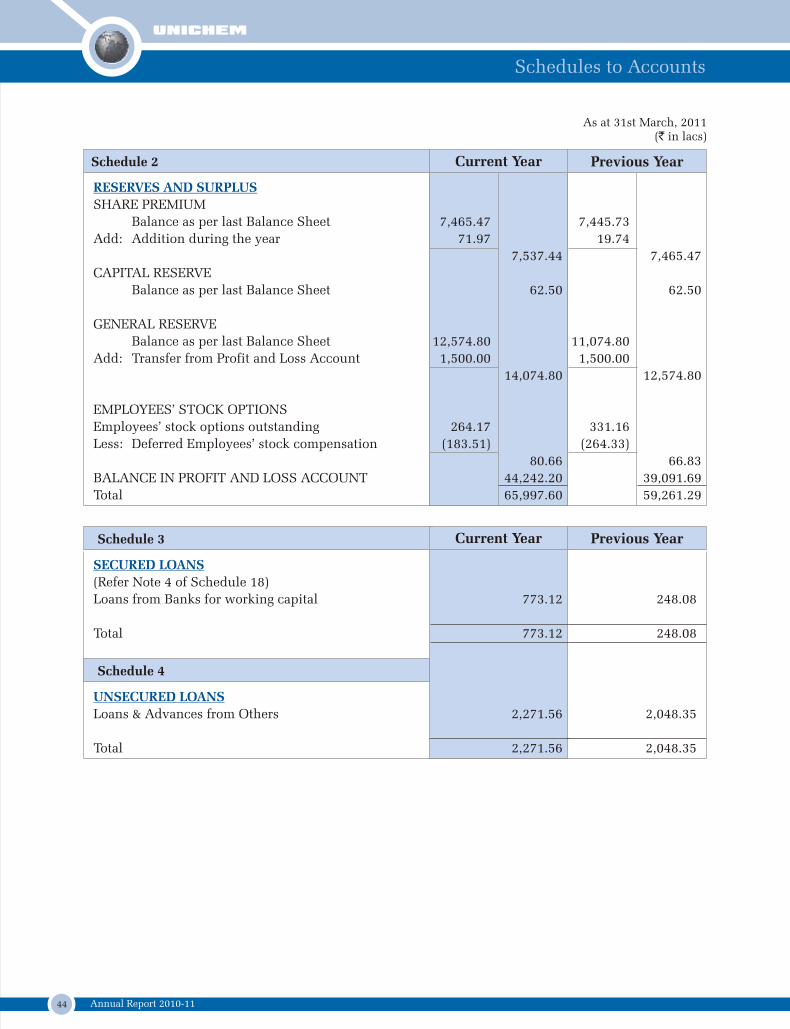
44 Annual Report 2010-11
Schedules to Accounts
As at 31st March, 2011( in lacs)`
SECURED LOANS
(Refer Note 4 of Schedule 18)
Loans from Banks for working capital 773.12 248.08
Total 773.12 248.08
Schedule 3
Schedule 4
Previous YearCurrent Year
Previous YearCurrent YearSchedule 2
RESERVES AND SURPLUS
SHARE PREMIUM
Balance as per last Balance Sheet 7,465.47 7,445.73
Add: Addition during the year 71.97 19.74
7,537.44 7,465.47
CAPITAL RESERVE
Balance as per last Balance Sheet 62.50 62.50
GENERAL RESERVE
Balance as per last Balance Sheet 12,574.80 11,074.80
Add: Transfer from Profit and Loss Account 1,500.00 1,500.00
14,074.80 12,574.80
EMPLOYEES’ STOCK OPTIONS
Employees’ stock options outstanding 264.17 331.16
Less: Deferred Employees’ stock compensation (183.51) (264.33)
80.66 66.83
BALANCE IN PROFIT AND LOSS ACCOUNT 44,242.20 39,091.69
Total 65,997.60 59,261.29
UNSECURED LOANS
Loans & Advances from Others 2,271.56 2,048.35
Total 2,271.56 2,048.35
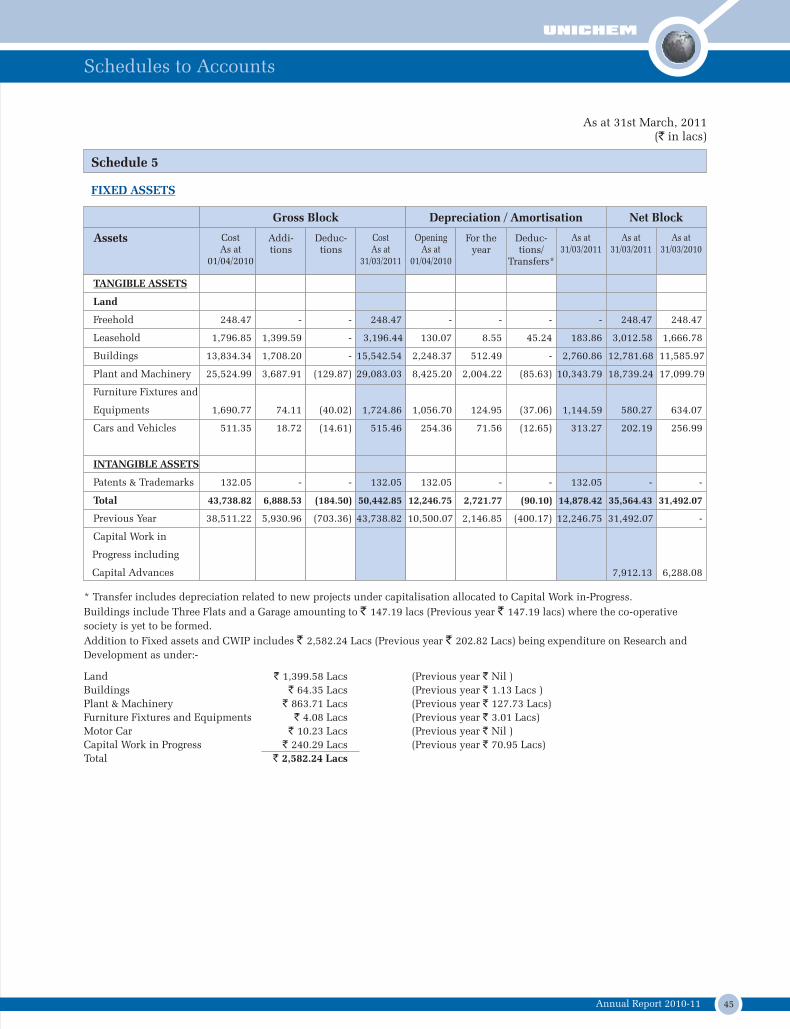
45Annual Report 2010-11
TANGIBLE ASSETS
Land
Freehold 248.47 - - 248.47 - - - - 248.47 248.47
Leasehold 1,796.85 1,399.59 - 3,196.44 130.07 8.55 45.24 183.86 3,012.58 1,666.78
Buildings 13,834.34 1,708.20 - 15,542.54 2,248.37 512.49 - 2,760.86 12,781.68 11,585.97
Plant and Machinery 25,524.99 3,687.91 (129.87) 29,083.03 8,425.20 2,004.22 (85.63) 10,343.79 18,739.24 17,099.79
Furniture Fixtures and
Equipments 1,690.77 74.11 (40.02) 1,724.86 1,056.70 124.95 (37.06) 1,144.59 580.27 634.07
Cars and Vehicles 511.35 18.72 (14.61) 515.46 254.36 71.56 (12.65) 313.27 202.19 256.99
INTANGIBLE ASSETS
Patents & Trademarks 132.05 - - 132.05 132.05 - - 132.05 - -
Total 43,738.82 6,888.53 (184.50) 50,442.85 12,246.75 2,721.77 (90.10) 14,878.42 35,564.43 31,492.07
Previous Year 38,511.22 5,930.96 (703.36) 43,738.82 10,500.07 2,146.85 (400.17) 12,246.75 31,492.07 -
Capital Work in
Progress including
Capital Advances 7,912.13 6,288.08
Assets Cost As at
01/04/2010
Cost As at
31/03/2011
Opening As at
01/04/2010
For the year
Deduc-tions/
Transfers*
Addi-tions
Deduc-tions
As at 31/03/2011
As at 31/03/2011
As at31/03/2010
Schedule 5
Gross Block Depreciation / Amortisation Net Block
FIXED ASSETS
* Transfer includes depreciation related to new projects under capitalisation allocated to Capital Work in-Progress.
Buildings include Three Flats and a Garage amounting to 147.19 lacs (Previous year 147.19 lacs) where the co-operative
society is yet to be formed.
Addition to Fixed assets and CWIP includes 2,582.24 Lacs (Previous year 202.82 Lacs) being expenditure on Research and
Development as under:-
` `
` `
As at 31st March, 2011( in lacs)`
Land 1,399.58 Lacs (Previous year Nil )
Buildings 64.35 Lacs (Previous year 1.13 Lacs )
Plant & Machinery 863.71 Lacs (Previous year 127.73 Lacs)
Furniture Fixtures and Equipments 4.08 Lacs (Previous year 3.01 Lacs)
Motor Car 10.23 Lacs (Previous year Nil )
Capital Work in Progress 240.29 Lacs (Previous year 70.95 Lacs)
Total 2,582.24 Lacs
` `
` `
` `
` `
` `
` `
`
Schedules to Accounts
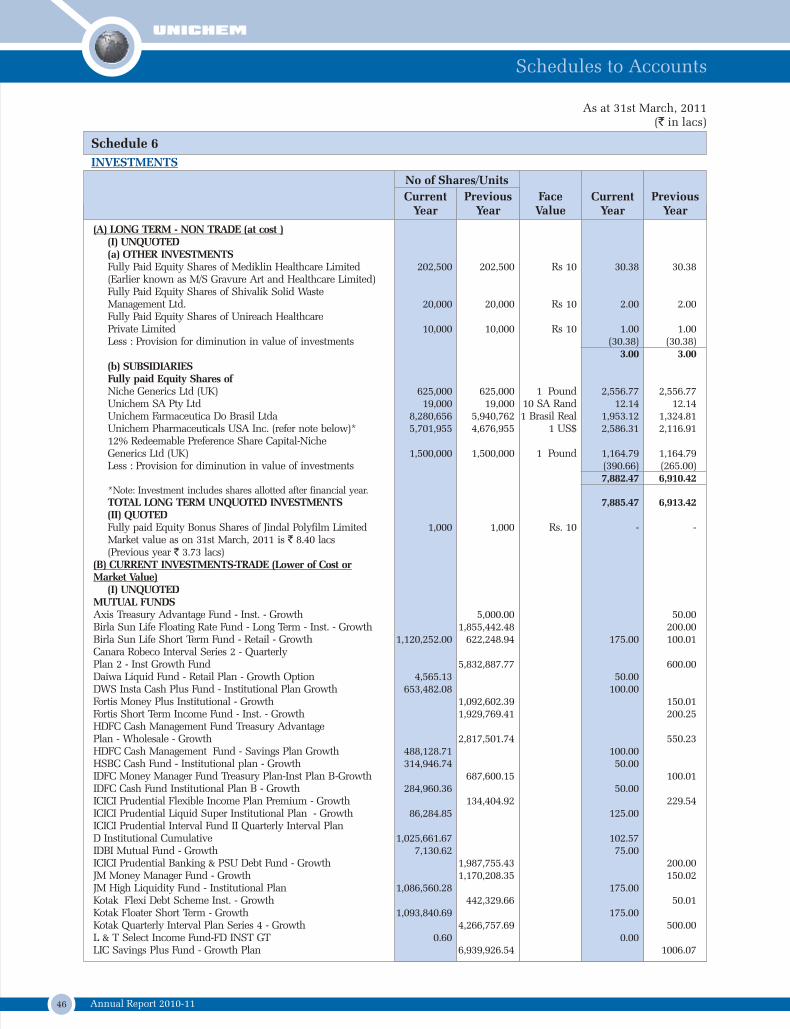
46 Annual Report 2010-11
As at 31st March, 2011( in lacs)`
Schedule 6
No of Shares/Units
Current Year
PreviousYear
FaceValue
CurrentYear
PreviousYear
(A) LONG TERM - NON TRADE (at cost )(I) UNQUOTED(a) OTHER INVESTMENTSFully Paid Equity Shares of Mediklin Healthcare Limited 202,500 202,500 Rs 10 30.38 30.38 (Earlier known as M/S Gravure Art and Healthcare Limited)Fully Paid Equity Shares of Shivalik Solid Waste Management Ltd. 20,000 20,000 Rs 10 2.00 2.00 Fully Paid Equity Shares of Unireach Healthcare Private Limited 10,000 10,000 Rs 10 1.00 1.00Less : Provision for diminution in value of investments (30.38) (30.38)
3.00 3.00 (b) SUBSIDIARIES Fully paid Equity Shares of Niche Generics Ltd (UK) 625,000 625,000 1 Pound 2,556.77 2,556.77 Unichem SA Pty Ltd 19,000 19,000 10 SA Rand 12.14 12.14 Unichem Farmaceutica Do Brasil Ltda 8,280,656 5,940,762 1 Brasil Real 1,953.12 1,324.81 Unichem Pharmaceuticals USA Inc. (refer note below)* 5,701,955 4,676,955 1 US$ 2,586.31 2,116.9112% Redeemable Preference Share Capital-Niche Generics Ltd (UK) 1,500,000 1,500,000 1 Pound 1,164.79 1,164.79 Less : Provision for diminution in value of investments (390.66) (265.00)
7,882.47 6,910.42*Note: Investment includes shares allotted after financial year.TOTAL LONG TERM UNQUOTED INVESTMENTS 7,885.47 6,913.42(II) QUOTED
Fully paid Equity Bonus Shares of Jindal Polyfilm Limited 1,000 1,000 Rs. 10 - - Market value as on 31st March, 2011 is ` 8.40 lacs (Previous year ` 3.73 lacs)(B) CURRENT INVESTMENTS-TRADE (Lower of Cost or Market Value)
(I) UNQUOTEDMUTUAL FUNDS Axis Treasury Advantage Fund - Inst. - Growth 5,000.00 50.00Birla Sun Life Floating Rate Fund - Long Term - Inst. - Growth 1,855,442.48 200.00Birla Sun Life Short Term Fund - Retail - Growth 1,120,252.00 622,248.94 175.00 100.01Canara Robeco Interval Series 2 - Quarterly Plan 2 - Inst Growth Fund 5,832,887.77 600.00Daiwa Liquid Fund - Retail Plan - Growth Option 4,565.13 50.00DWS Insta Cash Plus Fund - Institutional Plan Growth 653,482.08 100.00Fortis Money Plus Institutional - Growth 1,092,602.39 150.01Fortis Short Term Income Fund - Inst. - Growth 1,929,769.41 200.25HDFC Cash Management Fund Treasury Advantage Plan - Wholesale - Growth 2,817,501.74 550.23HDFC Cash Management Fund - Savings Plan Growth 488,128.71 100.00HSBC Cash Fund - Institutional plan - Growth 314,946.74 50.00IDFC Money Manager Fund Treasury Plan-Inst Plan B-Growth 687,600.15 100.01IDFC Cash Fund Institutional Plan B - Growth 284,960.36 50.00ICICI Prudential Flexible Income Plan Premium - Growth 134,404.92 229.54ICICI Prudential Liquid Super Institutional Plan - Growth 86,284.85 125.00ICICI Prudential Interval Fund II Quarterly Interval Plan D Institutional Cumulative 1,025,661.67 102.57IDBI Mutual Fund - Growth 7,130.62 75.00ICICI Prudential Banking & PSU Debt Fund - Growth 1,987,755.43 200.00JM Money Manager Fund - Growth 1,170,208.35 150.02JM High Liquidity Fund - Institutional Plan 1,086,560.28 175.00Kotak Flexi Debt Scheme Inst. - Growth 442,329.66 50.01Kotak Floater Short Term - Growth 1,093,840.69 175.00Kotak Quarterly Interval Plan Series 4 - Growth 4,266,757.69 500.00L & T Select Income Fund-FD INST GT 0.60 0.00LIC Savings Plus Fund - Growth Plan 6,939,926.54 1006.07
INVESTMENTS
Schedules to Accounts
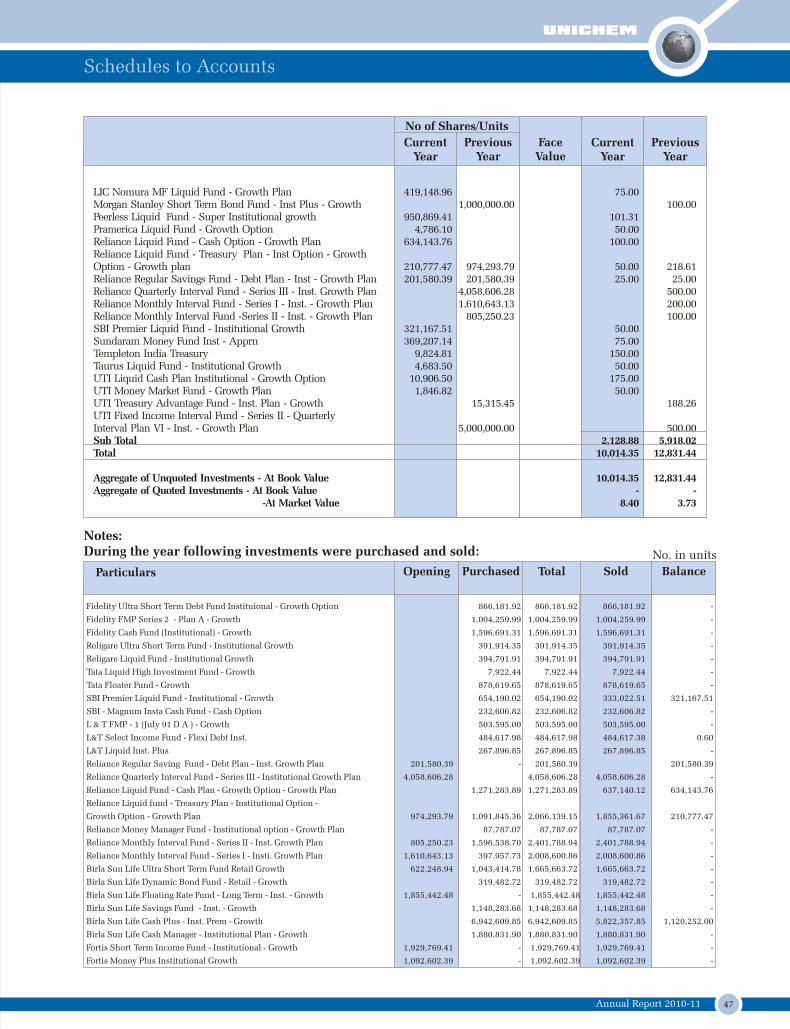
47Annual Report 2010-11
No of Shares/Units
Current Year
PreviousYear
FaceValue
CurrentYear
PreviousYear
LIC Nomura MF Liquid Fund - Growth Plan 419,148.96 75.00Morgan Stanley Short Term Bond Fund - Inst Plus - Growth 1,000,000.00 100.00Peerless Liquid Fund - Super Institutional growth 950,869.41 101.31Pramerica Liquid Fund - Growth Option 4,786.10 50.00Reliance Liquid Fund - Cash Option - Growth Plan 634,143.76 100.00Reliance Liquid Fund - Treasury Plan - Inst Option - Growth Option - Growth plan 210,777.47 974,293.79 50.00 218.61Reliance Regular Savings Fund - Debt Plan - Inst - Growth Plan 201,580.39 201,580.39 25.00 25.00Reliance Quarterly Interval Fund - Series III - Inst. Growth Plan 4,058,606.28 500.00Reliance Monthly Interval Fund - Series I - Inst. - Growth Plan 1,610,643.13 200.00Reliance Monthly Interval Fund -Series II - Inst. - Growth Plan 805,250.23 100.00SBI Premier Liquid Fund - Institutional Growth 321,167.51 50.00Sundaram Money Fund Inst - Apprn 369,207.14 75.00Templeton India Treasury 9,824.81 150.00Taurus Liquid Fund - Institutional Growth 4,683.50 50.00UTI Liquid Cash Plan Institutional - Growth Option 10,906.50 175.00UTI Money Market Fund - Growth Plan 1,846.82 50.00UTI Treasury Advantage Fund - Inst. Plan - Growth 15,315.45 188.26UTI Fixed Income Interval Fund - Series II - Quarterly Interval Plan VI - Inst. - Growth Plan 5,000,000.00 500.00Sub Total 2,128.88 5,918.02 Total 10,014.35 12,831.44
Aggregate of Unquoted Investments - At Book Value 10,014.35 12,831.44 Aggregate of Quoted Investments - At Book Value - - -At Market Value 8.40 3.73
Notes:During the year following investments were purchased and sold:
Particulars Opening Purchased Total Sold
Fidelity Ultra Short Term Debt Fund Instituional - Growth Option 866,181.92 866,181.92 866,181.92 -
Fidelity FMP Series 2 - Plan A - Growth 1,004,259.99 1,004,259.99 1,004,259.99 -
Fidelity Cash Fund (Institutional) - Growth 1,596,691.31 1,596,691.31 1,596,691.31 -
Religare Ultra Short Term Fund - Institutional Growth 391,914.35 391,914.35 391,914.35 -
Religare Liquid Fund - Institutional Growth 394,791.91 394,791.91 394,791.91 -
Tata Liquid High Investment Fund - Growth 7,922.44 7,922.44 7,922.44 -
Tata Floater Fund - Growth 878,619.65 878,619.65 878,619.65 -
SBI Premier Liquid Fund - Institutional - Growth 654,190.02 654,190.02 333,022.51 321,167.51
SBI - Magnum Insta Cash Fund - Cash Option 232,606.82 232,606.82 232,606.82 -
L & T FMP - 1 (July 91 D A ) - Growth 503,595.00 503,595.00 503,595.00 -
L&T Select Income Fund - Flexi Debt Inst. 484,617.98 484,617.98 484,617.38 0.60
L&T Liquid Inst. Plus 267,896.85 267,896.85 267,896.85 -
Reliance Regular Saving Fund - Debt Plan - Inst. Growth Plan 201,580.39 - 201,580.39 201,580.39
Reliance Quarterly Interval Fund - Series III - Institutional Growth Plan 4,058,606.28 4,058,606.28 4,058,606.28 -
Reliance Liquid Fund - Cash Plan - Growth Option - Growth Plan 1,271,283.89 1,271,283.89 637,140.12 634,143.76
Reliance Liquid fund - Treasury Plan - Institutional Option -
Growth Option - Growth Plan 974,293.79 1,091,845.36 2,066,139.15 1,855,361.67 210,777.47
Reliance Money Manager Fund - Institutional option - Growth Plan 87,787.07 87,787.07 87,787.07 -
Reliance Monthly Interval Fund - Series II - Inst. Growth Plan 805,250.23 1,596,538.70 2,401,788.94 2,401,788.94 -
Reliance Monthly Interval Fund - Series I - Insti. Growth Plan 1,610,643.13 397,957.73 2,008,600.86 2,008,600.86 -
Birla Sun Life Ultra Short Term Fund Retail Growth 622,248.94 1,043,414.78 1,665,663.72 1,665,663.72 -
Birla Sun Life Dynamic Bond Fund - Retail - Growth 319,482.72 319,482.72 319,482.72 -
Birla Sun Life Floating Rate Fund - Long Term - Inst. - Growth 1,855,442.48 - 1,855,442.48 1,855,442.48 -
Birla Sun Life Savings Fund - Inst. - Growth 1,148,283.68 1,148,283.68 1,148,283.68 -
Birla Sun Life Cash Plus - Inst. Prem - Growth 6,942,609.85 6,942,609.85 5,822,357.85 1,120,252.00
Birla Sun Life Cash Manager - Institutional Plan - Growth 1,880,831.90 1,880,831.90 1,880,831.90 -
Fortis Short Term Income Fund - Institutional - Growth 1,929,769.41 - 1,929,769.41 1,929,769.41 -
Fortis Money Plus Institutional Growth 1,092,602.39 - 1,092,602.39 1,092,602.39 -
Balance
No. in units
Schedules to Accounts
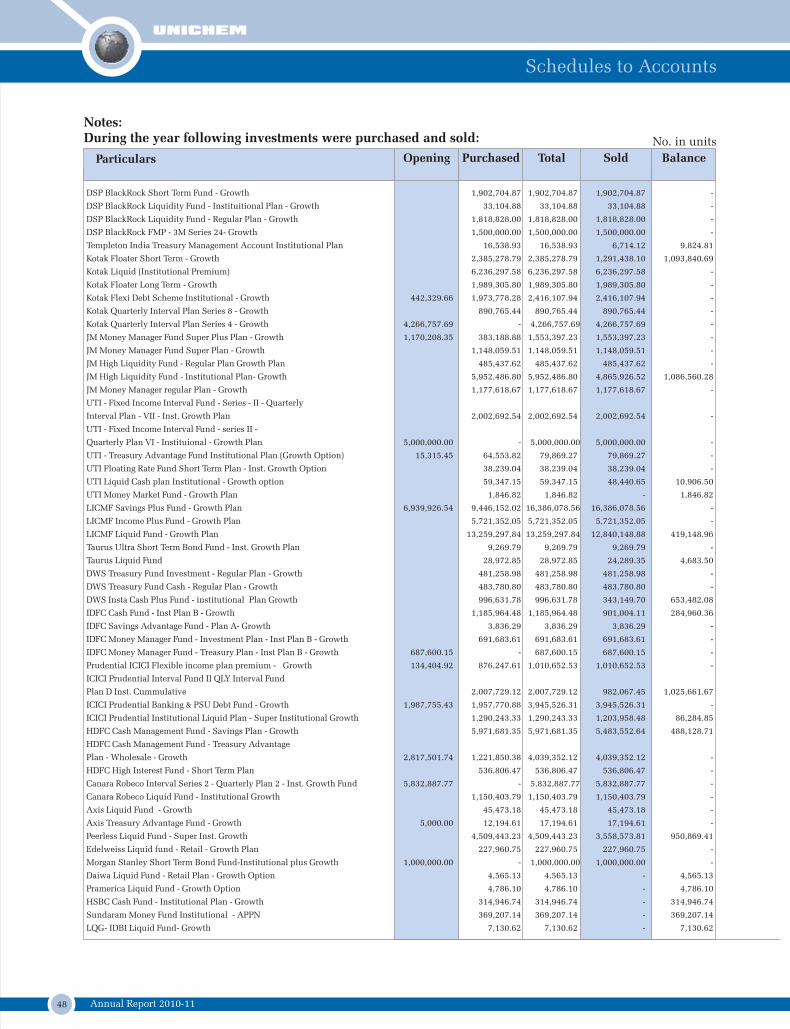
48 Annual Report 2010-11
Particulars Opening Purchased Total Sold Balance
Notes:During the year following investments were purchased and sold:
DSP BlackRock Short Term Fund - Growth 1,902,704.87 1,902,704.87 1,902,704.87 -
DSP BlackRock Liquidity Fund - Instituitional Plan - Growth 33,104.88 33,104.88 33,104.88 -
DSP BlackRock Liquidity Fund - Regular Plan - Growth 1,818,828.00 1,818,828.00 1,818,828.00 -
DSP BlackRock FMP - 3M Series 24- Growth 1,500,000.00 1,500,000.00 1,500,000.00 -
Templeton India Treasury Management Account Institutional Plan 16,538.93 16,538.93 6,714.12 9,824.81
Kotak Floater Short Term - Growth 2,385,278.79 2,385,278.79 1,291,438.10 1,093,840.69
Kotak Liquid (Institutional Premium) 6,236,297.58 6,236,297.58 6,236,297.58 -
Kotak Floater Long Term - Growth 1,989,305.80 1,989,305.80 1,989,305.80 -
Kotak Flexi Debt Scheme Institutional - Growth 442,329.66 1,973,778.28 2,416,107.94 2,416,107.94 -
Kotak Quarterly Interval Plan Series 8 - Growth 890,765.44 890,765.44 890,765.44 -
Kotak Quarterly Interval Plan Series 4 - Growth 4,266,757.69 - 4,266,757.69 4,266,757.69 -
JM Money Manager Fund Super Plus Plan - Growth 1,170,208.35 383,188.88 1,553,397.23 1,553,397.23 -
JM Money Manager Fund Super Plan - Growth 1,148,059.51 1,148,059.51 1,148,059.51 -
JM High Liquidity Fund - Regular Plan Growth Plan 485,437.62 485,437.62 485,437.62 -
JM High Liquidity Fund - Institutional Plan- Growth 5,952,486.80 5,952,486.80 4,865,926.52 1,086,560.28
JM Money Manager regular Plan - Growth 1,177,618.67 1,177,618.67 1,177,618.67 -
UTI - Fixed Income Interval Fund - Series - II - Quarterly
Interval Plan - VII - Inst. Growth Plan 2,002,692.54 2,002,692.54 2,002,692.54 -
UTI - Fixed Income Interval Fund - series II -
Quarterly Plan VI - Instituional - Growth Plan 5,000,000.00 - 5,000,000.00 5,000,000.00 -
UTI - Treasury Advantage Fund Institutional Plan (Growth Option) 15,315.45 64,553.82 79,869.27 79,869.27 -
UTI Floating Rate Fund Short Term Plan - Inst. Growth Option 38,239.04 38,239.04 38,239.04 -
UTI Liquid Cash plan Institutional - Growth option 59,347.15 59,347.15 48,440.65 10,906.50
UTI Money Market Fund - Growth Plan 1,846.82 1,846.82 - 1,846.82
LICMF Savings Plus Fund - Growth Plan 6,939,926.54 9,446,152.02 16,386,078.56 16,386,078.56 -
LICMF Income Plus Fund - Growth Plan 5,721,352.05 5,721,352.05 5,721,352.05 -
LICMF Liquid Fund - Growth Plan 13,259,297.84 13,259,297.84 12,840,148.88 419,148.96
Taurus Ultra Short Term Bond Fund - Inst. Growth Plan 9,269.79 9,269.79 9,269.79 -
Taurus Liquid Fund 28,972.85 28,972.85 24,289.35 4,683.50
DWS Treasury Fund Investment - Regular Plan - Growth 481,258.98 481,258.98 481,258.98 -
DWS Treasury Fund Cash - Regular Plan - Growth 483,780.80 483,780.80 483,780.80 -
DWS Insta Cash Plus Fund - institutional Plan Growth 996,631.78 996,631.78 343,149.70 653,482.08
IDFC Cash Fund - Inst Plan B - Growth 1,185,964.48 1,185,964.48 901,004.11 284,960.36
IDFC Savings Advantage Fund - Plan A- Growth 3,836.29 3,836.29 3,836.29 -
IDFC Money Manager Fund - Investment Plan - Inst Plan B - Growth 691,683.61 691,683.61 691,683.61 -
IDFC Money Manager Fund - Treasury Plan - Inst Plan B - Growth 687,600.15 - 687,600.15 687,600.15 -
Prudential ICICI Flexible income plan premium - Growth 134,404.92 876,247.61 1,010,652.53 1,010,652.53 -
ICICI Prudential Interval Fund II QLY Interval Fund
Plan D Inst. Cummulative 2,007,729.12 2,007,729.12 982,067.45 1,025,661.67
ICICI Prudential Banking & PSU Debt Fund - Growth 1,987,755.43 1,957,770.88 3,945,526.31 3,945,526.31 -
ICICI Prudential Institutional Liquid Plan - Super Institutional Growth 1,290,243.33 1,290,243.33 1,203,958.48 86,284.85
HDFC Cash Management Fund - Savings Plan - Growth 5,971,681.35 5,971,681.35 5,483,552.64 488,128.71
HDFC Cash Management Fund - Treasury Advantage
Plan - Wholesale - Growth 2,817,501.74 1,221,850.38 4,039,352.12 4,039,352.12 -
HDFC High Interest Fund - Short Term Plan 536,806.47 536,806.47 536,806.47 -
Canara Robeco Interval Series 2 - Quarterly Plan 2 - Inst. Growth Fund 5,832,887.77 - 5,832,887.77 5,832,887.77 -
Canara Robeco Liquid Fund - Institutional Growth 1,150,403.79 1,150,403.79 1,150,403.79 -
Axis Liquid Fund - Growth 45,473.18 45,473.18 45,473.18 -
Axis Treasury Advantage Fund - Growth 5,000.00 12,194.61 17,194.61 17,194.61 -
Peerless Liquid Fund - Super Inst. Growth 4,509,443.23 4,509,443.23 3,558,573.81 950,869.41
Edelweiss Liquid fund - Retail - Growth Plan 227,960.75 227,960.75 227,960.75 -
Morgan Stanley Short Term Bond Fund-Institutional plus Growth 1,000,000.00 - 1,000,000.00 1,000,000.00 -
Daiwa Liquid Fund - Retail Plan - Growth Option 4,565.13 4,565.13 - 4,565.13
Pramerica Liquid Fund - Growth Option 4,786.10 4,786.10 - 4,786.10
HSBC Cash Fund - Institutional Plan - Growth 314,946.74 314,946.74 - 314,946.74
Sundaram Money Fund Institutional - APPN 369,207.14 369,207.14 - 369,207.14
LQG- IDBI Liquid Fund- Growth 7,130.62 7,130.62 - 7,130.62
No. in units
Schedules to Accounts
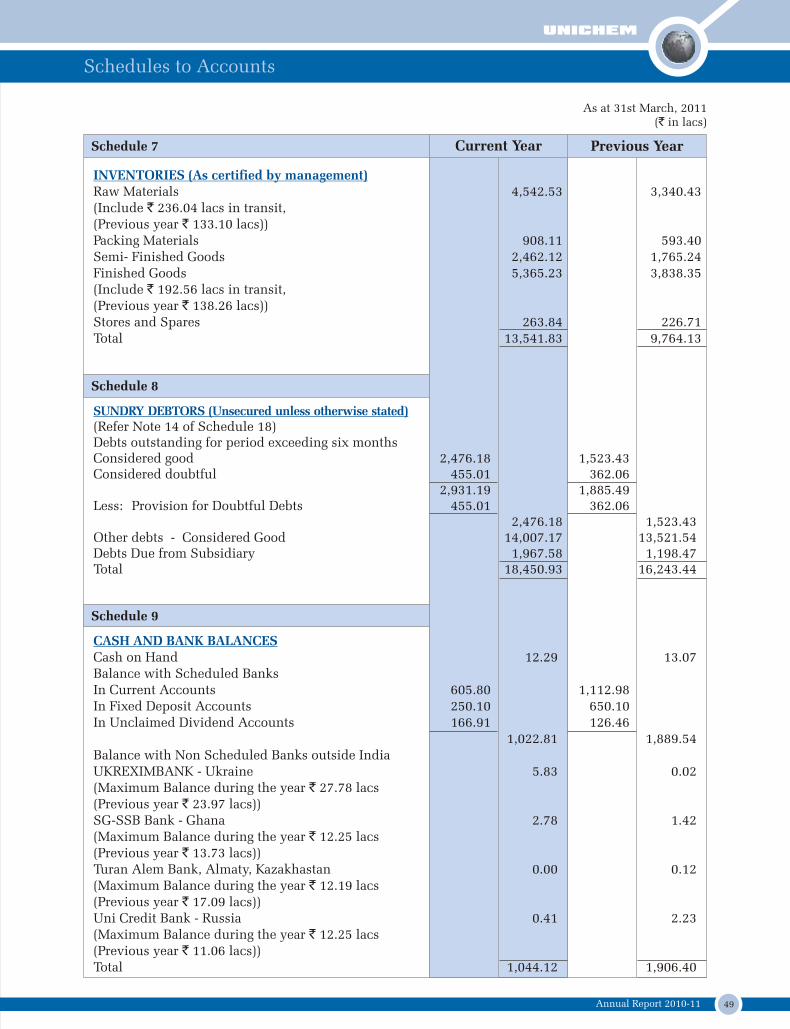
49Annual Report 2010-11
INVENTORIES (As certified by management)Raw Materials 4,542.53 3,340.43(Include ` 236.04 lacs in transit, (Previous year ` 133.10 lacs))Packing Materials 908.11 593.40Semi- Finished Goods 2,462.12 1,765.24Finished Goods 5,365.23 3,838.35(Include ` 192.56 lacs in transit, (Previous year ` 138.26 lacs))Stores and Spares 263.84 226.71Total 13,541.83 9,764.13
Previous YearCurrent YearSchedule 7
As at 31st March, 2011( in lacs)`
SUNDRY DEBTORS (Unsecured unless otherwise stated)(Refer Note 14 of Schedule 18)Debts outstanding for period exceeding six monthsConsidered good 2,476.18 1,523.43Considered doubtful 455.01 362.06
2,931.19 1,885.49Less: Provision for Doubtful Debts 455.01 362.06
2,476.18 1,523.43Other debts - Considered Good 14,007.17 13,521.54Debts Due from Subsidiary 1,967.58 1,198.47Total 18,450.93 16,243.44
Schedule 8
CASH AND BANK BALANCESCash on Hand 12.29 13.07Balance with Scheduled BanksIn Current Accounts 605.80 1,112.98In Fixed Deposit Accounts 250.10 650.10In Unclaimed Dividend Accounts 166.91 126.46
1,022.81 1,889.54Balance with Non Scheduled Banks outside IndiaUKREXIMBANK - Ukraine 5.83 0.02(Maximum Balance during the year ` 27.78 lacs (Previous year ` 23.97 lacs))SG-SSB Bank - Ghana 2.78 1.42(Maximum Balance during the year ` 12.25 lacs (Previous year ` 13.73 lacs))Turan Alem Bank, Almaty, Kazakhastan 0.00 0.12(Maximum Balance during the year ` 12.19 lacs (Previous year ` 17.09 lacs))Uni Credit Bank - Russia 0.41 2.23(Maximum Balance during the year ` 12.25 lacs(Previous year ` 11.06 lacs))Total 1,044.12 1,906.40
Schedule 9
Schedules to Accounts
50 Annual Report 2010-11
LOANS AND ADVANCES (UNSECURED)Considered good unless otherwise stated
Advances recoverable in Cash or in kind or for value to be receivedConsidered Good 3,594.66 3,322.73 Considered Doubtful 90.04 120.05
3,684.70 3,442.78 Less : Provision for Doubtful Advances 90.04 120.05
3,594.66 3,322.73 Deposits 374.76 350.28
Advance payment of Income Tax (Net of Provision for Taxation) 251.80 146.12Balance with Excise Department 816.91 525.55
1,068.71 671.67Total 5,038.13 4,344.68
Previous YearCurrent YearSchedule 10
As at 31st March, 2011( in lacs)`
CURRENT LIABILITIESDue to Directors 147.30 165.71Sundry CreditorsPayable to Micro, Small and Medium Enterprises(Refer note 5 of Schedule 18) - -Payable to Other Sundry Creditors 12,038.15 11,340.41
12,038.15 11,340.41Investor Education and Protection Fund shall becredited by the following (see note below)a) Unclaimed Dividend 166.91 126.46b) Unpaid matured deposits 0.75 1.14
167.66 127.60Other Current Liabilities 924.35 840.69
Total 13,277.46 12,474.41
Schedule 11
Schedule 12
Note:The actual amounts to be transferred to the Investor Education and Protection Fund in respect of item(a) and (b) shall be determined on the due dates.
PROVISIONS Proposed Dividend 2,526.71 -Tax on Proposed Dividend 409.89 -Interim Dividend (Refer Note 23 of Schedule 18) - 2,524.82Tax on Interim Dividend (Refer Note 23 of Schedule 18) - 419.34Provision for Employees benefit schemes 723.36 619.73
Total 3,659.96 3,563.89
Schedules to Accounts
51Annual Report 2010-11
Previous YearCurrent Year
For the year ended 31st March, 2011(` in lacs)
OTHER INCOMEDividend received 0.10 0.09Profit on sale of fixed assets 1.60 50.54Profit on sale of current investments 251.80 160.86Miscellaneous income 263.94 263.42Discounting Charges received 8.49 23.23Provision for expenses written back 63.57 160.22Foreign Exchange Fluctuation Gain (Net) 70.72 -
Total 660.22 658.36
Schedule 14
MANUFACTURING, SELLING & ADMINISTRATIVE EXPENSESRaw Materials Consumed 14,716.71 10,788.14 Packing materials, containers consumed 3,021.95 2,125.66 Stores and Spares consumed 611.66 376.78 Purchases of Finished goods 10,161.27 10,167.05 Manufacturing Charges 932.32 821.89 Personnel Cost : Salaries, wages, Ex-gratia bonus and commission 8,379.62 6,923.01 Contribution to Provident and other funds 692.02 589.39 Employees' Welfare Expenses 235.00 73.00 (Include ` 43.11 lacs (Previous year ` -131.88 lacs) 9,306.64 7,585.40 of Employees' compensation expenses under ESOS Schemes.)Power and Fuel 2,183.13 1,563.35 Rent 135.99 126.84 Insurance 187.32 162.11 Repairs: Plant and Machinery 286.38 251.25 Buildings 116.58 91.67 Others 401.78 374.37 Rates and Taxes 335.17 365.62 Advertising and sales promotion 7,851.27 6,131.94 Travelling and Conveyance 2,685.54 2,283.18 Freight outward 1,369.10 961.55 Directors' Fees 7.60 7.70 Commission on sales 1,188.12 892.28 Loss on sale / scrapping of assets 6.81 202.06 Foreign Exchange Fluctuation Loss (Net) - 224.22Bad debts, loans, advances and deposits written off - 427.26Less: adjusted out of provision for doubtful debts, loans, advances and deposits - 298.78
- 128.48Provision for doubtful debts, loans, advances and deposits for the year 62.93 41.94 Establishment and Administrative Expenses 3,184.58 2,434.40 Provision for Diminution of Investments in Subsidiary 125.66 72.00
58,878.51 48,179.88
Schedule 15
SALES / INCOME FROM OPERATIONS (GROSS)Sales 76,329.94 68,675.19Export benefits 392.66 337.11Sundries 299.60 339.02
Total 77,022.20 69,351.32
Schedule 13
Schedules to Accounts
52 Annual Report 2010-11
RESEARCH & DEVELOPMENT EXPENDITURE(At units approved by Dept of Scientific & Industrial Research)
Salaries, Wages and Exgratia 1,173.47 946.95 Contribution to Provident fund and other Funds 63.68 52.86 Employees' welfare expenses 10.07 11.02 Rates and Taxes 24.00 22.99 Repairs: Plant and Machinery 46.29 18.73 Buildings - 1.49 Others 35.34 33.85 Power and fuel 135.94 98.24 Travelling and conveyance 51.79 41.06 Others 2,127.74 1,450.83
Total 3,668.32 2,678.02
Previous YearCurrent Year
Schedule 16
INTERESTBanks 6.70 5.13 Other 188.12 172.08
194.82 177.21
Less : Interest earned (Refer note 10 of Schedule 18 ) 136.00 126.24 (TDS deducted of ` 13.66 lacs (Previous year ` 18.93 lacs))
Total 58.82 50.97
Schedule 17
Increase/(Decrease) in stocks of semi finished & finished goodsStocks at commencement Semi-Finished Goods 1,765.24 1,183.72 Finished Goods 3,838.35 4,676.52
5,603.59 5,860.24 Stocks at close Semi-Finished Goods 2,462.12 1,765.24 Finished Goods 5,365.23 3,838.35
7,827.35 5,603.59 (2,223.76) 256.65
Total 56,654.75 48,436.53
For the year ended 31st March, 2011(` in lacs)
Schedule 15
Schedules to Accounts
53Annual Report 2010-11
Schedule 18
1 Basis of AccountingThe financial statements are prepared under historical cost convention,on accrual basis,in accordance with the provisions of Companies Act,1956 and the accounting principles generally accepted in India and comply with the Accounting Standards prescribed in the Companies (Accounting Standards) Rules,2006.
2 Use of Estimates:The preparation of financial statements in conformity with Generally Accepted Accounting Principles in India requires management to make estimates and assumptions that affect the reported amounts of assets and liabilities and disclosure of contingent liabilities on the date of financial statements and the reported amounts of revenues and expenses during the reporting year. Actual results could differ from these estimates. Any revision to accounting estimates is recognised prospectively in current and future periods.
3 InventoriesInventories are valued after providing for obsolescenses as under :Stock of Raw materials are valued at lower of cost or Net realisable value ,which includes duties and taxes ( Except those subsequently recoverable).
Stock of Packing materials & Stores and spares are valued at cost ,which includes duties and taxes ( Except those subsequently recoverable).
Stock of Finished products including traded goods and Semi finished goods are valued at lower of cost or net realisable value.
However Raw materials & Semi finished goods held for use in the production of inventories are not written down below cost if the finished products in which they will be incorporated are expected to be sold at or above cost.
Cost includes material cost, labour, direct expenses, related production overheads and applicable taxes. Cost is determined on weighted average basis.
4 Fixed Assets and Depreciation/AmortisationFixed Assets are recorded at cost including any directly attributable expenses incurred (net of recoverable taxes) to bring the assets to working condition for their intended use. Advances paid towards the acquisition of fixed assets outstanding at each balance sheet date and the cost of fixed assets not ready for their intended use before such date are disclosed under capital work-in-progress
Depreciation is provided on Straight- Line Method on Buildings and Plant & Machinery except mentioned below and on Written Down Value Method on other fixed assets at rates specified in schedule XIV of Companies Act, 1956. Higher rates are considered based on useful lives of the assets determined by management as under;
Depreciation methods, useful lives and residual values are reviewed at each reporting date.Leasehold Land is amortised over the period of lease. Intangible assets are amortised on straight line basis over the useful lives of the assets not exceeding 10 years.Assets costing individually upto Rs. 5,000 are written off to revenue. Assets costing between Rs. 5,000 and Rs. 15,000 are depreciated fully in the year of purchase except when value of individual assets purchased in aggregate exceeds Rs. 100,000.
5 Research and Development ExpensesRevenue expenditure incurred on research and development is expensed as incurred. Capital expenditure on research and development is capitalised as fixed assets and depreciated in accordance with the depreciation policy of the Company.
Statement of Significant Accounting Policies
Assets Rates
Plant & Machiney (Lab Equipments) 4.75% to 20%
Computers and Softwares 16.21% to 25%
Schedules to Accounts
54 Annual Report 2010-11
6 Revenue RecognitionRevenue is recognised to the extent that it is probable that the economic benefits will flow to the Company and the revenue can be reliably measured.
Revenue from sales of goods is recognised when significant risks and rewards of ownership are transferred to the customers. Sales are net of sales tax, claims for date expired goods & breakage but inclusive of excise duty and rate differences , if any.
Revenue from Product development charges is recognised as and when services are rendered and related costs are incurred in accordance with the terms of the specific contracts. Benefits on account of entitlement to import of goods free of duty under the 'Duty Entitlement Pass Book under Duty Exemption Scheme' and benefits on account of export promotion schemes is accounted when the right to receive is reasonably certain. Interest income is recognised on a time proportion basis taking into account the amount outstanding and the rate applicable. Dividend income from investment is recognised when the right to receive payment is established.
7 Foreign Currency TransactionsThe transactions in foreign currencies are accounted for at the exchange rate prevailing on the date of transaction. The exchange difference arising on actual settlement of foreign exchange transaction are recognized in the Profit and Loss Account of the year. Monetory assets and liabilities in foreign exchange, which are outstanding as at the year end, are translated at the year end at the closing rate and the resultant exchange differences are recognised in the Profit and Loss Account.
Investments in foreign subsidiaries are recorded in Indian currency at the rate of exchange prevailing at the time when the original investments were made.
The premium or discounts arising at the inception of forward exchange contract is amortised as expense or income over the life of contract. Exchange differences on such contracts are recognised as gain / loss in the Profit and Loss account of the period.
8 InvestmentsInvestments that are readily realisable and intended to be held for not more than 12 months are classified as current investments. All other investments are classified as long-term investment. Current investments are carried at the lower of cost and fair value. Long-term investments are carried at cost less diminution in value, if any. Provisions are recognized for any decline, other than temporary, in the carrying value of long term investment as determined by management.
9 Borrowing costsBorrowing costs that are directly attributable to the acquisition, construction or production of qualifying assets are capitalised as part of the cost of such assets. A qualifying assets is one that necessarily takes substantial period of time to get ready for intended use. All other borrowing costs are charged to revenue.
10 Employee BenefitsShort Term Employee BenefitsShort term employee benefits are recognised in the Profit and Loss Account as an expense at their undiscounted amount.
Long Term Employee Benefits(a) Defined Contribution PlansEmployee benefits in the form of employees provident fund scheme, employee state insurance scheme, employee pension scheme and superannuation are recognised in the Profit and Loss Account on accrual basis.
(b) Defined Benefit PlanDefined Benefit Plans in form of Gratuity and Compensated Absenses are provided on the basis of actuarial valuations, as at the balance sheet date, carried out by an independent actuary using Projected Unit Credit Method. Actuarial gain or loss is charged in Profit & Loss A/c for the year.
Termination BenefitsCompensation paid to employees under Voluntary Retirement Scheme is recognised as an expense when incurred.
Schedules to Accounts
55Annual Report 2010-11
11 LeasesLeases where the lessor effectively retains substanially all the risks and benefits of ownership of leased assets are classified as operating leases. Lease rentals for asset taken on operating lease are charged to profit & loss account as incurred.
12 Earnings per shareThe basic earning per share ("EPS") is calculated by dividing the Profit/(Loss) after Tax by the weighted average number of Equity Shares outstanding. The diluted EPS is calculated after adjusting the weighted average number of Equity shares to give effect to the potential equity shares on the stock options outstanding.
13 Impairment of AssetsThe Management periodically assesses, using external and internal sources, whether there is an indication that an asset may be impaired. If any such indication exists, the recoverable amount of the asset is estimated in order to determine the extent of impairment loss. Recoverable amount is the higher of an asset’s net selling price and value in use. In assessing value in use, the estimated future cash flows expected from the continuing use of the asset and from its disposal are discounted to their present value using a pre-tax discount rate that reflects the current market assessments of time value of money and the risks specific to the asset. Net selling price is the amount obtainable from the sale of an asset in an arm's length transaction between knowledgeable, willing parties, less the cost of disposal. Reversal of impairment loss is recognised immediately as income in the profit and loss account.
14 Provisions, Contingent liabilities and Contingent assetsProvision is recognised when the Company has a present obligation as a result of past events and it is probable that outflow of resources will be required to settle the obligation, in respect of which a reliable estimates can be made. A disclosure for contingent liability is made when there is a possible obligation or a present obligation that may, but probably will not, require an out flow of resources. When there is a possible obligation or a present obligation in respect of which the likelihood of outflow of resources is remote, no provision or disclosure is made. Contingent assets are not recognised in the financial statements. Provisions and contingencies are reviewed at each balance sheet date and adjusted to reflect the correct management estimates.
15 Employees Stock Compensation CostsMeasurement and disclosure of the employee share-based payment plans is done in accordance with SEBI (Employee Stock Option Scheme and Employee Stock Purchase Scheme) Guidelines, 1999 and the Guidance Note on Accounting for Employee Share-based Payments, issued by the Institute of Chartered Accountants of India. The Company measures compensation cost as excess of the fair value of the Company's stock on the stock option grant date over the exercise price. Compensation expense, if any, is amortised over the vesting period of the option on a straight line basis.
16 TaxationCurrent tax is measured at an amount payable for the period in accordance with the Income Tax Act, 1961.
Deferred tax expense or benefit is recognised on timing differences being the difference between taxable incomes and accounting income that originate in one period and are capable of reversal in one or more subsequent periods. Deferred tax assets and liabilities are measured using the tax rates and tax laws that have been enacted or substantively enacted by the balance sheet date. Deferred tax assets in respect of unabsorbed depreciation and carry forward of losses are recognised only to the extent that there is virtual certainty that sufficient taxable income will be available to realise these assets. All other deferred tax assets are recognised only to the extent that there is reasonable certainty that sufficient future taxable income will be available to realise these assets. At each Balance Sheet date, the carrying value amount of defered tax assets are reviewed to reassure realisation.
The levy of Fringe Benefit Tax(FBT) is not applicable as the Finance (No.2) Act, 2009 has abolished FBT with effect from Financial Year 2009-2010.
17 Provision for Doubtful DebtsA percentage based provision is made for debtors outstanding for more than one year based on ageing analysis thereof and a specific provision is made in cases where the collection of debt is uncertain.
Schedules to Accounts
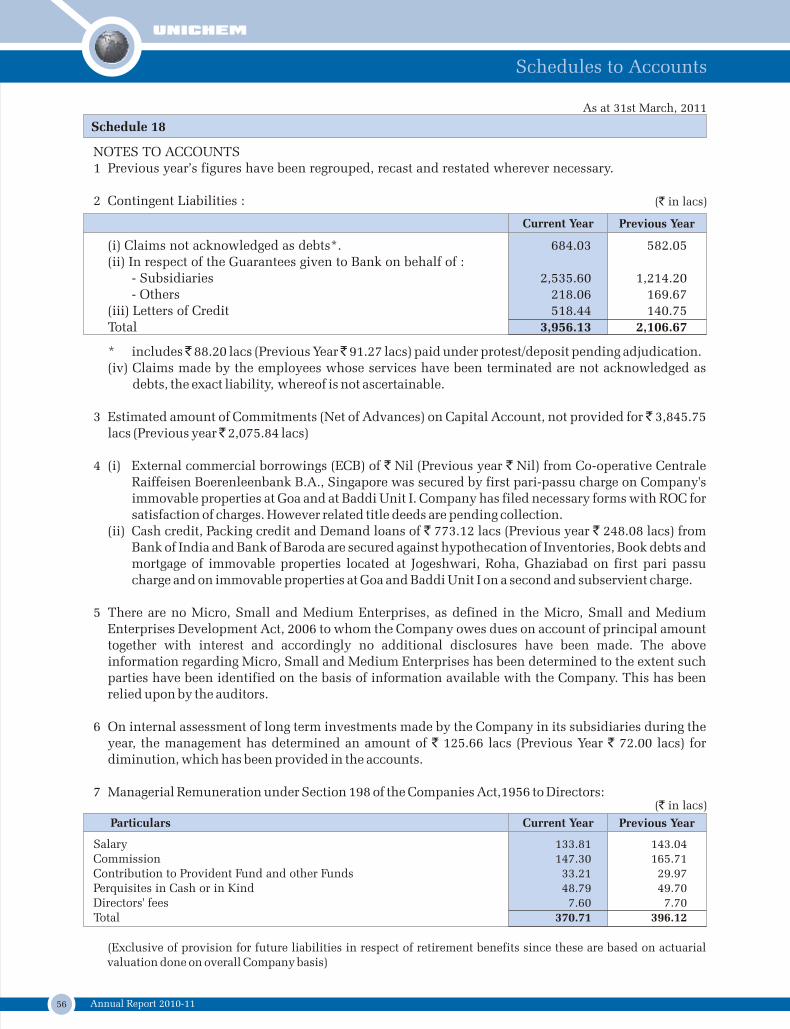
56 Annual Report 2010-11
Current Year Previous Year
(` in lacs)
Salary 133.81 143.04Commission 147.30 165.71 Contribution to Provident Fund and other Funds 33.21 29.97 Perquisites in Cash or in Kind 48.79 49.70 Directors' fees 7.60 7.70Total 370.71 396.12
Particulars
(Exclusive of provision for future liabilities in respect of retirement benefits since these are based on actuarial valuation done on overall Company basis)
Schedule 18
* includes ̀ 88.20 lacs (Previous Year ̀ 91.27 lacs) paid under protest/deposit pending adjudication.(iv) Claims made by the employees whose services have been terminated are not acknowledged as
debts, the exact liability, whereof is not ascertainable.
3 Estimated amount of Commitments (Net of Advances) on Capital Account, not provided for ̀ 3,845.75 lacs (Previous year ̀ 2,075.84 lacs)
4 (i) External commercial borrowings (ECB) of ` Nil (Previous year ` Nil) from Co-operative Centrale Raiffeisen Boerenleenbank B.A., Singapore was secured by first pari-passu charge on Company's immovable properties at Goa and at Baddi Unit I. Company has filed necessary forms with ROC for satisfaction of charges. However related title deeds are pending collection.
(ii) Cash credit, Packing credit and Demand loans of ` 773.12 lacs (Previous year ` 248.08 lacs) from Bank of India and Bank of Baroda are secured against hypothecation of Inventories, Book debts and mortgage of immovable properties located at Jogeshwari, Roha, Ghaziabad on first pari passu charge and on immovable properties at Goa and Baddi Unit I on a second and subservient charge.
5 There are no Micro, Small and Medium Enterprises, as defined in the Micro, Small and Medium Enterprises Development Act, 2006 to whom the Company owes dues on account of principal amount together with interest and accordingly no additional disclosures have been made. The above information regarding Micro, Small and Medium Enterprises has been determined to the extent such parties have been identified on the basis of information available with the Company. This has been relied upon by the auditors.
6 On internal assessment of long term investments made by the Company in its subsidiaries during the year, the management has determined an amount of ` 125.66 lacs (Previous Year ` 72.00 lacs) for diminution, which has been provided in the accounts.
7 Managerial Remuneration under Section 198 of the Companies Act,1956 to Directors:
NOTES TO ACCOUNTS1 Previous year’s figures have been regrouped, recast and restated wherever necessary.
2 Contingent Liabilities :
Current Year Previous Year
(` in lacs)
(i) Claims not acknowledged as debts*. 684.03 582.05 (ii) In respect of the Guarantees given to Bank on behalf of :
- Subsidiaries 2,535.60 1,214.20- Others 218.06 169.67
(iii) Letters of Credit 518.44 140.75Total 3,956.13 2,106.67
As at 31st March, 2011
Schedules to Accounts
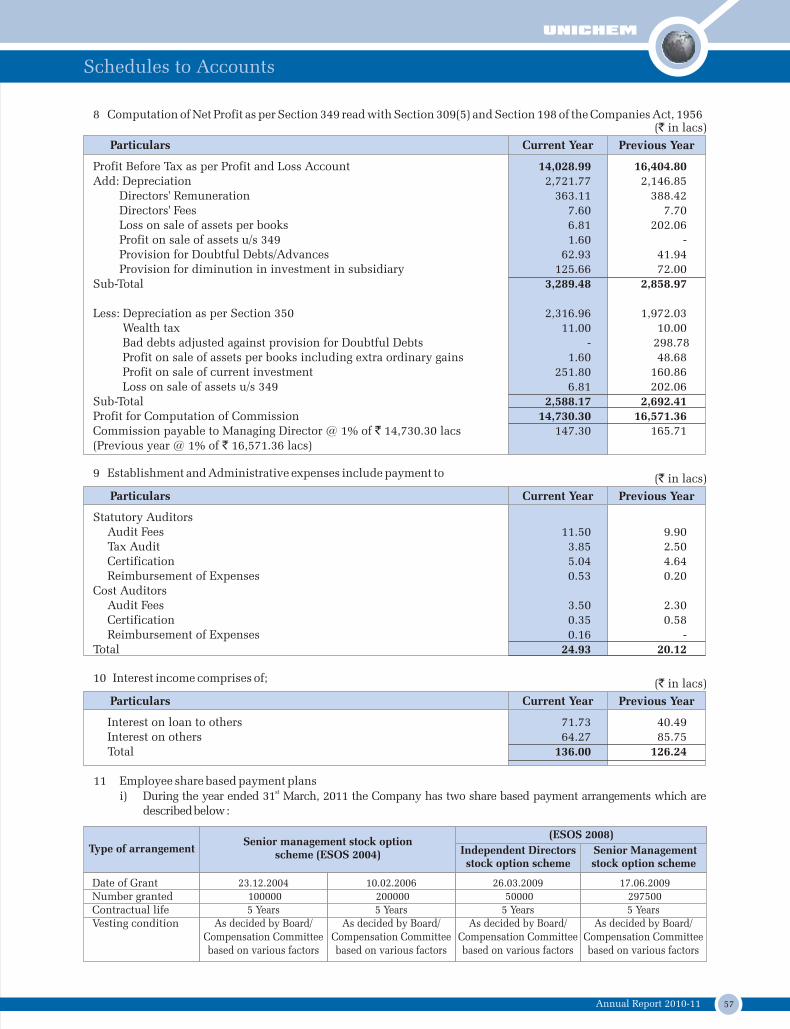
57Annual Report 2010-11
9 Establishment and Administrative expenses include payment to
Current Year Previous Year
(` in lacs)
Statutory AuditorsAudit Fees 11.50 9.90 Tax Audit 3.85 2.50 Certification 5.04 4.64 Reimbursement of Expenses 0.53 0.20
Cost Auditors Audit Fees 3.50 2.30Certification 0.35 0.58Reimbursement of Expenses 0.16 -
Total 24.93 20.12
Particulars
10 Interest income comprises of;
Current Year Previous Year
(` in lacs)
Interest on loan to others 71.73 40.49Interest on others 64.27 85.75Total 136.00 126.24
Particulars
8 Computation of Net Profit as per Section 349 read with Section 309(5) and Section 198 of the Companies Act, 1956
Current Year Previous Year
(` in lacs)
Profit Before Tax as per Profit and Loss Account 14,028.99 16,404.80 Add: Depreciation 2,721.77 2,146.85 Directors' Remuneration 363.11 388.42 Directors' Fees 7.60 7.70 Loss on sale of assets per books 6.81 202.06 Profit on sale of assets u/s 349 1.60 - Provision for Doubtful Debts/Advances 62.93 41.94 Provision for diminution in investment in subsidiary 125.66 72.00Sub-Total 3,289.48 2,858.97
Less: Depreciation as per Section 350 2,316.96 1,972.03 Wealth tax 11.00 10.00 Bad debts adjusted against provision for Doubtful Debts - 298.78 Profit on sale of assets per books including extra ordinary gains 1.60 48.68 Profit on sale of current investment 251.80 160.86 Loss on sale of assets u/s 349 6.81 202.06Sub-Total 2,588.17 2,692.41 Profit for Computation of Commission 14,730.30 16,571.36Commission payable to Managing Director @ 1% of ` 14,730.30 lacs 147.30 165.71(Previous year @ 1% of ` 16,571.36 lacs)
Particulars
11 Employee share based payment planssti) During the year ended 31 March, 2011 the Company has two share based payment arrangements which are
described below :
Type of arrangementSenior management stock option
scheme (ESOS 2004) Independent Directorsstock option scheme
Date of GrantNumber grantedContractual lifeVesting condition
23.12.2004 1000005 Years
As decided by Board/ Compensation Committee based on various factors
10.02.2006 2000005 Years
As decided by Board/ Compensation Committee based on various factors
Senior Management stock option scheme
26.03.2009 50000 5 Years
As decided by Board/ Compensation Committee based on various factors
17.06.2009 2975005 Years
As decided by Board/ Compensation Committee based on various factors
(ESOS 2008)
Schedules to Accounts
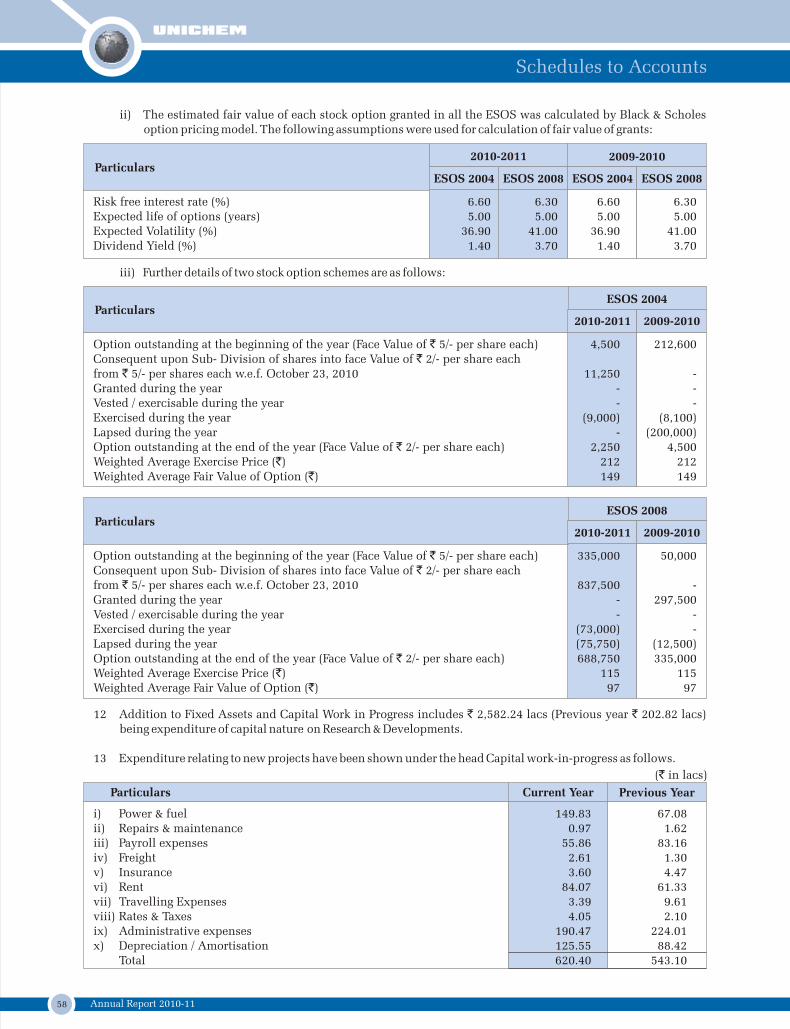
58 Annual Report 2010-11
Current Year Previous Year
(` in lacs)
i) Power & fuel 149.83 67.08 ii) Repairs & maintenance 0.97 1.62 iii) Payroll expenses 55.86 83.16 iv) Freight 2.61 1.30 v) Insurance 3.60 4.47 vi) Rent 84.07 61.33 vii) Travelling Expenses 3.39 9.61 viii) Rates & Taxes 4.05 2.10 ix) Administrative expenses 190.47 224.01 x) Depreciation / Amortisation 125.55 88.42
Total 620.40 543.10
Particulars
12 Addition to Fixed Assets and Capital Work in Progress includes ` 2,582.24 lacs (Previous year ` 202.82 lacs) being expenditure of capital nature on Research & Developments.
13 Expenditure relating to new projects have been shown under the head Capital work-in-progress as follows.
ii) The estimated fair value of each stock option granted in all the ESOS was calculated by Black & Scholes option pricing model. The following assumptions were used for calculation of fair value of grants:
Risk free interest rate (%) 6.60 6.30 6.60 6.30Expected life of options (years) 5.00 5.00 5.00 5.00Expected Volatility (%) 36.90 41.00 36.90 41.00Dividend Yield (%) 1.40 3.70 1.40 3.70
2009-20102010-2011
ESOS 2004 ESOS 2008 ESOS 2004 ESOS 2008
iii) Further details of two stock option schemes are as follows:
Option outstanding at the beginning of the year (Face Value of ` 5/- per share each) 4,500 212,600 Consequent upon Sub- Division of shares into face Value of ` 2/- per share each from ` 5/- per shares each w.e.f. October 23, 2010 11,250 -Granted during the year - -Vested / exercisable during the year - -Exercised during the year (9,000) (8,100)Lapsed during the year - (200,000)Option outstanding at the end of the year (Face Value of ` 2/- per share each) 2,250 4,500Weighted Average Exercise Price (`) 212 212Weighted Average Fair Value of Option (`) 149 149
ESOS 2004
2010-2011 2009-2010Particulars
Particulars
Option outstanding at the beginning of the year (Face Value of ` 5/- per share each) 335,000 50,000Consequent upon Sub- Division of shares into face Value of ` 2/- per share each from ` 5/- per shares each w.e.f. October 23, 2010 837,500 -Granted during the year - 297,500Vested / exercisable during the year - -Exercised during the year (73,000) -Lapsed during the year (75,750) (12,500)Option outstanding at the end of the year (Face Value of ` 2/- per share each) 688,750 335,000Weighted Average Exercise Price (`) 115 115Weighted Average Fair Value of Option (`) 97 97
ESOS 2008
2010-2011 2009-2010Particulars
Schedules to Accounts
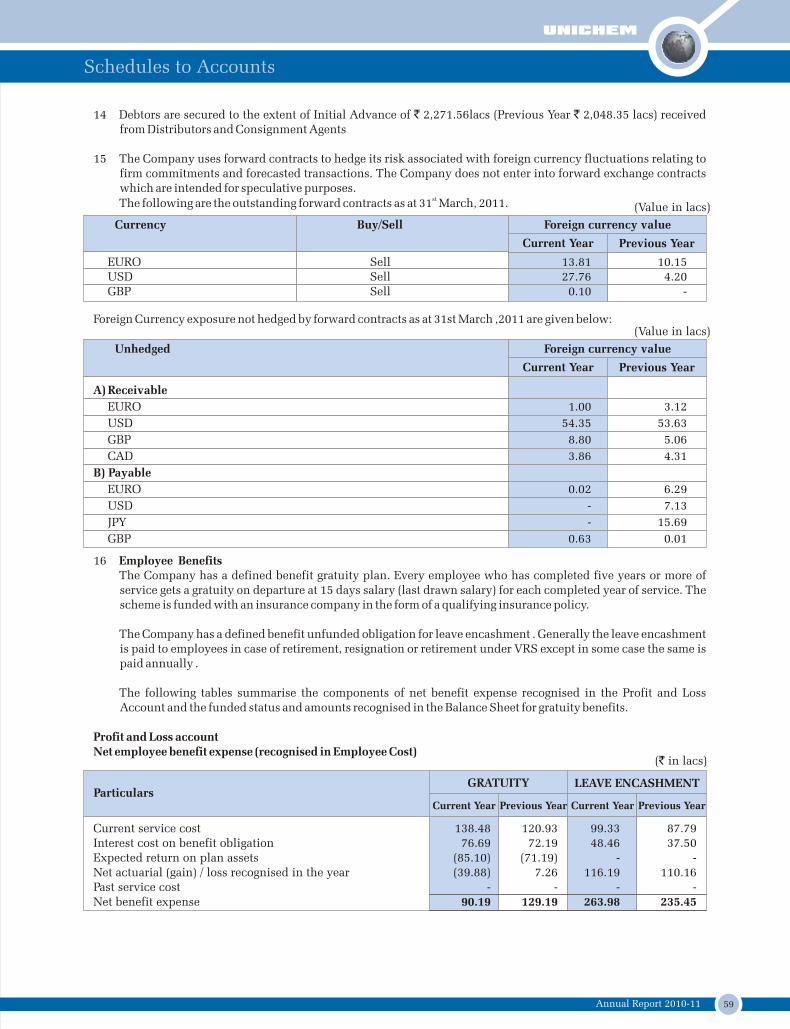
59Annual Report 2010-11
Current service cost 138.48 120.93 99.33 87.79Interest cost on benefit obligation 76.69 72.19 48.46 37.50Expected return on plan assets (85.10) (71.19) - -Net actuarial (gain) / loss recognised in the year (39.88) 7.26 116.19 110.16Past service cost - - - -Net benefit expense 90.19 129.19 263.98 235.45
LEAVE ENCASHMENTGRATUITY
Current Year Previous Year Current Year Previous Year
16 Employee BenefitsThe Company has a defined benefit gratuity plan. Every employee who has completed five years or more of service gets a gratuity on departure at 15 days salary (last drawn salary) for each completed year of service. The scheme is funded with an insurance company in the form of a qualifying insurance policy.
The Company has a defined benefit unfunded obligation for leave encashment . Generally the leave encashment is paid to employees in case of retirement, resignation or retirement under VRS except in some case the same is paid annually .
The following tables summarise the components of net benefit expense recognised in the Profit and Loss Account and the funded status and amounts recognised in the Balance Sheet for gratuity benefits.
Profit and Loss accountNet employee benefit expense (recognised in Employee Cost)
(` in lacs)
14 Debtors are secured to the extent of Initial Advance of ` 2,271.56lacs (Previous Year ` 2,048.35 lacs) received from Distributors and Consignment Agents
15 The Company uses forward contracts to hedge its risk associated with foreign currency fluctuations relating to firm commitments and forecasted transactions. The Company does not enter into forward exchange contracts which are intended for speculative purposes.
stThe following are the outstanding forward contracts as at 31 March, 2011. (Value in lacs)
Currency
Current Year Previous Year
Foreign currency valueBuy/Sell
(Value in lacs)
Unhedged
Current Year Previous Year
Foreign currency value
Foreign Currency exposure not hedged by forward contracts as at 31st March ,2011 are given below:
Particulars
A) Receivable
EURO 1.00 3.12
USD 54.35 53.63
GBP 8.80 5.06
CAD 3.86 4.31
B) Payable
EURO 0.02 6.29
USD - 7.13
JPY - 15.69
GBP 0.63 0.01
EURO Sell 13.81 10.15USD Sell 27.76 4.20GBP Sell 0.10 -
Schedules to Accounts
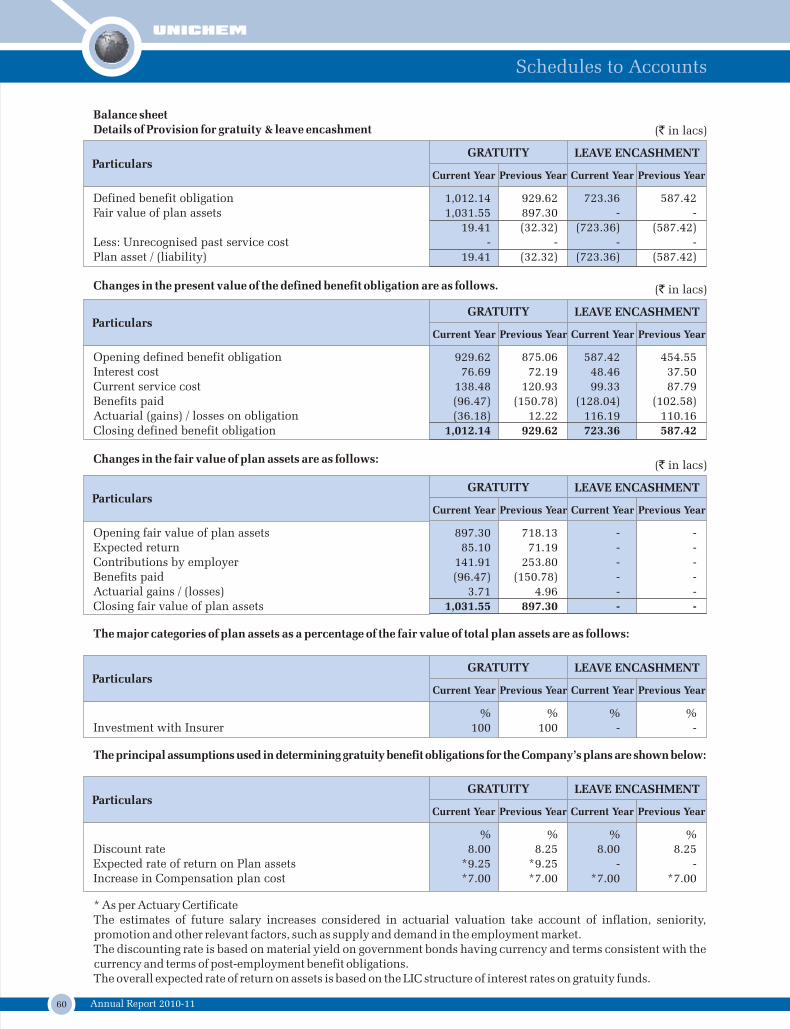
60 Annual Report 2010-11
Opening fair value of plan assets 897.30 718.13 - - Expected return 85.10 71.19 - - Contributions by employer 141.91 253.80 - - Benefits paid (96.47) (150.78) - - Actuarial gains / (losses) 3.71 4.96 - - Closing fair value of plan assets 1,031.55 897.30 - -
LEAVE ENCASHMENTGRATUITY
Current Year Previous Year Current Year Previous Year
Changes in the fair value of plan assets are as follows:
% % % %Investment with Insurer 100 100 - -
LEAVE ENCASHMENTGRATUITY
Current Year Previous Year Current Year Previous Year
The major categories of plan assets as a percentage of the fair value of total plan assets are as follows:
% % % %Discount rate 8.00 8.25 8.00 8.25Expected rate of return on Plan assets *9.25 *9.25 - -Increase in Compensation plan cost *7.00 *7.00 *7.00 *7.00
LEAVE ENCASHMENTGRATUITY
Current Year Previous Year Current Year Previous Year
The principal assumptions used in determining gratuity benefit obligations for the Company’s plans are shown below:
* As per Actuary CertificateThe estimates of future salary increases considered in actuarial valuation take account of inflation, seniority, promotion and other relevant factors, such as supply and demand in the employment market.The discounting rate is based on material yield on government bonds having currency and terms consistent with the currency and terms of post-employment benefit obligations.The overall expected rate of return on assets is based on the LIC structure of interest rates on gratuity funds.
Defined benefit obligation 1,012.14 929.62 723.36 587.42Fair value of plan assets 1,031.55 897.30 - -
19.41 (32.32) (723.36) (587.42)Less: Unrecognised past service cost - - - -Plan asset / (liability) 19.41 (32.32) (723.36) (587.42)
LEAVE ENCASHMENTGRATUITY
Current Year Previous Year Current Year Previous Year
Balance sheetDetails of Provision for gratuity & leave encashment
Opening defined benefit obligation 929.62 875.06 587.42 454.55Interest cost 76.69 72.19 48.46 37.50Current service cost 138.48 120.93 99.33 87.79Benefits paid (96.47) (150.78) (128.04) (102.58)Actuarial (gains) / losses on obligation (36.18) 12.22 116.19 110.16 Closing defined benefit obligation 1,012.14 929.62 723.36 587.42
LEAVE ENCASHMENTGRATUITY
Current Year Previous Year Current Year Previous Year
Changes in the present value of the defined benefit obligation are as follows. (` in lacs)
(` in lacs)
(` in lacs)
Particulars
Particulars
Particulars
Particulars
Particulars
Schedules to Accounts
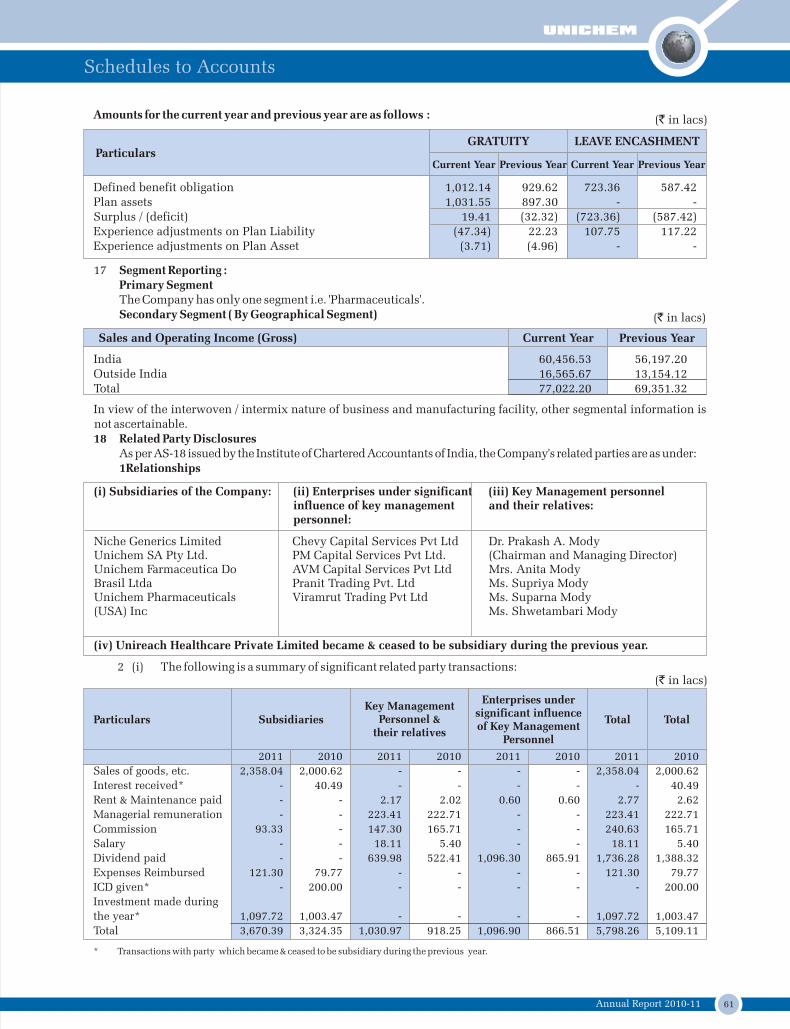
61Annual Report 2010-11
2 (i) The following is a summary of significant related party transactions:
Current Year Previous Year
India 60,456.53 56,197.20Outside India 16,565.67 13,154.12Total 77,022.20 69,351.32
Sales and Operating Income (Gross)
17 Segment Reporting :Primary SegmentThe Company has only one segment i.e. 'Pharmaceuticals'. Secondary Segment ( By Geographical Segment)
In view of the interwoven / intermix nature of business and manufacturing facility, other segmental information is not ascertainable.18 Related Party Disclosures
As per AS-18 issued by the Institute of Chartered Accountants of India, the Company's related parties are as under:1Relationships
Particulars SubsidiariesKey Management
Personnel & their relatives
Enterprises undersignificant influenceof Key Management
Personnel
Total Total
* Transactions with party which became & ceased to be subsidiary during the previous year.
Defined benefit obligation 1,012.14 929.62 723.36 587.42Plan assets 1,031.55 897.30 - -Surplus / (deficit) 19.41 (32.32) (723.36) (587.42)Experience adjustments on Plan Liability (47.34) 22.23 107.75 117.22 Experience adjustments on Plan Asset (3.71) (4.96) - -
LEAVE ENCASHMENTGRATUITY
Current Year Previous Year Current Year Previous Year
Amounts for the current year and previous year are as follows :
2011 2010 2011 2010 2011 2010 2011 2010
Sales of goods, etc. 2,358.04 2,000.62 - - - - 2,358.04 2,000.62
Interest received* - 40.49 - - - - - 40.49
Rent & Maintenance paid - - 2.17 2.02 0.60 0.60 2.77 2.62
Managerial remuneration - - 223.41 222.71 - - 223.41 222.71
Commission 93.33 - 147.30 165.71 - - 240.63 165.71
Salary - - 18.11 5.40 - - 18.11 5.40
Dividend paid - - 639.98 522.41 1,096.30 865.91 1,736.28 1,388.32
Expenses Reimbursed 121.30 79.77 - - - - 121.30 79.77
ICD given* - 200.00 - - - - - 200.00
Investment made during
the year* 1,097.72 1,003.47 - - - - 1,097.72 1,003.47
Total 3,670.39 3,324.35 1,030.97 918.25 1,096.90 866.51 5,798.26 5,109.11
Particulars
(` in lacs)
(i) Subsidiaries of the Company: (ii) Enterprises under significant influence of key management personnel:
(iii) Key Management personnel and their relatives:
Niche Generics LimitedUnichem SA Pty Ltd.Unichem Farmaceutica Do Brasil LtdaUnichem Pharmaceuticals (USA) Inc
Chevy Capital Services Pvt LtdPM Capital Services Pvt Ltd.AVM Capital Services Pvt LtdPranit Trading Pvt. LtdViramrut Trading Pvt Ltd
Dr. Prakash A. Mody (Chairman and Managing Director)Mrs. Anita ModyMs. Supriya ModyMs. Suparna ModyMs. Shwetambari Mody
(` in lacs)
(` in lacs)
(iv) Unireach Healthcare Private Limited became & ceased to be subsidiary during the previous year.
Schedules to Accounts
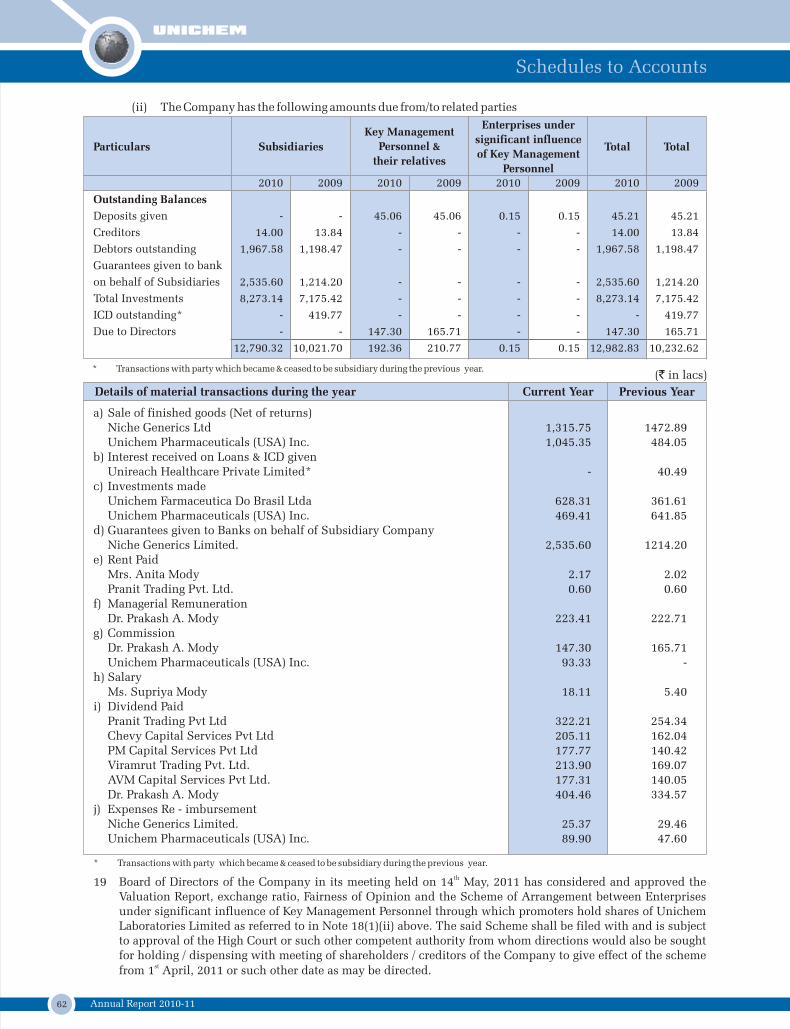
62 Annual Report 2010-11
Current Year Previous Year
(` in lacs)
a) Sale of finished goods (Net of returns)Niche Generics Ltd 1,315.75 1472.89Unichem Pharmaceuticals (USA) Inc. 1,045.35 484.05
b) Interest received on Loans & ICD givenUnireach Healthcare Private Limited* - 40.49
c) Investments madeUnichem Farmaceutica Do Brasil Ltda 628.31 361.61Unichem Pharmaceuticals (USA) Inc. 469.41 641.85
d) Guarantees given to Banks on behalf of Subsidiary CompanyNiche Generics Limited. 2,535.60 1214.20
e) Rent PaidMrs. Anita Mody 2.17 2.02Pranit Trading Pvt. Ltd. 0.60 0.60
f) Managerial RemunerationDr. Prakash A. Mody 223.41 222.71
g) CommissionDr. Prakash A. Mody 147.30 165.71 Unichem Pharmaceuticals (USA) Inc. 93.33 -
h) SalaryMs. Supriya Mody 18.11 5.40
i) Dividend PaidPranit Trading Pvt Ltd 322.21 254.34Chevy Capital Services Pvt Ltd 205.11 162.04PM Capital Services Pvt Ltd 177.77 140.42Viramrut Trading Pvt. Ltd. 213.90 169.07AVM Capital Services Pvt Ltd. 177.31 140.05Dr. Prakash A. Mody 404.46 334.57
j) Expenses Re - imbursementNiche Generics Limited. 25.37 29.46Unichem Pharmaceuticals (USA) Inc. 89.90 47.60
Details of material transactions during the year
(ii) The Company has the following amounts due from/to related parties
2010 2009 2010 2009 2010 2009 2010 2009
Outstanding Balances
Deposits given - - 45.06 45.06 0.15 0.15 45.21 45.21
Creditors 14.00 13.84 - - - - 14.00 13.84
Debtors outstanding 1,967.58 1,198.47 - - - - 1,967.58 1,198.47
Guarantees given to bank
on behalf of Subsidiaries 2,535.60 1,214.20 - - - - 2,535.60 1,214.20
Total Investments 8,273.14 7,175.42 - - - - 8,273.14 7,175.42
ICD outstanding* - 419.77 - - - - - 419.77
Due to Directors - - 147.30 165.71 - - 147.30 165.71
12,790.32 10,021.70 192.36 210.77 0.15 0.15 12,982.83 10,232.62
Particulars Subsidiaries
Key Management
Personnel &
their relatives
Enterprises under
significant influence
of Key Management
Personnel
Total Total
* Transactions with party which became & ceased to be subsidiary during the previous year.
* Transactions with party which became & ceased to be subsidiary during the previous year.
Schedules to Accounts
th19 Board of Directors of the Company in its meeting held on 14 May, 2011 has considered and approved the Valuation Report, exchange ratio, Fairness of Opinion and the Scheme of Arrangement between Enterprises under significant influence of Key Management Personnel through which promoters hold shares of Unichem Laboratories Limited as referred to in Note 18(1)(ii) above. The said Scheme shall be filed with and is subject to approval of the High Court or such other competent authority from whom directions would also be sought for holding / dispensing with meeting of shareholders / creditors of the Company to give effect of the scheme
stfrom 1 April, 2011 or such other date as may be directed.
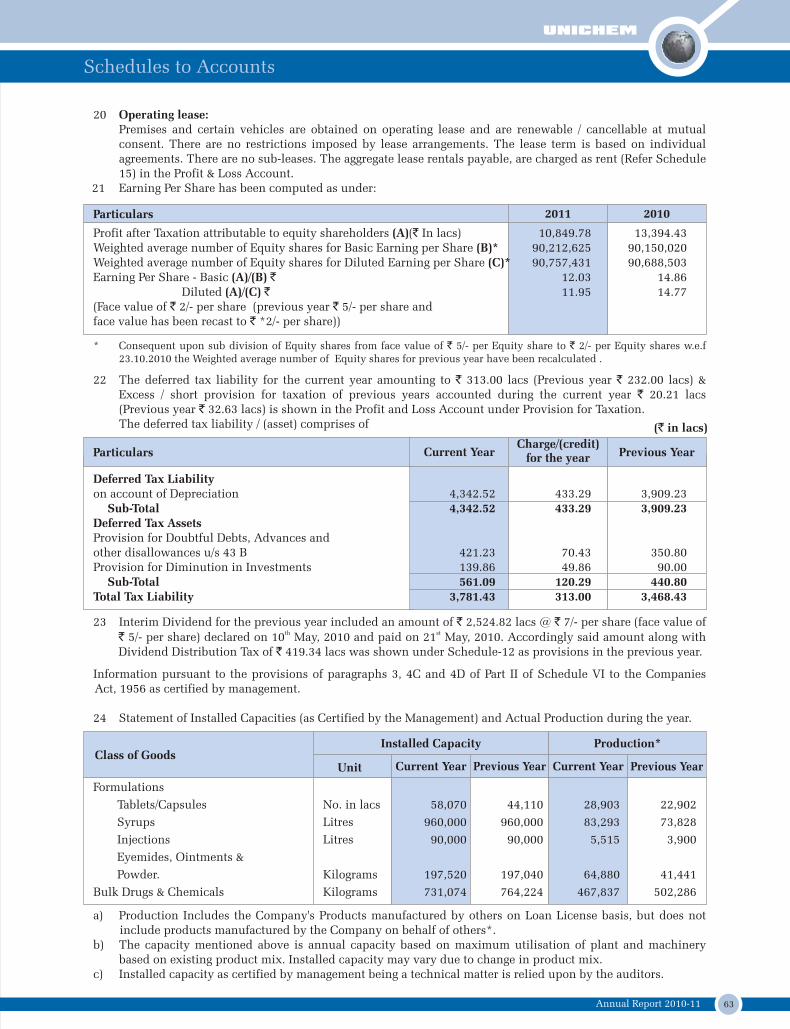
63Annual Report 2010-11
20 Operating lease:Premises and certain vehicles are obtained on operating lease and are renewable / cancellable at mutual consent. There are no restrictions imposed by lease arrangements. The lease term is based on individual agreements. There are no sub-leases. The aggregate lease rentals payable, are charged as rent (Refer Schedule 15) in the Profit & Loss Account.
21 Earning Per Share has been computed as under:
2011 2010
Profit after Taxation attributable to equity shareholders (A)(` In lacs) 10,849.78 13,394.43 Weighted average number of Equity shares for Basic Earning per Share (B)* 90,212,625 90,150,020 Weighted average number of Equity shares for Diluted Earning per Share (C)* 90,757,431 90,688,503 Earning Per Share - Basic (A)/(B) ` 12.03 14.86 Diluted (A)/(C) ` 11.95 14.77 (Face value of ` 2/- per share (previous year ` 5/- per share and face value has been recast to ` *2/- per share))
22 The deferred tax liability for the current year amounting to ` 313.00 lacs (Previous year ` 232.00 lacs) & Excess / short provision for taxation of previous years accounted during the current year ` 20.21 lacs (Previous year ` 32.63 lacs) is shown in the Profit and Loss Account under Provision for Taxation.The deferred tax liability / (asset) comprises of
Previous Year
Deferred Tax Liabilityon account of Depreciation 4,342.52 433.29 3,909.23
Sub-Total 4,342.52 433.29 3,909.23Deferred Tax AssetsProvision for Doubtful Debts, Advances and other disallowances u/s 43 B 421.23 70.43 350.80Provision for Diminution in Investments 139.86 49.86 90.00
Sub-Total 561.09 120.29 440.80 Total Tax Liability 3,781.43 313.00 3,468.43
(` in lacs)
Charge/(credit) for the yearCurrent Year
Information pursuant to the provisions of paragraphs 3, 4C and 4D of Part II of Schedule VI to the Companies Act, 1956 as certified by management.
24 Statement of Installed Capacities (as Certified by the Management) and Actual Production during the year.
Formulations
Tablets/Capsules No. in lacs 58,070 44,110 28,903 22,902
Syrups Litres 960,000 960,000 83,293 73,828
Injections Litres 90,000 90,000 5,515 3,900
Eyemides, Ointments &
Powder. Kilograms 197,520 197,040 64,880 41,441
Bulk Drugs & Chemicals Kilograms 731,074 764,224 467,837 502,286
Current YearClass of Goods
Unit Previous Year Current Year Previous Year
Installed Capacity Production*
a) Production Includes the Company's Products manufactured by others on Loan License basis, but does not include products manufactured by the Company on behalf of others*.
b) The capacity mentioned above is annual capacity based on maximum utilisation of plant and machinery based on existing product mix. Installed capacity may vary due to change in product mix.
c) Installed capacity as certified by management being a technical matter is relied upon by the auditors.
Particulars
Particulars
23 Interim Dividend for the previous year included an amount of ` 2,524.82 lacs @ ` 7/- per share (face value of th st` 5/- per share) declared on 10 May, 2010 and paid on 21 May, 2010. Accordingly said amount along with
Dividend Distribution Tax of ` 419.34 lacs was shown under Schedule-12 as provisions in the previous year.
* Consequent upon sub division of Equity shares from face value of ` 5/- per Equity share to ` 2/- per Equity shares w.e.f 23.10.2010 the Weighted average number of Equity shares for previous year have been recalculated .
Schedules to Accounts
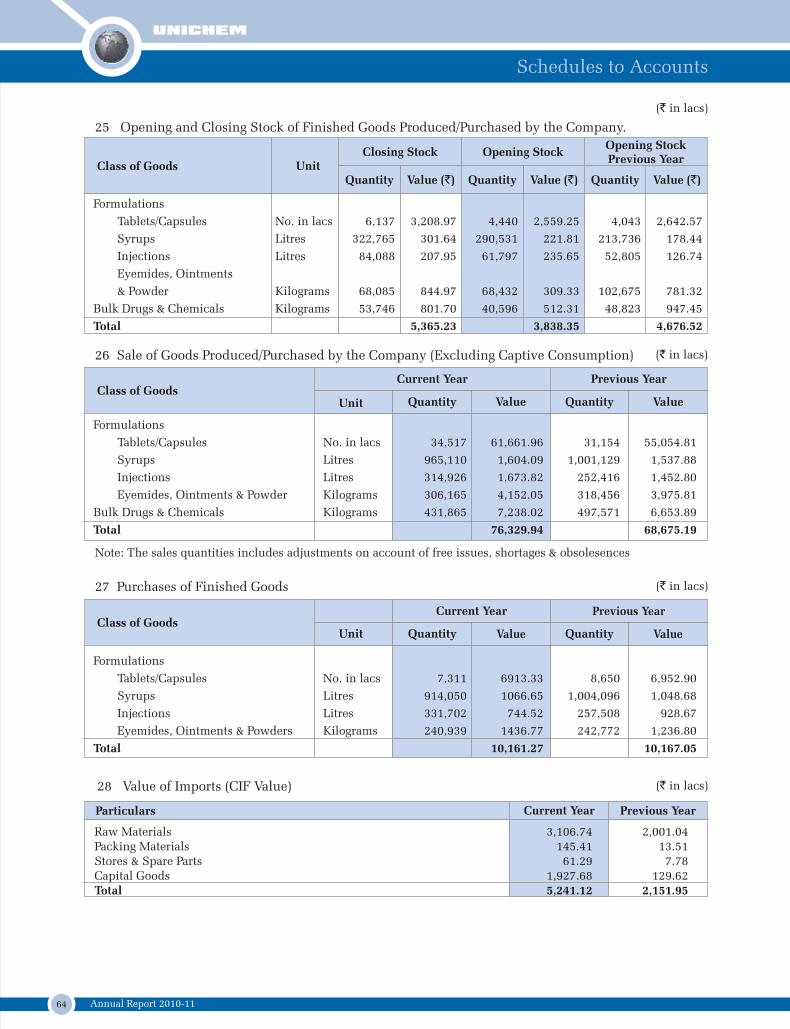
64 Annual Report 2010-11
25 Opening and Closing Stock of Finished Goods Produced/Purchased by the Company.
Formulations
Tablets/Capsules No. in lacs 6,137 3,208.97 4,440 2,559.25 4,043 2,642.57
Syrups Litres 322,765 301.64 290,531 221.81 213,736 178.44
Injections Litres 84,088 207.95 61,797 235.65 52,805 126.74
Eyemides, Ointments
& Powder Kilograms 68,085 844.97 68,432 309.33 102,675 781.32
Bulk Drugs & Chemicals Kilograms 53,746 801.70 40,596 512.31 48,823 947.45
Total 5,365.23 3,838.35 4,676.52
Class of Goods UnitClosing Stock Opening Stock
Opening StockPrevious Year
Quantity Value (`) Quantity Value (`) Quantity Value (`)
(` in lacs)
26 Sale of Goods Produced/Purchased by the Company (Excluding Captive Consumption)
Formulations
Tablets/Capsules No. in lacs 34,517 61,661.96 31,154 55,054.81
Syrups Litres 965,110 1,604.09 1,001,129 1,537.88
Injections Litres 314,926 1,673.82 252,416 1,452.80
Eyemides, Ointments & Powder Kilograms 306,165 4,152.05 318,456 3,975.81
Bulk Drugs & Chemicals Kilograms 431,865 7,238.02 497,571 6,653.89
Total 76,329.94 68,675.19
Note: The sales quantities includes adjustments on account of free issues, shortages & obsolesences
QuantityClass of Goods
Unit
Current Year Previous Year
27 Purchases of Finished Goods
Formulations
Tablets/Capsules No. in lacs 7,311 6913.33 8,650 6,952.90
Syrups Litres 914,050 1066.65 1,004,096 1,048.68
Injections Litres 331,702 744.52 257,508 928.67
Eyemides, Ointments & Powders Kilograms 240,939 1436.77 242,772 1,236.80
Total 10,161.27 10,167.05
Class of GoodsUnit Quantity Value
Current Year Previous Year
Quantity Value
(` in lacs)
(` in lacs)
Value ValueQuantity
Current Year Previous Year
(` in lacs)
Raw Materials 3,106.74 2,001.04 Packing Materials 145.41 13.51 Stores & Spare Parts 61.29 7.78 Capital Goods 1,927.68 129.62Total 5,241.12 2,151.95
28 Value of Imports (CIF Value)
Particulars
Schedules to Accounts
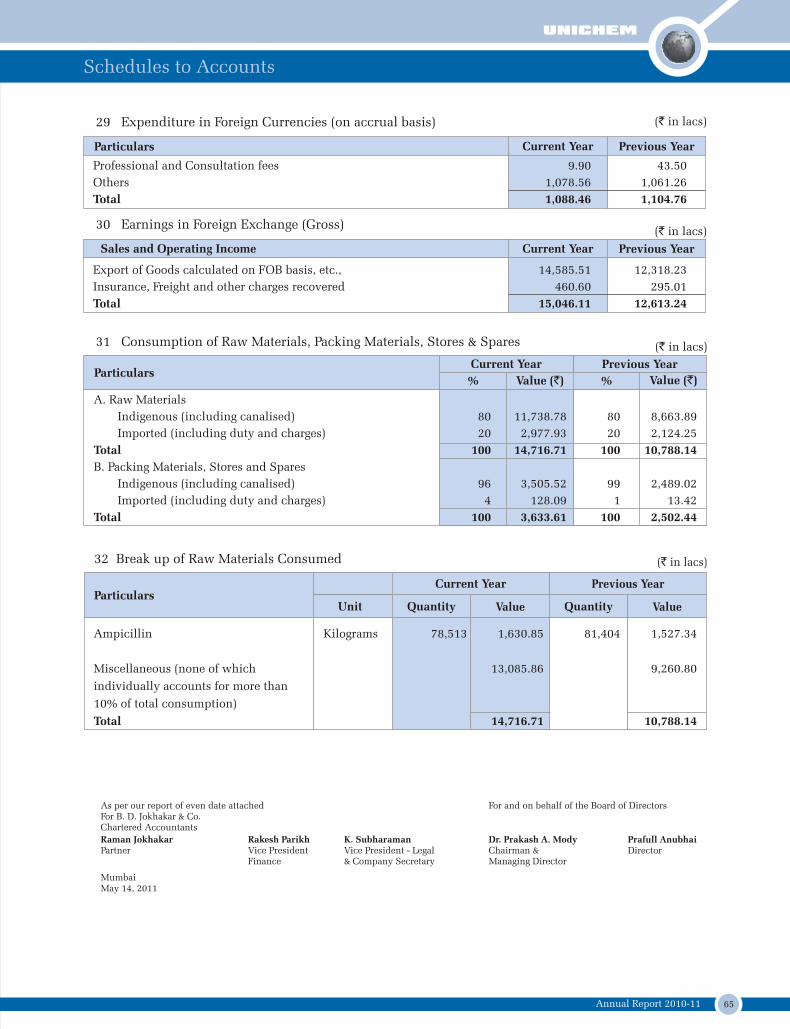
65Annual Report 2010-11
As per our report of even date attached For B. D. Jokhakar & Co.Chartered Accountants
For and on behalf of the Board of Directors
Raman Jokhakar Partner
Rakesh ParikhVice President Finance
K. SubharamanVice President - Legal & Company Secretary
Dr. Prakash A. ModyChairman & Managing Director
Prafull AnubhaiDirector
MumbaiMay 14, 2011
Current Year Previous Year
(` in lacs)
Professional and Consultation fees 9.90 43.50
Others 1,078.56 1,061.26
Total 1,088.46 1,104.76
29 Expenditure in Foreign Currencies (on accrual basis)
Current Year Previous Year
(` in lacs)
Export of Goods calculated on FOB basis, etc., 14,585.51 12,318.23
Insurance, Freight and other charges recovered 460.60 295.01
Total 15,046.11 12,613.24
Sales and Operating Income
30 Earnings in Foreign Exchange (Gross)
A. Raw Materials
Indigenous (including canalised) 80 11,738.78 80 8,663.89
Imported (including duty and charges) 20 2,977.93 20 2,124.25
Total 100 14,716.71 100 10,788.14
B. Packing Materials, Stores and Spares
Indigenous (including canalised) 96 3,505.52 99 2,489.02
Imported (including duty and charges) 4 128.09 1 13.42
Total 100 3,633.61 100 2,502.44
32 Break up of Raw Materials Consumed
Ampicillin Kilograms 78,513 1,630.85 81,404 1,527.34
Miscellaneous (none of which 13,085.86 9,260.80
individually accounts for more than
10% of total consumption)
Total 14,716.71 10,788.14
Unit Quantity Value
Current Year Previous Year
Quantity Value
Previous YearCurrent Year
% Value (`) Value (`)%
31 Consumption of Raw Materials, Packing Materials, Stores & Spares (` in lacs)
(` in lacs)
Particulars
Particulars
Particulars
Schedules to Accounts
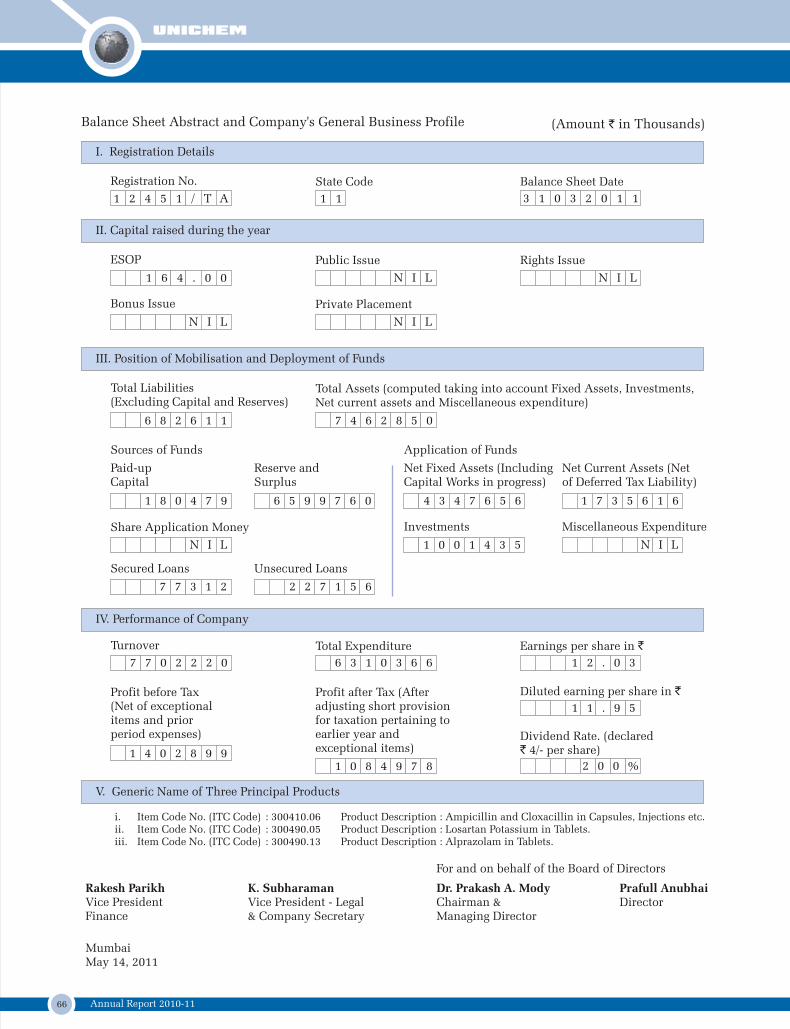
66 Annual Report 2010-11
(Amount ` in Thousands)Balance Sheet Abstract and Company's General Business Profile
For and on behalf of the Board of Directors
Rakesh ParikhVice President Finance
K. SubharamanVice President - Legal & Company Secretary
Dr. Prakash A. ModyChairman & Managing Director
Prafull AnubhaiDirector
MumbaiMay 14, 2011
I. Registration Details
Registration No. Balance Sheet DateState Code
II. Capital raised during the year
ESOP Public Issue Rights Issue
Bonus Issue Private Placement
III. Position of Mobilisation and Deployment of Funds
Total Liabilities (Excluding Capital and Reserves)
Total Assets (computed taking into account Fixed Assets, Investments, Net current assets and Miscellaneous expenditure)
Sources of Funds
Paid-up Capital
Reserve and Surplus
Secured Loans Unsecured Loans
Application of Funds
Net Current Assets (Net of Deferred Tax Liability)
Net Fixed Assets (Including Capital Works in progress)
Investments Miscellaneous Expenditure
IV. Performance of Company
Turnover Total Expenditure
Profit before Tax (Net of exceptional items and prior period expenses)
Profit after Tax (After adjusting short provision for taxation pertaining to earlier year and exceptional items)
Earnings per share in `
Diluted earning per share in `
Dividend Rate. (declared` 4/- per share)
V. Generic Name of Three Principal Products
i. Item Code No. (ITC Code) : 300410.06 Product Description : Ampicillin and Cloxacillin in Capsules, Injections etc.ii. Item Code No. (ITC Code) : 300490.05 Product Description : Losartan Potassium in Tablets.iii. Item Code No. (ITC Code) : 300490.13 Product Description : Alprazolam in Tablets.
1 2 4 5 1 / T A 1 1 3 1 0 3 2 0 1 1
1 6 4 . 0 0 N I L N I L
N I LN I L
6 8 2 6 1 1 7 4 6 2 8 5 0
1 8 0 4 7 9 6 5 9 9 7 6 0
7 7 3 1 2 2 2 7 1 5 6
4 3 4 7 6 5 6
1 0 0 1 4 3 5
1 7 3 5 6 1 6
N I L
7 7 0 2 2 2 0 6 3 1 0 3 6 6
1 4 0 2 8 9 91 0 8 4 9 7 8
1 2 . 0 3
1 1 . 9 5
2 0 0 %
Share Application Money
N I L
67Annual Report 2010-11
Consolidated Auditors’ Report
The Board of Directors
Unichem Laboratories Limited
Mumbai
We have audited the attached Consolidated Balance Sheet of Unichem Laboratories Limited and its subsidiaries
(‘the Group’) as at 31st March 2011, and also the Consolidated Profit and Loss Account and the Consolidated
Cash Flow Statement for the year ended on that date annexed thereto. These consolidated financial statements
are the responsibility of the Company’s Management. Our responsibility is to express an opinion on these
financial statements based on our audit.
We conducted our audit in accordance with auditing standards generally accepted in India. Those standards
require that we plan and perform the audit to obtain reasonable assurance about whether the financial
statements are prepared, in all material respects, in accordance with an identified financial reporting framework
and free of material misstatements. An audit includes examining, on a test basis, evidence supporting the
amounts and disclosures in the financial statements. An audit also includes assessing the accounting principles
used and significant estimates made by Management, as well as evaluating the overall financial statements
presentation. We believe that our audit provides a reasonable basis for our opinion.
We did not audit the financial statements of:
i) Three subsidiary companies whose financial statements reflect total assets (net) of ` 1,797.74 lacs as at
March 31, 2011, total revenues of ` 8,288.10 lacs and net cash inflow amounting to ` 15.65 lacs for the year
ended, and
ii) A subsidiary company whose financial statements reflect total assets (net) of ` 1.56 lacs as at February 28,
2011, total revenues of ` Nil and cash outflow of ` 1.28 lacs for the year ended.
These financial statements and other information of the subsidiaries were audited by other auditors whose
reports have been furnished to us, and our opinion, so far as it relates to the amounts included in respect of these
subsidiaries are based solely on the reports of the other auditors.
We report that the consolidated financial statements have been prepared by the management in accordance with
the requirements of Accounting Standard 21 - ‘Consolidated Financial Statements’ as notified by the Companies
(Accounting Standard) Rules, 2006.
On the basis of the information and explanations given to us and on the consideration of the separate audit
reports on individual audited financial statements of the Company and its subsidiaries, we are of the opinion that
the said consolidated financial statements give a true and fair view in conformity with the accounting principles
generally accepted in India:
(a) in the case of the Consolidated Balance Sheet, of the consolidated state of affairs of the Group as at 31st
March, 2011;
(b) in the case of the Consolidated Profit and Loss Account, of the Profit of the Group for the year then ended
and
(c) in the case of the Consolidated Cash Flow Statement, of the consolidated cash flows of the Group for the
year then ended.
For B. D. Jokhakar & Co.
Chartered Accountants
Firm Registration No. 104345W
Raman Jokhakar
Partner
Membership No. 103241
Mumbai
May 14, 2011
Auditors’ Report on the Consolidated Financial Statements
Consolidated Auditors’ Report
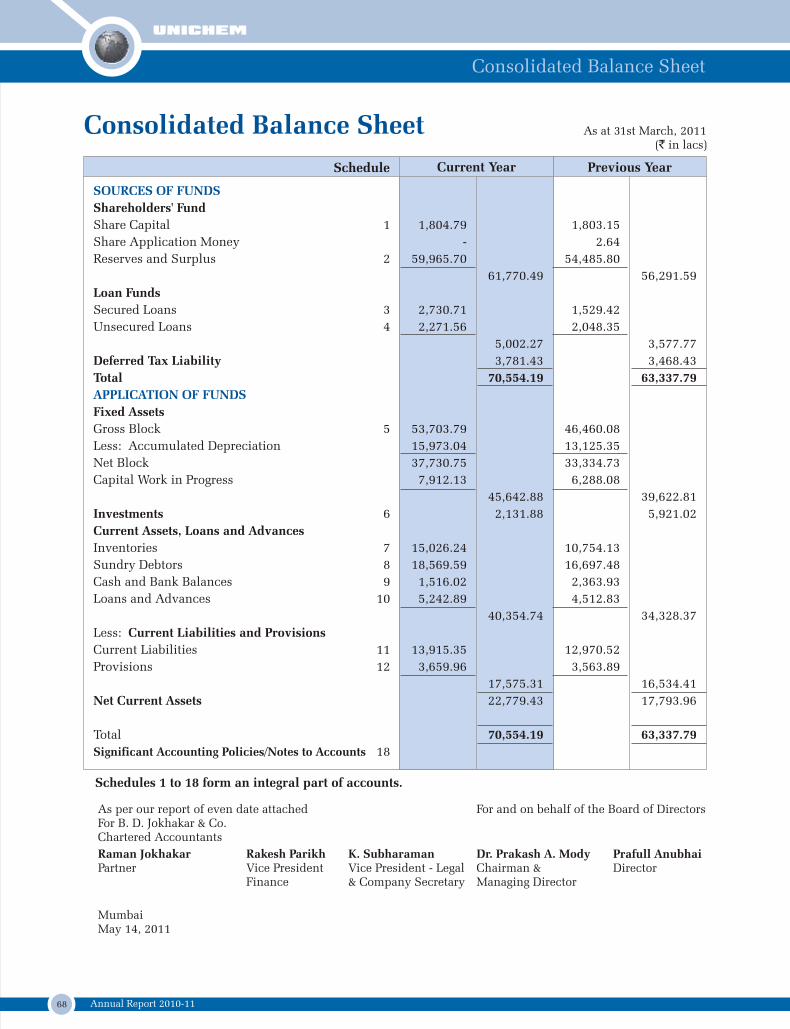
68 Annual Report 2010-11
SOURCES OF FUNDS
APPLICATION OF FUNDS
Shareholders' Fund
Share Capital 1 1,804.79 1,803.15
Share Application Money - 2.64
Reserves and Surplus 2 59,965.70 54,485.80
61,770.49 56,291.59
Loan Funds
Secured Loans 3 2,730.71 1,529.42
Unsecured Loans 4 2,271.56 2,048.35
5,002.27 3,577.77
Deferred Tax Liability 3,781.43 3,468.43
Total 70,554.19 63,337.79
Fixed Assets
Gross Block 5 53,703.79 46,460.08
Less: Accumulated Depreciation 15,973.04 13,125.35
Net Block 37,730.75 33,334.73
Capital Work in Progress 7,912.13 6,288.08
45,642.88 39,622.81
Investments 6 2,131.88 5,921.02
Current Assets, Loans and Advances
Inventories 7 15,026.24 10,754.13
Sundry Debtors 8 18,569.59 16,697.48
Cash and Bank Balances 9 1,516.02 2,363.93
Loans and Advances 10 5,242.89 4,512.83
40,354.74 34,328.37
Less: Current Liabilities and Provisions
Current Liabilities 11 13,915.35 12,970.52
Provisions 12 3,659.96 3,563.89
17,575.31 16,534.41
Net Current Assets 22,779.43 17,793.96
Total 70,554.19 63,337.79
Significant Accounting Policies/Notes to Accounts 18
Consolidated Balance Sheet As at 31st March, 2011(` in lacs)
Previous YearCurrent YearSchedule
As per our report of even date attached For B. D. Jokhakar & Co.Chartered Accountants
For and on behalf of the Board of Directors
Raman Jokhakar Partner
Rakesh ParikhVice President Finance
K. SubharamanVice President - Legal & Company Secretary
Dr. Prakash A. ModyChairman & Managing Director
Prafull AnubhaiDirector
MumbaiMay 14, 2011
Schedules 1 to 18 form an integral part of accounts.
Consolidated Balance Sheet
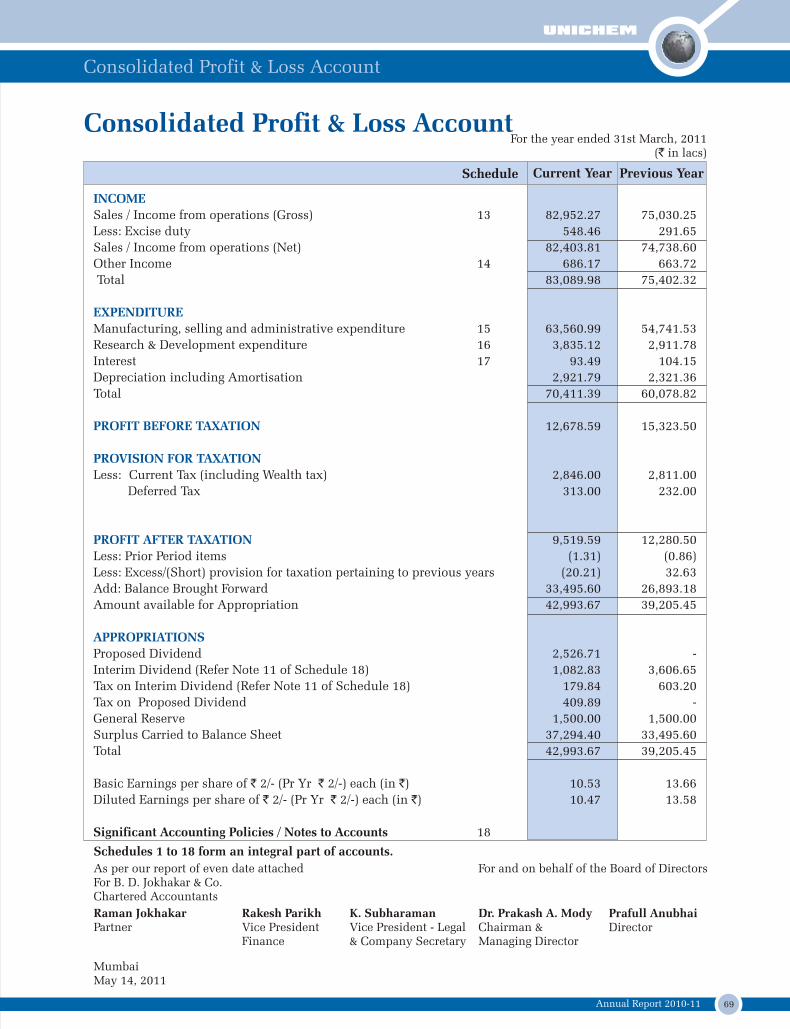
69Annual Report 2010-11
Consolidated Profit & Loss AccountFor the year ended 31st March, 2011
(` in lacs)
Schedule Current Year Previous Year
INCOME
EXPENDITURE
PROFIT BEFORE TAXATION
PROVISION FOR TAXATION
PROFIT AFTER TAXATION
APPROPRIATIONS
Sales / Income from operations (Gross) 13 82,952.27 75,030.25
Less: Excise duty 548.46 291.65
Sales / Income from operations (Net) 82,403.81 74,738.60
Other Income 14 686.17 663.72
Total 83,089.98 75,402.32
Manufacturing, selling and administrative expenditure 15 63,560.99 54,741.53
Research & Development expenditure 16 3,835.12 2,911.78
Interest 17 93.49 104.15
Depreciation including Amortisation 2,921.79 2,321.36
Total 70,411.39 60,078.82
12,678.59 15,323.50
Less: Current Tax (including Wealth tax) 2,846.00 2,811.00
Deferred Tax 313.00 232.00
9,519.59 12,280.50
Less: Prior Period items (1.31) (0.86)
Less: Excess/(Short) provision for taxation pertaining to previous years (20.21) 32.63
Add: Balance Brought Forward 33,495.60 26,893.18
Amount available for Appropriation 42,993.67 39,205.45
Proposed Dividend 2,526.71 -
Interim Dividend (Refer Note 11 of Schedule 18) 1,082.83 3,606.65
Tax on Interim Dividend (Refer Note 11 of Schedule 18) 179.84 603.20
Tax on Proposed Dividend 409.89 -
General Reserve 1,500.00 1,500.00
Surplus Carried to Balance Sheet 37,294.40 33,495.60
Total 42,993.67 39,205.45
Basic Earnings per share of ` 2/- (Pr Yr ` 2/-) each (in `) 10.53 13.66
Diluted Earnings per share of ` 2/- (Pr Yr ` 2/-) each (in `) 10.47 13.58
Significant Accounting Policies / Notes to Accounts 18
As per our report of even date attached For B. D. Jokhakar & Co.Chartered Accountants
For and on behalf of the Board of Directors
Raman Jokhakar Partner
Rakesh ParikhVice President Finance
K. SubharamanVice President - Legal & Company Secretary
Dr. Prakash A. ModyChairman & Managing Director
Prafull AnubhaiDirector
MumbaiMay 14, 2011
Schedules 1 to 18 form an integral part of accounts.
Consolidated Profit & Loss Account
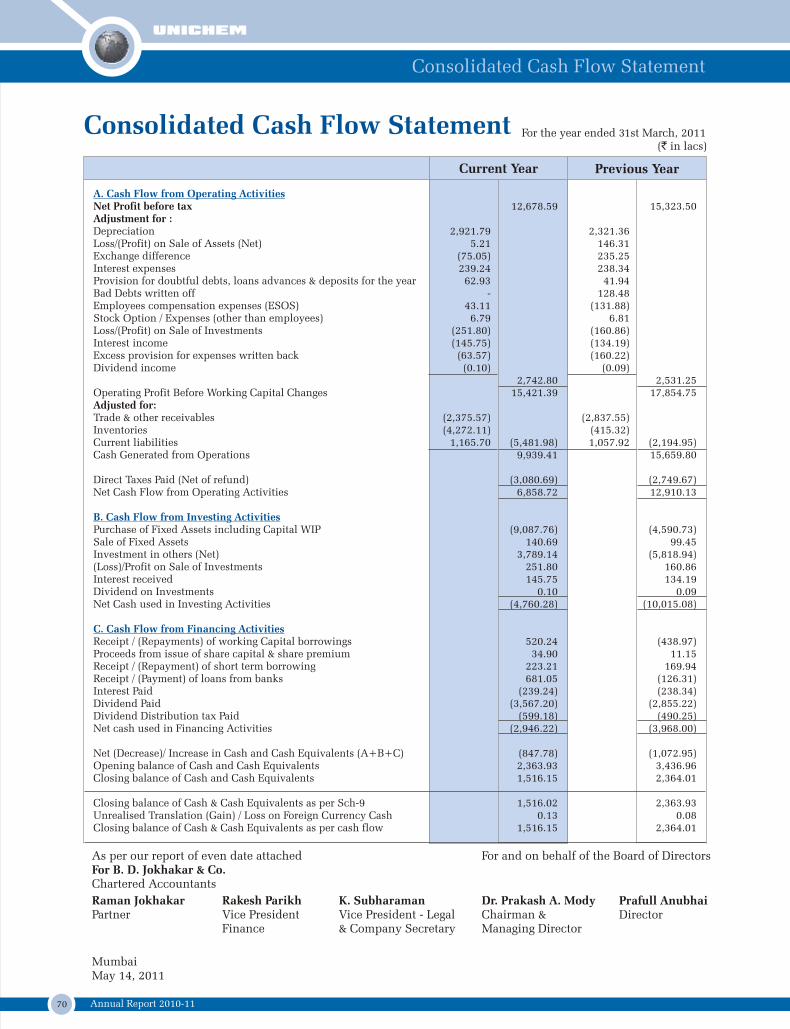
70 Annual Report 2010-11
Consolidated Cash Flow Statement For the year ended 31st March, 2011(` in lacs)
As per our report of even date attached For B. D. Jokhakar & Co.Chartered Accountants
For and on behalf of the Board of Directors
Raman Jokhakar Partner
Rakesh ParikhVice President Finance
K. SubharamanVice President - Legal & Company Secretary
Dr. Prakash A. ModyChairman & Managing Director
Prafull AnubhaiDirector
MumbaiMay 14, 2011
A. Cash Flow from Operating Activities
B. Cash Flow from Investing Activities
C. Cash Flow from Financing Activities
Net Profit before tax 12,678.59 15,323.50Adjustment for :Depreciation 2,921.79 2,321.36Loss/(Profit) on Sale of Assets (Net) 5.21 146.31Exchange difference (75.05) 235.25Interest expenses 239.24 238.34Provision for doubtful debts, loans advances & deposits for the year 62.93 41.94Bad Debts written off - 128.48Employees compensation expenses (ESOS) 43.11 (131.88)Stock Option / Expenses (other than employees) 6.79 6.81Loss/(Profit) on Sale of Investments (251.80) (160.86)Interest income (145.75) (134.19)Excess provision for expenses written back (63.57) (160.22)Dividend income (0.10) (0.09)
2,742.80 2,531.25Operating Profit Before Working Capital Changes 15,421.39 17,854.75Adjusted for:Trade & other receivables (2,375.57) (2,837.55)Inventories (4,272.11) (415.32)Current liabilities 1,165.70 (5,481.98) 1,057.92 (2,194.95)Cash Generated from Operations 9,939.41 15,659.80
Direct Taxes Paid (Net of refund) (3,080.69) (2,749.67)Net Cash Flow from Operating Activities 6,858.72 12,910.13
Purchase of Fixed Assets including Capital WIP (9,087.76) (4,590.73)Sale of Fixed Assets 140.69 99.45Investment in others (Net) 3,789.14 (5,818.94)(Loss)/Profit on Sale of Investments 251.80 160.86Interest received 145.75 134.19Dividend on Investments 0.10 0.09Net Cash used in Investing Activities (4,760.28) (10,015.08)
Receipt / (Repayments) of working Capital borrowings 520.24 (438.97)Proceeds from issue of share capital & share premium 34.90 11.15Receipt / (Repayment) of short term borrowing 223.21 169.94Receipt / (Payment) of loans from banks 681.05 (126.31)Interest Paid (239.24) (238.34)Dividend Paid (3,567.20) (2,855.22)Dividend Distribution tax Paid (599.18) (490.25)Net cash used in Financing Activities (2,946.22) (3,968.00)
Net (Decrease)/ Increase in Cash and Cash Equivalents (A+B+C) (847.78) (1,072.95)Opening balance of Cash and Cash Equivalents 2,363.93 3,436.96Closing balance of Cash and Cash Equivalents 1,516.15 2,364.01
Closing balance of Cash & Cash Equivalents as per Sch-9 1,516.02 2,363.93Unrealised Translation (Gain) / Loss on Foreign Currency Cash 0.13 0.08Closing balance of Cash & Cash Equivalents as per cash flow 1,516.15 2,364.01
Previous YearCurrent Year
Consolidated Cash Flow Statement
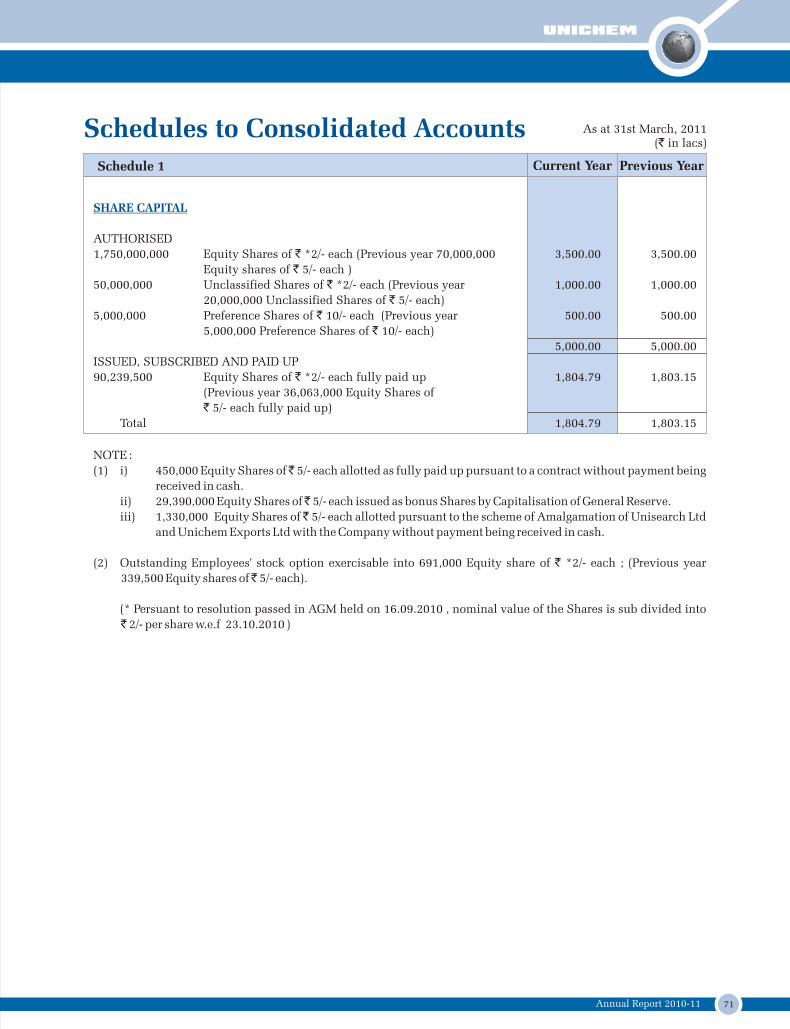
71Annual Report 2010-11
SHARE CAPITAL
AUTHORISED
1,750,000,000 Equity Shares of ` *2/- each (Previous year 70,000,000 3,500.00 3,500.00
Equity shares of ` 5/- each )
50,000,000 Unclassified Shares of ` *2/- each (Previous year 1,000.00 1,000.00
20,000,000 Unclassified Shares of ` 5/- each)
5,000,000 Preference Shares of ` 10/- each (Previous year 500.00 500.00
5,000,000 Preference Shares of ` 10/- each)
5,000.00 5,000.00
ISSUED, SUBSCRIBED AND PAID UP
90,239,500 Equity Shares of ` *2/- each fully paid up 1,804.79 1,803.15
(Previous year 36,063,000 Equity Shares of
` 5/- each fully paid up)
Total 1,804.79 1,803.15
As at 31st March, 2011(` in lacs)
Schedule 1 Current Year Previous Year
NOTE :
(1) i) 450,000 Equity Shares of ̀ 5/- each allotted as fully paid up pursuant to a contract without payment being
received in cash.
ii) 29,390,000 Equity Shares of ̀ 5/- each issued as bonus Shares by Capitalisation of General Reserve.
iii) 1,330,000 Equity Shares of ̀ 5/- each allotted pursuant to the scheme of Amalgamation of Unisearch Ltd
and Unichem Exports Ltd with the Company without payment being received in cash.
(2) Outstanding Employees' stock option exercisable into 691,000 Equity share of ` *2/- each ; (Previous year
339,500 Equity shares of ̀ 5/- each).
(* Persuant to resolution passed in AGM held on 16.09.2010 , nominal value of the Shares is sub divided into
` 2/- per share w.e.f 23.10.2010 )
Schedules to Consolidated Accounts
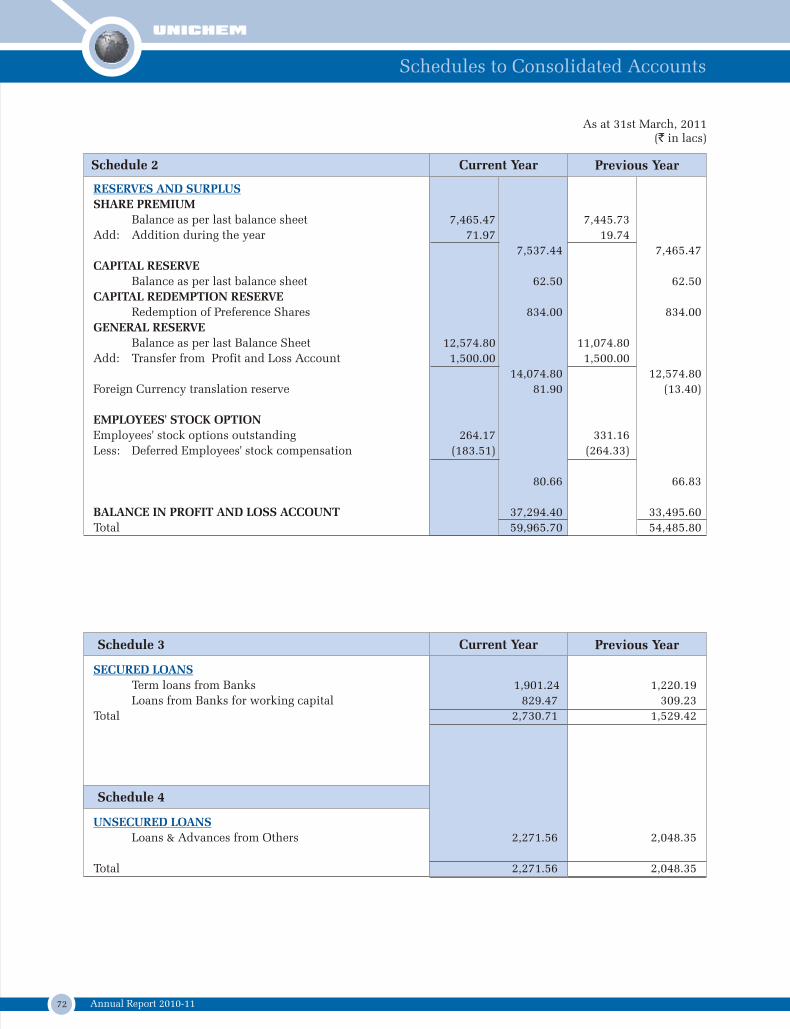
72 Annual Report 2010-11
RESERVES AND SURPLUS
SHARE PREMIUM
Balance as per last balance sheet 7,465.47 7,445.73
Add: Addition during the year 71.97 19.74
7,537.44 7,465.47
CAPITAL RESERVE
Balance as per last balance sheet 62.50 62.50
CAPITAL REDEMPTION RESERVE
Redemption of Preference Shares 834.00 834.00
GENERAL RESERVE
Balance as per last Balance Sheet 12,574.80 11,074.80
Add: Transfer from Profit and Loss Account 1,500.00 1,500.00
14,074.80 12,574.80
Foreign Currency translation reserve 81.90 (13.40)
EMPLOYEES' STOCK OPTION
Employees' stock options outstanding 264.17 331.16
Less: Deferred Employees' stock compensation (183.51) (264.33)
80.66 66.83
BALANCE IN PROFIT AND LOSS ACCOUNT 37,294.40 33,495.60
Total 59,965.70 54,485.80
Previous YearCurrent YearSchedule 2
Schedule 3
Schedule 4
SECURED LOANS
Term loans from Banks 1,901.24 1,220.19
Loans from Banks for working capital 829.47 309.23
Total 2,730.71 1,529.42
UNSECURED LOANS
Loans & Advances from Others 2,271.56 2,048.35
Total 2,271.56 2,048.35
As at 31st March, 2011(` in lacs)
Previous YearCurrent Year
Schedules to Consolidated Accounts
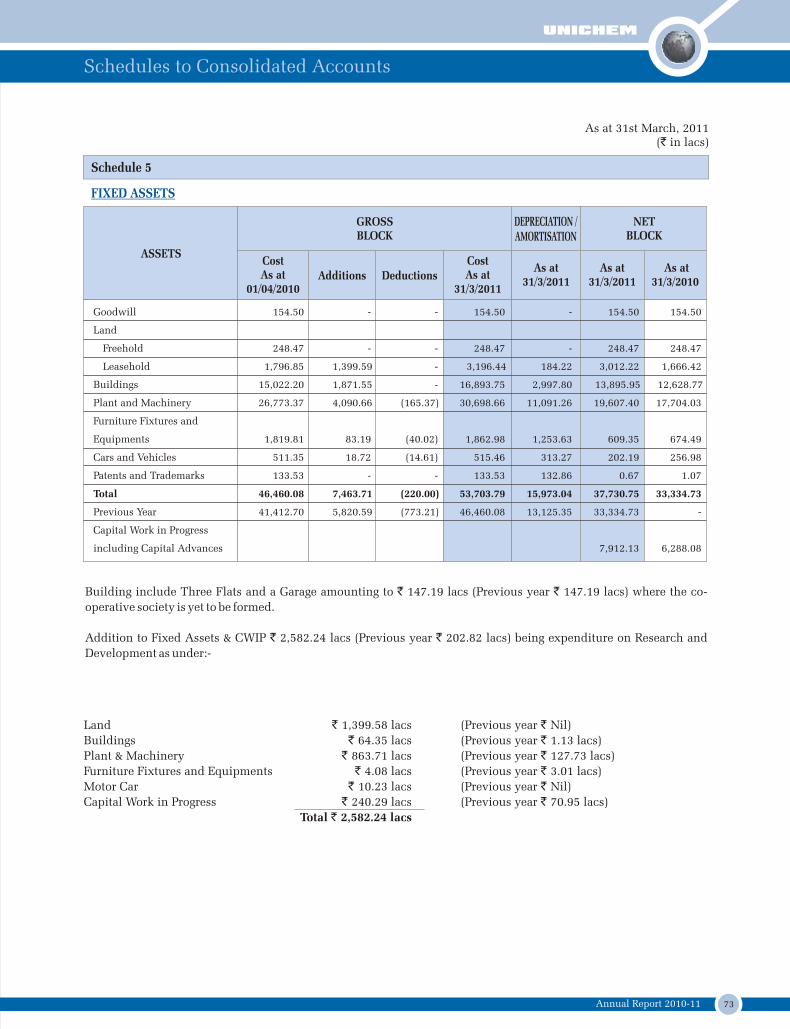
73Annual Report 2010-11
Schedule 5
FIXED ASSETS
As at 31st March, 2011(` in lacs)
GROSS BLOCK
DEPRECIATION /AMORTISATION
NET BLOCK
ASSETSCostAs at
01/04/2010Additions Deductions
CostAs at
31/3/2011
As at31/3/2011
As at31/3/2011
As at31/3/2010
Building include Three Flats and a Garage amounting to ` 147.19 lacs (Previous year ` 147.19 lacs) where the co-
operative society is yet to be formed.
Addition to Fixed Assets & CWIP ` 2,582.24 lacs (Previous year ` 202.82 lacs) being expenditure on Research and
Development as under:-
Goodwill 154.50 - - 154.50 - 154.50 154.50
Land
Freehold 248.47 - - 248.47 - 248.47 248.47
Leasehold 1,796.85 1,399.59 - 3,196.44 184.22 3,012.22 1,666.42
Buildings 15,022.20 1,871.55 - 16,893.75 2,997.80 13,895.95 12,628.77
Plant and Machinery 26,773.37 4,090.66 (165.37) 30,698.66 11,091.26 19,607.40 17,704.03
Furniture Fixtures and
Equipments 1,819.81 83.19 (40.02) 1,862.98 1,253.63 609.35 674.49
Cars and Vehicles 511.35 18.72 (14.61) 515.46 313.27 202.19 256.98
Patents and Trademarks 133.53 - - 133.53 132.86 0.67 1.07
Total 46,460.08 7,463.71 (220.00) 53,703.79 15,973.04 37,730.75 33,334.73
Previous Year 41,412.70 5,820.59 (773.21) 46,460.08 13,125.35 33,334.73 -
Capital Work in Progress
including Capital Advances 7,912.13 6,288.08
Land ` 1,399.58 lacs (Previous year ` Nil)
Buildings ` 64.35 lacs (Previous year ` 1.13 lacs)
Plant & Machinery ` 863.71 lacs (Previous year ` 127.73 lacs)
Furniture Fixtures and Equipments ` 4.08 lacs (Previous year ` 3.01 lacs)
Motor Car ` 10.23 lacs (Previous year ` Nil)
Capital Work in Progress ` 240.29 lacs (Previous year ` 70.95 lacs)
Total ` 2,582.24 lacs
Schedules to Consolidated Accounts
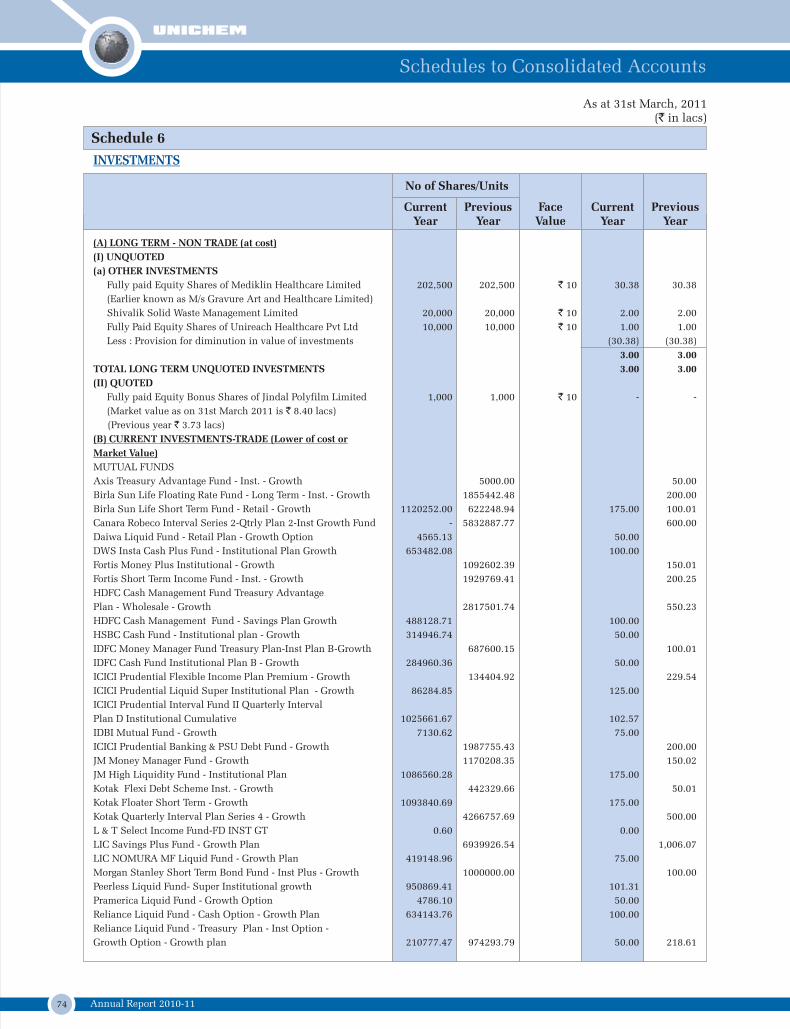
74 Annual Report 2010-11
(A) LONG TERM - NON TRADE (at cost)
(I) UNQUOTED
(a) OTHER INVESTMENTS
Fully paid Equity Shares of Mediklin Healthcare Limited 202,500 202,500 ` 10 30.38 30.38
(Earlier known as M/s Gravure Art and Healthcare Limited)
Shivalik Solid Waste Management Limited 20,000 20,000 ` 10 2.00 2.00
Fully Paid Equity Shares of Unireach Healthcare Pvt Ltd 10,000 10,000 ` 10 1.00 1.00
Less : Provision for diminution in value of investments (30.38) (30.38)
3.00 3.00
TOTAL LONG TERM UNQUOTED INVESTMENTS 3.00 3.00
(II) QUOTED
Fully paid Equity Bonus Shares of Jindal Polyfilm Limited 1,000 1,000 ` 10 - -
(Market value as on 31st March 2011 is ` 8.40 lacs)
(Previous year ` 3.73 lacs)
(B) CURRENT INVESTMENTS-TRADE (Lower of cost or
Market Value)
MUTUAL FUNDS
Axis Treasury Advantage Fund - Inst. - Growth 5000.00 50.00
Birla Sun Life Floating Rate Fund - Long Term - Inst. - Growth 1855442.48 200.00
Birla Sun Life Short Term Fund - Retail - Growth 1120252.00 622248.94 175.00 100.01
Canara Robeco Interval Series 2-Qtrly Plan 2-Inst Growth Fund - 5832887.77 600.00
Daiwa Liquid Fund - Retail Plan - Growth Option 4565.13 50.00
DWS Insta Cash Plus Fund - Institutional Plan Growth 653482.08 100.00
Fortis Money Plus Institutional - Growth 1092602.39 150.01
Fortis Short Term Income Fund - Inst. - Growth 1929769.41 200.25
HDFC Cash Management Fund Treasury Advantage
Plan - Wholesale - Growth 2817501.74 550.23
HDFC Cash Management Fund - Savings Plan Growth 488128.71 100.00
HSBC Cash Fund - Institutional plan - Growth 314946.74 50.00
IDFC Money Manager Fund Treasury Plan-Inst Plan B-Growth 687600.15 100.01
IDFC Cash Fund Institutional Plan B - Growth 284960.36 50.00
ICICI Prudential Flexible Income Plan Premium - Growth 134404.92 229.54
ICICI Prudential Liquid Super Institutional Plan - Growth 86284.85 125.00
ICICI Prudential Interval Fund II Quarterly Interval
Plan D Institutional Cumulative 1025661.67 102.57
IDBI Mutual Fund - Growth 7130.62 75.00
ICICI Prudential Banking & PSU Debt Fund - Growth 1987755.43 200.00
JM Money Manager Fund - Growth 1170208.35 150.02
JM High Liquidity Fund - Institutional Plan 1086560.28 175.00
Kotak Flexi Debt Scheme Inst. - Growth 442329.66 50.01
Kotak Floater Short Term - Growth 1093840.69 175.00
Kotak Quarterly Interval Plan Series 4 - Growth 4266757.69 500.00
L & T Select Income Fund-FD INST GT 0.60 0.00
LIC Savings Plus Fund - Growth Plan 6939926.54 1,006.07
LIC NOMURA MF Liquid Fund - Growth Plan 419148.96 75.00
Morgan Stanley Short Term Bond Fund - Inst Plus - Growth 1000000.00 100.00
Peerless Liquid Fund- Super Institutional growth 950869.41 101.31
Pramerica Liquid Fund - Growth Option 4786.10 50.00
Reliance Liquid Fund - Cash Option - Growth Plan 634143.76 100.00
Reliance Liquid Fund - Treasury Plan - Inst Option -
Growth Option - Growth plan 210777.47 974293.79 50.00 218.61
Schedule 6
No of Shares/Units
CurrentYear
PreviousYear
FaceValue
CurrentYear
PreviousYear
INVESTMENTS
As at 31st March, 2011(` in lacs)
Schedules to Consolidated Accounts
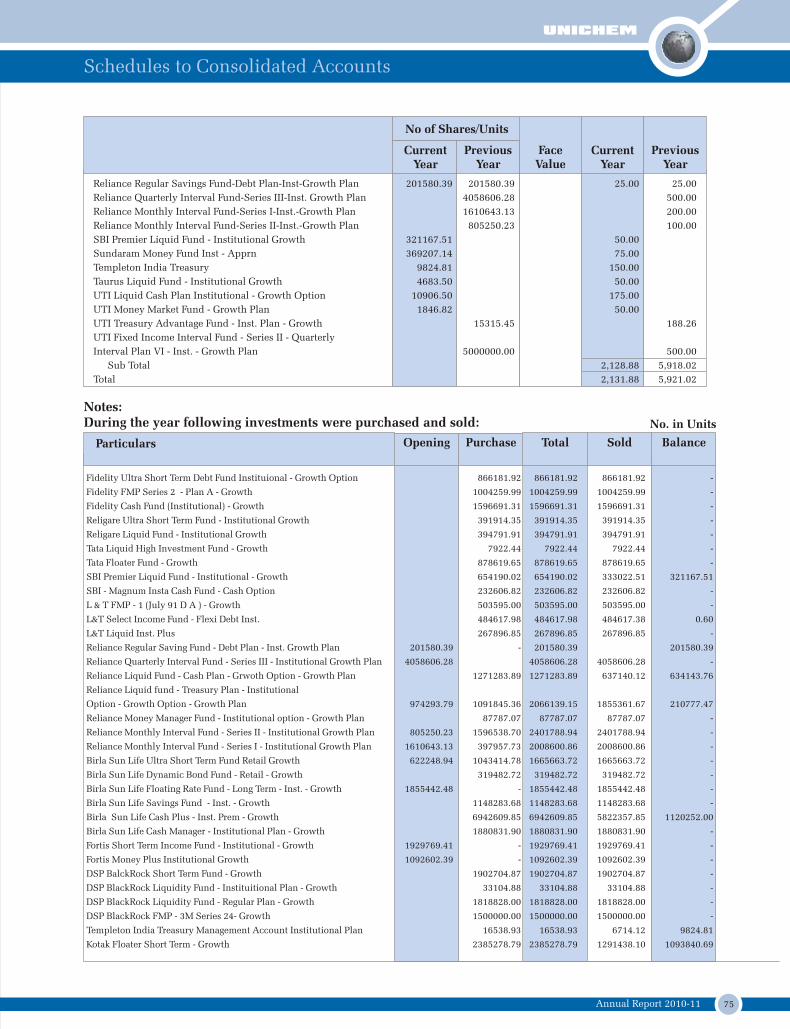
75Annual Report 2010-11
Reliance Regular Savings Fund-Debt Plan-Inst-Growth Plan 201580.39 201580.39 25.00 25.00
Reliance Quarterly Interval Fund-Series III-Inst. Growth Plan 4058606.28 500.00
Reliance Monthly Interval Fund-Series I-Inst.-Growth Plan 1610643.13 200.00
Reliance Monthly Interval Fund-Series II-Inst.-Growth Plan 805250.23 100.00
SBI Premier Liquid Fund - Institutional Growth 321167.51 50.00
Sundaram Money Fund Inst - Apprn 369207.14 75.00
Templeton India Treasury 9824.81 150.00
Taurus Liquid Fund - Institutional Growth 4683.50 50.00
UTI Liquid Cash Plan Institutional - Growth Option 10906.50 175.00
UTI Money Market Fund - Growth Plan 1846.82 50.00
UTI Treasury Advantage Fund - Inst. Plan - Growth 15315.45 188.26
UTI Fixed Income Interval Fund - Series II - Quarterly
Interval Plan VI - Inst. - Growth Plan 5000000.00 500.00
Sub Total 2,128.88 5,918.02
Total 2,131.88 5,921.02
No of Shares/Units
CurrentYear
PreviousYear
FaceValue
CurrentYear
PreviousYear
Notes:During the year following investments were purchased and sold:
Particulars Opening Purchase Total Sold Balance
No. in Units
Fidelity Ultra Short Term Debt Fund Instituional - Growth Option 866181.92 866181.92 866181.92 -
Fidelity FMP Series 2 - Plan A - Growth 1004259.99 1004259.99 1004259.99 -
Fidelity Cash Fund (Institutional) - Growth 1596691.31 1596691.31 1596691.31 -
Religare Ultra Short Term Fund - Institutional Growth 391914.35 391914.35 391914.35 -
Religare Liquid Fund - Institutional Growth 394791.91 394791.91 394791.91 -
Tata Liquid High Investment Fund - Growth 7922.44 7922.44 7922.44 -
Tata Floater Fund - Growth 878619.65 878619.65 878619.65 -
SBI Premier Liquid Fund - Institutional - Growth 654190.02 654190.02 333022.51 321167.51
SBI - Magnum Insta Cash Fund - Cash Option 232606.82 232606.82 232606.82 -
L & T FMP - 1 (July 91 D A ) - Growth 503595.00 503595.00 503595.00 -
L&T Select Income Fund - Flexi Debt Inst. 484617.98 484617.98 484617.38 0.60
L&T Liquid Inst. Plus 267896.85 267896.85 267896.85 -
Reliance Regular Saving Fund - Debt Plan - Inst. Growth Plan 201580.39 - 201580.39 201580.39
Reliance Quarterly Interval Fund - Series III - Institutional Growth Plan 4058606.28 4058606.28 4058606.28 -
Reliance Liquid Fund - Cash Plan - Grwoth Option - Growth Plan 1271283.89 1271283.89 637140.12 634143.76
Reliance Liquid fund - Treasury Plan - Institutional
Option - Growth Option - Growth Plan 974293.79 1091845.36 2066139.15 1855361.67 210777.47
Reliance Money Manager Fund - Institutional option - Growth Plan 87787.07 87787.07 87787.07 -
Reliance Monthly Interval Fund - Series II - Institutional Growth Plan 805250.23 1596538.70 2401788.94 2401788.94 -
Reliance Monthly Interval Fund - Series I - Institutional Growth Plan 1610643.13 397957.73 2008600.86 2008600.86 -
Birla Sun Life Ultra Short Term Fund Retail Growth 622248.94 1043414.78 1665663.72 1665663.72 -
Birla Sun Life Dynamic Bond Fund - Retail - Growth 319482.72 319482.72 319482.72 -
Birla Sun Life Floating Rate Fund - Long Term - Inst. - Growth 1855442.48 - 1855442.48 1855442.48 -
Birla Sun Life Savings Fund - Inst. - Growth 1148283.68 1148283.68 1148283.68 -
Birla Sun Life Cash Plus - Inst. Prem - Growth 6942609.85 6942609.85 5822357.85 1120252.00
Birla Sun Life Cash Manager - Institutional Plan - Growth 1880831.90 1880831.90 1880831.90 -
Fortis Short Term Income Fund - Institutional - Growth 1929769.41 - 1929769.41 1929769.41 -
Fortis Money Plus Institutional Growth 1092602.39 - 1092602.39 1092602.39 -
DSP BalckRock Short Term Fund - Growth 1902704.87 1902704.87 1902704.87 -
DSP BlackRock Liquidity Fund - Instituitional Plan - Growth 33104.88 33104.88 33104.88 -
DSP BlackRock Liquidity Fund - Regular Plan - Growth 1818828.00 1818828.00 1818828.00 -
DSP BlackRock FMP - 3M Series 24- Growth 1500000.00 1500000.00 1500000.00 -
Templeton India Treasury Management Account Institutional Plan 16538.93 16538.93 6714.12 9824.81
Kotak Floater Short Term - Growth 2385278.79 2385278.79 1291438.10 1093840.69
Schedules to Consolidated Accounts
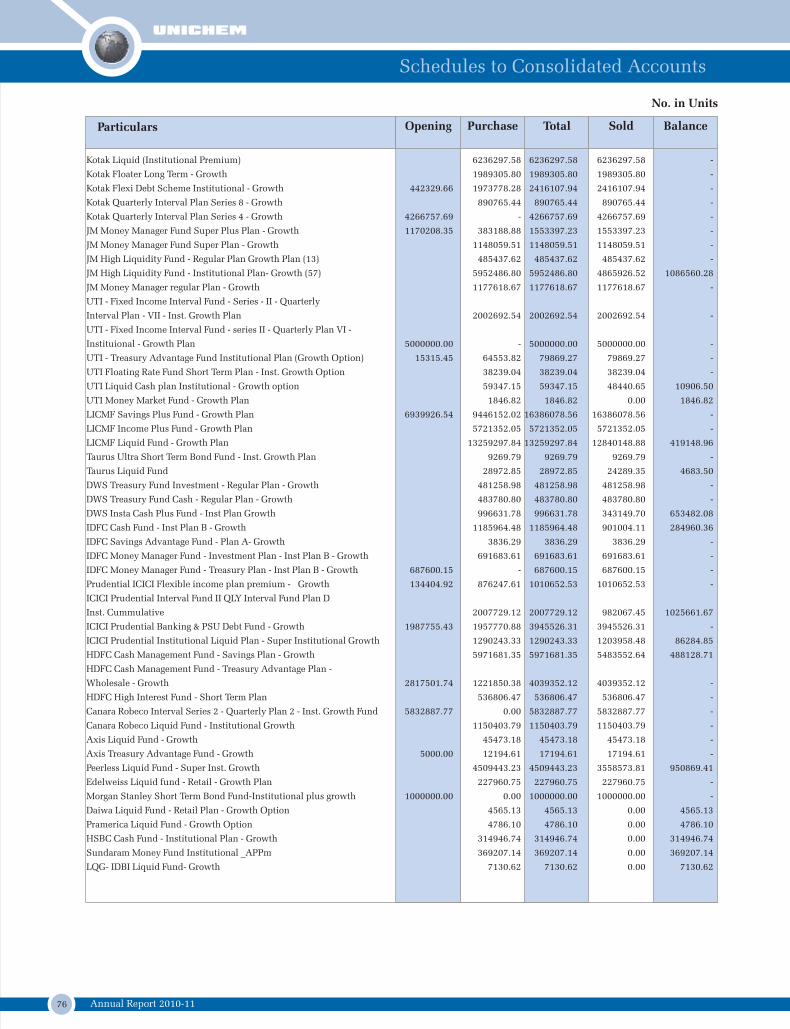
76 Annual Report 2010-11
Particulars Opening Purchase Total Sold Balance
Kotak Liquid (Institutional Premium) 6236297.58 6236297.58 6236297.58 -
Kotak Floater Long Term - Growth 1989305.80 1989305.80 1989305.80 -
Kotak Flexi Debt Scheme Institutional - Growth 442329.66 1973778.28 2416107.94 2416107.94 -
Kotak Quarterly Interval Plan Series 8 - Growth 890765.44 890765.44 890765.44 -
Kotak Quarterly Interval Plan Series 4 - Growth 4266757.69 - 4266757.69 4266757.69 -
JM Money Manager Fund Super Plus Plan - Growth 1170208.35 383188.88 1553397.23 1553397.23 -
JM Money Manager Fund Super Plan - Growth 1148059.51 1148059.51 1148059.51 -
JM High Liquidity Fund - Regular Plan Growth Plan (13) 485437.62 485437.62 485437.62 -
JM High Liquidity Fund - Institutional Plan- Growth (57) 5952486.80 5952486.80 4865926.52 1086560.28
JM Money Manager regular Plan - Growth 1177618.67 1177618.67 1177618.67 -
UTI - Fixed Income Interval Fund - Series - II - Quarterly
Interval Plan - VII - Inst. Growth Plan 2002692.54 2002692.54 2002692.54 -
UTI - Fixed Income Interval Fund - series II - Quarterly Plan VI -
Instituional - Growth Plan 5000000.00 - 5000000.00 5000000.00 -
UTI - Treasury Advantage Fund Institutional Plan (Growth Option) 15315.45 64553.82 79869.27 79869.27 -
UTI Floating Rate Fund Short Term Plan - Inst. Growth Option 38239.04 38239.04 38239.04 -
UTI Liquid Cash plan Institutional - Growth option 59347.15 59347.15 48440.65 10906.50
UTI Money Market Fund - Growth Plan 1846.82 1846.82 0.00 1846.82
LICMF Savings Plus Fund - Growth Plan 6939926.54 9446152.02 16386078.56 16386078.56 -
LICMF Income Plus Fund - Growth Plan 5721352.05 5721352.05 5721352.05 -
LICMF Liquid Fund - Growth Plan 13259297.84 13259297.84 12840148.88 419148.96
Taurus Ultra Short Term Bond Fund - Inst. Growth Plan 9269.79 9269.79 9269.79 -
Taurus Liquid Fund 28972.85 28972.85 24289.35 4683.50
DWS Treasury Fund Investment - Regular Plan - Growth 481258.98 481258.98 481258.98 -
DWS Treasury Fund Cash - Regular Plan - Growth 483780.80 483780.80 483780.80 -
DWS Insta Cash Plus Fund - Inst Plan Growth 996631.78 996631.78 343149.70 653482.08
IDFC Cash Fund - Inst Plan B - Growth 1185964.48 1185964.48 901004.11 284960.36
IDFC Savings Advantage Fund - Plan A- Growth 3836.29 3836.29 3836.29 -
IDFC Money Manager Fund - Investment Plan - Inst Plan B - Growth 691683.61 691683.61 691683.61 -
IDFC Money Manager Fund - Treasury Plan - Inst Plan B - Growth 687600.15 - 687600.15 687600.15 -
Prudential ICICI Flexible income plan premium - Growth 134404.92 876247.61 1010652.53 1010652.53 -
ICICI Prudential Interval Fund II QLY Interval Fund Plan D
Inst. Cummulative 2007729.12 2007729.12 982067.45 1025661.67
ICICI Prudential Banking & PSU Debt Fund - Growth 1987755.43 1957770.88 3945526.31 3945526.31 -
ICICI Prudential Institutional Liquid Plan - Super Institutional Growth 1290243.33 1290243.33 1203958.48 86284.85
HDFC Cash Management Fund - Savings Plan - Growth 5971681.35 5971681.35 5483552.64 488128.71
HDFC Cash Management Fund - Treasury Advantage Plan -
Wholesale - Growth 2817501.74 1221850.38 4039352.12 4039352.12 -
HDFC High Interest Fund - Short Term Plan 536806.47 536806.47 536806.47 -
Canara Robeco Interval Series 2 - Quarterly Plan 2 - Inst. Growth Fund 5832887.77 0.00 5832887.77 5832887.77 -
Canara Robeco Liquid Fund - Institutional Growth 1150403.79 1150403.79 1150403.79 -
Axis Liquid Fund - Growth 45473.18 45473.18 45473.18 -
Axis Treasury Advantage Fund - Growth 5000.00 12194.61 17194.61 17194.61 -
Peerless Liquid Fund - Super Inst. Growth 4509443.23 4509443.23 3558573.81 950869.41
Edelweiss Liquid fund - Retail - Growth Plan 227960.75 227960.75 227960.75 -
Morgan Stanley Short Term Bond Fund-Institutional plus growth 1000000.00 0.00 1000000.00 1000000.00 -
Daiwa Liquid Fund - Retail Plan - Growth Option 4565.13 4565.13 0.00 4565.13
Pramerica Liquid Fund - Growth Option 4786.10 4786.10 0.00 4786.10
HSBC Cash Fund - Institutional Plan - Growth 314946.74 314946.74 0.00 314946.74
Sundaram Money Fund Institutional _APPm 369207.14 369207.14 0.00 369207.14
LQG- IDBI Liquid Fund- Growth 7130.62 7130.62 0.00 7130.62
No. in Units
Schedules to Consolidated Accounts
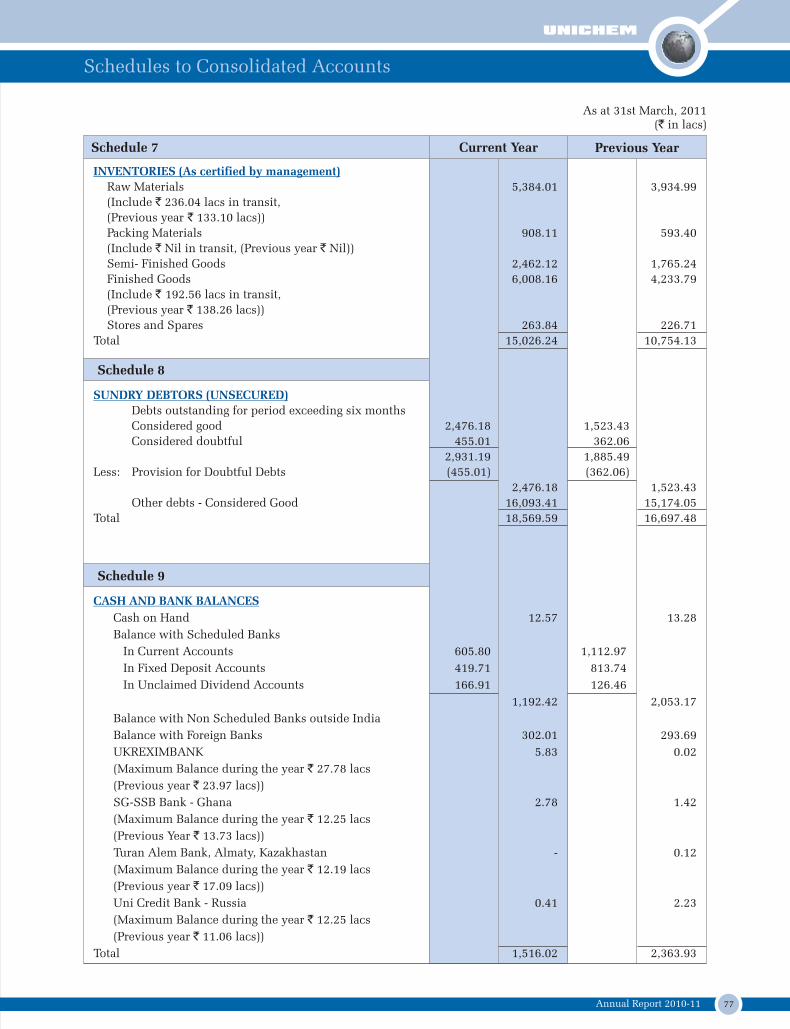
77Annual Report 2010-11
INVENTORIES (As certified by management)
Raw Materials 5,384.01 3,934.99
(Include ` 236.04 lacs in transit,
(Previous year ` 133.10 lacs))
Packing Materials 908.11 593.40
(Include ` Nil in transit, (Previous year ` Nil))
Semi- Finished Goods 2,462.12 1,765.24
Finished Goods 6,008.16 4,233.79
(Include ` 192.56 lacs in transit,
(Previous year ` 138.26 lacs))
Stores and Spares 263.84 226.71
Total 15,026.24 10,754.13
Previous YearCurrent YearSchedule 7
Schedule 8
SUNDRY DEBTORS (UNSECURED)
Debts outstanding for period exceeding six months
Considered good 2,476.18 1,523.43
Considered doubtful 455.01 362.06
2,931.19 1,885.49
Less: Provision for Doubtful Debts (455.01) (362.06)
2,476.18 1,523.43
Other debts - Considered Good 16,093.41 15,174.05
Total 18,569.59 16,697.48
Schedule 9
CASH AND BANK BALANCES
Cash on Hand 12.57 13.28
Balance with Scheduled Banks
In Current Accounts 605.80 1,112.97
In Fixed Deposit Accounts 419.71 813.74
In Unclaimed Dividend Accounts 166.91 126.46
1,192.42 2,053.17
Balance with Non Scheduled Banks outside India
Balance with Foreign Banks 302.01 293.69
UKREXIMBANK 5.83 0.02
(Maximum Balance during the year ` 27.78 lacs
(Previous year ` 23.97 lacs))
SG-SSB Bank - Ghana 2.78 1.42
(Maximum Balance during the year ` 12.25 lacs
(Previous Year ` 13.73 lacs))
Turan Alem Bank, Almaty, Kazakhastan - 0.12
(Maximum Balance during the year ` 12.19 lacs
(Previous year ` 17.09 lacs))
Uni Credit Bank - Russia 0.41 2.23
(Maximum Balance during the year ` 12.25 lacs
(Previous year ` 11.06 lacs))
Total 1,516.02 2,363.93
As at 31st March, 2011(` in lacs)
Schedules to Consolidated Accounts
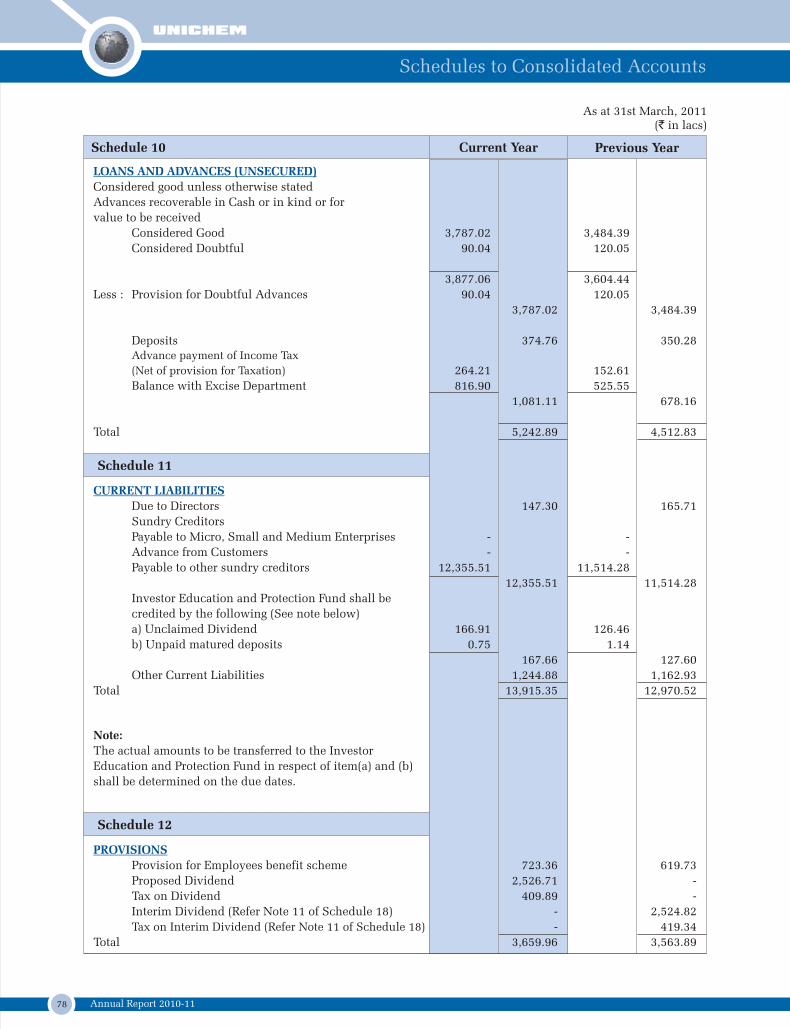
78 Annual Report 2010-11
LOANS AND ADVANCES (UNSECURED)
Considered good unless otherwise stated
Advances recoverable in Cash or in kind or for
value to be received
Considered Good 3,787.02 3,484.39
Considered Doubtful 90.04 120.05
3,877.06 3,604.44
Less : Provision for Doubtful Advances 90.04 120.05
3,787.02 3,484.39
Deposits 374.76 350.28Advance payment of Income Tax
(Net of provision for Taxation) 264.21 152.61
Balance with Excise Department 816.90 525.55
1,081.11 678.16
Total 5,242.89 4,512.83
Previous YearCurrent YearSchedule 10
Schedule 11
CURRENT LIABILITIES
Due to Directors 147.30 165.71
Sundry Creditors
Payable to Micro, Small and Medium Enterprises - -
Advance from Customers - -
Payable to other sundry creditors 12,355.51 11,514.28
12,355.51 11,514.28
Investor Education and Protection Fund shall be
credited by the following (See note below)
a) Unclaimed Dividend 166.91 126.46
b) Unpaid matured deposits 0.75 1.14
167.66 127.60
Other Current Liabilities 1,244.88 1,162.93
Total 13,915.35 12,970.52
Schedule 12
PROVISIONS
Provision for Employees benefit scheme 723.36 619.73
Proposed Dividend 2,526.71 -
Tax on Dividend 409.89 -
Interim Dividend (Refer Note 11 of Schedule 18) - 2,524.82
Tax on Interim Dividend (Refer Note 11 of Schedule 18) - 419.34
Total 3,659.96 3,563.89
As at 31st March, 2011(` in lacs)
Note:
The actual amounts to be transferred to the Investor
Education and Protection Fund in respect of item(a) and (b)
shall be determined on the due dates.
Schedules to Consolidated Accounts
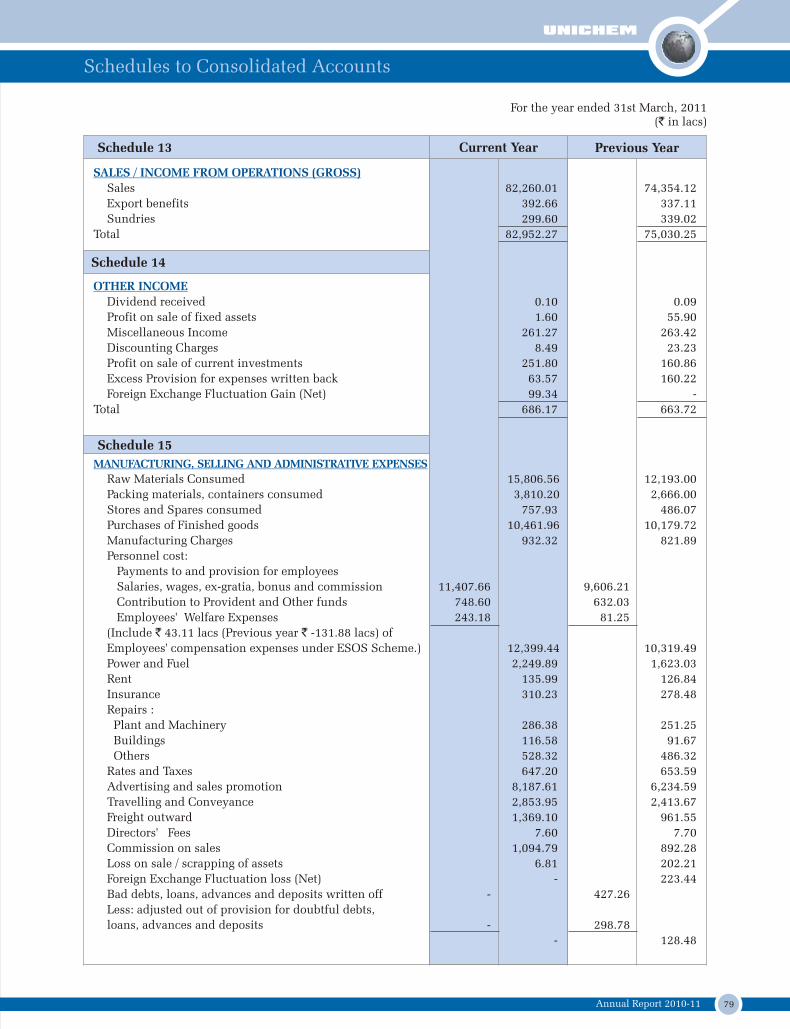
79Annual Report 2010-11
Previous YearCurrent Year
OTHER INCOME
Dividend received 0.10 0.09
Profit on sale of fixed assets 1.60 55.90
Miscellaneous Income 261.27 263.42
Discounting Charges 8.49 23.23
Profit on sale of current investments 251.80 160.86
Excess Provision for expenses written back 63.57 160.22
Foreign Exchange Fluctuation Gain (Net) 99.34 -
Total 686.17 663.72
Schedule 14
Schedule 15
MANUFACTURING, SELLING AND ADMINISTRATIVE EXPENSES
Raw Materials Consumed 15,806.56 12,193.00
Packing materials, containers consumed 3,810.20 2,666.00
Stores and Spares consumed 757.93 486.07
Purchases of Finished goods 10,461.96 10,179.72
Manufacturing Charges 932.32 821.89
Personnel cost:
Payments to and provision for employees
Salaries, wages, ex-gratia, bonus and commission 11,407.66 9,606.21
Contribution to Provident and Other funds 748.60 632.03
Employees' Welfare Expenses 243.18 81.25
(Include ` 43.11 lacs (Previous year ` -131.88 lacs) of
Employees' compensation expenses under ESOS Scheme.) 12,399.44 10,319.49
Power and Fuel 2,249.89 1,623.03
Rent 135.99 126.84
Insurance 310.23 278.48
Repairs :
Plant and Machinery 286.38 251.25
Buildings 116.58 91.67
Others 528.32 486.32
Rates and Taxes 647.20 653.59
Advertising and sales promotion 8,187.61 6,234.59
Travelling and Conveyance 2,853.95 2,413.67
Freight outward 1,369.10 961.55
Directors' Fees 7.60 7.70
Commission on sales 1,094.79 892.28
Loss on sale / scrapping of assets 6.81 202.21
Foreign Exchange Fluctuation loss (Net) - 223.44
Bad debts, loans, advances and deposits written off - 427.26
Less: adjusted out of provision for doubtful debts,
loans, advances and deposits - 298.78
- 128.48
Schedule 13
SALES / INCOME FROM OPERATIONS (GROSS)
Sales 82,260.01 74,354.12
Export benefits 392.66 337.11
Sundries 299.60 339.02
Total 82,952.27 75,030.25
For the year ended 31st March, 2011(` in lacs)
Schedules to Consolidated Accounts
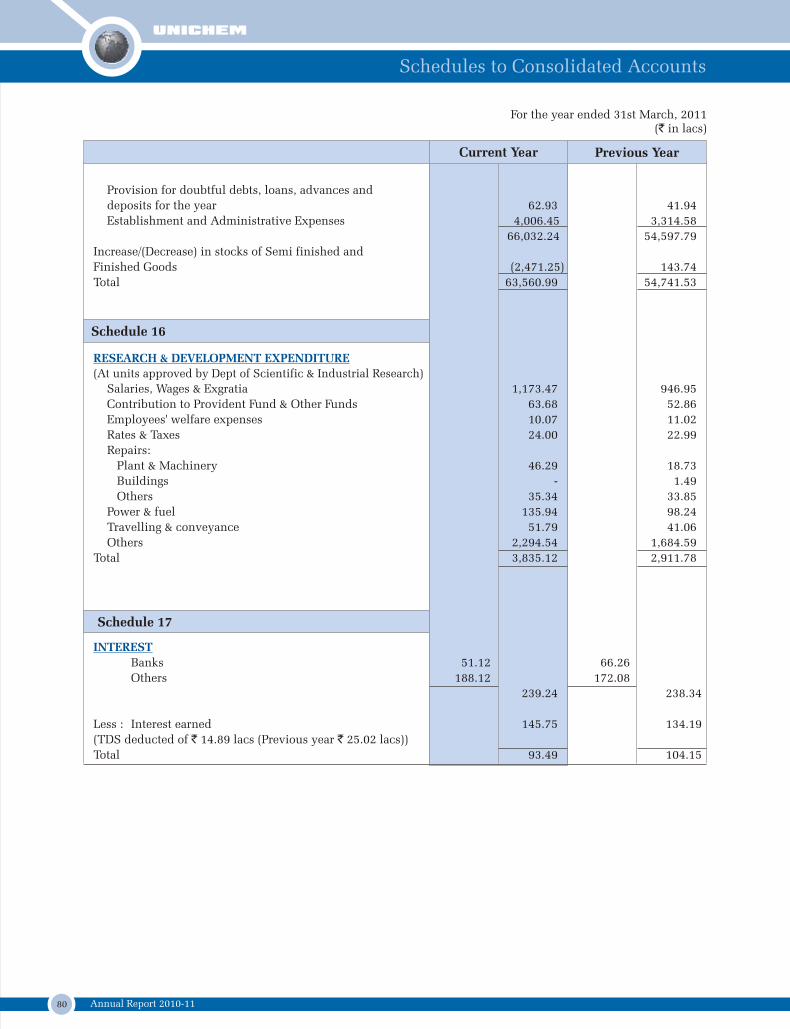
80 Annual Report 2010-11
RESEARCH & DEVELOPMENT EXPENDITURE
(At units approved by Dept of Scientific & Industrial Research)
Salaries, Wages & Exgratia 1,173.47 946.95
Contribution to Provident Fund & Other Funds 63.68 52.86
Employees' welfare expenses 10.07 11.02
Rates & Taxes 24.00 22.99
Repairs:
Plant & Machinery 46.29 18.73
Buildings - 1.49
Others 35.34 33.85
Power & fuel 135.94 98.24
Travelling & conveyance 51.79 41.06
Others 2,294.54 1,684.59
Total 3,835.12 2,911.78
Previous YearCurrent Year
Schedule 16
Schedule 17
INTEREST
Banks 51.12 66.26
Others 188.12 172.08
239.24 238.34
Less : Interest earned 145.75 134.19
(TDS deducted of ` 14.89 lacs (Previous year ` 25.02 lacs))
Total 93.49 104.15
For the year ended 31st March, 2011(` in lacs)
Provision for doubtful debts, loans, advances and
deposits for the year 62.93 41.94
Establishment and Administrative Expenses 4,006.45 3,314.58
66,032.24 54,597.79
Increase/(Decrease) in stocks of Semi finished and
Finished Goods (2,471.25) 143.74
Total 63,560.99 54,741.53
Schedules to Consolidated Accounts
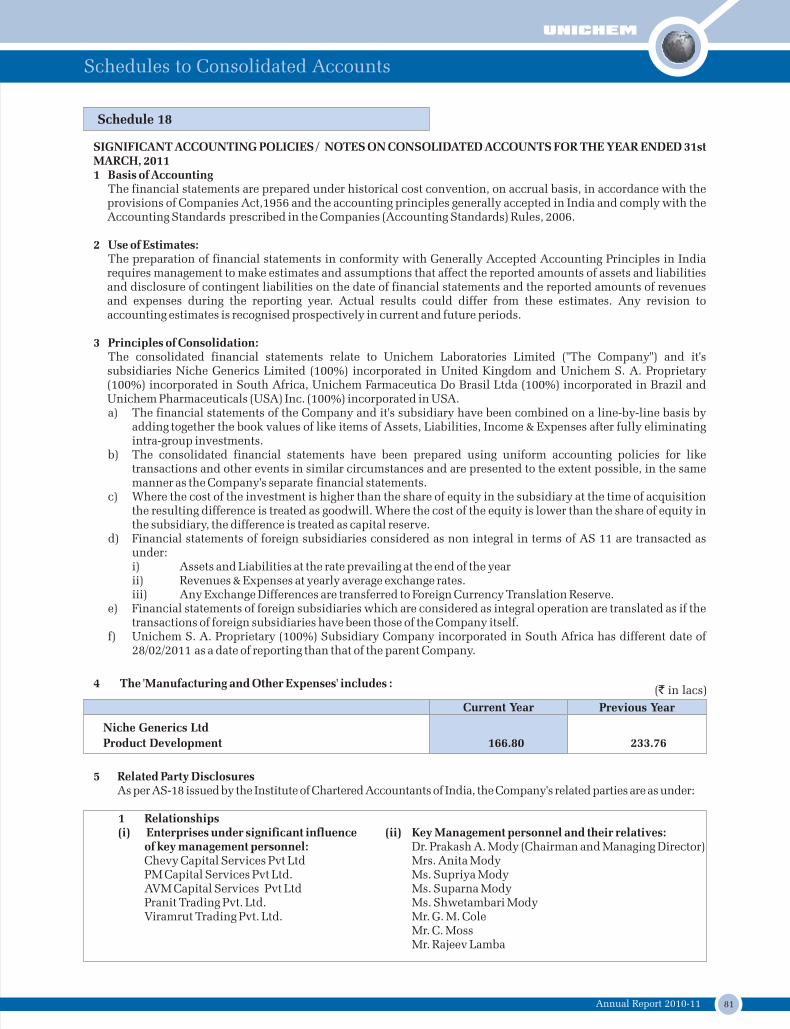
81Annual Report 2010-11
Schedule 18
SIGNIFICANT ACCOUNTING POLICIES / NOTES ON CONSOLIDATED ACCOUNTS FOR THE YEAR ENDED 31st MARCH, 20111 Basis of Accounting
The financial statements are prepared under historical cost convention, on accrual basis, in accordance with the provisions of Companies Act,1956 and the accounting principles generally accepted in India and comply with the Accounting Standards prescribed in the Companies (Accounting Standards) Rules, 2006.
2 Use of Estimates:The preparation of financial statements in conformity with Generally Accepted Accounting Principles in India requires management to make estimates and assumptions that affect the reported amounts of assets and liabilities and disclosure of contingent liabilities on the date of financial statements and the reported amounts of revenues and expenses during the reporting year. Actual results could differ from these estimates. Any revision to accounting estimates is recognised prospectively in current and future periods.
3 Principles of Consolidation:The consolidated financial statements relate to Unichem Laboratories Limited ("The Company") and it's subsidiaries Niche Generics Limited (100%) incorporated in United Kingdom and Unichem S. A. Proprietary (100%) incorporated in South Africa, Unichem Farmaceutica Do Brasil Ltda (100%) incorporated in Brazil and Unichem Pharmaceuticals (USA) Inc. (100%) incorporated in USA.a) The financial statements of the Company and it's subsidiary have been combined on a line-by-line basis by
adding together the book values of like items of Assets, Liabilities, Income & Expenses after fully eliminating intra-group investments.
b) The consolidated financial statements have been prepared using uniform accounting policies for like transactions and other events in similar circumstances and are presented to the extent possible, in the same manner as the Company's separate financial statements.
c) Where the cost of the investment is higher than the share of equity in the subsidiary at the time of acquisition the resulting difference is treated as goodwill. Where the cost of the equity is lower than the share of equity in the subsidiary, the difference is treated as capital reserve.
d) Financial statements of foreign subsidiaries considered as non integral in terms of AS 11 are transacted as under:i) Assets and Liabilities at the rate prevailing at the end of the yearii) Revenues & Expenses at yearly average exchange rates.iii) Any Exchange Differences are transferred to Foreign Currency Translation Reserve.
e) Financial statements of foreign subsidiaries which are considered as integral operation are translated as if the transactions of foreign subsidiaries have been those of the Company itself.
f) Unichem S. A. Proprietary (100%) Subsidiary Company incorporated in South Africa has different date of 28/02/2011 as a date of reporting than that of the parent Company.
Niche Generics Ltd
Product Development 166.80 233.76
Previous YearCurrent Year
(` in lacs)4 The 'Manufacturing and Other Expenses' includes :
5 Related Party DisclosuresAs per AS-18 issued by the Institute of Chartered Accountants of India, the Company's related parties are as under:
1 Relationships(i) Enterprises under significant influence (ii) Key Management personnel and their relatives:
of key management personnel: Dr. Prakash A. Mody (Chairman and Managing Director)Chevy Capital Services Pvt Ltd Mrs. Anita ModyPM Capital Services Pvt Ltd. Ms. Supriya ModyAVM Capital Services Pvt Ltd Ms. Suparna ModyPranit Trading Pvt. Ltd. Ms. Shwetambari ModyViramrut Trading Pvt. Ltd. Mr. G. M. Cole
Mr. C. MossMr. Rajeev Lamba
Schedules to Consolidated Accounts
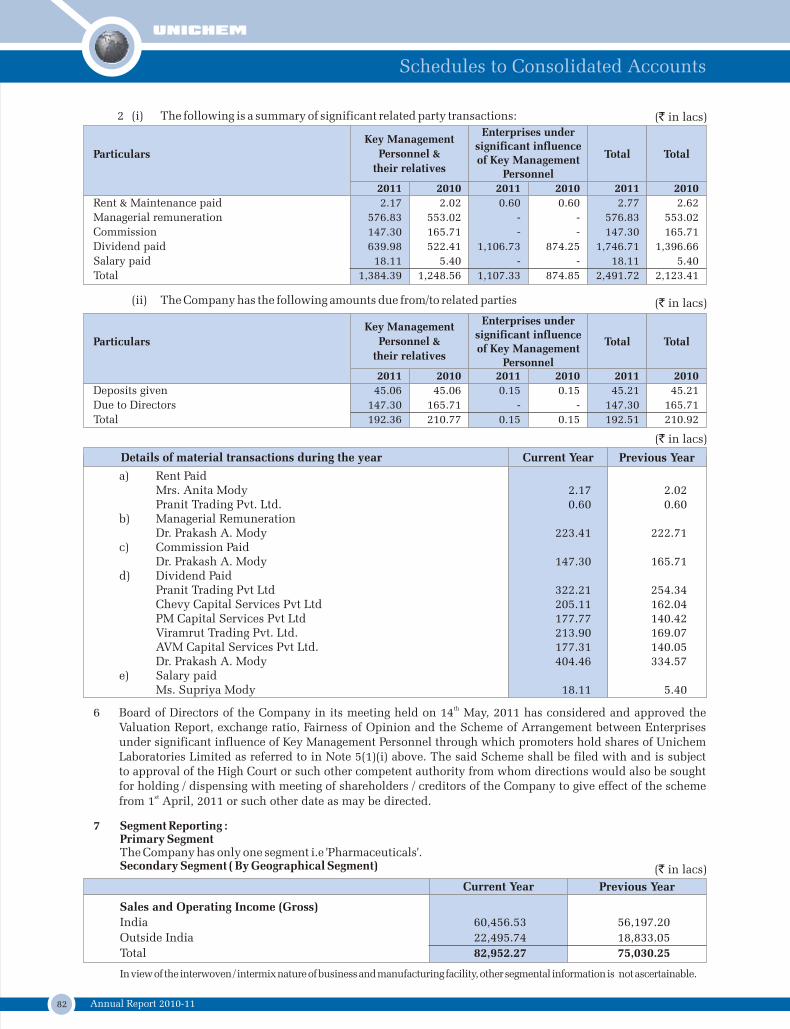
82 Annual Report 2010-11
7 Segment Reporting :Primary SegmentThe Company has only one segment i.e 'Pharmaceuticals'. Secondary Segment ( By Geographical Segment)
Sales and Operating Income (Gross)
India 60,456.53 56,197.20
Outside India 22,495.74 18,833.05
Total 82,952.27 75,030.25
Previous YearCurrent Year
(` in lacs)
In view of the interwoven / intermix nature of business and manufacturing facility, other segmental information is not ascertainable.
Current Year
a) Rent PaidMrs. Anita Mody 2.17 2.02Pranit Trading Pvt. Ltd. 0.60 0.60
b) Managerial RemunerationDr. Prakash A. Mody 223.41 222.71
c) Commission PaidDr. Prakash A. Mody 147.30 165.71
d) Dividend PaidPranit Trading Pvt Ltd 322.21 254.34Chevy Capital Services Pvt Ltd 205.11 162.04PM Capital Services Pvt Ltd 177.77 140.42Viramrut Trading Pvt. Ltd. 213.90 169.07AVM Capital Services Pvt Ltd. 177.31 140.05Dr. Prakash A. Mody 404.46 334.57
e) Salary paidMs. Supriya Mody 18.11 5.40
Details of material transactions during the year Previous Year
(` in lacs)
(ii) The Company has the following amounts due from/to related parties
2 (i) The following is a summary of significant related party transactions:
Particulars
Key Management
Personnel &
their relatives
Enterprises undersignificant influenceof Key Management
Personnel
Total Total
(` in lacs)
2011 2010 2011 2010 2011 2010
Rent & Maintenance paid 2.17 2.02 0.60 0.60 2.77 2.62
Managerial remuneration 576.83 553.02 - - 576.83 553.02
Commission 147.30 165.71 - - 147.30 165.71
Dividend paid 639.98 522.41 1,106.73 874.25 1,746.71 1,396.66
Salary paid 18.11 5.40 - - 18.11 5.40
Total 1,384.39 1,248.56 1,107.33 874.85 2,491.72 2,123.41
Particulars
Key Management
Personnel &
their relatives
Enterprises undersignificant influenceof Key Management
Personnel
Total
2011 2010 2011 2010 2011 2010
Deposits given 45.06 45.06 0.15 0.15 45.21 45.21
Due to Directors 147.30 165.71 - - 147.30 165.71
Total 192.36 210.77 0.15 0.15 192.51 210.92
Total
(` in lacs)
Schedules to Consolidated Accounts
th6 Board of Directors of the Company in its meeting held on 14 May, 2011 has considered and approved the Valuation Report, exchange ratio, Fairness of Opinion and the Scheme of Arrangement between Enterprises under significant influence of Key Management Personnel through which promoters hold shares of Unichem Laboratories Limited as referred to in Note 5(1)(i) above. The said Scheme shall be filed with and is subject to approval of the High Court or such other competent authority from whom directions would also be sought for holding / dispensing with meeting of shareholders / creditors of the Company to give effect of the scheme
stfrom 1 April, 2011 or such other date as may be directed.
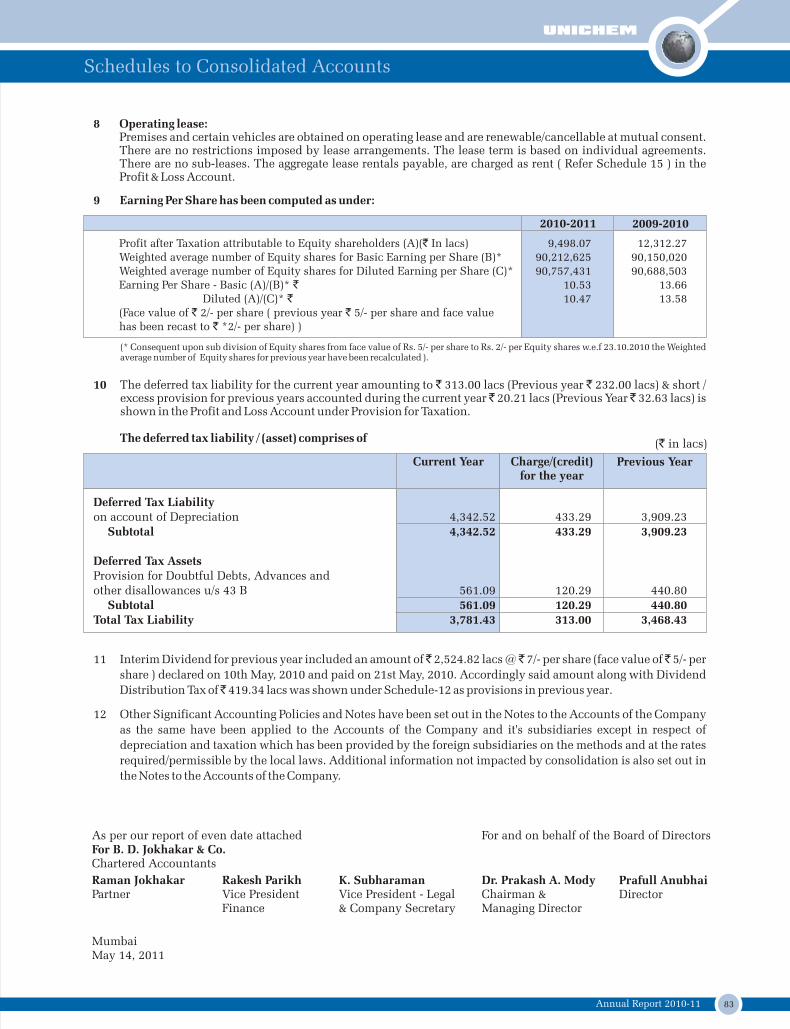
83Annual Report 2010-11
2010-2011
9 Earning Per Share has been computed as under:
2009-2010
10 The deferred tax liability for the current year amounting to ` 313.00 lacs (Previous year ` 232.00 lacs) & short / excess provision for previous years accounted during the current year ̀ 20.21 lacs (Previous Year ̀ 32.63 lacs) is shown in the Profit and Loss Account under Provision for Taxation.
The deferred tax liability / (asset) comprises of
Current Year Previous YearCharge/(credit) for the year
(` in lacs)
11 Interim Dividend for previous year included an amount of ̀ 2,524.82 lacs @ ̀ 7/- per share (face value of ̀ 5/- per
share ) declared on 10th May, 2010 and paid on 21st May, 2010. Accordingly said amount along with Dividend
Distribution Tax of ̀ 419.34 lacs was shown under Schedule-12 as provisions in previous year.
12 Other Significant Accounting Policies and Notes have been set out in the Notes to the Accounts of the Company
as the same have been applied to the Accounts of the Company and it's subsidiaries except in respect of
depreciation and taxation which has been provided by the foreign subsidiaries on the methods and at the rates
required/permissible by the local laws. Additional information not impacted by consolidation is also set out in
the Notes to the Accounts of the Company.
As per our report of even date attached For B. D. Jokhakar & Co.Chartered Accountants
For and on behalf of the Board of Directors
Raman Jokhakar Partner
Rakesh ParikhVice President Finance
K. SubharamanVice President - Legal & Company Secretary
Dr. Prakash A. ModyChairman & Managing Director
Prafull AnubhaiDirector
MumbaiMay 14, 2011
8 Operating lease:Premises and certain vehicles are obtained on operating lease and are renewable/cancellable at mutual consent. There are no restrictions imposed by lease arrangements. The lease term is based on individual agreements. There are no sub-leases. The aggregate lease rentals payable, are charged as rent ( Refer Schedule 15 ) in the Profit & Loss Account.
Profit after Taxation attributable to Equity shareholders (A)(` In lacs) 9,498.07 12,312.27 Weighted average number of Equity shares for Basic Earning per Share (B)* 90,212,625 90,150,020Weighted average number of Equity shares for Diluted Earning per Share (C)* 90,757,431 90,688,503 Earning Per Share - Basic (A)/(B)* ` 10.53 13.66 Diluted (A)/(C)* ` 10.47 13.58 (Face value of ` 2/- per share ( previous year ` 5/- per share and face value has been recast to ` *2/- per share) )
Deferred Tax Liability on account of Depreciation 4,342.52 433.29 3,909.23
Subtotal 4,342.52 433.29 3,909.23
Deferred Tax AssetsProvision for Doubtful Debts, Advances and other disallowances u/s 43 B 561.09 120.29 440.80
Subtotal 561.09 120.29 440.80Total Tax Liability 3,781.43 313.00 3,468.43
Schedules to Consolidated Accounts
(* Consequent upon sub division of Equity shares from face value of Rs. 5/- per share to Rs. 2/- per Equity shares w.e.f 23.10.2010 the Weighted average number of Equity shares for previous year have been recalculated ).
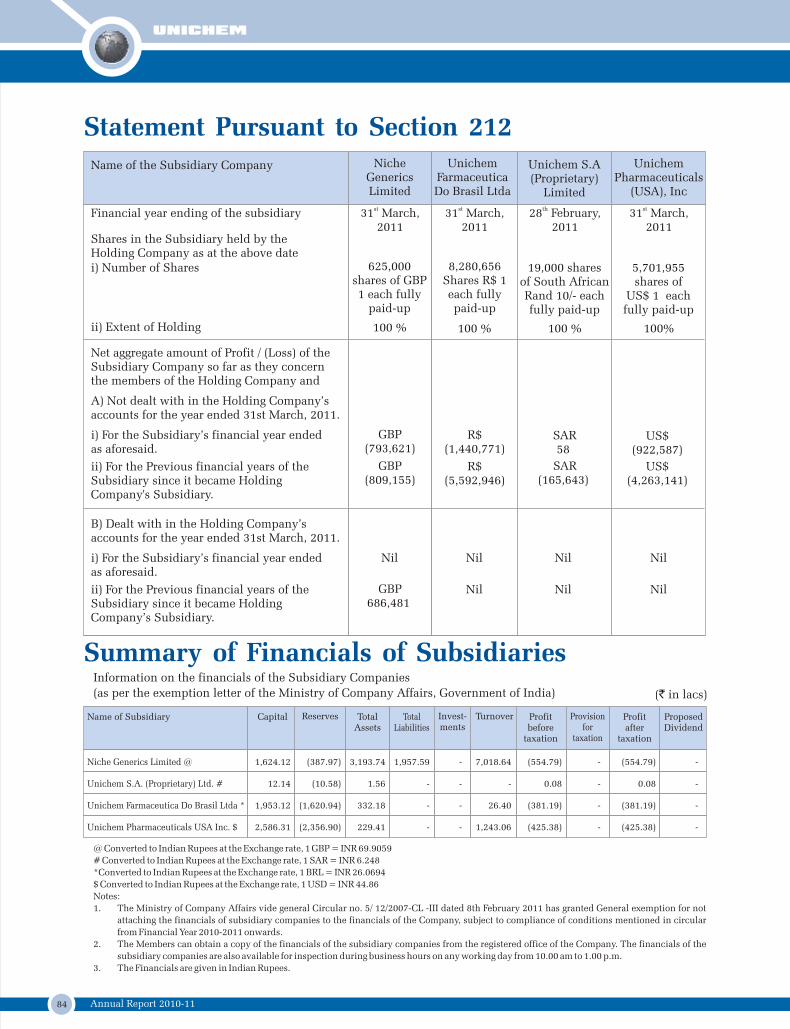
84 Annual Report 2010-11
Statement Pursuant to Section 212Unichem
Pharmaceuticals(USA), Inc
Unichem S.A (Proprietary)
Limited
UnichemFarmaceutica Do Brasil Ltda
Niche Generics Limited
st31 March, 2011
Financial year ending of the subsidiary
Shares in the Subsidiary held by the Holding Company as at the above datei) Number of Shares
ii) Extent of Holding
625,000 shares of GBP 1 each fully
paid-up
8,280,656 Shares R$ 1 each fullypaid-up
100 %
19,000 shares of South African Rand 10/- each fully paid-up
100 %
5,701,955 shares of
US$ 1 eachfully paid-up
100%
Name of the Subsidiary Company
GBP (809,155)
R$ (5,592,946)
SAR (165,643)
US$ (4,263,141)
GBP (793,621)
R$ (1,440,771)
SAR 58
US$ (922,587)
Net aggregate amount of Profit / (Loss) of the Subsidiary Company so far as they concern the members of the Holding Company and
A) Not dealt with in the Holding Company’saccounts for the year ended 31st March, 2011.
i) For the Subsidiary’s financial year endedas aforesaid.
B) Dealt with in the Holding Company’s accounts for the year ended 31st March, 2011.
i) For the Subsidiary’s financial year endedas aforesaid.
Nil Nil Nil Nil
ii) For the Previous financial years of the Subsidiary since it became Holding Company’s Subsidiary.
GBP 686,481
Nil Nil Nil
100 %
ii) For the Previous financial years of the Subsidiary since it became Holding Company's Subsidiary.
Summary of Financials of SubsidiariesInformation on the financials of the Subsidiary Companies
(as per the exemption letter of the Ministry of Company Affairs, Government of India)
@ Converted to Indian Rupees at the Exchange rate, 1 GBP = INR 69.9059
# Converted to Indian Rupees at the Exchange rate, 1 SAR = INR 6.248
*Converted to Indian Rupees at the Exchange rate, 1 BRL = INR 26.0694
$ Converted to Indian Rupees at the Exchange rate, 1 USD = INR 44.86
Notes:
1. The Ministry of Company Affairs vide general Circular no. 5/ 12/2007-CL -III dated 8th February 2011 has granted General exemption for not
attaching the financials of subsidiary companies to the financials of the Company, subject to compliance of conditions mentioned in circular
from Financial Year 2010-2011 onwards.
2. The Members can obtain a copy of the financials of the subsidiary companies from the registered office of the Company. The financials of the
subsidiary companies are also available for inspection during business hours on any working day from 10.00 am to 1.00 p.m.
3. The Financials are given in Indian Rupees.
Name of Subsidiary
Niche Generics Limited @
Unichem S.A. (Proprietary) Ltd. #
Unichem Farmaceutica Do Brasil Ltda *
Unichem Pharmaceuticals USA Inc. $
Capital
1,624.12
12.14
1,953.12
2,586.31
Reserves
(387.97)
(10.58)
(1,620.94)
(2,356.90)
Total Assets
3,193.74
1.56
332.18
229.41
Total Liabilities
1,957.59
-
-
-
Invest- ments
-
-
-
-
Turnover
7,018.64
-
26.40
1,243.06
Profit before
taxation
(554.79)
0.08
(381.19)
(425.38)
Provision for
taxation
-
-
-
-
Profit after
taxation
(554.79)
0.08
(381.19)
(425.38)
ProposedDividend
-
-
-
-
(` in lacs)
st31 March, 2011
th28 February,2011
st31 March, 2011
85Annual Report 2010-11
Noticeth Directors, in the Senior Management Cadre of the NOTICE is hereby given that the 48 Annual General
Company from time to time.Meeting of the members of UNICHEM LABORATORIES
LIMITED will be held on Thursday, July 28, 2011 at 3.30
RESOLVED FURTHER THAT Ms. Supriya Mody be p.m. at Hall of Culture, Nehru Centre, Dr. Annie Besant
paid initially compensation of 30 Lacs per annum Road, Worli, Mumbai – 400 018 to transact the following
with an authority to Board of Directors to pay such business.
further remuneration as it may deem fit subject to
maximum compensation of 50 Lacs per annum. In ORDINARY BUSINESS
addition Ms Supriya Mody be paid perquisites such 1. To consider and adopt Audited Balance Sheet as at
as Car, Medical Insurance, Provident Fund, March 31, 2011 and Audited Profit and Loss
Gratuity, Superannuation Fund, Leave entitlement, Account for the year ended on that date along with
ESOPs and such other benefits which are payable or the Reports of the Board of Directors and Auditors
applicable to employees in similar Senior thereon.st Management Cadre and position in the 2. To confirm 1 Interim Dividend of ̀ 1.2/- per Equity
organization.Share of ` 2/- each already paid for the year ended
March 31, 2011.
RESOLVED FURTHER THAT Dr. Prakash A Mody, 3. To declare Final Dividend for the year ended March
Chairman & Managing Director and Mr. K. 31, 2011.
Subharaman, 4. To appoint a Director in place of Mr. Prafull
, be and are hereby severally authorized to Anubhai, who retires by rotation and being eligible,
make applications to the Central Government offers himself for re-appointment.
whenever necessary or to any other statutory 5. To appoint a Director in place of Mr. Ramdas
authorities as per provisions of the Companies Act, Gandhi, who retires by rotation and being eligible,
1956 or any other Act, Rules or Regulations and to offers himself for re-appointment.
file necessary forms with the Ministry of Corporate 6. To re-appoint M/s. B. D. Jokhakar & Co., having
Affairs relating to appointment of Ms. Supriya registration no. 104345W, as Statutory Auditors of
Mody.the Company, to hold office from the conclusion of
this Annual General Meeting until the conclusion of
the next Annual General Meeting and to authorize
By order of the Board of Directors,the Board of Directors to fix their remuneration.
For Unichem Laboratories Limited
SPECIAL BUSINESS
K. Subharaman7. To consider and if thought fit, to pass with or
V. P. - Legal & Company Secretarywithout modification(s), the following resolution as
Mumbaia special resolution:
May 14, 2011
“RESOLVED THAT pursuant to the provisions of
NOTES:sub-section (1B) of section 314 and the Director’s
1. The Explanatory Statement pursuant to section Relatives (Office or Place of Profit) Amendment
173(2) of the Companies Act, 1956 in respect of the Rules, 2011 and other applicable provisions of the
item under Special Business is annexed hereto.Companies Act, 1956 for the time being in force and
subject to the prior approval of the Central
2. A MEMBER ENTITLED TO ATTEND AND VOTE Government, whenever required, the consent of the
AT THE MEETING IS ENTITLED TO APPOINT Company be and is hereby accorded to the
ONE OR MORE PROXIES TO ATTEND AND ON appointment of Ms. Supriya Mody, daughter of Dr.
POLL TO VOTE INSTEAD OF HIMSELF AND A Prakash A Mody, Chairman & Managing Director of
PROXY NEED NOT BE A MEMBER OF THE the Company, to hold office of profit in the
COMPANY. A blank form of proxy is enclosed and if Company as General Manager – Marketing &
intended to be used, should be completed, duly Strategy or such other posts as may be decided by
stamped, signed and deposited at the Registered the Compensation Committee and the Board of
`
`
Vice President - Legal & Company
Secretary
86 Annual Report 2010-11
Notice
Office of the Company not less than 48 hours before Mauritius (The Emerging Markets South Asia
the commencement of the Meeting. A power of Fund), Vardhaman Textiles Ltd., Vardhaman Special
attorney or any other authority, if any, under which Steels Ltd., Birla Sun Life Trustee Co. Pvt. Ltd., Gruh
it is signed (or a notarized copy thereof) must be Finance Ltd., etc. He has served on the Board of
deposited along with the proxy form. Unichem since 1979. He is the Chairman of the
Audit Committee and member of the Compensation
3. Corporate Members are requested to send a duly Committee of Unichem.
certified copy of the Board Resolution, pursuant to
Section 187 of the Companies Act, 1956, Mr. Ramdas Gandhi is an advocate and solicitor by
authorizing their representative to attend and vote profession. He holds a Masters degree in law from
at the Annual General Meeting. University of Bombay. He was enrolled as an
attorney at law in the High Court of Mumbai in
4. The Ministry of Corporate Affairs ("MCA") has taken 1956. He also served as partner in a leading law firm
a "Green Initiative in the Corporate Governance" by in India namely M/s. Bhaishanker Kanga &
allowing paperless compliances by companies and Girdharlal and of M/s. Manilal Kher Ambalal & Co.
has issued a circular on April 21, 2011 stating that He presently serves as director in Pidilite Industries
the service of document by a company can be made Limited, Aarti Industries Limited, Vinyl (India)
through electronic mode. In view of this Circular, Chemicals Limited and Aarti Drugs Limited. He has
the Company proposes to send notices, annual served on the Board of Unichem since 1985. He is
reports and various other correspondences via the Chairman of the Shareholders Grievance
emails in future. For this purpose, the shareholder is Committee and member of Audit Committee,
requested to update their email ids with the Compensation Committee and Management
Depository Participant (DP) in case of demat Committee of Unichem.
holdings and with the RTA in case of holdings in
physical form.
By order of the Board of Directors,
For Unichem Laboratories Limited5. The Register of Members and Share Transfer Books
of the Company will remain closed from July 18,
K. Subharaman2011 to July 22, 2011 (both days inclusive).
V.P. – Legal & Company Secretary
Mumbai6. As required under Clause 49 IV(G) of the Listing
May 14, 2011Agreement, the relevant information in respect of
the Directors seeking re-appointment at the Annual
General Meeting is given as under.
thAt the ensuing 48 Annual General Meeting, Mr.
Prafull Anubhai and Mr. Ramdas Gandhi retire by
rotation and being eligible, offer themselves for re-
appointment. Their profile is given below:
Mr. Prafull Anubhai, is a management consultant
and is associated with educational, research and
cultural institutions like Indian Institute of
Management (IIMA), Ahmedabad Education
Society (AES), Centre for Science Technology and
Policy (CSTEP), ATIRA, Saptak (An Indian Classical
Music organization), etc. He has done his
B.Sc.(Econ.) from the London School of Economics
and attended PMD at Harvard Business School. He
has over 30 years of experience in top management
of Textile and other businesses. He serves on the
Boards of Torrent Cables Ltd., The EMSAF –
87Annual Report 2010-11
Annexure to Notice
Brief Profile of Supriya Mody:Ms. Supriya Mody was appointed as Deputy General Ms. Supriya Mody holds MBA degree from London Manager in terms of the special resolution passed by the Business School and Bachelors degree in Business members on 22nd July, 2009. Subsequently, the Administration from the Ross School of Business, USA. Company also received approval of the Central She also holds Post graduation Certificate in Financial Government concerning her appointment. Markets Module from Association of Mutual Funds of
Ms. Supriya Mody has performed well in the last two India. Prior to joining Unichem, she has rich experience years and now she has taken over a bigger role and and successful career behind her having worked in responsibility in the organization. She is promoted as organizations like Merrill Lynch, Tower Capital & General Manager – Marketing & Strategy effective 1st Securities Pvt. Ltd., ASK Raymond James Securities (I) June 2011 and she supervises the marketing strategies for Pvt. Ltd. 7 major Marketing Divisions of the Company namely
None of the Directors, except Dr. Prakash A. Mody, is UVA, UNICHEM PHARMA, UNISEARCH CV, directly or indirectly interested in the aforesaid UNISEARCH CD, INTEGRA, NEU FOREVA, UNIKARE. resolution and recommends your acceptance thereof in Her appointment and progress has been well monitored the interest of the Company.by the Compensation Committee and the Board of
Directors who have decided to increase her
compensation commensurate with her role and
responsibilities in the organization. This is an enabling
resolution seeking one time approval for any increase in
her compensation from her present compensation to
such sum as may be determined by the compensation
committee subject to minimum of ̀ 30 Lacs but subject to
a maximum ` 50 Lacs excluding the identified
perquisites as mentioned in the resolution.
By order of the Board of Directors,
For Unichem Laboratories Limited
K. Subharaman
V.P. – Legal & Company Secretary
Mumbai
May 14, 2011
Explanatory Statement under section 173 (2) of the Companies Act, 1956
Item no. 7
88 Annual Report 2010-11
Green Initiative in Corporate Governance: Go Paperless.Dear Shareholder,
The Ministry of Corporate Affairs (MCA) has taken a “Green Initiative in Corporate Governance” (Circular No. 17/2011
dated 21.04.2011 and Circular No. 18/2011 dated 29.04.2011) allowing paperless compliances by Companies through
electronic mode. Companies are now permitted to send various notices /documents to its shareholders through
electronic mode to the registered email addresses of shareholders. This move by the Ministry is welcome since it will
benefit the society at large through reduction in paper consumption and contribution towards a Greener Environment.
It will also ensure prompt receipt of communication and avoid loss in postal transit.
Keeping in view the underlying theme and the circular issued by MCA, we are keen to participate in Green Initiative
and henceforth propose to send documents like General Meeting Notices (including AGM), Audited Financial
Statements, Directors’ Report, Auditors’ Report etc. to the shareholders in the electronic form, to the e-mail address
provided by you and made available to us by the Depositories, NSDL & CDSL using data maintained by the Depository
Participants (DP).
In case you are holding shares in electronic form and have registered your e-mail id with your DP, we will use the same
e-mail id to send various notices I documents, etc henceforth. If you desire to have a different e-mail id registered,
please update the same with your DP. In case you have not registered your e-mail id with the DP, please do the same
before 30th September, 2011.
All those shareholders who are holding shares in physical form are requested to immediately register their e-mail Ids
with our RTA at along with your Folio Number and Number of shares before 30th September, 2011.
Kindly note that if you still wish to receive a physical copy of all the above mentioned communications/ documents,
the Company undertakes to provide the same at free of cost to you, if a request is received by the company or its
Registrar. Please note that these documents will also be available on the Company’s website www.unichemlabs.com.
The physical copies of these notices/ documents will also be available at our Registered Office in Jogeshwari, Mumbai
for inspection during office hours.
We are sure, that as a responsible citizen, you will whole-heartedly support this initiative and will co-operate with the
Company in implementing the same.
For Unichem Laboratories Limited
K. Subharaman
V.P. – Legal & Company Secretary
89Annual Report 2010-11
Regd. Office: Unichem Bhavan, Prabhat Estate, Off S. V. Road, Jogeshwari (West), Mumbai - 400 102.
ATTENDANCE SLIP(To be handed over at the entrance of the Meeting Hall)
thI hearby record my presence at the 48 Annual General Meeting of the Company on Thursday, July 28,
2011 at 3.30 p.m. at Hall of Culture, Nehru Centre, Dr. Annie Besant Road, Worli, Mumbai – 400 018.
Folio No. / D.P. No. & Client I.D. No.:. ..........................................................................................................
Name of the Member / Proxy / Representative: .............................................................................................
Signature of the Member / Proxy / Representative: ........................................................................................
(Only members / proxies / representative are allowed to attend the Meeting)
Regd. Office: Unichem Bhavan, Prabhat Estate, Off S. V. Road, Jogeshwari (West), Mumbai - 400 102.
PROXY FORM
I/We .................................................................................................................................................. of
.............................being a member(s) of UNICHEM LABORATORIES LTD. hereby appoint................................
of............................. or failing whom ...................................................... .of........................................as
thmy/our proxy to attend and vote for me/us and on my/our behalf at the 48 Annual General Meeting of
the Members of the Company to be held on Thursday, July 28, 2011 at 3.30 pm at Hall of Culture, Nehru
Centre, Dr. Annie Besant Road, Worli, Mumbai – 400 018 and at any adjournment thereof.
Folio No. / D.P. No. & Client I.D. No. ............................................................................................................
No. of Shares held: ........................................................
Signed this ......................... day of .......................2011
Revenue
Stamp
Signature across Revenue Stamp
Note: The Proxy Form duly completed and signed should be deposited at the Registered Office at the Company shown above, not later
than 48 hours before the time of the meeting.
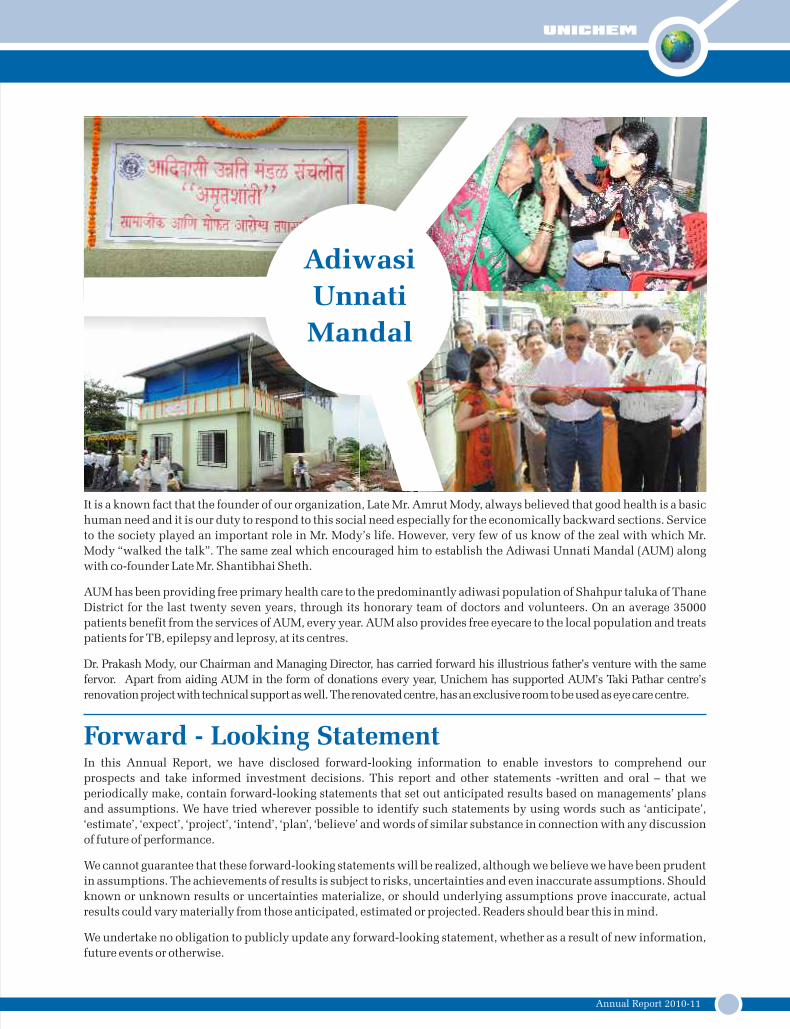
Annual Report 2010-11
Adiwasi
Unnati
Mandal
It is a known fact that the founder of our organization, Late Mr. Amrut Mody, always believed that good health is a basic
human need and it is our duty to respond to this social need especially for the economically backward sections. Service
to the society played an important role in Mr. Mody’s life. However, very few of us know of the zeal with which Mr.
Mody “walked the talk”. The same zeal which encouraged him to establish the Adiwasi Unnati Mandal (AUM) along
with co-founder Late Mr. Shantibhai Sheth.
AUM has been providing free primary health care to the predominantly adiwasi population of Shahpur taluka of Thane
District for the last twenty seven years, through its honorary team of doctors and volunteers. On an average 35000
patients benefit from the services of AUM, every year. AUM also provides free eyecare to the local population and treats
patients for TB, epilepsy and leprosy, at its centres.
Dr. Prakash Mody, our Chairman and Managing Director, has carried forward his illustrious father’s venture with the same
fervor. Apart from aiding AUM in the form of donations every year, Unichem has supported AUM’s Taki Pathar centre’s
renovation project with technical support as well. The renovated centre, has an exclusive room to be used as eye care centre.
Forward - Looking StatementIn this Annual Report, we have disclosed forward-looking information to enable investors to comprehend our
prospects and take informed investment decisions. This report and other statements -written and oral – that we
periodically make, contain forward-looking statements that set out anticipated results based on managements’ plans
and assumptions. We have tried wherever possible to identify such statements by using words such as ‘anticipate’,
‘estimate’, ‘expect’, ‘project’, ‘intend’, ‘plan’, ‘believe’ and words of similar substance in connection with any discussion
of future of performance.
We cannot guarantee that these forward-looking statements will be realized, although we believe we have been prudent
in assumptions. The achievements of results is subject to risks, uncertainties and even inaccurate assumptions. Should
known or unknown results or uncertainties materialize, or should underlying assumptions prove inaccurate, actual
results could vary materially from those anticipated, estimated or projected. Readers should bear this in mind.
We undertake no obligation to publicly update any forward-looking statement, whether as a result of new information,
future events or otherwise.