Embed Size (px)
Citation preview
Annual Report 2007

About Astellas
Astellas is an ethical pharmaceutical company which enjoys a substantial
market presence both in Japan and globally, thanks to its superior R&D abili-
ties and sales and marketing activities. Astellas will seek to actively develop
its business as a global pharmaceutical company originating in Japan that
helps improve the health of people around the world through the provision of
innovative and reliable pharmaceutical products.
Our Mission
Astellas will seek to enhance its enterprise value in a sustainable manner.
Astellas will seek to be the company of choice among all its stakeholders,
including its customers, shareholders, employees, and the global community.
Astellas will strive to gain the trust of all stakeholders and thereby enhance its
enterprise value.
Sustainable enhancement of enterprise valueJapan54.5%
NorthAmerica18.9%
Europe23.9%
Asia2.8%
Ethical Pharmaceuticals99.8%
Others0.2%
Sales by segment
Sales by operational base
Business Highlights 2
Financial Highlights 3
Message from the President 4
Medium-Term Plan“Strengthen platform for growth” 9
Corporate Social Responsibility 22
Corporate Governance 24
Board of Directors 24
Financial Section 27
Principal Subsidiaries and Affiliates 62
Investor Information 64
The most vital role of Astellas is to
create superior pharmaceuticals
that promise a healthier and more
enriched life for people all over the
world. Our challenge is to illuminate
the future. As a global pharmaceutical
company, Astellas is determined to be
a “Leading Light for Life.”
Leading Light for Life –––––
Note about forward-looking statements and forecasts
Statements made in this annual report with respect to current plans, estimates, strategies and beliefs and other statements of Astellas that are not historical facts are forward-looking statements about the future performance of Astellas. These statements are based on management’s current assumptions and beliefs in light of the information currently available to it and involve known and unknown risks and uncertainties. Consequently, undue reliance should not be placed on these statements. Astellas cautions the reader that a number of important factors could cause actual results to differ materially from those discussed in the forward-looking statements. Such factors include, but are not limited to: (i) changes in general economic conditions, and in the Pharmaceutical Affairs Law and other laws and regulations relating to markets of Astellas, (ii) currency exchange rate fluctuations, (iii) delays in new product launches, (iv) the inability of Astellas to market existing and new products effectively, (v) the inability of Astellas to continue to effectively research and develop products accepted by customers in highly competitive markets and (vi) infringements of intellectual property rights of third parties.
Contents
1Annual Report 2007
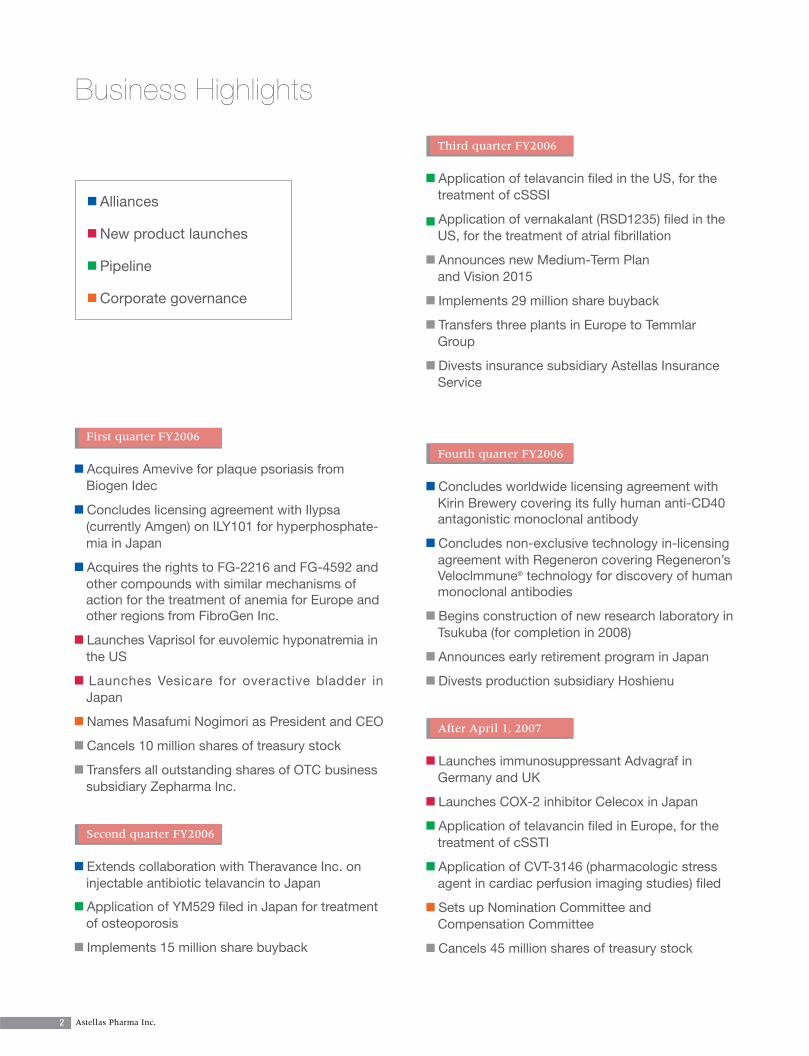
Business Highlights
First quarter FY2006
Acquires Amevive for plaque psoriasis from Biogen Idec
Concludes licensing agreement with Ilypsa (currently Amgen) on ILY101 for hyperphosphate-mia in Japan
Acquires the rights to FG-2216 and FG-4592 and other compounds with similar mechanisms of action for the treatment of anemia for Europe and other regions from FibroGen Inc.
Launches Vaprisol for euvolemic hyponatremia in the US
Launches Vesicare for overactive bladder in Japan
Names Masafumi Nogimori as President and CEO
Cancels 10 million shares of treasury stock
Transfers all outstanding shares of OTC business subsidiary Zepharma Inc.
Second quarter FY2006
Extends collaboration with Theravance Inc. on injectable antibiotic telavancin to Japan
Application of YM529 filed in Japan for treatment of osteoporosis
Implements 15 million share buyback
Third quarter FY2006
Application of telavancin filed in the US, for the treatment of cSSSI
Application of vernakalant (RSD1235) filed in the US, for the treatment of atrial fibrillation
Announces new Medium-Term Plan and Vision 2015
Implements 29 million share buyback
Transfers three plants in Europe to Temmlar Group
Divests insurance subsidiary Astellas Insurance Service
Fourth quarter FY2006
Concludes worldwide licensing agreement with Kirin Brewery covering its fully human anti-CD40 antagonistic monoclonal antibody
Concludes non-exclusive technology in-licensing agreement with Regeneron covering Regeneron’s Veloclmmune® technology for discovery of human monoclonal antibodies
Begins construction of new research laboratory in Tsukuba (for completion in 2008)
Announces early retirement program in Japan
Divests production subsidiary Hoshienu
After April 1, 2007
Launches immunosuppressant Advagraf in Germany and UK
Launches COX-2 inhibitor Celecox in Japan
Application of telavancin filed in Europe, for the treatment of cSSTI
Application of CVT-3146 (pharmacologic stress agent in cardiac perfusion imaging studies) filed
Sets up Nomination Committee and Compensation Committee
Cancels 45 million shares of treasury stock
Alliances
New product launches
Pipeline
Corporate governance
2 Astellas Pharma Inc.
Financial Highlights
¥ billion US$ million
2007 2006 2007
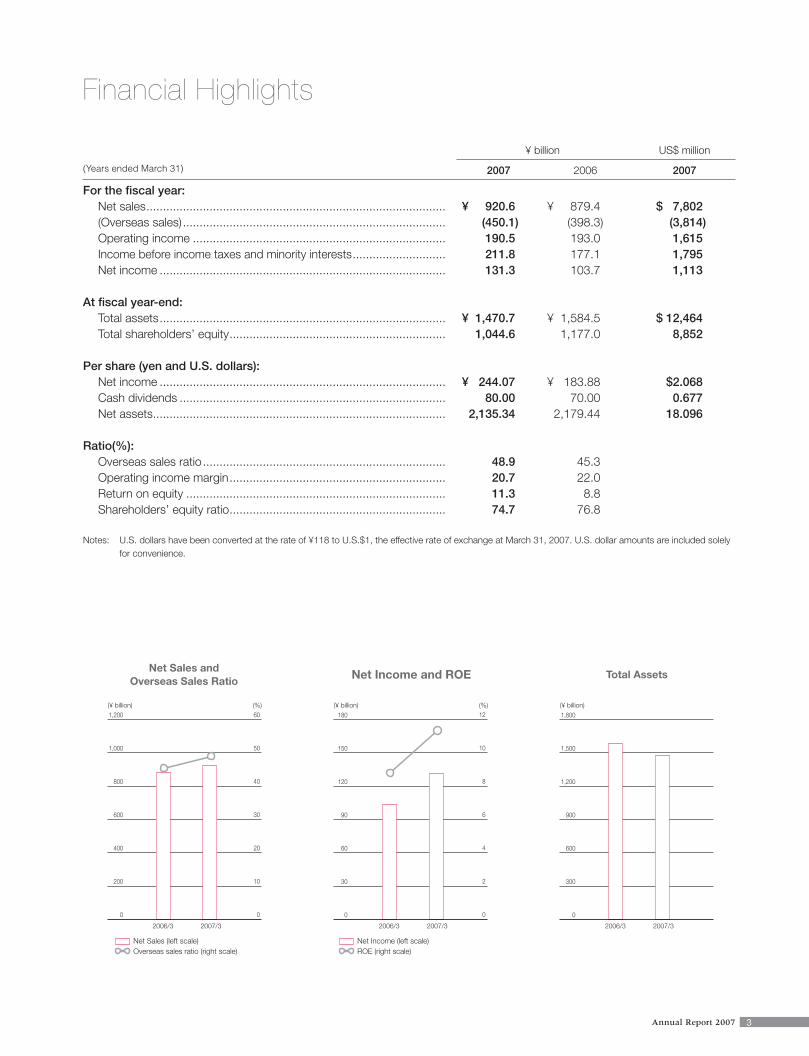
For the fiscal year: Net sales.......................................................................................... ¥ 920.6 ¥ 879.4 $ 7,802 (Overseas sales) ............................................................................... (450.1) (398.3) (3,814) Operating income ............................................................................ 190.5 193.0 1,615 Income before income taxes and minority interests............................ 211.8 177.1 1,795 Net income ...................................................................................... 131.3 103.7 1,113
At fiscal year-end: Total assets...................................................................................... ¥ 1,470.7 ¥ 1,584.5 $ 12,464 Total shareholders’ equity................................................................. 1,044.6 1,177.0 8,852
Per share (yen and U.S. dollars): Net income ...................................................................................... ¥ 244.07 ¥ 183.88 $2.068 Cash dividends ................................................................................ 80.00 70.00 0.677 Net assets........................................................................................ 2,135.34 2,179.44 18.096
Ratio(%): Overseas sales ratio......................................................................... 48.9 45.3 Operating income margin................................................................. 20.7 22.0 Return on equity .............................................................................. 11.3 8.8 Shareholders’ equity ratio................................................................. 74.7 76.8
Notes: U.S. dollars have been converted at the rate of ¥118 to U.S.$1, the effective rate of exchange at March 31, 2007. U.S. dollar amounts are included solely for convenience.
Net Sales andOverseas Sales Ratio Net Income and ROE Total Assets
0
200
400
600
800
1,000
1,200
0
10
20
30
40
50
60(¥ billion) (%)
2006/3
Net Sales (left scale)Overseas sales ratio (right scale)
Net Income (left scale)ROE (right scale)
2007/3
(¥ billion) (%)
2006/3 2007/3
(¥ billion)
2006/3 2007/3
0
30
60
90
120
150
180
0
2
4
6
8
10
12
0
300
600
900
1,200
1,500
1,800
(Years ended March 31)
3Annual Report 2007
Message from the President
Proactively investing in R&D to lay the foundations for future growth
In 2006 we drew up Vision 2015, our long-term management vision, clarifying the kind
of company we want Astellas to be in 2015. Then, in October of the same year, we
announced a new five-year medium term plan (fiscal 2006-2010) to specifically point
the way along the path to the achievement of the goals contained in Vision 2015.
While in the background we were drawing up these medium-term plan, on a
day-to-day basis we were working during fiscal 2006 (the term to March 2007) to
strengthen our business base through vigorous marketing activities to expand sales
of our mainstay products. At the same time, we continued to lay the foundations for
future growth by means of proactive investment in research and development.
In parallel with these activities, during the reporting term we completed the
divestiture of non-core business operations, turning Astellas into a dedicated ethical
pharmaceutical company able to focus its management resources on research and
development.
I assumed the post of president of Astellas on June 27, 2006, and I am pleased
to report that the business performance of Astellas for the term was satisfactory.
Business performance for fiscal 2006
Net sales rose in fiscal 2006, but operating income declined due to higher R&D expenses.
Despite this, we reported a year-on-year increase in net income.
The growth in net sales was driven primarily by increased sales of our mainstay
products in both the Japanese and overseas markets. This positive factor more than offset
a reduction in NHI drug prices in Japan, as well as the spin-off of our non-ethical pharma-
ceutical businesses. As a result, total sales on a consolidated basis came to ¥920.6 billion
(US$7,802 million), for an increase of 4.7% over the previous year.
Operating income declined by 1.3% year-on-year, to ¥190.5 billion (US$1,615 mil-
lion), due mainly to a sub
in-licensing of new drug ca
4 Astellas Pharma Inc.

5Annual Report 2007
Net income posted a strong growth of 26.7% over the previous year, to ¥131.3 billion
(US$1,113 million), thanks to extraordinary gains made on the divestiture of Zepharma Inc.,
a subsidiary engaged in the over-the-counter drugs business.
As described above, Astellas actively pursued alliances with other companies during
fiscal 2006, in the form of drug in-licensing and collaboration in drug discovery technol-
ogy. This led to a sharp increase in R&D expenses.
In April 2006 we signed licensing agreements with Ilypsa, Inc. (currently Amgen
Inc.) of the United States regarding their ILY101, treatment for hyperphosphatemia, and
concluded the licensing agreement on FibroGen’s investigational oral therapies for anemia
— FG-2216, FG-4592 and other compounds with similar mechanisms — for exclusive
development and marketing in Europe and other regions. In July of 2006 we signed a new
agreement with Theravance, Inc. of the U.S. which extended the existing licensing agree-
ment on telavancin to cover the Japanese market. Finally, in January 2007 we signed
a worldwide licensing agreement with Kirin Brewery of Japan covering its fully human
anti-CD40 antagonistic monoclonal antibody.
In addition to this introduction of drug candidate compounds from other companies,
in March 2007 we concluded a non-exclusive technology in-licensing agreement with
Regeneron of the U.S. covering Regeneron’s Veloclmmune® technology for discovery of
human monoclonal antibodies. This was in line with our long-term strategy of strengthen-
ing our own ability to develop new antibody drugs.
In addition to our continuing in-house research and development work, we are mak-
ing active use of in-licensing to reinforce our new drug pipeline, so that we will be able to
achieve sustained corporate growth driven by the constant launching of new drugs on the
market. We will remain always on the lookout for such licensing opportunities.
Regarding the Company’s business performance for fiscal 2007 (announced in May
2007), we project a year-on-year growth in sales of 5.1%, to ¥968.0 billion (US$8,203
million) on a consolidated basis, as a result of continued growth in sales of our main-
stay products. Meanwhile, R&D expenses, which experienced a one-time surge in fiscal
2006, are likely to decline in the current term, which should lead to operating income of
¥250.0 billion (US$2,118 million), and an increase of 15.8% in net income, to ¥152.0 billion
(US$1,288 million).
Vision 2015 & Our Five-Year Medium-Term Plan
In our Vision 2015, announced in 2006, we set out our vision of company we wished
Astellas to be in the year 2015, and prescribed some of the specific strategies that would
be necessary to realize that vision. In drawing up our vision, we took the current state
6 Astellas Pharma Inc.
of the pharmaceuticals industry and the future prospects for the pharmaceutical market
fully into consideration. After analyzing our present strength and future potential, we have
decided to create a business model for Astellas as a “Global Category Leader.” This refers
to a company that is a leader in several categories where a high level of unmet medical
needs exist and a high degree of expertise is required. A global category leader shows its
competitive superiority by providing value-added products globally.
For this purpose, it goes without saying that we must enhance our capabilities in
in-house R&D, and we must also actively engage in the in-licensing of drugs and drug-
discovery technologies from other companies. Through this two-pronged approach, we
can ensure that our new drug pipeline constantly remains active. At the same time, we
will maintain our marketing efforts to maximize the sales of existing drugs. We have deter-
mined that it is essential for us to strengthen our business base by steadily expanding our
drug pipeline.
To reinforce our organizational structure in support of this business model, we
have assigned management priority to securing an adequate supply of talented staff,
creating the optimum internal control structure, and centering our management style on
the fulfillment of our corporate social responsibilities, which we refer to as “CSR-based
management.”
In October 2006, as a specific path toward the achievement of the goals contained
in our Vision 2015, we drew up a five-year medium-term plan encompassing the business
terms from fiscal 2006 to fiscal 2010. During the course of this five-year period, Astellas
will face the expiry of substance patent on two major products, and the medium-term plan
is designed to address these issues and ensure steady growth. (See Page 9 for further
details.)
Improving capital efficiency
To raise the capital efficiency, we have put priority on accelerating investment in our ethical
pharmaceuticals operations as a means of increasing the Company’s enterprise value.
In addition, we intend to enhance total shareholder return by continuously raising the
per-share dividend and implementing share buybacks in a proactive and flexible manner.
In this way, we will be able to increase returns to our shareholders on a comprehensive
basis.
We paid an annual dividend for fiscal 2006 of ¥80 per share, representing an
increase of ¥10 per share over the previous term. In addition, we purchased 44 million of
the Company’s own shares from the market in the amount of ¥219.9 billion.
7Annual Report 2007

In May 2006 we cancelled 10 million of the shares in treasury, while in June 2007 we
cancelled 45 million shares.
In closing, Astellas made significant strides during fiscal 2006 – the second busi-
ness year following the merger – in building a base from which it can fully launch itself as a
global player in the ethical pharmaceuticals market. Now, one year after becoming presi-
dent of Astellas, I can truly say that I feel more confident than ever about the Company’s
future.
What specific measures, you may ask, will we at Astellas be taking to ensure attain-
ment of the goals we have set for ourselves in Vision 2015? For an answer to this question,
I would direct you to the section on our Medium-Term Plan on the following page. When
you have read that section, I am certain you will feel as confident about the Company’s
future as I do myself.
Masafumi NogimoriPresident & CEO
8 Astellas Pharma Inc.
Strengthen platform for growth
Medium-term plan
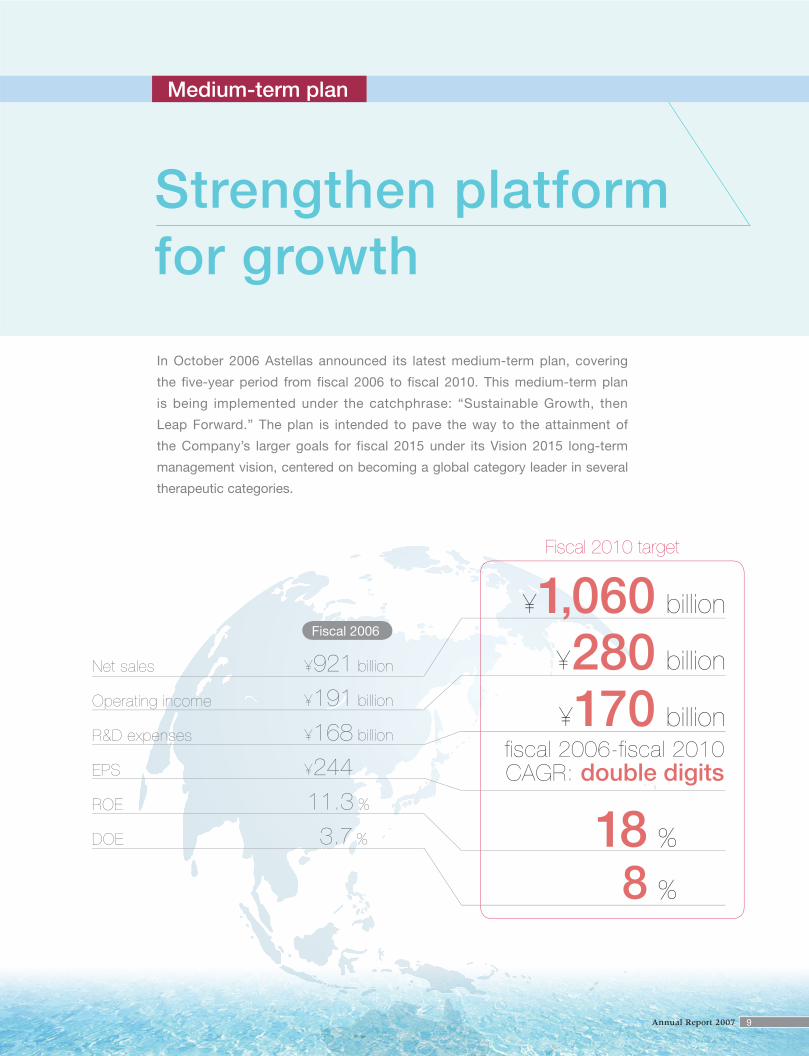
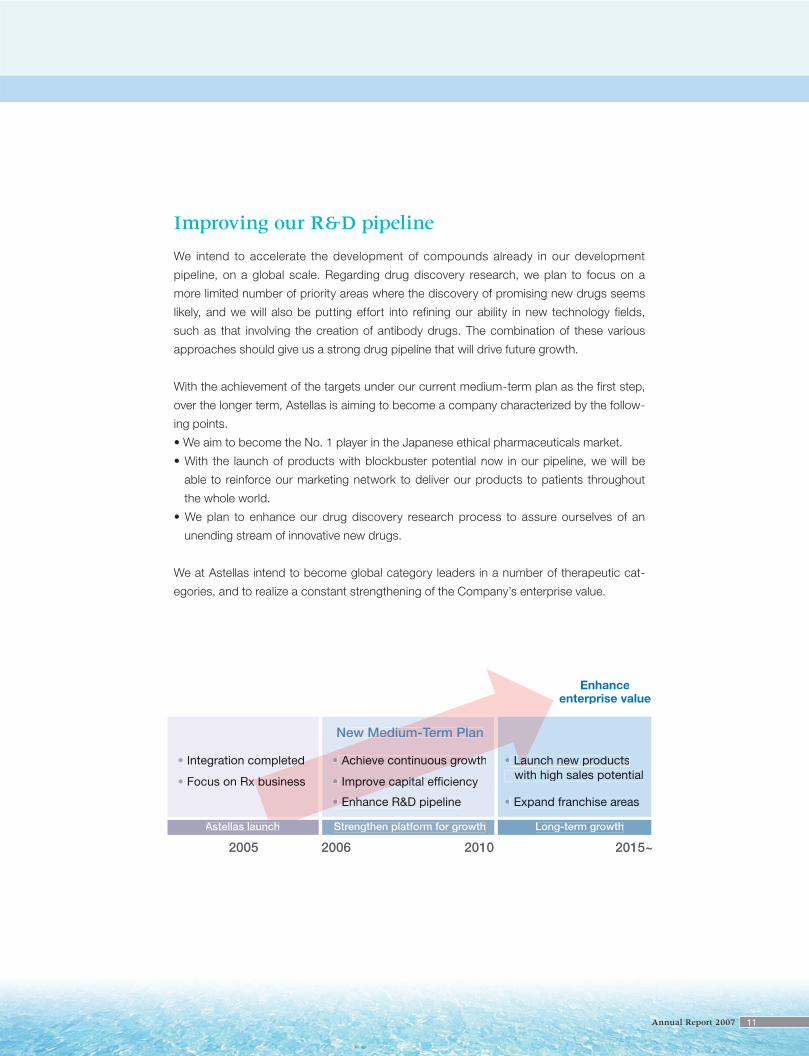
In October 2006 Astellas announced its latest medium-term plan, covering
the five-year period from fiscal 2006 to fiscal 2010. This medium-term plan
is being implemented under the catchphrase: “Sustainable Growth, then
Leap Forward.” The plan is intended to pave the way to the attainment of
the Company’s larger goals for fiscal 2015 under its Vision 2015 long-term
management vision, centered on becoming a global category leader in several
therapeutic categories.
¥1,060 billion
¥280 billionNet sales
Operating income
R&D expenses
EPS
ROE
DOE
¥921 billion
¥191 billion
¥168 billion
¥244
11.3 %
3.7 %
Fiscal 2010 target
Fiscal 2006
¥170 billionfiscal 2006-fiscal 2010CAGR: double digits
18 %
8 %
9Annual Report 2007
SummaryMedium-term plan
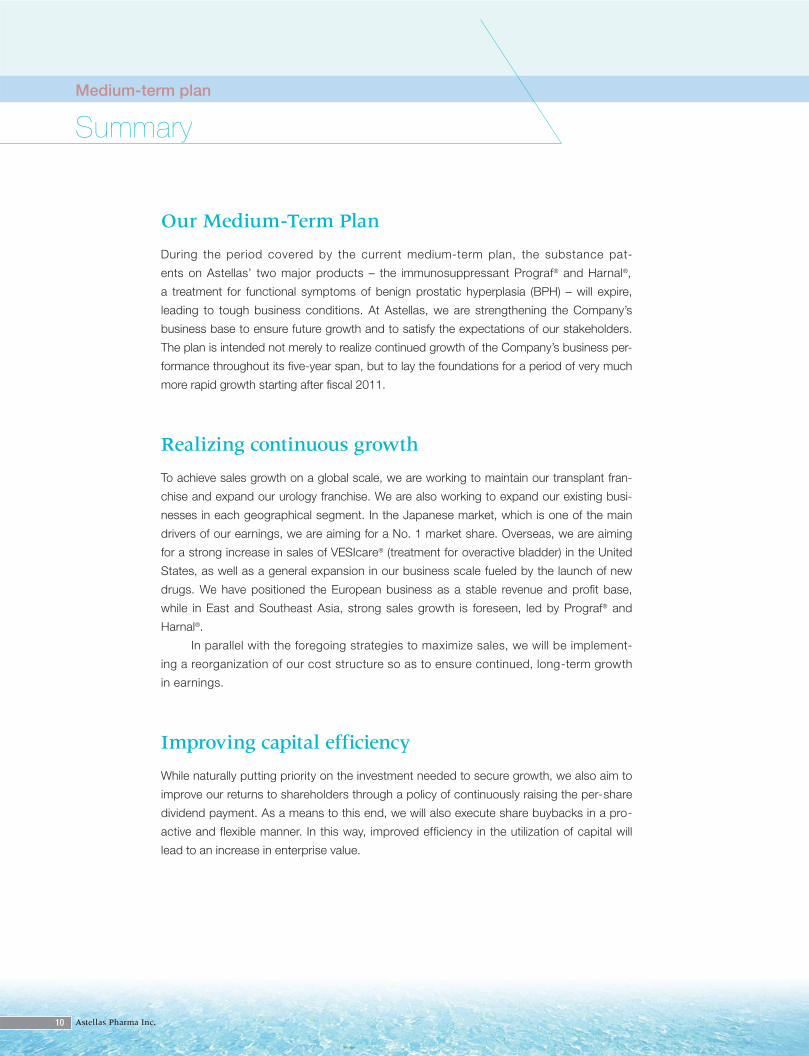
Our Medium-Term Plan
During the period covered by the current medium-term plan, the substance pat-
ents on Astellas’ two major products – the immunosuppressant Prograf® and Harnal®,
a treatment for functional symptoms of benign prostatic hyperplasia (BPH) – will expire,
leading to tough business conditions. At Astellas, we are strengthening the Company’s
business base to ensure future growth and to satisfy the expectations of our stakeholders.
The plan is intended not merely to realize continued growth of the Company’s business per-
formance throughout its five-year span, but to lay the foundations for a period of very much
more rapid growth starting after fiscal 2011.
Realizing continuous growth
To achieve sales growth on a global scale, we are working to maintain our transplant fran-
chise and expand our urology franchise. We are also working to expand our existing busi-
nesses in each geographical segment. In the Japanese market, which is one of the main
drivers of our earnings, we are aiming for a No. 1 market share. Overseas, we are aiming
for a strong increase in sales of VESIcare® (treatment for overactive bladder) in the United
States, as well as a general expansion in our business scale fueled by the launch of new
drugs. We have positioned the European business as a stable revenue and profit base,
while in East and Southeast Asia, strong sales growth is foreseen, led by Prograf® and
Harnal®.
In parallel with the foregoing strategies to maximize sales, we will be implement-
ing a reorganization of our cost structure so as to ensure continued, long-term growth
in earnings.
Improving capital efficiency
While naturally putting priority on the investment needed to secure growth, we also aim to
improve our returns to shareholders through a policy of continuously raising the per-share
dividend payment. As a means to this end, we will also execute share buybacks in a pro-
active and flexible manner. In this way, improved efficiency in the utilization of capital will
lead to an increase in enterprise value.
10 Astellas Pharma Inc.
Improving our R&D pipeline
We intend to accelerate the development of compounds already in our development
pipeline, on a global scale. Regarding drug discovery research, we plan to focus on a
more limited number of priority areas where the discovery of promising new drugs seems
likely, and we will also be putting effort into refining our ability in new technology fields,
such as that involving the creation of antibody drugs. The combination of these various
approaches should give us a strong drug pipeline that will drive future growth.
With the achievement of the targets under our current medium-term plan as the first step,
over the longer term, Astellas is aiming to become a company characterized by the follow-
ing points.
• We aim to become the No. 1 player in the Japanese ethical pharmaceuticals market.
• With the launch of products with blockbuster potential now in our pipeline, we will be
able to reinforce our marketing network to deliver our products to patients throughout
the whole world.
• We plan to enhance our drug discovery research process to assure ourselves of an
unending stream of innovative new drugs.
We at Astellas intend to become global category leaders in a number of therapeutic cat-
egories, and to realize a constant strengthening of the Company’s enterprise value.
• Integration completed
• Focus on Rx b
Strengthen platform for growth Long-term growth
s growth
capital efficiency
Enhance R&D pipeline
• Launch new products with high sales potential
• Expand franchise areas
Enhanceenterprise value
2005 2006 2010 2015~
ted
x business
• Achieve continuous grow
• Improve capita
• Enh
La
Astellas launch
New MediuMedium-Term Plan
11Annual Report 2007
At Astellas during the period of our current medium-term plan, we will face the consequences of
the expiration of substance patents on our two top-of-the-line drugs – Prograf® and Harnal®. Even
given these circumstances, however, we expect to achieve overall sales growth. Existing main
products are likely to grow, or, at the very least, to maintain their current level. In addition, the
launch of new drugs should ensure total sales growth.
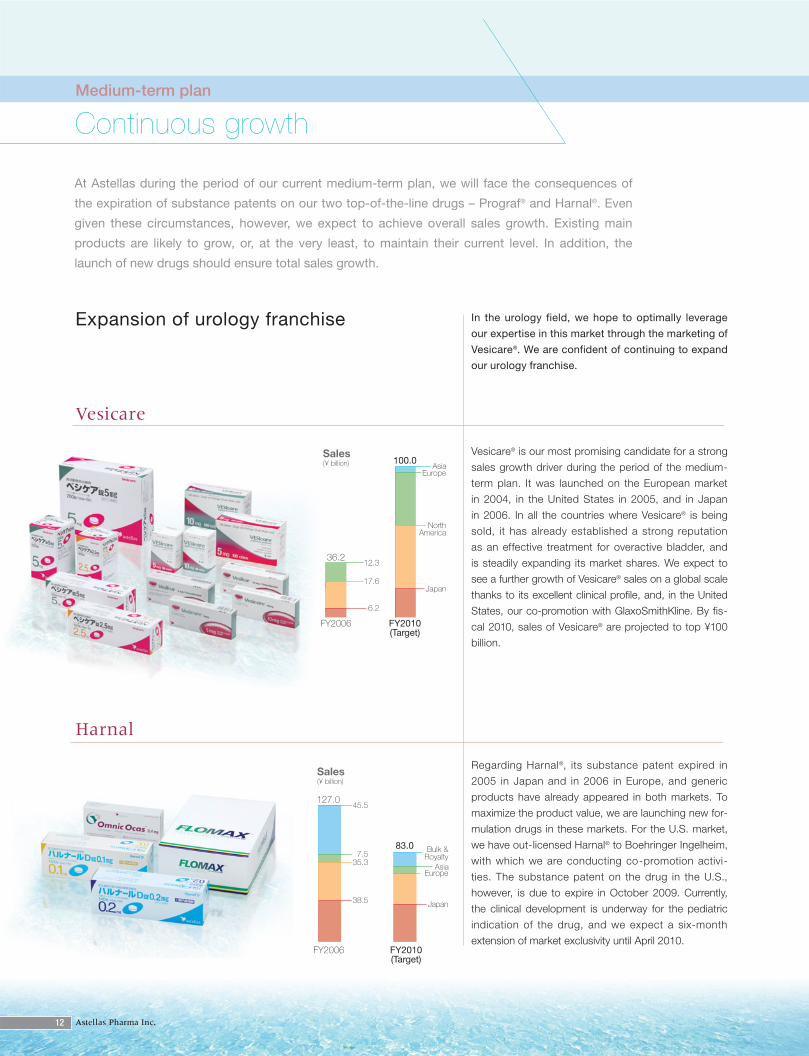
Harnal
Regarding Harnal®, its substance patent expired in
2005 in Japan and in 2006 in Europe, and generic
products have already appeared in both markets. To
maximize the product value, we are launching new for-
mulation drugs in these markets. For the U.S. market,
we have out-licensed Harnal® to Boehringer Ingelheim,
with which we are conducting co-promotion activi-
ties. The substance patent on the drug in the U.S.,
however, is due to expire in October 2009. Currently,
the clinical development is underway for the pediatric
indication of the drug, and we expect a six-month
extension of market exclusivity until April 2010.
Vesicare
Vesicare® is our most promising candidate for a strong
sales growth driver during the period of the medium-
term plan. It was launched on the European market
in 2004, in the United States in 2005, and in Japan
in 2006. In all the countries where Vesicare® is being
sold, it has already established a strong reputation
as an effective treatment for overactive bladder, and
is steadily expanding its market shares. We expect to
see a further growth of Vesicare® sales on a global scale
thanks to its excellent clinical profile, and, in the United
States, our co-promotion with GlaxoSmithKline. By fis-
cal 2010, sales of Vesicare® are projected to top ¥100
billion.
FY2006
Sales(¥ billion)
FY2010(Target)
36.212.3
17.6
6.2
AsiaEurope
NorthAmerica
Japan
100.0
Expansion of urology franchise
Continuous growthMedium-term plan
Sales(¥ billion)
127.0
83.0
45.5
7.535.3
38.5
FY2006 FY2010(Target)
Asia
Bulk &Royalty
Europe
Japan
In the urology field, we hope to optimally leverage
our expertise in this market through the marketing of
Vesicare®. We are confident of continuing to expand
our urology franchise.
12 Astellas Pharma Inc.
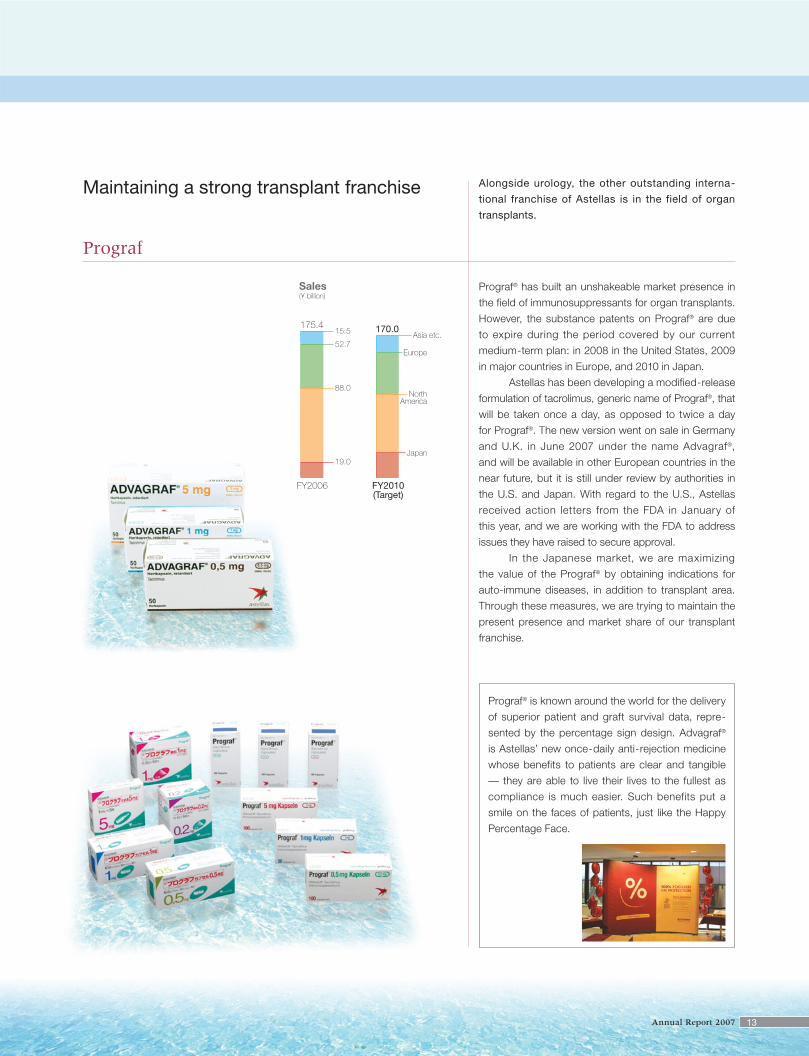
Prograf
Prograf® has built an unshakeable market presence in
the field of immunosuppressants for organ transplants.
However, the substance patents on Prograf® are due
to expire during the period covered by our current
medium-term plan: in 2008 in the United States, 2009
in major countries in Europe, and 2010 in Japan.
Astellas has been developing a modified-release
formulation of tacrolimus, generic name of Prograf®, that
will be taken once a day, as opposed to twice a day
for Prograf®. The new version went on sale in Germany
and U.K. in June 2007 under the name Advagraf®,
and will be available in other European countries in the
near future, but it is still under review by authorities in
the U.S. and Japan. With regard to the U.S., Astellas
received action letters from the FDA in January of
this year, and we are working with the FDA to address
issues they have raised to secure approval.
In the Japanese market, we are maximizing
the value of the Prograf® by obtaining indications for
auto-immune diseases, in addition to transplant area.
Through these measures, we are trying to maintain the
present presence and market share of our transplant
franchise.
Sales(¥ billion)
175.4 170.0
19.0
88.0
52.7
15.5
FY2006 FY2010(Target)
Asia etc.
Europe
NorthAmerica
Japan
Maintaining a strong transplant franchise
Prograf® is known around the world for the delivery
of superior patient and graft survival data, repre-
sented by the percentage sign design. Advagraf®
is Astellas’ new once-daily anti-rejection medicine
whose benefits to patients are clear and tangible
— they are able to live their lives to the fullest as
compliance is much easier. Such benefits put a
smile on the faces of patients, just like the Happy
Percentage Face.
Alongside urology, the other outstanding interna-
tional franchise of Astellas is in the field of organ
transplants.
13Annual Report 2007
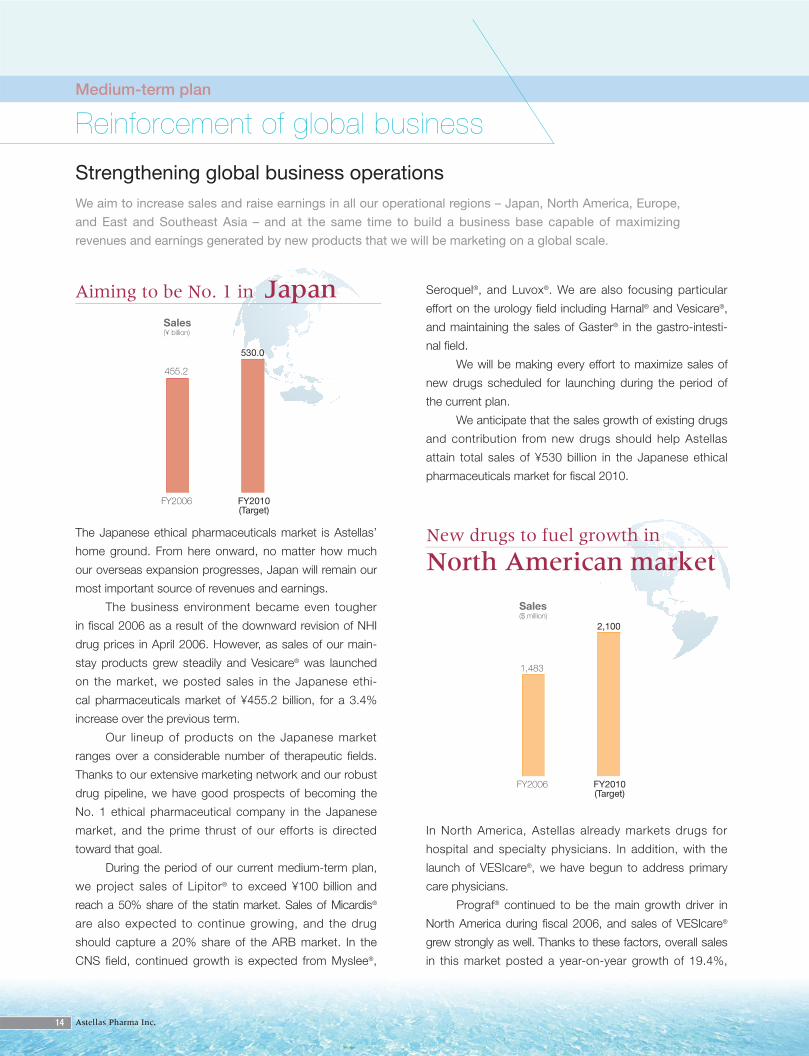
Seroquel®, and Luvox®. We are also focusing particular
effort on the urology field including Harnal® and Vesicare®,
and maintaining the sales of Gaster® in the gastro-intesti-
nal field.
We will be making every effort to maximize sales of
new drugs scheduled for launching during the period of
the current plan.
We anticipate that the sales growth of existing drugs
and contribution from new drugs should help Astellas
attain total sales of ¥530 billion in the Japanese ethical
pharmaceuticals market for fiscal 2010.
The Japanese ethical pharmaceuticals market is Astellas’
home ground. From here onward, no matter how much
our overseas expansion progresses, Japan will remain our
most important source of revenues and earnings.
The business environment became even tougher
in fiscal 2006 as a result of the downward revision of NHI
drug prices in April 2006. However, as sales of our main-
stay products grew steadily and Vesicare® was launched
on the market, we posted sales in the Japanese ethi-
cal pharmaceuticals market of ¥455.2 billion, for a 3.4%
increase over the previous term.
Our lineup of products on the Japanese market
ranges over a considerable number of therapeutic fields.
Thanks to our extensive marketing network and our robust
drug pipeline, we have good prospects of becoming the
No. 1 ethical pharmaceutical company in the Japanese
market, and the prime thrust of our efforts is directed
toward that goal.
During the period of our current medium-term plan,
we project sales of Lipitor® to exceed ¥100 billion and
reach a 50% share of the statin market. Sales of Micardis®
are also expected to continue growing, and the drug
should capture a 20% share of the ARB market. In the
CNS field, continued growth is expected from Myslee®,
Sales(¥ billion)
455.2
530.0
FY2006 FY2010(Target)
We aim to increase sales and raise earnings in all our operational regions – Japan, North America, Europe,
and East and Southeast Asia – and at the same time to build a business base capable of maximizing
revenues and earnings generated by new products that we will be marketing on a global scale.
Strengthening global business operations
Reinforcement of global businessMedium-term plan
Aiming to be No. 1 in Japan
New drugs to fuel growth in
North American market
Sales($ million)
1,483
2,100
FY2006 FY2010(Target)
In North America, Astellas already markets drugs for
hospital and specialty physicians. In addition, with the
launch of VESIcare®, we have begun to address primary
care physicians.
Prograf® continued to be the main growth driver in
North America during fiscal 2006, and sales of VESIcare®
grew strongly as well. Thanks to these factors, overall sales
in this market posted a year-on-year growth of 19.4%,
14 Astellas Pharma Inc.
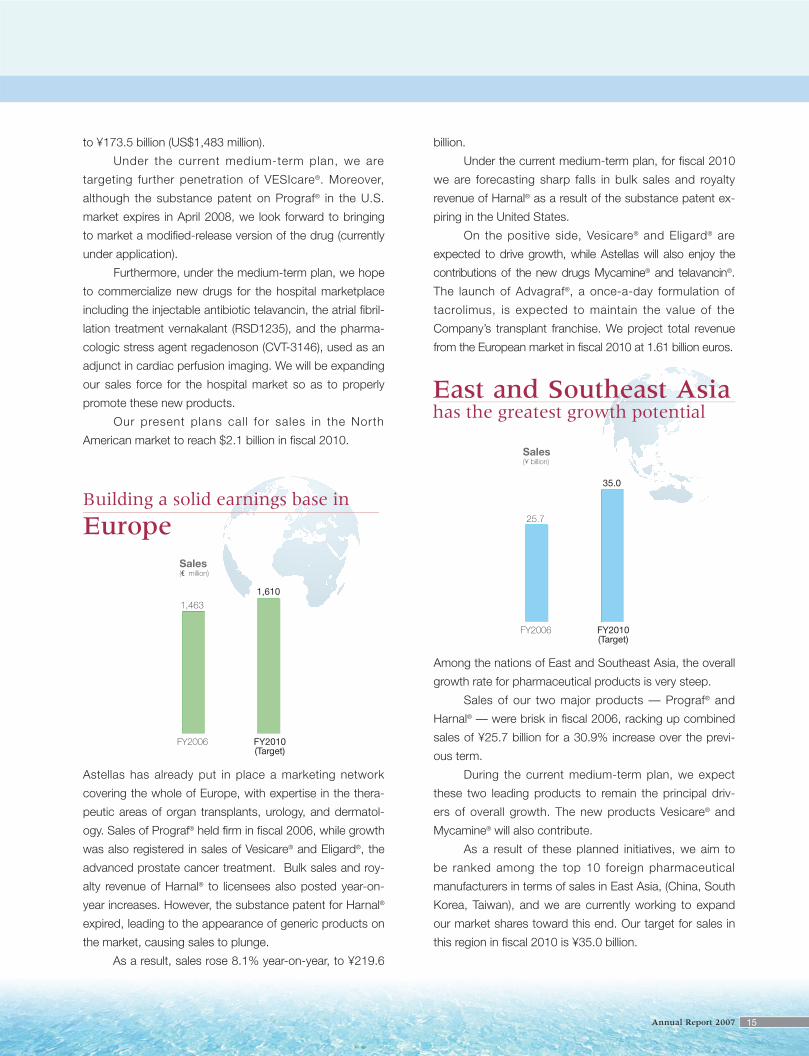
East and Southeast Asia has the greatest growth potential
Among the nations of East and Southeast Asia, the overall
growth rate for pharmaceutical products is very steep.
Sales of our two major products — Prograf® and
Harnal® — were brisk in fiscal 2006, racking up combined
sales of ¥25.7 billion for a 30.9% increase over the previ-
ous term.
During the current medium-term plan, we expect
these two leading products to remain the principal driv-
ers of overall growth. The new products Vesicare® and
Mycamine® will also contribute.
As a result of these planned initiatives, we aim to
be ranked among the top 10 foreign pharmaceutical
manufacturers in terms of sales in East Asia, (China, South
Korea, Taiwan), and we are currently working to expand
our market shares toward this end. Our target for sales in
this region in fiscal 2010 is ¥35.0 billion.
Sales(¥ billion)
25.7
35.0
FY2006 FY2010(Target)
Building a solid earnings base in
Europe
Astellas has already put in place a marketing network
covering the whole of Europe, with expertise in the thera-
peutic areas of organ transplants, urology, and dermatol-
ogy. Sales of Prograf® held firm in fiscal 2006, while growth
was also registered in sales of Vesicare® and Eligard®, the
advanced prostate cancer treatment. Bulk sales and roy-
alty revenue of Harnal® to licensees also posted year-on-
year increases. However, the substance patent for Harnal®
expired, leading to the appearance of generic products on
the market, causing sales to plunge.
As a result, sales rose 8.1% year-on-year, to ¥219.6
Sales(€ million)
1,463
1,610
FY2006 FY2010(Target)
to ¥173.5 billion (US$1,483 million).
Under the current medium-term plan, we are
targeting further penetration of VESIcare®. Moreover,
although the substance patent on Prograf® in the U.S.
market expires in April 2008, we look forward to bringing
to market a modified-release version of the drug (currently
under application).
Furthermore, under the medium-term plan, we hope
to commercialize new drugs for the hospital marketplace
including the injectable antibiotic telavancin, the atrial fibril-
lation treatment vernakalant (RSD1235), and the pharma-
cologic stress agent regadenoson (CVT-3146), used as an
adjunct in cardiac perfusion imaging. We will be expanding
our sales force for the hospital market so as to properly
promote these new products.
Our present plans call for sales in the North
American market to reach $2.1 billion in fiscal 2010.
billion.
Under the current medium-term plan, for fiscal 2010
we are forecasting sharp falls in bulk sales and royalty
revenue of Harnal® as a result of the substance patent ex-
piring in the United States.
On the positive side, Vesicare® and Eligard® are
expected to drive growth, while Astellas will also enjoy the
contributions of the new drugs Mycamine® and telavancin®.
The launch of Advagraf®, a once-a-day formulation of
tacrolimus, is expected to maintain the value of the
Company’s transplant franchise. We project total revenue
from the European market in fiscal 2010 at 1.61 billion euros.
15Annual Report 2007
Improving our cost structure
Astellas continues to proactively conduct investments
to fuel growth, such as investment in R&D and in sales
promotion initiatives. By fiscal 2010, we expect to spend
¥170 billion annually on investment in R&D, accounting for
an expected 16% of sales.
On other fronts, after searching for ways of more
efficiently conducting expenses, we have decided to
focus on improving production cost ratio and ratio of
SG&A expenses to sales by more rationally assigning
employees and downsizing our total workforce; and find-
ing ways of lowering procurement costs.
We have set a target of 57.5% for fiscal 2010 for the
ratio of the total sum of cost of sales and SG&A expenses
(after deduction of R&D expenses) to total sales. This
ratio was approximately 61% for fiscal 2006.
Thanks to our improved cost structure, in addition
to the increase in sales, we aim to attain the goal of ¥280
billion in operating income in fiscal 2010, which repre-
sents 26.5% of sales on a consolidated basis.
While on the one hand we are pursuing initiatives aimed at maximizing our sales, we are simultaneously
taking steps to raise profitability by improving our cost structure. The creation of an optimally-functioning
organization would lead to considerably more efficient and productive business operations.
Improving our cost structure and optimal organization
Building the most efficient organizational structure
The management of Astellas are working to redesign the
Company’s optimal functionality, so as to improve the effi-
ciency and productivity of the Company’s operations and
thereby establish a clear competitive advantage.
As of June 2006 Astellas had 18 production facili-
ties around the world, and we plan to reduce this number
to approximately 10 by the end of fiscal 2010. We began
the downsizing process in fiscal 2006 through the sale of
facilities and the shutdown of manufacturing plants, with
the result that we reduced our European and Japanese
facilities by three each, leaving us with a total of 12 facili-
ties as of the end of March 2007.
Another crucial element required to give us a com-
petitive advantage is the full utilization of our human
resources, and this issue is being addressed as a top
priority. As well as increasing investment in the hiring and
training of promising staff, we are giving considerable
thought to ways of raising our productivity through more
effective staff allocation and overall work force downsiz-
ing. Our total work force as of June 2006 was approxi-
mately 14,600 worldwide. As of the end of March 2007,
the number stood at approximately 13,900, and we hope
to reach the target of 13,500 employees (on a consoli-
dated basis) by the end of March 2011.
Improving our cost structureMedium-term plan
16 Astellas Pharma Inc.
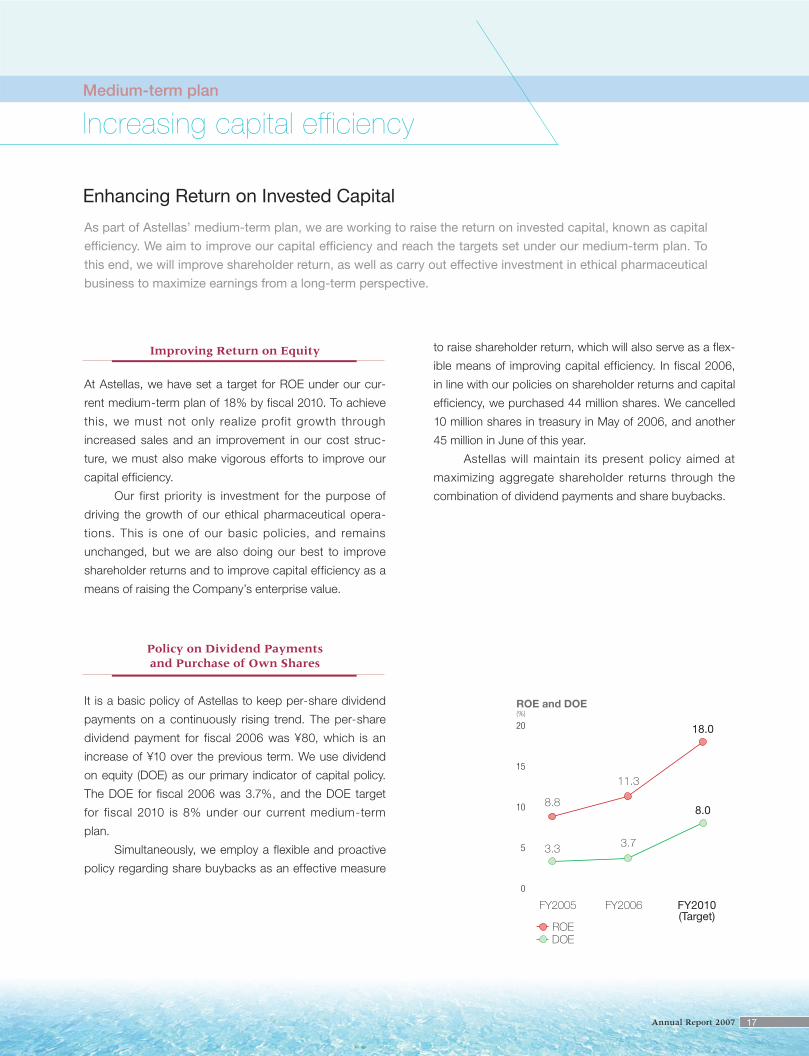
ROE and DOE(%)
FY2005
ROEDOE
FY2006 FY2010(Target)
8.8
11.3
3.73.3
8.0
18.0
0
5
10
15
20
Improving Return on Equity
At Astellas, we have set a target for ROE under our cur-
rent medium-term plan of 18% by fiscal 2010. To achieve
this, we must not only realize profit growth through
increased sales and an improvement in our cost struc-
ture, we must also make vigorous efforts to improve our
capital efficiency.
Our first priority is investment for the purpose of
driving the growth of our ethical pharmaceutical opera-
tions. This is one of our basic policies, and remains
unchanged, but we are also doing our best to improve
shareholder returns and to improve capital efficiency as a
means of raising the Company’s enterprise value.
Policy on Dividend Payments and Purchase of Own Shares
It is a basic policy of Astellas to keep per-share dividend
payments on a continuously rising trend. The per-share
dividend payment for fiscal 2006 was ¥80, which is an
increase of ¥10 over the previous term. We use dividend
on equity (DOE) as our primary indicator of capital policy.
The DOE for fiscal 2006 was 3.7%, and the DOE target
for fiscal 2010 is 8% under our current medium-term
plan.
Simultaneously, we employ a flexible and proactive
policy regarding share buybacks as an effective measure
Increasing capital efficiencyMedium-term plan
As part of Astellas’ medium-term plan, we are working to raise the return on invested capital, known as capital
efficiency. We aim to improve our capital efficiency and reach the targets set under our medium-term plan. To
this end, we will improve shareholder return, as well as carry out effective investment in ethical pharmaceutical
business to maximize earnings from a long-term perspective.
Enhancing Return on Invested Capital
to raise shareholder return, which will also serve as a flex-
ible means of improving capital efficiency. In fiscal 2006,
in line with our policies on shareholder returns and capital
efficiency, we purchased 44 million shares. We cancelled
10 million shares in treasury in May of 2006, and another
45 million in June of this year.
Astellas will maintain its present policy aimed at
maximizing aggregate shareholder returns through the
combination of dividend payments and share buybacks.
17Annual Report 2007
six priority areas of research.
To further strengthen our know-how in the tech-
nologies vital to drug discovery research, we have also
been working to develop a new technology base in the
field of antibodies in addition to our expertise in drug
discovery through fermentation and chemical synthe-
sis leveraging genomic technology. In March 2007 we
concluded a non-exclusive technology in- licensing
agreement wi th Regeneron of the U.S. cover ing
Regeneron’s VelocImmune®, a technology for the discov-
ery of human monoclonal antibodies.
In addition to the above, we are also taking steps
to speed up our new drug discovery process and make
it more effective by reorganizing our system of research
facilities. As part of this, we have commenced construc-
tion of a new research building (scheduled for completion
in August 2008) at our Miyukigaoka Research Center in
Tsukuba City, Ibaraki Prefecture.
Focusing investment on priority therapeutic areas and diseases
At Astellas, in our drug discovery research, we aim to dis-
cover drugs that people really need. To this end, we have
defined our priority research areas into which we focus
management resources. In deciding which research
themes to pursue, we take into careful consideration the
degree of unmet medical needs – including the level of
dissatisfaction with existing treatments, and the direc-
tion in which treatment methods are moving – as well
as market conditions such as potential competition, and
practical considerations such as the ability of Astellas to
effectively carry out research in a particular direction. We
have already established franchises on a global scale in
the therapeutic areas of urological diseases, and trans-
plantation (inflammation and immunology). In addition to
these two fields, we also put priority on the four fields of
the central nervous system & pain, diabetes, infectious
(including virus-caused) diseases, and cancer, giving us
Regarding the many compounds currently in our development pipeline, we are giving priority to in-house development of compounds with high potential on the global market.
Speeding up development in the existing pipeline and achieving steady progress
Medium-term plan
We put top priority on research and development to generate new drugs continually.
Enhancement of R&D pipeline(for mid-/long-term growth)
Reinforcing drug discovery research in both quality and quantity
18 Astellas Pharma Inc.
YM178
YM178 is an agent being developed for overactive blad-
der that works as a beta-3 receptor agonist. Astellas
was the first to determine in clinical study the proof of
concept of the mechanism for treating overactive blad-
der (OAB). Phase 2b trials has been completed in Europe
and Phase 2 trials are underway in Japan. Astellas already
undertakes global sales of the OAB treatment Vesicare®,
which functions as a muscarine antagonist. We will work
to speed up development of this compound that has an
action mechanism that differs from that of Vesicare®. We
expect that development of the project will enable us to
bolster the product lineup for the urology field, which is
one of our franchise areas.
In addition to these, YM155, an anti-cancer agent with
a new mechanism as a survivin expression inhibitor, is
in Phase 2 trials overseas and YM311, for which Astellas
concluded a licensing agreement with FibroGen in April
2006, is in Phase 2. Currently, clinical development of
YM311 (FG-2216) and FG-4592 is suspended because of
clinical hold as instructed by the FDA.
For projects currently in the latter stages of development,
we are working to bring them to the filing stage in order
to launch those new products during the period of the
current medium-term plan. In addition, in the Astellas
pipeline are compounds with high potential to become
leading products, which are expected to be released
on the market in FY2011 or later. Among these are the
oral Factor Xa inhibitor YM150, the overactive bladder
treatment YM178, the anti-cancer agent YM155, and
the oral EPO (erythropoietin) inducer YM311. From the
perspectives of market scale and the uniqueness of their
mechanisms, we expect these drugs to become future
earnings drivers, and are concentrating resources on
these projects to accelerate their global development.
YM150
YM150, an oral Factor Xa inhibitor, is an antithrombotic
agent currently being developed for two applications,
prevention of venous thromboembolism (VTE) after
orthopedic surgery, and prevention of thromboembolism
accompanying atrial fibrillation (AF), and is currently in
Phase 2. Amid intensifying competition in the develop-
ment of Factor Xa inhibitors spurred by the great need
for an antithrombotic agent with both efficacy and safety
profile, Astellas is working to accelerate development of
this project.
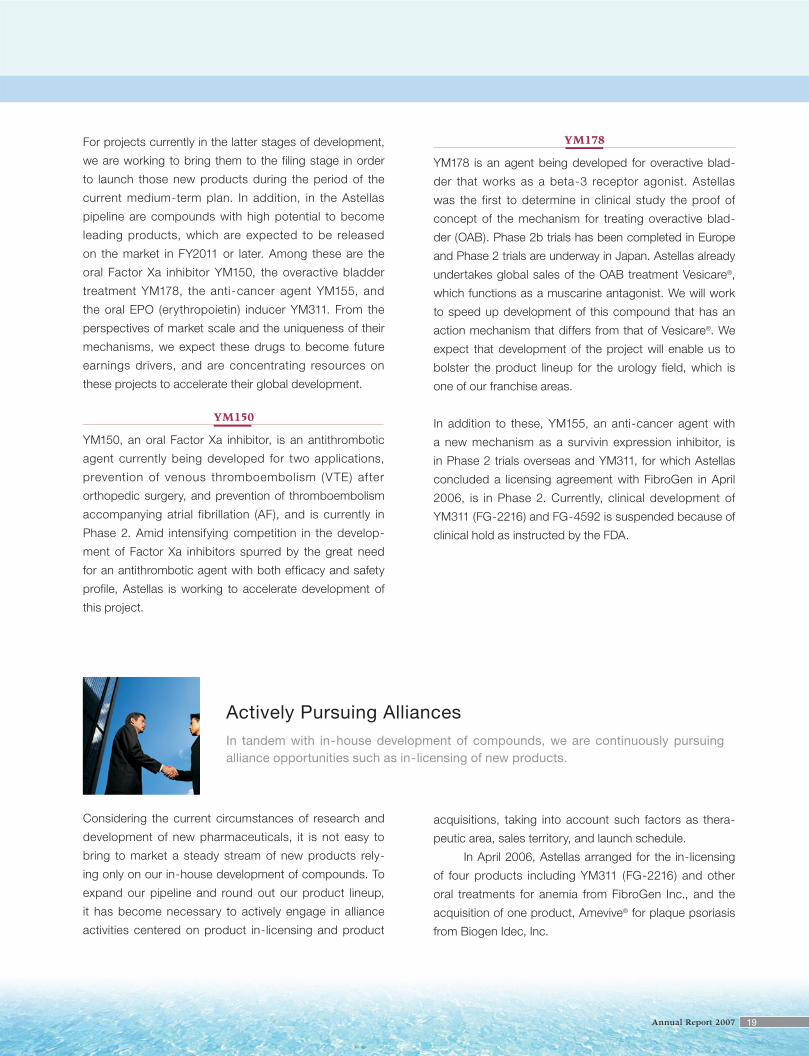
In tandem with in-house development of compounds, we are continuously pursuing alliance opportunities such as in-licensing of new products.
Actively Pursuing Alliances
Considering the current circumstances of research and
development of new pharmaceuticals, it is not easy to
bring to market a steady stream of new products rely-
ing only on our in-house development of compounds. To
expand our pipeline and round out our product lineup,
it has become necessary to actively engage in alliance
activities centered on product in-licensing and product
acquisitions, taking into account such factors as thera-
peutic area, sales territory, and launch schedule.
In April 2006, Astellas arranged for the in-licensing
of four products including YM311 (FG-2216) and other
oral treatments for anemia from FibroGen Inc., and the
acquisition of one product, Amevive® for plaque psoriasis
from Biogen Idec, Inc.
19Annual Report 2007
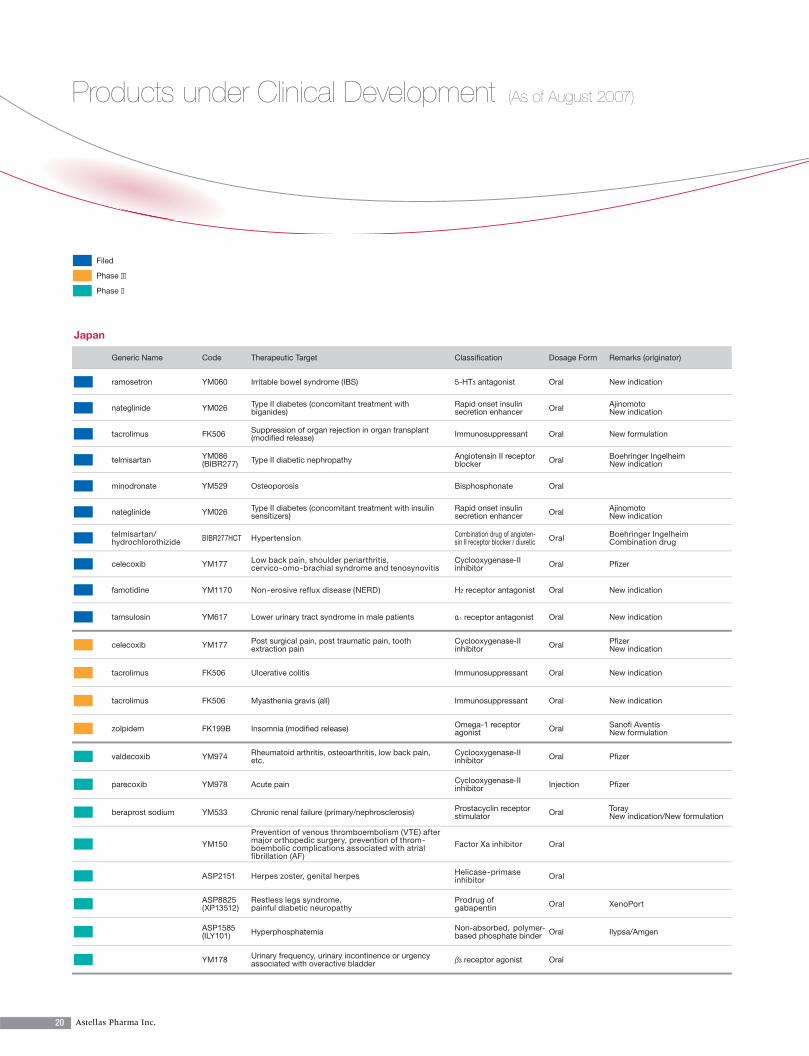
Japan
Generic Name Code Therapeutic Target Classifi cation Dosage Form Remarks (originator)
ramosetron YM060 Irritable bowel syndrome (IBS) 5-HT3 antagonist Oral New indication
nateglinide YM026 Type II diabetes (concomitant treatment with biganides)
Rapid onset insulin secretion enhancer Oral Ajinomoto
New indication
tacrolimus FK506 Suppression of organ rejection in organ transplant (modifi ed release) Immunosuppressant Oral New formulation
telmisartan YM086(BIBR277) Type II diabetic nephropathy Angiotensin II receptor
blocker Oral Boehringer Ingelheim New indication
minodronate YM529 Osteoporosis Bisphosphonate Oral
nateglinide YM026 Type II diabetes (concomitant treatment with insulin sensitizers)
Rapid onset insulin secretion enhancer Oral Ajinomoto
New indication
telmisartan/ hydrochlorothizide BIBR277HCT Hypertension Combination drug of angioten-
sin II receptor blocker / diuretic Oral Boehringer IngelheimCombination drug
celecoxib YM177 Low back pain, shoulder periarthritis, cervico-omo-brachial syndrome and tenosynovitis
Cyclooxygenase-II inhibitor Oral Pfi zer
famotidine YM1170 Non-erosive reflux disease (NERD) H2 receptor antagonist Oral New indication
tamsulosin YM617 Lower urinary tract syndrome in male patients α1 receptor antagonist Oral New indication
celecoxib YM177 Post surgical pain, post traumatic pain, tooth extraction pain
Cyclooxygenase-II inhibitor Oral Pfi zer
New indication
tacrolimus FK506 Ulcerative colitis Immunosuppressant Oral New indication
tacrolimus FK506 Myasthenia gravis (all) Immunosuppressant Oral New indication
zolpidem FK199B Insomnia (modifi ed release) Omega-1 receptor agonist Oral Sanofi Aventis
New formulation
valdecoxib YM974 Rheumatoid arthritis, osteoarthritis, low back pain, etc.
Cyclooxygenase-II inhibitor Oral Pfi zer
parecoxib YM978 Acute pain Cyclooxygenase-II inhibitor Injection Pfi zer
beraprost sodium YM533 Chronic renal failure (primary/nephrosclerosis) Prostacyclin receptor stimulator Oral Toray
New indication/New formulation
YM150
Prevention of venous thromboembolism (VTE) after major orthopedic surgery, prevention of throm-boembolic complications associated with atrial fibrillation (AF)
Factor Xa inhibitor Oral
ASP2151 Herpes zoster, genital herpes Helicase-primase inhibitor Oral
ASP8825(XP13512)
Restless legs syndrome,painful diabetic neuropathy
Prodrug of gabapentin Oral XenoPort
ASP1585(ILY101) Hyperphosphatemia Non-absorbed, polymer-
based phosphate binder Oral Ilypsa/Amgen
YM178 Urinary frequency, urinary incontinence or urgency associated with overactive bladder 3 receptor agonist Oral
Filed
Phase III
Phase II
Products under Clinical Development (As of August 2007)
20 Astellas Pharma Inc.
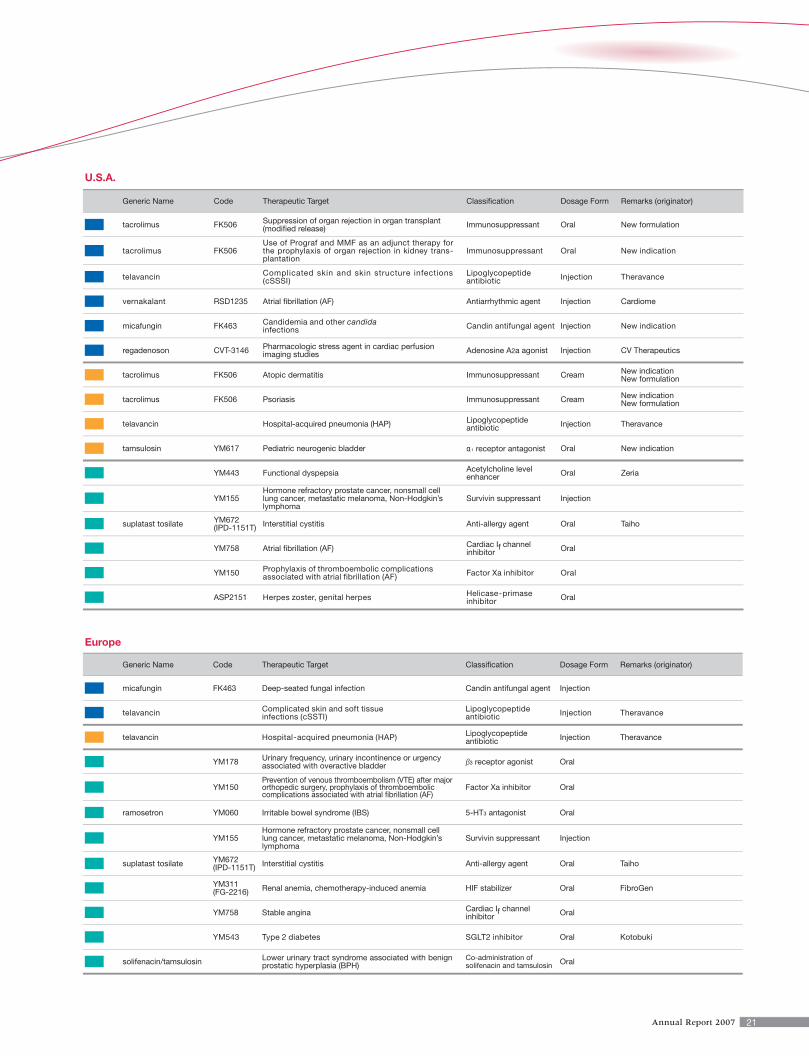
U.S.A.
Generic Name Code Therapeutic Target Classifi cation Dosage Form Remarks (originator)
tacrolimus FK506 Suppression of organ rejection in organ transplant (modifi ed release) Immunosuppressant Oral New formulation
tacrolimus FK506Use of Prograf and MMF as an adjunct therapy for the prophylaxis of organ rejection in kidney trans-plantation
Immunosuppressant Oral New indication
telavancin Complicated skin and skin structure infections (cSSSI)
Lipoglycopeptide antibiotic Injection Theravance
vernakalant RSD1235 Atrial fi brillation (AF) Antiarrhythmic agent Injection Cardiome
micafungin FK463 Candidemia and other candida infections Candin antifungal agent Injection New indication
regadenoson CVT-3146 Pharmacologic stress agent in cardiac perfusion imaging studies Adenosine A2a agonist Injection CV Therapeutics
tacrolimus FK506 Atopic dermatitis Immunosuppressant Cream New indication New formulation
tacrolimus FK506 Psoriasis Immunosuppressant Cream New indication New formulation
telavancin Hospital-acquired pneumonia (HAP) Lipoglycopeptide antibiotic Injection Theravance
tamsulosin YM617 Pediatric neurogenic bladder α1 receptor antagonist Oral New indication
YM443 Functional dyspepsia Acetylcholine level enhancer Oral Zeria
YM155Hormone refractory prostate cancer, nonsmall cell lung cancer, metastatic melanoma, Non-Hodgkin’s lymphoma
Survivin suppressant Injection
suplatast tosilate YM672 (IPD-1151T) Interstitial cystitis Anti-allergy agent Oral Taiho
YM758 Atrial fi brillation (AF) Cardiac If channel inhibitor Oral
YM150 Prophylaxis of thromboembolic complications associated with atrial fibrillation (AF) Factor Xa inhibitor Oral
ASP2151 Herpes zoster, genital herpes Helicase-primase inhibitor Oral
Europe
Generic Name Code Therapeutic Target Classifi cation Dosage Form Remarks (originator)
micafungin FK463 Deep-seated fungal infection Candin antifungal agent Injection
telavancin Complicated skin and soft tissue infections (cSSTI)
Lipoglycopeptide antibiotic Injection Theravance
telavancin Hospital-acquired pneumonia (HAP) Lipoglycopeptide antibiotic Injection Theravance
YM178 Urinary frequency, urinary incontinence or urgency associated with overactive bladder 3 receptor agonist Oral
YM150Prevention of venous thromboembolism (VTE) after major orthopedic surgery, prophylaxis of thromboembolic complications associated with atrial fi brillation (AF)
Factor Xa inhibitor Oral
ramosetron YM060 Irritable bowel syndrome (IBS) 5-HT3 antagonist Oral
YM155Hormone refractory prostate cancer, nonsmall cell lung cancer, metastatic melanoma, Non-Hodgkin’s lymphoma
Survivin suppressant Injection
suplatast tosilate YM672 (IPD-1151T) Interstitial cystitis Anti-allergy agent Oral Taiho
YM311(FG-2216) Renal anemia, chemotherapy-induced anemia HIF stabilizer Oral FibroGen
YM758 Stable angina Cardiac If channel inhibitor Oral
YM543 Type 2 diabetes SGLT2 inhibitor Oral Kotobuki
solifenacin/tamsulosin Lower urinary tract syndrome associated with benign prostatic hyperplasia (BPH)
Co-administration of solifenacin and tamsulosin Oral
21Annual Report 2007
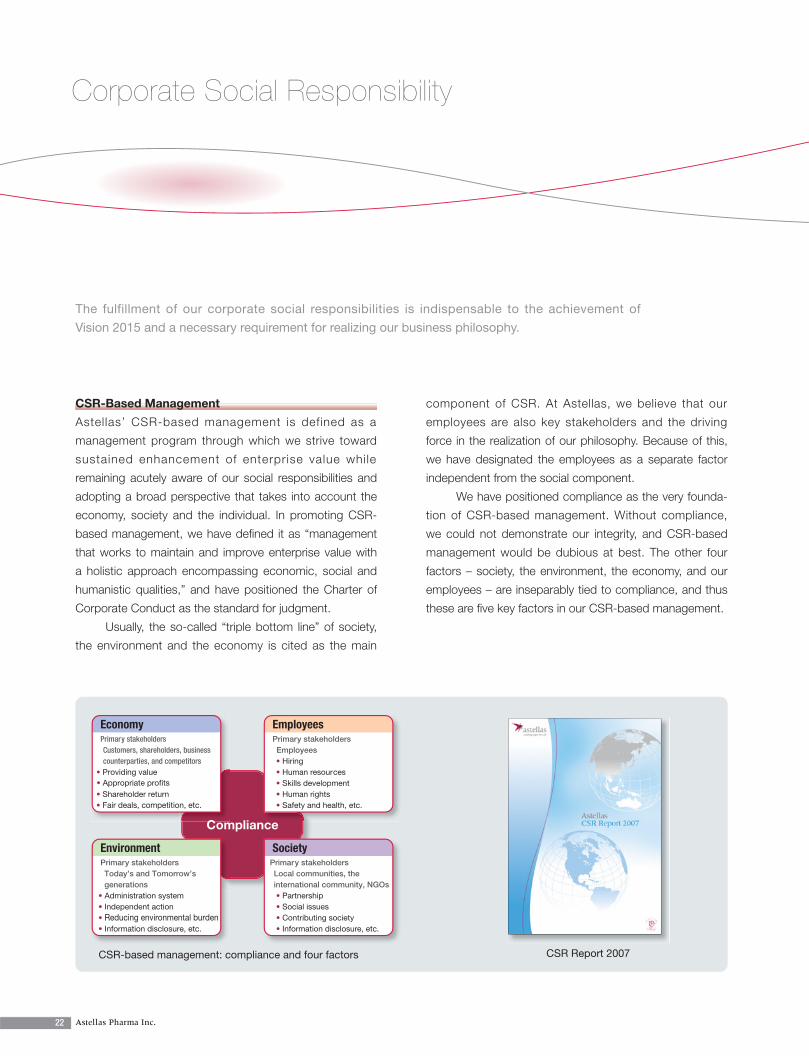
Compliance
EconomyPrimary stakeholdersCustomers, shareholders, businesscounterparties, and competitors
EmployeesPrimary stakeholdersEmployees• Hiring• Human resources• Skills development• Human rights• Safety and health, etc.
EnvironmentPrimary stakeholdersToday’s and Tomorrow’sgenerations
• Administration system• Independent action• Reducing environmental burden• Information disclosure, etc.
SocietyPrimary stakeholdersLocal communities, theinternational community, NGOs• Partnership• Social issues• Contributing society• Information disclosure, etc.
• Providing value
• Shareholder return• Fair deals, competition, etc.
• Appropriate profits
Corporate Social Responsibility
The fulfillment of our corporate social responsibilities is indispensable to the achievement of
Vision 2015 and a necessary requirement for realizing our business philosophy.
CSR-Based Management
Astellas’ CSR-based management is defined as a
management program through which we strive toward
sustained enhancement of enterprise value while
remaining acutely aware of our social responsibilities and
adopting a broad perspective that takes into account the
economy, society and the individual. In promoting CSR-
based management, we have defined it as “management
that works to maintain and improve enterprise value with
a holistic approach encompassing economic, social and
humanistic qualities,” and have positioned the Charter of
Corporate Conduct as the standard for judgment.
Usually, the so-called “triple bottom line” of society,
the environment and the economy is cited as the main
component of CSR. At Astellas, we believe that our
employees are also key stakeholders and the driving
force in the realization of our philosophy. Because of this,
we have designated the employees as a separate factor
independent from the social component.
We have positioned compliance as the very founda-
tion of CSR-based management. Without compliance,
we could not demonstrate our integrity, and CSR-based
management would be dubious at best. The other four
factors – society, the environment, the economy, and our
employees – are inseparably tied to compliance, and thus
these are five key factors in our CSR-based management.
CSR-based management: compliance and four factors CSR Report 2007
22 Astellas Pharma Inc.
Environmental Initiatives
In our Environmental and Safety Guidelines, the vision
that Astellas should aim for by the end of fiscal 2010 is
clearly shown in the form of unified standards. We also
formulate an Environmental Action Plan each year, setting
specific targets, and undertake measures to achieve
these targets. In fiscal 2006, we conducted a variety of
environmental initiatives to achieve our reduction targets
for atmospheric emissions of dichloromethane and carbon
dioxide in Japan, both of which were met four years ahead
of schedule. We also decided that the target set for fiscal
2007 as the final year for reducing chloroform atmospheric
emissions would be too difficult to achieve. Accordingly,
we extended the final year to fiscal 2009, while setting a
higher target.
Social Contribution Initiatives
Astellas promotes activities that contribute to the good
of society, and encourages communication with the
local community in the fields of medicine, healthcare and
welfare. Further, Astellas supports research in various
fields in medical science and pharmacology. In Japan,
from fiscal 2006 we began extending support to a patient
support program called “Starlight Partners.” During fiscal
2006, we extended support to 21 projects. We also
provided full support for the “Think Transplant” campaign
of the Japan Organ Transplant Network.
Currently, three research foundations in Japan, the
U.S. and Europe are helping the advancement of basic
and life sciences by supporting study programs for young
researchers and study-abroad programs for researchers
from developing countries.
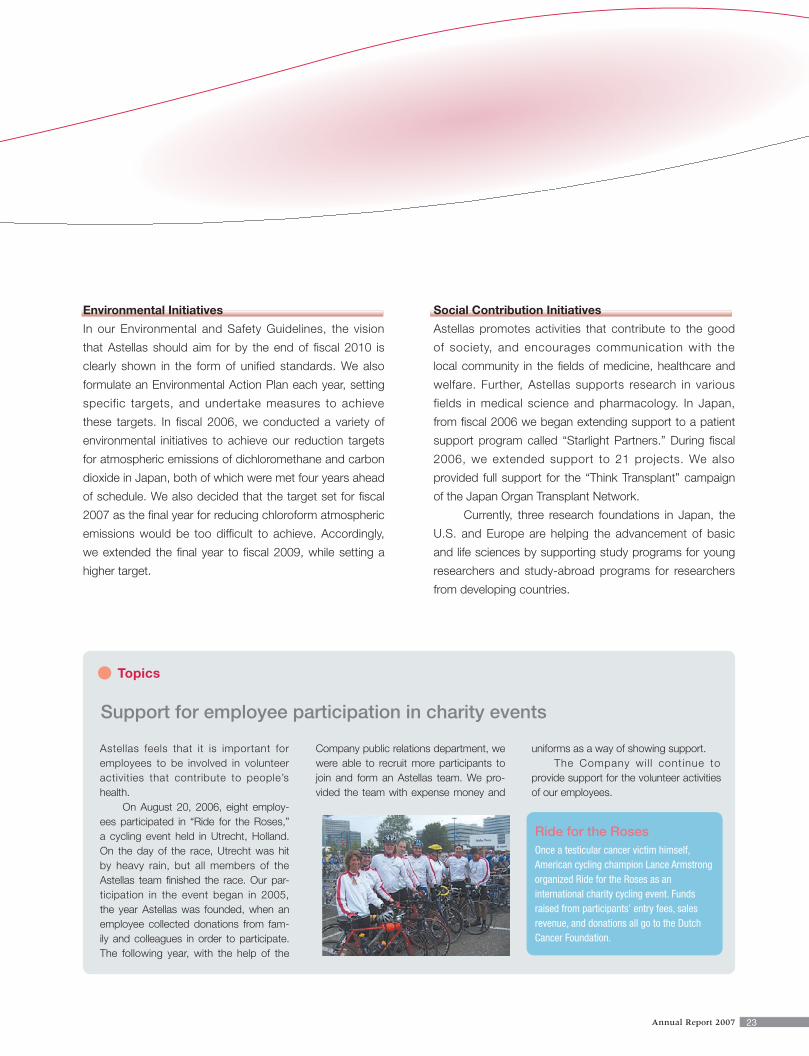
Astellas feels that it is important for employees to be involved in volunteer activities that contribute to people’s health.
On August 20, 2006, eight employ-ees participated in “Ride for the Roses,” a cycling event held in Utrecht, Holland. On the day of the race, Utrecht was hit by heavy rain, but all members of the Astellas team fi nished the race. Our par-ticipation in the event began in 2005, the year Astellas was founded, when an employee collected donations from fam-ily and colleagues in order to participate. The following year, with the help of the
Company public relations department, we were able to recruit more participants to join and form an Astellas team. We pro-vided the team with expense money and
uniforms as a way of showing support. The Company wil l continue to
provide support for the volunteer activities of our employees.
Support for employee participation in charity events
Ride for the Roses Once a testicular cancer victim himself, American cycling champion Lance Armstrong organized Ride for the Roses as an international charity cycling event. Funds raised from participants’ entry fees, sales revenue, and donations all go to the Dutch Cancer Foundation.
Topics
23Annual Report 2007
Corporate Governance
In line with its management strategy of maximizing enterprise value, Astellas has created a corporate
governance system aimed at maintaining a high degree of transparency and putting a stronger focus
than hitherto on social accountability.
Corporate Governance System
Astellas employs a corporate officer system to achieve a
clear separation between the strategic decision-making
and operational supervision function of management,
performed by the Company’s directors, and the execution
of day-to-day operational decisions, carried out by the
corporate officers.
The Board of Directors now consists of nine
members, of whom five are outside directors. These
outside directors have a wealth of experience and expertise
in the business and medical fields, bringing a broad
perspective to their duties as directors. The Board of
Auditors, consisting of four statutory auditors, of whom two
are outside auditors, is charged with the duty of auditing
the performance of duties by the directors.
In June 2007, the Board of Directors set up
the Nomination Committee and the Compensation
Committee as advisory councils in order to further
improve transparency and objectivity in the process of the
deliberation on the nomination and removal of members
of the Board, Corporate Auditors and Corporate Officers,
and compensation-related issues with regard to the Board
members and Corporate Officers.
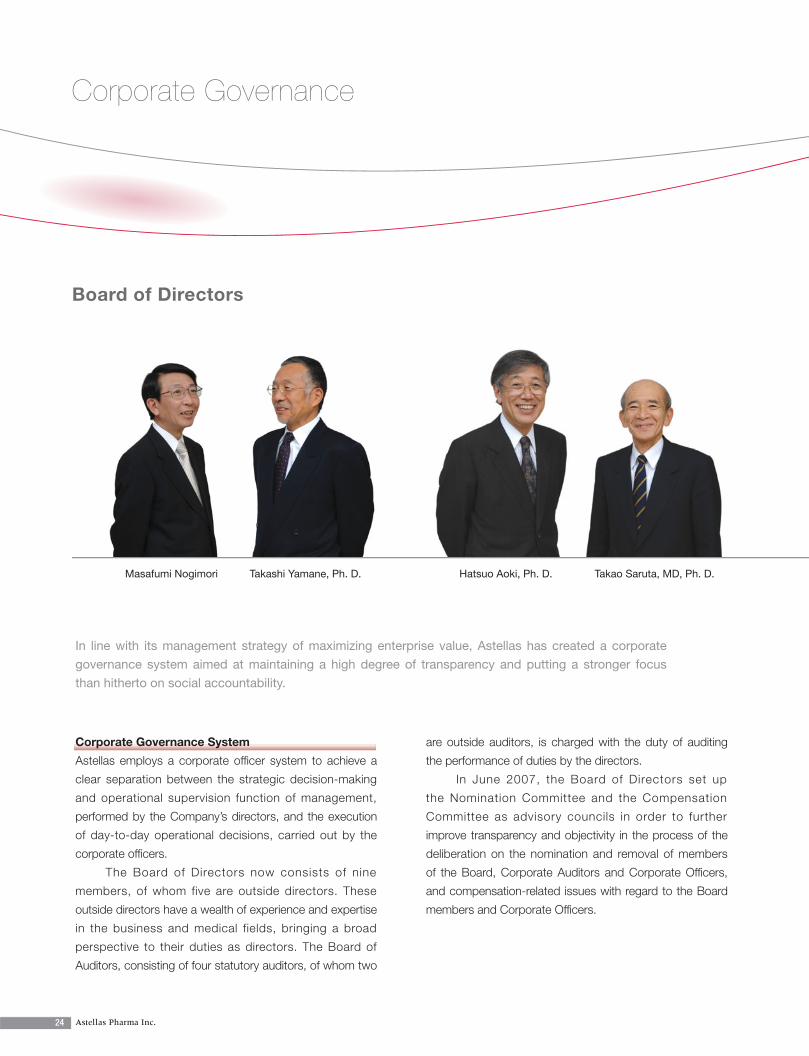
Takashi Yamane, Ph. D.Masafumi Nogimori Takao Saruta, MD, Ph. D.Hatsuo Aoki, Ph. D.
Board of Directors
24 Astellas Pharma Inc.
Internal Control System
The Astellas Group as a whole is rooted in a sound and
ethical corporate culture. We are working to develop
an internal controls system to ensure the integrity of
our business activities. The Group is working to ensure
that business is conducted in an appropriate manner
through the creation of a system to ensure the efficiency
of directors in the performance of their duties, as well as
through the appropriate internal controls, risk management
and compliance systems.
To realize appropriate risk management, corporate
social responsibility (CSR) management and information
disclosure, the functions are overseen by cross-divisional
committees, i.e. the Risk Management Committee, the
CSR Committee, and the Investor Relations Committee.
Our disclosure policy is available at
(http://www.astellas.com/global/about/disclosure/index.html)
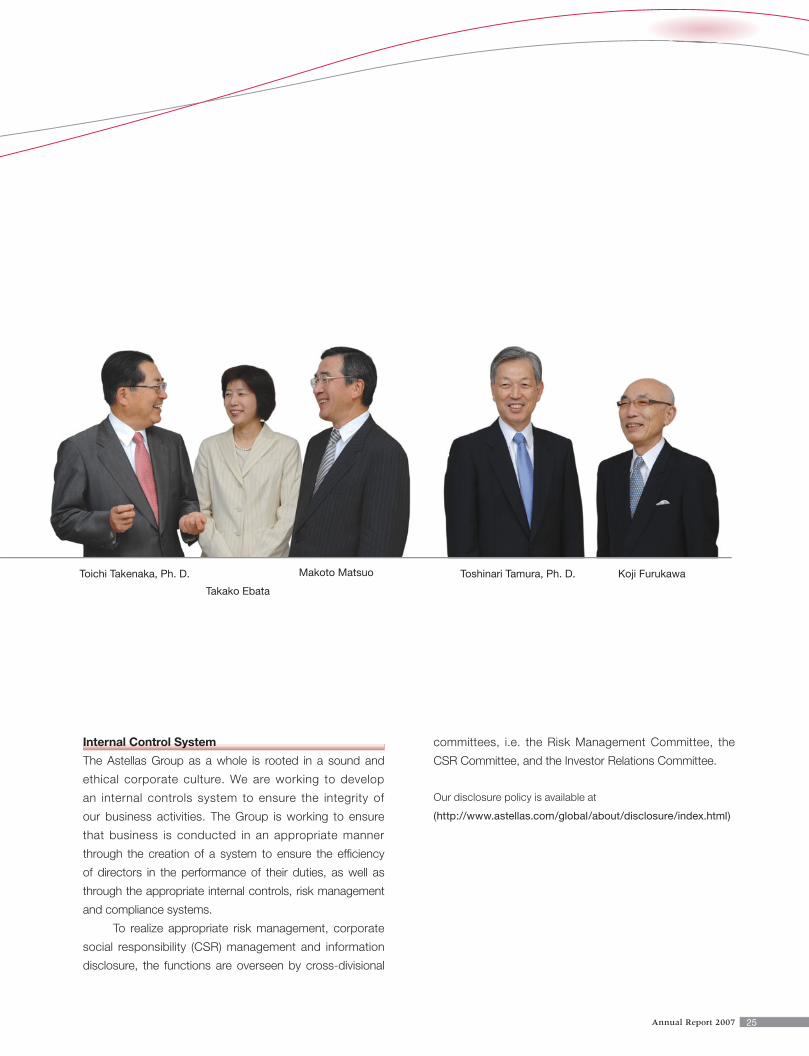
Toshinari Tamura, Ph. D.Makoto Matsuo
Takako Ebata
Toichi Takenaka, Ph. D. Koji Furukawa
25Annual Report 2007
Representative Directors and Co-Chairmen
Hatsuo Aoki, Ph. D.
Toichi Takenaka, Ph. D.
Representative Director,
President and Chief Executive Officer
Masafumi Nogimori
Representative Director, Executive Vice
President and CSO (Chief Science Officer)
Toshinari Tamura, Ph. D.
Directors
Makoto Matsuo*
Takashi Yamane, Ph. D.*
Koji Furukawa*
Takako Ebata*
Takao Saruta, MD, Ph. D.*
*Outside Directors
Corporate Auditors
Osamu Nagai
Shigeo Aoyagi
Hideo Yamada, Ph. D.*
Kiyomi Saito**Outside Corporate Auditors
Executive Corporate Officer
Kunihide Ichikawa
Senior Corporate Officers
Yasuo Ishii
Isao Yanagisawa, Ph. D.
Hirofumi Onosaka
Masao Shimizu
Hiroaki Hiraiwa
Takayoshi Mukaida
Hitoshi Ohta
Toshio Ohsawa
Corporate Officers
Iwaki Miyazaki
Tadao Hasegawa
Masaru Imahori
Katsuro Yamada
Makoto Nishimura, Ph. D.
Yoshiro Miyokawa
Yoshihiko Hatanaka
Michirou Ikeda
Rinta Ibuki, Ph. D.
Masaharu Asano, Ph. D.
Fujio Kitamura
Masao Yoshida
Shin-ichi Tsukamoto, Ph. D.
Seitaro Mutoh, Ph. D.
Seigo Kashii
Hidetoshi Shuto
Masaki Doi, Ph. D.
(As of June 27, 2007)
Apr. 1960 Joined Fujisawa Pharmaceutical Co., Ltd.June 1988 Director of FujisawaJan. 1993 Managing director of FujisawaJune 1995 Senior managing director of FujisawaJune 1999 President and CEO of FujisawaApr. 2005 Chairman of the CompanyJune 2006 Co–Chairman of the Company (present post)
Apr. 1964 Joined Yamanouchi Pharmaceutical Co., Ltd.June 1993 Director of YamanouchiJune 1997 Managing director of YamanouchiJune 1999 Senior managing director of YamanouchiJune 2000 President and CEO of YamanouchiApr. 2005 President and CEO of the CompanyJune 2006 Co–Chairman of the Company (present post)
Apr. 1975 Admitted to Bar and joined the law firm of Ozaki & Momo-o
Aug. 1978 Joined Weil, Gotshal & Manges LLP in New York, U.S.A.
Mar. 1979 Admitted to Bar in New York, U.S.A.Apr. 1989 Partner of the law firm of Momo-o, Matsuo &
NambaJune 2003 Corporate Auditor of the CompanyJune 2004 Director of the Company (present post)Apr. 2005 Part-time Associate Professor, School of Law,
Hitotsubashi University (present post)
Nov. 1974 Joined Sanwa & Co. (currently Deloite Touche Tohmatsu)
May 1977 Admitted to Certified Public AccountantApr. 1994 Associate Professor, Graduate School of Business
Administration, Keio UniversitySep. 1998 Visiting Scholar, Stanford University, U.S.A. Apr. 2001 Professor, Ph. D., Graduate School of Business
Administration, Keio University (present post)June 2005 Director of the Company (present post)
Apr. 1970 Joined Fujisawa Pharmaceutical Co., Ltd.June 1997 Director of FujisawaJune 2004 Corporate Executive Vice President and
Director of FujisawaApr. 2005 Executive Vice President of the CompanyJune 2006 President and CEO of the Company
(present post)
Apr. 1972 Joined Yamanouchi Pharmaceutical Co., Ltd.June 1998 Director of YamanouchiJune 2001 Managing Director of YamanouchiJune 2002 Senior Managing Director of YamanouchiJune 2004 Corporate Executive Vice President and
Director of YamanouchiOct. 2004 Executive Corporate Officer and
Representative Director of YamanouchiApr. 2005 Executive Vice President of the Company
(present post)
Apr. 1962 Joined Mitsubishi CorporationJune 1992 Director of Mitsubishi CorporationJune 1995 Managing Director of Mitsubishi CorporationApr. 1999 Executive Vice President and Representative
Director of Mitsubishi CorporationJune 2004 Vice Chairman and Director of Mitsubishi
Motors Corporation June 2006 Director of the Company (present post)Sep. 2006 Chairman and CEO of Japan Post Bank, Co.,
Ltd. (present post)
Apr. 1982 Joined Fujitsu LimitedJuly 1992 Joined McKinsey & Company, Inc., JapanFeb. 1998 Joined Amgen Limited Dec. 2000 Corporate Off icer, Business Development,
Amgen LimitedMar. 2003 Executive Director, Corporate Officer, CFO,
Marketing, Amgen LimitedJune 2005 Project Associate Professor, Academic Planning
& Coordination Office, The University of TokyoJune 2006 Director of the Company (present post)Apr. 2007 Project Associate Professor, Public Relations
Office, The University of Tokyo (present post)
Profile of Directors
Nov. 1969 Assistant, School of Medicine, Keio University
Apr. 1973 Assistant Professor, School of Medicine, Keio University
Apr. 1986 Professor, Department of Internal Medicine, School of Medicine, Keio University
Oct. 1995 Dean of School of Medicine, Keio UniversityJuly 2001 Trustee, Keio UniversityApr. 2005 Honorary Professor, Keio University (present
post)Apr. 2006 Special Advisor, Tokyo Saiseikai Central
Hospital (present post)June 2007 Director of the Company (present post)
26 Astellas Pharma Inc.
27Astellas Pharma Inc.
Financial SectionYear ended March 31, 2007
Contents
Key Financial Data 27
Management’s Discussion & Analysis 28
Consolidated Balance Sheets 38
Consolidated Statements of Income 40
Consolidated Statements of Cash Flows 41
Consolidated Statements of Changes in Net Assets 42
Notes to Consolidated Financial Statements 44
Report of Independent Auditors 61
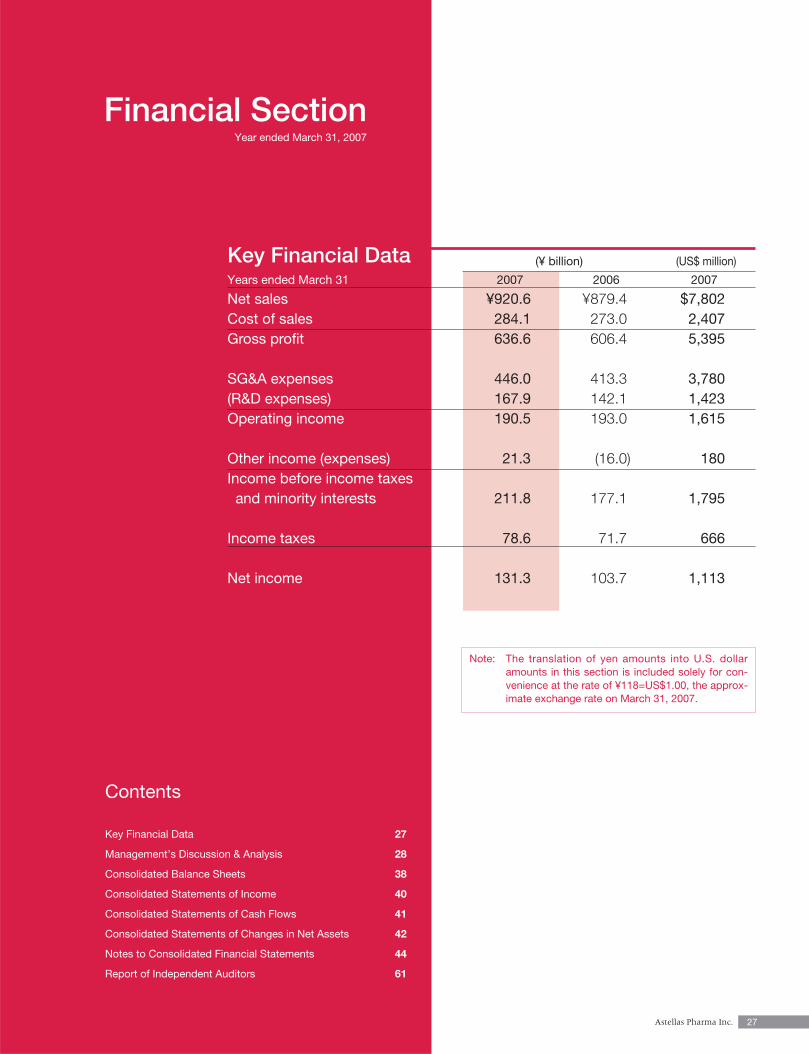
(¥ billion) (US$ million)
Years ended March 31 2007 2006 2007
Net sales ¥920.6 ¥879.4 $7,802Cost of sales 284.1 273.0 2,407Gross profit 636.6 606.4 5,395
SG&A expenses 446.0 413.3 3,780(R&D expenses) 167.9 142.1 1,423Operating income 190.5 193.0 1,615
Other income (expenses) 21.3 (16.0) 180Income before income taxesand minority interests 211.8 177.1 1,795
Income taxes 78.6 71.7 666
Net income 131.3 103.7 1,113
Key Financial Data
Note: The translation of yen amounts into U.S. dollaramounts in this section is included solely for con-venience at the rate of ¥118=US$1.00, the approx-imate exchange rate on March 31, 2007.
Business Philosophy and Management Policies
The business philosophy of Astellas comprises three parts: our raison d’être, our mission, and our beliefs. This
business philosophy expresses our vision of contributing to the health of people around the world by provid-
ing effective and reliable pharmaceutical products, thereby continuously enhancing the enterprise value of
Astellas. Our beliefs, which form the bedrock of our code of conduct, can be summarized under the following
four short headings: high ethical standards; customer focus; creativity; and competitive focus.
To translate this business philosophy into specific guidelines for action at the level of day-to-day busi-
ness operations, we have drawn up the Astellas Charter of Corporate Conduct. Similarly, to guide each of our
employees in their conduct of their tasks on a day-to-day basis, we have drawn up and distributed to all our
staff a manual entitled: Our Code of Conduct. We have chosen the term “CSR-based management” to
describe the practical application of these guidelines and principles to the actual conduct of business. The
prime purpose of our CSR activities – which include environmental preservation as a priority task – is to gain
and keep the support and trust of all our stakeholders, including our customers, shareholders, employees,
and the general public.
The Astellas Business Philosophy
Raison d’être: To contribute to the health of people around the world through the provision of innovative
and reliable pharmaceutical products
Mission: To enhance the Company’s enterprise value in a sustainable manner
Beliefs: High ethical standards
Customer focus
Creativity
Competitive focus
Management’s Discussion & Analysis
28 Astellas Pharma Inc.
29Astellas Pharma Inc.
Overview
Advanced countries are continuing to promote measures to curb medical expenses. The NHI drug price revi-
sion implemented in Japan in April 2006 was one such example. Under such conditions, to beat off even
fiercer competition, we worked to maximize sales of new and existing products, and also made proactive
R&D investment aimed at future growth.
On a consolidated basis, net sales increased 4.7% year-on-year, to ¥920.6 billion ($7,802 million), while
operating income decreased 1.3% to ¥190.5 billion ($1,615 million). Net income amounted to ¥131.3 billion
($1,113 million), up 26.7%.
On the sales front, the NHI drug price revision implemented in April 2006 in Japan had a negative impact
of around 7.5% on our sales, and the divesture of OTC subsidiary Zepharma, Inc. also pushed sales down.
However, the global expansion of mainstay ethical pharmaceuticals Prograf®, an immunosuppressant, and
Vesicare®, a treatment for overactive bladder, was the driving force behind sales, and in Japan, products such
as the hypercholesterolemia treatment Lipitor®, the long-acting angiotensin II receptor antagonist Micardis®
and the hypnotic Myslee® also showed continued sales growth. On the other hand, sales of mainstay product
the selective alpha-1 blocker Harnal® declined, reflecting decreased sales in Japan and Europe as a result of
patent expiry. Consequently, net sales increased 4.7% to ¥920.6 billion.
Gross profit came to ¥636.6 billion ($5,395 million), up 5.0% thanks to the sales increase and improve-
ment in the cost-of-sales ratio, which edged up 0.1 percentage point to 30.9%. In terms of expenses, selling,
general and administrative expenses increased 7.9% to ¥446.0 billion ($3,780 million). The increase was
attributable to a significant increase in research and development expenses, which swelled 18.2% to ¥167.9
billion ($1,423 million), mainly because of the upfront fees and development milestones for in-licensing of oral
anemia treatments from FibroGen, Inc. As a result, operating income decreased 1.3% to ¥190.5 billion.
Notwithstanding the decline in operating income, net income increased 26.7% to ¥131.3 billion due to
extraordinary gains, including a gain on the sale of subsidiaries’ shares and a gain on the sale of investment
securities.
30 Astellas Pharma Inc.
Net sales
Sales of global mainstay products
Prograf®
Prograf® has established a strong presence in the transplant field worldwide as a drug for the prevention of
rejection after organ transplants. In the United States, the largest transplant market, Prograf® is used by
around 90% of new liver transplant recipients and around 80% of new kidney transplant recipients.
In Japan, too, sales of Prograf® are steadily expanding, boosted by the additional indications of autoim-
mune diseases such as rheumatoid arthritis approved in 2005, as well as a steady increase from transplant
indications.
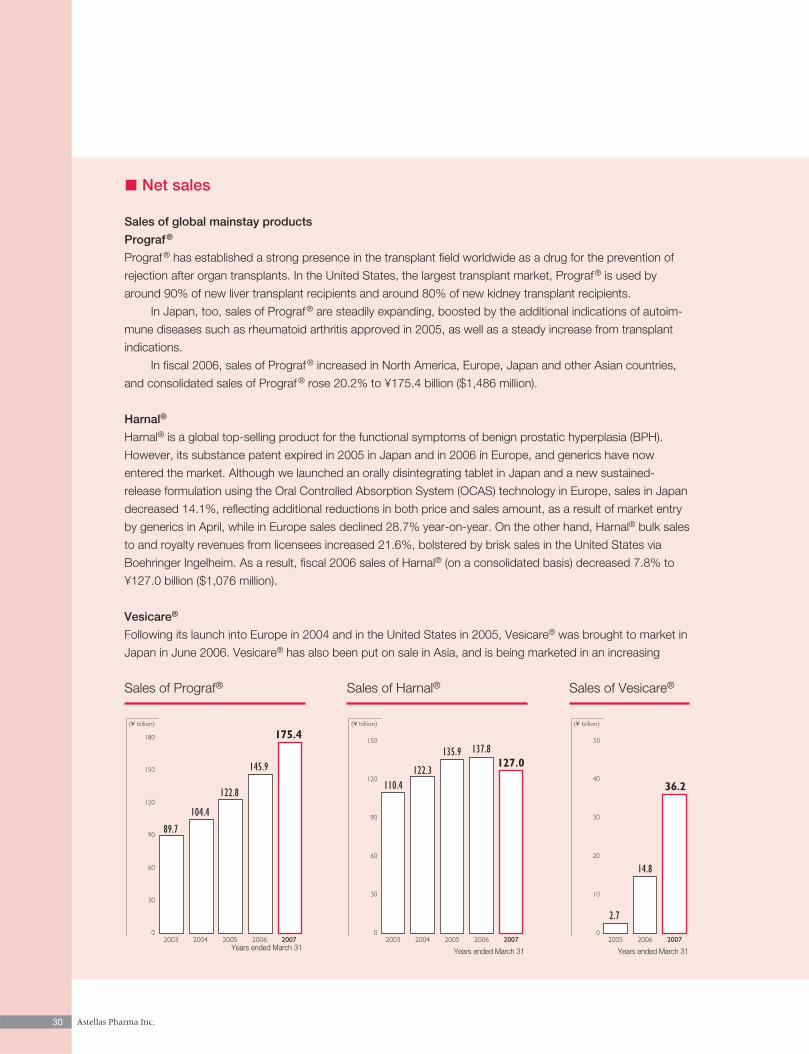
In fiscal 2006, sales of Prograf® increased in North America, Europe, Japan and other Asian countries,
and consolidated sales of Prograf ® rose 20.2% to ¥175.4 billion ($1,486 million).
Harnal®
Harnal® is a global top-selling product for the functional symptoms of benign prostatic hyperplasia (BPH).
However, its substance patent expired in 2005 in Japan and in 2006 in Europe, and generics have now
entered the market. Although we launched an orally disintegrating tablet in Japan and a new sustained-
release formulation using the Oral Controlled Absorption System (OCAS) technology in Europe, sales in Japan
decreased 14.1%, reflecting additional reductions in both price and sales amount, as a result of market entry
by generics in April, while in Europe sales declined 28.7% year-on-year. On the other hand, Harnal® bulk sales
to and royalty revenues from licensees increased 21.6%, bolstered by brisk sales in the United States via
Boehringer Ingelheim. As a result, fiscal 2006 sales of Harnal® (on a consolidated basis) decreased 7.8% to
¥127.0 billion ($1,076 million).
Vesicare®
Following its launch into Europe in 2004 and in the United States in 2005, Vesicare® was brought to market in
Japan in June 2006. Vesicare® has also been put on sale in Asia, and is being marketed in an increasing
Sales of Prograf®
0
60
30
90
120
150
180
(¥ billion)
2003 2004 2005 2006 2007
175.4
145.9
122.8
104.4
89.7
Sales of Harnal®
0
30
60
90
120
150
(¥ billion)
2003 2004 2005 2006 2007
127.0137.8135.9
122.3110.4
Years ended March 31 Years ended March 31
Sales of Vesicare®
0
10
20
30
40
50
(¥ billion)
2005 2006 2007
36.2
14.8
2.7
Years ended March 31
31Astellas Pharma Inc.
number of countries worldwide.
In the United States, promotional activities with co-promotion company GlaxoSmithKline also proved a
success, and the share of prescriptions in the market of VESIcare® for treatments of overactive bladder is
steadily increasing, making VESIcare® the second major brand-name drug.
In Europe, Vesicare® is the second major treatment for overactive bladder in the five main European
countries, the UK, Germany, France, Italy and Spain, and, even in European countries that are promoting
measures to curb medical expenses, Vesicare® is steadily expanding market share.
In Japan, Vesicare® has penetrated the market extremely smoothly from the start, and in fiscal 2006 was
already the second major product of its type.
Buoyed by extremely large sales gains of 128.7% in the United States and 73.3% in Europe and the recent
launch in Japan, fiscal 2006 consolidated sales of Vesicare® jumped 144.3% to ¥36.2 billion ($307 million).
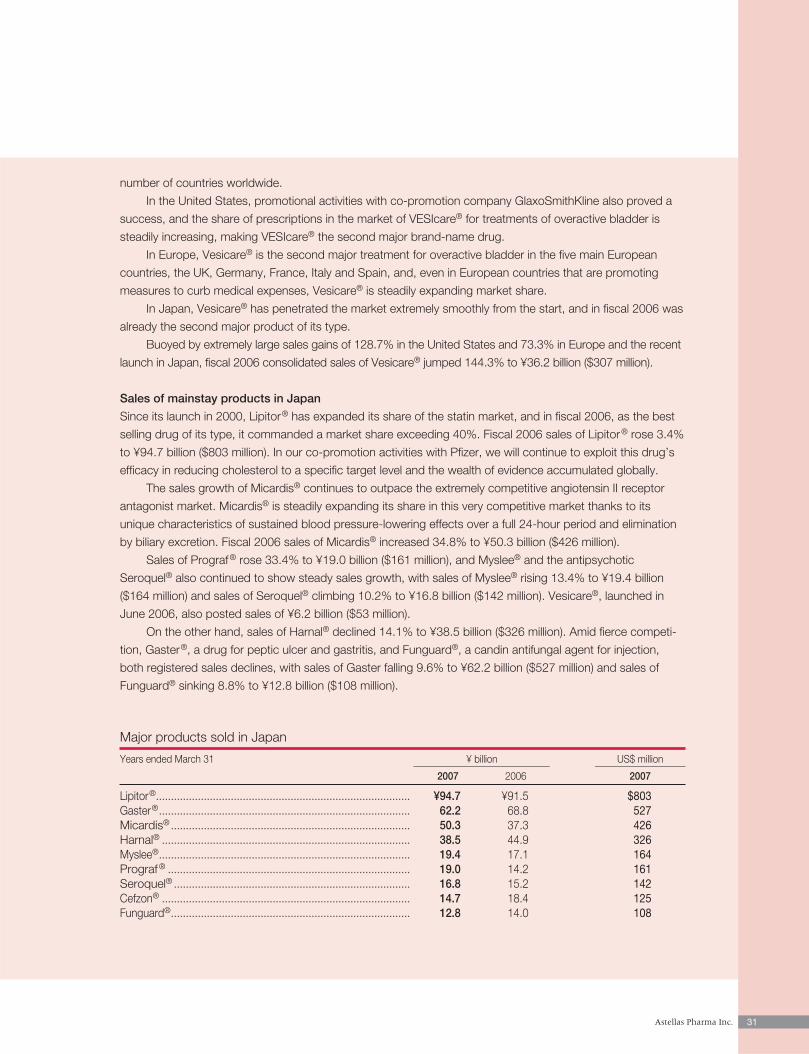
Sales of mainstay products in Japan
Since its launch in 2000, Lipitor® has expanded its share of the statin market, and in fiscal 2006, as the best
selling drug of its type, it commanded a market share exceeding 40%. Fiscal 2006 sales of Lipitor® rose 3.4%
to ¥94.7 billion ($803 million). In our co-promotion activities with Pfizer, we will continue to exploit this drug’s
efficacy in reducing cholesterol to a specific target level and the wealth of evidence accumulated globally.
The sales growth of Micardis® continues to outpace the extremely competitive angiotensin II receptor
antagonist market. Micardis® is steadily expanding its share in this very competitive market thanks to its
unique characteristics of sustained blood pressure-lowering effects over a full 24-hour period and elimination
by biliary excretion. Fiscal 2006 sales of Micardis® increased 34.8% to ¥50.3 billion ($426 million).
Sales of Prograf® rose 33.4% to ¥19.0 billion ($161 million), and Myslee® and the antipsychotic
Seroquel® also continued to show steady sales growth, with sales of Myslee® rising 13.4% to ¥19.4 billion
($164 million) and sales of Seroquel® climbing 10.2% to ¥16.8 billion ($142 million). Vesicare®, launched in
June 2006, also posted sales of ¥6.2 billion ($53 million).
On the other hand, sales of Harnal® declined 14.1% to ¥38.5 billion ($326 million). Amid fierce competi-
tion, Gaster®, a drug for peptic ulcer and gastritis, and Funguard®, a candin antifungal agent for injection,
both registered sales declines, with sales of Gaster falling 9.6% to ¥62.2 billion ($527 million) and sales of
Funguard® sinking 8.8% to ¥12.8 billion ($108 million).
Major products sold in Japan
Years ended March 31 ¥ billion US$ million
2007 2006 2007
Lipitor®..................................................................................... ¥94.7 ¥91.5 $803Gaster®.................................................................................... 62.2 68.8 527Micardis®................................................................................ 50.3 37.3 426Harnal® ................................................................................... 38.5 44.9 326Myslee®.................................................................................... 19.4 17.1 164Prograf® ................................................................................. 19.0 14.2 161Seroquel® ............................................................................... 16.8 15.2 142Cefzon® ................................................................................... 14.7 18.4 125Funguard®................................................................................ 12.8 14.0 108
Astellas Pharma Inc.
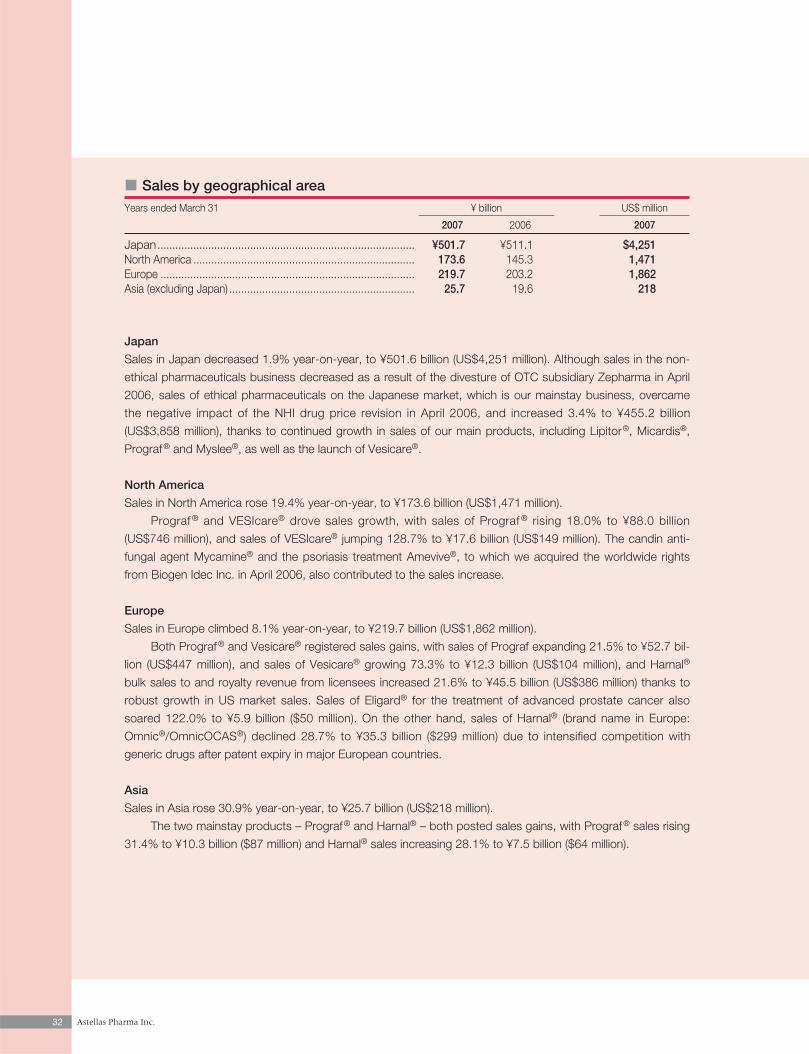
Sales by geographical areaYears ended March 31 ¥ billion US$ million
2007 2006 2007
Japan...................................................................................... ¥501.7 ¥511.1 $4,251North America .......................................................................... 173.6 145.3 1,471Europe ..................................................................................... 219.7 203.2 1,862Asia (excluding Japan) .............................................................. 25.7 19.6 218
Japan
Sales in Japan decreased 1.9% year-on-year, to ¥501.6 billion (US$4,251 million). Although sales in the non-
ethical pharmaceuticals business decreased as a result of the divesture of OTC subsidiary Zepharma in April
2006, sales of ethical pharmaceuticals on the Japanese market, which is our mainstay business, overcame
the negative impact of the NHI drug price revision in April 2006, and increased 3.4% to ¥455.2 billion
(US$3,858 million), thanks to continued growth in sales of our main products, including Lipitor®, Micardis®,
Prograf® and Myslee®, as well as the launch of Vesicare®.
North America
Sales in North America rose 19.4% year-on-year, to ¥173.6 billion (US$1,471 million).
Prograf ® and VESIcare® drove sales growth, with sales of Prograf ® rising 18.0% to ¥88.0 billion
(US$746 million), and sales of VESIcare® jumping 128.7% to ¥17.6 billion (US$149 million). The candin anti-
fungal agent Mycamine® and the psoriasis treatment Amevive®, to which we acquired the worldwide rights
from Biogen Idec Inc. in April 2006, also contributed to the sales increase.
Europe
Sales in Europe climbed 8.1% year-on-year, to ¥219.7 billion (US$1,862 million).
Both Prograf® and Vesicare® registered sales gains, with sales of Prograf expanding 21.5% to ¥52.7 bil-
lion (US$447 million), and sales of Vesicare® growing 73.3% to ¥12.3 billion (US$104 million), and Harnal®
bulk sales to and royalty revenue from licensees increased 21.6% to ¥45.5 billion (US$386 million) thanks to
robust growth in US market sales. Sales of Eligard® for the treatment of advanced prostate cancer also
soared 122.0% to ¥5.9 billion ($50 million). On the other hand, sales of Harnal® (brand name in Europe:
Omnic®/OmnicOCAS®) declined 28.7% to ¥35.3 billion ($299 million) due to intensified competition with
generic drugs after patent expiry in major European countries.
Asia
Sales in Asia rose 30.9% year-on-year, to ¥25.7 billion (US$218 million).
The two mainstay products – Prograf® and Harnal® – both posted sales gains, with Prograf® sales rising
31.4% to ¥10.3 billion ($87 million) and Harnal® sales increasing 28.1% to ¥7.5 billion ($64 million).
32
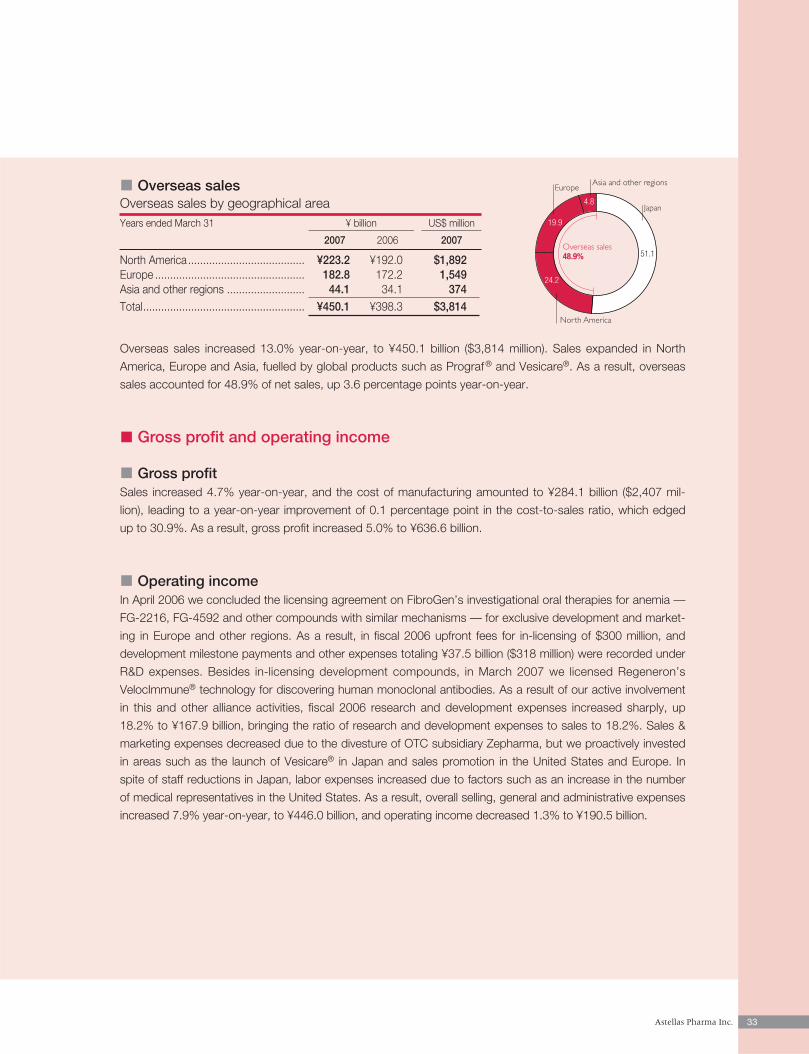
Astellas Pharma Inc.
Overseas salesOverseas sales by geographical areaYears ended March 31 ¥ billion US$ million
2007 2006 2007
North America....................................... ¥223.2 ¥192.0 $1,892Europe .................................................. 182.8 172.2 1,549Asia and other regions .......................... 44.1 34.1 374Total...................................................... ¥450.1 ¥398.3 $3,814
Overseas sales increased 13.0% year-on-year, to ¥450.1 billion ($3,814 million). Sales expanded in North
America, Europe and Asia, fuelled by global products such as Prograf® and Vesicare®. As a result, overseas
sales accounted for 48.9% of net sales, up 3.6 percentage points year-on-year.
Gross profit and operating income
Gross profitSales increased 4.7% year-on-year, and the cost of manufacturing amounted to ¥284.1 billion ($2,407 mil-
lion), leading to a year-on-year improvement of 0.1 percentage point in the cost-to-sales ratio, which edged
up to 30.9%. As a result, gross profit increased 5.0% to ¥636.6 billion.
Operating income In April 2006 we concluded the licensing agreement on FibroGen’s investigational oral therapies for anemia —
FG-2216, FG-4592 and other compounds with similar mechanisms — for exclusive development and market-
ing in Europe and other regions. As a result, in fiscal 2006 upfront fees for in-licensing of $300 million, and
development milestone payments and other expenses totaling ¥37.5 billion ($318 million) were recorded under
R&D expenses. Besides in-licensing development compounds, in March 2007 we licensed Regeneron’s
VelocImmune® technology for discovering human monoclonal antibodies. As a result of our active involvement
in this and other alliance activities, fiscal 2006 research and development expenses increased sharply, up
18.2% to ¥167.9 billion, bringing the ratio of research and development expenses to sales to 18.2%. Sales &
marketing expenses decreased due to the divesture of OTC subsidiary Zepharma, but we proactively invested
in areas such as the launch of Vesicare® in Japan and sales promotion in the United States and Europe. In
spite of staff reductions in Japan, labor expenses increased due to factors such as an increase in the number
of medical representatives in the United States. As a result, overall selling, general and administrative expenses
increased 7.9% year-on-year, to ¥446.0 billion, and operating income decreased 1.3% to ¥190.5 billion.
51.1
24.2
19.9
4.8Japan
Asia and other regions
Overseas sales48.9%
Europe
North America
33
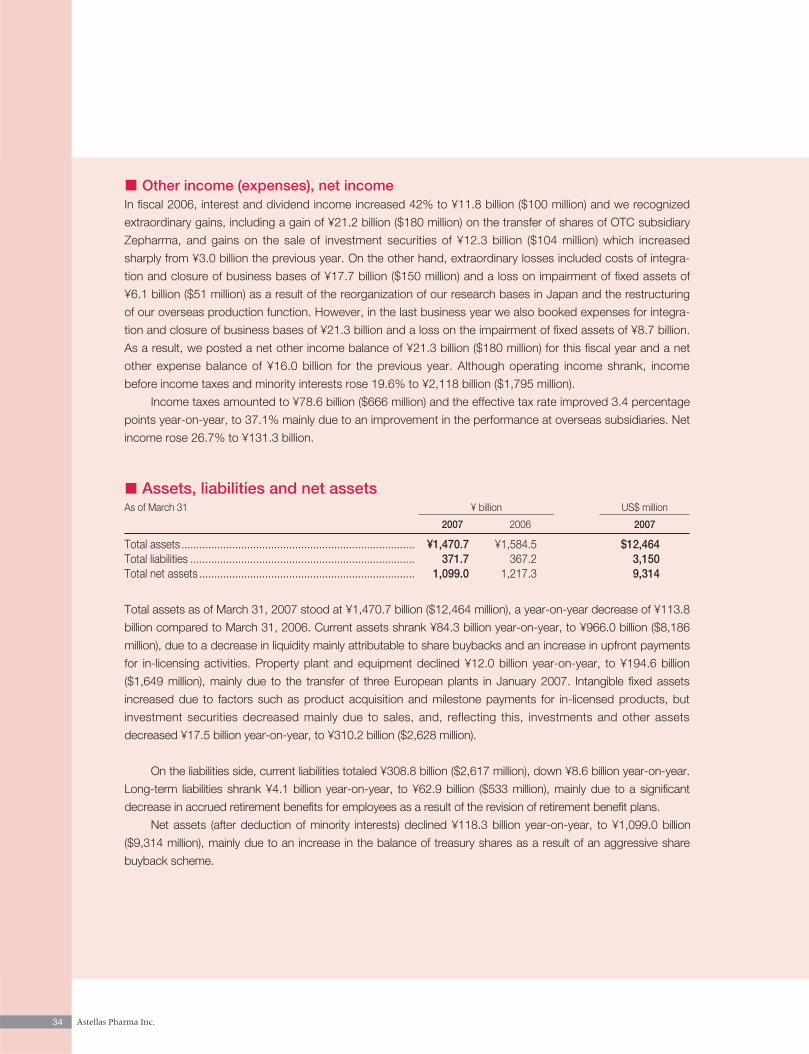
34 Astellas Pharma Inc.
Other income (expenses), net incomeIn fiscal 2006, interest and dividend income increased 42% to ¥11.8 billion ($100 million) and we recognized
extraordinary gains, including a gain of ¥21.2 billion ($180 million) on the transfer of shares of OTC subsidiary
Zepharma, and gains on the sale of investment securities of ¥12.3 billion ($104 million) which increased
sharply from ¥3.0 billion the previous year. On the other hand, extraordinary losses included costs of integra-
tion and closure of business bases of ¥17.7 billion ($150 million) and a loss on impairment of fixed assets of
¥6.1 billion ($51 million) as a result of the reorganization of our research bases in Japan and the restructuring
of our overseas production function. However, in the last business year we also booked expenses for integra-
tion and closure of business bases of ¥21.3 billion and a loss on the impairment of fixed assets of ¥8.7 billion.
As a result, we posted a net other income balance of ¥21.3 billion ($180 million) for this fiscal year and a net
other expense balance of ¥16.0 billion for the previous year. Although operating income shrank, income
before income taxes and minority interests rose 19.6% to ¥2,118 billion ($1,795 million).
Income taxes amounted to ¥78.6 billion ($666 million) and the effective tax rate improved 3.4 percentage
points year-on-year, to 37.1% mainly due to an improvement in the performance at overseas subsidiaries. Net
income rose 26.7% to ¥131.3 billion.
Assets, liabilities and net assetsAs of March 31 ¥ billion US$ million
2007 2006 2007
Total assets .............................................................................. ¥1,470.7 ¥1,584.5 $12,464Total liabilities ........................................................................... 371.7 367.2 3,150Total net assets ........................................................................ 1,099.0 1,217.3 9,314
Total assets as of March 31, 2007 stood at ¥1,470.7 billion ($12,464 million), a year-on-year decrease of ¥113.8
billion compared to March 31, 2006. Current assets shrank ¥84.3 billion year-on-year, to ¥966.0 billion ($8,186
million), due to a decrease in liquidity mainly attributable to share buybacks and an increase in upfront payments
for in-licensing activities. Property plant and equipment declined ¥12.0 billion year-on-year, to ¥194.6 billion
($1,649 million), mainly due to the transfer of three European plants in January 2007. Intangible fixed assets
increased due to factors such as product acquisition and milestone payments for in-licensed products, but
investment securities decreased mainly due to sales, and, reflecting this, investments and other assets
decreased ¥17.5 billion year-on-year, to ¥310.2 billion ($2,628 million).
On the liabilities side, current liabilities totaled ¥308.8 billion ($2,617 million), down ¥8.6 billion year-on-year.
Long-term liabilities shrank ¥4.1 billion year-on-year, to ¥62.9 billion ($533 million), mainly due to a significant
decrease in accrued retirement benefits for employees as a result of the revision of retirement benefit plans.
Net assets (after deduction of minority interests) declined ¥118.3 billion year-on-year, to ¥1,099.0 billion
($9,314 million), mainly due to an increase in the balance of treasury shares as a result of an aggressive share
buyback scheme.
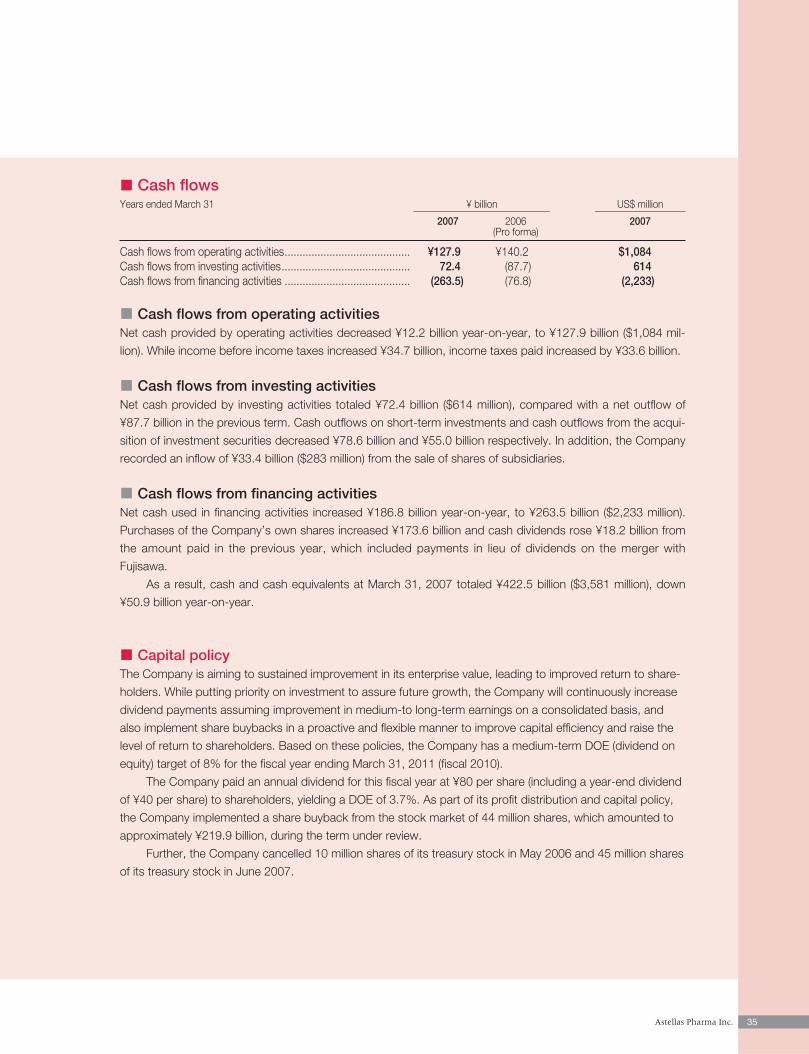
35Astellas Pharma Inc.
Cash flowsYears ended March 31 ¥ billion US$ million
2007 2006 2007(Pro forma)
Cash flows from operating activities.......................................... ¥127.9 ¥140.2 $1,084Cash flows from investing activities........................................... 72.4 (87.7) 614Cash flows from financing activities .......................................... (263.5) (76.8) (2,233)
Cash flows from operating activitiesNet cash provided by operating activities decreased ¥12.2 billion year-on-year, to ¥127.9 billion ($1,084 mil-
lion). While income before income taxes increased ¥34.7 billion, income taxes paid increased by ¥33.6 billion.
Cash flows from investing activitiesNet cash provided by investing activities totaled ¥72.4 billion ($614 million), compared with a net outflow of
¥87.7 billion in the previous term. Cash outflows on short-term investments and cash outflows from the acqui-
sition of investment securities decreased ¥78.6 billion and ¥55.0 billion respectively. In addition, the Company
recorded an inflow of ¥33.4 billion ($283 million) from the sale of shares of subsidiaries.
Cash flows from financing activitiesNet cash used in financing activities increased ¥186.8 billion year-on-year, to ¥263.5 billion ($2,233 million).
Purchases of the Company’s own shares increased ¥173.6 billion and cash dividends rose ¥18.2 billion from
the amount paid in the previous year, which included payments in lieu of dividends on the merger with
Fujisawa.
As a result, cash and cash equivalents at March 31, 2007 totaled ¥422.5 billion ($3,581 million), down
¥50.9 billion year-on-year.
Capital policyThe Company is aiming to sustained improvement in its enterprise value, leading to improved return to share-
holders. While putting priority on investment to assure future growth, the Company will continuously increase
dividend payments assuming improvement in medium-to long-term earnings on a consolidated basis, and
also implement share buybacks in a proactive and flexible manner to improve capital efficiency and raise the
level of return to shareholders. Based on these policies, the Company has a medium-term DOE (dividend on
equity) target of 8% for the fiscal year ending March 31, 2011 (fiscal 2010).
The Company paid an annual dividend for this fiscal year at ¥80 per share (including a year-end dividend
of ¥40 per share) to shareholders, yielding a DOE of 3.7%. As part of its profit distribution and capital policy,
the Company implemented a share buyback from the stock market of 44 million shares, which amounted to
approximately ¥219.9 billion, during the term under review.
Further, the Company cancelled 10 million shares of its treasury stock in May 2006 and 45 million shares
of its treasury stock in June 2007.
Pipeline Status
In Japan, Vesicare® obtained approval and was launched in June 2006, and the selective COX-2 inhibitor
Celecox® was approved in January 2007 and launched in June. An additional indication of Prograf® for lupus
nephritis, and of Funguard® for pediatric use and prophylaxis of infections in hematopoietic stem cell trans-
plantation patients were also approved in the term under review. Several candidates were filed, including the
immunosuppressant FK506 (modified release formulation), and YM529 for osteoporosis. Several projects,
including FK199B, a modified release formulation of zolpidem, a treatment for insomnia, are in phase III, and
the anti-thrombosis drug YM150 and some other projects are in phase II.Further, T-3811, a quinolone antibiotic (product name: Geninax®), obtained approval in July 2007.
Overseas, YM087 obtained approval for an additional indication of hypervolemic hyponatremia in the US inFebruary 2007. In Europe, the candin antifungal agent FK463 was filed in April 2006. In the US, an injectableantibiotic telavancin for complicated skin and skin structure infections, RSD1235 for atrial fibrillation, and anadditional indication of FK463 for candidemia and other candida infections were filed in December 2006.Several projects, including ASP2151 for herpes zoster and genital herpes, entered phase II. Clinical studies formany new drug candidates such as YM150 are ongoing.
FK506 modified release (product name: Advagraf ) obtained approval in Europe in April 2007 and was
launched in Britain and Germany in June 2007.
– Enhancement of product line by in-licensing activities
At Astellas, we are striving to enhance our product line by proactive in-licensing activities as well as strength-
ening our in-house research and development activities, to contribute to medium- and long-term growth.
In April 2006, the Company entered into a licensing agreement with Ilypsa, Inc. (currently Amgen Inc.) for
the right to develop and market the treatment of hyperphosphatemia ILY-101 in Japan. We also concluded a
license agreement with FibroGen, Inc. in April 2006 for oral anemia therapies FG-2216 (YM311), FG-4592 and
other compounds with similar mechanisms of action for exclusive development and marketing in Europe and
other regions. In July 2006, we agreed with Theravance, Inc. to add Japan to the collaboration for the devel-
opment and commercialization of the antibiotic telavancin. Astellas also entered into a licensing agreement
with Kirin on exclusive collaboration in developing and marketing its fully human anti-CD40 antagonistic mon-
oclonal antibodies.
36 Astellas Pharma Inc.
37Astellas Pharma Inc.
Business Risks
Principal risks that may affect the business results and financial position of Astellas include:
Impact of Pharmaceuticals Regulations:
The Company’s core business, the pharmaceutical business, is subject to different regulations in each country
where Astellas operates. Medical cost containment measures in developed countries, such as the NHI drug price
reduction implemented in Japan in April 2006, could have negative impacts on earnings. More stringent regula-
tions governing clinical development, production and distribution of pharmaceuticals could also increase costs.
Product Risk:
Business results could be adversely affected if Astellas cannot appropriately maintain and protect patents on
its leading products such as Prograf®, if any significant litigation is initiated, or if our products cause any unex-
pected adverse effects.
In addition, technology is rapidly advancing and Astellas faces intensifying global competition. If highly
competitive peer products are launched by competitors, the business results of Astellas could also be
adversely affected.
Inherent Uncertainties in Pharmaceutical R&D:
In general, the probability of discovering a promising compound through drug discovery research is not high.
It also requires a large amount of investment and a great deal of time to successfully launch a new product
after discovery of a new compound. Furthermore, it may be necessary to discontinue clinical development if
the effectiveness of a drug is not proven as initially expected, or if serious adverse effects arise. In addition,
pharmaceuticals are subject to legal restrictions in each country, so that authorization from local regulatory
authorities is a prerequisite for a product launch in each country. It is difficult to accurately foresee if and when
approvals for a new product can be obtained.
The research and development activities of Astellas are subject to these inherent risks.
Foreign Exchange Rate Fluctuations:
As the operations of Astellas are carried out in many countries, exchange rate fluctuations can affect the
Company’s business results and financial position.
The risks to which the business operations of Astellas are subject include, but are not limited to, those stated
above. There are various other risks, including: i) being made subject to a lawsuit during the process of busi-
ness, ii) delay/suspension of production due to disaster, or iii) the partial dependence of business results on
in-licensed products.
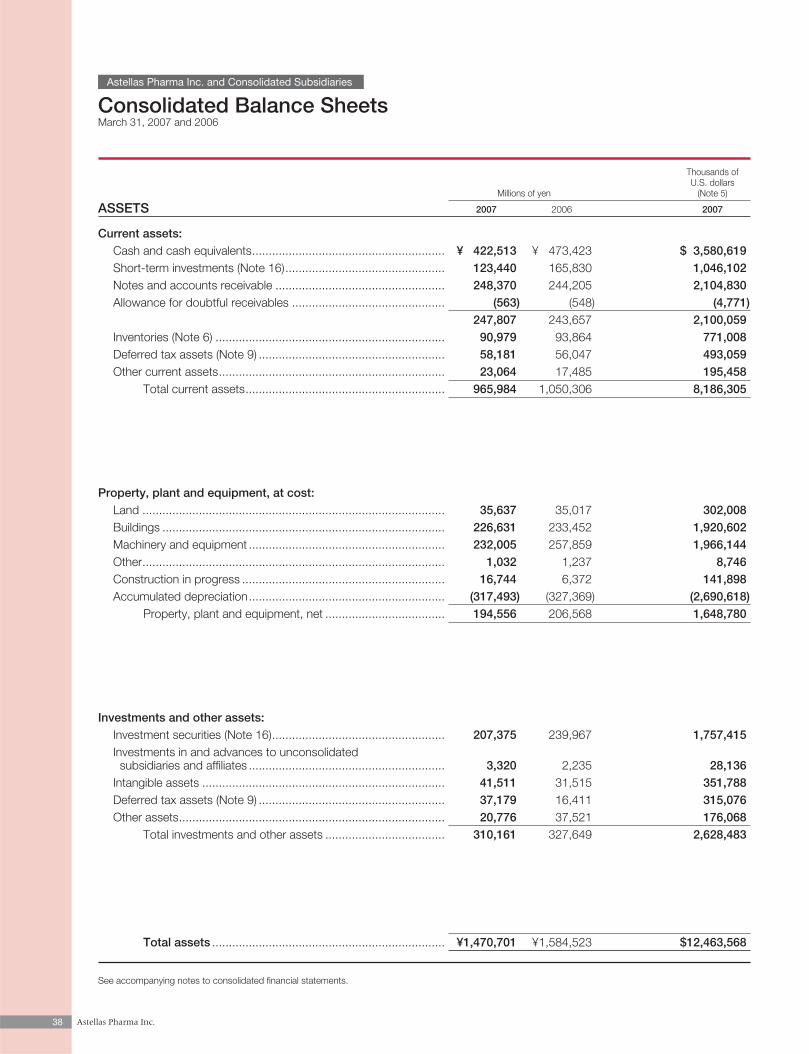
38 Astellas Pharma Inc.
Consolidated Balance SheetsMarch 31, 2007 and 2006
Astellas Pharma Inc. and Consolidated Subsidiaries
Thousands ofU.S. dollars
Millions of yen (Note 5)
ASSETS 2007 2006 2007
Current assets:Cash and cash equivalents.......................................................... ¥ 422,513 ¥ 473,423 $ 3,580,619Short-term investments (Note 16)................................................ 123,440 165,830 1,046,102Notes and accounts receivable ................................................... 248,370 244,205 2,104,830Allowance for doubtful receivables .............................................. (563) (548) (4,771)
247,807 243,657 2,100,059Inventories (Note 6) ..................................................................... 90,979 93,864 771,008Deferred tax assets (Note 9) ........................................................ 58,181 56,047 493,059Other current assets.................................................................... 23,064 17,485 195,458
Total current assets............................................................ 965,984 1,050,306 8,186,305
Property, plant and equipment, at cost:Land ........................................................................................... 35,637 35,017 302,008Buildings ..................................................................................... 226,631 233,452 1,920,602Machinery and equipment ........................................................... 232,005 257,859 1,966,144Other........................................................................................... 1,032 1,237 8,746Construction in progress ............................................................. 16,744 6,372 141,898Accumulated depreciation........................................................... (317,493) (327,369) (2,690,618)
Property, plant and equipment, net .................................... 194,556 206,568 1,648,780
Investments and other assets:Investment securities (Note 16).................................................... 207,375 239,967 1,757,415Investments in and advances to unconsolidatedsubsidiaries and affiliates ........................................................... 3,320 2,235 28,136
Intangible assets ......................................................................... 41,511 31,515 351,788Deferred tax assets (Note 9) ........................................................ 37,179 16,411 315,076Other assets................................................................................ 20,776 37,521 176,068
Total investments and other assets .................................... 310,161 327,649 2,628,483
Total assets ...................................................................... ¥1,470,701 ¥1,584,523 $12,463,568
See accompanying notes to consolidated financial statements.
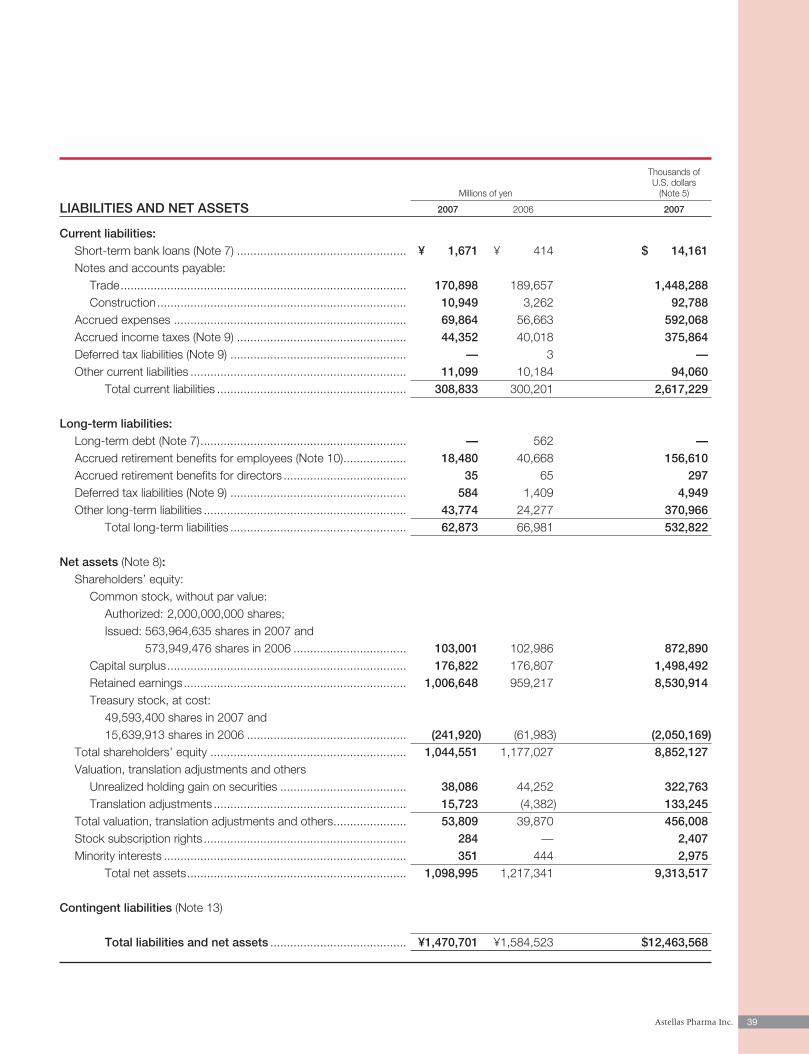
39Astellas Pharma Inc.
Thousands ofU.S. dollars
Millions of yen (Note 5)
LIABILITIES AND NET ASSETS 2007 2006 2007
Current liabilities:Short-term bank loans (Note 7) ................................................... ¥ 1,671 ¥ 414 $ 14,161Notes and accounts payable:
Trade...................................................................................... 170,898 189,657 1,448,288Construction........................................................................... 10,949 3,262 92,788
Accrued expenses ...................................................................... 69,864 56,663 592,068Accrued income taxes (Note 9) ................................................... 44,352 40,018 375,864Deferred tax liabilities (Note 9) ..................................................... — 3 —Other current liabilities ................................................................. 11,099 10,184 94,060
Total current liabilities ......................................................... 308,833 300,201 2,617,229
Long-term liabilities:Long-term debt (Note 7).............................................................. — 562 —Accrued retirement benefits for employees (Note 10)................... 18,480 40,668 156,610Accrued retirement benefits for directors ..................................... 35 65 297Deferred tax liabilities (Note 9) ..................................................... 584 1,409 4,949Other long-term liabilities ............................................................. 43,774 24,277 370,966
Total long-term liabilities ..................................................... 62,873 66,981 532,822
Net assets (Note 8):Shareholders’ equity:
Common stock, without par value:Authorized: 2,000,000,000 shares;Issued: 563,964,635 shares in 2007 and
573,949,476 shares in 2006 .................................. 103,001 102,986 872,890Capital surplus........................................................................ 176,822 176,807 1,498,492Retained earnings................................................................... 1,006,648 959,217 8,530,914Treasury stock, at cost:
49,593,400 shares in 2007 and15,639,913 shares in 2006 ................................................ (241,920) (61,983) (2,050,169)
Total shareholders’ equity ........................................................... 1,044,551 1,177,027 8,852,127Valuation, translation adjustments and others
Unrealized holding gain on securities ...................................... 38,086 44,252 322,763Translation adjustments .......................................................... 15,723 (4,382) 133,245
Total valuation, translation adjustments and others...................... 53,809 39,870 456,008Stock subscription rights............................................................. 284 — 2,407Minority interests ......................................................................... 351 444 2,975
Total net assets.................................................................. 1,098,995 1,217,341 9,313,517
Contingent liabilities (Note 13)
Total liabilities and net assets ......................................... ¥1,470,701 ¥1,584,523 $12,463,568
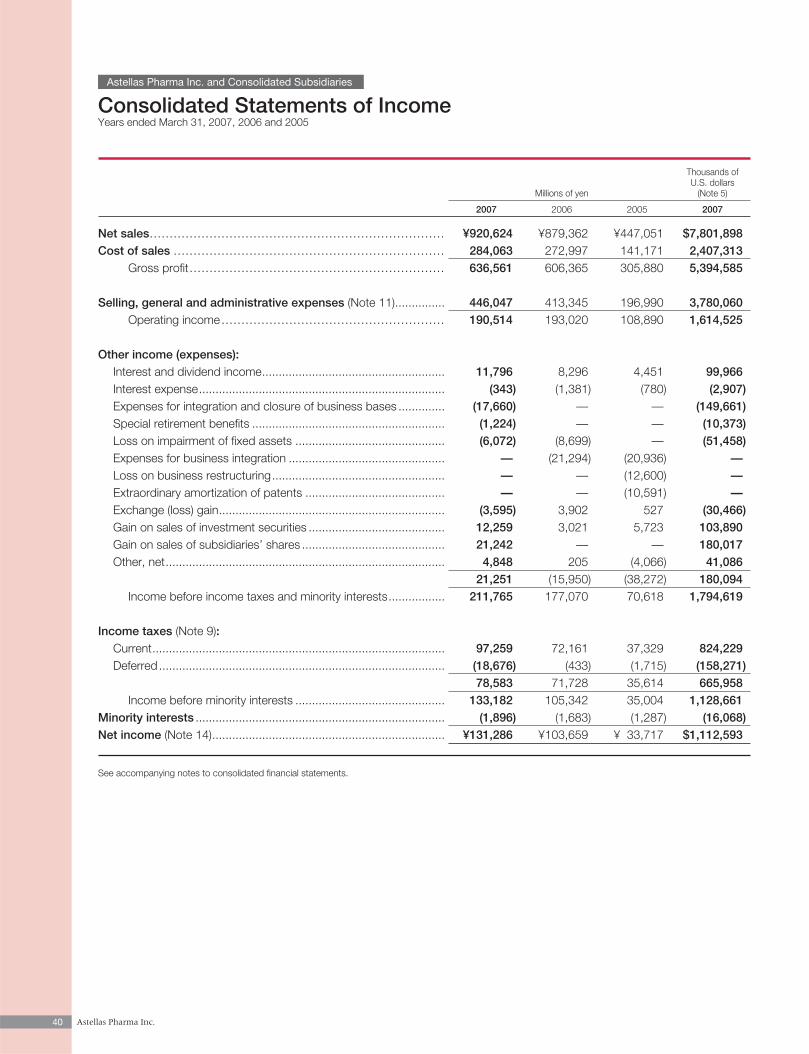
40 Astellas Pharma Inc.
Consolidated Statements of IncomeYears ended March 31, 2007, 2006 and 2005
Astellas Pharma Inc. and Consolidated Subsidiaries
Thousands ofU.S. dollars
Millions of yen (Note 5)
2007 2006 2005 2007
Net sales.......................................................................... ¥920,624 ¥879,362 ¥447,051 $7,801,898Cost of sales .................................................................... 284,063 272,997 141,171 2,407,313
Gross profit................................................................ 636,561 606,365 305,880 5,394,585
Selling, general and administrative expenses (Note 11)............... 446,047 413,345 196,990 3,780,060Operating income........................................................ 190,514 193,020 108,890 1,614,525
Other income (expenses):Interest and dividend income....................................................... 11,796 8,296 4,451 99,966Interest expense.......................................................................... (343) (1,381) (780) (2,907)Expenses for integration and closure of business bases .............. (17,660) — — (149,661)Special retirement benefits .......................................................... (1,224) — — (10,373)Loss on impairment of fixed assets ............................................. (6,072) (8,699) — (51,458)Expenses for business integration ............................................... — (21,294) (20,936) —Loss on business restructuring.................................................... — — (12,600) —Extraordinary amortization of patents .......................................... — — (10,591) —Exchange (loss) gain.................................................................... (3,595) 3,902 527 (30,466)Gain on sales of investment securities ......................................... 12,259 3,021 5,723 103,890Gain on sales of subsidiaries’ shares ........................................... 21,242 — — 180,017Other, net.................................................................................... 4,848 205 (4,066) 41,086
21,251 (15,950) (38,272) 180,094Income before income taxes and minority interests................. 211,765 177,070 70,618 1,794,619
Income taxes (Note 9):Current........................................................................................ 97,259 72,161 37,329 824,229Deferred ...................................................................................... (18,676) (433) (1,715) (158,271)
78,583 71,728 35,614 665,958Income before minority interests ............................................. 133,182 105,342 35,004 1,128,661
Minority interests ........................................................................... (1,896) (1,683) (1,287) (16,068)Net income (Note 14)...................................................................... ¥131,286 ¥103,659 ¥ 33,717 $1,112,593
See accompanying notes to consolidated financial statements.
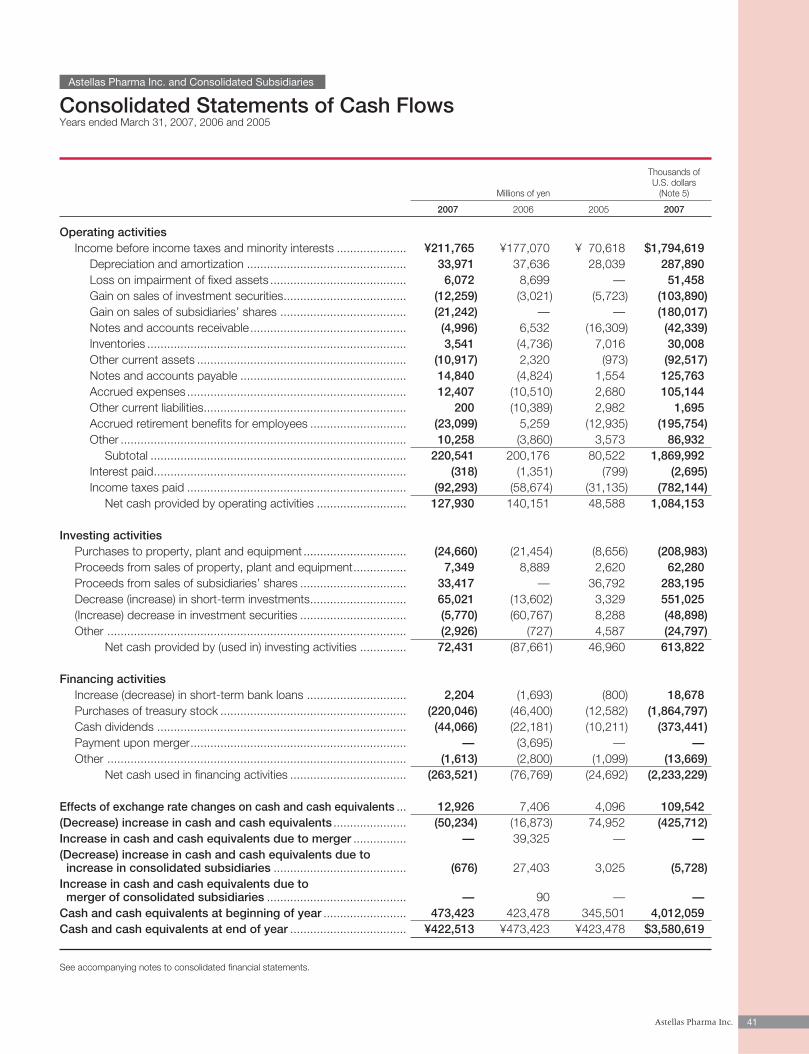
41Astellas Pharma Inc.
Astellas Pharma Inc. and Consolidated Subsidiaries
Consolidated Statements of Cash FlowsYears ended March 31, 2007, 2006 and 2005
Thousands ofU.S. dollars
Millions of yen (Note 5)
2007 2006 2005 2007
Operating activitiesIncome before income taxes and minority interests ..................... ¥211,765 ¥177,070 ¥ 70,618 $1,794,619
Depreciation and amortization ................................................ 33,971 37,636 28,039 287,890Loss on impairment of fixed assets ......................................... 6,072 8,699 — 51,458Gain on sales of investment securities..................................... (12,259) (3,021) (5,723) (103,890)Gain on sales of subsidiaries’ shares ...................................... (21,242) — — (180,017)Notes and accounts receivable............................................... (4,996) 6,532 (16,309) (42,339)Inventories .............................................................................. 3,541 (4,736) 7,016 30,008Other current assets ............................................................... (10,917) 2,320 (973) (92,517)Notes and accounts payable .................................................. 14,840 (4,824) 1,554 125,763Accrued expenses .................................................................. 12,407 (10,510) 2,680 105,144Other current liabilities............................................................. 200 (10,389) 2,982 1,695Accrued retirement benefits for employees ............................. (23,099) 5,259 (12,935) (195,754)Other ...................................................................................... 10,258 (3,860) 3,573 86,932
Subtotal ............................................................................. 220,541 200,176 80,522 1,869,992Interest paid............................................................................ (318) (1,351) (799) (2,695)Income taxes paid .................................................................. (92,293) (58,674) (31,135) (782,144)
Net cash provided by operating activities ........................... 127,930 140,151 48,588 1,084,153
Investing activitiesPurchases to property, plant and equipment ............................... (24,660) (21,454) (8,656) (208,983)Proceeds from sales of property, plant and equipment................ 7,349 8,889 2,620 62,280Proceeds from sales of subsidiaries’ shares ................................ 33,417 — 36,792 283,195Decrease (increase) in short-term investments............................. 65,021 (13,602) 3,329 551,025(Increase) decrease in investment securities ................................ (5,770) (60,767) 8,288 (48,898)Other .......................................................................................... (2,926) (727) 4,587 (24,797)
Net cash provided by (used in) investing activities .............. 72,431 (87,661) 46,960 613,822
Financing activitiesIncrease (decrease) in short-term bank loans .............................. 2,204 (1,693) (800) 18,678Purchases of treasury stock ........................................................ (220,046) (46,400) (12,582) (1,864,797)Cash dividends ........................................................................... (44,066) (22,181) (10,211) (373,441)Payment upon merger................................................................. — (3,695) — —Other .......................................................................................... (1,613) (2,800) (1,099) (13,669)
Net cash used in financing activities ................................... (263,521) (76,769) (24,692) (2,233,229)
Effects of exchange rate changes on cash and cash equivalents ... 12,926 7,406 4,096 109,542(Decrease) increase in cash and cash equivalents ...................... (50,234) (16,873) 74,952 (425,712)Increase in cash and cash equivalents due to merger ................ — 39,325 — —(Decrease) increase in cash and cash equivalents due to increase in consolidated subsidiaries ........................................ (676) 27,403 3,025 (5,728)
Increase in cash and cash equivalents due to merger of consolidated subsidiaries .......................................... — 90 — —
Cash and cash equivalents at beginning of year ......................... 473,423 423,478 345,501 4,012,059Cash and cash equivalents at end of year ................................... ¥422,513 ¥473,423 ¥423,478 $3,580,619
See accompanying notes to consolidated financial statements.
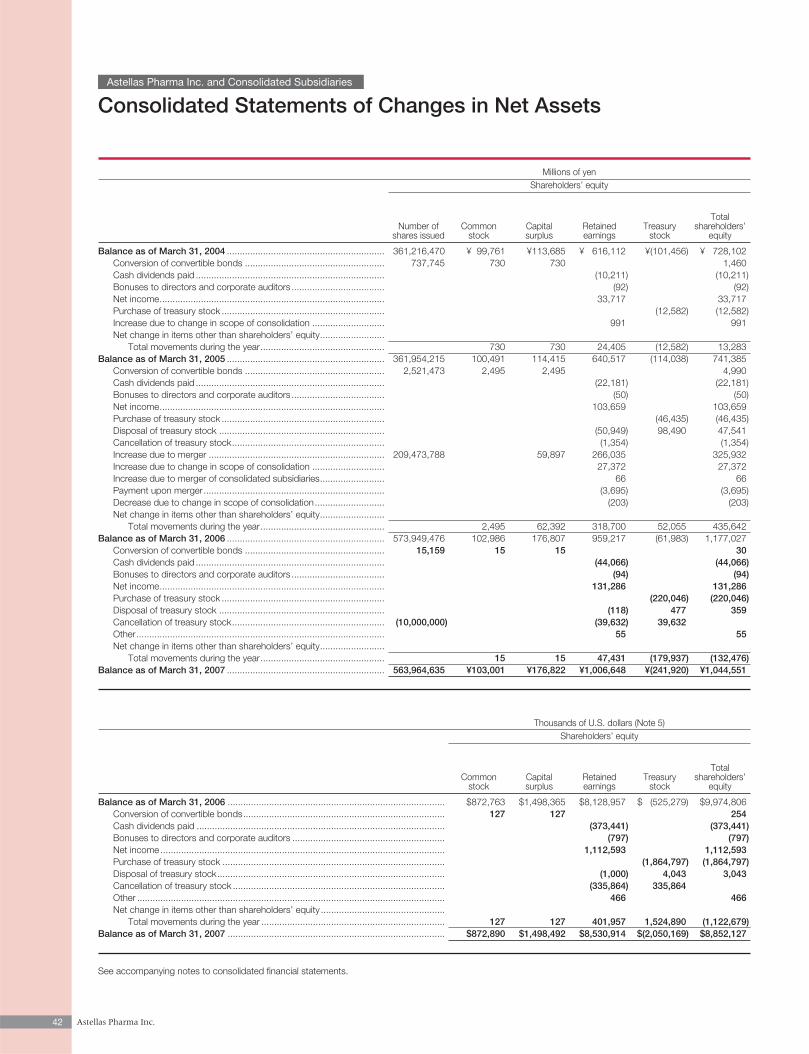
42 Astellas Pharma Inc.
Astellas Pharma Inc. and Consolidated Subsidiaries
Consolidated Statements of Changes in Net Assets
Millions of yenShareholders’ equity
TotalNumber of Common Capital Retained Treasury shareholders’
shares issued stock surplus earnings stock equity
Balance as of March 31, 2004 ............................................................. 361,216,470 ¥ 99,761 ¥113,685 ¥ 616,112 ¥(101,456) ¥ 728,102Conversion of convertible bonds ...................................................... 737,745 730 730 1,460Cash dividends paid ......................................................................... (10,211) (10,211)Bonuses to directors and corporate auditors .................................... (92) (92)Net income....................................................................................... 33,717 33,717Purchase of treasury stock ............................................................... (12,582) (12,582)Increase due to change in scope of consolidation ............................ 991 991Net change in items other than shareholders’ equity.........................
Total movements during the year................................................ 730 730 24,405 (12,582) 13,283Balance as of March 31, 2005 ............................................................. 361,954,215 100,491 114,415 640,517 (114,038) 741,385
Conversion of convertible bonds ...................................................... 2,521,473 2,495 2,495 4,990Cash dividends paid ......................................................................... (22,181) (22,181)Bonuses to directors and corporate auditors .................................... (50) (50)Net income....................................................................................... 103,659 103,659Purchase of treasury stock ............................................................... (46,435) (46,435)Disposal of treasury stock ................................................................ (50,949) 98,490 47,541Cancellation of treasury stock........................................................... (1,354) (1,354)Increase due to merger .................................................................... 209,473,788 59,897 266,035 325,932Increase due to change in scope of consolidation ............................ 27,372 27,372Increase due to merger of consolidated subsidiaries......................... 66 66Payment upon merger...................................................................... (3,695) (3,695)Decrease due to change in scope of consolidation........................... (203) (203)Net change in items other than shareholders’ equity.........................
Total movements during the year................................................ 2,495 62,392 318,700 52,055 435,642Balance as of March 31, 2006 ............................................................. 573,949,476 102,986 176,807 959,217 (61,983) 1,177,027
Conversion of convertible bonds ...................................................... 15,159 15 15 30Cash dividends paid ......................................................................... (44,066) (44,066)Bonuses to directors and corporate auditors .................................... (94) (94)Net income....................................................................................... 131,286 131,286Purchase of treasury stock ............................................................... (220,046) (220,046)Disposal of treasury stock ................................................................ (118) 477 359Cancellation of treasury stock........................................................... (10,000,000) (39,632) 39,632Other................................................................................................ 55 55Net change in items other than shareholders’ equity.........................
Total movements during the year................................................ 15 15 47,431 (179,937) (132,476)Balance as of March 31, 2007 ............................................................. 563,964,635 ¥103,001 ¥176,822 ¥1,006,648 ¥(241,920) ¥1,044,551
Thousands of U.S. dollars (Note 5)Shareholders’ equity
TotalCommon Capital Retained Treasury shareholders’
stock surplus earnings stock equity
Balance as of March 31, 2006 .................................................................................... $872,763 $1,498,365 $8,128,957 $ (525,279) $9,974,806Conversion of convertible bonds.............................................................................. 127 127 254Cash dividends paid ................................................................................................ (373,441) (373,441)Bonuses to directors and corporate auditors ........................................................... (797) (797)Net income.............................................................................................................. 1,112,593 1,112,593Purchase of treasury stock ...................................................................................... (1,864,797) (1,864,797)Disposal of treasury stock........................................................................................ (1,000) 4,043 3,043Cancellation of treasury stock .................................................................................. (335,864) 335,864Other ....................................................................................................................... 466 466Net change in items other than shareholders’ equity ................................................
Total movements during the year ....................................................................... 127 127 401,957 1,524,890 (1,122,679)Balance as of March 31, 2007 .................................................................................... $872,890 $1,498,492 $8,530,914 $(2,050,169) $8,852,127
See accompanying notes to consolidated financial statements.
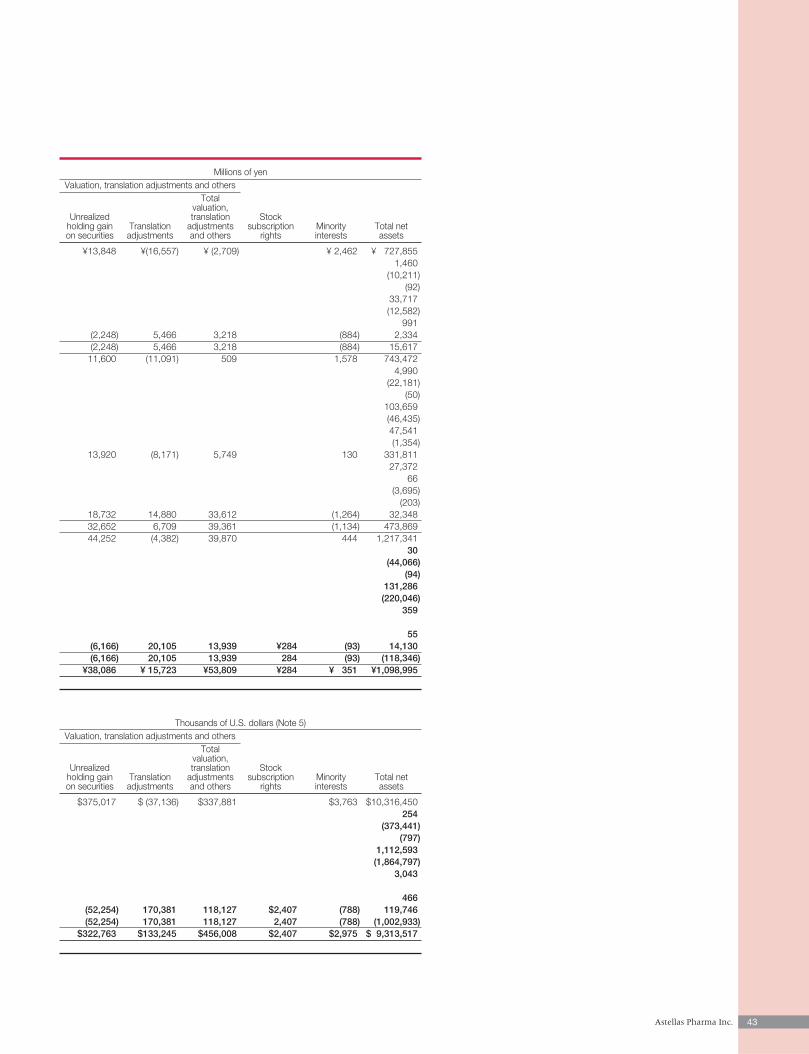
43Astellas Pharma Inc.
Millions of yenValuation, translation adjustments and others
Totalvaluation,
Unrealized translation Stock holding gain Translation adjustments subscription Minority Total neton securities adjustments and others rights interests assets
¥13,848 ¥(16,557) ¥ (2,709) ¥ 2,462 ¥ 727,8551,460
(10,211)(92)
33,717(12,582)
991(2,248) 5,466 3,218 (884) 2,334(2,248) 5,466 3,218 (884) 15,617
11,600 (11,091) 509 1,578 743,4724,990
(22,181)(50)
103,659(46,435)47,541(1,354)
13,920 (8,171) 5,749 130 331,81127,372
66(3,695)
(203)18,732 14,880 33,612 (1,264) 32,34832,652 6,709 39,361 (1,134) 473,86944,252 (4,382) 39,870 444 1,217,341
30(44,066)
(94)131,286(220,046)
359
55(6,166) 20,105 13,939 ¥284 (93) 14,130(6,166) 20,105 13,939 284 (93) (118,346)
¥38,086 ¥ 15,723 ¥53,809 ¥284 ¥ 351 ¥1,098,995
Thousands of U.S. dollars (Note 5)Valuation, translation adjustments and others
Totalvaluation,
Unrealized translation Stock holding gain Translation adjustments subscription Minority Total neton securities adjustments and others rights interests assets
$375,017 $ (37,136) $337,881 $3,763 $10,316,450254
(373,441)(797)
1,112,593(1,864,797)
3,043
466(52,254) 170,381 118,127 $2,407 (788) 119,746(52,254) 170,381 118,127 2,407 (788) (1,002,933)
$322,763 $133,245 $456,008 $2,407 $2,975 $ 9,313,517
44 Astellas Pharma Inc.
Astellas Pharma Inc. and Consolidated Subsidiaries
1. Basis of Presentation
Notes to Consolidated Financial StatementsMarch 31, 2007
Astellas Pharma Inc. (the “Company”) and its domesticsubsidiaries maintain their accounting records and preparetheir financial statements in accordance with accountingprinciples generally accepted in Japan, and its foreign sub-sidiaries maintain their books of account in conformity withthose of their countries of domicile. The accompanyingconsolidated financial statements have been prepared inaccordance with accounting principles generally acceptedin Japan, which are different in certain respects as to the
application and disclosure requirements of InternationalFinancial Reporting Standards, and are compiled from theconsolidated financial statements prepared by theCompany as required by the Securities and Exchange Lawof Japan.
Certain amounts in the prior years’ financial statementshave been reclassified to conform to the current year presentation.
(a) Basis of consolidation and accounting for invest-ments in unconsolidated subsidiaries and affiliates
The accompanying consolidated financial statementsinclude the accounts of the Company and significant com-panies controlled directly or indirectly by the Company.Companies over which the Company exercises significantinfluence in terms of their operating and financial policiesare included in the consolidated financial statements on anequity basis. All significant intercompany balances andtransactions are eliminated in consolidation.
Investments in subsidiaries and affiliates, which are notconsolidated or accounted for by the equity method, arecarried at cost or less. Where there has been a permanentdecline in the value of such investments, the Company haswritten them down.
All consolidated subsidiaries close their books ofaccount at March 31 for financial reporting purposes. Untilthe year ended March 31, 2006, Astellas Pharma China,Inc. had been consolidated based on the financial state-ments as of December 31. Astellas Pharma China, Inc. haschanged its fiscal year end to March 31 during this fiscalyear and accordingly its operating results and cash flowsfor 15 months ended March 31, 2007 were included in theconsolidated financial statements.
The excess of cost over underlying net assets at fairvalue at the date of acquisition is amortized over periodsnot exceeding 20 years on a straight-line basis except thatwhen the excess is immaterial, it is fully charged to incomein the year of acquisition. Such amortization is included inselling, general and administrative expenses.
(b) Foreign currency translationRevenue and expense accounts of the foreign consolidatedsubsidiaries are translated using the average exchange rateduring the year and, except for the components of net assetsexcluding minority interests, the balance sheet accounts aretranslated into yen at the exchange rates in effect at the
balance sheet date. The components of net assets excludingminority interests are translated at their historical exchangerates. Differences arising from the translation are presentedas translation adjustments and minority interests in theaccompanying consolidated financial statements.
(c) Cash equivalentsAll highly liquid investments with a maturity of three monthsor less when purchased are considered cash equivalents.
(d) InventoriesMerchandise is stated principally at the lower of cost ormarket, cost being determined by the average method.Finished goods are stated principally at cost by the averagemethod. Work in process, raw materials and supplies arestated principally at cost by the average method. However,inventories of the foreign consolidated subsidiaries arestated principally at the lower of cost or market, cost beingdetermined by the first-in, first-out method.
(e) Depreciation and amortizationDepreciation of property, plant and equipment is calculatedprincipally by the declining-balance method at rates basedon the estimated useful lives of the respective assets.However, depreciation of property, plant and equipment ofthe foreign consolidated subsidiaries is calculated princi-pally by the straight-line method. The useful lives of prop-erty, plant and equipment are summarized as follows:
Buildings and structures 2 to 60 yearsMachinery, equipment and vehicles 4 to 15 years
Intangible assets are amortized by the straight-linemethod over their estimated useful lives.
( f ) LeasesNoncancelable leases of the Company and its domesticconsolidated subsidiaries are accounted for as operatingleases (whether such leases are classified as operating orfinance leases) except that lease agreements which stipulatethe transfer of ownership of the leased assets to the lessee
2. Summary of Significant Accounting Policies
45Astellas Pharma Inc.
are accounted for as finance leases. However, leases of theforeign consolidated subsidiaries are generally classified andaccounted for as either finance or operating leases.
(g) Short-term investments and investment securitiesSecurities other than equity securities issued by sub-sidiaries and affiliates are classified into held-to-maturity orother securities. Held-to-maturity securities are carried atamortized cost. Marketable securities classified as othersecurities are carried at fair value with changes in unrealizedgain or loss, net of the applicable income taxes, includeddirectly in net assets. Non-marketable securities classifiedas other securities are stated at cost. Cost of securitiessold is determined by the moving average method.
(h) Research and development expensesResearch and development expenses are charged toincome as incurred.
( i ) Income taxesDeferred tax assets and liabilities are determined based onthe differences between financial reporting and the taxbases of the assets and liabilities and are measured usingthe enacted tax rates and laws which will be in effect whenthe differences are expected to reverse.
( j ) Retirement benefitsAccrued retirement benefits for employees and prepaidpension cost are recorded mainly at an amount calculatedbased on the retirement benefit obligation and the fairvalue of the pension plan assets at the balance sheetdates, as adjusted for unrecognized actuarial gain or lossand unrecognized prior service cost.
Actuarial gain and loss are being amortized in the year fol-lowing the year in which the gain or loss is recognized pri-marily by the straight-line method over the average remaining
years of service of the employees. Prior service cost is beingamortized as incurred by the straight-line method over theaverage remaining years of service of the employees.
Effective October 1, 2006, the retirement benefit plans ofthe former Yamanouchi Pharmaceutical Co., Ltd. and thoseof the former Fujisawa Pharmaceutical Co., Ltd. have beenintegrated into a newly established retirement benefit plans.Actuarial gain and loss recognized before the integration forthe former Fujisawa’s plans are being amortized in the yearfollowing the year in which the gain or loss is recognized bythe straight-line method over the period which is shorterthan the average remaining years of service of the employ-ees (10 years), and prior service cost recognized before theintegration for the former Fujisawa’s plans is being amor-tized as incurred by the straight-line method over the periodwhich is shorter than the average remaining years of serviceof the employees (10 years).
In addition, directors of certain domestic consolidatedsubsidiaries are customarily entitled to lump-sum paymentsunder their respective unfunded retirement benefits plans.The provision for retirement benefits for these directors hasbeen made at an estimated amount.
(k) Derivative financial instrumentsThe Company has entered into various derivatives transac-tions in order to manage certain risks arising mainly fromadverse fluctuations in foreign currency exchange rates andinterest rates. Derivative financial instruments are carried atfair value with any changes in unrealized gain or losscharged or credited to operations, except for those whichmeet the criteria for deferral hedge accounting under whichunrealized gain or loss is deferred as a component of netassets.
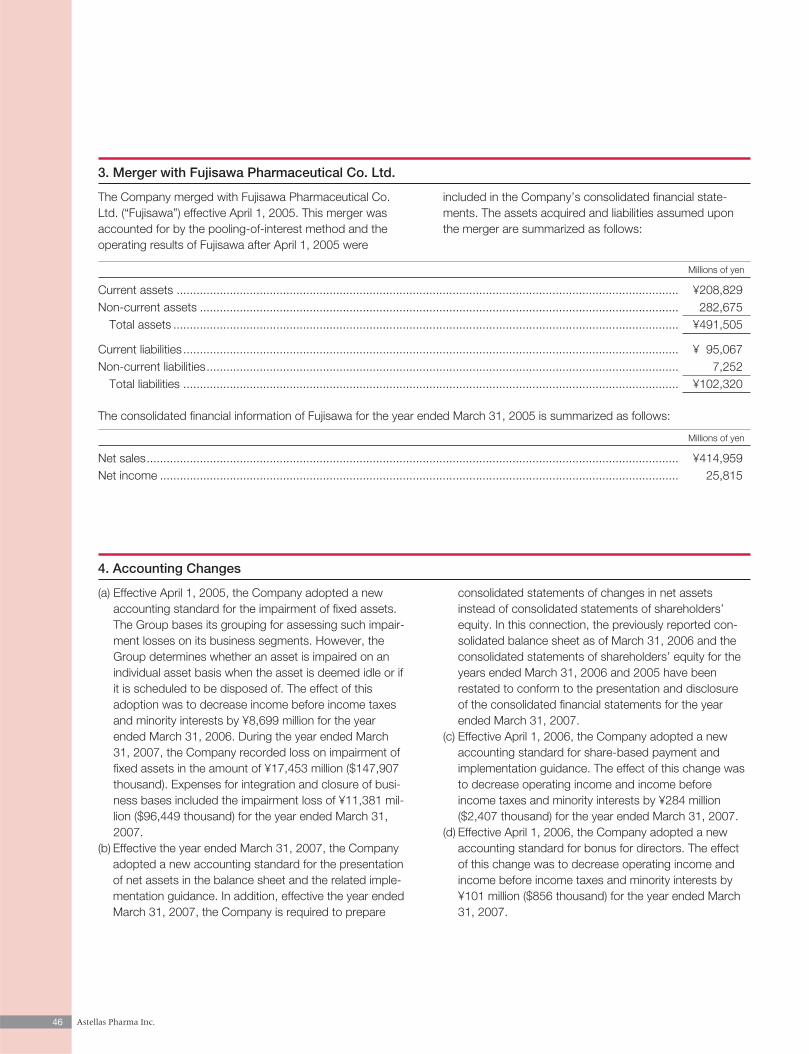
4. Accounting Changes
(a) Effective April 1, 2005, the Company adopted a newaccounting standard for the impairment of fixed assets.The Group bases its grouping for assessing such impair-ment losses on its business segments. However, theGroup determines whether an asset is impaired on anindividual asset basis when the asset is deemed idle or ifit is scheduled to be disposed of. The effect of thisadoption was to decrease income before income taxesand minority interests by ¥8,699 million for the yearended March 31, 2006. During the year ended March31, 2007, the Company recorded loss on impairment offixed assets in the amount of ¥17,453 million ($147,907thousand). Expenses for integration and closure of busi-ness bases included the impairment loss of ¥11,381 mil-lion ($96,449 thousand) for the year ended March 31,2007.
(b) Effective the year ended March 31, 2007, the Companyadopted a new accounting standard for the presentationof net assets in the balance sheet and the related imple-mentation guidance. In addition, effective the year endedMarch 31, 2007, the Company is required to prepare
consolidated statements of changes in net assetsinstead of consolidated statements of shareholders’equity. In this connection, the previously reported con-solidated balance sheet as of March 31, 2006 and theconsolidated statements of shareholders’ equity for theyears ended March 31, 2006 and 2005 have beenrestated to conform to the presentation and disclosureof the consolidated financial statements for the yearended March 31, 2007.
(c) Effective April 1, 2006, the Company adopted a newaccounting standard for share-based payment andimplementation guidance. The effect of this change wasto decrease operating income and income beforeincome taxes and minority interests by ¥284 million($2,407 thousand) for the year ended March 31, 2007.
(d) Effective April 1, 2006, the Company adopted a newaccounting standard for bonus for directors. The effectof this change was to decrease operating income andincome before income taxes and minority interests by¥101 million ($856 thousand) for the year ended March31, 2007.
3. Merger with Fujisawa Pharmaceutical Co. Ltd.
The Company merged with Fujisawa Pharmaceutical Co.Ltd. (“Fujisawa”) effective April 1, 2005. This merger wasaccounted for by the pooling-of-interest method and theoperating results of Fujisawa after April 1, 2005 were
included in the Company’s consolidated financial state-ments. The assets acquired and liabilities assumed uponthe merger are summarized as follows:
Millions of yen
Current assets ....................................................................................................................................................... ¥208,829Non-current assets ................................................................................................................................................ 282,675
Total assets ........................................................................................................................................................ ¥491,505
Current liabilities ..................................................................................................................................................... ¥ 95,067Non-current liabilities.............................................................................................................................................. 7,252
Total liabilities ..................................................................................................................................................... ¥102,320
The consolidated financial information of Fujisawa for the year ended March 31, 2005 is summarized as follows:
Millions of yen
Net sales................................................................................................................................................................ ¥414,959Net income ............................................................................................................................................................ 25,815
46 Astellas Pharma Inc.
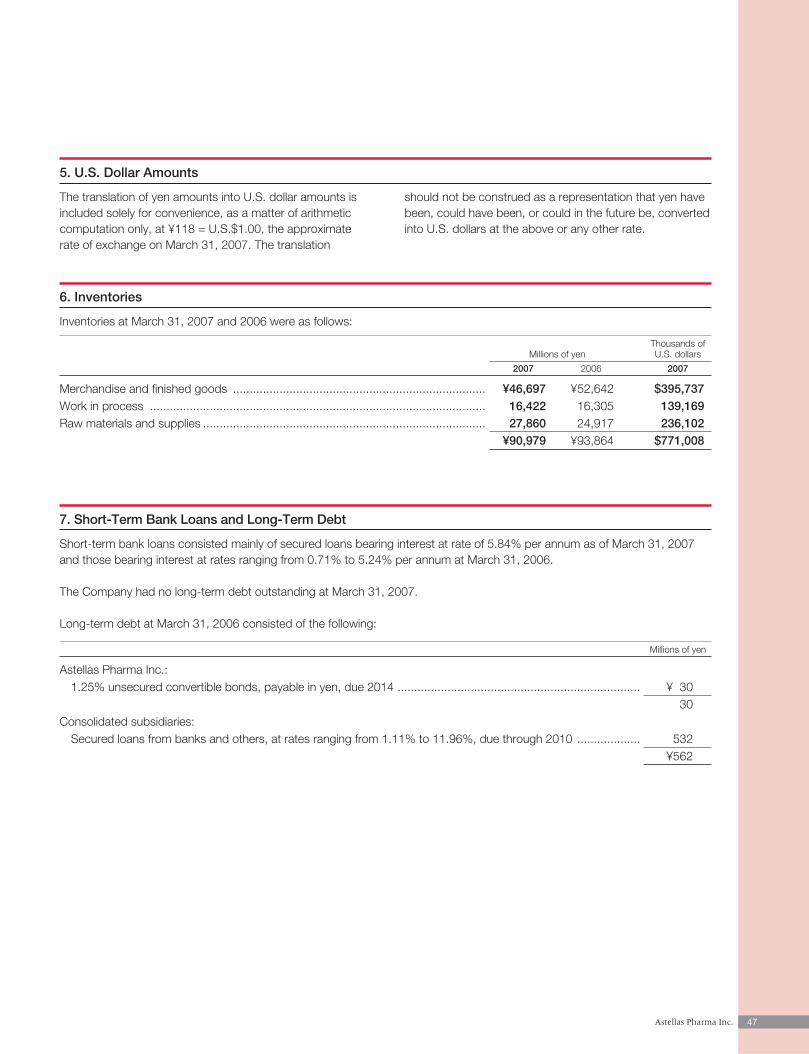
Short-term bank loans consisted mainly of secured loans bearing interest at rate of 5.84% per annum as of March 31, 2007and those bearing interest at rates ranging from 0.71% to 5.24% per annum at March 31, 2006.
The Company had no long-term debt outstanding at March 31, 2007.
Long-term debt at March 31, 2006 consisted of the following:
Millions of yen
Astellas Pharma Inc.:1.25% unsecured convertible bonds, payable in yen, due 2014 ......................................................................... ¥ 30
30Consolidated subsidiaries:
Secured loans from banks and others, at rates ranging from 1.11% to 11.96%, due through 2010 ................... 532¥562
7. Short-Term Bank Loans and Long-Term Debt
6. Inventories
Inventories at March 31, 2007 and 2006 were as follows:
Thousands ofMillions of yen U.S. dollars
2007 2006 2007
Merchandise and finished goods ............................................................................ ¥46,697 ¥52,642 $395,737Work in process ..................................................................................................... 16,422 16,305 139,169Raw materials and supplies ..................................................................................... 27,860 24,917 236,102
¥90,979 ¥93,864 $771,008
5. U.S. Dollar Amounts
The translation of yen amounts into U.S. dollar amounts isincluded solely for convenience, as a matter of arithmeticcomputation only, at ¥118 = U.S.$1.00, the approximaterate of exchange on March 31, 2007. The translation
should not be construed as a representation that yen havebeen, could have been, or could in the future be, convertedinto U.S. dollars at the above or any other rate.
47Astellas Pharma Inc.
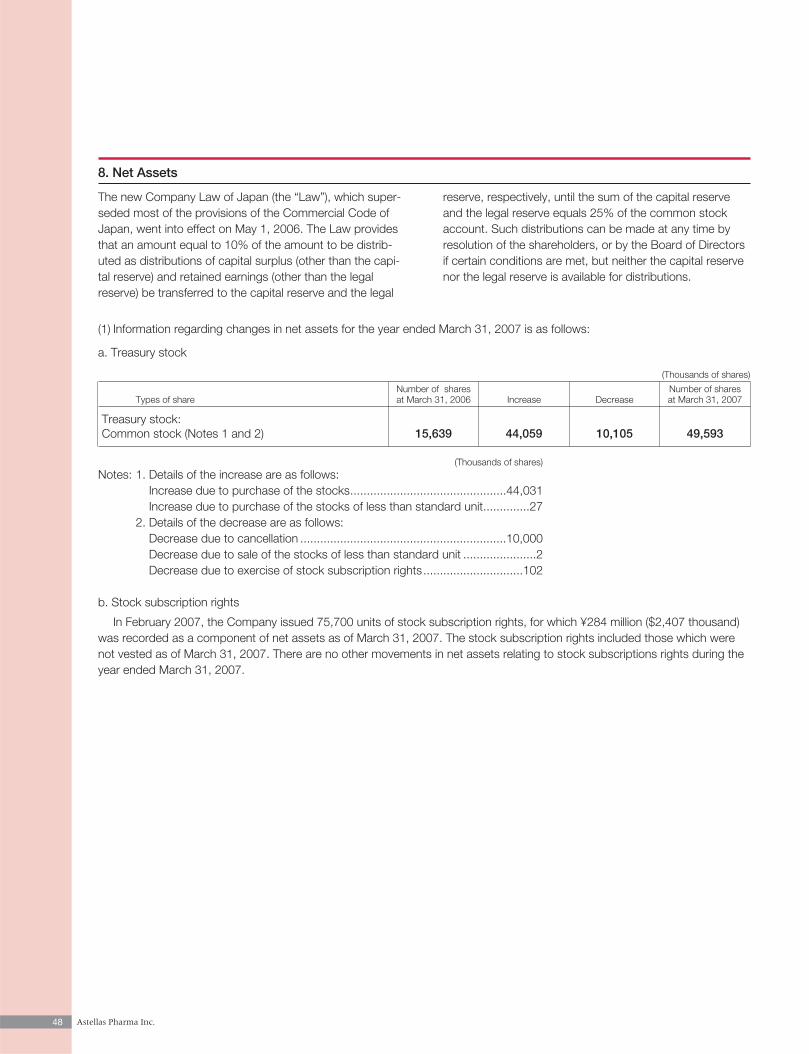
48 Astellas Pharma Inc.
8. Net Assets
The new Company Law of Japan (the “Law”), which super-seded most of the provisions of the Commercial Code ofJapan, went into effect on May 1, 2006. The Law providesthat an amount equal to 10% of the amount to be distrib-uted as distributions of capital surplus (other than the capi-tal reserve) and retained earnings (other than the legalreserve) be transferred to the capital reserve and the legal
reserve, respectively, until the sum of the capital reserveand the legal reserve equals 25% of the common stockaccount. Such distributions can be made at any time byresolution of the shareholders, or by the Board of Directorsif certain conditions are met, but neither the capital reservenor the legal reserve is available for distributions.
(1) Information regarding changes in net assets for the year ended March 31, 2007 is as follows:
a. Treasury stock
(Thousands of shares)
Number of shares Number of shares Types of share at March 31, 2006 Increase Decrease at March 31, 2007
Treasury stock:Common stock (Notes 1 and 2) 15,639 44,059 10,105 49,593
(Thousands of shares)Notes: 1. Details of the increase are as follows:
Increase due to purchase of the stocks...............................................44,031Increase due to purchase of the stocks of less than standard unit..............27
2. Details of the decrease are as follows:Decrease due to cancellation ..............................................................10,000Decrease due to sale of the stocks of less than standard unit ......................2Decrease due to exercise of stock subscription rights..............................102
b. Stock subscription rights
In February 2007, the Company issued 75,700 units of stock subscription rights, for which ¥284 million ($2,407 thousand)was recorded as a component of net assets as of March 31, 2007. The stock subscription rights included those which werenot vested as of March 31, 2007. There are no other movements in net assets relating to stock subscriptions rights during theyear ended March 31, 2007.
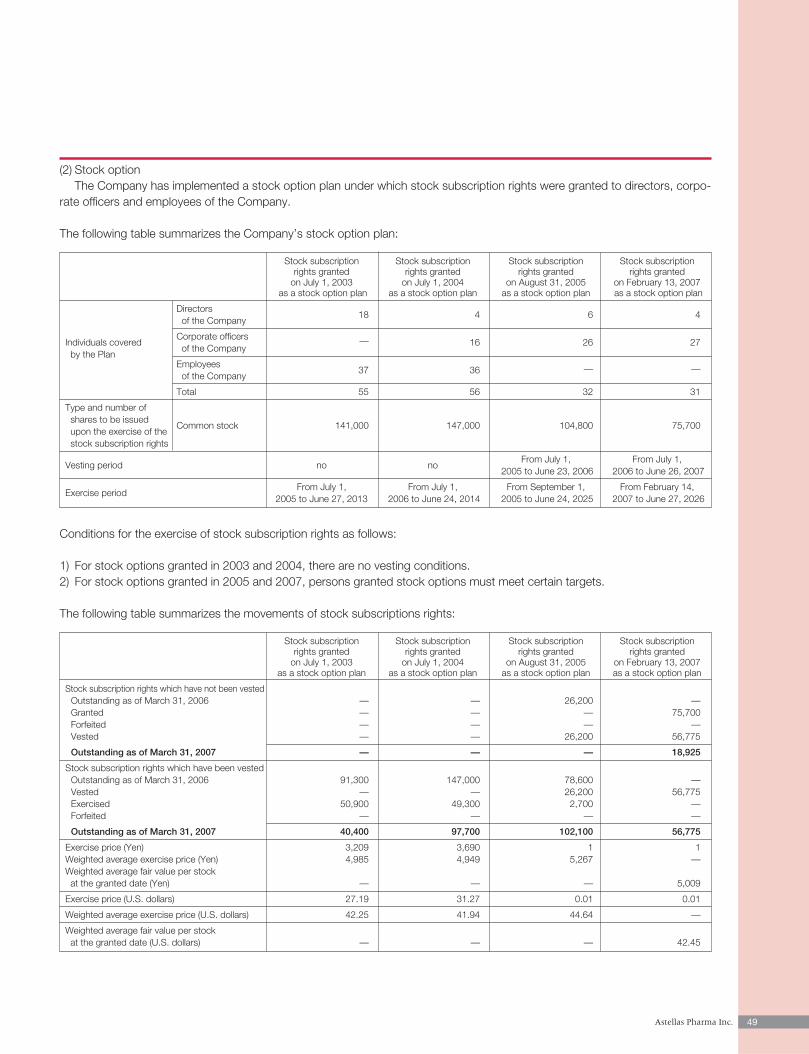
49Astellas Pharma Inc.
(2) Stock optionThe Company has implemented a stock option plan under which stock subscription rights were granted to directors, corpo-
rate officers and employees of the Company.
The following table summarizes the Company’s stock option plan:
Stock subscription Stock subscription Stock subscription Stock subscriptionrights granted rights granted rights granted rights granted
on July 1, 2003 on July 1, 2004 on August 31, 2005 on February 13, 2007as a stock option plan as a stock option plan as a stock option plan as a stock option plan
Directors 18 4 6 4
of the Company
Individuals covered Corporate officers — 16 26 27
by the Planof the Company
Employees 37 36 — —
of the Company
Total 55 56 32 31
Type and number of shares to be issued
Common stock 141,000 147,000 104,800 75,700upon the exercise of the stock subscription rights
Vesting period no noFrom July 1, From July 1,
2005 to June 23, 2006 2006 to June 26, 2007
Exercise periodFrom July 1, From July 1, From September 1, From February 14,
2005 to June 27, 2013 2006 to June 24, 2014 2005 to June 24, 2025 2007 to June 27, 2026
Conditions for the exercise of stock subscription rights as follows:
1) For stock options granted in 2003 and 2004, there are no vesting conditions.2) For stock options granted in 2005 and 2007, persons granted stock options must meet certain targets.
The following table summarizes the movements of stock subscriptions rights:
Stock subscription Stock subscription Stock subscription Stock subscriptionrights granted rights granted rights granted rights granted
on July 1, 2003 on July 1, 2004 on August 31, 2005 on February 13, 2007as a stock option plan as a stock option plan as a stock option plan as a stock option plan
Stock subscription rights which have not been vestedOutstanding as of March 31, 2006 — — 26,200 —Granted — — — 75,700Forfeited — — — —Vested — — 26,200 56,775
Outstanding as of March 31, 2007 — — — 18,925
Stock subscription rights which have been vestedOutstanding as of March 31, 2006 91,300 147,000 78,600 —Vested — — 26,200 56,775Exercised 50,900 49,300 2,700 —Forfeited — — — —
Outstanding as of March 31, 2007 40,400 97,700 102,100 56,775
Exercise price (Yen) 3,209 3,690 1 1Weighted average exercise price (Yen) 4,985 4,949 5,267 —Weighted average fair value per stock at the granted date (Yen) — — — 5,009
Exercise price (U.S. dollars) 27.19 31.27 0.01 0.01
Weighted average exercise price (U.S. dollars) 42.25 41.94 44.64 —
Weighted average fair value per stock at the granted date (U.S. dollars) — — — 42.45
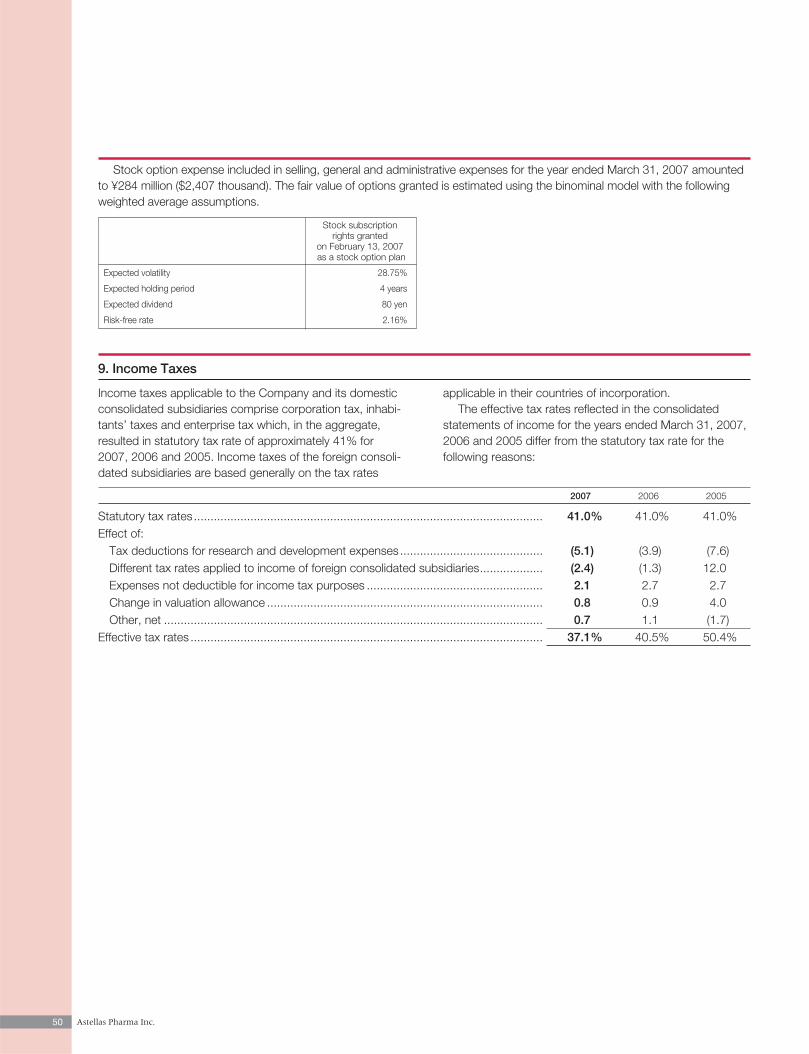
50 Astellas Pharma Inc.
9. Income Taxes
2007 2006 2005
Statutory tax rates......................................................................................................... 41.0% 41.0% 41.0%Effect of:
Tax deductions for research and development expenses........................................... (5.1) (3.9) (7.6)Different tax rates applied to income of foreign consolidated subsidiaries................... (2.4) (1.3) 12.0Expenses not deductible for income tax purposes ..................................................... 2.1 2.7 2.7Change in valuation allowance ................................................................................... 0.8 0.9 4.0Other, net .................................................................................................................. 0.7 1.1 (1.7)
Effective tax rates .......................................................................................................... 37.1% 40.5% 50.4%
Income taxes applicable to the Company and its domesticconsolidated subsidiaries comprise corporation tax, inhabi-tants’ taxes and enterprise tax which, in the aggregate,resulted in statutory tax rate of approximately 41% for2007, 2006 and 2005. Income taxes of the foreign consoli-dated subsidiaries are based generally on the tax rates
applicable in their countries of incorporation.The effective tax rates reflected in the consolidated
statements of income for the years ended March 31, 2007,2006 and 2005 differ from the statutory tax rate for the following reasons:
Stock option expense included in selling, general and administrative expenses for the year ended March 31, 2007 amountedto ¥284 million ($2,407 thousand). The fair value of options granted is estimated using the binominal model with the followingweighted average assumptions.
Stock subscriptionrights granted
on February 13, 2007as a stock option plan
Expected volatility 28.75%
Expected holding period 4 years
Expected dividend 80 yen
Risk-free rate 2.16%
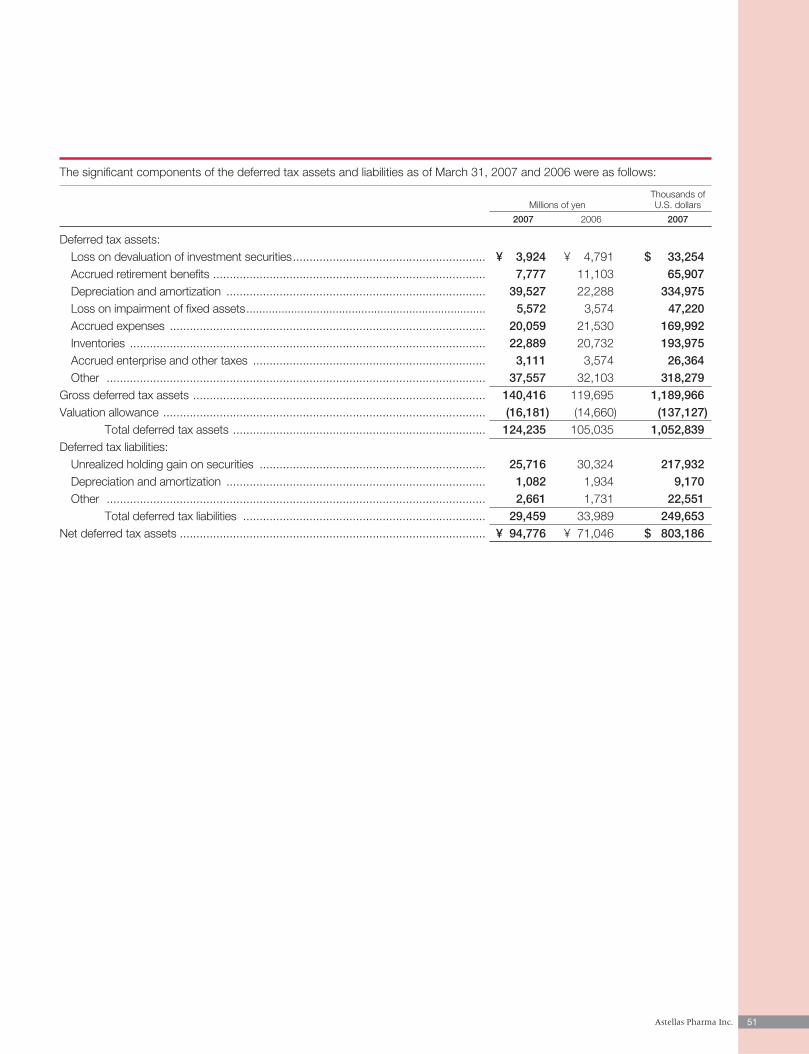
51Astellas Pharma Inc.
The significant components of the deferred tax assets and liabilities as of March 31, 2007 and 2006 were as follows:
Thousands ofMillions of yen U.S. dollars
2007 2006 2007
Deferred tax assets:Loss on devaluation of investment securities.......................................................... ¥ 3,924 ¥ 4,791 $ 33,254Accrued retirement benefits .................................................................................. 7,777 11,103 65,907Depreciation and amortization .............................................................................. 39,527 22,288 334,975Loss on impairment of fixed assets........................................................................... 5,572 3,574 47,220Accrued expenses ............................................................................................... 20,059 21,530 169,992Inventories ........................................................................................................... 22,889 20,732 193,975Accrued enterprise and other taxes ...................................................................... 3,111 3,574 26,364Other .................................................................................................................. 37,557 32,103 318,279
Gross deferred tax assets ........................................................................................ 140,416 119,695 1,189,966Valuation allowance ................................................................................................. (16,181) (14,660) (137,127)
Total deferred tax assets ............................................................................ 124,235 105,035 1,052,839Deferred tax liabilities:
Unrealized holding gain on securities .................................................................... 25,716 30,324 217,932Depreciation and amortization .............................................................................. 1,082 1,934 9,170Other .................................................................................................................. 2,661 1,731 22,551
Total deferred tax liabilities ......................................................................... 29,459 33,989 249,653Net deferred tax assets ............................................................................................ ¥ 94,776 ¥ 71,046 $ 803,186
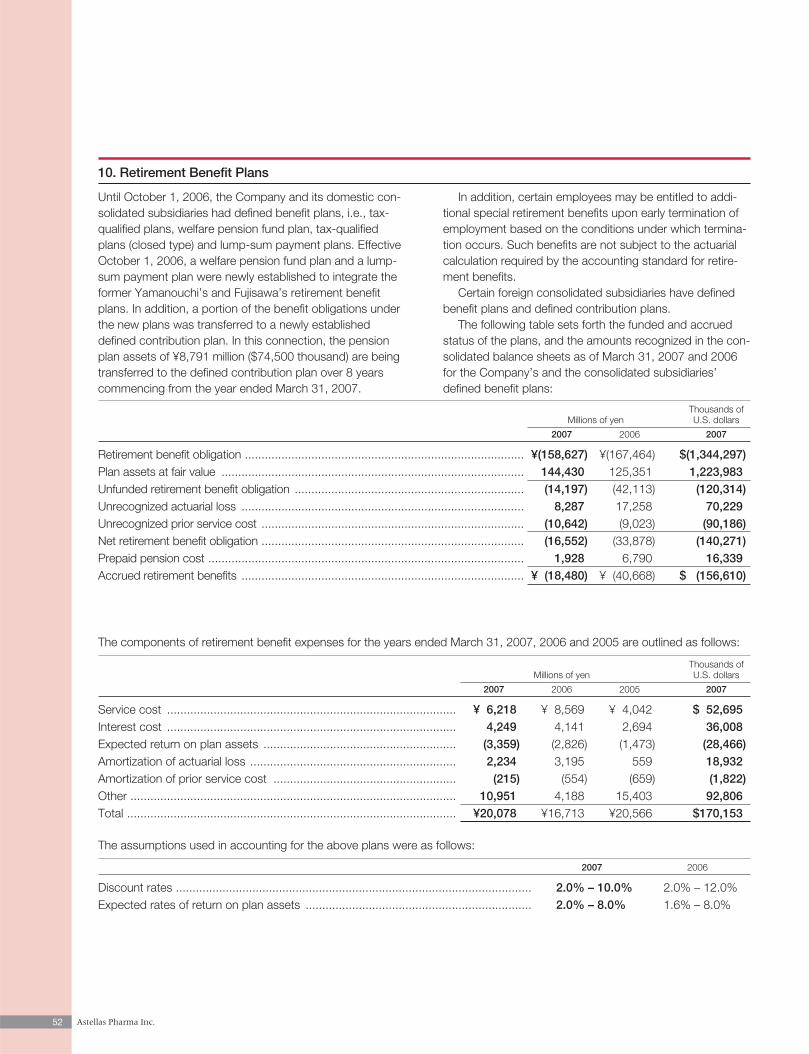
52 Astellas Pharma Inc.
The components of retirement benefit expenses for the years ended March 31, 2007, 2006 and 2005 are outlined as follows:
Thousands ofMillions of yen U.S. dollars
2007 2006 2005 2007
Service cost ....................................................................................... ¥ 6,218 ¥ 8,569 ¥ 4,042 $ 52,695Interest cost ....................................................................................... 4,249 4,141 2,694 36,008Expected return on plan assets .......................................................... (3,359) (2,826) (1,473) (28,466)Amortization of actuarial loss .............................................................. 2,234 3,195 559 18,932Amortization of prior service cost ....................................................... (215) (554) (659) (1,822)Other .................................................................................................. 10,951 4,188 15,403 92,806Total ................................................................................................... ¥20,078 ¥16,713 ¥20,566 $170,153
The assumptions used in accounting for the above plans were as follows:
2007 2006
Discount rates ........................................................................................................... 2.0% – 10.0% 2.0% – 12.0%Expected rates of return on plan assets .................................................................... 2.0% – 8.0% 1.6% – 8.0%
10. Retirement Benefit Plans
Until October 1, 2006, the Company and its domestic con-solidated subsidiaries had defined benefit plans, i.e., tax-qualified plans, welfare pension fund plan, tax-qualifiedplans (closed type) and lump-sum payment plans. EffectiveOctober 1, 2006, a welfare pension fund plan and a lump-sum payment plan were newly established to integrate theformer Yamanouchi’s and Fujisawa’s retirement benefitplans. In addition, a portion of the benefit obligations underthe new plans was transferred to a newly establisheddefined contribution plan. In this connection, the pensionplan assets of ¥8,791 million ($74,500 thousand) are beingtransferred to the defined contribution plan over 8 yearscommencing from the year ended March 31, 2007.
In addition, certain employees may be entitled to addi-tional special retirement benefits upon early termination ofemployment based on the conditions under which termina-tion occurs. Such benefits are not subject to the actuarialcalculation required by the accounting standard for retire-ment benefits.
Certain foreign consolidated subsidiaries have definedbenefit plans and defined contribution plans.
The following table sets forth the funded and accruedstatus of the plans, and the amounts recognized in the con-solidated balance sheets as of March 31, 2007 and 2006for the Company’s and the consolidated subsidiaries’defined benefit plans:
Thousands ofMillions of yen U.S. dollars
2007 2006 2007
Retirement benefit obligation .................................................................................... ¥(158,627) ¥(167,464) $(1,344,297)Plan assets at fair value ........................................................................................... 144,430 125,351 1,223,983Unfunded retirement benefit obligation ..................................................................... (14,197) (42,113) (120,314)Unrecognized actuarial loss ..................................................................................... 8,287 17,258 70,229Unrecognized prior service cost ............................................................................... (10,642) (9,023) (90,186)Net retirement benefit obligation ............................................................................... (16,552) (33,878) (140,271)Prepaid pension cost ............................................................................................... 1,928 6,790 16,339Accrued retirement benefits ..................................................................................... ¥ (18,480) ¥ (40,668) $ (156,610)
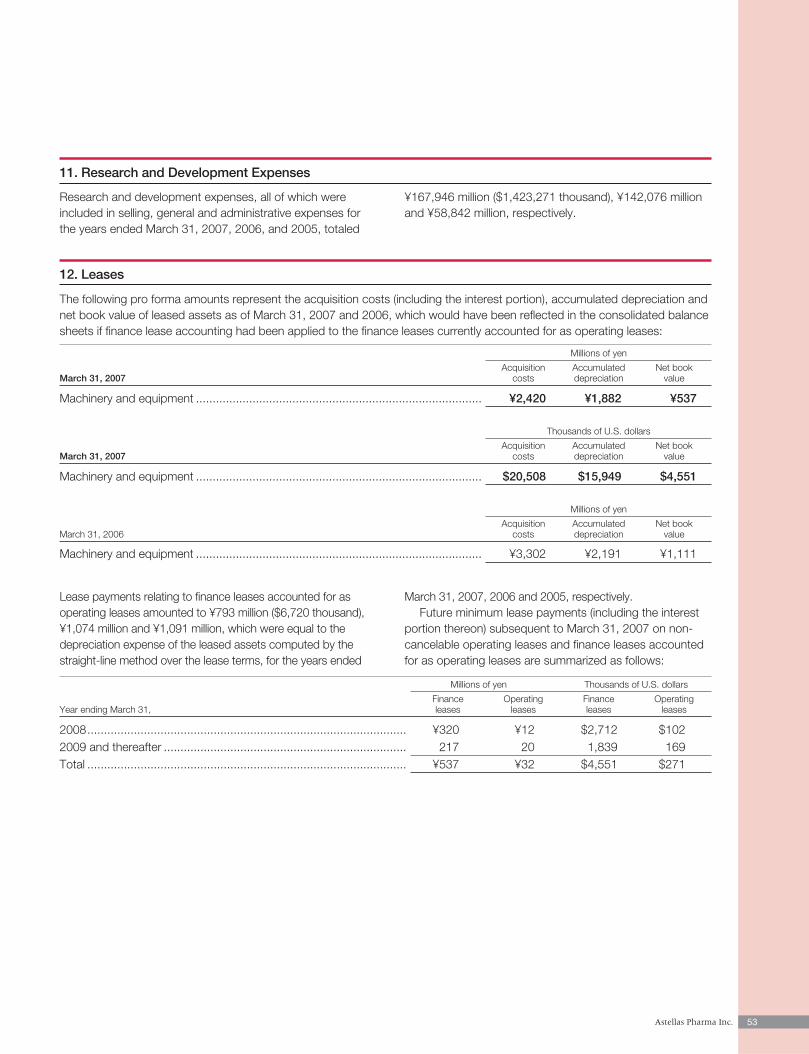
53Astellas Pharma Inc.
11. Research and Development Expenses
Research and development expenses, all of which wereincluded in selling, general and administrative expenses forthe years ended March 31, 2007, 2006, and 2005, totaled
¥167,946 million ($1,423,271 thousand), ¥142,076 millionand ¥58,842 million, respectively.
12. Leases
The following pro forma amounts represent the acquisition costs (including the interest portion), accumulated depreciation andnet book value of leased assets as of March 31, 2007 and 2006, which would have been reflected in the consolidated balancesheets if finance lease accounting had been applied to the finance leases currently accounted for as operating leases:
Millions of yen
Acquisition Accumulated Net bookMarch 31, 2007 costs depreciation value
Machinery and equipment ...................................................................................... ¥2,420 ¥1,882 ¥537
Thousands of U.S. dollars
Acquisition Accumulated Net bookMarch 31, 2007 costs depreciation value
Machinery and equipment ...................................................................................... $20,508 $15,949 $4,551
Millions of yen
Acquisition Accumulated Net bookMarch 31, 2006 costs depreciation value
Machinery and equipment ...................................................................................... ¥3,302 ¥2,191 ¥1,111
Millions of yen Thousands of U.S. dollars
Finance Operating Finance Operating Year ending March 31, leases leases leases leases
2008................................................................................................ ¥320 ¥12 $2,712 $1022009 and thereafter ......................................................................... 217 20 1,839 169Total ................................................................................................ ¥537 ¥32 $4,551 $271
Lease payments relating to finance leases accounted for asoperating leases amounted to ¥793 million ($6,720 thousand),¥1,074 million and ¥1,091 million, which were equal to thedepreciation expense of the leased assets computed by thestraight-line method over the lease terms, for the years ended
March 31, 2007, 2006 and 2005, respectively.Future minimum lease payments (including the interest
portion thereon) subsequent to March 31, 2007 on non-cancelable operating leases and finance leases accountedfor as operating leases are summarized as follows:
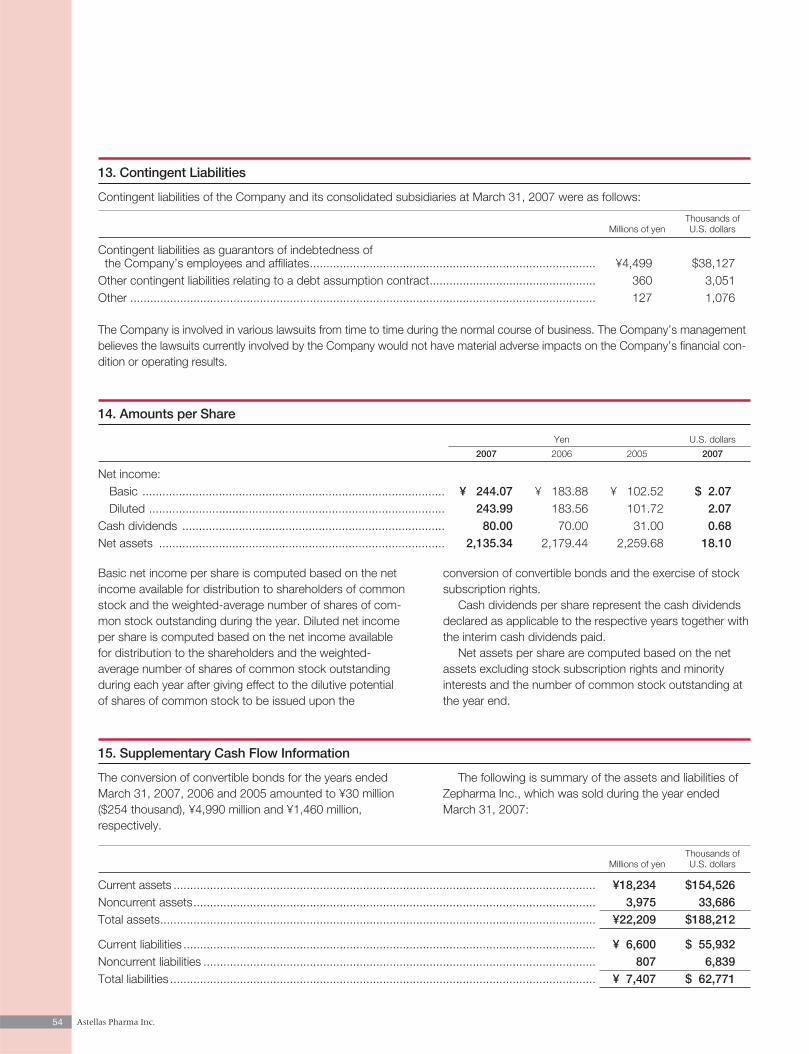
54 Astellas Pharma Inc.
13. Contingent Liabilities
Contingent liabilities of the Company and its consolidated subsidiaries at March 31, 2007 were as follows:
Thousands of Millions of yen U.S. dollars
Contingent liabilities as guarantors of indebtedness of the Company’s employees and affiliates...................................................................................... ¥4,499 $38,127
Other contingent liabilities relating to a debt assumption contract.................................................. 360 3,051Other ............................................................................................................................................ 127 1,076
The Company is involved in various lawsuits from time to time during the normal course of business. The Company’s managementbelieves the lawsuits currently involved by the Company would not have material adverse impacts on the Company’s financial con-dition or operating results.
Basic net income per share is computed based on the netincome available for distribution to shareholders of commonstock and the weighted-average number of shares of com-mon stock outstanding during the year. Diluted net incomeper share is computed based on the net income availablefor distribution to the shareholders and the weighted-average number of shares of common stock outstandingduring each year after giving effect to the dilutive potentialof shares of common stock to be issued upon the
conversion of convertible bonds and the exercise of stocksubscription rights.
Cash dividends per share represent the cash dividendsdeclared as applicable to the respective years together withthe interim cash dividends paid.
Net assets per share are computed based on the netassets excluding stock subscription rights and minorityinterests and the number of common stock outstanding atthe year end.
14. Amounts per Share
Yen U.S. dollars
2007 2006 2005 2007
Net income:Basic ........................................................................................... ¥ 244.07 ¥ 183.88 ¥ 102.52 $ 2.07Diluted ......................................................................................... 243.99 183.56 101.72 2.07
Cash dividends ............................................................................... 80.00 70.00 31.00 0.68Net assets ...................................................................................... 2,135.34 2,179.44 2,259.68 18.10
15. Supplementary Cash Flow Information
The conversion of convertible bonds for the years endedMarch 31, 2007, 2006 and 2005 amounted to ¥30 million($254 thousand), ¥4,990 million and ¥1,460 million, respectively.
The following is summary of the assets and liabilities ofZepharma Inc., which was sold during the year endedMarch 31, 2007:
Thousands of Millions of yen U.S. dollars
Current assets ............................................................................................................................... ¥18,234 $154,526Noncurrent assets......................................................................................................................... 3,975 33,686Total assets................................................................................................................................... ¥22,209 $188,212
Current liabilities ............................................................................................................................ ¥ 6,600 $ 55,932Noncurrent liabilities ...................................................................................................................... 807 6,839Total liabilities ................................................................................................................................ ¥ 7,407 $ 62,771
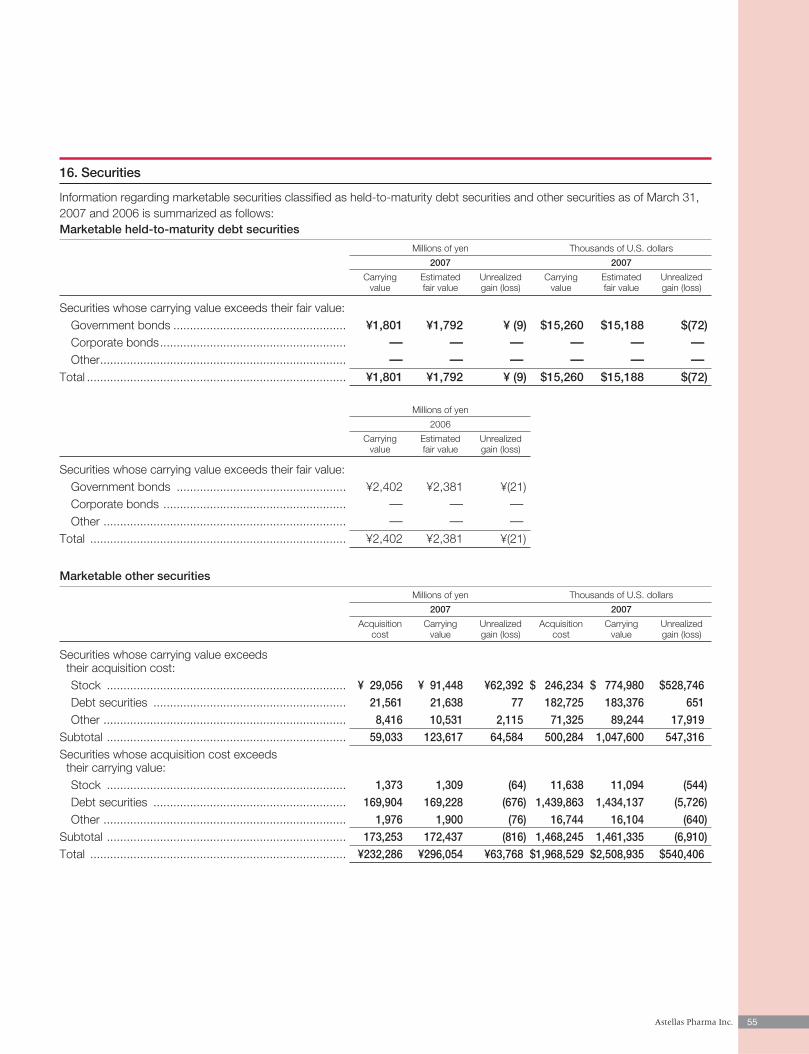
55Astellas Pharma Inc.
16. Securities
Information regarding marketable securities classified as held-to-maturity debt securities and other securities as of March 31,2007 and 2006 is summarized as follows:Marketable held-to-maturity debt securities
Millions of yen Thousands of U.S. dollars
2007 2007
Carrying Estimated Unrealized Carrying Estimated Unrealizedvalue fair value gain (loss) value fair value gain (loss)
Securities whose carrying value exceeds their fair value:Government bonds .................................................... ¥1,801 ¥1,792 ¥ (9) $15,260 $15,188 $(72)Corporate bonds........................................................ — — — — — —Other.......................................................................... — — — — — —
Total .............................................................................. ¥1,801 ¥1,792 ¥ (9) $15,260 $15,188 $(72)
Millions of yen
2006
Carrying Estimated Unrealizedvalue fair value gain (loss)
Securities whose carrying value exceeds their fair value:Government bonds ................................................... ¥2,402 ¥2,381 ¥(21)Corporate bonds ....................................................... — — —Other ......................................................................... — — —
Total ............................................................................. ¥2,402 ¥2,381 ¥(21)
Marketable other securities
Millions of yen Thousands of U.S. dollars
2007 2007
Acquisition Carrying Unrealized Acquisition Carrying Unrealizedcost value gain (loss) cost value gain (loss)
Securities whose carrying value exceeds their acquisition cost:Stock ........................................................................ ¥ 29,056 ¥ 91,448 ¥62,392 $ 246,234 $ 774,980 $528,746Debt securities .......................................................... 21,561 21,638 77 182,725 183,376 651Other ......................................................................... 8,416 10,531 2,115 71,325 89,244 17,919
Subtotal ........................................................................ 59,033 123,617 64,584 500,284 1,047,600 547,316Securities whose acquisition cost exceeds their carrying value:Stock ........................................................................ 1,373 1,309 (64) 11,638 11,094 (544)Debt securities .......................................................... 169,904 169,228 (676) 1,439,863 1,434,137 (5,726)Other ......................................................................... 1,976 1,900 (76) 16,744 16,104 (640)
Subtotal ........................................................................ 173,253 172,437 (816) 1,468,245 1,461,335 (6,910)Total ............................................................................. ¥232,286 ¥296,054 ¥63,768 $1,968,529 $2,508,935 $540,406
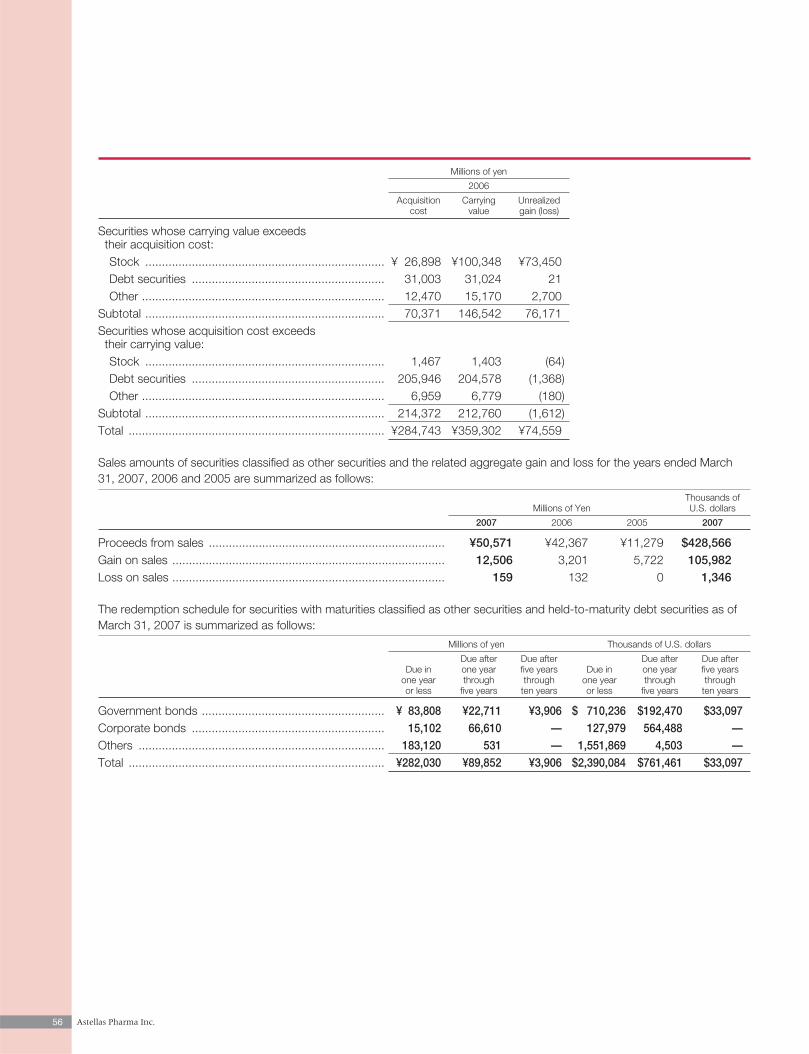
56 Astellas Pharma Inc.
Millions of yen
2006
Acquisition Carrying Unrealizedcost value gain (loss)
Securities whose carrying value exceeds their acquisition cost:Stock ........................................................................ ¥ 26,898 ¥100,348 ¥73,450Debt securities .......................................................... 31,003 31,024 21Other ......................................................................... 12,470 15,170 2,700
Subtotal ........................................................................ 70,371 146,542 76,171Securities whose acquisition cost exceeds their carrying value:Stock ........................................................................ 1,467 1,403 (64)Debt securities .......................................................... 205,946 204,578 (1,368)Other ......................................................................... 6,959 6,779 (180)
Subtotal ........................................................................ 214,372 212,760 (1,612)Total ............................................................................. ¥284,743 ¥359,302 ¥74,559
Sales amounts of securities classified as other securities and the related aggregate gain and loss for the years ended March31, 2007, 2006 and 2005 are summarized as follows:
Thousands of Millions of Yen U.S. dollars
2007 2006 2005 2007
Proceeds from sales ....................................................................... ¥50,571 ¥42,367 ¥11,279 $428,566Gain on sales .................................................................................. 12,506 3,201 5,722 105,982Loss on sales .................................................................................. 159 132 0 1,346
The redemption schedule for securities with maturities classified as other securities and held-to-maturity debt securities as ofMarch 31, 2007 is summarized as follows:
Millions of yen Thousands of U.S. dollars
Due after Due after Due after Due afterDue in one year five years Due in one year five years
one year through through one year through throughor less five years ten years or less five years ten years
Government bonds ....................................................... ¥ 83,808 ¥22,711 ¥3,906 $ 710,236 $192,470 $33,097Corporate bonds .......................................................... 15,102 66,610 — 127,979 564,488 —Others .......................................................................... 183,120 531 — 1,551,869 4,503 —Total ............................................................................. ¥282,030 ¥89,852 ¥3,906 $2,390,084 $761,461 $33,097
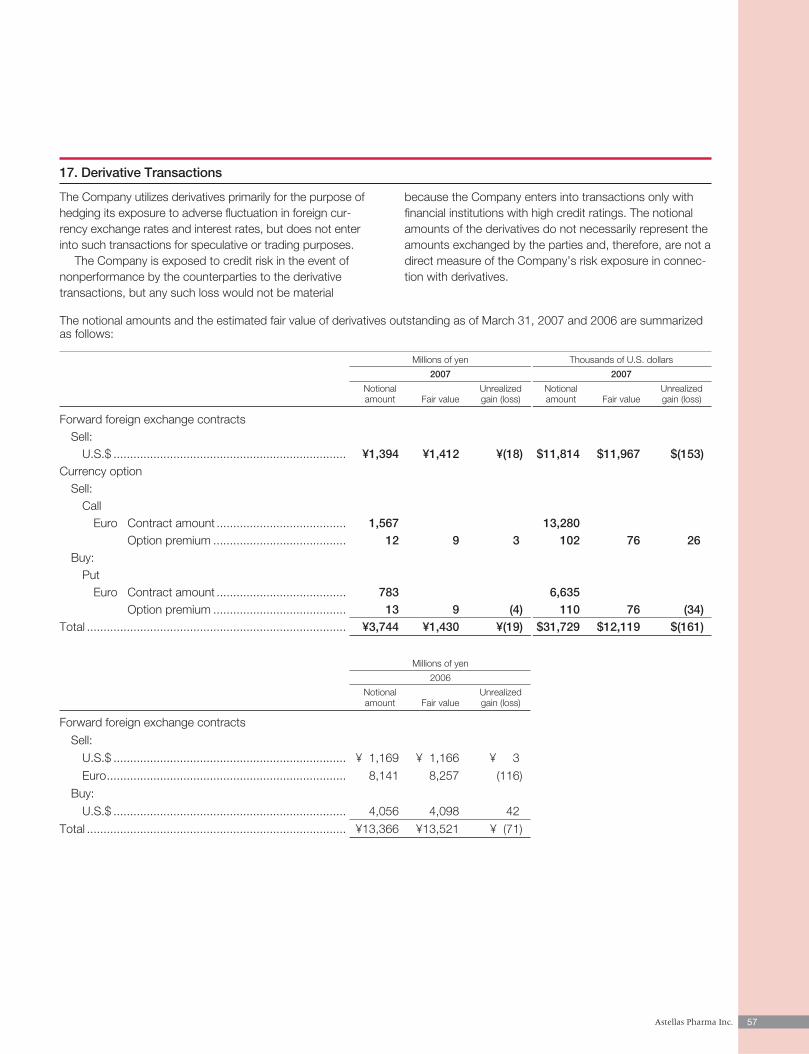
57Astellas Pharma Inc.
17. Derivative Transactions
The Company utilizes derivatives primarily for the purpose ofhedging its exposure to adverse fluctuation in foreign cur-rency exchange rates and interest rates, but does not enterinto such transactions for speculative or trading purposes.
The Company is exposed to credit risk in the event ofnonperformance by the counterparties to the derivativetransactions, but any such loss would not be material
because the Company enters into transactions only withfinancial institutions with high credit ratings. The notionalamounts of the derivatives do not necessarily represent theamounts exchanged by the parties and, therefore, are not adirect measure of the Company’s risk exposure in connec-tion with derivatives.
The notional amounts and the estimated fair value of derivatives outstanding as of March 31, 2007 and 2006 are summarizedas follows:
Millions of yen Thousands of U.S. dollars
2007 2007
Notional Unrealized Notional Unrealizedamount Fair value gain (loss) amount Fair value gain (loss)
Forward foreign exchange contractsSell:
U.S.$ ...................................................................... ¥1,394 ¥1,412 ¥(18) $11,814 $11,967 $(153)Currency option
Sell:Call
Euro Contract amount ....................................... 1,567 13,280Option premium ........................................ 12 9 3 102 76 26
Buy:Put
Euro Contract amount ....................................... 783 6,635Option premium ........................................ 13 9 (4) 110 76 (34)
Total .............................................................................. ¥3,744 ¥1,430 ¥(19) $31,729 $12,119 $(161)
Millions of yen
2006
Notional Unrealizedamount Fair value gain (loss)
Forward foreign exchange contracts
Sell:
U.S.$ ...................................................................... ¥ 1,169 ¥ 1,166 ¥ 3
Euro........................................................................ 8,141 8,257 (116)
Buy:
U.S.$ ...................................................................... 4,056 4,098 42
Total .............................................................................. ¥13,366 ¥13,521 ¥ (71)
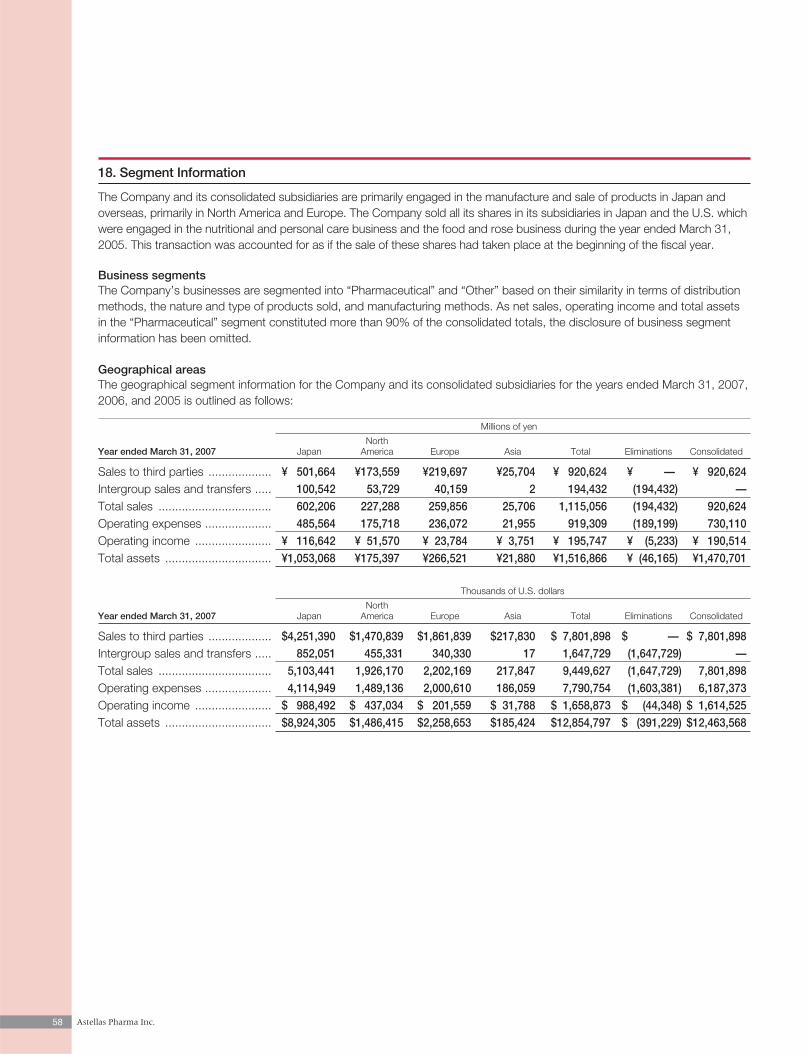
58 Astellas Pharma Inc.
18. Segment Information
The Company and its consolidated subsidiaries are primarily engaged in the manufacture and sale of products in Japan andoverseas, primarily in North America and Europe. The Company sold all its shares in its subsidiaries in Japan and the U.S. whichwere engaged in the nutritional and personal care business and the food and rose business during the year ended March 31,2005. This transaction was accounted for as if the sale of these shares had taken place at the beginning of the fiscal year.
Business segmentsThe Company’s businesses are segmented into “Pharmaceutical” and “Other” based on their similarity in terms of distributionmethods, the nature and type of products sold, and manufacturing methods. As net sales, operating income and total assetsin the “Pharmaceutical” segment constituted more than 90% of the consolidated totals, the disclosure of business segmentinformation has been omitted.
The geographical segment information for the Company and its consolidated subsidiaries for the years ended March 31, 2007,2006, and 2005 is outlined as follows:
Millions of yen
North Year ended March 31, 2007 Japan America Europe Asia Total Eliminations Consolidated
Sales to third parties ................... ¥ 501,664 ¥173,559 ¥219,697 ¥25,704 ¥ 920,624 ¥ — ¥ 920,624Intergroup sales and transfers ..... 100,542 53,729 40,159 2 194,432 (194,432) —Total sales .................................. 602,206 227,288 259,856 25,706 1,115,056 (194,432) 920,624Operating expenses .................... 485,564 175,718 236,072 21,955 919,309 (189,199) 730,110Operating income ....................... ¥ 116,642 ¥ 51,570 ¥ 23,784 ¥ 3,751 ¥ 195,747 ¥ (5,233) ¥ 190,514Total assets ................................ ¥1,053,068 ¥175,397 ¥266,521 ¥21,880 ¥1,516,866 ¥ (46,165) ¥1,470,701
Thousands of U.S. dollars
North Year ended March 31, 2007 Japan America Europe Asia Total Eliminations Consolidated
Sales to third parties ................... $4,251,390 $1,470,839 $1,861,839 $217,830 $ 7,801,898 $ — $ 7,801,898Intergroup sales and transfers ..... 852,051 455,331 340,330 17 1,647,729 (1,647,729) —Total sales .................................. 5,103,441 1,926,170 2,202,169 217,847 9,449,627 (1,647,729) 7,801,898Operating expenses .................... 4,114,949 1,489,136 2,000,610 186,059 7,790,754 (1,603,381) 6,187,373Operating income ....................... $ 988,492 $ 437,034 $ 201,559 $ 31,788 $ 1,658,873 $ (44,348) $ 1,614,525Total assets ................................ $8,924,305 $1,486,415 $2,258,653 $185,424 $12,854,797 $ (391,229) $12,463,568
Geographical areas
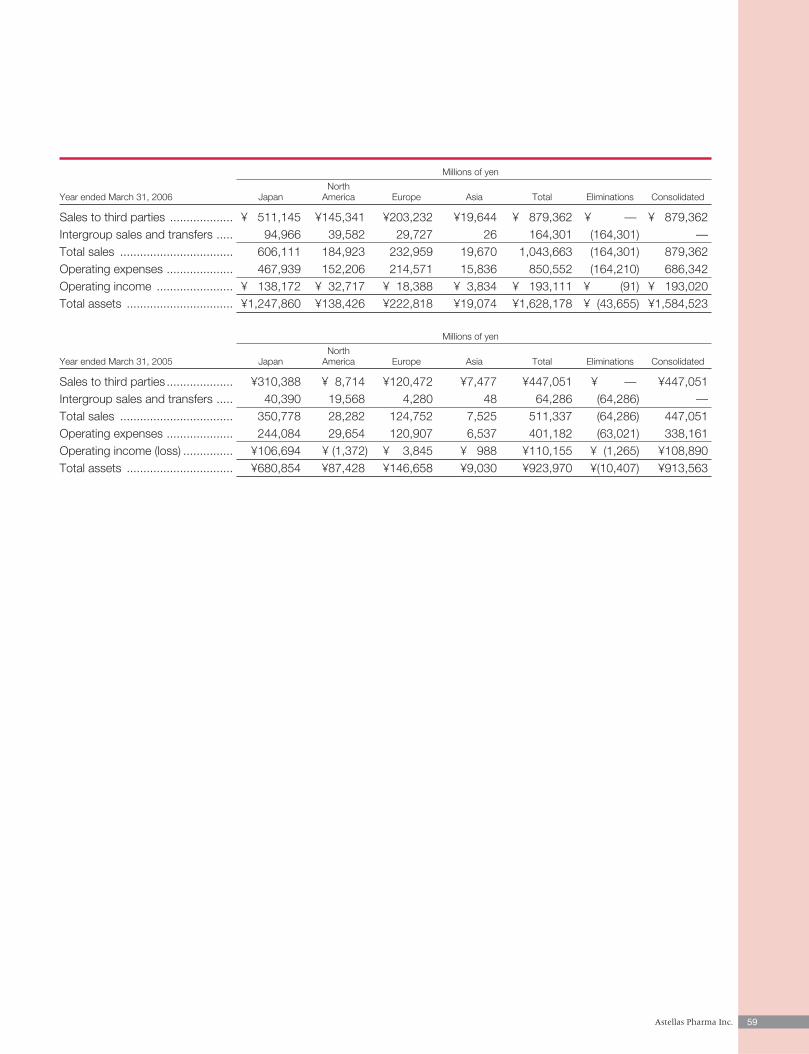
59Astellas Pharma Inc.
Millions of yen
North Year ended March 31, 2006 Japan America Europe Asia Total Eliminations Consolidated
Sales to third parties ................... ¥ 511,145 ¥145,341 ¥203,232 ¥19,644 ¥ 879,362 ¥ — ¥ 879,362Intergroup sales and transfers ..... 94,966 39,582 29,727 26 164,301 (164,301) —Total sales .................................. 606,111 184,923 232,959 19,670 1,043,663 (164,301) 879,362Operating expenses .................... 467,939 152,206 214,571 15,836 850,552 (164,210) 686,342Operating income ....................... ¥ 138,172 ¥ 32,717 ¥ 18,388 ¥ 3,834 ¥ 193,111 ¥ (91) ¥ 193,020Total assets ................................ ¥1,247,860 ¥138,426 ¥222,818 ¥19,074 ¥1,628,178 ¥ (43,655) ¥1,584,523
Millions of yen
North Year ended March 31, 2005 Japan America Europe Asia Total Eliminations Consolidated
Sales to third parties .................... ¥310,388 ¥ 8,714 ¥120,472 ¥7,477 ¥447,051 ¥ — ¥447,051Intergroup sales and transfers ..... 40,390 19,568 4,280 48 64,286 (64,286) —Total sales .................................. 350,778 28,282 124,752 7,525 511,337 (64,286) 447,051Operating expenses .................... 244,084 29,654 120,907 6,537 401,182 (63,021) 338,161Operating income (loss) ............... ¥106,694 ¥ (1,372) ¥ 3,845 ¥ 988 ¥110,155 ¥ (1,265) ¥108,890Total assets ................................ ¥680,854 ¥87,428 ¥146,658 ¥9,030 ¥923,970 ¥(10,407) ¥913,563
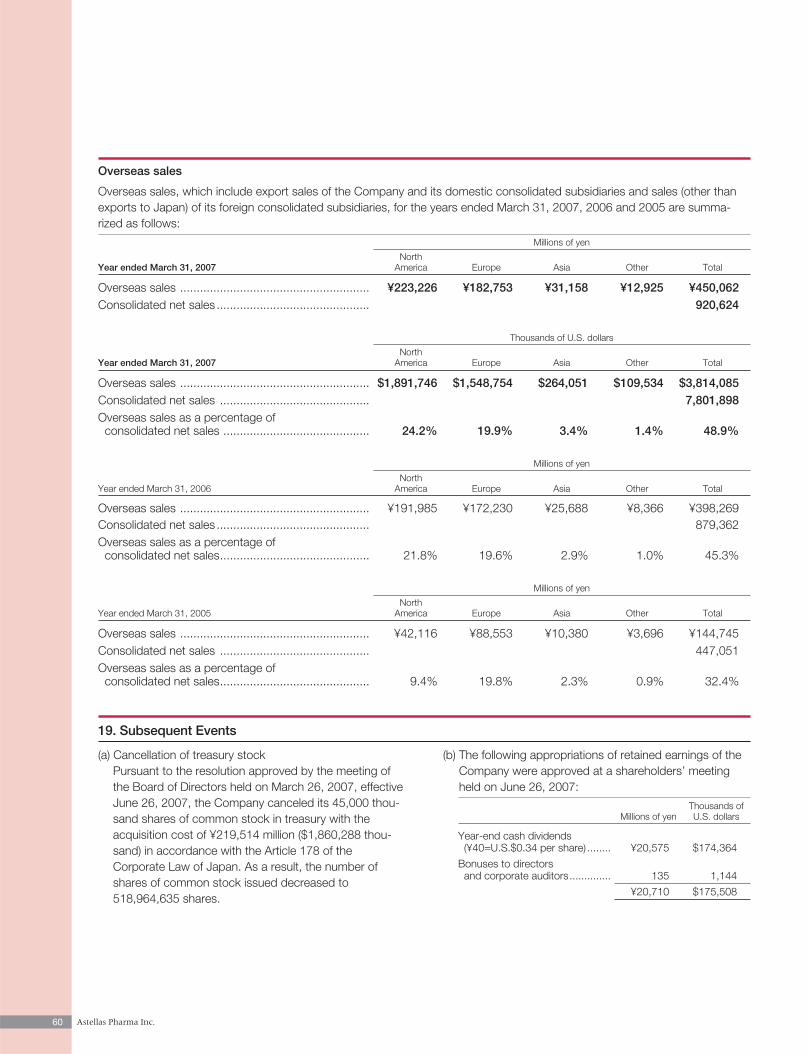
60 Astellas Pharma Inc.
Overseas sales
Overseas sales, which include export sales of the Company and its domestic consolidated subsidiaries and sales (other thanexports to Japan) of its foreign consolidated subsidiaries, for the years ended March 31, 2007, 2006 and 2005 are summa-rized as follows:
Millions of yen
North Year ended March 31, 2007 America Europe Asia Other Total
Overseas sales ......................................................... ¥223,226 ¥182,753 ¥31,158 ¥12,925 ¥450,062Consolidated net sales .............................................. 920,624
Thousands of U.S. dollars
North Year ended March 31, 2007 America Europe Asia Other Total
Overseas sales ......................................................... $1,891,746 $1,548,754 $264,051 $109,534 $3,814,085Consolidated net sales ............................................. 7,801,898Overseas sales as a percentage of consolidated net sales ............................................ 24.2% 19.9% 3.4% 1.4% 48.9%
Millions of yen
North Year ended March 31, 2006 America Europe Asia Other Total
Overseas sales ......................................................... ¥191,985 ¥172,230 ¥25,688 ¥8,366 ¥398,269Consolidated net sales .............................................. 879,362Overseas sales as a percentage of consolidated net sales............................................. 21.8% 19.6% 2.9% 1.0% 45.3%
Millions of yen
North Year ended March 31, 2005 America Europe Asia Other Total
Overseas sales ......................................................... ¥42,116 ¥88,553 ¥10,380 ¥3,696 ¥144,745Consolidated net sales ............................................. 447,051Overseas sales as a percentage of consolidated net sales............................................. 9.4% 19.8% 2.3% 0.9% 32.4%
(a) Cancellation of treasury stockPursuant to the resolution approved by the meeting ofthe Board of Directors held on March 26, 2007, effectiveJune 26, 2007, the Company canceled its 45,000 thou-sand shares of common stock in treasury with theacquisition cost of ¥219,514 million ($1,860,288 thou-sand) in accordance with the Article 178 of theCorporate Law of Japan. As a result, the number ofshares of common stock issued decreased to518,964,635 shares.
(b) The following appropriations of retained earnings of theCompany were approved at a shareholders’ meetingheld on June 26, 2007:
Thousands ofMillions of yen U.S. dollars
Year-end cash dividends(¥40=U.S.$0.34 per share) ........ ¥20,575 $174,364
Bonuses to directors and corporate auditors.............. 135 1,144
¥20,710 $175,508
19. Subsequent Events
61Astellas Pharma Inc.
The Board of DirectorsAstellas Pharma Inc.
We have audited the accompanying consolidated balance sheets of Astellas Pharma Inc. (the “Company”) and consolidated subsidiaries as of March 31, 2007 and 2006, and the related con-solidated statements of income, changes in net assets, and cash flows for each of the three years inthe period ended March 31, 2007, all expressed in yen. These financial statements are the responsi-bility of the Company’s management. Our responsibility is to express an opinion on these financialstatements based on our audits.
We conducted our audits in accordance with auditing standards generally accepted in Japan. Thosestandards require that we plan and perform the audit to obtain reasonable assurance about whetherthe financial statements are free of material misstatement. An audit includes examining, on a testbasis, evidence supporting the amounts and disclosures in the financial statements. An audit alsoincludes assessing the accounting principles used and significant estimates made by management, aswell as evaluating the overall financial statement presentation. We believe that our audits provide areasonable basis for our opinion.
In our opinion, the financial statements referred to above present fairly, in all material respects, theconsolidated financial position of Astellas Pharma Inc. and consolidated subsidiaries at March 31,2007 and 2006, and the consolidated results of their operations and their cash flows for each of thethree years in the period ended March 31, 2007 in conformity with accounting principles generallyaccepted in Japan.
Supplementary Information
As described in Note 4(a), effective April 1, 2005, the Company and its domestic consolidated sub-sidiaries adopted a new accounting standard for the impairment of fixed assets.
The U.S. dollar amounts in the accompanying consolidated financial statements with respect to theyear ended March 31, 2007 are presented solely for convenience. Our audit also included the transla-tion of yen amounts into U.S. dollar amounts and, in our opinion, such translation has been made onthe basis described in Note 5.
June 26, 2007
Report of Independent Auditors
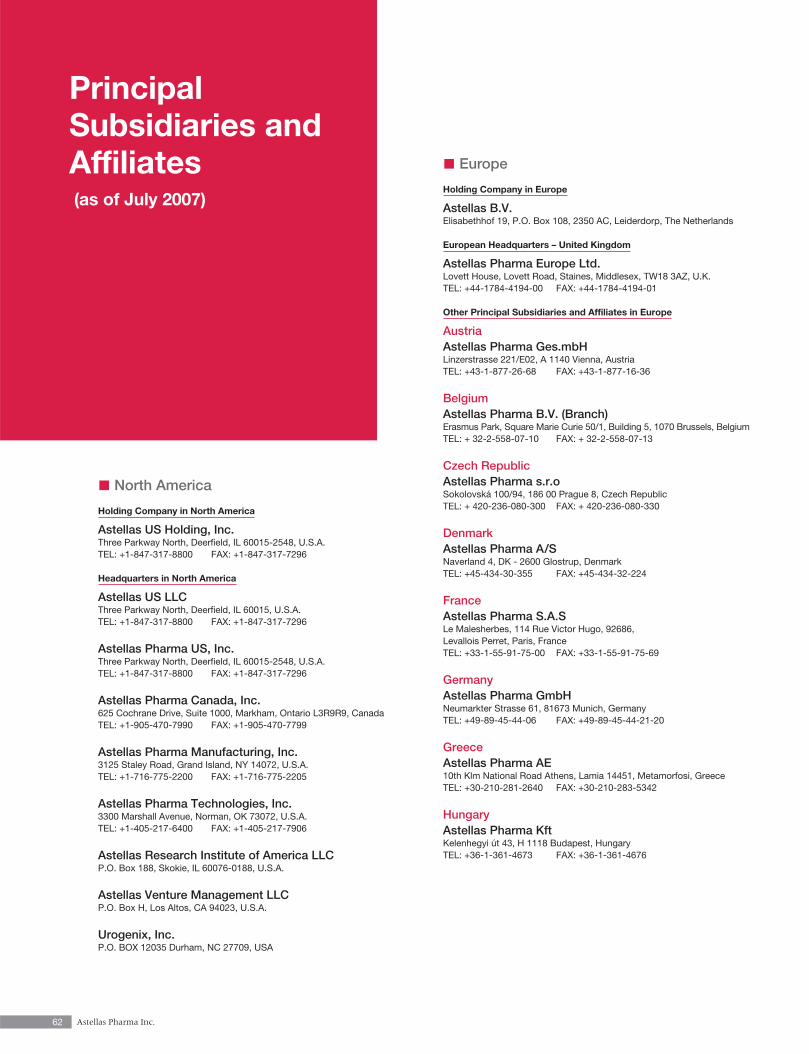
62 Astellas Pharma Inc.
PrincipalSubsidiaries andAffiliates(as of July 2007)
North America
Holding Company in North America
Astellas US Holding, Inc.Three Parkway North, Deerfield, IL 60015-2548, U.S.A.TEL: +1-847-317-8800 FAX: +1-847-317-7296
Headquarters in North America
Astellas US LLCThree Parkway North, Deerfield, IL 60015, U.S.A.TEL: +1-847-317-8800 FAX: +1-847-317-7296
Astellas Pharma US, Inc.Three Parkway North, Deerfield, IL 60015-2548, U.S.A.TEL: +1-847-317-8800 FAX: +1-847-317-7296
Astellas Pharma Canada, Inc.625 Cochrane Drive, Suite 1000, Markham, Ontario L3R9R9, CanadaTEL: +1-905-470-7990 FAX: +1-905-470-7799
Astellas Pharma Manufacturing, Inc.3125 Staley Road, Grand Island, NY 14072, U.S.A.TEL: +1-716-775-2200 FAX: +1-716-775-2205
Astellas Pharma Technologies, Inc.3300 Marshall Avenue, Norman, OK 73072, U.S.A.TEL: +1-405-217-6400 FAX: +1-405-217-7906
Astellas Research Institute of America LLCP.O. Box 188, Skokie, IL 60076-0188, U.S.A.
Astellas Venture Management LLCP.O. Box H, Los Altos, CA 94023, U.S.A.
Urogenix, Inc.P.O. BOX 12035 Durham, NC 27709, USA
Europe
Holding Company in Europe
Astellas B.V.Elisabethhof 19, P.O. Box 108, 2350 AC, Leiderdorp, The Netherlands
European Headquarters – United Kingdom
Astellas Pharma Europe Ltd.Lovett House, Lovett Road, Staines, Middlesex, TW18 3AZ, U.K.TEL: +44-1784-4194-00 FAX: +44-1784-4194-01
Other Principal Subsidiaries and Affiliates in Europe
AustriaAstellas Pharma Ges.mbHLinzerstrasse 221/E02, A 1140 Vienna, AustriaTEL: +43-1-877-26-68 FAX: +43-1-877-16-36
BelgiumAstellas Pharma B.V. (Branch)Erasmus Park, Square Marie Curie 50/1, Building 5, 1070 Brussels, BelgiumTEL: + 32-2-558-07-10 FAX: + 32-2-558-07-13
Czech RepublicAstellas Pharma s.r.oSokolovská 100/94, 186 00 Prague 8, Czech RepublicTEL: + 420-236-080-300 FAX: + 420-236-080-330
DenmarkAstellas Pharma A/SNaverland 4, DK - 2600 Glostrup, DenmarkTEL: +45-434-30-355 FAX: +45-434-32-224
FranceAstellas Pharma S.A.SLe Malesherbes, 114 Rue Victor Hugo, 92686, Levallois Perret, Paris, FranceTEL: +33-1-55-91-75-00 FAX: +33-1-55-91-75-69
GermanyAstellas Pharma GmbHNeumarkter Strasse 61, 81673 Munich, GermanyTEL: +49-89-45-44-06 FAX: +49-89-45-44-21-20
GreeceAstellas Pharma AE10th Klm National Road Athens, Lamia 14451, Metamorfosi, GreeceTEL: +30-210-281-2640 FAX: +30-210-283-5342
HungaryAstellas Pharma Kft Kelenhegyi út 43, H 1118 Budapest, HungaryTEL: +36-1-361-4673 FAX: +36-1-361-4676
63Astellas Pharma Inc.
IrelandAstellas Ireland Co., LimitedDamastown Road, Damastown Industrial Park, Mulhuddart, Dublin 15,Republic of IrelandTEL: +353-1-803-0800 FAX: +353-1-803-0801
Astellas Pharma Co., Limited25 The Courtyard, Kilcarbery Business Park, Clondalkin, Dublin 22,Republic of Ireland TEL: +353-1-467-1555 FAX: +353-1-467-1550
ItalyAstellas Pharma S.p.A.Via delle Industrie 1, 20061, Carugate, Milan, ItalyTEL: +39-02-92-138-1 FAX: +39-02-92-138-200
NetherlandsAstellas Pharma B.V.Elisabethhof 19, P.O. Box 108, 2350 AC, Leiderdorp, The Netherlands
Astellas Pharma Europe B.V.Elisabethhof 19, P.O. Box 108, 2350 AC, Leiderdorp, The Netherlands
Astellas Pharma International B.V.Elisabethhof 19, P.O. Box 108, 2350 AC, Leiderdorp, The Netherlands
NorwayAstellas Pharma A/S (Branch)Solbråveien 47, N–1383, Asker, NorwayTEL: +47-667-64-6000 FAX: +47-669-03-520
PolandAstellas Pharma Sp.zo.o.ul. Poleczki 21, 02-822, Warsaw, PolandTEL: +48-22-545-11-11 FAX: +48-22-545-11-10
PortugalAstellas Farma LimitadaEdificio Cinema, Rua José Fontana, nº1-1 andar, 2770-101 Paço de Arcos, PortugalTEL: +351-21-440-13-00 FAX: +351-21-440-13-01
RussiaZAO Astellas PharmaMarksistskaya Ulitsa 16, 109147, Moscow, RussiaTEL: +7-495-737-0755 FAX: +7-495-737-0753
South AfricaAstellas Pharma Pty Ltd.Gillooly’s View Office Park, Block F, Ground Floor, 5 Osborne Lane,Bedfordview 2007 Johannesburg, South AfricaTEL: +011-615-9433 FAX: +011-615-9427
SpainAstellas Pharma S.A.Parque Empresarial ‘La Finca’, Paseo del Club Deportivo nº1, Bloque 14,2a planta, 28223 Pozuelo de Alarcón, Madrid, SpainTEL: +34-91-495-2700 FAX: +34-91-495-2711
SwedenAstellas Pharma ABHaraldsgatan 5, SE-413 14, Gothenburg, SwedenTEL: +46-31-741-61-60 FAX: +46-31-711-07-57
SwitzerlandAstellas Pharma A.G.Grindelstrasse 6, CH-8304, Wallisellen, SwitzerlandTEL: +41-43-233-60-20 FAX: +41-43-233-60-30
United KingdomAstellas Pharma Ltd.Lovett House, Lovett Road, Staines, Middlesex, TW18 3AZ, U.K.TEL: +44-1784-4194-00 FAX: +44-1784-4194-01
Asia
Astellas Pharma China, Inc.No. 3 Jia 6 Road 10, Shenyang Economic & Technological Development Zone,Shenyang City, Liaoning Province, 110141, People’s Republic of ChinaTEL: +86-24-2581-4488 FAX: +86-24-2581-5211
Astellas Pharma Hong Kong Co., Ltd.Suite 708-709, 7/F, Prudential Tower, The Gateway, Harbour City, Kowloon,Hong KongTEL: +852-2377-9801 FAX: +852-2856-1440
Astellas Pharma Taiwan, Inc.5/F, No.10, Sec 3, Min-Sheng E. Rd., Taipei 104 Taiwan, R.O.C.TEL: +886-2-2507-5799 FAX: +886-2-2507-1808
Astellas Pharma Korea, Inc.6/F Kumha Bldg., 41-2 Chungdam-Dong Kangnam-Ku, Seoul, 135-766 KoreaTEL: +82-2-3448-0504 FAX: +82-2-3448-0510
Astellas Pharma Philippines, Inc.23/F, Salcedo Towers 169 H.V. del Costa Street Salcedo Village 1227 MakatiCity, PhilippinesTEL: +63-2-845-1558 FAX: +63-2-845-1567
Astellas Pharma (Thailand) Co., Ltd.10/F, Wave Place, 55 Wireless Road, Lumpini, Patumwan, Bangkok 10330,ThailandTEL: +66-2-655-4050 FAX: +66-2-655-4051
P.T. Astellas Pharma IndonesiaWisma Kyoei Prince Building 11/F, Jl. Jend. Sudirman Kav. 3, Jakarta 10220,IndonesiaTEL: +62-21-572-4344 FAX: +62-21-572-4345
Japan
Manufacturing subsidiariesAstellas Tokai Co., Ltd. Astellas Toyama Co., Ltd.Astellas Pharma Chemicals Co., Ltd.
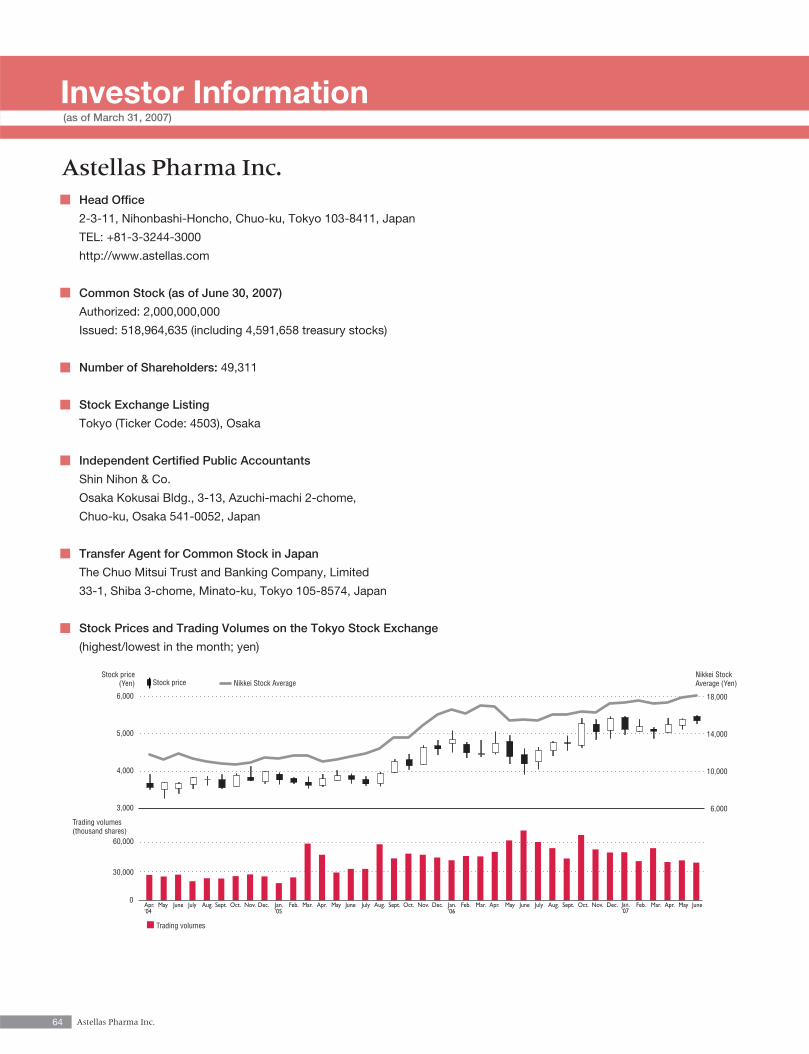
64 Astellas Pharma Inc.
Head Office
2-3-11, Nihonbashi-Honcho, Chuo-ku, Tokyo 103-8411, Japan
TEL: +81-3-3244-3000
http://www.astellas.com
Common Stock (as of June 30, 2007)
Authorized: 2,000,000,000
Issued: 518,964,635 (including 4,591,658 treasury stocks)
Number of Shareholders: 49,311
Stock Exchange Listing
Tokyo (Ticker Code: 4503), Osaka
Independent Certified Public Accountants
Shin Nihon & Co.
Osaka Kokusai Bldg., 3-13, Azuchi-machi 2-chome,
Chuo-ku, Osaka 541-0052, Japan
Transfer Agent for Common Stock in Japan
The Chuo Mitsui Trust and Banking Company, Limited
33-1, Shiba 3-chome, Minato-ku, Tokyo 105-8574, Japan
Stock Prices and Trading Volumes on the Tokyo Stock Exchange
(highest/lowest in the month; yen)
Apr.’04
May Apr. MayJune June July Aug. Sept. Oct. Nov. Dec. Jan.’06
Feb. Mar. Apr. May June July Aug. Sept. Oct. Nov. Dec. Jan.’07
Feb. Mar. Apr. May JuneJuly Aug. Sept. Oct. Nov. Dec. Jan.’05
Feb. Mar.0
60,000
30,000
Stock price(Yen)
Nikkei StockAverage (Yen)
Trading volumes(thousand shares)
6,000
10,000
14,000
18,000
3,000
4,000
5,000
6,000
Trading volumes
Nikkei Stock Average Stock price
Investor Information(as of March 31, 2007)
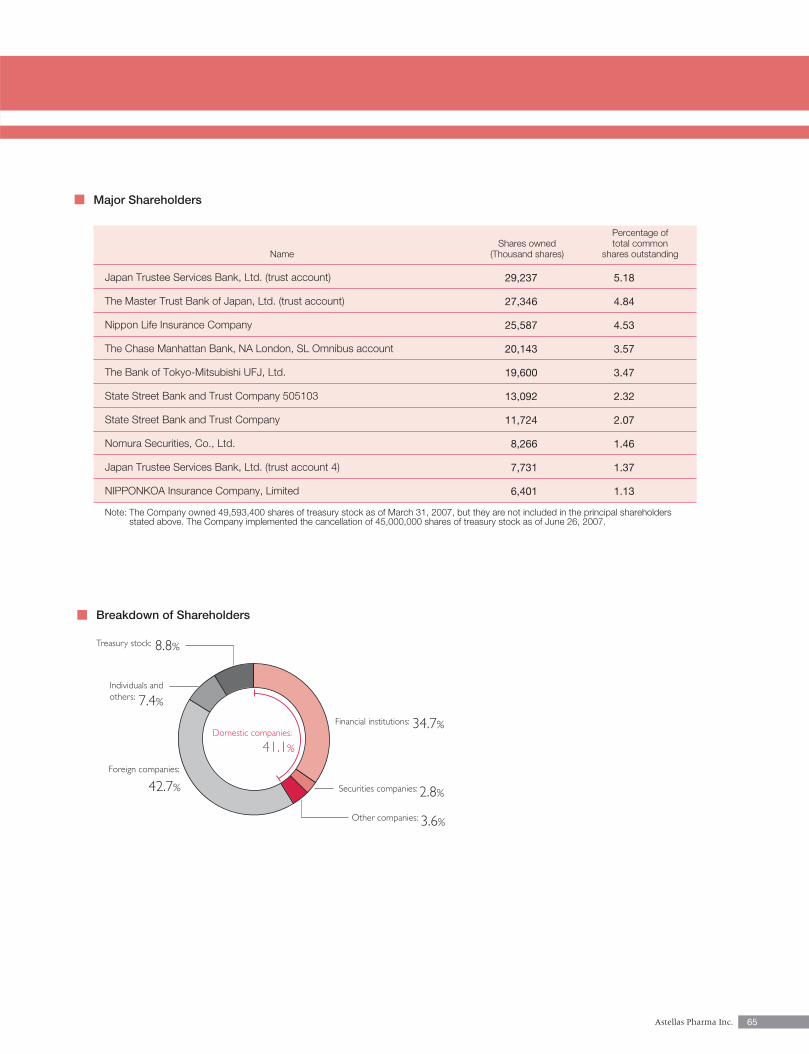
65Astellas Pharma Inc.
Percentage of Shares owned total common
Name (Thousand shares) shares outstanding
Japan Trustee Services Bank, Ltd. (trust account)
The Master Trust Bank of Japan, Ltd. (trust account)
Nippon Life Insurance Company
The Chase Manhattan Bank, NA London, SL Omnibus account
The Bank of Tokyo-Mitsubishi UFJ, Ltd.
State Street Bank and Trust Company 505103
State Street Bank and Trust Company
Nomura Securities, Co., Ltd.
Japan Trustee Services Bank, Ltd. (trust account 4)
NIPPONKOA Insurance Company, Limited
Note: The Company owned 49,593,400 shares of treasury stock as of March 31, 2007, but they are not included in the principal shareholdersstated above. The Company implemented the cancellation of 45,000,000 shares of treasury stock as of June 26, 2007.
Financial institutions:
Securities companies:
Other companies:
Treasury stock:
Individuals and others:
Foreign companies:
Domestic companies:
41.1%
34.7%
8.8%
7.4%
42.7% 2.8%
3.6%
29,237
27,346
25,587
20,143
19,600
13,092
11,724
8,266
7,731
6,401
5.18
4.84
4.53
3.57
3.47
2.32
2.07
1.46
1.37
1.13
Major Shareholders
Breakdown of Shareholders
2-3-11, Nihonbashi-Honcho,
Chuo-ku, Tokyo 103-8411, Japan
http://www.astellas.com
Printed in Japan on recycled paper