Embed Size (px)
Citation preview
Annual Report2010 1
CORPORATE INFORMATION
Board of Directors
Executive Directors M. Afzal Khan Chairman KhawajaAmanullahAskari ChiefExecutiveOfficer Maj. Gen. (Ret’d.) S. Z. M. Askree Director Ms. Shirin Safdar Director
Non Executive Directors Abdul Maajid Qureshi Director S. M. Sibtain Director M. Salim Khan Director Dr. M. Humayun Khan Director M. Zafar Iqbal Director M. Zafar Khan Director Adnan Aurangzeb Director
Company Secretary Khawaja Shaiq Tanveer
Audit Committee Adnan Aurangzeb Chairman Maj. Gen. (Ret’d.) S. Z. M. Askree Member Ms. Shirin Safdar Member Dr. M. Humayun Khan Member
Auditors KPMG Taseer Hadi & Co. Chartered Accountants
Legal Advisors Chima & Ibrahim, Raja Rashid, Javaid Qureshi
Bankers Allied Bank of Pakistan The Royal Bank of Scotland National Bank of Pakistan Bank Alfalah Limited Habib Metropolitan Bank Standard Chartered Bank Bank of Khyber Dubai Islamic Bank Askari Bank Limited
Registered Office Biafo Industries Limited OfficeNo.203-204,2ndFloor,MuhammadGulistanKhanHouse, 82-East,Fazal-Ul-HaqRoad,BlueArea,Islamabad.Pakistan Tel:+92512277358-9,2829532-3,2272613,2802218Fax:+92512274744 Website: www.biafo.com, Email: [email protected], [email protected]
Factory Biafo Industries Limited PlotNo:70,PhaseIII,IndustrialEstate,Hattar,DisttHaripur,KhyberPakhtunkhwa.Pakistan Tel:+92995617830Fax:+92995617497 Website: www.biafo.com, Email: [email protected]
Shares Registrar Riasat Ishtiaq Consulting (Pvt) Ltd OfficeNo.19-20,2ndFloor,HillViewPlaza,JinnahAvenue,BlueArea,Islamabad. Tel:+92512272152,7101536Fax:+92512273158

Annual Report2010 2
NOTICE OF 22nd ANNUAL GENERAL MEETING OFSHAREHOLDERS
Noticeisherebygiventhatthe22ndAnnualGeneralMeetingofBiafoIndustriesLimitedwillbeheldonTuesday26October2010at11.30a.m.at#203,2ndFloor,M.GulistanKhanHouse,82East,FazalulHaqRoad,BlueArea,Islamabadtotransactthefollowingbusiness:
ORDINARY BUSINESS
1. Toconfirmtheminutesofthe21stAnnualGeneralMeetingheldonOctober29,2009.2. ToreceiveandadopttheAuditedAccountsoftheCompanyfortheyearendedJune30,2010
together with Auditors’ report and Directors’ report thereon.3. To approve the payment offinal dividendofRs. 2.50per share (25%) and also the interim
dividendofRs1.00pershare(10%)declaredonFebruary23,2010andinterimdividendofRs.1.00pershare(10%)declaredonApril27,2010makingatotalofRs.4.50pershare(45%)fortheyearendedJune30,2010.
4. To appointAuditors for the year 2010-11 and to fix their remuneration. RetiringAuditorsM/s KPMG Taseer Hadi & Co. Chartered Accountants, being eligible offer themselves for reappointmentfortheyear2010-11.
5. Toelect10DirectorsinaccordancewiththeprovisionsoftheCompaniesOrdinance1984.
6. SPECIAL BUSINESS
To approve the following resolution “Resolved that additional new object clauses be inserted in the Memorandum of Association of
the company subject to the approval from Securities & Exchange Commission of Pakistan”.
7. TotransactsuchotherbusinessasmaybeplacedbeforethemeetingwiththepermissionoftheChairman.
By order of the Board
Khawaja Shaiq Tanveer Islamabad:September20,2010 CompanySecretary
NOTES:
1. TheBoardhasfixedthenumberofDirectorat10andallthe10retiringDirectorsbeingeligibleofferthemselvesforre-election.
Annual Report2010 3
1)M.AfzalKhan2)M.Salim3)AbdulMaajidQureshi4)S.M.Sibtain5)Maj.Gen(R)S.Z.MAskree6)M.HumayunKhan7)M.ZafarIqbal8)M.ZafarKhan9)AdnanAurangzeb10)Ms.ShirinSafdar
2. ShareTransferBooksoftheCompanywillremainclosedfromOctober19,2010toOctober26,2010bothdaysinclusive.
3. Amemberentitledtoattendandvoteatthemeetingshallbeentitledtoappointanotherperson,as his/her and proxy to attend, demand or join in demanding a poll, speak and vote instead of his/her and a proxy so appointed shall have such rights, as attending, speaking and voting at the meeting as are available to a member. Proxies in order to be effective must be received at the registeredofficeofthecompanynotlaterthan48hoursbeforethemeetingdulystamped,signedand witnessed. A proxy need not be a member of the Company.
4. CDCShareholdersortheirproxiesarerequiredtobringwiththemtheiroriginalNationalIdentitycards or Passports along with the Participant’s ID numbers and their Account Numbers at the time of attending the Annual General Meeting in order to authenticate their usual documents required for such purposes.
5. ShareholdersarerequestedtopromptlynotifyinwritingtotheCompanyofanychangeintheiraddress.
STATEMENT U/S 160(1) OF THE COMPANIES ORDINANCE 1984
TheBoardofDirectorsofthecompanyhasrecommendedthatinordertoincreasetheprofitabilityof the company new objects clauses be inserted in the memorandiun of association of the company. Currently the company is a single object company and cannot do any other business therefore its is recommended that new object clauses be included in the memorandum so that at any time some other business may be carried on which may conveniently or advantageously be combined with the existing business of the company.
If any of the shareholder intend to see the proposed object clauses he/she can obtain it from the Registeredofficeofthecompanyat203,2ndFloor,MuhammadGulistanKhanHouse,82-East,BlueArea,Islamabad.Tel:051-2277358-9.
Annual Report2010 4
BIAFO INDUSTRIES LTD.DIRECTORS’ REPORT
YourDirectorsarepleasedtopresentthe22ndAnnualReportofthecompanyfortheyearendedJune2010.
FINANCIALRESULTS
In the period under review your company had to operate under serious pressure of the changing security situation and the response of the relevant government functionaries both on provincial and federal level.
In the period under review as advised in the our Quarterly/Half Yearly report ending December, 2009,banonmovementofexplosiveshadbeenplacedbytheprovincialGovernmentsofKhyberPakhtunkhwa and Punjab which prevented any supplies to the customers in the provinces for approximately1monthrespectively.FurthermoretheChiefInspectorofExplosivessuspendedtheproductionandsalesofthecompany’sproductsfortheperiod14th.November,2009to1st.December,2009.Thecompany’sbusinesswasseriouslyaffectedintwomonthsofthisfinancialyear.
We pleased to advise the members that subsequently the Ministry of Industries and Production vide theirletterNo.6(1)/2009/Ops-Expofdated19-05-2010statedthatthematterregardingcommercialexplosives, transported to the EPZ’s from Tariff area i.e. Pakistan has been settled with approval of competent authorities, which is in line with opinion of the M/O Commerce, EPZ and Ministry of DefenceProductionetc.TheclarificationinthisregardshasalsobeenincorporatedindraftExplosivesRules2009stating“CommercialexplosivestransportedfromTariffareainPakistantoEPZwillbeconsidered as an export”.
ThementionedletterclarifiesandconfirmsthepositiontakenbyBiafointheincidentofthestoppageof two trucks destined for Saindak Export Zone under the Explosives Rules which led to the suspension of licences and closure of the factory.
Inthelightoftheaboveeventthecompany’sgrosssalesincreasedby2.81%toRs.767.75manditsnetsalesby1.12%toRs.588.49mcomparedtothepreviousfinancialyear.Despitethesubstantialtransportation cost increase in the secondHalf of the financial year under review (due to lowertonnagetruckspermittedbytheChiefInspectorofExplosive)thecompany’sgrossprofitincreasedby3.13%toRs.191.80m,andgrossprofitmarginwas32.59%incomparison to31.95%in thepreviousfinancialyear.
OperatingprofitandProfitbeforetaxationwasmarginallyloweratRs.159.58mandRs.148.53mcompared to the previous year, due to increase in distribution costs and administrative expenses.
Netprofitaftertaxationfortheyear,reducedby1.86%toRs.112.33m,duetohigherincidentof
Annual Report2010 5
taxation payable, because of reduced exports, as a result of transportation and security issues raised bytheGovernmentfunctionaries,resultinginEPSofRs.5.62(2009–Rs.5.72).
Sales in the period under review showed growth in Oil and Gas sector, Construction and Mining Sector and to the Neelum Jhelum Hydel Project. Sales to the export customers at Saindak and Duddar and sales to distributors declined due to security issues.
The year 2009-10 also saw substantial inflationary impact across all expenses although themanagement kept the situation monitored and controlled where possible. Due to the absence of long termborrowingbythecompany,financialcostswerereduced.
NetworthofthecompanyfortheyearunderreviewincreasedbyRs.34.32mtoRs.473.07m.
Expenditures are within budget approved by the Board of Directors and over all expenditures were belowthebudgetedfigureasapprovedbytheBoardofDirectors.
Production :
Production was affected by the closure of the Plant, and the transportation and security issues raised by the Government authorities due to security situation in the country effected our expectation of higher growth in the year under review.
However the Plant performed satisfactorily in meeting demand of the customers on a timely basis. Your company continues its commitment to its customers to improve quality of its products to their satisfaction and requirement, through regular training and application of rigorous quality system. Resources for improvement in products continue to be provided to the Plant for this purpose.
FutureProspects:
We await the commencement of large hydro electric projects like Bhasha, Kohala, Bunji and Munda Damsetc.whicharedependentonGovernmentfinancesanddonorssupport.TheeffectoflargescalefloodinginAugust–September,2010willincreasedemandonfinancialresourcesofGovernmentfor rehabilitation and recovery, and which in addition to the requirement of Defense expenditure, administrativeexpensesanddebtservicing,willconstraintthegovernmentfinancesfordevelopmentallocation.
Our sales will be affected in the sectors of Distributors, Cement units and Oil and Gas sector where the major exploration of British Petroleum (BP) has been cancelled due to sale of the Pakistan Operations.
BIAFO INDUSTRIES LTD.DIRECTORS’ REPORT
Annual Report2010 6
Dividend : TheBoardhasapprovedfinalcashdividendofRs.2.50pershare(25%)andalso1stinterimcash
dividendofRs.1.00pershare(10%)declaredon23rd.February,2010and2ndinterimcashdividendofRs.1.00pershare(10%)declaredon27th.April,2010fortheyearendedJune,2010.
CODEOFCORPORATEGOVERNANCE:
We are pleased to report that the company has taken necessary measures to comply with the provision of the Code of Corporate Governance as incorporated in listing regulations of the Stock Exchanges.
The Board regularly reviews the company’s strategic direction. Business plans and targets are set by the Chairman/Chief Executive & are reviewed by the Board. The Board is committed to maintain a high standard of good corporate governance. The company is in the process of implementing the provisions set out by Securities & Exchange Commission of Pakistan (SECP) and the accordingly amended listing rules by Stock Exchanges.
As required by the Code of Corporate Governance, your directors are pleased to report that:
• Financial statement prepared by themanagement of the company, present fairly its state ofaffairs,theresultsofitsoperations,cashflow&changesinequity.
• Properbooksofaccountofthecompanyhavebeenmaintained.
• Accountingpolicieshavebeenconsistentlyappliedinthepreparationoffinancialstatementsand accounting estimates, except for those disclosed in the accounts & accounting estimates are based on reasonable & prudent judgment.
• InternationalaccountingstandardsasapplicableinPakistanhavebeenfollowedinthepreparationoffinancialstatementsandanydeparturetherefromhasbeenadequatelydisclosed.
• Thesystemofinternalcontrolsissoundandhasbeeneffectivelyimplementedandmonitored.
• Thereisnosignificantdoubtaboutthecompany’sabilitytocontinueasagoingconcern.
• Therehasbeennomaterialdeparturefromthebestpracticesofcorporategovernance,asdetailedin the listing regulations.
BIAFO INDUSTRIES LTD.DIRECTORS’ REPORT
Annual Report2010 7
• There are no statutory payments on account of taxes, duties, levies and charges which areoutstandingasonJune30,2010exceptforthosestatedinthefinancialstatements.
• NotradingotherthenthatdisclosedinthereportwascarriedoutbytheDirectors,CEO,andCFO,CompanySecretaryandtheirspousesandminorchildren.
• A statement as to the value of investment of Provident Fund as on June 30, 2010 isRs.11,701,291/-
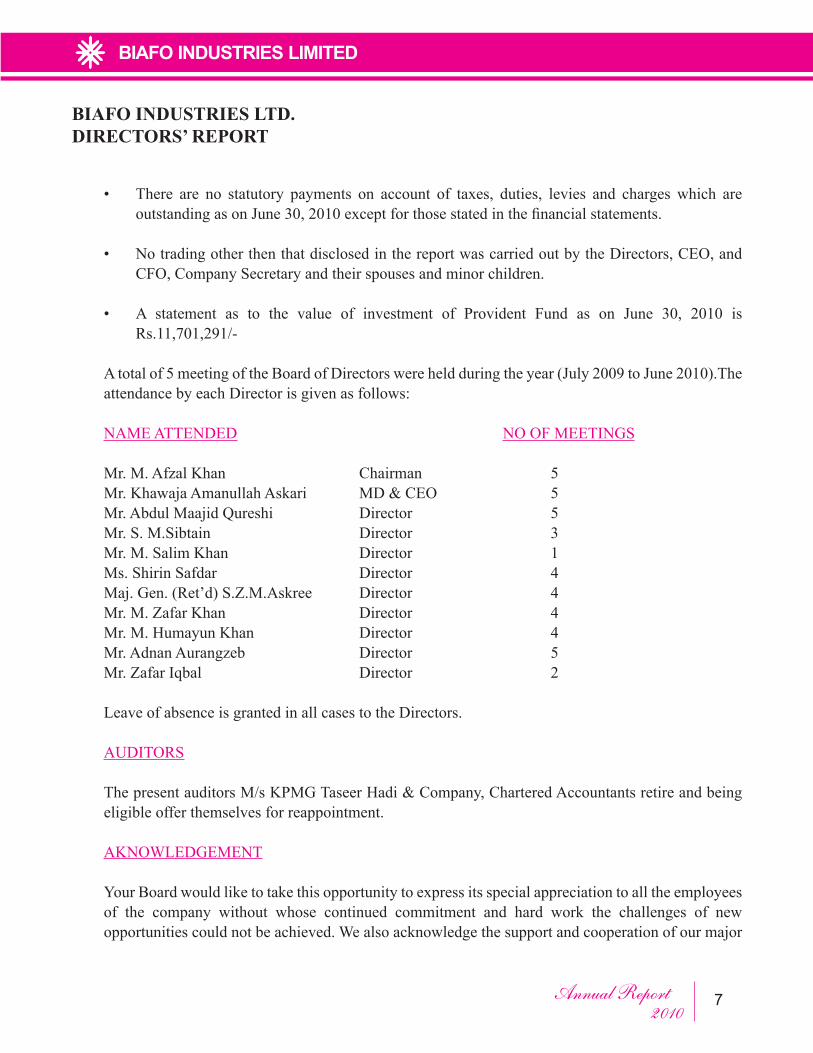
Atotalof5meetingoftheBoardofDirectorswereheldduringtheyear(July2009toJune2010).Theattendance by each Director is given as follows:
NAME ATTENDED NOOFMEETINGS
Mr.M.AfzalKhan Chairman 5 Mr.KhawajaAmanullahAskari MD&CEO 5 Mr.AbdulMaajidQureshi Director 5 Mr.S.M.Sibtain Director 3 Mr.M.SalimKhan Director 1 Ms.ShirinSafdar Director 4 Maj.Gen.(Ret’d)S.Z.M.Askree Director 4 Mr.M.ZafarKhan Director 4 Mr.M.HumayunKhan Director 4 Mr.AdnanAurangzeb Director 5 Mr.ZafarIqbal Director 2
Leave of absence is granted in all cases to the Directors.
AUDITORS
The present auditors M/s KPMG Taseer Hadi & Company, Chartered Accountants retire and being eligible offer themselves for reappointment.
AKNOWLEDGEMENT
Your Board would like to take this opportunity to express its special appreciation to all the employees of the company without whose continued commitment and hard work the challenges of new opportunities could not be achieved. We also acknowledge the support and cooperation of our major
BIAFO INDUSTRIES LTD.DIRECTORS’ REPORT
Annual Report2010 8
BIAFO INDUSTRIES LTD.DIRECTORS’ REPORT
stake holders, customers, supplier and our Bankers specially Allied Bank Ltd, National Bank of Pakistan, Bank Alfalah Ltd, Royal Bank of Scotland, Standard Chartered and Bank of Khyber.
PATTERNOFSHAREHOLDING
Pattern of share holding is enclosed.
On Behalf of the Board
Islamabad Chief Executive 20September2010 Khawaja Amanullah Askari
Annual Report2010 9
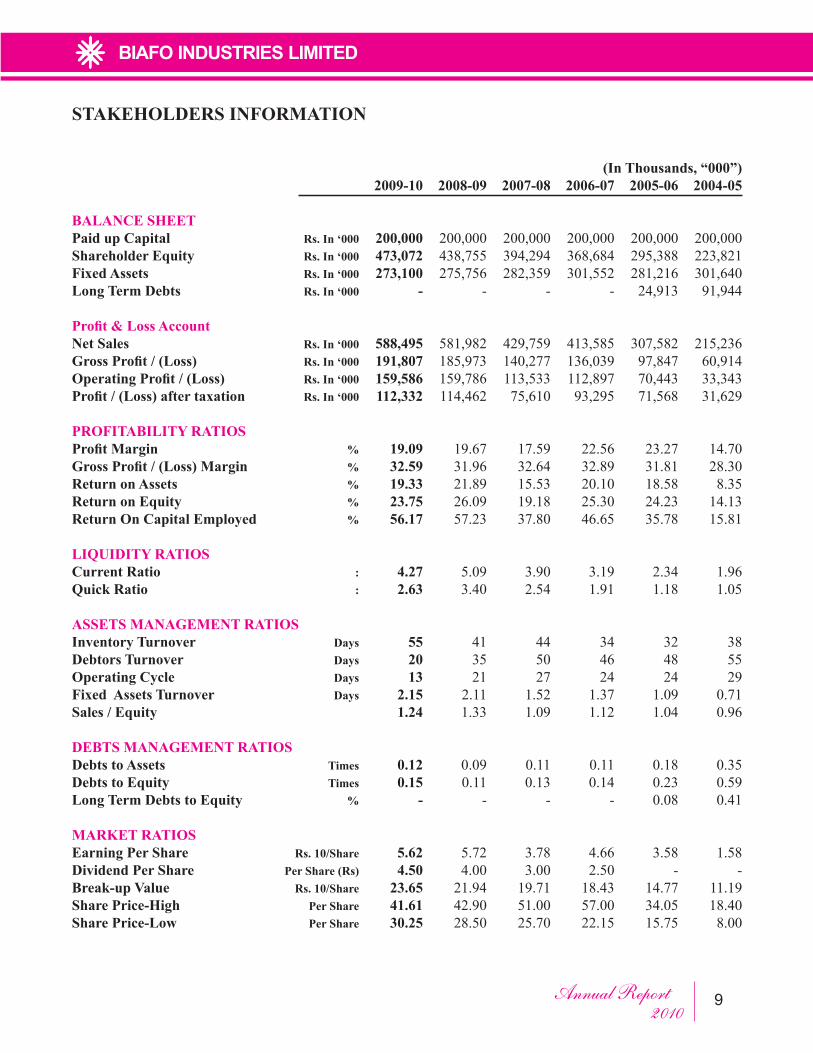
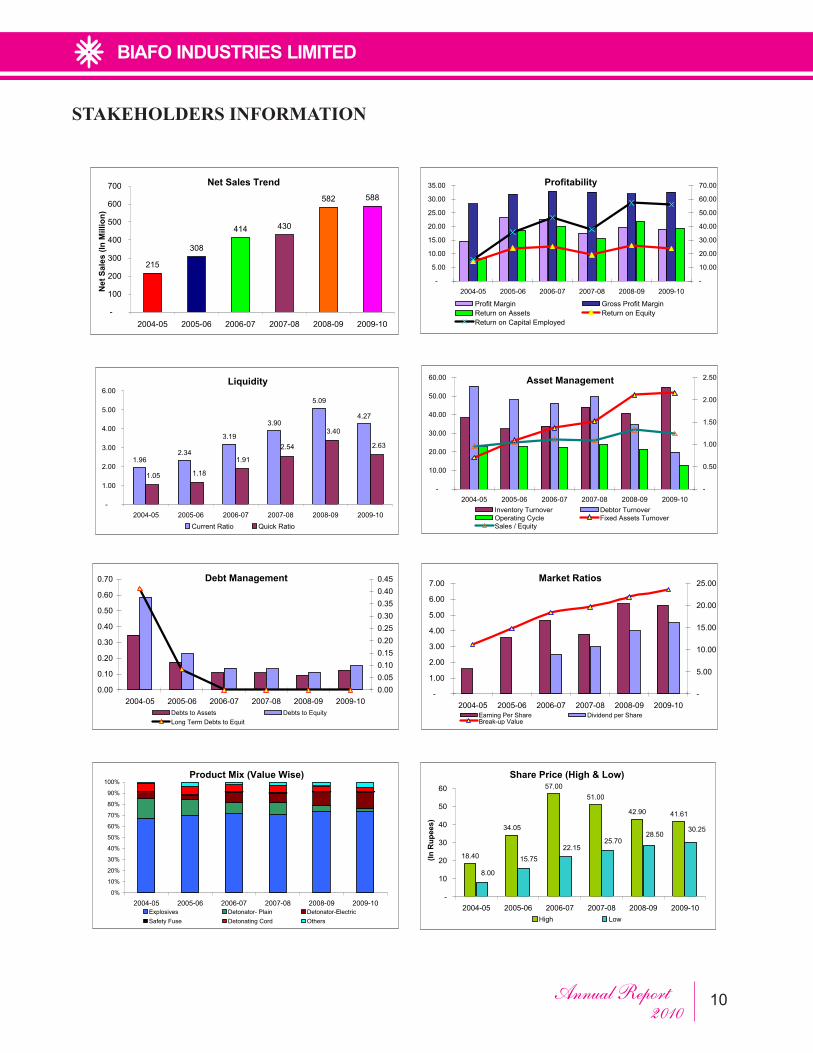
STAKEHOLDERS INFORMATION
(In Thousands, “000”) 2009-10 2008-09 2007-08 2006-07 2005-06 2004-05
BALANCE SHEET Paid up Capital Rs. In ‘000 200,000 200,000 200,000 200,000 200,000 200,000Shareholder Equity Rs. In ‘000 473,072 438,755 394,294 368,684 295,388 223,821Fixed Assets Rs. In ‘000 273,100 275,756 282,359 301,552 281,216 301,640Long Term Debts Rs. In ‘000 - - - - 24,913 91,944
Profit & Loss Account Net Sales Rs. In ‘000 588,495 581,982 429,759 413,585 307,582 215,236Gross Profit / (Loss) Rs. In ‘000 191,807 185,973 140,277 136,039 97,847 60,914Operating Profit / (Loss) Rs. In ‘000 159,586 159,786 113,533 112,897 70,443 33,343Profit / (Loss) after taxation Rs. In ‘000 112,332 114,462 75,610 93,295 71,568 31,629
PROFITABILITY RATIOS Profit Margin % 19.09 19.67 17.59 22.56 23.27 14.70Gross Profit / (Loss) Margin % 32.59 31.96 32.64 32.89 31.81 28.30Return on Assets % 19.33 21.89 15.53 20.10 18.58 8.35Return on Equity % 23.75 26.09 19.18 25.30 24.23 14.13Return On Capital Employed % 56.17 57.23 37.80 46.65 35.78 15.81
LIQUIDITY RATIOS Current Ratio : 4.27 5.09 3.90 3.19 2.34 1.96Quick Ratio : 2.63 3.40 2.54 1.91 1.18 1.05
ASSETS MANAGEMENT RATIOS Inventory Turnover Days 55 41 44 34 32 38Debtors Turnover Days 20 35 50 46 48 55Operating Cycle Days 13 21 27 24 24 29Fixed Assets Turnover Days 2.15 2.11 1.52 1.37 1.09 0.71Sales / Equity 1.24 1.33 1.09 1.12 1.04 0.96
DEBTS MANAGEMENT RATIOS Debts to Assets Times 0.12 0.09 0.11 0.11 0.18 0.35Debts to Equity Times 0.15 0.11 0.13 0.14 0.23 0.59Long Term Debts to Equity % - - - - 0.08 0.41
MARKET RATIOS Earning Per Share Rs. 10/Share 5.62 5.72 3.78 4.66 3.58 1.58Dividend Per Share Per Share (Rs) 4.50 4.00 3.00 2.50 - -Break-up Value Rs. 10/Share 23.65 21.94 19.71 18.43 14.77 11.19Share Price-High Per Share 41.61 42.90 51.00 57.00 34.05 18.40Share Price-Low Per Share 30.25 28.50 25.70 22.15 15.75 8.00
Annual Report2010 10
STAKEHOLDERS INFORMATION
Net Sales Trend
215
308
414 430
582 588
-
100
200
300
400
500
600
700
2004-05 2005-06 2006-07 2007-08 2008-09 2009-10
Net
Sal
es (I
n M
illio
n)
Profitability
-
5.00
10.00
15.00
20.00
25.00
30.00
35.00
2004-05 2005-06 2006-07 2007-08 2008-09 2009-10-
10.00
20.00
30.00
40.00
50.00
60.00
70.00
Profit Margin Gross Profit MarginReturn on Assets Return on EquityReturn on Capital Employed
Liquidity
1.962.34
3.19
3.90
5.09
4.27
1.05 1.18
1.91
2.54
3.40
2.63
-
1.00
2.00
3.00
4.00
5.00
6.00
2004-05 2005-06 2006-07 2007-08 2008-09 2009-10Current Ratio Quick Ratio
Asset Management
-
10.00
20.00
30.00
40.00
50.00
60.00
2004-05 2005-06 2006-07 2007-08 2008-09 2009-10-
0.50
1.00
1.50
2.00
2.50
Inventory Turnover Debtor TurnoverOperating Cycle Fixed Assets TurnoverSales / Equity
Debt Management
0.00
0.10
0.20
0.30
0.40
0.50
0.60
0.70
2004-05 2005-06 2006-07 2007-08 2008-09 2009-100.000.050.100.150.200.250.300.350.400.45
Debts to Assets Debts to EquityLong Term Debts to Equit
Market Ratios
-
1.00
2.00
3.00
4.00
5.00
6.00
7.00
2004-05 2005-06 2006-07 2007-08 2008-09 2009-10-
5.00
10.00
15.00
20.00
25.00
Earning Per Share Dividend per ShareBreak-up Value
Product Mix (Value Wise)
0%
10%
20%
30%
40%
50%
60%
70%
80%
90%
100%
2004-05 2005-06 2006-07 2007-08 2008-09 2009-10Explosives Detonator- Plain Detonator-ElectricSafety Fuse Detonating Cord Others
Share Price (High & Low)
18.40
34.05
57.0051.00
42.90 41.61
8.00
15.7522.15
25.7028.50
30.25
-
10
20
30
40
50
60
2004-05 2005-06 2006-07 2007-08 2008-09 2009-10
(In R
upee
s)
High Low

Annual Report2010 11
STATEMENT OF COMPLIANCE WITH THE CODE OF CORPORATE GOVERNANCE TO THE MEMEBERSFor the year ended June 30, 2010
This statement is being presented to comply with the Code of Corporate Governance contained in the Listing Regulations of the Karachi, Lahore and Islamabad stock exchanges for the purpose of establishing a framework of good corporate governance, whereby, as listed company is managed in compliance with best practices of corporate governance.
TheCompanyhasappliedtheprinciplescontainedintheCodeinthefollowingmanner:-
1. TheCompanyencouragesrepresentationofindependentnon-executivedirectorsonitsBoardofDirectors.AtpresenttheBoardincludes07independentnon-executivedirectorsoutoftotalstrengthof11members.
2. Thedirectorshaveconfirmedthatnoneofthemisservingasadirectorintenormorelistedcompanies including this company.
3. All the residentdirectorsof theCompanyare registeredas taxpayers andnoneof themhasdefaultedinpaymentofanyloantoabankingcompany,aDFIoranNBFIorbeingamemberof stock exchange has been declared as a defaulter by that stock exchange.
4. Therewasnocasualvacancyduringtheyear.
5. TheBoardhasprepared“StatementofEthicsandBusinessPractices”whichhasbeensignedbyall the Directors and employees of the Company.
6. TheBoardhasformulatedandadoptedvisionandmissionstatement.
7. All thepowersof theBoardhavebeendulyexercisedanddecisiononmaterial transactionsincluding appointment and determination of remuneration and terms and conditions of employment of the CEO and other Executive directors have been taken by the Board.
8. The meetings of the Board were presided over by the Chairman and the Board met at least once in every quarter. Written notices of the Board Meetings, along with agenda and working papers were circulated at least seven days before the meetings. The minutes of the meeting were appropriately recorded and circulated within thirty days of the respective meeting.
9. All the Directors on the Board are fully conversant with their duties and responsibilities as Director of corporate bodies. It has accordingly not been felt necessary to put them through any orientation.
10. NonewappointmentsofCEO,CFO,CompanySecretaryandInternalAuditorhavebeenmadeduring the year.
11. TheDirectors’reportforthisyearhasbeenpreparedincompliancewithrequirementsoftheCode and fully describes the salient matters required to be disclosed.

Annual Report2010 12
12. The financial statements of the companywere duly endorsed byCEO andCFO before theapproval of the Board.
13. TheDirectors,CEOandexecutivesdonotholdanyinterestinthesharesofthecompanyotherthan that disclosed in the pattern of shareholding.
14. ThecompanyhascompliedwithallthecorporateandfinancialreportingrequirementsoftheCode.
15. TheBoardhasformedanauditcommittee.Itcomprises04members,outofwhich02membersarenon-executivedirectorsincludingtheChairmanofthecommittee.
16. ThemeetingsoftheauditcommitteewereheldatleastonceeveryquarterpriortoapprovalofinterimandfinalresultsoftheCompanyandasrequiredbytheCode.Thetermsofreferenceofthe committee have been formed and advised to the committee for compliance.
17. TheBoardhasoutsourcedtheinternalauditfunctiontoRiasatKhan&Cowhoisconsideredsuitably qualified and experienced for the purpose and is conversant with the policies andprocedures of the company and they are involved in the internal audit function.
18. ThestatutoryauditorsoftheCompanyhaveconfirmedthattheyhavebeengivenasatisfactoryrating under the quality control review programme of the Institute of Chartered Accountants of Pakistan,thattheyoranyofthepartnersofthefirm,theirspousesandminorchildrendonotholdsharesoftheCompanyandthat thefirmandall itspartnersareincompliancewiththeInternationalFederationofAccountants(IFAC)guidelinesoncodeofethicsasadoptedbytheInstitute of Chartered Accountants of Pakistan.
19. ThestatutoryauditorsorthepersonsassociatedwiththemhavenotbeenappointedtoprovideotherservicesexceptinaccordancewiththelistingregulationandtheauditorshaveconfirmedthattheyhaveobservedIFACguidelinesinthisregard.
20. WeconfirmthatallothermaterialprinciplescontainedintheCodeofCorporateGovernancehave been compiled with.
21. TherelatedpartytransactionshavebeenplacedbeforetheauditcommitteeandapprovedbytheBoardofDirectorstocomplywiththerequirementsoflistingregulationnumberof37oftheKarachi Stock Exchange (Guarantee) Limited.
Islamabad: M. Afzal Khan20September2010 Chairman
Annual Report2010 13
REVIEW REPORT TO THE MEMBERSON STATEMENT OF COMPLIANCE WITH THE BEST PRACTICESOF CODE OF CORPORATE GOVERNANCE
We have reviewed the Statement of Compliance with the best practices contained in the Code of Corporate Governance prepared by the Board of Directors of Biafo Industries Limited (“the Company”) to comply with the Listing Regulations of the Karachi and Islamabad Stock Exchanges where the Company is listed.
The responsibility for compliance with the Code of Corporate Governance is that of the Board of Directors of the Company. Our responsibility is to review, to the extent where such compliance can beobjectivelyverified,whethertheStatementofCompliancereflectsthestatusoftheCompany’scompliance with the provisions of the Code of Corporate Governance and report if it does not. A review is limited primarily to inquiries of the Company personnel and review of various documents prepared by the Company to comply with the Code.
Aspartofourauditoffinancialstatementswearerequiredtoobtainanunderstandingoftheaccountingand internal control systems sufficient toplan theaudit anddevelopaneffectiveaudit approach.We are not required to consider whether the Board’s statement on internal control covers all risks and controls, or to form an opinion on the effectiveness of such internal controls, the Company’s corporate governance procedures and risks.
Further,Sub-Regulation (xiii) ofListingRegulations37notifiedby theKarachiStockExchange(Guarantee) Limited vide circular KSE/N-269 dated 19 January 2009 requires the Company toplace before the board of directors for their consideration and approval related party transactions distinguishing between transactions carried out on terms equivalent to those that prevail in arm’s length transactions and transactions which are not executed at arm’s length price recording proper justification for using such alternate pricing mechanism. Further, all such transactions are alsorequired to be separately placed before the audit committee. We are only required and have ensured compliance of requirement to the extent of approval of related party transactions by the board of directors and placement of such transactions before the audit committee. We have not carried out any procedures to determine whether the related party transactions were undertaken at arm’s length price or not.
Based on our review, nothing has come to our attention, which causes us to believe that the Statement ofCompliancedoesnotappropriately reflect theCompany’scompliance, inallmaterial respects,with the best practices contained in the Code of Corporate Governance.
KPMG Taseer Hadi & Co.Islamabad Chartered Accountants20September2010 RiazPesnani
Annual Report2010 14
AUDITORS’ REPORT TO THE MEMBERSOF BIAFO INDUSTRIES LIMITED
WehaveauditedtheannexedbalancesheetofBiafoIndustriesLimited(“theCompany”)asat30June2010andtherelatedprofitandlossaccount,statementofcomprehensiveincome,cashflowstatementandstatementofchangesinequitytogetherwith the notes forming part thereof, for the year then ended and we state that we have obtained all the information and explanations which, to the best of our knowledge and belief, were necessary for the purposes of our audit.
It is the responsibility of the Company’s management to establish and maintain a system of internal control, and prepare and present the above said statements in conformity with the approved accounting standards and requirements of the Companies Ordinance,1984.Ourresponsibilityistoexpressanopiniononthesestatementsbasedonouraudit.
We conducted our audit in accordance with the auditing standards as applicable in Pakistan. These standards require that we plan and perform the audit to obtain reasonable assurance about whether the above said statements are free of any material misstatement. An audit includes examining, on a test basis, evidence supporting the amounts and disclosures in the above said statements.Anauditalsoincludesassessingtheaccountingpoliciesandsignificantestimatesmadebymanagement,aswellas,evaluating the overall presentation of the above said statements. We believe that our audit provides a reasonable basis for our opinionand,afterdueverification,wereportthat:
a) in our opinion, proper books of account have been kept by the Company as required by the Companies ordinance, 1984;
b) in our opinion:
i) thebalancesheetandprofitandlossaccounttogetherwiththenotesthereonhavebeendrawnupinconformitywith theCompaniesOrdinance,1984,andare inagreementwith thebooksofaccountandarefurther inaccordancewithaccountingpoliciesconsistentlyapplied,exceptforthechangeasmentionedinnote2.5tothefinancialstatements,withwhichweconcur;
ii) theexpenditureincurredduringtheyearwasforthepurposeoftheCompany’sbusiness;and
iii) the business conducted, investments made and the expenditure incurred during the year were in accordance withtheobjectsoftheCompany;
c) in our opinion and to the best of our information and according to the explanations given to us, the balance sheet, profit and loss account, statement of comprehensive income, cashflow statement and statement of changes inequity together with the notes forming part thereof conform with approved accounting standards as applicable in Pakistan,and,givetheinformationrequiredbytheCompaniesOrdinance,1984,inthemannersorequiredandrespectivelygiveatrueandfairviewofthestateoftheCompany’saffairsasat30June2010andoftheprofit,itscashflowsandchangesinequityfortheyearthenended;and
d) inouropinion,ZakatdeductibleatsourceundertheZakatandUshrOrdinance,1980(XVIIIof1980)wasdeductedbytheCompanyanddepositedintheCentralZakatFundestablishedundersection7ofthatOrdinance.
KPMG Taseer Hadi & Co.Islamabad Chartered Accountants20September2010 RiazPesnani
Annual Report2010 15
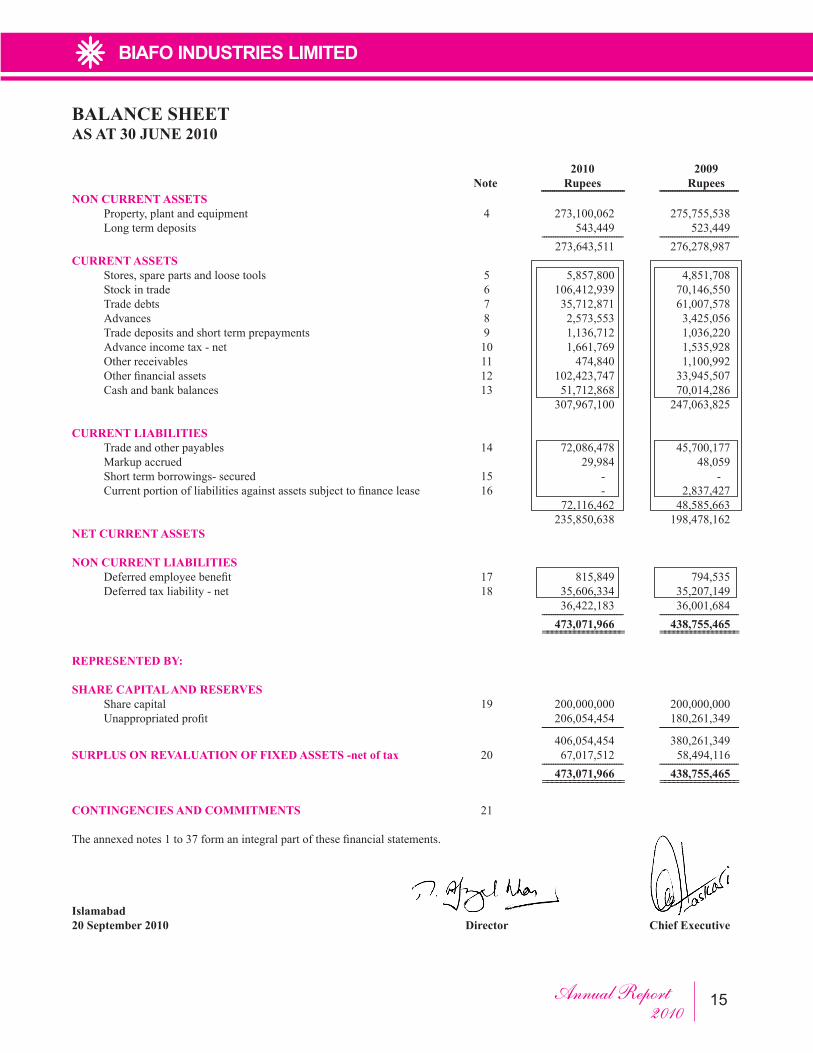
BALANCE SHEETAS AT 30 JUNE 2010
2010 2009 Note Rupees Rupees -------------------------------------- ------------------------------------NON CURRENT ASSETS Property,plantandequipment 4 273,100,062 275,755,538 Longtermdeposits 543,449 523,449 ------------------------------------ ------------------------------------ 273,643,511 276,278,987CURRENT ASSETS Stores,sparepartsandloosetools 5 5,857,800 4,851,708 Stockintrade 6 106,412,939 70,146,550 Tradedebts 7 35,712,871 61,007,578 Advances 8 2,573,553 3,425,056 Tradedepositsandshorttermprepayments 9 1,136,712 1,036,220 Advanceincometax-net 10 1,661,769 1,535,928 Otherreceivables 11 474,840 1,100,992 Otherfinancialassets 12 102,423,747 33,945,507 Cashandbankbalances 13 51,712,868 70,014,286 307,967,100 247,063,825
CURRENT LIABILITIES Tradeandotherpayables 14 72,086,478 45,700,177 Markupaccrued 29,984 48,059 Shorttermborrowings-secured 15 - - Currentportionofliabilitiesagainstassetssubjecttofinancelease 16 - 2,837,427 72,116,462 48,585,663 235,850,638 198,478,162NET CURRENT ASSETS
NON CURRENT LIABILITIES Deferredemployeebenefit 17 815,849 794,535 Deferredtaxliability-net 18 35,606,334 35,207,149 36,422,183 36,001,684 ------------------------------------ ------------------------------------ 473,071,966 438,755,465 ================== ==================
REPRESENTED BY:
SHARE CAPITAL AND RESERVES Sharecapital 19 200,000,000 200,000,000 Unappropriatedprofit 206,054,454 180,261,349 ------------------------------------ ------------------------------------ 406,054,454 380,261,349SURPLUS ON REVALUATION OF FIXED ASSETS -net of tax 20 67,017,512 58,494,116 ------------------------------------ ------------------------------------ 473,071,966 438,755,465 ================== ==================
CONTINGENCIES AND COMMITMENTS 21
Theannexednotes1to37formanintegralpartofthesefinancialstatements.
Islamabad20 September 2010 Director Chief Executive
Annual Report2010 16
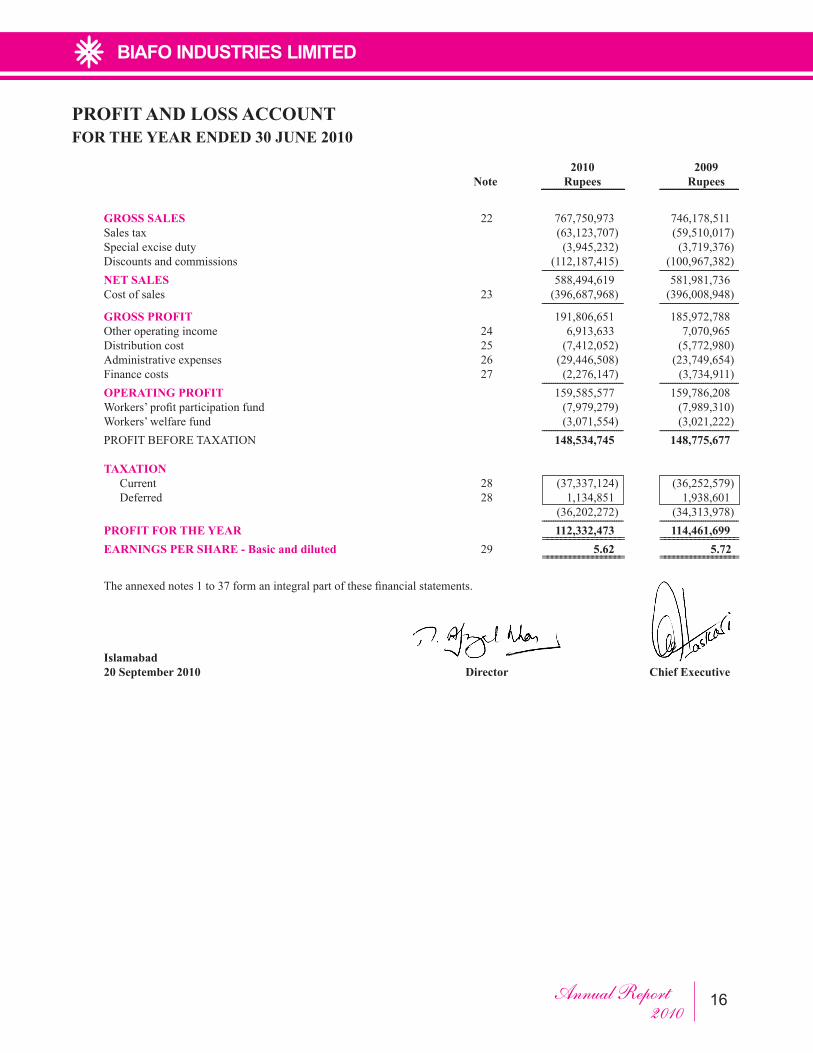
PROFIT AND LOSS ACCOUNT FOR THE YEAR ENDED 30 JUNE 2010
2010 2009 Note Rupees Rupees -------------------------------------- ------------------------------------ GROSS SALES 22 767,750,973 746,178,511 Salestax (63,123,707) (59,510,017) Specialexciseduty (3,945,232) (3,719,376) Discountsandcommissions (112,187,415) (100,967,382) ------------------------------------ ------------------------------------ NET SALES 588,494,619 581,981,736 Costofsales 23 (396,687,968) (396,008,948) ------------------------------------ ------------------------------------ GROSS PROFIT 191,806,651 185,972,788 Otheroperatingincome 24 6,913,633 7,070,965 Distributioncost 25 (7,412,052) (5,772,980) Administrativeexpenses 26 (29,446,508) (23,749,654) Financecosts 27 (2,276,147) (3,734,911) ------------------------------------ ------------------------------------ OPERATING PROFIT 159,585,577 159,786,208 Workers’profitparticipationfund (7,979,279) (7,989,310) Workers’welfarefund (3,071,554) (3,021,222) ------------------------------------ ------------------------------------ PROFITBEFORETAXATION 148,534,745 148,775,677
TAXATION Current 28 (37,337,124) (36,252,579) Deferred 28 1,134,851 1,938,601 (36,202,272) (34,313,978) ------------------------------------ ------------------------------------ PROFIT FOR THE YEAR 112,332,473 114,461,699 ================== ================== EARNINGS PER SHARE - Basic and diluted 29 5.62 5.72 ================== ==================
Theannexednotes1to37formanintegralpartofthesefinancialstatements.
Islamabad 20 September 2010 Director Chief Executive
Annual Report2010 17
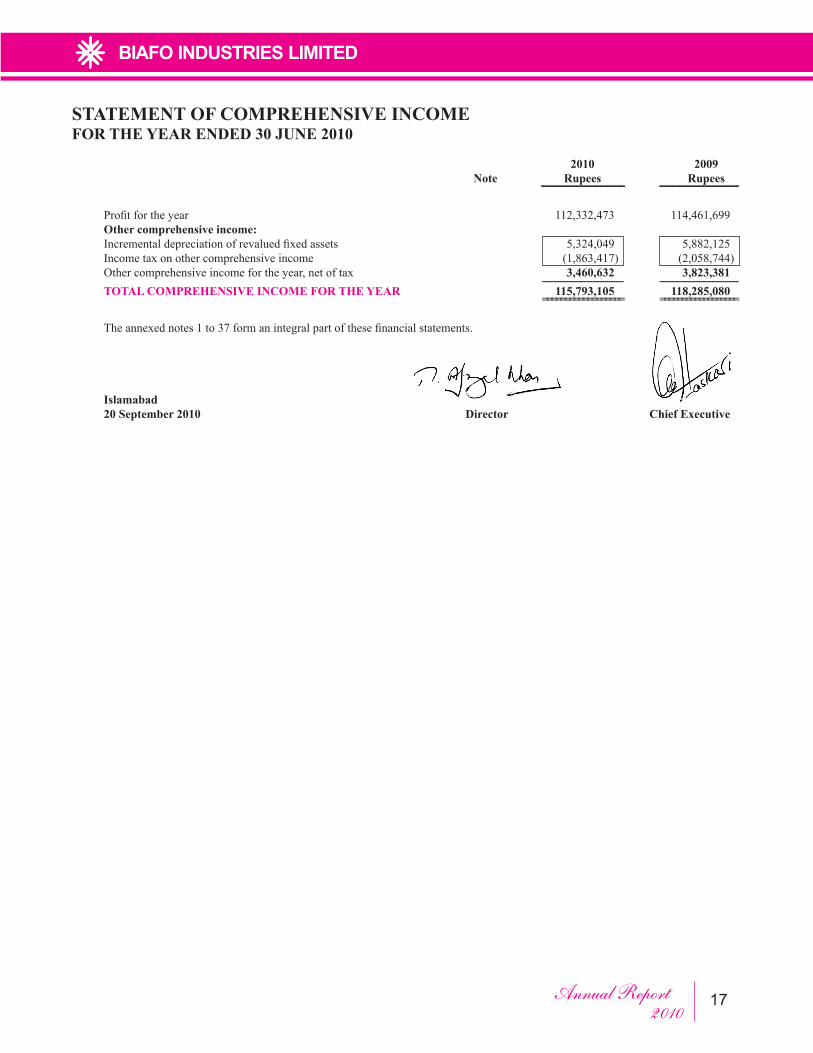
STATEMENT OF COMPREHENSIVE INCOMEFOR THE YEAR ENDED 30 JUNE 2010
2010 2009 Note Rupees Rupees -------------------------------------- ------------------------------------ Profitfortheyear 112,332,473 114,461,699 Other comprehensive income: Incrementaldepreciationofrevaluedfixedassets 5,324,049 5,882,125 Incometaxonothercomprehensiveincome (1,863,417) (2,058,744) Other comprehensive income for the year, net of tax 3,460,632 3,823,381 ------------------------------------ ------------------------------------ TOTAL COMPREHENSIVE INCOME FOR THE YEAR 115,793,105 118,285,080 ================== ==================
Theannexednotes1to37formanintegralpartofthesefinancialstatements.
Islamabad 20 September 2010 Director Chief Executive
Annual Report2010 18
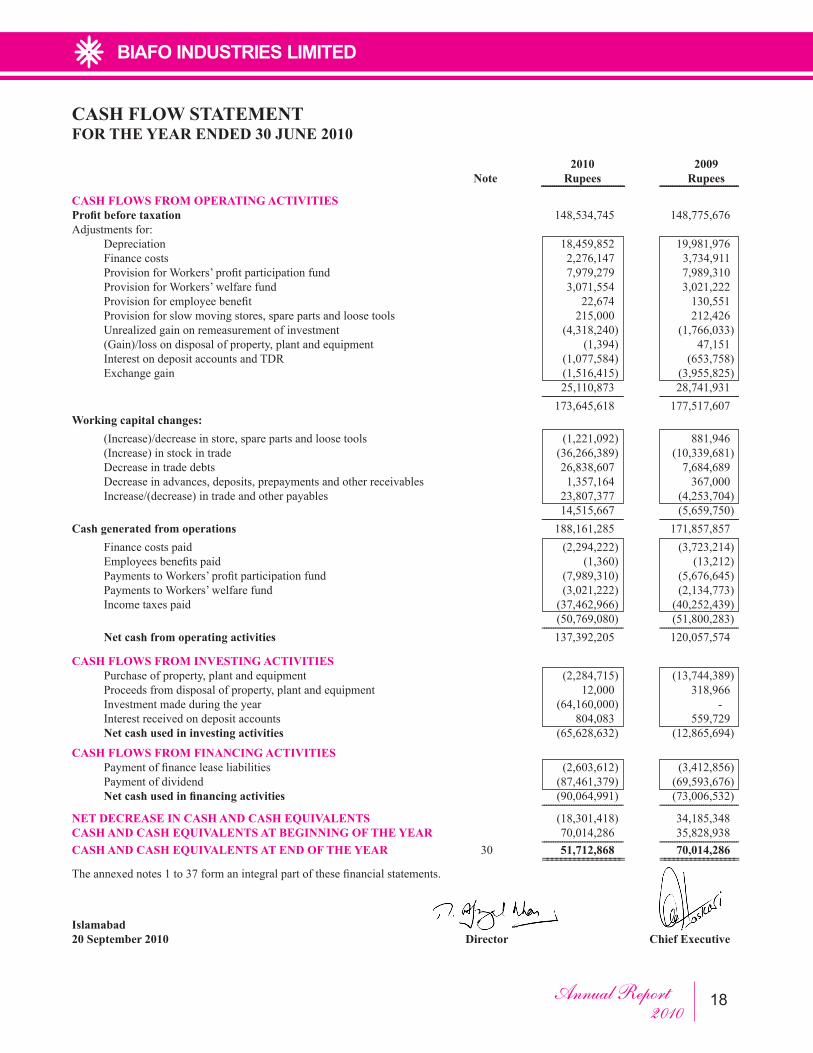
CASH FLOW STATEMENTFOR THE YEAR ENDED 30 JUNE 2010
2010 2009 Note Rupees Rupees -------------------------------------- ------------------------------------CASH FLOWS FROM OPERATING ACTIVITIESProfit before taxation 148,534,745 148,775,676Adjustments for: Depreciation 18,459,852 19,981,976 Financecosts 2,276,147 3,734,911 ProvisionforWorkers’profitparticipationfund 7,979,279 7,989,310 ProvisionforWorkers’welfarefund 3,071,554 3,021,222 Provisionforemployeebenefit 22,674 130,551 Provisionforslowmovingstores,sparepartsandloosetools 215,000 212,426 Unrealizedgainonremeasurementofinvestment (4,318,240) (1,766,033) (Gain)/lossondisposalofproperty,plantandequipment (1,394) 47,151 InterestondepositaccountsandTDR (1,077,584) (653,758) Exchangegain (1,516,415) (3,955,825) 25,110,873 28,741,931 ------------------------------------ ------------------------------------ 173,645,618 177,517,607Working capital changes: (Increase)/decreaseinstore,sparepartsandloosetools (1,221,092) 881,946 (Increase)instockintrade (36,266,389) (10,339,681) Decreaseintradedebts 26,838,607 7,684,689 Decreaseinadvances,deposits,prepaymentsandotherreceivables 1,357,164 367,000 Increase/(decrease)intradeandotherpayables 23,807,377 (4,253,704) 14,515,667 (5,659,750) ------------------------------------ ------------------------------------Cash generated from operations 188,161,285 171,857,857 Financecostspaid (2,294,222) (3,723,214) Employeesbenefitspaid (1,360) (13,212) PaymentstoWorkers’profitparticipationfund (7,989,310) (5,676,645) PaymentstoWorkers’welfarefund (3,021,222) (2,134,773) Incometaxespaid (37,462,966) (40,252,439) (50,769,080) (51,800,283) ------------------------------------ ------------------------------------ Net cash from operating activities 137,392,205 120,057,574
CASH FLOWS FROM INVESTING ACTIVITIES Purchaseofproperty,plantandequipment (2,284,715) (13,744,389) Proceedsfromdisposalofproperty,plantandequipment 12,000 318,966 Investmentmadeduringtheyear (64,160,000) - Interestreceivedondepositaccounts 804,083 559,729 Net cash used in investing activities (65,628,632) (12,865,694)
CASH FLOWS FROM FINANCING ACTIVITIES Paymentoffinanceleaseliabilities (2,603,612) (3,412,856) Paymentofdividend (87,461,379) (69,593,676) Net cash used in financing activities (90,064,991) (73,006,532) ------------------------------------ ------------------------------------NET DECREASE IN CASH AND CASH EQUIVALENTS (18,301,418) 34,185,348CASH AND CASH EQUIVALENTS AT BEGINNING OF THE YEAR 70,014,286 35,828,938 ------------------------------------ ------------------------------------CASH AND CASH EQUIVALENTS AT END OF THE YEAR 30 51,712,868 70,014,286 ================== ==================Theannexednotes1to37formanintegralpartofthesefinancialstatements.
Islamabad20 September 2010 Director Chief Executive
Annual Report2010 19
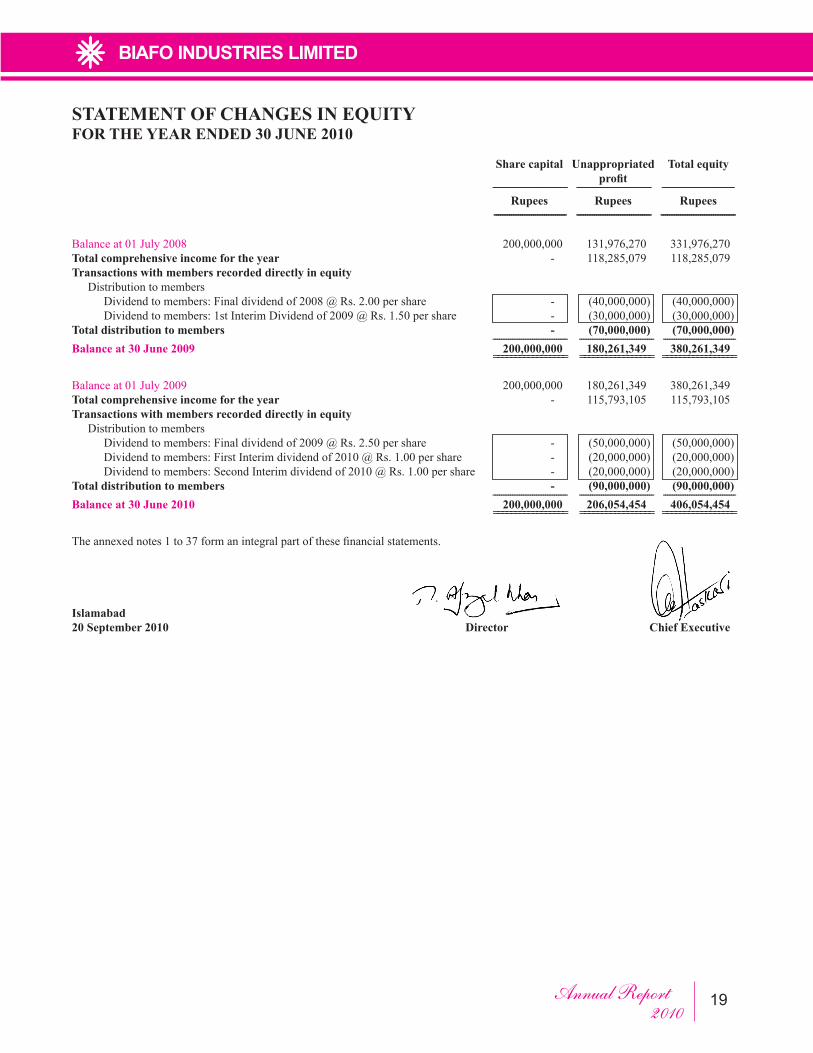
STATEMENT OF CHANGES IN EQUITYFOR THE YEAR ENDED 30 JUNE 2010
Share capital Unappropriated Total equity profit ---------------------------------- ---------------------------------- --------------------------------- Rupees Rupees Rupees --------------------------------- ---------------------------------- ----------------------------------Balanceat01July2008 200,000,000 131,976,270 331,976,270Total comprehensive income for the year - 118,285,079 118,285,079Transactions with members recorded directly in equity Distribution to members Dividendtomembers:[email protected] - (40,000,000) (40,000,000) Dividendtomembers:[email protected] - (30,000,000) (30,000,000)Total distribution to members - (70,000,000) (70,000,000) ---------------------------------- ---------------------------------- ---------------------------------Balance at 30 June 2009 200,000,000 180,261,349 380,261,349 ================= ================= =================
Balanceat01July2009 200,000,000 180,261,349 380,261,349Total comprehensive income for the year - 115,793,105 115,793,105Transactions with members recorded directly in equity Distribution to members Dividendtomembers:[email protected] - (50,000,000) (50,000,000) Dividendtomembers:[email protected] - (20,000,000) (20,000,000) Dividendtomembers:[email protected] - (20,000,000) (20,000,000)Total distribution to members - (90,000,000) (90,000,000) ---------------------------------- ---------------------------------- ---------------------------------Balance at 30 June 2010 200,000,000 206,054,454 406,054,454 ================= ================= =================
Theannexednotes1to37formanintegralpartofthesefinancialstatements.
Islamabad20 September 2010 Director Chief Executive
Annual Report2010 20
1 LEGAL STATUS AND OPERATIONS
BiafoIndustriesLimited(“theCompany”)wasincorporatedinPakistanon07September1988asapubliclimitedcompanyundertheCompaniesOrdinance,1984anditssharesarequotedonthe Karachi and Islamabad Stock Exchanges.
TheCompanystarteditscommercialproductionon01July1994andisprincipallyengagedinthemanufacturing of commercial explosives and blasting accessories including detonators and other materials. The Company has set up its industrial undertaking in Hattar Industrial Estate, Khyber Pakhtoonkhwa,with its registeredoffice locatedat203-204,2ndFloor,GulistanKhanHouse,82-E,Fazal-ul-HaqRoad,BlueArea,Islamabad,Pakistan.
2 BASIS OF PREPARATION
2.1 Statement of compliance
These financial statements have been prepared in accordance with the approved accountingstandards as applicable in Pakistan. Approved accounting standards comprise of such International FinancialReportingStandards(IFRSs)issuedbytheInternationalAccountingStandardsBoardasarenotifiedundertheCompaniesOrdinance,1984,provisionsofanddirectivesissuedundertheCompaniesOrdinance,1984.Incaserequirementsdiffer,theprovisionsordirectivesoftheCompaniesOrdinance,1984,shallprevail.
2.2 Basis of measurement
These financial statements have been prepared on the historical cost basis except for thefollowing;
- certainitemsofproperty,plantandequipmentaremeasuredatrevaluedamounts;and - investmentatfairvaluethroughprofitorlossismeasuredatfairmarketvalue.
The methods used to measure fair values are discussed further in their respective policy notes.
2.3 Functional and presentation currency
These financial statements are presented in Pakistan Rupee (PKR), which is the Company’sfunctionalcurrency.AllfinancialinformationpresentedinPKRhasbeenroundedofftothenearestof PKR, unless otherwise stated.
2.4 Significant estimates
The preparation of financial statements in conformitywith the approved accounting standards
NOTES TO THE FINANCIAL STATEMENTSFOR THE YEAR ENDED 30 JUNE 2010
Annual Report2010 21
requires management to make judgments, estimates and assumptions that affect the application of policies and reported amounts of assets and liabilities, income and expenses. The estimates and associated assumptions are based on historical experience and various other factors that are believed to be reasonable under the circumstances, the results of which form the basis of making judgment about carrying value of assets and liabilities that are not readily apparent from other sources. Actual results may differ from these estimates.
The estimates and underlying assumptions are reviewed on an ongoing basis. Revisions to accounting estimates are recognized in the period in which estimates are revised if the revision affects only that period, or in the period of the revision and future periods if the revision affects both current and future periods.
Judgments made by the management in the application of approved accounting standards that havesignificanteffectonthefinancialstatementsandestimateswithasignificantriskofmaterialadjustment in the next year are discussed in the ensuing paragraphs.
Property, plant and equipment
The Company reviews the useful lives of property, plant and equipment on regular basis. Any change in the estimates in future years might affect the carrying amounts of the respective items of assets with a corresponding affect on the depreciation and impairment.
Provisions
Estimates of the amount of provisions recognized are based on current legal and constructive requirements.Becauseactualoutflowscandifferfromestimatesduetochangesinlaws,regulations,public expectations, technology, prices and conditions, and can take place many years in the future, the carrying amounts of provisions are regularly reviewed and adjusted to take account of such changes.
Impairment of assets
The carrying amounts of the Company’s assets are reviewed at each balance sheet date to determine whether there is any indication of impairment loss. Any change in the estimates in future years might affect the carrying amounts of the respective assets with a corresponding affect on the depreciation charge and impairment.
Taxation
Estimates and judgments occur in the calculation of certain tax liabilities and in the determination of the recoverability of certain deferred tax assets, which arise from temporary differences and
NOTES TO THE FINANCIAL STATEMENTSFOR THE YEAR ENDED 30 JUNE 2010
Annual Report2010 22
carry forwards. The Company takes into account the current income tax law and decisions taken by appellate authorities. Instances where the Company’s view differs from the view taken by the income tax department at the assessment stage and where the Company considers that its view on items of material nature is in accordance with law, the amounts are shown as contingent liabilities.
2.5 Change in accounting policy
The Company applied revised IAS 1 “Presentation of Financial Statements”, which becameeffectivefrom01January2009.Accordinglyallowners’changesinequityarepresentedinthestatement of changes in equity,whereas all non-owner changes in equity are presented in thestatement of comprehensive income.
Comparative information has been re-presented in conformity with the revised standard. Thechange in accounting policy impacts presentation only without any impact on earnings per share.
2.6 New accounting standards and IFRIC interpretations that are not yet effective
The following standards, interpretations and amendments to approved accounting standards areeffectiveforaccountingperiodsbeginningfromthedatesspecifiedbelow.Thesestandards,interpretations and the amendments are either not relevant to the Company’s operations or are not expectedtohavesignificantimpactontheCompany’sfinancialstatements;
IFRS2(amendmentsrelatingtogroupcash-settledshare-basedPaymenttransactions)-Share-basedPayment(effectiveforannualperiodsbeginningonorafter01January2010).
IFRS5(amendmentsresultingfromApril2009AnnualImprovementstoIFRSs)-Non-CurrentAssets Held for Sale and Discontinued Operations (effective for annual periods beginning on or after01January2010).
IFRS 8 (amendments resulting fromApril 2009Annual Improvements to IFRSs) - OperatingSegments(effectiveforannualperiodsonorafter01January2010).
IFRS9-(ClassificationandMeasurement)-FinancialInstruments(effectiveforannualperiodsbeginningonorafter01January2010).
IAS1(amendmentsresultingfromApril2009AnnualImprovementstoIFRSs)-PresentationofFinancialStatements(effectiveforannualperiodsbeginningonorafter01January2010).
IAS7(amendments resultingfromApril2009Annual Improvements to IFRSs) -StatementofCashFlows(effectiveforannualperiodsbeginningonorafter01January2010).
NOTES TO THE FINANCIAL STATEMENTSFOR THE YEAR ENDED 30 JUNE 2010
Annual Report2010 23
IAS17(amendmentsresultingfromApril2009AnnualImprovementstoIFRSs)-Leases(effectiveforannualperiodsbeginningonorafter01January2010).
IAS24 (revised definition of related parties) -RelatedPartyDisclosures (effective for annualperiodsbeginningonorafter01January2011).
IAS32(amendmentsrelatingtoclassificationofrightissue)-FinancialInstruments:Presentation(effectiveforannualperiodsbeginningonorafter01January2010).
IAS36(amendmentsresultingfromApril2009AnnualImprovementstoIFRSs)-ImpairmentofAssets(effectiveforannualperiodsbeginningonorafter01January2010).
IAS 39 (amendments resulting fromApril 2009Annual Improvements to IFRSs) - FinancialInstruments:RecognitionandMeasurement(effectiveforannualperiodsbeginningonorafter01January2010).
IFRIC14(IAS19-TheLimitonaDefinedBenefitAsset,MinimumFundingRequirementsandtheir Interaction), amendment with respect to voluntary prepaid contributions is effective for annual periodsbeginningonorafter01January2011.
IFRIC 19 - Extinguishing Financial Liabilities with Equity Instruments (effective for annualperiodsbeginningonorafter01July2010.
The International Accounting Standards Board made certain amendments to existing standards as part of its improvement project. The effective dates for these amendments vary by standard and will be applicable to the Company in ensuing years. These amendments are unlikely to have an impactontheCompany’sfinancialstatements.
3 SIGNIFICANT ACCOUNTING POLICIES
The accounting policies set out below have been applied consistently to all periods presented in thesefinancialstatements,exceptasexplainedinnote2.5whichaddresseschangeinaccountingpolicy.
3.1 Property, plant and equipment
3.1.1 Owned
Property, plant and equipment other than leasehold land and capital work in progress, is stated at cost or revalued amount less accumulated depreciation and accumulated impairment losses, if any.
NOTES TO THE FINANCIAL STATEMENTSFOR THE YEAR ENDED 30 JUNE 2010
Annual Report2010 24
Leasehold land is stated at cost or revalued amount, as the case may be. Capital work in progress is stated at cost less accumulated impairment losses, if any, and is transferred to the respective item of property, plant and equipment when available for intended use. Cost in relation to property, plant and equipment comprises acquisition and other directly attributable costs.
Depreciation is recognized inprofitor loss accountona reducingbalancemethodat the ratesspecifiedinnote4tothefinancialstatements.Depreciationischargedfromthedatetheassetisacquired or capitalized to the date it is disposed off. Leasehold land is not depreciated.
Surplus arising on revaluation is credited to the surplus on revaluation offixed asset account.Deficit arising on subsequent revaluation of property, plant and equipment is adjusted againstthebalanceintheabovementionedsurplusaccount.Thesurplusonrevaluationoffixedassetstothe extent of incremental depreciation charged on the related assets is transferred to equity net of deferredtaxwithanyremaininglossrecognisedimmediatelyinprofitorloss.
The cost of replacing part of an item of property, plant and equipment is recognised in the carrying amountoftheitemifitisprobablethatthefutureeconomicbenefitsembodiedwithinthepartwillflowtotheCompanyanditscostcanbemeasuredreliably.Thecarryingamountofthereplacedpartisderecognized.Thecostsoftheday-to-dayservicingofproperty,plantandequipmentarerecognisedinprofitorlossasincurred.
Gains and losses on disposal of an item of property, plant and equipment are determined by comparing the proceeds from disposal with the carrying amount of property, plant and equipment, andarerecognisednetwithin“otheroperatingincome”inprofitorlossaccount.Whenrevaluedassetissold,theamountincludedinthesurplusonrevaluationoffixedassetsnetofdeferredtaxis transferred directly to equity.
3.1.2 Leased
Leased property, plant and equipment in terms of which the Company assumes substantially all therisksandrewardsofownershipareclassifiedasfinanceleases.Uponinitialrecognitiontheleased asset is measured at an amount equal to the lower of its fair value and the present value of the minimum lease payments. Subsequent to initial recognition, the asset is accounted for in accordance with the accounting policy applicable to that asset.
Minimumleasepaymentsmadeunderfinanceleasesareapportionedbetweenthefinancechargesand the reduction of outstanding liability. The outstanding obligations under the lease agreements areshownasaliabilitynetoffinancechargesallocabletofutureperiods.Thefinancechargeisallocated to each period using the lease term so as to produce a constant periodic rate of interest on the remaining balance of the liability. Contingent lease payments are accounted for by revising
NOTES TO THE FINANCIAL STATEMENTSFOR THE YEAR ENDED 30 JUNE 2010
Annual Report2010 25
the minimum lease payments over the remaining term of the lease when the lease adjustment is confirmed.
Leased assets are depreciated over the useful life of the asset using the reducing balance method at theratesgiveninnote4tothesefinancialstatements.
3.2 Stock in trade
Stock in trade is measured at lower of cost and net realizable value. Cost is determined as follows:
Material in transit: at material cost plus other charges paid thereon Raw material: at moving average cost Work in process: at material cost Finishedgoods: atmovingaveragecostandrelatedmanufacturingexpenses
Cost comprises of purchase and other costs incurred in bringing the material to their present locationandcondition.Netrealizablevaluesignifiestheestimatedsellingpriceintheordinarycourse of business less estimated costs necessarily to be incurred in order to make a sale.
3.3 Stores, spare parts and loose tools
Stores, spare parts and loose tools are valued at the lower of cost and net realizable value less allowance for slow moving and obsolete items. Cost is determined on the weighted average basis and comprises costs of purchase and other costs incurred in bringing the items to their present locationandcondition.Netrealizablevaluesignifiestheestimatedsellingpriceintheordinarycourse of business less costs necessarily to be incurred in order to make a sale.
The Company reviews the carrying amount of stores and spare parts on a regular basis and provision is made for obsolescence.
3.4 Investments
All purchases and sale of investments are recognized using settlement date accounting. Settlement date is the date on which investments are delivered to or by the Company. All investments are derecognizedwhen the right to receiveeconomicbenefits from the investmentshasexpiredorhas been transferred and the Company has transferred substantially all the risks and rewards of ownership.
3.4.1 Investments held to maturity
InvestmentswithfixedordeterminablepaymentsandfixedmaturityandwheretheCompanyhas
NOTES TO THE FINANCIAL STATEMENTSFOR THE YEAR ENDED 30 JUNE 2010
Annual Report2010 26
positive intentandability tohold investments tomaturityareclassifiedas investmentsheld tomaturity. These are initially recognized at cost inclusive of transaction costs and are subsequently carried at amortized cost using the effective interest rate method, less any impairment losses.
3.4.2 Investment at fair value through profit or loss
Aninvestmentisclassifiedatfairvaluethroughprofitorlossifitisheldfortradingorisdesignatedassuchuponinitialrecognition.Financialinstrumentsaredesignatedatfairvaluethroughprofitorloss if the Company manages such investments and makes purchase and sale decisions based on theirfairvalueinaccordancewiththeCompany’sinvestmentstrategy.Allinvestmentsclassifiedasinvestmentsatfairvaluethroughprofitorlossareinitiallymeasuredatcostbeingfairvalueofconsideration given. At subsequent dates these investments are measured at fair value, determined on the basis of prevailing market prices, with any resulting gain or loss recognized directly in the profitandlossaccount.
3.5 Taxation
Taxation comprises current and deferred tax income tax. Income tax expense is recognized in the profitandlossaccountexcepttotheextentthatitrelatestoitemsrecognizeddirectlyinequity,ifany, in which case the tax amounts are recognized in equity.
3.5.1 Current
Provision for current taxation is based on taxable income for the year at the applicable tax rates after taking into account tax credit and tax rebates, if any and any adjustment to tax payable in respect of previous years.
3.5.2 Deferred
Deferred tax is recognized using the balance sheet liability method providing for temporary differencesbetweenthecarryingamountsofassetsandliabilitiesforfinancialstatementsandthecorresponding tax bases used in the computation of tax. In addition Company also records deferred tax asset on available tax losses. The amount of deferred tax provided is based on the expected manner of realization or settlement of the carrying amount of assets and liabilities using the tax rates enacted at the balance sheet date.
Adeferredtaxassetisrecognizedonlytotheextentthatitisprobablethatfuturetaxableprofitswill be available against which the asset can be utilized. Deferred tax assets are reduced to the extentthatitisnolongerprobablethattherelatedtaxbenefitwillberealized.FurthertheCompanyalsorecognizesdeferredtaxliabilityonsurplusonrevaluationoffixedassetswhichisadjusted
NOTES TO THE FINANCIAL STATEMENTSFOR THE YEAR ENDED 30 JUNE 2010
Annual Report2010 27
against the related surplus. The effect on deferred taxation of the portion of income expected to fall under presumptive tax regime is adjusted in accordance with the requirements of accounting technicalrelease27oftheInstituteofCharteredAccountantsofPakistan.
Deferred tax assets and liabilities are offset if there is a legally enforceable right to offset current tax liabilities and assets, and they relate to income taxes levied by the same tax authority.
3.6 Employee benefits
Salaries,wagesandbenefitsareaccruedintheperiodinwhichtheassociatedservicesarerenderedby employees of the Company and measured on an undiscounted basis. The accounting policy for employeeretirementbenefitsisdescribedbelow;
3.6.1 Accumulating compensated absences
TheCompanymakesprovisionforcompensatedun-availedabsencesaccumulatedbyitsemployeesandchargefortheyearisrecognizedinprofitandlossaccount.
3.6.2 Provident fund
The Company has established a recognized provident fund for the management employees. Effective01July2004,thebenefitisalsoavailabletoworkersoftheCompany.ProvisionismadeinthefinancialstatementsfortheamountpayablebytheCompanytothefundandinthisregardcontributionsaremademonthlyattherateof8.33%ofbasicsalaryequallybytheCompanyandtheemployee.Obligationsforcontributionstoplanisrecognisedasanemployeebenefitexpenseinprofitorlossaccountwhentheyaredue.
3.7 Revenue recognition
Revenue from the sale of goods is measured at the fair value of the consideration received or receivable, net of government levies, trade discounts and commission. Revenue is recognised whenthesignificantrisksandrewardsofownershiphavebeentransferredtothebuyer,recoveryof the consideration is probable, the associated costs and possible return of goods can be estimated reliably, there is no continuing management involvement with the goods, and the amount of revenue can be measured reliably.
Services include training, and professional services. Revenue from services is recognized as the services are completed or ratably over the contractual period.
3.8 Foreign currencies
PKR is the functional currency of the Company. Transactions in foreign currencies are recorded
NOTES TO THE FINANCIAL STATEMENTSFOR THE YEAR ENDED 30 JUNE 2010
Annual Report2010 28
at the rates of exchange ruling on the date of the transaction. All monetary assets and liabilities denominated in foreign currencies are translated into PKR at the rate of exchange ruling on the balance sheet date and exchange differences, if any, are charged to income for the year.
3.9 Finance income and cost
Financeincomecomprisesinterestincomeonfundsinvested,exchangegainandchangesinthefairvalueoffinancialassetatfairvaluethroughprofitorloss.Incomeonbankdepositsisaccruedon a time proportion basis by reference to the principal outstanding and the applicable rate of return.Foreigncurrencygainsandlossesarereportedonanetbasis.
Financecostcomprisesinterestexpenseonborrowings,financechargeonleasedassetsandbankcharges. Borrowing costs incurred for the construction of any qualifying asset are capitalised during the period of time that is required to complete and prepare the asset for its intended use. Otherborrowingcostsareexpensedintheprofitandlossaccountintheperiodinwhichtheyareincurred.
3.10 Financial instruments
FinancialassetsandfinancialliabilitiesarerecognizedatthetimewhentheCompanybecomesapartytothecontractualprovisionsoftheinstruments.TheCompanyde-recognizesafinancialasset or a portion of financial assetwhen, and onlywhen, theCompany looses control of thecontractualrightthatcomprisethefinancialassetorportionoffinancialasset.While,afinancialliabilityorpartoffinancialliabilityisde-recognizedfromthebalancesheetwhen,andonlywhen,it is extinguished i.e.,when theobligation specified in thecontract isdischarged, cancelledorexpired.
Financialassetsmainlycompriselongtermdeposits,tradedebts,advances,otherreceivables,cashandbankbalances.Financialliabilitiesareclassifiedaccordingtothesubstanceofthecontractualarrangementsenteredinto.Significantfinancialliabilitiesareobligationsunderleasefinance,longterm loans, creditors, accrued and other liabilities.
Allfinancialassetsandliabilitiesareinitiallymeasuredatfairvalue.Thesefinancialassetsandliabilities are subsequently measured at fair value, or cost, as the case may be.
3.11 Offsetting
Financialassetsandliabilitiesandtaxassetsandliabilitiesaresetoffinthebalancesheet,onlywhen the Company has a legally enforceable right to set off the recognized amounts and intends either to settle on a net basis or to realize the assets and settle the liabilities simultaneously.
NOTES TO THE FINANCIAL STATEMENTSFOR THE YEAR ENDED 30 JUNE 2010
Annual Report2010 29
3.12 Trade and other payables
Liabilities for trade and other payables are carried at cost which is fair value of the consideration to be paid in the future for goods and services received.
3.13 Trade and other receivables
Trade and other receivable are stated at original invoice amount as reduced by appropriate provision for impairment. Known impaired receivables are written off, while receivables considered doubtful of recovery are fully provided for.
The allowance for doubtful accounts is based on the Company’s assessment of the Collectability of counterparty accounts. The Company regularly reviews its debts and receivables that remain outstandingpasttheirapplicablepaymenttermsandestablishesallowanceandpotentialwrite-offsby considering factors such as historical experience, credit quality, age of the accounts receivable balances, and current economic conditions that may affect a customer’s ability to pay.
3.14 Provisions
A provision is recognized in the balance sheet when the Company has a legal or constructive obligationasaresultofapastevent,anditisprobablethatanoutflowofeconomicbenefitswillbe required to settle the obligation and a reliable estimate can be made of the amount of obligation. Provisionsarereviewedateachbalancesheetdateandifrequiredareadjustedtoreflectthecurrentbest estimate.
3.15 Dividend
Dividend distribution to the Company’s members is recognised as a liability in the period in which the dividends are approved.
3.16 Cash and cash equivalents
Cashandcashequivalentsforthepurposeofcashflowstatementcomprisecashinhandandatbank and short term borrowings that form an integral part of the Company’s cash management. Cash and cash equivalents are carried in the balance sheet at cost.
3.17 Impairment
3.17.1 Financial assets
Afinancialasset isassessedateachreportingdate todeterminewhether there isanyobjectiveevidencethatitisimpaired.Afinancialassetisconsideredtobeimpairedifobjectiveevidence
NOTES TO THE FINANCIAL STATEMENTSFOR THE YEAR ENDED 30 JUNE 2010
Annual Report2010 30
indicatesthatoneormoreeventshavehadanegativeeffectontheestimatedfuturecashflowsofthat asset.
Individually significant financial assets are tested for impairment on an individual basis. Theremaining financial assets are assessed collectively in groups that share similar credit riskcharacteristics.
Allimpairmentlossesarerecognisedinprofitorlossaccount.Animpairmentlossisreversedintheprofitandlossaccountifthereversalcanberelatedobjectivelytoaneventoccurringaftertheimpairment loss was recognised.
3.17.2 Non financial assets
The carrying amount of the Company’s assets are reviewed at each balance sheet date to determine whether there is any indication of impairment loss. If any such indication exists, recoverable amount is estimated in order to determine the extent of the impairment loss, if any.
Therecoverableamountofanassetorcash-generatingunitisthegreaterofitsvalueinuseanditsfairvaluelesscoststosell.Inassessingvalueinuse,theestimatedfuturecashflowsarediscountedtotheirpresentvalueusingapre-taxdiscountratethatreflectscurrentmarketassessmentsofthetimevalueofmoneyandtherisksspecifictotheasset.Intheabsenceofanyinformationaboutthefairvalueofacash-generatingunit,therecoverableamountisdeemedtobethevalueinuse.Forthe purpose of impairment testing, assets are grouped together into the smallest group of assets thatgeneratescashinflowsfromcontinuingusethatarelargelyindependentofthecashinflowsofotherassetsorgroupsofassets(the“cash-generatingunit”)
Animpairmentlossisrecognisedif thecarryingamountofanassetor itscash-generatingunitexceedsitsestimatedrecoverableamount.Impairmentlossesarerecognisedinprofitorloss.Whereconditions giving rise to impairment subsequently reverse, the effect of the impairment charge is alsoreversedasacredittotheprofitandlossaccount.Reversalofimpairmentlossisrestrictedtothe original cost of asset.
NOTES TO THE FINANCIAL STATEMENTSFOR THE YEAR ENDED 30 JUNE 2010
Annual Report2010 31
NO
TE
S TO
TH
E F
INA
NC
IAL
STAT
EM
EN
TS
FOR
TH
E Y
EA
R E
ND
ED
30
JUN
E 2
010
4 PR
OPE
RT
Y, P
LA
NT
AN
D E
QU
IPM
EN
T
Note
Leas
ehol
d la
ndBu
ildin
g on
lease
hold
land
Plan
t and
m
achi
nery
Fork
lifte
rTo
ols a
nd
equi
pmen
tTu
be w
ellO
ffice
equi
pmen
tFu
rnitu
re an
fix
ture
sEl
ectr
icap
plia
nces
Vehi
cles
Capi
tal w
ork
in
prog
ress
Sub
tota
lFo
rk li
fter
Plan
t and
m
achi
nery
Vehi
cles
Sub
tota
l
Rupe
es
Cost/
Rev
alue
d am
ount
Balan
ceasat01July2008
72,298,000
27,855,850
234,303,720
708,458
998,926
306,600
2,181,289
1,542,209
551,379
1,555,407
110,700
342,412,538
1,285,000
4,247,315
9,482,681
15,014,996
357,427,534
Additions
-
-
12,548,484
-
-
-
311,340
30,000
-
723,790
130,775
13,744,389
-
-
-
-
13,744,389
Disposals
-
-
-
-
-
-
-
-
-
(691,294)
-
(691,294)
-
-
-
-
(691,294)
Transfe
rin/(out)
-
241,475
-
-
-
-
-
-
-
1,973,780
(241,475)
1,973,780
-
-
(1,973,780)
(1,973,780)
-
Bala
nce a
s at 3
0 Jun
e 200
972,298,000
28,097,325
246,852,204
708,458
998,926
306,600
2,492,629
1,572,209
551,379
3,561,683
-
357,439,413
1,285,000
4,247,315
7,508,901
13,041,216
370,480,629
Balan
ceasat01July2009
72,298,000
28,097,325
246,852,204
708,458
998,926
306,600
2,492,629
1,572,209
551,379
3,561,683
-
357,439,413
1,285,000
4,247,315
7,508,901
13,041,216
370,480,629
Additions
-
-
200,000
-
-
-
91,500
-
152,800
1,446,455
406,160
2,296,915
-
-
-
-
2,296,915
Revaluationsu
rplus/(deficit)
4.2&21
9,135,100
5,388,355
(1,005,389)
-
-
-
-
-
-
-
-
13,518,066
-
-
-
-
13,518,066
Disposals
-
-
-
-
-
-
-
-
(24,200)
-
-
(24,200)
-
-
-
-
(24,200)
Transfe
rin/(out)
-
-
4,247,315
1,285,000
-
-
-
-
-
7,508,901
-
13,041,216
(1,285,000)
(4,247,315)
(7,508,901)
(13,041,216)
-
Bala
nce a
s at 3
0 Jun
e 201
081,433,100
33,485,680
250,294,130
1,993,458
998,926
306,600
2,584,129
1,572,209
679,979
12,517,039
406,160
386,271,410
-
-
-
-
386,271,410
Depr
ecia
tion
Balan
ceasat01July2008
-
2,054,368
65,373,786
607,931
782,048
247,208
1,607,116
1,134,619
255,480
274,733
-
72,337,288
133,253
488,071
2,109,679
2,731,003
75,068,291
Chargefortheyear
-
648,957
17,655,910
10,053
21,688
5,939
180,581
43,381
29,590
290,625
-
18,886,724
115,175
375,924
604,153
1,095,252
19,981,976
Ondisp
osals
-
-
-
-
-
-
-
-
-
(325,177)
-
(325,177)
-
-
-
-
(325,177)
Transfe
rin/(out)
-
-
-
-
-
-
-
-
-
693,492
-
693,492
-
-
(693,492)
(693,492)
-
Bala
nce a
s at 3
0 Jun
e 200
9-
2,703,325
83,029,696
617,984
803,736
253,147
1,787,697
1,178,000
285,070
933,673
-
91,592,328
248,428
863,995
2,020,339
3,132,762
94,725,090
Balan
ceasat01July2009
-
2,703,325
83,029,696
617,984
803,736
253,147
1,787,697
1,178,000
285,070
933,673
-
91,592,328
248,428
863,995
2,020,339
3,132,762
94,725,090
Chargefortheyear
-
754,458
16,171,235
17,686
19,519
5,345
149,745
39,421
27,771
464,406
-
17,649,586
95,019
310,138
405,109
810,266
18,459,852
Ondisp
osals
-
-
-
-
-
-
-
-
(13,594)
-
-
(13,594)
-
-
-
-
(13,594)
Transfe
rin/(out)
-
-
1,174,133
343,447
-
-
-
-
-
2,425,448
-
3,943,028
(343,447)
(1,174,133)
(2,425,448)
(3,943,028)
-
Bala
nce a
s at 3
0 Jun
e 201
0-
3,457,783
100,375,064
979,117
823,255
258,492
1,937,442
1,217,421
299,247
3,823,527
-
113,171,348
-
-
-
-
113,171,348
Carr
ying
amou
nts -
June
2009
72,298,000
25,394,000
163,822,508
90,474
195,190
53,453
704,932
394,209
266,309
2,628,010
-
265,847,085
1,036,572
3,383,320
5,488,562
9,908,454
275,755,539
Carr
ying
amou
nts -
June
2010
81,43
3,100
30,02
7,897
149,9
19,06
6
1,0
14,34
1
175,6
71
48,10
8
64
6,687
35
4,788
38
0,732
8,6
93,51
2
406,1
60
273,1
00,06
2
-
-
-
-
273,1
00,06
2
Rate
s of d
epre
ciatio
n pe
r ann
um-
2.5
0%10
%10
%10
%10
%10
-33.3
3%10
%10
%10
%-
10
%10
%10
%
Own
edLe
ased
Tota
l
Rupe
esRu
pees
Annual Report2010 32
NOTES TO THE FINANCIAL STATEMENTSFOR THE YEAR ENDED 30 JUNE 2010
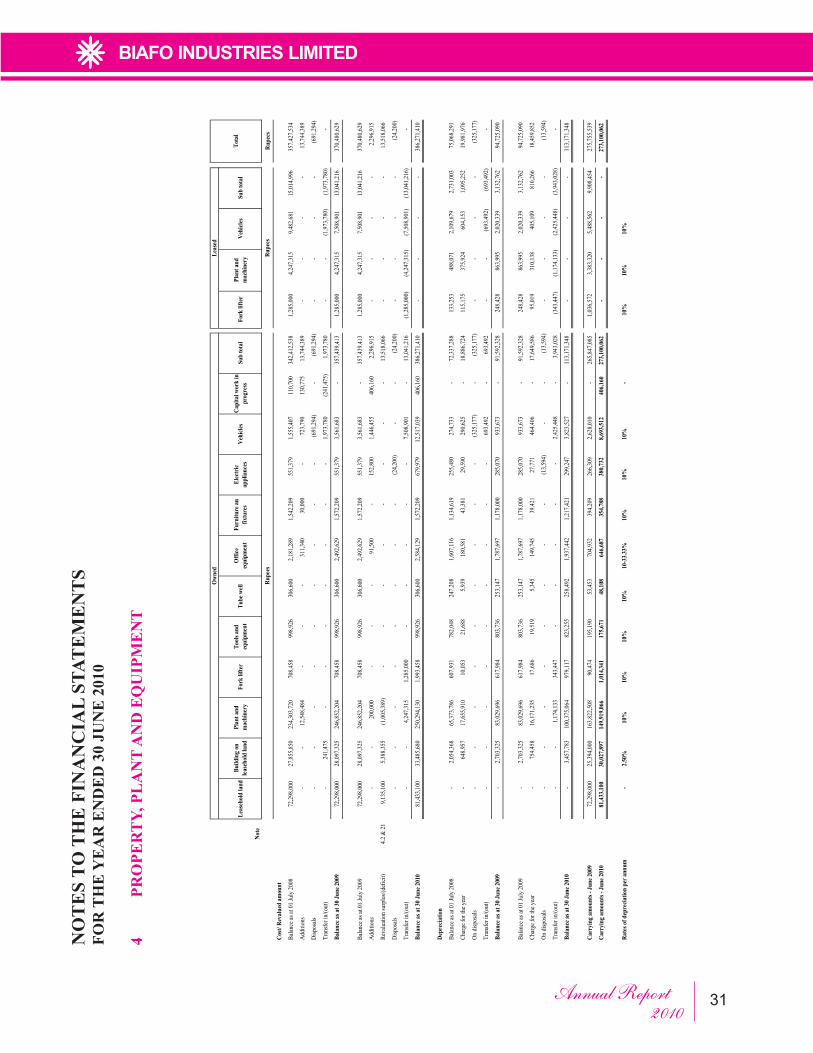
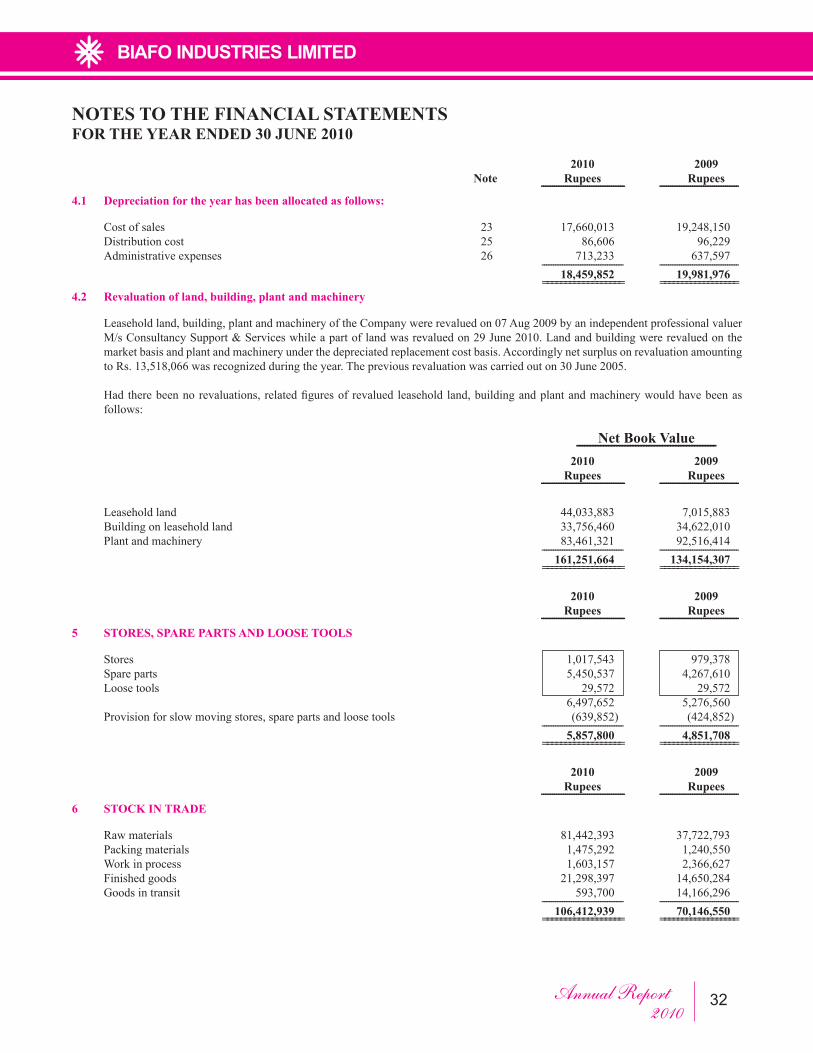
2010 2009 Note Rupees Rupees -------------------------------------- ------------------------------------4.1 Depreciation for the year has been allocated as follows:
Costofsales 23 17,660,013 19,248,150 Distributioncost 25 86,606 96,229 Administrativeexpenses 26 713,233 637,597 ------------------------------------ ------------------------------------ 18,459,852 19,981,976 ================== ==================4.2 Revaluation of land, building, plant and machinery
Leaseholdland,building,plantandmachineryoftheCompanywererevaluedon07Aug2009byanindependentprofessionalvaluerM/sConsultancySupport&Serviceswhileapartoflandwasrevaluedon29June2010.Landandbuildingwererevaluedonthemarket basis and plant and machinery under the depreciated replacement cost basis. Accordingly net surplus on revaluation amounting toRs.13,518,066wasrecognizedduringtheyear.Thepreviousrevaluationwascarriedouton30June2005.
Had therebeennorevaluations, relatedfiguresof revalued leasehold land,buildingandplantandmachinerywouldhavebeenasfollows:
Net Book Value ---------------------------------------------------- 2010 2009 Rupees Rupees -------------------------------------- ------------------------------------ Leaseholdland 44,033,883 7,015,883 Buildingonleaseholdland 33,756,460 34,622,010 Plantandmachinery 83,461,321 92,516,414 ------------------------------------ ------------------------------------ 161,251,664 134,154,307 ================== ==================
2010 2009 Rupees Rupees -------------------------------------- ------------------------------------5 STORES, SPARE PARTS AND LOOSE TOOLS
Stores 1,017,543 979,378 Spareparts 5,450,537 4,267,610 Loosetools 29,572 29,572 6,497,652 5,276,560 Provisionforslowmovingstores,sparepartsandloosetools (639,852) (424,852) ------------------------------------ ------------------------------------ 5,857,800 4,851,708 ================== ==================
2010 2009 Rupees Rupees -------------------------------------- ------------------------------------6 STOCK IN TRADE
Rawmaterials 81,442,393 37,722,793 Packingmaterials 1,475,292 1,240,550 Workinprocess 1,603,157 2,366,627 Finishedgoods 21,298,397 14,650,284 Goodsintransit 593,700 14,166,296 ------------------------------------ ------------------------------------ 106,412,939 70,146,550 ================== ==================
Annual Report2010 33
NOTES TO THE FINANCIAL STATEMENTSFOR THE YEAR ENDED 30 JUNE 2010
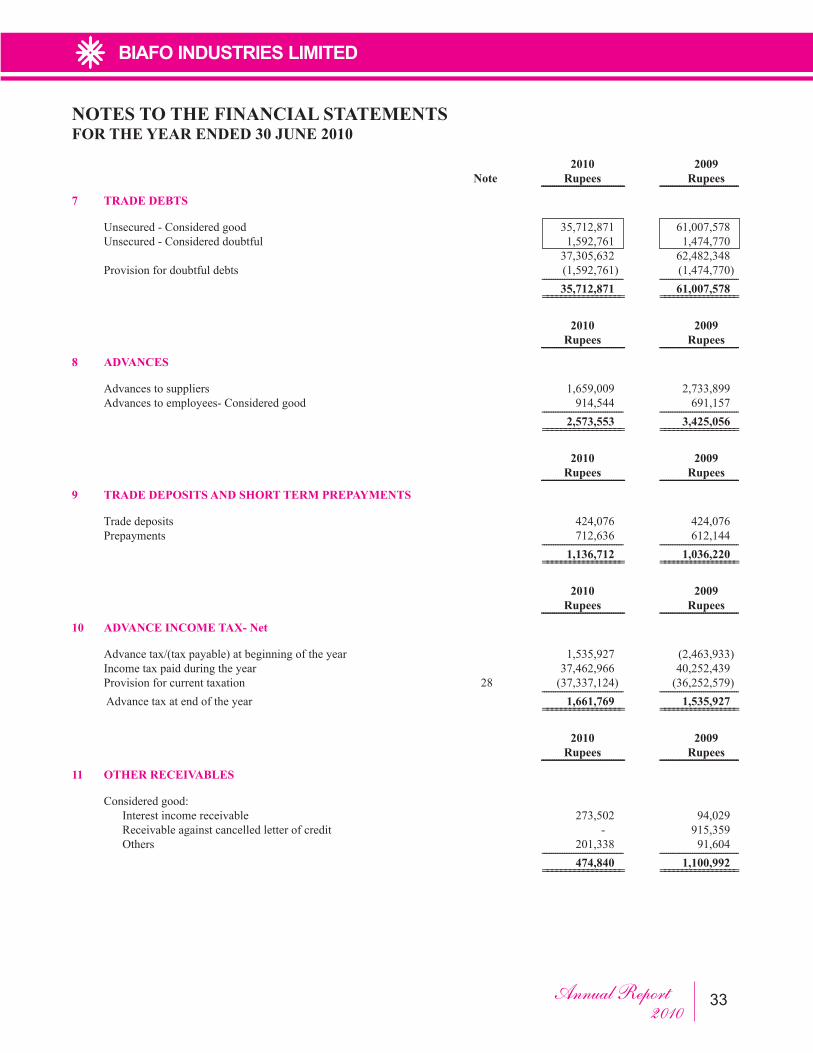
2010 2009 Note Rupees Rupees -------------------------------------- ------------------------------------7 TRADE DEBTS
Unsecured-Consideredgood 35,712,871 61,007,578 Unsecured-Considereddoubtful 1,592,761 1,474,770 37,305,632 62,482,348 Provisionfordoubtfuldebts (1,592,761) (1,474,770) ------------------------------------ ------------------------------------ 35,712,871 61,007,578 ================== ==================
2010 2009 Rupees Rupees -------------------------------------- ------------------------------------8 ADVANCES
Advancestosuppliers 1,659,009 2,733,899 Advancestoemployees-Consideredgood 914,544 691,157 ------------------------------------ ------------------------------------ 2,573,553 3,425,056 ================== ==================
2010 2009 Rupees Rupees -------------------------------------- ------------------------------------9 TRADE DEPOSITS AND SHORT TERM PREPAYMENTS
Tradedeposits 424,076 424,076 Prepayments 712,636 612,144 ------------------------------------ ------------------------------------ 1,136,712 1,036,220 ================== ==================
2010 2009 Rupees Rupees -------------------------------------- ------------------------------------10 ADVANCE INCOME TAX- Net
Advancetax/(taxpayable)atbeginningoftheyear 1,535,927 (2,463,933) Incometaxpaidduringtheyear 37,462,966 40,252,439 Provisionforcurrenttaxation 28 (37,337,124) (36,252,579) ------------------------------------ ------------------------------------ Advance tax at end of the year 1,661,769 1,535,927 ================== ==================
2010 2009 Rupees Rupees -------------------------------------- ------------------------------------11 OTHER RECEIVABLES
Considered good: Interestincomereceivable 273,502 94,029 Receivableagainstcancelledletterofcredit - 915,359 Others 201,338 91,604 ------------------------------------ ------------------------------------ 474,840 1,100,992 ================== ==================
Annual Report2010 34
NOTES TO THE FINANCIAL STATEMENTSFOR THE YEAR ENDED 30 JUNE 2010
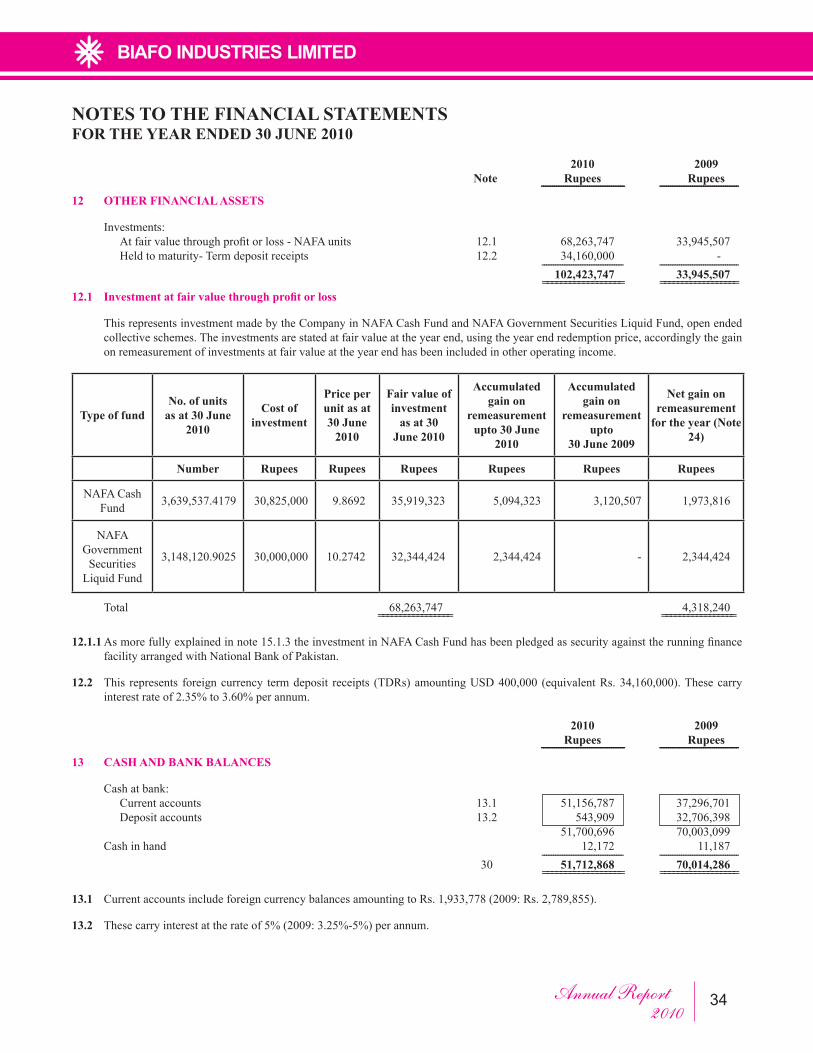
2010 2009 Note Rupees Rupees -------------------------------------- ------------------------------------12 OTHER FINANCIAL ASSETS
Investments: Atfairvaluethroughprofitorloss-NAFAunits 12.1 68,263,747 33,945,507 Heldtomaturity-Termdepositreceipts 12.2 34,160,000 - ------------------------------------ ------------------------------------ 102,423,747 33,945,507 ================== ==================12.1 Investment at fair value through profit or loss
ThisrepresentsinvestmentmadebytheCompanyinNAFACashFundandNAFAGovernmentSecuritiesLiquidFund,openendedcollective schemes. The investments are stated at fair value at the year end, using the year end redemption price, accordingly the gain on remeasurement of investments at fair value at the year end has been included in other operating income.
Type of fundNo. of units
as at 30 June 2010
Cost of investment
Price per unit as at 30 June
2010
Fair value of investment
as at 30 June 2010
Accumulated gain on
remeasurement upto 30 June
2010
Accumulated gain on
remeasurement upto
30 June 2009
Net gain on remeasurement
for the year (Note 24)
Number Rupees Rupees Rupees Rupees Rupees Rupees
NAFACashFund 3,639,537.4179 30,825,000 9.8692 35,919,323 5,094,323 3,120,507 1,973,816
NAFAGovernment
Securities LiquidFund
3,148,120.9025 30,000,000 10.2742 32,344,424 2,344,424 - 2,344,424
Total 68,263,747 4,318,240 ================= =================
12.1.1Asmorefullyexplainedinnote15.1.3theinvestmentinNAFACashFundhasbeenpledgedassecurityagainsttherunningfinancefacility arranged with National Bank of Pakistan.
12.2 This represents foreigncurrency termdeposit receipts (TDRs)amountingUSD400,000 (equivalentRs.34,160,000).Thesecarryinterestrateof2.35%to3.60%perannum.
2010 2009 Rupees Rupees -------------------------------------- ------------------------------------13 CASH AND BANK BALANCES
Cash at bank: Currentaccounts 13.1 51,156,787 37,296,701 Depositaccounts 13.2 543,909 32,706,398 51,700,696 70,003,099 Cashinhand 12,172 11,187 ------------------------------------ ------------------------------------ 30 51,712,868 70,014,286 ================== ==================
13.1 CurrentaccountsincludeforeigncurrencybalancesamountingtoRs.1,933,778(2009:Rs.2,789,855).
13.2 Thesecarryinterestattherateof5%(2009:3.25%-5%)perannum.
Annual Report2010 35
NOTES TO THE FINANCIAL STATEMENTSFOR THE YEAR ENDED 30 JUNE 2010
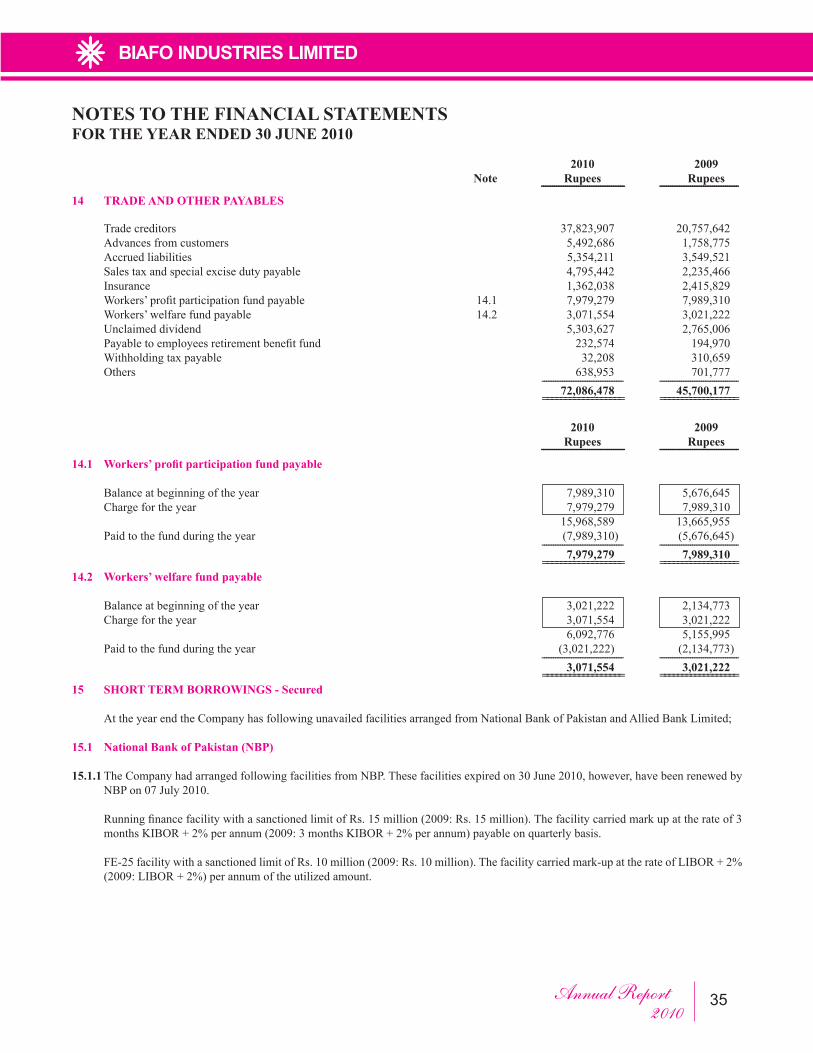
2010 2009 Note Rupees Rupees -------------------------------------- ------------------------------------14 TRADE AND OTHER PAYABLES
Tradecreditors 37,823,907 20,757,642 Advancesfromcustomers 5,492,686 1,758,775 Accruedliabilities 5,354,211 3,549,521 Salestaxandspecialexcisedutypayable 4,795,442 2,235,466 Insurance 1,362,038 2,415,829 Workers’profitparticipationfundpayable 14.1 7,979,279 7,989,310 Workers’welfarefundpayable 14.2 3,071,554 3,021,222 Unclaimeddividend 5,303,627 2,765,006 Payabletoemployeesretirementbenefitfund 232,574 194,970 Withholdingtaxpayable 32,208 310,659 Others 638,953 701,777 ------------------------------------ ------------------------------------ 72,086,478 45,700,177 ================== ==================
2010 2009 Rupees Rupees -------------------------------------- ------------------------------------14.1 Workers’ profit participation fund payable
Balanceatbeginningoftheyear 7,989,310 5,676,645 Chargefortheyear 7,979,279 7,989,310 15,968,589 13,665,955 Paidtothefundduringtheyear (7,989,310) (5,676,645) ------------------------------------ ------------------------------------ 7,979,279 7,989,310 ================== ==================14.2 Workers’ welfare fund payable
Balanceatbeginningoftheyear 3,021,222 2,134,773 Chargefortheyear 3,071,554 3,021,222 6,092,776 5,155,995 Paidtothefundduringtheyear (3,021,222) (2,134,773) ------------------------------------ ------------------------------------ 3,071,554 3,021,222 ================== ==================15 SHORT TERM BORROWINGS - Secured
AttheyearendtheCompanyhasfollowingunavailedfacilitiesarrangedfromNationalBankofPakistanandAlliedBankLimited;
15.1 National Bank of Pakistan (NBP)
15.1.1TheCompanyhadarrangedfollowingfacilitiesfromNBP.Thesefacilitiesexpiredon30June2010,however,havebeenrenewedbyNBPon07July2010.
RunningfinancefacilitywithasanctionedlimitofRs.15million(2009:Rs.15million).Thefacilitycarriedmarkupattherateof3monthsKIBOR+2%perannum(2009:3monthsKIBOR+2%perannum)payableonquarterlybasis.
FE-25facilitywithasanctionedlimitofRs.10million(2009:Rs.10million).Thefacilitycarriedmark-upattherateofLIBOR+2%(2009:LIBOR+2%)perannumoftheutilizedamount.
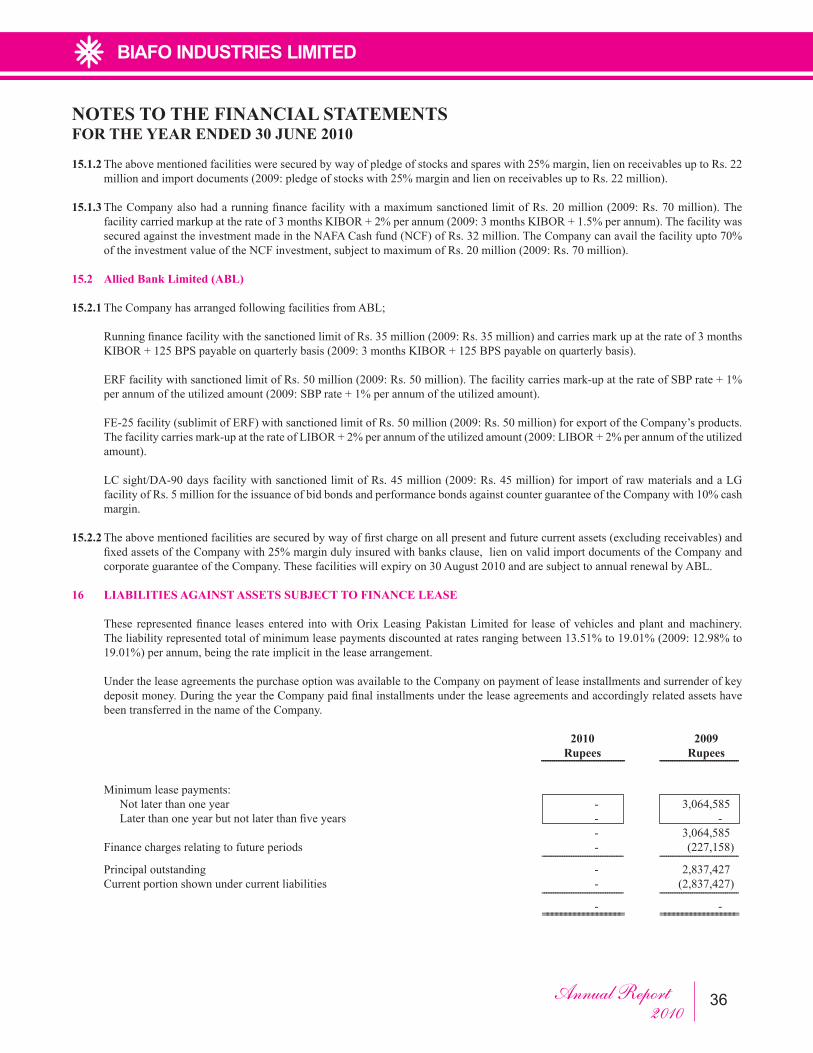
Annual Report2010 36
NOTES TO THE FINANCIAL STATEMENTSFOR THE YEAR ENDED 30 JUNE 2010
15.1.2Theabovementionedfacilitiesweresecuredbywayofpledgeofstocksandspareswith25%margin,lienonreceivablesuptoRs.22millionandimportdocuments(2009:pledgeofstockswith25%marginandlienonreceivablesuptoRs.22million).
15.1.3TheCompanyalsohadarunningfinancefacilitywithamaximumsanctionedlimitofRs.20million(2009:Rs.70million).Thefacilitycarriedmarkupattherateof3monthsKIBOR+2%perannum(2009:3monthsKIBOR+1.5%perannum).ThefacilitywassecuredagainsttheinvestmentmadeintheNAFACashfund(NCF)ofRs.32million.TheCompanycanavailthefacilityupto70%oftheinvestmentvalueoftheNCFinvestment,subjecttomaximumofRs.20million(2009:Rs.70million).
15.2 Allied Bank Limited (ABL)
15.2.1TheCompanyhasarrangedfollowingfacilitiesfromABL;
RunningfinancefacilitywiththesanctionedlimitofRs.35million(2009:Rs.35million)andcarriesmarkupattherateof3monthsKIBOR+125BPSpayableonquarterlybasis(2009:3monthsKIBOR+125BPSpayableonquarterlybasis).
ERFfacilitywithsanctionedlimitofRs.50million(2009:Rs.50million).Thefacilitycarriesmark-upattherateofSBPrate+1%perannumoftheutilizedamount(2009:SBPrate+1%perannumoftheutilizedamount).
FE-25facility(sublimitofERF)withsanctionedlimitofRs.50million(2009:Rs.50million)forexportoftheCompany’sproducts.Thefacilitycarriesmark-upattherateofLIBOR+2%perannumoftheutilizedamount(2009:LIBOR+2%perannumoftheutilizedamount).
LCsight/DA-90daysfacilitywithsanctionedlimitofRs.45million(2009:Rs.45million)forimportofrawmaterialsandaLGfacilityofRs.5millionfortheissuanceofbidbondsandperformancebondsagainstcounterguaranteeoftheCompanywith10%cashmargin.
15.2.2Theabovementionedfacilitiesaresecuredbywayoffirstchargeonallpresentandfuturecurrentassets(excludingreceivables)andfixedassetsoftheCompanywith25%margindulyinsuredwithbanksclause,lienonvalidimportdocumentsoftheCompanyandcorporateguaranteeoftheCompany.Thesefacilitieswillexpiryon30August2010andaresubjecttoannualrenewalbyABL.
16 LIABILITIES AGAINST ASSETS SUBJECT TO FINANCE LEASE
These representedfinance leases entered intowithOrixLeasingPakistanLimited for leaseofvehicles andplant andmachinery.Theliabilityrepresentedtotalofminimumleasepaymentsdiscountedatratesrangingbetween13.51%to19.01%(2009:12.98%to19.01%)perannum,beingtherateimplicitintheleasearrangement.
UndertheleaseagreementsthepurchaseoptionwasavailabletotheCompanyonpaymentofleaseinstallmentsandsurrenderofkeydepositmoney.DuringtheyeartheCompanypaidfinalinstallmentsundertheleaseagreementsandaccordinglyrelatedassetshavebeen transferred in the name of the Company.
2010 2009 Rupees Rupees -------------------------------------- ------------------------------------ Minimum lease payments: Notlaterthanoneyear - 3,064,585 Laterthanoneyearbutnotlaterthanfiveyears - - - 3,064,585 Financechargesrelatingtofutureperiods - (227,158) ------------------------------------ ------------------------------------ Principaloutstanding - 2,837,427 Currentportionshownundercurrentliabilities - (2,837,427) ------------------------------------ ------------------------------------ - - ================== ==================
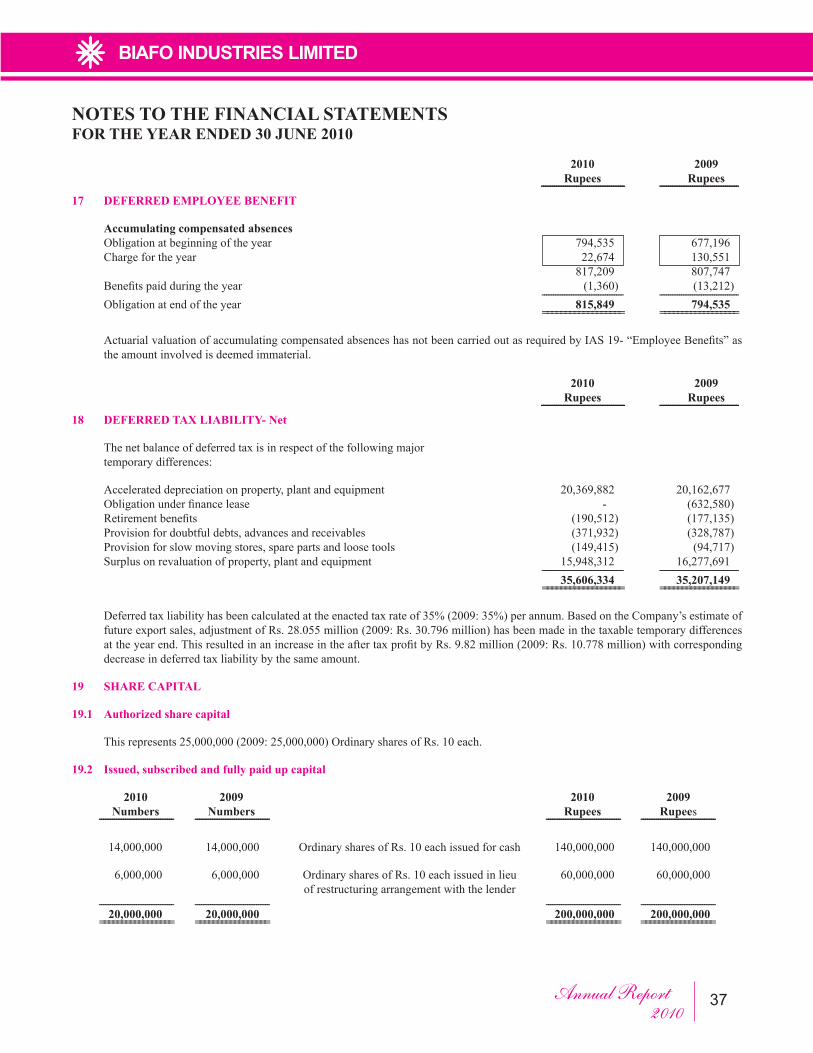
Annual Report2010 37
NOTES TO THE FINANCIAL STATEMENTSFOR THE YEAR ENDED 30 JUNE 2010
2010 2009 Rupees Rupees -------------------------------------- ------------------------------------17 DEFERRED EMPLOYEE BENEFIT
Accumulating compensated absences Obligationatbeginningoftheyear 794,535 677,196 Chargefortheyear 22,674 130,551 817,209 807,747 Benefitspaidduringtheyear (1,360) (13,212) ------------------------------------ ------------------------------------ Obligation at end of the year 815,849 794,535 ================== ==================
ActuarialvaluationofaccumulatingcompensatedabsenceshasnotbeencarriedoutasrequiredbyIAS19-“EmployeeBenefits”asthe amount involved is deemed immaterial.
2010 2009 Rupees Rupees -------------------------------------- ------------------------------------18 DEFERRED TAX LIABILITY- Net
The net balance of deferred tax is in respect of the following major temporary differences:
Accelerateddepreciationonproperty,plantandequipment 20,369,882 20,162,677 Obligationunderfinancelease - (632,580) Retirementbenefits (190,512) (177,135) Provisionfordoubtfuldebts,advancesandreceivables (371,932) (328,787) Provisionforslowmovingstores,sparepartsandloosetools (149,415) (94,717) Surplusonrevaluationofproperty,plantandequipment 15,948,312 16,277,691 ------------------------------------ ------------------------------------ 35,606,334 35,207,149 ================== ==================
Deferredtaxliabilityhasbeencalculatedattheenactedtaxrateof35%(2009:35%)perannum.BasedontheCompany’sestimateoffutureexportsales,adjustmentofRs.28.055million(2009:Rs.30.796million)hasbeenmadeinthetaxabletemporarydifferencesattheyearend.ThisresultedinanincreaseintheaftertaxprofitbyRs.9.82million(2009:Rs.10.778million)withcorrespondingdecrease in deferred tax liability by the same amount.
19 SHARE CAPITAL
19.1 Authorized share capital
Thisrepresents25,000,000(2009:25,000,000)OrdinarysharesofRs.10each.
19.2 Issued, subscribed and fully paid up capital
2010 2009 2010 2009 Numbers Numbers Rupees Rupees ---------------------------------- ---------------------------------- ---------------------------------- ---------------------------------- 14,000,000 14,000,000 OrdinarysharesofRs.10eachissuedforcash 140,000,000 140,000,000
6,000,000 6,000,000 OrdinarysharesofRs.10eachissuedinlieu 60,000,000 60,000,000 of restructuring arrangement with the lender ---------------------------------- ---------------------------------- ---------------------------------- ---------------------------------- 20,000,000 20,000,000 200,000,000 200,000,000 ================= ================= ================= =================
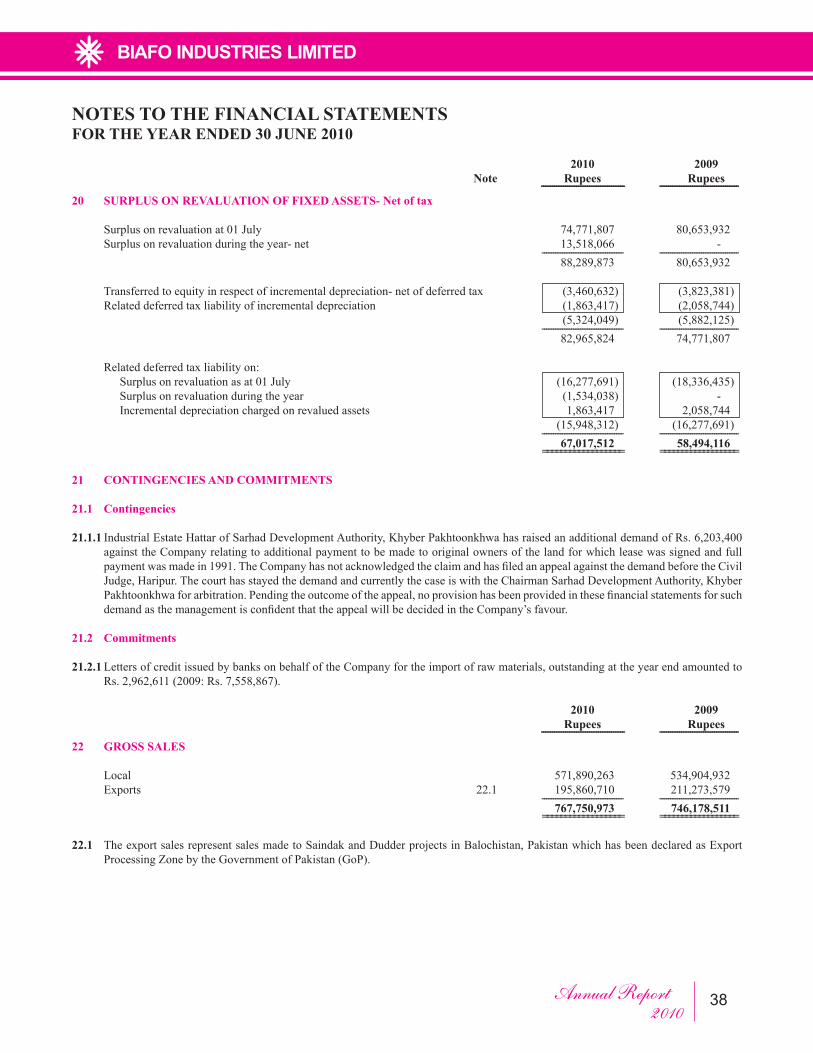
Annual Report2010 38
NOTES TO THE FINANCIAL STATEMENTSFOR THE YEAR ENDED 30 JUNE 2010
2010 2009 Note Rupees Rupees -------------------------------------- ------------------------------------20 SURPLUS ON REVALUATION OF FIXED ASSETS- Net of tax
Surplusonrevaluationat01July 74,771,807 80,653,932 Surplusonrevaluationduringtheyear-net 13,518,066 - ------------------------------------ ------------------------------------ 88,289,873 80,653,932
Transferredtoequityinrespectofincrementaldepreciation-netofdeferredtax (3,460,632) (3,823,381) Relateddeferredtaxliabilityofincrementaldepreciation (1,863,417) (2,058,744) (5,324,049) (5,882,125) ------------------------------------ ------------------------------------ 82,965,824 74,771,807
Related deferred tax liability on: Surplusonrevaluationasat01July (16,277,691) (18,336,435) Surplusonrevaluationduringtheyear (1,534,038) - Incrementaldepreciationchargedonrevaluedassets 1,863,417 2,058,744 (15,948,312) (16,277,691) ------------------------------------ ------------------------------------ 67,017,512 58,494,116 ================== ==================
21 CONTINGENCIES AND COMMITMENTS
21.1 Contingencies
21.1.1IndustrialEstateHattarofSarhadDevelopmentAuthority,KhyberPakhtoonkhwahasraisedanadditionaldemandofRs.6,203,400against the Company relating to additional payment to be made to original owners of the land for which lease was signed and full paymentwasmadein1991.TheCompanyhasnotacknowledgedtheclaimandhasfiledanappealagainstthedemandbeforetheCivilJudge, Haripur. The court has stayed the demand and currently the case is with the Chairman Sarhad Development Authority, Khyber Pakhtoonkhwaforarbitration.Pendingtheoutcomeoftheappeal,noprovisionhasbeenprovidedinthesefinancialstatementsforsuchdemandasthemanagementisconfidentthattheappealwillbedecidedintheCompany’sfavour.
21.2 Commitments
21.2.1 Letters of credit issued by banks on behalf of the Company for the import of raw materials, outstanding at the year end amounted to Rs.2,962,611(2009:Rs.7,558,867).
2010 2009 Rupees Rupees -------------------------------------- ------------------------------------22 GROSS SALES
Local 571,890,263 534,904,932 Exports 22.1 195,860,710 211,273,579 ------------------------------------ ------------------------------------ 767,750,973 746,178,511 ================== ==================
22.1 The export sales represent sales made to Saindak and Dudder projects in Balochistan, Pakistan which has been declared as Export Processing Zone by the Government of Pakistan (GoP).
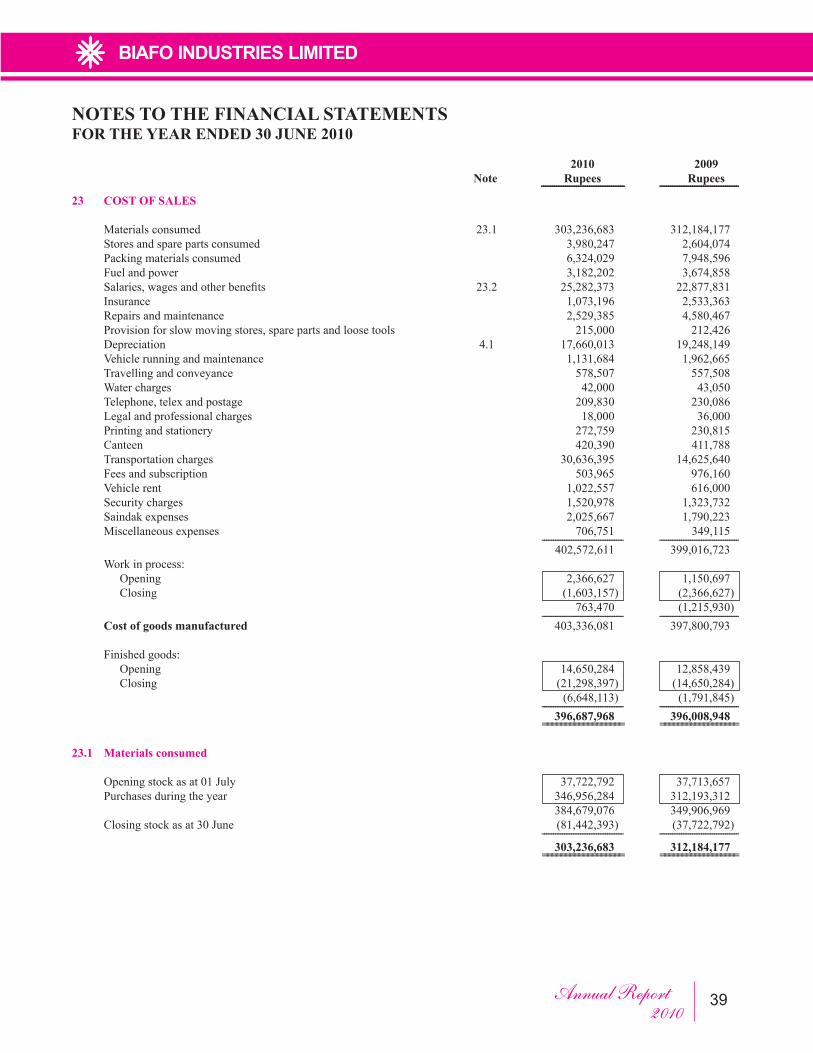
Annual Report2010 39
NOTES TO THE FINANCIAL STATEMENTSFOR THE YEAR ENDED 30 JUNE 2010
2010 2009 Note Rupees Rupees -------------------------------------- ------------------------------------23 COST OF SALES
Materialsconsumed 23.1 303,236,683 312,184,177 Storesandsparepartsconsumed 3,980,247 2,604,074 Packingmaterialsconsumed 6,324,029 7,948,596 Fuelandpower 3,182,202 3,674,858 Salaries,wagesandotherbenefits 23.2 25,282,373 22,877,831 Insurance 1,073,196 2,533,363 Repairsandmaintenance 2,529,385 4,580,467 Provisionforslowmovingstores,sparepartsandloosetools 215,000 212,426 Depreciation 4.1 17,660,013 19,248,149 Vehiclerunningandmaintenance 1,131,684 1,962,665 Travellingandconveyance 578,507 557,508 Watercharges 42,000 43,050 Telephone,telexandpostage 209,830 230,086 Legalandprofessionalcharges 18,000 36,000 Printingandstationery 272,759 230,815 Canteen 420,390 411,788 Transportationcharges 30,636,395 14,625,640 Feesandsubscription 503,965 976,160 Vehiclerent 1,022,557 616,000 Securitycharges 1,520,978 1,323,732 Saindakexpenses 2,025,667 1,790,223 Miscellaneousexpenses 706,751 349,115 ------------------------------------ ------------------------------------ 402,572,611 399,016,723 Work in process: Opening 2,366,627 1,150,697 Closing (1,603,157) (2,366,627) 763,470 (1,215,930) ------------------------------------ ------------------------------------ Cost of goods manufactured 403,336,081 397,800,793
Finishedgoods: Opening 14,650,284 12,858,439 Closing (21,298,397) (14,650,284) (6,648,113) (1,791,845) ------------------------------------ ------------------------------------ 396,687,968 396,008,948 ================== ==================
23.1 Materials consumed
Openingstockasat01July 37,722,792 37,713,657 Purchasesduringtheyear 346,956,284 312,193,312 384,679,076 349,906,969 Closingstockasat30June (81,442,393) (37,722,792) ------------------------------------ ------------------------------------ 303,236,683 312,184,177 ================== ==================
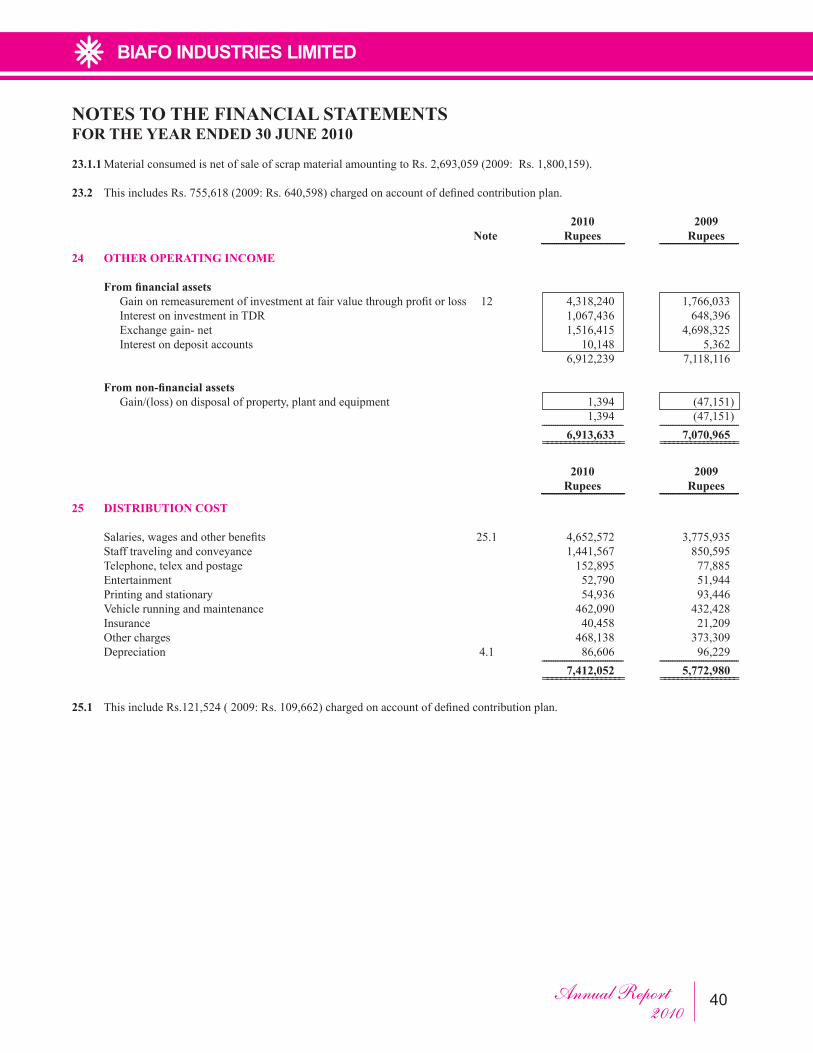
Annual Report2010 40
NOTES TO THE FINANCIAL STATEMENTSFOR THE YEAR ENDED 30 JUNE 2010
23.1.1MaterialconsumedisnetofsaleofscrapmaterialamountingtoRs.2,693,059(2009:Rs.1,800,159).
23.2 ThisincludesRs.755,618(2009:Rs.640,598)chargedonaccountofdefinedcontributionplan.
2010 2009 Note Rupees Rupees -------------------------------------- ------------------------------------24 OTHER OPERATING INCOME
From financial assets Gainonremeasurementofinvestmentatfairvaluethroughprofitorloss 12 4,318,240 1,766,033 InterestoninvestmentinTDR 1,067,436 648,396 Exchangegain-net 1,516,415 4,698,325 Interestondepositaccounts 10,148 5,362 6,912,239 7,118,116
From non-financial assets Gain/(loss)ondisposalofproperty,plantandequipment 1,394 (47,151) 1,394 (47,151) ------------------------------------ ------------------------------------ 6,913,633 7,070,965 ================== ==================
2010 2009 Rupees Rupees -------------------------------------- ------------------------------------25 DISTRIBUTION COST
Salaries,wagesandotherbenefits 25.1 4,652,572 3,775,935 Stafftravelingandconveyance 1,441,567 850,595 Telephone,telexandpostage 152,895 77,885 Entertainment 52,790 51,944 Printingandstationary 54,936 93,446 Vehiclerunningandmaintenance 462,090 432,428 Insurance 40,458 21,209 Othercharges 468,138 373,309 Depreciation 4.1 86,606 96,229 ------------------------------------ ------------------------------------ 7,412,052 5,772,980 ================== ==================
25.1 ThisincludeRs.121,524(2009:Rs.109,662)chargedonaccountofdefinedcontributionplan.
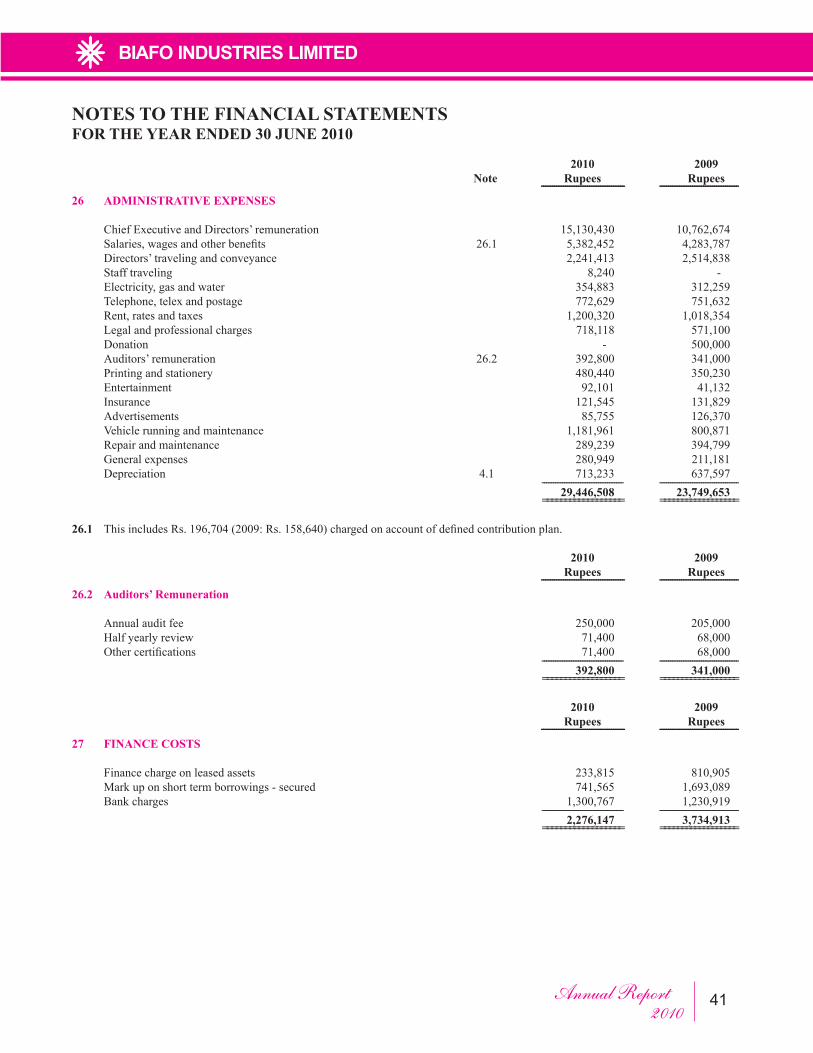
Annual Report2010 41
NOTES TO THE FINANCIAL STATEMENTSFOR THE YEAR ENDED 30 JUNE 2010
2010 2009 Note Rupees Rupees -------------------------------------- ------------------------------------26 ADMINISTRATIVE EXPENSES
ChiefExecutiveandDirectors’remuneration 15,130,430 10,762,674 Salaries,wagesandotherbenefits 26.1 5,382,452 4,283,787 Directors’travelingandconveyance 2,241,413 2,514,838 Stafftraveling 8,240 - Electricity,gasandwater 354,883 312,259 Telephone,telexandpostage 772,629 751,632 Rent,ratesandtaxes 1,200,320 1,018,354 Legalandprofessionalcharges 718,118 571,100 Donation - 500,000 Auditors’remuneration 26.2 392,800 341,000 Printingandstationery 480,440 350,230 Entertainment 92,101 41,132 Insurance 121,545 131,829 Advertisements 85,755 126,370 Vehiclerunningandmaintenance 1,181,961 800,871 Repairandmaintenance 289,239 394,799 Generalexpenses 280,949 211,181 Depreciation 4.1 713,233 637,597 ------------------------------------ ------------------------------------ 29,446,508 23,749,653 ================== ==================
26.1 ThisincludesRs.196,704(2009:Rs.158,640)chargedonaccountofdefinedcontributionplan.
2010 2009 Rupees Rupees -------------------------------------- ------------------------------------26.2 Auditors’ Remuneration
Annualauditfee 250,000 205,000 Halfyearlyreview 71,400 68,000 Othercertifications 71,400 68,000 ------------------------------------ ------------------------------------ 392,800 341,000 ================== ==================
2010 2009 Rupees Rupees -------------------------------------- ------------------------------------27 FINANCE COSTS
Financechargeonleasedassets 233,815 810,905 Markuponshorttermborrowings-secured 741,565 1,693,089 Bankcharges 1,300,767 1,230,919 ------------------------------------ ------------------------------------ 2,276,147 3,734,913 ================== ==================
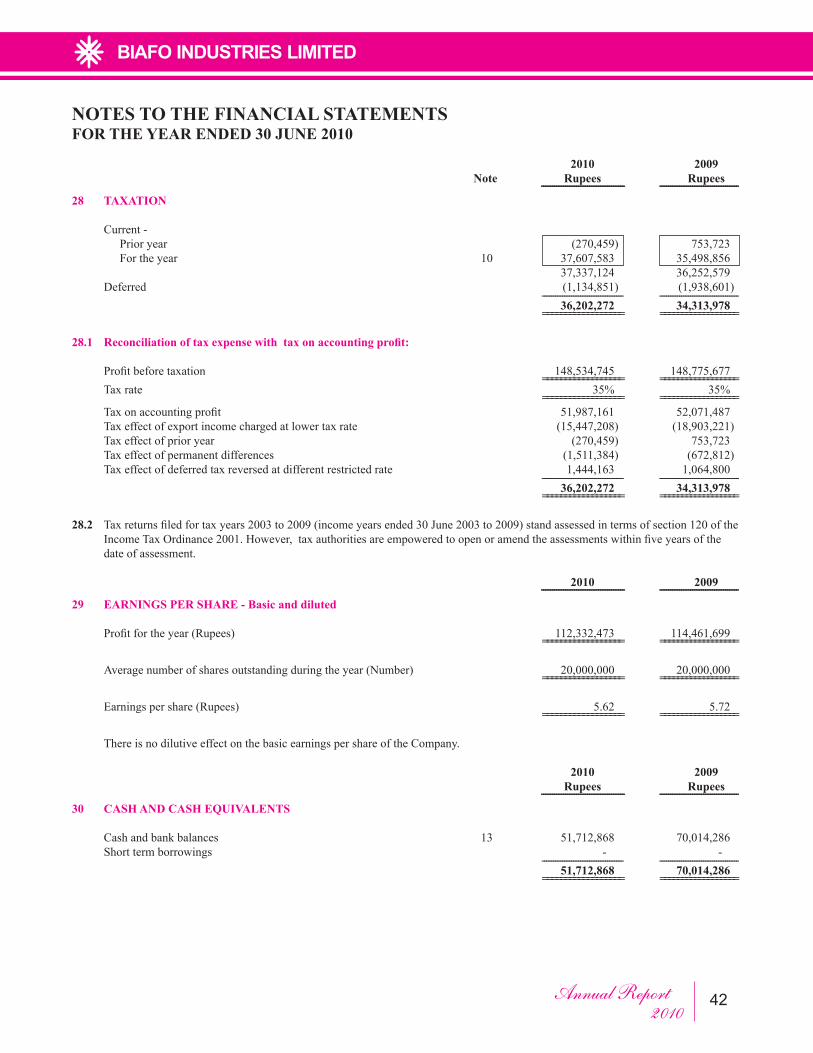
Annual Report2010 42
NOTES TO THE FINANCIAL STATEMENTSFOR THE YEAR ENDED 30 JUNE 2010
2010 2009 Note Rupees Rupees -------------------------------------- ------------------------------------28 TAXATION
Current- Prioryear (270,459) 753,723 Fortheyear 10 37,607,583 35,498,856 37,337,124 36,252,579 Deferred (1,134,851) (1,938,601) ------------------------------------ ------------------------------------ 36,202,272 34,313,978 ================== ==================
28.1 Reconciliation of tax expense with tax on accounting profit:
Profitbeforetaxation 148,534,745 148,775,677 ================== ================== Taxrate 35% 35% ================== ================== Taxonaccountingprofit 51,987,161 52,071,487 Taxeffectofexportincomechargedatlowertaxrate (15,447,208) (18,903,221) Taxeffectofprioryear (270,459) 753,723 Taxeffectofpermanentdifferences (1,511,384) (672,812) Taxeffectofdeferredtaxreversedatdifferentrestrictedrate 1,444,163 1,064,800 ------------------------------------ ------------------------------------ 36,202,272 34,313,978 ================== ==================
28.2 Taxreturnsfiledfortaxyears2003to2009(incomeyearsended30June2003to2009)standassessedintermsofsection120oftheIncomeTaxOrdinance2001.However,taxauthoritiesareempoweredtoopenoramendtheassessmentswithinfiveyearsofthedate of assessment.
2010 2009 -------------------------------------- ------------------------------------29 EARNINGS PER SHARE - Basic and diluted
Profitfortheyear(Rupees) 112,332,473 114,461,699 ================== ==================
Averagenumberofsharesoutstandingduringtheyear(Number) 20,000,000 20,000,000 ================== ==================
Earningspershare(Rupees) 5.62 5.72 ================== ==================
There is no dilutive effect on the basic earnings per share of the Company.
2010 2009 Rupees Rupees -------------------------------------- ------------------------------------30 CASH AND CASH EQUIVALENTS
Cashandbankbalances 13 51,712,868 70,014,286 Shorttermborrowings - - ------------------------------------ ------------------------------------ 51,712,868 70,014,286 ================== ==================
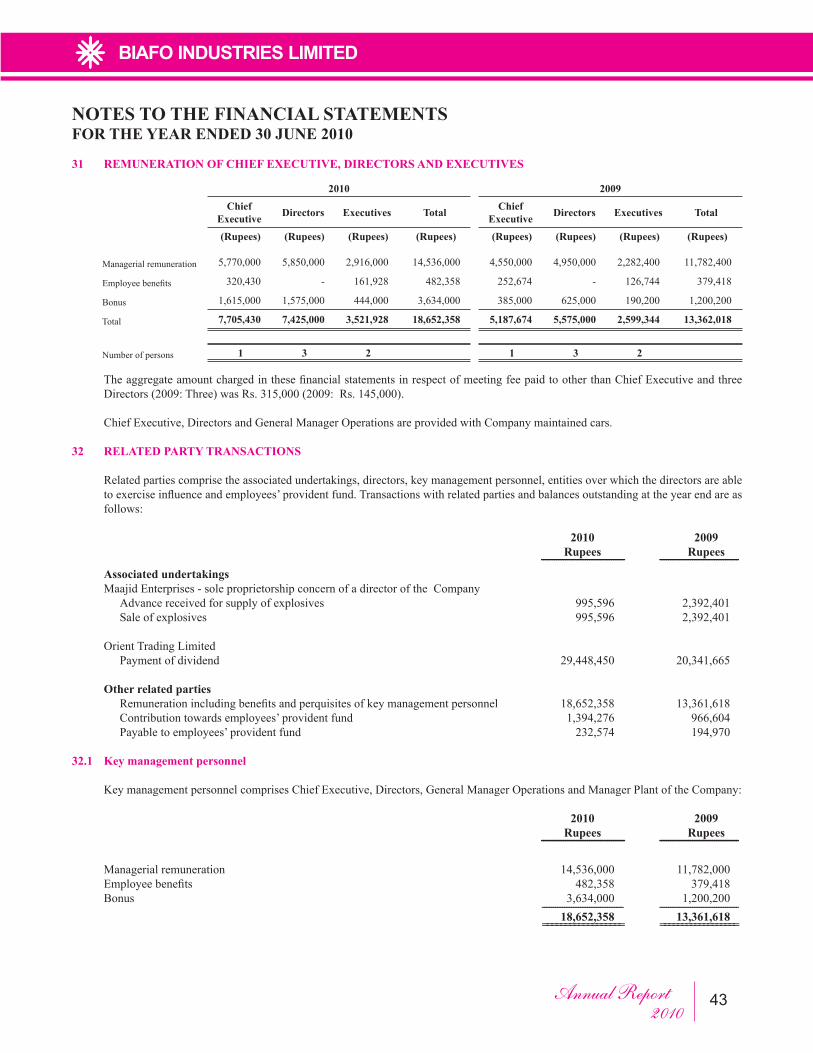
Annual Report2010 43
NOTES TO THE FINANCIAL STATEMENTSFOR THE YEAR ENDED 30 JUNE 2010
31 REMUNERATION OF CHIEF EXECUTIVE, DIRECTORS AND EXECUTIVES
TheaggregateamountchargedinthesefinancialstatementsinrespectofmeetingfeepaidtootherthanChiefExecutiveandthreeDirectors(2009:Three)wasRs.315,000(2009:Rs.145,000).
Chief Executive, Directors and General Manager Operations are provided with Company maintained cars.
32 RELATED PARTY TRANSACTIONS
Related parties comprise the associated undertakings, directors, key management personnel, entities over which the directors are able toexerciseinfluenceandemployees’providentfund.Transactionswithrelatedpartiesandbalancesoutstandingattheyearendareasfollows:
2010 2009 Rupees Rupees -------------------------------------- ------------------------------------ Associated undertakings MaajidEnterprises-soleproprietorshipconcernofadirectoroftheCompany Advancereceivedforsupplyofexplosives 995,596 2,392,401 Saleofexplosives 995,596 2,392,401
Orient Trading Limited Paymentofdividend 29,448,450 20,341,665
Other related parties Remunerationincludingbenefitsandperquisitesofkeymanagementpersonnel 18,652,358 13,361,618 Contributiontowardsemployees’providentfund 1,394,276 966,604 Payabletoemployees’providentfund 232,574 194,970
32.1 Key management personnel
Key management personnel comprises Chief Executive, Directors, General Manager Operations and Manager Plant of the Company:
2010 2009 Rupees Rupees -------------------------------------- ------------------------------------ Managerialremuneration 14,536,000 11,782,000 Employeebenefits 482,358 379,418 Bonus 3,634,000 1,200,200 ------------------------------------ ------------------------------------ 18,652,358 13,361,618 ================== ==================
2010Chief
Executive Directors Executives Total
(Rupees) (Rupees) (Rupees) (Rupees)
5,770,000 5,850,000 2,916,000 14,536,000
320,430 - 161,928 482,358
1,615,000 1,575,000 444,000 3,634,000
7,705,430 7,425,000 3,521,928 18,652,358
1 3 2
Managerial remuneration
Employeebenefits
Bonus
Total
Number of persons
2009Chief
Executive Directors Executives Total
(Rupees) (Rupees) (Rupees) (Rupees)
4,550,000 4,950,000 2,282,400 11,782,400
252,674 - 126,744 379,418
385,000 625,000 190,200 1,200,200
5,187,674 5,575,000 2,599,344 13,362,018
1 3 2
Annual Report2010 44
NOTES TO THE FINANCIAL STATEMENTSFOR THE YEAR ENDED 30 JUNE 2010
33 FINANCIAL RISK MANAGEMENT
TheCompanyhasexposuretothefollowingrisksfromitsuseoffinancialinstruments:
- Creditrisk - Liquidityrisk - Marketrisk
This note presents information about the Company’s exposure to each of the above risks, the Company’s objectives, policies and processesformeasuringandmanagingrisk.Furtherquantitativedisclosuresareincludedthroughoutthesefinancialstatements.
The Board of Directors has overall responsibility for the establishment and oversight of the Company’s risk management framework. The Board is responsible for developing and monitoring the Company’s risk management policies.
The Company’s risk management policies are established to identify and analyse the risks faced by the Company, to set appropriate risk limits and controls, and to monitor risks and adherence to limits. Risk management policies and systems are reviewed regularly toreflectchangesinmarketconditionsandtheCompany’sactivities.TheCompany,throughitstrainingandmanagementstandardsand procedures, aims to develop a disciplined and constructive control environment in which all employees understand their roles and obligations.
The Company’s Audit Committee oversees how management monitors compliance with the Company’s risk management policies and procedures and reviews the adequacy of the risk management framework in relation to the risks faced by the Company. The Audit Committee is assisted in its oversight role by Internal Audit. Internal Audit undertakes both regular and adhoc reviews of risk management controls and procedures, the results of which are reported to the Audit Committee.
33.1 Credit risk
Creditriskrefers totheriskthat thecounterpartywillfail toperformorfail topayamountsdue,resultinginfinancial loss totheCompany. The primary activities of the Company are manufacturing and sale of commercial explosives. The Company is exposed to credit risk from its operation and certain investing activities.
The Company’s credit risk exposures are categorised under the following headings:
Counterparties
In relation to theCompany’sexposure tocredit risk, tradedebtors,financial institutionsaremajorcounterpartiesandCompany’spolicies to manage risk in relation to these counter parties are explained in the following paragraphs.
Trade debts
CreditriskwithrespecttotradedebtsisdiversifiedduetothenumberofentitiescomprisingtheCompany’scustomerbase.Tradedebtsare essentially due from the entities engaged in cement manufacturing, construction, mining, oil and gas exploration service providers and agents. The Company has a credit policy that governs the management of credit risk, including the establishment of counterparty creditrepaymenttimelineandspecifictransactionapprovals.TheCompanylimitscreditriskbyassessingcreditworthinessofpotentialcounterparties before entering into transactions with them and continuing to evaluate their creditworthiness after transactions have been initiated.Further theCompany for allmajor customers enters into awritten agreement, and amongst the provisions agreedare product rates, discount levels and repayment terms. The Company’s exposure and the credit ratings of its counterparties are continuously monitored and the aggregate value of transactions concluded is spread amongst approved counterparties.
Collectability is assessed based on the creditworthiness of the customer as determined by credit checks and the customer’s payment history to the Company. The Company establishes a provision for doubtful debts in respect of trade debts and historically such losses have been within management’s expectations.
Annual Report2010 45
NOTES TO THE FINANCIAL STATEMENTSFOR THE YEAR ENDED 30 JUNE 2010
Bank balances and investments
TheCompanymaintainsitsbankbalancesandmakesinvestmentsinmoneymarketfundswithfinancialinstitutionsofhighcreditratings.TheinvestmentmadeinaNAFACashfundandNAFAGovernmentSecuritiesLiquidFundisexposedtominimalcreditriskastheseareopen-endedcollectiveschemes,whiledepositsheldwithbankscaneitherberedeemedupondemandorhaveashorttermmaturity of six months and therefore also bear minimal risk.
Exposure to credit risk
The carrying amount of financial assets of theCompany represents themaximum credit exposure.TheCompany does not haveanysignificantcreditriskexposuretoanysinglecounterpartyoranygroupofcounterpartieshavingsimilarcharacteristicsandthemaximumfinancialexposureduetocreditriskontheCompany’sfinancialassetsasat30Junewas;
2010 2009 Rupees Rupees -------------------------------------- ------------------------------------ Tradedebts-net 35,712,871 61,007,578 Advances 2,573,553 3,425,056 Tradedeposits 424,076 424,076 Otherreceivables 474,840 1,100,992 Otherfinancialassets 102,423,747 33,945,507 Bankbalances 51,712,868 70,003,099 ------------------------------------ ------------------------------------ 193,321,956 169,906,308 ================== ==================
The maximum exposure to credit risk for trade debts at the reporting date by type of customer was:
2010 2009 Rupees Rupees -------------------------------------- ------------------------------------ Cementmanufacturers 13,426,676 10,404,317 Oilandgasexplorationserviceproviders 6,798,500 7,106,002 Constructionandminingentities 15,605,686 43,431,937 Agents 1,474,770 1,540,092 ------------------------------------ ------------------------------------ 37,305,632 62,482,348 ================== ==================
Impairment losses
The aging of trade debts at the reporting date was:
2010 2009 Gross debts Impairment Gross debts Impairment ---------------------------------------------------------------------- ---------------------------------------------------------------------- Rupees Rupees Rupees Rupees
Notpastdue 26,618,933 - 42,152,707 - Pastdue0-30days 1,701,358 - 13,584,178 - Pastdue31-60days 1,044,225 - - - Pastdue61-90days - - - - Pastdue91-365days 6,348,355 - 5,152,702 - Over365days 1,592,761 1,592,761 1,592,761 1,474,770 ----------------------------- ----------------------------- ----------------------------- ----------------------------- 37,305,632 1,592,761 62,482,348 1,474,770 =============== =============== =============== ===============
Annual Report2010 46
NOTES TO THE FINANCIAL STATEMENTSFOR THE YEAR ENDED 30 JUNE 2010
The management constantly evaluates the creditworthiness of the customers and considers the historical payment record of customers. In relation to the trade debts that are past due the management believes that counterparties will discharge their obligations and accordingly no additional allowance for impairment is required.
The allowance account in respect of other receivables is used to record impairment losses, when no recovery of the amount owing is possible;atthatpointtheamountconsideredirrecoverableiswrittenoffbytheCompany.
33.2 Liquidity risk
LiquidityriskresultsfromtheCompany’spotentialinabilitytomeetitsfinancialliabilities,e.g.settlementofborrowings,payingitssuppliersandsettlingfinanceleaseobligations.TheresponsibilityforliquidityriskmanagementrestswiththeBoardofDirectorsoftheCompanyandtheirapproachinthisregardistoensurethattheCompanyalwayshassufficientliquiditytomeetitsliabilitieswhendue, without incurring unacceptable losses or risking damage to the Company’s reputation. Beyond effective net working capital and cashmanagement,theCompanymitigatesliquidityriskbyarrangingshorttermfinancingfromhighlyratedfinancialinstitutions.
ThematurityprofileoftheCompany’sfinancialliabilitiesbasedonthecontractualamountsisasfollows:
2010 2009 ---------------------------------------------------------------------- ---------------------------------------------------------------------- Carrying Contractual Carrying Contractual amount cash flows amount cash flows ---------------------------------------------------------------------- ---------------------------------------------------------------------- Rupees Rupees
Maturity upto one year Liabilitiesagainstassetssubjecttofinancelease - - 2,837,427 2,610,269 Shorttermborrowings - - - - Markupaccrued 29,984 29,984 48,059 48,059 Tradeandotherpayables 50,006,758 50,006,758 30,500,433 30,500,433 50,036,742 50,036,742 33,385,919 33,158,761
Maturity after one year and upto two years Liabilitiesagainstassetssubjecttofinancelease - - - - ----------------------------- ----------------------------- ----------------------------- ----------------------------- 50,036,742 50,036,742 33,385,919 33,158,761 =============== =============== =============== ===============33.3 Market risk
MarketfluctuationsmayresultincashflowandprofitvolatilityriskfortheCompany.TheCompany’soperatingactivitiesaswellasitsinvestmentandfinancingactivitiesareaffectedbychangesinforeignexchangerates,interestratesandsecurityprices.Tooptimizetheallocationofthefinancialresourcesaswellassecureanoptimalreturnforitsshareholders,theCompanyidentifies,analyzesandproactivelymanagestheassociatedfinancialmarketrisks.TheCompanyseekstomanageandcontroltheserisksprimarilythroughitsregularoperatingandfinancingactivities.
Foreign currency risk management
PKR is the functional currency of the Company and exposure arises from transactions and balances in currencies other than PKR as foreignexchangeratefluctuationsmaycreateunwantedandunperdicticableearningsandcashflowvolatility.TheCompany’spotentialcurrencyexposurecomprise;
- Transactionalexposureinrespectofnonfunctionalcurrencymonetaryitems. - Transactionalexposureinrespectofnonfunctionalcurrencyexpenditureandrevenues.
Annual Report2010 47
NOTES TO THE FINANCIAL STATEMENTSFOR THE YEAR ENDED 30 JUNE 2010
Thepotentialcurrencyexposuresarediscussedbelow;
Transactional exposure in respect of non functional currency monetary items
Monetaryitems,includingfinancialassetsandliabilities,denominatedincurrenciesotherthanthefunctionalcurrencyoftheCompanyareperiodicallyrestatedtoPKRequivalent,andtheassociatedgainorlossistakentotheprofitandlossaccount.Theforeigncurrencyrisk related to monetary items is managed as part of the risk management strategy.
Transactional exposure in respect of non functional currency expenditure and revenues
Certain operating and capital expenditure is incurred by the Company in currency other than the functional currency. Certain sales revenue is earned in currencies other than the functional currency of the Company. These currency risks are managed as a part of overall risk management strategy. The Company does not enter into forward exchange contracts.
Exposure to foreign currency risk
The Company’s exposure to foreign currency risk was as follows based on following amounts:
2010 2009 USD USD -------------------------------------- ------------------------------------ Tradedebts - 330,830 Bankbalances 697,653 434,252 Advancefromcustomer (38,673) - ------------------------------------ ------------------------------------ 658,980 765,082 ================== ==================
Thesignificantexchangeratesappliedduringtheyearwere:
Average rate Reporting date mid spot rate 2010 2009 2010 2009 Rupees Rupees Rupees Rupees ------------------------------ ------------------------------ ------------------------------ ------------------------------ USD 1 83.38 78.82 85.59 81.45 =============== =============== =============== =============== Sensitivity analysis
A10percentweakeningofthePKRagainsttheUSDat30Junewouldhaveincreasedequityandprofitorlossbytheamountsshownbelow. This analysis assumes that all other variables, in particular interest rates, remain constant.
2010 2009 Rupees Rupees -------------------------------------- ------------------------------------ Profitandlossaccount 5,640,211 6,231,593 ================== ==================
A10percentstrengtheningofthePKRagainsttheUSDat30JunewouldhavehadtheequalbutoppositeeffectonUSDtotheamountsshown above, on the basis that all other variables remain constant.
Interest rate risk
Theinterestrateriskistheriskthatthevalueofthefinancialinstrumentwillfluctuateduetochangesinthemarketinterestrates.Sensitivitytointerestrateriskarisesfrommismatchesoffinancialassetsandliabilitiesthatmatureinagivenperiod.TheCompanyadoptsapolicytoensurethatinterestrateriskarisingonitsfinancialassetsisminimizedbyinvestinginfixedrateinvestmentslikeTDRs.
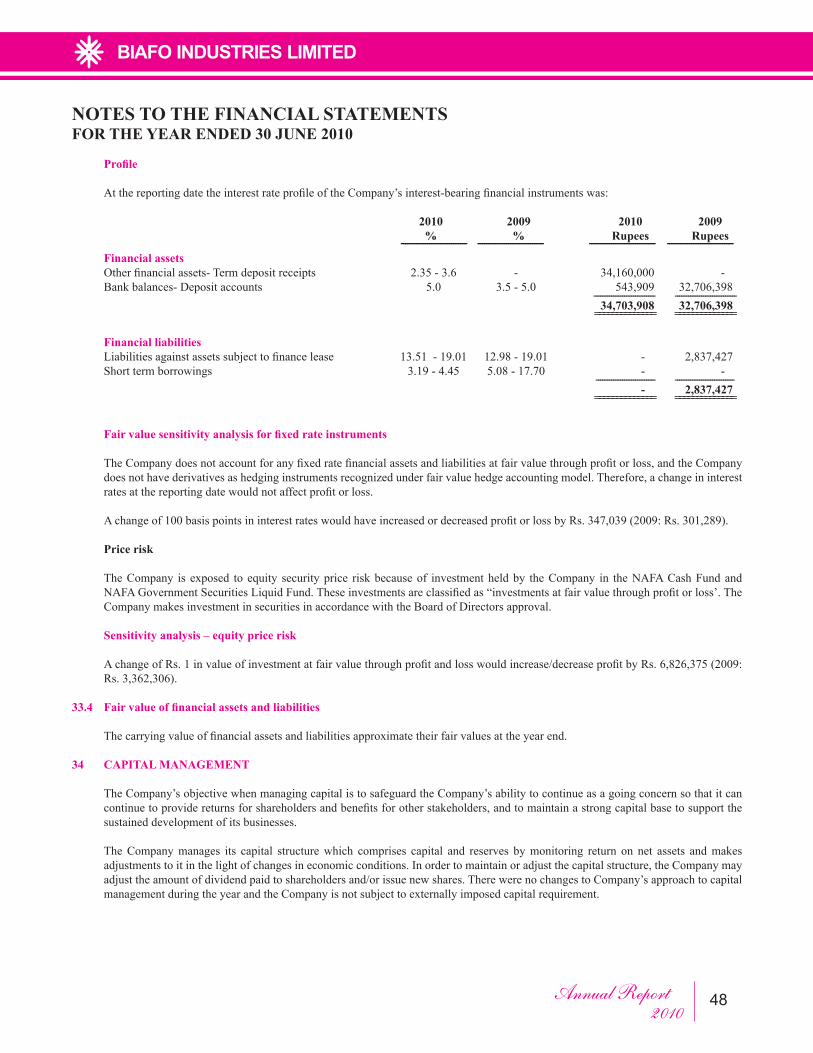
Annual Report2010 48
NOTES TO THE FINANCIAL STATEMENTSFOR THE YEAR ENDED 30 JUNE 2010
Profile
AtthereportingdatetheinterestrateprofileoftheCompany’sinterest-bearingfinancialinstrumentswas:
2010 2009 2010 2009 % % Rupees Rupees ------------------------------ ------------------------------ ------------------------------ ------------------------------ Financial assets Otherfinancialassets-Termdepositreceipts 2.35-3.6 - 34,160,000 - Bankbalances-Depositaccounts 5.0 3.5-5.0 543,909 32,706,398 ---------------------------- ---------------------------- 34,703,908 32,706,398 ============== ==============
Financial liabilities Liabilitiesagainstassetssubjecttofinancelease 13.51-19.01 12.98-19.01 - 2,837,427 Shorttermborrowings 3.19-4.45 5.08-17.70 - - --------------------------- --------------------------- - 2,837,427 ============== ==============
Fair value sensitivity analysis for fixed rate instruments
TheCompanydoesnotaccountforanyfixedratefinancialassetsandliabilitiesatfairvaluethroughprofitorloss,andtheCompanydoes not have derivatives as hedging instruments recognized under fair value hedge accounting model. Therefore, a change in interest ratesatthereportingdatewouldnotaffectprofitorloss.
Achangeof100basispointsininterestrateswouldhaveincreasedordecreasedprofitorlossbyRs.347,039(2009:Rs.301,289).
Price risk
TheCompany is exposed toequity securityprice riskbecauseof investmentheldby theCompany in theNAFACashFundandNAFAGovernmentSecuritiesLiquidFund.Theseinvestmentsareclassifiedas“investmentsatfairvaluethroughprofitorloss’.TheCompany makes investment in securities in accordance with the Board of Directors approval.
Sensitivity analysis – equity price risk
AchangeofRs.1invalueofinvestmentatfairvaluethroughprofitandlosswouldincrease/decreaseprofitbyRs.6,826,375(2009:Rs.3,362,306).
33.4 Fair value of financial assets and liabilities
Thecarryingvalueoffinancialassetsandliabilitiesapproximatetheirfairvaluesattheyearend.
34 CAPITAL MANAGEMENT
The Company’s objective when managing capital is to safeguard the Company’s ability to continue as a going concern so that it can continuetoprovidereturnsforshareholdersandbenefitsforotherstakeholders,andtomaintainastrongcapitalbasetosupportthesustained development of its businesses.
The Company manages its capital structure which comprises capital and reserves by monitoring return on net assets and makes adjustments to it in the light of changes in economic conditions. In order to maintain or adjust the capital structure, the Company may adjust the amount of dividend paid to shareholders and/or issue new shares. There were no changes to Company’s approach to capital management during the year and the Company is not subject to externally imposed capital requirement.
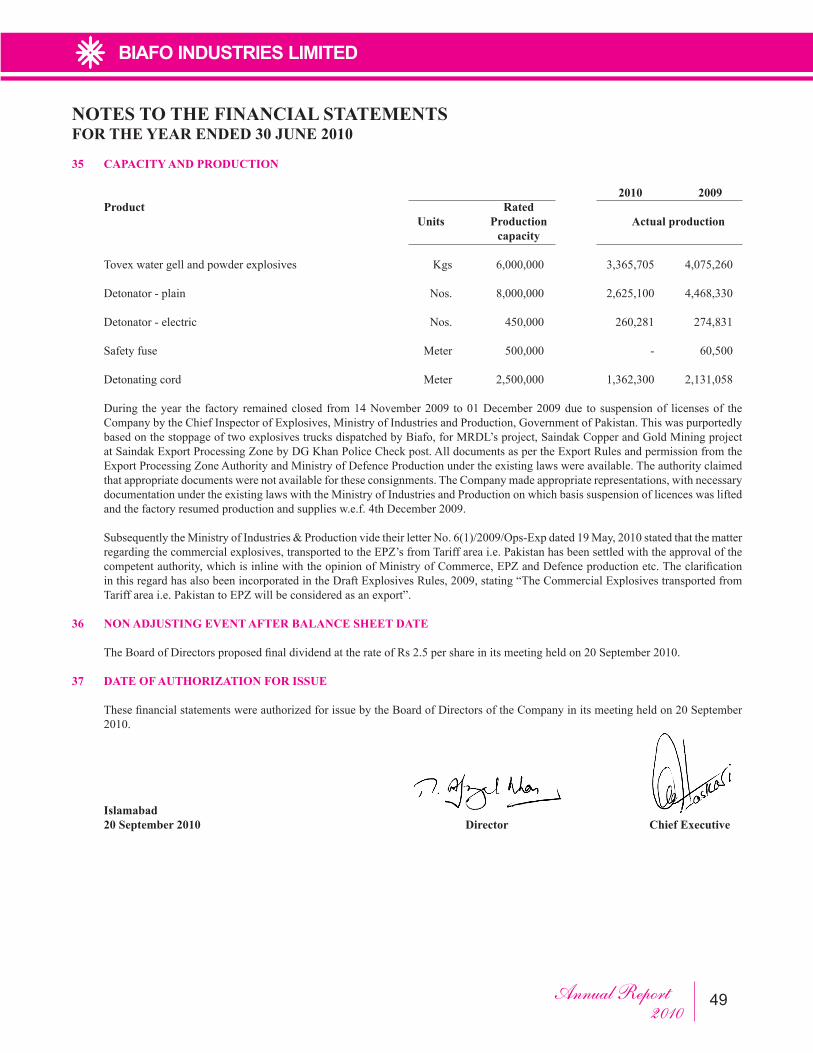
Annual Report2010 49
NOTES TO THE FINANCIAL STATEMENTSFOR THE YEAR ENDED 30 JUNE 2010
35 CAPACITY AND PRODUCTION
2010 2009 Product Rated Units Production Actual production capacity
Tovexwatergellandpowderexplosives Kgs 6,000,000 3,365,705 4,075,260
Detonator-plain Nos. 8,000,000 2,625,100 4,468,330
Detonator-electric Nos. 450,000 260,281 274,831
Safetyfuse Meter 500,000 - 60,500
Detonatingcord Meter 2,500,000 1,362,300 2,131,058
During theyear the factory remainedclosed from14November2009 to01December2009due to suspensionof licensesof theCompany by the Chief Inspector of Explosives, Ministry of Industries and Production, Government of Pakistan. This was purportedly based on the stoppage of two explosives trucks dispatched by Biafo, for MRDL’s project, Saindak Copper and Gold Mining project at Saindak Export Processing Zone by DG Khan Police Check post. All documents as per the Export Rules and permission from the Export Processing Zone Authority and Ministry of Defence Production under the existing laws were available. The authority claimed that appropriate documents were not available for these consignments. The Company made appropriate representations, with necessary documentation under the existing laws with the Ministry of Industries and Production on which basis suspension of licences was lifted andthefactoryresumedproductionandsuppliesw.e.f.4thDecember2009.
SubsequentlytheMinistryofIndustries&ProductionvidetheirletterNo.6(1)/2009/Ops-Expdated19May,2010statedthatthematterregarding the commercial explosives, transported to the EPZ’s from Tariff area i.e. Pakistan has been settled with the approval of the competentauthority,whichisinlinewiththeopinionofMinistryofCommerce,EPZandDefenceproductionetc.TheclarificationinthisregardhasalsobeenincorporatedintheDraftExplosivesRules,2009,stating“TheCommercialExplosivestransportedfromTariff area i.e. Pakistan to EPZ will be considered as an export”.
36 NON ADJUSTING EVENT AFTER BALANCE SHEET DATE
TheBoardofDirectorsproposedfinaldividendattherateofRs2.5pershareinitsmeetingheldon20September2010.
37 DATE OF AUTHORIZATION FOR ISSUE
ThesefinancialstatementswereauthorizedforissuebytheBoardofDirectorsoftheCompanyinitsmeetingheldon20September2010.
Islamabad 20 September 2010 Director Chief Executive
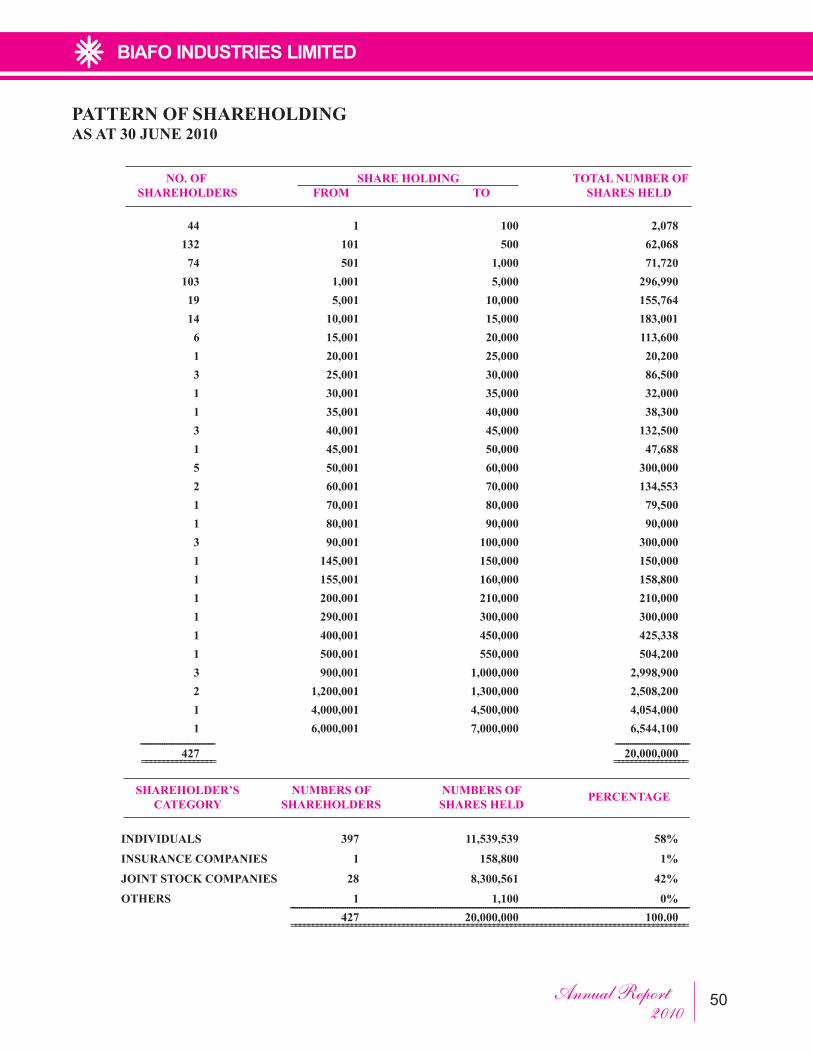
Annual Report2010 50
PATTERN OF SHAREHOLDINGAS AT 30 JUNE 2010
NO. OF SHARE HOLDING TOTAL NUMBER OF SHAREHOLDERS FROM TO SHARES HELD
44 1 100 2,078 132 101 500 62,068 74 501 1,000 71,720 103 1,001 5,000 296,990 19 5,001 10,000 155,764 14 10,001 15,000 183,001 6 15,001 20,000 113,600 1 20,001 25,000 20,200 3 25,001 30,000 86,500 1 30,001 35,000 32,000 1 35,001 40,000 38,300 3 40,001 45,000 132,500 1 45,001 50,000 47,688 5 50,001 60,000 300,000 2 60,001 70,000 134,553 1 70,001 80,000 79,500 1 80,001 90,000 90,000 3 90,001 100,000 300,000 1 145,001 150,000 150,000 1 155,001 160,000 158,800 1 200,001 210,000 210,000 1 290,001 300,000 300,000 1 400,001 450,000 425,338 1 500,001 550,000 504,200 3 900,001 1,000,000 2,998,900 2 1,200,001 1,300,000 2,508,200 1 4,000,001 4,500,000 4,054,000 1 6,000,001 7,000,000 6,544,100 ---------------------------------- ---------------------------------- 427 20,000,000 ================= =================
SHAREHOLDER’S NUMBERS OF NUMBERS OF PERCENTAGE CATEGORY SHAREHOLDERS SHARES HELD
INDIVIDUALS 397 11,539,539 58%
INSURANCE COMPANIES 1 158,800 1%
JOINT STOCK COMPANIES 28 8,300,561 42%
OTHERS 1 1,100 0% -------------------------------------------------------------------------------------------------------------------------------------------------------------------------------------- 427 20,000,000 100.00 ============================================================================================
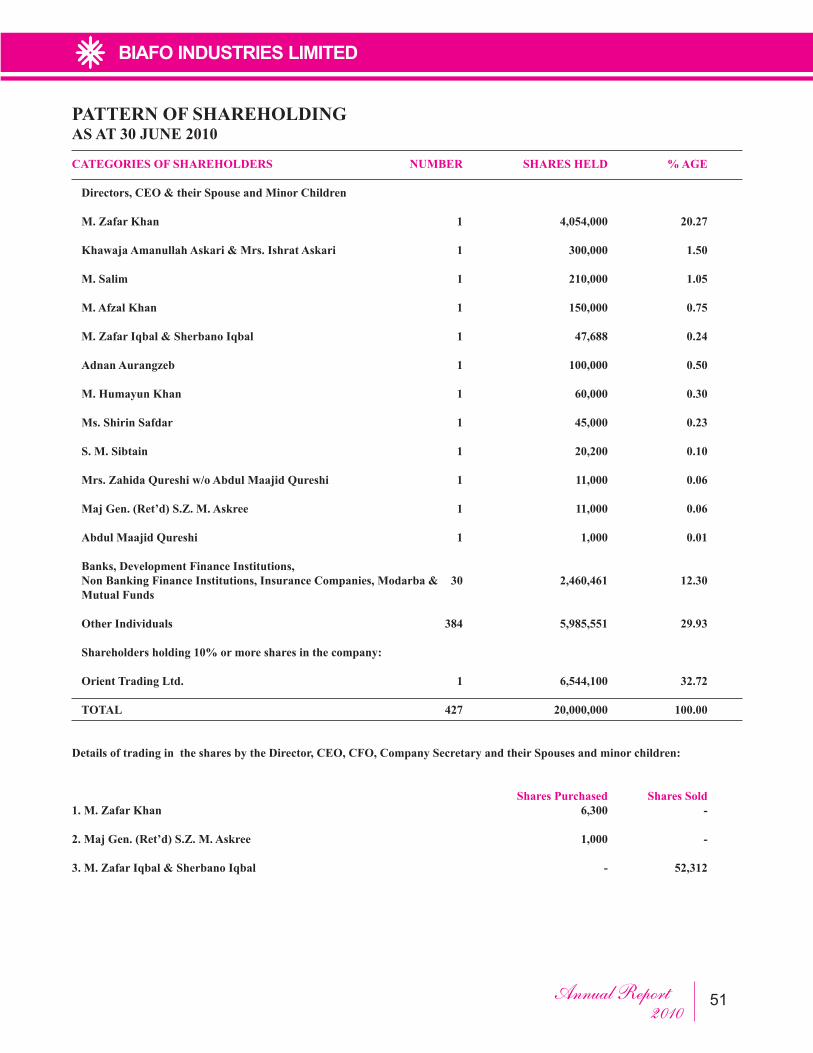
Annual Report2010 51
PATTERN OF SHAREHOLDINGAS AT 30 JUNE 2010
CATEGORIES OF SHAREHOLDERS NUMBER SHARES HELD % AGE
Directors, CEO & their Spouse and Minor Children
M. Zafar Khan 1 4,054,000 20.27
Khawaja Amanullah Askari & Mrs. Ishrat Askari 1 300,000 1.50
M. Salim 1 210,000 1.05
M. Afzal Khan 1 150,000 0.75
M. Zafar Iqbal & Sherbano Iqbal 1 47,688 0.24
Adnan Aurangzeb 1 100,000 0.50
M. Humayun Khan 1 60,000 0.30
Ms. Shirin Safdar 1 45,000 0.23
S. M. Sibtain 1 20,200 0.10
Mrs. Zahida Qureshi w/o Abdul Maajid Qureshi 1 11,000 0.06
Maj Gen. (Ret’d) S.Z. M. Askree 1 11,000 0.06
Abdul Maajid Qureshi 1 1,000 0.01
Banks, Development Finance Institutions, Non Banking Finance Institutions, Insurance Companies, Modarba & 30 2,460,461 12.30Mutual Funds
Other Individuals 384 5,985,551 29.93
Shareholders holding 10% or more shares in the company:
Orient Trading Ltd. 1 6,544,100 32.72
TOTAL 427 20,000,000 100.00
Details of trading in the shares by the Director, CEO, CFO, Company Secretary and their Spouses and minor children:
Shares Purchased Shares Sold1. M. Zafar Khan 6,300 -
2. Maj Gen. (Ret’d) S.Z. M. Askree 1,000 -
3. M. Zafar Iqbal & Sherbano Iqbal - 52,312
Annual Report2010 52
FORM OF PROXY
The SecretaryBiafo Industries LimitedOfficeNo:203-204,2ndFloor,Muhammad Gulistan Khan House,Fazal-Ul-HaqRoad,BlueArea,Islamabad.
I/We ________________________________ Of __________________________________ being member of BIAFO INDUSTRIES LIMITED and Holder of ____________ Ordinary Shares as per Share Register Folio(Number) _____________ and/ or CDC Participant I.D. No. ____________ and Sub Account No. ____________ hereby appoint ___________________________ of __________________________(Name)
asmy/ourproxytovoteforme/usandonmy/ourbehalfatthe22ndAnnualGeneralMeetingoftheCompanytobeheldatitsregisteredoffice,203,2ndFloor,M.GulistanKhanHouse,82EastFazal-Ul-HaqRoad,BlueArea,IslamabadonOctober26,2010andanyadjournmentthereof.
Signed_________________________dayof_________________________2010
Signature
Signature should agree with the specimen signatureregistered with the Company)
WITNESSES:
1. Signature__________________________ 2. Signature__________________________
Name _____________________________ Name _____________________________
Address ___________________________ Address ___________________________
__________________________________ __________________________________
NIC or ____________________________ NIC or ____________________________
Passport No.________________________ Passport No.________________________
Note:1. AmemberentitledtobepresentandvoteattheMeetingmayappointaproxytoattendandvoteforhim/her.
A proxy need not be a member of the Company.2. ProxiesinordertobeeffectivemustbereceivedattheRegisteredOfficeoftheCompanynotlessthan48
hours before the Meeting.3. CDCShareholdersandtheirProxiesmusteachattachanattestedphotocopyoftheirNationalIdentityCardor
Passport with the proxy form.