Embed Size (px)
Citation preview

A N N U A L R E P O R T 2 0 1 0

O N T H E C O V E R Megan Johnson enjoys the simple everyday joys of motherhood. She receives important health care information through text4baby, an innovative mobile service for expectant and new mothers made possible by the National Healthy Mothers, Healthy Babies Coalition, founding sponsor Johnson & Johnson and multiple other partners. Text4baby symbolizes our commitment to caring for the health and well-being of mothers and babies, the Johnson & Johnson legacy for 125 years. Learn more on page 24.
Despite an extraordinarily challenging year, our people introduced new products, advanced
our pipelines and expanded businesses in emerging markets.
We are on our way to restoring
McNeil Consumer Healthcare to the high levels of quality and compliance that people expect of all
Johnson & Johnson companies and that we expect of ourselves.
Meanwhile, we are bringing forward innovations that
better health care for people around the world. We remain steeped in our tradition of caring for others,
driven by values deeply rooted in Our Credo.

C H A I R M A N ’ S L E T T E R 1
C H A I R M A N ’ S L E T T E R
To Our Shareholders
2010 will be remembered as a year in which our company was severely tested on numerous fronts. Yet our people continued the hallmark work of Johnson & Johnson: finding new ways to care for the health and well-being of people around the world. There were challenges we fully expected, particularly those related to the continuing global economic downturn and loss of patent exclusivity on some of our major pharmaceutical products. And there was a challenge we did not expect: the painful and disappointing experience of the McNeil Consumer Healthcare product recalls. Despite the trying moments of 2010, our people introduced new products, advanced our pipelines and expanded businesses in emerging markets. We remain steeped in our tradition of caring for others, driven by values deeply rooted in Our Credo. While we face near-term business pressures, we enter 2011 on a strong foundation to achieve long-term sustainable growth.
2010 Results
We continued to deliver earnings growth in 2010, with many of our businesses performing well in light of the macroeconomic conditions. Several factors impacted the health care industry in general and Johnson & Johnson. Medical devices and consumer businesses felt the effects of a continued economic slowdown. In health care, we anticipate continuing to feel those effects in 2011. There were costs associated with U.S. health care reform, which was implemented early in the year. In addition, we faced lost sales and remediation costs resulting from our consumer over-the-counter product recalls, as well as generic competition in our pharmaceuticals business. Despite these headwinds, we continued to grow earnings
while maintaining investments for future revenue and earnings growth. With these investments, we are developing a number of exciting new products that have the potential to address significant unmet health care needs. Worldwide sales for 2010 were $61.6 billion, a decrease of 1.3 percent operationally (reflecting the challenges noted as well as the 53rd accounting week included in the 2009 results). Adjusted earnings were $13.3 billion1, an increase of 2.9 percent despite a sales decline. Adjusted earnings per share increased 2.8 percent1. In a tough global economy, we maintained our financial discipline. We generated free cash flow of approximately $14 billion2 and held our AAA credit rating. We also executed a $1.1 billion debt offering at the lowest interest rate for long-term corporate debt in history. We had a one-year decline in total shareholder return of about half a percent. Over longer time frames, we continue to compare favorably to most stock indices, beating all major sector performance benchmarks on a three-year and 10-year basis. The one-year decline in shareholder return was disappointing, but reflects both the uncertainty around health care reform that hampered many in our sector and the impact of our consumer product recalls.
McNeil coNsuMeR HealtHcaRe
Our people dedicate themselves to providing the most trusted brands and high-quality products to help others around the world.
WilliaM c. WeldoN
Chairman, Board of Directors, and Chief Executive Officer
$61.9
N E T SA L E S (in billions of dollars)
2009 20102006 2007 2 0 0 9 2 0 1 02 0 0 6 2 0 0 7
$4.40
$3.63
$4.78
$3.73
D I LU T E D E A R N I N G S P E R S H A R E (in dollars)
2 0 0 9 2 0 1 02 0 0 6 2 0 0 7
$1.620$53.3
$61.1 $61.6$63.7
2008 2 0 0 8
$4.57 $1.930
2 0 0 8
$1.795
$2.110
$1.455
D I V I D E N D S PA I D P E R S H A R E (in dollars)
J O H N S O N & J O H N S O N 2 0 1 0 A N N U A L R E P O R T2
Thus, our experience with the McNeil Consumer Healthcare recalls has been difficult for all of us. Most important, we disappointed our customers. Trust and confidence in Johnson & Johnson and our products are fundamental to everything we do. Even though millions of customers remain supportive of our work to assure quality and restore our consumer brands to the market, that trust and confidence have been truly tested. During this past year, I visited many manufacturing locations around the world. I can assure you that our people are dedicated to giving our customers the highest-quality products, with no compromises whatsoever. It is our responsibility to learn from what happened, address problems at their root causes and ensure that only the highest-quality products reach our customers. That hard work—and the subsequent results—will help earn back trust and respect. We are on our way to restoring McNeil Consumer Healthcare to the high levels of quality and compliance that people expect of all Johnson & Johnson companies and that we expect of ourselves. As part of this commitment, we accelerated the imple- mentation of organizational changes to our Supply Chain, Manufacturing and Quality and Compliance areas, which began early in 2010. We also undertook a thorough review of how we operated our manufacturing plants and examined in detail the historical production records of McNeil Consumer Healthcare products sold in the U.S. and produced in McNeil’s internal manufacturing network. We have completed this internal review, and we will continue to conduct reviews at external sites that manufacture McNeil products. If these reviews reveal any further issues, we will not hesitate to take whatever steps are needed, including further market action, to ensure that our products meet world-class quality standards. These and other steps we have taken under the Comprehensive Action Plan submitted to the U.S. Food and Drug Administration (FDA) constitute an uncompromising effort to ensure high quality at McNeil. These actions will help us assure that moving forward, our products in the marketplace live up to the standards and expectations that consumers have for all products coming from Johnson & Johnson. At the same time, we are focused on returning the recalled products to the marketplace in 2011. We began shipping a small amount of product in the fourth quarter of 2010, and alternate supply of the remaining key products will ramp up in the latter half of 2011. At the appropriate time, we will invest in market support for our over-the-counter brands. We also will be introducing product and packaging innovations for a number of products, especially those for young children.
2010 HigHligHts
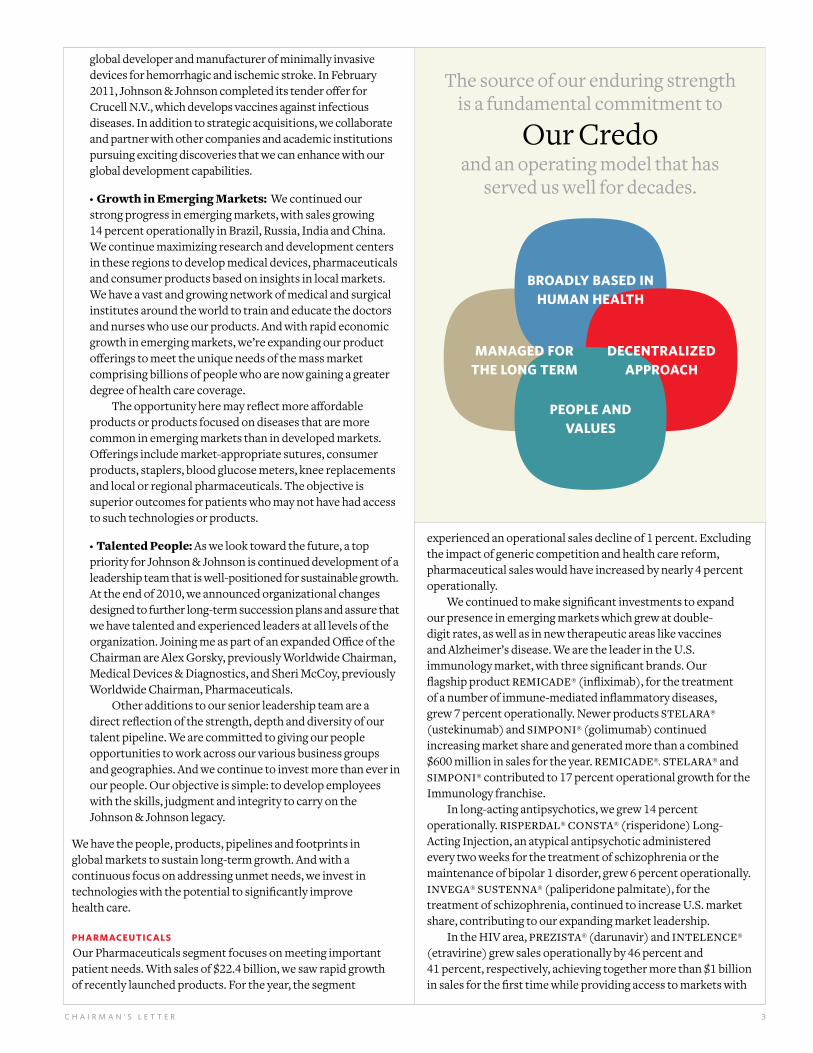
Even as we faced challenges throughout 2010, we remained unwavering in who we are as a company. The source of our enduring strength is a fundamental commitment to Our Credo and an operating model that has served us well for decades. Our operating model includes a commitment to being broadly based in human health care; a decentralized management approach that keeps our people close to customers; managing for the long term; and a focus on people and values. We focus on four growth enablers—products, pipelines, global presence and people—that support the model and enable accelerated growth.
Our 2010 accomplishments reflect the strength of our model and growth enablers.
• New Products: We introduced innovative products across our businesses and saw strong growth in recently introduced products. These include consumer products that address emerging health care needs, such as JOHNSON’S® NATURAL® baby products and LISTERINE® ZERO™ mouthwash. In our Medical Devices and Diagnostics (MD&D) segment, we launched more than 50 new products. For example, a new ENSEAL® tissue-sealing device for large vessel sealing in open surgery was introduced in the U.S., strengthening our energy surgical instrument portfolio. In Pharmaceuticals, we saw growth of key innovations approved in 2009—NUCYNTA®* (tapentadol) for pain, STELARA® (ustekinumab) and SIMPONI® (golimumab) in immunology, and INVEGA® SUSTENNA® (paliperidone palmitate) for schizophrenia. With a consistent flow of new products based on scientific innovation, approximately a quarter of Johnson & Johnson sales last year came from new products introduced in the past five years, and approximately 70 percent of our sales were from products with No. 1 or No. 2 global market share positions.
• Leading Product Pipelines: Across our businesses, we invested nearly $7 billion in research and development to advance our newest technologies and pipeline compounds. Our Pharmaceuticals pipeline is recognized as among the best in the industry. Rivaroxaban**, our anti-coagulant, has been filed in the U.S. for the prevention of stroke in patients with atrial fibrilation, a condition that can lead to major physical and behaviorial impairments, or death. The Company also responded to the FDA Complete Response Letter for its review of the rivaroxaban filing for preventing deep vein thrombosis and pulmonary embolism following total knee and hip replacement surgery. Abiraterone acetate, an investigational compound for the treatment of metastatic advanced prostate cancer from last year’s acquisition of Cougar Biotechnology, was granted priority review in the U.S. and accepted for accelerated assessment in Europe. Telaprevir,*** for hepatitis C, an undertreated global infectious disease, has also been accepted for accelerated assessment in Europe. Additionally, we filed TMC278 for HIV in both the U.S. and Europe. In MD&D, the Fibrin Pad, a revolutionary hemostasis product that combines two biomaterials and two biologics to stop bleeding during surgical procedures, was filed for regula-tory approval with the FDA. • Targeted Acquisitions: We believe in an organic and collaborative approach to innovation. In addition to our own internal research and development programs, we create partnerships through licensing and make targeted acquisitions to either add a capability or gain an asset from which we can drive more value. We acquired Micrus Endovascular, a
* NUCYNTA® is licensed from Grünenthal GmBH. ** Rivaroxaban is co-developed with Bayer HealthCare.*** Telaprevir is developed in collaboration with Vertex Pharmaceuticals, Inc.
C H A I R M A N ’ S L E T T E R 3
global developer and manufacturer of minimally invasive devices for hemorrhagic and ischemic stroke. In February 2011, Johnson & Johnson completed its tender offer for Crucell N.V., which develops vaccines against infectious diseases. In addition to strategic acquisitions, we collaborate and partner with other companies and academic institutions pursuing exciting discoveries that we can enhance with our global development capabilities.
• Growth in Emerging Markets: We continued our strong progress in emerging markets, with sales growing 14 percent operationally in Brazil, Russia, India and China. We continue maximizing research and development centers in these regions to develop medical devices, pharmaceuticals and consumer products based on insights in local markets. We have a vast and growing network of medical and surgical institutes around the world to train and educate the doctors and nurses who use our products. And with rapid economic growth in emerging markets, we’re expanding our product offerings to meet the unique needs of the mass market comprising billions of people who are now gaining a greater degree of health care coverage. The opportunity here may reflect more affordable products or products focused on diseases that are more common in emerging markets than in developed markets. Offerings include market-appropriate sutures, consumer products, staplers, blood glucose meters, knee replacements and local or regional pharmaceuticals. The objective is superior outcomes for patients who may not have had access to such technologies or products.
• Talented People: As we look toward the future, a top priority for Johnson & Johnson is continued development of a leadership team that is well-positioned for sustainable growth. At the end of 2010, we announced organizational changes designed to further long-term succession plans and assure that we have talented and experienced leaders at all levels of the organization. Joining me as part of an expanded Office of the Chairman are Alex Gorsky, previously Worldwide Chairman, Medical Devices & Diagnostics, and Sheri McCoy, previously Worldwide Chairman, Pharmaceuticals. Other additions to our senior leadership team are a direct reflection of the strength, depth and diversity of our talent pipeline. We are committed to giving our people opportunities to work across our various business groups and geographies. And we continue to invest more than ever in our people. Our objective is simple: to develop employees with the skills, judgment and integrity to carry on the Johnson & Johnson legacy.
We have the people, products, pipelines and footprints in global markets to sustain long-term growth. And with a continuous focus on addressing unmet needs, we invest in technologies with the potential to significantly improve health care.
PHaRMaceuticals
Our Pharmaceuticals segment focuses on meeting important patient needs. With sales of $22.4 billion, we saw rapid growth of recently launched products. For the year, the segment
experienced an operational sales decline of 1 percent. Excluding the impact of generic competition and health care reform, pharmaceutical sales would have increased by nearly 4 percent operationally. We continued to make significant investments to expand our presence in emerging markets which grew at double-digit rates, as well as in new therapeutic areas like vaccines and Alzheimer’s disease. We are the leader in the U.S. immunology market, with three significant brands. Our flagship product REMICADE® (infliximab), for the treatment of a number of immune-mediated inflammatory diseases, grew 7 percent operationally. Newer products STELARA® (ustekinumab) and SIMPONI® (golimumab) continued increasing market share and generated more than a combined $600 million in sales for the year. REMICADE®, STELARA® and
SIMPONI® contributed to 17 percent operational growth for the Immunology franchise. In long-acting antipsychotics, we grew 14 percent operationally. RISPERDAL® CONSTA® (risperidone) Long- Acting Injection, an atypical antipsychotic administered every two weeks for the treatment of schizophrenia or the maintenance of bipolar 1 disorder, grew 6 percent operationally. INVEGA® SUSTENNA® (paliperidone palmitate), for the treatment of schizophrenia, continued to increase U.S. market share, contributing to our expanding market leadership. In the HIV area, PREZISTA® (darunavir) and INTELENCE® (etravirine) grew sales operationally by 46 percent and 41 percent, respectively, achieving together more than $1 billion in sales for the first time while providing access to markets with
The source of our enduring strength is a fundamental commitment to
Our Credo and an operating model that has
served us well for decades.
PeoPle aNdValues
MaNaged foRtHe loNg teRM
BRoadly Based iNHuMaN HealtH
deceNtRalizedaPPRoacH
J O H N S O N & J O H N S O N 2 0 1 0 A N N U A L R E P O R T4
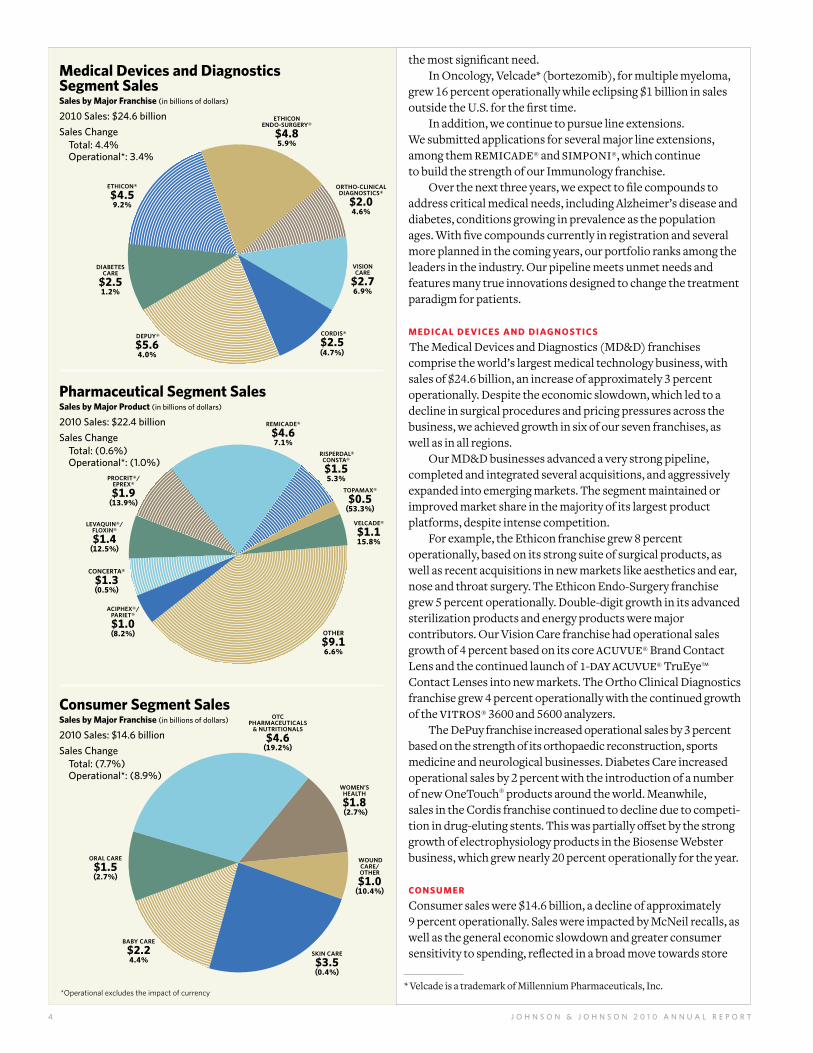
the most significant need. In Oncology, Velcade* (bortezomib), for multiple myeloma, grew 16 percent operationally while eclipsing $1 billion in sales outside the U.S. for the first time. In addition, we continue to pursue line extensions. We submitted applications for several major line extensions, among them REMICADE® and SIMPONI®, which continue to build the strength of our Immunology franchise. Over the next three years, we expect to file compounds to address critical medical needs, including Alzheimer’s disease and diabetes, conditions growing in prevalence as the population ages. With five compounds currently in registration and several more planned in the coming years, our portfolio ranks among the leaders in the industry. Our pipeline meets unmet needs and features many true innovations designed to change the treatment paradigm for patients.
Medical deVices aNd diagNostics
The Medical Devices and Diagnostics (MD&D) franchises comprise the world’s largest medical technology business, with sales of $24.6 billion, an increase of approximately 3 percent operationally. Despite the economic slowdown, which led to a decline in surgical procedures and pricing pressures across the business, we achieved growth in six of our seven franchises, as well as in all regions. Our MD&D businesses advanced a very strong pipeline, completed and integrated several acquisitions, and aggressively expanded into emerging markets. The segment maintained or improved market share in the majority of its largest product platforms, despite intense competition. For example, the Ethicon franchise grew 8 percent operationally, based on its strong suite of surgical products, as well as recent acquisitions in new markets like aesthetics and ear, nose and throat surgery. The Ethicon Endo-Surgery franchise grew 5 percent operationally. Double-digit growth in its advanced sterilization products and energy products were major contributors. Our Vision Care franchise had operational sales growth of 4 percent based on its core ACUVUE® Brand Contact Lens and the continued launch of 1-DAY ACUVUE® TruEye™ Contact Lenses into new markets. The Ortho Clinical Diagnostics franchise grew 4 percent operationally with the continued growth of the VITROS® 3600 and 5600 analyzers. The DePuy franchise increased operational sales by 3 percent based on the strength of its orthopaedic reconstruction, sports medicine and neurological businesses. Diabetes Care increased operational sales by 2 percent with the introduction of a number of new OneTouch® products around the world. Meanwhile, sales in the Cordis franchise continued to decline due to competi-tion in drug-eluting stents. This was partially offset by the strong growth of electrophysiology products in the Biosense Webster business, which grew nearly 20 percent operationally for the year.
coNsuMeR
Consumer sales were $14.6 billion, a decline of approximately 9 percent operationally. Sales were impacted by McNeil recalls, as well as the general economic slowdown and greater consumer sensitivity to spending, reflected in a broad move towards store
* Velcade is a trademark of Millennium Pharmaceuticals, Inc.* Operational excludes the impact of currency
Medical devices and diagnostics segment salessales by Major franchise (in billions of dollars)
2010 Sales: $24.6 billion
Sales Change Total: 4.4% Operational*: 3.4%
MD&D
DEPUY®
$5.64.0%
ETHICON ENDO-SURGERY®
$4.85.9%
DIABETES CARE
$2.51.2%
ORTHO-CLINICALDIAGNOSTICS®
$2.04.6%
VISION CARE
$2.76.9%
CORDIS®
$2.5(4.7%)
ETHICON®
$4.59.2%
Pharm
Pharmaceutical segment salessales by Major Product (in billions of dollars)
2010 Sales: $22.4 billion
Sales Change Total: (0.6%) Operational*: (1.0%)
LEVAQUIN®/FLOXIN®
$1.4(12.5%)
PROCRIT®/EPREX®
$1.9(13.9%)
OTHER
$9.16.6%
CONCERTA®
$1.3(0.5%)
REMICADE®
$4.67.1%
RISPERDAL®CONSTA®
$1.55.3%
TOPAMAX®
$0.5(53.3%)
VELCADE®
$1.115.8%
ACIPHEX®/ PARIET®
$1.0(8.2%)
consumer segment salessales by Major franchise (in billions of dollars)
2010 Sales: $14.6 billion
Sales Change Total: (7.7%) Operational*: (8.9%)
BABY CARE
$2.24.4%
SKIN CARE
$3.5(0.4%)
WOUND CARE/OTHER
$1.0(10.4%)
OTC PHARMACEUTICALS
& NUTRITIONALS
$4.6(19.2%)
ORAL CARE
$1.5(2.7%)
Consumer
WOMEN’S HEALTH
$1.8 (2.7%)
C H A I R M A N ’ S L E T T E R 5
brands and smaller sizes in certain markets. Despite the headwinds, we saw positive momentum in emerging markets, where sales grew by double digits. Operational sales decreased in most of our consumer franchises. However, we saw growth in many product lines, including DABAO® skin care products, NICORETTE®, JOHNSON’S®, AVEENO® and LE PETIT MARSEILLAIS®, where our science-based innovations and expansion into emerging markets continued to drive strong results. We also introduced new product innovations and line extensions to iconic brands, such as JOHNSON’S® NATURAL®, LISTERINE® ZERO™, PRECISE™ from the makers of TYLENOL®, ZYRTEC® Liquid Gels and CYTOMIMIC™ technology in several new skin care products. Our Consumer business continues to distinguish itself with science-based innovations, proprietary technologies and recommendations by health care professionals. More than a billion people around the world count on our consumer products for themselves and their families.
ouR eNduRiNg stReNgtH
With the challenges of 2010, and within the context of our 125th anniversary in 2011, we are reminded more than ever of our heritage. Unwavering commitment to the principles embodied in Our Credo and an appreciation for the elements of our operating model are as strong today as at any time in our history. We are not perfect; we will make mistakes. And when we do, we hold ourselves accountable to correct them. That accountability is inherent in Our Credo. Its tenets demand a special level of responsibility … first to patients and customers, then to our employees, our communities and our shareholders. Our Credo remains our North Star. Another enduring strength is the character of the people of Johnson & Johnson. Despite diverse businesses, we are united by an extraordinary bond—a commitment to caring for one person at a time and touching the world—originating from Our Credo values. It is a quiet sense of purpose focused around the lives we affect, the families and children we touch, and the professionals who support their health. Our products, our pipeline and our global presence make us strong as a company. Our people and Our Credo set us apart.
ouR coMMitMeNt to WoMeN aNd cHildReN
As our businesses have diversified and expanded globally, Johnson & Johnson remains true to the foundation of our company: caring for the health and well-being of mothers and children. We have a heritage unlike any other company. Because we are especially privileged to touch mothers at the most intimate moments with their newborn child, we have a bond forged on deep emotional trust—one that builds a special connection with people. It also magnifies our commitment to help ensure that mothers and children, wherever they may live, enjoy good health care. Consistent with our legacy, Johnson & Johnson responded
with a five-year commitment to the United Nations’ renewed efforts to advance the Millennium Development Goals of reducing mortality in women and children by 2015. Our commitment aims to help as many as 120 million women each year for the next five years, reaching 50 countries. It includes initiatives such as mobile health information for expectant mothers, safe birth programs and 200 million doses annually of mebendazole, a treatment for intestinal worms in children. In addition to this commitment, we support nearly 650 other philanthropic programs in more than 50 countries. While working on saving and improving the lives of women and children, we also focus on building the skills of people who serve community health needs, as well as
preventing diseases and reducing stigma and disability in underserved communities.
ouR coMMitMeNt to you
I commit to you, our shareholders, that as we enter 2011, Johnson & Johnson is well-positioned for future growth. We will restore quality and confidence in our products. We will continue to introduce differentiated new products that advance important unmet needs in human health and well-being. We will continue building and advancing pipelines that fuel our long-term success. And we’ll continue expanding into new health care categories and emerging markets that offer unprecedented opportunities to touch more people around the world with better care. Most important, we will never lose sight of who we are. Our Credo, our operating model and our people are enduring sources of success. We are deeply committed to the people who use our products, to our employees, to the communities in which we live and work, and to you, our loyal shareholders.
William C. WeldonChairman, Board of Directors, and Chief Executive Officer
March 16, 2011
1 Excludes special items.
2 Free cash flow is defined as operating cash flow less capital spending. See Reconciliation of Non-GAAP Financial Measures, page 76.
unwavering commitment to the principles embodied in our credo and an appreciation for the elements of our operating model are as strong today as at any time in our history.

J O H N S O N & J O H N S O N 2 0 1 0 A N N U A L R E P O R T6
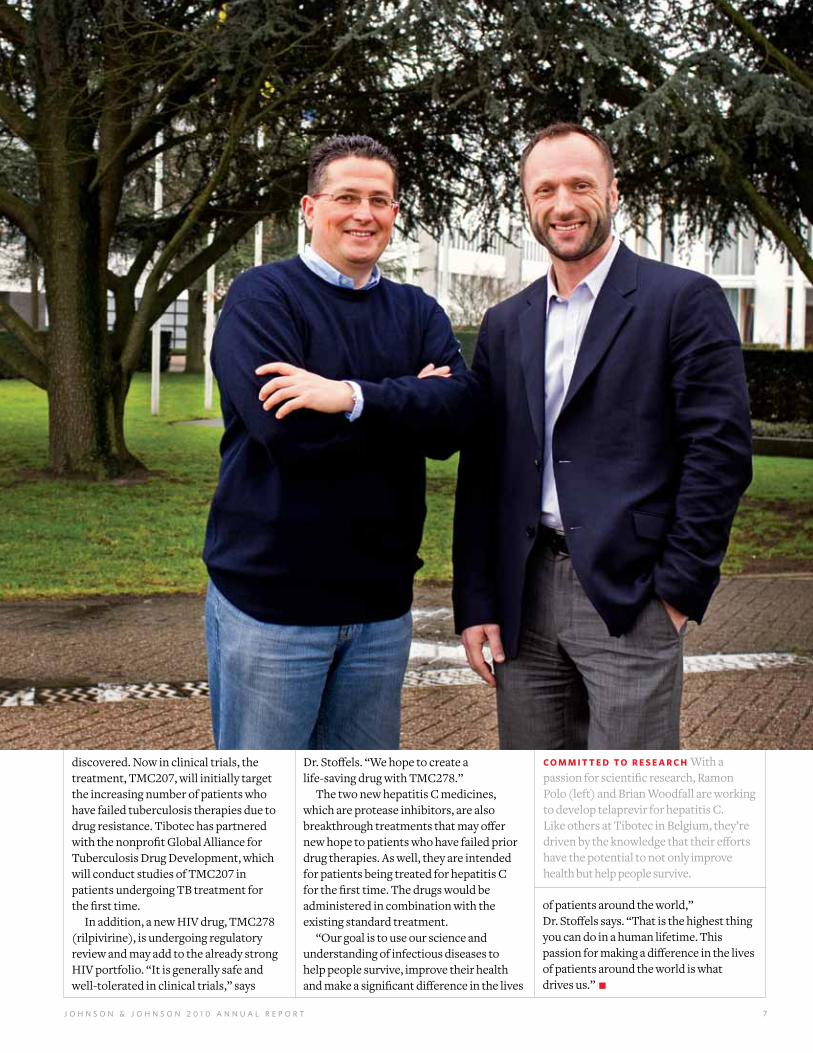
“Many people don’t tolerate the current drugs very well and feel sick,” says Woodfall, Vice President of Global Clinical Development for Tibotec Pharmaceuticals. “And at the end of the treatment, so many people aren’t cured.” The current standard treatment may be successful in less than 50 percent of patients who have the most prevalent form of hepatitis C, and there are no alternative medicines for those who don’t respond. About 170 million people worldwide are infected with hepatitis C, with 3 to 4 million new cases each year, according to the World Health Organization. It is a common cause of cirrhosis of the liver, liver cancer and liver transplants worldwide.
INNOVATIVE TREATMENTS AIM TO CURE MORE PATIENTS
To meet this critical need, Tibotec Pharmaceuticals is developing two new treatments for hepatitis C. The drugs, telaprevir and TMC435*, have the potential to cure significantly more people than currently available therapies and to halve patients’ treatment time, from 12 months to six. Telaprevir was named one of the top 10 medical innovations for 2011 by the Cleveland Clinic. It is now undergoing
review by the U.S. Food and Drug Admin-istration and the European Medicines Agency. TMC435 is being evaluated globally in several large Phase III trials. “These drugs will potentially decrease patients’ time away from work and family, and get them back to improved health faster,” Woodfall says. “Our research is driven by an intense commitment to save lives and improve patients’ health on a day-to-day basis.”
R&D EXPANDS IN INFECTIOUS DISEASES
The hepatitis C medicines are among the treatments that the Infectious Diseases and Vaccines Therapeutic Area is developing to address high unmet medical needs globally. Already a world leader in HIV medicines, the franchise is developing new treatments for tuberculosis (TB) and HIV, and has part-nered with Crucell N.V. to develop an influenza treatment and vaccine. In February 2011, Johnson & Johnson completed its tender offer for Crucell, which develops vaccines against infectious diseases world-wide. As a result, Crucell will now operate as the center for vaccines within the Pharmaceuticals group. “We are developing more effective treatments for infectious diseases to improve the lives of millions of people around the world,” says Paul Stoffels, M.D., Worldwide Chairman, Pharmaceuticals. “In addition to our growing research and
development in infectious diseases,” he adds, “we will have a greater impact on improving human health globally with our expansion into prevention as we build our vaccines pipeline, particularly in emerging markets.”
BREAKTHROUGH TREATMENTS
One of the world’s oldest and most deadly infectious diseases, tuberculosis kills 1.8 million people a year. Company researchers’ work in TB has been ground-breaking, and for the first time in more than 40 years, a new class of drugs potentially effective against TB has been
* Telaprevir is developed in collaboration with Vertex Pharmaceuticals, Inc.; TMC435 is developed in collaboration with Medivir AB.
Hope for Patients With Infectious Diseases
A s a researcher working on hepatitis C clinical trials around the world, Brian Woodfall, M.D., is only too aware of the challenges patients face. Many endure yearlong drug treatments
only to have to undergo a liver transplant or even die from complications related to the blood-borne virus.
P H a r m a c e u t I c a l s
J O H N S O N & J O H N S O N 2 0 1 0 A N N U A L R E P O R T 7
C O M M I T T E D T O R E S E A R C H With a passion for scientific research, Ramon Polo (left) and Brian Woodfall are working to develop telaprevir for hepatitis C. Like others at Tibotec in Belgium, they’re driven by the knowledge that their efforts have the potential to not only improve health but help people survive.
discovered. Now in clinical trials, the treatment, TMC207, will initially target the increasing number of patients who have failed tuberculosis therapies due to drug resistance. Tibotec has partnered with the nonprofit Global Alliance for Tuberculosis Drug Development, which will conduct studies of TMC207 in patients undergoing TB treatment for the first time. In addition, a new HIV drug, TMC278 (rilpivirine), is undergoing regulatory review and may add to the already strong HIV portfolio. “It is generally safe and well-tolerated in clinical trials,” says
Dr. Stoffels. “We hope to create a life-saving drug with TMC278.” The two new hepatitis C medicines, which are protease inhibitors, are also breakthrough treatments that may offer new hope to patients who have failed prior drug therapies. As well, they are intended for patients being treated for hepatitis C for the first time. The drugs would be administered in combination with the existing standard treatment. “Our goal is to use our science and understanding of infectious diseases to help people survive, improve their health and make a significant difference in the lives
of patients around the world,” Dr. Stoffels says. “That is the highest thing you can do in a human lifetime. This passion for making a difference in the lives of patients around the world is what drives us.”

J O H N S O N & J O H N S O N 2 0 1 0 A N N U A L R E P O R T8
Rivaroxaban* is a promising experimental medicine that may soon become a new alternative to warfarin for reducing the risk of unwanted blood clots. Johnson & Johnson Pharmaceutical Research & Development, LLC (J&JPRD) recently submitted a New Drug Application to the U.S. Food & Drug Administration (FDA) seeking approval to use rivaroxaban to prevent strokes in patients with the most common heart rhythm disorder—atrial fibrillation. Results from the ROCKET AF trial, comparing rivaroxaban to warfarin, a widely used but challenging-to-manage drug, were presented at the American Heart Association annual meeting. The study’s outcome suggests that “rivaroxaban has the potential to protect the 2.3 million Americans with atrial fibrillation from stroke and its devastating complica-tions,” according to Peter M. DiBattiste, M.D., Vice President of Cardiovascular Development, J&JPRD. ROCKET AF is the seventh successful Phase III trial in the ongoing rivarox-aban development program. In 2011, J&JPRD also expects to learn from the FDA whether rivaroxaban will be approved for the prevention of blood clots following total knee or total hip replacement surgeries.
reducing the risk of Heart Disease
*Rivaroxaban is co-developed with Bayer HealthCare.
advancing cancer care
“Living with cancer, you need a positive attitude,” says 64-year-old Richard Pflaum of Bath, England. “What you need is to be able to take some sort of action.” So Richard is participating in an ongoing clinical study with abiraterone acetate, a promising investigational medicine for the treatment of metastatic advanced prostate cancer. Globally, prostate cancer is the second most frequently diagnosed cancer in men and the fifth most common cancer overall. More than 900,000 new cases of prostate cancer were diagnosed in 2008, and more than 258,000 men died from the disease, a 16 percent
increase from 2002. Abiraterone acetate has not received marketing authoriza-tion and is for investigational use only. Based on positive results from a completed Phase III study, marketing applications were filed with regulatory authorities in the U.S. and Europe in December 2010, with additional filings planned for 2011. With abiraterone acetate, the oncology franchise is devel-oping strategies it hopes will one day help prevent or cure certain types of prostate and other cancers. Researchers are working hand-in-hand with today’s top oncology experts, testing compounds that
disrupt the surrounding tumor microenvironment that helps cancer thrive and using biomarkers to improve patient outcomes. Abiraterone acetate acts by blocking the synthesis of hormones produced by the body, including those produced by prostate cancer tissue to fuel its growth, according to William Hait, M.D., Ph.D., Global Therapeutic Area Head, Oncology. “We believe that abiraterone acetate is an impor-tant medical advance, and we look forward to further devel-oping additional therapies for oncology patients that will help save the lives of people around the world,” he says.
F I G H T I N G C A N C E R Clinical trial participant Richard Pflaum and wife Kathy hope he’ll benefit from advances in treating cancer.

9J O H N S O N & J O H N S O N 2 0 1 0 A N N U A L R E P O R T
Worldwide, 300 million people live with diabetes—almost equal to the entire U.S. population. “Diabetes is a far-reaching, complex disease,” says Martin Fitchet, M.D., Head of the Cardiovascular and Metabolism Therapeutic Area. “We are working to develop new treatment options that will not only help better manage the disease but have the potential to limit its progression.” In 2010, a large clinical development program for canagliflozin* and new collaborations supported the Company’s commitment to build a portfolio of diabetes treatments. Canagliflozin is an investigational oral, selective sodium-glucose transporter-2 (SGLT2) inhibitor being studied in patients for the treatment of type 2 diabetes. The Phase III clinical trial program involves more than 10,000 patients. A new collaboration with Metabolex, Inc. focuses on discovering, developing and commercializing new treatment options for people with type 2 diabetes and obesity. An agreement was entered into with Diamyd Medical AB to support the development of pharmaceuti-cals targeting autoimmune diabetes and its complica-tions, in particular the treatment and prevention of type 1 diabetes.
targeting Diabetes
Pursuing solutions in Immunology
*Canagliflozin is developed in collaboration with Mitsubishi-Tanabe Pharma Corporation.
Elizabeth Menduke, 47, lives outside Los Angeles, where she owns her own business. As a result of her psoriasis, she once had scaly red patches on more than 70 percent of her body. After treatment with stelara®
(ustekinumab) for plaque psoriasis, Elizabeth says, “I am so very excited to have clearer skin again.” stelara®, a treatment approved for moderate to severe plaque psoriasis, is now available in more than 50 countries as a result of additional marketing approvals in 2010.
Another treatment, sImPonI® (golimumab), approved in 2009 for the treat-ment of rheumatoid arthritis, psoriatic arthritis and ankylosing spondylitis, is now approved in approximately 40 countries. Two additional applications filed in 2010 seek to expand the U.S. label to include inhibition of the progression of structural damage in the treatment of rheumatoid arthritis and psoriatic arthritis. remIcaDe® (infliximab), a treatment with 15 FDA approvals, also received addi-tional marketing approvals in 2010, including several in Japan. In all, remIcaDe® is available in 100 countries. Such incremental growth with existing products is an important strategy for the Immunology Therapeutic Area, which also expanded research and development capabilities
into new treatment areas. In June, Centocor Ortho Biotech Inc. acquired RespiVert Ltd., a drug discovery company focused on developing inhaled small-molecule therapies for the treatment of pulmonary diseases. Sue Dillon, Ph.D., Global Therapeutic Area Head, Immunology, explains that the acquisition strengthens capabilities to further build a pipeline of novel oral and biologic therapies. “We’re focused on areas such as asthma, chronic obstructive pulmonary disease, idiopathic pulmonary fibrosis, sarcoidosis and lupus,” says Dillon, “where we can continue to make a difference in patients’ lives.”
C L E A R E R S K I N Psoriasis once kept Elizabeth Menduke from feeling her best. But she has clearer skin after treatment with stelara® for plaque psoriasis.

Specialized surgical staples are often used to connect tissue during certain surgeries. They’re credited with quicker recovery times than suturing by hand. But in emerging markets, it often costs too much to use specialized equipment designed for developed markets. Dr. Zhao is excited about what the new surgical tool could mean for his patients. “Patients who can now receive better health care at lower cost are certainly grateful,” he says. “Now, patients don’t carry the psychological weight of financial burden, so their recovery is complete.” For a health care company passionate about meeting the unmet needs of hundreds of millions more patients, Johnson & Johnson needs to challenge its innovation capability to develop solutions that will be both appropriate and afford-able. To that end, Johnson & Johnson is strategically basing research and develop-ment (R&D) centers in emerging markets to develop medical devices and pharma-ceutical and consumer products based on insights available in local markets.
EMERGING MARKET NEEDS
The Asia Pacific region is home to more than 4 billion people, almost 60 percent of the world’s population. While the more affluent societies, such as Japan, Australia, coastal China and metropolitan India, have access to innovative products and services, a large segment of the population has been unable to access or afford much beyond a very basic level of health care until now. Recent health care reforms in China and India, spurred by continuing economic growth in these countries, are
creating possibilities for governments to deliver a higher standard of care to many more people. Such reforms, along with the rise of a middle class and expectations of a better quality of life, are providing Johnson & Johnson with an enormous opportunity to address a previously underserved market. These mass markets are being addressed with a different business model that is focused on bringing an appropriate port-folio of technology and products to smaller and more rural health care settings, matching the specific range of procedures offered. This approach has led to the development of high-quality, affordable products that provide superior outcomes for patients who would not otherwise have access to such technology.
PASSION FOR INNOVATION
“Our vision is to be a source of innovation for emerging markets and address the unique needs of Asia Pacific patients,” says Michael del Prado, Company Group Chairman, Medical Devices & Diagnostics, Asia Pacific. “This might include devices for specific disease states that are prevalent in Asia, simplified and smaller instruments, multi-use or disposable products that are more economical, or a product range for rural health centers.” In June 2011, a Medical Devices and Diagnostics R&D center will open in Suzhou, China, focused on market- appropriate innovation for fast-growing emerging markets. Functions to support this innovation will also be based on the campus, including new product development and marketing, clinical research, regulatory, quality assurance and operations.
Johnson & Johnson has also entered into pharmaceutical research partnerships that connect biotech, medical and academic communities to its global research centers. One is a partnership in cancer research formed in 2008 with Tianjin Medical University Cancer Hospital in China. In November 2010, a research collaboration between Tsinghua University in China and Janssen Pharmaceutica N.V. was announced. “This five-year strategic partnership aims to accelerate discovery research and foster new therapeutic approaches for infectious diseases, an area of significant unmet medical need and one where we feel we can contribute positively to public health goals in China,” says Kim Taylor, Company Group Chairman, Pharmaceuticals, Asia Pacific. In 2009, Johnson & Johnson established a first-of-its-kind late-phase chemical entity facility, Analytical and Pharmaceutical Development Center, in Mumbai, India. The center will play a key role in addressing major global health care challenges, many of which also face Mumbai and the region. For the consumer sector, the Emerging Market Innovation Center that opened in Shanghai in 2007 is built on a consumer closeness and bonding program, an integral part of emerging market product design and development to meet needs in China. “I am happy Johnson & Johnson is focused on making new technologies and better health care accessible to lower-income patients,” says Dr. Zhao. “This results in better outcomes and fewer complications, really improving the lives of patients.”
Local Insights Inspire New Products
Surgeon Zhao Zhongliang serves a farming community in China’s Hebei province. He recently worked with the Ethicon Endo-Surgery franchise to develop a new, market-appropriate surgical
stapler to meet needs of patients like his.
I M P R O V I N G L I V E S Surgeon Zhao Zhongliang is happy to be a part of making new technologies and better health care accessible to patients like those in the farming community he serves.
J O H N S O N & J O H N S O N 2 0 1 0 A N N U A L R E P O R T10
E m E r g I N g m a r k E t s


J O H N S O N & J O H N S O N 2 0 1 0 A N N U A L R E P O R T12
In June 2010, Johnson & Johnson Consumer Companies, Inc. launched the Johnson’s® natural® baby line in North America, bringing new, affordable natural baby products to moms at mass retail. The brand was developed in response to the growing number of parents, like Sara, who are environmen-tally conscious and also want natural products for their babies. All five products are at least 98 percent natural (derived from fruits or plants). “A growing number of consumers everywhere in the world want a natural solution,” says Patrick Mutchler, Company Group Chairman. “As the global leader in baby care, it’s our responsibility to meet the different needs of different mothers.”
NATURAL AND MORE SUSTAINABLE
Johnson’s® poured more than 100 years of experience plus science, rigorous testing and expertise into developing the natural line. One challenge was defining just what is “natural.” While many organizations have formulated standards, these criteria don’t address the unique needs of babies. “Not all natural products are mild enough for a baby’s skin,” says Jean Holland, Worldwide Franchise, R&D Director. For example, a baby’s skin is thinner and more sensitive than an adult’s,
Holland says. “Some natural ingredients, such as essential oils, can be irritating or allergenic.” Johnson’s® ultimately developed a standard for babies, called the Best for BaBy naturals™ Standard. This led to a formulation that is 98 percent natural for the washes and 99 percent natural for the lotions, using plant- and fruit-derived ingredients. It contains the no More tears® formula and the first 100 percent naturally derived fragrance, allerfree™, which is free of known allergens and irritating essential oils. In addition, Johnson’s® natural® packaging is thoughtful of sustainability considerations. The plastic bottles contain no colorant, use up to 60 percent post-consumer recycled content and feature silkscreened graphics rather than labels, reducing packaging weight and waste. The product line was honored with an earthwards™ designation, which Johnson & Johnson gives to products that demonstrate significant improvements in their environmental footprint. Further, Johnson’s® natural® forged a partnership with the National Wildlife Federation* to encourage children’s exploration of their natural surroundings.
c o n s u M e r
natural choices
ELEVATES HERITAGE BRAND
“Both the traditional and natural Johnson’s® products meet the expectations of purity, mildness and gentleness inherent in our heritage business,” Holland says. “It’s all about giving moms a choice.” The line includes three baby and two kids products: Johnson’s® natural® Baby Lotion, Johnson’s® natural® head-to-toe™ Foaming Baby Wash, Johnson’s® natural® Baby Shampoo, Johnson’s® natural® Kids 3-in-1 Shampoo, Conditioner & Body Wash, and Johnson’s® natural® Kids 2-in-1 Hand & Face Foaming Wash. Sara Snow, meanwhile, especially appreciates that the prices are lower than some specialty natural brands and that the products are available at mass retail. “I really like that it’s affordable, so that anyone can get their hands on it,” says Sara, who was such a fan of the products that she became a spokeswoman. “To go with a product that for so long has been a trusted brand like Johnson’s®, that really does the research, people find a real sense of security and comfort in that.”
ara Snow, an Indianapolis-based TV host and green-living expert, gives her baby a “rub-a-dub-dub cleaning” with Johnson’s® natural® head-to-toe™ Foaming Baby Wash, then hands her daughter to Dad for the towel snuggle. “Especially for baby products, less is more,” says Sara. “It’s a fantastic product.”
S
*A trademark of the National Wildlife Federation. Please visit www.nwf.org.
M I L D A N D G E N T L E
Sara Snow continues to be environmentally conscious with her choices for her child, like using Johnson’s® natural® baby products. The product line was recognized with an earthwards™ designation and has forged a partnership with the National Wildlife Federation. Learn more at www.johnsonsbaby.com.

J O H N S O N & J O H N S O N 2 0 1 0 A N N U A L R E P O R T 25

J O H N S O N & J O H N S O N 2 0 1 0 A N N U A L R E P O R T14
One of the body’s strongest substances, tooth enamel, plays a vital role in protecting the sensitive inner tooth from daily wear and tear. Yet with today’s lifestyle of eating and drinking on the go—particularly acidic food and drink—enamel erosion is all too common. In the U.K., 91 percent of dentists report seeing patients with acid erosion on a weekly basis, and 9 in 10 adults experience cavities caused by tooth decay. Rinsing with listerine® Total Care Enamel Guard, a unique blend of listerine® essential oils and enhanced fluoride, helps re-mineralize and re-harden tooth enamel. The product was successfully launched in the U.K. in August 2010 and is expanding into Europe and other markets globally. The listerine® brand was a significant driver of the Oral Care business in 2010. listerine® Total Care products, including listerine® Total Care Enamel Guard, accounted for more than half the brand’s total sales. “The continued success of listerine® mouthwash in Europe is based on a deep understanding of consumer needs, met through innovative products,” says Neil Dickenson, Oral Care Franchise Director, Europe, Middle East and Africa. “listerine® Total Care has been a key focus, driving growth across the region.”
Before pediatric Motrin® became available in the town of Lv Xiang in 2010, fevers in children like Yun Han Yang in this part of China were commonly treated with an injection, if at all. Her mom, Hai Yan Li, says being able to go to the local clinic for an oral treatment is easier on every-one. She’s comforted knowing Motrin® offers safe and effective relief from fevers. Pediatric Motrin® has been manufactured in China since 1999, when it was introduced there. It quickly became the market leader in
the pediatric fever category in larger cities. Since 2009, an education and awareness campaign has successfully brought this No. 1 pediatrician-recommended anti-fever solution to more children across the country, including those in smaller cities or towns like Lv Xiang. The campaign uses a first-of-its-kind Fever Treatment Guide, developed by Shanghai Johnson & Johnson Pharmaceuticals, Ltd. in collaboration with the China Medical Association, to address incorrect treatments for fever
in children, especially prevalent in smaller communities. Pediatricians nationwide have widely embraced the guide, and Motrin® has gained their trust, as well as the trust of parents like Hai Yan Li. Shanghai Johnson & Johnson Pharmaceuticals and the China Medical Association also collaborate on Motrin® Pediatric World Window, launched in 2004 to improve pediatric care by providing continuous education to pediatricians. More than 20,000 pediatricians from around China have participated in satellite symposia on the latest advances in pediatric academic knowledge and research.
strengthening the trust of Pediatricians and Parents
Guarding against tooth erosion
T R E AT I N G F E V E R Doctors in more areas of China are now able to give children like Yun Han Yang pediatric Motrin®.

J O H N S O N & J O H N S O N 2 0 1 0 A N N U A L R E P O R T 15
A little more than two decades ago, when Johnson & Johnson Industrial Ltda. in Brazil launched a campaign to raise awareness of the harmful effects of tanning without protection, it took a primary role in educating Brazilians on the importance of using sunscreen. sundown® was the first ever sunscreen introduced in Brazil, in 1984. Since then, the company has continued to educate people about sun protection and bring forward meaningful products.
The Research and Technology Center in São José dos Campos matches sun protection innovation with consumer lifestyles in Brazil’s mostly tropical climate. “Skin care in general has become more important to Brazilian consumers, who are now more aware of the need for sunscreen, and dermatologists are recommending sunscreen for all ages,” says Maria Eduarda Kertesz, Vice President, Beauty, in Latin America. “We’ve responded to this trend with products that combine other skin care benefits, such as anti-aging, with sun protection, making it easier for consumers to use and dermatologists to recommend and encourage daily application of sun protection.” Dermatologists have
been integral to the success of RoC® Minesol, today the No. 1 dermatologist-recom-mended sunscreen brand in Brazil. In fact, one out of two sunscreens sold in the country is a Johnson & Johnson consumer brand. “The strong educational material we have offered to Brazilians during more than two decades is one of the main reasons consumers are making an informed choice to use sun protection,” says Kertesz. “We’ve played a role in making sun protection part of the daily routine for people in Brazil.”
Protecting skin
connecting with consumersonline
Online and home shopping specialty channels are showing tremendous growth globally in the premium skin care and beauty category. These include TV and mobile-enabled shopping, branded stores and door-to-door sales. The advantages specialty channels offer, including discounts and fast delivery, make them attractive to price-sensitive loyal customers and early adopters. The Consumer business is moving into these alternate channels and building organizational capabilities to support the strategy. The Korean skin care market is one example. In 2010 the neutroGena® brand saw double-digit growth in Korea by engaging consumers with content and solutions for acne through a clear-skin website. Products specifically designed for sale online, with direct links to purchase, were the brand’s main revenue drivers. Strategic alliances with top online retailers helped make clean & clear® the No. 1 teen skin care brand in major online channels in Korea. And the aveeno® Baby site has become the hub for sharing the aveeno® product experi-ence as well as for viral marketing. Efforts like these in Korea contributed to growth outside the U.S. in 2010.
W E A R I N G S U N P R O T E C T I O N
Brazilians Mariana and Pedro enjoy their time at the beach. Their mom knows daily application of sunscreen helps protect against the sun’s damaging rays.
At Gaetano Pini Hospital in Milan, Italy, Dr. D’Imporzano now has access to a new hemostasis product from Ethicon, Inc. that can be used to stop bleeding. EvicEl® Fibrin Sealant (Human), once thawed, is ready on-demand to help surgeons meet critical bleeding challenges. EvicEl® is a fibrin sealant approved for general hemostasis in surgery (that is, it can be used in any surgical setting) when control of bleeding by standard surgical techniques is ineffective or impractical. The human plasma-based biologics in EvicEl® sealant allow it to work independently of the patient’s clotting factors, creating a simple solution for complex bleeding problems. Often, surgical success depends on the ability to quickly and effectively control bleeding at the surgical site. EvicEl® sealant has become a critical tool to assist surgeons in ensuring that bleeding during and after surgery doesn’t become life-threatening. “The availability of so powerful a topical hemostatic product is extremely important,” says Dr. D’Imporzano. “Using a product like EvicEl®, together with a minimally invasive surgical approach, can lead to improved outcomes for patients.” EvicEl® sealant is the first product from Omrix Biopharmaceuticals, Inc. that Ethicon is taking to more global markets. When Ethicon acquired Omrix in 2008, EvicEl® sealant was available in one country. By the end of 2009, it was in 10 countries, and at the end of 2010, in 20 countries, including Italy, where it launched in October. “This is a great example of how we’ve used our scale to quickly globalize important products,” says Randy Hubbell, Worldwide Vice President, Ethicon Biosurgery unit. “With EvicEl® we’ve
taken the best technology, leveraged the global network of Johnson & Johnson companies and provided a strategic plan executed by local teams. Now more doctors can access this leading technology and make meaningful differences for their patients.” Because EvicEl® sealant is both a biologic and a medical device product, knowledge and experience in launching pharmaceuticals as well as medical devices was needed to expand to so many markets so quickly. In markets like Turkey and Greece, Medical Devices and Diagnostics (MD&D) teams reached out to their counterparts in Pharmaceuticals. Local expertise was the best way to manage the complexity in Italy, which has 21 provinces with distinct regulatory bodies, each with specific requirements. “Our strategy was to provide local leadership with comprehensive, cross-functional tools,” says Ron Horton, Group Product Director, Ethicon, Inc., who led the EvicEl® sealant globalization efforts. “The approach we used is scalable and adaptable for other business units, which could prove beneficial for teams in both the MD&D and pharmaceutical segments as they work to achieve global business goals.”
GLOBALIZATION DRIVES BUSINESS
The ability to quickly globalize products is just one way the MD&D business segment is capitalizing on globalization. Another is by developing market-appropriate products. Today the global MD&D market is worth approximately $350 billion, more than 50 percent of which is outside the United States, where markets are growing at a slightly faster rate. And emerging markets are growing still faster—two to three times the rate of the overall market.
In China, product offerings are being expanded to meet the unique needs of the mass market, which comprises hundreds of millions of people who now have access to some degree of health care. MD&D businesses have launched a number of market-appropriate products in China recently. Ethicon Endo-Surgery, Inc. introduced the AdvAnt™ 55 Linear Stapler in 2008 and the HCS Disposable Curved Circular Stapler in 2010. Designed for specific Asian markets, the OnEtOUcH® UltRAvUE™ blood glucose meter from LifeScan, Inc. was successfully launched in Japan in mid-2008 and is now a popular meter there. The meter was introduced in 2010 in China, where diabetes is quickly becoming an epidemic. Recent data indicates that one in 10 people in China now have the disease. To further accelerate progress in emerging markets, more research and development is being done outside the U.S. (See story on page 10.)
PATIENT NEEDS DRIVE EFFORTS
Efforts to develop market-appropriate products and quickly globalize new and existing products rely on an ability to leverage capabilities throughout Johnson & Johnson. The result is reaching more of the world with products that can make a difference. And that excites the Biosurgicals team too. “We’ve achieved an important market presence with EvicEl®, paving the way for products we’re developing,” says Dan Wildman, Worldwide President of Ethicon, Inc., responsible for the Ethicon Biosurgery unit. “By meeting significant needs of surgeons, we’re meeting vital needs of their patients.”
During total hip or knee surgery, it can be extremely challenging to control bleeding,” says surgeon Marco D’Imporzano, M.D. “The bleeding site is often difficult to reach, and it is difficult to
control this bleeding with traditional surgical techniques.”
S U R G I C A L S U C C E S S Dr. Marco D’Imporzano completes about 1,000 hip and knee replacements each year. He says adjunctive hemostatic products like EvicEl® sealant, combined with a minimally invasive approach to proce-dures, may improve outcomes.
Reaching More of the WorldM E d i c A l d E v i c E s & d i A g n O s t i c s
J O H N S O N & J O H N S O N 2 0 1 0 A N N U A L R E P O R T16


stopping deadly infections
Nearly 125 years ago, Johnson & Johnson pioneered ready-to-use surgical dressings that helped keep pathogens from infecting wounds. Now, Advanced Sterilization Products (ASP), a division of Ethicon, Inc., is pioneering the reduction of pathogens from health care settings with glOsAiR™ area disinfection products. The World Health Organization estimates that in Europe, more than 4 million patients are affected by
approximately 4.5 million episodes of health care-associated infections (HAIs) each year, causing 16 million extra days of hospital stay and 37,000 deaths. Another conse-quence: HAIs place significant cost pressure on hospitals. glOsAiR™ helps reduce the risk of HAIs and is on course to become a new standard of care. Studies show that this safe and user-friendly technology—a hydrogen peroxide dry-mist system—is a more effective method of disinfecting health care settings, following cleaning, than sole reliance on manual application of tradi-tional disinfectants. “These machines have helped us maintain a good standard of cleaning and manage a safe patient environment,” says Paul Andrews, Housekeeping Manager, Dorset County
Hospital, England. The local emergency hospital has used glOsAiR™ 400 Systems to help reduce HAI rates. “We’ve achieved one of the lowest MRSA rates in the National Health System since adding glOsAiR™ to our infection-prevention practices,” says Andrews. Since acquiring Gloster Europe in 2009, ASP has leveraged its ability to take glOsAiR™ to more markets. A global rollout began with launches throughout Europe in 2010; plans are to launch in the U.S. in 2011.
A World Without limits for People With diabetes
Diabetes is a global epidemic that’s increasing at an alarming rate. “One of the biggest challenges people with diabetes face is keeping their blood glucose levels in range,” says Kenneth Moritsugu, M.D., Vice President, LifeScan, Inc. “Better control can lead to fewer long-term complica-tions and ultimately can lower health care costs.” That’s why the Diabetes Care franchise remains dedi-cated to creating a world without limits for people with diabetes, delivering innovative products and tools that are easy for health care providers to teach and give patients more helpful information. In 2010, LifeScan began a global rollout of the OneTouch® Verio™ Blood Glucose Monitoring System. This accurate, easy-to-use system requires no coding and filters out many common interferences, reducing the chance for error. The system was test-marketed in the Netherlands with patients on insulin therapy and launched in Australia and Europe. Other markets will follow in 2011. Also in 2010, Animas Corporation, a leader in insulin pump systems, partnered with the Juvenile Diabetes Research Foundation to develop a first-generation partially automated glucose management system, a step toward the goal of revolutionizing treatment of type 1 diabetes.
I N F E C T I O N P R E V E N T I O N
Paul Andrews and colleague Carrole White use a glOsAiR™ 400 System to help reduce health care-associated infections at Dorset County Hospital in England.
J O H N S O N & J O H N S O N 2 0 1 0 A N N U A L R E P O R T18

new strength for stroke treatment
About 15 million people worldwide suffer a stroke each year, and as many as one-third die from it, according to the World Health Organization. Often, treatment or interven-tions to prevent stroke require physicians to use special devices to gain access to the brain. Two companies on which neuro-interventional-ists rely for such devices have come together to create one of the broadest portfolios and one of the deepest pipelines in the neurovascular industry. In September 2010, Johnson & Johnson acquired Micrus Endovascular Corporation, a global devel-oper and manufacturer of minimally invasive devices for hemorrhagic (caused by bleeding) and ischemic (caused by a blockage) stroke. “There are significant unmet needs in the treatment of neurovascular disease,” says P. Laxmin Laxminarain, Worldwide President, Codman & Shurtleff. Micrus Endovascular and Codman Neurovascular develop innovative and complementary products and technologies for treating cerebral aneurysms, which can lead to stroke. “Our hope is that by bringing these companies together,” says Laxminarain, “we can fuel rapid and meaningful innovation that further improves therapeutic options and access to care, and ultimately makes a difference in the treatment of this debilitating condition.”
Unlocking the dimensions of the Human Heart
Thomas Buehler, 57, of Round Lake, Ill., is hopeful he has kicked atrial fibrillation (AFib) for life. He hasn’t had a recur-rence since his AFib ablation* procedure more than a year ago, and his electrophysiologist, Andrea Natale, M.D., F.A.C.C., F.H.R.S., shares his optimism. “Although we can never tell a patient to forget about it completely,” says Dr. Natale, “in general when people do well beyond one year, the chance of a recurrence later
in life is very small.” The most common form of irregular heartbeat, AFib affects more than 20 million people worldwide and is the leading cause of stroke among people over age 65. A treatment called AFib ablation passes energy through a thin wire catheter placed inside the heart to disrupt specific tissue identified as a trigger. The carto® 3 System, the most advanced 3-D imaging technology from Biosense Webster, Inc., helps electrophysiologists perform AFib ablation with a high degree of accuracy. “There is a very fine line between doing the right thing for the patient and taking a chance of a complication,” says
Dr. Natale. “The carto® 3 System shows you, in real time, exactly where you are. It allows you to create a virtual geometry of the heart, to do the procedure very accurately.” For seven years prior to his procedure, Tom suffered frequent AFib flare-ups that lasted anywhere from two to eight hours. “It was depressing,” he says, recalling the extreme fatigue that came with them. Recently retired, he loves taking long walks and is enjoying living life again. “All that anxiety and stress is gone. My life has changed completely.”
O P T I M I S T I C O U T L O O K A heart out of rhythm caused fatigue and worry for volunteer fireman Thomas Buehler. Since his AFib ablation procedure, he says the anxiety and stress he once felt are gone.
* thermocool® Navigation Catheters are approved for drug refractory recurrent symptomatic paroxysmal atrial fibrillation when used with carto® Systems (excluding navistar® RMT thermocool® Catheter).
J O H N S O N & J O H N S O N 2 0 1 0 A N N U A L R E P O R T 19
J O H N S O N & J O H N S O N 2 0 1 0 A N N U A L R E P O R T20
Johnson & Johnson Supply Chain (JJSC) helps coordinate the path that our health care products take to reach people—doctors, nurses and patients, mothers, fathers and other caregivers— and meet their needs. “Processing orders, myself and others I work with genuinely feel how important it is to get high-quality product to where it ought to be,” says Elaine Eager, International Supply Group Team Leader, DePuy (Ireland), who once personally transported a knee implant to a hospital due to an urgent patient need. “It’s not simply about moving product from one place to another—it’s about transforming lives.” Worldwide, JJSC includes a network of manufacturing sites, external manufacturers, distribution centers and approximately 50,000 associates. “Our supply chain organization is a large part of who we are as a company and plays a vital role in our ability to meet the needs of our customers,” says Ajit Shetty, Ph.D., Corporate Vice President responsible for JJSC. “We have deployed a new supply chain operating model that will enable growth, drive quality and compliance, and help us run more efficiently so we can more effectively serve patients and consumers worldwide.”
A NEW HOLISTIC MODEL
The formation of an enterprise supply chain operating model was announced in January 2010. Objectives of the new organization are to enable growth, drive quality and compliance, improve costs and provide professional development for our people. Created by business leaders in all three sectors, the model will coordinate essential supply chain functions—like
procurement, customer and logistics services, and asset allocation—while maintaining critical decentralization of sector operating companies, one of the proven strategies of Johnson & Johnson. “Ultimately, this new approach to the supply chain will improve the experience our customers have when doing business with Johnson & Johnson companies while generating incremental value for our businesses,” says Shetty.
ENABLING PERFORMANCE TODAY
The organizational design for JJSC includes a new operating model for Quality & Compliance (Q&C) and a new structure for Supply Chain Strategy and Project Management. Cross-sector collaboration that the new enterprise model helps facilitate is already playing out in recovery plans related to manufacturing issues experienced at McNeil Consumer Healthcare. “The McNeil situation has all of us rethinking business continuity planning and how we utilize our plants and partner suppliers,” says Robert Salerno, Vice President, Supply Chain Strategy and Project Management, JJSC. “Rather than plan around one operating unit, we can approach manufacturing from a Johnson & Johnson vantage point. With the new supply chain model, we’re more able to leverage assets, best practices, systems and technologies while offering supply chain leaders professional development opportunities across our companies.” The new operating model will also create a single framework for Q&C across companies, inclusive of common quality standards by product types such as devices,
drugs and combination products. “By standardizing processes in our quality systems and by providing greater oversight in this area, we can reduce complexity and risk in the area of quality,” says Kathy Wengel, Chief Quality Officer, JJSC. NURTURING GROWTH TOMORROW
In addition to improving quality and compliance, the new model is designed to enable growth and improve efficiency and effectiveness. Again, cross-sector collaboration—key to bringing forth health care technologies that draw on expertise from more than one business segment—will flourish as manufacturing and quality experts from various business units have opportunities to combine their talents. “Campus Ireland” is one example. There are six manufacturing facilities in Ireland across our Medical Devices and Diagnostics and Pharmaceutical businesses. The close proximity of these facilities enables the companies to work collaboratively on a range of projects while facilitating the transfer of employees between sites for specific projects, career development and promotion opportunities. Campus leaders in Ireland are also working toward creation of a shared state-of-the-art manufacturing facility for convergent medical technology products. “Our journey to coordinate our supply chain organizations is under way,” Shetty says. “The operating model has the potential to benefit those we serve by driving quality, efficiency and effectiveness in all we do and touching—and transforming—lives for years to come.”
T here’s a pride and also a big sense of responsibility in what we do,” says Ray Hanley, Operations Development Coordinator, DePuy (Ireland). “Some 600
knees leave here every day to be implanted in patients around the world.”
P U T T I N G PAT I E N T S F I R S T
“Close collaboration with colleagues throughout the supply chain allows me to gain a holistic appreciation of the steps between my activities and each patient,” says Ray Hanley in Cork, Ireland. When such insights are used in decision-making, “It’s how we put patients first.”
J o h n s o n & J o h n s o n s u p p l y C h a i n
pathway to patients

J O H N S O N & J O H N S O N 2 0 1 0 A N N U A L R E P O R T22
Having heard Joseph Lister speak in 1876, Robert Wood Johnson was inspired to start a company to manufacture the first mass-produced sterile surgical dressings and sutures according to Lister’s methods, helping to make surgery safer and save lives.
With his brothers, James Wood Johnson and Edward Mead Johnson, he founded Johnson & Johnson, a company that has come to be known for its caring.Caring inspires the people of Johnson & Johnson to advance health and well-being. Just as the Johnson brothers did, we embrace research and science, bring forward innovative ideas, products and services, and work with partners in health care to touch lives throughout the world. “Meeting unmet needs in health care, one of our most important mandates, is to foster innovation both internally and through external collaborations,” says Garry Neil, M.D., Corporate Vice President, Corporate Office of Science & Technology. “Throughout our business segments, we have talented and driven scientists whose work is at the heart of product innovations we continue to bring forward, just as we’ve done for 125 years.” Dr. Frederick Barnett Kilmer was the Company’s first scientific director and chief publicity officer, from 1889–1934. Dr. Kilmer spread knowledge of antiseptic methods for treating wounds, furthered the scientific direction of the Company, and helped earn trust for its expanding product lines among physicians and patients. His tenure saw many pioneering firsts, including steam sterilization techniques, first aid kits, JOHNSON’S® Baby Powder and BAND-AID® Brand Adhesive Bandages—invented by employee Earle Dickson. As Johnson & Johnson grew, new
companies were added. With new companies came great scientists. Dr. Philip Levine studied human blood and discovered many of the subgroups in blood typing. His work led to the development of RhoGAM®, the first Rho (D) immunoglobulin product to treat hemolytic disease of the newborn and a product that has helped save the lives of countless babies. Dr. Paul Janssen, a Belgian scientist and one of the 20th century’s most innovative and inspiring pharmaceutical researchers, discovered haloperidol and led teams credited with discovering 80 medicines. The promise of new innovations inspires Johnson & Johnson scientists today. Miri Seiberg, Shawn Stad and Marie-Pierre de Béthune are among the select scientists who share the distinction of having received the Johnson Medal for Research and Development for outstanding science and technology relating to contributions to a specific product or process. Named after the late General Robert Wood Johnson, who authored Our Credo in 1943, it is the most prestigious award for research and development in the corporation. Each of the honoree’s experiences demonstrates that caring for others combined with innovative research and science makes all the difference. “Johnson & Johnson enables us to be at the cutting edge of technology,” says
Miri Seiberg, Ph.D., Distinguished Research Fellow at the Skin Biology group, Johnson & Johnson Consumer Companies, Inc. “We can combine knowledge and technology with innovative ideas to create better products and better serve our customers.” Seiberg is a 2003 recipient for the discovery and development of the “Total-Soy” skin care platform technology. “As scientists make new discoveries and gain a deeper understanding of the human body, more doors open to develop new products,” says Shawn Stad, Staff Engineer at DePuy, Inc., a 2010 recipient for his role in developing the VIPER®2 Minimally Invasive Spine System. “There will always be a need for medical intervention, and there will always be value in doing it better.” For Marie-Pierre de Béthune, Ph.D., Vice President, External Innovation at Tibotec, BVBA, receiving the medal shows that ultimately the work makes a difference for patients. “The highest recognition I can get is when patients thank us for the drugs,” says de Béthune who was awarded the recognition in 2009 for the discovery and development of PREZISTA™ (darunavir), for the treatment of HIV-1 infection. “Each patient who says thank you is as breathtaking as the next. You don’t get used to it.”
A P O R T R A I T O F I N N O VAT I O N Since 1886, generations of Johnson & Johnson employees have brought forth transformative ideas and products. Every invention, every product, every breakthrough has been and will be powered by people and inspired by their caring. These are just some of our landmark inventions and products. A guide to the photo is on the inside back cover. Learn more at www.jnj.com/ourhistory.
125 Years of CaringJ O H N S O N & J O H N S O N


J O H N S O N & J O H N S O N 2 0 1 0 A N N U A L R E P O R T24
Caring for Women and Children
Sarah Omega in Kenya, Yu Haixia in China and Megan Johnson in
the United States share something in common. Each of these mother’s lives has been touched by Johnson & Johnson and its network of community-based partners, working together to better health and save and improve lives. “Caring for the health of mothers and children has been a pillar of our philanthropic initiatives for the last 100 years,” says Sharon D’Agostino, Vice President, Worldwide Corporate Contributions, Johnson & Johnson. In 2010, Johnson & Johnson continued its long-standing legacy with a five-year commitment in response to the United Nations’ call to action to achieve the Millennium Development Goals (MDG) of reducing mortality in women and children by 2015. The commitment aims to help as many as 120 million women each year over the next five years, reaching 50 countries through our philanthropic programs. “We have a responsibility to share our resources and bring the latest knowledge, technology and medicine to improve the lives of women and children,” says D’Agostino. The MDG commitment includes research and development efforts to bring forward new treatments for HIV and tuberculosis (see related story on page 6); 200 million doses annually of
mebendazole, a treatment for intestinal worms in children (see the Company’s 2009 annual report); extended support for a variety of safe birth programs; and a significant expansion of mobile health initiatives in countries with high infant mortality rates and high mobile penetration, such as Bangladesh, China, India, Mexico, Nigeria and South Africa.
SAFE PREGNANCY AND BIRTH PROGRAMS
Sarah Omega suffered 12 years of incontinence and social rejection because of fistula, an injury resulting from prolonged childbirth. “It was the first time I could afford a genuine smile,” she says, recalling the day it was repaired. The United Nations Population Fund (UNFPA) estimates that more than 2 million women have untreated fistulas, and approximately 100,000 more develop the condition each year. Johnson & Johnson supports UNFPA and key hospitals such as Addis Ababa Fistula Hospital in Ethiopia and Comprehensive Community Based Rehabilitation in Dar es Salaam, Tanzania, to prevent and treat fistula and help survivors rebuild their lives. Another example of a safe birth program: When Yu Haixia’s son, Song Xiaoyan, was born, he could not breathe on his own until nurses performed life-giving resuscitation. Xiaoyan is one of thousands of children given new life through China’s Neonatal Resuscitation Program (NRP), a joint effort by Johnson & Johnson, the Chinese Ministry of Health and the American Academy of Pediatrics to address birth asphyxia—when a baby is unable to breathe at birth. Since its launch in late 2004, more than 100,000 medical professionals from more than 20 provinces have been trained. In studies conducted by the Chinese Ministry of Health, birth asphyxia
mortality declined by 53 percent in the 360 hospitals surveyed.
MOBILE HEALTH FOR MOTHERS
Alessandra, 2, is the joy of her mother Megan Johnson’s life. But so far, Megan’s second pregnancy seems much harder on her than her first. So the Middletown, Conn., mom is using the text4baby service for help. “Messages and reminders from text4baby help put me at ease. Being relaxed is better for me and my baby,” she says. Text4baby offers free health information for expectant mothers and through a baby’s first year of life, easily accessible through cell phones. This landmark project is made possible through a public-private partnership that includes government, corporations, academic institutions, professional associations, trial agencies and nonprofit organizations. Johnson & Johnson is the founding sponsor of the text4baby service and expanded its commitment in 2010 with a multimillion-dollar, multi-year pledge. This support will significantly accelerate the reach of text4baby in the United States.
MAXIMIZING IMPACT
“The impact we have on people’s lives is a vitally important aspect of our giving and caring as a company,” says D’Agostino. “Equally important is the support we provide to our community-based partners. We provide strategic guidance as well as financial support, working with these organizations to measure their results and ensure that programs are having the desired effect.” In the last decade, Johnson & Johnson and its operating companies have provided more than $4.3 billion in grants, product donations and patient assistance, touching lives around the world.
O u r C a r i n g

J O H N S O N & J O H N S O N 2 0 1 0 A N N U A L R E P O R T 25
S A F E B I R T H P R O G R A M S After surgery repaired her fistula, Sarah Omega (top) went from being a victim of social stigma to a social advocate with the UNFPA Campaign to End Fistula. Yu Haixia (bottom left) remembers vividly the horrifying silence and then her baby’s first cry, a sign he could breathe on his own, after nurses performed life-giving resuscitation. Megan Johnson (bottom right) is using text4baby to help her during her second pregnancy as she tries to take the best care of herself, daughter Alessandra and baby on-the-way. Read their stories, and more about the Company’s philanthropic efforts, on www.jnj.com/ourcaring.

J O H N S O N & J O H N S O N 2 0 1 0 A N N U A L R E P O R T26
The recycling cooperative Futura in São José dos Campos, Brazil, is a strong community of people otherwise invisible to society. Its members proudly do work that provides a service to the larger community and serves a significant purpose. “The work we do here is important because people outside learn about recycling through us,” says Iraci Leandro dos Santos. She proclaims the Futura mantra: “We recycle and the Earth benefits.” Iraci is a catador, one of many who collect and process
waste material for recycling, living and working in cooperatives. The cooperatives create a purpose-filled way of life, providing a level of dignity for its members, who are poor and formally unemployed. In 2009, Project Phoenix was started to help Futura and other cooperatives in Brazil responsibly foster their lifestyle and improve their livelihood. The catadores have operated largely on an unwritten social code of cooperation. Project Phoenix helps cooperatives improve their operational processes,
document policies and develop a stronger social infrastructure. “Social and operational infrastructure will enable the cooperatives to grow responsibly, while documented policies will reduce risks, making the catadores more attractive to businesses,” says Michael Maggio, Vice President, Global Strategic Design Operations, Johnson & Johnson. “That’s important, because they provide valuable recycled content to suppliers and companies, like us, that are increasingly interested in using these materials.” Project Phoenix is modeled on SA8000, a global social accountability standard for ethical working conditions, developed by Social Accountability International.
recycling Material and reshaping Lives
SA8000 is based on the United Nations Universal Declaration of Human Rights, Convention on the Rights of the Child and various International Labour Organization conventions. It includes nine basic principles, such as documented policies on child labor, discrimination and health and safety. “We’re seeing great progress, especially from Futura, which has relationships with one of our suppliers, Suzano, which makes packaging for Band-aid® Brand Adhesive Bandages,” says Maggio. “Ultimately we’d like to see the catadores achieve SA8000 certification.”
M E A N I N G F U L L I F E Iraci Leandro dos Santos finds purpose in the mantra “We recycle and the Earth benefits.”

27J O H N S O N & J O H N S O N 2 0 1 0 A N N U A L R E P O R T
First RowWILLIAM C. WELDON Chairman, Board of Directors; Chief Executive Officer; and Chairman, Executive Committee
Second Row, Left to Right MARY SUE COLEMAN, PH.D. President, University of Michigan
JAMES G. CULLEN Retired President and Chief Operating Officer, Bell Atlantic Corporation
Third Row, Left to Right IAN E. L . DAVIS Managing Director Emeritus; Former Worldwide Managing Director, McKinsey & Company
MICHAEL M. E. JOHNS, M.D. Chancellor, Emory University
Fourth Row, Left to Right SUSAN L. LINDQUIST, PH.D. Member and Former Director, Whitehead Institute for Biomedical Research; Professor of Biology, Massachusetts Institute of Technology
ANNE M. MULCAHY
Former Chairman and Chief Executive Officer, Xerox Corporation
Fifth Row, Left to Right LEO F. MULLIN Retired Chairman and Chief Executive Officer, Delta Air Lines, Inc.
WILLIAM D. PEREZ Senior Advisor, Greenhill & Co., Inc.; Retired President and Chief Executive Officer, Wm. Wrigley Jr. Company
Sixth Row, Left to Right CHARLES PRINCE Chairman, Sconset Group, LLC; Senior Counselor, Albright Capital Management LLC; Retired Chairman and Chief Executive Officer, Citigroup Inc.
DAVID SATCHER, M.D., PH.D. Director, Center of Excellence on Health Disparities,Director, Satcher Health Leadership Institute and Poussaint-Satcher-Cosby Chair in Mental Health, Morehouse School of Medicine; Former U.S. Surgeon General
Board of Directors
COMMITTEES OF THE BOARD
AUDIT
The Audit Committee, composed entirely of indepen-dent Directors, helps the Board oversee the Company’s finan-cial accounting and reporting practices. It recommends the independent public auditor for appointment by the Board and reviews its performance. In addition, the Committee monitors the adequacy of internal accounting practices, procedures and controls; reviews the Company’s financial reporting process and disclo-sure procedures; and helps the Board oversee the Company’s legal compliance programs.
James G. Cullen, ChairmanMary Sue Coleman, Ph.D. Ian E. L. DavisLeo F. Mullin
COMPENSATION & BENEFITS
The Compensation & Benefits Committee, composed entirely of independent Directors, establishes the Company’s executive compensation philosophy and principles and approves the annual compen-sation and long-term incentives for the Company’s directors and executive offi-cers. The Committee also reviews the philosophy and policies of the non-Board Management Compensation Committee, which determines management compensation and establishes perquisites and other compensation policies for non-executive employees. Additionally, the Committee oversees the management of the various retirement, pension, long-term incentive, savings, health and welfare plans that cover the Company’s employees.
Charles Prince, ChairmanMichael M. E. Johns, M.D.Anne M. MulcahyWilliam D. Perez

J O H N S O N & J O H N S O N 2 0 1 0 A N N U A L R E P O R T28
FINANCE
The Finance Committee exercises the authority of the Board during the intervals between Board meetings. The Finance Committee is composed of the Chairman of the Board and the Presiding Director.
William C. Weldon, ChairmanJames G. Cullen
NOMINATING & CORPORATE
GOVERNANCE
The Nominating & Corporate Governance Committee, composed entirely of independent Directors, is responsible for overseeing corporate governance matters, reviewing possible candidates for Board membership and recommending nominees for election. The Committee is also responsible for overseeing the process for performance evaluations of the Board and its committees. Additionally, the Committee reviews the Company’s executive succession plans and executive resources.
William D. Perez, ChairmanJames G. Cullen Anne M. MulcahyCharles Prince
PUBLIC POLICY
The Public Policy Advisory Committee reviews the Company’s policies, programs and practices on public health issues regarding the environ-ment and the health and safety of employees. The Committee also reviews the Company’s governmental affairs and policies and other public policy issues facing the Company. The Committee advises and makes recommendations to the Board on these issues as appropriate. The Public Policy Advisory Committee is composed of independent
Directors; one of the Company’s Vice Chairmen, Executive Committee; and the Vice Presidents for Corporate Affairs, Government Affairs and Policy, and Johnson & Johnson Supply Chain.
Leo F. Mullin, ChairmanIan E. L. DavisAlex GorskyClifford E. Holland Susan L. Lindquist, Ph.D. Brian D. Perkins David Satcher, M.D., Ph.D. Ajit S. Shetty, Ph.D.
SCIENCE & TECHNOLOGY
The Science & Technology Advisory Committee, composed of independent Directors and the Company’s Vice President, Science and Technology, helps the Board with scientific matters impacting the Company’s business, including monitoring the strategy and effectiveness of the Company’s research and development organization; reviewing the effectiveness of scientific aspects of the Company’s product safety processes; overseeing major business development activities related to the acquisition of new science or technology; and identifying and understanding significant new science and technology policy issues and trends.
David Satcher, M.D., Ph.D., Chairman
Mary Sue Coleman, Ph.D.Michael M. E. Johns, M.D. Susan L. Lindquist, Ph.D.Garry A. Neil, M.D.
CORPORATE OFFICERS
WILLIAM C. WELDON
Chairman, Board of DirectorsChief Executive OfficerChairman, Executive Committee
DOMINIC J. CARUSO
Vice President Finance Chief Financial OfficerExecutive Committee
DOUGLAS K. CHIA
Corporate Secretary Assistant General Counsel
STEPHEN J. COSGROVE
Corporate Controller
LAVERNE H. COUNCIL
Vice President Chief Information Officer
RUSSELL C. DEYO
Vice President General CounselExecutive Committee
PETER M. FASOLO
Worldwide Vice President Human Resources Executive Committee
ALEX GORSKY
Vice Chairman Executive Committee
RAYMOND C. JORDAN
Vice President Public Affairs & Corporate Communication
SHERILYN S. MCCOY
Vice Chairman Executive Committee
JOHN A. PAPA
Treasurer
BRIAN D. PERKINSVice President Corporate Affairs
EXECUTIVE COMMITTEE
The Executive Committee of Johnson & Johnson is the principal management group responsible for the operations and allocation of the resources of the Company. This Committee oversees and coordinates the activities of the Consumer, Pharmaceuticals and Medical Devices and Diagnostics business segments. Each subsidiary within the business segments is, with some exceptions, managed by citizens of the country where it is located.
WORLDWIDE CHAIRMEN
CONSUMER GROUP
Jesse J. Wu
MEDICAL DEVICES &
DIAGNOSTICS GROUP
Michael F. Mahoney
PHARMACEUTICALS GROUP
Joaquin DuatoPaul Stoffels, M. D.
COMPANY GROUP
CHAIRMEN
ROBERTO DE O. MARQUES
MICHAEL J. F. DEL PRADO
SETH H. Z. FISCHER
GARY FISCHETTI
JANE GRIFFITHS
GUY J. LEBEAU, M.D.
KAREN A. LICITRA
PATRICK D. MUTCHLER
DAVID Y. NORTON
MICHEL PAUL
JACQUES PEETERS
GARY J. PRUDEN
MARC E. ROBINSON
MICHAEL E. SNEED
PERICLES P. STAMATIADES
KIM TAYLOR
NICHOLAS J. VALERIANI
Table of Contents
J O H N S O N & J O H N S O N 2 0 1 0 A N N U A L R E P O R T 29
Corporate Governance and Management’s Responsibility
Johnson & Johnson is guided by the values set forth in Our Credo,created by General Robert Wood Johnson in 1943. These principleshave guided us over the years and continue to set the tone ofintegrity for the entire Company. At all levels, the employees ofJohnson & Johnson are committed to the ethical principles embod-ied in Our Credo and these principles have been woven into thefabric of the Company.
The values articulated in Our Credo extend to our accountingand financial responsibilities to Johnson & Johnson shareholdersand investors. We, the management of Johnson & Johnson, areresponsible for the integrity and objectivity of the accompanyingfinancial statements and related information. We are also responsi-ble for ensuring that financial data is reported accurately and in amanner that facilitates the understanding of this data.
As evidence of our commitment to this responsibility, wemaintain a well-designed system of internal accounting controls,encourage strong and effective corporate governance from ourBoard of Directors, continuously review our business results andstrategic choices, and focus on financial stewardship.
Our corporate staff of professionally trained internal auditors,who travel worldwide, monitor our system of internal accountingcontrols designed to provide reasonable assurance that assets aresafeguarded and that transactions and events are recorded properly.Our internal controls include self-assessments and internal reviewsof our operating companies.
During 2010, the Company continued to invest significant timeand resources in order to ensure compliance with Section 404 ofthe Sarbanes-Oxley Act of 2002. Based on the work performed, wehave concluded that our internal control over financial reportingwas effective as of January 2, 2011. We refer you to Management’sReport on Internal Control Over Financial Reporting on page 73.
We require the management teams of our operating compa-nies to certify their compliance with our Policy on Business Conduct,which sets forth the Company’s commitment to conduct its busi-ness affairs with integrity and comply with the governing laws andregulations. We have a systematic program designed to ensurecompliance with these policies and provide means of reporting anyconcerns about violations of the policy. Please visit our website atwww.investor.jnj.com/governance/conduct.cfm to view our Policyon Business Conduct.
PricewaterhouseCoopers LLP, an independent registered publicaccounting firm, is engaged to perform an integrated audit of ourconsolidated financial statements and internal control over financialreporting. The Report of Independent Registered Public AccountingFirm is on page 72.
The Audit Committee of our Board of Directors is composedsolely of independent directors with the financial knowledge andexperience to provide appropriate oversight. We review internalcontrol matters and key accounting and financial reporting issueswith the Audit Committee on a regular basis. In addition, the inde-pendent auditors, the General Counsel, the Chief Financial Officer,the Chief Compliance Officer and the Vice President of InternalAudit regularly meet in private sessions with our Audit Committeeto discuss the results of their work, including observations on theadequacy of internal financial controls, the quality of financialreporting and confirmation that they are properly discharging theirresponsibilities and other relevant matters.
Our Executive Committee is continuously involved in thereview of financial results as well as developing and understandingstrategies and key initiatives for long-term growth. Our intent is toensure that we maintain objectivity in our business assessments,constructively challenge the approach to business opportunities andissues, and monitor our business results and the related controls.
Our consolidated financial statements and financial data thatfollow have been prepared in conformity with accounting principlesgenerally accepted in the United States of America and includeamounts that are based upon our best judgments. We are commit-ted to present and discuss results of operations in a clear andtransparent manner in order to provide timely, comprehensive andunderstandable information to our shareholders.
William C. Weldon Dominic J. CarusoChairman, Board of Directors, Vice President, Finance,and Chief Executive Officer and Chief Financial Officer
MANAGEMENT’S DISCUSSION AND ANALYSIS
30 Organization and Business Segments30 Results of Operations31 Analysis of Sales by Business Segments33 Analysis of Consolidated Earnings Before Provision
for Taxes on Income36 Liquidity and Capital Resources37 Other Information40 Cautionary Factors That May Affect Future Results
AUDITED CONSOLIDATED FINANCIAL STATEMENTS
41 Consolidated Balance Sheets42 Consolidated Statements of Earnings43 Consolidated Statements of Equity44 Consolidated Statements of Cash Flows45 Notes to Consolidated Financial Statements72 Report of Independent Registered Public Accounting Firm73 Management’s Report on Internal Control Over
Financial ReportingSUPPORTING SCHEDULES
74 Summary of Operations and Statistical Data 2000–201075 Shareholder Return Performance Graphs76 Reconciliation of Non-GAAP Financial Measures
Management’s Discussion and Analysis of Results of Operations and Financial Condition
30 J O H N S O N & J O H N S O N 2 0 1 0 A N N U A L R E P O R T
Organization and Business SegmentsDESCRIPTION OF THE COMPANY AND BUSINESS SEGMENTS
Johnson & Johnson and its subsidiaries (the “Company”) haveapproximately 114,000 employees worldwide engaged in theresearch and development, manufacture and sale of a broad rangeof products in the health care field. The Company conducts businessin virtually all countries of the world with the primary focus onproducts related to human health and well-being.
The Company is organized into three business segments:Consumer, Pharmaceutical and Medical Devices and Diagnostics.The Consumer segment includes a broad range of products used inthe baby care, skin care, oral care, wound care and women’s healthcare fields, as well as nutritional and over-the-counter pharmaceuti-cal products and wellness and prevention platforms. These productsare marketed to the general public and sold both to retail outletsand distributors throughout the world. The Pharmaceutical segmentincludes products in the following areas: anti-infective, antipsy-chotic, contraceptive, dermatology, gastrointestinal, hematology,immunology, neurology, oncology, pain management and virology.These products are distributed directly to retailers, wholesalers andhealth care professionals for prescription use. The Medical Devicesand Diagnostics segment includes a broad range of products distrib-uted to wholesalers, hospitals and retailers used principally in theprofessional fields by physicians, nurses, therapists, hospitals, diag-nostic laboratories and clinics. These products include BiosenseWebster’s electrophysiology products; Cordis’ circulatory diseasemanagement products; DePuy’s orthopaedic joint reconstruction,spinal care, neurological and sports medicine products; Ethicon’ssurgical care, aesthetics and women’s health products; EthiconEndo-Surgery’s minimally invasive surgical products and advancedsterilization products; LifeScan’s blood glucose monitoring andinsulin delivery products; Ortho-Clinical Diagnostics’ professionaldiagnostic products and Vistakon’s disposable contact lenses.
The Company’s structure is based upon the principle ofdecentralized management. The Executive Committee ofJohnson & Johnson is the principal management group responsiblefor the operations and allocation of the resources of the Company.This Committee oversees and coordinates the activities of theConsumer, Pharmaceutical and Medical Devices and Diagnosticsbusiness segments.
In all of its product lines, the Company competes with compa-nies both local and global, located throughout the world. Competi-tion exists in all product lines without regard to the number and sizeof the competing companies involved. Competition in research,involving the development and the improvement of new and existingproducts and processes, is particularly significant. The developmentof new and innovative products is important to the Company’ssuccess in all areas of its business. This also includes protectingthe Company’s portfolio of intellectual property. The competitiveenvironment requires substantial investments in continuingresearch and in maintaining sales forces. In addition, the develop-ment and maintenance of customer demand for the Company’sconsumer products involves significant expenditures for advertisingand promotion.
MANAGEMENT’S OBJECTIVESThe Company manages within a strategic framework aimed atachieving sustainable growth. To accomplish this, the Company’smanagement operates the business consistent with certain strate-gic principles that have proven successful over time. To this end, theCompany participates in growth areas in human health care and iscommitted to attaining leadership positions in these growth areasthrough the development of high quality, innovative products andservices. New products introduced within the past five yearsaccounted for approximately 25% of 2010 sales. In 2010, $6.8 bil-lion, or 11.1% of sales, was invested in research and development.This investment reflects management’s commitment to the impor-tance of ongoing development of new and differentiated productsand services to sustain long-term growth.
With more than 250 operating companies located in 60countries, the Company views its principle of decentralized man-agement as an asset and fundamental to the success of a broadlybased business. It also fosters an entrepreneurial spirit, combiningthe extensive resources of a large organization with the ability toanticipate and react quickly to local market changes and challenges.
The Company is committed to developing global business lead-ers who can drive growth objectives. Businesses are managed for thelong-term in order to sustain leadership positions and achieve growththat provides an enduring source of value to our shareholders.
Our Credo unifies the management team and the Company’sdedicated employees in achieving these objectives, and provides acommon set of values that serve as a constant reminder of theCompany’s responsibilities to its customers, employees, communi-ties and shareholders. The Company believes that these basicprinciples, along with its overall mission of improving the qualityof life for people everywhere, will enable Johnson & Johnson tocontinue to be among the leaders in the health care industry.
Results of OperationsANALYSIS OF CONSOLIDATED SALES
In 2010, worldwide sales decreased 0.5% to $61.6 billion, comparedto a decrease of 2.9% in 2009 and an increase of 4.3% in 2008.These sales changes consisted of the following:
Sales (decrease)/increase due to: 2010 2009 2008
Volume (0.5)% (0.2) 1.1
Price (0.8) (0.1) 0.8
Currency 0.8 (2.6) 2.4
Total (0.5)% (2.9) 4.3
Sales by U.S. companies were $29.5 billion in 2010, $30.9 billion in2009 and $32.3 billion in 2008. This represents a decrease of 4.7%in 2010, a decrease of 4.4% in 2009 and a decrease of 0.4% in2008. Sales by international companies were $32.1 billion in 2010,$31.0 billion in 2009 and $31.4 billion in 2008. This represents anincrease of 3.6% in 2010, a decrease of 1.4% in 2009 and anincrease of 9.7% in 2008.
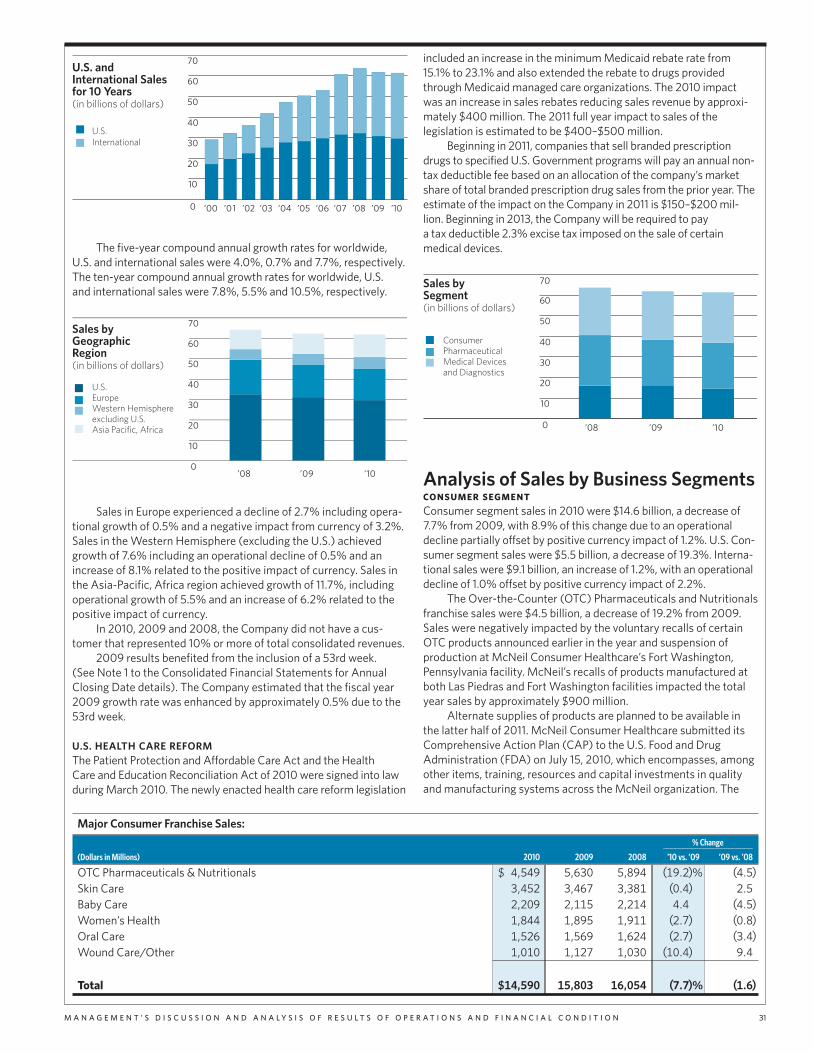
M A N A G E M E N T ’ S D I S C U S S I O N A N D A N A L Y S I S O F R E S U L T S O F O P E R A T I O N S A N D F I N A N C I A L C O N D I T I O N 31
The five-year compound annual growth rates for worldwide,U.S. and international sales were 4.0%, 0.7% and 7.7%, respectively.The ten-year compound annual growth rates for worldwide, U.S.and international sales were 7.8%, 5.5% and 10.5%, respectively.
Sales in Europe experienced a decline of 2.7% including opera-tional growth of 0.5% and a negative impact from currency of 3.2%.Sales in the Western Hemisphere (excluding the U.S.) achievedgrowth of 7.6% including an operational decline of 0.5% and anincrease of 8.1% related to the positive impact of currency. Sales inthe Asia-Pacific, Africa region achieved growth of 11.7%, includingoperational growth of 5.5% and an increase of 6.2% related to thepositive impact of currency.
In 2010, 2009 and 2008, the Company did not have a cus-tomer that represented 10% or more of total consolidated revenues.
2009 results benefited from the inclusion of a 53rd week.(See Note 1 to the Consolidated Financial Statements for AnnualClosing Date details). The Company estimated that the fiscal year2009 growth rate was enhanced by approximately 0.5% due to the53rd week.
U.S. HEALTH CARE REFORMThe Patient Protection and Affordable Care Act and the HealthCare and Education Reconciliation Act of 2010 were signed into lawduring March 2010. The newly enacted health care reform legislation
60
70
50
40
30
20
10
0
Sales byGeographicRegion(in billions of dollars)
U.S.EuropeWestern Hemisphereexcluding U.S.Asia Pacific, Africa
0 0 10
U.S. andInternational Salesfor 10 Years(in billions of dollars)
U.S.International
60
70
50
40
30
20
10
0 00 01 02 03 04 05 06 07 0 0 10
included an increase in the minimum Medicaid rebate rate from15.1% to 23.1% and also extended the rebate to drugs providedthrough Medicaid managed care organizations. The 2010 impactwas an increase in sales rebates reducing sales revenue by approxi-mately $400 million. The 2011 full year impact to sales of thelegislation is estimated to be $400–$500 million.
Beginning in 2011, companies that sell branded prescriptiondrugs to specified U.S. Government programs will pay an annual non-tax deductible fee based on an allocation of the company’s marketshare of total branded prescription drug sales from the prior year. Theestimate of the impact on the Company in 2011 is $150–$200 mil-lion. Beginning in 2013, the Company will be required to paya tax deductible 2.3% excise tax imposed on the sale of certainmedical devices.
Analysis of Sales by Business SegmentsCONSUMER SEGMENT
Consumer segment sales in 2010 were $14.6 billion, a decrease of7.7% from 2009, with 8.9% of this change due to an operationaldecline partially offset by positive currency impact of 1.2%. U.S. Con-sumer segment sales were $5.5 billion, a decrease of 19.3%. Interna-tional sales were $9.1 billion, an increase of 1.2%, with an operationaldecline of 1.0% offset by positive currency impact of 2.2%.
The Over-the-Counter (OTC) Pharmaceuticals and Nutritionalsfranchise sales were $4.5 billion, a decrease of 19.2% from 2009.Sales were negatively impacted by the voluntary recalls of certainOTC products announced earlier in the year and suspension ofproduction at McNeil Consumer Healthcare’s Fort Washington,Pennsylvania facility. McNeil’s recalls of products manufactured atboth Las Piedras and Fort Washington facilities impacted the totalyear sales by approximately $900 million.
Alternate supplies of products are planned to be available inthe latter half of 2011. McNeil Consumer Healthcare submitted itsComprehensive Action Plan (CAP) to the U.S. Food and DrugAdministration (FDA) on July 15, 2010, which encompasses, amongother items, training, resources and capital investments in qualityand manufacturing systems across the McNeil organization. The
’08
70
60
50
40
30
20
10
0
Sales bySegment(in billions of dollars)
ConsumerPharmaceuticalMedical Devicesand Diagnostics
’0 ’10
Major Consumer Franchise Sales:
% Change______________________(Dollars in Millions) 2010 2009 2008 ’10 vs. ’09 ’09 vs. ’08
OTC Pharmaceuticals & Nutritionals $ 4,549 5,630 5,894 (19.2)% (4.5)
Skin Care 3,452 3,467 3,381 (0.4) 2.5
Baby Care 2,209 2,115 2,214 4.4 (4.5)
Women’s Health 1,844 1,895 1,911 (2.7) (0.8)
Oral Care 1,526 1,569 1,624 (2.7) (3.4)
Wound Care/Other 1,010 1,127 1,030 (10.4) 9.4
Total $14,590 15,803 16,054 (7.7)% (1.6)

32 J O H N S O N & J O H N S O N 2 0 1 0 A N N U A L R E P O R T
Company continues to communicate with the FDA on remediationactions and is on schedule with the commitments made in the CAP.
The Skin Care franchise sales were $3.5 billion, a decline of0.4% compared to the prior year due in part to a temporary reduc-tion in shipments of Neutrogena products due to product supplyconstraints partially offset by growth in the AVEENO®, JOHNSON’s®Adult, LE PETIT MARSEILLAIS® and DABAO® skin care lines. TheBaby Care franchise sales grew by 4.4% to $2.2 billion in 2010,primarily due to growth in the Asia Pacific region partially offset bythe impact of the economic situation in Venezuela. The Women’sHealth franchise sales were $1.8 billion, a decrease of 2.7% primarilydue to increased competitive pressures and the impact of the eco-nomic situation in Venezuela. The Oral Care franchise sales were$1.5 billion, a decrease of 2.7% primarily due to the divestiture of theEFFERDENT®/Effergrip® brands in the fiscal fourth quarter of 2009and lower sales of mouth rinses and toothbrushes in the UnitedStates. The Wound Care/Other franchise sales were $1.0 billion, adecrease of 10.4% primarily due to private label competition andslower category growth.
Consumer segment sales in 2009 were $15.8 billion, adecrease of 1.6% from 2008, with 2.0% of this change due to opera-tional growth and negative currency impact of 3.6%. U.S. Consumersegment sales were $6.8 billion, a decrease of 1.4%. Internationalsales were $9.0 billion, a decrease of 1.7%, with growth of 4.7%achieved by operations and a decrease of 6.4% resulting from thenegative impact of currency fluctuations.
PHARMACEUTICAL SEGMENTPharmaceutical segment sales in 2010 were $22.4 billion, adecrease of 0.6% from 2009, with an operational decline of 1.0%and a positive currency impact of 0.4%. U.S. sales were $12.5 billion,a decrease of 4.0%. International sales were $9.9 billion, anincrease of 4.2%, which included 3.4% operational growth and apositive currency impact of 0.8%. Pharmaceutical segment sales in2010 were reduced by approximately $400 million as a result ofU.S. health care reform legislation.
REMICADE® (infliximab), a biologic approved for the treatmentof a number of immune mediated inflammatory diseases, achievedsales of $4.6 billion in 2010, with growth of 7.1% over the prior year.U.S. export sales grew 24.3% versus the prior year primarily drivenby market growth. REMICADE® is competing in a market that isexperiencing increased competition due to new entrants, includingthe successful launches of STELARA® (ustekinumab) andSIMPONI® (golimumab) and the expansion of indications forexisting competitors.
PROCRIT® (Epoetin alfa) and EPREX® (Epoetin alfa) had com-bined sales of $1.9 billion in 2010, a decline of 13.9% compared tothe prior year. Lower sales of PROCRIT® and EPREX® were primarilydue to the declining markets for Erythropoiesis Stimulating Agents(ESAs). EPREX® also experienced increased competition.
RISPERDAL® CONSTA® (risperidone), a long-acting injectableantipsychotic, achieved sales of $1.5 billion in 2010, representing anincrease of 5.3% as compared to the prior year. Solid growth of 16.4%was achieved outside the U.S., with very strong growth in Japan. Inthe U.S. the successful launch of INVEGA® SUSTENNA™ (paliperi-done palmitate) also increased the growth of the long-actinginjectable antipsychotic market.
LEVAQUIN® (levofloxacin)/FLOXIN® (ofloxacin) sales were$1.4 billion, a decline of 12.5% versus the prior year primarily due tothe decline in the market and increased penetration of generics.Market exclusivity in the U.S. expires in June 2011. The expirationof a product’s market exclusivity is likely to result in a significantreduction in sales.
CONCERTA® (methylphenidate HCl), a product for the treat-ment of attention deficit hyperactivity disorder (ADHD), achievedsales of $1.3 billion in 2010, a decrease of 0.5% compared to theprior year. Sales growth in the U.S. was impacted by lower marketshare and the health care reform legislation enacted in March 2010resulting from changes to rebates to Medicaid managed care organ-izations. On November 1, 2010, the Company entered into a U.S.supply and distribution agreement with Watson Laboratories, Inc. todistribute an authorized generic version of CONCERTA® beginningMay 1, 2011. This authorized generic launch is likely to result in asignificant reduction in CONCERTA® sales.
VELCADE® (bortezomib), a product for the treatment for mul-tiple myeloma, for which the Company has commercial rights inEurope and the rest of the world outside the U.S., achieved sales of$1.1 billion in 2010, representing an increase of 15.8% as comparedto the prior year.
ACIPHEX®/PARIET® (rabeprazole sodium) sales were$1.0 billion, a decline of 8.2% versus the prior year due to increasedcompetition from generics in the category.
TOPAMAX® (topiramate), experienced a sales declineof 53.3% compared to the prior year. Market exclusivity forTOPAMAX® expired in March 2009 in the U.S. and in September2009 in most European countries. Multiple generics have enteredthe market. Loss of market exclusivity for the TOPAMAX® patenthas resulted in the significant reduction of sales in the U.S.and Europe.
In 2010, Other Pharmaceutical sales were $9.1 billion, represent-ing a growth of 6.6% over the prior year. Contributors to the increasewere sales of STELARA® (ustekinumab), SIMPONI® (golimumab),
Major Pharmaceutical Product Revenues*:
% Change______________________(Dollars in Millions) 2010 2009 2008 ’10 vs. ’09 ’09 vs. ’08
REMICADE® (infliximab) $ 4,610 4,304 3,748 7.1% 14.8
PROCRIT®/EPREX® (Epoetin alfa) 1,934 2,245 2,460 (13.9) (8.7)
RISPERDAL® CONSTA® (risperidone) 1,500 1,425 1,309 5.3 8.9
LEVAQUIN®/FLOXIN® (levofloxacin/ofloxacin) 1,357 1,550 1,591 (12.5) (2.6)
CONCERTA® (methylphenidate HCl) 1,319 1,326 1,247 (0.5) 6.3
VELCADE® (bortezomib) 1,080 933 787 15.8 18.6
ACIPHEX®/PARIET® (rabeprazole sodium) 1,006 1,096 1,158 (8.2) (5.4)
TOPAMAX® (topiramate) 538 1,151 2,731 (53.3) (57.9)
Other Pharmaceuticals 9,052 8,490 9,536 6.6 (11.0)
Total $22,396 22,520 24,567 (0.6)% (8.3)
* Prior year amounts have been reclassified to conform to current presentation.
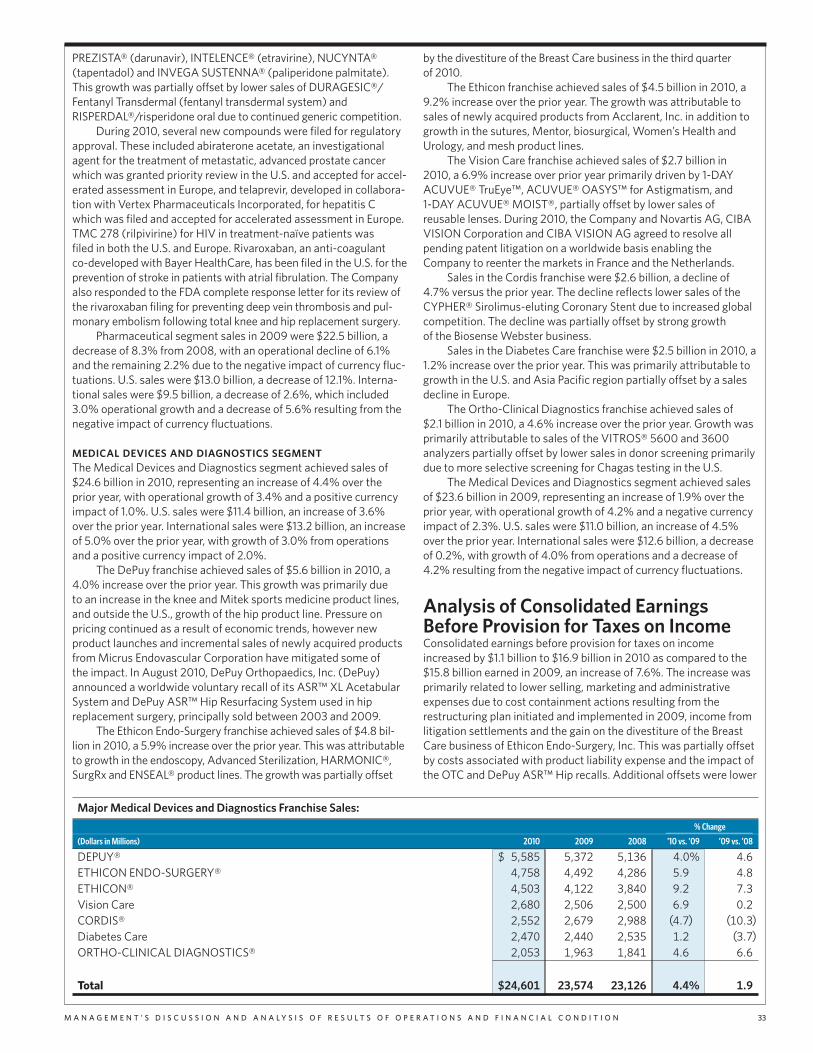
M A N A G E M E N T ’ S D I S C U S S I O N A N D A N A L Y S I S O F R E S U L T S O F O P E R A T I O N S A N D F I N A N C I A L C O N D I T I O N 33
PREZISTA® (darunavir), INTELENCE® (etravirine), NUCYNTA®(tapentadol) and INVEGA SUSTENNA® (paliperidone palmitate).This growth was partially offset by lower sales of DURAGESIC®/Fentanyl Transdermal (fentanyl transdermal system) andRISPERDAL®/risperidone oral due to continued generic competition.
During 2010, several new compounds were filed for regulatoryapproval. These included abiraterone acetate, an investigationalagent for the treatment of metastatic, advanced prostate cancerwhich was granted priority review in the U.S. and accepted for accel-erated assessment in Europe, and telaprevir, developed in collabora-tion with Vertex Pharmaceuticals Incorporated, for hepatitis Cwhich was filed and accepted for accelerated assessment in Europe.TMC 278 (rilpivirine) for HIV in treatment-naïve patients wasfiled in both the U.S. and Europe. Rivaroxaban, an anti-coagulantco-developed with Bayer HealthCare, has been filed in the U.S. for theprevention of stroke in patients with atrial fibrulation. The Companyalso responded to the FDA complete response letter for its review ofthe rivaroxaban filing for preventing deep vein thrombosis and pul-monary embolism following total knee and hip replacement surgery.
Pharmaceutical segment sales in 2009 were $22.5 billion, adecrease of 8.3% from 2008, with an operational decline of 6.1%and the remaining 2.2% due to the negative impact of currency fluc-tuations. U.S. sales were $13.0 billion, a decrease of 12.1%. Interna-tional sales were $9.5 billion, a decrease of 2.6%, which included3.0% operational growth and a decrease of 5.6% resulting from thenegative impact of currency fluctuations.
MEDICAL DEVICES AND DIAGNOSTICS SEGMENTThe Medical Devices and Diagnostics segment achieved sales of$24.6 billion in 2010, representing an increase of 4.4% over theprior year, with operational growth of 3.4% and a positive currencyimpact of 1.0%. U.S. sales were $11.4 billion, an increase of 3.6%over the prior year. International sales were $13.2 billion, an increaseof 5.0% over the prior year, with growth of 3.0% from operationsand a positive currency impact of 2.0%.
The DePuy franchise achieved sales of $5.6 billion in 2010, a4.0% increase over the prior year. This growth was primarily dueto an increase in the knee and Mitek sports medicine product lines,and outside the U.S., growth of the hip product line. Pressure onpricing continued as a result of economic trends, however newproduct launches and incremental sales of newly acquired productsfrom Micrus Endovascular Corporation have mitigated some ofthe impact. In August 2010, DePuy Orthopaedics, Inc. (DePuy)announced a worldwide voluntary recall of its ASR™ XL AcetabularSystem and DePuy ASR™ Hip Resurfacing System used in hipreplacement surgery, principally sold between 2003 and 2009.
The Ethicon Endo-Surgery franchise achieved sales of $4.8 bil-lion in 2010, a 5.9% increase over the prior year. This was attributableto growth in the endoscopy, Advanced Sterilization, HARMONIC®,SurgRx and ENSEAL® product lines. The growth was partially offset
by the divestiture of the Breast Care business in the third quarterof 2010.
The Ethicon franchise achieved sales of $4.5 billion in 2010, a9.2% increase over the prior year. The growth was attributable tosales of newly acquired products from Acclarent, Inc. in addition togrowth in the sutures, Mentor, biosurgical, Women’s Health andUrology, and mesh product lines.
The Vision Care franchise achieved sales of $2.7 billion in2010, a 6.9% increase over prior year primarily driven by 1-DAYACUVUE® TruEye™, ACUVUE® OASYS™ for Astigmatism, and1-DAY ACUVUE® MOIST®, partially offset by lower sales ofreusable lenses. During 2010, the Company and Novartis AG, CIBAVISION Corporation and CIBA VISION AG agreed to resolve allpending patent litigation on a worldwide basis enabling theCompany to reenter the markets in France and the Netherlands.
Sales in the Cordis franchise were $2.6 billion, a decline of4.7% versus the prior year. The decline reflects lower sales of theCYPHER® Sirolimus-eluting Coronary Stent due to increased globalcompetition. The decline was partially offset by strong growthof the Biosense Webster business.
Sales in the Diabetes Care franchise were $2.5 billion in 2010, a1.2% increase over the prior year. This was primarily attributable togrowth in the U.S. and Asia Pacific region partially offset by a salesdecline in Europe.
The Ortho-Clinical Diagnostics franchise achieved sales of$2.1 billion in 2010, a 4.6% increase over the prior year. Growth wasprimarily attributable to sales of the VITROS® 5600 and 3600analyzers partially offset by lower sales in donor screening primarilydue to more selective screening for Chagas testing in the U.S.
The Medical Devices and Diagnostics segment achieved salesof $23.6 billion in 2009, representing an increase of 1.9% over theprior year, with operational growth of 4.2% and a negative currencyimpact of 2.3%. U.S. sales were $11.0 billion, an increase of 4.5%over the prior year. International sales were $12.6 billion, a decreaseof 0.2%, with growth of 4.0% from operations and a decrease of4.2% resulting from the negative impact of currency fluctuations.
Analysis of Consolidated EarningsBefore Provision for Taxes on IncomeConsolidated earnings before provision for taxes on incomeincreased by $1.1 billion to $16.9 billion in 2010 as compared to the$15.8 billion earned in 2009, an increase of 7.6%. The increase wasprimarily related to lower selling, marketing and administrativeexpenses due to cost containment actions resulting from therestructuring plan initiated and implemented in 2009, income fromlitigation settlements and the gain on the divestiture of the BreastCare business of Ethicon Endo-Surgery, Inc. This was partially offsetby costs associated with product liability expense and the impact ofthe OTC and DePuy ASR™ Hip recalls. Additional offsets were lower
Major Medical Devices and Diagnostics Franchise Sales:
% Change_____________________(Dollars in Millions) 2010 2009 2008 ’10 vs. ’09 ’09 vs. ’08
DEPUY® $ 5,585 5,372 5,136 4.0% 4.6
ETHICON ENDO-SURGERY® 4,758 4,492 4,286 5.9 4.8
ETHICON® 4,503 4,122 3,840 9.2 7.3
Vision Care 2,680 2,506 2,500 6.9 0.2
CORDIS® 2,552 2,679 2,988 (4.7) (10.3)
Diabetes Care 2,470 2,440 2,535 1.2 (3.7)
ORTHO-CLINICAL DIAGNOSTICS® 2,053 1,963 1,841 4.6 6.6
Total $24,601 23,574 23,126 4.4% 1.9
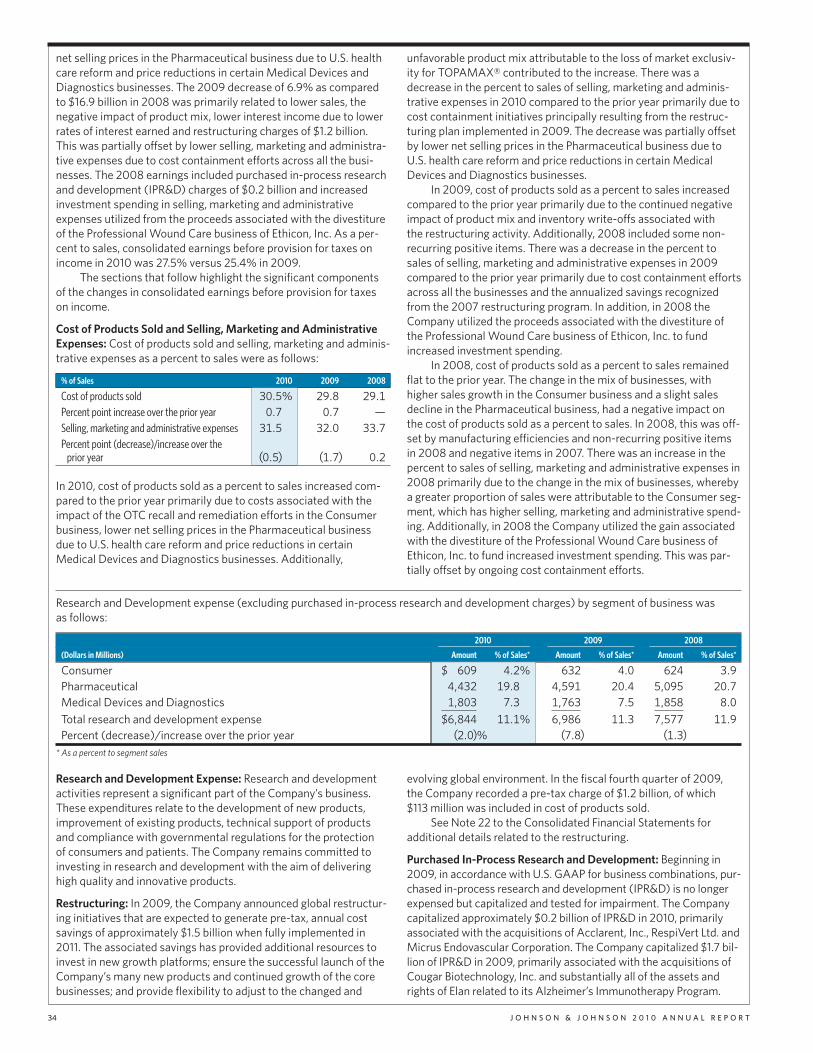
34 J O H N S O N & J O H N S O N 2 0 1 0 A N N U A L R E P O R T
net selling prices in the Pharmaceutical business due to U.S. healthcare reform and price reductions in certain Medical Devices andDiagnostics businesses. The 2009 decrease of 6.9% as comparedto $16.9 billion in 2008 was primarily related to lower sales, thenegative impact of product mix, lower interest income due to lowerrates of interest earned and restructuring charges of $1.2 billion.This was partially offset by lower selling, marketing and administra-tive expenses due to cost containment efforts across all the busi-nesses. The 2008 earnings included purchased in-process researchand development (IPR&D) charges of $0.2 billion and increasedinvestment spending in selling, marketing and administrativeexpenses utilized from the proceeds associated with the divestitureof the Professional Wound Care business of Ethicon, Inc. As a per-cent to sales, consolidated earnings before provision for taxes onincome in 2010 was 27.5% versus 25.4% in 2009.
The sections that follow highlight the significant componentsof the changes in consolidated earnings before provision for taxeson income.
Cost of Products Sold and Selling, Marketing and AdministrativeExpenses: Cost of products sold and selling, marketing and adminis-trative expenses as a percent to sales were as follows:
% of Sales 2010 2009 2008
Cost of products sold 30.5% 29.8 29.1
Percent point increase over the prior year 0.7 0.7 —Selling, marketing and administrative expenses 31.5 32.0 33.7
Percent point (decrease)/increase over theprior year (0.5) (1.7) 0.2
In 2010, cost of products sold as a percent to sales increased com-pared to the prior year primarily due to costs associated with theimpact of the OTC recall and remediation efforts in the Consumerbusiness, lower net selling prices in the Pharmaceutical businessdue to U.S. health care reform and price reductions in certainMedical Devices and Diagnostics businesses. Additionally,
unfavorable product mix attributable to the loss of market exclusiv-ity for TOPAMAX® contributed to the increase. There was adecrease in the percent to sales of selling, marketing and adminis-trative expenses in 2010 compared to the prior year primarily due tocost containment initiatives principally resulting from the restruc-turing plan implemented in 2009. The decrease was partially offsetby lower net selling prices in the Pharmaceutical business due toU.S. health care reform and price reductions in certain MedicalDevices and Diagnostics businesses.
In 2009, cost of products sold as a percent to sales increasedcompared to the prior year primarily due to the continued negativeimpact of product mix and inventory write-offs associated withthe restructuring activity. Additionally, 2008 included some non-recurring positive items. There was a decrease in the percent tosales of selling, marketing and administrative expenses in 2009compared to the prior year primarily due to cost containment effortsacross all the businesses and the annualized savings recognizedfrom the 2007 restructuring program. In addition, in 2008 theCompany utilized the proceeds associated with the divestiture ofthe Professional Wound Care business of Ethicon, Inc. to fundincreased investment spending.
In 2008, cost of products sold as a percent to sales remainedflat to the prior year. The change in the mix of businesses, withhigher sales growth in the Consumer business and a slight salesdecline in the Pharmaceutical business, had a negative impact onthe cost of products sold as a percent to sales. In 2008, this was off-set by manufacturing efficiencies and non-recurring positive itemsin 2008 and negative items in 2007. There was an increase in thepercent to sales of selling, marketing and administrative expenses in2008 primarily due to the change in the mix of businesses, wherebya greater proportion of sales were attributable to the Consumer seg-ment, which has higher selling, marketing and administrative spend-ing. Additionally, in 2008 the Company utilized the gain associatedwith the divestiture of the Professional Wound Care business ofEthicon, Inc. to fund increased investment spending. This was par-tially offset by ongoing cost containment efforts.
Research and Development expense (excluding purchased in-process research and development charges) by segment of business wasas follows:
2010 2009 2008_____________________ _____________________ _____________________(Dollars in Millions) Amount % of Sales* Amount % of Sales* Amount % of Sales*
Consumer $ 609 4.2% 632 4.0 624 3.9
Pharmaceutical 4,432 19.8 4,591 20.4 5,095 20.7
Medical Devices and Diagnostics 1,803 7.3 1,763 7.5 1,858 8.0
Total research and development expense $6,844 11.1% 6,986 11.3 7,577 11.9
Percent (decrease)/increase over the prior year (2.0)% (7.8) (1.3)
* As a percent to segment sales
Research and Development Expense: Research and developmentactivities represent a significant part of the Company’s business.These expenditures relate to the development of new products,improvement of existing products, technical support of productsand compliance with governmental regulations for the protectionof consumers and patients. The Company remains committed toinvesting in research and development with the aim of deliveringhigh quality and innovative products.
Restructuring: In 2009, the Company announced global restructur-ing initiatives that are expected to generate pre-tax, annual costsavings of approximately $1.5 billion when fully implemented in2011. The associated savings has provided additional resources toinvest in new growth platforms; ensure the successful launch of theCompany’s many new products and continued growth of the corebusinesses; and provide flexibility to adjust to the changed and
evolving global environment. In the fiscal fourth quarter of 2009,the Company recorded a pre-tax charge of $1.2 billion, of which$113 million was included in cost of products sold.
See Note 22 to the Consolidated Financial Statements foradditional details related to the restructuring.
Purchased In-Process Research and Development: Beginning in2009, in accordance with U.S. GAAP for business combinations, pur-chased in-process research and development (IPR&D) is no longerexpensed but capitalized and tested for impairment. The Companycapitalized approximately $0.2 billion of IPR&D in 2010, primarilyassociated with the acquisitions of Acclarent, Inc., RespiVert Ltd. andMicrus Endovascular Corporation. The Company capitalized $1.7 bil-lion of IPR&D in 2009, primarily associated with the acquisitions ofCougar Biotechnology, Inc. and substantially all of the assets andrights of Elan related to its Alzheimer’s Immunotherapy Program.
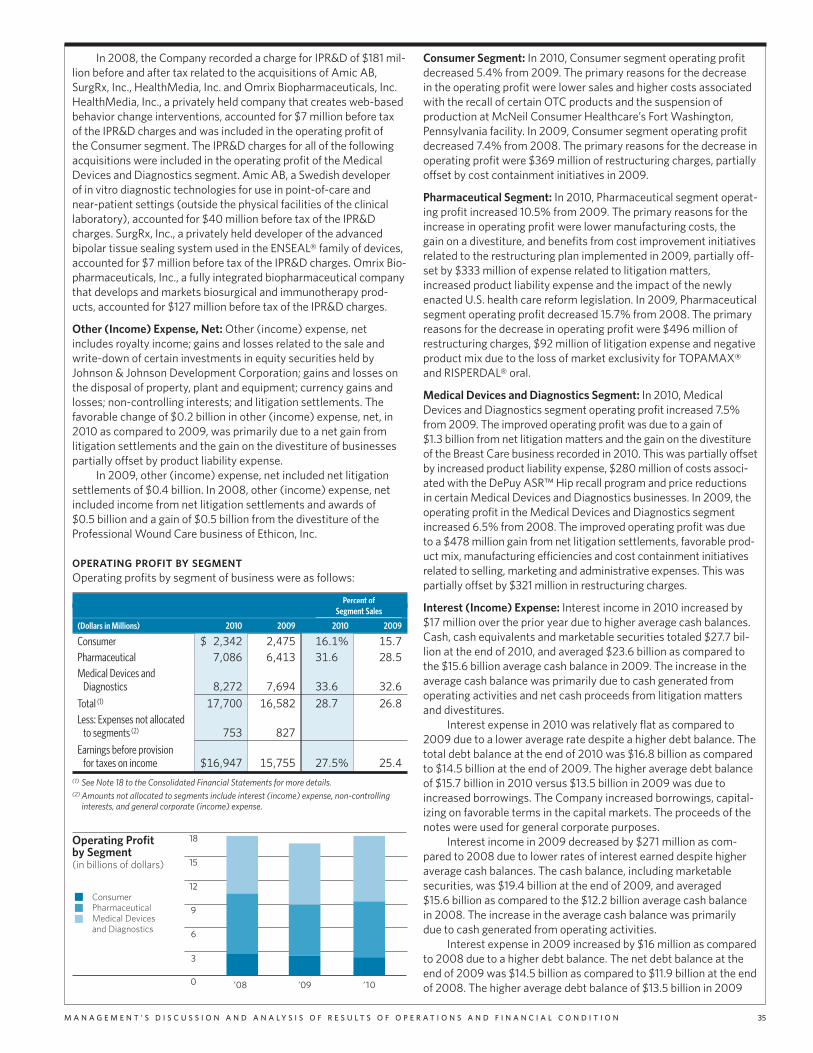
M A N A G E M E N T ’ S D I S C U S S I O N A N D A N A L Y S I S O F R E S U L T S O F O P E R A T I O N S A N D F I N A N C I A L C O N D I T I O N 35
In 2008, the Company recorded a charge for IPR&D of $181 mil-lion before and after tax related to the acquisitions of Amic AB,SurgRx, Inc., HealthMedia, Inc. and Omrix Biopharmaceuticals, Inc.HealthMedia, Inc., a privately held company that creates web-basedbehavior change interventions, accounted for $7 million before taxof the IPR&D charges and was included in the operating profit ofthe Consumer segment. The IPR&D charges for all of the followingacquisitions were included in the operating profit of the MedicalDevices and Diagnostics segment. Amic AB, a Swedish developerof in vitro diagnostic technologies for use in point-of-care andnear-patient settings (outside the physical facilities of the clinicallaboratory), accounted for $40 million before tax of the IPR&Dcharges. SurgRx, Inc., a privately held developer of the advancedbipolar tissue sealing system used in the ENSEAL® family of devices,accounted for $7 million before tax of the IPR&D charges. Omrix Bio-pharmaceuticals, Inc., a fully integrated biopharmaceutical companythat develops and markets biosurgical and immunotherapy prod-ucts, accounted for $127 million before tax of the IPR&D charges.
Other (Income) Expense, Net: Other (income) expense, netincludes royalty income; gains and losses related to the sale andwrite-down of certain investments in equity securities held byJohnson & Johnson Development Corporation; gains and losses onthe disposal of property, plant and equipment; currency gains andlosses; non-controlling interests; and litigation settlements. Thefavorable change of $0.2 billion in other (income) expense, net, in2010 as compared to 2009, was primarily due to a net gain fromlitigation settlements and the gain on the divestiture of businessespartially offset by product liability expense.
In 2009, other (income) expense, net included net litigationsettlements of $0.4 billion. In 2008, other (income) expense, netincluded income from net litigation settlements and awards of$0.5 billion and a gain of $0.5 billion from the divestiture of theProfessional Wound Care business of Ethicon, Inc.
OPERATING PROFIT BY SEGMENTOperating profits by segment of business were as follows:
Percent ofSegment Sales_____________________
(Dollars in Millions) 2010 2009 2010 2009
Consumer $ 2,342 2,475 16.1% 15.7
Pharmaceutical 7,086 6,413 31.6 28.5
Medical Devices andDiagnostics 8,272 7,694 33.6 32.6
Total (1) 17,700 16,582 28.7 26.8
Less: Expenses not allocatedto segments (2) 753 827
Earnings before provisionfor taxes on income $16,947 15,755 27.5% 25.4
(1) See Note 18 to the Consolidated Financial Statements for more details.(2) Amounts not allocated to segments include interest (income) expense, non-controlling
interests, and general corporate (income) expense.
Operating Profitby Segment(in billions of dollars)
ConsumerPharmaceuticalMedical Devicesand Diagnostics
18
12
15
9
6
3
0 ’08 ’09 ’10
Consumer Segment: In 2010, Consumer segment operating profitdecreased 5.4% from 2009. The primary reasons for the decreasein the operating profit were lower sales and higher costs associatedwith the recall of certain OTC products and the suspension ofproduction at McNeil Consumer Healthcare’s Fort Washington,Pennsylvania facility. In 2009, Consumer segment operating profitdecreased 7.4% from 2008. The primary reasons for the decrease inoperating profit were $369 million of restructuring charges, partiallyoffset by cost containment initiatives in 2009.
Pharmaceutical Segment: In 2010, Pharmaceutical segment operat-ing profit increased 10.5% from 2009. The primary reasons for theincrease in operating profit were lower manufacturing costs, thegain on a divestiture, and benefits from cost improvement initiativesrelated to the restructuring plan implemented in 2009, partially off-set by $333 million of expense related to litigation matters,increased product liability expense and the impact of the newlyenacted U.S. health care reform legislation. In 2009, Pharmaceuticalsegment operating profit decreased 15.7% from 2008. The primaryreasons for the decrease in operating profit were $496 million ofrestructuring charges, $92 million of litigation expense and negativeproduct mix due to the loss of market exclusivity for TOPAMAX®and RISPERDAL® oral.
Medical Devices and Diagnostics Segment: In 2010, MedicalDevices and Diagnostics segment operating profit increased 7.5%from 2009. The improved operating profit was due to a gain of$1.3 billion from net litigation matters and the gain on the divestitureof the Breast Care business recorded in 2010. This was partially offsetby increased product liability expense, $280 million of costs associ-ated with the DePuy ASR™ Hip recall program and price reductionsin certain Medical Devices and Diagnostics businesses. In 2009, theoperating profit in the Medical Devices and Diagnostics segmentincreased 6.5% from 2008. The improved operating profit was dueto a $478 million gain from net litigation settlements, favorable prod-uct mix, manufacturing efficiencies and cost containment initiativesrelated to selling, marketing and administrative expenses. This waspartially offset by $321 million in restructuring charges.
Interest (Income) Expense: Interest income in 2010 increased by$17 million over the prior year due to higher average cash balances.Cash, cash equivalents and marketable securities totaled $27.7 bil-lion at the end of 2010, and averaged $23.6 billion as compared tothe $15.6 billion average cash balance in 2009. The increase in theaverage cash balance was primarily due to cash generated fromoperating activities and net cash proceeds from litigation mattersand divestitures.
Interest expense in 2010 was relatively flat as compared to2009 due to a lower average rate despite a higher debt balance. Thetotal debt balance at the end of 2010 was $16.8 billion as comparedto $14.5 billion at the end of 2009. The higher average debt balanceof $15.7 billion in 2010 versus $13.5 billion in 2009 was due toincreased borrowings. The Company increased borrowings, capital-izing on favorable terms in the capital markets. The proceeds of thenotes were used for general corporate purposes.
Interest income in 2009 decreased by $271 million as com-pared to 2008 due to lower rates of interest earned despite higheraverage cash balances. The cash balance, including marketablesecurities, was $19.4 billion at the end of 2009, and averaged$15.6 billion as compared to the $12.2 billion average cash balancein 2008. The increase in the average cash balance was primarilydue to cash generated from operating activities.
Interest expense in 2009 increased by $16 million as comparedto 2008 due to a higher debt balance. The net debt balance at theend of 2009 was $14.5 billion as compared to $11.9 billion at the endof 2008. The higher average debt balance of $13.5 billion in 2009
36 J O H N S O N & J O H N S O N 2 0 1 0 A N N U A L R E P O R T
versus $12.9 billion in 2008 was primarily related to funding acquisi-tions and investments and the purchase of the Company’s CommonStock under the ongoing Common Stock repurchase programannounced on July 9, 2007.
Interest income in 2008 decreased by $91 million as comparedto 2007 due to lower rates of interest earned despite higher averagecash balances. The cash balance, including marketable securities,was $12.8 billion at the end of 2008, and averaged $12.2 billionas compared to the $6.6 billion average cash balance in 2007. Theincrease in the average cash balance was primarily due to cashgenerated from operating activities.
Interest expense in 2008 increased by $139 million as com-pared to 2007 due to a higher debt balance. In the second half of2007, the Company converted some of its short-term debt to fixedlong-term debt at higher interest rates. The net debt balance at theend of 2008 was $11.9 billion as compared to $9.5 billion at the endof 2007. The higher debt balance in 2008 was primarily due tothe purchase of the Company’s Common Stock under the ongoingCommon Stock repurchase program announced on July 9, 2007and to fund acquisitions.
Provision for Taxes on Income: The worldwide effective income taxrate was 21.3% in 2010, 22.1% in 2009 and 23.5% in 2008. The2010 tax rate decreased as compared to 2009 due to decreases intaxable income in higher tax jurisdictions relative to taxable incomein lower tax jurisdictions and certain U.S. tax adjustments. The2009 tax rate decreased as compared to 2008 due to increases intaxable income in lower tax jurisdictions relative to taxable incomein higher tax jurisdictions.
Liquidity and Capital ResourcesLIQUIDITY & CASH FLOWS
Cash and cash equivalents were $19.4 billion at the end of 2010 ascompared with $15.8 billion at the end of 2009. The primary sourcesof cash that contributed to the $3.6 billion increase versus the prioryear were $16.4 billion of cash generated from operating activities,$2.4 billion net proceeds from long and short-term debt and$0.5 billion proceeds from the disposal of assets. The major uses ofcash were capital spending of $2.4 billion, acquisitions of $1.3 bil-lion, net investment purchases of $4.7 billion, dividends to share-holders of $5.8 billion, and the repurchase of Common Stock, net ofproceeds from the exercise of options, of $1.6 billion.
Cash flows from operations were $16.4 billion in 2010. Themajor sources of cash flow were net income of $13.3 billion,adjusted for non-cash charges for depreciation, amortization, stockbased compensation and deferred tax provision of $3.9 billion.The remaining changes to operating cash flow were increases inaccounts receivable, inventories and other assets.
In 2010, the Company continued to have access to liquiditythrough the commercial paper market. For additional details onborrowings, see Note 7 to the Consolidated Financial Statements.
The Company anticipates that operating cash flows, existingcredit facilities and access to the commercial paper markets willprovide sufficient resources to fund operating needs in 2011.
FINANCING AND MARKET RISKThe Company uses financial instruments to manage the impactof foreign exchange rate changes on cash flows. Accordingly, theCompany enters into forward foreign exchange contracts to protectthe value of certain foreign currency assets and liabilities and tohedge future foreign currency transactions primarily related to prod-uct costs. Gains or losses on these contracts are offset by the gainsor losses on the underlying transactions. A 10% appreciation of theU.S. Dollar from the January 2, 2011 market rates would increase theunrealized value of the Company’s forward contracts by $239 mil-lion. Conversely, a 10% depreciation of the U.S. Dollar from theJanuary 2, 2011 market rates would decrease the unrealized value ofthe Company’s forward contracts by $292 million. In either scenario,the gain or loss on the forward contract would be offset by the gainor loss on the underlying transaction, and therefore, would haveno impact on future anticipated earnings and cash flows.
The Company hedges the exposure to fluctuations in currencyexchange rates, and the effect on certain assets and liabilities inforeign currency, by entering into currency swap contracts. A 1%change in the spread between U.S. and foreign interest rates on theCompany’s interest rate sensitive financial instruments would eitherincrease or decrease the unrealized value of the Company’s swapcontracts by approximately $212 million. In either scenario, at matu-rity, the gain or loss on the swap contract would be offset by the gainor loss on the underlying transaction, and therefore, would have noimpact on future anticipated cash flows.
The Company does not enter into financial instruments fortrading or speculative purposes. Further, the Company has a policyof only entering into contracts with parties that have at least an “A”(or equivalent) credit rating. The counterparties to these contractsare major financial institutions and there is no significant concentra-tion of exposure with any one counterparty. Management believesthe risk of loss is remote.
The Company has access to substantial sources of funds atnumerous banks worldwide. In September 2010, the Companysecured a new 364-day Credit Facility. Total credit available to theCompany approximates $10 billion, which expires September 22,2011. Interest charged on borrowings under the credit line agree-ment is based on either bids provided by banks, the prime rate orLondon Interbank Offered Rates (LIBOR), plus applicable margins.Commitment fees under the agreement are not material.
Total borrowings at the end of 2010 and 2009 were $16.8 bil-lion and $14.5 billion, respectively. The increase in borrowingsbetween 2010 and 2009 was a result of financing for general corpo-rate purposes and the continuation of the Company’s CommonStock repurchase program announced in 2007. In 2010, net cash(cash and current marketable securities, net of debt) was $10.9 bil-lion compared to net cash of $4.9 billion in 2009. Total debt repre-sented 22.9% of total capital (shareholders’ equity and total debt)in 2010 and 22.3% of total capital in 2009. Shareholders’ equity
12
18
9
6
3
0’09 ’10’08
1
M A N A G E M E N T ’ S D I S C U S S I O N A N D A N A L Y S I S O F R E S U L T S O F O P E R A T I O N S A N D F I N A N C I A L C O N D I T I O N 37
per share at the end of 2010 was $20.66 compared with $18.37 atyear-end 2009, an increase of 12.5%.
A summary of borrowings can be found in Note 7 to theConsolidated Financial Statements.
CONTRACTUAL OBLIGATIONS AND COMMITMENTSThe Company’s contractual obligations are primarily for leases, debtand unfunded retirement plans, with no other significant obliga-tions. To satisfy these obligations, the Company will use cash fromoperations. The following table summarizes the Company’s contrac-tual obligations and their aggregate maturities as of January 2, 2011(see Notes 7, 10 and 16 to the Consolidated Financial Statementsfor further details):
Long-term Interest on UnfundedDebt Debt Retirement Operating
(Dollars in Millions) Obligations Obligations Plans Leases Total
2011 $ 13 528 54 182 777
2012 644 507 55 159 1,365
2013 509 457 59 130 1,155
2014 9 444 62 106 621
2015 — 444 69 89 602
After 2015 7,994 5,180 428 74 13,676
Total $9,169 7,560 727 740 18,196
For tax matters, see Note 8 to the Consolidated Financial Statements.
SHARE REPURCHASE AND DIVIDENDSOn July 9, 2007, the Company announced that its Board of Directorsapproved a stock repurchase program authorizing the Company tobuy back up to $10.0 billion of the Company’s Common Stock. As ofJanuary 2, 2011, the current stock repurchase program has beencompleted. The Company repurchased an aggregate of 158.3 millionshares of Johnson & Johnson Common Stock at a cost of $10.0 bil-lion. The Company funded the share repurchase program through acombination of available cash and debt. In addition, the Companyhas an annual program to repurchase shares for use in employeestock and incentive plans.
The Company increased its dividend in 2010 for the 48th con-secutive year. Cash dividends paid were $2.110 per share in 2010,compared with dividends of $1.930 per share in 2009 and $1.795per share in 2008. The dividends were distributed as follows:
2010 2009 2008
First quarter $0.490 0.460 0.415
Second quarter 0.540 0.490 0.460
Third quarter 0.540 0.490 0.460
Fourth quarter 0.540 0.490 0.460
Total $2.110 1.930 1.795
On January 3, 2011, the Board of Directors declared a regular quar-terly cash dividend of $0.540 per share, payable on March 15, 2011,to shareholders of record as of March 1, 2011. The Company expectsto continue the practice of paying regular cash dividends.
Other InformationCRITICAL ACCOUNTING POLICIES AND ESTIMATES
Management’s discussion and analysis of results of operationsand financial condition are based on the Company’s consolidatedfinancial statements that have been prepared in accordance withaccounting principles generally accepted in the U.S. (GAAP). Thepreparation of these financial statements requires that manage-ment make estimates and assumptions that affect the amountsreported for revenues, expenses, assets, liabilities and other related
disclosures. Actual results may or may not differ from these esti-mates. The Company believes that the understanding of certain keyaccounting policies and estimates are essential in achieving moreinsight into the Company’s operating results and financial condition.These key accounting policies include revenue recognition, incometaxes, legal and self-insurance contingencies, valuation of long-livedassets, assumptions used to determine the amounts recorded forpensions and other employee benefit plans and accounting forstock options.
Revenue Recognition: The Company recognizes revenue from prod-uct sales when goods are shipped or delivered, and title and riskof loss pass to the customer. Provisions for certain rebates, salesincentives, trade promotions, coupons, product returns and dis-counts to customers are accounted for as reductions in sales in thesame period the related sales are recorded.
Product discounts granted are based on the terms of arrange-ments with direct, indirect and other market participants, as wellas market conditions, including prices charged by competitors.Rebates, the largest being the Medicaid rebate provision, are esti-mated based on contractual terms, historical experience, trendanalysis and projected market conditions in the various marketsserved. The Company evaluates market conditions for products orgroups of products primarily through the analysis of wholesaler andother third-party sell-through and market research data, as well asinternally generated information.
Sales returns are generally estimated and recorded based onhistorical sales and returns information. Products that exhibitunusual sales or return patterns due to dating, competition or othermarketing matters are specifically investigated and analyzed as partof the accounting for sales return accruals.
Sales returns allowances represent a reserve for products thatmay be returned due to expiration, destruction in the field, or in spe-cific areas, product recall. The returns reserve is based on historicalreturn trends by product and by market as a percent to gross sales.In accordance with the Company’s accounting policies, the Companygenerally issues credit to customers for returned goods. TheCompany’s sales return reserves are accounted for in accordancewith the U.S. GAAP guidance for revenue recognition when right ofreturn exists. Sales return reserves are recorded at full sales value.Sales returns in the Consumer and Pharmaceutical segments arealmost exclusively not resalable. Sales returns for certain franchisesin the Medical Devices and Diagnostics segment are typically resal-able but are not material. The Company rarely exchanges productsfrom inventory for returned products. The sales returns reserve forthe total Company has ranged between 1.0% and 1.2% of annual nettrade sales during the prior three fiscal reporting years 2008–2010.
Promotional programs, such as product listing allowances andcooperative advertising arrangements, are recorded in the yearincurred. Continuing promotional programs include coupons andvolume-based sales incentive programs. The redemption cost ofconsumer coupons is based on historical redemption experience byproduct and value. Volume-based incentive programs are based onestimated sales volumes for the incentive period and are recordedas products are sold. The Company also earns service revenue forco-promotion of certain products. For all years presented, servicerevenues were less than 2% of total revenues and are included insales to customers. These arrangements are evaluated to determinethe appropriate amounts to be deferred.
In addition, the Company enters into collaboration arrange-ments, which contain multiple revenue generating activities. Therevenue for these arrangements is recognized as each activity isperformed or delivered, based on the relative fair value. Upfrontfees received as part of these arrangements are deferred and recog-nized as revenue earned over the obligation period. See Note 1 to
38 J O H N S O N & J O H N S O N 2 0 1 0 A N N U A L R E P O R T
the Consolidated Financial Statements for additional disclosureson collaborations.
Reasonably likely changes to assumptions used to calculatethe accruals for rebates, returns and promotions are not anticipatedto have a material effect on the financial statements. The Companycurrently discloses the impact of changes to assumptions in thequarterly or annual filing in which there is a material financialstatement impact.
Below are tables that show the progression of accrued rebates,returns, promotions, reserve for doubtful accounts and reserve forcash discounts by segment of business for the fiscal years endedJanuary 2, 2011 and January 3, 2010.
CONSUMER SEGMENT
Balance at Balance atBeginning Payments/ End
(Dollars in Millions) of Period Accruals Other of Period
2010Accrued rebates (1) $121 361 (351) 131
Accrued returns 127 156 (138) 145
Accrued promotions 272 2,418 (2,396) 294
Subtotal $520 2,935 (2,885) 570
Reserve for doubtful accounts 107 6 (56) 57
Reserve for cash discounts 21 249 (249) 21
Total $648 3,190 (3,190) 648
2009Accrued rebates (1) $131 380 (390) 121
Accrued returns 115 134 (122) 127
Accrued promotions 202 1,996 (1,926) 272
Subtotal $448 2,510 (2,438) 520
Reserve for doubtful accounts 110 23 (26) 107
Reserve for cash discounts 22 285 (286) 21
Total $580 2,818 (2,750) 648
(1) Includes reserve for customer rebates of $50 million at January 2, 2011 and $46 million atJanuary 3, 2010, recorded as a contra asset.
PHARMACEUTICAL SEGMENT
Balance at Balance atBeginning Payments/ End
(Dollars in Millions) of Period Accruals Other of Period
2010Accrued rebates (1)(2) $1,064 4,768 (4,312) 1,520
Accrued returns 342 27 (75) 294
Accrued promotions 84 135 (136) 83
Subtotal $1,490 4,930 (4,523) 1,897
Reserve for doubtful accounts 83 91 (29) 145
Reserve for cash discounts 48 379 (373) 54
Total $1,621 5,400 (4,925) 2,096
2009Accrued rebates (1) $1,261 3,975 (4,172) 1,064
Accrued returns 490 147 (295) 342
Accrued promotions 107 330 (353) 84
Subtotal $1,858 4,452 (4,820) 1,490
Reserve for doubtful accounts 48 37 (2) 83
Reserve for cash discounts 23 462 (437) 48
Total $1,929 4,951 (5,259) 1,621
(1) Includes reserve for customer rebates of $320 million at January 2, 2011 and $372 millionat January 3, 2010, recorded as a contra asset.
(2) Includes additional sales rebates to Medicaid managed care organizations as a result ofhealth care reform legislation.
MEDICAL DEVICES AND DIAGNOSTICS SEGMENT
Balance at Balance atBeginning Payments/ End
(Dollars in Millions) of Period Accruals Other of Period
2010Accrued rebates (1) $454 2,363 (2,322) 495
Accrued returns 220 334 (353) 201
Accrued promotions 73 111 (134) 50
Subtotal $747 2,808 (2,809) 746
Reserve for doubtful accounts 143 33 (38) 138
Reserve for cash discounts 32 484 (481) 35
Total $922 3,325 (3,328) 919
2009Accrued rebates (1) $416 2,229 (2,191) 454
Accrued returns 189 74 (43) 220
Accrued promotions 47 120 (94) 73
Subtotal $652 2,423 (2,328) 747
Reserve for doubtful accounts 109 50 (16) 143
Reserve for cash discounts 34 416 (418) 32
Total $795 2,889 (2,762) 922
(1) Includes reserve for customer rebates of $331 million at January 2, 2011 and $311 millionat January 3, 2010, recorded as a contra asset.
Income Taxes: Income taxes are recorded based on amountsrefundable or payable for the current year and include the results ofany difference between U.S. GAAP accounting and tax reporting,recorded as deferred tax assets or liabilities. The Company esti-mates deferred tax assets and liabilities based on current tax regula-tions and rates. Changes in tax laws and rates may affect recordeddeferred tax assets and liabilities in the future. Managementbelieves that changes in these estimates would not have a materialeffect on the Company’s results of operations, cash flows orfinancial position.
In 2007, in accordance with U.S. GAAP, the Company adoptedthe standard related to accounting for uncertainty in income taxes.The Codification prescribes a recognition threshold and measure-ment attribute for the financial statement recognition and measure-ment of a tax position taken or expected to be taken in a tax return.The Codification also provides guidance on derecognition, classifi-cation and other matters. See Note 8 to the Consolidated FinancialStatements for further information regarding income taxes.
At January 2, 2011 and January 3, 2010, the cumulativeamounts of undistributed international earnings were approximately$37.0 billion and $32.2 billion, respectively. The Company intendsto continue to reinvest its undistributed international earnings toexpand its international operations; therefore, no U.S. tax expensehas been recorded with respect to the undistributed portion notintended for repatriation.
Legal and Self Insurance Contingencies: The Company recordsaccruals for various contingencies including legal proceedings andproduct liability cases as these arise in the normal course of business.The accruals are based on management’s judgment as to the proba-bility of losses and, where applicable, actuarially determined esti-mates. Additionally, the Company records insurance receivableamounts from third-party insurers when recovery is probable. Asappropriate, reserves against these receivables are recorded for esti-mated amounts that may not be collected from third-party insurers.
The Company follows the provisions of U.S. GAAP when record-ing litigation related contingencies. A liability is recorded when a lossis probable and can be reasonably estimated. The best estimate ofa loss within a range is accrued; however, if no estimate in the rangeis better than any other, the minimum amount is accrued.
M A N A G E M E N T ’ S D I S C U S S I O N A N D A N A L Y S I S O F R E S U L T S O F O P E R A T I O N S A N D F I N A N C I A L C O N D I T I O N 39
Long-Lived and Intangible Assets: The Company assesseschanges in economic conditions and makes assumptions regardingestimated future cash flows in evaluating the value of theCompany’s property, plant and equipment, goodwill and intangibleassets. As these assumptions and estimates may change overtime, it may or may not be necessary for the Company to recordimpairment charges.
Employee Benefit Plans: The Company sponsors various retirementand pension plans, including defined benefit, defined contributionand termination indemnity plans, which cover most employeesworldwide. These plans are based on assumptions for the discountrate, expected return on plan assets, expected salary increases andhealth care cost trend rates. See Note 10 to the Consolidated Finan-cial Statements for further details on these rates and the effect arate change would have on the Company’s results of operations.
Stock Based Compensation: The Company recognizes compensa-tion expense associated with the issuance of equity instruments toemployees for their services. The fair value of each award is esti-mated on the date of grant using the Black-Scholes option valuationmodel and is expensed in the financial statements over the vestingperiod. The input assumptions used in determining fair value arethe expected life, expected volatility, risk-free rate and the dividendyield. See Note 17 to the Consolidated Financial Statements foradditional information.
NEW ACCOUNTING PRONOUNCEMENTSRefer to Note 1 to the Consolidated Financial Statements for recentlyadopted accounting pronouncements and recently issued account-ing pronouncements not yet adopted as of January 2, 2011.
ECONOMIC AND MARKET FACTORSThe Company is aware that its products are used in an environmentwhere, for more than a decade, policymakers, consumers and busi-nesses have expressed concerns about the rising cost of health care.In response to these concerns, the Company has a long-standingpolicy of pricing products responsibly. For the period 2000–2010, inthe United States, the weighted average compound annual growthrate of the Company’s net price increases for health care products(prescription and over-the-counter drugs, hospital and professionalproducts) was below the U.S. Consumer Price Index (CPI).
Inflation rates continue to have an effect on worldwideeconomies and, consequently, on the way companies operate. TheCompany accounted for operations in Venezuela as highly inflation-ary in 2010, as the prior three-year cumulative inflation rate has sur-passed 100%. In the face of increasing costs, the Company strivesto maintain its profit margins through cost reduction programs,productivity improvements and periodic price increases.
The Company is exposed to fluctuations in currency exchangerates. A 1% change in the value of the U.S. Dollar as compared toall foreign currencies in which the Company had sales, income orexpense in 2010 would have increased or decreased the translationof foreign sales by approximately $300 million and income by$65 million.
The Company faces various worldwide health care changesthat may continue to result in pricing pressures that include healthcare cost containment and government legislation relating to sales,promotions and reimbursement.
Changes in the behavior and spending patterns of purchasersof health care products and services, including delaying medicalprocedures, rationing prescription medications, reducing thefrequency of physician visits and foregoing health care insurancecoverage, as a result of the current global economic downturn,may continue to impact the Company’s businesses.
The Company also operates in an environment which hasbecome increasingly hostile to intellectual property rights. Genericdrug firms have filed Abbreviated New Drug Applications (ANDAs)seeking to market generic forms of most of the Company’s key phar-maceutical products, prior to expiration of the applicable patentscovering those products. In the event the Company is not successfulin defending the patent claims challenged in ANDA filings, thegeneric firms will then introduce generic versions of the product atissue, resulting in the potential for substantial market share andrevenue losses for that product. For further information see thediscussion on “Litigation Against Filers of Abbreviated New DrugApplications” in Note 21 to the Consolidated Financial Statements.
LEGAL PROCEEDINGSThe Company is involved in numerous product liability cases in theUnited States, many of which concern alleged adverse reactions todrugs and medical devices. The damages claimed are substantial,and while the Company is confident of the adequacy of the warningsand instructions for use that accompany such products, it is notfeasible to predict the ultimate outcome of litigation. However, theCompany believes that in most cases product liability will be sub-stantially covered by existing amounts accrued in the Company’sbalance sheet under its self-insurance program.
The Company is also involved in a number of patent, trademarkand other lawsuits, as well as investigations, incidental to its busi-ness. The ultimate legal and financial liability of the Company inrespect to all claims, lawsuits and proceedings referred to abovecannot be reasonably estimated. However, in the Company’s opin-ion, based on its examination of these matters, its experience todate, and discussions with counsel, the ultimate outcome of legalproceedings, net of liabilities already accrued in the Company’sbalance sheet, is not expected to be material to the Company’sfinancial position, although the resolution in any reporting periodof one or more of these matters could have a material impact onthe Company’s results of operations and cash flows for that period.
See Note 21 to the Consolidated Financial Statements forfurther information regarding legal proceedings.
COMMON STOCK MARKET PRICESThe Company’s Common Stock is listed on the New York StockExchange under the symbol JNJ. The composite market price rangesfor Johnson & Johnson Common Stock during 2010 and 2009 were:
2010 2009____________________ ____________________High Low High Low
First quarter $65.95 61.89 61.00 46.25
Second quarter 66.20 57.55 56.65 50.12
Third quarter 62.70 56.86 62.47 55.71
Fourth quarter 64.92 61.25 65.41 58.78
Year-end close $61.85 64.41
40 J O H N S O N & J O H N S O N 2 0 1 0 A N N U A L R E P O R T
Cautionary Factors That May AffectFuture ResultsThis Annual Report contains forward-looking statements. Forward-looking statements do not relate strictly to historical or current factsand anticipate results based on management’s plans that are sub-ject to uncertainty. Forward-looking statements may be identifiedby the use of words such as “plans,” “expects,” “will,” “anticipates,”“estimates” and other words of similar meaning in conjunction with,among other things, discussions of future operations, financialperformance, the Company’s strategy for growth, product develop-ment, regulatory approval, market position and expenditures.
Forward-looking statements are based on current expectationsof future events. The Company cannot guarantee that any forward-looking statement will be accurate, although the Company believesthat it has been reasonable in its expectations and assumptions.Investors should realize that if underlying assumptions prove inac-curate or that unknown risks or uncertainties materialize, actualresults could vary materially from the Company’s expectations andprojections. Investors are therefore cautioned not to place unduereliance on any forward-looking statements. The Company does notundertake to update any forward-looking statements as a result ofnew information or future events or developments.
Risks and uncertainties include, but are not limited to, generalindustry conditions and competition; economic factors, such asinterest rate and currency exchange rate fluctuations; technologicaladvances, new products and patents attained by competitors; chal-lenges inherent in new product development, including obtainingregulatory approvals; challenges to patents; significant litigationadverse to the Company; impact of business combinations; financialdistress and bankruptcies experienced by significant customersand suppliers; changes to governmental laws and regulations andU.S. and foreign health care reforms; trends toward healthcare costcontainment; increased scrutiny of the healthcare industry by gov-ernment agencies; changes in behavior and spending patterns ofpurchasers of healthcare products and services; manufacturingdifficulties or delays; product efficacy or safety concerns resultingin product recalls or regulatory action.
The Company’s report on Form 10-K for the year endedJanuary 2, 2011 includes, in Exhibit 99, a discussion of additionalfactors that could cause actual results to differ from expectations.The Company notes these factors as permitted by the PrivateSecurities Litigation Reform Act of 1995.
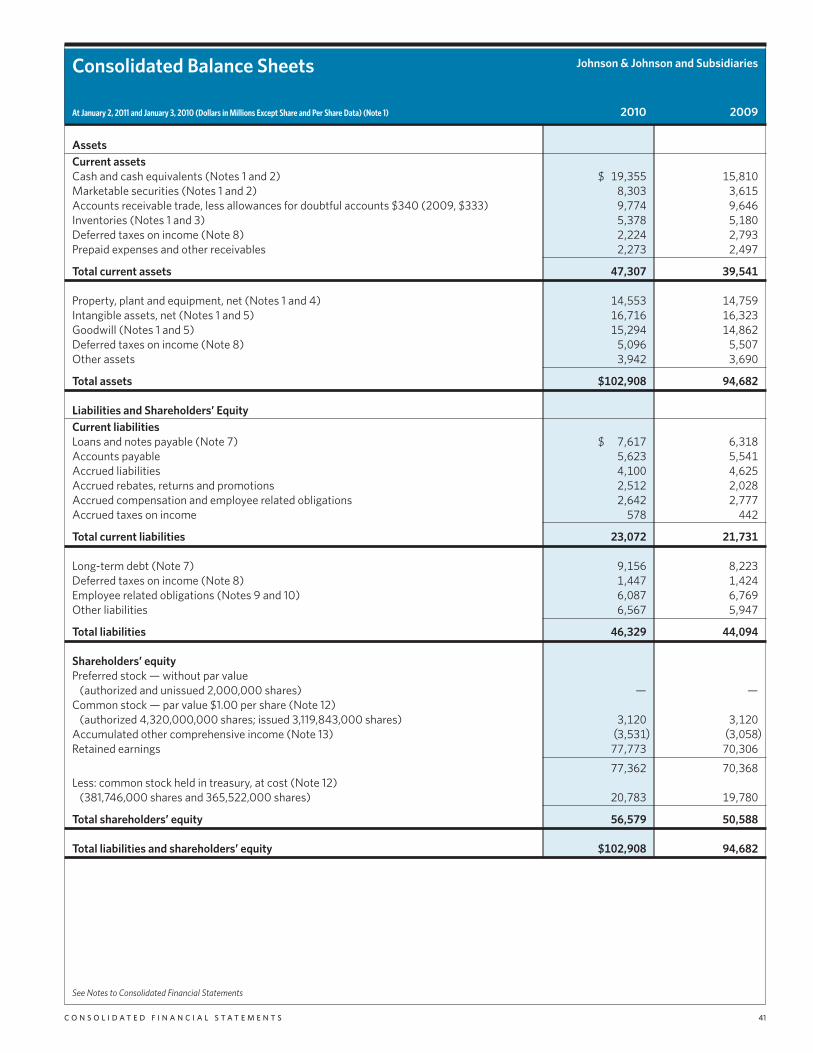
Consolidated Balance Sheets Johnson & Johnson and Subsidiaries
At January 2, 2011 and January 3, 2010 (Dollars in Millions Except Share and Per Share Data) (Note 1) 2010 2009
C O N S O L I D A T E D F I N A N C I A L S T A T E M E N T S 41
AssetsCurrent assetsCash and cash equivalents (Notes 1 and 2) $ 19,355 15,810Marketable securities (Notes 1 and 2) 8,303 3,615Accounts receivable trade, less allowances for doubtful accounts $340 (2009, $333) 9,774 9,646Inventories (Notes 1 and 3) 5,378 5,180Deferred taxes on income (Note 8) 2,224 2,793Prepaid expenses and other receivables 2,273 2,497
Total current assets 47,307 39,541
Property, plant and equipment, net (Notes 1 and 4) 14,553 14,759Intangible assets, net (Notes 1 and 5) 16,716 16,323Goodwill (Notes 1 and 5) 15,294 14,862Deferred taxes on income (Note 8) 5,096 5,507Other assets 3,942 3,690
Total assets $102,908 94,682
Liabilities and Shareholders’ EquityCurrent liabilitiesLoans and notes payable (Note 7) $ 7,617 6,318Accounts payable 5,623 5,541Accrued liabilities 4,100 4,625Accrued rebates, returns and promotions 2,512 2,028Accrued compensation and employee related obligations 2,642 2,777Accrued taxes on income 578 442
Total current liabilities 23,072 21,731
Long-term debt (Note 7) 9,156 8,223Deferred taxes on income (Note 8) 1,447 1,424Employee related obligations (Notes 9 and 10) 6,087 6,769Other liabilities 6,567 5,947
Total liabilities 46,329 44,094
Shareholders’ equityPreferred stock — without par value
(authorized and unissued 2,000,000 shares) — —Common stock — par value $1.00 per share (Note 12)
(authorized 4,320,000,000 shares; issued 3,119,843,000 shares) 3,120 3,120Accumulated other comprehensive income (Note 13) (3,531) (3,058)Retained earnings 77,773 70,306
77,362 70,368Less: common stock held in treasury, at cost (Note 12)
(381,746,000 shares and 365,522,000 shares) 20,783 19,780
Total shareholders’ equity 56,579 50,588
Total liabilities and shareholders’ equity $102,908 94,682
See Notes to Consolidated Financial Statements
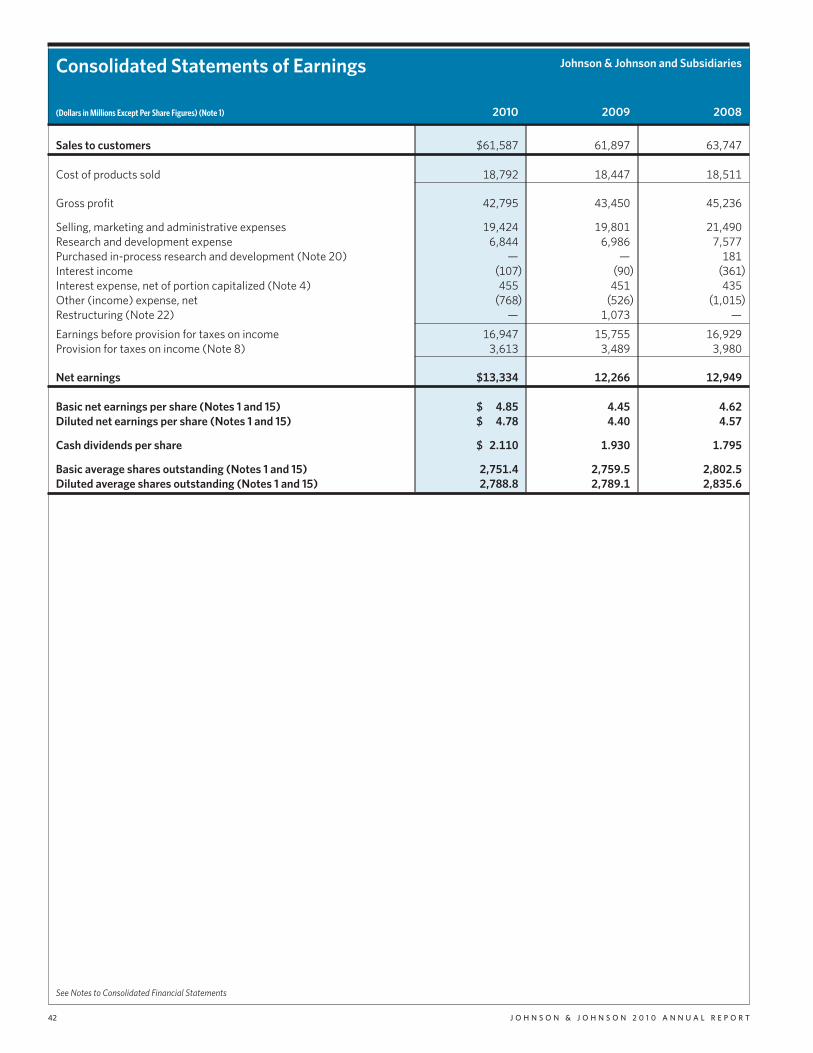
Consolidated Statements of Earnings Johnson & Johnson and Subsidiaries
(Dollars in Millions Except Per Share Figures) (Note 1) 2010 2009 2008
42 J O H N S O N & J O H N S O N 2 0 1 0 A N N U A L R E P O R T
Sales to customers $61,587 61,897 63,747
Cost of products sold 18,792 18,447 18,511
Gross profit 42,795 43,450 45,236
Selling, marketing and administrative expenses 19,424 19,801 21,490Research and development expense 6,844 6,986 7,577Purchased in-process research and development (Note 20) — — 181Interest income (107) (90) (361)Interest expense, net of portion capitalized (Note 4) 455 451 435Other (income) expense, net (768) (526) (1,015)Restructuring (Note 22) — 1,073 —
Earnings before provision for taxes on income 16,947 15,755 16,929Provision for taxes on income (Note 8) 3,613 3,489 3,980
Net earnings $13,334 12,266 12,949
Basic net earnings per share (Notes 1 and 15) $ 4.85 4.45 4.62Diluted net earnings per share (Notes 1 and 15) $ 4.78 4.40 4.57
Cash dividends per share $ 2.110 1.930 1.795
Basic average shares outstanding (Notes 1 and 15) 2,751.4 2,759.5 2,802.5Diluted average shares outstanding (Notes 1 and 15) 2,788.8 2,789.1 2,835.6
See Notes to Consolidated Financial Statements
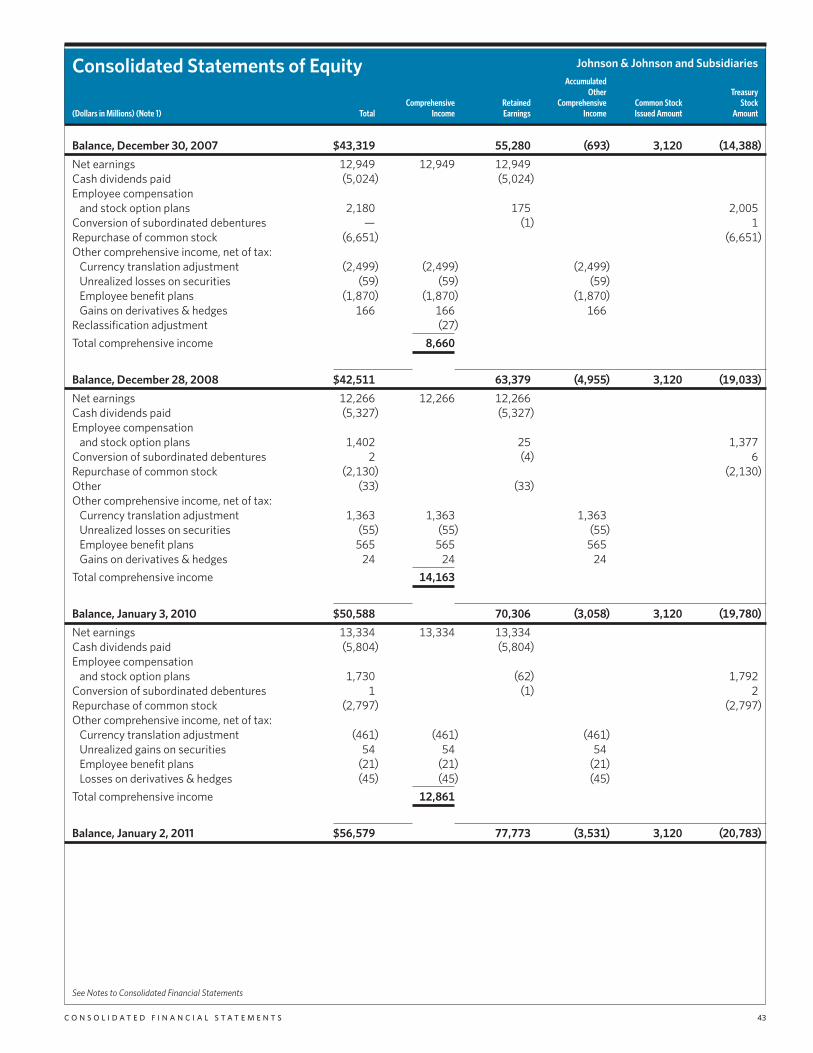
Consolidated Statements of Equity Johnson & Johnson and SubsidiariesAccumulated
Other TreasuryComprehensive Retained Comprehensive Common Stock Stock
(Dollars in Millions) (Note 1) Total Income Earnings Income Issued Amount Amount
C O N S O L I D A T E D F I N A N C I A L S T A T E M E N T S 43
Balance, December 30, 2007 $43,319 55,280 (693) 3,120 (14,388)
Net earnings 12,949 12,949 12,949Cash dividends paid (5,024) (5,024)Employee compensation
and stock option plans 2,180 175 2,005Conversion of subordinated debentures — (1) 1Repurchase of common stock (6,651) (6,651)Other comprehensive income, net of tax:
Currency translation adjustment (2,499) (2,499) (2,499)Unrealized losses on securities (59) (59) (59)Employee benefit plans (1,870) (1,870) (1,870)Gains on derivatives & hedges 166 166 166
Reclassification adjustment (27)
Total comprehensive income 8,660
Balance, December 28, 2008 $42,511 63,379 (4,955) 3,120 (19,033)
Net earnings 12,266 12,266 12,266Cash dividends paid (5,327) (5,327)Employee compensation
and stock option plans 1,402 25 1,377Conversion of subordinated debentures 2 (4) 6Repurchase of common stock (2,130) (2,130)Other (33) (33)Other comprehensive income, net of tax:
Currency translation adjustment 1,363 1,363 1,363Unrealized losses on securities (55) (55) (55)Employee benefit plans 565 565 565Gains on derivatives & hedges 24 24 24
Total comprehensive income 14,163
Balance, January 3, 2010 $50,588 70,306 (3,058) 3,120 (19,780)
Net earnings 13,334 13,334 13,334Cash dividends paid (5,804) (5,804)Employee compensation
and stock option plans 1,730 (62) 1,792Conversion of subordinated debentures 1 (1) 2Repurchase of common stock (2,797) (2,797)Other comprehensive income, net of tax:
Currency translation adjustment (461) (461) (461)Unrealized gains on securities 54 54 54Employee benefit plans (21) (21) (21)Losses on derivatives & hedges (45) (45) (45)
Total comprehensive income 12,861
Balance, January 2, 2011 $56,579 77,773 (3,531) 3,120 (20,783)
See Notes to Consolidated Financial Statements

Consolidated Statements of Cash Flows Johnson & Johnson and Subsidiaries
(Dollars in Millions) (Note 1) 2010 2009 2008
44 J O H N S O N & J O H N S O N 2 0 1 0 A N N U A L R E P O R T
Cash flows from operating activitiesNet earnings $13,334 12,266 12,949Adjustments to reconcile net earnings to cash flows from
operating activities:Depreciation and amortization of property and intangibles 2,939 2,774 2,832Stock based compensation 614 628 627Purchased in-process research and development — — 181Deferred tax provision 356 (436) 22Accounts receivable allowances 12 58 86
Changes in assets and liabilities, net of effects from acquisitions:(Increase)/decrease in accounts receivable (207) 453 (736)(Increase)/decrease in inventories (196) 95 (101)Increase/(decrease) in accounts payable and accrued liabilities 20 (507) (272)(Increase)/decrease in other current and non-current assets (574) 1,209 (1,600)Increase in other current and non-current liabilities 87 31 984
Net cash flows from operating activities 16,385 16,571 14,972
Cash flows from investing activitiesAdditions to property, plant and equipment (2,384) (2,365) (3,066)Proceeds from the disposal of assets 524 154 785Acquisitions, net of cash acquired (Note 20) (1,269) (2,470) (1,214)Purchases of investments (15,788) (10,040) (3,668)Sales of investments 11,101 7,232 3,059Other (primarily intangibles) (38) (109) (83)
Net cash used by investing activities (7,854) (7,598) (4,187)
Cash flows from financing activitiesDividends to shareholders (5,804) (5,327) (5,024)Repurchase of common stock (2,797) (2,130) (6,651)Proceeds from short-term debt 7,874 9,484 8,430Retirement of short-term debt (6,565) (6,791) (7,319)Proceeds from long-term debt 1,118 9 1,638Retirement of long-term debt (32) (219) (24)Proceeds from the exercise of stock options/excess tax benefits 1,226 882 1,486
Net cash used by financing activities (4,980) (4,092) (7,464)
Effect of exchange rate changes on cash and cash equivalents (6) 161 (323)
Increase in cash and cash equivalents 3,545 5,042 2,998Cash and cash equivalents, beginning of year (Note 1) 15,810 10,768 7,770
Cash and cash equivalents, end of year (Note 1) $19,355 15,810 10,768
Supplemental cash flow dataCash paid during the year for:
Interest $ 491 533 525Income taxes 2,442 2,363 4,068
Supplemental schedule of noncash investing and financing activitiesTreasury stock issued for employee compensation and
stock option plans, net of cash proceeds $ 673 541 593Conversion of debt 1 2 —
AcquisitionsFair value of assets acquired $ 1,321 3,345 1,328Fair value of liabilities assumed and non-controlling interests (52) (875) (114)
Net cash paid for acquisitions $ 1,269 2,470 1,214
See Notes to Consolidated Financial Statements

Notes to Consolidated Financial Statements
N O T E S T O C O N S O L I D A T E D F I N A N C I A L S T A T E M E N T S 45
1. Summary of Significant Accounting PoliciesPRINCIPLES OF CONSOLIDATIONThe consolidated financial statements include the accountsof Johnson & Johnson and subsidiaries (the “Company”). Inter-company accounts and transactions are eliminated.
DESCRIPTION OF THE COMPANY AND BUSINESS SEGMENTSThe Company has approximately 114,000 employees worldwideengaged in the research and development, manufacture and sale ofa broad range of products in the health care field. The Companyconducts business in virtually all countries of the world and its pri-mary focus is on products related to human health and well-being.
The Company is organized into three business segments:Consumer, Pharmaceutical and Medical Devices and Diagnostics.The Consumer segment manufactures and markets a broad range ofproducts used in the baby care, skin care, oral care, wound care andwomen’s health care fields, as well as nutritional and over-the-counter pharmaceutical products and wellness and prevention plat-forms. These products are marketed to the general public and soldboth to retail outlets and distributors throughout the world. ThePharmaceutical segment includes products in the following areas:anti-infective, antipsychotic, contraceptive, dermatology, gastroin-testinal, hematology, immunology, neurology, oncology, pain man-agement and virology. These products are distributed directly toretailers, wholesalers and health care professionals for prescriptionuse. The Medical Devices and Diagnostics segment includes abroad range of products distributed to wholesalers, hospitals andretailers used principally in the professional fields by physicians,nurses, therapists, hospitals, diagnostic laboratories and clinics.These products include Biosense Webster’s electrophysiology prod-ucts; Cordis’ circulatory disease management products; DePuy’sorthopaedic joint reconstruction, spinal care, neurological andsports medicine products; Ethicon’s surgical care, aesthetics andwomen’s health products; Ethicon Endo-Surgery’s minimallyinvasive surgical products and advanced sterilization products;LifeScan’s blood glucose monitoring and insulin delivery products;Ortho-Clinical Diagnostics’ professional diagnostic products andVistakon’s disposable contact lenses.
NEW ACCOUNTING PRONOUNCEMENTSRECENTLY ADOPTED ACCOUNTING PRONOUNCEMENTSDuring the fiscal first quarter of 2010 the Company adopted theFinancial Accounting Standards Board (FASB) guidance andamendments related to the criteria for separating considerationin multiple-deliverable revenue arrangements. The guidance(a) provides principles and application guidance on whether multi-ple deliverables exist, how the arrangement should be separated,and the consideration allocated; (b) requires an entity to allocaterevenue in an arrangement using estimated selling prices of deliver-ables if a vendor does not have vendor-specific objective evidenceor third-party evidence of selling price; and (c) eliminates the use ofthe residual method and requires an entity to allocate the revenueusing the relative selling price method. The adoption did not havea material impact on the Company’s results of operations, cashflows or financial position; however it expanded the disclosures formultiple-deliverable revenue arrangements.
During the fiscal first quarter of 2010, the Company adoptedthe FASB standard related to variable interest entities. The adoptionof this standard did not have an impact on the Company’s results ofoperations, cash flows or financial position.
During the fiscal first quarter of 2010, the Company adoptedthe new accounting guidance on fair value measurements anddisclosures. This guidance requires the Company to disclose theamount of significant transfers between Level 1 and Level 2 inputsand the reasons for these transfers as well as the reasons for anytransfers in or out of Level 3 of the fair value hierarchy. In addition,the guidance clarifies certain existing disclosure requirements.The adoption of this standard did not have a material impact on theCompany’s results of operations, cash flows or financial position.
RECENTLY ISSUED ACCOUNTING STANDARDS,NOT ADOPTED AS OF JANUARY 2, 2011During the fiscal second quarter of 2010 the FASB issued anaccounting standard update related to revenue recognition underthe milestone method. The objective of the accounting standardupdate is to provide guidance on defining a milestone and determin-ing when it may be appropriate to apply the milestone method ofrevenue recognition for research or development transactions.This guidance was effective on a prospective basis for milestonesachieved in fiscal years, and interim periods within those years,beginning on or after June 15, 2010. The adoption of this standard isnot expected to have a material impact on the Company’s results ofoperations, cash flows or financial position.
CASH EQUIVALENTSThe Company considers securities with maturities of three monthsor less, when purchased, to be cash equivalents.
INVESTMENTSShort-term marketable securities are carried at cost, which approxi-mates fair value. Investments classified as available-for-sale arecarried at estimated fair value with unrealized gains and lossesrecorded as a component of accumulated other comprehensiveincome. Long-term debt securities that the Company has the abilityand intent to hold until maturity are carried at amortized cost.Management determines the appropriate classification of its invest-ment in debt and equity securities at the time of purchase andre-evaluates such determination at each balance sheet date. TheCompany periodically reviews its investments in equity securitiesfor impairment and adjusts these investments to their fair valuewhen a decline in market value is deemed to be other than tempo-rary. If losses on these securities are considered to be other thantemporary, the loss is recognized in earnings.
PROPERTY, PLANT AND EQUIPMENT AND DEPRECIATIONProperty, plant and equipment are stated at cost. The Companyutilizes the straight-line method of depreciation over the estimateduseful lives of the assets:
Building and building equipment 20–40 yearsLand and leasehold improvements 10–20 yearsMachinery and equipment 2–13 years
The Company capitalizes certain computer software and develop-ment costs, included in machinery and equipment, when incurredin connection with developing or obtaining computer software forinternal use. Capitalized software costs are amortized over theestimated useful lives of the software, which generally range from3 to 8 years.
The Company reviews long-lived assets to assess recoverabilityusing undiscounted cash flows. When certain events or changes inoperating or economic conditions occur, an impairment assessmentmay be performed on the recoverability of the carrying value ofthese assets. If the asset is determined to be impaired, the loss ismeasured based on the difference between the asset’s fair valueand its carrying value. If quoted market prices are not available, theCompany will estimate fair value using a discounted value ofestimated future cash flows.
REVENUE RECOGNITIONThe Company recognizes revenue from product sales when thegoods are shipped or delivered and title and risk of loss pass to thecustomer. Provisions for certain rebates, sales incentives, trade pro-motions, coupons, product returns and discounts to customers areaccounted for as reductions in sales in the same period the relatedsales are recorded.
Product discounts granted are based on the terms of arrange-ments with direct, indirect and other market participants, as wellas market conditions, including prices charged by competitors.Rebates, the largest being the Medicaid rebate provision, are esti-mated based on contractual terms, historical experience, trendanalysis and projected market conditions in the various marketsserved. The Company evaluates market conditions for products orgroups of products primarily through the analysis of wholesaler andother third-party sell-through and market research data, as well asinternally generated information.
Sales returns are generally estimated and recorded based onhistorical sales and returns information. Products that exhibitunusual sales or return patterns due to dating, competition or othermarketing matters are specifically investigated and analyzed as partof the accounting for sales return accruals. Sales returns allowancesrepresent a reserve for products that may be returned due to expira-tion, destruction in the field, or in specific areas, product recall.The returns reserve is based on historical return trends by productand by market as a percent to gross sales. In accordance with theCompany’s accounting policies, the Company generally issues creditto customers for returned goods. The Company’s sales return
reserves are accounted for in accordance with U.S. GAAP guidancefor revenue recognition when right of return exists. Sales returnreserves are recorded at full sales value. Sales returns in the Con-sumer and Pharmaceutical segments are almost exclusively notresalable. Sales returns for certain franchises in the Medical Devicesand Diagnostics segment are typically resalable but are not mate-rial. The Company rarely exchanges products from inventory forreturned products. The sales returns reserve for the total Companyhas ranged between 1.0% and 1.2% of annual sales to customersduring the prior three fiscal reporting years 2008–2010.
Promotional programs, such as product listing allowances andcooperative advertising arrangements, are recorded in the yearincurred. Continuing promotional programs include coupons andvolume-based sales incentive programs. The redemption cost ofconsumer coupons is based on historical redemption experience byproduct and value. Volume-based incentive programs are based onthe estimated sales volumes for the incentive period and arerecorded as products are sold. The Company also earns service rev-enue for co-promotion of certain products and includes it in salesto customers. These arrangements are evaluated to determine theappropriate amounts to be deferred.
SHIPPING AND HANDLINGShipping and handling costs incurred were $945 million, $964 mil-lion and $1,017 million in 2010, 2009 and 2008, respectively, andare included in selling, marketing and administrative expense. Theamount of revenue received for shipping and handling is less than0.5% of sales to customers for all periods presented.
INVENTORIESInventories are stated at the lower of cost or market determined bythe first-in, first-out method.
INTANGIBLE ASSETS AND GOODWILLThe authoritative literature on U.S. GAAP requires that goodwilland intangible assets with indefinite lives be assessed annually forimpairment. The Company completed the annual impairment testfor 2010 in the fiscal fourth quarter and no impairment was deter-mined. Future impairment tests will be performed annually in thefiscal fourth quarter, or sooner if a triggering event occurs.
Intangible assets that have finite useful lives continue to beamortized over their useful lives, and are reviewed for impairmentwhen warranted by economic conditions. See Note 5 for furtherdetails on Intangible Assets and Goodwill.
FINANCIAL INSTRUMENTSAs required by U.S. GAAP, all derivative instruments are recordedon the balance sheet at fair value. Changes in the fair value ofderivatives are recorded each period in current earnings or othercomprehensive income, depending on whether the derivative isdesignated as part of a hedge transaction, and if so, the type ofhedge transaction.
46 J O H N S O N & J O H N S O N 2 0 1 0 A N N U A L R E P O R T

The Company documents all relationships between hedgeditems and derivatives. The overall risk management strategyincludes reasons for undertaking hedge transactions and enteringinto derivatives. The objectives of this strategy are: (1) minimizeforeign currency exposure’s impact on the Company’s financialperformance; (2) protect the Company’s cash flow from adversemovements in foreign exchange rates; (3) ensure the appropriate-ness of financial instruments; and (4) manage the enterprise riskassociated with financial institutions. See Note 6 for additionalinformation on Financial Instruments.
PRODUCT LIABILITYAccruals for product liability claims are recorded, on an undis-counted basis, when it is probable that a liability has been incurredand the amount of the liability can be reasonably estimated basedon existing information. The accruals are adjusted periodically asadditional information becomes available. As a result of cost andavailability factors, effective November 1, 2005, the Companyceased purchasing third-party product liability insurance. Based onthe availability of prior coverage, receivables for insurance recover-ies related to product liability claims are recorded on an undis-counted basis, when it is probable that a recovery will be realized.
RESEARCH AND DEVELOPMENTResearch and development expenses are expensed as incurred.Upfront and milestone payments made to third-parties in connec-tion with research and development collaborations are expensed asincurred up to the point of regulatory approval. Payments made tothird parties subsequent to regulatory approval are capitalizedand amortized over the remaining useful life of the related product.Amounts capitalized for such payments are included in otherintangibles, net of accumulated amortization.
The Company enters into collaborative arrangements, typicallywith other pharmaceutical or biotechnology companies, to developand commercialize drug candidates or intellectual property. Thesearrangements typically involve two (or more) parties who are activeparticipants in the collaboration and are exposed to significant risksand rewards dependent on the commercial success of the activities.These collaborations usually involve various activities by one ormore parties, including research and development, marketing andselling and distribution. Often, these collaborations require upfront,milestone and royalty or profit share payments, contingent upon theoccurrence of certain future events linked to the success of the assetin development. Amounts due from collaborative partners related todevelopment activities are generally reflected as a reduction ofresearch and development expense because the performance of
contract development services is not central to the Company’soperations. In general, the income statement presentation forthese collaborations is as follows:
Nature/Type of Collaboration Statement of Earnings Presentation
Third-party sale of product Sales to customersRoyalties/milestones paid to
collaborative partner(post-regulatory approval)* Cost of goods sold
Royalties received from collaborative partner Other income (expense), netUpfront payments & milestones
paid to collaborative partner(pre-regulatory approval) Research and development expense
Research and development paymentsto collaborative partner Research and development expense
Research and developmentpayments received fromcollaborative partner Reduction of research and development expense
* Milestones are capitalized as intangible assets and amortized to cost of goods sold overthe useful life.
ADVERTISINGCosts associated with advertising are expensed in the year incurredand are included in the selling, marketing and administrativeexpenses. Advertising expenses worldwide, which are comprised oftelevision, radio, print media and Internet advertising, were $2.5 bil-lion, $2.4 billion and $2.9 billion in 2010, 2009 and 2008, respectively.
INCOME TAXESThe Company intends to continue to reinvest its undistributedinternational earnings to expand its international operations; there-fore, no U.S. tax expense has been recorded with respect to theundistributed portion not intended for repatriation. At January 2,2011 and January 3, 2010, the cumulative amount of undistributedinternational earnings was approximately $37.0 billion and$32.2 billion, respectively.
Deferred income taxes are recognized for tax consequencesof temporary differences by applying enacted statutory tax rates,applicable to future years, to differences between the financialreporting and the tax basis of existing assets and liabilities.
NET EARNINGS PER SHAREBasic earnings per share is computed by dividing net earnings avail-able to common shareholders by the weighted average number ofcommon shares outstanding for the period. Diluted earnings pershare reflects the potential dilution that could occur if securitieswere exercised or converted into common stock using the treasurystock method.
N O T E S T O C O N S O L I D A T E D F I N A N C I A L S T A T E M E N T S 47
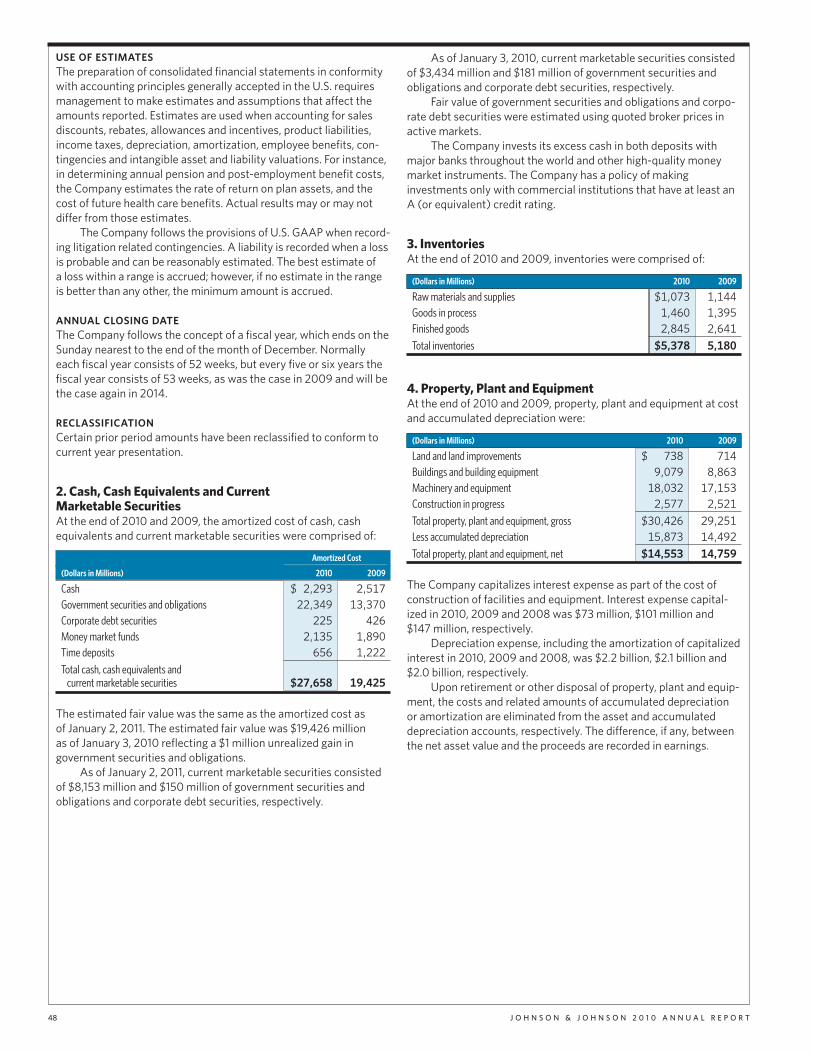
USE OF ESTIMATESThe preparation of consolidated financial statements in conformitywith accounting principles generally accepted in the U.S. requiresmanagement to make estimates and assumptions that affect theamounts reported. Estimates are used when accounting for salesdiscounts, rebates, allowances and incentives, product liabilities,income taxes, depreciation, amortization, employee benefits, con-tingencies and intangible asset and liability valuations. For instance,in determining annual pension and post-employment benefit costs,the Company estimates the rate of return on plan assets, and thecost of future health care benefits. Actual results may or may notdiffer from those estimates.
The Company follows the provisions of U.S. GAAP when record-ing litigation related contingencies. A liability is recorded when a lossis probable and can be reasonably estimated. The best estimate ofa loss within a range is accrued; however, if no estimate in the rangeis better than any other, the minimum amount is accrued.
ANNUAL CLOSING DATEThe Company follows the concept of a fiscal year, which ends on theSunday nearest to the end of the month of December. Normallyeach fiscal year consists of 52 weeks, but every five or six years thefiscal year consists of 53 weeks, as was the case in 2009 and will bethe case again in 2014.
RECLASSIFICATIONCertain prior period amounts have been reclassified to conform tocurrent year presentation.
2. Cash, Cash Equivalents and CurrentMarketable SecuritiesAt the end of 2010 and 2009, the amortized cost of cash, cashequivalents and current marketable securities were comprised of:
Amortized Cost_________________________(Dollars in Millions) 2010 2009
Cash $ 2,293 2,517
Government securities and obligations 22,349 13,370
Corporate debt securities 225 426
Money market funds 2,135 1,890
Time deposits 656 1,222
Total cash, cash equivalents andcurrent marketable securities $27,658 19,425
The estimated fair value was the same as the amortized cost asof January 2, 2011. The estimated fair value was $19,426 millionas of January 3, 2010 reflecting a $1 million unrealized gain in
As of January 2, 2011, current marketable securities consistedof $8,153 million and $150 million of government securities andobligations and corporate debt securities, respectively.
As of January 3, 2010, current marketable securities consistedof $3,434 million and $181 million of government securities andobligations and corporate debt securities, respectively.
Fair value of government securities and obligations and corpo-rate debt securities were estimated using quoted broker prices inactive markets.
The Company invests its excess cash in both deposits withmajor banks throughout the world and other high-quality moneymarket instruments. The Company has a policy of makinginvestments only with commercial institutions that have at least anA (or equivalent) credit rating.
3. InventoriesAt the end of 2010 and 2009, inventories were comprised of:
(Dollars in Millions) 2010 2009
Raw materials and supplies $1,073 1,144
Goods in process 1,460 1,395
Finished goods 2,845 2,641
Total inventories $5,378 5,180
4. Property, Plant and EquipmentAt the end of 2010 and 2009, property, plant and equipment at costand accumulated depreciation were:
(Dollars in Millions) 2010 2009
Land and land improvements $ 738 714
Buildings and building equipment 9,079 8,863
Machinery and equipment 18,032 17,153
Construction in progress 2,577 2,521
Total property, plant and equipment, gross $30,426 29,251
Less accumulated depreciation 15,873 14,492
Total property, plant and equipment, net $14,553 14,759
The Company capitalizes interest expense as part of the cost ofconstruction of facilities and equipment. Interest expense capital-ized in 2010, 2009 and 2008 was $73 million, $101 million and$147 million, respectively.
Depreciation expense, including the amortization of capitalizedinterest in 2010, 2009 and 2008, was $2.2 billion, $2.1 billion and$2.0 billion, respectively.
Upon retirement or other disposal of property, plant and equip-ment, the costs and related amounts of accumulated depreciationor amortization are eliminated from the asset and accumulateddepreciation accounts, respectively. The difference, if any, betweenthe net asset value and the proceeds are recorded in earnings.
48 J O H N S O N & J O H N S O N 2 0 1 0 A N N U A L R E P O R T
government securities and obligations.
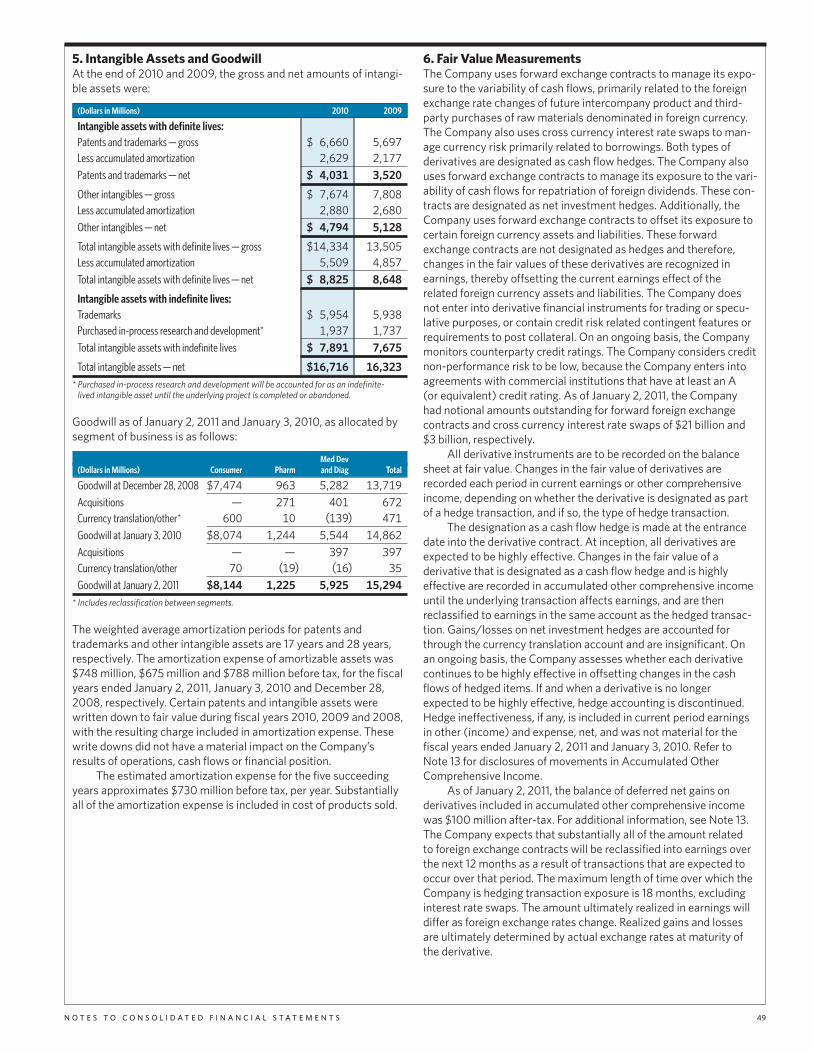
5. Intangible Assets and GoodwillAt the end of 2010 and 2009, the gross and net amounts of intangi-ble assets were:
(Dollars in Millions) 2010 2009
Intangible assets with definite lives:Patents and trademarks — gross $ 6,660 5,697
Less accumulated amortization 2,629 2,177
Patents and trademarks — net $ 4,031 3,520
Other intangibles — gross $ 7,674 7,808
Less accumulated amortization 2,880 2,680
Other intangibles — net $ 4,794 5,128
Total intangible assets with definite lives — gross $14,334 13,505
Less accumulated amortization 5,509 4,857
Total intangible assets with definite lives — net $ 8,825 8,648
Intangible assets with indefinite lives:Trademarks $ 5,954 5,938
Purchased in-process research and development* 1,937 1,737
Total intangible assets with indefinite lives $ 7,891 7,675
Total intangible assets — net $16,716 16,323
* Purchased in-process research and development will be accounted for as an indefinite-lived intangible asset until the underlying project is completed or abandoned.
Goodwill as of January 2, 2011 and January 3, 2010, as allocated bysegment of business is as follows:
Med Dev(Dollars in Millions) Consumer Pharm and Diag Total
Goodwill at December 28, 2008 $7,474 963 5,282 13,719
Acquisitions — 271 401 672
Currency translation/other* 600 10 (139) 471
Goodwill at January 3, 2010 $8,074 1,244 5,544 14,862
Acquisitions — — 397 397
Currency translation/other 70 (19) (16) 35
Goodwill at January 2, 2011 $8,144 1,225 5,925 15,294
* Includes reclassification between segments.
The weighted average amortization periods for patents andtrademarks and other intangible assets are 17 years and 28 years,respectively. The amortization expense of amortizable assets was$748 million, $675 million and $788 million before tax, for the fiscalyears ended January 2, 2011, January 3, 2010 and December 28,2008, respectively. Certain patents and intangible assets werewritten down to fair value during fiscal years 2010, 2009 and 2008,with the resulting charge included in amortization expense. Thesewrite downs did not have a material impact on the Company’sresults of operations, cash flows or financial position.
The estimated amortization expense for the five succeedingyears approximates $730 million before tax, per year. Substantiallyall of the amortization expense is included in cost of products sold.
6. Fair Value MeasurementsThe Company uses forward exchange contracts to manage its expo-sure to the variability of cash flows, primarily related to the foreignexchange rate changes of future intercompany product and third-party purchases of raw materials denominated in foreign currency.The Company also uses cross currency interest rate swaps to man-age currency risk primarily related to borrowings. Both types ofderivatives are designated as cash flow hedges. The Company alsouses forward exchange contracts to manage its exposure to the vari-ability of cash flows for repatriation of foreign dividends. These con-tracts are designated as net investment hedges. Additionally, theCompany uses forward exchange contracts to offset its exposure tocertain foreign currency assets and liabilities. These forwardexchange contracts are not designated as hedges and therefore,changes in the fair values of these derivatives are recognized inearnings, thereby offsetting the current earnings effect of therelated foreign currency assets and liabilities. The Company doesnot enter into derivative financial instruments for trading or specu-lative purposes, or contain credit risk related contingent features orrequirements to post collateral. On an ongoing basis, the Companymonitors counterparty credit ratings. The Company considers creditnon-performance risk to be low, because the Company enters intoagreements with commercial institutions that have at least an A(or equivalent) credit rating. As of January 2, 2011, the Companyhad notional amounts outstanding for forward foreign exchangecontracts and cross currency interest rate swaps of $21 billion and$3 billion, respectively.
All derivative instruments are to be recorded on the balancesheet at fair value. Changes in the fair value of derivatives arerecorded each period in current earnings or other comprehensiveincome, depending on whether the derivative is designated as partof a hedge transaction, and if so, the type of hedge transaction.
The designation as a cash flow hedge is made at the entrancedate into the derivative contract. At inception, all derivatives areexpected to be highly effective. Changes in the fair value of aderivative that is designated as a cash flow hedge and is highlyeffective are recorded in accumulated other comprehensive incomeuntil the underlying transaction affects earnings, and are thenreclassified to earnings in the same account as the hedged transac-tion. Gains/losses on net investment hedges are accounted forthrough the currency translation account and are insignificant. Onan ongoing basis, the Company assesses whether each derivativecontinues to be highly effective in offsetting changes in the cashflows of hedged items. If and when a derivative is no longerexpected to be highly effective, hedge accounting is discontinued.Hedge ineffectiveness, if any, is included in current period earningsin other (income) and expense, net, and was not material for thefiscal years ended January 2, 2011 and January 3, 2010. Refer toNote 13 for disclosures of movements in Accumulated OtherComprehensive Income.
As of January 2, 2011, the balance of deferred net gains onderivatives included in accumulated other comprehensive incomewas $100 million after-tax. For additional information, see Note 13.The Company expects that substantially all of the amount relatedto foreign exchange contracts will be reclassified into earnings overthe next 12 months as a result of transactions that are expected tooccur over that period. The maximum length of time over which theCompany is hedging transaction exposure is 18 months, excludinginterest rate swaps. The amount ultimately realized in earnings willdiffer as foreign exchange rates change. Realized gains and lossesare ultimately determined by actual exchange rates at maturity ofthe derivative.
N O T E S T O C O N S O L I D A T E D F I N A N C I A L S T A T E M E N T S 49
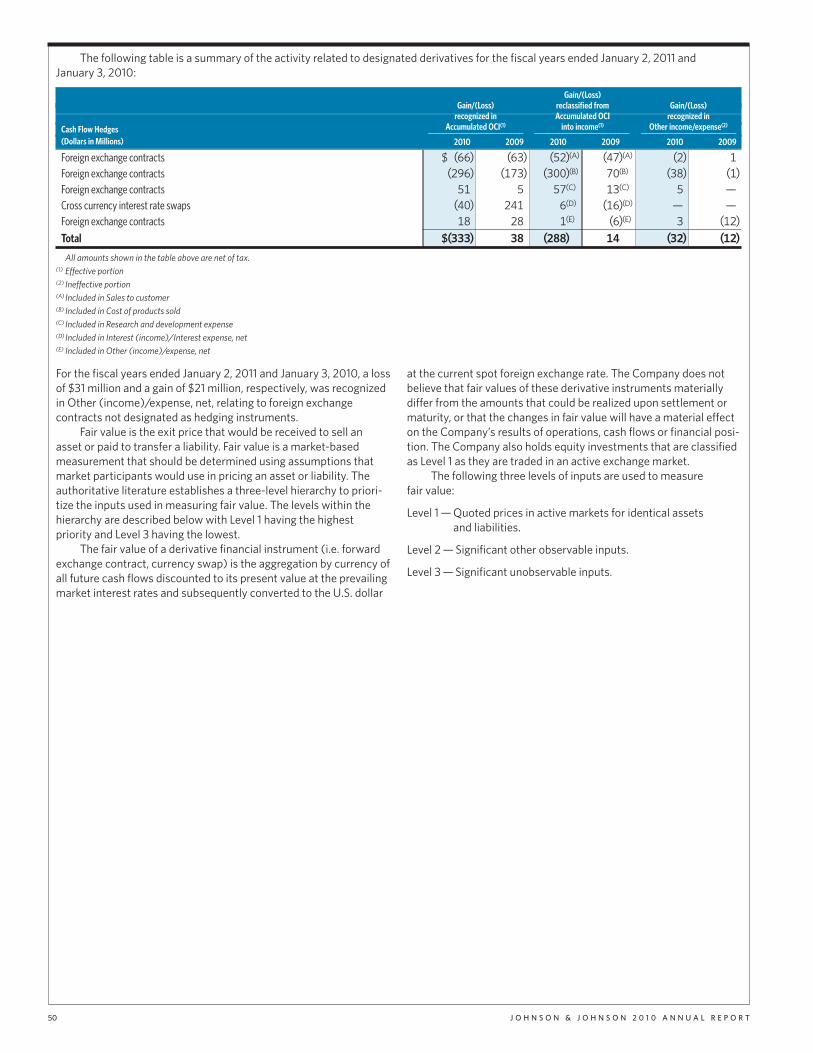
The following table is a summary of the activity related to designated derivatives for the fiscal years ended January 2, 2011 andJanuary 3, 2010:
Gain/(Loss)Gain/(Loss) reclassified from Gain/(Loss)
recognized in Accumulated OCI recognized in
Cash Flow Hedges Accumulated OCI(1) into income(1) Other income/expense(2)_______________________ _______________________ _______________________
(Dollars in Millions) 2010 2009 2010 2009 2010 2009
Foreign exchange contracts $ (66) (63) (52)(A) (47)(A) (2) 1
Foreign exchange contracts (296) (173) (300)(B) 70(B) (38) (1)
Foreign exchange contracts 51 5 57(C) 13(C) 5 —Cross currency interest rate swaps (40) 241 6(D) (16)(D) — —Foreign exchange contracts 18 28 1(E) (6)(E) 3 (12)
Total $(333) 38 (288) 14 (32) (12)
All amounts shown in the table above are net of tax.(1) Effective portion(2) Ineffective portion(A) Included in Sales to customer(B) Included in Cost of products sold(C) Included in Research and development expense(D)Included in Interest (income)/Interest expense, net(E) Included in Other (income)/expense, net
50 J O H N S O N & J O H N S O N 2 0 1 0 A N N U A L R E P O R T
For the fiscal years ended January 2, 2011 and January 3, 2010, a lossof $31 million and a gain of $21 million, respectively, was recognizedin Other (income)/expense, net, relating to foreign exchangecontracts not designated as hedging instruments.
Fair value is the exit price that would be received to sell anasset or paid to transfer a liability. Fair value is a market-basedmeasurement that should be determined using assumptions thatmarket participants would use in pricing an asset or liability. Theauthoritative literature establishes a three-level hierarchy to priori-tize the inputs used in measuring fair value. The levels within thehierarchy are described below with Level 1 having the highestpriority and Level 3 having the lowest.
The fair value of a derivative financial instrument (i.e. forwardexchange contract, currency swap) is the aggregation by currency ofall future cash flows discounted to its present value at the prevailingmarket interest rates and subsequently converted to the U.S. dollar
at the current spot foreign exchange rate. The Company does notbelieve that fair values of these derivative instruments materiallydiffer from the amounts that could be realized upon settlement ormaturity, or that the changes in fair value will have a material effecton the Company’s results of operations, cash flows or financial posi-tion. The Company also holds equity investments that are classifiedas Level 1 as they are traded in an active exchange market.
The following three levels of inputs are used to measurefair value:
Level 1 — Quoted prices in active markets for identical assetsand liabilities.
Level 2 — Significant other observable inputs.
Level 3 — Significant unobservable inputs.

The Company’s significant financial assets and liabilities measured at fair value as of January 2, 2011 and January 3, 2010 were as follows:
2010 2009________________________________________________ ______(Dollars in Millions) Level 1 Level 2 Level 3 Total Total(1)
Derivatives designated as hedging instruments:
Assets:Foreign exchange contracts $ — 321 — 321 436
Cross currency interest rate swaps (2) — 17 — 17 126
Total — 338 — 338 562
Liabilities:Foreign exchange contracts — 586 — 586 608Cross currency interest rate swaps (3) — 502 — 502 571
Total — 1,088 — 1,088 1,179
Derivatives not designated as hedging instruments:
Assets:Foreign exchange contracts — 19 — 19 33
Liabilities:Foreign exchange contracts — 39 — 39 40
Other investments $1,165 — — 1,165 1,134(1) 2009 assets and liabilities are all classified as Level 2 with the exception of other investments of $1,134 million which are classified as Level 1.(2) Includes $14 million and $119 million of non-current assets for the fiscal years ending January 2, 2011 and January 3, 2010, respectively.(3) Includes $502 million and $517 million of non-current liabilities for the fiscal years ending January 2, 2011 and January 3, 2010, respectively.
See Notes 2 and 7 for financial assets and liabilities held at carrying amount on the Consolidated Balance Sheet.
N O T E S T O C O N S O L I D A T E D F I N A N C I A L S T A T E M E N T S 51
7. BorrowingsThe components of long-term debt are as follows:
Effective Effective(Dollars in Millions) 2010 Rate % 2009 Rate %
5.15% Debentures due 2012 $ 599 5.18% 599 5.18
3.80% Debentures due 2013 500 3.82 500 3.82
5.55% Debentures due 2017 1,000 5.55 1,000 5.55
5.15% Debentures due 2018 898 5.15 898 5.15
4.75% Notes due 2019(1B Euro 1.3268) (2)/(1B Euro 1.4382) (3) 1,319(2) 5.35 1,429(3) 5.35
3% Zero Coupon ConvertibleSubordinated Debentures due 2020 194 3.00 188 3.00
2.95% Debentures due 2020 541 3.15 — —6.73% Debentures due 2023 250 6.73 250 6.73
5.50% Notes due 2024(500MM GBP 1.5403) (2)/(500MM GBP 1.6189) (3) 764(2) 5.71 803(3) 5.71
6.95% Notes due 2029 294 7.14 294 7.14
4.95% Debenture due 2033 500 4.95 500 4.95
5.95% Notes due 2037 995 5.99 995 5.99
5.86% Debentures due 2038 700 5.86 700 5.86
4.50% Debentures due 2040 539 4.63 — —Other (Includes Industrial
Revenue Bonds) 76 101
9,169(4) 5.25(1) 8,257(4) 5.42(1)
Less current portion 13 34
$9,156 8,223
(1) Weighted average effective rate.(2) Translation rate at January 2, 2011.(3) Translation rate at January 3, 2010.(4) The excess of the fair value over the carrying value of debt was $1.0 billion in 2010 and
$0.8 billion in 2009.
Fair value of the non-current debt was estimated using marketprices, which were corroborated by quoted broker prices inactive markets.
The Company has access to substantial sources of funds atnumerous banks worldwide. In September 2010, the Companysecured a new 364-day Credit Facility. Total credit available to theCompany approximates $10 billion, which expires September 22,2011. Interest charged on borrowings under the credit line agree-ments is based on either bids provided by banks, the prime rate orLondon Interbank Offered Rates (LIBOR), plus applicable margins.Commitment fees under the agreements are not material.
Throughout 2010 the Company continued to have access toliquidity through the commercial paper market. Short-term borrow-ings and the current portion of long-term debt amounted to approxi-mately $7.6 billion at the end of 2010, of which $7.4 billion wasborrowed under the Commercial Paper Program. The remainderrepresents principally local borrowing by international subsidiaries.
The Company has a shelf registration with the Securities andExchange Commission that enables the Company to issue on atimely basis debt securities and warrants to purchase debt securities.
Aggregate maturities of long-term obligations commencing in2010 are:
(Dollars in Millions) After2011 2012 2013 2014 2015 2015
$13 644 509 9 — 7,994
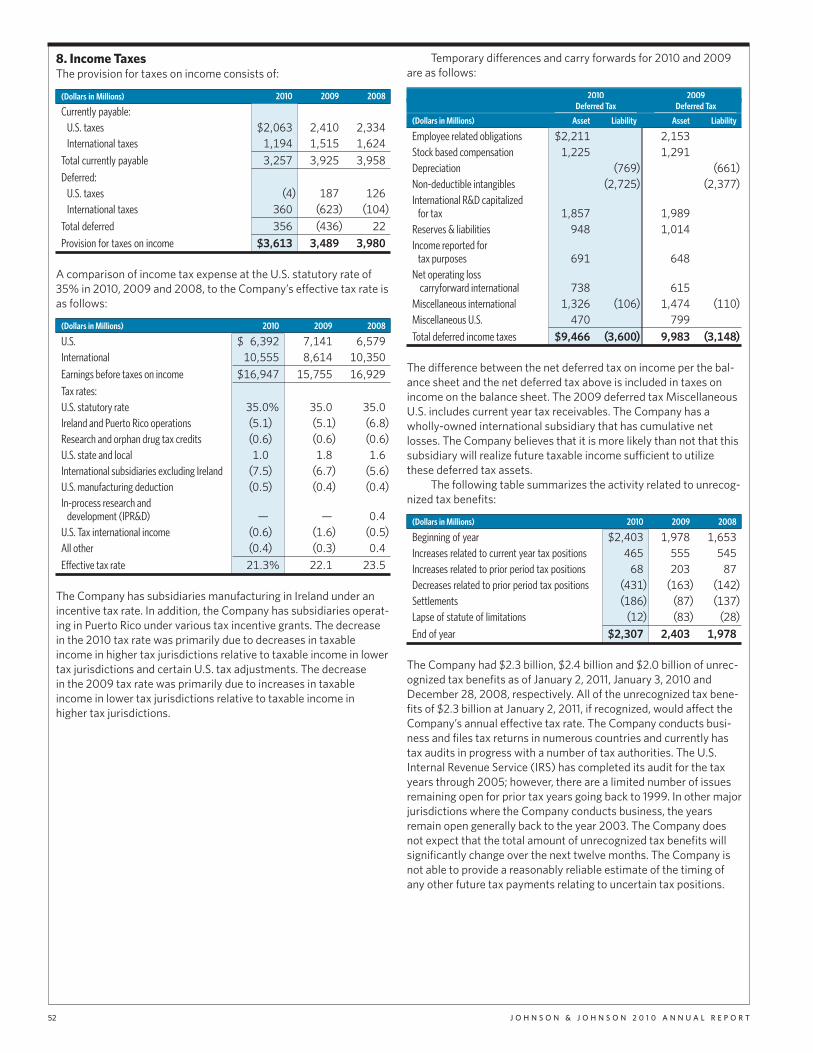
8. Income TaxesThe provision for taxes on income consists of:
(Dollars in Millions) 2010 2009 2008
Currently payable:U.S. taxes $2,063 2,410 2,334
International taxes 1,194 1,515 1,624
Total currently payable 3,257 3,925 3,958
Deferred:U.S. taxes (4) 187 126
International taxes 360 (623) (104)
Total deferred 356 (436) 22
Provision for taxes on income $3,613 3,489 3,980
A comparison of income tax expense at the U.S. statutory rate of35% in 2010, 2009 and 2008, to the Company’s effective tax rate isas follows:
(Dollars in Millions) 2010 2009 2008
U.S. $ 6,392 7,141 6,579
International 10,555 8,614 10,350
Earnings before taxes on income $16,947 15,755 16,929
Tax rates:U.S. statutory rate 35.0% 35.0 35.0
Ireland and Puerto Rico operations (5.1) (5.1) (6.8)
Research and orphan drug tax credits (0.6) (0.6) (0.6)
U.S. state and local 1.0 1.8 1.6
International subsidiaries excluding Ireland (7.5) (6.7) (5.6)
U.S. manufacturing deduction (0.5) (0.4) (0.4)
In-process research anddevelopment (IPR&D) — — 0.4
U.S. Tax international income (0.6) (1.6) (0.5)
All other (0.4) (0.3) 0.4
Effective tax rate 21.3% 22.1 23.5
The Company has subsidiaries manufacturing in Ireland under anincentive tax rate. In addition, the Company has subsidiaries operat-ing in Puerto Rico under various tax incentive grants. The decreasein the 2010 tax rate was primarily due to decreases in taxableincome in higher tax jurisdictions relative to taxable income in lowertax jurisdictions and certain U.S. tax adjustments. The decreasein the 2009 tax rate was primarily due to increases in taxableincome in lower tax jurisdictions relative to taxable income inhigher tax jurisdictions.
Temporary differences and carry forwards for 2010 and 2009are as follows:
2010 2009Deferred Tax Deferred Tax____________________ ____________________
(Dollars in Millions) Asset Liability Asset Liability
Employee related obligations $2,211 2,153
Stock based compensation 1,225 1,291
Depreciation (769) (661)
Non-deductible intangibles (2,725) (2,377)
International R&D capitalizedfor tax 1,857 1,989
Reserves & liabilities 948 1,014
Income reported fortax purposes 691 648
Net operating losscarryforward international 738 615
Miscellaneous international 1,326 (106) 1,474 (110)
Miscellaneous U.S. 470 799
Total deferred income taxes $9,466 (3,600) 9,983 (3,148)
The difference between the net deferred tax on income per the bal-ance sheet and the net deferred tax above is included in taxes onincome on the balance sheet. The 2009 deferred tax MiscellaneousU.S. includes current year tax receivables. The Company has awholly-owned international subsidiary that has cumulative netlosses. The Company believes that it is more likely than not that thissubsidiary will realize future taxable income sufficient to utilizethese deferred tax assets.
The following table summarizes the activity related to unrecog-nized tax benefits:
(Dollars in Millions) 2010 2009 2008
Beginning of year $2,403 1,978 1,653
Increases related to current year tax positions 465 555 545
Increases related to prior period tax positions 68 203 87
Decreases related to prior period tax positions (431) (163) (142)
Settlements (186) (87) (137)
Lapse of statute of limitations (12) (83) (28)
End of year $2,307 2,403 1,978
The Company had $2.3 billion, $2.4 billion and $2.0 billion of unrec-ognized tax benefits as of January 2, 2011, January 3, 2010 andDecember 28, 2008, respectively. All of the unrecognized tax bene-fits of $2.3 billion at January 2, 2011, if recognized, would affect theCompany’s annual effective tax rate. The Company conducts busi-ness and files tax returns in numerous countries and currently hastax audits in progress with a number of tax authorities. The U.S.Internal Revenue Service (IRS) has completed its audit for the taxyears through 2005; however, there are a limited number of issuesremaining open for prior tax years going back to 1999. In other majorjurisdictions where the Company conducts business, the yearsremain open generally back to the year 2003. The Company doesnot expect that the total amount of unrecognized tax benefits willsignificantly change over the next twelve months. The Company isnot able to provide a reasonably reliable estimate of the timing ofany other future tax payments relating to uncertain tax positions.
52 J O H N S O N & J O H N S O N 2 0 1 0 A N N U A L R E P O R T
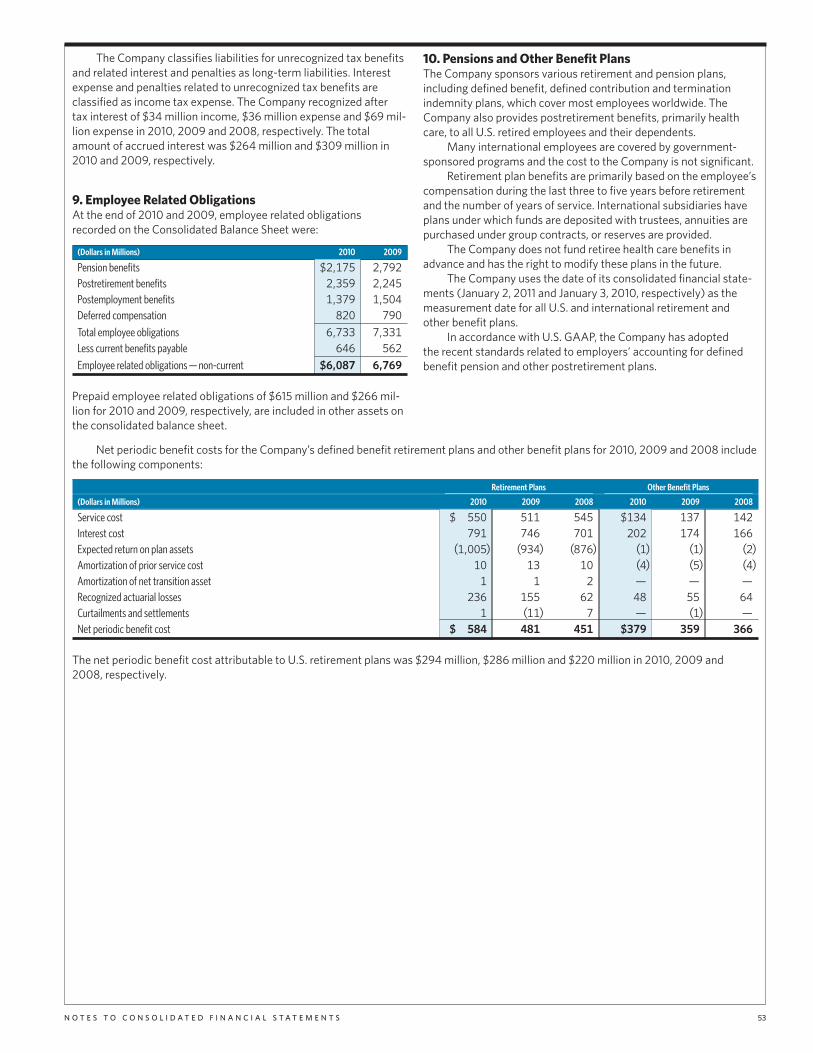
N O T E S T O C O N S O L I D A T E D F I N A N C I A L S T A T E M E N T S 53
The Company classifies liabilities for unrecognized tax benefitsand related interest and penalties as long-term liabilities. Interestexpense and penalties related to unrecognized tax benefits areclassified as income tax expense. The Company recognized aftertax interest of $34 million income, $36 million expense and $69 mil-lion expense in 2010, 2009 and 2008, respectively. The totalamount of accrued interest was $264 million and $309 million in2010 and 2009, respectively.
9. Employee Related ObligationsAt the end of 2010 and 2009, employee related obligationsrecorded on the Consolidated Balance Sheet were:
(Dollars in Millions) 2010 2009
Pension benefits $2,175 2,792
Postretirement benefits 2,359 2,245
Postemployment benefits 1,379 1,504
Deferred compensation 820 790
Total employee obligations 6,733 7,331
Less current benefits payable 646 562
Employee related obligations — non-current $6,087 6,769
Prepaid employee related obligations of $615 million and $266 mil-lion for 2010 and 2009, respectively, are included in other assets onthe consolidated balance sheet.
10. Pensions and Other Benefit PlansThe Company sponsors various retirement and pension plans,including defined benefit, defined contribution and terminationindemnity plans, which cover most employees worldwide. TheCompany also provides postretirement benefits, primarily healthcare, to all U.S. retired employees and their dependents.
Many international employees are covered by government-sponsored programs and the cost to the Company is not significant.
Retirement plan benefits are primarily based on the employee’scompensation during the last three to five years before retirementand the number of years of service. International subsidiaries haveplans under which funds are deposited with trustees, annuities arepurchased under group contracts, or reserves are provided.
The Company does not fund retiree health care benefits inadvance and has the right to modify these plans in the future.
The Company uses the date of its consolidated financial state-ments (January 2, 2011 and January 3, 2010, respectively) as themeasurement date for all U.S. and international retirement andother benefit plans.
In accordance with U.S. GAAP, the Company has adoptedthe recent standards related to employers’ accounting for definedbenefit pension and other postretirement plans.
Net periodic benefit costs for the Company’s defined benefit retirement plans and other benefit plans for 2010, 2009 and 2008 includethe following components:
Retirement Plans Other Benefit Plans____________________________________ ____________________________________(Dollars in Millions) 2010 2009 2008 2010 2009 2008
Service cost $ 550 511 545 $134 137 142
Interest cost 791 746 701 202 174 166
Expected return on plan assets (1,005) (934) (876) (1) (1) (2)
Amortization of prior service cost 10 13 10 (4) (5) (4)
Amortization of net transition asset 1 1 2 — — —Recognized actuarial losses 236 155 62 48 55 64
Curtailments and settlements 1 (11) 7 — (1) —Net periodic benefit cost $ 584 481 451 $379 359 366
The net periodic benefit cost attributable to U.S. retirement plans was $294 million, $286 million and $220 million in 2010, 2009 and2008, respectively.
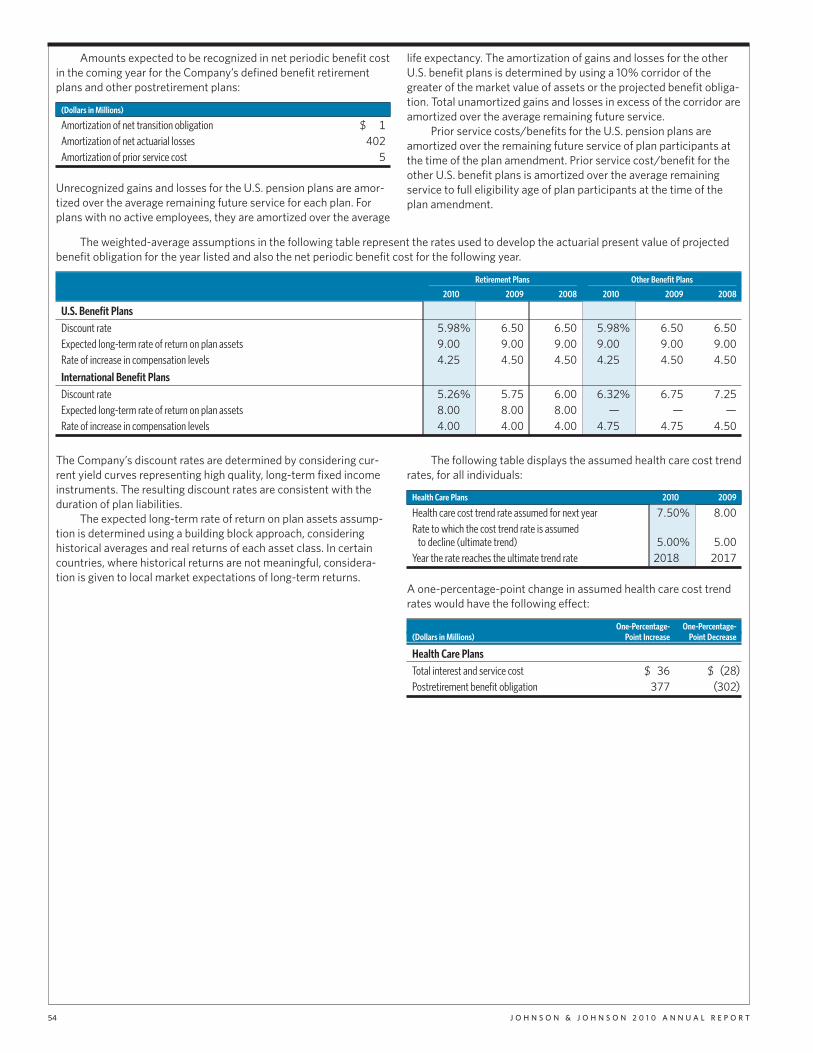
54 J O H N S O N & J O H N S O N 2 0 1 0 A N N U A L R E P O R T
Amounts expected to be recognized in net periodic benefit costin the coming year for the Company’s defined benefit retirementplans and other postretirement plans:
(Dollars in Millions)
Amortization of net transition obligation $ 1
Amortization of net actuarial losses 402
Amortization of prior service cost 5
Unrecognized gains and losses for the U.S. pension plans are amor-tized over the average remaining future service for each plan. Forplans with no active employees, they are amortized over the average
life expectancy. The amortization of gains and losses for the otherU.S. benefit plans is determined by using a 10% corridor of thegreater of the market value of assets or the projected benefit obliga-tion. Total unamortized gains and losses in excess of the corridor areamortized over the average remaining future service.
Prior service costs/benefits for the U.S. pension plans areamortized over the remaining future service of plan participants atthe time of the plan amendment. Prior service cost/benefit for theother U.S. benefit plans is amortized over the average remainingservice to full eligibility age of plan participants at the time of theplan amendment.
The Company’s discount rates are determined by considering cur-rent yield curves representing high quality, long-term fixed incomeinstruments. The resulting discount rates are consistent with theduration of plan liabilities.
The expected long-term rate of return on plan assets assump-tion is determined using a building block approach, consideringhistorical averages and real returns of each asset class. In certaincountries, where historical returns are not meaningful, considera-tion is given to local market expectations of long-term returns.
The following table displays the assumed health care cost trendrates, for all individuals:
Health Care Plans 2010 2009
Health care cost trend rate assumed for next year 7.50% 8.00
Rate to which the cost trend rate is assumedto decline (ultimate trend) 5.00% 5.00
Year the rate reaches the ultimate trend rate 2018 2017
A one-percentage-point change in assumed health care cost trendrates would have the following effect:
One-Percentage- One-Percentage-(Dollars in Millions) Point Increase Point Decrease
Health Care Plans
Total interest and service cost $ 36 $ (28)
Postretirement benefit obligation 377 (302)
The weighted-average assumptions in the following table represent the rates used to develop the actuarial present value of projectedbenefit obligation for the year listed and also the net periodic benefit cost for the following year.
Retirement Plans Other Benefit Plans____________________________________ ____________________________________2010 2009 2008 2010 2009 2008
U.S. Benefit Plans
Discount rate 5.98% 6.50 6.50 5.98% 6.50 6.50
Expected long-term rate of return on plan assets 9.00 9.00 9.00 9.00 9.00 9.00
Rate of increase in compensation levels 4.25 4.50 4.50 4.25 4.50 4.50
International Benefit Plans
Discount rate 5.26% 5.75 6.00 6.32% 6.75 7.25
Expected long-term rate of return on plan assets 8.00 8.00 8.00 — — —Rate of increase in compensation levels 4.00 4.00 4.00 4.75 4.75 4.50
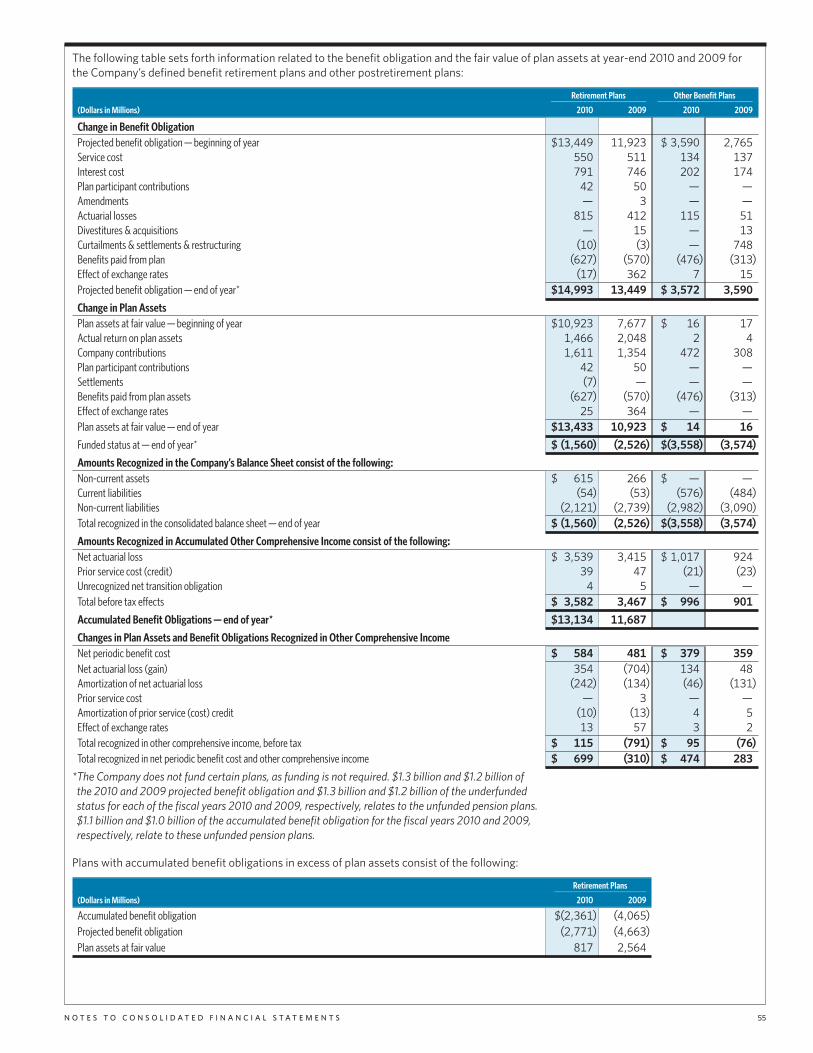
N O T E S T O C O N S O L I D A T E D F I N A N C I A L S T A T E M E N T S 55
The following table sets forth information related to the benefit obligation and the fair value of plan assets at year-end 2010 and 2009 forthe Company’s defined benefit retirement plans and other postretirement plans:
Retirement Plans Other Benefit Plans_______________________ _______________________(Dollars in Millions) 2010 2009 2010 2009
Change in Benefit ObligationProjected benefit obligation — beginning of year $13,449 11,923 $ 3,590 2,765Service cost 550 511 134 137Interest cost 791 746 202 174Plan participant contributions 42 50 — —Amendments — 3 — —Actuarial losses 815 412 115 51Divestitures & acquisitions — 15 — 13Curtailments & settlements & restructuring (10) (3) — 748Benefits paid from plan (627) (570) (476) (313)Effect of exchange rates (17) 362 7 15
Projected benefit obligation — end of year* $14,993 13,449 $ 3,572 3,590
Change in Plan AssetsPlan assets at fair value — beginning of year $10,923 7,677 $ 16 17Actual return on plan assets 1,466 2,048 2 4Company contributions 1,611 1,354 472 308Plan participant contributions 42 50 — —Settlements (7) — — —Benefits paid from plan assets (627) (570) (476) (313)Effect of exchange rates 25 364 — —Plan assets at fair value — end of year $13,433 10,923 $ 14 16
Funded status at — end of year* $ (1,560) (2,526) $(3,558) (3,574)
Amounts Recognized in the Company’s Balance Sheet consist of the following:Non-current assets $ 615 266 $ — —Current liabilities (54) (53) (576) (484)Non-current liabilities (2,121) (2,739) (2,982) (3,090)
Total recognized in the consolidated balance sheet — end of year $ (1,560) (2,526) $(3,558) (3,574)
Amounts Recognized in Accumulated Other Comprehensive Income consist of the following:Net actuarial loss $ 3,539 3,415 $ 1,017 924Prior service cost (credit) 39 47 (21) (23)Unrecognized net transition obligation 4 5 — —Total before tax effects $ 3,582 3,467 $ 996 901
Accumulated Benefit Obligations — end of year* $13,134 11,687
Changes in Plan Assets and Benefit Obligations Recognized in Other Comprehensive IncomeNet periodic benefit cost $ 584 481 $ 379 359
Net actuarial loss (gain) 354 (704) 134 48Amortization of net actuarial loss (242) (134) (46) (131)Prior service cost — 3 — —Amortization of prior service (cost) credit (10) (13) 4 5Effect of exchange rates 13 57 3 2
Total recognized in other comprehensive income, before tax $ 115 (791) $ 95 (76)
Total recognized in net periodic benefit cost and other comprehensive income $ 699 (310) $ 474 283
*The Company does not fund certain plans, as funding is not required. $1.3 billion and $1.2 billion ofthe 2010 and 2009 projected benefit obligation and $1.3 billion and $1.2 billion of the underfundedstatus for each of the fiscal years 2010 and 2009, respectively, relates to the unfunded pension plans.$1.1 billion and $1.0 billion of the accumulated benefit obligation for the fiscal years 2010 and 2009,respectively, relate to these unfunded pension plans.
Plans with accumulated benefit obligations in excess of plan assets consist of the following:
Retirement Plans_______________________(Dollars in Millions) 2010 2009
Accumulated benefit obligation $(2,361) (4,065)
Projected benefit obligation (2,771) (4,663)
Plan assets at fair value 817 2,564
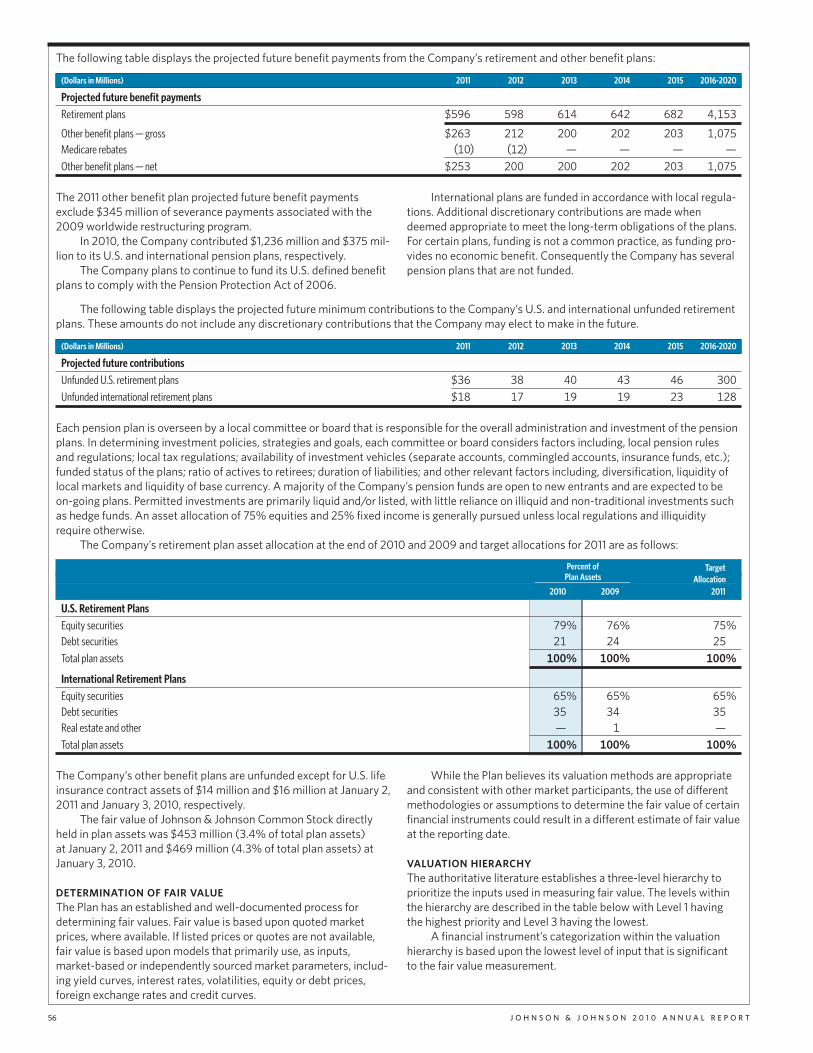
56 J O H N S O N & J O H N S O N 2 0 1 0 A N N U A L R E P O R T
The following table displays the projected future benefit payments from the Company’s retirement and other benefit plans:
(Dollars in Millions) 2011 2012 2013 2014 2015 2016-2020
Projected future benefit payments
Retirement plans $596 598 614 642 682 4,153
Other benefit plans — gross $263 212 200 202 203 1,075
Medicare rebates (10) (12) — — — —Other benefit plans — net $253 200 200 202 203 1,075
The 2011 other benefit plan projected future benefit paymentsexclude $345 million of severance payments associated with the2009 worldwide restructuring program.
In 2010, the Company contributed $1,236 million and $375 mil-lion to its U.S. and international pension plans, respectively.
The Company plans to continue to fund its U.S. defined benefitplans to comply with the Pension Protection Act of 2006.
International plans are funded in accordance with local regula-tions. Additional discretionary contributions are made whendeemed appropriate to meet the long-term obligations of the plans.For certain plans, funding is not a common practice, as funding pro-vides no economic benefit. Consequently the Company has severalpension plans that are not funded.
The following table displays the projected future minimum contributions to the Company’s U.S. and international unfunded retirementplans. These amounts do not include any discretionary contributions that the Company may elect to make in the future.
(Dollars in Millions) 2011 2012 2013 2014 2015 2016-2020
Projected future contributions
Unfunded U.S. retirement plans $36 38 40 43 46 300
Unfunded international retirement plans $18 17 19 19 23 128
Each pension plan is overseen by a local committee or board that is responsible for the overall administration and investment of the pensionplans. In determining investment policies, strategies and goals, each committee or board considers factors including, local pension rulesand regulations; local tax regulations; availability of investment vehicles (separate accounts, commingled accounts, insurance funds, etc.);funded status of the plans; ratio of actives to retirees; duration of liabilities; and other relevant factors including, diversification, liquidity oflocal markets and liquidity of base currency. A majority of the Company’s pension funds are open to new entrants and are expected to beon-going plans. Permitted investments are primarily liquid and/or listed, with little reliance on illiquid and non-traditional investments suchas hedge funds. An asset allocation of 75% equities and 25% fixed income is generally pursued unless local regulations and illiquidityrequire otherwise.
The Company’s retirement plan asset allocation at the end of 2010 and 2009 and target allocations for 2011 are as follows:
Percent of TargetPlan Assets Allocation_______________________
2010 2009 2011
U.S. Retirement Plans
Equity securities 79% 76% 75%
Debt securities 21 24 25
Total plan assets 100% 100% 100%
International Retirement Plans
Equity securities 65% 65% 65%
Debt securities 35 34 35
Real estate and other — 1 —Total plan assets 100% 100% 100%
The Company’s other benefit plans are unfunded except for U.S. lifeinsurance contract assets of $14 million and $16 million at January 2,2011 and January 3, 2010, respectively.
The fair value of Johnson & Johnson Common Stock directlyheld in plan assets was $453 million (3.4% of total plan assets)at January 2, 2011 and $469 million (4.3% of total plan assets) atJanuary 3, 2010.
DETERMINATION OF FAIR VALUEThe Plan has an established and well-documented process fordetermining fair values. Fair value is based upon quoted marketprices, where available. If listed prices or quotes are not available,fair value is based upon models that primarily use, as inputs,market-based or independently sourced market parameters, includ-ing yield curves, interest rates, volatilities, equity or debt prices,foreign exchange rates and credit curves.
While the Plan believes its valuation methods are appropriateand consistent with other market participants, the use of differentmethodologies or assumptions to determine the fair value of certainfinancial instruments could result in a different estimate of fair valueat the reporting date.
VALUATION HIERARCHYThe authoritative literature establishes a three-level hierarchy toprioritize the inputs used in measuring fair value. The levels withinthe hierarchy are described in the table below with Level 1 havingthe highest priority and Level 3 having the lowest.
A financial instrument’s categorization within the valuationhierarchy is based upon the lowest level of input that is significantto the fair value measurement.
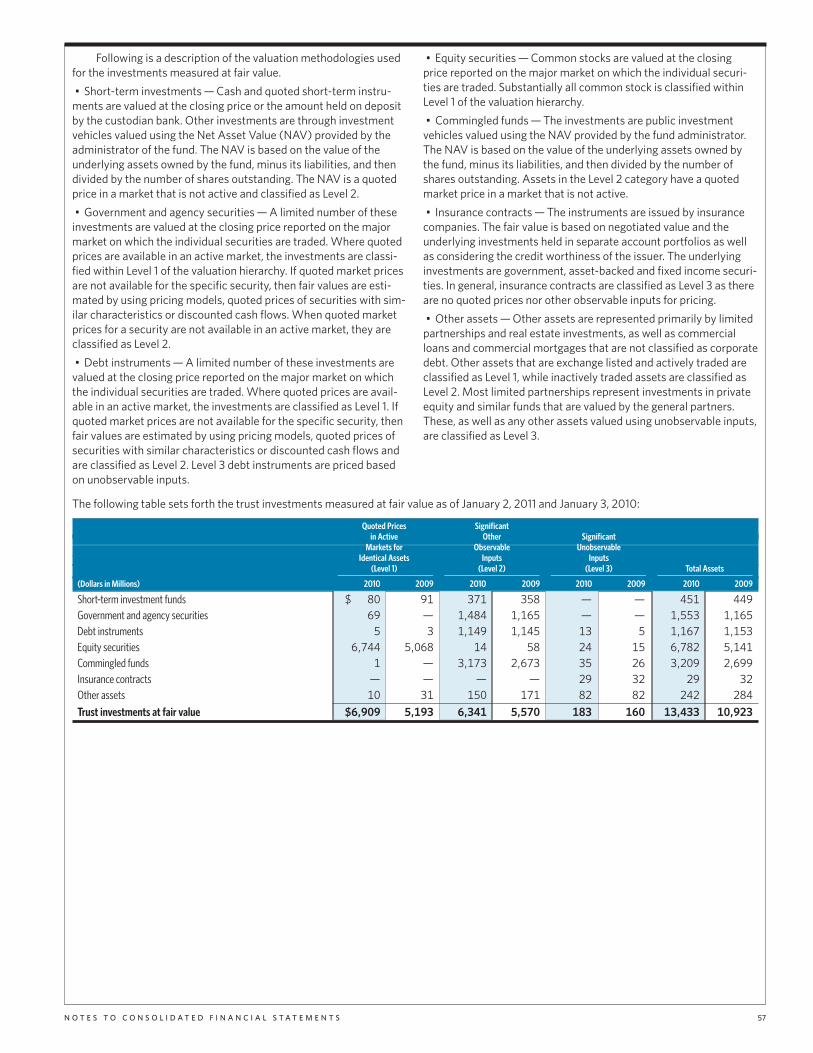
N O T E S T O C O N S O L I D A T E D F I N A N C I A L S T A T E M E N T S 57
Following is a description of the valuation methodologies usedfor the investments measured at fair value.
• Short-term investments — Cash and quoted short-term instru-ments are valued at the closing price or the amount held on depositby the custodian bank. Other investments are through investmentvehicles valued using the Net Asset Value (NAV) provided by theadministrator of the fund. The NAV is based on the value of theunderlying assets owned by the fund, minus its liabilities, and thendivided by the number of shares outstanding. The NAV is a quotedprice in a market that is not active and classified as Level 2.
• Government and agency securities — A limited number of theseinvestments are valued at the closing price reported on the majormarket on which the individual securities are traded. Where quotedprices are available in an active market, the investments are classi-fied within Level 1 of the valuation hierarchy. If quoted market pricesare not available for the specific security, then fair values are esti-mated by using pricing models, quoted prices of securities with sim-ilar characteristics or discounted cash flows. When quoted marketprices for a security are not available in an active market, they areclassified as Level 2.
• Debt instruments — A limited number of these investments arevalued at the closing price reported on the major market on whichthe individual securities are traded. Where quoted prices are avail-able in an active market, the investments are classified as Level 1. Ifquoted market prices are not available for the specific security, thenfair values are estimated by using pricing models, quoted prices ofsecurities with similar characteristics or discounted cash flows andare classified as Level 2. Level 3 debt instruments are priced basedon unobservable inputs.
• Equity securities — Common stocks are valued at the closingprice reported on the major market on which the individual securi-ties are traded. Substantially all common stock is classified withinLevel 1 of the valuation hierarchy.
• Commingled funds — The investments are public investmentvehicles valued using the NAV provided by the fund administrator.The NAV is based on the value of the underlying assets owned bythe fund, minus its liabilities, and then divided by the number ofshares outstanding. Assets in the Level 2 category have a quotedmarket price in a market that is not active.
• Insurance contracts — The instruments are issued by insurancecompanies. The fair value is based on negotiated value and theunderlying investments held in separate account portfolios as wellas considering the credit worthiness of the issuer. The underlyinginvestments are government, asset-backed and fixed income securi-ties. In general, insurance contracts are classified as Level 3 as thereare no quoted prices nor other observable inputs for pricing.
• Other assets — Other assets are represented primarily by limitedpartnerships and real estate investments, as well as commercialloans and commercial mortgages that are not classified as corporatedebt. Other assets that are exchange listed and actively traded areclassified as Level 1, while inactively traded assets are classified asLevel 2. Most limited partnerships represent investments in privateequity and similar funds that are valued by the general partners.These, as well as any other assets valued using unobservable inputs,are classified as Level 3.
The following table sets forth the trust investments measured at fair value as of January 2, 2011 and January 3, 2010:
Quoted Prices Significantin Active Other Significant
Markets for Observable UnobservableIdentical Assets Inputs Inputs
(Level 1) (Level 2) (Level 3) Total Assets_______________________ _______________________ _______________________ _______________________(Dollars in Millions) 2010 2009 2010 2009 2010 2009 2010 2009
Short-term investment funds $ 80 91 371 358 — — 451 449
Government and agency securities 69 — 1,484 1,165 — — 1,553 1,165
Debt instruments 5 3 1,149 1,145 13 5 1,167 1,153
Equity securities 6,744 5,068 14 58 24 15 6,782 5,141
Commingled funds 1 — 3,173 2,673 35 26 3,209 2,699
Insurance contracts — — — — 29 32 29 32
Other assets 10 31 150 171 82 82 242 284
Trust investments at fair value $6,909 5,193 6,341 5,570 183 160 13,433 10,923
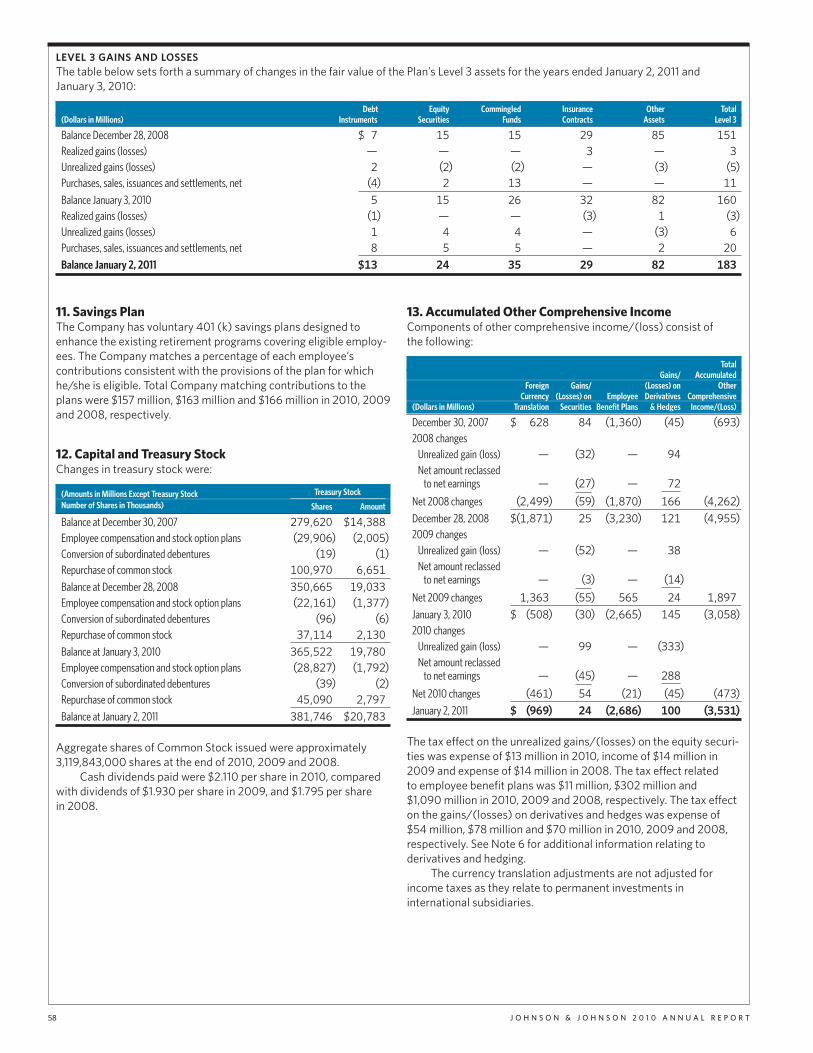
58 J O H N S O N & J O H N S O N 2 0 1 0 A N N U A L R E P O R T
LEVEL 3 GAINS AND LOSSESThe table below sets forth a summary of changes in the fair value of the Plan’s Level 3 assets for the years ended January 2, 2011 andJanuary 3, 2010:
Debt Equity Commingled Insurance Other Total(Dollars in Millions) Instruments Securities Funds Contracts Assets Level 3
Balance December 28, 2008 $ 7 15 15 29 85 151
Realized gains (losses) — — — 3 — 3
Unrealized gains (losses) 2 (2) (2) — (3) (5)
Purchases, sales, issuances and settlements, net (4) 2 13 — — 11
Balance January 3, 2010 5 15 26 32 82 160
Realized gains (losses) (1) — — (3) 1 (3)
Unrealized gains (losses) 1 4 4 — (3) 6
Purchases, sales, issuances and settlements, net 8 5 5 — 2 20
Balance January 2, 2011 $13 24 35 29 82 183
11. Savings PlanThe Company has voluntary 401 (k) savings plans designed toenhance the existing retirement programs covering eligible employ-ees. The Company matches a percentage of each employee’scontributions consistent with the provisions of the plan for whichhe/she is eligible. Total Company matching contributions to theplans were $157 million, $163 million and $166 million in 2010, 2009and 2008, respectively.
12. Capital and Treasury StockChanges in treasury stock were:
(Amounts in Millions Except Treasury Stock Treasury Stock_______________________Number of Shares in Thousands) Shares Amount
Balance at December 30, 2007 279,620 $14,388
Employee compensation and stock option plans (29,906) (2,005)
Conversion of subordinated debentures (19) (1)
Repurchase of common stock 100,970 6,651
Balance at December 28, 2008 350,665 19,033
Employee compensation and stock option plans (22,161) (1,377)
Conversion of subordinated debentures (96) (6)
Repurchase of common stock 37,114 2,130
Balance at January 3, 2010 365,522 19,780
Employee compensation and stock option plans (28,827) (1,792)
Conversion of subordinated debentures (39) (2)
Repurchase of common stock 45,090 2,797
Balance at January 2, 2011 381,746 $20,783
Aggregate shares of Common Stock issued were approximately3,119,843,000 shares at the end of 2010, 2009 and 2008.
Cash dividends paid were $2.110 per share in 2010, comparedwith dividends of $1.930 per share in 2009, and $1.795 per sharein 2008.
13. Accumulated Other Comprehensive IncomeComponents of other comprehensive income/(loss) consist ofthe following:
TotalGains/ Accumulated
Foreign Gains/ (Losses) on OtherCurrency (Losses) on Employee Derivatives Comprehensive
(Dollars in Millions) Translation Securities Benefit Plans & Hedges Income/(Loss)
December 30, 2007 $ 628 84 (1,360) (45) (693)
2008 changesUnrealized gain (loss) — (32) — 94
Net amount reclassedto net earnings — (27) — 72
Net 2008 changes (2,499) (59) (1,870) 166 (4,262)
December 28, 2008 $(1,871) 25 (3,230) 121 (4,955)
2009 changesUnrealized gain (loss) — (52) — 38
Net amount reclassedto net earnings — (3) — (14)
Net 2009 changes 1,363 (55) 565 24 1,897
January 3, 2010 $ (508) (30) (2,665) 145 (3,058)
2010 changesUnrealized gain (loss) — 99 — (333)
Net amount reclassedto net earnings — (45) — 288
Net 2010 changes (461) 54 (21) (45) (473)
January 2, 2011 $ (969) 24 (2,686) 100 (3,531)
The tax effect on the unrealized gains/(losses) on the equity securi-ties was expense of $13 million in 2010, income of $14 million in2009 and expense of $14 million in 2008. The tax effect relatedto employee benefit plans was $11 million, $302 million and$1,090 million in 2010, 2009 and 2008, respectively. The tax effecton the gains/(losses) on derivatives and hedges was expense of$54 million, $78 million and $70 million in 2010, 2009 and 2008,respectively. See Note 6 for additional information relating toderivatives and hedging.
The currency translation adjustments are not adjusted forincome taxes as they relate to permanent investments ininternational subsidiaries.
N O T E S T O C O N S O L I D A T E D F I N A N C I A L S T A T E M E N T S 59
14. International Currency TranslationFor translation of its subsidiaries operating in non-U.S. Dollar cur-rencies, the Company has determined that the local currencies ofits international subsidiaries are the functional currencies exceptthose in highly inflationary economies, which are defined as thosewhich have had compound cumulative rates of inflation of 100%or more during the past three years, or where a substantial portionof its cash flows are not in the local currency.
In consolidating international subsidiaries, balance sheet cur-rency effects are recorded as a component of accumulated othercomprehensive income. This equity account includes the resultsof translating all balance sheet assets and liabilities at currentexchange rates, except for those located in highly inflationaryeconomies. The translation of balance sheet accounts for highlyinflationary economies are reflected in the operating results.
An analysis of the changes during 2010, 2009 and 2008 forforeign currency translation adjustments is included in Note 13.
Net currency transaction gains and losses included in other(income) expense were losses of $130 million, $210 million and$31 million in 2010, 2009 and 2008, respectively.
15. Earnings Per ShareThe following is a reconciliation of basic net earnings per share todiluted net earnings per share for the fiscal years ended January 2,2011, January 3, 2010 and December 28, 2008:
(In Millions Except Per Share Data) 2010 2009 2008
Basic net earnings per share $ 4.85 4.45 4.62
Average sharesoutstanding — basic 2,751.4 2,759.5 2,802.5
Potential shares exercisableunder stock option plans 156.1 118.0 179.0
Less: shares repurchasedunder treasury stock method (122.3) (92.0) (149.6)
Convertible debt shares 3.6 3.6 3.7
Adjusted average sharesoutstanding — diluted 2,788.8 2,789.1 2,835.6
Diluted net earnings per share $ 4.78 4.40 4.57
The diluted net earnings per share calculation includes the dilutiveeffect of convertible debt that is offset by the related reductionin interest expense of $4 million after-tax for years 2010, 2009and 2008.
Diluted net earnings per share excludes 66 million, 121 millionand 59 million shares underlying stock options for 2010, 2009 and2008, respectively, as the exercise price of these options wasgreater than their average market value, which would result in ananti-dilutive effect on diluted earnings per share.
16. Rental Expense and Lease CommitmentsRentals of space, vehicles, manufacturing equipment and office anddata processing equipment under operating leases were approxi-mately $299 million, $322 million and $309 million in 2010, 2009and 2008, respectively.
The approximate minimum rental payments required underoperating leases that have initial or remaining non-cancelable leaseterms in excess of one year at January 2, 2011 are:
(Dollars in Millions) After2011 2012 2013 2014 2015 2015 Total
$182 159 130 106 89 74 740
Commitments under capital leases are not significant.
17. Common Stock, Stock Option Plans and StockCompensation AgreementsAt January 2, 2011, the Company had 7 stock-based compensationplans. The shares outstanding are for contracts under the Company’s2000 Stock Option Plan, the 2005 Long-Term Incentive Plan, the1997 Non-Employee Director’s Plan and the ALZA Corporation,Inverness Medical Technology, Inc., and Scios Inc. Stock OptionPlans. During 2010, no options or restricted shares were grantedunder any of these plans except under the 2005 Long-TermIncentive Plan.
The compensation cost that has been charged against incomefor these plans was $614 million, $628 million and $627 million for2010, 2009 and 2008, respectively. The total income tax benefitrecognized in the income statement for share-based compensationcosts was $205 million, $210 million and $210 million for 2010,2009 and 2008, respectively. The total unrecognized compensationcost was $613 million as of January 2, 2011, $612 million as ofJanuary 3, 2010 and $632 million as of December 28, 2008.The weighted average period for this cost to be recognized was1.05 years, 1.16 years and 1.06 years for 2010, 2009, and 2008,respectively. Share-based compensation costs capitalized as partof inventory were insignificant in all periods.
STOCK OPTIONSStock options expire 10 years from the date of grant and vestover service periods that range from six months to four years.All options are granted at the average of the high and low prices ofthe Company’s Common Stock on the New York Stock Exchangeon the date of grant. Under the 2005 Long-Term Incentive Plan, theCompany may issue up to 260 million shares of common stock.Shares available for future grants under the 2005 Long-TermIncentive Plan were 121.3 million at the end of 2010.
The Company settles employee stock option exercises withtreasury shares. Treasury shares are replenished throughout theyear for the number of shares used to settle employee stockoption exercises.
The fair value of each option award was estimated on the dateof grant using the Black-Scholes option valuation model that usesthe assumptions noted in the following table. Expected volatilityrepresents a blended rate of 4-year daily historical average volatilityrate, and a 5-week average implied volatility rate based on at-the-money traded Johnson & Johnson options with a life of 2 years.Historical data is used to determine the expected life of the option.The risk-free rate was based on the U.S. Treasury yield curve ineffect at the time of grant.
The average fair value of options granted was $8.03, $8.35 and$7.66, in 2010, 2009, and 2008, respectively. The fair value wasestimated based on the weighted average assumptions of:
2010 2009 2008
Risk-free rate 2.78% 2.71% 2.97%
Expected volatility 17.4% 19.5% 15.0%
Expected life 6.0 yrs 6.0 yrs 6.0 yrsDividend yield 3.30% 3.30% 2.90%

60 J O H N S O N & J O H N S O N 2 0 1 0 A N N U A L R E P O R T
A summary of option activity under the Plan as of January 2, 2011,January 3, 2010 and December 28, 2008 and changes during theyears ending on those dates is presented below: Aggregate
Weighted AggregateOutstanding Average Intrinsic Value
(Shares in Thousands) Shares Exercise Price (Dollars in Millions)
Shares at December 30, 2007 228,629 $56.83 $2,411
Options granted 22,428 61.80
Options exercised (30,033) 50.27
Options canceled/forfeited (5,525) 61.90
Shares at December 28, 2008 215,499 58.14 $ 597
Options granted 21,576 58.32
Options exercised (18,225) 50.97
Options canceled/forfeited (6,131) 61.85
Shares at January 3, 2010 212,719 58.66 $1,310
Options granted 13,996 62.62
Options exercised (25,020) 51.84
Options canceled/forfeited (8,005) 62.36
Shares at January 2, 2011 193,690 $59.68 $ 648
The total intrinsic value of options exercised was $278 million,$184 million and $506 million in 2010, 2009 and 2008, respectively.
The following table summarizes stock options outstanding andexercisable at January 2, 2011:
(Shares in Thousands) Outstanding Exercisable_______________________________________________________ __________________Average Average
Exercise Average Exercise ExercisePrice Range Options Life(1) Price Options Price
$25.00-$40.08 50 0.9 $29.53 50 $29.53
$41.26-$49.86 532 0.5 47.43 532 47.43
$50.52-$52.80 20,155 2.1 52.20 20,115 52.20
$53.00-$53.93 24,114 3.0 53.93 24,114 53.93
$54.04-$57.30 24,332 1.1 57.28 24,332 57.28
$57.44-$58.34 39,343 6.5 58.33 20,175 58.33
$58.42-$65.10 33,020 7.8 62.11 1,147 61.21
$65.62-$68.37 52,144 4.8 65.97 50,810 65.98
193,690 4.7 $59.68 141,275 $59.25
(1) Average contractual life remaining in years.
Stock options exercisable at January 3, 2010 and December 28,2008 were 148,349 at an average price of $57.26 and an averagelife of 5.0 years and 144,962 at an average price of $56.25 and anaverage life of 5.3 years, respectively.
RESTRICTED SHARE UNITSThe Company grants restricted share units with a vesting period ofthree years. The Company settles employee stock issuances withtreasury shares. Treasury shares are replenished throughout theyear for the number of shares used for employee stock issuances.
A summary of share activity under the Plan as of January 2, 2011:
Outstanding(Shares in Thousands) Shares
Shares at December 30, 2007 13,661
Granted 10,105
Issued (40)
Canceled/forfeited (1,468)
Shares at December 28, 2008 22,258
Granted 11,172
Issued (5,714)
Canceled/forfeited (1,392)
Shares at January 3, 2010 26,324
Granted 12,003
Issued (6,297)
Canceled/forfeited (2,296)
Shares at January 2, 2011 29,734
The average fair value of the restricted share units granted was$56.69, $52.79 and $56.70 in 2010, 2009 and 2008, respectively,using the fair market value at the date of grant. The fair value ofrestricted share units was discounted for dividends, which are notpaid on the restricted share units during the vesting period.The fair value of restricted share units settled was $375.0 million,$308.4 million and $2.5 million in 2010, 2009 and 2008,respectively.
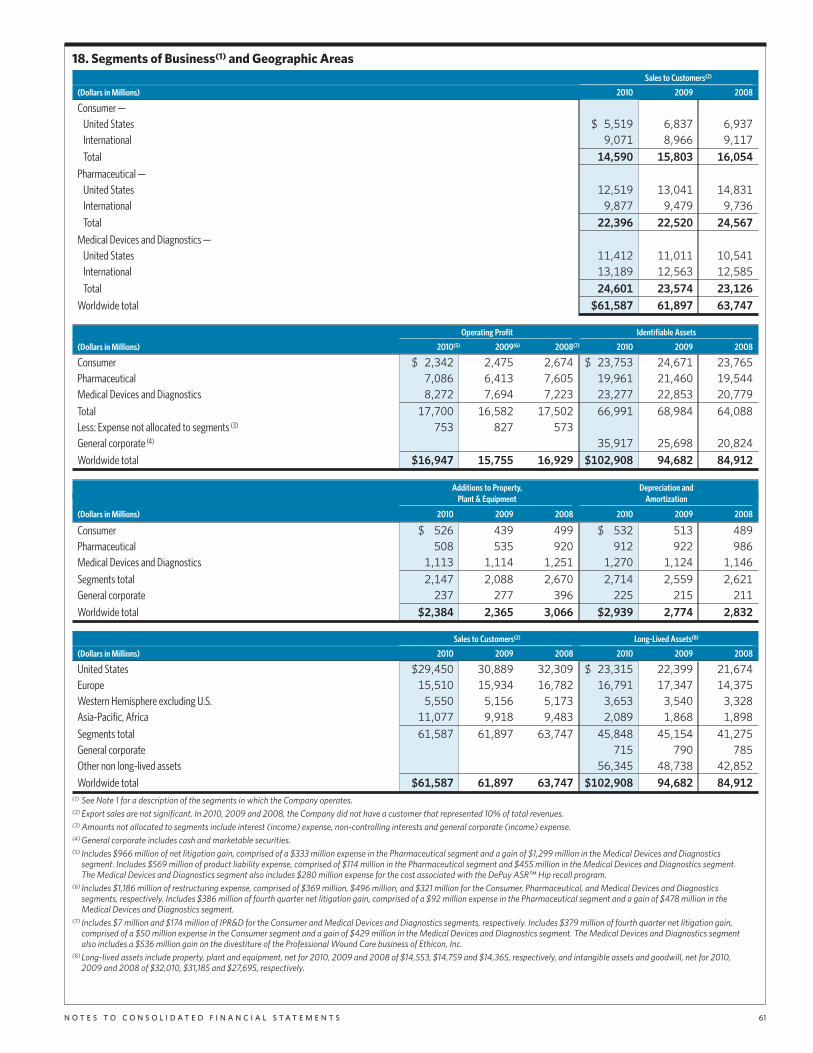
N O T E S T O C O N S O L I D A T E D F I N A N C I A L S T A T E M E N T S 61
18. Segments of Business(1) and Geographic AreasSales to Customers(2)__________________________________________
(Dollars in Millions) 2010 2009 2008
Consumer —United States $ 5,519 6,837 6,937
International 9,071 8,966 9,117
Total 14,590 15,803 16,054
Pharmaceutical —United States 12,519 13,041 14,831
International 9,877 9,479 9,736
Total 22,396 22,520 24,567
Medical Devices and Diagnostics —United States 11,412 11,011 10,541
International 13,189 12,563 12,585
Total 24,601 23,574 23,126
Worldwide total $61,587 61,897 63,747
Operating Profit Identifiable Assets__________________________________________ __________________________________________(Dollars in Millions) 2010(5) 2009(6) 2008(7) 2010 2009 2008
Consumer $ 2,342 2,475 2,674 $ 23,753 24,671 23,765
Pharmaceutical 7,086 6,413 7,605 19,961 21,460 19,544
Medical Devices and Diagnostics 8,272 7,694 7,223 23,277 22,853 20,779
Total 17,700 16,582 17,502 66,991 68,984 64,088
Less: Expense not allocated to segments (3) 753 827 573
General corporate (4) 35,917 25,698 20,824
Worldwide total $16,947 15,755 16,929 $102,908 94,682 84,912
Additions to Property, Depreciation andPlant & Equipment Amortization__________________________________________ __________________________________________
(Dollars in Millions) 2010 2009 2008 2010 2009 2008
Consumer $ 526 439 499 $ 532 513 489
Pharmaceutical 508 535 920 912 922 986
Medical Devices and Diagnostics 1,113 1,114 1,251 1,270 1,124 1,146
Segments total 2,147 2,088 2,670 2,714 2,559 2,621
General corporate 237 277 396 225 215 211
Worldwide total $2,384 2,365 3,066 $2,939 2,774 2,832
Sales to Customers(2) Long-Lived Assets(8)__________________________________________ __________________________________________(Dollars in Millions) 2010 2009 2008 2010 2009 2008
United States $29,450 30,889 32,309 $ 23,315 22,399 21,674
Europe 15,510 15,934 16,782 16,791 17,347 14,375
Western Hemisphere excluding U.S. 5,550 5,156 5,173 3,653 3,540 3,328
Asia-Pacific, Africa 11,077 9,918 9,483 2,089 1,868 1,898
Segments total 61,587 61,897 63,747 45,848 45,154 41,275
General corporate 715 790 785
Other non long-lived assets 56,345 48,738 42,852
Worldwide total $61,587 61,897 63,747 $102,908 94,682 84,912(1) See Note 1 for a description of the segments in which the Company operates.(2) Export sales are not significant. In 2010, 2009 and 2008, the Company did not have a customer that represented 10% of total revenues.(3) Amounts not allocated to segments include interest (income) expense, non-controlling interests and general corporate (income) expense.(4) General corporate includes cash and marketable securities.(5) Includes $966 million of net litigation gain, comprised of a $333 million expense in the Pharmaceutical segment and a gain of $1,299 million in the Medical Devices and Diagnostics
segment. Includes $569 million of product liability expense, comprised of $114 million in the Pharmaceutical segment and $455 million in the Medical Devices and Diagnostics segment.The Medical Devices and Diagnostics segment also includes $280 million expense for the cost associated with the DePuy ASR™ Hip recall program.
(6) Includes $1,186 million of restructuring expense, comprised of $369 million, $496 million, and $321 million for the Consumer, Pharmaceutical, and Medical Devices and Diagnosticssegments, respectively. Includes $386 million of fourth quarter net litigation gain, comprised of a $92 million expense in the Pharmaceutical segment and a gain of $478 million in theMedical Devices and Diagnostics segment.
(7) Includes $7 million and $174 million of IPR&D for the Consumer and Medical Devices and Diagnostics segments, respectively. Includes $379 million of fourth quarter net litigation gain,comprised of a $50 million expense in the Consumer segment and a gain of $429 million in the Medical Devices and Diagnostics segment. The Medical Devices and Diagnostics segmentalso includes a $536 million gain on the divestiture of the Professional Wound Care business of Ethicon, Inc.
(8) Long-lived assets include property, plant and equipment, net for 2010, 2009 and 2008 of $14,553, $14,759 and $14,365, respectively, and intangible assets and goodwill, net for 2010,2009 and 2008 of $32,010, $31,185 and $27,695, respectively.
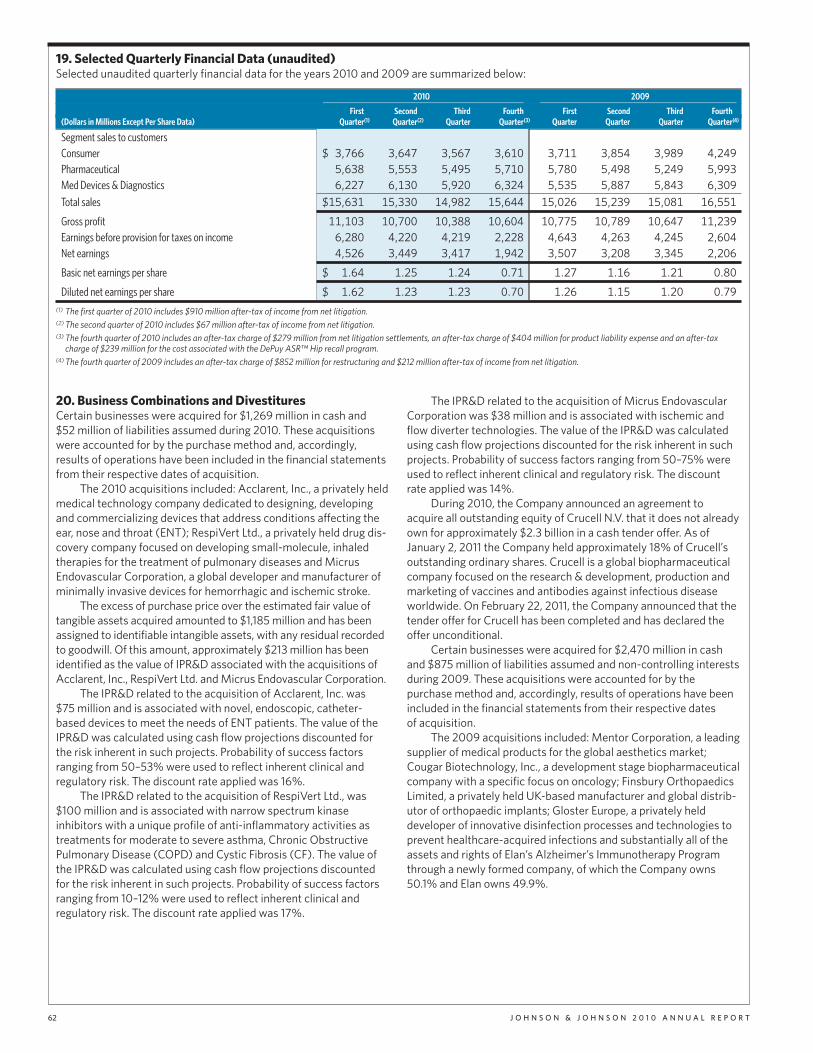
62 J O H N S O N & J O H N S O N 2 0 1 0 A N N U A L R E P O R T
19. Selected Quarterly Financial Data (unaudited)Selected unaudited quarterly financial data for the years 2010 and 2009 are summarized below:
2010 2009_________________________________________________ ________________________________________________First Second Third Fourth First Second Third Fourth
(Dollars in Millions Except Per Share Data) Quarter(1) Quarter(2) Quarter Quarter(3) Quarter Quarter Quarter Quarter(4)
Segment sales to customersConsumer $ 3,766 3,647 3,567 3,610 3,711 3,854 3,989 4,249
Pharmaceutical 5,638 5,553 5,495 5,710 5,780 5,498 5,249 5,993
Med Devices & Diagnostics 6,227 6,130 5,920 6,324 5,535 5,887 5,843 6,309
Total sales $15,631 15,330 14,982 15,644 15,026 15,239 15,081 16,551
Gross profit 11,103 10,700 10,388 10,604 10,775 10,789 10,647 11,239
Earnings before provision for taxes on income 6,280 4,220 4,219 2,228 4,643 4,263 4,245 2,604
Net earnings 4,526 3,449 3,417 1,942 3,507 3,208 3,345 2,206
Basic net earnings per share $ 1.64 1.25 1.24 0.71 1.27 1.16 1.21 0.80
Diluted net earnings per share $ 1.62 1.23 1.23 0.70 1.26 1.15 1.20 0.79
(1) The first quarter of 2010 includes $910 million after-tax of income from net litigation.(2) The second quarter of 2010 includes $67 million after-tax of income from net litigation.(3) The fourth quarter of 2010 includes an after-tax charge of $279 million from net litigation settlements, an after-tax charge of $404 million for product liability expense and an after-tax
charge of $239 million for the cost associated with the DePuy ASR™ Hip recall program.(4) The fourth quarter of 2009 includes an after-tax charge of $852 million for restructuring and $212 million after-tax of income from net litigation.
20. Business Combinations and DivestituresCertain businesses were acquired for $1,269 million in cash and$52 million of liabilities assumed during 2010. These acquisitionswere accounted for by the purchase method and, accordingly,results of operations have been included in the financial statementsfrom their respective dates of acquisition.
The 2010 acquisitions included: Acclarent, Inc., a privately heldmedical technology company dedicated to designing, developingand commercializing devices that address conditions affecting theear, nose and throat (ENT); RespiVert Ltd., a privately held drug dis-covery company focused on developing small-molecule, inhaledtherapies for the treatment of pulmonary diseases and MicrusEndovascular Corporation, a global developer and manufacturer ofminimally invasive devices for hemorrhagic and ischemic stroke.
The excess of purchase price over the estimated fair value oftangible assets acquired amounted to $1,185 million and has beenassigned to identifiable intangible assets, with any residual recordedto goodwill. Of this amount, approximately $213 million has beenidentified as the value of IPR&D associated with the acquisitions ofAcclarent, Inc., RespiVert Ltd. and Micrus Endovascular Corporation.
The IPR&D related to the acquisition of Acclarent, Inc. was$75 million and is associated with novel, endoscopic, catheter-based devices to meet the needs of ENT patients. The value of theIPR&D was calculated using cash flow projections discounted forthe risk inherent in such projects. Probability of success factorsranging from 50–53% were used to reflect inherent clinical andregulatory risk. The discount rate applied was 16%.
The IPR&D related to the acquisition of RespiVert Ltd., was$100 million and is associated with narrow spectrum kinaseinhibitors with a unique profile of anti-inflammatory activities astreatments for moderate to severe asthma, Chronic ObstructivePulmonary Disease (COPD) and Cystic Fibrosis (CF). The value ofthe IPR&D was calculated using cash flow projections discountedfor the risk inherent in such projects. Probability of success factorsranging from 10–12% were used to reflect inherent clinical andregulatory risk. The discount rate applied was 17%.
The IPR&D related to the acquisition of Micrus EndovascularCorporation was $38 million and is associated with ischemic andflow diverter technologies. The value of the IPR&D was calculatedusing cash flow projections discounted for the risk inherent in suchprojects. Probability of success factors ranging from 50–75% wereused to reflect inherent clinical and regulatory risk. The discountrate applied was 14%.
During 2010, the Company announced an agreement toacquire all outstanding equity of Crucell N.V. that it does not alreadyown for approximately $2.3 billion in a cash tender offer. As ofJanuary 2, 2011 the Company held approximately 18% of Crucell’soutstanding ordinary shares. Crucell is a global biopharmaceuticalcompany focused on the research & development, production andmarketing of vaccines and antibodies against infectious diseaseworldwide. On February 22, 2011, the Company announced that thetender offer for Crucell has been completed and has declared theoffer unconditional.
Certain businesses were acquired for $2,470 million in cashand $875 million of liabilities assumed and non-controlling interestsduring 2009. These acquisitions were accounted for by thepurchase method and, accordingly, results of operations have beenincluded in the financial statements from their respective datesof acquisition.
The 2009 acquisitions included: Mentor Corporation, a leadingsupplier of medical products for the global aesthetics market;Cougar Biotechnology, Inc., a development stage biopharmaceuticalcompany with a specific focus on oncology; Finsbury OrthopaedicsLimited, a privately held UK-based manufacturer and global distrib-utor of orthopaedic implants; Gloster Europe, a privately helddeveloper of innovative disinfection processes and technologies toprevent healthcare-acquired infections and substantially all of theassets and rights of Elan’s Alzheimer’s Immunotherapy Programthrough a newly formed company, of which the Company owns50.1% and Elan owns 49.9%.
N O T E S T O C O N S O L I D A T E D F I N A N C I A L S T A T E M E N T S 63
The excess of purchase price over the estimated fair value oftangible assets acquired amounted to $2,940 million and has beenassigned to identifiable intangible assets, with any residual recordedto goodwill. Of this amount, approximately $1,737 million has beenidentified as the value of IPR&D primarily associated with theacquisitions of Cougar Biotechnology, Inc. and substantially all ofthe assets and rights of Elan’s Alzheimer’s Immunotherapy Program.Additionally, approximately $1,107 million has been identified as thevalue of other intangible assets, including patents & technology andcustomer relationships primarily associated with the acquisition ofMentor Corporation.
The IPR&D related to the acquisition of Cougar Biotechnology,Inc. was $971 million and is associated with abiraterone acetate, alate stage, first-in-class compound for the treatment of prostate can-cer. The value of the IPR&D was calculated using cash flow projec-tions discounted for the risk inherent in such projects. Probability ofsuccess factors ranging from 60–85% were used to reflect inherentclinical and regulatory risk. The discount rate applied was 23.5%.
During 2009, the Company acquired substantially all of theassets and rights of Elan’s Alzheimer’s Immunotherapy Programthrough a newly formed company, Janssen Alzheimer Immunother-apy (JAI), of which the Company owns 50.1% and Elan owns 49.9%.In addition, the Company purchased approximately 107 millionnewly issued American Depositary Receipts (ADRs) of Elan, repre-senting 18.4% of Elan’s outstanding ordinary shares. As part of thistransaction, the Company paid $885 million to Elan and committedto fund up to $250 million of Elan’s share of research and develop-ment spending by JAI. Of this total consideration of $1,135 million,$793 million represents the fair value of the 18.4% investment inElan based on Elan’s share price in an actively traded market as ofthe date of this transaction. The IPR&D related to this transactionwas $679 million and is associated with bapineuzumab, a potentialfirst-in-class treatment that is being evaluated for slowing the pro-gression of Alzheimer’s Disease. The value of the IPR&D was calcu-lated using cash flow projections discounted for the risk inherent insuch projects. Probability of success factors ranging from 40–50%were used to reflect inherent clinical and regulatory risk. The dis-count rate applied was 26%. The non-controlling interest related tothis transaction was $590 million, which the Company has recordedin other non-current liabilities.
Certain businesses were acquired for $1,214 million in cash and$114 million of liabilities assumed during 2008. These acquisitionswere accounted for by the purchase method and, accordingly,results of operations have been included in the financial statementsfrom their respective dates of acquisition.
The 2008 acquisitions included: Amic AB, a privately heldSwedish developer of in vitro diagnostic technologies for use inpoint-of-care and near-patient settings; Beijing Dabao CosmeticsCo., Ltd., a company that sells personal care brands in China;SurgRx, Inc., a privately held developer of the advanced bipolartissue sealing system used in the ENSEAL® family of devices;HealthMedia, Inc., a privately held company that creates web-basedbehavior change interventions; LGE Performance Systems, Inc., aprivately held company known as Human Performance Institute™,which develops science-based training programs to improveemployee engagement and productivity and Omrix Biopharmaceuti-cals, Inc., a fully integrated biopharmaceutical company that devel-ops and markets biosurgical and immunotherapy products.
The excess of purchase price over the estimated fair value oftangible assets acquired amounted to $891 million and has beenassigned to identifiable intangible assets, with any residual recordedto goodwill. Approximately $181 million has been identified as thevalue of IPR&D associated with the acquisitions of Omrix Biophar-maceuticals, Inc., Amic AB, SurgRx, Inc. and HealthMedia, Inc.
The IPR&D charge related to the acquisition of Omrix Biophar-maceuticals, Inc. was $127 million and is associated with stand-alone and combination biosurgical technologies used to achievehemostasis. The value of the IPR&D was calculated using cash flowprojections discounted for the risk inherent in such projects.Probability of success factors ranging from 60–90% were used toreflect inherent clinical and regulatory risk. The discount rateapplied was 14%.
The IPR&D charge related to the acquisition of Amic AB was$40 million and is associated with point-of-care device and 4CASTChip technologies. The value of the IPR&D was calculated usingcash flow projections discounted for the risk inherent in suchprojects. The discount rate applied was 20%.
The IPR&D charge related to the acquisition of SurgRx, Inc. was$7 million and is associated with vessel cutting and sealing surgicaldevices. The value of the IPR&D was calculated using cash flow pro-jections discounted for the risk inherent in such projects. Probabilityof success factors ranging from 90–95% were used to reflect inher-ent clinical and regulatory risk. The discount rate applied was 18%.
The IPR&D charge related to the acquisition of HealthMedia,Inc. was $7 million and is associated primarily with processenhancements to software technology. The value of the IPR&Dwas calculated using cash flow projections discounted for the riskinherent in such projects. A probability of success factor of 90%was used to reflect inherent risk. The discount rate applied was 14%.
Supplemental pro forma information for 2010, 2009 and 2008in accordance with U.S. GAAP standards related to business combi-nations, and goodwill and other intangible assets, is not provided,as the impact of the aforementioned acquisitions did not have amaterial effect on the Company’s results of operations, cash flowsor financial position.
With the exception of the divestiture of the Breast CareBusiness of Ethicon Endo-Surgery Inc., for which the gain is recordedin other (income) expense in 2010, and the divestiture of the Profes-sional Wound Care business of Ethicon, Inc., which resulted in again of $536 million before tax, and is recorded in other (income)expense, net, in 2008, divestitures in 2010, 2009 and 2008 did nothave a material effect on the Company’s results of operations, cashflows or financial position.
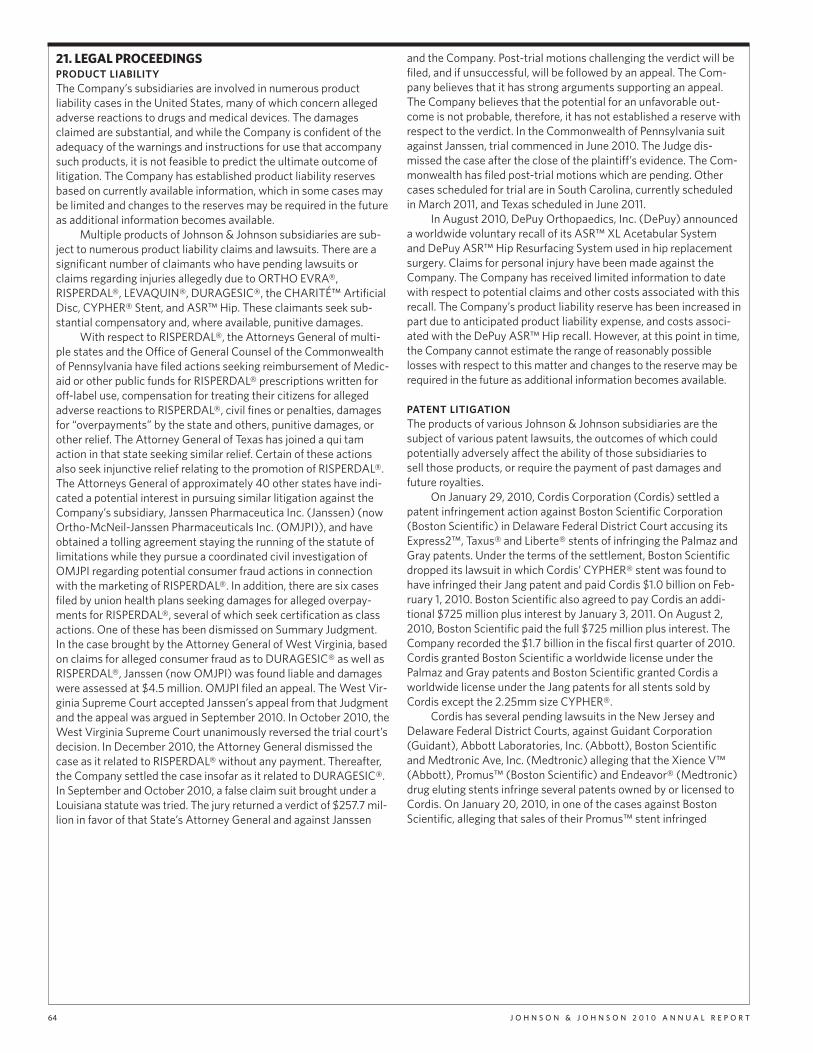
64 J O H N S O N & J O H N S O N 2 0 1 0 A N N U A L R E P O R T
21. LEGAL PROCEEDINGSPRODUCT LIABILITYThe Company’s subsidiaries are involved in numerous productliability cases in the United States, many of which concern allegedadverse reactions to drugs and medical devices. The damagesclaimed are substantial, and while the Company is confident of theadequacy of the warnings and instructions for use that accompanysuch products, it is not feasible to predict the ultimate outcome oflitigation. The Company has established product liability reservesbased on currently available information, which in some cases maybe limited and changes to the reserves may be required in the futureas additional information becomes available.
Multiple products of Johnson & Johnson subsidiaries are sub-ject to numerous product liability claims and lawsuits. There are asignificant number of claimants who have pending lawsuits orclaims regarding injuries allegedly due to ORTHO EVRA®,RISPERDAL®, LEVAQUIN®, DURAGESIC®, the CHARITÉ™ ArtificialDisc, CYPHER® Stent, and ASR™ Hip. These claimants seek sub-stantial compensatory and, where available, punitive damages.
With respect to RISPERDAL®, the Attorneys General of multi-ple states and the Office of General Counsel of the Commonwealthof Pennsylvania have filed actions seeking reimbursement of Medic-aid or other public funds for RISPERDAL® prescriptions written foroff-label use, compensation for treating their citizens for allegedadverse reactions to RISPERDAL®, civil fines or penalties, damagesfor “overpayments” by the state and others, punitive damages, orother relief. The Attorney General of Texas has joined a qui tamaction in that state seeking similar relief. Certain of these actionsalso seek injunctive relief relating to the promotion of RISPERDAL®.The Attorneys General of approximately 40 other states have indi-cated a potential interest in pursuing similar litigation against theCompany’s subsidiary, Janssen Pharmaceutica Inc. (Janssen) (nowOrtho-McNeil-Janssen Pharmaceuticals Inc. (OMJPI)), and haveobtained a tolling agreement staying the running of the statute oflimitations while they pursue a coordinated civil investigation ofOMJPI regarding potential consumer fraud actions in connectionwith the marketing of RISPERDAL®. In addition, there are six casesfiled by union health plans seeking damages for alleged overpay-ments for RISPERDAL®, several of which seek certification as classactions. One of these has been dismissed on Summary Judgment.In the case brought by the Attorney General of West Virginia, basedon claims for alleged consumer fraud as to DURAGESIC® as well asRISPERDAL®, Janssen (now OMJPI) was found liable and damageswere assessed at $4.5 million. OMJPI filed an appeal. The West Vir-ginia Supreme Court accepted Janssen’s appeal from that Judgmentand the appeal was argued in September 2010. In October 2010, theWest Virginia Supreme Court unanimously reversed the trial court’sdecision. In December 2010, the Attorney General dismissed thecase as it related to RISPERDAL® without any payment. Thereafter,the Company settled the case insofar as it related to DURAGESIC®.In September and October 2010, a false claim suit brought under aLouisiana statute was tried. The jury returned a verdict of $257.7 mil-lion in favor of that State’s Attorney General and against Janssen
and the Company. Post-trial motions challenging the verdict will befiled, and if unsuccessful, will be followed by an appeal. The Com-pany believes that it has strong arguments supporting an appeal.The Company believes that the potential for an unfavorable out-come is not probable, therefore, it has not established a reserve withrespect to the verdict. In the Commonwealth of Pennsylvania suitagainst Janssen, trial commenced in June 2010. The Judge dis-missed the case after the close of the plaintiff’s evidence. The Com-monwealth has filed post-trial motions which are pending. Othercases scheduled for trial are in South Carolina, currently scheduledin March 2011, and Texas scheduled in June 2011.
In August 2010, DePuy Orthopaedics, Inc. (DePuy) announceda worldwide voluntary recall of its ASR™ XL Acetabular Systemand DePuy ASR™ Hip Resurfacing System used in hip replacementsurgery. Claims for personal injury have been made against theCompany. The Company has received limited information to datewith respect to potential claims and other costs associated with thisrecall. The Company’s product liability reserve has been increased inpart due to anticipated product liability expense, and costs associ-ated with the DePuy ASR™ Hip recall. However, at this point in time,the Company cannot estimate the range of reasonably possiblelosses with respect to this matter and changes to the reserve may berequired in the future as additional information becomes available.
PATENT LITIGATIONThe products of various Johnson & Johnson subsidiaries are thesubject of various patent lawsuits, the outcomes of which couldpotentially adversely affect the ability of those subsidiaries tosell those products, or require the payment of past damages andfuture royalties.
On January 29, 2010, Cordis Corporation (Cordis) settled apatent infringement action against Boston Scientific Corporation(Boston Scientific) in Delaware Federal District Court accusing itsExpress2™, Taxus® and Liberte® stents of infringing the Palmaz andGray patents. Under the terms of the settlement, Boston Scientificdropped its lawsuit in which Cordis’ CYPHER® stent was found tohave infringed their Jang patent and paid Cordis $1.0 billion on Feb-ruary 1, 2010. Boston Scientific also agreed to pay Cordis an addi-tional $725 million plus interest by January 3, 2011. On August 2,2010, Boston Scientific paid the full $725 million plus interest. TheCompany recorded the $1.7 billion in the fiscal first quarter of 2010.Cordis granted Boston Scientific a worldwide license under thePalmaz and Gray patents and Boston Scientific granted Cordis aworldwide license under the Jang patents for all stents sold byCordis except the 2.25mm size CYPHER®.
Cordis has several pending lawsuits in the New Jersey andDelaware Federal District Courts, against Guidant Corporation(Guidant), Abbott Laboratories, Inc. (Abbott), Boston Scientificand Medtronic Ave, Inc. (Medtronic) alleging that the Xience V™(Abbott), Promus™ (Boston Scientific) and Endeavor® (Medtronic)drug eluting stents infringe several patents owned by or licensed toCordis. On January 20, 2010, in one of the cases against BostonScientific, alleging that sales of their Promus™ stent infringed
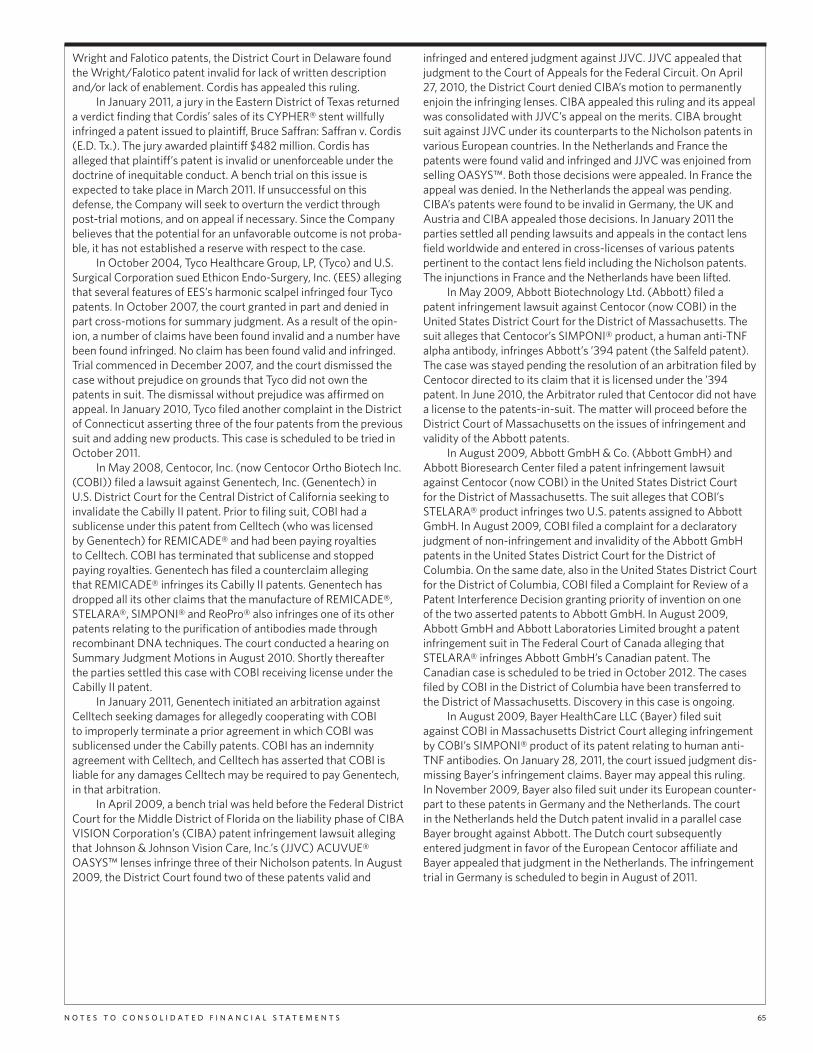
N O T E S T O C O N S O L I D A T E D F I N A N C I A L S T A T E M E N T S 65
Wright and Falotico patents, the District Court in Delaware foundthe Wright/Falotico patent invalid for lack of written descriptionand/or lack of enablement. Cordis has appealed this ruling.
In January 2011, a jury in the Eastern District of Texas returneda verdict finding that Cordis’ sales of its CYPHER® stent willfullyinfringed a patent issued to plaintiff, Bruce Saffran: Saffran v. Cordis(E.D. Tx.). The jury awarded plaintiff $482 million. Cordis hasalleged that plaintiff’s patent is invalid or unenforceable under thedoctrine of inequitable conduct. A bench trial on this issue isexpected to take place in March 2011. If unsuccessful on thisdefense, the Company will seek to overturn the verdict throughpost-trial motions, and on appeal if necessary. Since the Companybelieves that the potential for an unfavorable outcome is not proba-ble, it has not established a reserve with respect to the case.
In October 2004, Tyco Healthcare Group, LP, (Tyco) and U.S.Surgical Corporation sued Ethicon Endo-Surgery, Inc. (EES) allegingthat several features of EES’s harmonic scalpel infringed four Tycopatents. In October 2007, the court granted in part and denied inpart cross-motions for summary judgment. As a result of the opin-ion, a number of claims have been found invalid and a number havebeen found infringed. No claim has been found valid and infringed.Trial commenced in December 2007, and the court dismissed thecase without prejudice on grounds that Tyco did not own thepatents in suit. The dismissal without prejudice was affirmed onappeal. In January 2010, Tyco filed another complaint in the Districtof Connecticut asserting three of the four patents from the previoussuit and adding new products. This case is scheduled to be tried inOctober 2011.
In May 2008, Centocor, Inc. (now Centocor Ortho Biotech Inc.(COBI)) filed a lawsuit against Genentech, Inc. (Genentech) inU.S. District Court for the Central District of California seeking toinvalidate the Cabilly II patent. Prior to filing suit, COBI had asublicense under this patent from Celltech (who was licensedby Genentech) for REMICADE® and had been paying royaltiesto Celltech. COBI has terminated that sublicense and stoppedpaying royalties. Genentech has filed a counterclaim allegingthat REMICADE® infringes its Cabilly II patents. Genentech hasdropped all its other claims that the manufacture of REMICADE®,STELARA®, SIMPONI® and ReoPro® also infringes one of its otherpatents relating to the purification of antibodies made throughrecombinant DNA techniques. The court conducted a hearing onSummary Judgment Motions in August 2010. Shortly thereafterthe parties settled this case with COBI receiving license under theCabilly II patent.
In January 2011, Genentech initiated an arbitration againstCelltech seeking damages for allegedly cooperating with COBIto improperly terminate a prior agreement in which COBI wassublicensed under the Cabilly patents. COBI has an indemnityagreement with Celltech, and Celltech has asserted that COBI isliable for any damages Celltech may be required to pay Genentech,in that arbitration.
In April 2009, a bench trial was held before the Federal DistrictCourt for the Middle District of Florida on the liability phase of CIBAVISION Corporation’s (CIBA) patent infringement lawsuit allegingthat Johnson & Johnson Vision Care, Inc.’s (JJVC) ACUVUE®OASYS™ lenses infringe three of their Nicholson patents. In August2009, the District Court found two of these patents valid and
infringed and entered judgment against JJVC. JJVC appealed thatjudgment to the Court of Appeals for the Federal Circuit. On April27, 2010, the District Court denied CIBA’s motion to permanentlyenjoin the infringing lenses. CIBA appealed this ruling and its appealwas consolidated with JJVC’s appeal on the merits. CIBA broughtsuit against JJVC under its counterparts to the Nicholson patents invarious European countries. In the Netherlands and France thepatents were found valid and infringed and JJVC was enjoined fromselling OASYS™. Both those decisions were appealed. In France theappeal was denied. In the Netherlands the appeal was pending.CIBA’s patents were found to be invalid in Germany, the UK andAustria and CIBA appealed those decisions. In January 2011 theparties settled all pending lawsuits and appeals in the contact lensfield worldwide and entered in cross-licenses of various patentspertinent to the contact lens field including the Nicholson patents.The injunctions in France and the Netherlands have been lifted.
In May 2009, Abbott Biotechnology Ltd. (Abbott) filed apatent infringement lawsuit against Centocor (now COBI) in theUnited States District Court for the District of Massachusetts. Thesuit alleges that Centocor’s SIMPONI® product, a human anti-TNFalpha antibody, infringes Abbott’s ’394 patent (the Salfeld patent).The case was stayed pending the resolution of an arbitration filed byCentocor directed to its claim that it is licensed under the ’394patent. In June 2010, the Arbitrator ruled that Centocor did not havea license to the patents-in-suit. The matter will proceed before theDistrict Court of Massachusetts on the issues of infringement andvalidity of the Abbott patents.
In August 2009, Abbott GmbH & Co. (Abbott GmbH) andAbbott Bioresearch Center filed a patent infringement lawsuitagainst Centocor (now COBI) in the United States District Courtfor the District of Massachusetts. The suit alleges that COBI’sSTELARA® product infringes two U.S. patents assigned to AbbottGmbH. In August 2009, COBI filed a complaint for a declaratoryjudgment of non-infringement and invalidity of the Abbott GmbHpatents in the United States District Court for the District ofColumbia. On the same date, also in the United States District Courtfor the District of Columbia, COBI filed a Complaint for Review of aPatent Interference Decision granting priority of invention on oneof the two asserted patents to Abbott GmbH. In August 2009,Abbott GmbH and Abbott Laboratories Limited brought a patentinfringement suit in The Federal Court of Canada alleging thatSTELARA® infringes Abbott GmbH’s Canadian patent. TheCanadian case is scheduled to be tried in October 2012. The casesfiled by COBI in the District of Columbia have been transferred tothe District of Massachusetts. Discovery in this case is ongoing.
In August 2009, Bayer HealthCare LLC (Bayer) filed suitagainst COBI in Massachusetts District Court alleging infringementby COBI’s SIMPONI® product of its patent relating to human anti-TNF antibodies. On January 28, 2011, the court issued judgment dis-missing Bayer’s infringement claims. Bayer may appeal this ruling.In November 2009, Bayer also filed suit under its European counter-part to these patents in Germany and the Netherlands. The courtin the Netherlands held the Dutch patent invalid in a parallel caseBayer brought against Abbott. The Dutch court subsequentlyentered judgment in favor of the European Centocor affiliate andBayer appealed that judgment in the Netherlands. The infringementtrial in Germany is scheduled to begin in August of 2011.
66 J O H N S O N & J O H N S O N 2 0 1 0 A N N U A L R E P O R T
The following chart summarizes various patent lawsuits concerning products of the Company’s subsidiaries that have yet toproceed to trial:
J&J Plaintiff/Product Company Patents Patent Holder Court Trial Date** Date Filed
CYPHER® Stent Cordis Wall Wall E.D. TX Q2/11 11/07
CYPHER® Stent Cordis Saffran Saffran E.D. TX *Trial concluded 10/07
Blood Glucose Meters and Strips LifeScan Wilsey Roche Diagnostics D. DE * 11/07
SIMPONI® Centocor/COBI Salfeld Abbott Laboratories MA * 05/09
SIMPONI® Centocor/COBI Boyle Bayer Healthcare MA *** 08/09
STELARA® Centocor/COBI Salfeld Abbott GmbH MA * 08/09* Trial date to be scheduled.
** Q reflects the Company’s fiscal quarter.
*** Summary judgment granted.
As noted in the following chart, 30-month stays expired during 2009, 2010, and will expire in 2011, 2012 and 2013 with respect toANDA challenges regarding various products:
Brand Name Patent/NDA Generic Trial Date 30-MonthProduct Holder Challenger Court Date** Filed Stay Expiration
CONCERTA® Ortho-McNeil-Janssen Andrx D. DE Q4/07 09/05 None18, 27, 36 and 54 mg controlled ALZA KUDCO D. DE * 01/10 05/12release tablet Impax and Teva D. DE * 11/10 04/13
LEVAQUIN® 250, 500, 750 mg tablet Ortho-McNeil Lupin D. NJ * 10/06 03/09
ORTHO TRI-CYCLEN® LO Ortho-McNeil Watson D. NJ * 10/08 03/110.18 mg/0.025 mg, 0.215 mg/0.025 mg Sandoz D. NJ * 10/11and 0.25 mg/0.025 mg Lupin D. NJ * 01/10 06/12
Mylan D. NJ * 11/10 04/13
ULTRAM ER® 100, 200, 300 mg tablet Ortho-McNeil/Biovail Par D. DE Q2/09 05/07 09/0906/07 11/0910/07 03/10
ULTRAM ER® 100, 200, 300 mg tablet Ortho-McNeil/Biovail Impax D. DE 08/08 01/1111/08 03/11
ULTRAM ER® 100, 200, 300 mg tablet Ortho-McNeil/Biovail Paddock D. MN * 09/09 01/12
ULTRAM ER® 100, 200, 300 mg tablet Ortho-McNeil/Biovail Cipher D. DE * 10/09 03/12
ULTRAM ER® 100, 200, 300 mg tablet Ortho-McNeil/Biovail Lupin D. DE * 01/10 06/12
PREZISTA® Tibotec Mylan D. NJ * 11/10 12/13Tibotec Lupin D. NJ * 11/10 12/13
* Trial date to be scheduled.
** Q reflects the Company’s fiscal quarter.
LITIGATION AGAINST FILERS OF ABBREVIATED NEW DRUGAPPLICATIONS (ANDAs)The following chart indicates lawsuits pending against generic firmsthat filed Abbreviated New Drug Applications (ANDAs) seekingto market generic forms of products sold by various subsidiaries ofthe Company prior to expiration of the applicable patents coveringthose products. These ANDAs typically include allegations of
non-infringement, invalidity and unenforceability of these patents.In the event the subsidiary of the Company involved is not success-ful in these actions, or the statutory 30-month stay expires beforea ruling from the District Court is obtained, the firms involved willhave the ability, upon FDA approval, to introduce generic versionsof the product at issue resulting in very substantial market shareand revenue losses for the product of the Company’s subsidiary.
In June 2009, Centocor’s (now COBI) lawsuit alleging thatAbbott’s HUMIRA® anti-TNF alpha product infringes Centocor’s’775 patent went to trial in Federal District Court in the Eastern Dis-trict of Texas. On June 28, 2009 a jury returned a verdict finding thepatent valid and willfully infringed, and awarded Centocor damagesof approximately $1.7 billion. A bench trial on Abbott’s defenses,of inequitable conduct and prosecution laches, was held in August2009, and the District Court decided these issues in favor of Cento-cor. All of Abbott’s post trial motions have been denied except thatthe District Court granted Abbott’s motion to overturn the juryfinding of willfulness. Judgment in the amount of approximately
$1.9 billion, inclusive of interest was entered in favor of Centocor inDecember 2009, and Abbott filed an appeal to the Court of Appealsfor the Federal Circuit; therefore the Company has not reflected anyof the $1.9 billion in its consolidated financial statements. The oralargument on appeal was held on November 2, 2010. In December2009, Centocor also filed a new lawsuit in the Eastern District ofTexas seeking damages for infringement of the ’775 patent attribut-able to sales of HUMIRA® subsequent to the jury verdict in June2009. On February 23, 2011, the Court of Appeals reversed the June2009 decision and the $1.9 billion judgement of the District Court.

N O T E S T O C O N S O L I D A T E D F I N A N C I A L S T A T E M E N T S 67
In October 2008, the Company’s subsidiary Ortho-McNeil-Janssen Pharmaceuticals, Inc. (OMJPI) filed suit in Federal DistrictCourt in New Jersey against Watson Laboratories, Inc. (Watson) inresponse to Watson’s ANDA regarding ORTHO TRI-CYCLEN® LO.In June 2009, OMJPI filed suit in Federal District Court in NewJersey against Sandoz Laboratories, Inc. (Sandoz) in response toSandoz’s ANDA regarding ORTHO TRI-CYCLEN® LO. The Sandozand Watson cases have been consolidated. In September 2010,OMJPI entered into a settlement agreement with Sandoz.
In January 2010, the Company’s subsidiary OMJPI filed suit inFederal District Court in New Jersey against Lupin Ltd. and LupinPharmaceuticals, Inc. (collectively Lupin) in response to Lupin’sANDA regarding ORTHO TRI-CYCLEN® LO. The Lupin case has beenconsolidated with the Watson case (discussed above). In November2010, the Company’s subsidiary OMJPI filed suit in Federal DistrictCourt in New Jersey against Mylan Inc. and Mylan Pharmaceuticals,Inc. (collectively Mylan), and Famy Care, Ltd., in response to FamyCare’s ANDA regarding ORTHO TRI-CYCLEN® LO.
In the action by McNEIL-PPC, Inc. (McNeil-PPC) and ALZA Cor-poration (ALZA) against Andrx Corporation (Andrx) with respect toits ANDA challenge to the CONCERTA® patents, a five-day non-jurytrial was held in the Federal District Court in Delaware in December2007. In March 2009, the court ruled that one CONCERTA® patentwould not be infringed by Andrx’s proposed generic product and thatthe patent was invalid because it was not enabled. The court dis-missed without prejudice Andrx’s declaratory judgment suit on a sec-ond patent for lack of jurisdiction. McNeil-PPC and ALZA filed anappeal in May 2009. The appeals court heard argument on February3, 2010. On April 26, 2010, the court of appeals affirmed the judg-ment of the district court that the patent is invalid because it is notenabled. The court did not reach the issue of infringement.
In January 2010, ALZA and OMJPI filed suit in Federal DistrictCourt in Delaware against Kremers-Urban, LLC and KUDCO Ireland,Ltd. (KUDCO) in response to KUDCO’s ANDA challenge regardingCONCERTA® tablets. In its notice letter, KUDCO contends that twoALZA patents for CONCERTA® are invalid and not infringed by aKUDCO generic. One patent has since been dropped from the case.
In November 2010, ALZA and OMJPI filed suit in FederalDistrict Court in Delaware against Impax Laboratories, Inc., TevaPharmaceuticals USA, Inc. and Teva Pharmaceutical Industries, Ltd.in response to notice from Impax that it made a major amendmentto its ANDA with respect to its 56 mg dose generic version ofCONCERTA®. In its notice letter describing its major amendment,Impax contends that a CONCERTA® patent is invalid and notinfringed by its proposed generic version.
In the action against Lupin Pharmaceuticals, Inc. (Lupin)regarding its ANDA concerning LEVAQUIN®, Lupin contended thatthe U.S. Patent and Trademark Office improperly granted a patentterm extension to the patent that Ortho-McNeil, Inc. (now Ortho-McNeil-Janssen Pharmaceuticals, Inc. (OMJPI)) licenses fromDaiichi Pharmaceuticals, Inc. (Daiichi). Lupin alleged that the activeingredient in LEVAQUIN® was the subject of prior marketing, andtherefore was not eligible for the patent term extension. Lupin con-ceded validity and that its product would violate the patent if mar-keted prior to the expiration of the original patent term. Summaryjudgment against Lupin was granted in May 2009 and Lupinappealed. Oral argument was held in September 2009. In May2010, the Court of Appeals affirmed the judgment of the trial courtin favor of Ortho-McNeil (now OMJPI) and Daiichi that the patentterm extension covering LEVAQUIN® (levofloxacin) is valid.Thereafter, Lupin requested rehearing en banc, which was denied.
In the ULTRAM® ER actions, Ortho-McNeil, Inc. (now OMJPI),filed lawsuits (each for different dosages) in the U.S. District Courtof Delaware against Par Pharmaceuticals, Inc. and Par Pharmaceuti-cals Companies, Inc. (Par) in May, June and October 2007, on twoTramadol ER formulation patents owned by Purdue Pharma Prod-ucts L.P. (Purdue) and Napp Pharmaceutical Group Ltd. (Napp).OMJPI also filed lawsuits (each for different dosages) against ImpaxLaboratories, Inc. (Impax) on a Tramadol ER formulation patentowned by Purdue and Napp in August and November 2008. Purdue,Napp and Biovail Laboratories International SRL (Biovail) (the NDAholder) joined as co-plaintiffs in the lawsuits against Par and Impax,but Biovail and OMJPI were subsequently dismissed for lack ofstanding. The trial against Par took place in April 2009. In August2009, the Court issued a decision finding the patents-in-suit invalid.Purdue has appealed that decision. In November 2009, the caseagainst Impax was stayed with the consent of all parties. In Septem-ber and October 2009, respectively, Purdue filed suits againstPaddock Laboratories, Inc. (Paddock) and Cipher PharmaceuticalsInc. (Cipher) on its Tramadol ER formulation patents. In June 2010,the Federal Circuit Court affirmed the District Court’s decision in thePar case. The case against Cipher, Impax and Paddock were dis-missed based on the collateral estoppel effect of the Par decision.
In January 2010, Purdue filed a suit against Lupin Ltd. on itsTramadol ER formulation patents.
In November 2010, the Company’s subsidiary Tibotec, Inc.(Tibotec) filed suit in Federal District Court in New Jersey againstLupin, Ltd., Lupin Pharmaceuticals, Inc. (collectively Lupin), Mylan,Inc. and Mylan Pharmaceuticals, Inc. (collectively Mylan) in responseto Lupin’s and Mylan’s respective ANDA’s regarding PREZISTA®.
In January 2011, Tibotec, Inc. (Tibotec) received a Paragraph IVNotification from Teva Pharmaceuticals, Inc. advising that Teva hasfiled an ANDA seeking approval to market a generic PREZISTA®product before the expiration of certain patents owned or licensedby Tibotec. Tibotec is evaluating this Notification.
GENERAL LITIGATIONIn September 2004, plaintiffs in an employment discriminationlitigation initiated against the Company in 2001 in Federal DistrictCourt in New Jersey moved to certify a class of all African Americanand Hispanic salaried employees of the Company and its affiliates inthe U.S., who were employed at any time from November 1997 tothe present. Plaintiffs seek monetary damages for the period 1997through the present (including punitive damages) and equitablerelief. The Court denied plaintiffs’ class certification motion inDecember 2006 and their motion for reconsideration in April 2007.Plaintiffs sought to appeal these decisions and, in April 2008, theCourt of Appeals ruled that plaintiffs’ appeal of the denial of classcertification was untimely. In July 2009, plaintiffs filed a motion forcertification of a modified class, which the Company opposed. Thedistrict court denied plaintiffs’ motion in July 2010, and the Courtof Appeals denied plaintiffs’ request for leave to appeal the denialof certification of the modified class. The Company will continue todefend against the plaintiffs’ individual claims of discrimination.
In September 2009, Centocor Ortho Biotech Products, L.P.(COBLP) intervened in an inventorship dispute between KansasUniversity Center for Research (KUCR) involving certain U.S.Government-owned VELCADE® formulation patents. KUCR broughtthis action against the U.S. Government in the District of Kansas seek-ing to add two Kansas University scientists to the patents. The U.S.Government licensed the patents (and their foreign counterparts)to Millennium Pharmaceuticals, Inc. (MPI), who in turn sublicensed

68 J O H N S O N & J O H N S O N 2 0 1 0 A N N U A L R E P O R T
the patents (and their foreign counterparts) to COBI for commercialmarketing outside the U.S. If KUCR succeeds in its co-inventorshipclaim and establishes co-ownership in the U.S. VELCADE® formula-tion patents, there is a potential for the same issue to arise withrespect to the foreign counterparts of the patents. If KUCR is suc-cessful, this may adversely affect COBI’s license rights in those coun-tries. In May 2010, the parties reached an agreement to resolve thedisputes in this case and will submit the inventorship issue to arbitra-tion, and the case has been stayed pending the arbitration. If KUCRwins the arbitration, the parties will request that the Court issue anorder to correct inventorship on the relevant patents; if the U.S.Government, COBI, and MPI prevail, the case will be dismissedwith prejudice.
In February 2009, Basilea Pharmaceutica AG (Basilea) broughtan arbitration against Johnson & Johnson, Johnson & JohnsonPharmaceutical Research & Development, L.L.C. and Cilag GmbHInternational alleging that the Company breached the 2005 LicenseAgreement for Ceftobiprole by, among other things, failing to secureFDA approval of the cSSSI (skin) indication and allegedly failing toproperly develop the pneumonia indication. In November 2010, thearbitration panel issued its decision and the Company has satisfiedthe damages award.
In May 2009, COBI commenced an arbitration proceedingbefore the American Arbitration Association against Schering-PloughCorporation and its subsidiary Schering-Plough (Ireland) Company(collectively, Schering-Plough). COBI and Schering-Plough areparties to a series of agreements (Distribution Agreements) thatgrant Schering-Plough the exclusive right to distribute the drugsREMICADE® and SIMPONI® worldwide, except within the UnitedStates, Japan, Taiwan, Indonesia, and the People’s Republic ofChina (including Hong Kong) (the Territory). COBI distributesREMICADE® and SIMPONI®, the next generation treatment, withinthe United States. In the arbitration, COBI seeks a declaration thatthe agreement and merger between Merck & Co., Inc. (Merck) andSchering-Plough constitutes a change of control under the terms ofthe Distribution Agreements that permits COBI to terminate theAgreements. The termination of the Distribution Agreements wouldreturn to COBI the right to distribute REMICADE® and SIMPONI®within the Territory. Schering-Plough has filed a response to COBI’sarbitration demand that denies that it has undergone a change ofcontrol. The arbitrators were selected and the evidentiary portion ofthe hearing was concluded in October 2010. Oral argument washeld in late 2010. A decision is expected during the first half of 2011.
In December 2009, the State of Israel (Sheba Medical Center)filed suit in the District Court in Tel Aviv Jaffa against various Omrixaffiliates. In the lawsuit, the State claims that an employee of agovernment-owned hospital was the inventor on several patentsrelated to fibrin glue technology, that he developed while he was agovernment employee. The State claims that he had no right totransfer any intellectual property to Omrix because it belongs to theState. The State is seeking damages plus royalty on QUIXIL™ andEVICEL™ or, alternatively, transfer of the patents to the State.
AVERAGE WHOLESALE PRICE (AWP) LITIGATIONThe Company and several of its pharmaceutical subsidiaries, alongwith numerous other pharmaceutical companies, are defendants ina series of lawsuits in state and federal courts involving allegationsthat the pricing and marketing of certain pharmaceutical productsamounted to fraudulent and otherwise actionable conduct because,among other things, the companies allegedly reported an inflatedAverage Wholesale Price (AWP) for the drugs at issue. Many ofthese cases, both federal actions and state actions removed to
federal court, have been consolidated for pre-trial purposes in aMulti-District Litigation (MDL) in Federal District Court in Boston,Massachusetts. The plaintiffs in these cases include classes of pri-vate persons or entities that paid for any portion of the purchase ofthe drugs at issue based on AWP, and state government entities thatmade Medicaid payments for the drugs at issue based on AWP.
The MDL Court identified classes of Massachusetts-only pri-vate insurers providing “Medi-gap” insurance coverage and privatepayers for physician-administered drugs where payments werebased on AWP (Class 2 and Class 3), and a national class ofindividuals who made co-payments for physician-administereddrugs covered by Medicare (Class 1). A trial of the two Massachu-setts-only class actions concluded before the MDL Court in Decem-ber 2006. In June 2007, the MDL Court issued post-trial rulings,dismissing the Johnson & Johnson defendants from the case regard-ing all claims of Classes 2 and 3, and subsequently of Class 1 as well.Plaintiffs appealed the Class 1 judgment and, in September 2009,the Court of Appeals vacated the judgment and remanded forfurther proceedings in the District Court. The Johnson & Johnsondefendants then filed a motion for summary judgment with regardto Class 1, which the District Court granted in part and denied inpart. Subsequently, the Johnson & Johnson defendants filed amotion challenging the adequacy of Plaintiffs’ proposed classrepresentative, which is pending.
AWP cases brought by various Attorneys General have pro-ceeded to trial against other manufacturers. Three state casesagainst certain of the Company’s subsidiaries have been set fortrial: Idaho in October 2011, Kentucky in January 2012 andKansas in March 2013. Other state cases are likely to be set fortrial in the coming year. In addition, an AWP case against theJohnson & Johnson defendants brought by the state of Pennsylvaniawas tried in Commonwealth Court in October and November 2010.The Court found in the State’s favor with regard to certain of itsclaims under the Pennsylvania Unfair Trade Practices and ConsumerProtection Law, entered an injunction, and awarded $45 million inrestitution and $6.5 million in civil penalties. The Court found in theJohnson & Johnson defendants favor on the State’s claims of UnjustEnrichment, Misrepresentation/Fraud, Civil Conspiracy, and oncertain of the State’s claims under the Pennsylvania Unfair TradePractices and Consumer Protection Law. The parties are currentlyengaged in post trial briefing, which will be followed by an appealto the Pennsylvania Supreme Court if necessary. The Companybelieves that it has strong arguments supporting an appeal. TheCompany believes that the potential for an unfavorable outcomeis not probable, therefore, it has not established a reserve withrespect to the verdict.
In April 2010, a lawsuit was filed in the United States DistrictCourt for the Northern District of California against the Company,Omnicare, Inc., and other unidentified companies or individuals. TheCompany filed a motion to dismiss. Plaintiffs then filed an amendedcomplaint. The amended complaint asserts that defendantsengaged in an unlawful trying arrangement in violation of the Sher-man Act and the California Business and Professions Code. Theamended complaint also asserted claims of unjust enrichment andcivil conspiracy. The Company moved to dismiss the amended com-plaint. On January 13, 2011, the court granted the Company’s motionto dismiss as to all causes of action in the amended complaint, andgranted plaintiffs’ leave to file an amended complaint.
Johnson & Johnson has been named the nominal defendant insix shareholder derivative lawsuits in the U.S. District Court for theDistrict of New Jersey on behalf of Company shareholders againstcertain current and former directors and officers of the Company

N O T E S T O C O N S O L I D A T E D F I N A N C I A L S T A T E M E N T S 69
derivatively on behalf of the Company: Calamore v. Coleman et. al.,filed April 21, 2010; Carpenters Pension Fund of West Virginia v.Weldon, et. al., filed May 5, 2010; Feldman v. Coleman, et. al., filedMay 6, 2010; Hawaii Laborers Pension Fund v. Weldon, et. al., filedMay 14, 2010; Ryan v. Weldon, et. al., filed June 18, 2010; and Min-neapolis Firefighters’ Relief Association, NECA-IBEW Pension TrustFund, and NECA-IBEW Welfare Trust Fund v. Weldon, et. al., filedJune 24, 2010. These actions were consolidated on August 17, 2010into one lawsuit: In re Johnson & Johnson Shareholder DerivativeLitigation. An amended consolidated complaint was filed onDecember 17, 2010. An additional derivative suit was filed in the U.S.District Court for the District of New Jersey on December 1, 2010:Copeland v. Mulcahy, et al. That lawsuit has been consolidated intothe In re Johnson & Johnson Shareholder Derivative Litigation. Addi-tionally, Johnson & Johnson has been named the nominal defendantin a shareholder derivative lawsuit in New Jersey Superior Court onbehalf of Company shareholders against certain current and formerdirectors and officers of the Company derivatively on behalf of theCompany: Wolin v. Johnson & Johnson, filed September 23, 2010.The parties to the Wolin action have stipulated that the Wolinaction shall be stayed until the In re Johnson & Johnson ShareholderDerivative Litigation is completely resolved. Each of these share-holder derivative actions is similar in its claims and collectively theyassert a variety of alleged breaches of fiduciary duties, including,among other things, that the defendants allegedly engaged in,approved of, or failed to remedy or prevent defective medicaldevices, improper pharmaceutical rebates, improper off-label mar-keting of pharmaceutical and medical device products, violations ofcurrent good manufacturing practice regulations that resulted inproduct recalls, and failed to disclose the aforementioned allegedmisconduct in the Company’s filings under the Securities ExchangeAct of 1934. Each complaint seeks a variety of relief, includingmonetary damages and corporate governance reforms.
On July 27, 2010, a complaint was filed by a shareholder of theCompany in New Jersey Superior Court, Chancery Division, Middle-sex County (Lipschutz v. Johnson & Johnson) seeking to compelinspection of Company books and records with respect to certainproduct recalls and various manufacturing plants. This lawsuit wasdismissed on October 7, 2010.
OTHERIn July 2003, Centocor (now COBI) received a request that it volun-tarily provide documents and information to the criminal divisionof the U.S. Attorney’s Office, District of New Jersey, in connectionwith its investigation into various Centocor marketing practices.Subsequent requests for documents have been received from theU.S. Attorney’s Office. Both the Company and Centocor haveresponded to these requests for documents and information.
In December 2003, Ortho-McNeil Pharmaceutical, Inc. (nowOMJPI) received a subpoena from the U.S. Attorney’s Office inBoston, Massachusetts seeking documents relating to the market-ing, including alleged off-label marketing, of the drug TOPAMAX®(topiramate). In the fiscal second quarter of 2010, OMJPI enteredinto a settlement agreement resolving the federal government’sinvestigation. As one part of the settlement, Ortho-McNeil Pharma-ceutical, LLC, a subsidiary of OMJPI, has pled guilty to a single mis-demeanor violation of the Food, Drug and Cosmetic Act and paida criminal fine. OMJPI denies it engaged in any wrongful conduct,beyond acknowledging the limited conduct of Ortho-McNeilPharmaceutical, LLC, that is the basis of the misdemeanor plea.
In addition the settlement included a civil payment, part of whichwas paid to the federal government and part of which was paid orset aside for payment to states for their Medicaid programs.
In January 2004, Janssen Pharmaceutica Inc. (now OMJPI)received a subpoena from the Office of the Inspector General of theU.S. Office of Personnel Management seeking documents concerningsales and marketing of, any and all payments to physicians in connec-tion with sales and marketing of, and clinical trials for, RISPERDAL®(risperidone) from 1997 to 2002. Documents subsequent to 2002have also been requested. An additional subpoena seeking informa-tion about marketing of and adverse reactions to RISPERDAL® wasreceived from the U.S. Attorney’s Office for the Eastern District ofPennsylvania in November 2005. Subpoenas seeking testimony fromvarious witnesses before a grand jury have also been received.Janssen is cooperating in responding to ongoing requests for docu-ments and witnesses. The government is continuing to activelyinvestigate this matter. In February 2010, the government served CivilInvestigative Demands seeking additional information relating tosales and marketing of RISPERDAL® and sales and marketing ofINVEGA®. The focus of these matters is the alleged promotion ofRISPERDAL® and INVEGA® for off-label uses. The government hasnotified the Company that there are pending qui tam actions allegingoff-label promotion of RISPERDAL®. Discussions are ongoing in aneffort to resolve potential criminal and civil claims arising from thesematters. Whether a resolution can be reached and on what terms isuncertain. While a loss is probable with respect to this matter, theCompany is unable to estimate a potential loss at this time. The ulti-mate resolution of these matters is not expected to have a materialadverse effect on the Company’s financial position, although the res-olution in any reporting period could have a material impact on theCompany’s results of operations and cash flows for that period.
In September 2004, Ortho Biotech Inc. (now COBI) receiveda subpoena from the U.S. Office of Inspector General’s Denver,Colorado field office seeking documents directed to the sales andmarketing of PROCRIT® (Epoetin alfa) from 1997 to the present, aswell as to dealings with U.S. Oncology Inc., a healthcare servicesnetwork for oncologists. COBI has responded to the subpoena.
In November 2007, the Attorney General of the Common-wealth of Massachusetts issued a Civil Investigative Demand toDePuy Orthopaedics, Inc. (DePuy) seeking information regardingfinancial relationships between a number of Massachusetts-basedorthopedic surgeons and providers, and DePuy Orthopaedics, Inc.DePuy has responded to Massachusetts’ additional requests.
In July 2005, Scios Inc. (Scios) received a subpoena from theU.S. Attorney’s Office, District of Massachusetts, seeking documentsrelated to the sales and marketing of NATRECOR®. Scios respondedto the subpoena. In early August 2005, Scios was advised that theinvestigation would be handled by the U.S. Attorney’s Office for theNorthern District of California in San Francisco. Additional requestsfor documents have been received and responded to and former Sciosemployees have testified before a grand jury in San Francisco. Thequi tam complaints were unsealed on February 19, 2009. The U.S.government has intervened in one of the qui tam actions, and fileda complaint against Scios and the Company in June 2009. Scios andJohnson & Johnson filed a motion to dismiss the qui tam complaintfiled by the government, and that motion was denied. The criminalinvestigation is continuing and discussions are underway in an effortto settle this matter. Whether a settlement can be reached and onwhat terms is uncertain.
70 J O H N S O N & J O H N S O N 2 0 1 0 A N N U A L R E P O R T
In September 2005, the Company received a subpoena fromthe U.S. Attorney’s Office, District of Massachusetts, seeking docu-ments related to sales and marketing of eight drugs to Omnicare,Inc., (Omnicare) a manager of pharmaceutical benefits for long-term care facilities. The Company’s subsidiaries involved respondedto the subpoena. Several employees of the Company’s pharmaceuti-cal subsidiaries were subpoenaed to testify before a grand jury inconnection with this investigation. In April 2009, the Companywas served with the complaints in two civil qui tam cases related tomarketing of prescription drugs to Omnicare. On January 15, 2010,the government filed a complaint intervening in the cases. Thecomplaint asserts claims under the federal False Claims Act and arelated state law claim in connection with the marketing of severaldrugs to Omnicare. The complaints allege that Johnson & Johnsonprovided Omnicare with rebates and other alleged kickbacks, and inso doing, caused Omnicare to file false claims with Medicaid andother government programs. Subsequently, the Commonwealth ofMassachusetts, Virginia, and Kentucky, and the States of Californiaand Indiana intervened in the action. The Company’s motion to dis-miss the government’s and relators’ complaints, the government’sand relators’ oppositions, and the Company’s reply brief have beenfiled. A hearing on the Company’s motion to dismiss was held onOctober 7, 2010. The court has not ruled on the motion.
In November 2005, a lawsuit was filed under seal against theCompany, along with codefendants McKesson Corporation andOmnicare, Inc., by a former employee in the United States DistrictCourt for the Eastern District of Pennsylvania, United States ex rel.Scott Bartz v. Ortho McNeil Pharmaceutical, Inc., et al. After investi-gation, the United States declined to intervene. The case was subse-quently unsealed, and the Company was served with the operativecomplaint on January 3, 2011. The complaint alleges that Defen-dants engaged in various improper transactions that were allegedlydesigned to report false prescription drug prices to the federal gov-ernment in order to reduce the Company’s Medicaid rebate obliga-tions. The complaint further alleges that the Company improperlyretaliated against the Plaintiff for having raised these allegationsinternally. The complaint alleges a variety of causes of action underthe federal False Claims Act and corresponding state and localstatutes. The Company has not yet responded to the complaint, butanticipates filing a motion to dismiss.
In February 2006, the Company received a subpoena from theU.S. Securities & Exchange Commission (SEC) requesting docu-ments relating to the participation by several Johnson & Johnsonsubsidiaries in the United Nations Iraq Oil for Food Program. Thesubsidiaries are cooperating with the SEC and U.S. Department ofJustice (DOJ).
In February 2007, the Company voluntarily disclosed to the DOJand the SEC that subsidiaries outside the United States are believed tohave made improper payments in connection with the sale of medicaldevices in two small-market countries, which payments may fallwithin the jurisdiction of the Foreign Corrupt Practices Act (FCPA). Inthe course of continuing dialogues with the agencies, other issuespotentially rising to the level of FCPA violations in additional marketshave been brought to the attention of the agencies by the Company.The Company has provided and will continue to provide additionalinformation to the DOJ and SEC, and will cooperate with the agencies’reviews of these matters. Law enforcement agencies of a number ofother countries are also pursuing investigations of matters voluntarilydisclosed by the Company to the DOJ and SEC. Discussions areunderway in an effort to resolve these matters, and the Iraq Oil forFood matter referenced above, but whether agreement can bereached, and on what terms, is uncertain.
In May 2007, the New York State Attorney General issued asubpoena seeking information relating to the marketing and safetyof PROCRIT®. The Company has responded to these requests.
In April 2007, the Company received two subpoenas from theOffice of the Attorney General of the State of Delaware. The sub-poenas seek documents and information relating to nominal pricingagreements. For purposes of the subpoenas, nominal pricing agree-ments are defined as agreements under which the Company agreedto provide a pharmaceutical product for less than ten percent of theAverage Manufacturer Price for the product. The Companyresponded to these requests.
In March 2008, the Company received a letter request fromthe Attorney General of the State of Michigan. The request seeksdocuments and information relating to nominal price transactions.The Company responded to the request.
In June 2008, the Company received a subpoena from theUnited States Attorney’s Office for the District of Massachusettsrelating to the marketing of biliary stents by the Company’s Cordissubsidiary. Cordis is cooperating in responding to the subpoena.A False Claims Act complaint was filed in Dallas relating to similarissues. The U.S. Department of Justice and several states havedeclined to intervene at this time. A motion to dismiss the Texasqui tam case is pending.
In April 2009, the Company received a HIPPA subpoena from theU.S. Attorney’s Office for the District of Massachusetts (Boston) seek-ing information regarding the Company’s financial relationship withseveral psychiatrists. The Company has responded to this request.
In April 2009, Ortho-Clinical Diagnostics, Inc. (OCD) receiveda grand jury subpoena from the U.S. Department of Justice,Antitrust Division, requesting documents and information for theperiod beginning September 1, 2000 through the present, pertainingto an investigation of alleged violations of the antitrust laws in theblood reagents industry. The Company complied with the subpoena.In November 2010, the Antitrust Division provided notice that it hasclosed its investigation. In the weeks following the public announce-ment that OCD had received a subpoena from the AntitrustDivision, multiple class action complaints were filed. The variouscases were consolidated for pre-trial purposes in the EasternDistrict of Pennsylvania.
In May 2009, the New Jersey Attorney General issued a sub-poena to DePuy Orthopaedics, Inc., seeking information regardingthe financial interest of clinical investigators who performed clinicalstudies for DePuy Orthopaedics, Inc. and DePuy Spine, Inc. DePuyOrthopaedics has responded to these requests.
In May 2010, the Company received a letter from the UnitedStates House of Representatives’ Committee on Oversight andGovernment Reform (Committee) requesting information anddocuments regarding the April 2010 recall of various infants’ andchildren’s liquid products by McNeil Consumer Healthcare Divisionof McNEIL-PPC, Inc. (McNeil Consumer Healthcare). The Companyproduced documents and other information in response to theserequests. In May 2010, the Committee conducted a public hearing.Thereafter, the Company received additional information requestsfrom the Committee, including requests regarding the recall ofcertain Motrin products by McNeil Consumer Healthcare. TheCompany produced documents and other information in responseto these requests. The Committee held another public hearing onSeptember 30, 2010, and the Company continues to cooperatefully with the Committee’s ongoing information requests.
In addition, McNeil Consumer Healthcare, and certain affiliatesincluding Johnson & Johnson (“the Companies”), received grandjury subpoenas from the United States Attorney’s Office for theEastern District of Pennsylvania requesting documents broadlyrelating to recent recalls of various products of McNeil ConsumerHealthcare, and the FDA inspections of the Fort Washington,Pennsylvania and Lancaster, Pennsylvania manufacturing facilities.In addition, the government has served McNEIL-PPC Inc. with a CivilInvestigative Demand seeking records relevant to its investigationto determine if there was a violation of the False Claims Act. TheCompanies are cooperating with the United States Attorney’s Officein responding to these subpoenas.
The Companies have also received Civil Investigative Demands(CIDs) from multiple State Attorneys General Offices broadly relat-ing to the McNeil recall issues. The Companies continue to producedocuments in response to these CIDs and otherwise cooperate withthese inquiries. On January 12, 2011, the Oregon Attorney Generalfiled a civil complaint against Johnson & Johnson, McNEIL-PPC, Inc,and McNeil Healthcare LLC in state court alleging civil violations ofthe Oregon unlawful trade practices act relating to an earlier recallof a McNeil OTC product. The defendants intend to seek dismissalof this civil complaint.
Furthermore, a lawsuit was filed in September 2010 by a share-holder in the United States District Court for the District of NewJersey: Monk v. Johnson & Johnson. The complaint seeks classcertification based upon the anti-fraud provisions of the federalsecurities laws related to the McNeil manufacturing facilities. Morespecifically, this complaint alleges that the Companies and certainindividuals, including officers and employees, failed to disclose thata number of manufacturing facilities were failing to maintain currentgood manufacturing practices (cGMPs) and, that as a result, theprice of the Company’s stock has declined significantly.
Multiple complaints seeking class action certification related tothe McNeil recalls have been filed in the United States District Courtfor the Eastern District of Pennsylvania, the Northern District of Illi-nois, the Central District of California, and the Southern District ofOhio. These consumer complaints allege generally that purchasers ofvarious McNeil medicines are owed monetary damages and penal-ties because they paid premium prices for defective medicationsrather than less expensive alternative medications. Each complaintseeks certification of a nation-wide class of purchasers of these med-icines. On October 8, 2010, the Judicial Panel on Multidistrict Litiga-tion consolidated these consumer complaints: Haviland v. McNeil(E.D. Pa.); Smith v. McNeil (N.D. Ill.); Burrell v. McNeil (N.D. Ill.);DeGroot v. McNeil (N.D. Ill.); Michaud v. McNeil, (N.D. Ill.); Nguyenv. McNeil (N.D. Ill.); Roberson v. McNeil (N.D. Ill.); Rivera v. Johnson& Johnson (C.D. Cal.), and Coleman v. McNeil (S.D. Ohio) for pretrialproceedings in the United States District Court for the Eastern Dis-trict of Pennsylvania. Plaintiffs filed a “Consolidated Amended CivilConsumer Class Action Complaint” (CAC) naming additional partiesand claims on January 12, 2011. Defendants currently intend to file amotion to dismiss the CAC, which motion will be filed on March 2,2011, and is scheduled to be heard on May 10, 2011.
In recent years the Company has received numerous requestsfrom a variety of United States Congressional Committees toproduce information relevant to ongoing congressional inquiries.It is the Company’s policy to cooperate with these inquiries byproducing the requested information.
With respect to all the above matters, the Company and itssubsidiaries are vigorously contesting the allegations assertedagainst them and otherwise pursuing defenses to maximize theprospect of success. The Company and its subsidiaries involved inthese matters continually evaluate their strategies in managingthese matters and, where appropriate, pursue settlements and otherresolutions where those are in the best interest of the Company.
The Company is also involved in a number of patent, trademarkand other lawsuits incidental to its business.
The ultimate legal and financial liability of the Company inrespect to all claims, lawsuits and proceedings referred to above can-not be reasonably estimated. However, in the Company’s opinion,based on its examination of these matters, its experience to date anddiscussions with counsel, the ultimate outcome of legal proceedings,net of liabilities accrued in the Company’s balance sheet, is notexpected to have a material adverse effect on the Company’s finan-cial position, although the resolution in any reporting period of oneor more of these matters could have a material impact on theCompany’s results of operations and cash flows for that period.
22. RestructuringIn the fourth quarter of 2009, the Company announced globalrestructuring initiatives designed to strengthen the Company’s posi-tion as one of the world’s leading global health care companies. Thisprogram will allow the Company to invest in new growth platforms;ensure the successful launch of its many new products and contin-ued growth of its core businesses; and provide flexibility to adjust tothe changed and evolving global environment.
During the fiscal fourth quarter of 2009, the Company recorded$1.2 billion in related pre-tax charges, of which approximately$830 million of the pre-tax restructuring charges are expected torequire cash payments. The $1.2 billion of restructuring charges con-sists of severance costs of $748 million, asset write-offs of $362 mil-lion and $76 million related to leasehold and contract obligations.The $362 million of asset write-offs relate to inventory of $113 million(recorded in cost of products sold), property, plant and equipment of$107 million, intangible assets of $81 million and other assets of$61 million. Additionally, as part of this program the Company plansto eliminate approximately 7,500 positions, of which approximately5,000 have been eliminated since the restructuring was announced.
The following table summarizes the severance charges and theassociated spending for the fiscal year ended 2010:
(Dollars in Millions) Severance
2009 restructuring charge $ 748
Cash outlays (62)
Reserve balance, January 3, 2010 686
Cash outlays (341)
Reserve balance, January 2, 2011* $ 345
* Cash outlays for severance are expected to be substantially paid out over the next 12 monthsin accordance with the Company’s plans and local laws.
For additional information on the restructuring as it relates to thesegments, see Note 18.
N O T E S T O C O N S O L I D A T E D F I N A N C I A L S T A T E M E N T S 71

Report of Independent Registered Public Accounting Firm
72 J O H N S O N & J O H N S O N 2 0 1 0 A N N U A L R E P O R T
To the Shareholders and Board of Directors of Johnson & Johnson:
In our opinion, the accompanying consolidated balance sheets andthe related consolidated statements of earnings, statements ofequity, and statements of cash flows present fairly, in all materialrespects, the financial position of Johnson & Johnson and its sub-sidiaries (“the Company”) at January 2, 2011 and January 3, 2010,and the results of their operations and their cash flows for each ofthe three years in the period ended January 2, 2011 in conformitywith accounting principles generally accepted in the United Statesof America. Also in our opinion, the Company maintained, in allmaterial respects, effective internal control over financial reportingas of January 2, 2011, based on criteria established in InternalControl — Integrated Framework issued by the Committee of Spon-soring Organizations of the Treadway Commission (COSO). TheCompany’s management is responsible for these financial state-ments, for maintaining effective internal control over financialreporting and for its assessment of the effectiveness of internal con-trol over financial reporting, included in the accompanying “Man-agement’s Report on Internal Control over Financial Reporting.” Ourresponsibility is to express opinions on these financial statementsand on the Company’s internal control over financial reportingbased on our integrated audits. We conducted our audits in accor-dance with the standards of the Public Company Accounting Over-sight Board (United States). Those standards require that we planand perform the audits to obtain reasonable assurance aboutwhether the financial statements are free of material misstatementand whether effective internal control over financial reporting wasmaintained in all material respects. Our audits of the financial state-ments included examining, on a test basis, evidence supporting theamounts and disclosures in the financial statements, assessing theaccounting principles used and significant estimates made by man-agement, and evaluating the overall financial statement presenta-tion. Our audit of internal control over financial reporting includedobtaining an understanding of internal control over financial report-ing, assessing the risk that a material weakness exists, and testingand evaluating the design and operating effectiveness of internal
control based on the assessed risk. Our audits also included per-forming such other procedures as we considered necessary in thecircumstances. We believe that our audits provide a reasonablebasis for our opinions.
As discussed in Note 1 to the Consolidated Financial State-ments, the Company changed the manner in which it accounts forbusiness combinations in 2009.
A company’s internal control over financial reporting is aprocess designed to provide reasonable assurance regarding thereliability of financial reporting and the preparation of financialstatements for external purposes in accordance with generallyaccepted accounting principles. A company’s internal control overfinancial reporting includes those policies and procedures that(i) pertain to the maintenance of records that, in reasonable detail,accurately and fairly reflect the transactions and dispositions of theassets of the company; (ii) provide reasonable assurance that trans-actions are recorded as necessary to permit preparation of financialstatements in accordance with generally accepted accounting prin-ciples, and that receipts and expenditures of the company are beingmade only in accordance with authorizations of management anddirectors of the company; and (iii) provide reasonable assuranceregarding prevention or timely detection of unauthorized acquisi-tion, use, or disposition of the company’s assets that could have amaterial effect on the financial statements.
Because of its inherent limitations, internal control over finan-cial reporting may not prevent or detect misstatements. Also, pro-jections of any evaluation of effectiveness to future periods aresubject to the risk that controls may become inadequate because ofchanges in conditions, or that the degree of compliance with thepolicies or procedures may deteriorate.
New York, New YorkFebruary 24, 2011
Management’s Report on Internal Control Over Financial Reporting
M A N A G E M E N T ’ S R E P O R T O N I N T E R N A L C O N T R O L O V E R F I N A N C I A L R E P O R T I N G 73
Under Section 404 of the Sarbanes-Oxley Act of 2002, manage-ment is required to assess the effectiveness of the Company’s inter-nal control over financial reporting as of the end of each fiscal yearand report, based on that assessment, whether the Company’sinternal control over financial reporting is effective.
Management of the Company is responsible for establishingand maintaining adequate internal control over financial reporting.The Company’s internal control over financial reporting is designedto provide reasonable assurance as to the reliability of the Company’sfinancial reporting and the preparation of external financial state-ments in accordance with generally accepted accounting principles.
Internal controls over financial reporting, no matter how welldesigned, have inherent limitations. Therefore, internal control overfinancial reporting determined to be effective can provide only rea-sonable assurance with respect to financial statement preparationand may not prevent or detect all misstatements. Moreover, projec-tions of any evaluation of effectiveness to future periods are subjectto the risk that controls may become inadequate because ofchanges in conditions, or that the degree of compliance with thepolicies or procedures may deteriorate.
The Company’s management has assessed the effectiveness ofthe Company’s internal control over financial reporting as of January2, 2011. In making this assessment, the Company used the criteria
established by the Committee of Sponsoring Organizations of theTreadway Commission (COSO) in “Internal Control-IntegratedFramework.” These criteria are in the areas of control environment,risk assessment, control activities, information and communication,and monitoring. The Company’s assessment included extensivedocumenting, evaluating and testing the design and operatingeffectiveness of its internal controls over financial reporting.
Based on the Company’s processes and assessment, asdescribed above, management has concluded that, as of January 2,2011, the Company’s internal control over financial reportingwas effective.
The effectiveness of the Company’s internal control overfinancial reporting as of January 2, 2011 has been audited byPricewaterhouseCoopers LLP, an independent registered publicaccounting firm, as stated in their report, which appears herein.
William C. Weldon Dominic J. CarusoChairman, Board of Directors, Vice President, Finance,and Chief Executive Officer and Chief Financial Officer

74 S U M M A R Y O F O P E R A T I O N S A N D S T A T I S T I C A L D A T A
Summary of Operations and Statistical Data 2000-2010
(Dollars in Millions Except Per Share Figures) 2010 2009 2008 2007 2006 2005 2004 2003 2002 2001 2000
Sales to customer — U.S. $29,450 30,889 32,309 32,444 29,775 28,377 27,770 25,274 22,455 19,825 17,316Sales to customer — International 32,137 31,008 31,438 28,651 23,549 22,137 19,578 16,588 13,843 12,492 11,856
Total sales 61,587 61,897 63,747 61,095 53,324 50,514 47,348 41,862 36,298 32,317 29,172
Cost of products sold 18,792 18,447 18,511 17,751 15,057 14,010 13,474 12,231 10,498 9,622 8,987Selling, marketing and administrative expenses 19,424 19,801 21,490 20,451 17,433 17,211 16,174 14,463 12,520 11,510 10,675Research and development expense 6,844 6,986 7,577 7,680 7,125 6,462 5,344 4,834 4,094 3,704 3,186Purchased in-process research and development — — 181 807 559 362 18 918 189 105 66Interest income (107) (90) (361) (452) (829) (487) (195) (177) (256) (456) (429)Interest expense, net of portion capitalized 455 451 435 296 63 54 187 207 160 153 204Other (income) expense, net (768) (526) (1,015) 534 (671) (214) 15 (385) 294 185 (94)Restructuring — 1,073 — 745 — — — — — — —
44,640 46,142 46,818 47,812 38,737 37,398 35,017 32,091 27,499 24,823 22,595
Earnings before provision for taxes on income 16,947 15,755 16,929 13,283 14,587 13,116 12,331 9,771 8,799 7,494 6,577Provision for taxes on income 3,613 3,489 3,980 2,707 3,534 3,056 4,151 2,923 2,522 2,089 1,813
Net earnings 13,334 12,266 12,949 10,576 11,053 10,060 8,180 6,848 6,277 5,405 4,764
Percent of sales to customers 21.7 19.8 20.3 17.3 20.7 19.9 17.3 16.4 17.3 16.7 16.3Diluted net earnings per share of common stock $ 4.78 4.40 4.57 3.63 3.73 3.35 2.74 2.29 2.06 1.75 1.55Percent return on average shareholders’ equity 24.9 26.4 30.2 25.6 28.3 28.2 27.3 27.1 26.4 24.0 25.3
Percent increase (decrease) over previous year:Sales to customers (0.5) (2.9) 4.3 14.6 5.6 6.7 13.1 15.3 12.3 10.8 6.6Diluted net earnings per share 8.6 (3.7) 25.9 (2.7) 11.3 22.3 19.7 11.2 17.7 12.9 15.7
Supplementary expense data:Cost of materials and services $27,586 27,651 29,346 27,967 22,912 22,328 21,053 18,568 16,540 15,333 14,113Total employment costs 13,934 14,587 14,523 14,571 13,444 12,364 11,581 10,542 8,942 8,153 7,376Depreciation and amortization 2,939 2,774 2,832 2,777 2,177 2,093 2,124 1,869 1,662 1,605 1,592Maintenance and repairs (1) 657 567 583 483 506 510 462 395 360 372 327Total tax expense (2) 5,070 5,052 5,558 4,177 4,857 4,285 5,215 3,890 3,325 2,854 2,517
Supplementary balance sheet data:Property, plant and equipment, net 14,553 14,759 14,365 14,185 13,044 10,830 10,436 9,846 8,710 7,719 7,409Additions to property, plant and equipment 2,384 2,365 3,066 2,942 2,666 2,632 2,175 2,262 2,099 1,731 1,689Total assets 102,908 94,682 84,912 80,954 70,556 58,864 54,039 48,858 40,984 38,771 34,435Long-term debt 9,156 8,223 8,120 7,074 2,014 2,017 2,565 2,955 2,022 2,217 3,163Operating cash flow 16,385 16,571 14,972 15,022 14,248 11,799 11,089 10,571 8,135 8,781 6,889
Common stock informationDividends paid per share $ 2.110 1.930 1.795 1.620 1.455 1.275 1.095 0.925 0.795 0.700 0.620Shareholders’ equity per share $ 20.66 18.37 15.35 15.25 13.59 13.01 10.95 9.25 7.79 8.05 6.82Market price per share (year-end close) $ 61.85 64.41 58.56 67.38 66.02 60.10 63.42 50.62 53.11 59.86 52.53Average shares outstanding (millions) — basic 2,751.4 2,759.5 2,802.5 2,882.9 2,936.4 2,973.9 2,968.4 2,968.1 2,998.3 3,033.8 2,993.5
— diluted 2,788.8 2,789.1 2,835.6 2,910.7 2,961.0 3,002.8 2,992.7 2,995.1 3,049.1 3,089.3 3,075.2
Employees (thousands) 114.0 115.5 118.7 119.2 122.2 115.6 109.9 110.6 108.3 101.8 100.9
(1) Also included in cost of materials and services category.(2) Includes taxes on income, payroll, property and other business taxes.
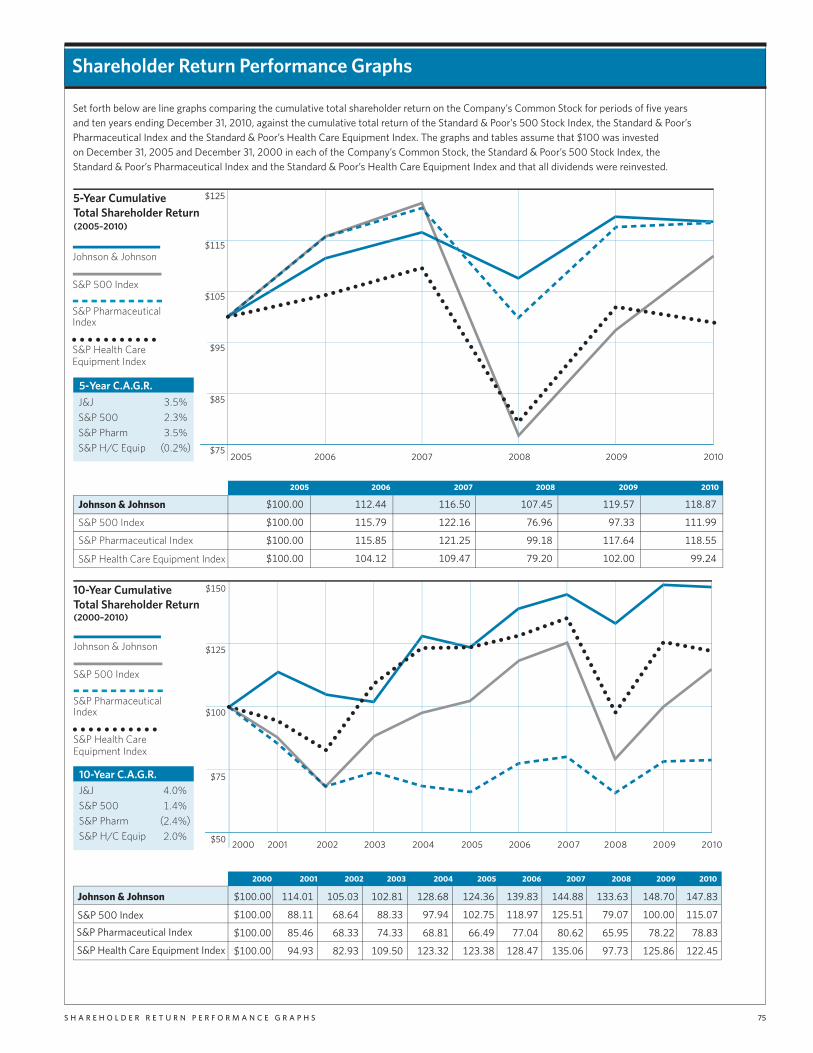
Shareholder Return Performance Graphs
S H A R E H O L D E R R E T U R N P E R F O R M A N C E G R A P H S 75
2005 2006 2007 2008 2009 2010
S&P 500 Index
S&P Pharmaceutical Index
S&P Health Care Equipment Index
S&P Health Care Equipment Index
10-Year CumulativeTotal Shareholder Return
(2005–2010)
(2000–2010)
S&P 500 Index
S&P Health CareEquipment Index
$150
$125
$100
$75
$50
hn n & hn n
S&P PharmaceuticalIndex
2000 2001 2002 200 200 2005 2006 2007 2008 2009 2010
S&P Index
S&P Pharma euti al Index
10-Year C R&
S&P 500
S&P Pharm
S&P H C Equip
Set rth el are line raph mparin the umulati e t tal hareh lder return n the C mpan C mm n St r peri d e earand ten ear endin e em er a ain t the umulati e t tal return the Standard & P r St Index the Standard & P rPharma euti al Index and the Standard & P r Health Care Equipment Index he raph and ta le a ume that a in e ted
n e em er and e em er in ea h the C mpan C mm n St the Standard & P r St Index theStandard & P r Pharma euti al Index and the Standard & P r Health Care Equipment Index and that all di idend ere rein e ted
5-Year CumulativeTotal Shareholder Return
$125
$115
$ 5
$ 5
$75
S&P 500 Index
S&P Health CareEquipment Index
hn n & hn n
S&P PharmaceuticalIndex
5-Year C R
&
S&P 500
S&P Pharm
pS&P H C Equi
$105
3.5%
2.3%
3.5%
(0.2%)
$100 00 112 11 50 107 5 11 57 11 7
$100 00 115 7 122 1 7 7 111
$100 00 115 5 121 25 1 117 11 55
$100 00 10 12 10 7 7 20 102 00 2
$100 00 11 01 105 0 102 1 12 12 1 1 1 1 70 1 7
$100 00 11 7 102 75 11 7 125 51 7 07 100 00 115 07
$100 00 5 7 1 77 0 0 2 5 5 7 22 7
$100 00 2 10 50 12 2 12 12 7 1 5 0 7 7 125 122 5
4.0%
1.4%
(2.4%)
2.0%
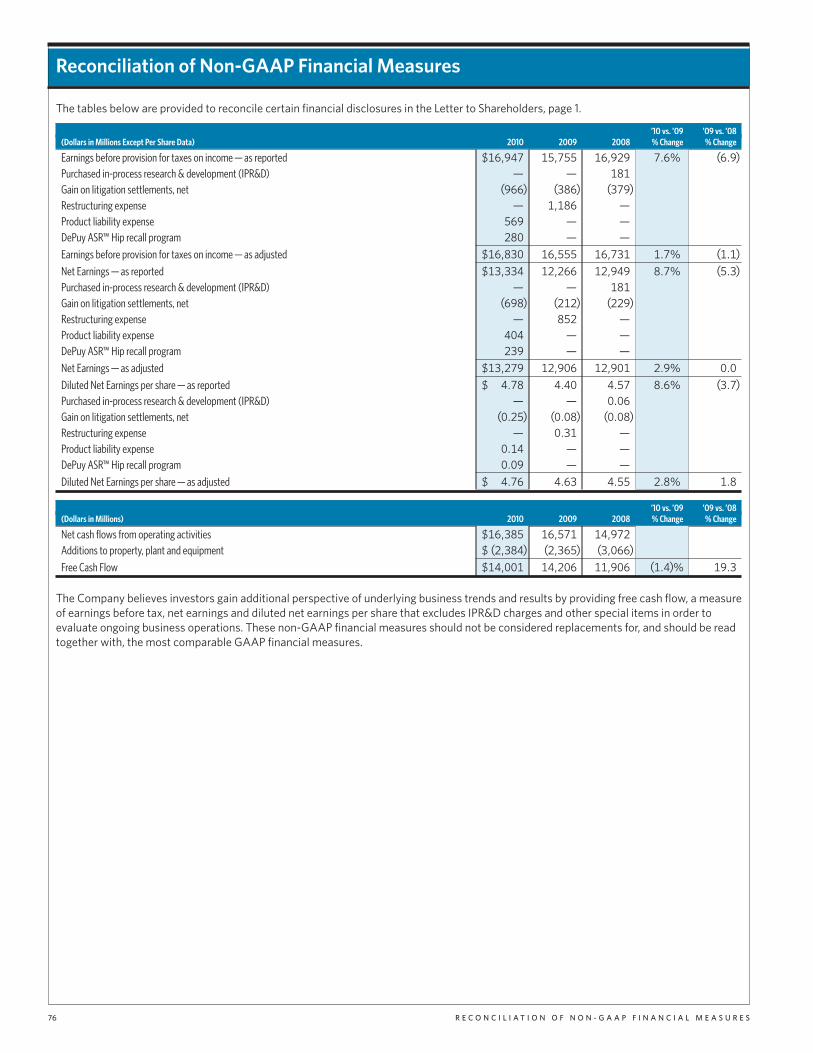
76 R E C O N C I L I A T I O N O F N O N - G A A P F I N A N C I A L M E A S U R E S
Reconciliation of Non-GAAP Financial Measures
The tables below are provided to reconcile certain financial disclosures in the Letter to Shareholders, page 1.
’10 vs. ’09 ’09 vs. ’08(Dollars in Millions Except Per Share Data) 2010 2009 2008 % Change % Change
Earnings before provision for taxes on income — as reported $16,947 15,755 16,929 7.6% (6.9)
Purchased in-process research & development (IPR&D) — — 181
Gain on litigation settlements, net (966) (386) (379)
Restructuring expense — 1,186 —Product liability expense 569 — —DePuy ASR™ Hip recall program 280 — —Earnings before provision for taxes on income — as adjusted $16,830 16,555 16,731 1.7% (1.1)
Net Earnings — as reported $13,334 12,266 12,949 8.7% (5.3)
Purchased in-process research & development (IPR&D) — — 181
Gain on litigation settlements, net (698) (212) (229)
Restructuring expense — 852 —Product liability expense 404 — —DePuy ASR™ Hip recall program 239 — —Net Earnings — as adjusted $13,279 12,906 12,901 2.9% 0.0
Diluted Net Earnings per share — as reported $ 4.78 4.40 4.57 8.6% (3.7)
Purchased in-process research & development (IPR&D) — — 0.06
Gain on litigation settlements, net (0.25) (0.08) (0.08)
Restructuring expense — 0.31 —Product liability expense 0.14 — —DePuy ASR™ Hip recall program 0.09 — —Diluted Net Earnings per share — as adjusted $ 4.76 4.63 4.55 2.8% 1.8
’10 vs. ’09 ’09 vs. ’08(Dollars in Millions) 2010 2009 2008 % Change % Change
Net cash flows from operating activities $16,385 16,571 14,972
Additions to property, plant and equipment $ (2,384) (2,365) (3,066)
Free Cash Flow $14,001 14,206 11,906 (1.4)% 19.3
The Company believes investors gain additional perspective of underlying business trends and results by providing free cash flow, a measureof earnings before tax, net earnings and diluted net earnings per share that excludes IPR&D charges and other special items in order toevaluate ongoing business operations. These non-GAAP financial measures should not be considered replacements for, and should be readtogether with, the most comparable GAAP financial measures.

C O R P O R A T E A N D S H A R E H O L D E R I N F O R M A T I O N
The paper used in this publication is made from 30% and 100% post-consumer recycled fiber, is Forest Stewardship Council™ certified for chain of custody and was manufactured with green energy credits for purchase of electricity generated from renewable-energy sources such as wind and low-impact hydro resources.
JOHNSON & JOHNSON ON THE WEB
Company website: www.jnj.com
Online annual report: www.investor.jnj.com/2010annualreport
Company blog: www.jnjbtw.com
Johnson & Johnson history blog: www.kilmerhouse.com
Facebook: Follow the Johnson & Johnson Network
Twitter: @JNJComm; @JNJStories; @JNJVideo; @JNJHistory
YouTube: www.youtube.com/JNJhealth©Johnson & Johnson 2011
The Johnson & Johnson annual report contains many of the valuable trademarks owned and used by the Johnson & Johnson Family of Companies in the United States and internationally to distinguish products and services of outstanding quality.
15 17
125 YEARS OF CARING(See story on page 22)
1, 2, 3 Company founders James Wood Johnson (left), Edward Mead Johnson (top)and Robert Wood Johnson (bottom)
4 Advertisement, circa 1960 5 SigMA® Rotating Platform Knee,
DePuy Orthopaedics, inc.
6 Our Credo, 1948
7 JOHNSON’S® Baby Shampoo, Johnson & Johnson Consumer Products Company
8 CYPHER® Sirolimus-eluting Coronary Stent, Cordis Corporation
9 First Aid Wood’s Emergency Case, 1939
10 RED CROSS® Catgut No. 4 , 1907
11 BAND-AiD® Brand DRYBAK Adhesive Bandages, circa 1930
12 Rho (D) immune globulin (Human) RhogAM®, 1969, Ortho-Clinical Diagnostics
13 JOHNSON’S® Baby Powder, circa 1920
14 Extra Strength TYLENOL® Rapid Release gels, McNeil-PPC, inc.
15 1-DAY ACUVUE® TRUEYE™ Contact Lenses, Johnson & Johnson Vision Care, inc.
16 ORTHO-gYNOL® (Nonoxynol-9), Ortho Pharmaceutical Corporation
17 PROCRiT® (Epoetin Alfa); Centocor Ortho Biotech Products, LP
1
2
34
5
6
7 8
910 11 12
14 1613
PRINCIPAL OFFICEOne Johnson & Johnson PlazaNew Brunswick, New Jersey 08933(732) 524-0400
ANNUAL MEETING
The Annual Meeting of Shareholders will take place April 28, 2011, at the Hyatt Regency New Brunswick, 2 Albany Street, New Brunswick, New Jersey. The meeting will convene at 10 a.m. All shareholders are cordially invited to attend. A formal Notice of Meeting, Proxy Statement and Proxy have been sent to shareholders.
CORPORATE GOVERNANCE
Copies of the Company’s 2010 Annual Report on Form 10-K, Quarterly Reports on Form 10-Q and Current Reports on Form 8-K to the Securities and Exchange Commission, Proxy Statement, and this Annual Report are available online at www.investor.jnj.com/sec-filings.cfm, or to shareholders without charge upon written request to the Secretary at the Company’s principal address or by calling (800) 950-5089.
In addition, on the Company’s Corporate Governance website at www.investor.jnj.com/ governance.cfm, shareholders can view the Company’s Principles of Corporate Governance, Charters of the Audit Committee, Compensation & Benefits Committee and Nominating & Corporate Governance Committee, Policy on Business Conduct for Employees and Code of Business Conduct & Ethics for Members of the Board of Directors and Executive Officers. Copies of these documents are available to shareholders without charge upon written request to the Secretary at the Company’s principal address.
The Company is required to file as an Exhibit to its Form 10-K for each fiscal year certifica-tions under Section 302 of the Sarbanes-Oxley Act signed by the Chief Executive Officer and the Chief Financial Officer. In addition, the Company is required to submit a certification signed by the Chief Executive Officer to the New York Stock Exchange within 30 days fol-lowing the Annual Meeting of Shareholders. Copies of the certifications filed for previous years are posted on the Company’s Corporate Governance website, and future certifications will be posted promptly upon filing.
COMMON STOCK
Listed on New York Stock ExchangeStock Symbol JNJ
SHAREHOLDER RELATIONS CONTACT
Douglas K. ChiaCorporate Secretary(732) 524-2455
INVESTOR RELATIONS CONTACT
Louise MehrotraVice President, Investor Relations(800) 950-5089(732) 524-6492
TRANSFER AGENT AND REGISTRAR
Questions regarding stock holdings, certificate replacement/transfer, dividends and address changes should be directed to:
Computershare Trust Company, N.A.250 Royall StreetCanton, MA 02021(800) 328-9033 or(781) 575-2718 (outside the U.S.)www.computershare.com
DIVIDEND REINVESTMENT PLAN
The Plan allows for full or partial dividend reinvestment, and additional monthly cash investments up to $50,000 per year, in Johnson & Johnson common stock without brokerage commissions or service charges on stock purchases. If you are interested in participating in the Plan and need an authoriza-tion form and/or more information, please call Computershare Trust Company, N.A. at (800) 328-9033 or (781) 575-2718 (outside the U.S.).
HEARING IMPAIRED
Shareholders who have inquiries regarding stock-related matters can communicate directly with Computershare Trust Company, N.A. via a telecommunications device (TDD). The telephone number for this service is (800) 952-9245 or (781) 575-2692 (outside the U.S.).
Registered shareholders who wish to receive electronic notice of online access to future annual reports and proxy materials instead of paper copies may register online: www.computershare-na.com/green.
Beneficial Johnson & Johnson shareholders (you own shares through a broker or bank) can register for online delivery of materials by going to http://enroll.icsdelivery.com/jnj.