Embed Size (px)
Citation preview

1
ANNUAL REPORT AS OF
31 DECEMBER 2015 OF THE TERNIENERGIA GROUP

2
TerniEnergia S.p.A.
Registered office in Strada dello Stabilimento 1, 05035 Narni (TR)
Authorised, issued and paid-up share capital: Euro 57,007,230
Terni Register of Companies no. 01339010553
Branches and Offices
Narni – Strada dello Stabilimento, 1
Milan – Corso Magenta, 85
Lecce – Via Costadura, 3
Athens – 52, Akadimias Street
Cape Town - Boulevard Office Park, 2nd floor, Block D, Searle. District of Woodstock
Warsaw - Sw. Krolewska 16, 00-103
Bucharest - Str. Popa Petre 5
Board of Directors
Chairman and CEO
Stefano Neri
Directors
Fabrizio Venturi
Sergio Agosta
Giovanni Fabrizi (*)
Francesca Ricci
Monica Federici
Paolo Ottone Migliavacca
Mario Marco Molteni
Domenico De Marinis
(*) Co-opted by the Board on 29 October 2015 as a replacement for Umberto Paparelli whose term of office ended 7 August 2015
Board of Statutory Auditors
Ernesto Santaniello (Chairman)
Vittorio Pellegrini
Simonetta Magni
Independent auditors
PriceWaterhouseCoopers S.p.A.
3
TERNIENERGIA GROUP – 2015 CONSOLIDATED FINANCIAL STATEMENTS
Contents
1 REPORT ON OPERATIONS................................................................................................................................................. 6
1.1 MACROECONOMIC SCENARIO .............................................................................................................................. 6
1.2 TRENDS IN THE MARKET OF REFERENCE ............................................................................................................ 7
1.3 THE GROUP’S BUSINESS AND MISSION ............................................................................................................10
1.4 THE GROUP’S STRUCTURE ...................................................................................................................................12
1.5 MAIN EVENTS DURING THE FINANCIAL YEAR ENDED 31 DECEMBER 2015 ..............................................13
1.5.1 New 2015-2017 Industrial Plan, “Fast on the smart energy road”. ...................................13
1.5.2 Merger by incorporation of the fully owned company Lucos Alternative Energies S.p.A.
into TerniEnergia S.p.A................................................................................................................13
1.5.3 Authorisation of the plant for treatment of liquid waste in Nera Montoro (TR) ...........13
1.5.4 Contracts for the construction of two photovoltaic plants in the Republic of South
Africa for an overall installed power capacity of 148.5 MWp ............................................14
1.5.5 Increased voting rights ................................................................................................................14
1.5.6 Valorisation of photovoltaic assets; 50% of SPV DT Srl sold. ..............................................15
1.5.7 Acquisition of New Gas Trade Srl and the launch of TerniEnergia Gas&Power SpA .....15
1.5.8 Shareholders’ Meeting approves the 2014 financial statements as well as the
distribution of a dividend equal to Euro 0.065 per share ....................................................16
1.5.9 New PFU plant at Borgo Val di Taro .........................................................................................16
1.5.10 Divestment of Free Energia ........................................................................................................17
1.5.11 Valorisation of photovoltaic assets; 50% of JV SAIM Energy 2 Srl sold ............................19
1.5.12 Update of the 2015-2017 Industrial Plan, “Fast on the smart energy road” ...................20
1.5.13 Acquisition of 100% of share capital of Greenled Industry by TerniEnergia ...................21
1.5.14 Multi-year agreement with Avanti Communications to distribute connectivity between
the renewable energy plants in South Africa and Italy ........................................................22
1.5.15 Valorisation of photovoltaic assets continues: 50% of four SPVs sold to Renewable
European Investment Italy 3 ......................................................................................................22
1.6 PERFORMANCE OF OPERATIONS .......................................................................................................................24
1.7 INVESTMENTS ........................................................................................................................................................32
1.8 HUMAN RESOURCES .............................................................................................................................................32

4
1.9 ENVIRONMENTAL POLICY ....................................................................................................................................33
1.10 R&D...........................................................................................................................................................................33
1.11 RISK FACTORS RELATED TO THE REFERENCE SECTOR ....................................................................................34
1.12 RELATIONS WITH RELATED PARTIES .................................................................................................................35
1.13 INFORMATION REQUIRED BY ART. 123 BIS OF THE TUF (CONSOLIDATED F INANCIAL ACT) .................36
1.14 OTHER INFORMATION ..........................................................................................................................................38
1.15 SIGNIFICANT EVENTS AFTER YEAR-END............................................................................................................40
1.16 CORPORATE GOVERNANCE REPORT .................................................................................................................40
1.17 BUSINESS OUTLOOK ..............................................................................................................................................40
2 FINANCIAL STATEMENTS ......................................................................................................................................42
2.1 CONSOLIDATED STATEMENT OF FINANCIAL POSITION ....................................................................42
2.2 CONSOLIDATED STATEMENT OF COMPREHENSIVE INCOME ..........................................................44
2.3 STATEMENT OF CHANGES IN CONSOLIDATED SHAREHOLDERS’ EQUITY .....................................45
2.4 CONSOLIDATED CASH FLOW STATEMENT ...........................................................................................46
3 EXPLANATORY NOTES TO THE CONSOLIDATED FINANCIAL STATEMENTS FOR THE YEAR CLOSED ON 31
DECEMBER 2015 .................................................................................................................................................................47
3.1 GENERAL INFORMATION .........................................................................................................................47
3.2 SEGMENT REPORTING .............................................................................................................................48
3.3 FORM, CONTENT AND APPLIED ACCOUNTING PRINCIPLES .............................................................50
3.4 COMMENTS ON THE MAIN STATEMENT OF FINANCIAL POSITION ITEMS: ..................................72
3.4.1 INTANGIBLE FIXED ASSETS .........................................................................................................72
3.4.2 TANGIBLE FIXED ASSETS ..............................................................................................................74
3.4.3 EQUITY INVESTMENTS .................................................................................................................77
3.4.4 PREPAID TAXES ...............................................................................................................................80
3.4.5 NON-CURRENT FINANCIAL RECEIVABLES .................................................................................83
3.4.6 INVENTORIES .................................................................................................................................84
3.4.7 TRADE RECEIVABLES ....................................................................................................................85
3.4.8 OTHER CURRENT ASSETS ............................................................................................................86
3.4.9 DERIVATIVES ..................................................................................................................................87
3.4.10 FINANCIAL RECEIVABLES.............................................................................................................87
3.4.11 CASH AND CASH EQUIVA LENTS.................................................................................................88
5
3.4.12 ASSETS HELD FOR SALE................................................................................................................88
3.5 COMMENTS ON THE MAIN LIABILITY AND EQUITY ITEMS ..............................................................89
3.5.1 SHAREHOLDERS’ EQUITY ............................................................................................................89
3.5.2 PROVISIONS FOR EMPLOYEE BENEFITS ...................................................................................91
3.5.3 PROVISIONS FOR DEFERRED TAXES..........................................................................................93
3.5.4 NON-CURRENT FINANCIAL PAYABLES......................................................................................94
3.5.5 OTHER NON-CURRENT LIABILITIES ...........................................................................................95
3.5.6 DERIVATIVES ..................................................................................................................................95
3.5.7 TRADE PAYABLES ..........................................................................................................................96
3.5.8 PAYABLES AND OTHER FINANCIAL LIABILITIES ......................................................................96
3.5.9 INCOME TAX PAYABLES ..............................................................................................................99
3.5.10 OTHER CURRENT LIABILITIES......................................................................................................99
3.5.11 COMMITMENTS AND ISSUED GUARANTEES AS WELL AS POTENTIAL LIABILITIES ..... 100
3.6 COMMENTS ON THE MAIN INCOME STATEMENT ITEMS ............................................................. 106
3.6.1 REVENUES ................................................................................................................................... 106
3.6.2 CHANGE IN INVENTORIES OF SEMI-FINISHED AND FINISHED PRODUCTS .................... 106
3.6.3 COST OF RAW MATERIALS, CONSUMABLES AND GOODS ................................................ 107
3.6.4 COSTS FOR SERVICES ................................................................................................................ 108
3.6.5 PERSONNEL COSTS .................................................................................................................... 108
3.6.6 OTHER OPERATING COSTS....................................................................................................... 109
3.6.7 AMORTISATION, DEPRECIATION, ALLOCATIONS AND WRITE-DOWNS ......................... 109
3.6.8 FINANCIAL INCOME AND CHARGES ....................................................................................... 110
3.6.9 PROFIT SHARE FROM JOINT VENTURES ................................................................................ 111
3.6.10 TAXES ........................................................................................................................................... 112
3.7 RELATIONS WITH RELATED PARTIES .................................................................................................. 112
3.8 MANAGEMENT OF FINANCIAL RISKS ................................................................................................. 120
3.9 ATYPICAL AND/OR UNUSUAL TRANSACTIONS ................................................................................ 125
3.10 OTHER INFORMATION .......................................................................................................................... 126
4. CERTIFICATION OF THE CONSOLIDATED FINANCIAL STATEMENTS PURSUANT TO ART. 154-BIS OF
LEGISLATIVE DECREE 58/98 AND ART. 81-TER OF CONSOB REGULATION NO. 11971/99, AND ITS
SUBSEQUENT AMENDMENTS AND SUPPLEMENTS ..................................................................................... 131

6
1 REPORT ON OPERATIONS
1.1 MACROECONOMIC SCENARIO
In 2015, economic growth continued in the principal developed countries, but the slowdown in the
Chinese economy had a negative impact on raw material prices and on the growth rates of emerging
countries. China’s adjustment period from high levels of investment and indebtedness constitutes
an element of weakness for the country and a risk for the global economy.
In the Eurozone, growth is continuing, but remains fragile. The programme to purchase Eurosystem
government bonds has proven to be effective in supporting economic activity as a whole, with the
effects to date in line with the initial forecasts. However, the weakness in external demand and the
drop in petroleum prices gave rise to new risks for lower inflation and growth, which became more
evident in recent months. The ECB’s Governing Council introduced additional expansionary
measures and extended the bond purchase programme in December. The Council is determined to
use all available tools, including the possibility of changing the size, composition and duration of the
purchasing programme for public and private securities, if it becomes necessary in order to combat
downward risks and to ensure inflation returns to values that are consistent with price stability.
In Italy, economic activity began to grow again at the beginning of 2015, with a balance of +0.6% for
the full year. The recovery is continuing gradually in Italy. Spurred by exports, which had sustained
economic activity over the last four years are now reflecting weakness in the markets outside the
EU, and are gradually being replaced by internal demand, in particular in consumer goods and
rebuilding inventories. In addition to the recovery in the manufacturing cycle, there are also signs
of growth in services and, after a prolonged recession, a stabilisation in construction. However,
forecasts for investments reflect uncertainty regarding external demand. During the summer
months, employment figures continued to growth, particularly for young people and in services.
Hiring proceeded with a re-composition that favoured stable contracts. The forecasts of businesses
regarding the employment scenario are cautiously optimistic.
The trend in consumer prices, which reflected the recent drop in petroleum prices, remains very low
(0.2% annual rate in September). However, the slow recovery of core inflation continues, which has
been, until now, supported by the acceleration in prices for services. Households and businesses
expect very limited inflation in the upcoming months, but gradually returning. The portion of
consumers who expect prices to fall has decreased.
Inflation fell in December to 0.1% annually. Forecasts by households and businesses point to a
modest recovery in prices in upcoming months, but they will remain at contained levels. Inflation
7
forecasts reflect the recent decline in energy prices, but also the persistent under-utilisation of
production capacity, which contributes to keeping core prices at minimum values.
Lending to the private sector strengthened in autumn, as loans to businesses grew for the first time
in nearly four years. Supply conditions continued to ease. The cost of new loans to businesses were
at very contained levels from an historic perspective and the differential on the corresponding
average interest rate in the Eurozone was eliminated (it was one percentage point at the end of
2012). However, the dispersion of credit conditions between economic activity sectors and business
size remained high, although lower than the peaks reached during the recession.
Overall, gross domestic product could grow at around 1.5% in 2016 and 2017. Inflation will gradually
increase to 0.3% this year and 1.2% next year. Investments, which have until now been characterised
by modest growth, could benefit from forecasts of more favourable demand and lending conditions
and from the effects of stimulus measures introduced by the Stability Law. Consumer goods may
growth as a result of the recovery in available income, also supported by strength in the labour
market.
Significant risks remain, including, most importantly, those associated with the global context, which
became more evident in recent weeks. In particular, the possibility of a slowdown in emerging
economies, which could become more pronounced and persistent than had been expected until
now, would have serious repercussions on financial and currency markets. At the same time,
monetary policy must decisively combat the risk of downward inflation, which could result from
either growth in demand that is lower than expected, if the unutilised production capacity remains
at current high levels for a long period of time, as well as from additional drops in raw material
prices, if they generate feedback effects on wage dynamics. The scenario described above assumes
that the confidence of households, businesses and financial operators continues in Italy and the
Eurozone, and that decisive cyclical support measures continue.
1.2 TRENDS IN THE MARKET OF REFERENCE
At a global level in 2015, 59 GW of new photovoltaic power was installed, a growth in demand of
34% over 2014. The last quarter of 2015 demonstrated how photovoltaic demand still depends on
the support of public policies, which can be unpredictable, with both positive and negative
consequences.
The reference is to the unexpected extension of the investment tax credit in the United States, which
caused a notable increase in forecasts for that market. With the extension of the ITC, demand in the
U.S. as a percentage of global demand from 2015 to 2020 will grow from an average of 10% to 15%,

8
despite the forecasts for marked growth in the Asia-Pacific region as well. Forecasts for Japan, the
United Kingdom and China remain, however, low.
Emerging markets are increasingly more significant. Beginning this year, India will become a market
in which several GW will be installed annually. Mexico and Brazil should prove to be up to the task
of their commitments. Others, such as the Philippines, Pakistan and Bangladesh in Asia, as well as
Uruguay, Guatemala and Panama in Latin American, will break the 100 MW threshold.
According to analysts, the result of the COP 21 will be important for diversification in PV markets,
driving demand in Latin America, Asia and Africa. In fact, many countries have promised significant
cuts in emissions and photovoltaic power is seen as a quick, effective and scalable solution to obtain
these results.
The collapse in oil prices and declines in other commodity fossil fuels did not stop progress in
renewable sources. In 2015, investments in clean energy reached a new record, with half of the new
global electrical power from wind and photovoltaic sources. In the year just completed, USD 328.9
billion was invested in renewables, a growth of 4% over USD 315.9 billion in 2014, which surpasses
the previous record set in 2011 with USD 318 billion.
In 2015, investments in renewable sources were 6 times greater than 2004, and growth continued
despite the 4 factors that acted as a hindrance: the collapse of prices for fossil fuels, reduction in
the cost of photovoltaic power, which reduces investments at an equivalent rate with the installed
power, the recovery in the dollar, and the slowdown of the European economy. This is a clear
response to those who expected investments in the sector to suffer a setback as combustible fossil
fuels became cheaper. In fact, in the 18 months prior to the end of 2015, the price per barrel of
petroleum on the Brent index declined 67%, the price of coal on the north-western European hub
declined 35%, and the price of natural gas on the Henry Hub in the U.S. dropped 48%.
On the other hand, renewables have several strengths: they are increasingly more competitive, they
are now chosen in many developing countries because they can become operational extremely
rapidly, and they reduce the exposure of these countries to price volatility in fossil fuels. It is not
very likely that this trend will reverse, given the climate agreement reached in December in Paris.
The bulk of investments in renewables, USD 199 billion (+4% compared to 2014), was directed at
utility-scale projects such as wind and photovoltaic parks, biomass or waste-to-energy plants, and
small hydropower plants. Note that expenditures on smart grids and utility-scale accumulations
increased by 11% over 2014, reaching USD 20 billion at a global level. Investments in smaller
projects, especially roof photovoltaic systems, grew 12%, to USD 67.4 billion, with Japan in the lead,
followed closely by the United States and China. The largest investment in biomass was for the 330
MW plant in Klabin Ortiguera in Brazil, with USD 921 million, while the largest geo-thermal plant
was the Guris Efeler project in Turkey (170 MW for USD 717 million).

9
Analysing the various markets, China was in the lead in terms of investments, with USD 110 billion
(+17% over 2014), followed by the United States with USD 56 billion (+8%). In contrast, Europe
posted a decline of 18% compared to the previous year, with expenditures of USD 58.5 billion, the
lowest level since 2006. The sole exception to the general decline (Germany -42%, France -53%) was
the British market, where investments rose 24% to USD 23.4 billion. Brazil also saw its investments
decrease by 10%, while expenditures for renewables grew 23% in India. New markets like Mexico
(+116%), Chile, South Africa, and Morocco are becoming increasingly important, which in total
invested tens of billions of dollars.
Africa and the Middle East are the two regions with the largest potential for growth in clean energy.
Together they amounted USD 13.4 billion in 2015, +54% over 2014, due to a combination of strong
demographic growth (and related electricity demand) as well as the abundance of sun and wind.

10
1.3 THE GROUP’S BUSINESS AND MISSION
TerniEnergia aims to establish itself as the first independent Italian “smart energy company”
operating in the sectors of renewable energies, energy efficiency, and waste and energy
management through its individual business model.
The Industrial Plan from February 2015, “Fast on the smart energy road”, was updated and approved
by the TerniEnergia Board of Directors on 29 October 2015. In particular, the plan is based on the
following business assumptions:
- backlog of work orders in the photovoltaic sector, both acquired and those in the process of being
acquired abroad;
- development of significant commercial cross-selling opportunities in the sectors of energy
efficiency (strong growth) and in gas & power management;
- strong diversification of the TerniEnergia business within anti-cyclical sectors and completion of
core activities of the Group along the entire value chain of energy, ranging from the design of plants
to advanced post-sales services.
A new strategic element of the plan approved by the Board of Directors in February 2015 is the
search for potential corporate and business partnerships in the environmental sector, including the
possibility of spinning off the waste management sector in a “newco”, which may represent a
“national leader” industrial platform open to participation of new investors focused on the green &
circular economy sector.
The overall number of photovoltaic plants constructed by TerniEnergia since the start of
operations is equal to 273, with cumulative capacity of circa 284.1 MWp (including 13.2 MWp held
100% by the company and 30 MWp in joint venture, allocated to power generation activities). In
addition, biomass plants for a total of 1.5 Mwe and 2 MWt are connected to the grid.
The overall production of energy in full ownership and joint venture plants for power generation
activities was equal to circa 64 million kWh.
Within the environmental sector, plants for the treatment and recovery of unused tires in Nera
Montoro and Borgo Val di Taro, as well as for biodigestion and GreenAsm composting are
operational, as are the Nera Montoro groundwater purification plants. The Free Energia Group
11
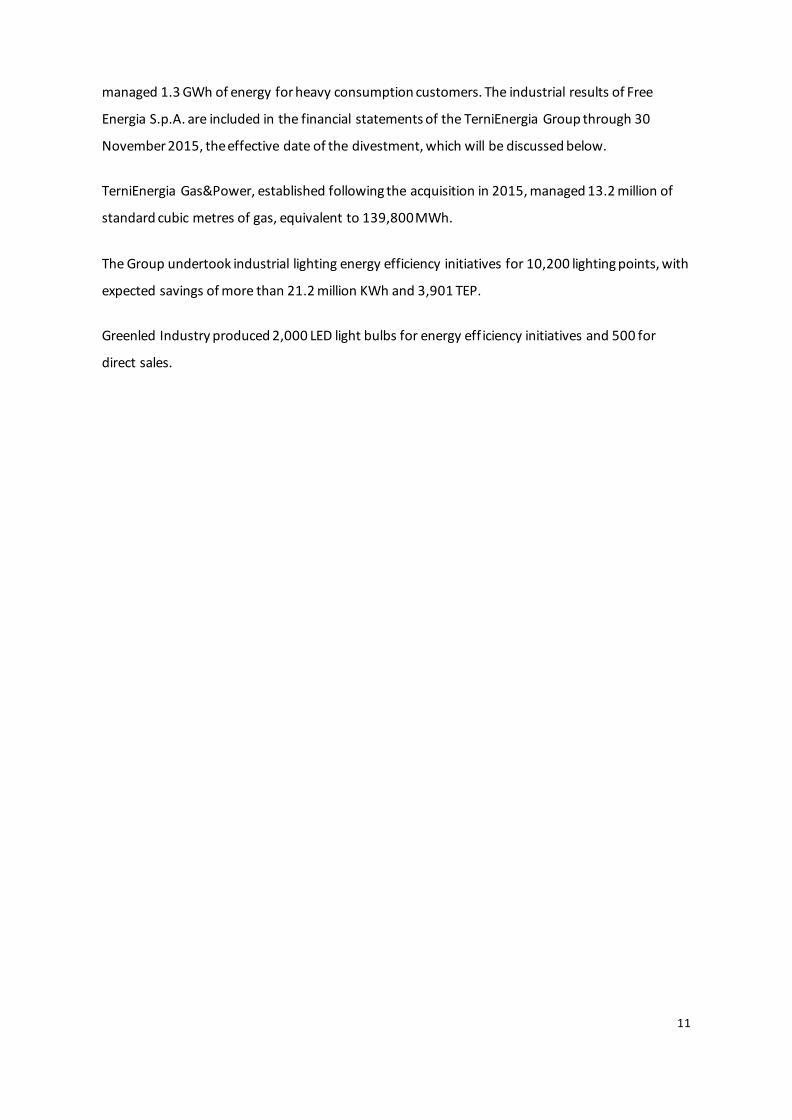
managed 1.3 GWh of energy for heavy consumption customers. The industrial results of Free
Energia S.p.A. are included in the financial statements of the TerniEnergia Group through 30
November 2015, the effective date of the divestment, which will be discussed below.
TerniEnergia Gas&Power, established following the acquisition in 2015, managed 13.2 million of
standard cubic metres of gas, equivalent to 139,800 MWh.
The Group undertook industrial lighting energy efficiency initiatives for 10,200 lighting points, with
expected savings of more than 21.2 million KWh and 3,901 TEP.
Greenled Industry produced 2,000 LED light bulbs for energy eff iciency initiatives and 500 for
direct sales.

12
1.4 THE GROUP’S STRUCTURE
TERNIENERGIA S.P.A.
100%
NEWCOENERGY S.R.L.
REBIS POWER S.R.L.
CAPITAL SOLAR S.R.L.
INVESTIMENTI INFRASTRUTTURE S.R.L.
CAPITAL ENERGY S.R.L.
SOC AGR FOTOSOLARA BONNANARA S.R.L.
ENERGIA NUOVA S.R.L.
SOC AGR FOTOSOLARA ORISTANO S.R.L.
MEET SOLAR S.R.L.
INFOCACIUCCI S.R.L.
RINNOVA S.R.L. 50% ENERGIA ALTERNATIVA S.R.L.
ENERGIA BASILICATA S.R.L.
SOLTER S.R.L.
ENERGIA LUCANA S.R.L.
GIRASOLE S.R.L.
VERDE ENERGIA S.R.L.
GUGLIONESI S.R.L.
FESTINA S.R.L.
GREEN ASM S.R.L.
SOCIETÀ AGRICOLA PADRIA SRL
SOC AGR FOTOSOLARA CHEREMULE S.R.L.
SOC AGR FOTOSOLARA ITTIREDDU S.R.L.
80% TEVASA L.t.d.
TECI S.R.L. TERNIENERGIA PROJECT L.t.d.
MEET GREEN ITALIA S.R.L.
70%
IGREEN PATROL S.R.L.
LYTENERGY S.R.L.
TERNIENERGIA POLSKA Sp.z.o.o.
5%
TERNIENERGIA SOLAR SOUTH AFRICA L.t.d.
SOL TARENTI S.R.L.
TERNIENERGIA S.p.A. HELLAS M.E.P.E.
TERNIENERGIAROMANIA S.R.L.
T.E.R.N.I. SOLARENERGY S.R.L.
ALCHIMIA ENERGY 3 S.R.L.
TERNIENERGIA GAS&POWER S.P.A.
GREENLED INDUSTRY S.P.A.
13
1.5 MAIN EVENTS DURING THE FINANCIAL YEAR ENDED 31 DECEMBER 2015
1.5.1 New 2015-2017 Industrial Plan, “Fast on the smart energy road”.
On 9 February 2015, the Board of Directors of TerniEnergia approved the 2015-2017 Industrial Plan,
“Fast on the smart energy road,” and updated the Group’s 2014 forecast.
1.5.2 Merger by incorporation of the fully owned company Lucos Alternative Energies S.p.A. into
TerniEnergia S.p.A.
On 27 February 2015, the Board of Directors of TerniEnergia and the extraordinary shareholders’
meeting of Lucos Alternative Energies approved the operation for the merger by incorporation of
Lucos (fully owned by TerniEnergia) into TerniEnergia by approval of the relative merger project
drafted in accordance with Articles 2501-ter and 2505 of the Italian Civil Code and previously
rendered public in accordance with the law.
The merger is part of the industrial and strategic policy as well as the 2015-2017 Industrial Plan “Fast
on the smart energy road” presented on 9 February 2015, which aims to develop the energy
efficiency business. In particular, the merger will shorten the control chain which will allow for more
effective financial management of energy efficiency activities, improved industrial coordination of
energy saving activities, the attainment of productive and financial synergies as well as the
attainment of significant savings in fixed operational and managerial costs.
The transaction was concluded on 14 May 2015 with the signature of the merger deed. It was
registered with the Terni Commercial Registry Office on 21 May 2015, the date that the legal effects
of the transaction began.
1.5.3 Authorisation of the plant for treatment of liquid waste in Nera Montoro (TR)
On 3 March 2015, TerniEnergia communicated that, by means of Executive Resolution of the
Province of Terni no. 11458/2015, an “Integrated Environmental Authorisation (IEA)” was issued in
relation to the “Operational plan for restoration of the groundwater of the industrial site of Nera
Montoro (TR) – adjustment to provisions and implementation of current plants with the
introduction of new sections for liquid waste treatment with third parties”.
14
In particular, the attainment of authorisations will allow TerniEnergia to complete the investments
on the biological and chemical/physical plants that are already operational in order to comply with
the provisions for the restoration project of the groundwater of Nera Montoro, as approved by the
Umbria Region in April 2011 (emissions with qualities and characteristics of “deep waters”). Finally,
by means of the IEA, TerniEnergia may expand the treatment capacities of the existing plants by
creating a new purifier for the purposes of starting up the business for treatment of special liquid
wastes (e.g. agricultural, industrial, chemical/organic and inorganic, etc.). The authorisation will
allow for the treatment of 58,000 cubic meters/year of inflowing waste, represented by both liquid
water and pumpable muds. The capex of this additional investment is approximately Euro 3 million
and will allow for the realisation of new plants with elevated quality within the green industrial pole
of Nera Montoro (TR), intercepting flows of liquid waste that are currently send to plants outside
the Umbria region and at the same time meeting the industrial demand of central Italy.
1.5.4 Contracts for the construction of two photovoltaic plants in the Republic of South Africa for
an overall installed power capacity of 148.5 MWp
On 12 March 2015, TerniEnergia – as part of its process of internationalisation of the photovoltaic
EPC (engineering, procurement and construction) business – announced the start-up of construction
of industrial-size photovoltaic plants in South Africa with a total power of 148.5 MWp on behalf of
a primary Italian utility company.
In particular, work began following the definitive EPC and O&M (operation and maintenance)
contracts that provide for the construction by TerniEnergia Project PTY Ltd, a South African
subsidiary of TerniEnergia S.p.A., of two photovoltaic plants with the "EPC Contract" (turnkey)
formula and that include the supply of panels and inverters, respectively, in the locality Paleisheuwel
with a power of 82.5 MWp and in Tom Burke for 66 MWp of installed capacity, for a total
consideration of approximately Euro 120 million, calculated using the 31 December 2015 exchange
rate.
1.5.5 Increased voting rights
On 16 March 2015, the TerniEnergia Extraordinary Shareholders’ Meeting was held with the
attendance of shareholders representing 63.01% of the share capital, passing amendments to the
Articles of Association (Article 6) with a 99.95% favourable vote, which introduce the mechanism of
increased voting rights. The introduction of this mechanism aims to create incentives for medium

15
to long term investment and therefore the stability of the shareholding structure, in compliance
with the right pursuant to Article 127-quinquies of the Consolidated Financial Act – recently
introduced – as well as Article 20 of Law decree 91 of 24 June 2014 (known as the “Competitiveness
Decree”). In particular, the introduced regulations provide, in fact, for the assignment of two votes
to each ordinary share held by the same shareholder for a continuing period of not less than two
years, effective as of the date of registration within a specific list created and maintained by the
Company.
1.5.6 Valorisation of photovoltaic assets; 50% of SPV DT Srl sold.
On 24 March 2015, as part of its strategy aimed at enhancing the value its photovoltaic assets,
TerniEnergia S.p.A. signed an agreement for the sale to AEGA ENERGY PRIMA AS (a fund governed by
the laws of Norway) of 50% of the share capital of DT Srl, owner of an industrial-sized plant with
total installed capacity of approximately 1 MWp.
The price for 50% of the shares was agreed between the parties at approximately Euro 0.5 million
and AEGA ENERGY PRIMA AS paid in cash.
1.5.7 Acquisition of New Gas Trade Srl and the launch of TerniEnergia Gas&Power SpA
On 23 April 2015, TerniEnergia signed an agreement with La Mercantile Srl of La Spezia for
acquisition of 85% of the share capital of the company New Gas Trade Srl (NGT), an Italian concern
which operates in the upstream and liquefied natural gas sectors, in the integrated management of
energy commodities area. The price for the shares was agreed between the parties at approximately
Euro 150 thousand and TerniEnergia paid in cash.
Subsequently, on 9 July 2015, the Board of Directors of TerniEnergia resolved to acquire the
remaining 15% of the share capital of New Gas Trade Srl (NGT) held by Intermonte Holding SIM, a
MiFID-governed company. The sale price was agreed at Euro 49 thousand, payable in cash.
Through the acquisition of NGT, TerniEnergia is pursuing the objective of competing its energy
management offer through access to the dual fuel market for industrial customers, ensuring real
savings on the "cost component, including due to the Group's energy efficiency activity, thereby
continuing its focus on the objective of promoting growth externally as per the "Fast on the energy
smart road” Industrial Plan.
Finally, on 7 October 2015, the Extraordinary Shareholders’ Meeting of New Gas Trade approved
the transformation of the company from S.r.l. into S.p.A., and the change in company name to

16
TerniEnergia Gas&Power S.p.A., with the resulting amendments to Art. 1 of the Articles of
Association.
The change in the company name is part of the Group’s broader reorganisation plan, aimed at:
- participating in all phases of the energy and gas value chain in Italy, integrating
purchasing, trading and marketing of natural gas and LNG with the activities of generating and
managing electricity;
- optimising growth opportunities in the gas sector which, in Italy as well as globally, posted
positive results in 2015 both in terms of volumes as well as margins, with more compelling growth
forecasts, including in relation to the electricity sector;
- better distinguishing the role of the Company in relationships with institutions, the market, the
financial and business community as well as customers.
Furthermore, the Extraordinary Shareholders’ Meeting resolved a divisible increase in share capital
for cash, from Euro 100 thousand up to a maximum of Euro 1 million. The share capital increase
has already been subscribed for Euro 0.5 million. In order to achieve better industrial coordination
of the business, the company will be merged by incorporation into TerniEnergia in the first half of
2016.
1.5.8 Shareholders’ Meeting approves the 2014 financial statements as well as the distribution of
a dividend equal to Euro 0.065 per share
On 24 April 2015, the Shareholders' Meeting of TerniEnergia examined and unanimously approved
the draft financial statements and the distribution of a dividend of Euro 0.065 per ordinary share,
gross of tax. The dividend was paid on 20 May 2015, with voucher no. 6 paid on 18 May 2015.
1.5.9 New PFU plant at Borgo Val di Taro
On 21 July, the Company inaugurated its second installation for the treatment and recovery of out-
of-use tyres (PFU), located in the Municipality of Borgo Val di Taro (Parma).
The technologically innovative system, installed by TerniEnergia, required an overall investment of
Euro 5.5 million. The plant became operational at the end of 2015 and has a processing capacity of
26,400 tonnes/annum in a restored and converted industrial area of 10,000 square metres, of which
2,000 are covered.

17
Through construction of this plant, TerniEnergia strengthens its national leadership position in the
industrial PFU recovery market, pursuing the objective of sustainability by reducing/cancelling
entirely the dispersion of this waste, implementing the market opportunities provided by the
legislative framework, which provides for full traceability of the tyre at the end of its useful life.
With two plants at Nera Montoro (TR) and Borgo Val di Taro (PR), TerniEnergia is set to reach a
processing capacity of approximately 20% of the domestic requirement.
1.5.10 Divestment of Free Energia
On 2 October 2015, the TerniEnergia Board of Directors resolved to approve a divestment
transaction through the signing of a divestment agreement. The subject of the agreement is the
transfer, for a maximum of all of the shares that TerniEnergia owns in Free Energia S.p.A., equivalent
to 3,674,604 shares, and equivalent to 97.60% of the share capital of the latter, in execution of an
agreement between the Company and the principal former shareholders of Free Energia. The
compensation for the transaction was the repurchase of all of the TerniEnergia shares owned by the
former shareholders of Free Energia, up to a maximum of 6,477,550. Hence, on 7 August 2015, the
TerniEnergia Board of Directors resolved to accept the proposals of the principal former
shareholders of Free Energia, received on 31 July 2015, to suppress the effects of the investment
agreement signed on 1 August 2014, according to which, as part of a share capital increase reserved
to said shareholders, they subscribed 6,477,550 TerniEnergia shares through the transfer of
3,674,604 Free Energia shares, equivalent to 97.60% of its share capital. As a result of this
transaction, Free Energia became part of TerniEnergia Group. In executing said investment
agreement, on 21 October 2014, TerniEnergia informed the market that an authorisation request
was pending with CONSOB for the publication of the prospectus for admission to trading of
TerniEnergia shares resulting from the share capital increase in service of the Free Energia
acquisition. Subsequently, on 31 July 2015, as indicated above, TerniEnergia received from the
principal former shareholders of Free Energia a proposal to suppress the effects of the signed
investment agreement. On 7 August 2015, the Board of Directors resolved to accept this proposal,
also ratifying the withdrawal of the prospectus under review by CONSOB and prepared by the
Chairman of the Board of Directors on 6 August 2015.
Also on 7 August, the Board of Directors accepted the resignation of Umberto Paparelli, one of the
principal former shareholders of Free Energia, from the role of Deputy Chairman and member of
the Board of Directors of TerniEnergia.
The key reasons that the Board of Directors of TerniEnergia S.p.A. decided to accept the proposal of
the principal former shareholders of Free Energia involved certain tax disputes of Free Energia for
18
the years 2009-2013, as well as assessments inherent in the forecasts for energy trading activities
and possible developments in the gas market.
The effectiveness of the divestment agreement as it relates to the transfer of Free Energia shares in
exchange for TerniEnergia shares was subject to the twofold condition of approval by the
Bondholders’ Meeting and the Shareholders’ Meeting.
The compensation for the transfer of the entire investment in Free Energia (with the exception of a
minor amount of shares in the event not all of the former shareholders of Free Energia opted to
participate in the divestment agreement) consisted of TerniEnergia shares subscribed by the
principal former shareholders of Free Energia from the dedicated share capital increase of 21
October 2014. The value of the compensation was confirmed by an opinion issued on 30 September
2015 by an independent expert designated by the parties, who confirmed that the value of the
entire investment in Free Energia was between Euro 15 million and Euro 20 million, indicating that
said value could be considered equivalent to the value assigned to the unlisted TerniEnergia shares,
thereby not necessitating any cash adjustment.
Thus, the Board of Directors decided to proceed with the transfer as per the divestment agreement
at a value that represented the median of the aforementioned range of the appraisal and, therefore,
for a value deemed fair of Euro 17.5 million.
In addition to the reciprocal granting of declarations and guarantees that are typical of this type of
transaction, the divestment agreement also envisaged governance during the interim period
between the subscription date and the closing date, with joint management of certain operating
aspects of Free Energia for specific issues, including treasury and the release of guarantees provided
by TerniEnergia, as co-guarantor, to Free Energia as part of supply relationships.
As a result of analyses performed by TerniEnergia, the transaction was not considered a “transaction
between related parties”.
As regards the effects on the “Fast on the smart energy road” Industrial Plan presented to the
market on 9 February 2015, the Board decided, on 7 August 2015, among other things, to confirm
the strategic and financial objectives envisaged for 2015 and to affirm the business model and
organisational structure based on four business lines (Technical Services, Cleantech, Energy
Management and Energy Saving) that would cover the entire energy value chain.
On 30 November 2015, TerniEnergia S.p.A. concluded the divestment transaction for the transfer of
Free Energia S.p.A. shares, receiving as payment the shares in TerniEnergia owned by shareholders
of Free Energia.
In particular, as communicated to the market on the same date, on 2 October 2015, the Board of
Directors of TerniEnergia resolved to sign the divestment contract for the transfer of the Free

19
Energia shares to the principal formers shareholders of Free Energia, in exchange for unlisted
TerniEnergia shares.
The divestment contract included two precedent conditions: approval expressed (i) by the meeting
of the holders of the “TerniEnergia Euro 25,000,000.00 Notes due 2019” bond, held on 16 November
2015 and (ii) by the Shareholders’ Meeting held on 18 November 2015. Subsequent to the fulfilment
of these conditions, with the reversal of the Free Energia shares and the transfer of the TerniEnergia
shares to the qualified broker, this divestment agreement was completed on 30 November 2015.
Consequently, TerniEnergia sold 3,315,936 shares in Free Energia (equivalent to 88.07% of the entire
share capital of Free Energia) to BA & Partners S.p.A., Sistematica S.p.A., Energetica S.p.A. and Feed
S.p.A., obtaining in exchange 5,845,290 own shares (equivalent to 13.26% of the share capital of
TerniEnergia). Moreover, following the closing of the year, 358,668 shares were sold. Profit
distribution rights for 2015 were retained pro quota by said purchasers. Refer to explanatory note
no. 3.6.8 of the income statement for the effects of this transaction on the financial statements.
Part of the own shares resulting from said divestment transaction were used to purchase shares of
Greenled Industry S.p.A., as will be explained below. The remaining shares can be used for any
transactions that involve third party investors, which have not yet been identified.
1.5.11 Valorisation of photovoltaic assets; 50% of JV SAIM Energy 2 Srl sold
As part of the strategy to enhance the value of the photovoltaic assets, TerniEnergia signed an
agreement to sell 50% of the shares of SAIM Energy 2 Srl, a company that manages a 997.04 kWp
photovoltaic plant located in the city of Torchiarolo in the province of Brindisi, to Fabrizio Venturi.
The total value of the sale was agreed between the parties to be Euro 650 thousand, including 412
thousand pertaining to the value of the shares of the JV SAIM Energy 2 Srl and Euro 238 thousand
pertaining to the value of the dividends resolved but not yet paid for the portion due to
TerniEnergia. The sales deed for the shares in the JV SAIM Energy 2 Srl was subject to a
termination clause in the case of failed approval of the transaction from the leasing company with
which the company had stipulated contracts for the photovoltaic plant, no later than 31 March
2016.
As Fabrizio Venturi is an executive director of TerniEnergia, the transaction is considered an
insignificant transaction with a related party. In applying the procedures for transactions with
related parties as well as CONSOB Regulation no. 17221 of 12 March 2010, the Committee for
Transactions with Related Parties was informed of the terms and conditions of the transaction and
20
expressed its favourable opinion, supported by an appraisal prepared by an independent expert,
on the advantage to and economic interest of TerniEnergia in the transaction.
1.5.12 Update of the 2015-2017 Industrial Plan, “Fast on the smart energy road”
On 29 October 2015, the Board of Directors approved the update to the 2015-2017 Industrial Plan,
which was considered appropriate following the deconsolidation of Free Energia from the Group,
consequent to the divestment contract approved by the Board on 2 October 2015.
The package of TerniEnergia shares received as compensation for the transfer of the investment in
Free Energia may be used for possible extraordinary transactions in forming business or strategic
alliances that involve third party investors, which have not yet been identified. These transactions
may target:
- Companies in the EPC sector of plants producing energy from renewable sources (not exclusively
photovoltaic), operating at an international level, in order to take advantage of this period of
strong global growth, led by the increase in energy needs of emerging countries, new international
policies on containing global warming, and, above all, the increase in investments in the sector;
- Companies operating in the Gas&Power management sector, also at an international level, in
order to strengthen and accelerate commercial, operational and post-sale services development
for TerniEnergia Gas&Power, a subsidiary of the Group that is active in trading energy, natural gas
and liquefied natural gas;
- Companies operating in “smart technologies” for the demand to reduce energy consumption by
large industrial, commercial and public administration entities, in order to increase the entity’s
energy efficiency margins by implementing proprietary technologies.
The updated plan confirms the organisational structure, which continues to be based on 4
functional business lines: Technical Services, Cleantech, Energy Management and Energy Saving.
TerniEnergia confirms a significant increase in revenues and profitability in 2017 and, at the same
time, a decrease in the NFP and increase in margins.

21
1.5.13 Acquisition of 100% of share capital of Greenled Industry by TerniEnergia
On 30 November 2015, having received the favourable opinion of the Committee for Transactions
with Related Parties, the Board of Directors of TerniEnergia S.p.A. resolved to acquire up to 100%
of the share capital of Greenled Industry S.p.A. (“Greenled”), a company that produces and sells
light bulbs with LED technology.
In particular, on 27 November 2015, the Board of Directors of Italeaf S.p.A., the controlling
shareholder of Greenled, resolved to propose to TerniEnergia the acquisition of Greenled shares
(the “Transaction”) at market value, based on the appraisal of a specially designated independent
expert. The sales price for 100% of the shares representing the share capital of Greenled was
agreed at Euro 3.5 million, as indicated by the assessment performed by the independent expert
appointed by TerniEnergia.
After receiving the proposal from Italeaf, the TerniEnergia Board of Directors decided in favour of
the transaction, resolving to submit it for the approval of the Shareholders’ Meeting called for 28
December 2015.
Greenled produces and sells LED light bulbs, which are considering high performing in terms of
energy efficiency and savings, and with considerable technological capabilities.
For TerniEnergia, the acquisition optimises the supply chain for the Energy Saving business line,
which carries out energy efficiency projects, in which the purchasing of LED light bulbs represents
the most significant cost item. Hence, this transaction is consistent with the objectives of
TerniEnergia and in line with growth in the Energy Saving sector envisaged in the Industrial Plan
presented to the financial community on 30 October 2015.
TerniEnergia’s acquisition of Greenled is considered a transaction between related parties, as it
was carried out with the latter’s parent company, Italeaf S.p.A., which holds an investment
representing 46.78% of the share capital of TerniEnergia, over which it exercises control pursuant
to Art. 2359, paragraph 1, no. 2 of the Italian Civil Code and Art. 93 of the TUF (Consolidated
Financial Act).
In addition, Greenled shareholders are related parties with the company.

22
Therefore, the transaction was approved by the Board of TerniEnergia after receiving the
favourable opinion of the Committee for Transactions with Related Parties, in accordance with
CONSOB Regulation no. 17221/2010 and the procedure adopted by the company.
Consequently, TerniEnergia prepared a disclosure document, in accordance with the instructions
in the governing regulation as well as the Procedure for Transaction with Related Parties,
approved by the Board of Directors of TerniEnergia S.p.A. on 30 November 2010.
On 28 December 2015, the TerniEnergia S.p.A. Shareholders’ Meeting approved this investment
transaction for the purchase of up to 100% of the shares representing the share capital of
Greenled Industry S.p.A. against the transfer, as payment, of up to 2,078,195 own shares,
equivalent to 4.71% of the share capital.
The counter value of Euro 3.5 million, paid through the transfer of 2,078,195 own shares,
corresponds to 4.71% of the share capital of TerniEnergia. Refer to Explanatory Note no. 3.5.1 for
the effects of this transaction on the financial statements.
1.5.14 Multi-year agreement with Avanti Communications to distribute connectivity between the
renewable energy plants in South Africa and Italy
In December 2015, TerniEnergia informed the market that it had signed a multi-year agreement
with Avanti Communications, leading supplier of satellite data communications services in Europe,
the Middle East and Africa. The company will use the Avanti’s Ka-band satellite technology to
provide high speed, broadband connectivity for its giant photovoltaic plants located in
Paleisheuwel and Tom Burke in South Africa, which are under construction by a leading Italian
utility. The satellite service is provided through a VPN (Virtual Private Network) to ensure that the
IP traffic is secure and encrypted between the points of transmission and reception.
1.5.15 Valorisation of photovoltaic assets continues: 50% of four SPVs sold to Renewable
European Investment Italy 3
On 30 December 2015, as part of its strategy to enhance the value of photovoltaic assets,
TerniEnergia signed an agreement to sell 50% of the share capital of the SPVs (Special Purpose
Vehicles) Investimenti Infrastrutture Srl, Società Agricola Fotosolara Oristano Srl, Società Agricola
Fotosolara Bonannaro Srl and Infocaciucci Srl to Renewable European Investment Italy 3 – REI III Srl,
a company belonging to the Radiant Clean Energy Fund. These SPVs own a total of four industrial-
size photovoltaic plants for total installed power of 3.3 MWp.

23
The total sales price was agreed between the parties to be Euro 1.7 million. The cash payment from
Renewable European Investment Italy 3 – REI III Srl was received in January 2016.
The agreements to sell the investments in the SPVs Investimenti Infrastrutture Srl, Società Agricola
Fotosolara Oristano Srl, Società Agricola Fotosolara Bonannaro Srl and Infocaciucci Srl were subject
to precedent conditions, including the negative result of due diligence reviews, failure to receive
approval of the operation by the leasing company with which the company stipulated contracts for
photovoltaic plants by 30 March 2017, and the failure of the seller to issue adequate guarantees on
the restitution of the sales price should the leasing party not give its approval.

24
1.6 PERFORMANCE OF OPERATIONS
Below are summarised the main economic and financial highlights of the TerniEnergia Group as at
31 December 2015 compared to those of the previous year.
2015 2014
Change Change
(in Euro) %
Income Statement
Net revenues from sales and services 368,740,277 95,191,364 273,548,913 n.a.
EBITDA 25,241,031 18,003,466 7,237,565 40%
EBIT 17,130,414 8,433,047 8,697,367 103%
Result for the period 2,557,445 6,203,581 (3,646,136) (59)%
EBITDA margin 6.8% 18.9% (12.1)% (64)%
31 December 31 December Change Change
(in Euro) 2015 2014 %
Financial data
Fixed assets 125,960,176 151,305,332 (25,345,156) (17)%
Net working capital, excluding provisions and other liabilities 17,202,726 28,216,107 (11,013,381) (39)%
Net financial position 87,371,548 108,174,685 (20,803,137) (19)%
Shareholders’ equity 55,791,353 71,346,754 (15,555,401) (22)%
Performance indicators 31 December 31 December
2015 2014
PROFITABILITY RATIOS
ROE 4.8% 9.5%
ROI 10.6% 4.6%
ROS 4.6% 8.9%
FINANCIAL RATIOS
Fixed asset coverage 1.56 1.48
Short-term NFP / Shareholders’ equity 0.15 0.26
NFP / Shareholders’ equity 1.57 1.52
NFP / Net invested capital 0.61 0.60
Shareholders’ equity / Net invested capital 0.39 0.40
NFP / EBITDA 3.46 6.01
NET WORKING CAPITAL ROTATION
Net working capital / Revenues 6.30% 38.10%

25
Consolidated net revenues for the year amount to Euro 368,740 thousand, an increase of Euro
273,549 thousand over the previous year. On one hand, the increase is due to the inclusion of Free
Energia in the scope of consolidation as of 21 October 2014 until 30 November 2015, following the
merger and subsequent divestment transactions described in the previous paragraphs. On the other
hand, it is due to progress in the constructions works for EPC activities related to the two projects
in South Africa. The contribution to 2015 revenues ascribable to Free Energia is equal to Euro
246,414 thousand. EBITDA is Euro 25,241 thousand, a considerable increase (+40%) over 31
December 2014 (Euro 18,003 thousand), due mainly to the inclusion of Free Energia in the scope of
consolidation as well as the status of EPC activities in the construction projects in South Africa.
EBITDA margin is equivalent to 6.8%, down from 2014 (18.9%), due to the modified business model.
Revenues and margins are the highest ever achieved in the Group’s history.
The decline in statement of financial position figures from the previous year is essentially
attributable to the divestment of Free Energia at the end of November 2015, with the resulting
decrease, in particular, of shareholders’ equity, from Euro 71,346 thousand to Euro 55,791
thousand, and the sale of 50% of the share capital of the SPVs Investimenti Infrastrutture Srl, Società
Agricola Fotosolara Oristano Srl, Società Agricola Fotosolara Bonannaro Srl and Infocaciucci Srl to
Renewable European Investment Italy 3 – REI III Srl, which resulted, in particular, in the decrease in
tangible fixed assets and net financial position.

26
ECONOMIC RESULTS
The financial results of the Group are summarised below:
2015 2014 Change
Change
(in Euro) %
Net revenues from sales and services 368,740,277 95,191,364 273,548,913 n.a.
Cost of production (335,980,070) (71,446,441) (264,533,629) n.a.
Added value 32,760,206 23,744,923 9,015,283 37.97%
Personnel costs (7,519,175) (5,741,457) (1,777,718) 30.96%
EBITDA 25,241,031 18,003,466 7,237,565 40.20%
Amortisation, depreciation, allocations and write-downs (8,110,618) (9,570,419) 1,459,801 (15.25)%
Operating result 17,130,414 8,433,047 8,697,367 103.13%
Financial income and expenses (10,351,957) (10,080,568) (271,389) 2.69%
Profit share from joint ventures (665,015) 907,637 (1,572,652) n.a.
Pre-tax result 6,113,442 (739,884) 6,853,326 n.a.
Income taxes (3,555,997) 6,943,465 (10,499,462) n.a.
Net result 2,557,445 6,203,581 (3,646,136) (58.77)%
At 31 December 2015, the Group posted consolidated revenues from sales and services of Euro
368,740 thousand, up from Euro 273,549 thousand in the previous year (Euro 95,191 thousand).
This mainly reflects the inclusion of Free Energia in the scope of consolidation effective from 21
October 2014 to 30 November 2015, following the merger and subsequent divestment transactions
described above, as well as the progress in the constructions projects in South Africa for EPC
activities. The contribution to 2015 revenues ascribable to Free Energia is equal to Euro 246,414
thousand.
Revenues relative to Technical Service activities are Euro 107,831 thousand, broken down as
follows: revenues relative to EPC activities in the photovoltaic sector are Euro 96,476 thousand (Euro
5,210 as of 31 December 2014) and refer to the works for the realisation of photovoltaic plants
during that period in South Africa. Revenues deriving from the management of photovoltaic plants
(Power Generation Fotovoltaico) amounted to Euro 7,083 thousand, a significant decrease with
respect to the previous year (Euro 16,039 thousand) due to the disposal of certain photovoltaic
assets during 2015 as described above.
The Cleantech business line had revenues of Euro 8,678 thousand, up 14.1% compared to the prior
year, mainly due to the full year of operations of the PFU in Nera Montoro as well as the
strengthening of biodigester activities. Revenues from the Energy Saving business line amount to

27
Euro 2,494 thousand, an increase over 2014, due to several important energy efficiency projects
which took place in 2015.
Direct production costs, which are primarily variable in nature, totalled Euro 335,980 thousand, an
increase of Euro 264,534 thousand compared to the previous year (Euro 71,446 thousand), primarily
due to the different types of activities and the entry of the Energy Management business line, in line
with the changes posted in revenues. EBITDA increased from Euro 18,033 thousand in 2014 to Euro
25,241 thousand in 2015. This substantial increase in EBITDA is due to the inclusion of Free Energia
in the scope of consolidation through November 2015 and EPC activities in the two “giant”
construction works in South Africa.
Amortisation, depreciation, allocations and write-downs in the reclassified income statement have
decreased from Euro 9,570 thousand in the previous year to Euro 8,111 thousand. This result is the
combination of lower depreciation for the fewer photovoltaic plants fully owned by the Group,
partially offset by the effect of higher write-downs posted in 2015.
Financial management, which had a negative balance of Euro 10,352 thousand, is essentially in line
with 2014 due to the combined effect of, on one hand, the higher impact of bank commissions,
attributable to sureties guaranteeing the projects in South Africa, net of the reduction in interest
expense deriving from lower average indebtedness over 2015 compared to the prior year, while on
the other, recognition of 2014 dividends disbursed in 2015 by Free Energia, which left the Group at
the end of 2015.
The significant variation in the item “Income taxes” is attributable to the fact that there was a
positive balance in 2014 of Euro 6,943 thousand as a result of the recognition of tax income related
to the “Tremonti Ambientale” (environmental law) for certain Group companies that owned large
photovoltaic parks. However, in 2015 there was a higher tax rate, equivalent to 58%, that is
imputable in particular to the effects of the IRES reduction beginning in 2017, which caused a
recalculation of deferred taxes in 2015.
The net result for the year as at 31 December 2015 has a positive balance of Euro 2,557 thousand,
with a decrease in absolute terms of Euro 3,646 thousand compared to the figure for last year (Euro
6,204 thousand), as a result of the dynamics described above.
With regard to the modalities for representation of results, refer to that reported below in the
paragraph “Alternative performance indicators”.
28
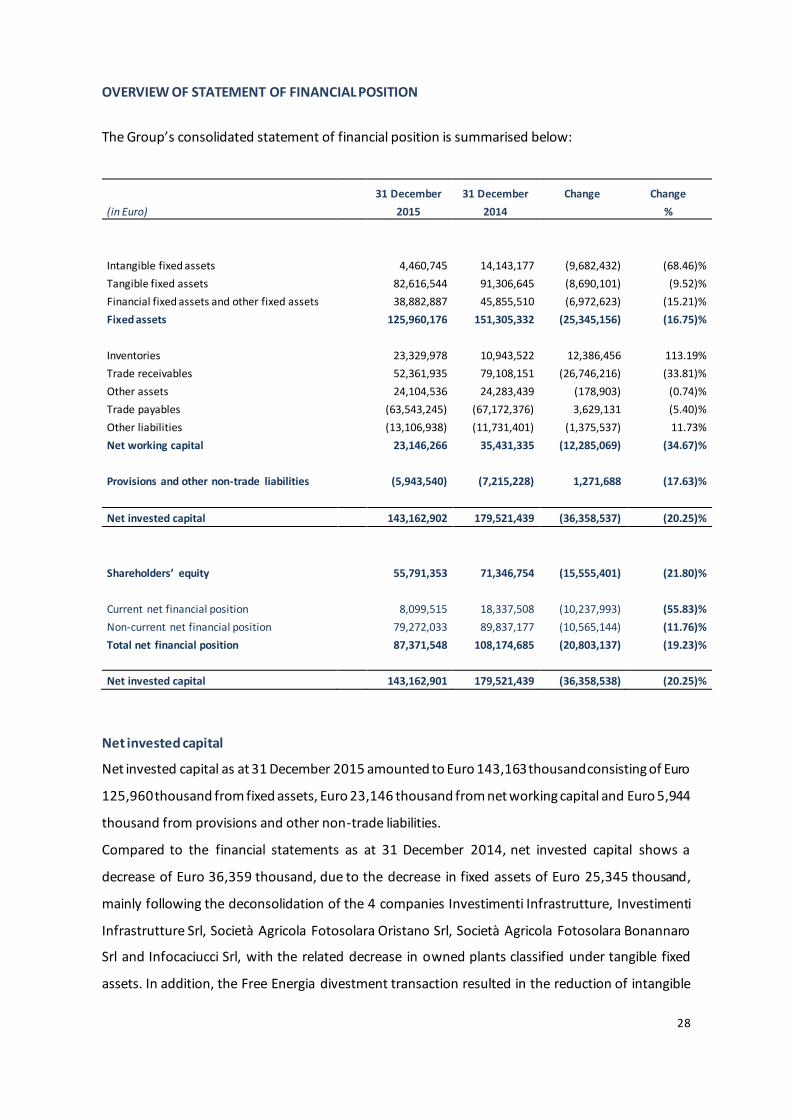
OVERVIEW OF STATEMENT OF FINANCIAL POSITION
The Group’s consolidated statement of financial position is summarised below:
31 December 31 December Change Change
(in Euro) 2015 2014 %
Intangible fixed assets 4,460,745 14,143,177 (9,682,432) (68.46)%
Tangible fixed assets 82,616,544 91,306,645 (8,690,101) (9.52)%
Financial fixed assets and other fixed assets 38,882,887 45,855,510 (6,972,623) (15.21)%
Fixed assets 125,960,176 151,305,332 (25,345,156) (16.75)%
Inventories 23,329,978 10,943,522 12,386,456 113.19%
Trade receivables 52,361,935 79,108,151 (26,746,216) (33.81)%
Other assets 24,104,536 24,283,439 (178,903) (0.74)%
Trade payables (63,543,245) (67,172,376) 3,629,131 (5.40)%
Other liabilities (13,106,938) (11,731,401) (1,375,537) 11.73%
Net working capital 23,146,266 35,431,335 (12,285,069) (34.67)%
Provisions and other non-trade liabilities (5,943,540) (7,215,228) 1,271,688 (17.63)%
Net invested capital 143,162,902 179,521,439 (36,358,537) (20.25)%
Shareholders’ equity 55,791,353 71,346,754 (15,555,401) (21.80)%
Current net financial position 8,099,515 18,337,508 (10,237,993) (55.83)%
Non-current net financial position 79,272,033 89,837,177 (10,565,144) (11.76)%
Total net financial position 87,371,548 108,174,685 (20,803,137) (19.23)%
Net invested capital 143,162,901 179,521,439 (36,358,538) (20.25)%
Net invested capital
Net invested capital as at 31 December 2015 amounted to Euro 143,163 thousand consisting of Euro
125,960 thousand from fixed assets, Euro 23,146 thousand from net working capital and Euro 5,944
thousand from provisions and other non-trade liabilities.
Compared to the financial statements as at 31 December 2014, net invested capital shows a
decrease of Euro 36,359 thousand, due to the decrease in fixed assets of Euro 25,345 thousand,
mainly following the deconsolidation of the 4 companies Investimenti Infrastrutture, Investimenti
Infrastrutture Srl, Società Agricola Fotosolara Oristano Srl, Società Agricola Fotosolara Bonannaro
Srl and Infocaciucci Srl, with the related decrease in owned plants classified under tangible fixed
assets. In addition, the Free Energia divestment transaction resulted in the reduction of intangible
29
fixed assets and financial fixed assets due to, respectively, the goodwill from the consolidation of
the equity investment and the securities used by Free Energia as collateral for guarantees issued on
the supplies of electricity.
The decrease in net working capital is mainly attributable to the combined effect of the increase of
raw material inventories, consisting primarily of panels, used in constructing the two photovoltaic
plants in South Africa, and the reduction in trade receivables after the exclusion of Free Energia
S.p.A. from the scope of consolidation.
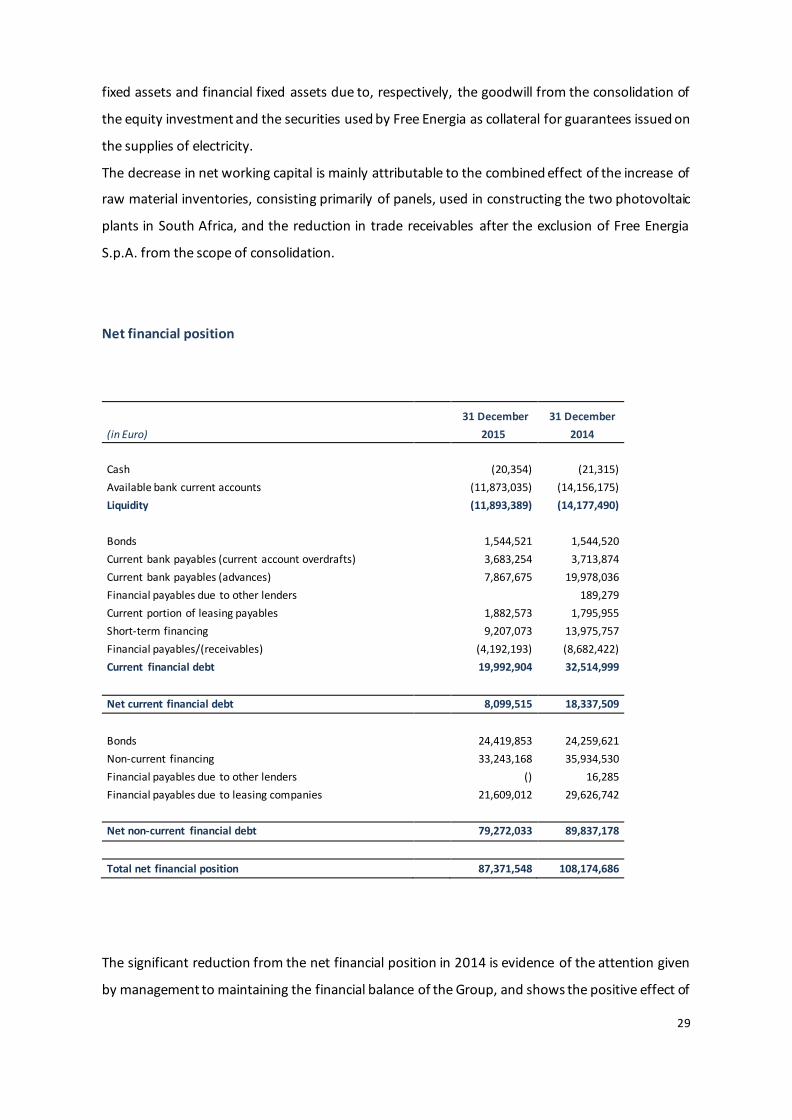
Net financial position
31 December 31 December
(in Euro) 2015 2014
Cash (20,354) (21,315)
Available bank current accounts (11,873,035) (14,156,175)
Liquidity (11,893,389) (14,177,490)
Bonds 1,544,521 1,544,520
Current bank payables (current account overdrafts) 3,683,254 3,713,874
Current bank payables (advances) 7,867,675 19,978,036
Financial payables due to other lenders 189,279
Current portion of leasing payables 1,882,573 1,795,955
Short-term financing 9,207,073 13,975,757
Financial payables/(receivables) (4,192,193) (8,682,422)
Current financial debt 19,992,904 32,514,999
Net current financial debt 8,099,515 18,337,509
Bonds 24,419,853 24,259,621
Non-current financing 33,243,168 35,934,530
Financial payables due to other lenders () 16,285
Financial payables due to leasing companies 21,609,012 29,626,742
Net non-current financial debt 79,272,033 89,837,178
Total net financial position 87,371,548 108,174,686
The significant reduction from the net financial position in 2014 is evidence of the attention given
by management to maintaining the financial balance of the Group, and shows the positive effect of

30
the deconsolidation of the 4 companies Investimenti Infrastrutture, Investimenti Infrastrutture Srl,
Società Agricola Fotosolara Oristano Srl, Società Agricola Fotosolara Bonannaro Srl and Infocaciucci
Srl, as well as of Free Energia.
Net debt at 31 December 2015 amounted to Euro 87,372 thousand, divided into short-term portion
of Euro 8,099 thousand and long-term portion of Euro 79,272 thousand. The long-term portion is
primarily attributable to leases entered into with major financial institutions to cover the financial
requirements necessary for the development of photovoltaic plants that are fully available to the
company and for the investments in the biodigestion plant and the used tire treatment plant in Nera
Montoro. Non-current financial debt also includes the quota due beyond 12 months of the
corporate financing granted to the parent company TerniEnergia at the end of 2013, and mainly
composed of an unsecured loan totalling Euro 10 million with a duration of 60 months and
reimbursement in 20 quarterly instalments, as well as an unsecured loan of Euro 5 million with a
duration of 60 months and lump sum reimbursement at the expiration date, both issued by Veneto
Banca. Finally, the non-current financial debt also includes the bond with a nominal value of Euro
25 million and a duration of 5 years, annual coupon of 6.875%, as well as reimbursement in a lump
sum at the expiration date (month of February 2019). The current quota includes the interest
accrued in 2015, equal to Euro 1,544 thousand, and relative to the coupon paid in the month of
February 2016.
It should also be noted that the current financial payables comprise part of the payments incurred
for investments already made or still under construction and for which on 31 December 2015 the
company had not yet entered into a specific contract financing in the medium/long term. In
particular, they refer to the second treatment plant for used tyres completed at the end of 2015, a
pyrogasification plant and a composting plant under construction in Apulia.
The short-term financial position for an amount of Euro 8,010 thousand is basically made up of
short-term debt to banks for overdrafts (Euro 3,683 thousand) or advances on invoices and/or
contracts (Euro 7,868 thousand), short-term financing to banks for Euro 9,207 thousand, short-term
portion of lease payables for Euro 1,883 thousand, cash for Euro 11,893 thousand, and the short-
term portion of financial receivables and securities for Euro 4,192 thousand.
31
Shareholders' equity
As at 31 December 2015, shareholders' equity, including income for the period, amounted to Euro
55,791 thousand, a decrease from the previous year of Euro 15,555 thousand. For more details,
please refer to the Explanatory Note 3.5.1.
ALTERNATIVE PERFORMANCE INDICATORS
The items shown in the reclassified financial statements are in part extracted from the financial
statements required by law and listed in the remainder of this document and partly aggregated;
with regard to the latter, the following table shows the composition and notes referring to the items
of the statutory financial statements, as required by the CESR Recommendation (CESR/05-17 b).
Revenues: this item is given by the sum of revenues from sales and services.
Cost of production: the item is given by the sum of consumption of raw materials, cost of services
and other operating costs, changes in inventories of raw materials and consumables and finished
products.
Depreciation, amortisation and allocations: this item is given by the sum of amortisation and write-
downs of intangible assets, depreciation and impairment of tangible assets, and provisions for the
write-down of receivables.
EBITDA (Earnings Before Interest, Taxes, Depreciation and Amortisation) is an economic indicator
not defined by the International Accounting Standards. EBITDA is a measure used by management
to monitor and evaluate the operating performance of the Company, considered significant by the
management, as it is not affected by the volatility due to the effects of different criteria for the
determination of tax income, the amount and features of the capital used and
depreciation/amortisation policies. EBITDA is defined as the operating profit before depreciation
and amortisation of tangible and intangible assets, financial income and expenses and income taxes.
EBIT (Earnings Before Interest and Taxes) is the operating profit gross of financial income and
charges as well as income taxes.
The abovementioned values, such as EBITDA and EBIT, are commonly identified without having a
uniform definition in the accounting standards or in the Italian Civil Code and, therefore, might not
be comparable with similarly named values of other entities.
Other assets: this item is given by the sum of the items of other current assets and other financial
assets.
Other liabilities: this item is given by the sum of the items of tax payables and other liabilities.
Fixed assets: this item is given by the sum of intangible and tangible assets as well as financial fixed

32
assets.
Net working capital: this item is given by the sum of closing inventories, trade receivables, other
assets and assets held for sale, excluding trade payables and other liabilities.
Net working capital, excluding provisions and other liabilities: this item is given by the algebraic sum
of net working capital and provisions and other non-current liabilities.
The Net Financial Position (NFP), used as a financial indicator of indebtedness, is represented as the
sum of the following positive and negative components from the statement of financial position, as
required by CONSOB notice no. 6064293 of 28 July 2006.
Positive items: cash and cash equivalents, highly liquid securities under current assets, short-term
financial receivables and derivative instruments. Negative items: payables to banks, payables to
other lenders, leasing and factoring companies.
1.7 INVESTMENTS
(in Euro) Direct
investments Increase from
purchases
Total investments
as of
31/12/2015
31-Dec-2014 Change %
Software 310,810 310,810 809,122 (498,312) (61.6%)
Other intangible assets 1,075,603 1,075,603 1,502,940 (427,337) (28.4%)
Goodwill 145,600 145,600 9,055,368 (8,909,768) (98.4%)
Plant and machinery 2,541,712 2,541,712 1,085,730 1,455,982 134.1%
Industrial equipment 45,599 45,599 39,900 5,699 14.3%
Other goods 17,910 17,910 888,349 (870,439) (98.0%)
Other fixed assets in progress
3,255,318 3,255,318 2,236,011 1,019,307 45.6%
Total 7,246,952 145,600 7,392,552 15,617,420 (8,224,868) (52.66%)
1.8 HUMAN RESOURCES
The Parent Company applied Legislative Decree no. 81/2008, appointing a security manager and
entrusting a qualified and experienced outsourcer with the analysis of risks and the related
evaluation report.
Procedures have been implemented in compliance with currently effective legislation and, in this
regard, medical examinations as well as training and refresher courses on safety at work and within

33
the working environment are regularly carried out for all the employees of the Group.
Incentive plans have been envisaged for managers with strategic responsibilities and executive
directors of the Group in the form of an increase in their remuneration that is directly proportional
to the targets achieved.
As at 31 December 2015, there were 131 employees, primarily under the Parent Company and
classified as follows:
31-Dec-2015 31-Dec-2014
Actual Average Actual Average
Executives 4 3.67 6 4.42
Middle managers 12 9.16 11 12.17
Office workers 43 40.41 49 43.16
Manual workers 72 64.08 56 67.25
Total 131 120.34 122 127
The total employees increased from 122 in 2014 to 131 in 2015.
1.9 ENVIRONMENTAL POLICY
The Group’s mission provides for the respect and protection of the environment. TerniEnergia is
active in the sectors of energy, environment and services, in view of sustainable development, and
its objectives are economic growth, environmentally-friendly efficiency and social progress.
The mission of the TerniEnergia Group reflects the target to try to achieve an increasingly high level
of performance in pursuing a policy of innovation and economic growth, respecting the ecosystem,
through the careful use of natural resources.
More specifically, the construction of energy production plants is subject to authorisation
procedures which may require the implementation of EIA (Environmental Impact Assessment - VIA,
“Valutazione Impatto Ambientale”) procedures.
1.10 R&D
Pursuant to Art. 2428, paragraph 2, number 1, it is hereby acknowledged that in the year ended 31
December 2015, the Group carried out research and development whose costs were fully expensed
in the income statement.
34
1.11 RISK FACTORS RELATED TO THE REFERENCE SECTOR
In order to comply with the provisions pursuant to Italian Legislative Decree no. 58 of 24 February
1998 and, specifically, under Art. 154-ter as to the description of the main risks and uncertainties,
below are reported the risks and/or uncertainties and the related actions taken by the Group to
neutralise their effects on the economic-financial position and performance.
Activities pertaining to the construction and operation of plants for the production of energy from
renewable sources, similarly to new environmental activities, are extremely regulated; TerniEnergia
analyses in detail the regulations of reference in order to be constantly updated and to adopt, if
possible, optimal applicable solutions. During the implementation of its operations, TerniEnergia
therefore is subject to risks deriving respectively from external factors pertaining to the regulatory
and macroeconomic context of reference, including the legislative, financial and credit sectors
where the Group operates or which result from strategic choices adopted during operations and
which expose the Group itself to specific risks as well as internal risks deriving from ordinary
operational management.
The Group is therefore significantly influenced by trends in scenario variables that are not controlled
by TerniEnergia itself, including the issue and/or revocation of administrative authorisations,
developments in the regulatory framework, the energy produced by photovoltaic, biomass and
biogas plants, and assumptions made in relation to the price of sold electrical and thermal energy.
In order to contain these risks, TerniEnergia has diversified both the types of investment as well as
the locations of the operational plants in order to diversify risks across different enterprises. In
addition, the sector is characterised by a high level of competition as well as rapid and significant
technological innovation with consequences in terms of financial requirements.
Participation in policies for the support and strengthening of the sector reported a significant
decrease that culminated in the issue of the Spalmaincentivi (Incentive Diversification) Decree.
Italian Legislative Decree no. 91 of 24 June 2014, the so-called “Spalmaincentivi Decree”, contains
“urgent provisions for the agricultural sector as well as for environmental protection, energy
efficiency of school and university buildings, the launching and growth of companies, the
containment of costs affecting electrical prices and the immediate fulfilment of obligations pursuant
to European regulations”.
35
Despite the introduction of legislative provisions for decreasing incentives relative to the production
of electrical energy (as of 2015) – and which involve an inevitable decrease in cash flows from
investments – the management of the Parent Company believes it can confirm the existence of a
satisfactory level of profitability from the completed investments.
For the purposes of diversifying and mitigating risk relative to the regulatory framework of
reference, TerniEnergia has for some time implemented an internationalisation strategy by
conducting its activities for the design and construction of major industrial plans for the production
of electrical energy from renewable sources in countries with regulations that are favourable to the
development of such investments.
The construction of plants from renewable energy sources is primarily financed through project
financing, leasing and/or financing sources of both public and private origin. In light of the market
situation and the regulatory norms, there is also the risk associated with obtaining the financing that
is necessary or sufficient to realise projects or whether favourable conditions are obtained. In
addition, these financing contracts could provide for certain limitations, including in terms of timing,
and relative to the construction and operational start-up of the plants or may require the issuing of
guarantees.
During its current phase of developing business, the Group must constantly monitor these risk
factors in order to evaluate, in advance, any potentially negative factors and initiate any opportune
actions to mitigate them.
With regard to risks pertaining to legal disputes that are underway, refer to note 3.5.11 of the
Explanatory Notes.
With regard to interest rate risk, liquidity risk and credit risk, refer to note 3.8 of the Explanatory
Notes.
1.12 RELATIONS WITH RELATED PARTIES
With reference to relations with related parties, reference is made to the Explanatory Notes to the
Financial Statements (Note 3.7).

36
1.13 INFORMATION REQUIRED BY ART. 123 BIS OF THE TUF (CONSOLIDATED FINANCIAL ACT)
Structure of share capital
Categories of shares composing the share capital of the Parent Company:
N° OF SHARES % OF LISTED SHARE
CAPITAL RIGHTS AND OBLIGATIONS
Ordinary shares 44,089,550 100 The shares are registered and give the right to vote at ordinary and extraordinary shareholders’ meeting as well
as the right to participate in profits
The amount of the capital subscribed and paid up on 31 December 2015 was equal to Euro
57,007,230, divided into 44,089,550 ordinary shares, without par value. It should be noted that
3,767,095 shares, representing unlisted (as at the reporting date) own shares deriving from the
share capital increase of 13 October 2014 are marked by ISIN Code IT0005059230 and differ with
respect to those of the TerniEnergia shares that are currently in circulation.
The company has not issued other financial instruments that give the right to underwrite newly
issued shares.
The Group has not issued other financial instruments that give the right to underwrite newly issued
shares.
Restrictions on the transfer of securities
At the date of this report, there are no restrictions on the transfer of securities, such as limits on the
ownership of securities or the need to obtain approval by the Group or other holders of securities.
Significant shareholdings
As at 31 December 2015, significant shareholdings in the Group’s equity, as resulting from the
notices given pursuant to article 120 of the TUF and from the findings in the Register of
Shareholders, were the following:
Shareholder Investment No. of shares % of share capital
Stefano Neri
Direct 108,452 0.25%
through Italeaf S.p.A. (*) 20,717,103 46.99%
TerniEnergia S.p.A. Direct (**) 4,012,998 9.10%
(*) Italeaf is controlled by Stefano Neri, who owns 0.25% of the share capital directly and 51.15% indirectly, through Skill & Trust Holding, of which he holds 62.92% of the share capital directly. (**) own shares

37
Stefano Neri, Fabrizio Venturi and Monica Federici are directors of the Parent Company and
shareholders, with investments held directly and indirectly. More precisely, the shareholdings are
as follows:
31/12/2014 Changes 31/12/2015
Total no. of shares 44,089,550 44,089,550
Shares % Purchases Sales Shares %
Italeaf S.p.A. 20,624,644 46.78% 1,342,459 1,250,000 20,717,103 46.99%
Fabrizio Venturi 219,054 0.50% 144,400 74,654 0.17%
Monica Federici 10,240 0.02% 10,240 0.02%
Stefano Neri 108,452 0.25% 108,452 0.25%
Stefano Neri directly holds 0.25% of the share capital of the Parent Company and controls Italeaf
S.p.A., of which he holds 2.67% directly and 51.15% indirectly through Skill & Trust Holding, of which
he owns a controlling stake of 62.92% of the share capital.
Securities conferring special rights
At the date of this report, the Group has not issued securities which confer special control rights.
Restrictions on voting rights
At the date of this report, the By-laws do not provide for restrictions on the right to vote.
Shareholder agreements
At the date of this report, there are no shareholder agreements or agreements between significant
shareholders pursuant to Art. 122 of the TUF.
Own shares As of 31 December 2015, the own shares in the portfolio totalled 4,012,998, corresponding to 9.10%
of the share capital.

38
1.14 OTHER INFORMATION
Litigation, investigations and judicial proceedings in progress
With respect to litigation, investigations and legal proceedings, please refer to what is stated in the
Explanatory Notes under note 3.5.11.
Legislative Decree 231/2001 and Code of Ethics
The Parent Company has a specific governance structure that is essentially geared to the objective
of creating value for shareholders, while acknowledging the social importance of the activities in
which it is engaged.
In addition, an organisational and management model in accordance with Legislative Decree
231/2001 is being implemented. This model is composed of a General Section, a Special Section and
the Code of Ethics.
In the general section, the main contents of the model, the essential components and adopted
auditing tools have been defined.
The model has three external appendices:
- the Code of Ethics, which, designed as a "charter of values", sets out the general principles which
the company's activities must comply with and in some parts is more extensive than the Decree, as
it describes the “ethical” commitment of the company, regardless of any criminal and administrative
liability (and hence also stigmatised behaviours which in themselves could potentially breach or
circumvent the provisions of the Decree);
- the Disciplinary System, which acts as a penalty instrument based on the general national labour
contract category and integrates the missing requirement provided for by the Consolidated Labour
Act (Art. 30, Legislative Decree 81/08) for the protection of Health and Safety at Work (SSL);
- the Articles of Association (with the Operating Regulations) of the Supervisory Board, a body in
charge of overseeing the functioning and observance of the model, which must receive specific
disclosures on corporate activities.
The Code of Ethics is an integral part of the System of Internal Control and Risk Management and
expresses the principles of business ethics which the Group recognises as its own and with which
directors, employees, consultants and partners must comply. This code was revised in December
2013 to further enhance the importance of sustainable operations that take into account the
legitimate interests of all stakeholders.
The Company performs on-going activities to promote the Code with respect to all its interlocutors,
while at the same time carrying out initiatives to improve working life in the field of training and
information to its employees.

39
Legislative Decree 196/2003
The Parent Company, in accordance with Legislative Decree no. 196/2003, has developed ad hoc
procedures for management control and information technology, in order to protect the
confidentiality of data of any kind and, in general, privacy, both externally and within the company.
The norm is consistent with the ISO 9001 quality management system, which reduces, to the extent
possible, the risk of destruction or accidental loss of data from unauthorised access or handling. The
aim is to protect the organisation from committing offenses involving administrative liability, such
as computer crime and illegal data processing, pursuant to Art. 24-bis of Legislative Decree
231/2001.
Performance of the Parent Company on the stock exchange
During the course of 2015, the TerniEnergia stock maintained a stable trend up until the month of
May, when a negative trend began, coinciding with the period in which the leading indices of
financial markets experienced pressure associated with the structural downward adjustment of raw
material prices and Asian stock exchanges. Signals that were interpreted as evidence of weakness
in the economy were reflected in petroleum prices, which began a negative trend, nearly reaching
historic minimum levels. Companies in the energy sector suffered the consequences.
The stock reported, during the course of the year, an average price of Euro 1.687 and average daily
volumes of 54,967 shares. On 17 March 2015, the price reported a maximum value of Euro 1.97; the
peak in volumes (861,817 shares) occurred on 16 March 2015.
Since the IPO and following the admission into the STAR segment of Borsa Italiana at the end of
2010, TerniEnergia maintains open and constant communications with investors and stakeholders
40
through an effective policy of communications implemented by the internal and external Investor
Relations department, which is entrusted with managing relations with the financial community.
During 2015, the Investor Relations team participated in requested one-to-one meetings with
analysts and investors in addition to taking part in public events such as:
Presentation of the 2015-2017 Industrial Plan, “Fast on the smart energy road”, (Milan -
Hotel Principe di Savoia) to the business and financial community 9 February 2015
Star Conference (Milano, Palazzo Mezzanotte) – One-to-one meetings: 24 - 25 March 2015,
organised by Borsa Italiana;
Star Conference London (London Stock Exchange) - One-to-one meetings: 5-6 October 2015;
Update to Industrial Plan and “Smart to restart industry” Workshop (Milan, Palazzo
Mezzanotte) - Presentation to the business and financial community promoted by Italeaf on 30 October 2015.
The stock is followed by Intermonte Sim through coverage studies and notes published periodically.
1.15 SIGNIFICANT EVENTS AFTER YEAR-END
For significant events occurred after the closing of the year, refer to the information in the
Explanatory Notes under note 3.10 Other information.
1.16 CORPORATE GOVERNANCE REPORT
The annual report on corporate governance and shareholding structure is available on the website
of the Parent Company at: www.ternienergia.com “Corporate Governance” section.
1.17 BUSINESS OUTLOOK
TerniEnergia plans to increase the contribution from orders within the photovoltaic sector already
secured and those in the process of being securing, including based on the time schedule set forth
in the final contracts. In addition, the company intends to take advantage of the extremely positive
global context for the sector, strengthening scouting activities and market analyses to develop new
projects (not only in the photovoltaic sector), in order to evaluate the possibility of creating an
“Italian leader” industrial platform through which to secure major work orders abroad.
Furthermore, consistent with the strategic objectives envisaged in the updated Business Plan,
TerniEnergia has launched a new initiative to strengthen and consolidate the activities of the Energy

41
Saving business line, from which contracts are expected for significant energy savings interventions
to be carried out for leading industrial operators. In this regard, the “Hub” project was launched, a
new operating method to open up the industrial energy efficiency market through “third party
financing” in Italy. The objective of “TerniEnergia Hub” is to form a strategic alliance between all
players in the value chain to meet the needs of capital markets, selecting energy efficiency projects
and interventions with the third party financing (FTT) formula, assessing the economic returns from
the business plan and the technological risk and proposing it to institutional investors in order to
finance their realisation or acquire credits generated from energy savings. The operation seeks to
create a specialised investment asset class, that allows capital markets to invest in Italian energy
saving projects. This is one of the factors that, according to models in the financial community, have
impeded development of the market to finance energy efficiency initiatives until now, causing
frustration in the sector’s value chain and delaying the achievement of projects of significant size.
Additionally, TerniEnergia plans to maximise returns from the acquisition of Greenled Industry, by
optimising the supply chain for the Energy Saving business line, in which the purchasing of LED light
bulbs represents the most significant cost item. Hence, this transaction is consistent with the
objectives of TerniEnergia and in line with growth in the Energy Saving sector.
As a result of the full integration of the new dedicated company TerniEnergia Gas&Power in Energy
Management business line, the Group plans to: access the dual fuel market for industrial customers;
participate in all phases of the energy and gas value chain in Italy, integrating purchasing, trading
and marketing of natural gas and LNG with the activities of generating and managing electricity;
optimise growth opportunities in the gas sector; and better distinguish the role of the Company in
relationships with institutions, the market, the financial and business community as well as
customers.
As part of the Cleantech business line’s activities, the search for potential corporate and business
partnerships in the environmental sector represents a new strategic element, including the
possibility of spinning off the waste management sector in a “newco”, which may represent a
“national leader” industrial platform open to participation of new investors focused on the green &
circular economy sector.
Moreover, TerniEnergia will continue to pursue research aimed at entry into the sector for the
development and industrial production of solutions and smart technologies for energy efficiency
and Cleantech. This will create strong diversification of TerniEnergia’s business into anti-cyclical
sectors and will complete the core activities of the Group across the entire energy value chain,
ranging from the design of plants to advanced post-sales services.

42
2 FINANCIAL STATEMENTS
2.1 CONSOLIDATED STATEMENT OF FINANCIAL POSITION
Note 31 December 31 December
(in Euro) 2015 2014
ASSETS Intangible fixed assets 3.4.1 4,460,745 14,143,177 Tangible fixed assets 3.4.2 82,616,544 91,306,645
Equity investments 3.4.3 2,157,923 7,672,891 Prepaid taxes 3.4.4 13,133,614 14,998,053 Non-current financial receivables 3.4.5 23,591,350 23,003,783
Total non-current financial assets 125,960,176 151,124,549
Inventories 3.4.6 23,329,978 10,943,522 Trade receivables 3.4.7 52,361,935 79,108,151 Other current assets 3.4.8 24,104,536 23,755,477 Derivatives 3.4.9 527,962 Financial receivables 3.4.10 4,192,193 8,682,422 Cash and cash equivalents 3.4.11 11,893,388 14,177,490
Total current financial assets 115,882,030 137,195,024
Assets held for sale 3.4.12 180,783
TOTAL ASSETS 241,842,206 288,500,356
LIABILITIES AND SHAREHOLDERS’ EQUITY Share capital 57,007,230 57,007,230 Reserves (3,964,935) 7,084,436
Result for the period 1,947,386 5,948,086
Total Group equity 54,989,681 70,039,752
Equity attributable to minority interests 191,614 1,051,507 Result of the period attributable to minority interests 610,058 255,495
Total equity 3.5.1 55,791,353 71,346,754
Provisions for employee benefits 3.5.2 1,149,966 1,061,790 Deferred taxes 3.5.3 1,294,323 1,628,920 Non-current financial payables 3.5.4 79,272,033 89,837,177
Other non-current liabilities 3.5.5 247,492 153,192 Derivatives 3.5.6 3,251,759 4,371,326
Total non-current liabilities 85,215,573 97,052,405
Trade payables 3.5.7 63,543,245 67,172,376 Payables and other financial liabilities 3.5.8 24,185,097 41,197,420 Taxes payable 3.5.9 1,330,322 1,656,825 Other current liabilities 3.5.10 11,776,616 10,074,576
Total current liabilities 100,835,280 120,101,197
TOTAL LIABILITIES 186,050,853 217,153,602
TOTAL LIABILITIES AND SHAREHOLDERS’ EQUITY 241,842,206 288,500,356

43
CONSOLIDATED INCOME STATEMENT
Note 2015 2014
(in Euro)
Revenues 3.6.1 362,944,612 87,341,876
Other operating revenues 5,795,664 7,849,488
Change in inventories of semi-finished and finished products 3.6.2 (2,411,575) 1,607,414
Cost of raw materials, consumables and goods 3.6.3 (181,043,229) (44,462,688)
Costs for services 3.6.4 (148,988,932) (25,050,748)
Personnel costs 3.6.5 (7,519,175) (5,741,457)
Other operating costs 3.6.6 (3,536,334) (3,540,419)
Amortisation, depreciation, allocations and write-downs 3.6.7 (8,110,618) (9,570,419)
Operating result 17,130,414 8,433,047
Financial income 3.6.8 2,472,850 1,397,692
Financial charges 3.6.8 (12,824,807) (11,478,260)
Profit share from joint ventures 3.6.9 (665,015) 907,637
Pre-tax result 6,113,442 (739,884)
Taxes 3.6.10 (3,555,997) 6,943,465
Net (profit)/loss of the year 2,557,445 6,203,581
- of which pertaining to the Group 1,947,386 5,948,086
- of which pertaining to minority interests 610,058 255,495
Earnings per share - base and diluted 0.045 0.152

44
2.2 CONSOLIDATED STATEMENT OF COMPREHENSIVE INCOME
Note
31 December
(in Euro) 2015 2014
Net profit for the period 2,557,445 6,203,581
Change in cash flow hedge reserve 1,290,954 (1,675,119)
Translation difference 335,031 (96,095)
Tax effect of charges/(income) recognised in equity (309,829) 460,658
Total other income statement items of the period that will be recognised later in the income statement
3.5.1 1,316,156 (1,310,556)
Actuarial gains/(losses) from employee termination indemnities (84,943)
Tax effect of charges/(income) recognised in equity 23,359
Total other income statement items of the period that will not be
recognised later in the income statement 3.5.1 3,873,601 (61,584)
Total comprehensive income for the period 3,873,601 4,831,441
· of which pertaining to the Group 3,263,542 4,575,946
· of which pertaining to minority interests 610,058 255,495

45
2.3 STATEMENT OF CHANGES IN CONSOLIDATED SHAREHOLDERS’ EQUITY
Description
Share capital
Reserves Total
reserves Result for the
period Total Group
equity Minority
equity Total equity
(in Euro) Price
premium reserve
Legal reserve Extraordinary
reserve Other
reserves
Balance as of 31 December 2013 50,529,680 5,123,322 1,961,905 11,879,177 (22,602,524) (3,638,119) 6,708,295 53,599,856 287,967 53,887,823
Allocation of profits 95,748 6,612,547 6,708,295 (6,708,295)
Dividend distribution (437,508) (1,819,212) (2,256,720) (2,256,720) (2,256,720)
Share capital increase 6,477,550 8,161,713 8,161,713 14,639,263 14,639,263
Expenses for share capital increase (385,866) (385,866) (385,866) (385,866)
Purchase of own shares (141,137) (141,137) (141,137) (141,137)
Other movements 8,411 8,411 8,411 763,540 771,951
Transactions with shareholders 6,477,550 8,161,713 95,748 (437,508) 4,274,743 12,094,696 (6,708,295) 11,863,951 763,540 12,627,490
Net profit for the period - - - - - - 5,948,086 5,948,086 255,495 6,203,581
Other items of the statement of comprehensive income
- - - - (1,372,140) (1,372,140) (1,372,140) (1,372,140)
Total profit for the period (1,372,140) (1,372,140) 5,948,086 4,575,946 255,495 4,831,441
Balance as of 30 December 2014 57,007,230 13,285,035 2,057,653 11,441,669 (19,699,921) 7,084,436 5,948,086 70,039,752 1,307,002 71,346,754
Description
Share capital
Reserves
Total reserves
Result for the period
Total Group equity
Minority equity
Total equity
(in Euro) Price
premium
reserve
Legal reserve Extraordinary
reserve
Other
reserves
Balance as of 31 December 2014 57,007,230 13,285,035 2,057,653 11,441,669 (19,699,921) 7,084,436 5,948,086 70,039,752 1,307,002 71,346,754
Allocation of profits 84,485 5,863,601 5,948,086 (5,948,086)
Dividend distribution (1,260,605) (1,605,216) (2,865,821) (2,865,821) (2,865,821)
Purchase of own shares (15,673,073) (15,673,073) (15,673,073) (15,673,073)
Sale of own shares 3,500,000 3,500,000 3,500,000 3,500,000
Purchases under common control (2,090,815) (2,090,815) (2,090,815) (2,090,815)
Other movements (1,183,905) (1,183,905) (1,183,905) (1,115,388) (2,299,293)
Transactions with shareholders 84,485 (1,260,605) (11,189,407) (12,365,527) (5,948,086) (18,313,613) (1,115,388) (19,429,002)
Net profit for the period - - - - - - 1,947,387 1,947,387 610,058 2,557,445
Other items of the statement of comprehensive income
- - - - 1,316,156 1,316,156 1,316,156 1,316,156
Total profit for the period 1,316,156 1,316,156 1,947,387 3,263,542 610,058 3,873,601
Balance as of 31 December 2015 57,007,230 13,285,035 2,142,138 10,181,064 (29,573,173) (3,964,935) 1,947,387 54,989,681 801,672 55,791,353

46
2.4 CONSOLIDATED CASH FLOW STATEMENT
31 December
(in Euro) Note 2015 2014
Pre-tax profit 6,113,442 (739,884)
Amortisation/depreciation 5,682,450 9,164,938
Write-downs of fixed assets and receivables 2,428,168 405,481
Allocations to the employee benefits fund 201,897 393,886
Result of joint ventures accounted for at equity and reversal of margin 665,015 (907,637)
Effect of derivatives in income statement 313,507
Change in inventories (12,043,200) (2,484,360)
Change in trade receivables (41,297,362) (5,118,885)
Change in other assets (3,950,358) (16,825,444)
Change in trade payables 53,494,143 (4,761,519)
Change in other liabilities 8,865,470 (833,473)
Payment of employee benefits (100,020) (63,779)
Net cash flow (used in)/generated by operating activities 20,373,151 (21,770,676)
Investments in tangible fixed assets (6,824,129) 2,096,236
Disposals of tangible fixed assets
Investments in intangible fixed assets (384,581) (1,237,333)
Disposals of intangible fixed assets
Acquisitions/Disposals (8,452,833) 2,250,382
Equity investments 4,223,550 778,899
Change in receivables and other financial assets (3,049,496) (2,401,483)
Net cash flow used in investing activities (14,487,489) 1,486,701
Change in payables and other financial assets 4,215,401 (971,353)
Change in non-current financial payables (1,957,076) 26,507,937
Other changes in shareholders’ equity (7,562,268) (1,488,443)
Expenses for share capital increase (385,866)
Payment of dividends (2,865,821) (2,256,720)
Net cash flow generated by financing activities (8,169,763) 21,405,555
Comprehensive cash flow for the period (2,284,101) 1,121,580
Cash and cash equivalents at the beginning of the period 14,177,490 13,055,910
Cash and cash equivalents at the end of the period 11,893,389 14,177,490
Interest (paid)/collected (10,389,089) (9,798,989)
Income taxes paid (105,289)

47
3 EXPLANATORY NOTES TO THE CONSOLIDATED FINANCIAL STATEMENTS FOR THE YEAR
CLOSED ON 31 DECEMBER 2015
3.1 GENERAL INFORMATION
TerniEnergia S.p.A. (“TerniEnergia”, “Company” or “Parent Company”) is a joint stock company with
registered office in Narni (Italy), Strada dello Stabilimento 1, listed on the Italian Stock Exchange on
the Star segment of MTA.
TerniEnergia, founded in the month of September 2005 and part of the Italeaf Group, is the first
“Italian smart energy company” and operates in the renewable energy field, in energy efficiency and
in energy and waste management. TerniEnergia acts as a system integrator, with a turnkey offer for
industrial photovoltaic plants, both on behalf of third parties and on its own, including through joint
ventures with primary national operators. The Company seeks to strengthen sales of solar energy.
TerniEnergia operates in waste management, in the recovery of material and energy and in the
development and production of technologies. In particular, the Company is active in the recovery of
out-of-use tyres; in the treatment of biodegradable waste through the implementation of
biodigesters; in the production of energy from biomass; in the management of biological depuration
plants; in the decommissioning of industrial plants; in the recovery of metals that must be
demolished and the improvement of industrial plants; and in the development and production of
technological equipment. The Group is active in energy management, the sale of energy to high
energy-consuming customers, the realisation of software and IT services for energy and is a provider
of administrative, financial and credit management services. In addition, TerniEnergia operates in
the development of energy efficiency plants both in EPC and FTT (financing by third parties) with
the objective of increasing energy production from renewable sources, energy savings and
decreasing emissions according to the European environmental policies.

48
3.2 SEGMENT REPORTING
In accordance with IFRS 8, the information relating to the sector as at 31 December 2015 is provided
below.
The Group operates through four business units:
Technical Service business unit: production of energy from various renewable sources
(photovoltaic) as well as the realisation of plants from renewable sources (EPC and O&M
activities);
Cleantech business unit: efficient management of energy recovery plants and recovery of
materials from marginal resources (biodigestion and pyrogasification, used tyre treatment,
recovery of waters) in addition to the management of plants for the production of
renewable energy from traced and sustainable vegetable oil and the sale of vegetable oil.
Energy Management business unit: sale of energy to high energy-consumption customers,
software and IT services for energy, administrative, financial and credit management
services.
Energy Saving business unit: solutions for lighting and industrial energy efficiency with
highly innovative technologies, Esco activities (by means of financing through third parties)
and Espco (EPC and consulting).
From the geographical point of view, the Technical Service segment includes the revenue for the
construction of photovoltaic plants in South Africa by the subsidiary TerniEnergia Project Ltd.
With reference to the other segments, the Group operates primarily in Italy.
The criteria used to identify areas of activity subject to reporting are in line with the ways in which
the management manages the Group. In particular, the structuring of the business segments
disclosed corresponds to the structure of the report periodically reviewed by the Board of Directors
for the purposes of managing the business of the Group.
The Group's management assesses the performance of the various operating segments, using the
following indicators:
• revenues by operating segment;
• gross operating margin by operating segment.
The criteria used for the allocation of revenues for each operating segment is based on the volume
of sales made in each sector. The costs are allocated directly to each operating segment.

49
2015
Technical Service
Cleantech Energy Saving
Energy Management
Total
Revenues 107,831,452 8,678,058 2,494,297 249,736,470 368,740,276
Operating costs (91,485,949) (5,985,826) (1,668,309) (244,359,160) (343,499,244)
EBITDA 16,345,503 2,692,232 825,987 5,377,309 25,241,032
Amortisation, depreciation and provisions (5,746,400) (1,062,825) (37,617) (1,263,776) (8,110,618)
EBIT 10,599,102 1,629,407 788,371 4,113,533 17,130,413
2015
Technical
Service Cleantech
Energy
Saving
Energy
Management Total
Fixed assets 43,891,275 39,985,539 8,345,679 2,020,226 94,242,719
Net working capital 19,966,916 434,362 381,825 (11,172) 20,771,931
50
3.3 FORM, CONTENT AND APPLIED ACCOUNTING PRINCIPLES
These consolidated financial statements have been prepared on a going-concern basis, as the
Directors have verified that no financial, operational or other indicators exist which might suggest
critical issues regarding the Group’s abilities to meet its obligations in the foreseeable future and,
specifically, in the next 12 months.
In the application of Regulation (EC) no. 1606/2002 of 19 July 2002, the financial statements as at
31 December 2015, were prepared in compliance with the International Accounting Standards
IAS/IFRS (hereinafter also referred to as IFRS) as endorsed by the European Commission and
supplemented by the related interpretations (Standing Interpretations Committee – SIC and
International Financial Reporting Interpretations Committee – IFRIC) issued by the International
Accounting Standard Board (IASB).
The general principle adopted in preparing these financial statements is the historical cost
convention, except for derivative instruments and financial assets, for which IAS 39 allows the
measurement at fair value method.
The consolidated financial statements are expressed in Euros since this is the currency in which the
transactions of the Group companies are carried out. All data reported in the notes to the financial
statements are expressed in Euros, except as otherwise stated.
The Group has opted to use the income statement by nature, while assets and liabilities in the
statement of financial position are divided into current and non-current items. The cash flow
statement has been prepared according to the indirect method. It should be noted that, in order to
comply with the indications contained in CONSOB Resolution no. 15519 of 28 July 2006 “Provisions
on financial statement formats” (Disposizioni in materia di schemi di bilancio), note 3.7 reports the
consolidated income statement, the consolidated statement of financial position and the
consolidated cash flow statement, specifying significant amounts of positions or settlement
agreements arising from transactions carried out with related parties, for any individual item in the
financial statements.
To provide a better representation of the situation, in certain cases the balances from the previous
year were reclassified without any effect on the result and on the Group’s shareholders’ equity.
51
These consolidated financial statements were approved by the Parent Company’s Board of Directors
on 14 March 2016, and were audited by PricewaterhouseCoopers S.p.A.
52
Effects of changes in accounting principles
New IFRSs and IFRIC Interpretations
The accounting policies adopted for the preparation of these financial statements are the same used
for the preparation of the annual financial statements of the Group for the year ended on 31
December 2014, except for the standards and interpretations listed below, applicable from 1
January 2015.
Accounting standards, amendments and interpretations applied effective 1 January 2015
The amendments and interpretations applicable from 1 January 2015 are listed below:
IFRIC 21 – Levies, adopted with EU Regulation no. 634/2014. The interpretation discusses the
accounting treatment of a liability for the payment of levies and taxes, in the event the liability is
part of the application scope of IAS 37.
2011-2013 IFRS Annual Improvement Cycle adopted with EU Regulation no. 1361/2014 as part of
the annual improvements and general review of international accounting standards.
Accounting standards and interpretations to be applied in the future
The following accounting standards, interpretations and amendments are applicable from 1 January
2016:
2010-2012 IFRS Annual Improvement Cycle, adopted with EU Regulation no. 28/2015 as
part of the annual improvements and general review of international accounting standards.
IAS 19 - Employee Benefits - Defined Benefit Plans: employee contributions, adopted with
EU Regulation no. 29/2015. The amendment provides clarification on the application of IAS
19 to defined benefit plans that imply involuntary contributions from employees or third
parties. These contributions reduce the cost of the entity to provide benefits and, to the
extent they are commensurate with the service provided by the employee in a given period,
can be fully deducted from the period’s costs, rather than spread over the working life of
said employee.

53
IFRS 11 - Joint Arrangements, amended with EU Regulation no. 2173/2015. The amendment
establishes that an entity adopts the standards in IFRS 3 to recognise the accounting effects
of the acquisition of an interest in a joint arrangement that constitutes a business. The new
element introduced applies to both the acquisition of an initial interest as well as
subsequent acquisitions of additional interests. Conversely, an investment held prior to the
effective date of the change, is not restated if the acquisition of an additional interest results
in joint control being maintained (or rather, the acquisition of an additional interest does
not result in obtaining control of the investee). The IFRS 3 principles involved include:
Measurement of assets and liabilities at fair value;
Recognition of costs related to the acquisition as expenses for the period in which they were
incurred and services received, with the exception of costs to issue debt or equity securities
that are recognised in accordance with IFRS 3;
Recognition of deferred taxes resulting from the initial recognition in assets and liabilities,
with the exception of those related to goodwill, as required by IFRS 3 and IAS 12;
Recognition of the surplus in the payment made with respect to the net value of the
amounts of assets acquired and liabilities assumed identifiable as goodwill;
Review to reduce the value of a CGU to which goodwill was allocated, to be performed at
least annually, or any time there is an indication of impairment, pursuant to IAS 36.
IAS 16 - Property, Plant and Equipment and IAS 38 - Intangible Assets, amended with EU
Regulation no. 2231/2015. The amendment introduces certain clarifications on the
depreciation/amortisation method based on revenues (among those allowed by pre-
existing versions of IAS 16 and IAS 38, respectively, for tangible and intangible assets),
defining them as unsuitable for tangible assets and reserving the right to apply them to
intangible assets only in circumstances in which it can be demonstrated that the revenues
and consumption of economic benefits deriving from the asset are closely correlated. Based
on this amendment, the cases in which revenues generated by the activity that envisage the
use of a depreciable/amortisable asset reflect different factors from the expected
consumption of the resulting economic benefits, such as, for example, the sale of asset,
performance of a different production process, and changes in sales prices.
2012-2014 IFRS Annual Improvement Cycle adopted with EU Regulation no. 2343/2015 as
part of the annual improvements and general review of international accounting standards.
IAS 1 - Presentation of Financial Statements, amended with EU Regulation no. 2406/2015.
The amendment aims to improve the effectiveness and clarity of financial statement
disclosure, encouraging companies to express and represent their professional judgment in

54
presenting the necessary information. In particular, the changes introduced explain the
guidelines contained in the accounting standard on materiality, aggregation of items,
presentation of sub-totals, the financial statement structure and disclosure of accounting
policies adopted. The information requirements for the section of other components of
comprehensive income were also changed. In particular, the amendment explicitly requires
that the portion of comprehensive income relating to associates and joint ventures is
reported, using the equity method and indicating whether these amounts will or will not be
subsequently reclassified in the profit or loss for the year.
IAS 27 - Separate Financial Statements, amended with EU Regulation no. 2441/2015. With
regard to entities that prepare separate financial statements, the amendment introduces
the option of adopting the equity method to recognise investments in subsidiaries,
associates and joint ventures. The recognition option is in addition to those already allowed
in previous version of the accounting standard (cost method and IAS 39 method). The
amendment also provides a clearer definition of separate financial statements.
Finally, at the approval date of these financial statements, IASB had issued certain accounting
standards, amendments and interpretations that had not yet been endorsed by the European
Commission:
IFRS 9 - Financial Instruments;
IFRS 14 - Regulatory Deferral Accounts;
IFRS 15 - Revenues from Contracts with Customers;
IFRS 16 - Leases;
Amendments to IFRS 10, IFRS 12, and IAS 28 - Investment Entities: applying the consolidation
exception;
Amendments to IFRS 10 and IAS 28 - Sales or Contributions of Assets between an Investor
and its Associate or Joint Venture;
Amendment to IAS 12 regarding recognition of deferred tax assets for unrealised losses.
The effects on the statement of comprehensive income at 31 December 2015 and on the statement
of financial position at 31 December 2014 and 31 December 2015 are not significant.
Change in scope of consolidation

55
The consolidated financial statements as of 31 December 2015 include the financial statements of
the parent company TerniEnergia S.p.A. and the financial statements of all the companies in which
it holds, directly or indirectly controls.
The financial statements consolidated as of 31 December 2015, i.e. the date of the consolidated
financial statements, are those prepared and approved by the Boards of Directors of each company,
adjusted, where necessary, to align with the accounting principles of the Parent Company.
Below are listed the companies included in the scope of consolidation and the related percentages
of ownership held by the Group, either directly or indirectly, as at 31 December 2015:
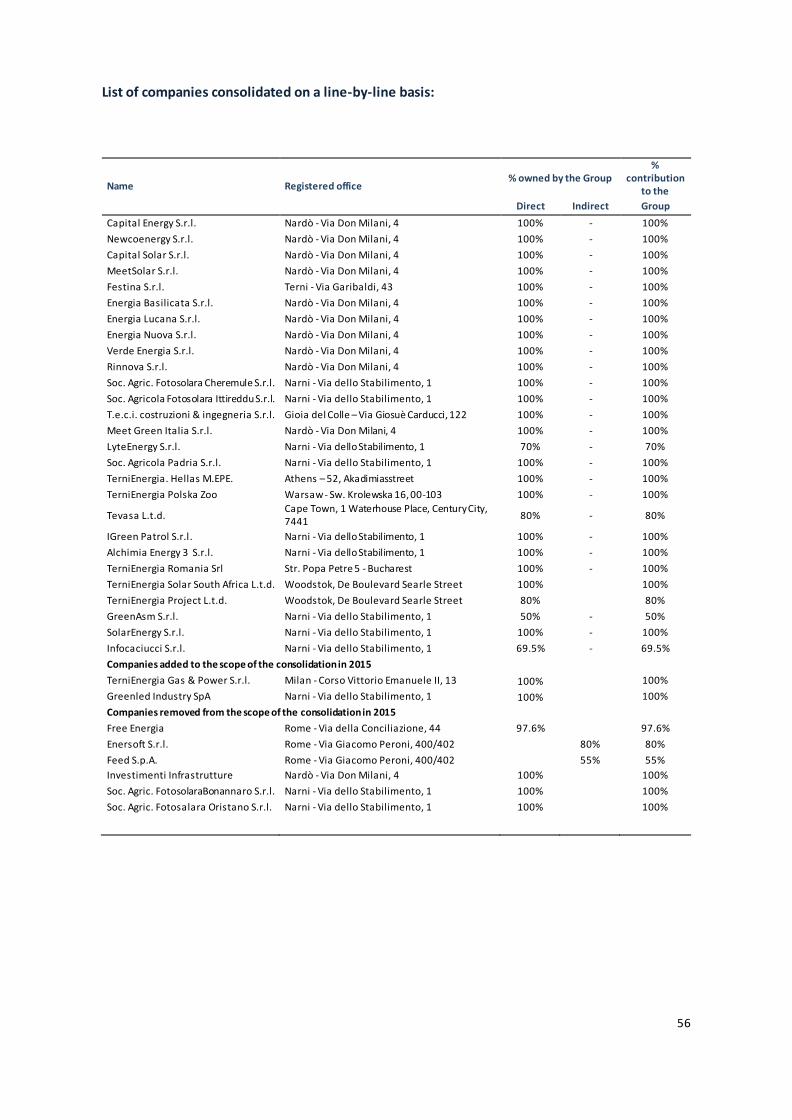
56
List of companies consolidated on a line-by-line basis:
Name Registered office % owned by the Group
% contribution
to the
Direct Indirect Group
Capital Energy S.r.l. Nardò - Via Don Milani, 4 100% - 100%
Newcoenergy S.r.l. Nardò - Via Don Milani, 4 100% - 100%
Capital Solar S.r.l. Nardò - Via Don Milani, 4 100% - 100%
MeetSolar S.r.l. Nardò - Via Don Milani, 4 100% - 100%
Festina S.r.l. Terni - Via Garibaldi, 43 100% - 100%
Energia Basilicata S.r.l. Nardò - Via Don Milani, 4 100% - 100%
Energia Lucana S.r.l. Nardò - Via Don Milani, 4 100% - 100%
Energia Nuova S.r.l. Nardò - Via Don Milani, 4 100% - 100%
Verde Energia S.r.l. Nardò - Via Don Milani, 4 100% - 100%
Rinnova S.r.l. Nardò - Via Don Milani, 4 100% - 100%
Soc. Agric. Fotosolara Cheremule S.r.l. Narni - Via dello Stabilimento, 1 100% - 100%
Soc. Agricola Fotosolara Ittireddu S.r.l. Narni - Via dello Stabilimento, 1 100% - 100%
T.e.c.i. costruzioni & ingegneria S.r.l. Gioia del Colle – Via Giosuè Carducci, 122 100% - 100%
Meet Green Italia S.r.l. Nardò - Via Don Milani, 4 100% - 100%
LyteEnergy S.r.l. Narni - Via dello Stabilimento, 1 70% - 70%
Soc. Agricola Padria S.r.l. Narni - Via dello Stabilimento, 1 100% - 100%
TerniEnergia. Hellas M.EPE. Athens – 52, Akadimiasstreet 100% - 100%
TerniEnergia Polska Zoo Warsaw - Sw. Krolewska 16, 00-103 100% - 100%
Tevasa L.t.d. Cape Town, 1 Waterhouse Place, Century City, 7441
80% - 80%
IGreen Patrol S.r.l. Narni - Via dello Stabilimento, 1 100% - 100%
Alchimia Energy 3 S.r.l. Narni - Via dello Stabilimento, 1 100% - 100%
TerniEnergia Romania Srl Str. Popa Petre 5 - Bucharest 100% - 100%
TerniEnergia Solar South Africa L.t.d. Woodstok, De Boulevard Searle Street 100% 100%
TerniEnergia Project L.t.d. Woodstok, De Boulevard Searle Street 80% 80%
GreenAsm S.r.l. Narni - Via dello Stabilimento, 1 50% - 50%
SolarEnergy S.r.l. Narni - Via dello Stabilimento, 1 100% - 100%
Infocaciucci S.r.l. Narni - Via dello Stabilimento, 1 69.5% - 69.5%
Companies added to the scope of the consolidation in 2015
TerniEnergia Gas & Power S.r.l. Milan - Corso Vittorio Emanuele II, 13 100% 100%
Greenled Industry SpA Narni - Via dello Stabilimento, 1 100% 100%
Companies removed from the scope of the consolidation in 2015
Free Energia Rome - Via della Conciliazione, 44 97.6% 97.6%
Enersoft S.r.l. Rome - Via Giacomo Peroni, 400/402 80% 80%
Feed S.p.A. Rome - Via Giacomo Peroni, 400/402 55% 55%
Investimenti Infrastrutture Nardò - Via Don Milani, 4 100% 100%
Soc. Agric. FotosolaraBonannaro S.r.l. Narni - Via dello Stabilimento, 1 100% 100%
Soc. Agric. Fotosalara Oristano S.r.l. Narni - Via dello Stabilimento, 1 100% 100%

57
List of companies consolidated with the equity method:
Name Registered office % owned by the Group
% contribution to the
Direct Indirect Group
Girasole S.r.l. Narni - Via dello Stabilimento, 1 50% - 50%
Guglionesi S.r.l. Narni - Via dello Stabilimento, 1 50% - 50%
Energia Alternativa S.r.l. Narni - Via dello Stabilimento, 1 50% - 50%
Solter S.r.l. Narni - Via dello Stabilimento, 1 50% - 50%
Companies added to the scope of the consolidation using the equity method in 2015
Investimenti Infrastrutture Nardò - Via Don Milani, 4 50% - 50%
Soc. Agric. FotosolaraBonannaro S.r.l. Narni - Via dello Stabilimento, 1 50% - 50%
Soc. Agric. Oristano S.r.l. Narni - Via dello Stabilimento, 1 50% - 50%
Rebis Power Narni - Via dello Stabilimento, 1 50% - 50%
Companies removed from the scope of the consolidation using the equity method in 2015
D.T. S.r.l. Narni - Via dello Stabilimento, 1 50% - 50%
Saim Energy 2 S.r.l. Narni - Via dello Stabilimento, 1 50% - 50%
Subsidiary companies are consolidated on a line-by-line basis. Joint ventures, which are entities
subject to joint control, are measured and consolidated at equity.
The main consolidation criteria adopted in applying the line-by-line consolidation method are the
following:
• subsidiary companies are consolidated starting from the date when control is actually transferred
to the Group, and they cease to be consolidated on the date when control is transferred outside of
the Group;
• where required, adjustments are made to the financial statements of subsidiary companies in
order to align the accounting standards with those adopted by the Group;
• assets and liabilities, charges and income of companies consolidated on a line-by-line basis are
fully recognised in the consolidated financial statements; the book value of equity investments is
derecognised against the corresponding portion of equity of the investee companies, measuring the
single asset and liability items at their fair value as at the date of acquisition of the control. Any
difference between transaction costs and fair value as at the date the assets are purchased and
liabilities are acquired is charged to goodwill. In the event that the process to allocate the purchase
price results in a negative difference, such difference is immediately recognised in the income
statement as at the date of acquisition;
• debt and credit relations, costs and revenues, and financial income and charges between
companies consolidated on a line-by-line basis, as well as the effects of all the transactions effected
between the same, are derecognised;

58
• the portions of shareholders’ equity and of the result for the period attributable to minority
shareholders, if existing, are reported separately in shareholders’ equity and in the consolidated
income statement, respectively.
Joint ventures are accounted for in these consolidated financial statements according to the equity
method described below:
the book value of equity investments in the joint ventures is adjusted to the equity of the
same as adjusted, if required, to reflect the application of the IFRS;
any profits or losses pertaining to the parent company are accounted for as from the date
when the joint control has started and up to the date in which the joint control or significant
influence ceases; in the event that, as a result of losses, the company valued according to
the method in question shows a negative equity, the book value of the equity investment is
cancelled and the surplus (if any) pertaining to the Parent Company is recognised under
liabilities; any changes in equity of the companies valued at equity not represented by the
income statement result are accounted for directly as an adjustment to equity reserves;
in application of IAS 28, paragraph 22, significant unrealised profits and losses generated
from transactions effected between the Parent Company and joint ventures valued at
equity are derecognised according to the value of the stake held by the company in the
investee company itself; unrealised losses are derecognised, except for the case when they
represent an impairment. Of the significant activities carried out by the Parent Company
with the joint ventures, note the sale of photovoltaic plants; with reference to these
transactions, the margins realised by the Parent Company from the aforementioned sales
are derecognised, to the extent of the relevant quota not realised with third parties. In
particular, the derecognition of the aforementioned margins is made through the
adjustment of the quota relating to the Parent Company, which is equal, in this case, to 50%
of the relevant revenues and of the direct costs incurred in the construction of the
photovoltaic plant, whereas the quota pertaining to the third party which participates in the
joint venture was maintained in the financial statements.
It should be noted that the application of the method outlined above may entail the derecognition
of considerable margins in relation to the volume of works realised on behalf of the joint ventures,
59
with the consequent reduction in the book value of the equity investment which may cause it to be
written off. After a reset of the value of investment, further reduction is recognised as a liability.
This liability, which in previous financial years was recognised in the consolidated financial
statements as a provision for risks and charges, is recognised, in these financial statements, under
other liabilities (current and non-current), as it does not represent a legal or implied obligation to
cover the losses of the subsidiary company. It is in fact a reduction in the value of the equity
investment in the joint venture arising from the elision of deferred margins which will be recognised
in the consolidated income statement in subsequent financial years, according to the amortisation
schedule of the transferred plants.
Accounting treatment of foreign currency transactions
Transactions in foreign currency
Transactions in foreign currencies are translated into the functional currency of each entity in the
Group at the exchange rate in effect on the transaction date. Monetary items in foreign currencies
at the reporting date are converted into the functional currency using the exchange rate at that
date. Exchange rate gains or losses of a monetary item are represented by the difference between
amortised cost in the functional currency at the beginning of the year, adjusted to reflect the
effective interest and payments for the year, and the amortised cost in foreign currency translated
recorded at the exchange rate at the date of the financial statements. Exchange differences arising
on translation are recognised in the income statement.
Financial statements of foreign operations
The assets and liabilities of foreign operations are translated into Euros using the exchange rate
recorded at the date of the financial statements. The income and expenses of foreign operations
are converted into Euros at the average exchange rate for the year, if there are no significant
differences with respect to their conversion for the individual transactions.
Exchange rate differences arising on translation are recognised directly in equity under "Translation
reserve". On disposal of a foreign operation, partial or total, the amount of the differences
accumulated in this reserve is recognised in the income statement.
Gains and losses on exchange arising from translations of receivables or payables with foreign
operations, the collection or payment of which is neither planned nor likely in the foreseeable
future, are considered part of the net investment in a foreign operation and are recognised directly
in shareholders’ equity in the aforementioned reserve.

60
Accounting principles applied in the valuation of the main statement of financial position items
The principal accounting policies adopted are described below:
Intangible fixed assets
Intangible assets are composed of non-monetary assets without physical substance, clearly
identifiable and capable of generating future economic benefits. These assets are recorded at
purchase or production cost or contribution, including any additional charges and expenses directly
attributable to preparing the asset for its intended use, net of accumulated amortisation and any
impairment losses. Amortisation begins when the asset is available for use and is recognised
systematically over the residual possibility of its use, and thus over the estimated useful life.
During the year in which the intangible asset is initially recognised, amortisation is calculated taking
into consideration the effective utilisation of the asset.
Licenses and other intangible assets
For licenses, patents and other intangible assets, the amortisation is calculated with the linear
method in order to allocate the cost incurred for the acquisition of the right in the shorter of the
expected use and the duration of its contracts starting from the moment in which the right may be
exercised and is generally a period between 3 and 5 years.
This item also classifies the costs of administrative rights already obtained or still in progress for the
construction of photovoltaic systems, acquired through subsidiaries. These assets are not subject to
amortisation, as long as they are not used for the construction of photovoltaic plant.
Goodwill
Goodwill recognised as an intangible asset is connected to a business combination transaction and
represents the difference between the cost incurred for the acquisition of a company or a business
unit and the sum of the values assigned, on the basis of the current values the time of acquisition,
to the individual assets and liabilities comprising the share of the company or business unit. Having
an indefinite useful life, goodwill is not subject to amortisation but is tested for impairment at least
annually, unless the market and management indicators identified by the Group suggest that
goodwill should be tested for impairment in the preparation of interim financial statements. For the
purposes of the impairment test, goodwill is allocated to individual cash-generating units (CGU), i.e.

61
the smallest financially independent business units through which the Group operates in different
market segments. Goodwill related to the acquisition of consolidated companies is recognised under
intangible assets. Goodwill related to associated companies or subsidiaries is included in the value
of investments.
Tangible fixed assets
Tangible fixed assets are evaluated at the cost of acquisition or production or contribution, including
any additional charges and expenses directly attributable to preparing the asset for its intended use,
less accumulated depreciation and any impairment losses. The cost includes expenditures directly
incurred to prepare the assets for their use.
The expenses incurred for maintenance and repair costs of an ordinary and/or cyclic nature are
charged directly to the income statement in the period in which they are incurred. The capitalisation
of costs related to the expansion, modernisation or improvement of facilities owned or leased by
the Group is carried out to the extent that they meet the requirements for being classified separately
as an asset or part of an asset, applying the component approach, according to which each
component with an independent assessment of useful life and its value must be treated individually.
Depreciation is charged on a straight-line basis at rates designed to write off an asset until the end
of its useful life.
During the year in which the tangible asset is initially recognised, depreciation is calculated taking
into consideration the effective utilisation of the asset.
The Company’s estimates of useful life for the various categories of tangible fixed assets are as
follows:
Description Period
Plant and machinery 12 years
Industrial and commercial equipment 7 years
Photovoltaic plants 20 years
Other assets 4 – 10 years
Inverters 10 years

62
Goods subject to leasing
Financial leasing
On the date of initial recognition, the leasing company books the asset under fixed assets and a
financial liability for the value equal to the lower of the fair value of the asset and the present value
of minimum lease payments at the date of inception of the lease using the interest rate implicit in
the lease or the marginal rate of interest of the loan. Subsequently, an amount equal to the portion
of the equipment's depreciation and financial charges separated from the rent paid during the year
is charged to the income statement.
Operating leasing
Rental income or expenses relating to leasing contracts, which may be qualified as operating leases,
are recognised in the income statement on a straight-line basis in relation to the duration of the
contract.
Impairment of tangible and intangible fixed assets
On each date of reference of the financial statements, intangible assets with a defined useful life
are analysed in order to identify whether there are any indicators, originating from external sources
within the Group, of decrease in the value of the same. In cases when such indicators are present,
the company estimates the recoverable amount of these assets, recording any impairment with
respect to its book value in the income statement. The recoverable amount of an asset is the greater
of its fair value less costs to sell and its value in use, which is equivalent to the present value of
estimated future cash flows of the asset. In determining the value in use, the estimated future cash
flows are discounted using a discount rate that reflects the current market valuation of the cost of
the money considered in relation to duration of the investment and to the specific risk of the asset.
For an asset that does not generate largely independent cash flows, the value in use is determined
based on the cash-generating unit to which the asset belongs. An impairment loss is recognised in
the income statement whenever the carrying amount of the asset, or of the cash-generating unit to
which it is allocated, is higher than the recoverable value.
For depreciated/amortised assets, any indications of impairment loss are evaluated. If the asset is
impaired, the recoverable value of the asset is estimated, recognising any cost surplus to the income
statement.

63
If the conditions for a prior impairment cease to be present, the accounting value of the asset, other
than goodwill, is restored to the income statement, within the limit of the book value that the asset
would have had if it had not been written down and depreciated/amortised.
Trade receivables and other current assets
Trade receivables and other current assets are evaluated at their initial recognition at fair value. In
subsequent periods, these activities are evaluated at amortised cost using the effective interest rate
method.
If there is objective evidence of elements indicating a reduction in value, the asset is reduced to the
equivalent of the discounted value of the cash flows that can be obtained in the future. The
impairment losses are recognised in the income statement. If in subsequent periods the reasons for
the write-down cease to be present, the value of the assets is reinstated.
Inventories
Inventories are evaluated at the lower of acquisition cost or production cost and net realisable value
is the amount that an enterprise expects to obtain from their sale in the ordinary course of business,
net of selling costs. The cost of inventories of raw, ancillary and consumable materials and finished
products and goods is determined by using the weighted average cost method.
The cost of finished goods and semi-finished goods includes the cost of design, raw materials, direct
labour and other production costs (based on normal operating capacity). The financial costs are not
included in the valuation of the inventories.
The inventory also includes, as part of products in progress, the value of all PV installations in
progress or already completed, for which, at the reference date of the financial statements, all the
accounting conditions for recognition of the corresponding sale revenue have not yet been met.
Non-current assets held for sale and discontinued operations - IFRS 5
Non-current assets held for sale and discontinued operations, whose accounting values will be
recovered principally through a sale transaction rather than through continuing use, are valued at
the lower of their carrying amount and fair value less costs to sell. In particular, a disposal group is
considered to be a composite of directly related assets and liabilities to be sold in a single
transaction. The discontinued operations are, however, made up of a significant component of the

64
Group, such as, for example, a separate major business unit, or geographical area of operations, or
a subsidiary acquired exclusively with a view to resale.
In accordance with IFRS, the data relating to non-current assets held for sale and discontinued
operations are presented in two specific items of the statement of financial position: assets held for
sale and liabilities directly associated with assets held for sale.
With exclusive reference to discontinued operations, their net economic results during the sale
process, capital gains/losses on the disposal itself, and the adjustment of their net book value to fair
value are presented in the item "Depreciation, amortisation and write-downs" which are indicated
separately from the other components included therein in the notes to the financial statements.
Cash and cash equivalents
Cash and cash equivalents include cash on hand, deposits held at call with banks and other short-
term highly liquid (convertible into cash within ninety days). The bank overdrafts are classified under
"Current financial liabilities".
Financial receivables
This category includes the assets not represented by derivative instruments and not listed in an
active market, from which fixed or determinable payments are expected. Such assets are classified
as current assets, except for the portions with expiration of more than 12 months, which are
included within the non-current assets.
Shareholders’ equity
Share capital
The share capital is composed of the capital subscribed and paid up by the Parent Company. The
costs strictly attributable to the issuance of shares are classified as a reduction of the share capital
when they are costs directly attributable to capital operations, net of deferred taxes.
Own shares
These are recognised as a decrease in the shareholders’ equity of the Group. Profits or losses for the
purchase, sale, issuance or cancellation of own shares are not recognised in the income statement.
Other reserves
These include earnings from previous years for the portion not distributed or allocated to reserves
(in the case of profits) or to be carried forward (in case of losses). In addition, the item includes
65
transfers from other equity reserves when the restrictions to which they were subjected are
released, as well as the effects of the recognition of changes in accounting policies and significant
errors. Finally, the item includes the reserve for cash flow hedges relating to recognition of the
"effective" amount of the hedge related to the joint venture, as required by IAS 28.
Financial liabilities
Financial liabilities include loans, commercial debt and other financial liabilities and are measured
at fair value upon initial recognition. The initial value is then adjusted in order to take into account
repayments and amortisation of the difference between the reimbursement value and the initial
value. The amortisation is calculated on the basis of the effective interest rate represented by the
rate that aligns, at the time of initial recognition, the present value of the cash flows associated with
the liability and the initial carrying value (amortised cost method).
Other financial liabilities are classified under current liabilities, unless the company has an
unconditional right to defer their payment for at least twelve months after the reporting date.
Provisions for risks and charges
Provisions for risks and charges are recognised when: (i) the Group has a current obligation, legal or
implicit, arising from a past event, and (ii) it is probable that the obligation will be onerous (iii) the
amount of the obligation can be estimated reliably. The funds are recorded based on management's
best estimate of the amount that the company would rationally pay to settle the obligation or to
transfer it to third parties. Where the effect of time is significant and the payment dates of the
obligations can be reliably estimated, the provision is discounted. The funds are periodically updated
to reflect changes in cost estimates, timing and discount rate.
Provision for employee benefits (TFR)
In defined benefit plans, which include severance benefits payable to employees pursuant to Art.
2120 of the Italian Civil Code, the amount of benefit to be paid to the employee can be quantified
only after the termination of the employment relationship, and it is linked to one or more factors
such as age, years of service and remuneration. Therefore, its cost is charged to the income
statement on the basis of actuarial calculations. The liability recognised in the statement of financial
position for defined benefit plans is the present value of the obligation at the reporting date. The
obligations for defined benefit plans are determined annually by an independent actuary using the
projected unit credit method. The present value of the defined benefit plan is determined by
66
discounting future cash flows at an interest rate equal to that of bonds (treasury/government
bonds) issued in Euro and takes into account the duration of the pension plan. Actuarial gains and
losses arising from these adjustments and changes in actuarial assumptions are charged from the
year 2013, with retroactive effect to shareholders’ equity.
As of 1 January 2007, the 2007 Financial Act and related decrees introduced significant changes to
the TFR, including the right of employees to decide the destination of their future benefits. In
particular, the new TFR flows may be directed to external pension funds or kept within the company.
In the case of allocation to external pensions, the company is subject only to the payment of a
defined contribution to the fund chosen, and from that date the newly matured portions are
considered defined contribution plans and not subject to actuarial valuation.
Revenue recognition Revenues and other income are recognised at fair value of the sales, net of discounts, allowances
and rebates and taxes directly related to the provision of services.
The item reports the revenues from the sale of photovoltaic systems, which are recognised when
the company has transferred the significant risks and rewards of ownership of assets, and has
ceased to exercise control over the transferred assets.
Revenues from services are recognised when they can be reliably estimated with reference to the
stage of completion on the reporting date.
Revenues related to energy efficiency in public and/or private entities fall within the scope of IFRIC
12 and IFRIC 4, respectively. These types of contracts are made up of two elements:
• The first part of a contract (efficiency activities) generates, in turn, two types of revenue :
o the first is equal to the fair value of the energy savings (calculated as the present value
of expected cash flows using market parameters faced by municipalities to achieve medium
to long term).
o the second, caused by the clear timing misalignments between the incurrence of costs
for carrying out the activity and the recovery in fifteen years (or the contract duration) of
the related revenue generates a financial asset each year. This financial asset and the related
economic, operational and financial components over the fifteen years are determined
based on the instructions in "Application no. 3 CIU - IFRIC 12 Service Concession
Arrangements”, in the paragraph relating to the financial asset model and in accordance
with the combined provisions of IAS 17 and IFRIC 4 for contracts with private parties.
• The second element (maintenance activities) is reflected in the accounts (in accordance with
IAS 18), for expertise gained.

67
Recognition of costs
Expenses are recognised when they are related to goods and services purchased or consumed in the
period in which they are incurred or when there is no future utility in accordance with the accrual
principle.
Financial income and charges
Financial income and charges are recognised in the income statement on an accrual basis and are
recorded at the amount of the effective interest.
Financial charges that are directly attributable to the acquisition, construction or production of an
asset that qualifies for capitalisation are capitalised as part of the asset’s cost. Capitalisation ceases
when the asset is ready for its intended use or sale. Interest expense is recognised based on the
effective interest method. Other financial charges are charged to the income statement on an
accruals basis.
Dividends
Dividends are recognised when the shareholders' are entitled to receive payment, which normally
corresponds to the approval of the dividend distribution.
The distribution of dividends to shareholders of TerniEnergia S.p.A. is recorded as a liability in the
period in which the distribution is approved by the shareholders’ meeting.
Current and deferred taxes
Current taxes are calculated based on the taxable income for the year, using tax rates in force on
the date of the financial statements.
Deferred and prepaid taxes are calculated in respect of all timing differences arising between the
tax base of an asset or liability and its carrying value. Prepaid taxes, including those related to tax
loss carry-forwards and for the portion not offset by deferred taxes, are recognised to the extent
that it is probable that future taxable profit will be available against which they can be recovered.
Deferred and prepaid taxes are measured using the tax rates that are expected to apply in the
periods in which the timing differences will be realised or settled.

68
Current, deferred and prepaid taxes are recognised in the income statement, except for those
relating to items charged or credited directly to shareholders’ equity, in which case the tax effect is
recognised directly in shareholders’ equity. Current, deferred and prepaid taxes are offset when
there is a legally enforceable right to compensation and a settlement of the net balance is expected.
Foreign currency translation
Items expressed in a currency other than the functional currency (cash, assets and liabilities to be
received or paid in fixed or determinable amounts of money, etc.) and non-monetary items
(advances to suppliers of goods and/or services, goodwill, intangible assets, etc.) are initially
recorded at the rates prevailing on the transaction date. Subsequently, monetary items are
converted into the functional currency using the exchange rates at the reporting date, and
differences arising on conversion are recognised in the income statement. Non-monetary items are
carried at the transaction exchange rate, except in the case of persistently unfavourable reference
exchange rates, in which case exchange differences are recognised in the income statement.
Earnings per share
Basic
Basic earnings per share are calculated by dividing the net income of the company by the weighted
average number of ordinary shares outstanding during the year, excluding own shares.
Diluted
For the purpose of calculating diluted earnings per share, the weighted average number of shares
outstanding is adjusted by assuming the exercise by all owners of rights having potential dilutive
effect, while the net profit of the Company is adjusted to take into account any effects, net of taxes,
of exercising those rights. The diluted earnings per share is not calculated in case of losses, as any
dilutive effect would result in an increase in earnings per share.
Use of estimates
The preparation of financial statements in compliance with IFRS requires the execution of estimates
and assumptions that affect the reported amounts of assets and liabilities and the related
disclosures, as well as on the assets and liabilities at the date of the financial statements. The
estimates and associated assumptions are based on historical experience and other factors
considered reasonable in the circumstances and are adopted when the accounting value of assets

69
and liabilities is not easily inferable from other sources. The actual results could differ from such
estimates. Estimates and assumptions are reviewed periodically and the effects of any changes are
reflected in the income statement if they involve only that year. In the event that the revision affects
both current and future periods, the change is recognised in the period in which the revision is made
and in future years.
It is believed that certain accounting standards are particularly important for understanding the
financial statements and for this purpose, the main items affected by the use of estimates and the
main assumptions used by management in the evaluation process of these items is presented below,
in accordance with the above-mentioned international accounting standards. The critical element
of such estimates is, in fact, the use of assumptions and/or professional judgments about matters
that are inherently uncertain.
Changes in the conditions underlying the assumptions and judgments could have a significant
impact on future results.
Future recovery of prepaid taxes
As of 31 December 2015, the financial statements include prepaid taxes for an amount whose
recovery in future years is considered by the management as highly probable. These prepaid taxes
can only be recovered if sufficiently large profits are attained in the future.
The assessment of recoverability takes into account the estimate of future taxable income and is
based on prudent tax planning; however, when it is ascertained that the Group is not able to recover
all or part of the prepaid taxes in the future, the consequent adjustment would be charged to the
income statement in the year in which this circumstance arises.
Allowance for bad debts
The allowance for bad debts reflects the management's estimate of losses inherent to the portfolio
of receivables from final customers and from the sales network. The allowance for bad debts is
estimated based on losses expected by the Group, calculated on past experience with similar
receivables, current and historical past-due amounts, losses and collections, and the monitoring of
credit quality and projections about economic conditions and market. The extension and possible
deterioration of the economic and financial crisis could cause a further deterioration in the financial
condition of the Group’s debtors with respect to that already taken into account in calculating the
funds recorded in the financial statements.
Recoverable value of non-current assets

70
Non-current assets include real estate properties, plant and equipment, intangible assets (in
particular, the value of permits), investments and other financial assets. The management
periodically reviews the accounting value of non-current assets held and used and of the assets to
be disposed of when events and circumstances require such review. This activity is performed using
estimates of future cash flows expected from the use or sale of the asset and a suitable discount
rate to calculate the present value. When the accounting value of non-current assets have suffered
an impairment, the Group recognises a write-down for the amount by which the carrying amount
of the asset exceeds its recoverable amount through use or sale, as determined with reference to
the most recent business plans.
Derivative financial instruments
Derivative financial instruments are used for hedging, to reduce risks of changes in interest rates
and market prices. In accordance with IAS 39, derivative financial instruments can be recorded in
accordance with the procedures established for hedge accounting only when, at the beginning of
the hedge, there is formal designation and documentation of the hedging relationship, it is assumed
that the hedge is highly effective, its effectiveness can be reliably measured and the hedge is highly
effective throughout the financial reporting periods for which it is designated.
All derivative financial instruments are measured at fair value in accordance with IAS 39. When
financial instruments meet the conditions for hedge accounting, the following accounting treatment
applies:
Fair value hedge - Where a derivative financial instrument is designated as a hedge against exposure
to changes in the fair value of an asset or liability attributable to a particular risk and could affect
profit or loss, the gain or loss arising from subsequent measurements of the fair value of the hedging
instrument are recognised in the income statement. The gain or loss on the hedged item,
attributable to the hedged risk, adjusts the carrying amount of the hedged item and is recognised
in the income statement.
Cash flow hedge - Where a derivative financial instrument is designated as a hedge of the exposure
to variability in future cash flows of an asset or liability recognised in the financial statements or a
highly probable forecasted transaction and could affect profit or loss, the effective portion of the
gain or loss on the derivative financial instrument is recognised directly in shareholders’ equity. The
gain or loss is eliminated from equity and recognised in the income statement in the period in which
the related economic effect of the hedged transaction is detected. The gain or loss associated with
a hedge (or part of a hedge) that has become ineffective is recognised in the income statement
immediately. If a hedging instrument or hedge relationship is terminated but the hedged transaction

71
has not yet been realised, the gains and losses accrued up to that time in equity are recognised in
the income statement, corresponding to the recognition of the economic effects of the hedged
transaction. If the hedged transaction is no longer expected to occur, the cumulative gains or losses
not yet realised in equity are recognised immediately in the income statement.
If hedge accounting cannot be applied, the gains or losses arising from the fair value of derivative
financial instruments are recognised immediately in the income statement. The financial assets and
liabilities measured at fair value are classified into three hierarchical levels described below,
according to the relevance of the information (input) used in determining the fair value.
In particular:
Level 1: this level includes current assets/liabilities for which the fair value is determined based on
quoted prices (unadjusted) in active markets for identical assets or liabilities;
Level 2: this level includes current assets/liabilities for which the fair value is determined based on
inputs other than quoted prices as in Level 1, but that, for these assets/liabilities, are directly or
indirectly observable in the market;
Level 3: this level includes in current assets/liabilities for which the fair value is determined on the
basis of non-observable market data.

72
3.4 COMMENTS ON THE MAIN STATEMENT OF FINANCIAL POSITION ITEMS:
NON-CURRENT ASSETS
3.4.1 INTANGIBLE FIXED ASSETS
The tables below show, respectively, the analysis of variations in the "Original Cost" (Table 1), the
"Accumulated Amortisation" (Table 2) and "Net Values" (Table 3) related to intangible assets.
(Table 1)
INTANGIBLE FIXED ASSETS ORIGINAL COST
Values as of
31/12/2014 Increases
Decreases for Write-downs/ Values as of
31/12/2015 (in Euro) disposals Reclassifications
Software 2,177,506 310,810 (1,441,409) 1,046,907
Other 2,332,249 1,075,603 (1,736,929) (72,158) 1,598,765
Building lease 331,452 (14,128) 317,324
Authorisations 10,957 10,957
Goodwill 11,390,544 145,600 (9,055,368) 2,480,776
Patents 116,450 430,000 546,450
Total 16,359,158 1,962,013 (12,233,707) (86,286) 6,001,178
(Table 2)
INTANGIBLE FIXED ASSETS ACCUMULATED AMORTISATION
Values as of 31/12/2014
Amortisation Reclassifications/ Values as of
31/12/2015 (in Euro) Decreases
Software 1,085,369 99,103 (559,750) 624,722
Patents 116,450 129,597 246,047
Other 1,014,162 139,254 (483,751) 669,665
Total 2,215,981 367,954 (1,043,501) 1,540,433
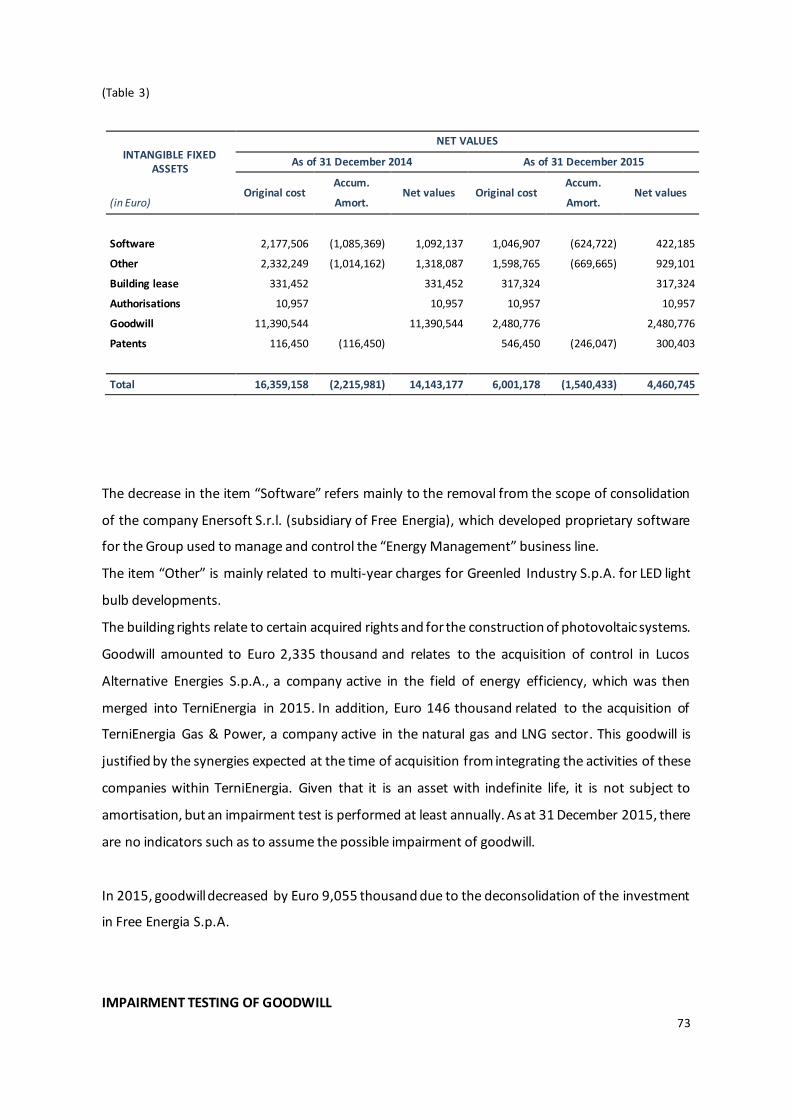
73
(Table 3)
INTANGIBLE FIXED ASSETS
NET VALUES
As of 31 December 2014 As of 31 December 2015
Original cost Accum.
Net values Original cost Accum.
Net values (in Euro) Amort. Amort.
Software 2,177,506 (1,085,369) 1,092,137 1,046,907 (624,722) 422,185
Other 2,332,249 (1,014,162) 1,318,087 1,598,765 (669,665) 929,101
Building lease 331,452 331,452 317,324 317,324
Authorisations 10,957 10,957 10,957 10,957
Goodwill 11,390,544 11,390,544 2,480,776 2,480,776
Patents 116,450 (116,450) 546,450 (246,047) 300,403
Total 16,359,158 (2,215,981) 14,143,177 6,001,178 (1,540,433) 4,460,745
The decrease in the item “Software” refers mainly to the removal from the scope of consolidation
of the company Enersoft S.r.l. (subsidiary of Free Energia), which developed proprietary software
for the Group used to manage and control the “Energy Management” business line.
The item “Other” is mainly related to multi-year charges for Greenled Industry S.p.A. for LED light
bulb developments.
The building rights relate to certain acquired rights and for the construction of photovoltaic systems.
Goodwill amounted to Euro 2,335 thousand and relates to the acquisition of control in Lucos
Alternative Energies S.p.A., a company active in the field of energy efficiency, which was then
merged into TerniEnergia in 2015. In addition, Euro 146 thousand related to the acquisition of
TerniEnergia Gas & Power, a company active in the natural gas and LNG sector. This goodwill is
justified by the synergies expected at the time of acquisition from integrating the activities of these
companies within TerniEnergia. Given that it is an asset with indefinite life, it is not subject to
amortisation, but an impairment test is performed at least annually. As at 31 December 2015, there
are no indicators such as to assume the possible impairment of goodwill.
In 2015, goodwill decreased by Euro 9,055 thousand due to the deconsolidation of the investment
in Free Energia S.p.A.
IMPAIRMENT TESTING OF GOODWILL

74
The balance of goodwill was tested at the level of individual CGU, identified as autonomous units
generating cash flows to which the goodwill relates and which is monitored for internal
management purposes by the Group. In particular, the cash-generating units identified:
represent the lowest level within the enterprise to which the goodwill relates and the
basis on which monitoring is performed for management control purposes;
are expected to benefit from the synergies of the business combination;
could be represented at the level of reporting from a set of clear, reliable and measurable
information flows.
In particular, goodwill can be broken down as follows:
Values in thousands of Euro
The estimate of the recoverable amount of the CGUs has been determined on the basis of the
criteria marked by prudence and in accordance with the dictates of the principles of accounting
standards (IAS 36) and consistent with the IFRS measurement practices. Specifically, to identify the
recoverable amount defined as the "use value" of the CGU, management discounted the cash flows
(DCF Model) extrapolated from the three-year financial plans drawn up and approved by the Board
of Directors for the 2015-2017 reference period and developed over a timeline until 2019. The cash
flow forecast was determined by using, in particular, the operating cash flow for the reference
period, prepared on the basis of the results achieved in previous years and future forecasts. The rate
used to discount cash flows, equivalent to 8.5%, was determined on the basis of market information
on the cost of money and the risks specific to the asset (Weighted Average Cost of Capital, WACC).
The test performed showed that the recoverable amount of the individual CGU is higher than the
net invested capital (including goodwill).
Therefore, the result of the aforementioned impairment test did not indicate the need for to adjust
the value of goodwill booked in the financial statements.
3.4.2 TANGIBLE FIXED ASSETS
2015 2014
Lucos Alternative Energies SpA 2,335 2,335
Free Energia - 9,055
TerniEnergia Gas&Power 146 -
Total Goodwill 2,481 11,390

75
The tables below show, respectively, the analysis of variations of the "Original Cost" (Table 1), the
“Accumulated depreciation and write-downs" (Table 2) and "Net values" (Table 3) relating to
tangible fixed assets as of 31 December 2014 and 31 December 2015:
(Table 1)
TANGIBLE FIXED ASSETS ORIGINAL COST
Values as of 31/12/2014
Increases Decreases for
Reclassifications Values as of 31/12/2015 (in Euro) disposals
Land and buildings 4,827,808 4,827,808
Plant and machinery 85,916,046 2,541,712 (12,627,929) 6,408,708 82,238,537
Industrial equipment 819,126 45,599 864,724
Other assets 1,111,590 17,910 (110,849) 1,018,651
Work in progress 18,121,711 3,255,318 (6,333,519) 15,043,510
TOTAL 110,796,279 5,860,539 (12,738,778) 75,189 103,993,229
(Table 2)
TANGIBLE FIXED ASSETS ACCUMULATED DEPRECIATION AND WRITE-DOWNS
Values as of 31/12/2014
Depreciation Other Reclassifications/ Values as of
31/12/2015 (in Euro) increases Other
Land and buildings 324,888 127,286 452,174
Plant and machinery 17,694,469 3,846,458 (2,300,304) 19,240,623
Industrial equipment 675,530 112,673 788,204
Other assets 794,747 123,544 (22,606) 895,685
TOTAL 19,489,634 4,209,962 (2,322,911) 21,376,685

76
(Table 3)
TANGIBLE FIXED ASSETS NET VALUES
As of 31 December 2014 As of 31 December 2015
(in Euro) Original cost
Accum.
depr. and write-downs
Net values Original cost
Accum. depr
and write-downs
Net values
Land and buildings 4,827,808 (324,888) 4,502,920 4,827,808 (452,174) 4,375,634
Plant and machinery 85,916,046 (17,694,469) 68,221,577 82,238,537 (19,240,623) 62,997,914
Industrial equipment 819,126 (675,530) 143,595 864,724 (788,204) 76,521
Other assets 1,111,590 (794,747) 316,843 1,018,651 (895,685) 122,966
Work in progress 18,121,711 18,121,711 15,043,510 15,043,510
TOTAL 110,796,279 (19,489,634) 91,306,646 103,993,229 (21,376,685) 82,616,544
Investments in land and buildings amounted to Euro 4,376 thousand mainly due to the value of the
properties owned by the Group. In particular, these properties are represented by two industrial
buildings in the plant of Nera Montoro used for the Group's industrial operations, as well as the
value of land allocated for the construction of a composting plant in Lecce.
As of 31 December 2015, "Plant and equipment" includes the value of photovoltaic systems with a
total capacity of 12.5 MW as well as the value of two PFU treatment plants (used tyres), the
biodigestion plant and the treatment plant of groundwater, the latter all present within the Nera
Montoro plant. The change in the item is primarily due to the net effect of, on one hand, the
decrease following the sale of 50% of the share in the companies Investimenti Infrastrutture Srl,
Società Agricola Fotosolara Oristano Srl, Società Agricola Fotosolara Bonannaro Srl and Infocaciucci
Srl, consolidated as of 31 December 2015 using the equity method, and, on the other hand, the
increase after the PFU treatment plant in Borgo Val di Taro became operational.
The latter factor explains the decrease in work in progress in 2015. The remainder of that item,
amounting to Euro 15,044 thousand, includes investments in progress and not yet completed in the
period ended on 31 December 2015. These investments relate to:
- the anaerobic digester and composting plant in Calimera (province of Lecce);
- the plant with cogeneration of energy through the pyrogasification of virgin wood to produce
electricity and heat, near the town of Borgosesia (province of Vercelli). Note that the delay in the
date the plant became operational was due to a series of environmental regulations and
technological adaptations that were still underway at the date these financial statements were
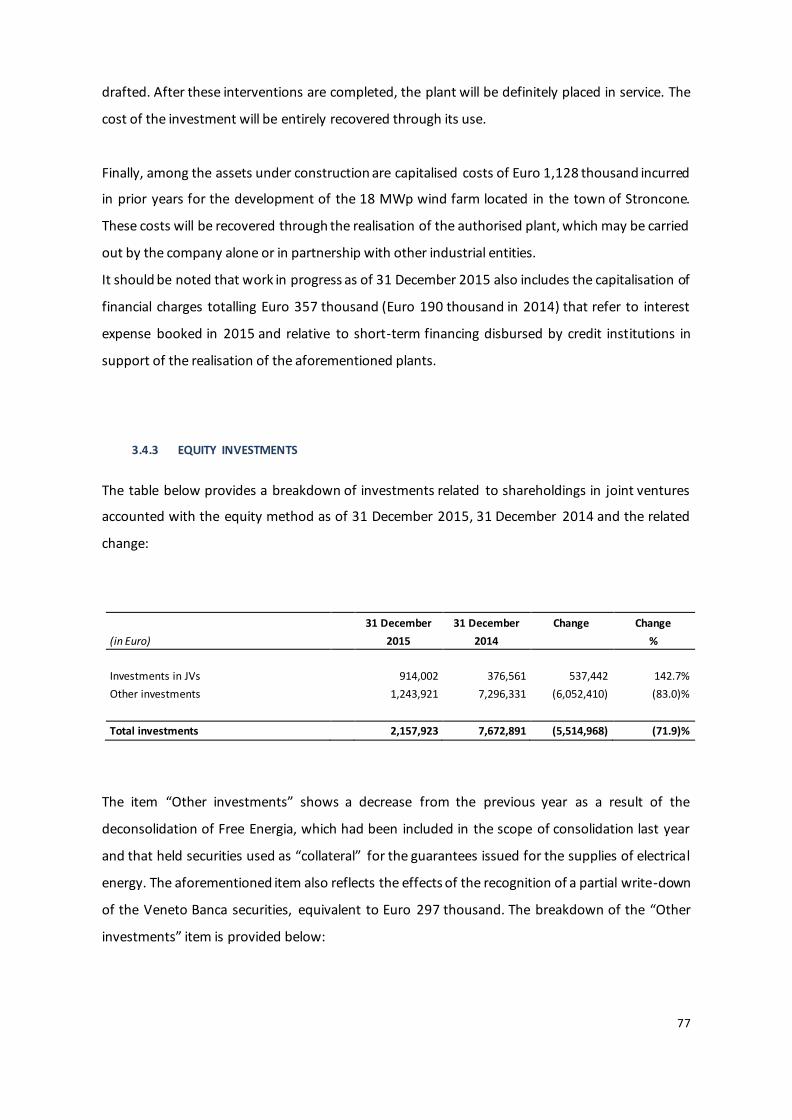
77
drafted. After these interventions are completed, the plant will be definitely placed in service. The
cost of the investment will be entirely recovered through its use.
Finally, among the assets under construction are capitalised costs of Euro 1,128 thousand incurred
in prior years for the development of the 18 MWp wind farm located in the town of Stroncone.
These costs will be recovered through the realisation of the authorised plant, which may be carried
out by the company alone or in partnership with other industrial entities.
It should be noted that work in progress as of 31 December 2015 also includes the capitalisation of
financial charges totalling Euro 357 thousand (Euro 190 thousand in 2014) that refer to interest
expense booked in 2015 and relative to short-term financing disbursed by credit institutions in
support of the realisation of the aforementioned plants.
3.4.3 EQUITY INVESTMENTS
The table below provides a breakdown of investments related to shareholdings in joint ventures
accounted with the equity method as of 31 December 2015, 31 December 2014 and the related
change:
31 December 31 December Change Change
(in Euro) 2015 2014 %
Investments in JVs 914,002 376,561 537,442 142.7%
Other investments 1,243,921 7,296,331 (6,052,410) (83.0)%
Total investments 2,157,923 7,672,891 (5,514,968) (71.9)%
The item “Other investments” shows a decrease from the previous year as a result of the
deconsolidation of Free Energia, which had been included in the scope of consolidation last year
and that held securities used as “collateral” for the guarantees issued for the supplies of electrical
energy. The aforementioned item also reflects the effects of the recognition of a partial write-down
of the Veneto Banca securities, equivalent to Euro 297 thousand. The breakdown of the “Other
investments” item is provided below:

78
31.12.2015
Veneto Banca securities 1,242,420
Other investments 1,501
Total 1,243,921
The joint ventures are active in the identification, development, financing, design, construction and
commissioning of photovoltaic plants in Italy, and the sale of electricity produced by them.
The value of investments in joint ventures at 31 December 2015 and their relative valuation with
the equity method for each company is presented below:
Investment 31 December 2015 Equity investments Deferred Margin
Energia Alternativa S.r.l. 149,884 149,884
Solter (79,483) (79,483)
Girasole S.r.l.. (35,613) (35,613)
Guglionesi S.r.l. (16,863) (16,863)
Bonnanara S.r.l. (53,305) (53,305)
Oristano S.r.l. (35,272) (35,272)
Investimenti Infrastrutture S.r.l. 35,278 35,278
Infocaciucci S.r.l. 158,755 158,755
Rebis Power S.r.l. 570,085 570,085
Total 693,466 914,002 (220,535)
It should be noted that the application of the equity method in prior years resulted in the elimination
of significant margins in relation to the volume of work undertaken on behalf of the joint ventures,
with the consequent reduction of the carrying value of the investment. After a reset of the value of
investment, further reduction is recognised as a liability. This liability, called "Deferred Margin", is
recognised under other liabilities (current and non-current), because it is not representative of a
legal or implicit obligation to cover the losses of the investee, but a decrease in the value of the joint
venture investment consequent to the elimination of deferred margins in subsequent years that will
be recognised in the consolidated income statement in accordance with the amortisation schedule
of the transferred plants.

79
Investments in joint ventures are classified in the statement of financial position for Euro 914
thousand in the item “Equity investments” and Euro 220 thousand in the item “Deferred margin”
amongst other current liabilities.
In order to present more complete information, the following table sets forth the aggregate net
financial debt of the primary joint ventures at 31 December 2015.
Energia
Alternativa Solter Girasole Guglionesi
Rebis Power
Investimenti Infrastrutture
Soc. Agric.
Fotosolara Bonnanaro
S.r.l.
Soc. Agric.
Fotosolara Oristano
S.r.l.
Infocaciucci S.r.l.
Total
Cash
Bank current accounts 1,030,685 93,258 137,690 35,444 24,406 36,220 43,800 18,867 1,420,370
Liquidity (A) 1,030,685 93,258 137,690 35,444 24,406 36,220 43,800 18,867 1,420,370
Current financial payables
Current bank payables
- mortgages (988,334) (340,000) (1,328,334)
- sale and leaseback (1,424,631) (645,492) (283,885) (107,446) (156,466) (66,197) (73,669) (98,082) (159,655) (3,015,523)
- to other shareholders (618,622) (500,000) (85,000) (1,203,622)
- to TerniEnergia (314,084) (438,939) (85,000) (4,019) (527,958)
Non-current financial payables
- mortgages (12,650,611) (1,350,000) (14,000,611)
- project financing
- sale and leaseback (21,468,114) (9,615,338) (4,601,423) (2,091,046) (2,198,225) (1,097,494) (1,749,916) (2,329,818) (2,180,170) (47,331,544)
- to other shareholders (479,891) (267,752) (747,643)
- to TerniEnergia (7,453,320) (1,430,565) (538,671) (282,403) (899,304) (842,852) (1,015,045) (12,462,159)
Financial debt (B) (44,603,632) (11,691,395) (8,532,809) (2,918,647) (2,354,691) (2,062,995) (2,666,436) (3,442,946) (2,343,844) (80,617,395)
Net financial debt (A+B) (43,572,947) (11,598,137) (8,395,119) (2,883,202) (2,354,691) (2,038,589) (2,630,217) (3,399,146) (2,324,977) (79,197,024)
It should be noted that the 50% of the values of net financial debt shown in the table above refer to
TerniEnergia Group, equivalent to the stakes held by the Group in the joint ventures.
Joint ventures generally finance investments in photovoltaic systems through loans granted by
shareholders or through medium to long-term loans from financial institutions and leasing
companies. The long-term borrowings are principally secured by mortgages on photovoltaic joint
ventures, by pledges on receivables and cash and cash equivalents of joint ventures, and guarantees
granted by the shareholders. The parent company has issued - in favour of some joint ventures -
takeover agreements amounting to Euro 17.5 million at 31 December 2015 (for further details see
Note 3.5.11 “Commitments and guarantees” as well as 3.7 “Related parties”).
Some loans require both the shareholders and the joint venture to comply with certain corporate
and financial parameters. In particular, the corporate parameters provide the ability for lenders to

80
request early repayment of the loans in the event of any changes in the shareholding structure of
the joint venture, while the financial parameters include:
the requirement for joint ventures to comply with certain ratios - typically 15%/85% - for
shareholders’ equity/debt;
the right of financial institutions to require early repayment in the event of:
i) a debt service cover ratio below 1.05 (debt service cover ratio is the ratio of a)
expected cash flows from the project funded in a given year and b) interest,
including payments related to derivative instruments, and the principal amount of
debt maturing in the same year);
ii) a loan life coverage ratio less than 1.10 (i.e. the present value of expected cash
flows from the project compared to the amount of the sums paid and not yet
repaid);
The possibility of the joint venture to distribute dividends is i) subject to satisfaction of a debt service
cover ratio generally equal to or greater than 1.15 and the loan life coverage ratio generally equal
or greater than 1.20 and ii) limited to the amount of free cash as defined by the contract.
As of 31 December 2015, all covenants were met. It should be noted that the cash flows to service
the debt of the joint venture are derived from the tariffs of the GSE and the sale of electricity
produced by photovoltaic systems owned by the joint venture.
3.4.4 PREPAID TAXES
The table below provides a breakdown of prepaid taxes as of 31 December 2015, 31 December 2014
and the relevant change:
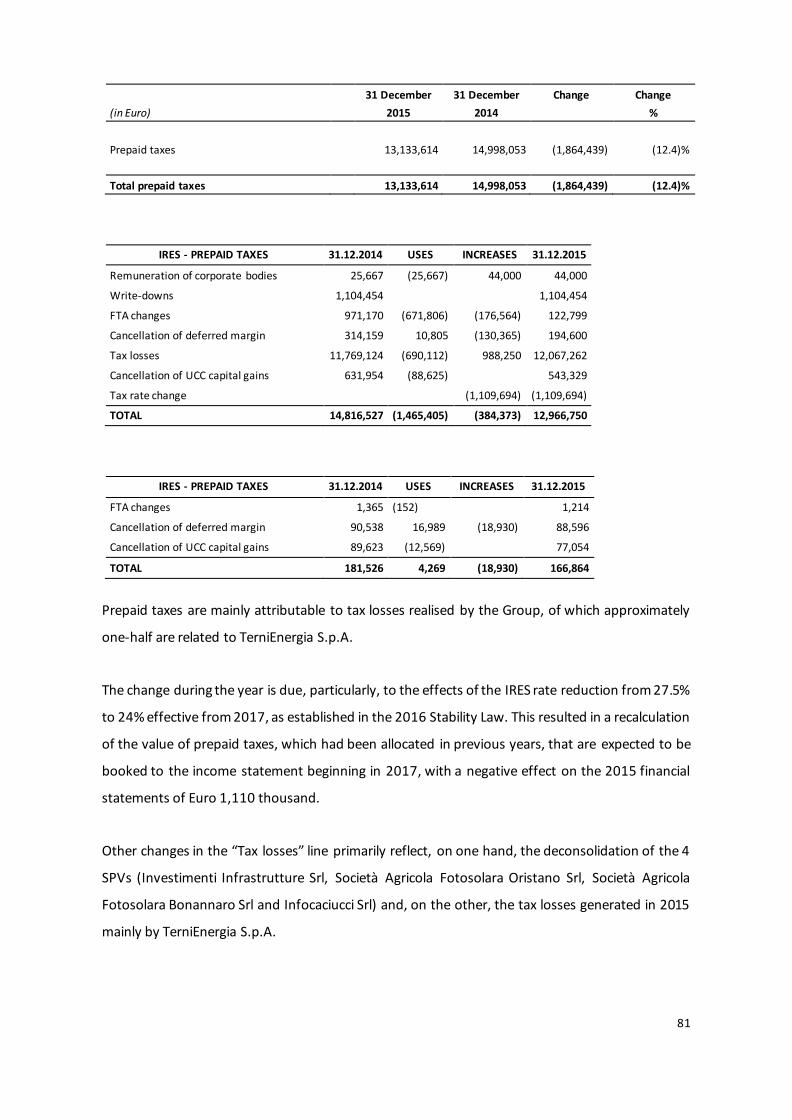
81
31 December 31 December Change Change
(in Euro) 2015 2014 %
Prepaid taxes 13,133,614 14,998,053 (1,864,439) (12.4)%
Total prepaid taxes 13,133,614 14,998,053 (1,864,439) (12.4)%
IRES - PREPAID TAXES 31.12.2014 USES INCREASES 31.12.2015
Remuneration of corporate bodies 25,667 (25,667) 44,000 44,000
Write-downs 1,104,454 1,104,454
FTA changes 971,170 (671,806) (176,564) 122,799
Cancellation of deferred margin 314,159 10,805 (130,365) 194,600
Tax losses 11,769,124 (690,112) 988,250 12,067,262
Cancellation of UCC capital gains 631,954 (88,625) 543,329
Tax rate change (1,109,694) (1,109,694)
TOTAL 14,816,527 (1,465,405) (384,373) 12,966,750
IRES - PREPAID TAXES 31.12.2014 USES INCREASES 31.12.2015
FTA changes 1,365 (152) 1,214
Cancellation of deferred margin 90,538 16,989 (18,930) 88,596
Cancellation of UCC capital gains 89,623 (12,569) 77,054
TOTAL 181,526 4,269 (18,930) 166,864
Prepaid taxes are mainly attributable to tax losses realised by the Group, of which approximately
one-half are related to TerniEnergia S.p.A.
The change during the year is due, particularly, to the effects of the IRES rate reduction from 27.5%
to 24% effective from 2017, as established in the 2016 Stability Law. This resulted in a recalculation
of the value of prepaid taxes, which had been allocated in previous years, that are expected to be
booked to the income statement beginning in 2017, with a negative effect on the 2015 financial
statements of Euro 1,110 thousand.
Other changes in the “Tax losses” line primarily reflect, on one hand, the deconsolidation of the 4
SPVs (Investimenti Infrastrutture Srl, Società Agricola Fotosolara Oristano Srl, Società Agricola
Fotosolara Bonannaro Srl and Infocaciucci Srl) and, on the other, the tax losses generated in 2015
mainly by TerniEnergia S.p.A.

82
The balance of prepaid taxes on tax losses includes those resulting from the application of the
“Tremonti ambientale” (environmental law), for a total of Euro 6,400 thousand, which was
recognised in the financial statements as of 31 December 2014.
These losses are internally assessed to be recoverable in light of the Group’s forecasts and industrial
plan. With regard to the effects deriving from the application of the “Tremonti Ambientale”, refer
to the explanation below, already provided in the financial statements as of 31 December 2014.
Article 6, paragraphs 13-19 of Law no. 388/00 (subsequently repealed by means of Legislative
Decree no. 83/2012), which refers to the tax incentive known as “Tremonti Ambientale” for small
and medium-sized companies. It envisages that the portion of income allocated to environmental
investments, including photovoltaic plants designed to decrease consumption of conventional
electrical energy by companies, is not relevant for purposes of calculating income taxes.
As a result, and although the norm was very detailed and provided for an incentive that was also
applicable to investments in photovoltaic plants, Energia Alternativa s.r.l. and T.E.R.NI Solarenergy
s.r.l. – similar to many other companies operating in the photovoltaic sector – did not utilise the
incentive as it was not specified if the incentive was in addition to the so-called “energy discount”.
In light of that specified above, as a result, and despite the facts that Energia Alternativa s.r.l. and
T.E.R.NI Solarenergy s.r.l. had, during the 2009 and 2010 tax periods (i.e. during the period of
effectiveness of the energy discount law), realized “environmental investments” that were
potentially subject to facilitation, they never utilized the environmental tax deductions due to the
regulatory uncertainty as to whether it was in addition to the governmental energy account
contribution.
In 2012, the following ended this uncertainty:
i) Art. 19 of the so-called “V energy account” provided for combination within certain limits;
ii) the Ministry of Economic Development confirmed this interpretation.
The companies conducted in-depth analyses – including with the support of knowledgeable
consultants – regarding the possibility of using the incentive and decided to take advantage of it,
recognising the relative effects in the financial statements of 31 December 2014.
The benefits deriving from the application of the aforementioned norm in the consolidated financial
statements amounts to a total of Euro 9,711 thousand. In particular, the tax incentive was partially

83
booked – Euro 3,302 thousand – through the booking of IRES receivables and the relative
extraordinary proceeds from the re-liquidation of taxes pertaining to those years for which the
“supplementary tax return” could be presented, while the remaining part – Euro 6,400 thousand –
was booked through the allocation of prepaid taxes on tax losses that were additionally usable as
an offset.
The tax losses on which prepaid assets were recognised are internally assessed to be recoverable in
light of the Group’s forecasts and industrial plan.
3.4.5 NON-CURRENT FINANCIAL RECEIVABLES
The following table provides a breakdown of non-current financial receivables as of 31 December
2015, 31 December 2014 and the related change:
31 December 31 December Change Change
(in Euro) 2015 2014 %
Soc. Agricola Fotosalara Bonnanaro S.r.l. 842,852 842,852 n.a.
Solter S.r.l. 1,445,909 1,716,153 (270,244) (15.7)%
Investimenti Infrastrutture S.r.l. 874,304 874,304 n.a.
Dt S.r.l. 375,422 (375,422) (100.0)%
Soltarenti S.r.l. 1,477,513 1,061,562 415,951 39.2%
Energia Alternativa S.r.l. 7,903,521 8,899,087 (995,566) (11.2)%
Soc. Agricola Fotosalara Oristano S.r.l. 1,015,045 1,015,045 n.a.
Girasole S.r.l. 708,695 579,155 129,540 22.4%
Solaren S.r.l. n.a.
Guglionesi S.r.l. 402,799 398,567 4,232 1.1%
Financial assets 8,173,942 6,481,307 1,692,635 26.1%
Security deposits 746,770 1,567,916 (821,146) (52.4)%
Other financial receivables 1,924,614 (1,924,614) (100.0)%
Total non-current financial receivables 23,591,350 23,003,783 587,567 2.6%
This item includes Euro 8,174 thousand in financial receivables recorded as a result of the
application of IFRIC 12 and IFRIC 4 to contracts for energy efficiency and interest-bearing loans
granted to the joint ventures that are renewed automatically from year to year unless resolved.
These receivables represent the fair value of the expected cash flows from energy efficiency
activities carried out on a number of municipalities and industrial plants. These contracts are

84
intended to improve the energy efficiency of public lighting systems. The services performed consist
of the planning, design and maintenance of interventions aimed at efficiency.
The increase recorded in the item "Financial assets energy efficiency" compared to the previous year
is due in particular to new energy efficiency contracts signed during the year. The change in financial
receivables from joint ventures is primarily attributable to the sale of 50% of the shares in
Investimenti Infrastrutture Srl, Società Agricola Fotosolara Oristano Srl and Società Agricola
Fotosolara Bonannaro Srl, previously 100% owned.
The item “Security deposits” primarily includes the sums deposited by the special purpose
companies which own the photovoltaic plants as guarantees for the leasing contracts stipulated for
the financing of the plants themselves.
The change in the item mainly refers to the deconsolidation of Investimenti Infrastrutture Srl,
Società Agricola Fotosolara Oristano Srl, Società Agricola Fotosolara Bonannaro Srl and Infocaciucci
Srl.
As at 31 December 2014, the item “Other financial receivables” included receivables held by Feed
SpA, a company belonging to the Free Group, which was removed from the scope of consolidation
in 2015.
CURRENT ASSETS
3.4.6 INVENTORIES
The following table provides a breakdown of the item in question as of 31 December 2015, 31
December 2014 and the related change:
31 December 31 December Change Change
(in Euro) 2015 2014 %
Raw materials 16,406,222 1,760,019 14,646,203 n.a.
Finished products 448,085 653,578 (205,494) (31.4)%
Work in progress 6,475,671 8,529,924 (2,054,253) (24.1)%
Total inventories 23,329,978 10,943,522 12,386,455 113.2%

85
The item “Raw materials” primarily refers to panels that have not yet been installed for the
construction projects in South Africa and, to a lesser extent, miscellaneous material (carpentry and
electrical materials) used for the construction of photovoltaic plants.
As of 31 December 2015, work in progress mainly includes the costs incurred for the design,
development and construction of several power plants currently still in progress in South Africa.
During 2015, this balance of this item decreased following the start of construction in South Africa
and, hence, the resulting attribution to the two EPC work orders of part of these costs (Euro 3.6
million).
The finished products as of 31 December 2015 mainly relate to the raw and secondary materials
arising from the recovery of used tyres, as well as to the "TR gridless" equipment (apparatus for
providing low voltage power using a stand-alone photovoltaic energy and batteries) and "TR WOC"
equipment (sensor to detect weld defects in real time). For these products, the company is
implementing a strategy for marketing abroad.
3.4.7 TRADE RECEIVABLES
The following table provides a breakdown of the item in question as of 31 December 2015, 31
December 2014 and the related change:
31 December 31 December Change Change
(in Euro) 2015 2014 %
Receivables from customers 51,914,887 78,255,608 (26,340,721) (33.7)%
Receivables from joint ventures 444,370 518,733 (74,363) (14.3)%
Receivables from parent company 613,981 959,335 (345,354) n.a.
Receivables from associates 115,668 101,446 14,222 14.0%
Allowance for bad debts (726,972) (726,972) 0.0%
Total trade receivables 52,361,935 79,108,151 (26,746,215) (33.8)%
As of 31 December 2015, trade receivables, mainly from customers, amount to Euro 52,362
thousand. The change in trade receivables compared to the same period of the previous year is
mainly due to the removal of Free Energia from the scope of consolidation.
The receivables from customers include an amount of approximately Euro 2.9 million, which is the
balance of an original consideration of Euro 40 million from the sale, in 2011, of two photovoltaic
plants totalling approximately 12 megawatts of power, which are currently fully deployed. The other

86
party did not honour its obligations for this receivable, although in December 2012 an agreement
had been reached for the payment of the amount due. Despite repeated attempts to settle the issue
out of court, in August 2013 the parent company was forced to initiate legal action to recover this
receivable. In particular, the Parent Company, with the assistance of its legal advisors, believes the
other party’s reasons for refusing to pay are specious in light of the serious and concrete factual and
legal elements. Therefore, as of the reporting date, the Parent Company is reasonably certain that
it will not have a liability with said company, also considering that there are no indicators that would
suggest the counterparty is at risk of not having the economic-financial resources to honour its
obligations with TerniEnergia. For more details, please refer to Note 3.5.11.
The amount of trade receivables is adjusted by an allowance for bad debt of Euro 726 thousand to
cover the risk of default of certain receivables arising in previous years.
For a breakdown of receivables from joint ventures, please refer to the paragraph 3.7, which lists all
the transactions with the related parties as of 31 December 2015.
As of 31 December 2015, the nominal value of trade receivables approximates their fair value.
3.4.8 OTHER CURRENT ASSETS
The following table provides a breakdown of financial receivables as of 31 December 2015, 31
December 2014 and the related change:
31 December 31 December Change Change
(in Euro) 2015 2014 %
VAT receivable 3,310,416 4,571,267 (1,260,851) (27.6)%
Advances to suppliers 606,851 369,209 237,641 64.4%
Deferred charges 1,045,778 1,991,729 (945,951) (47.5)%
Other receivables 19,141,492 16,823,272 2,318,219 13.8%
Total other current assets 24,104,536 23,755,477 349,058 1.5%
The decrease in the VAT receivable and deferred changes is due to the deconsolidation of
Investimenti Infrastrutture Srl, Società Agricola Fotosolara Oristano Srl, Società Agricola Fotosolara
Bonannaro Srl and Infocaciucci Srl.
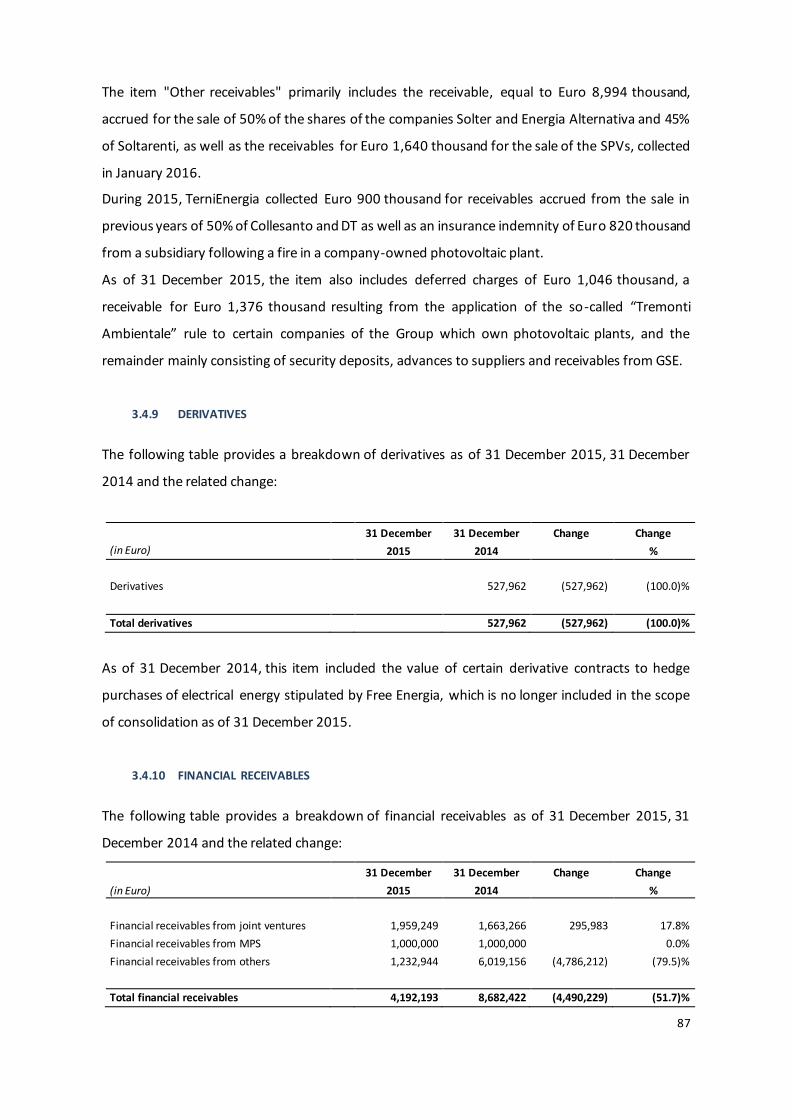
87
The item "Other receivables" primarily includes the receivable, equal to Euro 8,994 thousand,
accrued for the sale of 50% of the shares of the companies Solter and Energia Alternativa and 45%
of Soltarenti, as well as the receivables for Euro 1,640 thousand for the sale of the SPVs, collected
in January 2016.
During 2015, TerniEnergia collected Euro 900 thousand for receivables accrued from the sale in
previous years of 50% of Collesanto and DT as well as an insurance indemnity of Euro 820 thousand
from a subsidiary following a fire in a company-owned photovoltaic plant.
As of 31 December 2015, the item also includes deferred charges of Euro 1,046 thousand, a
receivable for Euro 1,376 thousand resulting from the application of the so-called “Tremonti
Ambientale” rule to certain companies of the Group which own photovoltaic plants, and the
remainder mainly consisting of security deposits, advances to suppliers and receivables from GSE.
3.4.9 DERIVATIVES
The following table provides a breakdown of derivatives as of 31 December 2015, 31 December
2014 and the related change:
31 December 31 December Change Change
(in Euro) 2015 2014 %
Derivatives 527,962 (527,962) (100.0)%
Total derivatives 527,962 (527,962) (100.0)%
As of 31 December 2014, this item included the value of certain derivative contracts to hedge
purchases of electrical energy stipulated by Free Energia, which is no longer included in the scope
of consolidation as of 31 December 2015.
3.4.10 FINANCIAL RECEIVABLES
The following table provides a breakdown of financial receivables as of 31 December 2015, 31
December 2014 and the related change:
31 December 31 December Change Change
(in Euro) 2015 2014 %
Financial receivables from joint ventures 1,959,249 1,663,266 295,983 17.8%
Financial receivables from MPS 1,000,000 1,000,000 0.0%
Financial receivables from others 1,232,944 6,019,156 (4,786,212) (79.5)%
Total financial receivables 4,192,193 8,682,422 (4,490,229) (51.7)%
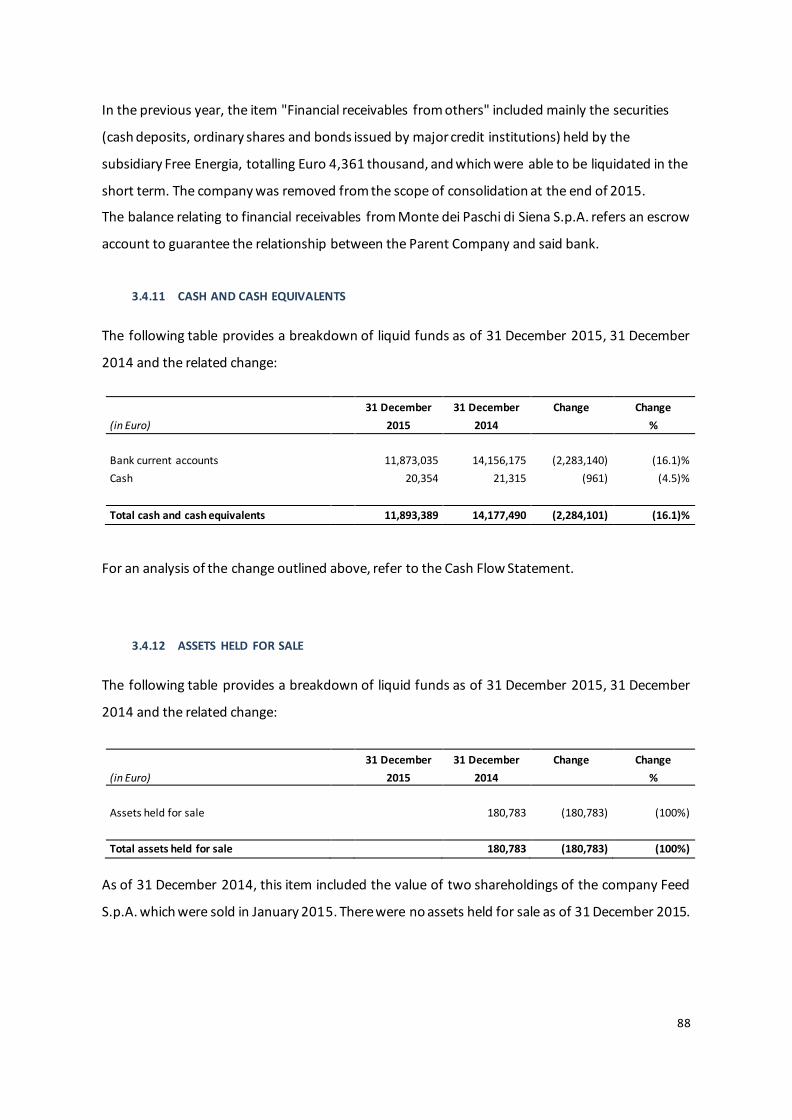
88
In the previous year, the item "Financial receivables from others" included mainly the securities
(cash deposits, ordinary shares and bonds issued by major credit institutions) held by the
subsidiary Free Energia, totalling Euro 4,361 thousand, and which were able to be liquidated in the
short term. The company was removed from the scope of consolidation at the end of 2015.
The balance relating to financial receivables from Monte dei Paschi di Siena S.p.A. refers an escrow
account to guarantee the relationship between the Parent Company and said bank.
3.4.11 CASH AND CASH EQUIVALENTS
The following table provides a breakdown of liquid funds as of 31 December 2015, 31 December
2014 and the related change:
31 December 31 December Change Change
(in Euro) 2015 2014 %
Bank current accounts 11,873,035 14,156,175 (2,283,140) (16.1)%
Cash 20,354 21,315 (961) (4.5)%
Total cash and cash equivalents 11,893,389 14,177,490 (2,284,101) (16.1)%
For an analysis of the change outlined above, refer to the Cash Flow Statement.
3.4.12 ASSETS HELD FOR SALE
The following table provides a breakdown of liquid funds as of 31 December 2015, 31 December
2014 and the related change:
31 December 31 December Change Change
(in Euro) 2015 2014 %
Assets held for sale 180,783 (180,783) (100%)
Total assets held for sale 180,783 (180,783) (100%)
As of 31 December 2014, this item included the value of two shareholdings of the company Feed
S.p.A. which were sold in January 2015. There were no assets held for sale as of 31 December 2015.

89
3.5 COMMENTS ON THE MAIN LIABILITY AND EQUITY ITEMS
3.5.1 SHAREHOLDERS’ EQUITY
As of 31 December 2015, the subscribed and paid share capital of the Parent Company amounted
to Euro 57,007,230 divided into 44,089,550 ordinary shares of no par value.
As of 31 December 2015, the legal reserve amounted to Euro 2,142 thousand and was increased by
Euro 84 thousand, following the shareholders’ resolution to allocated the profit for the year ended
31 December 2014.
The change in the item “Other reserves” is due to the distribution of the dividend approved by the
Shareholders’ Meeting of 24 April 2015 for Euro 2,866 thousand, a portion of which was obtained
from the Extraordinary Reserve, for Euro 1,261 thousand.
As of 31 December 2015, the item "Other reserves" includes the positive change in the reserve for
cash flow hedges totalling Euro 981 thousand. This reserve reflects the lower negative fair value,
net of related tax effects, of derivative instruments to hedge the risk of changes in cash flows related
to fluctuations in interest rates on some medium/long-term loans. These derivative contracts meet
IFRS requirements for hedge accounting and, therefore, changes in the fair value of these derivatives
are recognised - solely for the "effective" portion - in a specific equity reserve ("cash flow hedge
reserve"). The change in this reserve is indicated in the statement of comprehensive income. The
total value of the cash flow hedge reserve as of 31 December 2015 is negative for Euro 4,524
thousand (Euro 5,505 thousand as of 31 December 2014).
The “Other reserves” item also includes the negative difference, for Euro 2,091 thousand, between
the fair value of the investment in Greenled Industry S.p.A. (from appraisal), included in the scope
of consolidation effective 31 December 2015, and the net book value of the assets acquired from
said company. This was considered a transaction “under common control”, which is not included in
the application scope of IFRS 3 and the accounting treatment adopted conforms with the provisions
of OPI 1.
The equity of minority interests is accounted for mainly by the share capital and reserves belonging
to the minority shareholders of GreeASM S.r.l. and the South African companies, TerniEnergia

90
Project and Tevasa. The change in this item is attributable to the removal of the Free Energia Group
from the scope of consolidation.
The changes during the year pertain to own shares, which reflect the following transactions:
- On 13 October 2014, the issuer’s Ordinary Shareholders’ Meeting authorised the Board of
Directors and, on its behalf, the Chairman of said Board, to purchase a maximum of
2,656,720 own shares, on a rotating basis for a maximum of 18 months from the date of the
Shareholders’ Meeting, representing an amount not exceeding 6% of the share capital, with
regard to any resolutions and executions of share capital increases and decreases during
the authorisation’s term of validity. The authorisation allows the Board to pursue the
objectives of maintaining a portfolio of ordinary TerniEnergia shares to be used as
consideration in any extraordinary transactions, offering shareholders an additional tool for
monetising their investment, purchasing own shares with an investment perspective of the
medium/long-term, and, acting in compliance with governing regulations either directly or
through intermediaries, containing abnormal changes in the stock price or to normalise
performance in trading volumes or prices against temporary distortive factors linked to
excessive volatility or restricted liquidity in exchanges.
- As thoroughly explained in the Report on Operations, on 2 October 2015, the Board of
Directors of TerniEnergia resolved to sign the divestment contract for the transfer of the
Free Energia shares to the principal formers shareholders of Free Energia, in exchange for
unlisted TerniEnergia SpA shares. The divestment contract included two precedent
conditions: approval expressed (i) by the meeting of the holders of the “TerniEnergia Euro
25,000,000.00 Notes due 2019” bond, held on 16 November 2015 and (ii) by the
Shareholders’ Meeting held on 18 November 2015. Subsequent to the fulfilment of these
conditions, with the reversal of the Free Energia shares and the transfer of the TerniEnergia
shares to the qualified broker, this divestment agreement was completed on 30 November
2015. Consequently, TerniEnergia sold 3,315,936 shares in Free Energia (equivalent to
88.07% of the entire share capital of Free Energia) to BA & Partners S.p.A., Sistematica
S.p.A., Energetica S.p.A. and Feed S.p.A., obtaining in exchange 5,845,290 own shares for a
counter value of Euro 15.4 million, supported by an appraisal conducted by independent
experts (equivalent to 13.26% of the share capital of TerniEnergia). For the economic effect
of the transaction, please refer to Note 3.6.8 for the income statement.
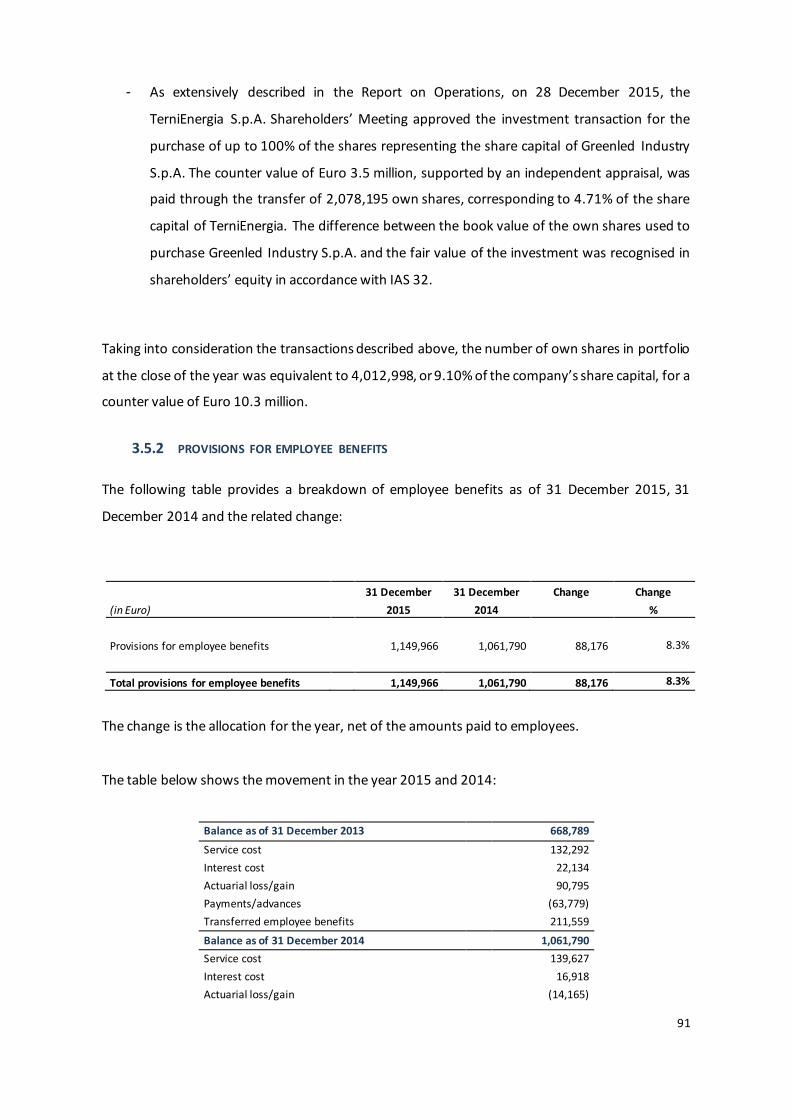
91
- As extensively described in the Report on Operations, on 28 December 2015, the
TerniEnergia S.p.A. Shareholders’ Meeting approved the investment transaction for the
purchase of up to 100% of the shares representing the share capital of Greenled Industry
S.p.A. The counter value of Euro 3.5 million, supported by an independent appraisal, was
paid through the transfer of 2,078,195 own shares, corresponding to 4.71% of the share
capital of TerniEnergia. The difference between the book value of the own shares used to
purchase Greenled Industry S.p.A. and the fair value of the investment was recognised in
shareholders’ equity in accordance with IAS 32.
Taking into consideration the transactions described above, the number of own shares in portfolio
at the close of the year was equivalent to 4,012,998, or 9.10% of the company’s share capital, for a
counter value of Euro 10.3 million.
3.5.2 PROVISIONS FOR EMPLOYEE BENEFITS
The following table provides a breakdown of employee benefits as of 31 December 2015, 31
December 2014 and the related change:
31 December 31 December Change Change
(in Euro) 2015 2014 %
Provisions for employee benefits 1,149,966 1,061,790 88,176 8.3%
Total provisions for employee benefits 1,149,966 1,061,790 88,176 8.3%
The change is the allocation for the year, net of the amounts paid to employees.
The table below shows the movement in the year 2015 and 2014:
Balance as of 31 December 2013 668,789
Service cost 132,292
Interest cost 22,134
Actuarial loss/gain 90,795
Payments/advances (63,779)
Transferred employee benefits 211,559
Balance as of 31 December 2014 1,061,790
Service cost 139,627
Interest cost 16,918
Actuarial loss/gain (14,165)

92
Payments/advances (131,101)
Transferred employee benefits 76,897
Balance as of 31 December 2015 1,149,966
The primary actuarial assumptions used in the valuation of pension plans with defined benefits and
of the component of severance pay that has retained the nature of a defined benefit plan are as
follows:

93
Employee termination provisions (TFR)
31-Dec-2015 31-Dec-2014
Annual discount rate 2.30% 1.86%
Annual inflation rate
2016 1.50% 2015 0.60% 2017 1.80% 2016 1.20% 2018 1.70% 2017 1.50% 2019 1.60% 2018 1.50%
2020 and beyond 2.00% 2019 and beyond 2.00%
Annual TFR rate of increase
2016 2.63% 2015 1.95% 2017 2.85% 2016 2.40%
2018 2.77% 2017 2.63% 2019 2.70% 2018 2.63%
2020 and beyond 3.00% 2019 and beyond 3.00%
Annual rate of increase in salaries
manual workers 0.50% 0.50% office workers and middle managers
0.50% 0.50%
executives 1.50% 1.50%
Turnover rate 6.50% 6.50%
3.5.3 PROVISIONS FOR DEFERRED TAXES
The following table provides a breakdown of deferred taxes as of 31 December 2015, 31 December
2014 and the related change:
31 December 31 December Change Change
(in Euro) 2015 2014 %
Provisions for deferred taxes 1,294,323 1,628,920 (334,597) (20.5)%
Total provisions for deferred taxes 1,294,323 1,628,920 (334,597) (20.5)%

94
The balance of provisions for deferred taxes mainly relates to deferred taxes recognised at the time
of transition of the financial statements of certain subsidiaries from Italian GAAP to IFRS.
The decrease reflects the effect of the IRES rate reduction from 27.5% to 24% effective from 2017,
as established in the 2016 Stability Law.
3.5.4 NON-CURRENT FINANCIAL PAYABLES
The following table provides a breakdown of non-current financial payables as of 31 December
2015, 31 December 2014 and the related change:
31 December 31 December Change Change
(in Euro) 2015 2014 %
Financial payables for leasing 21,609,012 29,626,742 (8,017,730) (27.1)%
Non-current financial payables (other lenders) 140,704 16,285 124,419 n.a.
Non-current financial payables (mortgages) 33,102,464 35,934,530 (2,832,066) (7.9)%
Bonds 24,419,853 24,259,621 160,232 0.7%
Total non-current financial receivables 79,272,033 89,837,178 (10,565,143) (11.8)%
The decrease in non-current financial payables is primarily due to the deconsolidation of the
companies Investimenti Infrastrutture Srl, Società Agricola Fotosolara Oristano Srl, Società Agricola
Fotosolara Bonannaro Srl and Infocaciucci Srl following the sale of 50% of the shares held.
Financial payables for leasing, amounting to Euro 21,609 thousand, relate to loans contracted for
finance company-owned plants. In particular, they refer to "non-recourse" debt for photovoltaic
plants owned by the Group, the OFMSW (Organic Fraction Municipal Solid Waste) treatment plant
in the Nera Montoro facility, as well as the PFU (used tyres) treatment plant in Nera Montoro. These
loans do not include covenants and restrictions to the distribution of generated profits.
The item "Non-current financial payables (mortgages)", amounting to Euro 33,102 thousand, mainly
includes the non-current portion of loans related to 7 photovoltaic plants owned by TERNI
SolarEnergy S.r.l., which were disbursed in the form of project financing. As a guarantee of this
financing stipulated in 2010, a pledge was created on the shares of TERNI SolarEnergy itself. The
remainder of the balance relates to corporate financing granted to the parent company
TerniEnergia, made up mainly by the non-current portion of an unsecured loan issued at the end of

95
2013 for an original amount of Euro 10 million and a period of 60 months, repayable in 20 quarterly
instalments, in addition to an unsecured loan of Euro 5 million with a duration of 60 months,
repayable in one instalment at maturity, both provided by Veneto Banca.
The “Bonds” item refers to the bond issue from the Parent Company TerniEnergia in February 2014.
The bond issue, named “TerniEnergia 2019”, is equal to Euro 25 million with a five-year duration
and gross fixed rate equal to 6.875% with annual coupon, traded in the ExtraMOT PRO market, the
professional segment of the ExtraMOT bond market managed by Borsa Italiana. The payable is
reported net of issue costs.
3.5.5 OTHER NON-CURRENT LIABILITIES
The following table provides a breakdown of the item in question as of 31 December 2015, 31
December 2014 and the related change:
31 December 31 December Change Change
(in Euro) 2015 2014 %
Other non-current liabilities 50,000 50,000 n.a.
Deferred margin 197,492 153,192 44,300 n.a.
Total other non-current liabilities 247,492 153,192 94,300 n.a.
The item “other non-current liabilities” includes the long-term portion of deferred margin booked
in the financial statements after the cancellation of the equity investments in joint ventures in order
to incorporate the additional decrease generated by the booking of equity.
3.5.6 DERIVATIVES
The following table provides a breakdown of the item in question as of 31 December 2015, 31
December 2014 and the related change:
31 December 31 December Change Change
(in Euro) 2015 2014 %
Hedging derivatives 3,251,759 4,371,326 (1,119,567) (25.6)%
Total derivatives 3,251,759 4,371,326 (1,119,567) (25.6)%
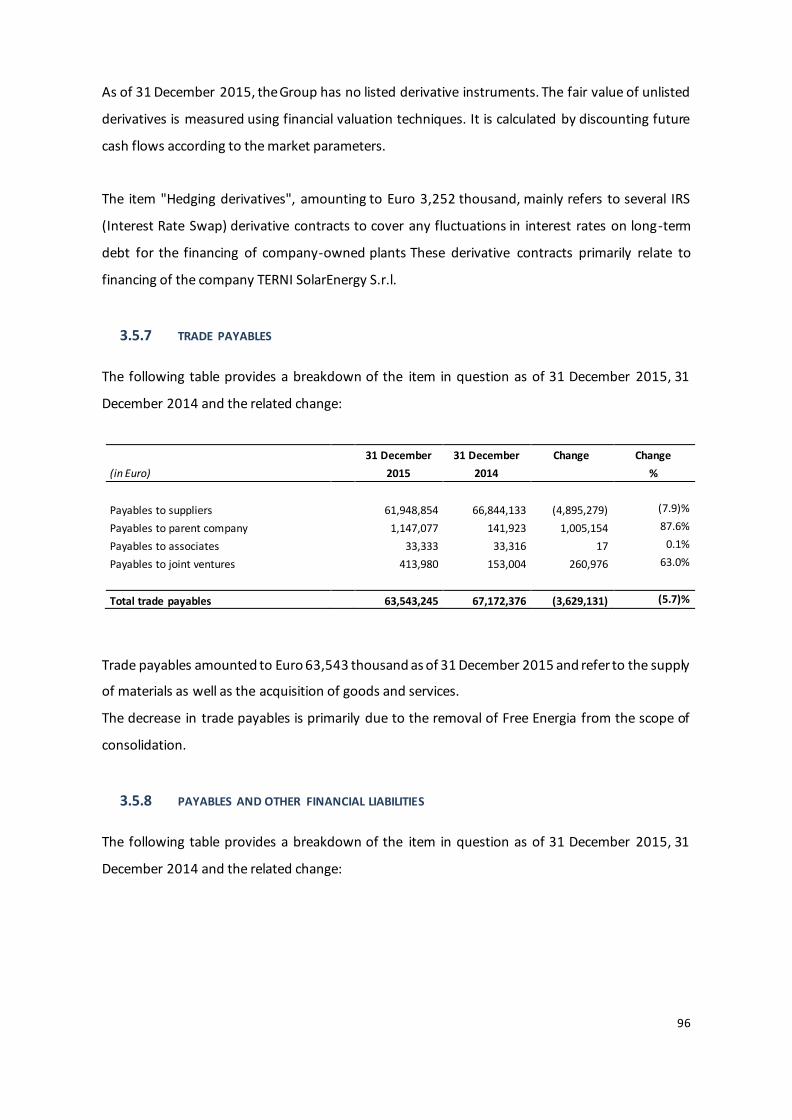
96
As of 31 December 2015, the Group has no listed derivative instruments. The fair value of unlisted
derivatives is measured using financial valuation techniques. It is calculated by discounting future
cash flows according to the market parameters.
The item "Hedging derivatives", amounting to Euro 3,252 thousand, mainly refers to several IRS
(Interest Rate Swap) derivative contracts to cover any fluctuations in interest rates on long-term
debt for the financing of company-owned plants These derivative contracts primarily relate to
financing of the company TERNI SolarEnergy S.r.l.
3.5.7 TRADE PAYABLES
The following table provides a breakdown of the item in question as of 31 December 2015, 31
December 2014 and the related change:
31 December 31 December Change Change
(in Euro) 2015 2014 %
Payables to suppliers 61,948,854 66,844,133 (4,895,279) (7.9)%
Payables to parent company 1,147,077 141,923 1,005,154 87.6%
Payables to associates 33,333 33,316 17 0.1%
Payables to joint ventures 413,980 153,004 260,976 63.0%
Total trade payables 63,543,245 67,172,376 (3,629,131) (5.7)%
Trade payables amounted to Euro 63,543 thousand as of 31 December 2015 and refer to the supply
of materials as well as the acquisition of goods and services.
The decrease in trade payables is primarily due to the removal of Free Energia from the scope of
consolidation.
3.5.8 PAYABLES AND OTHER FINANCIAL LIABILITIES
The following table provides a breakdown of the item in question as of 31 December 2015, 31
December 2014 and the related change:

97
31 December 31 December Change Change
(in Euro) 2015 2014 %
Current bank payables (current account overdrafts) 3,683,254 3,713,874 (30,620)
(0.8)%
Current bank payables (advances) 7,867,675 19,978,036 (12,110,361) (60.6)%
Financial payables due to other lenders 189,279 (189,279) (100.0)%
Current portion of leasing payables 1,882,573 1,795,955 86,618 4.8%
Short-term financing 9,207,073 13,975,757 (4,768,684) (34.1)%
Bonds 1,544,521 1,544,520 1 0.0%
Total payables and other financial liabilities 24,185,097 41,197,421 (17,012,324)
(41.3)%
The item “Payables and other financial liabilities” mainly refers to payables to banks for overdrafts
and advances on the account contracts and invoices, as well as the short-term portion of debt for
financing and leasing.
The change in the item "Current bank payables (advances)" is due to the removal of Free Energia
from the scope of consolidation, while the reduction in short-term debt is essentially attributable to
repayments made by TerniEnergia during the year.
It should also be noted that the current financial payables comprise part of the payments incurred
for investments already made or still under construction and for which on 31 December 2015 the
company had not yet entered into a specific contract financing in the medium/long term. In
particular, they refer to the second treatment plant for used tyres completed at the end of 2015, a
pyrogasification plant and a composting plant under construction in Apulia.
The following table presents the net financial debt at 31 December 2015 and 31 December 2014:
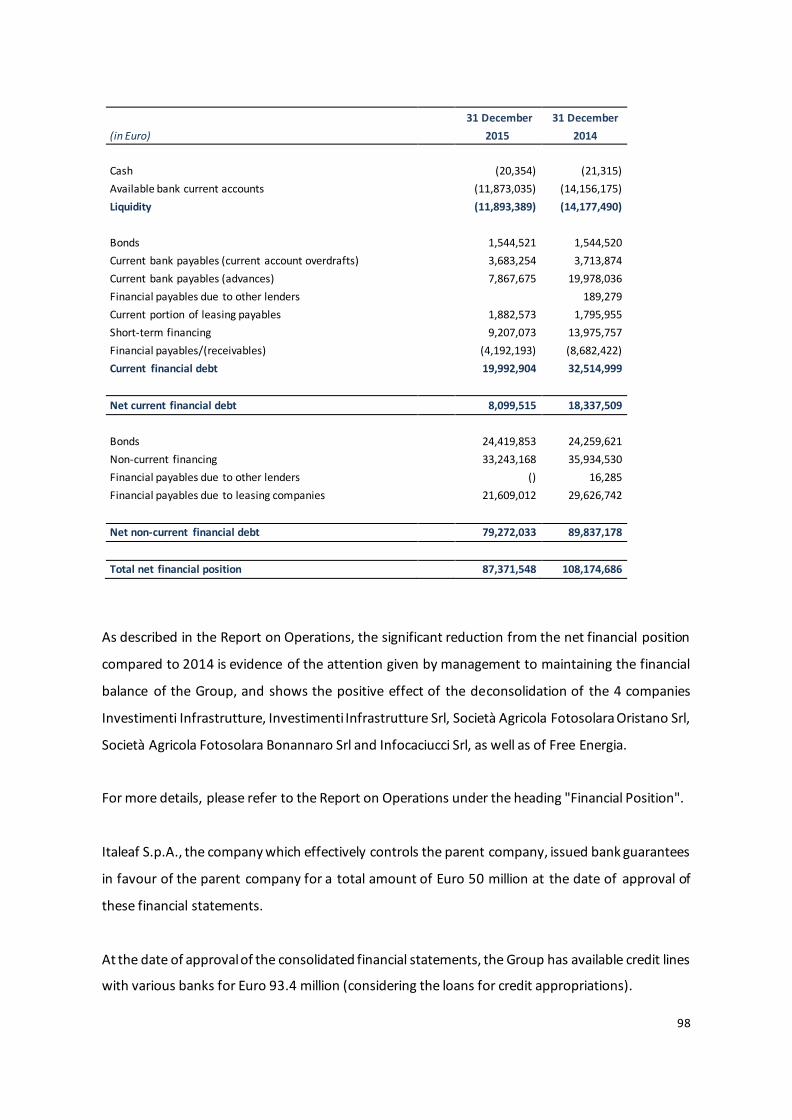
98
31 December 31 December
(in Euro) 2015 2014
Cash (20,354) (21,315)
Available bank current accounts (11,873,035) (14,156,175)
Liquidity (11,893,389) (14,177,490)
Bonds 1,544,521 1,544,520
Current bank payables (current account overdrafts) 3,683,254 3,713,874
Current bank payables (advances) 7,867,675 19,978,036
Financial payables due to other lenders 189,279
Current portion of leasing payables 1,882,573 1,795,955
Short-term financing 9,207,073 13,975,757
Financial payables/(receivables) (4,192,193) (8,682,422)
Current financial debt 19,992,904 32,514,999
Net current financial debt 8,099,515 18,337,509
Bonds 24,419,853 24,259,621
Non-current financing 33,243,168 35,934,530
Financial payables due to other lenders () 16,285
Financial payables due to leasing companies 21,609,012 29,626,742
Net non-current financial debt 79,272,033 89,837,178
Total net financial position 87,371,548 108,174,686
As described in the Report on Operations, the significant reduction from the net financial position
compared to 2014 is evidence of the attention given by management to maintaining the financial
balance of the Group, and shows the positive effect of the deconsolidation of the 4 companies
Investimenti Infrastrutture, Investimenti Infrastrutture Srl, Società Agricola Fotosolara Oristano Srl,
Società Agricola Fotosolara Bonannaro Srl and Infocaciucci Srl, as well as of Free Energia.
For more details, please refer to the Report on Operations under the heading "Financial Position".
Italeaf S.p.A., the company which effectively controls the parent company, issued bank guarantees
in favour of the parent company for a total amount of Euro 50 million at the date of approval of
these financial statements.
At the date of approval of the consolidated financial statements, the Group has available credit lines
with various banks for Euro 93.4 million (considering the loans for credit appropriations).

99
3.5.9 INCOME TAX PAYABLES
The following table provides a breakdown of the item in question as of 31 December 2015, 31
December 2014 and the related change:
31 December 31 December Change Change
(in Euro) 2015 2014 %
Direct taxes 1,330,322 1,656,825 (326,503) (19.7)%
Total income taxes payable 1,330,322 1,656,825 (326,503) (19.7)%
Direct taxes refer to payables for taxes which accrued as of 31 December 2015, primarily from
TerniEnergia Project.
3.5.10 OTHER CURRENT LIABILITIES
The following table provides a breakdown of the item in question as of 31 December 2015, 31
December 2014 and the related change:
31 December 31 December Change Change
(in Euro) 2015 2014 %
Withholding tax 85,078 464,422 (379,345) (81.7)%
Payables to personnel 892,675 1,085,316 (192,641) (17.7)%
Payables to social security and welfare institutions
360,617 400,024 (39,407) (9.9)%
Deferred margin 23,043 43,368 (20,325) (46.9)%
Other current liabilities 10,415,202 8,081,444 2,333,759 28.9%
Total other current liabilities 11,776,615 10,074,574 1,702,040 16.9%
The decrease in payables to personnel and social security and welfare institutions is due to the
deconsolidation of Free Energia in November 2015.
The item “Other current payables” primarily includes advances that are invoiced to customers as of
31 December 2015. The increase is due to advances invoiced for the projects in South Africa.
100
3.5.11 COMMITMENTS AND ISSUED GUARANTEES AS WELL AS POTENTIAL LIABILITIES
Guarantees issued
In some cases, the customers of the Parent Company have funded the purchase of the photovoltaic
system through lease agreements with leasing companies. For some of these customers, the Parent
Company has signed with the leasing company an agreement providing for the replacement of the
customer in the lease agreement in the event of, and subject to, the breach of the respective
customers. The customers have committed, in this case, to transfer to TerniEnergia the leasing
agreement and any debt outstanding at the date of transfer, if generated by a power plant under
contract.
The directors of TerniEnergia believe that the probability of occurrence of transfer is extremely
remote, since, in practice and with the exception of the initial maxi-rents, the leasing contracts are
made in order to allow the financial coverage of the instalments from the income flows generated
by the plant. Considering also the existence of an initial maxi-rent paid by the customer to the
leasing company, the values in effect at the time of the replacement - based on current development
plans for the cash flows of photovoltaic systems affected - would see a surplus of income generated
by energy production compared to outflows for rents due.
As of 31 December 2015, residual payables due from customers to leasing companies for which the
above mentioned agreements were made amount to Euro 58.1 million, of which Euro 39.9 million
for companies managed or owned by related parties. In reference to the related parties, Euro 19.8
million are from joint ventures, Euro 1.9 million from the parent company Italeaf SpA, and Euro 18.2
million for other related parties. The remainder of the liability, equivalent to Euro 18.1 million, refers
to other third-party customers.
For the same reasons outlined above, the directors also believe that a potential replacement in the
lease agreements by the parent company would not adversely affect the economic situation of
TerniEnergia. See also Note 3.7 Related parties.
As of 31 December 2015, leading banks and insurance companies have issued guarantees on the
contractual obligations of the parent company TerniEnergia towards customers for a total of Euro
16.2 million.

101
Potential liabilities
Litigation, investigations and judicial proceedings in progress
As of 31 December 2015, there were no legal proceedings or litigation pending against TerniEnergia
or other Group companies, except as outlined below.
Litigation with Milis Energy SpA
The dispute concerns the divestment made by Milis Energy against TerniEnergia on a photovoltaic
system on greenhouses constructed in Sardinia in the Municipality of Milis. Milis Energy has alleged
that TerniEnergia S.p.A. has breached the contract for the construction of this plant and for that
reason it has suspended payment of Euro 7 million, claiming that bolts (allegedly impaired) must be
replaced, with the amount of work estimated at Euro 50 thousand.
By virtue of this, Milis Energy then proceeded to exclude Terni Energia from the work site, with an
expulsion deed dated 17 July 2013.
TerniEnergia filed an appeal before the Court of Oristano, which issued an order dated 4 February
2014 declaring this expulsion illegal and ordering Milis Energy to immediately reinstate TerniEnergia
with full possession of the works covered by the contract. Milis Energy appealed this ruling, which
was admitted by the multi-member Court of Oristano.
TerniEnergia sought and obtained an injunction against a receivable owed to Milis Energy S.p.A. in
the amount of Euro 5,940,000.00, as compensation due from Milis for the contract referred to in
the preceding paragraph.
The Court of Milan upheld the appeal and issued the injunction that has been duly served.
The party has appealed and the first hearing took place on 27 May 2014; on that date, the judge
attempted an unsuccessful mediation. By means of an order dated 17 September 2014, the Court
of Milan issued a ruling on the request for provisional execution put forth by TerniEnergia, accepting
the request for an amount totalling Euro 5,089,991.93, excluding interest and granting the
provisional execution of the opposing decree. The aforementioned sum was paid by the
counterparty at the beginning of October 2014. The judge recognised the provisional execution for
an amount less than that due to the customer, as a prudential measure given that, in the estimate
by Milis, the defects and faults resulted in alleged damage of Euro 850 thousand. The judge ordered
an expert opinion to be developed, which is currently underway.
In addition, the Company has two other receivables with this customer, not included in the
injunction decree, for a premium, equal to Euro 1,050 thousand Euro, and for the supply and

102
instalment of panels for Euro 1,038 thousand. As regards the former, Milis, despite payment
requests, has no intention of paying the amount, stating that there is a dispute with GSE as to the
proven completion of the work as of 31 December 2010 and the consequent recognition of the
related energy account. This dispute was resolved with the ruling of the Council of State no.
2823/2014 and subsequent ruling no. 4122/2015 (following the appeal for revocation by GSE). In
fact, these decisions established that the works were completed by 31 December 2010, and as a
result of these rulings, Milis is collecting from GSE the contribution relative to the plants completed
by 31 December 2010.
In relation to the receivable for panel installation, Milis has objected that the price of the panels
should have been included in the amount of the original contract. This objection is considered
groundless as these panels weren’t part of the original agreement, as they were commissioned by
Milis at a later date.
TerniEnergia had not as yet undertaken legal action to recover these amounts as the ruling of the
Council of State was only recently finalised, but has since made a request for payment. Should Milis
not respond to the request, the company will take legal action.
The Company does not believe that there are significant risks for the recovery of the entire
receivable, given the financial capacity of Milis and considering the opinion of the Company’s legal
advisors responsible for the case, who confirmed that there are no plausible reasons for Milis to not
pay the amount due and the high probability of success of any legal action.
Litigation with Mada Srl
The litigation is due to the default on payment of a photovoltaic plant with a capacity of 997 kWp
on the part of the company Mada Srl.
Accordingly, the Parent Company, only after repeated requests for payment:
· has taken steps to remove the solar panels and other removable materials from the site (in
compliance with what was decided in the previous private correspondence between the parties);
· filed a subpoena to appear before the Court of Terni, in order to confirm the serious default
of the customer with respect to contractual obligations and therefore to obtain the termination of
said contract pursuant to Art. 1453 of the Italian Civil Code, resulting in the sentencing of the
customer to pay all damages suffered and the amount of Euro 1,046,890.00 (the amount identified
as the loss of earnings, calculated as 30% of the contract price, whose total amount was Euro
3,489,640.00) or a greater or smaller amount that will be determined in the course of the
proceedings. The case was registered under general registry 2005/11. In the course of the

103
proceedings referred to in the previous point, TerniEnergia was notified of a deed of appointment
of an arbitrator and request for arbitration, on 7 December 2011. Opposition to arbitration was
implemented by serving a deed dated 27 December 2011 and, in any case, by identifying its
arbitrator in the unlikely event that the ordinary judge was not deemed to retain jurisdiction. On
the date of preparation of these financial statements, the arbitration ruling was issued dismissing
the claim for compensation of Mada. With regard to the proceedings before the Court of Terni, the
judge remitted the case to 14 April 2014 in order to await the ruling, and to avoid a conflict between
definitive sentences. The counterparty contested the ruling before the Court of Appeals of Perugia.
It is not believed, however, that this appeal will be accepted given the justifications for the ruling
and the reasons for appeal themselves. Upon conclusion of the hearing of 11 June 2015, in which
the counterparty demanded that the preliminary investigation be repeated, the Court decided to
postpone the conclusion of the hearing to 20 October 2016.
As a result, notwithstanding the uncertainty that characterises each dispute and – on the basis of
the assessments already developed by our lawyers - the Parent Company believes that there are
reasonable grounds for considering success highly probable in the civil action above. Based on the
above summary of the facts, expressed in the civil case that the Parent Company has promoted and
given a possible reconciliation with the customer resulting in the conclusion of the supply, it is not
considered appropriate to apply any residual impairment of costs (approximately Euro 0.4 million),
included in work in progress as of 31 December 2015.
Litigation with Regni
The Parent Company is involved in two disputes with the heirs of Regni, which arose as a result of
the failure by the latter to grant a right of easement necessary for the passage of the cable duct of
a photovoltaic system owned by the Group. The first dispute is pending before the Council of State,
on appeal, and concerns the trial and appeal of the order for demolition and restoration of part of
the cable duct realised in the absence of the security authorisation of easement of the land on which
it was placed, issued by the Municipality of Perugia. The second dispute was initiated by the Parent
Company against the Regni heirs before the Court of Perugia in order to obtain the concession of
the power line easement, pursuant to the commitments made by the Regnis themselves, when they
awarded TerniEnergia the photovoltaic plant project and the surface rights relating to the land on
which it was to be constructed.
In reference to the former, a suspension was granted of the decision of the TAR authorising the
demolition and restoration and the hearing on the merits is expected. In reference to the latter, a
referral for negotiations was arranged. In fact, with reference to pending lawsuits, the heirs of Regni

104
have made proposals for settlement. The negotiations are still on-going. In the meantime, the judge
accepted the request for technical appraisal in order to ascertain whether the original draft, by Mr
Regni, Engineer, was lacking or incorrect. At the moment, the expert survey ordered by the judge
and relative to the status of the sites and project is underway.
The Parent Company, with the assistance of its legal counsel, has reasonable grounds to believe that
a probable liability is not likely to be borne by the Parent Company, nor, at present, are there
elements such as to forecast a loss in value of the investment in the subsidiary which owns the
photovoltaic plant in question.
TerniEnergia tax issues
Notice of assessment referring to "black list costs"
On 20 July 2013, the company was served a tax assessment notice by the auditors of the Tax Audit
Department of the Regional Division of Umbria, which asserted the existence of commercial dealings
undertaken in 2010 between TerniEnergia and companies located in countries with privileged
taxation systems for the purchase of photovoltaic panels. In order for these costs to be deducted,
Art. 110, par. 10 of the TUIR requires that one of the following be proven (and the burden of proof
falls on the taxpayer): (i) that the foreign companies mainly carry out an actual commercial activity
(ii) or that the transactions that were carried out correspond to an actual financial interest and were
correctly executed.
Subsequently, on 28 March 2014, the Italian Inland Revenue Service served TerniEnergia a
notification requesting that it provide documentation in proof of either of the requirements of Art.
110. The Company provided the requested documentation. On 13 February 2015, the Inland
Revenue Service/Audit Department of the Regional Division of Umbria compiled cross-examination
minutes, formalising the audits and the documentation submitted by the company, which it deemed
inadequate in terms of fulfilling the requirements. Subsequently, on 10 April 2015, the Company
produced additional documentation which it had in the meantime acquired to apply toward proving
the deductibility of the costs in question.
On 3 June 2015, the Inland Revenue Service ruled the copious documentation provided by the
Company as inadequate and served a notice of assessment with which it assessed a higher tax for
IRES (Corporate Income Tax) of Euro 1,886 thousand, for the alleged undue deduction of the costs
relative to the suppliers located in the so-called "black list" countries, as well as a financial penalty
of Euro 1,886 thousand plus legal interest.

105
The Parent Company immediately considered the elements mentioned by the Inland Revenue
Service in its notice of assessment to be completely unfounded, and given the valid arguments and
copious documentation in its possession, will challenge the assessment in court. As such, on 1
September 2015, the Parent Company submitted an appeal with the Provincial Tax Commission of
Perugia, and added a request for suspension that was received by said Commission on 14 October
2015. The hearing was held on 17 November 2015. On 26 January 2016, the Provincial Tax
Commission of Perugia issued its ruling, which upheld the appeal by TerniEnergia.
As at the date of this report, the Inland Revenue Service had not submitted a counter-appeal.
On the basis of the above, TerniEnergia believes that the current risk linked to the aforementioned
event should be considered remote and therefore should not require a provision in the financial
statements.
Tax Assessment Notice
In 2015, the Parent Company was audited by the Italian Tax Police – Terni Tax Police Unit. The audit,
which focused on the 2012 tax period, began on 12 March 2015 and was concluded on 5 June 2015,
with the drafting of the Tax Assessment Notice. It referred to the check of the correctness of the tax
accounting in relation to direct taxes (IRES and IRAP) and the value added tax (VAT). The assessment
was sent in September. The Company submitted a request for tax assessment settlement in
November and settled the dispute with a total disbursement of Euro 38 thousand in 8 instalments,
of which the last will be paid in 2017.

106
3.6 COMMENTS ON THE MAIN INCOME STATEMENT ITEMS
3.6.1 REVENUES
The following table presents the details of this item for the years ended 31 December 2015 and
2014:
2015 2014 Change % Change
(in Euro)
Cleantech revenues 8,678,058 7,602,761 1,075,297 14.1%
Technical Services revenues 107,831,452 31,591,388 76,240,063 n.a.
Energy Saving revenues 2,494,297 1,634,338 859,959 52.6%
Energy Management revenues 249,736,471 54,362,877 195,373,594 n.a.
Total 368,740,277 95,191,364 273,548,913 n.a.
As at 31 December 2015, the Group recognised consolidated revenues from sales and services of
Euro 368,740 thousand, a significant increase compared to 2014 (Euro 273,549 thousand), mainly
due to the revenues from the Energy Management operations, totalling Euro 249,736 thousand, and
Free Energia SpA which was added to the scope of consolidation in the last quarter of 2014 and
removed effective 30 November 2015. The revenues from the Technical Services also grew
significantly, amounting to Euro 107,831 thousand (Euro 31,591 as at 31 December 2014), primarily
from the revenues for the construction of the photovoltaic plants in South Africa and the
management of the fully owned Photovoltaic plants (Power Generation Fotovoltaico).
The Cleantech business line had revenues of Euro 8,678 thousand, up 14.1% compared to 2014,
mainly due to the full year of operations of the PFU in Nera Montoro as well as the strengthening of
biodigester activities. Revenues from the Energy Saving business line amount to Euro 2,494
thousand, an increase over 2014, due to several important energy efficiency projects which took
place in 2015.
3.6.2 CHANGE IN INVENTORIES OF SEMI-FINISHED AND FINISHED PRODUCTS
The following table presents the details of this item for the years ended 31 December 2015 and
2014:

107
2015 2014 Change % Change
(in Euro)
Finished products (118,014) (71,143) (46,871) 65.9%
Semi-finished products (12,600) 12,600 (100.0)%
Work in progress (2,293,561) 1,691,157 (3,984,718) n.a.
Total (2,411,575) 1,607,414 (4,018,989) n.a.
The change from the prior year is primarily the result of the change in work in progress, which
reflects, in particular, the start of construction in South Africa and, hence, the resulting attribution
to the two EPC work orders of part of these costs (around Euro 3.6 million).
The change in finished product inventories is due to the decrease in the value of finished products
for the used tyre treatment plant.
3.6.3 COST OF RAW MATERIALS, CONSUMABLES AND GOODS
The following table presents the details of this item for the years ended 31 December 2015 and
2014:
2015 2014 Change % Change
(in Euro)
Purchase of materials 93,232,905 44,336,952 48,895,953 110.3%
Fuels and lubricants 261,568 302,401 (40,833) (13.5)%
Change in inventories of raw materials, consumables and goods
(17,211,870) (176,664) (17,035,206) n.a.
Purchase of energy 104,760,627 104,760,627 n.a.
Total 181,043,229 44,462,689 136,580,540 n.a.
The considerable increase in this item is ascribable to the inclusion of Free Energia in the scope of
consolidation through 30 November 2015, which resulted in the recognition of the “Purchase of
energy” item for Euro 104,761 thousand, and the increase in the cost for the purchase of materials,
which grew from Euro 44,337 thousand to Euro 93,233 thousand, due to materials (mainly panels)
purchased for the EPC work orders for the photovoltaic plants in South Africa.

108
3.6.4 COSTS FOR SERVICES
The following table presents the details of this item for the years ended 31 December 2015 and
2014:
2015 2014 Change % Change
(in Euro)
Subcontractors 2,719,908 1,919,013 800,894 29.4%
Consultancy and external collaborators 5,279,425 2,909,238 2,370,187 44.9%
Rental and hire 795,648 697,386 98,263 12.4%
Parent company services 1,920,245 1,894,470 25,775 1.3%
Leasing of real estate properties 141,876 46,663 95,212 67.1%
Transportation 107,174,612 11,376,820 95,797,792 89.4%
Energy/Gas services 15,275,525 15,275,525 100.0%
Maintenance, repairs and assistance 1,166,971 801,856 365,115 31.3%
Security and insurance 831,959 1,077,980 (246,021) (22.8)%
Other costs for services 13,682,763 4,327,321 9,355,442 n.a.
Total 148,988,932 25,050,747 123,938,185 n.a.
The change in the item with respect to the previous year is primarily attributable to Energy
Management activities relating to Free Energia and, for the remainder, costs for external services
for the construction of the South African work sites. The “Parent company services" item includes
the compensation paid by the Parent Company of the Group for services provided by the parent
company Italeaf S.p.A.; for more details also refer to note 3.7.
3.6.5 PERSONNEL COSTS
The following table presents the details of this item for the years ended 31 December 2015 and
2014:
2015 2014 Change % Change
(in Euro)
Wages and salaries 4,700,881 3,271,533 1,429,348 43.7%
Social security contributions 1,617,994 1,201,934 416,060 34.6%
Remuneration of directors 676,778 477,806 198,972 41.6%
Allocation to the provision for employee benefits 180,803 236,363 (55,560) (23.5)%
Temporary staff 342,720 553,821 (211,101) (38.1)%
Total 7,519,175 5,741,457 1,777,718 31.0%
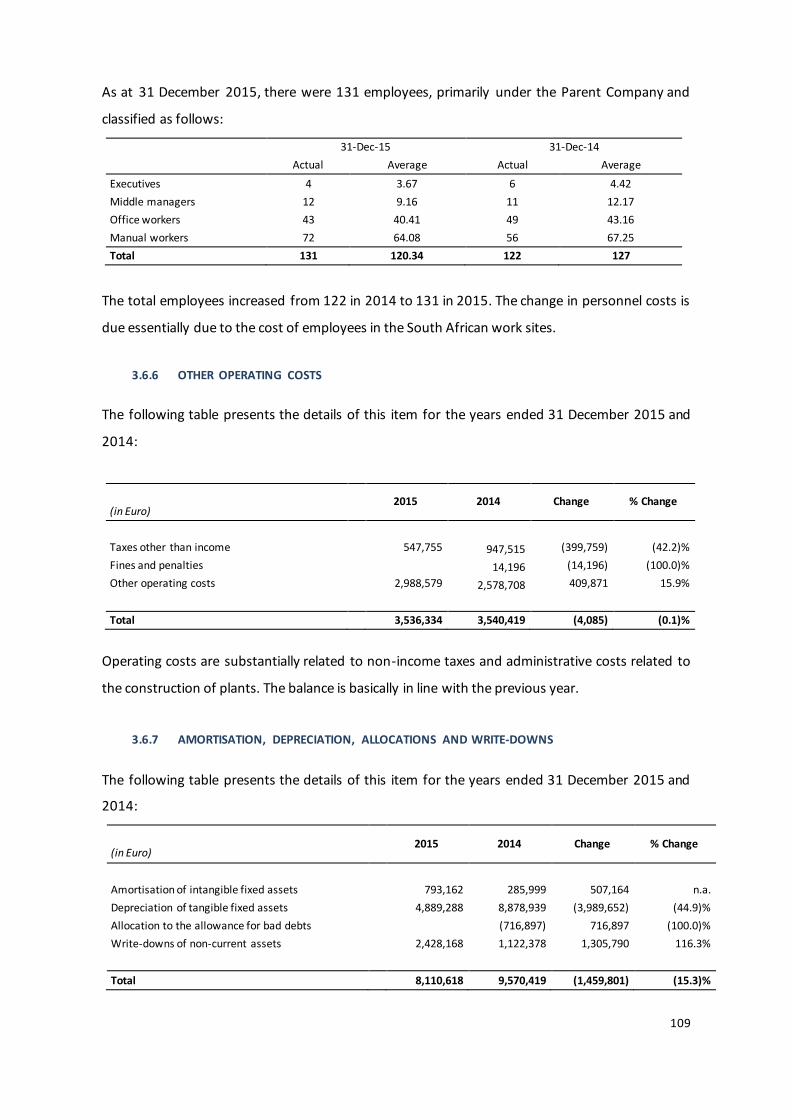
109
As at 31 December 2015, there were 131 employees, primarily under the Parent Company and
classified as follows:
31-Dec-15 31-Dec-14
Actual Average Actual Average
Executives 4 3.67 6 4.42
Middle managers 12 9.16 11 12.17
Office workers 43 40.41 49 43.16
Manual workers 72 64.08 56 67.25
Total 131 120.34 122 127
The total employees increased from 122 in 2014 to 131 in 2015. The change in personnel costs is
due essentially due to the cost of employees in the South African work sites.
3.6.6 OTHER OPERATING COSTS
The following table presents the details of this item for the years ended 31 December 2015 and
2014:
2015 2014 Change % Change
(in Euro)
Taxes other than income 547,755 947,515 (399,759) (42.2)%
Fines and penalties 14,196 (14,196) (100.0)%
Other operating costs 2,988,579 2,578,708 409,871 15.9%
Total 3,536,334 3,540,419 (4,085) (0.1)%
Operating costs are substantially related to non-income taxes and administrative costs related to
the construction of plants. The balance is basically in line with the previous year.
3.6.7 AMORTISATION, DEPRECIATION, ALLOCATIONS AND WRITE-DOWNS
The following table presents the details of this item for the years ended 31 December 2015 and
2014:
2015 2014 Change % Change
(in Euro)
Amortisation of intangible fixed assets 793,162 285,999 507,164 n.a.
Depreciation of tangible fixed assets 4,889,288 8,878,939 (3,989,652) (44.9)%
Allocation to the allowance for bad debts (716,897) 716,897 (100.0)%
Write-downs of non-current assets 2,428,168 1,122,378 1,305,790 116.3%
Total 8,110,618 9,570,419 (1,459,801) (15.3)%

110
The change in the item "Depreciation of tangible fixed assets" is attributable to the decrease in the
number of photovoltaic plants in operation and owned by the Group during the course of 2015.
The item “Write-downs of non-current assets”, equivalent to Euro 2,428 thousand, mainly includes
the write-downs of other receivables for Euro 1,291 thousand, of Veneto Banca securities for Euro
297 thousand, and inventory for Euro 82 thousand. These write-downs were carried out to align the
book value of these assets with their recoverable value.
3.6.8 FINANCIAL INCOME AND CHARGES
The following table presents the details of this item for the years ended 31 December 2015 and
2014:
2015 2014 Change % Change
(in Euro)
Interest expense on financial payables (8,579,237) (8,443,850) (135,387) 1.6%
Bank commissions (2,366,588) (1,355,269) (1,011,319) 74.6%
Interest on bonds (1,878,983) (1,679,141) (199,842) 11.9%
Total financial charges (12,824,807) (11,478,260) (1,346,547) 11.7%
Interest income on bank current accounts 353,414 16,812 336,602 n.a.
Interest income from joint ventures 344,553 23,002 321,551 n.a.
Other financial income 1,774,883 1,357,878 417,004 30.7%
Total financial income 2,472,850 1,397,692 1,075,158 76.9%
Total (10,351,957) (10,080,568) (271,389) 2.7%
Financial management, which had a negative balance of Euro 10,352 thousand, is essentially in line
with the previous year, due to the combined effect of, on one hand, the higher impact of bank
commissions, mainly attributable to commissions on sureties guaranteeing the EPC projects in South
Africa, net of the reduction in interest expense deriving from lower average indebtedness over 2015
compared to the prior year, while on the other, recognition of 2014 dividends equivalent to Euro
1,503 thousand disbursed by Free Energia, which left the Group on 31 December 2015.
In reference to the latter and the effects of its deconsolidation, note that the positive effect in the
income statement from the gain (recognised in the separate financial statements of TerniEnergia
SpA), equivalent to Euro 2,201 thousand, related to the difference between the fair value of the
investment and the its book value, was essentially offset by the negative effect from the attribution
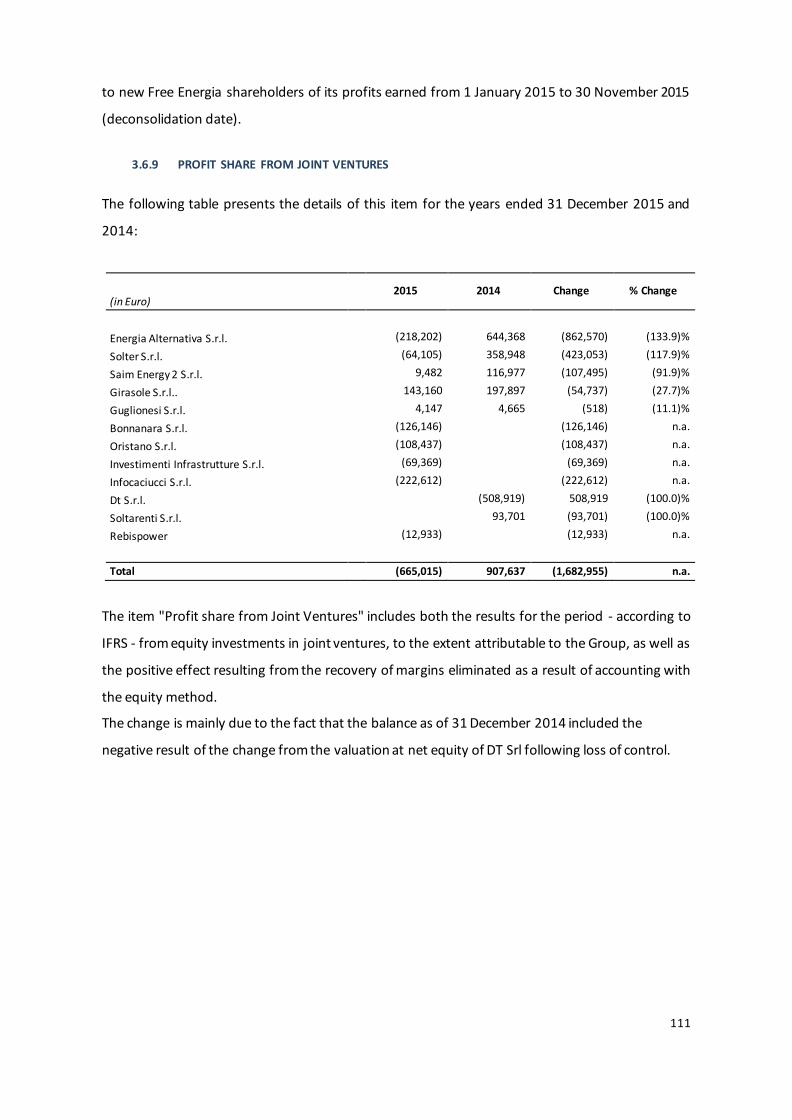
111
to new Free Energia shareholders of its profits earned from 1 January 2015 to 30 November 2015
(deconsolidation date).
3.6.9 PROFIT SHARE FROM JOINT VENTURES
The following table presents the details of this item for the years ended 31 December 2015 and
2014:
2015 2014 Change % Change
(in Euro)
Energia Alternativa S.r.l. (218,202) 644,368 (862,570) (133.9)%
Solter S.r.l. (64,105) 358,948 (423,053) (117.9)%
Saim Energy 2 S.r.l. 9,482 116,977 (107,495) (91.9)%
Girasole S.r.l.. 143,160 197,897 (54,737) (27.7)%
Guglionesi S.r.l. 4,147 4,665 (518) (11.1)%
Bonnanara S.r.l. (126,146) (126,146) n.a.
Oristano S.r.l. (108,437) (108,437) n.a.
Investimenti Infrastrutture S.r.l. (69,369) (69,369) n.a.
Infocaciucci S.r.l. (222,612) (222,612) n.a.
Dt S.r.l. (508,919) 508,919 (100.0)%
Soltarenti S.r.l. 93,701 (93,701) (100.0)%
Rebispower (12,933) (12,933) n.a.
Total (665,015) 907,637 (1,682,955) n.a.
The item "Profit share from Joint Ventures" includes both the results for the period - according to
IFRS - from equity investments in joint ventures, to the extent attributable to the Group, as well as
the positive effect resulting from the recovery of margins eliminated as a result of accounting with
the equity method.
The change is mainly due to the fact that the balance as of 31 December 2014 included the
negative result of the change from the valuation at net equity of DT Srl following loss of control.

112
3.6.10 TAXES
The following table presents the details of this item for the years ended 31 December 2015 and
2014:
2015 2014 Change % Change
(in Euro)
Current taxes 2,756,308 808,330 1,947,978 n.a.
Prepaid taxes 927,516 (7,787,154) 8,714,670 (111.9)%
Deferred taxes (127,826) 35,358 (163,184) n.a.
Total 3,555,997 (6,943,466) 10,499,464 n.a.
The significant variation in the item “Income taxes” is attributable to the fact that there was a
positive balance in 2014 of Euro 6,943 thousand as a result of the recognition of tax income related
to the “Tremonti Ambientale” (environmental law) for certain Group companies that owned large
photovoltaic parks (refer to Note 3.4.4 for additional information). However, in 2015 there was a
higher tax rate, equivalent to 58%, that is imputable in particular to the effects of the IRES reduction
beginning in 2017, which caused a recalculation of deferred taxes in 2015.
3.7 RELATIONS WITH RELATED PARTIES
Shown below are the financial statements reporting transactions with related parties, in compliance
with CONSOB Resolution no. 15519 dated 27 July 2006.

113
CONSOLIDATED STATEMENT OF FINANCIAL POSITION PURSUANT TO CONSOB RESOLUTION no.
15519 of 27 JULY 2006
31
December of which with
31
December of which with (in Euro) 2015 related parties 2014 related parties
ASSETS Intangible fixed assets 4,460,745 14,143,177
Tangible fixed assets 82,616,544 91,306,645
Equity investments 2,157,923 7,672,891
Prepaid taxes 13,133,614 14,998,053
Non-current financial receivables 23,591,350 14,670,638 23,003,783 13,801,261
Total non-current financial assets 125,960,176 14,670,638 151,124,549 13,801,261
Inventories 23,329,978 10,943,522
Trade receivables 52,361,935 1,238,201 79,108,151 19,411,097 Other current assets 24,104,536 303,673 23,755,477 1,098,201
Derivatives 527,962 Financial receivables 4,192,193 1,959,249 8,682,422 1,663,266
Cash and cash equivalents 11,893,389 14,177,490
Total current financial assets 115,882,031 3,501,123 137,195,024 22,172,564
Assets held for sale 180,783
TOTAL ASSETS 241,842,207 18,171,761 288,500,356 35,973,825
LIABILITIES AND SHAREHOLDERS’ EQUITY
Share capital 57,007,230 57,007,230
Reserves (3,964,935) 7,084,436
Result for the period 1,947,386 5,948,086
Total Group equity 54,989,681 70,039,752
Equity attributable to minority interests 191,614 1,051,507
Result of the period attributable to minority interests 610,058 255,495
Total equity 55,791,353 71,346,754
Provisions for employee benefits 1,149,966 1,061,790
Deferred taxes 1,294,323 1,628,920 Non-current financial payables 79,272,033 89,837,177 Other non-current liabilities 247,492 153,192
Derivatives 3,251,759 4,371,326
Total non-current liabilities 85,215,573 97,052,405
Trade payables 63,543,245 1,594,390 67,172,376 6,108,143
Payables and other financial liabilities 24,185,097 41,197,420 Taxes payable 1,330,322 1,656,825
Other current liabilities 11,776,616 52,164 10,074,576 25,842
Total current liabilities 100,835,280 1,646,554 120,101,197 6,133,985
TOTAL LIABILITIES 186,050,853 1,646,554 217,153,602 6,133,985
TOTAL LIABILITIES AND SHAREHOLDERS’ EQUITY 241,842,206 1,646,554 288,500,356 6,133,985

114
CONSOLIDATED INCOME STATEMENT PURSUANT TO CONSOB RESOLUTION no. 15519 of 27 JULY
2006
2015
of which with 2014
of which with
(in Euro) related parties related parties
Revenues 362,944,612 87,341,876 11,644,580
Other operating revenues 5,795,664 1,541,663 7,849,488 568,587
Change in inventories of semi-finished and finished products (2,411,575) 1,607,414
Cost of raw materials, consumables and goods (181,043,229) (95,000) (44,462,688) (1,568,429)
Costs for services (148,988,932) (2,818,525) (25,050,748) (2,131,765)
Personnel costs (7,519,175) (625,679) (5,741,457) (568,112)
Other operating costs (3,536,334) (3,540,419)
Amortisation, depreciation, allocations and write-downs (8,110,618) (9,570,419)
Operating result 17,130,414 8,433,047
Financial income 2,472,850 344,553 1,397,692 96,028
Financial charges (12,824,807) (987,416) (11,478,260) (1,004,891)
Profit share from joint ventures (665,015) 907,637
Pre-tax result 6,113,442 (739,884)
Taxes (3,555,997) 6,943,465
Net (profit)/loss of the year 2,557,445 6,203,581

115
CONSOLIDATED CASH FLOW STATEMENT PURSUANT TO CONSOB RESOLUTION no. 15519 of 27
JULY 2006
31 December
(in Euro) 2015 2014
Pre-tax profit 6,113,442 (739,884)
Amortisation/depreciation 5,682,450 9,164,938
Write-downs of fixed assets and receivables 2,428,168 405,481
Allocations to the employee benefits fund 201,897 393,886
Result of joint ventures accounted for at equity and reversal of margin 665,015 (907,637)
Effect of derivatives in income statement 313,507
Change in inventories (12,043,200) (2,484,360)
Change in trade receivables (41,297,362) (5,118,885)
Change in other assets (3,950,358) (16,825,444)
Change in trade payables 53,494,143 (4,761,519)
Change in other liabilities 8,865,470 (833,473)
Payment of employee benefits (100,020) (63,779)
Net cash flow (used in)/generated by operating activities 20,373,151 (21,770,676)
of which with related parties 14,479,993 6,880,600
Investments in tangible fixed assets (6,824,129) 2,096,236
Disposals of tangible fixed assets
Investments in intangible fixed assets (384,581) (1,237,333)
Disposals of intangible fixed assets
Acquisitions/Disposals (8,452,833) 2,250,382
Equity investments 4,223,550 778,899
Change in receivables and other financial assets (3,049,496) (2,401,483)
Net cash flow used in investing activities (14,487,489) 1,486,701
of which with related parties (1,165,360) (12,731,942)
Change in payables and other financial assets 4,215,401 (971,353)
Change in non-current financial payables (1,957,076) 26,507,937
Other changes in shareholders’ equity (7,562,268) (1,488,443)
Expenses for share capital increase (385,866)
Payment of dividends (2,865,821) (2,256,720)
Net cash flow generated by financing activities (8,169,763) 21,405,555
of which with related parties
Comprehensive cash flow for the period (2,284,101) 1,121,580
Cash and cash equivalents at the beginning of the period 14,177,490 13,055,910
Cash and cash equivalents at the end of the period 11,893,389 14,177,490
116
Relations with related parties
Transactions with related parties are attributable to activities that relate to ordinary operations and
are based on normal market conditions, similar to the settlement of interest-bearing loans. As of 31
December 2015, there were no significant transactions with related parties of non–recurring nature
or which were unusual and/or atypical.
Transactions between the Parent Company, the joint ventures and other related parties mainly refer
to:
commercial transactions relating to the construction of photovoltaic plants and maintenance
services with joint ventures and companies managed or owned by related parties and
companies participating in joint ventures with TerniEnergia;
financial relations relative to financing granted to joint ventures (see also Note 3.4.5);
agreements for taking over leasing contracts related to photovoltaic plants in the cases of,
and subordinate to, the default on the part of some companies managed or owned by related
parties, joint ventures and the parent company Italeaf S.p.A. (see also Note 3.5.11
Commitments and Guarantees Issued);
transactions involving the supply of services (technical, organisational, leasing of real estate,
legal and administrative) with the parent Italeaf S.p.A.;
guarantees issued by the parent company Italeaf S.p.A. in favour of credit institutions which
financed TerniEnergia;
professional services by the director Francesca Ricci.
The following table details the economic and financial effects of transactions of commercial and
financial nature with related parties as of 31 December 2015.
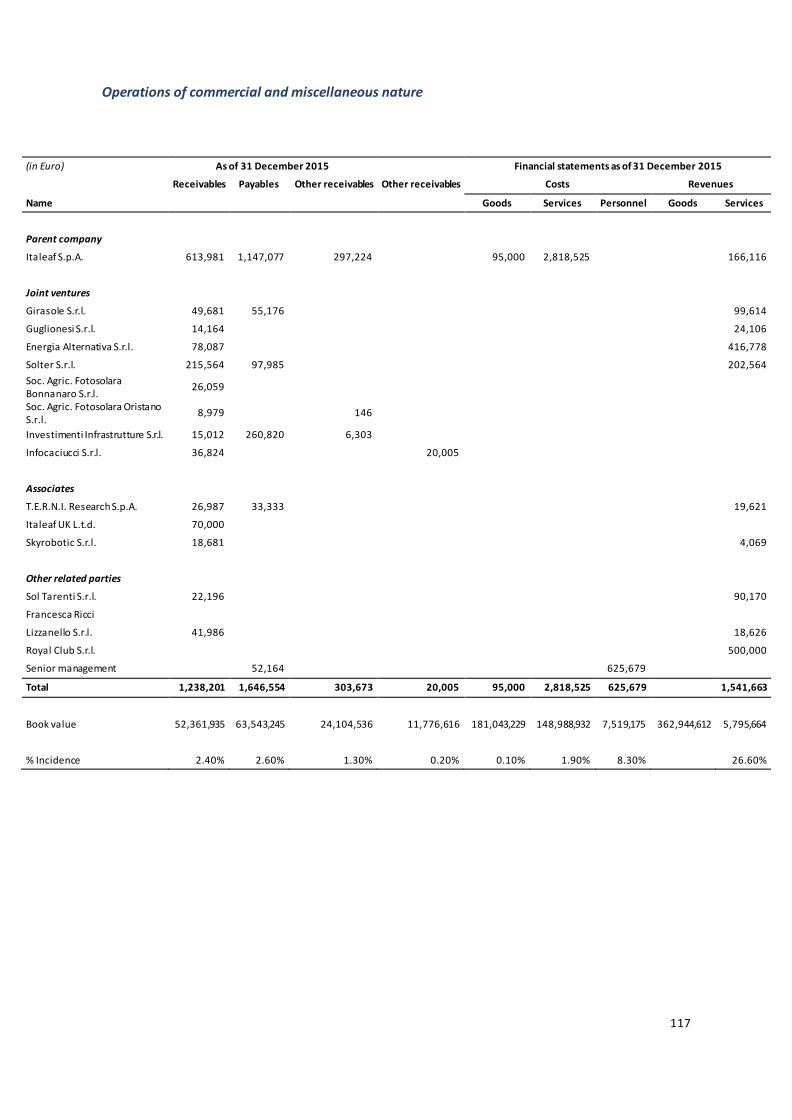
117
Operations of commercial and miscellaneous nature
(in Euro) As of 31 December 2015 Financial statements as of 31 December 2015
Receivables Payables Other receivables Other receivables Costs Revenues
Name Goods Services Personnel Goods Services
Parent company
Italeaf S.p.A. 613,981 1,147,077 297,224 95,000 2,818,525 166,116
Joint ventures
Girasole S.r.l. 49,681 55,176 99,614
Guglionesi S.r.l. 14,164 24,106
Energia Alternativa S.r.l. 78,087 416,778
Solter S.r.l. 215,564 97,985 202,564
Soc. Agric. Fotosolara Bonnanaro S.r.l.
26,059
Soc. Agric. Fotosolara Oristano S.r.l.
8,979 146
Investimenti Infrastrutture S.r.l. 15,012 260,820 6,303
Infocaciucci S.r.l. 36,824 20,005
Associates
T.E.R.N.I. Research S.p.A. 26,987 33,333 19,621
Italeaf UK L.t.d. 70,000
Skyrobotic S.r.l. 18,681 4,069
Other related parties
Sol Tarenti S.r.l. 22,196 90,170
Francesca Ricci
Lizzanello S.r.l. 41,986 18,626
Royal Club S.r.l. 500,000
Senior management 52,164 625,679
Total 1,238,201 1,646,554 303,673 20,005 95,000 2,818,525 625,679 1,541,663
Book value 52,361,935 63,543,245 24,104,536 11,776,616 181,043,229 148,988,932 7,519,175 362,944,612 5,795,664
% Incidence 2.40% 2.60% 1.30% 0.20% 0.10% 1.90% 8.30% 26.60%

118
Operations of financial nature
(in Euro) As of 31 December 2015 Financial statements as of 31
December 2015
Name Receivables Guarantees
received Payables
Takeover commitments
Charges Income
Parent company
Italeaf S.p.A. 49,617,707 625,063 1,897,947 987,416
Joint ventures
Girasole S.r.l. 1,147,634 1,183,864 29,541
Guglionesi S.r.l. 374,799 11,233
Energia Alternativa S.r.l. 8,482,143 16,311,879 248,525
Solter S.r.l. 1,820,227 55,254
Soc. Agric. Fotosolara Bonnanaro S.r.l. 968,916
Soc. Agric. Fotosolara Oristano S.r.l. 1,190,921
Investimenti Infrastrutture S.r.l. 975,295
Infocaciucci S.r.l. 192,439 2,339,825
Associates
T.E.R.N.I. Research S.p.A. 2,356,110
Other related parties
Sol Tarenti S.r.l. 1,477,513 8,063,346
Camene S.r.l. 2,714,529
Royal Club Snc 2,678,714
Lizzanello S.r.l. 1,770
Saim Energy 2 S.r.l. 2,373,686
Total 16,629,887 49,617,707 625,063 39,919,900 987,416 344,553
Book value 27,783,543 103,457,130 12,824,807 2,472,850
% Incidence 59.90% 0.60% 7.70% 13.90%
Below are brief comments on the transactions entered into between the Group and related parties:
Commercial transactions
Commercial transactions mainly related to:
O&M contracts between the joint venture companies for photovoltaic plants and restoration
activities of the plants due to thefts;

119
framework agreement between the Parent Company and Italeaf S.p.A. on the provision of
administrative and logistical services, including the leasing of the properties located in Narni,
Strada dello Stabilimento 1, in Milan, Via Borgogna and Lecce, the management of legal and
corporate affairs, and the management of human resources and IT systems;
receivables from tax consolidation from the parent company T.E.R.N.I. Research S.p.A.
(consolidating company based on the tax consolidation agreement which the Company had
adopted for the period 2011 – 2013);
tender agreement with the company Royal Club s.r.l. for works restoring an industrialised
building which will incorporate a used tyres treatment plant;
remuneration received by executive members of the Board of Directors and the executive
with strategic responsibility for services provided to the Group.
Operations of financial nature
Current and non-current financial receivables as well as financial income for the year ended 31
December 2015 relate to interest-bearing loans with joint ventures.
It should be noted that the effective parent company Italeaf S.p.A., has provided major banks, as of
31 December 2015, with guarantees on bank loans to TerniEnergia totalling Euro 49.6 million and
for which it requested – from the subsidiary - commissions on sureties of Euro 987 thousand,
included under financial expenses.
For some customers who have financed the purchase of the PV plant through finance lease
agreements with leasing companies, the parent company signed an agreement with the latter taking
over the lease in the event of, and subject to, the failure by its customers. As of 31 December 2015,
residual payables from leasing contracts for which the above mentioned agreements were made
amount to Euro 58.1 million, of which Euro 20.1 million for companies managed or owned by related
parties. In reference to the related parties, Euro 19.8 million are from joint ventures, Euro 1.9 million
from the parent company Italeaf SpA, and Euro 18.1 million for other related parties. The remainder
of the liability, equivalent to Euro 18.1 million, refers to other third-party customers.
Remuneration to senior management
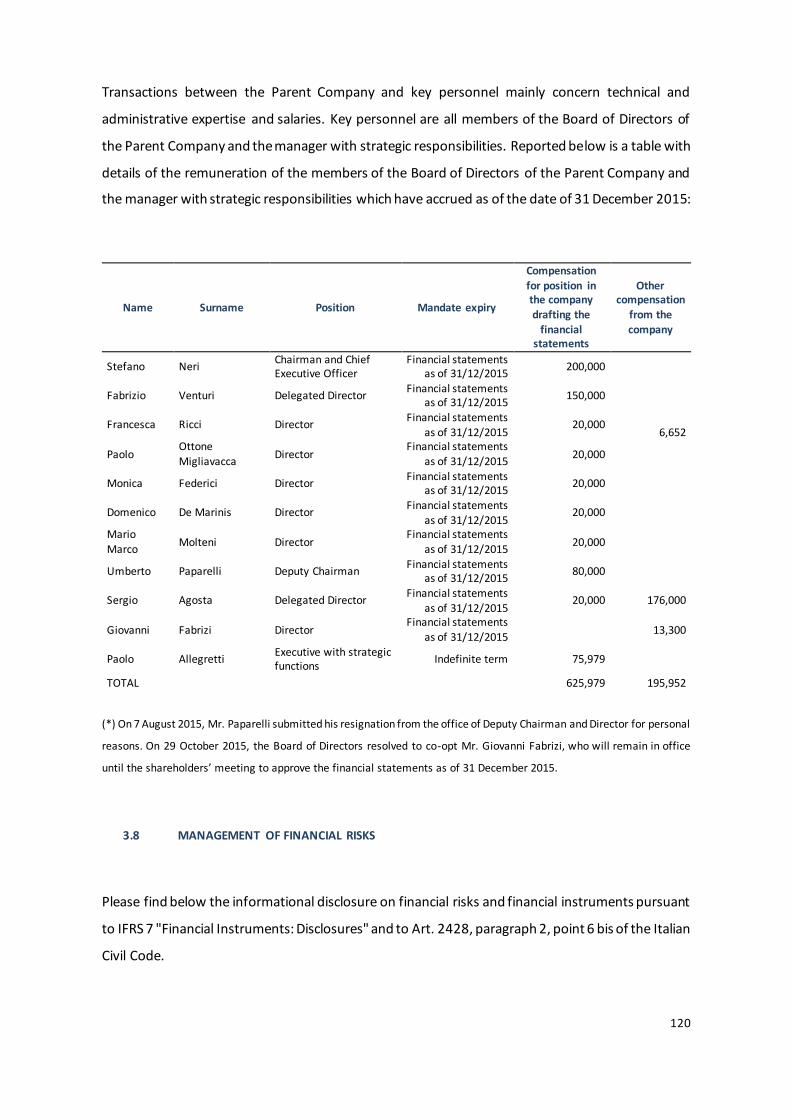
120
Transactions between the Parent Company and key personnel mainly concern technical and
administrative expertise and salaries. Key personnel are all members of the Board of Directors of
the Parent Company and the manager with strategic responsibilities. Reported below is a table with
details of the remuneration of the members of the Board of Directors of the Parent Company and
the manager with strategic responsibilities which have accrued as of the date of 31 December 2015:
Name Surname Position Mandate expiry
Compensation for position in the company
drafting the financial
statements
Other compensation
from the company
Stefano Neri Chairman and Chief Executive Officer
Financial statements as of 31/12/2015
200,000
Fabrizio Venturi Delegated Director Financial statements
as of 31/12/2015 150,000
Francesca Ricci Director Financial statements
as of 31/12/2015 20,000
6,652
Paolo Ottone
Migliavacca Director
Financial statements
as of 31/12/2015 20,000
Monica Federici Director Financial statements
as of 31/12/2015 20,000
Domenico De Marinis Director Financial statements
as of 31/12/2015 20,000
Mario Marco
Molteni Director Financial statements
as of 31/12/2015 20,000
Umberto Paparelli Deputy Chairman Financial statements
as of 31/12/2015 80,000
Sergio Agosta Delegated Director Financial statements
as of 31/12/2015 20,000 176,000
Giovanni Fabrizi Director Financial statements
as of 31/12/2015 13,300
Paolo Allegretti Executive with strategic functions
Indefinite term 75,979 TOTAL 625,979 195,952
(*) On 7 August 2015, Mr. Paparelli submitted his resignation from the office of Deputy Chairman and Director for personal
reasons. On 29 October 2015, the Board of Directors resolved to co-opt Mr. Giovanni Fabrizi, who will remain in office
until the shareholders’ meeting to approve the financial statements as of 31 December 2015.
3.8 MANAGEMENT OF FINANCIAL RISKS
Please find below the informational disclosure on financial risks and financial instruments pursuant
to IFRS 7 "Financial Instruments: Disclosures" and to Art. 2428, paragraph 2, point 6 bis of the Italian
Civil Code.

121
The financial risks associated with the operations of the Group are attributable to the following:
- Market risks related to the Group's exposure to financial instruments that generate interest
(interest rate risk);
- Liquidity risks relating to the availability of financial resources and access to the credit
market;
- Credit risks, resulting from normal commercial transactions or financing activities.
The Group specifically monitors each of these financial risks, with the objective of promptly
minimising them through appropriate management policies and also through the use of derivative
hedging instruments.
In the following paragraphs, the potential impact on results deriving from hypothetical fluctuations
in benchmarks is analysed through sensitivity analysis. These analyses are based, as required by IFRS
7, on simplified scenarios applied to the final results of the reference periods and, by their very
nature, cannot be considered indicators of the actual effects of future changes in benchmarks in the
case of differing financial structures and market conditions nor can they reflect the
interrelationships and complexity of the markets.
Interest rate risk
The management of interest rate risk aims to lessen the negative impact of fluctuations in interest
rates which may affect the income statement and statement of financial position.
Group's financial debt
The Group's financial debt is divided equally between short-term and medium/long term. With
regard to the debt in the short term, the joint management of assets and liabilities in the short term
makes the Group relatively immune to changes in interest rates. Regarding long term debt, interest
rate risk was managed primarily through the use of derivative interest rate instruments illustrated
in Note 3.5.6.
The Parent Company deposits the financial resources generated by operating activities in its bank
accounts, and depending on the needs of its subsidiaries, transfers the necessary liquidity to the
company through financing. The Group uses external financial resources mainly in the form of
overdrafts, advances on invoices, as well as medium-term corporate loans or finance leases
dedicated to individual investment projects (photovoltaic or environmental treatment plants).
Financial receivables from joint ventures and subsidiaries are regulated by loan agreements that
provide for the application of a lending rate equal to the six month Euribor, with a spread of 3%.

122
For a detailed breakdown of the net financial debt of the Group, refer to Note 3.5.8.
Sensitivity analyses
Interest rate risk is measured through sensitivity analyses, as provided for in IFRS 7. With regard to
the financial position of the Group at a floating rate, if the benchmark interest rates were higher
(lower) by 50 basis points at 31 December 2015, operating income, gross of tax, would have been
lower (higher) by Euro 218 thousand and shareholders’ equity lower (higher) by Euro 157 thousand.
Liquidity risk
Liquidity risk can manifest itself in the inability to efficiently manage ordinary commercial and
investment dynamics as well as not being able to reimburse payables on due dates. In order to
support efficient management of liquidity and contribute to the growth in its businesses, the Parent
Company has adopted a set of tools with the aim of optimising the management of financial
resources. This objective was achieved through financing relations between the Parent Company
and the joint ventures and its subsidiaries as well as an active presence in financial markets in order
to obtain adequate credit lines short and medium term. In this context, the Group has cash and
endorsement credit lines for the short-term and medium-term measures to cope with financial
requirements.
Net debt at 31 December 2015 amounted to Euro 87,372 thousand, divided into short-term portion
of Euro 8,100 thousand and long-term portion of Euro 79,272 thousand. Net debt in the short term
is lower than shareholders’ equity, showing a good financial balance. In particular, it should also be
noted that the current financial payables comprise part of the payments incurred for investments
already made or still under construction and for which on 31 December 2015 the company had not
yet entered into a specific contract financing in the medium-long term. In particular, they refer to
the second treatment plant for used tyres completed at the end of 2015, a pyrogasification plant
and a composting plant under construction in Apulia.
The long-term portion is attributable mainly to lease and mortgage contracts with major financial
institutions to cover the financial requirements necessary for the development of industrial plants
(solar farms and 'environmental' facilities) held entirely at the full disposal of the Group in addition
to corporate financing provided by Veneto Banca in December 2013 and a bond issue of Euro 25
million expiring as a lump sum in February 2019.

123
Management believes that net financial position is to be considered balanced, both in relation to
capitalisation and the operations of the Group (note that the non-current borrowings is related in
large part to photovoltaic plants financed with leverage typical for the sector). Therefore, the
TerniEnergia Group is able to meet the requirements arising from investment activities,
management of working capital and reimbursement of payables when they become due.
Liquidity analysis as of 31 December 2015
Financial liabilities Less than 1 year From 1 to 5 years
More than 5 years (in Euro)
Non-current liabilities
Financial payables 79,272,033 46,791,935 32,480,098
Current liabilities
Trade payables 63,543,245 63,543,245
Payables and other financial liabilities 24,185,097 24,185,097
Total financial liabilities 167,000,375 87,728,342 46,791,935 32,480,098
Against the financial and trade payables totalling Euro 167,000 thousand, of which Euro 87,111
thousand related in part to financial payables for leases and financing of specific projects
(photovoltaic plants and "environmental" facilities), there are outstanding financial assets for the
following amounts.
Financial receivables Less than 1 year
From 1 to 5 years
More than 5 years (in Euro)
Non-current assets
Financial receivables 23,591,350 23,591,350
Current assets
Cash and cash equivalents 11,893,389
Trade receivables 52,361,935 52,361,935
Financial receivables 4,192,193 4,192,193
Total financial assets 92,038,867 56,554,128 23,591,350
Revocable credit lines 17,790,000
Credit limit factoring 0
Total 109,828,867 56,554,128 23,591,350
It is apparent, therefore, that the Group retains liquid funds and credit lines that are sufficient to
finance itself, taking into account that most of the non-current financial payables, amounting to

124
Euro 87,111 thousand, refer to the leasing and financing of the Group's industrial plants
(photovoltaic plants and "environmental" facilities), whose recovery takes place over a long-term
period through the cash generation of the plants themselves.
Credit risk
The Group is not exposed to significant credit risk, both to the counterparties of its commercial
transactions and in its financing and investing activities, with the exception of a specific position for
which a dispute arose in 2013 (see also that reported in Note 3.5.11).
The Group constantly monitors its commercial exposure as well as the collection of receivables
within the prescribed contractual periods. It should be noted that the significant increase reported
in the year 2015 within the trade receivables item is due to the removal of Free Energia S.p.A. from
the scope of consolidation.
The amount of financial assets deemed of doubtful recoverability and of insignificant amounts,
however, is covered by appropriate provisions to the allowance for bad debts.
The following tables provide a breakdown of financial assets as of 31 December 2015, grouped by
expiration dates and net of the allowance for bad debts.
31/12/2015 Trade receivables
Receivables not yet past-due 45,173,062
Past-due by less than 6 months 2,238,841
Past-due from 6 months to 1 years 977,239
Past-due from 1 to 3 years 982,296
Past-due for over 3 years 3,717,469
Allowance for bad debts (726,972)
Total trade receivables 52,361,935
To complete the disclosure, note that the balance of past-due receivables for more than 3 years
includes a specific position for Euro 2.9 million with an important customer, for which a litigation
procedure has been initiated, as described in Note 3.5.11.
Summary table of financial assets and liabilities by category

125
The following table reports the classification of the financial instruments of the Group companies in
accordance with IAS 39:
Financial statements as of 31 December 2015
Assets measured at fair value in
income
statement
Investments held to maturity
Loans and receivables
Financial assets available for sale
Non-current assets
Non-current financial receivables 23,591,350
Current assets
Trade receivables 52,361,935
Financial receivables 4,192,193
Liabilities
measured at fair value in income
statement
Hedging liabilities
Liabilities recognised at
amortised cost
Non-current liabilities
Non-current financial payables 79,272,033
Current liabilities
Current financial payables 24,185,097
Trade payables 63,543,245
Financial statements as of 31 December
2014
Assets measured at fair value in
income statement
Investments
held to maturity
Loans and
receivables
Financial assets
available for sale
Non-current assets
Non-current financial receivables 23,003,783
Non-current assets
Trade receivables 79,108,151
Financial receivables 8,682,422
Liabilities
measured at fair value in income
statement
Hedging liabilities
Liabilities
recognised at amortised cost
Non-current liabilities
Non-current financial payables 89,837,177
Current liabilities
Current financial payables 41,197,420
Trade payables 67,172,376
3.9 ATYPICAL AND/OR UNUSUAL TRANSACTIONS
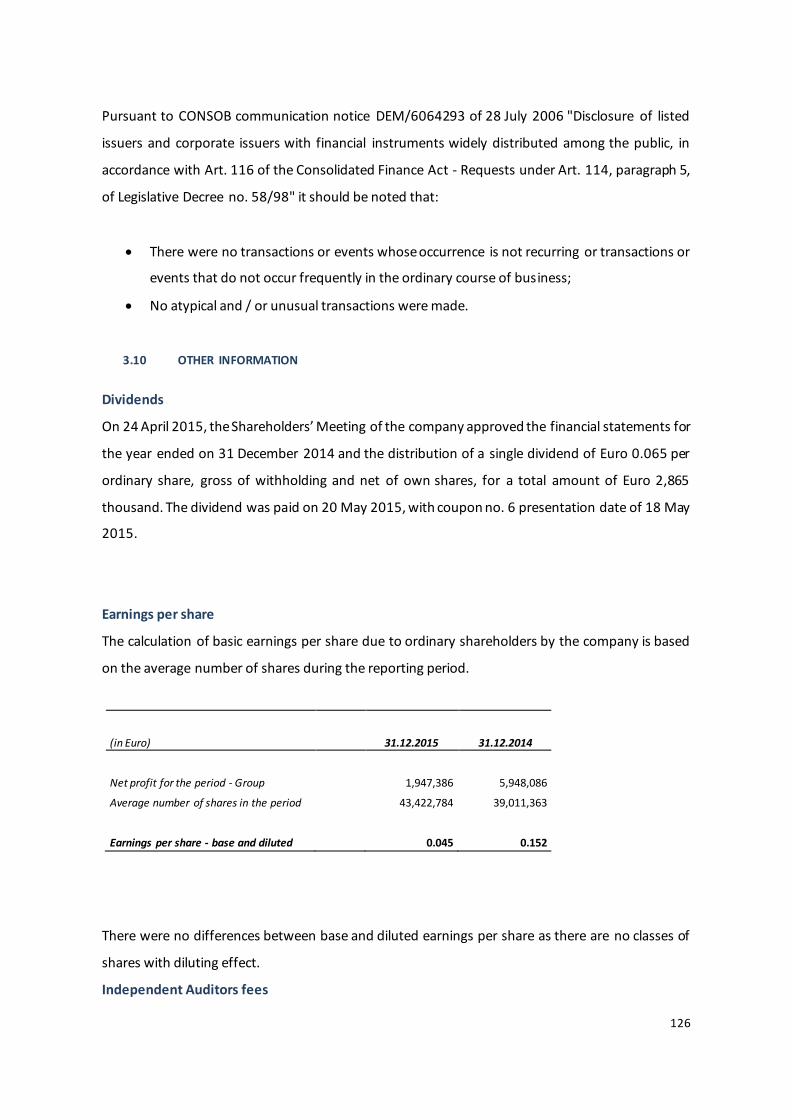
126
Pursuant to CONSOB communication notice DEM/6064293 of 28 July 2006 "Disclosure of listed
issuers and corporate issuers with financial instruments widely distributed among the public, in
accordance with Art. 116 of the Consolidated Finance Act - Requests under Art. 114, paragraph 5,
of Legislative Decree no. 58/98" it should be noted that:
There were no transactions or events whose occurrence is not recurring or transactions or
events that do not occur frequently in the ordinary course of business;
No atypical and / or unusual transactions were made.
3.10 OTHER INFORMATION
Dividends
On 24 April 2015, the Shareholders’ Meeting of the company approved the financial statements for
the year ended on 31 December 2014 and the distribution of a single dividend of Euro 0.065 per
ordinary share, gross of withholding and net of own shares, for a total amount of Euro 2,865
thousand. The dividend was paid on 20 May 2015, with coupon no. 6 presentation date of 18 May
2015.
Earnings per share
The calculation of basic earnings per share due to ordinary shareholders by the company is based
on the average number of shares during the reporting period.
(in Euro) 31.12.2015 31.12.2014
Net profit for the period - Group 1,947,386 5,948,086
Average number of shares in the period 43,422,784 39,011,363
Earnings per share - base and diluted 0.045 0.152
There were no differences between base and diluted earnings per share as there are no classes of
shares with diluting effect.
Independent Auditors fees
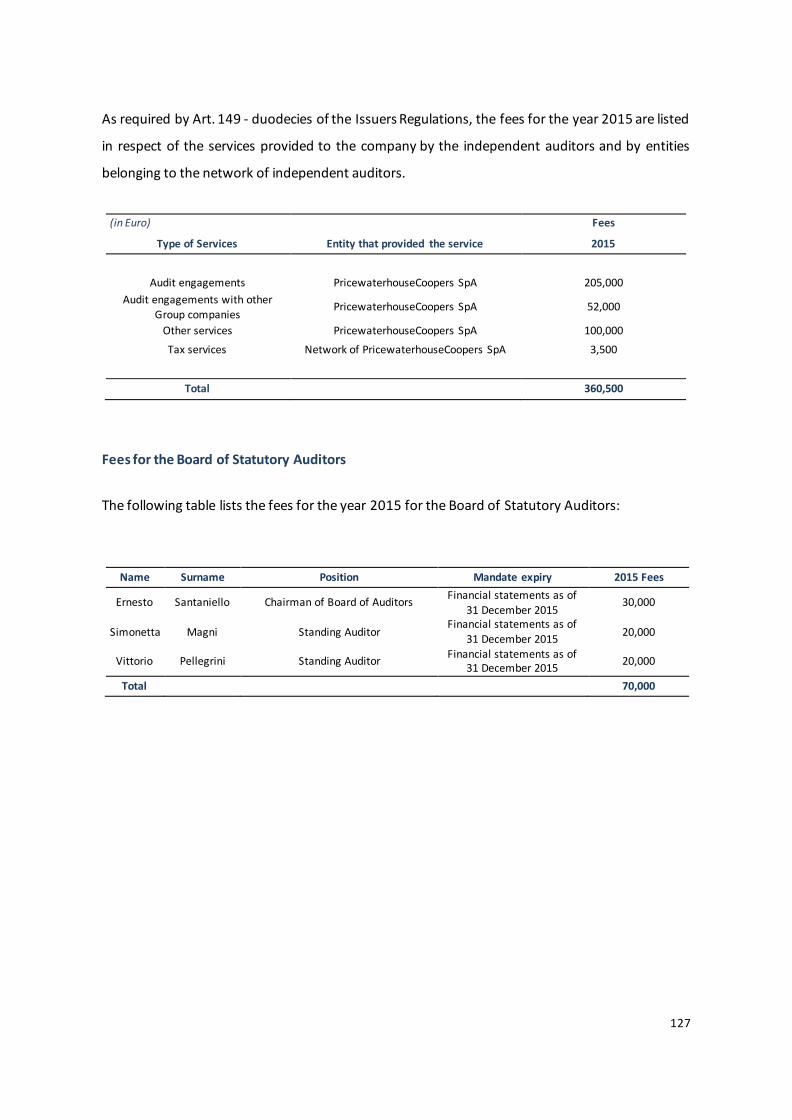
127
As required by Art. 149 - duodecies of the Issuers Regulations, the fees for the year 2015 are listed
in respect of the services provided to the company by the independent auditors and by entities
belonging to the network of independent auditors.
(in Euro) Fees
Type of Services Entity that provided the service 2015
Audit engagements PricewaterhouseCoopers SpA 205,000
Audit engagements with other
Group companies PricewaterhouseCoopers SpA 52,000
Other services PricewaterhouseCoopers SpA 100,000
Tax services Network of PricewaterhouseCoopers SpA 3,500
Total 360,500
Fees for the Board of Statutory Auditors
The following table lists the fees for the year 2015 for the Board of Statutory Auditors:
Name Surname Position Mandate expiry 2015 Fees
Ernesto Santaniello Chairman of Board of Auditors Financial statements as of
31 December 2015 30,000
Simonetta Magni Standing Auditor Financial statements as of
31 December 2015 20,000
Vittorio Pellegrini Standing Auditor Financial statements as of
31 December 2015 20,000
Total 70,000

128
Subsequent events
Sale of Free Energia SpA shares
After the year-end closing, 358,668 shares of Free Energia SpA were sold as part of the divestment
transaction that was fully described in the previous sections of the financial statements, in particular
Section 1.5.10 of the Report on Operations, to which the reader is referred.
Subsidiary TerniEnergia Middle East Power LLC established in Abu Dhabi, 51% controlled by Al
Hamed Group with 49% investment from TerniEnergia, with share capital equivalent to 150
thousand dirham
In January 2016, as part of the global growth strategy, TerniEnergia S.p.A. established the company
TerniEnergia Middle East Power LLC in Abu Dhabi, governed under UAE law, with a 51% investment
from Khalid Al Hamed Group LLC and 49% from TerniEnergia. The subsidiary will operate in Middle
Eastern countries and within the Gulf Cooperation Council (GCC), with 150 thousand dirham in share
capital.
In particular, TerniEnergia and Al Hamed Group signed a shareholders’ agreement governing the
company’s operations, which was the subject of a strategic agreement previously signed by the
parties and announced to the market on 29 April 2014. The Board of Directors of TerniEnergia
Middle East Power LLC will have a Board of Directors consisting of two members, Chairman and CEO
of Khalid Al Hamed Group LLC, Sheik Khalid Bin Ahmed Al Hamed, and Chairman and CEO of
TerniEnergia S.p.A., Stefano Neri. The profits from the company’s operations will be divided as
follows: 75% to TerniEnergia S.p.A. and 25% to Khalid Al Hamed Group LLC.
The agreement envisages that Khalid Al Hamed Group LLC will primarily be involved in the
management of relations with the local government authorities as well as the facilitation of
authorisation processes, the acquisition of operational requirements and support during
negotiations with financial partners and with banking institutions supporting business operations,
while TerniEnergia will be responsible for managing the operational and industrial component. By
means of this managerial model, the parties aim to unite and enhance the value of the know-how
and technological competencies of TerniEnergia in the energy and environmental sectors, with the
financial endowment and business development skills of the Al Hamed Group, thereby ensuring
rapid growth for TerniEnergia Middle East Power LLC.
129
“TerniEnergia Hub” presented, the new operating formula for the Group’s Energy Saving business
line
On 11 February, TerniEnergia presented the “Hub” project, a new operating method to open up the
industrial energy efficiency market through “third party financing” in Italy.
The objective of “TerniEnergia Hub” is to form a strategic alliance between all players in the value
chain to meet the needs of capital markets. The formula that the Group uses in the renewables and
energy management sectors can also bring advantages to the industrial energy efficiency sector, as
was explained in a presentation to a select audience of partners and suppliers during a workshop
held in the conference room of the Hotel Principe di Savoia in Milan. In the three-year plan “Fast on
the smart energy road”, TerniEnergia gave particular attention to developing the Energy Saving
business line, by defining a new business model.
Among the applicable methods, TerniEnergia added:
1) Financial leasing:
The action was completed and accepted by the end user. The Hub assesses the intervention and
assumes ownership, absorbing the business risk, and finances it through financial leasing.
TerniEnergia is responsible for performance guarantees, assuming the role of Esco, compensates
the partner for the investment made for technology costs and for the O&M assets. The partner
recovers the invested equity, making it available for new interventions, while TerniEnergia Hub is
compensated through the savings generated and guarantees the expected return to the investor.
At the conclusion of the contract, TerniEnergia redeems the plant and transfers ownership to the
end user.
2) Securitisation of receivables
This action was also completed and accepted by the end user. The Hub assesses the intervention
and uses a special purpose vehicle to purchase the energy efficiency plant, compensating the
partner for the investment made in technology costs and the O&M asset. The SPV transfers the plant
and discounted receivable to the investor. The securitisation can also be applied to portfolios of
similar transactions, if there is not one single high-value project.
3) Financing from the contract signing
This intervention is only in the planning stage and the end user has signed the contract for
installation and management. TerniEnergia Hub will acquire the contract and activate the
procedures to finance the project through the FTT formula. The possibility of issuing guarantees, the
track record and the TerniEnergia governance system will release the necessary capital for the
investment. Once the contact is acquired, depending on the type, entity, business plan and quality

130
of the intervention, TerniEnergia will decided whether to activate the leasing option or the
securitisation of receivables option.

131
4. CERTIFICATION OF THE CONSOLIDATED FINANCIAL STATEMENTS PURSUANT TO ART. 154-BIS
OF LEGISLATIVE DECREE 58/98 AND ART. 81-TER OF CONSOB REGULATION NO. 11971/99, AND
ITS SUBSEQUENT AMENDMENTS AND SUPPLEMENTS
1. The undersigned, Mr. Stefano Neri, acting in the capacity of Chairman and Chief Executive Officer,
and Mr. Paolo Allegretti, acting in the capacity of Manager responsible for preparing corporate
accounting documents of TerniEnergia S.p.A., hereby certify, in consideration of the provisions
under Art. 154-bis, paragraphs 3 and 4, of Legislative Decree no. 58 of 24 February 1998:
• the adequacy with reference to the characteristics of the enterprise;
• the effective application of the administrative and accounting procedures for the preparation of
the consolidated financial statements as of 31 December 2015.
2. To this end, no further significant aspects emerged.
3. It is further certified that the consolidated financial statements:
(a) are consistent with the results reported in the books and in the accounting records;
(b) are prepared in accordance with International Financial Reporting Standards as endorsed by the
European Union pursuant to Regulation (EC) no. 1606/2002 and, to the best of our knowledge,
provides a true and fair view of the financial and economic position of the issue and of the overall
companies included within the scope of consolidation.
4. Finally, we certify that the consolidated financial statements include a reliable analysis of
references to important events which occurred in 2015 and their effect on the consolidated financial
statements in addition to a description of the primary risks and uncertainties. The consolidated
financial statements also include a reliable analysis of significant information on relations with
related parties.
5. This certification is issued pursuant to and for the purposes of Art. 154-bis, paragraphs 2 and 5,
of Legislative Decree no. 58 of 1998.
Nera Montoro, 14 March 2016
Chief Executive Officer The Manager responsible for preparing corporate
accounting document