Embed Size (px)
Citation preview
ssss
ANNUAL REPORT
2016
This report has been prepared in line with the requirements of the Capital Markets Authority (CMA) particularly with regards to Corporate Governance guidelines and Listing rules. In addition, special consideration has been given to the applicable laws of the Ministry of Commerce and Investment (MoCI) and international best practices of good governance and transparency.
BOARD OF DIRECTORS REPORT 2016 2
TABLE OF CONTENTS CHAIRMAN’S LETTER TO SHAREHOLDERS ........................................................................................................................... 3
INTRODUCING NEW BRAND IDENTITY ................................................................................................................................. 5
CORPORATE INFORMATION ................................................................................................................................................. 6
PERFORMANCE AT A GLANCE ............................................................................................................................................. 7
ANALYSIS OF FINANCIAL RESULTS ........................................................................................................................................ 8
BUSINESS REVIEW .................................................................................................................................................................... 9
BUSINESS SECTORS ................................................................................................................................................................ 10
SUBSIDIARY COMPANIES ..................................................................................................................................................... 11
ASSOCIATED COMPANIES .................................................................................................................................................. 12
FINANCIAL REVIEW ............................................................................................................................................................... 21
KEY FINANCIAL INDICATORS .............................................................................................................................................. 22
BALANCE SHEET .................................................................................................................................................................... 23
STATEMENT OF INCOME ...................................................................................................................................................... 26
KEY RATIOS............................................................................................................................................................................. 29
KEY FINANCIAL DATA ........................................................................................................................................................... 30
GEOGRAPHICAL ANALYSIS OF REVENUE ......................................................................................................................... 31
BANK LOANS AND DEBT INSTRUMENTS ............................................................................................................................. 32
REPAYMENT PROFILE ............................................................................................................................................................ 32
PAYMENTS TO GOVERNMENT AUTHORITIES ..................................................................................................................... 32
DIVIDEND POLICY ................................................................................................................................................................. 33
INTERNATIONAL FINANCIAL REPORTING STANDARDS (IFRS) ......................................................................................... 34
MANAGEMENT FRAMEWORK ............................................................................................................................................. 35
MANAGEMENT STRUCTURE & PHILOSOPHY ..................................................................................................................... 36
BOARD OF DIRECTORS ........................................................................................................................................................ 37
HUMAN CAPITAL DEVELOPMENT ....................................................................................................................................... 39
CORPORATE GOVERNANCE .............................................................................................................................................. 42
GOVERNANCE PERFORMANCE ......................................................................................................................................... 43
AUDIT COMMITTEE REPORT ................................................................................................................................................. 46
RISK MANAGEMENT ............................................................................................................................................................. 47
LIQUIDITY MANAGEMENT POLICY ..................................................................................................................................... 48
RELATED PARTY TRANSACTIONS ......................................................................................................................................... 49
BOARD AND MANAGEMENT REMUNERATION ................................................................................................................ 52
BOARD DECLARATION / CONFIRMATION ........................................................................................................................ 53
SHAREHOLDING INTERESTS .................................................................................................................................................. 55
SHAREHOLDING STATISTICS ................................................................................................................................................. 55
OUTLOOK ............................................................................................................................................................................... 57
FUTURE AT A GLANCE .......................................................................................................................................................... 58
BOARD OF DIRECTORS REPORT 2016 3
CHAIRMAN’S LETTER TO SHAREHOLDERS
In the Name of Allah, the Most Compassionate, the Most Merciful Praise be to Allah, prayer and peace be upon the Messenger of Allah
Distinguished shareholders of Saudi Industrial Services Co. (SISCO), It is my honor and pleasure to present to you the annual directors’ report of your company; highlighting the details and developments for the fiscal year 2016 and shedding some light on the company’s future prospects. I hope you will find this report useful and thorough. During 2016, SISCO continued its journey on the path that was adopted in its 2015 strategy, that focused on developments in its three key market segments, where the team has experience in their administrative, technical, and operational areas. These segments are ports & terminals, logistics and industrial services and water solutions; where SISCO operates through its subsidiaries and affiliated companies. SISCO’s structure is one of a strategic holding company, and it supports its group companies by providing advice in: talent management, strategic finance and treasury, legal services, and assists our subsidiaries and affiliates to adopting international best practices in corporate governance and compliance. Another key value addition is through fostering cooperation, coordination and healthy cooperation among the group companies to achieve our future strategic objectives. SISCO’s management is always on the look-out for strategies to expand the company’s foot-print in the chosen segments, to serve the interests of the Company and its shareholders. In line with our new strategy, the company has also reinvigorated its corporate identity and consequently, a new branding strategy and logo have been adopted. Alhamdulillah, despite the challenges and rapidly changing condition, all of the group companies were able to deliver results in-line with expectations from the previous year. SISCO’s revenue grew by 3.9% to SAR 640 million and net income increased by 2.2% from 2015 to SAR 92.1 million. As of the Ports sector, the economy slowed down during 2016, resulting in lower gateway volume for the Saudi ports, however, Red Sea Gateway Terminal Co. recorded an increase in its total volume on the back of strong trans-shipment performance. The terminal also received an approval from Saudi Ports Authority for the berth extension in order to accommodate three mega vessels simultaneously. SISCO also managed to secure financing on time for the expansion project; which will increase the terminal’s handling capacity by more than 40%, once the project is completed towards the end of 2017. In the Logistics sector, Tusdeer has been focusing on replicating its successful model of bonded re-export zone to other areas by establishing new logistics centers of a similar international standard. The conceptual designs and layout for Jeddah Logistics Park in Al-Khumra area has been prepared and the project built-out will be in stages in accordance to market demands. This is the first project of its kind in the Kingdom; it will provide total integrated logistics facilities and auxiliary operational services to its tenants. The development of the Logistics Park in Jeddah Industrial City 1 has also started; the logistic hub will address the traffic congestion issues for heavy vehicles in the surrounding area. SISCO affiliated company S A Talke has also expanded its foot-print in the western region of the country and signed operational services contracts with Petro Rabigh and National Petrochemical Company. In the water sector, Kindasa Water Co. has started the development of a new 6,000 cm3 per day capacity plant in Rabigh and the plant is expected to start its operations in the first half of 2018. The construction of the plant is being financed through Islamic Murabaha facility arranged from local banks and internal revenue generated by the company’s operations. On the distribution side, international Water Distribution Co. (Tawzea) secured a 10-year concession for water distribution to Jeddah Industrial Cities 2 and 3. In addition Tawzea managed to sign contracts for management/operations in other developing smaller industrial cities in the country. SISCO’s continued successes are testament to the confidence that the government and local authorities place in the companies’ abilities to deliver on its promise, complete the projects in time and operate them on par with international standards, contributing to the economic stability and national development of the Kingdom. During 2016, the company made efforts to minimize the impact of power price adjustments and increases in labor costs by focusing on efficiency, in support of the government’s initiatives to reduce reliance on subsidies. SISCO
BOARD OF DIRECTORS REPORT 2016 4
will be faced with similar challenges during 2017. Operational costs are expected to continue to rise, but we will strive to deliver the results that are expected of us, considering the prevailing market condition and economic environment, and continue to do our part in helping the government in achieving its objectives for Vision 2030 initiatives. Ultimately, I would like to thank you for your continued support and faith in the company. I would also to like take this opportunity to thank my fellow members of the board and executive management team of SISCO, and its group companies for their efforts, which are clearly reflected in the results of 2016. We look forward to a more prosperous 2017 In Sha’Allah. Chairman of the Board Mohamed Ahmed Alireza
BOARD OF DIRECTORS REPORT 2016 5
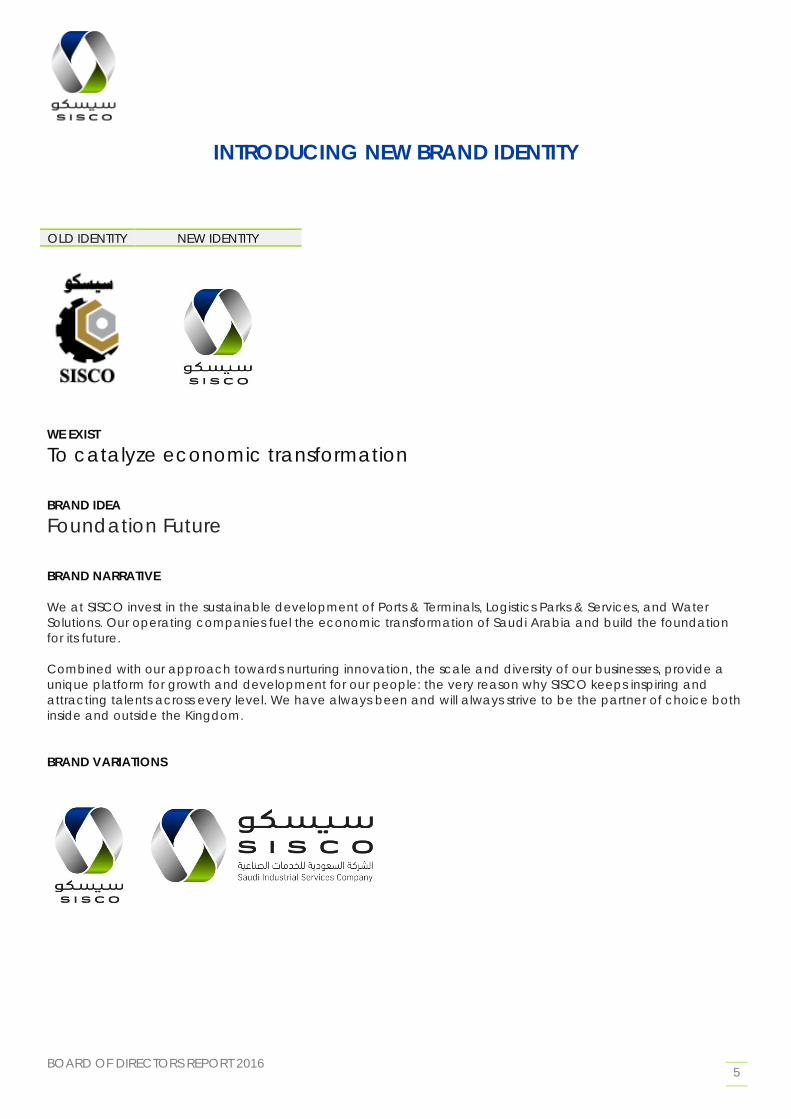
INTRODUCING NEW BRAND IDENTITY
OLD IDENTITY NEW IDENTITY
WE EXIST
To catalyze economic transformation BRAND IDEA Foundation Future BRAND NARRATIVE We at SISCO invest in the sustainable development of Ports & Terminals, Logistics Parks & Services, and Water Solutions. Our operating companies fuel the economic transformation of Saudi Arabia and build the foundation for its future. Combined with our approach towards nurturing innovation, the scale and diversity of our businesses, provide a unique platform for growth and development for our people: the very reason why SISCO keeps inspiring and attracting talents across every level. We have always been and will always strive to be the partner of choice both inside and outside the Kingdom. BRAND VARIATIONS
BOARD OF DIRECTORS REPORT 2016 6
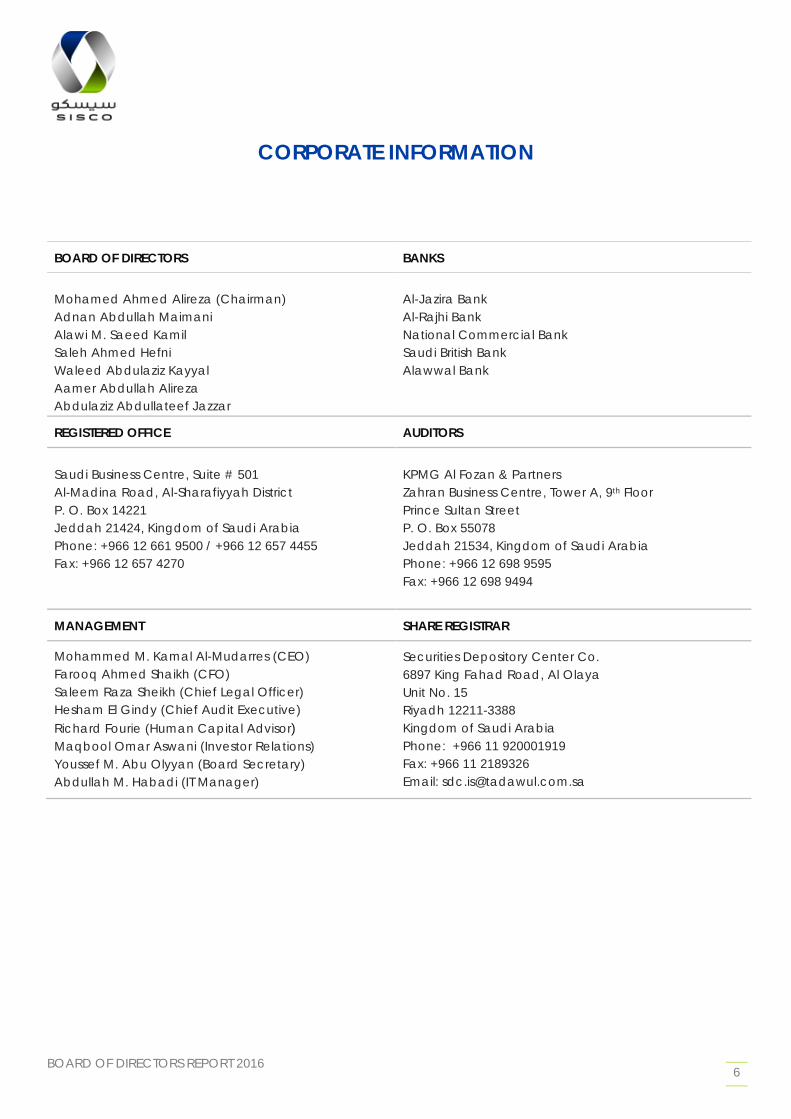
CORPORATE INFORMATION
BOARD OF DIRECTORS BANKS
Mohamed Ahmed Alireza (Chairman) Adnan Abdullah Maimani Alawi M. Saeed Kamil Saleh Ahmed Hefni Waleed Abdulaziz Kayyal Aamer Abdullah Alireza Abdulaziz Abdullateef Jazzar
Al-Jazira Bank Al-Rajhi Bank National Commercial Bank Saudi British Bank Alawwal Bank
REGISTERED OFFICE AUDITORS
Saudi Business Centre, Suite # 501 Al-Madina Road, Al-Sharafiyyah District P. O. Box 14221 Jeddah 21424, Kingdom of Saudi Arabia Phone: +966 12 661 9500 / +966 12 657 4455 Fax: +966 12 657 4270
KPMG Al Fozan & Partners Zahran Business Centre, Tower A, 9th Floor Prince Sultan Street P. O. Box 55078 Jeddah 21534, Kingdom of Saudi Arabia Phone: +966 12 698 9595 Fax: +966 12 698 9494
MANAGEMENT SHARE REGISTRAR
Mohammed M. Kamal Al-Mudarres (CEO) Farooq Ahmed Shaikh (CFO) Saleem Raza Sheikh (Chief Legal Officer) Hesham El Gindy (Chief Audit Executive) Richard Fourie (Human Capital Advisor) Maqbool Omar Aswani (Investor Relations) Youssef M. Abu Olyyan (Board Secretary) Abdullah M. Habadi (IT Manager)
Securities Depository Center Co. 6897 King Fahad Road, Al Olaya Unit No. 15 Riyadh 12211-3388 Kingdom of Saudi Arabia Phone: +966 11 920001919 Fax: +966 11 2189326 Email: [email protected]

BOARD OF DIRECTORS REPORT 2016 7
PERFORMANCE AT A GLANCE (in SAR million)
473
520
561
616
640
2012
2013
2014
2015
2016
REVENUE
38
56
78
91
92
2012
2013
2014
2015
2016
NET INCOME
184
210
241
265
272
2012
2013
2014
2015
2016
EBITDA
173
214
265
258
266
2012
2013
2014
2015
2016
CASH FLOW FROM OPERATIONS
766
826
913
972
1,024
2012
2013
2014
2015
2016
SHAREHOLDERS' EQUITY
928
1,146
1,187
998
1,013
2012
2013
2014
2015
2016
MARKET CAPITALIZATION
BOARD OF DIRECTORS REPORT 2016 8
ANALYSIS OF FINANCIAL RESULTS
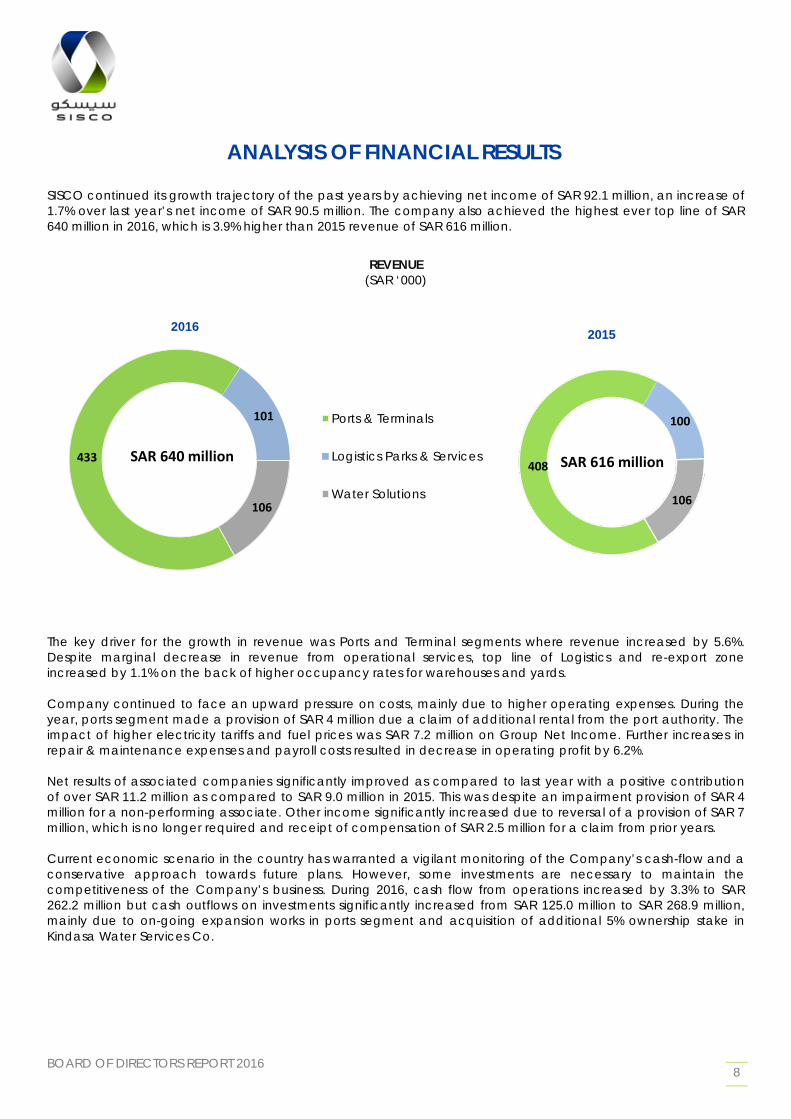
SISCO continued its growth trajectory of the past years by achieving net income of SAR 92.1 million, an increase of 1.7% over last year’s net income of SAR 90.5 million. The company also achieved the highest ever top line of SAR 640 million in 2016, which is 3.9% higher than 2015 revenue of SAR 616 million.
REVENUE (SAR ‘000)
The key driver for the growth in revenue was Ports and Terminal segments where revenue increased by 5.6%. Despite marginal decrease in revenue from operational services, top line of Logistics and re-export zone increased by 1.1% on the back of higher occupancy rates for warehouses and yards. Company continued to face an upward pressure on costs, mainly due to higher operating expenses. During the year, ports segment made a provision of SAR 4 million due a claim of additional rental from the port authority. The impact of higher electricity tariffs and fuel prices was SAR 7.2 million on Group Net Income. Further increases in repair & maintenance expenses and payroll costs resulted in decrease in operating profit by 6.2%. Net results of associated companies significantly improved as compared to last year with a positive contribution of over SAR 11.2 million as compared to SAR 9.0 million in 2015. This was despite an impairment provision of SAR 4 million for a non-performing associate. Other income significantly increased due to reversal of a provision of SAR 7 million, which is no longer required and receipt of compensation of SAR 2.5 million for a claim from prior years. Current economic scenario in the country has warranted a vigilant monitoring of the Company’s cash-flow and a conservative approach towards future plans. However, some investments are necessary to maintain the competitiveness of the Company’s business. During 2016, cash flow from operations increased by 3.3% to SAR 262.2 million but cash outflows on investments significantly increased from SAR 125.0 million to SAR 268.9 million, mainly due to on-going expansion works in ports segment and acquisition of additional 5% ownership stake in Kindasa Water Services Co.
433
101
106
SAR 640 million
Ports & Terminals
Logistics Parks & Services
Water Solutions
408
100
106
SAR 616 million
2016
2015
BOARD OF DIRECTORS REPORT 2016 9
BUSINESS REVIEW
BOARD OF DIRECTORS REPORT 2016 10
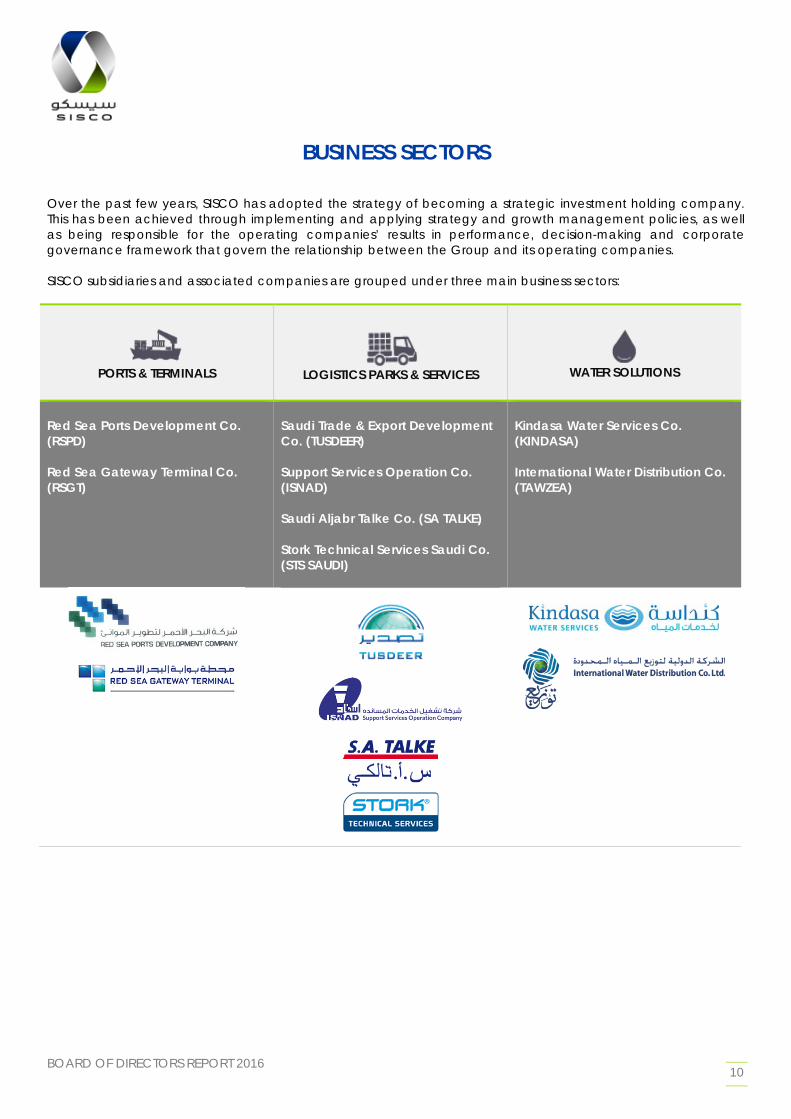
BUSINESS SECTORS Over the past few years, SISCO has adopted the strategy of becoming a strategic investment holding company. This has been achieved through implementing and applying strategy and growth management policies, as well as being responsible for the operating companies’ results in performance, decision-making and corporate governance framework that govern the relationship between the Group and its operating companies. SISCO subsidiaries and associated companies are grouped under three main business sectors:
PORTS & TERMINALS
LOGISTICS PARKS & SERVICES
WATER SOLUTIONS
Red Sea Ports Development Co. (RSPD) Red Sea Gateway Terminal Co. (RSGT)
Saudi Trade & Export Development Co. (TUSDEER) Support Services Operation Co. (ISNAD) Saudi Aljabr Talke Co. (SA TALKE) Stork Technical Services Saudi Co. (STS SAUDI)
Kindasa Water Services Co. (KINDASA) International Water Distribution Co. (TAWZEA)
BOARD OF DIRECTORS REPORT 2016 11
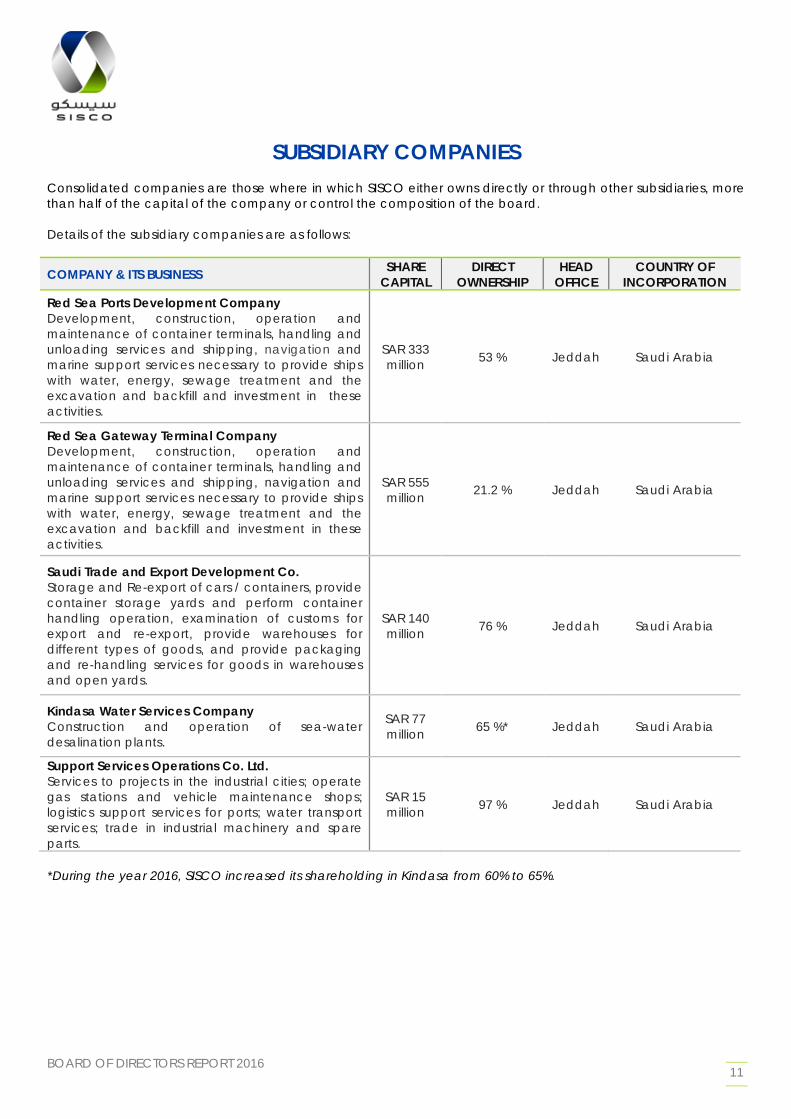
SUBSIDIARY COMPANIES Consolidated companies are those where in which SISCO either owns directly or through other subsidiaries, more than half of the capital of the company or control the composition of the board. Details of the subsidiary companies are as follows:
COMPANY & ITS BUSINESS SHARE CAPITAL
DIRECT OWNERSHIP
HEAD OFFICE
COUNTRY OF INCORPORATION
Red Sea Ports Development Company Development, construction, operation and maintenance of container terminals, handling and unloading services and shipping, navigation and marine support services necessary to provide ships with water, energy, sewage treatment and the excavation and backfill and investment in these activities.
SAR 333 million 53 % Jeddah Saudi Arabia
Red Sea Gateway Terminal Company Development, construction, operation and maintenance of container terminals, handling and unloading services and shipping, navigation and marine support services necessary to provide ships with water, energy, sewage treatment and the excavation and backfill and investment in these activities.
SAR 555 million 21.2 % Jeddah Saudi Arabia
Saudi Trade and Export Development Co. Storage and Re-export of cars / containers, provide container storage yards and perform container handling operation, examination of customs for export and re-export, provide warehouses for different types of goods, and provide packaging and re-handling services for goods in warehouses and open yards.
SAR 140 million 76 % Jeddah Saudi Arabia
Kindasa Water Services Company Construction and operation of sea-water desalination plants.
SAR 77 million 65 %* Jeddah Saudi Arabia
Support Services Operations Co. Ltd. Services to projects in the industrial cities; operate gas stations and vehicle maintenance shops; logistics support services for ports; water transport services; trade in industrial machinery and spare parts.
SAR 15 million 97 % Jeddah Saudi Arabia
*During the year 2016, SISCO increased its shareholding in Kindasa from 60% to 65%.
BOARD OF DIRECTORS REPORT 2016 12
ASSOCIATED COMPANIES Associated companies are those where SISCO has substantial long-term interest and where SISCO is in a position to exercise a significant influence over the associated company by participating in their financial and operating policy decisions. Details of the associated companies are as follows:
COMPANY & ITS BUSINESS SHARE CAPITAL
DIRECT OWNERSHIP
HEAD OFFICE
COUNTRY OF INCORPORATION
International Water Distribution Co. Construction of public works of water, sewage, irrigation and sanitation (water and storm water drainage); and mechanical works, waterworks, sewage technology and pumping stations; maintenance and operation of water facilities, sewage and running channeling water to various networks.
SAR 146 million 50 % Jeddah Saudi Arabia
Saudi Al-Jabr Talke Company Implementation of contracting construction, operation and maintenance of warehouses and logistics for the petrochemical sector contracts.
SAR 12 million 33.33 % Jubail Saudi Arabia
Stork Technical Services Company Maintenance and operation of power plants and oil and gas, water desalination and petrochemical plants and calibration of precision machining and provide mechanical and electrical related services.
SAR 20 million 45 % Jubail Saudi Arabia
OTHER DIRECT INVESTMENTS SISCO has invested USD 2.5 million (SAR 9.4 million) in Growth Gate Corporation BSC (Bahrain). SISCO’s investment represents 1.17% of Growth Gate’s total share capital of USD 213.3 million. OTHER INDIRECT INVESTMENTS SISCO has indirect investment in Water and Environment Saudi Service Company Limited (“WESSCO”) through its subsidiary Kindasa Water Services Company, which owns 49% of WESSCO. SISCO has indirect investment in Xenmet SA, Vaduz (“Xenmet”) through its subsidiary Saudi Trade and Export Development Company, which owns 25% of Xenmet SA.
BOARD OF DIRECTORS REPORT 2016 13
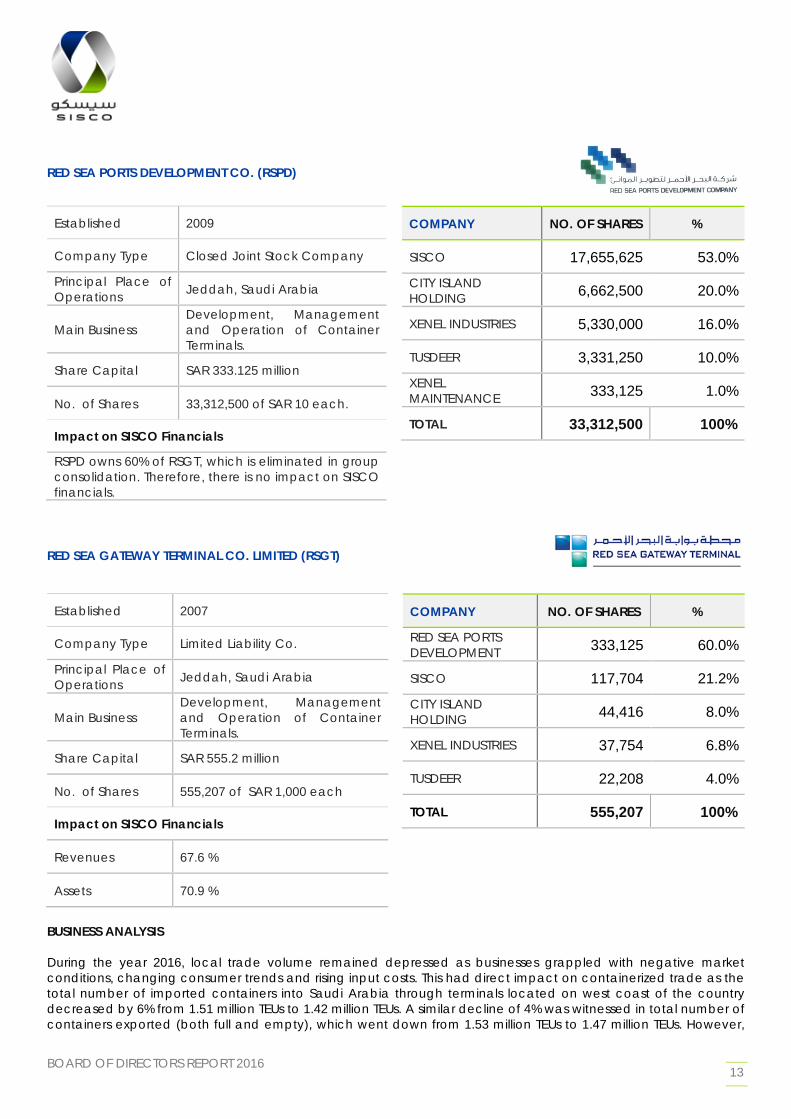
RED SEA PORTS DEVELOPMENT CO. (RSPD)
Established 2009
Company Type Closed Joint Stock Company
Principal Place of Operations Jeddah, Saudi Arabia
Main Business Development, Management and Operation of Container Terminals.
Share Capital SAR 333.125 million
No. of Shares 33,312,500 of SAR 10 each.
Impact on SISCO Financials
RSPD owns 60% of RSGT, which is eliminated in group consolidation. Therefore, there is no impact on SISCO financials.
COMPANY NO. OF SHARES %
SISCO 17,655,625 53.0% CITY ISLAND HOLDING 6,662,500 20.0%
XENEL INDUSTRIES 5,330,000 16.0%
TUSDEER 3,331,250 10.0% XENEL MAINTENANCE 333,125 1.0%
TOTAL 33,312,500 100%
RED SEA GATEWAY TERMINAL CO. LIMITED (RSGT)
Established 2007
Company Type Limited Liability Co.
Principal Place of Operations Jeddah, Saudi Arabia
Main Business Development, Management and Operation of Container Terminals.
Share Capital SAR 555.2 million
No. of Shares 555,207 of SAR 1,000 each
Impact on SISCO Financials
Revenues 67.6 %
Assets 70.9 %
COMPANY NO. OF SHARES %
RED SEA PORTS DEVELOPMENT 333,125 60.0%
SISCO 117,704 21.2% CITY ISLAND HOLDING 44,416 8.0%
XENEL INDUSTRIES 37,754 6.8%
TUSDEER 22,208 4.0%
TOTAL 555,207 100%
BUSINESS ANALYSIS During the year 2016, local trade volume remained depressed as businesses grappled with negative market conditions, changing consumer trends and rising input costs. This had direct impact on containerized trade as the total number of imported containers into Saudi Arabia through terminals located on west coast of the country decreased by 6% from 1.51 million TEUs to 1.42 million TEUs. A similar decline of 4% was witnessed in total number of containers exported (both full and empty), which went down from 1.53 million TEUs to 1.47 million TEUs. However,
BOARD OF DIRECTORS REPORT 2016 14
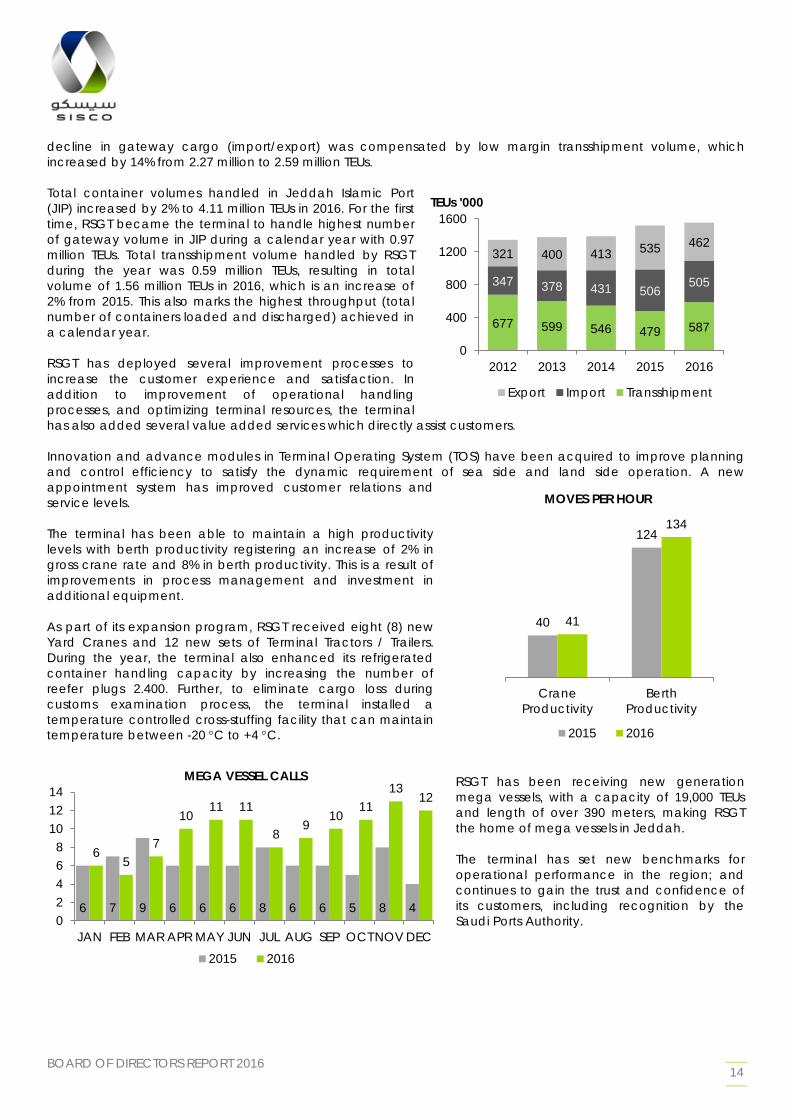
decline in gateway cargo (import/export) was compensated by low margin transshipment volume, which increased by 14% from 2.27 million to 2.59 million TEUs. Total container volumes handled in Jeddah Islamic Port (JIP) increased by 2% to 4.11 million TEUs in 2016. For the first time, RSGT became the terminal to handle highest number of gateway volume in JIP during a calendar year with 0.97 million TEUs. Total transshipment volume handled by RSGT during the year was 0.59 million TEUs, resulting in total volume of 1.56 million TEUs in 2016, which is an increase of 2% from 2015. This also marks the highest throughput (total number of containers loaded and discharged) achieved in a calendar year. RSGT has deployed several improvement processes to increase the customer experience and satisfaction. In addition to improvement of operational handling processes, and optimizing terminal resources, the terminal has also added several value added services which directly assist customers. Innovation and advance modules in Terminal Operating System (TOS) have been acquired to improve planning and control efficiency to satisfy the dynamic requirement of sea side and land side operation. A new appointment system has improved customer relations and service levels. The terminal has been able to maintain a high productivity levels with berth productivity registering an increase of 2% in gross crane rate and 8% in berth productivity. This is a result of improvements in process management and investment in additional equipment. As part of its expansion program, RSGT received eight (8) new Yard Cranes and 12 new sets of Terminal Tractors / Trailers. During the year, the terminal also enhanced its refrigerated container handling capacity by increasing the number of reefer plugs 2.400. Further, to eliminate cargo loss during customs examination process, the terminal installed a temperature controlled cross-stuffing facility that can maintain temperature between -20 °C to +4 °C.
RSGT has been receiving new generation mega vessels, with a capacity of 19,000 TEUs and length of over 390 meters, making RSGT the home of mega vessels in Jeddah. The terminal has set new benchmarks for operational performance in the region; and continues to gain the trust and confidence of its customers, including recognition by the Saudi Ports Authority.
40
124
41
134
CraneProductivity
BerthProductivity
MOVES PER HOUR
2015 2016
6 7 9 6 6 6 8 6 6 5 8 4
6 5
7
10 11 11
8 9
10 11
13 12
02468
101214
JAN FEB MAR APR MAY JUN JUL AUG SEP OCT NOV DEC
MEGA VESSEL CALLS
2015 2016
677 599 546 479 587
347 378 431 506 505
321 400 413 535 462
0
400
800
1200
1600
2012 2013 2014 2015 2016
TEUs '000
Export Import Transshipment
BOARD OF DIRECTORS REPORT 2016 15
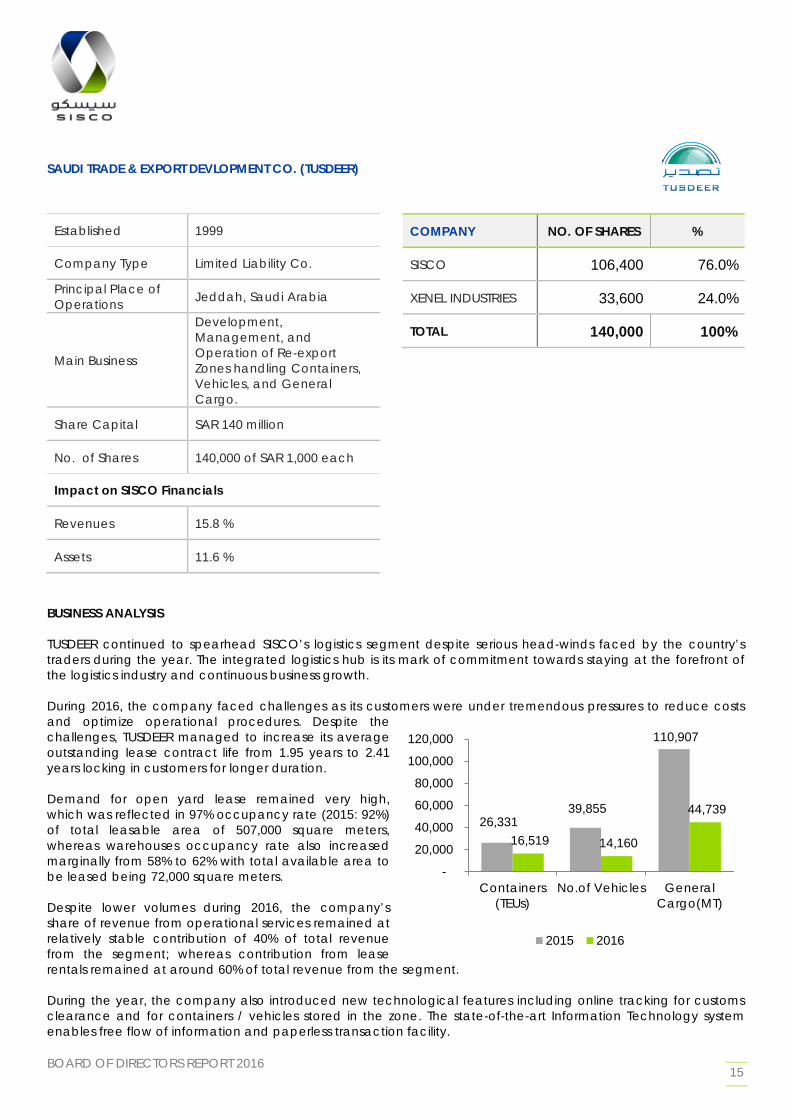
SAUDI TRADE & EXPORT DEVLOPMENT CO. (TUSDEER)
Established 1999
Company Type Limited Liability Co.
Principal Place of Operations Jeddah, Saudi Arabia
Main Business
Development, Management, and Operation of Re-export Zones handling Containers, Vehicles, and General Cargo.
Share Capital SAR 140 million
No. of Shares 140,000 of SAR 1,000 each
Impact on SISCO Financials
Revenues 15.8 %
Assets 11.6 %
COMPANY NO. OF SHARES %
SISCO 106,400 76.0%
XENEL INDUSTRIES 33,600 24.0%
TOTAL 140,000 100%
BUSINESS ANALYSIS TUSDEER continued to spearhead SISCO’s logistics segment despite serious head-winds faced by the country’s traders during the year. The integrated logistics hub is its mark of commitment towards staying at the forefront of the logistics industry and continuous business growth. During 2016, the company faced challenges as its customers were under tremendous pressures to reduce costs and optimize operational procedures. Despite the challenges, TUSDEER managed to increase its average outstanding lease contract life from 1.95 years to 2.41 years locking in customers for longer duration. Demand for open yard lease remained very high, which was reflected in 97% occupancy rate (2015: 92%) of total leasable area of 507,000 square meters, whereas warehouses occupancy rate also increased marginally from 58% to 62% with total available area to be leased being 72,000 square meters. Despite lower volumes during 2016, the company’s share of revenue from operational services remained at relatively stable contribution of 40% of total revenue from the segment; whereas contribution from lease rentals remained at around 60% of total revenue from the segment. During the year, the company also introduced new technological features including online tracking for customs clearance and for containers / vehicles stored in the zone. The state-of-the-art Information Technology system enables free flow of information and paperless transaction facility.
26,331 39,855
110,907
16,519 14,160
44,739
-
20,000
40,000
60,000
80,000
100,000
120,000
Containers(TEUs)
No.of Vehicles GeneralCargo(MT)
2015 2016
BOARD OF DIRECTORS REPORT 2016 16
SUPPORT SERVICES OPERATION COMPANY LIMITED (ISNAD)
Established 2004
Company Type Limited Liability Co.
Principal Place of Operations
Jeddah, Riyadh Saudi Arabia
Main Business
Logistics Operation Management and services including investing and developing logistics services hubs, logistics operations, and, logistics maintenance services.
Share Capital SAR 15 million
No. of Shares 15,000 of SAR 1,000 each
Impact on SISCO Financials
Revenues 0.2%
Assets 0.8%
COMPANY NO. OF SHARES %
SISCO 14,550 97.0%
TUSDEER 450 3.0%
TOTAL 15,000 100%
BUSINESS ANALYSIS ISNAD continues to transform its business model by increasing focus on providing logistics services, enhancing current associated logistics products, and developing new products and services. The company aims at being the leading logistics services support provider in the country. In addition to its activities in logistics operation management in port, ISNAD has expanded its profile to provide maintenance services to transportation companies by deploying professional mobile workshops.
BOARD OF DIRECTORS REPORT 2016 17
AL-JABR TALKE COMPANY LTD. (SA TALKE)
Established 2004
Company Type Limited Liability Co.
Principal Place of Operations Jubail, Saudi Arabia
Main Business Packaging, Material Handling, Distribution of Petro-chemical and / or Hazardous materials.
Share Capital SAR 12 million
No. of Shares 12,000 of SAR 10 each
Impact on SISCO Financials
S.A. TALKE is not a consolidated subsidiary of SISCO group; therefore there is no direct contribution towards SISCO’s Consolidated Assets or Revenues.
Revenues SAR 157.5 million
Assets SAR 106.8 million
COMPANY NO. OF SHARES %
SISCO 4,000 33.3%
TALKE Gmbh 4,000 33.3% AZMEEL CORP (AL-JABR GROUP) 4,000 33.3%
TOTAL 12,000 100%
BUSINESS ANALYSIS During the year, Company expanded its foot-print in Saudi Arabia with the acquisition of two major contracts in the Western Region with NATPET in Yanbu and Petro Rabigh in Rabigh. The Company’s improved commercial and operational performance has also reflected in better financial results, as the revenue increased by 3.7% to SAR 157.5 million, and asset base increased 20.4% reflecting management’s optimism for coming years.
BOARD OF DIRECTORS REPORT 2016 18
STORK TECHNICAL SERVICES SAUDI ARABIA LTD. (STS SAUDI)
Established 2014
Company Type Limited Liability Co.
Head Office Jubail, Saudi Arabia
Main Business
Maintenance and Operations of Industrial Plants including petro-chemical, water desalination, and power generation plants and providing related electro-mechanical services.
Share Capital SAR 20 million
No. of Shares 20,000 per SAR 1,000
Impact on SISCO Financials
STS SAUDI is not a consolidated subsidiary of SISCO group; therefore there is no direct contribution towards SISCO’s Consolidated Assets or Revenues.
Revenues SAR 1,016 million
Assets SAR 9,205 million
COMPANY NO. OF SHARES %
SISCO 9,000 45.0% STORK TECHNICAL SERVICES HOLDING BV
11,000 55.0%
TOTAL 20,000 100.0%
BUSINESS ANALYSIS STS Saudi workshop facility is located in Jubail Industrial City. The workshop, which spans on 5,000 m2 plot with 2,700 m2 covered area, can provide rotating equipment services, pumps / boilers / valve services, clamp manufacturing, fabrication and machining, and gear repair services. In addition to that, STS Saudi also provides on-site inspection and management services of the machinery for a wide range of shut-down services.
During 2016 the company has been successfully in implementing some of projects, however due to the slowdown in the oil and petrochemicals market globally and locally, the company's business has been affected by this decline in its operational and financial results. The company's management is seeking to maintain its market share in light of the intense competition in this area and under these market conditions. SISCO is evaluating the overall performance of the company and re-assessing its strategy to continue this business.
BOARD OF DIRECTORS REPORT 2016 19
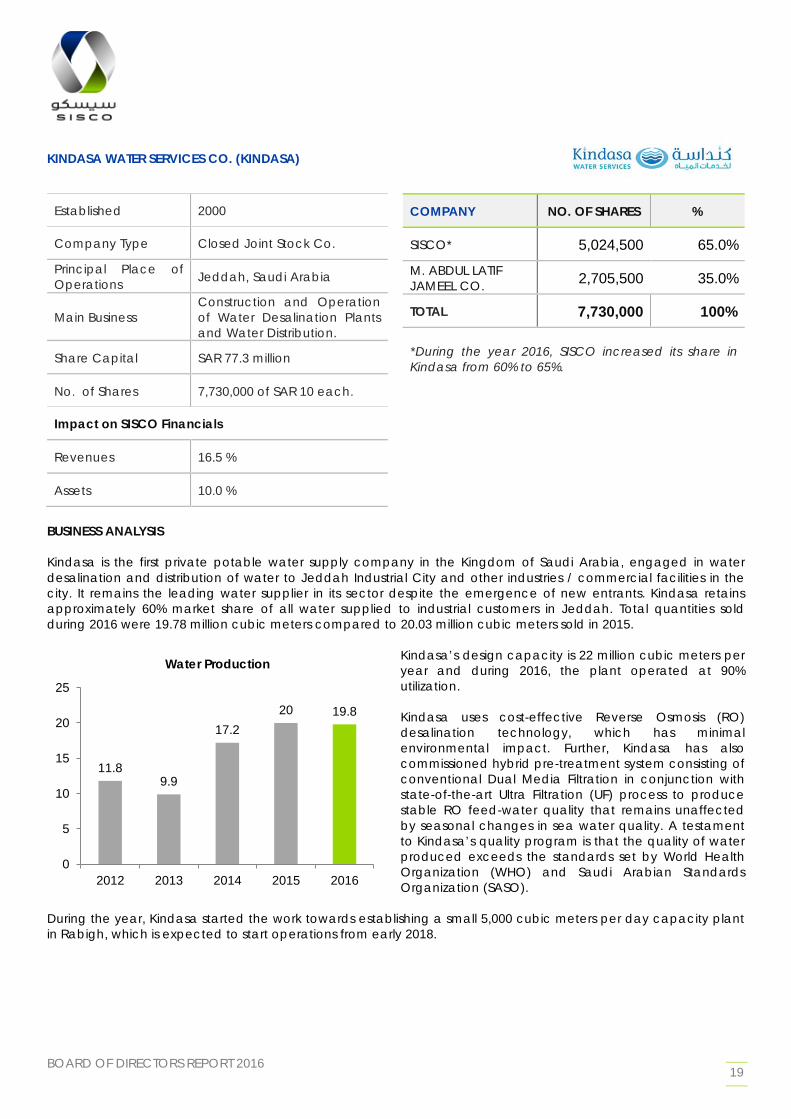
KINDASA WATER SERVICES CO. (KINDASA)
Established 2000
Company Type Closed Joint Stock Co.
Principal Place of Operations Jeddah, Saudi Arabia
Main Business Construction and Operation of Water Desalination Plants and Water Distribution.
Share Capital SAR 77.3 million
No. of Shares 7,730,000 of SAR 10 each.
Impact on SISCO Financials
Revenues 16.5 %
Assets 10.0 %
COMPANY NO. OF SHARES %
SISCO* 5,024,500 65.0% M. ABDUL LATIF JAMEEL CO. 2,705,500 35.0%
TOTAL 7,730,000 100%
*During the year 2016, SISCO increased its share in Kindasa from 60% to 65%.
BUSINESS ANALYSIS Kindasa is the first private potable water supply company in the Kingdom of Saudi Arabia, engaged in water desalination and distribution of water to Jeddah Industrial City and other industries / commercial facilities in the city. It remains the leading water supplier in its sector despite the emergence of new entrants. Kindasa retains approximately 60% market share of all water supplied to industrial customers in Jeddah. Total quantities sold during 2016 were 19.78 million cubic meters compared to 20.03 million cubic meters sold in 2015.
Kindasa’s design capacity is 22 million cubic meters per year and during 2016, the plant operated at 90% utilization. Kindasa uses cost-effective Reverse Osmosis (RO) desalination technology, which has minimal environmental impact. Further, Kindasa has also commissioned hybrid pre-treatment system consisting of conventional Dual Media Filtration in conjunction with state-of-the-art Ultra Filtration (UF) process to produce stable RO feed-water quality that remains unaffected by seasonal changes in sea water quality. A testament to Kindasa’s quality program is that the quality of water produced exceeds the standards set by World Health Organization (WHO) and Saudi Arabian Standards Organization (SASO).
During the year, Kindasa started the work towards establishing a small 5,000 cubic meters per day capacity plant in Rabigh, which is expected to start operations from early 2018.
11.8 9.9
17.2 20 19.8
0
5
10
15
20
25
2012 2013 2014 2015 2016
Water Production
BOARD OF DIRECTORS REPORT 2016 20
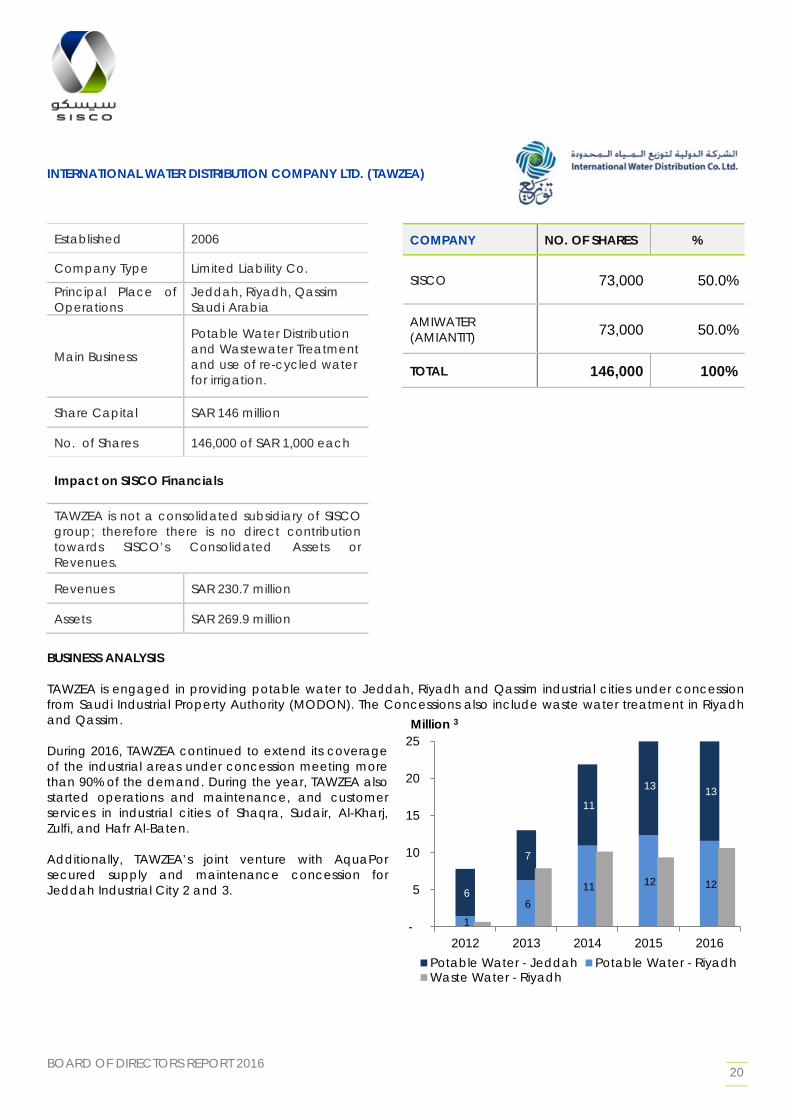
INTERNATIONAL WATER DISTRIBUTION COMPANY LTD. (TAWZEA)
Established 2006
Company Type Limited Liability Co.
Principal Place of Operations
Jeddah, Riyadh, Qassim Saudi Arabia
Main Business
Potable Water Distribution and Wastewater Treatment and use of re-cycled water for irrigation.
Share Capital SAR 146 million
No. of Shares 146,000 of SAR 1,000 each
Impact on SISCO Financials
TAWZEA is not a consolidated subsidiary of SISCO group; therefore there is no direct contribution towards SISCO’s Consolidated Assets or Revenues.
Revenues SAR 230.7 million
Assets SAR 269.9 million
COMPANY NO. OF SHARES %
SISCO 73,000 50.0%
AMIWATER (AMIANTIT) 73,000 50.0%
TOTAL 146,000 100%
BUSINESS ANALYSIS TAWZEA is engaged in providing potable water to Jeddah, Riyadh and Qassim industrial cities under concession from Saudi Industrial Property Authority (MODON). The Concessions also include waste water treatment in Riyadh and Qassim. During 2016, TAWZEA continued to extend its coverage of the industrial areas under concession meeting more than 90% of the demand. During the year, TAWZEA also started operations and maintenance, and customer services in industrial cities of Shaqra, Sudair, Al-Kharj, Zulfi, and Hafr Al-Baten. Additionally, TAWZEA’s joint venture with AquaPor secured supply and maintenance concession for Jeddah Industrial City 2 and 3.
1 6
11 12 12 6
7
11
13 13
-
5
10
15
20
25
2012 2013 2014 2015 2016
Million 3
Potable Water - Jeddah Potable Water - RiyadhWaste Water - Riyadh
BOARD OF DIRECTORS REPORT 2016 21
FINANCIAL REVIEW
BOARD OF DIRECTORS REPORT 2016 22
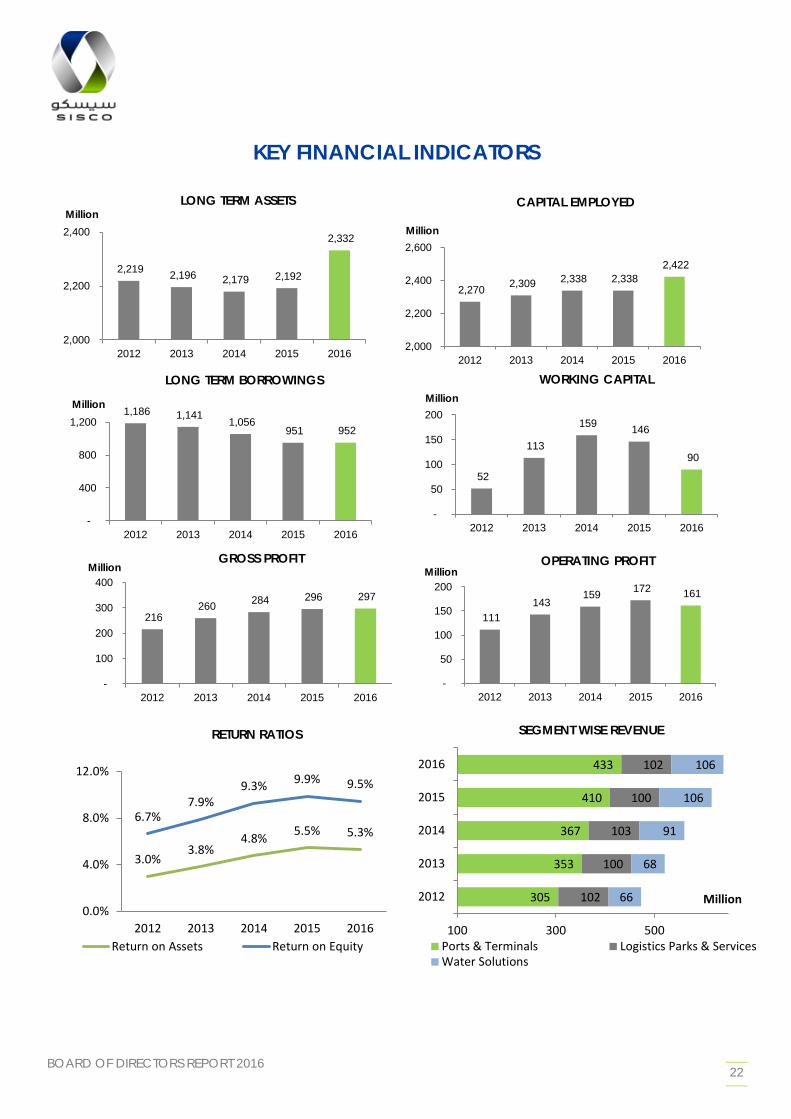
KEY FINANCIAL INDICATORS
2,219 2,196 2,179 2,192
2,332
2,000
2,200
2,400
2012 2013 2014 2015 2016
Million LONG TERM ASSETS
2,270 2,309 2,338 2,338 2,422
2,000
2,200
2,400
2,600
2012 2013 2014 2015 2016
Million
CAPITAL EMPLOYED
52
113
159 146
90
-
50
100
150
200
2012 2013 2014 2015 2016
Million WORKING CAPITAL
216 260 284 296 297
-
100
200
300
400
2012 2013 2014 2015 2016
Million GROSS PROFIT
111 143
159 172 161
-
50
100
150
200
2012 2013 2014 2015 2016
Million OPERATING PROFIT
305
353
367
410
433
102
100
103
100
102
66
68
91
106
106
100 300 500
2012
2013
2014
2015
2016
Million
SEGMENT WISE REVENUE
Ports & Terminals Logistics Parks & ServicesWater Solutions
1,186 1,141 1,056 951 952
-
400
800
1,200
2012 2013 2014 2015 2016
Million
LONG TERM BORROWINGS
3.0% 3.8%
4.8% 5.5% 5.3% 6.7%
7.9% 9.3% 9.9% 9.5%
0.0%
4.0%
8.0%
12.0%
2012 2013 2014 2015 2016
RETURN RATIOS
Return on Assets Return on Equity
BOARD OF DIRECTORS REPORT 2016 23
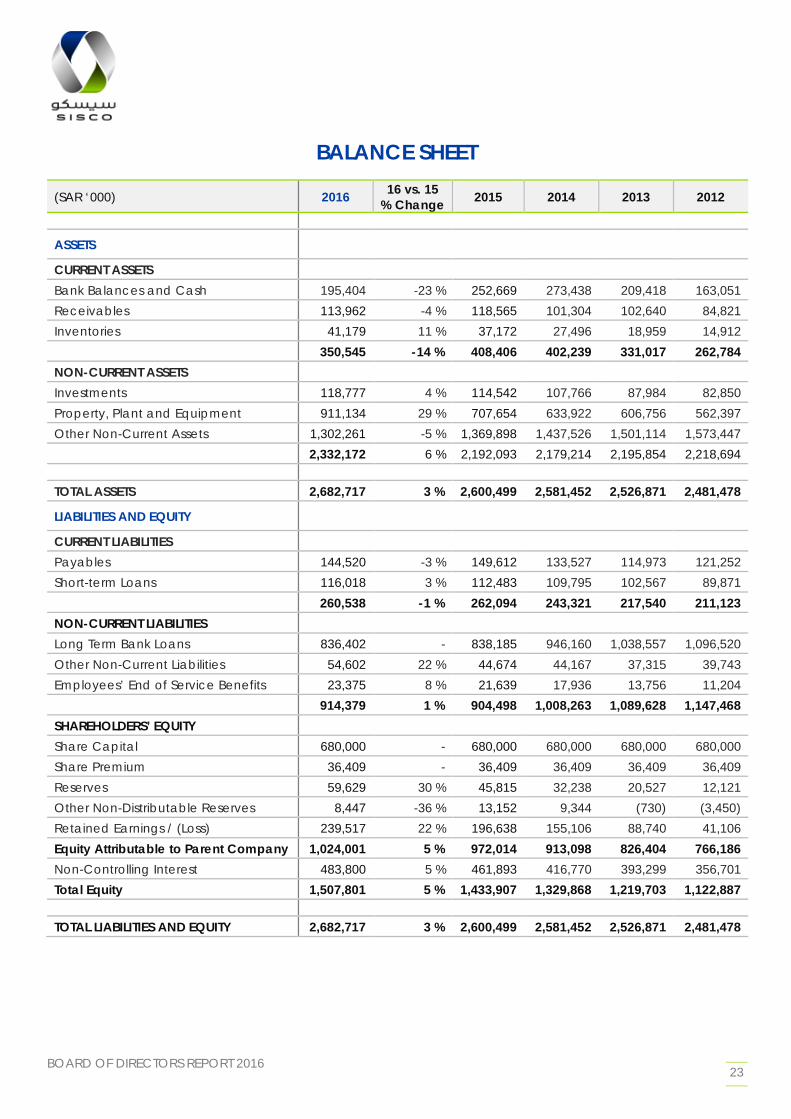
BALANCE SHEET
(SAR ‘000) 2016 16 vs. 15 % Change 2015 2014 2013 2012
ASSETS
CURRENT ASSETS Bank Balances and Cash 195,404 -23 % 252,669 273,438 209,418 163,051 Receivables 113,962 -4 % 118,565 101,304 102,640 84,821 Inventories 41,179 11 % 37,172 27,496 18,959 14,912 350,545 -14 % 408,406 402,239 331,017 262,784 NON-CURRENT ASSETS Investments 118,777 4 % 114,542 107,766 87,984 82,850 Property, Plant and Equipment 911,134 29 % 707,654 633,922 606,756 562,397 Other Non-Current Assets 1,302,261 -5 % 1,369,898 1,437,526 1,501,114 1,573,447 2,332,172 6 % 2,192,093 2,179,214 2,195,854 2,218,694 TOTAL ASSETS 2,682,717 3 % 2,600,499 2,581,452 2,526,871 2,481,478
LIABILITIES AND EQUITY
CURRENT LIABILITIES Payables 144,520 -3 % 149,612 133,527 114,973 121,252 Short-term Loans 116,018 3 % 112,483 109,795 102,567 89,871 260,538 -1 % 262,094 243,321 217,540 211,123 NON-CURRENT LIABILITIES Long Term Bank Loans 836,402 - 838,185 946,160 1,038,557 1,096,520 Other Non-Current Liabilities 54,602 22 % 44,674 44,167 37,315 39,743 Employees’ End of Service Benefits 23,375 8 % 21,639 17,936 13,756 11,204 914,379 1 % 904,498 1,008,263 1,089,628 1,147,468 SHAREHOLDERS’ EQUITY Share Capital 680,000 - 680,000 680,000 680,000 680,000 Share Premium 36,409 - 36,409 36,409 36,409 36,409 Reserves 59,629 30 % 45,815 32,238 20,527 12,121 Other Non-Distributable Reserves 8,447 -36 % 13,152 9,344 (730) (3,450) Retained Earnings / (Loss) 239,517 22 % 196,638 155,106 88,740 41,106 Equity Attributable to Parent Company 1,024,001 5 % 972,014 913,098 826,404 766,186 Non-Controlling Interest 483,800 5 % 461,893 416,770 393,299 356,701 Total Equity 1,507,801 5 % 1,433,907 1,329,868 1,219,703 1,122,887 TOTAL LIABILITIES AND EQUITY 2,682,717 3 % 2,600,499 2,581,452 2,526,871 2,481,478
BOARD OF DIRECTORS REPORT 2016 24
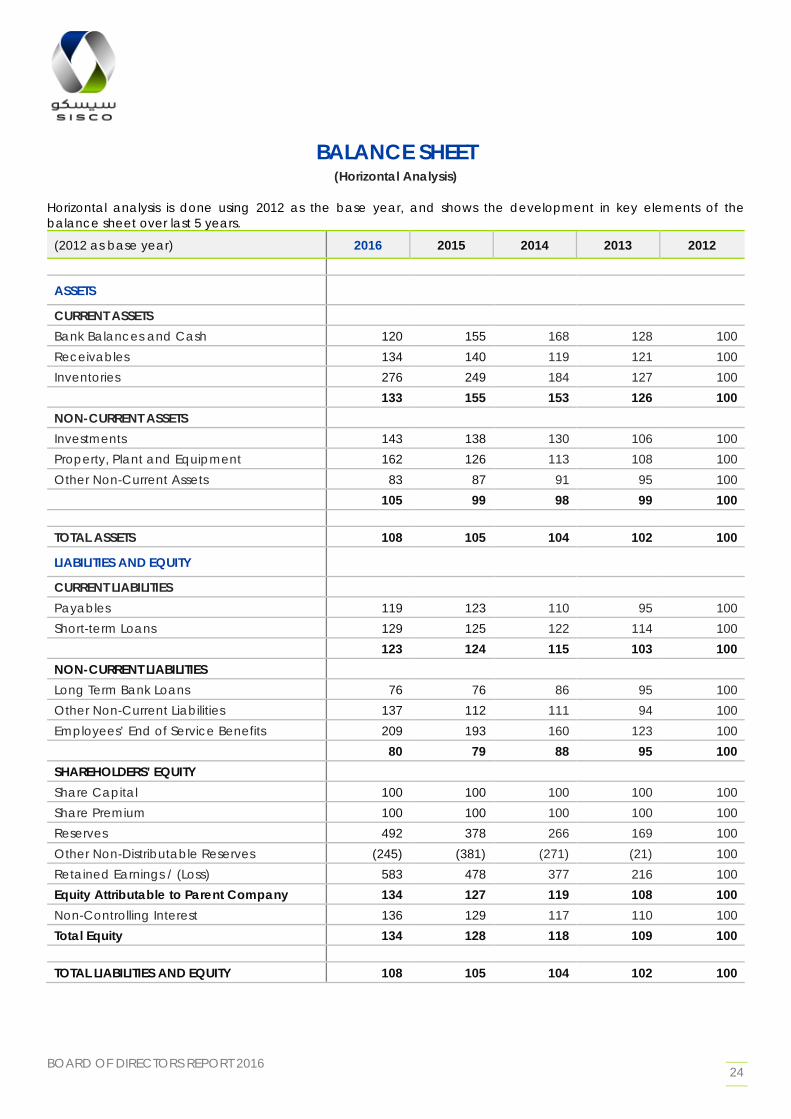
BALANCE SHEET (Horizontal Analysis)
Horizontal analysis is done using 2012 as the base year, and shows the development in key elements of the balance sheet over last 5 years.
(2012 as base year) 2016 2015 2014 2013 2012
ASSETS
CURRENT ASSETS Bank Balances and Cash 120 155 168 128 100 Receivables 134 140 119 121 100 Inventories 276 249 184 127 100 133 155 153 126 100 NON-CURRENT ASSETS Investments 143 138 130 106 100 Property, Plant and Equipment 162 126 113 108 100 Other Non-Current Assets 83 87 91 95 100 105 99 98 99 100 TOTAL ASSETS 108 105 104 102 100
LIABILITIES AND EQUITY
CURRENT LIABILITIES Payables 119 123 110 95 100 Short-term Loans 129 125 122 114 100 123 124 115 103 100 NON-CURRENT LIABILITIES Long Term Bank Loans 76 76 86 95 100 Other Non-Current Liabilities 137 112 111 94 100 Employees’ End of Service Benefits 209 193 160 123 100 80 79 88 95 100 SHAREHOLDERS’ EQUITY Share Capital 100 100 100 100 100 Share Premium 100 100 100 100 100 Reserves 492 378 266 169 100 Other Non-Distributable Reserves (245) (381) (271) (21) 100 Retained Earnings / (Loss) 583 478 377 216 100 Equity Attributable to Parent Company 134 127 119 108 100 Non-Controlling Interest 136 129 117 110 100 Total Equity 134 128 118 109 100 TOTAL LIABILITIES AND EQUITY 108 105 104 102 100
BOARD OF DIRECTORS REPORT 2016 25
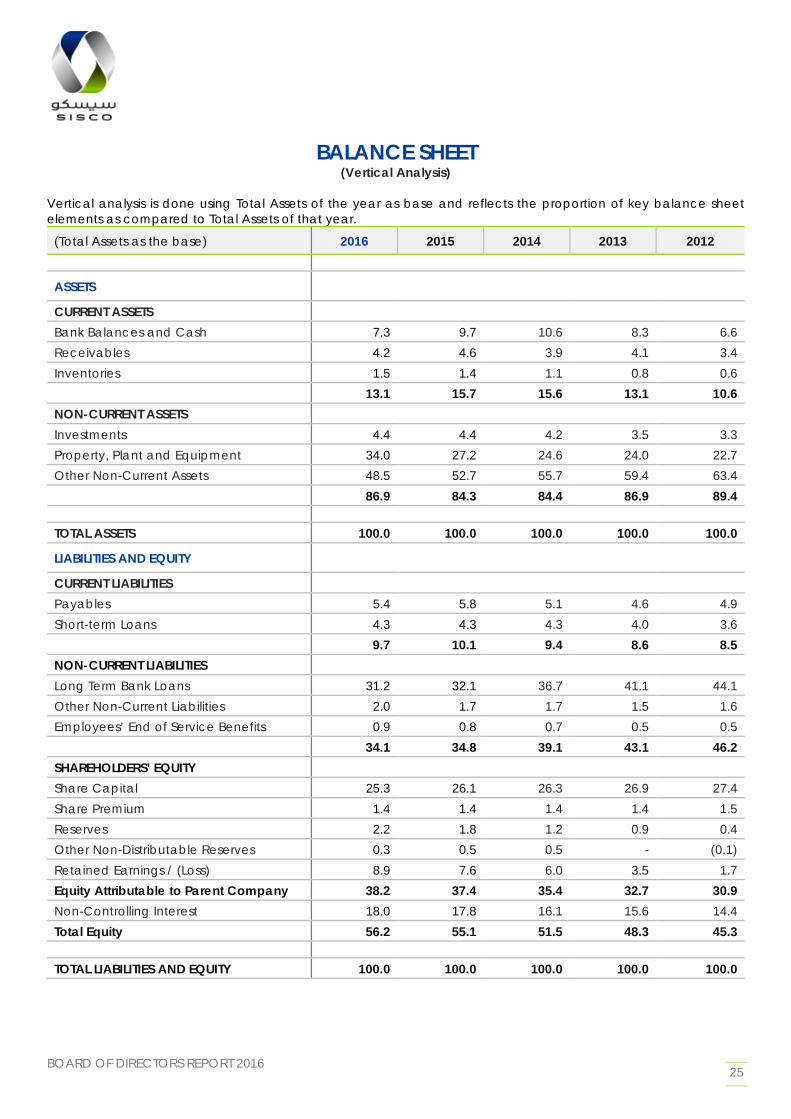
BALANCE SHEET (Vertical Analysis)
Vertical analysis is done using Total Assets of the year as base and reflects the proportion of key balance sheet elements as compared to Total Assets of that year.
(Total Assets as the base) 2016 2015 2014 2013 2012
ASSETS
CURRENT ASSETS Bank Balances and Cash 7.3 9.7 10.6 8.3 6.6 Receivables 4.2 4.6 3.9 4.1 3.4 Inventories 1.5 1.4 1.1 0.8 0.6 13.1 15.7 15.6 13.1 10.6 NON-CURRENT ASSETS Investments 4.4 4.4 4.2 3.5 3.3 Property, Plant and Equipment 34.0 27.2 24.6 24.0 22.7 Other Non-Current Assets 48.5 52.7 55.7 59.4 63.4 86.9 84.3 84.4 86.9 89.4 TOTAL ASSETS 100.0 100.0 100.0 100.0 100.0
LIABILITIES AND EQUITY
CURRENT LIABILITIES Payables 5.4 5.8 5.1 4.6 4.9 Short-term Loans 4.3 4.3 4.3 4.0 3.6 9.7 10.1 9.4 8.6 8.5 NON-CURRENT LIABILITIES Long Term Bank Loans 31.2 32.1 36.7 41.1 44.1 Other Non-Current Liabilities 2.0 1.7 1.7 1.5 1.6 Employees’ End of Service Benefits 0.9 0.8 0.7 0.5 0.5 34.1 34.8 39.1 43.1 46.2 SHAREHOLDERS’ EQUITY Share Capital 25.3 26.1 26.3 26.9 27.4 Share Premium 1.4 1.4 1.4 1.4 1.5 Reserves 2.2 1.8 1.2 0.9 0.4 Other Non-Distributable Reserves 0.3 0.5 0.5 - (0.1) Retained Earnings / (Loss) 8.9 7.6 6.0 3.5 1.7 Equity Attributable to Parent Company 38.2 37.4 35.4 32.7 30.9 Non-Controlling Interest 18.0 17.8 16.1 15.6 14.4 Total Equity 56.2 55.1 51.5 48.3 45.3 TOTAL LIABILITIES AND EQUITY 100.0 100.0 100.0 100.0 100.0
BOARD OF DIRECTORS REPORT 2016 26
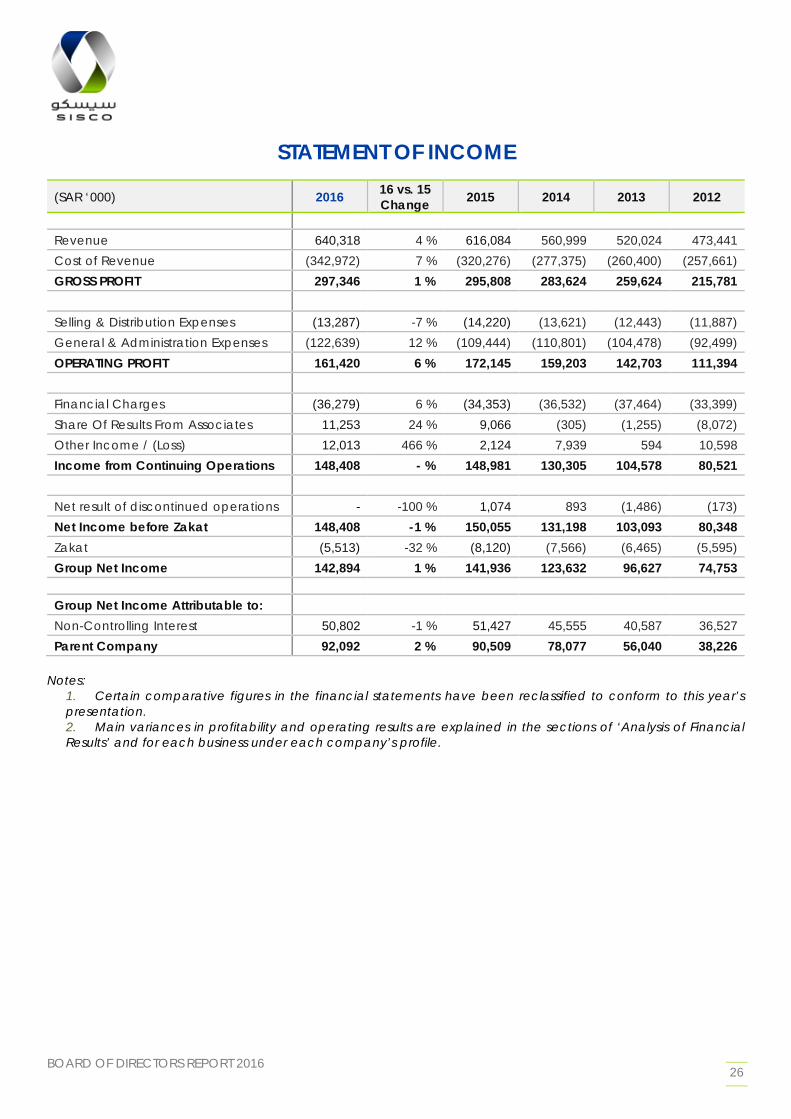
STATEMENT OF INCOME
(SAR ‘000) 2016 16 vs. 15 Change 2015 2014 2013 2012
Revenue 640,318 4 % 616,084 560,999 520,024 473,441 Cost of Revenue (342,972) 7 % (320,276) (277,375) (260,400) (257,661) GROSS PROFIT 297,346 1 % 295,808 283,624 259,624 215,781 Selling & Distribution Expenses (13,287) -7 % (14,220) (13,621) (12,443) (11,887) General & Administration Expenses (122,639) 12 % (109,444) (110,801) (104,478) (92,499) OPERATING PROFIT 161,420 6 % 172,145 159,203 142,703 111,394 Financial Charges (36,279) 6 % (34,353) (36,532) (37,464) (33,399) Share Of Results From Associates 11,253 24 % 9,066 (305) (1,255) (8,072) Other Income / (Loss) 12,013 466 % 2,124 7,939 594 10,598 Income from Continuing Operations 148,408 - % 148,981 130,305 104,578 80,521 Net result of discontinued operations - -100 % 1,074 893 (1,486) (173) Net Income before Zakat 148,408 -1 % 150,055 131,198 103,093 80,348 Zakat (5,513) -32 % (8,120) (7,566) (6,465) (5,595) Group Net Income 142,894 1 % 141,936 123,632 96,627 74,753 Group Net Income Attributable to: Non-Controlling Interest 50,802 -1 % 51,427 45,555 40,587 36,527 Parent Company 92,092 2 % 90,509 78,077 56,040 38,226
Notes:
1. Certain comparative figures in the financial statements have been reclassified to conform to this year’s presentation. 2. Main variances in profitability and operating results are explained in the sections of ‘Analysis of Financial Results’ and for each business under each company’s profile.
BOARD OF DIRECTORS REPORT 2016 27
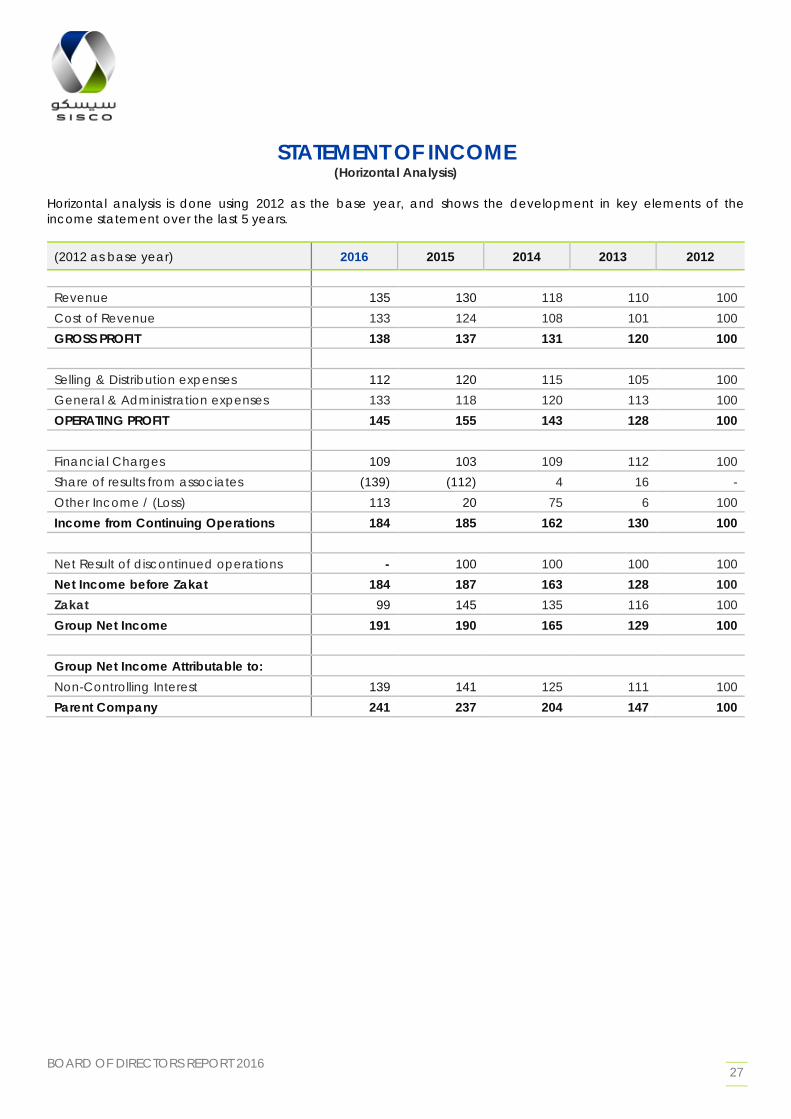
STATEMENT OF INCOME (Horizontal Analysis)
Horizontal analysis is done using 2012 as the base year, and shows the development in key elements of the income statement over the last 5 years.
(2012 as base year) 2016 2015 2014 2013 2012 Revenue 135 130 118 110 100 Cost of Revenue 133 124 108 101 100 GROSS PROFIT 138 137 131 120 100 Selling & Distribution expenses 112 120 115 105 100 General & Administration expenses 133 118 120 113 100 OPERATING PROFIT 145 155 143 128 100 Financial Charges 109 103 109 112 100 Share of results from associates (139) (112) 4 16 - Other Income / (Loss) 113 20 75 6 100 Income from Continuing Operations 184 185 162 130 100 Net Result of discontinued operations - 100 100 100 100 Net Income before Zakat 184 187 163 128 100 Zakat 99 145 135 116 100 Group Net Income 191 190 165 129 100 Group Net Income Attributable to: Non-Controlling Interest 139 141 125 111 100 Parent Company 241 237 204 147 100
BOARD OF DIRECTORS REPORT 2016 28
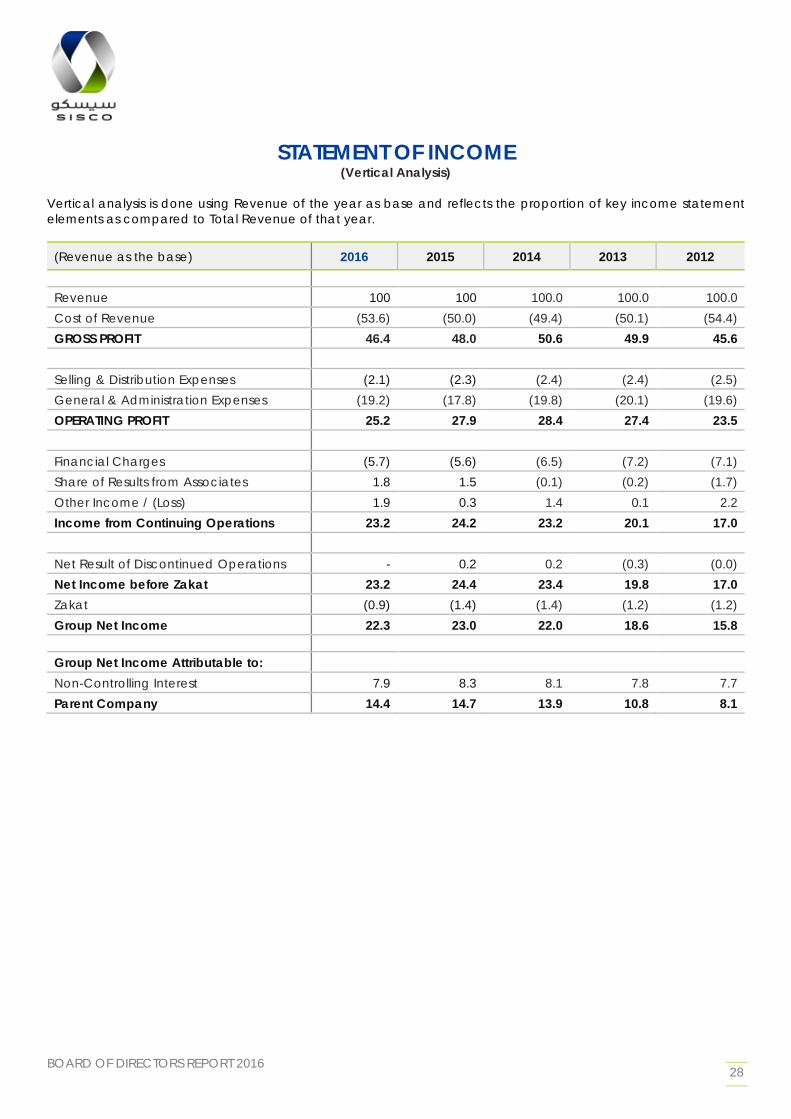
STATEMENT OF INCOME (Vertical Analysis)
Vertical analysis is done using Revenue of the year as base and reflects the proportion of key income statement elements as compared to Total Revenue of that year.
(Revenue as the base) 2016 2015 2014 2013 2012 Revenue 100 100 100.0 100.0 100.0 Cost of Revenue (53.6) (50.0) (49.4) (50.1) (54.4) GROSS PROFIT 46.4 48.0 50.6 49.9 45.6 Selling & Distribution Expenses (2.1) (2.3) (2.4) (2.4) (2.5) General & Administration Expenses (19.2) (17.8) (19.8) (20.1) (19.6) OPERATING PROFIT 25.2 27.9 28.4 27.4 23.5 Financial Charges (5.7) (5.6) (6.5) (7.2) (7.1) Share of Results from Associates 1.8 1.5 (0.1) (0.2) (1.7) Other Income / (Loss) 1.9 0.3 1.4 0.1 2.2 Income from Continuing Operations 23.2 24.2 23.2 20.1 17.0 Net Result of Discontinued Operations - 0.2 0.2 (0.3) (0.0) Net Income before Zakat 23.2 24.4 23.4 19.8 17.0 Zakat (0.9) (1.4) (1.4) (1.2) (1.2) Group Net Income 22.3 23.0 22.0 18.6 15.8 Group Net Income Attributable to: Non-Controlling Interest 7.9 8.3 8.1 7.8 7.7 Parent Company 14.4 14.7 13.9 10.8 8.1
BOARD OF DIRECTORS REPORT 2016 29
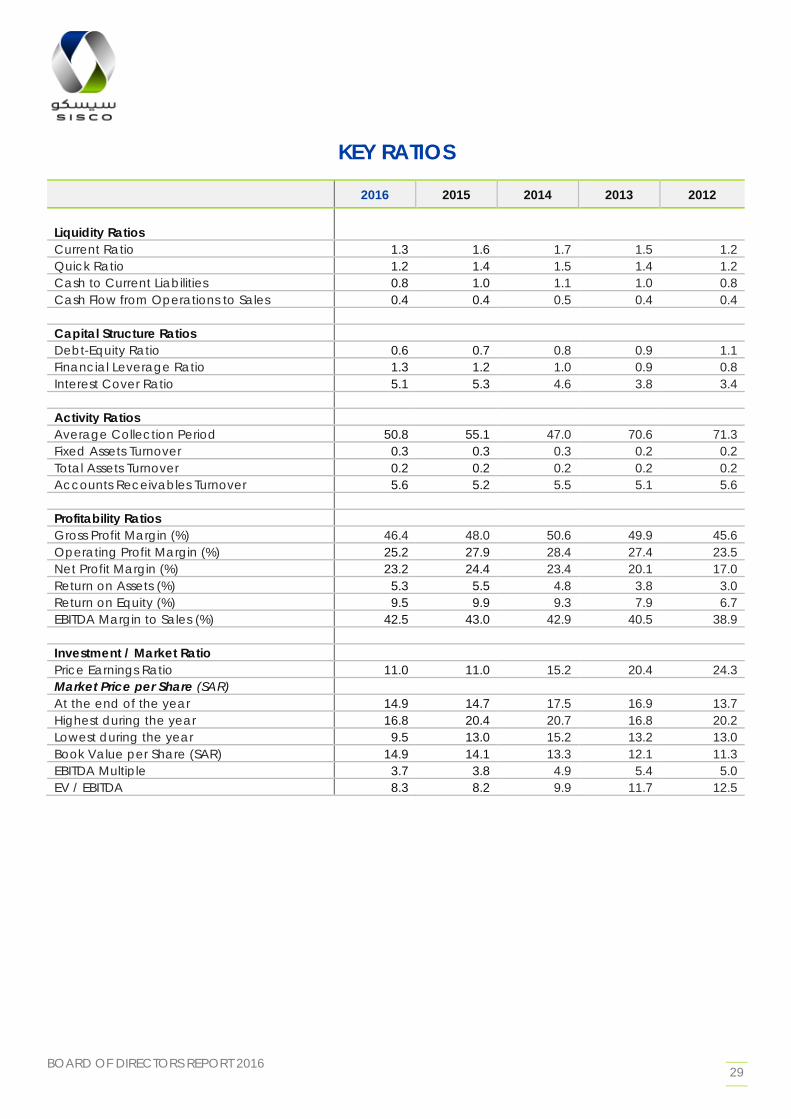
KEY RATIOS
2016 2015 2014 2013 2012 Liquidity Ratios
Current Ratio 1.3 1.6 1.7 1.5 1.2 Quick Ratio 1.2 1.4 1.5 1.4 1.2 Cash to Current Liabilities 0.8 1.0 1.1 1.0 0.8 Cash Flow from Operations to Sales 0.4 0.4 0.5 0.4 0.4 Capital Structure Ratios Debt-Equity Ratio 0.6 0.7 0.8 0.9 1.1 Financial Leverage Ratio 1.3 1.2 1.0 0.9 0.8 Interest Cover Ratio 5.1 5.3 4.6 3.8 3.4 Activity Ratios Average Collection Period 50.8 55.1 47.0 70.6 71.3 Fixed Assets Turnover 0.3 0.3 0.3 0.2 0.2 Total Assets Turnover 0.2 0.2 0.2 0.2 0.2 Accounts Receivables Turnover 5.6 5.2 5.5 5.1 5.6 Profitability Ratios Gross Profit Margin (%) 46.4 48.0 50.6 49.9 45.6 Operating Profit Margin (%) 25.2 27.9 28.4 27.4 23.5 Net Profit Margin (%) 23.2 24.4 23.4 20.1 17.0 Return on Assets (%) 5.3 5.5 4.8 3.8 3.0 Return on Equity (%) 9.5 9.9 9.3 7.9 6.7 EBITDA Margin to Sales (%) 42.5 43.0 42.9 40.5 38.9 Investment / Market Ratio Price Earnings Ratio 11.0 11.0 15.2 20.4 24.3 Market Price per Share (SAR) At the end of the year 14.9 14.7 17.5 16.9 13.7 Highest during the year 16.8 20.4 20.7 16.8 20.2 Lowest during the year 9.5 13.0 15.2 13.2 13.0 Book Value per Share (SAR) 14.9 14.1 13.3 12.1 11.3 EBITDA Multiple 3.7 3.8 4.9 5.4 5.0 EV / EBITDA 8.3 8.2 9.9 11.7 12.5
BOARD OF DIRECTORS REPORT 2016 30
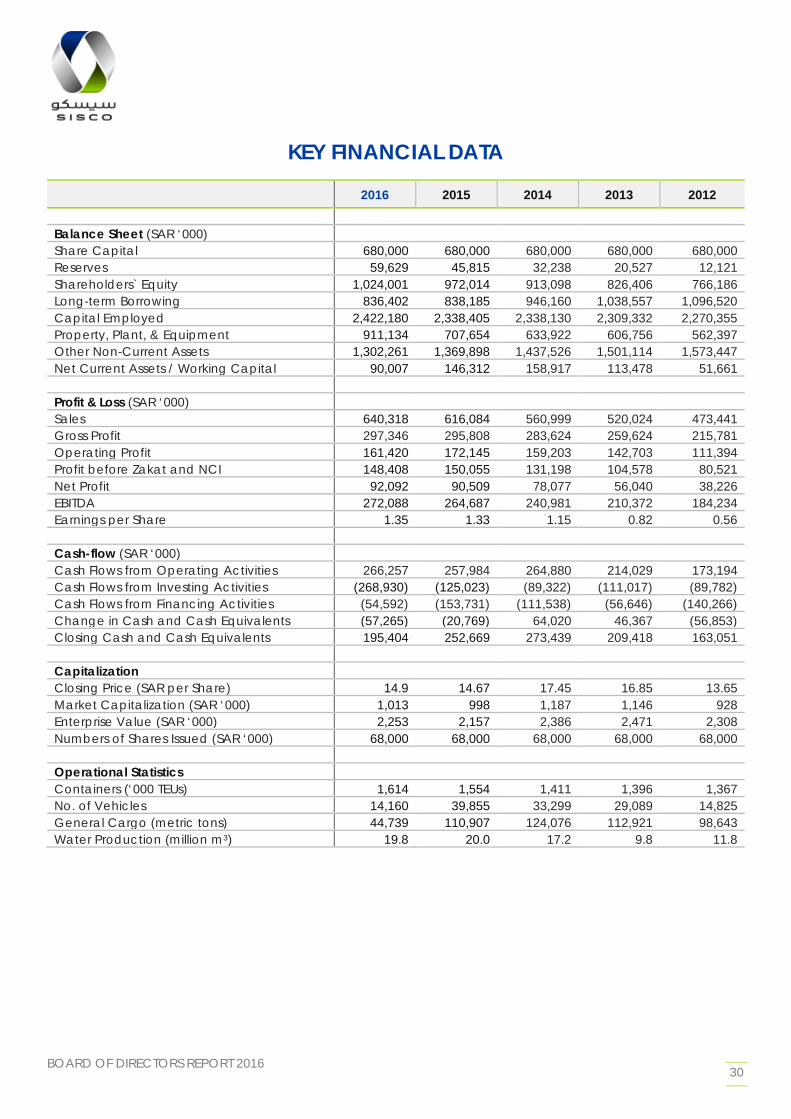
KEY FINANCIAL DATA
2016 2015 2014 2013 2012 Balance Sheet (SAR ‘000) Share Capital 680,000 680,000 680,000 680,000 680,000 Reserves 59,629 45,815 32,238 20,527 12,121 Shareholders` Equity 1,024,001 972,014 913,098 826,406 766,186 Long-term Borrowing 836,402 838,185 946,160 1,038,557 1,096,520 Capital Employed 2,422,180 2,338,405 2,338,130 2,309,332 2,270,355 Property, Plant, & Equipment 911,134 707,654 633,922 606,756 562,397 Other Non-Current Assets 1,302,261 1,369,898 1,437,526 1,501,114 1,573,447 Net Current Assets / Working Capital 90,007 146,312 158,917 113,478 51,661 Profit & Loss (SAR ‘000) Sales 640,318 616,084 560,999 520,024 473,441 Gross Profit 297,346 295,808 283,624 259,624 215,781 Operating Profit 161,420 172,145 159,203 142,703 111,394 Profit before Zakat and NCI 148,408 150,055 131,198 104,578 80,521 Net Profit 92,092 90,509 78,077 56,040 38,226 EBITDA 272,088 264,687 240,981 210,372 184,234 Earnings per Share 1.35 1.33 1.15 0.82 0.56 Cash-flow (SAR ‘000) Cash Flows from Operating Activities 266,257 257,984 264,880 214,029 173,194 Cash Flows from Investing Activities (268,930) (125,023) (89,322) (111,017) (89,782) Cash Flows from Financing Activities (54,592) (153,731) (111,538) (56,646) (140,266) Change in Cash and Cash Equivalents (57,265) (20,769) 64,020 46,367 (56,853) Closing Cash and Cash Equivalents 195,404 252,669 273,439 209,418 163,051 Capitalization Closing Price (SAR per Share) 14.9 14.67 17.45 16.85 13.65 Market Capitalization (SAR ‘000) 1,013 998 1,187 1,146 928 Enterprise Value (SAR ‘000) 2,253 2,157 2,386 2,471 2,308 Numbers of Shares Issued (SAR ‘000) 68,000 68,000 68,000 68,000 68,000 Operational Statistics Containers (‘000 TEUs) 1,614 1,554 1,411 1,396 1,367 No. of Vehicles 14,160 39,855 33,299 29,089 14,825 General Cargo (metric tons) 44,739 110,907 124,076 112,921 98,643 Water Production (million m3) 19.8 20.0 17.2 9.8 11.8
BOARD OF DIRECTORS REPORT 2016 31
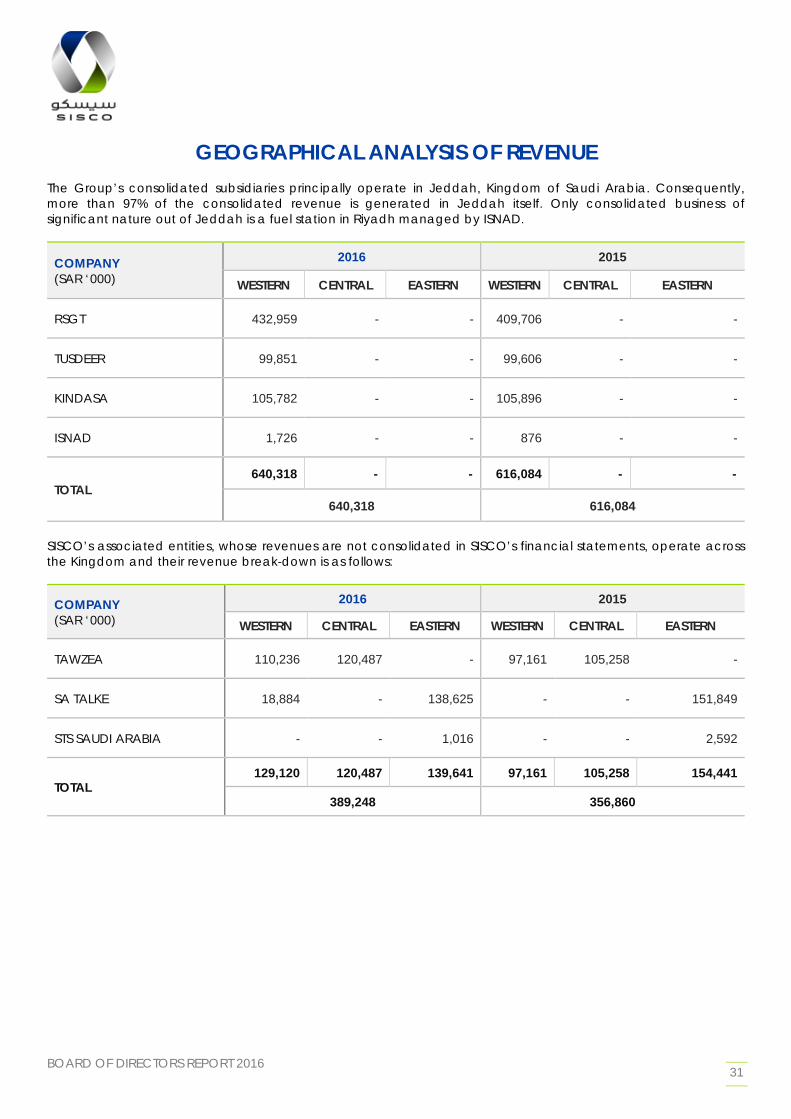
GEOGRAPHICAL ANALYSIS OF REVENUE The Group’s consolidated subsidiaries principally operate in Jeddah, Kingdom of Saudi Arabia. Consequently, more than 97% of the consolidated revenue is generated in Jeddah itself. Only consolidated business of significant nature out of Jeddah is a fuel station in Riyadh managed by ISNAD.
COMPANY (SAR ‘000)
2016 2015
WESTERN CENTRAL EASTERN WESTERN CENTRAL EASTERN
RSGT 432,959 - - 409,706 - -
TUSDEER 99,851 - - 99,606 - -
KINDASA 105,782 - - 105,896 - -
ISNAD 1,726 - - 876 - -
TOTAL 640,318 - - 616,084 - -
640,318 616,084
SISCO’s associated entities, whose revenues are not consolidated in SISCO’s financial statements, operate across the Kingdom and their revenue break-down is as follows:
COMPANY (SAR ‘000)
2016 2015
WESTERN CENTRAL EASTERN WESTERN CENTRAL EASTERN
TAWZEA 110,236 120,487 - 97,161 105,258 -
SA TALKE 18,884 - 138,625 - - 151,849
STS SAUDI ARABIA - - 1,016 - - 2,592
TOTAL 129,120 120,487 139,641 97,161 105,258 154,441
389,248 356,860
BOARD OF DIRECTORS REPORT 2016 32
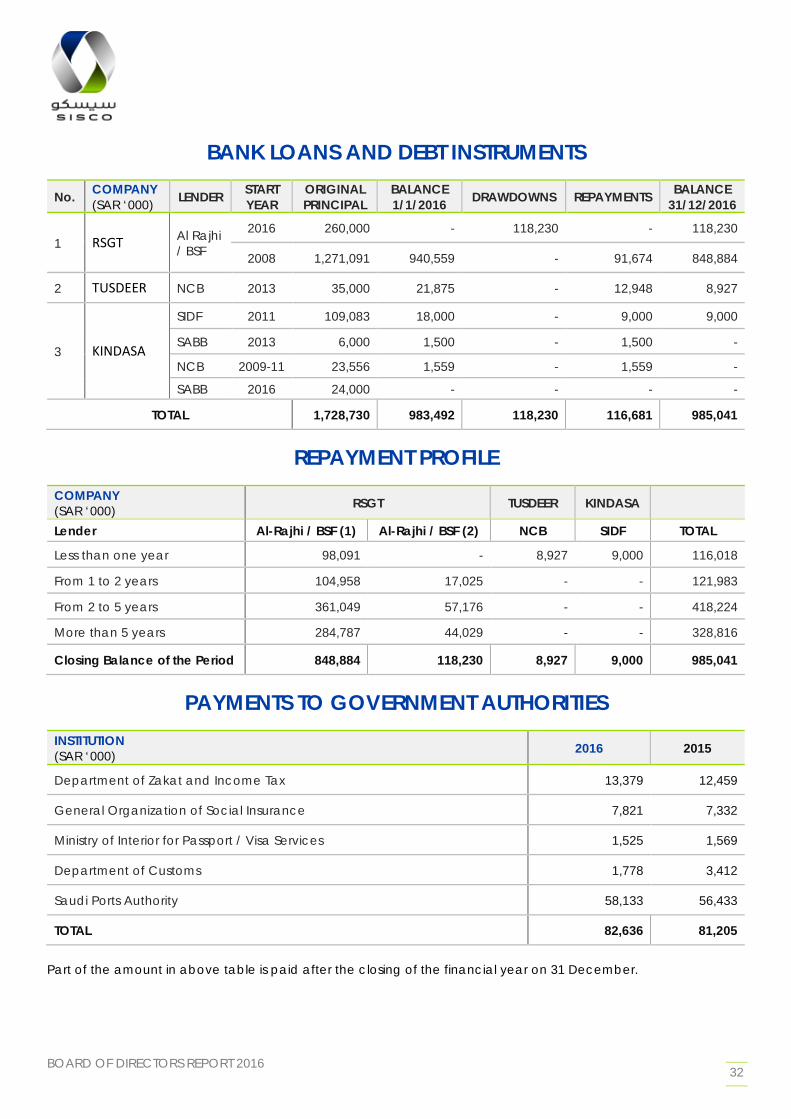
BANK LOANS AND DEBT INSTRUMENTS
No. COMPANY (SAR ‘000) LENDER START
YEAR ORIGINAL PRINCIPAL
BALANCE 1/1/2016 DRAWDOWNS REPAYMENTS BALANCE
31/12/2016
1 RSGT Al Rajhi / BSF
2016 260,000 - 118,230 - 118,230
2008 1,271,091 940,559 - 91,674 848,884
2 TUSDEER NCB 2013 35,000 21,875 - 12,948 8,927
3 KINDASA
SIDF 2011 109,083 18,000 - 9,000 9,000
SABB 2013 6,000 1,500 - 1,500 -
NCB 2009-11 23,556 1,559 - 1,559 -
SABB 2016 24,000 - - - -
TOTAL 1,728,730 983,492 118,230 116,681 985,041
REPAYMENT PROFILE
COMPANY (SAR ‘000) RSGT TUSDEER KINDASA
Lender Al-Rajhi / BSF (1) Al-Rajhi / BSF (2) NCB SIDF TOTAL
Less than one year 98,091 - 8,927 9,000 116,018
From 1 to 2 years 104,958 17,025 - - 121,983
From 2 to 5 years 361,049 57,176 - - 418,224
More than 5 years 284,787 44,029 - - 328,816
Closing Balance of the Period 848,884 118,230 8,927 9,000 985,041
PAYMENTS TO GOVERNMENT AUTHORITIES
INSTITUTION (SAR ‘000) 2016 2015
Department of Zakat and Income Tax 13,379 12,459
General Organization of Social Insurance 7,821 7,332
Ministry of Interior for Passport / Visa Services 1,525 1,569
Department of Customs 1,778 3,412
Saudi Ports Authority 58,133 56,433
TOTAL 82,636 81,205
Part of the amount in above table is paid after the closing of the financial year on 31 December.
BOARD OF DIRECTORS REPORT 2016 33
DIVIDEND POLICY The Company’s dividend policy is governed by Articles (40) and (41) of its Articles of Association. Article 40 mandates that the Company sets aside ten (10) percent of Net Profits after Zakat as statutory reserve and five (5) percent of Net Profits after Zakat as special reserve until each reserve reaches fifty (50) percent of the company’s paid up share capital. Thereafter, the remaining profits can be distributed as follows: 1. Equivalent of 5% of the company’s paid up share capital to the shareholders. 2. 10% of the remaining amount to the Board members as their remuneration. 3. Distribute the remaining to the shareholders with due consideration to business requirements. Article (41) authorizes the Board to fix the date and place for distribution of dividends. Once the cash dividend is approved by the shareholders, it is distributed accordingly after deducting the with-holding taxes on non-resident/foreign shareholders in accordance with applicable rules and regulations of General Authority of Zakat and Tax (GAZT).
BOARD OF DIRECTORS REPORT 2016 34
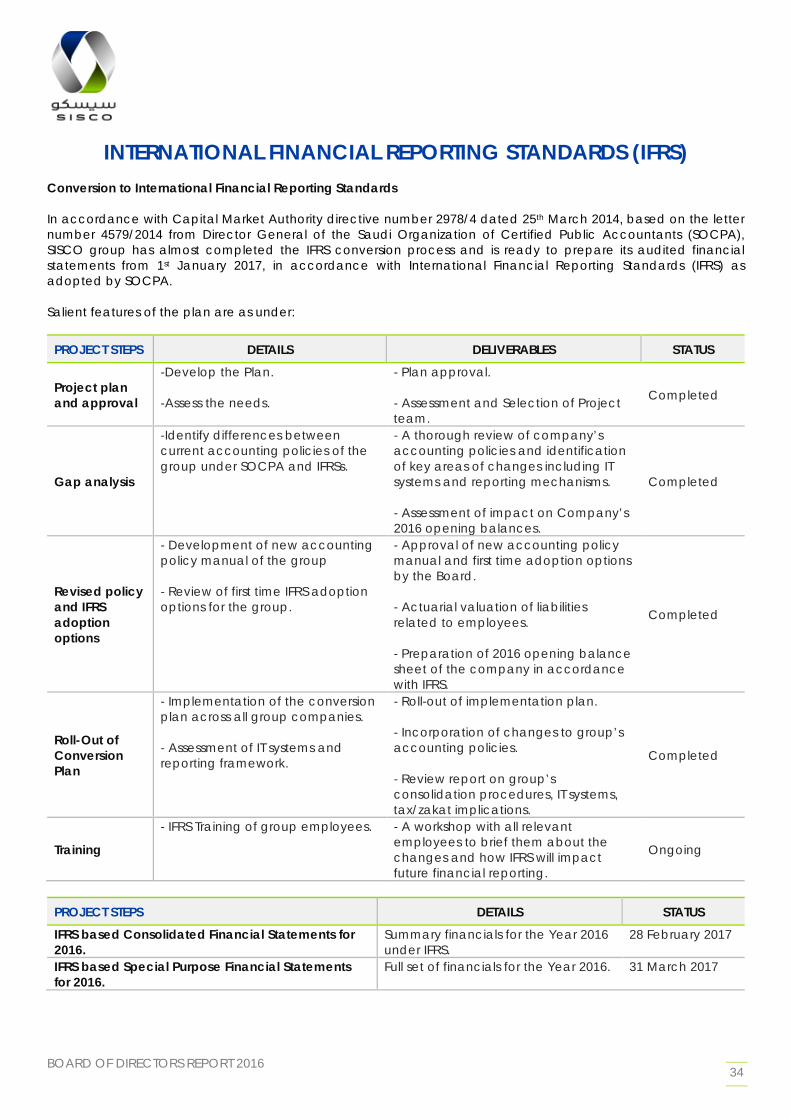
INTERNATIONAL FINANCIAL REPORTING STANDARDS (IFRS) Conversion to International Financial Reporting Standards In accordance with Capital Market Authority directive number 2978/4 dated 25th March 2014, based on the letter number 4579/2014 from Director General of the Saudi Organization of Certified Public Accountants (SOCPA), SISCO group has almost completed the IFRS conversion process and is ready to prepare its audited financial statements from 1st January 2017, in accordance with International Financial Reporting Standards (IFRS) as adopted by SOCPA. Salient features of the plan are as under:
PROJECT STEPS DETAILS DELIVERABLES STATUS
Project plan and approval
-Develop the Plan. -Assess the needs.
- Plan approval. - Assessment and Selection of Project team.
Completed
Gap analysis
-Identify differences between current accounting policies of the group under SOCPA and IFRSs.
- A thorough review of company’s accounting policies and identification of key areas of changes including IT systems and reporting mechanisms. - Assessment of impact on Company’s 2016 opening balances.
Completed
Revised policy and IFRS adoption options
- Development of new accounting policy manual of the group - Review of first time IFRS adoption options for the group.
- Approval of new accounting policy manual and first time adoption options by the Board. - Actuarial valuation of liabilities related to employees. - Preparation of 2016 opening balance sheet of the company in accordance with IFRS.
Completed
Roll-Out of Conversion Plan
- Implementation of the conversion plan across all group companies. - Assessment of IT systems and reporting framework.
- Roll-out of implementation plan. - Incorporation of changes to group’s accounting policies. - Review report on group’s consolidation procedures, IT systems, tax/zakat implications.
Completed
Training
- IFRS Training of group employees. - A workshop with all relevant employees to brief them about the changes and how IFRS will impact future financial reporting.
Ongoing
PROJECT STEPS DETAILS STATUS IFRS based Consolidated Financial Statements for 2016.
Summary financials for the Year 2016 under IFRS.
28 February 2017
IFRS based Special Purpose Financial Statements for 2016.
Full set of financials for the Year 2016. 31 March 2017
BOARD OF DIRECTORS REPORT 2016 35
MANAGEMENT FRAMEWORK
BOARD OF DIRECTORS REPORT 2016 36
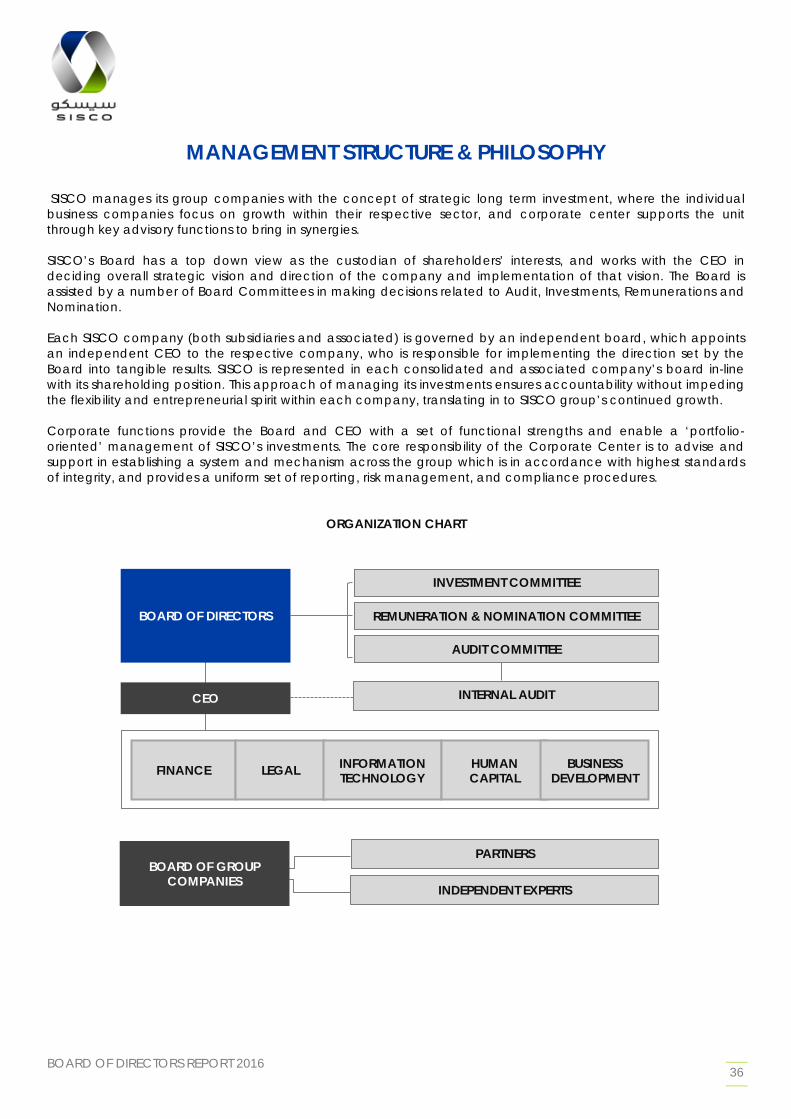
MANAGEMENT STRUCTURE & PHILOSOPHY
SISCO manages its group companies with the concept of strategic long term investment, where the individual business companies focus on growth within their respective sector, and corporate center supports the unit through key advisory functions to bring in synergies. SISCO’s Board has a top down view as the custodian of shareholders’ interests, and works with the CEO in deciding overall strategic vision and direction of the company and implementation of that vision. The Board is assisted by a number of Board Committees in making decisions related to Audit, Investments, Remunerations and Nomination. Each SISCO company (both subsidiaries and associated) is governed by an independent board, which appoints an independent CEO to the respective company, who is responsible for implementing the direction set by the Board into tangible results. SISCO is represented in each consolidated and associated company’s board in-line with its shareholding position. This approach of managing its investments ensures accountability without impeding the flexibility and entrepreneurial spirit within each company, translating in to SISCO group’s continued growth. Corporate functions provide the Board and CEO with a set of functional strengths and enable a ‘portfolio-oriented’ management of SISCO’s investments. The core responsibility of the Corporate Center is to advise and support in establishing a system and mechanism across the group which is in accordance with highest standards of integrity, and provides a uniform set of reporting, risk management, and compliance procedures.
ORGANIZATION CHART
PARTNERS
INDEPENDENT EXPERTS
BOARD OF GROUP COMPANIES
FINANCE LEGAL INFORMATION TECHNOLOGY
HUMAN CAPITAL
BUSINESS DEVELOPMENT
INVESTMENT COMMITTEE
REMUNERATION & NOMINATION COMMITTEE
AUDIT COMMITTEE
INTERNAL AUDIT
BOARD OF DIRECTORS
CEO
BOARD OF DIRECTORS REPORT 2016 37
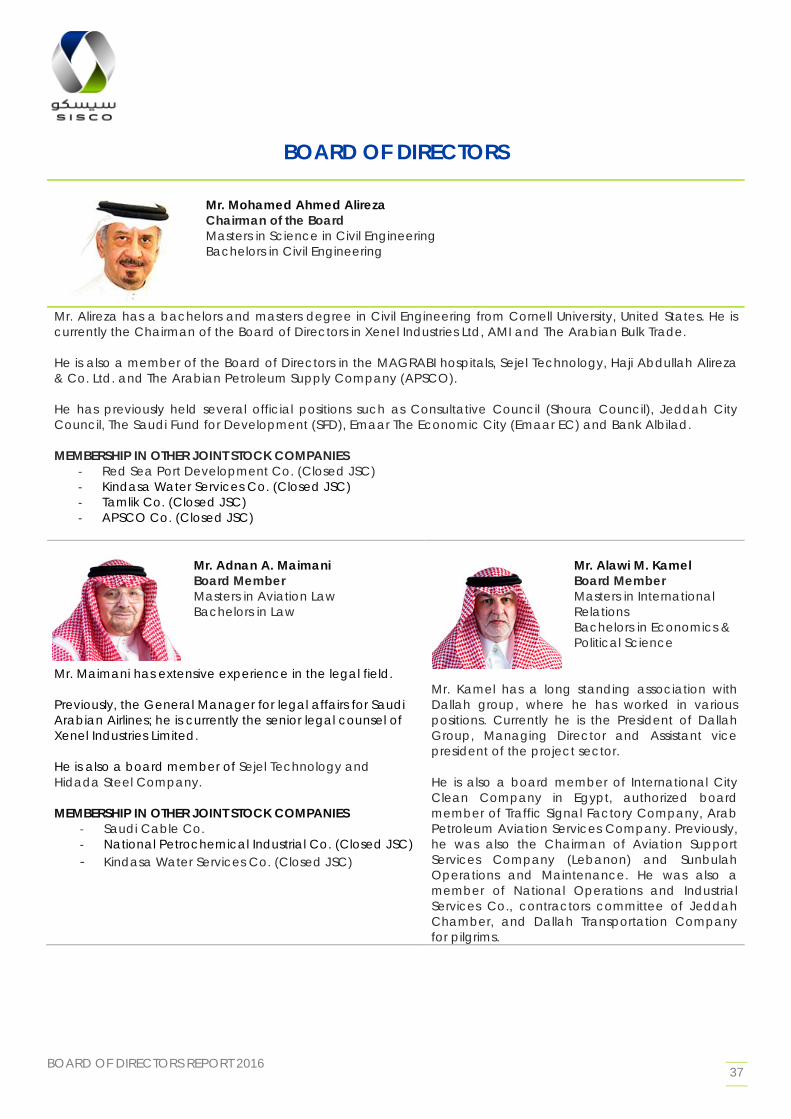
BOARD OF DIRECTORS
Mr. Mohamed Ahmed Alireza Chairman of the Board Masters in Science in Civil Engineering Bachelors in Civil Engineering
Mr. Alireza has a bachelors and masters degree in Civil Engineering from Cornell University, United States. He is currently the Chairman of the Board of Directors in Xenel Industries Ltd, AMI and The Arabian Bulk Trade. He is also a member of the Board of Directors in the MAGRABI hospitals, Sejel Technology, Haji Abdullah Alireza & Co. Ltd. and The Arabian Petroleum Supply Company (APSCO). He has previously held several official positions such as Consultative Council (Shoura Council), Jeddah City Council, The Saudi Fund for Development (SFD), Emaar The Economic City (Emaar EC) and Bank Albilad. MEMBERSHIP IN OTHER JOINT STOCK COMPANIES
- Red Sea Port Development Co. (Closed JSC) - Kindasa Water Services Co. (Closed JSC) - Tamlik Co. (Closed JSC) - APSCO Co. (Closed JSC)
Mr. Adnan A. Maimani Board Member Masters in Aviation Law Bachelors in Law
Mr. Maimani has extensive experience in the legal field. Previously, the General Manager for legal affairs for Saudi Arabian Airlines; he is currently the senior legal counsel of Xenel Industries Limited. He is also a board member of Sejel Technology and Hidada Steel Company. MEMBERSHIP IN OTHER JOINT STOCK COMPANIES
- Saudi Cable Co. - National Petrochemical Industrial Co. (Closed JSC) - Kindasa Water Services Co. (Closed JSC)
Mr. Alawi M. Kamel Board Member Masters in International Relations Bachelors in Economics & Political Science
Mr. Kamel has a long standing association with Dallah group, where he has worked in various positions. Currently he is the President of Dallah Group, Managing Director and Assistant vice president of the project sector. He is also a board member of International City Clean Company in Egypt, authorized board member of Traffic Signal Factory Company, Arab Petroleum Aviation Services Company. Previously, he was also the Chairman of Aviation Support Services Company (Lebanon) and Sunbulah Operations and Maintenance. He was also a member of National Operations and Industrial Services Co., contractors committee of Jeddah Chamber, and Dallah Transportation Company for pilgrims.
BOARD OF DIRECTORS REPORT 2016 38
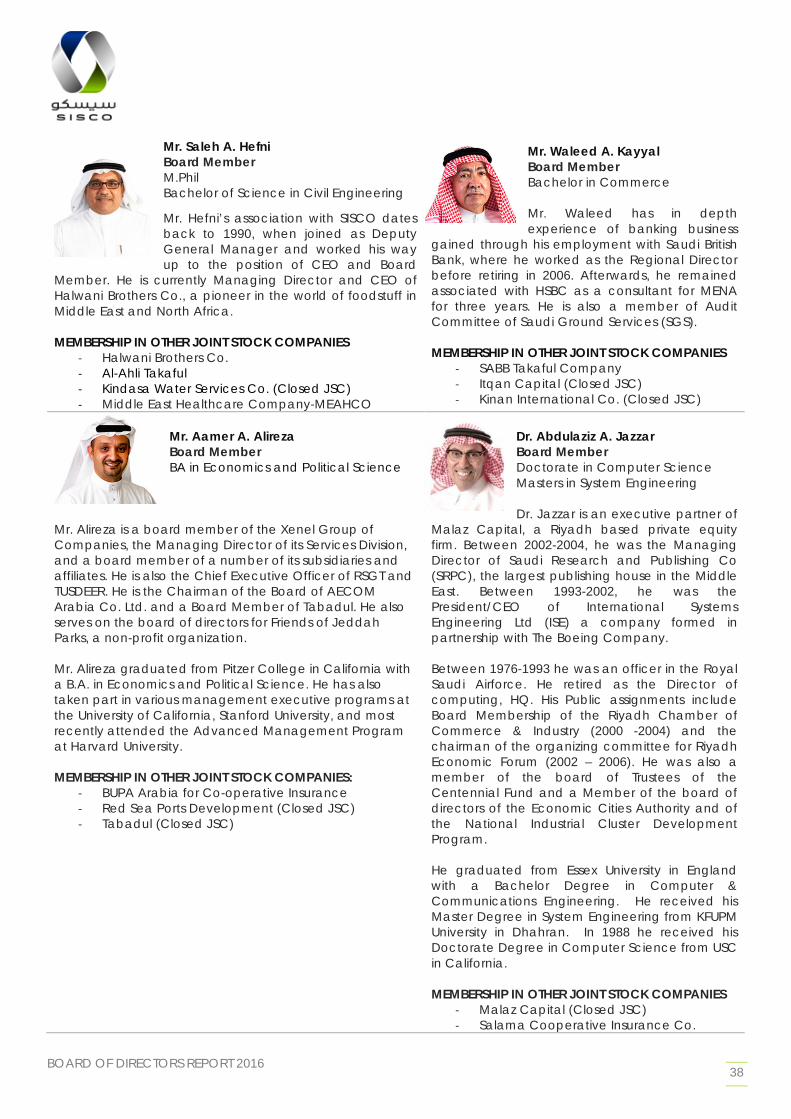
Mr. Saleh A. Hefni Board Member M.Phil Bachelor of Science in Civil Engineering
Mr. Hefni’s association with SISCO dates back to 1990, when joined as Deputy General Manager and worked his way up to the position of CEO and Board
Member. He is currently Managing Director and CEO of Halwani Brothers Co., a pioneer in the world of foodstuff in Middle East and North Africa. MEMBERSHIP IN OTHER JOINT STOCK COMPANIES
- Halwani Brothers Co. - Al-Ahli Takaful - Kindasa Water Services Co. (Closed JSC) - Middle East Healthcare Company-MEAHCO
Mr. Waleed A. Kayyal Board Member Bachelor in Commerce Mr. Waleed has in depth experience of banking business
gained through his employment with Saudi British Bank, where he worked as the Regional Director before retiring in 2006. Afterwards, he remained associated with HSBC as a consultant for MENA for three years. He is also a member of Audit Committee of Saudi Ground Services (SGS). MEMBERSHIP IN OTHER JOINT STOCK COMPANIES
- SABB Takaful Company - Itqan Capital (Closed JSC) - Kinan International Co. (Closed JSC)
Mr. Aamer A. Alireza Board Member BA in Economics and Political Science
Mr. Alireza is a board member of the Xenel Group of Companies, the Managing Director of its Services Division, and a board member of a number of its subsidiaries and affiliates. He is also the Chief Executive Officer of RSGT and TUSDEER. He is the Chairman of the Board of AECOM Arabia Co. Ltd. and a Board Member of Tabadul. He also serves on the board of directors for Friends of Jeddah Parks, a non-profit organization. Mr. Alireza graduated from Pitzer College in California with a B.A. in Economics and Political Science. He has also taken part in various management executive programs at the University of California, Stanford University, and most recently attended the Advanced Management Program at Harvard University. MEMBERSHIP IN OTHER JOINT STOCK COMPANIES:
- BUPA Arabia for Co-operative Insurance - Red Sea Ports Development (Closed JSC) - Tabadul (Closed JSC)
Dr. Abdulaziz A. Jazzar Board Member Doctorate in Computer Science Masters in System Engineering Dr. Jazzar is an executive partner of
Malaz Capital, a Riyadh based private equity firm. Between 2002-2004, he was the Managing Director of Saudi Research and Publishing Co (SRPC), the largest publishing house in the Middle East. Between 1993-2002, he was the President/CEO of International Systems Engineering Ltd (ISE) a company formed in partnership with The Boeing Company. Between 1976-1993 he was an officer in the Royal Saudi Airforce. He retired as the Director of computing, HQ. His Public assignments include Board Membership of the Riyadh Chamber of Commerce & Industry (2000 -2004) and the chairman of the organizing committee for Riyadh Economic Forum (2002 – 2006). He was also a member of the board of Trustees of the Centennial Fund and a Member of the board of directors of the Economic Cities Authority and of the National Industrial Cluster Development Program. He graduated from Essex University in England with a Bachelor Degree in Computer & Communications Engineering. He received his Master Degree in System Engineering from KFUPM University in Dhahran. In 1988 he received his Doctorate Degree in Computer Science from USC in California. MEMBERSHIP IN OTHER JOINT STOCK COMPANIES
- Malaz Capital (Closed JSC) - Salama Cooperative Insurance Co.
BOARD OF DIRECTORS REPORT 2016 39
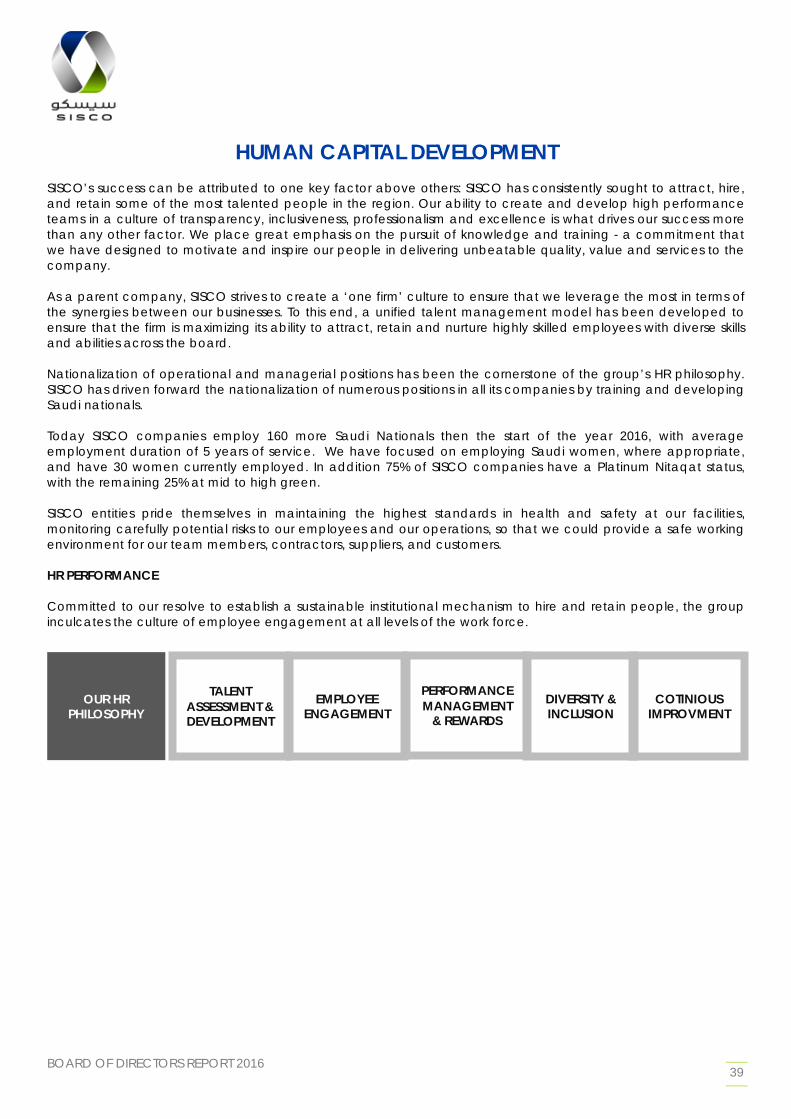
HUMAN CAPITAL DEVELOPMENT SISCO’s success can be attributed to one key factor above others: SISCO has consistently sought to attract, hire, and retain some of the most talented people in the region. Our ability to create and develop high performance teams in a culture of transparency, inclusiveness, professionalism and excellence is what drives our success more than any other factor. We place great emphasis on the pursuit of knowledge and training - a commitment that we have designed to motivate and inspire our people in delivering unbeatable quality, value and services to the company. As a parent company, SISCO strives to create a ‘one firm’ culture to ensure that we leverage the most in terms of the synergies between our businesses. To this end, a unified talent management model has been developed to ensure that the firm is maximizing its ability to attract, retain and nurture highly skilled employees with diverse skills and abilities across the board. Nationalization of operational and managerial positions has been the cornerstone of the group’s HR philosophy. SISCO has driven forward the nationalization of numerous positions in all its companies by training and developing Saudi nationals. Today SISCO companies employ 160 more Saudi Nationals then the start of the year 2016, with average employment duration of 5 years of service. We have focused on employing Saudi women, where appropriate, and have 30 women currently employed. In addition 75% of SISCO companies have a Platinum Nitaqat status, with the remaining 25% at mid to high green. SISCO entities pride themselves in maintaining the highest standards in health and safety at our facilities, monitoring carefully potential risks to our employees and our operations, so that we could provide a safe working environment for our team members, contractors, suppliers, and customers. HR PERFORMANCE Committed to our resolve to establish a sustainable institutional mechanism to hire and retain people, the group inculcates the culture of employee engagement at all levels of the work force.
TALENT ASSESSMENT & DEVELOPMENT
EMPLOYEE ENGAGEMENT
PERFORMANCE MANAGEMENT
& REWARDS DIVERSITY & INCLUSION
OUR HR PHILOSOPHY
COTINIOUS IMPROVMENT
BOARD OF DIRECTORS REPORT 2016 40
SISCO as a group of companies engaged in 809 man hours of training during 2016 and plan to significantly increase this number in 2017 by implementing the SISCO management development program, as well as continuing to run our industry specific training such as the Admiral program.
At SISCO we face an exciting and challenging time in the Kingdom, the 2030 vision positions SISCO in a very favorable place to be able to take advantage of a number of the government initiatives. As we prepare the group to be in the best position to benefit from the 2030 vision, and to best leverage the group position, we see an opportunity to grow and develop our future leaders and managers.
We have, at a group level, put together a program that would train and develop the future leaders and managers who have been identified as those who we want to retain and develop for our future expansion.
In achieving our goal of being the employer of choice, we recognize the importance of talent development and meet it through various managerial and skills-based training programs. Our port business launched The Admiral program, which aims at training talented Saudi graduates in the area of container terminal operations and prepare them for future managerial and leadership positions within the group.
BOARD OF DIRECTORS REPORT 2016 41
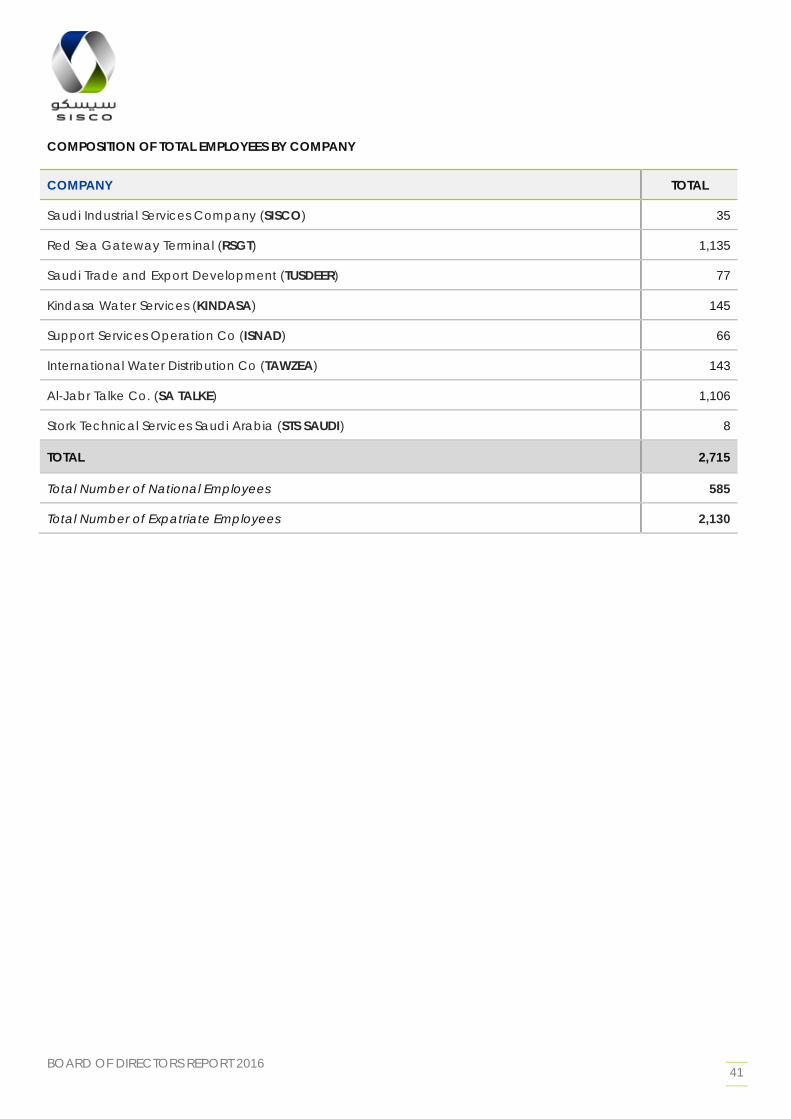
COMPOSITION OF TOTAL EMPLOYEES BY COMPANY
COMPANY TOTAL
Saudi Industrial Services Company (SISCO) 35
Red Sea Gateway Terminal (RSGT) 1,135
Saudi Trade and Export Development (TUSDEER) 77
Kindasa Water Services (KINDASA) 145
Support Services Operation Co (ISNAD) 66
International Water Distribution Co (TAWZEA) 143
Al-Jabr Talke Co. (SA TALKE) 1,106
Stork Technical Services Saudi Arabia (STS SAUDI) 8
TOTAL 2,715
Total Number of National Employees 585
Total Number of Expatriate Employees 2,130
BOARD OF DIRECTORS REPORT 2016 42
CORPORATE
GOVERNANCE
BOARD OF DIRECTORS REPORT 2016 43
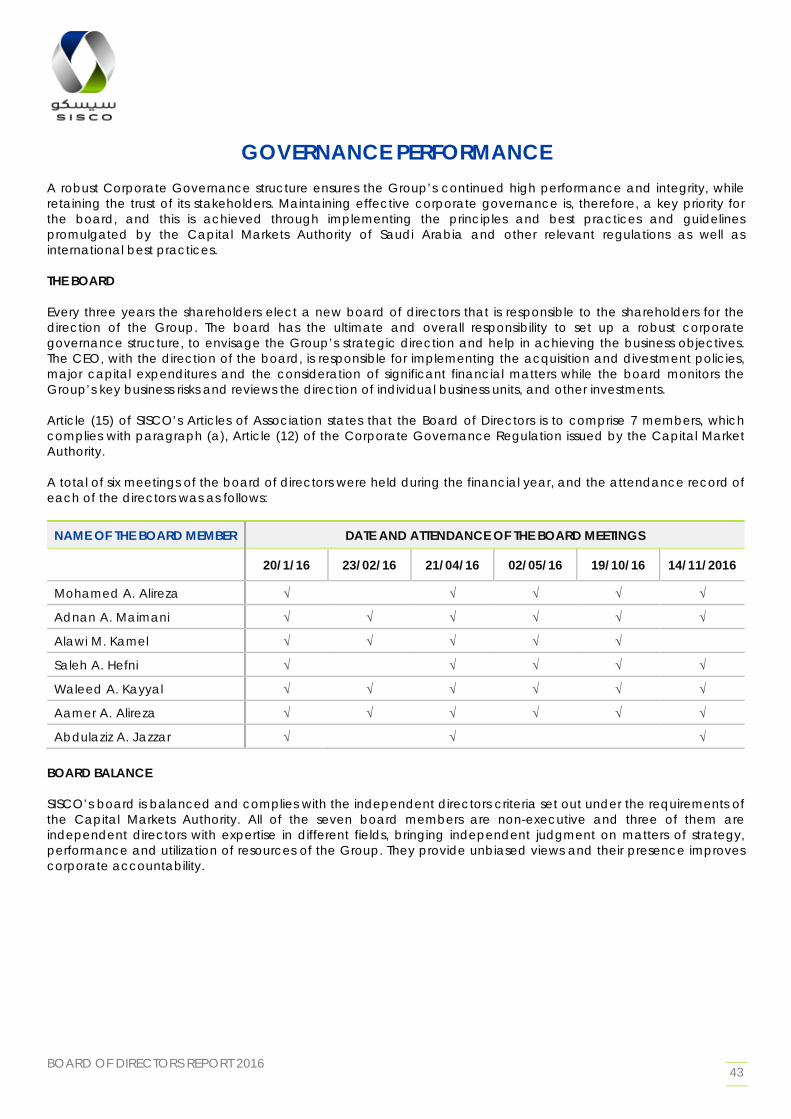
GOVERNANCE PERFORMANCE A robust Corporate Governance structure ensures the Group’s continued high performance and integrity, while retaining the trust of its stakeholders. Maintaining effective corporate governance is, therefore, a key priority for the board, and this is achieved through implementing the principles and best practices and guidelines promulgated by the Capital Markets Authority of Saudi Arabia and other relevant regulations as well as international best practices. THE BOARD Every three years the shareholders elect a new board of directors that is responsible to the shareholders for the direction of the Group. The board has the ultimate and overall responsibility to set up a robust corporate governance structure, to envisage the Group’s strategic direction and help in achieving the business objectives. The CEO, with the direction of the board, is responsible for implementing the acquisition and divestment policies, major capital expenditures and the consideration of significant financial matters while the board monitors the Group’s key business risks and reviews the direction of individual business units, and other investments. Article (15) of SISCO’s Articles of Association states that the Board of Directors is to comprise 7 members, which complies with paragraph (a), Article (12) of the Corporate Governance Regulation issued by the Capital Market Authority. A total of six meetings of the board of directors were held during the financial year, and the attendance record of each of the directors was as follows:
NAME OF THE BOARD MEMBER DATE AND ATTENDANCE OF THE BOARD MEETINGS
20/1/16 23/02/16 21/04/16 02/05/16 19/10/16 14/11/2016
Mohamed A. Alireza √ √ √ √ √
Adnan A. Maimani √ √ √ √ √ √
Alawi M. Kamel √ √ √ √ √
Saleh A. Hefni √ √ √ √ √
Waleed A. Kayyal √ √ √ √ √ √
Aamer A. Alireza √ √ √ √ √ √
Abdulaziz A. Jazzar √ √ √ BOARD BALANCE SISCO’s board is balanced and complies with the independent directors criteria set out under the requirements of the Capital Markets Authority. All of the seven board members are non-executive and three of them are independent directors with expertise in different fields, bringing independent judgment on matters of strategy, performance and utilization of resources of the Group. They provide unbiased views and their presence improves corporate accountability.
BOARD OF DIRECTORS REPORT 2016 44
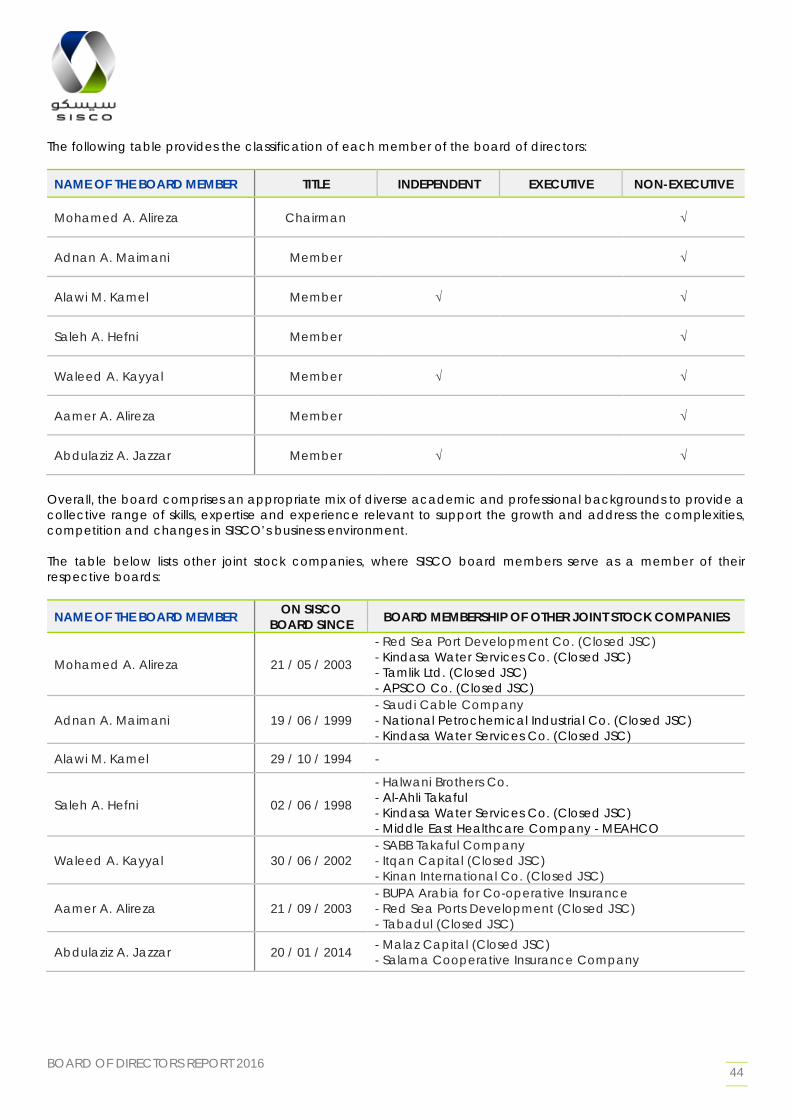
The following table provides the classification of each member of the board of directors:
NAME OF THE BOARD MEMBER TITLE INDEPENDENT EXECUTIVE NON-EXECUTIVE
Mohamed A. Alireza Chairman √
Adnan A. Maimani Member √
Alawi M. Kamel Member √ √
Saleh A. Hefni Member √
Waleed A. Kayyal Member √ √
Aamer A. Alireza Member √
Abdulaziz A. Jazzar Member √ √
Overall, the board comprises an appropriate mix of diverse academic and professional backgrounds to provide a collective range of skills, expertise and experience relevant to support the growth and address the complexities, competition and changes in SISCO’s business environment. The table below lists other joint stock companies, where SISCO board members serve as a member of their respective boards:
NAME OF THE BOARD MEMBER ON SISCO BOARD SINCE BOARD MEMBERSHIP OF OTHER JOINT STOCK COMPANIES
Mohamed A. Alireza 21 / 05 / 2003
- Red Sea Port Development Co. (Closed JSC) - Kindasa Water Services Co. (Closed JSC) - Tamlik Ltd. (Closed JSC) - APSCO Co. (Closed JSC)
Adnan A. Maimani 19 / 06 / 1999 - Saudi Cable Company - National Petrochemical Industrial Co. (Closed JSC) - Kindasa Water Services Co. (Closed JSC)
Alawi M. Kamel 29 / 10 / 1994 -
Saleh A. Hefni 02 / 06 / 1998
- Halwani Brothers Co. - Al-Ahli Takaful - Kindasa Water Services Co. (Closed JSC) - Middle East Healthcare Company - MEAHCO
Waleed A. Kayyal 30 / 06 / 2002 - SABB Takaful Company - Itqan Capital (Closed JSC) - Kinan International Co. (Closed JSC)
Aamer A. Alireza 21 / 09 / 2003 - BUPA Arabia for Co-operative Insurance - Red Sea Ports Development (Closed JSC) - Tabadul (Closed JSC)
Abdulaziz A. Jazzar 20 / 01 / 2014 - Malaz Capital (Closed JSC) - Salama Cooperative Insurance Company
BOARD OF DIRECTORS REPORT 2016 45
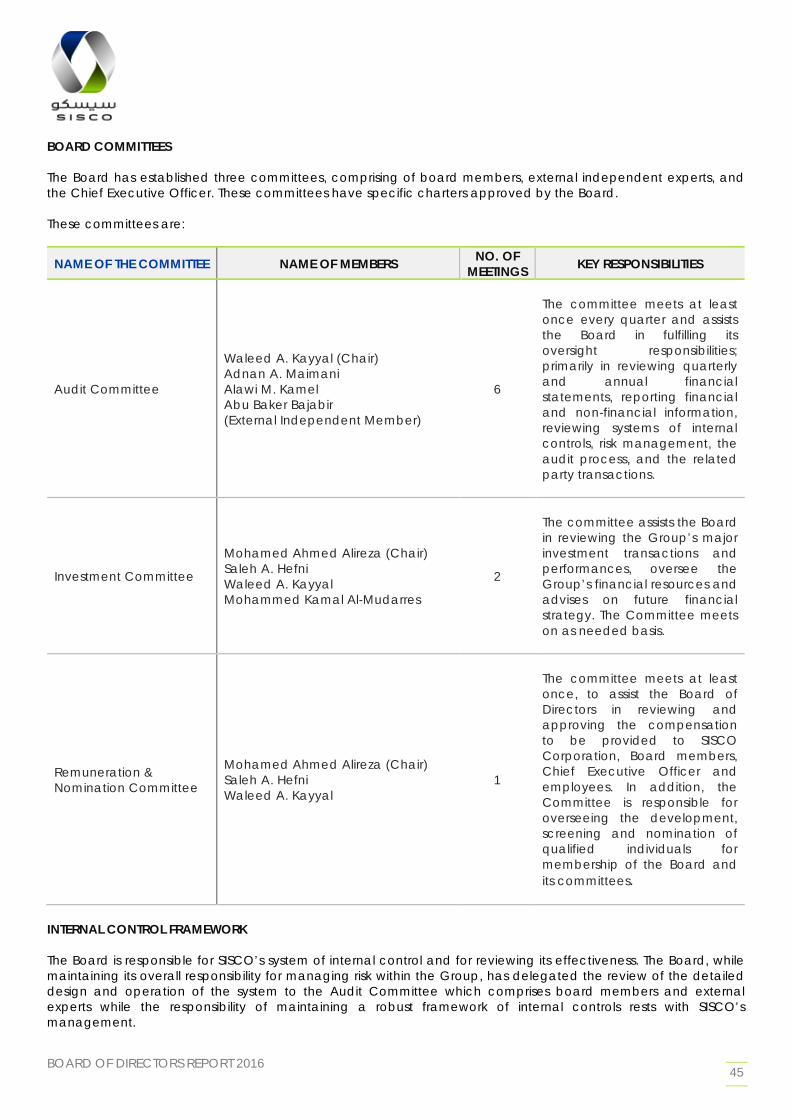
BOARD COMMITTEES The Board has established three committees, comprising of board members, external independent experts, and the Chief Executive Officer. These committees have specific charters approved by the Board. These committees are:
NAME OF THE COMMITTEE NAME OF MEMBERS NO. OF MEETINGS KEY RESPONSIBILITIES
Audit Committee
Waleed A. Kayyal (Chair) Adnan A. Maimani Alawi M. Kamel Abu Baker Bajabir (External Independent Member)
6
The committee meets at least once every quarter and assists the Board in fulfilling its oversight responsibilities; primarily in reviewing quarterly and annual financial statements, reporting financial and non-financial information, reviewing systems of internal controls, risk management, the audit process, and the related party transactions.
Investment Committee
Mohamed Ahmed Alireza (Chair) Saleh A. Hefni Waleed A. Kayyal Mohammed Kamal Al-Mudarres
2
The committee assists the Board in reviewing the Group’s major investment transactions and performances, oversee the Group’s financial resources and advises on future financial strategy. The Committee meets on as needed basis.
Remuneration & Nomination Committee
Mohamed Ahmed Alireza (Chair) Saleh A. Hefni Waleed A. Kayyal
1
The committee meets at least once, to assist the Board of Directors in reviewing and approving the compensation to be provided to SISCO Corporation, Board members, Chief Executive Officer and employees. In addition, the Committee is responsible for overseeing the development, screening and nomination of qualified individuals for membership of the Board and its committees.
INTERNAL CONTROL FRAMEWORK The Board is responsible for SISCO’s system of internal control and for reviewing its effectiveness. The Board, while maintaining its overall responsibility for managing risk within the Group, has delegated the review of the detailed design and operation of the system to the Audit Committee which comprises board members and external experts while the responsibility of maintaining a robust framework of internal controls rests with SISCO’s management.
BOARD OF DIRECTORS REPORT 2016 46
The Group maintains an effective internal control framework comprising clear structures, authority limits, accountabilities, well understood policies and procedures, and annual budgets. The Board meets regularly to consider SISCO’s financial performance, business growth and development plans, capital expenditure proposals and other key performance indicators. INTERNAL AUDIT FUNCTION The Audit Committee annually reviews the appropriateness of resources and capabilities of the internal audit function. The Chief Audit Executive functionally reports to the Audit Committee. The Audit Committee approves the annual audit plan, based on an annual risk assessment. The internal audit function undertakes audit of financial, operational, and compliance controls, and reports the audit results to the Audit Committee. The boards of major subsidiaries have established their own audit committees with dedicated internal audit resources. SISCO monitors the functioning of their internal audit department by having its nominated members in the audit committees of those subsidiaries.
AUDIT COMMITTEE REPORT
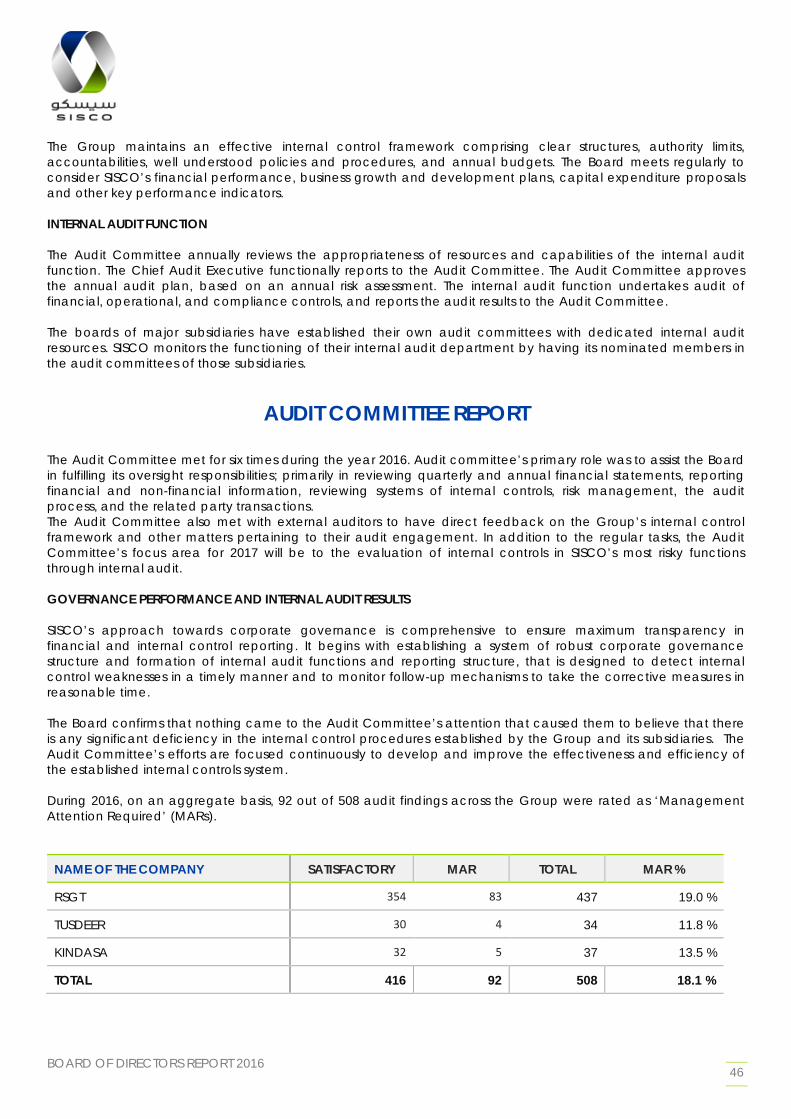
The Audit Committee met for six times during the year 2016. Audit committee’s primary role was to assist the Board in fulfilling its oversight responsibilities; primarily in reviewing quarterly and annual financial statements, reporting financial and non-financial information, reviewing systems of internal controls, risk management, the audit process, and the related party transactions. The Audit Committee also met with external auditors to have direct feedback on the Group’s internal control framework and other matters pertaining to their audit engagement. In addition to the regular tasks, the Audit Committee’s focus area for 2017 will be to the evaluation of internal controls in SISCO’s most risky functions through internal audit. GOVERNANCE PERFORMANCE AND INTERNAL AUDIT RESULTS SISCO’s approach towards corporate governance is comprehensive to ensure maximum transparency in financial and internal control reporting. It begins with establishing a system of robust corporate governance structure and formation of internal audit functions and reporting structure, that is designed to detect internal control weaknesses in a timely manner and to monitor follow-up mechanisms to take the corrective measures in reasonable time. The Board confirms that nothing came to the Audit Committee’s attention that caused them to believe that there is any significant deficiency in the internal control procedures established by the Group and its subsidiaries. The Audit Committee’s efforts are focused continuously to develop and improve the effectiveness and efficiency of the established internal controls system. During 2016, on an aggregate basis, 92 out of 508 audit findings across the Group were rated as ‘Management Attention Required’ (MARs).
NAME OF THE COMPANY SATISFACTORY MAR TOTAL MAR %
RSGT 354 83 437 19.0 %
TUSDEER 30 4 34 11.8 %
KINDASA 32 5 37 13.5 %
TOTAL 416 92 508 18.1 %
BOARD OF DIRECTORS REPORT 2016 47
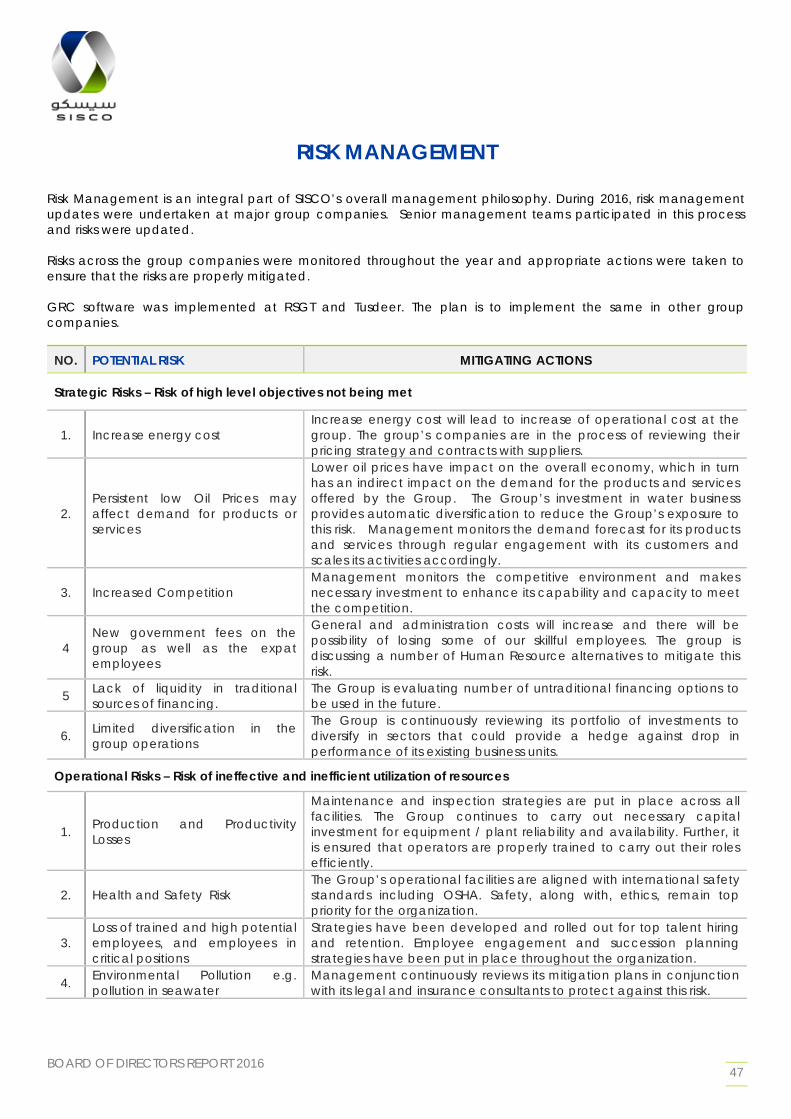
RISK MANAGEMENT
Risk Management is an integral part of SISCO’s overall management philosophy. During 2016, risk management updates were undertaken at major group companies. Senior management teams participated in this process and risks were updated. Risks across the group companies were monitored throughout the year and appropriate actions were taken to ensure that the risks are properly mitigated. GRC software was implemented at RSGT and Tusdeer. The plan is to implement the same in other group companies.
NO. POTENTIAL RISK MITIGATING ACTIONS
Strategic Risks – Risk of high level objectives not being met
1. Increase energy cost Increase energy cost will lead to increase of operational cost at the group. The group’s companies are in the process of reviewing their pricing strategy and contracts with suppliers.
2. Persistent low Oil Prices may affect demand for products or services
Lower oil prices have impact on the overall economy, which in turn has an indirect impact on the demand for the products and services offered by the Group. The Group’s investment in water business provides automatic diversification to reduce the Group’s exposure to this risk. Management monitors the demand forecast for its products and services through regular engagement with its customers and scales its activities accordingly.
3. Increased Competition Management monitors the competitive environment and makes necessary investment to enhance its capability and capacity to meet the competition.
4 New government fees on the group as well as the expat employees
General and administration costs will increase and there will be possibility of losing some of our skillful employees. The group is discussing a number of Human Resource alternatives to mitigate this risk.
5 Lack of liquidity in traditional sources of financing.
The Group is evaluating number of untraditional financing options to be used in the future.
6. Limited diversification in the group operations
The Group is continuously reviewing its portfolio of investments to diversify in sectors that could provide a hedge against drop in performance of its existing business units.
Operational Risks – Risk of ineffective and inefficient utilization of resources
1. Production and Productivity Losses
Maintenance and inspection strategies are put in place across all facilities. The Group continues to carry out necessary capital investment for equipment / plant reliability and availability. Further, it is ensured that operators are properly trained to carry out their roles efficiently.
2. Health and Safety Risk The Group’s operational facilities are aligned with international safety standards including OSHA. Safety, along with, ethics, remain top priority for the organization.
3. Loss of trained and high potential employees, and employees in critical positions
Strategies have been developed and rolled out for top talent hiring and retention. Employee engagement and succession planning strategies have been put in place throughout the organization.
4. Environmental Pollution e.g. pollution in seawater
Management continuously reviews its mitigation plans in conjunction with its legal and insurance consultants to protect against this risk.
BOARD OF DIRECTORS REPORT 2016 48
LIQUIDITY MANAGEMENT POLICY Cash liquidity is managed, controlled, and carried out in accordance with the policies approved by the Board after thorough debates within the Board. The purpose of the policies is to ensure that adequate cost-effective funding is available at all times and exposure to financial risk is minimized. The risks managed are liquidity risk, interest rate risk, and currency exchange rate risk. Derivative financial instruments like hedging strategies are applied to manage exposure to interest rate risk and currency risk. SISCO’s liquidity policy objectives include implementation of good business practices such as repayment of obligations on a timely basis that assist in building the image of the company for future funding requirements and meeting business commitments on a timely basis. Liquidity risk is mitigated by careful monitoring of cash flow needs, regular communication with our credit providers, and careful selection of financial strategies and appropriate financial partners.
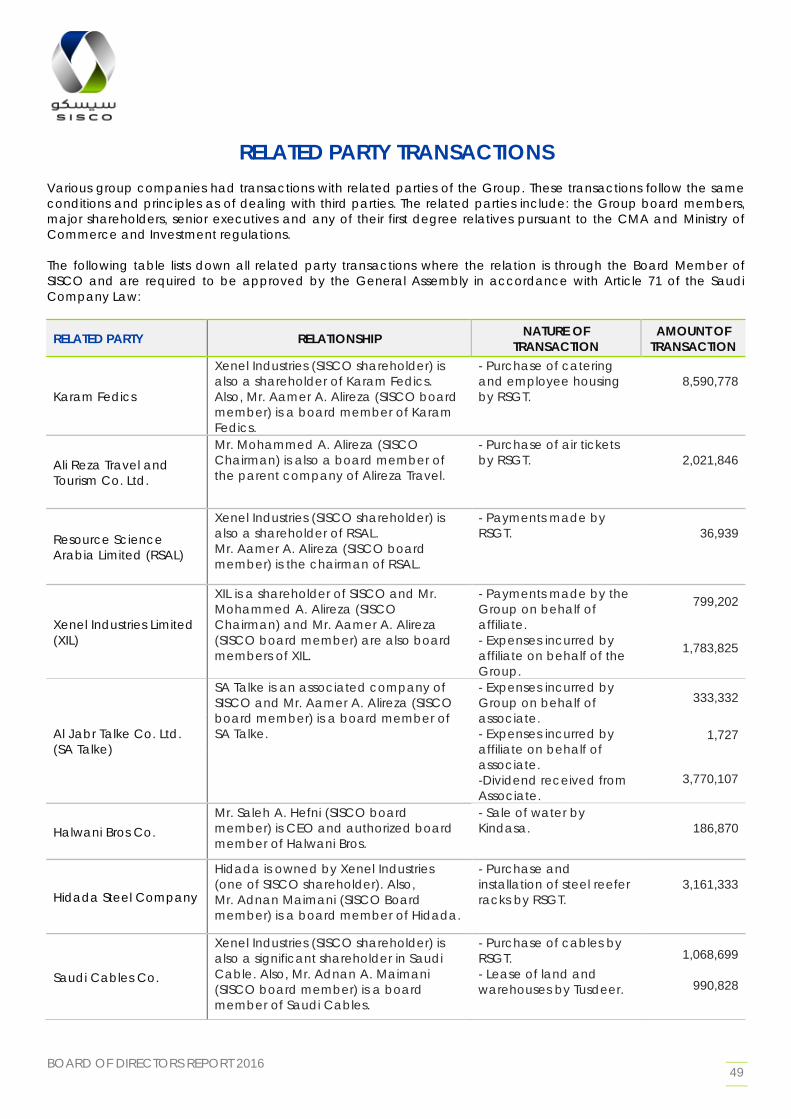
BOARD OF DIRECTORS REPORT 2016 49
RELATED PARTY TRANSACTIONS Various group companies had transactions with related parties of the Group. These transactions follow the same conditions and principles as of dealing with third parties. The related parties include: the Group board members, major shareholders, senior executives and any of their first degree relatives pursuant to the CMA and Ministry of Commerce and Investment regulations. The following table lists down all related party transactions where the relation is through the Board Member of SISCO and are required to be approved by the General Assembly in accordance with Article 71 of the Saudi Company Law:
RELATED PARTY RELATIONSHIP NATURE OF TRANSACTION
AMOUNT OF TRANSACTION
Karam Fedics
Xenel Industries (SISCO shareholder) is also a shareholder of Karam Fedics. Also, Mr. Aamer A. Alireza (SISCO board member) is a board member of Karam Fedics.
- Purchase of catering and employee housing by RSGT.
8,590,778
Ali Reza Travel and Tourism Co. Ltd.
Mr. Mohammed A. Alireza (SISCO Chairman) is also a board member of the parent company of Alireza Travel.
- Purchase of air tickets by RSGT.
2,021,846
Resource Science Arabia Limited (RSAL)
Xenel Industries (SISCO shareholder) is also a shareholder of RSAL. Mr. Aamer A. Alireza (SISCO board member) is the chairman of RSAL.
- Payments made by RSGT.
36,939
Xenel Industries Limited (XIL)
XIL is a shareholder of SISCO and Mr. Mohammed A. Alireza (SISCO Chairman) and Mr. Aamer A. Alireza (SISCO board member) are also board members of XIL.
- Payments made by the Group on behalf of affiliate. - Expenses incurred by affiliate on behalf of the Group.
799,202
1,783,825
Al Jabr Talke Co. Ltd. (SA Talke)
SA Talke is an associated company of SISCO and Mr. Aamer A. Alireza (SISCO board member) is a board member of SA Talke.
- Expenses incurred by Group on behalf of associate. - Expenses incurred by affiliate on behalf of associate. -Dividend received from Associate.
333,332
1,727
3,770,107
Halwani Bros Co. Mr. Saleh A. Hefni (SISCO board member) is CEO and authorized board member of Halwani Bros.
- Sale of water by Kindasa.
186,870
Hidada Steel Company
Hidada is owned by Xenel Industries (one of SISCO shareholder). Also, Mr. Adnan Maimani (SISCO Board member) is a board member of Hidada.
- Purchase and installation of steel reefer racks by RSGT.
3,161,333
Saudi Cables Co.
Xenel Industries (SISCO shareholder) is also a significant shareholder in Saudi Cable. Also, Mr. Adnan A. Maimani (SISCO board member) is a board member of Saudi Cables.
- Purchase of cables by RSGT. - Lease of land and warehouses by Tusdeer.
1,068,699
990,828
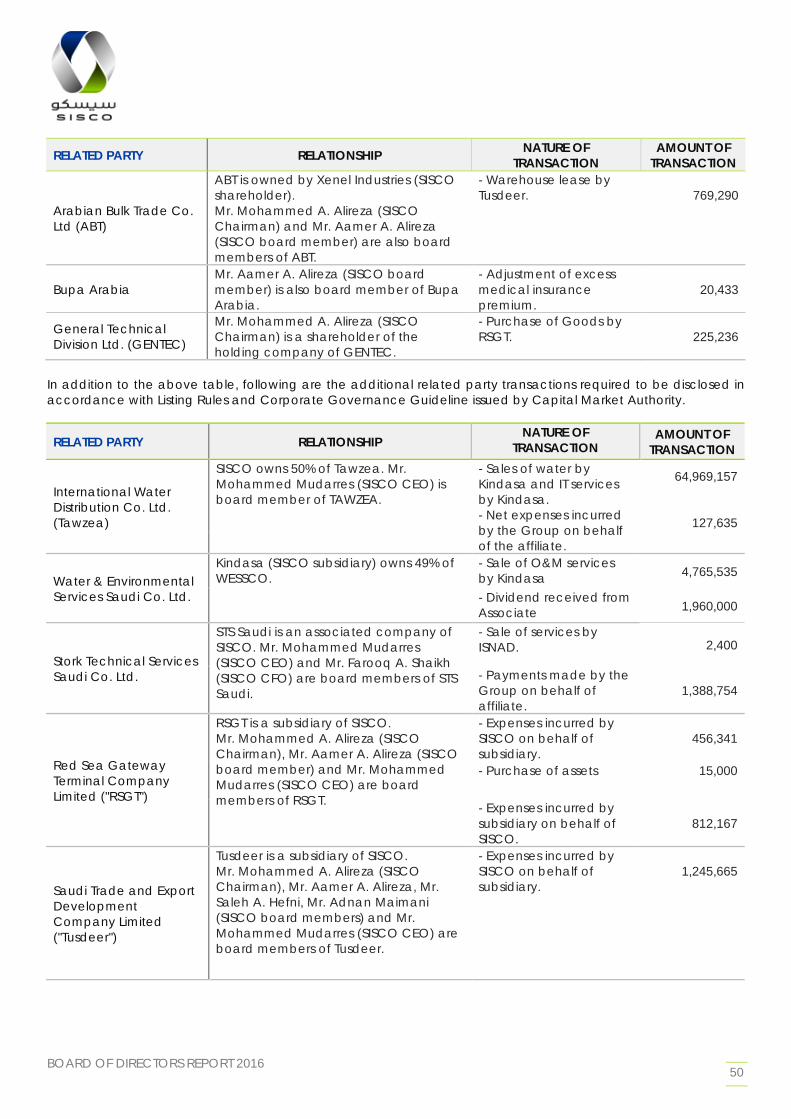
BOARD OF DIRECTORS REPORT 2016 50
RELATED PARTY RELATIONSHIP NATURE OF TRANSACTION
AMOUNT OF TRANSACTION
Arabian Bulk Trade Co. Ltd (ABT)
ABT is owned by Xenel Industries (SISCO shareholder). Mr. Mohammed A. Alireza (SISCO Chairman) and Mr. Aamer A. Alireza (SISCO board member) are also board members of ABT.
- Warehouse lease by Tusdeer.
769,290
Bupa Arabia Mr. Aamer A. Alireza (SISCO board member) is also board member of Bupa Arabia.
- Adjustment of excess medical insurance premium.
20,433
General Technical Division Ltd. (GENTEC)
Mr. Mohammed A. Alireza (SISCO Chairman) is a shareholder of the holding company of GENTEC.
- Purchase of Goods by RSGT.
225,236
In addition to the above table, following are the additional related party transactions required to be disclosed in accordance with Listing Rules and Corporate Governance Guideline issued by Capital Market Authority.
RELATED PARTY RELATIONSHIP NATURE OF
TRANSACTION AMOUNT OF
TRANSACTION
International Water Distribution Co. Ltd. (Tawzea)
SISCO owns 50% of Tawzea. Mr. Mohammed Mudarres (SISCO CEO) is board member of TAWZEA.
- Sales of water by Kindasa and IT services by Kindasa. - Net expenses incurred by the Group on behalf of the affiliate.
64,969,157
127,635
Water & Environmental Services Saudi Co. Ltd.
Kindasa (SISCO subsidiary) owns 49% of WESSCO.
- Sale of O&M services by Kindasa 4,765,535
- Dividend received from Associate 1,960,000
Stork Technical Services Saudi Co. Ltd.
STS Saudi is an associated company of SISCO. Mr. Mohammed Mudarres (SISCO CEO) and Mr. Farooq A. Shaikh (SISCO CFO) are board members of STS Saudi.
- Sale of services by ISNAD. 2,400
- Payments made by the Group on behalf of affiliate.
1,388,754
Red Sea Gateway Terminal Company Limited ("RSGT")
RSGT is a subsidiary of SISCO. Mr. Mohammed A. Alireza (SISCO Chairman), Mr. Aamer A. Alireza (SISCO board member) and Mr. Mohammed Mudarres (SISCO CEO) are board members of RSGT.
- Expenses incurred by SISCO on behalf of subsidiary.
456,341
- Purchase of assets 15,000
- Expenses incurred by subsidiary on behalf of SISCO.
812,167
Saudi Trade and Export Development Company Limited ("Tusdeer")
Tusdeer is a subsidiary of SISCO. Mr. Mohammed A. Alireza (SISCO Chairman), Mr. Aamer A. Alireza, Mr. Saleh A. Hefni, Mr. Adnan Maimani (SISCO board members) and Mr. Mohammed Mudarres (SISCO CEO) are board members of Tusdeer.
- Expenses incurred by SISCO on behalf of subsidiary.
1,245,665
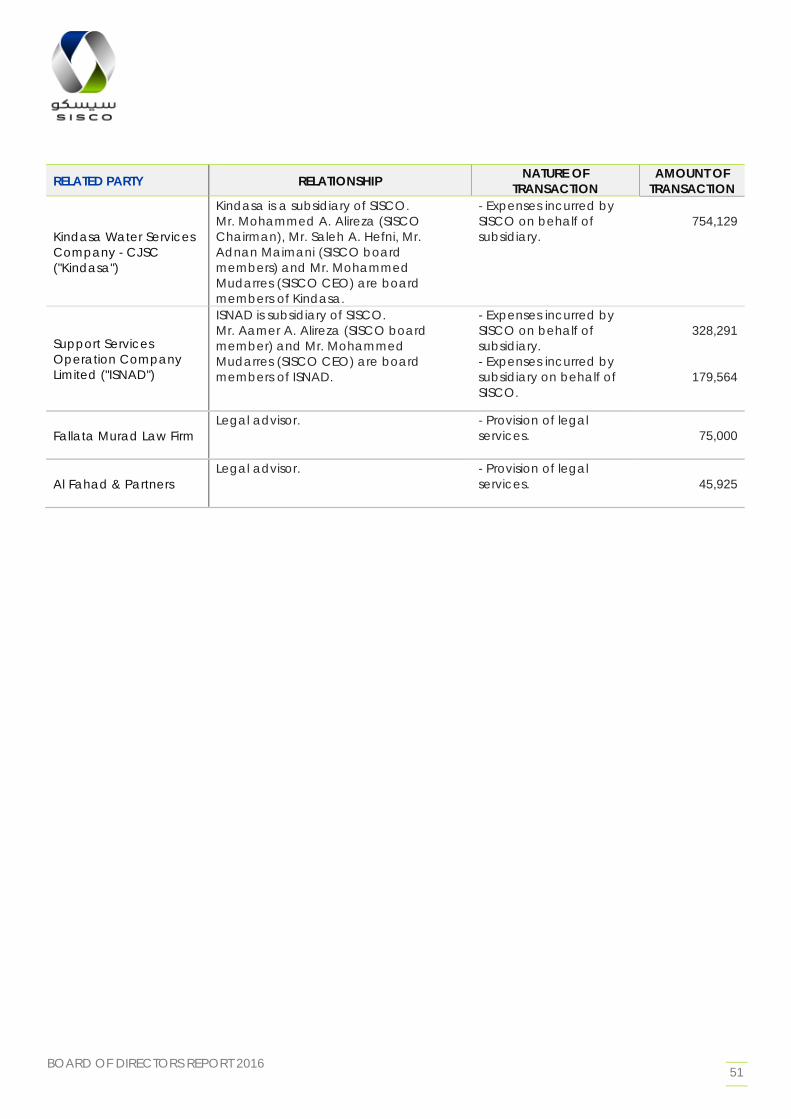
BOARD OF DIRECTORS REPORT 2016 51
RELATED PARTY RELATIONSHIP NATURE OF TRANSACTION
AMOUNT OF TRANSACTION
Kindasa Water Services Company - CJSC ("Kindasa")
Kindasa is a subsidiary of SISCO. Mr. Mohammed A. Alireza (SISCO Chairman), Mr. Saleh A. Hefni, Mr. Adnan Maimani (SISCO board members) and Mr. Mohammed Mudarres (SISCO CEO) are board members of Kindasa.
- Expenses incurred by SISCO on behalf of subsidiary.
754,129
Support Services Operation Company Limited ("ISNAD")
ISNAD is subsidiary of SISCO. Mr. Aamer A. Alireza (SISCO board member) and Mr. Mohammed Mudarres (SISCO CEO) are board members of ISNAD.
- Expenses incurred by SISCO on behalf of subsidiary. - Expenses incurred by subsidiary on behalf of SISCO.
328,291
179,564
Fallata Murad Law Firm Legal advisor. - Provision of legal
services.
75,000
Al Fahad & Partners Legal advisor. - Provision of legal
services.
45,925
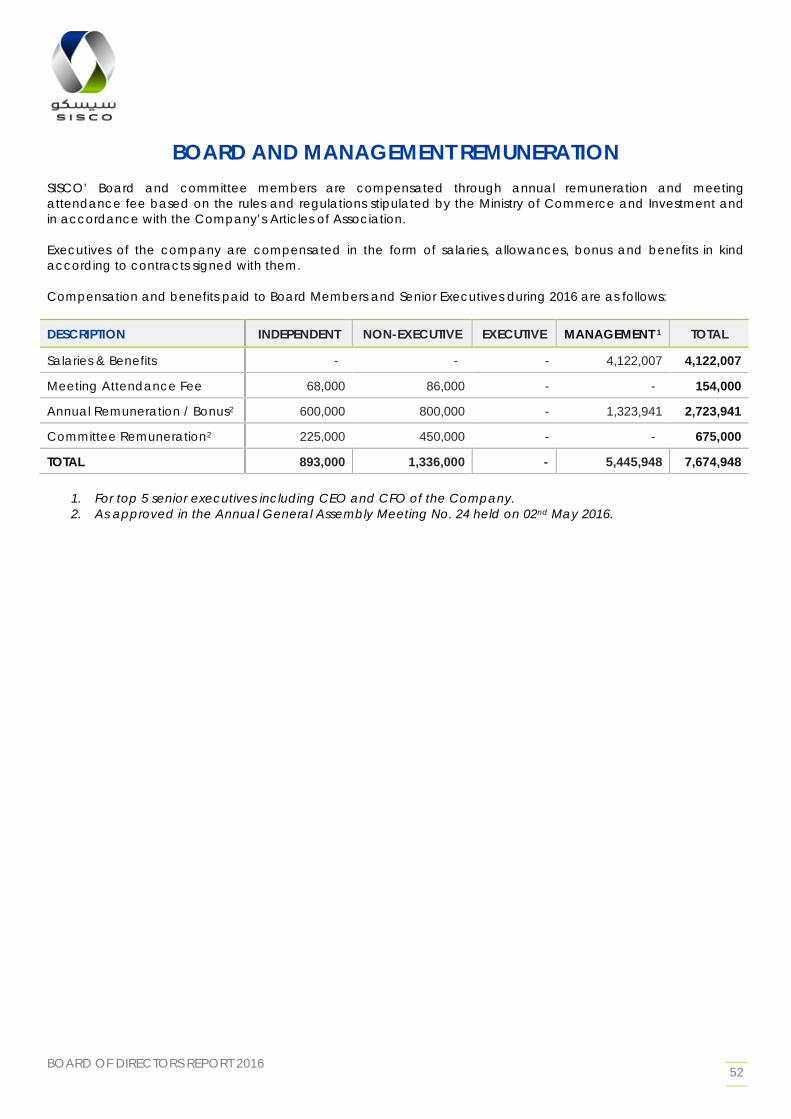
BOARD OF DIRECTORS REPORT 2016 52
BOARD AND MANAGEMENT REMUNERATION SISCO’ Board and committee members are compensated through annual remuneration and meeting attendance fee based on the rules and regulations stipulated by the Ministry of Commerce and Investment and in accordance with the Company’s Articles of Association. Executives of the company are compensated in the form of salaries, allowances, bonus and benefits in kind according to contracts signed with them. Compensation and benefits paid to Board Members and Senior Executives during 2016 are as follows:
DESCRIPTION INDEPENDENT NON-EXECUTIVE EXECUTIVE MANAGEMENT 1 TOTAL
Salaries & Benefits - - - 4,122,007 4,122,007
Meeting Attendance Fee 68,000 86,000 - - 154,000
Annual Remuneration / Bonus2 600,000 800,000 - 1,323,941 2,723,941
Committee Remuneration2 225,000 450,000 - - 675,000
TOTAL 893,000 1,336,000 - 5,445,948 7,674,948
1. For top 5 senior executives including CEO and CFO of the Company. 2. As approved in the Annual General Assembly Meeting No. 24 held on 02nd May 2016.
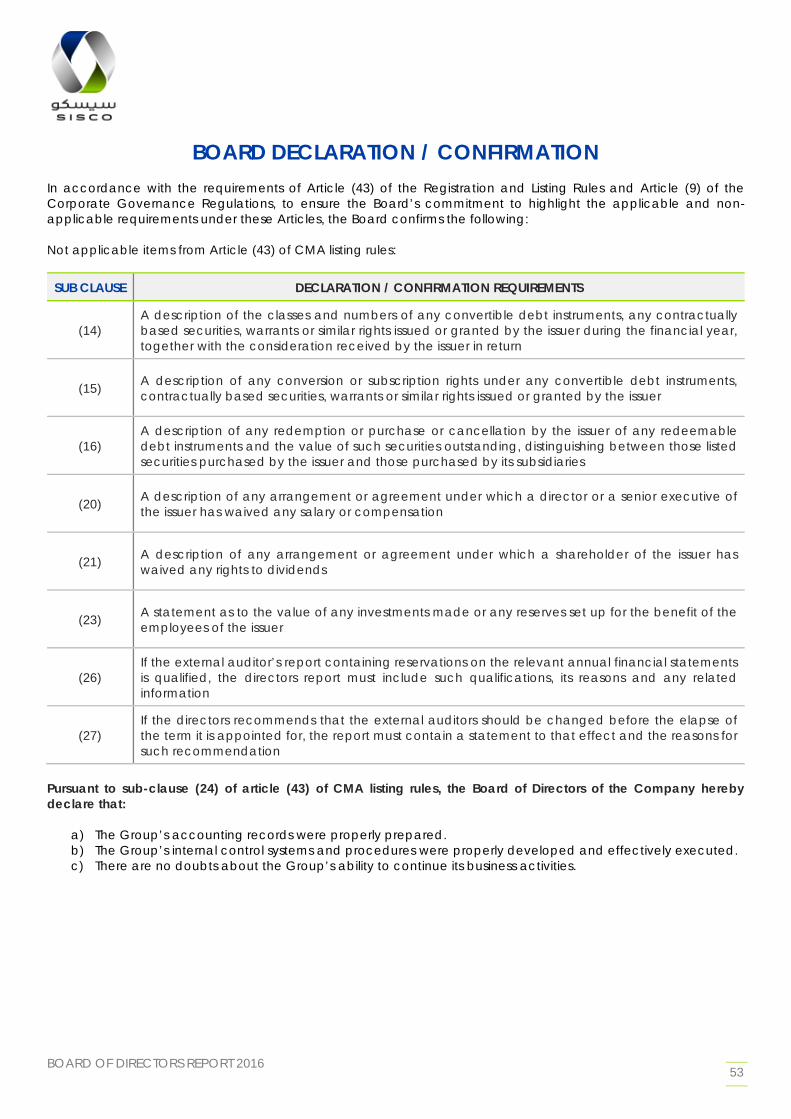
BOARD OF DIRECTORS REPORT 2016 53
BOARD DECLARATION / CONFIRMATION In accordance with the requirements of Article (43) of the Registration and Listing Rules and Article (9) of the Corporate Governance Regulations, to ensure the Board’s commitment to highlight the applicable and non-applicable requirements under these Articles, the Board confirms the following: Not applicable items from Article (43) of CMA listing rules:
SUB CLAUSE DECLARATION / CONFIRMATION REQUIREMENTS
(14) A description of the classes and numbers of any convertible debt instruments, any contractually based securities, warrants or similar rights issued or granted by the issuer during the financial year, together with the consideration received by the issuer in return
(15) A description of any conversion or subscription rights under any convertible debt instruments, contractually based securities, warrants or similar rights issued or granted by the issuer
(16) A description of any redemption or purchase or cancellation by the issuer of any redeemable debt instruments and the value of such securities outstanding, distinguishing between those listed securities purchased by the issuer and those purchased by its subsidiaries
(20) A description of any arrangement or agreement under which a director or a senior executive of the issuer has waived any salary or compensation
(21) A description of any arrangement or agreement under which a shareholder of the issuer has waived any rights to dividends
(23) A statement as to the value of any investments made or any reserves set up for the benefit of the employees of the issuer
(26) If the external auditor’s report containing reservations on the relevant annual financial statements is qualified, the directors report must include such qualifications, its reasons and any related information
(27) If the directors recommends that the external auditors should be changed before the elapse of the term it is appointed for, the report must contain a statement to that effect and the reasons for such recommendation
Pursuant to sub-clause (24) of article (43) of CMA listing rules, the Board of Directors of the Company hereby declare that:
a) The Group’s accounting records were properly prepared. b) The Group’s internal control systems and procedures were properly developed and effectively executed. c) There are no doubts about the Group’s ability to continue its business activities.
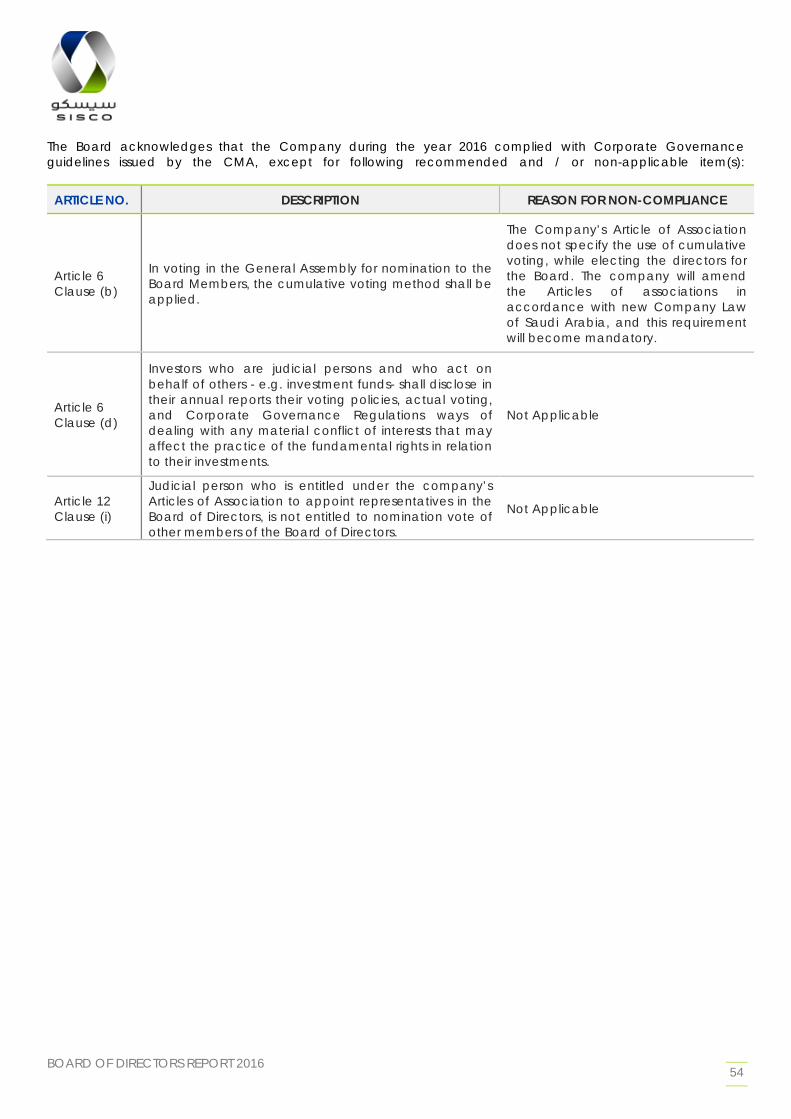
BOARD OF DIRECTORS REPORT 2016 54
The Board acknowledges that the Company during the year 2016 complied with Corporate Governance guidelines issued by the CMA, except for following recommended and / or non-applicable item(s):
ARTICLE NO. DESCRIPTION REASON FOR NON-COMPLIANCE
Article 6 Clause (b)
In voting in the General Assembly for nomination to the Board Members, the cumulative voting method shall be applied.
The Company’s Article of Association does not specify the use of cumulative voting, while electing the directors for the Board. The company will amend the Articles of associations in accordance with new Company Law of Saudi Arabia, and this requirement will become mandatory.
Article 6 Clause (d)
Investors who are judicial persons and who act on behalf of others - e.g. investment funds- shall disclose in their annual reports their voting policies, actual voting, and Corporate Governance Regulations ways of dealing with any material conflict of interests that may affect the practice of the fundamental rights in relation to their investments.
Not Applicable
Article 12 Clause (i)
Judicial person who is entitled under the company’s Articles of Association to appoint representatives in the Board of Directors, is not entitled to nomination vote of other members of the Board of Directors.
Not Applicable
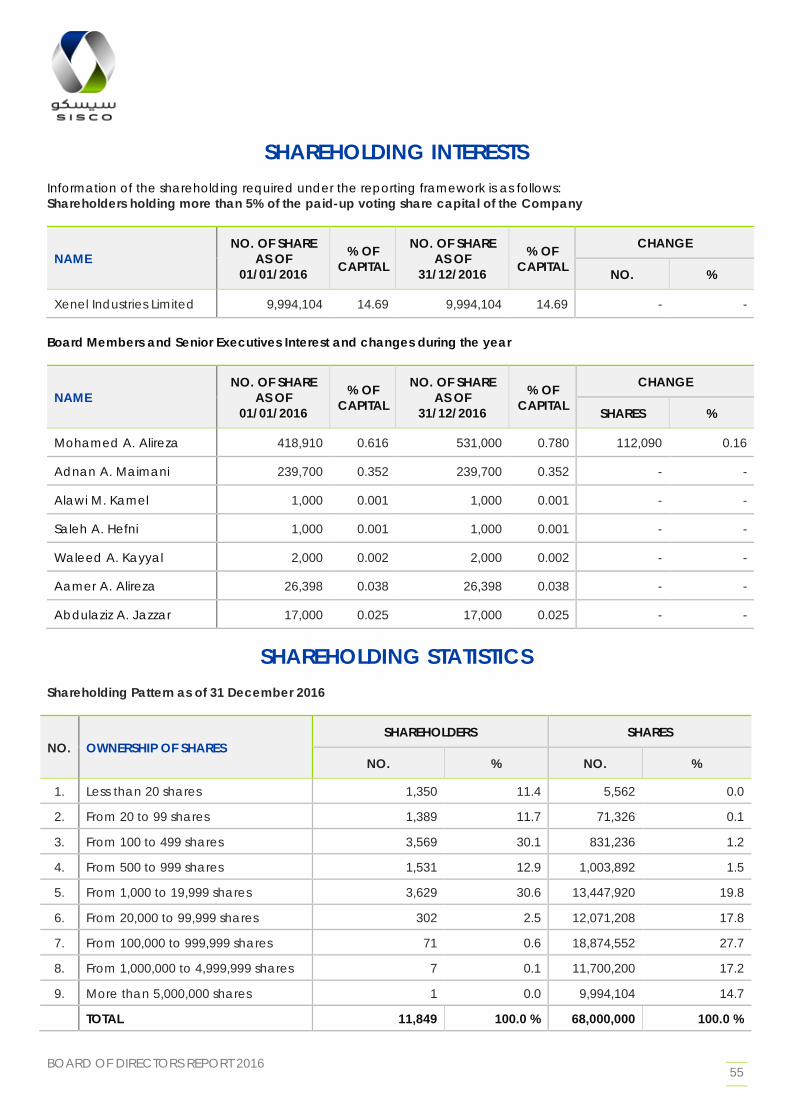
BOARD OF DIRECTORS REPORT 2016 55
SHAREHOLDING INTERESTS Information of the shareholding required under the reporting framework is as follows: Shareholders holding more than 5% of the paid-up voting share capital of the Company
NAME NO. OF SHARE
AS OF 01/01/2016
% OF CAPITAL
NO. OF SHARE AS OF
31/12/2016
% OF CAPITAL
CHANGE
NO. %
Xenel Industries Limited 9,994,104 14.69 9,994,104 14.69 - -
Board Members and Senior Executives Interest and changes during the year
NAME NO. OF SHARE
AS OF 01/01/2016
% OF CAPITAL
NO. OF SHARE AS OF
31/12/2016
% OF CAPITAL
CHANGE
SHARES %
Mohamed A. Alireza 418,910 0.616 531,000 0.780 112,090 0.16
Adnan A. Maimani 239,700 0.352 239,700 0.352 - -
Alawi M. Kamel 1,000 0.001 1,000 0.001 - -
Saleh A. Hefni 1,000 0.001 1,000 0.001 - -
Waleed A. Kayyal 2,000 0.002 2,000 0.002 - -
Aamer A. Alireza 26,398 0.038 26,398 0.038 - -
Abdulaziz A. Jazzar 17,000 0.025 17,000 0.025 - -
SHAREHOLDING STATISTICS Shareholding Pattern as of 31 December 2016
NO. OWNERSHIP OF SHARES SHAREHOLDERS SHARES
NO. % NO. %
1. Less than 20 shares 1,350 11.4 5,562 0.0
2. From 20 to 99 shares 1,389 11.7 71,326 0.1
3. From 100 to 499 shares 3,569 30.1 831,236 1.2
4. From 500 to 999 shares 1,531 12.9 1,003,892 1.5
5. From 1,000 to 19,999 shares 3,629 30.6 13,447,920 19.8
6. From 20,000 to 99,999 shares 302 2.5 12,071,208 17.8
7. From 100,000 to 999,999 shares 71 0.6 18,874,552 27.7
8. From 1,000,000 to 4,999,999 shares 7 0.1 11,700,200 17.2
9. More than 5,000,000 shares 1 0.0 9,994,104 14.7
TOTAL 11,849 100.0 % 68,000,000 100.0 %
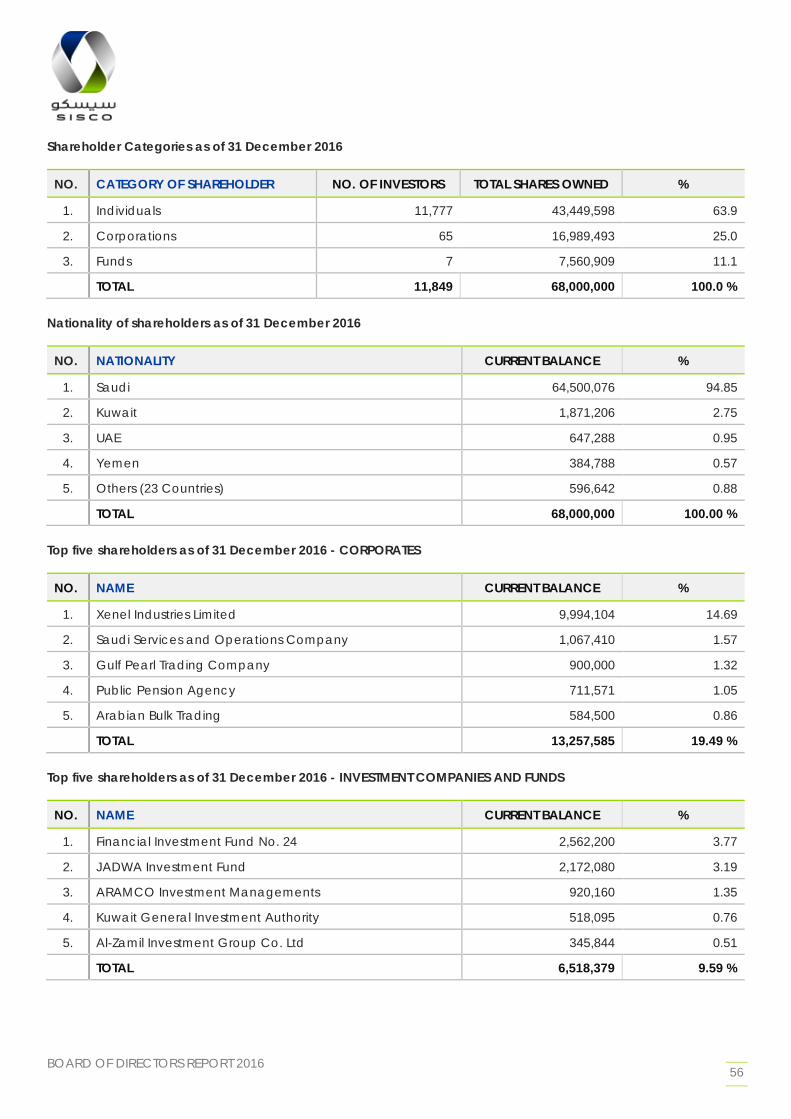
BOARD OF DIRECTORS REPORT 2016 56
Shareholder Categories as of 31 December 2016
NO. CATEGORY OF SHAREHOLDER NO. OF INVESTORS TOTAL SHARES OWNED %
1. Individuals 11,777 43,449,598 63.9
2. Corporations 65 16,989,493 25.0
3. Funds 7 7,560,909 11.1
TOTAL 11,849 68,000,000 100.0 % Nationality of shareholders as of 31 December 2016
NO. NATIONALITY CURRENT BALANCE %
1. Saudi 64,500,076 94.85
2. Kuwait 1,871,206 2.75
3. UAE 647,288 0.95
4. Yemen 384,788 0.57
5. Others (23 Countries) 596,642 0.88
TOTAL 68,000,000 100.00 % Top five shareholders as of 31 December 2016 - CORPORATES
NO. NAME CURRENT BALANCE %
1. Xenel Industries Limited 9,994,104 14.69
2. Saudi Services and Operations Company 1,067,410 1.57
3. Gulf Pearl Trading Company 900,000 1.32
4. Public Pension Agency 711,571 1.05
5. Arabian Bulk Trading 584,500 0.86
TOTAL 13,257,585 19.49 % Top five shareholders as of 31 December 2016 - INVESTMENT COMPANIES AND FUNDS
NO. NAME CURRENT BALANCE %
1. Financial Investment Fund No. 24 2,562,200 3.77
2. JADWA Investment Fund 2,172,080 3.19
3. ARAMCO Investment Managements 920,160 1.35
4. Kuwait General Investment Authority 518,095 0.76
5. Al-Zamil Investment Group Co. Ltd 345,844 0.51
TOTAL 6,518,379 9.59 %
BOARD OF DIRECTORS REPORT 2016 57
OUTLOOK
BOARD OF DIRECTORS REPORT 2016 58
FUTURE AT A GLANCE The National Transformation Plan 2020 and Vision 2030 placed the enhancement of non-oil revenue for Saudi government high on the agenda. As a result of various measures announced (and some already implemented), Saudi Arabia’s economy is expected to continue its consolidation and government’s focus on fiscal disciplines remains unfettered. Consequently, economic activity is likely to remain subdued as cuts to public remuneration will hit domestic trade hard and contractors will be affected by further government efforts to rationalize procurement. For SISCO, the theme for 2017 is to capitalize on all possible avenues for developing the three growth pillars: Ports & Terminals, Logistics Parks & Services and Water Solutions; as they are well-positioned to participate in the government’s drive for a more inclusive role of private sector in areas of utilities, transport and logistics. PORTS & TERMINALS The year 2016 stood out in terms of consolidation for global container shipping industry, both in terms of outright mergers but also in the newer and larger alliances being forged to cut costs. The year also witnessed unprecedented events of a government-sponsored shipping line filing for court protection and a national regional shipping line being acquired by a European carrier. Locally, growth in trade volume for Saudi Arabia is expected to remain muted resulting in lower demand for imported cargo and materials. This is expected to have direct impact on the terminal’s gateway volume. Management’s focus is on increasing the capacity utilization through trans-shipment business, but the margins are expected to be under pressure. Expansion of the terminal is progressing as per the plan with 71.3% of the civil works completed by end of 2016. As per the plan, the civil construction is expected to be completed by August 2017 and 4 new cranes are expected to be delivered in October 2017. Once the expansion works are completed, the capacity of the terminal will increase to about 2.5 million TEUs. LOGISTICS PARKS & SERVICES Tusdeer has been able to weather the storm of local economic slowdown, due to its unique position and business model. However, owing to most of Tusdeer’s customers facing commercial challenges, the growth prospects for additional/new leases are to be rationalized. Progress on Jeddah Logistics Park in the south of the Industrial City is slow due to delays in obtaining approvals from relevant government agencies. Similarly, ISNAD’s Logistics Hub has also faced bottlenecks in construction, which are currently being addressed. SISCO has now re-structured to put both Tusdeer and ISNAD under one management structure to improve the service offering to their customers. WATER SOLUTIONS Water segment is expected to remain stable and well-positioned to take advantage of the government’s drive for private sector participation. Key risk in this segment is of increased utility prices, if the company is unable to or is restricted from passing on the cost increase to customers. Kindasa is setting up a new plant with 5,000 cubic meters per day capacity in Rabigh and it is expected to start production from mid-2018.