Embed Size (px)
Citation preview
Annual Report 2013
001-064BilSaipem13Ing.qxd 8-04-2014 10:20 AM Pagina I
Countries in which Saipem operates
EUROPE
Austria, Belgium, Croatia, Cyprus, Denmark,
France, Greece, Italy, Luxembourg, Malta,
Netherlands, Norway, Poland, Portugal,
Romania, Spain, Sweden, Switzerland, Turkey,
United Kingdom
AMERICAS
Bolivia, Brazil, Canada, Chile, Colombia,
Dominican Republic, Ecuador, Mexico, Peru,
Suriname, United States, Venezuela
CIS
Azerbaijan, Kazakhstan, Russia, Turkmenistan,
Ukraine
AFRICA
Algeria, Angola, Cameroon, Congo, Egypt,
Gabon, Ghana, Libya, Mauritania, Morocco,
Mozambique, Nigeria, South Africa, Togo,
Uganda
MIDDLE EAST
Iraq, Kuwait, Oman, Qatar, Saudi Arabia,
United Arab Emirates, Yemen
FAR EAST AND OCEANIA
Australia, China, India, Indonesia, Japan,
Malaysia, Myanmar, Pakistan,
Papua New Guinea, Singapore,
Thailand, Vietnam
MissionPursuing satisfaction of our Clients in the energy industry,
we tackle each challenge with safe, reliable and innovative
solutions.
Our competent, multi-local teams provide sustainable
development for our Company and for the communities
in which we operate.
Our core values
Commitment to health and safety, openness, flexibility,
integration, innovation, quality, competitiveness, teamwork,
humility, internationalisation, responsibility and integrity.
Annual Report 2013
Disclaimer
By their nature, forward-looking statements are subject to risk and uncertainty since they are dependent upon circumstances whichshould or are considered likely to occur in the future and are outside of the Company’s control. These include, but are not limited to:monetary exchange and interest rate fluctuations, commodity price volatility, credit and liquidity risks, HSE risks, the levels of capitalexpenditure in the oil and gas industry and other sectors, political instability in areas where the Group operates, actions by competitors,success of commercial transactions, risks associated with the execution of projects (including ongoing investment projects), in addition tochanges in stakeholders’ expectations and other changes affecting business conditions.Actual results could therefore differ materially from the forward-looking statements.The financial reports contain in-depth analyses of some of the aforementioned risks.Forward-looking statements are to be considered in the context of the date of their release. Saipem SpA is under no obligation to review,update or correct them subsequently, except where this is a mandatory requirement of the applicable legislation.The forward-looking statements given herein are not intended to constitute an invitation to invest or to provide legal, accounting, tax orinvestment advice and should not be relied upon in that regard.
Shareholders’ Meeting of May 6, 2014Notice of the Shareholders’ Meeting was published in the daily newspaper Il Sole 24 Ore on March 27, 2014
4 Letter to the Shareholders
5 Board of Directors and auditorsof Saipem SpA
7 Saipem Group structure
12 Saipem SpA share performance
14 Glossary
Directors’ Report
Consolidated FinancialStatements
Addendum
17 Operating review17 New contracts and backlog18 Capital expenditure19 Offshore Engineering & Construction25 Onshore Engineering & Construction29 Offshore Drilling31 Onshore Drilling33 Financial and economic results33 Results of operations36 Balance sheet and financial position39 Reclassified cash flow statement40 Summary of the effects of restatement: financial statements42 Key profit and financial indicators43 Sustainability45 Research and development47 Quality, Health, Safety and Environment50 Human resources55 Information technology57 Governance58 Risk management61 Additional information63 Reconciliation of reclassified balance sheet
and cash flow statement to statutory schemes
66 Consolidated financial statements72 Notes to the consolidated financial statements
142 Management’s Certification143 Independent Auditors’ Report
145 Sustainability Performance
4
Dear Shareholders,
2013 proved a particularly difficult year for Saipem due to asuccession of events that impacted adversely on the year’sresults, particularly in the Engineering & Construction sector.The exception was the Drilling sector which continued to followthe positive trend registered in recent years.Overall, compared on a basis consistent with the Company’sapproved 2012 reporting, revenues decreased by 10.2% andEBITDA by 71.8%, while the year saw the Company post a negativenet result of €404 million.The principal causes of this significant deterioration in resultsincluded:- reduced activity in both the Offshore and Onshore sectors on a
number of high margin contracts that had boosted 2012 results,following their completion in 2012 and early 2013;
- a significant increase in 2013 in the incidence of contractswhose lower margins reflected the extremely competitivemarket conditions prevailing between 2009 and 2012;
- commercial decisions taken to facilitate entry into the Brazilianmarket, judged to have medium-term potential, where the firstcontracts acquired by the Company have low margins;
- delays to important contract awards, particularly for large-scaleinternational pipeline projects and deep-water fielddevelopments.
In addition, from May 2013 onwards, the combination of adeterioration in commercial relations in Algeria in the wake ofinvestigations being conducted by the Algerian authorities andcritical issues that emerged in relation to Onshore E&C projectsunder execution in Mexico and Canada, Offshore E&C projectsunderway in the Gulf of Mexico and completion works on a vesseldue to be installed in the Mediterranean had a further negativeimpact on the year’s results.The Company’s share price, which lost 49% of its value over thecourse of 2013, was impacted at the beginning of the year by theannouncement revising 2013 earnings guidance sharplydownwards, which caused the price to fall to €19.90.Subsequently, after a second downward revision of guidance inmid-June had caused a second sharp drop to a year low of€12.60, the Saipem stock closed out 2013 at a price of €15.54.In terms of results by business line, Offshore Engineering& Construction posted revenues in line with the previous year,while EBITDA fell by 62%, with activities concentrated in WestAfrica, Kazakhstan and Saudi Arabia. In the Onshore Engineering& Construction segment, revenues fell 21.8% and EBITDA totallednegative €614 million, while activities were concentrated in theMiddle East, Canada and Australia. Offshore Drilling revenues roseby 8.2% and EBITDA by 10.2%, with the improvement mainly due toa full year of operations by the semi-submersible platformsScarabeo 8, Scarabeo 3 and Scarabeo 6. Onshore Drilling sectorrevenues and EBITDA were essentially in line with 2012. Activities
in the sector were concentrated in South America and SaudiArabia.In terms of health and safety, the Company’s LTIFR (Lost TimeInjury Frequency Rate) fell from the previous year’s 0.32 to a verylow 0.26. However, the six fatal accidents that occurred during theyear (three in 2012) serve to remind us that a constant effort isneeded to ensure that attention to health and safety is kept highat all sites on which Saipem operates.Capital expenditure in 2013 amounted to €908 million, against€1,015 million in 2012. Sector by sector, Offshore Engineering& Construction saw the end of final completion work and sea trialson the Saipem’s new pipelay vessel Castorone, which beganoperations in the second quarter, while construction workcontinued on the new base in Brazil. In Onshore Engineering& Construction, the new covered fabrication yard in Edmonton,Canada, which is the first of its kind in North America, and whichwill allow Saipem to accelerate project delivery times wasinaugurated during the last quarter of the year. The OffshoreDrilling sector saw the completion of class reinstatement workson the semi-submersible rigs Scarabeo 5 and Scarabeo 7 and thejack-up Perro Negro 3, while in the Onshore Drilling sector, finalcompletion works were carried out on four new rigs scheduled foroperations in Saudi Arabia. Two other significant events affectingthe Company’s fixed assets regarded the capsizing and sinking onJuly 1, 2013 of the jack-up drilling rig Perro Negro 6 while it wascarrying out rig positioning prior to the beginning of drillingoperations near the mouth of the Congo River and the sale onDecember 30, 2013 of the Firenze FPSO (Floating ProductionStorage and Offloading) vessel to Eni.On December 5, 2013, the Italian stock market regulator Consobclosed the proceedings it had commenced on July 19, 2013 withregard to a potential ‘non-compliance with international accountingstandards’ of the Separate and Consolidated Financial Statementsat December 31, 2012. The only consequence of the proceedingsfor Saipem was the restatement of the 2012 Financial Statementsin line with Consob’s indications and corresponding adjustmentmade to the 2013 Financial Statements for the same amount.Aggregate net profit for 2012 and 2013 remained unchanged.As in the second half of 2013, possible delays by Oil Companies inawarding new contracts may lead to reduced visibility with regardto expected order backlog levels, which consequently makes itharder to forecast associated revenues and margins. For thisreason, Saipem has chosen to adopt a policy of cautious guidance,reflecting the increased level of uncertainty in today’s market.For 2014, Saipem expects revenues of between €12.5 and€13.6 billion, EBIT of between €600 and €750 million and a netprofit of between €280 and €380 million. Final results willdepend on the outcome of current tenders, on the timing ofproject awards and on the start date of operations, since this willdetermine the extent to which revenues and margins earned maybe recognised in 2014. However, the commercial market outlook
Saipem Annual Report / Letter to the Shareholders
Letter to the Shareholders
remains positive, with a large number of contracts to be awardedin the near future for which Saipem holds a solid competitiveposition, including pipe-laying projects in ultra-deep waters,subsea developments in deep and ultra-deep waters, FPSOconstruction projects and large onshore projects featuring a highlevel of technological complexity. Investments are expected tototal approximately €750 million and net financial debt is
expected to be approximately €4.2 billion, both figuresrepresenting decreases on 2013 levels. 2014 is expected to be ayear of transition with a return to profitability. The extent of therecovery will depend not only on the pace of contract awards, butalso on the efficient operational and commercial execution oflow-margin contracts still in the backlog, which in 2014 shouldaccount for approximately €5 billion.
March 14, 2014 On behalf of the Board of Directors
The Chairman The Chief Executive OfficerAlberto Meomartini Umberto Vergine
BOARD OF DIRECTORS
ChairmanAlberto Meomartini
Deputy ChairmanPiergaetano Marchetti1
Chief Executive OfficerUmberto Vergine
DirectorsFabrizio Barbieri2
Gabriele Galateri di GenolaNicola GrecoMaurizio MontagneseMauro SacchettoMichele Volpi
BOARD OF STATUTORY AUDITORS
ChairmanMario Busso
Statutory AuditorsAnna GervasoniAdriano Propersi
Alternate AuditorsGiulio GambaPaolo Sfameni
Independent AuditorsReconta Ernst & Young SpA
Saipem is a subsidiary of Eni SpA
(1) Appointed as Director and Deputy Chairman by the Board of Directors on July 30, 2013.(2) Appointed on April 30, 2013 by the Shareholders’ Meeting called to approve the 2012 Annual Report.
Saipem Annual Report / Letter to the Shareholders
5


Saipem Annual Report / Saipem Group structure
7
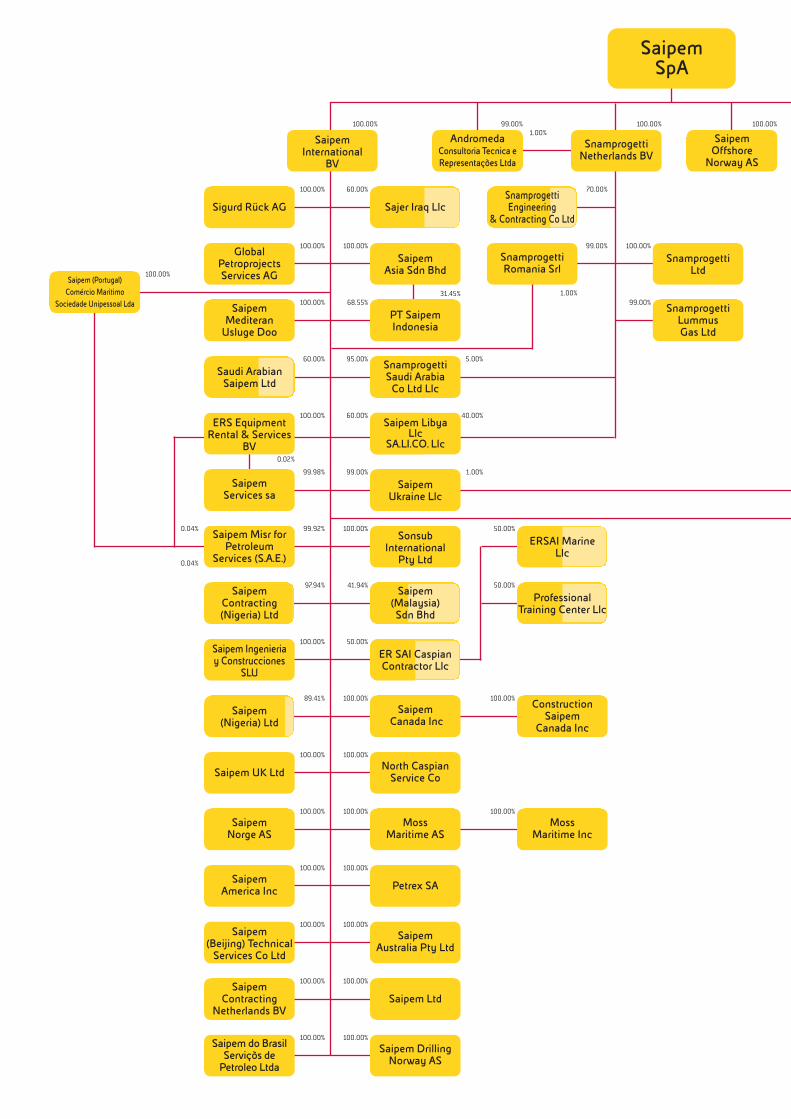
Saipem Group structure(subsidiaries)
100.00%
95.00%
SaipemSpA
Saipem International
BV
Sigurd Rück AG
SaipemAsia Sdn Bhd
GlobalPetroprojectsServices AG
PT SaipemIndonesia
Saipem (Portugal)
Comércio Maritimo
Sociedade Unipessoal Lda SaipemMediteran
Usluge Doo
Saudi ArabianSaipem Ltd
SaipemUkraine Llc
SonsubInternational
Pty Ltd
SaipemContracting(Nigeria) Ltd
Saipem Ingenieriay Construcciones
SLU
Saipem(Nigeria) Ltd
Saipem(Malaysia)Sdn Bhd
ER SAI CaspianContractor Llc
SaipemCanada Inc
North CaspianService Co
ERS EquipmentRental & Services
BV
SaipemServices sa
100.00%
60.00%
100.00%
68.55%
99.00%
100.00%
100.00% 50.00%
100.00%
100.00%
ConstructionSaipem
Canada Inc
100.00%
MossMaritime Inc
100.00%
5.00%
100.00%
100.00%
100.00%
60.00%
97.94%
89.41%
41.94%
100.00%
100.00%
100.00%
0.02%
MossMaritime AS
Petrex SA
AndromedaConsultoria Tecnica eRepresentações Ltda
99.98%
99.00%
SnamprogettiNetherlands BV
100.00%
SnamprogettiLtd
SnamprogettiRomania Srl
SnamprogettiLummusGas Ltd
99.00%
1.00%
100.00%
99.00%
1.00%
Saipem UK Ltd
SaipemNorge AS
100.00%
100.00%
99.92%Saipem Misr for
PetroleumServices (S.A.E.)
0.04%
0.04%
SaipemAustralia Pty Ltd
SnamprogettiSaudi Arabia
Co Ltd Llc
SaipemAmerica Inc
100.00%
1.00%
100.00%
100.00%
Saipem Ltd
Saipem do BrasilServiçõs de
Petroleo Ltda
Saipem(Beijing) Technical
Services Co Ltd
100.00%
31.45%
100.00%
Saipem LibyaLlc
SA.LI.CO. Llc
60.00% 40.00%
Sajer Iraq Llc
100.00%Saipem
ContractingNetherlands BV
SaipemOffshore
Norway AS
100.00%
ERSAI MarineLlc
50.00%
ProfessionalTraining Center Llc
50.00%
100.00%
Saipem DrillingNorway AS
70.00%SnamprogettiEngineering
& Contracting Co Ltd
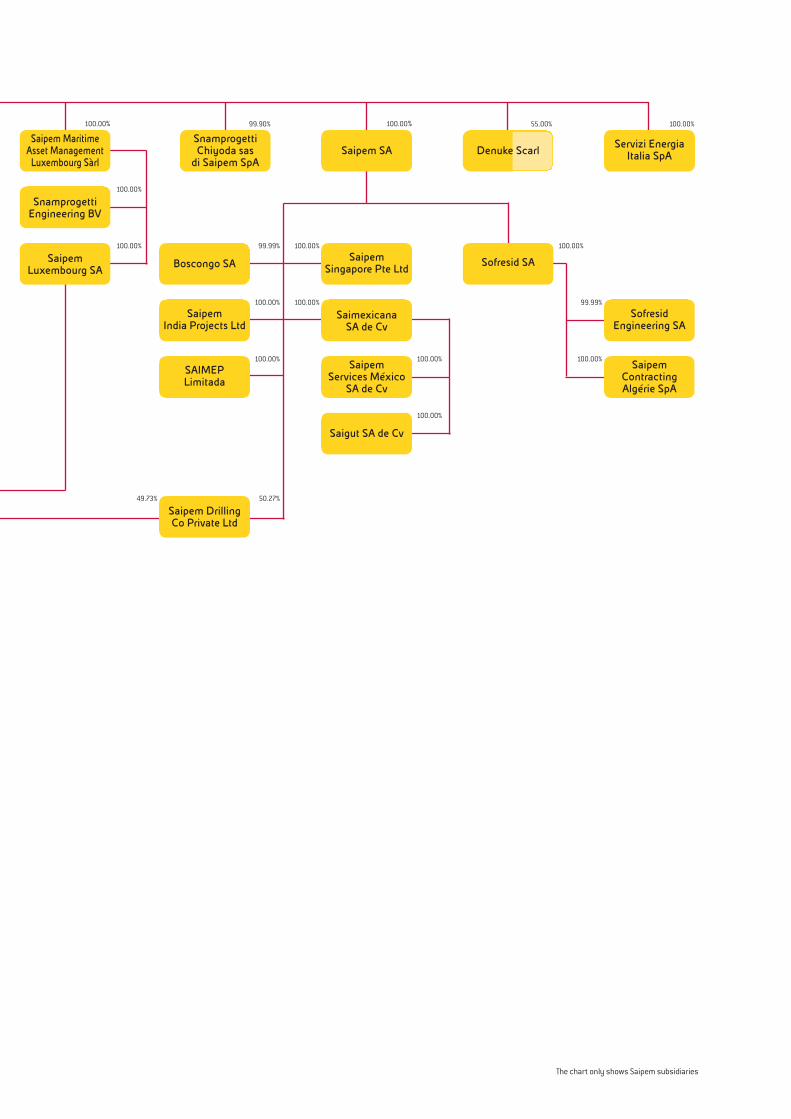
The chart only shows Saipem subsidiaries
Servizi EnergiaItalia SpA
SnamprogettiChiyoda sas
di Saipem SpA
SaipemLuxembourg SA
Sofresid SA Boscongo SA
SofresidEngineering SA
SaipemIndia Projects Ltd
SaimexicanaSA de Cv
100.00%99.90%
Saipem SA
100.00%
100.00%
100.00%
99.99%
100.00%
SaipemServices México
SA de Cv
100.00%
Saigut SA de Cv
100.00%
100.00%
SaipemContractingAlgérie SpA
100.00%
Saipem MaritimeAsset Management
Luxembourg Sàrl
100.00%
SaipemSingapore Pte Ltd
100.00%
99.99%
SnamprogettiEngineering BV
100.00%
Saipem DrillingCo Private Ltd
49.73% 50.27%
Denuke Scarl
55.00%
SAIMEPLimitada
100.00%


Directors’ Report saipem
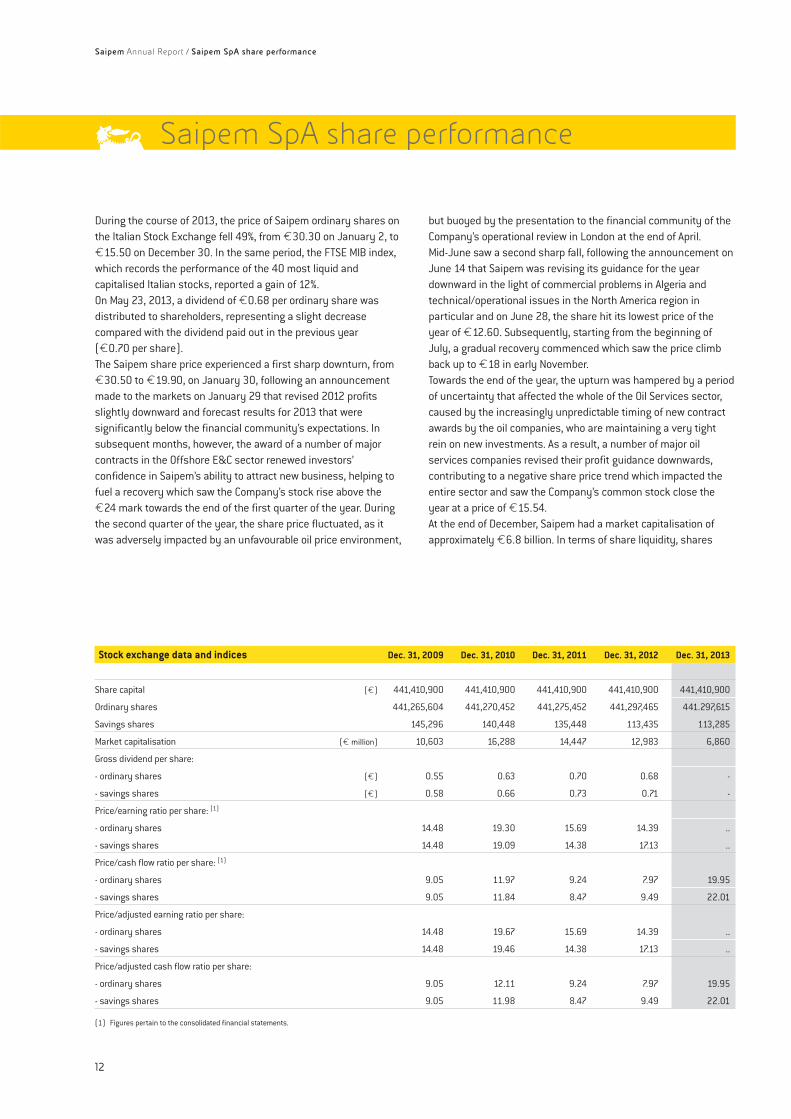
Stock exchange data and indices Dec. 31, 2009 Dec. 31, 2010 Dec. 31, 2011 Dec. 31, 2012 Dec. 31, 2013
Share capital (€) 441,410,900 441,410,900 441,410,900 441,410,900 441,410,900
Ordinary shares 441,265,604 441,270,452 441,275,452 441,297,465 441.297,615
Savings shares 145,296 140,448 135,448 113,435 113,285
Market capitalisation (€ million) 10,603 16,288 14,447 12,983 6,860
Gross dividend per share:
- ordinary shares (€) 0.55 0.63 0.70 0.68 -
- savings shares (€) 0.58 0.66 0.73 0.71 -
Price/earning ratio per share: (1)
- ordinary shares 14.48 19.30 15.69 14.39 ..
- savings shares 14.48 19.09 14.38 17.13 ..
Price/cash flow ratio per share: (1)
- ordinary shares 9.05 11.97 9.24 7.97 19.95
- savings shares 9.05 11.84 8.47 9.49 22.01
Price/adjusted earning ratio per share:
- ordinary shares 14.48 19.67 15.69 14.39 ..
- savings shares 14.48 19.46 14.38 17.13 ..
Price/adjusted cash flow ratio per share:
- ordinary shares 9.05 12.11 9.24 7.97 19.95
- savings shares 9.05 11.98 8.47 9.49 22.01
(1) Figures pertain to the consolidated financial statements.
12
During the course of 2013, the price of Saipem ordinary shares onthe Italian Stock Exchange fell 49%, from €30.30 on January 2, to€15.50 on December 30. In the same period, the FTSE MIB index,which records the performance of the 40 most liquid andcapitalised Italian stocks, reported a gain of 12%.On May 23, 2013, a dividend of €0.68 per ordinary share wasdistributed to shareholders, representing a slight decreasecompared with the dividend paid out in the previous year(€0.70 per share).The Saipem share price experienced a first sharp downturn, from€30.50 to €19.90, on January 30, following an announcementmade to the markets on January 29 that revised 2012 profitsslightly downward and forecast results for 2013 that weresignificantly below the financial community’s expectations. Insubsequent months, however, the award of a number of majorcontracts in the Offshore E&C sector renewed investors’confidence in Saipem’s ability to attract new business, helping tofuel a recovery which saw the Company’s stock rise above the€24 mark towards the end of the first quarter of the year. Duringthe second quarter of the year, the share price fluctuated, as itwas adversely impacted by an unfavourable oil price environment,
but buoyed by the presentation to the financial community of theCompany’s operational review in London at the end of April.Mid-June saw a second sharp fall, following the announcement onJune 14 that Saipem was revising its guidance for the yeardownward in the light of commercial problems in Algeria andtechnical/operational issues in the North America region inparticular and on June 28, the share hit its lowest price of theyear of €12.60. Subsequently, starting from the beginning ofJuly, a gradual recovery commenced which saw the price climbback up to €18 in early November.Towards the end of the year, the upturn was hampered by a periodof uncertainty that affected the whole of the Oil Services sector,caused by the increasingly unpredictable timing of new contractawards by the oil companies, who are maintaining a very tightrein on new investments. As a result, a number of major oilservices companies revised their profit guidance downwards,contributing to a negative share price trend which impacted theentire sector and saw the Company’s common stock close theyear at a price of €15.54.At the end of December, Saipem had a market capitalisation ofapproximately €6.8 billion. In terms of share liquidity, shares
Saipem Annual Report / Saipem SpA share performance
Saipem SpA share performance
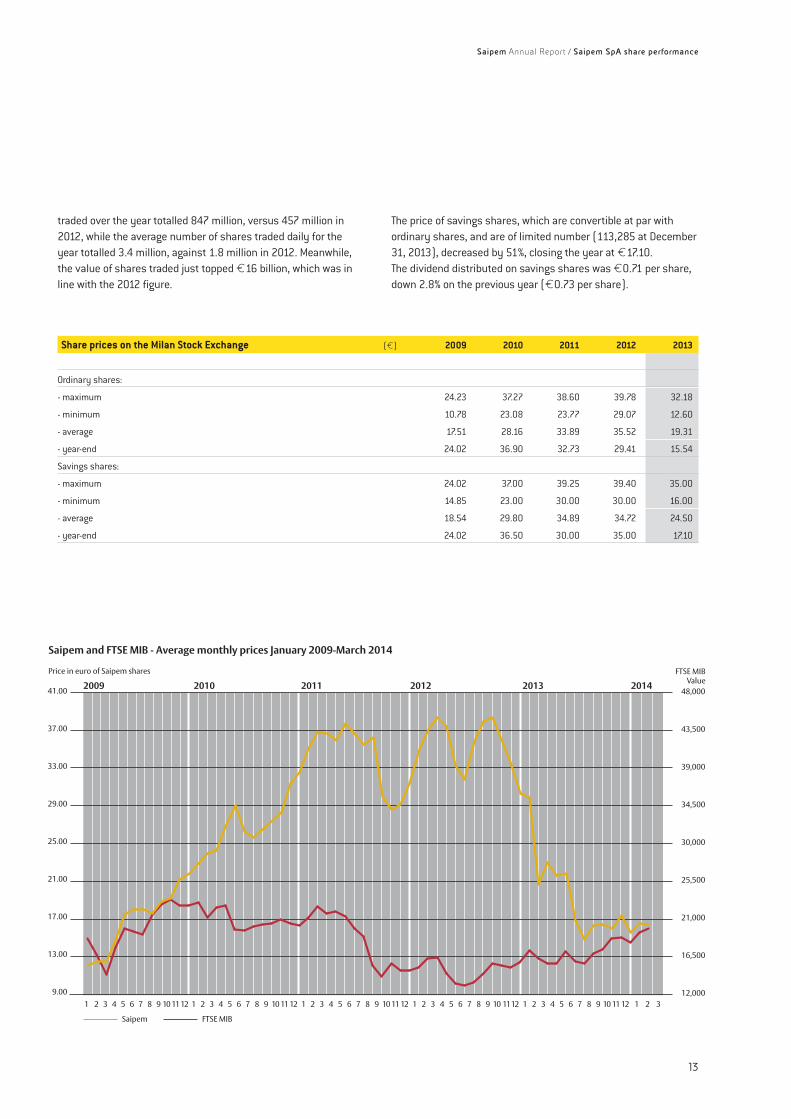
Share prices on the Milan Stock Exchange (€) 2009 2010 2011 2012 2013
Ordinary shares:
- maximum 24.23 37.27 38.60 39.78 32.18
- minimum 10.78 23.08 23.77 29.07 12.60
- average 17.51 28.16 33.89 35.52 19.31
- year-end 24.02 36.90 32.73 29.41 15.54
Savings shares:
- maximum 24.02 37.00 39.25 39.40 35.00
- minimum 14.85 23.00 30.00 30.00 16.00
- average 18.54 29.80 34.89 34.72 24.50
- year-end 24.02 36.50 30.00 35.00 17.10
1 2 3 4 5 6 7 8 9 10 1112 1 2 3 4 5 6 7 8 9 10 11 12 1 2 3 4 5 6 7 8 9 10 11 12 1 2 3 4 5 6 7 8 9 10 1112 1 2 3 4 5 6 7 8 9 10 11 12 1 2 3
2009 2010 2012 20142011 2013
Saipem FTSE MIB
Price in euro of Saipem shares
Saipem and FTSE MIB - Average monthly prices January 2009-March 2014
FTSE MIBValue
41.00
12,000
21,000
16,500
25,500
30,000
48,000
9.00
13.00
17.00
37.00
33.00
29.00
25.00
21.00
39,000
43,500
34,500
traded over the year totalled 847 million, versus 457 million in2012, while the average number of shares traded daily for theyear totalled 3.4 million, against 1.8 million in 2012. Meanwhile,the value of shares traded just topped €16 billion, which was inline with the 2012 figure.
The price of savings shares, which are convertible at par withordinary shares, and are of limited number (113,285 at December31, 2013), decreased by 51%, closing the year at €17.10.The dividend distributed on savings shares was €0.71 per share,down 2.8% on the previous year (€0.73 per share).
Saipem Annual Report / Saipem SpA share performance
13
Financial terms
- Adjusted net result net result adjusted to exclude specialitems.
- EBIT Earnings Before Interest and Tax (operating result).- EBITDA Earnings Before Interest, Taxes, Depreciation and
Amortisation.- IFRS International Financial Reporting Standards. Accounting
standards issued by the IASB (International AccountingStandards Board) and adopted by the European Commission,comprising International Financial Reporting Standards (IFRS),International Accounting Standards (IAS) and theinterpretations issued by the International Financial ReportingInterpretation Committee (IFRIC) and the StandingInterpretations Committee (SIC) adopted by IASB. The nameInternational Financial Reporting Standards (IFRS) has beenadopted by IASB for the principles issued after May 2003.Standards issued before May 2003 have maintained thedenomination IAS.
- Leverage a measure of a company’s level of indebtedness,calculated as the ratio between net borrowings andshareholders’ equity including minority interest.
- OECD Organisation for Economic Cooperation andDevelopment.
- ROACE Return On Average Capital Employed, calculated as theratio between the net result before minority interest, plus netfinance charges on net borrowings less the related tax effectand net average capital employed.
- Special items items of income arising from events ortransactions that are non-recurring or that are not consideredto be representative of the ordinary course of business.
Operational terms
- Buckle detection system that utilises electromagnetic wavesduring pipelaying to signal collapse of or deformations topipeline laid.
- Carbon Capture and Storage technology which enables thecarbon present in gaseous effluents from hydrocarboncombustion and treatment plants to be captured and storedover long periods of time in underground geologicalformations, thus reducing or eliminating carbon dioxideemissions into the atmosphere.
- Central Processing Facility production unit performing thefirst transformation of crude oil or natural gas.
- Commissioning series of processes and proceduresundertaken in order to start operations of a gas pipeline,associated plants and equipment.
- Concrete coating reinforced concrete coating for subseapipelines in order to ballast and protect them from damageand corrosion.
- Conventional waters water depths of up to 500 metres.- Cracking chemical-physical process, typically employed in
dedicated refinery plants, whose objective is to break downthe heavy hydrocarbon molecules obtained from primarydistillation into lighter fractions.
- Deck area of a vessel or platform where process plants,equipment, accommodation modules and drilling units arelocated.
- Decommissioning process undertaken in order to endoperations of a gas pipeline, associated plant and equipment.Decommissioning may occur at the end of the life of the plant,following an accident, for technical or financial reasons,and/or on environmental or safety grounds.
- Deep-waters water depths of over 500 metres.- Downstream all operations that follow exploration and
production operations in the oil sector.- Drillship vessel capable of self-propulsion, designed to carry
out drilling operations in deep waters.- Dry-tree wellhead located above the water on a floating
production platform.- Dynamic Positioned Heavy Lifting Vessel vessel equipped
with a heavy-lift crane, capable of holding a precise positionthrough the use of thrusters, thereby counteracting the forceof the wind, sea, current, etc.
- EPC Engineering, Procurement, Construction. A type ofcontract typical of the Onshore construction sector,comprising the provision of engineering services,procurement of materials and construction. The term ‘turnkey’is used to indicate that the system is delivered to the clientready for operations, i.e. already commissioned.
- EPCI (Engineering, Procurement, Construction, Installation)type of contract typical of the Offshore construction sector,which relates to the realisation of a complex project where theglobal or main contractor (usually a construction company ora consortium) provides the engineering services,procurement of materials, construction of the system and itsinfrastructure, transport to site, installation andcommissioning/preparatory activities for the start-up ofoperations.
- Fabrication yard yard at which offshore structures arefabricated.
- Facilities auxiliary services, structures and installationsrequired to support the main systems.
- FDS Field Development Ship. Dynamically-positionedmulti-purpose crane and pipelay vessel.
- FEED Front-End Engineering and Design. Basic engineeringand preliminary activities carried out before beginning acomplex project to evaluate its technical aspects and enablean initial estimate of the investment required.
- Flare tall metal structure used to burn off gas produced byoil/gas separation in oil fields when it is not possible to utiliseit on site or ship it elsewhere.
- FLNG Floating Liquefied Natural Gas unit used for thetreatment, liquefaction and storage of gas which issubsequently transferred onto vessels for transportation toend-use markets.
- Floatover type of module installation on offshore platformsthat does not require lifting operations. A specialised vesseltransporting the module uses a ballast system to positionitself directly above the location where the module is to beinstalled. Once this has been completed, the vessel backs offand the module is secured to the support structure.
14
Saipem Annual Report / Glossary
Glossary
Saipem Annual Report / Glossary
15
- Flowline pipeline used to connect individual wells to amanifold or to gathering and processing facilities.
- FPSO vessel Floating Production, Storage and Offloadingsystem comprising a large tanker equipped with ahigh-capacity production facility. This system, moored at thebow to maintain a geo-stationary position, is effectively atemporarily fixed platform that uses risers to connect thesubsea wellheads to the on-board processing, storage andoffloading systems.
- FSRU Floating Storage Regasification Unit. A floating terminalin which liquefied natural gas is stored and then regasifiedbefore being transported by pipeline.
- Gas export line pipeline for carrying gas from the subseareservoirs to the mainland.
- LNG Liquefied Natural Gas, obtained by cooling natural gas tominus 160 °C. At normal pressure, gas is liquefied to facilitateits transportation from the place of extraction to that ofprocessing and/or utilisation. A tonne of LNG equates to 1,500cubic metres of gas.
- LPG Liquefied Petroleum Gas. Produced in refineries throughthe fractionation of crude oil and subsequent processes, liquidpetroleum gas exists in a gaseous state at ambienttemperatures and atmospheric pressure, but changes to aliquid state under moderate pressure at ambienttemperatures, thus enabling large quantities to be stored ineasy-to-handle metal pressure vessels.
- Hydrocracker installation in which large hydrocarbonmolecules are broken down into smaller ones.
- Hydrotesting operation involving high pressure (higher thanoperational pressure) water being pumped into a pipeline toensure that it is devoid of defects.
- Hydrotreating refining process aimed at improving thecharacteristics of oil fractions.
- International Oil Companies privately-owned, typicallypublicly traded, oil companies engaged in various fields of theupstream and/or downstream oil industry.
- Jacket platform underside structure fixed to the seabed usingpiles.
- Jack-up mobile self-lifting unit comprising a hull andretractable legs used for offshore drilling operations.
- J-laying method of pipelaying that utilises an almost verticallaunch ramp, making the pipe configuration resemble theletter ‘J’. This configuration is suited to deep-water pipelaying.
- Leased FPSO FPSO vessel for which a lease contract is inplace between a client/lessee (i.e. an oil company) and acontractor/lessor, whereby the lessee makes lease paymentsto the lessor for use of the vessel for a specific period of time.At the end of the lease term, the lessee has the option topurchase the FPSO.
- Local Content policy whereby a company develops localcapabilities, transfers its technical and managerial know-howand enhances the local labour market and businessesthrough its own business activities.
- LTI (Lost Time Injury) any work-related injury that renders theinjured person temporarily unable to perform any regular jobor restricted work on any day/shift after the day or shift onwhich the injury occurred.
- Midstream sector comprising all those activities relating tothe construction and management of the oil transportinfrastructure.
- Moon pool opening in the hull of a drillship to allow for thepassage of operational equipment.
- Mooring buoy offshore mooring system.
- Multipipe system subsea gas/liquid gravity separationsystem using a series of small diameter vertical separatorsoperating in parallel (for deep water application).
- National Oil Companies State-owned/controlled companiesengaged in oil exploration, production, transportation andconversion.
- NDT (Non Destructive Testing) a series of inspections andtests used to detect structural defects conducted usingmethods that do not alter the material under inspection.
- NDT Phased Array non-destructive testing method thatemploys ultrasound to detect structural or welding defects.
- Offshore/Onshore the term offshore indicates a portion ofopen sea and, by extension, the activities carried out in thisarea, while onshore refers to land operations.
- Oil Services Industry companies that provide services to theoil exploration and production sector but which are notdirectly engaged themselves in oil production.
- Pig piece of equipment used to clean, descale and survey apipeline internally.
- Piggyback pipeline small-diameter pipeline, fixed to a largerpipeline, used to transport a product other than that of themain line.
- Pile long, heavy steel pylon driven into the seabed. A systemof piles is used as the foundation for anchoring a fixedplatform or other offshore structures.
- Pipe-in-pipe subsea pipeline system comprising 2 coaxialpipes, used to transport hot fluids (oil and gas). The inner pipetransports the fluid, whereas the outer pipe carries theinsulating material necessary to reduce heat loss to the sea.The outer pipe also protects the pipeline from water pressure.
- Pipe-in-pipe forged end forged end of coaxial double pipe.- Pipelayer vessel used for subsea pipelaying.- Pipeline pipes and auxiliary equipment used principally for
transporting crude oil, oil products and natural gas to thepoint of delivery.
- Pipe Tracking System (PTS) an electronic system used toensure the full traceability of the components of subsea pipesinstalled on a project.
- Piping and Instrumentation Diagram (P&ID) Piping andInstrumentation. Diagram showing all plant equipment, pipingand instrumentation with associated shutdown and safetyvalves.
- Pre-commissioning comprises pipeline cleaning out anddrying.
- Pre-drilling template support structure for a drilling platform.- Pre-Salt layer a geological formation present on the
continental shelves offshore Brazil and Africa.- Pre Travel Counselling health and medical advice designed to
take into account the health of the individual worker andensure that he/she is furnished with adequate information onthe specific risks present in his/her country of destinationand the preventive measures that should be adopted.
- Pulling minor operations on oil wells due to maintenance ormarginal replacements.
- QHSE Quality, Health, Safety, Environment.- Rig drilling installation comprising the derrick, the drill deck
(which supports the derrick), and ancillary installations thatenable the descent, ascent and rotation of the drill unit as wellas mud extraction.
- Riser manifold connecting the subsea wellhead to thesurface.
- ROV Remotely Operated Vehicle. Unmanned vehicle, piloted andpowered via umbilical, used for subsea surveys and operations.
Saipem Annual Report / Glossary
16
- Shale gas unconventional gas extracted from shale deposits.- Shallow waters see Conventional waters.- Sick Building Syndrome a combination of ailments associated
with a person’s place of work. The exact causes of thesyndrome are not known but the presence of volatile organiccompounds, formaldehyde, moulds and dust mites may becontributing factors.
- S-laying method of pipelaying that utilises the elasticproperties of steel, making the pipe configuration resemblethe letter ‘S’, with one end on the seabed and the other undertension on-board the ship. This configuration is suited tomedium to shallow-water pipelaying.
- Slug catcher equipment for the purification of gas.- Sour water water containing dissolved pollutants.- Spar floating production system, anchored to the seabed by
means of a semi-rigid mooring system, comprising a verticalcylindrical hull supporting the platform structure.
- Spare capacity relationship between crude oil production andproduction capacity, i.e. quantity of oil which is not currentlyneeded to meet demand.
- Spool connection between a subsea pipeline and the platformriser, or between the terminations of 2 pipelines.
- Spoolsep unit used to separate water from oil as part of thecrude oil treatment process.
- Stripping process through which volatile compounds areremoved from the liquid solution or the solid mass in whichthey have been diluted.
- Subsea processing operations performed in offshore oiland/or natural gas field developments, especially relating tothe equipment and technology employed for the extraction,treatment and transportation of oil or gas below sea level.
- Subsea tiebacks lines connecting new oil fields with existingfixed or floating facilities.
- Subsea treatment a new process for the development ofmarginal fields. The system involves the injection andtreatment of sea-water directly on the seabed.
- SURF Subsea, Umbilicals, Risers, Flowlines. Facilities,pipelines and equipment connecting the well or subseasystem to a floating unit.
- Tender Assisted Drilling unit (TAD) an offshore platformcomplete with drilling tower, connected to a drilling supporttender vessel housing all necessary ancillary infrastructures.
- Tandem Offloading method used for the transfer of liquids(oil or LNG) between 2 offshore units in a line via aerial,floating or subsea lines (unlike side-by-side offloading, wherethe 2 units are positioned next to each other).
- Tar sands mixture of clay, sand, mud, water and bitumen.The bitumen in tar sands is composed principally of highmolecular weight hydrocarbons and can be converted into avariety of oil products.
- Template rigid and modular subsea structure where theoilfield well-heads are located.
- Tendon pulling cables used on tension leg platforms to ensureplatform stability during operations.
- Tension Leg Platform (TLP) fixed-type floating platform heldin position by a system of tendons and anchored to ballastcaissons located on the seabed. These platforms are used inultra-deep waters.
- Tie-in connection between a production line and a subseawellhead or simply a connection between two pipelinesections.
- Tight oil oil ‘trapped’ in liquid form deep below the earth’ssurface in low permeability rock formations, which it isdifficult to extract using conventional methods.
- Topside portion of a platform above the jacket.- Train series of units that achieve a complex refining,
petrochemical, liquefaction or natural gas regasificationprocess. A plant can be made up of one or more trains ofequal capacity operating in parallel.
- Trenching burying of offshore or onshore pipelines.- Trunkline oil pipeline connecting large storage facilities to the
production facilities, refineries and/or onshore terminals.- Umbilical flexible connecting sheath, containing flexible pipes
and cables.- Upstream relating to exploration and production operations.- Vacuum second stage of oil distillation.- Wellhead fixed structure separating the well from the outside
environment.- Wellhead Barge (WHB) vessel equipped for drilling, workover
and production (partial or total) operations, connected toprocess and/or storage plants.
- Workover major maintenance operation on a well orreplacement of subsea equipment used to transport the oil tothe surface.
17
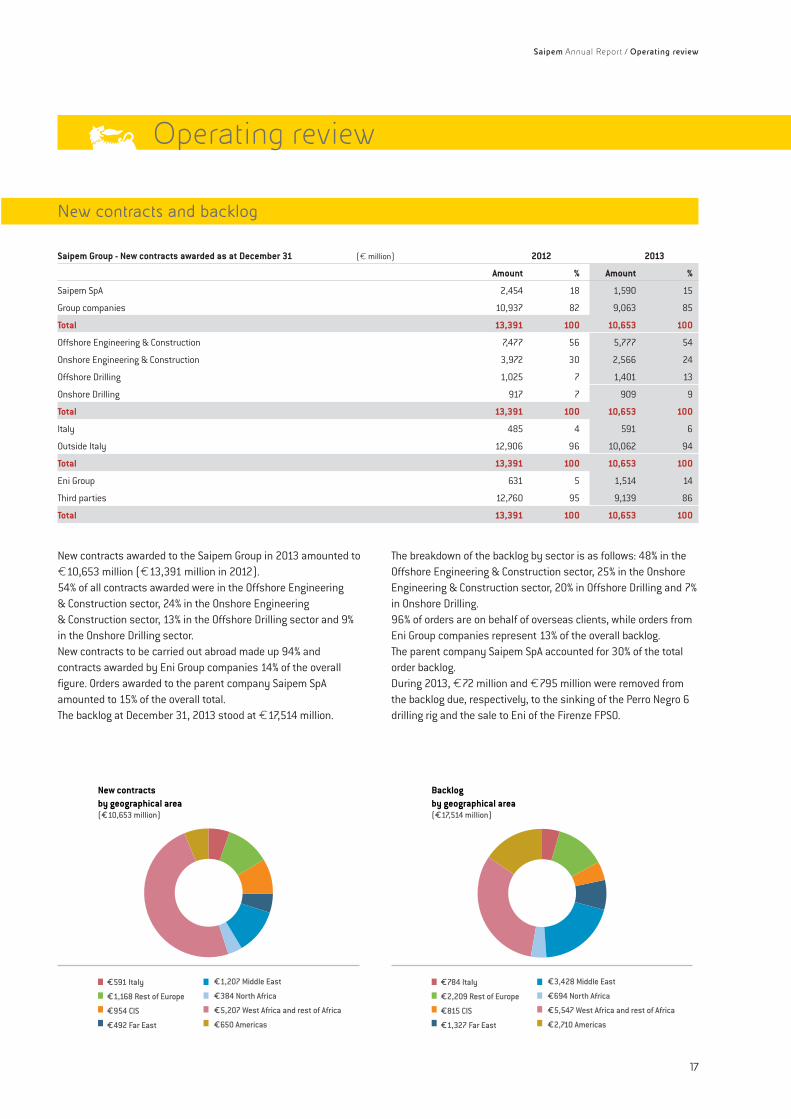
New contracts awarded to the Saipem Group in 2013 amounted to€10,653 million (€13,391 million in 2012).54% of all contracts awarded were in the Offshore Engineering& Construction sector, 24% in the Onshore Engineering& Construction sector, 13% in the Offshore Drilling sector and 9%in the Onshore Drilling sector.New contracts to be carried out abroad made up 94% andcontracts awarded by Eni Group companies 14% of the overallfigure. Orders awarded to the parent company Saipem SpAamounted to 15% of the overall total.The backlog at December 31, 2013 stood at €17,514 million.
The breakdown of the backlog by sector is as follows: 48% in theOffshore Engineering & Construction sector, 25% in the OnshoreEngineering & Construction sector, 20% in Offshore Drilling and 7%in Onshore Drilling.96% of orders are on behalf of overseas clients, while orders fromEni Group companies represent 13% of the overall backlog.The parent company Saipem SpA accounted for 30% of the totalorder backlog.During 2013, €72 million and €795 million were removed fromthe backlog due, respectively, to the sinking of the Perro Negro 6drilling rig and the sale to Eni of the Firenze FPSO.
New contracts and backlog
Saipem Group - New contracts awarded as at December 31 (€ million) 2012 2013
Amount % Amount %
Saipem SpA 2,454 18 1,590 15
Group companies 10,937 82 9,063 85
Total 13,391 100 10,653 100
Offshore Engineering & Construction 7,477 56 5,777 54
Onshore Engineering & Construction 3,972 30 2,566 24
Offshore Drilling 1,025 7 1,401 13
Onshore Drilling 917 7 909 9
Total 13,391 100 10,653 100
Italy 485 4 591 6
Outside Italy 12,906 96 10,062 94
Total 13,391 100 10,653 100
Eni Group 631 5 1,514 14
Third parties 12,760 95 9,139 86
Total 13,391 100 10,653 100
New contractsby geographical area(€10,653 million)
€591 Italy
€1,168 Rest of Europe
€954 CIS
€492 Far East
€1,207 Middle East
€384 North Africa
€5,207 West Africa and rest of Africa
€650 Americas
Backlog by geographical area(€17,514 million)
€784 Italy
€2,209 Rest of Europe
€815 CIS
€1,327 Far East
€3,428 Middle East
€694 North Africa
€5,547 West Africa and rest of Africa
€2,710 Americas
Operating review
Saipem Annual Report / Operating review
Saipem Group - Backlog as at December 31 (€ million) 2012 2013
Amount % Amount %
Saipem SpA 8,549 43 5,189 30
Group companies 11,190 57 12,325 70
Total 19,739 100 17,514 100
Offshore Engineering & Construction 8,721 44 8,447 48
Onshore Engineering & Construction 6,701 34 4,436 25
Offshore Drilling 3,238 16 3,390 20
Onshore Drilling 1,079 6 1,241 7
Total 19,739 100 17,514 100
Italy 1,719 9 784 4
Outside Italy 18,020 91 16,730 96
Total 19,739 100 17,514 100
Eni Group 2,526 13 2,261 13
Third parties 17,213 87 15,253 87
Total 19,739 100 17,514 100
Capital expenditure (€ million) 2012 2013
Saipem SpA 89 157
Other Group companies 926 751
Total 1,015 908
Offshore Engineering & Construction 525 398
Onshore Engineering & Construction 84 125
Offshore Drilling 284 174
Onshore Drilling 122 211
Total 1,015 908
Saipem Annual Report / Operating review
18
Capital expenditure
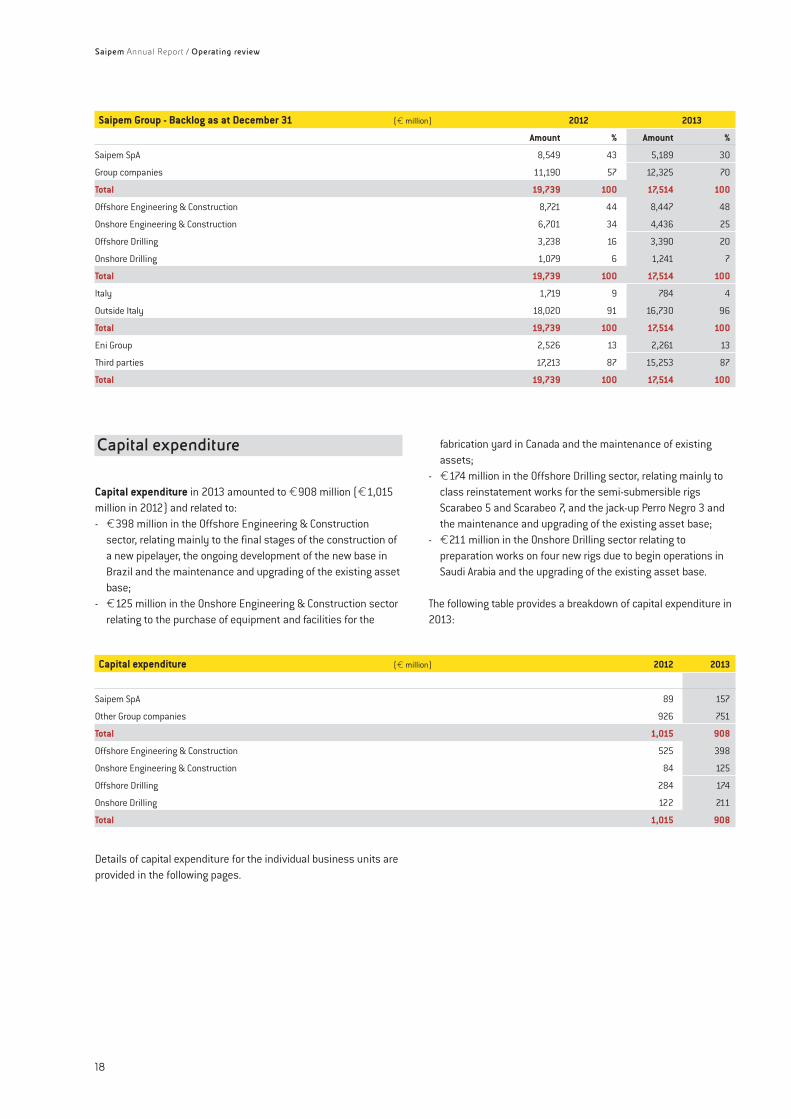
Capital expenditure in 2013 amounted to €908 million (€1,015million in 2012) and related to:- €398 million in the Offshore Engineering & Construction
sector, relating mainly to the final stages of the construction ofa new pipelayer, the ongoing development of the new base inBrazil and the maintenance and upgrading of the existing assetbase;
- €125 million in the Onshore Engineering & Construction sectorrelating to the purchase of equipment and facilities for the
fabrication yard in Canada and the maintenance of existingassets;
- €174 million in the Offshore Drilling sector, relating mainly toclass reinstatement works for the semi-submersible rigsScarabeo 5 and Scarabeo 7, and the jack-up Perro Negro 3 andthe maintenance and upgrading of the existing asset base;
- €211 million in the Onshore Drilling sector relating topreparation works on four new rigs due to begin operations inSaudi Arabia and the upgrading of the existing asset base.
The following table provides a breakdown of capital expenditure in2013:
Details of capital expenditure for the individual business units areprovided in the following pages.
General overview
The Saipem Group possesses a strong, technologically advancedand highly versatile fleet as well as world class engineering andproject management expertise. These unique capabilities andcompetences, together with a long-standing presence in strategicfrontier markets, represent an industrial model that is particularlywell suited to EPCI projects.
The end of the first half of 2013 saw the Castorone – the new330-metre long, 39-metre wide mono-hull pipelay vesselequipped with a class 3 dynamic positioning (DP) system, anS-lay system and features allowing for the installation of a J-laytower – begin to operate. After the vessel had successfullycompleted initial shallow water tests however, technical issuesrequired deep-water testing to be extended. As mentioned in theprofit warning issued on June 14, 2013, additional maintenancework was also required to replace defective parts that werecompromising the vessel’s productivity.The Castorone has been designed for challenging large-diameter,deep-water pipelay projects, but it also possesses the flexibilityand productivity necessary for effective deployment on lesscomplex projects.The vessel’s distinctive features include a class 3 DP system, thecapacity to fabricate and lay triple joint pipes of up to 48” indiameter (60” including coating) with a tensioning capacity of upto 750 tonnes (up to 1,500 tonnes in conditions of pipe floodingusing a special patented clamp), a highly automated firing linemade up of 7 workstations (3 welding and 4completion/inspection stations), an articulated stinger forpipelaying in shallow and deep-water with an advanced controlsystem, and the capacity to operate in extreme environments(Ice Class A0).
Meanwhile, the current trend for deep-water field developmentscontinues to drive the success of the FDS 2, which is a 183-metrelong, 32-metre wide mono-hull equipped with a cutting-edge class3 DP system and a pipeline fabrication system. The FDS 2 has avertical J-lay tower with a holding capacity of 2,000 tonnescapable of laying quad joint sealines of up to 36” in diameter andalso possesses the capability to operate in S-lay mode.With its 1,000 tonne crane and two 750 and 500 tonne capstanwinches (the latter featuring a heave compensation system), theFDS 2 is suited to even the most challenging of deep-waterprojects.Saipem’s fleet of technologically advanced vessels also includesthe Saipem 7000, which is equipped with a dynamic positioningsystem, has a 14,000-tonne lifting capacity, is capable of layingsubsea pipelines in ultra-deep waters using the J-lay system andcan handle a suspended load of up to 1,450 tonnes during pipelay
operations. The fleet further comprises the Castoro Sei, asemi-submersible pipelay vessel capable of laying large diametersubsea pipelines, the Field Development Ship (FDS), which is aspecial purpose vessel used in the development of deep-waterfields, equipped with a dynamic positioning system, a 600-tonnelifting capacity crane and a vertical pipelaying system capable ofoperating in water depths of over 2,000 metres and the Saipem3000, which is capable of laying flexible pipelines and installingumbilicals and mooring systems in deep-waters and installingsubsea structures of up to 2,200 tonnes.
Saipem is involved on an ongoing basis in the management anddevelopment of its fleet, carrying out constant maintenance andcontinuous upgrading and improvement of its assets in line withtechnological developments and client requirements, with the aimof maintaining its operating capacity and high safety standards ina continuously evolving market.
During the year, work continued in Brazil for the development of afabrication yard for subsea and floating facilities, as well as alogistics base on a 35 hectare area purchased in October 2011located in the district of Guarujá. The works are expected to becompleted during the second quarter of 2014, as per schedule.The area is situated strategically at about 350 km from the SantosBasin, the offshore Brazilian region where Pre-Salt fields havebeen discovered in ultra-deep water, and at 650 km from theCampos Basin, the most important offshore basin in Brazil.Saipem’s work in the new yard will complement the servicesoffered by the highly specialised ultra-deep water fleet that theCompany has developed over the last few years and will alsoenable Saipem to meet the particularly stringent local contentrequirements imposed in Brazil in the hi-tech ultra-deep waterdevelopment sector.
During the year, the Karimun fabrication yard in Indonesiacontinued construction work on various Group projects.Saipem also enjoys a strong position in the subsea market,thanks to its use of highly sophisticated technologies, such assubsea ROVs and specially equipped robots capable of carryingout complex deep-water pipeline operations.Finally, the Company is also active in the Leased FPSO sector, witha fleet comprising the Cidade de Vitoria, and the Gimboa.
Market conditions
2013 saw a slight downward revision of global growth estimatesfor the Offshore E&C sector. With demand for oil growing moreslowly than the supply, leading to expectations of a small drop inoil prices, Oil Company spending grew more slowly than had been
19
Saipem Annual Report / Operating review
Offshore Engineering & Construction
Saipem Annual Report / Operating review
20
forecast one year ago. In spite of this, the year saw excellentlevels of activity registered in almost all segments.
The subsea development segment continued to grow at asustained rate, with a much higher number of subsea unitsentering into production than in 2012. The North Sea/NorthAtlantic area was the most active (and indeed is expected toremain so in 2014), followed by Latin America (first and foremostBrazil) and West Africa (particularly Angola and Nigeria, with thedevelopment of the Pluto, Saturn, Venus and Mars fields for BP andUsan for Total). As a result of the high levels of activity registeredin the North Sea, operations in shallow waters in 2013 were muchhigher than they have been in the past. Deep-water discoverieshowever continued to be the main driver of growth in the sector,with the year seeing important discoveries such as Flemish Passin Canada, Sigsbee in the Gulf of Mexico, as well as the AngolanPre-Salt reservoirs in the Kwanza Basin, which could prove to haveenormous potential.The small diameter pipeline market continued to grow during2013, driven by a large number of projects in South-East Asia(Malaysia and Vietnam), deep-water developments in the Gulf ofMexico and intense activity in the Middle East, such as theongoing operations on the Al Wasit project located in the PersianGulf. In Latin America and the North Sea/North Atlantic area, a dropwas registered in installed kilometres, while West Africa postedsimilar levels to 2012, with growth forecast for 2014.Meanwhile the large diameter pipeline registered lower levels ofactivity in 2013 than in the previous year. The drop in activityaffected in particular a number of areas that in 2012 had beenparticularly active, as the result of the completion of operationson a number of major pipelay projects. Especially affected by thistrend were the Asia-Pacific and the North Sea/North Atlantic areas.Conversely, the Gulf of Mexico registered an increase in installedkilometres thanks to the large number of pipelines laid onultra-deep water operations (e.g. Walker Ridge and KeathleyCanyon).
The fixed platform installation sector recorded a marked increasein units installed, mainly in the Asia-Pacific and Gulf of Mexicoareas. The former accounted for almost half of all globalinstallations in absolute terms, with activities concentrated inparticular offshore China, Malaysia and Indonesia. Another verydynamic area was the Middle East/Caspian Sea area, which byitself accounted for more than a quarter of all global installations.Most of these were located in the United Arab Emirates andSaudi Arabia, where a number of major large-scale projects areunderway, such as Umm Lulu, Satah Al Razboot (SARB), UpperZakum, and Al Wasit. Finally, the year saw an increase in heavylifting activities, which accounted for around a fifth of allinstallations.Following the slowdown in 2012, the FPSO segment registered arecovery in terms of installations as a result of a number of newunits installed in Brazil. In parallel, there was a drop in the numberof orders placed for new units, due to Brazilian company OGX filingfor bankruptcy. In spite of this, Brazil continues to represent a keymarket for the sector, accounting for almost half of global demand.
The positive phase for the FSRU (Floating Storage RegasificationUnit) continued during 2013, with the FSRU Toscana commencingoperations and a number of new orders placed for new units inLatin America and the Middle East.The FLNG segment continued to register rapid growth, but theupwards trend is not without its elements of uncertainty.While the number of projects where the use of FLNG technology isbeing considered is growing, decision-making is taking longerthan anticipated and there have been a number of situations inwhich oil companies have eventually rejected FLNG in favour ofthe use of pipelines. A recent decision in favour of FLNG howeverarrived on the Browse project, in which Woodside has opted todevelop a floating unit concept. Australia and Asia-Pacific are thekey areas for the FLNG segment, although there are potentialprospects for development in other areas, such as Mozambique,Iraq, Israel, and Brazil.
New contracts
The most significant contracts awarded to the Group in 2013 were:- for Total Upstream Nigeria Ltd, an EPCI contract for the subsea
development of the Egina field. The scope of work includesengineering, procurement, fabrication, installation andpre-commissioning of subsea oil production and gas exportpipelines, flexible jumpers, and umbilicals;
- for ExxonMobil, in Angola, the EPCI contract Kizomba SatellitePhase 2 for subsea facilities, with fabrication to be carried outat the yards in Soyo and Ambriz. The scope of work includesengineering, procurement, fabrication and installation ofproduction and water injection pipelines and flowlines, rigidjumpers and other related subsea structures;
- for the Burullus Gas Co, in Egypt, a contract encompassing theengineering, procurement, installation, pre-commissioning andcommissioning support of subsea facilities in the West DeltaDeep Marine Concession;
- for Saudi Aramco, in Saudi Arabia, an EPCI contract for theengineering, procurement, fabrication, transport andinstallation of offshore facilities, including three platforms,three jackets and associated pipelines (approximately 30kilometres) and subsea cables (25 kilometres). Fabricationactivities will be carried out at the STAR yard in Saudi Arabia;
- for Cardon IV (a joint venture between Eni and Repsol), acontract encompassing the transportation and installation of ahub platform and two satellite platforms, an offshore exportpipeline and two infield flowlines, along with the related tie-inoperations;
- for Petrobras, in Brazil, an EPCI contract for the SapinhoàNorte/Iracema Sul project to be developed in the Santos BasinPre-Salt Region. The scope of work includes engineering,procurement, fabrication and installation of two offshorepipelines, with related terminations (PLETs);
- for Dragados, two T&I contracts for the transport and installationof two offshore platforms in Mexican waters in the Gulf ofMexico. The platforms will be installed using the float-overmethod, which has never been used before in the Gulf of Mexico;
Saipem Annual Report / Operating review
21
- for South Stream Transport BV, the contract for the preparatoryconstruction works of the South Stream Offshore Pipeline.The contract encompasses the engineering and procurementactivities required before construction begins, as well as theupgrading works to the equipment needed for pipelaying.The South Stream offshore pipeline will connect the RussianBlack Sea shore, in the area of Anapa, to the Bulgarian coastnear Varna, crossing the Turkish Exclusive Economic Zone ofthe Black Sea;
- for GDF Suez, in the UK, phase 2 of the Cygnus project,encompassing the installation of an infield flowline, an exportpipeline and umbilicals in the Southern Gas Basin;
- for Nord Stream AG, in the UK, the Main Repair contract for NordStream, which encompasses activities and services related tothe maintenance of two gas export pipelines;
- for Agip Kazakhstan North Caspian Operating Co NV, the EPCcontract for the EP Clusters 2 and 3 project in the framework ofthe Kashagan field development in Kazakhstan. The contractincludes engineering, procurement, fabrication, load-out andtransportation of three topside production manifold modules.All fabrication activities as well as all fabrication engineering willbe carried out in Kazakhstan, at the ER SAI yard in Kuryk;
- for Hyundai Heavy Industries, a contract for the fabrication ofoffshore structures off the coast of Congo. The scope of workencompasses the fabrication of the conductor pipes and of themooring and tendon piles for a tension leg platform;
- two EPCI contracts in Saudi Arabia for the construction of a newplatform and the upgrade of the obsolete control and safetysystems on three existing platforms located in the Arabian Gulf.All fabrication activities will be carried out at the STAR yard inSaudi Arabia.
Capital expenditure
Capital expenditure in the Offshore Engineering & Constructionsector mainly related to the final stages of the construction of anew pipelayer, the ongoing development of a new base in Braziland the maintenance and upgrading of the existing asset base.
Work performed
The biggest and most important projects underway or completedduring 2013 were.
In Saudi Arabia, for Saudi Aramco:- installation work is underway as part of the Al Wasit Gas
Program, for the development of the Arabiyah and Hasbahoffshore fields. The contract encompasses the engineering,procurement, construction and installation of 15 fixedplatforms, an export pipeline, offshore lines, and subsea andcontrol cables. Operations have begun under the same contractsupplementing the scope of work with the engineering,procurement, transport, installation and commissioning of2 trunklines in the Arabiyah and Hasbah fields;
- under the Long Term Agreement, for the engineering,procurement, construction, transport and installation ofstructures, platforms and pipelines, work is currently beingcarried out on two separate projects involving the installation offive pipelines, and the construction and installation of twojackets and three decks.
In Iraq, work continued for South Oil Co on the project Iraq CrudeOil Export Expansion - Phase 2, within the framework of theexpansion of the Basra Oil Terminal. The contract encompassesthe engineering, procurement, construction and installation of aCentral Metering and Manifold Platform (CMMP), along withassociated facilities.
In the Far East:- work was completed for PTT Exploration and Production Public
Co Ltd in Myanmar on the Zawtika project, encompassing thetransportation and installation of a Central Processing andLiving Quarters Platform;
- work was completed for Bien Dong Petroleum Operating Co onthe Bien Dong project in Vietnam, which encompassed theengineering, transportation and installation of pipelines andsubsea cables as well as of two platforms and interconnectingbridges;
- work was completed for Pearl Oil Ltd, in Indonesia, on the RubyField project, involving the transport and installation of twoplatforms;
- engineering is underway and design work is at the preparatorystage on the Masela FLNG project for Inpex Masela Ltd, inIndonesia, which encompasses the Front-end Engineering andDesign (FEED);
- work was completed on the Hai Su Trang Development projectfor Petrovietnam Technical Services Co in Vietnam. The contractencompassed the engineering, transportation and installationwork on 2 wellhead platforms and a pipeline;
- work is ongoing for Husky Oil China Ltd, in China, on the Liwan3-1 project, which encompasses the engineering, procurementand installation of two pipelines, umbilicals, and the transportand installation of a subsea production system linking thewellheads to a processing platform.
Engineering and logistical preparation work is underway inAustralia for INPEX on the Ichthys LNG project, which consists ofthe engineering, procurement, construction and installation of asubsea pipeline connecting the offshore central processingfacility to the onshore processing facility in Darwin.
In West Africa:- for Cabinda Gulf Oil Co Ltd (CABGOC), the second installation
campaign was completed on the Congo River Crossing Pipelineproject in Angola, which comprises engineering, procurement,fabrication and the installation of three subsea pipelines andsubsea spools, as well as trenching and crossing works. Theproject is being carried out off the coasts of Angola and theDemocratic Republic of the Congo;
- work for Total E&P Nigeria Ltd on the OFON2 - D030 project in
Saipem Annual Report / Operating review
22
Nigeria for new offshore facilities in the Ofon field wascompleted and received provisional acceptance. The contractinvolves the engineering, procurement, construction andinstallation of the OFP2 jacket, as well as the transportation andinstallation of the new OFQ platform complete with livingquarters;
- work was completed on the Usan Fairleads project for ElfPetroleum Nigeria (Total) encompassing the disconnection andreconnection of mooring lines to allow for thereplacement/refurbishment of twelve fairleads on an FPSOvessel;
- work was completed on the Usan project for Elf PetroleumNigeria (Total), relating to the subsea development of the Usandeep-water field, located approximately 160 km south of PortHarcourt in Nigeria. The contract comprised the engineering,procurement, construction, installation and assistance for thecommissioning and start-up of subsea umbilicals, flowlines andrisers connecting subsea wells to the FPSO system, as well asthe construction of the oil loading terminal, consisting of anoffloading buoy and 2 offloading lines, and part of the FPSOanchoring system;
- work was completed for Total E&P Congo on the N’Kossacontract in Congo, encompassing the removal of a flexiblejumper, the installation of two new flexible jumpers,procurement and pre-commissioning;
- for Mobil Producing Nigeria Unlimited, work was completed onthe contract for the Asasa Pressure Maintenance, Usari FA-FRRisers and Edop Pipeline Extension projects, encompassingthe fabrication and installation of pipelines, risers and subseaspools at a maximum water depth of fifty metres;
- engineering and procurement activities were almost completedoffshore Nigeria on the Bonga North West contract for ShellNigeria Exploration and Production Co Ltd (SNEPCo).The contract encompasses the engineering, procurement,construction, installation and pre-commissioning services forpipe-in-pipe production flowlines, flowlines for injecting waterinto fields as well as related subsea production facilities;
- work is underway for CABGOC, in Angola, on the Mafumeira 2project comprising engineering, procurement, fabrication,installation and pre-commissioning of URF (umbilical, riser andflowline) facilities and export pipelines;
- work is underway for ExxonMobil, in Angola, on the KizombaSatellite Phase 2 project at the yards in Soyo and Ambriz.The scope of work includes engineering, procurement,fabrication and installation of production and water injectionpipelines and flowlines, rigid jumpers and other related subseastructures;
- work started for Total Upstream Nigeria Ltd on an EPCI contractfor the subsea development of the Egina field. The scope ofwork includes engineering, procurement, fabrication,installation and pre-commissioning of subsea oil productionand gas export pipelines, flexible jumpers, and umbilicals;
- work started for Total Exploration and Production on the GirRI(Girassol Resources Initiatives) contract, in Block 17 inAngola, which encompasses engineering, procurement,fabrication, installation and commissioning of changes to thetopside of the pumping system on the FPSOs Girassol and Dalia;
- work started for Eni Congo, in Congo, on a contractencompassing the engineering, procurement, fabrication andtransportation of the Litchendjili jacket, piles and relatedappurtenances;
- work is underway for CABGOC, in Angola, on the EPCI 3 contractencompassing the engineering, procurement andpre-fabrication activities for subsequent offshore modificationsand tie-ins on the existing Mafumeira Norte platform and thefuture Mafumeira Sul production platforms.
Work started for the Burullus Gas Co, in Egypt, on a project in thearea of the West Delta Deep Marine Concession encompassing theengineering, procurement, construction and installation of subseawellheads and related infrastructures, umbilicals and flowlines.Work also continued for Burullus Gas Co on the Multi Role FieldSupport Vessel Services contract offshore Alexandria.
In the North Sea:- commissioning was completed for Total on the K4-Z project in
the Dutch sector of the North Sea, a contract involving theengineering, procurement, construction and installation of apipeline and a piggy back line. The project also includes pipelinetrenching, burial and shore approach works;
- work is underway for Dong E&P in the Danish sector of theNorth Sea on the Hejre project, which encompassesengineering, procurement, construction and installation of twopipelines that will connect the Hejre field to the Hejre platform;
- work started for Det Norske Oljeselskap ASA on a contractencompassing the transportation and installation of the IvarAasen jacket and the topside, in the Norwegian sector of theNorth Sea;
- preparatory activities commenced for GDF Suez, in the UK, onphase 2 of the Cygnus project, encompassing the installation ofan infield flowline, an export pipeline and umbilicals in theSouthern Gas Basin;
- various structures were installed using the Saipem 7000 forConocoPhillips (Jasmin, Eldfisk, Ekofish), Nexen (GoldenEagle) and Statoil (Gudrun).
In Russia, work is underway for Lukoil-Nizhnevolzhskneft on theFilanovsky contract for the engineering, procurement, fabricationand installation of an oil pipeline and a gas pipeline in amaximum water depth of 6 metres, along with related onshorepipelines connecting the riser block in the offshore field to theonshore shut-off valves. Work also commenced on the additionalscope of work comprising the transport and installation of fourplatforms.
In Croatia, work was completed for Inagip on the Inagip IKAAdriatico project, encompassing the transportation andinstallation of the IKA JZ jacket, associated appurtenances andsubsea pipelines.
In the framework of the Under Water Operation, in Azerbaijan,subsea inspection, maintenance and repair works continued forBP Exploration (Caspian Sea) Ltd on BP offshore infrastructures inthe Azeri offshore, including platforms installed by BP in previous
Saipem Annual Report / Operating review
23
years. In addition, work is underway on the Chirag Oil Project forAIOC, work is underway on the transportation and installation of ajacket (construction of which was completed in the first fewmonths of 2013), while work on the topside has been completed.
In Kazakhstan:- for Agip KCO, as part of the programme for the development of
the Kashagan field:• logistical support work is underway on the Hook-Up and
Commissioning project, encompassing the hook-up andcommissioning of offshore facilities. Work has beencompleted on the fabrication and completion of modules atthe Kuryk yard;
• work has been completed on the New Hook-Up,Pre-commissioning and Commissioning Assistance project,which principally involved the completion of theinterconnecting components between modules on islands Aand D;
- work continued for Teniz Burgylau Llp, a consortium withKeppel Kazakhstan Llp, on the fabrication, outfitting andcommissioning of a jack-up rig.
In addition, in Kazakhstan, for Agip KCO (consortium in which Eni,ExxonMobil, Shell, Total and KazMunaiGas hold shares of 16.81%each, with smaller stakes also held by CNPC and Inpex), Saipemundertook the Trunkline and Production Flowlines based on clientspecifications, completing the requested work in 2010. The projectencompassed the engineering, procurement, coating, laying andcommissioning of pipelines, fibre optic cables and umbilicals. Afterleakages were detected in a section of the onshore pipelines, theclient asked Saipem to address the issue under the guarantee.However, Saipem, having received advice from qualified externallegal consultants, does not consider itself obliged to perform theseworks, given that acceptance of the works performed was obtainedin October 2010, meaning that the guarantee period expired inOctober 2011. Saipem has invited the client to investigate otherpotential areas of responsibility for the problems identified(e.g. management of the pipeline by the client after delivery,inadequate specifications provided by client; inadequate quality ofthe piping). At the current point in time, no dispute is underway.
In the Gulf of Mexico:- pipelay work was completed for Chevron on the Jack Saint Malo
project, which encompasses the transport and installation of anexport pipeline connecting the floating platform Jack SaintMalo;
- work commenced for Discovery Producers Llc on the contractfor the transport and installation of the gas export pipelineKeathley Canyon Connector.
In Brazil, for Petrobras:- work was completed on the Guara & Lula-Nordest gas export
pipeline project, which encompassed the transportation,installation and pre-commissioning of two export sealines, aswell as the engineering, procurement and construction ofrelated subsea equipment;
- engineering and procurement work was completed andfabrication is underway on the P55-SCR contract, which also
encompasses the transportation and offshore installation offlowlines and risers serving the semi-submersible platformP-55 to be installed in the Roncador field, in the Campos Basin,off the coast of the Rio de Janeiro state in Brazil;
- work continued on the contract for the construction of the RotaCabiúnas gas export trunkline, situated in the Santos BasinPre-Salt Region. The development comprises the engineeringand procurement of subsea equipment and the installation of agas pipeline in a maximum water depth of 2,200 metres.The pipeline will connect the Central Gathering Manifold in theLula field, in the Santos Basin, to the onshore Processing Plantof Cabiúnas, located in the Macaé district, in the State of Rio deJaneiro;
- work continued on the Sapinhoà Norte and Cernambi Sulproject, encompassing the engineering, procurement,fabrication, installation and pre-commissioning of the SLWR(Steel Lazy Wave Riser) for the collection system at theSapinhoà Norte field, and of the FSHR (Free Standing HybridRisers) for the gas export systems at the Sapinhoà Norte andCernambi Sul fields. Preparatory work also started on theSapinhoà Norte and Iracema Sul project;
- work began in the Santos Basin on the Lula NE Cernambicontract for the engineering, procurement, construction andinstallation of a gas pipeline and related subsea equipment.
In Venezuela:- work began for Cardon IV on the Perla EP project encompassing
the transport and installation of three platforms and threepipelines;
- work continued for PDVSA in Venezuela on the construction ofthe Dragon - CIGMA project involving the transportation andinstallation of the gas pipeline which will connect the Dragongas platform to the CIGMA complex.
In Italy, work for OLT Offshore LNG Toscana to convert the gascarrier ship, Golar Frost, has almost been completed. The contractcomprises the conversion of the gas carrier vessel provided by theclient into a floating LNG regasification terminal, in addition to alloffshore works necessary for installation and commissioning.
In the Leased FPSO segment, the following vessels carried outoperations during 2013:- the FPSO Cidade de Vitoria carried out operations as part of an
eleven-year contract with Petrobras on the second phase ofdevelopment of the Golfinho field, situated off the coast ofBrazil at a water depth of 1,400 metres;
- the FPSO Gimboa carried out operations on behalf of SonangolP&P, under a six-year contract for the provision and operation ofan FPSO unit for the development of the Gimboa field, located inBlock 4/05 offshore Angola, at a water depth of 700 metres.
The Firenze FPSO vessel also operated during the year and then,on December 30, 2013, was sold to Eni. The contract signed withEni in 2009 provided for the option to purchase the vessel – whichis currently deployed in the Eni-operated Aquila field off the coastof Puglia – subsequent to the conversion and commissioning ofthe vessel, which was completed at the end of last year.
Saipem Annual Report / Operating review
24
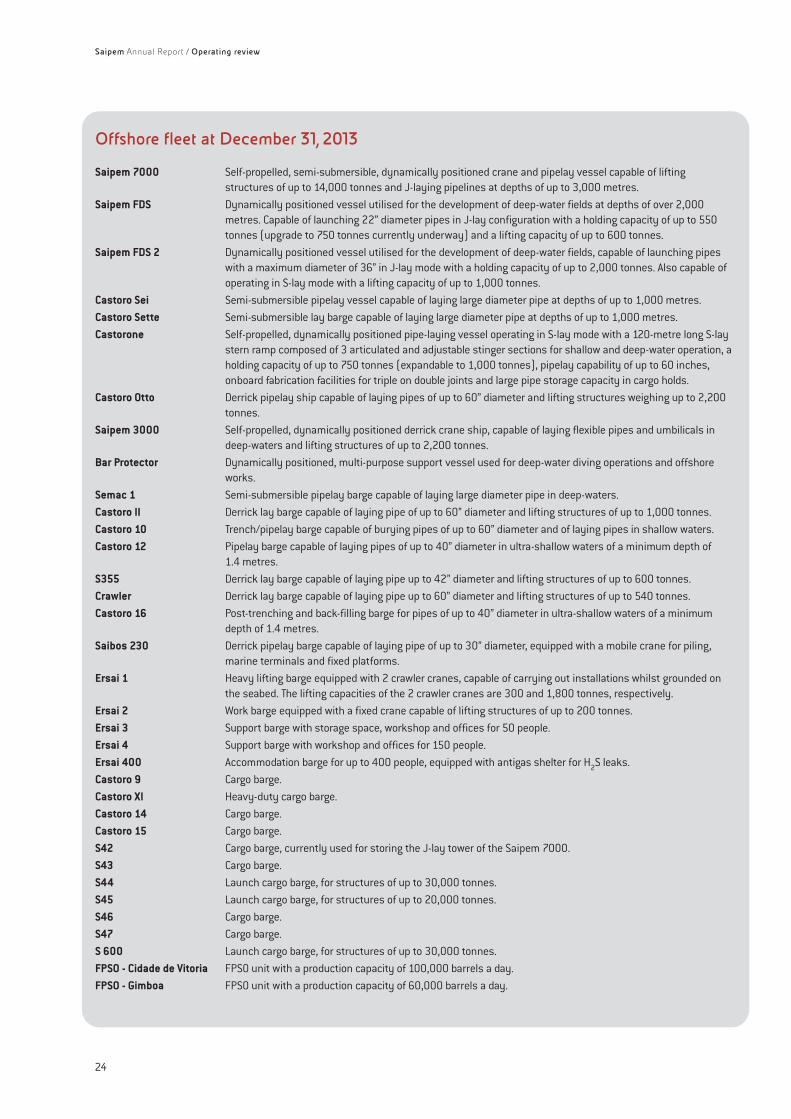
Offshore fleet at December 31, 2013
Saipem 7000 Self-propelled, semi-submersible, dynamically positioned crane and pipelay vessel capable of liftingstructures of up to 14,000 tonnes and J-laying pipelines at depths of up to 3,000 metres.
Saipem FDS Dynamically positioned vessel utilised for the development of deep-water fields at depths of over 2,000metres. Capable of launching 22” diameter pipes in J-lay configuration with a holding capacity of up to 550tonnes (upgrade to 750 tonnes currently underway) and a lifting capacity of up to 600 tonnes.
Saipem FDS 2 Dynamically positioned vessel utilised for the development of deep-water fields, capable of launching pipeswith a maximum diameter of 36” in J-lay mode with a holding capacity of up to 2,000 tonnes. Also capable ofoperating in S-lay mode with a lifting capacity of up to 1,000 tonnes.
Castoro Sei Semi-submersible pipelay vessel capable of laying large diameter pipe at depths of up to 1,000 metres.Castoro Sette Semi-submersible lay barge capable of laying large diameter pipe at depths of up to 1,000 metres.Castorone Self-propelled, dynamically positioned pipe-laying vessel operating in S-lay mode with a 120-metre long S-lay
stern ramp composed of 3 articulated and adjustable stinger sections for shallow and deep-water operation, aholding capacity of up to 750 tonnes (expandable to 1,000 tonnes), pipelay capability of up to 60 inches,onboard fabrication facilities for triple on double joints and large pipe storage capacity in cargo holds.
Castoro Otto Derrick pipelay ship capable of laying pipes of up to 60” diameter and lifting structures weighing up to 2,200tonnes.
Saipem 3000 Self-propelled, dynamically positioned derrick crane ship, capable of laying flexible pipes and umbilicals indeep-waters and lifting structures of up to 2,200 tonnes.
Bar Protector Dynamically positioned, multi-purpose support vessel used for deep-water diving operations and offshoreworks.
Semac 1 Semi-submersible pipelay barge capable of laying large diameter pipe in deep-waters.Castoro II Derrick lay barge capable of laying pipe of up to 60” diameter and lifting structures of up to 1,000 tonnes.Castoro 10 Trench/pipelay barge capable of burying pipes of up to 60” diameter and of laying pipes in shallow waters.Castoro 12 Pipelay barge capable of laying pipes of up to 40” diameter in ultra-shallow waters of a minimum depth of
1.4 metres.S355 Derrick lay barge capable of laying pipe up to 42” diameter and lifting structures of up to 600 tonnes.Crawler Derrick lay barge capable of laying pipe up to 60” diameter and lifting structures of up to 540 tonnes.Castoro 16 Post-trenching and back-filling barge for pipes of up to 40” diameter in ultra-shallow waters of a minimum
depth of 1.4 metres.Saibos 230 Derrick pipelay barge capable of laying pipe of up to 30” diameter, equipped with a mobile crane for piling,
marine terminals and fixed platforms.Ersai 1 Heavy lifting barge equipped with 2 crawler cranes, capable of carrying out installations whilst grounded on
the seabed. The lifting capacities of the 2 crawler cranes are 300 and 1,800 tonnes, respectively.Ersai 2 Work barge equipped with a fixed crane capable of lifting structures of up to 200 tonnes.Ersai 3 Support barge with storage space, workshop and offices for 50 people.Ersai 4 Support barge with workshop and offices for 150 people.Ersai 400 Accommodation barge for up to 400 people, equipped with antigas shelter for H2S leaks.Castoro 9 Cargo barge.Castoro XI Heavy-duty cargo barge.Castoro 14 Cargo barge.Castoro 15 Cargo barge.S42 Cargo barge, currently used for storing the J-lay tower of the Saipem 7000.S43 Cargo barge.S44 Launch cargo barge, for structures of up to 30,000 tonnes.S45 Launch cargo barge, for structures of up to 20,000 tonnes.S46 Cargo barge.S47 Cargo barge.S 600 Launch cargo barge, for structures of up to 30,000 tonnes.FPSO - Cidade de Vitoria FPSO unit with a production capacity of 100,000 barrels a day.FPSO - Gimboa FPSO unit with a production capacity of 60,000 barrels a day.
25
General overview
The Saipem Group’s Onshore Engineering & Construction expertiseis focused on the execution of large projects with a high degree ofcomplexity in terms of engineering, technology and operations,with a strong bias towards challenging projects in difficultenvironments and remote areas.
Saipem enjoys a worldwide leading position in the Onshoresector, providing a complete range of integrated basic anddetailed engineering, procurement, project management andconstruction services, principally to the Oil&Gas, complex civiland marine infrastructure and environmental markets.The Company places great emphasis on maximising local contentduring project execution in a large number of the areas in whichit operates.
Market conditions
Conditions in 2013 on the Onshore E&C market saw investmentsremain steady at levels comparable with 2012, with the award of anumber of important EPC contracts in various segments(Upstream, LNG, Pipelines and Refining) and a surge of newproject announcements in North America driven by the growingavailability of raw materials from non-conventional oil and gassources. Canada has been taking advantage of theseopportunities, which have seen it become one of the top locationsin terms of volumes of investments, with the year again bringingan increase in the value of projects awarded in the country.Meanwhile, a series of contract awards made in the LNG, Pipelinesand Petrochemical segments in 2013 saw the US rank first interms of global volume of investments. Thanks to its abundantresources, North America continues to be a focus of investmentactivity, as demonstrated by the significant increase in plannedprojects recorded in the last two years. The Middle East on theother hand, while continuing to attract interest on the part of E&Cinvestors, has been showing signs of a downturn, due inparticular to a drop in activity in Saudi Arabia in 2013, followingthe major investments made in the country in previous years.Investment levels in the area have however been sustained byrecent contract awards made in Iraq (providing confirmation ofthe greater political stability achieved in the country over the lasttwo years), in the United Arab Emirates in the Upstream segmentand finally in Iran and Oman. North Africa saw a series ofimportant contract awards made in Algeria in the Refining andUpstream sectors, with investments in the country picking upfollowing a period of political instability. A general decline ininvestments was registered in the Asia-Pacific area. This wascaused by a fall in spending levels in Australia (which, followingthe major project awards seen in the LNG sector in recent years, is
now capitalising on the investments made), India, South Koreaand Indonesia. Levels of investment in the area were sustained byChina, with the pipelines segment in particular posting a strongperformance, Vietnam, where a major EPC contract was awardedin the Refining segment, and Malaysia, which saw awards in theLNG sector.Investments in the Upstream segment experienced an upturn,following the contraction in spending seen in 2012, which cameon the back of the high levels of investments registered inprevious years. 2013 saw a number of important EPC contractawards in the Middle East (UAE and Iraq), North America (Canada)and North Africa (Algeria). In Iraq, following a period characterisedby political uncertainty, the favourable conditions that emergedduring 2012 continued to prevail, with new awards made for theBadra and Akkas field development projects. In the United ArabEmirates, major EPC contract awards were made by ZADCO,ADMA-OPCO and ADCO. In Algeria, Onshore E&C activities picked up,with awards made for the development of the Alrar field and theconstruction of a gas treatment plant in Touat. In Canada, awardscontinued for the development of non-conventional oil sources,such as tar sands, underpinned by oil prices that were sufficientlyhigh to make new projects profitable.The Upstream segment continued to show good short to mediumterm growth potential driven by both ongoing gas and oil fielddiscoveries and developments, as well as the need to maintainproduction levels in existing fields.With the abundance of available gas in North Americaunderpinning the realisation of a large number of projects in boththe US and Canada, the Pipelines segment posted anotherpositive performance in 2013, with investments up comparedwith the previous year. Noteworthy projects included the Canadian‘Prince Rupert’ gas transmission project and the NGL pipelinedevelopments in the US backed by Enterprise Products Partnersand Oneok. During the opening months of 2013, the segment sawthe award in China of phase 2 of the third ‘West-East China’ gaspipeline. This is a project of significant dimensions which,together with new pipeline installation projects in Iran and Mexico,made a significant contribution to the good performanceregistered in the segment.The abundance of available gas continued to be the driving factorbehind the preference for gas pipelines over oil pipelines,particularly in countries looking to expand their distributionnetworks, such as the US, Canada and China.The LNG market continued to grow steadily, registering a rise ininvestments compared with 2012. Thanks to its abundance of gasfrom non-conventional sources, North America and the US inparticular saw the award of a number of important projects duringthe year. This included the award of contracts for five LNG trainsby Cheniere – three at Corpus Christi (trains 1, 2 and 3), due to bebuilt in stages, plus two at Sabine Pass (trains 3 and 4) – and twotrains by Freeport LNG in Freeport (trains 1 and 2). The US LNG
Onshore Engineering & Construction
Saipem Annual Report / Operating review
Saipem Annual Report / Operating review
26
market has seen a growing number of companies showinvestment interest over the last two years. In the Asia-Pacificarea, 2013 saw a fall in investments which was principally causedby a slowdown in major project EPC awards in Australia, followinga four-year period characterised by high levels of spending.Despite the fact that some projects may suffer delays as a resultof a gradual rise in production costs, there continue to besubstantial opportunities in the area. In Malaysia, Petronasawarded two EPC contracts in Kertih and Bintulu, while in the CIS,investments picked up in Russia, with Gazprom awarding the firstLNG contract in the Yamal peninsula.Investments in the Refining segment maintained the positivetrend seen during the first half of 2013, with a large number ofEPC contracts finalised. Projects awarded in the Middle Eastincluded the Sohar refinery expansion project in Oman, phase 2 ofQatar’s Ras Laffan refinery project, as well as a project for Aramcoin Riyadh, Saudi Arabia and a number of minor projects in Kuwait.Recently the project for the Karbala oil refinery in Iraq wasawarded. In North Africa, Sonatrach made a series of major awardsin Algeria for the Biskra, Ghardaïa and Tiaret oil refineries.In the Asia-Pacific area, Petrovietnam began construction works atNghi Son in Vietnam. In Latin America, PDVSA embarked on phase1 of its Batalla de Santa Inés refinery situated in Venezuela, whilein the CIS area, Lukoil awarded the contract for the expansion andupgrade of its Volgograd refinery in Russia. There was alsosignificant activity in Europe, with Socar awarding the project tobuild the Izmir refinery in Turkey.Following a series of substantial investments in 2012, thePetrochemical segment registered a fall in spending.Overall spending for the year was however boosted by the awardof important contracts in the US by Chevron at Old Ocean, Texas(construction of two polyethylene units) and by Dow in Freeport,Texas. Despite the contraction in spending, the segment isshowing signs of buoyancy, with a number of minor EPC contractsawarded in various geographical areas.Although failing to reach the high levels witnessed in the previousyear, spending in the Fertilisers segment was nevertheless good,with EPC contracts awarded in a number of geographical areas.In the Middle East, a contract was awarded for the construction ofan ammonia plant in Waad Al Shamal, Saudi Arabia; in West Africa,Dangote awarded a contract for a fertiliser plant in Nigeria; in theCIS, Socar awarded contracts for its Sumgayit (Azerbaijan) andPhosagro (Russia) projects; in North America, Incitec Pivotawarded the contract for its Waggaman, US, ammonia productionplant; and in Indonesia, Panca Amara Utama awarded the contractfor its Luwuk project.The Infrastructure market maintained a positive trend in bothcivil and port infrastructures segments, particularly in emergingcountries characterised by rapid economic development.
New contracts
The most significant contracts awarded to the Group during 2013were:- for Dangote Fertiliser Ltd, an EPC contract for a new ammonia
and urea production complex to be realised in Edo State, Nigeria.
The scope of work encompasses engineering, procurement andconstruction of two twin production streams and relatedutilities and off-site facilities;
- for Star Refinery AS, an EPC contract for the construction of theSocar Refinery, in Turkey, encompassing the engineering,procurement and construction of the refinery and three newcrude oil unloading jetties adjacent to the Petkim Petrochemicalfacility;
- the EPC contract Tempa Rossa for Eni, in Italy, encompassingimprovements to the storage infrastructure for crude oil;
- the EPC contract Cemex Plant Saluggia for Sogin, in Italy,encompassing the engineering, procurement and constructionof a temporary storage facility for radioactive liquid waste;
- the Zubair Gathering System project for Morning Star for GeneralServices Llc and ExxonMobil Iraq Ltd, in Iraq, whichencompasses the construction of a gathering system, flowlinesand interconnecting facilities, as well as the distribution node;
- the Rotondella contract for Sogin, in Italy, encompassing theconstruction of a plant for the concrete encasement ofradioactive waste, the building which will house the plant and abuilding for the storage of cement products.
Capital expenditure
Capital expenditure in the Onshore Engineering & Constructionsector focused mainly on the acquisition of equipment andfacilities for the base in Canada, which was inaugurated onNovember 19, as well as on maintenance of the existing assetbase.
Work performed
The biggest and most important projects underway or completedduring 2013 were.
In Saudi Arabia:- for Saudi Aramco, construction work was completed on the
Manifa Field contract for the construction of the gas/oilseparation trains at the Manifa Field in Saudi Arabia. The projectencompassed the engineering, procurement and constructionof three gas/oil separation trains, gas dehydration, crude inletmanifolds and the flare gas system;
- for Safco, work continued on the Safco V contract, whichencompasses the engineering, procurement and constructionof a urea production plant, together with associated utilities andoff-site systems and interconnecting structures to existingplants;
- for the Emirate of Makkah Province, installation work wascompleted, while procurement and construction workcontinued on the Stormwater Drainage Program - Package 8project, encompassing the procurement, installation,construction and assistance during the commissioning of anew rainwater drainage system, serving the northern side ofthe city of Jeddah;
- for Saudi Aramco and Sumitomo Chemical, work continued on
Saipem Annual Report / Operating review
27
the contract for the Naphtha and Aromatics Package of theRabigh II project. The scope of work includes the engineering,procurement and construction of two processing units: aNaphtha Reformer Unit and an Aromatics Complex.
In Qatar, work on the EPC Qafco 5 - Qafco 6 project for QatarFertiliser Co SAQ in the industrial area of Qafco in the city ofMesaieed was completed. The project comprises engineering,procurement, construction and commissioning of 4 new ammoniaand urea production plants and associated serviceinfrastructures. The plants will go on to form the world’s largestammonia and urea production site.
In the United Arab Emirates:- activities continued on the contract for Abu Dhabi Gas
Development Co Ltd forming part of the development of thehigh sulphur content Shah sourgas field, encompassing thetreatment of 1 billion cubic feet a day of sourgas from the Shahfield, the separation of the sulphur from the natural gas and thetransportation of both to treatment facilities near Habshan andRuwais in the northern part of the Emirate;
- for the Etihad Rail Co in Abu Dhabi, work continued on a projectencompassing the engineering and construction of a railwayline linking the natural gas production fields of Shah andHabshan (located inland) to the Port of Ruwais.
In Kuwait, construction work continued for Kuwait Oil Co (KOC) onthe BS 171 contract, which encompasses the engineering,procurement, construction and commissioning of a new gasbooster station consisting of two trains for gas compression anddehydration. The gas will be subsequently conveyed to the Mina AlAhmadi refinery.
In Iraq:- work is underway for Fluor Transworld Services Inc and Morning
Star for General Services Llc on the West Qurna project. Thecontract comprises engineering, procurement, construction,pre-commissioning and commissioning of water treatment andconveyance infrastructure, a pipeline and a water injectionsystem;
- work is underway for State Company of fertiliser South Region,on the Khor Al-Zubair fertiliser Plant Rehabilitation project,which encompasses engineering, procurement andtransportation for ammonia and urea units;
- work is underway for Basrah Gas Co (BGC) on the rehabilitationof two terminals (Marine and Storage) at Umm Qasr port inBasrah province;
- work commenced on the Zubair Gathering System project forMorning Star for General Services Llc and ExxonMobil Iraq Ltd,which encompasses the construction of a gathering system,flowlines and interconnecting facilities, as well as thedistribution node.
In Morocco, work continued on a contract for the expansion of thePort of Tangiers for Tangier Mediterranean Special Agency, in ajoint venture with Bouygues Travaux Publics and Bouygues Maroc.
In Turkey, work started for Star Refinery AS on the AegeanRefinery project, encompassing the engineering, procurementand construction of a refinery.
In Algeria, for Sonatrach:- construction activities were completed on the contract for gas
pipeline GK3 - lot 3, covering the engineering, procurement andconstruction of a gas transportation system. Lot 3 comprises agas pipeline system from Mechtatine to Tamlouka in thenortheast of Algeria, which then connects the latter to Skikdaand El-Kala, located on the northeast coast of the country;
- construction work was completed and commissioning startedon the contract for the construction of infrastructure for an LPGtreatment plant in the Hassi Messaoud oil complex. Thecontract comprises the engineering, procurement andconstruction of 3 LPG trains;
- construction work was completed on the project for Sonatrachand First Calgary Petroleum for the construction of facilities forthe treatment of natural gas extracted from the MenzelLedjmet East field and from the future developments of theCentral Area Field Complex. The contract encompasses theengineering, procurement and construction of the natural gasgathering and treatment plant and related export pipelines;
- construction work continued on the LNG GL3Z Arzew contract,which comprises engineering, procurement and construction ofa liquefaction plant and the construction of utilities, a generatorset and jetty.
In Nigeria:- work was completed for ChevronTexaco on the Escravos GTL
project. The plant will comprise 2 parallel trains;- work is underway for Southern Swamp Associated Gas Solution
(SSAGS) on the Southern Swamp contract, comprisingengineering, procurement, construction and commissioning ofcompression facilities at four sites and of new gas centralproduction facilities at one of the sites, which will treat therouted associated gas;
- work continued for Dangote Fertiliser Ltd on a new ammoniaand urea production complex to be realised in Edo State.The scope of work encompasses engineering, procurement andconstruction of two twin production streams and relatedutilities and off-site facilities;
- work is underway for Total Exploration and Production Nigeria Ltd(TEPNG) on the Northern Option Pipeline project, comprisingengineering, procurement, construction and commissioning of apipeline that will connect Rumuji to Imo River;
- work was completed for the Nigerian National Petroleum Corp(NNPC) and Chevron on the contract for the Olero CreekRestoration project, which included the refurbishment ofproduction facilities in the Olero Creek swamp area in DeltaState;
- work continued for the Government of Rivers State on thecontract for the engineering, procurement and construction ofthe first and second train of the Independent Power Plant atAfam;
- work commenced for Shell Petroleum Development Co of Nigeriaon the Otumara-Saghara-Escravos Pipeline contract. The
In Mexico:- work is underway for Transcanada (Transportadora de Gas
Natural Norte-Noroeste) on the El Encino project, comprisingengineering, procurement and construction of a pipeline fromEl Encino (Chihuahua State) to Topolobampo (Sinaloa State).The project includes two compressor stations and threemetering stations;
- work continued for PEMEX on the Tula and Salamanca contractfor the construction of two desulphurisation units and twoamine regeneration units to be built at two of the client’srefineries. The facilities will be built at the Miguel Hidalgorefinery, located 2,000 metres above sea level near the town ofTula and at the Antonio M. Amor refinery, located 1,700 metresabove sea level near the town of Salamanca.
Engineering and construction of two pipelines has almost beencompleted on the Produccion Temprana 2012 project forPetrojunín in Faja Orinoco, Venezuela.
In Suriname, for Staatsolie, work has almost been completed onthe contract encompassing engineering, procurement, fabricationand construction for the expansion of the Tout Lui Faut refinery,located south of the capital Paramaribo.
In Australia:- work is at an advanced stage of completion for Gladstone LNG
Operations Pty Ltd on the Gladstone LNG contract, involving theengineering, procurement and construction of a gas pipelineconnecting the Bowen and Surat fields to the Gladstone StateDevelopment Area (GSDA) near the city of Gladstone,Queensland, where an LNG liquefaction and export plant is dueto be built;
- construction activities continued for Chevron on the GorgonLNG jetty and marine structures project. The scope of workconsists of the engineering, procurement, fabrication,construction and commissioning of the LNG jetty and relatedmarine structures for the new Chevron Gorgon LNG plant onBarrow Island, 70 kilometres off the Pilbara coast of WesternAustralia.
contract encompasses the engineering, procurement,fabrication and commissioning of a network of pipelines in aswamp area, to connect the client’s flowstations in theOtumara, Saghara and Escravos fields.
In Italy:- construction activities are being completed for the Eni Refining
& Marketing Division in connection with the first industrialscale application of EST (Eni Slurry Technology), as part of theproject for the construction of a refinery at Sannazzaro. EST –to whose development Saipem made a significant contribution– has the capacity to convert almost completely heavy oilresidues into lighter products;
- for Rete Ferroviaria Italiana SpA (Ferrovie dello Stato Group),work is underway on the contract for the detailed engineering,project management and construction of a 39 km section ofhigh-speed railway line and of an additional 12 km ofinterconnections with the existing conventional railway, alongthe Treviglio-Brescia section across the Milan, Bergamo andBrescia provinces, as well as all associated works, such aspower lines, works to reduce road interference, road crossingsand environmental mitigation.
In Poland, engineering work continued for Polskie LNG on thePolskie contract for the construction of a re-gasification terminal.The contract encompasses the engineering, procurement andconstruction of the regasification facilities, including 2 liquid gasstorage tanks.
In Canada:- work continued on the Sunrise EPC contract for Husky Oil,
which encompasses the engineering, procurement andconstruction of the Central Processing Facilities, comprising 2plants;
- works are underway for Canadian Natural Resources Ltd in theAthabasca region of Alberta, on the engineering, procurementand construction of a Secondary Upgrader plant, under acontract included in the Horizon Oil Sands - HydrotreaterPhase 2 project;
- Front-end Engineering and Design (FEED) work was completed,while activities relating to an additional scope of workcontinued, on the Statoil Corner Project for KKD Statoil Canada.
Saipem Annual Report / Operating review
28
29
General overview
At year end 2013, the Saipem Offshore Drilling fleet consisted ofseventeen vessels: seven deep-water units for operations atdepths in excess of 1,000 metres (the drillships Saipem 10000and Saipem 12000 and the semi-submersible drilling rigsScarabeo 5, Scarabeo 6, Scarabeo 7, Scarabeo 8 and Scarabeo 9),two for mid-water operations at depths of up to 1,000 metres (thesemi-submersible drilling rigs Scarabeo 3 and Scarabeo 4), twohigh specification jack-ups for operations at depths of from 300 to375 feet (Perro Negro 7 and Perro Negro 8), five standard jack-upsfor activities at depths up to 300 feet (Perro Negro 2, Perro Negro3, Perro Negro 4, Perro Negro 5 and Ocean Spur) and one bargetender rig (TAD). All units are the property of Saipem, with theexception of the jack-up Ocean Spur, which is on lease from thirdparties. The fleet also includes other minor units operating mainlyoffshore Peru. In 2013, Saipem’s Offshore Drilling fleet operated inthe Norwegian sector of the North Sea and the Barents Sea, in theMediterranean Sea, the Red Sea, the Persian Gulf, offshoreMozambique in West Africa and offshore Ecuador and Peru.
Market conditions
The majority of investments made in the Offshore Drilling sector in2013 were concentrated in the Golden Triangle of West Africa,Brazil and the Gulf of Mexico. West Africa, with Angola leading theway, maintained its position as the key area for offshoreexploratory activities in Africa, Brazil continued its leadership ofthe deep-water market, while the Gulf of Mexico, on the back of anumber of new discoveries, followed the growth trend seen in theprevious years.Worldwide in 2013, the overall number of rigs under contract grewcompared with 2012. The increase was concentrated in the MiddleEast and Asia-Pacific for jack-ups and the Gulf of Mexico and WestAfrica for the floaters market. In absolute terms, Latin Americaonce again proved to be the key area for the floaters market,particularly for drillships.Global utilisation rates were up compared with 2012 andcontinued to top the 90% mark. In the floaters segment, utilisationrates close to 100% were recorded in a number of areas of theworld (particularly for drillships in the Gulf of Mexico and LatinAmerica and semi-submersibles in Northern Europe and LatinAmerica). Conversely, a slight drop was registered in West Africa.Utilisation rates for jack-ups rose grew in all areas, with thehighest figures recorded for jack-ups operating in North WesternEurope and for high spec type jack-ups.Average day rates in 2013 grew slightly compared with 2012,with the biggest increases seen in the Gulf of Mexico and WestAfrica for both jack-ups and floaters segments. 2013 rates forfloaters operating in ultra-deep waters were on average in line
with 2012 levels, but the maximum rates paid on the marketdipped.Despite a contraction in orders placed for new floaters comparedwith previous years, new rig construction levels remained strong.At year-end 2013, 129 rigs (including rigs being built for theBrazilian market by local operators) were under construction.Of these, a significant number – particularly jack-ups, but to alesser extent also drillships and semi-submersibles – had notsecured contracts.Meanwhile, 6 rigs were removed from the market during the year– less than half the number registered in 2012: 2 high specjack-ups (one due to conversion and another due to accident) and4 standard jack-ups (demolition, conversion or sale).
New contracts
The most significant contracts awarded to the Group during 2013were:- a five year extension of the charter by Eni of the drillship
Saipem 10000 starting from the third quarter of 2014 fordrilling activities operations worldwide;
- a one year extension of the charter by IEOC of thesemi-submersible Scarabeo 4 for operations in Egypt;
- a two-year extension of the charter by Eni Congo of the SaipemTAD for drilling operations offshore Congo;
- a ten-year charter by Saudi Aramco of the jack-up Perro Negro5, commencing in the fourth quarter of 2014. The Perro Negro 5is currently operating in the Persian Gulf.
Capital expenditure
Capital expenditure in the Offshore Drilling sector in 2013 relatedmainly to class reinstatement works for the semi-submersible rigsScarabeo 5 and Scarabeo 7 and the jack-up Perro Negro 3, as wellas maintenance and upgrading of the existing asset base.
Work performed
In 2013, Saipem’s offshore units drilled 127 wells totalling201,037 metres.The fleet was deployed as follows:- deep-water units: the drillship Saipem 12000 continued to
operate in Angola for Total, while the drillship Saipem 10000operated under a long-term contract with Eni, first inMozambique and then towards the end of the year in Nigeria;the semi-submersible rig Scarabeo 9 operated on a long-termcontract with Eni, first in Togo and Ghana and then in thesecond half of the year in Angola; the semi-submersible rig
Offshore Drilling
Saipem Annual Report / Operating review
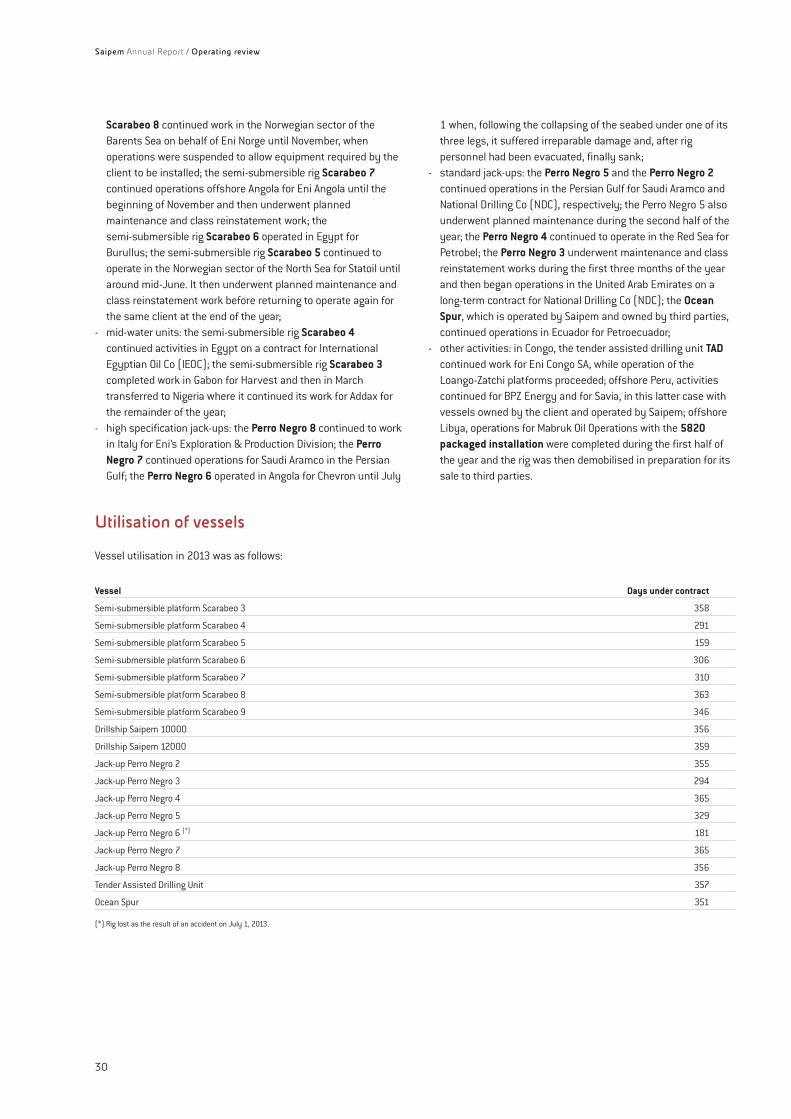
1 when, following the collapsing of the seabed under one of itsthree legs, it suffered irreparable damage and, after rigpersonnel had been evacuated, finally sank;
- standard jack-ups: the Perro Negro 5 and the Perro Negro 2continued operations in the Persian Gulf for Saudi Aramco andNational Drilling Co (NDC), respectively; the Perro Negro 5 alsounderwent planned maintenance during the second half of theyear; the Perro Negro 4 continued to operate in the Red Sea forPetrobel; the Perro Negro 3 underwent maintenance and classreinstatement works during the first three months of the yearand then began operations in the United Arab Emirates on along-term contract for National Drilling Co (NDC); the OceanSpur, which is operated by Saipem and owned by third parties,continued operations in Ecuador for Petroecuador;
- other activities: in Congo, the tender assisted drilling unit TADcontinued work for Eni Congo SA, while operation of theLoango-Zatchi platforms proceeded; offshore Peru, activitiescontinued for BPZ Energy and for Savia, in this latter case withvessels owned by the client and operated by Saipem; offshoreLibya, operations for Mabruk Oil Operations with the 5820packaged installation were completed during the first half ofthe year and the rig was then demobilised in preparation for itssale to third parties.
Scarabeo 8 continued work in the Norwegian sector of theBarents Sea on behalf of Eni Norge until November, whenoperations were suspended to allow equipment required by theclient to be installed; the semi-submersible rig Scarabeo 7continued operations offshore Angola for Eni Angola until thebeginning of November and then underwent plannedmaintenance and class reinstatement work; thesemi-submersible rig Scarabeo 6 operated in Egypt forBurullus; the semi-submersible rig Scarabeo 5 continued tooperate in the Norwegian sector of the North Sea for Statoil untilaround mid-June. It then underwent planned maintenance andclass reinstatement work before returning to operate again forthe same client at the end of the year;
- mid-water units: the semi-submersible rig Scarabeo 4continued activities in Egypt on a contract for InternationalEgyptian Oil Co (IEOC); the semi-submersible rig Scarabeo 3completed work in Gabon for Harvest and then in Marchtransferred to Nigeria where it continued its work for Addax forthe remainder of the year;
- high specification jack-ups: the Perro Negro 8 continued to workin Italy for Eni’s Exploration & Production Division; the PerroNegro 7 continued operations for Saudi Aramco in the PersianGulf; the Perro Negro 6 operated in Angola for Chevron until July
Utilisation of vessels
Vessel utilisation in 2013 was as follows:
Vessel Days under contract
Semi-submersible platform Scarabeo 3 358
Semi-submersible platform Scarabeo 4 291
Semi-submersible platform Scarabeo 5 159
Semi-submersible platform Scarabeo 6 306
Semi-submersible platform Scarabeo 7 310
Semi-submersible platform Scarabeo 8 363
Semi-submersible platform Scarabeo 9 346
Drillship Saipem 10000 356
Drillship Saipem 12000 359
Jack-up Perro Negro 2 355
Jack-up Perro Negro 3 294
Jack-up Perro Negro 4 365
Jack-up Perro Negro 5 329
Jack-up Perro Negro 6 (*) 181
Jack-up Perro Negro 7 365
Jack-up Perro Negro 8 356
Tender Assisted Drilling Unit 357
Ocean Spur 351
(*) Rig lost as the result of an accident on July 1, 2013.
Saipem Annual Report / Operating review
30
Capital expenditure
Capital expenditure in the Onshore Drilling sector during 2013related mainly to preparation works on four new rigs due tooperate in Saudi Arabia and upgrading of the existing asset base.
Work performed
373 wells, were drilled during 2013, with a total of approximately820,872 metres drilled.In South America, Saipem operated in a number of countries:in Peru, work was carried out for various clients (including Repsol,Petrobras, Pluspetrol, Perenco, Savia and Interoil) deployingtwenty one company-owned rigs (one of which was transferred toEcuador towards year-end 2013 for work on a new contract) andoperating six rigs owned by clients or third parties; in Bolivia, fourrigs were deployed for YPFB Andina, Pluspetrol and Repsol;in Brazil, work was completed for Petrobras and the two rigs weremobilised to new areas of operations in South America and theMiddle East for work on new contracts; in Colombia, workcontinued for various clients, including Ecopetrol, Equion, Canacol,Schlumberger Surenco and Parex Resources, involving thedeployment of seven rigs; in Chile, work was commenced forENAP deploying two rigs; in Ecuador, three company-owned rigsand one third party rig operated for various clients, includingRepsol, Tecpetrol, Petrobel and Petroamazonas; finally,in Venezuela, work continued for PDVSA involving the deploymentof twenty eight rigs.In Saudi Arabia, sixteen rigs continued operations for SaudiAramco and completed work for South Rub Al-Khali Co (SRAK);two rigs from Algeria, one from Congo and one from Brazil are dueto arrive in the country.In the Caspian region, Saipem operated in Kazakhstan for variousclients, such as KPO, Agip KCO, Zhaikmunai and UOG, using 5 of itsown rigs and 3 supplied by a partner.In North Africa, Saipem deployed six rigs on operations in Algeriafor various clients, including Groupement Sonatrach Agip,Gazprom, PTTEP and Repsol and one rig in Mauritania for Total.It also operated in Morocco for Longreach using a rig which wasdeployed in the first half of the year in Algeria. The rigs deployed inAlgeria were transferred on to other operations during the year(one to Morocco, one to Turkey and two to Saudi Arabia, while tworigs are still in the country awaiting mobilisation to otherlocations). In West Africa, Saipem continued operations in Congoon behalf of Eni Congo SA using 2 of its own rigs (one of which hasnow been transferred to Saudi Arabia for work on a long-termcontract) and operating 1 rig owned by the client.Operations in Italy saw the deployment of one rig whichperformed work for Eni in Trecate in the Novara area and for Totalin the Tempa Rossa area.
31
General overview
The size of Saipem’s onshore drilling rig fleet increased to 108 in2013 (including units under construction). Of these, 97 are ownedby Saipem, while 11 are owned by third parties but operated bySaipem. The areas of operations were South America (Peru, Bolivia,Brazil, Colombia, Ecuador, Chile and Venezuela), Saudi Arabia, theCaspian Sea area (Kazakhstan), Africa (Algeria, Mauritania,Morocco and Congo), Europe (Italy and Ukraine) and Turkey.
Market conditions
Global spending in the Onshore Drilling sector during 2013registered an increase, due mainly to an increase in conventionaldrilling carried out using advanced rigs and the exploration anddevelopment of non-conventional reserves.In the United States, the number of rigs deployed dropped slightlyduring 2013, while day rates were essentially unchanged from2012. In Canada, investments were essentially unchanged, whilethe number of active rigs fell slightly.Globally, onshore drilling operations followed the positive trendregistered in 2012. The Middle East confirmed during the year thatit is a growing market, with Saudi Arabia showing good levels ofdemand and other countries situated in the area such as Kuwaitand the United Arab Emirates also posting buoyant performances.The Caspian Sea area also registered strong levels of activitydespite being a relatively small market. The European market onthe other hand remained small and fragmented. North Africashowed a degree of dynamism, with growth registered in a numberof areas, such as Morocco. Finally, conditions in Latin Americacontinued to be difficult, with high levels of competition and with2013 showing little in the way of significant growth in spending.
New contracts
The most significant contracts awarded to the Group during 2013were:- a three year extension of a contract with Eni Congo for the
operation of a rig owned by the client;- extensions of contracts of varying durations with various
clients for drilling operations in South America;- contracts with various clients for the use of 17 rigs for durations
ranging from 6 months to 5 years in the Middle East, theCaspian Sea region, South America, West Africa, Turkey andUkraine. Two of these rigs will operate for Shell on a worldwidelong-term contract under which Saipem will provide on-callservices designed to facilitate the oil company’s entry into newcountries and carry out worldwide onshore exploratory drillingoperations under certain predefined conditions.
Saipem Annual Report / Operating review
Onshore Drilling
(plus one under completion), located as follows: 28 in Venezuela,20 in Saudi Arabia, 19 in Peru, 7 in Colombia, 5 in Kazakhstan, 4 inBolivia, 3 in Ecuador, 2 in Algeria, 2 in Chile, 1 in Congo, 1 in Italy, 1in Mauritania, 1 in Turkey, 1 in Morocco and 1 in Ukraine.In addition, 6 third-party rigs were deployed in Peru, 1 in Congo, 1in Ecuador and 3 by the joint venture company SaiPar inKazakhstan.
In Ukraine and Turkey, Saipem deployed one rig on operations forShell.
Utilisation of rigs
The average utilisation of rigs was 96% (97.2% in 2012).At December 31, 2013, Company-owned rigs amounted to 96
Saipem Annual Report / Operating review
32
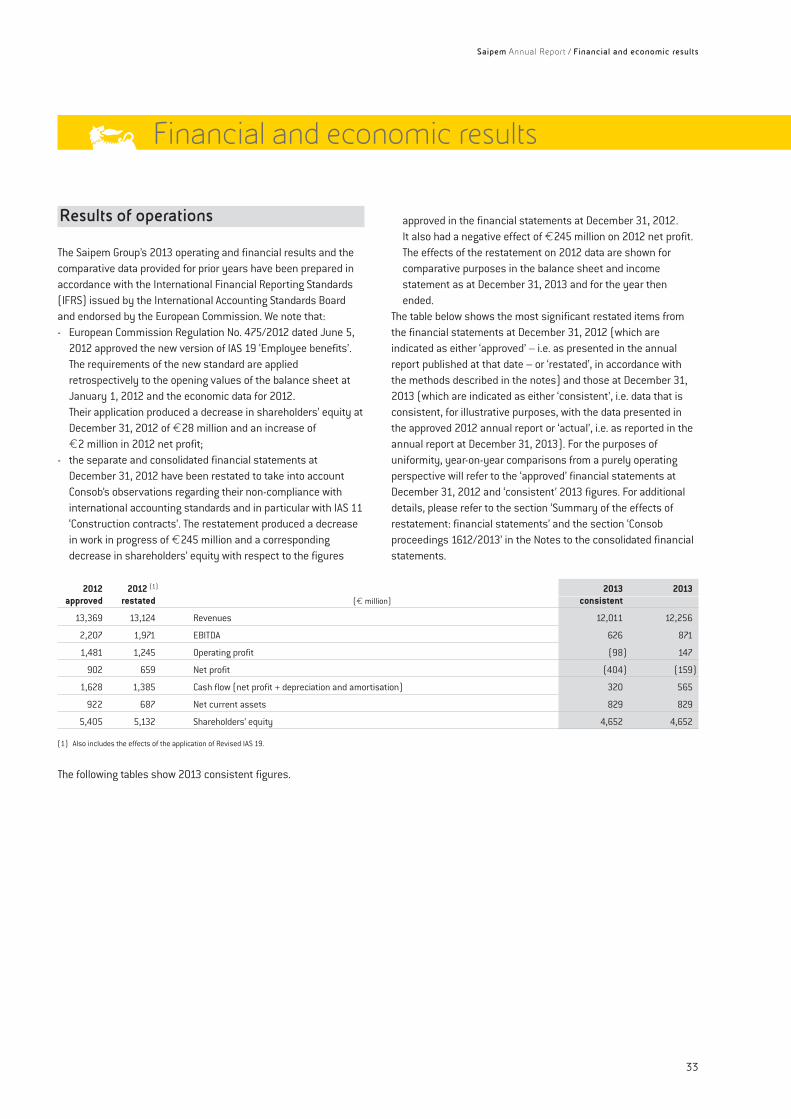
33
Saipem Annual Report / Financial and economic results
Financial and economic results
Results of operations
The Saipem Group’s 2013 operating and financial results and thecomparative data provided for prior years have been prepared inaccordance with the International Financial Reporting Standards(IFRS) issued by the International Accounting Standards Boardand endorsed by the European Commission. We note that:- European Commission Regulation No. 475/2012 dated June 5,
2012 approved the new version of IAS 19 ‘Employee benefits’.The requirements of the new standard are appliedretrospectively to the opening values of the balance sheet atJanuary 1, 2012 and the economic data for 2012.Their application produced a decrease in shareholders’ equity atDecember 31, 2012 of €28 million and an increase of€2 million in 2012 net profit;
- the separate and consolidated financial statements atDecember 31, 2012 have been restated to take into accountConsob’s observations regarding their non-compliance withinternational accounting standards and in particular with IAS 11‘Construction contracts’. The restatement produced a decreasein work in progress of €245 million and a correspondingdecrease in shareholders’ equity with respect to the figures
approved in the financial statements at December 31, 2012.It also had a negative effect of €245 million on 2012 net profit.The effects of the restatement on 2012 data are shown forcomparative purposes in the balance sheet and incomestatement as at December 31, 2013 and for the year thenended.
The table below shows the most significant restated items fromthe financial statements at December 31, 2012 (which areindicated as either ‘approved’ – i.e. as presented in the annualreport published at that date – or ‘restated’, in accordance withthe methods described in the notes) and those at December 31,2013 (which are indicated as either ‘consistent’, i.e. data that isconsistent, for illustrative purposes, with the data presented inthe approved 2012 annual report or ‘actual’, i.e. as reported in theannual report at December 31, 2013). For the purposes ofuniformity, year-on-year comparisons from a purely operatingperspective will refer to the ‘approved’ financial statements atDecember 31, 2012 and ‘consistent’ 2013 figures. For additionaldetails, please refer to the section ‘Summary of the effects ofrestatement: financial statements’ and the section ‘Consobproceedings 1612/2013’ in the Notes to the consolidated financialstatements.
2012 2012 (1) 2013 2013approved restated (€ million) consistent
13,369 13,124 Revenues 12,011 12,256
2,207 1,971 EBITDA 626 871
1,481 1,245 Operating profit (98) 147
902 659 Net profit (404) (159)
1,628 1,385 Cash flow (net profit + depreciation and amortisation) 320 565
922 687 Net current assets 829 829
5,405 5,132 Shareholders’ equity 4,652 4,652
(1) Also includes the effects of the application of Revised IAS 19.
The following tables show 2013 consistent figures.
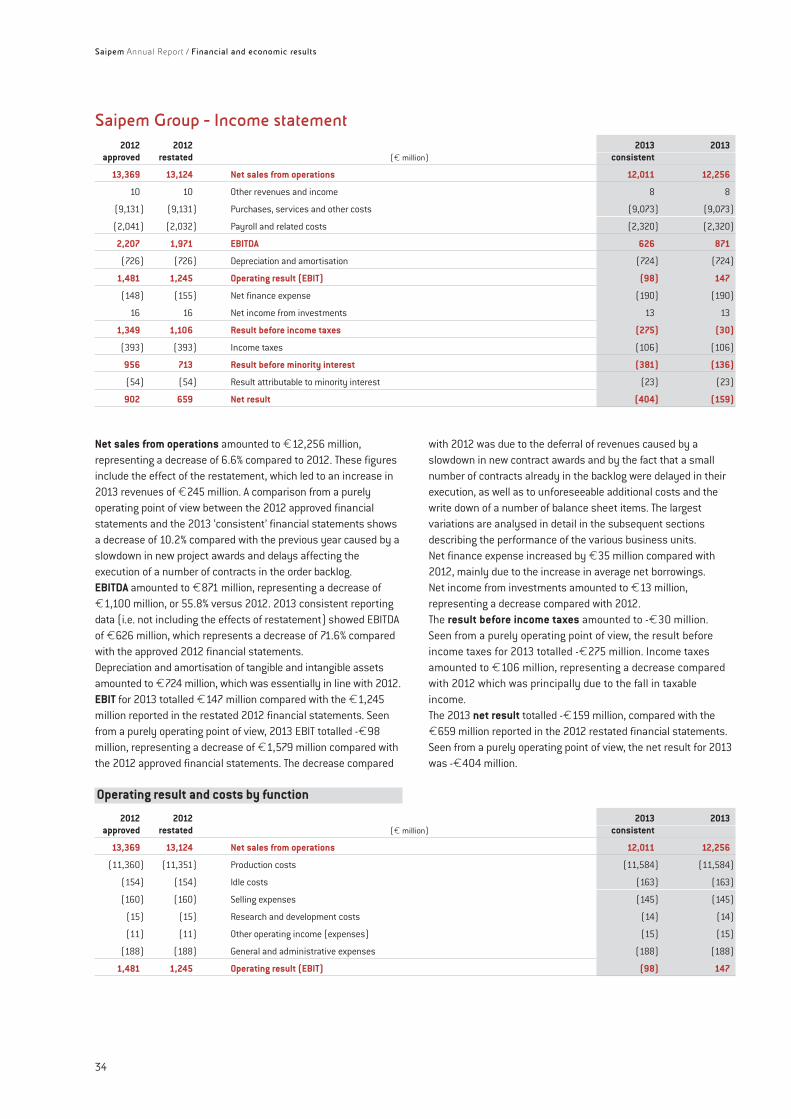
Operating result and costs by function
2012 2012 2013 2013approved restated (€ million) consistent
13,369 13,124 Net sales from operations 12,011 12,256
(11,360) (11,351) Production costs (11,584) (11,584)
(154) (154) Idle costs (163) (163)
(160) (160) Selling expenses (145) (145)
(15) (15) Research and development costs (14) (14)
(11) (11) Other operating income (expenses) (15) (15)
(188) (188) General and administrative expenses (188) (188)
1,481 1,245 Operating result (EBIT) (98) 147
Saipem Annual Report / Financial and economic results
34
Net sales from operations amounted to €12,256 million,representing a decrease of 6.6% compared to 2012. These figuresinclude the effect of the restatement, which led to an increase in2013 revenues of €245 million. A comparison from a purelyoperating point of view between the 2012 approved financialstatements and the 2013 ‘consistent’ financial statements showsa decrease of 10.2% compared with the previous year caused by aslowdown in new project awards and delays affecting theexecution of a number of contracts in the order backlog.EBITDA amounted to €871 million, representing a decrease of€1,100 million, or 55.8% versus 2012. 2013 consistent reportingdata (i.e. not including the effects of restatement) showed EBITDAof €626 million, which represents a decrease of 71.6% comparedwith the approved 2012 financial statements.Depreciation and amortisation of tangible and intangible assetsamounted to €724 million, which was essentially in line with 2012.EBIT for 2013 totalled €147 million compared with the €1,245million reported in the restated 2012 financial statements. Seenfrom a purely operating point of view, 2013 EBIT totalled -€98million, representing a decrease of €1,579 million compared withthe 2012 approved financial statements. The decrease compared
with 2012 was due to the deferral of revenues caused by aslowdown in new contract awards and by the fact that a smallnumber of contracts already in the backlog were delayed in theirexecution, as well as to unforeseeable additional costs and thewrite down of a number of balance sheet items. The largestvariations are analysed in detail in the subsequent sectionsdescribing the performance of the various business units.Net finance expense increased by €35 million compared with2012, mainly due to the increase in average net borrowings.Net income from investments amounted to €13 million,representing a decrease compared with 2012.The result before income taxes amounted to -€30 million.Seen from a purely operating point of view, the result beforeincome taxes for 2013 totalled -€275 million. Income taxesamounted to €106 million, representing a decrease comparedwith 2012 which was principally due to the fall in taxableincome.The 2013 net result totalled -€159 million, compared with the€659 million reported in the 2012 restated financial statements.Seen from a purely operating point of view, the net result for 2013was -€404 million.
Saipem Group - Income statement
2012 2012 2013 2013approved restated (€ million) consistent
13,369 13,124 Net sales from operations 12,011 12,256
10 10 Other revenues and income 8 8
(9,131) (9,131) Purchases, services and other costs (9,073) (9,073)
(2,041) (2,032) Payroll and related costs (2,320) (2,320)
2,207 1,971 EBITDA 626 871
(726) (726) Depreciation and amortisation (724) (724)
1,481 1,245 Operating result (EBIT) (98) 147
(148) (155) Net finance expense (190) (190)
16 16 Net income from investments 13 13
1,349 1,106 Result before income taxes (275) (30)
(393) (393) Income taxes (106) (106)
956 713 Result before minority interest (381) (136)
(54) (54) Result attributable to minority interest (23) (23)
902 659 Net result (404) (159)
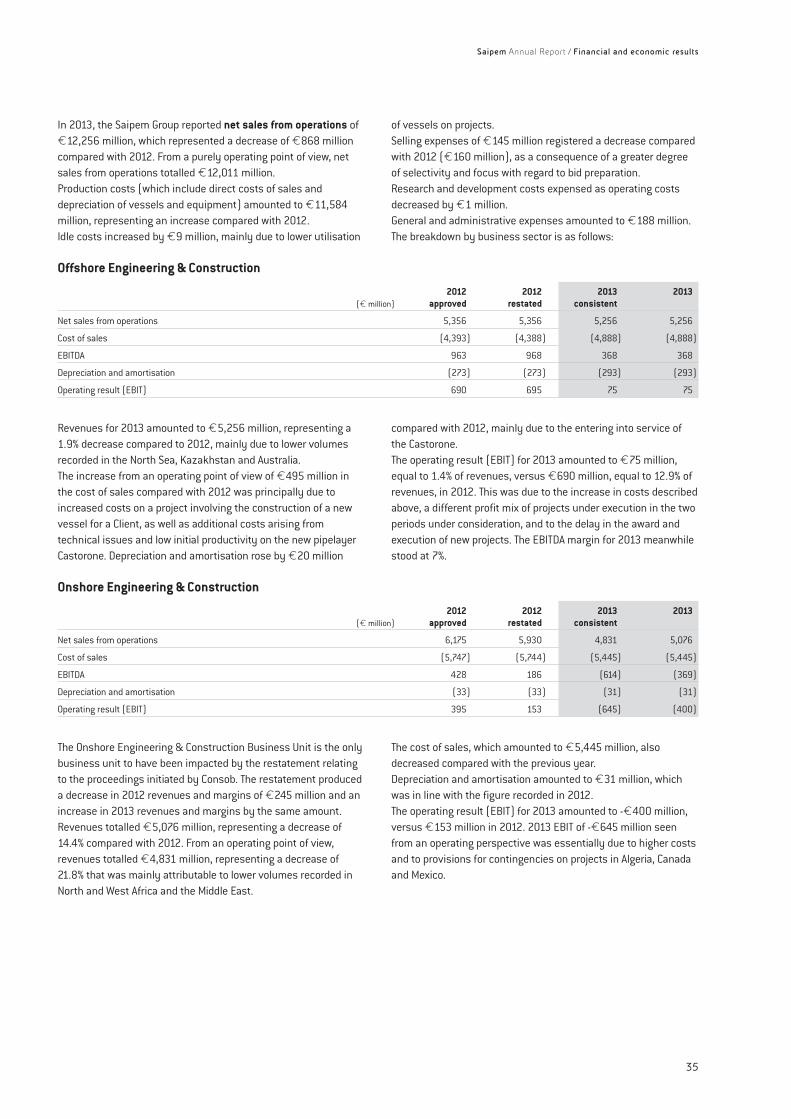
Saipem Annual Report / Financial and economic results
35
In 2013, the Saipem Group reported net sales from operations of€12,256 million, which represented a decrease of €868 millioncompared with 2012. From a purely operating point of view, netsales from operations totalled €12,011 million.Production costs (which include direct costs of sales anddepreciation of vessels and equipment) amounted to €11,584million, representing an increase compared with 2012.Idle costs increased by €9 million, mainly due to lower utilisation
of vessels on projects.Selling expenses of €145 million registered a decrease comparedwith 2012 (€160 million), as a consequence of a greater degreeof selectivity and focus with regard to bid preparation.Research and development costs expensed as operating costsdecreased by €1 million.General and administrative expenses amounted to €188 million.The breakdown by business sector is as follows:
Revenues for 2013 amounted to €5,256 million, representing a1.9% decrease compared to 2012, mainly due to lower volumesrecorded in the North Sea, Kazakhstan and Australia.The increase from an operating point of view of €495 million inthe cost of sales compared with 2012 was principally due toincreased costs on a project involving the construction of a newvessel for a Client, as well as additional costs arising fromtechnical issues and low initial productivity on the new pipelayerCastorone. Depreciation and amortisation rose by €20 million
compared with 2012, mainly due to the entering into service ofthe Castorone.The operating result (EBIT) for 2013 amounted to €75 million,equal to 1.4% of revenues, versus €690 million, equal to 12.9% ofrevenues, in 2012. This was due to the increase in costs describedabove, a different profit mix of projects under execution in the twoperiods under consideration, and to the delay in the award andexecution of new projects. The EBITDA margin for 2013 meanwhilestood at 7%.
Offshore Engineering & Construction
2012 2012 2013 2013(€ million) approved restated consistent
Net sales from operations 5,356 5,356 5,256 5,256
Cost of sales (4,393) (4,388) (4,888) (4,888)
EBITDA 963 968 368 368
Depreciation and amortisation (273) (273) (293) (293)
Operating result (EBIT) 690 695 75 75
The Onshore Engineering & Construction Business Unit is the onlybusiness unit to have been impacted by the restatement relatingto the proceedings initiated by Consob. The restatement produceda decrease in 2012 revenues and margins of €245 million and anincrease in 2013 revenues and margins by the same amount.Revenues totalled €5,076 million, representing a decrease of14.4% compared with 2012. From an operating point of view,revenues totalled €4,831 million, representing a decrease of21.8% that was mainly attributable to lower volumes recorded inNorth and West Africa and the Middle East.
The cost of sales, which amounted to €5,445 million, alsodecreased compared with the previous year.Depreciation and amortisation amounted to €31 million, whichwas in line with the figure recorded in 2012.The operating result (EBIT) for 2013 amounted to -€400 million,versus €153 million in 2012. 2013 EBIT of -€645 million seenfrom an operating perspective was essentially due to higher costsand to provisions for contingencies on projects in Algeria, Canadaand Mexico.
Onshore Engineering & Construction
2012 2012 2013 2013(€ million) approved restated consistent
Net sales from operations 6,175 5,930 4,831 5,076
Cost of sales (5,747) (5,744) (5,445) (5,445)
EBITDA 428 186 (614) (369)
Depreciation and amortisation (33) (33) (31) (31)
Operating result (EBIT) 395 153 (645) (400)
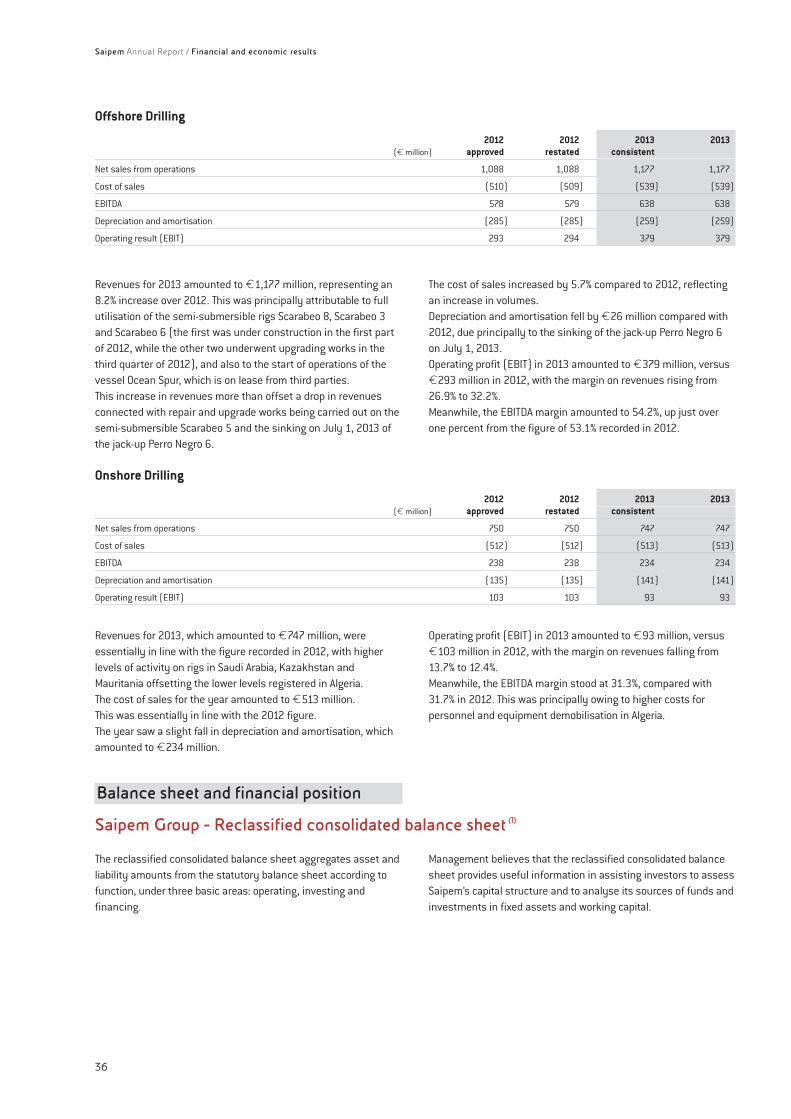
The reclassified consolidated balance sheet aggregates asset andliability amounts from the statutory balance sheet according tofunction, under three basic areas: operating, investing andfinancing.
Management believes that the reclassified consolidated balancesheet provides useful information in assisting investors to assessSaipem’s capital structure and to analyse its sources of funds andinvestments in fixed assets and working capital.
Balance sheet and financial position
Saipem Group - Reclassified consolidated balance sheet (1)
Saipem Annual Report / Financial and economic results
36
Onshore Drilling
2012 2012 2013 2013(€ million) approved restated consistent
Net sales from operations 750 750 747 747
Cost of sales (512) (512) (513) (513)
EBITDA 238 238 234 234
Depreciation and amortisation (135) (135) (141) (141)
Operating result (EBIT) 103 103 93 93
Revenues for 2013, which amounted to €747 million, wereessentially in line with the figure recorded in 2012, with higherlevels of activity on rigs in Saudi Arabia, Kazakhstan andMauritania offsetting the lower levels registered in Algeria.The cost of sales for the year amounted to €513 million.This was essentially in line with the 2012 figure.The year saw a slight fall in depreciation and amortisation, whichamounted to €234 million.
Operating profit (EBIT) in 2013 amounted to €93 million, versus€103 million in 2012, with the margin on revenues falling from13.7% to 12.4%.Meanwhile, the EBITDA margin stood at 31.3%, compared with31.7% in 2012. This was principally owing to higher costs forpersonnel and equipment demobilisation in Algeria.
Offshore Drilling
2012 2012 2013 2013(€ million) approved restated consistent
Net sales from operations 1,088 1,088 1,177 1,177
Cost of sales (510) (509) (539) (539)
EBITDA 578 579 638 638
Depreciation and amortisation (285) (285) (259) (259)
Operating result (EBIT) 293 294 379 379
Revenues for 2013 amounted to €1,177 million, representing an8.2% increase over 2012. This was principally attributable to fullutilisation of the semi-submersible rigs Scarabeo 8, Scarabeo 3and Scarabeo 6 (the first was under construction in the first partof 2012, while the other two underwent upgrading works in thethird quarter of 2012), and also to the start of operations of thevessel Ocean Spur, which is on lease from third parties.This increase in revenues more than offset a drop in revenuesconnected with repair and upgrade works being carried out on thesemi-submersible Scarabeo 5 and the sinking on July 1, 2013 ofthe jack-up Perro Negro 6.
The cost of sales increased by 5.7% compared to 2012, reflectingan increase in volumes.Depreciation and amortisation fell by €26 million compared with2012, due principally to the sinking of the jack-up Perro Negro 6on July 1, 2013.Operating profit (EBIT) in 2013 amounted to €379 million, versus€293 million in 2012, with the margin on revenues rising from26.9% to 32.2%.Meanwhile, the EBITDA margin amounted to 54.2%, up just overone percent from the figure of 53.1% recorded in 2012.
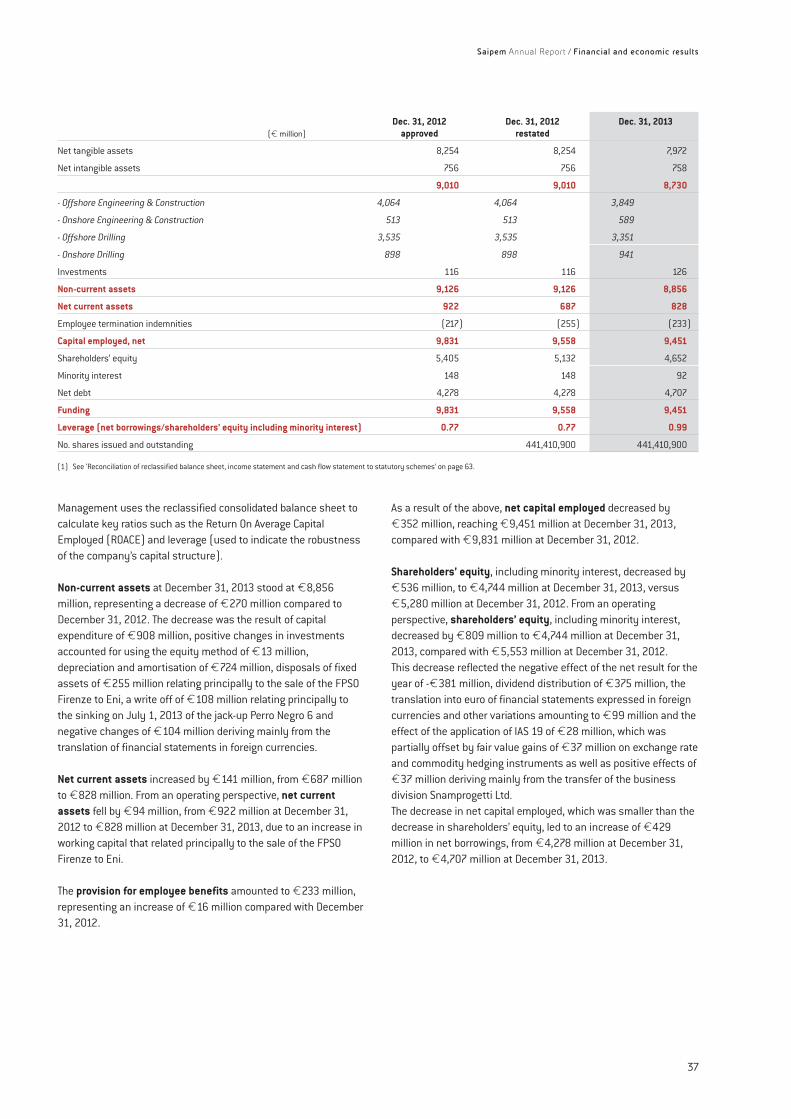
Saipem Annual Report / Financial and economic results
37
Dec. 31, 2012 Dec. 31, 2012 Dec. 31, 2013(€ million) approved restated
Net tangible assets 8,254 8,254 7,972
Net intangible assets 756 756 758
9,010 9,010 8,730
- Offshore Engineering & Construction 4,064 4,064 3,849
- Onshore Engineering & Construction 513 513 589
- Offshore Drilling 3,535 3,535 3,351
- Onshore Drilling 898 898 941
Investments 116 116 126
Non-current assets 9,126 9,126 8,856
Net current assets 922 687 828
Employee termination indemnities (217) (255) (233)
Capital employed, net 9,831 9,558 9,451
Shareholders’ equity 5,405 5,132 4,652
Minority interest 148 148 92
Net debt 4,278 4,278 4,707
Funding 9,831 9,558 9,451
Leverage (net borrowings/shareholders’ equity including minority interest) 0.77 0.77 0.99
No. shares issued and outstanding 441,410,900 441,410,900
(1) See ‘Reconciliation of reclassified balance sheet, income statement and cash flow statement to statutory schemes’ on page 63.
Management uses the reclassified consolidated balance sheet tocalculate key ratios such as the Return On Average CapitalEmployed (ROACE) and leverage (used to indicate the robustnessof the company’s capital structure).
Non-current assets at December 31, 2013 stood at €8,856million, representing a decrease of €270 million compared toDecember 31, 2012. The decrease was the result of capitalexpenditure of €908 million, positive changes in investmentsaccounted for using the equity method of €13 million,depreciation and amortisation of €724 million, disposals of fixedassets of €255 million relating principally to the sale of the FPSOFirenze to Eni, a write off of €108 million relating principally tothe sinking on July 1, 2013 of the jack-up Perro Negro 6 andnegative changes of €104 million deriving mainly from thetranslation of financial statements in foreign currencies.
Net current assets increased by €141 million, from €687 millionto €828 million. From an operating perspective, net currentassets fell by €94 million, from €922 million at December 31,2012 to €828 million at December 31, 2013, due to an increase inworking capital that related principally to the sale of the FPSOFirenze to Eni.
The provision for employee benefits amounted to €233 million,representing an increase of €16 million compared with December31, 2012.
As a result of the above, net capital employed decreased by€352 million, reaching €9,451 million at December 31, 2013,compared with €9,831 million at December 31, 2012.
Shareholders’ equity, including minority interest, decreased by€536 million, to €4,744 million at December 31, 2013, versus€5,280 million at December 31, 2012. From an operatingperspective, shareholders’ equity, including minority interest,decreased by €809 million to €4,744 million at December 31,2013, compared with €5,553 million at December 31, 2012.This decrease reflected the negative effect of the net result for theyear of -€381 million, dividend distribution of €375 million, thetranslation into euro of financial statements expressed in foreigncurrencies and other variations amounting to €99 million and theeffect of the application of IAS 19 of €28 million, which waspartially offset by fair value gains of €37 million on exchange rateand commodity hedging instruments as well as positive effects of€37 million deriving mainly from the transfer of the businessdivision Snamprogetti Ltd.The decrease in net capital employed, which was smaller than thedecrease in shareholders’ equity, led to an increase of €429million in net borrowings, from €4,278 million at December 31,2012, to €4,707 million at December 31, 2013.
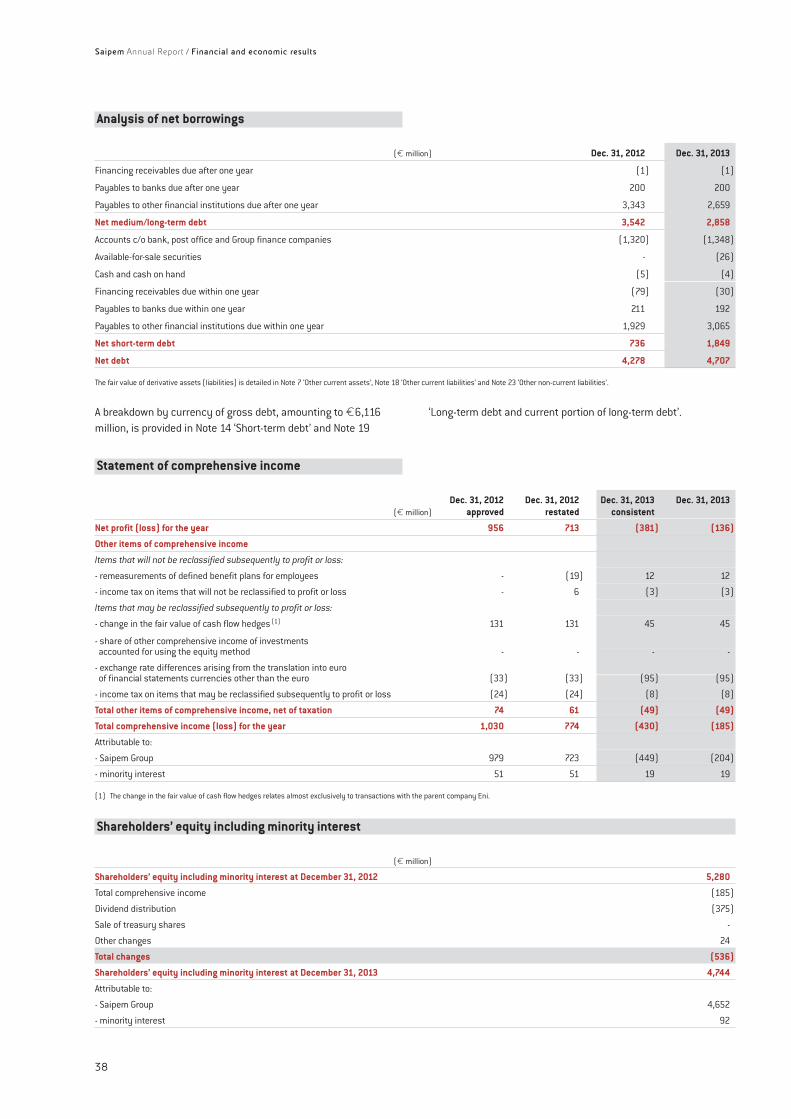
Saipem Annual Report / Financial and economic results
38
Analysis of net borrowings
(€ million) Dec. 31, 2012 Dec. 31, 2013
Financing receivables due after one year (1) (1)
Payables to banks due after one year 200 200
Payables to other financial institutions due after one year 3,343 2,659
Net medium/long-term debt 3,542 2,858
Accounts c/o bank, post office and Group finance companies (1,320) (1,348)
Available-for-sale securities - (26)
Cash and cash on hand (5) (4)
Financing receivables due within one year (79) (30)
Payables to banks due within one year 211 192
Payables to other financial institutions due within one year 1,929 3,065
Net short-term debt 736 1,849
Net debt 4,278 4,707
The fair value of derivative assets (liabilities) is detailed in Note 7 ‘Other current assets’, Note 18 ‘Other current liabilities’ and Note 23 ‘Other non-current liabilities’.
A breakdown by currency of gross debt, amounting to €6,116million, is provided in Note 14 ‘Short-term debt’ and Note 19
‘Long-term debt and current portion of long-term debt’.
Statement of comprehensive income
Dec. 31, 2012 Dec. 31, 2012 Dec. 31, 2013 Dec. 31, 2013(€ million) approved restated consistent
Net profit (loss) for the year 956 713 (381) (136)
Other items of comprehensive income
Items that will not be reclassified subsequently to profit or loss:
- remeasurements of defined benefit plans for employees - (19) 12 12
- income tax on items that will not be reclassified to profit or loss - 6 (3) (3)
Items that may be reclassified subsequently to profit or loss:
- change in the fair value of cash flow hedges (1) 131 131 45 45
- share of other comprehensive income of investments accounted for using the equity method - - - -
- exchange rate differences arising from the translation into euroof financial statements currencies other than the euro (33) (33) (95) (95)
- income tax on items that may be reclassified subsequently to profit or loss (24) (24) (8) (8)
Total other items of comprehensive income, net of taxation 74 61 (49) (49)
Total comprehensive income (loss) for the year 1,030 774 (430) (185)
Attributable to:
- Saipem Group 979 723 (449) (204)
- minority interest 51 51 19 19
(1) The change in the fair value of cash flow hedges relates almost exclusively to transactions with the parent company Eni.
Shareholders’ equity including minority interest
(€ million)
Shareholders’ equity including minority interest at December 31, 2012 5,280
Total comprehensive income (185)
Dividend distribution (375)
Sale of treasury shares -
Other changes 24
Total changes (536)
Shareholders’ equity including minority interest at December 31, 2013 4,744
Attributable to:
- Saipem Group 4,652
- minority interest 92
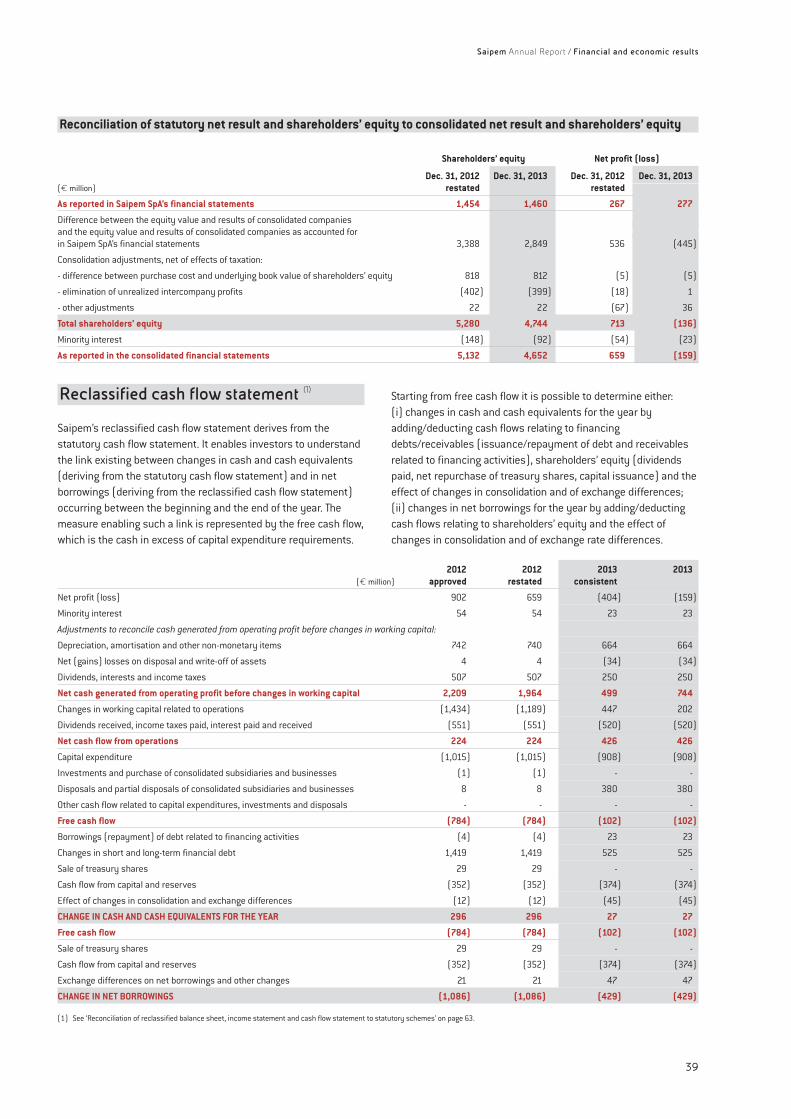
Saipem Annual Report / Financial and economic results
39
Reconciliation of statutory net result and shareholders’ equity to consolidated net result and shareholders’ equity
Shareholders’ equity Net profit (loss)
Dec. 31, 2012 Dec. 31, 2013 Dec. 31, 2012 Dec. 31, 2013(€ million) restated restated
As reported in Saipem SpA’s financial statements 1,454 1,460 267 277
Difference between the equity value and results of consolidated companies and the equity value and results of consolidated companies as accounted for in Saipem SpA’s financial statements 3,388 2,849 536 (445)
Consolidation adjustments, net of effects of taxation:
- difference between purchase cost and underlying book value of shareholders’ equity 818 812 (5) (5)
- elimination of unrealized intercompany profits (402) (399) (18) 1
- other adjustments 22 22 (67) 36
Total shareholders’ equity 5,280 4,744 713 (136)
Minority interest (148) (92) (54) (23)
As reported in the consolidated financial statements 5,132 4,652 659 (159)
Saipem’s reclassified cash flow statement derives from thestatutory cash flow statement. It enables investors to understandthe link existing between changes in cash and cash equivalents(deriving from the statutory cash flow statement) and in netborrowings (deriving from the reclassified cash flow statement)occurring between the beginning and the end of the year. Themeasure enabling such a link is represented by the free cash flow,which is the cash in excess of capital expenditure requirements.
Starting from free cash flow it is possible to determine either:(i) changes in cash and cash equivalents for the year byadding/deducting cash flows relating to financingdebts/receivables (issuance/repayment of debt and receivablesrelated to financing activities), shareholders’ equity (dividendspaid, net repurchase of treasury shares, capital issuance) and theeffect of changes in consolidation and of exchange differences;(ii) changes in net borrowings for the year by adding/deductingcash flows relating to shareholders’ equity and the effect ofchanges in consolidation and of exchange rate differences.
Reclassified cash flow statement (1)
2012 2012 2013 2013(€ million) approved restated consistent
Net profit (loss) 902 659 (404) (159)
Minority interest 54 54 23 23
Adjustments to reconcile cash generated from operating profit before changes in working capital:
Depreciation, amortisation and other non-monetary items 742 740 664 664
Net (gains) losses on disposal and write-off of assets 4 4 (34) (34)
Dividends, interests and income taxes 507 507 250 250
Net cash generated from operating profit before changes in working capital 2,209 1,964 499 744
Changes in working capital related to operations (1,434) (1,189) 447 202
Dividends received, income taxes paid, interest paid and received (551) (551) (520) (520)
Net cash flow from operations 224 224 426 426
Capital expenditure (1,015) (1,015) (908) (908)
Investments and purchase of consolidated subsidiaries and businesses (1) (1) - -
Disposals and partial disposals of consolidated subsidiaries and businesses 8 8 380 380
Other cash flow related to capital expenditures, investments and disposals - - - -
Free cash flow (784) (784) (102) (102)
Borrowings (repayment) of debt related to financing activities (4) (4) 23 23
Changes in short and long-term financial debt 1,419 1,419 525 525
Sale of treasury shares 29 29 - -
Cash flow from capital and reserves (352) (352) (374) (374)
Effect of changes in consolidation and exchange differences (12) (12) (45) (45)
CHANGE IN CASH AND CASH EQUIVALENTS FOR THE YEAR 296 296 27 27
Free cash flow (784) (784) (102) (102)
Sale of treasury shares 29 29 - -
Cash flow from capital and reserves (352) (352) (374) (374)
Exchange differences on net borrowings and other changes 21 21 47 47
CHANGE IN NET BORROWINGS (1,086) (1,086) (429) (429)
(1) See ‘Reconciliation of reclassified balance sheet, income statement and cash flow statement to statutory schemes’ on page 63.
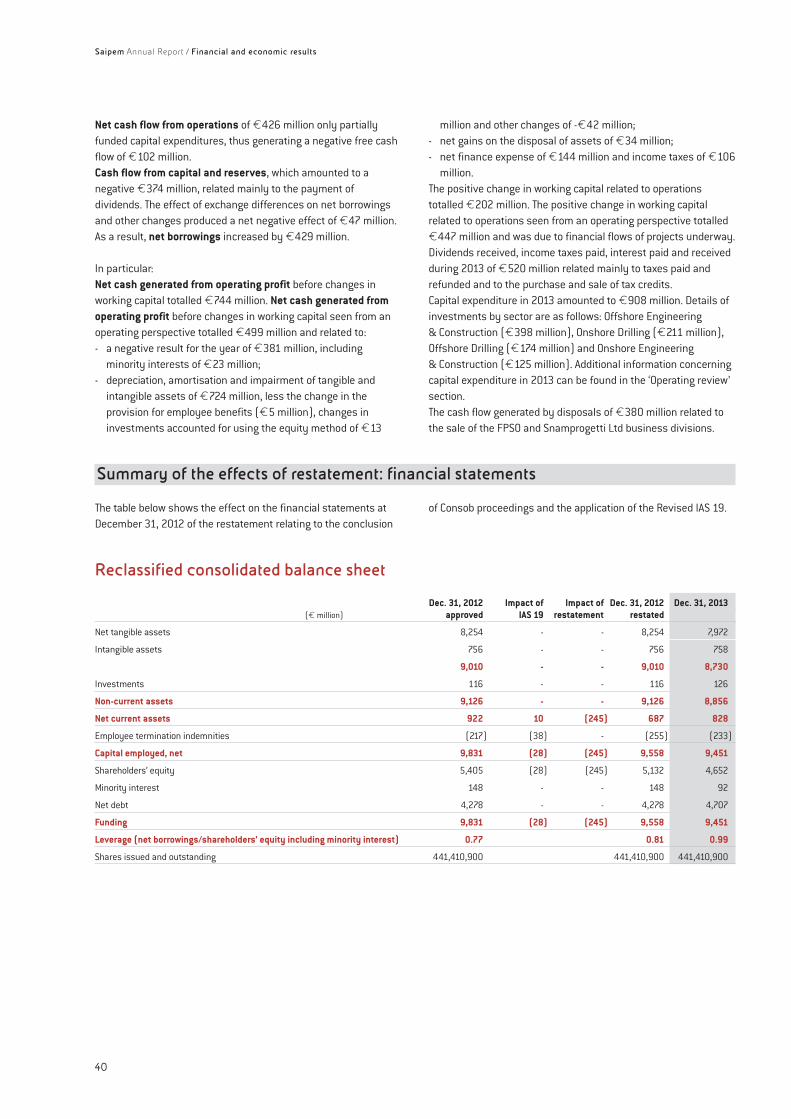
Net cash flow from operations of €426 million only partiallyfunded capital expenditures, thus generating a negative free cashflow of €102 million.Cash flow from capital and reserves, which amounted to anegative €374 million, related mainly to the payment ofdividends. The effect of exchange differences on net borrowingsand other changes produced a net negative effect of €47 million.As a result, net borrowings increased by €429 million.
In particular:Net cash generated from operating profit before changes inworking capital totalled €744 million. Net cash generated fromoperating profit before changes in working capital seen from anoperating perspective totalled €499 million and related to:- a negative result for the year of €381 million, including
minority interests of €23 million;- depreciation, amortisation and impairment of tangible and
intangible assets of €724 million, less the change in theprovision for employee benefits (€5 million), changes ininvestments accounted for using the equity method of €13
million and other changes of -€42 million;- net gains on the disposal of assets of €34 million;- net finance expense of €144 million and income taxes of €106
million.The positive change in working capital related to operationstotalled €202 million. The positive change in working capitalrelated to operations seen from an operating perspective totalled€447 million and was due to financial flows of projects underway.Dividends received, income taxes paid, interest paid and receivedduring 2013 of €520 million related mainly to taxes paid andrefunded and to the purchase and sale of tax credits.Capital expenditure in 2013 amounted to €908 million. Details ofinvestments by sector are as follows: Offshore Engineering& Construction (€398 million), Onshore Drilling (€211 million),Offshore Drilling (€174 million) and Onshore Engineering& Construction (€125 million). Additional information concerningcapital expenditure in 2013 can be found in the ‘Operating review’section.The cash flow generated by disposals of €380 million related tothe sale of the FPSO and Snamprogetti Ltd business divisions.
Saipem Annual Report / Financial and economic results
40
Summary of the effects of restatement: financial statements
The table below shows the effect on the financial statements atDecember 31, 2012 of the restatement relating to the conclusion
of Consob proceedings and the application of the Revised IAS 19.
Reclassified consolidated balance sheet
Dec. 31, 2012 Impact of Impact of Dec. 31, 2012 Dec. 31, 2013(€ million) approved IAS 19 restatement restated
Net tangible assets 8,254 - - 8,254 7,972
Intangible assets 756 - - 756 758
9,010 - - 9,010 8,730
Investments 116 - - 116 126
Non-current assets 9,126 - - 9,126 8,856
Net current assets 922 10 (245) 687 828
Employee termination indemnities (217) (38) - (255) (233)
Capital employed, net 9,831 (28) (245) 9,558 9,451
Shareholders’ equity 5,405 (28) (245) 5,132 4,652
Minority interest 148 - - 148 92
Net debt 4,278 - - 4,278 4,707
Funding 9,831 (28) (245) 9,558 9,451
Leverage (net borrowings/shareholders’ equity including minority interest) 0.77 0.81 0.99
Shares issued and outstanding 441,410,900 441,410,900 441,410,900
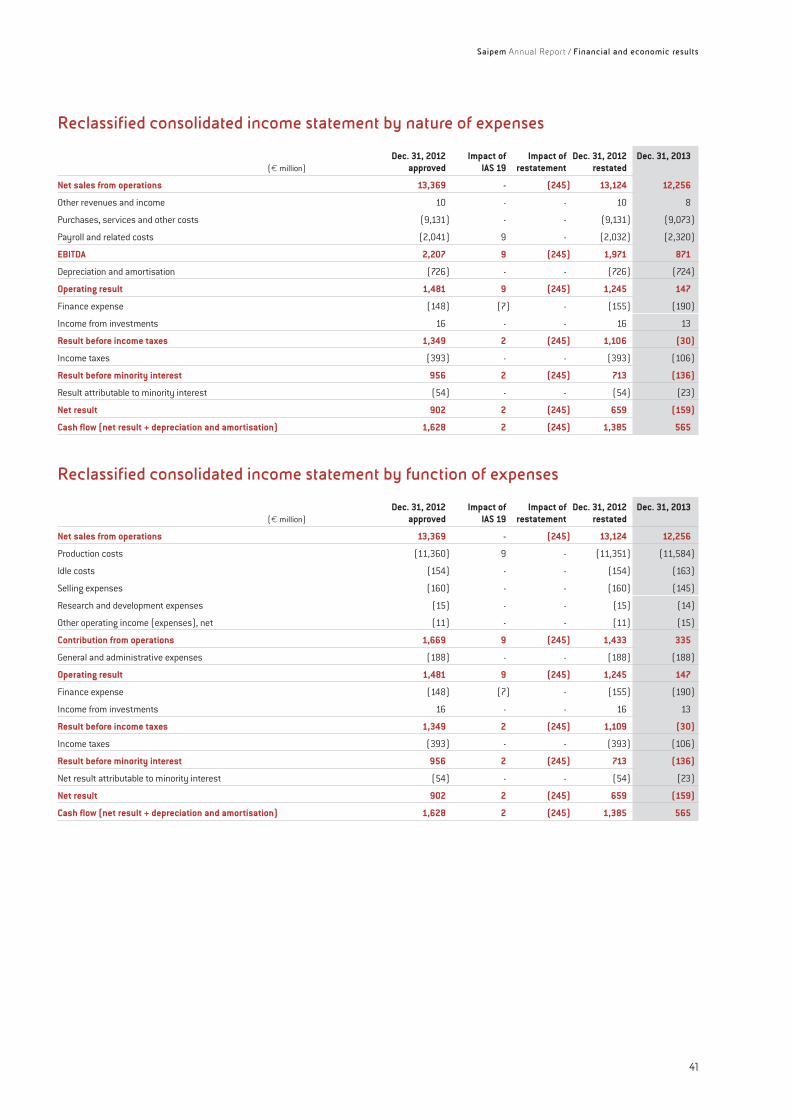
Saipem Annual Report / Financial and economic results
41
Reclassified consolidated income statement by nature of expenses
Dec. 31, 2012 Impact of Impact of Dec. 31, 2012 Dec. 31, 2013(€ million) approved IAS 19 restatement restated
Net sales from operations 13,369 - (245) 13,124 12,256
Other revenues and income 10 - - 10 8
Purchases, services and other costs (9,131) - - (9,131) (9,073)
Payroll and related costs (2,041) 9 - (2,032) (2,320)
EBITDA 2,207 9 (245) 1,971 871
Depreciation and amortisation (726) - - (726) (724)
Operating result 1,481 9 (245) 1,245 147
Finance expense (148) (7) - (155) (190)
Income from investments 16 - - 16 13
Result before income taxes 1,349 2 (245) 1,106 (30)
Income taxes (393) - - (393) (106)
Result before minority interest 956 2 (245) 713 (136)
Result attributable to minority interest (54) - - (54) (23)
Net result 902 2 (245) 659 (159)
Cash flow (net result + depreciation and amortisation) 1,628 2 (245) 1,385 565
Reclassified consolidated income statement by function of expenses
Dec. 31, 2012 Impact of Impact of Dec. 31, 2012 Dec. 31, 2013(€ million) approved IAS 19 restatement restated
Net sales from operations 13,369 - (245) 13,124 12,256
Production costs (11,360) 9 - (11,351) (11,584)
Idle costs (154) - - (154) (163)
Selling expenses (160) - - (160) (145)
Research and development expenses (15) - - (15) (14)
Other operating income (expenses), net (11) - - (11) (15)
Contribution from operations 1,669 9 (245) 1,433 335
General and administrative expenses (188) - - (188) (188)
Operating result 1,481 9 (245) 1,245 147
Finance expense (148) (7) - (155) (190)
Income from investments 16 - - 16 13
Result before income taxes 1,349 2 (245) 1,109 (30)
Income taxes (393) - - (393) (106)
Result before minority interest 956 2 (245) 713 (136)
Net result attributable to minority interest (54) - - (54) (23)
Net result 902 2 (245) 659 (159)
Cash flow (net result + depreciation and amortisation) 1,628 2 (245) 1,385 565
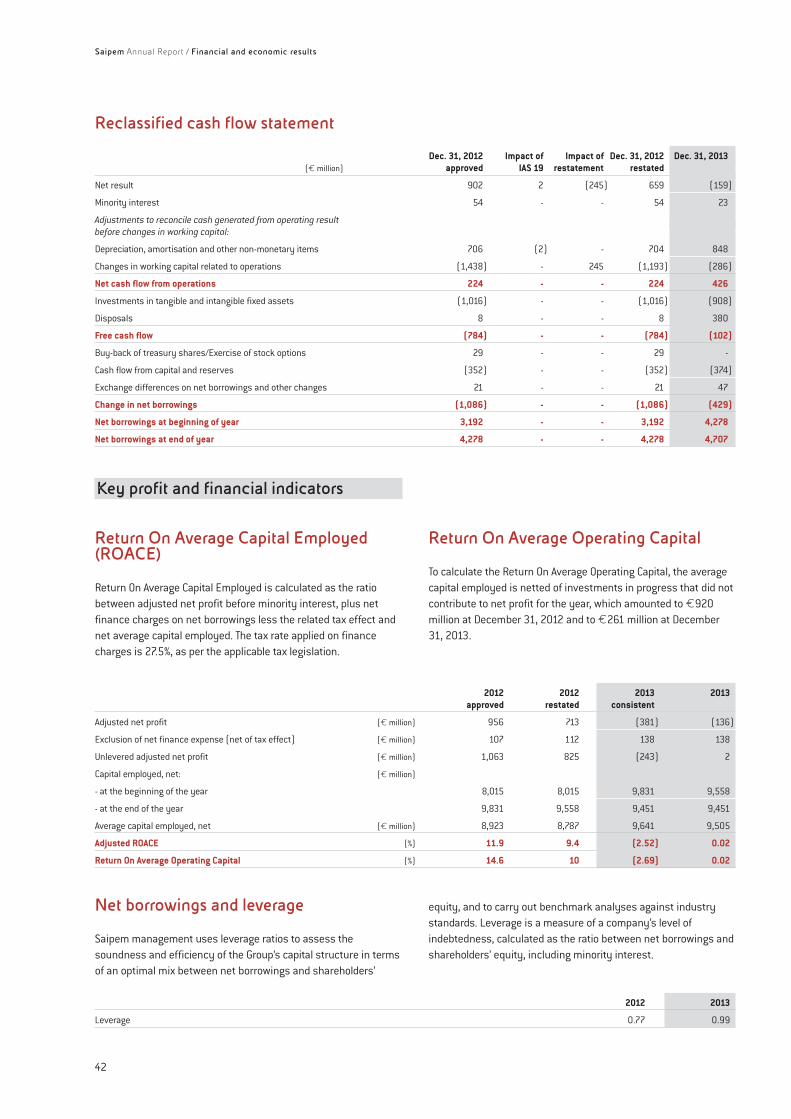
Saipem Annual Report / Financial and economic results
42
Return On Average Capital Employed(ROACE)
Return On Average Capital Employed is calculated as the ratiobetween adjusted net profit before minority interest, plus netfinance charges on net borrowings less the related tax effect andnet average capital employed. The tax rate applied on financecharges is 27.5%, as per the applicable tax legislation.
Return On Average Operating Capital
To calculate the Return On Average Operating Capital, the averagecapital employed is netted of investments in progress that did notcontribute to net profit for the year, which amounted to €920million at December 31, 2012 and to €261 million at December31, 2013.
Key profit and financial indicators
2012 2012 2013 2013approved restated consistent
Adjusted net profit (€ million) 956 713 (381) (136)
Exclusion of net finance expense (net of tax effect) (€ million) 107 112 138 138
Unlevered adjusted net profit (€ million) 1,063 825 (243) 2
Capital employed, net: (€ million)
- at the beginning of the year 8,015 8,015 9,831 9,558
- at the end of the year 9,831 9,558 9,451 9,451
Average capital employed, net (€ million) 8,923 8,787 9,641 9,505
Adjusted ROACE (%) 11.9 9.4 (2.52) 0.02
Return On Average Operating Capital (%) 14.6 10 (2.69) 0.02
Net borrowings and leverage
Saipem management uses leverage ratios to assess thesoundness and efficiency of the Group’s capital structure in termsof an optimal mix between net borrowings and shareholders’
equity, and to carry out benchmark analyses against industrystandards. Leverage is a measure of a company’s level ofindebtedness, calculated as the ratio between net borrowings andshareholders’ equity, including minority interest.
2012 2013
Leverage 0.77 0.99
Reclassified cash flow statement
Dec. 31, 2012 Impact of Impact of Dec. 31, 2012 Dec. 31, 2013(€ million) approved IAS 19 restatement restated
Net result 902 2 (245) 659 (159)
Minority interest 54 - - 54 23
Adjustments to reconcile cash generated from operating resultbefore changes in working capital:
Depreciation, amortisation and other non-monetary items 706 (2) - 704 848
Changes in working capital related to operations (1,438) - 245 (1,193) (286)
Net cash flow from operations 224 - - 224 426
Investments in tangible and intangible fixed assets (1,016) - - (1,016) (908)
Disposals 8 - - 8 380
Free cash flow (784) - - (784) (102)
Buy-back of treasury shares/Exercise of stock options 29 - - 29 -
Cash flow from capital and reserves (352) - - (352) (374)
Exchange differences on net borrowings and other changes 21 - - 21 47
Change in net borrowings (1,086) - - (1,086) (429)
Net borrowings at beginning of year 3,192 - - 3,192 4,278
Net borrowings at end of year 4,278 - - 4,278 4,707
43
Saipem is committed to managing its operations in a sustainableand responsible way, to promoting dialogue and to consolidatingrelations with its stakeholders and sees these pledges as a vitalrequirement for building – particularly through the deployment ofa strategy of local content – shared values that contribute to thesocio-economic development of the areas in which it operates.Saipem adopts a system of governance which seeks to ensure thatits principles and values are translated into concrete actions. To dothis, it employs a Management by Objectives approach, usingmanagement tools to set itself specific sustainability objectives.The Sustainability Committee1, which exercises a sustainabilitystrategy setting role, met three times in an official capacity during2013 to discuss the results achieved in 2012, to approve the 2012Sustainability Report, and to lay down lines of action for the nextfour-year period.
Measuring value creationin local communities
Saipem’s sustainability strategy focuses above all on themaximisation of Local Content, which means facilitating thetransfer of knowledge and professional development with a viewto creating job opportunities, increasing entrepreneurial skills andachieving growth in local human capital. As part of this strategy,Saipem is committed to quantifying its real contribution to thesocio-economic development of local communities.Accordingly, the year saw the continuing application of the SELCEModel (Saipem Externalities Local Content Evaluation), this timeto perform an analysis of operations in Indonesia, Saudi Arabiaand Australia. In addition, the results obtained in the previousanalysis, which was carried out for Nigeria, were updated.The Model consists of a methodology that enables the analysisand quantification of value generated (i.e. the direct, indirect andinduced effects, measured in terms of economic value,employment and human capital development) by the localcontent strategy over a given time frame and in a specificgeographical situation. Since 2009 the SELCE model has beenapplied in Kazakhstan, Angola, Peru, Algeria, Nigeria, France,Indonesia, Saudi Arabia and Australia and has been placed at thedisposal of clients on a number of projects.
Sustainability reporting
Local sustainability projects, as well as stakeholder engagementand interaction initiatives, proceeded in 2013 in the areas whereSaipem operates, in particular those in which the Company
already has or expects to have a long-term presence. The mainareas of intervention were in entrepreneurial and local skillsdevelopment (Peru, Venezuela, Kazakhstan and Nigeria),improvements to the education and health systems (Kazakhstan,Azerbaijan and Brazil), health promotion campaigns (Congo,Angola and Nigeria) and providing support with medical facilitiesand connected services (Kazakhstan, Peru and Venezuela).The development of local resources, with the aim of enhancingemployment opportunities and increasing the income generatedlocally by the Company’s activities continued to be a centraltheme of Saipem’s development support programmes.Further information on sustainability strategies, programmes andactions implemented during 2013 are detailed in the document‘Saipem Sustainability 2013’ and are also published on theCompany website.
Local Community initiatives
For the third successive year, Saipem has opted, based on theresults of materiality analyses and sector benchmarking, toreport on its sustainability activities through two complementarypublications, whose structure remains unchanged from theprevious year.In order to ensure transparent disclosure and facilitatecomparison with other actors present on the market, thedocument ‘Sustainability Performance’ is published as anAddendum to this Annual Report. ‘Sustainability Performance’ isdrafted in accordance with the international guidelines of theGlobal Reporting Initiative (GRI - version G3). It describes theGroup’s sustainability objectives and performances in 2013,including detailed qualitative and quantitative information andyearly comparisons.The second document published is ‘Saipem Sustainability 2013’,which aims to describe the commitments undertaken, initiativesconcluded and the results obtained by Saipem in relation tothemes considered material by its stakeholders.
‘Saipem Sustainability 2013’ covers the following principle areas:local development and the promotion of Local Content, skills andpersonnel management, including the promotion of health andsafety, business opportunities and business integrity, supplychains, human rights and working conditions.The document also contains numerous country focuses whichtestify to the concrete realisation of sustainability strategies atoperating sites.Furthermore, for the fourth year running, Saipem will call on apanel of external and independent experts to provide comments
Sustainability
Saipem Annual Report / Sustainability
(1) The Saipem Sustainability Committee is composed of the Chief Executive Officer (Chairman) plus the heads of the Company’s business areas and managers of key functions.

on the quality of reporting and on Saipem’s sustainabilityinitiatives and strategy. 2013 also saw the panel participate in thepreparation and design of the report. In October 2013, an ExpertPanel Workshop was held to discuss the principal themesproposed for inclusion in the Saipem Sustainability 2013 and tocarry out a materiality analysis. The results of the workshopserved as input for the preparation of the report.
During the year, Saipem continued communications targetedmainly at local stakeholders in the form of ‘Country Reports’ and‘Project Reports’ focusing on key countries or significant projects.The year also saw the publication of a report on the ‘Puerto Nuevo’project in Colombia and Country Reports on Nigeria (an update tothe previous edition) and Angola (produced in both English andPortuguese).
Saipem Annual Report / Sustainability
44
45
In mid-2013, Saipem carried out a restructuring of its researchand development activities, with the rationale that the capabilityto offer advanced technological solutions represents a crucialfactor for sustaining and enhancing the Company’s competitiveadvantage in both the medium and long term.
As part of the change, a new corporate research and developmentdepartment was created with the goal of maximising and fullyleveraging Saipem’s research and development efforts throughcareful management. The research and development departmentsof the Business Units will remain focused on defining specificdevelopment proposals and managing projects and initiatives.
The restructuring initiative is expected to bear fruit in the nearfuture. In the meantime, 2013 saw Saipem press on with itsresearch and development programme, working on distinctivesolutions in technologically-advanced sectors, such as the deepand ultra-deep waters and floating platform sectors and thedevelopment of new procedures and equipment for subseaexcavation and pipelaying under extreme conditions. The yearalso saw the improvement of proprietary process technologiesand the expansion of the Company’s portfolio of environmentalservices.
In the deep-water segment, the focus of R&D efforts was on thedevelopment of innovative subsea processing systems and workcarried out in partnership with a number of leading oil companies.
The Joint Industry Project (JIP), which is based on the patented‘Multipipe gas/liquid gravity separation system’, can count on thefinancial support of three oil majors. The project encompasses thedefinition of an entire subsea station for two cases of applicationas well as the evaluation of the design maturity of all of thestation’s individual components, particularly from the point ofview of construction. The JIP has been completed, and the systemis now assessed as mature for project application. Additionalanalyses were conducted on the separator to test scenariosspecifically requested by operators involving the maintenance ofthe system using vessels with very limited lifting capacity.
The year saw 3-phase hydraulic testing using a reduced scalemodel on the ‘Spoolsep’ liquid/liquid gravity separation system.The tests, which covered the full range of plannedexperimentation, were completed in November. A number of visitsto the pilot plant by oil companies were organised with a view tosecuring their involvement in the next phase of systemqualification.
In addition, a number of further studies also financed by oilcompanies were conducted with the aim of evaluating Saipem’ssubsea separation systems for various specific applications.
Work also continued during the year together with an industrialpartner on the design of subsea produced water treatmentsolutions. SPRINGSTM, the result of the joint efforts of Total, Saipemand Veolia is designed for the subsea removal of sulphatespresent in seawater. A small pilot unit has been built for acampaign of offshore tests due to take place during the secondhalf of 2014.
Technology development activities in the floating productionfacilities segment remained focused on the creation of innovativesolutions for floating liquefaction facilities (FLNG) with theobjective of achieving more efficient and safer gas productionunder what are increasingly challenging conditions. Work wasalso carried out with the aim of providing direct support to FLNGprojects currently being undertaken by Saipem. This included thequalification of a tandem LNG offloading system using floatingflexible hoses.
Significant results were also achieved during the year in the SURF(Subsea, Umbilicals, Risers and Flowlines) segment, where anumber of innovative solutions developed over recent yearsbegan to come to fruition, bringing with them the prospect of newopportunities to be exploited on the subsea field developmentmarket. In addition, studies were also launched with regard tosubsea flowline heating solutions.
In terms of deep and ultra-deep water applications, furtheranalyses conducted on a number of riser concepts confirmedtheir feasibility and relevance. Studies were also begun duringthe period on intervention downlines. The aim of thesedevelopments is to define new solutions for deployment in thecommissioning and intervention phase of deep-water projects,with the aim of ensuring mechanical integrity and saferoperability.
Work to develop a J-lay installation method adapted to plasticlined pipe continued. Tests carried out together with an industrialpartner produced promising results and the next phase ofdevelopment, which will complete the process of industrialqualification, is due to begin during the first half of 2014.Following the completion of a process of screening for the activeheating of flowlines, development worked kicked off in 2013 withthe aim of developing and qualifying a solution that will enable thetechnology to be adapted for J-lay installation.
Newly designed components providing high pulling capacity wereinstalled on a clamp on board a pipelay vessel and used ondeep-water pipeline installation projects.Studies aimed at obtaining improvements in the reel lay processand equipment continued. A new solution was evaluated fromboth a technical and economic point of view with positive results.
Research and development
Saipem Annual Report / Research and development
Saipem Annual Report / Research and development
46
A significant effort went into the development of criteria to allowthe heavier steel cables used in deep-water lifting operations andpipeline shore approaches to be safely replaced with rope madefrom synthetic fibres. Characterisation and qualification of ropemade using large diameter fibres and validation work oninnovative tensioning systems were concluded during the year.Studies also continued on the application of new fibre-basedsystems providing a very high pulling capacity.Development work and testing was also stepped up with a view toapplication on a real project of a system designed to preventpipeline flooding during continuous laying operations.Engineering, prototype construction and testing of the criticalcomponents of the system continued to take place, as well as asubstantial review of the entire system.Testing was carried out successfully on a new instrument for theremote measurement of pipeline internal ovalisation during layingoperations. The industrialisation/production process is nowunderway.
New welding equipment which provides improved quality welds oncoated carbon steel sealines was successfully applied on anoffshore construction project.Following the excellent results obtained during numericsimulations for a new highly productive offshore pipeline weldingprocess, an experimental validation campaign was planned.Meanwhile, the new welded joint coating system, which wassubjected to testing in previous years, was scheduled forapplication on a project encompassing J-lay, S-lay and multiplejoint fabrication operations. The production process for the systemequipment is currently underway.The new RFID pipe tracking system was used for the first timeon-board the pipelay vessel Castorone on a project situated in theGulf of Mexico.
A new system was developed that is designed to reduce the risksassociated with S-lay operations by allowing the rapid release ofmachinery from pipe strings on the launch ramp in the event ofuncontrolled pipeline movements. Tests are currently drawingtowards a close, meaning that production of the system will beready to commence.
With regard to subsea operations, developments of the pipe repairsystem continued with the aim of extending its applicability tohydrosulfuric acid-rich environments as well as to acidenvironments in general.Tests were also conducted during the year on a prototype of aninnovative system for sealine repair that can also be used forconstruction operations. The system does not involve the use of atraditional telescopic joint and is also suitable for diverlessapplication.
In the sealine trenching area, the experiments at sea oftechniques for the transplantation of the aquatic plant Posidoniacontinued, confirming the positive results obtained previously.Meanwhile, with preliminary studies on a new subsea pipelinetrenching and installation method with a very low environmentalimpact having concluded, the focus of the work shifted todeveloping the method and equipment for actual application.Other studies conducted in parallel focused on developing optimaltrench excavation techniques for use with hard soils, reducing theweight of equipment through the use of alternative materials anda new system for measuring the burial depth of pipelines afterthey have been laid in trenches.
Development work continued on tools used to simulate and guideoffshore construction operations with the aim of enhancing theiranalytical power and improving real time monitoring duringoperations.
Process development activities focused on the achievement ofcontinuous improvements in the environmental compatibility ofproprietary fertiliser production technology ‘SnamprogettiTM Urea’,licensed to 127 units world-wide. At present the focus of the effortis on minimising the environmental impact of Urea plants (UreaZero Emission) through the implementation of innovativetechnologies currently under development. A collaboration hasbeen launched with the Fraunhofer Institut involving thedevelopment and supply of technological components that will bevalidated in a special facility at the University of Bologna and thenincluded in ‘Urea Zero Emission’ process flows.
Following the technology screening phase conducted during 2012,a new innovation project was launched comprising a number ofdifferent research components, whose aim is to achieveincreased energy efficiencies in process facilities. 2013 saw thecompletion of a study of hydroelectric energy production usingwaterfalls found in cooling water systems.
Other research and development activities with an environmentaltheme conducted during 2013 included the positive conclusion ofa project concerning the use of geothermal waste waters toreactivate geothermal fields, which represents an interesting andenvironmentally sustainable option for reusing potentialpollutants. The experimental procedure developed on the projectmakes it possible to verify in advance whether any potentiallynegative effects (e.g. corrosion) may result from re-injection.Finally, development work on a model for predicting undergroundwater flows was completed during 2014. The model has beendesigned for application with environmental containment andremediation systems and water resource development andprotection projects. The software is currently being subjected tointegration with company standards.
Saipem Annual Report / Quality, Health, Safety and Environment
47
Quality
During 2013, Saipem top management chose to emphasise andreinforce the Company’s commitment to delivering products andservices that meet the highest standards of quality, which it hasidentified as the key to maintaining and sustaining long-termcompetitive advantages.To ensure the effective promotion and dissemination of acompany culture based on a sound, proactive management ofquality issues which recognises their importance for achievingthe desired operating results, Quality Assurance and QualityControl operations have been placed under the direct supervisionof the Chief Executive Officer.
July saw the roll out of the ‘Bring quality to the next level’programme, which aims to provide a tool to further enhance theCompany’s quality system, promote a company culture orientedtowards the pursuit of excellence and the highest qualitystandards and to bring increased competitiveness and improvedcommercial success.Implementation of the programme, which has a two-year timehorizon, is being overseen by a Steering Committee composed ofmanagers from a number of different Company functions, whichreports periodically to Saipem’s Executive Committee on progressmade.The programme’s priority areas, which were identified on the basisof an initial phase of assessment of the quality managementsystem, are being worked on by a number of interdepartmentalworkgroups, each of which is managed by a Workstream Leaderand supervised by a Workstream Sponsor.5 workstreams, each with a six-month duration, have beenlaunched:- ‘Cost of non-quality’, which aims to define methods and tools
for identifying and monitoring the costs associated with a lackof quality on individual projects as well as on a more generalcompany-wide level, thus enabling Company management toidentify corrective actions, improvement programmes andareas of priority.
- ‘Lessons Learned’, which aims to define and implementmethods and systems for capitalising on experience acquiredon projects and disseminating information to all levels/areas ofthe Company with regard to both successful and unsuccessfulpractices, thus providing guidelines for handling events andsituations that have already been encountered in the past.
- ‘Supply Chain of Materials’, involving an analysis of the entireSaipem materials supply chain, including an evaluation ofrecurring causes of non-conformities, so that areas forintervention and process optimisations can be identified.The suitability/effectiveness of the actions identified will besubjected to a preliminary assessment in which they will beapplied to a number of selected strategic commodity classes.
- ‘Offshore Fabrication Subcontractor’, consisting of an analysisof the process of supervision implemented for constructionworks carried out by subcontractors at third party fabricationyards, with a view to identifying methods, procedures and toolsfor ensuring that the objectives are met.
- ‘Top management critical metrics - Drilling’, whose aim is todevelop an integrated system of key performance indicatorsthat will allow Company and Business Unit management tosystematically monitor the economic and operating resultsachieved by the Drilling business and to set corrective actionswhere required.
In parallel with the five workstreams, a communications plan waslaunched which aims to ensure the involvement of all Saipempersonnel in the various initiatives.
Additional workstreams are due to be launched in April 2014based on the results achieved in the first phase of theprogramme.
2013 also saw the continuation of many initiatives worked onduring 2012, including:
System Quality:- issue of a new Management System Guideline for the
company’s regulatory system, the definition of Company WorkProcesses and the designation of the Process Owners;
- training for Managing Directors and Branch Managers regardingthe Quality initiatives currently underway and their impact onthe Operating Companies;
- definition of a certification model for the new CorporateGovernance Model by a third party body;
- publication and dissemination of a set of Corporate Standardsgoverning Group Quality Assurance and Quality Controlactivities;
- implementation of a new reporting system on the QualityManagement Systems (QMS) implemented at Group OperatingCompanies;
- Customer Satisfaction surveys conducted on all projectscurrently underway.
Project Quality Management:- integration of the Project Quality Management methodologies
for Onshore and Offshore projects;- updating of the Document Systems used on vessels in line with
new Corporate guidelines currently in the process of beingissued;
- application on projects of the new Project Quality Managementreporting system.
Quality, Health, Safety and Environment
Saipem Annual Report / Quality, Health, Safety and Environment
48
Quality Control:- implementation of standardised Quality Control Plans for
Onshore and Offshore E&C projects;- creation of a library of best practices related to advanced
ultrasonic weld testing methodologies;- completion of qualification of NDT Phased Array methodologies
at the Petromar and Star fabrication yards;- issue of dedicated criteria for the maintenance and testing of
BOP systems used on drilling projects;- dissemination at all yards of uniform Quality Control
requirements based on past experience, and reorganisation ofQuality Control teams;
- implementation of new reporting system on the Quality Controlmanagement Systems implemented on Onshore and Offshoreprojects.
Safety
The Total Recordable Incident Frequency Rate for 2013 was 1.16,which was above the target set for the year of 1.06.Overall, there was a drop in Lost Time Injuries, which are injuriesthat cause absences from work, and an increase in minorincidents, or Total Recordable Incidents. The year unfortunatelysaw a total of six fatal accidents. Two members of contractor staffwere killed when the walls of a trench collapsed on them, aSaipem employee was crushed by a pipe during lifting and movingoperations on board a barge, another Saipem employee fell intothe sea during equipment handling operations on board a vessel,while a third Saipem employee died from electrocution. In additionto these incidents, 2013 also witnessed the sinking of the PerroNegro 6, which occurred when the seabed the rig was resting oncollapsed. One person is currently missing as a result of theincident.
Activities and initiatives carried out during 2013 with the aim ofmaintaining high workplace health and safety standards included:- HSE training in accordance with a plan that encompasses
both the recent State-Regions Agreement and the Saipem HSEtraining protocol. An International HSE Training Protocol is alsocurrently being developed in order to ensure that all Saipemcompanies and branches are fully aligned in terms ofplanning and delivery of HSE courses. A key element in thisdrive are the ongoing developments being made on the new‘Delphi’ training portal, whose principal aims are tostandardise and share teaching materials and to provide areference point for HSE trainers and all types of traininginitiatives;
- particular attention was paid to emergency management, withworkers attending dedicated courses dealing with thepsychological and behavioural aspects of emergency situationsas well as operational issues. The training was delivered inconjunction with the Italian Civil Protection authority(Protezione Civile);
- a significant effort was also directed at developing andenhancing software applications designed to improve HSE
business and management processes. The year in fact saw thelaunch of the software application ‘Corinth’, which is used tomanage the HSE audit process at Saipem SpA as well as of the‘Nike’ application, which is designed to ensure thestandardisation of Personal Protective Equipment;
- meanwhile, the roll out of the Leadership in Health and Safetyprogramme and its adaptation to suit the requirements of thevarious local companies continued apace. The year opened witha change in the tools and materials used on the programme(e.g. films, workbooks, manuals, posters), following the changein Saipem’s top management team;
- the ongoing roll out of the various phases of the programmecontinued, encompassing all levels of the Company:• senior and junior managers and supervisors attended the
first phase workshops, which are designed to raiseawareness among the top levels of the Company with regardto the importance of their role in ensuring safety within theirorganisations and to provide them with the tools they need toact as leaders;
• a number of the leaders who attended the first phase,selected based on their positions and personality type, tookresponsibility for the delivery of the programme’s secondphase, which consisted of a series of cascading eventsdesigned to disseminate the basic principles of theprogramme to all Saipem employees;
• the third phase of the programme, consisting of the ‘FiveStars’ courses, which deal with the most appropriate ways forintervening in situations of unsafe behaviour, was attendedby thousands of Saipem operatives, who have directfirst-hand contact with the risks associated with theCompany’s business;
• meanwhile, the drive continued to promote the five ‘LeadingBehaviours’ – non-negotiable behaviours that Saipem aimsto ensure become a part of the DNA of all its employees –via the implementation of dedicated communicationscampaigns as well as by leveraging the positive influencethat a group of employees selected for their naturalcharisma and who already practice the Leading Behavioursare expected to have on their colleagues. The campaign hasreceived the prestigious Eni Safety Award which is given tothe best safety initiative implemented at Eni Groupcompanies;
- in addition to providing Eni with support with the roll out of its‘Eni in Safety’ programme, the activities conducted by the LHSFoundation during the year included a Flashmob contest tocelebrate ‘World day for Safety and Health at work’, participationat the ‘Ambiente e Lavoro’ (Work and Environment) tradeexhibition held in Bologna and the organisation of a series of‘Piccoli Leader in Safety’ (Little Leaders in Safety) events at anumber of elementary schools.
Finally, the year saw Saipem SpA enhance its levels of governanceby achieving OHSAS 18001 (Health and Safety) and ISO 14001(Environment) certifications issued by the independentcertification body Det Norske Veritas (DNV). A further 18 Groupcompanies and branches also obtained the certification.
Saipem Annual Report / Quality, Health, Safety and Environment
49
Environment
Numerous activities and environmental initiatives were pursuedduring the year, including:- the development of effective response plans for dealing with
accidental spills for all sites and projects, as well as theorganisation of training initiatives and periodic drills forpersonnel involved in all relevant activities. Saipem also offeredits cooperation with and took part in a number of drillsorganised by Eni;
- the promotion of the ‘Reduce Your Foodprint’ initiative organisedin connection with World Environment Day June 5, 2013, whichaims to reduce food wastage;
- with regard to energy saving, the year saw Saipem completeenergy efficiency analyses for a number of its offices inaccordance with ISO 50001:2001 ‘Energy ManagementSystems’. It also took part in a project organised by MimprendoItalia under which an energy assessment was conducted for theSaipem 7000, with the aim of identifying efficient methods forreducing on board fuel consumption;
- the review of the environmental controls in place pursuant toLegislative Decree No. 231/2001, which is nearing completion,led to an update to the Company’s environmental regulatorydocumentation. The Company’s environmental documentsystem represents a useful tool for helping to preventenvironmental crime;
- organisation of ‘Environmental Train the Trainer’ courses aimedat international personnel working in the field of HSE who havebeen identified as potential environmental trainers;
- consolidation of the company’s new environmentalcommunication tools, including the environmental magazine‘eNews’, which illustrates the principle environmental initiativesoccurring within Saipem, ‘Breaking eNEWS’, which covers globalinitiatives and lessons learned, and ‘Italian eNEWS’, whichprovides updates regarding environmental legislation for sitesin Italy.
Health
With regard to health-related issues, the year saw Saipemcontinue with its normal activities and promote a series of newinitiatives:- 6,018 preventive medical check-ups were carried out for Italian
and international personnel; 391 people required furtherexamination and 11 were alcohol and drug tested;
- the diffusion of the ‘Pre-Travel Counselling’ programme for allpersonnel due to work abroad continued during the year.1,081 employees received training, including updates based oninternational health alerts. Since its launch in 2008, theprogramme has provided in the region of 5,000 employees withprecise, accurate information concerning the risks connectedwith their destination, as required under the applicablelegislation. Health protocols and pre-travel training have beenvalidated by the Institute of Occupational Medicine at theUniversità Cattolica del Sacro Cuore in Rome;
- the drive to raise vaccine awareness in relation to bothmandatory and strongly recommended vaccines for Italian andforeign sites proceeded throughout the year, with a total of1,370 vaccines administered, while, the agreement signed withthe local health authority ASLMI2 in Milan for yellow fevervaccination also continued;
- the ‘Sì Viaggiare’ international travellers’ handbook applicationwas launched for the Apple and Windows 8 platform, while anAndroid version is currently under development. The applicationis available in two versions: an Enterprise version for Saipememployees and a Customer version for general use by allinternational travellers;
- the year also saw work take place under agreements with avariety of medical facilities and hospitals on a wide range ofissues. The partnership with Rome’s La Sapienza Universityinvolving an epidemiological study of 10 years of preventivecheck-ups under the overseas health protocol for Italianemployees ended in December, while the partnerships with theIRCCS Policlinico di San Donato Milanese for health promotioninitiatives, with the CIRM (Centro Internazionale Radio Medico)for the provision of radio medical advice to employees workingon board Saipem’s offshore fleet and with Milan’s Sacco hospitalfor infectious disease testing of employees returning from workabroad all continued;
- work also continued on a number of established programmessuch as the healthy diet initiative ‘H-factor’, ‘Choose Life’, whichis designed to promote a healthy lifestyle, and thetelecardiology programme. Significant efforts were alsodirected at a number of new initiatives, including a WeightControl and Obesity Prevention Program, an anti-smokingcampaign based on behavioural change tools called ‘Don’t takemy breath away’ and a programme which aims to create aculture of cardiovascular disease prevention;
- finally, Saipem also organised events to coincide with a numberof international awareness days celebrated by the World HealthOrganisation, namely World Hepatitis Day, World Diabetes Dayand World AIDS Day. Presentations, posters and leaflets wereproduced to publicise all of the above events and initiatives.
50
Workforce
The year saw the workforce continue to grow, moving from 44,980resources (of whom 18,025 with critical skills) in 2012 to 48,607(of whom 18,662 with critical skills) at the end of 2013.The increase was mainly connected with a greater use of directhiring on projects under execution in the Onshore E&C sector, inparticular in Mexico and Canada.The number of women managers also increased in 2013 by 0.8%and that of local managers by 0.7%.
Payroll
In line with employment dynamics, the value of the payrollincreased in comparison with the previous year (€2,320 million atthe end of 2013 compared to €2,032 million in 2012). The increasewas caused by a change in the salary mix (average pro-capitasalary of €49.3 thousand in 2013 compared with €48.3 thousandin 2012), as well as by the growth recorded in the workforce.
Organisation
Saipem conducted an analysis and redefinition of itsorganisational structure and corporate governance models andprocesses during 2013 with the aim of strengthening itscompliance and governance system, ensuring more effectivebusiness management and improving performance.The initiative saw the Company’s business areas reorganised andintegrated under the control of the Chief Operating Officer.The organisational structure resulting from the integration of theEngineering & Construction and Drilling businesses has thefollowing characteristics:- four dedicated structures – Onshore, Offshore, Drilling and
Floaters – responsible for looking after the various productsegments and assigned responsibility for defining andimplementing business strategies and plans worldwide;
- eight Regional Managers representing Saipem in theirrespective geographical areas, responsible for integratedbusiness promotion and local content optimisation;
- the central functions – ‘Commercial’, ‘Tendering’, ‘Engineering,Technologies and Commissioning’ and ‘Project Management’,which have a worldwide, cross-product steering, coordinationand control role.
In addition, the following initiatives were completed as part of thegovernance enhancement effort during 2013 with the aim ofensuring oversight on a number of critical issues and activities:- creation of the following committees:
• the Executive Committee, whose role is to advise the CEO inrelation to key business decisions and provide evaluations
regarding significant or critical aspects, e.g. reviews of theoperating results of the business areas or the Company’seconomic-financial performance;
• the Risk Committee, which is responsible for advising theCEO on strategies for managing Saipem’s principal risks;
• the Regulatory System Compliance Committee and theRegulatory System Technical Committee, whose role is tosystematically verify that the Company’s regulatorysystems are consistent with the compliance andgovernance models;
- the following functions and positions were assigned to report tothe CEO:• the Chief Financial and Compliance Officer, to ensure the
governance of the principal functions involved in themanagement of the compliance and governance system, i.e.administration, finance and control, corporate affairs andgovernance, general counsel and information andcommunication technology;
• Integrated Risk Management, responsible for theidentification, analysis, monitoring and reporting of theCompany’s main risks;
• Health, Safety and Environment and Quality, to ensure thedissemination within the Company of a culture, processesand tools related to these areas;
• Procurement, Contract and Industrial Risk Management, withthe aim of ensuring the integrated management of thesebusiness support functions, which make an importantcontribution in terms of project results;
• Public Affairs and Communication, with the aim of ensuring afocused, strategic approach to external communications,image management and public affairs;
• Business and Technology Development, with the aim ofestablishing an integrated approach to promotion of theCompany’s capabilities and products and leveraging of itstechnology research and development effort.
Meanwhile, as part of the drive to enhance the Company’s InternalControl and Risk Management System, the year saw:- the launch of an initiative to develop and implement a new
authorisation matrix for Saipem SpA and its branches – a toolused for the Governance of the main companyprocesses/activities and/or those considered most sensitive.In addition, alignment of the authorisation matrices used insubsidiaries and their branches was started, with standardpowers and economic limits set commensurate with thedimensions and complexity of the entities in question;
- the Saipem regulatory system was subjected to review with theaim of emphasising the responsibilities of Process Owners,promoting greater integration of the main principles ofcompliance into the processes, and redefining Saipem SpA’ssteering, coordination and control role and the operationalautonomy of Saipem companies.
Human resources
Saipem Annual Report / Human resources
The function also oversaw the issuing of Management SystemGuidelines (MSG) for the following processes: Regulatory System,Market Abuse, Legal, Procurement, and Services for Personnel.In the Group’s foreign entities, the introduction of the newauthorisation matrices was accompanied by ongoing work toestablish new company structures, adapt the existingorganisational structures to ensure compliance with the companymodel and review the systems of powers and delegation ofauthority in place.
Human Resources Management
The current market scenario and the global climate in whichSaipem operates increasingly calls for rapid, targeted measuresthat are in full compliance with all applicable labour, trade union,tax and welfare legislation.Within this context, the Human Resources Management functioncontinued to fulfil its guidance, coordination and control remit,which included constant efforts to develop and integrate tools tosupport the Company’s strategic decision-making processes.As in the first half of the year, the function pressed on with a raftof actions designed to obtain significant results in terms ofoptimization of personnel costs and improved operationalefficiency and efficacy.These included actions designed to enable the monitoring andcontrol of critical human resources phenomena such as holiday,overtime, working hours and absenteeism.In addition, the year saw the launch of a number of actions of amore global scope designed to ensure more accurate andeffective management of operating processes in local HRdepartments. The implementations of these actions will continuethrough into 2014.The second half of the year also saw additional enhancementsmade to the technical functionalities of the principal analysis andreporting systems used by the Human Resources Department.These increased the effectiveness and efficiency of themanagement actions and measures implemented and alsoproduced improvements in terms of better coordination andintegration between the various department structures.Following the introduction of the HR Management Portal –a web-based tool capable of integrating data from the variousinformation systems use by the Company and performinganalyses and overviews to provide business intelligence inrelation to key human resources phenomena – the developmentand improvement initiatives continued, with the year seeing anextension of the portal’s scope of application, which at presentencompasses the monitoring of key areas such as holidays,accrued compensatory time, overtime, workforce data,remuneration policies, business trips and assignments,international mobility and expatriation policies.In addition, tests were recently commenced involving thecollection and analysis of data from a number of overseas Saipemcompanies that are characterised by comparatively complexoperational and organisational set ups. The medium-term goal isto provide coverage through the HR Portal for the main Saipem
overseas operating companies with a view to achieving improvedintegration, sharing and leveraging of know-how, experience andwork tools within the HR professional family.With regard to international mobility, which represents a criticalsuccess factor of great strategic importance for the business, thework started in 2012 continued, focusing on two main areas –on the one hand developing and innovating the informationsupport systems used, and on the other, analysing and redefiningexpatriation methodologies and policies to ensure that they fullymeet operating requirements (which can vary depending on thetype of project or environment) and the needs of Saipempersonnel, i.e. in terms of providing a more effective work-lifebalance.Market benchmarking techniques were used to define newprocedures and methods for calculating expatriate salarypackages for a number of professional families identified as beingcritical for Saipem’s business, with a view to ensuring betteralignment with market practices and rates.The HR Management function also pressed on during the yearwith the development of the Country Card information tool, whichhas been designed to provide storage and access both centrallyand at branch level of up-to-date HR-related data (e.g. labour, tax,welfare and trade union legislation) for the countries in whichSaipem operates.The platform will be used as a communication channel for thedissemination of corporate guidelines and for gathering data forlocal surveys and analyses and will also reinforces ties andimprove integration between the central and local HRdepartments.The tool was already partially tested during the second half of2013 when conducting annual surveys on cost of living, benefits,and cars and transportation allowances. The use of the CountryCard tool produced a significant saving in terms of the timenecessary to carry out the survey and also led to greater datagathering efficiency.In the light of the positive results obtained from the roll out of theOverseas Tool application in GHRS (GHRS is the informationsystem used for Saipem personnel management andadministration), which was developed in 2012 with the aim ofensuring more effective management of expatriation processesand overseas contracts, analysis and roll out phases wereconducted in several overseas locations where there are a largenumber of international personnel under assignment.Also, with a view to achieving continuous improvements in themodule, additional modifications were made to increase theeffectiveness and speed of the operating processes related toexpatriate personnel management.Finally, the entire Human Resources document/proceduralsystem, which contains the standards applied for all of the mainHR operating processes at all Group companies, was revised andupdated during the year. This was done with the aim of ensuringclear, transparent communication with Saipem human resourcesand achieving incisive management of critical/high impact issuesthrough the implementation of a more robust, structured systemof regulations.
Saipem Annual Report / Human resources
51
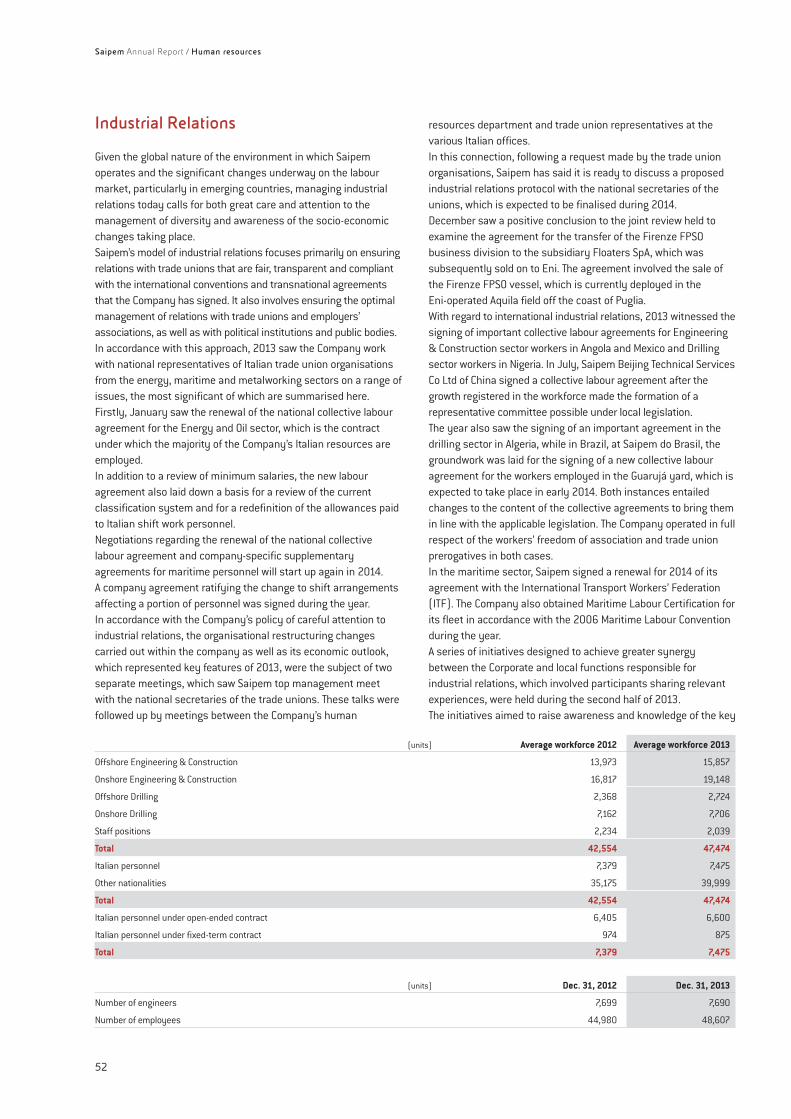
Saipem Annual Report / Human resources
52
Industrial Relations
Given the global nature of the environment in which Saipemoperates and the significant changes underway on the labourmarket, particularly in emerging countries, managing industrialrelations today calls for both great care and attention to themanagement of diversity and awareness of the socio-economicchanges taking place.Saipem’s model of industrial relations focuses primarily on ensuringrelations with trade unions that are fair, transparent and compliantwith the international conventions and transnational agreementsthat the Company has signed. It also involves ensuring the optimalmanagement of relations with trade unions and employers’associations, as well as with political institutions and public bodies.In accordance with this approach, 2013 saw the Company workwith national representatives of Italian trade union organisationsfrom the energy, maritime and metalworking sectors on a range ofissues, the most significant of which are summarised here.Firstly, January saw the renewal of the national collective labouragreement for the Energy and Oil sector, which is the contractunder which the majority of the Company’s Italian resources areemployed.In addition to a review of minimum salaries, the new labouragreement also laid down a basis for a review of the currentclassification system and for a redefinition of the allowances paidto Italian shift work personnel.Negotiations regarding the renewal of the national collectivelabour agreement and company-specific supplementaryagreements for maritime personnel will start up again in 2014.A company agreement ratifying the change to shift arrangementsaffecting a portion of personnel was signed during the year.In accordance with the Company’s policy of careful attention toindustrial relations, the organisational restructuring changescarried out within the company as well as its economic outlook,which represented key features of 2013, were the subject of twoseparate meetings, which saw Saipem top management meetwith the national secretaries of the trade unions. These talks werefollowed up by meetings between the Company’s human
resources department and trade union representatives at thevarious Italian offices.In this connection, following a request made by the trade unionorganisations, Saipem has said it is ready to discuss a proposedindustrial relations protocol with the national secretaries of theunions, which is expected to be finalised during 2014.December saw a positive conclusion to the joint review held toexamine the agreement for the transfer of the Firenze FPSObusiness division to the subsidiary Floaters SpA, which wassubsequently sold on to Eni. The agreement involved the sale ofthe Firenze FPSO vessel, which is currently deployed in theEni-operated Aquila field off the coast of Puglia.With regard to international industrial relations, 2013 witnessed thesigning of important collective labour agreements for Engineering& Construction sector workers in Angola and Mexico and Drillingsector workers in Nigeria. In July, Saipem Beijing Technical ServicesCo Ltd of China signed a collective labour agreement after thegrowth registered in the workforce made the formation of arepresentative committee possible under local legislation.The year also saw the signing of an important agreement in thedrilling sector in Algeria, while in Brazil, at Saipem do Brasil, thegroundwork was laid for the signing of a new collective labouragreement for the workers employed in the Guarujá yard, which isexpected to take place in early 2014. Both instances entailedchanges to the content of the collective agreements to bring themin line with the applicable legislation. The Company operated in fullrespect of the workers’ freedom of association and trade unionprerogatives in both cases.In the maritime sector, Saipem signed a renewal for 2014 of itsagreement with the International Transport Workers’ Federation(ITF). The Company also obtained Maritime Labour Certification forits fleet in accordance with the 2006 Maritime Labour Conventionduring the year.A series of initiatives designed to achieve greater synergybetween the Corporate and local functions responsible forindustrial relations, which involved participants sharing relevantexperiences, were held during the second half of 2013.The initiatives aimed to raise awareness and knowledge of the key
(units) Average workforce 2012 Average workforce 2013
Offshore Engineering & Construction 13,973 15,857
Onshore Engineering & Construction 16,817 19,148
Offshore Drilling 2,368 2,724
Onshore Drilling 7,162 7,706
Staff positions 2,234 2,039
Total 42,554 47,474
Italian personnel 7,379 7,475
Other nationalities 35,175 39,999
Total 42,554 47,474
Italian personnel under open-ended contract 6,405 6,600
Italian personnel under fixed-term contract 974 875
Total 7,379 7,475
(units) Dec. 31, 2012 Dec. 31, 2013
Number of engineers 7,699 7,690
Number of employees 44,980 48,607
Saipem Annual Report / Human resources
53
regulations governing industrial relations within Saipem and wereaimed at internal HR personnel and agencies belonging to therecruitment and selection sector.Local level initiatives carried out during the year included a pilotinitiative promoted by ERSAI Llc in Kazakhstan which aims todisseminate the content of the Code of Ethics to local workers,particularly with regard to issues connected with workers’ rights.
Development, Selection and Training
Saipem continues to place great emphasis on human resourcesdevelopment as a fundamental element for ensuring an effectivedefinition of its workforce in qualitative terms and works toensure that the development of internal resources is based onprocesses that are closely linked to the Company’s businessneeds. As part of its human resources development approach,efforts continued during 2013 to update, consolidate, simplify andintegrate the People Strategy and the Employee Value Proposition.In accordance with the Compensation and Nomination Committee,the succession plans in place for strategic company positionswere updated in response to the changes to the organisationaland business scenario that occurred during the year.Competence Assurance systems were implemented to ensureoptimized monitoring of onshore and offshore constructioncompetencies. The systems provide a structured and directapproach to the oversight of competencies and also encompasssupport actions such as training events, tutoring and assignmentto specific projects.Following the employee engagement analysis conducted atSaipem SpA at the end of 2012, improvement measures wereimplemented in areas where the satisfaction results were lowest.The measures focused on both specific processes and specificsegments of the Saipem population. With the aim of providinggreater support to the Company’s younger employees, a projectentitled ‘Share and Shape’ was launched. The objective of theinitiative is to secure a more direct level of engagement onthe part of the company’s less senior employees with regard tothe formulation of improvement proposals to top management.The proposals will be translated into projects which it is hoped willattract the interest of the entire Saipem population.To ensure it can constantly maintain the levels of excellence themarket expects of it, Saipem’s selection activities are orientedtowards identifying personnel offering extensive, relevantprofessional experience and capabilities. With a view to developingand fostering such capabilities, which it can often be difficult tosource on the labour market, Saipem is continuing to invest inemployer branding exercises and initiatives aimed at the Italian’stop secondary level technical schools and universities.September 2013 saw the start of the second edition of thepostgraduate master’s program in ‘Safety and EnvironmentalManagement in the Oil&Gas Industry’, which is organised incollaboration with the University of Bologna and Eni CorporateUniversity. Participants on the course included European andnon-European students in addition to Italian students.Taking its cue from developments in the worlds of industry andeducation, Saipem aims to build lasting relations with Italy’s
technical institutes in order to strengthen its image, cultivate anawareness of its business activities and enhance its ability toattract young school leavers and influence their training paths.Activities on the ‘Synergy’ project, which the Company launched inpartnership with the technical schools ‘A. Volta’ in Lodi and‘E. Fermi’ in Lecce to achieve these aims, continued during 2013.With the aim of achieving full compliance and promoting a culture oftraceability, transparency and openness, the year saw theintroduction in Saipem’s Italian offices of a dedicated softwareapplication for use during the selection and hiring process.The software is designed for close monitoring of the selectionprocess and allows a number of different analyses to be performed.In accordance with drivers defined as part of the Company’sPeople Strategy concerning the promotion and dissemination ofintegrated, transparent tools for effective personnel management,2013 saw the roll-out (initially in Italy only) of a new learningmanagement software application called ‘Peoplearning’, which isdesigned to ensure enhanced governance of the training systemby providing support to all the actors involved in the trainingprocess during all process phases, introducing a self-serviceapproach, and by promoting greater ownership and responsibilityof all those involved, with the aim of achieving greatertransparency and obtaining an optimum return on the investmentSaipem has made in the competencies of its personnel.The system is also designed to integrate with resource developmenttools, fully leverage the training matrixes defined for each role andensure effective monitoring and tracking of mandatory health, safetyand environmental certification and training.In line with the key elements of the Employee Value Proposition,the training projects and initiatives implemented during 2013were targeted at achieving greater leverage of the Company’stechnical resources and at developing skills characterised by highlevels of specialisation. Deployment of the training matrix – a toolused to define training programmes and professional certificationcourses for roles deemed critical to Saipem’s business with theaim of ensuring professional excellence and monitoring theCompany’s technical and professional know-how – wasconsolidated and has been elevated to best practice status.Meanwhile the year also saw the continuation of efforts to expandand monitor the activities of the Saipem Training Centres, whosemission is to provide oversight of Saipem knowledge and topromote training courses structured based on the needs ofindividual roles.Pursuant to relevant Legal Compliance requirements, the Companycontinued during the year with its drive to ensure thedissemination of the Internal Control Model at all hierarchical levelsboth in Italy and abroad, with e-learning courses being organised inconnection with Legislative Decree No. 231/2001 and Securityissues. Training initiatives for the members of the ComplianceCommittee of subsidiaries also continued during the year, as didthose required by Legislative Decree No. 81/2008 for Employers,Safety Managers, Safety Supervisors and Safety Officers.The year also saw the delivery of three editions of the trainingcourse aimed at Managing Directors of major overseas companies.The course is specifically focused on the following areas:- Corporate Governance and Compliance;- Business Context (focusing on communication);
Saipem Annual Report / Human resources
54
- Corporate Finance and Financial Statements;- Stakeholder Management;- Contract Management;- Integration between internal functions.An internationally oriented programme on Business Leadershipaimed at a number of critical roles, such as Project Directors andArea/Country Managers, was held successfully once again inconjunction with Eni Corporate University and Eni.In order to respond to the need for innovation and cost controlduring the design phase, a dedicated workshop for engineers wasorganised.With regard to overseas employees, Local Content initiativescontinued in Kazakhstan and Saudi Arabia with the aim ofincreasing the use of local resources in technical roles in theoffshore and drilling sectors.Saipem also confirmed its strong interest during the year incountries such as Brazil and Canada, where businessdevelopment activities were flanked by an intensification ofemployer branding and resource attraction, retention andengagement initiatives. In the Guarujá Yard in Brazil,comprehensive modularised training plans combining theory andpractice were commenced for prefabrication and fabricationtechnical personnel.
Compensation
The international market conditions and economic outlookcontinued to dictate a prudent and focused approach to thedefinition of compensation policies in 2013.Accordingly, variable incentive plans (including project incentives)and retention systems, which continued to be subject to carefulanalysis and rationalisation, were adopted, taking into account thespecific characteristics of the relevant labour markets and currentbusiness trends and future outlooks. Extreme selectiveness andprecision were adopted in determining the annual variableincentive scheme in terms of reducing spending and the number ofbeneficiaries, in line with the Company’s results.As regards management incentive plans, the short-term monetaryincentive plan, which is linked to individual performance, and thelong-term monetary plan, linked to the Company’s long-termperformance, were confirmed for both Italian and internationalmanagerial resources.Individual annual monetary incentives, which were based onactual 2012 management performance, were paid out in March to133 Italian senior managers, representing 44% of the total, with atotal cost outlay of €3,637,500 (11.24% of total compensation atJanuary 1, 2013). The new targets for 2013 for the samepopulation of senior managers were also defined.Additionally, July saw the allocation of deferred monetaryincentives to 133 senior managers, representing 44% of all seniormanagers, with a total cost outlay of €2,083,000.In order to boost the motivation of critical management resources,guarantee Saipem’s long-term performance and keep theremuneration package in line with the market average, the Boardof Directors confirmed the long-term monetary plan for criticalmanagerial resources. The plan was implemented in October 2013
for 78 Italian senior managers, representing 24.9% of Italianmanagerial resources, with a total cost outlay of €2,893,000.Furthermore, in compliance with legal obligations pursuant toArticle 123-ter of Legislative Decree No. 58/1998 and Article84-quater of the Consob Issuers Regulation, the ‘2013Remuneration Report’ was prepared. This document was approvedby Saipem’s Board of Directors on March 13, 2013 and publishedon the Company’s website. Subsequently, the first section of thereport was also approved by the Shareholders at the GeneralMeeting held on April 30, 2013.Finally, at global level, the adoption of the single grading systemfor organisational positions was further consolidated. The systemmakes it possible to carry out uniform, cross-companycompensation analyses which can be used to set more accuratesalary strategies that are better suited to the specificities of localmarkets.
Internal communications
Internal communications activities carried out during the yearwere devoted to increasing active employee participation and thesharing of information and content.Activities included the roll-out of the web TV network, which is nowavailable at all the Company’s Italian offices, the launch of acampaign in support of the SaiTube video platform, which allowsregistered employees to upload and share video content, and thebeginning of development work on a new microsite aimed at newhires with limited knowledge of the Company, which will help themto obtain the information and tools they need to get started in theirjobs. The year also saw the go live of local intranet channels at theCompany’s Nigerian, Brazilian and Australian offices, and thecontinuation of preliminary activities geared towards intranet rollout in Canada, Mexico and USA. Meanwhile, following a requestmade by maritime personnel for increased distribution of theCompany’s in-house magazine ‘Orizzonti’ on board the Company’sfleet of vessels, work was started during the year on developing adynamic system of distribution which would take into account thegeographical location of the vessels, in conjunction with theMaritime Certifications and Flags Management unit.Finally, the year’s internal communications initiatives alsoincluded two traditional engagements – Saipem family day andthe end of year employees’ meeting. For the family event, a videowas produced entitled ‘Saipem and the oil cycle’, which usedanimations and clear, simple language to illustrate the Company’srole in the various phases of oil production, from extraction totransportation, while for the annual meeting in December, a videocompilation of the year’s various milestones was put together.The evening also saw the launch of an initiative called ‘Lascia unsegno’ (Leave Your Mark), consisting of a register in which guestswere invited to leave their signature, a personal message and ahand print using a selection of coloured stamps. During 2014, theregister will go on a journey to the various Saipem offices andsites around the world in a kind of global relay in which theCompany’s international workers will be encouraged to symbolisetheir own personal commitment to meeting Saipem’s goals byleaving their mark in the register.
Information, Communication,Technologies
The change initiatives implemented on the Company’s informationmanagement systems in 2013 produced significant results interms of both applications and infrastructure.In terms of applications, the year saw the virtual completion of aprogramme of initiatives which over the past three years havebeen the focus of Saipem’s investments in enterprise softwareapplications, i.e.: 1) SAP Consolidation; 2) e-Procurement;3) Business Intelligence; 4) HR system; 5) Workload Management.These initiatives were accompanied by a broad range of businesssupport initiatives, which demonstrated the Company’s firmcommitment to its strategy of work process digitalization.1) The roll out of SAP R/3 at Saipem do Brasil was completed.The system will be operational as of January 2014. Meanwhile theroll out of the inventory management application SAP MaterialLedger, which has been coordinated to include Spectec’s assetmaintenance management system AMOS, continued at the mainSaipem Group companies using SAP.July saw the introduction of Saipem’s new e-Procurementsystem, which is based on SAP SRM module 7.0. The aim of theproject is to ensure the continuity of the e-Business services,which were previously provided by Eni for the entire Group usingSRM 4.0, via a carefully planned migration strategy involvingupdates to the electronic catalogue, consolidation andstandardisation of the existing processes and standardisation ofuser interfaces, leveraging the functionalities offered by the newtechnology. The results of the project as at the end of the 2013were very positive, with a completely issue-free implementationand increased user numbers for the platform, compared with theprevious version.2) The new Business Intelligence initiatives led to theidentification of new service areas in Procurement, HR, WMSareas, as well as in the Offshore E&C and Drilling business areas.A number of releases were completed in 2013, while thedashboard for the business areas are scheduled for release in thefirst half of 2014.3) In the HR area, the OSA (One Step Ahead) project beingdeveloped in partnership with Oracle Corp relating to thePeoplesoft HCM (GHRS) application continued. The new releasescompleted during the year were a Saipem SpA Recruitmentmodule and the cloud solution developed for training processescalled PeopLearning. Meanwhile work on the Talent Managementmodule will carry on through into 2014. The roll out of theSaipem-developed international payroll solution continued apace.As of year end 2013, roll outs had been completed for the payrollsof 16 Saipem Group companies. Due to the complexity involved,the roll out of the payroll solution on to GHRS, which by itselfcovers more than 7,000 individual payslips, is now scheduled forcompletion during the first half of 2014, meaning the ambitious
goal of achieving 30,000 monthly payrolls will have to wait untilnext year. Development and maintenance of the software and HRmanagement activities have been offshored to Saipem IndiaProjects Ltd in Chennai, producing significant cost savings.In parallel with the introduction of the new payroll solution, ICT isalso aiming to introduce the new Falcon suite of applicationswithin Group companies. The suite will provide a standard solutionfor international HR management satisfying all local requirementsplus all related authorisation workflows, and will also enableuniform, centralised management of personal and contract datathat in the long term it will be possible to use as a basis forproducing comprehensive operational and analytical reporting.In particular the PiPe module, which handles labour costs data,when integrated with payroll systems and SAP, has been shown tolead to a drastic improvement in both the quality and reliability ofthe data produced.4) The roll out of the workload management system whichcurrently provides coverage of all operating areas in terms ofbusiness demand and HR capacity, corresponding to a total ofover 30,000 resources managed, has essentially been completed,together with the release of the dashboard for top and middlemanagement on the company’s Business Intelligence system,which can be accessed via web and on tablet devices.
Business support development initiatives carried out during 2013focused on the adoption of innovative tools targeted at increasingthe efficiency and quality of engineering design and constructionactivities and on a review of the support offered to the Company’sbusiness processes by existing applications. This second area ofintervention, which has been called Project InformationManagement, is an improvement initiative that the ICT function iscarrying out for the Engineering, Project Management and Qualityfunctions which aims to identify areas in which improvements inefficiency can be targeted.Through partnerships in place with major suppliers of softwaresolutions, Saipem continued during 2013 with its strategy ofadopting wherever possible standard platforms enhanced on thebasis of a continuous dialogue between the suppliers’development centres and Saipem experts. The adoption of newmodelling tool Intergraph SmartPlant 3D and the development ofnew processes for automated drawing generation and forchecking engineering data quality and consistency weresuccessfully completed. The lessons learned from the experiencehave been leveraged to obtain a competitive edge on newcontracts requiring the use of the same product. Additionalbusiness support initiatives were carried out during the year tosupport site operations, with the porting of a new application formanaging piping spools and the related technical documentationfor use on ‘rugged’ site-suitable tablet devices. Use of theapplication has seen a drastic drop in issues related to fabricationwork carried out by subcontractors.
Saipem Annual Report / Information technology
55
Information technology
Saipem Annual Report / Information technology
56
The year also saw the deployment of a new constructionmanagement suite called Cosmo, which features site activityplanning integrated with Oracle Primavera, functionalities for jobaccounting and the development of pre-commissioning andcommissioning plans, plus a new quality system.With regard to IT infrastructure, the roll out of the WIE (WindowsInfrastructure Evolution) project – which will allow Saipem to takeadvantage of the benefits deriving from the functionalities of newMicrosoft products, in particular Windows Seven – was completed.The change programme was implemented using ProjectManagement techniques in order to minimise risk and identifyany potential critical issues and interdependencies betweenindividual activities.In addition to the project activities outlined above, 2013 also sawthe ICT function establish a presence in Chennai, India, where anumber of infrastructure activities have been offshored, thuslaying the foundations for a future internationalisation of the
company’s infrastructure management services. 2014 is expectedto see 24x7 first level support for international servers and localnetworks.2013 governance, compliance and security processes werecarried out according to schedule. New ICT initiatives launchedduring the year regarded the definition of application profiles forthe Company’s principal software applications and automatic roleassignment to users via the adoption of the CA RCM role and usermanagement module. This approach was combined with acutting-edge use of IT security technologies and is designed tomitigate the security risks associated with data processing by thecompany information systems. Another significantsecurity-related development was the introduction of advancedcredential management systems. This initiative included theadoption of the Oracle FastLogon system, which enables users toaccess the principal Company applications on a Single Sign-Onbasis.
57
The ‘Corporate Governance Report and Shareholding Structure’(the ‘Report’) pursuant to Article 123-bis of the ConsolidatedFinance Act has been prepared as a separate document, approvedby Saipem’s Board of Directors on March 14, 2014, and publishedon Saipem’s website at www.saipem.com under the section‘Corporate Governance’.The Report was prepared in accordance with the criteria containedin the ‘Format for Corporate Governance and ShareholdingStructure Reporting - 4th Edition (January 2013)’ published byBorsa Italiana SpA and in the Corporate Governance Code.The Report provides a comprehensive overview of the CorporateGovernance System adopted by Saipem SpA. It also furnishes aprofile of Saipem and the principles by which it operates, and givesinformation on the Company’s shareholding structure and itsadherence to the Corporate Governance Code (including the mainpractices of governance applied and the key characteristics of thesystem of internal controls and segregation of duties). Finally, it
describes the composition and operation of the administration andcontrol bodies and their committees, roles and powers.The Report also indicates the procedures adopted with regard to‘Transactions involving interests held by Board Directors andStatutory Auditors and transactions with related parties’, whichcan be consulted on Saipem’s website, www.saipem.com, underthe section ‘Corporate Governance’, as well as the communicationpolicy for institutional investors and shareholders, and the policyregarding the disclosure of inside information which is containedin the Company’s ‘Market Abuse’ procedure.
The criteria applied for determining the remuneration of Directorsare illustrated in the ‘2014 Remuneration Report’, drafted inaccordance with Article 123-ter of Legislative Decree No. 58/1998and Article 84-quater of the Consob Issuers Regulation. The Reportis published in the ‘Corporate Governance’ section on Saipem’swebsite.
Governance
Saipem Annual Report / Governance
58
Saipem implements and maintains an adequate system ofinternal controls and risk management, composed of instruments,organisational structures and company regulations designed tosafeguard Company assets and to ensure the effectiveness andefficiency of company processes, reliable financial reporting, andcompliance with all laws and regulations, the Articles ofAssociation and Company procedures. The structure of theinternal control system of Saipem, which is an integral part of theCompany’s Organisational and Management Model, assignsspecific roles to the company’s management bodies, compliancecommittees, control bodies, company management and allpersonnel. It is based on the principles contained in the Code ofEthics and the Corporate Governance Code as well as applicablelegislation, the CoSO Report1 and national and international bestpractices.Additional information on the internal control system and riskmanagement, including details concerning its architecture,instruments and design, as well as the roles, responsibilities andduties of its key actors, is contained in the Corporate GovernanceReport and Shareholding Structure document.The main industrial risks that Saipem faces and is activelymonitoring and managing are the following:(i) the HSE risk associated with the potential occurrence of
accidents, malfunctions, or failures with injury to personsand damage to the environment and impacts on operatingand financial results;
(ii) the country risk;(iii) the project risk associated with the executions phase of
engineering and construction contracts undertaken by theOnshore E&C and Offshore E&C Business Units.
Financial risks are managed in accordance with guidelinesdefined by the Parent Company, with the objective of aligning andcoordinating Group companies’ policies on financial risks.
HSE (Health, Safety & Environment) risk
Saipem’s business activities conducted both in and outside Italyare subject to a broad range of national legislation andregulations, including laws implementing international protocolsand conventions relating to specific sectors of activity.Saipem is fully committed to a process of continuousimprovement of its safety, health, and environmentalperformance, to minimising the impact of its operations and toensuring compliance with all applicable legislation.An ongoing process of risk identification, evaluation andmitigation is at the heart of HSE management operations in allphases of activity and for all business units. This process isimplemented through the adoption of effective management
procedures and systems designed to suit the specificcharacteristics of each activity and the sites in which they takeplace and with a view to achieving the continuous improvement ofplant and processes.The Saipem HSE organisational model establishes varying levelsof responsibility, starting from the persons closest to the risksources, who are best positioned to assess the potential impactof risks and to ensure adequate preventive measures are put inplace. In addition, HSE departments perform a governance,coordination, support and control role and issue and updateguidelines, procedures and best practices designed to ensurecontinuous improvement.In recent years, as a result of Law No. 121/2011, environmentaloffenses have joined health and safety offenses as one of theunderlying offenses that could result in corporate liability underLegislative Decree No. 231/2001. In response to thisdevelopment, Saipem has put in place an action plan involving amultidisciplinary team with the aim of ensuring that theCompany’s HSE model is adequate to prevent environmentalcrime. This effort has included the updating of the Company’s HSEdocument system.In addition, campaigns to raise awareness on health, safety andenvironmental issues are frequently launched at work sites.In recent years, these have included the ‘Leadership in Health andSafety’, ‘Choose Life’ and ‘Working at Height’ campaigns.Saipem has always invested heavily in HSE training and continuesto work to promote and facilitate training, not just at a theoreticallevel, but also in terms of effective practical training experiences,particularly on the most key important HSE issues.All HSE initiatives and management of HSE issues are subjected toperiodic audits conducted by independent bodies, who verify thatthe quality of the Company’s HSE management is in compliancewith international standards ISO 14001 (Environment) and OHSAS18001 (Health and Safety). Both Saipem SpA as well as a numberof other Group companies have achieved this certification.HSE monitoring is also carried out either directly or indirectly oncontractor companies.
Country risk
Substantial portions of Saipem’s operations are performed incountries outside the EU and North America, certain of which maybe politically, socially or economically less stable. Developments inthe political framework, economic crisis, internal social unrest andconflicts with other countries can compromise temporarily orpermanently Saipem’s ability to operate cost efficiently in suchcountries and may require specific measures (where possible incompliance with Saipem corporate policy) to be taken at an
Risk management
Saipem Annual Report / Risk management
(1) The Committee of Sponsoring Organizations of the Treadway Commission (1992), Internal Control - Integrated Framework.
Saipem Annual Report / Risk management
59
organisational or management level in order to enable thecontinuation of activities underway in conditions that differ fromthose originally anticipated. If Saipem’s ability to operate istemporarily compromised, demobilisation is planned according tocriteria designed to guarantee the protection of Company assetsthat remain on-site and to minimise the business interruption byemploying solutions that accelerate and reduce the cost ofbusiness recovery once favourable conditions have returned.The measures outlined above may be costly and have an impact onexpected results. Further risks associated with activities in suchcountries are: (i) lack of well-established and reliable legal systemsand uncertainties surrounding enforcement of contractual rights;(ii) unfavourable developments in laws and regulations andunilateral contract changes, leading to reductions in the value ofSaipem’s assets, forced sales and expropriations; (iii) restrictionson construction, drilling, imports and exports; (iv) tax increases;(v) civil and social unrest leading to sabotage, attacks, violence andsimilar incidents. Such events are predictable only to a very limitedextent and may occur and develop at any time, causing a materiallyadverse impact on Saipem’s financial position and results.Saipem regularly monitors political, social and economic risk incountries in which it operates or intends to invest, drawing onreports on principal project risks and related trends prepared inaccordance with Corporate Risk Management Policy and RiskManagement procedures and Standards and Security reportsprepared in accordance with the Corporate Security Policy andGuidelines on Security Activities.Legislative Decree No. 81/2008 (the Consolidated Act on healthand safety at the workplace) provides a basis for a new model ofrisk assessment in which security risks may be accounted for viatheir inclusion among the ‘particular risks’ referred to in Article 28of the decree, which states that ‘the assessment pursuant toArticle 17, paragraph 1, letter a) [...] shall take into account allrisks to the health and safety of workers, including those forgroups of workers who are exposed to particular risks...’.To manage the specific security risks to which it is exposed in thecountries where it operates, Saipem has adopted a security modelbased on the criteria of prevention, precaution, protection,information, promotion and participation, with the aim ofprotecting the safety of employees, contractors and the public, aswell as the integrity of assets and brand reputation.The Company’s security function has implemented acomprehensive security management system, which constitutesan organisational, legal and procedural tool for minimising andmanaging the consequences of security related events.The system is designed for the management of risks derivingfrom unlawful acts committed by physical or juridical personswhich may expose the company and its assets, people and imageto potential damage.This is made possible by synergies between the securityfunctions and the units in charge of the Company’s maritimecertification and logistics bases.In its role as a Contractor, Saipem thus applies the higheststandards of security, facilitating the conduction of its businessactivities in all contractual phases, from the bid phase through toproject execution, by ensuring that all operations can be carriedout in conditions of security for all its personnel and assets.
Specific project risks
The main objectives of the Industrial Risk Management functionare to:- promote the use of the Risk Management methodology for
tenders and in the execution phase of projects managed byBusiness Units as well as on the Company’s principalinvestment projects;
- assure periodic reporting to management on principal projectrisks and on trends observed, aggregated by Business Unit andat global level. Implement project portfolio analyses in order tosupport management decisions and provide an understandingof the external macro risk factors on projects that may impacton company results so that Management can intervene bydeploying the appropriate risk management tools of avoidance,mitigation, transfer and acceptance;
- assure the spread of a risk management culture within Saipemwith a view to achieving structured management of risk andopportunity during business activities and contributing also toimproved management of contingencies;
- provide advice, support and guidelines to the Business Unitsand projects in identifying and evaluating risks andopportunities and in all activities related to the implementationof mitigation and improvement measures for risk managementand the optimisation of opportunities respectively;
- define, develop and update tools and methods for collectingand organising lessons learned and making them available toprojects;
- ensure adequate training and the necessary support tocommercial and project management teams;
- ensure that Corporate Guidelines, Procedures and Standardsare constantly updated in accordance with internationalStandards and Codes of Practice, promoting full compliance andcorrect application within Saipem and its subsidiaries;
- contribute to promoting the observance of the Golden Rulesand Silver Guidelines, the tool for regulating risk assumptionthrough which Saipem assigns management the responsibilityfor the decision to assume significant risks.
The Standards and Procedures in force at Saipem are in line withthe principal international risk management standards.
Insurance
The Corporate Insurance function, in close cooperation with topmanagement, defines annual Saipem Group guidelines forinsurance coverage against the risk of damage to property, thirdparty liability, as well as risks related to the performance ofcontracts.An Insurance Programme is defined on the basis of the guidelines,which identifies specific excess and maximum limit coverage foreach type of risk based on an analysis that takes into accountclaim statistics for recent years, industry statistics and conditionsoffered by the international insurance market.The Saipem insurance programme is structured in such a way asto appropriately transfer risks deriving from operations to theinsurance market, in particular the risks associated with the
Saipem Annual Report / Risk management
60
management of the fleet, equipment and other assets, includingthird party liability risks and risks deriving from the performanceof contracts awarded by its Clients.Given the coverage that is offered by the insurance market andthe changing circumstances on the energy market in whichSaipem operates, it is not possible to guarantee that allcircumstances and events will be adequately covered by theinsurance programme. Equally, due to the volatility of theinsurance market, it cannot be guaranteed that it will be possiblein the future to reasonably maintain adequate insurance coverageat the current rates, terms and conditions.Within the Saipem Insurance Programme, a distinction can bemade between insurance cover for Group assets (‘Corporateinsurance policies’) and the insurance cover connected withproject execution.
Corporate insurance policies
The Corporate insurance programme is structured with an initialband of risk that is self-insured through a captive reinsurancecompany, with amounts in excess covered by a catastrophicinsurance programme taken out on the insurance market.The catastrophic insurance programme is composed of policiesthat cover damage to property, and maritime and non-maritimethird party liability. Cover can be broken down as follows:
Damage to property- ‘Fleet Insurance’ policy: covers the entire fleet against events
that cause partial or total damage to vessels;- ‘Equipment’ policy: covers all onshore and offshore equipment,
for example site equipment, onshore drilling rigs, subseaRemote Operating Vehicles (ROV), etc.;
- ‘Transport’ policy: covers transport, handling and storage ofassets and equipment by land, sea or air;
- ‘Buildings and Sites’ policy: covers owned or rented buildings,offices, storage facilities and shipyards;
- ‘Other minor risks’ policy: covers minor risks such as theft andemployee dishonesty.
Third-party liability- ‘Protection & Indemnity’ (‘P&I’) policy: shipowners’ liability
cover through a P&I Club that is part of the International Groupof P&I Clubs for events occurring during transit and for eventsoccurring during offshore drilling and construction operations;
- ‘Comprehensive General Liability’ policy: covers all other typesof general and third party liability claims arising from Saipem’sindustrial activities and supplements the specific P&I coverage;
- ‘Employer’s Liability’ and ‘Personal Accident’ policies: thesecover employer liability and employee accident risksrespectively on the basis of the specific regulations in force ineach country where the Group operates.
A key tool in the management of Saipem’s insurable risks is thecaptive reinsurance company Sigurd Rück AG, set up andoperational since 2008, which covers the initial part of risk.Sigurd Rück AG in turn carries out risk mitigation by re-insuring itsportfolio on primary securities markets.
Project execution insurance policies
For all contracts awarded, specific project insurance coveragemust be taken out. Generally, the contractual responsibility forsuch insurance lies with the Client.Where the responsibility lies with the contractor, Saipem takes outinsurance that will cover all risks connected with the project forits entire duration.Usually it takes out ‘Builders’ All Risks’ insurance, which coversthe scope of work of the contract, i.e. damage to the works underconstruction, as well as to equipment, products and materialsrequired for its construction and third party liability for all worksto be performed by the Group during all phases of projectexecution (engineering, transportation, construction, assembly,testing) including the contractual guarantee period.The high insurance premiums and excesses on such policies arean incentive to Saipem in its efforts to achieve the continuousimprovement of its prevention and protection processes in termsof quality, health, safety and environmental impact.
61
Purchase of treasury shares
No treasury shares were purchased on the market during 2013.Saipem SpA holds 1,939,832 treasury shares (1,996,482 atDecember 31, 2012), amounting to €43 million (€43 million atDecember 31, 2012). These are ordinary shares of Saipem SpAwith a nominal value of €1 each.At March 14, 2014, the share capital amounted to €441,410,900.On the same day, the number of shares in circulation was439,471,068.
Consob Regulation on Markets
Article 36 of Consob Regulation on Markets:conditions for the listing of shares of companieswith control over companies established and regulatedunder the law of non-EU countriesWith regard to the regulations setting out conditions for the listingof shares of companies with control over companies establishedand regulated under the law of non-EU countries that are deemedto be of material significance in relation to the consolidatedfinancial statements, the Company discloses that at December 31,2013, the following seventeen Saipem subsidiaries fell within thescope of application of the regulation in question:- Saipem Australia Pty Ltd;- Petrex SA;- Snamprogetti Saudi Arabia Co Ltd Llc;- Saipem Contracting (Nigeria) Ltd;- PT Saipem Indonesia;- ER SAI Caspian Contractor Llc;- Saipem Misr for Petroleum Services (S.A.E.);- Saipem (Nigeria) Ltd;- Saudi Arabian Saipem Ltd;- Global Petroprojects Services AG;- Saipem America Inc;- Saipem Asia Sdn Bhd;- Saipem do Brasil Serviçõs de Petroleo Ltda;- Saipem Contracting Algérie SpA;- Saipem Canada Inc;- Saipem Offshore Norway AS;- Saipem Drilling Norway AS.Procedures designed to ensure full compliance with Article 36have already been adopted.
No further Regulatory Compliance Plans are scheduled for 2014.
Article 37 of Consob Regulation on Markets: conditionspreventing the admission to trading on an Italianregulated market of the shares of subsidiaries subjectto management and coordination by another companyPursuant to the requirements set out in paragraph 9 of Article2.6.2 of the Rules of the Markets organised and managed byBorsa Italiana SpA, the Board of Directors in its meeting of March14, 2014, ascertained that the Company satisfies the conditionsset out in Article 37 of Consob Regulation on Markets for theadmission to trading on an Italian regulated market of the sharesof subsidiaries subject to management and coordination byanother company.The Board of Directors meeting on March 14, 2014 also verifiedthat the composition of the Board itself, as appointed by theShareholders’ Meeting of May 4, 2011, and of its internalCommittees, was in accordance with letter d), paragraph 1 ofArticle 37. The Board is in fact made up of a majority ofindependent directors and the Committees (the Compensationand Nomination Committee and the Audit and Risk Committee)are composed exclusively of independent directors.
Disclosure of transactionswith related parties
Transactions with related parties entered into by Saipem andidentified by IAS 24 concern mainly the exchange of goods, thesupply of services, and the provision and utilisation of financialresources, including entering into derivative contracts. All suchtransactions are an integral part of ordinary day-to-day businessand are carried out on an arm’s length basis (i.e. at conditionswhich would be applied between independent parties) and in theinterest of Group companies.Directors, general managers and senior managers with strategicresponsibilities must declare, every 6 months, any transactionsthey enter into with Saipem SpA or its subsidiaries, directly orthrough a third party, in accordance with the provisions of IAS 24.The amounts of trade, financial or other operations with relatedparties are provided in Note 44 to the consolidated financialstatements.
Transactions with the parent companyEni and companies subject to its directionand coordination
Saipem is subject to the direction and coordination of Eni SpA.Transactions with Eni SpA and with entities subject to its directionand coordination constitute transactions with related parties andare commented on in Note 44 ‘Transactions with related parties’ inthe notes to the consolidated financial statements.
Additional information
Saipem Annual Report / Additional information
Saipem Annual Report / Additional Information
62
Events subsequent to year-end
New contracts
In the first few weeks of 2014, Saipem was awarded contractsamounting to approximately €800 million. The main acquisitionsconcern Canada and the Republic of Congo. In Canada, CNRL(Canadian Natural Resources) awarded Saipem a number ofOnshore E&C contracts for the development of the HydrotreaterPhase 3 of the Horizon Oil Sands Project, in the Athabasca region.The scope of the contracts includes engineering, procurement andconstruction of a combined Hydrotreating Unit, a Sour WaterConcentrator Unit and a Sulphur Recovery Train Unit, along withthe construction works of supporting units. The project will becompleted in the first half 2017.In the Republic of Congo, Eni Congo awarded Saipem a contract for anonshore treatment plan to treat the feed stream from the Litchendjilioffshore platform, located south of Pointe-Noire which, transportedthrough a dedicated pipeline, will produce treated gas and stabilisedcondensate. The scope of work includes engineering, procurement,construction, transport, early gas production, pre-commissioning,commissioning and start-up of the Litchendjili gas treatment plant.The work will be completed in the second half of 2016.In February 2014, Saipem was awarded new Offshore Engineering& Construction contracts in Indonesia and the Republic of theCongo with a total value of US $520 million. Details of the contractscan be found in the Company’s press release of February 24, 2014.In March 2014, Saipem was awarded a contract by StreamTransport BV for the construction of the first line of the SouthStream Offshore Pipeline, from Russia to Bulgaria across the BlackSea, for a total value of approximately €2 billion.
Outlook
As in the second half of 2013, delays by Oil Companies inawarding new contracts have led to reduced visibility with regardto expected order backlog levels, which consequently makes itharder to forecast associated revenues and margins.For this reason, Saipem has chosen to adopt a policy of cautiousguidance, reflecting the increased level of uncertainty in today’smarket.For 2014, Saipem expects revenues of between €12.5 and €13.6billion, EBIT of between €600 and €750 million and a net profit ofbetween €280 and €380 million.Final results will depend on the outcome of current tenders, onthe timing of project awards and on the start date of operations,since this will determine the extent to which revenues andmargins earned may be recognised in 2014.However, the commercial market outlook remains positive, with alarge number of contracts to be awarded in the near future forwhich Saipem holds a solid competitive position, includingpipe-laying projects in ultra-deep waters, subsea developments indeep and ultra-deep waters, FPSO construction projects and largehighly-technologically complex onshore projects.Investments are expected to total approximately €750 millionand net financial debt is expected to be approximately €4.2
billion, both figures representing decreases on 2013 levels.2014 should be a year of transition with a return to profitability.The extent of the recovery will depend not only on the pace ofcontract awards, but also on the efficient operational andcommercial execution of low-margin contracts still in the backlog,which in 2014 should account for approximately €5 billion.
Committees of the Board of Directors
In compliance with the provisions of the new CorporateGovernance Code for listed companies, the Board of Directorsresolved to form:- the Executive Committee, whose role is to advise the CEO in
relation to key business decisions and provide evaluationsregarding significant or critical aspects, e.g. reviews of theoperating results of the business areas or the Company’seconomic-financial performance;
- the Risks Committee, which is responsible for advising the CEOon strategies for managing Saipem’s principal risks;
- the Regulatory System Compliance Committee and theRegulatory System Technical Committee, whose role is tosystematically verify that the Company’s regulatory systemsare consistent with the compliance and governance models.
Non-GAAP measures
Some of the performance indicators used in the ‘Directors’ Report’are not included in the IFRS (i.e. they are what are known as non-GAAP measures).Non-GAAP measures are disclosed to enhance the user’sunderstanding of the Group’s performance and are not intended tobe considered as a substitute for IFRS measures.The non-GAAP measures used in the ‘Directors’ Report’ are as follows:- cash flow: the sum of net profit plus depreciation and
amortisation;- capital expenditure: calculated by excluding investments in
equity interests from total investments;- EBITDA: a useful measure for evaluating the operating
performance of the Group as a whole and of the individualsectors of activity, in addition to operating profit. EBITDA is anintermediate measure, which is calculated by addingdepreciation and amortisation to operating profit;
- non-current assets: the sum of net tangible assets, netintangible assets and investments;
- net current assets: includes working capital and provisions forcontingencies;
- net capital employed: the sum of non-current assets, workingcapital and the provision for employee benefits;
- funding: shareholders’ equity, minority interest and netborrowings.
Secondary offices
Pursuant to Article 2428 of the Italian Civil Code, the Companydeclares that it has a secondary office in Cortemaggiore (PC),Via Enrico Mattei, 20.
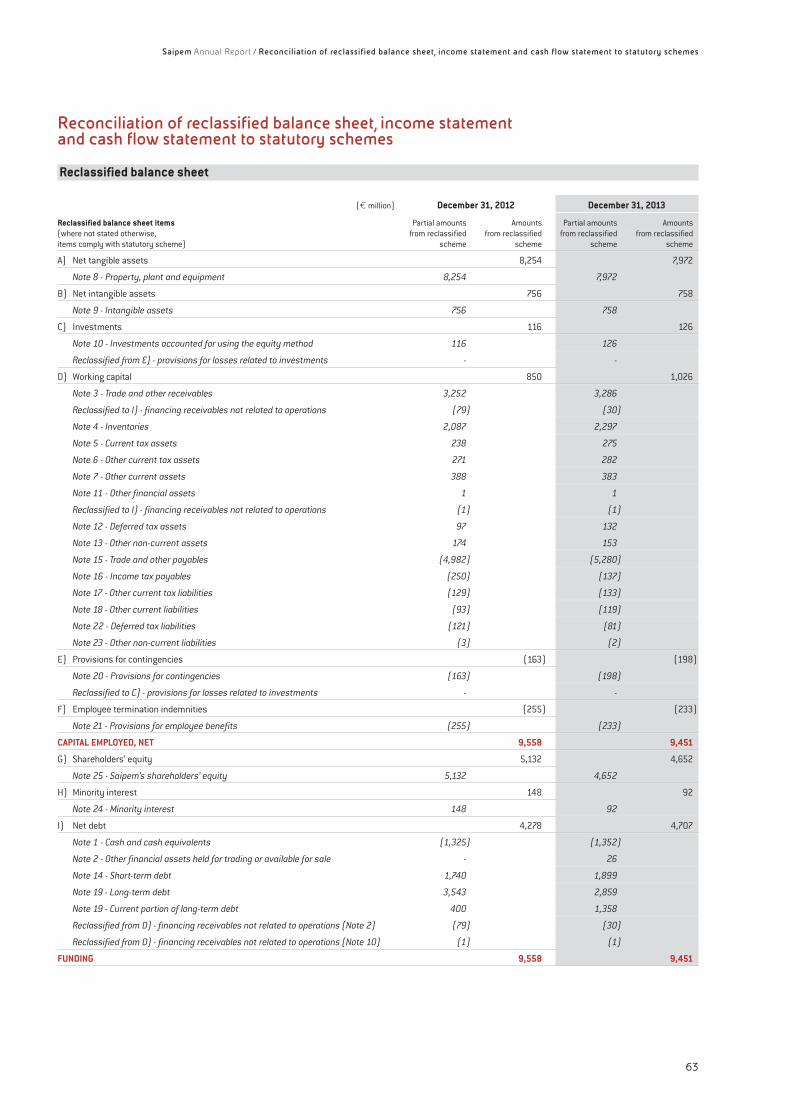
Reconciliation of reclassified balance sheet, income statementand cash flow statement to statutory schemes
Reclassified balance sheet
(€ million) December 31, 2012 December 31, 2013
Reclassified balance sheet items Partial amounts Amounts Partial amounts Amounts(where not stated otherwise, from reclassified from reclassified from reclassified from reclassifieditems comply with statutory scheme) scheme scheme scheme scheme
A) Net tangible assets 8,254 7,972
Note 8 - Property, plant and equipment 8,254 7,972
B) Net intangible assets 756 758
Note 9 - Intangible assets 756 758
C) Investments 116 126
Note 10 - Investments accounted for using the equity method 116 126
Reclassified from E) - provisions for losses related to investments - -
D) Working capital 850 1,026
Note 3 - Trade and other receivables 3,252 3,286
Reclassified to I) - financing receivables not related to operations (79) (30)
Note 4 - Inventories 2,087 2,297
Note 5 - Current tax assets 238 275
Note 6 - Other current tax assets 271 282
Note 7 - Other current assets 388 383
Note 11 - Other financial assets 1 1
Reclassified to I) - financing receivables not related to operations (1) (1)
Note 12 - Deferred tax assets 97 132
Note 13 - Other non-current assets 174 153
Note 15 - Trade and other payables (4,982) (5,280)
Note 16 - Income tax payables (250) (137)
Note 17 - Other current tax liabilities (129) (133)
Note 18 - Other current liabilities (93) (119)
Note 22 - Deferred tax liabilities (121) (81)
Note 23 - Other non-current liabilities (3) (2)
E) Provisions for contingencies (163) (198)
Note 20 - Provisions for contingencies (163) (198)
Reclassified to C) - provisions for losses related to investments - -
F) Employee termination indemnities (255) (233)
Note 21 - Provisions for employee benefits (255) (233)
CAPITAL EMPLOYED, NET 9,558 9,451
G) Shareholders’ equity 5,132 4,652
Note 25 - Saipem’s shareholders’ equity 5,132 4,652
H) Minority interest 148 92
Note 24 - Minority interest 148 92
I) Net debt 4,278 4,707
Note 1 - Cash and cash equivalents (1,325) (1,352)
Note 2 - Other financial assets held for trading or available for sale - 26
Note 14 - Short-term debt 1,740 1,899
Note 19 - Long-term debt 3,543 2,859
Note 19 - Current portion of long-term debt 400 1,358
Reclassified from D) - financing receivables not related to operations (Note 2) (79) (30)
Reclassified from D) - financing receivables not related to operations (Note 10) (1) (1)
FUNDING 9,558 9,451
Saipem Annual Report / Reconciliation of reclassified balance sheet, income statement and cash flow statement to statutory schemes
63
Saipem Annual Report / Reconciliation of reclassified balance sheet, income statement and cash flow statement to statutory schemes
64
Reclassified income statementThe only items of the reclassified income statement which differfrom the statutory scheme are those stated hereafter:- other income and revenues (€169 million) relating to
compensation for damages (€165 million), gains on disposalsof assets (€1 million) and reimbursements for services thatare not part of core operations (€2 million), which areindicated in the statutory scheme under ‘Other finance income(expense)’, were recognised in the reclassified incomestatement as a reduction in the related costs;
- ‘finance income’ (€656 million), ‘finance expenses’(-€798 million) and ‘derivatives’ (-€48 million), which areindicated separately under the statutory scheme, are statedunder the item ‘finance (expense) income’ (-€190 million) inthe reclassified income statement.
All other items are unchanged.
Reclassified cash flow statementThe only items of the reclassified cash flow statement which differfrom the statutory scheme are those stated hereafter:- the items ‘depreciation and amortisation’ (€724 million),
‘change in the provision for employee benefits’ (-€5 million),‘other changes’ (-€42 million) and ‘effect of accounting usingthe equity method’ (-€13 million), indicated separately andincluded in cash generated from operating profit in thestatutory scheme, are shown net under the item‘depreciation/amortisation and other non-monetary items’(€664 million);
- the items ‘income taxes’ (€106 million), ‘interest expense’(€159 million) and ‘interest income’ (-€15 million), indicatedseparately and included in cash generated from operating profitin the statutory scheme, are shown net under the item‘dividends, interests and taxes’ (€250 million);
- the items regarding changes in ‘other assets and liabilities’(€901 million), ‘provisions for contingencies’ (€28 million),‘inventories’ (-€368 million), ‘trade receivables’(-€298 million) and ‘trade payables’ (-€61 million), indicatedseparately and included in cash generated from operating profitin the statutory scheme, are shown net under the item‘changes in working capital related to operations’(€202 million);
- the items ‘interest received’ (€16 million), ‘dividends received’(€1 million), ‘income taxes paid net of refunds of tax credits’(-€379 million) and ‘interest paid’ (-€158 million), indicatedseparately and included in cash generated from operating profitin the statutory scheme, are shown net under the item‘dividends received, income taxes paid and interest paid andreceived’ (-€520 million);
- the items relating to investments in ‘intangible assets’(-€893 million) and ‘tangible assets’ (-€15 million), indicatedseparately and included in cash flow from investing activities inthe statutory scheme, are shown net under the item ‘capitalexpenditure’ (-€908 million);
- the items relating to investments in ‘securities’ (-€27 million),investments in ‘financing receivables’ (-€5 million) anddisposals of ‘financing receivables’ (€55 million), indicatedseparately and included in cash flow used in investing activities
in the statutory scheme, are shown under the item ‘borrowings(repayment) of debt related to financing activities’(€23 million);
- the items ‘proceeds from long-term debt’ (€919 million),‘repayments of long-term debt’ (-€615 million) and ‘increase(decrease) in short-term debt’ (€221 million), indicatedseparately and included in net cash used in financing activitiesin the statutory scheme, are shown net under the item‘changes in short and long-term financial debt’ (€525 million).
All other items are unchanged.

Consolidated Financial Statements 2013 saipem
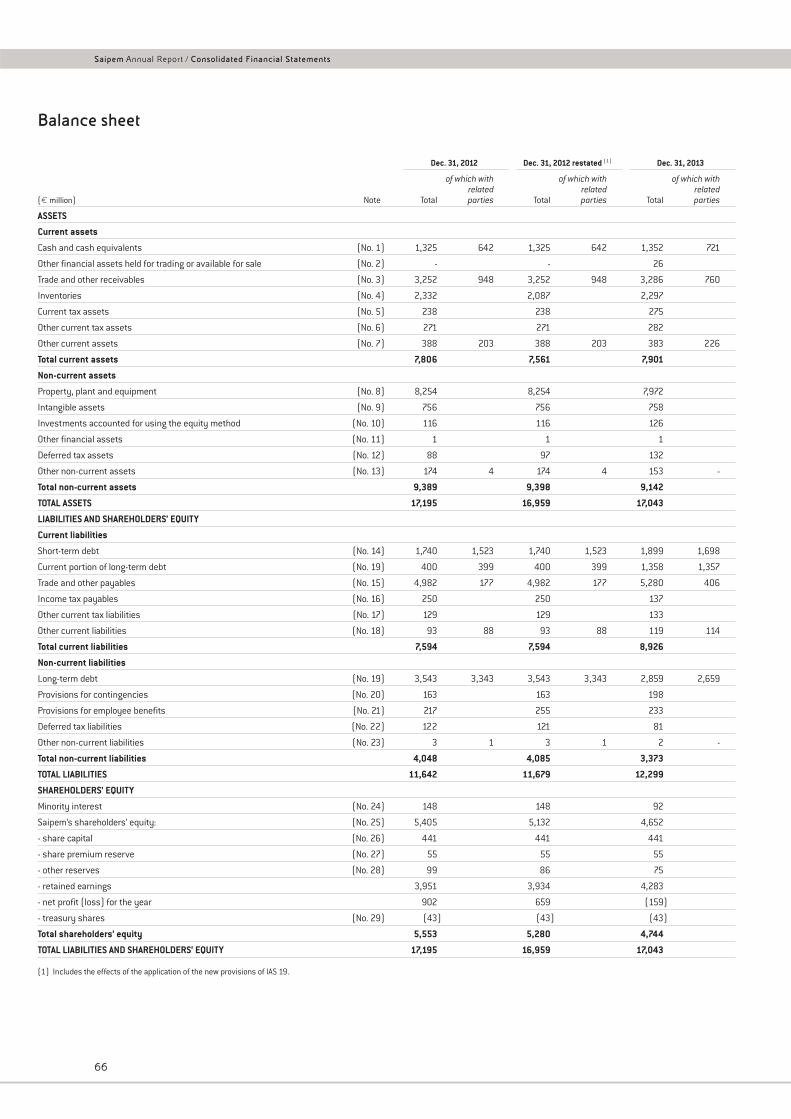
Saipem Annual Report / Consolidated Financial Statements
66
Balance sheet
Dec. 31, 2012 Dec. 31, 2012 restated (1) Dec. 31, 2013
of which with of which with of which withrelated related related
(€ million) Note Total parties Total parties Total parties
ASSETS
Current assets
Cash and cash equivalents (No. 1) 1,325 642 1,325 642 1,352 721
Other financial assets held for trading or available for sale (No. 2) - - 26
Trade and other receivables (No. 3) 3,252 948 3,252 948 3,286 760
Inventories (No. 4) 2,332 2,087 2,297
Current tax assets (No. 5) 238 238 275
Other current tax assets (No. 6) 271 271 282
Other current assets (No. 7) 388 203 388 203 383 226
Total current assets 7,806 7,561 7,901
Non-current assets
Property, plant and equipment (No. 8) 8,254 8,254 7,972
Intangible assets (No. 9) 756 756 758
Investments accounted for using the equity method (No. 10) 116 116 126
Other financial assets (No. 11) 1 1 1
Deferred tax assets (No. 12) 88 97 132
Other non-current assets (No. 13) 174 4 174 4 153 -
Total non-current assets 9,389 9,398 9,142
TOTAL ASSETS 17,195 16,959 17,043
LIABILITIES AND SHAREHOLDERS’ EQUITY
Current liabilities
Short-term debt (No. 14) 1,740 1,523 1,740 1,523 1,899 1,698
Current portion of long-term debt (No. 19) 400 399 400 399 1,358 1,357
Trade and other payables (No. 15) 4,982 177 4,982 177 5,280 406
Income tax payables (No. 16) 250 250 137
Other current tax liabilities (No. 17) 129 129 133
Other current liabilities (No. 18) 93 88 93 88 119 114
Total current liabilities 7,594 7,594 8,926
Non-current liabilities
Long-term debt (No. 19) 3,543 3,343 3,543 3,343 2,859 2,659
Provisions for contingencies (No. 20) 163 163 198
Provisions for employee benefits (No. 21) 217 255 233
Deferred tax liabilities (No. 22) 122 121 81
Other non-current liabilities (No. 23) 3 1 3 1 2 -
Total non-current liabilities 4,048 4,085 3,373
TOTAL LIABILITIES 11,642 11,679 12,299
SHAREHOLDERS’ EQUITY
Minority interest (No. 24) 148 148 92
Saipem’s shareholders’ equity: (No. 25) 5,405 5,132 4,652
- share capital (No. 26) 441 441 441
- share premium reserve (No. 27) 55 55 55
- other reserves (No. 28) 99 86 75
- retained earnings 3,951 3,934 4,283
- net profit (loss) for the year 902 659 (159)
- treasury shares (No. 29) (43) (43) (43)
Total shareholders’ equity 5,553 5,280 4,744
TOTAL LIABILITIES AND SHAREHOLDERS’ EQUITY 17,195 16,959 17,043
(1) Includes the effects of the application of the new provisions of IAS 19.
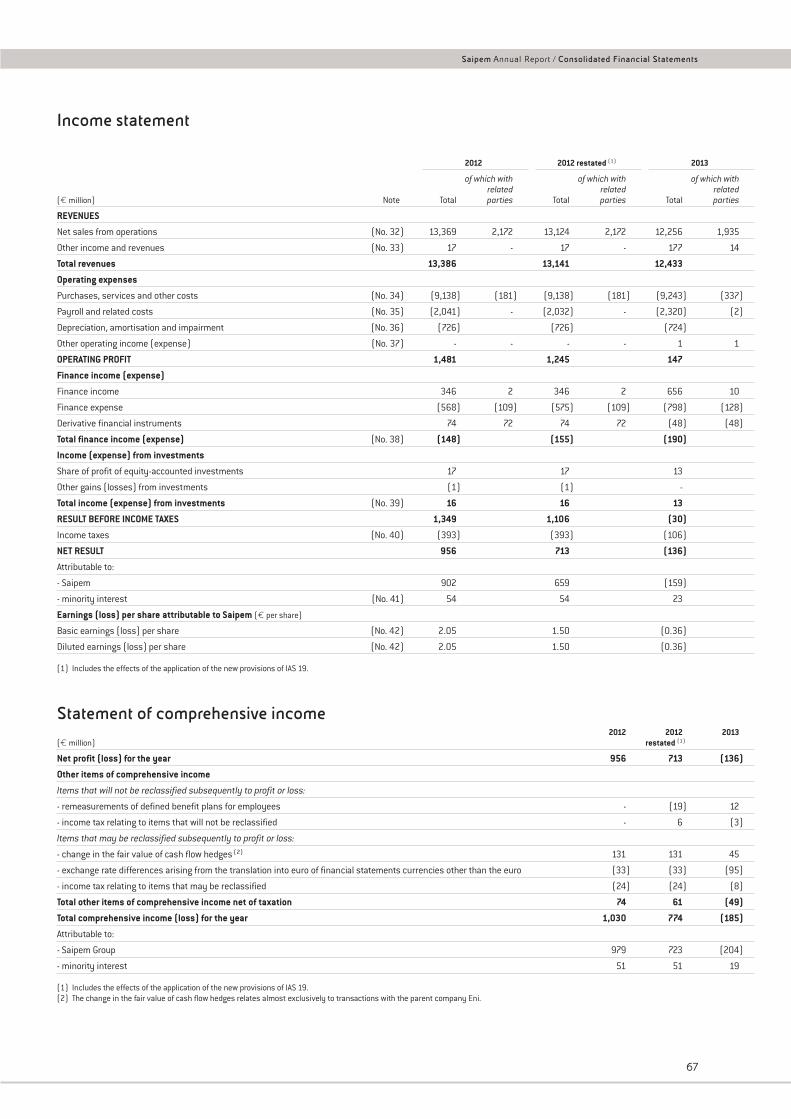
Income statement
2012 2012 restated (1) 2013
of which with of which with of which withrelated related related
(€ million) Note Total parties Total parties Total parties
REVENUES
Net sales from operations (No. 32) 13,369 2,172 13,124 2,172 12,256 1,935
Other income and revenues (No. 33) 17 - 17 - 177 14
Total revenues 13,386 13,141 12,433
Operating expenses
Purchases, services and other costs (No. 34) (9,138) (181) (9,138) (181) (9,243) (337)
Payroll and related costs (No. 35) (2,041) - (2,032) - (2,320) (2)
Depreciation, amortisation and impairment (No. 36) (726) (726) (724)
Other operating income (expense) (No. 37) - - - - 1 1
OPERATING PROFIT 1,481 1,245 147
Finance income (expense)
Finance income 346 2 346 2 656 10
Finance expense (568) (109) (575) (109) (798) (128)
Derivative financial instruments 74 72 74 72 (48) (48)
Total finance income (expense) (No. 38) (148) (155) (190)
Income (expense) from investments
Share of profit of equity-accounted investments 17 17 13
Other gains (losses) from investments (1) (1) -
Total income (expense) from investments (No. 39) 16 16 13
RESULT BEFORE INCOME TAXES 1,349 1,106 (30)
Income taxes (No. 40) (393) (393) (106)
NET RESULT 956 713 (136)
Attributable to:
- Saipem 902 659 (159)
- minority interest (No. 41) 54 54 23
Earnings (loss) per share attributable to Saipem (€ per share)
Basic earnings (loss) per share (No. 42) 2.05 1.50 (0.36)
Diluted earnings (loss) per share (No. 42) 2.05 1.50 (0.36)
(1) Includes the effects of the application of the new provisions of IAS 19.
Statement of comprehensive income2012 2012 2013
(€ million) restated (1)
Net profit (loss) for the year 956 713 (136)
Other items of comprehensive income
Items that will not be reclassified subsequently to profit or loss:
- remeasurements of defined benefit plans for employees - (19) 12
- income tax relating to items that will not be reclassified - 6 (3)
Items that may be reclassified subsequently to profit or loss:
- change in the fair value of cash flow hedges (2) 131 131 45
- exchange rate differences arising from the translation into euro of financial statements currencies other than the euro (33) (33) (95)
- income tax relating to items that may be reclassified (24) (24) (8)
Total other items of comprehensive income net of taxation 74 61 (49)
Total comprehensive income (loss) for the year 1,030 774 (185)
Attributable to:
- Saipem Group 979 723 (204)
- minority interest 51 51 19
(1) Includes the effects of the application of the new provisions of IAS 19.(2) The change in the fair value of cash flow hedges relates almost exclusively to transactions with the parent company Eni.
Saipem Annual Report / Consolidated Financial Statements
67
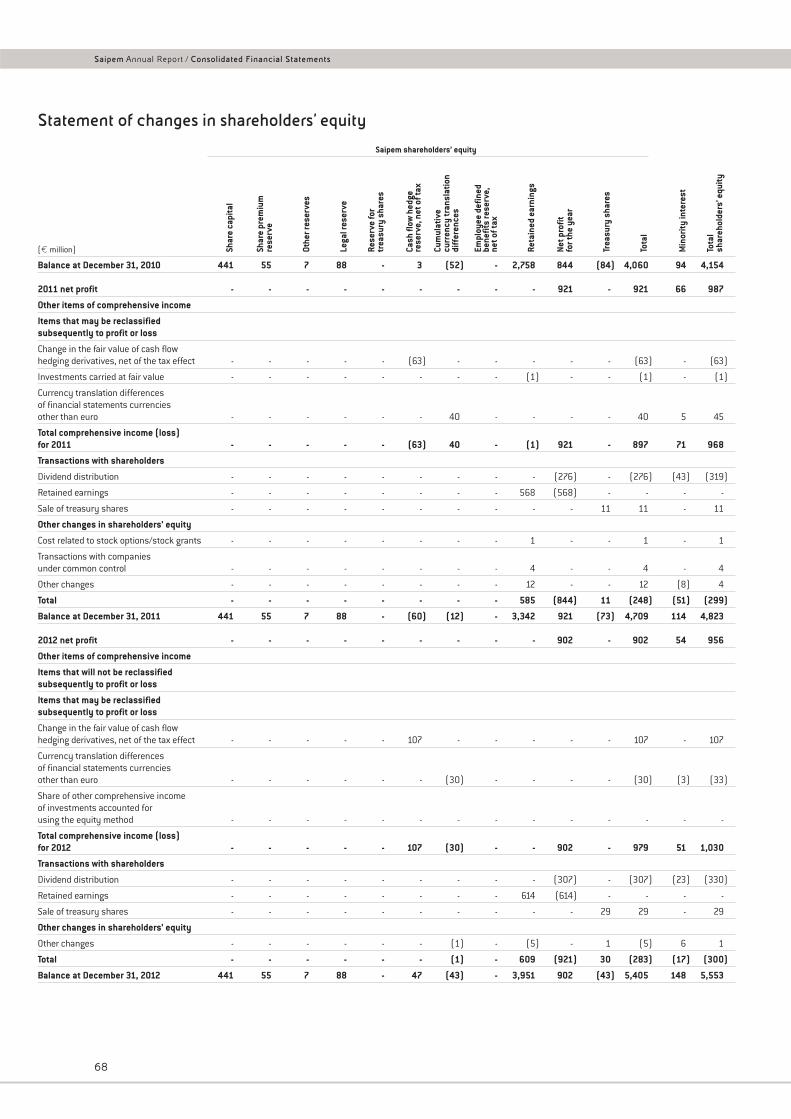
Statement of changes in shareholders’ equity
Saipem shareholders’ equity
(€ million)
Balance at December 31, 2010 441 55 7 88 - 3 (52) - 2,758 844 (84) 4,060 94 4,154
2011 net profit - - - - - - - - - 921 - 921 66 987
Other items of comprehensive income
Items that may be reclassifiedsubsequently to profit or loss
Change in the fair value of cash flowhedging derivatives, net of the tax effect - - - - - (63) - - - - - (63) - (63)
Investments carried at fair value - - - - - - - - (1) - - (1) - (1)
Currency translation differencesof financial statements currenciesother than euro - - - - - - 40 - - - - 40 5 45
Total comprehensive income (loss)for 2011 - - - - - (63) 40 - (1) 921 - 897 71 968
Transactions with shareholders
Dividend distribution - - - - - - - - - (276) - (276) (43) (319)
Retained earnings - - - - - - - - 568 (568) - - - -
Sale of treasury shares - - - - - - - - - - 11 11 - 11
Other changes in shareholders’ equity
Cost related to stock options/stock grants - - - - - - - - 1 - - 1 - 1
Transactions with companies under common control - - - - - - - - 4 - - 4 - 4
Other changes - - - - - - - - 12 - - 12 (8) 4
Total - - - - - - - - 585 (844) 11 (248) (51) (299)
Balance at December 31, 2011 441 55 7 88 - (60) (12) - 3,342 921 (73) 4,709 114 4,823
2012 net profit - - - - - - - - - 902 - 902 54 956
Other items of comprehensive income
Items that will not be reclassifiedsubsequently to profit or loss
Items that may be reclassifiedsubsequently to profit or loss
Change in the fair value of cash flowhedging derivatives, net of the tax effect - - - - - 107 - - - - - 107 - 107
Currency translation differencesof financial statements currenciesother than euro - - - - - - (30) - - - - (30) (3) (33)
Share of other comprehensive incomeof investments accounted forusing the equity method - - - - - - - - - - - - - -
Total comprehensive income (loss)for 2012 - - - - - 107 (30) - - 902 - 979 51 1,030
Transactions with shareholders
Dividend distribution - - - - - - - - - (307) - (307) (23) (330)
Retained earnings - - - - - - - - 614 (614) - - - -
Sale of treasury shares - - - - - - - - - - 29 29 - 29
Other changes in shareholders’ equity
Other changes - - - - - - (1) - (5) - 1 (5) 6 1
Total - - - - - - (1) - 609 (921) 30 (283) (17) (300)
Balance at December 31, 2012 441 55 7 88 - 47 (43) - 3,951 902 (43) 5,405 148 5,553
Shar
e ca
pita
l
Shar
e pr
emiu
mre
serv
e
Othe
r res
erve
s
Lega
l res
erve
Rese
rve
for
trea
sury
sha
res
Cash
flow
hed
gere
serv
e, n
et o
f tax
Cum
ulat
ive
curr
ency
tran
slat
ion
diff
eren
ces
Empl
oyee
def
ined
bene
fits
rese
rve,
net o
f tax
Reta
ined
ear
ning
s
Net p
rofit
for t
he y
ear
Trea
sury
sha
res
Tota
l
Min
ority
inte
rest
Tota
lsh
areh
olde
rs’ e
quity
Saipem Annual Report / Consolidated Financial Statements
68
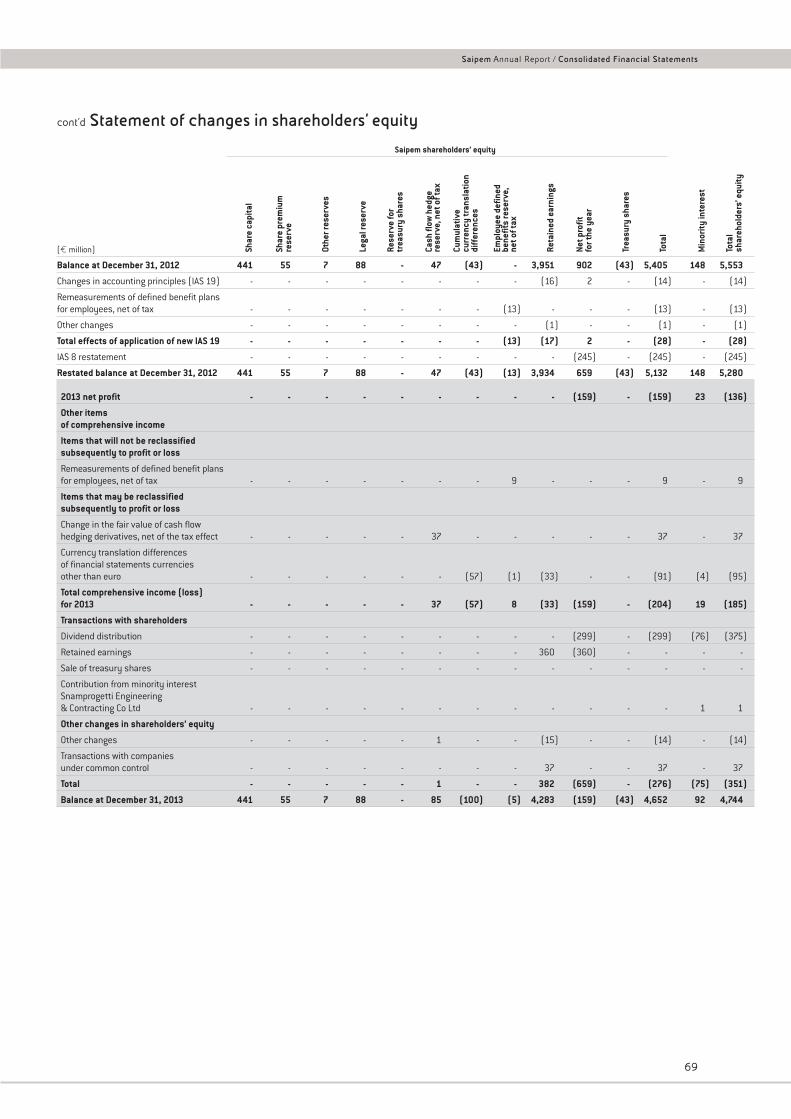
cont’d Statement of changes in shareholders’ equity
Saipem shareholders’ equity
(€ million)
Balance at December 31, 2012 441 55 7 88 - 47 (43) - 3,951 902 (43) 5,405 148 5,553
Changes in accounting principles (IAS 19) - - - - - - - - (16) 2 - (14) - (14)
Remeasurements of defined benefit plansfor employees, net of tax - - - - - - - (13) - - - (13) - (13)
Other changes - - - - - - - - (1) - - (1) - (1)
Total effects of application of new IAS 19 - - - - - - - (13) (17) 2 - (28) - (28)
IAS 8 restatement - - - - - - - - - (245) - (245) - (245)
Restated balance at December 31, 2012 441 55 7 88 - 47 (43) (13) 3,934 659 (43) 5,132 148 5,280
2013 net profit - - - - - - - - - (159) - (159) 23 (136)
Other items of comprehensive income
Items that will not be reclassifiedsubsequently to profit or loss
Remeasurements of defined benefit plansfor employees, net of tax - - - - - - - 9 - - - 9 - 9
Items that may be reclassifiedsubsequently to profit or loss
Change in the fair value of cash flowhedging derivatives, net of the tax effect - - - - - 37 - - - - - 37 - 37
Currency translation differencesof financial statements currenciesother than euro - - - - - - (57) (1) (33) - - (91) (4) (95)
Total comprehensive income (loss)for 2013 - - - - - 37 (57) 8 (33) (159) - (204) 19 (185)
Transactions with shareholders
Dividend distribution - - - - - - - - - (299) - (299) (76) (375)
Retained earnings - - - - - - - - 360 (360) - - - -
Sale of treasury shares - - - - - - - - - - - - - -
Contribution from minority interestSnamprogetti Engineering& Contracting Co Ltd - - - - - - - - - - - - 1 1
Other changes in shareholders’ equity
Other changes - - - - - 1 - - (15) - - (14) - (14)
Transactions with companiesunder common control - - - - - - - - 37 - - 37 - 37
Total - - - - - 1 - - 382 (659) - (276) (75) (351)
Balance at December 31, 2013 441 55 7 88 - 85 (100) (5) 4,283 (159) (43) 4,652 92 4,744
Shar
e ca
pita
l
Shar
e pr
emiu
mre
serv
e
Othe
r res
erve
s
Lega
l res
erve
Rese
rve
for
trea
sury
sha
res
Cash
flow
hed
gere
serv
e, n
et o
f tax
Cum
ulat
ive
curr
ency
tran
slat
ion
diff
eren
ces
Empl
oyee
def
ined
bene
fits
rese
rve,
net o
f tax
Reta
ined
ear
ning
s
Net p
rofit
for t
he y
ear
Trea
sury
sha
res
Tota
l
Min
ority
inte
rest
Tota
lsh
areh
olde
rs’ e
quity
Saipem Annual Report / Consolidated Financial Statements
69
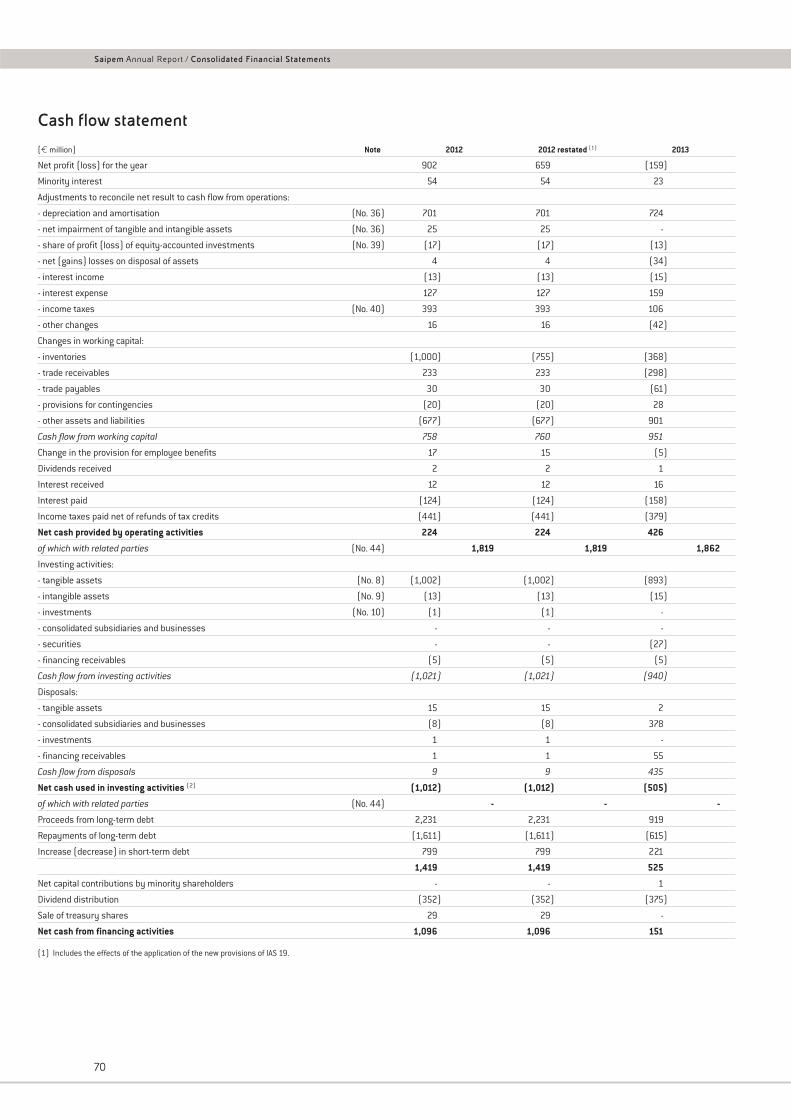
Cash flow statement
(€ million) Note 2012 2012 restated (1) 2013
Net profit (loss) for the year 902 659 (159)
Minority interest 54 54 23
Adjustments to reconcile net result to cash flow from operations:
- depreciation and amortisation (No. 36) 701 701 724
- net impairment of tangible and intangible assets (No. 36) 25 25 -
- share of profit (loss) of equity-accounted investments (No. 39) (17) (17) (13)
- net (gains) losses on disposal of assets 4 4 (34)
- interest income (13) (13) (15)
- interest expense 127 127 159
- income taxes (No. 40) 393 393 106
- other changes 16 16 (42)
Changes in working capital:
- inventories (1,000) (755) (368)
- trade receivables 233 233 (298)
- trade payables 30 30 (61)
- provisions for contingencies (20) (20) 28
- other assets and liabilities (677) (677) 901
Cash flow from working capital 758 760 951
Change in the provision for employee benefits 17 15 (5)
Dividends received 2 2 1
Interest received 12 12 16
Interest paid (124) (124) (158)
Income taxes paid net of refunds of tax credits (441) (441) (379)
Net cash provided by operating activities 224 224 426
of which with related parties (No. 44) 1,819 1,819 1,862
Investing activities:
- tangible assets (No. 8) (1,002) (1,002) (893)
- intangible assets (No. 9) (13) (13) (15)
- investments (No. 10) (1) (1) -
- consolidated subsidiaries and businesses - - -
- securities - - (27)
- financing receivables (5) (5) (5)
Cash flow from investing activities (1,021) (1,021) (940)
Disposals:
- tangible assets 15 15 2
- consolidated subsidiaries and businesses (8) (8) 378
- investments 1 1 -
- financing receivables 1 1 55
Cash flow from disposals 9 9 435
Net cash used in investing activities (2) (1,012) (1,012) (505)
of which with related parties (No. 44) - - -
Proceeds from long-term debt 2,231 2,231 919
Repayments of long-term debt (1,611) (1,611) (615)
Increase (decrease) in short-term debt 799 799 221
1,419 1,419 525
Net capital contributions by minority shareholders - - 1
Dividend distribution (352) (352) (375)
Sale of treasury shares 29 29 -
Net cash from financing activities 1,096 1,096 151
(1) Includes the effects of the application of the new provisions of IAS 19.
Saipem Annual Report / Consolidated Financial Statements
70
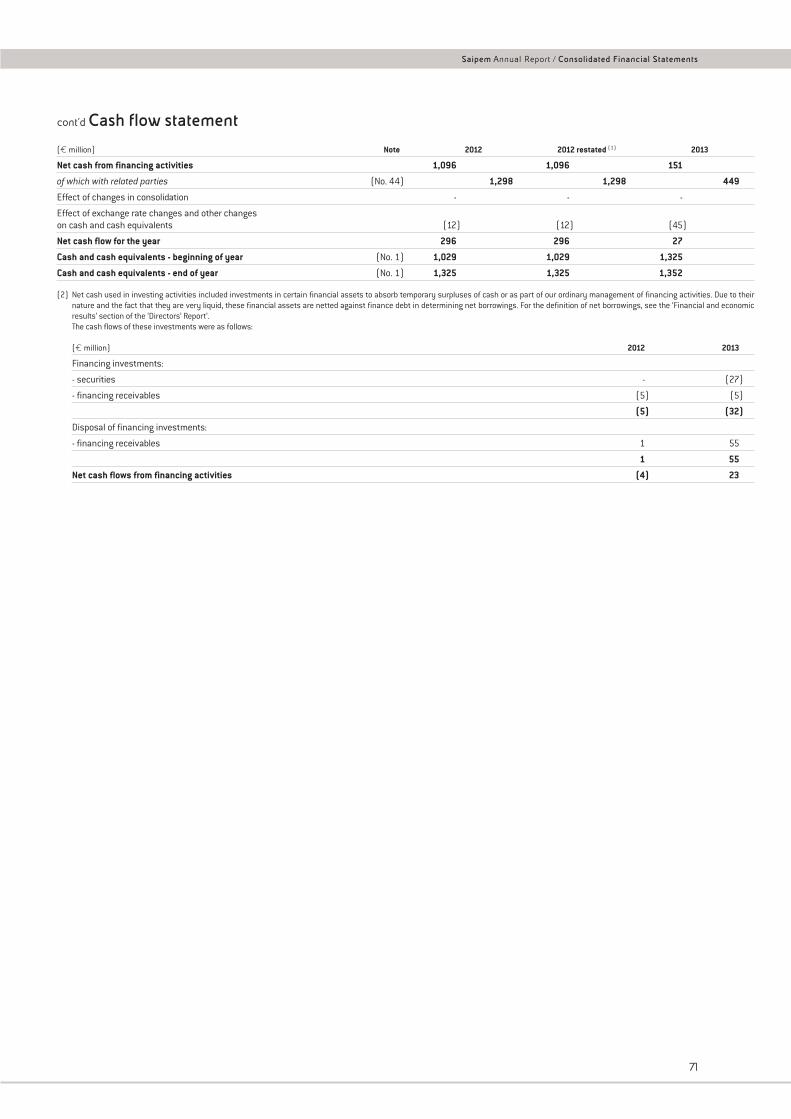
Saipem Annual Report / Consolidated Financial Statements
71
cont’d Cash flow statement
(€ million) Note 2012 2012 restated (1) 2013
Net cash from financing activities 1,096 1,096 151
of which with related parties (No. 44) 1,298 1,298 449
Effect of changes in consolidation - - -
Effect of exchange rate changes and other changeson cash and cash equivalents (12) (12) (45)
Net cash flow for the year 296 296 27
Cash and cash equivalents - beginning of year (No. 1) 1,029 1,029 1,325
Cash and cash equivalents - end of year (No. 1) 1,325 1,325 1,352
(2) Net cash used in investing activities included investments in certain financial assets to absorb temporary surpluses of cash or as part of our ordinary management of financing activities. Due to theirnature and the fact that they are very liquid, these financial assets are netted against finance debt in determining net borrowings. For the definition of net borrowings, see the ‘Financial and economicresults’ section of the ‘Directors’ Report’.The cash flows of these investments were as follows:
(€ million) 2012 2013
Financing investments:
- securities - (27)
- financing receivables (5) (5)
(5) (32)
Disposal of financing investments:
- financing receivables 1 55
1 55
Net cash flows from financing activities (4) 23
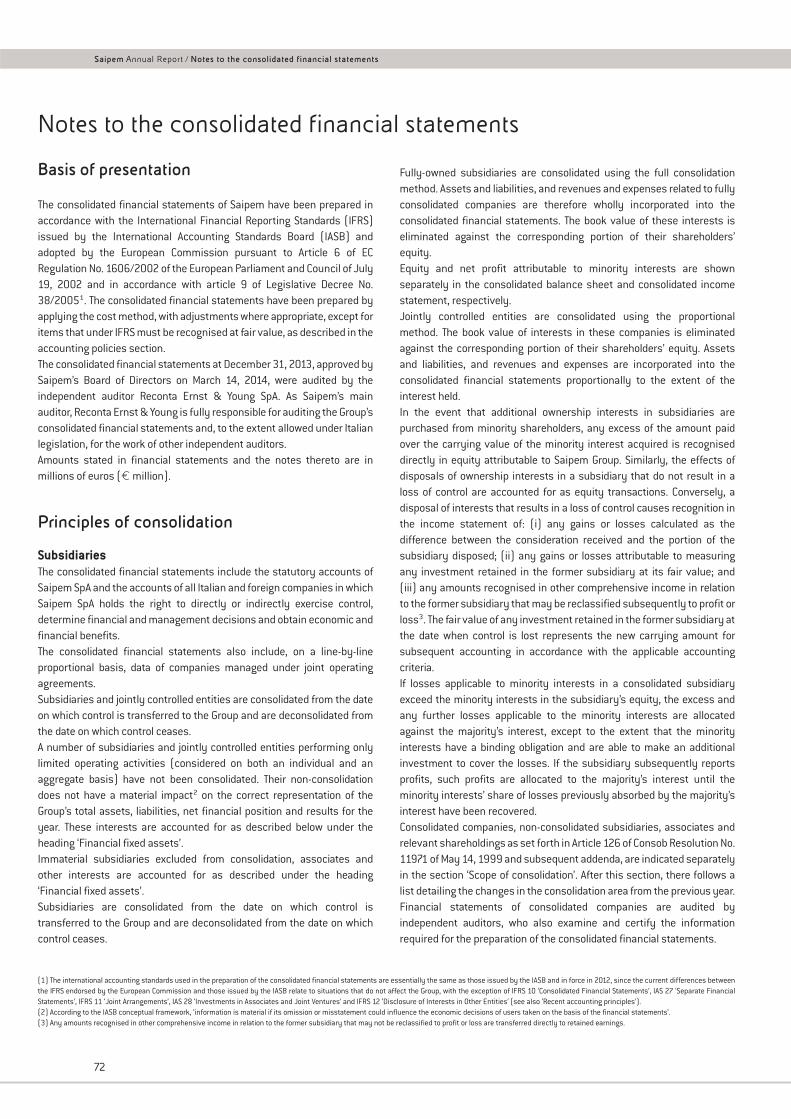
72
Saipem Annual Report / Notes to the consolidated financial statements
Basis of presentation
The consolidated financial statements of Saipem have been prepared inaccordance with the International Financial Reporting Standards (IFRS)issued by the International Accounting Standards Board (IASB) andadopted by the European Commission pursuant to Article 6 of ECRegulation No. 1606/2002 of the European Parliament and Council of July19, 2002 and in accordance with article 9 of Legislative Decree No.38/20051. The consolidated financial statements have been prepared byapplying the cost method, with adjustments where appropriate, except foritems that under IFRS must be recognised at fair value, as described in theaccounting policies section.The consolidated financial statements at December 31, 2013, approved bySaipem’s Board of Directors on March 14, 2014, were audited by theindependent auditor Reconta Ernst & Young SpA. As Saipem’s mainauditor, Reconta Ernst & Young is fully responsible for auditing the Group’sconsolidated financial statements and, to the extent allowed under Italianlegislation, for the work of other independent auditors.Amounts stated in financial statements and the notes thereto are inmillions of euros (€ million).
Principles of consolidation
SubsidiariesThe consolidated financial statements include the statutory accounts ofSaipem SpA and the accounts of all Italian and foreign companies in whichSaipem SpA holds the right to directly or indirectly exercise control,determine financial and management decisions and obtain economic andfinancial benefits.The consolidated financial statements also include, on a line-by-lineproportional basis, data of companies managed under joint operatingagreements.Subsidiaries and jointly controlled entities are consolidated from the dateon which control is transferred to the Group and are deconsolidated fromthe date on which control ceases.A number of subsidiaries and jointly controlled entities performing onlylimited operating activities (considered on both an individual and anaggregate basis) have not been consolidated. Their non-consolidationdoes not have a material impact2 on the correct representation of theGroup’s total assets, liabilities, net financial position and results for theyear. These interests are accounted for as described below under theheading ‘Financial fixed assets’.Immaterial subsidiaries excluded from consolidation, associates andother interests are accounted for as described under the heading‘Financial fixed assets’.Subsidiaries are consolidated from the date on which control istransferred to the Group and are deconsolidated from the date on whichcontrol ceases.
Fully-owned subsidiaries are consolidated using the full consolidationmethod. Assets and liabilities, and revenues and expenses related to fullyconsolidated companies are therefore wholly incorporated into theconsolidated financial statements. The book value of these interests iseliminated against the corresponding portion of their shareholders’equity.Equity and net profit attributable to minority interests are shownseparately in the consolidated balance sheet and consolidated incomestatement, respectively.Jointly controlled entities are consolidated using the proportionalmethod. The book value of interests in these companies is eliminatedagainst the corresponding portion of their shareholders’ equity. Assetsand liabilities, and revenues and expenses are incorporated into theconsolidated financial statements proportionally to the extent of theinterest held.In the event that additional ownership interests in subsidiaries arepurchased from minority shareholders, any excess of the amount paidover the carrying value of the minority interest acquired is recogniseddirectly in equity attributable to Saipem Group. Similarly, the effects ofdisposals of ownership interests in a subsidiary that do not result in aloss of control are accounted for as equity transactions. Conversely, adisposal of interests that results in a loss of control causes recognition inthe income statement of: (i) any gains or losses calculated as thedifference between the consideration received and the portion of thesubsidiary disposed; (ii) any gains or losses attributable to measuringany investment retained in the former subsidiary at its fair value; and(iii) any amounts recognised in other comprehensive income in relationto the former subsidiary that may be reclassified subsequently to profit orloss3. The fair value of any investment retained in the former subsidiary atthe date when control is lost represents the new carrying amount forsubsequent accounting in accordance with the applicable accountingcriteria.If losses applicable to minority interests in a consolidated subsidiaryexceed the minority interests in the subsidiary’s equity, the excess andany further losses applicable to the minority interests are allocatedagainst the majority’s interest, except to the extent that the minorityinterests have a binding obligation and are able to make an additionalinvestment to cover the losses. If the subsidiary subsequently reportsprofits, such profits are allocated to the majority’s interest until theminority interests’ share of losses previously absorbed by the majority’sinterest have been recovered.Consolidated companies, non-consolidated subsidiaries, associates andrelevant shareholdings as set forth in Article 126 of Consob Resolution No.11971 of May 14, 1999 and subsequent addenda, are indicated separatelyin the section ‘Scope of consolidation’. After this section, there follows alist detailing the changes in the consolidation area from the previous year.Financial statements of consolidated companies are audited byindependent auditors, who also examine and certify the informationrequired for the preparation of the consolidated financial statements.
(1) The international accounting standards used in the preparation of the consolidated financial statements are essentially the same as those issued by the IASB and in force in 2012, since the current differences betweenthe IFRS endorsed by the European Commission and those issued by the IASB relate to situations that do not affect the Group, with the exception of IFRS 10 ‘Consolidated Financial Statements’, IAS 27 ‘Separate FinancialStatements’, IFRS 11 ‘Joint Arrangements’, IAS 28 ‘Investments in Associates and Joint Ventures’ and IFRS 12 ‘Disclosure of Interests in Other Entities’ (see also ‘Recent accounting principles’).(2) According to the IASB conceptual framework, ‘information is material if its omission or misstatement could influence the economic decisions of users taken on the basis of the financial statements’.(3) Any amounts recognised in other comprehensive income in relation to the former subsidiary that may not be reclassified to profit or loss are transferred directly to retained earnings.
Notes to the consolidated financial statements
73
Saipem Annual Report / Notes to the consolidated financial statements
Business combinationsBusiness combination transactions are recognised using the acquisitionmethod. The amount transferred in a business combination is determinedat the date the controlling interest is acquired and is equivalent to the fairvalue of the assets transferred, of liabilities incurred or assumed, and ofany equity instruments issued by the acquirer. Costs directly attributableto the transaction are recognised in the income statement when they areincurred.The shareholders’ equity in consolidated companies is determined byattributing to each of the balance sheet items its fair value at the date onwhich control is acquired4, except for where International FinancialReporting Standards require otherwise. The excess of the purchase priceof an acquired entity over the total fair value assigned to assets acquiredand liabilities assumed is recognised as goodwill. Negative goodwill isrecognised in the income statement.If the degree of control acquired is not total, the equity attributable tominority interests is determined on the basis of the fair value of theassets and liabilities at the date on which control is acquired, excludingany related goodwill (partial goodwill method). Alternatively, the full valueof goodwill arising on the acquisition is recognised, including the shareattributable to minority interest (full goodwill method). In this latter case,equity attributable to minority interests is shown at fair value includingthe related goodwill5. The choice of method is made for each individualbusiness combination on a transaction by transaction basis.Where control of a company is achieved in stages, the purchase cost isthe fair value of the previously held ownership interest plus theconsideration paid for the additional ownership interest. Any differencebetween the fair value of the previously held ownership interest and itscarrying amount is recognised in the income statement. In addition, whencontrol of a company is obtained, any amounts recognised in othercomprehensive income in relation to the company are taken to profit orloss. Amounts that may not be reclassified to profit or loss are recognisedin equity.Where provisional amounts have been recorded for the assets andliabilities of an acquiree during the reporting period in which a business
combination occurs, these amounts are retrospectively adjusted withinone year of the acquisition date to reflect new information obtained aboutfacts and circumstances that existed as of the acquisition date.
Intercompany transactionsUnrealised intercompany profit arising on transactions betweenconsolidated companies is eliminated, as are intercompany receivables,payables, revenues and expenses, guarantees (including performancebonds), commitments and risks between consolidated companies.Unrealised profits resulting from transactions with equity accountedinvestments are eliminated in proportion to the Group’s interest. In bothcases, intercompany losses are not eliminated since they are consideredan impairment indicator of the assets transferred.
Foreign currency translationFinancial statements of foreign companies having a functional currencyother than the euro are converted into euro applying: (i) closing exchangerates for assets and liabilities; (ii) historical exchange rates for equityaccounts; and (iii) average rates for the year to the income statement(source: Bank of Italy).Cumulative exchange rate differences resulting from this translation arerecognised in shareholders’ equity under the item ‘Cumulative currencytranslation differences’ (included in ‘Other reserves’) for the portionrelating to the Group’s interest and under ‘Minority interest’ for the portionrelated to minority shareholders. Cumulative exchange differences arecharged to the income statement when an investment is fully disposed ofor when the investment ceases to qualify as a controlled company. In theevent of a partial disposal that does not result in the loss of control, theportion of exchange differences relating to the interest sold is recognisedunder minority interest in equity.The financial statements translated into euros are those denominated inthe functional currency, i.e. the local currency or the currency in whichmost financial transactions and assets and liabilities are denominated.The exchange rates that have been applied for the translation of financialstatements in foreign currencies are as follows:
(4) The criteria used for determining fair value are described in the section ‘Fair value measurement’. (5) The decision to apply the partial or full goodwill method is also made for business combinations where negative goodwill is taken to the income statement (i.e. a gain on bargain purchase).
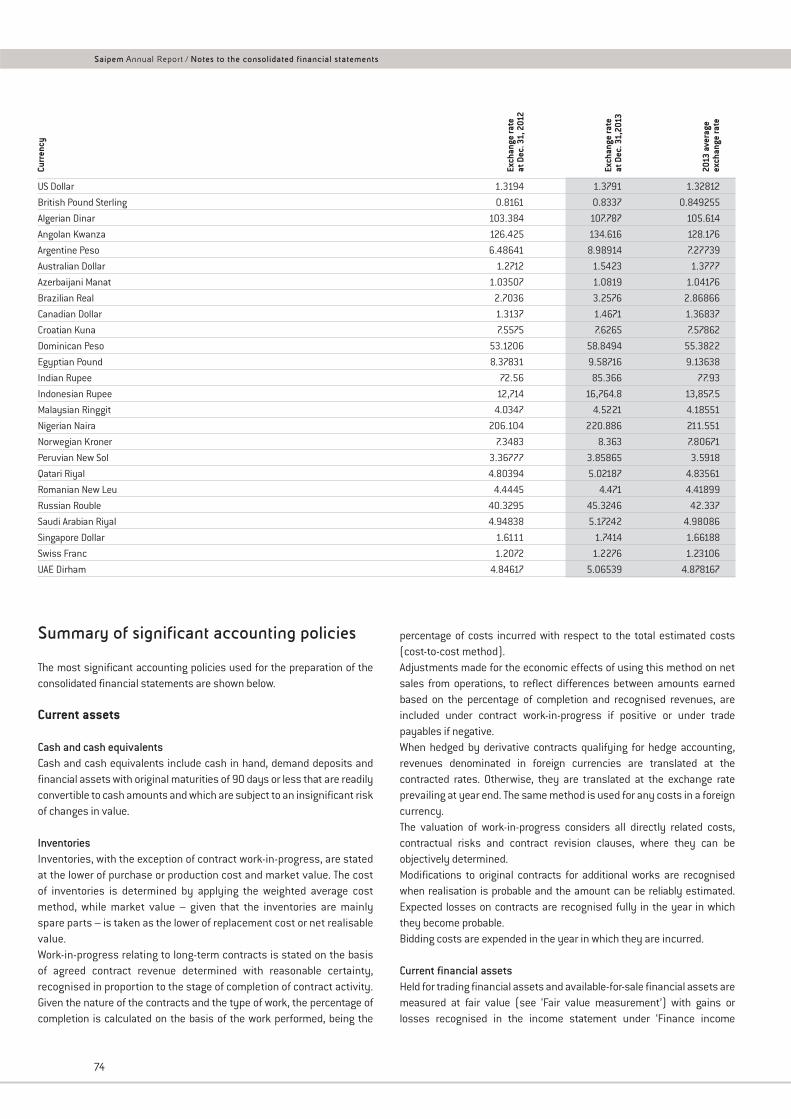
74
Saipem Annual Report / Notes to the consolidated financial statements
Summary of significant accounting policies
The most significant accounting policies used for the preparation of theconsolidated financial statements are shown below.
Current assets
Cash and cash equivalentsCash and cash equivalents include cash in hand, demand deposits andfinancial assets with original maturities of 90 days or less that are readilyconvertible to cash amounts and which are subject to an insignificant riskof changes in value.
InventoriesInventories, with the exception of contract work-in-progress, are statedat the lower of purchase or production cost and market value. The costof inventories is determined by applying the weighted average costmethod, while market value – given that the inventories are mainlyspare parts – is taken as the lower of replacement cost or net realisablevalue.Work-in-progress relating to long-term contracts is stated on the basisof agreed contract revenue determined with reasonable certainty,recognised in proportion to the stage of completion of contract activity.Given the nature of the contracts and the type of work, the percentage ofcompletion is calculated on the basis of the work performed, being the
percentage of costs incurred with respect to the total estimated costs(cost-to-cost method).Adjustments made for the economic effects of using this method on netsales from operations, to reflect differences between amounts earnedbased on the percentage of completion and recognised revenues, areincluded under contract work-in-progress if positive or under tradepayables if negative.When hedged by derivative contracts qualifying for hedge accounting,revenues denominated in foreign currencies are translated at thecontracted rates. Otherwise, they are translated at the exchange rateprevailing at year end. The same method is used for any costs in a foreigncurrency.The valuation of work-in-progress considers all directly related costs,contractual risks and contract revision clauses, where they can beobjectively determined.Modifications to original contracts for additional works are recognisedwhen realisation is probable and the amount can be reliably estimated.Expected losses on contracts are recognised fully in the year in whichthey become probable.Bidding costs are expended in the year in which they are incurred.
Current financial assetsHeld for trading financial assets and available-for-sale financial assets aremeasured at fair value (see ‘Fair value measurement’) with gains orlosses recognised in the income statement under ‘Finance income
US Dollar 1.3194 1.3791 1.32812
British Pound Sterling 0.8161 0.8337 0.849255
Algerian Dinar 103.384 107.787 105.614
Angolan Kwanza 126.425 134.616 128.176
Argentine Peso 6.48641 8.98914 7.27739
Australian Dollar 1.2712 1.5423 1.3777
Azerbaijani Manat 1.03507 1.0819 1.04176
Brazilian Real 2.7036 3.2576 2.86866
Canadian Dollar 1.3137 1.4671 1.36837
Croatian Kuna 7.5575 7.6265 7.57862
Dominican Peso 53.1206 58.8494 55.3822
Egyptian Pound 8.37831 9.58716 9.13638
Indian Rupee 72.56 85.366 77.93
Indonesian Rupee 12,714 16,764.8 13,857.5
Malaysian Ringgit 4.0347 4.5221 4.18551
Nigerian Naira 206.104 220.886 211.551
Norwegian Kroner 7.3483 8.363 7.80671
Peruvian New Sol 3.36777 3.85865 3.5918
Qatari Riyal 4.80394 5.02187 4.83561
Romanian New Leu 4.4445 4.471 4.41899
Russian Rouble 40.3295 45.3246 42.337
Saudi Arabian Riyal 4.94838 5.17242 4.98086
Singapore Dollar 1.6111 1.7414 1.66188
Swiss Franc 1.2072 1.2276 1.23106
UAE Dirham 4.84617 5.06539 4.878167
Curr
ency
Exch
ange
rate
at D
ec. 3
1, 2
012
Exch
ange
rate
at D
ec. 3
1,20
13
2013
ave
rage
exch
ange
rate
75
Saipem Annual Report / Notes to the consolidated financial statements
(expense)’ and in the equity reserve6 related to ‘Other items ofcomprehensive income’, respectively. In the latter case, changes in fairvalue recognised in equity are taken to the income statement when theasset is sold or impaired.Assets are assessed for objective evidence of an impairment loss. Thismay include significant breaches of contracts, serious financialdifficulties or the high probability of insolvency of the counterparty.Losses are deducted from the carrying amount of the asset.Interest and dividends on financial assets stated at fair value areaccounted for on an accruals basis as ‘Finance income (expense)’7 and‘Other income (expense) from investments’, respectively.When the purchase or sale of a financial asset occurs under a contractwhose terms require delivery of the asset within the time frameestablished generally by regulation or convention in the market placeconcerned (e.g. purchase of securities on regulated markets), thetransaction is accounted for on the settlement date.Receivables are stated at amortised cost (see ‘Financial fixed assets -Receivables and financial assets held to maturity’).Transferred financial assets are derecognised from assets when thecontractual rights to receive the cash flows of the financial assets aretransferred together with the risks and rewards of ownership.
Non-current assets
Tangible assetsTangible assets are recognised using the cost model and stated at theirpurchase or production cost including any costs directly attributable tobringing the asset into operation. In addition, when a substantial amountof time is required to make the asset ready for use, the purchase price orproduction cost includes borrowing costs that theoretically would havebeen avoided had the investment not been made. The purchase orproduction cost is net of government grants related to assets, which areonly recognised when all the required conditions have been met.In the case of a present obligation for the dismantling and removal of assetsand the restoration of sites, the carrying value includes, with acorresponding entry to a specific provision, the estimated (discounted)costs to be borne at the moment the asset is retired. The accountingtreatment of changes in estimates for these provisions, the passage of timeand the discount rate are indicated under ‘Provisions for contingencies’.Assets held under finance leases or under leasing arrangements that donot take the legal form of a finance lease but substantially transfer all therisks and rewards of ownership of the leased asset are recognised at fairvalue, net of taxes due from the lessor or, if lower, at the present value ofthe minimum lease payments, within tangible assets. A correspondingfinancial debt payable to the lessor is recognised as a financial liability.These assets are depreciated using the criteria described below. Where itis not reasonably certain that the purchase option will be exercised,leased assets are depreciated over the shorter of the lease term and theestimated useful life of the asset.Expenditures on renewals, improvements and transformations thatextend the useful lives of the related asset are capitalised when it is likelythat they will increase the future economic benefits expected from theasset.
Tangible assets are depreciated systematically using a straight-linemethod over their useful life, which is an estimate of the period over whichthe assets will be used by the company. When the tangible assetcomprises more than one significant element with different useful lives,each component is depreciated separately. The depreciable amount of anasset is its cost less the estimated residual value at the end of its usefullife, if this is significant and can be reasonably determined. Land is notdepreciated, even where purchased with a building. Tangible assets heldfor sale are not depreciated but are valued at the lower of book value andfair value less costs to sell (see ‘Non-current assets held for sale’).Changes to depreciation schedules related to changes in the estimateduseful life or the residual value of an asset or in the expected pattern ofconsumption of the future economic benefits flowing from an asset areaccounted for prospectively.Replacement costs of identifiable components in complex assets arecapitalised and depreciated over their useful life. The residual book valueof the component that has been replaced is charged to the incomestatement. Ordinary maintenance and repair costs are expensed whenincurred.The carrying value of tangible assets is reviewed for impairmentwhenever events indicate that the carrying amounts for those assets maynot be recoverable. The recoverability of an asset is assessed bycomparing its carrying value with the recoverable amount, representedby the higher of fair value less costs to sell and value in use.Value in use is the present value of the future cash flows expected to bederived from the use of the asset and, if significant and reasonablydeterminable, from its disposal at the end of its useful life, net ofdisposal costs. Cash flows are determined on the basis of reasonableand documented assumptions that represent the best estimate of thefuture economic conditions during the remaining useful life of theasset, giving more importance to independent assumptions.Discounting is carried out at a rate that reflects current marketassessments of the time value of money and the risks specific to theasset that are not reflected in the estimate of future cash flows. Thediscount rate used is the Weighted Average Cost of Capital (WACC)adjusted for risks specific to the market.Value in use is calculated net of the tax effect, as this method results invalues similar to those resulting from discounting pre-tax cash flows at apre-tax discount rate deriving, through an iteration process, from apost-tax valuation.Valuation is carried out for each single asset or, if the realisable value ofsingle assets cannot be determined, for the smallest identifiable group ofassets that generates independent cash inflows from their continuoususe, referred to as cash generating units. If the reasons for impairmentcease to exist, the impairment loss is reversed to the income statementas income from revaluation. The value of the asset is written back to thelower of the recoverable amount and the original book value beforeimpairment, less the depreciation that would have been charged had noimpairment loss been recognised.Tangible assets destined for specific operating projects, for which nofurther future use is envisaged due to the characteristics of the assetitself or the high usage sustained during the execution of the project, areamortised over the duration of the project.
(6) Changes in the fair value of available-for-sale financial assets denominated in foreign currencies due to changes in exchange rates are recognised in profit or loss.(7) Interest income on financial assets held for trading is included in the fair value measurement of the instrument and recognised under ‘Finance income (expense)’ in the item ‘Income (expense) from securities held fortrading’. Interest income on financial assets available for sale is recognised under ‘Finance income (expense)’ in the item ‘Finance income’.
76
Saipem Annual Report / Notes to the consolidated financial statements
Intangible assetsIntangible assets are identifiable assets without physical substance thatare controlled by the company and from which future economic benefitsare expected, as well as goodwill acquired in business combinations. Anasset is classified as intangible when management is able to distinguishit clearly from goodwill. This condition is normally met when: (i) theintangible asset arises from legal or contractual rights, or (ii) the asset isseparable, i.e. can be sold, transferred, licensed, rented or exchanged,either individually or as an integral part of other assets. An entity controlsan asset if it has the power to obtain the future economic benefits derivingfrom the underlying resource and to restrict the access of others to thosebenefits. Intangible assets are stated at purchase or production cost asdetermined with the criteria used for tangible assets.Intangible assets with a defined useful life are amortised systematicallyover their useful life estimated as the period over which the assets will beused by the company. The amount to be amortised and the recoverabilityof their book value are determined in accordance with the criteriadescribed in the section ‘Tangible assets’.Goodwill and other intangible assets with an indefinite useful life are notamortised. The recoverability of their carrying value is reviewed at leastannually and whenever events or changes in circumstances indicate thatthe carrying value may not be recoverable.Goodwill is tested for impairment at the level of the cash generating unitto which goodwill has been allocated. The cash generating unit is thesmallest identifiable group of assets that generates cash inflows fromcontinuing use, and that are largely independent of the cash inflows fromother assets or groups of assets, on which company managementmonitors the return on the investment in that goodwill. If the carryingamount of the cash generating unit, including goodwill allocated thereto,determined by taking into account the impairment of non-current assetsthat are part of the cash generating unit, exceeds the cash generatingunit’s recoverable amount8, the excess is recognised as impairment. Theimpairment loss is first allocated to reduce the carrying amount ofgoodwill. Any remaining excess is allocated on a pro-rata basis to thecarrying value of the assets that form the cash generating unit.Impairment charges against goodwill are not reversed9.
Costs of technological development activitiesCosts of technological development activities are capitalised when theCompany can demonstrate:(a) the technical feasibility of completing the intangible asset so that it
will be available for use or sale;(b) its intention to complete the asset and use or sell it;(c) its ability to use or sell the asset;(d) how the intangible asset will generate probable future economic
benefits;(e) the availability of adequate technical, financial and other resources
to complete the development and to use or sell the asset;(f) its ability to measure reliably the expenditure attributable to the
intangible asset during its development.
GrantsGrants related to assets are recorded as a reduction of the purchase priceor production cost of the related assets when there is reasonable
assurance that all the required conditions attached to them, agreed uponwith government entities, will be met. Grants related to income arerecognised as income over the periods necessary to match them with therelated costs.
Financial fixed assets
INVESTMENTSInvestments in subsidiaries and jointly-controlled entities excluded fromconsolidation and associates are accounted for using the equity method.Jointly-controlled entities are those entities over which Saipem holds theright, jointly with its partners, to govern financial and operating policies so asto obtain benefits. Associated companies are companies over which Saipemexercises a significant influence, i.e. the power to participate in financial andoperating policy decisions, without exercising control or joint control.In accordance with the equity method of accounting, investments arerecognised at purchase cost. Any difference between the cost of theinvestment and the company’s share of the fair value of the netidentifiable assets of the investment is treated in the same way as forbusiness combinations. Subsequently, the carrying amount is adjusted totake into account: (i) the post-acquisition change in the investor’s shareof net assets of the investee; and (ii) the investor’s share of the investee’sother comprehensive income. Shares of changes in the net assets ofinvestees that are not recognised in profit or loss or other comprehensiveincome of the investee are recognised in the income statement whenthey reflect the substance of a disposal of an interest in said investee.Dividends received from an investee reduce the carrying amount of theinvestment. When using the equity method, the adjustments required forthe consolidation process are applied (see ‘Principles of consolidation’).When there is objective evidence of impairment (see also ‘Currentfinancial assets’), the recoverability is tested by comparing the carryingamount and the related recoverable amount determined adopting thecriteria indicated in the item ‘Tangible assets’.If it does not result in a misrepresentation of the company’s financialcondition and consolidated results, subsidiaries excluded fromconsolidation and associates are accounted for at cost, adjusted forimpairment charges.When the reasons for their impairment cease to exist, investmentsaccounted for at cost are revalued within the limit of the impairmentmade and their effects are taken to the income statement item ‘Otherincome (expense) from investments’.A disposal of interests that results in a loss of joint control or significantinfluence causes recognition in the income statement of: (i) any gains orlosses calculated as the difference between the consideration received andthe portion of the carrying amount disposed; (ii) any gains or lossesattributable to measuring any investment retained at its fair value; and(iii) any amounts recognised in other comprehensive income in relation tothe investee that may be reclassified subsequently to profit or loss10. Thefair value of any retained interest at the date when joint control or significantinfluence is lost represents the new carrying amount for subsequentaccounting in accordance with the applicable accounting criteria.Other investments, included in non-current assets, are recognised at fairvalue with changes reported in the equity reserve related to ‘Other itemsof comprehensive income’. Changes in fair value recognised in equity are
(8) For the definition of recoverable amount see ‘Tangible assets’.(9) Impairment charges are not reversed even if no loss, or a smaller loss, would have been recognised had the impairment been assessed only at the end of the subsequent interim period.(10) Any amounts recognised in other comprehensive income in relation to the former jointly-controlled entity or associate that may not be reclassified to profit or loss are transferred directly to retained earnings.
77
Saipem Annual Report / Notes to the consolidated financial statements
charged to the income statement when the investment is sold orimpaired. When investments are not traded in a public market and fairvalue cannot be reasonably determined, investments are accounted forat cost, adjusted for impairment losses, which may not be reversed11.The investor’s share of any losses exceeding the carrying amount isrecognised in a specific provision to the extent that that investor isrequired to fulfil legal or implicit obligations towards the investee or tocover its losses.
RECEIVABLES AND HELD-TO-MATURITY FINANCIAL ASSETSReceivables and financial assets to be held to maturity are stated at cost,i.e. at the fair value of the consideration received, plus transaction costs(e.g. agency or consultancy fees, etc.). The initial carrying amount issubsequently adjusted to take into account principal repayments,impairment losses, and cumulative amortisation of any differencebetween the initial amount and the maturity amount. Amortisation iscarried out on the basis of the effective interest rate computed at initialrecognition, which is the rate that exactly discounts estimated futurecash flows to the instrument’s initial carrying amount (i.e. the amortisedcost method). Receivables for finance leases are recognised at anamount equal to the present value of the lease payments and thepurchase option price or any residual value; the amount is discounted atthe interest rate implicit in the lease.Any impairment is recognised by comparing the carrying value with thepresent value of the expected cash flows discounted at the effectiveinterest rate computed at initial recognition or adjusted to reflectcontractual repricing dates (see also ‘Current assets’). Receivables andheld-to-maturity financial assets are recognised net of the provision forimpairment losses. When the impairment loss is definite, the provision isused; otherwise it is released. Changes to the carrying amount ofreceivables or financial assets arising from measurement at amortisedcost are recognised as ‘Finance income (expenses)’.
Assets held for sale and discontinued operationsNon-current assets and current and non-current assets included withindisposal groups, whose carrying amount will be recovered principallythrough a sale transaction rather than through their continuing use, areclassified as held for sale. This condition is considered met when the saleis highly probable and the asset or disposal group is available forimmediate sale in its current condition. Non-current assets held for sale,current and non-current assets included within disposal groups andliabilities directly associated with them are recognised in the balancesheet separately from the entity’s other assets and liabilities.Non-current assets held for sale are not depreciated and are measured atthe lower of the fair value less costs to sell and their carrying amount (see‘Fair value measurement’).The classification of investments accounted for using the equity methodas held for sale requires the suspension of the application of this methodof accounting. In such cases, the carrying amount is therefore equal tothe value deriving from the application of the equity method at the date ofreclassification.Any difference between the carrying amount and the fair value less costs tosell is taken to the income statement as an impairment loss; anysubsequent reversal is recognised up to the cumulative impairment losses,including those recognised prior to qualification of the asset as held for sale.
Non-current assets and current and non-current assets included withindisposal groups and classified as held for sale constitute a discontinuedoperation if: (i) they represent a separate major line of business orgeographical area of operations; (ii) they are part of a single coordinatedplan to dispose of a separate major line of business or geographical areaof operations; and (iii) they are a subsidiary acquired with a view to resale.Profit or loss of discontinued operations, as well as any gains or losses ontheir disposal are reported separately in the income statement, net of anytax effects. The results of discontinued operations are also reported in thecomparative figures for prior years.When the sale of a subsidiary is planned and this will lead to loss ofcontrol, all of its assets and liabilities are classified as held for sale. Thisapplies whether or not an interest is retained in the former subsidiaryafter the sale.
Financial liabilitiesDebt is carried at amortised cost (see ‘Financial fixed assets - Receivablesand held-to-maturity financial assets’). Financial liabilities are eliminatedwhen they have been settled, or when the contractual condition has beenfulfiled or cancelled or when it has expired.
Provisions for contingenciesProvisions for contingencies concern risks and charges of a definitenature and whose existence is certain or probable but for which atyear-end the timing or amount of future expenditure is uncertain.Provisions are recognised when: (i) there is a present obligation, eitherlegal or constructive, as a result of a past event; (ii) it is probable that anoutflow of resources embodying economic benefits will be required tosettle the obligation; and (iii) a reliable estimate can be made of theamount of the obligation. Provisions represent the best estimate of theexpenditure required to settle the obligation or to transfer it to thirdparties at the balance sheet date. The amount recognised for onerouscontracts is the lower of the cost necessary to fulfil the contractobligations, net of the economic benefits expected to be received under it,and any compensation or penalties arising from failure to fulfil theseobligations. Where the effect of the time value of money is material andthe payment dates of the obligations can be reliably estimated, theprovisions should be discounted using a pre-tax discount rate thatreflects the current market assessments of the time value of money andthe risks specific to the liability. The increase in the provision due to thepassage of time is recognised as ‘Finance (expense) income’.When the liability regards a tangible asset, the provision is stated with acorresponding entry to the asset to which it refers and taken to theincome statement through the depreciation process.The costs that the company expects to bear to carry out restructuringplans are recognised when the company formally defines the plan andthe interested parties have developed a valid expectation that therestructuring will occur.Provisions are periodically updated to show the variations of estimates ofcosts, production times and actuarial rates. Increases or decreases forchanges in estimates for provisions recognised in prior periods arerecognised in the same income statement item used to accrue theprovision, or, when a liability regards tangible assets, through an entrycorresponding to the assets to which they refer, within the limits of thecarrying amount. Any excess is taken to the income statement.
(11) Impairment charges are not reversed even if no loss, or a smaller loss, would have been recognised had the impairment been assessed only at the end of the subsequent interim period.
78
Saipem Annual Report / Notes to the consolidated financial statements
In the notes to the consolidated financial statements, the followingcontingent liabilities are described: (i) possible, but not probableobligations arising from past events, whose existence will be confirmedonly by the occurrence or non-occurrence of one or more uncertain futureevents not wholly within the control of the company; and (ii) presentobligations arising from past events whose amount cannot be measuredwith sufficient reliability or whose settlement will probably not require anoutflow of resources embodying economic benefits.
Provisions for employee benefitsPost-employment benefits are established on the basis of benefit plans,including informal arrangements, which are classified as either ‘definedcontribution plans’ or ‘defined benefit plans’ depending on theircharacteristics. In the first case, the company’s obligation, which consistsof making payments to the State or to a trust or fund, is determined on thebasis of the contributions due.The liabilities arising from defined benefit plans, net of any plan assets,are determined on the basis of actuarial assumptions and charged on anaccruals basis during the employment period required to obtain thebenefits.The net interest, which is recognised in profit or loss, includes theexpected return on plan assets and the interest cost. Net interest isdetermined by applying the discount rate for liabilities to liabilities net ofany plan assets. The net interest on defined benefit plans is posted to‘Financial income (expenses)’.Remeasurements of the net defined benefit liability, which compriseactuarial gains and losses arising from changes in actuarial assumptionsor from experience adjustments and the return on plan assets excludingamounts included in net interest, are recognised in the statement of othercomprehensive income. Remeasurements of net defined benefit assetsexcluding amounts included in net interest are also recognised in thestatement of other comprehensive income.Long-term benefits obligations are determined by adopting actuarialassumptions. The effects of remeasurement are taken to profit or loss intheir entirety.
Treasury sharesTreasury shares are recognised at cost and deducted from equity. Gainsor losses from the subsequent sale of treasury shares are recorded as anincrease (or decrease) in equity.
RevenuesRevenues for contract work-in-progress are recognised by reference tothe stage of completion of a contract determined using the cost-to-costmethod. Revenues for contract work-in-progress in a foreign currency arerecognised at the euro exchange rate on the date when the stage ofcompletion of a contract is measured and accepted by the client. Thisvalue is adjusted to take into account exchange differences arising onderivatives that qualify for hedge accounting.Advances are recognised at the exchange rate on the date of payment.Requests for additional payments deriving from a change in the scope ofthe work are included in the total amount of revenues when it is probablethat the client will approve the variation and the relevant amount. Claimsderiving for example from additional costs incurred for reasonsattributable to the client are included in the total amount of revenues
when it is probable that the client will accept them. Work that has not yetbeen accepted is recognised at the year-end exchange rate.Revenues associated with sales of products and services, with theexception of contract work-in-progress, are recorded when the significantrisks and rewards of ownership pass to the customer or when thetransaction can be considered settled and associated revenue can bereliably measured.Revenues related to partially rendered services are recognised byreference to the stage of completion, providing this can be measuredreliably and that there is no significant uncertainty regarding thecollectability of the amount and the related costs. Otherwise they arerecognised only to the extent of the recoverable costs incurred.Revenues are stated at the fair value of considerations received orreceivable, net of returns, discounts, rebates and bonuses, as well asdirectly related taxation.
CostsCosts are recognised in relation to goods and services, excluding contractwork-in-progress, sold or consumed within the year, through systematicallocation over the useful life of the related asset, or when their futurebenefits cannot be determined.Operating lease payments are recognised in the income statement overthe length of the contract.Labour costs comprise remuneration paid, provisions made to pensionfunds, accrued holidays, national insurance and social securitycontributions in compliance with national contracts of employment andcurrent legislation.Stock options granted to senior managers, given their compensatorynature, are included in labour costs. The instruments granted arerecognised at their fair value at the grant date and are not subject tosubsequent adjustments. The current portion is calculated pro-rata overthe vesting period12. The fair value of stock options is determined usingvaluation techniques which consider conditions related to the exercise ofoptions, the market value of shares, expected volatility and the risk-freeinterest rate.The fair value of stock options is shown in the item ‘Payroll and relatedcosts’ as a contra entry to ‘Other reserves’ in equity.The costs for the acquisition of new knowledge or discoveries, the studyof products or alternative processes, new techniques or models, theplanning and construction of prototypes or any other costs incurred forother scientific research activities or technological development, aregenerally considered current costs and expensed as incurred. Thesecosts are capitalised (see ‘Intangible assets’) only when they meet therequirements listed under ‘Costs of technological development activities’.
Exchange rate differencesRevenues and costs associated with transactions in currencies other thanthe functional currency are translated using the exchange rate at the dateof the transaction.Monetary assets and liabilities in currencies other than the functionalcurrency are converted by applying the year-end exchange rate. Anyexchange differences are recognised in the income statement.Non-monetary assets and liabilities denominated in currencies other thanthe functional currency valued at cost are translated at the initialexchange rate. Non-monetary assets that are re-measured at fair value
(12) Period between the date of the award and the date on which the option can be exercised.
79
Saipem Annual Report / Notes to the consolidated financial statements
(i.e. at their recoverable amount or realisable value), are translated at theexchange rate applicable on the date of re-measurement.
DividendsDividends are recognised at the date of the general shareholders’ meetingin which they were declared, except when the sale of shares before theex-dividend date is certain.
Income taxesCurrent income taxes are determined on the basis of estimated taxableincome. The estimated liability is recognised in ‘Income tax payables’.Current income tax assets and liabilities are measured at the amountexpected to be paid to (recovered from) the tax authorities, using the taxrates (and tax laws) that have been enacted or substantively enacted bythe balance sheet date.Deferred tax assets or liabilities are recognised for temporary differencesbetween the carrying amounts and tax bases of assets and liabilities,based on tax rates and tax laws that have been enacted or substantivelyenacted for future years. Deferred tax assets are recognised when theirrecovery is considered probable. The recoverability of deferred taxes isconsidered probable when it is expected that sufficient taxable profit willbe available in the periods in which the temporary differences reverseagainst which deductible temporary differences can be utilised.Similarly, unused tax credits and deferred tax assets on tax losses arerecognised to the extent that they can be recovered.For temporary differences associated with investments in subsidiaries,jointly-controlled entities and associated companies, deferred taxliabilities are not recorded if the investor is able to control the timing of thereversal of the temporary difference and it is probable that the reversalwill not occur in the foreseeable future.Deferred tax assets and liabilities are recorded under non-current assetsand liabilities and are offset at single entity level if related to offsettabletaxes. The balance of the offset, if positive, is recognised under ‘Deferredtax assets’ and, if negative, under ‘Deferred tax liabilities’.When the results of transactions are recognised directly in shareholders’equity, current taxes, deferred tax assets and liabilities are also chargedto equity.
DerivativesA derivative is a financial instrument which has the followingcharacteristics: (i) its value changes in response to the changes in aspecified interest rate, financial instrument price, commodity price, foreignexchange rate or other variable; (ii) it requires no initial net investment orthe investment is small; and (iii) it is settled at a future date.Derivatives, including embedded derivatives that are separated from thehost contract, are assets and liabilities measured at fair value.Consistently with its business requirements, Saipem classifies derivativesas hedging instruments whenever possible. The fair value of derivativeliabilities takes into account the issuer’s own non-performance risk (see‘Fair value measurement’).Derivatives are classified as hedging instruments when the relationshipbetween the derivative and the hedged item is formally documented andthe effectiveness of the hedge, assessed on an ongoing basis, isdemonstrated to be high. When hedging instruments cover the risk ofchanges in the fair value of the hedged item (e.g. hedging of changes inthe fair value of fixed rate assets/liabilities), they are recognised at fairvalue, with changes taken to the income statement. Accordingly, the
hedged item is adjusted through profit or loss for changes in fair valueattributable to the hedged risk, regardless of the provisions of othermeasurement criteria generally applicable to the type of instrument inquestion.A cash flow hedge is a hedge of the exposure to variability in cash flowsthat could affect profit or loss and that is attributable to a particular riskassociated with a recognised asset or liability (such as future interestpayments on variable rate debt) or a highly probable forecast transaction,such as project income/costs.The effective portion of variations in fair value of derivatives designatedas hedges under IAS 39 is recorded initially in a hedging reserve related toother items of comprehensive income. This reserve is recognised in theincome statement in the period in which the hedged item affects profit orloss.The ineffective portion of changes in fair value of derivatives, as well asthe entire change in fair value of those derivatives not designated ashedges or that do not meet the criteria set out in IAS 39, are taken directlyto the income statement under ‘Finance income (expense)’.Changes in the fair value of derivatives which do not satisfy the conditionsfor being qualified as hedges are recognised in the income statement.Specifically, changes in the fair value of non-hedging interest rate andforeign currency derivatives are recognised in the income statementunder ‘Finance income (expense)’; conversely, changes in the fair valueof non-hedging commodity derivatives are recognised in the incomestatement under ‘Other operating income (expense)’.
Fair value measurementFair value is defined as the price that would be received to sell an asset orpaid to transfer a liability (i.e. the ‘exit price’) in an orderly transaction thatis not a forced sale, liquidation sale or a distressed sale between marketparticipants at the measurement date.Fair value is determined based on market conditions at the measurementdate and the assumptions that market participants would use (i.e. it is amarket-based measurement). Fair value measurement assumes thetransaction to sell the asset or transfer the liability occurs in a principalmarket or, in the absence of a principal market, in the most advantageousmarket to which the entity has access. It does not consider an entity’sintent to sell the asset or transfer the liability.Fair value measurements of non-financial assets take into account amarket participant’s ability to generate economic benefits by using theasset in its highest and best use or by selling it to another marketparticipant that would use the asset in its highest and best use. Thehighest and best use is determined from the perspective of marketparticipants, even if the entity intends a different use. An entity’s currentuse of a non-financial asset is presumed to be its highest and best useunless market or other factors suggest that a different use by marketparticipants would maximise the value of the asset.In the absence of quoted market prices, the fair value of a financial ornon-financial liability or an entity’s own equity instruments is taken as thefair value of the corresponding asset held by another market participantat the measurement date.Counterparty credit risk and own credit risk are taken into account indetermining the fair value of a liability.In the absence of quoted market prices, an entity uses valuationtechniques appropriate in the circumstances and for which sufficient dataare available to measure fair value, maximising the use of relevantobservable inputs and minimising the use of unobservable inputs.
80
Saipem Annual Report / Notes to the consolidated financial statements
Financial statements13
Assets and liabilities of the balance sheet are classified as current andnon-current. Items of the income statement are presented by nature14.The statement of comprehensive income shows net profit together withincome and expenses that are recognised directly in equity in accordancewith IFRS.The statement of changes in shareholders’ equity includes profit and lossfor the year, transactions with shareholders and other changes inshareholders’ equity.The cash flow statement is prepared using the indirect method, wherebynet profit is adjusted for the effects of non-cash transactions.
Changes to accounting principlesEuropean Commission Regulation No. 475/2012 dated June 5, 2012approved the new version of IAS 19 ‘Employee benefits’. For furtherinformation on the effects of the requirements of IAS 19, see the section‘Restatement of financial statements at December 31, 2012’ of the Notesto the consolidated financial statements.In addition, IFRS 13 ‘Fair Value Measurement’ became applicable as ofJanuary 1, 2013, following its approval by European CommissionRegulation No. 1255/2012 dated December 11, 2012. IFRS 13 regards asingle IFRS framework for fair value measurements required or allowed forby other IFRSs as well as disclosure. The application of the provisions didnot produce any significant effects.
Financial risk managementThe main financial risks that Saipem is facing and actively monitoring andmanaging are the following:(i) the market risk deriving from exposure to fluctuations in interest
rates and exchange rates between the euro and the other currenciesused by the company and the risk deriving from exposure tocommodity price volatility;
(ii) the credit risk deriving from the possible default of a counterparty;(iii) the liquidity risk deriving from the risk that suitable sources of
funding for the Group’s operations may not be available.Financial risks are managed in accordance with guidelines issuedcentrally, with the objective of aligning and coordinating Saipem Grouppolicies on financial risks.For further details on industrial risks, see the ‘Risk management’ sectionin the Directors’ Report.
MARKET RISKMarket risk is the possibility that changes in currency exchange rates,interest rates or commodity prices will adversely affect the value of theGroup’s financial assets, liabilities or expected future cash flows. Saipemactively manages market risk in accordance with a set of policies andguidelines that provide a centralised model of conducting finance,treasury and risk management operations based on the Group TreasuryStructures.
Exchange rate riskExchange rate risk derives from the fact that Saipem’s operations areconducted in currencies other than the euro and that revenues and costs
from a significant portion of projects implemented are denominated andsettled in non-euro currencies. This impacts on:- individual profits, which may be significantly affected by exchange rate
fluctuations on specific transactions arising from the time lag existingbetween the execution of a given transaction and the definition of therelevant contractual terms (economic risk) and by the conversion offoreign currency-denominated trade and financial payables andreceivables (transaction risk);
- the Group’s reported results and shareholders’ equity, as financialstatements of subsidiaries denominated in currencies other than theeuro are translated from their functional currency into euro.
Saipem’s foreign exchange risk management policy is to minimiseeconomic and transactional exposures arising from foreign currencymovements and to optimise the economic exchange risk connected withcommodity prices. Saipem does not undertake any hedging activity forrisks deriving from the translation of foreign currency denominatedprofits or assets and liabilities of subsidiaries that prepare financialstatements in a currency other than the euro.Saipem uses a number of different types of derivative contract to reduceeconomic and transaction exposure such as currency swaps, forwardsand options. The fair value of exchange rate derivatives is determined bythe Corporate Finance Unit of Eni SpA on the basis of standard valuationmodels and market prices/input provided by specialised sources.Planning, coordination and management of this activity at Group level isthe responsibility of the Saipem Treasury Department, which closelymonitors the correlation between derivatives and their underlying flowsas well as ensuring their correct accounting representation in compliancewith the International Financial Reporting Standards (IFRS).An exchange rate sensitivity analysis was performed for those currenciesother than euro for which exchange risk exposure in 2013 was highest inorder to calculate the effect on the income statement and shareholders’equity of hypothetical positive and negative variations of 10% in exchangerates.The analysis was performed for all relevant financial assets and liabilitiesdenominated in the currencies considered and regarded in particular thefollowing items:- exchange rate derivatives;- trade and other receivables;- trade and other payables;- cash and cash equivalents;- short and long-term financial liabilities.For exchange rate derivatives, the sensitivity analysis on fair value wasconducted by comparing the conditions underlying the forward price fixedin the contract (i.e. spot exchange rate and interest rate) with spot ratesand interest rate curves corresponding to the relevant contractualmaturity dates, on the basis of year-end exchange rates subjected tohypothetical positive and negative changes of 10%, with the resultingeffects weighted on the basis of the notional amounts.The analysis did not examine the effect of exchange rate fluctuations onthe measurement of work-in-progress because work in progress doesnot constitute a financial asset under IAS 32. Moreover, the analysisregards exposure to exchange rate risk in accordance with IFRS 7 andtherefore does not consider the effects of the conversion of financial
(13) The structure of the financial statements is the same as that used in the 2012 Annual Report, with the exception of: (i) the statement of comprehensive income where, as a result of the changes to IAS 1 ‘Presentation ofFinancial Statements’, items of other comprehensive income are grouped based on whether they may be reclassified to profit or loss subsequently in accordance with the relevant IFRS (i.e. reclassification adjustments); and(ii) application of the new provisions of IAS 19, whose effects are described in the section ‘Changes to accounting principles’.(14) Additional information regarding financial instruments, applying the classification required by IFRS, is provided under Note 31 ‘Guarantees, commitments and risks - Additional information on financial instruments’.
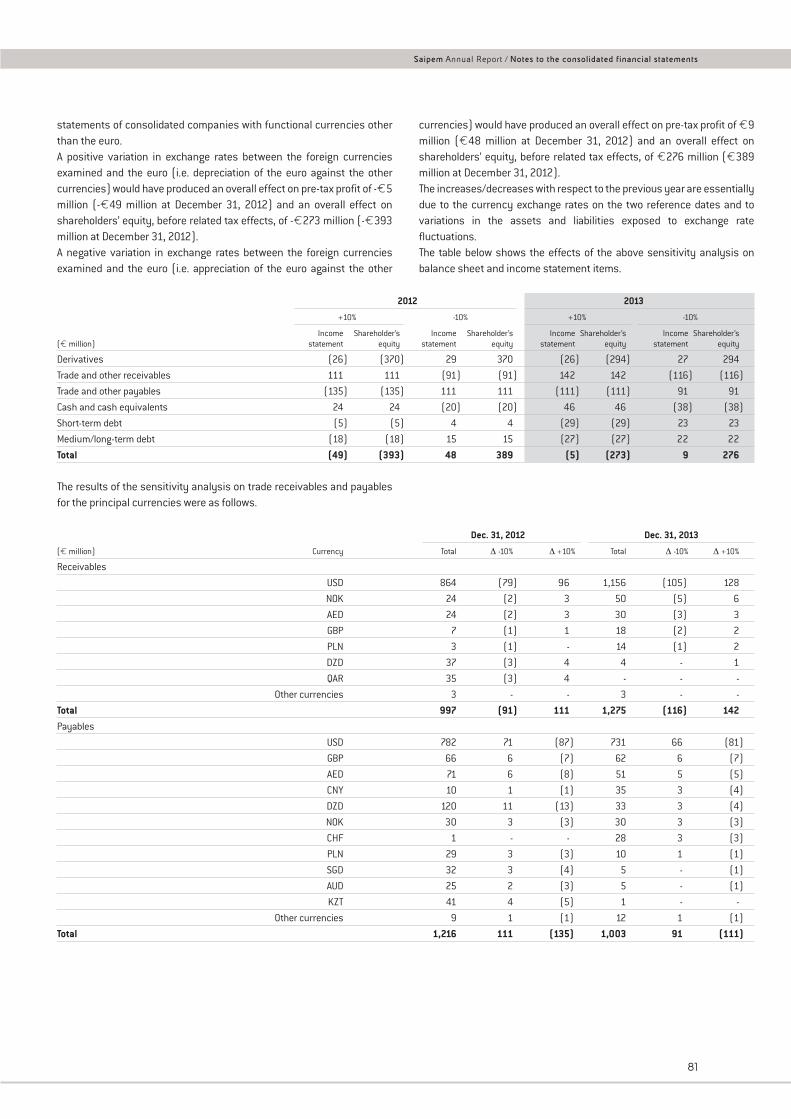
81
Saipem Annual Report / Notes to the consolidated financial statements
statements of consolidated companies with functional currencies otherthan the euro.A positive variation in exchange rates between the foreign currenciesexamined and the euro (i.e. depreciation of the euro against the othercurrencies) would have produced an overall effect on pre-tax profit of -€5million (-€49 million at December 31, 2012) and an overall effect onshareholders’ equity, before related tax effects, of -€273 million (-€393million at December 31, 2012).A negative variation in exchange rates between the foreign currenciesexamined and the euro (i.e. appreciation of the euro against the other
currencies) would have produced an overall effect on pre-tax profit of €9million (€48 million at December 31, 2012) and an overall effect onshareholders’ equity, before related tax effects, of €276 million (€389million at December 31, 2012).The increases/decreases with respect to the previous year are essentiallydue to the currency exchange rates on the two reference dates and tovariations in the assets and liabilities exposed to exchange ratefluctuations.The table below shows the effects of the above sensitivity analysis onbalance sheet and income statement items.
2012 2013
+10% -10% +10% -10%
Income Shareholder’s Income Shareholder’s Income Shareholder’s Income Shareholder’s(€ million) statement equity statement equity statement equity statement equity
Derivatives (26) (370) 29 370 (26) (294) 27 294
Trade and other receivables 111 111 (91) (91) 142 142 (116) (116)
Trade and other payables (135) (135) 111 111 (111) (111) 91 91
Cash and cash equivalents 24 24 (20) (20) 46 46 (38) (38)
Short-term debt (5) (5) 4 4 (29) (29) 23 23
Medium/long-term debt (18) (18) 15 15 (27) (27) 22 22
Total (49) (393) 48 389 (5) (273) 9 276
The results of the sensitivity analysis on trade receivables and payablesfor the principal currencies were as follows.
Dec. 31, 2012 Dec. 31, 2013
(€ million) Currency Total Δ -10% Δ +10% Total Δ -10% Δ +10%
Receivables
USD 864 (79) 96 1,156 (105) 128
NOK 24 (2) 3 50 (5) 6
AED 24 (2) 3 30 (3) 3
GBP 7 (1) 1 18 (2) 2
PLN 3 (1) - 14 (1) 2
DZD 37 (3) 4 4 - 1
QAR 35 (3) 4 - - -
Other currencies 3 - - 3 - -
Total 997 (91) 111 1,275 (116) 142Payables
USD 782 71 (87) 731 66 (81)
GBP 66 6 (7) 62 6 (7)
AED 71 6 (8) 51 5 (5)
CNY 10 1 (1) 35 3 (4)
DZD 120 11 (13) 33 3 (4)
NOK 30 3 (3) 30 3 (3)
CHF 1 - - 28 3 (3)
PLN 29 3 (3) 10 1 (1)
SGD 32 3 (4) 5 - (1)
AUD 25 2 (3) 5 - (1)
KZT 41 4 (5) 1 - -
Other currencies 9 1 (1) 12 1 (1)
Total 1,216 111 (135) 1,003 91 (111)
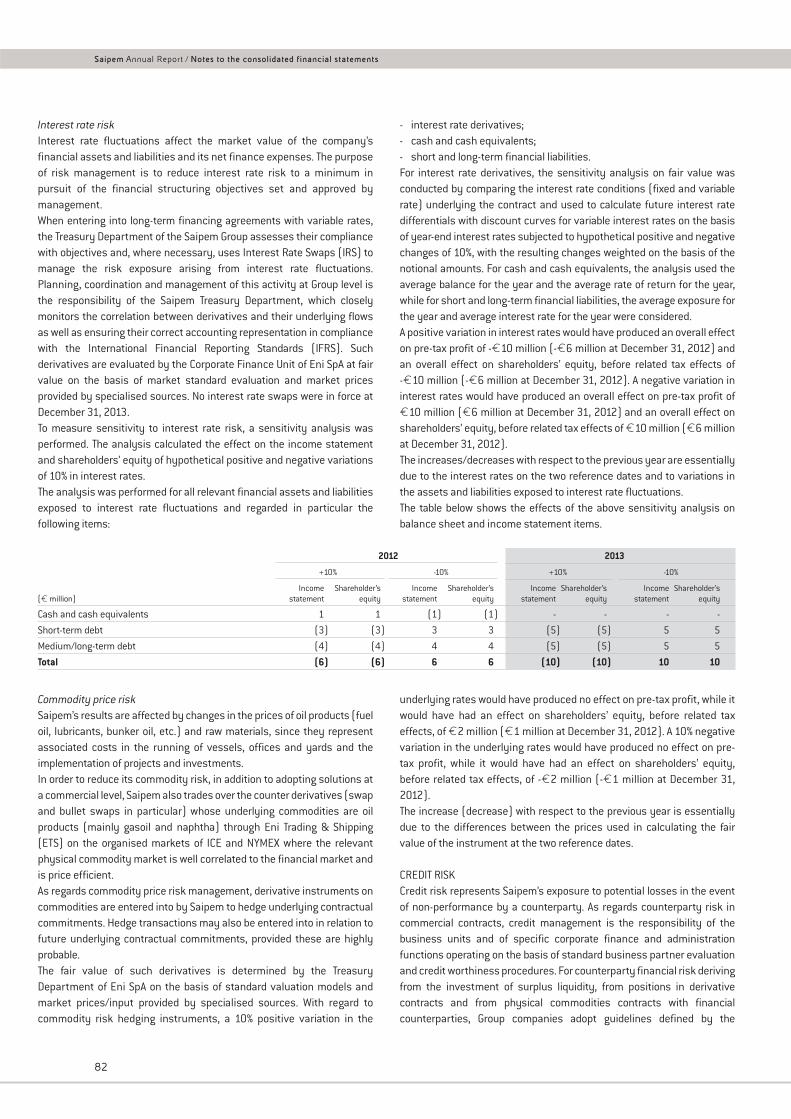
82
Saipem Annual Report / Notes to the consolidated financial statements
Interest rate riskInterest rate fluctuations affect the market value of the company’sfinancial assets and liabilities and its net finance expenses. The purposeof risk management is to reduce interest rate risk to a minimum inpursuit of the financial structuring objectives set and approved bymanagement.When entering into long-term financing agreements with variable rates,the Treasury Department of the Saipem Group assesses their compliancewith objectives and, where necessary, uses Interest Rate Swaps (IRS) tomanage the risk exposure arising from interest rate fluctuations.Planning, coordination and management of this activity at Group level isthe responsibility of the Saipem Treasury Department, which closelymonitors the correlation between derivatives and their underlying flowsas well as ensuring their correct accounting representation in compliancewith the International Financial Reporting Standards (IFRS). Suchderivatives are evaluated by the Corporate Finance Unit of Eni SpA at fairvalue on the basis of market standard evaluation and market pricesprovided by specialised sources. No interest rate swaps were in force atDecember 31, 2013.To measure sensitivity to interest rate risk, a sensitivity analysis wasperformed. The analysis calculated the effect on the income statementand shareholders’ equity of hypothetical positive and negative variationsof 10% in interest rates.The analysis was performed for all relevant financial assets and liabilitiesexposed to interest rate fluctuations and regarded in particular thefollowing items:
- interest rate derivatives;- cash and cash equivalents;- short and long-term financial liabilities.For interest rate derivatives, the sensitivity analysis on fair value wasconducted by comparing the interest rate conditions (fixed and variablerate) underlying the contract and used to calculate future interest ratedifferentials with discount curves for variable interest rates on the basisof year-end interest rates subjected to hypothetical positive and negativechanges of 10%, with the resulting changes weighted on the basis of thenotional amounts. For cash and cash equivalents, the analysis used theaverage balance for the year and the average rate of return for the year,while for short and long-term financial liabilities, the average exposure forthe year and average interest rate for the year were considered.A positive variation in interest rates would have produced an overall effecton pre-tax profit of -€10 million (-€6 million at December 31, 2012) andan overall effect on shareholders’ equity, before related tax effects of-€10 million (-€6 million at December 31, 2012). A negative variation ininterest rates would have produced an overall effect on pre-tax profit of€10 million (€6 million at December 31, 2012) and an overall effect onshareholders’ equity, before related tax effects of €10 million (€6 millionat December 31, 2012).The increases/decreases with respect to the previous year are essentiallydue to the interest rates on the two reference dates and to variations inthe assets and liabilities exposed to interest rate fluctuations.The table below shows the effects of the above sensitivity analysis onbalance sheet and income statement items.
2012 2013
+10% -10% +10% -10%
Income Shareholder’s Income Shareholder’s Income Shareholder’s Income Shareholder’s(€ million) statement equity statement equity statement equity statement equity
Cash and cash equivalents 1 1 (1) (1) - - - -
Short-term debt (3) (3) 3 3 (5) (5) 5 5
Medium/long-term debt (4) (4) 4 4 (5) (5) 5 5
Total (6) (6) 6 6 (10) (10) 10 10
Commodity price riskSaipem’s results are affected by changes in the prices of oil products (fueloil, lubricants, bunker oil, etc.) and raw materials, since they representassociated costs in the running of vessels, offices and yards and theimplementation of projects and investments.In order to reduce its commodity risk, in addition to adopting solutions ata commercial level, Saipem also trades over the counter derivatives (swapand bullet swaps in particular) whose underlying commodities are oilproducts (mainly gasoil and naphtha) through Eni Trading & Shipping(ETS) on the organised markets of ICE and NYMEX where the relevantphysical commodity market is well correlated to the financial market andis price efficient.As regards commodity price risk management, derivative instruments oncommodities are entered into by Saipem to hedge underlying contractualcommitments. Hedge transactions may also be entered into in relation tofuture underlying contractual commitments, provided these are highlyprobable.The fair value of such derivatives is determined by the TreasuryDepartment of Eni SpA on the basis of standard valuation models andmarket prices/input provided by specialised sources. With regard tocommodity risk hedging instruments, a 10% positive variation in the
underlying rates would have produced no effect on pre-tax profit, while itwould have had an effect on shareholders’ equity, before related taxeffects, of €2 million (€1 million at December 31, 2012). A 10% negativevariation in the underlying rates would have produced no effect on pre-tax profit, while it would have had an effect on shareholders’ equity,before related tax effects, of -€2 million (-€1 million at December 31,2012).The increase (decrease) with respect to the previous year is essentiallydue to the differences between the prices used in calculating the fairvalue of the instrument at the two reference dates.
CREDIT RISKCredit risk represents Saipem’s exposure to potential losses in the eventof non-performance by a counterparty. As regards counterparty risk incommercial contracts, credit management is the responsibility of thebusiness units and of specific corporate finance and administrationfunctions operating on the basis of standard business partner evaluationand credit worthiness procedures. For counterparty financial risk derivingfrom the investment of surplus liquidity, from positions in derivativecontracts and from physical commodities contracts with financialcounterparties, Group companies adopt guidelines defined by the
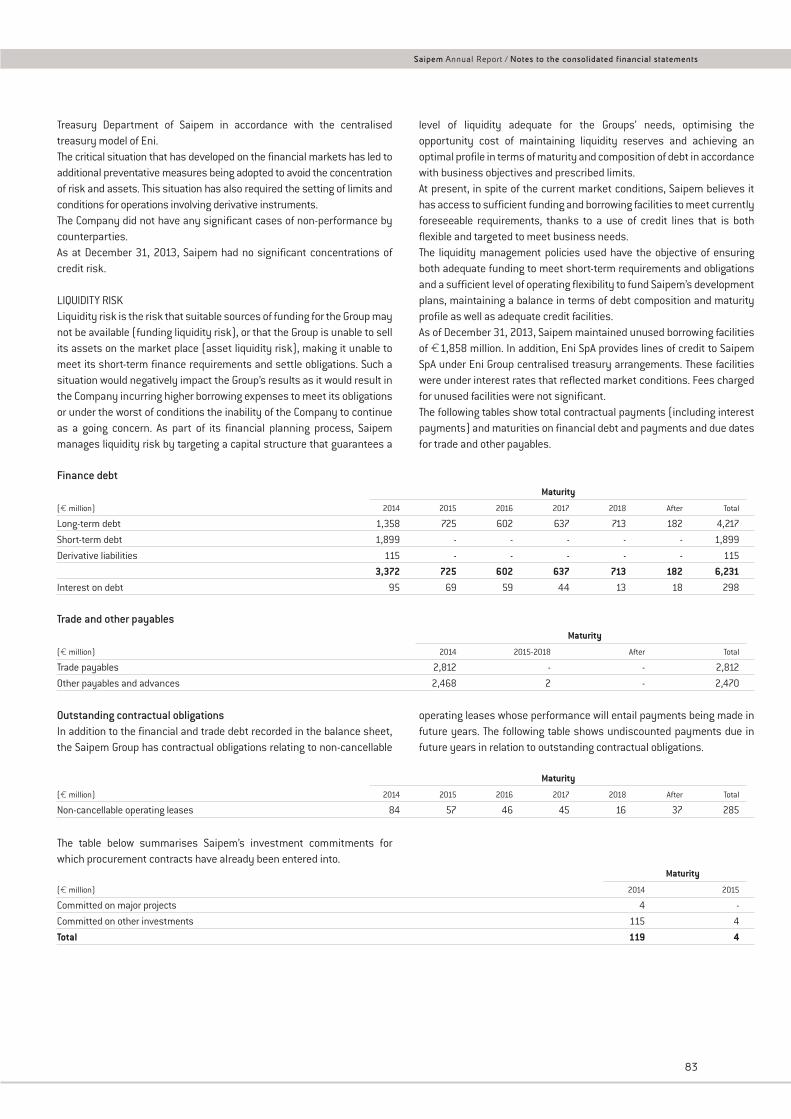
83
Saipem Annual Report / Notes to the consolidated financial statements
Treasury Department of Saipem in accordance with the centralisedtreasury model of Eni.The critical situation that has developed on the financial markets has led toadditional preventative measures being adopted to avoid the concentrationof risk and assets. This situation has also required the setting of limits andconditions for operations involving derivative instruments.The Company did not have any significant cases of non-performance bycounterparties.As at December 31, 2013, Saipem had no significant concentrations ofcredit risk.
LIQUIDITY RISKLiquidity risk is the risk that suitable sources of funding for the Group maynot be available (funding liquidity risk), or that the Group is unable to sellits assets on the market place (asset liquidity risk), making it unable tomeet its short-term finance requirements and settle obligations. Such asituation would negatively impact the Group’s results as it would result inthe Company incurring higher borrowing expenses to meet its obligationsor under the worst of conditions the inability of the Company to continueas a going concern. As part of its financial planning process, Saipemmanages liquidity risk by targeting a capital structure that guarantees a
level of liquidity adequate for the Groups’ needs, optimising theopportunity cost of maintaining liquidity reserves and achieving anoptimal profile in terms of maturity and composition of debt in accordancewith business objectives and prescribed limits.At present, in spite of the current market conditions, Saipem believes ithas access to sufficient funding and borrowing facilities to meet currentlyforeseeable requirements, thanks to a use of credit lines that is bothflexible and targeted to meet business needs.The liquidity management policies used have the objective of ensuringboth adequate funding to meet short-term requirements and obligationsand a sufficient level of operating flexibility to fund Saipem’s developmentplans, maintaining a balance in terms of debt composition and maturityprofile as well as adequate credit facilities.As of December 31, 2013, Saipem maintained unused borrowing facilitiesof €1,858 million. In addition, Eni SpA provides lines of credit to SaipemSpA under Eni Group centralised treasury arrangements. These facilitieswere under interest rates that reflected market conditions. Fees chargedfor unused facilities were not significant.The following tables show total contractual payments (including interestpayments) and maturities on financial debt and payments and due datesfor trade and other payables.
Finance debtMaturity
(€ million) 2014 2015 2016 2017 2018 After Total
Long-term debt 1,358 725 602 637 713 182 4,217
Short-term debt 1,899 - - - - - 1,899
Derivative liabilities 115 - - - - - 115
3,372 725 602 637 713 182 6,231Interest on debt 95 69 59 44 13 18 298
Trade and other payablesMaturity
(€ million) 2014 2015-2018 After Total
Trade payables 2,812 - - 2,812
Other payables and advances 2,468 2 - 2,470
The table below summarises Saipem’s investment commitments forwhich procurement contracts have already been entered into.
Outstanding contractual obligationsIn addition to the financial and trade debt recorded in the balance sheet,the Saipem Group has contractual obligations relating to non-cancellable
operating leases whose performance will entail payments being made infuture years. The following table shows undiscounted payments due infuture years in relation to outstanding contractual obligations.
Maturity
(€ million) 2014 2015 2016 2017 2018 After Total
Non-cancellable operating leases 84 57 46 45 16 37 285
Maturity
(€ million) 2014 2015
Committed on major projects 4 -
Committed on other investments 115 4
Total 119 4
84
Saipem Annual Report / Notes to the consolidated financial statements
Use of accounting estimates
The preparation of financial statements and interim reports in accordancewith generally accepted accounting standards requires management tomake accounting estimates based on complex or subjective judgements,past experience and assumptions deemed reasonable and realistic basedon the information available at the time. The use of these estimates andassumptions affects the reported amounts of assets and liabilities andthe disclosure of contingent assets and liabilities at the balance sheetdate and the reported amounts of income and expenses during thereporting period. Actual results may differ from these estimates given theuncertainty surrounding the assumptions and conditions upon which theestimates are based.Summarised below are those accounting estimates used in thepreparation of consolidated financial statements and interim reports thatare considered critical because they require management to make a largenumber of subjective judgements, assumptions and estimates regardingmatters that are inherently uncertain. Changes in the conditionsunderlying such judgements, assumptions and estimates may have asignificant effect on future results.
CONTRACT WORK IN PROGRESSContract work in progress for long-term contracts – for which estimatesnecessarily have a significant subjective component – are measured onthe basis of estimated revenues and costs over the full life of the contract.Contract work in progress includes extra revenues from additional worksfollowing modifications to the original contracts if their realisation isprobable and the amount can be reliably estimated.
IMPAIRMENT OF ASSETSImpairment losses are recognised if events and changes incircumstances indicate that the carrying amount of tangible andintangible assets may not be recoverable.Impairment is recognised in the event of significant permanent changesin the outlook for the market segment in which the asset is used.Determining as to whether and how much an asset is impaired involvesmanagement estimates on complex and highly uncertain factors, such asfuture market performances, the effects of inflation and technologicalimprovements on operating costs, and the outlook for global or regionalmarket supply and demand conditions.The amount of an impairment loss is determined by comparing thecarrying amount of an asset with its recoverable amount (the higher offair value less costs to sell and value in use calculated as the presentvalue of the future cash flows expected to be derived from the use of theasset net of disposal costs). The expected future cash flows used forimpairment reviews are based on judgemental assessments of futurevariables such as prices, costs, demand growth rate and productionvolumes, considering the information available at the date of the reviewand are discounted at a rate that reflects the risk inherent in the relevantactivity. Goodwill and other intangible assets with an indefinite useful lifeare not amortised. The recoverability of their carrying amount is reviewedat least annually and whenever events or changes in circumstancesindicate that the carrying amount may not be recoverable. Goodwill istested for impairment at cash-generating unit level, i.e. the smallestaggregate on which the company, directly or indirectly, evaluates the
return on the capital expenditure to which goodwill relates. If therecoverable amount of a cash generating unit is lower than the carryingamount, goodwill allocated to that cash generating unit is impaired up tothat difference; if the carrying amount of goodwill is less than the amountof impairment, the assets of the cash generating unit are impaired on apro-rata basis for the residual difference.
BUSINESS COMBINATIONSAccounting for business combinations requires the difference betweenthe purchase price and the net assets of an acquired business to beallocated to the various assets and liabilities of the acquired business.Most assets and liabilities are measured at fair value for the purpose ofallocation. Any positive difference that cannot be allocated is recognisedas goodwill. Negative residual differences are taken to the incomestatement. Management uses all available information to make these fairvalue determinations and, for the most significant businesscombinations, typically uses external evaluations.
CONTINGENCIESSaipem records provisions for contingencies primarily in relation toemployee benefits, litigation and tax issues. Determining appropriateamounts for provisions is a complex estimation process that includessubjective judgements.
PROVISIONS FOR EMPLOYEE BENEFITSPost-employment benefit plans arising from defined benefit plans areevaluated with reference to uncertain events and based upon actuarialassumptions including among others discount rates, expected rates ofsalary increases, mortality rates, retirement dates and medical costtrends.The significant assumptions used to account for such benefits aredetermined as follows: (i) discount and inflation rates reflect the rates atwhich the benefits could be effectively settled. Indicators used inselecting the discount rate include rates of return on high-qualitycorporate bonds or, where there is no deep market in such bonds, themarket yields on government bonds. The inflation rates reflect marketconditions observed country by country; (ii) the future salary levels ofindividual employees are determined including an estimate of futurechanges attributed to general price levels (consistent with inflation rateassumptions), productivity, seniority and promotion; (iii) medical costtrend assumptions reflect an estimate of the actual future changes in thecost of the healthcare related benefits provided to the plan participantsand are based on past and current medical cost trends includinghealthcare inflation, and changes in health status of the participants; and(iv) demographic assumptions such as mortality, disability and turnoverreflect the best estimate of these future events for the individualemployees involved, based principally on available actuarial data.Changes in the net defined benefit liability (asset) related toremeasurements routinely occur and comprise, among other things,changes in actuarial assumptions, experience adjustments (i.e. theeffects of differences between the previous actuarial assumptions andwhat has actually occurred) and the return on plan assets, excludingamounts included in net interest. Remeasurements of defined benefitplans are recognised in the statement of comprehensive income, whileremeasurements of long-term benefits are taken to profit or loss.
Recent accounting principles
Accounting standards and interpretations issued by IASB/IFRICand endorsed by the European UnionEuropean Commission Regulation No. 1254/2012 dated December 11,2012 approved IFRS 10 ‘Consolidated Financial Statements’ and theupdated version of IAS 27 ‘Separate Financial Statements’ which set downthe principles to be adopted for drafting the consolidated and separatefinancial statements, respectively. IFRS 10 establishes a single controlmodel that applies to all entities, including special purpose entities.According to the new definition, an investor controls an investee when itis exposed to, or has rights to, variable returns from its involvement withthe investee and has the ability to affect those returns through its powerover the investee. The standard indicates factors to consider whendetermining whether an investor has control over an investee, includingpotential rights, protective rights, and the existence of agency orfranchise relationships. The new version also recognises the possibilitythat an entity may hold control with less than a majority of voting rights asa consequence of the dispersion of holdings or the passive behaviour ofother investors. The provisions of IFRS 10 and of the new version of IAS 27are applicable for annual periods beginning on or after January 1, 2014.
European Commission Regulation No. 1254/2012 dated December 11,2012 approved IFRS 11 ‘Joint Arrangements’ and the updated version ofIAS 28 ‘Investments in Associates and Joint Ventures’. IFRS 11 establishestwo types of joint arrangement – joint operations and joint ventures – onthe basis of the rights and obligations of the joint venturers – anddetermines the appropriate accounting to be used for their recognition inthe financial statements. For interests in joint ventures, the new versionrequires the use of the equity method of accounting, thereby eliminatingthe option to apply the proportionate consolidation method. Participationin a joint operation implies recognition of the assets and liabilities and thecosts and revenues associated with the agreement on the basis of therights and obligations exercised regardless of the participating interestheld. The revised edition of IAS 28 defines the accounting treatment forthe sale of an investment, or portion of an investment, in an associate ora joint venture. The provisions of IFRS 11 and of the new version of IAS 28are applicable for annual periods beginning on or after January 1, 2014.
European Commission Regulation No. 1254/2012 dated December 11,2012 approved IFRS 12 ‘Disclosure of Interests in Other Entities’, whichsets out the disclosures required in relation to subsidiaries andassociated companies, joint operations and joint ventures, as well asunconsolidated structured entities. IFRS 12 provisions are applicable forannual periods beginning on or after January 1, 2014.
European Commission Regulation No. 313/2013 dated April 4, 2013approved the document: ‘Consolidated Financial Statements, JointArrangements and Disclosure of Interests in Other Entities: TransitionGuidance (Amendments to IFRS 10, IFRS 11 and IFRS 12)’, which clarifiesand simplifies the transition requirements in IFRS 10, IFRS 11 and IFRS 12.
The provisions are applicable for annual periods beginning on or afterJanuary 1, 201415.
European Commission Regulation No. 1256/2012 dated December 13,2012 approved the amendments to IAS 32 ‘Financial Instruments:Offsetting Financial Assets and Financial Liabilities’, which establish:(i) that financial assets and liabilities can only be offset when the entityhas a legally enforceable right to do so in all circumstances, i.e. both in thenormal course of business and in the event of insolvency, default orbankruptcy of one of the contracting parties; and (ii) that some grosssettlement systems can be considered equivalent to a net settlement ifthey include features that eliminate or result in insignificant credit andliquidity risk. IAS 32 amendments are applicable for annual periodsbeginning on or after January 1, 2014.
European Commission Regulation No. 1374/2013 dated December 19,2013 approved a number of amendments to IAS 36 ‘Recoverable AmountDisclosures for Non-Financial Assets (Amendments to IAS 36)’, whichestablishes additional disclosure requirements, namely: (i) disclosure ofthe recoverable amount of individual assets or cash-generating units forwhich an entity has recognised or reversed an impairment loss during thereporting period; and (ii) additional disclosures required in cases wherethe recoverable amount is based on fair value less costs of disposal. IAS36 amendments are applicable for annual periods beginning on or afterJanuary 1, 2014.
European Commission Regulation No. 1375/2013 dated December 19,2013 approved ‘Financial Instruments: ‘Novation of Derivatives andContinuation of Hedge Accounting’ (Amendments to IAS 39 ‘FinancialInstruments: Recognition and Measurement’). The amendmentestablishes that it is not necessary to discontinue hedge accounting asthe result of the novation of a hedging derivative which sees the originalcounterparty replaced by a central counterparty, provided that thisoccurs as a consequence of laws or regulations or the introduction of lawsor regulations. IAS 39 amendments are applicable for annual periodsbeginning on or after January 1, 2014.
Accounting standards and interpretations issued by IASB/IFRIC but not yet endorsed by the European UnionOn November 12, 2009, the IASB issued IFRS 9 ‘Financial Instruments’,which changes the recognition and measurement of financial assets andtheir classification in the financial statements. The new provisions require,inter alia, a classification and measurement model of financial assetsbased exclusively on the following categories: (i) financial assetsmeasured at amortised cost; and (ii) financial assets measured at fairvalue. The new provisions also require investments in equity instruments,other than subsidiaries, jointly controlled entities or associates, to bemeasured at fair value with value changes recognised in profit or loss. Ifthese investments are not held for trading purposes, subsequent changesin the fair value can be recognised in other comprehensive income, withonly dividend income recognised in profit or loss. Amounts taken to other
85
Saipem Annual Report / Notes to the consolidated financial statements
(15) In accordance with IFRS 10 and IFRS 11 transition requirements, the new provisions will be applied retrospectively beginning January 1, 2014. The opening values of the balance sheet at January 1, 2013 and theeconomic data for 2013 will be adjusted accordingly. As application of IFRS 11 will impact on the consolidation by the Saipem Group of most of its jointly-controlled entities, which will be classified as joint ventures and assuch be accounted for using the equity method rather than, as was previously the case, using the proportional method, application of the new provisions in the consolidated financial statements is estimated at the balancesheet date to lead to: (i) a decrease in net sales from operations of €413 million, together with an increase in operating profit and a simultaneous decrease in income from investments of €10 million in the 2013 incomestatement; (ii) a positive variation in net capital employed and a negative variation in net borrowings at January 1, 2013 of €81 million; and (iii) a positive variation in net capital employed and a negative variation in netborrowings at December 31, 2013 of €53 million. The application of the new provisions would also cause a non material variation in 2013 regarding ‘Transactions with related parties’.
comprehensive income shall not be subsequently transferred to profit orloss, even at disposal. On October 28, 2010, the IASB reissued IFRS 9 toincorporate classification and measurement criteria for financial liabilities.In particular, the new version of IFRS 9 requires changes in the fair value offinancial liabilities designated as at fair value through profit or loss arisingfrom the entity’s own credit risk to be presented in other comprehensiveincome. Such changes may however be recognised in profit or loss in orderto avoid an accounting mismatch with related assets. On November 19,2013, the IASB again reissued IFRS 9 to incorporate new hedge accountingrules which seek to ensure hedging transactions entered into are alignedwith entities’ risk management strategies and to establish a moreprinciples-based approach than was employed previously. The principalamendments regard: (i) hedge effectiveness, which is to be assessed onlyprospectively; (ii) the possibility to modify a hedging relationship after itsinitial designation, provided that the risk management objective remainsthe same (rebalancing); (iii) the possibility, provided certain conditionsare met, to designate risk components of non-financial items, net positionsor layer components as the hedged item; (iv) the possibility to designatean aggregated exposure (i.e. the combination of an eligible hedged itemand a derivative instrument) as a hedged item; and (v) accounting for thetime value component of an option or the forward element of a forwardcontract that has been excluded from the designated hedging relationship,depending on the characteristics of the hedged item. The amendmentsissued in November 2013 also removed the effective date of IFRS 9, whichwill now be defined once the standard has been finalised (previousrevisions referred to January 1, 2015).
On May 20, 2013, the IFRIC issued interpretation IFRIC 21 ‘Levies’(hereafter IFRIC 21), which defines the accounting treatment to be applied
86
Saipem Annual Report / Notes to the consolidated financial statements
for levies charged by public authorities (e.g. contributions to be paid forparticipation in a specific market) other than taxes, fines and penalties.IFRIC 21 sets out recognition criteria for this type of liability, identifyingthe obligating event for their recognition as the activity that triggers thepayment of the levy in accordance with the relevant legislation. IFRS 21provisions are applicable for annual periods beginning on or after January1, 2014.
On November 21, 2013, IASB issued ‘Defined Benefit Plans: EmployeeContributions (Amendments to IAS 19)’, which allows defined benefit plancontributions from employees or third parties to be recognised as areduction in the service cost in the period in which the related service isrendered, provided that the contributions: (i) are set out in the formalterms of the plan; (ii) are linked to service; and (iii) are independent of thenumber of years of service (e.g. a fixed percentage of the employee’ssalary, a fixed amount throughout the service period or contributions thatare dependent on the employee’s age). The amendments are applicablefor annual periods beginning on or after July 1, 2014 (for Saipem: 2015financial statements).
On December 12, 2013, the IASB published ‘Annual Improvements to IFRSs2010-2012 Cycle’ and ‘Annual Improvements to IFRSs 2011-2013 Cycle’,which essentially consist of changes of a technical and editorial nature toexisting standards. The changes are applicable for annual periodsbeginning on or after January 1, 2014 (for Saipem: 2015 financialstatements).
Saipem is currently reviewing these new standards to determine theirlikely impact on the Group’s results if adopted.
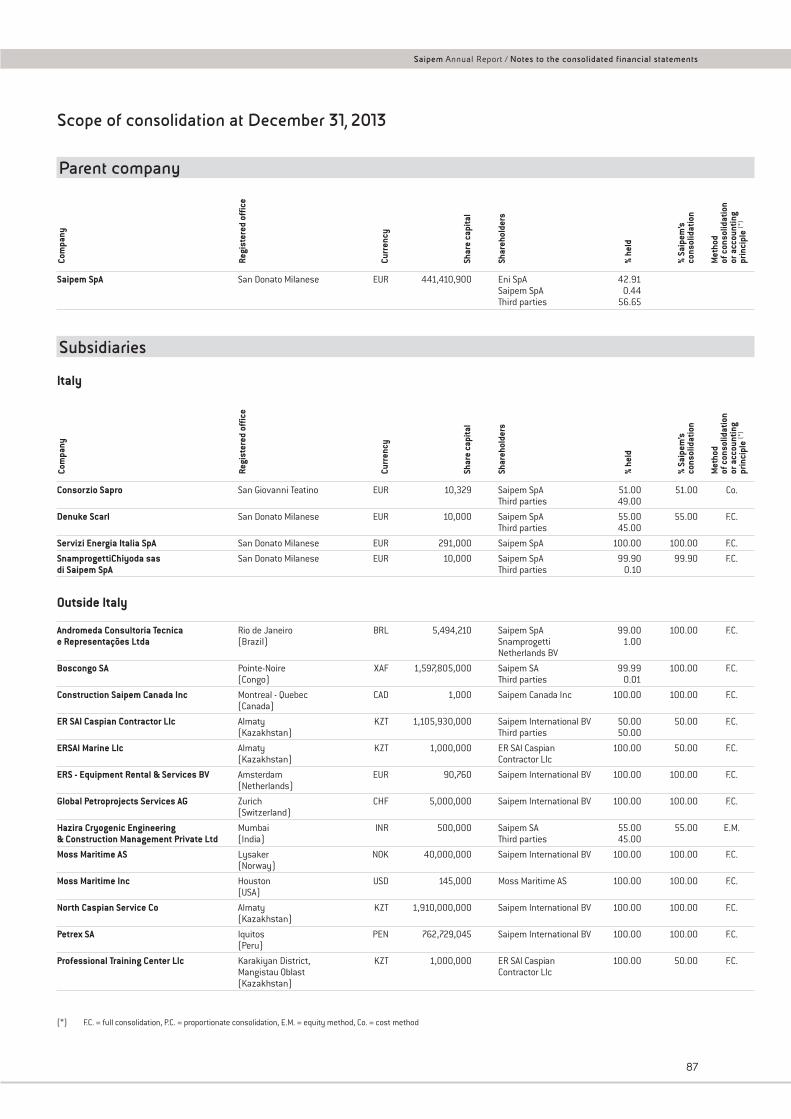
87
Saipem Annual Report / Notes to the consolidated financial statements
Scope of consolidation at December 31, 2013
Parent company
Saipem SpA San Donato Milanese EUR 441,410,900 Eni SpA 42.91Saipem SpA 0.44Third parties 56.65
Subsidiaries
Italy
Consorzio Sapro San Giovanni Teatino EUR 10,329 Saipem SpA 51.00 51.00 Co.Third parties 49.00
Denuke Scarl San Donato Milanese EUR 10,000 Saipem SpA 55.00 55.00 F.C.Third parties 45.00
Servizi Energia Italia SpA San Donato Milanese EUR 291,000 Saipem SpA 100.00 100.00 F.C.
SnamprogettiChiyoda sas San Donato Milanese EUR 10,000 Saipem SpA 99.90 99.90 F.C.di Saipem SpA Third parties 0.10
Outside Italy
Andromeda Consultoria Tecnica Rio de Janeiro BRL 5,494,210 Saipem SpA 99.00 100.00 F.C.e Representações Ltda (Brazil) Snamprogetti 1.00
Netherlands BV
Boscongo SA Pointe-Noire XAF 1,597,805,000 Saipem SA 99.99 100.00 F.C.(Congo) Third parties 0.01
Construction Saipem Canada Inc Montreal - Quebec CAD 1,000 Saipem Canada Inc 100.00 100.00 F.C.(Canada)
ER SAI Caspian Contractor Llc Almaty KZT 1,105,930,000 Saipem International BV 50.00 50.00 F.C.(Kazakhstan) Third parties 50.00
ERSAI Marine Llc Almaty KZT 1,000,000 ER SAI Caspian 100.00 50.00 F.C.(Kazakhstan) Contractor Llc
ERS - Equipment Rental & Services BV Amsterdam EUR 90,760 Saipem International BV 100.00 100.00 F.C.(Netherlands)
Global Petroprojects Services AG Zurich CHF 5,000,000 Saipem International BV 100.00 100.00 F.C.(Switzerland)
Hazira Cryogenic Engineering Mumbai INR 500,000 Saipem SA 55.00 55.00 E.M.& Construction Management Private Ltd (India) Third parties 45.00
Moss Maritime AS Lysaker NOK 40,000,000 Saipem International BV 100.00 100.00 F.C.(Norway)
Moss Maritime Inc Houston USD 145,000 Moss Maritime AS 100.00 100.00 F.C.(USA)
North Caspian Service Co Almaty KZT 1,910,000,000 Saipem International BV 100.00 100.00 F.C.(Kazakhstan)
Petrex SA Iquitos PEN 762,729,045 Saipem International BV 100.00 100.00 F.C.(Peru)
Professional Training Center Llc Karakiyan District, KZT 1,000,000 ER SAI Caspian 100.00 50.00 F.C.Mangistau Oblast Contractor Llc(Kazakhstan)
Com
pany
Regi
ster
ed o
ffic
e
Curr
ency
Shar
e ca
pita
l
Shar
ehol
ders
% he
ld
% Sa
ipem
’sco
nsol
idat
ion
Met
hod
of c
onso
lidat
ion
or a
ccou
ntin
gpr
inci
ple
(*)
Com
pany
Regi
ster
ed o
ffic
e
Curr
ency
Shar
e ca
pita
l
Shar
ehol
ders
% he
ld
% Sa
ipem
’sco
nsol
idat
ion
Met
hod
of c
onso
lidat
ion
or a
ccou
ntin
gpr
inci
ple
(*)
(*) F.C. = full consolidation, P.C. = proportionate consolidation, E.M. = equity method, Co. = cost method
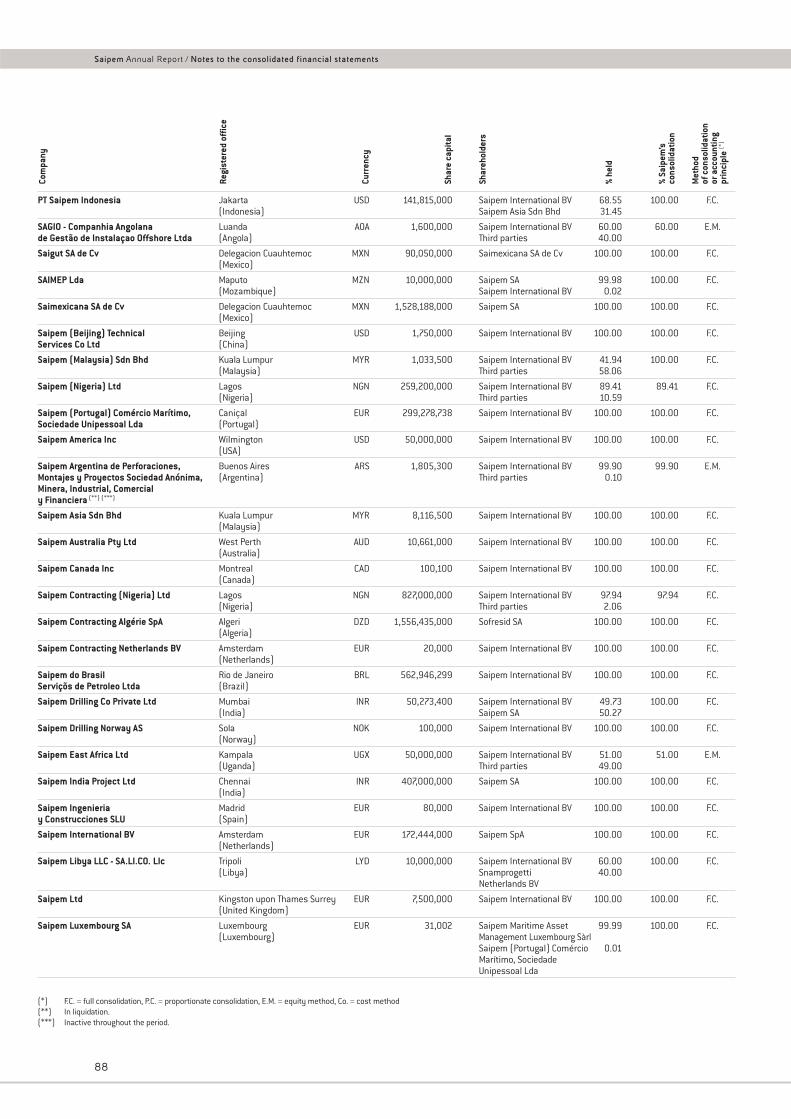
88
Saipem Annual Report / Notes to the consolidated financial statements
PT Saipem Indonesia Jakarta USD 141,815,000 Saipem International BV 68.55 100.00 F.C.(Indonesia) Saipem Asia Sdn Bhd 31.45
SAGIO - Companhia Angolana Luanda AOA 1,600,000 Saipem International BV 60.00 60.00 E.M.de Gestão de Instalaçao Offshore Ltda (Angola) Third parties 40.00
Saigut SA de Cv Delegacion Cuauhtemoc MXN 90,050,000 Saimexicana SA de Cv 100.00 100.00 F.C.(Mexico)
SAIMEP Lda Maputo MZN 10,000,000 Saipem SA 99.98 100.00 F.C.(Mozambique) Saipem International BV 0.02
Saimexicana SA de Cv Delegacion Cuauhtemoc MXN 1,528,188,000 Saipem SA 100.00 100.00 F.C.(Mexico)
Saipem (Beijing) Technical Beijing USD 1,750,000 Saipem International BV 100.00 100.00 F.C.Services Co Ltd (China)
Saipem (Malaysia) Sdn Bhd Kuala Lumpur MYR 1,033,500 Saipem International BV 41.94 100.00 F.C.(Malaysia) Third parties 58.06
Saipem (Nigeria) Ltd Lagos NGN 259,200,000 Saipem International BV 89.41 89.41 F.C.(Nigeria) Third parties 10.59
Saipem (Portugal) Comércio Marítimo, Caniçal EUR 299,278,738 Saipem International BV 100.00 100.00 F.C.Sociedade Unipessoal Lda (Portugal)
Saipem America Inc Wilmington USD 50,000,000 Saipem International BV 100.00 100.00 F.C.(USA)
Saipem Argentina de Perforaciones, Buenos Aires ARS 1,805,300 Saipem International BV 99.90 99.90 E.M.Montajes y Proyectos Sociedad Anónima, (Argentina) Third parties 0.10Minera, Industrial, Comercialy Financiera (**) (***)
Saipem Asia Sdn Bhd Kuala Lumpur MYR 8,116,500 Saipem International BV 100.00 100.00 F.C.(Malaysia)
Saipem Australia Pty Ltd West Perth AUD 10,661,000 Saipem International BV 100.00 100.00 F.C.(Australia)
Saipem Canada Inc Montreal CAD 100,100 Saipem International BV 100.00 100.00 F.C.(Canada)
Saipem Contracting (Nigeria) Ltd Lagos NGN 827,000,000 Saipem International BV 97.94 97.94 F.C.(Nigeria) Third parties 2.06
Saipem Contracting Algérie SpA Algeri DZD 1,556,435,000 Sofresid SA 100.00 100.00 F.C.(Algeria)
Saipem Contracting Netherlands BV Amsterdam EUR 20,000 Saipem International BV 100.00 100.00 F.C.(Netherlands)
Saipem do Brasil Rio de Janeiro BRL 562,946,299 Saipem International BV 100.00 100.00 F.C.Serviçõs de Petroleo Ltda (Brazil)
Saipem Drilling Co Private Ltd Mumbai INR 50,273,400 Saipem International BV 49.73 100.00 F.C.(India) Saipem SA 50.27
Saipem Drilling Norway AS Sola NOK 100,000 Saipem International BV 100.00 100.00 F.C.(Norway)
Saipem East Africa Ltd Kampala UGX 50,000,000 Saipem International BV 51.00 51.00 E.M.(Uganda) Third parties 49.00
Saipem India Project Ltd Chennai INR 407,000,000 Saipem SA 100.00 100.00 F.C.(India)
Saipem Ingenieria Madrid EUR 80,000 Saipem International BV 100.00 100.00 F.C.y Construcciones SLU (Spain)
Saipem International BV Amsterdam EUR 172,444,000 Saipem SpA 100.00 100.00 F.C.(Netherlands)
Saipem Libya LLC - SA.LI.CO. Llc Tripoli LYD 10,000,000 Saipem International BV 60.00 100.00 F.C.(Libya) Snamprogetti 40.00
Netherlands BV
Saipem Ltd Kingston upon Thames Surrey EUR 7,500,000 Saipem International BV 100.00 100.00 F.C.(United Kingdom)
Saipem Luxembourg SA Luxembourg EUR 31,002 Saipem Maritime Asset 99.99 100.00 F.C.(Luxembourg) Management Luxembourg Sàrl
Saipem (Portugal) Comércio 0.01Marítimo, SociedadeUnipessoal Lda
Com
pany
Regi
ster
ed o
ffic
e
Curr
ency
Shar
e ca
pita
l
Shar
ehol
ders
% he
ld
% Sa
ipem
’sco
nsol
idat
ion
Met
hod
of c
onso
lidat
ion
or a
ccou
ntin
gpr
inci
ple
(*)
(*) F.C. = full consolidation, P.C. = proportionate consolidation, E.M. = equity method, Co. = cost method(**) In liquidation.(***) Inactive throughout the period.
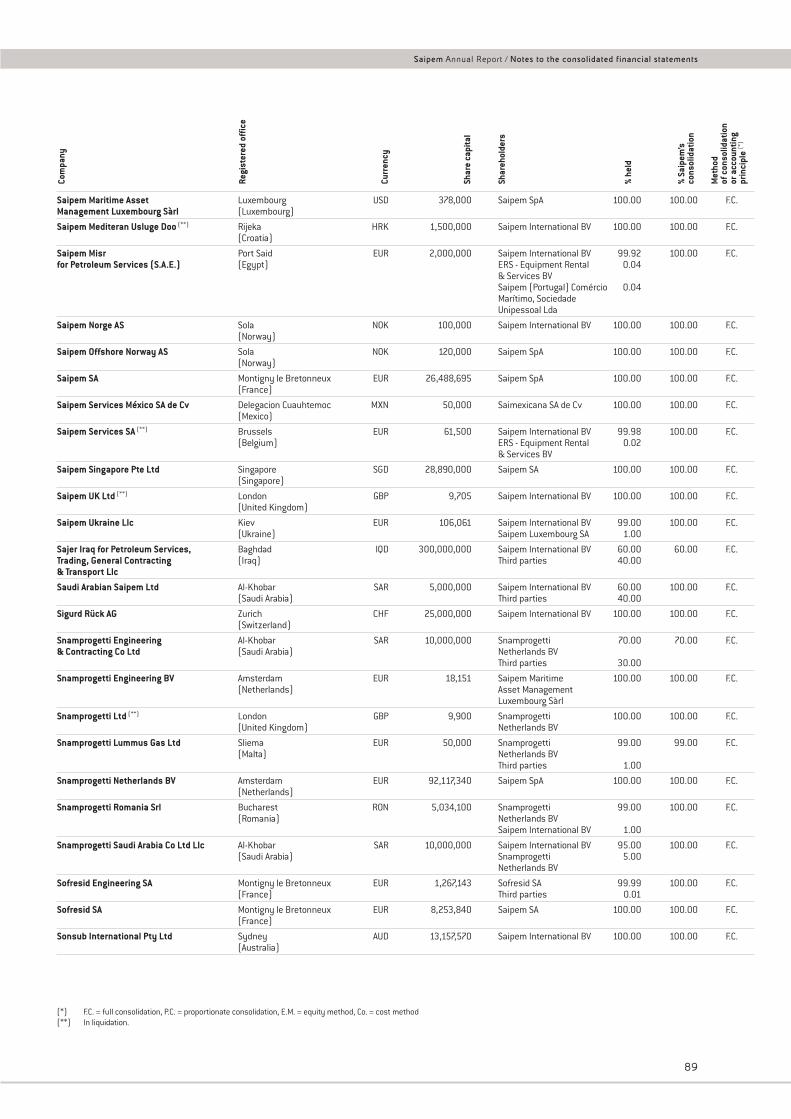
89
Saipem Annual Report / Notes to the consolidated financial statements
Saipem Maritime Asset Luxembourg USD 378,000 Saipem SpA 100.00 100.00 F.C.Management Luxembourg Sàrl (Luxembourg)
Saipem Mediteran Usluge Doo (**) Rijeka HRK 1,500,000 Saipem International BV 100.00 100.00 F.C.(Croatia)
Saipem Misr Port Said EUR 2,000,000 Saipem International BV 99.92 100.00 F.C.for Petroleum Services (S.A.E.) (Egypt) ERS - Equipment Rental 0.04
& Services BVSaipem (Portugal) Comércio 0.04Marítimo, SociedadeUnipessoal Lda
Saipem Norge AS Sola NOK 100,000 Saipem International BV 100.00 100.00 F.C.(Norway)
Saipem Offshore Norway AS Sola NOK 120,000 Saipem SpA 100.00 100.00 F.C.(Norway)
Saipem SA Montigny le Bretonneux EUR 26,488,695 Saipem SpA 100.00 100.00 F.C.(France)
Saipem Services México SA de Cv Delegacion Cuauhtemoc MXN 50,000 Saimexicana SA de Cv 100.00 100.00 F.C.(Mexico)
Saipem Services SA (**) Brussels EUR 61,500 Saipem International BV 99.98 100.00 F.C.(Belgium) ERS - Equipment Rental 0.02
& Services BV
Saipem Singapore Pte Ltd Singapore SGD 28,890,000 Saipem SA 100.00 100.00 F.C.(Singapore)
Saipem UK Ltd (**) London GBP 9,705 Saipem International BV 100.00 100.00 F.C.(United Kingdom)
Saipem Ukraine Llc Kiev EUR 106,061 Saipem International BV 99.00 100.00 F.C.(Ukraine) Saipem Luxembourg SA 1.00
Sajer Iraq for Petroleum Services, Baghdad IQD 300,000,000 Saipem International BV 60.00 60.00 F.C.Trading, General Contracting (Iraq) Third parties 40.00& Transport Llc
Saudi Arabian Saipem Ltd Al-Khobar SAR 5,000,000 Saipem International BV 60.00 100.00 F.C.(Saudi Arabia) Third parties 40.00
Sigurd Rück AG Zurich CHF 25,000,000 Saipem International BV 100.00 100.00 F.C.(Switzerland)
Snamprogetti Engineering Al-Khobar SAR 10,000,000 Snamprogetti 70.00 70.00 F.C.& Contracting Co Ltd (Saudi Arabia) Netherlands BV
Third parties 30.00
Snamprogetti Engineering BV Amsterdam EUR 18,151 Saipem Maritime 100.00 100.00 F.C.(Netherlands) Asset Management
Luxembourg Sàrl
Snamprogetti Ltd (**) London GBP 9,900 Snamprogetti 100.00 100.00 F.C.(United Kingdom) Netherlands BV
Snamprogetti Lummus Gas Ltd Sliema EUR 50,000 Snamprogetti 99.00 99.00 F.C.(Malta) Netherlands BV
Third parties 1.00
Snamprogetti Netherlands BV Amsterdam EUR 92,117,340 Saipem SpA 100.00 100.00 F.C.(Netherlands)
Snamprogetti Romania Srl Bucharest RON 5,034,100 Snamprogetti 99.00 100.00 F.C.(Romania) Netherlands BV
Saipem International BV 1.00
Snamprogetti Saudi Arabia Co Ltd Llc Al-Khobar SAR 10,000,000 Saipem International BV 95.00 100.00 F.C.(Saudi Arabia) Snamprogetti 5.00
Netherlands BV
Sofresid Engineering SA Montigny le Bretonneux EUR 1,267,143 Sofresid SA 99.99 100.00 F.C.(France) Third parties 0.01
Sofresid SA Montigny le Bretonneux EUR 8,253,840 Saipem SA 100.00 100.00 F.C.(France)
Sonsub International Pty Ltd Sydney AUD 13,157,570 Saipem International BV 100.00 100.00 F.C.(Australia)
Com
pany
Regi
ster
ed o
ffic
e
Curr
ency
Shar
e ca
pita
l
Shar
ehol
ders
% he
ld
% Sa
ipem
’sco
nsol
idat
ion
Met
hod
of c
onso
lidat
ion
or a
ccou
ntin
gpr
inci
ple
(*)
(*) F.C. = full consolidation, P.C. = proportionate consolidation, E.M. = equity method, Co. = cost method(**) In liquidation.
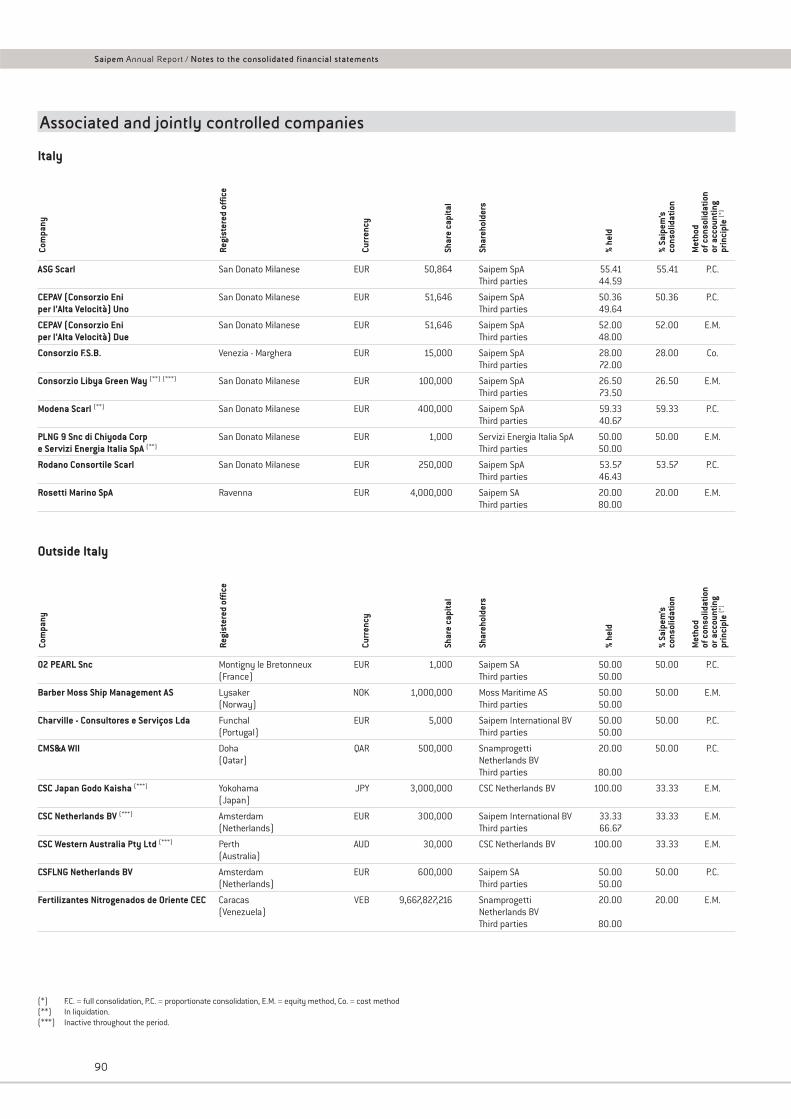
90
Saipem Annual Report / Notes to the consolidated financial statements
Associated and jointly controlled companies
Italy
ASG Scarl San Donato Milanese EUR 50,864 Saipem SpA 55.41 55.41 P.C.Third parties 44.59
CEPAV (Consorzio Eni San Donato Milanese EUR 51,646 Saipem SpA 50.36 50.36 P.C.per l’Alta Velocità) Uno Third parties 49.64
CEPAV (Consorzio Eni San Donato Milanese EUR 51,646 Saipem SpA 52.00 52.00 E.M.per l’Alta Velocità) Due Third parties 48.00
Consorzio F.S.B. Venezia - Marghera EUR 15,000 Saipem SpA 28.00 28.00 Co.Third parties 72.00
Consorzio Libya Green Way (**) (***) San Donato Milanese EUR 100,000 Saipem SpA 26.50 26.50 E.M.Third parties 73.50
Modena Scarl (**) San Donato Milanese EUR 400,000 Saipem SpA 59.33 59.33 P.C.Third parties 40.67
PLNG 9 Snc di Chiyoda Corp San Donato Milanese EUR 1,000 Servizi Energia Italia SpA 50.00 50.00 E.M.e Servizi Energia Italia SpA (**) Third parties 50.00
Rodano Consortile Scarl San Donato Milanese EUR 250,000 Saipem SpA 53.57 53.57 P.C.Third parties 46.43
Rosetti Marino SpA Ravenna EUR 4,000,000 Saipem SA 20.00 20.00 E.M.Third parties 80.00
Outside Italy
02 PEARL Snc Montigny le Bretonneux EUR 1,000 Saipem SA 50.00 50.00 P.C.(France) Third parties 50.00
Barber Moss Ship Management AS Lysaker NOK 1,000,000 Moss Maritime AS 50.00 50.00 E.M.(Norway) Third parties 50.00
Charville - Consultores e Serviços Lda Funchal EUR 5,000 Saipem International BV 50.00 50.00 P.C.(Portugal) Third parties 50.00
CMS&A Wll Doha QAR 500,000 Snamprogetti 20.00 50.00 P.C.(Qatar) Netherlands BV
Third parties 80.00
CSC Japan Godo Kaisha (***) Yokohama JPY 3,000,000 CSC Netherlands BV 100.00 33.33 E.M.(Japan)
CSC Netherlands BV (***) Amsterdam EUR 300,000 Saipem International BV 33.33 33.33 E.M.(Netherlands) Third parties 66.67
CSC Western Australia Pty Ltd (***) Perth AUD 30,000 CSC Netherlands BV 100.00 33.33 E.M.(Australia)
CSFLNG Netherlands BV Amsterdam EUR 600,000 Saipem SA 50.00 50.00 P.C.(Netherlands) Third parties 50.00
Fertilizantes Nitrogenados de Oriente CEC Caracas VEB 9,667,827,216 Snamprogetti 20.00 20.00 E.M.(Venezuela) Netherlands BV
Third parties 80.00
Com
pany
Regi
ster
ed o
ffic
e
Curr
ency
Shar
e ca
pita
l
Shar
ehol
ders
% he
ld
% Sa
ipem
’sco
nsol
idat
ion
Met
hod
of c
onso
lidat
ion
or a
ccou
ntin
gpr
inci
ple
(*)
Com
pany
Regi
ster
ed o
ffic
e
Curr
ency
Shar
e ca
pita
l
Shar
ehol
ders
% he
ld
% Sa
ipem
’sco
nsol
idat
ion
Met
hod
of c
onso
lidat
ion
or a
ccou
ntin
gpr
inci
ple
(*)
(*) F.C. = full consolidation, P.C. = proportionate consolidation, E.M. = equity method, Co. = cost method(**) In liquidation.(***) Inactive throughout the period.
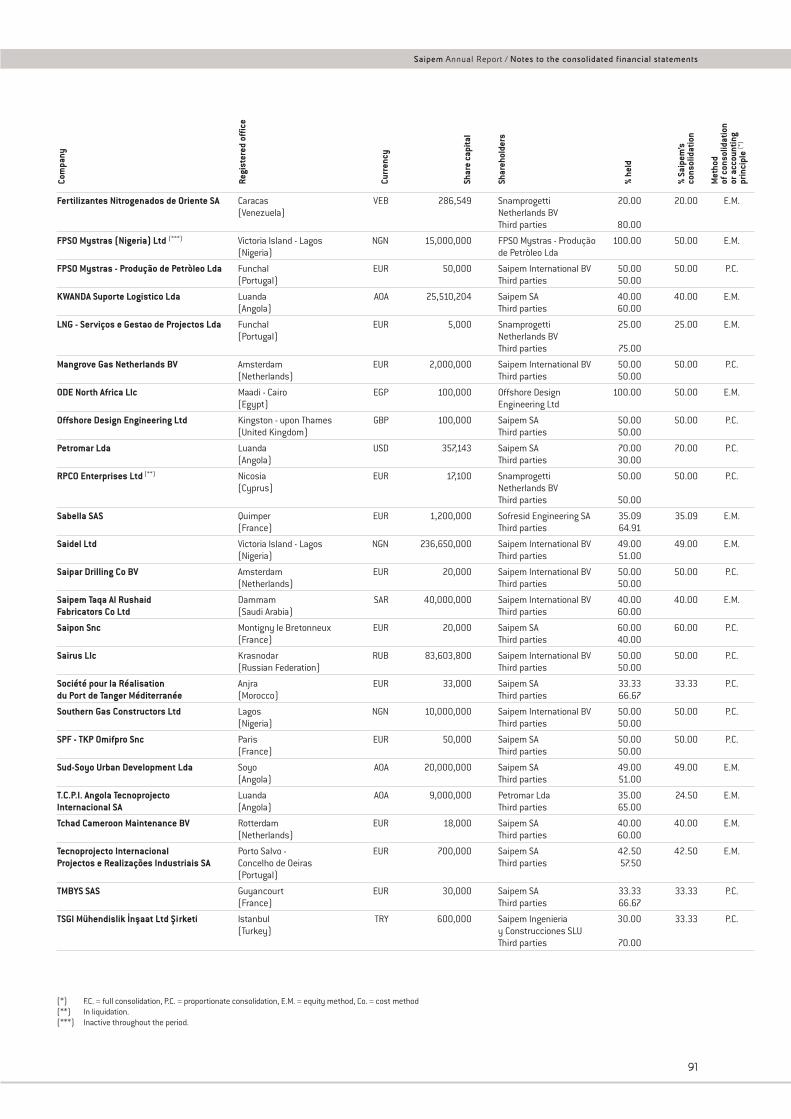
91
Saipem Annual Report / Notes to the consolidated financial statements
Fertilizantes Nitrogenados de Oriente SA Caracas VEB 286,549 Snamprogetti 20.00 20.00 E.M.(Venezuela) Netherlands BV
Third parties 80.00
FPSO Mystras (Nigeria) Ltd (***) Victoria Island - Lagos NGN 15,000,000 FPSO Mystras - Produção 100.00 50.00 E.M.(Nigeria) de Petròleo Lda
FPSO Mystras - Produção de Petròleo Lda Funchal EUR 50,000 Saipem International BV 50.00 50.00 P.C.(Portugal) Third parties 50.00
KWANDA Suporte Logistico Lda Luanda AOA 25,510,204 Saipem SA 40.00 40.00 E.M.(Angola) Third parties 60.00
LNG - Serviços e Gestao de Projectos Lda Funchal EUR 5,000 Snamprogetti 25.00 25.00 E.M.(Portugal) Netherlands BV
Third parties 75.00
Mangrove Gas Netherlands BV Amsterdam EUR 2,000,000 Saipem International BV 50.00 50.00 P.C.(Netherlands) Third parties 50.00
ODE North Africa Llc Maadi - Cairo EGP 100,000 Offshore Design 100.00 50.00 E.M.(Egypt) Engineering Ltd
Offshore Design Engineering Ltd Kingston - upon Thames GBP 100,000 Saipem SA 50.00 50.00 P.C.(United Kingdom) Third parties 50.00
Petromar Lda Luanda USD 357,143 Saipem SA 70.00 70.00 P.C.(Angola) Third parties 30.00
RPCO Enterprises Ltd (**) Nicosia EUR 17,100 Snamprogetti 50.00 50.00 P.C.(Cyprus) Netherlands BV
Third parties 50.00
Sabella SAS Quimper EUR 1,200,000 Sofresid Engineering SA 35.09 35.09 E.M.(France) Third parties 64.91
Saidel Ltd Victoria Island - Lagos NGN 236,650,000 Saipem International BV 49.00 49.00 E.M.(Nigeria) Third parties 51.00
Saipar Drilling Co BV Amsterdam EUR 20,000 Saipem International BV 50.00 50.00 P.C.(Netherlands) Third parties 50.00
Saipem Taqa Al Rushaid Dammam SAR 40,000,000 Saipem International BV 40.00 40.00 E.M.Fabricators Co Ltd (Saudi Arabia) Third parties 60.00
Saipon Snc Montigny le Bretonneux EUR 20,000 Saipem SA 60.00 60.00 P.C.(France) Third parties 40.00
Sairus Llc Krasnodar RUB 83,603,800 Saipem International BV 50.00 50.00 P.C.(Russian Federation) Third parties 50.00
Société pour la Réalisation Anjra EUR 33,000 Saipem SA 33.33 33.33 P.C.du Port de Tanger Méditerranée (Morocco) Third parties 66.67
Southern Gas Constructors Ltd Lagos NGN 10,000,000 Saipem International BV 50.00 50.00 P.C.(Nigeria) Third parties 50.00
SPF - TKP Omifpro Snc Paris EUR 50,000 Saipem SA 50.00 50.00 P.C.(France) Third parties 50.00
Sud-Soyo Urban Development Lda Soyo AOA 20,000,000 Saipem SA 49.00 49.00 E.M.(Angola) Third parties 51.00
T.C.P.I. Angola Tecnoprojecto Luanda AOA 9,000,000 Petromar Lda 35.00 24.50 E.M.Internacional SA (Angola) Third parties 65.00
Tchad Cameroon Maintenance BV Rotterdam EUR 18,000 Saipem SA 40.00 40.00 E.M.(Netherlands) Third parties 60.00
Tecnoprojecto Internacional Porto Salvo - EUR 700,000 Saipem SA 42.50 42.50 E.M.Projectos e Realizações Industriais SA Concelho de Oeiras Third parties 57.50
(Portugal)
TMBYS SAS Guyancourt EUR 30,000 Saipem SA 33.33 33.33 P.C.(France) Third parties 66.67
TSGI Mühendislik I·nsaat Ltd Sirketi Istanbul TRY 600,000 Saipem Ingenieria 30.00 33.33 P.C.(Turkey) y Construcciones SLU
Third parties 70.00
Com
pany
Regi
ster
ed o
ffic
e
Curr
ency
Shar
e ca
pita
l
Shar
ehol
ders
% he
ld
% Sa
ipem
’sco
nsol
idat
ion
Met
hod
of c
onso
lidat
ion
or a
ccou
ntin
gpr
inci
ple
(*)
(*) F.C. = full consolidation, P.C. = proportionate consolidation, E.M. = equity method, Co. = cost method(**) In liquidation.(***) Inactive throughout the period.
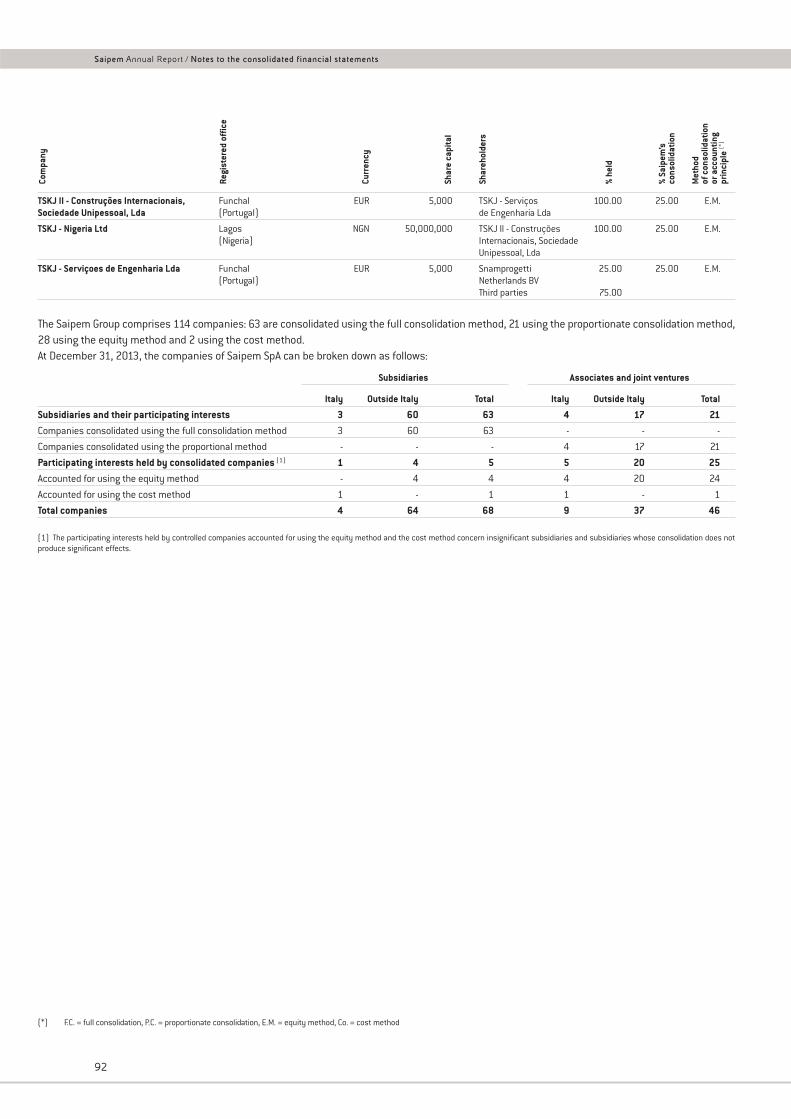
92
Saipem Annual Report / Notes to the consolidated financial statements
TSKJ II - Construções Internacionais, Funchal EUR 5,000 TSKJ - Serviços 100.00 25.00 E.M.Sociedade Unipessoal, Lda (Portugal) de Engenharia Lda
TSKJ - Nigeria Ltd Lagos NGN 50,000,000 TSKJ II - Construções 100.00 25.00 E.M.(Nigeria) Internacionais, Sociedade
Unipessoal, Lda
TSKJ - Serviçoes de Engenharia Lda Funchal EUR 5,000 Snamprogetti 25.00 25.00 E.M.(Portugal) Netherlands BV
Third parties 75.00
The Saipem Group comprises 114 companies: 63 are consolidated using the full consolidation method, 21 using the proportionate consolidation method,28 using the equity method and 2 using the cost method.At December 31, 2013, the companies of Saipem SpA can be broken down as follows:
Subsidiaries Associates and joint ventures
Italy Outside Italy Total Italy Outside Italy Total
Subsidiaries and their participating interests 3 60 63 4 17 21Companies consolidated using the full consolidation method 3 60 63 - - -
Companies consolidated using the proportional method - - - 4 17 21
Participating interests held by consolidated companies (1) 1 4 5 5 20 25Accounted for using the equity method - 4 4 4 20 24
Accounted for using the cost method 1 - 1 1 - 1
Total companies 4 64 68 9 37 46
(1) The participating interests held by controlled companies accounted for using the equity method and the cost method concern insignificant subsidiaries and subsidiaries whose consolidation does notproduce significant effects.
Com
pany
Regi
ster
ed o
ffic
e
Curr
ency
Shar
e ca
pita
l
Shar
ehol
ders
% he
ld
% Sa
ipem
’sco
nsol
idat
ion
Met
hod
of c
onso
lidat
ion
or a
ccou
ntin
gpr
inci
ple
(*)
(*) F.C. = full consolidation, P.C. = proportionate consolidation, E.M. = equity method, Co. = cost method
93
Changes in the scope of consolidation
Changes in the scope of consolidation with respect to the consolidatedfinancial statements at December 31, 2012, are detailed below in dateorder.
New incorporations, disposals, liquidations, mergers and changes to theconsolidation method:- Saipem Qatar Llc, previously accounted for using the equity method,
was removed from the Register of Companies;- Snamprogetti Engineering & Contracting Co Ltd, with registered
offices in Saudi Arabia, was incorporated and consolidated using the fullconsolidation method;
- SAIMEP Lda, with registered offices in Mozambique, was incorporatedand consolidated using the full consolidation method;
- CSC Western Australia Pty Ltd, with registered offices in Australia, wasincorporated and is accounted for using the equity method;
- CSC Japan Godo Kaisha, with registered offices in Japan, wasincorporated and is accounted for using the equity method;
- Bonny Project Management Co Ltd, previously accounted for using theequity method, was removed from the Register of Companies;
- Saipem Ingenieria y Construcciones, SLU, previously consolidatedusing the equity method, was consolidated using the full consolidationmethod;
- TSGI Mühendislik Insaat Ltd Sirketi, with registered offices in Turkey,was incorporated and consolidated using the proportionate method;
- Varisal - Serviços de Consultadoria e Marketing, Unipessoal Lda,previously consolidated using the full consolidation method, wasremoved from the Register of Companies;
- BOS Investment Ltd, previously accounted for using the cost method,was removed from the Register of Companies;
- BOS - UIE Ltd, previously accounted for using the cost method, wasremoved from the Register of Companies;
- Saibos Akogep Snc, consolidated using the proportionate method, wasplaced into liquidation and subsequently removed from the Register ofCompanies;
- Servicios de Construcciones Caucedo SA, previously accounted forusing the equity method, was removed from the Register of Companies;
- following a capital increase, ownership of Sabella SAS is as follows:35.09% by Sofresid Engineering SA and 64.91% by third parties;
- Consorzio Libya Green Way, accounted for using the equity method,was placed into liquidation;
- Milano-Brescia-Verona Scarl, previously accounted for using theequity method, was removed from the Register of Companies;
- CSFLNG Netherlands BV, with registered offices in Amsterdam, wasincorporated and consolidated using the proportionate method;
- PLNG 9 Snc di Chiyoda Corp e Servizi Energia Italia SpA, accounted forusing the equity method, was placed into liquidation;
- Dalia Floater Angola Snc, consolidated using the proportionate method,was placed into liquidation and subsequently removed from theRegister of Companies;
- Floaters SpA, with registered offices in San Donato Milanese, wasincorporated and accounted for using the cost method, andsubsequently sold to Eni;
- Saipem Services SA, consolidated using the full consolidation method,was placed into liquidation.
Changes of company names or transfers of holdings between Groupcompanies not affecting the scope of consolidation:- Snamprogetti Canada Inc, fully consolidated, changed name to Saipem
Canada Inc.
Saipem Annual Report / Notes to the consolidated financial statements
94
Restatement of financial statements at December 31, 2012
Restatement due to changes in the requirements of IAS 19European Commission Regulation No. 475/2012 dated June 5, 2012 approved the new version of IAS 19 ‘Employee benefits’ which, amongst other things,introduces: (i) the requirement to immediately recognise all actuarial gains and losses through other comprehensive income, thereby eliminating theoption to apply the corridor method. The actuarial gains and losses recognised in the statement of comprehensive income are not subsequently taken tothe income statement; and (ii) recognition of the ‘net interest’ amount, consisting of interest income on plan assets and interest costs on the definedbenefit obligation, in profit or loss. The ‘net interest’ is determined by applying the discount rate for liabilities to liabilities net of plan assets. ‘Net interest’on defined benefit plans is recognised in ‘Finance income (expenses)’. The new IAS 19 requirements are applied retrospectively to the opening values of the balance sheet at January 1, 2012 and the economic data for 2012.Their application, gross and net of tax, produced the following effects on the consolidated financial statements: (i) a reduction of shareholders’ equity atJanuary 1, 2012 of €20 million and €16 million; and (ii) a reduction in shareholders’ equity at December 31, 2012 of €38 million and €28 million, ofwhich €19 million and €13 million for 2012 actuarial gains and losses recognised in other items of comprehensive income. The effect on the 2012 netresult was immaterial, amounting to €2 million. In addition, the recognition of the ‘net interest’ on defined benefit plans under ‘Finance income(expenses)’ rather than as payroll costs, as was previously the case, caused a positive variation in 2012 operating profit of €9 million.
Consob proceedings 1612/2013 On January 29, 2013, Saipem SpA issued a press release announcing a new estimate of earnings for the full year 2012 and issued an earnings guidancefor 2013. In connection with that press release, on January 31, 2013 Saipem received a communication from Consob, the Italian market authority, askingthe Company to describe the process of evaluation and the considerations that led to the decision to issue such a press release and to report to Consobthe information and data used to revise the previous earning guidance.On June 14, 2013, Saipem SpA issued a press release further revising its guidance for 2013 operating profit and net profit, Consob sent a new request forinformation on June 19, 2013, regarding: (i) Saipem’s contractual relationships with the customer Sonatrach starting from January 2013; (ii) the contractsfor which the expected margins have been revised downwards and the relevant reasons. On July 1, 2013, Saipem responded to the above requests. OnJuly 19, 2013, Consob communicated to Saipem the commencement of a proceeding to review potential issues of non-compliance of Saipem’s 2012separate and consolidated financial statements with the accounting standard IAS 11 (Construction contracts). According to Consob’s communication,Saipem should have recognised in the 2012 financial statements the estimate revisions relating to certain contracts which were in progress at December31, 2012. These estimate revisions were included in the profit warning issued on June 14, 2013 and recognised in the accounts of the first half of 2013.Furthermore, Consob alleged that an increase of costs/losses related to 2012 should have been recorded in the 2012 financial statements, which Saipemdid not recognise in either its 2012 financial statements or in its 2013 interim financial statements.In the report on the third quarter of 2013, Saipem announced that it would recognise errors in the separate and consolidated financial statements as ofDecember 31, 2013, in accordance with IAS 8, paragraph 42. Therefore, in the 2013 annual report, the comparative financial statements for 2012 wererestated to recognise €245 million of lower contract revenues relating to the projects whose accounting was questioned by Consob.On December 5, 2013, Consob, after obtaining additional clarifications and information from Saipem, informed Saipem that it would dismiss theproceeding without requesting Saipem to disclose further accounting information or further challenging the 2012 accounts.On March 14, 2014, the Saipem Board of Directors approved the separate and consolidated financial statements for 2013, which were prepared inaccordance with the announcement made in the report on the third quarter of 2013. Specifically, the adjustment made to the 2012 accounts, which werepresented as comparative information in the 2013 financial statements, determined a reduction of €245 million in the 2012 net profit and in the netequity as of December 31, 2012, without any tax effect, therefore determining a corresponding increase in the 2013 full year result.
Saipem Annual Report / Notes to the consolidated financial statements
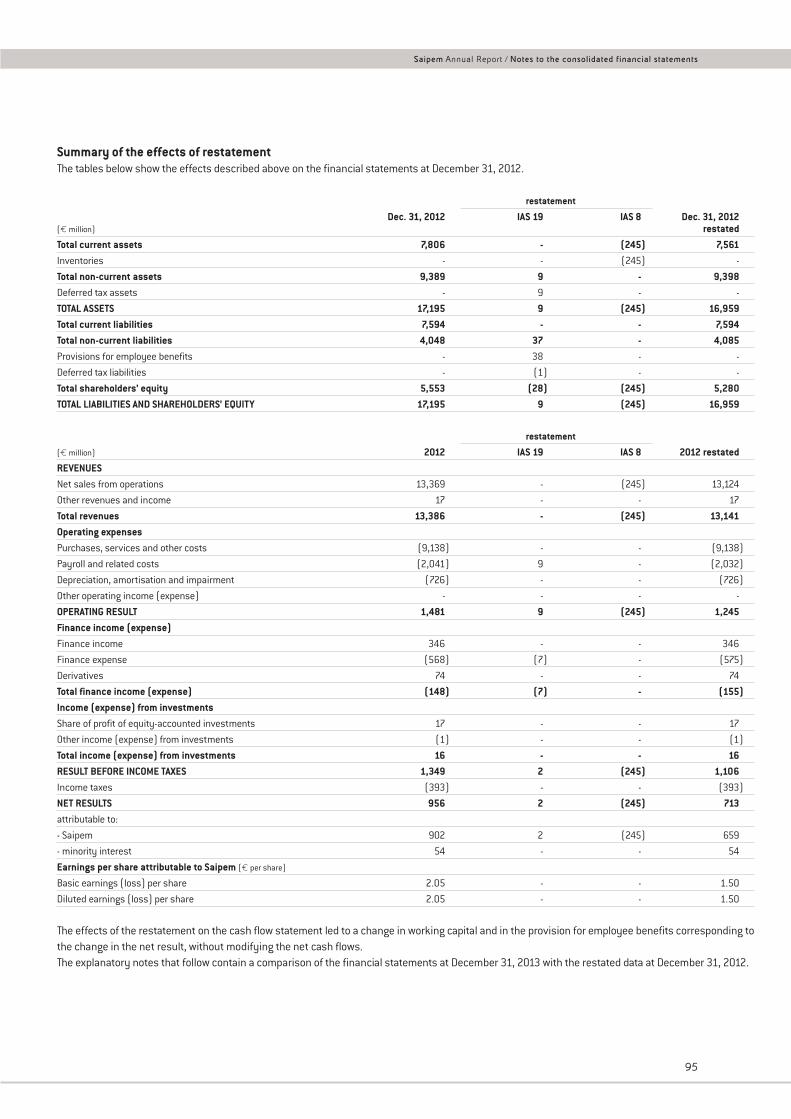
Summary of the effects of restatementThe tables below show the effects described above on the financial statements at December 31, 2012.
restatement
Dec. 31, 2012 IAS 19 IAS 8 Dec. 31, 2012(€ million) restatedTotal current assets 7,806 - (245) 7,561Inventories - - (245) -
Total non-current assets 9,389 9 - 9,398Deferred tax assets - 9 - -
TOTAL ASSETS 17,195 9 (245) 16,959Total current liabilities 7,594 - - 7,594Total non-current liabilities 4,048 37 - 4,085Provisions for employee benefits - 38 - -
Deferred tax liabilities - (1) - -
Total shareholders’ equity 5,553 (28) (245) 5,280TOTAL LIABILITIES AND SHAREHOLDERS’ EQUITY 17,195 9 (245) 16,959
restatement
(€ million) 2012 IAS 19 IAS 8 2012 restatedREVENUESNet sales from operations 13,369 - (245) 13,124
Other revenues and income 17 - - 17
Total revenues 13,386 - (245) 13,141 Operating expensesPurchases, services and other costs (9,138) - - (9,138)
Payroll and related costs (2,041) 9 - (2,032)
Depreciation, amortisation and impairment (726) - - (726)
Other operating income (expense) - - - -
OPERATING RESULT 1,481 9 (245) 1,245Finance income (expense)Finance income 346 - - 346
Finance expense (568) (7) - (575)
Derivatives 74 - - 74
Total finance income (expense) (148) (7) - (155)Income (expense) from investmentsShare of profit of equity-accounted investments 17 - - 17
Other income (expense) from investments (1) - - (1)
Total income (expense) from investments 16 - - 16RESULT BEFORE INCOME TAXES 1,349 2 (245) 1,106 Income taxes (393) - - (393)
NET RESULTS 956 2 (245) 713attributable to:
- Saipem 902 2 (245) 659
- minority interest 54 - - 54
Earnings per share attributable to Saipem (€ per share)
Basic earnings (loss) per share 2.05 - - 1.50
Diluted earnings (loss) per share 2.05 - - 1.50
The effects of the restatement on the cash flow statement led to a change in working capital and in the provision for employee benefits corresponding tothe change in the net result, without modifying the net cash flows. The explanatory notes that follow contain a comparison of the financial statements at December 31, 2013 with the restated data at December 31, 2012.
95
Saipem Annual Report / Notes to the consolidated financial statements
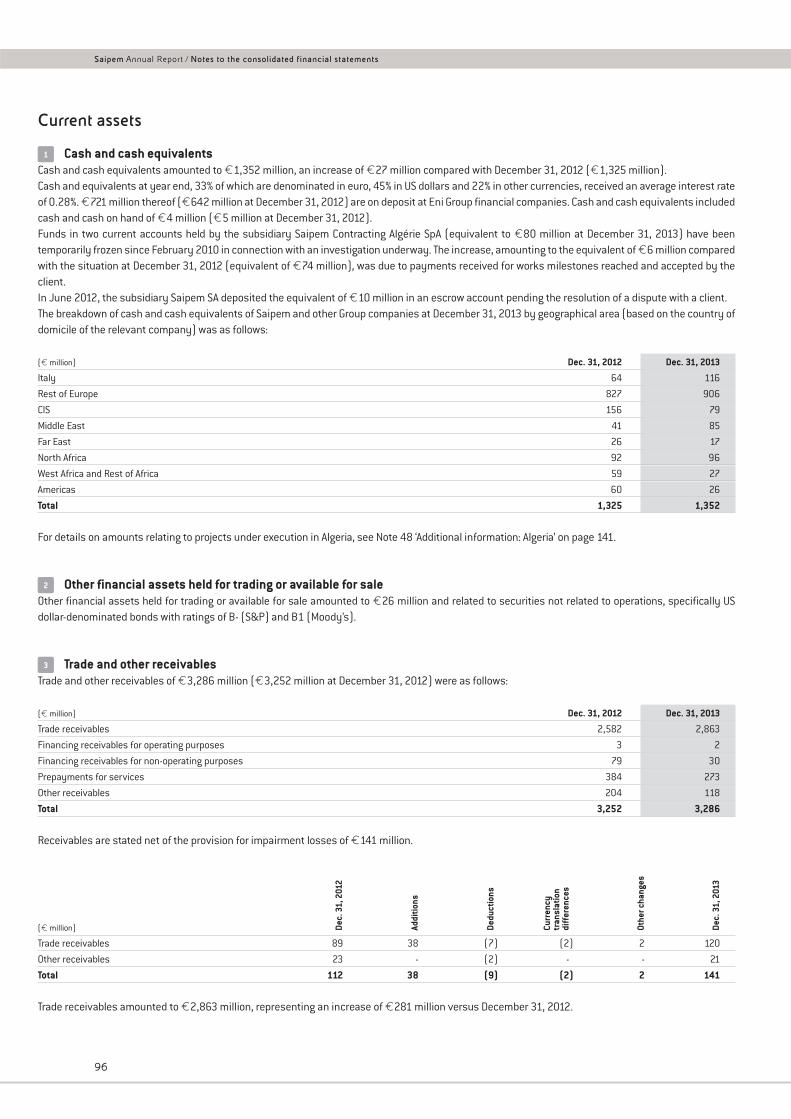
Current assets
Cash and cash equivalentsCash and cash equivalents amounted to €1,352 million, an increase of €27 million compared with December 31, 2012 (€1,325 million).Cash and equivalents at year end, 33% of which are denominated in euro, 45% in US dollars and 22% in other currencies, received an average interest rateof 0.28%. €721 million thereof (€642 million at December 31, 2012) are on deposit at Eni Group financial companies. Cash and cash equivalents includedcash and cash on hand of €4 million (€5 million at December 31, 2012).Funds in two current accounts held by the subsidiary Saipem Contracting Algérie SpA (equivalent to €80 million at December 31, 2013) have beentemporarily frozen since February 2010 in connection with an investigation underway. The increase, amounting to the equivalent of €6 million comparedwith the situation at December 31, 2012 (equivalent of €74 million), was due to payments received for works milestones reached and accepted by theclient.In June 2012, the subsidiary Saipem SA deposited the equivalent of €10 million in an escrow account pending the resolution of a dispute with a client.The breakdown of cash and cash equivalents of Saipem and other Group companies at December 31, 2013 by geographical area (based on the country ofdomicile of the relevant company) was as follows:
(€ million) Dec. 31, 2012 Dec. 31, 2013
Italy 64 116
Rest of Europe 827 906
CIS 156 79
Middle East 41 85
Far East 26 17
North Africa 92 96
West Africa and Rest of Africa 59 27
Americas 60 26
Total 1,325 1,352
For details on amounts relating to projects under execution in Algeria, see Note 48 ‘Additional information: Algeria’ on page 141.
Other financial assets held for trading or available for saleOther financial assets held for trading or available for sale amounted to €26 million and related to securities not related to operations, specifically USdollar-denominated bonds with ratings of B- (S&P) and B1 (Moody’s).
Trade and other receivablesTrade and other receivables of €3,286 million (€3,252 million at December 31, 2012) were as follows:
(€ million) Dec. 31, 2012 Dec. 31, 2013
Trade receivables 2,582 2,863
Financing receivables for operating purposes 3 2
Financing receivables for non-operating purposes 79 30
Prepayments for services 384 273
Other receivables 204 118
Total 3,252 3,286
Receivables are stated net of the provision for impairment losses of €141 million.
(€ million)
Trade receivables 89 38 (7) (2) 2 120
Other receivables 23 - (2) - - 21
Total 112 38 (9) (2) 2 141
Trade receivables amounted to €2,863 million, representing an increase of €281 million versus December 31, 2012.
Dec.
31,
201
2
Addi
tions
Dedu
ctio
ns
Curr
ency
tran
slat
ion
diff
eren
ces
Othe
r cha
nges
Dec.
31,
201
3
3
2
1
96
Saipem Annual Report / Notes to the consolidated financial statements
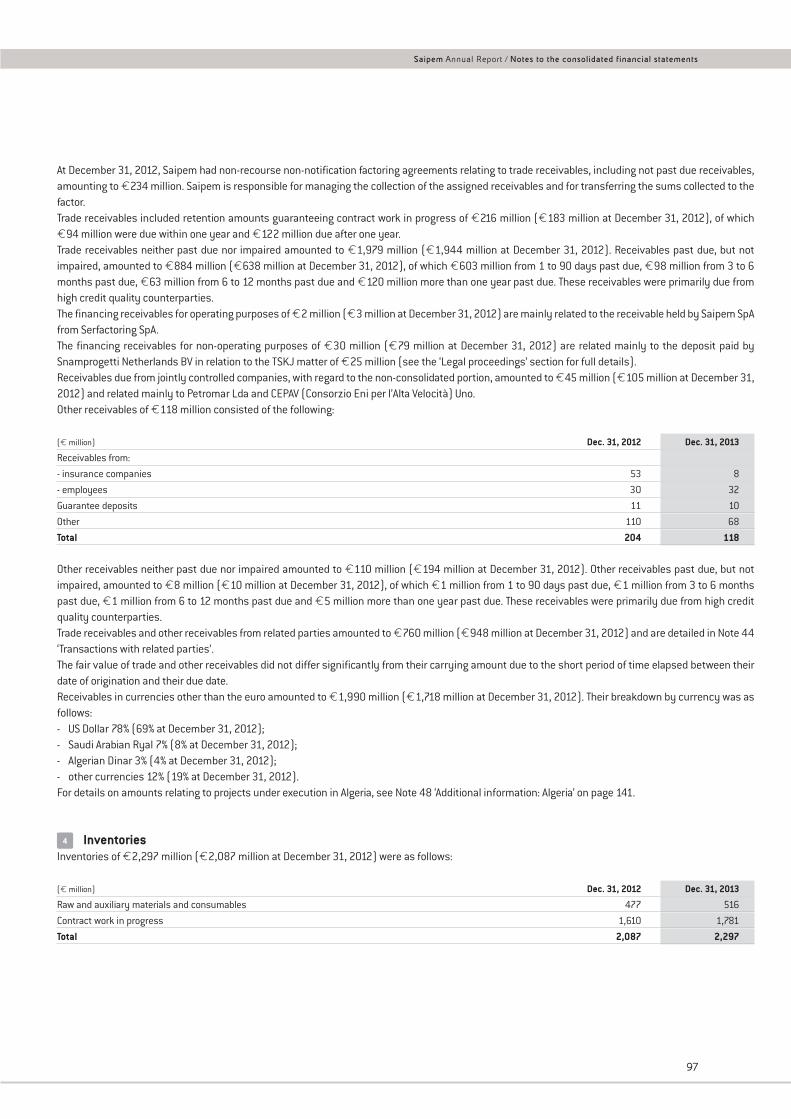
At December 31, 2012, Saipem had non-recourse non-notification factoring agreements relating to trade receivables, including not past due receivables,amounting to €234 million. Saipem is responsible for managing the collection of the assigned receivables and for transferring the sums collected to thefactor.Trade receivables included retention amounts guaranteeing contract work in progress of €216 million (€183 million at December 31, 2012), of which€94 million were due within one year and €122 million due after one year.Trade receivables neither past due nor impaired amounted to €1,979 million (€1,944 million at December 31, 2012). Receivables past due, but notimpaired, amounted to €884 million (€638 million at December 31, 2012), of which €603 million from 1 to 90 days past due, €98 million from 3 to 6months past due, €63 million from 6 to 12 months past due and €120 million more than one year past due. These receivables were primarily due fromhigh credit quality counterparties.The financing receivables for operating purposes of €2 million (€3 million at December 31, 2012) are mainly related to the receivable held by Saipem SpAfrom Serfactoring SpA.The financing receivables for non-operating purposes of €30 million (€79 million at December 31, 2012) are related mainly to the deposit paid bySnamprogetti Netherlands BV in relation to the TSKJ matter of €25 million (see the ‘Legal proceedings’ section for full details).Receivables due from jointly controlled companies, with regard to the non-consolidated portion, amounted to €45 million (€105 million at December 31,2012) and related mainly to Petromar Lda and CEPAV (Consorzio Eni per l’Alta Velocità) Uno.Other receivables of €118 million consisted of the following:
(€ million) Dec. 31, 2012 Dec. 31, 2013
Receivables from:
- insurance companies 53 8
- employees 30 32
Guarantee deposits 11 10
Other 110 68
Total 204 118
Other receivables neither past due nor impaired amounted to €110 million (€194 million at December 31, 2012). Other receivables past due, but notimpaired, amounted to €8 million (€10 million at December 31, 2012), of which €1 million from 1 to 90 days past due, €1 million from 3 to 6 monthspast due, €1 million from 6 to 12 months past due and €5 million more than one year past due. These receivables were primarily due from high creditquality counterparties.Trade receivables and other receivables from related parties amounted to €760 million (€948 million at December 31, 2012) and are detailed in Note 44‘Transactions with related parties’.The fair value of trade and other receivables did not differ significantly from their carrying amount due to the short period of time elapsed between theirdate of origination and their due date.Receivables in currencies other than the euro amounted to €1,990 million (€1,718 million at December 31, 2012). Their breakdown by currency was asfollows:- US Dollar 78% (69% at December 31, 2012);- Saudi Arabian Ryal 7% (8% at December 31, 2012);- Algerian Dinar 3% (4% at December 31, 2012);- other currencies 12% (19% at December 31, 2012).For details on amounts relating to projects under execution in Algeria, see Note 48 ‘Additional information: Algeria’ on page 141.
InventoriesInventories of €2,297 million (€2,087 million at December 31, 2012) were as follows:
(€ million) Dec. 31, 2012 Dec. 31, 2013
Raw and auxiliary materials and consumables 477 516
Contract work in progress 1,610 1,781
Total 2,087 2,297
4
97
Saipem Annual Report / Notes to the consolidated financial statements
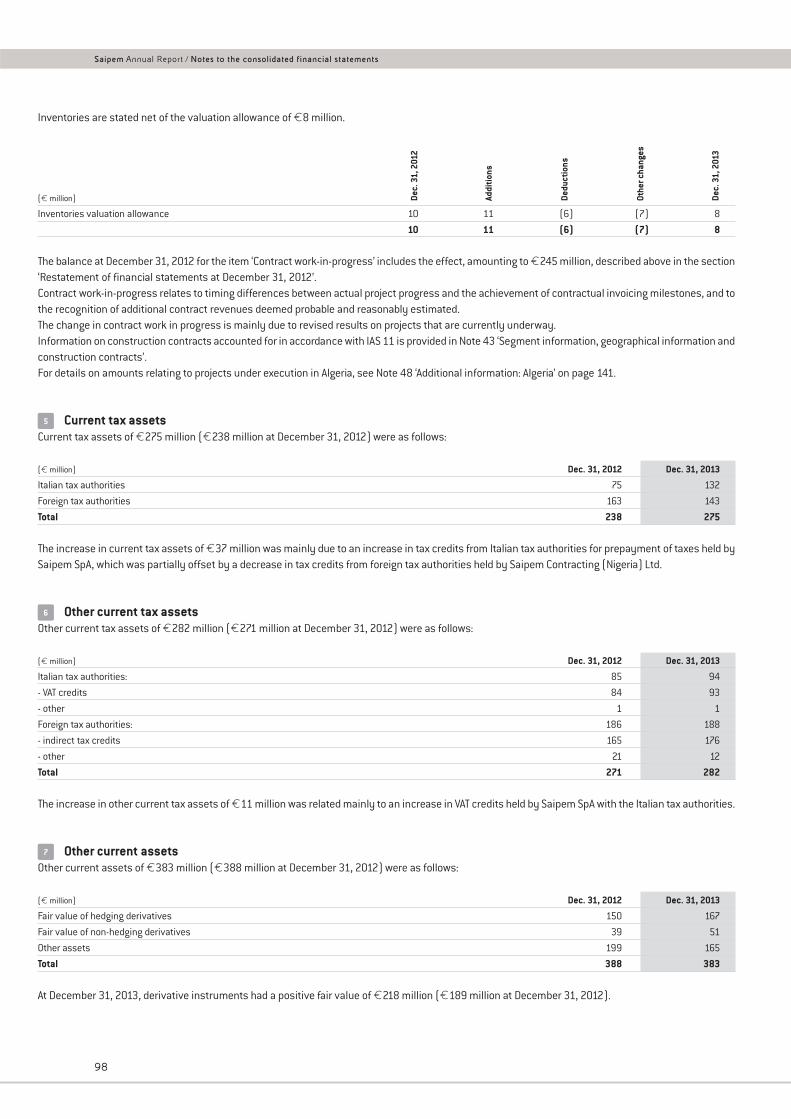
Inventories are stated net of the valuation allowance of €8 million.
(€ million)
Inventories valuation allowance 10 11 (6) (7) 8
10 11 (6) (7) 8
The balance at December 31, 2012 for the item ‘Contract work-in-progress’ includes the effect, amounting to €245 million, described above in the section‘Restatement of financial statements at December 31, 2012’.Contract work-in-progress relates to timing differences between actual project progress and the achievement of contractual invoicing milestones, and tothe recognition of additional contract revenues deemed probable and reasonably estimated.The change in contract work in progress is mainly due to revised results on projects that are currently underway.Information on construction contracts accounted for in accordance with IAS 11 is provided in Note 43 ‘Segment information, geographical information andconstruction contracts’.For details on amounts relating to projects under execution in Algeria, see Note 48 ‘Additional information: Algeria’ on page 141.
Current tax assetsCurrent tax assets of €275 million (€238 million at December 31, 2012) were as follows:
(€ million) Dec. 31, 2012 Dec. 31, 2013
Italian tax authorities 75 132
Foreign tax authorities 163 143
Total 238 275
The increase in current tax assets of €37 million was mainly due to an increase in tax credits from Italian tax authorities for prepayment of taxes held bySaipem SpA, which was partially offset by a decrease in tax credits from foreign tax authorities held by Saipem Contracting (Nigeria) Ltd.
Other current tax assetsOther current tax assets of €282 million (€271 million at December 31, 2012) were as follows:
(€ million) Dec. 31, 2012 Dec. 31, 2013
Italian tax authorities: 85 94
- VAT credits 84 93
- other 1 1
Foreign tax authorities: 186 188
- indirect tax credits 165 176
- other 21 12
Total 271 282
The increase in other current tax assets of €11 million was related mainly to an increase in VAT credits held by Saipem SpA with the Italian tax authorities.
Other current assetsOther current assets of €383 million (€388 million at December 31, 2012) were as follows:
(€ million) Dec. 31, 2012 Dec. 31, 2013
Fair value of hedging derivatives 150 167
Fair value of non-hedging derivatives 39 51
Other assets 199 165
Total 388 383
At December 31, 2013, derivative instruments had a positive fair value of €218 million (€189 million at December 31, 2012).
7
6
5De
c. 3
1, 2
012
Addi
tions
Dedu
ctio
ns
Othe
r cha
nges
Dec.
31,
201
3
98
Saipem Annual Report / Notes to the consolidated financial statements
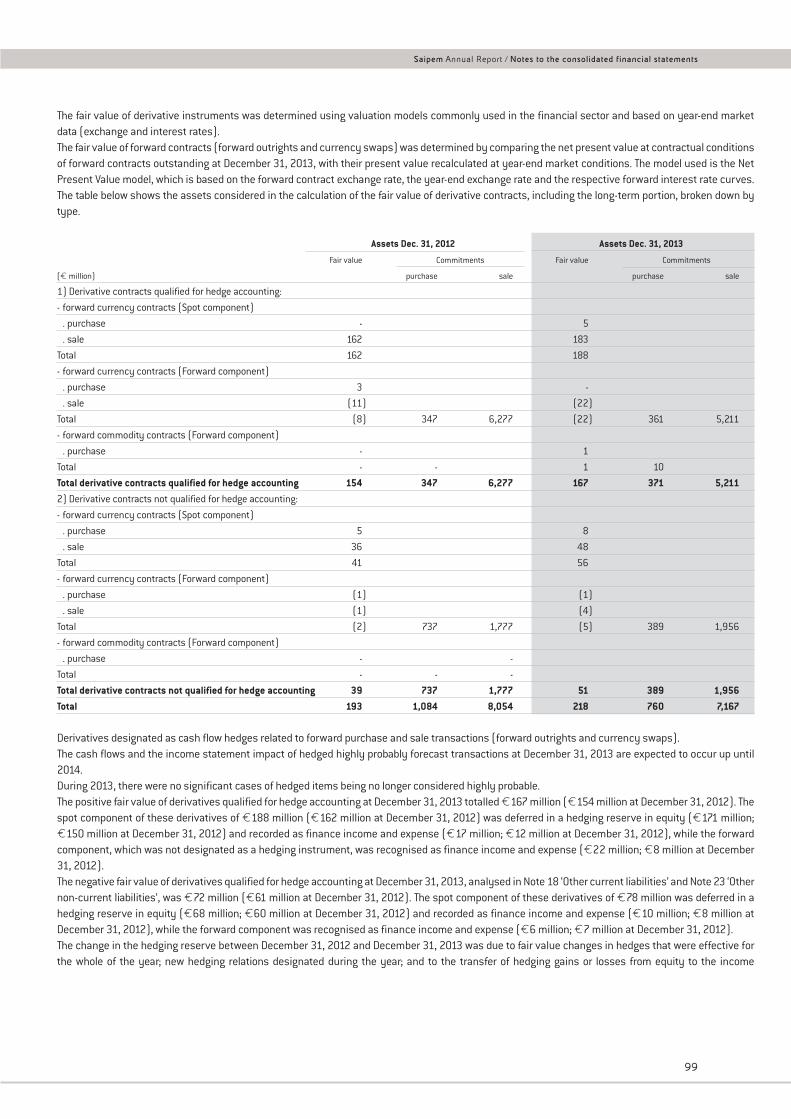
The fair value of derivative instruments was determined using valuation models commonly used in the financial sector and based on year-end marketdata (exchange and interest rates).The fair value of forward contracts (forward outrights and currency swaps) was determined by comparing the net present value at contractual conditionsof forward contracts outstanding at December 31, 2013, with their present value recalculated at year-end market conditions. The model used is the NetPresent Value model, which is based on the forward contract exchange rate, the year-end exchange rate and the respective forward interest rate curves.The table below shows the assets considered in the calculation of the fair value of derivative contracts, including the long-term portion, broken down bytype.
Assets Dec. 31, 2012 Assets Dec. 31, 2013
Fair value Commitments Fair value Commitments
(€ million) purchase sale purchase sale
1) Derivative contracts qualified for hedge accounting:
- forward currency contracts (Spot component)
. purchase - 5
. sale 162 183
Total 162 188
- forward currency contracts (Forward component)
. purchase 3 -
. sale (11) (22)
Total (8) 347 6,277 (22) 361 5,211
- forward commodity contracts (Forward component)
. purchase - 1
Total - - 1 10
Total derivative contracts qualified for hedge accounting 154 347 6,277 167 371 5,2112) Derivative contracts not qualified for hedge accounting:
- forward currency contracts (Spot component)
. purchase 5 8
. sale 36 48
Total 41 56
- forward currency contracts (Forward component)
. purchase (1) (1)
. sale (1) (4)
Total (2) 737 1,777 (5) 389 1,956
- forward commodity contracts (Forward component)
. purchase - -
Total - - -
Total derivative contracts not qualified for hedge accounting 39 737 1,777 51 389 1,956Total 193 1,084 8,054 218 760 7,167
Derivatives designated as cash flow hedges related to forward purchase and sale transactions (forward outrights and currency swaps).The cash flows and the income statement impact of hedged highly probably forecast transactions at December 31, 2013 are expected to occur up until2014.During 2013, there were no significant cases of hedged items being no longer considered highly probable.The positive fair value of derivatives qualified for hedge accounting at December 31, 2013 totalled €167 million (€154 million at December 31, 2012). Thespot component of these derivatives of €188 million (€162 million at December 31, 2012) was deferred in a hedging reserve in equity (€171 million;€150 million at December 31, 2012) and recorded as finance income and expense (€17 million; €12 million at December 31, 2012), while the forwardcomponent, which was not designated as a hedging instrument, was recognised as finance income and expense (€22 million; €8 million at December31, 2012).The negative fair value of derivatives qualified for hedge accounting at December 31, 2013, analysed in Note 18 ‘Other current liabilities’ and Note 23 ‘Othernon-current liabilities’, was €72 million (€61 million at December 31, 2012). The spot component of these derivatives of €78 million was deferred in ahedging reserve in equity (€68 million; €60 million at December 31, 2012) and recorded as finance income and expense (€10 million; €8 million atDecember 31, 2012), while the forward component was recognised as finance income and expense (€6 million; €7 million at December 31, 2012).The change in the hedging reserve between December 31, 2012 and December 31, 2013 was due to fair value changes in hedges that were effective forthe whole of the year; new hedging relations designated during the year; and to the transfer of hedging gains or losses from equity to the income
99
Saipem Annual Report / Notes to the consolidated financial statements
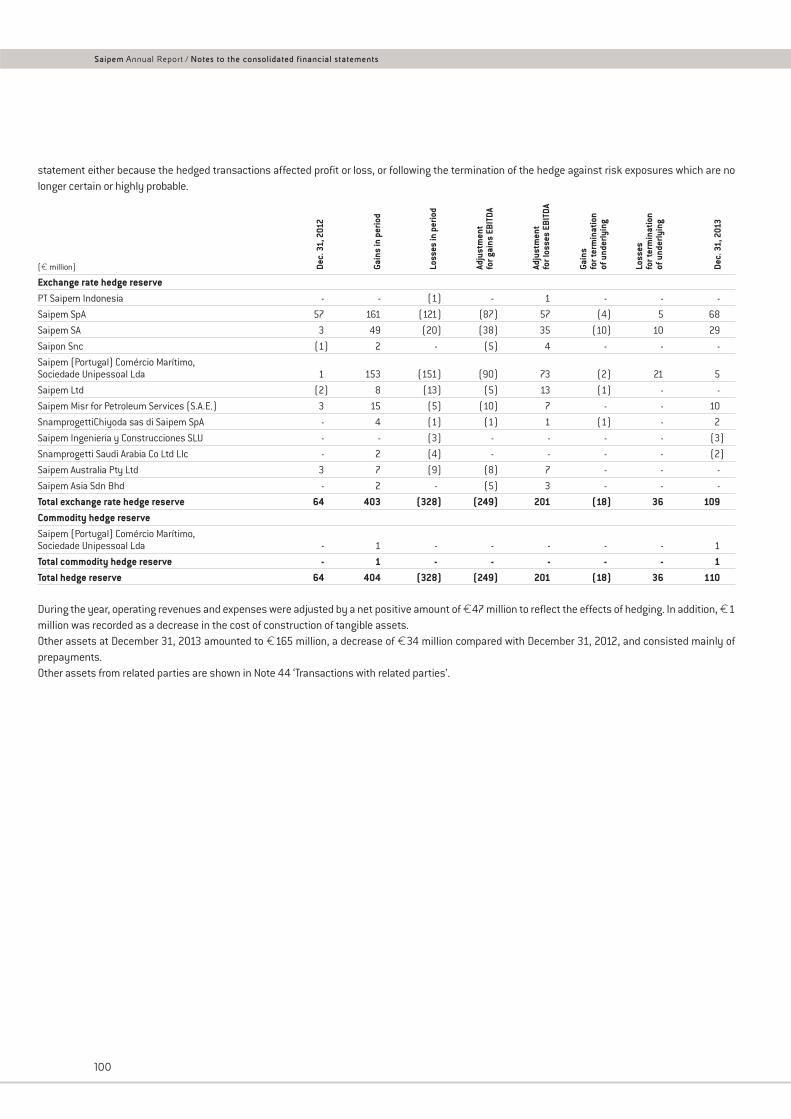
statement either because the hedged transactions affected profit or loss, or following the termination of the hedge against risk exposures which are nolonger certain or highly probable.
(€ million)
Exchange rate hedge reservePT Saipem Indonesia - - (1) - 1 - - -
Saipem SpA 57 161 (121) (87) 57 (4) 5 68
Saipem SA 3 49 (20) (38) 35 (10) 10 29
Saipon Snc (1) 2 - (5) 4 - - -
Saipem (Portugal) Comércio Marítimo,Sociedade Unipessoal Lda 1 153 (151) (90) 73 (2) 21 5
Saipem Ltd (2) 8 (13) (5) 13 (1) - -
Saipem Misr for Petroleum Services (S.A.E.) 3 15 (5) (10) 7 - - 10
SnamprogettiChiyoda sas di Saipem SpA - 4 (1) (1) 1 (1) - 2
Saipem Ingenieria y Construcciones SLU - - (3) - - - - (3)
Snamprogetti Saudi Arabia Co Ltd Llc - 2 (4) - - - - (2)
Saipem Australia Pty Ltd 3 7 (9) (8) 7 - - -
Saipem Asia Sdn Bhd - 2 - (5) 3 - - -
Total exchange rate hedge reserve 64 403 (328) (249) 201 (18) 36 109Commodity hedge reserveSaipem (Portugal) Comércio Marítimo,Sociedade Unipessoal Lda - 1 - - - - - 1
Total commodity hedge reserve - 1 - - - - - 1Total hedge reserve 64 404 (328) (249) 201 (18) 36 110
During the year, operating revenues and expenses were adjusted by a net positive amount of €47 million to reflect the effects of hedging. In addition, €1million was recorded as a decrease in the cost of construction of tangible assets.Other assets at December 31, 2013 amounted to €165 million, a decrease of €34 million compared with December 31, 2012, and consisted mainly ofprepayments.Other assets from related parties are shown in Note 44 ‘Transactions with related parties’.
Dec.
31,
201
2
Gain
s in
per
iod
Loss
es in
per
iod
Adju
stm
ent
for g
ains
EBI
TDA
Adju
stm
ent
for l
osse
s EB
ITDA
Gain
sfo
r ter
min
atio
nof
und
erly
ing
Loss
esfo
r ter
min
atio
nof
und
erly
ing
Dec.
31,
201
3
100
Saipem Annual Report / Notes to the consolidated financial statements
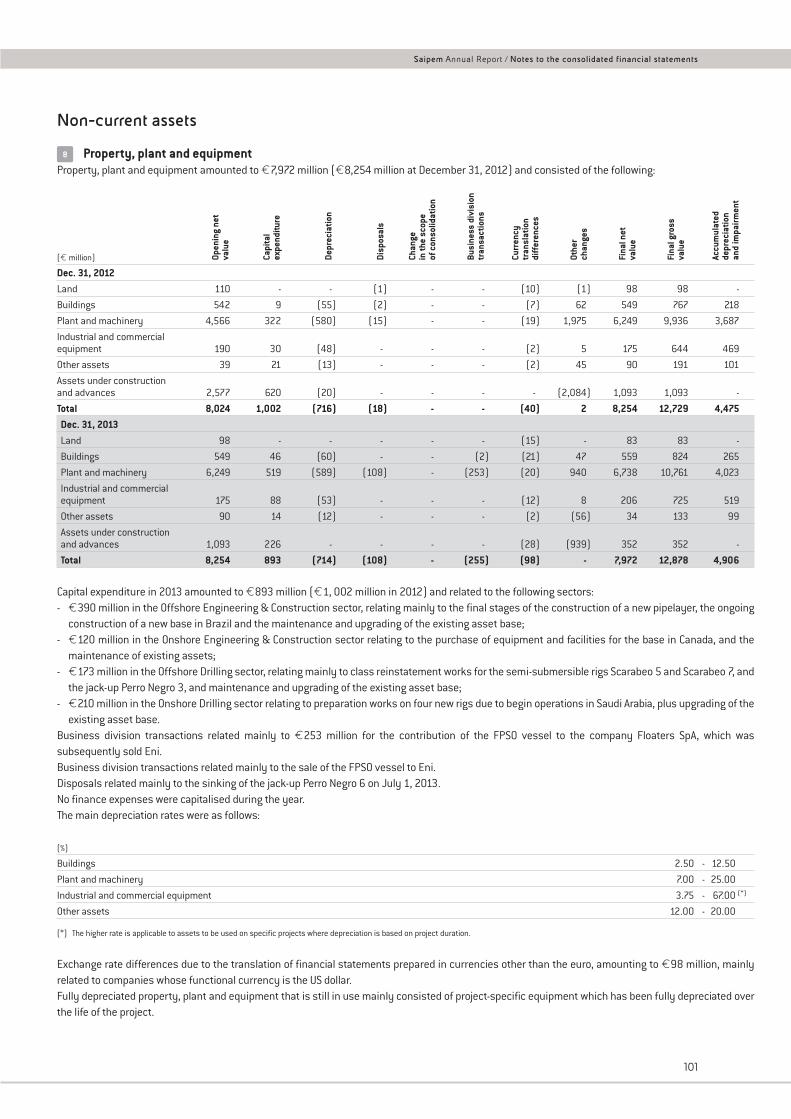
Non-current assets
Property, plant and equipmentProperty, plant and equipment amounted to €7,972 million (€8,254 million at December 31, 2012) and consisted of the following:
(€ million)
Dec. 31, 2012Land 110 - - (1) - - (10) (1) 98 98 -
Buildings 542 9 (55) (2) - - (7) 62 549 767 218
Plant and machinery 4,566 322 (580) (15) - - (19) 1,975 6,249 9,936 3,687
Industrial and commercialequipment 190 30 (48) - - - (2) 5 175 644 469
Other assets 39 21 (13) - - - (2) 45 90 191 101
Assets under constructionand advances 2,577 620 (20) - - - - (2,084) 1,093 1,093 -
Total 8,024 1,002 (716) (18) - - (40) 2 8,254 12,729 4,475Dec. 31, 2013Land 98 - - - - - (15) - 83 83 -
Buildings 549 46 (60) - - (2) (21) 47 559 824 265
Plant and machinery 6,249 519 (589) (108) - (253) (20) 940 6,738 10,761 4,023
Industrial and commercialequipment 175 88 (53) - - - (12) 8 206 725 519
Other assets 90 14 (12) - - - (2) (56) 34 133 99
Assets under constructionand advances 1,093 226 - - - - (28) (939) 352 352 -
Total 8,254 893 (714) (108) - (255) (98) - 7,972 12,878 4,906
Capital expenditure in 2013 amounted to €893 million (€1, 002 million in 2012) and related to the following sectors:- €390 million in the Offshore Engineering & Construction sector, relating mainly to the final stages of the construction of a new pipelayer, the ongoing
construction of a new base in Brazil and the maintenance and upgrading of the existing asset base;- €120 million in the Onshore Engineering & Construction sector relating to the purchase of equipment and facilities for the base in Canada, and the
maintenance of existing assets;- €173 million in the Offshore Drilling sector, relating mainly to class reinstatement works for the semi-submersible rigs Scarabeo 5 and Scarabeo 7, and
the jack-up Perro Negro 3, and maintenance and upgrading of the existing asset base;- €210 million in the Onshore Drilling sector relating to preparation works on four new rigs due to begin operations in Saudi Arabia, plus upgrading of the
existing asset base.Business division transactions related mainly to €253 million for the contribution of the FPSO vessel to the company Floaters SpA, which wassubsequently sold Eni.Business division transactions related mainly to the sale of the FPSO vessel to Eni.Disposals related mainly to the sinking of the jack-up Perro Negro 6 on July 1, 2013.No finance expenses were capitalised during the year.The main depreciation rates were as follows:
(%)
Buildings 2.50 - 12.50
Plant and machinery 7.00 - 25.00
Industrial and commercial equipment 3.75 - 67.00 (*)
Other assets 12.00 - 20.00
(*) The higher rate is applicable to assets to be used on specific projects where depreciation is based on project duration.
Exchange rate differences due to the translation of financial statements prepared in currencies other than the euro, amounting to €98 million, mainlyrelated to companies whose functional currency is the US dollar.Fully depreciated property, plant and equipment that is still in use mainly consisted of project-specific equipment which has been fully depreciated overthe life of the project.
Open
ing
net
valu
e
Capi
tal
expe
nditu
re
Depr
ecia
tion
Disp
osal
s
Chan
gein
the
scop
eof
con
solid
atio
n
Busi
ness
div
isio
n tr
ansa
ctio
ns
Curr
ency
tran
slat
ion
diff
eren
ces
Othe
rch
ange
s
Fina
l net
valu
e
Fina
l gro
ssva
lue
Accu
mul
ated
depr
ecia
tion
and
impa
irmen
t
8
101
Saipem Annual Report / Notes to the consolidated financial statements
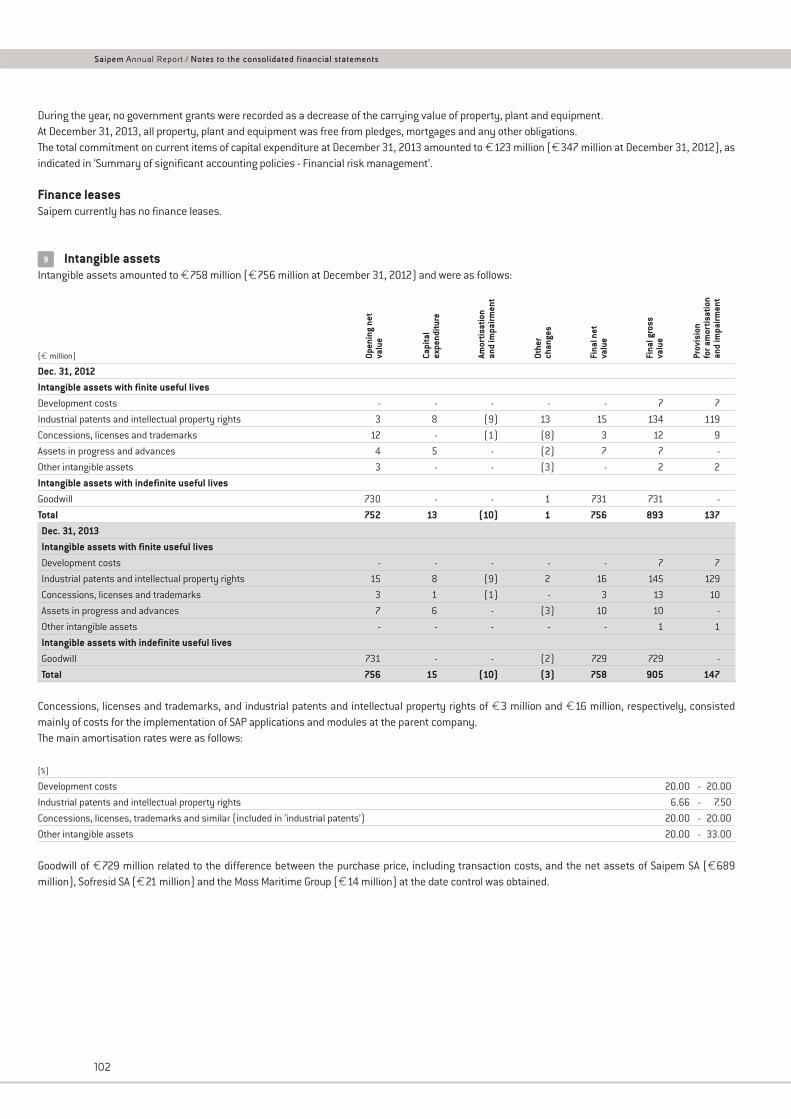
During the year, no government grants were recorded as a decrease of the carrying value of property, plant and equipment.At December 31, 2013, all property, plant and equipment was free from pledges, mortgages and any other obligations.The total commitment on current items of capital expenditure at December 31, 2013 amounted to €123 million (€347 million at December 31, 2012), asindicated in ‘Summary of significant accounting policies - Financial risk management’.
Finance leasesSaipem currently has no finance leases.
Intangible assetsIntangible assets amounted to €758 million (€756 million at December 31, 2012) and were as follows:
(€ million)
Dec. 31, 2012Intangible assets with finite useful livesDevelopment costs - - - - - 7 7
Industrial patents and intellectual property rights 3 8 (9) 13 15 134 119
Concessions, licenses and trademarks 12 - (1) (8) 3 12 9
Assets in progress and advances 4 5 - (2) 7 7 -
Other intangible assets 3 - - (3) - 2 2
Intangible assets with indefinite useful livesGoodwill 730 - - 1 731 731 -
Total 752 13 (10) 1 756 893 137Dec. 31, 2013Intangible assets with finite useful livesDevelopment costs - - - - - 7 7
Industrial patents and intellectual property rights 15 8 (9) 2 16 145 129
Concessions, licenses and trademarks 3 1 (1) - 3 13 10
Assets in progress and advances 7 6 - (3) 10 10 -
Other intangible assets - - - - - 1 1
Intangible assets with indefinite useful livesGoodwill 731 - - (2) 729 729 -
Total 756 15 (10) (3) 758 905 147
Concessions, licenses and trademarks, and industrial patents and intellectual property rights of €3 million and €16 million, respectively, consistedmainly of costs for the implementation of SAP applications and modules at the parent company.The main amortisation rates were as follows:
(%)
Development costs 20.00 - 20.00
Industrial patents and intellectual property rights 6.66 - 7.50
Concessions, licenses, trademarks and similar (included in ‘industrial patents’) 20.00 - 20.00
Other intangible assets 20.00 - 33.00
Goodwill of €729 million related to the difference between the purchase price, including transaction costs, and the net assets of Saipem SA (€689million), Sofresid SA (€21 million) and the Moss Maritime Group (€14 million) at the date control was obtained.
Open
ing
net
valu
e
Capi
tal
expe
nditu
re
Amor
tisat
ion
and
impa
irmen
t
Othe
rch
ange
s
Fina
l net
valu
e
Fina
l gro
ssva
lue
Prov
isio
nfo
r am
ortis
atio
nan
d im
pairm
ent
9
102
Saipem Annual Report / Notes to the consolidated financial statements
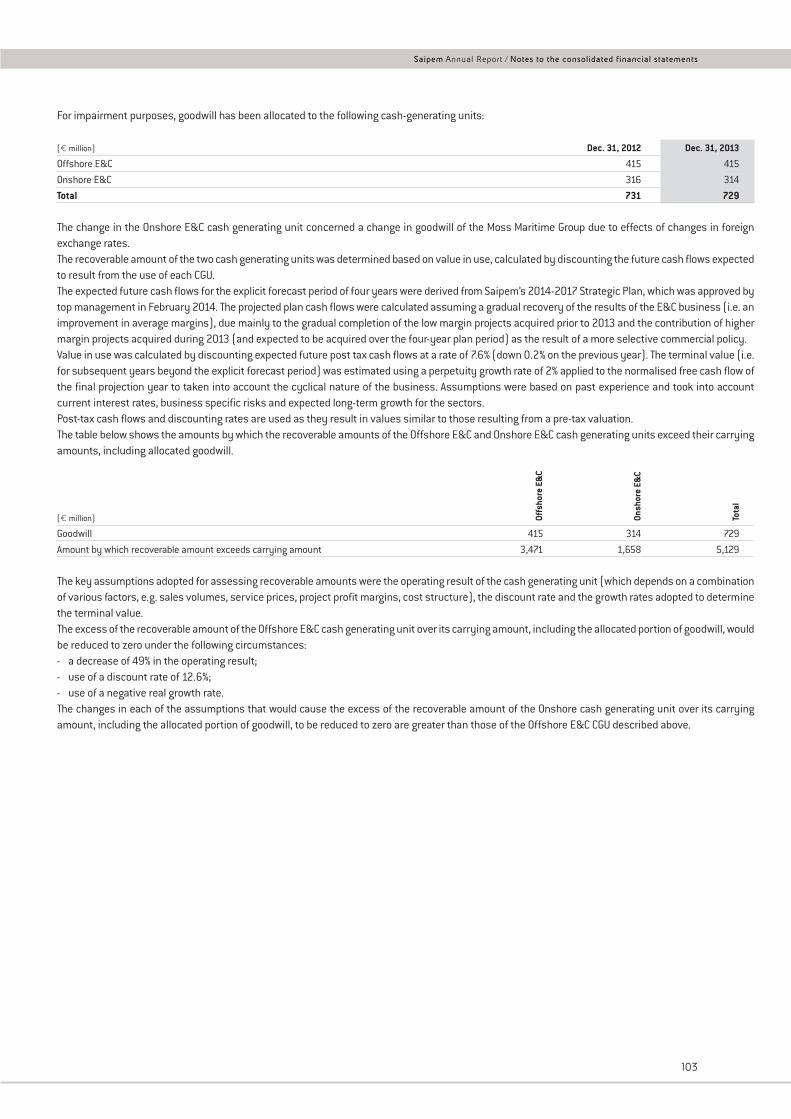
For impairment purposes, goodwill has been allocated to the following cash-generating units:
(€ million) Dec. 31, 2012 Dec. 31, 2013
Offshore E&C 415 415
Onshore E&C 316 314
Total 731 729
The change in the Onshore E&C cash generating unit concerned a change in goodwill of the Moss Maritime Group due to effects of changes in foreignexchange rates.The recoverable amount of the two cash generating units was determined based on value in use, calculated by discounting the future cash flows expectedto result from the use of each CGU.The expected future cash flows for the explicit forecast period of four years were derived from Saipem’s 2014-2017 Strategic Plan, which was approved bytop management in February 2014. The projected plan cash flows were calculated assuming a gradual recovery of the results of the E&C business (i.e. animprovement in average margins), due mainly to the gradual completion of the low margin projects acquired prior to 2013 and the contribution of highermargin projects acquired during 2013 (and expected to be acquired over the four-year plan period) as the result of a more selective commercial policy.Value in use was calculated by discounting expected future post tax cash flows at a rate of 7.6% (down 0.2% on the previous year). The terminal value (i.e.for subsequent years beyond the explicit forecast period) was estimated using a perpetuity growth rate of 2% applied to the normalised free cash flow ofthe final projection year to taken into account the cyclical nature of the business. Assumptions were based on past experience and took into accountcurrent interest rates, business specific risks and expected long-term growth for the sectors.Post-tax cash flows and discounting rates are used as they result in values similar to those resulting from a pre-tax valuation.The table below shows the amounts by which the recoverable amounts of the Offshore E&C and Onshore E&C cash generating units exceed their carryingamounts, including allocated goodwill.
(€ million)
Goodwill 415 314 729
Amount by which recoverable amount exceeds carrying amount 3,471 1,658 5,129
The key assumptions adopted for assessing recoverable amounts were the operating result of the cash generating unit (which depends on a combinationof various factors, e.g. sales volumes, service prices, project profit margins, cost structure), the discount rate and the growth rates adopted to determinethe terminal value.The excess of the recoverable amount of the Offshore E&C cash generating unit over its carrying amount, including the allocated portion of goodwill, wouldbe reduced to zero under the following circumstances:- a decrease of 49% in the operating result;- use of a discount rate of 12.6%;- use of a negative real growth rate.The changes in each of the assumptions that would cause the excess of the recoverable amount of the Onshore cash generating unit over its carryingamount, including the allocated portion of goodwill, to be reduced to zero are greater than those of the Offshore E&C CGU described above.
Offs
hore
E&
C
Onsh
ore
E&C
Tota
l
103
Saipem Annual Report / Notes to the consolidated financial statements
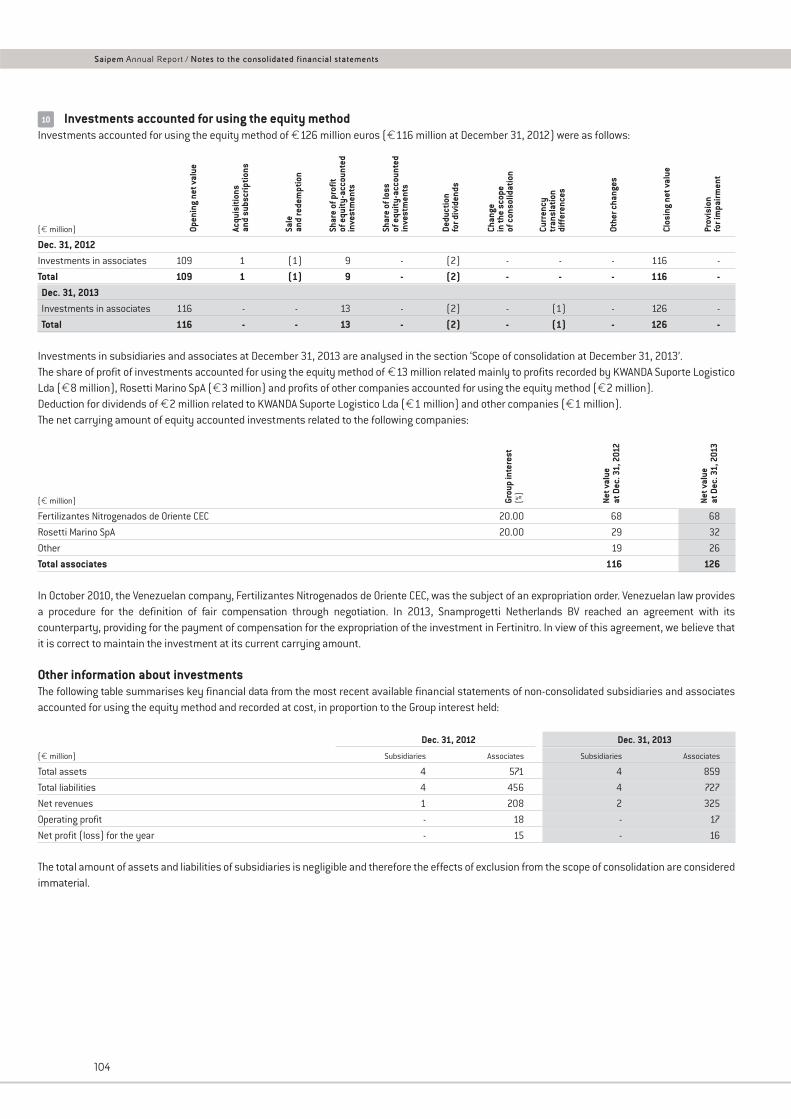
Investments accounted for using the equity methodInvestments accounted for using the equity method of €126 million euros (€116 million at December 31, 2012) were as follows:
(€ million)
Dec. 31, 2012Investments in associates 109 1 (1) 9 - (2) - - - 116 -
Total 109 1 (1) 9 - (2) - - - 116 -Dec. 31, 2013Investments in associates 116 - - 13 - (2) - (1) - 126 -
Total 116 - - 13 - (2) - (1) - 126 -
Investments in subsidiaries and associates at December 31, 2013 are analysed in the section ‘Scope of consolidation at December 31, 2013’.The share of profit of investments accounted for using the equity method of €13 million related mainly to profits recorded by KWANDA Suporte LogisticoLda (€8 million), Rosetti Marino SpA (€3 million) and profits of other companies accounted for using the equity method (€2 million).Deduction for dividends of €2 million related to KWANDA Suporte Logistico Lda (€1 million) and other companies (€1 million).The net carrying amount of equity accounted investments related to the following companies:
(€ million)
Fertilizantes Nitrogenados de Oriente CEC 20.00 68 68
Rosetti Marino SpA 20.00 29 32
Other 19 26
Total associates 116 126
In October 2010, the Venezuelan company, Fertilizantes Nitrogenados de Oriente CEC, was the subject of an expropriation order. Venezuelan law providesa procedure for the definition of fair compensation through negotiation. In 2013, Snamprogetti Netherlands BV reached an agreement with itscounterparty, providing for the payment of compensation for the expropriation of the investment in Fertinitro. In view of this agreement, we believe thatit is correct to maintain the investment at its current carrying amount.
Other information about investmentsThe following table summarises key financial data from the most recent available financial statements of non-consolidated subsidiaries and associatesaccounted for using the equity method and recorded at cost, in proportion to the Group interest held:
Dec. 31, 2012 Dec. 31, 2013
(€ million) Subsidiaries Associates Subsidiaries Associates
Total assets 4 571 4 859
Total liabilities 4 456 4 727
Net revenues 1 208 2 325
Operating profit - 18 - 17
Net profit (loss) for the year - 15 - 16
The total amount of assets and liabilities of subsidiaries is negligible and therefore the effects of exclusion from the scope of consolidation are consideredimmaterial.
Grou
p in
tere
st(%
)
Net v
alue
at D
ec. 3
1, 2
012
Net v
alue
at D
ec. 3
1, 2
013
Open
ing
net v
alue
Acqu
isiti
ons
and
subs
crip
tions
Sale
and
rede
mpt
ion
Shar
e of
pro
fitof
equ
ity-a
ccou
nted
inve
stm
ents
Shar
e of
loss
of e
quity
-acc
ount
edin
vest
men
ts
Dedu
ctio
nfo
r div
iden
ds
Chan
ge
in th
e sc
ope
of c
onso
lidat
ion
Curr
ency
tr
ansl
atio
ndi
ffer
ence
s
Othe
r cha
nges
Clos
ing
net v
alue
Prov
isio
nfo
r im
pairm
ent
10
104
Saipem Annual Report / Notes to the consolidated financial statements
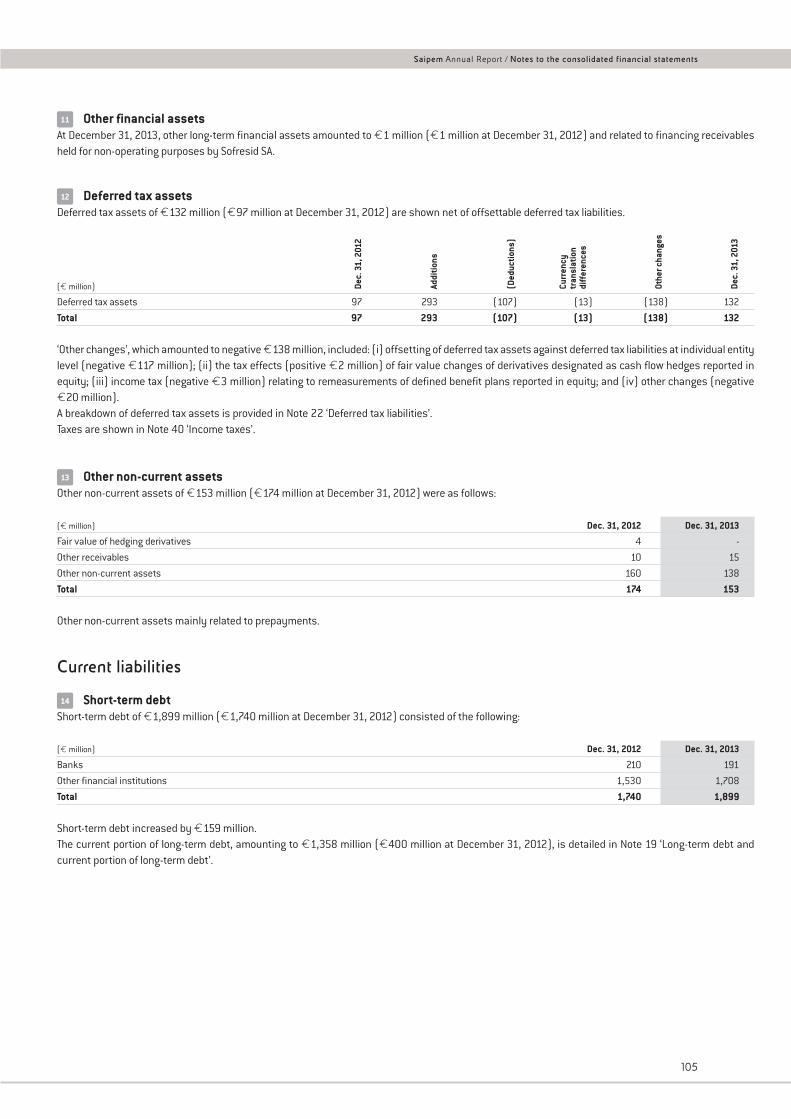
Other financial assetsAt December 31, 2013, other long-term financial assets amounted to €1 million (€1 million at December 31, 2012) and related to financing receivablesheld for non-operating purposes by Sofresid SA.
Deferred tax assetsDeferred tax assets of €132 million (€97 million at December 31, 2012) are shown net of offsettable deferred tax liabilities.
(€ million)
Deferred tax assets 97 293 (107) (13) (138) 132
Total 97 293 (107) (13) (138) 132
‘Other changes’, which amounted to negative €138 million, included: (i) offsetting of deferred tax assets against deferred tax liabilities at individual entitylevel (negative €117 million); (ii) the tax effects (positive €2 million) of fair value changes of derivatives designated as cash flow hedges reported inequity; (iii) income tax (negative €3 million) relating to remeasurements of defined benefit plans reported in equity; and (iv) other changes (negative€20 million).A breakdown of deferred tax assets is provided in Note 22 ‘Deferred tax liabilities’.Taxes are shown in Note 40 ‘Income taxes’.
Other non-current assetsOther non-current assets of €153 million (€174 million at December 31, 2012) were as follows:
(€ million) Dec. 31, 2012 Dec. 31, 2013
Fair value of hedging derivatives 4 -
Other receivables 10 15
Other non-current assets 160 138
Total 174 153
Other non-current assets mainly related to prepayments.
Current liabilities
Short-term debtShort-term debt of €1,899 million (€1,740 million at December 31, 2012) consisted of the following:
(€ million) Dec. 31, 2012 Dec. 31, 2013
Banks 210 191
Other financial institutions 1,530 1,708
Total 1,740 1,899
Short-term debt increased by €159 million.The current portion of long-term debt, amounting to €1,358 million (€400 million at December 31, 2012), is detailed in Note 19 ‘Long-term debt andcurrent portion of long-term debt’.
14
13
Dec.
31,
201
2
Addi
tions
(Ded
uctio
ns)
Curr
ency
tran
slat
ion
diff
eren
ces
Othe
r cha
nges
Dec.
31,
201
3
12
11
105
Saipem Annual Report / Notes to the consolidated financial statements
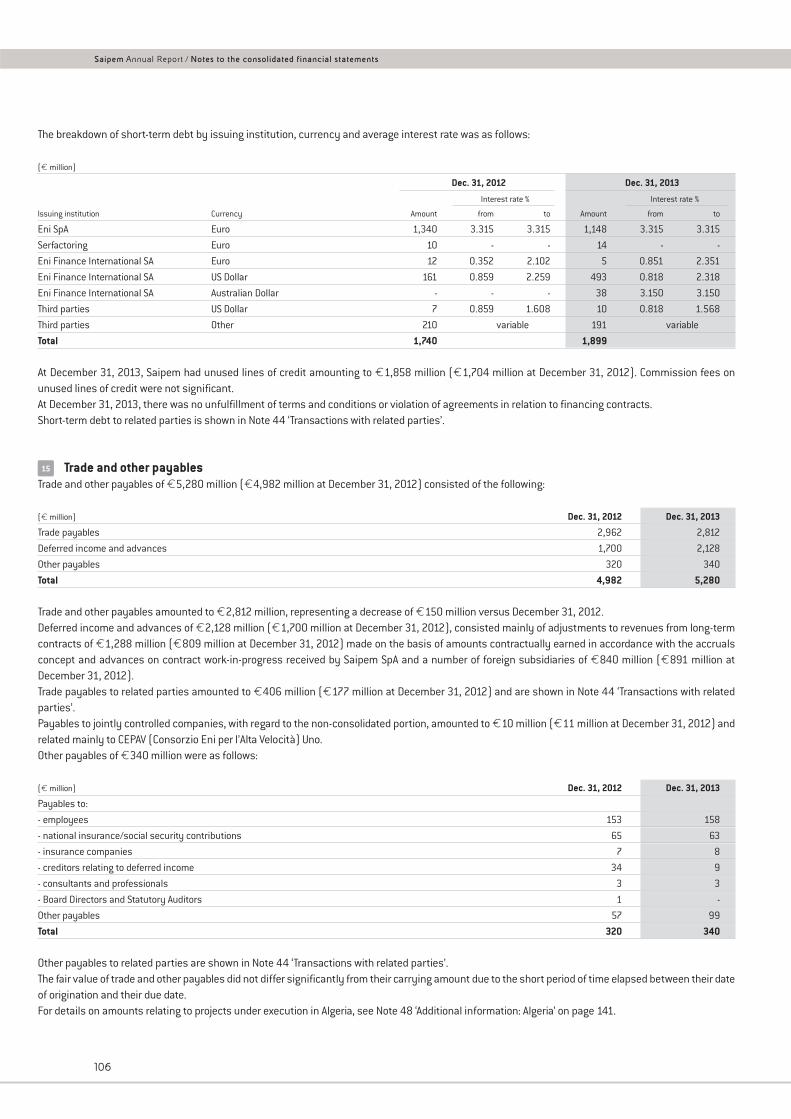
The breakdown of short-term debt by issuing institution, currency and average interest rate was as follows:
(€ million)
Dec. 31, 2012 Dec. 31, 2013
Interest rate % Interest rate %
Issuing institution Currency Amount from to Amount from to
Eni SpA Euro 1,340 3.315 3.315 1,148 3.315 3.315
Serfactoring Euro 10 - - 14 - -
Eni Finance International SA Euro 12 0.352 2.102 5 0.851 2.351
Eni Finance International SA US Dollar 161 0.859 2.259 493 0.818 2.318
Eni Finance International SA Australian Dollar - - - 38 3.150 3.150
Third parties US Dollar 7 0.859 1.608 10 0.818 1.568
Third parties Other 210 variable 191 variable
Total 1,740 1,899
At December 31, 2013, Saipem had unused lines of credit amounting to €1,858 million (€1,704 million at December 31, 2012). Commission fees onunused lines of credit were not significant.At December 31, 2013, there was no unfulfillment of terms and conditions or violation of agreements in relation to financing contracts.Short-term debt to related parties is shown in Note 44 ‘Transactions with related parties’.
Trade and other payablesTrade and other payables of €5,280 million (€4,982 million at December 31, 2012) consisted of the following:
(€ million) Dec. 31, 2012 Dec. 31, 2013
Trade payables 2,962 2,812
Deferred income and advances 1,700 2,128
Other payables 320 340
Total 4,982 5,280
Trade and other payables amounted to €2,812 million, representing a decrease of €150 million versus December 31, 2012.Deferred income and advances of €2,128 million (€1,700 million at December 31, 2012), consisted mainly of adjustments to revenues from long-termcontracts of €1,288 million (€809 million at December 31, 2012) made on the basis of amounts contractually earned in accordance with the accrualsconcept and advances on contract work-in-progress received by Saipem SpA and a number of foreign subsidiaries of €840 million (€891 million atDecember 31, 2012).Trade payables to related parties amounted to €406 million (€177 million at December 31, 2012) and are shown in Note 44 ‘Transactions with relatedparties’.Payables to jointly controlled companies, with regard to the non-consolidated portion, amounted to €10 million (€11 million at December 31, 2012) andrelated mainly to CEPAV (Consorzio Eni per l’Alta Velocità) Uno.Other payables of €340 million were as follows:
(€ million) Dec. 31, 2012 Dec. 31, 2013
Payables to:
- employees 153 158
- national insurance/social security contributions 65 63
- insurance companies 7 8
- creditors relating to deferred income 34 9
- consultants and professionals 3 3
- Board Directors and Statutory Auditors 1 -
Other payables 57 99
Total 320 340
Other payables to related parties are shown in Note 44 ‘Transactions with related parties’.The fair value of trade and other payables did not differ significantly from their carrying amount due to the short period of time elapsed between their dateof origination and their due date.For details on amounts relating to projects under execution in Algeria, see Note 48 ‘Additional information: Algeria’ on page 141.
15
106
Saipem Annual Report / Notes to the consolidated financial statements
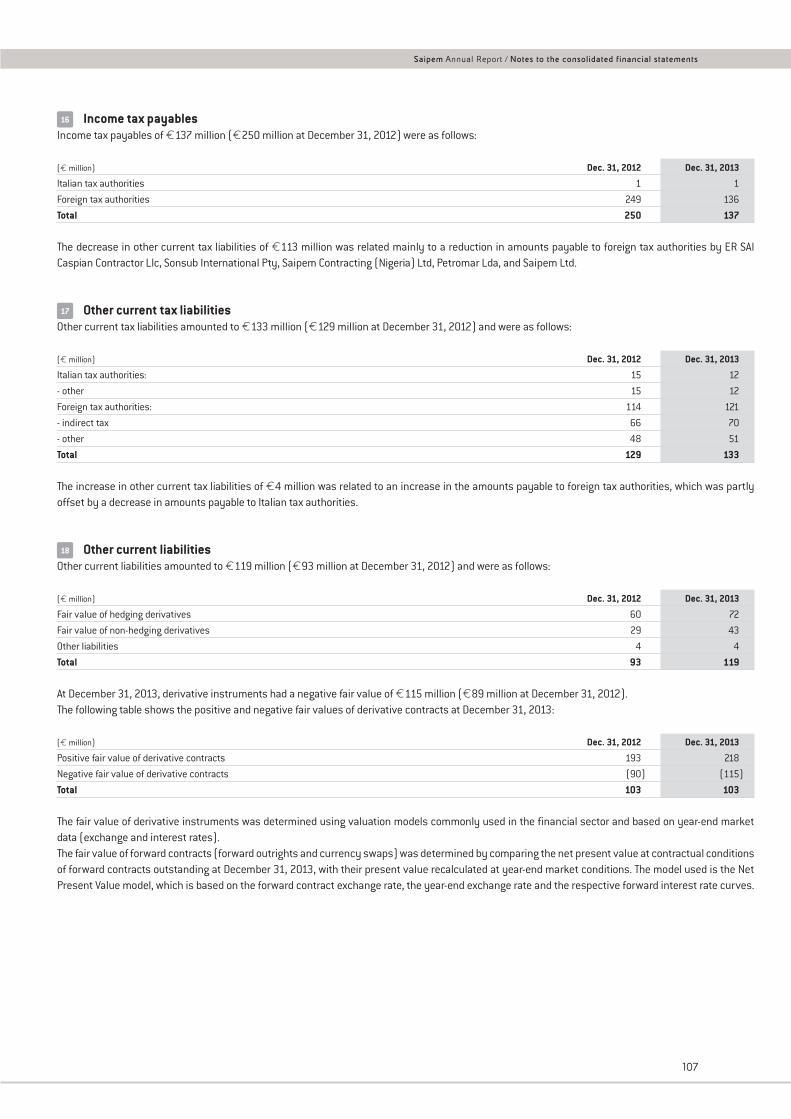
Income tax payablesIncome tax payables of €137 million (€250 million at December 31, 2012) were as follows:
(€ million) Dec. 31, 2012 Dec. 31, 2013
Italian tax authorities 1 1
Foreign tax authorities 249 136
Total 250 137
The decrease in other current tax liabilities of €113 million was related mainly to a reduction in amounts payable to foreign tax authorities by ER SAICaspian Contractor Llc, Sonsub International Pty, Saipem Contracting (Nigeria) Ltd, Petromar Lda, and Saipem Ltd.
Other current tax liabilitiesOther current tax liabilities amounted to €133 million (€129 million at December 31, 2012) and were as follows:
(€ million) Dec. 31, 2012 Dec. 31, 2013
Italian tax authorities: 15 12
- other 15 12
Foreign tax authorities: 114 121
- indirect tax 66 70
- other 48 51
Total 129 133
The increase in other current tax liabilities of €4 million was related to an increase in the amounts payable to foreign tax authorities, which was partlyoffset by a decrease in amounts payable to Italian tax authorities.
Other current liabilitiesOther current liabilities amounted to €119 million (€93 million at December 31, 2012) and were as follows:
(€ million) Dec. 31, 2012 Dec. 31, 2013
Fair value of hedging derivatives 60 72
Fair value of non-hedging derivatives 29 43
Other liabilities 4 4
Total 93 119
At December 31, 2013, derivative instruments had a negative fair value of €115 million (€89 million at December 31, 2012).The following table shows the positive and negative fair values of derivative contracts at December 31, 2013:
(€ million) Dec. 31, 2012 Dec. 31, 2013
Positive fair value of derivative contracts 193 218
Negative fair value of derivative contracts (90) (115)
Total 103 103
The fair value of derivative instruments was determined using valuation models commonly used in the financial sector and based on year-end marketdata (exchange and interest rates).The fair value of forward contracts (forward outrights and currency swaps) was determined by comparing the net present value at contractual conditionsof forward contracts outstanding at December 31, 2013, with their present value recalculated at year-end market conditions. The model used is the NetPresent Value model, which is based on the forward contract exchange rate, the year-end exchange rate and the respective forward interest rate curves.
18
17
16
107
Saipem Annual Report / Notes to the consolidated financial statements
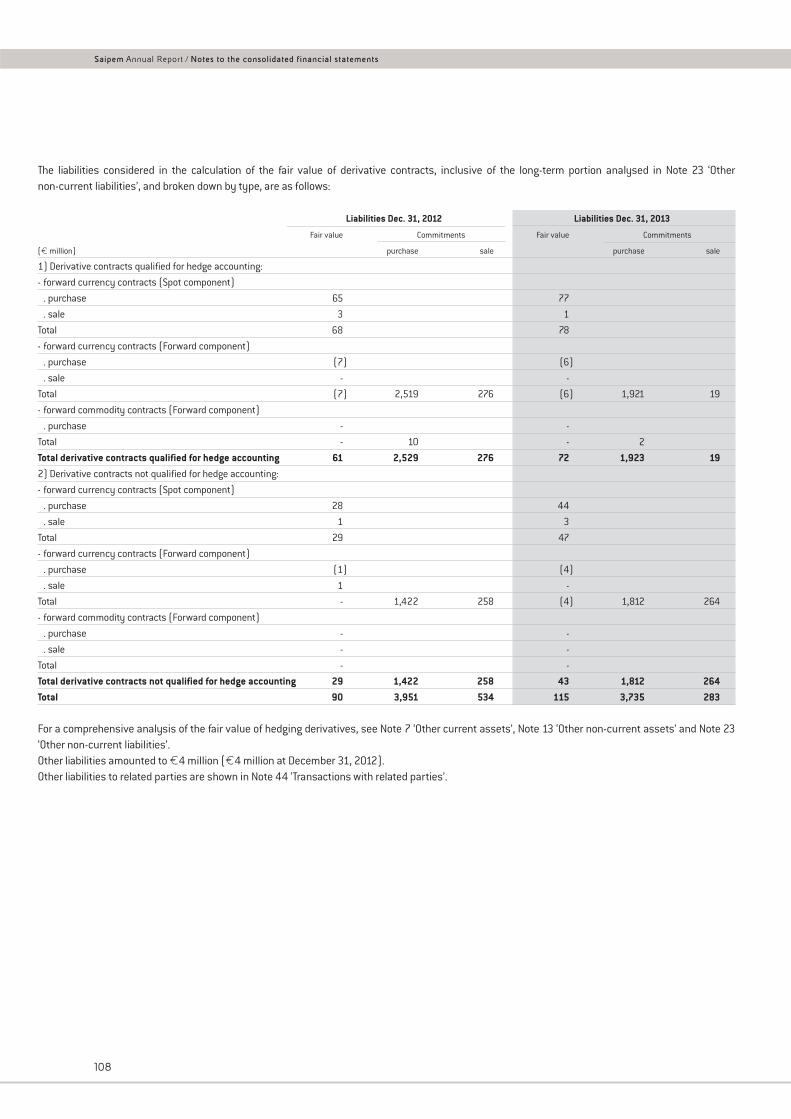
The liabilities considered in the calculation of the fair value of derivative contracts, inclusive of the long-term portion analysed in Note 23 ‘Othernon-current liabilities’, and broken down by type, are as follows:
Liabilities Dec. 31, 2012 Liabilities Dec. 31, 2013
Fair value Commitments Fair value Commitments
(€ million) purchase sale purchase sale
1) Derivative contracts qualified for hedge accounting:
- forward currency contracts (Spot component)
. purchase 65 77
. sale 3 1
Total 68 78
- forward currency contracts (Forward component)
. purchase (7) (6)
. sale - -
Total (7) 2,519 276 (6) 1,921 19
- forward commodity contracts (Forward component)
. purchase - -
Total - 10 - 2
Total derivative contracts qualified for hedge accounting 61 2,529 276 72 1,923 192) Derivative contracts not qualified for hedge accounting:
- forward currency contracts (Spot component)
. purchase 28 44
. sale 1 3
Total 29 47
- forward currency contracts (Forward component)
. purchase (1) (4)
. sale 1 -
Total - 1,422 258 (4) 1,812 264
- forward commodity contracts (Forward component)
. purchase - -
. sale - -
Total - -
Total derivative contracts not qualified for hedge accounting 29 1,422 258 43 1,812 264Total 90 3,951 534 115 3,735 283
For a comprehensive analysis of the fair value of hedging derivatives, see Note 7 ‘Other current assets’, Note 13 ‘Other non-current assets’ and Note 23‘Other non-current liabilities’.Other liabilities amounted to €4 million (€4 million at December 31, 2012).Other liabilities to related parties are shown in Note 44 ‘Transactions with related parties’.
108
Saipem Annual Report / Notes to the consolidated financial statements
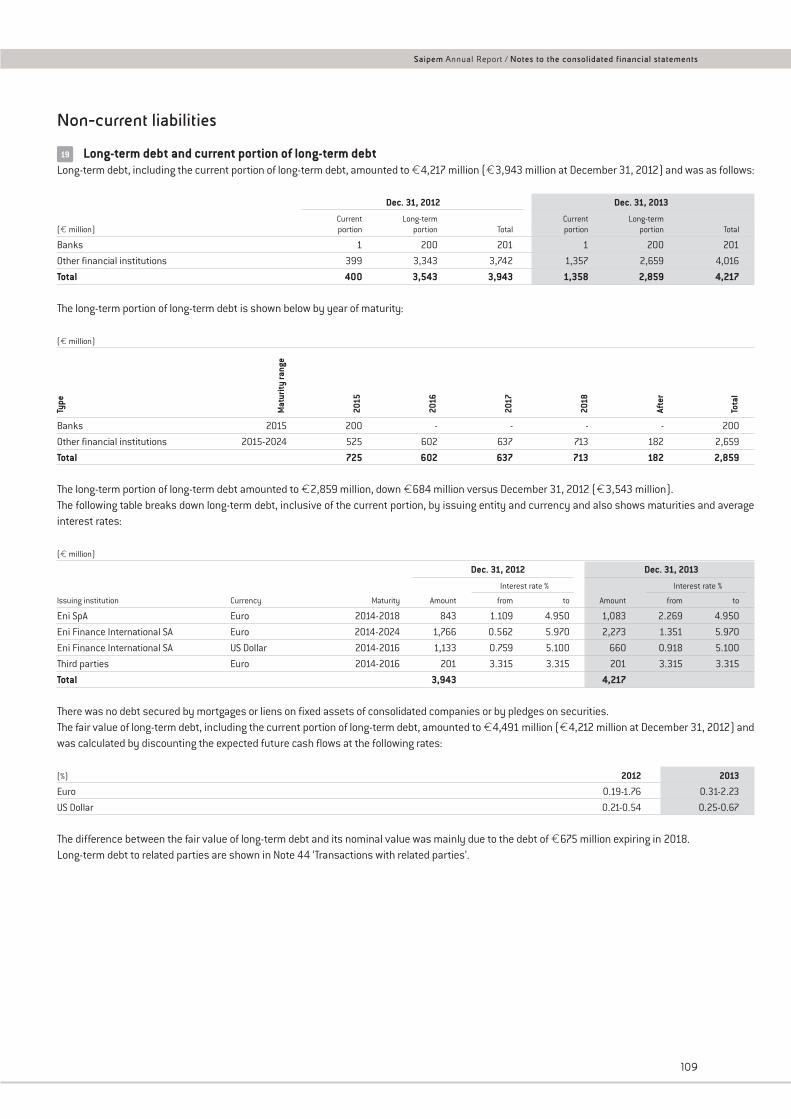
Non-current liabilities
Long-term debt and current portion of long-term debtLong-term debt, including the current portion of long-term debt, amounted to €4,217 million (€3,943 million at December 31, 2012) and was as follows:
Dec. 31, 2012 Dec. 31, 2013
Current Long-term Current Long-term(€ million) portion portion Total portion portion Total
Banks 1 200 201 1 200 201
Other financial institutions 399 3,343 3,742 1,357 2,659 4,016
Total 400 3,543 3,943 1,358 2,859 4,217
The long-term portion of long-term debt is shown below by year of maturity:
(€ million)
Banks 2015 200 - - - - 200
Other financial institutions 2015-2024 525 602 637 713 182 2,659
Total 725 602 637 713 182 2,859
The long-term portion of long-term debt amounted to €2,859 million, down €684 million versus December 31, 2012 (€3,543 million).The following table breaks down long-term debt, inclusive of the current portion, by issuing entity and currency and also shows maturities and averageinterest rates:
(€ million)
Dec. 31, 2012 Dec. 31, 2013
Interest rate % Interest rate %
Issuing institution Currency Maturity Amount from to Amount from to
Eni SpA Euro 2014-2018 843 1.109 4.950 1,083 2.269 4.950
Eni Finance International SA Euro 2014-2024 1,766 0.562 5.970 2,273 1.351 5.970
Eni Finance International SA US Dollar 2014-2016 1,133 0.759 5.100 660 0.918 5.100
Third parties Euro 2014-2016 201 3.315 3.315 201 3.315 3.315
Total 3,943 4,217
There was no debt secured by mortgages or liens on fixed assets of consolidated companies or by pledges on securities.The fair value of long-term debt, including the current portion of long-term debt, amounted to €4,491 million (€4,212 million at December 31, 2012) andwas calculated by discounting the expected future cash flows at the following rates:
(%) 2012 2013
Euro 0.19-1.76 0.31-2.23
US Dollar 0.21-0.54 0.25-0.67
The difference between the fair value of long-term debt and its nominal value was mainly due to the debt of €675 million expiring in 2018.Long-term debt to related parties are shown in Note 44 ‘Transactions with related parties’.
Type
Mat
urity
rang
e
2015
2016
2017
2018
Afte
r
Tota
l
19
109
Saipem Annual Report / Notes to the consolidated financial statements
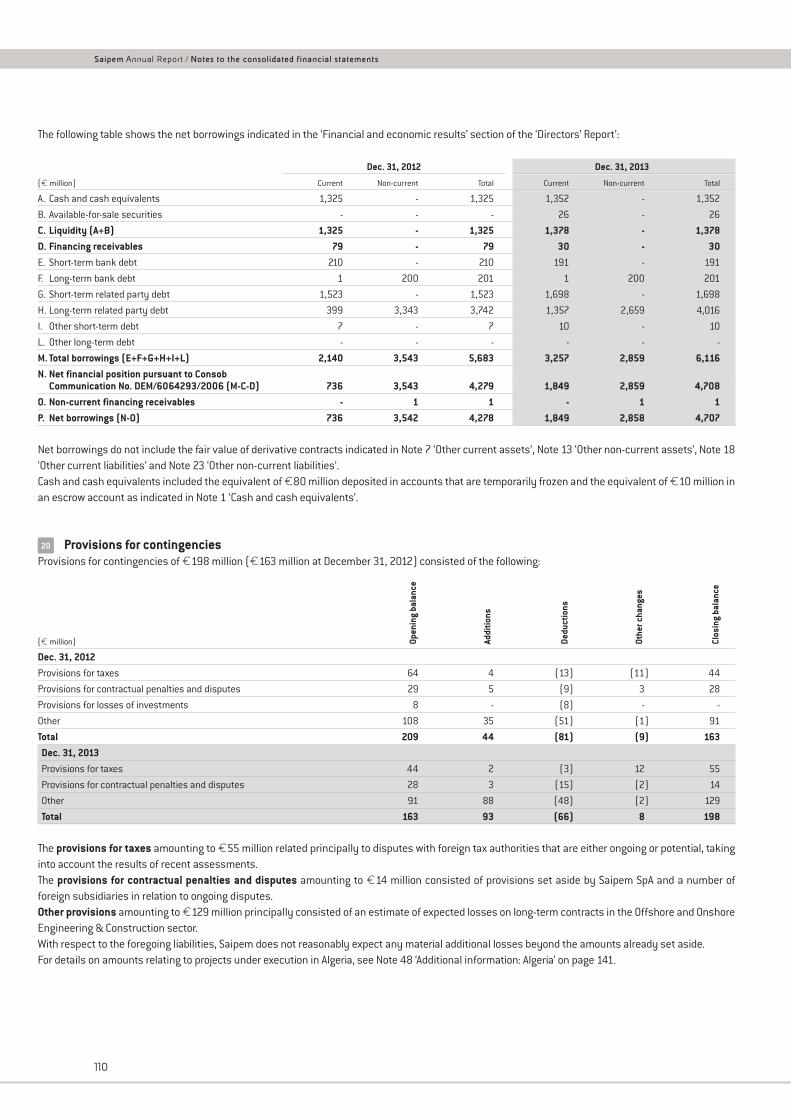
The following table shows the net borrowings indicated in the ‘Financial and economic results’ section of the ‘Directors’ Report’:
Dec. 31, 2012 Dec. 31, 2013
(€ million) Current Non-current Total Current Non-current Total
A. Cash and cash equivalents 1,325 - 1,325 1,352 - 1,352
B. Available-for-sale securities - - - 26 - 26
C. Liquidity (A+B) 1,325 - 1,325 1,378 - 1,378D. Financing receivables 79 - 79 30 - 30E. Short-term bank debt 210 - 210 191 - 191
F. Long-term bank debt 1 200 201 1 200 201
G. Short-term related party debt 1,523 - 1,523 1,698 - 1,698
H. Long-term related party debt 399 3,343 3,742 1,357 2,659 4,016
I. Other short-term debt 7 - 7 10 - 10
L. Other long-term debt - - - - - -
M. Total borrowings (E+F+G+H+I+L) 2,140 3,543 5,683 3,257 2,859 6,116N. Net financial position pursuant to Consob
Communication No. DEM/6064293/2006 (M-C-D) 736 3,543 4,279 1,849 2,859 4,708O. Non-current financing receivables - 1 1 - 1 1P. Net borrowings (N-O) 736 3,542 4,278 1,849 2,858 4,707
Net borrowings do not include the fair value of derivative contracts indicated in Note 7 ‘Other current assets’, Note 13 ‘Other non-current assets’, Note 18‘Other current liabilities’ and Note 23 ‘Other non-current liabilities’.Cash and cash equivalents included the equivalent of €80 million deposited in accounts that are temporarily frozen and the equivalent of €10 million inan escrow account as indicated in Note 1 ‘Cash and cash equivalents’.
Provisions for contingenciesProvisions for contingencies of €198 million (€163 million at December 31, 2012) consisted of the following:
(€ million)
Dec. 31, 2012Provisions for taxes 64 4 (13) (11) 44
Provisions for contractual penalties and disputes 29 5 (9) 3 28
Provisions for losses of investments 8 - (8) - -
Other 108 35 (51) (1) 91
Total 209 44 (81) (9) 163Dec. 31, 2013Provisions for taxes 44 2 (3) 12 55
Provisions for contractual penalties and disputes 28 3 (15) (2) 14
Other 91 88 (48) (2) 129
Total 163 93 (66) 8 198
The provisions for taxes amounting to €55 million related principally to disputes with foreign tax authorities that are either ongoing or potential, takinginto account the results of recent assessments.The provisions for contractual penalties and disputes amounting to €14 million consisted of provisions set aside by Saipem SpA and a number offoreign subsidiaries in relation to ongoing disputes.Other provisions amounting to €129 million principally consisted of an estimate of expected losses on long-term contracts in the Offshore and OnshoreEngineering & Construction sector.With respect to the foregoing liabilities, Saipem does not reasonably expect any material additional losses beyond the amounts already set aside.For details on amounts relating to projects under execution in Algeria, see Note 48 ‘Additional information: Algeria’ on page 141.
Open
ing
bala
nce
Addi
tions
Dedu
ctio
ns
Othe
r cha
nges
Clos
ing
bala
nce
20
110
Saipem Annual Report / Notes to the consolidated financial statements
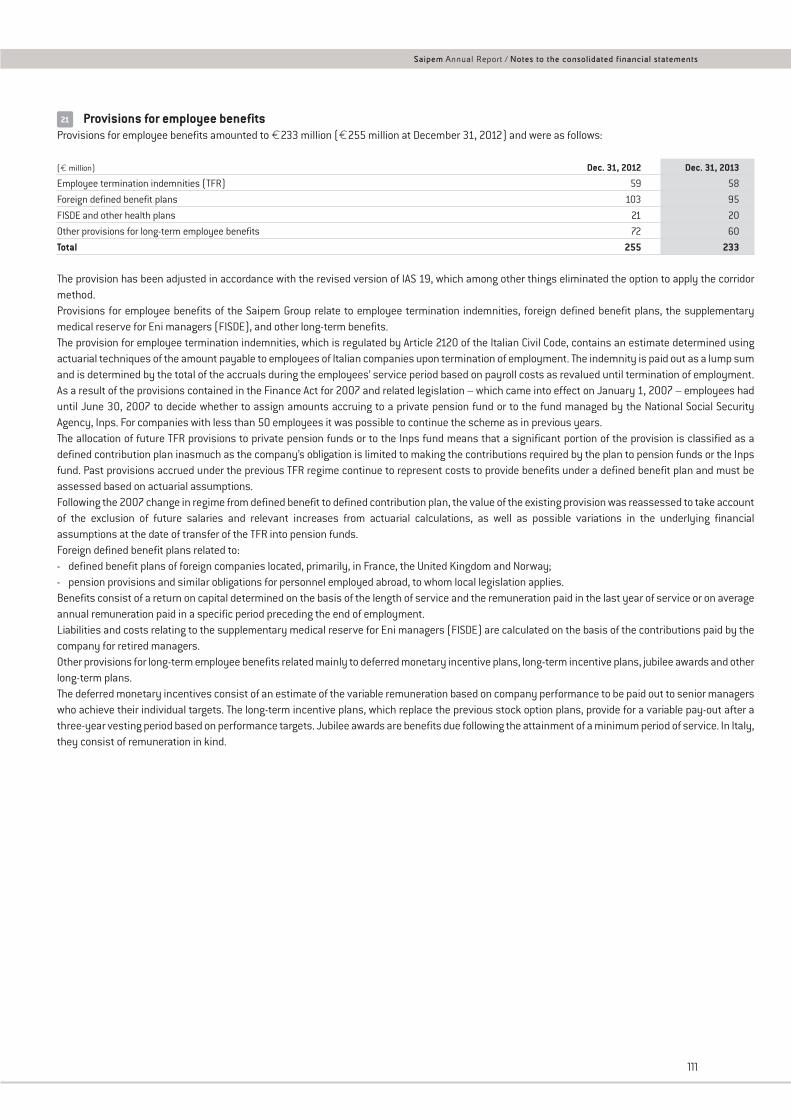
Provisions for employee benefitsProvisions for employee benefits amounted to €233 million (€255 million at December 31, 2012) and were as follows:
(€ million) Dec. 31, 2012 Dec. 31, 2013
Employee termination indemnities (TFR) 59 58
Foreign defined benefit plans 103 95
FISDE and other health plans 21 20
Other provisions for long-term employee benefits 72 60
Total 255 233
The provision has been adjusted in accordance with the revised version of IAS 19, which among other things eliminated the option to apply the corridormethod.Provisions for employee benefits of the Saipem Group relate to employee termination indemnities, foreign defined benefit plans, the supplementarymedical reserve for Eni managers (FISDE), and other long-term benefits.The provision for employee termination indemnities, which is regulated by Article 2120 of the Italian Civil Code, contains an estimate determined usingactuarial techniques of the amount payable to employees of Italian companies upon termination of employment. The indemnity is paid out as a lump sumand is determined by the total of the accruals during the employees’ service period based on payroll costs as revalued until termination of employment.As a result of the provisions contained in the Finance Act for 2007 and related legislation – which came into effect on January 1, 2007 – employees haduntil June 30, 2007 to decide whether to assign amounts accruing to a private pension fund or to the fund managed by the National Social SecurityAgency, Inps. For companies with less than 50 employees it was possible to continue the scheme as in previous years.The allocation of future TFR provisions to private pension funds or to the Inps fund means that a significant portion of the provision is classified as adefined contribution plan inasmuch as the company’s obligation is limited to making the contributions required by the plan to pension funds or the Inpsfund. Past provisions accrued under the previous TFR regime continue to represent costs to provide benefits under a defined benefit plan and must beassessed based on actuarial assumptions.Following the 2007 change in regime from defined benefit to defined contribution plan, the value of the existing provision was reassessed to take accountof the exclusion of future salaries and relevant increases from actuarial calculations, as well as possible variations in the underlying financialassumptions at the date of transfer of the TFR into pension funds.Foreign defined benefit plans related to:- defined benefit plans of foreign companies located, primarily, in France, the United Kingdom and Norway;- pension provisions and similar obligations for personnel employed abroad, to whom local legislation applies.Benefits consist of a return on capital determined on the basis of the length of service and the remuneration paid in the last year of service or on averageannual remuneration paid in a specific period preceding the end of employment.Liabilities and costs relating to the supplementary medical reserve for Eni managers (FISDE) are calculated on the basis of the contributions paid by thecompany for retired managers.Other provisions for long-term employee benefits related mainly to deferred monetary incentive plans, long-term incentive plans, jubilee awards and otherlong-term plans.The deferred monetary incentives consist of an estimate of the variable remuneration based on company performance to be paid out to senior managerswho achieve their individual targets. The long-term incentive plans, which replace the previous stock option plans, provide for a variable pay-out after athree-year vesting period based on performance targets. Jubilee awards are benefits due following the attainment of a minimum period of service. In Italy,they consist of remuneration in kind.
21
111
Saipem Annual Report / Notes to the consolidated financial statements
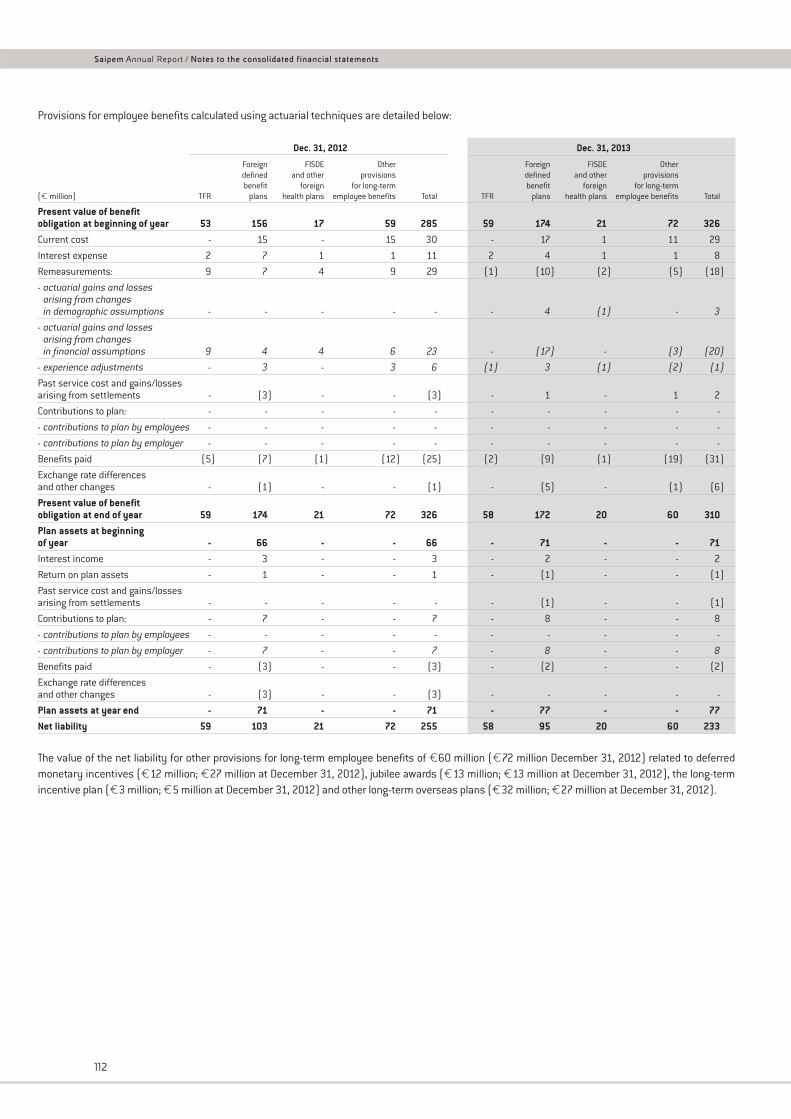
Provisions for employee benefits calculated using actuarial techniques are detailed below:
Dec. 31, 2012 Dec. 31, 2013
Foreign FISDE Other Foreign FISDE Other defined and other provisions defined and other provisionsbenefit foreign for long-term benefit foreign for long-term
(€ million) TFR plans health plans employee benefits Total TFR plans health plans employee benefits Total
Present value of benefitobligation at beginning of year 53 156 17 59 285 59 174 21 72 326Current cost - 15 - 15 30 - 17 1 11 29
Interest expense 2 7 1 1 11 2 4 1 1 8
Remeasurements: 9 7 4 9 29 (1) (10) (2) (5) (18)
- actuarial gains and lossesarising from changesin demographic assumptions - - - - - - 4 (1) - 3
- actuarial gains and lossesarising from changesin financial assumptions 9 4 4 6 23 - (17) - (3) (20)
- experience adjustments - 3 - 3 6 (1) 3 (1) (2) (1)
Past service cost and gains/lossesarising from settlements - (3) - - (3) - 1 - 1 2
Contributions to plan: - - - - - - - - - -
- contributions to plan by employees - - - - - - - - - -
- contributions to plan by employer - - - - - - - - - -
Benefits paid (5) (7) (1) (12) (25) (2) (9) (1) (19) (31)
Exchange rate differences and other changes - (1) - - (1) - (5) - (1) (6)
Present value of benefit obligation at end of year 59 174 21 72 326 58 172 20 60 310Plan assets at beginningof year - 66 - - 66 - 71 - - 71Interest income - 3 - - 3 - 2 - - 2
Return on plan assets - 1 - - 1 - (1) - - (1)
Past service cost and gains/lossesarising from settlements - - - - - - (1) - - (1)
Contributions to plan: - 7 - - 7 - 8 - - 8
- contributions to plan by employees - - - - - - - - - -
- contributions to plan by employer - 7 - - 7 - 8 - - 8
Benefits paid - (3) - - (3) - (2) - - (2)
Exchange rate differences and other changes - (3) - - (3) - - - - -
Plan assets at year end - 71 - - 71 - 77 - - 77Net liability 59 103 21 72 255 58 95 20 60 233
The value of the net liability for other provisions for long-term employee benefits of €60 million (€72 million December 31, 2012) related to deferredmonetary incentives (€12 million; €27 million at December 31, 2012), jubilee awards (€13 million; €13 million at December 31, 2012), the long-termincentive plan (€3 million; €5 million at December 31, 2012) and other long-term overseas plans (€32 million; €27 million at December 31, 2012).
112
Saipem Annual Report / Notes to the consolidated financial statements
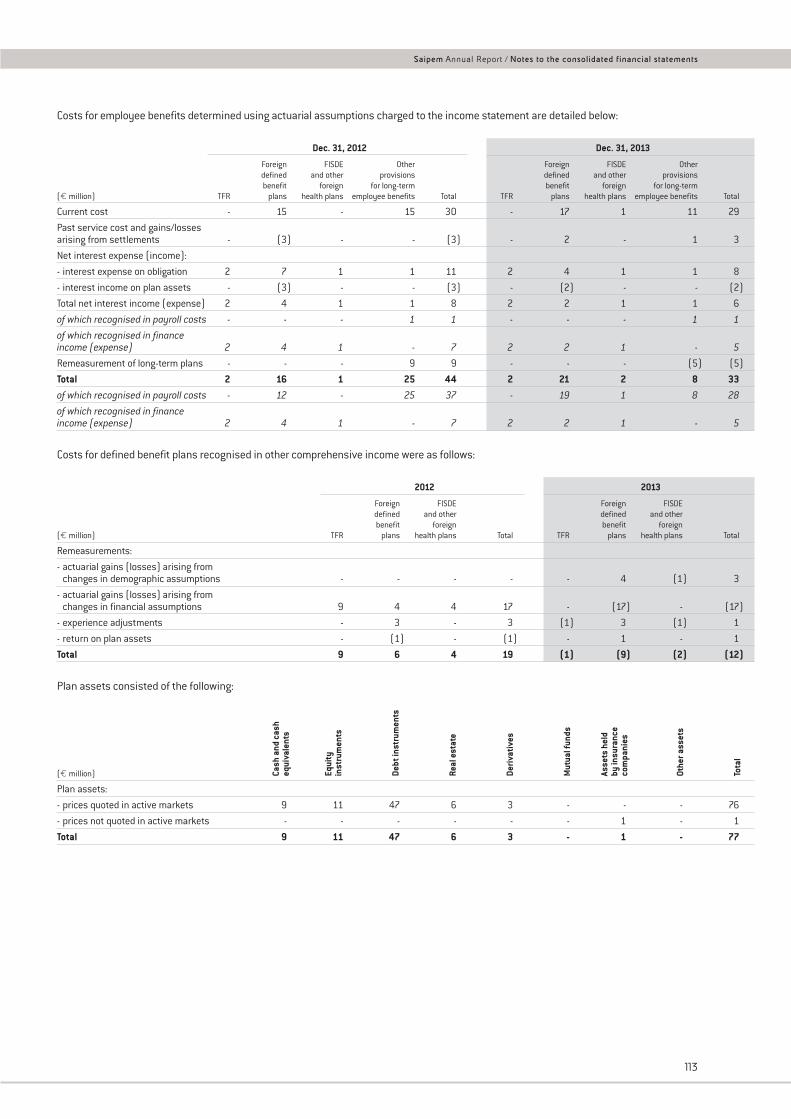
Costs for employee benefits determined using actuarial assumptions charged to the income statement are detailed below:
Dec. 31, 2012 Dec. 31, 2013
Foreign FISDE Other Foreign FISDE Other defined and other provisions defined and other provisionsbenefit foreign for long-term benefit foreign for long-term
(€ million) TFR plans health plans employee benefits Total TFR plans health plans employee benefits Total
Current cost - 15 - 15 30 - 17 1 11 29
Past service cost and gains/lossesarising from settlements - (3) - - (3) - 2 - 1 3
Net interest expense (income):
- interest expense on obligation 2 7 1 1 11 2 4 1 1 8
- interest income on plan assets - (3) - - (3) - (2) - - (2)
Total net interest income (expense) 2 4 1 1 8 2 2 1 1 6
of which recognised in payroll costs - - - 1 1 - - - 1 1
of which recognised in financeincome (expense) 2 4 1 - 7 2 2 1 - 5
Remeasurement of long-term plans - - - 9 9 - - - (5) (5)
Total 2 16 1 25 44 2 21 2 8 33of which recognised in payroll costs - 12 - 25 37 - 19 1 8 28
of which recognised in financeincome (expense) 2 4 1 - 7 2 2 1 - 5
Costs for defined benefit plans recognised in other comprehensive income were as follows:
2012 2013
Foreign FISDE Foreign FISDEdefined and other defined and otherbenefit foreign benefit foreign
(€ million) TFR plans health plans Total TFR plans health plans Total
Remeasurements:
- actuarial gains (losses) arising fromchanges in demographic assumptions - - - - - 4 (1) 3
- actuarial gains (losses) arising fromchanges in financial assumptions 9 4 4 17 - (17) - (17)
- experience adjustments - 3 - 3 (1) 3 (1) 1
- return on plan assets - (1) - (1) - 1 - 1
Total 9 6 4 19 (1) (9) (2) (12)
Plan assets consisted of the following:
(€ million)
Plan assets:
- prices quoted in active markets 9 11 47 6 3 - - - 76
- prices not quoted in active markets - - - - - - 1 - 1
Total 9 11 47 6 3 - 1 - 77
Cash
and
cas
h eq
uiva
lent
s
Equi
tyin
stru
men
ts
Debt
inst
rum
ents
Real
est
ate
Deriv
ativ
es
Mut
ual f
unds
Asse
ts h
eld
by in
sura
nce
com
pani
es
Othe
r ass
ets
Tota
l
113
Saipem Annual Report / Notes to the consolidated financial statements
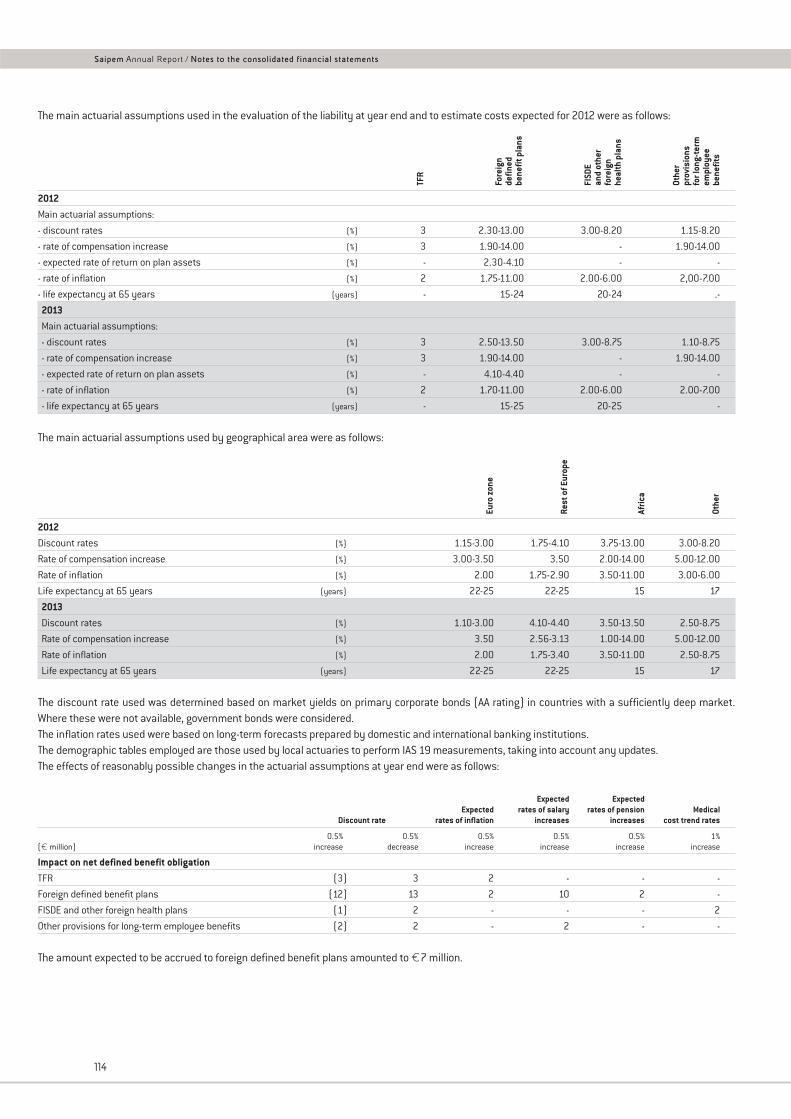
The main actuarial assumptions used in the evaluation of the liability at year end and to estimate costs expected for 2012 were as follows:
2012Main actuarial assumptions:
- discount rates (%) 3 2.30-13.00 3.00-8.20 1.15-8.20
- rate of compensation increase (%) 3 1.90-14.00 - 1.90-14.00
- expected rate of return on plan assets (%) - 2.30-4.10 - -
- rate of inflation (%) 2 1.75-11.00 2.00-6.00 2,00-7.00
- life expectancy at 65 years (years) - 15-24 20-24 .-
2013Main actuarial assumptions:
- discount rates (%) 3 2.50-13.50 3.00-8.75 1.10-8.75
- rate of compensation increase (%) 3 1.90-14.00 - 1.90-14.00
- expected rate of return on plan assets (%) - 4.10-4.40 - -
- rate of inflation (%) 2 1.70-11.00 2.00-6.00 2.00-7.00
- life expectancy at 65 years (years) - 15-25 20-25 -
The main actuarial assumptions used by geographical area were as follows:
2012Discount rates (%) 1.15-3.00 1.75-4.10 3.75-13.00 3.00-8.20
Rate of compensation increase (%) 3.00-3.50 3.50 2.00-14.00 5.00-12.00
Rate of inflation (%) 2.00 1.75-2.90 3.50-11.00 3.00-6.00
Life expectancy at 65 years (years) 22-25 22-25 15 17
2013Discount rates (%) 1.10-3.00 4.10-4.40 3.50-13.50 2.50-8.75
Rate of compensation increase (%) 3.50 2.56-3.13 1.00-14.00 5.00-12.00
Rate of inflation (%) 2.00 1.75-3.40 3.50-11.00 2.50-8.75
Life expectancy at 65 years (years) 22-25 22-25 15 17
The discount rate used was determined based on market yields on primary corporate bonds (AA rating) in countries with a sufficiently deep market.Where these were not available, government bonds were considered.The inflation rates used were based on long-term forecasts prepared by domestic and international banking institutions.The demographic tables employed are those used by local actuaries to perform IAS 19 measurements, taking into account any updates.The effects of reasonably possible changes in the actuarial assumptions at year end were as follows:
Expected ExpectedExpected rates of salary rates of pension Medical
Discount rate rates of inflation increases increases cost trend rates
0.5% 0.5% 0.5% 0.5% 0.5% 1%(€ million) increase decrease increase increase increase increase
Impact on net defined benefit obligationTFR (3) 3 2 - - -
Foreign defined benefit plans (12) 13 2 10 2 -
FISDE and other foreign health plans (1) 2 - - - 2
Other provisions for long-term employee benefits (2) 2 - 2 - -
The amount expected to be accrued to foreign defined benefit plans amounted to €7 million.
Euro
zon
e
Rest
of E
urop
e
Afric
a
Othe
r
TFR
Fore
ign
defin
ed
bene
fit p
lans
FISD
Ean
d ot
her
fore
ign
heal
th p
lans
Othe
r pr
ovis
ions
fo
r lon
g-te
rmem
ploy
eebe
nefit
s
114
Saipem Annual Report / Notes to the consolidated financial statements
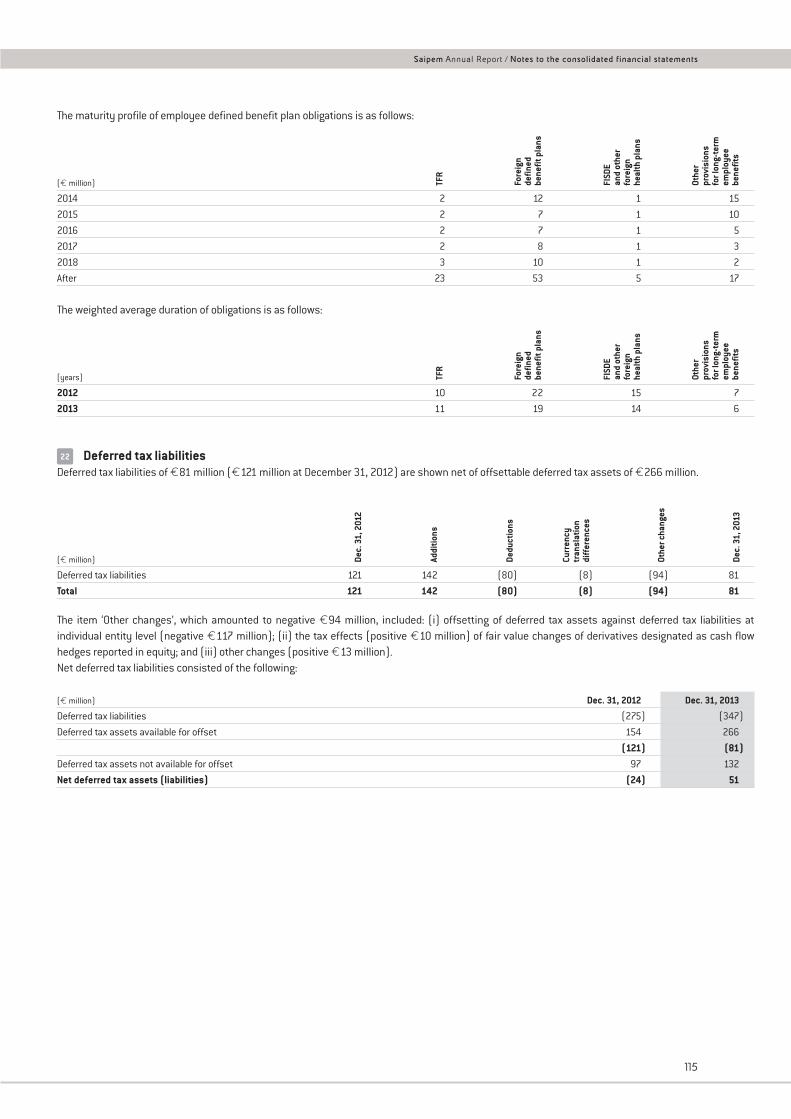
The maturity profile of employee defined benefit plan obligations is as follows:
(€ million)
2014 2 12 1 15
2015 2 7 1 10
2016 2 7 1 5
2017 2 8 1 3
2018 3 10 1 2
After 23 53 5 17
The weighted average duration of obligations is as follows:
(years)
2012 10 22 15 7
2013 11 19 14 6
Deferred tax liabilitiesDeferred tax liabilities of €81 million (€121 million at December 31, 2012) are shown net of offsettable deferred tax assets of €266 million.
(€ million)
Deferred tax liabilities 121 142 (80) (8) (94) 81
Total 121 142 (80) (8) (94) 81
The item ‘Other changes’, which amounted to negative €94 million, included: (i) offsetting of deferred tax assets against deferred tax liabilities atindividual entity level (negative €117 million); (ii) the tax effects (positive €10 million) of fair value changes of derivatives designated as cash flowhedges reported in equity; and (iii) other changes (positive €13 million).Net deferred tax liabilities consisted of the following:
(€ million) Dec. 31, 2012 Dec. 31, 2013
Deferred tax liabilities (275) (347)
Deferred tax assets available for offset 154 266
(121) (81)Deferred tax assets not available for offset 97 132
Net deferred tax assets (liabilities) (24) 51
Dec.
31,
201
2
Addi
tions
Dedu
ctio
ns
Curr
ency
tran
slat
ion
diff
eren
ces
Othe
r cha
nges
Dec.
31,
201
3
22
TFR
Fore
ign
defin
ed
bene
fit p
lans
FISD
Ean
d ot
her
fore
ign
heal
th p
lans
Othe
r pr
ovis
ions
fo
r lon
g-te
rmem
ploy
eebe
nefit
s
TFR
Fore
ign
defin
ed
bene
fit p
lans
FISD
Ean
d ot
her
fore
ign
heal
th p
lans
Othe
r pr
ovis
ions
fo
r lon
g-te
rmem
ploy
eebe
nefit
s
115
Saipem Annual Report / Notes to the consolidated financial statements
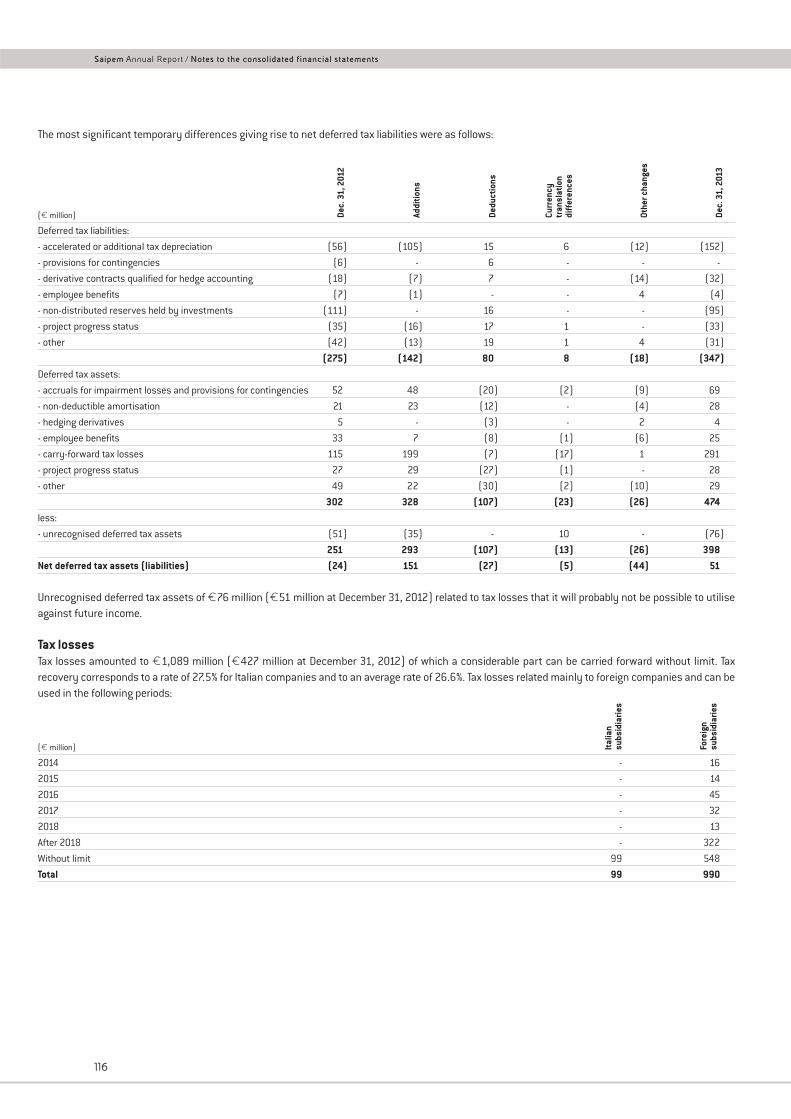
The most significant temporary differences giving rise to net deferred tax liabilities were as follows:
(€ million)
Deferred tax liabilities:
- accelerated or additional tax depreciation (56) (105) 15 6 (12) (152)
- provisions for contingencies (6) - 6 - - -
- derivative contracts qualified for hedge accounting (18) (7) 7 - (14) (32)
- employee benefits (7) (1) - - 4 (4)
- non-distributed reserves held by investments (111) - 16 - - (95)
- project progress status (35) (16) 17 1 - (33)
- other (42) (13) 19 1 4 (31)
(275) (142) 80 8 (18) (347)Deferred tax assets:
- accruals for impairment losses and provisions for contingencies 52 48 (20) (2) (9) 69
- non-deductible amortisation 21 23 (12) - (4) 28
- hedging derivatives 5 - (3) - 2 4
- employee benefits 33 7 (8) (1) (6) 25
- carry-forward tax losses 115 199 (7) (17) 1 291
- project progress status 27 29 (27) (1) - 28
- other 49 22 (30) (2) (10) 29
302 328 (107) (23) (26) 474less:
- unrecognised deferred tax assets (51) (35) - 10 - (76)
251 293 (107) (13) (26) 398Net deferred tax assets (liabilities) (24) 151 (27) (5) (44) 51
Unrecognised deferred tax assets of €76 million (€51 million at December 31, 2012) related to tax losses that it will probably not be possible to utiliseagainst future income.
Tax lossesTax losses amounted to €1,089 million (€427 million at December 31, 2012) of which a considerable part can be carried forward without limit. Taxrecovery corresponds to a rate of 27.5% for Italian companies and to an average rate of 26.6%. Tax losses related mainly to foreign companies and can beused in the following periods:
(€ million)
2014 - 16
2015 - 14
2016 - 45
2017 - 32
2018 - 13
After 2018 - 322
Without limit 99 548
Total 99 990
Italia
nsu
bsid
iarie
s
Fore
ign
subs
idia
ries
Dec.
31,
201
2
Addi
tions
Dedu
ctio
ns
Curr
ency
tran
slat
ion
diff
eren
ces
Othe
r cha
nges
Dec.
31,
201
3
116
Saipem Annual Report / Notes to the consolidated financial statements
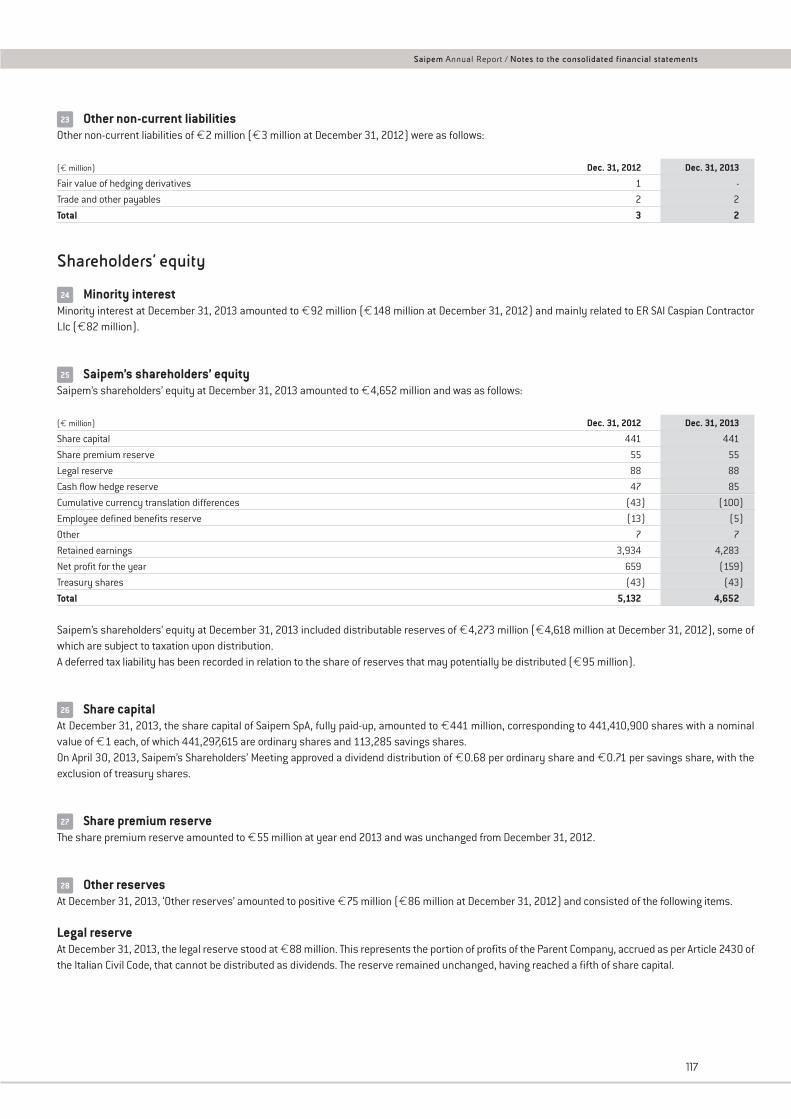
Other non-current liabilitiesOther non-current liabilities of €2 million (€3 million at December 31, 2012) were as follows:
(€ million) Dec. 31, 2012 Dec. 31, 2013
Fair value of hedging derivatives 1 -
Trade and other payables 2 2
Total 3 2
Shareholders’ equity
Minority interestMinority interest at December 31, 2013 amounted to €92 million (€148 million at December 31, 2012) and mainly related to ER SAI Caspian ContractorLlc (€82 million).
Saipem’s shareholders’ equitySaipem’s shareholders’ equity at December 31, 2013 amounted to €4,652 million and was as follows:
(€ million) Dec. 31, 2012 Dec. 31, 2013
Share capital 441 441
Share premium reserve 55 55
Legal reserve 88 88
Cash flow hedge reserve 47 85
Cumulative currency translation differences (43) (100)
Employee defined benefits reserve (13) (5)
Other 7 7
Retained earnings 3,934 4,283
Net profit for the year 659 (159)
Treasury shares (43) (43)
Total 5,132 4,652
Saipem’s shareholders’ equity at December 31, 2013 included distributable reserves of €4,273 million (€4,618 million at December 31, 2012), some ofwhich are subject to taxation upon distribution.A deferred tax liability has been recorded in relation to the share of reserves that may potentially be distributed (€95 million).
Share capitalAt December 31, 2013, the share capital of Saipem SpA, fully paid-up, amounted to €441 million, corresponding to 441,410,900 shares with a nominalvalue of €1 each, of which 441,297,615 are ordinary shares and 113,285 savings shares.On April 30, 2013, Saipem’s Shareholders’ Meeting approved a dividend distribution of €0.68 per ordinary share and €0.71 per savings share, with theexclusion of treasury shares.
Share premium reserveThe share premium reserve amounted to €55 million at year end 2013 and was unchanged from December 31, 2012.
Other reservesAt December 31, 2013, ‘Other reserves’ amounted to positive €75 million (€86 million at December 31, 2012) and consisted of the following items.
Legal reserveAt December 31, 2013, the legal reserve stood at €88 million. This represents the portion of profits of the Parent Company, accrued as per Article 2430 ofthe Italian Civil Code, that cannot be distributed as dividends. The reserve remained unchanged, having reached a fifth of share capital.
28
27
26
25
24
23
117
Saipem Annual Report / Notes to the consolidated financial statements
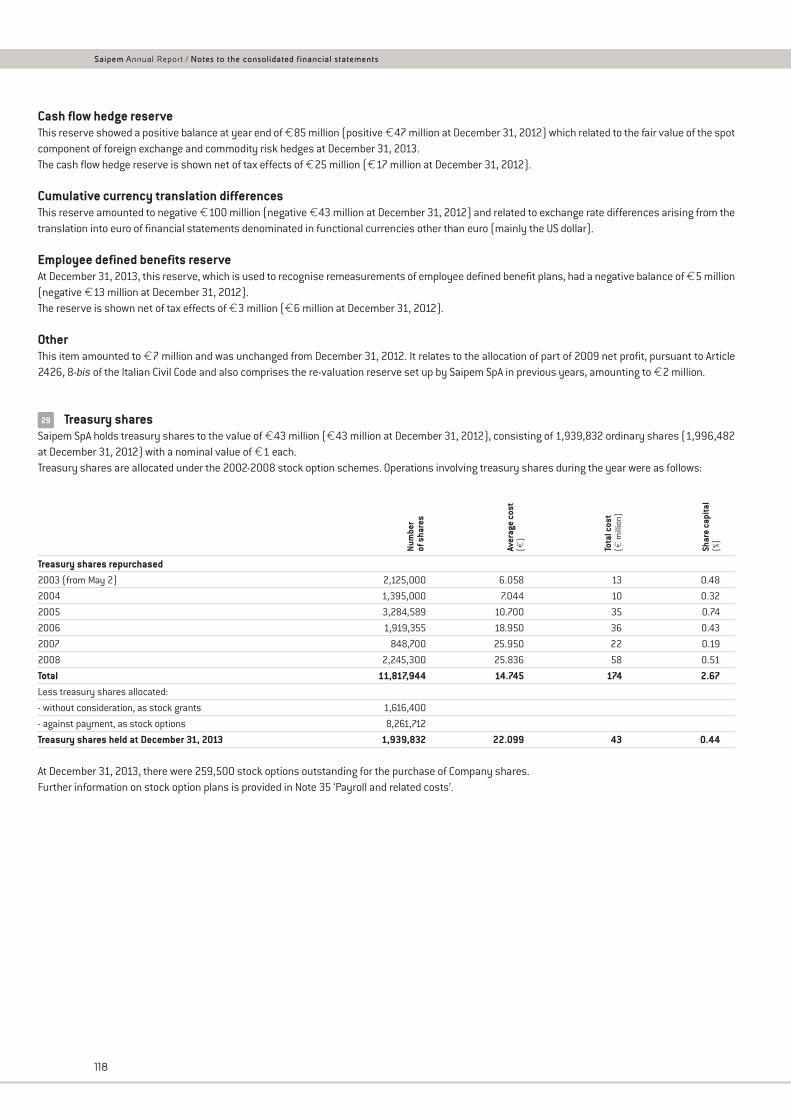
Cash flow hedge reserveThis reserve showed a positive balance at year end of €85 million (positive €47 million at December 31, 2012) which related to the fair value of the spotcomponent of foreign exchange and commodity risk hedges at December 31, 2013.The cash flow hedge reserve is shown net of tax effects of €25 million (€17 million at December 31, 2012).
Cumulative currency translation differencesThis reserve amounted to negative €100 million (negative €43 million at December 31, 2012) and related to exchange rate differences arising from thetranslation into euro of financial statements denominated in functional currencies other than euro (mainly the US dollar).
Employee defined benefits reserveAt December 31, 2013, this reserve, which is used to recognise remeasurements of employee defined benefit plans, had a negative balance of €5 million(negative €13 million at December 31, 2012).The reserve is shown net of tax effects of €3 million (€6 million at December 31, 2012).
Other This item amounted to €7 million and was unchanged from December 31, 2012. It relates to the allocation of part of 2009 net profit, pursuant to Article2426, 8-bis of the Italian Civil Code and also comprises the re-valuation reserve set up by Saipem SpA in previous years, amounting to €2 million.
Treasury sharesSaipem SpA holds treasury shares to the value of €43 million (€43 million at December 31, 2012), consisting of 1,939,832 ordinary shares (1,996,482at December 31, 2012) with a nominal value of €1 each.Treasury shares are allocated under the 2002-2008 stock option schemes. Operations involving treasury shares during the year were as follows:
Treasury shares repurchased2003 (from May 2) 2,125,000 6.058 13 0.48
2004 1,395,000 7.044 10 0.32
2005 3,284,589 10.700 35 0.74
2006 1,919,355 18.950 36 0.43
2007 848,700 25.950 22 0.19
2008 2,245,300 25.836 58 0.51
Total 11,817,944 14.745 174 2.67Less treasury shares allocated:
- without consideration, as stock grants 1,616,400
- against payment, as stock options 8,261,712
Treasury shares held at December 31, 2013 1,939,832 22.099 43 0.44
At December 31, 2013, there were 259,500 stock options outstanding for the purchase of Company shares.Further information on stock option plans is provided in Note 35 ‘Payroll and related costs’.
Num
ber
of s
hare
s
Aver
age
cost
(€)
Tota
l cos
t(€
mill
ion)
Shar
e ca
pita
l(%
)
29
118
Saipem Annual Report / Notes to the consolidated financial statements
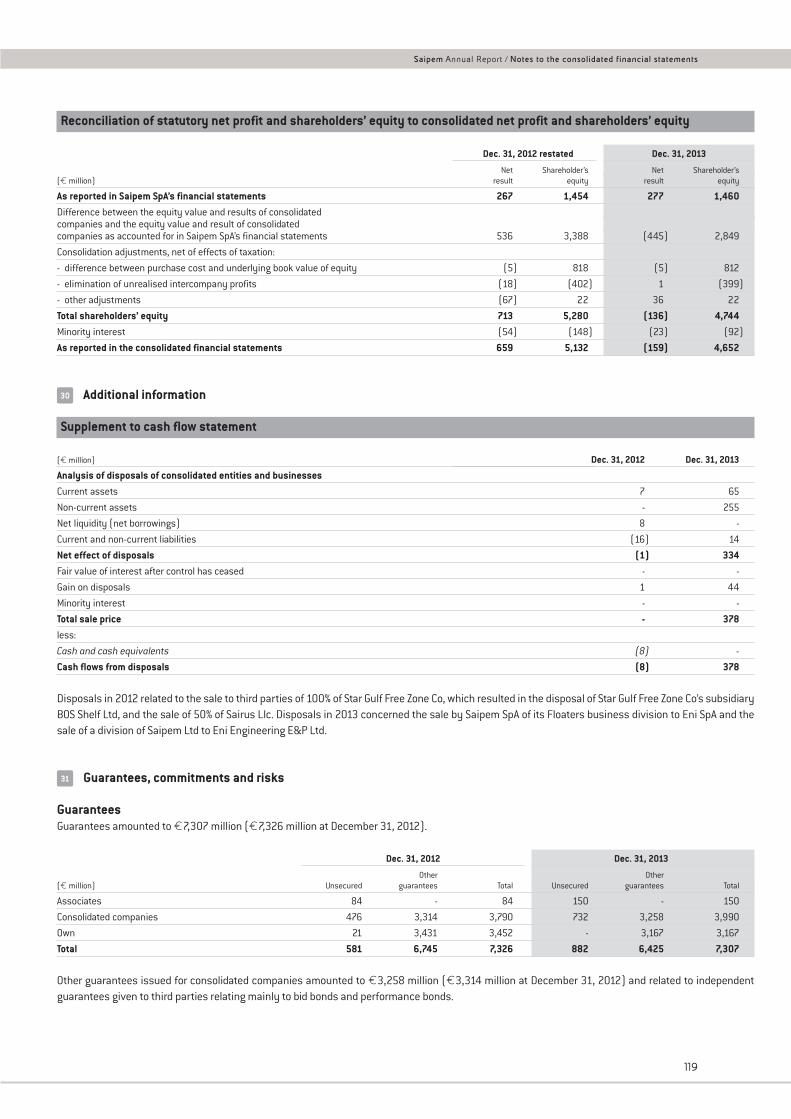
Reconciliation of statutory net profit and shareholders’ equity to consolidated net profit and shareholders’ equity
Dec. 31, 2012 restated Dec. 31, 2013
Net Shareholder’s Net Shareholder’s(€ million) result equity result equity
As reported in Saipem SpA’s financial statements 267 1,454 277 1,460Difference between the equity value and results of consolidatedcompanies and the equity value and result of consolidated companies as accounted for in Saipem SpA’s financial statements 536 3,388 (445) 2,849
Consolidation adjustments, net of effects of taxation:
- difference between purchase cost and underlying book value of equity (5) 818 (5) 812
- elimination of unrealised intercompany profits (18) (402) 1 (399)
- other adjustments (67) 22 36 22
Total shareholders’ equity 713 5,280 (136) 4,744Minority interest (54) (148) (23) (92)
As reported in the consolidated financial statements 659 5,132 (159) 4,652
Additional information
Supplement to cash flow statement
(€ million) Dec. 31, 2012 Dec. 31, 2013
Analysis of disposals of consolidated entities and businessesCurrent assets 7 65
Non-current assets - 255
Net liquidity (net borrowings) 8 -
Current and non-current liabilities (16) 14
Net effect of disposals (1) 334Fair value of interest after control has ceased - -
Gain on disposals 1 44
Minority interest - -
Total sale price - 378less:
Cash and cash equivalents (8) -
Cash flows from disposals (8) 378
Disposals in 2012 related to the sale to third parties of 100% of Star Gulf Free Zone Co, which resulted in the disposal of Star Gulf Free Zone Co’s subsidiaryBOS Shelf Ltd, and the sale of 50% of Sairus Llc. Disposals in 2013 concerned the sale by Saipem SpA of its Floaters business division to Eni SpA and thesale of a division of Saipem Ltd to Eni Engineering E&P Ltd.
Guarantees, commitments and risks
GuaranteesGuarantees amounted to €7,307 million (€7,326 million at December 31, 2012).
Dec. 31, 2012 Dec. 31, 2013
Other Other(€ million) Unsecured guarantees Total Unsecured guarantees Total
Associates 84 - 84 150 - 150
Consolidated companies 476 3,314 3,790 732 3,258 3,990
Own 21 3,431 3,452 - 3,167 3,167
Total 581 6,745 7,326 882 6,425 7,307
Other guarantees issued for consolidated companies amounted to €3,258 million (€3,314 million at December 31, 2012) and related to independentguarantees given to third parties relating mainly to bid bonds and performance bonds.
31
30
119
Saipem Annual Report / Notes to the consolidated financial statements
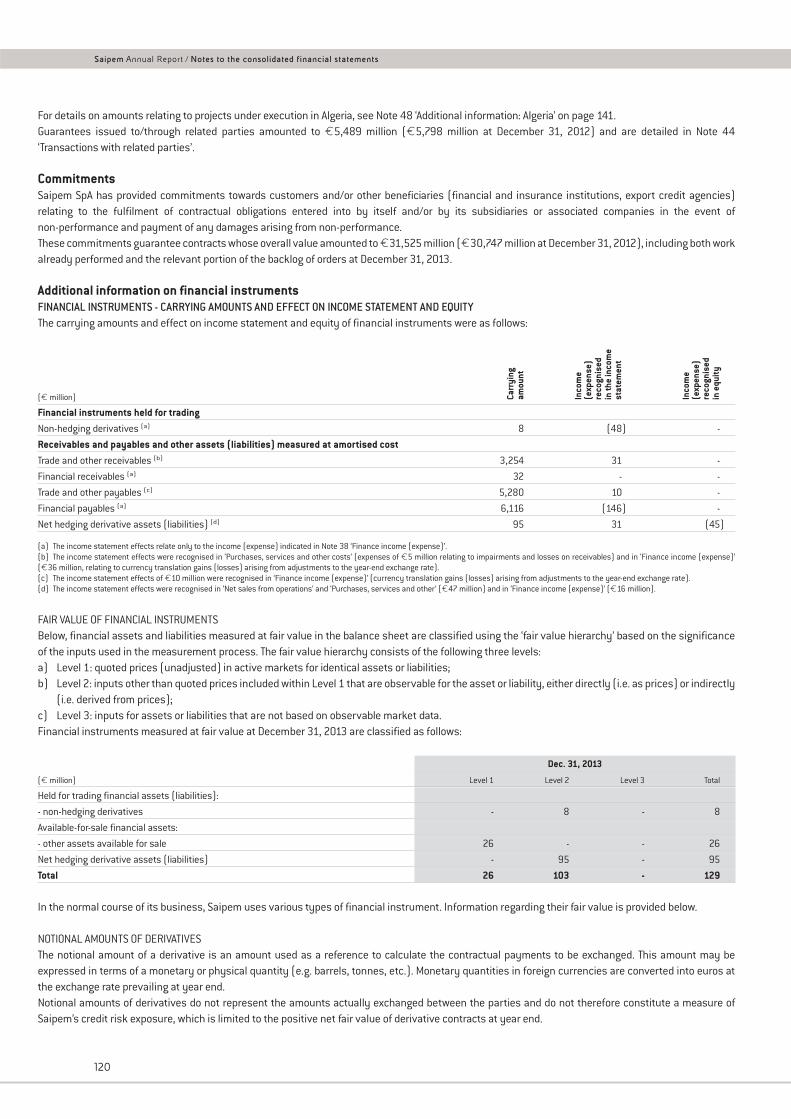
For details on amounts relating to projects under execution in Algeria, see Note 48 ‘Additional information: Algeria’ on page 141.Guarantees issued to/through related parties amounted to €5,489 million (€5,798 million at December 31, 2012) and are detailed in Note 44‘Transactions with related parties’.
Commitments Saipem SpA has provided commitments towards customers and/or other beneficiaries (financial and insurance institutions, export credit agencies)relating to the fulfilment of contractual obligations entered into by itself and/or by its subsidiaries or associated companies in the event ofnon-performance and payment of any damages arising from non-performance.These commitments guarantee contracts whose overall value amounted to €31,525 million (€30,747 million at December 31, 2012), including both workalready performed and the relevant portion of the backlog of orders at December 31, 2013.
Additional information on financial instrumentsFINANCIAL INSTRUMENTS - CARRYING AMOUNTS AND EFFECT ON INCOME STATEMENT AND EQUITYThe carrying amounts and effect on income statement and equity of financial instruments were as follows:
(€ million)
Financial instruments held for tradingNon-hedging derivatives (a) 8 (48) -
Receivables and payables and other assets (liabilities) measured at amortised costTrade and other receivables (b) 3,254 31 -
Financial receivables (a) 32 - -
Trade and other payables (c) 5,280 10 -
Financial payables (a) 6,116 (146) -
Net hedging derivative assets (liabilities) (d) 95 31 (45)
(a) The income statement effects relate only to the income (expense) indicated in Note 38 ‘Finance income (expense)’.(b) The income statement effects were recognised in ‘Purchases, services and other costs’ (expenses of €5 million relating to impairments and losses on receivables) and in ‘Finance income (expense)’(€36 million, relating to currency translation gains (losses) arising from adjustments to the year-end exchange rate).(c) The income statement effects of €10 million were recognised in ‘Finance income (expense)’ (currency translation gains (losses) arising from adjustments to the year-end exchange rate).(d) The income statement effects were recognised in ‘Net sales from operations’ and ‘Purchases, services and other’ (€47 million) and in ‘Finance income (expense)’ (€16 million).
FAIR VALUE OF FINANCIAL INSTRUMENTSBelow, financial assets and liabilities measured at fair value in the balance sheet are classified using the ‘fair value hierarchy’ based on the significanceof the inputs used in the measurement process. The fair value hierarchy consists of the following three levels:a) Level 1: quoted prices (unadjusted) in active markets for identical assets or liabilities;b) Level 2: inputs other than quoted prices included within Level 1 that are observable for the asset or liability, either directly (i.e. as prices) or indirectly
(i.e. derived from prices);c) Level 3: inputs for assets or liabilities that are not based on observable market data.Financial instruments measured at fair value at December 31, 2013 are classified as follows:
Dec. 31, 2013
(€ million) Level 1 Level 2 Level 3 Total
Held for trading financial assets (liabilities):
- non-hedging derivatives - 8 - 8
Available-for-sale financial assets:
- other assets available for sale 26 - - 26
Net hedging derivative assets (liabilities) - 95 - 95
Total 26 103 - 129
In the normal course of its business, Saipem uses various types of financial instrument. Information regarding their fair value is provided below.
NOTIONAL AMOUNTS OF DERIVATIVESThe notional amount of a derivative is an amount used as a reference to calculate the contractual payments to be exchanged. This amount may beexpressed in terms of a monetary or physical quantity (e.g. barrels, tonnes, etc.). Monetary quantities in foreign currencies are converted into euros atthe exchange rate prevailing at year end.Notional amounts of derivatives do not represent the amounts actually exchanged between the parties and do not therefore constitute a measure ofSaipem’s credit risk exposure, which is limited to the positive net fair value of derivative contracts at year end.
Carr
ying
amou
nt
Inco
me
(exp
ense
)re
cogn
ised
in th
e in
com
est
atem
ent
Inco
me
(exp
ense
)re
cogn
ised
in e
quity
120
Saipem Annual Report / Notes to the consolidated financial statements
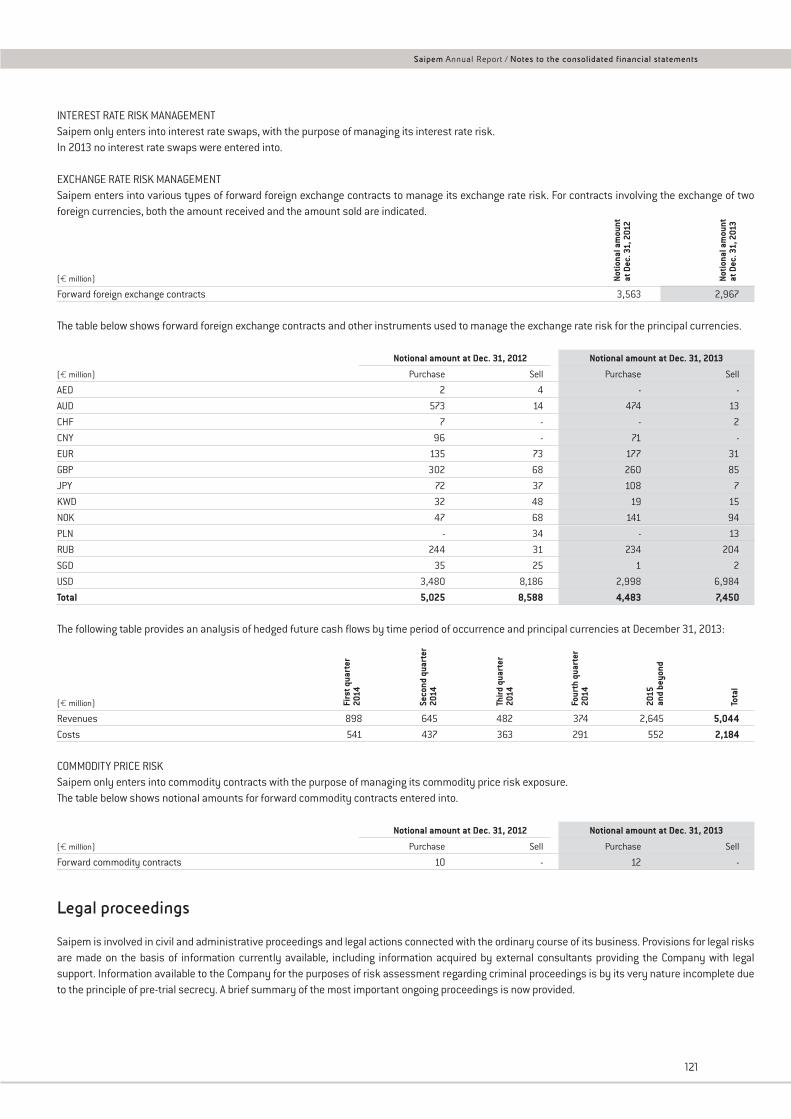
INTEREST RATE RISK MANAGEMENTSaipem only enters into interest rate swaps, with the purpose of managing its interest rate risk.In 2013 no interest rate swaps were entered into.
EXCHANGE RATE RISK MANAGEMENTSaipem enters into various types of forward foreign exchange contracts to manage its exchange rate risk. For contracts involving the exchange of twoforeign currencies, both the amount received and the amount sold are indicated.
(€ million)
Forward foreign exchange contracts 3,563 2,967
The table below shows forward foreign exchange contracts and other instruments used to manage the exchange rate risk for the principal currencies.
Notional amount at Dec. 31, 2012 Notional amount at Dec. 31, 2013
(€ million) Purchase Sell Purchase Sell
AED 2 4 - -
AUD 573 14 474 13
CHF 7 - - 2
CNY 96 - 71 -
EUR 135 73 177 31
GBP 302 68 260 85
JPY 72 37 108 7
KWD 32 48 19 15
NOK 47 68 141 94
PLN - 34 - 13
RUB 244 31 234 204
SGD 35 25 1 2
USD 3,480 8,186 2,998 6,984
Total 5,025 8,588 4,483 7,450
The following table provides an analysis of hedged future cash flows by time period of occurrence and principal currencies at December 31, 2013:
(€ million)
Revenues 898 645 482 374 2,645 5,044Costs 541 437 363 291 552 2,184
COMMODITY PRICE RISKSaipem only enters into commodity contracts with the purpose of managing its commodity price risk exposure.The table below shows notional amounts for forward commodity contracts entered into.
Notional amount at Dec. 31, 2012 Notional amount at Dec. 31, 2013
(€ million) Purchase Sell Purchase Sell
Forward commodity contracts 10 - 12 -
Legal proceedings
Saipem is involved in civil and administrative proceedings and legal actions connected with the ordinary course of its business. Provisions for legal risksare made on the basis of information currently available, including information acquired by external consultants providing the Company with legalsupport. Information available to the Company for the purposes of risk assessment regarding criminal proceedings is by its very nature incomplete dueto the principle of pre-trial secrecy. A brief summary of the most important ongoing proceedings is now provided.
Firs
t qua
rter
2014
Seco
nd q
uart
er20
14
Third
qua
rter
2014
Four
th q
uart
er20
14
2015
and
beyo
nd
Tota
l
Notio
nal a
mou
ntat
Dec
. 31,
201
2
Notio
nal a
mou
ntat
Dec
. 31,
201
3
121
Saipem Annual Report / Notes to the consolidated financial statements
CEPAV (Consorzio Eni per l’Alta Velocità) UnoSaipem has a 50.36% interest in the CEPAV Uno Consortium (‘the Consortium’), which in 1991 entered into an agreement with TAV SpA (‘TAV’, now ReteFerroviaria Italiana SpA - ‘RFI’) for the construction of the Milan-Bologna high-velocity/high-capacity railway line.In connection with this project, the Consortium asked the client for an extension to the works completion schedule and a supplementary payment ofapproximately €800 million, later revised to €1,770 million. The Consortium and RFI sought to reach an amicable settlement, but negotiations werecalled off on March 14, 2006, when the proposals put forward by RFI were deemed unsatisfactory by the Consortium. On April 27, 2006, the Consortiumsent a Notice of Arbitration to RFI, as provided for under the contract terms and conditions. On March 23, 2009, the Arbitration Panel, replying to anincidental question submitted to it by the parties, issued an interim award which in substance allowed RFI to carry out checks on accounting recordsincluding records related to subcontracts awarded by the Consortium and by contractors. Assuming that this interim award was vitiated, on April 8, 2010,the Consortium challenged it before the Rome Court of Appeal in order to have it annulled.Meanwhile, on August 7, 2012 the Arbitration Panel issued a partial decision deposited at the Arbitration Chamber for public contracts, awarding the sumof €54,253 million (€40,136 million for reservations and €14,117 million for simple interest at July 31, 2012), as well as the right to a monetaryadjustment, quantification of which was postponed until the final award, plus interest (simple and compound) from August 2, 2012 until completefulfilment of obligations. The Consortium thus issued RFI with an order for the payment of €54,254,012.17, which was duly paid by RFI to the Consortiumon February 7, 2013.On November 27, 2012, the Consortium filed three further notices of arbitration against RFI, respectively: (i) for €1,813,250,392.18, plus interest andinflation adjustments for damages arising from delays and the loss of the early completion premium and reserves; (ii) for €254,342,862.53, plus interestand inflation adjustments, for reserves related to variations to the scope of work; and (iii) for €40,730,012, plus interest and inflation adjustments, forreserves related to non-payment for partial inspections and pre-service testing. RFI did not appoint an arbitrator and on December 18, 2012, lodged anappeal pursuant to Article 700 of the Italian code of civil procedure before the Court of Rome requesting that the Court prohibit the Consortium from askingthe President of the Council of State to nominate RFI’s arbitrator. On February 20, the Court of Rome rejected the appeal of RFI and ordered it to pay thelegal costs of the Consortium. An appeal filed by RFI pursuant to Article 669-terdecies of the Italian code of civil procedure against the order of February20, 2013 was also rejected by the Court of Rome in a ruling dated June 11, 2013. RFI was again ordered to pay the Consortium’s legal fees.On July 24, 2013, the representatives of the Consortium and RFI met to sign a ‘proposed settlement agreement for disputes pending between the Parties’.In the weeks following the meeting, a Settlement Agreement was negotiated, which the parties signed on December 4, 2013. In accordance with theagreement, RFI paid the Consortium a total of €200 million, including the amount already paid on February 7, 2013 in connection with the partialarbitration award.Accordingly, the parties have withdrawn all outstanding disputes, while RFI has released to the Consortium 80% of performance bonds and retentionmonies.
TSKJ Consortium - Investigations by US, Italian and other overseas authoritiesSnamprogetti Netherlands BV has a 25% holding in the TSKJ Consortium of companies. The remaining interests are held in equal shares of 25% by KBR,Technip and JGC. From 1994, the TSKJ Consortium was involved in the construction of natural gas liquefaction facilities at Bonny Island, Nigeria.Snamprogetti SpA, the parent company of Snamprogetti Netherlands BV, was a direct subsidiary of Eni SpA until February 2006, when an agreement wasentered into for the sale of Snamprogetti SpA to Saipem SpA. Snamprogetti SpA was merged into Saipem SpA as of October 1, 2008. As part of the sale ofSnamprogetti SpA, Eni agreed to indemnify Saipem for potential losses resulting from the investigations into the TSKJ matter, including in connection withits subsidiaries.Various judicial authorities, including the Public Prosecutor’s office of Milan, have carried out investigations into alleged improper payments made by theTSKJ Consortium to certain Nigerian public officials. The proceedings in both the US and Nigeria have been resolved through settlements.The proceedings in Italy: the TSKJ matter has seen investigations by the Milan Public Prosecutor’s office against unknown persons since 2004. Since March10, 2009, the Company has received requests to produce documents from the Milan Public Prosecutor’s office. The investigation regards events dating backto 1994 and also concerns the period subsequent to the introduction of Legislative Decree No. 231 of June 8, 2001 regarding the administrativeresponsibility of companies. The proceedings brought by the Milan Public Prosecutor against Eni SpA and Saipem SpA related to administrative liability underLegislative Decree No. 231 of 2001 arising from offences of gross international corruption allegedly committed by two former managers of Snamprogetti.The Milan Public Prosecutor requested the application of precautionary measures pursuant to Legislative Decree No. 231 consisting in Saipem SpA andEni SpA being debarred from activities involving – directly or indirectly – any agreement with the Nigerian National Petroleum Corp and its subsidiaries,claiming the ineffectiveness and inadequacy and violation of the organisational, management and control model adopted to prevent the commission ofthe alleged offences by persons subject to direction and supervision.On November 17, 2009, the Judge for the Preliminary Investigation rejected the request for precautionary measures of disqualification filed by the MilanPublic Prosecutor against Saipem and Eni. The Milan Public Prosecutor subsequently appealed against this decision. On February 9, 2010, the Court ofAppeal, exercising the function of judicial review court, handed down its ruling, which dismissed as unfounded the appeal of the Milan Public Prosecutorand upheld the decision of the Judge for the Preliminary Investigation. On September 30, 2010, an appeal against this decision filed by the Milan PublicProsecutor was upheld by the Court of Cassation, which ruled that the request for precautionary measures was also admissible pursuant to Law No.231/2001 in cases of alleged international corruption. The Milan Public Prosecutor’s office subsequently withdrew its request for precautionary measuresagainst Eni and Saipem following the payment by Snamprogetti Netherlands BV of a deposit of €24,530,580, which was also on behalf of Saipem SpA.The accusations regarded alleged acts of corruption in Nigeria committed until and after July 31, 2004, with the aggravating circumstance of SnamprogettiSpA’s having allegedly obtained significant financial gain (indicated as being not less than US $65 million).
122
Saipem Annual Report / Notes to the consolidated financial statements
On December 3, 2010, Saipem’s defence counsel received notice of the scheduling of a preliminary hearing, accompanied by a request for committal totrial. On January 26, 2011, at the conclusion of the hearings, the Judge for the Preliminary Hearing ordered Saipem SpA (as the legal entity incorporatingSnamprogetti SpA) and five former Snamprogetti SpA employees to stand trial. The first trial hearing was held on May 10, 2011.During February 2012, following a request made by the defence to this effect, the Court dismissed the charges against the physical persons underinvestigation, ruling that they had expired under the statute of limitations. The Court also ordered a separate trial for the continuation of proceedingsagainst the legal person of Saipem SpA only, scheduling a series of hearings.On July 11, 2013, once the pre-trial and the trial hearings had been declared closed and the parties had presented their conclusions, the Court of Milanruled that Saipem SpA had committed the unlawful administrative act, but accepted the existence of the attenuating circumstances provided for by Article12, No. 2, letter a) of Legislative Decree No. 231/2001, sentencing the Company to pay a total fine of €600,000 and ordering the confiscation of thedeposit of €24,530,580 posted by Snamprogetti Netherlands BV.Saipem’s involvement in the investigation into the activity of the TSKJ Consortium in Nigeria during the period 1994-2004 is due solely to the fact that in2006 Saipem SpA acquired Snamprogetti SpA, the parent company of Snamprogetti Netherlands BV, which holds a 25% stake in the TSKJ Consortium.The decision taken by the Court has no financial impact on Saipem since Eni, at the time of the sale of Snamprogetti SpA to Saipem, undertook to indemnifySaipem for losses sustained in connection with the TSKJ matter.On September 17, 2013, the Court of Milan made the reasons for its verdict known, ahead of the October 9 deadline. The Company has lodged an appealagainst the first instance ruling.
AlgeriaOn February 4, 2011, the Milan Public Prosecutor’s office, through Eni, requested the transmission of documentation pursuant to Article 248 of the ItalianCode of Criminal Procedure relating to the activities of Saipem Group companies in Algeria in connection with an allegation of international corruption. Thecrime of ‘international corruption’ specified in the request is one of the offences punishable under Legislative Decree No. 231 of June 8, 2001 inconnection with the direct liability of collective entities for crimes committed by their own employees.The collection of documentation was commenced in prompt compliance with the request, and on February 16, 2011, Saipem filed the material requested.On November 22, 2012, Saipem SpA received a notification of inquiry from the Public Prosecutor of the Court of Milan related to unlawful administrativeacts arising from the crime of international corruption pursuant to Article 25, paragraphs 2 and 3 of Legislative Decree No. 231/2001, together with arequest to provide documentation regarding a number of contracts connected with activities in Algeria.This request was followed by notification of a seizure order on November 30, 2012, two further requests for documentation on December 18, 2012 andFebruary 25, 2013 and the issue of a search warrant on January 16, 2013.On February 7, 2013, a further search, which included offices belonging to Eni SpA, was conducted to obtain additional documentation relating to brokeragecontracts and subcontracts entered into by Saipem in connection with its Algerian projects.The subject of the investigations are allegations of corruption which, according to the Milan Public Prosecutor, occurred up until March 2010 in relation toa number of contracts the Company was awarded in Algeria.Persons subject to investigation include a current employee and several former employees of the Company, including the former Deputy Chairman andCEO and the former Chief Operating Officer of the Engineering & Construction Business Unit. The Company collaborated fully with the Prosecutor’s Officeon every occasion and rapidly implemented decisive managerial and administrative restructuring measures, irrespective of any liability that might resultfrom the investigations.In agreement with its Internal Control Bodies and the Compliance Committee, and having duly informed the Prosecutor’s Office, Saipem performed its ownchecks on the contracts that are subject to investigation, and to this end appointed an external legal firm. On July 17, 2013, the Board of Directors analysedthe conclusions reached by the external consultants following an internal investigation carried out in relation to a number of brokerage contracts andsubcontracts regarding projects in Algeria. The internal investigation was based on the examination of documents and interviews of personnel from theCompany and other companies in the Group, excluding those who, to the best knowledge of the Company, were directly involved in the criminalinvestigation, so as not to interfere with the investigative activities of the Prosecutor. The Board, confirming its full cooperation with the investigativeauthorities, has decided to convey the findings of the external consultants to the Public Prosecutor of Milan, for assessment and appropriate action withinthe wider context of the ongoing investigation. The consultants reported to the Board: (i) that they found no evidence of payments to Algerian publicofficials through the brokerage contracts or subcontracts examined; and (ii) that they found violations, deemed detrimental to the interests of theCompany, of internal rules and procedures – in force at the time – in relation to the approval and management of brokerage contracts and subcontractsexamined and a number of activities in Algeria.The Board has decided to initiate legal action against certain former employees and suppliers in order to protect the interests of the Company, reservingthe right to take any further action necessary should additional information emerge.On June 14, 2013, the Saipem SpA legal counsel received notification of a first request submitted by the Milan Public Prosecutor’s office for an extensionto the Preliminary Investigations of at least six months. Notification of a second request for an extension to the Preliminary Investigations of a further sixmonths was received on January 8, 2014.Meanwhile, at the request of the US Department of Justice (‘DoJ’), Saipem SpA has entered into a ‘tolling agreement’ which extends by 6 months thelimitation period applicable to any possible violations of federal laws of the United States in relation to previous activities of Saipem and its subsidiaries.The tolling agreement, which was recently renewed until May 2014, does not constitute an admission by Saipem SpA of having committed any unlawfulact, nor does it imply any recognition on the Company’s part of United States jurisdiction in relation to any investigation or proceedings. Saipem thereforeintends to offer its complete cooperation in relation to investigations by the US authorities.
123
Saipem Annual Report / Notes to the consolidated financial statements
We also note that investigations commenced in 2010 into the activities of third parties are still underway in Algeria in relation to which a number of SaipemContracting Algérie SpA’s current accounts in local currency were frozen. Some of these bank accounts were subsequently unfrozen, although two inAlgerian Dinar, containing in total the equivalent of €80,055,735 (calculated at the exchange rate prevailing on December 31, 2013) remain frozen.The two bank accounts in question relate to the Menzel Ledjmet Est (‘MLE’ and GK3 pipeline projects). The frozen MLE bank account is no longer used forMLE project payments, while the GK3 bank account is still being used to receive contractual payments in Algerian Dinars due in relation to the project. Theoutstanding payments amount to an approximate equivalent of €13,840,831 (calculated at the exchange rate prevailing on December 31, 2013).In August 2012, Saipem Contracting Algérie SpA received formal notice that an investigation was underway into the company upon the matter’s referral tothe Chambre d’accusation at the Court of Algiers. Saipem Contracting Algérie SpA is alleged to have taken advantage of the authority or influence ofrepresentatives of a government-owned industrial and trading company in order to inflate prices in relation to contracts awarded by that company.On January 30, 2013, the ‘Chambre d’accusation’ ordered Saipem Contracting Algérie SpA to stand trial and further ordered that the aforementioned bankaccounts remain frozen. Saipem Contracting Algérie SpA has lodged an appeal at the Supreme Court. Finally, we note that on March 24, 2013, a search wascarried out on the premises of Saipem Contracting Algérie SpA.Subsequently, on March 28, 2013, the then legal representative of Saipem Contracting Algérie SpA was summoned to appear at the Court of Algiers, wherehe received verbal notification from the investigating Judge of an investigation underway ‘into Saipem for charges pursuant to Article 25 a, 32 and 53 ofAnti-corruption Law No. 01/2006’. The investigating Judge also requested documentation (articles of association) and other information concerningSaipem Contracting Algérie SpA, Saipem SpA and Saipem SA.On April 18, 2013, a hearing was held before the Algerian Supreme Court which rejected a request to unfreeze the abovementioned bank accounts that hadbeen made by Saipem Contracting Algérie SpA in 2010.Subsequently, on May 18, 19 and 20, 2013, additional searches were carried out at two Algerian offices belonging to Saipem Contracting Algérie SpA,during which documentation relating to Saipem subcontractors was requested.The investigations in Algeria are still currently ongoing.
KuwaitOn June 21, 2011, a warrant requested by the Milan Public Prosecutor was served on Saipem for the search of the office of a Saipem employee. The warrantwas issued in connection with alleged crimes committed by said employee together with third parties related to the award of tenders by Saipem SpA tothird companies for a project in Kuwait.In connection with the same matter, the Public Prosecutor also served a notice of indictment upon Saipem SpA pursuant to Italian Legislative Decree No.231/2001. In this regard, the Company believes that its position will be successfully cleared, since it is the injured party in respect of the illicit conductunder investigation.Having consulted its lawyers, and in agreement with the Compliance Committee Auditors and the Internal Control Bodies, Saipem, through its InternalAudit function, and also using an external consulting company, promptly undertook an internal audit of the project under investigation.As a precautionary measure, and in compliance with the contract in force, Saipem suspended the employee under investigation while awaiting furtherdevelopments.The audit showed that the Saipem SpA employee in question was not involved in anything worthy of note. The suspension was therefore lifted and theemployee assigned to other duties.The Public Prosecutor ordered the release of the documents seized from the employee in relation to the matter.On March 2, 2012, Saipem SpA was served a request to extend the preliminary investigations filed by the Public Prosecutor.As of such date, the Company has received no further notifications, nor has there been any further news or evidence of any developments in the investigations.
EniPower - Enquiries by the JudiciaryAs part of the inquiries commenced by the Milan Public Prosecutor (criminal proceedings 2460/2003 R.G.N.R. pending at the Milan Public Prosecutor’soffice) into contracts awarded by EniPower to various companies, Snamprogetti SpA (now Saipem SpA as engineering and procurement servicescontractor), together with other parties, were served a notice informing them that they were under investigation pursuant to Article 25 of LegislativeDecree No. 231/2001. Preliminary investigations ended in August 2007, with a favourable outcome for Snamprogetti SpA, which was not included amongthe parties still under investigation for whom committals for trial were requested.Snamprogetti subsequently brought proceedings against the physical and legal persons implicated in transactions relating to the Company and reachedsettlements with a number of parties that requested the application of settlement procedures. Following the conclusion of the preliminary hearing, criminalproceedings continued against former employees of the above companies as well as against employees and managers of a number of their suppliers,pursuant to Legislative Decree No. 231/2001. Eni SpA, EniPower SpA and Snamprogetti SpA presented themselves as plaintiffs in the preliminary hearing.The preliminary hearing related to the main proceeding concluded on April 27, 2009. The Judge for the preliminary hearing requested that all parties that didnot request the application of plea agreements stand trial, with the exception of a number of parties for whom the statute of limitations applied.In the hearing of March 2, 2010, the Court confirmed the admission as plaintiffs of Eni SpA, EniPower SpA and Saipem SpA against the defendants underthe provisions of Legislative Decree No. 231/2001. The defendants of the other companies involved were also sued. The examination of the witnesses wascompleted and the parties presented their conclusions. Subsequently, at the hearing of September 20, 2011, sentence was passed which includedseveral convictions and acquittals for numerous physical and legal defendants, the latter being deemed responsible for unlawful administrative acts, withfines being imposed and value confiscation for significant sums ordered. The Court likewise rejected the admission as plaintiffs of the parties accused ofunlawful administrative acts pursuant to Legislative Decree No. 231/2001.
124
Saipem Annual Report / Notes to the consolidated financial statements
On December 19, 2011 the grounds for the ruling were filed with the office of the clerk of the court.The convicted parties promptly filed an appeal against the above sentence. On October 24, 2013, the Milan Court of Appeal essentially confirmed the firstinstance ruling, which it modified only partially in relation to a number of physical persons against whom it dismissed the charges, ruling that they hadexpired under the statute of limitations.
Fos CavaouWith reference to the Fos Cavaou (‘FOS’) project for the construction of the regasification terminal, arbitration proceedings are pending before theInternational Chamber of Commerce in Paris (‘Paris ICC’) between the client Société du Terminal Méthanier de Fos Cavaou (‘STMFC’, now Fosmax LNG) andthe contractor STS (a French ‘société en participation’ made up of Saipem SA (50%), Tecnimont SpA (49%) and Sofregaz SA (1%)).On July 11, 2011, the parties signed a mediation memorandum pursuant to the rules of Conciliation and Arbitration of the Paris ICC. The mediationprocedure ended on December 31, 2011 without agreement having been reached, as Fosmax LNG refused to extend the deadline.On January 24, 2012, the secretariat of the International Arbitration Court of the Paris ICC notified STS of the commencement of arbitration proceedings asrequested by Fosmax LNG. The brief filed by Fosmax LNG in support of its request for arbitration included a demand for payment of approximately €264million for damages allegedly suffered, penalties for delays and costs for the completion of works (‘mise en régie’). Of the total sum demanded,approximately €142 million is for loss of profit, an item excluded from the contract except for cases of malice or gross negligence. STS is of the opinionthat no acts of gross negligence or wilful misconduct capable of rendering the contractual limitation of liability inapplicable, as Fosmax LNG maintains,have been committed.STS has filed its defence brief, including a counterclaim for damages due to the excessive interference of Fosmax LNG in works execution and as paymentfor extra works not recognised by the client (reserving the right to quantify the amount of such extra works at a later stage in proceedings). On October19, 2012, Fosmax LNG lodged a ‘Mémoire en demande’. Against this, STS lodged its own ‘Mémoire en défense’ on January 28, 2013, in which it filed acounterclaim for €338 million.The final hearing was held on April 1, while the award is expected to be issued at the end of 2014.
Arbitration on Menzel Ledjmet Est project, AlgeriaWith regard to the contract entered into on March 22, 2009, by Saipem SpA and Saipem Contracting Algérie SpA (collectively, ‘Saipem’) on the one handand Société Nationale pour la Recherche, la Production, le Transport, la Transformation et la Commercialisation des Hydrocarbures SpA (‘Sonatrach’) andFirst Calgary Petroleums LP (collectively, the ‘Client’) on the other, for the engineering, procurement and construction of the natural gas gathering andtreatment plant and related export pipelines in the Menzel Ledjmet Est field in Algeria on December 23, 2013, Saipem filed a request for arbitration withthe International Chamber of Commerce in Paris (‘Paris ICC’). The Client was notified of the request on January 8, 2014.In its request for arbitration, Saipem has asked the arbitral tribunal to grant: (i) an extension of 14.5 months to the contractual term; and (ii) Saipem’s rightto receive approximately €580 million (less the €145.8 million already paid by First Calgary Petroleums LP) relating to an increase in the contract pricefor the extension of the contract terms, variation orders, unpaid invoices past due and spare parts, as well as a sum yet to be quantified for havingcompleted the works in advance of the contractually agreed term.Both Sonatrach and First Calgary Petroleums LP (this latter wholly owned by the Eni Group since 2008) have appointed their arbitrator, while the presidentof the arbitral tribunal is currently being appointed.
Arbitration proceedings regarding LPG project in Algeria With reference to contract for the construction of the LDHP ZCINA plant for the ‘extraction des liquides des gaz associés Hassi Messaoud et séparationd’huile’ (LDHP ZCINA unit for extraction of liquids from associated gas from the Hassi Messaoud field and oil-gas separation), entered into on November12, 2008 between on the one hand Sonatrach and on the other Saipem SA and Saipem Contracting Algérie SpA (collectively ‘Saipem’), on March 14, 2014,Saipem filed a request for arbitration with the International Chamber of Commerce in Paris.Saipem has asked the Arbitration Panel to order Sonatrach to pay the equivalent of circa €171.1 million for additional costs incurred as contractor duringthe execution of the project in relation to variation orders, time extensions, force majeure, non-payment or late payment of invoices and related interest.Sonatrach is required to file its answer within 30 days of receiving the application for arbitration.
Relations with ConsobWith regard to Saipem’s relations with Consob, the following events occurred during 2013.a) Following the issue by Saipem SpA of its press release of January 29, 2013, in which it revised its 2012 earnings guidance and its outlook for 2013,
Saipem received a communication from Consob dated January 31, 2013 asking it to reconstruct the process of evaluation and the considerations thatled to the decision to issue the press release in question, to describe the information and data used to arrive at the revision of its guidance for 2012and 2013 profit and its outlook for 2014, and to provide a list of persons included in the register maintained pursuant to Article 115-bis of theConsolidated Finance Act who had access to the data and information referred to in the press release.Subsequently, in a letter dated February 1, 2013, Consob announced the commencement of an inspection of Saipem pursuant to Article 187-octies,paragraph 3 of Legislative Decree No. 58 of February 24, 1998 with the purpose of gathering documents and information regarding the preparation ofthe press release, the handling of privileged information, and compliance with legislation concerning transactions by relevant parties.Consob’s inspection of Saipem offices, which commenced on February 4, 2013, following a letter of assignment dated February 1, 2013, was concludedon June 7, 2013 with the issue of a record of documents seized.
125
Saipem Annual Report / Notes to the consolidated financial statements
b) On June 19, 2013, Consob sent Saipem SpA notification of charges concerning a number of violations of Article 115-bis of Legislative Decree No.58/1998 which the regulator said it had found evidence of.According to Consob, the violations regarded:(i) procedures for the maintenance of the register of persons with access to inside information;(ii) the Company’s failure to make certain entries or tardiness in making such entries or the incompleteness of such entries.The charges notified regard violations punishable by administrative sanctions. Consob will issue a decision after examining the Company’s argumentswithin a maximum of 360 days starting from June 19, 2013.
c) On June 20, 2013, Consob sent the Saipem SpA Board of Statutory Auditors and Saipem SpA, as joint obligor, notification of charges regarding allegedviolations of Article 149, paragraph 3 of Legislative Decree No. 58/1998 committed by the Board. Article 149 requires the Board of Statutory Auditorsto report to Consob without delay on any irregularities it encounters during its supervisory duties and to transmit all relevant minutes of meetings andinspections conducted as well as any other relevant documentation.Consob believes that, during the period June 2011-September 2012, the Board of Statutory Auditors should have reported to Consob on irregularities itdetected in relation to a number of situations that had led to requests for inspections by the Company’s Internal Audit function and externalconsultants and in relation to which the Board had requested in 2011 corrective and improvement actions to the Company’s system of internalcontrols.The situations cited by Consob related to:1) exceptions made to procedures in connection with contractual relations with a supplier on the Kuwait project;2) irregularities concerning a number of contracts awarded to Saipem in Iraq consisting of a failure to comply with Company procedures; 3) fraud committed until 2011 by a former employee of Saipem’s Indian branch.In a reply sent to Consob in February 2013, the Board of Statutory Auditors stated that it had not considered the critical issues and irregularitiesdetected as requiring reporting to Consob pursuant to Article 149, paragraph 3, of the Consolidated Finance Act. Consob however indicated that it hadsent its notification of charges based on the assumption that the Board of Statutory Auditors is ‘required to report any irregularity whatsoeverencountered during its supervision of the correctness of operations and the adequacy of the system of internal controls’.On July 23, 2013, the Board of Statutory Auditors submitted a comprehensive brief containing its own arguments in response to the communicationreceived from Consob, in which it asserted that that there were no grounds for considering the questions as ‘irregularities’ having relevance pursuantto Article 149, paragraph 3 of the Consolidated Finance Act, in view of the characteristics and significance of the facts in relation to the dimensions,structures and organisational complexity of the Saipem Group. The Board of Statutory Auditors also noted in its brief the diligence and rapidity of its own actions, which saw the launch of an audit with assistancefrom external consultants, the issue of recommendations for possible corrective actions and continual monitoring of their implementation by theCompany. The charges notified regard alleged violations punishable by administrative sanction.Consob will issue a decision after examining the Board of Statutory Auditors’ arguments, within a maximum of 360 days starting from June 20, 2013.Saipem also received the notification since, under the law, in the event of the application of administrative sanction, the Company is also held jointlyresponsible.
d) On July 19, 2013, Consob advised Saipem that it was commencing proceedings based upon an alleged failure to comply with international accountingstandards in the preparation of Saipem’s separate and consolidated financial statements as of December 31, 2012, particularly IAS 11, concerning thevaluation of certain long-term contracts. In its notice, Consob made particular reference to the contracts that were the subject of the profit warning onJune 14, 2013, whose economic impact was reflected in the interim report as of June 30, 2013. Consob alleged that the impact of the revised expectedprofitability of these contracts did not pertain to 2013. Saipem promptly provided its response to Consob, producing documentation supporting theassessments that were made of the long-term contracts and the opinion of a qualified, independent expert on the conformity of the valuationmethodologies used with IAS 11.Following the Company’s press release of October 28, 2013 and a series of further exchanges of information, the regulatory authority Consob declared,in a ruling issued on December 5, 2013 that, based on the contents of the press release, the proceedings commenced on July 19, 2013 with regard toa potential ‘non-compliance with international accounting standards’ of the separate and consolidated financial statements as at and for the yearended 2012 had been closed.The content of Consob’s communication of December 5, 2013 is shown below: “RE: Proceedings 1612/2013 - Non-compliance of the separate and consolidated financial statements at and for the year ended December 31, 2012 ofSaipem SpA with Article 154-ter, paragraph 7, or Article 157, paragraph 2 of Legislative Decree No. 58/1998 - Communication regarding conclusion ofproceedings and request pursuant to Article 114, paragraph 5 of Legislative Decree No. 58/1998. We refer herein to proceedings 1612/2013 commenced by this Division on July 19, 2013 regarding the adoption of measures pursuant to Article154-ter, paragraph 7, or Article 157, paragraph 2 of Legislative Decree No. 58/1998 in relation to a potential non-compliance with internationalaccounting standards of the separate and consolidated financial statements of Saipem SpA as at and for the year ended December 31, 2012 andsubsequent correspondence with the Company in question.We also refer to the press release issued by the Company on October 28, 2013 on the occasion of the approval of its Interim Report at September 30, 2013,in which the Company states, inter alia, that ‘In light of the comments made by Consob in its notice of July 19, 2013, and for the sole purpose of preventingany possible differences with Consob in relation to the interpretation and application of accounting principles (in particular IAS 11) to its financialstatements, Saipem prepared pro-forma balance sheets as of January 1, 2013, June 30, 2013 and September 30, 2013, which reflect the allocation of costs
126
Saipem Annual Report / Notes to the consolidated financial statements
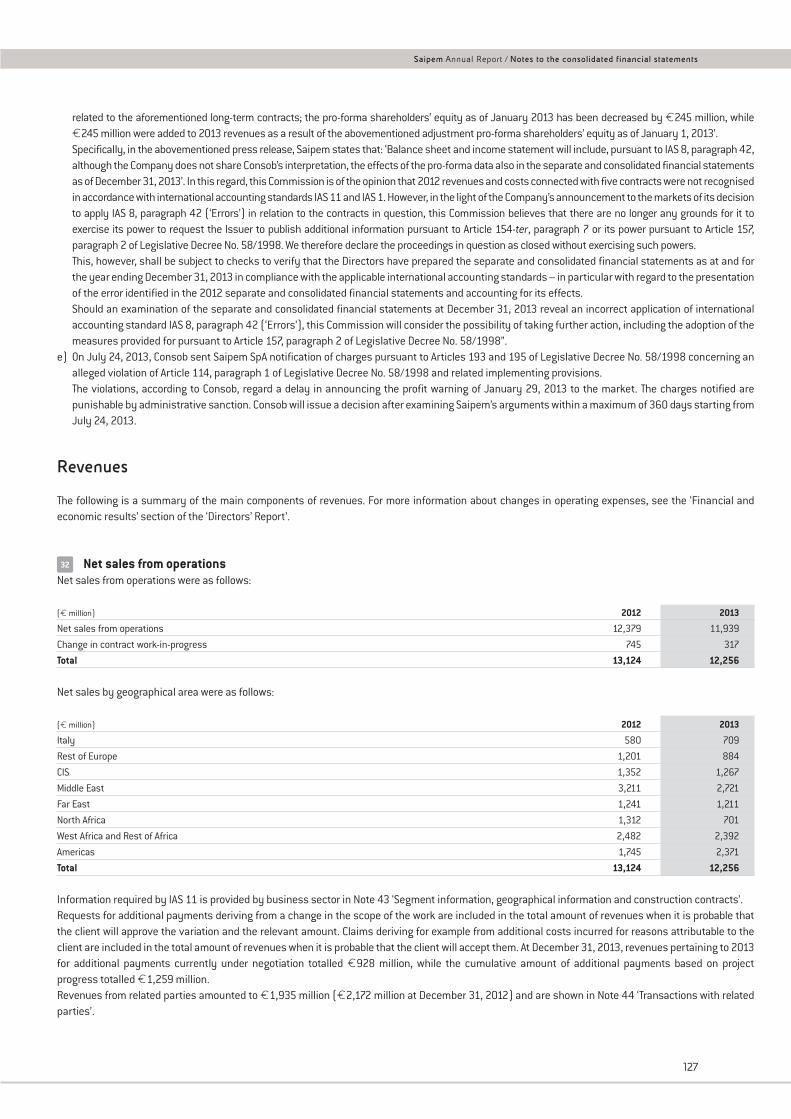
related to the aforementioned long-term contracts; the pro-forma shareholders’ equity as of January 2013 has been decreased by €245 million, while€245 million were added to 2013 revenues as a result of the abovementioned adjustment pro-forma shareholders’ equity as of January 1, 2013’. Specifically, in the abovementioned press release, Saipem states that: ‘Balance sheet and income statement will include, pursuant to IAS 8, paragraph 42,although the Company does not share Consob’s interpretation, the effects of the pro-forma data also in the separate and consolidated financial statementsas of December 31, 2013’. In this regard, this Commission is of the opinion that 2012 revenues and costs connected with five contracts were not recognisedin accordance with international accounting standards IAS 11 and IAS 1. However, in the light of the Company’s announcement to the markets of its decisionto apply IAS 8, paragraph 42 (‘Errors’) in relation to the contracts in question, this Commission believes that there are no longer any grounds for it toexercise its power to request the Issuer to publish additional information pursuant to Article 154-ter, paragraph 7 or its power pursuant to Article 157,paragraph 2 of Legislative Decree No. 58/1998. We therefore declare the proceedings in question as closed without exercising such powers.This, however, shall be subject to checks to verify that the Directors have prepared the separate and consolidated financial statements as at and forthe year ending December 31, 2013 in compliance with the applicable international accounting standards – in particular with regard to the presentationof the error identified in the 2012 separate and consolidated financial statements and accounting for its effects.Should an examination of the separate and consolidated financial statements at December 31, 2013 reveal an incorrect application of internationalaccounting standard IAS 8, paragraph 42 (‘Errors’), this Commission will consider the possibility of taking further action, including the adoption of themeasures provided for pursuant to Article 157, paragraph 2 of Legislative Decree No. 58/1998”.
e) On July 24, 2013, Consob sent Saipem SpA notification of charges pursuant to Articles 193 and 195 of Legislative Decree No. 58/1998 concerning analleged violation of Article 114, paragraph 1 of Legislative Decree No. 58/1998 and related implementing provisions.The violations, according to Consob, regard a delay in announcing the profit warning of January 29, 2013 to the market. The charges notified arepunishable by administrative sanction. Consob will issue a decision after examining Saipem’s arguments within a maximum of 360 days starting fromJuly 24, 2013.
Revenues
The following is a summary of the main components of revenues. For more information about changes in operating expenses, see the ‘Financial andeconomic results’ section of the ‘Directors’ Report’.
Net sales from operationsNet sales from operations were as follows:
(€ million) 2012 2013
Net sales from operations 12,379 11,939
Change in contract work-in-progress 745 317
Total 13,124 12,256
Net sales by geographical area were as follows:
(€ million) 2012 2013
Italy 580 709
Rest of Europe 1,201 884
CIS 1,352 1,267
Middle East 3,211 2,721
Far East 1,241 1,211
North Africa 1,312 701
West Africa and Rest of Africa 2,482 2,392
Americas 1,745 2,371
Total 13,124 12,256
Information required by IAS 11 is provided by business sector in Note 43 ‘Segment information, geographical information and construction contracts’.Requests for additional payments deriving from a change in the scope of the work are included in the total amount of revenues when it is probable thatthe client will approve the variation and the relevant amount. Claims deriving for example from additional costs incurred for reasons attributable to theclient are included in the total amount of revenues when it is probable that the client will accept them. At December 31, 2013, revenues pertaining to 2013for additional payments currently under negotiation totalled €928 million, while the cumulative amount of additional payments based on projectprogress totalled €1,259 million.Revenues from related parties amounted to €1,935 million (€2,172 million at December 31, 2012) and are shown in Note 44 ‘Transactions with relatedparties’.
32
127
Saipem Annual Report / Notes to the consolidated financial statements
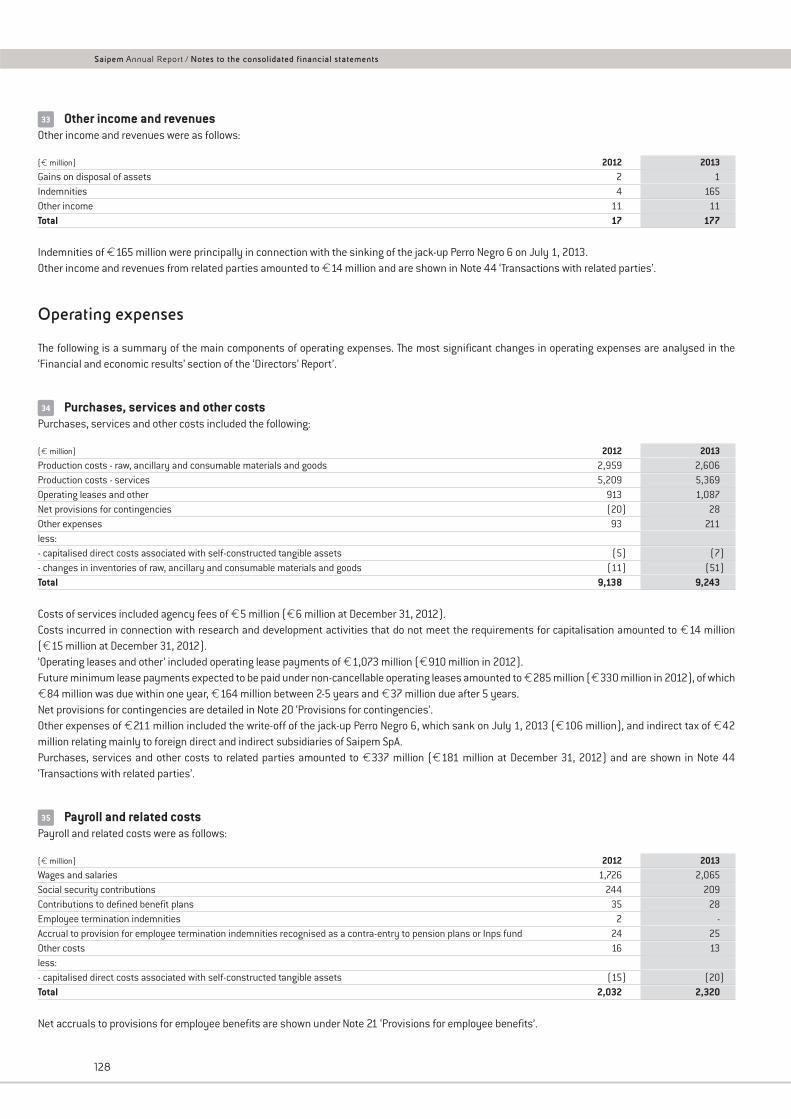
Other income and revenuesOther income and revenues were as follows:
(€ million) 2012 2013Gains on disposal of assets 2 1Indemnities 4 165Other income 11 11Total 17 177
Indemnities of €165 million were principally in connection with the sinking of the jack-up Perro Negro 6 on July 1, 2013.Other income and revenues from related parties amounted to €14 million and are shown in Note 44 ‘Transactions with related parties’.
Operating expenses
The following is a summary of the main components of operating expenses. The most significant changes in operating expenses are analysed in the‘Financial and economic results’ section of the ‘Directors’ Report’.
Purchases, services and other costsPurchases, services and other costs included the following:
(€ million) 2012 2013Production costs - raw, ancillary and consumable materials and goods 2,959 2,606Production costs - services 5,209 5,369Operating leases and other 913 1,087Net provisions for contingencies (20) 28Other expenses 93 211less:- capitalised direct costs associated with self-constructed tangible assets (5) (7)- changes in inventories of raw, ancillary and consumable materials and goods (11) (51)Total 9,138 9,243
Costs of services included agency fees of €5 million (€6 million at December 31, 2012).Costs incurred in connection with research and development activities that do not meet the requirements for capitalisation amounted to €14 million(€15 million at December 31, 2012).‘Operating leases and other’ included operating lease payments of €1,073 million (€910 million in 2012).Future minimum lease payments expected to be paid under non-cancellable operating leases amounted to €285 million (€330 million in 2012), of which€84 million was due within one year, €164 million between 2-5 years and €37 million due after 5 years.Net provisions for contingencies are detailed in Note 20 ‘Provisions for contingencies’.Other expenses of €211 million included the write-off of the jack-up Perro Negro 6, which sank on July 1, 2013 (€106 million), and indirect tax of €42million relating mainly to foreign direct and indirect subsidiaries of Saipem SpA.Purchases, services and other costs to related parties amounted to €337 million (€181 million at December 31, 2012) and are shown in Note 44‘Transactions with related parties’.
Payroll and related costsPayroll and related costs were as follows:
(€ million) 2012 2013Wages and salaries 1,726 2,065Social security contributions 244 209Contributions to defined benefit plans 35 28Employee termination indemnities 2 -Accrual to provision for employee termination indemnities recognised as a contra-entry to pension plans or Inps fund 24 25Other costs 16 13less:- capitalised direct costs associated with self-constructed tangible assets (15) (20)Total 2,032 2,320
Net accruals to provisions for employee benefits are shown under Note 21 ‘Provisions for employee benefits’.
35
34
33
128
Saipem Annual Report / Notes to the consolidated financial statements
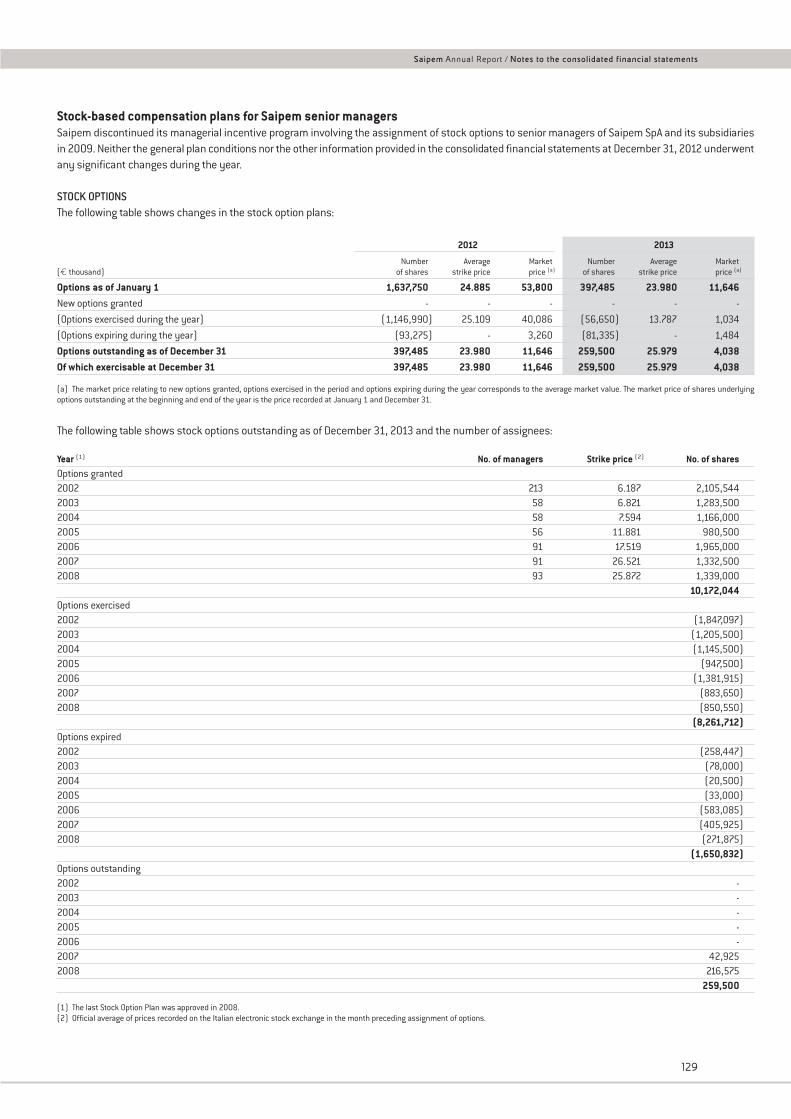
Stock-based compensation plans for Saipem senior managersSaipem discontinued its managerial incentive program involving the assignment of stock options to senior managers of Saipem SpA and its subsidiariesin 2009. Neither the general plan conditions nor the other information provided in the consolidated financial statements at December 31, 2012 underwentany significant changes during the year.
STOCK OPTIONSThe following table shows changes in the stock option plans:
2012 2013
Number Average Market Number Average Market(€ thousand) of shares strike price price (a) of shares strike price price (a)
Options as of January 1 1,637,750 24.885 53,800 397,485 23.980 11,646New options granted - - - - - -
(Options exercised during the year) (1,146,990) 25.109 40,086 (56,650) 13.787 1,034
(Options expiring during the year) (93,275) - 3,260 (81,335) - 1,484
Options outstanding as of December 31 397,485 23.980 11,646 259,500 25.979 4,038Of which exercisable at December 31 397,485 23.980 11,646 259,500 25.979 4,038
(a) The market price relating to new options granted, options exercised in the period and options expiring during the year corresponds to the average market value. The market price of shares underlyingoptions outstanding at the beginning and end of the year is the price recorded at January 1 and December 31.
The following table shows stock options outstanding as of December 31, 2013 and the number of assignees:
Year (1) No. of managers Strike price (2) No. of sharesOptions granted2002 213 6.187 2,105,5442003 58 6.821 1,283,5002004 58 7.594 1,166,0002005 56 11.881 980,5002006 91 17.519 1,965,0002007 91 26.521 1,332,5002008 93 25.872 1,339,000
10,172,044Options exercised2002 (1,847,097)2003 (1,205,500)2004 (1,145,500)2005 (947,500)2006 (1,381,915)2007 (883,650)2008 (850,550)
(8,261,712)Options expired2002 (258,447)2003 (78,000)2004 (20,500)2005 (33,000)2006 (583,085)2007 (405,925)2008 (271,875)
(1,650,832)Options outstanding2002 -2003 -2004 -2005 -2006 -2007 42,9252008 216,575
259,500
(1) The last Stock Option Plan was approved in 2008.(2) Official average of prices recorded on the Italian electronic stock exchange in the month preceding assignment of options.
129
Saipem Annual Report / Notes to the consolidated financial statements
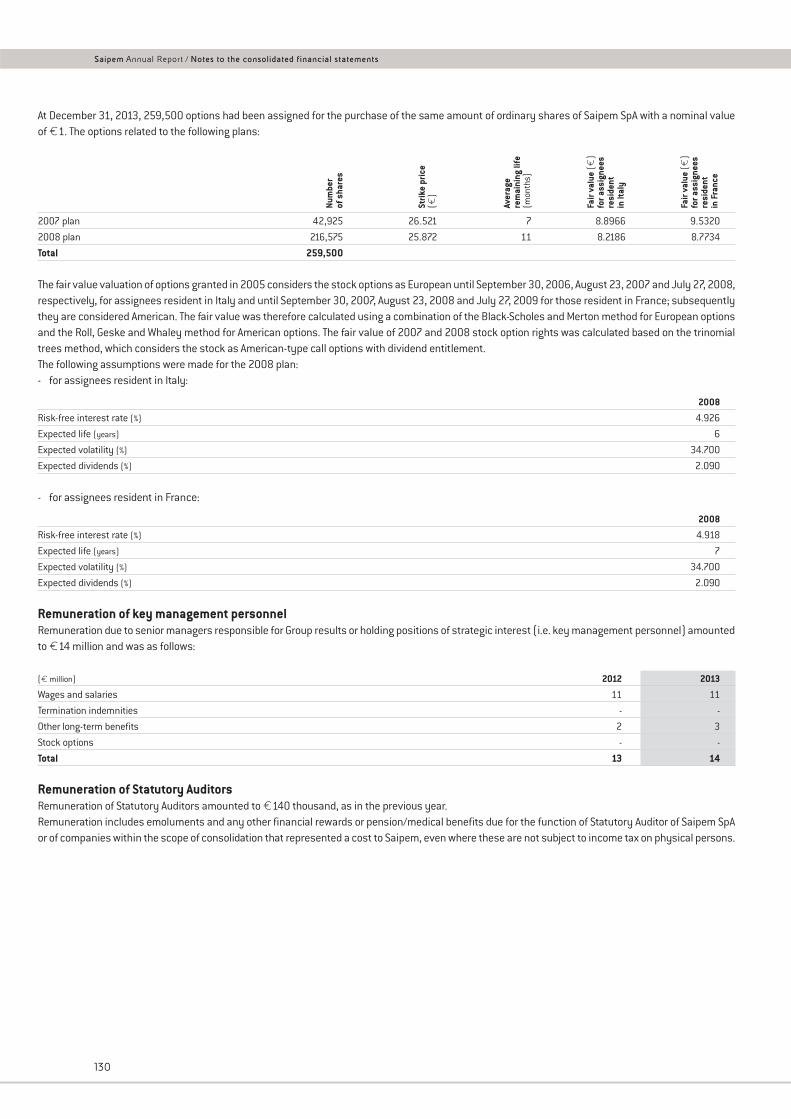
At December 31, 2013, 259,500 options had been assigned for the purchase of the same amount of ordinary shares of Saipem SpA with a nominal valueof €1. The options related to the following plans:
2007 plan 42,925 26.521 7 8.8966 9.5320
2008 plan 216,575 25.872 11 8.2186 8.7734
Total 259,500
The fair value valuation of options granted in 2005 considers the stock options as European until September 30, 2006, August 23, 2007 and July 27, 2008,respectively, for assignees resident in Italy and until September 30, 2007, August 23, 2008 and July 27, 2009 for those resident in France; subsequentlythey are considered American. The fair value was therefore calculated using a combination of the Black-Scholes and Merton method for European optionsand the Roll, Geske and Whaley method for American options. The fair value of 2007 and 2008 stock option rights was calculated based on the trinomialtrees method, which considers the stock as American-type call options with dividend entitlement.The following assumptions were made for the 2008 plan:- for assignees resident in Italy:
2008
Risk-free interest rate (%) 4.926
Expected life (years) 6
Expected volatility (%) 34.700
Expected dividends (%) 2.090
- for assignees resident in France:
2008
Risk-free interest rate (%) 4.918
Expected life (years) 7
Expected volatility (%) 34.700
Expected dividends (%) 2.090
Remuneration of key management personnelRemuneration due to senior managers responsible for Group results or holding positions of strategic interest (i.e. key management personnel) amountedto €14 million and was as follows:
(€ million) 2012 2013
Wages and salaries 11 11
Termination indemnities - -
Other long-term benefits 2 3
Stock options - -
Total 13 14
Remuneration of Statutory AuditorsRemuneration of Statutory Auditors amounted to €140 thousand, as in the previous year.Remuneration includes emoluments and any other financial rewards or pension/medical benefits due for the function of Statutory Auditor of Saipem SpAor of companies within the scope of consolidation that represented a cost to Saipem, even where these are not subject to income tax on physical persons.
Num
ber
of s
hare
s
Strik
e pr
ice
(€)
Aver
age
rem
aini
ng li
fe(m
onth
s)
Fair
valu
e (€
)fo
r ass
igne
esre
side
ntin
Ital
y
Fair
valu
e (€
)fo
r ass
igne
esre
side
ntin
Fra
nce
130
Saipem Annual Report / Notes to the consolidated financial statements
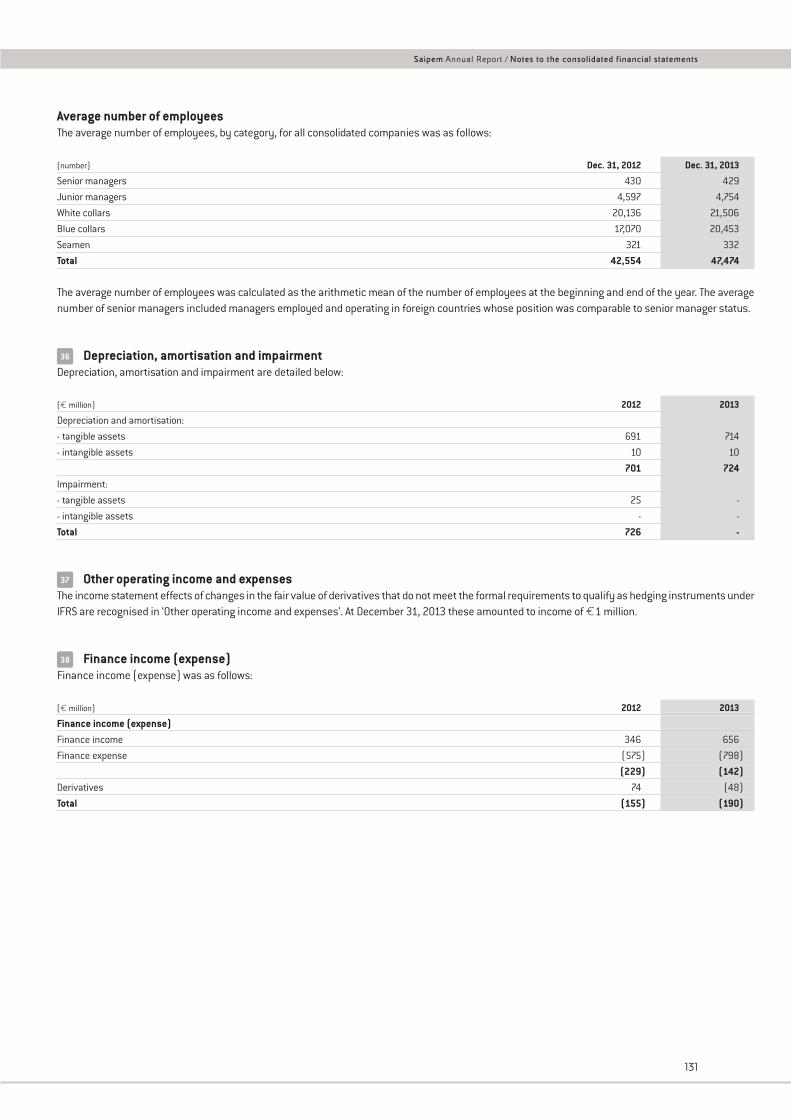
Average number of employeesThe average number of employees, by category, for all consolidated companies was as follows:
(number) Dec. 31, 2012 Dec. 31, 2013
Senior managers 430 429
Junior managers 4,597 4,754
White collars 20,136 21,506
Blue collars 17,070 20,453
Seamen 321 332
Total 42,554 47,474
The average number of employees was calculated as the arithmetic mean of the number of employees at the beginning and end of the year. The averagenumber of senior managers included managers employed and operating in foreign countries whose position was comparable to senior manager status.
Depreciation, amortisation and impairmentDepreciation, amortisation and impairment are detailed below:
(€ million) 2012 2013
Depreciation and amortisation:
- tangible assets 691 714
- intangible assets 10 10
701 724Impairment:
- tangible assets 25 -
- intangible assets - -
Total 726 -
Other operating income and expensesThe income statement effects of changes in the fair value of derivatives that do not meet the formal requirements to qualify as hedging instruments underIFRS are recognised in ‘Other operating income and expenses’. At December 31, 2013 these amounted to income of €1 million.
Finance income (expense)Finance income (expense) was as follows:
(€ million) 2012 2013
Finance income (expense)Finance income 346 656
Finance expense (575) (798)
(229) (142)Derivatives 74 (48)
Total (155) (190)
38
37
36
131
Saipem Annual Report / Notes to the consolidated financial statements
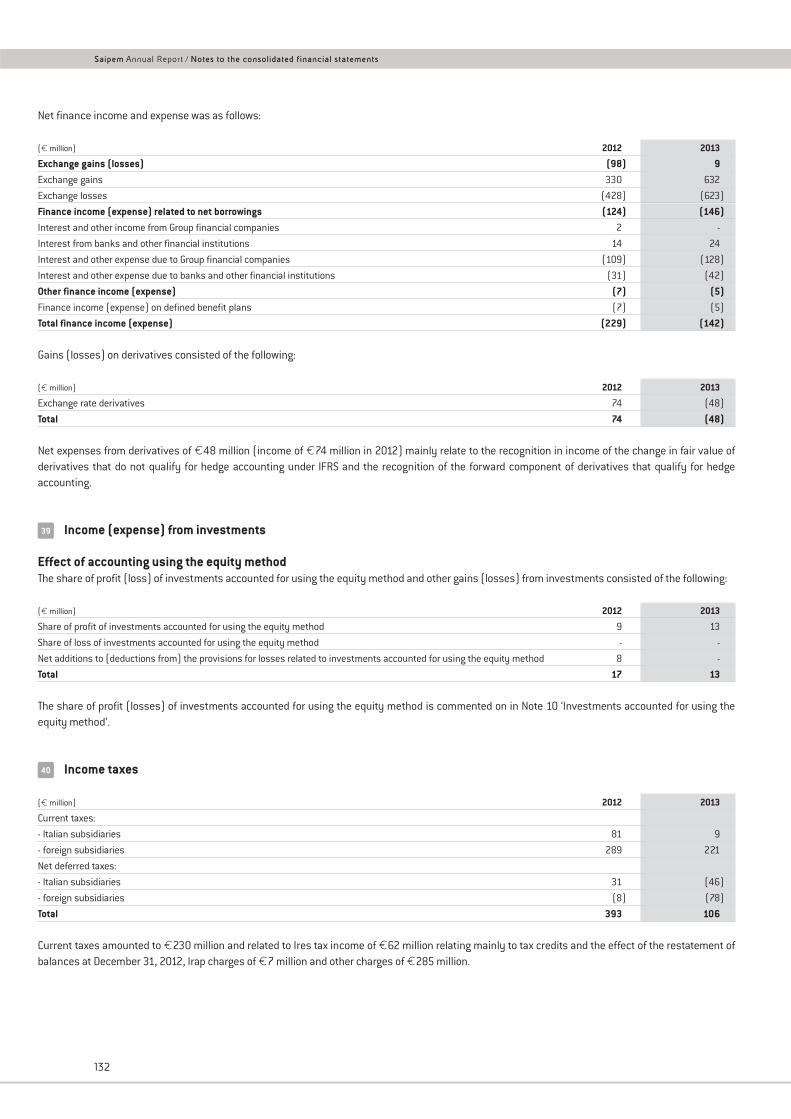
Net finance income and expense was as follows:
(€ million) 2012 2013
Exchange gains (losses) (98) 9Exchange gains 330 632
Exchange losses (428) (623)
Finance income (expense) related to net borrowings (124) (146)Interest and other income from Group financial companies 2 -
Interest from banks and other financial institutions 14 24
Interest and other expense due to Group financial companies (109) (128)
Interest and other expense due to banks and other financial institutions (31) (42)
Other finance income (expense) (7) (5)Finance income (expense) on defined benefit plans (7) (5)
Total finance income (expense) (229) (142)
Gains (losses) on derivatives consisted of the following:
(€ million) 2012 2013
Exchange rate derivatives 74 (48)
Total 74 (48)
Net expenses from derivatives of €48 million (income of €74 million in 2012) mainly relate to the recognition in income of the change in fair value ofderivatives that do not qualify for hedge accounting under IFRS and the recognition of the forward component of derivatives that qualify for hedgeaccounting.
Income (expense) from investments
Effect of accounting using the equity methodThe share of profit (loss) of investments accounted for using the equity method and other gains (losses) from investments consisted of the following:
(€ million) 2012 2013
Share of profit of investments accounted for using the equity method 9 13
Share of loss of investments accounted for using the equity method - -
Net additions to (deductions from) the provisions for losses related to investments accounted for using the equity method 8 -
Total 17 13
The share of profit (losses) of investments accounted for using the equity method is commented on in Note 10 ‘Investments accounted for using theequity method’.
Income taxes
(€ million) 2012 2013
Current taxes:
- Italian subsidiaries 81 9
- foreign subsidiaries 289 221
Net deferred taxes:
- Italian subsidiaries 31 (46)
- foreign subsidiaries (8) (78)
Total 393 106
Current taxes amounted to €230 million and related to Ires tax income of €62 million relating mainly to tax credits and the effect of the restatement ofbalances at December 31, 2012, Irap charges of €7 million and other charges of €285 million.
40
39
132
Saipem Annual Report / Notes to the consolidated financial statements
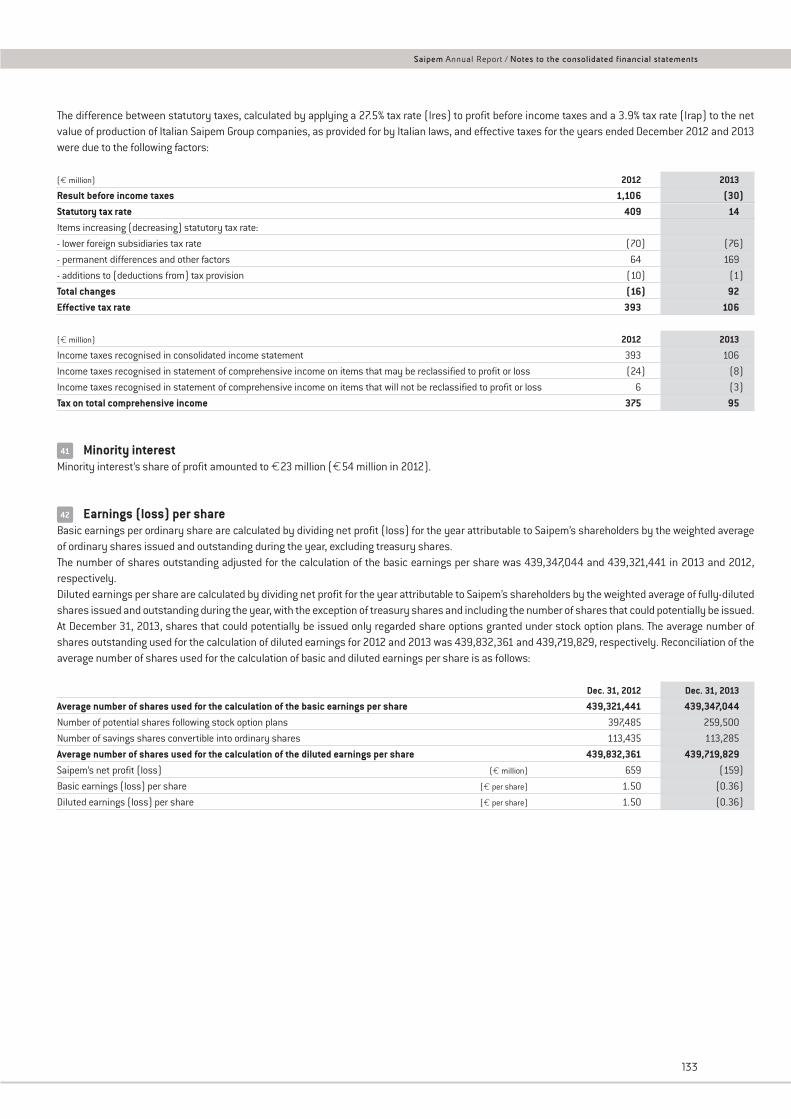
The difference between statutory taxes, calculated by applying a 27.5% tax rate (Ires) to profit before income taxes and a 3.9% tax rate (Irap) to the netvalue of production of Italian Saipem Group companies, as provided for by Italian laws, and effective taxes for the years ended December 2012 and 2013were due to the following factors:
(€ million) 2012 2013
Result before income taxes 1,106 (30)Statutory tax rate 409 14Items increasing (decreasing) statutory tax rate:
- lower foreign subsidiaries tax rate (70) (76)
- permanent differences and other factors 64 169
- additions to (deductions from) tax provision (10) (1)
Total changes (16) 92Effective tax rate 393 106
(€ million) 2012 2013
Income taxes recognised in consolidated income statement 393 106
Income taxes recognised in statement of comprehensive income on items that may be reclassified to profit or loss (24) (8)
Income taxes recognised in statement of comprehensive income on items that will not be reclassified to profit or loss 6 (3)
Tax on total comprehensive income 375 95
Minority interestMinority interest’s share of profit amounted to €23 million (€54 million in 2012).
Earnings (loss) per shareBasic earnings per ordinary share are calculated by dividing net profit (loss) for the year attributable to Saipem’s shareholders by the weighted averageof ordinary shares issued and outstanding during the year, excluding treasury shares.The number of shares outstanding adjusted for the calculation of the basic earnings per share was 439,347,044 and 439,321,441 in 2013 and 2012,respectively.Diluted earnings per share are calculated by dividing net profit for the year attributable to Saipem’s shareholders by the weighted average of fully-dilutedshares issued and outstanding during the year, with the exception of treasury shares and including the number of shares that could potentially be issued.At December 31, 2013, shares that could potentially be issued only regarded share options granted under stock option plans. The average number ofshares outstanding used for the calculation of diluted earnings for 2012 and 2013 was 439,832,361 and 439,719,829, respectively. Reconciliation of theaverage number of shares used for the calculation of basic and diluted earnings per share is as follows:
Dec. 31, 2012 Dec. 31, 2013
Average number of shares used for the calculation of the basic earnings per share 439,321,441 439,347,044Number of potential shares following stock option plans 397,485 259,500
Number of savings shares convertible into ordinary shares 113,435 113,285
Average number of shares used for the calculation of the diluted earnings per share 439,832,361 439,719,829Saipem’s net profit (loss) (€ million) 659 (159)
Basic earnings (loss) per share (€ per share) 1.50 (0.36)
Diluted earnings (loss) per share (€ per share) 1.50 (0.36)
42
41
133
Saipem Annual Report / Notes to the consolidated financial statements
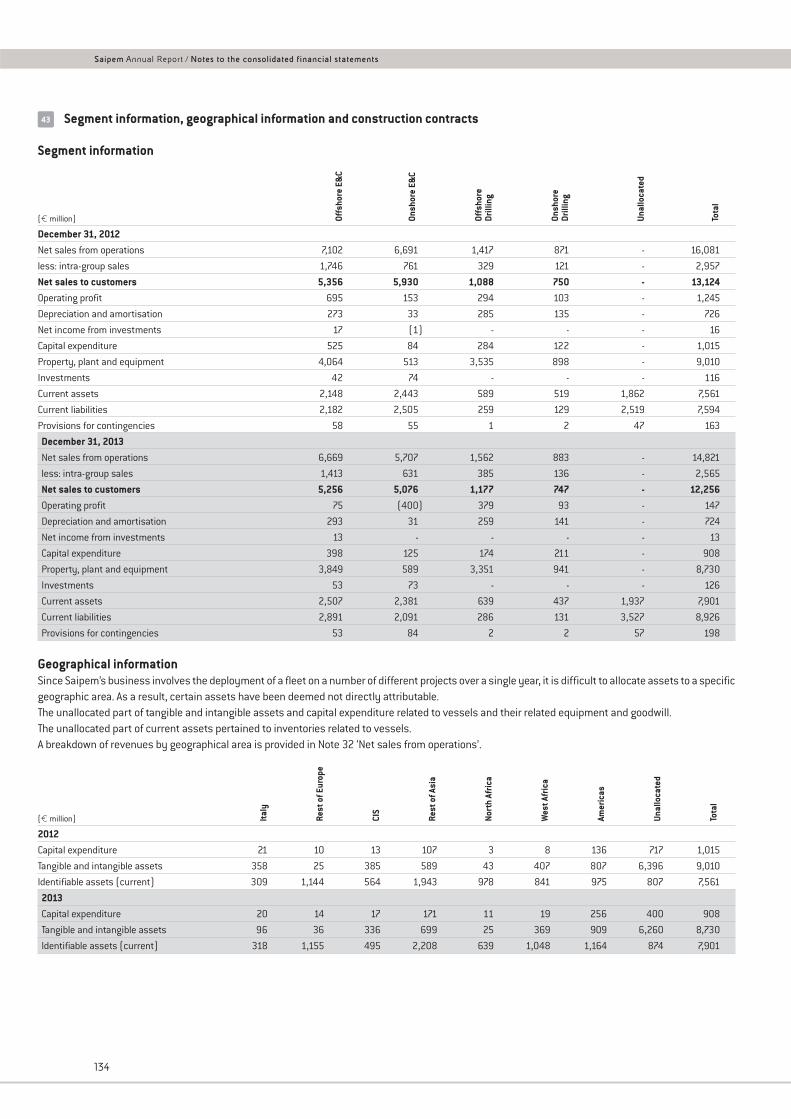
Segment information, geographical information and construction contracts
Segment information
(€ million)
December 31, 2012Net sales from operations 7,102 6,691 1,417 871 - 16,081
less: intra-group sales 1,746 761 329 121 - 2,957
Net sales to customers 5,356 5,930 1,088 750 - 13,124Operating profit 695 153 294 103 - 1,245
Depreciation and amortisation 273 33 285 135 - 726
Net income from investments 17 (1) - - - 16
Capital expenditure 525 84 284 122 - 1,015
Property, plant and equipment 4,064 513 3,535 898 - 9,010
Investments 42 74 - - - 116
Current assets 2,148 2,443 589 519 1,862 7,561
Current liabilities 2,182 2,505 259 129 2,519 7,594
Provisions for contingencies 58 55 1 2 47 163
December 31, 2013Net sales from operations 6,669 5,707 1,562 883 - 14,821
less: intra-group sales 1,413 631 385 136 - 2,565
Net sales to customers 5,256 5,076 1,177 747 - 12,256Operating profit 75 (400) 379 93 - 147
Depreciation and amortisation 293 31 259 141 - 724
Net income from investments 13 - - - - 13
Capital expenditure 398 125 174 211 - 908
Property, plant and equipment 3,849 589 3,351 941 - 8,730
Investments 53 73 - - - 126
Current assets 2,507 2,381 639 437 1,937 7,901
Current liabilities 2,891 2,091 286 131 3,527 8,926
Provisions for contingencies 53 84 2 2 57 198
Geographical informationSince Saipem’s business involves the deployment of a fleet on a number of different projects over a single year, it is difficult to allocate assets to a specificgeographic area. As a result, certain assets have been deemed not directly attributable.The unallocated part of tangible and intangible assets and capital expenditure related to vessels and their related equipment and goodwill.The unallocated part of current assets pertained to inventories related to vessels.A breakdown of revenues by geographical area is provided in Note 32 ‘Net sales from operations’.
(€ million)
2012Capital expenditure 21 10 13 107 3 8 136 717 1,015
Tangible and intangible assets 358 25 385 589 43 407 807 6,396 9,010
Identifiable assets (current) 309 1,144 564 1,943 978 841 975 807 7,561
2013Capital expenditure 20 14 17 171 11 19 256 400 908
Tangible and intangible assets 96 36 336 699 25 369 909 6,260 8,730
Identifiable assets (current) 318 1,155 495 2,208 639 1,048 1,164 874 7,901
Italy
Rest
of E
urop
e
CIS
Rest
of A
sia
Nort
h Af
rica
Wes
t Afr
ica
Amer
icas
Unal
loca
ted
Tota
l
Offs
hore
E&
C
Onsh
ore
E&C
Offs
hore
Drill
ing
Onsh
ore
Drill
ing
Unal
loca
ted
Tota
l
43
134
Saipem Annual Report / Notes to the consolidated financial statements
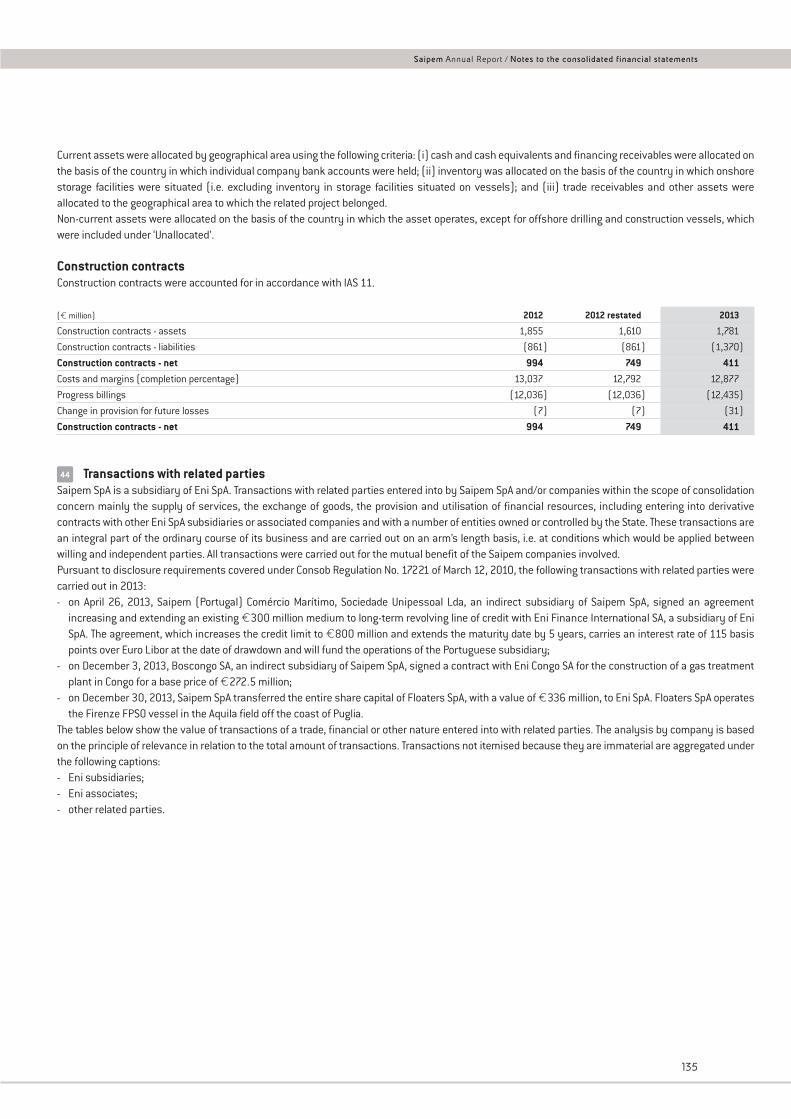
Current assets were allocated by geographical area using the following criteria: (i) cash and cash equivalents and financing receivables were allocated onthe basis of the country in which individual company bank accounts were held; (ii) inventory was allocated on the basis of the country in which onshorestorage facilities were situated (i.e. excluding inventory in storage facilities situated on vessels); and (iii) trade receivables and other assets wereallocated to the geographical area to which the related project belonged.Non-current assets were allocated on the basis of the country in which the asset operates, except for offshore drilling and construction vessels, whichwere included under ‘Unallocated’.
Construction contractsConstruction contracts were accounted for in accordance with IAS 11.
(€ million) 2012 2012 restated 2013
Construction contracts - assets 1,855 1,610 1,781
Construction contracts - liabilities (861) (861) (1,370)
Construction contracts - net 994 749 411Costs and margins (completion percentage) 13,037 12,792 12,877
Progress billings (12,036) (12,036) (12,435)
Change in provision for future losses (7) (7) (31)
Construction contracts - net 994 749 411
Transactions with related partiesSaipem SpA is a subsidiary of Eni SpA. Transactions with related parties entered into by Saipem SpA and/or companies within the scope of consolidationconcern mainly the supply of services, the exchange of goods, the provision and utilisation of financial resources, including entering into derivativecontracts with other Eni SpA subsidiaries or associated companies and with a number of entities owned or controlled by the State. These transactions arean integral part of the ordinary course of its business and are carried out on an arm’s length basis, i.e. at conditions which would be applied betweenwilling and independent parties. All transactions were carried out for the mutual benefit of the Saipem companies involved.Pursuant to disclosure requirements covered under Consob Regulation No. 17221 of March 12, 2010, the following transactions with related parties werecarried out in 2013:- on April 26, 2013, Saipem (Portugal) Comércio Marítimo, Sociedade Unipessoal Lda, an indirect subsidiary of Saipem SpA, signed an agreement
increasing and extending an existing €300 million medium to long-term revolving line of credit with Eni Finance International SA, a subsidiary of EniSpA. The agreement, which increases the credit limit to €800 million and extends the maturity date by 5 years, carries an interest rate of 115 basispoints over Euro Libor at the date of drawdown and will fund the operations of the Portuguese subsidiary;
- on December 3, 2013, Boscongo SA, an indirect subsidiary of Saipem SpA, signed a contract with Eni Congo SA for the construction of a gas treatmentplant in Congo for a base price of €272.5 million;
- on December 30, 2013, Saipem SpA transferred the entire share capital of Floaters SpA, with a value of €336 million, to Eni SpA. Floaters SpA operatesthe Firenze FPSO vessel in the Aquila field off the coast of Puglia.
The tables below show the value of transactions of a trade, financial or other nature entered into with related parties. The analysis by company is basedon the principle of relevance in relation to the total amount of transactions. Transactions not itemised because they are immaterial are aggregated underthe following captions:- Eni subsidiaries;- Eni associates;- other related parties.
44
135
Saipem Annual Report / Notes to the consolidated financial statements
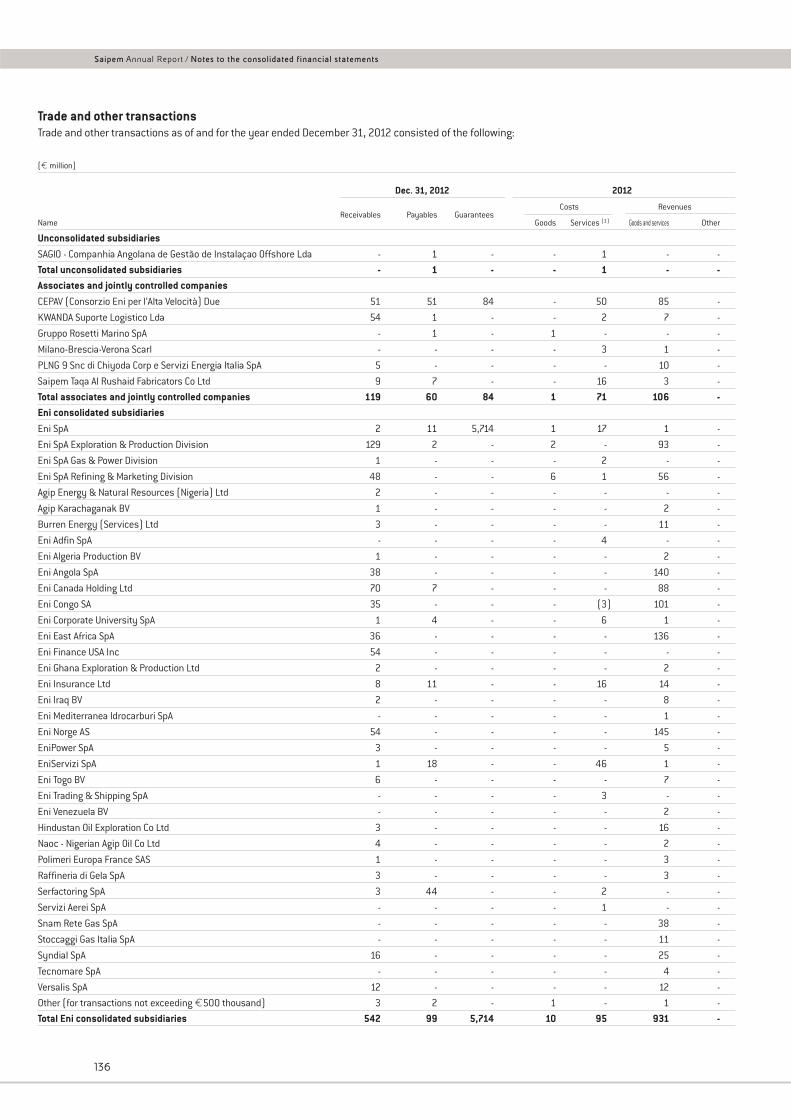
Trade and other transactionsTrade and other transactions as of and for the year ended December 31, 2012 consisted of the following:
(€ million)
Dec. 31, 2012 2012
Costs Revenues
NameReceivables Payables Guarantees
Goods Services (1) Goods and services Other
Unconsolidated subsidiariesSAGIO - Companhia Angolana de Gestão de Instalaçao Offshore Lda - 1 - - 1 - -
Total unconsolidated subsidiaries - 1 - - 1 - -Associates and jointly controlled companiesCEPAV (Consorzio Eni per l’Alta Velocità) Due 51 51 84 - 50 85 -
KWANDA Suporte Logistico Lda 54 1 - - 2 7 -
Gruppo Rosetti Marino SpA - 1 - 1 - - -
Milano-Brescia-Verona Scarl - - - - 3 1 -
PLNG 9 Snc di Chiyoda Corp e Servizi Energia Italia SpA 5 - - - - 10 -
Saipem Taqa Al Rushaid Fabricators Co Ltd 9 7 - - 16 3 -
Total associates and jointly controlled companies 119 60 84 1 71 106 -Eni consolidated subsidiariesEni SpA 2 11 5,714 1 17 1 -
Eni SpA Exploration & Production Division 129 2 - 2 - 93 -
Eni SpA Gas & Power Division 1 - - - 2 - -
Eni SpA Refining & Marketing Division 48 - - 6 1 56 -
Agip Energy & Natural Resources (Nigeria) Ltd 2 - - - - - -
Agip Karachaganak BV 1 - - - - 2 -
Burren Energy (Services) Ltd 3 - - - - 11 -
Eni Adfin SpA - - - - 4 - -
Eni Algeria Production BV 1 - - - - 2 -
Eni Angola SpA 38 - - - - 140 -
Eni Canada Holding Ltd 70 7 - - - 88 -
Eni Congo SA 35 - - - (3) 101 -
Eni Corporate University SpA 1 4 - - 6 1 -
Eni East Africa SpA 36 - - - - 136 -
Eni Finance USA Inc 54 - - - - - -
Eni Ghana Exploration & Production Ltd 2 - - - - 2 -
Eni Insurance Ltd 8 11 - - 16 14 -
Eni Iraq BV 2 - - - - 8 -
Eni Mediterranea Idrocarburi SpA - - - - - 1 -
Eni Norge AS 54 - - - - 145 -
EniPower SpA 3 - - - - 5 -
EniServizi SpA 1 18 - - 46 1 -
Eni Togo BV 6 - - - - 7 -
Eni Trading & Shipping SpA - - - - 3 - -
Eni Venezuela BV - - - - - 2 -
Hindustan Oil Exploration Co Ltd 3 - - - - 16 -
Naoc - Nigerian Agip Oil Co Ltd 4 - - - - 2 -
Polimeri Europa France SAS 1 - - - - 3 -
Raffineria di Gela SpA 3 - - - - 3 -
Serfactoring SpA 3 44 - - 2 - -
Servizi Aerei SpA - - - - 1 - -
Snam Rete Gas SpA - - - - - 38 -
Stoccaggi Gas Italia SpA - - - - - 11 -
Syndial SpA 16 - - - - 25 -
Tecnomare SpA - - - - - 4 -
Versalis SpA 12 - - - - 12 -
Other (for transactions not exceeding €500 thousand) 3 2 - 1 - 1 -
Total Eni consolidated subsidiaries 542 99 5,714 10 95 931 -
136
Saipem Annual Report / Notes to the consolidated financial statements
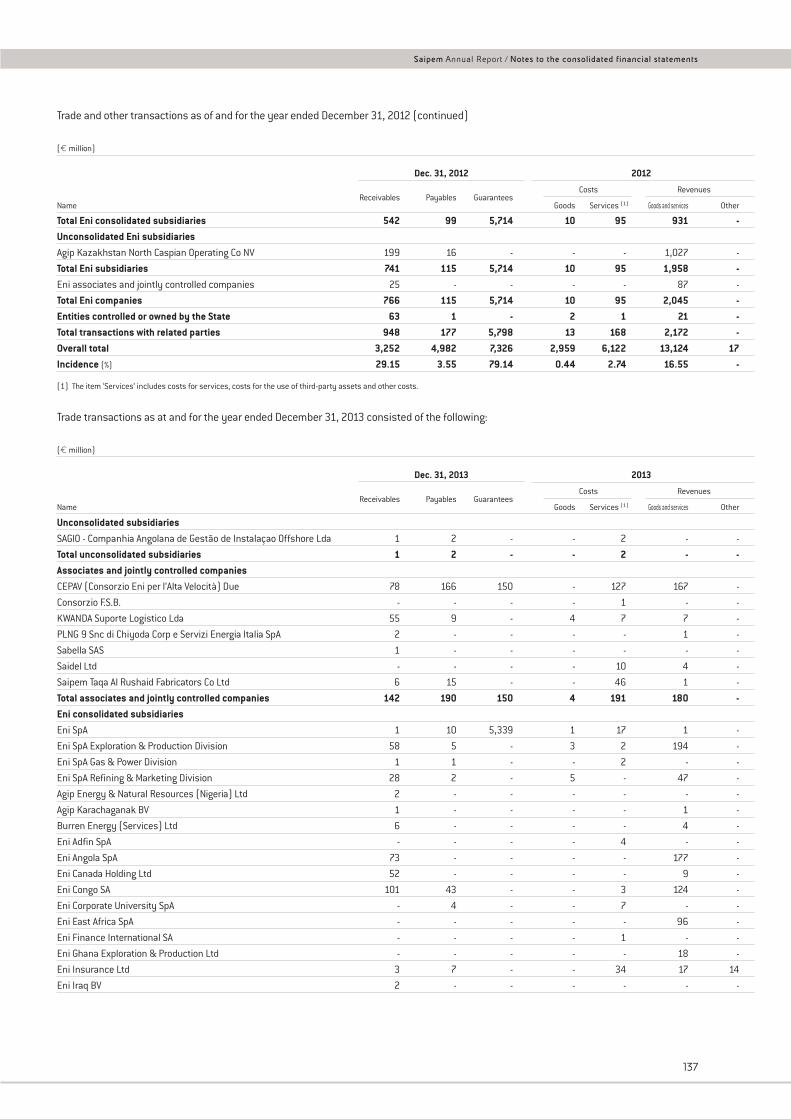
Trade and other transactions as of and for the year ended December 31, 2012 (continued)
(€ million)
Dec. 31, 2012 2012
Costs Revenues
NameReceivables Payables Guarantees
Goods Services (1) Goods and services Other
Total Eni consolidated subsidiaries 542 99 5,714 10 95 931 -Unconsolidated Eni subsidiariesAgip Kazakhstan North Caspian Operating Co NV 199 16 - - - 1,027 -
Total Eni subsidiaries 741 115 5,714 10 95 1,958 -Eni associates and jointly controlled companies 25 - - - - 87 -
Total Eni companies 766 115 5,714 10 95 2,045 -Entities controlled or owned by the State 63 1 - 2 1 21 -Total transactions with related parties 948 177 5,798 13 168 2,172 -Overall total 3,252 4,982 7,326 2,959 6,122 13,124 17Incidence (%) 29.15 3.55 79.14 0.44 2.74 16.55 -
(1) The item ‘Services’ includes costs for services, costs for the use of third-party assets and other costs.
Trade transactions as at and for the year ended December 31, 2013 consisted of the following:
(€ million)
Dec. 31, 2013 2013
Costs Revenues
NameReceivables Payables Guarantees
Goods Services (1) Goods and services Other
Unconsolidated subsidiariesSAGIO - Companhia Angolana de Gestão de Instalaçao Offshore Lda 1 2 - - 2 - -
Total unconsolidated subsidiaries 1 2 - - 2 - -Associates and jointly controlled companiesCEPAV (Consorzio Eni per l’Alta Velocità) Due 78 166 150 - 127 167 -
Consorzio F.S.B. - - - - 1 - -
KWANDA Suporte Logistico Lda 55 9 - 4 7 7 -
PLNG 9 Snc di Chiyoda Corp e Servizi Energia Italia SpA 2 - - - - 1 -
Sabella SAS 1 - - - - - -
Saidel Ltd - - - - 10 4 -
Saipem Taqa Al Rushaid Fabricators Co Ltd 6 15 - - 46 1 -
Total associates and jointly controlled companies 142 190 150 4 191 180 -Eni consolidated subsidiariesEni SpA 1 10 5,339 1 17 1 -
Eni SpA Exploration & Production Division 58 5 - 3 2 194 -
Eni SpA Gas & Power Division 1 1 - - 2 - -
Eni SpA Refining & Marketing Division 28 2 - 5 - 47 -
Agip Energy & Natural Resources (Nigeria) Ltd 2 - - - - - -
Agip Karachaganak BV 1 - - - - 1 -
Burren Energy (Services) Ltd 6 - - - - 4 -
Eni Adfin SpA - - - - 4 - -
Eni Angola SpA 73 - - - - 177 -
Eni Canada Holding Ltd 52 - - - - 9 -
Eni Congo SA 101 43 - - 3 124 -
Eni Corporate University SpA - 4 - - 7 - -
Eni East Africa SpA - - - - - 96 -
Eni Finance International SA - - - - 1 - -
Eni Ghana Exploration & Production Ltd - - - - - 18 -
Eni Insurance Ltd 3 7 - - 34 17 14
Eni Iraq BV 2 - - - - - -
137
Saipem Annual Report / Notes to the consolidated financial statements
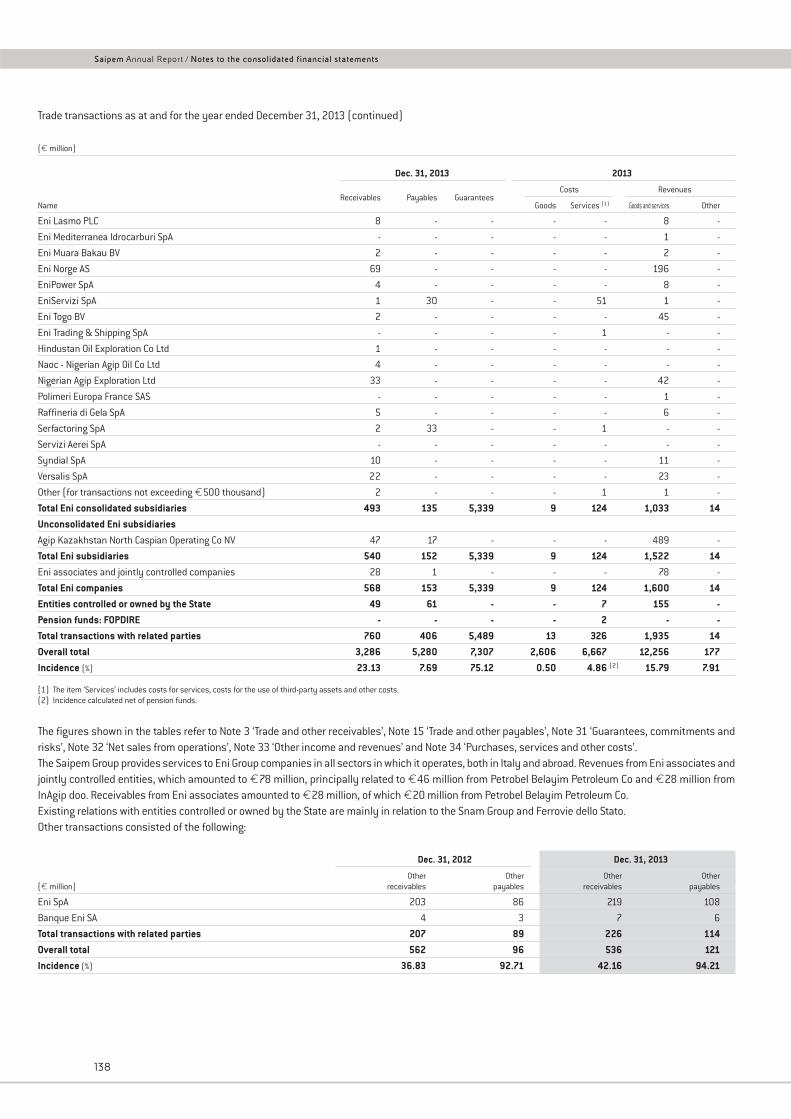
Trade transactions as at and for the year ended December 31, 2013 (continued)
(€ million)
Dec. 31, 2013 2013
Costs Revenues
NameReceivables Payables Guarantees
Goods Services (1) Goods and services Other
Eni Lasmo PLC 8 - - - - 8 -
Eni Mediterranea Idrocarburi SpA - - - - - 1 -
Eni Muara Bakau BV 2 - - - - 2 -
Eni Norge AS 69 - - - - 196 -
EniPower SpA 4 - - - - 8 -
EniServizi SpA 1 30 - - 51 1 -
Eni Togo BV 2 - - - - 45 -
Eni Trading & Shipping SpA - - - - 1 - -
Hindustan Oil Exploration Co Ltd 1 - - - - - -
Naoc - Nigerian Agip Oil Co Ltd 4 - - - - - -
Nigerian Agip Exploration Ltd 33 - - - - 42 -
Polimeri Europa France SAS - - - - - 1 -
Raffineria di Gela SpA 5 - - - - 6 -
Serfactoring SpA 2 33 - - 1 - -
Servizi Aerei SpA - - - - - - -
Syndial SpA 10 - - - - 11 -
Versalis SpA 22 - - - - 23 -
Other (for transactions not exceeding €500 thousand) 2 - - - 1 1 -
Total Eni consolidated subsidiaries 493 135 5,339 9 124 1,033 14Unconsolidated Eni subsidiariesAgip Kazakhstan North Caspian Operating Co NV 47 17 - - - 489 -
Total Eni subsidiaries 540 152 5,339 9 124 1,522 14Eni associates and jointly controlled companies 28 1 - - - 78 -
Total Eni companies 568 153 5,339 9 124 1,600 14Entities controlled or owned by the State 49 61 - - 7 155 -Pension funds: FOPDIRE - - - - 2 - -Total transactions with related parties 760 406 5,489 13 326 1,935 14Overall total 3,286 5,280 7,307 2,606 6,667 12,256 177Incidence (%) 23.13 7.69 75.12 0.50 4.86 (2) 15.79 7.91
(1) The item ‘Services’ includes costs for services, costs for the use of third-party assets and other costs.(2) Incidence calculated net of pension funds.
The figures shown in the tables refer to Note 3 ‘Trade and other receivables’, Note 15 ‘Trade and other payables’, Note 31 ‘Guarantees, commitments andrisks’, Note 32 ‘Net sales from operations’, Note 33 ‘Other income and revenues’ and Note 34 ‘Purchases, services and other costs’.The Saipem Group provides services to Eni Group companies in all sectors in which it operates, both in Italy and abroad. Revenues from Eni associates andjointly controlled entities, which amounted to €78 million, principally related to €46 million from Petrobel Belayim Petroleum Co and €28 million fromInAgip doo. Receivables from Eni associates amounted to €28 million, of which €20 million from Petrobel Belayim Petroleum Co.Existing relations with entities controlled or owned by the State are mainly in relation to the Snam Group and Ferrovie dello Stato.Other transactions consisted of the following:
Dec. 31, 2012 Dec. 31, 2013
Other Other Other Other(€ million) receivables payables receivables payables
Eni SpA 203 86 219 108
Banque Eni SA 4 3 7 6
Total transactions with related parties 207 89 226 114Overall total 562 96 536 121Incidence (%) 36.83 92.71 42.16 94.21
138
Saipem Annual Report / Notes to the consolidated financial statements
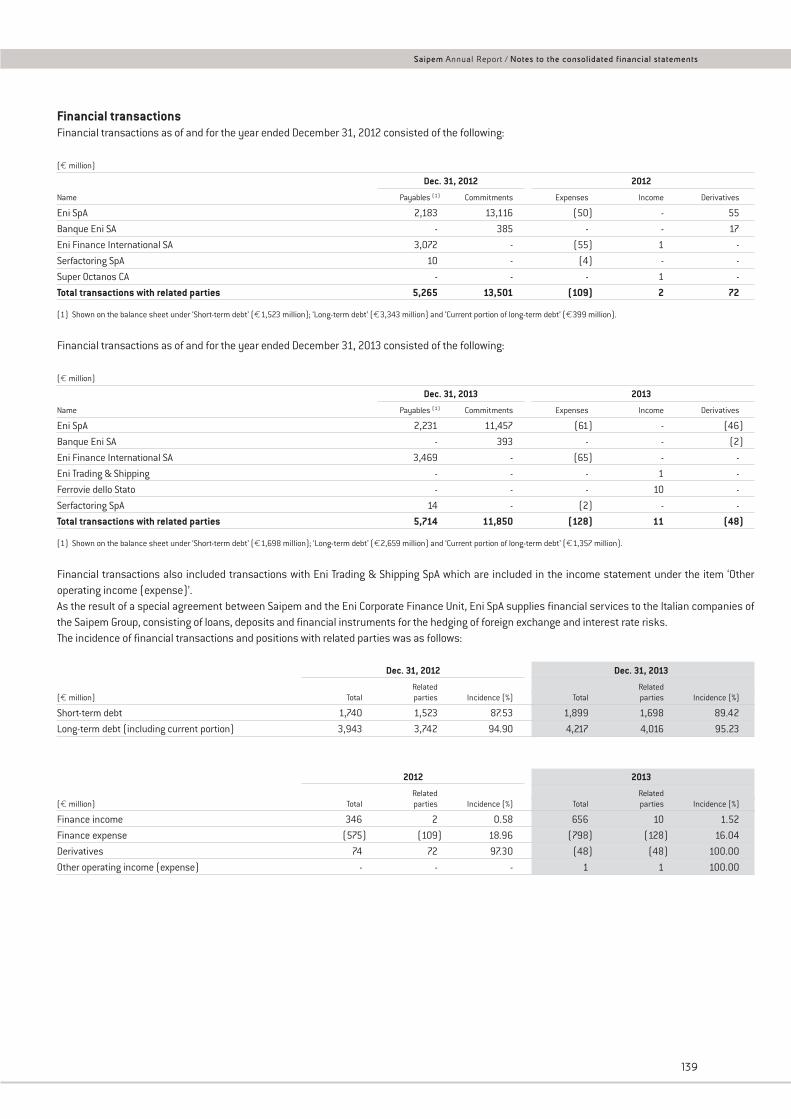
Financial transactionsFinancial transactions as of and for the year ended December 31, 2012 consisted of the following:
(€ million)
Dec. 31, 2012 2012
Name Payables (1) Commitments Expenses Income Derivatives
Eni SpA 2,183 13,116 (50) - 55
Banque Eni SA - 385 - - 17
Eni Finance International SA 3,072 - (55) 1 -
Serfactoring SpA 10 - (4) - -
Super Octanos CA - - - 1 -
Total transactions with related parties 5,265 13,501 (109) 2 72
(1) Shown on the balance sheet under ‘Short-term debt’ (€1,523 million); ‘Long-term debt’ (€3,343 million) and ‘Current portion of long-term debt’ (€399 million).
Financial transactions as of and for the year ended December 31, 2013 consisted of the following:
(€ million)
Dec. 31, 2013 2013
Name Payables (1) Commitments Expenses Income Derivatives
Eni SpA 2,231 11,457 (61) - (46)
Banque Eni SA - 393 - - (2)
Eni Finance International SA 3,469 - (65) - -
Eni Trading & Shipping - - - 1 -
Ferrovie dello Stato - - - 10 -
Serfactoring SpA 14 - (2) - -
Total transactions with related parties 5,714 11,850 (128) 11 (48)
(1) Shown on the balance sheet under ‘Short-term debt’ (€1,698 million); ‘Long-term debt’ (€2,659 million) and ‘Current portion of long-term debt’ (€1,357 million).
Financial transactions also included transactions with Eni Trading & Shipping SpA which are included in the income statement under the item ‘Otheroperating income (expense)’.As the result of a special agreement between Saipem and the Eni Corporate Finance Unit, Eni SpA supplies financial services to the Italian companies ofthe Saipem Group, consisting of loans, deposits and financial instruments for the hedging of foreign exchange and interest rate risks.The incidence of financial transactions and positions with related parties was as follows:
Dec. 31, 2012 Dec. 31, 2013
Related Related(€ million) Total parties Incidence (%) Total parties Incidence (%)
Short-term debt 1,740 1,523 87.53 1,899 1,698 89.42
Long-term debt (including current portion) 3,943 3,742 94.90 4,217 4,016 95.23
2012 2013
Related Related(€ million) Total parties Incidence (%) Total parties Incidence (%)
Finance income 346 2 0.58 656 10 1.52
Finance expense (575) (109) 18.96 (798) (128) 16.04
Derivatives 74 72 97.30 (48) (48) 100.00
Other operating income (expense) - - - 1 1 100.00
139
Saipem Annual Report / Notes to the consolidated financial statements
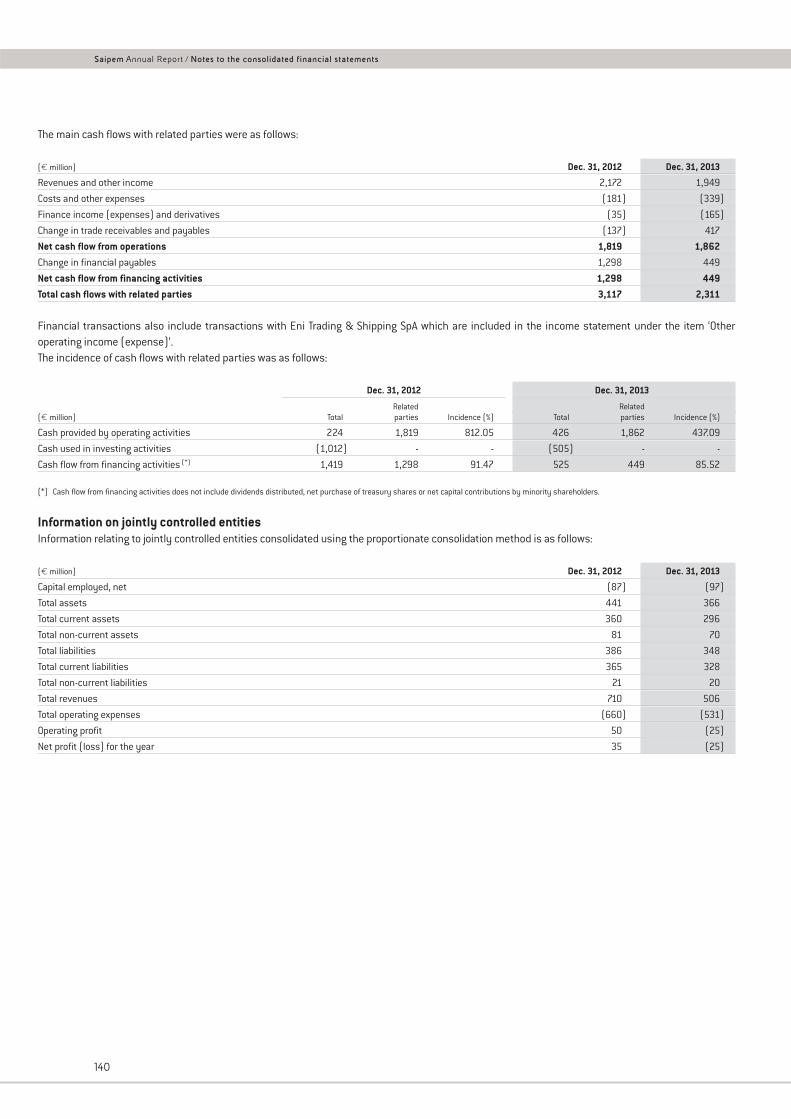
The main cash flows with related parties were as follows:
(€ million) Dec. 31, 2012 Dec. 31, 2013
Revenues and other income 2,172 1,949
Costs and other expenses (181) (339)
Finance income (expenses) and derivatives (35) (165)
Change in trade receivables and payables (137) 417
Net cash flow from operations 1,819 1,862Change in financial payables 1,298 449
Net cash flow from financing activities 1,298 449Total cash flows with related parties 3,117 2,311
Financial transactions also include transactions with Eni Trading & Shipping SpA which are included in the income statement under the item ‘Otheroperating income (expense)’.The incidence of cash flows with related parties was as follows:
Dec. 31, 2012 Dec. 31, 2013
Related Related(€ million) Total parties Incidence (%) Total parties Incidence (%)
Cash provided by operating activities 224 1,819 812.05 426 1,862 437.09
Cash used in investing activities (1,012) - - (505) - -
Cash flow from financing activities (*) 1,419 1,298 91.47 525 449 85.52
(*) Cash flow from financing activities does not include dividends distributed, net purchase of treasury shares or net capital contributions by minority shareholders.
Information on jointly controlled entitiesInformation relating to jointly controlled entities consolidated using the proportionate consolidation method is as follows:
(€ million) Dec. 31, 2012 Dec. 31, 2013
Capital employed, net (87) (97)
Total assets 441 366
Total current assets 360 296
Total non-current assets 81 70
Total liabilities 386 348
Total current liabilities 365 328
Total non-current liabilities 21 20
Total revenues 710 506
Total operating expenses (660) (531)
Operating profit 50 (25)
Net profit (loss) for the year 35 (25)
140
Saipem Annual Report / Notes to the consolidated financial statements
141
Saipem Annual Report / Notes to the consolidated financial statements
Significant non-recurring events and operationsNo significant non-recurring events or operations took place in 2013.
Transactions deriving from atypical or unusual transactionsIn 2012 and 2013, no transactions deriving from atypical and/or unusual transactions were reported.
Events subsequent to year endInformation on subsequent events is provided in the section ‘Directors’ Report’.
Additional information - AlgeriaFurther to the disclosures provided in the Algeria paragraph of the ‘Legal proceedings’ section, we note the following additional information with regard toprojects under execution in Algeria as at December 31, 2013:- funds in two current accounts (ref. Note 1) (equivalent to €80 million at December 31, 2013) are currently temporarily frozen;- trade receivables (ref. Note 3) at December 31, 2013 totalled €249 million, of which receivables past due, but not impaired, amounting to €171 million
(€99 million from 1 to 3 months past due, €1 million from 3 to 6 months past due, €22 million from 6 to 12 months past due and €49 million morethan one year past due);
- work in progress (ref. Note 4) on projects under execution amounted to €147 million;- deferred income and advance payments (ref. Note 15) totalled €90 million and €31 million, respectively;- provisions for future losses (ref. Note 20) for projects under execution amounted to €6 million;- guarantees (ref. Note 31) on projects under execution totalled €716 million.
48
47
46
45
Certification pursuant to Article 154-bis, paragraph 5of Legislative Decree No. 58/1998 ‘Testo Unico della Finanza’(Consolidated Tax Law)
1. The undersigned Umberto Vergine and Alberto Chiarini in their capacity as CEO and manager responsible for the preparation of financial reports ofSaipem SpA, respectively, pursuant to Article 154-bis, paragraphs 3 and 4 of Legislative Decree No. 58 of February 24, 1998, certify that the internalcontrols over financial reporting in place for the preparation of the consolidated financial statements at December 31, 2013 and during the period coveredby the report, were:- adequate to the Company structure, and- effectively applied during the process of preparation of the Report.
2. Internal controls over financial reporting in place for the preparation of the consolidated financial statements at December 31, 2013 have been definedand the evaluation of their effectiveness has been assessed based on principles and methodologies adopted by Saipem in accordance with the InternalControl - Integrated Framework Model issued by the Committee of Sponsoring Organisations of the Treadway Commission, which represents aninternationally-accepted framework for the internal control system.
3. The undersigned officers also certify that:3.1 these 2013 consolidated financial statements:
a) were prepared in accordance with the evaluation and measurement criteria issued by the International Accounting Standards Board (IASB) andadopted by the European Commission according to the procedure set forth in Article 6 of the European Regulation (CE) No. 1606/2002 of theEuropean Parliament and European Council of July 19, 2002;
b) correspond to the Company’s evidence and accounting books and entries;c) fairly represent the financial, results of operations and cash flows of the parent company and the Group consolidated companies as of and for
the period presented in this Report;3.2 the Directors’ Report provides a reliable analysis of business trends and results, including a trend analysis of the parent company and the Group
companies, as well as a description of the main risks and uncertain situations to which they are exposed.
March 14, 2014
Umberto Vergine Alberto ChiariniCEO Chief Financial Officer and Compliance Officer
142
Independent Auditors’ Report
143
144
Addendum - Sustainability Performance 2013 saipem


Sustainability PerformanceThis Addendum provides information on the Saipem Group’ssustainability performance and has been drafted pursuant to theGuidelines of the Global Reporting Initiative (version G3.0).The information contained herein has been structured inaccordance with the recommendations of GRI and supplements theinformation disclosed previously in sections of the Annual Reportand through other tools used to report on the year’s performance,as detailed in the chapter ‘Methodology, criteria and principles ofreporting’.
IndexOrganisational profile ii
Commitments, results and objectives iv
Methodology, criteria and principles of reporting vii
Governance, commitment, stakeholder involvement ix
Disclosure on management approach xii
Sustainability indicators xiv
Independent Auditors’ Report xxviii
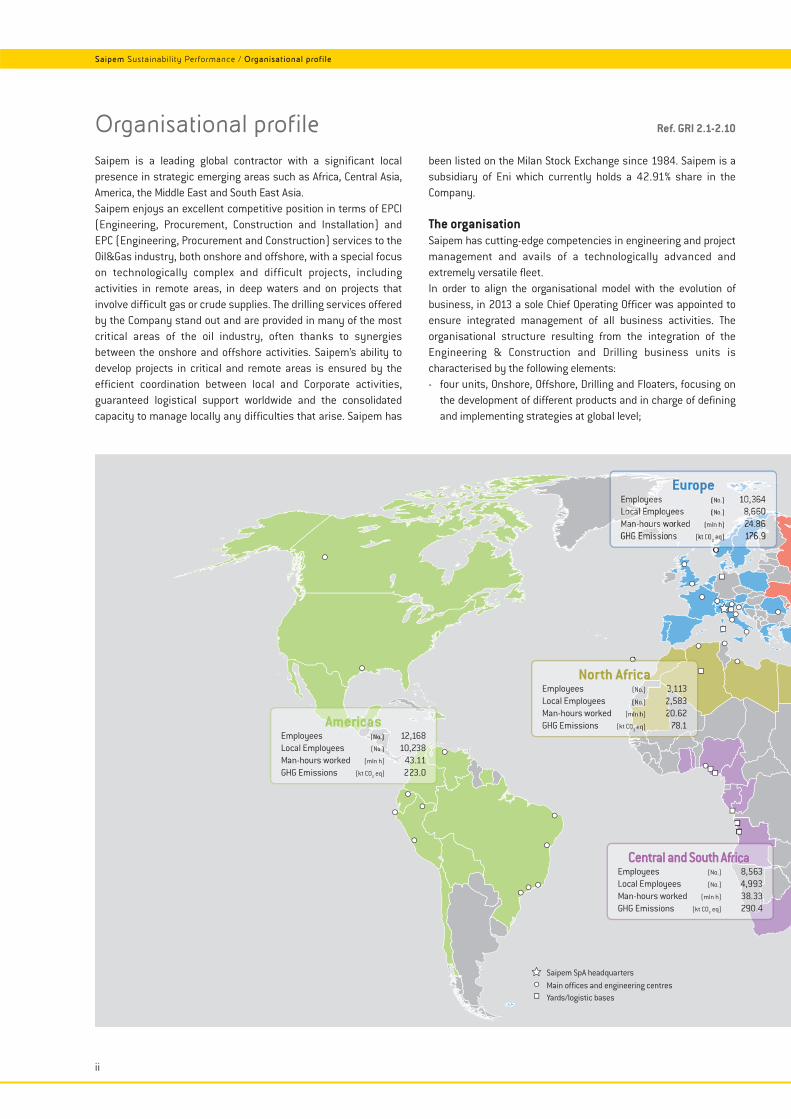
Saipem is a leading global contractor with a significant localpresence in strategic emerging areas such as Africa, Central Asia,America, the Middle East and South East Asia.Saipem enjoys an excellent competitive position in terms of EPCI(Engineering, Procurement, Construction and Installation) andEPC (Engineering, Procurement and Construction) services to theOil&Gas industry, both onshore and offshore, with a special focuson technologically complex and difficult projects, includingactivities in remote areas, in deep waters and on projects thatinvolve difficult gas or crude supplies. The drilling services offeredby the Company stand out and are provided in many of the mostcritical areas of the oil industry, often thanks to synergiesbetween the onshore and offshore activities. Saipem’s ability todevelop projects in critical and remote areas is ensured by theefficient coordination between local and Corporate activities,guaranteed logistical support worldwide and the consolidatedcapacity to manage locally any difficulties that arise. Saipem has
been listed on the Milan Stock Exchange since 1984. Saipem is asubsidiary of Eni which currently holds a 42.91% share in theCompany.
The organisationSaipem has cutting-edge competencies in engineering and projectmanagement and avails of a technologically advanced andextremely versatile fleet.In order to align the organisational model with the evolution ofbusiness, in 2013 a sole Chief Operating Officer was appointed toensure integrated management of all business activities. Theorganisational structure resulting from the integration of theEngineering & Construction and Drilling business units ischaracterised by the following elements:- four units, Onshore, Offshore, Drilling and Floaters, focusing on
the development of different products and in charge of definingand implementing strategies at global level;
Main offices and engineering centres
Saipem SpA headquarters
Yards/logistic bases
AmericasEmployees (No.) 12,168Local Employees (No.) 10,238Man-hours worked (mln h) 43.11GHG Emissions (kt CO
2 eq) 223.0
EuropeEmployees (No.) 10,364Local Employees (No.) 8,660Man-hours worked (mln h) 24.86GHG Emissions (kt CO
2 eq) 176.9
North AfricaEmployees (No.) 3,113Local Employees (No.) 2,583Man-hours worked (mln h) 20.62GHG Emissions (kt CO
2 eq) 78.1
Central and South Africa Employees (No.) 8,563Local Employees (No.) 4,993Man-hours worked (mln h) 38.33GHG Emissions (kt CO
2 eq) 290.4
ii
Organisational profile Ref. GRI 2.1-2.10
Saipem Sustainability Performance / Organisational profile
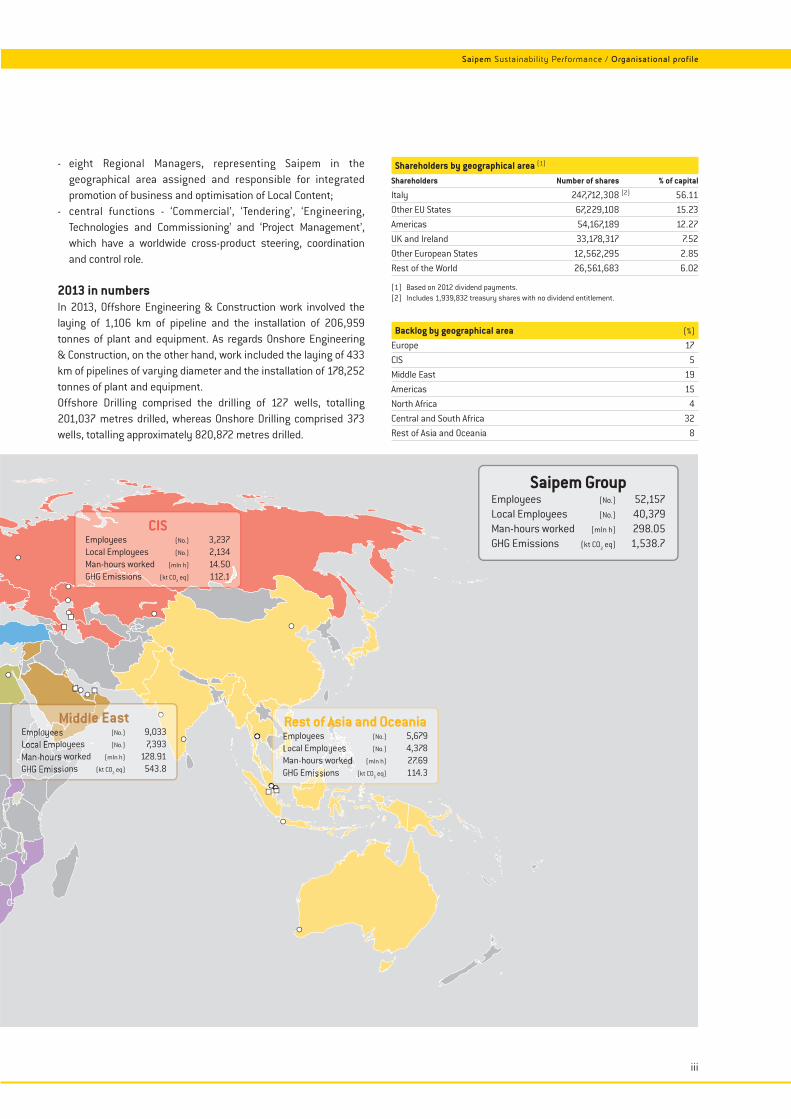
Saipem Sustainability Performance / Organisational profile
iii
- eight Regional Managers, representing Saipem in thegeographical area assigned and responsible for integratedpromotion of business and optimisation of Local Content;
- central functions - ‘Commercial’, ‘Tendering’, ‘Engineering,Technologies and Commissioning’ and ‘Project Management’,which have a worldwide cross-product steering, coordinationand control role.
2013 in numbersIn 2013, Offshore Engineering & Construction work involved thelaying of 1,106 km of pipeline and the installation of 206,959tonnes of plant and equipment. As regards Onshore Engineering& Construction, on the other hand, work included the laying of 433km of pipelines of varying diameter and the installation of 178,252tonnes of plant and equipment.Offshore Drilling comprised the drilling of 127 wells, totalling201,037 metres drilled, whereas Onshore Drilling comprised 373wells, totalling approximately 820,872 metres drilled.
Shareholders by geographical area (1)
Shareholders Number of shares % of capital
Italy 247,712,308 (2) 56.11
Other EU States 67,229,108 15.23
Americas 54,167,189 12.27
UK and Ireland 33,178,317 7.52
Other European States 12,562,295 2.85
Rest of the World 26,561,683 6.02
(1) Based on 2012 dividend payments.(2) Includes 1,939,832 treasury shares with no dividend entitlement.
Backlog by geographical area (%)
Europe 17
CIS 5
Middle East 19
Americas 15
North Africa 4
Central and South Africa 32
Rest of Asia and Oceania 8
CISEmployees (No.) 3,237Local Employees (No.) 2,134Man-hours worked (mln h) 14.50GHG Emissions (kt CO
2 eq) 112.1
Middle EastEmployees (No.) 9,033Local Employees (No.) 7,393Man-hours worked (mln h) 128.91GHG Emissions (kt CO
2 eq) 543.8
Rest of Asia and OceaniaEmployees (No.) 5,679Local Employees (No.) 4,378Man-hours worked (mln h) 27.69GHG Emissions (kt CO
2 eq) 114.3
Saipem GroupEmployees (No.) 52,157Local Employees (No.) 40,379Man-hours worked (mln h) 298.05GHG Emissions (kt CO
2 eq) 1,538.7
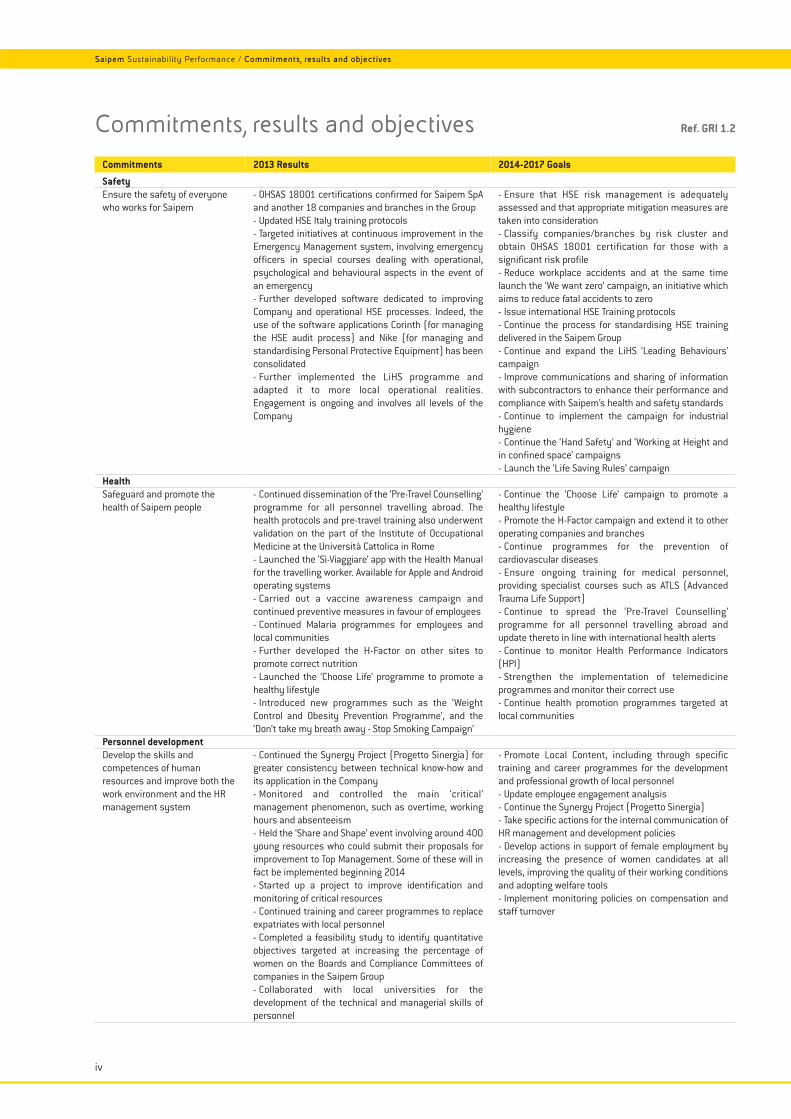
Commitments
SafetyEnsure the safety of everyonewho works for Saipem
HealthSafeguard and promote thehealth of Saipem people
Personnel developmentDevelop the skills andcompetences of humanresources and improve both thework environment and the HRmanagement system
2013 Results
- OHSAS 18001 certifications confirmed for Saipem SpAand another 18 companies and branches in the Group- Updated HSE Italy training protocols- Targeted initiatives at continuous improvement in theEmergency Management system, involving emergencyofficers in special courses dealing with operational,psychological and behavioural aspects in the event ofan emergency- Further developed software dedicated to improvingCompany and operational HSE processes. Indeed, theuse of the software applications Corinth (for managingthe HSE audit process) and Nike (for managing andstandardising Personal Protective Equipment) has beenconsolidated- Further implemented the LiHS programme andadapted it to more local operational realities.Engagement is ongoing and involves all levels of theCompany
- Continued dissemination of the ‘Pre-Travel Counselling’programme for all personnel travelling abroad. Thehealth protocols and pre-travel training also underwentvalidation on the part of the Institute of OccupationalMedicine at the Università Cattolica in Rome- Launched the ‘Sì-Viaggiare’ app with the Health Manualfor the travelling worker. Available for Apple and Androidoperating systems- Carried out a vaccine awareness campaign andcontinued preventive measures in favour of employees- Continued Malaria programmes for employees andlocal communities- Further developed the H-Factor on other sites topromote correct nutrition- Launched the ‘Choose Life’ programme to promote ahealthy lifestyle- Introduced new programmes such as the ‘WeightControl and Obesity Prevention Programme’, and the‘Don’t take my breath away - Stop Smoking Campaign’
- Continued the Synergy Project (Progetto Sinergia) forgreater consistency between technical know-how andits application in the Company- Monitored and controlled the main ‘critical’management phenomenon, such as overtime, workinghours and absenteeism- Held the ‘Share and Shape’ event involving around 400young resources who could submit their proposals forimprovement to Top Management. Some of these will infact be implemented beginning 2014- Started up a project to improve identification andmonitoring of critical resources- Continued training and career programmes to replaceexpatriates with local personnel- Completed a feasibility study to identify quantitativeobjectives targeted at increasing the percentage ofwomen on the Boards and Compliance Committees ofcompanies in the Saipem Group- Collaborated with local universities for thedevelopment of the technical and managerial skills ofpersonnel
2014-2017 Goals
- Ensure that HSE risk management is adequatelyassessed and that appropriate mitigation measures aretaken into consideration- Classify companies/branches by risk cluster andobtain OHSAS 18001 certification for those with asignificant risk profile- Reduce workplace accidents and at the same timelaunch the ‘We want zero’ campaign, an initiative whichaims to reduce fatal accidents to zero- Issue international HSE Training protocols- Continue the process for standardising HSE trainingdelivered in the Saipem Group- Continue and expand the LiHS ‘Leading Behaviours’campaign- Improve communications and sharing of informationwith subcontractors to enhance their performance andcompliance with Saipem’s health and safety standards- Continue to implement the campaign for industrialhygiene- Continue the ‘Hand Safety’ and ‘Working at Height andin confined space’ campaigns- Launch the ‘Life Saving Rules’ campaign
- Continue the ‘Choose Life’ campaign to promote ahealthy lifestyle- Promote the H-Factor campaign and extend it to otheroperating companies and branches- Continue programmes for the prevention ofcardiovascular diseases- Ensure ongoing training for medical personnel,providing specialist courses such as ATLS (AdvancedTrauma Life Support)- Continue to spread the ‘Pre-Travel Counselling’programme for all personnel travelling abroad andupdate thereto in line with international health alerts- Continue to monitor Health Performance Indicators(HPI)- Strengthen the implementation of telemedicineprogrammes and monitor their correct use- Continue health promotion programmes targeted atlocal communities
- Promote Local Content, including through specifictraining and career programmes for the developmentand professional growth of local personnel- Update employee engagement analysis- Continue the Synergy Project (Progetto Sinergia)- Take specific actions for the internal communication ofHR management and development policies- Develop actions in support of female employment byincreasing the presence of women candidates at alllevels, improving the quality of their working conditionsand adopting welfare tools- Implement monitoring policies on compensation andstaff turnover
iv
Commitments, results and objectives Ref. GRI 1.2
Saipem Sustainability Performance / Commitments, results and objectives
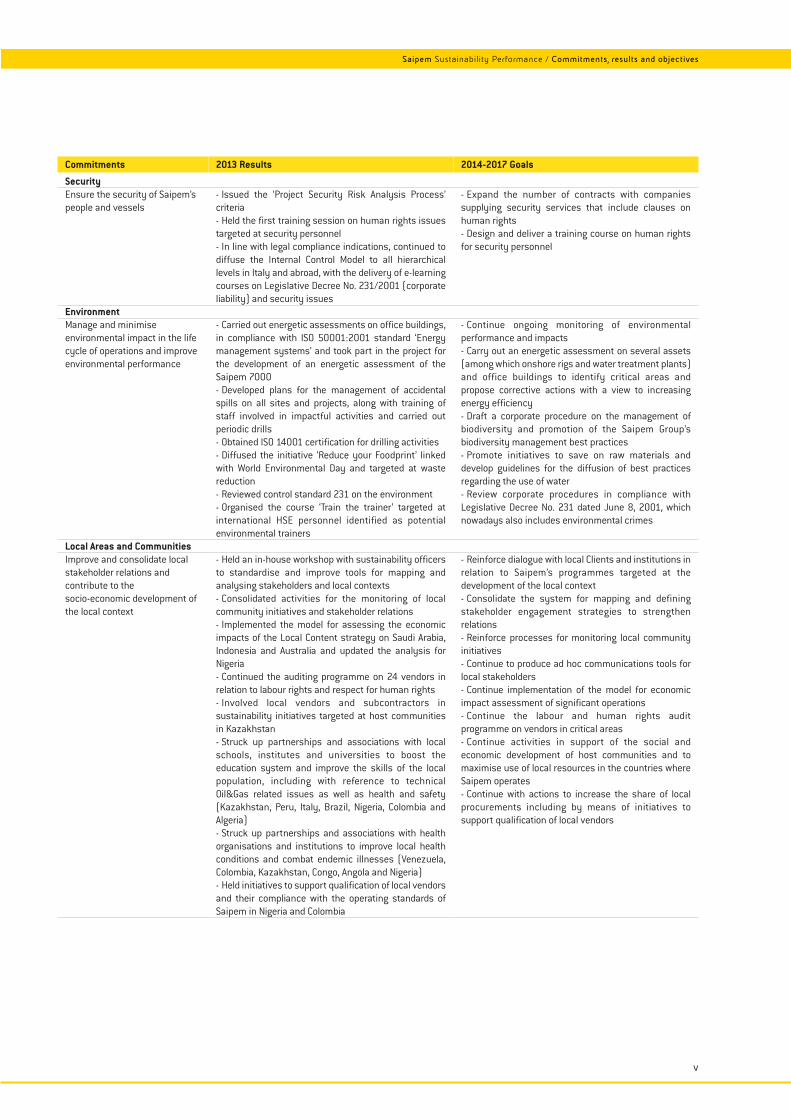
Saipem Sustainability Performance / Commitments, results and objectives
v
2013 Results
- Issued the ‘Project Security Risk Analysis Process’criteria- Held the first training session on human rights issuestargeted at security personnel- In line with legal compliance indications, continued todiffuse the Internal Control Model to all hierarchicallevels in Italy and abroad, with the delivery of e-learningcourses on Legislative Decree No. 231/2001 (corporateliability) and security issues
- Carried out energetic assessments on office buildings,in compliance with ISO 50001:2001 standard ‘Energymanagement systems’ and took part in the project forthe development of an energetic assessment of theSaipem 7000- Developed plans for the management of accidentalspills on all sites and projects, along with training ofstaff involved in impactful activities and carried outperiodic drills- Obtained ISO 14001 certification for drilling activities- Diffused the initiative ‘Reduce your Foodprint’ linkedwith World Environmental Day and targeted at wastereduction- Reviewed control standard 231 on the environment- Organised the course ‘Train the trainer’ targeted atinternational HSE personnel identified as potentialenvironmental trainers
- Held an in-house workshop with sustainability officersto standardise and improve tools for mapping andanalysing stakeholders and local contexts- Consolidated activities for the monitoring of localcommunity initiatives and stakeholder relations- Implemented the model for assessing the economicimpacts of the Local Content strategy on Saudi Arabia,Indonesia and Australia and updated the analysis forNigeria- Continued the auditing programme on 24 vendors inrelation to labour rights and respect for human rights- Involved local vendors and subcontractors insustainability initiatives targeted at host communitiesin Kazakhstan- Struck up partnerships and associations with localschools, institutes and universities to boost theeducation system and improve the skills of the localpopulation, including with reference to technicalOil&Gas related issues as well as health and safety(Kazakhstan, Peru, Italy, Brazil, Nigeria, Colombia andAlgeria)- Struck up partnerships and associations with healthorganisations and institutions to improve local healthconditions and combat endemic illnesses (Venezuela,Colombia, Kazakhstan, Congo, Angola and Nigeria)- Held initiatives to support qualification of local vendorsand their compliance with the operating standards ofSaipem in Nigeria and Colombia
2014-2017 Goals
- Expand the number of contracts with companiessupplying security services that include clauses onhuman rights- Design and deliver a training course on human rightsfor security personnel
- Continue ongoing monitoring of environmentalperformance and impacts- Carry out an energetic assessment on several assets(among which onshore rigs and water treatment plants)and office buildings to identify critical areas andpropose corrective actions with a view to increasingenergy efficiency- Draft a corporate procedure on the management ofbiodiversity and promotion of the Saipem Group’sbiodiversity management best practices- Promote initiatives to save on raw materials anddevelop guidelines for the diffusion of best practicesregarding the use of water- Review corporate procedures in compliance withLegislative Decree No. 231 dated June 8, 2001, whichnowadays also includes environmental crimes
- Reinforce dialogue with local Clients and institutions inrelation to Saipem’s programmes targeted at thedevelopment of the local context- Consolidate the system for mapping and definingstakeholder engagement strategies to strengthenrelations- Reinforce processes for monitoring local communityinitiatives- Continue to produce ad hoc communications tools forlocal stakeholders- Continue implementation of the model for economicimpact assessment of significant operations- Continue the labour and human rights auditprogramme on vendors in critical areas- Continue activities in support of the social andeconomic development of host communities and tomaximise use of local resources in the countries whereSaipem operates- Continue with actions to increase the share of localprocurements including by means of initiatives tosupport qualification of local vendors
Commitments
SecurityEnsure the security of Saipem’speople and vessels
EnvironmentManage and minimiseenvironmental impact in the lifecycle of operations and improveenvironmental performance
Local Areas and CommunitiesImprove and consolidate localstakeholder relations andcontribute to thesocio-economic development ofthe local context
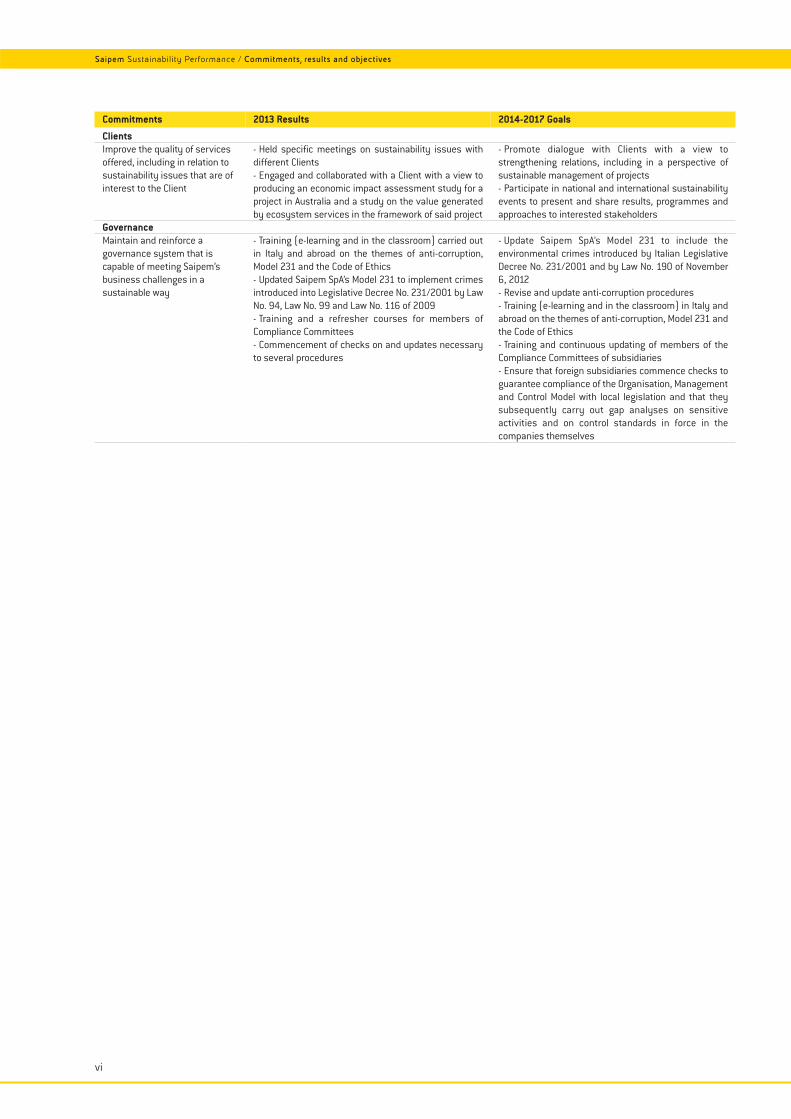
Saipem Sustainability Performance / Commitments, results and objectives
vi
Commitments
ClientsImprove the quality of servicesoffered, including in relation tosustainability issues that are ofinterest to the Client
GovernanceMaintain and reinforce agovernance system that iscapable of meeting Saipem’sbusiness challenges in asustainable way
2013 Results
- Held specific meetings on sustainability issues withdifferent Clients- Engaged and collaborated with a Client with a view toproducing an economic impact assessment study for aproject in Australia and a study on the value generatedby ecosystem services in the framework of said project
- Training (e-learning and in the classroom) carried outin Italy and abroad on the themes of anti-corruption,Model 231 and the Code of Ethics- Updated Saipem SpA’s Model 231 to implement crimesintroduced into Legislative Decree No. 231/2001 by LawNo. 94, Law No. 99 and Law No. 116 of 2009- Training and a refresher courses for members ofCompliance Committees- Commencement of checks on and updates necessaryto several procedures
2014-2017 Goals
- Promote dialogue with Clients with a view tostrengthening relations, including in a perspective ofsustainable management of projects- Participate in national and international sustainabilityevents to present and share results, programmes andapproaches to interested stakeholders
- Update Saipem SpA’s Model 231 to include theenvironmental crimes introduced by Italian LegislativeDecree No. 231/2001 and by Law No. 190 of November6, 2012- Revise and update anti-corruption procedures- Training (e-learning and in the classroom) in Italy andabroad on the themes of anti-corruption, Model 231 andthe Code of Ethics- Training and continuous updating of members of theCompliance Committees of subsidiaries- Ensure that foreign subsidiaries commence checks toguarantee compliance of the Organisation, Managementand Control Model with local legislation and that theysubsequently carry out gap analyses on sensitiveactivities and on control standards in force in thecompanies themselves
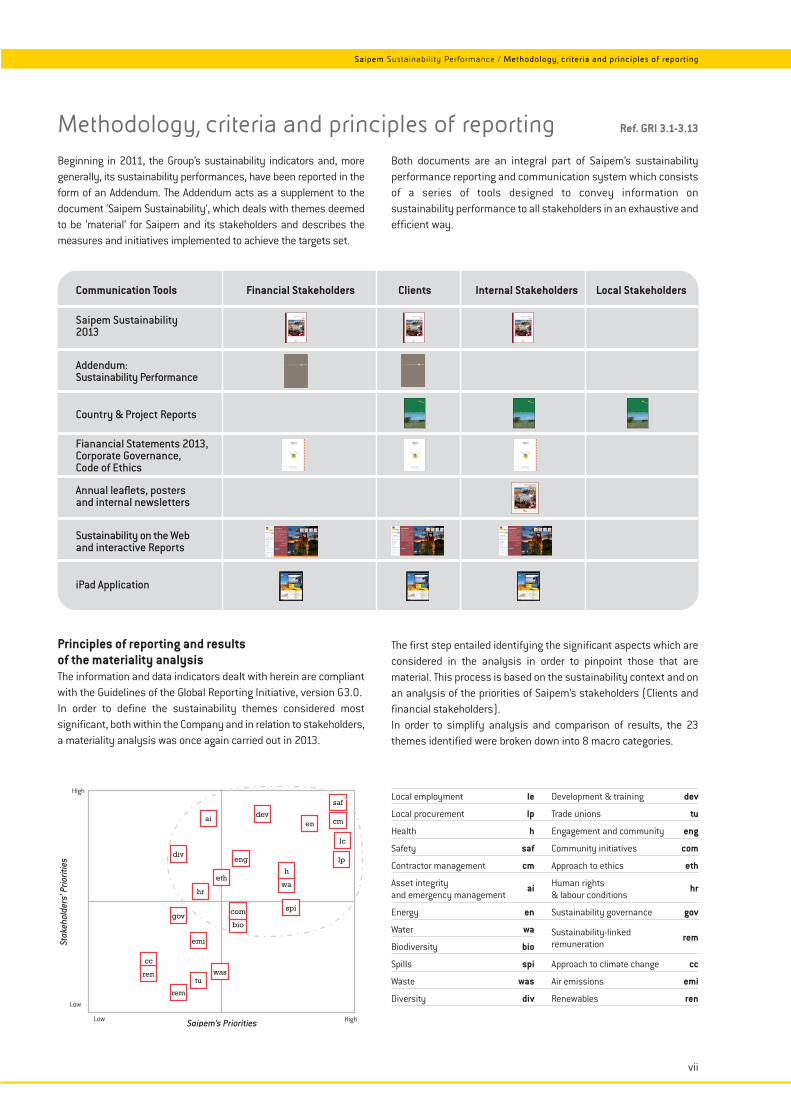
Saipem Sustainability Performance / Methodology, criteria and principles of reporting
vii
Methodology, criteria and principles of reporting Ref. GRI 3.1-3.13
Beginning in 2011, the Group’s sustainability indicators and, moregenerally, its sustainability performances, have been reported in theform of an Addendum. The Addendum acts as a supplement to thedocument ‘Saipem Sustainability’, which deals with themes deemedto be ‘material’ for Saipem and its stakeholders and describes themeasures and initiatives implemented to achieve the targets set.
Both documents are an integral part of Saipem’s sustainabilityperformance reporting and communication system which consistsof a series of tools designed to convey information onsustainability performance to all stakeholders in an exhaustive andefficient way.
Communication Tools Financial Stakeholders Clients Internal Stakeholders Local Stakeholders Saipem Sustainability 2013
Addendum: Sustainability Performance
Country & Project Reports
Fianancial Statements 2013,Corporate Governance,Code of Ethics Annual leaflets, postersand internal newsletters
Sustainability on the Weband interactive Reports
iPad Application
Principles of reporting and resultsof the materiality analysisThe information and data indicators dealt with herein are compliantwith the Guidelines of the Global Reporting Initiative, version G3.0.In order to define the sustainability themes considered mostsignificant, both within the Company and in relation to stakeholders,a materiality analysis was once again carried out in 2013.
The first step entailed identifying the significant aspects which areconsidered in the analysis in order to pinpoint those that arematerial. This process is based on the sustainability context and onan analysis of the priorities of Saipem’s stakeholders (Clients andfinancial stakeholders).In order to simplify analysis and comparison of results, the 23themes identified were broken down into 8 macro categories.
Saipem’s Priorities
Stak
ehol
ders
’ Prio
ritie
s
Low
Low
High
High
lc
lp
saf
eng
en
hr
ai
wa
h
dev
eth
bio
com spi
cc
emi
tuwas
rem
gov
div
ren
cm
Local employment le Development & training dev
Local procurement lp Trade unions tu
Health h Engagement and community eng
Safety saf Community initiatives com
Contractor management cm Approach to ethics eth
Asset integrity ai Human rights hrand emergency management & labour conditions
Energy en Sustainability governance gov
Water wa Sustainability-linked remBiodiversity bio remuneration
Spills spi Approach to climate change cc
Waste was Air emissions emi
Diversity div Renewables ren
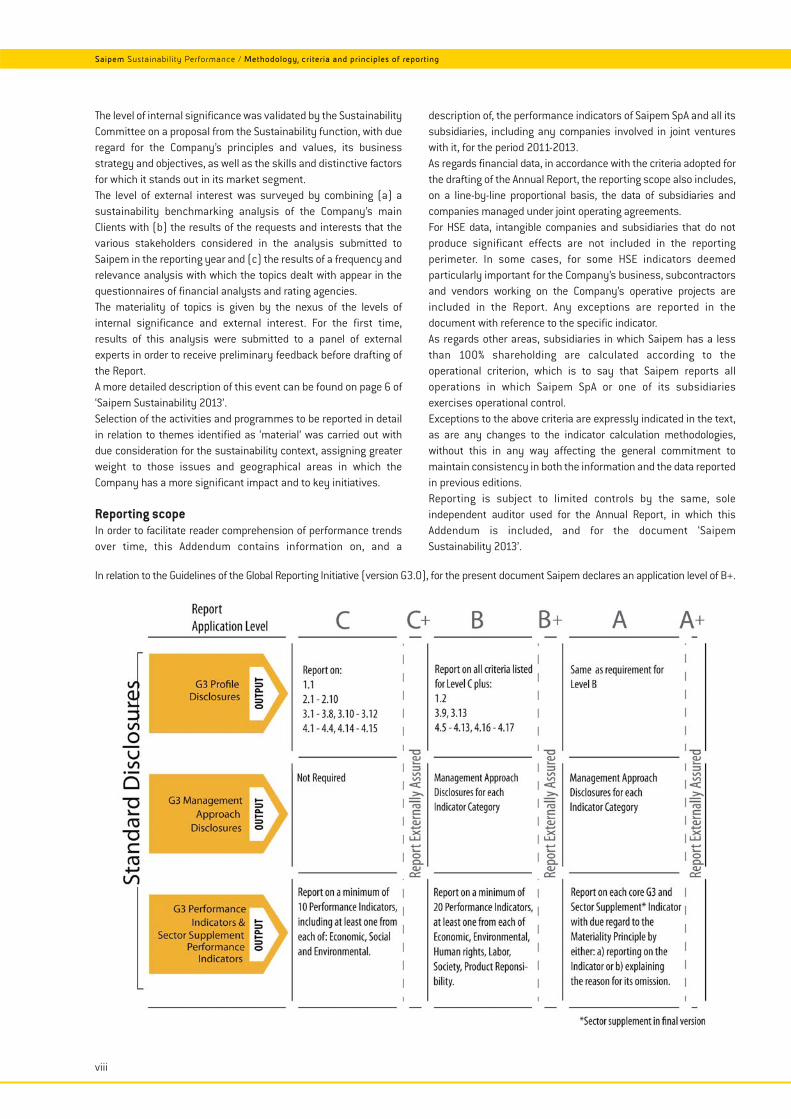
Saipem Sustainability Performance / Methodology, criteria and principles of reporting
viii
description of, the performance indicators of Saipem SpA and all itssubsidiaries, including any companies involved in joint ventureswith it, for the period 2011-2013.As regards financial data, in accordance with the criteria adopted forthe drafting of the Annual Report, the reporting scope also includes,on a line-by-line proportional basis, the data of subsidiaries andcompanies managed under joint operating agreements.For HSE data, intangible companies and subsidiaries that do notproduce significant effects are not included in the reportingperimeter. In some cases, for some HSE indicators deemedparticularly important for the Company’s business, subcontractorsand vendors working on the Company’s operative projects areincluded in the Report. Any exceptions are reported in thedocument with reference to the specific indicator.As regards other areas, subsidiaries in which Saipem has a lessthan 100% shareholding are calculated according to theoperational criterion, which is to say that Saipem reports alloperations in which Saipem SpA or one of its subsidiariesexercises operational control.Exceptions to the above criteria are expressly indicated in the text,as are any changes to the indicator calculation methodologies,without this in any way affecting the general commitment tomaintain consistency in both the information and the data reportedin previous editions.Reporting is subject to limited controls by the same, soleindependent auditor used for the Annual Report, in which thisAddendum is included, and for the document ‘SaipemSustainability 2013’.
The level of internal significance was validated by the SustainabilityCommittee on a proposal from the Sustainability function, with dueregard for the Company’s principles and values, its businessstrategy and objectives, as well as the skills and distinctive factorsfor which it stands out in its market segment.The level of external interest was surveyed by combining (a) asustainability benchmarking analysis of the Company’s mainClients with (b) the results of the requests and interests that thevarious stakeholders considered in the analysis submitted toSaipem in the reporting year and (c) the results of a frequency andrelevance analysis with which the topics dealt with appear in thequestionnaires of financial analysts and rating agencies.The materiality of topics is given by the nexus of the levels ofinternal significance and external interest. For the first time,results of this analysis were submitted to a panel of externalexperts in order to receive preliminary feedback before drafting ofthe Report.A more detailed description of this event can be found on page 6 of‘Saipem Sustainability 2013’.Selection of the activities and programmes to be reported in detailin relation to themes identified as ‘material’ was carried out withdue consideration for the sustainability context, assigning greaterweight to those issues and geographical areas in which theCompany has a more significant impact and to key initiatives.
Reporting scopeIn order to facilitate reader comprehension of performance trendsover time, this Addendum contains information on, and a
In relation to the Guidelines of the Global Reporting Initiative (version G3.0), for the present document Saipem declares an application level of B+.
Saipem Sustainability Performance / Governance, commitment, stakeholder involvement
ix
Governance, commitment, stakeholder involvement Ref. GRI 4.1-4.17
Saipem is committed to maintaining and reinforcing a system ofGovernance that is in line with the standards of international bestpractices and is suited to the complexity of the Company’s make-up.A brief description of the Company’s governance structure is givenbelow. Further details are available in the document ‘CorporateGovernance and Shareholding Structure Report 2013’ [CGR 2013],in the ‘Compensation Report’, in the Code of Ethics and in theGovernance section of the Company’s website.
Governance structure of the organisation
Saipem’s organisational structure is characterised by the presenceof a Board of Directors, a pivotal body in the governance system, towhich management of the Company is exclusively entrusted.Supervisory functions are the responsibility of the Board ofStatutory Auditors, whereas external auditors are in charge of thelegal auditing of accounts. The Shareholders’ Meeting manifests thewill of the shareholders through resolutions adopted in compliancewith the law and the Company’s Articles of Association. The currentBoard of Directors is made up of 9 members, of whom 8 are nonexecutive and 6 are independent. Two committees with advisoryand consulting functions have been set up within the Board ofDirectors. These are the Audit and Risk Committee, consisting of 3independent non-executive members, and the Compensation andNomination Committee, likewise made up of 3 independentnon-executive members.
Dialogue with shareholders
Communications with shareholders are ensured by the manager ofthe Secretary’s Office and any information that is of interest tothem is made available on the Saipem website or can be requestedvia e-mail by writing to: [email protected] protect minority interests, one Statutory Auditor and oneAlternate Statutory Auditor from the Board of Statutory Auditors arechosen from among the candidates put forward by minorityshareholders. The Shareholders’ Meeting appoints the Chairman ofthe Board of Statutory Auditors from the list put forward by theminority shareholders.More generally, information is guaranteed by means of ampledocumentation made available to investors, the market and thepress on the Saipem website. It is further ensured by means ofpress releases, periodical meetings with institutional investors, thefinancial community and the press. Saipem employees have anumber of dedicated information channels available, including theintranet portal, the quarterly magazine ‘Orizzonti’ and a largenumber of newsletters and local magazines.Furthermore, information and dialogue channels provided for underagreements with the trade unions are ensured within the industrialrelations system so that all employees receive timely information,are consulted and can participate.Saipem provides employees and stakeholders with an informationchannel – overseen by the Compliance Committee in a way that
ensures confidentiality and prevents any form of retaliation –through which it is possible to report any problems related to theinternal control system, financial reporting, corporateadministrative liability, fraud or other topics (i.e. violations of theCode of Ethics, mobbing, theft, security, etc.).
Compensation
Compensation of the CEO and of Senior Managers with strategicresponsibilities comprises a fixed component and an annualvariable component. The latter is set with reference to Saipem’syearly objectives in terms of new contracts, investments andbacklog, adjusted EBITDA and sustainability.For issues relating to the compensation of Directors, StatutoryAuditors and Senior Managers with strategic responsibilities, seethe ‘Compensation Report’, available to the public at Companyheadquarters and in the ‘Corporate Governance’ section of theCompany website www.saipem.com.
Transparency and correctness
The Saipem procedure ‘Transactions involving interests held byBoard Directors and Statutory Auditors and Transactions withRelated Parties’ (available at www.saipem.com in the ‘CorporateGovernance’ section), which aims to ensure transparency as wellas substantive and procedural correctness in transactions withother parties, was approved in 2010 and amended by the Board ofDirectors on March 13, 2012.
Requirements for Board membership
Directors shall meet the honourability requirements prescribed byregulations, possess the professional expertise and experience tocarry out their mandate efficiently and effectively, and be able todedicate sufficient time and resources to their offices. Incompliance with the Corporate Governance Code, the Board ofDirectors carries out a yearly Board Review on the size,composition and level of functioning and efficiency of the Boardand its Committees. To this end, it avails of the assistance of aspecialist external consultant.
Mission, values and codes of conduct
Clear recognition of the Company’s values and responsibilities is afoundational element of Saipem’s relations with its stakeholders.The following principles, further underscored in the Company’sMission Statement, are applied universally throughout Groupoperations. Compliance with the law, regulations, statutoryprovisions, self-regulatory codes, ethical integrity and fairness, is aconstant commitment and duty of all Saipem people when carryingout their duties and responsibilities. Alongside a commitment to
Saipem Sustainability Performance / Governance, commitment, stakeholder involvement
x
transparency, energy efficiency and sustainable development,these principles characterise the conduct of the entireorganisation. The Code of Ethics clearly defines the values thatSaipem recognises, accepts and shares, as well as theresponsibilities the Company assumes towards internal andexternal parties.In order to guarantee the achievement of business objectives, theBoard of Directors has so far approved the following Policydocuments: ‘Our People’; ‘Our Partners in the value chain’; ‘GlobalCompliance’; ‘Corporate Governance’; ‘Operational Excellence’; ‘OurInstitutional Partners’; ‘Information Management’; ‘Our tangible andintangible assets’; ‘Sustainability’; ‘Integrity in our operations’. Asshown in this document, the results of the Company and itssubsidiaries in the social, environmental and economic spherestestifies to the degree to which the aforementioned principles havebeen implemented.
Performance managementand assessment
The Board of Directors receives from the delegated directors, at theBoard meetings and, in any case, at least once every three months,a report on the activity carried out in the exercise of the delegatedduties, on the Group’s activity and on major transactions carriedout by the Company or its subsidiaries, and approves the StrategicPlan which, alongside specifically economic and financial themes,includes objectives related to the sustainability aspects ofSaipem’s business.The main risks referable to the HSE area are identified, monitoredand managed by Saipem through an Integrated HSE ManagementSystem based on yearly planning, implementation, control, reviewof results and setting of new targets. The performance is presentedand discussed at each meeting of the Board of Directors, whichsubsequently issues operative instructions. Furthermore, as partof the implementation of the policy of maximising Local Content,and with regard to the management of the Company’s personnel,the Board of Directors is likewise informed, when needed, of theCompany’s social performance.
Board review
In accordance with international best practices and in compliancewith the Stock Exchange Code, the Board of Directors of Saipemannually conducts a Board Review on the size, composition andfunctioning of the Board of Directors and its committees and mayprovide advice on professionals whose presence on the Board itdeems to be appropriate.Every four months, the Sustainability Committee, chaired by theCEO, is presented with the main performance results and activitiesunderway as regards sustainability. The Committee then suppliesguidelines and approves the activity plan. The Committee is alsoinformed about, and provisionally approves, the external report onthe year’s sustainability performance, which is subsequently
approved formally by the Board of Directors concurrently with theAnnual Report.
Risk management
Having consulted with the Audit and Risk Committee, on July 30,2013 the Board of Directors approved the ‘Principles of IntegratedRisk Management’. The Integrated Risk Management (IRM)process, characterised by a structured and systematic approach,requires that the risk principles be efficiently identified, assessed,managed, monitored, represented and, where possible,transformed into opportunities and competitive advantage. On thebasis of the principles approved by the Board of Directors, Saipemdeveloped and implemented a Model for the integratedmanagement of Company risks. This is now an integral part of theRisk and Internal Control Management System. Defined incompliance with the principles and with international bestpractices, the Model follows an organic and concise vision of therisks to which the Company is exposed, greater consistency ofmethodologies and tools to support risk management, andstrengthening of awareness at all levels to the effect that anappropriate assessment and management of risks of various typescan have a positive impact on the achievement of objectives andon the Company’s value. To this end, the Model is characterised bythe following elements:(i) Risk Governance: represents the general framework as
regards roles, responsibilities and information flows formanagement of the main Company risks. Roles andresponsibilities under the risk governance model are dividedinto three separate levels of control;
(ii) Process: represents the grouping of all activities throughwhich the various actors identify, measure, manage andmonitor the main risks that could influence Saipem’s ability toachieve its objectives;
(iii) Reporting: reports and represents the results of the RiskAssessment, highlighting the most significant risks in termsof likelihood and potential impact as well as the plans fordealing with them.
Codes of conduct adopted
The Universal Declaration of Human Rights adopted by the UnitedNations, the Fundamental Conventions of the ILO (InternationalLabour Organisation) and the OECD Guidelines for MultinationalEnterprises, are fundamental principles on which Saipem bases itsCode of Ethics and conducts its operations.
Associations
Saipem participates in numerous initiatives and associations thathave as their main objective the sharing of best practices withintheir specific business sectors.
Saipem Sustainability Performance / Governance, commitment, stakeholder involvement
xi
Saipem has adopted a communications policy targeted at achieving constant dialogue with investors and systematic diffusion of comprehensive and timelyinformation on Company activities. Information to investors and the market takes place through press releases, the periodical presentation of financial results and thebroad documentation made available and constantly updated on the Company website, as well as periodical meetings with institutional investors and financialanalysts. Shareholders are mainly involved through interfacing with the Company Secretary function. In 2013, management met the financial community during 17Road Shows held in the main stock exchanges and at 5 financial conferences.In 2013, Saipem provided a number of informative sustainability documents to EIRIS, VIGEO, Financière de l’Echiquier, Global Sustainability Rating, the Ethical Counciland Storebrand. Saipem also took part in the Carbon Disclosure Project (CDP).
Financial stakeholders
Saipem collaborates with organisations or NGOs, above all at local level, and at times through specific partnership agreements, with the aim of implementingcommunity initiatives tailored to the area’s specificities and main problems. Cooperation with local NGOs is for the most part in the Congo and in Kazakhstan and istargeted at conducting studies and implementing initiatives of a local nature.Cooperation with the NGO Eurasia Foundation of Central Asia (EFCA) in Kazakhstan proceeded in 2013 with a view to completing initiatives aimed at education in thelocal community. Work with the Junior Achievement Azerbaijan (JAA) to reinforce the technical skills of university students also went ahead. In Colombia, the Companycooperated with a number of local NGOs to increase awareness on environmental issues.
Local organisations and NGOs
Reporting on operating projects is constant. Project Managers and project staff hold interviews and meetings and reply to the requests of Clients, who are often presenton-site in day-to-day operations. Clients are also involved in HSE training initiatives, such as environmental awareness campaigns or the LiHS (Leadership in Healthand Safety) programme. At the end of each significant project, and on an annual basis, the Client is asked for feedback using the Customer Satisfaction tool.Furthermore, meetings with Clients or potential Clients are organised in pre-bid and bid phase and can involve a number of specific aspects such as Saipem’s approachto sustainability. In 2013, Saipem held numerous meetings with Clients to involve them in its sustainability strategy in South America, Canada, Saudi Arabia, Australiaand Azerbaijan.The Company also cooperated with Qatar Petroleum on the ‘Sustainable Development Industry (SDI) Reporting Qatar’.
Clients
Workers’ representatives and trade unions are involved in collective bargaining and in other forms of dialogue regarding specific local activities, including throughperiodical meetings. Management of Company employees is the responsibility of the Human Resources function on all Group operating sites, as described in thedocument ‘Saipem Sustainability 2013’. 2013 saw analysis of the results of the engagement survey launched at the end of 2012. This was targeted at Senior Managers,Middle Managers and Office Staff of Saipem SpA and Saipem UK Ltd. 6,292 employees were invited to take part in this survey, 75% of whom took up the invitation.The overall result of Engagement in Saipem is 53%. The key questions of the survey were with reference to three behaviours: ‘Say, stay, strive’.Around 400 young resources aged between 28 and 35 and with international experience of 3 to 5 years were subsequently involved and given the opportunity tosubmit some of their proposals to Saipem top management.In Angola, employees, along with their spouses, partners and children, participated in the Little LiHS workshop. Personnel engagement and training activities onsustainability themes continued throughout 2013 with the organisation of thematic seminars and specific meetings with managerial functions.
Employees
As described in the document ‘Saipem Sustainability 2013’, each operating company or project has a specific approach to relations with local communities. This takesinto account both the role of Saipem and the socio-economic and cultural context in which the Company operates. Many initiatives involving local communities wereheld during 2013. In Kazakhstan, a public meeting was held with the population of Kuryk village to present and discuss the Ersai sustainability plan. On that occasion,several local stakeholders were identified to supervise and monitor the execution of activities. This was done in order to strengthen the sense of responsibility forsuccess as well as recognition of these initiatives on the part of the community.In Nigeria, relations with local communities are defined and regulated in Memorandums of Understanding (MoU) signed by the Company, the Client (for projects) andrepresentatives of the communities affected by operations. Other local community initiatives and projects were held in the Congo, Colombia, Kazakhstan, Indonesia,Peru, Venezuela, Mexico, Angola and Brazil (for further details see ‘Saipem Sustainability 2013’).
Local communities
Engagement with governments and, above all, local authorities is defined in relation to the circumstances in which Saipem operates, taking into consideration thespecificities of the country and the social context. Alongside institutional and official relations with the authorities, Saipem cooperates with public bodies for the launchof initiatives in favour of local communities and local areas. In this regard, Saipem collaborates with local government health entities, hospitals and medical centres toimplement projects targeted at raising awareness of diseases such as Malaria and AIDS in the Congo and Nigeria, as well as with environmental protection bodies inthe Congo and Kazakhstan. In 2013, cooperation with the Municipality of Guarujá in Brazil proceeded apace following the signing of the ‘Declaration of Intent’. Saipemworks with local institutions such as schools and universities, including through specific partnership agreements in order to contribute to the development of aneducation system that meets the needs of the private sector, with particular reference to the Oil&Gas industry. Numerous initiatives are underway in Algeria,Kazakhstan, Italy, the Congo, Indonesia, Azerbaijan and Colombia in this regard.
Governments and local authorities
Relations with vendors are discussed in the document ‘Saipem Sustainability 2013’, where the selection and assessment processes are described. At local level,specific initiatives for vendor involvement are constantly ongoing. These aim to improve the quality of supplies and to encourage vendors to comply with Saipem’squality, health and safety, environmental and social requirements. In this regard, meetings were held most especially with vendors in India, China and Brazil. InKazakhstan, vendors were involved in initiatives for local communities. Forums targeted at vendors in Venezuela, Nigeria, Brazil and Colombia were organised in 2013,as were training courses in Azerbaijan and Nigeria. The Company supported Aboriginal companies in Australia and Canada through a variety of initiatives. Finally, it isworth mentioning the meetings organised periodically with vendors with whom strategic agreements have been signed.
Vendors
Stakeholder relations Ref. GRI 4.14-4.17
The methods adopted by the Company to identify, map and engage with stakeholders locally are described in the document ‘Saipem Sustainability 2013’. The mainstakeholder engagement activities carried out in 2013 are outlined below.
Saipem Sustainability Performance / Disclosure on management approach
xii
Disclosure on management approach
The management approach to sustainability issues pursuant to theGuidelines of the Global Reporting Initiative, version G3.0, isdescribed below. All documents mentioned are available on theCompany website www.saipem.com.
Economic performance
Saipem is an international Oil&Gas contractor whose revenues in2013 totalled €12 billion. The Company has in excess of 52,000employees and is present in more than 70 countries, often on amedium- to long-term basis and in difficult or ‘frontier’ conditions.For this reason, the Company is committed to minimising anynegative impacts on those areas and to contributing to themaximisation of positive impacts through the implementation oflocal sustainable development strategies.
Further details can be found in the ‘Annual Report 2013’ and in thechapter ‘Developing long-term competitiveness’ of ‘SaipemSustainability 2013’.
Environment
For Saipem, supplying excellent products and services goes handin hand with its commitment to environmental protection. Saipemhas defined an HSE management system that constitutes abenchmark for all productive units and that requires systematicauditing in order to ensure compliance with national andinternational legislation and regulations and with the conditions ofcontracts entered into with Clients. Alongside the HSE andEnvironmental Managers and their teams working in Corporate andin the main operating companies, each operating project isspecifically assigned an HSE team. Reducing environmentalimpacts to a minimum is an objective found along the entire lifecycle of a project, from engineering phase through tode-commissioning. Furthermore, technological innovation at theservice of Company assets is combined with the implementation ofbest practices on operating projects to pursue constantimprovement of the Company’s environmental performance.
Further information can be found in the chapter ‘Minimisingenvironmental impacts’ of ‘Saipem Sustainability 2013’, in theDirectors’ Report contained in the ‘Annual Report 2013’, in thesection ‘Commitments, results and objectives’ of this Addendumand in the ‘Sustainability’ section of the Company website.
Labour practices and indicatorsof decent working conditions
Saipem believes that human capital is a key element for its durablecompetitive success. This is why it is vital to ensure adequateprotection of labour, the continuous development of skills andcompetences, the creation of a working environment that offers
equal opportunities for all on the basis of merit and withoutdiscrimination, while at the same time guaranteeing respect forand adaptation to the characteristics of individual situations. Theworkplace health and safety of all Saipem personnel are a priorityobjective and are constantly monitored and guaranteed in theCompany’s operations management activities through anintegrated HSE management system. Industrial relations arehandled with due regard for the specificities of localsocio-economic contexts as well as for labour laws in force in thecountry where the Company is operating.
Further information can be found in the chapters ‘Competency as abusiness driver’ and ‘A safe workplace and a healthy workforce toensure excellence’ of ‘Saipem Sustainability 2013’, in the‘Sustainability’ section of the Company website, in the Directors’Report contained in the ‘Annual Report 2013’ and in the section‘Commitments, results and objectives’ of this Addendum.
Human rights
Saipem complies with international human and workers’ rightslegislation and in turn is committed to ensuring that its ownsuppliers duly observe these. Saipem’s sustainability policydeclares explicitly that ‘respect for Human Rights is the foundationof inclusive growth of societies and local areas and, consequently,of the companies that work within them’. Saipem contributes to thecreation of the socio-economic conditions required for the effectiveenjoyment of fundamental rights and promotes the professionalgrowth and well-being of its own local human resources. Asexpressed quite clearly in the Code of Ethics, Saipem undertakes tospread knowledge of Company values and principles, including byimplementing suitable procedures of control, and protecting thespecific rights of local populations.
Further information can be found in the Code of Ethics, in theSustainability policy, in the chapters ‘Competency as a businessdriver’ and ‘Local Content approach: delivering shared value’ of‘Saipem Sustainability 2013’, in the ‘Sustainability’ section of theCompany website, in the Directors’ Report contained in the ‘AnnualReport 2013’ and in the section ‘Commitments, results andobjectives’ of this Addendum.
Society
Saipem is committed to contributing to the long-term social andeconomic development of the countries in which it operates. Thisresult is mainly pursued through the employment of localpersonnel, the transfer of know-how (technical and non-technical)and procurement of goods and services from local suppliers. With aview to minimising impacts on local populations and areas, Saipemhas implemented specific tools to analyse the local context andidentify areas of intervention and lines of action. As regardsrelations with local areas, Saipem avails of a process for identifying
Saipem Sustainability Performance / Disclosure on management approach
xiii
the main stakeholders, as well as the means for involving them in away conducive to constructive and ongoing dialogue.
Further information can be found in the Sustainability policy, in thechapters ‘Partnering with local communities’ and ‘Local Contentapproach: delivering shared value’ of ‘Saipem Sustainability 2013’,in the ‘Sustainability’ section of the Company website, in theDirectors’ Report contained in the ‘Annual Report 2013’ and in thesection ‘Commitments, results and objectives’ of this Addendum.
Responsibilities for products
Customer satisfaction is a key factor of sustainable business.Quality and HSE management systems have been implemented on
each Saipem project to realise quality products and services and toperform activities in conditions of maximum safety. In compliancewith Corporate policy for Quality, all of Saipem’s operatingcompanies have implemented a Quality Management System inaccordance with ISO 9001, Corporate guidelines and the relevantstandards. A Customer Satisfaction system has also been designedand implemented.
Further information can be found in the Sustainability policy, in thechapter ‘A safe workplace and a healthy workforce to ensureexcellence’ of ‘Saipem Sustainability 2013’, in the Directors’ Reportcontained in the ‘Annual Report 2013’ and in the section‘Commitments, results and objectives’ of this Addendum.
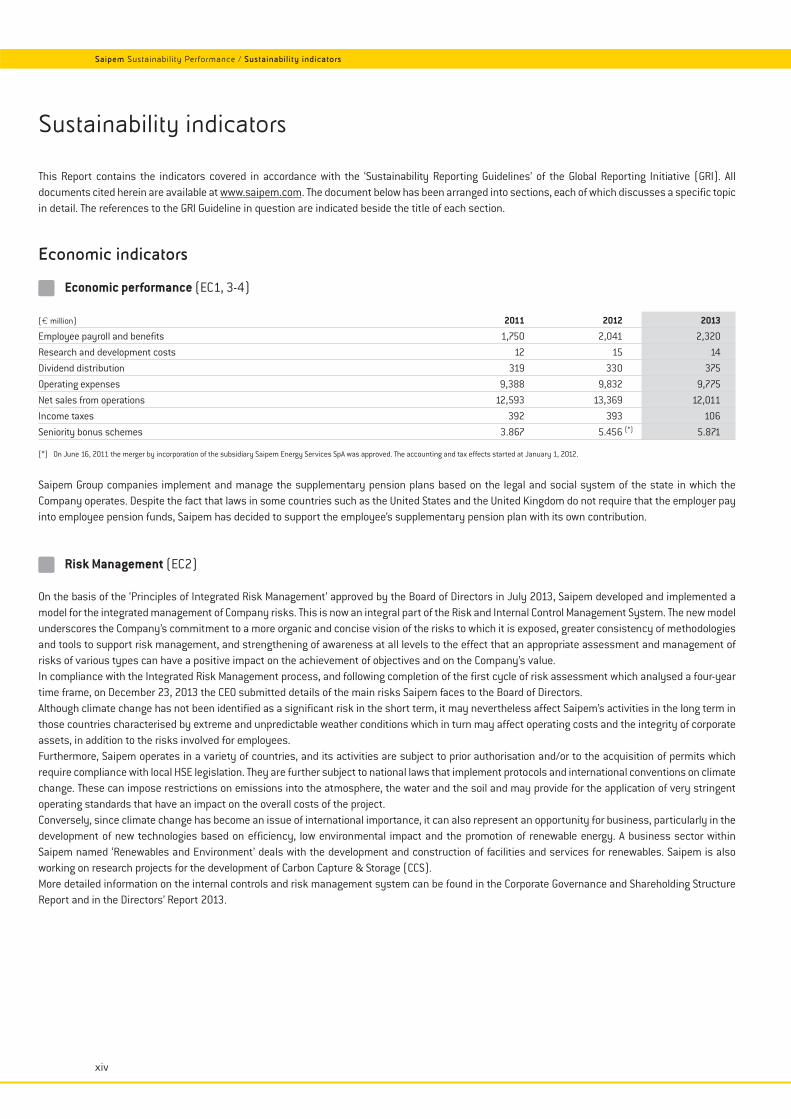
Sustainability indicators
This Report contains the indicators covered in accordance with the ‘Sustainability Reporting Guidelines’ of the Global Reporting Initiative (GRI). Alldocuments cited herein are available at www.saipem.com. The document below has been arranged into sections, each of which discusses a specific topicin detail. The references to the GRI Guideline in question are indicated beside the title of each section.
Economic indicators
Economic performance (EC1, 3-4)
(€ million) 2011 2012 2013
Employee payroll and benefits 1,750 2,041 2,320
Research and development costs 12 15 14
Dividend distribution 319 330 375
Operating expenses 9,388 9,832 9,775
Net sales from operations 12,593 13,369 12,011
Income taxes 392 393 106
Seniority bonus schemes 3.867 5.456 (*) 5.871
(*) On June 16, 2011 the merger by incorporation of the subsidiary Saipem Energy Services SpA was approved. The accounting and tax effects started at January 1, 2012.
Saipem Group companies implement and manage the supplementary pension plans based on the legal and social system of the state in which theCompany operates. Despite the fact that laws in some countries such as the United States and the United Kingdom do not require that the employer payinto employee pension funds, Saipem has decided to support the employee’s supplementary pension plan with its own contribution.
Risk Management (EC2)
On the basis of the ‘Principles of Integrated Risk Management’ approved by the Board of Directors in July 2013, Saipem developed and implemented amodel for the integrated management of Company risks. This is now an integral part of the Risk and Internal Control Management System. The new modelunderscores the Company’s commitment to a more organic and concise vision of the risks to which it is exposed, greater consistency of methodologiesand tools to support risk management, and strengthening of awareness at all levels to the effect that an appropriate assessment and management ofrisks of various types can have a positive impact on the achievement of objectives and on the Company’s value.In compliance with the Integrated Risk Management process, and following completion of the first cycle of risk assessment which analysed a four-yeartime frame, on December 23, 2013 the CEO submitted details of the main risks Saipem faces to the Board of Directors.Although climate change has not been identified as a significant risk in the short term, it may nevertheless affect Saipem’s activities in the long term inthose countries characterised by extreme and unpredictable weather conditions which in turn may affect operating costs and the integrity of corporateassets, in addition to the risks involved for employees.Furthermore, Saipem operates in a variety of countries, and its activities are subject to prior authorisation and/or to the acquisition of permits whichrequire compliance with local HSE legislation. They are further subject to national laws that implement protocols and international conventions on climatechange. These can impose restrictions on emissions into the atmosphere, the water and the soil and may provide for the application of very stringentoperating standards that have an impact on the overall costs of the project.Conversely, since climate change has become an issue of international importance, it can also represent an opportunity for business, particularly in thedevelopment of new technologies based on efficiency, low environmental impact and the promotion of renewable energy. A business sector withinSaipem named ‘Renewables and Environment’ deals with the development and construction of facilities and services for renewables. Saipem is alsoworking on research projects for the development of Carbon Capture & Storage (CCS).More detailed information on the internal controls and risk management system can be found in the Corporate Governance and Shareholding StructureReport and in the Directors’ Report 2013.
xiv
Saipem Sustainability Performance / Sustainability indicators
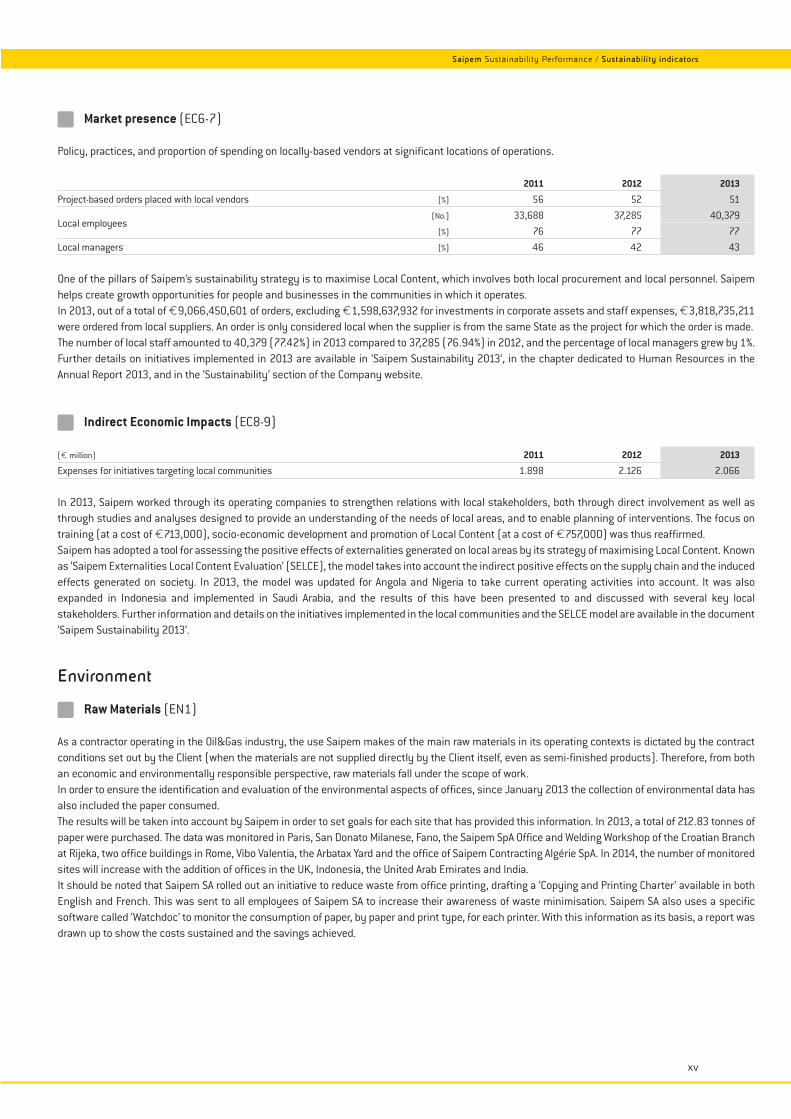
Market presence (EC6-7)
Policy, practices, and proportion of spending on locally-based vendors at significant locations of operations.
2011 2012 2013
Project-based orders placed with local vendors (%) 56 52 51
Local employees(No.) 33,688 37,285 40,379
(%) 76 77 77
Local managers (%) 46 42 43
One of the pillars of Saipem’s sustainability strategy is to maximise Local Content, which involves both local procurement and local personnel. Saipemhelps create growth opportunities for people and businesses in the communities in which it operates.In 2013, out of a total of €9,066,450,601 of orders, excluding €1,598,637,932 for investments in corporate assets and staff expenses, €3,818,735,211were ordered from local suppliers. An order is only considered local when the supplier is from the same State as the project for which the order is made.The number of local staff amounted to 40,379 (77.42%) in 2013 compared to 37,285 (76.94%) in 2012, and the percentage of local managers grew by 1%.Further details on initiatives implemented in 2013 are available in ‘Saipem Sustainability 2013’, in the chapter dedicated to Human Resources in theAnnual Report 2013, and in the ‘Sustainability’ section of the Company website.
Indirect Economic Impacts (EC8-9)
(€ million) 2011 2012 2013
Expenses for initiatives targeting local communities 1.898 2.126 2.066
In 2013, Saipem worked through its operating companies to strengthen relations with local stakeholders, both through direct involvement as well asthrough studies and analyses designed to provide an understanding of the needs of local areas, and to enable planning of interventions. The focus ontraining (at a cost of €713,000), socio-economic development and promotion of Local Content (at a cost of €757,000) was thus reaffirmed.Saipem has adopted a tool for assessing the positive effects of externalities generated on local areas by its strategy of maximising Local Content. Knownas ‘Saipem Externalities Local Content Evaluation’ (SELCE), the model takes into account the indirect positive effects on the supply chain and the inducedeffects generated on society. In 2013, the model was updated for Angola and Nigeria to take current operating activities into account. It was alsoexpanded in Indonesia and implemented in Saudi Arabia, and the results of this have been presented to and discussed with several key localstakeholders. Further information and details on the initiatives implemented in the local communities and the SELCE model are available in the document‘Saipem Sustainability 2013’.
Environment
Raw Materials (EN1)
As a contractor operating in the Oil&Gas industry, the use Saipem makes of the main raw materials in its operating contexts is dictated by the contractconditions set out by the Client (when the materials are not supplied directly by the Client itself, even as semi-finished products). Therefore, from bothan economic and environmentally responsible perspective, raw materials fall under the scope of work.In order to ensure the identification and evaluation of the environmental aspects of offices, since January 2013 the collection of environmental data hasalso included the paper consumed.The results will be taken into account by Saipem in order to set goals for each site that has provided this information. In 2013, a total of 212.83 tonnes ofpaper were purchased. The data was monitored in Paris, San Donato Milanese, Fano, the Saipem SpA Office and Welding Workshop of the Croatian Branchat Rijeka, two office buildings in Rome, Vibo Valentia, the Arbatax Yard and the office of Saipem Contracting Algérie SpA. In 2014, the number of monitoredsites will increase with the addition of offices in the UK, Indonesia, the United Arab Emirates and India.It should be noted that Saipem SA rolled out an initiative to reduce waste from office printing, drafting a ‘Copying and Printing Charter’ available in bothEnglish and French. This was sent to all employees of Saipem SA to increase their awareness of waste minimisation. Saipem SA also uses a specificsoftware called ‘Watchdoc’ to monitor the consumption of paper, by paper and print type, for each printer. With this information as its basis, a report wasdrawn up to show the costs sustained and the savings achieved.
xv
Saipem Sustainability Performance / Sustainability indicators
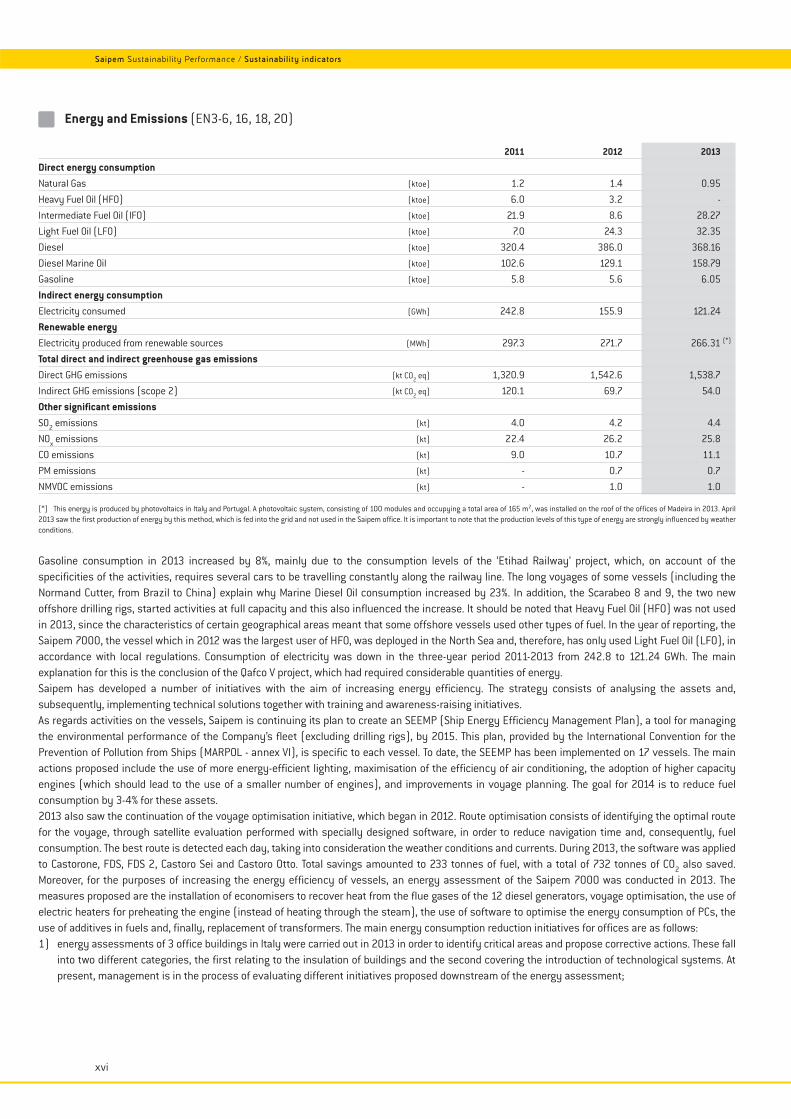
Energy and Emissions (EN3-6, 16, 18, 20)
2011 2012 2013
Direct energy consumptionNatural Gas (ktoe) 1.2 1.4 0.95
Heavy Fuel Oil (HFO) (ktoe) 6.0 3.2 -
Intermediate Fuel Oil (IFO) (ktoe) 21.9 8.6 28.27
Light Fuel Oil (LFO) (ktoe) 7.0 24.3 32.35
Diesel (ktoe) 320.4 386.0 368.16
Diesel Marine Oil (ktoe) 102.6 129.1 158.79
Gasoline (ktoe) 5.8 5.6 6.05
Indirect energy consumption Electricity consumed (GWh) 242.8 155.9 121.24
Renewable energyElectricity produced from renewable sources (MWh) 297.3 271.7 266.31 (*)
Total direct and indirect greenhouse gas emissionsDirect GHG emissions (kt CO2 eq) 1,320.9 1,542.6 1,538.7
Indirect GHG emissions (scope 2) (kt CO2 eq) 120.1 69.7 54.0
Other significant emissionsSO2 emissions (kt) 4.0 4.2 4.4
NOx emissions (kt) 22.4 26.2 25.8
CO emissions (kt) 9.0 10.7 11.1
PM emissions (kt) - 0.7 0.7
NMVOC emissions (kt) - 1.0 1.0
(*) This energy is produced by photovoltaics in Italy and Portugal. A photovoltaic system, consisting of 100 modules and occupying a total area of 165 m2, was installed on the roof of the offices of Madeira in 2013. April2013 saw the first production of energy by this method, which is fed into the grid and not used in the Saipem office. It is important to note that the production levels of this type of energy are strongly influenced by weatherconditions.
Gasoline consumption in 2013 increased by 8%, mainly due to the consumption levels of the ‘Etihad Railway’ project, which, on account of thespecificities of the activities, requires several cars to be travelling constantly along the railway line. The long voyages of some vessels (including theNormand Cutter, from Brazil to China) explain why Marine Diesel Oil consumption increased by 23%. In addition, the Scarabeo 8 and 9, the two newoffshore drilling rigs, started activities at full capacity and this also influenced the increase. It should be noted that Heavy Fuel Oil (HFO) was not usedin 2013, since the characteristics of certain geographical areas meant that some offshore vessels used other types of fuel. In the year of reporting, theSaipem 7000, the vessel which in 2012 was the largest user of HFO, was deployed in the North Sea and, therefore, has only used Light Fuel Oil (LFO), inaccordance with local regulations. Consumption of electricity was down in the three-year period 2011-2013 from 242.8 to 121.24 GWh. The mainexplanation for this is the conclusion of the Qafco V project, which had required considerable quantities of energy.Saipem has developed a number of initiatives with the aim of increasing energy efficiency. The strategy consists of analysing the assets and,subsequently, implementing technical solutions together with training and awareness-raising initiatives.As regards activities on the vessels, Saipem is continuing its plan to create an SEEMP (Ship Energy Efficiency Management Plan), a tool for managingthe environmental performance of the Company’s fleet (excluding drilling rigs), by 2015. This plan, provided by the International Convention for thePrevention of Pollution from Ships (MARPOL - annex VI), is specific to each vessel. To date, the SEEMP has been implemented on 17 vessels. The mainactions proposed include the use of more energy-efficient lighting, maximisation of the efficiency of air conditioning, the adoption of higher capacityengines (which should lead to the use of a smaller number of engines), and improvements in voyage planning. The goal for 2014 is to reduce fuelconsumption by 3-4% for these assets.2013 also saw the continuation of the voyage optimisation initiative, which began in 2012. Route optimisation consists of identifying the optimal routefor the voyage, through satellite evaluation performed with specially designed software, in order to reduce navigation time and, consequently, fuelconsumption. The best route is detected each day, taking into consideration the weather conditions and currents. During 2013, the software was appliedto Castorone, FDS, FDS 2, Castoro Sei and Castoro Otto. Total savings amounted to 233 tonnes of fuel, with a total of 732 tonnes of CO2 also saved.Moreover, for the purposes of increasing the energy efficiency of vessels, an energy assessment of the Saipem 7000 was conducted in 2013. Themeasures proposed are the installation of economisers to recover heat from the flue gases of the 12 diesel generators, voyage optimisation, the use ofelectric heaters for preheating the engine (instead of heating through the steam), the use of software to optimise the energy consumption of PCs, theuse of additives in fuels and, finally, replacement of transformers. The main energy consumption reduction initiatives for offices are as follows:1) energy assessments of 3 office buildings in Italy were carried out in 2013 in order to identify critical areas and propose corrective actions. These fall
into two different categories, the first relating to the insulation of buildings and the second covering the introduction of technological systems. Atpresent, management is in the process of evaluating different initiatives proposed downstream of the energy assessment;
xvi
Saipem Sustainability Performance / Sustainability indicators
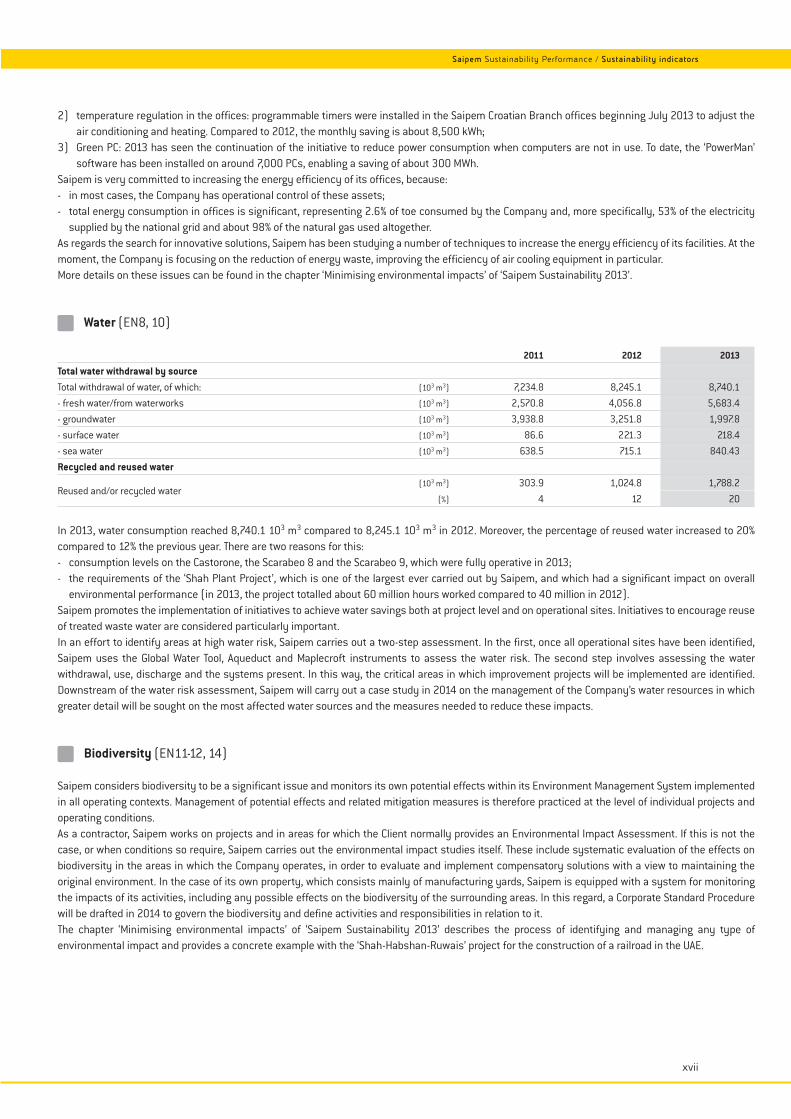
2) temperature regulation in the offices: programmable timers were installed in the Saipem Croatian Branch offices beginning July 2013 to adjust theair conditioning and heating. Compared to 2012, the monthly saving is about 8,500 kWh;
3) Green PC: 2013 has seen the continuation of the initiative to reduce power consumption when computers are not in use. To date, the ‘PowerMan’software has been installed on around 7,000 PCs, enabling a saving of about 300 MWh.
Saipem is very committed to increasing the energy efficiency of its offices, because:- in most cases, the Company has operational control of these assets;- total energy consumption in offices is significant, representing 2.6% of toe consumed by the Company and, more specifically, 53% of the electricity
supplied by the national grid and about 98% of the natural gas used altogether.As regards the search for innovative solutions, Saipem has been studying a number of techniques to increase the energy efficiency of its facilities. At themoment, the Company is focusing on the reduction of energy waste, improving the efficiency of air cooling equipment in particular.More details on these issues can be found in the chapter ‘Minimising environmental impacts’ of ‘Saipem Sustainability 2013’.
Water (EN8, 10)
2011 2012 2013
Total water withdrawal by sourceTotal withdrawal of water, of which: (103 m3) 7,234.8 8,245.1 8,740.1
- fresh water/from waterworks (103 m3) 2,570.8 4,056.8 5,683.4
- groundwater (103 m3) 3,938.8 3,251.8 1,997.8
- surface water (103 m3) 86.6 221.3 218.4
- sea water (103 m3) 638.5 715.1 840.43
Recycled and reused water
Reused and/or recycled water(103 m3) 303.9 1,024.8 1,788.2
(%) 4 12 20
In 2013, water consumption reached 8,740.1 103 m3 compared to 8,245.1 103 m3 in 2012. Moreover, the percentage of reused water increased to 20%compared to 12% the previous year. There are two reasons for this:- consumption levels on the Castorone, the Scarabeo 8 and the Scarabeo 9, which were fully operative in 2013;- the requirements of the ‘Shah Plant Project’, which is one of the largest ever carried out by Saipem, and which had a significant impact on overall
environmental performance (in 2013, the project totalled about 60 million hours worked compared to 40 million in 2012).Saipem promotes the implementation of initiatives to achieve water savings both at project level and on operational sites. Initiatives to encourage reuseof treated waste water are considered particularly important.In an effort to identify areas at high water risk, Saipem carries out a two-step assessment. In the first, once all operational sites have been identified,Saipem uses the Global Water Tool, Aqueduct and Maplecroft instruments to assess the water risk. The second step involves assessing the waterwithdrawal, use, discharge and the systems present. In this way, the critical areas in which improvement projects will be implemented are identified.Downstream of the water risk assessment, Saipem will carry out a case study in 2014 on the management of the Company’s water resources in whichgreater detail will be sought on the most affected water sources and the measures needed to reduce these impacts.
Biodiversity (EN11-12, 14)
Saipem considers biodiversity to be a significant issue and monitors its own potential effects within its Environment Management System implementedin all operating contexts. Management of potential effects and related mitigation measures is therefore practiced at the level of individual projects andoperating conditions.As a contractor, Saipem works on projects and in areas for which the Client normally provides an Environmental Impact Assessment. If this is not thecase, or when conditions so require, Saipem carries out the environmental impact studies itself. These include systematic evaluation of the effects onbiodiversity in the areas in which the Company operates, in order to evaluate and implement compensatory solutions with a view to maintaining theoriginal environment. In the case of its own property, which consists mainly of manufacturing yards, Saipem is equipped with a system for monitoringthe impacts of its activities, including any possible effects on the biodiversity of the surrounding areas. In this regard, a Corporate Standard Procedurewill be drafted in 2014 to govern the biodiversity and define activities and responsibilities in relation to it.The chapter ‘Minimising environmental impacts’ of ‘Saipem Sustainability 2013’ describes the process of identifying and managing any type ofenvironmental impact and provides a concrete example with the ‘Shah-Habshan-Ruwais’ project for the construction of a railroad in the UAE.
xvii
Saipem Sustainability Performance / Sustainability indicators
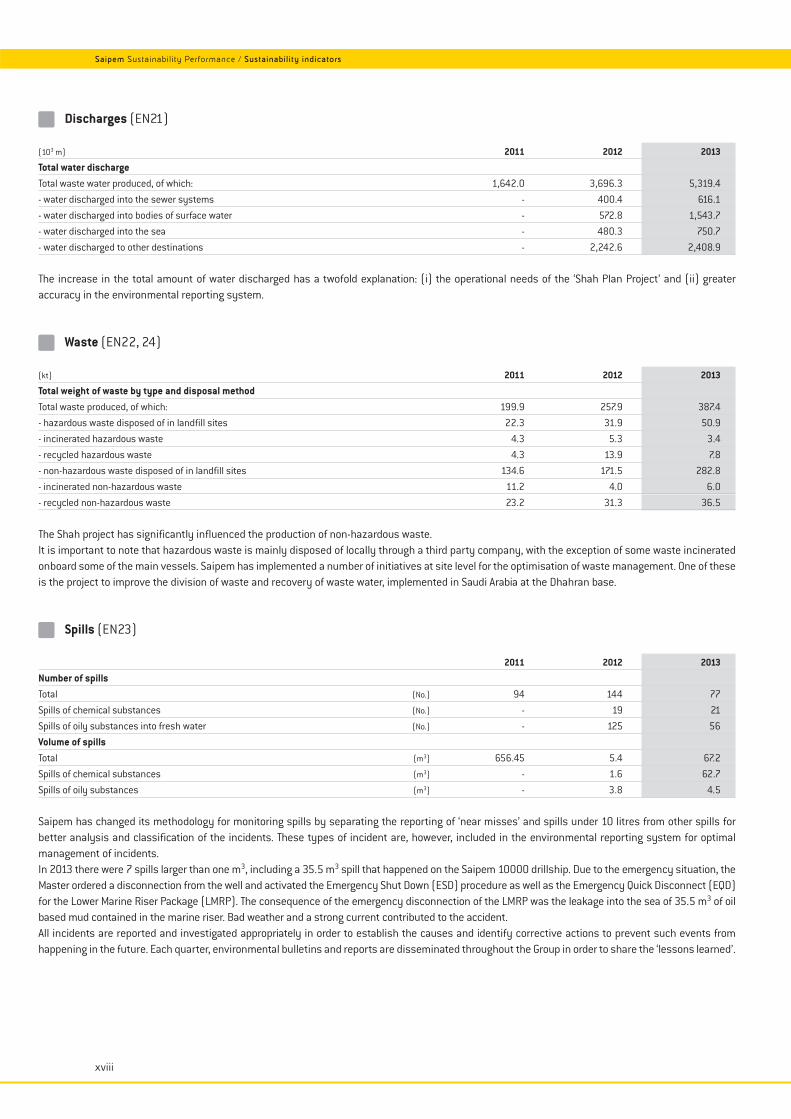
Discharges (EN21)
(103 m) 2011 2012 2013
Total water dischargeTotal waste water produced, of which: 1,642.0 3,696.3 5,319.4
- water discharged into the sewer systems - 400.4 616.1
- water discharged into bodies of surface water - 572.8 1,543.7
- water discharged into the sea - 480.3 750.7
- water discharged to other destinations - 2,242.6 2,408.9
The increase in the total amount of water discharged has a twofold explanation: (i) the operational needs of the ‘Shah Plan Project’ and (ii) greateraccuracy in the environmental reporting system.
Waste (EN22, 24)
(kt) 2011 2012 2013
Total weight of waste by type and disposal methodTotal waste produced, of which: 199.9 257.9 387.4
- hazardous waste disposed of in landfill sites 22.3 31.9 50.9
- incinerated hazardous waste 4.3 5.3 3.4
- recycled hazardous waste 4.3 13.9 7.8
- non-hazardous waste disposed of in landfill sites 134.6 171.5 282.8
- incinerated non-hazardous waste 11.2 4.0 6.0
- recycled non-hazardous waste 23.2 31.3 36.5
The Shah project has significantly influenced the production of non-hazardous waste.It is important to note that hazardous waste is mainly disposed of locally through a third party company, with the exception of some waste incineratedonboard some of the main vessels. Saipem has implemented a number of initiatives at site level for the optimisation of waste management. One of theseis the project to improve the division of waste and recovery of waste water, implemented in Saudi Arabia at the Dhahran base.
Spills (EN23)
2011 2012 2013
Number of spillsTotal (No.) 94 144 77
Spills of chemical substances (No.) - 19 21
Spills of oily substances into fresh water (No.) - 125 56
Volume of spillsTotal (m3) 656.45 5.4 67.2
Spills of chemical substances (m3) - 1.6 62.7
Spills of oily substances (m3) - 3.8 4.5
Saipem has changed its methodology for monitoring spills by separating the reporting of ‘near misses’ and spills under 10 litres from other spills forbetter analysis and classification of the incidents. These types of incident are, however, included in the environmental reporting system for optimalmanagement of incidents.In 2013 there were 7 spills larger than one m3, including a 35.5 m3 spill that happened on the Saipem 10000 drillship. Due to the emergency situation, theMaster ordered a disconnection from the well and activated the Emergency Shut Down (ESD) procedure as well as the Emergency Quick Disconnect (EQD)for the Lower Marine Riser Package (LMRP). The consequence of the emergency disconnection of the LMRP was the leakage into the sea of 35.5 m3 of oilbased mud contained in the marine riser. Bad weather and a strong current contributed to the accident.All incidents are reported and investigated appropriately in order to establish the causes and identify corrective actions to prevent such events fromhappening in the future. Each quarter, environmental bulletins and reports are disseminated throughout the Group in order to share the ‘lessons learned’.
xviii
Saipem Sustainability Performance / Sustainability indicators
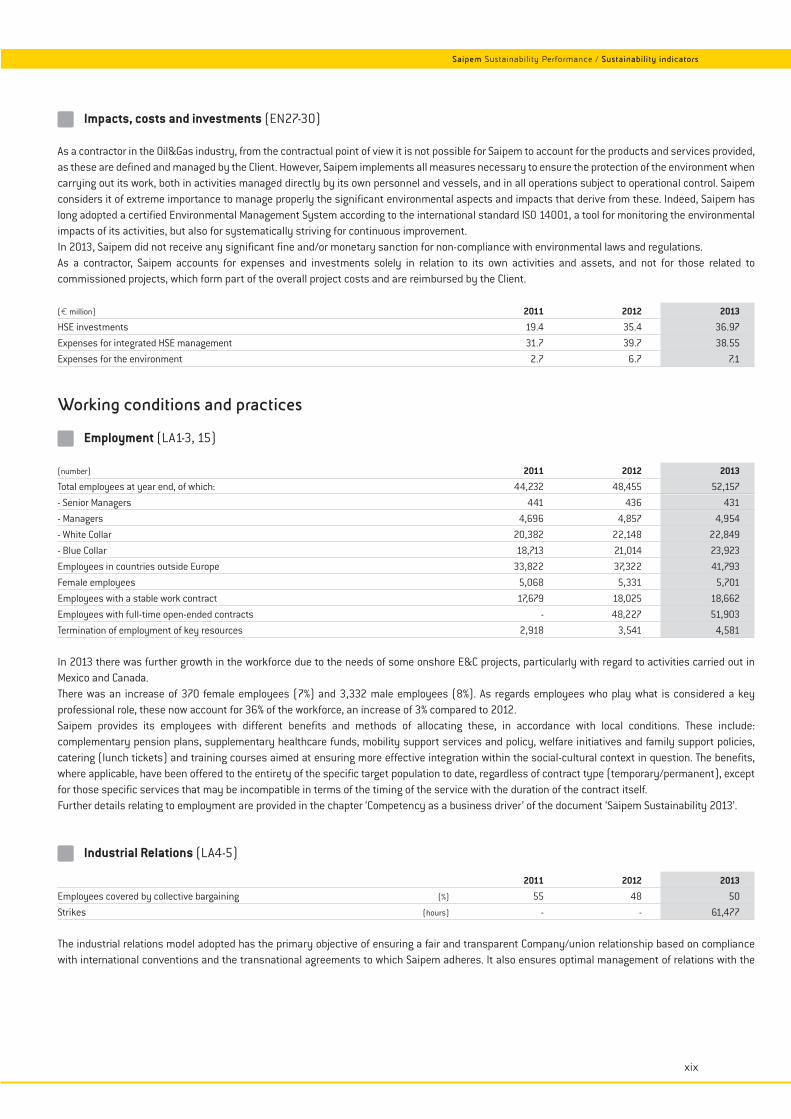
Impacts, costs and investments (EN27-30)
As a contractor in the Oil&Gas industry, from the contractual point of view it is not possible for Saipem to account for the products and services provided,as these are defined and managed by the Client. However, Saipem implements all measures necessary to ensure the protection of the environment whencarrying out its work, both in activities managed directly by its own personnel and vessels, and in all operations subject to operational control. Saipemconsiders it of extreme importance to manage properly the significant environmental aspects and impacts that derive from these. Indeed, Saipem haslong adopted a certified Environmental Management System according to the international standard ISO 14001, a tool for monitoring the environmentalimpacts of its activities, but also for systematically striving for continuous improvement.In 2013, Saipem did not receive any significant fine and/or monetary sanction for non-compliance with environmental laws and regulations.As a contractor, Saipem accounts for expenses and investments solely in relation to its own activities and assets, and not for those related tocommissioned projects, which form part of the overall project costs and are reimbursed by the Client.
(€ million) 2011 2012 2013
HSE investments 19.4 35.4 36.97
Expenses for integrated HSE management 31.7 39.7 38.55
Expenses for the environment 2.7 6.7 7.1
Working conditions and practices
Employment (LA1-3, 15)
(number) 2011 2012 2013
Total employees at year end, of which: 44,232 48,455 52,157
- Senior Managers 441 436 431
- Managers 4,696 4,857 4,954
- White Collar 20,382 22,148 22,849
- Blue Collar 18,713 21,014 23,923
Employees in countries outside Europe 33,822 37,322 41,793
Female employees 5,068 5,331 5,701
Employees with a stable work contract 17,679 18,025 18,662
Employees with full-time open-ended contracts - 48,227 51,903
Termination of employment of key resources 2,918 3,541 4,581
In 2013 there was further growth in the workforce due to the needs of some onshore E&C projects, particularly with regard to activities carried out inMexico and Canada.There was an increase of 370 female employees (7%) and 3,332 male employees (8%). As regards employees who play what is considered a keyprofessional role, these now account for 36% of the workforce, an increase of 3% compared to 2012.Saipem provides its employees with different benefits and methods of allocating these, in accordance with local conditions. These include:complementary pension plans, supplementary healthcare funds, mobility support services and policy, welfare initiatives and family support policies,catering (lunch tickets) and training courses aimed at ensuring more effective integration within the social-cultural context in question. The benefits,where applicable, have been offered to the entirety of the specific target population to date, regardless of contract type (temporary/permanent), exceptfor those specific services that may be incompatible in terms of the timing of the service with the duration of the contract itself.Further details relating to employment are provided in the chapter ‘Competency as a business driver’ of the document ‘Saipem Sustainability 2013’.
Industrial Relations (LA4-5)
2011 2012 2013
Employees covered by collective bargaining (%) 55 48 50
Strikes (hours) - - 61,477
The industrial relations model adopted has the primary objective of ensuring a fair and transparent Company/union relationship based on compliancewith international conventions and the transnational agreements to which Saipem adheres. It also ensures optimal management of relations with the
xix
Saipem Sustainability Performance / Sustainability indicators
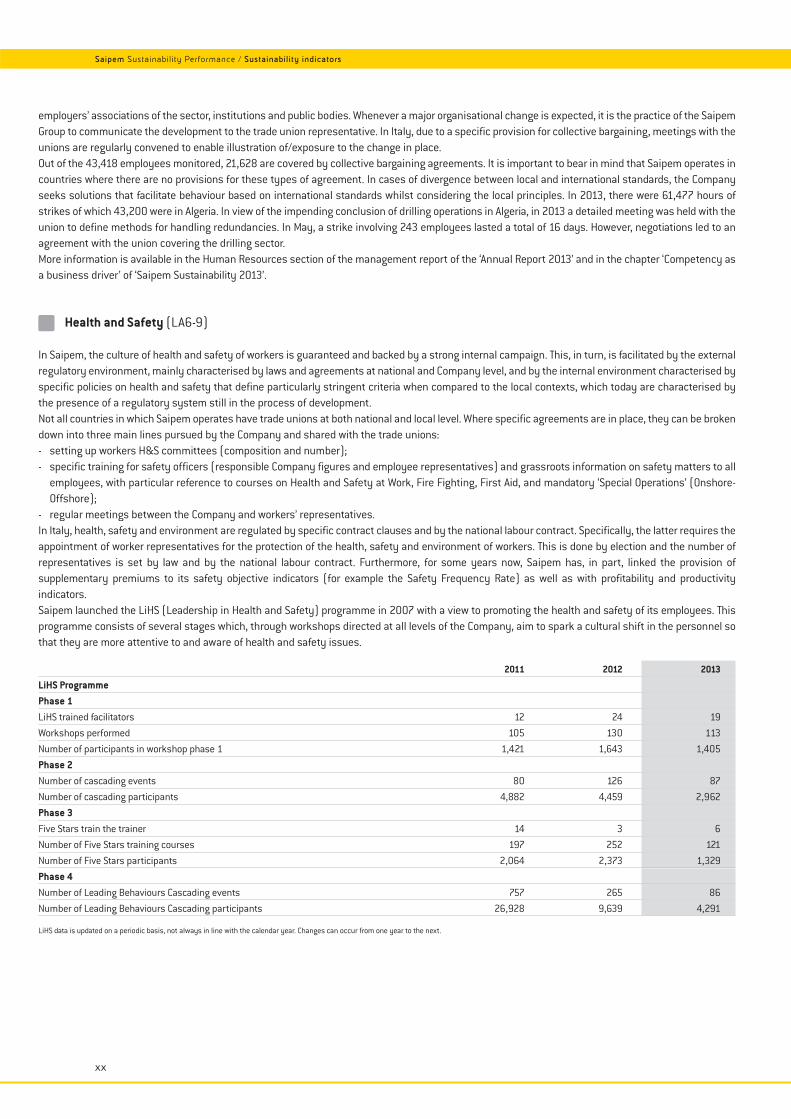
employers’ associations of the sector, institutions and public bodies. Whenever a major organisational change is expected, it is the practice of the SaipemGroup to communicate the development to the trade union representative. In Italy, due to a specific provision for collective bargaining, meetings with theunions are regularly convened to enable illustration of/exposure to the change in place.Out of the 43,418 employees monitored, 21,628 are covered by collective bargaining agreements. It is important to bear in mind that Saipem operates incountries where there are no provisions for these types of agreement. In cases of divergence between local and international standards, the Companyseeks solutions that facilitate behaviour based on international standards whilst considering the local principles. In 2013, there were 61,477 hours ofstrikes of which 43,200 were in Algeria. In view of the impending conclusion of drilling operations in Algeria, in 2013 a detailed meeting was held with theunion to define methods for handling redundancies. In May, a strike involving 243 employees lasted a total of 16 days. However, negotiations led to anagreement with the union covering the drilling sector.More information is available in the Human Resources section of the management report of the ‘Annual Report 2013’ and in the chapter ‘Competency asa business driver’ of ‘Saipem Sustainability 2013’.
Health and Safety (LA6-9)
In Saipem, the culture of health and safety of workers is guaranteed and backed by a strong internal campaign. This, in turn, is facilitated by the externalregulatory environment, mainly characterised by laws and agreements at national and Company level, and by the internal environment characterised byspecific policies on health and safety that define particularly stringent criteria when compared to the local contexts, which today are characterised bythe presence of a regulatory system still in the process of development.Not all countries in which Saipem operates have trade unions at both national and local level. Where specific agreements are in place, they can be brokendown into three main lines pursued by the Company and shared with the trade unions:- setting up workers H&S committees (composition and number);- specific training for safety officers (responsible Company figures and employee representatives) and grassroots information on safety matters to all
employees, with particular reference to courses on Health and Safety at Work, Fire Fighting, First Aid, and mandatory ‘Special Operations’ (Onshore-Offshore);
- regular meetings between the Company and workers’ representatives.In Italy, health, safety and environment are regulated by specific contract clauses and by the national labour contract. Specifically, the latter requires theappointment of worker representatives for the protection of the health, safety and environment of workers. This is done by election and the number ofrepresentatives is set by law and by the national labour contract. Furthermore, for some years now, Saipem has, in part, linked the provision ofsupplementary premiums to its safety objective indicators (for example the Safety Frequency Rate) as well as with profitability and productivityindicators.Saipem launched the LiHS (Leadership in Health and Safety) programme in 2007 with a view to promoting the health and safety of its employees. Thisprogramme consists of several stages which, through workshops directed at all levels of the Company, aim to spark a cultural shift in the personnel sothat they are more attentive to and aware of health and safety issues.
2011 2012 2013
LiHS ProgrammePhase 1LiHS trained facilitators 12 24 19
Workshops performed 105 130 113
Number of participants in workshop phase 1 1,421 1,643 1,405
Phase 2Number of cascading events 80 126 87
Number of cascading participants 4,882 4,459 2,962
Phase 3Five Stars train the trainer 14 3 6
Number of Five Stars training courses 197 252 121
Number of Five Stars participants 2,064 2,373 1,329
Phase 4Number of Leading Behaviours Cascading events 757 265 86
Number of Leading Behaviours Cascading participants 26,928 9,639 4,291
LiHS data is updated on a periodic basis, not always in line with the calendar year. Changes can occur from one year to the next.
xx
Saipem Sustainability Performance / Sustainability indicators
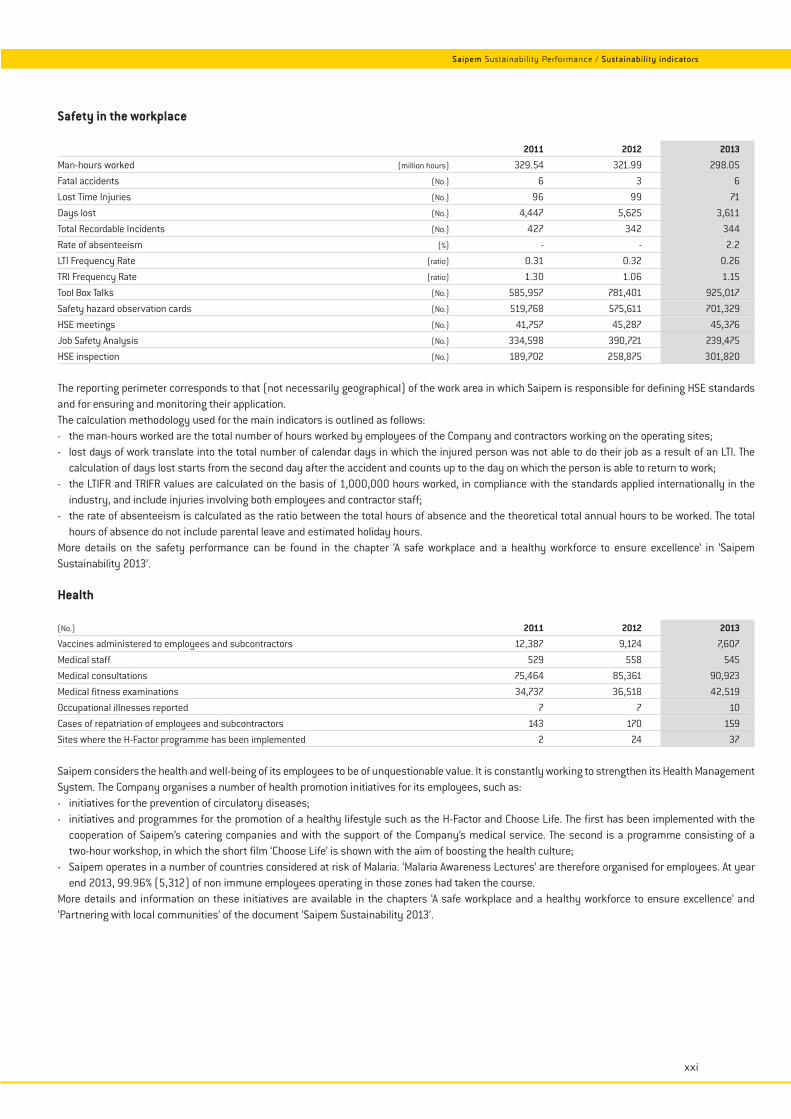
Safety in the workplace
2011 2012 2013
Man-hours worked (million hours) 329.54 321.99 298.05
Fatal accidents (No.) 6 3 6
Lost Time Injuries (No.) 96 99 71
Days lost (No.) 4,447 5,625 3,611
Total Recordable Incidents (No.) 427 342 344
Rate of absenteeism (%) - - 2.2
LTI Frequency Rate (ratio) 0.31 0.32 0.26
TRI Frequency Rate (ratio) 1.30 1.06 1.15
Tool Box Talks (No.) 585,957 781,401 925,017
Safety hazard observation cards (No.) 519,768 575,611 701,329
HSE meetings (No.) 41,757 45,287 45,376
Job Safety Analysis (No.) 334,598 390,721 239,475
HSE inspection (No.) 189,702 258,875 301,820
The reporting perimeter corresponds to that (not necessarily geographical) of the work area in which Saipem is responsible for defining HSE standardsand for ensuring and monitoring their application.The calculation methodology used for the main indicators is outlined as follows:- the man-hours worked are the total number of hours worked by employees of the Company and contractors working on the operating sites;- lost days of work translate into the total number of calendar days in which the injured person was not able to do their job as a result of an LTI. The
calculation of days lost starts from the second day after the accident and counts up to the day on which the person is able to return to work;- the LTIFR and TRIFR values are calculated on the basis of 1,000,000 hours worked, in compliance with the standards applied internationally in the
industry, and include injuries involving both employees and contractor staff;- the rate of absenteeism is calculated as the ratio between the total hours of absence and the theoretical total annual hours to be worked. The total
hours of absence do not include parental leave and estimated holiday hours.More details on the safety performance can be found in the chapter ‘A safe workplace and a healthy workforce to ensure excellence’ in ‘SaipemSustainability 2013’.
Health
(No.) 2011 2012 2013
Vaccines administered to employees and subcontractors 12,387 9,124 7,607
Medical staff 529 558 545
Medical consultations 75,464 85,361 90,923
Medical fitness examinations 34,737 36,518 42,519
Occupational illnesses reported 7 7 10
Cases of repatriation of employees and subcontractors 143 170 159
Sites where the H-Factor programme has been implemented 2 24 37
Saipem considers the health and well-being of its employees to be of unquestionable value. It is constantly working to strengthen its Health ManagementSystem. The Company organises a number of health promotion initiatives for its employees, such as:- initiatives for the prevention of circulatory diseases;- initiatives and programmes for the promotion of a healthy lifestyle such as the H-Factor and Choose Life. The first has been implemented with the
cooperation of Saipem’s catering companies and with the support of the Company’s medical service. The second is a programme consisting of atwo-hour workshop, in which the short film ‘Choose Life’ is shown with the aim of boosting the health culture;
- Saipem operates in a number of countries considered at risk of Malaria. ‘Malaria Awareness Lectures’ are therefore organised for employees. At yearend 2013, 99.96% (5,312) of non immune employees operating in those zones had taken the course.
More details and information on these initiatives are available in the chapters ‘A safe workplace and a healthy workforce to ensure excellence’ and‘Partnering with local communities’ of the document ‘Saipem Sustainability 2013’.
xxi
Saipem Sustainability Performance / Sustainability indicators
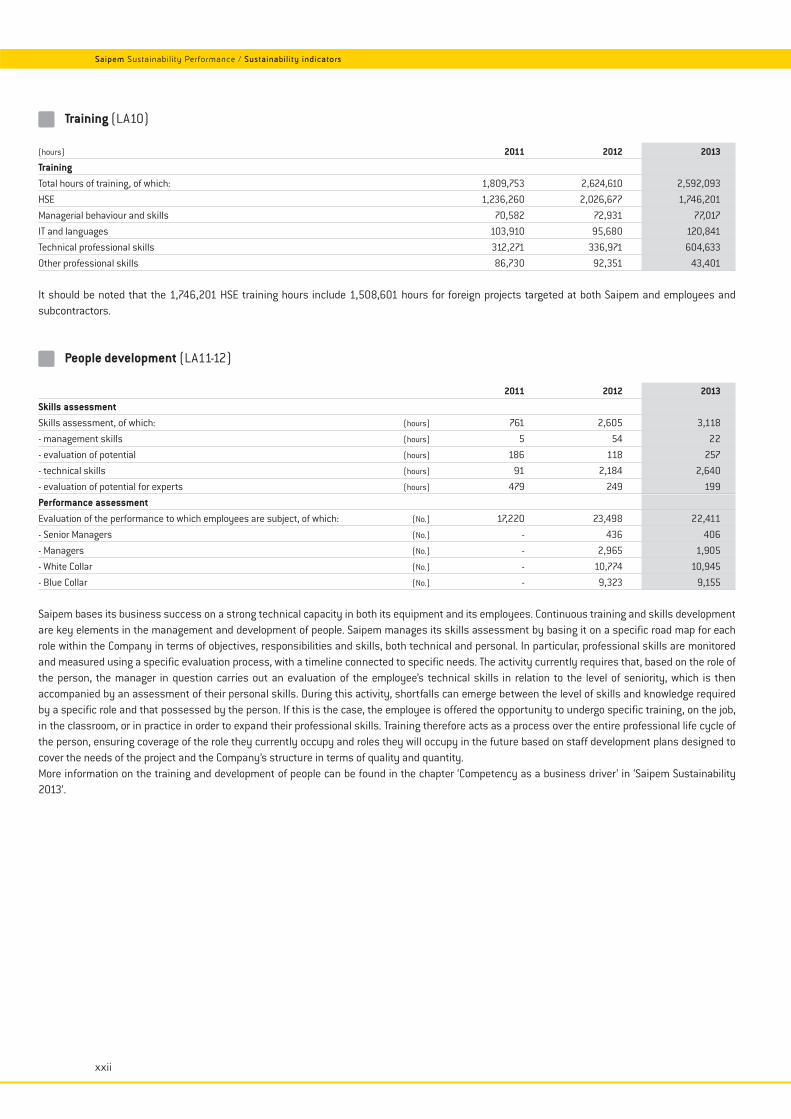
Training (LA10)
(hours) 2011 2012 2013
TrainingTotal hours of training, of which: 1,809,753 2,624,610 2,592,093
HSE 1,236,260 2,026,677 1,746,201
Managerial behaviour and skills 70,582 72,931 77,017
IT and languages 103,910 95,680 120,841
Technical professional skills 312,271 336,971 604,633
Other professional skills 86,730 92,351 43,401
It should be noted that the 1,746,201 HSE training hours include 1,508,601 hours for foreign projects targeted at both Saipem and employees andsubcontractors.
People development (LA11-12)
2011 2012 2013
Skills assessmentSkills assessment, of which: (hours) 761 2,605 3,118
- management skills (hours) 5 54 22
- evaluation of potential (hours) 186 118 257
- technical skills (hours) 91 2,184 2,640
- evaluation of potential for experts (hours) 479 249 199
Performance assessmentEvaluation of the performance to which employees are subject, of which: (No.) 17,220 23,498 22,411
- Senior Managers (No.) - 436 406
- Managers (No.) - 2,965 1,905
- White Collar (No.) - 10,774 10,945
- Blue Collar (No.) - 9,323 9,155
Saipem bases its business success on a strong technical capacity in both its equipment and its employees. Continuous training and skills developmentare key elements in the management and development of people. Saipem manages its skills assessment by basing it on a specific road map for eachrole within the Company in terms of objectives, responsibilities and skills, both technical and personal. In particular, professional skills are monitoredand measured using a specific evaluation process, with a timeline connected to specific needs. The activity currently requires that, based on the role ofthe person, the manager in question carries out an evaluation of the employee’s technical skills in relation to the level of seniority, which is thenaccompanied by an assessment of their personal skills. During this activity, shortfalls can emerge between the level of skills and knowledge requiredby a specific role and that possessed by the person. If this is the case, the employee is offered the opportunity to undergo specific training, on the job,in the classroom, or in practice in order to expand their professional skills. Training therefore acts as a process over the entire professional life cycle ofthe person, ensuring coverage of the role they currently occupy and roles they will occupy in the future based on staff development plans designed tocover the needs of the project and the Company’s structure in terms of quality and quantity.More information on the training and development of people can be found in the chapter ‘Competency as a business driver’ in ‘Saipem Sustainability2013’.
xxii
Saipem Sustainability Performance / Sustainability indicators
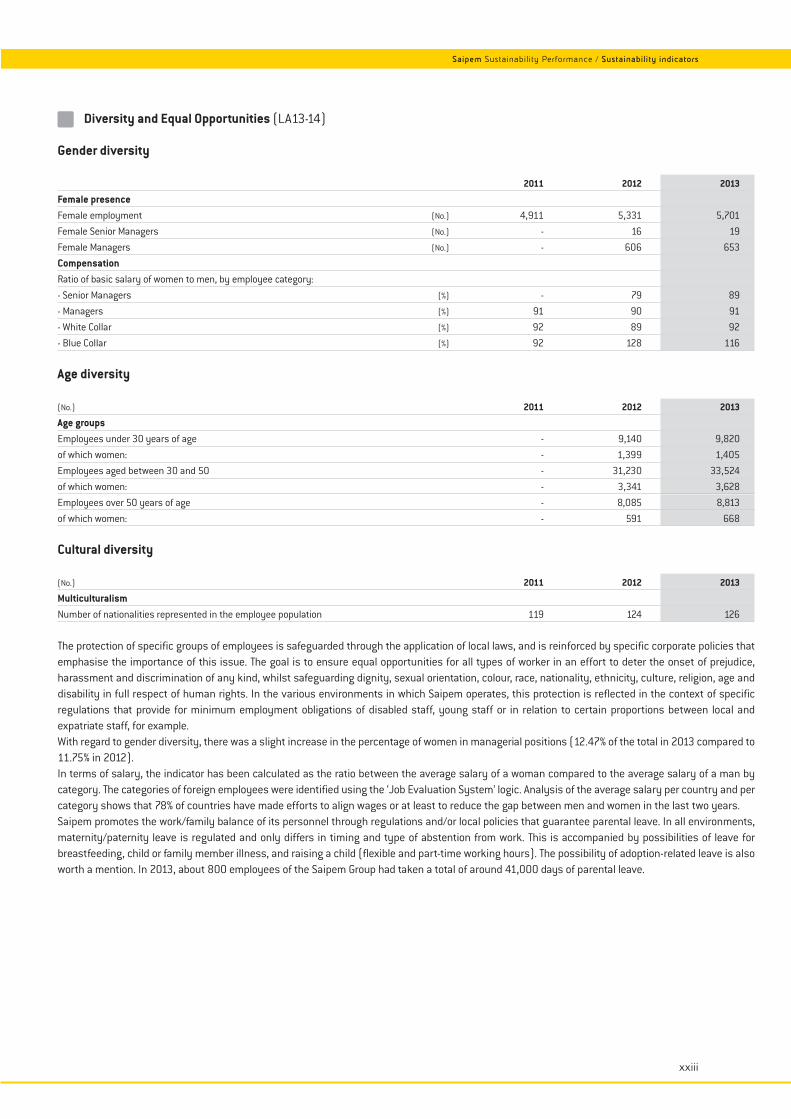
Diversity and Equal Opportunities (LA13-14)
Gender diversity
2011 2012 2013
Female presenceFemale employment (No.) 4,911 5,331 5,701
Female Senior Managers (No.) - 16 19
Female Managers (No.) - 606 653
CompensationRatio of basic salary of women to men, by employee category:
- Senior Managers (%) - 79 89
- Managers (%) 91 90 91
- White Collar (%) 92 89 92
- Blue Collar (%) 92 128 116
Age diversity
(No.) 2011 2012 2013
Age groupsEmployees under 30 years of age - 9,140 9,820
of which women: - 1,399 1,405
Employees aged between 30 and 50 - 31,230 33,524
of which women: - 3,341 3,628
Employees over 50 years of age - 8,085 8,813
of which women: - 591 668
Cultural diversity
(No.) 2011 2012 2013
MulticulturalismNumber of nationalities represented in the employee population 119 124 126
The protection of specific groups of employees is safeguarded through the application of local laws, and is reinforced by specific corporate policies thatemphasise the importance of this issue. The goal is to ensure equal opportunities for all types of worker in an effort to deter the onset of prejudice,harassment and discrimination of any kind, whilst safeguarding dignity, sexual orientation, colour, race, nationality, ethnicity, culture, religion, age anddisability in full respect of human rights. In the various environments in which Saipem operates, this protection is reflected in the context of specificregulations that provide for minimum employment obligations of disabled staff, young staff or in relation to certain proportions between local andexpatriate staff, for example.With regard to gender diversity, there was a slight increase in the percentage of women in managerial positions (12.47% of the total in 2013 compared to11.75% in 2012).In terms of salary, the indicator has been calculated as the ratio between the average salary of a woman compared to the average salary of a man bycategory. The categories of foreign employees were identified using the ‘Job Evaluation System’ logic. Analysis of the average salary per country and percategory shows that 78% of countries have made efforts to align wages or at least to reduce the gap between men and women in the last two years.Saipem promotes the work/family balance of its personnel through regulations and/or local policies that guarantee parental leave. In all environments,maternity/paternity leave is regulated and only differs in timing and type of abstention from work. This is accompanied by possibilities of leave forbreastfeeding, child or family member illness, and raising a child (flexible and part-time working hours). The possibility of adoption-related leave is alsoworth a mention. In 2013, about 800 employees of the Saipem Group had taken a total of around 41,000 days of parental leave.
xxiii
Saipem Sustainability Performance / Sustainability indicators
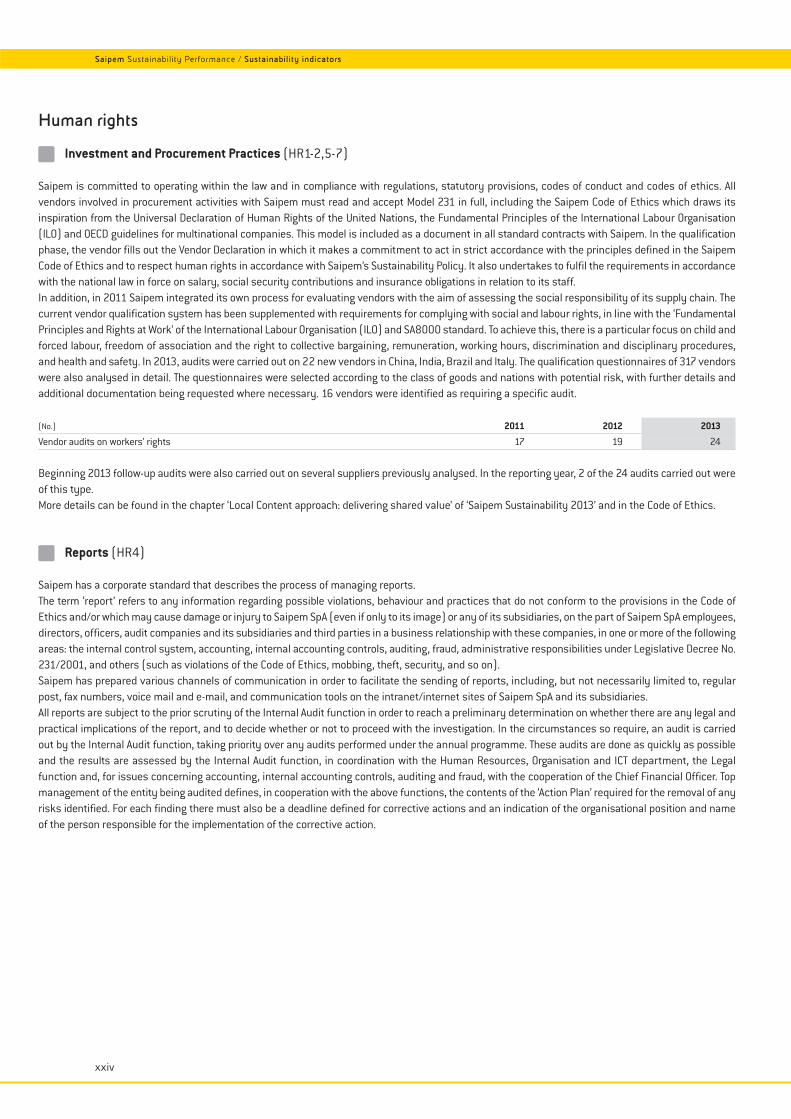
Human rights
Investment and Procurement Practices (HR1-2,5-7)
Saipem is committed to operating within the law and in compliance with regulations, statutory provisions, codes of conduct and codes of ethics. Allvendors involved in procurement activities with Saipem must read and accept Model 231 in full, including the Saipem Code of Ethics which draws itsinspiration from the Universal Declaration of Human Rights of the United Nations, the Fundamental Principles of the International Labour Organisation(ILO) and OECD guidelines for multinational companies. This model is included as a document in all standard contracts with Saipem. In the qualificationphase, the vendor fills out the Vendor Declaration in which it makes a commitment to act in strict accordance with the principles defined in the SaipemCode of Ethics and to respect human rights in accordance with Saipem’s Sustainability Policy. It also undertakes to fulfil the requirements in accordancewith the national law in force on salary, social security contributions and insurance obligations in relation to its staff.In addition, in 2011 Saipem integrated its own process for evaluating vendors with the aim of assessing the social responsibility of its supply chain. Thecurrent vendor qualification system has been supplemented with requirements for complying with social and labour rights, in line with the ‘FundamentalPrinciples and Rights at Work’ of the International Labour Organisation (ILO) and SA8000 standard. To achieve this, there is a particular focus on child andforced labour, freedom of association and the right to collective bargaining, remuneration, working hours, discrimination and disciplinary procedures,and health and safety. In 2013, audits were carried out on 22 new vendors in China, India, Brazil and Italy. The qualification questionnaires of 317 vendorswere also analysed in detail. The questionnaires were selected according to the class of goods and nations with potential risk, with further details andadditional documentation being requested where necessary. 16 vendors were identified as requiring a specific audit.
(No.) 2011 2012 2013
Vendor audits on workers’ rights 17 19 24
Beginning 2013 follow-up audits were also carried out on several suppliers previously analysed. In the reporting year, 2 of the 24 audits carried out wereof this type.More details can be found in the chapter ‘Local Content approach: delivering shared value’ of ‘Saipem Sustainability 2013’ and in the Code of Ethics.
Reports (HR4)
Saipem has a corporate standard that describes the process of managing reports.The term ‘report’ refers to any information regarding possible violations, behaviour and practices that do not conform to the provisions in the Code ofEthics and/or which may cause damage or injury to Saipem SpA (even if only to its image) or any of its subsidiaries, on the part of Saipem SpA employees,directors, officers, audit companies and its subsidiaries and third parties in a business relationship with these companies, in one or more of the followingareas: the internal control system, accounting, internal accounting controls, auditing, fraud, administrative responsibilities under Legislative Decree No.231/2001, and others (such as violations of the Code of Ethics, mobbing, theft, security, and so on).Saipem has prepared various channels of communication in order to facilitate the sending of reports, including, but not necessarily limited to, regularpost, fax numbers, voice mail and e-mail, and communication tools on the intranet/internet sites of Saipem SpA and its subsidiaries.All reports are subject to the prior scrutiny of the Internal Audit function in order to reach a preliminary determination on whether there are any legal andpractical implications of the report, and to decide whether or not to proceed with the investigation. In the circumstances so require, an audit is carriedout by the Internal Audit function, taking priority over any audits performed under the annual programme. These audits are done as quickly as possibleand the results are assessed by the Internal Audit function, in coordination with the Human Resources, Organisation and ICT department, the Legalfunction and, for issues concerning accounting, internal accounting controls, auditing and fraud, with the cooperation of the Chief Financial Officer. Topmanagement of the entity being audited defines, in cooperation with the above functions, the contents of the ‘Action Plan’ required for the removal of anyrisks identified. For each finding there must also be a deadline defined for corrective actions and an indication of the organisational position and nameof the person responsible for the implementation of the corrective action.
xxiv
Saipem Sustainability Performance / Sustainability indicators
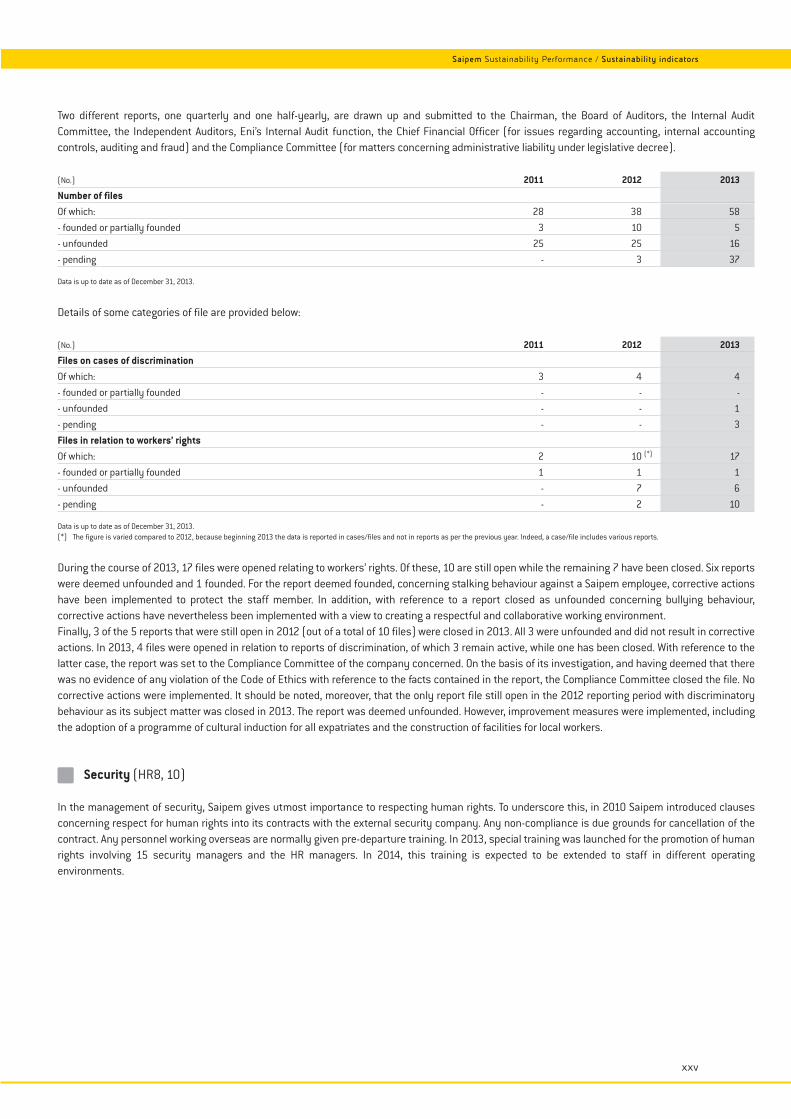
Two different reports, one quarterly and one half-yearly, are drawn up and submitted to the Chairman, the Board of Auditors, the Internal AuditCommittee, the Independent Auditors, Eni’s Internal Audit function, the Chief Financial Officer (for issues regarding accounting, internal accountingcontrols, auditing and fraud) and the Compliance Committee (for matters concerning administrative liability under legislative decree).
(No.) 2011 2012 2013
Number of filesOf which: 28 38 58
- founded or partially founded 3 10 5
- unfounded 25 25 16
- pending - 3 37
Data is up to date as of December 31, 2013.
Details of some categories of file are provided below:
(No.) 2011 2012 2013
Files on cases of discriminationOf which: 3 4 4
- founded or partially founded - - -
- unfounded - - 1
- pending - - 3
Files in relation to workers’ rightsOf which: 2 10 (*) 17
- founded or partially founded 1 1 1
- unfounded - 7 6
- pending - 2 10
Data is up to date as of December 31, 2013.(*) The figure is varied compared to 2012, because beginning 2013 the data is reported in cases/files and not in reports as per the previous year. Indeed, a case/file includes various reports.
During the course of 2013, 17 files were opened relating to workers’ rights. Of these, 10 are still open while the remaining 7 have been closed. Six reportswere deemed unfounded and 1 founded. For the report deemed founded, concerning stalking behaviour against a Saipem employee, corrective actionshave been implemented to protect the staff member. In addition, with reference to a report closed as unfounded concerning bullying behaviour,corrective actions have nevertheless been implemented with a view to creating a respectful and collaborative working environment.Finally, 3 of the 5 reports that were still open in 2012 (out of a total of 10 files) were closed in 2013. All 3 were unfounded and did not result in correctiveactions. In 2013, 4 files were opened in relation to reports of discrimination, of which 3 remain active, while one has been closed. With reference to thelatter case, the report was set to the Compliance Committee of the company concerned. On the basis of its investigation, and having deemed that therewas no evidence of any violation of the Code of Ethics with reference to the facts contained in the report, the Compliance Committee closed the file. Nocorrective actions were implemented. It should be noted, moreover, that the only report file still open in the 2012 reporting period with discriminatorybehaviour as its subject matter was closed in 2013. The report was deemed unfounded. However, improvement measures were implemented, includingthe adoption of a programme of cultural induction for all expatriates and the construction of facilities for local workers.
Security (HR8, 10)
In the management of security, Saipem gives utmost importance to respecting human rights. To underscore this, in 2010 Saipem introduced clausesconcerning respect for human rights into its contracts with the external security company. Any non-compliance is due grounds for cancellation of thecontract. Any personnel working overseas are normally given pre-departure training. In 2013, special training was launched for the promotion of humanrights involving 15 security managers and the HR managers. In 2014, this training is expected to be extended to staff in different operatingenvironments.
xxv
Saipem Sustainability Performance / Sustainability indicators
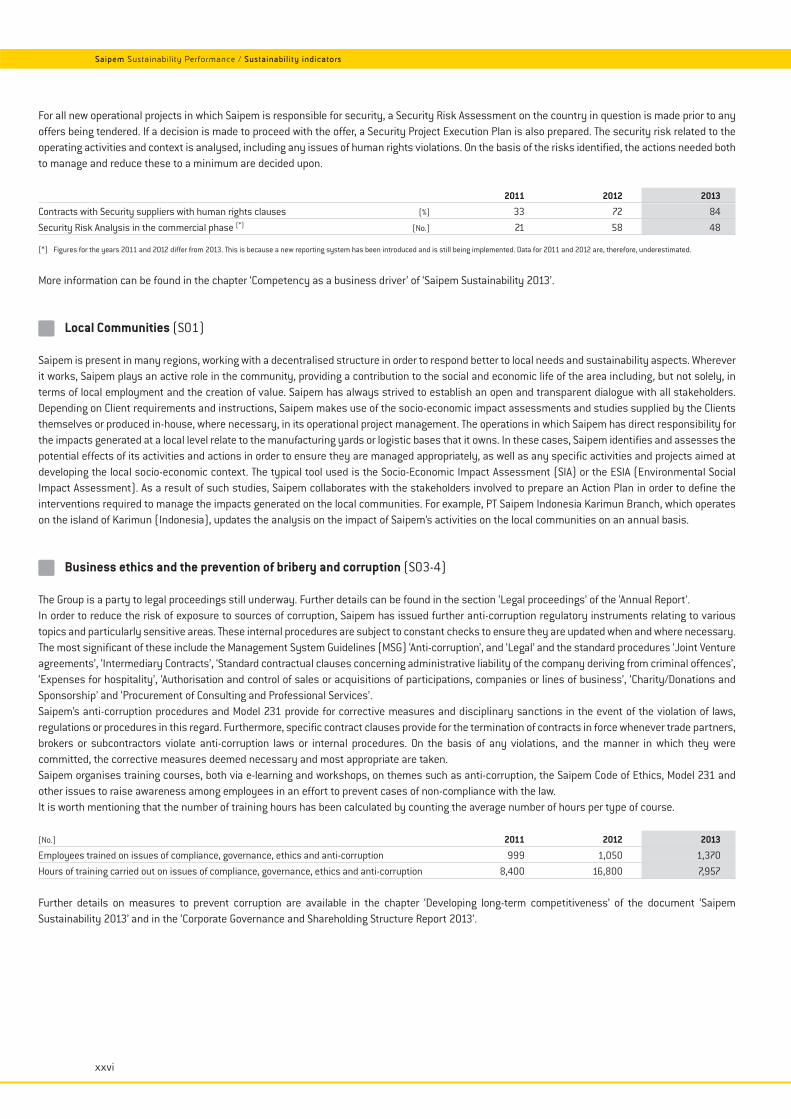
For all new operational projects in which Saipem is responsible for security, a Security Risk Assessment on the country in question is made prior to anyoffers being tendered. If a decision is made to proceed with the offer, a Security Project Execution Plan is also prepared. The security risk related to theoperating activities and context is analysed, including any issues of human rights violations. On the basis of the risks identified, the actions needed bothto manage and reduce these to a minimum are decided upon.
2011 2012 2013
Contracts with Security suppliers with human rights clauses (%) 33 72 84
Security Risk Analysis in the commercial phase (*) (No.) 21 58 48
(*) Figures for the years 2011 and 2012 differ from 2013. This is because a new reporting system has been introduced and is still being implemented. Data for 2011 and 2012 are, therefore, underestimated.
More information can be found in the chapter ‘Competency as a business driver’ of ‘Saipem Sustainability 2013’.
Local Communities (SO1)
Saipem is present in many regions, working with a decentralised structure in order to respond better to local needs and sustainability aspects. Whereverit works, Saipem plays an active role in the community, providing a contribution to the social and economic life of the area including, but not solely, interms of local employment and the creation of value. Saipem has always strived to establish an open and transparent dialogue with all stakeholders.Depending on Client requirements and instructions, Saipem makes use of the socio-economic impact assessments and studies supplied by the Clientsthemselves or produced in-house, where necessary, in its operational project management. The operations in which Saipem has direct responsibility forthe impacts generated at a local level relate to the manufacturing yards or logistic bases that it owns. In these cases, Saipem identifies and assesses thepotential effects of its activities and actions in order to ensure they are managed appropriately, as well as any specific activities and projects aimed atdeveloping the local socio-economic context. The typical tool used is the Socio-Economic Impact Assessment (SIA) or the ESIA (Environmental SocialImpact Assessment). As a result of such studies, Saipem collaborates with the stakeholders involved to prepare an Action Plan in order to define theinterventions required to manage the impacts generated on the local communities. For example, PT Saipem Indonesia Karimun Branch, which operateson the island of Karimun (Indonesia), updates the analysis on the impact of Saipem’s activities on the local communities on an annual basis.
Business ethics and the prevention of bribery and corruption (SO3-4)
The Group is a party to legal proceedings still underway. Further details can be found in the section ‘Legal proceedings’ of the ‘Annual Report’.In order to reduce the risk of exposure to sources of corruption, Saipem has issued further anti-corruption regulatory instruments relating to varioustopics and particularly sensitive areas. These internal procedures are subject to constant checks to ensure they are updated when and where necessary.The most significant of these include the Management System Guidelines (MSG) ‘Anti-corruption’, and ‘Legal’ and the standard procedures ‘Joint Ventureagreements’, ‘Intermediary Contracts’, ‘Standard contractual clauses concerning administrative liability of the company deriving from criminal offences’,‘Expenses for hospitality’, ‘Authorisation and control of sales or acquisitions of participations, companies or lines of business’, ‘Charity/Donations andSponsorship’ and ‘Procurement of Consulting and Professional Services’.Saipem’s anti-corruption procedures and Model 231 provide for corrective measures and disciplinary sanctions in the event of the violation of laws,regulations or procedures in this regard. Furthermore, specific contract clauses provide for the termination of contracts in force whenever trade partners,brokers or subcontractors violate anti-corruption laws or internal procedures. On the basis of any violations, and the manner in which they werecommitted, the corrective measures deemed necessary and most appropriate are taken.Saipem organises training courses, both via e-learning and workshops, on themes such as anti-corruption, the Saipem Code of Ethics, Model 231 andother issues to raise awareness among employees in an effort to prevent cases of non-compliance with the law.It is worth mentioning that the number of training hours has been calculated by counting the average number of hours per type of course.
(No.) 2011 2012 2013
Employees trained on issues of compliance, governance, ethics and anti-corruption 999 1,050 1,370
Hours of training carried out on issues of compliance, governance, ethics and anti-corruption 8,400 16,800 7,957
Further details on measures to prevent corruption are available in the chapter ‘Developing long-term competitiveness’ of the document ‘SaipemSustainability 2013’ and in the ‘Corporate Governance and Shareholding Structure Report 2013’.
xxvi
Saipem Sustainability Performance / Sustainability indicators
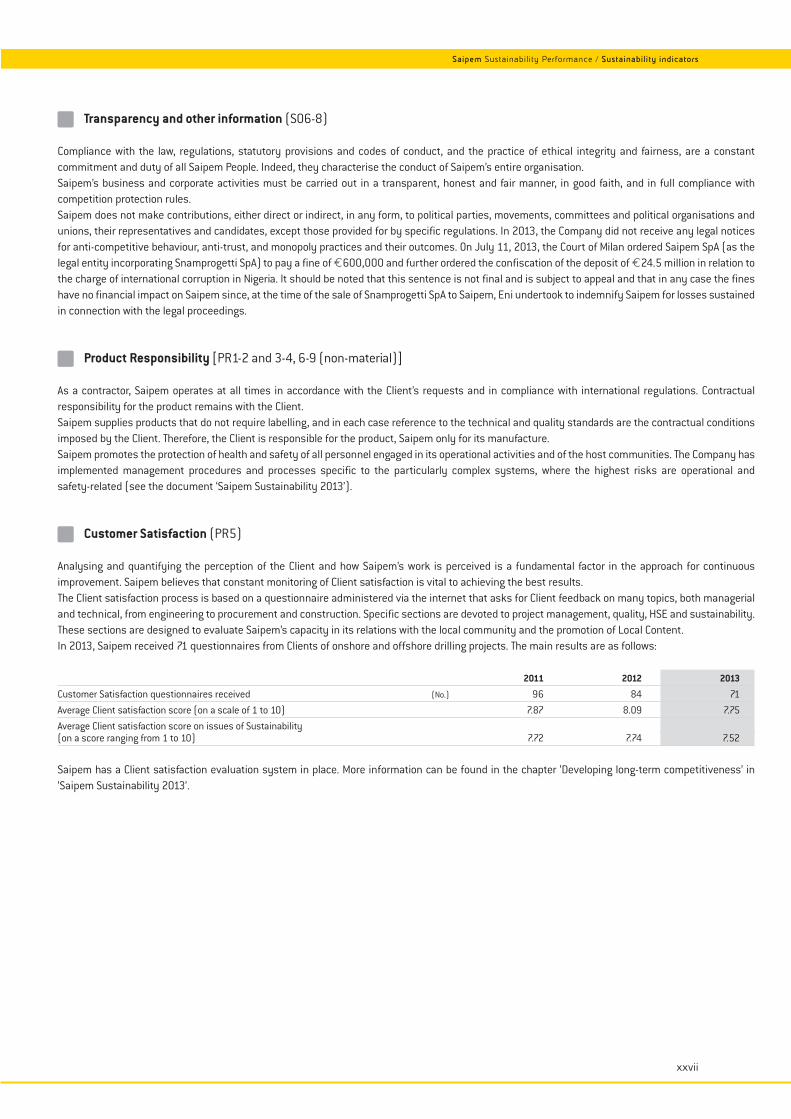
Transparency and other information (SO6-8)
Compliance with the law, regulations, statutory provisions and codes of conduct, and the practice of ethical integrity and fairness, are a constantcommitment and duty of all Saipem People. Indeed, they characterise the conduct of Saipem’s entire organisation.Saipem’s business and corporate activities must be carried out in a transparent, honest and fair manner, in good faith, and in full compliance withcompetition protection rules.Saipem does not make contributions, either direct or indirect, in any form, to political parties, movements, committees and political organisations andunions, their representatives and candidates, except those provided for by specific regulations. In 2013, the Company did not receive any legal noticesfor anti-competitive behaviour, anti-trust, and monopoly practices and their outcomes. On July 11, 2013, the Court of Milan ordered Saipem SpA (as thelegal entity incorporating Snamprogetti SpA) to pay a fine of €600,000 and further ordered the confiscation of the deposit of €24.5 million in relation tothe charge of international corruption in Nigeria. It should be noted that this sentence is not final and is subject to appeal and that in any case the fineshave no financial impact on Saipem since, at the time of the sale of Snamprogetti SpA to Saipem, Eni undertook to indemnify Saipem for losses sustainedin connection with the legal proceedings.
Product Responsibility [PR1-2 and 3-4, 6-9 (non-material)]
As a contractor, Saipem operates at all times in accordance with the Client’s requests and in compliance with international regulations. Contractualresponsibility for the product remains with the Client.Saipem supplies products that do not require labelling, and in each case reference to the technical and quality standards are the contractual conditionsimposed by the Client. Therefore, the Client is responsible for the product, Saipem only for its manufacture.Saipem promotes the protection of health and safety of all personnel engaged in its operational activities and of the host communities. The Company hasimplemented management procedures and processes specific to the particularly complex systems, where the highest risks are operational andsafety-related (see the document ‘Saipem Sustainability 2013’).
Customer Satisfaction (PR5)
Analysing and quantifying the perception of the Client and how Saipem’s work is perceived is a fundamental factor in the approach for continuousimprovement. Saipem believes that constant monitoring of Client satisfaction is vital to achieving the best results.The Client satisfaction process is based on a questionnaire administered via the internet that asks for Client feedback on many topics, both managerialand technical, from engineering to procurement and construction. Specific sections are devoted to project management, quality, HSE and sustainability.These sections are designed to evaluate Saipem’s capacity in its relations with the local community and the promotion of Local Content.In 2013, Saipem received 71 questionnaires from Clients of onshore and offshore drilling projects. The main results are as follows:
2011 2012 2013
Customer Satisfaction questionnaires received (No.) 96 84 71
Average Client satisfaction score (on a scale of 1 to 10) 7.87 8.09 7.75
Average Client satisfaction score on issues of Sustainability(on a score ranging from 1 to 10) 7.72 7.74 7.52
Saipem has a Client satisfaction evaluation system in place. More information can be found in the chapter ‘Developing long-term competitiveness’ in‘Saipem Sustainability 2013’.
xxvii
Saipem Sustainability Performance / Sustainability indicators
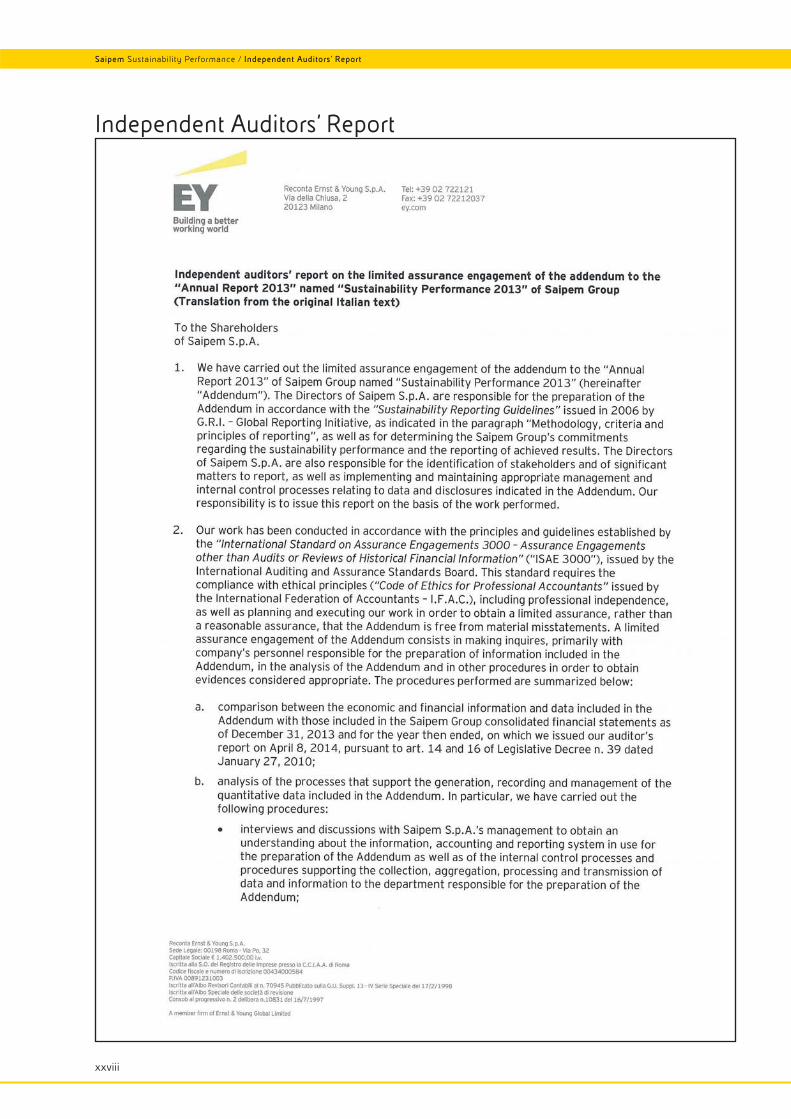
Saipem Sustainability Performance / Independent Auditors’ Report
xxviii
Independent Auditors’ Report
Saipem Sustainability Performance / Independent Auditors’ Report
xxix

Headquarters: San Donato Milanese (Milan) - Italy
Via Martiri di Cefalonia, 67
Branches:
Cortemaggiore (Piacenza) - Italy
Via Enrico Mattei, 20
Information for Shareholders
Saipem SpA, Via Martiri di Cefalonia, 67 - 20097
San Donato Milanese (Milan) - Italy
Relations with institutional investors
and financial analysts
Fax +39-0252054295
e-mail: [email protected]
Publications
Bilancio al 31 dicembre (in Italian)
Annual Report (in English)
Interim Consolidated Report as of June 30
(in Italian and English)
Saipem Sustainability (in English)
Also available on Saipem’s website:
www.saipem.com
Website: www.saipem.com
Operator: +39-025201
Design: Gruppo Korus Srl - Rome - Italy
Cover: Inarea
Layout and supervision: Studio Joly Srl - Rome - Italy
Printing: STILGRAF - Viadana (Mantova) - Italy
saipem Società per Azioni
Share Capital €441,410,900 fully paid up
Tax identification number and Milan Companies’
Register No. 00825790157

www.saipem.com