Embed Size (px)
Citation preview

Marex Spectron Group Limited
Annual Report and Financial Statements
Year ended 31 December 2017
Registration Number 05613060
Marex Spectron Group Limited
1
TABLE OF CONTENTS
Company Information ................................................................................................................................................... 2
Directors’ Report .......................................................................................................................................................... 3
Directors’ Responsibilities Statement........................................................................................................................... 8
Strategic Report ............................................................................................................................................................ 9
Independent Auditor’s Report .................................................................................................................................... 26
Consolidated Income Statement ................................................................................................................................. 29
Consolidated Statement of Other Comprehensive Income ......................................................................................... 29
Statements of Financial Position ................................................................................................................................ 30
Statement of the Changes in Equity and Movements in Reserves ............................................................................. 32
Cash Flow Statements ................................................................................................................................................ 34
Notes to the Financial Statements............................................................................................................................... 36
Marex Spectron Group Limited
2
COMPANY INFORMATION
Country of Incorporation England and Wales
Legal Form Private limited company
Directors S J N Heale (Chairman)
I T Lowitt (Chief Executive Officer)
J H Baldwin
J C Cohen
Lord S Fink
D A Hallgarten
J M Isaacs CBE
P Kadas
J E Nader
R B Nagioff
V Pignatti-Morano Campori
S H Sparke
C R Stent
S Van Den Born
Company Secretary S Linsley
Registered Office 155 Bishopsgate, London, EC2M 3TQ
Auditors Deloitte LLP
Hill House, 1 Little New Street, London, EC4A 3TR
Bankers Lloyds Bank plc
25 Gresham Street, London, EC2V 7HN
Bank Leumi (UK) plc
20 Stratford Place, London, W1C 1BG
HSBC Bank plc
Level 19, 8 Canada Square, London, E14 5HQ
Barclays Bank plc
1 Churchill Place, London, E13 5BH

Marex Spectron Group Limited
3
DIRECTORS’ REPORT
The directors present their report and audited consolidated financial statements of Marex Spectron Group Limited
(‘Marex Spectron’, ‘the Group’ or ‘the firm’) and the standalone financial statements for Marex Spectron Group
Limited (‘the Company’) for the year ended 31 December 2017.
About Marex Spectron
Marex Spectron is a leading independent global commodities brokerage headquartered in London with a global
network spanning Asia and North America, with dominant market shares in many major agricultural, metal and
energy products. The firm has a broad range of clients including commodity producers and consumers, banks,
hedge funds, asset managers, brokers, commodity trading advisors and professional traders.
We are members of the London Metal Exchange (‘the LME’), where we are a Category 1 Member and Ring
Dealer; the CME Group of exchanges (‘the CME’), the Intercontinental Exchange group of exchanges (‘ICE’) and
many others.
We are regulated in the UK by the Financial Conduct Authority (‘the FCA’, which also regulates our Group under
consolidated supervision), in the US by the National Futures Association (‘the NFA’) and the US Commodities
Futures Trading Commission (‘the CFTC’), in Hong Kong by the Securities and Futures Commission (‘the SFC’),
and in Singapore by the Monetary Authority of Singapore (‘the MAS’) and the International Exchange Singapore
(‘the IES’).
We believe the unique competitive attributes of Marex Spectron include:
1. our breadth of commodity market coverage across Energy, Metals and Agricultural products;
2. extensive depth of services across Commodity Brokerage in each market segment and Financial Futures
and Options;
3. a diversified client base consisting of blue chip commodity producers / consumers as well as leading
financial players in our market;
4. an efficient and scalable platform; and
5. our proprietary technology, data and analytic offerings.
While other competitors might match our offering in one specific commodity category, we are unique in being top
ranked across Metals, Energy and Agricultural products.
In Energy, we provide agency brokerage across over-the-counter (‘OTC’) and Exchange-Cleared Contracts with a
focus on Fuel Oil, Natural Gas, Iron Ore, Coal, Crude, Light Ends, Environmental and Freight.
In Metals, we provide brokerage and market making services for base and precious metals (Aluminium, Copper,
Nickel, Zinc, Lead and Gold). We are one of the leading Ring Dealers on the LME.
In Agriculture, we are primarily a broker, but also provide market making in specific option products (Cocoa,
Coffee, Sugar and European Grains).
Around 60% of our commissions are generated by commodity producers / consumers and 40% by financial
companies who participate in our markets. We do substantial business with many of the largest participants in
commodities.
We are deeply embedded in the global commodity market infrastructure, with 35 exchanges in our connectivity
networks. We clear over 145 million contracts a year on exchange and execute over 20 million trades a year for
our clients. We operate out of 10 offices globally with over 500 employees in Europe, North America and Asia.
Increasingly, we are providing our clients not just with access to market liquidity, and to management of order flow
(screen, voice and Direct Market Access), but also data and analysis. Funds and money managers are ever more
reliant on quantitative data to support trading and execution decisions. To fill the gap in the market resulting from
banks scaling back and to attract institutional clients, Marex Spectron has invested in ‘Intelligence’ (including
proprietary models) and ‘Content’ (quotes, reports, research) which provide advantage over traditional client
technology providers, and enables us to differentiate ourselves from brokerage competitors. Our NEON platform
in Metals and Nanolytics data is a leader in the industry.
Marex Spectron Group Limited
DIRECTORS’ REPORT (CONTINUED)
1. Defined on page 13 of the strategic report.
4
Chief Executive Officer’s Review
2017 was another successful year for the firm. Although gross revenues decreased to $322 million from $330
million in 2016, net revenues1 saw a $3 million increase to $246 million from $243 million in 2016. This was
despite challenging markets, which were characterised by very low volatility that negatively affected our business.
Profit before tax (‘PBT’) was marginally down at $25.4 million, compared to 2016’s $27.0 million, and was mainly
the result of a higher level of investment which will fuel revenue growth in the future. These are strong numbers
and we are proud of what we have accomplished.
Highlights from the year included:
▪ expansion of our global footprint, with an enhanced presence in North America, as both the Calgary
Crude Oil business and Houston Natural Gas Liquids (‘NGL’) business started to generate material
revenues;
▪ further growth from our Asian business, having expanded our metals presence in Singapore, and this is
an area where we continue to see significant energy and metals opportunities;
▪ the strengthening of our existing European franchises, as we entered new markets, such as European
Physical Wet Freight and EU Carbon Emissions, and further grew our energy clearing capabilities;
▪ the launch of Marex Solutions, a division dedicated to building customised derivative solutions that we
expect to become an important part of Marex Spectron’s OTC offering;
▪ the launch of our own liquidity pools that are now being offered in Canadian Crude;
▪ the expansion of the NEON electronic trading, risk and data platform, with the addition of new
functionality in metals and energy, as well as the launch of NEON Mobile; and
▪ a great deal of work went into preparing the firm for the new MiFID II regime, which was seamlessly
implemented at the start of 2018.
The increased financial strength of our business is reflected in the $50 million expansion of our working capital
facility, which at the end of 2017 stood at $115 million with Barclays Bank, Lloyds Bank, Bank Leumi UK,
Industrial Commercial Bank of China Limited (‘ICBC’) and Allied Irish Bank (‘AIB’). We also added a new $10
million receivables facility with Royal Bank of Scotland.
We are proud of what we have achieved over the past year, particularly as these were not straightforward market
conditions, with the lowest volatility for decades.
As always, we continue to be prudent and sensible, maintaining our strong liquidity and capital profile, alongside a
lean cost structure, and we anticipate additional revenue growth in 2018 from many of our new initiatives.
We have built a strong brand, providing our clients with what we believe is unrivalled breadth of coverage across
our chosen markets with leading franchises, services and intellectual content. These attributes will only strengthen
as we further develop our own technologies, add new services, and gain ever greater market share.
To deliver these initiatives, we have developed extensive capabilities in our Support and Control team and have
built a highly scalable operational platform that allows us to grow the business with limited increases in cost. We
have always understood the value of the Support and Control organisation and we are committed to continuing to
strengthen our control, risk management and client services.
Our people are the basis of our competitive advantage and we have created an environment where ambitious,
hardworking and talented people choose to build their careers and are excited to work. To further strengthen this,
we have initiated an internal multi-year cultural values program that we believe is a vital element to building a
successful business, embracing respect for clients, personal integrity, collaboration, development, and adaptability.
As we continue to build our firm, I would like to thank all our clients for their continued support, and our
employees for their effort and hard work.

Marex Spectron Group Limited
DIRECTORS’ REPORT (CONTINUED)
5
Conclusion and future developments
In 2017, despite challenging market conditions, Marex Spectron delivered strong revenues and profits. The firm
also continued to invest across products and geographies to increase its diversification and provide an even stronger
platform for future growth. It is testament to the strength of the firm’s financial position that shareholders in 2017
were paid a $20m dividend.
Marex Spectron is well positioned to benefit from improving commodity markets and an increase in market
volatility, but we are not reliant on such an environment. The firm has strived to increase its broader
competitiveness, in particular the strengthening of the OTC derivatives offering, together with leading technology
capabilities. We have also continued to build on our market share, attract new clients and hire some of the best
talent. The future is always uncertain, but management is confident that Marex Spectron is well placed to continue
on this trajectory.
I T Lowitt
Chief Executive Officer
29 March 2018
Directors
The following directors have held office throughout the year and to the date of this report, except where noted:
S J N Heale (Chairman)
I T Lowitt (Chief Executive Officer)
J H Baldwin
J C Cohen
Lord S Fink
D A Hallgarten
J M Isaacs CBE
P Kadas
J E Nader
R B Nagioff
V Pignatti-Morano Campori
S H Sparke
C R Stent
S Van Den Born
Indemnity of directors
Each director is indemnified out of the assets of the Group against all costs, charges, losses and liabilities incurred
by them in the proper exercise of their duties. Directors who have resigned during the year also benefit from the
same indemnity arrangement. In addition, the directors are covered by an insurance policy.

Marex Spectron Group Limited
DIRECTORS’ REPORT (CONTINUED)
6
Directors’ statement as to disclosure of information to the Auditor
Each of the persons, who is a director at the date of approval of this report, confirms that:
▪ so far as he / she is aware, there is no relevant audit information of which the Group’s auditor is
unaware; and
▪ that he / she has taken all the steps that he / she ought to have taken as a director in order to make
himself / herself aware of any relevant audit information and to establish that the Group’s auditor is
aware of that information.
This confirmation is given and should be interpreted in accordance with the provisions of s418 of the Companies
Act 2006.
Charitable and political contributions
Marex Spectron maintains a $100,000 per annum fund to support employees in their charitable fundraising
activities. It does this by donating 50% of the sum raised by the employee to the chosen charities. In order to
ensure that the fund can be accessed by as many employees as possible, donations from the Company are capped at
$2,500 per fundraising event. The total charitable donations from this programme were $65,709 during the year
ended 31 December 2017 (2016: $35,792).
No contributions were made for political purposes during the year (2016: $nil).
Foreign exchange
The following foreign exchange rates have been used in the preparation of these financial statements:
2017 2016
Average
Rate
Year-end
Rate
Average
Rate
Year-end
Rate
GBP / USD 1.2888 1.3515 1.3554 1.2345
USD / EUR 1.1295 1.1998 1.1070 1.0524
Going concern
After reviewing the Group and Company’s annual budget, liquidity requirements, plans and financial arrangements
the directors are satisfied that the Group and Company have adequate resources to continue to operate for the
foreseeable future and for at least 12 months from the date of signing of the balance sheet and confirm that the
Group and Company are a going concern. For this reason they continue to adopt the going concern basis in the
preparation of these financial statements.
Events after the reporting period
Events since the statement of financial position date are disclosed in note 34.
Contingent liabilities
During the year, the Group has disclosed a contingent liability, details of which can be found in note 27.
Based on advice received from external legal counsel, the directors are of the opinion that it is not probable that the
Group will be required to make a payment and therefore no provision for this matter has been recognised in the
financial statements.
Overseas branches
The Group has branches, as defined in s1046(3) of the Companies Act 2006, in Canada, Germany, Norway and the
US.
Marex Spectron Group Limited
DIRECTORS’ REPORT (CONTINUED)
7
Dividends
During the year, Marex Spectron Group Limited paid a dividend of $20 million (2016: $ 20 million).
Financial risk management
Financial risk management objectives are included in the strategic report.
Future developments
Future developments are included in the Chief Executive Officer’s review.
Employees
Applications for employment by disabled persons are always fully considered, bearing in mind the respective
aptitudes and abilities of the applicant concerned. In the event of members of staff becoming disabled, every effort
is made to ensure that their employment with the Group continues and that appropriate training is arranged. It is
the policy of the Group that the training, career development and promotion of a disabled person should, as far as
possible, be identical to that of a person who does not suffer from a disability.
The Group places considerable value on the involvement of its employees and has continued to keep them
informed on matters affecting them as employees and on the various factors affecting the performance of the Group
and the Company. This is achieved through formal and informal meetings and the Group website.
Auditor
The auditor, Deloitte LLP, has expressed their willingness to continue in office as auditor and appropriate
arrangements have been put in place for them to be deemed reappointed as auditor pursuant to sections 485 – 488
of the Companies Act 2006.
Approved by the Board and signed on its behalf by:
I T Lowitt
Director
29 March 2018

Marex Spectron Group Limited
8
DIRECTORS’ RESPONSIBILITIES STATEMENT
The directors are responsible for preparing the Annual Report and Financial Statements in accordance with
applicable law and regulations. Company law requires the directors to prepare financial statements for each
financial year. Under that law the directors have elected to prepare the financial statements in accordance with
International Financial Reporting Standards (‘IFRSs’) as adopted by the European Union. In accordance with
company law, the directors must not approve the financial statements unless they are satisfied that they give a true
and fair view of the state of affairs of the Group and Company and of the profit or loss of the Group and Company
for that period.
In preparing these financial statements, International Accounting Standard (‘IAS’) 1 requires directors to:
▪ properly select and apply accounting policies;
▪ present information, including accounting policies, in a manner that provides relevant, reliable,
comparable and understandable information;
▪ provide additional disclosures when compliance with the specific requirements in IFRSs are
insufficient to enable users to understand the impact of particular transactions, other events and
conditions on the Group and Company’s financial position and financial performance; and
▪ make an assessment of the Group and Company’s ability to continue as a going concern.
The directors are responsible for keeping adequate accounting records that are sufficient to show and explain the
Group and Company’s transactions and disclose with reasonable accuracy at any time the financial position of the
Group and Company and enable them to ensure that the financial statements comply with the Companies Act 2006.
They are also responsible for safeguarding the assets of the Group and Company and, hence, for taking reasonable
steps for the prevention and detection of fraud and other irregularities.
The directors are responsible for the maintenance and integrity of the corporate and financial information included
on the Company’s website. Legislation in the United Kingdom governing the preparation and dissemination of
financial statements may differ from legislation in other jurisdictions.
Marex Spectron Group Limited
1.
2017: Deferred consideration from the sale of London Clearing House (‘LCH’) shares in 2013. 9
2014: Income received from the sale of Eclipse Energy Holding A.S.
2013: Income received from the sale of London Clearing House (‘LCH’) shares.
STRATEGIC REPORT
Review of financial performance
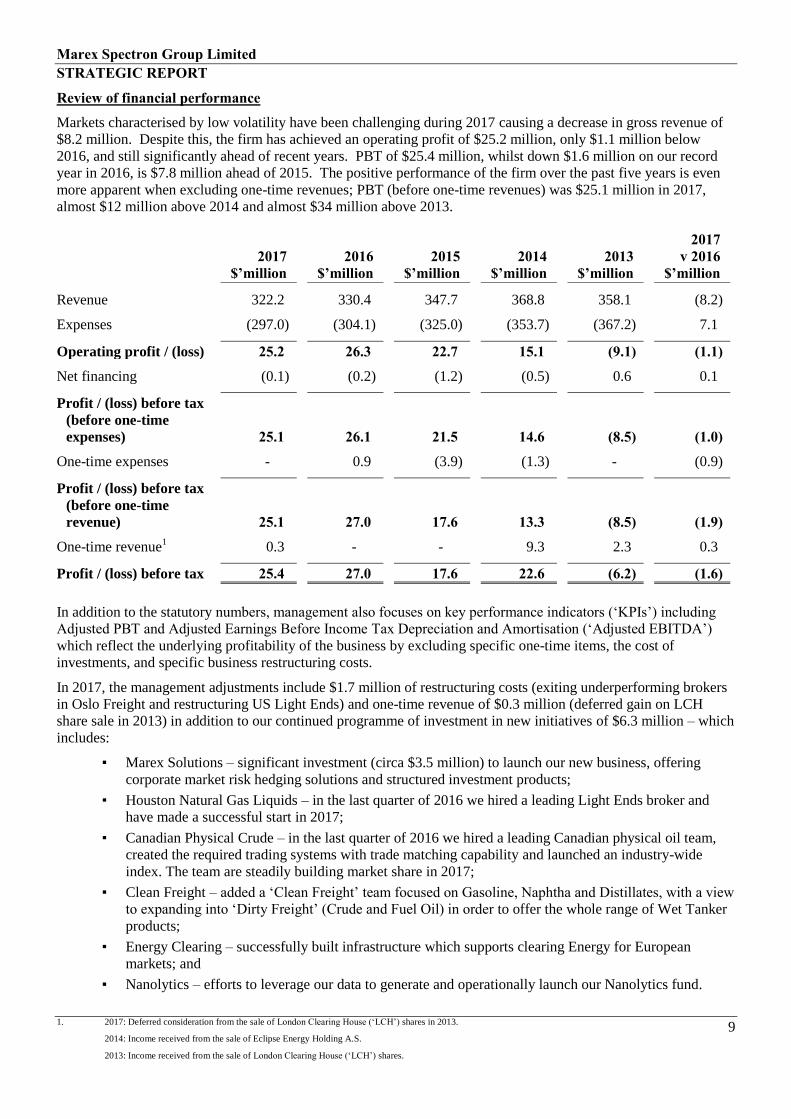
Markets characterised by low volatility have been challenging during 2017 causing a decrease in gross revenue of
$8.2 million. Despite this, the firm has achieved an operating profit of $25.2 million, only $1.1 million below
2016, and still significantly ahead of recent years. PBT of $25.4 million, whilst down $1.6 million on our record
year in 2016, is $7.8 million ahead of 2015. The positive performance of the firm over the past five years is even
more apparent when excluding one-time revenues; PBT (before one-time revenues) was $25.1 million in 2017,
almost $12 million above 2014 and almost $34 million above 2013.
2017
$’million
2016
$’million
2015
$’million
2014
$’million
2013
$’million
2017
v 2016
$’million
Revenue 322.2 330.4 347.7 368.8 358.1 (8.2)
Expenses (297.0) (304.1) (325.0) (353.7) (367.2) 7.1
Operating profit / (loss) 25.2 26.3 22.7 15.1 (9.1) (1.1)
Net financing (0.1) (0.2) (1.2) (0.5) 0.6 0.1
Profit / (loss) before tax
(before one-time
expenses)
25.1
26.1
21.5
14.6
(8.5)
(1.0)
One-time expenses - 0.9 (3.9) (1.3) - (0.9)
Profit / (loss) before tax
(before one-time
revenue)
25.1
27.0
17.6
13.3
(8.5)
(1.9)
One-time revenue1 0.3 - - 9.3 2.3 0.3
Profit / (loss) before tax 25.4 27.0 17.6 22.6 (6.2) (1.6)
In addition to the statutory numbers, management also focuses on key performance indicators (‘KPIs’) including
Adjusted PBT and Adjusted Earnings Before Income Tax Depreciation and Amortisation (‘Adjusted EBITDA’)
which reflect the underlying profitability of the business by excluding specific one-time items, the cost of
investments, and specific business restructuring costs.
In 2017, the management adjustments include $1.7 million of restructuring costs (exiting underperforming brokers
in Oslo Freight and restructuring US Light Ends) and one-time revenue of $0.3 million (deferred gain on LCH
share sale in 2013) in addition to our continued programme of investment in new initiatives of $6.3 million – which
includes:
▪ Marex Solutions – significant investment (circa $3.5 million) to launch our new business, offering
corporate market risk hedging solutions and structured investment products;
▪ Houston Natural Gas Liquids – in the last quarter of 2016 we hired a leading Light Ends broker and
have made a successful start in 2017;
▪ Canadian Physical Crude – in the last quarter of 2016 we hired a leading Canadian physical oil team,
created the required trading systems with trade matching capability and launched an industry-wide
index. The team are steadily building market share in 2017;
▪ Clean Freight – added a ‘Clean Freight’ team focused on Gasoline, Naphtha and Distillates, with a view
to expanding into ‘Dirty Freight’ (Crude and Fuel Oil) in order to offer the whole range of Wet Tanker
products;
▪ Energy Clearing – successfully built infrastructure which supports clearing Energy for European
markets; and
▪ Nanolytics – efforts to leverage our data to generate and operationally launch our Nanolytics fund.
Marex Spectron Group Limited
10
STRATEGIC REPORT (CONTINUED)
Review of financial performance (continued)
Despite increasing current year operating expenses, these initiatives will either generate profits to help strengthen
our platform in the future or will be discontinued.
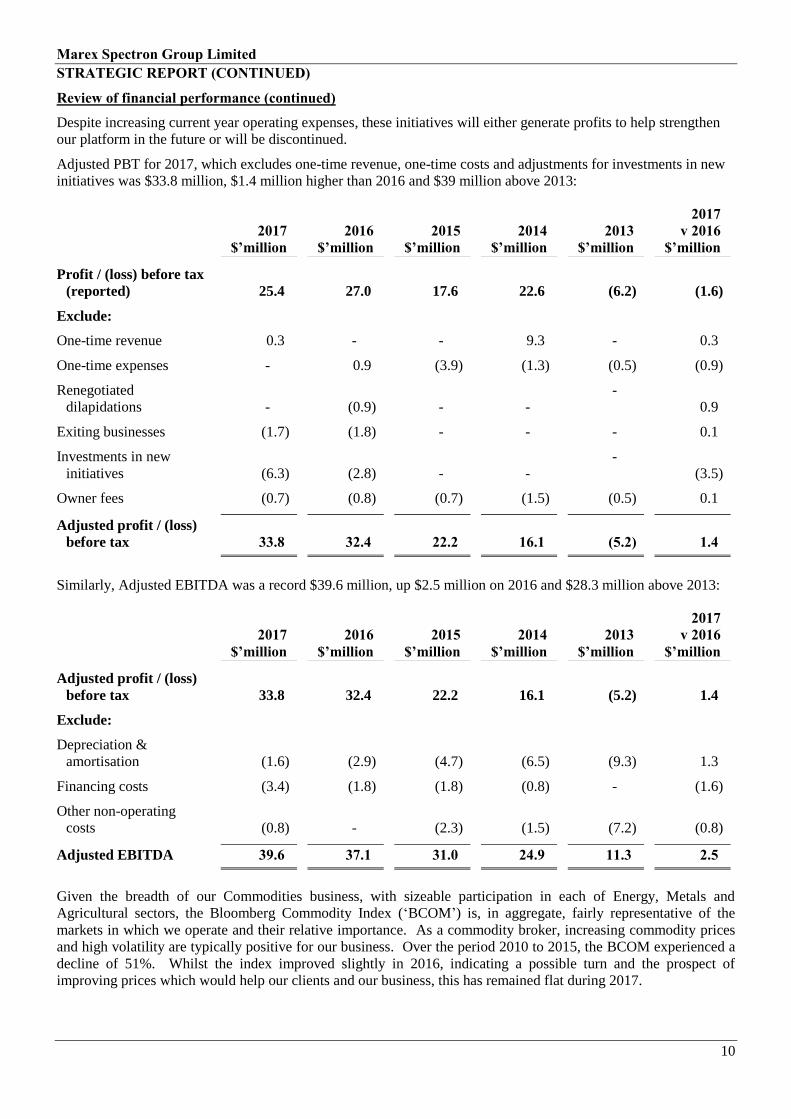
Adjusted PBT for 2017, which excludes one-time revenue, one-time costs and adjustments for investments in new
initiatives was $33.8 million, $1.4 million higher than 2016 and $39 million above 2013:
2017
$’million
2016
$’million
2015
$’million
2014
$’million
2013
$’million
2017
v 2016
$’million
Profit / (loss) before tax
(reported) 25.4 27.0 17.6 22.6
(6.2) (1.6)
Exclude:
One-time revenue 0.3 - - 9.3 - 0.3
One-time expenses - 0.9 (3.9) (1.3) (0.5) (0.9)
Renegotiated
dilapidations - (0.9) - -
-
0.9
Exiting businesses (1.7) (1.8) - - - 0.1
Investments in new
initiatives (6.3) (2.8) - -
-
(3.5)
Owner fees (0.7) (0.8) (0.7) (1.5) (0.5) 0.1
Adjusted profit / (loss)
before tax
33.8
32.4
22.2
16.1
(5.2)
1.4
Similarly, Adjusted EBITDA was a record $39.6 million, up $2.5 million on 2016 and $28.3 million above 2013:
2017
$’million
2016
$’million
2015
$’million
2014
$’million
2013
$’million
2017
v 2016
$’million
Adjusted profit / (loss)
before tax 33.8 32.4 22.2
16.1
(5.2) 1.4
Exclude:
Depreciation &
amortisation (1.6) (2.9) (4.7) (6.5)
(9.3) 1.3
Financing costs (3.4) (1.8) (1.8) (0.8) - (1.6)
Other non-operating
costs (0.8) - (2.3) (1.5)
(7.2) (0.8)
Adjusted EBITDA 39.6 37.1 31.0 24.9 11.3 2.5
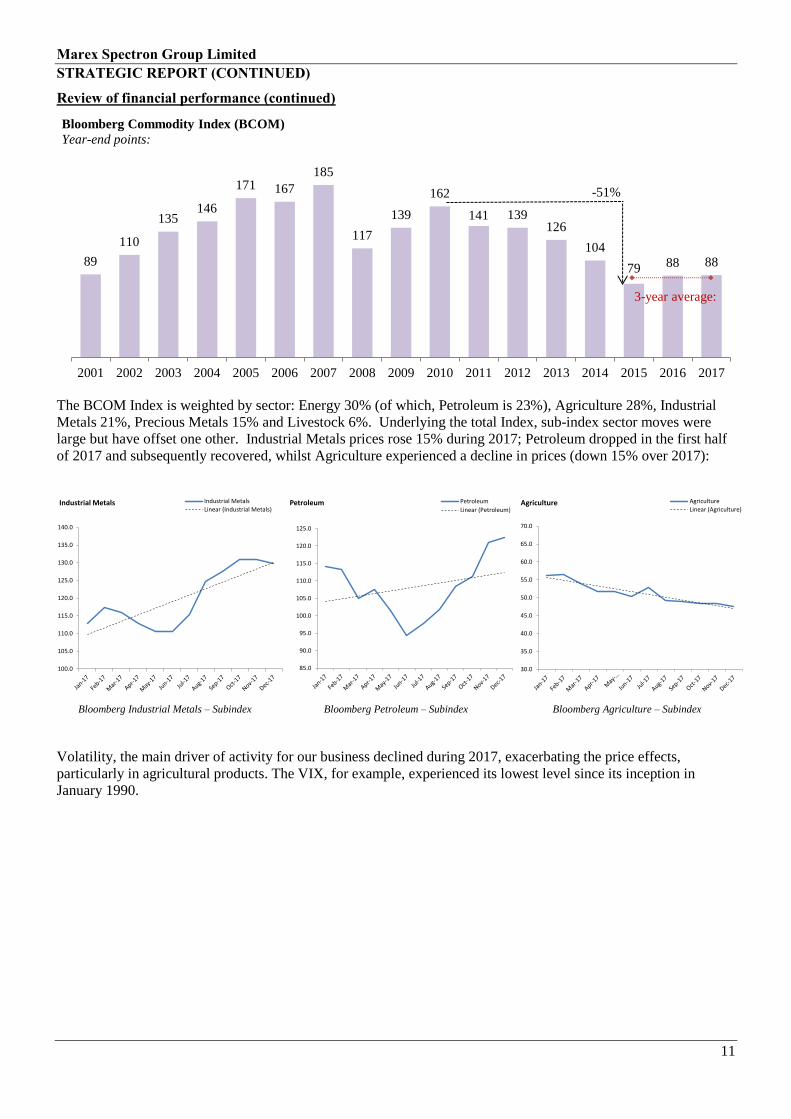
Given the breadth of our Commodities business, with sizeable participation in each of Energy, Metals and
Agricultural sectors, the Bloomberg Commodity Index (‘BCOM’) is, in aggregate, fairly representative of the
markets in which we operate and their relative importance. As a commodity broker, increasing commodity prices
and high volatility are typically positive for our business. Over the period 2010 to 2015, the BCOM experienced a
decline of 51%. Whilst the index improved slightly in 2016, indicating a possible turn and the prospect of
improving prices which would help our clients and our business, this has remained flat during 2017.
Marex Spectron Group Limited
11
STRATEGIC REPORT (CONTINUED)
Review of financial performance (continued)
The BCOM Index is weighted by sector: Energy 30% (of which, Petroleum is 23%), Agriculture 28%, Industrial
Metals 21%, Precious Metals 15% and Livestock 6%. Underlying the total Index, sub-index sector moves were
large but have offset one other. Industrial Metals prices rose 15% during 2017; Petroleum dropped in the first half
of 2017 and subsequently recovered, whilst Agriculture experienced a decline in prices (down 15% over 2017):
Bloomberg Industrial Metals – Subindex Bloomberg Petroleum – Subindex Bloomberg Agriculture – Subindex
Volatility, the main driver of activity for our business declined during 2017, exacerbating the price effects,
particularly in agricultural products. The VIX, for example, experienced its lowest level since its inception in
January 1990.
89
110
135 146
171 167
185
117
139
162
141 139 126
104
79 88 88
2001 2002 2003 2004 2005 2006 2007 2008 2009 2010 2011 2012 2013 2014 2015 2016 2017
Bloomberg Commodity Index (BCOM)
Year-end points:
3-year average:
-51%
100.0
105.0
110.0
115.0
120.0
125.0
130.0
135.0
140.0
Industrial Metals Industrial Metals
Linear (Industrial Metals)
85.0
90.0
95.0
100.0
105.0
110.0
115.0
120.0
125.0
Petroleum Petroleum
Linear (Petroleum)
30.0
35.0
40.0
45.0
50.0
55.0
60.0
65.0
70.0
Agriculture Agriculture
Linear (Agriculture)

Marex Spectron Group Limited
12
STRATEGIC REPORT (CONTINUED)
Review of financial performance (continued)
At the level of individual markets, whilst higher than the volatility in the VIX, commodity market volatility was
also markedly lower than in 2016, this was particularly evident on the LME as illustrated below:
25.7 27.3
22.0
15.5
12.8 12.8
17.5
32.7 31.5
22.5 24.2
17.8
14.2 14.2
16.7 15.8
11.1
2001 2002 2003 2004 2005 2006 2007 2008 2009 2010 2011 2012 2013 2014 2015 2016 2017
VIX Index
Average for the year:
PY long-term
average
20.2
Record low
volatility
0
5
10
15
20
25
30
Jan
-16
Feb
-16
Mar
-16
Ap
r-1
6
May
-16
Jun
-16
Jul-
16
Au
g-1
6
Sep
-16
Oct
-16
No
v-1
6
Dec
-16
Jan
-17
Feb
-17
Mar
-17
Ap
r-1
7
May
-17
Jun
-17
Jul-
17
Au
g-1
7
Sep
-17
Oct
-17
No
v-1
7
Dec
-17
LME volatility Av 2016: 16.9Av 2017: 15.3
vs. -9%
Marex Spectron Group Limited
13
STRATEGIC REPORT (CONTINUED)
Review of financial performance (continued)
Business review
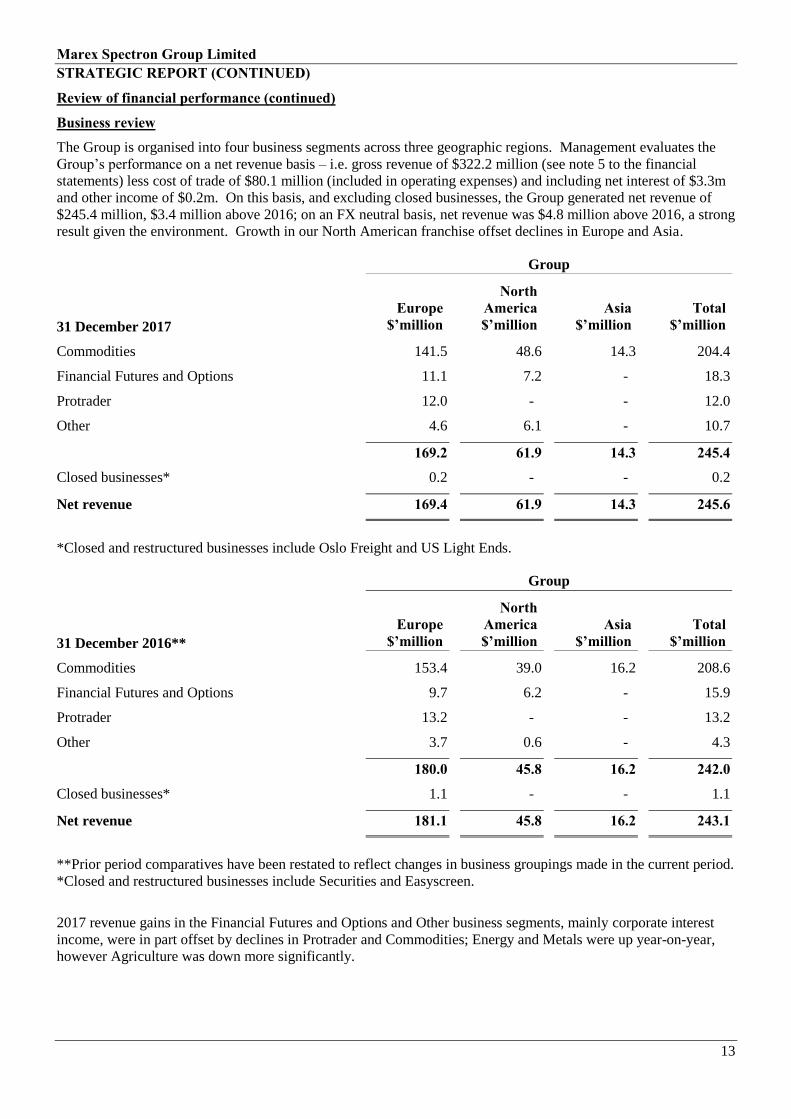
The Group is organised into four business segments across three geographic regions. Management evaluates the
Group’s performance on a net revenue basis – i.e. gross revenue of $322.2 million (see note 5 to the financial
statements) less cost of trade of $80.1 million (included in operating expenses) and including net interest of $3.3m
and other income of $0.2m. On this basis, and excluding closed businesses, the Group generated net revenue of
$245.4 million, $3.4 million above 2016; on an FX neutral basis, net revenue was $4.8 million above 2016, a strong
result given the environment. Growth in our North American franchise offset declines in Europe and Asia.
Group
31 December 2017
Europe
$’million
North
America
$’million
Asia
$’million
Total
$’million
Commodities 141.5 48.6 14.3 204.4
Financial Futures and Options 11.1 7.2 - 18.3
Protrader 12.0 - - 12.0
Other 4.6 6.1 - 10.7
169.2 61.9 14.3 245.4
Closed businesses* 0.2 - - 0.2
Net revenue 169.4 61.9 14.3 245.6
*Closed and restructured businesses include Oslo Freight and US Light Ends.
Group
31 December 2016**
Europe
$’million
North
America
$’million
Asia
$’million
Total
$’million
Commodities 153.4 39.0 16.2 208.6
Financial Futures and Options 9.7 6.2 - 15.9
Protrader 13.2 - - 13.2
Other 3.7 0.6 - 4.3
180.0 45.8 16.2 242.0
Closed businesses* 1.1 - - 1.1
Net revenue 181.1 45.8 16.2 243.1
**Prior period comparatives have been restated to reflect changes in business groupings made in the current period.
*Closed and restructured businesses include Securities and Easyscreen.
2017 revenue gains in the Financial Futures and Options and Other business segments, mainly corporate interest
income, were in part offset by declines in Protrader and Commodities; Energy and Metals were up year-on-year,
however Agriculture was down more significantly.
Marex Spectron Group Limited
1 Market share is calculated as Marex volumes as a percentage of externally sourced total market volume information 14
2 External source: Combination of Intercontinental Exchange (‘ICE’) and Chicago Mercantile Exchange (‘CME’)
3 External source: The London Energy Brokers Association (‘LEBA’)
4 External source: CME
STRATEGIC REPORT (CONTINUED)
Review of financial performance (continued)
Business review (continued)
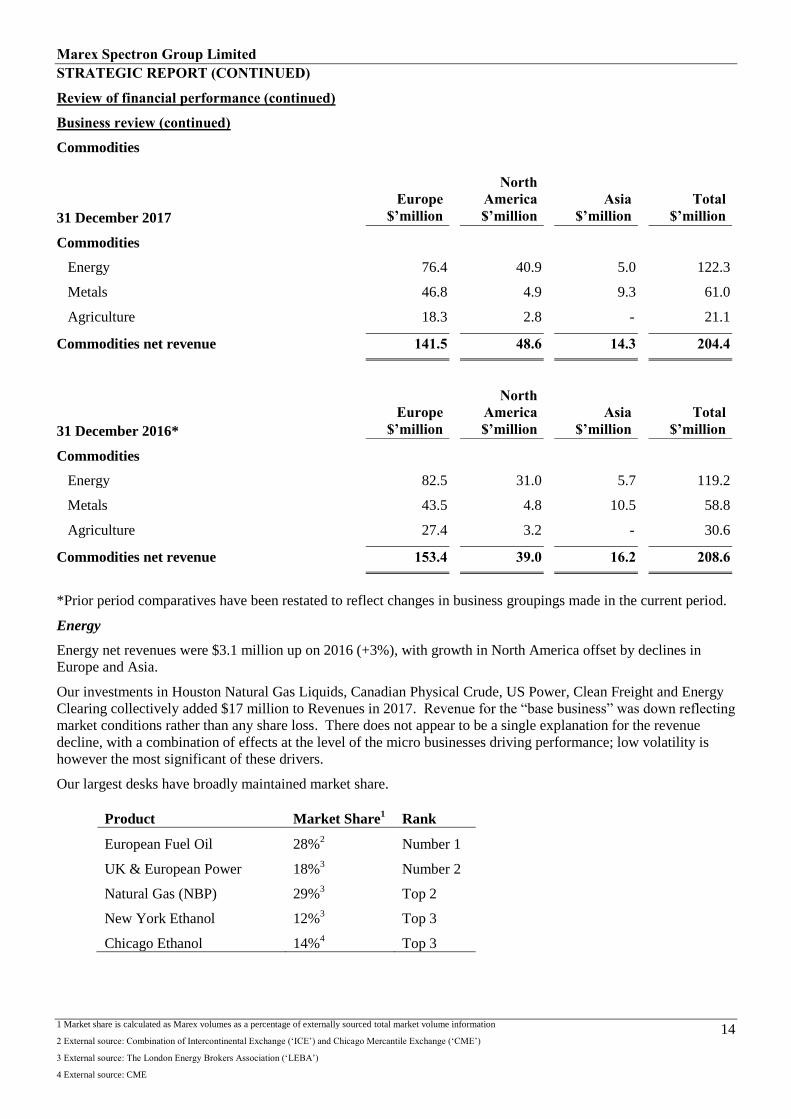
Commodities
31 December 2017
Europe
$’million
North
America
$’million
Asia
$’million
Total
$’million
Commodities
Energy 76.4 40.9 5.0 122.3
Metals 46.8 4.9 9.3 61.0
Agriculture 18.3 2.8 - 21.1
Commodities net revenue 141.5 48.6 14.3 204.4
31 December 2016*
Europe
$’million
North
America
$’million
Asia
$’million
Total
$’million
Commodities
Energy 82.5 31.0 5.7 119.2
Metals 43.5 4.8 10.5 58.8
Agriculture 27.4 3.2 - 30.6
Commodities net revenue 153.4 39.0 16.2 208.6
*Prior period comparatives have been restated to reflect changes in business groupings made in the current period.
Energy
Energy net revenues were $3.1 million up on 2016 (+3%), with growth in North America offset by declines in
Europe and Asia.
Our investments in Houston Natural Gas Liquids, Canadian Physical Crude, US Power, Clean Freight and Energy
Clearing collectively added $17 million to Revenues in 2017. Revenue for the “base business” was down reflecting
market conditions rather than any share loss. There does not appear to be a single explanation for the revenue
decline, with a combination of effects at the level of the micro businesses driving performance; low volatility is
however the most significant of these drivers.
Our largest desks have broadly maintained market share.
Product Market Share1 Rank
European Fuel Oil 28%2 Number 1
UK & European Power 18%3 Number 2
Natural Gas (NBP) 29%3 Top 2
New York Ethanol 12%3 Top 3
Chicago Ethanol 14%4 Top 3
Marex Spectron Group Limited
5 Market share is calculated as Marex volumes as a percentage of externally sourced total market volume information 15
6 External source: ICE
7 External source: Euronext
STRATEGIC REPORT (CONTINUED)
Review of financial performance (continued)
Business review (continued)
Commodities (continued)
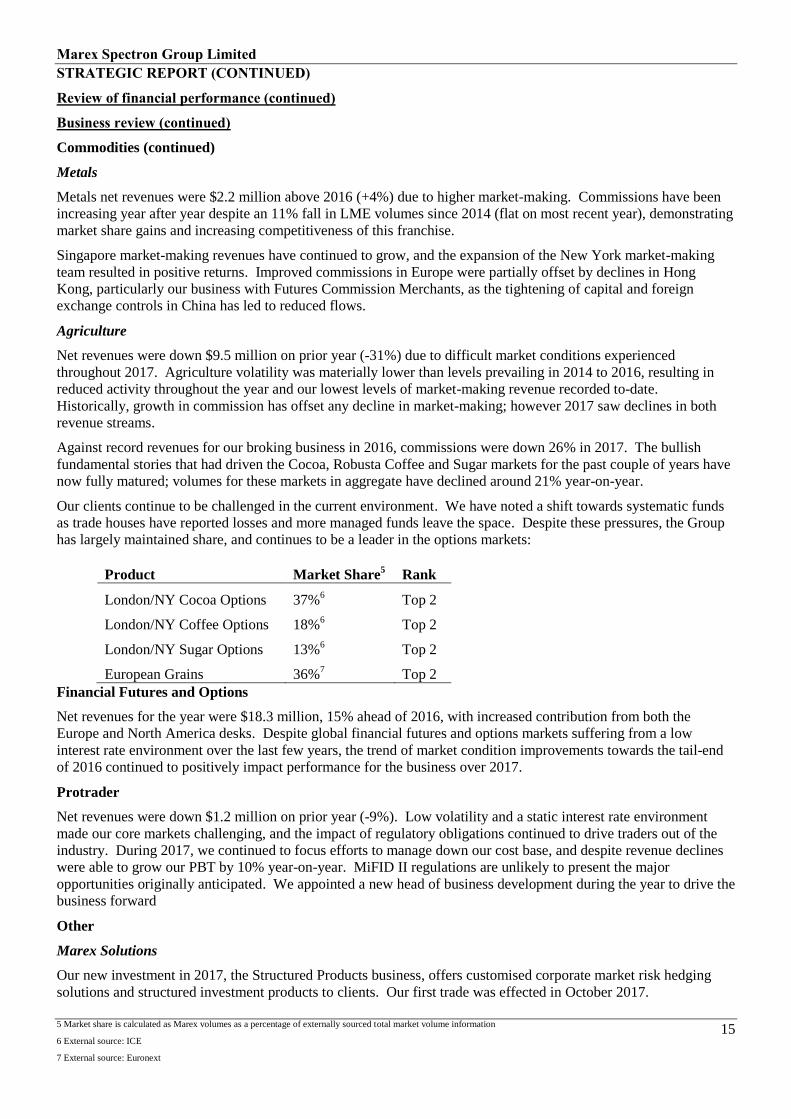
Metals
Metals net revenues were $2.2 million above 2016 (+4%) due to higher market-making. Commissions have been
increasing year after year despite an 11% fall in LME volumes since 2014 (flat on most recent year), demonstrating
market share gains and increasing competitiveness of this franchise.
Singapore market-making revenues have continued to grow, and the expansion of the New York market-making
team resulted in positive returns. Improved commissions in Europe were partially offset by declines in Hong
Kong, particularly our business with Futures Commission Merchants, as the tightening of capital and foreign
exchange controls in China has led to reduced flows.
Agriculture
Net revenues were down $9.5 million on prior year (-31%) due to difficult market conditions experienced
throughout 2017. Agriculture volatility was materially lower than levels prevailing in 2014 to 2016, resulting in
reduced activity throughout the year and our lowest levels of market-making revenue recorded to-date.
Historically, growth in commission has offset any decline in market-making; however 2017 saw declines in both
revenue streams.
Against record revenues for our broking business in 2016, commissions were down 26% in 2017. The bullish
fundamental stories that had driven the Cocoa, Robusta Coffee and Sugar markets for the past couple of years have
now fully matured; volumes for these markets in aggregate have declined around 21% year-on-year.
Our clients continue to be challenged in the current environment. We have noted a shift towards systematic funds
as trade houses have reported losses and more managed funds leave the space. Despite these pressures, the Group
has largely maintained share, and continues to be a leader in the options markets:
Product Market Share5 Rank
London/NY Cocoa Options 37%6 Top 2
London/NY Coffee Options 18%6 Top 2
London/NY Sugar Options 13%6 Top 2
European Grains 36%7 Top 2
Financial Futures and Options
Net revenues for the year were $18.3 million, 15% ahead of 2016, with increased contribution from both the
Europe and North America desks. Despite global financial futures and options markets suffering from a low
interest rate environment over the last few years, the trend of market condition improvements towards the tail-end
of 2016 continued to positively impact performance for the business over 2017.
Protrader
Net revenues were down $1.2 million on prior year (-9%). Low volatility and a static interest rate environment
made our core markets challenging, and the impact of regulatory obligations continued to drive traders out of the
industry. During 2017, we continued to focus efforts to manage down our cost base, and despite revenue declines
were able to grow our PBT by 10% year-on-year. MiFID II regulations are unlikely to present the major
opportunities originally anticipated. We appointed a new head of business development during the year to drive the
business forward
Other
Marex Solutions
Our new investment in 2017, the Structured Products business, offers customised corporate market risk hedging
solutions and structured investment products to clients. Our first trade was effected in October 2017.

Marex Spectron Group Limited
16
STRATEGIC REPORT (CONTINUED)
Review of financial performance (continued)
Business review (continued)
Other (continued)
Corporate Net Interest Income
Net revenues for the year were $8.8 million, an increase of $6.3 million on 2016. Our efforts to improve yield in
our portfolio were successful: while increased rates and higher client balances on exchanges helped considerably,
active management of our liquidity through treasury holdings and having our operating banks pay for cash on
deposit were also important contributors.
Balance sheet
Shareholders’ equity reduced by $1.4 million following the net effect of profit after tax of $17.5 million (2016:
$20.5 million), dividend payments made to shareholders of $20.0 million (2016: $20.0 million) and the gain in
value of available-for-sale assets (net of deferred tax) of $1.1 million (2016: loss of $0.3 million ). Since 2012,
tangible equity has increased by $31.6 million (16.0%). Since 2014, this has added $18.1 million (8.5%) to
tangible equity compared to $13.5 million (6.8%) from 2012 to 2014.
2017
$’million
2016
$’million
2015
$’million
2014
$’million
2013
$’million
2012
$’million
Shareholders’ equity 372.4 373.8 373.6 357.3 338.8 345.4
Goodwill (141.0) (141.0) (141.0) (144.0) (145.6) (145.6)
Tangible equity 231.4 232.8 232.6 213.3 193.2 199.8
2017 2016
$’million Assets Liabilities Assets Liabilities
Cash and cash equivalents 89.2 - 188.2 -
Financial instruments (Treasuries) 226.3 - 120.2 -
Short-term borrowings - (60.0) - (40.0)
Liquid resources 315.5 (60.0) 308.4 (40.0)
Trade receivables 580.0 - 622.9 -
Other receivables 27.5 - 23.4 -
Trade payables - (580.6) - (647.3)
Other payables - (58.9) - (60.3)
Trade and other receivables / (payables) 607.5 (639.5) 646.3 (707.6)
Financial instruments 6.9 (9.3) 24.0 (12.0)
Matched principal broking (FX and bullion) 6.9 (9.3) 24.0 (12.0)
Net tax liabilities - (3.1) - (1.3)
Provisions - (0.3) - (0.3)
Non-current assets 13.7 - 15.3 -
Other 13.7 (3.4) 15.3 (1.6)
943.6 (712.2) 994.0 (761.2)
Tangible equity 231.4 232.8

Marex Spectron Group Limited
17
STRATEGIC REPORT (CONTINUED)
Review of financial performance (continued)
Balance sheet (continued)
Overall, total assets on the balance sheet have decreased by $50.4 million (5%) year-on-year. Trade payables,
representing client activity reduced $66.7 million (10%) from $647.3 million to $580.6 million as at 31 December
2017. Trade receivables, mainly driven by margin requirements with exchanges reduced as the Group posted $42.9
million (7%) less collateral from $622.9 million to $580.0 million at the year end.
Deployment of equity
The Group’s liquid resources have decreased by $12.9 million (5%) from $268.4 million to $255.5 million as at 31
December 2017. Cash and cash equivalents have decreased by $99 million (53%) year-on-year with the Group
utilising $60.0 million (2016: $35.0 million) of the available credit facility and nil (2016: $5 million) of bank
overdraft facilities at the year end. The total US Treasuries have increased by $106.1 million (88%) from $120.2
million to $226.3 million as at 31 December 2017. Net financial instruments have decreased by $14.4 million
(120%) with other net payables down $2.3 million (10%) year-on-year.
2017
$’million
2016
$’million
2015
$’million
2017 v 2016
$’million
2017 v 2016
%
Cash and cash equivalents 89.2 188.2 158.3 (99.0) (53%)
Financial instruments –
(Treasuries) 226.3 120.2 119.5 106.1 88%
Warrant inventory - - 15.9 - n.m.
Repurchase agreements - - (18.9) - n.m.
Short-term borrowings (60.0) (40.0) - (20.0) 50%
Liquid resources 255.5 268.4 274.8 (12.9) (5%)
Trade receivables 580.0 622.9 634.9 (42.9) (7%)
Trade payables (580.6) (647.3) (632.8) 66.7 (10%)
Net trade (payables) /
receivables
(0.6)
(24.4)
2.1
23.8 (97%)
Financial instruments –
assets 6.9 24.0 4.9 (17.1) (71%)
Financial instruments –
liabilities (9.3) (12.0) (3.5) 2.7 (23%)
Matched principal
broking / (FX and
bullion)
(2.4)
12.0
1.4
(14.4)
(120%)
Other receivables 27.5 23.4 13.5 4.1 18%
Other payables (58.9) (60.3) (74.0) 1.4 (2%)
Net tax liabilities (3.1) (1.3) (2.4) (1.8) (138%)
Provisions (0.3) (0.3) (1.4) - n.m.
Non-current assets 13.7 15.3 18.6 (1.6) (10%)
Other net payables (21.1) (23.2) (45.7) 2.1 (9%)
Tangible equity 231.4 232.8 232.6 (1.4) (1%)
Marex Spectron Group Limited
18
STRATEGIC REPORT (CONTINUED)
Review of financial performance (continued)
Balance sheet (continued)
Liquidity
Group liquidity resources are the Group’s cash or assets that can be quickly converted to meet immediate and short-
term obligations. The resources include non-segregated cash, unencumbered US Treasuries, LME house forward
profits in excess of house margin requirements, and LME house warrant inventory. The Group also includes the
undrawn portion of its committed working capital facility in its liquidity resources. In 2017, the Group increased
its working capital facility by $50 million to $115 million, with two additional relationship banks (AIB and ICBC),
and one of the existing three banks (Barclays) increasing their commitments to the facility (Bank Leumi and Lloyds
Bank maintained their prior commitment levels).
The firm includes LME house forward profits in excess of LME house IM requirements in its liquid resources as
the Group is able to convert these to cash on a trade date plus one-day basis through sale of the fully hedged house
positions. These are included in trade receivables on the balance sheet, and arise from house positions that are in
the money, but the cash is not received until the position settlement. The Group also considers LME House
warrants as a source of liquidity as the Group is able to covert these to cash on a trade date plus one-day basis, just
as it can with excess forward profits.
Average Group Liquidity Resources through 2017 were $229 million (2016 average: $231 million). Liquidity
resources at 2017 year-end were $189 million (2016 year-end: $248 million). There was a decline in liquidity in
December 2017 due to rapid price appreciation in metals, which materially increased the requirement of our clients
who drew their credit lines, and ran down their operational balances. In 2018, there has been a recovery back to the
2017 average levels indicating that the decline was an unusual event.
Regulatory capital
The Group is subject to minimum capital requirements as prescribed by the EU and implemented through the
Capital Requirements Directive (‘the Directive’) and the Capital Requirements Regulation (‘CRR’), collectively
referred to as CRD IV
The Group is regulated by the FCA and the Group has regulated subsidiaries operating in jurisdictions outside of
the UK. The Group and its subsidiaries are in compliance with the regulatory requirements and are appropriately
capitalised relative to the minimum requirements as set by the relevant competent authority.
The Group has a strong capital base with the Group’s Own Funds composed of instruments qualifying as Common
equity Tier 1 capital (‘CET 1’) instruments. The Group’s minimum capital requirements consist of market, credit
and operational risk calculated under standardised methodologies.
As at 31 December, 2017 the Group had Own Funds of $213.3 million (2016: $211.9 million) and a total minimum
capital requirement (‘Pillar 1’) of $88.4 million (2016: $87.6 million).
The Group reported a Pillar 1 excess of $124.9 million (2016: $124.3 million). This excess is consistent year-on-
year. The main constituent of the Pillar 1 requirement is Market Risk capital charges.
As at 31 December 2017, the Group reported a capital ratio of 19.30% (2016: 19.34%). The ratio expresses the
Group’s capital as a percentage of Total Risk Exposure (Pillar 1 divided by 8%) where the regulatory minimum is
8%. The Group manages its capital structure in order to comply with regulatory requirements, ensuring its capital
base is adequate to cover the risks inherent in the business and to maximise shareholder value through the strategic
deployment of capital to support the Group’s growth and strategic options. The Group performs capital projections
and stress testing at least annually as part of the Group’s Internal Capital Adequacy Assessment Process
(‘ICAAP’).
Return on assets
The return on assets computation, as required by Article 90 of the Directive, as at 31 December 2017 is 6.8%
(2016: 7%). The return on assets reflects the Company’s operating profit of $25.2 million (2016: $26.3 million) as
a percentage of the net assets $372.4 million (2016: $373.8 million).
Marex Spectron Group Limited
19
STRATEGIC REPORT (CONTINUED)
Overview of risk management
Excellence in risk management is at the core of Marex Spectron’s business operations. The Group has stringent
risk management procedures and well-established risk management processes. Marex Spectron views risk
management as a key factor in delivering its strategic business aims and objectives whilst ensuring its long-term
sustainability and effective corporate governance.
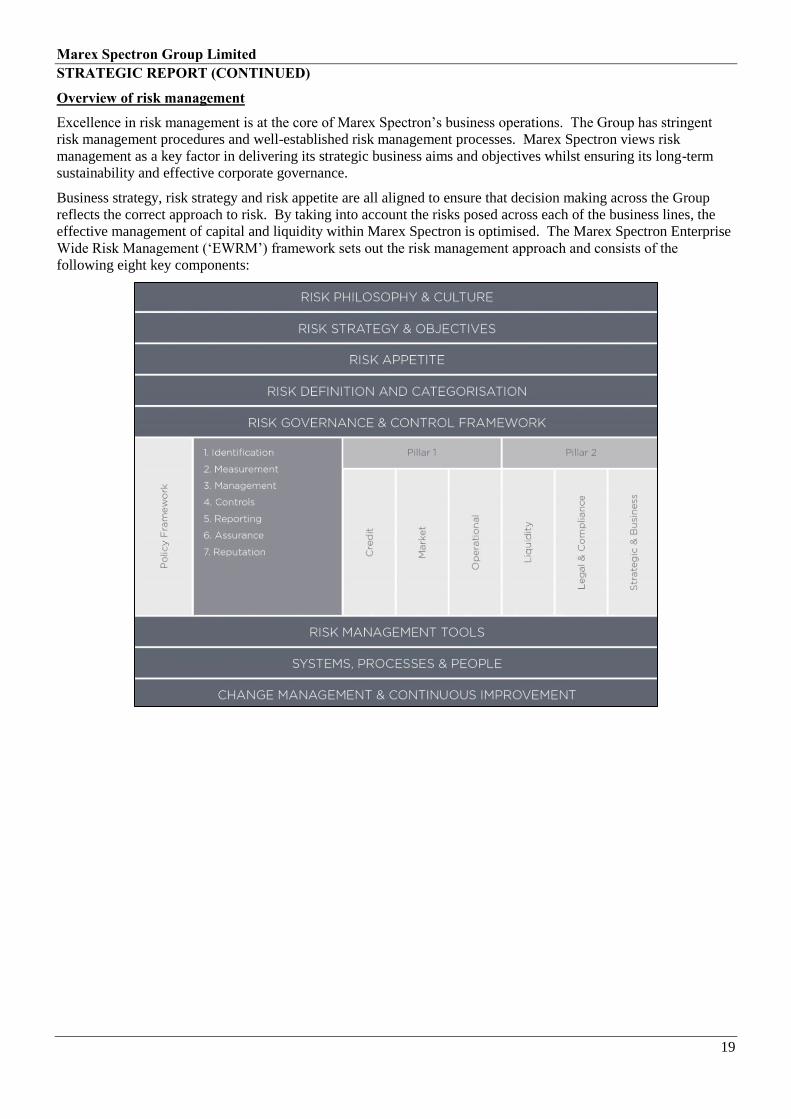
Business strategy, risk strategy and risk appetite are all aligned to ensure that decision making across the Group
reflects the correct approach to risk. By taking into account the risks posed across each of the business lines, the
effective management of capital and liquidity within Marex Spectron is optimised. The Marex Spectron Enterprise
Wide Risk Management (‘EWRM’) framework sets out the risk management approach and consists of the
following eight key components:
Marex Spectron Group Limited
20
STRATEGIC REPORT (CONTINUED)
Overview of risk management (continued)
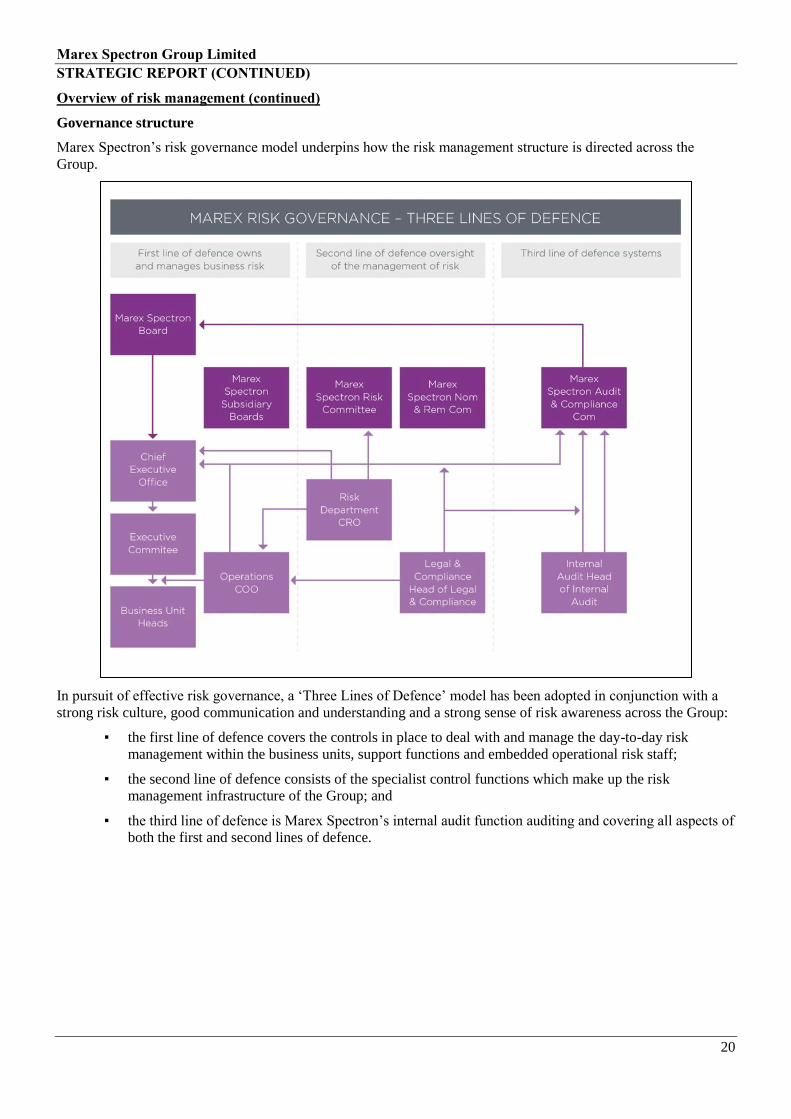
Governance structure
Marex Spectron’s risk governance model underpins how the risk management structure is directed across the
Group.
In pursuit of effective risk governance, a ‘Three Lines of Defence’ model has been adopted in conjunction with a
strong risk culture, good communication and understanding and a strong sense of risk awareness across the Group:
▪ the first line of defence covers the controls in place to deal with and manage the day-to-day risk
management within the business units, support functions and embedded operational risk staff;
▪ the second line of defence consists of the specialist control functions which make up the risk
management infrastructure of the Group; and
▪ the third line of defence is Marex Spectron’s internal audit function auditing and covering all aspects of
both the first and second lines of defence.
Marex Spectron Group Limited
21
STRATEGIC REPORT (CONTINUED)
Overview of risk management (continued)
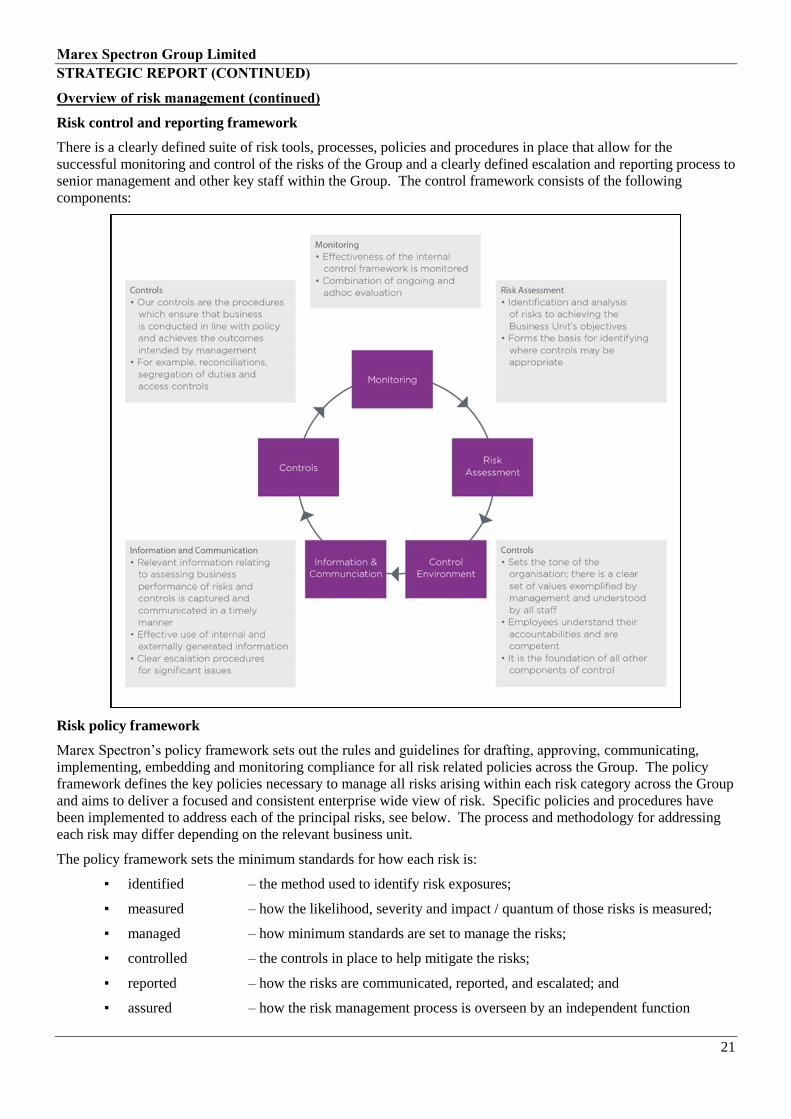
Risk control and reporting framework
There is a clearly defined suite of risk tools, processes, policies and procedures in place that allow for the
successful monitoring and control of the risks of the Group and a clearly defined escalation and reporting process to
senior management and other key staff within the Group. The control framework consists of the following
components:
Risk policy framework
Marex Spectron’s policy framework sets out the rules and guidelines for drafting, approving, communicating,
implementing, embedding and monitoring compliance for all risk related policies across the Group. The policy
framework defines the key policies necessary to manage all risks arising within each risk category across the Group
and aims to deliver a focused and consistent enterprise wide view of risk. Specific policies and procedures have
been implemented to address each of the principal risks, see below. The process and methodology for addressing
each risk may differ depending on the relevant business unit.
The policy framework sets the minimum standards for how each risk is:
▪ identified – the method used to identify risk exposures;
▪ measured – how the likelihood, severity and impact / quantum of those risks is measured;
▪ managed – how minimum standards are set to manage the risks;
▪ controlled – the controls in place to help mitigate the risks;
▪ reported – how the risks are communicated, reported, and escalated; and
▪ assured – how the risk management process is overseen by an independent function
Marex Spectron Group Limited
22
STRATEGIC REPORT (CONTINUED)
Overview of risk management (continued)
Internal audit
Marex Spectron has an internal audit function and this represents the Group’s third line of defence providing
independent assurance to senior management and the Board. The objectives of Internal Audit are to assess the
effectiveness of the Group’s risk management, internal controls and governance process; whether operational and
financial controls are appropriate and consistently applied; the effectiveness of internal controls for the
safeguarding of assets; the reliability and integrity of management information; and the adequacy of processes to
ensure compliance with applicable laws and regulations.
The Board’s assessment of the principal risks
The directors of the Group confirm that they have carried out a robust assessment of the principal risks facing the
Group, including those that would threaten its business model, future performance, solvency or liquidity.
The Group faces a variety of risks that are inherent in its normal course of business. These risks can be categorised
into: Financial; Operational; and Strategic and Business. The following are deemed to be the principal risks and
uncertainties that could affect Marex Spectron’s activities within each of these areas and are described, below,
along with how the Group seeks to manage or mitigate each of these risk exposures.
Financial risk
Liquidity risk
Liquidity is essential to Marex Spectron’s businesses. Liquidity risk is the risk that the Group either does not have
sufficient financial resources available to meet its obligations as they fall due or can only secure such resources at
excessive cost.
Liquidity risk is assessed and managed under the Individual Liquidity Adequacy Assessment (‘ILAA’) and
liquidity risk framework. The Group’s liquidity could be impaired by an inability to sell assets or unforeseen
outflows of cash or collateral. This situation may arise due to circumstances beyond Marex Spectron’s control.
This includes general market disruption, operational problems that affect third parties or the Group or from the
perception amongst market participants that the Group is experiencing greater liquidity risk.
Marex Spectron’s ability to sell assets may be further impaired if other market participants are seeking to sell
similar assets at the same time as is likely to occur in a liquidity or other market crisis. Given the Group’s
significant position on a number of exchanges and its market-maker role, there is an expectation that Marex
Spectron will continue to make a market in stress conditions.
To mitigate liquidity risk, the Group has implemented robust cash management policies and procedures that
monitor liquidity daily to ensure that Marex Spectron has sufficient resources to meet its margin requirements at
clearing houses and third party brokers. There are strict guidelines in relation to the products and product duration
into which excess liquidity can be invested.
Excess liquidity is invested in highly liquid instruments, such as cash deposits with financial institutions for a
period of less than three months and US Treasuries with a maturity of up to two years.
The financial liabilities are based upon rates set on a daily basis, (apart from Marex Spectron’s financing of
warrants and the credit facility, where the rates are set for the term of the loan and / or repo). For assets not
marked-to-market, there are no material differences between their carrying and fair value.
Marex Spectron has a varied client base that can hold both long and short positions in the same product. As a
significant market maker, the Group’s exchange exposure has, at any given point in time, some element of liquidity
offset or aggregation benefit.
In the event of a liquidity issue arising, the Group has recourse to existing global cash resources. Marex Spectron
also has a $10 million committed receivable finance facility, a $15 million uncommitted overdraft facility and a
$115 million committed revolving credit facility as additional contingency funding.
Marex Spectron Group Limited
23
STRATEGIC REPORT (CONTINUED)
Overview of risk management (continued)
Financial risk (continued)
Credit risk
Credit risk is the risk that third parties who owe Marex Spectron money, securities or other assets fail to perform on
their contractual obligations. This situation may arise due to their lack of liquidity, bankruptcy, operational failure
as well as for other reasons. In addition, failure or concerns regarding a default by an institution could lead to
significant liquidity problems, losses or subsequent defaults of other institutions. This could adversely affect the
Group, given the commercial soundness of many financial institutions may be closely related as a result of clearing,
credit, trading or other relationships between institutions.
Marex Spectron is exposed to credit risk arising from a number of sources, including:
▪ the temporary credit exposure that arises from the timing of margin payments, where the Group
delivers margin to a clearing house before receiving the matching payment either from a non-credit
client or from a credit client from whom margin has been called since the credit limit has been
exceeded;
▪ the extension of credit to clients in relation to initial and variation margin payments;
▪ settlement risk arising from the release of currency or warrants prior to settlement by the counterparty –
given that most settlement is on a delivery-versus-payment basis, this is mainly confined to a small
number of trades in LME warrants with the most creditworthy counterparties; and
▪ exposure to non-client counterparties, including exchanges, clearing houses or deposit-taking
institutions holding assets of the Group, including exchange memberships, default fund contributions
and cash deposits.
This risk is mitigated by the robust client approval process, the taking of collateral and the continual and real time
monitoring of clients / counterparties and their exposures. Most clients are required to pre-fund their obligations to
Marex, but a subset are granted credit facilities following detailed qualitative and quantitative analysis and approval
by the Group’s Executive Credit and Risk Committee and, if necessary, the Board Risk Committee.
Concentrations of risk are carefully monitored and controlled, whether they are the result of a single client or
counterparty, geography, sector, market or product and remedial action is taken where either a risk appetite level is
approached / breached or where considered necessary for other reasons.
Market risk
Market risk is defined as the risk of loss that arises from fluctuations in the values of the Group’s traded positions
due to adverse changes in market prices, volatilities, interest rates and foreign exchange. It also includes the risks
that arise from open foreign exchange and interest rate positions on the balance sheet; for example, via our
derivatives, cash and investment balances and bank borrowings.
Marex Spectron incurs market risk primarily as a result of taking positions in the course of its market-making
business. The Group generally aims to match buyers and sellers in the markets where it operates: the Group has a
relatively low appetite for intraday position risk, but in businesses such as Metals and Agricultural Commodities it
is necessary to augment market liquidity with firm liquidity.
Market risk can also arise in relation to client-driven trading where timing issues or market opening hours result in
the business carrying a position for a short period of time, typically overnight. Spread, outright and option risks
result from cash and derivative exposures in commodities, foreign exchange and financial products. Risks are
generally limited to highly liquid exchange-traded and foreign exchange contracts.
The Board has clearly defined its risk appetite for market risk and a variety of measurement methodologies,
including Value-at-Risk (‘VaR’), scenario analysis and stress testing are used to quantify and assess the levels of
market risk to which the Group is exposed. Positions can be managed or additional hedging instruments can be
acquired to ensure risk remains within the defined risk appetite.

Marex Spectron Group Limited
24
STRATEGIC REPORT (CONTINUED)
Overview of risk management (continued)
Financial risk (continued)
Market risk (continued)
Marex Spectron’s overall exposure to market risk is mitigated by its operation as an intermediary on most
transactions. As an intermediary, the Group aims to minimise its market risk by matching buyers and sellers.
However, from time-to-time, Marex Spectron will take the risk of a given trade onto its own books within pre-
defined parameters and risk limits which are monitored and controlled by the Risk Department.
Capital management
The primary objective of Marex Spectron’s capital management is to ensure that it maintains strong capital ratios in
order to support its business growth as well as to maximise shareholder value. The Group manages its capital
structure and makes adjustments to it in light of changes in economic conditions. In addition, Marex Spectron
manages its capital so that it complies with the requirements of the regulatory authorities, as well as ensuring its
capital base is adequate to cover the risks inherent in the business as defined in the Group’s Internal Capital
Adequacy Assessment Process (‘ICAAP’) document.
Operational risk
Operational risk is the risk of losses resulting from inadequate or failed internal processes, people, and systems or
from external events. It is inherent in all the products, activities, processes and systems. Therefore, managing
operational risk is considered the responsibility of all Group employees.
The Board recognises the business imperative to identify, assess, manage, mitigate and report operational risk. The
firm adopts a ‘Three Lines of Defence’ model, where each line of defence has specific roles and responsibilities in
the implementation of the Operational Risk Framework (‘ORF’). The Risk Function has the responsibility to
design, maintain and implement the ORF.
The Framework enables the directors to define the operational risk profile of the firm via the performance of
periodic risk assessments, the collection of loss data through internal risk event reporting systems and the
monitoring of the set of key risk indicators, ensuring the risk profile stays within the firm’s risk appetite.
All the framework’s components concur with the definition of the scenario analysis used in determining the
Group’s internal capital assessment for operational risk within its ICAAP.
Information security / cyber risk
Information security, data confidentiality, integrity and availability of information are of critical importance to our
businesses. Technology risk is inherent not only in the Group’s information technology assets, but also in the
people and processes that interact with them. Cyber risk, which is part of technology risk, is the risk that Marex
Spectron’s systems will not operate properly or will be compromised as a result of cyber-attacks, security breaches,
unauthorised access, loss, destruction or alteration of data, unavailability of service, computer viruses or other
events that could have an adverse security impact. As a result, the Group could be subject to litigation, suffer
financial loss not covered by insurance, experience disruption of businesses, liability to clients, regulatory
intervention or reputational damage.
Although Marex Spectron has business continuity plans, businesses face a wide variety of operational risks,
including technology risk arising from dependencies on information technology, third-party suppliers and the
worldwide telecommunications infrastructure. The increasing sophistication of cyber-attacks means that a cyber-
attack is inherently unpredictable and could occur without detection for an extended period of time.
The Group maintains active links with peer associations and appropriate government agencies to keep abreast of
developments and has timely access to cyber threat intelligence. Service and infrastructure disruption risks are
managed through Marex Spectron’s business continuity management plan, the incident response plan, the
operational risk management program and other contingency and resiliency plans.
Marex Spectron Group Limited
25
STRATEGIC REPORT (CONTINUED)
Overview of risk management (continued)
Operational risk (continued)
Legal and compliance
Compliance or regulatory risk arises from a failure or inability to comply with the laws, regulations or codes
applicable specifically to the financial services industry. Non-compliance can lead to fines, public reprimands,
enforced suspensions of services or, in extreme cases, withdrawal of authorisation to operate.
Companies within the Group are subject to authorisation by the LME, the CME, ICE, the NYSE Euronext and
Eurex. Marex Spectron is regulated on a consolidated basis in the UK by the FCA, in the US by the NFA and
CFTC, in Hong Kong by the SFC, and in Singapore by the MAS and IES.
Legal risk can also arise through litigation or the failure of contractual documentation when relied upon. Litigation
risk is difficult to completely eliminate, but the Group mitigates this risk through its transparent and considered
approach to the activities which it undertakes. The failure of contractual documentation when relied upon is
mitigated by using market standard documents wherever possible and ensuring that bespoke or amended
documentation is thoroughly reviewed by the internal Legal Department and / or external counsel.
Strategic and business risk
This risk is defined as the impact of a change or a failure to change Marex Spectron’s business model which
impacts its ability to meet its strategic or financial objectives. It might arise from the pursuit of an unsuccessful
business plan, from making slow or poor business decisions, from the substandard execution of decisions, from
inadequate resource allocation, or from a failure to respond well to changes in the business environment.
The Group’s Board and Executive Committee regularly review Marex Spectron’s regulatory and business
environment, the performance and capital requirements of its business lines, the level of investment in new and
existing activities and its remuneration policy. The Group performs on-going surveillance of market trends, the
regulatory landscape and customer demand. This is supported by risk scenario contingency planning and the
assessment of emerging risks.
The directors, in preparing this strategic report, have complied with s414C of the Companies Act 2006.
I T Lowitt
Director
29 March 2018
26
INDEPENDENT AUDITOR’S REPORT TO THE MEMBERS OF
MAREX SPECTRON GROUP LIMITED
Report on the audit of the financial statements
Opinion
In our opinion:
▪ the financial statements give a true and fair view of the state of the Group’s and of the parent
company’s affairs as at 31 December 2017 and of the Group’s profit for the year then ended;
▪ the Group financial statements have been properly prepared in accordance with International Financial
Reporting Standards (IFRSs) as adopted by the European Union;
▪ the parent company financial statements have been properly prepared in accordance with IFRSs as
adopted by the European Union and as applied in accordance with the provisions of the Companies Act
2006; and
▪ the financial statements have been prepared in accordance with the requirements of the Companies Act
2006.
We have audited the financial statements of Marex Spectron Group Limited (‘the parent company’) and its
subsidiaries (the ‘Group’) which comprise:
▪ the consolidated income statement;
▪ the consolidated statement of other comprehensive income;
▪ the consolidated and parent company statements of financial position;
▪ the consolidated and parent company statements of changes in equity and movements in reserves;
▪ the consolidated and parent company cash flow statements; and
▪ the related notes 1 to 35.
The financial reporting framework that has been applied in their preparation is applicable law and International
Financial Reporting Standards (IFRSs) as adopted by the European Union and, as regards the parent company
financial statements, as applied in accordance with the provisions of the Companies Act 2006.
Basis for opinion
We conducted our audit in accordance with International Standards on Auditing (UK) (ISAs(UK)) and applicable
law. Our responsibilities under those standards are further described in the auditor’s responsibilities for the audit of
the financial statements section of our report.
We are independent of the Group and the parent company in accordance with the ethical requirements that are
relevant to our audit of the financial statements in the UK, including the FRC’s Ethical Standard, and we have
fulfilled our other ethical responsibilities in accordance with these requirements. We believe that the audit
evidence we have obtained is sufficient and appropriate to provide a basis for our opinion.
Conclusions relating to going concern
We are required by ISAs (UK) to report in respect of the following matters where:
▪ the directors’ use of the going concern basis of accounting in preparation of the financial statements is
not appropriate; or
▪ the directors have not disclosed in the financial statements any identified material uncertainties that
may cast significant doubt about the Group’s or the parent company’s ability to continue to adopt the
going concern basis of accounting for a period of at least twelve months from the date when the
financial statements are authorised for issue.
We have nothing to report in respect of these matters.

INDEPENDENT AUDITOR’S REPORT TO THE MEMBERS OF
MAREX SPECTRON GROUP LIMITED (CONTINUED)
27
Other information
The directors are responsible for the other information. The other information comprises the information included
in the annual report, other than the financial statements and our auditor’s report thereon. Our opinion on the
financial statements does not cover the other information and, except to the extent otherwise explicitly stated in our
report, we do not express any form of assurance conclusion thereon.
In connection with our audit of the financial statements, our responsibility is to read the other information and, in
doing so, consider whether the other information is materially inconsistent with the financial statements or our
knowledge obtained in the audit or otherwise appears to be materially misstated. If we identify such material
inconsistencies or apparent material misstatements, we are required to determine whether there is a material
misstatement in the financial statements or a material misstatement of the other information. If, based on the work
we have performed, we conclude that there is a material misstatement of this other information, we are required to
report that fact.
We have nothing to report in respect of these matters.
Responsibilities of directors
As explained more fully in the directors’ responsibilities statement, the directors are responsible for the preparation
of the financial statements and for being satisfied that they give a true and fair view, and for such internal control as
the directors determine is necessary to enable the preparation of financial statements that are free from material
misstatement, whether due to fraud or error.
In preparing the financial statements, the directors are responsible for assessing the Group’s and the parent
company’s ability to continue as a going concern, disclosing, as applicable, matters related to going concern and
using the going concern basis of accounting unless the directors either intend to liquidate the Group or the parent
company or to cease operations, or have no realistic alternative but to do so.
Auditor’s responsibilities for the audit of the financial statements
Our objectives are to obtain reasonable assurance about whether the financial statements as a whole are free from
material misstatement, whether due to fraud or error, and to issue an auditor’s report that includes our opinion.
Reasonable assurance is a high level of assurance, but is not a guarantee that an audit conducted in accordance with
ISAs (UK) will always detect a material misstatement when it exists. Misstatements can arise from fraud or error
and are considered material if, individually or in the aggregate, they could reasonably be expected to influence the
economic decisions of users taken on the basis of these financial statements.
A further description of our responsibilities for the audit of the financial statements is located on the Financial
Reporting Council’s website at: www.frc.org.uk/auditorsresponsibilities. This description forms part of our
auditor’s report.
Use of our report
This report is made solely to the company’s members, as a body, in accordance with Chapter 3 of Part 16 of the
Companies Act 2006. Our audit work has been undertaken so that we might state to the company’s members those
matters we are required to state to them in an auditor’s report and for no other purpose. To the fullest extent
permitted by law, we do not accept or assume responsibility to anyone other than the company and the company’s
members as a body, for our audit work, for this report, or for the opinions we have formed.
Report on other legal and regulatory requirements
Opinions on other matters prescribed by the Companies Act 2006
In our opinion, based on the work undertaken in the course of the audit:
▪ the information given in the strategic report and the directors’ report for the financial year for which the
financial statements are prepared is consistent with the financial statements; and
▪ the strategic report and the directors’ report have been prepared in accordance with applicable legal
requirements.
In the light of the knowledge and understanding of the Group and of the parent company and their environment
obtained in the course of the audit, we have not identified any material misstatements in the strategic report or the
directors’ report.
INDEPENDENT AUDITOR’S REPORT TO THE MEMBERS OF
MAREX SPECTRON GROUP LIMITED (CONTINUED)
28
Matters on which we are required to report by exception
Under the Companies Act 2006 we are required to report in respect of the following matters if, in our opinion:
▪ adequate accounting records have not been kept by the parent company, or returns adequate for our
audit have not been received from branches not visited by us; or
▪ the parent company financial statements are not in agreement with the accounting records and returns;
or
▪ certain disclosures of directors’ remuneration specified by law are not made; or
▪ we have not received all the information and explanations we require for our audit.
We have nothing to report in respect of these matters.
James Polson (Senior Statutory Auditor)
For and on behalf of Deloitte LLP
Statutory Auditor
London, United Kingdom
29 March 2018
Marex Spectron Group Limited
29
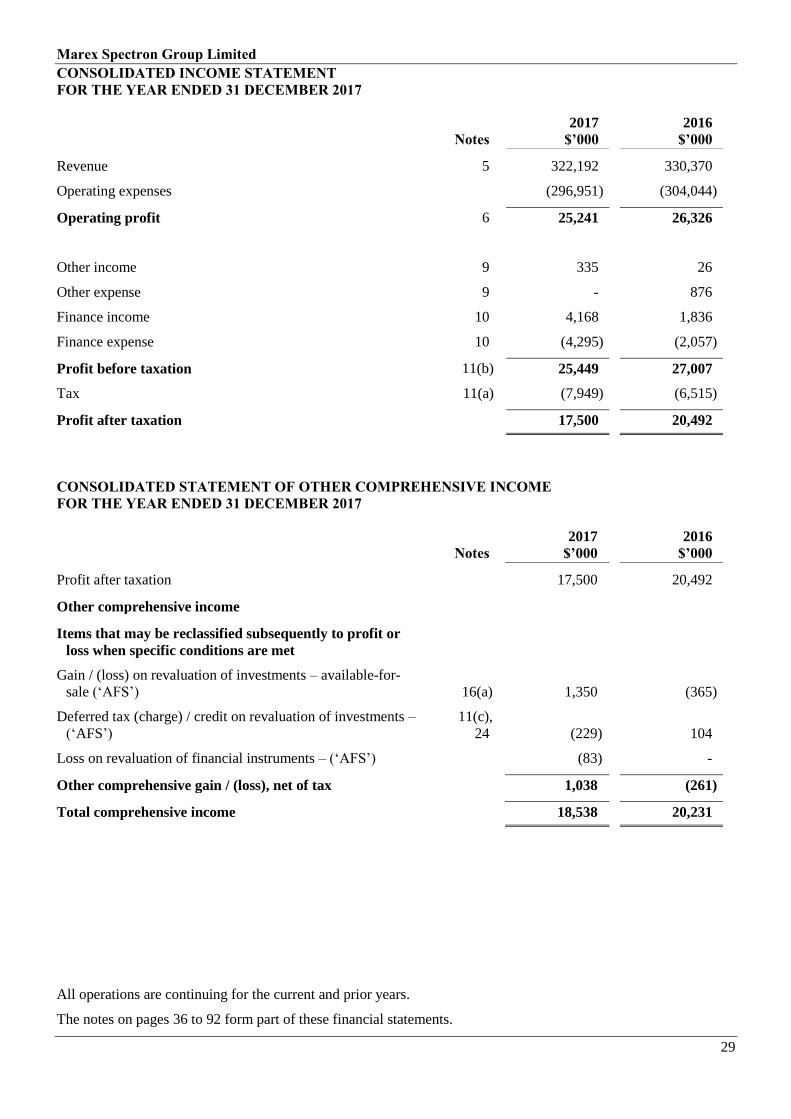
CONSOLIDATED INCOME STATEMENT
FOR THE YEAR ENDED 31 DECEMBER 2017
Notes
2017
$’000
2016
$’000
Revenue 5 322,192 330,370
Operating expenses (296,951) (304,044)
Operating profit 6 25,241 26,326
Other income 9 335 26
Other expense 9 - 876
Finance income 10 4,168 1,836
Finance expense 10 (4,295) (2,057)
Profit before taxation 11(b) 25,449 27,007
Tax 11(a) (7,949) (6,515)
Profit after taxation 17,500 20,492
CONSOLIDATED STATEMENT OF OTHER COMPREHENSIVE INCOME
FOR THE YEAR ENDED 31 DECEMBER 2017
Notes
2017
$’000
2016
$’000
Profit after taxation 17,500 20,492
Other comprehensive income
Items that may be reclassified subsequently to profit or
loss when specific conditions are met
Gain / (loss) on revaluation of investments – available-for-
sale (‘AFS’) 16(a) 1,350 (365)
Deferred tax (charge) / credit on revaluation of investments –
(‘AFS’)
11(c),
24 (229) 104
Loss on revaluation of financial instruments – (‘AFS’) (83) -
Other comprehensive gain / (loss), net of tax 1,038 (261)
Total comprehensive income 18,538 20,231
All operations are continuing for the current and prior years.
The notes on pages 36 to 92 form part of these financial statements.

Marex Spectron Group Limited
30
STATEMENTS OF FINANCIAL POSITION
AS AT 31 DECEMBER 2017
Group Company
Notes
2017
$’000
2016
$’000
2017
$’000
2016
$’000
Assets
Non-current assets
Goodwill 13 140,969 140,969 - -
Intangible assets 14 776 537 46 46
Property, plant and equipment 15 2,673 2,501 - -
Investments – (‘AFS’) 16(a) 8,314 6,896 3,944 3,134
Investments in subsidiaries 16(b) - - 331,722 331,722
Deferred tax 24 1,627 4,759 - 120
Other assets 17 316 - - -
Subordinated loans due to group
undertakings 18 - - 17,500 17,500
Financial instruments – fair value
through profit or loss, pledged as
collateral - 653 - -
Financial instruments – held to
maturity 19 35,472 12,500 - -
Financial instruments – held to
maturity, pledged as collateral 19 84,430 22,486 - -
Financial instruments – (‘AFS’),
pledged as collateral 20 14,924 - - -
Total non-current assets 289,501 191,301 353,212 352,522
Current assets
Derivative instruments 23 6,943 24,012 - -
Financial instruments – held to
maturity 19 625 23,564 - -
Financial instruments – held to
maturity, pledged as collateral 19 55,648 61,659 - -
Financial instruments – (‘AFS’) 20 35,164 - - -
Trade and other receivables 21 607,468 646,301 78 57
Corporation tax 83 322 - -
Cash and cash equivalents 89,224 188,178 34 486
Total current assets 795,155 944,036 112 543
Total assets 1,084,656 1,135,337 353,324 353,065
The notes on pages 36 to 92 form part of these financial statements.

Marex Spectron Group Limited
31
STATEMENTS OF FINANCIAL POSITION
AS AT 31 DECEMBER 2017 (CONTINUED)
Group Company
Notes
2017
$’000
2016
$’000
2017
$’000
2016
$’000
Liabilities
Current liabilities
Derivative instruments 23 9,308 12,027 - -
Trade and other payables 25 639,445 707,580 20,904 1,877
Short-term borrowings 22 60,001 40,000 - -
Corporation tax 3,229 1,632 - -
Provisions 26 289 265 - -
Total current liabilities 712,272 761,504 20,904 1,877
Non-current liabilities
Deferred tax 24 - - 18 -
Total non-current liabilities - - 18 -
Total liabilities 712,272 761,504 20,922 1,877
Total net assets 372,384 373,833 332,402 351,188
Equity
Share capital 28, 29 176,238 176,238 176,238 176,238
Share premium 29 134,314 134,301 134,286 134,286
Retained earnings 29 62,127 64,627 21,720 41,178
Revaluation reserve 29 (51) (1,089) 158 (514)
Other reserves 29 (244) (244) - -
Total equity 372,384 373,833 332,402 351,188
The Company reported a profit for year ended 31 December 2017 of $542,243 (2016: $992,938).
The financial statements on pages 29 to 92 were approved and authorised for issue by the Board of Directors on
22 March 2018 and signed on its behalf by:
I T Lowitt
Director
29 March 2018
Registration Number: 05613060
The notes on pages 36 to 92 form part of these financial statements.

Marex Spectron Group Limited
32
STATEMENT OF THE CHANGES IN EQUITY AND MOVEMENTS IN RESERVES
FOR THE YEAR ENDED 31 DECEMBER 2017
Group
Share
capital
$’000
Share
premium
$’000
Retained
earnings
$’000
Reval-
uation
reserve
$’000
Other
reserve
$’000
Total
$’000
At 1 January 2016 176,238 134,286 64,135 (828) (244) 373,587
Profit for the period - - 20,492 - - 20,492
Loss on revaluation of
investments – (‘AFS’) - - - (365) - (365)
Deferred tax on revaluation of
investments – (‘AFS’) - - - 104 - 104
Capital contribution - 15 - - - 15
Dividends (note 12) - - (20,000) - - (20,000)
At 31 December 2016
and 1 January 2017
176,238
134,301
64,627
(1,089)
(244)
373,833
Profit for the period - - 17,500 - - 17,500
Gain on revaluation of
investments – (‘AFS’) - - - 1,350 - 1,350
Deferred tax on revaluation of
investments – (‘AFS’) - - - (229) - (229)
Loss on revaluation of financial
instruments – (‘AFS’) - - - (83) - (83)
Capital contribution - 13 - - - 13
Dividends (note 12) - - (20,000) - - (20,000)
At 31 December 2017 176,238 134,314 62,127 (51) (244) 372,384
The notes on pages 36 to 92 form part of these financial statements.

Marex Spectron Group Limited
33
STATEMENT OF THE CHANGES IN EQUITY AND MOVEMENTS IN RESERVES
FOR THE YEAR ENDED 31 DECEMBER 2017 (CONTINUED)
Company
Share
capital
$’000
Share
premium
$’000
Retained
earnings
$’000
Reval-
uation
reserve
$’000
Total
$’000
At 1 January 2016 176,238 134,286 60,185 (493) 370,216
Profit for the period (note 33) - - 993 - 993
Loss on revaluation of
investments – (‘AFS’) - - - (31) (31)
Deferred tax on revaluation of
investments – (‘AFS’) - - - 10 10
Dividends (note 12) - - (20,000) - (20,000)
At 31 December 2016
and 1 January 2017
176,238
134,286
41,178
(514)
351,188
Profit for the period (note 33) - - 542 - 542
Gain on revaluation of
investments – (‘AFS’) - - - 810 810
Deferred tax on revaluation of
investments – (‘AFS’) - - - (138) (138)
Dividends (note 12) - - (20,000) - (20,000)
At 31 December 2017 176,238 134,286 21,720 158 332,402
The notes on pages 36 to 92 form part of these financial statements.

Marex Spectron Group Limited
34
CASH FLOW STATEMENTS
FOR THE YEAR ENDED 31 DECEMBER 2017
Group Company
Notes
2017
$’000
2016
$’000
2017
$’000
2016
$’000
Profit before tax 25,449 27,007 542 1,014
Adjustment to reconcile profit
before tax to net cash flows:
Depreciation of property, plant and
equipment 6, 15 1,491 2,535 - -
Loss on disposal of property, plant and
equipment 6 20 - - -
Amortisation of intangible assets 6, 14 135 389 - -
Movement in financial instruments –
fair value through profit or loss 653 5 - -
Increase / (decrease) in provisions 26 24 (1,148) - -
Interest income (4,168) (1,210) (703) (320)
Interest expense 4,295 1,964 - -
Provision for bad and doubtful debts 6, 21 270 126 - -
Operating cash flows before changes
in working capital
28,169
29,668
(161)
694
Working capital adjustments:
Decrease in trade and other receivables 39,545 1,972 (21) 26,958
(Decrease) / increase in trade and other
payables (67,927) 206 19,027 992
Decrease in inventory - 15,870 - -
Decrease / (increase) in derivative
instruments – assets 17,069 (19,076) - -
(Decrease) / increase in derivative
instruments – liabilities (2,719) 8,485 - -
Increase in financial assets – held to
maturity (55,966) (685) - -
Increase in financial assets – (‘AFS’) (50,171) - - -
Cash (outflow) / inflow from
operating activities
(92,000)
36,440
18,845
28,644
Corporation tax paid (3,526) (6,342) - (94)
Net cash (outflow) / inflow from
operating activities
(95,526)
30,098
18,845
28,550
The notes on pages 36 to 92 form part of these financial statements.
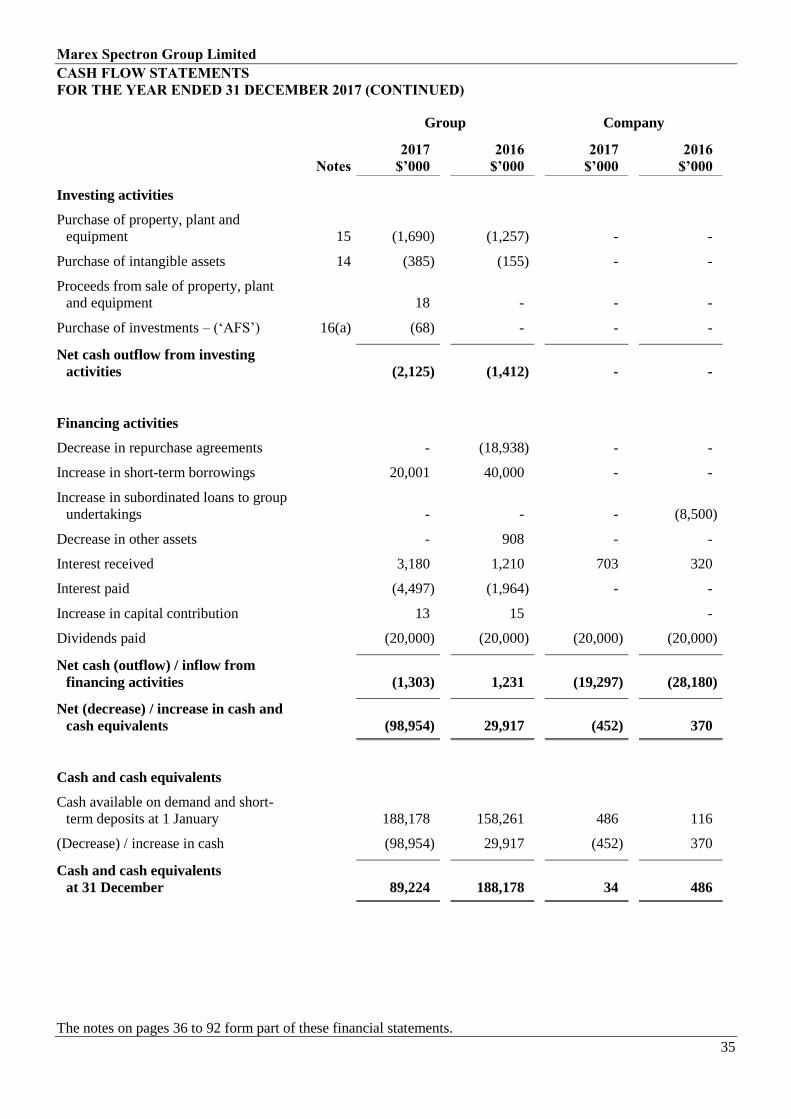
Marex Spectron Group Limited
35
CASH FLOW STATEMENTS
FOR THE YEAR ENDED 31 DECEMBER 2017 (CONTINUED)
Group Company
Notes
2017
$’000
2016
$’000
2017
$’000
2016
$’000
Investing activities
Purchase of property, plant and
equipment 15 (1,690) (1,257) - -
Purchase of intangible assets 14 (385) (155) - -
Proceeds from sale of property, plant
and equipment 18 - - -
Purchase of investments – (‘AFS’) 16(a) (68) - - -
Net cash outflow from investing
activities
(2,125)
(1,412)
-
-
Financing activities
Decrease in repurchase agreements - (18,938) - -
Increase in short-term borrowings 20,001 40,000 - -
Increase in subordinated loans to group
undertakings - - - (8,500)
Decrease in other assets - 908 - -
Interest received 3,180 1,210 703 320
Interest paid (4,497) (1,964) - -
Increase in capital contribution 13 15 -
Dividends paid (20,000) (20,000) (20,000) (20,000)
Net cash (outflow) / inflow from
financing activities
(1,303)
1,231
(19,297)
(28,180)
Net (decrease) / increase in cash and
cash equivalents
(98,954)
29,917
(452)
370
Cash and cash equivalents
Cash available on demand and short-
term deposits at 1 January 188,178 158,261 486 116
(Decrease) / increase in cash (98,954) 29,917 (452) 370
Cash and cash equivalents
at 31 December
89,224
188,178
34
486
The notes on pages 36 to 92 form part of these financial statements.
Marex Spectron Group Limited
36
NOTES TO THE FINANCIAL STATEMENTS
FOR THE YEAR ENDED 31 DECEMBER 2017
1. GENERAL INFORMATION
Marex Spectron Group Limited (‘the Company’) is a company incorporated in England and Wales under the
Companies Act. The address of the registered office is 155 Bishopsgate, London EC2M 3TQ. The principal
activities of the Group and the nature of the Group’s operations are set out in note 5 and in the Strategic
Report.
The Group and company financial statements are presented in US Dollars (‘USD’) which is also the currency
of the primary economic environment in which the Group operates. Foreign operations are included in
accordance with the policies set out in note 3(k).
2. ADOPTION OF NEW AND REVISED STANDARDS
(a) Amendments to IFRSs that are mandatorily effective for the current year
In the current year, the Group has applied a number of amendments to IFRSs and a new Interpretation issued
by the International Accounting Standards Board (‘IASB’) that are mandatorily effective for an accounting
period that begins on or after 1 January 2017. Their adoption has not had any material impact on the
disclosures or on the amounts reported in these financial statements.
▪ Amendments to IAS 7 Disclosure Initiative
The Group has adopted the amendments to IAS 7 for the first time in the current year. The amendments
require an entity to provide disclosures that enable users of financial statements to evaluate changes in
liabilities arising from financing activities, including both cash and non-cash changes. The application of
these amendments has had no impact on the Group’s consolidated financial statements.
▪ Amendments to IAS 12 Recognition of Deferred Tax Assets for Unrealised Losses
The Group has adopted the amendments to IAS 12 for the first time in the current year. The amendments
clarify how an entity should evaluate whether there will be sufficient future taxable profits against which it
can utilise a deductible temporary difference. The application of these amendments has had no impact on the
Group’s consolidated financial statements as the Group already assesses the sufficiency of future taxable
profits in a way that is consistent with these amendments
▪ Annual Improvements to IFRSs 2014–2016 Cycle
The Group has adopted the amendments to IFRS 12 included in the Annual Improvements to IFRSs 2014 -
2016 Cycle for the first time in the current year. The other amendments included in this package are not yet
mandatorily effective and they have not been early adopted by the Group. IFRS 12 states that an entity need
not provide summarised financial information for interests in subsidiaries, associates or joint ventures that
are classified (or included in a disposal group that is classified) as held for sale. The amendments clarify that
this is the only concession from the disclosure requirements of IFRS 12 for such interests.
Marex Spectron Group Limited
NOTES TO THE FINANCIAL STATEMENTS
FOR THE YEAR ENDED 31 DECEMBER 2017 (CONTINUED)
37
2. ADOPTION OF NEW AND REVISED STANDARDS (CONTINUED)
(b) New and revised IFRSs in issue, but not yet effective
At the date of authorisation of these financial statements, the Group has not applied the following new and
revised IFRSs that have been issued, but are not yet effective and, in some cases, had not yet been adopted
by the EU:
IFRS 9 Financial Instruments
IFRS 15 Revenue from Contracts with Customers
IFRS 16 Leases
IFRS 2 (amendments) Classification and Measurement of Share-based Payment
Transactions
IFRS 4 (amendments) Applying IFRS 9 Financial Instruments with IFRS 4
Annual Improvements to
IFRSs 2014 - 2016 Cycle
Amendments to IFRS 1 First-time Adoption of International
Financial Reporting Standards and IFRS 28 Investments
in Associates and Joint Ventures
IFRS 10 and IAS 28
(amendments)
Sale or Contribution of Assets between an Investor and
It’s Associate or Joint Venture
IFRIC 22 Foreign Currency Transactions and Advanced
Consideration
IFRIC 23 Uncertainty over Income Tax Treatments
The directors do not expect that the adoption of the Standards listed above will have a material impact on the
financial statements of the Group in future periods, except as noted below:
▪ IFRS 9 Financial Instruments
The Group will apply IFRS 9 from 1 January 2018. The Group has elected not to restate comparatives on
initial application of IFRS 9. The full impact of adopting IFRS 9 on the Group’s consolidated financial
statements will depend on the financial instruments that the Group has during 2018 as well as on economic
conditions and judgements made as at the year end. Upon adoption, the Group will classify its financial
assets as measured at amortised cost, fair value through profit or loss or fair value through other
comprehensive income, depending on its business model for managing those financial assets and the assets’
contractual cash flow characteristics. The previous classification at ‘fair value through profit or loss’, ‘loans
and receivables’, ‘available-for-sale’ and ‘financial liabilities at amortised cost’ upon adoption will be
discontinued. The Group has evaluated the impact from the application of IFRS 9 on its financial statements
and determined that the change does not result in any material impact on the current year or would materially
impact 2018.
▪ IFRS 15 Revenue from Contracts with Customers
IFRS 15 establishes a single comprehensive model for entities to use in accounting for revenue arising from
contracts with customers. IFRS 15 will supersede the current revenue recognition guidance including IAS
18 Revenue, IAS 11 Construction Contracts and the related Interpretations when it becomes effective for
accounting periods beginning on or after 1 January 2018. The Group is required to adopt IFRS 15 for the
year ending 31 December 2018 and will adopt the modified retrospective approach without restatement of
comparatives. The Group has evaluated the impact from the application of IFRS 15 on its financial
statements and determined that the change does not result in any material impact on the current year or
would materially impact 2018.
Marex Spectron Group Limited
NOTES TO THE FINANCIAL STATEMENTS
FOR THE YEAR ENDED 31 DECEMBER 2017 (CONTINUED)
38
2. ADOPTION OF NEW AND REVISED STANDARDS (CONTINUED)
(b) New and revised IFRSs in issue, but not yet effective (continued)
▪ IFRS 16 Leases
IFRS 16 introduces a comprehensive model for the identification of lease arrangements and accounting
treatments for both lessors and lessees. IFRS 16 will supersede the current lease guidance including IAS 17
Leases and the related interpretations when it becomes effective for accounting periods beginning on or after
1 January 2019 for which the Group will not be adopting early. No decision has been made about whether to
use any of the transitional options in IFRS 16. IFRS 16 distinguishes leases and service contracts on the
basis of whether an identified asset is controlled by a customer. Distinctions of operating leases (off balance
sheet) and finance leases (on balance sheet) are removed for lessee accounting, and is replaced by a model
where a right of use asset and a corresponding liability have to be recognised for all leases by lessees (i.e. all
on balance sheet) except for short-term leases and leases of low value assets.
The Group is currently evaluating the effect of IFRS 16 on its financial statements.
3. SIGNIFICANT ACCOUNTING POLICIES
(a) Basis of accounting
The consolidated financial statements of the Group and the standalone financial statements of Marex
Spectron Group Limited have been prepared in accordance with International Financial Reporting Standards
(‘IFRS’) as issued by the International Accounting Standards Board (‘IASB’) as well as interpretations
issued by the IFRS Interpretations Committee (‘IFRIC’) as endorsed by the European Union (‘EU’).
The Company has taken the exemption in section 408(3) of the Companies Act 2006 not to present a
standalone income statement, standalone statement of comprehensive income and related notes that form part
of the financial statements.
The financial statements have been prepared on the historical cost basis, except for the revaluation of certain
financial instruments that are measured at revalued amounts or fair values at the end of each reporting
period, as explained in the accounting policies below. Historical cost is generally based on the fair value of
the consideration given in exchange for goods and services.
Fair value is the price that would be received to sell an asset or paid to transfer a liability in an orderly
transaction between market participants at the measurement date, regardless of whether that price is directly
observable or estimated using another valuation technique. In estimating the fair value of an asset or a
liability, the Group takes into account the characteristics of the asset or liability if market participants would
take those characteristics into account when pricing the asset or liability at the measurement date. Fair value
for measurement and/or disclosure purposes in these consolidated financial statements is determined on such
a basis, except for share-based payment transactions that are within the scope of IFRS 2, leasing transactions
that are within the scope of IAS 17, and measurements that have some similarities to fair value but are not
fair value, such as net realisable value in IAS 2 or value in use in IAS 36.
In addition, for financial reporting purposes, fair value measurements are categorised into Level 1, 2 or 3
based on the degree to which the inputs to the fair value measurements are observable and the significance of
the inputs to the fair value measurement in its entirety, which are described as follows:
▪ Level 1 inputs are quoted prices (unadjusted) in active markets for identical assets or liabilities that the
entity can access at the measurement date;
▪ Level 2 inputs are inputs, other than quoted prices included within Level 1, that are observable for the
asset or liability, either directly or indirectly; and
▪ Level 3 inputs are unobservable inputs for the asset or liability.
The principal accounting policies adopted are set out below.

Marex Spectron Group Limited
NOTES TO THE FINANCIAL STATEMENTS
FOR THE YEAR ENDED 31 DECEMBER 2017 (CONTINUED)
39
3. SIGNIFICANT ACCOUNTING POLICIES (CONTINUED)
(b) Basis of consolidation
The consolidated financial statements incorporate the financial statements of the Company and entities
controlled by the Company (‘its subsidiaries’) made up to 31 December each year. Control is achieved when
the Company:
▪ has the power over the investee;
▪ is exposed, or has rights, to variable return from its involvement with the investee; and
▪ has the ability to use its power to affect its returns.
The Company reassesses whether or not it controls an investee if facts and circumstances indicate that there
are changes to one or more of the three elements of control listed above.
Consolidation of a subsidiary begins when the Company obtains control over the subsidiary and ceases when
the Company loses control of the subsidiary. Specifically, the results of subsidiaries acquired or disposed of
during the year are included in the consolidated income statement from the date the Company gains control
until the date when the Company ceases to control the subsidiary.
Where necessary, adjustments are made to the financial statements of subsidiaries to bring the accounting
policies used into line with the Group’s accounting policies.
All intragroup assets and liabilities, equity, income, expenses and cash flows relating to transactions between
the members of the Group are eliminated on consolidation.
(c) Going concern
The directors have, at the time of approving the financial statements, a reasonable expectation that the
Company and the Group have adequate resources to continue in operational existence for the foreseeable
future. Thus they continue to adopt the going concern basis of accounting in preparing the financial
statements.
(d) Business combinations
Acquisitions of subsidiaries and businesses are accounted for using the acquisition method. The
consideration transferred in a business combination is measured at fair value, which is calculated as the sum
of the acquisition-date fair values of assets transferred by the Group, liabilities incurred by the Group to the
former owners of the acquiree and the equity interest issued by the Group in exchange for control of the
acquiree. Acquisition-related costs are recognised in profit or loss as incurred.
At the acquisition date, the identifiable assets acquired and the liabilities assumed are recognised at their fair
value at the acquisition date, except that:
▪ deferred tax assets or liabilities and assets or liabilities related to employee benefit arrangements are
recognised and measured in accordance with IAS 12 Income Taxes and IAS 19 Employee Benefits
respectively; and
▪ assets (or disposal groups) that are classified as held for sale in accordance with IFRS 5 Non-current
Assets Held for Sale and Discontinued Operations are measured in accordance with that standard.
Goodwill arises on the acquisition of subsidiaries and represents the excess of the cost of the acquisition
(including the fair value of deferred and contingent consideration) of a business combination, over the share
in the fair value of identifiable assets, liabilities and contingent liabilities acquired. Cost comprises the fair
values of assets given, liabilities assumed and equity instruments issued, plus any direct costs of acquisition.

Marex Spectron Group Limited
NOTES TO THE FINANCIAL STATEMENTS
FOR THE YEAR ENDED 31 DECEMBER 2017 (CONTINUED)
40
3. SIGNIFICANT ACCOUNTING POLICIES (CONTINUED)
(e) Goodwill
Goodwill is initially recognised and measured as set out above.
Goodwill has an indefinite useful economic life and is measured at cost less any accumulated impairment
losses. It is tested for impairment annually and whenever there is an indicator of impairment. Where the
carrying value exceeds the higher of the value in use or fair value less cost to sell, an impairment loss is
recognised in the income statement.
(f) Revenue recognition
Revenue is recognised when it is probable that the economic benefits will flow to the Group and the revenue
can be reliably measured. Revenue is measured at the fair value of the consideration received or receivable
taking into account any trade discounts and volume rebates granted by the Group.
Revenue comprises the following:
▪ execution and clearing commissions, which are recognised on a trade date basis;
▪ metals market making, energy broking and foreign exchange trading activity where the Group acts as
principal, which is typically recognised on a fair value basis whereby movements in fair values of the
position are recognised in the income statement;
▪ desk facilities, licence and software fees, and market data fees which are recognised on an accruals
basis; and
▪ net interest directly relating to the trading activities of the Group are recognised on an accruals basis.
Other income primarily comprises exchange rebates and is recognised on an accruals basis.
In accordance with accepted practice, those financial instruments held for trading purposes are fair valued
and subsequent gains and losses are recognised in the income statement.
(g) Dividend income
Dividend income from investments is recognised when the shareholder’s rights to receive payment have
been established (provided that it is probable that the economic benefits will flow to the Group and the
amount of revenue can be measured reliably).
(h) Finance income and expense
Finance income is earned on balances held at exchanges, clearing houses, banks and brokers, and on
overdrawn client balances. Finance expenses are paid on overdrawn accounts with brokers and exchanges,
client and counterparty balances and short-term borrowings. Finance income and expenses are recognised on
an amortised cost basis using the effective interest rate (‘EIR’) method.
(i) Leases
Rentals payable under operating leases are charged to the income statement on a straight-line basis over the
term of the relevant lease except where another more systematic basis is more representative of the time
pattern in which economic benefits from the lease asset are consumed.
In the event that lease incentives are received to enter into operating leases, such incentives are recognised as
a liability. The aggregate benefit of incentives is recognised as a reduction of rental expense on a straight-
line basis over the lease term, except where another systematic basis is more representative of the time
pattern in which economic benefits from the leased asset are consumed.

Marex Spectron Group Limited
NOTES TO THE FINANCIAL STATEMENTS
FOR THE YEAR ENDED 31 DECEMBER 2017 (CONTINUED)
41
3. SIGNIFICANT ACCOUNTING POLICIES (CONTINUED)
(j) Borrowing costs
Borrowing costs consist of interest and other costs that are incurred in connection with the borrowing of
funds and are expensed in the income statement over the period of the borrowing facility.
(k) Foreign currency translation
The Group and Company financial statements are presented in US Dollars (‘USD’), which is also the
currency of the primary economic environment (the functional currency) and the presentational currency of
the Group.
For each entity, the Group determines the functional currency and items included in the financial statements
of each entity are measured using that functional currency.
Transactions entered into by Group entities in a currency other than USD are recorded at the rates prevailing
when the transactions occur. Foreign currency monetary assets and liabilities are translated at the rates
prevailing at the reporting date. Exchange differences arising on the retranslation of monetary assets and
liabilities are similarly recognised immediately in the income statement.
On consolidation, the results of overseas operations are translated into USD at rates approximating to those
prevailing when the transactions took place. All assets and liabilities of overseas operations, including
goodwill arising on the acquisition of those operations, are translated at the rates ruling at the prevailing date.
(l) Employee benefits
Short-term employee benefits
Short-term employee benefits are expensed as the related service is provided. A liability is recognised for
the amount expected to be paid if the Group has a present legal or constructive obligation to pay this amount
as a result of past service provided by the employee and the obligation can be estimated reliably.
Retirement benefits: defined contribution schemes
The Group operates defined contribution schemes. Payments to defined contribution retirement benefit
schemes are recognised as an expense when employees have rendered services entitling them to
contributions.

Marex Spectron Group Limited
NOTES TO THE FINANCIAL STATEMENTS
FOR THE YEAR ENDED 31 DECEMBER 2017 (CONTINUED)
42
3. SIGNIFICANT ACCOUNTING POLICIES (CONTINUED)
(m) Taxation
The tax expense represents the sum of the tax currently payable and deferred tax.
Current tax
The tax currently payable is based on taxable profit for the year. Taxable profit differs from net profit as
reported in the income statement because it excludes items of income or expense that are taxable or
deductible in other years and it further excludes items that are never taxable or deductible. The Group’s
liability for current tax is calculated using tax rates that have been enacted or substantively enacted by the
balance sheet date.
Deferred tax
Deferred tax is the tax expected to be payable or recoverable on differences between the carrying amounts of
assets and liabilities in the financial statements and the corresponding tax bases used in the computation of
taxable profit, and is accounted for using the balance sheet liability method. Deferred tax liabilities are
generally recognised for all taxable temporary differences and deferred tax assets are recognised to the extent
that it is probable that taxable profits will be available against which deductible temporary differences can be
utilised. Such assets and liabilities are not recognised if the temporary difference arises from the initial
recognition of goodwill or from the initial recognition (other than in a business combination) of other assets
and liabilities in a transaction that affects neither the taxable profit nor the accounting profit.
Deferred tax liabilities are recognised for taxable temporary differences arising on investments in
subsidiaries and associates, and interests in joint ventures, except where the Group is able to control the
reversal of the temporary difference and it is probable that the temporary difference will not reverse in the
foreseeable future. Deferred tax assets arising from deductible temporary differences associated with such
investments and interests are only recognised to the extent that it is probable that there will be sufficient
taxable profits against which to utilise the benefits of the temporary differences and they are expected to
reverse in the foreseeable future.
The carrying amount of deferred tax assets is reviewed at each balance sheet date and reduced to the extent
that it is no longer probable that sufficient taxable profits will be available to allow all or part of the asset to
be recovered.
Deferred tax is calculated at the tax rates that are expected to apply in the period when the liability is settled
or the asset is realised based on tax laws and rates that have been enacted or substantively enacted at the
balance sheet date. Deferred tax is charged or credited in the income statement, except when it relates to
items charged or credited in other comprehensive income, in which case the deferred tax is also dealt with in
other comprehensive income.
The measurement of deferred tax liabilities and assets reflects the tax consequences that would follow from
the manner in which the Group expects, at the end of the reporting period, to recover or settle the carrying
amount of its assets and liabilities.
Deferred tax assets and liabilities are offset when there is a legally enforceable right to set off current tax
assets against current tax liabilities and when they relate to income taxes levied by the same taxation
authority and the Group intends to settle its current tax assets and liabilities on a net basis.
Current tax and deferred tax for the year
Current and deferred tax are recognised in profit or loss, except when they relate to items that are recognised
in other comprehensive income or directly in equity, in which case, the current and deferred tax are also
recognised in other comprehensive income or directly in equity respectively. Where current tax or deferred
tax arises from the initial accounting for a business combination, the tax effect is included in the accounting
for the business combination.
Marex Spectron Group Limited
NOTES TO THE FINANCIAL STATEMENTS
FOR THE YEAR ENDED 31 DECEMBER 2017 (CONTINUED)
43
3. SIGNIFICANT ACCOUNTING POLICIES (CONTINUED)
(n) Property, plant and equipment
Property, plant and equipment are stated at cost, net of accumulated depreciation and any accumulated
impairment losses.
As well as the purchase price, cost includes the directly attributable costs and the estimated present value of
any future costs of dismantling and removing items. The corresponding liability is recognised within
provisions.
Depreciation is recognised so as to write off the cost or valuation of assets less their residual values over
their useful lives, using the straight-line method, on the following bases:
Leasehold improvements over the remaining length of the lease or
20% per annum straight-line, where appropriate
Furniture, fixtures and fittings 20% to 50% per annum straight-line
Computer equipment 20% to 50% per annum straight-line
Depreciation methods, useful lives and residual values are reviewed at each reporting date and adjusted if
appropriate.
An item of property, plant and equipment is derecognised upon disposal or when no future economic benefits
are expected to arise from the continued use of the asset. The gain or loss arising on the disposal or
scrappage of an asset is determined as the difference between the sales proceeds and the carrying amount of
the asset and is recognised in the income statement.
(o) Intangible Assets
Internally generated intangible assets (software development costs)
Expenditure on internally generated intangible assets is only capitalised if it can be demonstrated that:
▪ it is technically feasible to develop the product for it to be available for use or sold;
▪ adequate resources are available to complete the development;
▪ there is an intention to complete and use or sell the product;
▪ the Group is able to use or sell the product;
▪ use or sale of the product will generate future economic benefits; and
▪ expenditure on the project can be measured reliably.
Capitalised development costs are measured at cost less any accumulated amortisation and any impairment
losses. Amortisation is calculated on a straight-line basis over estimated economic useful lives of 2 to 5
years, which represents the period that the Group expects to benefit from using or selling the products
developed, and is recognised in the income statement.
The amount initially recognised for internally generated intangible assets is the sum of the expenditure
incurred from the date when the intangible asset first meets the recognition criteria listed above. Where no
internally generated asset can be recognised development expenditure is recognised in profit and loss in the
period in which it is incurred.
Software licences
Software licences have a finite useful economic life of 2 to 5 years with the option of renewal at the end of
this period. They are amortised in the consolidated income statement on a straight-line basis over the period
of the licence.
An intangible asset is derecognised on disposal, or when no future economic benefits are expected from use
or disposal. Gains or losses arising from derecognition of an intangible asset, measured as the difference
between the net disposal proceeds and the carrying amount of the asset, are recognised in the consolidated
income statement when the asset is derecognised.

Marex Spectron Group Limited
NOTES TO THE FINANCIAL STATEMENTS
FOR THE YEAR ENDED 31 DECEMBER 2017 (CONTINUED)
44
3. SIGNIFICANT ACCOUNTING POLICIES (CONTINUED)
(p) Impairment of non-financial assets
Impairment tests on goodwill and other intangible assets with indefinite useful lives are undertaken annually.
Other non-financial assets are subject to impairment tests whenever events or changes in circumstances
indicate that their carrying amount may not be recoverable.
The recoverable amount is the higher of fair value less costs of disposal and value in use. In assessing value
in use, the estimated future cash flows are discounted to their present value using a pre-tax discount rate that
reflects current market assessments of the time value of money and risks specific to the asset for which the
estimates of future cash flows have not been adjusted.
The impairment test is carried out on the asset’s cash generating unit (i.e. the smallest group of assets in
which the asset belongs for which there are separately identifiable cash flows).
An impairment loss in respect of goodwill is not reversed. For other assets, an impairment loss is reversed
only to the extent that the asset’s carrying amount does not exceed the carrying amount that would have been
determined, net of depreciation or amortisation, if no impairment loss had been recognised.
Where the carrying value of an asset exceeds its recoverable amount an impairment loss is recognised in the
income statement.
(q) Financial instruments
Initial recognition and measurement
Financial assets and financial liabilities are recognised in the Group’s balance sheet when the Group
becomes a party to the contractual provisions of the instrument.
Financial assets and financial liabilities are initially measured at fair value. Transaction costs that are
directly attributable to the acquisition or issue of financial assets and financial liabilities (other than financial
assets and financial liabilities at fair value through profit or loss) are added to or deducted from the fair value
of the financial assets or financial liabilities, as appropriate, on initial recognition. Transaction costs directly
attributable to the acquisition of financial assets or financial liabilities at fair value through profit or loss are
recognised immediately in profit or loss.
Effective interest method
The effective interest rate method is a method of calculating the amortised cost of a financial instrument and
allocating interest income or expense over the relevant period. The effective interest rate (‘EIR’) is the rate
that exactly discounts estimated future cash receipts (including all fees and points paid or received that form
an integral part of the effective interest rate, transaction costs and other premiums or discounts) through the
expected life of the financial instrument, or, where appropriate, a shorter period, to the net carrying amount
on initial recognition.
Financial assets
All financial assets are recognised and derecognised on a trade date where the purchase or sale of a financial
asset is under a contract whose terms require delivery of the financial asset within the timeframe established
by the market concerned, and are initially measured at fair value, plus transaction costs, except for those
financial assets classified as at fair value through profit or loss, which are initially measured at fair value.

Marex Spectron Group Limited
NOTES TO THE FINANCIAL STATEMENTS
FOR THE YEAR ENDED 31 DECEMBER 2017 (CONTINUED)
45
3. SIGNIFICANT ACCOUNTING POLICIES (CONTINUED)
(q) Financial instruments (continued)
Financial assets (continued)
Income is recognised on an effective interest basis for debt instruments other than those financial assets
classified as at fair value through profit or loss (‘FVTPL’).
Financial assets are classified into the following specified categories depending on the nature and purpose of
the financial assets and are determined at the time of initial recognition.
▪ Fair value through profit or loss: this category includes financial assets held for trading. They are
carried in the balance sheet at fair value with changes in fair value recognised in the income statement.
▪ Loans and receivables: these assets are non-derivative financial assets with fixed or determinable
payments that are not quoted in an active market. They arise principally through the provision of
goods and services to customers (‘trade debtors’), but also incorporate other types of contractual
monetary assets. They are carried at amortised cost using the EIR method less provision for any
impairment.
▪ Available-for-sale: these assets comprise the Group’s strategic investments in entities not qualifying as
subsidiaries, associates or jointly controlled entities, and investments in memberships, seats and
interests in investment exchanges. They are carried at fair value with changes in fair value recognised
in other comprehensive income. Fair values of quoted investments are based on current prices. If the
market for a financial asset is not active and for unlisted securities, the Group establishes fair value by
using the latest available trade price adjusted as necessary to reflect current market conditions.
▪ Held to maturity: held to maturity investments are financial assets with fixed or determinable payments
and fixed maturities where the Group has the intention and ability to hold to maturity. These assets are
measured at amortised cost, using the effective interest method less any impairment. The amortisation
is included in the income statement.
Derecognition of financial assets
The Group derecognises a financial asset only when the contractual rights to the cash flows from the asset
expire, or when it transfers the financial asset and substantially all the risks and rewards of ownership of the
asset to another entity.
Financial liabilities
Financial liabilities are classified as either financial liabilities at ‘FVTPL’ or ‘other financial liabilities’.
The Group classifies its financial liabilities into the following categories, depending on the purpose for
which the liability was assumed. The Group’s accounting policy for each category is as follows:
▪ Fair value through profit or loss (‘FVTPL’): this category includes financial instruments held for
trading. They are carried in the balance sheet at fair value with changes in fair value recognised in the
income statement.
▪ Other financial liabilities: other financial liabilities include the following items:
▪ trade and other payables and other short-term monetary liabilities which are recognised at
amortised cost; and
▪ bank borrowings, such interest-bearing liabilities are subsequently measured at amortised cost
using the EIR method, which ensures that any interest expense over the period to repayment is
recognised at a constant rate on the balance of the liability carried in the statement of financial
position.

Marex Spectron Group Limited
NOTES TO THE FINANCIAL STATEMENTS
FOR THE YEAR ENDED 31 DECEMBER 2017 (CONTINUED)
46
3. SIGNIFICANT ACCOUNTING POLICIES (CONTINUED)
(q) Financial instruments (continued)
Derecognition of financial liabilities
A financial liability is derecognised when the obligation under the liability is discharged, cancelled or
expires. In circumstances where a financial liability is replaced by the same lender yet the contractual terms
are substantially different or modified, the original financial liability will be derecognised at the point of
contractual exchange and the new financial liability recognised.
Offsetting of financial assets and liabilities
Financial assets and liabilities are offset and the net amount is reported in the statement of financial position
if there is a currently enforceable legal right to offset the recognised amounts and there is an intention and
ability to settle on a net basis, or to realise the assets and liabilities simultaneously.
Specific instruments
▪ Derivative instruments
Derivative assets and derivative liabilities at fair value through profit or loss are over-the-counter foreign
exchange and precious metal contracts. These are entered to manage foreign exchange and precious metal
contracts transacted between the Group and their customers.
(r) Impairment of financial assets
The Group assesses at each reporting date, whether there is objective evidence that a financial asset or group
of financial assets, other than those at fair value through profit or loss, are impaired. An impairment exists if
one or more events that has occurred since initial recognition of the financial asset (an incurred ‘loss event’),
has an impact on the estimated future cash flows of the financial asset or group of financial assets that can be
reliably measured.
For listed and unlisted equity investments classified as available-for-sale, a significant or prolonged decline
in the fair value of the security below its cost is considered to be objective evidence of impairment.
When an available-for-sale asset is considered to be impaired, cumulative gains or losses previously
recognised in other comprehensive income are reclassified to profit or loss in the period.
For all other financial assets, objective evidence of impairment could include:
▪ debtors or a group of debtors experiencing significant difficulties, or there is high probability they will
enter bankruptcy;
▪ default or delinquency in interest or principal payments; and / or
▪ significant financial difficulty of the issuer or counterparty.
Marex Spectron Group Limited
NOTES TO THE FINANCIAL STATEMENTS
FOR THE YEAR ENDED 31 DECEMBER 2017 (CONTINUED)
47
3. SIGNIFICANT ACCOUNTING POLICIES (CONTINUED)
(s) Cash and cash equivalents
Cash and cash equivalents in the statement of financial position comprise cash at banks and on hand, and
short-term deposits.
(t) Cash and non-cash distributions
The Company recognises a liability to make cash or non-cash distributions to its equity holders when the
distribution is authorised and the distribution is no longer at the discretion of the Company. As per the
corporate laws in the United Kingdom, a distribution is authorised when it is approved by the shareholders.
A corresponding amount is recognised directly in equity.
Non-cash distributions are measured at the fair value of the assets to be distributed with fair value re-
measurement recognised directly in equity. Upon distribution of non-cash assets, any difference between the
carrying amount of the liability and the carrying amount of the assets distributed is recognised in the
consolidated income statement.
(u) Client money
As required by the UK FCA’s Client Assets Sourcebook (‘CASS’) rules and the CFTC’s client money rules,
the Group maintains certain balances on behalf of clients with banks, exchanges, clearing houses and brokers
in segregated accounts. These amounts and the related liabilities to clients, whose recourse is limited to
segregated accounts, are not included in the statement of financial position as the Group is not beneficially
entitled thereto.

Marex Spectron Group Limited
NOTES TO THE FINANCIAL STATEMENTS
FOR THE YEAR ENDED 31 DECEMBER 2017 (CONTINUED)
48
4. CRITICAL ACCOUNTING ESTIMATES AND JUDGEMENTS
In the application of the Group’s accounting policies, which are described in note 3, the directors are
required to make judgements, estimates and assumptions about the carrying amounts of assets and liabilities
that are not readily apparent from other sources. The estimates and associated assumptions are based on
historical experience and other factors that are considered to be relevant. Actual results may differ from
these estimates.
The estimates and underlying assumptions are reviewed on an on-going basis and revisions to accounting
estimates are recognised in the period in which the estimate is revised. Significant judgement and estimates
are necessary in relation to the following matters:
(a) Estimates
▪ Impairment of non-financial assets
The Group’s impairment testing for goodwill and non-financial assets with indefinite useful lives is based on
the fair value less costs of disposal. The fair value less costs of disposal calculation is based on available
data from similar assets or observable market prices less incremental costs for disposing of the assets and is
estimated by using the pre-tax price earnings multiples derived from adjusting comparative peer multiples.
This multiple is applied to the pre-tax earnings of each cash generating units (‘CGUs’) arising in the period.
▪ Fair value of financial instruments
The Group determines the fair value of financial instruments that are not quoted, based on estimates using
present values or other valuation techniques. Those techniques are significantly affected by the assumptions
used, including discount rates and estimates of future cash flows. Where market prices are not readily
available, fair value is either based on estimates obtained from independent experts or quoted market prices
of comparable instruments. In that regard, the derived fair value estimates cannot be substantiated by
comparison with independent markets and, in many cases, may not be capable of being realised immediately.
(b) Judgements
▪ Provisions and contingent liabilities
The Group determines the provisions and contingent liabilities based on management’s assessment of
relevant information and advice available at the time of preparing the financial statements. Outcomes are
uncertain and dependent on future events. Where outcomes differ from management’s expectations,
differences from the amount initially provided are reflected in the consolidated income statement in the
period the outcome it determined.
▪ Taxation
The Group determines the provision for deferred tax on temporary differences where tax recognition occurs
at a different time from accounting recognition.
The Group has recognised deferred tax assets in respect of losses and temporary differences. Deferred tax
liabilities are generally recognised for all temporary differences with deferred tax assets being recognised in
respect of unused tax losses and other temporary differences to the extent that it is probable that there will be
future taxable profits against which the losses and other temporary differences can be utilised. The Group
has considered their carrying value as at 31 December 2017 and concluded that, based on management’s
estimates, sufficient taxable profits will be generated in future years to recover recognised deferred tax
assets.
▪ Provisions against trade and other receivables
Using information available at the balance sheet date, the directors make judgements based on experience
regarding the level of provision required to account for potentially uncollectible receivables.
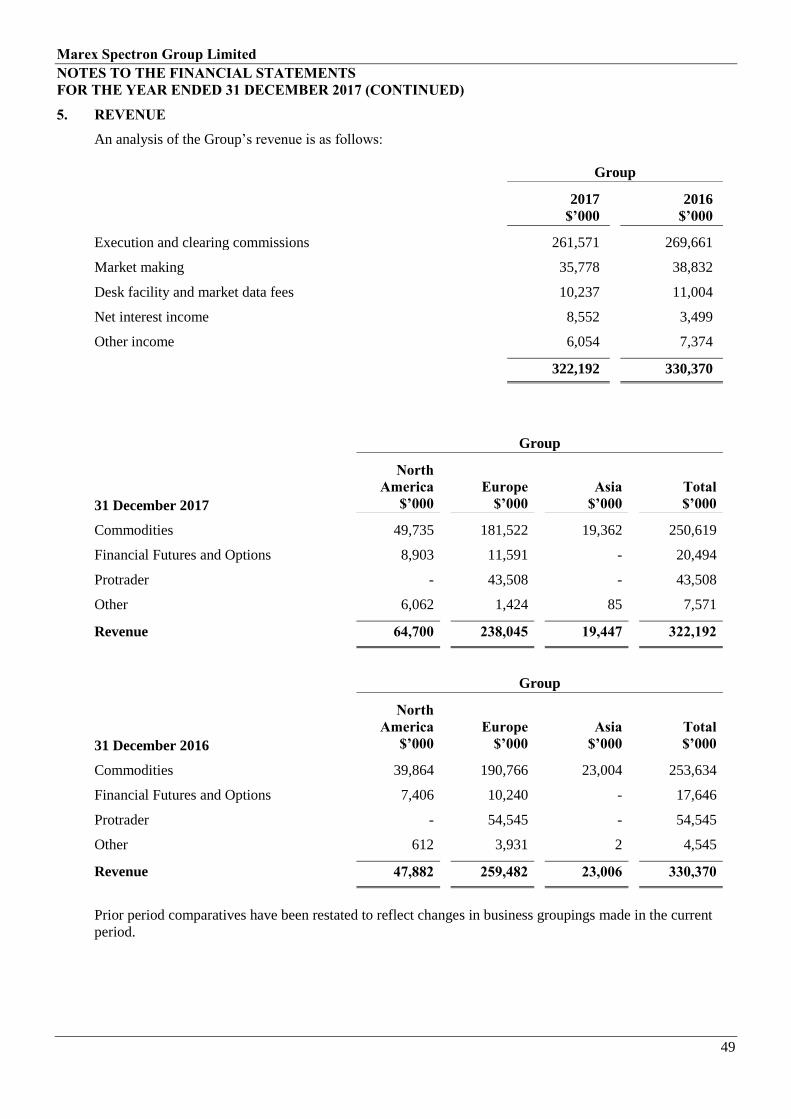
Marex Spectron Group Limited
NOTES TO THE FINANCIAL STATEMENTS
FOR THE YEAR ENDED 31 DECEMBER 2017 (CONTINUED)
49
5. REVENUE
An analysis of the Group’s revenue is as follows:
Group
2017
$’000
2016
$’000
Execution and clearing commissions 261,571 269,661
Market making 35,778 38,832
Desk facility and market data fees 10,237 11,004
Net interest income 8,552 3,499
Other income 6,054 7,374
322,192 330,370
Group
31 December 2017
North
America
$’000
Europe
$’000
Asia
$’000
Total
$’000
Commodities 49,735 181,522 19,362 250,619
Financial Futures and Options 8,903 11,591 - 20,494
Protrader - 43,508 - 43,508
Other 6,062 1,424 85 7,571
Revenue 64,700 238,045 19,447 322,192
Group
31 December 2016
North
America
$’000
Europe
$’000
Asia
$’000
Total
$’000
Commodities 39,864 190,766 23,004 253,634
Financial Futures and Options 7,406 10,240 - 17,646
Protrader - 54,545 - 54,545
Other 612 3,931 2 4,545
Revenue 47,882 259,482 23,006 330,370
Prior period comparatives have been restated to reflect changes in business groupings made in the current
period.
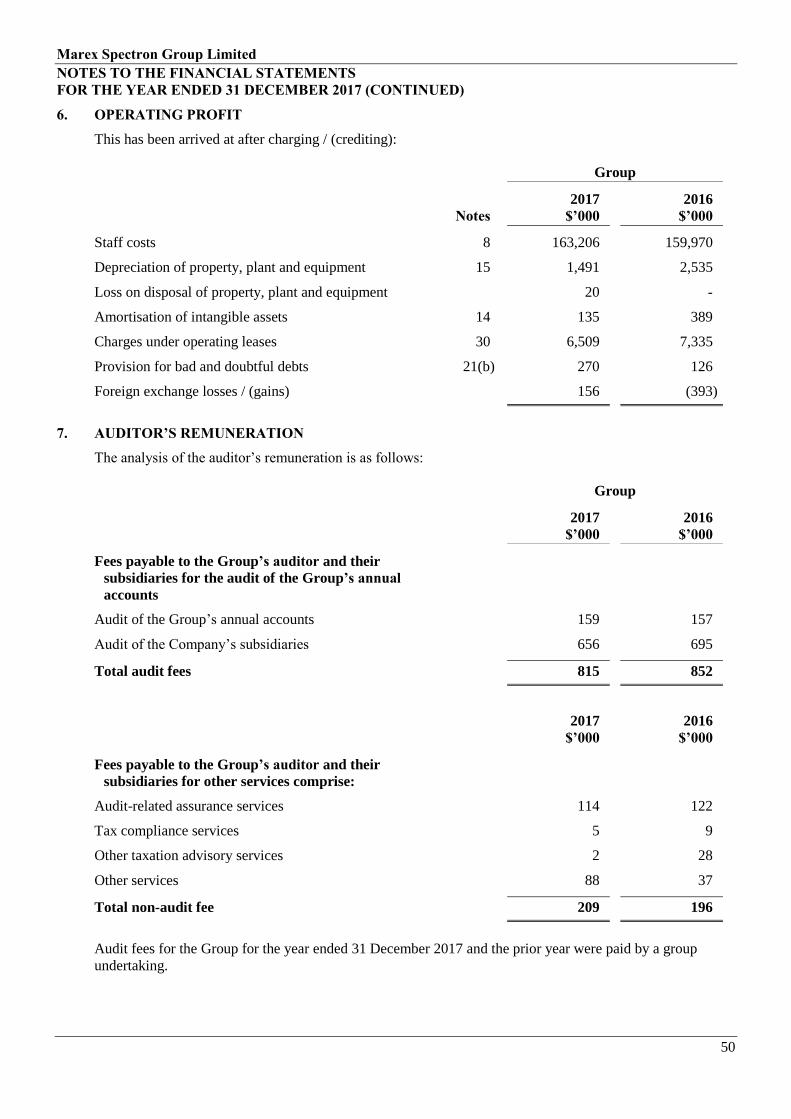
Marex Spectron Group Limited
NOTES TO THE FINANCIAL STATEMENTS
FOR THE YEAR ENDED 31 DECEMBER 2017 (CONTINUED)
50
6. OPERATING PROFIT
This has been arrived at after charging / (crediting):
Group
Notes
2017
$’000
2016
$’000
Staff costs 8 163,206 159,970
Depreciation of property, plant and equipment 15 1,491 2,535
Loss on disposal of property, plant and equipment 20 -
Amortisation of intangible assets 14 135 389
Charges under operating leases 30 6,509 7,335
Provision for bad and doubtful debts 21(b) 270 126
Foreign exchange losses / (gains) 156 (393)
7. AUDITOR’S REMUNERATION
The analysis of the auditor’s remuneration is as follows:
Group
2017
$’000
2016
$’000
Fees payable to the Group’s auditor and their
subsidiaries for the audit of the Group’s annual
accounts
Audit of the Group’s annual accounts 159 157
Audit of the Company’s subsidiaries 656 695
Total audit fees 815 852
2017
$’000
2016
$’000
Fees payable to the Group’s auditor and their
subsidiaries for other services comprise:
Audit-related assurance services 114 122
Tax compliance services 5 9
Other taxation advisory services 2 28
Other services 88 37
Total non-audit fee 209 196
Audit fees for the Group for the year ended 31 December 2017 and the prior year were paid by a group
undertaking.

Marex Spectron Group Limited
NOTES TO THE FINANCIAL STATEMENTS
FOR THE YEAR ENDED 31 DECEMBER 2017 (CONTINUED)
51
8. STAFF COSTS
Group
2017
Number
2016
Number
Front Office 278 275
Control & Support 231 225
Average monthly number of staff 509 500
Group
2017
$’000
2016
$’000
Aggregate wages and salaries 145,956 141,202
Employer’s National Insurance Contributions and
similar taxes
12,862
14,524
Short-term monetary benefits 2,677 2,540
Defined pension contribution cost 1,172 1,217
Apprenticeship levy 242 -
Redundancy payments 297 487
Total staff costs 163,206 159,970
As at 31 December 2017, there were contributions totalling $194,517 (2016: $171,119) payable to the
defined contribution pension scheme by the Group.
9. OTHER INCOME AND EXPENSE
Group
2017
$’000
2016
$’000
Other income
Dividends received 48 24
Other 287 2
335 26
Group
2017
$’000
2016
$’000
Other expense
Leasehold dilapidations and provisions - 876
- 876

Marex Spectron Group Limited
NOTES TO THE FINANCIAL STATEMENTS
FOR THE YEAR ENDED 31 DECEMBER 2017 (CONTINUED)
52
10. FINANCE INCOME AND EXPENSE
Group
2017
$’000
2016
$’000
Finance income
Bank interest income 608 388
Interest income on held to maturity investments 3,560 1,448
4,168 1,836
Group
2017
$’000
2016
$’000
Finance expense
Bank interest expense (1,146) (438)
Credit facility interest expense (3,149) (1,619)
(4,295) (2,057)
For further details on the credit facility, refer to note 22.
11. TAXATION
(a) Tax charge
Group
Notes
2017
$’000
2016
$’000
Current tax
UK and foreign corporation tax on profit for the year 4,869 5,737
Adjustment in respect of prior years 494 143
5,363 5,880
Deferred tax
Origination and reversal of temporary differences 2,420 1,433
Adjustment in respect of prior years – US losses - (582)
Adjustment in respect of prior years – other 166 (216)
24 2,586 635
Tax charge for the year 11(b) 7,949 6,515

Marex Spectron Group Limited
NOTES TO THE FINANCIAL STATEMENTS
FOR THE YEAR ENDED 31 DECEMBER 2017 (CONTINUED)
53
11. TAXATION (CONTINUED)
(b) Reconciliation between tax charge / credit and profit before tax
The tax assessed for the year is higher (2016: higher) than the standard rate of corporation tax in the UK
19.25% (2016: 20.00%). The standard rate of corporation tax in the UK reduced from 20% to 19% on 1
April 2017. Accordingly, UK corporation tax for this accounting period has been calculated at 19.25% of
the estimated assessable profits for the period. Taxation for other jurisdictions is calculated at rates
prevailing in the relevant jurisdictions. Finance (No. 2) Act 2015 enacted reductions in the UK corporation
tax rate to 19% with effect from 1 April 2017 and 18% with effect from 1 April 2020. Finance Act 2016
enacted a further reduction in the UK corporation tax rate to 17% by 2020 and this reduction in the tax rate
will impact the current tax charge in future periods.
Group
Notes
2017
$’000
2016
$’000
Profit before tax 25,449 27,007
Expected tax expense based on the standard rate of
corporation tax in the UK of 19.25% (2016: 20.00%) 4,899 5,401
Explained by:
Effect of overseas tax rates 747 546
Expenses not deductible for tax purposes 468 745
Income not subject to tax (63) (5)
Tax losses not recognised for deferred tax purposes 601 315
Foreign exchange and other differences 637 168
Prior year adjustments 660 (655)
Tax charge for the year 11(a) 7,949 6,515
(c) Amounts recognised in other comprehensive income
Amounts directly recognised in the consolidated statement of other comprehensive income relate to
available-for-sale financial assets. The amount recognised in 2017 is a deferred tax charge of $229,000
(2016: credit of $104,000).
12. DIVIDENDS PAID AND PROPOSED
The Company paid an interim dividend of $20,000,000 during the year (2016: $20,000,000).
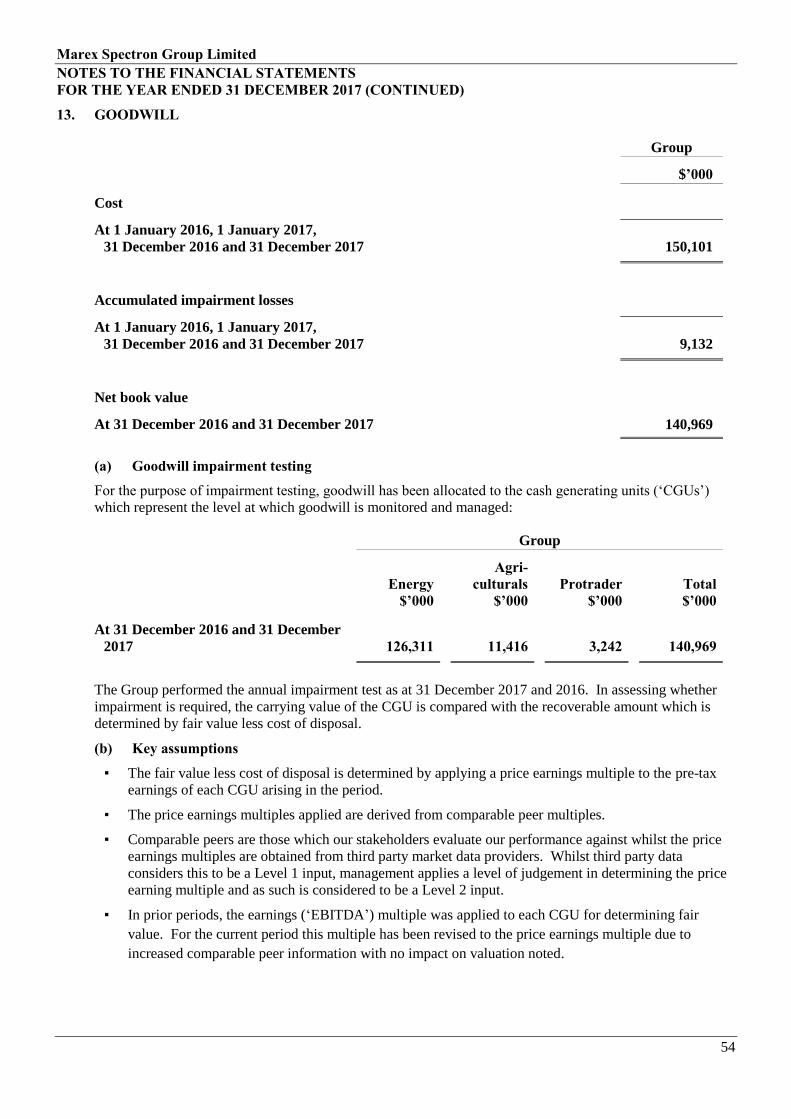
Marex Spectron Group Limited
NOTES TO THE FINANCIAL STATEMENTS
FOR THE YEAR ENDED 31 DECEMBER 2017 (CONTINUED)
54
13. GOODWILL
Group
$’000
Cost
At 1 January 2016, 1 January 2017,
31 December 2016 and 31 December 2017
150,101
Accumulated impairment losses
At 1 January 2016, 1 January 2017,
31 December 2016 and 31 December 2017
9,132
Net book value
At 31 December 2016 and 31 December 2017 140,969
(a) Goodwill impairment testing
For the purpose of impairment testing, goodwill has been allocated to the cash generating units (‘CGUs’)
which represent the level at which goodwill is monitored and managed:
Group
Energy
$’000
Agri-
culturals
$’000
Protrader
$’000
Total
$’000
At 31 December 2016 and 31 December
2017 126,311 11,416 3,242 140,969
The Group performed the annual impairment test as at 31 December 2017 and 2016. In assessing whether
impairment is required, the carrying value of the CGU is compared with the recoverable amount which is
determined by fair value less cost of disposal.
(b) Key assumptions
▪ The fair value less cost of disposal is determined by applying a price earnings multiple to the pre-tax
earnings of each CGU arising in the period.
▪ The price earnings multiples applied are derived from comparable peer multiples.
▪ Comparable peers are those which our stakeholders evaluate our performance against whilst the price
earnings multiples are obtained from third party market data providers. Whilst third party data
considers this to be a Level 1 input, management applies a level of judgement in determining the price
earning multiple and as such is considered to be a Level 2 input.
▪ In prior periods, the earnings (‘EBITDA’) multiple was applied to each CGU for determining fair
value. For the current period this multiple has been revised to the price earnings multiple due to
increased comparable peer information with no impact on valuation noted.

Marex Spectron Group Limited
NOTES TO THE FINANCIAL STATEMENTS
FOR THE YEAR ENDED 31 DECEMBER 2017 (CONTINUED)
55
14. INTANGIBLE ASSETS
Group
Internally
generated
software
$’000
Software
development
$’000
Trademarks
$’000
Total
$’000
Cost
At 1 January 2016 - 8,601 46 8,647
Additions - 155 - 155
Disposals - (2,089) - (2,089)
At December 2016 and 1 January 2017 - 6,667 46 6,713
Additions 300 85 - 385
Transfers - (19) - (19)
At 31 December 2017 300 6,733 46 7,079
Impairment provisions and amortisation
At 1 January 2016 - 7,876 - 7,876
Charge for the year (note 6) - 389 - 389
Disposals - (2,089) - (2,089)
At December 2016 and 1 January 2017 - 6,176 - 6,176
Charge for the year (note 6) 15 120 - 135
Transfers - (8) - (8)
At 31 December 2017 15 6,288 - 6,303
Net book value
At 31 December 2017 285 445 46 776
At 31 December 2016 - 491 46 537
During the year, the Group reclassified assets with a net book value of $11,002 from software development
held within intangible assets to computer equipment held within property plant and equipment. The cost of
these assets were $18,863 with an accumulated depreciation balance of $7,861. The directors consider this
to be a more appropriate classification for these assets.
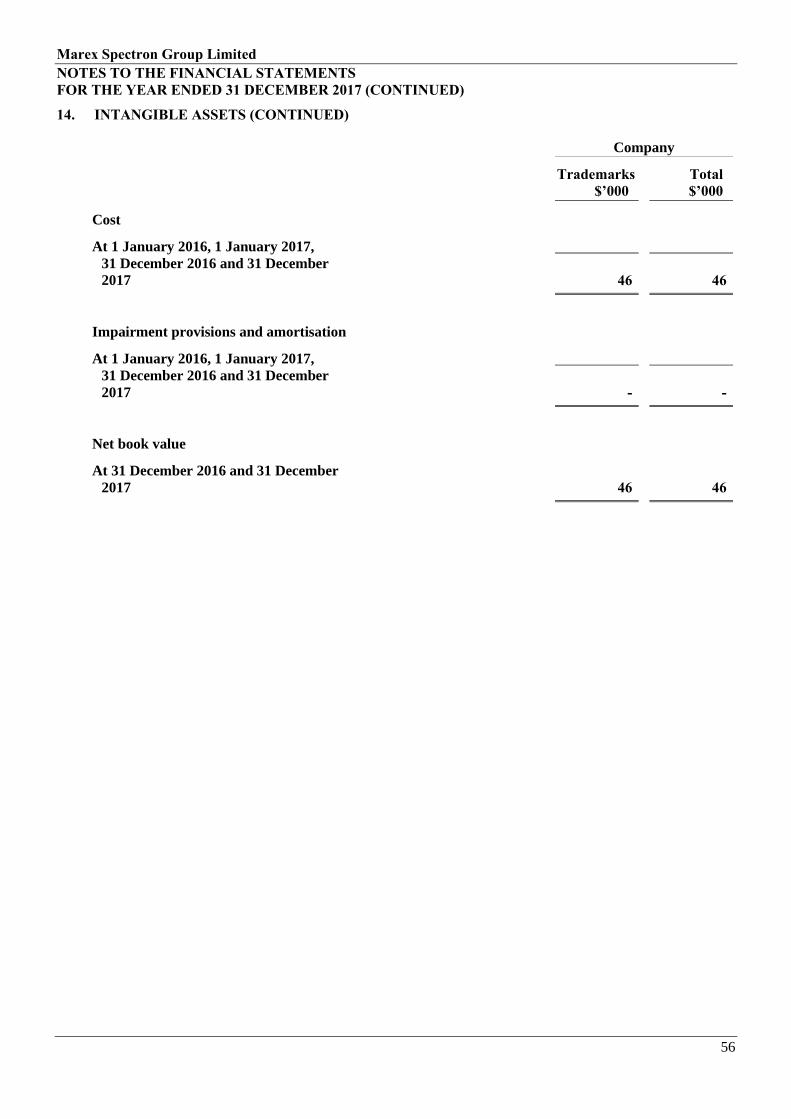
Marex Spectron Group Limited
NOTES TO THE FINANCIAL STATEMENTS
FOR THE YEAR ENDED 31 DECEMBER 2017 (CONTINUED)
56
14. INTANGIBLE ASSETS (CONTINUED)
Company
Trademarks
$’000
Total
$’000
Cost
At 1 January 2016, 1 January 2017,
31 December 2016 and 31 December
2017
46
46
Impairment provisions and amortisation
At 1 January 2016, 1 January 2017,
31 December 2016 and 31 December
2017
-
-
Net book value
At 31 December 2016 and 31 December
2017 46 46

Marex Spectron Group Limited
NOTES TO THE FINANCIAL STATEMENTS
FOR THE YEAR ENDED 31 DECEMBER 2017 (CONTINUED)
57
15. PROPERTY, PLANT AND EQUIPMENT
Group
Leasehold
improve-
ments
$’000
Computer
equipment
$’000
Furniture,
fixtures and
fittings
$’000
Total
$’000
Cost
At 1 January 2016 8,406 17,957 4,392 30,755
Additions 333 918 6 1,257
Disposals (3,248) (2,525) (634) (6,407)
At 1 January 2017 5,491 16,350 3,764 25,605
Additions 260 1,413 17 1,690
Disposals - (295) - (295)
Transfers - 19 - 19
At 31 December 2017 5,751 17,487 3,781 27,019
Depreciation
At 1 January 2016 6,678 16,367 3,931 26,976
Charge for the year (note 6) 1,178 1,157 200 2,535
Disposals (3,248) (2,525) (634) (6,407)
At 1 January 2017 4,608 14,999 3,497 23,104
Charge for the year (note 6) 504 889 98 1,491
Disposals - (257) - (257)
Transfers - 8 - 8
At 31 December 2017 5,112 15,639 3,595 24,346
Net book value
At 31 December 2017 639 1,848 186 2,673
At 31 December 2016 883 1,351 267 2,501
During the year, the Group reclassified assets with a net book value of $11,002 from software development
held within intangible assets to computer equipment held within property plant and equipment. The cost of
these assets were $18,863 with an accumulated depreciation balance of $7,861. The directors consider this
to be a more appropriate classification for these assets.

Marex Spectron Group Limited
NOTES TO THE FINANCIAL STATEMENTS
FOR THE YEAR ENDED 31 DECEMBER 2017 (CONTINUED)
58
16. INVESTMENTS
(a) Available-for-sale investments
Group Company
2017
$’000
2016
$’000
2017
$’000
2016
$’000
Cost
At 1 January 6,896 7,261 3,134 3,165
Revaluation 1,350 (365) 810 (31)
Additions 68 - - -
At 31 December 8,314 6,896 3,944 3,134
Listed investments 2,394 1,901 1,116 892
Unlisted investments 5,920 4,995 2,828 2,242
8,314 6,896 3,944 3,134
Investments comprise shares and seats held in clearing houses which are deemed relevant to the Group’s
trading activities and are classified as available-for-sale financial assets and recorded at fair value with
changes in fair value reported in equity. The fair value for these investments is determined at the latest
available traded price.
(b) Investments in subsidiaries
Company
2017
$’000
2016
$’000
Cost
At 1 January 331,722 331,722
At 31 December 331,722 331,722

Marex Spectron Group Limited
NOTES TO THE FINANCIAL STATEMENTS
FOR THE YEAR ENDED 31 DECEMBER 2017 (CONTINUED)
59
16. INVESTMENTS (CONTINUED)
(c) Group subsidiaries and undertakings
The subsidiaries of the Company as at 31 December 2017 are as follows:
Subsidiaries held directly
Name / Registered office
Country of
incorporation
/ Principal
place of
business Class
Proportion of
ownership
interest Nature of business
Marex Financial Limited
155 Bishopsgate, London,
EC2M 3TQ
England and
Wales
Ordinary
shares
100% Commodities and
financial
instruments
broker and clearer
Marex Hong Kong Limited
20/F Alexandra House, 16-
20 Chater Road, Central,
Hong Kong
Hong Kong Ordinary
shares
100% Futures and options
broking
Marex North America LLC
360 Madison Ave, Third
Floor, New York 10017
United States of
America
Membership
interest
100% Commodities and
financial
instruments
broker and clearer
Marex Spectron International
Limited 1
155 Bishopsgate, London,
EC2M 3TQ
England and
Wales
Ordinary
shares
100% Energy OTC
broking
Spectron Services Limited
155 Bishopsgate, London,
EC2M 3TQ
England and
Wales
Ordinary
shares
100% Facilities services
1 Marex Spectron International Limited operates branches in the following countries:
▪ Canada – Suite 400, 4th Floor, 110-9th Avenue SW, Calgary, Alberta, Canada
▪ Germany – Romerstrass 31 , 63486 Bruchkobel, Frankfurt
▪ Norway – Kronprinsesse Marthas Plass 1, 0160 Oslo, Norge
▪ United States of America – 360 Madison Ave, Third Floor, New York 10017
Subsidiaries held indirectly
Name / Registered office
Country of
incorporation
/ Principal
place of
business Class
Proportion
of
ownership
interest
Nature of
business
Marex Spectron Ltd
20/F Alexandra House, 16-20
Chater Road, Central, Hong Kong
Hong Kong Ordinary
shares
100% Dormant
Marex Spectron Pte Ltd
8 Marina Way, 33-06 Asia Tower
1, Singapore, 018960
Singapore Ordinary
shares
100% Dormant
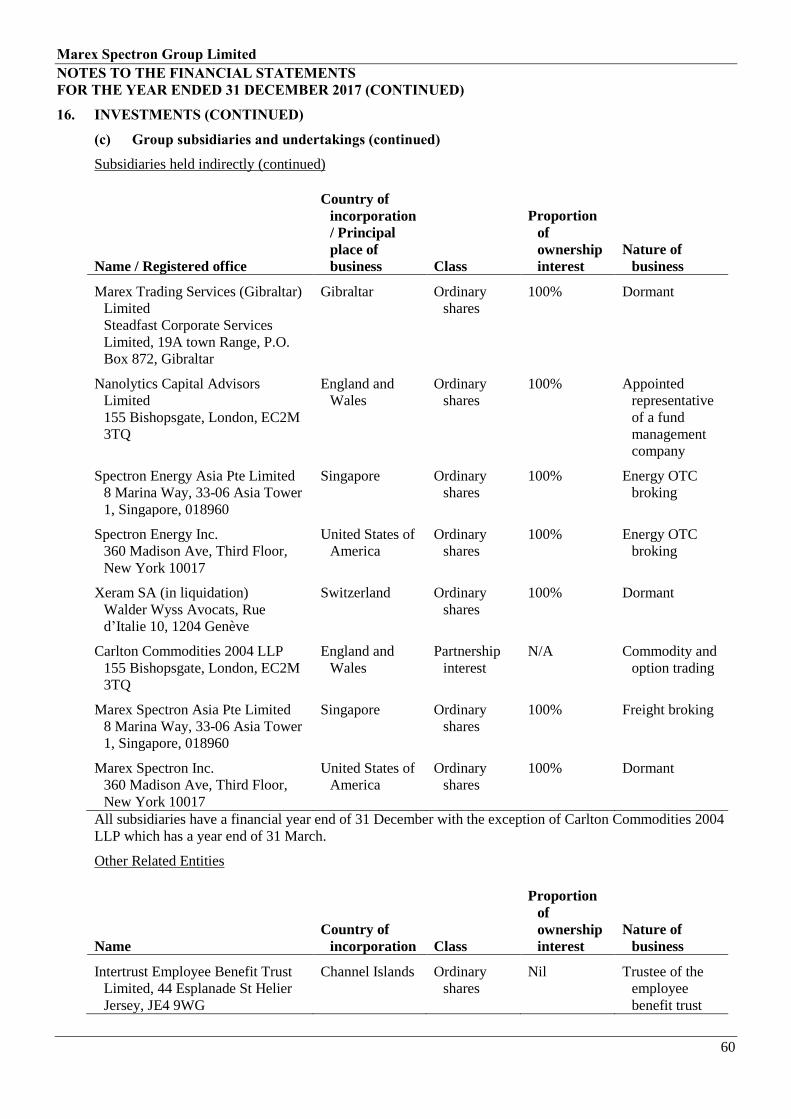
Marex Spectron Group Limited
NOTES TO THE FINANCIAL STATEMENTS
FOR THE YEAR ENDED 31 DECEMBER 2017 (CONTINUED)
60
16. INVESTMENTS (CONTINUED)
(c) Group subsidiaries and undertakings (continued)
Subsidiaries held indirectly (continued)
Name / Registered office
Country of
incorporation
/ Principal
place of
business Class
Proportion
of
ownership
interest
Nature of
business
Marex Trading Services (Gibraltar)
Limited
Steadfast Corporate Services
Limited, 19A town Range, P.O.
Box 872, Gibraltar
Gibraltar Ordinary
shares
100% Dormant
Nanolytics Capital Advisors
Limited
155 Bishopsgate, London, EC2M
3TQ
England and
Wales
Ordinary
shares
100% Appointed
representative
of a fund
management
company
Spectron Energy Asia Pte Limited
8 Marina Way, 33-06 Asia Tower
1, Singapore, 018960
Singapore Ordinary
shares
100% Energy OTC
broking
Spectron Energy Inc.
360 Madison Ave, Third Floor,
New York 10017
United States of
America
Ordinary
shares
100% Energy OTC
broking
Xeram SA (in liquidation)
Walder Wyss Avocats, Rue
d’Italie 10, 1204 Genève
Switzerland Ordinary
shares
100% Dormant
Carlton Commodities 2004 LLP
155 Bishopsgate, London, EC2M
3TQ
England and
Wales
Partnership
interest
N/A Commodity and
option trading
Marex Spectron Asia Pte Limited
8 Marina Way, 33-06 Asia Tower
1, Singapore, 018960
Singapore Ordinary
shares
100% Freight broking
Marex Spectron Inc.
360 Madison Ave, Third Floor,
New York 10017
United States of
America
Ordinary
shares
100% Dormant
All subsidiaries have a financial year end of 31 December with the exception of Carlton Commodities 2004
LLP which has a year end of 31 March.
Other Related Entities
Name
Country of
incorporation Class
Proportion
of
ownership
interest
Nature of
business
Intertrust Employee Benefit Trust
Limited, 44 Esplanade St Helier
Jersey, JE4 9WG
Channel Islands Ordinary
shares
Nil Trustee of the
employee
benefit trust
Marex Spectron Group Limited
NOTES TO THE FINANCIAL STATEMENTS
FOR THE YEAR ENDED 31 DECEMBER 2017 (CONTINUED)
61
17. OTHER ASSETS
Following the signing of the ‘Tax Cuts and Jobs Act’ on 22 December 2017 there has been a significant
number of changes in US corporate taxation. Alternative Minimum Tax (‘AMT’) has been abolished from 1
January 2018 and all tax credits arising from payments of AMT suffered up to 31 December 2017 are no
longer deemed a deferred tax asset, instead these amounts of $316,362 now recognised as other non-current
assets and are eligible for a refund in future years.
18. SUBORDINATED LOANS DUE TO GROUP UNDERTAKINGS
The Revolving Subordinated Loan Agreement with Marex North America LLC was renewed during the year
ended 31 December 2016 with the approval of the CME. The new facility has a drawing termination date of
30 September 2018, maturity date of 30 September 2021 and total credit line of $55,000,000 (2016:
$55,000,000). The subordinated borrowings of $17,500,000 (2016: $17,500,000) are unsecured and carry
interest at the daily three-month LIBOR plus 2.75% (2016: LIBOR plus 2.75%).
The subordinated borrowings qualify as equity capital as defined by the CFTC regulation 1.17d.
19. FINANCIAL INSTRUMENTS – HELD TO MATURITY
Held to maturity financial instruments comprises US Treasuries with maturity dates from January 2018 to
November 2019.
During the year, the Group has pledged $140,077,783 (2016: $84,144,641) US Treasuries to counterparties
as collateral for financing transactions. Financial instruments which have been pledged in this way are held
under certain terms and conditions set out in specific agreements with each counterparty. In these
agreements it is generally stated that whilst the US Treasury is pledged at the counterparty the Group cannot:
▪ sell or transfer the financial instrument;
▪ dispose of the financial instrument; or
▪ have any third party rights associated with the financial instrument whereby it can be used as security
towards any further financing activities.
20. FINANCIAL INSTRUMENTS – AVAILABLE FOR SALE
Available for sale financial instruments comprises US Treasuries which will fully mature by 31 October
2019.
During the year, the Group has pledged $50,087,109 (2016: $nil) US Treasuries to counterparties as
collateral for financing transactions. Financial instruments which have been pledged in this way are held
under certain terms and conditions set out in specific agreements with each counterparty. In these
agreements it is generally stated that whilst the US Treasury is pledged at the counterparty the Group cannot:
▪ sell or transfer the financial instrument;
▪ dispose of the financial instrument; or
▪ have any third party rights associated with the financial instrument whereby it can be used as security
towards any further financing activities.

Marex Spectron Group Limited
NOTES TO THE FINANCIAL STATEMENTS
FOR THE YEAR ENDED 31 DECEMBER 2017 (CONTINUED)
62
21. TRADE AND OTHER RECEIVABLES
Group Company
2017
$’000
2016
$’000
2017
$’000
2016
$’000
Amounts due from exchanges, clearing
houses and other counterparties 488,736 558,848 - -
Trade debtors 20,796 21,107 - -
Default funds and deposits 70,454 42,959 - -
Amounts due from group undertakings - - 66 57
Loans receivable 716 645 - -
Other tax and social security taxes 1,551 1,635 - -
Other debtors 18,382 14,710 - -
Prepayments 6,833 6,397 12 -
607,468 646,301 78 57
Included in the amounts due from exchanges, clearing houses and other counterparties are segregated
balances of $385,554,449 (2016: $458,156,000) and non-segregated balances of $103,181,890 (2016:
$100,692,000).
Trade receivables disclosed above are classified as loans and receivables and, therefore, measured at
amortised cost with the exception of amounts due from exchanges, clearing houses and other counterparties
of $203,481,640 (2016: $166,622,729) which are classified as fair value through profit or loss.
Included in other debtors is $10,358,550 (2016: $7,088,313) which is due in more than one year, relating to
sign-on bonuses which are awarded to employees and amortised over the term of the contract.
Amounts due from exchanges, clearing houses and other counterparties and trade debtors are stated after
deducting impairment provisions of $1,265,000 (2016: $1,299,000).
Trade receivables are assessed on an individual basis for impairment, with a provision recognised for the
Group’s entire exposure on the impaired trade receivable. The directors consider that the carrying amount of
trade and other receivables is approximately equal to their fair value.

Marex Spectron Group Limited
NOTES TO THE FINANCIAL STATEMENTS
FOR THE YEAR ENDED 31 DECEMBER 2017 (CONTINUED)
63
21. TRADE AND OTHER RECEIVABLES (CONTINUED)
(a) Ageing of past due, but not impaired, receivables
Group
2017
$’000
2016
$’000
Less than 30 days 5,674 5,272
31 to 60 days 1,685 1,846
61 to 90 days 1,077 701
91 to 120 days 399 449
More than 120 days 895 1,452
9,730 9,720
(b) Reconciliation of the movement in provisions for bad and doubtful debts
Group
Notes
2017
$’000
2016
$’000
As at 1 January 1,299 4,949
Charged to the consolidated income
statement 6 270 126
Bad debts written off (290) (3,778)
Foreign exchange revaluation (14) 2
At 31 December 1,265 1,299
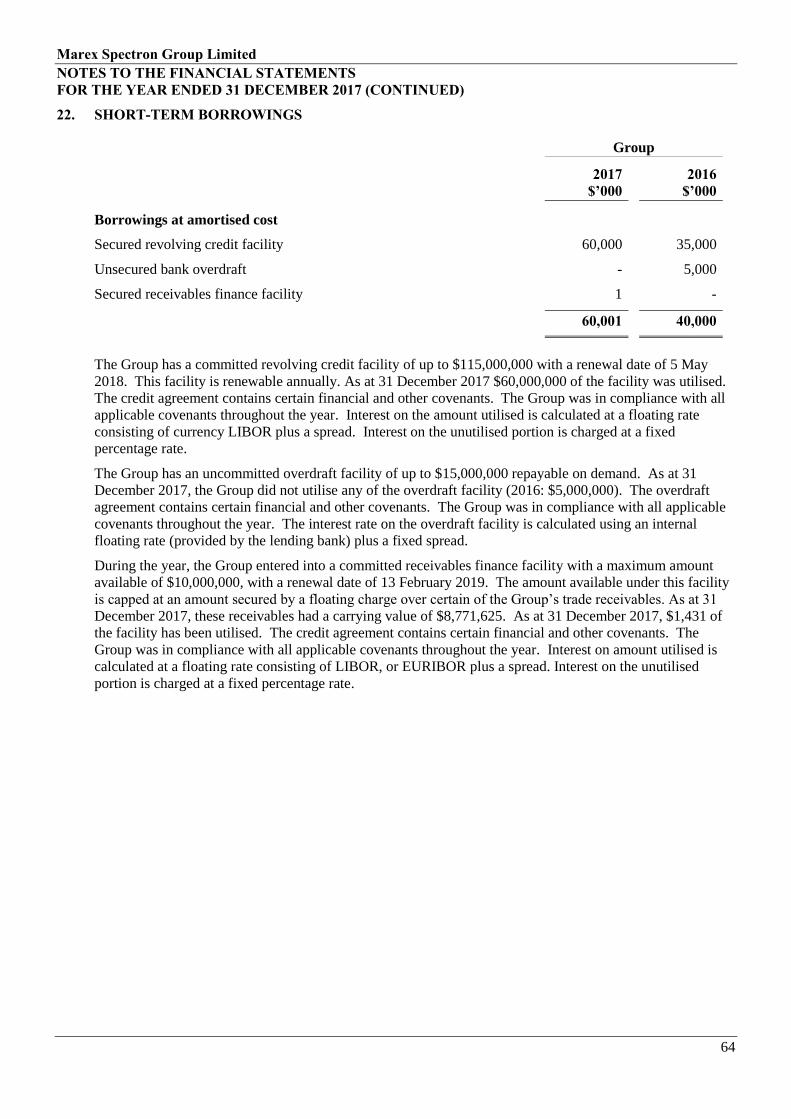
Marex Spectron Group Limited
NOTES TO THE FINANCIAL STATEMENTS
FOR THE YEAR ENDED 31 DECEMBER 2017 (CONTINUED)
64
22. SHORT-TERM BORROWINGS
Group
2017
$’000
2016
$’000
Borrowings at amortised cost
Secured revolving credit facility 60,000 35,000
Unsecured bank overdraft - 5,000
Secured receivables finance facility 1 -
60,001 40,000
The Group has a committed revolving credit facility of up to $115,000,000 with a renewal date of 5 May
2018. This facility is renewable annually. As at 31 December 2017 $60,000,000 of the facility was utilised.
The credit agreement contains certain financial and other covenants. The Group was in compliance with all
applicable covenants throughout the year. Interest on the amount utilised is calculated at a floating rate
consisting of currency LIBOR plus a spread. Interest on the unutilised portion is charged at a fixed
percentage rate.
The Group has an uncommitted overdraft facility of up to $15,000,000 repayable on demand. As at 31
December 2017, the Group did not utilise any of the overdraft facility (2016: $5,000,000). The overdraft
agreement contains certain financial and other covenants. The Group was in compliance with all applicable
covenants throughout the year. The interest rate on the overdraft facility is calculated using an internal
floating rate (provided by the lending bank) plus a fixed spread.
During the year, the Group entered into a committed receivables finance facility with a maximum amount
available of $10,000,000, with a renewal date of 13 February 2019. The amount available under this facility
is capped at an amount secured by a floating charge over certain of the Group’s trade receivables. As at 31
December 2017, these receivables had a carrying value of $8,771,625. As at 31 December 2017, $1,431 of
the facility has been utilised. The credit agreement contains certain financial and other covenants. The
Group was in compliance with all applicable covenants throughout the year. Interest on amount utilised is
calculated at a floating rate consisting of LIBOR, or EURIBOR plus a spread. Interest on the unutilised
portion is charged at a fixed percentage rate.
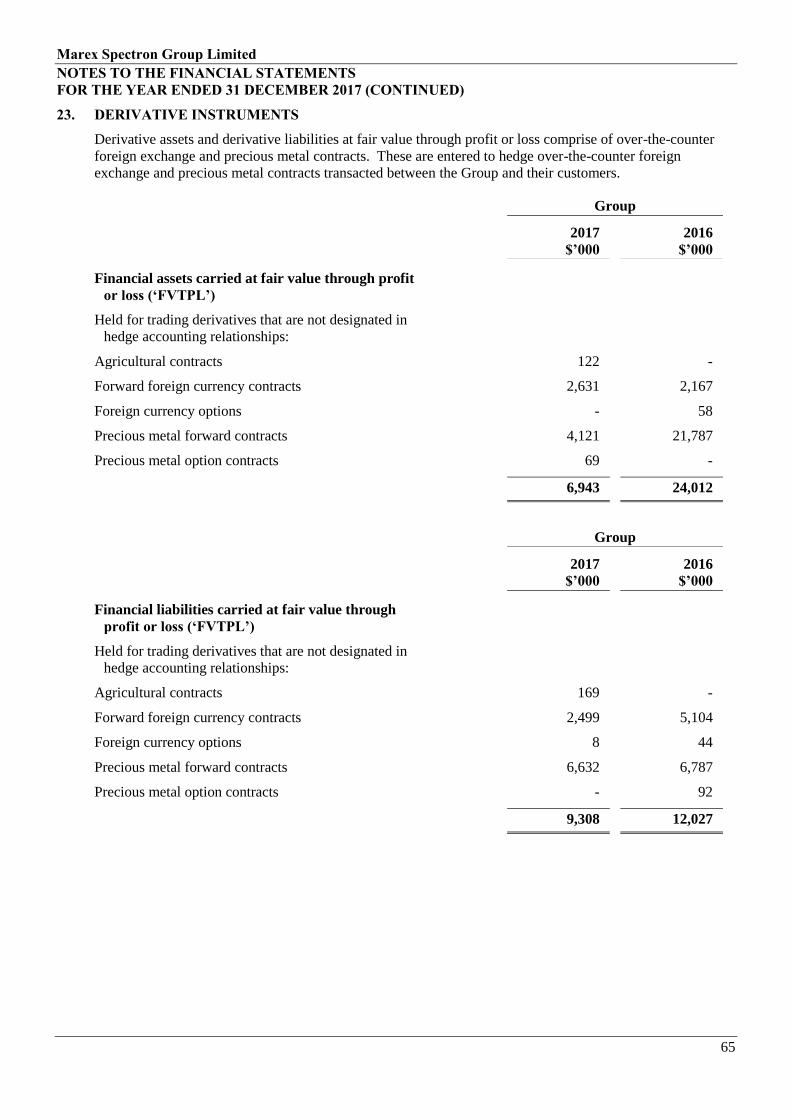
Marex Spectron Group Limited
NOTES TO THE FINANCIAL STATEMENTS
FOR THE YEAR ENDED 31 DECEMBER 2017 (CONTINUED)
65
23. DERIVATIVE INSTRUMENTS
Derivative assets and derivative liabilities at fair value through profit or loss comprise of over-the-counter
foreign exchange and precious metal contracts. These are entered to hedge over-the-counter foreign
exchange and precious metal contracts transacted between the Group and their customers.
Group
2017
$’000
2016
$’000
Financial assets carried at fair value through profit
or loss (‘FVTPL’)
Held for trading derivatives that are not designated in
hedge accounting relationships:
Agricultural contracts 122 -
Forward foreign currency contracts 2,631 2,167
Foreign currency options - 58
Precious metal forward contracts 4,121 21,787
Precious metal option contracts 69 -
6,943 24,012
Group
2017
$’000
2016
$’000
Financial liabilities carried at fair value through
profit or loss (‘FVTPL’)
Held for trading derivatives that are not designated in
hedge accounting relationships:
Agricultural contracts 169 -
Forward foreign currency contracts 2,499 5,104
Foreign currency options 8 44
Precious metal forward contracts 6,632 6,787
Precious metal option contracts - 92
9,308 12,027

Marex Spectron Group Limited
NOTES TO THE FINANCIAL STATEMENTS
FOR THE YEAR ENDED 31 DECEMBER 2017 (CONTINUED)
66
24. DEFERRED TAX
Group Company
2017
$’000
2016
$’000
2017
$’000
2016
$’000
Revaluation of investments – available-
for-sale (642) (411) (18) 120
Depreciation in excess of capital
allowances 1,297 1,815 - -
Tax losses 901 3,299 - -
Other 71 56 - -
31 December 1,627 4,759 (18) 120
Group Company
2017
$’000
2016
$’000
2017
$’000
2016
$’000
At 1 January 4,759 5,290 120 111
Charged to the income statement (note
11(a)) (2,586) (635) - -
(Charged) / credited to other
comprehensive income (229) 104 (138) 10
Foreign exchange differences and other (317) - - (1)
31 December 1,627 4,759 (18) 120
Deferred tax assets and liabilities are offset where the Group has a legally enforceable right to do so.
Deferred tax balances have been calculated at the effective tax rate ruling at the balance sheet date. The
Finance (No. 2) Act 2015 reduced the UK corporation tax rate from 20% to 19% with effect from 1 April
2017 and to 18% with effect from 1 April 2020 and was substantively enacted on 18 November 2015.
The Finance Act 2016 enacted a further reduction in the UK corporation tax rate to 17% by 2020 and was
substantively enacted on 15 September 2016. The reduction of the UK corporation tax rate to 17% has been
recognised in the deferred tax charge within the closing deferred tax position.
(a) Unrecognised deferred tax assets
The Group has unrecognised deferred tax assets in respect of:
▪ employee compensation deductions of $4,865,000 (2016: $4,445,000). The potential deferred tax asset
at 17% (2016: 17%) is $827,131 (2016: $756,000). These assets have not been recognised as it is not
foreseeable when a tax deduction will arise; and
▪ tax losses of $12,340,000 (2016: $11,240,000). Of this amount, $12,340,000 (2016: $11,240,000)
relates to losses with no expiry date. Losses of $1,670,000 (2016: $1,010,000) are subject to approval
by the relevant tax authorities. These assets are not recognised on the basis of insufficient evidence
concerning profits being available against which deferred tax assets could be utilised.
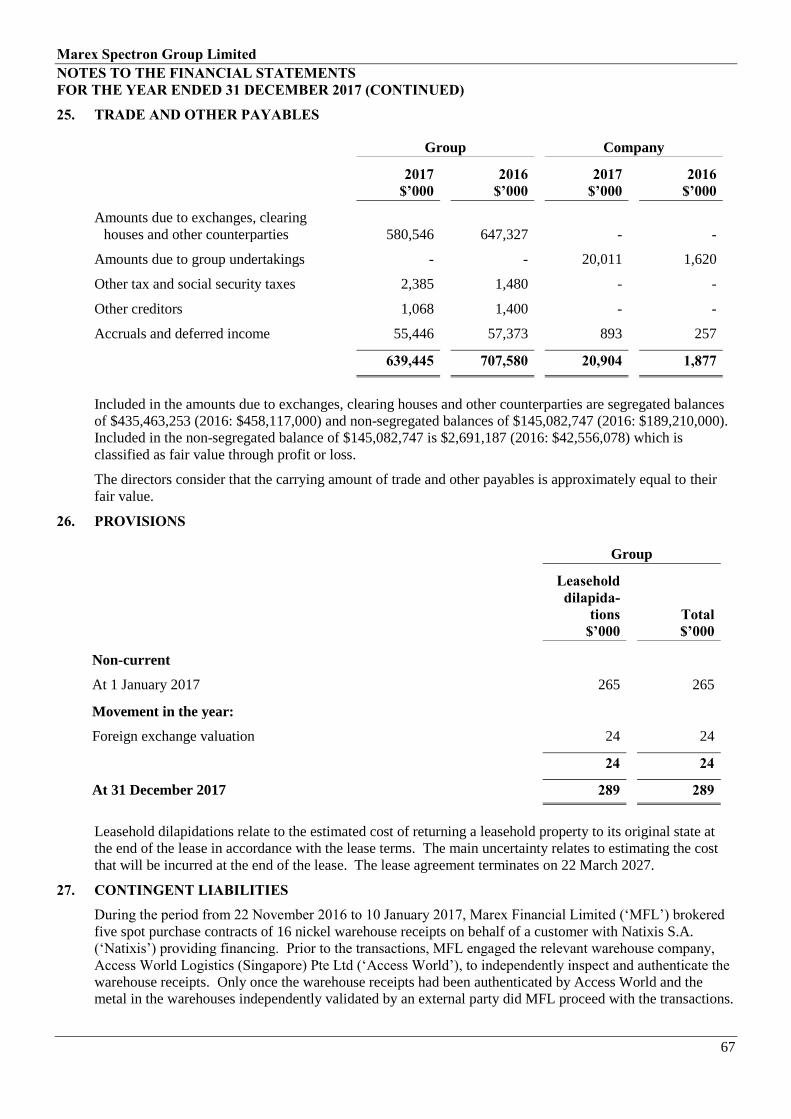
Marex Spectron Group Limited
NOTES TO THE FINANCIAL STATEMENTS
FOR THE YEAR ENDED 31 DECEMBER 2017 (CONTINUED)
67
25. TRADE AND OTHER PAYABLES
Group Company
2017
$’000
2016
$’000
2017
$’000
2016
$’000
Amounts due to exchanges, clearing
houses and other counterparties 580,546 647,327 - -
Amounts due to group undertakings - - 20,011 1,620
Other tax and social security taxes 2,385 1,480 - -
Other creditors 1,068 1,400 - -
Accruals and deferred income 55,446 57,373 893 257
639,445 707,580 20,904 1,877
Included in the amounts due to exchanges, clearing houses and other counterparties are segregated balances
of $435,463,253 (2016: $458,117,000) and non-segregated balances of $145,082,747 (2016: $189,210,000).
Included in the non-segregated balance of $145,082,747 is $2,691,187 (2016: $42,556,078) which is
classified as fair value through profit or loss.
The directors consider that the carrying amount of trade and other payables is approximately equal to their
fair value.
26. PROVISIONS
Group
Leasehold
dilapida-
tions
$’000
Total
$’000
Non-current
At 1 January 2017 265 265
Movement in the year:
Foreign exchange valuation 24 24
24 24
At 31 December 2017 289 289
Leasehold dilapidations relate to the estimated cost of returning a leasehold property to its original state at
the end of the lease in accordance with the lease terms. The main uncertainty relates to estimating the cost
that will be incurred at the end of the lease. The lease agreement terminates on 22 March 2027.
27. CONTINGENT LIABILITIES
During the period from 22 November 2016 to 10 January 2017, Marex Financial Limited (‘MFL’) brokered
five spot purchase contracts of 16 nickel warehouse receipts on behalf of a customer with Natixis S.A.
(‘Natixis’) providing financing. Prior to the transactions, MFL engaged the relevant warehouse company,
Access World Logistics (Singapore) Pte Ltd (‘Access World’), to independently inspect and authenticate the
warehouse receipts. Only once the warehouse receipts had been authenticated by Access World and the
metal in the warehouses independently validated by an external party did MFL proceed with the transactions.
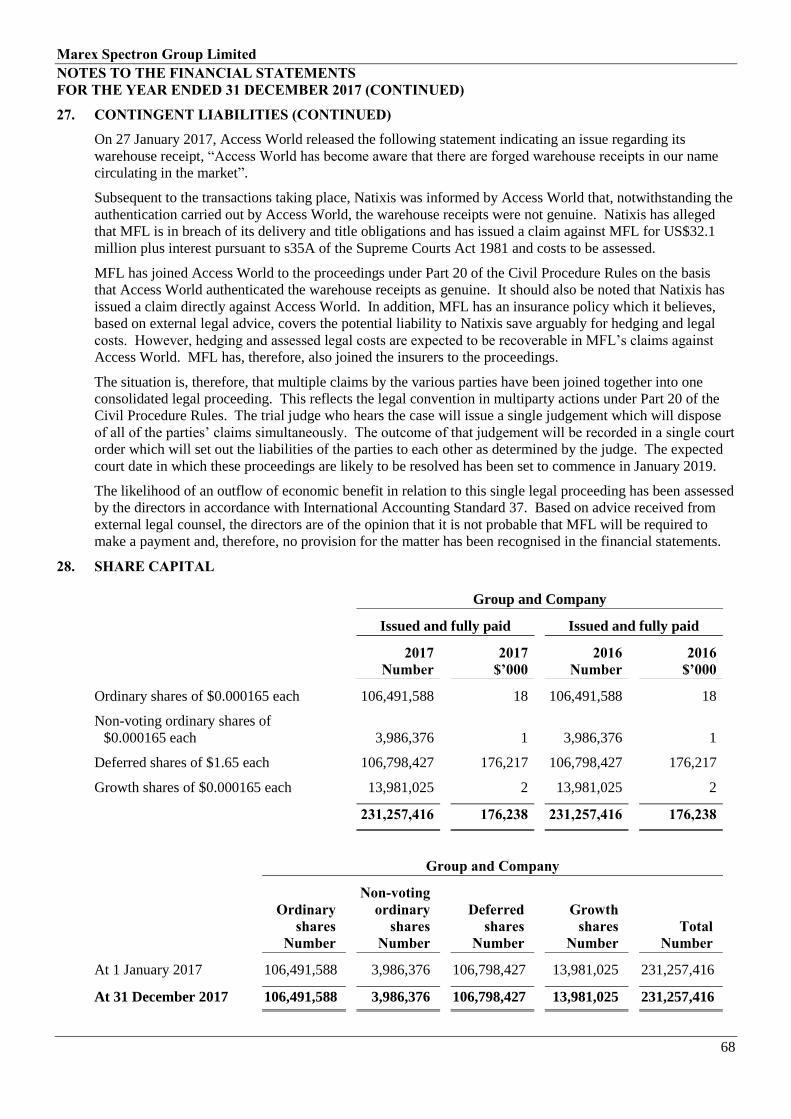
Marex Spectron Group Limited
NOTES TO THE FINANCIAL STATEMENTS
FOR THE YEAR ENDED 31 DECEMBER 2017 (CONTINUED)
68
27. CONTINGENT LIABILITIES (CONTINUED)
On 27 January 2017, Access World released the following statement indicating an issue regarding its
warehouse receipt, “Access World has become aware that there are forged warehouse receipts in our name
circulating in the market”.
Subsequent to the transactions taking place, Natixis was informed by Access World that, notwithstanding the
authentication carried out by Access World, the warehouse receipts were not genuine. Natixis has alleged
that MFL is in breach of its delivery and title obligations and has issued a claim against MFL for US$32.1
million plus interest pursuant to s35A of the Supreme Courts Act 1981 and costs to be assessed.
MFL has joined Access World to the proceedings under Part 20 of the Civil Procedure Rules on the basis
that Access World authenticated the warehouse receipts as genuine. It should also be noted that Natixis has
issued a claim directly against Access World. In addition, MFL has an insurance policy which it believes,
based on external legal advice, covers the potential liability to Natixis save arguably for hedging and legal
costs. However, hedging and assessed legal costs are expected to be recoverable in MFL’s claims against
Access World. MFL has, therefore, also joined the insurers to the proceedings.
The situation is, therefore, that multiple claims by the various parties have been joined together into one
consolidated legal proceeding. This reflects the legal convention in multiparty actions under Part 20 of the
Civil Procedure Rules. The trial judge who hears the case will issue a single judgement which will dispose
of all of the parties’ claims simultaneously. The outcome of that judgement will be recorded in a single court
order which will set out the liabilities of the parties to each other as determined by the judge. The expected
court date in which these proceedings are likely to be resolved has been set to commence in January 2019.
The likelihood of an outflow of economic benefit in relation to this single legal proceeding has been assessed
by the directors in accordance with International Accounting Standard 37. Based on advice received from
external legal counsel, the directors are of the opinion that it is not probable that MFL will be required to
make a payment and, therefore, no provision for the matter has been recognised in the financial statements.
28. SHARE CAPITAL
Group and Company
Issued and fully paid Issued and fully paid
2017
Number
2017
$’000
2016
Number
2016
$’000
Ordinary shares of $0.000165 each 106,491,588 18 106,491,588 18
Non-voting ordinary shares of
$0.000165 each
3,986,376
1
3,986,376
1
Deferred shares of $1.65 each 106,798,427 176,217 106,798,427 176,217
Growth shares of $0.000165 each 13,981,025 2 13,981,025 2
231,257,416 176,238 231,257,416 176,238
Group and Company
Ordinary
shares
Number
Non-voting
ordinary
shares
Number
Deferred
shares
Number
Growth
shares
Number
Total
Number
At 1 January 2017 106,491,588 3,986,376 106,798,427 13,981,025 231,257,416
At 31 December 2017 106,491,588 3,986,376 106,798,427 13,981,025 231,257,416

Marex Spectron Group Limited
NOTES TO THE FINANCIAL STATEMENTS
FOR THE YEAR ENDED 31 DECEMBER 2017 (CONTINUED)
69
28. SHARE CAPITAL (CONTINUED)
The rights of the shares are as follows:
Class of share Rights
Ordinary shares Full voting rights and right to participate in ordinary dividends ranking
pari passu with non-voting ordinary shares. In the event of a winding
up, entitled to a return of capital ranking pari passu with non-voting
ordinary shares and no right of redemption.
Non-voting ordinary shares As per ordinary shares, other than having no voting rights.
Deferred shares No voting rights, no right to participate in dividends and no right to
redemption. In the event of a winding up, entitled to a return of capital
ranking pari passu with ordinary shares for any capital in excess of £50
billion.
Growth shares No voting rights, no rights to participate in dividends, no entitlement to
participate in winding up.
In 2010, 2012, 2015 and 2016 the Group issued growth shares to 21
individuals, which entitle the holders to a share of the proceeds from a
‘liquidity event’, such as an Initial Public Offering or a sale, if the
proceeds exceeded some specific level thereby diluting existing ordinary
shareholders. The holders of growth shares are not entitled to receive
dividends nor do they have voting rights and cannot impact the timing of
a transaction.
The growth shares vest over 3 to 5 years, but do not expire and may be
redeemed prior to a liquidity event, or converted into non-voting
ordinary shares, whereby the Company issues the growth share holder a
number of non-voting ordinary shares equal in value to the redemption
price, or in cash.
The directors’ view is that it is currently probable the growth shares will
be converted into non-voting shares and, therefore, they are treated as
equity-settled share based payments.
29. RESERVES
The following describes the nature and purpose of each reserve within total equity:
Reserves Description
Share capital Amount subscribed for share capital at nominal value.
Share premium Amount of consideration received over and above the par value of shares.
Retained earnings Cumulative net gains and losses recognised in the income statement or
statement of other comprehensive income.
Revaluation reserve Cumulative unrealised gains on investments in exchanges that are held as
available-for-sale and recognised in equity.
Other reserves Foreign currency translation reserve.

Marex Spectron Group Limited
NOTES TO THE FINANCIAL STATEMENTS
FOR THE YEAR ENDED 31 DECEMBER 2017 (CONTINUED)
70
30. LEASE COMMITMENTS
The Group has entered into commercial leases on its properties.
The lessee has the options of renewal on each of these leases subject to negotiation between the Group, as
lessee, and each landlord in the period preceding the expiration of each lease. There were no restrictions
placed upon the lessee by entering into these leases.
Group
Notes
2017
$’000
2016
$’000
Lease payments under operating leases
recognised as an expense in the year 6 6,509 7,335
The total future minimum lease payments are due as follows:
Group
2017
$’000
2016
$’000
Within one year 6,793 6,393
In the second to fifth years inclusive 12,891 13,794
After five years 2,117 470
21,801 20,657
The total sublease receipts included in the income statement during the year is $1,683,043 (2016:
$1,949,074).
The total future minimum sublease receipts are due as follows:
Group
2017
$’000
2016
$’000
Within one year 459 412
In the second to fifth years inclusive 1,224 1,537
1,683 1,949

Marex Spectron Group Limited
NOTES TO THE FINANCIAL STATEMENTS
FOR THE YEAR ENDED 31 DECEMBER 2017 (CONTINUED)
71
31. FINANCIAL INSTRUMENTS
(a) Capital risk management
For the purpose of the Group’s capital management, capital includes issued share capital, share premium and
all other equity reserves attributable to the equity holders of the parent as disclosed in notes 28 and 0. The
primary objective of the Group’s capital management is to maximise shareholder value.
In order to achieve this overall objective, the Group’s capital management, amongst other things, aims to
ensure that it meets financial covenants attached to the interest-bearing loans and borrowings that define
capital structure requirements. Breaches in meeting the financial covenants would permit the bank to
immediately call loans and borrowings. There have been no breaches in the financial covenants of any
interest-bearing loans and borrowings in the current year.
Many of the Group’s material operating subsidiaries are subject to regulatory restrictions and minimum
capital requirements. As at 31 December 2017, each of these subsidiaries had net capital in excess of the
requisite minimum requirements. These requirements are designed to ensure institutions have an adequate
capital base to support the nature and scale of their operations. Management of regulatory capital forms an
important part of the Group’s risk governance structure. A robust programme of regular monitoring and
review takes place to ensure each regulated entity is in adherence with local rules and has capital in excess of
external and internal limits. Regular submissions are made and constantly maintained with internal limits
assessed against the Group’s risk appetite, as determined by the Board.
No changes were made in objectives, policies or processes for managing capital during the year.
(b) Categories of financial instruments
Some of the Group’s assets are carried at fair value or contract amounts that approximate fair value. Set out
below is an analysis of the categories of financial instruments.

Marex Spectron Group Limited
NOTES TO THE FINANCIAL STATEMENTS
FOR THE YEAR ENDED 31 DECEMBER 2017 (CONTINUED)
72
31. FINANCIAL INSTRUMENTS (CONTINUED)
(b) Categories of financial instruments (continued)
Group
FVTPL
$’000
Available-
for-sale
$’000
Held-to-
maturity
$’000
Loans and
receivables
$’000
Total
$’000
Financial assets:
Cash and cash equivalents - - - 89,224 89,224
Financial instruments - 50,088 176,175 - 226,263
Amounts due from exchanges,
clearing houses and other
counterparties 203,482 - - 285,254 488,736
Trade debtors - - - 20,796 20,796
Default funds and deposits - - - 70,454 70,454
Loans receivable - - - 716 716
Other debtors - - - 2,952 2,952
Other tax and social security
taxes - - - 1,551 1,551
Investments – available-for-sale - 8,314 - - 8,314
Derivative instruments 6,943 - - - 6,943
31 December 2017 210,425 58,402 176,175 470,947 915,949
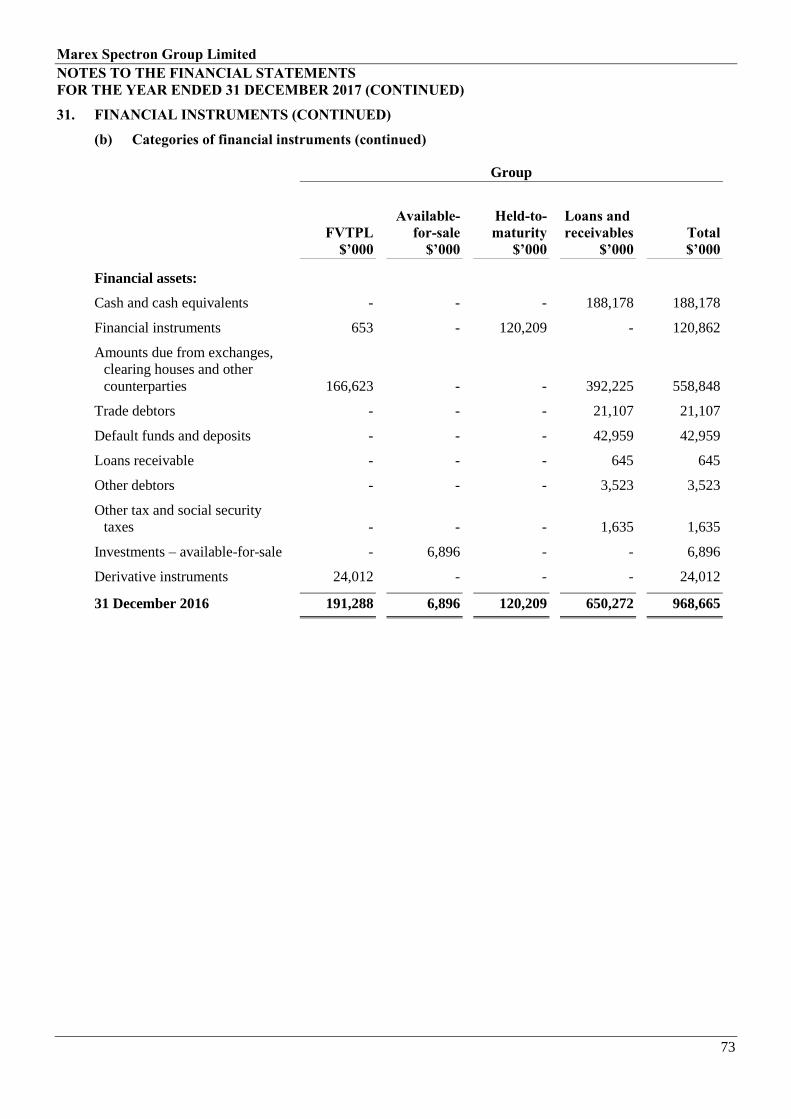
Marex Spectron Group Limited
NOTES TO THE FINANCIAL STATEMENTS
FOR THE YEAR ENDED 31 DECEMBER 2017 (CONTINUED)
73
31. FINANCIAL INSTRUMENTS (CONTINUED)
(b) Categories of financial instruments (continued)
Group
FVTPL
$’000
Available-
for-sale
$’000
Held-to-
maturity
$’000
Loans and
receivables
$’000
Total
$’000
Financial assets:
Cash and cash equivalents - - - 188,178 188,178
Financial instruments 653 - 120,209 - 120,862
Amounts due from exchanges,
clearing houses and other
counterparties 166,623 - - 392,225 558,848
Trade debtors - - - 21,107 21,107
Default funds and deposits - - - 42,959 42,959
Loans receivable - - - 645 645
Other debtors - - - 3,523 3,523
Other tax and social security
taxes - - - 1,635 1,635
Investments – available-for-sale - 6,896 - - 6,896
Derivative instruments 24,012 - - - 24,012
31 December 2016 191,288 6,896 120,209 650,272 968,665
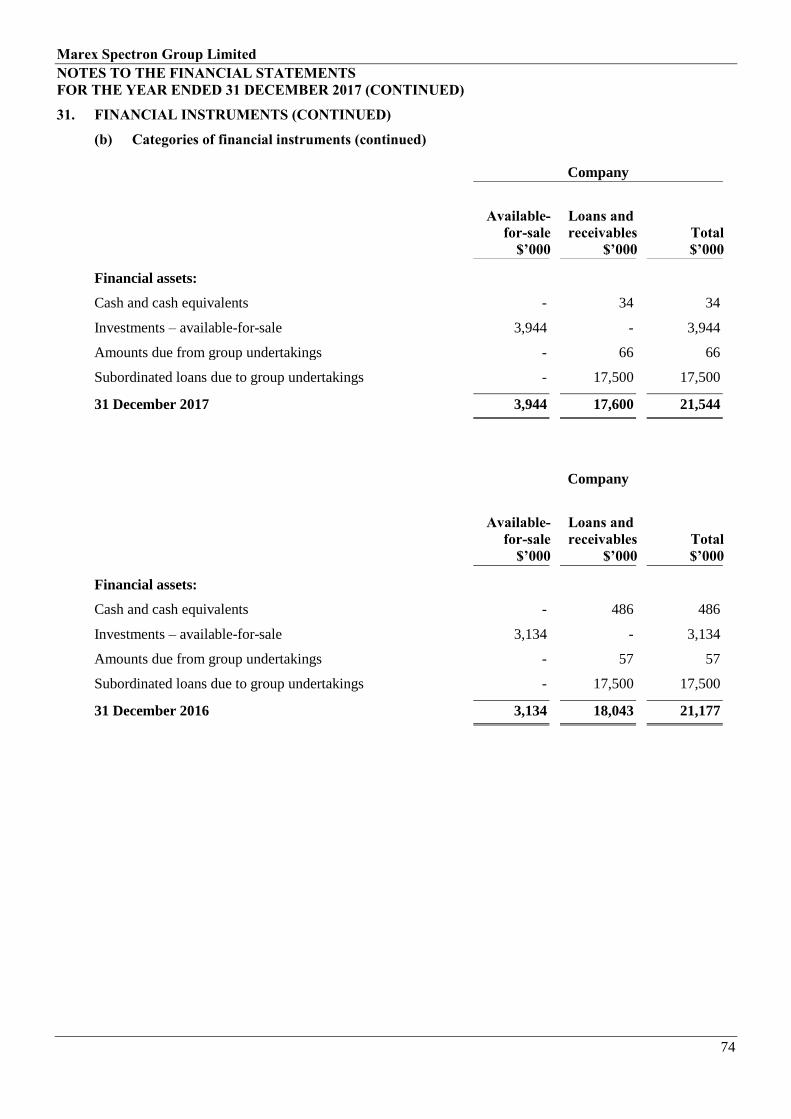
Marex Spectron Group Limited
NOTES TO THE FINANCIAL STATEMENTS
FOR THE YEAR ENDED 31 DECEMBER 2017 (CONTINUED)
74
31. FINANCIAL INSTRUMENTS (CONTINUED)
(b) Categories of financial instruments (continued)
Company
Available-
for-sale
$’000
Loans and
receivables
$’000
Total
$’000
Financial assets:
Cash and cash equivalents - 34 34
Investments – available-for-sale 3,944 - 3,944
Amounts due from group undertakings - 66 66
Subordinated loans due to group undertakings - 17,500 17,500
31 December 2017 3,944 17,600 21,544
Company
Available-
for-sale
$’000
Loans and
receivables
$’000
Total
$’000
Financial assets:
Cash and cash equivalents - 486 486
Investments – available-for-sale 3,134 - 3,134
Amounts due from group undertakings - 57 57
Subordinated loans due to group undertakings - 17,500 17,500
31 December 2016 3,134 18,043 21,177

Marex Spectron Group Limited
NOTES TO THE FINANCIAL STATEMENTS
FOR THE YEAR ENDED 31 DECEMBER 2017 (CONTINUED)
75
31. FINANCIAL INSTRUMENTS (CONTINUED)
(b) Categories of financial instruments (continued)
Group
FVTPL
$’000
Amortised
cost
$’000
Total
$’000
Financial liabilities:
Amounts due to exchanges, clearing houses and other
counterparties 2,691 577,855 580,546
Derivative instruments 9,308 - 9,308
Other tax and social security taxes - 2,385 2,385
Other creditors - 1,068 1,068
Accruals and deferred income - 55,446 55,446
Short-term borrowings - 60,001 60,001
31 December 2017 11,999 696,755 708,754
Group
FVTPL
$’000
Amortised
cost
$’000
Total
$’000
Financial liabilities:
Amounts due to exchanges, clearing houses and other
counterparties 42,556 604,771 647,327
Derivative instruments 12,027 - 12,027
Other tax and social security taxes - 1,480 1,480
Other creditors - 1,400 1,400
Accruals and deferred income - 57,373 57,373
Short-term borrowings - 40,000 40,000
31 December 2016 54,583 705,024 759,607
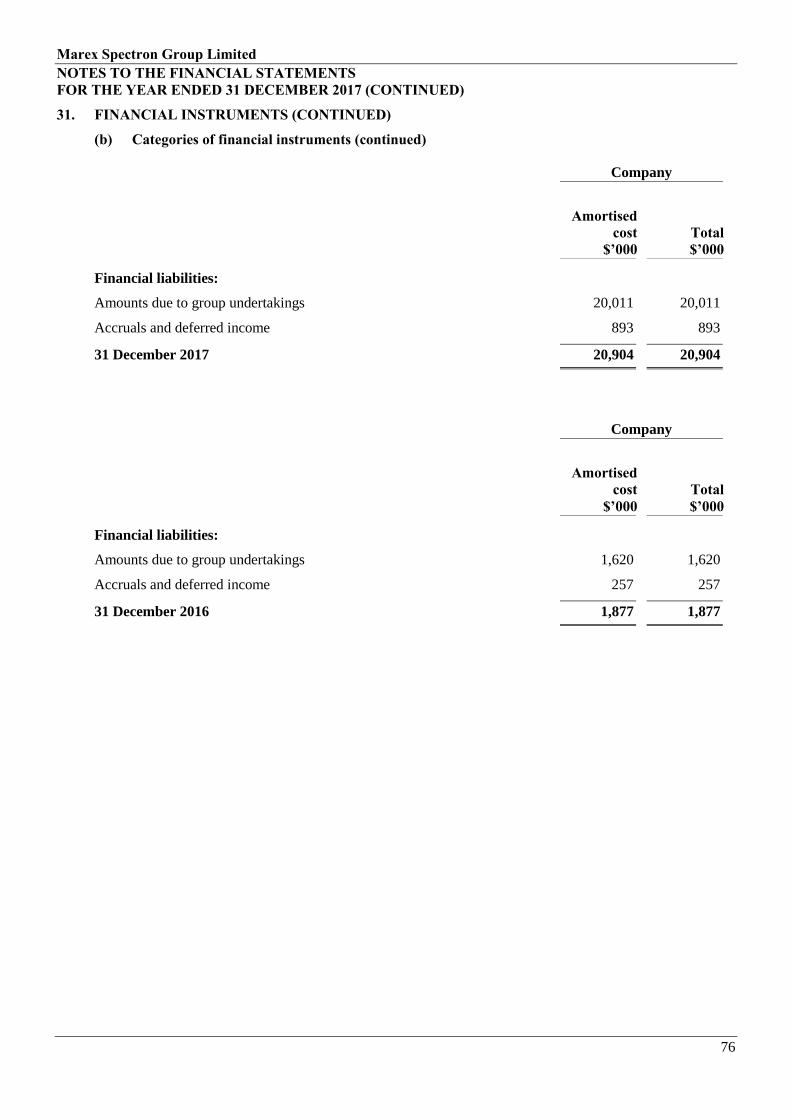
Marex Spectron Group Limited
NOTES TO THE FINANCIAL STATEMENTS
FOR THE YEAR ENDED 31 DECEMBER 2017 (CONTINUED)
76
31. FINANCIAL INSTRUMENTS (CONTINUED)
(b) Categories of financial instruments (continued)
Company
Amortised
cost
$’000
Total
$’000
Financial liabilities:
Amounts due to group undertakings 20,011 20,011
Accruals and deferred income 893 893
31 December 2017 20,904 20,904
Company
Amortised
cost
$’000
Total
$’000
Financial liabilities:
Amounts due to group undertakings 1,620 1,620
Accruals and deferred income 257 257
31 December 2016 1,877 1,877
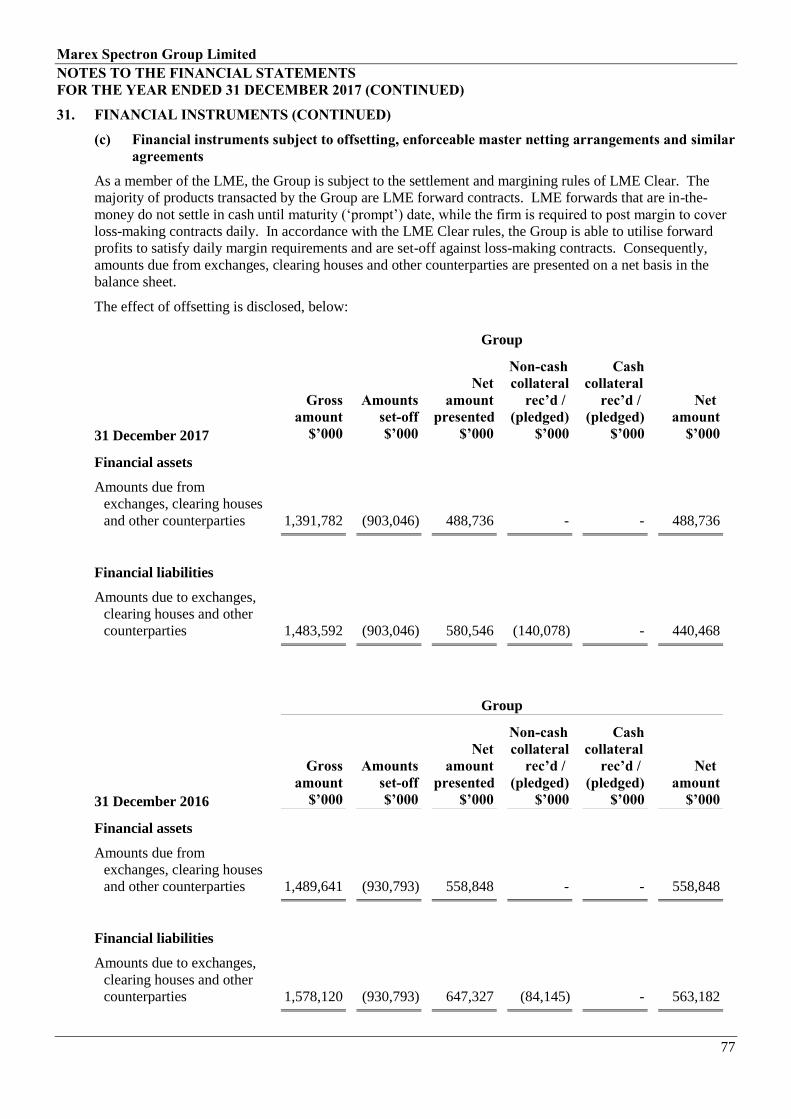
Marex Spectron Group Limited
NOTES TO THE FINANCIAL STATEMENTS
FOR THE YEAR ENDED 31 DECEMBER 2017 (CONTINUED)
77
31. FINANCIAL INSTRUMENTS (CONTINUED)
(c) Financial instruments subject to offsetting, enforceable master netting arrangements and similar
agreements
As a member of the LME, the Group is subject to the settlement and margining rules of LME Clear. The
majority of products transacted by the Group are LME forward contracts. LME forwards that are in-the-
money do not settle in cash until maturity (‘prompt’) date, while the firm is required to post margin to cover
loss-making contracts daily. In accordance with the LME Clear rules, the Group is able to utilise forward
profits to satisfy daily margin requirements and are set-off against loss-making contracts. Consequently,
amounts due from exchanges, clearing houses and other counterparties are presented on a net basis in the
balance sheet.
The effect of offsetting is disclosed, below:
Group
31 December 2017
Gross
amount
$’000
Amounts
set-off
$’000
Net
amount
presented
$’000
Non-cash
collateral
rec’d /
(pledged)
$’000
Cash
collateral
rec’d /
(pledged)
$’000
Net
amount
$’000
Financial assets
Amounts due from
exchanges, clearing houses
and other counterparties 1,391,782 (903,046) 488,736 - - 488,736
Financial liabilities
Amounts due to exchanges,
clearing houses and other
counterparties 1,483,592 (903,046) 580,546 (140,078) - 440,468
Group
31 December 2016
Gross
amount
$’000
Amounts
set-off
$’000
Net
amount
presented
$’000
Non-cash
collateral
rec’d /
(pledged)
$’000
Cash
collateral
rec’d /
(pledged)
$’000
Net
amount
$’000
Financial assets
Amounts due from
exchanges, clearing houses
and other counterparties 1,489,641 (930,793) 558,848 - - 558,848
Financial liabilities
Amounts due to exchanges,
clearing houses and other
counterparties 1,578,120 (930,793) 647,327 (84,145) - 563,182
Marex Spectron Group Limited
NOTES TO THE FINANCIAL STATEMENTS
FOR THE YEAR ENDED 31 DECEMBER 2017 (CONTINUED)
78
31. FINANCIAL INSTRUMENTS (CONTINUED)
(d) Financial risk management objectives
The Group’s activities expose it to a number of financial risks including market risk, operational risk, credit
risk and liquidity risk as discussed in the strategic report.
The Group manages these risks through various control mechanisms and its approach to risk management is
both prudent and evolving.
Overall responsibility for risk management rests with the Board. Dedicated resources within the Risk
Department control and manage the exposures of the Group’s own positions, the positions of its clients and
its exposures to its counterparties as well as operational exposures, within the risk appetite set by the Board.
Credit risk
The maximum credit risk exposure relating to financial assets is represented by the carrying value as at the
balance sheet date. Credit risk in the Group principally arises from cash and cash equivalents deposited with
third party institutions, exposures from transactions and balances with exchanges and clearing houses, and
exposures resulting from transactions and balances relating to customers and counterparties, some of which
have been granted credit lines.
The Group only makes treasury deposits with banks and financial institutions that have received approval
from the Group’s Executive Credit and Risk Committee. These deposits are also subject to counterparty
limits with respect to concentration and maturity.
The Group’s exposure to customer and counterparty transactions and balances is managed through the
Group’s credit policies and, where appropriate, the use of initial and variation margin credit limits in
conjunction with overall position limits for all customers and counterparties. These exposures are monitored
both intraday and overnight. The limits are set by the Group’s Executive Credit and Risk Committee
through a formalised process.

Marex Spectron Group Limited
NOTES TO THE FINANCIAL STATEMENTS
FOR THE YEAR ENDED 31 DECEMBER 2017 (CONTINUED)
79
31. FINANCIAL INSTRUMENTS (CONTINUED)
(d) Financial risk management objectives (continued)
Credit quality
The table below does not take into account collateral held.
Group Company
2017
$’000
2016
$’000
2017
$’000
2016
$’000
AA and above 178,226 65,437 - -
AA- 102,813 290,814 34 486
A+ 23,468 34,349 - -
A 177,212 193,223 - -
A- 3,761 9,767 - -
BBB+ 1,017 1,301 - -
Lower and unrated 429,452 373,774 21,510 20,691
915,949 968,665 21,544 21,177
Group Company
Financial assets
2017
$’000
2016
$’000
2017
$’000
2016
$’000
Investments – available-for-sale 8,314 6,896 3,944 3,134
Financial instruments – held to maturity 226,263 120,209 - -
Financial instruments – fair value through
profit or loss - 653 - -
Derivative assets 6,943 24,012 - -
Amounts due from exchanges, clearing
houses and other counterparties 488,736 558,848 - -
Trade debtors 20,796 21,107 - -
Default funds and deposits 70,454 42,959 - -
Amounts due from group undertakings - - 66 57
Loans receivable 716 645 - -
Other debtors 2,952 3,523 - -
Cash and cash equivalents 89,224 188,178 34 486
Other tax and social security taxes 1,551 1,635 - -
Subordinated loans due to group
undertakings - - 17,500 17,500
915,949 968,665 21,544 21,177
Marex Spectron Group Limited
NOTES TO THE FINANCIAL STATEMENTS
FOR THE YEAR ENDED 31 DECEMBER 2017 (CONTINUED)
80
31. FINANCIAL INSTRUMENTS (CONTINUED)
(d) Financial risk management objectives (continued)
Credit quality (continued)
The Group has received no collateral in respect of its derivative assets during the year ended 31 December
2017 (2016: $8,636,349). Collateral was recognised in amounts due to exchanges, clearing houses and other
counterparties as at 31 December 2016.
Market risk
The Group’s activities expose it to financial risks primarily generated through foreign exchange, interest rate
and commodity market price exposures which are outlined in the strategic report.
Market risk sensitivity
As principally an intermediary, the Group’s market risk exposure is modest. It manages this market risk
exposure using appropriate risk management techniques within pre-defined and independently monitored
parameters and limits.
The Group uses a range of tools to monitor and limit market risk exposures. These include Value-at-Risk
(‘VaR’), sensitivity analysis and stress testing.
Value at risk (‘VaR’)
VaR is a technique that estimates the potential losses that could occur on risk positions as a result of
movements in market rates and prices over a specified time horizon and to a given level of confidence.
The VaR model used by the Group is based upon the Monte Carlo simulation technique. This model derives
plausible future scenarios from past series of recorded market rates and prices, taking account of inter-
relationships between different markets and rates, including interest rates and foreign exchange rates. The
model also incorporates the effect of option features on the underlying exposures.
The Monte Carlo simulation model used by the Group incorporates the following features:
▪ 5,000 simulations using a variance covariance matrix;
▪ simulations generated using geometric Brownian motion;
▪ an exceptional decay factor is applied across an estimation period of 250 days; and
▪ VaR is calculated to a 1-day, 99.75% one tail confidence level.
The Group validates VaR by comparing to alternative risk measures, for example, scenario analysis and
exchange initial margins as well as the back testing of calculated results against actual profit and loss.
Although a valuable guide to risk, VaR should always be viewed in the context of its limitations, for
example:
▪ the use of historical data as a proxy for estimating future events may not encompass all potential events,
particularly those which are extreme in nature;
▪ the use of a 1-day holding period assumes that all positions can be liquidated or hedged in 1-day. This
may not fully reflect the market risk arising at times of severe liquidity stress, when a 1-day holding
period may be insufficient to liquidate or hedge all positions fully;
▪ the use of a 99.75% confidence level, by definition, does not take into account losses that might occur
beyond this level of confidence;
▪ the VaR, disclosed below, is calculated on the basis of exposures outstanding at the close of business
and, therefore, does not necessarily reflect intra-day exposure; and
▪ VaR is unlikely to reflect loss potential on exposures that only arise under significant market moves.

Marex Spectron Group Limited
NOTES TO THE FINANCIAL STATEMENTS
FOR THE YEAR ENDED 31 DECEMBER 2017 (CONTINUED)
81
31. FINANCIAL INSTRUMENTS (CONTINUED)
(d) Financial risk management objectives (continued)
Value at risk (‘VaR’) (continued)
The Group recognises these limitations by augmenting its VaR limits with other position and sensitivity limit
structures. The Group also applies a wide range of stress testing, both on individual portfolios and on the
Group’s consolidated positions. The VaR as at 31 December 2017 was $1,349,517 (2016: $1,135,273) and
the average monthly VaR for the year ended 31 December 2017 was $1,453,529 (2016: $1,183,237).
Foreign currency risk
As the majority of the revenue generated, and assets and liabilities of the Group are in US Dollars, there is
minimal exposure to structural currency risk. Management monitors currency exposure on a daily basis and
buys or sells currency to minimise the exposure.
Foreign exchange sensitivity
The majority of the Group’s net assets are in US Dollars which minimises the effect exchange rate
fluctuations will have on overall net assets.
Interest rate risk
The Group is exposed to interest rate risk on cash, investments, derivatives, client balances and bank
borrowings.
The main interest rate risk is derived from interest-bearing deposits in which the Group invests surplus funds
and bank borrowings.
The Group’s exposure to interest rate fluctuations is limited through the offset that exists between the bulk of
its interest bearing assets and interest bearing liabilities. Since the return paid on client liabilities is generally
reset to prevailing market interest rates on an overnight basis, the Group is only exposed for the time it takes
to reset its investments which are held at rates fixed for a maturity which does not exceed three months, with
the exception of US Treasuries which have a maturity of up to two years.
Operational risk
Operational risk is the risk of loss arising through failures associated with personnel, processes or systems, or
from external events. It is inherent in every business organisation and covers a wide spectrum of issues.
Operational risk is managed through systems and procedures in which processes are documented,
authorisation is independent, and transactions are monitored and reconciled.
The Group maintains disaster recovery or contingency facilities to support operations and ensure business
continuity. The invocation of these facilities is regularly tested.
Compliance or Regulatory risk arises from a failure or inability to comply with the laws, regulations or codes
applicable specifically to the Group. Non-compliance can lead to fines, public reprimands, enforced
suspensions of services, or in extreme cases, withdrawal of authorisation to operate.
Companies within the Group are subject to authorisation by the LME, the CME Group of exchanges, NLX,
DGCX, London Stock Exchange, ICE US, NYSE Liffe, ICE Futures and Eurex. The Group is regulated in
the UK by the FCA (which regulates the Group under consolidated supervision), in the US by the NFA and
CFTC, in Hong Kong by the SFC, and in Singapore by the MAS and IES.
Geographical risk arises from the physical separation of some elements of the Group from the central control
locations. Internal control failure is the risk arising from the inadequacy or breakdown of critical internal
control processes.
Marex Spectron Group Limited
NOTES TO THE FINANCIAL STATEMENTS
FOR THE YEAR ENDED 31 DECEMBER 2017 (CONTINUED)
82
31. FINANCIAL INSTRUMENTS (CONTINUED)
(d) Financial risk management objectives (continued)
Concentration risk
To mitigate the concentration of credit risk exposure to a particular single customer, counterparty or group of
affiliated customers or counterparties, the Group monitors these exposures carefully and ensures that these
remain within pre-defined limits. Large exposure limits are determined in accordance with appropriate
regulatory rules.
Further concentration risk controls are in place to limit exposure to clients or counterparties within single
countries of origin and operation through specific country credit risk limits as set by the Board Risk
Committee.
The largest concentration of cash balances as at 31 December 2017 was 79% (2016: 74%) to a UK-based,
AA- rated global banking group (2016: UK-based, AA- rated global banking group).
The largest concentration of exposures to exchanges, clearing houses and other counterparties as at 31
December 2017 was 38% (2016: 30%) to the LME (2016: LME).
Liquidity risk
The Group defines liquidity risk as the failure to meet its day-to-day capital and cash flow requirements.
Liquidity risk is assessed and managed under the Individual Liquidity Adequacy Assessment (‘ILAA’) and
Liquidity Risk Framework. To mitigate liquidity risk, the Group has implemented robust cash management
policies and procedures that monitor liquidity daily to ensure that the Group has sufficient resources to meet
its margin requirement at clearing houses and third party brokers. In the event of a liquidity issue arising, the
Group has recourse to existing global cash resources after which it could draw down on a $55 million
committed revolving credit facility, $10 million receivables finance facility and $15 million overdraft facility
as an additional contingency funding.
There are strict guidelines followed in relation to products and duration into which excess liquidity can be
invested. Excess liquidity is invested in highly liquid instruments, such as cash deposits with financial
institutions for a period of less than three months and US Treasuries with a maturity of up to two years.
The financial liabilities are based upon rates set on a daily basis, apart from the financing of the warrant
positions and the credit facility where the rates are set for the term of the loan. For assets not marked-to-
market there is no material difference between the carrying value and fair value.
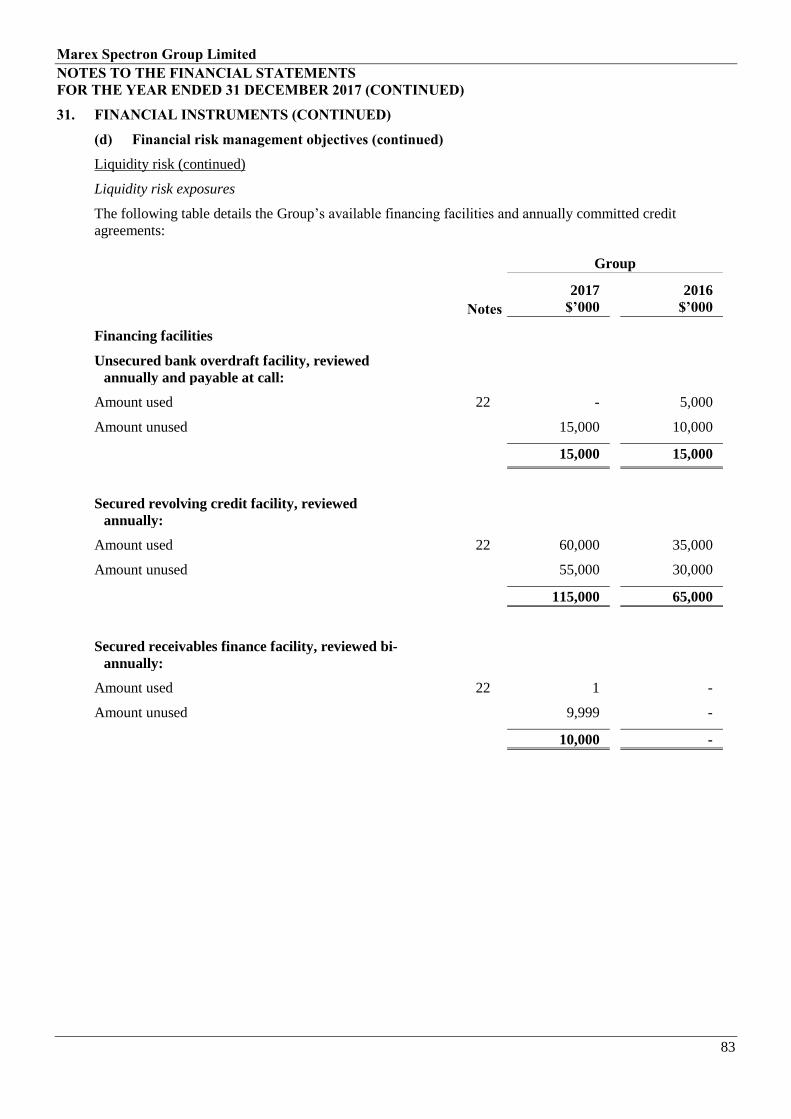
Marex Spectron Group Limited
NOTES TO THE FINANCIAL STATEMENTS
FOR THE YEAR ENDED 31 DECEMBER 2017 (CONTINUED)
83
31. FINANCIAL INSTRUMENTS (CONTINUED)
(d) Financial risk management objectives (continued)
Liquidity risk (continued)
Liquidity risk exposures
The following table details the Group’s available financing facilities and annually committed credit
agreements:
Group
Notes
2017
$’000
2016
$’000
Financing facilities
Unsecured bank overdraft facility, reviewed
annually and payable at call:
Amount used 22 - 5,000
Amount unused 15,000 10,000
15,000 15,000
Secured revolving credit facility, reviewed
annually:
Amount used 22 60,000 35,000
Amount unused 55,000 30,000
115,000 65,000
Secured receivables finance facility, reviewed bi-
annually:
Amount used 22 1 -
Amount unused 9,999 -
10,000 -

Marex Spectron Group Limited
NOTES TO THE FINANCIAL STATEMENTS
FOR THE YEAR ENDED 31 DECEMBER 2017 (CONTINUED)
84
31. FINANCIAL INSTRUMENTS (CONTINUED)
(d) Financial risk management objectives (continued)
Liquidity risk (continued)
Liquidity risk exposures
The following table details the Group’s expected undiscounted contractual maturity for non-derivative
financial liabilities:
Group
On demand
$’000
Less than 3
months
$’000
3 to 12
months
$’000
1 to 5
years
$’000
Total
$’000
Amounts due to
exchanges, clearing
houses and other
counterparties 580,546 - - - 580,546
Other tax and social
security taxes - 2,385 - - 2,385
Other creditors - 1,068 - - 1,068
Accruals and deferred
income - 52,679 2,767 - 55,446
Short-term borrowings - 60,001 - - 60,001
At 31 December 2017 580,546 116,133 2,767 - 699,446
Group
On demand
$’000
Less than 3
months
$’000
3 to 12
months
$’000
1 to 5
years
$’000
Total
$’000
Amounts due to
exchanges, clearing
houses and other
counterparties 647,327 - - - 647,327
Other tax and social
security taxes - 1,480 - - 1,480
Other creditors - 1,400 - - 1,400
Accruals and deferred
income - 52,438 4,601 334 57,373
Short-term borrowings - 40,000 - - 40,000
At 31 December 2016 647,327 95,318 4,601 334 747,580
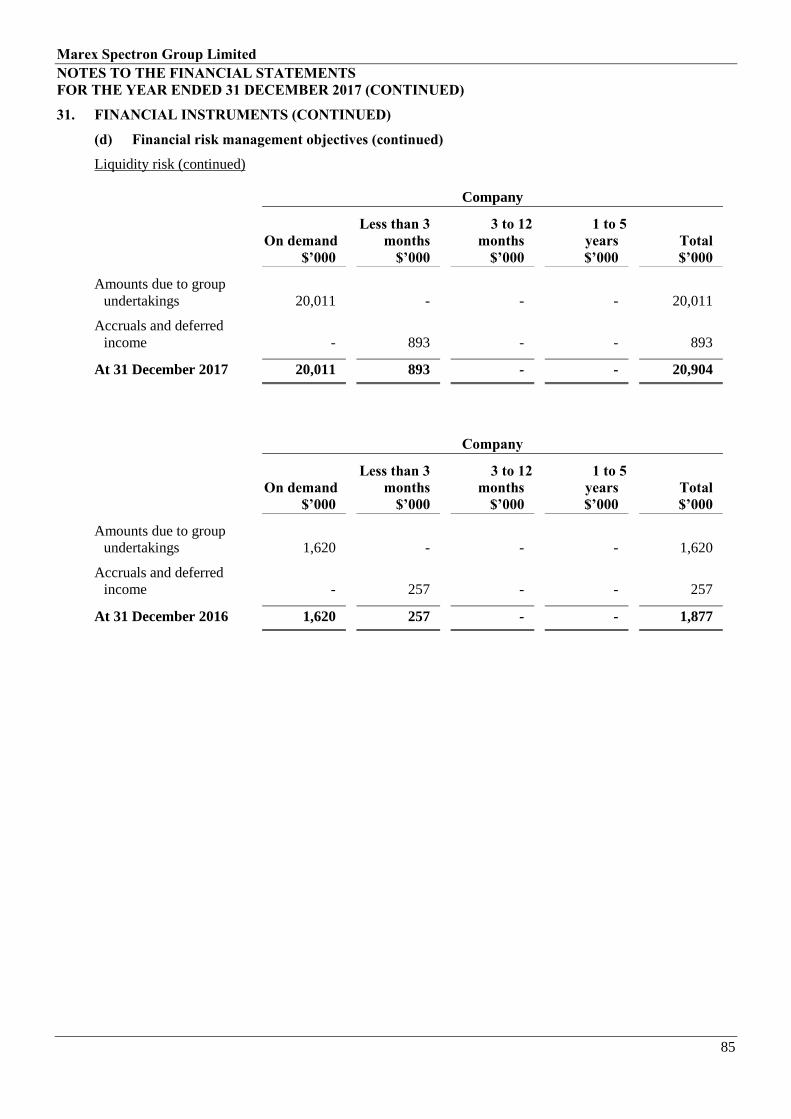
Marex Spectron Group Limited
NOTES TO THE FINANCIAL STATEMENTS
FOR THE YEAR ENDED 31 DECEMBER 2017 (CONTINUED)
85
31. FINANCIAL INSTRUMENTS (CONTINUED)
(d) Financial risk management objectives (continued)
Liquidity risk (continued)
Company
On demand
$’000
Less than 3
months
$’000
3 to 12
months
$’000
1 to 5
years
$’000
Total
$’000
Amounts due to group
undertakings 20,011 - - - 20,011
Accruals and deferred
income - 893 - - 893
At 31 December 2017 20,011 893 - - 20,904
Company
On demand
$’000
Less than 3
months
$’000
3 to 12
months
$’000
1 to 5
years
$’000
Total
$’000
Amounts due to group
undertakings 1,620 - - - 1,620
Accruals and deferred
income - 257 - - 257
At 31 December 2016 1,620 257 - - 1,877

Marex Spectron Group Limited
NOTES TO THE FINANCIAL STATEMENTS
FOR THE YEAR ENDED 31 DECEMBER 2017 (CONTINUED)
86
31. FINANCIAL INSTRUMENTS (CONTINUED)
(d) Financial risk management objectives (continued)
Liquidity risk (continued)
Shown below is the Group’s expected undiscounted contractual maturity for non-derivative financial assets:
Group
On demand
$’000
Less than 3
months
$’000
3 to 12
months
$’000
1 to 5
years
$’000
Total
$’000
Amounts due from
exchanges, clearing
houses and other
counterparties 488,736 - - - 488,736
Trade debtors - 20,796 - - 20,796
Default funds and
deposits - 70,454 - - 70,454
Loans receivable 477 - 239 - 716
Other debtors - 2,717 3 232 2,952
Cash and cash equivalents 89,224 - - - 89,224
Other tax and social
security taxes - 1,551 - - 1,551
At 31 December 2017 578,437 95,518 242 232 674,429
Group
On demand
$’000
Less than 3
months
$’000
3 to 12
months
$’000
1 to 5
years
$’000
Total
$’000
Amounts due from
exchanges, clearing
houses and other
counterparties 558,848 - - - 558,848
Trade debtors - 21,107 - - 21,107
Default funds and
deposits - 42,959 - - 42,959
Loans receivable 436 11 198 - 645
Other debtors - 3,281 18 224 3,523
Cash and cash equivalents 188,178 - - - 188,178
Other tax and social
security taxes - 1,635 - - 1,635
At 31 December 2016 747,462 68,993 216 224 816,895

Marex Spectron Group Limited
NOTES TO THE FINANCIAL STATEMENTS
FOR THE YEAR ENDED 31 DECEMBER 2017 (CONTINUED)
87
31. FINANCIAL INSTRUMENTS (CONTINUED)
(d) Financial risk management objectives (continued)
Liquidity risk (continued)
Shown below is the Company’s expected undiscounted contractual maturity for non-derivative financial
assets:
Company
On demand
$’000
Less than 3
months
$’000
3 to 12
months
$’000
1 to 5
years
$’000
Total
$’000
Amounts due from group
undertakings 66 - - - 66
Cash and cash equivalents 34 - - - 34
Subordinated loans due to
group undertakings - - - 17,500 17,500
At 31 December 2017 100 - - 17,500 17,600
Company
On demand
$’000
Less than 3
months
$’000
3 to 12
months
$’000
1 to 5
years
$’000
Total
$’000
Amounts due from group
undertakings 57 - - - 57
Cash and cash equivalents 486 - - - 486
Subordinated loans due to
group undertakings - - - 17,500 17,500
At 31 December 2016 543 - - 17,500 18,043
Both assets and liabilities are included to understand the Group’s liquidity risk management as the liquidity
is managed on a net asset and liability basis.
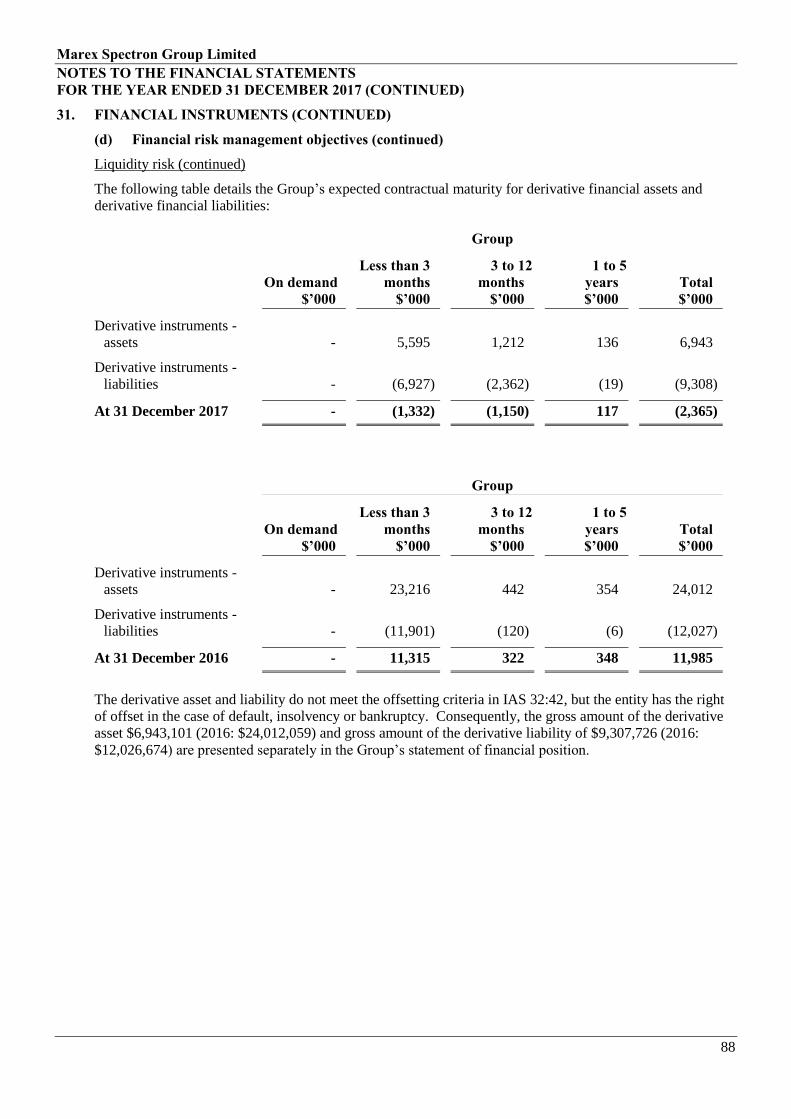
Marex Spectron Group Limited
NOTES TO THE FINANCIAL STATEMENTS
FOR THE YEAR ENDED 31 DECEMBER 2017 (CONTINUED)
88
31. FINANCIAL INSTRUMENTS (CONTINUED)
(d) Financial risk management objectives (continued)
Liquidity risk (continued)
The following table details the Group’s expected contractual maturity for derivative financial assets and
derivative financial liabilities:
Group
On demand
$’000
Less than 3
months
$’000
3 to 12
months
$’000
1 to 5
years
$’000
Total
$’000
Derivative instruments -
assets - 5,595 1,212 136 6,943
Derivative instruments -
liabilities - (6,927) (2,362) (19) (9,308)
At 31 December 2017 - (1,332) (1,150) 117 (2,365)
Group
On demand
$’000
Less than 3
months
$’000
3 to 12
months
$’000
1 to 5
years
$’000
Total
$’000
Derivative instruments -
assets - 23,216 442 354 24,012
Derivative instruments -
liabilities - (11,901) (120) (6) (12,027)
At 31 December 2016 - 11,315 322 348 11,985
The derivative asset and liability do not meet the offsetting criteria in IAS 32:42, but the entity has the right
of offset in the case of default, insolvency or bankruptcy. Consequently, the gross amount of the derivative
asset $6,943,101 (2016: $24,012,059) and gross amount of the derivative liability of $9,307,726 (2016:
$12,026,674) are presented separately in the Group’s statement of financial position.

Marex Spectron Group Limited
NOTES TO THE FINANCIAL STATEMENTS
FOR THE YEAR ENDED 31 DECEMBER 2017 (CONTINUED)
89
31. FINANCIAL INSTRUMENTS (CONTINUED)
(d) Financial risk management objectives (continued)
Fair value measurement
The information set out below provides information about how the Group determines fair values of various
financial assets and financial liabilities.
The following table provides an analysis of financial instruments that are measured subsequent to initial
recognition at fair value, grouped into Levels 1 to 3 based on the degree to which the fair value is observable:
▪ Level 1 fair value measurements are those derived from quoted prices (unadjusted) in active markets
for identical assets or liabilities;
▪ Level 2 fair value measurements are those derived from inputs other than quoted prices included within
Level 1 that are observable for the asset or liability, either directly (i.e. as prices) or indirectly (i.e.
derived from prices); and
▪ Level 3 fair value measurements are those derived from valuation techniques that include inputs for the
asset or liability that are not based on observable market data (unobservable inputs).
The level 2 pricing for investments is based on the latest traded price. The level 2 pricing for derivative
instruments is based on counterparty information which provides daily valuations.
The level 3 pricing for derivative instruments are determined using quantitative models that require the use
of multiple market inputs including commodity prices, interest and foreign exchange rates to generate
continuous yield or pricing curves and volatility factors, which are used to value the position.
The following table shows an analysis of the financial assets and liabilities recorded at fair value shown in
accordance with the fair value hierarchy.
Group
Level 1
$’000
Level 2
$’000
Level 3
$’000
Total
$’000
Financial assets at FVTPL:
Amounts due from exchanges, clearing
houses and other counterparties 203,482 - - 203,482
Derivative instruments - 6,822 121 6,943
Available-for-sale financial assets
Investments 2,394 5,920 - 8,314
Financial liabilities at FVTPL:
Amounts due to exchanges, clearing
houses and other counterparties (2,691) - - (2,691)
Derivative instruments - (9,139) (169) (9,308)
At 31 December 2017 203,185 3,603 (48) 206,740
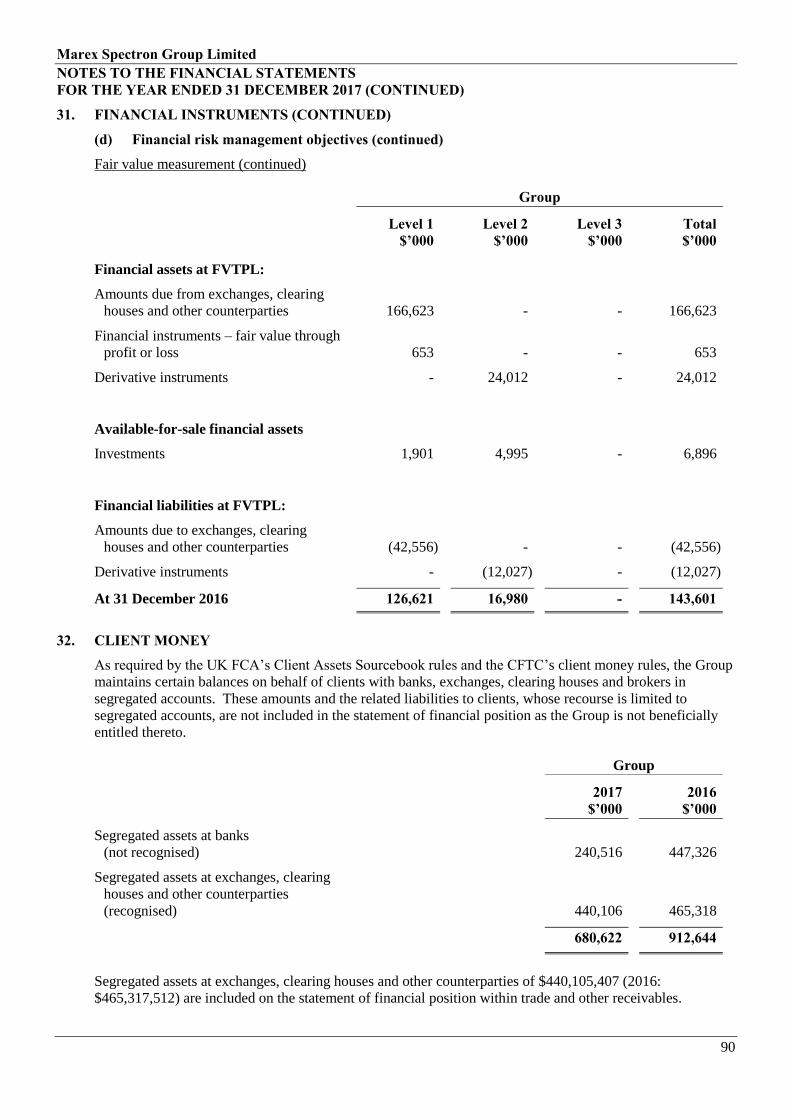
Marex Spectron Group Limited
NOTES TO THE FINANCIAL STATEMENTS
FOR THE YEAR ENDED 31 DECEMBER 2017 (CONTINUED)
90
31. FINANCIAL INSTRUMENTS (CONTINUED)
(d) Financial risk management objectives (continued)
Fair value measurement (continued)
Group
Level 1
$’000
Level 2
$’000
Level 3
$’000
Total
$’000
Financial assets at FVTPL:
Amounts due from exchanges, clearing
houses and other counterparties 166,623 - - 166,623
Financial instruments – fair value through
profit or loss 653 - - 653
Derivative instruments - 24,012 - 24,012
Available-for-sale financial assets
Investments 1,901 4,995 - 6,896
Financial liabilities at FVTPL:
Amounts due to exchanges, clearing
houses and other counterparties (42,556) - - (42,556)
Derivative instruments - (12,027) - (12,027)
At 31 December 2016 126,621 16,980 - 143,601
32. CLIENT MONEY
As required by the UK FCA’s Client Assets Sourcebook rules and the CFTC’s client money rules, the Group
maintains certain balances on behalf of clients with banks, exchanges, clearing houses and brokers in
segregated accounts. These amounts and the related liabilities to clients, whose recourse is limited to
segregated accounts, are not included in the statement of financial position as the Group is not beneficially
entitled thereto.
Group
2017
$’000
2016
$’000
Segregated assets at banks
(not recognised) 240,516 447,326
Segregated assets at exchanges, clearing
houses and other counterparties
(recognised) 440,106 465,318
680,622 912,644
Segregated assets at exchanges, clearing houses and other counterparties of $440,105,407 (2016:
$465,317,512) are included on the statement of financial position within trade and other receivables.

Marex Spectron Group Limited
NOTES TO THE FINANCIAL STATEMENTS
FOR THE YEAR ENDED 31 DECEMBER 2017 (CONTINUED)
91
33. COMPANY PROFIT AND LOSS
As permitted by section 408 of the Companies Act 2006, the Company has elected not to present its income
statement for the year. The Company reported a profit for year ended 31 December 2017 of $542,243 (2016:
$992,938).
34. EVENTS AFTER THE BALANCE SHEET DATE
There are no significant events subsequent to the reporting date.
35. RELATED PARTY TRANSACTIONS
(a) Parent and ultimate controlling party
In these financial statements of the Group, being the Company and its subsidiaries, subsidiaries refer to the
entities controlled by the Company as disclosed in note 16(c).
In the directors’ opinion, the immediate parent and ultimate controlling party of the Company is Amphitryon
Limited, a company incorporated in Jersey, Channel Islands.
(b) Key Management Personnel
The remuneration paid to directors for their services to the Group was as follows:
Group
2017
$’000
2016
$’000
Aggregate wages and salaries 7,884 7,158
Short-term monetary benefits 80 71
7,964 7,229
The remuneration of the highest paid director for their services to the Group was $2,599,963 (2016:
$2,224,764). No pension contributions were made on their behalf whilst they were a director of the Group
(2016: $nil). As at 31 December 2017, there were no directors in the Group’s defined contribution scheme
(2016: nil).
The remuneration paid to other Key Management Personnel for their services to the Group was as follows:
Group
2017
$’000
2016
$’000
Aggregate wages and salaries 4,882 5,371
Short-term monetary benefits 32 33
Defined pension cost 58 40
4,972 5,444
Marex Spectron Group Limited
NOTES TO THE FINANCIAL STATEMENTS
FOR THE YEAR ENDED 31 DECEMBER 2017 (CONTINUED)
92
35. RELATED PARTY TRANSACTIONS (CONTINUED)
(c) Key Management Personnel transactions
The Group made loans to certain directors associated with equity awards of $47,340 (2016: $141,971). In
addition, the Group made loans to certain senior current and former employees relating to tax payments
associated with equity awards of $429,433 (2016: $293,561). The loans are non-interest bearing and will be
repayable under the terms of the equity award arising at the liquidating event.
During the year, certain employee directors of the Company were part of a long-term senior management
compensation plan arranged by the majority shareholders of the Company. The majority of the
compensation plan payable under these arrangements is contingent upon sale of the Company and the sale
price being at a level which provides all the shareholders of the Company with a profit. A minority of the
compensation plan is contingent on the profits of the Company exceeding a given threshold over a multi-year
period. The only time when the company will be required to make a payment under this plan would be when
it is sold by its shareholders.
(d) Transactions with entities having significant influence over the Group
Balances and transactions between the Company and its subsidiaries which are related parties have been
eliminated on consolidation and not disclosed in this note.
The Group pays management fees to parties associated with the ultimate parent company based on a
percentage of the Group’s profitability amounting to $694,258 (2016: $767,560).
During the year, the Group did not receive any consortium relief from entities that have significant influence
over the Group (2016: $815,892). The payable balance at 31 December 2017 was $619,302 (2016:
$567,660).