Embed Size (px)
Citation preview
Annual Report and Financial Statements
for the year ended 31 December 2016
Dimensional Funds ICVC
Authorised and Regulated by the Financial Conduct Authority

No marketing notification has been submitted in Germany for the following Funds of Dimensional Funds ICVC:
Global Short-Dated Bond FundInternational Core Equity FundInternational Value FundUnited Kingdom Core Equity FundUnited Kingdom Small Companies FundUnited Kingdom Value Fund
Accordingly, these Funds must not be publicly marketed in Germany.
Table of Contents
1Dimensional Fund Advisors Ltd.
Dimensional Funds ICVC
Annual Report and Financial Statements, 31 December 2016
General Information* 2
Investment Objective and Policy* 3
Authorised Corporate Directors’ Investment Report* 6
Incorporation and Share Capital* 10
The Sub-Funds 10
Sub-Fund Cross-Holdings 10
Authorised Status* 10
Regulatory Disclosure* 10
Remuneration Disclosures* 10
Responsibilities of the Authorised Corporate Director 11
Responsibilities of the Depositary 11
Report of the Depositary to the Shareholders 11
Directors' Statement 11
Independent Auditors’ Report 12
The Annual Report and Financial Statements for each of the below Sub-Funds (the “Funds”);
Emerging Markets Core Equity FundGlobal Short-Dated Bond FundInternational Core Equity FundInternational Value FundUnited Kingdom Core Equity FundUnited Kingdom Small Companies FundUnited Kingdom Value Fund
are set out in the following order:
Fund Information 14
Portfolio Statement* 31
Statement of Total Return 136
Statement of Change in Net Assets Attributable to Shareholders 136
Balance Sheet 137
Notes to the Financial Statements 138
Distribution Tables 156
Supplemental Information 165
* These collectively comprise the Authorised Corporate Directors’ (“ACD”) Report
Dimensional Fund Advisors Ltd.
Dimensional Funds ICVC
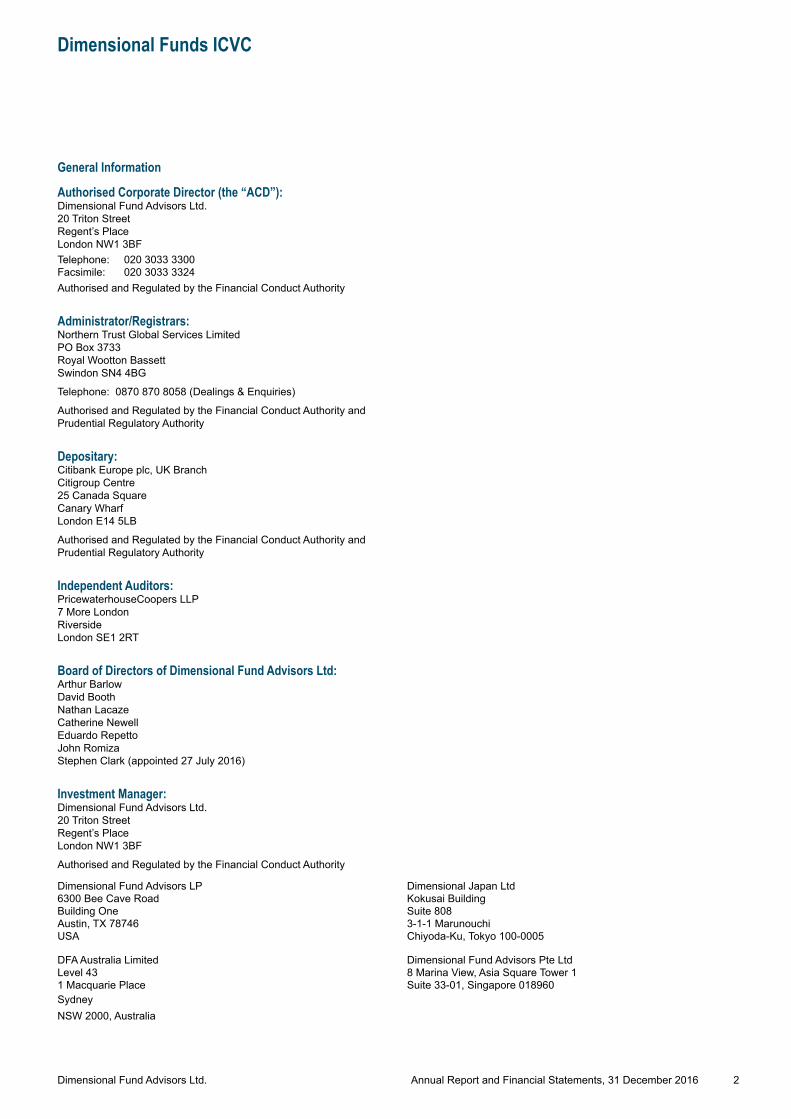
General Information
2Annual Report and Financial Statements, 31 December 2016
Authorised Corporate Director (the “ACD”):Dimensional Fund Advisors Ltd.20 Triton StreetRegent’s PlaceLondon NW1 3BFTelephone: 020 3033 3300Facsimile: 020 3033 3324Authorised and Regulated by the Financial Conduct Authority
Administrator/Registrars:Northern Trust Global Services LimitedPO Box 3733Royal Wootton BassettSwindon SN4 4BG
Telephone: 0870 870 8058 (Dealings & Enquiries)
Authorised and Regulated by the Financial Conduct Authority andPrudential Regulatory Authority
Depositary:Citibank Europe plc, UK BranchCitigroup Centre25 Canada SquareCanary WharfLondon E14 5LB
Authorised and Regulated by the Financial Conduct Authority andPrudential Regulatory Authority
Independent Auditors:PricewaterhouseCoopers LLP7 More LondonRiversideLondon SE1 2RT
Board of Directors of Dimensional Fund Advisors Ltd:Arthur BarlowDavid BoothNathan LacazeCatherine NewellEduardo RepettoJohn RomizaStephen Clark (appointed 27 July 2016)
Investment Manager:Dimensional Fund Advisors Ltd.20 Triton StreetRegent’s PlaceLondon NW1 3BF
Authorised and Regulated by the Financial Conduct Authority
Dimensional Fund Advisors LP Dimensional Japan Ltd6300 Bee Cave Road Kokusai BuildingBuilding One Suite 808Austin, TX 78746 3-1-1 MarunouchiUSA Chiyoda-Ku, Tokyo 100-0005
DFA Australia Limited Dimensional Fund Advisors Pte LtdLevel 43 8 Marina View, Asia Square Tower 11 Macquarie Place Suite 33-01, Singapore 018960SydneyNSW 2000, Australia
Dimensional Fund Advisors Ltd.
Dimensional Funds ICVC
Investment Objective and Policy
3Annual Report and Financial Statements, 31 December 2016
Emerging Markets Core Equity Fund The investment objective of the Emerging Markets Core Equity Fund (the “Fund”) is to maximise long-term total return.
The investment policy of this Fund is to purchase transferable securities of publicly-traded companies in emerging markets which the ACD deems eligible or of companies which derive a significant proportion of their business from such emerging markets.
The Fund will generally have a higher allocation to small-cap companies and in companies which the ACD deems to be eligible value stocks, and a corresponding lower allocation to large growth companies, in each case, relative to the securities eligible for investment by the Fund across all the various markets on which it may invest. Companies are considered small primarily based on a company’s market capitalisation. Securities are considered value stocks primarily because a company’s shares have a high book value in relation to their market value. In assessing value, the ACD may consider additional factors such as price to cash flow or price to earnings ratios, as well as economic conditions and developments in the issuer’s industry. The criteria the ACD uses for assessing value are subject to change from time to time. The ACD may also modify Fund allocations after considering other factors which the ACD determines to be appropriate, such as free float, momentum, trading strategies, liquidity management, and profitability, as well as other factors that the ACD determines to be appropriate given market conditions. In assessing profitability, the ACD may consider different ratios, such as that of earnings or profits from operations relative to book value or assets.
Emerging market countries are countries that are generally considered to be developing or emerging countries by the World Bank or International Finance Corporation or otherwise are regarded by their own authorities as developing. Currently, the Fund intends to purchase a broad and diverse group of securities or depositary receipts of companies which are organised under the laws of, or maintain their principal place of business in, emerging markets countries which are traded on the principal exchanges of Brazil, Chile, Colombia, Czech Republic, Greece, Hong Kong, Hungary, India, Indonesia, Malaysia, Mexico, Peru, Philippines, Poland, South Africa, South Korea, Taiwan, Thailand and Turkey. The ACD reserves the right to amend the list of countries at any time. Any amendment to this list will be notified in the periodic reports of the Fund.
A fuller statement of Investment Policy is available in the Prospectus.
Global Short-Dated Bond FundThe investment objective of the Global Short-Dated Bond Fund (the “Fund”) is to seek to maximise current income while preserving capital.
The investment policy of this Fund is to purchase high quality, investment grade short term fixed income and floating-rate securities and money market instruments issued by governmental, quasi-governmental and corporate issuers in developed countries which mature in five years or less from the date of settlement of the purchase of the instrument. At the present time, developed countries comprise Australia, Austria, Belgium, Canada, Denmark, Finland, France, Germany, Hong Kong, Ireland, Italy, Japan, Luxembourg, Netherlands, New Zealand, Norway, Singapore, Spain, Sweden, Switzerland, Portugal, the United Kingdom and the United States. It is not the current intention of the Fund to invest in emerging markets. The ACD reserves the right to amend the list of countries at any time. Any amendment to this list will be notified in the periodic reports of the Fund.
Under normal circumstances the Fund will invest most of its assets in investment grade short term fixed income and floating-rate securities and money market instruments; it is expected that most of the assets of the Fund held in foreign-currency-denominated instruments will be hedged back into the base currency of the portfolio.
A fuller statement of Investment Policy is available in the Prospectus.
Dimensional Fund Advisors Ltd.
Dimensional Funds ICVC
Investment Objective and Policy (continued)
4Annual Report and Financial Statements, 31 December 2016
International Core Equity Fund The investment objective of the International Core Equity Fund (the “Fund”) is to maximise long-term total return.
The investment policy of this Fund is to purchase transferable securities of certain non-United Kingdom companies. Generally, the Fund intends to purchase a broad and diverse group of readily marketable stocks of companies organised under the laws of certain developed countries, excluding the United Kingdom and in securities of companies organised under the laws of other eligible markets, including the United Kingdom, the majority of whose revenues derive from, or the majority of whose business is conducted in, these countries. The Fund will generally be overweighted in small companies and in shares which the ACD deems to be eligible value stocks, and underweighted in large growth companies. At the present time, the Fund may invest in Australia, Austria, Belgium, Canada, Denmark, Finland, France, Germany, Greece, Hong Kong, Ireland, Israel, Italy, Japan, Netherlands, New Zealand, Norway, Portugal, Singapore, Spain, Sweden, Switzerland and the United States of America. The ACD reserves the right to amend the list of countries at any time. Companies are considered small primarily based on a company’s market capitalisation. Securities are considered value stocks primarily because a company’s shares have a high book value in relation to their market value. In assessing value, the ACD may consider additional factors such as price to cash flow or price-to-earnings ratios, as well as economic conditions and developments in the issuer’s industry. The criteria the ACD uses for assessing value are subject to change from time to time. The Fund’s investment objective may also be achieved through the use of depositary receipts representing securities of companies meeting the above criteria. The ACD may also modify Fund allocations after considering other factors which the ACD determines to be appropriate, such as free float, momentum, trading strategies, liquidity management, and profitability, as well as other factors that the ACD determines to be appropriate given market conditions. In assessing profitability, the ACD may consider different ratios, such as that of earnings or profits from operations relative to book value or assets.
A fuller statement of Investment Policy is available in the Prospectus.
International Value Fund The investment objective of the International Value Fund (the “Fund”) is to maximise long-term total return.
The investment policy of this Fund is to purchase transferable securities of certain non-United Kingdom companies which the ACD deems eligible value stocks. Generally the Fund intends to purchase a broad and diverse group of readily marketable stocks of companies organised under the laws of certain developed countries, excluding the United Kingdom, and in securities of companies organised under the laws of other eligible markets, including the United Kingdom, the majority of whose revenues derive from, or the majority of whose business is conducted in these countries. At the present time the Fund may invest in Australia, Austria, Belgium, Canada, Denmark, Finland, France, Germany, Greece, Hong Kong, Ireland, Israel, Italy, Japan, Netherlands, New Zealand, Norway, Portugal, Singapore, Spain, Sweden, Switzerland and the United States of America. The ACD reserves the right to amend the list of countries at any time. Securities are considered value stocks primarily because a company’s shares have a high book value in relation to their market value. In assessing value, the ACD may consider additional factors such as price to cash flow or price-to-earnings ratios, as well as economic conditions and developments in the issuer’s industry. The criteria the ACD uses for assessing value are subject to change from time to time. The Fund’s investment objective may also be achieved through the use of depositary receipts representing securities of companies meeting the above criteria. The ACD may also modify Fund allocations after considering other factors which the ACD determines to be appropriate, such as free float, momentum, trading strategies, liquidity management, and profitability, as well as other factors that the ACD determines to be appropriate given market conditions. In assessing profitability, the ACD may consider different ratios, such as that of earnings or profits from operations relative to book value or assets.
A fuller statement of Investment Policy is available in the Prospectus.
Dimensional Fund Advisors Ltd.
Dimensional Funds ICVC
Investment Objective and Policy (continued)
5Annual Report and Financial Statements, 31 December 2016
United Kingdom Core Equity Fund The investment objective of the United Kingdom Core Equity Fund (the “Fund”) is to maximise long-term total return.
The investment policy of this Fund is to purchase transferable securities of United Kingdom companies. Generally the Fund intends to purchase a broad and diverse group of readily marketable stocks of United Kingdom companies traded principally on the London Stock Exchange or an over-the-counter market (primarily the United Kingdom over-the-counter market). The Fund will generally be overweighted in small companies and in shares which the ACD deems to be eligible value stocks, and underweighted in large growth companies. Companies are considered small primarily based on a company’s market capitalisation. Securities are considered to be value stocks primarily because a company’s shares have a high book value in relation to their market value. In assessing value, the ACD may consider additional factors such as price to cash flow or price-to-earnings ratios, as well as economic conditions and developments in the issuer’s industry. The criteria the ACD uses for assessing value are subject to change from time to time. The ACD may also modify Fund allocations after considering other factors which the ACD determines to be appropriate, such as free float, momentum, trading strategies, liquidity management, and profitability, as well as other factors that the ACD determines to be appropriate given market conditions. In assessing profitability, the ACD may consider different ratios, such as that of earnings or profits from operations relative to book value or assets.
A fuller statement of Investment Policy is available in the Prospectus.
United Kingdom Small Companies Fund The investment objective of the United Kingdom Small Companies Fund (the “Fund”) is to maximise long-term total return.
The investment policy of this Fund is to purchase transferable securities of United Kingdom companies which the ACD deems eligible small companies. Generally the Fund intends to purchase a broad and diverse group of readily marketable stocks of United Kingdom small companies which are traded principally on the London Stock Exchange or on an over-the-counter market (primarily United Kingdom over-the-counter market). Companies are considered small primarily based on a company’s market capitalisation.
A fuller statement of Investment Policy is available in the Prospectus.
United Kingdom Value Fund The investment objective of the United Kingdom Value Fund (the “Fund”) is to maximise long-term total return.
The investment policy of this Fund is to purchase transferable securities of United Kingdom companies which the ACD deems eligible value stocks. Generally the Fund intends to purchase a broad and diverse group of readily marketable stocks of United Kingdom companies traded principally on the London Stock Exchange or on over-the-counter market (primarily United Kingdom over-the-counter market) that the ACD determines to be value stocks. Securities are considered value stocks primarily because a company’s shares have a high book value in relation to their market value. In assessing value, the ACD may consider additional factors such as price to cash flow or price-to-earnings ratios, as well as economic conditions and developments in the issuer’s industry. The criteria the ACD uses for assessing value are subject to change from time to time. The ACD may also modify Fund allocations after considering other factors which the ACD determines to be appropriate, such as free float, momentum, trading strategies, liquidity management, and profitability, as well as other factors that the ACD determines to be appropriate given market conditions. In assessing profitability, the ACD may consider different ratios, such as that of earnings or profits from operations relative to book value or assets.
A fuller statement of Investment Policy is available in the Prospectus.
Dimensional Fund Advisors Ltd.
Dimensional Funds ICVC
Authorised Corporate Directors’ Investment Report
6Annual Report and Financial Statements, 31 December 2016
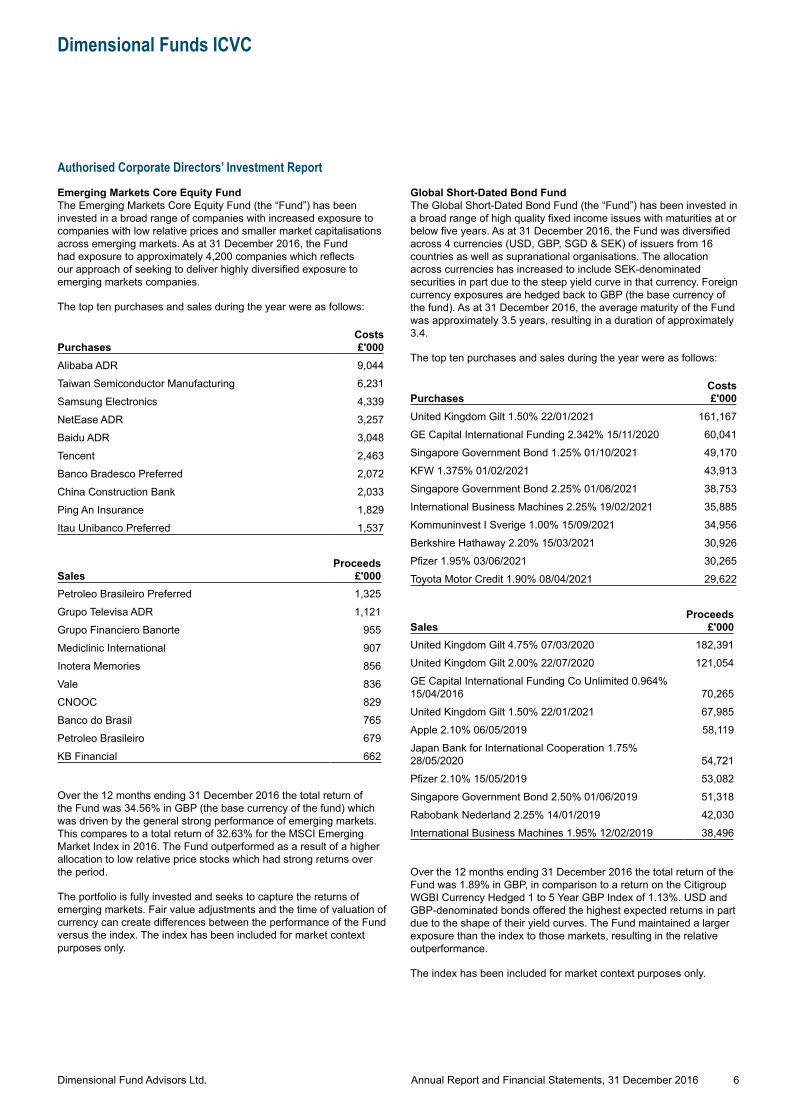
Emerging Markets Core Equity Fund The Emerging Markets Core Equity Fund (the “Fund”) has been invested in a broad range of companies with increased exposure to companies with low relative prices and smaller market capitalisations across emerging markets. As at 31 December 2016, the Fund had exposure to approximately 4,200 companies which reflects our approach of seeking to deliver highly diversified exposure to emerging markets companies.
The top ten purchases and sales during the year were as follows:
PurchasesCosts £'000
Alibaba ADR 9,044Taiwan Semiconductor Manufacturing 6,231Samsung Electronics 4,339NetEase ADR 3,257Baidu ADR 3,048Tencent 2,463Banco Bradesco Preferred 2,072China Construction Bank 2,033Ping An Insurance 1,829Itau Unibanco Preferred 1,537
SalesProceeds
£'000Petroleo Brasileiro Preferred 1,325Grupo Televisa ADR 1,121Grupo Financiero Banorte 955Mediclinic International 907Inotera Memories 856Vale 836CNOOC 829Banco do Brasil 765Petroleo Brasileiro 679KB Financial 662
Over the 12 months ending 31 December 2016 the total return of the Fund was 34.56% in GBP (the base currency of the fund) which was driven by the general strong performance of emerging markets. This compares to a total return of 32.63% for the MSCI Emerging Market Index in 2016. The Fund outperformed as a result of a higher allocation to low relative price stocks which had strong returns over the period.
The portfolio is fully invested and seeks to capture the returns of emerging markets. Fair value adjustments and the time of valuation of currency can create differences between the performance of the Fund versus the index. The index has been included for market context purposes only.
Global Short-Dated Bond Fund The Global Short-Dated Bond Fund (the “Fund”) has been invested in a broad range of high quality fixed income issues with maturities at or below five years. As at 31 December 2016, the Fund was diversified across 4 currencies (USD, GBP, SGD & SEK) of issuers from 16 countries as well as supranational organisations. The allocation across currencies has increased to include SEK-denominated securities in part due to the steep yield curve in that currency. Foreign currency exposures are hedged back to GBP (the base currency of the fund). As at 31 December 2016, the average maturity of the Fund was approximately 3.5 years, resulting in a duration of approximately 3.4.
The top ten purchases and sales during the year were as follows:
PurchasesCosts £'000
United Kingdom Gilt 1.50% 22/01/2021 161,167GE Capital International Funding 2.342% 15/11/2020 60,041Singapore Government Bond 1.25% 01/10/2021 49,170KFW 1.375% 01/02/2021 43,913Singapore Government Bond 2.25% 01/06/2021 38,753International Business Machines 2.25% 19/02/2021 35,885Kommuninvest I Sverige 1.00% 15/09/2021 34,956Berkshire Hathaway 2.20% 15/03/2021 30,926Pfizer 1.95% 03/06/2021 30,265Toyota Motor Credit 1.90% 08/04/2021 29,622
SalesProceeds
£'000United Kingdom Gilt 4.75% 07/03/2020 182,391United Kingdom Gilt 2.00% 22/07/2020 121,054GE Capital International Funding Co Unlimited 0.964% 15/04/2016 70,265United Kingdom Gilt 1.50% 22/01/2021 67,985Apple 2.10% 06/05/2019 58,119Japan Bank for International Cooperation 1.75% 28/05/2020 54,721Pfizer 2.10% 15/05/2019 53,082Singapore Government Bond 2.50% 01/06/2019 51,318Rabobank Nederland 2.25% 14/01/2019 42,030International Business Machines 1.95% 12/02/2019 38,496
Over the 12 months ending 31 December 2016 the total return of the Fund was 1.89% in GBP, in comparison to a return on the Citigroup WGBI Currency Hedged 1 to 5 Year GBP Index of 1.13%. USD and GBP-denominated bonds offered the highest expected returns in part due to the shape of their yield curves. The Fund maintained a larger exposure than the index to those markets, resulting in the relative outperformance.
The index has been included for market context purposes only.
Dimensional Fund Advisors Ltd.
Dimensional Funds ICVC
Authorised Corporate Directors’ Investment Report (continued)
7Annual Report and Financial Statements, 31 December 2016
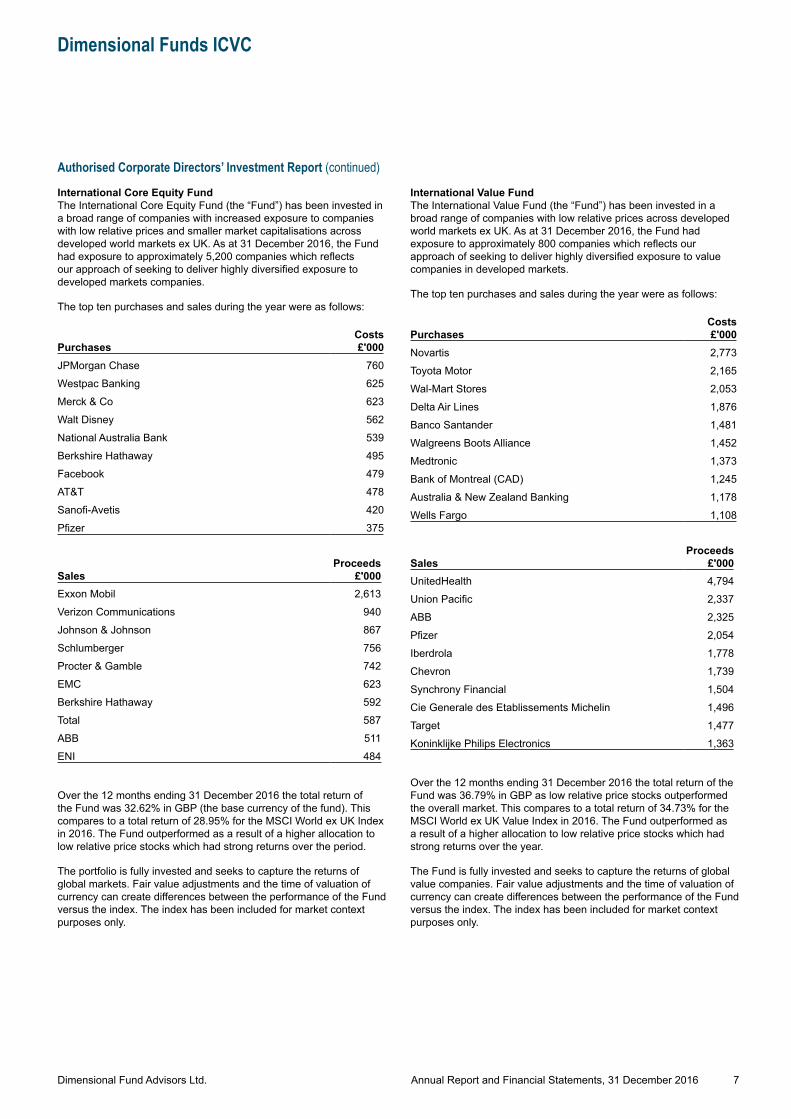
International Core Equity Fund The International Core Equity Fund (the “Fund”) has been invested in a broad range of companies with increased exposure to companies with low relative prices and smaller market capitalisations across developed world markets ex UK. As at 31 December 2016, the Fund had exposure to approximately 5,200 companies which reflects our approach of seeking to deliver highly diversified exposure to developed markets companies.
The top ten purchases and sales during the year were as follows:
PurchasesCosts £'000
JPMorgan Chase 760Westpac Banking 625Merck & Co 623Walt Disney 562National Australia Bank 539Berkshire Hathaway 495Facebook 479AT&T 478Sanofi-Avetis 420Pfizer 375
SalesProceeds
£'000Exxon Mobil 2,613Verizon Communications 940Johnson & Johnson 867Schlumberger 756Procter & Gamble 742EMC 623Berkshire Hathaway 592Total 587ABB 511ENI 484
Over the 12 months ending 31 December 2016 the total return of the Fund was 32.62% in GBP (the base currency of the fund). This compares to a total return of 28.95% for the MSCI World ex UK Index in 2016. The Fund outperformed as a result of a higher allocation to low relative price stocks which had strong returns over the period.
The portfolio is fully invested and seeks to capture the returns of global markets. Fair value adjustments and the time of valuation of currency can create differences between the performance of the Fund versus the index. The index has been included for market context purposes only.
International Value FundThe International Value Fund (the “Fund”) has been invested in a broad range of companies with low relative prices across developed world markets ex UK. As at 31 December 2016, the Fund had exposure to approximately 800 companies which reflects our approach of seeking to deliver highly diversified exposure to value companies in developed markets.
The top ten purchases and sales during the year were as follows:
PurchasesCosts £'000
Novartis 2,773Toyota Motor 2,165Wal-Mart Stores 2,053Delta Air Lines 1,876Banco Santander 1,481Walgreens Boots Alliance 1,452Medtronic 1,373Bank of Montreal (CAD) 1,245Australia & New Zealand Banking 1,178Wells Fargo 1,108
SalesProceeds
£'000UnitedHealth 4,794Union Pacific 2,337ABB 2,325Pfizer 2,054Iberdrola 1,778Chevron 1,739Synchrony Financial 1,504Cie Generale des Etablissements Michelin 1,496Target 1,477Koninklijke Philips Electronics 1,363
Over the 12 months ending 31 December 2016 the total return of the Fund was 36.79% in GBP as low relative price stocks outperformed the overall market. This compares to a total return of 34.73% for the MSCI World ex UK Value Index in 2016. The Fund outperformed as a result of a higher allocation to low relative price stocks which had strong returns over the year.
The Fund is fully invested and seeks to capture the returns of global value companies. Fair value adjustments and the time of valuation of currency can create differences between the performance of the Fund versus the index. The index has been included for market context purposes only.
Dimensional Fund Advisors Ltd.
Dimensional Funds ICVC
Authorised Corporate Directors’ Investment Report (continued)
8Annual Report and Financial Statements, 31 December 2016
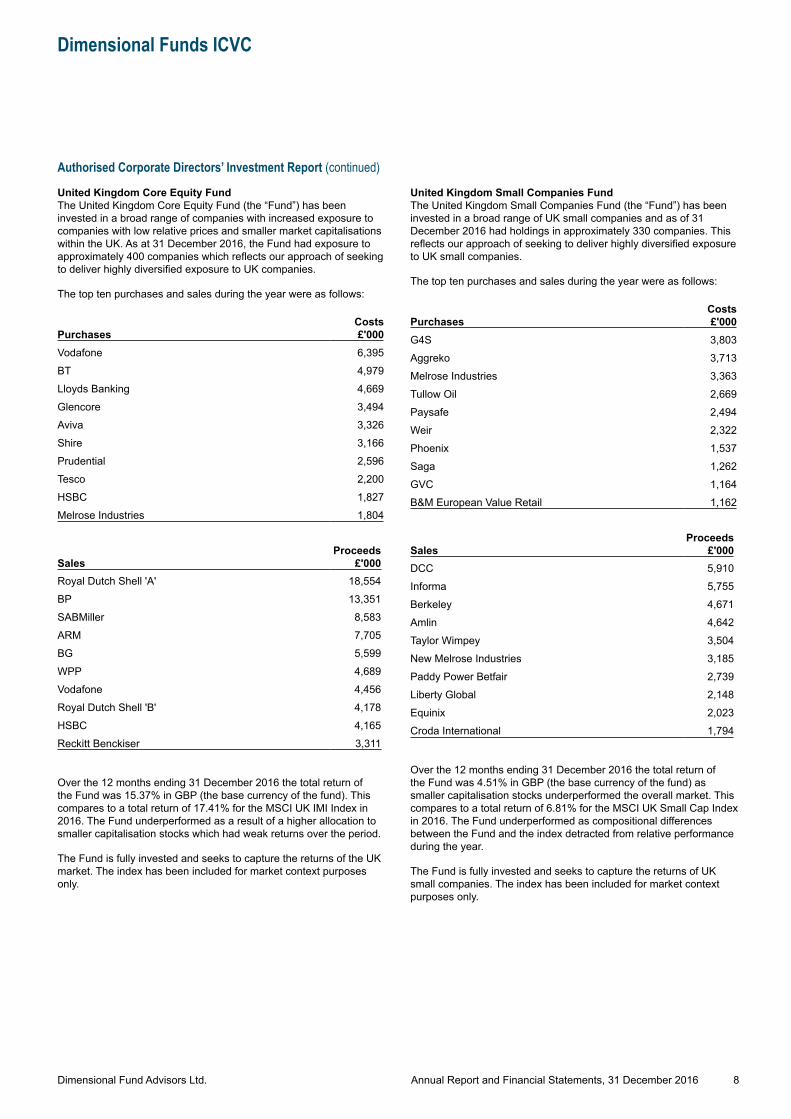
United Kingdom Core Equity Fund The United Kingdom Core Equity Fund (the “Fund”) has been invested in a broad range of companies with increased exposure to companies with low relative prices and smaller market capitalisations within the UK. As at 31 December 2016, the Fund had exposure to approximately 400 companies which reflects our approach of seeking to deliver highly diversified exposure to UK companies.
The top ten purchases and sales during the year were as follows:
PurchasesCosts £'000
Vodafone 6,395BT 4,979Lloyds Banking 4,669Glencore 3,494Aviva 3,326Shire 3,166Prudential 2,596Tesco 2,200HSBC 1,827Melrose Industries 1,804
SalesProceeds
£'000Royal Dutch Shell 'A' 18,554BP 13,351SABMiller 8,583ARM 7,705BG 5,599WPP 4,689Vodafone 4,456Royal Dutch Shell 'B' 4,178HSBC 4,165Reckitt Benckiser 3,311
Over the 12 months ending 31 December 2016 the total return of the Fund was 15.37% in GBP (the base currency of the fund). This compares to a total return of 17.41% for the MSCI UK IMI Index in 2016. The Fund underperformed as a result of a higher allocation to smaller capitalisation stocks which had weak returns over the period.
The Fund is fully invested and seeks to capture the returns of the UK market. The index has been included for market context purposes only.
United Kingdom Small Companies Fund The United Kingdom Small Companies Fund (the “Fund”) has been invested in a broad range of UK small companies and as of 31 December 2016 had holdings in approximately 330 companies. This reflects our approach of seeking to deliver highly diversified exposure to UK small companies.
The top ten purchases and sales during the year were as follows:
PurchasesCosts £'000
G4S 3,803Aggreko 3,713Melrose Industries 3,363Tullow Oil 2,669Paysafe 2,494Weir 2,322Phoenix 1,537Saga 1,262GVC 1,164B&M European Value Retail 1,162
SalesProceeds
£'000DCC 5,910Informa 5,755Berkeley 4,671Amlin 4,642Taylor Wimpey 3,504New Melrose Industries 3,185Paddy Power Betfair 2,739Liberty Global 2,148Equinix 2,023Croda International 1,794
Over the 12 months ending 31 December 2016 the total return of the Fund was 4.51% in GBP (the base currency of the fund) as smaller capitalisation stocks underperformed the overall market. This compares to a total return of 6.81% for the MSCI UK Small Cap Index in 2016. The Fund underperformed as compositional differences between the Fund and the index detracted from relative performance during the year.
The Fund is fully invested and seeks to capture the returns of UK small companies. The index has been included for market context purposes only.
Dimensional Fund Advisors Ltd.
Dimensional Funds ICVC
Authorised Corporate Directors’ Investment Report (continued)
9Annual Report and Financial Statements, 31 December 2016
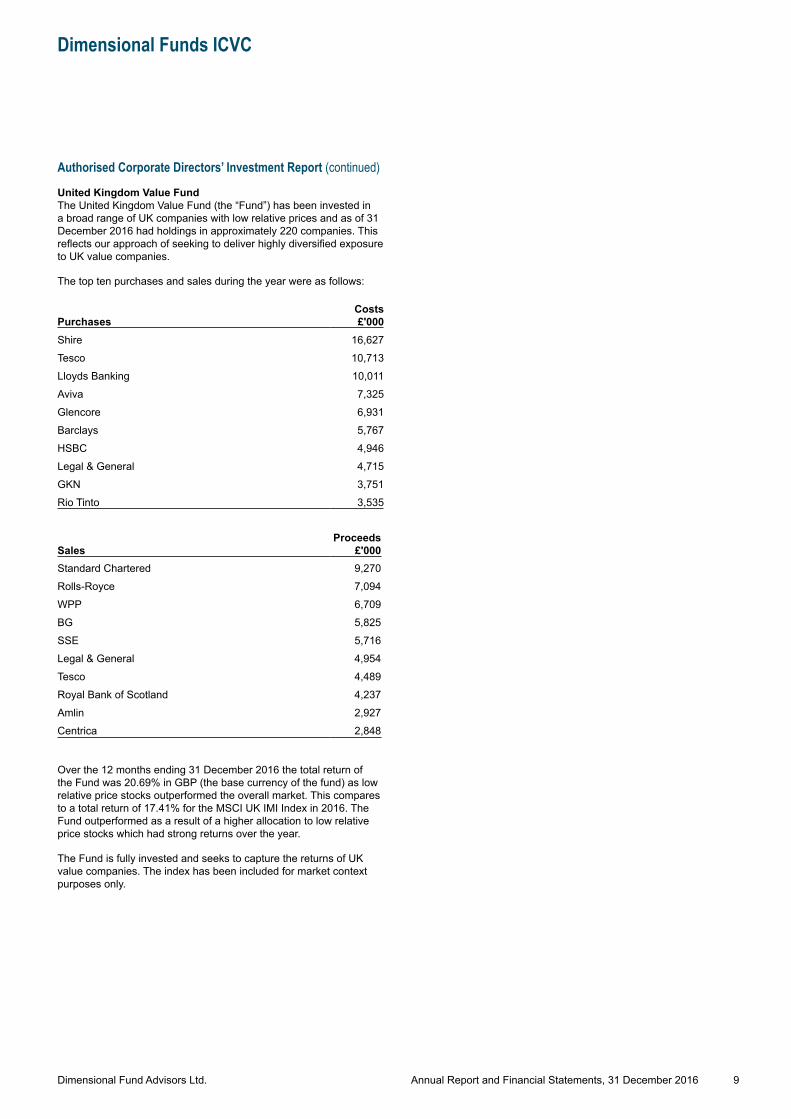
United Kingdom Value Fund The United Kingdom Value Fund (the “Fund”) has been invested in a broad range of UK companies with low relative prices and as of 31 December 2016 had holdings in approximately 220 companies. This reflects our approach of seeking to deliver highly diversified exposure to UK value companies.
The top ten purchases and sales during the year were as follows:
PurchasesCosts £'000
Shire 16,627Tesco 10,713Lloyds Banking 10,011Aviva 7,325Glencore 6,931Barclays 5,767HSBC 4,946Legal & General 4,715GKN 3,751Rio Tinto 3,535
SalesProceeds
£'000Standard Chartered 9,270Rolls-Royce 7,094WPP 6,709BG 5,825SSE 5,716Legal & General 4,954Tesco 4,489Royal Bank of Scotland 4,237Amlin 2,927Centrica 2,848
Over the 12 months ending 31 December 2016 the total return of the Fund was 20.69% in GBP (the base currency of the fund) as low relative price stocks outperformed the overall market. This compares to a total return of 17.41% for the MSCI UK IMI Index in 2016. The Fund outperformed as a result of a higher allocation to low relative price stocks which had strong returns over the year.
The Fund is fully invested and seeks to capture the returns of UK value companies. The index has been included for market context purposes only.
Dimensional Fund Advisors Ltd.
Dimensional Funds ICVC
10Annual Report and Financial Statements, 31 December 2016
The Authorised Corporate Director (the “ACD”) presents the audited annual report and financial statements of Dimensional Funds ICVC for the year ended 31 December 2016.
Incorporation and Share Capital Dimensional Funds ICVC (the “Company”) is an Open-Ended Investment Company ("OEIC") with variable capital incorporated with limited liability and registered in England and Wales under number IC000258 and authorised by the Financial Conduct Authority ("FCA") on 24 September 2003 under the Open-Ended Investment Companies Regulations 2001.
The maximum share capital of the Company is £500,000,000,000 and the minimum share capital is £100. Shares have no par value. The share capital of the Company at all times equals the aggregate net asset values of the Funds.
The base currency for the Company is United Kingdom Pounds Sterling. The Company is of unlimited duration.
The Sub-Funds The Company is structured as an “umbrella” company and comprises seven authorised investment sub-funds. Different sub-funds may be established from time to time by the ACD with the agreement of Citibank Europe plc, UK Branch (the “Depositary”) and approval of the FCA. The sub-funds are operated separately and the assets of each sub-fund are managed in accordance with the investment objective and policy applicable to that sub-fund. The following sub-funds are currently available:
Emerging Markets Core Equity Fund Global Short-Dated Bond Fund International Core Equity Fund International Value Fund United Kingdom Core Equity Fund United Kingdom Small Companies Fund United Kingdom Value Fund
Sub-Fund Cross-Holdings No sub-fund held shares in any other sub-fund within the ICVC during the current or prior year.Authorised Status*Authorised Status The Company represents segregated portfolios of assets and, accordingly, assets of a sub-fund belong exclusively to that sub-fund and shall not be used or made available to discharge (directly or indirectly) the liabilities of, or claims against, any other person or body, including the Company and any other sub-fund and shall not be available for any such purpose. Shareholders are not liable for debts of the Company.Regulatory Disclosure*
Regulatory DisclosureThis document has been issued by Dimensional Fund Advisors Ltd. (Authorised and Regulated by the FCA Firm Reference Number 150100) as ACD.
Past performance is not necessarily a guide to future performance. The value of shares can go down as well as up and is not guaranteed. Changes in rates of exchange may also cause the value of shares to fluctuate.
Remuneration Disclosures*Remuneration DisclosuresThe ACD has established a remuneration policy (the “Remuneration Policy”). The Remuneration Policy complies with the FCA rules regarding remuneration and is designed to ensure that the ACD’s remuneration practices, for those staff in scope of the applicable rules:
(i) are consistent with and promote sound and effective risk management;
(ii) do not encourage risk taking and are consistent with the risk profiles, or the instrument of incorporation or prospectus of any UCITS fund it manages;
(iii) do not impair the ACD’s compliance with its duty to act in the best interests of those funds; and
(iv) include fixed and variable components of remuneration including salaries and discretionary pension benefits.
When applying the Remuneration Policy, the ACD will comply with the applicable rules in a way, and to the extent, that is appropriate to the size, internal organisation and the nature, scope and complexity of the ACD’s activities.
Further details will be available on the ACD’s website (www.dimensional.com). A paper copy of this information provided on the website is available free of charge following a request to the ACD.
Dimensional Fund Advisors Ltd.
Dimensional Funds ICVC
11Annual Report and Financial Statements, 31 December 2016
Responsibilities of the Authorised Corporate DirectorThe FCA Rules requires the Authorised Corporate Director ("ACD") to prepare the annual report and financial statements for each accounting year which give a true and fair view of the financial position of the Company for the year, and the net revenue and the net gains for the year. In preparing the financial statements, the ACD is required to:
● comply with the Statement of Recommended Practice relating for UK Authorised Funds issued by The Investment Management Association in May 2014, the Company’s Instrument of Incorporation, United Kingdom Generally Accepted Accounting Principles and applicable accounting standards subject to any material departures which are required to be disclosed and explained in the financial statements;
● select suitable accounting policies and then apply them consistently;
● make judgements and estimates that are reasonable and prudent;
● keep proper accounting records which enable it to demonstrate that the financial statements as prepared comply with the above requirements; and
● prepare the financial statements on the going concern basis unless it is inappropriate to presume that the Company will continue in operation for the foreseeable future.
The ACD is responsible for the management of the Company and its sub-funds in accordance with the Prospectus, FCA Rules and Open-Ended Investment Companies Regulations 2001 (“Regulations”). The ACD is responsible for taking reasonable steps for the prevention and detection of fraud and other irregularities. The ACD confirms that the above requirements have been met in preparing the financial statements.
Responsibilities of the Depositary Citibank Europe plc, UK Branch (the “Depositary”) is responsible for (i) the safekeeping of assets which are entrusted to it; (ii) the monitoring of the cash flows of the company; and (iii) ensuring that the sale issue, repurchase, redemption and cancellation of units, the valuation of units and the application of income (the “Services”) are carried out in accordance with the Financial Conduct Authority’s Collective Investment Scheme Sourcebook (“the COLL Sourcebook”), the Regulations and the Company’s Instrument of Incorporation and Prospectus, as appropriate, in relation to the pricing of, and dealings in, the shares of the Company, the application of the income of the Company, and the investment and borrowing powers of the Company.
Report of the Depositary to the Shareholdersfor the year ended 31 December 2016
The Depositary is responsible for the safekeeping of all of the property of the Company (other than tangible moveable property) which is entrusted to it and for the collection of revenue that arises from that property.
It is the duty of the Depositary to take reasonable care to ensure that the Company is managed in accordance with the FCA Rules, as amended, the Regulations, the Company’s Instrument of Incorporation and Prospectus, in relation to the pricing of, and dealings in shares in the Company; the application of revenue of the Company; and the investment and borrowing powers applicable to the Company.
Having carried out such procedures as we consider necessary to discharge our responsibilities as Depositary of the Company, it is our opinion, based on the information available to us and the explanations provided, that in all material respects the Company, acting through the ACD, has been managed in accordance with the UCITS Requirements applicable to the Services.
● has carried out the issue, sale, redemption and cancellations and calculation of the price of the Company’s shares and the application of the Company’s revenue in accordance with the FCA Rules and, where applicable, the Regulations, the Instrument of Incorporation and Prospectus of the Company; and
● has observed the investment and borrowing powers and restrictions applicable to the Company.
Citibank Europe plc, UK Branch London 27 March 2017
Directors' StatementThis report has been prepared in accordance with the requirements of FCA Rules and Collective Investment Schemes sourcebook (“COLL”), as issued and amended.
The financial statements on pages 136 to 164 were approved on 27 March 2017 by the ACD and signed on their behalf by:
Arthur Barlow
Dimensional Fund Advisors Ltd.
Dimensional Funds ICVC
Independent Auditors’ Report to the Shareholders of Dimensional Funds ICVC
12Annual Report and Financial Statements, 31 December 2016
Report on the financial statements
Our opinionIn our opinion, Dimensional Funds ICVC’s financial statements, (the “financial statements of the Company”):
● give a true and fair view of the financial position of the Company and each of the sub-funds as at 31 December 2016 and of the net revenue and the net capital gains on the scheme property of the Company and each of the sub-funds for the year then ended; and
● have been properly prepared in accordance with United Kingdom Generally Accepted Accounting Practice, the Statement of Recommended Practice for UK Authorised Funds, the Collective Investment Schemes sourcebook and the Instrument of Incorporation.
What we have auditedDimensional Funds ICVC (the “Company”) is an umbrella fund with a number of sub funds. The financial statements of the Company, included within the Annual Report and Financial Statements (the “Annual Report”) comprise the financial statements of each of the sub-funds, which are prepared by Dimensional Fund Advisors Ltd (the “Authorised Corporate Director”), and comprise for each of the sub-funds:
● the Balance Sheet as at 31 December 2016;
● the Statement of Total Return for the year then ended;
● the Statement of Change in Net Assets Attributable to Shareholders for the year then ended;
● the notes to the financial statements, which include a summary of significant accounting policies and other explanatory information; and
● the Distribution Tables
The financial reporting framework that has been applied in their preparation is applicable law and United Kingdom Accounting Standards (United Kingdom Generally Accepted Accounting Practice), the Statement of Recommended Practice ‘Financial Statements of UK Authorised Funds’ issued by the Investment Management Association (the “Statement of Recommended Practice for UK Authorised Funds”), the Collective Investment Schemes sourcebook and the Instrument of Incorporation.
In applying the financial reporting framework, the Authorised Corporate Director has made a number of subjective judgements, for example in respect of significant accounting estimates. In making such estimates, they have made assumptions and considered future events.
Opinions on matters prescribed by the Collective Investment Schemes sourcebookIn our opinion:
● we have obtained all the information and explanations we consider necessary for the purposes of the audit; and
● the information given in the Authorised Corporate Director’s Report for the financial year for which the financial statements are prepared is consistent with the financial statements.
Other matters on which we are required to report by exception
Propriety of accounting records and information and explanations receivedUnder the Collective Investment Schemes sourcebook we are required to report to you if, in our opinion:
● proper accounting records have not been kept; or
● the financial statements are not in agreement with the accounting records and returns.
We have no exceptions to report arising from this responsibility.
Responsibilities for the financial statements and the audit
Our responsibilities and those of the Authorised Corporate DirectorAs explained more fully in the Authorised Corporate Director’s Responsibilities Statement set out on page 11, the Authorised Corporate Director is responsible for the preparation of the financial statements and for being satisfied that they give a true and fair view.
Our responsibility is to audit and express an opinion on the financial statements in accordance with applicable law and International Standards on Auditing (UK and Ireland) (“ISAs (UK & Ireland)”). Those standards require us to comply with the Auditing Practices Board’s Ethical Standards for Auditors.
This report, including the opinions, has been prepared for and only for the Company’s shareholders as a body in accordance with paragraph 4.5.12 of the Collective Investment Schemes sourcebook as required by paragraph 67(2) of the Open-Ended Investment Companies Regulations 2001 and for no other purpose.
We do not, in giving these opinions, accept or assume responsibility for any other purpose or to any other person to whom this report is shown or into whose hands it may come save where expressly agreed by our prior consent in writing.
What an audit of financial statements involvesWe conducted our audit in accordance with ISAs (UK & Ireland). An audit involves obtaining evidence about the amounts and disclosures in the financial statements sufficient to give reasonable assurance that the financial statements are free from material misstatement, whether caused by fraud or error. This includes an assessment of:
● whether the accounting policies are appropriate to the Company’s and each of the Company’s sub-funds’ circumstances and have been consistently applied and adequately disclosed;
● the reasonableness of significant accounting estimates made by the Authorised Corporate Director; and
● the overall presentation of the financial statements.
We primarily focus our work in these areas by assessing the directors’ judgements against available evidence, forming our own judgements, and evaluating the disclosures in the financial statements.
We test and examine information, using sampling and other auditing techniques, to the extent we consider necessary to provide a reasonable basis for us to draw conclusions. We obtain audit evidence through testing the effectiveness of controls, substantive procedures or a combination of both.
Dimensional Fund Advisors Ltd.
Dimensional Funds ICVC
Independent Auditors’ Report to the Shareholders of Dimensional Funds ICVC (continued)
13Annual Report and Financial Statements, 31 December 2016
In addition, we read all the financial and non-financial information in the Annual Report to identify material inconsistencies with the audited financial statements and to identify any information that is apparently materially incorrect based on, or materially inconsistent with, the knowledge acquired by us in the course of performing the audit. If we become aware of any apparent material misstatements or inconsistencies we consider the implications for our report.
PricewaterhouseCoopers LLP Chartered Accountants and Statutory Auditors London 28 March 2017
Notes:
a) The maintenance and integrity of the dimensional.com websiteis the responsibility of the Authorised Corporate Director; thework carried out by the auditors does not involve considerationof these matters and, accordingly, the auditors accept noresponsibility for any changes that may have occurred to thefinancial statements since they were initially presented on thewebsite.
b) Legislation in the United Kingdom governing the preparationand dissemination of financial statements may differ fromlegislation in other jurisdictions.
Dimensional Fund Advisors Ltd.
Dimensional Funds ICVC
Fund Information
14Annual Report and Financial Statements, 31 December 2016
The following tables show the performance of each share class on a fund by fund basis. The “Return after charges” percentage is calculated as the “Return after operating charges” per share divided by the “opening net asset value per share”.
The Fund’s performance in the Authorised Corporate Directors Investment Report differs from the “Return after charges” disclosed in the Comparative Tables due to Fund performance being calculated based on the latest published price rather than the period end return after operating charges.
Transaction costs are incurred when investments are bought or sold by a fund in order to achieve the investment objective. These transaction costs affect an investor in different ways depending on whether they are joining, leaving or continuing with their investment in the Fund.
Direct transaction costs include broker execution commission and taxes. A broker commission is the fee paid to a broker to execute a share trade when buying and selling the fund's underlying investments in order to achieve the investment objective.
To protect existing investors, portfolio transaction costs incurred as a result of investors buying and selling shares in the Fund may be recovered from those investors through a ‘dilution adjustment’ to the price they pay or receive. The current policy of the ACD is to charge a dilution adjustment to subscriptions in the UK Value, UK Small Companies and UK Core Equity Funds (see page 138 for further details). In the following comparative tables, direct transaction costs are stated after deducting the proportion of the amounts collected from dilution adjustments. A negative transactions costs figure might arise where there is a timing difference between inflows and the settlement of the resultant purchases.
In addition, there are indirect portfolio transaction costs arising from the ‘dealing spread’ – the difference between the buying and selling prices of underlying investments in the portfolio. Unlike shares whereby broker commissions and stamp duty are paid by the fund on each transaction, other types of investments (such as bonds, money instruments, derivatives) do not have separately identifiable transaction costs; these costs form part of the dealing spread. Dealing spreads vary considerably depending on the transaction value and money market sentiment. Dealing spreads are disclosed on page 154.

Dimensional Fund Advisors Ltd.
Emerging Markets Core Equity Fund
Fund Information
15Annual Report and Financial Statements, 31 December 2016
Comparative Tablesfor the financial year ended 31 December 2016
Income Shares
CHANGE IN NET ASSET VALUE PER SHARE2016
(pence per share)2015
(pence per share)2014
(pence per share)
Opening net asset value per share 2,400.28 2,721.60 2,629.82
Return before operating charges* 848.30 (253.30) 158.25Operating charges (calculated on average price) (19.27) (18.50) (19.08)
Return after operating charges* 829.03 (271.80) 139.17
Distributions on income shares (58.15) (49.52) (47.39)
Closing net asset value per share 3,171.16 2,400.28 2,721.60
* after direct transaction costs of: 0.92 0.70 1.28
PERFORMANCE
Return after charges 34.54% (9.99)% 5.29%
OTHER INFORMATIONClosing net asset value (£'000) 555,491 301,456 319,692Closing number of shares 17,516,943 12,559,218 11,746,471Operating charges 0.67% 0.69% 0.70%Direct transaction costs 0.03% 0.03% 0.05%
PRICES
Highest share price 3,447.00 3,141.00 3,036.00Lowest share price 2,220.00 2,222.00 2,456.00
Accumulation Shares
CHANGE IN NET ASSET VALUE PER SHARE2016
(pence per share)2015
(pence per share)2014
(pence per share)
Opening net asset value per share 2,899.32 3,222.95 3,061.08
Return before operating charges* 1,026.40 (301.69) 184.08Operating charges (calculated on average price) (23.09) (21.94) (22.21)
Return after operating charges* 1,003.31 (323.63) 161.87
Distributions (70.41) (58.78) (55.26)
Retained distributions on accumulation shares 70.41 58.78 55.26
Closing net asset value per share 3,902.63 2,899.32 3,222.95
* after direct transaction costs of: 1.10 0.84 1.49
PERFORMANCE
Return after charges 34.60% (10.04)% 5.29%
OTHER INFORMATIONClosing net asset value (£'000) 579,865 427,478 457,170Closing number of shares 14,858,322 14,744,064 14,184,816Operating charges 0.67% 0.69% 0.70%Direct transaction costs 0.03% 0.03% 0.05%
PRICES
Highest share price 4,183.00 3,719.00 3,547.00Lowest share price 2,681.00 2,642.00 2,858.00
Dimensional Fund Advisors Ltd.
Emerging Markets Core Equity Fund
Fund Information (continued)
16Annual Report and Financial Statements, 31 December 2016
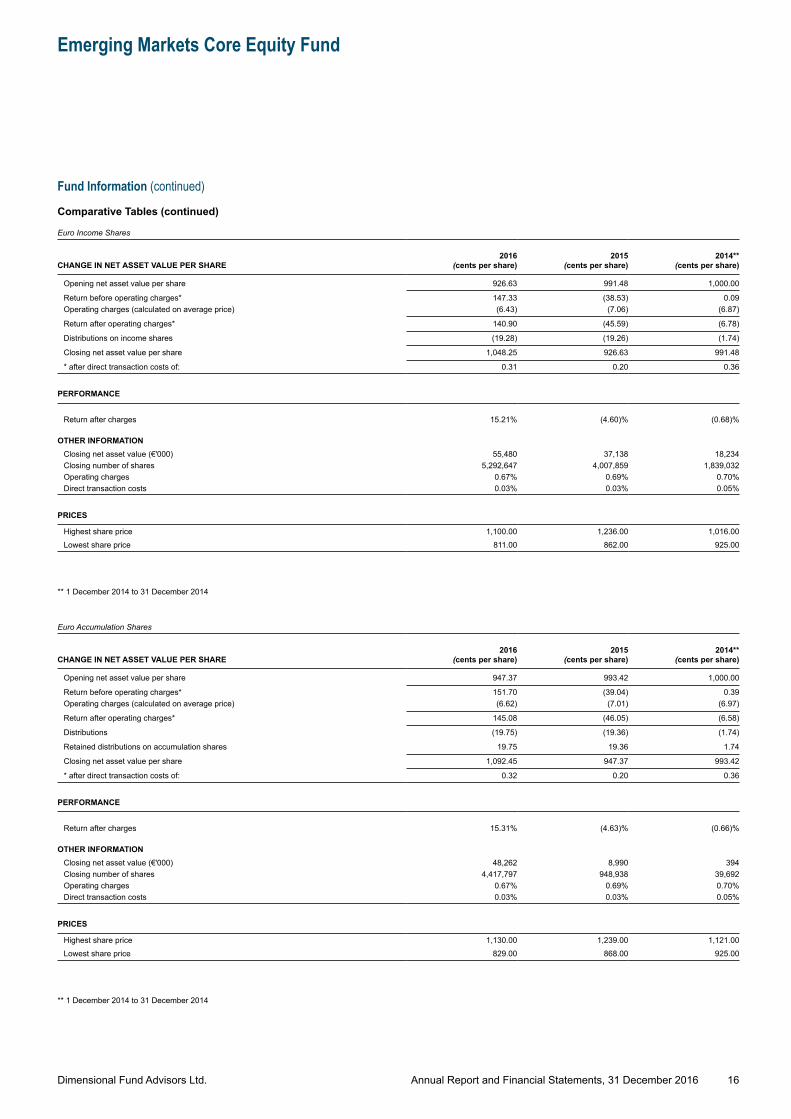
Comparative Tables (continued)
Euro Income Shares
CHANGE IN NET ASSET VALUE PER SHARE2016
(cents per share)2015
(cents per share)2014**
(cents per share)
Opening net asset value per share 926.63 991.48 1,000.00
Return before operating charges* 147.33 (38.53) 0.09Operating charges (calculated on average price) (6.43) (7.06) (6.87)
Return after operating charges* 140.90 (45.59) (6.78)
Distributions on income shares (19.28) (19.26) (1.74)
Closing net asset value per share 1,048.25 926.63 991.48
* after direct transaction costs of: 0.31 0.20 0.36
PERFORMANCE
Return after charges 15.21% (4.60)% (0.68)%
OTHER INFORMATIONClosing net asset value (€'000) 55,480 37,138 18,234Closing number of shares 5,292,647 4,007,859 1,839,032Operating charges 0.67% 0.69% 0.70%Direct transaction costs 0.03% 0.03% 0.05%
PRICES
Highest share price 1,100.00 1,236.00 1,016.00Lowest share price 811.00 862.00 925.00
** 1 December 2014 to 31 December 2014
Euro Accumulation Shares
CHANGE IN NET ASSET VALUE PER SHARE2016
(cents per share)2015
(cents per share)2014**
(cents per share)
Opening net asset value per share 947.37 993.42 1,000.00
Return before operating charges* 151.70 (39.04) 0.39Operating charges (calculated on average price) (6.62) (7.01) (6.97)
Return after operating charges* 145.08 (46.05) (6.58)
Distributions (19.75) (19.36) (1.74)
Retained distributions on accumulation shares 19.75 19.36 1.74
Closing net asset value per share 1,092.45 947.37 993.42
* after direct transaction costs of: 0.32 0.20 0.36
PERFORMANCE
Return after charges 15.31% (4.63)% (0.66)%
OTHER INFORMATIONClosing net asset value (€'000) 48,262 8,990 394Closing number of shares 4,417,797 948,938 39,692Operating charges 0.67% 0.69% 0.70%Direct transaction costs 0.03% 0.03% 0.05%
PRICES
Highest share price 1,130.00 1,239.00 1,121.00Lowest share price 829.00 868.00 925.00
** 1 December 2014 to 31 December 2014
Dimensional Fund Advisors Ltd.
Emerging Markets Core Equity Fund
Fund Information (continued)
17Annual Report and Financial Statements, 31 December 2016
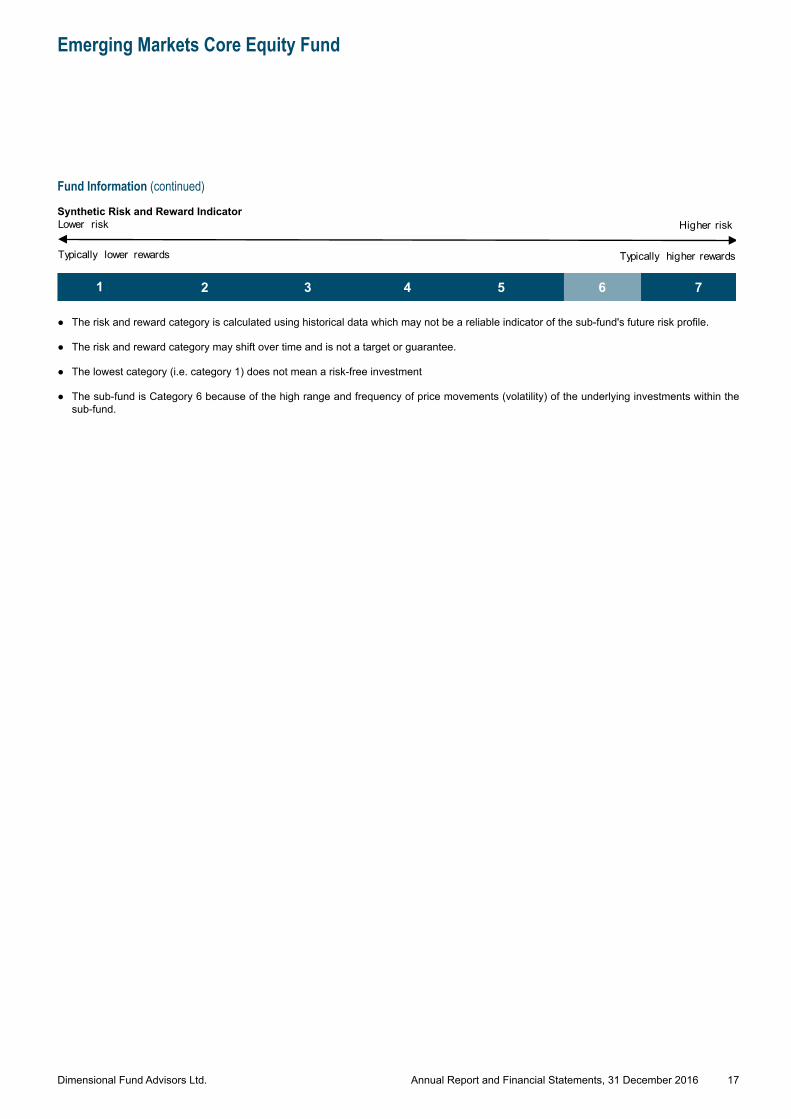
Synthetic Risk and Reward Indicator
0
2Lower risk Higher risk
Typically lower rewards Typically higher rewards
5 74321 6
● The risk and reward category is calculated using historical data which may not be a reliable indicator of the sub-fund's future risk profile.
● The risk and reward category may shift over time and is not a target or guarantee.
● The lowest category (i.e. category 1) does not mean a risk-free investment
● The sub-fund is Category 6 because of the high range and frequency of price movements (volatility) of the underlying investments within the sub-fund.
Comparative Tables (continued)
Euro Income Shares
CHANGE IN NET ASSET VALUE PER SHARE2016
(cents per share)2015
(cents per share)2014**
(cents per share)
Opening net asset value per share 926.63 991.48 1,000.00
Return before operating charges* 147.33 (38.53) 0.09Operating charges (calculated on average price) (6.43) (7.06) (6.87)
Return after operating charges* 140.90 (45.59) (6.78)
Distributions on income shares (19.28) (19.26) (1.74)
Closing net asset value per share 1,048.25 926.63 991.48
* after direct transaction costs of: 0.31 0.20 0.36
PERFORMANCE
Return after charges 15.21% (4.60)% (0.68)%
OTHER INFORMATIONClosing net asset value (€'000) 55,480 37,138 18,234Closing number of shares 5,292,647 4,007,859 1,839,032Operating charges 0.67% 0.69% 0.70%Direct transaction costs 0.03% 0.03% 0.05%
PRICES
Highest share price 1,100.00 1,236.00 1,016.00Lowest share price 811.00 862.00 925.00
** 1 December 2014 to 31 December 2014
Euro Accumulation Shares
CHANGE IN NET ASSET VALUE PER SHARE2016
(cents per share)2015
(cents per share)2014**
(cents per share)
Opening net asset value per share 947.37 993.42 1,000.00
Return before operating charges* 151.70 (39.04) 0.39Operating charges (calculated on average price) (6.62) (7.01) (6.97)
Return after operating charges* 145.08 (46.05) (6.58)
Distributions (19.75) (19.36) (1.74)
Retained distributions on accumulation shares 19.75 19.36 1.74
Closing net asset value per share 1,092.45 947.37 993.42
* after direct transaction costs of: 0.32 0.20 0.36
PERFORMANCE
Return after charges 15.31% (4.63)% (0.66)%
OTHER INFORMATIONClosing net asset value (€'000) 48,262 8,990 394Closing number of shares 4,417,797 948,938 39,692Operating charges 0.67% 0.69% 0.70%Direct transaction costs 0.03% 0.03% 0.05%
PRICES
Highest share price 1,130.00 1,239.00 1,121.00Lowest share price 829.00 868.00 925.00
** 1 December 2014 to 31 December 2014
Dimensional Fund Advisors Ltd.
Global Short-Dated Bond Fund
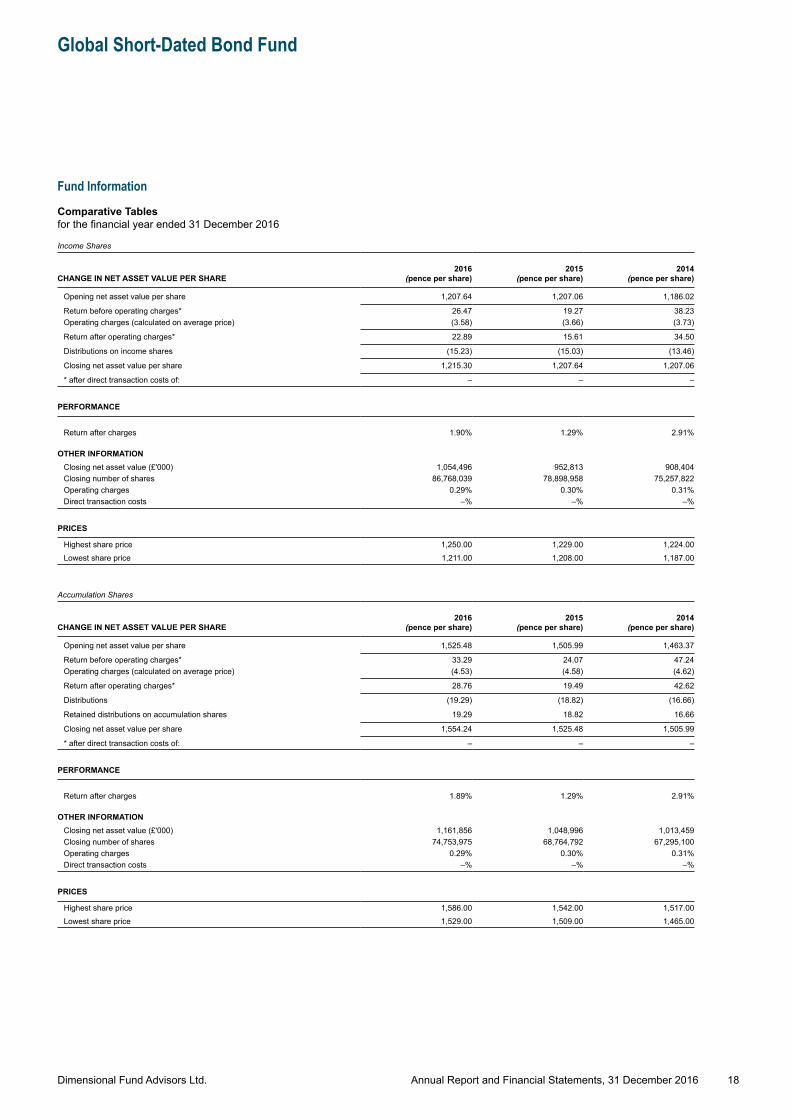
Fund Information
18Annual Report and Financial Statements, 31 December 2016
Comparative Tablesfor the financial year ended 31 December 2016
Income Shares
CHANGE IN NET ASSET VALUE PER SHARE2016
(pence per share)2015
(pence per share)2014
(pence per share)
Opening net asset value per share 1,207.64 1,207.06 1,186.02
Return before operating charges* 26.47 19.27 38.23Operating charges (calculated on average price) (3.58) (3.66) (3.73)
Return after operating charges* 22.89 15.61 34.50
Distributions on income shares (15.23) (15.03) (13.46)
Closing net asset value per share 1,215.30 1,207.64 1,207.06
* after direct transaction costs of: – – –
PERFORMANCE
Return after charges 1.90% 1.29% 2.91%
OTHER INFORMATIONClosing net asset value (£'000) 1,054,496 952,813 908,404Closing number of shares 86,768,039 78,898,958 75,257,822Operating charges 0.29% 0.30% 0.31%Direct transaction costs –% –% –%
PRICES
Highest share price 1,250.00 1,229.00 1,224.00Lowest share price 1,211.00 1,208.00 1,187.00
Accumulation Shares
CHANGE IN NET ASSET VALUE PER SHARE2016
(pence per share)2015
(pence per share)2014
(pence per share)
Opening net asset value per share 1,525.48 1,505.99 1,463.37
Return before operating charges* 33.29 24.07 47.24Operating charges (calculated on average price) (4.53) (4.58) (4.62)
Return after operating charges* 28.76 19.49 42.62
Distributions (19.29) (18.82) (16.66)
Retained distributions on accumulation shares 19.29 18.82 16.66
Closing net asset value per share 1,554.24 1,525.48 1,505.99
* after direct transaction costs of: – – –
PERFORMANCE
Return after charges 1.89% 1.29% 2.91%
OTHER INFORMATIONClosing net asset value (£'000) 1,161,856 1,048,996 1,013,459Closing number of shares 74,753,975 68,764,792 67,295,100Operating charges 0.29% 0.30% 0.31%Direct transaction costs –% –% –%
PRICES
Highest share price 1,586.00 1,542.00 1,517.00Lowest share price 1,529.00 1,509.00 1,465.00
Dimensional Fund Advisors Ltd.
Global Short-Dated Bond Fund
Fund Information (continued)
19Annual Report and Financial Statements, 31 December 2016
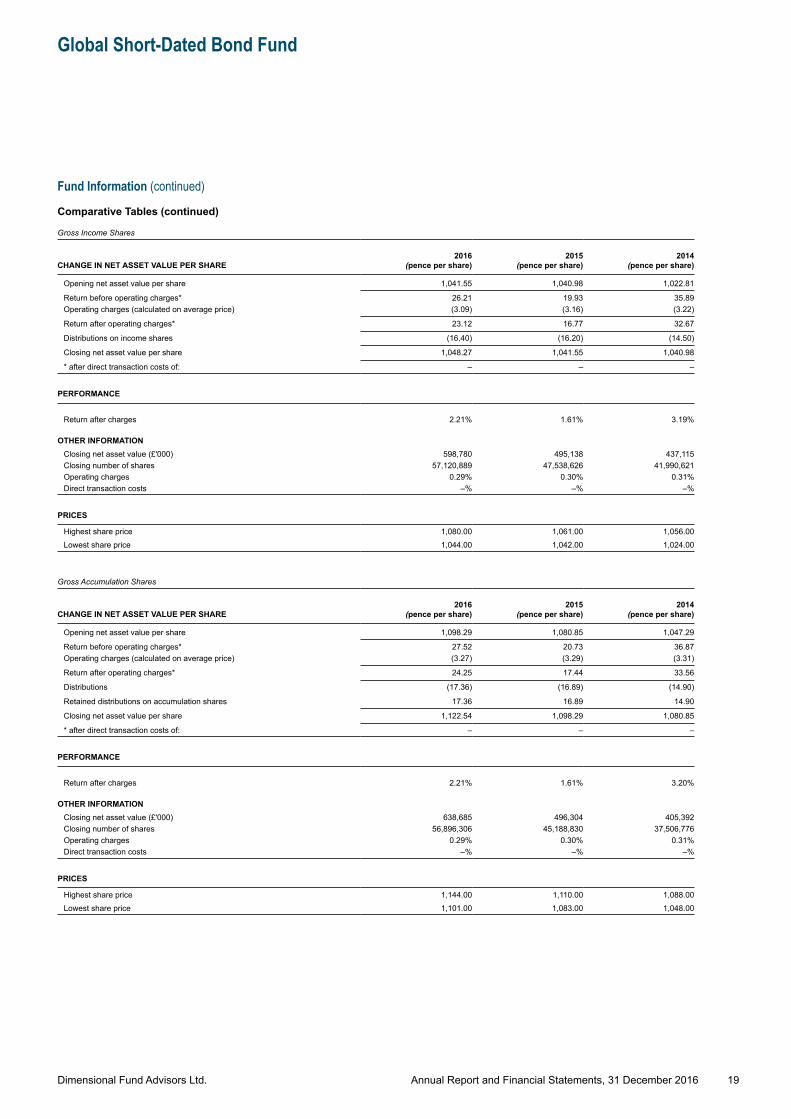
Comparative Tables (continued)
Gross Income Shares
CHANGE IN NET ASSET VALUE PER SHARE2016
(pence per share)2015
(pence per share)2014
(pence per share)
Opening net asset value per share 1,041.55 1,040.98 1,022.81
Return before operating charges* 26.21 19.93 35.89Operating charges (calculated on average price) (3.09) (3.16) (3.22)
Return after operating charges* 23.12 16.77 32.67
Distributions on income shares (16.40) (16.20) (14.50)
Closing net asset value per share 1,048.27 1,041.55 1,040.98
* after direct transaction costs of: – – –
PERFORMANCE
Return after charges 2.21% 1.61% 3.19%
OTHER INFORMATIONClosing net asset value (£'000) 598,780 495,138 437,115Closing number of shares 57,120,889 47,538,626 41,990,621Operating charges 0.29% 0.30% 0.31%Direct transaction costs –% –% –%
PRICES
Highest share price 1,080.00 1,061.00 1,056.00Lowest share price 1,044.00 1,042.00 1,024.00
Gross Accumulation Shares
CHANGE IN NET ASSET VALUE PER SHARE2016
(pence per share)2015
(pence per share)2014
(pence per share)
Opening net asset value per share 1,098.29 1,080.85 1,047.29
Return before operating charges* 27.52 20.73 36.87Operating charges (calculated on average price) (3.27) (3.29) (3.31)
Return after operating charges* 24.25 17.44 33.56
Distributions (17.36) (16.89) (14.90)
Retained distributions on accumulation shares 17.36 16.89 14.90
Closing net asset value per share 1,122.54 1,098.29 1,080.85
* after direct transaction costs of: – – –
PERFORMANCE
Return after charges 2.21% 1.61% 3.20%
OTHER INFORMATIONClosing net asset value (£'000) 638,685 496,304 405,392Closing number of shares 56,896,306 45,188,830 37,506,776Operating charges 0.29% 0.30% 0.31%Direct transaction costs –% –% –%
PRICES
Highest share price 1,144.00 1,110.00 1,088.00Lowest share price 1,101.00 1,083.00 1,048.00
Dimensional Fund Advisors Ltd.
Global Short-Dated Bond Fund
Fund Information (continued)
20Annual Report and Financial Statements, 31 December 2016
Synthetic Risk and Reward Indicator
0
2Lower risk Higher risk
Typically lower rewards Typically higher rewards
5 742 31 6
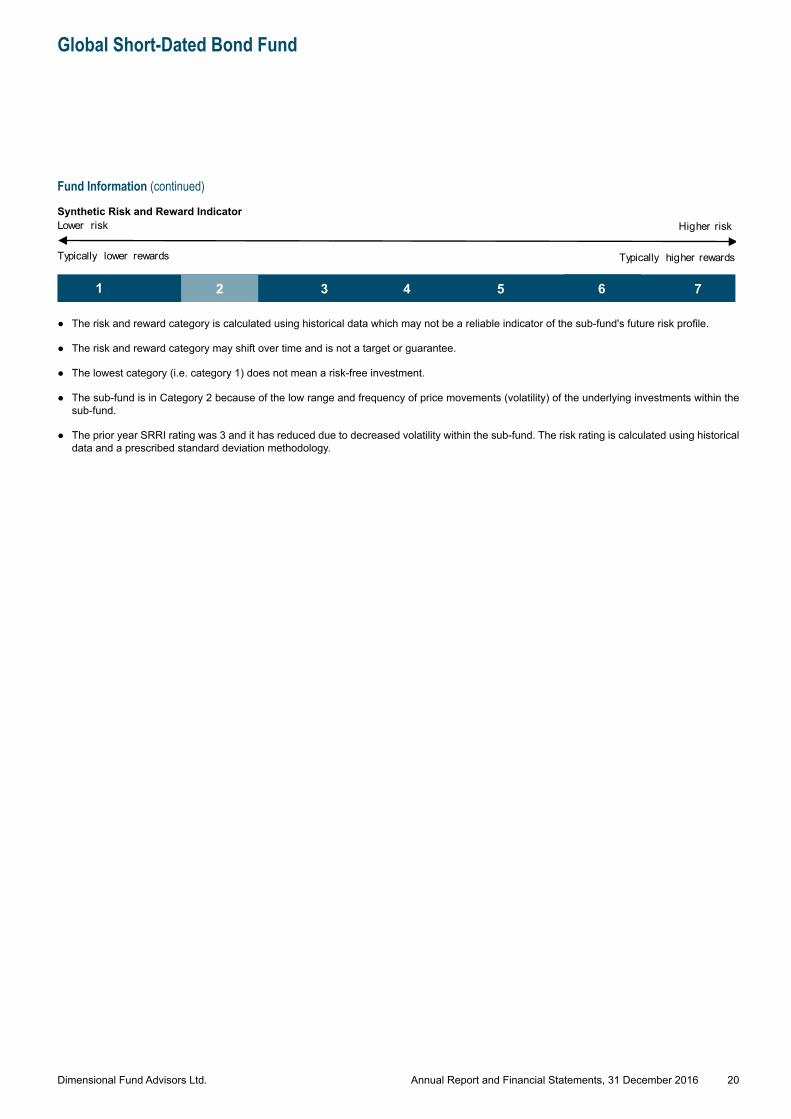
● The risk and reward category is calculated using historical data which may not be a reliable indicator of the sub-fund's future risk profile.
● The risk and reward category may shift over time and is not a target or guarantee.
● The lowest category (i.e. category 1) does not mean a risk-free investment.
● The sub-fund is in Category 2 because of the low range and frequency of price movements (volatility) of the underlying investments within the sub-fund.
● The prior year SRRI rating was 3 and it has reduced due to decreased volatility within the sub-fund. The risk rating is calculated using historical data and a prescribed standard deviation methodology.
Dimensional Fund Advisors Ltd.
International Core Equity Fund
Fund Information
21Annual Report and Financial Statements, 31 December 2016
Comparative Tablesfor the financial year ended 31 December 2016Fo
Income Shares
CHANGE IN NET ASSET VALUE PER SHARE2016
(pence per share)2015
(pence per share)2014
(pence per share)
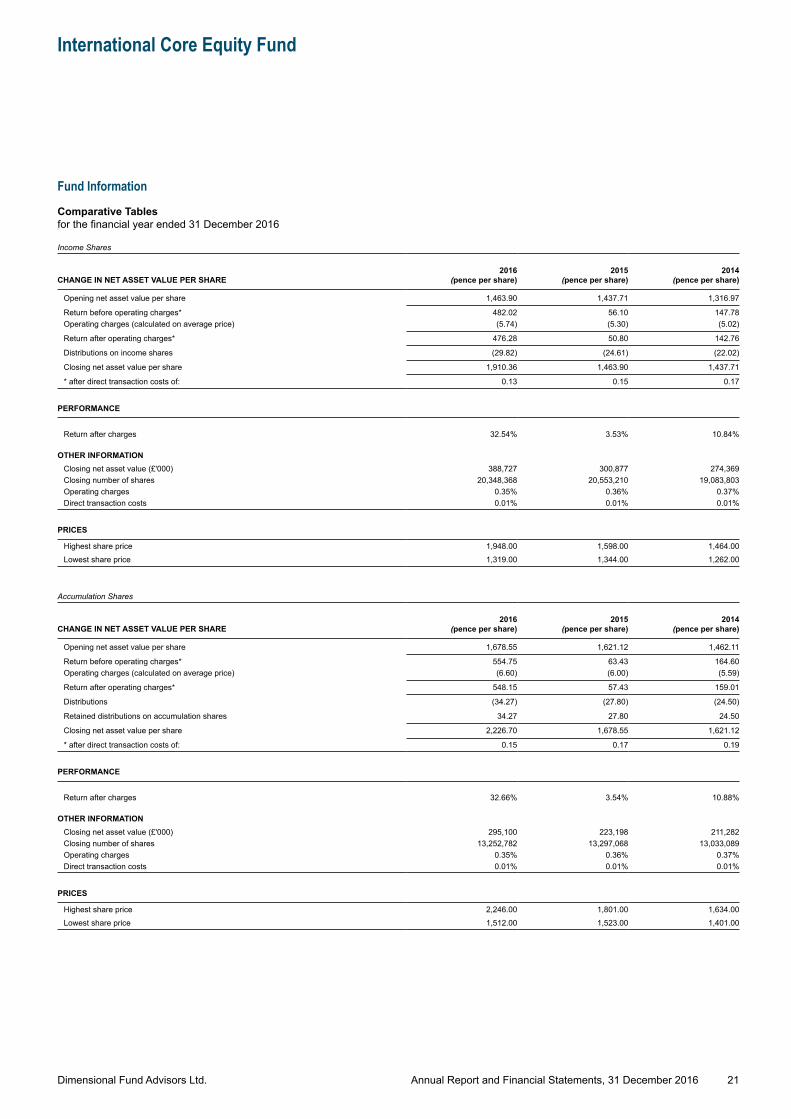
Opening net asset value per share 1,463.90 1,437.71 1,316.97
Return before operating charges* 482.02 56.10 147.78Operating charges (calculated on average price) (5.74) (5.30) (5.02)
Return after operating charges* 476.28 50.80 142.76
Distributions on income shares (29.82) (24.61) (22.02)
Closing net asset value per share 1,910.36 1,463.90 1,437.71
* after direct transaction costs of: 0.13 0.15 0.17
PERFORMANCE
Return after charges 32.54% 3.53% 10.84%
OTHER INFORMATIONClosing net asset value (£'000) 388,727 300,877 274,369Closing number of shares 20,348,368 20,553,210 19,083,803Operating charges 0.35% 0.36% 0.37%Direct transaction costs 0.01% 0.01% 0.01%
PRICES
Highest share price 1,948.00 1,598.00 1,464.00Lowest share price 1,319.00 1,344.00 1,262.00
Accumulation Shares
CHANGE IN NET ASSET VALUE PER SHARE2016
(pence per share)2015
(pence per share)2014
(pence per share)
Opening net asset value per share 1,678.55 1,621.12 1,462.11
Return before operating charges* 554.75 63.43 164.60Operating charges (calculated on average price) (6.60) (6.00) (5.59)
Return after operating charges* 548.15 57.43 159.01
Distributions (34.27) (27.80) (24.50)
Retained distributions on accumulation shares 34.27 27.80 24.50
Closing net asset value per share 2,226.70 1,678.55 1,621.12
* after direct transaction costs of: 0.15 0.17 0.19
PERFORMANCE
Return after charges 32.66% 3.54% 10.88%
OTHER INFORMATIONClosing net asset value (£'000) 295,100 223,198 211,282Closing number of shares 13,252,782 13,297,068 13,033,089Operating charges 0.35% 0.36% 0.37%Direct transaction costs 0.01% 0.01% 0.01%
PRICES
Highest share price 2,246.00 1,801.00 1,634.00Lowest share price 1,512.00 1,523.00 1,401.00
Dimensional Fund Advisors Ltd.
International Core Equity Fund
Fund Information (continued)
22Annual Report and Financial Statements, 31 December 2016
Synthetic Risk and Reward Indicator
0
2Lower risk Higher risk
Typically lower rewards Typically higher rewards
5 74321 6
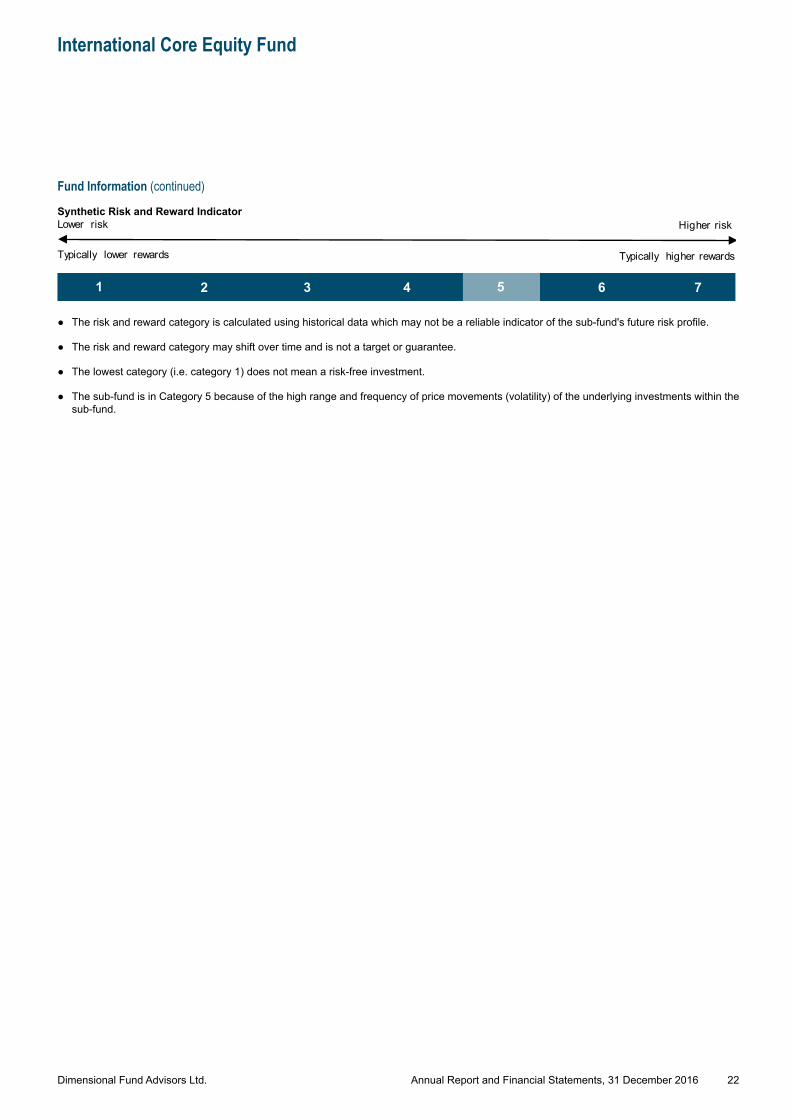
● The risk and reward category is calculated using historical data which may not be a reliable indicator of the sub-fund's future risk profile.
● The risk and reward category may shift over time and is not a target or guarantee.
● The lowest category (i.e. category 1) does not mean a risk-free investment.
● The sub-fund is in Category 5 because of the high range and frequency of price movements (volatility) of the underlying investments within the sub-fund.
Dimensional Fund Advisors Ltd.
International Value Fund
Fund Information
23Annual Report and Financial Statements, 31 December 2016
Comparative Tablesfor the financial year ended 31 December 2016
Income Shares
CHANGE IN NET ASSET VALUE PER SHARE2016
(pence per share)2015
(pence per share)2014
(pence per share)
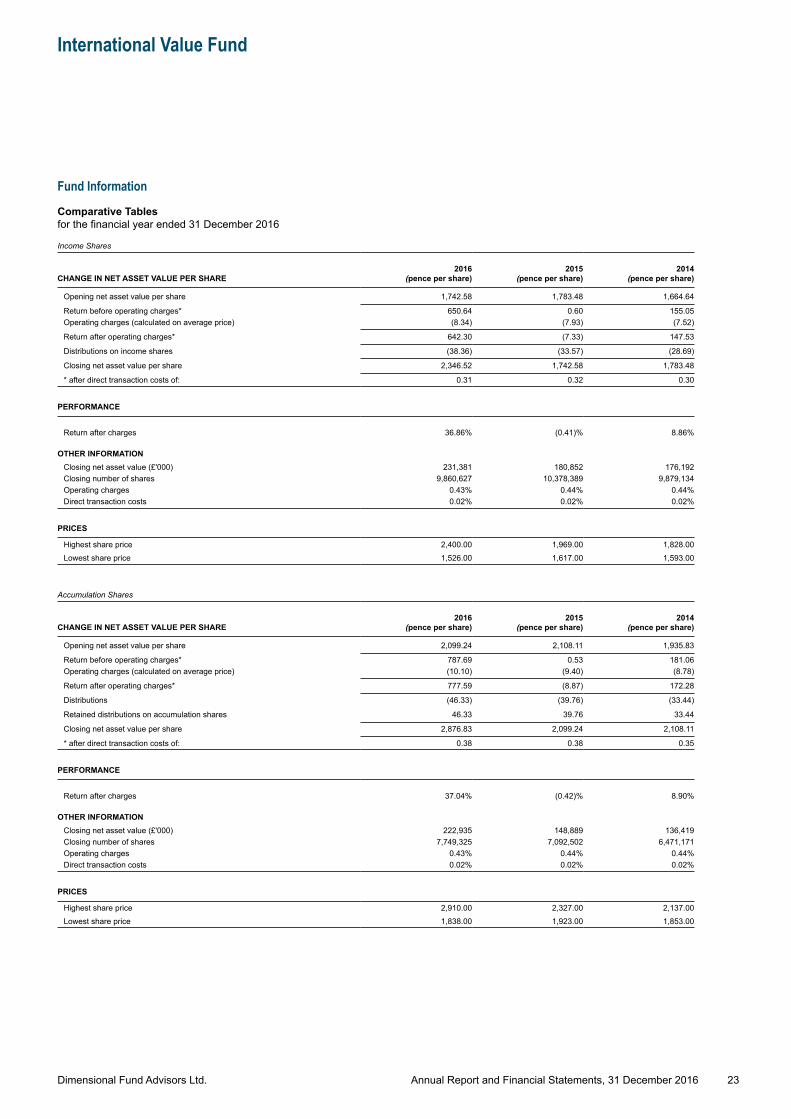
Opening net asset value per share 1,742.58 1,783.48 1,664.64
Return before operating charges* 650.64 0.60 155.05Operating charges (calculated on average price) (8.34) (7.93) (7.52)
Return after operating charges* 642.30 (7.33) 147.53
Distributions on income shares (38.36) (33.57) (28.69)
Closing net asset value per share 2,346.52 1,742.58 1,783.48
* after direct transaction costs of: 0.31 0.32 0.30
PERFORMANCE
Return after charges 36.86% (0.41)% 8.86%
OTHER INFORMATIONClosing net asset value (£'000) 231,381 180,852 176,192Closing number of shares 9,860,627 10,378,389 9,879,134Operating charges 0.43% 0.44% 0.44%Direct transaction costs 0.02% 0.02% 0.02%
PRICES
Highest share price 2,400.00 1,969.00 1,828.00Lowest share price 1,526.00 1,617.00 1,593.00
Accumulation Shares
CHANGE IN NET ASSET VALUE PER SHARE2016
(pence per share)2015
(pence per share)2014
(pence per share)
Opening net asset value per share 2,099.24 2,108.11 1,935.83
Return before operating charges* 787.69 0.53 181.06Operating charges (calculated on average price) (10.10) (9.40) (8.78)
Return after operating charges* 777.59 (8.87) 172.28
Distributions (46.33) (39.76) (33.44)
Retained distributions on accumulation shares 46.33 39.76 33.44
Closing net asset value per share 2,876.83 2,099.24 2,108.11
* after direct transaction costs of: 0.38 0.38 0.35
PERFORMANCE
Return after charges 37.04% (0.42)% 8.90%
OTHER INFORMATIONClosing net asset value (£'000) 222,935 148,889 136,419Closing number of shares 7,749,325 7,092,502 6,471,171Operating charges 0.43% 0.44% 0.44%Direct transaction costs 0.02% 0.02% 0.02%
PRICES
Highest share price 2,910.00 2,327.00 2,137.00Lowest share price 1,838.00 1,923.00 1,853.00
Dimensional Fund Advisors Ltd.
International Value Fund
Fund Information (continued)
24Annual Report and Financial Statements, 31 December 2016
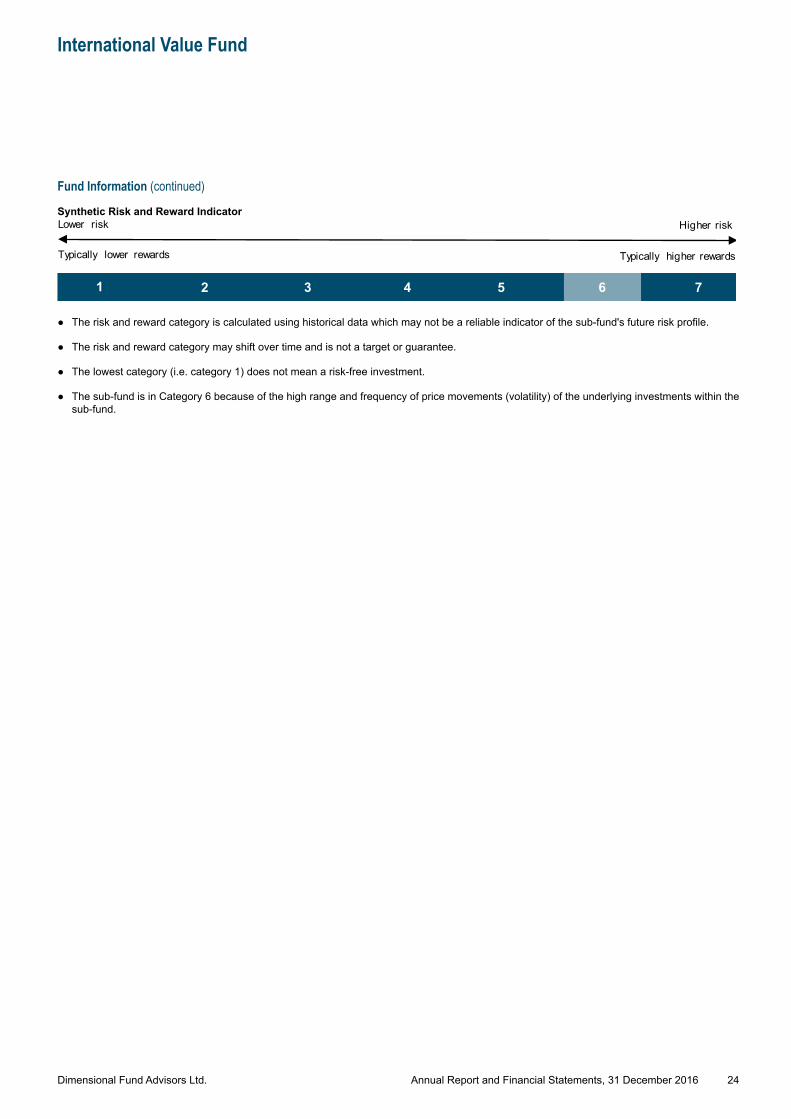
Synthetic Risk and Reward Indicator
0
2Lower risk Higher risk
Typically lower rewards Typically higher rewards
5 74321 6
● The risk and reward category is calculated using historical data which may not be a reliable indicator of the sub-fund's future risk profile.
● The risk and reward category may shift over time and is not a target or guarantee.
● The lowest category (i.e. category 1) does not mean a risk-free investment.
● The sub-fund is in Category 6 because of the high range and frequency of price movements (volatility) of the underlying investments within the sub-fund.
Dimensional Fund Advisors Ltd.
United Kingdom Core Equity Fund
Fund Information
25Annual Report and Financial Statements, 31 December 2016
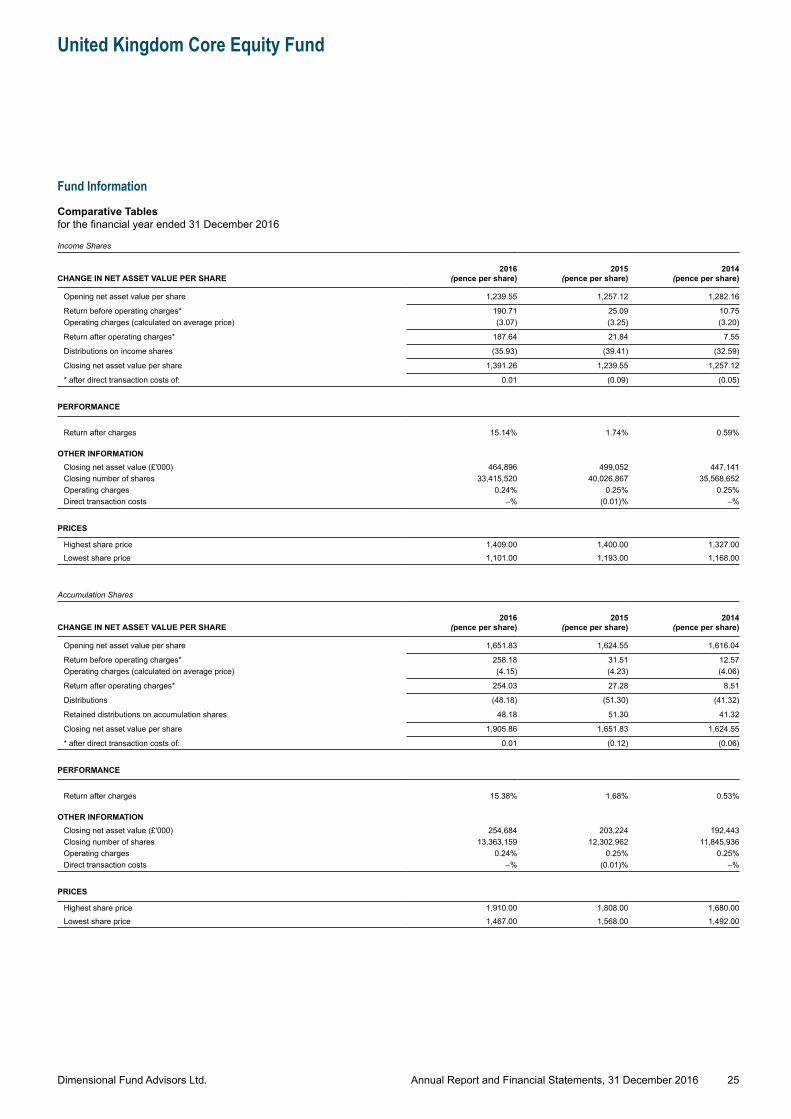
Comparative Tablesfor the financial year ended 31 December 2016
Income Shares
CHANGE IN NET ASSET VALUE PER SHARE2016
(pence per share)2015
(pence per share)2014
(pence per share)
Opening net asset value per share 1,239.55 1,257.12 1,282.16
Return before operating charges* 190.71 25.09 10.75Operating charges (calculated on average price) (3.07) (3.25) (3.20)
Return after operating charges* 187.64 21.84 7.55
Distributions on income shares (35.93) (39.41) (32.59)
Closing net asset value per share 1,391.26 1,239.55 1,257.12
* after direct transaction costs of: 0.01 (0.09) (0.05)
PERFORMANCE
Return after charges 15.14% 1.74% 0.59%
OTHER INFORMATIONClosing net asset value (£'000) 464,896 499,052 447,141Closing number of shares 33,415,520 40,026,867 35,568,652Operating charges 0.24% 0.25% 0.25%Direct transaction costs –% (0.01)% –%
PRICES
Highest share price 1,409.00 1,400.00 1,327.00Lowest share price 1,101.00 1,193.00 1,168.00
Accumulation Shares
CHANGE IN NET ASSET VALUE PER SHARE2016
(pence per share)2015
(pence per share)2014
(pence per share)
Opening net asset value per share 1,651.83 1,624.55 1,616.04
Return before operating charges* 258.18 31.51 12.57Operating charges (calculated on average price) (4.15) (4.23) (4.06)
Return after operating charges* 254.03 27.28 8.51
Distributions (48.18) (51.30) (41.32)
Retained distributions on accumulation shares 48.18 51.30 41.32
Closing net asset value per share 1,905.86 1,651.83 1,624.55
* after direct transaction costs of: 0.01 (0.12) (0.06)
PERFORMANCE
Return after charges 15.38% 1.68% 0.53%
OTHER INFORMATIONClosing net asset value (£'000) 254,684 203,224 192,443Closing number of shares 13,363,159 12,302,962 11,845,936Operating charges 0.24% 0.25% 0.25%Direct transaction costs –% (0.01)% –%
PRICES
Highest share price 1,910.00 1,808.00 1,680.00Lowest share price 1,467.00 1,568.00 1,492.00
Dimensional Fund Advisors Ltd.
United Kingdom Core Equity Fund
Fund Information (continued)
26Annual Report and Financial Statements, 31 December 2016
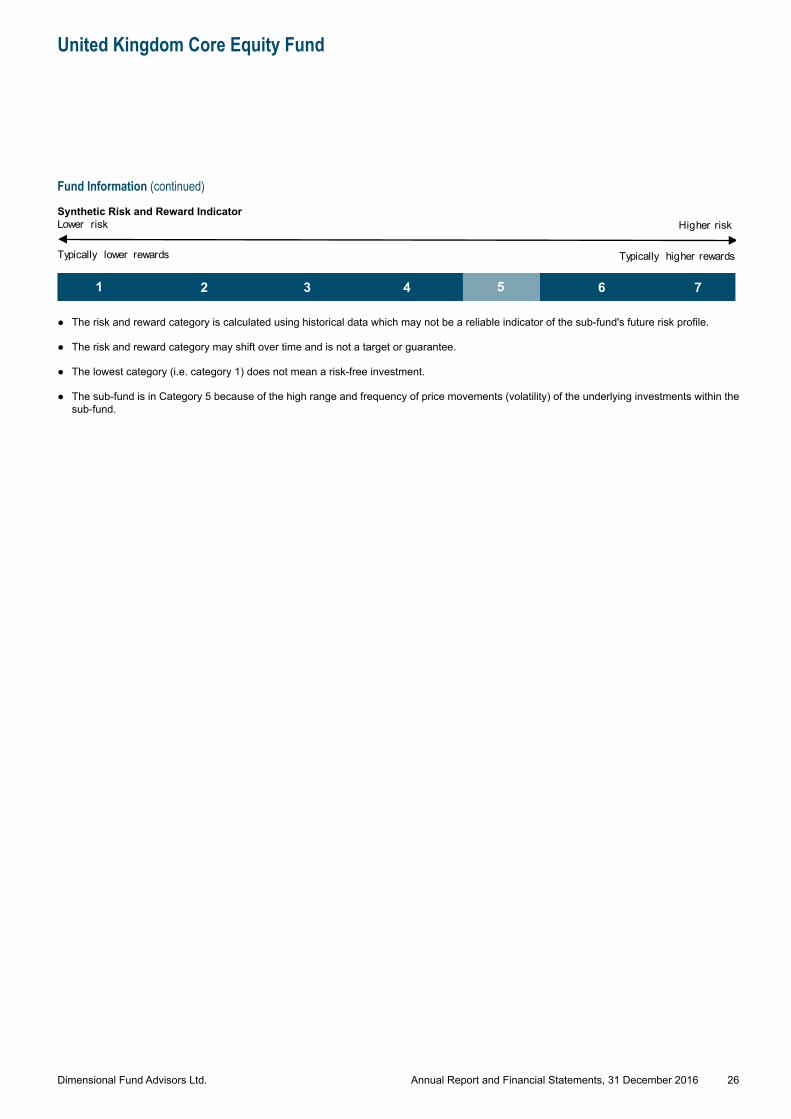
Synthetic Risk and Reward Indicator
0
2Lower risk Higher risk
Typically lower rewards Typically higher rewards
5 74321 6
● The risk and reward category is calculated using historical data which may not be a reliable indicator of the sub-fund's future risk profile.
● The risk and reward category may shift over time and is not a target or guarantee.
● The lowest category (i.e. category 1) does not mean a risk-free investment.
● The sub-fund is in Category 5 because of the high range and frequency of price movements (volatility) of the underlying investments within the sub-fund.
Dimensional Fund Advisors Ltd.
United Kingdom Small Companies Fund
Fund Information
27Annual Report and Financial Statements, 31 December 2016
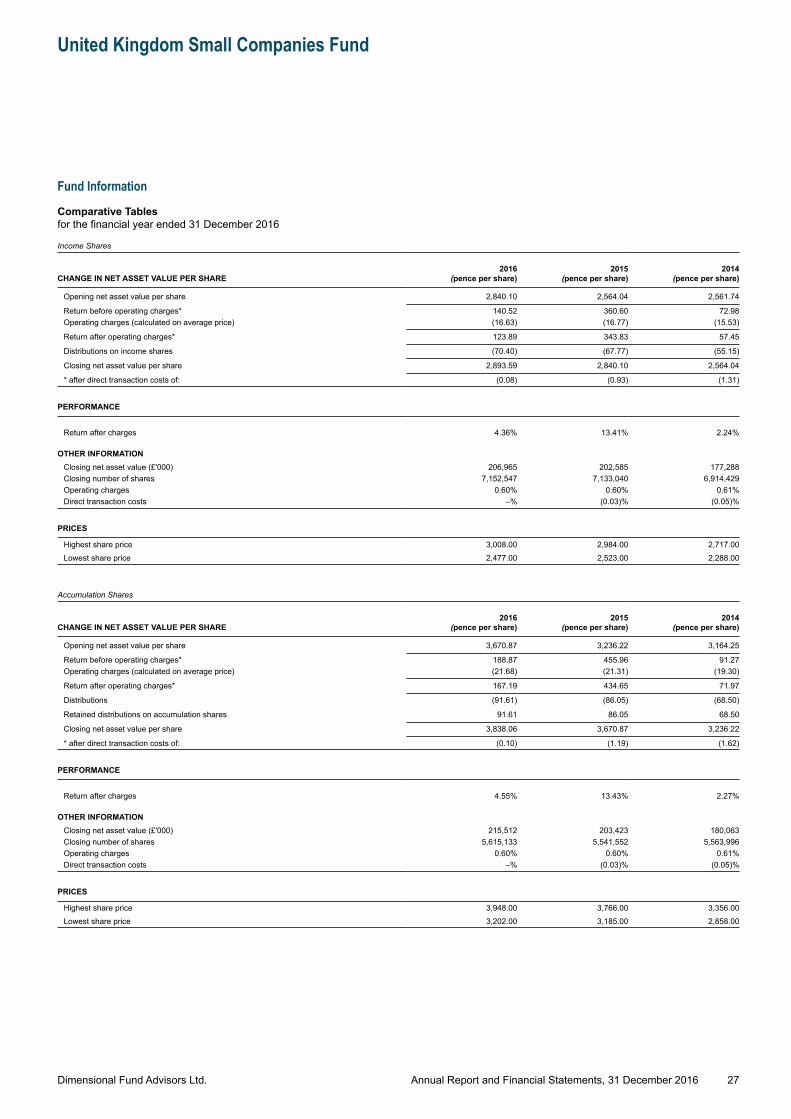
Comparative Tablesfor the financial year ended 31 December 2016
Income Shares
CHANGE IN NET ASSET VALUE PER SHARE2016
(pence per share)2015
(pence per share)2014
(pence per share)
Opening net asset value per share 2,840.10 2,564.04 2,561.74
Return before operating charges* 140.52 360.60 72.98Operating charges (calculated on average price) (16.63) (16.77) (15.53)
Return after operating charges* 123.89 343.83 57.45
Distributions on income shares (70.40) (67.77) (55.15)
Closing net asset value per share 2,893.59 2,840.10 2,564.04
* after direct transaction costs of: (0.08) (0.93) (1.31)
PERFORMANCE
Return after charges 4.36% 13.41% 2.24%
OTHER INFORMATIONClosing net asset value (£'000) 206,965 202,585 177,288Closing number of shares 7,152,547 7,133,040 6,914,429Operating charges 0.60% 0.60% 0.61%Direct transaction costs –% (0.03)% (0.05)%
PRICES
Highest share price 3,008.00 2,984.00 2,717.00Lowest share price 2,477.00 2,523.00 2,288.00
Accumulation Shares
CHANGE IN NET ASSET VALUE PER SHARE2016
(pence per share)2015
(pence per share)2014
(pence per share)
Opening net asset value per share 3,670.87 3,236.22 3,164.25
Return before operating charges* 188.87 455.96 91.27Operating charges (calculated on average price) (21.68) (21.31) (19.30)
Return after operating charges* 167.19 434.65 71.97
Distributions (91.61) (86.05) (68.50)
Retained distributions on accumulation shares 91.61 86.05 68.50
Closing net asset value per share 3,838.06 3,670.87 3,236.22
* after direct transaction costs of: (0.10) (1.19) (1.62)
PERFORMANCE
Return after charges 4.55% 13.43% 2.27%
OTHER INFORMATIONClosing net asset value (£'000) 215,512 203,423 180,063Closing number of shares 5,615,133 5,541,552 5,563,996Operating charges 0.60% 0.60% 0.61%Direct transaction costs –% (0.03)% (0.05)%
PRICES
Highest share price 3,948.00 3,766.00 3,356.00Lowest share price 3,202.00 3,185.00 2,858.00
Dimensional Fund Advisors Ltd.
United Kingdom Small Companies Fund
Fund Information (continued)
28Annual Report and Financial Statements, 31 December 2016
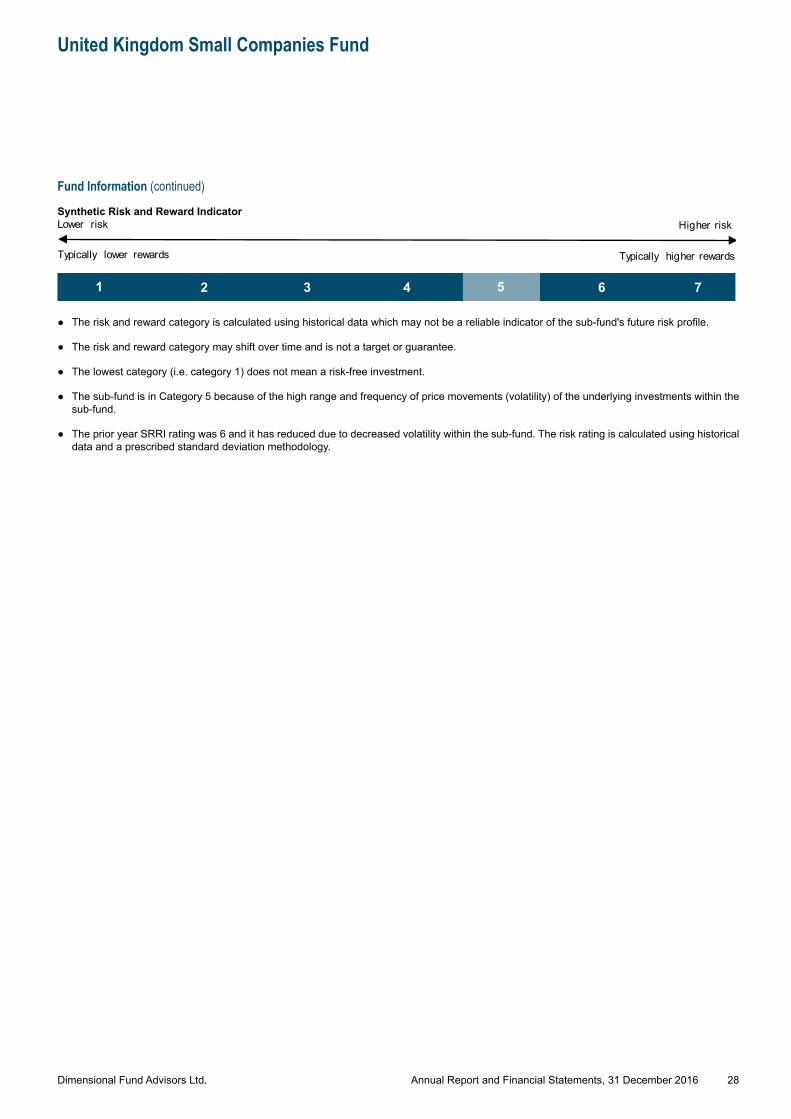
Synthetic Risk and Reward Indicator
0
2Lower risk Higher risk
Typically lower rewards Typically higher rewards
5 74321 6
● The risk and reward category is calculated using historical data which may not be a reliable indicator of the sub-fund's future risk profile.
● The risk and reward category may shift over time and is not a target or guarantee.
● The lowest category (i.e. category 1) does not mean a risk-free investment.
● The sub-fund is in Category 5 because of the high range and frequency of price movements (volatility) of the underlying investments within the sub-fund.
● The prior year SRRI rating was 6 and it has reduced due to decreased volatility within the sub-fund. The risk rating is calculated using historical data and a prescribed standard deviation methodology.
Dimensional Fund Advisors Ltd.
United Kingdom Value Fund
Fund Information
29Annual Report and Financial Statements, 31 December 2016
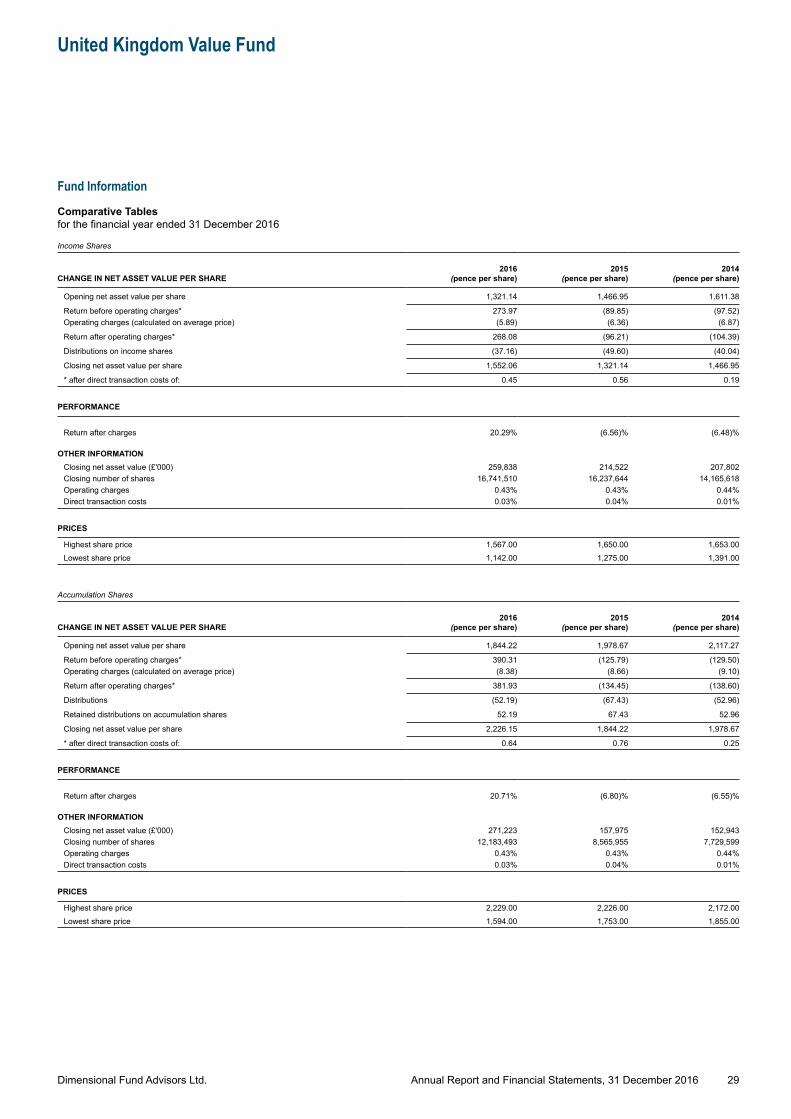
Comparative Tablesfor the financial year ended 31 December 2016
Income Shares
CHANGE IN NET ASSET VALUE PER SHARE2016
(pence per share)2015
(pence per share)2014
(pence per share)
Opening net asset value per share 1,321.14 1,466.95 1,611.38
Return before operating charges* 273.97 (89.85) (97.52)Operating charges (calculated on average price) (5.89) (6.36) (6.87)
Return after operating charges* 268.08 (96.21) (104.39)
Distributions on income shares (37.16) (49.60) (40.04)
Closing net asset value per share 1,552.06 1,321.14 1,466.95
* after direct transaction costs of: 0.45 0.56 0.19
PERFORMANCE
Return after charges 20.29% (6.56)% (6.48)%
OTHER INFORMATIONClosing net asset value (£'000) 259,838 214,522 207,802Closing number of shares 16,741,510 16,237,644 14,165,618Operating charges 0.43% 0.43% 0.44%Direct transaction costs 0.03% 0.04% 0.01%
PRICES
Highest share price 1,567.00 1,650.00 1,653.00Lowest share price 1,142.00 1,275.00 1,391.00
Accumulation Shares
CHANGE IN NET ASSET VALUE PER SHARE2016
(pence per share)2015
(pence per share)2014
(pence per share)
Opening net asset value per share 1,844.22 1,978.67 2,117.27
Return before operating charges* 390.31 (125.79) (129.50)Operating charges (calculated on average price) (8.38) (8.66) (9.10)
Return after operating charges* 381.93 (134.45) (138.60)
Distributions (52.19) (67.43) (52.96)
Retained distributions on accumulation shares 52.19 67.43 52.96
Closing net asset value per share 2,226.15 1,844.22 1,978.67
* after direct transaction costs of: 0.64 0.76 0.25
PERFORMANCE
Return after charges 20.71% (6.80)% (6.55)%
OTHER INFORMATIONClosing net asset value (£'000) 271,223 157,975 152,943Closing number of shares 12,183,493 8,565,955 7,729,599Operating charges 0.43% 0.43% 0.44%Direct transaction costs 0.03% 0.04% 0.01%
PRICES
Highest share price 2,229.00 2,226.00 2,172.00Lowest share price 1,594.00 1,753.00 1,855.00
Dimensional Fund Advisors Ltd.
United Kingdom Value Fund
Fund Information (continued)
30Annual Report and Financial Statements, 31 December 2016
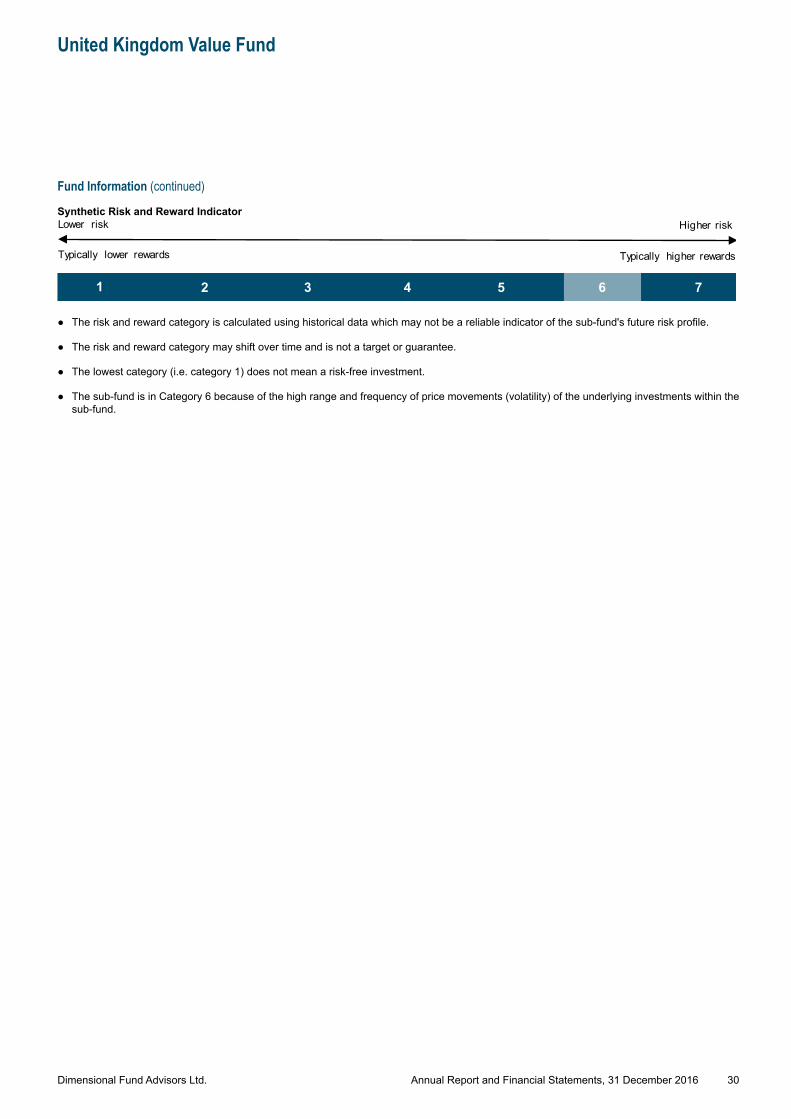
Synthetic Risk and Reward Indicator
0
2Lower risk Higher risk
Typically lower rewards Typically higher rewards
5 74321 6
● The risk and reward category is calculated using historical data which may not be a reliable indicator of the sub-fund's future risk profile.
● The risk and reward category may shift over time and is not a target or guarantee.
● The lowest category (i.e. category 1) does not mean a risk-free investment.
● The sub-fund is in Category 6 because of the high range and frequency of price movements (volatility) of the underlying investments within the sub-fund.
Dimensional Fund Advisors Ltd.
Emerging Markets Core Equity Fund
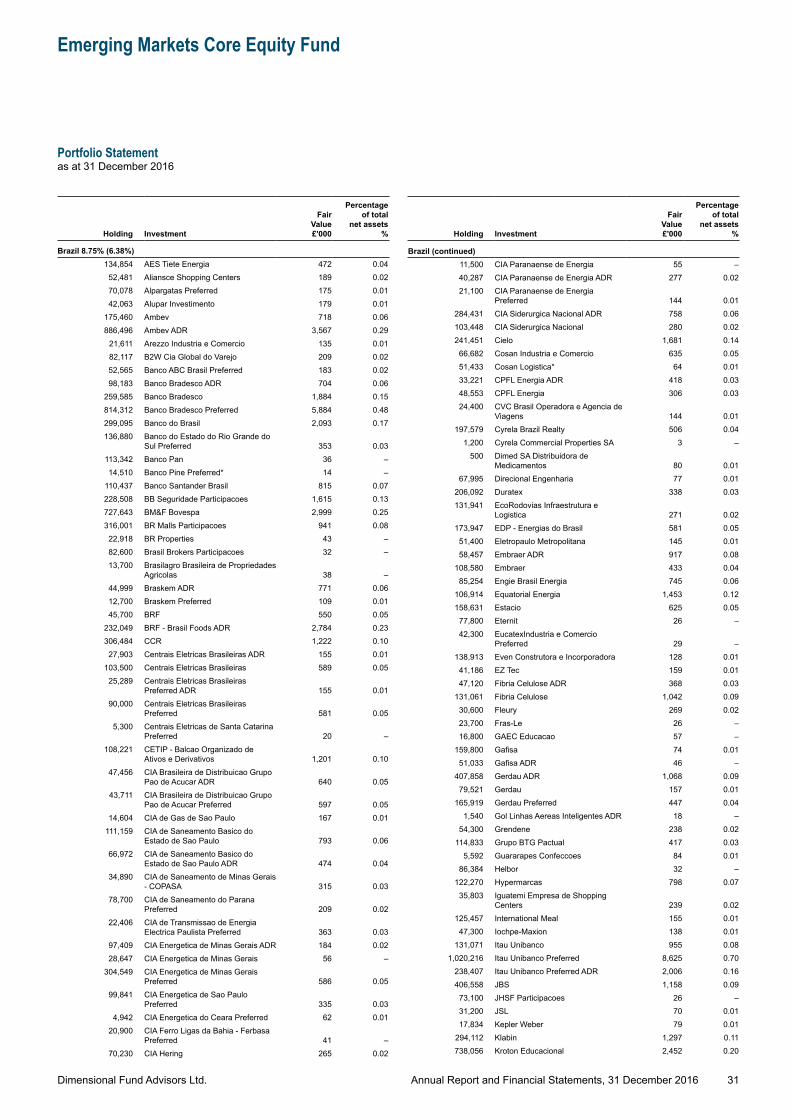
Portfolio Statementas at 31 December 2016
31Annual Report and Financial Statements, 31 December 2016
Holding Investment
Fair Value £'000
Percentage of total
net assets %
Brazil 8.75% (6.38%)134,854 AES Tiete Energia 472 0.04
52,481 Aliansce Shopping Centers 189 0.0270,078 Alpargatas Preferred 175 0.0142,063 Alupar Investimento 179 0.01
175,460 Ambev 718 0.06886,496 Ambev ADR 3,567 0.29
21,611 Arezzo Industria e Comercio 135 0.0182,117 B2W Cia Global do Varejo 209 0.0252,565 Banco ABC Brasil Preferred 183 0.0298,183 Banco Bradesco ADR 704 0.06
259,585 Banco Bradesco 1,884 0.15814,312 Banco Bradesco Preferred 5,884 0.48299,095 Banco do Brasil 2,093 0.17136,880 Banco do Estado do Rio Grande do
Sul Preferred 353 0.03113,342 Banco Pan 36 –14,510 Banco Pine Preferred* 14 –
110,437 Banco Santander Brasil 815 0.07228,508 BB Seguridade Participacoes 1,615 0.13727,643 BM&F Bovespa 2,999 0.25316,001 BR Malls Participacoes 941 0.08
22,918 BR Properties 43 –82,600 Brasil Brokers Participacoes 32 –13,700 Brasilagro Brasileira de Propriedades
Agricolas 38 –44,999 Braskem ADR 771 0.0612,700 Braskem Preferred 109 0.0145,700 BRF 550 0.05
232,049 BRF - Brasil Foods ADR 2,784 0.23306,484 CCR 1,222 0.1027,903 Centrais Eletricas Brasileiras ADR 155 0.01
103,500 Centrais Eletricas Brasileiras 589 0.0525,289 Centrais Eletricas Brasileiras
Preferred ADR 155 0.0190,000 Centrais Eletricas Brasileiras
Preferred 581 0.055,300 Centrais Eletricas de Santa Catarina
Preferred 20 –108,221 CETIP - Balcao Organizado de
Ativos e Derivativos 1,201 0.1047,456 CIA Brasileira de Distribuicao Grupo
Pao de Acucar ADR 640 0.0543,711 CIA Brasileira de Distribuicao Grupo
Pao de Acucar Preferred 597 0.0514,604 CIA de Gas de Sao Paulo 167 0.01
111,159 CIA de Saneamento Basico do Estado de Sao Paulo 793 0.06
66,972 CIA de Saneamento Basico do Estado de Sao Paulo ADR 474 0.04
34,890 CIA de Saneamento de Minas Gerais - COPASA 315 0.03
78,700 CIA de Saneamento do Parana Preferred 209 0.02
22,406 CIA de Transmissao de Energia Electrica Paulista Preferred 363 0.03
97,409 CIA Energetica de Minas Gerais ADR 184 0.0228,647 CIA Energetica de Minas Gerais 56 –
304,549 CIA Energetica de Minas Gerais Preferred 586 0.05
99,841 CIA Energetica de Sao Paulo Preferred 335 0.03
4,942 CIA Energetica do Ceara Preferred 62 0.0120,900 CIA Ferro Ligas da Bahia - Ferbasa
Preferred 41 –70,230 CIA Hering 265 0.02
Holding Investment
Fair Value £'000
Percentage of total
net assets %
Brazil (continued)11,500 CIA Paranaense de Energia 55 –40,287 CIA Paranaense de Energia ADR 277 0.0221,100 CIA Paranaense de Energia
Preferred 144 0.01284,431 CIA Siderurgica Nacional ADR 758 0.06103,448 CIA Siderurgica Nacional 280 0.02241,451 Cielo 1,681 0.1466,682 Cosan Industria e Comercio 635 0.0551,433 Cosan Logistica* 64 0.0133,221 CPFL Energia ADR 418 0.0348,553 CPFL Energia 306 0.0324,400 CVC Brasil Operadora e Agencia de
Viagens 144 0.01197,579 Cyrela Brazil Realty 506 0.04
1,200 Cyrela Commercial Properties SA 3 –500 Dimed SA Distribuidora de
Medicamentos 80 0.0167,995 Direcional Engenharia 77 0.01
206,092 Duratex 338 0.03131,941 EcoRodovias Infraestrutura e
Logistica 271 0.02173,947 EDP - Energias do Brasil 581 0.0551,400 Eletropaulo Metropolitana 145 0.0158,457 Embraer ADR 917 0.08
108,580 Embraer 433 0.0485,254 Engie Brasil Energia 745 0.06
106,914 Equatorial Energia 1,453 0.12158,631 Estacio 625 0.0577,800 Eternit 26 –42,300 EucatexIndustria e Comercio
Preferred 29 –138,913 Even Construtora e Incorporadora 128 0.0141,186 EZ Tec 159 0.0147,120 Fibria Celulose ADR 368 0.03
131,061 Fibria Celulose 1,042 0.0930,600 Fleury 269 0.0223,700 Fras-Le 26 –16,800 GAEC Educacao 57 –
159,800 Gafisa 74 0.0151,033 Gafisa ADR 46 –
407,858 Gerdau ADR 1,068 0.0979,521 Gerdau 157 0.01
165,919 Gerdau Preferred 447 0.041,540 Gol Linhas Aereas Inteligentes ADR 18 –
54,300 Grendene 238 0.02114,833 Grupo BTG Pactual 417 0.03
5,592 Guararapes Confeccoes 84 0.0186,384 Helbor 32 –
122,270 Hypermarcas 798 0.0735,803 Iguatemi Empresa de Shopping
Centers 239 0.02125,457 International Meal 155 0.0147,300 Iochpe-Maxion 138 0.01
131,071 Itau Unibanco 955 0.081,020,216 Itau Unibanco Preferred 8,625 0.70
238,407 Itau Unibanco Preferred ADR 2,006 0.16406,558 JBS 1,158 0.0973,100 JHSF Participacoes 26 –31,200 JSL 70 0.0117,834 Kepler Weber 79 0.01
294,112 Klabin 1,297 0.11738,056 Kroton Educacional 2,452 0.20
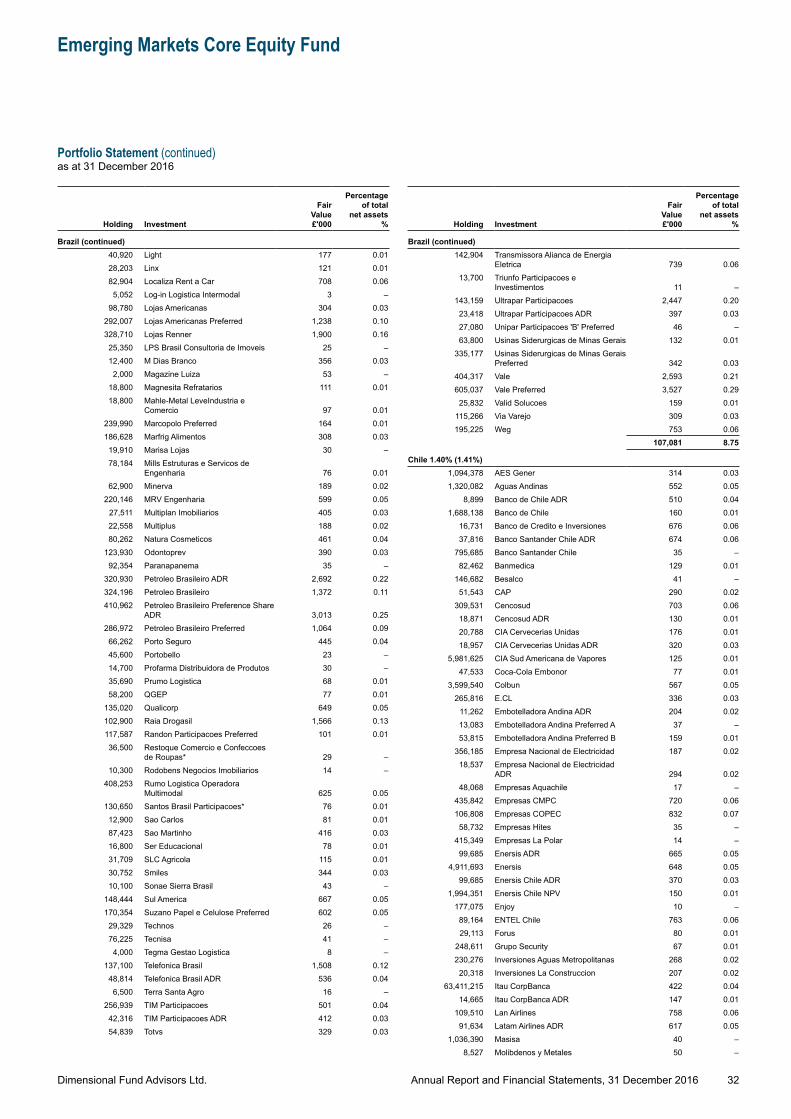
Dimensional Fund Advisors Ltd.
Emerging Markets Core Equity Fund
Portfolio Statement (continued)as at 31 December 2016
32Annual Report and Financial Statements, 31 December 2016
Holding Investment
Fair Value £'000
Percentage of total
net assets %
Brazil (continued)40,920 Light 177 0.0128,203 Linx 121 0.0182,904 Localiza Rent a Car 708 0.06
5,052 Log-in Logistica Intermodal 3 –98,780 Lojas Americanas 304 0.03
292,007 Lojas Americanas Preferred 1,238 0.10328,710 Lojas Renner 1,900 0.1625,350 LPS Brasil Consultoria de Imoveis 25 –12,400 M Dias Branco 356 0.03
2,000 Magazine Luiza 53 –18,800 Magnesita Refratarios 111 0.0118,800 Mahle-Metal LeveIndustria e
Comercio 97 0.01239,990 Marcopolo Preferred 164 0.01186,628 Marfrig Alimentos 308 0.03
19,910 Marisa Lojas 30 –78,184 Mills Estruturas e Servicos de
Engenharia 76 0.0162,900 Minerva 189 0.02
220,146 MRV Engenharia 599 0.0527,511 Multiplan Imobiliarios 405 0.0322,558 Multiplus 188 0.0280,262 Natura Cosmeticos 461 0.04
123,930 Odontoprev 390 0.0392,354 Paranapanema 35 –
320,930 Petroleo Brasileiro ADR 2,692 0.22324,196 Petroleo Brasileiro 1,372 0.11410,962 Petroleo Brasileiro Preference Share
ADR 3,013 0.25286,972 Petroleo Brasileiro Preferred 1,064 0.09
66,262 Porto Seguro 445 0.0445,600 Portobello 23 –14,700 Profarma Distribuidora de Produtos 30 –35,690 Prumo Logistica 68 0.0158,200 QGEP 77 0.01
135,020 Qualicorp 649 0.05102,900 Raia Drogasil 1,566 0.13117,587 Randon Participacoes Preferred 101 0.0136,500 Restoque Comercio e Confeccoes
de Roupas* 29 –10,300 Rodobens Negocios Imobiliarios 14 –
408,253 Rumo Logistica Operadora Multimodal 625 0.05
130,650 Santos Brasil Participacoes* 76 0.0112,900 Sao Carlos 81 0.0187,423 Sao Martinho 416 0.0316,800 Ser Educacional 78 0.0131,709 SLC Agricola 115 0.0130,752 Smiles 344 0.0310,100 Sonae Sierra Brasil 43 –
148,444 Sul America 667 0.05170,354 Suzano Papel e Celulose Preferred 602 0.05
29,329 Technos 26 –76,225 Tecnisa 41 –4,000 Tegma Gestao Logistica 8 –
137,100 Telefonica Brasil 1,508 0.1248,814 Telefonica Brasil ADR 536 0.04
6,500 Terra Santa Agro 16 –256,939 TIM Participacoes 501 0.04
42,316 TIM Participacoes ADR 412 0.0354,839 Totvs 329 0.03
Holding Investment
Fair Value £'000
Percentage of total
net assets %
Brazil (continued)142,904 Transmissora Alianca de Energia
Eletrica 739 0.0613,700 Triunfo Participacoes e
Investimentos 11 –143,159 Ultrapar Participacoes 2,447 0.2023,418 Ultrapar Participacoes ADR 397 0.0327,080 Unipar Participacoes 'B' Preferred 46 –63,800 Usinas Siderurgicas de Minas Gerais 132 0.01
335,177 Usinas Siderurgicas de Minas Gerais Preferred 342 0.03
404,317 Vale 2,593 0.21605,037 Vale Preferred 3,527 0.2925,832 Valid Solucoes 159 0.01
115,266 Via Varejo 309 0.03195,225 Weg 753 0.06
107,081 8.75
Chile 1.40% (1.41%)1,094,378 AES Gener 314 0.031,320,082 Aguas Andinas 552 0.05
8,899 Banco de Chile ADR 510 0.041,688,138 Banco de Chile 160 0.01
16,731 Banco de Credito e Inversiones 676 0.0637,816 Banco Santander Chile ADR 674 0.06
795,685 Banco Santander Chile 35 –82,462 Banmedica 129 0.01
146,682 Besalco 41 –51,543 CAP 290 0.02
309,531 Cencosud 703 0.0618,871 Cencosud ADR 130 0.0120,788 CIA Cervecerias Unidas 176 0.0118,957 CIA Cervecerias Unidas ADR 320 0.03
5,981,625 CIA Sud Americana de Vapores 125 0.0147,533 Coca-Cola Embonor 77 0.01
3,599,540 Colbun 567 0.05265,816 E.CL 336 0.03
11,262 Embotelladora Andina ADR 204 0.0213,083 Embotelladora Andina Preferred A 37 –53,815 Embotelladora Andina Preferred B 159 0.01
356,185 Empresa Nacional de Electricidad 187 0.0218,537 Empresa Nacional de Electricidad
ADR 294 0.0248,068 Empresas Aquachile 17 –
435,842 Empresas CMPC 720 0.06106,808 Empresas COPEC 832 0.0758,732 Empresas Hites 35 –
415,349 Empresas La Polar 14 –99,685 Enersis ADR 665 0.05
4,911,693 Enersis 648 0.0599,685 Enersis Chile ADR 370 0.03
1,994,351 Enersis Chile NPV 150 0.01177,075 Enjoy 10 –89,164 ENTEL Chile 763 0.0629,113 Forus 80 0.01
248,611 Grupo Security 67 0.01230,276 Inversiones Aguas Metropolitanas 268 0.0220,318 Inversiones La Construccion 207 0.02
63,411,215 Itau CorpBanca 422 0.0414,665 Itau CorpBanca ADR 147 0.01
109,510 Lan Airlines 758 0.0691,634 Latam Airlines ADR 617 0.05
1,036,390 Masisa 40 –8,527 Molibdenos y Metales 50 –
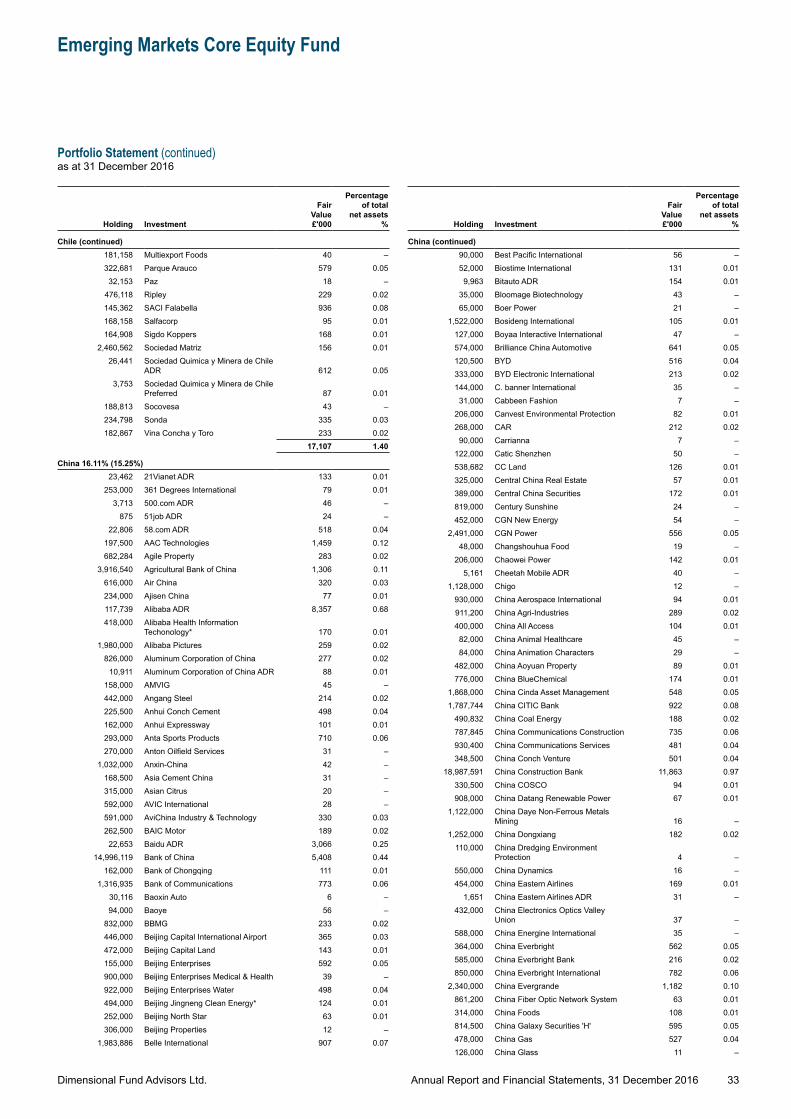
Dimensional Fund Advisors Ltd.
Emerging Markets Core Equity Fund
Portfolio Statement (continued)as at 31 December 2016
33Annual Report and Financial Statements, 31 December 2016
Holding Investment
Fair Value £'000
Percentage of total
net assets %
Chile (continued)181,158 Multiexport Foods 40 –322,681 Parque Arauco 579 0.05
32,153 Paz 18 –476,118 Ripley 229 0.02145,362 SACI Falabella 936 0.08168,158 Salfacorp 95 0.01164,908 Sigdo Koppers 168 0.01
2,460,562 Sociedad Matriz 156 0.0126,441 Sociedad Quimica y Minera de Chile
ADR 612 0.053,753 Sociedad Quimica y Minera de Chile
Preferred 87 0.01188,813 Socovesa 43 –234,798 Sonda 335 0.03182,867 Vina Concha y Toro 233 0.02
17,107 1.40
China 16.11% (15.25%)23,462 21Vianet ADR 133 0.01
253,000 361 Degrees International 79 0.013,713 500.com ADR 46 –
875 51job ADR 24 –22,806 58.com ADR 518 0.04
197,500 AAC Technologies 1,459 0.12682,284 Agile Property 283 0.02
3,916,540 Agricultural Bank of China 1,306 0.11616,000 Air China 320 0.03234,000 Ajisen China 77 0.01117,739 Alibaba ADR 8,357 0.68418,000 Alibaba Health Information
Techonology* 170 0.011,980,000 Alibaba Pictures 259 0.02
826,000 Aluminum Corporation of China 277 0.0210,911 Aluminum Corporation of China ADR 88 0.01
158,000 AMVIG 45 –442,000 Angang Steel 214 0.02225,500 Anhui Conch Cement 498 0.04162,000 Anhui Expressway 101 0.01293,000 Anta Sports Products 710 0.06270,000 Anton Oilfield Services 31 –
1,032,000 Anxin-China 42 –168,500 Asia Cement China 31 –315,000 Asian Citrus 20 –592,000 AVIC International 28 –591,000 AviChina Industry & Technology 330 0.03262,500 BAIC Motor 189 0.02
22,653 Baidu ADR 3,066 0.2514,996,119 Bank of China 5,408 0.44
162,000 Bank of Chongqing 111 0.011,316,935 Bank of Communications 773 0.06
30,116 Baoxin Auto 6 –94,000 Baoye 56 –
832,000 BBMG 233 0.02446,000 Beijing Capital International Airport 365 0.03472,000 Beijing Capital Land 143 0.01155,000 Beijing Enterprises 592 0.05900,000 Beijing Enterprises Medical & Health 39 –922,000 Beijing Enterprises Water 498 0.04494,000 Beijing Jingneng Clean Energy* 124 0.01252,000 Beijing North Star 63 0.01306,000 Beijing Properties 12 –
1,983,886 Belle International 907 0.07
Holding Investment
Fair Value £'000
Percentage of total
net assets %
China (continued)90,000 Best Pacific International 56 –52,000 Biostime International 131 0.01
9,963 Bitauto ADR 154 0.0135,000 Bloomage Biotechnology 43 –65,000 Boer Power 21 –
1,522,000 Bosideng International 105 0.01127,000 Boyaa Interactive International 47 –574,000 Brilliance China Automotive 641 0.05120,500 BYD 516 0.04333,000 BYD Electronic International 213 0.02144,000 C. banner International 35 –31,000 Cabbeen Fashion 7 –
206,000 Canvest Environmental Protection 82 0.01268,000 CAR 212 0.0290,000 Carrianna 7 –
122,000 Catic Shenzhen 50 –538,682 CC Land 126 0.01325,000 Central China Real Estate 57 0.01389,000 Central China Securities 172 0.01819,000 Century Sunshine 24 –452,000 CGN New Energy 54 –
2,491,000 CGN Power 556 0.0548,000 Changshouhua Food 19 –
206,000 Chaowei Power 142 0.015,161 Cheetah Mobile ADR 40 –
1,128,000 Chigo 12 –930,000 China Aerospace International 94 0.01911,200 China Agri-Industries 289 0.02400,000 China All Access 104 0.0182,000 China Animal Healthcare 45 –84,000 China Animation Characters 29 –
482,000 China Aoyuan Property 89 0.01776,000 China BlueChemical 174 0.01
1,868,000 China Cinda Asset Management 548 0.051,787,744 China CITIC Bank 922 0.08
490,832 China Coal Energy 188 0.02787,845 China Communications Construction 735 0.06930,400 China Communications Services 481 0.04348,500 China Conch Venture 501 0.04
18,987,591 China Construction Bank 11,863 0.97330,500 China COSCO 94 0.01908,000 China Datang Renewable Power 67 0.01
1,122,000 China Daye Non-Ferrous Metals Mining 16 –
1,252,000 China Dongxiang 182 0.02110,000 China Dredging Environment
Protection 4 –550,000 China Dynamics 16 –454,000 China Eastern Airlines 169 0.01
1,651 China Eastern Airlines ADR 31 –432,000 China Electronics Optics Valley
Union 37 –588,000 China Energine International 35 –364,000 China Everbright 562 0.05585,000 China Everbright Bank 216 0.02850,000 China Everbright International 782 0.06
2,340,000 China Evergrande 1,182 0.10861,200 China Fiber Optic Network System 63 0.01314,000 China Foods 108 0.01814,500 China Galaxy Securities 'H' 595 0.05478,000 China Gas 527 0.04126,000 China Glass 11 –
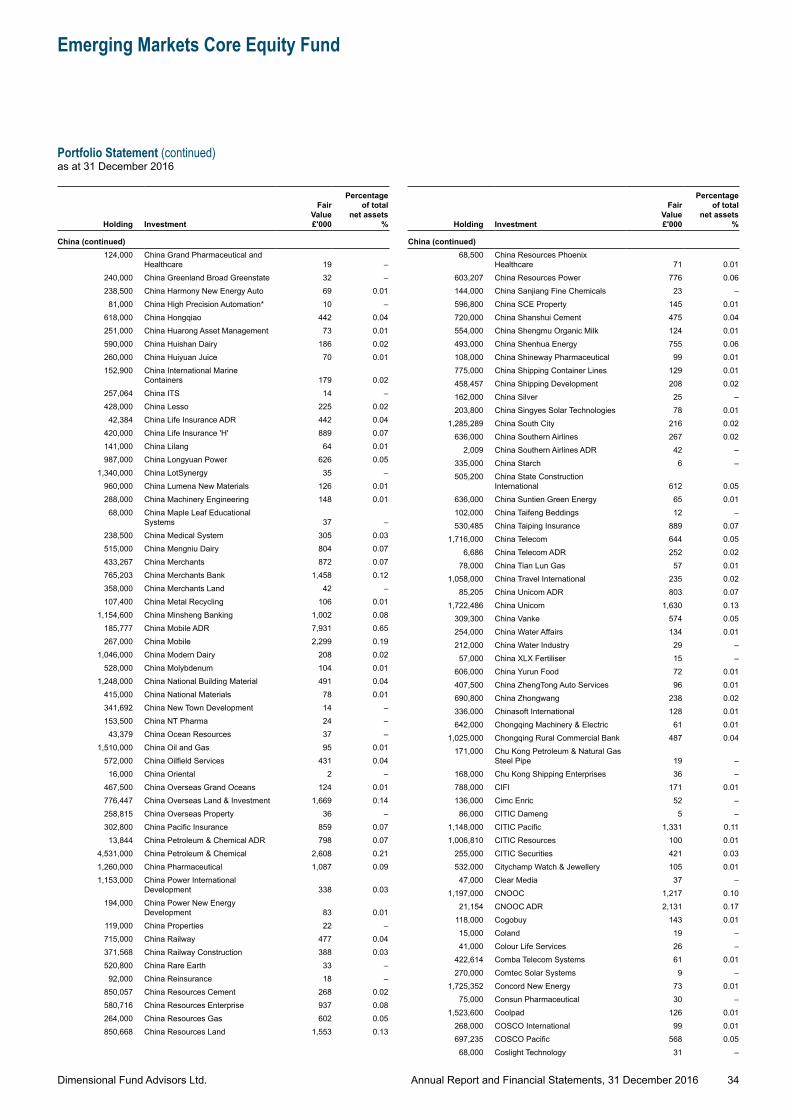
Dimensional Fund Advisors Ltd.
Emerging Markets Core Equity Fund
Portfolio Statement (continued)as at 31 December 2016
34Annual Report and Financial Statements, 31 December 2016
Holding Investment
Fair Value £'000
Percentage of total
net assets %
China (continued)124,000 China Grand Pharmaceutical and
Healthcare 19 –240,000 China Greenland Broad Greenstate 32 –238,500 China Harmony New Energy Auto 69 0.01
81,000 China High Precision Automation* 10 –618,000 China Hongqiao 442 0.04251,000 China Huarong Asset Management 73 0.01590,000 China Huishan Dairy 186 0.02260,000 China Huiyuan Juice 70 0.01152,900 China International Marine
Containers 179 0.02257,064 China ITS 14 –428,000 China Lesso 225 0.02
42,384 China Life Insurance ADR 442 0.04420,000 China Life Insurance 'H' 889 0.07141,000 China Lilang 64 0.01987,000 China Longyuan Power 626 0.05
1,340,000 China LotSynergy 35 –960,000 China Lumena New Materials 126 0.01288,000 China Machinery Engineering 148 0.01
68,000 China Maple Leaf Educational Systems 37 –
238,500 China Medical System 305 0.03515,000 China Mengniu Dairy 804 0.07433,267 China Merchants 872 0.07765,203 China Merchants Bank 1,458 0.12358,000 China Merchants Land 42 –107,400 China Metal Recycling 106 0.01
1,154,600 China Minsheng Banking 1,002 0.08185,777 China Mobile ADR 7,931 0.65267,000 China Mobile 2,299 0.19
1,046,000 China Modern Dairy 208 0.02528,000 China Molybdenum 104 0.01
1,248,000 China National Building Material 491 0.04415,000 China National Materials 78 0.01341,692 China New Town Development 14 –153,500 China NT Pharma 24 –43,379 China Ocean Resources 37 –
1,510,000 China Oil and Gas 95 0.01572,000 China Oilfield Services 431 0.04
16,000 China Oriental 2 –467,500 China Overseas Grand Oceans 124 0.01776,447 China Overseas Land & Investment 1,669 0.14258,815 China Overseas Property 36 –302,800 China Pacific Insurance 859 0.07
13,844 China Petroleum & Chemical ADR 798 0.074,531,000 China Petroleum & Chemical 2,608 0.211,260,000 China Pharmaceutical 1,087 0.091,153,000 China Power International
Development 338 0.03194,000 China Power New Energy
Development 83 0.01119,000 China Properties 22 –715,000 China Railway 477 0.04371,568 China Railway Construction 388 0.03520,800 China Rare Earth 33 –92,000 China Reinsurance 18 –
850,057 China Resources Cement 268 0.02580,716 China Resources Enterprise 937 0.08264,000 China Resources Gas 602 0.05850,668 China Resources Land 1,553 0.13
Holding Investment
Fair Value £'000
Percentage of total
net assets %
China (continued)68,500 China Resources Phoenix
Healthcare 71 0.01603,207 China Resources Power 776 0.06144,000 China Sanjiang Fine Chemicals 23 –596,800 China SCE Property 145 0.01720,000 China Shanshui Cement 475 0.04554,000 China Shengmu Organic Milk 124 0.01493,000 China Shenhua Energy 755 0.06108,000 China Shineway Pharmaceutical 99 0.01775,000 China Shipping Container Lines 129 0.01458,457 China Shipping Development 208 0.02162,000 China Silver 25 –203,800 China Singyes Solar Technologies 78 0.01
1,285,289 China South City 216 0.02636,000 China Southern Airlines 267 0.02
2,009 China Southern Airlines ADR 42 –335,000 China Starch 6 –505,200 China State Construction
International 612 0.05636,000 China Suntien Green Energy 65 0.01102,000 China Taifeng Beddings 12 –530,485 China Taiping Insurance 889 0.07
1,716,000 China Telecom 644 0.056,686 China Telecom ADR 252 0.02
78,000 China Tian Lun Gas 57 0.011,058,000 China Travel International 235 0.02
85,205 China Unicom ADR 803 0.071,722,486 China Unicom 1,630 0.13
309,300 China Vanke 574 0.05254,000 China Water Affairs 134 0.01212,000 China Water Industry 29 –57,000 China XLX Fertiliser 15 –
606,000 China Yurun Food 72 0.01407,500 China ZhengTong Auto Services 96 0.01690,800 China Zhongwang 238 0.02336,000 Chinasoft International 128 0.01642,000 Chongqing Machinery & Electric 61 0.01
1,025,000 Chongqing Rural Commercial Bank 487 0.04171,000 Chu Kong Petroleum & Natural Gas
Steel Pipe 19 –168,000 Chu Kong Shipping Enterprises 36 –788,000 CIFI 171 0.01136,000 Cimc Enric 52 –86,000 CITIC Dameng 5 –
1,148,000 CITIC Pacific 1,331 0.111,006,810 CITIC Resources 100 0.01
255,000 CITIC Securities 421 0.03532,000 Citychamp Watch & Jewellery 105 0.0147,000 Clear Media 37 –
1,197,000 CNOOC 1,217 0.1021,154 CNOOC ADR 2,131 0.17
118,000 Cogobuy 143 0.0115,000 Coland 19 –41,000 Colour Life Services 26 –
422,614 Comba Telecom Systems 61 0.01270,000 Comtec Solar Systems 9 –
1,725,352 Concord New Energy 73 0.0175,000 Consun Pharmaceutical 30 –
1,523,600 Coolpad 126 0.01268,000 COSCO International 99 0.01697,235 COSCO Pacific 568 0.0568,000 Coslight Technology 31 –
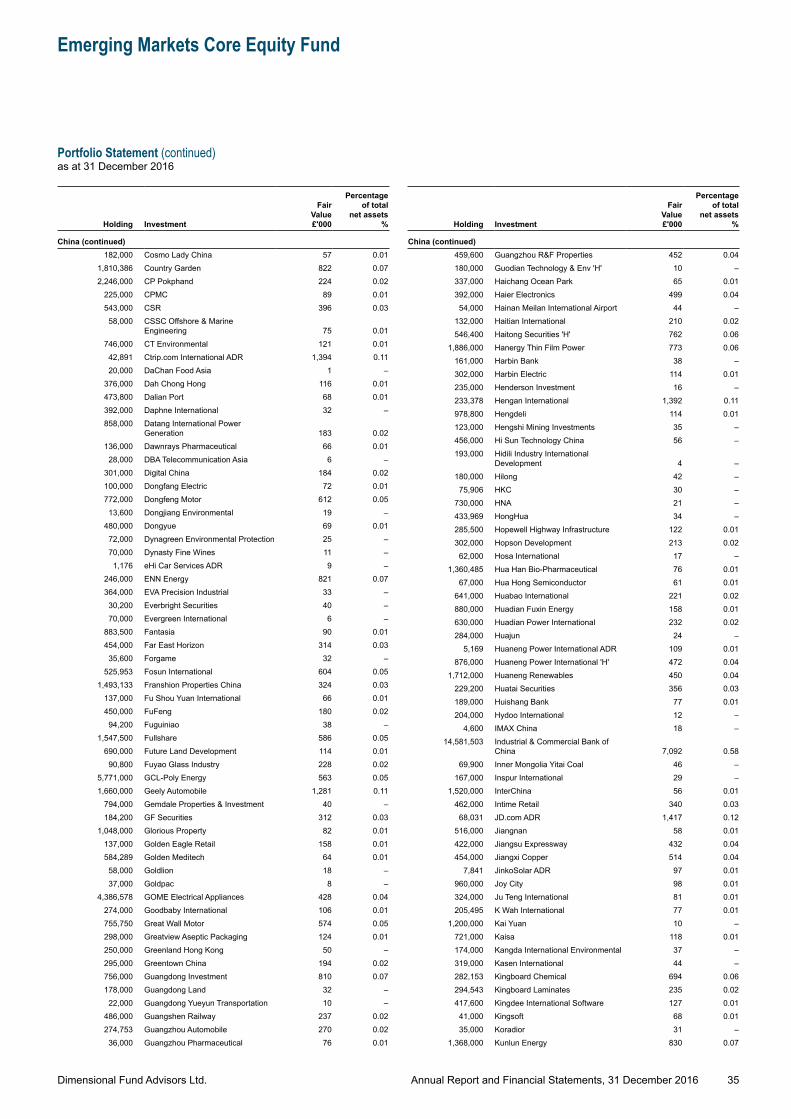
Dimensional Fund Advisors Ltd.
Emerging Markets Core Equity Fund
Portfolio Statement (continued)as at 31 December 2016
35Annual Report and Financial Statements, 31 December 2016
Holding Investment
Fair Value £'000
Percentage of total
net assets %
China (continued)182,000 Cosmo Lady China 57 0.01
1,810,386 Country Garden 822 0.072,246,000 CP Pokphand 224 0.02
225,000 CPMC 89 0.01543,000 CSR 396 0.03
58,000 CSSC Offshore & Marine Engineering 75 0.01
746,000 CT Environmental 121 0.0142,891 Ctrip.com International ADR 1,394 0.1120,000 DaChan Food Asia 1 –
376,000 Dah Chong Hong 116 0.01473,800 Dalian Port 68 0.01392,000 Daphne International 32 –858,000 Datang International Power
Generation 183 0.02136,000 Dawnrays Pharmaceutical 66 0.01
28,000 DBA Telecommunication Asia 6 –301,000 Digital China 184 0.02100,000 Dongfang Electric 72 0.01772,000 Dongfeng Motor 612 0.05
13,600 Dongjiang Environmental 19 –480,000 Dongyue 69 0.01
72,000 Dynagreen Environmental Protection 25 –70,000 Dynasty Fine Wines 11 –1,176 eHi Car Services ADR 9 –
246,000 ENN Energy 821 0.07364,000 EVA Precision Industrial 33 –30,200 Everbright Securities 40 –70,000 Evergreen International 6 –
883,500 Fantasia 90 0.01454,000 Far East Horizon 314 0.03
35,600 Forgame 32 –525,953 Fosun International 604 0.05
1,493,133 Franshion Properties China 324 0.03137,000 Fu Shou Yuan International 66 0.01450,000 FuFeng 180 0.02
94,200 Fuguiniao 38 –1,547,500 Fullshare 586 0.05
690,000 Future Land Development 114 0.0190,800 Fuyao Glass Industry 228 0.02
5,771,000 GCL-Poly Energy 563 0.051,660,000 Geely Automobile 1,281 0.11
794,000 Gemdale Properties & Investment 40 –184,200 GF Securities 312 0.03
1,048,000 Glorious Property 82 0.01137,000 Golden Eagle Retail 158 0.01584,289 Golden Meditech 64 0.01
58,000 Goldlion 18 –37,000 Goldpac 8 –
4,386,578 GOME Electrical Appliances 428 0.04274,000 Goodbaby International 106 0.01755,750 Great Wall Motor 574 0.05298,000 Greatview Aseptic Packaging 124 0.01250,000 Greenland Hong Kong 50 –295,000 Greentown China 194 0.02756,000 Guangdong Investment 810 0.07178,000 Guangdong Land 32 –22,000 Guangdong Yueyun Transportation 10 –
486,000 Guangshen Railway 237 0.02274,753 Guangzhou Automobile 270 0.02
36,000 Guangzhou Pharmaceutical 76 0.01
Holding Investment
Fair Value £'000
Percentage of total
net assets %
China (continued)459,600 Guangzhou R&F Properties 452 0.04180,000 Guodian Technology & Env 'H' 10 –337,000 Haichang Ocean Park 65 0.01392,000 Haier Electronics 499 0.0454,000 Hainan Meilan International Airport 44 –
132,000 Haitian International 210 0.02546,400 Haitong Securities 'H' 762 0.06
1,886,000 Hanergy Thin Film Power 773 0.06161,000 Harbin Bank 38 –302,000 Harbin Electric 114 0.01235,000 Henderson Investment 16 –233,378 Hengan International 1,392 0.11978,800 Hengdeli 114 0.01123,000 Hengshi Mining Investments 35 –456,000 Hi Sun Technology China 56 –193,000 Hidili Industry International
Development 4 –180,000 Hilong 42 –75,906 HKC 30 –
730,000 HNA 21 –433,969 HongHua 34 –285,500 Hopewell Highway Infrastructure 122 0.01302,000 Hopson Development 213 0.0262,000 Hosa International 17 –
1,360,485 Hua Han Bio-Pharmaceutical 76 0.0167,000 Hua Hong Semiconductor 61 0.01
641,000 Huabao International 221 0.02880,000 Huadian Fuxin Energy 158 0.01630,000 Huadian Power International 232 0.02284,000 Huajun 24 –
5,169 Huaneng Power International ADR 109 0.01876,000 Huaneng Power International 'H' 472 0.04
1,712,000 Huaneng Renewables 450 0.04229,200 Huatai Securities 356 0.03189,000 Huishang Bank 77 0.01204,000 Hydoo International 12 –
4,600 IMAX China 18 –14,581,503 Industrial & Commercial Bank of
China 7,092 0.5869,900 Inner Mongolia Yitai Coal 46 –
167,000 Inspur International 29 –1,520,000 InterChina 56 0.01
462,000 Intime Retail 340 0.0368,031 JD.com ADR 1,417 0.12
516,000 Jiangnan 58 0.01422,000 Jiangsu Expressway 432 0.04454,000 Jiangxi Copper 514 0.04
7,841 JinkoSolar ADR 97 0.01960,000 Joy City 98 0.01324,000 Ju Teng International 81 0.01205,495 K Wah International 77 0.01
1,200,000 Kai Yuan 10 –721,000 Kaisa 118 0.01174,000 Kangda International Environmental 37 –319,000 Kasen International 44 –282,153 Kingboard Chemical 694 0.06294,543 Kingboard Laminates 235 0.02417,600 Kingdee International Software 127 0.0141,000 Kingsoft 68 0.0135,000 Koradior 31 –
1,368,000 Kunlun Energy 830 0.07
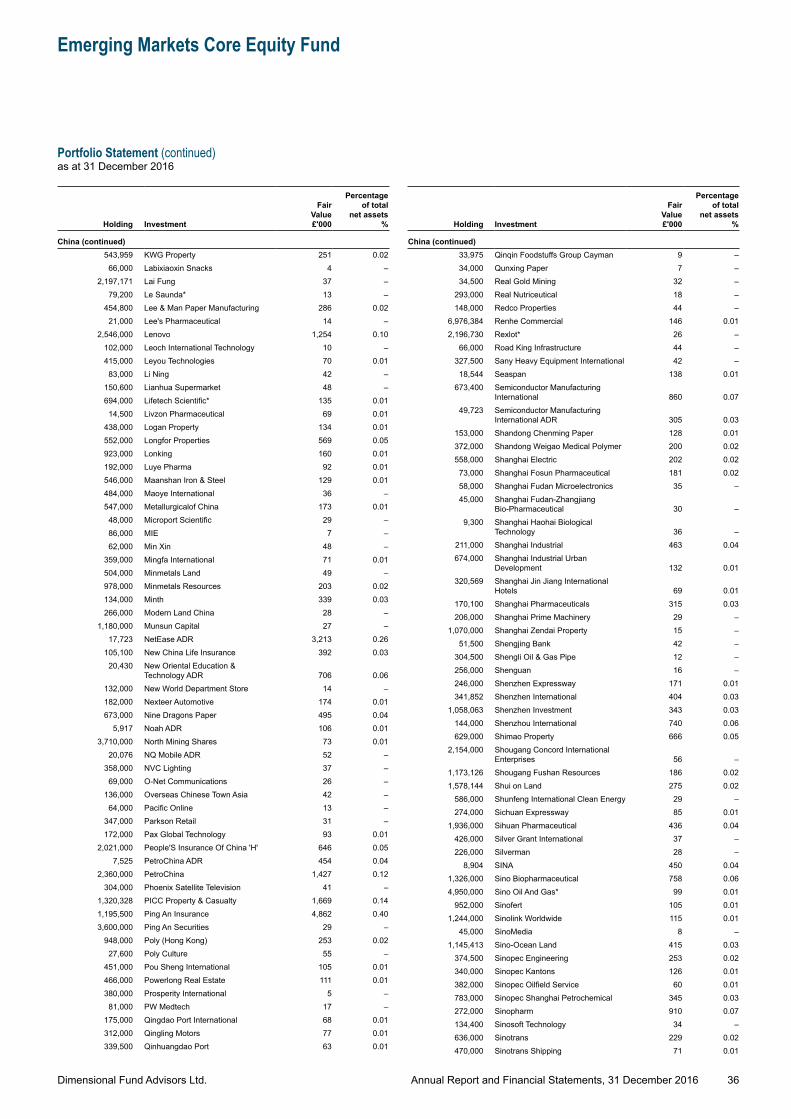
Dimensional Fund Advisors Ltd.
Emerging Markets Core Equity Fund
Portfolio Statement (continued)as at 31 December 2016
36Annual Report and Financial Statements, 31 December 2016
Holding Investment
Fair Value £'000
Percentage of total
net assets %
China (continued)543,959 KWG Property 251 0.02
66,000 Labixiaoxin Snacks 4 –2,197,171 Lai Fung 37 –
79,200 Le Saunda* 13 –454,800 Lee & Man Paper Manufacturing 286 0.02
21,000 Lee's Pharmaceutical 14 –2,546,000 Lenovo 1,254 0.10
102,000 Leoch International Technology 10 –415,000 Leyou Technologies 70 0.01
83,000 Li Ning 42 –150,600 Lianhua Supermarket 48 –694,000 Lifetech Scientific* 135 0.01
14,500 Livzon Pharmaceutical 69 0.01438,000 Logan Property 134 0.01552,000 Longfor Properties 569 0.05923,000 Lonking 160 0.01192,000 Luye Pharma 92 0.01546,000 Maanshan Iron & Steel 129 0.01484,000 Maoye International 36 –547,000 Metallurgicalof China 173 0.01
48,000 Microport Scientific 29 –86,000 MIE 7 –62,000 Min Xin 48 –
359,000 Mingfa International 71 0.01504,000 Minmetals Land 49 –978,000 Minmetals Resources 203 0.02134,000 Minth 339 0.03266,000 Modern Land China 28 –
1,180,000 Munsun Capital 27 –17,723 NetEase ADR 3,213 0.26
105,100 New China Life Insurance 392 0.0320,430 New Oriental Education &
Technology ADR 706 0.06132,000 New World Department Store 14 –182,000 Nexteer Automotive 174 0.01673,000 Nine Dragons Paper 495 0.04
5,917 Noah ADR 106 0.013,710,000 North Mining Shares 73 0.01
20,076 NQ Mobile ADR 52 –358,000 NVC Lighting 37 –69,000 O-Net Communications 26 –
136,000 Overseas Chinese Town Asia 42 –64,000 Pacific Online 13 –
347,000 Parkson Retail 31 –172,000 Pax Global Technology 93 0.01
2,021,000 People'S Insurance Of China 'H' 646 0.057,525 PetroChina ADR 454 0.04
2,360,000 PetroChina 1,427 0.12304,000 Phoenix Satellite Television 41 –
1,320,328 PICC Property & Casualty 1,669 0.141,195,500 Ping An Insurance 4,862 0.403,600,000 Ping An Securities 29 –
948,000 Poly (Hong Kong) 253 0.0227,600 Poly Culture 55 –
451,000 Pou Sheng International 105 0.01466,000 Powerlong Real Estate 111 0.01380,000 Prosperity International 5 –81,000 PW Medtech 17 –
175,000 Qingdao Port International 68 0.01312,000 Qingling Motors 77 0.01339,500 Qinhuangdao Port 63 0.01
Holding Investment
Fair Value £'000
Percentage of total
net assets %
China (continued)33,975 Qinqin Foodstuffs Group Cayman 9 –34,000 Qunxing Paper 7 –34,500 Real Gold Mining 32 –
293,000 Real Nutriceutical 18 –148,000 Redco Properties 44 –
6,976,384 Renhe Commercial 146 0.012,196,730 Rexlot* 26 –
66,000 Road King Infrastructure 44 –327,500 Sany Heavy Equipment International 42 –18,544 Seaspan 138 0.01
673,400 Semiconductor Manufacturing International 860 0.07
49,723 Semiconductor Manufacturing International ADR 305 0.03
153,000 Shandong Chenming Paper 128 0.01372,000 Shandong Weigao Medical Polymer 200 0.02558,000 Shanghai Electric 202 0.0273,000 Shanghai Fosun Pharmaceutical 181 0.0258,000 Shanghai Fudan Microelectronics 35 –45,000 Shanghai Fudan-Zhangjiang
Bio-Pharmaceutical 30 –9,300 Shanghai Haohai Biological
Technology 36 –211,000 Shanghai Industrial 463 0.04674,000 Shanghai Industrial Urban
Development 132 0.01320,569 Shanghai Jin Jiang International
Hotels 69 0.01170,100 Shanghai Pharmaceuticals 315 0.03206,000 Shanghai Prime Machinery 29 –
1,070,000 Shanghai Zendai Property 15 –51,500 Shengjing Bank 42 –
304,500 Shengli Oil & Gas Pipe 12 –256,000 Shenguan 16 –246,000 Shenzhen Expressway 171 0.01341,852 Shenzhen International 404 0.03
1,058,063 Shenzhen Investment 343 0.03144,000 Shenzhou International 740 0.06629,000 Shimao Property 666 0.05
2,154,000 Shougang Concord International Enterprises 56 –
1,173,126 Shougang Fushan Resources 186 0.021,578,144 Shui on Land 275 0.02
586,000 Shunfeng International Clean Energy 29 –274,000 Sichuan Expressway 85 0.01
1,936,000 Sihuan Pharmaceutical 436 0.04426,000 Silver Grant International 37 –226,000 Silverman 28 –
8,904 SINA 450 0.041,326,000 Sino Biopharmaceutical 758 0.064,950,000 Sino Oil And Gas* 99 0.01
952,000 Sinofert 105 0.011,244,000 Sinolink Worldwide 115 0.01
45,000 SinoMedia 8 –1,145,413 Sino-Ocean Land 415 0.03
374,500 Sinopec Engineering 253 0.02340,000 Sinopec Kantons 126 0.01382,000 Sinopec Oilfield Service 60 0.01783,000 Sinopec Shanghai Petrochemical 345 0.03272,000 Sinopharm 910 0.07134,400 Sinosoft Technology 34 –636,000 Sinotrans 229 0.02470,000 Sinotrans Shipping 71 0.01
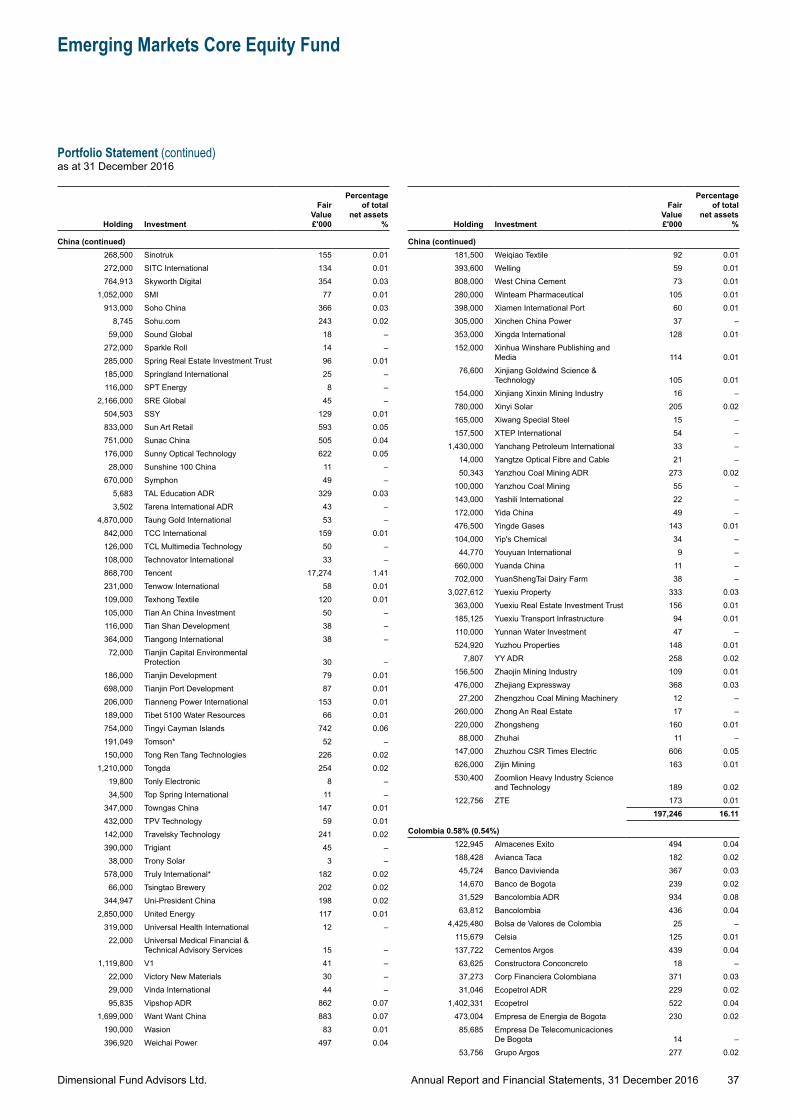
Dimensional Fund Advisors Ltd.
Emerging Markets Core Equity Fund
Portfolio Statement (continued)as at 31 December 2016
37Annual Report and Financial Statements, 31 December 2016
Holding Investment
Fair Value £'000
Percentage of total
net assets %
China (continued)268,500 Sinotruk 155 0.01272,000 SITC International 134 0.01764,913 Skyworth Digital 354 0.03
1,052,000 SMI 77 0.01913,000 Soho China 366 0.03
8,745 Sohu.com 243 0.0259,000 Sound Global 18 –
272,000 Sparkle Roll 14 –285,000 Spring Real Estate Investment Trust 96 0.01185,000 Springland International 25 –116,000 SPT Energy 8 –
2,166,000 SRE Global 45 –504,503 SSY 129 0.01833,000 Sun Art Retail 593 0.05751,000 Sunac China 505 0.04176,000 Sunny Optical Technology 622 0.05
28,000 Sunshine 100 China 11 –670,000 Symphon 49 –
5,683 TAL Education ADR 329 0.033,502 Tarena International ADR 43 –
4,870,000 Taung Gold International 53 –842,000 TCC International 159 0.01126,000 TCL Multimedia Technology 50 –108,000 Technovator International 33 –868,700 Tencent 17,274 1.41231,000 Tenwow International 58 0.01109,000 Texhong Textile 120 0.01105,000 Tian An China Investment 50 –116,000 Tian Shan Development 38 –364,000 Tiangong International 38 –72,000 Tianjin Capital Environmental
Protection 30 –186,000 Tianjin Development 79 0.01698,000 Tianjin Port Development 87 0.01206,000 Tianneng Power International 153 0.01189,000 Tibet 5100 Water Resources 66 0.01754,000 Tingyi Cayman Islands 742 0.06191,049 Tomson* 52 –150,000 Tong Ren Tang Technologies 226 0.02
1,210,000 Tongda 254 0.0219,800 Tonly Electronic 8 –34,500 Top Spring International 11 –
347,000 Towngas China 147 0.01432,000 TPV Technology 59 0.01142,000 Travelsky Technology 241 0.02390,000 Trigiant 45 –38,000 Trony Solar 3 –
578,000 Truly International* 182 0.0266,000 Tsingtao Brewery 202 0.02
344,947 Uni-President China 198 0.022,850,000 United Energy 117 0.01
319,000 Universal Health International 12 –22,000 Universal Medical Financial &
Technical Advisory Services 15 –1,119,800 V1 41 –
22,000 Victory New Materials 30 –29,000 Vinda International 44 –95,835 Vipshop ADR 862 0.07
1,699,000 Want Want China 883 0.07190,000 Wasion 83 0.01396,920 Weichai Power 497 0.04
Holding Investment
Fair Value £'000
Percentage of total
net assets %
China (continued)181,500 Weiqiao Textile 92 0.01393,600 Welling 59 0.01808,000 West China Cement 73 0.01280,000 Winteam Pharmaceutical 105 0.01398,000 Xiamen International Port 60 0.01305,000 Xinchen China Power 37 –353,000 Xingda International 128 0.01152,000 Xinhua Winshare Publishing and
Media 114 0.0176,600 Xinjiang Goldwind Science &
Technology 105 0.01154,000 Xinjiang Xinxin Mining Industry 16 –780,000 Xinyi Solar 205 0.02165,000 Xiwang Special Steel 15 –157,500 XTEP International 54 –
1,430,000 Yanchang Petroleum International 33 –14,000 Yangtze Optical Fibre and Cable 21 –50,343 Yanzhou Coal Mining ADR 273 0.02
100,000 Yanzhou Coal Mining 55 –143,000 Yashili International 22 –172,000 Yida China 49 –476,500 Yingde Gases 143 0.01104,000 Yip's Chemical 34 –44,770 Youyuan International 9 –
660,000 Yuanda China 11 –702,000 YuanShengTai Dairy Farm 38 –
3,027,612 Yuexiu Property 333 0.03363,000 Yuexiu Real Estate Investment Trust 156 0.01185,125 Yuexiu Transport Infrastructure 94 0.01110,000 Yunnan Water Investment 47 –524,920 Yuzhou Properties 148 0.01
7,807 YY ADR 258 0.02156,500 Zhaojin Mining Industry 109 0.01476,000 Zhejiang Expressway 368 0.0327,200 Zhengzhou Coal Mining Machinery 12 –
260,000 Zhong An Real Estate 17 –220,000 Zhongsheng 160 0.0188,000 Zhuhai 11 –
147,000 Zhuzhou CSR Times Electric 606 0.05626,000 Zijin Mining 163 0.01530,400 Zoomlion Heavy Industry Science
and Technology 189 0.02122,756 ZTE 173 0.01
197,246 16.11
Colombia 0.58% (0.54%)122,945 Almacenes Exito 494 0.04188,428 Avianca Taca 182 0.0245,724 Banco Davivienda 367 0.0314,670 Banco de Bogota 239 0.0231,529 Bancolombia ADR 934 0.0863,812 Bancolombia 436 0.04
4,425,480 Bolsa de Valores de Colombia 25 –115,679 Celsia 125 0.01137,722 Cementos Argos 439 0.0463,625 Constructora Conconcreto 18 –37,273 Corp Financiera Colombiana 371 0.0331,046 Ecopetrol ADR 229 0.02
1,402,331 Ecopetrol 522 0.04473,004 Empresa de Energia de Bogota 230 0.0285,685 Empresa De Telecomunicaciones
De Bogota 14 –53,756 Grupo Argos 277 0.02
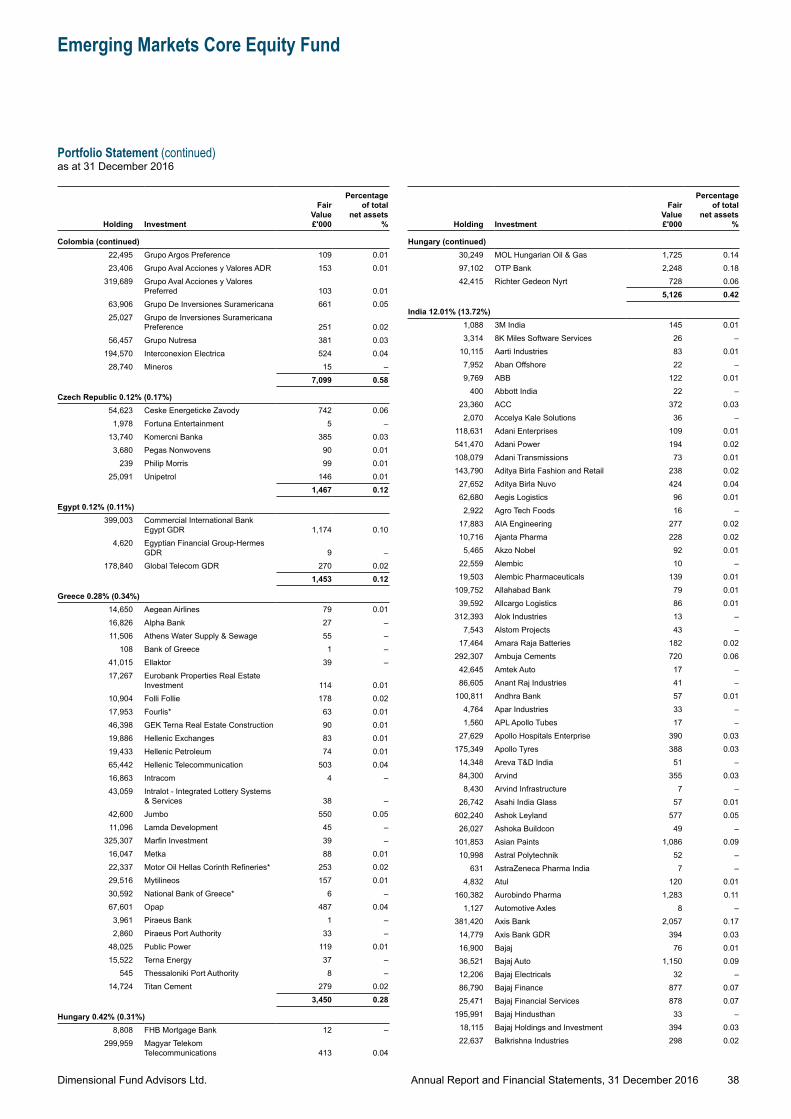
Dimensional Fund Advisors Ltd.
Emerging Markets Core Equity Fund
Portfolio Statement (continued)as at 31 December 2016
38Annual Report and Financial Statements, 31 December 2016
Holding Investment
Fair Value £'000
Percentage of total
net assets %
Colombia (continued)22,495 Grupo Argos Preference 109 0.0123,406 Grupo Aval Acciones y Valores ADR 153 0.01
319,689 Grupo Aval Acciones y Valores Preferred 103 0.01
63,906 Grupo De Inversiones Suramericana 661 0.0525,027 Grupo de Inversiones Suramericana
Preference 251 0.0256,457 Grupo Nutresa 381 0.03
194,570 Interconexion Electrica 524 0.0428,740 Mineros 15 –
7,099 0.58
Czech Republic 0.12% (0.17%)54,623 Ceske Energeticke Zavody 742 0.06
1,978 Fortuna Entertainment 5 –13,740 Komercni Banka 385 0.03
3,680 Pegas Nonwovens 90 0.01239 Philip Morris 99 0.01
25,091 Unipetrol 146 0.011,467 0.12
Egypt 0.12% (0.11%)399,003 Commercial International Bank
Egypt GDR 1,174 0.104,620 Egyptian Financial Group-Hermes
GDR 9 –178,840 Global Telecom GDR 270 0.02
1,453 0.12
Greece 0.28% (0.34%)14,650 Aegean Airlines 79 0.0116,826 Alpha Bank 27 –11,506 Athens Water Supply & Sewage 55 –
108 Bank of Greece 1 –41,015 Ellaktor 39 –17,267 Eurobank Properties Real Estate
Investment 114 0.0110,904 Folli Follie 178 0.0217,953 Fourlis* 63 0.0146,398 GEK Terna Real Estate Construction 90 0.0119,886 Hellenic Exchanges 83 0.0119,433 Hellenic Petroleum 74 0.0165,442 Hellenic Telecommunication 503 0.0416,863 Intracom 4 –43,059 Intralot - Integrated Lottery Systems
& Services 38 –42,600 Jumbo 550 0.0511,096 Lamda Development 45 –
325,307 Marfin Investment 39 –16,047 Metka 88 0.0122,337 Motor Oil Hellas Corinth Refineries* 253 0.0229,516 Mytilineos 157 0.0130,592 National Bank of Greece* 6 –67,601 Opap 487 0.04
3,961 Piraeus Bank 1 –2,860 Piraeus Port Authority 33 –
48,025 Public Power 119 0.0115,522 Terna Energy 37 –
545 Thessaloniki Port Authority 8 –14,724 Titan Cement 279 0.02
3,450 0.28
Hungary 0.42% (0.31%)8,808 FHB Mortgage Bank 12 –
299,959 Magyar Telekom Telecommunications 413 0.04
Holding Investment
Fair Value £'000
Percentage of total
net assets %
Hungary (continued)30,249 MOL Hungarian Oil & Gas 1,725 0.1497,102 OTP Bank 2,248 0.1842,415 Richter Gedeon Nyrt 728 0.06
5,126 0.42
India 12.01% (13.72%)1,088 3M India 145 0.013,314 8K Miles Software Services 26 –
10,115 Aarti Industries 83 0.017,952 Aban Offshore 22 –9,769 ABB 122 0.01
400 Abbott India 22 –23,360 ACC 372 0.03
2,070 Accelya Kale Solutions 36 –118,631 Adani Enterprises 109 0.01541,470 Adani Power 194 0.02108,079 Adani Transmissions 73 0.01143,790 Aditya Birla Fashion and Retail 238 0.0227,652 Aditya Birla Nuvo 424 0.0462,680 Aegis Logistics 96 0.01
2,922 Agro Tech Foods 16 –17,883 AIA Engineering 277 0.0210,716 Ajanta Pharma 228 0.02
5,465 Akzo Nobel 92 0.0122,559 Alembic 10 –19,503 Alembic Pharmaceuticals 139 0.01
109,752 Allahabad Bank 79 0.0139,592 Allcargo Logistics 86 0.01
312,393 Alok Industries 13 –7,543 Alstom Projects 43 –
17,464 Amara Raja Batteries 182 0.02292,307 Ambuja Cements 720 0.0642,645 Amtek Auto 17 –86,605 Anant Raj Industries 41 –
100,811 Andhra Bank 57 0.014,764 Apar Industries 33 –1,560 APL Apollo Tubes 17 –
27,629 Apollo Hospitals Enterprise 390 0.03175,349 Apollo Tyres 388 0.0314,348 Areva T&D India 51 –84,300 Arvind 355 0.03
8,430 Arvind Infrastructure 7 –26,742 Asahi India Glass 57 0.01
602,240 Ashok Leyland 577 0.0526,027 Ashoka Buildcon 49 –
101,853 Asian Paints 1,086 0.0910,998 Astral Polytechnik 52 –
631 AstraZeneca Pharma India 7 –4,832 Atul 120 0.01
160,382 Aurobindo Pharma 1,283 0.111,127 Automotive Axles 8 –
381,420 Axis Bank 2,057 0.1714,779 Axis Bank GDR 394 0.0316,900 Bajaj 76 0.0136,521 Bajaj Auto 1,150 0.0912,206 Bajaj Electricals 32 –86,790 Bajaj Finance 877 0.0725,471 Bajaj Financial Services 878 0.07
195,991 Bajaj Hindusthan 33 –18,115 Bajaj Holdings and Investment 394 0.0322,637 Balkrishna Industries 298 0.02

Dimensional Fund Advisors Ltd.
Emerging Markets Core Equity Fund
Portfolio Statement (continued)as at 31 December 2016
39Annual Report and Financial Statements, 31 December 2016
Holding Investment
Fair Value £'000
Percentage of total
net assets %
India (continued)106,842 Ballarpur Industries 20 –
23,576 Balmer Lawrie 67 0.0163,754 Balrampur Chini Mills 96 0.01
270,134 Bank of Baroda 496 0.04136,761 Bank of India 175 0.01
863 Bannari Amman Sugars 19 –4,283 BASF 59 0.01
12,986 Bata India 70 0.019,909 BEML 119 0.01
110,231 Berger Paints India 278 0.025,307 BF Utilities 25 –6,658 BGR Energy Systems 9 –
21,182 Bharat Electronics 349 0.0346,281 Bharat Financial Inclusion 326 0.0362,278 Bharat Forge 677 0.06
287,490 Bharat Heavy Electricals 416 0.03135,896 Bharat Petroleum 1,029 0.08473,013 Bharti Airtel 1,732 0.14212,640 Bharti Infratel 876 0.07
25,321 Biocon 287 0.0216,660 Birla 125 0.0118,884 Bliss Gvs Pharma 35 –1,925 Blue Dart Express 101 0.019,910 Blue Star 57 0.01
47,753 Bombay Dyeing & Manufacturing 27 –1,545 Bosch 389 0.039,540 Brigade Enterprises 17 –7,855 Britannia Industries 271 0.02
120,661 Cadila Healthcare 513 0.04188,224 Cairn 546 0.05
4,521 Can Fin Homes 86 0.0168,130 Canara Bank 214 0.02
5,835 Capital First 40 –13,505 Caplin Point Laboratories 55 0.0112,836 Carborundum Universal 38 –60,458 Castrol India 275 0.0216,275 CCL Productions 52 –13,681 Ceat 190 0.0227,943 Century Plyboards India 56 0.0114,929 Century Textiles & Industries 142 0.01
1,044 Cera Sanitaryware 25 –35,969 CESC 276 0.0272,110 Chambal Fertilizers & Chemicals 61 0.0131,276 Chennai Petroleum 103 0.01
125,864 Chennai Super Kings Cricket* 3 –17,458 Cholamandalam Investment and
Finance 197 0.02152,720 Cipla 1,037 0.0962,292 City Union Bank 96 0.01
4,146 Clariant Chemicals India 34 –125,336 Coal India 450 0.04
37,385 Colgate-Palmolive 404 0.0320,111 Container Corporation of India 267 0.0240,789 Coromandel International 143 0.0179,480 Corporation Bank 40 –54,556 Cox & Kings 117 0.01
8,333 Credit Analysis And Research* 130 0.016,916 Crisil 182 0.02
197,526 Crompton Greaves 140 0.01197,526 Crompton Greaves Consumer
Electricals* 344 0.03
Holding Investment
Fair Value £'000
Percentage of total
net assets %
India (continued)30,420 Cummins 297 0.02
194,047 Dabur 642 0.0511,150 Dalmia Bharat 180 0.0213,451 DB 58 0.0124,373 DB Realty 11 –13,495 DCM Shriram 35 –18,910 Deepak Fertilizers & Petrochemicals 47 –20,878 Deepak Nitrite 23 –31,557 Delta 41 –34,206 DEN Networks 28 –92,430 Dena Bank 36 –79,590 Development Credit Bank 103 0.0194,705 Dewan Housing Finance 277 0.02
7,787 Dhanuka Agritech 68 0.0122,540 Dishman Pharmaceuticals and
Chemicals 58 0.01182,258 DISHTV 184 0.0238,410 Divis Laboratories 359 0.03
246,451 DLF 328 0.0323,086 Dr. Reddy's Laboratories ADR 840 0.0719,809 Dr. Reddy's Laboratories 725 0.06
1,059 Dynamatic Technologies 36 –10,903 Eclerx Services 182 0.02
223,044 Edelweiss Financial Services 261 0.024,711 Eicher Motors 1,229 0.10
38,371 EID Parry 117 0.0178,986 EIH 89 0.01
5,269 Elgi Equipments 11 –24,184 Emami 272 0.02
108,014 Engineers India 196 0.021,761 Entertainment Network India 17 –8,644 Eros Internation Media 17 –
48,068 Escorts* 170 0.0119,543 Essel Propack 57 0.0125,305 Eveready Industries India 65 0.01
118,822 Exide Industries 256 0.021,368 FAG Bearings 63 0.01
20,345 FDC 54 0.01558,462 Federal Bank 447 0.04
8,513 Federal-Mogul Goetze India 50 –39,111 Finolex Cables 193 0.0218,443 Finolex Industries 97 0.01
126,039 Firstsource Solutions 57 0.0155,712 Fortis Healthcare 120 0.0152,626 Future Enterprise Retail 11 –52,626 Future Retail* 81 0.0113,169 Gabriel India 17 –
150,725 Gail India 787 0.0635,630 Gateway Distriparks 104 0.0114,511 Gati 20 –9,359 Gayatri Projects 75 0.01
17,372 Geometric 52 –32,986 GHCL 98 0.0121,905 GIC Housing Finance 70 0.01
2,980 Gillette India 153 0.014,013 GlaxoSmithKline Consumer
Healthcare 240 0.024,145 Glaxosmithkline Pharmaceuticals 135 0.01
71,676 Glenmark Pharmaceuticals 764 0.061,172,092 GMR Infrastructure 166 0.01
6,267 Godfrey Phillips 76 0.01
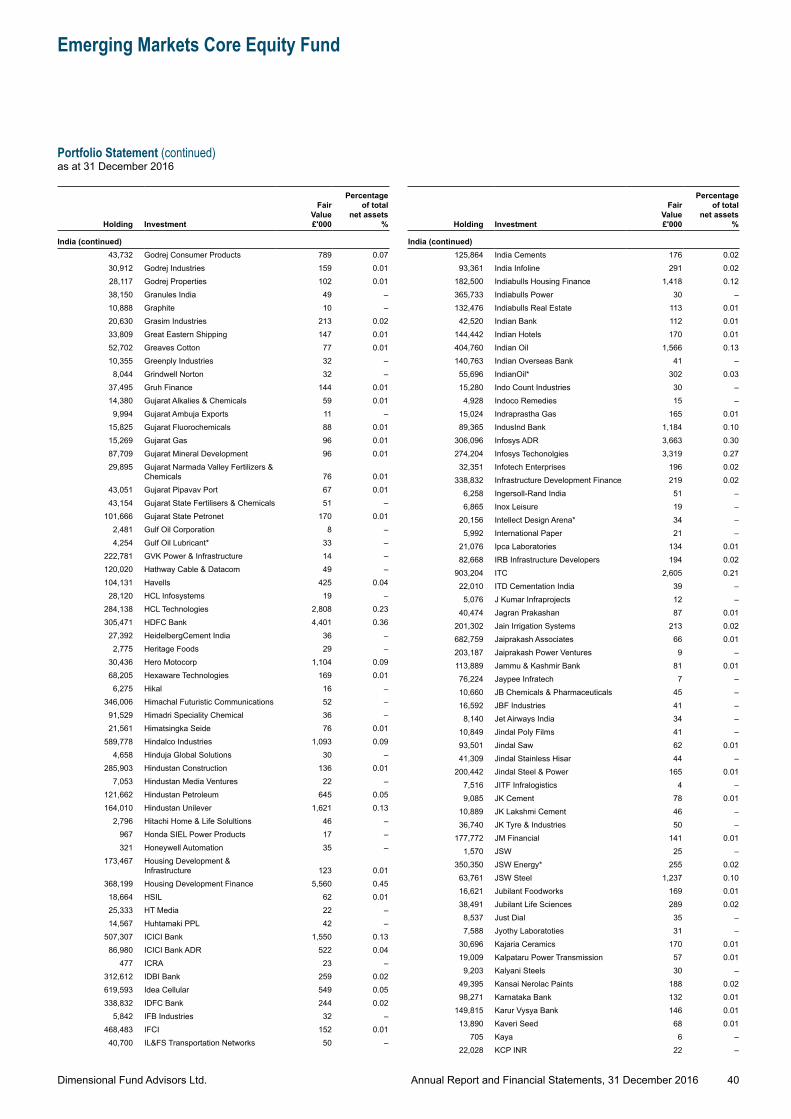
Dimensional Fund Advisors Ltd.
Emerging Markets Core Equity Fund
Portfolio Statement (continued)as at 31 December 2016
40Annual Report and Financial Statements, 31 December 2016
Holding Investment
Fair Value £'000
Percentage of total
net assets %
India (continued)43,732 Godrej Consumer Products 789 0.0730,912 Godrej Industries 159 0.0128,117 Godrej Properties 102 0.0138,150 Granules India 49 –10,888 Graphite 10 –20,630 Grasim Industries 213 0.0233,809 Great Eastern Shipping 147 0.0152,702 Greaves Cotton 77 0.0110,355 Greenply Industries 32 –8,044 Grindwell Norton 32 –
37,495 Gruh Finance 144 0.0114,380 Gujarat Alkalies & Chemicals 59 0.01
9,994 Gujarat Ambuja Exports 11 –15,825 Gujarat Fluorochemicals 88 0.0115,269 Gujarat Gas 96 0.0187,709 Gujarat Mineral Development 96 0.0129,895 Gujarat Narmada Valley Fertilizers &
Chemicals 76 0.0143,051 Gujarat Pipavav Port 67 0.0143,154 Gujarat State Fertilisers & Chemicals 51 –
101,666 Gujarat State Petronet 170 0.012,481 Gulf Oil Corporation 8 –4,254 Gulf Oil Lubricant* 33 –
222,781 GVK Power & Infrastructure 14 –120,020 Hathway Cable & Datacom 49 –104,131 Havells 425 0.04
28,120 HCL Infosystems 19 –284,138 HCL Technologies 2,808 0.23305,471 HDFC Bank 4,401 0.3627,392 HeidelbergCement India 36 –2,775 Heritage Foods 29 –
30,436 Hero Motocorp 1,104 0.0968,205 Hexaware Technologies 169 0.01
6,275 Hikal 16 –346,006 Himachal Futuristic Communications 52 –91,529 Himadri Speciality Chemical 36 –21,561 Himatsingka Seide 76 0.01
589,778 Hindalco Industries 1,093 0.094,658 Hinduja Global Solutions 30 –
285,903 Hindustan Construction 136 0.017,053 Hindustan Media Ventures 22 –
121,662 Hindustan Petroleum 645 0.05164,010 Hindustan Unilever 1,621 0.13
2,796 Hitachi Home & Life Solultions 46 –967 Honda SIEL Power Products 17 –321 Honeywell Automation 35 –
173,467 Housing Development & Infrastructure 123 0.01
368,199 Housing Development Finance 5,560 0.4518,664 HSIL 62 0.0125,333 HT Media 22 –14,567 Huhtamaki PPL 42 –
507,307 ICICI Bank 1,550 0.1386,980 ICICI Bank ADR 522 0.04
477 ICRA 23 –312,612 IDBI Bank 259 0.02619,593 Idea Cellular 549 0.05338,832 IDFC Bank 244 0.02
5,842 IFB Industries 32 –468,483 IFCI 152 0.01
40,700 IL&FS Transportation Networks 50 –
Holding Investment
Fair Value £'000
Percentage of total
net assets %
India (continued)125,864 India Cements 176 0.02
93,361 India Infoline 291 0.02182,500 Indiabulls Housing Finance 1,418 0.12365,733 Indiabulls Power 30 –132,476 Indiabulls Real Estate 113 0.0142,520 Indian Bank 112 0.01
144,442 Indian Hotels 170 0.01404,760 Indian Oil 1,566 0.13140,763 Indian Overseas Bank 41 –55,696 IndianOil* 302 0.0315,280 Indo Count Industries 30 –4,928 Indoco Remedies 15 –
15,024 Indraprastha Gas 165 0.0189,365 IndusInd Bank 1,184 0.10
306,096 Infosys ADR 3,663 0.30274,204 Infosys Techonolgies 3,319 0.2732,351 Infotech Enterprises 196 0.02
338,832 Infrastructure Development Finance 219 0.026,258 Ingersoll-Rand India 51 –6,865 Inox Leisure 19 –
20,156 Intellect Design Arena* 34 –5,992 International Paper 21 –
21,076 Ipca Laboratories 134 0.0182,668 IRB Infrastructure Developers 194 0.02
903,204 ITC 2,605 0.2122,010 ITD Cementation India 39 –5,076 J Kumar Infraprojects 12 –
40,474 Jagran Prakashan 87 0.01201,302 Jain Irrigation Systems 213 0.02682,759 Jaiprakash Associates 66 0.01203,187 Jaiprakash Power Ventures 9 –113,889 Jammu & Kashmir Bank 81 0.0176,224 Jaypee Infratech 7 –10,660 JB Chemicals & Pharmaceuticals 45 –16,592 JBF Industries 41 –8,140 Jet Airways India 34 –
10,849 Jindal Poly Films 41 –93,501 Jindal Saw 62 0.0141,309 Jindal Stainless Hisar 44 –
200,442 Jindal Steel & Power 165 0.017,516 JITF Infralogistics 4 –9,085 JK Cement 78 0.01
10,889 JK Lakshmi Cement 46 –36,740 JK Tyre & Industries 50 –
177,772 JM Financial 141 0.011,570 JSW 25 –
350,350 JSW Energy* 255 0.0263,761 JSW Steel 1,237 0.1016,621 Jubilant Foodworks 169 0.0138,491 Jubilant Life Sciences 289 0.02
8,537 Just Dial 35 –7,588 Jyothy Laboratoties 31 –
30,696 Kajaria Ceramics 170 0.0119,009 Kalpataru Power Transmission 57 0.01
9,203 Kalyani Steels 30 –49,395 Kansai Nerolac Paints 188 0.0298,271 Karnataka Bank 132 0.01
149,815 Karur Vysya Bank 146 0.0113,890 Kaveri Seed 68 0.01
705 Kaya 6 –22,028 KCP INR 22 –
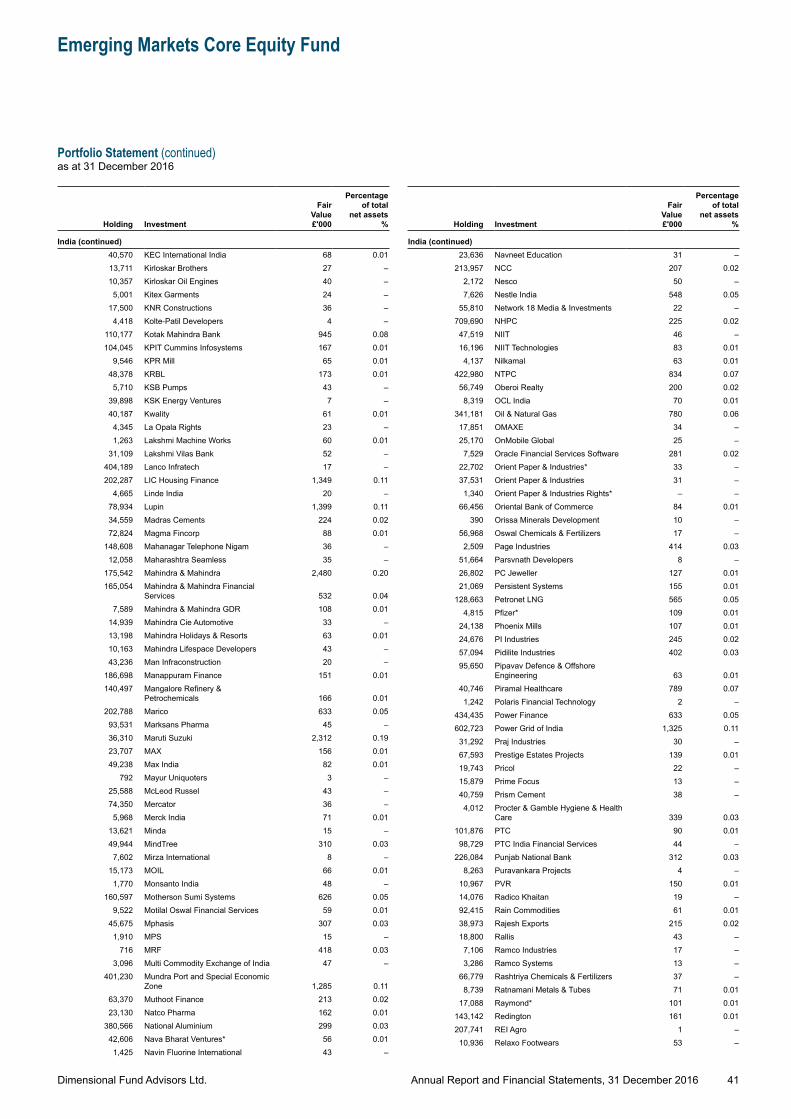
Dimensional Fund Advisors Ltd.
Emerging Markets Core Equity Fund
Portfolio Statement (continued)as at 31 December 2016
41Annual Report and Financial Statements, 31 December 2016
Holding Investment
Fair Value £'000
Percentage of total
net assets %
India (continued)40,570 KEC International India 68 0.0113,711 Kirloskar Brothers 27 –10,357 Kirloskar Oil Engines 40 –5,001 Kitex Garments 24 –
17,500 KNR Constructions 36 –4,418 Kolte-Patil Developers 4 –
110,177 Kotak Mahindra Bank 945 0.08104,045 KPIT Cummins Infosystems 167 0.01
9,546 KPR Mill 65 0.0148,378 KRBL 173 0.01
5,710 KSB Pumps 43 –39,898 KSK Energy Ventures 7 –40,187 Kwality 61 0.01
4,345 La Opala Rights 23 –1,263 Lakshmi Machine Works 60 0.01
31,109 Lakshmi Vilas Bank 52 –404,189 Lanco Infratech 17 –202,287 LIC Housing Finance 1,349 0.11
4,665 Linde India 20 –78,934 Lupin 1,399 0.1134,559 Madras Cements 224 0.0272,824 Magma Fincorp 88 0.01
148,608 Mahanagar Telephone Nigam 36 –12,058 Maharashtra Seamless 35 –
175,542 Mahindra & Mahindra 2,480 0.20165,054 Mahindra & Mahindra Financial
Services 532 0.047,589 Mahindra & Mahindra GDR 108 0.01
14,939 Mahindra Cie Automotive 33 –13,198 Mahindra Holidays & Resorts 63 0.0110,163 Mahindra Lifespace Developers 43 –43,236 Man Infraconstruction 20 –
186,698 Manappuram Finance 151 0.01140,497 Mangalore Refinery &
Petrochemicals 166 0.01202,788 Marico 633 0.05
93,531 Marksans Pharma 45 –36,310 Maruti Suzuki 2,312 0.1923,707 MAX 156 0.0149,238 Max India 82 0.01
792 Mayur Uniquoters 3 –25,588 McLeod Russel 43 –74,350 Mercator 36 –5,968 Merck India 71 0.01
13,621 Minda 15 –49,944 MindTree 310 0.03
7,602 Mirza International 8 –15,173 MOIL 66 0.01
1,770 Monsanto India 48 –160,597 Motherson Sumi Systems 626 0.05
9,522 Motilal Oswal Financial Services 59 0.0145,675 Mphasis 307 0.03
1,910 MPS 15 –716 MRF 418 0.03
3,096 Multi Commodity Exchange of India 47 –401,230 Mundra Port and Special Economic
Zone 1,285 0.1163,370 Muthoot Finance 213 0.0223,130 Natco Pharma 162 0.01
380,566 National Aluminium 299 0.0342,606 Nava Bharat Ventures* 56 0.01
1,425 Navin Fluorine International 43 –
Holding Investment
Fair Value £'000
Percentage of total
net assets %
India (continued)23,636 Navneet Education 31 –
213,957 NCC 207 0.022,172 Nesco 50 –7,626 Nestle India 548 0.05
55,810 Network 18 Media & Investments 22 –709,690 NHPC 225 0.0247,519 NIIT 46 –16,196 NIIT Technologies 83 0.01
4,137 Nilkamal 63 0.01422,980 NTPC 834 0.0756,749 Oberoi Realty 200 0.02
8,319 OCL India 70 0.01341,181 Oil & Natural Gas 780 0.0617,851 OMAXE 34 –25,170 OnMobile Global 25 –7,529 Oracle Financial Services Software 281 0.02
22,702 Orient Paper & Industries* 33 –37,531 Orient Paper & Industries 31 –1,340 Orient Paper & Industries Rights* – –
66,456 Oriental Bank of Commerce 84 0.01390 Orissa Minerals Development 10 –
56,968 Oswal Chemicals & Fertilizers 17 –2,509 Page Industries 414 0.03
51,664 Parsvnath Developers 8 –26,802 PC Jeweller 127 0.0121,069 Persistent Systems 155 0.01
128,663 Petronet LNG 565 0.054,815 Pfizer* 109 0.01
24,138 Phoenix Mills 107 0.0124,676 PI Industries 245 0.0257,094 Pidilite Industries 402 0.0395,650 Pipavav Defence & Offshore
Engineering 63 0.0140,746 Piramal Healthcare 789 0.07
1,242 Polaris Financial Technology 2 –434,435 Power Finance 633 0.05602,723 Power Grid of India 1,325 0.1131,292 Praj Industries 30 –67,593 Prestige Estates Projects 139 0.0119,743 Pricol 22 –15,879 Prime Focus 13 –40,759 Prism Cement 38 –4,012 Procter & Gamble Hygiene & Health
Care 339 0.03101,876 PTC 90 0.0198,729 PTC India Financial Services 44 –
226,084 Punjab National Bank 312 0.038,263 Puravankara Projects 4 –
10,967 PVR 150 0.0114,076 Radico Khaitan 19 –92,415 Rain Commodities 61 0.0138,973 Rajesh Exports 215 0.0218,800 Rallis 43 –7,106 Ramco Industries 17 –3,286 Ramco Systems 13 –
66,779 Rashtriya Chemicals & Fertilizers 37 –8,739 Ratnamani Metals & Tubes 71 0.01
17,088 Raymond* 101 0.01143,142 Redington 161 0.01207,741 REI Agro 1 –10,936 Relaxo Footwears 53 –
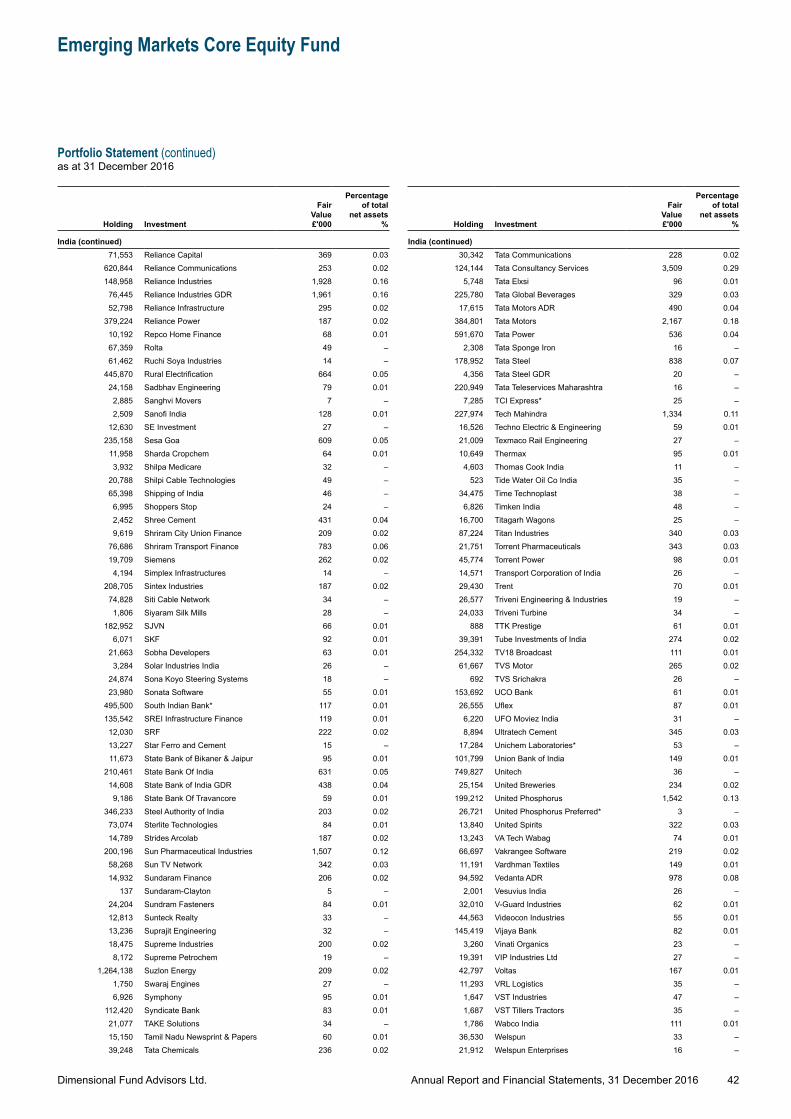
Dimensional Fund Advisors Ltd.
Emerging Markets Core Equity Fund
Portfolio Statement (continued)as at 31 December 2016
42Annual Report and Financial Statements, 31 December 2016
Holding Investment
Fair Value £'000
Percentage of total
net assets %
India (continued)71,553 Reliance Capital 369 0.03
620,844 Reliance Communications 253 0.02148,958 Reliance Industries 1,928 0.16
76,445 Reliance Industries GDR 1,961 0.1652,798 Reliance Infrastructure 295 0.02
379,224 Reliance Power 187 0.0210,192 Repco Home Finance 68 0.0167,359 Rolta 49 –61,462 Ruchi Soya Industries 14 –
445,870 Rural Electrification 664 0.0524,158 Sadbhav Engineering 79 0.01
2,885 Sanghvi Movers 7 –2,509 Sanofi India 128 0.01
12,630 SE Investment 27 –235,158 Sesa Goa 609 0.05
11,958 Sharda Cropchem 64 0.013,932 Shilpa Medicare 32 –
20,788 Shilpi Cable Technologies 49 –65,398 Shipping of India 46 –6,995 Shoppers Stop 24 –2,452 Shree Cement 431 0.049,619 Shriram City Union Finance 209 0.02
76,686 Shriram Transport Finance 783 0.0619,709 Siemens 262 0.02
4,194 Simplex Infrastructures 14 –208,705 Sintex Industries 187 0.02
74,828 Siti Cable Network 34 –1,806 Siyaram Silk Mills 28 –
182,952 SJVN 66 0.016,071 SKF 92 0.01
21,663 Sobha Developers 63 0.013,284 Solar Industries India 26 –
24,874 Sona Koyo Steering Systems 18 –23,980 Sonata Software 55 0.01
495,500 South Indian Bank* 117 0.01135,542 SREI Infrastructure Finance 119 0.01
12,030 SRF 222 0.0213,227 Star Ferro and Cement 15 –11,673 State Bank of Bikaner & Jaipur 95 0.01
210,461 State Bank Of India 631 0.0514,608 State Bank of India GDR 438 0.04
9,186 State Bank Of Travancore 59 0.01346,233 Steel Authority of India 203 0.02
73,074 Sterlite Technologies 84 0.0114,789 Strides Arcolab 187 0.02
200,196 Sun Pharmaceutical Industries 1,507 0.1258,268 Sun TV Network 342 0.0314,932 Sundaram Finance 206 0.02
137 Sundaram-Clayton 5 –24,204 Sundram Fasteners 84 0.0112,813 Sunteck Realty 33 –13,236 Suprajit Engineering 32 –18,475 Supreme Industries 200 0.02
8,172 Supreme Petrochem 19 –1,264,138 Suzlon Energy 209 0.02
1,750 Swaraj Engines 27 –6,926 Symphony 95 0.01
112,420 Syndicate Bank 83 0.0121,077 TAKE Solutions 34 –15,150 Tamil Nadu Newsprint & Papers 60 0.0139,248 Tata Chemicals 236 0.02
Holding Investment
Fair Value £'000
Percentage of total
net assets %
India (continued)30,342 Tata Communications 228 0.02
124,144 Tata Consultancy Services 3,509 0.295,748 Tata Elxsi 96 0.01
225,780 Tata Global Beverages 329 0.0317,615 Tata Motors ADR 490 0.04
384,801 Tata Motors 2,167 0.18591,670 Tata Power 536 0.04
2,308 Tata Sponge Iron 16 –178,952 Tata Steel 838 0.07
4,356 Tata Steel GDR 20 –220,949 Tata Teleservices Maharashtra 16 –
7,285 TCI Express* 25 –227,974 Tech Mahindra 1,334 0.1116,526 Techno Electric & Engineering 59 0.0121,009 Texmaco Rail Engineering 27 –10,649 Thermax 95 0.01
4,603 Thomas Cook India 11 –523 Tide Water Oil Co India 35 –
34,475 Time Technoplast 38 –6,826 Timken India 48 –
16,700 Titagarh Wagons 25 –87,224 Titan Industries 340 0.0321,751 Torrent Pharmaceuticals 343 0.0345,774 Torrent Power 98 0.0114,571 Transport Corporation of India 26 –29,430 Trent 70 0.0126,577 Triveni Engineering & Industries 19 –24,033 Triveni Turbine 34 –
888 TTK Prestige 61 0.0139,391 Tube Investments of India 274 0.02
254,332 TV18 Broadcast 111 0.0161,667 TVS Motor 265 0.02
692 TVS Srichakra 26 –153,692 UCO Bank 61 0.0126,555 Uflex 87 0.01
6,220 UFO Moviez India 31 –8,894 Ultratech Cement 345 0.03
17,284 Unichem Laboratories* 53 –101,799 Union Bank of India 149 0.01749,827 Unitech 36 –25,154 United Breweries 234 0.02
199,212 United Phosphorus 1,542 0.1326,721 United Phosphorus Preferred* 3 –13,840 United Spirits 322 0.0313,243 VA Tech Wabag 74 0.0166,697 Vakrangee Software 219 0.0211,191 Vardhman Textiles 149 0.0194,592 Vedanta ADR 978 0.08
2,001 Vesuvius India 26 –32,010 V-Guard Industries 62 0.0144,563 Videocon Industries 55 0.01
145,419 Vijaya Bank 82 0.013,260 Vinati Organics 23 –
19,391 VIP Industries Ltd 27 –42,797 Voltas 167 0.0111,293 VRL Logistics 35 –1,647 VST Industries 47 –1,687 VST Tillers Tractors 35 –1,786 Wabco India 111 0.01
36,530 Welspun 33 –21,912 Welspun Enterprises 16 –
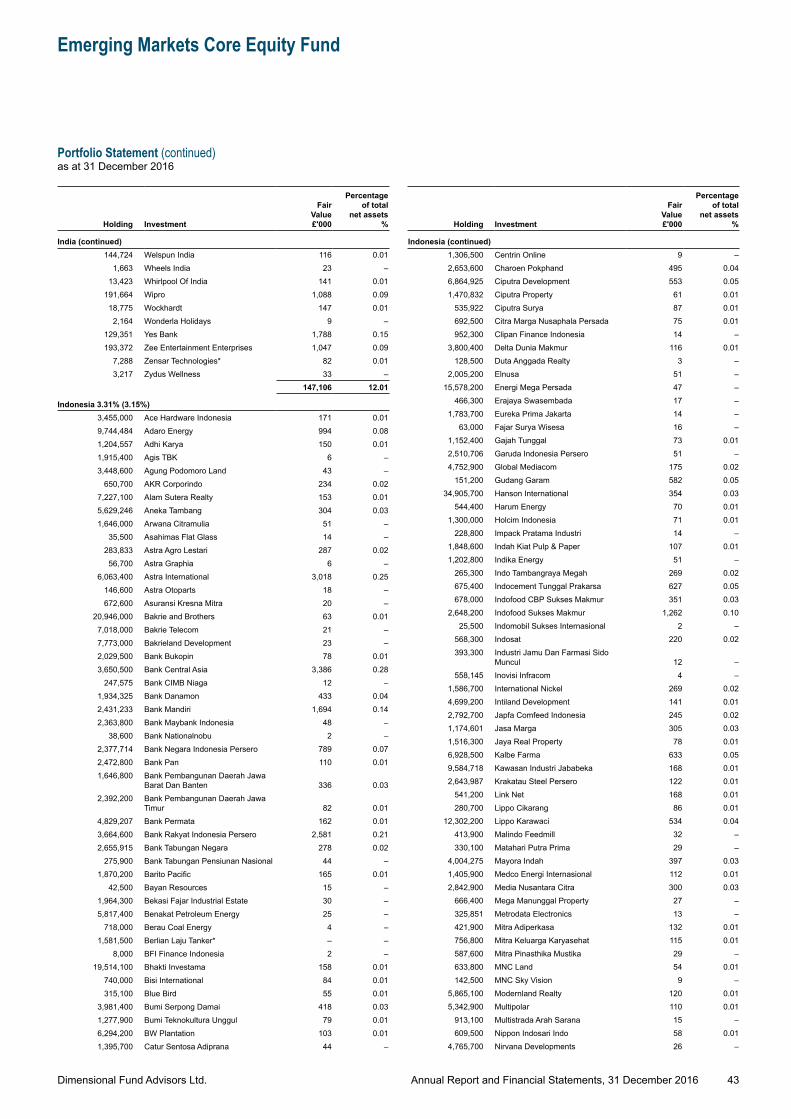
Dimensional Fund Advisors Ltd.
Emerging Markets Core Equity Fund
Portfolio Statement (continued)as at 31 December 2016
43Annual Report and Financial Statements, 31 December 2016
Holding Investment
Fair Value £'000
Percentage of total
net assets %
India (continued)144,724 Welspun India 116 0.01
1,663 Wheels India 23 –13,423 Whirlpool Of India 141 0.01
191,664 Wipro 1,088 0.0918,775 Wockhardt 147 0.01
2,164 Wonderla Holidays 9 –129,351 Yes Bank 1,788 0.15193,372 Zee Entertainment Enterprises 1,047 0.09
7,288 Zensar Technologies* 82 0.013,217 Zydus Wellness 33 –
147,106 12.01
Indonesia 3.31% (3.15%)3,455,000 Ace Hardware Indonesia 171 0.019,744,484 Adaro Energy 994 0.081,204,557 Adhi Karya 150 0.011,915,400 Agis TBK 6 –3,448,600 Agung Podomoro Land 43 –
650,700 AKR Corporindo 234 0.027,227,100 Alam Sutera Realty 153 0.015,629,246 Aneka Tambang 304 0.031,646,000 Arwana Citramulia 51 –
35,500 Asahimas Flat Glass 14 –283,833 Astra Agro Lestari 287 0.02
56,700 Astra Graphia 6 –6,063,400 Astra International 3,018 0.25
146,600 Astra Otoparts 18 –672,600 Asuransi Kresna Mitra 20 –
20,946,000 Bakrie and Brothers 63 0.017,018,000 Bakrie Telecom 21 –7,773,000 Bakrieland Development 23 –2,029,500 Bank Bukopin 78 0.013,650,500 Bank Central Asia 3,386 0.28
247,575 Bank CIMB Niaga 12 –1,934,325 Bank Danamon 433 0.042,431,233 Bank Mandiri 1,694 0.142,363,800 Bank Maybank Indonesia 48 –
38,600 Bank Nationalnobu 2 –2,377,714 Bank Negara Indonesia Persero 789 0.072,472,800 Bank Pan 110 0.011,646,800 Bank Pembangunan Daerah Jawa
Barat Dan Banten 336 0.032,392,200 Bank Pembangunan Daerah Jawa
Timur 82 0.014,829,207 Bank Permata 162 0.013,664,600 Bank Rakyat Indonesia Persero 2,581 0.212,655,915 Bank Tabungan Negara 278 0.02
275,900 Bank Tabungan Pensiunan Nasional 44 –1,870,200 Barito Pacific 165 0.01
42,500 Bayan Resources 15 –1,964,300 Bekasi Fajar Industrial Estate 30 –5,817,400 Benakat Petroleum Energy 25 –
718,000 Berau Coal Energy 4 –1,581,500 Berlian Laju Tanker* – –
8,000 BFI Finance Indonesia 2 –19,514,100 Bhakti Investama 158 0.01
740,000 Bisi International 84 0.01315,100 Blue Bird 55 0.01
3,981,400 Bumi Serpong Damai 418 0.031,277,900 Bumi Teknokultura Unggul 79 0.016,294,200 BW Plantation 103 0.011,395,700 Catur Sentosa Adiprana 44 –
Holding Investment
Fair Value £'000
Percentage of total
net assets %
Indonesia (continued)1,306,500 Centrin Online 9 –2,653,600 Charoen Pokphand 495 0.046,864,925 Ciputra Development 553 0.051,470,832 Ciputra Property 61 0.01
535,922 Ciputra Surya 87 0.01692,500 Citra Marga Nusaphala Persada 75 0.01952,300 Clipan Finance Indonesia 14 –
3,800,400 Delta Dunia Makmur 116 0.01128,500 Duta Anggada Realty 3 –
2,005,200 Elnusa 51 –15,578,200 Energi Mega Persada 47 –
466,300 Erajaya Swasembada 17 –1,783,700 Eureka Prima Jakarta 14 –
63,000 Fajar Surya Wisesa 16 –1,152,400 Gajah Tunggal 73 0.012,510,706 Garuda Indonesia Persero 51 –4,752,900 Global Mediacom 175 0.02
151,200 Gudang Garam 582 0.0534,905,700 Hanson International 354 0.03
544,400 Harum Energy 70 0.011,300,000 Holcim Indonesia 71 0.01
228,800 Impack Pratama Industri 14 –1,848,600 Indah Kiat Pulp & Paper 107 0.011,202,800 Indika Energy 51 –
265,300 Indo Tambangraya Megah 269 0.02675,400 Indocement Tunggal Prakarsa 627 0.05678,000 Indofood CBP Sukses Makmur 351 0.03
2,648,200 Indofood Sukses Makmur 1,262 0.1025,500 Indomobil Sukses Internasional 2 –
568,300 Indosat 220 0.02393,300 Industri Jamu Dan Farmasi Sido
Muncul 12 –558,145 Inovisi Infracom 4 –
1,586,700 International Nickel 269 0.024,699,200 Intiland Development 141 0.012,792,700 Japfa Comfeed Indonesia 245 0.021,174,601 Jasa Marga 305 0.031,516,300 Jaya Real Property 78 0.016,928,500 Kalbe Farma 633 0.059,584,718 Kawasan Industri Jababeka 168 0.012,643,987 Krakatau Steel Persero 122 0.01
541,200 Link Net 168 0.01280,700 Lippo Cikarang 86 0.01
12,302,200 Lippo Karawaci 534 0.04413,900 Malindo Feedmill 32 –330,100 Matahari Putra Prima 29 –
4,004,275 Mayora Indah 397 0.031,405,900 Medco Energi Internasional 112 0.012,842,900 Media Nusantara Citra 300 0.03
666,400 Mega Manunggal Property 27 –325,851 Metrodata Electronics 13 –421,900 Mitra Adiperkasa 132 0.01756,800 Mitra Keluarga Karyasehat 115 0.01587,600 Mitra Pinasthika Mustika 29 –633,800 MNC Land 54 0.01142,500 MNC Sky Vision 9 –
5,865,100 Modernland Realty 120 0.015,342,900 Multipolar 110 0.01
913,100 Multistrada Arah Sarana 15 –609,500 Nippon Indosari Indo 58 0.01
4,765,700 Nirvana Developments 26 –
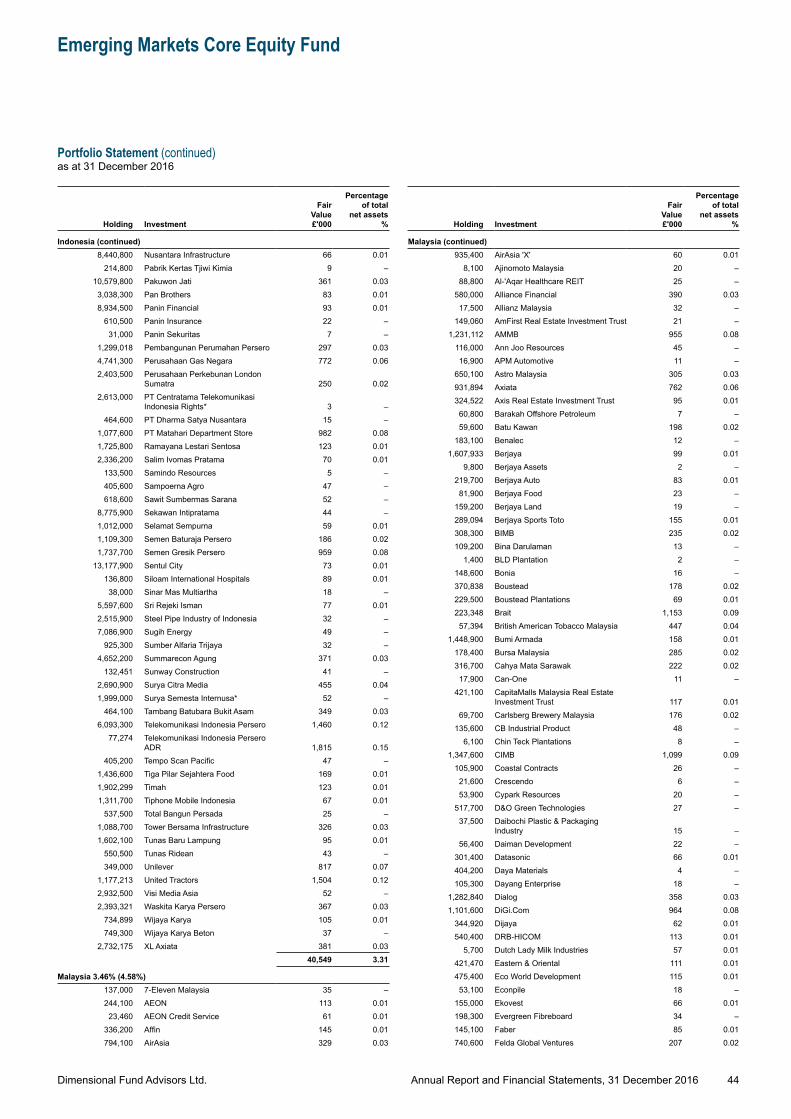
Dimensional Fund Advisors Ltd.
Emerging Markets Core Equity Fund
Portfolio Statement (continued)as at 31 December 2016
44Annual Report and Financial Statements, 31 December 2016
Holding Investment
Fair Value £'000
Percentage of total
net assets %
Indonesia (continued)8,440,800 Nusantara Infrastructure 66 0.01
214,800 Pabrik Kertas Tjiwi Kimia 9 –10,579,800 Pakuwon Jati 361 0.03
3,038,300 Pan Brothers 83 0.018,934,500 Panin Financial 93 0.01
610,500 Panin Insurance 22 –31,000 Panin Sekuritas 7 –
1,299,018 Pembangunan Perumahan Persero 297 0.034,741,300 Perusahaan Gas Negara 772 0.062,403,500 Perusahaan Perkebunan London
Sumatra 250 0.022,613,000 PT Centratama Telekomunikasi
Indonesia Rights* 3 –464,600 PT Dharma Satya Nusantara 15 –
1,077,600 PT Matahari Department Store 982 0.081,725,800 Ramayana Lestari Sentosa 123 0.012,336,200 Salim Ivomas Pratama 70 0.01
133,500 Samindo Resources 5 –405,600 Sampoerna Agro 47 –618,600 Sawit Sumbermas Sarana 52 –
8,775,900 Sekawan Intipratama 44 –1,012,000 Selamat Sempurna 59 0.011,109,300 Semen Baturaja Persero 186 0.021,737,700 Semen Gresik Persero 959 0.08
13,177,900 Sentul City 73 0.01136,800 Siloam International Hospitals 89 0.01
38,000 Sinar Mas Multiartha 18 –5,597,600 Sri Rejeki Isman 77 0.012,515,900 Steel Pipe Industry of Indonesia 32 –7,086,900 Sugih Energy 49 –
925,300 Sumber Alfaria Trijaya 32 –4,652,200 Summarecon Agung 371 0.03
132,451 Sunway Construction 41 –2,690,900 Surya Citra Media 455 0.041,999,000 Surya Semesta Internusa* 52 –
464,100 Tambang Batubara Bukit Asam 349 0.036,093,300 Telekomunikasi Indonesia Persero 1,460 0.12
77,274 Telekomunikasi Indonesia Persero ADR 1,815 0.15
405,200 Tempo Scan Pacific 47 –1,436,600 Tiga Pilar Sejahtera Food 169 0.011,902,299 Timah 123 0.011,311,700 Tiphone Mobile Indonesia 67 0.01
537,500 Total Bangun Persada 25 –1,088,700 Tower Bersama Infrastructure 326 0.031,602,100 Tunas Baru Lampung 95 0.01
550,500 Tunas Ridean 43 –349,000 Unilever 817 0.07
1,177,213 United Tractors 1,504 0.122,932,500 Visi Media Asia 52 –2,393,321 Waskita Karya Persero 367 0.03
734,899 Wijaya Karya 105 0.01749,300 Wijaya Karya Beton 37 –
2,732,175 XL Axiata 381 0.0340,549 3.31
Malaysia 3.46% (4.58%)137,000 7-Eleven Malaysia 35 –244,100 AEON 113 0.01
23,460 AEON Credit Service 61 0.01336,200 Affin 145 0.01794,100 AirAsia 329 0.03
Holding Investment
Fair Value £'000
Percentage of total
net assets %
Malaysia (continued)935,400 AirAsia 'X' 60 0.01
8,100 Ajinomoto Malaysia 20 –88,800 Al-'Aqar Healthcare REIT 25 –
580,000 Alliance Financial 390 0.0317,500 Allianz Malaysia 32 –
149,060 AmFirst Real Estate Investment Trust 21 –1,231,112 AMMB 955 0.08
116,000 Ann Joo Resources 45 –16,900 APM Automotive 11 –
650,100 Astro Malaysia 305 0.03931,894 Axiata 762 0.06324,522 Axis Real Estate Investment Trust 95 0.0160,800 Barakah Offshore Petroleum 7 –59,600 Batu Kawan 198 0.02
183,100 Benalec 12 –1,607,933 Berjaya 99 0.01
9,800 Berjaya Assets 2 –219,700 Berjaya Auto 83 0.0181,900 Berjaya Food 23 –
159,200 Berjaya Land 19 –289,094 Berjaya Sports Toto 155 0.01308,300 BIMB 235 0.02109,200 Bina Darulaman 13 –
1,400 BLD Plantation 2 –148,600 Bonia 16 –370,838 Boustead 178 0.02229,500 Boustead Plantations 69 0.01223,348 Brait 1,153 0.0957,394 British American Tobacco Malaysia 447 0.04
1,448,900 Bumi Armada 158 0.01178,400 Bursa Malaysia 285 0.02316,700 Cahya Mata Sarawak 222 0.0217,900 Can-One 11 –
421,100 CapitaMalls Malaysia Real Estate Investment Trust 117 0.01
69,700 Carlsberg Brewery Malaysia 176 0.02135,600 CB Industrial Product 48 –
6,100 Chin Teck Plantations 8 –1,347,600 CIMB 1,099 0.09
105,900 Coastal Contracts 26 –21,600 Crescendo 6 –53,900 Cypark Resources 20 –
517,700 D&O Green Technologies 27 –37,500 Daibochi Plastic & Packaging
Industry 15 –56,400 Daiman Development 22 –
301,400 Datasonic 66 0.01404,200 Daya Materials 4 –105,300 Dayang Enterprise 18 –
1,282,840 Dialog 358 0.031,101,600 DiGi.Com 964 0.08
344,920 Dijaya 62 0.01540,400 DRB-HICOM 113 0.01
5,700 Dutch Lady Milk Industries 57 0.01421,470 Eastern & Oriental 111 0.01475,400 Eco World Development 115 0.0153,100 Econpile 18 –
155,000 Ekovest 66 0.01198,300 Evergreen Fibreboard 34 –145,100 Faber 85 0.01740,600 Felda Global Ventures 207 0.02
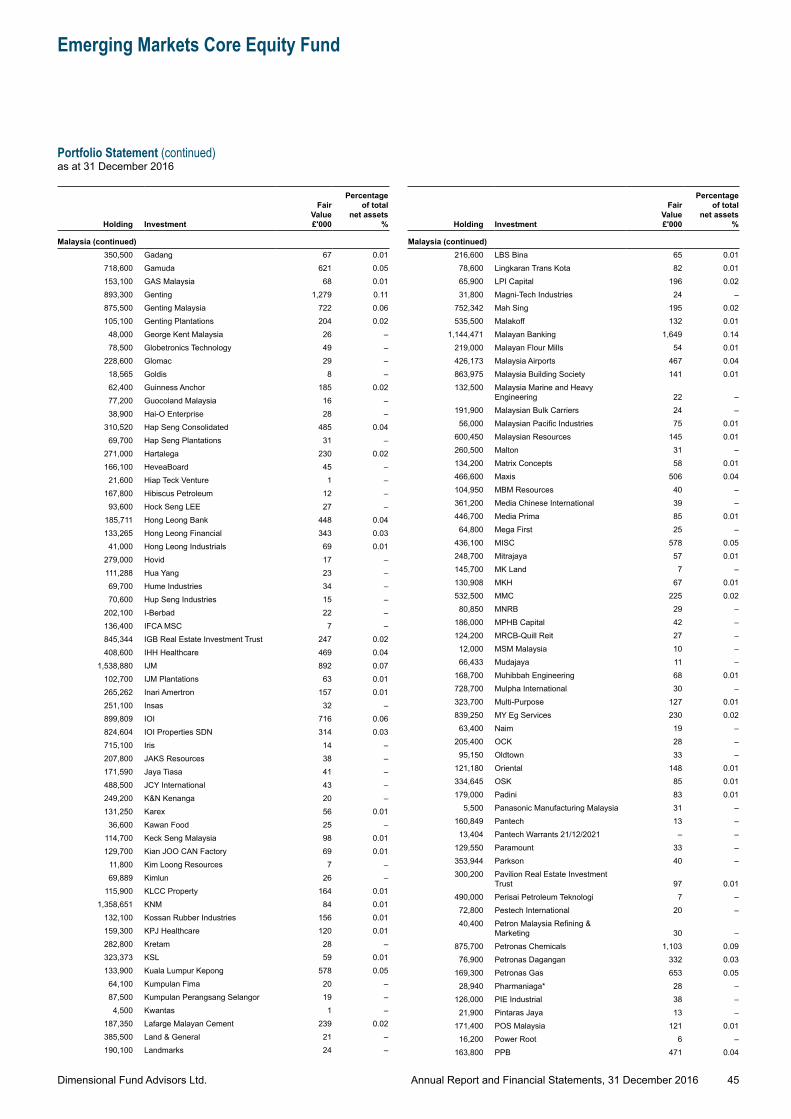
Dimensional Fund Advisors Ltd.
Emerging Markets Core Equity Fund
Portfolio Statement (continued)as at 31 December 2016
45Annual Report and Financial Statements, 31 December 2016
Holding Investment
Fair Value £'000
Percentage of total
net assets %
Malaysia (continued)350,500 Gadang 67 0.01718,600 Gamuda 621 0.05153,100 GAS Malaysia 68 0.01893,300 Genting 1,279 0.11875,500 Genting Malaysia 722 0.06105,100 Genting Plantations 204 0.02
48,000 George Kent Malaysia 26 –78,500 Globetronics Technology 49 –
228,600 Glomac 29 –18,565 Goldis 8 –62,400 Guinness Anchor 185 0.0277,200 Guocoland Malaysia 16 –38,900 Hai-O Enterprise 28 –
310,520 Hap Seng Consolidated 485 0.0469,700 Hap Seng Plantations 31 –
271,000 Hartalega 230 0.02166,100 HeveaBoard 45 –21,600 Hiap Teck Venture 1 –
167,800 Hibiscus Petroleum 12 –93,600 Hock Seng LEE 27 –
185,711 Hong Leong Bank 448 0.04133,265 Hong Leong Financial 343 0.03
41,000 Hong Leong Industrials 69 0.01279,000 Hovid 17 –111,288 Hua Yang 23 –69,700 Hume Industries 34 –70,600 Hup Seng Industries 15 –
202,100 I-Berbad 22 –136,400 IFCA MSC 7 –845,344 IGB Real Estate Investment Trust 247 0.02408,600 IHH Healthcare 469 0.04
1,538,880 IJM 892 0.07102,700 IJM Plantations 63 0.01265,262 Inari Amertron 157 0.01251,100 Insas 32 –899,809 IOI 716 0.06824,604 IOI Properties SDN 314 0.03715,100 Iris 14 –207,800 JAKS Resources 38 –171,590 Jaya Tiasa 41 –488,500 JCY International 43 –249,200 K&N Kenanga 20 –131,250 Karex 56 0.01
36,600 Kawan Food 25 –114,700 Keck Seng Malaysia 98 0.01129,700 Kian JOO CAN Factory 69 0.01
11,800 Kim Loong Resources 7 –69,889 Kimlun 26 –
115,900 KLCC Property 164 0.011,358,651 KNM 84 0.01
132,100 Kossan Rubber Industries 156 0.01159,300 KPJ Healthcare 120 0.01282,800 Kretam 28 –323,373 KSL 59 0.01133,900 Kuala Lumpur Kepong 578 0.05
64,100 Kumpulan Fima 20 –87,500 Kumpulan Perangsang Selangor 19 –4,500 Kwantas 1 –
187,350 Lafarge Malayan Cement 239 0.02385,500 Land & General 21 –190,100 Landmarks 24 –
Holding Investment
Fair Value £'000
Percentage of total
net assets %
Malaysia (continued)216,600 LBS Bina 65 0.01
78,600 Lingkaran Trans Kota 82 0.0165,900 LPI Capital 196 0.0231,800 Magni-Tech Industries 24 –
752,342 Mah Sing 195 0.02535,500 Malakoff 132 0.01
1,144,471 Malayan Banking 1,649 0.14219,000 Malayan Flour Mills 54 0.01426,173 Malaysia Airports 467 0.04863,975 Malaysia Building Society 141 0.01132,500 Malaysia Marine and Heavy
Engineering 22 –191,900 Malaysian Bulk Carriers 24 –56,000 Malaysian Pacific Industries 75 0.01
600,450 Malaysian Resources 145 0.01260,500 Malton 31 –134,200 Matrix Concepts 58 0.01466,600 Maxis 506 0.04104,950 MBM Resources 40 –361,200 Media Chinese International 39 –446,700 Media Prima 85 0.0164,800 Mega First 25 –
436,100 MISC 578 0.05248,700 Mitrajaya 57 0.01145,700 MK Land 7 –130,908 MKH 67 0.01532,500 MMC 225 0.0280,850 MNRB 29 –
186,000 MPHB Capital 42 –124,200 MRCB-Quill Reit 27 –12,000 MSM Malaysia 10 –66,433 Mudajaya 11 –
168,700 Muhibbah Engineering 68 0.01728,700 Mulpha International 30 –323,700 Multi-Purpose 127 0.01839,250 MY Eg Services 230 0.0263,400 Naim 19 –
205,400 OCK 28 –95,150 Oldtown 33 –
121,180 Oriental 148 0.01334,645 OSK 85 0.01179,000 Padini 83 0.01
5,500 Panasonic Manufacturing Malaysia 31 –160,849 Pantech 13 –13,404 Pantech Warrants 21/12/2021 – –
129,550 Paramount 33 –353,944 Parkson 40 –300,200 Pavilion Real Estate Investment
Trust 97 0.01490,000 Perisai Petroleum Teknologi 7 –72,800 Pestech International 20 –40,400 Petron Malaysia Refining &
Marketing 30 –875,700 Petronas Chemicals 1,103 0.0976,900 Petronas Dagangan 332 0.03
169,300 Petronas Gas 653 0.0528,940 Pharmaniaga* 28 –
126,000 PIE Industrial 38 –21,900 Pintaras Jaya 13 –
171,400 POS Malaysia 121 0.0116,200 Power Root 6 –
163,800 PPB 471 0.04
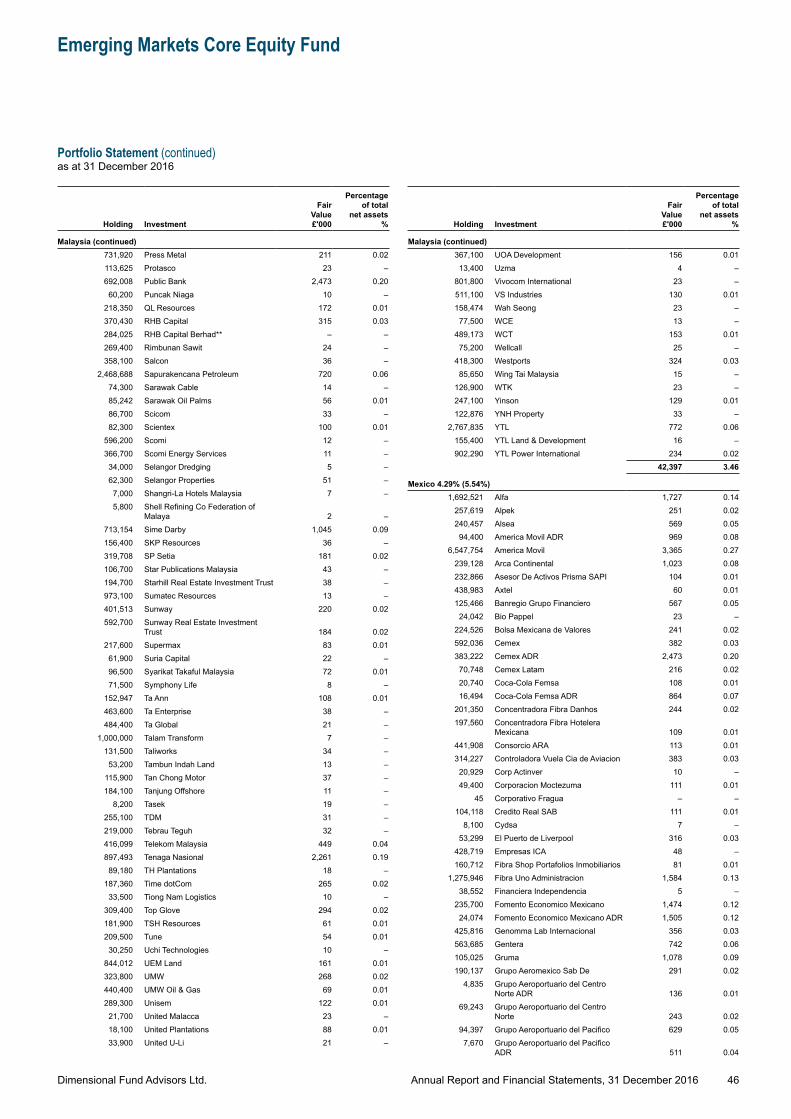
Dimensional Fund Advisors Ltd.
Emerging Markets Core Equity Fund
Portfolio Statement (continued)as at 31 December 2016
46Annual Report and Financial Statements, 31 December 2016
Holding Investment
Fair Value £'000
Percentage of total
net assets %
Malaysia (continued)731,920 Press Metal 211 0.02113,625 Protasco 23 –692,008 Public Bank 2,473 0.20
60,200 Puncak Niaga 10 –218,350 QL Resources 172 0.01370,430 RHB Capital 315 0.03284,025 RHB Capital Berhad** – –269,400 Rimbunan Sawit 24 –358,100 Salcon 36 –
2,468,688 Sapurakencana Petroleum 720 0.0674,300 Sarawak Cable 14 –85,242 Sarawak Oil Palms 56 0.0186,700 Scicom 33 –82,300 Scientex 100 0.01
596,200 Scomi 12 –366,700 Scomi Energy Services 11 –34,000 Selangor Dredging 5 –62,300 Selangor Properties 51 –7,000 Shangri-La Hotels Malaysia 7 –5,800 Shell Refining Co Federation of
Malaya 2 –713,154 Sime Darby 1,045 0.09156,400 SKP Resources 36 –319,708 SP Setia 181 0.02106,700 Star Publications Malaysia 43 –194,700 Starhill Real Estate Investment Trust 38 –973,100 Sumatec Resources 13 –401,513 Sunway 220 0.02592,700 Sunway Real Estate Investment
Trust 184 0.02217,600 Supermax 83 0.01
61,900 Suria Capital 22 –96,500 Syarikat Takaful Malaysia 72 0.0171,500 Symphony Life 8 –
152,947 Ta Ann 108 0.01463,600 Ta Enterprise 38 –484,400 Ta Global 21 –
1,000,000 Talam Transform 7 –131,500 Taliworks 34 –53,200 Tambun Indah Land 13 –
115,900 Tan Chong Motor 37 –184,100 Tanjung Offshore 11 –
8,200 Tasek 19 –255,100 TDM 31 –219,000 Tebrau Teguh 32 –416,099 Telekom Malaysia 449 0.04897,493 Tenaga Nasional 2,261 0.19
89,180 TH Plantations 18 –187,360 Time dotCom 265 0.02
33,500 Tiong Nam Logistics 10 –309,400 Top Glove 294 0.02181,900 TSH Resources 61 0.01209,500 Tune 54 0.01
30,250 Uchi Technologies 10 –844,012 UEM Land 161 0.01323,800 UMW 268 0.02440,400 UMW Oil & Gas 69 0.01289,300 Unisem 122 0.01
21,700 United Malacca 23 –18,100 United Plantations 88 0.0133,900 United U-Li 21 –
Holding Investment
Fair Value £'000
Percentage of total
net assets %
Malaysia (continued)367,100 UOA Development 156 0.01
13,400 Uzma 4 –801,800 Vivocom International 23 –511,100 VS Industries 130 0.01158,474 Wah Seong 23 –77,500 WCE 13 –
489,173 WCT 153 0.0175,200 Wellcall 25 –
418,300 Westports 324 0.0385,650 Wing Tai Malaysia 15 –
126,900 WTK 23 –247,100 Yinson 129 0.01122,876 YNH Property 33 –
2,767,835 YTL 772 0.06155,400 YTL Land & Development 16 –902,290 YTL Power International 234 0.02
42,397 3.46
Mexico 4.29% (5.54%)1,692,521 Alfa 1,727 0.14
257,619 Alpek 251 0.02240,457 Alsea 569 0.0594,400 America Movil ADR 969 0.08
6,547,754 America Movil 3,365 0.27239,128 Arca Continental 1,023 0.08232,866 Asesor De Activos Prisma SAPI 104 0.01438,983 Axtel 60 0.01125,466 Banregio Grupo Financiero 567 0.0524,042 Bio Pappel 23 –
224,526 Bolsa Mexicana de Valores 241 0.02592,036 Cemex 382 0.03383,222 Cemex ADR 2,473 0.2070,748 Cemex Latam 216 0.0220,740 Coca-Cola Femsa 108 0.0116,494 Coca-Cola Femsa ADR 864 0.07
201,350 Concentradora Fibra Danhos 244 0.02197,560 Concentradora Fibra Hotelera
Mexicana 109 0.01441,908 Consorcio ARA 113 0.01314,227 Controladora Vuela Cia de Aviacion 383 0.0320,929 Corp Actinver 10 –49,400 Corporacion Moctezuma 111 0.01
45 Corporativo Fragua – –104,118 Credito Real SAB 111 0.01
8,100 Cydsa 7 –53,299 El Puerto de Liverpool 316 0.03
428,719 Empresas ICA 48 –160,712 Fibra Shop Portafolios Inmobiliarios 81 0.01
1,275,946 Fibra Uno Administracion 1,584 0.1338,552 Financiera Independencia 5 –
235,700 Fomento Economico Mexicano 1,474 0.1224,074 Fomento Economico Mexicano ADR 1,505 0.12
425,816 Genomma Lab Internacional 356 0.03563,685 Gentera 742 0.06105,025 Gruma 1,078 0.09190,137 Grupo Aeromexico Sab De 291 0.02
4,835 Grupo Aeroportuario del Centro Norte ADR 136 0.01
69,243 Grupo Aeroportuario del Centro Norte 243 0.02
94,397 Grupo Aeroportuario del Pacifico 629 0.057,670 Grupo Aeroportuario del Pacifico
ADR 511 0.04
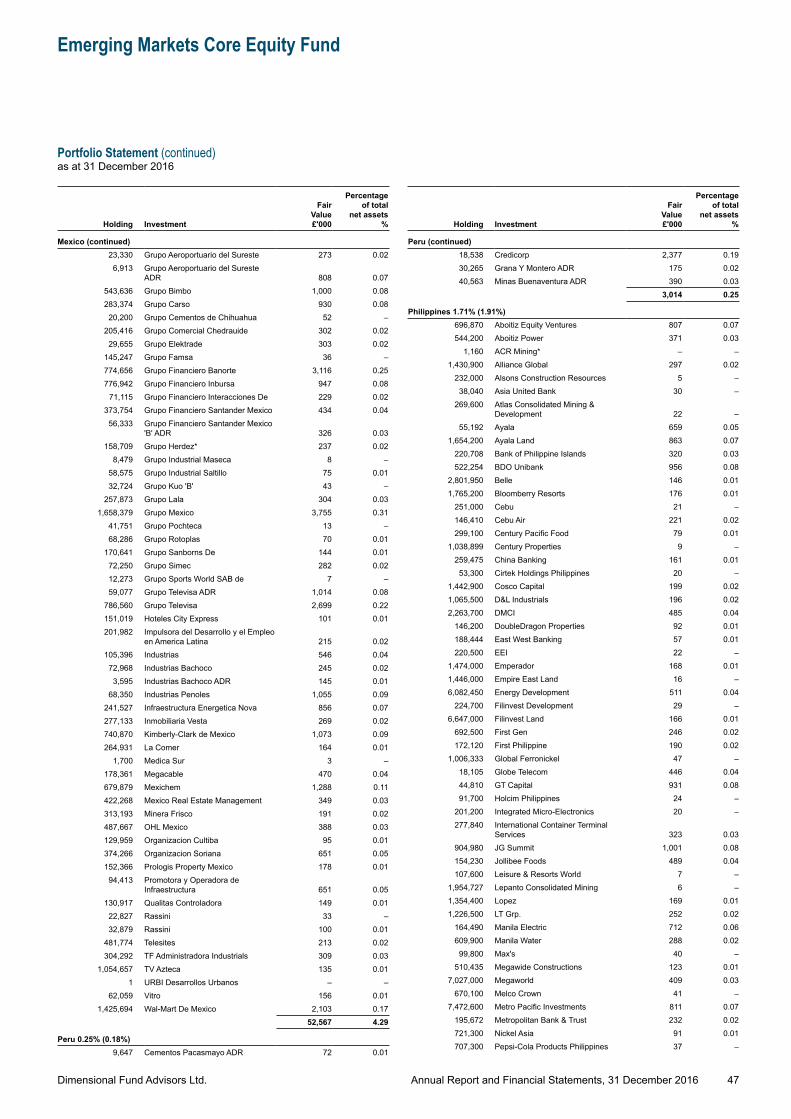
Dimensional Fund Advisors Ltd.
Emerging Markets Core Equity Fund
Portfolio Statement (continued)as at 31 December 2016
47Annual Report and Financial Statements, 31 December 2016
Holding Investment
Fair Value £'000
Percentage of total
net assets %
Mexico (continued)23,330 Grupo Aeroportuario del Sureste 273 0.02
6,913 Grupo Aeroportuario del Sureste ADR 808 0.07
543,636 Grupo Bimbo 1,000 0.08283,374 Grupo Carso 930 0.08
20,200 Grupo Cementos de Chihuahua 52 –205,416 Grupo Comercial Chedrauide 302 0.02
29,655 Grupo Elektrade 303 0.02145,247 Grupo Famsa 36 –774,656 Grupo Financiero Banorte 3,116 0.25776,942 Grupo Financiero Inbursa 947 0.08
71,115 Grupo Financiero Interacciones De 229 0.02373,754 Grupo Financiero Santander Mexico 434 0.04
56,333 Grupo Financiero Santander Mexico 'B' ADR 326 0.03
158,709 Grupo Herdez* 237 0.028,479 Grupo Industrial Maseca 8 –
58,575 Grupo Industrial Saltillo 75 0.0132,724 Grupo Kuo 'B' 43 –
257,873 Grupo Lala 304 0.031,658,379 Grupo Mexico 3,755 0.31
41,751 Grupo Pochteca 13 –68,286 Grupo Rotoplas 70 0.01
170,641 Grupo Sanborns De 144 0.0172,250 Grupo Simec 282 0.0212,273 Grupo Sports World SAB de 7 –59,077 Grupo Televisa ADR 1,014 0.08
786,560 Grupo Televisa 2,699 0.22151,019 Hoteles City Express 101 0.01201,982 Impulsora del Desarrollo y el Empleo
en America Latina 215 0.02105,396 Industrias 546 0.04
72,968 Industrias Bachoco 245 0.023,595 Industrias Bachoco ADR 145 0.01
68,350 Industrias Penoles 1,055 0.09241,527 Infraestructura Energetica Nova 856 0.07277,133 Inmobiliaria Vesta 269 0.02740,870 Kimberly-Clark de Mexico 1,073 0.09264,931 La Comer 164 0.01
1,700 Medica Sur 3 –178,361 Megacable 470 0.04679,879 Mexichem 1,288 0.11422,268 Mexico Real Estate Management 349 0.03313,193 Minera Frisco 191 0.02487,667 OHL Mexico 388 0.03129,959 Organizacion Cultiba 95 0.01374,266 Organizacion Soriana 651 0.05152,366 Prologis Property Mexico 178 0.01
94,413 Promotora y Operadora de Infraestructura 651 0.05
130,917 Qualitas Controladora 149 0.0122,827 Rassini 33 –32,879 Rassini 100 0.01
481,774 Telesites 213 0.02304,292 TF Administradora Industrials 309 0.03
1,054,657 TV Azteca 135 0.011 URBI Desarrollos Urbanos – –
62,059 Vitro 156 0.011,425,694 Wal-Mart De Mexico 2,103 0.17
52,567 4.29
Peru 0.25% (0.18%)9,647 Cementos Pacasmayo ADR 72 0.01
Holding Investment
Fair Value £'000
Percentage of total
net assets %
Peru (continued)18,538 Credicorp 2,377 0.1930,265 Grana Y Montero ADR 175 0.0240,563 Minas Buenaventura ADR 390 0.03
3,014 0.25
Philippines 1.71% (1.91%)696,870 Aboitiz Equity Ventures 807 0.07544,200 Aboitiz Power 371 0.03
1,160 ACR Mining* – –1,430,900 Alliance Global 297 0.02
232,000 Alsons Construction Resources 5 –38,040 Asia United Bank 30 –
269,600 Atlas Consolidated Mining & Development 22 –
55,192 Ayala 659 0.051,654,200 Ayala Land 863 0.07
220,708 Bank of Philippine Islands 320 0.03522,254 BDO Unibank 956 0.08
2,801,950 Belle 146 0.011,765,200 Bloomberry Resorts 176 0.01
251,000 Cebu 21 –146,410 Cebu Air 221 0.02299,100 Century Pacific Food 79 0.01
1,038,899 Century Properties 9 –259,475 China Banking 161 0.01
53,300 Cirtek Holdings Philippines 20 –1,442,900 Cosco Capital 199 0.021,065,500 D&L Industrials 196 0.022,263,700 DMCI 485 0.04
146,200 DoubleDragon Properties 92 0.01188,444 East West Banking 57 0.01220,500 EEI 22 –
1,474,000 Emperador 168 0.011,446,000 Empire East Land 16 –6,082,450 Energy Development 511 0.04
224,700 Filinvest Development 29 –6,647,000 Filinvest Land 166 0.01
692,500 First Gen 246 0.02172,120 First Philippine 190 0.02
1,006,333 Global Ferronickel 47 –18,105 Globe Telecom 446 0.0444,810 GT Capital 931 0.0891,700 Holcim Philippines 24 –
201,200 Integrated Micro-Electronics 20 –277,840 International Container Terminal
Services 323 0.03904,980 JG Summit 1,001 0.08154,230 Jollibee Foods 489 0.04107,600 Leisure & Resorts World 7 –
1,954,727 Lepanto Consolidated Mining 6 –1,354,400 Lopez 169 0.011,226,500 LT Grp. 252 0.02
164,490 Manila Electric 712 0.06609,900 Manila Water 288 0.0299,800 Max's 40 –
510,435 Megawide Constructions 123 0.017,027,000 Megaworld 409 0.03
670,100 Melco Crown 41 –7,472,600 Metro Pacific Investments 811 0.07
195,672 Metropolitan Bank & Trust 232 0.02721,300 Nickel Asia 91 0.01707,300 Pepsi-Cola Products Philippines 37 –
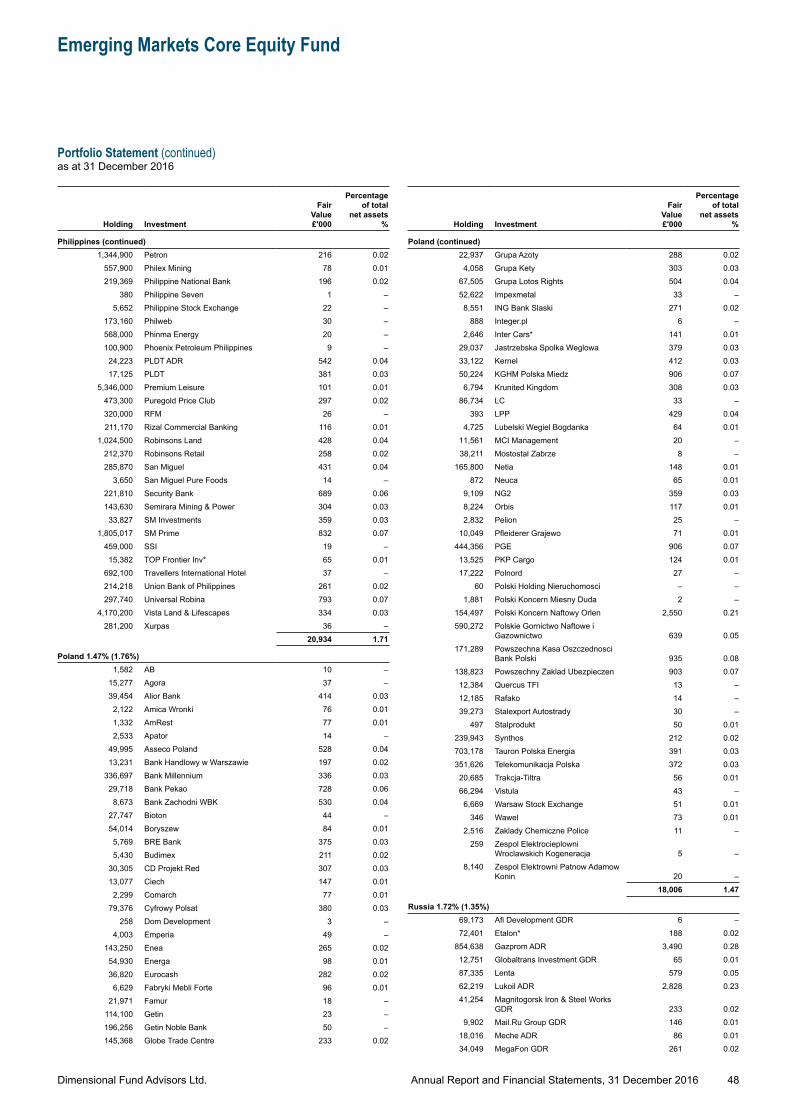
Dimensional Fund Advisors Ltd.
Emerging Markets Core Equity Fund
Portfolio Statement (continued)as at 31 December 2016
48Annual Report and Financial Statements, 31 December 2016
Holding Investment
Fair Value £'000
Percentage of total
net assets %
Philippines (continued)1,344,900 Petron 216 0.02
557,900 Philex Mining 78 0.01219,369 Philippine National Bank 196 0.02
380 Philippine Seven 1 –5,652 Philippine Stock Exchange 22 –
173,160 Philweb 30 –568,000 Phinma Energy 20 –100,900 Phoenix Petroleum Philippines 9 –24,223 PLDT ADR 542 0.0417,125 PLDT 381 0.03
5,346,000 Premium Leisure 101 0.01473,300 Puregold Price Club 297 0.02320,000 RFM 26 –211,170 Rizal Commercial Banking 116 0.01
1,024,500 Robinsons Land 428 0.04212,370 Robinsons Retail 258 0.02285,870 San Miguel 431 0.04
3,650 San Miguel Pure Foods 14 –221,810 Security Bank 689 0.06143,630 Semirara Mining & Power 304 0.03
33,827 SM Investments 359 0.031,805,017 SM Prime 832 0.07
459,000 SSI 19 –15,382 TOP Frontier Inv* 65 0.01
692,100 Travellers International Hotel 37 –214,218 Union Bank of Philippines 261 0.02297,740 Universal Robina 793 0.07
4,170,200 Vista Land & Lifescapes 334 0.03281,200 Xurpas 36 –
20,934 1.71
Poland 1.47% (1.76%)1,582 AB 10 –
15,277 Agora 37 –39,454 Alior Bank 414 0.03
2,122 Amica Wronki 76 0.011,332 AmRest 77 0.012,533 Apator 14 –
49,995 Asseco Poland 528 0.0413,231 Bank Handlowy w Warszawie 197 0.02
336,697 Bank Millennium 336 0.0329,718 Bank Pekao 728 0.06
8,673 Bank Zachodni WBK 530 0.0427,747 Bioton 44 –54,014 Boryszew 84 0.01
5,769 BRE Bank 375 0.035,430 Budimex 211 0.02
30,305 CD Projekt Red 307 0.0313,077 Ciech 147 0.01
2,299 Comarch 77 0.0179,376 Cyfrowy Polsat 380 0.03
258 Dom Development 3 –4,003 Emperia 49 –
143,250 Enea 265 0.0254,930 Energa 98 0.0136,820 Eurocash 282 0.02
6,629 Fabryki Mebli Forte 96 0.0121,971 Famur 18 –
114,100 Getin 23 –196,256 Getin Noble Bank 50 –145,368 Globe Trade Centre 233 0.02
Holding Investment
Fair Value £'000
Percentage of total
net assets %
Poland (continued)22,937 Grupa Azoty 288 0.02
4,058 Grupa Kety 303 0.0367,505 Grupa Lotos Rights 504 0.0452,622 Impexmetal 33 –8,551 ING Bank Slaski 271 0.02
888 Integer.pl 6 –2,646 Inter Cars* 141 0.01
29,037 Jastrzebska Spolka Weglowa 379 0.0333,122 Kernel 412 0.0350,224 KGHM Polska Miedz 906 0.07
6,794 Krunited Kingdom 308 0.0386,734 LC 33 –
393 LPP 429 0.044,725 Lubelski Wegiel Bogdanka 64 0.01
11,561 MCI Management 20 –38,211 Mostostal Zabrze 8 –
165,800 Netia 148 0.01872 Neuca 65 0.01
9,109 NG2 359 0.038,224 Orbis 117 0.012,832 Pelion 25 –
10,049 Pfleiderer Grajewo 71 0.01444,356 PGE 906 0.0713,525 PKP Cargo 124 0.0117,222 Polnord 27 –
60 Polski Holding Nieruchomosci – –1,881 Polski Koncern Miesny Duda 2 –
154,497 Polski Koncern Naftowy Orlen 2,550 0.21590,272 Polskie Gornictwo Naftowe i
Gazownictwo 639 0.05171,289 Powszechna Kasa Oszczednosci
Bank Polski 935 0.08138,823 Powszechny Zaklad Ubezpieczen 903 0.0712,384 Quercus TFI 13 –12,185 Rafako 14 –39,273 Stalexport Autostrady 30 –
497 Stalprodukt 50 0.01239,943 Synthos 212 0.02703,178 Tauron Polska Energia 391 0.03351,626 Telekomunikacja Polska 372 0.0320,685 Trakcja-Tiltra 56 0.0166,294 Vistula 43 –6,669 Warsaw Stock Exchange 51 0.01
346 Wawel 73 0.012,516 Zaklady Chemiczne Police 11 –
259 Zespol Elektrocieplowni Wroclawskich Kogeneracja 5 –
8,140 Zespol Elektrowni Patnow Adamow Konin 20 –
18,006 1.47
Russia 1.72% (1.35%)69,173 Afi Development GDR 6 –72,401 Etalon* 188 0.02
854,638 Gazprom ADR 3,490 0.2812,751 Globaltrans Investment GDR 65 0.0187,335 Lenta 579 0.0562,219 Lukoil ADR 2,828 0.2341,254 Magnitogorsk Iron & Steel Works
GDR 233 0.029,902 Mail.Ru Group GDR 146 0.01
18,016 Meche ADR 86 0.0134,049 MegaFon GDR 261 0.02
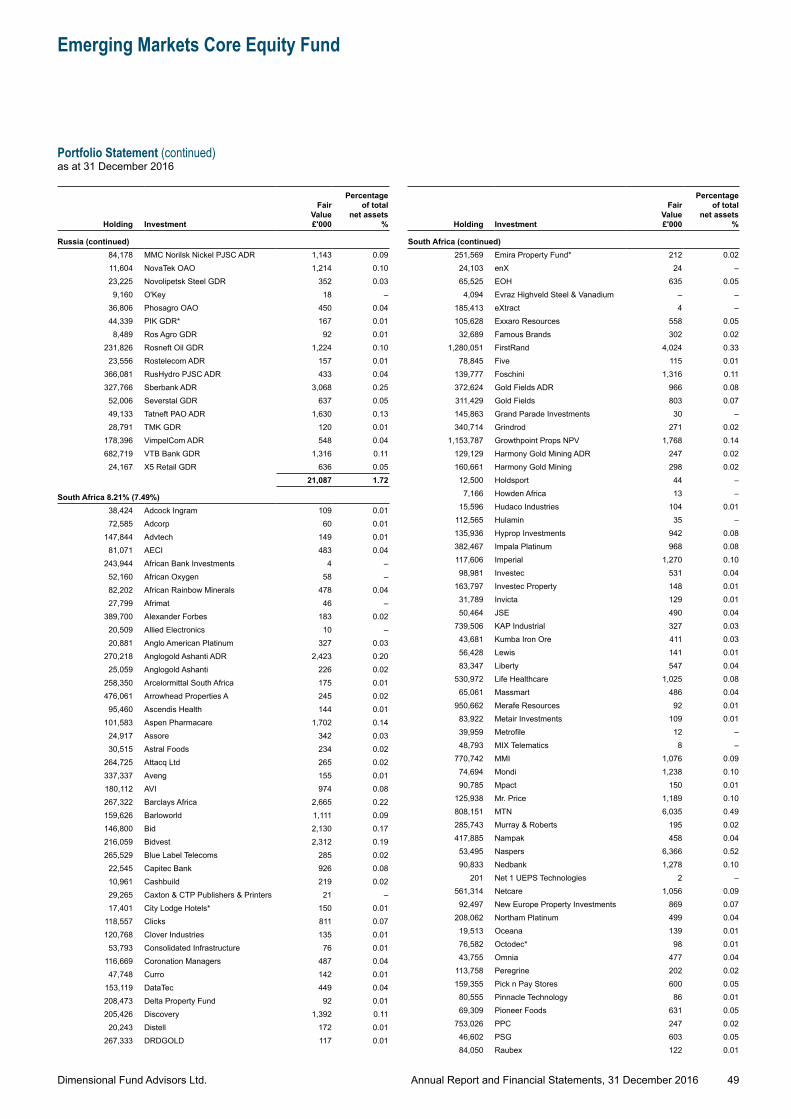
Dimensional Fund Advisors Ltd.
Emerging Markets Core Equity Fund
Portfolio Statement (continued)as at 31 December 2016
49Annual Report and Financial Statements, 31 December 2016
Holding Investment
Fair Value £'000
Percentage of total
net assets %
Russia (continued)84,178 MMC Norilsk Nickel PJSC ADR 1,143 0.0911,604 NovaTek OAO 1,214 0.1023,225 Novolipetsk Steel GDR 352 0.03
9,160 O'Key 18 –36,806 Phosagro OAO 450 0.0444,339 PIK GDR* 167 0.01
8,489 Ros Agro GDR 92 0.01231,826 Rosneft Oil GDR 1,224 0.1023,556 Rostelecom ADR 157 0.01
366,081 RusHydro PJSC ADR 433 0.04327,766 Sberbank ADR 3,068 0.2552,006 Severstal GDR 637 0.0549,133 Tatneft PAO ADR 1,630 0.1328,791 TMK GDR 120 0.01
178,396 VimpelCom ADR 548 0.04682,719 VTB Bank GDR 1,316 0.1124,167 X5 Retail GDR 636 0.05
21,087 1.72
South Africa 8.21% (7.49%)38,424 Adcock Ingram 109 0.0172,585 Adcorp 60 0.01
147,844 Advtech 149 0.0181,071 AECI 483 0.04
243,944 African Bank Investments 4 –52,160 African Oxygen 58 –82,202 African Rainbow Minerals 478 0.0427,799 Afrimat 46 –
389,700 Alexander Forbes 183 0.0220,509 Allied Electronics 10 –20,881 Anglo American Platinum 327 0.03
270,218 Anglogold Ashanti ADR 2,423 0.2025,059 Anglogold Ashanti 226 0.02
258,350 Arcelormittal South Africa 175 0.01476,061 Arrowhead Properties A 245 0.02
95,460 Ascendis Health 144 0.01101,583 Aspen Pharmacare 1,702 0.1424,917 Assore 342 0.0330,515 Astral Foods 234 0.02
264,725 Attacq Ltd 265 0.02337,337 Aveng 155 0.01180,112 AVI 974 0.08267,322 Barclays Africa 2,665 0.22159,626 Barloworld 1,111 0.09146,800 Bid 2,130 0.17216,059 Bidvest 2,312 0.19265,529 Blue Label Telecoms 285 0.02
22,545 Capitec Bank 926 0.0810,961 Cashbuild 219 0.0229,265 Caxton & CTP Publishers & Printers 21 –17,401 City Lodge Hotels* 150 0.01
118,557 Clicks 811 0.07120,768 Clover Industries 135 0.01
53,793 Consolidated Infrastructure 76 0.01116,669 Coronation Managers 487 0.0447,748 Curro 142 0.01
153,119 DataTec 449 0.04208,473 Delta Property Fund 92 0.01205,426 Discovery 1,392 0.11
20,243 Distell 172 0.01267,333 DRDGOLD 117 0.01
Holding Investment
Fair Value £'000
Percentage of total
net assets %
South Africa (continued)251,569 Emira Property Fund* 212 0.02
24,103 enX 24 –65,525 EOH 635 0.05
4,094 Evraz Highveld Steel & Vanadium – –185,413 eXtract 4 –105,628 Exxaro Resources 558 0.0532,689 Famous Brands 302 0.02
1,280,051 FirstRand 4,024 0.3378,845 Five 115 0.01
139,777 Foschini 1,316 0.11372,624 Gold Fields ADR 966 0.08311,429 Gold Fields 803 0.07145,863 Grand Parade Investments 30 –340,714 Grindrod 271 0.02
1,153,787 Growthpoint Props NPV 1,768 0.14129,129 Harmony Gold Mining ADR 247 0.02160,661 Harmony Gold Mining 298 0.0212,500 Holdsport 44 –7,166 Howden Africa 13 –
15,596 Hudaco Industries 104 0.01112,565 Hulamin 35 –135,936 Hyprop Investments 942 0.08382,467 Impala Platinum 968 0.08117,606 Imperial 1,270 0.1098,981 Investec 531 0.04
163,797 Investec Property 148 0.0131,789 Invicta 129 0.0150,464 JSE 490 0.04
739,506 KAP Industrial 327 0.0343,681 Kumba Iron Ore 411 0.0356,428 Lewis 141 0.0183,347 Liberty 547 0.04
530,972 Life Healthcare 1,025 0.0865,061 Massmart 486 0.04
950,662 Merafe Resources 92 0.0183,922 Metair Investments 109 0.0139,959 Metrofile 12 –48,793 MIX Telematics 8 –
770,742 MMI 1,076 0.0974,694 Mondi 1,238 0.1090,785 Mpact 150 0.01
125,938 Mr. Price 1,189 0.10808,151 MTN 6,035 0.49285,743 Murray & Roberts 195 0.02417,885 Nampak 458 0.0453,495 Naspers 6,366 0.5290,833 Nedbank 1,278 0.10
201 Net 1 UEPS Technologies 2 –561,314 Netcare 1,056 0.0992,497 New Europe Property Investments 869 0.07
208,062 Northam Platinum 499 0.0419,513 Oceana 139 0.0176,582 Octodec* 98 0.0143,755 Omnia 477 0.04
113,758 Peregrine 202 0.02159,355 Pick n Pay Stores 600 0.0580,555 Pinnacle Technology 86 0.0169,309 Pioneer Foods 631 0.05
753,026 PPC 247 0.0246,602 PSG 603 0.0584,050 Raubex 122 0.01
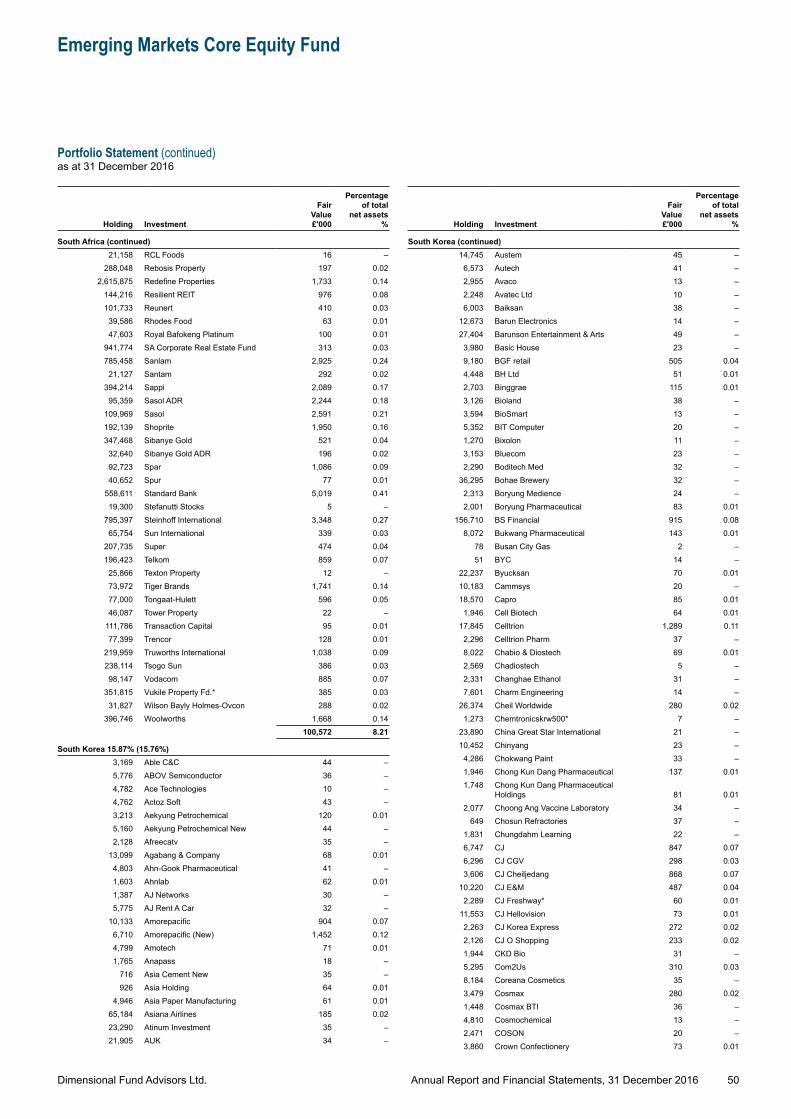
Dimensional Fund Advisors Ltd.
Emerging Markets Core Equity Fund
Portfolio Statement (continued)as at 31 December 2016
50Annual Report and Financial Statements, 31 December 2016
Holding Investment
Fair Value £'000
Percentage of total
net assets %
South Africa (continued)21,158 RCL Foods 16 –
288,048 Rebosis Property 197 0.022,615,875 Redefine Properties 1,733 0.14
144,216 Resilient REIT 976 0.08101,733 Reunert 410 0.03
39,586 Rhodes Food 63 0.0147,603 Royal Bafokeng Platinum 100 0.01
941,774 SA Corporate Real Estate Fund 313 0.03785,458 Sanlam 2,925 0.24
21,127 Santam 292 0.02394,214 Sappi 2,089 0.17
95,359 Sasol ADR 2,244 0.18109,969 Sasol 2,591 0.21192,139 Shoprite 1,950 0.16347,468 Sibanye Gold 521 0.04
32,640 Sibanye Gold ADR 196 0.0292,723 Spar 1,086 0.0940,652 Spur 77 0.01
558,611 Standard Bank 5,019 0.4119,300 Stefanutti Stocks 5 –
795,397 Steinhoff International 3,348 0.2765,754 Sun International 339 0.03
207,735 Super 474 0.04196,423 Telkom 859 0.07
25,866 Texton Property 12 –73,972 Tiger Brands 1,741 0.1477,000 Tongaat-Hulett 596 0.0546,087 Tower Property 22 –
111,786 Transaction Capital 95 0.0177,399 Trencor 128 0.01
219,959 Truworths International 1,038 0.09238,114 Tsogo Sun 386 0.03
885 0.0798,147 Vodacom 351,815 Vukile Property Fd.* 385 0.0331,827 Wilson Bayly Holmes-Ovcon 288 0.02
396,746 Woolworths 1,668 0.14100,572 8.21
South Korea 15.87% (15.76%)3,169 Able C&C 44 –5,776 ABOV Semiconductor 36 –4,782 Ace Technologies 10 –4,762 Actoz Soft 43 –3,213 Aekyung Petrochemical 120 0.015,160 Aekyung Petrochemical New 44 –2,128 Afreecatv 35 –
13,099 Agabang & Company 68 0.014,803 Ahn-Gook Pharmaceutical 41 –1,603 Ahnlab 62 0.011,387 AJ Networks 30 –5,775 AJ Rent A Car 32 –
10,133 Amorepacific 904 0.076,710 Amorepacific (New) 1,452 0.124,799 Amotech 71 0.011,765 Anapass 18 –
716 Asia Cement New 35 –926 Asia Holding 64 0.01
4,946 Asia Paper Manufacturing 61 0.0165,184 Asiana Airlines 185 0.0223,290 Atinum Investment 35 –21,905 AUK 34 –
Holding Investment
Fair Value £'000
Percentage of total
net assets %
South Korea (continued)14,745 Austem 45 –6,573 Autech 41 –2,955 Avaco 13 –2,248 Avatec Ltd 10 –6,003 Baiksan 38 –
12,673 Barun Electronics 14 –27,404 Barunson Entertainment & Arts 49 –3,980 Basic House 23 –9,180 BGF retail 505 0.044,448 BH Ltd 51 0.012,703 Binggrae 115 0.013,126 Bioland 38 –3,594 BioSmart 13 –5,352 BIT Computer 20 –1,270 Bixolon 11 –3,153 Bluecom 23 –2,290 Boditech Med 32 –
36,295 Bohae Brewery 32 –2,313 Boryung Medience 24 –2,001 Boryung Pharmaceutical 83 0.01
156,710 BS Financial 915 0.088,072 Bukwang Pharmaceutical 143 0.01
78 Busan City Gas 2 –51 BYC 14 –
22,237 Byucksan 70 0.0110,183 Cammsys 20 –18,570 Capro 85 0.01
1,946 Cell Biotech 64 0.0117,845 Celltrion 1,289 0.112,296 Celltrion Pharm 37 –8,022 Chabio & Diostech 69 0.012,569 Chadiostech 5 –2,331 Changhae Ethanol 31 –7,601 Charm Engineering 14 –
26,374 Cheil Worldwide 280 0.021,273 Chemtronicskrw500* 7 –
23,890 China Great Star International 21 –10,452 Chinyang 23 –4,286 Chokwang Paint 33 –1,946 Chong Kun Dang Pharmaceutical 137 0.011,748 Chong Kun Dang Pharmaceutical
Holdings 81 0.012,077 Choong Ang Vaccine Laboratory 34 –
649 Chosun Refractories 37 –1,831 Chungdahm Learning 22 –6,747 CJ 847 0.076,296 CJ CGV 298 0.033,606 CJ Cheiljedang 868 0.07
10,220 CJ E&M 487 0.042,289 CJ Freshway* 60 0.01
11,553 CJ Hellovision 73 0.012,263 CJ Korea Express 272 0.022,126 CJ O Shopping 233 0.021,944 CKD Bio 31 –5,295 Com2Us 310 0.038,184 Coreana Cosmetics 35 –3,479 Cosmax 280 0.021,448 Cosmax BTI 36 –4,810 Cosmochemical 13 –2,471 COSON 20 –3,860 Crown Confectionery 73 0.01
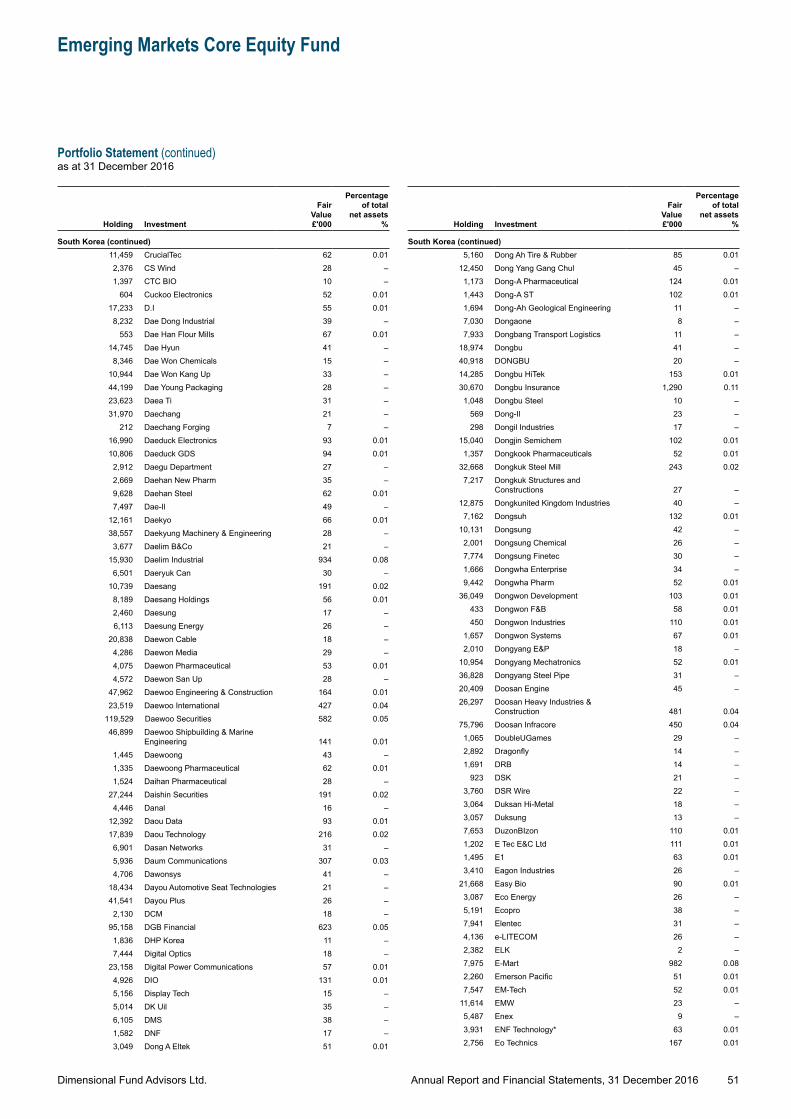
Dimensional Fund Advisors Ltd.
Emerging Markets Core Equity Fund
Portfolio Statement (continued)as at 31 December 2016
51Annual Report and Financial Statements, 31 December 2016
Holding Investment
Fair Value £'000
Percentage of total
net assets %
South Korea (continued)11,459 CrucialTec 62 0.012,376 CS Wind 28 –1,397 CTC BIO 10 –
604 Cuckoo Electronics 52 0.0117,233 D.I 55 0.01
8,232 Dae Dong Industrial 39 –553 Dae Han Flour Mills 67 0.01
14,745 Dae Hyun 41 –8,346 Dae Won Chemicals 15 –
10,944 Dae Won Kang Up 33 –44,199 Dae Young Packaging 28 –23,623 Daea Ti 31 –31,970 Daechang 21 –
212 Daechang Forging 7 –16,990 Daeduck Electronics 93 0.0110,806 Daeduck GDS 94 0.01
2,912 Daegu Department 27 –2,669 Daehan New Pharm 35 –9,628 Daehan Steel 62 0.017,497 Dae-Il 49 –
12,161 Daekyo 66 0.0138,557 Daekyung Machinery & Engineering 28 –3,677 Daelim B&Co 21 –
15,930 Daelim Industrial 934 0.086,501 Daeryuk Can 30 –
10,739 Daesang 191 0.028,189 Daesang Holdings 56 0.012,460 Daesung 17 –6,113 Daesung Energy 26 –
20,838 Daewon Cable 18 –4,286 Daewon Media 29 –4,075 Daewon Pharmaceutical 53 0.014,572 Daewon San Up 28 –
47,962 Daewoo Engineering & Construction 164 0.01427 0.0423,519 Daewoo International
119,529 Daewoo Securities 582 0.0546,899 Daewoo Shipbuilding & Marine
Engineering 141 0.011,445 Daewoong 43 –1,335 Daewoong Pharmaceutical 62 0.011,524 Daihan Pharmaceutical 28 –
27,244 Daishin Securities 191 0.024,446 Danal 16 –
12,392 Daou Data 93 0.0117,839 Daou Technology 216 0.02
6,901 Dasan Networks 31 –5,936 Daum Communications 307 0.034,706 Dawonsys 41 –
18,434 Dayou Automotive Seat Technologies 21 –41,541 Dayou Plus 26 –2,130 DCM 18 –
95,158 DGB Financial 623 0.051,836 DHP Korea 11 –7,444 Digital Optics 18 –
23,158 Digital Power Communications 57 0.014,926 DIO 131 0.015,156 Display Tech 15 –5,014 DK Uil 35 –6,105 DMS 38 –1,582 DNF 17 –3,049 Dong A Eltek 51 0.01
Holding Investment
Fair Value £'000
Percentage of total
net assets %
South Korea (continued)5,160 Dong Ah Tire & Rubber 85 0.01
12,450 Dong Yang Gang Chul 45 –1,173 Dong-A Pharmaceutical 124 0.011,443 Dong-A ST 102 0.011,694 Dong-Ah Geological Engineering 11 –7,030 Dongaone 8 –7,933 Dongbang Transport Logistics 11 –
18,974 Dongbu 41 –40,918 DONGBU 20 –14,285 Dongbu HiTek 153 0.0130,670 Dongbu Insurance 1,290 0.111,048 Dongbu Steel 10 –
569 Dong-Il 23 –298 Dongil Industries 17 –
15,040 Dongjin Semichem 102 0.011,357 Dongkook Pharmaceuticals 52 0.01
32,668 Dongkuk Steel Mill 243 0.027,217 Dongkuk Structures and
Constructions 27 –12,875 Dongkunited Kingdom Industries 40 –7,162 Dongsuh 132 0.01
10,131 Dongsung 42 –2,001 Dongsung Chemical 26 –7,774 Dongsung Finetec 30 –1,666 Dongwha Enterprise 34 –9,442 Dongwha Pharm 52 0.01
36,049 Dongwon Development 103 0.01433 Dongwon F&B 58 0.01450 Dongwon Industries 110 0.01
1,657 Dongwon Systems 67 0.012,010 Dongyang E&P 18 –
10,954 Dongyang Mechatronics 52 0.0136,828 Dongyang Steel Pipe 31 –20,409 Doosan Engine 45 –26,297 Doosan Heavy Industries &
Construction 481 0.0475,796 Doosan Infracore 450 0.04
1,065 DoubleUGames 29 –2,892 Dragonfly 14 –1,691 DRB 14 –
923 DSK 21 –3,760 DSR Wire 22 –3,064 Duksan Hi-Metal 18 –3,057 Duksung 13 –7,653 DuzonBIzon 110 0.011,202 E Tec E&C Ltd 111 0.011,495 E1 63 0.013,410 Eagon Industries 26 –
21,668 Easy Bio 90 0.013,087 Eco Energy 26 –5,191 Ecopro 38 –7,941 Elentec 31 –4,136 e-LITECOM 26 –2,382 ELK 2 –7,975 E-Mart 982 0.082,260 Emerson Pacific 51 0.017,547 EM-Tech 52 0.01
11,614 EMW 23 –5,487 Enex 9 –3,931 ENF Technology* 63 0.012,756 Eo Technics 167 0.01
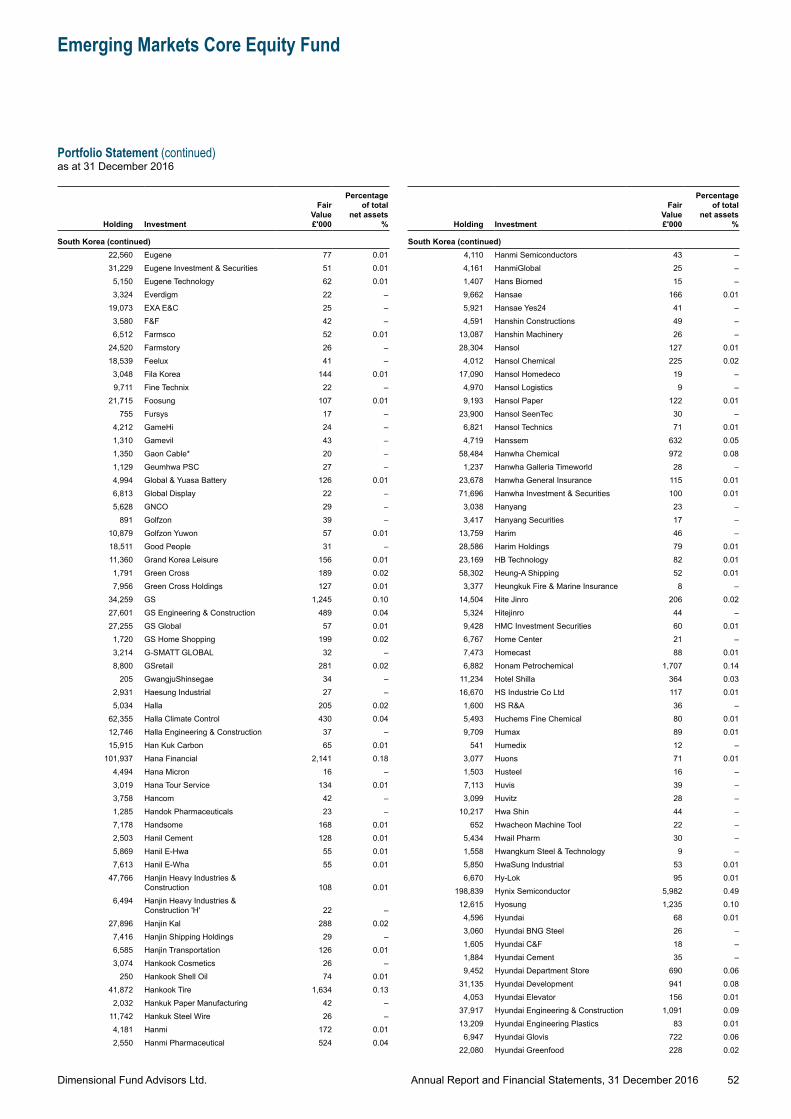
Dimensional Fund Advisors Ltd.
Emerging Markets Core Equity Fund
Portfolio Statement (continued)as at 31 December 2016
52Annual Report and Financial Statements, 31 December 2016
Holding Investment
Fair Value £'000
Percentage of total
net assets %
South Korea (continued)22,560 Eugene 77 0.0131,229 Eugene Investment & Securities 51 0.01
5,150 Eugene Technology 62 0.013,324 Everdigm 22 –
19,073 EXA E&C 25 –3,580 F&F 42 –6,512 Farmsco 52 0.01
24,520 Farmstory 26 –18,539 Feelux 41 –3,048 Fila Korea 144 0.019,711 Fine Technix 22 –
21,715 Foosung 107 0.01755 Fursys 17 –
4,212 GameHi 24 –1,310 Gamevil 43 –1,350 Gaon Cable* 20 –1,129 Geumhwa PSC 27 –4,994 Global & Yuasa Battery 126 0.016,813 Global Display 22 –5,628 GNCO 29 –
891 Golfzon 39 –10,879 Golfzon Yuwon 57 0.0118,511 Good People 31 –11,360 Grand Korea Leisure 156 0.011,791 Green Cross 189 0.027,956 Green Cross Holdings 127 0.01
34,259 GS 1,245 0.1027,601 GS Engineering & Construction 489 0.0427,255 GS Global 57 0.01
1,720 GS Home Shopping 199 0.023,214 G-SMATT GLOBAL 32 –8,800 GSretail 281 0.02
205 GwangjuShinsegae 34 –2,931 Haesung Industrial 27 –5,034 Halla 205 0.02
62,355 Halla Climate Control 430 0.0412,746 Halla Engineering & Construction 37 –15,915 Han Kuk Carbon 65 0.01
101,937 Hana Financial 2,141 0.184,494 Hana Micron 16 –3,019 Hana Tour Service 134 0.013,758 Hancom 42 –1,285 Handok Pharmaceuticals 23 –7,178 Handsome 168 0.012,503 Hanil Cement 128 0.015,869 Hanil E-Hwa 55 0.017,613 Hanil E-Wha 55 0.01
47,766 Hanjin Heavy Industries & Construction 108 0.01
6,494 Hanjin Heavy Industries & Construction 'H' 22 –
27,896 Hanjin Kal 288 0.027,416 Hanjin Shipping Holdings 29 –6,585 Hanjin Transportation 126 0.013,074 Hankook Cosmetics 26 –
250 Hankook Shell Oil 74 0.0141,872 Hankook Tire 1,634 0.13
2,032 Hankuk Paper Manufacturing 42 –11,742 Hankuk Steel Wire 26 –4,181 Hanmi 172 0.012,550 Hanmi Pharmaceutical 524 0.04
Holding Investment
Fair Value £'000
Percentage of total
net assets %
South Korea (continued)4,110 Hanmi Semiconductors 43 –4,161 HanmiGlobal 25 –1,407 Hans Biomed 15 –9,662 Hansae 166 0.015,921 Hansae Yes24 41 –4,591 Hanshin Constructions 49 –
13,087 Hanshin Machinery 26 –28,304 Hansol 127 0.01
4,012 Hansol Chemical 225 0.0217,090 Hansol Homedeco 19 –4,970 Hansol Logistics 9 –9,193 Hansol Paper 122 0.01
23,900 Hansol SeenTec 30 –6,821 Hansol Technics 71 0.014,719 Hanssem 632 0.05
58,484 Hanwha Chemical 972 0.081,237 Hanwha Galleria Timeworld 28 –
23,678 Hanwha General Insurance 115 0.0171,696 Hanwha Investment & Securities 100 0.01
3,038 Hanyang 23 –3,417 Hanyang Securities 17 –
13,759 Harim 46 –28,586 Harim Holdings 79 0.0123,169 HB Technology 82 0.0158,302 Heung-A Shipping 52 0.01
3,377 Heungkuk Fire & Marine Insurance 8 –14,504 Hite Jinro 206 0.02
5,324 Hitejinro 44 –9,428 HMC Investment Securities 60 0.016,767 Home Center 21 –7,473 Homecast 88 0.016,882 Honam Petrochemical 1,707 0.14
11,234 Hotel Shilla 364 0.0316,670 HS Industrie Co Ltd 117 0.01
1,600 HS R&A 36 –5,493 Huchems Fine Chemical 80 0.019,709 Humax 89 0.01
541 Humedix 12 –3,077 Huons 71 0.011,503 Husteel 16 –7,113 Huvis 39 –3,099 Huvitz 28 –
10,217 Hwa Shin 44 –652 Hwacheon Machine Tool 22 –
5,434 Hwail Pharm 30 –1,558 Hwangkum Steel & Technology 9 –5,850 HwaSung Industrial 53 0.016,670 Hy-Lok 95 0.01
198,839 Hynix Semiconductor 5,982 0.4912,615 Hyosung 1,235 0.10
4,596 Hyundai 68 0.013,060 Hyundai BNG Steel 26 –1,605 Hyundai C&F 18 –1,884 Hyundai Cement 35 –9,452 Hyundai Department Store 690 0.06
31,135 Hyundai Development 941 0.084,053 Hyundai Elevator 156 0.01
37,917 Hyundai Engineering & Construction 1,091 0.0913,209 Hyundai Engineering Plastics 83 0.01
6,947 Hyundai Glovis 722 0.0622,080 Hyundai Greenfood 228 0.02
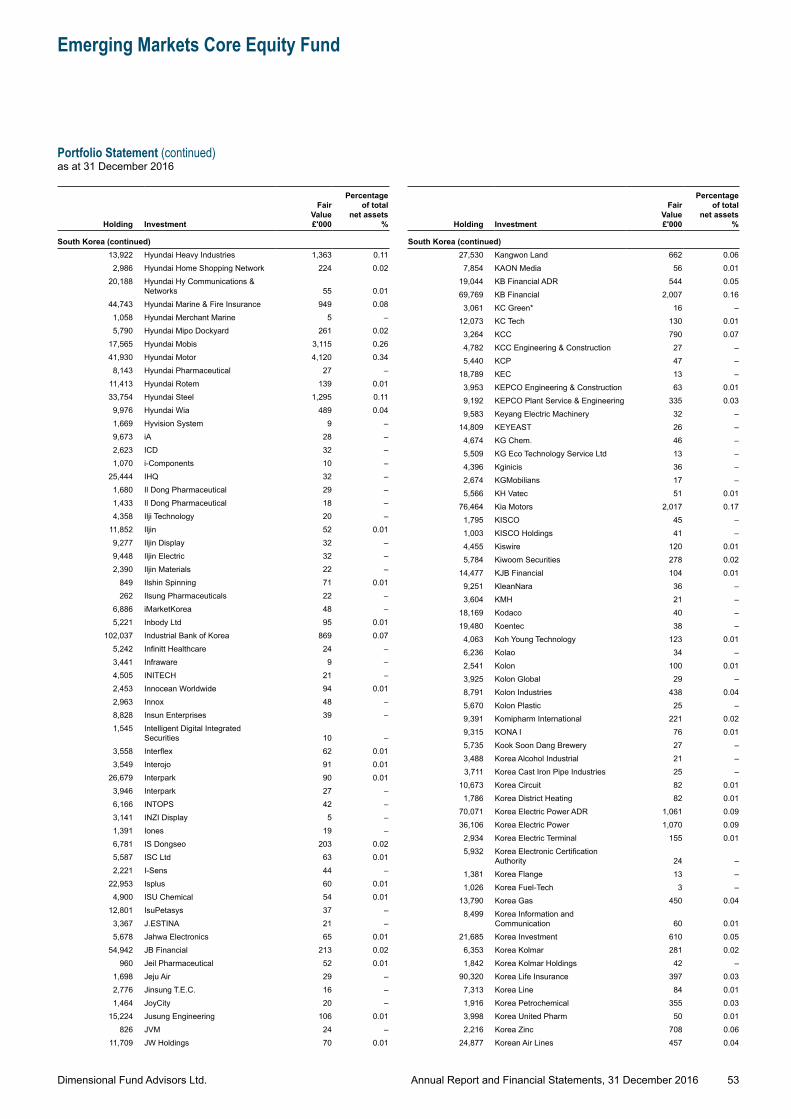
Dimensional Fund Advisors Ltd.
Emerging Markets Core Equity Fund
Portfolio Statement (continued)as at 31 December 2016
53Annual Report and Financial Statements, 31 December 2016
Holding Investment
Fair Value £'000
Percentage of total
net assets %
South Korea (continued)13,922 Hyundai Heavy Industries 1,363 0.112,986 Hyundai Home Shopping Network 224 0.02
20,188 Hyundai Hy Communications & Networks 55 0.01
44,743 Hyundai Marine & Fire Insurance 949 0.081,058 Hyundai Merchant Marine 5 –5,790 Hyundai Mipo Dockyard 261 0.02
17,565 Hyundai Mobis 3,115 0.2641,930 Hyundai Motor 4,120 0.34
8,143 Hyundai Pharmaceutical 27 –11,413 Hyundai Rotem 139 0.0133,754 Hyundai Steel 1,295 0.119,976 Hyundai Wia 489 0.041,669 Hyvision System 9 –9,673 iA 28 –2,623 ICD 32 –1,070 i-Components 10 –
25,444 IHQ 32 –1,680 Il Dong Pharmaceutical 29 –1,433 Il Dong Pharmaceutical 18 –4,358 Ilji Technology 20 –
11,852 Iljin 52 0.019,277 Iljin Display 32 –9,448 Iljin Electric 32 –2,390 Iljin Materials 22 –
849 Ilshin Spinning 71 0.01262 Ilsung Pharmaceuticals 22 –
6,886 iMarketKorea 48 –5,221 Inbody Ltd 95 0.01
102,037 Industrial Bank of Korea 869 0.075,242 Infinitt Healthcare 24 –3,441 Infraware 9 –4,505 INITECH 21 –2,453 Innocean Worldwide 94 0.012,963 Innox 48 –8,828 Insun Enterprises 39 –1,545 Intelligent Digital Integrated
Securities 10 –3,558 Interflex 62 0.013,549 Interojo 91 0.01
26,679 Interpark 90 0.013,946 Interpark 27 –6,166 INTOPS 42 –3,141 INZI Display 5 –1,391 Iones 19 –6,781 IS Dongseo 203 0.025,587 ISC Ltd 63 0.012,221 I-Sens 44 –
22,953 Isplus 60 0.014,900 ISU Chemical 54 0.01
12,801 IsuPetasys 37 –3,367 J.ESTINA 21 –5,678 Jahwa Electronics 65 0.01
54,942 JB Financial 213 0.02960 Jeil Pharmaceutical 52 0.01
1,698 Jeju Air 29 –2,776 Jinsung T.E.C. 16 –1,464 JoyCity 20 –
15,224 Jusung Engineering 106 0.01826 JVM 24 –
11,709 JW Holdings 70 0.01
Holding Investment
Fair Value £'000
Percentage of total
net assets %
South Korea (continued)27,530 Kangwon Land 662 0.06
7,854 KAON Media 56 0.0119,044 KB Financial ADR 544 0.0569,769 KB Financial 2,007 0.16
3,061 KC Green* 16 –12,073 KC Tech 130 0.01
3,264 KCC 790 0.074,782 KCC Engineering & Construction 27 –5,440 KCP 47 –
18,789 KEC 13 –3,953 KEPCO Engineering & Construction 63 0.019,192 KEPCO Plant Service & Engineering 335 0.039,583 Keyang Electric Machinery 32 –
14,809 KEYEAST 26 –4,674 KG Chem. 46 –5,509 KG Eco Technology Service Ltd 13 –4,396 Kginicis 36 –2,674 KGMobilians 17 –5,566 KH Vatec 51 0.01
76,464 Kia Motors 2,017 0.171,795 KISCO 45 –1,003 KISCO Holdings 41 –4,455 Kiswire 120 0.015,784 Kiwoom Securities 278 0.02
14,477 KJB Financial 104 0.019,251 KleanNara 36 –3,604 KMH 21 –
18,169 Kodaco 40 –19,480 Koentec 38 –4,063 Koh Young Technology 123 0.016,236 Kolao 34 –2,541 Kolon 100 0.013,925 Kolon Global 29 –8,791 Kolon Industries 438 0.045,670 Kolon Plastic 25 –9,391 Komipharm International 221 0.029,315 KONA I 76 0.015,735 Kook Soon Dang Brewery 27 –3,488 Korea Alcohol Industrial 21 –3,711 Korea Cast Iron Pipe Industries 25 –
10,673 Korea Circuit 82 0.011,786 Korea District Heating 82 0.01
70,071 Korea Electric Power ADR 1,061 0.0936,106 Korea Electric Power 1,070 0.09
2,934 Korea Electric Terminal 155 0.015,932 Korea Electronic Certification
Authority 24 –1,381 Korea Flange 13 –1,026 Korea Fuel-Tech 3 –
13,790 Korea Gas 450 0.048,499 Korea Information and
Communication 60 0.0121,685 Korea Investment 610 0.05
6,353 Korea Kolmar 281 0.021,842 Korea Kolmar Holdings 42 –
90,320 Korea Life Insurance 397 0.037,313 Korea Line 84 0.011,916 Korea Petrochemical 355 0.033,998 Korea United Pharm 50 0.012,216 Korea Zinc 708 0.06
24,877 Korean Air Lines 457 0.04
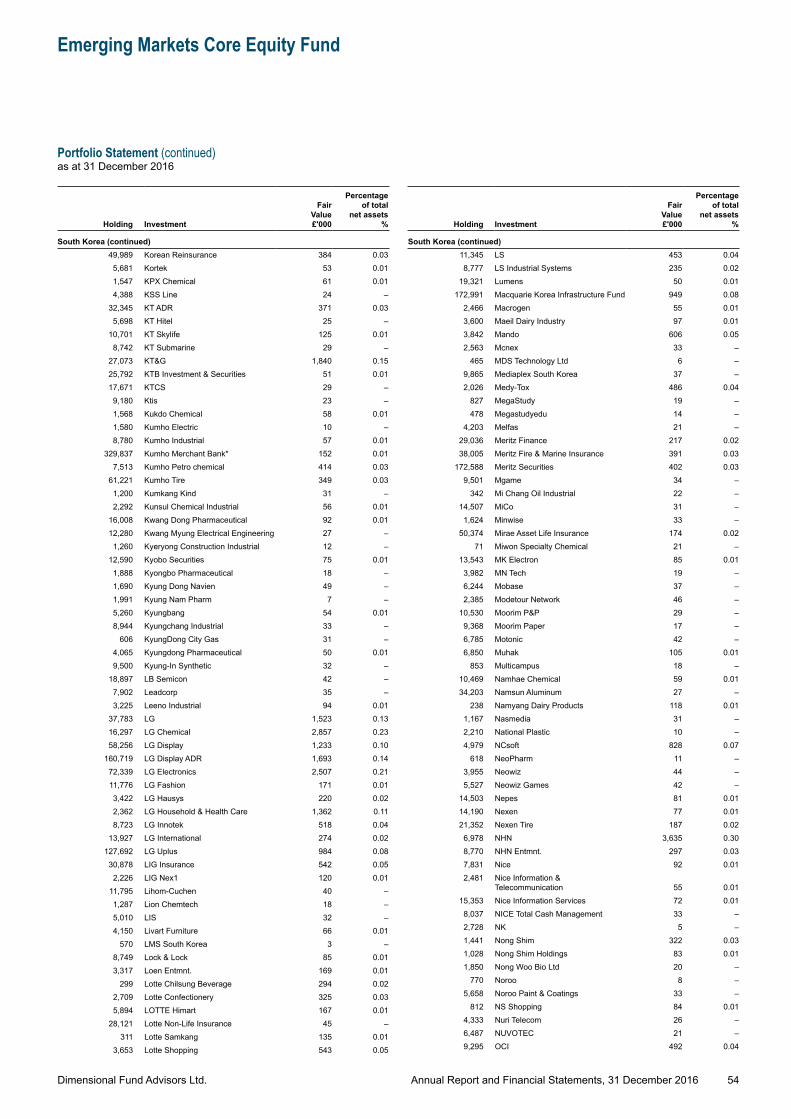
Dimensional Fund Advisors Ltd.
Emerging Markets Core Equity Fund
Portfolio Statement (continued)as at 31 December 2016
54Annual Report and Financial Statements, 31 December 2016
Holding Investment
Fair Value £'000
Percentage of total
net assets %
South Korea (continued)49,989 Korean Reinsurance 384 0.03
5,681 Kortek 53 0.011,547 KPX Chemical 61 0.014,388 KSS Line 24 –
32,345 KT ADR 371 0.035,698 KT Hitel 25 –
10,701 KT Skylife 125 0.018,742 KT Submarine 29 –
27,073 KT&G 1,840 0.1525,792 KTB Investment & Securities 51 0.0117,671 KTCS 29 –9,180 Ktis 23 –1,568 Kukdo Chemical 58 0.011,580 Kumho Electric 10 –8,780 Kumho Industrial 57 0.01
329,837 Kumho Merchant Bank* 152 0.017,513 Kumho Petro chemical 414 0.03
61,221 Kumho Tire 349 0.031,200 Kumkang Kind 31 –2,292 Kunsul Chemical Industrial 56 0.01
16,008 Kwang Dong Pharmaceutical 92 0.0112,280 Kwang Myung Electrical Engineering 27 –1,260 Kyeryong Construction Industrial 12 –
12,590 Kyobo Securities 75 0.011,888 Kyongbo Pharmaceutical 18 –1,690 Kyung Dong Navien 49 –1,991 Kyung Nam Pharm 7 –5,260 Kyungbang 54 0.018,944 Kyungchang Industrial 33 –
606 KyungDong City Gas 31 –4,065 Kyungdong Pharmaceutical 50 0.019,500 Kyung-In Synthetic 32 –
18,897 LB Semicon 42 –7,902 Leadcorp 35 –3,225 Leeno Industrial 94 0.01
37,783 LG 1,523 0.1316,297 LG Chemical 2,857 0.2358,256 LG Display 1,233 0.10
160,719 LG Display ADR 1,693 0.1472,339 LG Electronics 2,507 0.2111,776 LG Fashion 171 0.013,422 LG Hausys 220 0.022,362 LG Household & Health Care 1,362 0.118,723 LG Innotek 518 0.04
13,927 LG International 274 0.02127,692 LG Uplus 984 0.08
30,878 LIG Insurance 542 0.052,226 LIG Nex1 120 0.01
11,795 Lihom-Cuchen 40 –1,287 Lion Chemtech 18 –5,010 LIS 32 –4,150 Livart Furniture 66 0.01
570 LMS South Korea 3 –8,749 Lock & Lock 85 0.013,317 Loen Entmnt. 169 0.01
299 Lotte Chilsung Beverage 294 0.022,709 Lotte Confectionery 325 0.035,894 LOTTE Himart 167 0.01
28,121 Lotte Non-Life Insurance 45 –311 Lotte Samkang 135 0.01
3,653 Lotte Shopping 543 0.05
Holding Investment
Fair Value £'000
Percentage of total
net assets %
South Korea (continued)11,345 LS 453 0.048,777 LS Industrial Systems 235 0.02
19,321 Lumens 50 0.01172,991 Macquarie Korea Infrastructure Fund 949 0.08
2,466 Macrogen 55 0.013,600 Maeil Dairy Industry 97 0.013,842 Mando 606 0.052,563 Mcnex 33 –
465 MDS Technology Ltd 6 –9,865 Mediaplex South Korea 37 –2,026 Medy-Tox 486 0.04
827 MegaStudy 19 –478 Megastudyedu 14 –
4,203 Melfas 21 –29,036 Meritz Finance 217 0.0238,005 Meritz Fire & Marine Insurance 391 0.03
172,588 Meritz Securities 402 0.039,501 Mgame 34 –
342 Mi Chang Oil Industrial 22 –14,507 MiCo 31 –1,624 Minwise 33 –
50,374 Mirae Asset Life Insurance 174 0.0271 Miwon Specialty Chemical 21 –
13,543 MK Electron 85 0.013,982 MN Tech 19 –6,244 Mobase 37 –2,385 Modetour Network 46 –
10,530 Moorim P&P 29 –9,368 Moorim Paper 17 –6,785 Motonic 42 –6,850 Muhak 105 0.01
853 Multicampus 18 –10,469 Namhae Chemical 59 0.0134,203 Namsun Aluminum 27 –
238 Namyang Dairy Products 118 0.011,167 Nasmedia 31 –2,210 National Plastic 10 –4,979 NCsoft 828 0.07
618 NeoPharm 11 –3,955 Neowiz 44 –5,527 Neowiz Games 42 –
14,503 Nepes 81 0.0114,190 Nexen 77 0.0121,352 Nexen Tire 187 0.02
6,978 NHN 3,635 0.308,770 NHN Entmnt. 297 0.037,831 Nice 92 0.012,481 Nice Information &
Telecommunication 55 0.0115,353 Nice Information Services 72 0.01
8,037 NICE Total Cash Management 33 –2,728 NK 5 –1,441 Nong Shim 322 0.031,028 Nong Shim Holdings 83 0.011,850 Nong Woo Bio Ltd 20 –
770 Noroo 8 –5,658 Noroo Paint & Coatings 33 –
812 NS Shopping 84 0.014,333 Nuri Telecom 26 –6,487 NUVOTEC 21 –9,295 OCI 492 0.04
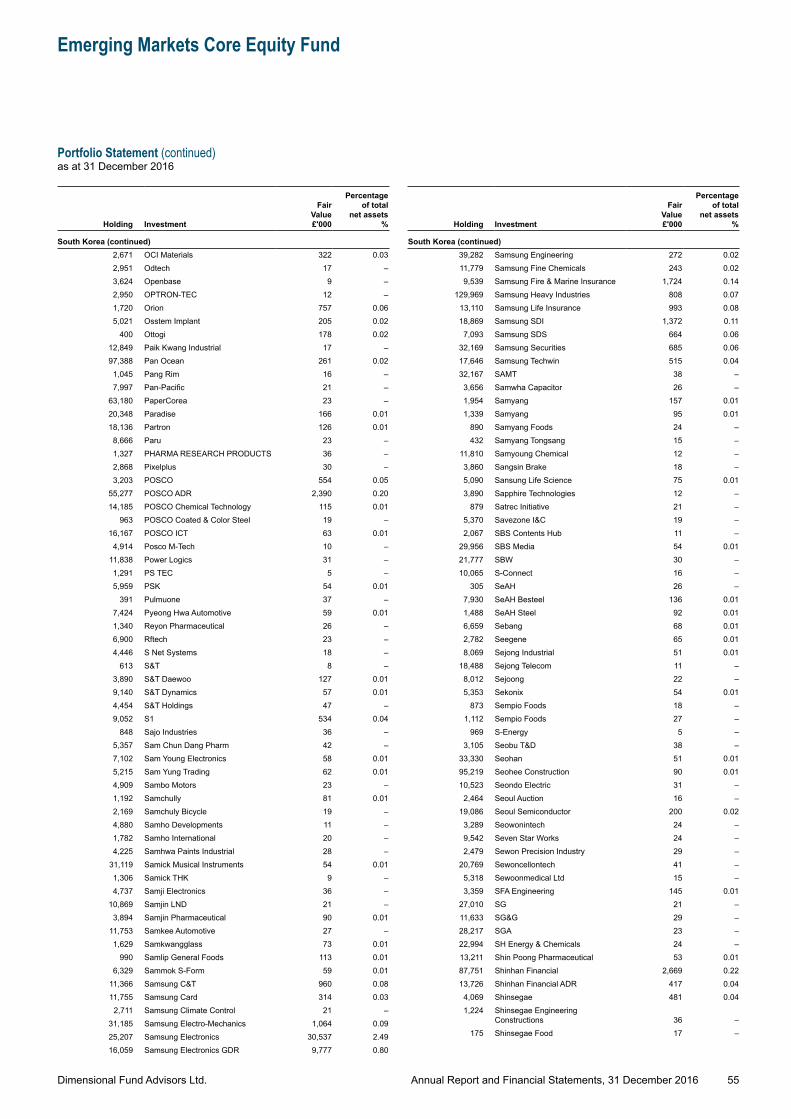
Dimensional Fund Advisors Ltd.
Emerging Markets Core Equity Fund
Portfolio Statement (continued)as at 31 December 2016
55Annual Report and Financial Statements, 31 December 2016
Holding Investment
Fair Value £'000
Percentage of total
net assets %
South Korea (continued)2,671 OCI Materials 322 0.032,951 Odtech 17 –3,624 Openbase 9 –2,950 OPTRON-TEC 12 –1,720 Orion 757 0.065,021 Osstem Implant 205 0.02
400 Ottogi 178 0.0212,849 Paik Kwang Industrial 17 –97,388 Pan Ocean 261 0.02
1,045 Pang Rim 16 –7,997 Pan-Pacific 21 –
63,180 PaperCorea 23 –20,348 Paradise 166 0.0118,136 Partron 126 0.01
8,666 Paru 23 –1,327 PHARMA RESEARCH PRODUCTS 36 –2,868 Pixelplus 30 –3,203 POSCO 554 0.05
55,277 POSCO ADR 2,390 0.2014,185 POSCO Chemical Technology 115 0.01
963 POSCO Coated & Color Steel 19 –16,167 POSCO ICT 63 0.01
4,914 Posco M-Tech 10 –11,838 Power Logics 31 –1,291 PS TEC 5 –5,959 PSK 54 0.01
391 Pulmuone 37 –7,424 Pyeong Hwa Automotive 59 0.011,340 Reyon Pharmaceutical 26 –6,900 Rftech 23 –4,446 S Net Systems 18 –
613 S&T 8 –3,890 S&T Daewoo 127 0.019,140 S&T Dynamics 57 0.014,454 S&T Holdings 47 –9,052 S1 534 0.04
848 Sajo Industries 36 –5,357 Sam Chun Dang Pharm 42 –7,102 Sam Young Electronics 58 0.015,215 Sam Yung Trading 62 0.014,909 Sambo Motors 23 –1,192 Samchully 81 0.012,169 Samchuly Bicycle 19 –4,880 Samho Developments 11 –1,782 Samho International 20 –4,225 Samhwa Paints Industrial 28 –
31,119 Samick Musical Instruments 54 0.011,306 Samick THK 9 –4,737 Samji Electronics 36 –
10,869 Samjin LND 21 –3,894 Samjin Pharmaceutical 90 0.01
11,753 Samkee Automotive 27 –1,629 Samkwangglass 73 0.01
990 Samlip General Foods 113 0.016,329 Sammok S-Form 59 0.01
11,366 Samsung C&T 960 0.0811,755 Samsung Card 314 0.03
2,711 Samsung Climate Control 21 –31,185 Samsung Electro-Mechanics 1,064 0.0925,207 Samsung Electronics 30,537 2.4916,059 Samsung Electronics GDR 9,777 0.80
Holding Investment
Fair Value £'000
Percentage of total
net assets %
South Korea (continued)39,282 Samsung Engineering 272 0.0211,779 Samsung Fine Chemicals 243 0.029,539 Samsung Fire & Marine Insurance 1,724 0.14
129,969 Samsung Heavy Industries 808 0.0713,110 Samsung Life Insurance 993 0.0818,869 Samsung SDI 1,372 0.117,093 Samsung SDS 664 0.06
32,169 Samsung Securities 685 0.0617,646 Samsung Techwin 515 0.0432,167 SAMT 38 –3,656 Samwha Capacitor 26 –1,954 Samyang 157 0.011,339 Samyang 95 0.01
890 Samyang Foods 24 –432 Samyang Tongsang 15 –
11,810 Samyoung Chemical 12 –3,860 Sangsin Brake 18 –5,090 Sansung Life Science 75 0.013,890 Sapphire Technologies 12 –
879 Satrec Initiative 21 –5,370 Savezone I&C 19 –2,067 SBS Contents Hub 11 –
29,956 SBS Media 54 0.0121,777 SBW 30 –10,065 S-Connect 16 –
305 SeAH 26 –7,930 SeAH Besteel 136 0.011,488 SeAH Steel 92 0.016,659 Sebang 68 0.012,782 Seegene 65 0.018,069 Sejong Industrial 51 0.01
18,488 Sejong Telecom 11 –8,012 Sejoong 22 –5,353 Sekonix 54 0.01
873 Sempio Foods 18 –1,112 Sempio Foods 27 –
969 S-Energy 5 –3,105 Seobu T&D 38 –
33,330 Seohan 51 0.0195,219 Seohee Construction 90 0.0110,523 Seondo Electric 31 –2,464 Seoul Auction 16 –
19,086 Seoul Semiconductor 200 0.023,289 Seowonintech 24 –9,542 Seven Star Works 24 –2,479 Sewon Precision Industry 29 –
20,769 Sewoncellontech 41 –5,318 Sewoonmedical Ltd 15 –3,359 SFA Engineering 145 0.01
27,010 SG 21 –11,633 SG&G 29 –28,217 SGA 23 –22,994 SH Energy & Chemicals 24 –13,211 Shin Poong Pharmaceutical 53 0.0187,751 Shinhan Financial 2,669 0.2213,726 Shinhan Financial ADR 417 0.04
4,069 Shinsegae 481 0.041,224 Shinsegae Engineering
Constructions 36 –175 Shinsegae Food 17 –
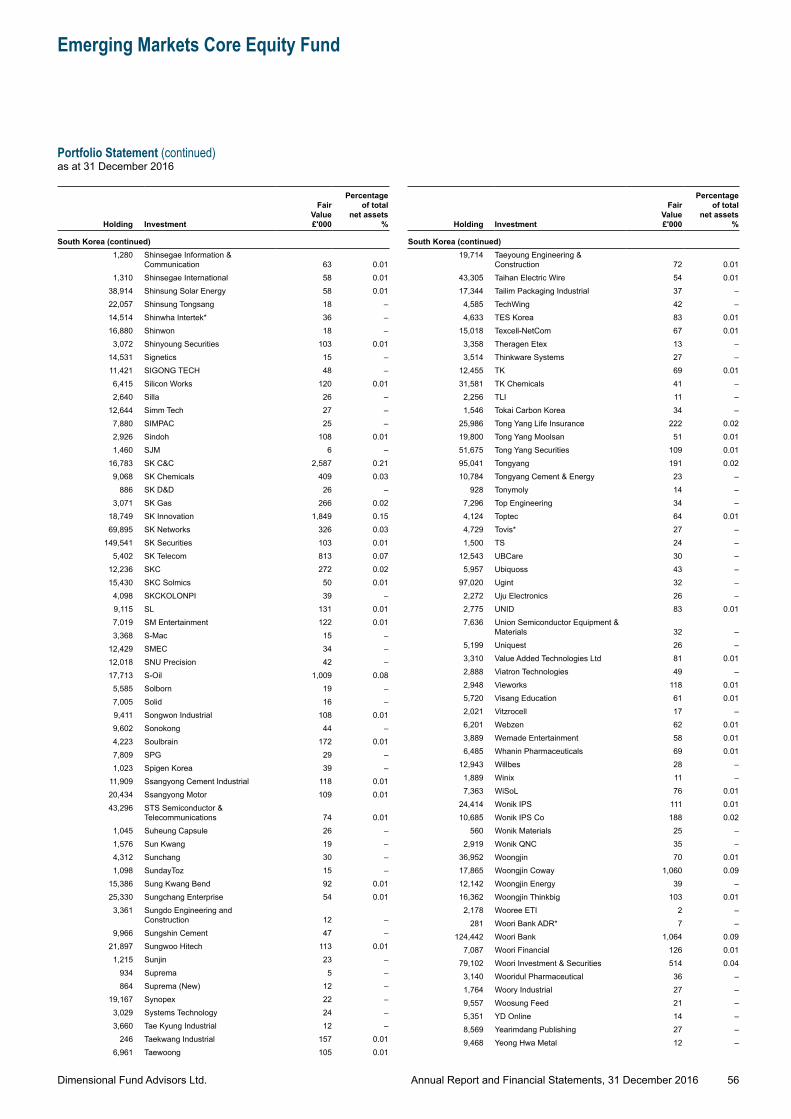
Dimensional Fund Advisors Ltd.
Emerging Markets Core Equity Fund
Portfolio Statement (continued)as at 31 December 2016
56Annual Report and Financial Statements, 31 December 2016
Holding Investment
Fair Value £'000
Percentage of total
net assets %
South Korea (continued)1,280 Shinsegae Information &
Communication 63 0.011,310 Shinsegae International 58 0.01
38,914 Shinsung Solar Energy 58 0.0122,057 Shinsung Tongsang 18 –14,514 Shinwha Intertek* 36 –16,880 Shinwon 18 –3,072 Shinyoung Securities 103 0.01
14,531 Signetics 15 –11,421 SIGONG TECH 48 –6,415 Silicon Works 120 0.012,640 Silla 26 –
12,644 Simm Tech 27 –7,880 SIMPAC 25 –2,926 Sindoh 108 0.011,460 SJM 6 –
16,783 SK C&C 2,587 0.219,068 SK Chemicals 409 0.03
886 SK D&D 26 –3,071 SK Gas 266 0.02
18,749 SK Innovation 1,849 0.1569,895 SK Networks 326 0.03
149,541 SK Securities 103 0.015,402 SK Telecom 813 0.07
12,236 SKC 272 0.0215,430 SKC Solmics 50 0.01
4,098 SKCKOLONPI 39 –9,115 SL 131 0.017,019 SM Entertainment 122 0.013,368 S-Mac 15 –
12,429 SMEC 34 –12,018 SNU Precision 42 –17,713 S-Oil 1,009 0.08
5,585 Solborn 19 –7,005 Solid 16 –9,411 Songwon Industrial 108 0.019,602 Sonokong 44 –4,223 Soulbrain 172 0.017,809 SPG 29 –1,023 Spigen Korea 39 –
11,909 Ssangyong Cement Industrial 118 0.0120,434 Ssangyong Motor 109 0.0143,296 STS Semiconductor &
Telecommunications 74 0.011,045 Suheung Capsule 26 –1,576 Sun Kwang 19 –4,312 Sunchang 30 –1,098 SundayToz 15 –
15,386 Sung Kwang Bend 92 0.0125,330 Sungchang Enterprise 54 0.01
3,361 Sungdo Engineering and Construction 12 –
9,966 Sungshin Cement 47 –21,897 Sungwoo Hitech 113 0.01
1,215 Sunjin 23 –934 Suprema 5 –864 Suprema (New) 12 –
19,167 Synopex 22 –3,029 Systems Technology 24 –3,660 Tae Kyung Industrial 12 –
246 Taekwang Industrial 157 0.016,961 Taewoong 105 0.01
Holding Investment
Fair Value £'000
Percentage of total
net assets %
South Korea (continued)19,714 Taeyoung Engineering &
Construction 72 0.0143,305 Taihan Electric Wire 54 0.0117,344 Tailim Packaging Industrial 37 –4,585 TechWing 42 –4,633 TES Korea 83 0.01
15,018 Texcell-NetCom 67 0.013,358 Theragen Etex 13 –3,514 Thinkware Systems 27 –
12,455 TK 69 0.0131,581 TK Chemicals 41 –2,256 TLI 11 –1,546 Tokai Carbon Korea 34 –
25,986 Tong Yang Life Insurance 222 0.0219,800 Tong Yang Moolsan 51 0.0151,675 Tong Yang Securities 109 0.0195,041 Tongyang 191 0.0210,784 Tongyang Cement & Energy 23 –
928 Tonymoly 14 –7,296 Top Engineering 34 –4,124 Toptec 64 0.014,729 Tovis* 27 –1,500 TS 24 –
12,543 UBCare 30 –5,957 Ubiquoss 43 –
97,020 Ugint 32 –2,272 Uju Electronics 26 –2,775 UNID 83 0.017,636 Union Semiconductor Equipment &
Materials 32 –5,199 Uniquest 26 –3,310 Value Added Technologies Ltd 81 0.012,888 Viatron Technologies 49 –2,948 Vieworks 118 0.015,720 Visang Education 61 0.012,021 Vitzrocell 17 –6,201 Webzen 62 0.013,889 Wemade Entertainment 58 0.016,485 Whanin Pharmaceuticals 69 0.01
12,943 Willbes 28 –1,889 Winix 11 –7,363 WiSoL 76 0.01
24,414 Wonik IPS 111 0.0110,685 Wonik IPS Co 188 0.02
560 Wonik Materials 25 –2,919 Wonik QNC 35 –
36,952 Woongjin 70 0.0117,865 Woongjin Coway 1,060 0.0912,142 Woongjin Energy 39 –16,362 Woongjin Thinkbig 103 0.01
2,178 Wooree ETI 2 –281 Woori Bank ADR* 7 –
124,442 Woori Bank 1,064 0.097,087 Woori Financial 126 0.01
79,102 Woori Investment & Securities 514 0.043,140 Wooridul Pharmaceutical 36 –1,764 Woory Industrial 27 –9,557 Woosung Feed 21 –5,351 YD Online 14 –8,569 Yearimdang Publishing 27 –9,468 Yeong Hwa Metal 12 –
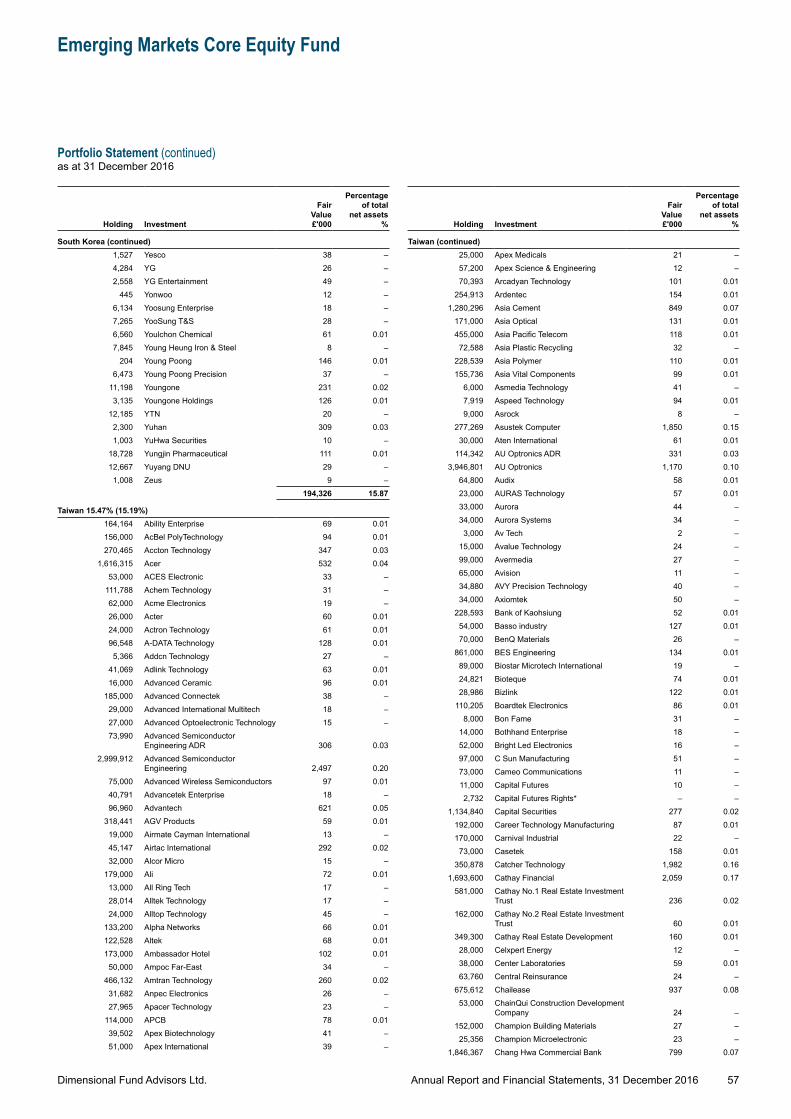
Dimensional Fund Advisors Ltd.
Emerging Markets Core Equity Fund
Portfolio Statement (continued)as at 31 December 2016
57Annual Report and Financial Statements, 31 December 2016
Holding Investment
Fair Value £'000
Percentage of total
net assets %
South Korea (continued)1,527 Yesco 38 –4,284 YG 26 –2,558 YG Entertainment 49 –
445 Yonwoo 12 –6,134 Yoosung Enterprise 18 –7,265 YooSung T&S 28 –6,560 Youlchon Chemical 61 0.017,845 Young Heung Iron & Steel 8 –
204 Young Poong 146 0.016,473 Young Poong Precision 37 –
11,198 Youngone 231 0.023,135 Youngone Holdings 126 0.01
12,185 YTN 20 –2,300 Yuhan 309 0.031,003 YuHwa Securities 10 –
18,728 Yungjin Pharmaceutical 111 0.0112,667 Yuyang DNU 29 –1,008 Zeus 9 –
194,326 15.87
Taiwan 15.47% (15.19%)164,164 Ability Enterprise 69 0.01156,000 AcBel PolyTechnology 94 0.01270,465 Accton Technology 347 0.03
1,616,315 Acer 532 0.0453,000 ACES Electronic 33 –
111,788 Achem Technology 31 –62,000 Acme Electronics 19 –26,000 Acter 60 0.0124,000 Actron Technology 61 0.0196,548 A-DATA Technology 128 0.01
5,366 Addcn Technology 27 –41,069 Adlink Technology 63 0.0116,000 Advanced Ceramic 96 0.01
185,000 Advanced Connectek 38 –29,000 Advanced International Multitech 18 –27,000 Advanced Optoelectronic Technology 15 –73,990 Advanced Semiconductor
Engineering ADR 306 0.032,999,912 Advanced Semiconductor
Engineering 2,497 0.2075,000 Advanced Wireless Semiconductors 97 0.0140,791 Advancetek Enterprise 18 –96,960 Advantech 621 0.05
318,441 AGV Products 59 0.0119,000 Airmate Cayman International 13 –45,147 Airtac International 292 0.0232,000 Alcor Micro 15 –
179,000 Ali 72 0.0113,000 All Ring Tech 17 –28,014 Alltek Technology 17 –24,000 Alltop Technology 45 –
133,200 Alpha Networks 66 0.01122,528 Altek 68 0.01173,000 Ambassador Hotel 102 0.01
50,000 Ampoc Far-East 34 –466,132 Amtran Technology 260 0.02
31,682 Anpec Electronics 26 –27,965 Apacer Technology 23 –
114,000 APCB 78 0.0139,502 Apex Biotechnology 41 –51,000 Apex International 39 –
Holding Investment
Fair Value £'000
Percentage of total
net assets %
Taiwan (continued)25,000 Apex Medicals 21 –57,200 Apex Science & Engineering 12 –70,393 Arcadyan Technology 101 0.01
254,913 Ardentec 154 0.011,280,296 Asia Cement 849 0.07
171,000 Asia Optical 131 0.01455,000 Asia Pacific Telecom 118 0.0172,588 Asia Plastic Recycling 32 –
228,539 Asia Polymer 110 0.01155,736 Asia Vital Components 99 0.01
6,000 Asmedia Technology 41 –7,919 Aspeed Technology 94 0.019,000 Asrock 8 –
277,269 Asustek Computer 1,850 0.1530,000 Aten International 61 0.01
114,342 AU Optronics ADR 331 0.033,946,801 AU Optronics 1,170 0.10
64,800 Audix 58 0.0123,000 AURAS Technology 57 0.0133,000 Aurora 44 –34,000 Aurora Systems 34 –3,000 Av Tech 2 –
15,000 Avalue Technology 24 –99,000 Avermedia 27 –65,000 Avision 11 –34,880 AVY Precision Technology 40 –34,000 Axiomtek 50 –
228,593 Bank of Kaohsiung 52 0.0154,000 Basso industry 127 0.0170,000 BenQ Materials 26 –
861,000 BES Engineering 134 0.0189,000 Biostar Microtech International 19 –24,821 Bioteque 74 0.0128,986 Bizlink 122 0.01
110,205 Boardtek Electronics 86 0.018,000 Bon Fame 31 –
14,000 Bothhand Enterprise 18 –52,000 Bright Led Electronics 16 –97,000 C Sun Manufacturing 51 –73,000 Cameo Communications 11 –11,000 Capital Futures 10 –2,732 Capital Futures Rights* – –
1,134,840 Capital Securities 277 0.02192,000 Career Technology Manufacturing 87 0.01170,000 Carnival Industrial 22 –73,000 Casetek 158 0.01
350,878 Catcher Technology 1,982 0.161,693,600 Cathay Financial 2,059 0.17
581,000 Cathay No.1 Real Estate Investment Trust 236 0.02
162,000 Cathay No.2 Real Estate Investment Trust 60 0.01
349,300 Cathay Real Estate Development 160 0.0128,000 Celxpert Energy 12 –38,000 Center Laboratories 59 0.0163,760 Central Reinsurance 24 –
675,612 Chailease 937 0.0853,000 ChainQui Construction Development
Company 24 –152,000 Champion Building Materials 27 –25,356 Champion Microelectronic 23 –
1,846,367 Chang Hwa Commercial Bank 799 0.07
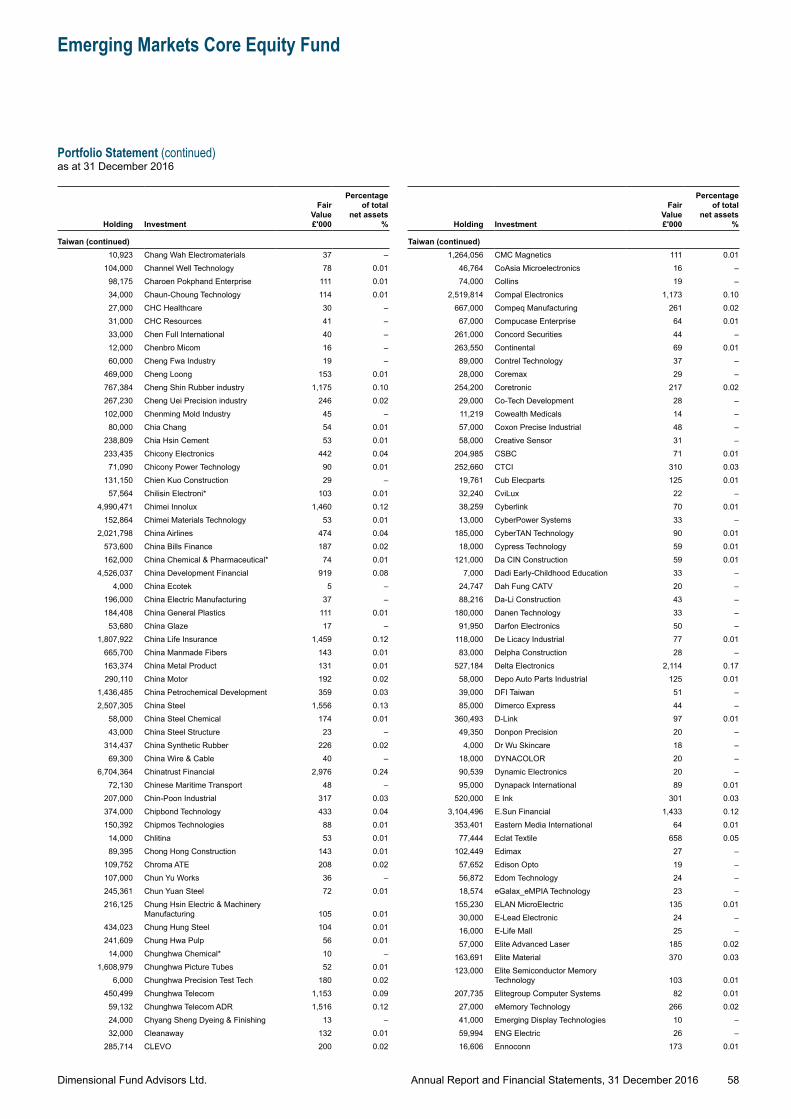
Dimensional Fund Advisors Ltd.
Emerging Markets Core Equity Fund
Portfolio Statement (continued)as at 31 December 2016
58Annual Report and Financial Statements, 31 December 2016
Holding Investment
Fair Value £'000
Percentage of total
net assets %
Taiwan (continued)10,923 Chang Wah Electromaterials 37 –
104,000 Channel Well Technology 78 0.0198,175 Charoen Pokphand Enterprise 111 0.0134,000 Chaun-Choung Technology 114 0.0127,000 CHC Healthcare 30 –31,000 CHC Resources 41 –33,000 Chen Full International 40 –12,000 Chenbro Micom 16 –60,000 Cheng Fwa Industry 19 –
469,000 Cheng Loong 153 0.01767,384 Cheng Shin Rubber industry 1,175 0.10267,230 Cheng Uei Precision industry 246 0.02102,000 Chenming Mold Industry 45 –80,000 Chia Chang 54 0.01
238,809 Chia Hsin Cement 53 0.01233,435 Chicony Electronics 442 0.04
71,090 Chicony Power Technology 90 0.01131,150 Chien Kuo Construction 29 –57,564 Chilisin Electroni* 103 0.01
4,990,471 Chimei Innolux 1,460 0.12152,864 Chimei Materials Technology 53 0.01
2,021,798 China Airlines 474 0.04573,600 China Bills Finance 187 0.02162,000 China Chemical & Pharmaceutical* 74 0.01
4,526,037 China Development Financial 919 0.084,000 China Ecotek 5 –
196,000 China Electric Manufacturing 37 –184,408 China General Plastics 111 0.0153,680 China Glaze 17 –
1,807,922 China Life Insurance 1,459 0.12665,700 China Manmade Fibers 143 0.01163,374 China Metal Product 131 0.01290,110 China Motor 192 0.02
1,436,485 China Petrochemical Development 359 0.032,507,305 China Steel 1,556 0.13
58,000 China Steel Chemical 174 0.0143,000 China Steel Structure 23 –
314,437 China Synthetic Rubber 226 0.0269,300 China Wire & Cable 40 –
6,704,364 Chinatrust Financial 2,976 0.2472,130 Chinese Maritime Transport 48 –
207,000 Chin-Poon Industrial 317 0.03374,000 Chipbond Technology 433 0.04150,392 Chipmos Technologies 88 0.01
14,000 Chlitina 53 0.0189,395 Chong Hong Construction 143 0.01
109,752 Chroma ATE 208 0.02107,000 Chun Yu Works 36 –245,361 Chun Yuan Steel 72 0.01216,125 Chung Hsin Electric & Machinery
Manufacturing 105 0.01434,023 Chung Hung Steel 104 0.01241,609 Chung Hwa Pulp 56 0.01
14,000 Chunghwa Chemical* 10 –1,608,979 Chunghwa Picture Tubes 52 0.01
6,000 Chunghwa Precision Test Tech 180 0.02450,499 Chunghwa Telecom 1,153 0.0959,132 Chunghwa Telecom ADR 1,516 0.1224,000 Chyang Sheng Dyeing & Finishing 13 –32,000 Cleanaway 132 0.01
285,714 CLEVO 200 0.02
Holding Investment
Fair Value £'000
Percentage of total
net assets %
Taiwan (continued)1,264,056 CMC Magnetics 111 0.01
46,764 CoAsia Microelectronics 16 –74,000 Collins 19 –
2,519,814 Compal Electronics 1,173 0.10667,000 Compeq Manufacturing 261 0.0267,000 Compucase Enterprise 64 0.01
261,000 Concord Securities 44 –263,550 Continental 69 0.0189,000 Contrel Technology 37 –28,000 Coremax 29 –
254,200 Coretronic 217 0.0229,000 Co-Tech Development 28 –11,219 Cowealth Medicals 14 –57,000 Coxon Precise Industrial 48 –58,000 Creative Sensor 31 –
204,985 CSBC 71 0.01252,660 CTCI 310 0.0319,761 Cub Elecparts 125 0.0132,240 CviLux 22 –38,259 Cyberlink 70 0.0113,000 CyberPower Systems 33 –
185,000 CyberTAN Technology 90 0.0118,000 Cypress Technology 59 0.01
121,000 Da CIN Construction 59 0.017,000 Dadi Early-Childhood Education 33 –
24,747 Dah Fung CATV 20 –88,216 Da-Li Construction 43 –
180,000 Danen Technology 33 –91,950 Darfon Electronics 50 –
118,000 De Licacy Industrial 77 0.0183,000 Delpha Construction 28 –
527,184 Delta Electronics 2,114 0.1758,000 Depo Auto Parts Industrial 125 0.0139,000 DFI Taiwan 51 –85,000 Dimerco Express 44 –
360,493 D-Link 97 0.0149,350 Donpon Precision 20 –4,000 Dr Wu Skincare 18 –
18,000 DYNACOLOR 20 –90,539 Dynamic Electronics 20 –95,000 Dynapack International 89 0.01
520,000 E Ink 301 0.033,104,496 E.Sun Financial 1,433 0.12
353,401 Eastern Media International 64 0.0177,444 Eclat Textile 658 0.05
102,449 Edimax 27 –57,652 Edison Opto 19 –56,872 Edom Technology 24 –18,574 eGalax_eMPIA Technology 23 –
155,230 ELAN MicroElectric 135 0.0130,000 E-Lead Electronic 24 –16,000 E-Life Mall 25 –57,000 Elite Advanced Laser 185 0.02
163,691 Elite Material 370 0.03123,000 Elite Semiconductor Memory
Technology 103 0.01207,735 Elitegroup Computer Systems 82 0.0127,000 eMemory Technology 266 0.0241,000 Emerging Display Technologies 10 –59,994 ENG Electric 26 –16,606 Ennoconn 173 0.01
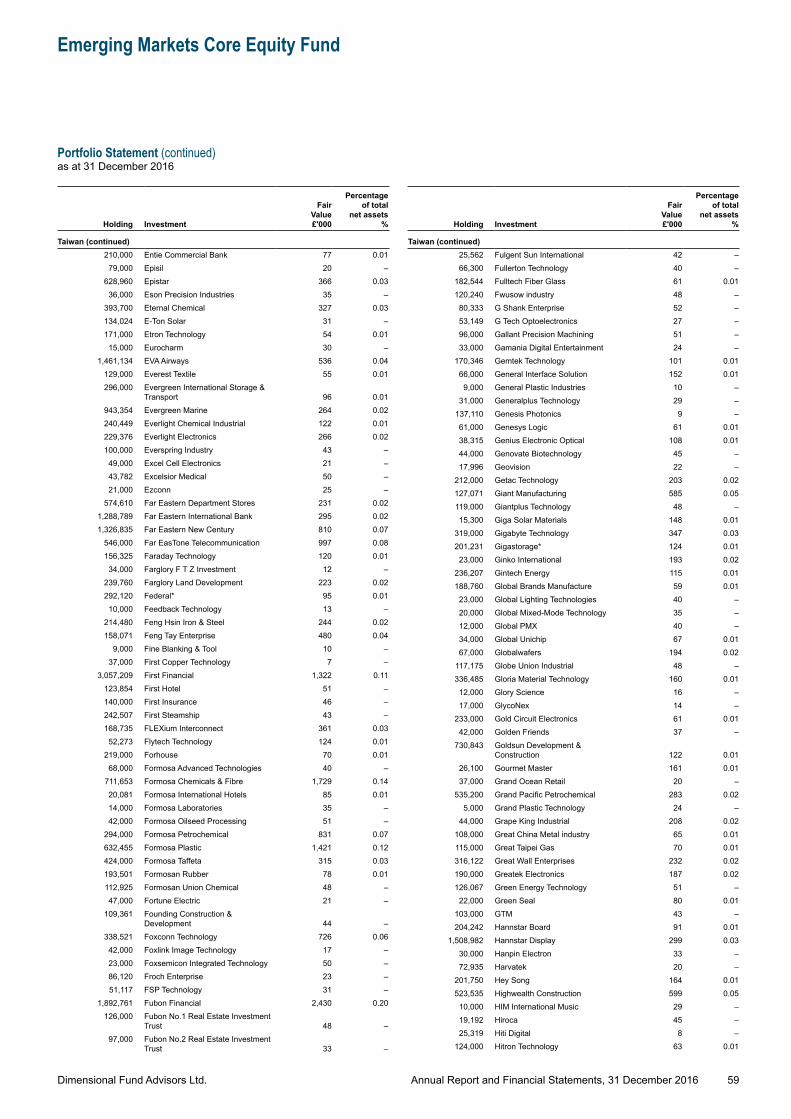
Dimensional Fund Advisors Ltd.
Emerging Markets Core Equity Fund
Portfolio Statement (continued)as at 31 December 2016
59Annual Report and Financial Statements, 31 December 2016
Holding Investment
Fair Value £'000
Percentage of total
net assets %
Taiwan (continued)210,000 Entie Commercial Bank 77 0.01
79,000 Episil 20 –628,960 Epistar 366 0.03
36,000 Eson Precision Industries 35 –393,700 Eternal Chemical 327 0.03134,024 E-Ton Solar 31 –171,000 Etron Technology 54 0.01
15,000 Eurocharm 30 –1,461,134 EVA Airways 536 0.04
129,000 Everest Textile 55 0.01296,000 Evergreen International Storage &
Transport 96 0.01943,354 Evergreen Marine 264 0.02240,449 Everlight Chemical Industrial 122 0.01229,376 Everlight Electronics 266 0.02100,000 Everspring Industry 43 –49,000 Excel Cell Electronics 21 –43,782 Excelsior Medical 50 –21,000 Ezconn 25 –
574,610 Far Eastern Department Stores 231 0.021,288,789 Far Eastern International Bank 295 0.021,326,835 Far Eastern New Century 810 0.07
546,000 Far EasTone Telecommunication 997 0.08156,325 Faraday Technology 120 0.01
34,000 Farglory F T Z Investment 12 –239,760 Farglory Land Development 223 0.02292,120 Federal* 95 0.01
10,000 Feedback Technology 13 –214,480 Feng Hsin Iron & Steel 244 0.02158,071 Feng Tay Enterprise 480 0.04
9,000 Fine Blanking & Tool 10 –37,000 First Copper Technology 7 –
3,057,209 First Financial 1,322 0.11123,854 First Hotel 51 –140,000 First Insurance 46 –242,507 First Steamship 43 –168,735 FLEXium Interconnect 361 0.03
52,273 Flytech Technology 124 0.01219,000 Forhouse 70 0.01
68,000 Formosa Advanced Technologies 40 –711,653 Formosa Chemicals & Fibre 1,729 0.1420,081 Formosa International Hotels 85 0.0114,000 Formosa Laboratories 35 –42,000 Formosa Oilseed Processing 51 –
294,000 Formosa Petrochemical 831 0.07632,455 Formosa Plastic 1,421 0.12424,000 Formosa Taffeta 315 0.03193,501 Formosan Rubber 78 0.01112,925 Formosan Union Chemical 48 –47,000 Fortune Electric 21 –
109,361 Founding Construction & Development 44 –
338,521 Foxconn Technology 726 0.0642,000 Foxlink Image Technology 17 –23,000 Foxsemicon Integrated Technology 50 –86,120 Froch Enterprise 23 –51,117 FSP Technology 31 –
1,892,761 Fubon Financial 2,430 0.20126,000 Fubon No.1 Real Estate Investment
Trust 48 –97,000 Fubon No.2 Real Estate Investment
Trust 33 –
Holding Investment
Fair Value £'000
Percentage of total
net assets %
Taiwan (continued)25,562 Fulgent Sun International 42 –66,300 Fullerton Technology 40 –
182,544 Fulltech Fiber Glass 61 0.01120,240 Fwusow industry 48 –80,333 G Shank Enterprise 52 –53,149 G Tech Optoelectronics 27 –96,000 Gallant Precision Machining 51 –33,000 Gamania Digital Entertainment 24 –
170,346 Gemtek Technology 101 0.0166,000 General Interface Solution 152 0.01
9,000 General Plastic Industries 10 –31,000 Generalplus Technology 29 –
137,110 Genesis Photonics 9 –61,000 Genesys Logic 61 0.0138,315 Genius Electronic Optical 108 0.0144,000 Genovate Biotechnology 45 –17,996 Geovision 22 –
212,000 Getac Technology 203 0.02127,071 Giant Manufacturing 585 0.05119,000 Giantplus Technology 48 –15,300 Giga Solar Materials 148 0.01
319,000 Gigabyte Technology 347 0.03201,231 Gigastorage* 124 0.0123,000 Ginko International 193 0.02
236,207 Gintech Energy 115 0.01188,760 Global Brands Manufacture 59 0.0123,000 Global Lighting Technologies 40 –20,000 Global Mixed-Mode Technology 35 –12,000 Global PMX 40 –34,000 Global Unichip 67 0.0167,000 Globalwafers 194 0.02
117,175 Globe Union Industrial 48 –336,485 Gloria Material Technology 160 0.01
12,000 Glory Science 16 –17,000 GlycoNex 14 –
233,000 Gold Circuit Electronics 61 0.0142,000 Golden Friends 37 –
730,843 Goldsun Development & Construction 122 0.01
26,100 Gourmet Master 161 0.0137,000 Grand Ocean Retail 20 –
535,200 Grand Pacific Petrochemical 283 0.025,000 Grand Plastic Technology 24 –
44,000 Grape King Industrial 208 0.02108,000 Great China Metal industry 65 0.01115,000 Great Taipei Gas 70 0.01316,122 Great Wall Enterprises 232 0.02190,000 Greatek Electronics 187 0.02126,067 Green Energy Technology 51 –22,000 Green Seal 80 0.01
103,000 GTM 43 –204,242 Hannstar Board 91 0.01
1,508,982 Hannstar Display 299 0.0330,000 Hanpin Electron 33 –72,935 Harvatek 20 –
201,750 Hey Song 164 0.01523,535 Highwealth Construction 599 0.0510,000 HIM International Music 29 –19,192 Hiroca 45 –25,319 Hiti Digital 8 –
124,000 Hitron Technology 63 0.01
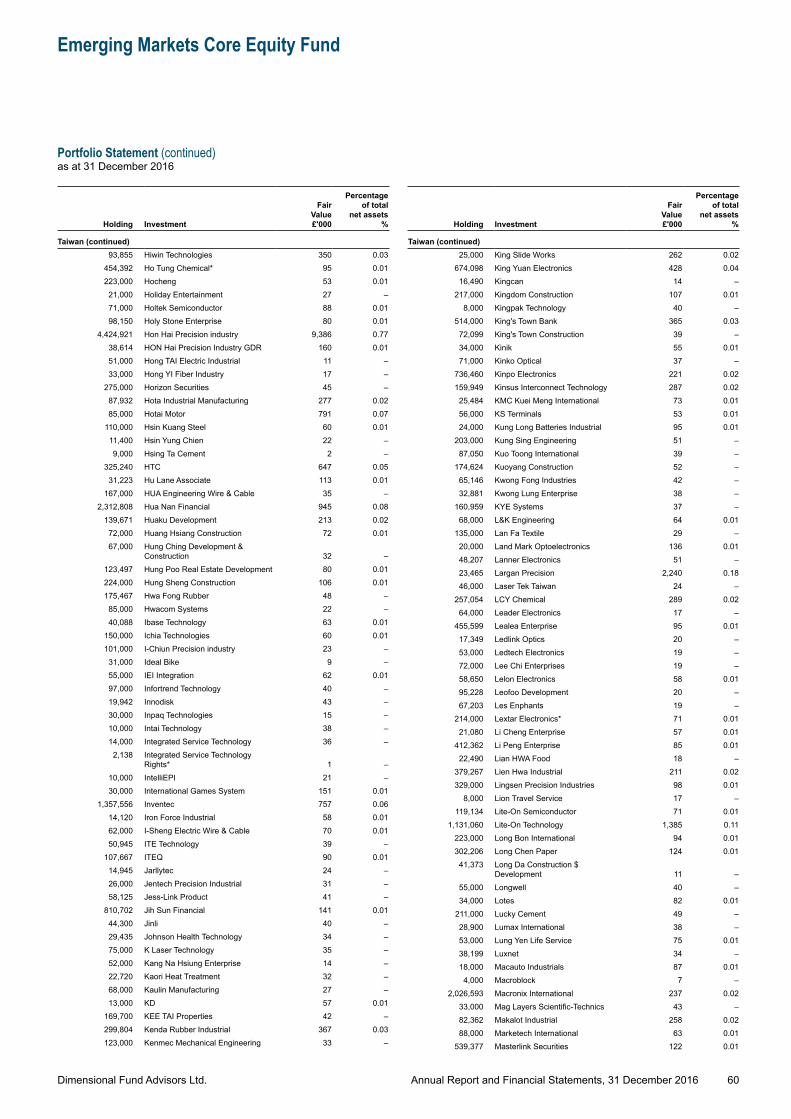
Dimensional Fund Advisors Ltd.
Emerging Markets Core Equity Fund
Portfolio Statement (continued)as at 31 December 2016
60Annual Report and Financial Statements, 31 December 2016
Holding Investment
Fair Value £'000
Percentage of total
net assets %
Taiwan (continued)93,855 Hiwin Technologies 350 0.03
454,392 Ho Tung Chemical* 95 0.01223,000 Hocheng 53 0.01
21,000 Holiday Entertainment 27 –71,000 Holtek Semiconductor 88 0.0198,150 Holy Stone Enterprise 80 0.01
4,424,921 Hon Hai Precision industry 9,386 0.7738,614 HON Hai Precision Industry GDR 160 0.0151,000 Hong TAI Electric Industrial 11 –33,000 Hong YI Fiber Industry 17 –
275,000 Horizon Securities 45 –87,932 Hota Industrial Manufacturing 277 0.0285,000 Hotai Motor 791 0.07
110,000 Hsin Kuang Steel 60 0.0111,400 Hsin Yung Chien 22 –9,000 Hsing Ta Cement 2 –
325,240 HTC 647 0.0531,223 Hu Lane Associate 113 0.01
167,000 HUA Engineering Wire & Cable 35 –2,312,808 Hua Nan Financial 945 0.08
139,671 Huaku Development 213 0.0272,000 Huang Hsiang Construction 72 0.0167,000 Hung Ching Development &
Construction 32 –123,497 Hung Poo Real Estate Development 80 0.01224,000 Hung Sheng Construction 106 0.01175,467 Hwa Fong Rubber 48 –85,000 Hwacom Systems 22 –40,088 Ibase Technology 63 0.01
150,000 Ichia Technologies 60 0.01101,000 I-Chiun Precision industry 23 –31,000 Ideal Bike 9 –55,000 IEI Integration 62 0.0197,000 Infortrend Technology 40 –19,942 Innodisk 43 –30,000 Inpaq Technologies 15 –10,000 Intai Technology 38 –14,000 Integrated Service Technology 36 –2,138 Integrated Service Technology
Rights* 1 –10,000 IntelliEPI 21 –30,000 International Games System 151 0.01
1,357,556 Inventec 757 0.0614,120 Iron Force Industrial 58 0.0162,000 I-Sheng Electric Wire & Cable 70 0.0150,945 ITE Technology 39 –
107,667 ITEQ 90 0.0114,945 Jarllytec 24 –26,000 Jentech Precision Industrial 31 –58,125 Jess-Link Product 41 –
810,702 Jih Sun Financial 141 0.0144,300 Jinli 40 –29,435 Johnson Health Technology 34 –75,000 K Laser Technology 35 –52,000 Kang Na Hsiung Enterprise 14 –22,720 Kaori Heat Treatment 32 –68,000 Kaulin Manufacturing 27 –13,000 KD 57 0.01
169,700 KEE TAI Properties 42 –299,804 Kenda Rubber Industrial 367 0.03123,000 Kenmec Mechanical Engineering 33 –
Holding Investment
Fair Value £'000
Percentage of total
net assets %
Taiwan (continued)25,000 King Slide Works 262 0.02
674,098 King Yuan Electronics 428 0.0416,490 Kingcan 14 –
217,000 Kingdom Construction 107 0.018,000 Kingpak Technology 40 –
514,000 King's Town Bank 365 0.0372,099 King's Town Construction 39 –34,000 Kinik 55 0.0171,000 Kinko Optical 37 –
736,460 Kinpo Electronics 221 0.02159,949 Kinsus Interconnect Technology 287 0.0225,484 KMC Kuei Meng International 73 0.0156,000 KS Terminals 53 0.0124,000 Kung Long Batteries Industrial 95 0.01
203,000 Kung Sing Engineering 51 –87,050 Kuo Toong International 39 –
174,624 Kuoyang Construction 52 –65,146 Kwong Fong Industries 42 –32,881 Kwong Lung Enterprise 38 –
160,959 KYE Systems 37 –68,000 L&K Engineering 64 0.01
135,000 Lan Fa Textile 29 –20,000 Land Mark Optoelectronics 136 0.0148,207 Lanner Electronics 51 –23,465 Largan Precision 2,240 0.1846,000 Laser Tek Taiwan 24 –
257,054 LCY Chemical 289 0.0264,000 Leader Electronics 17 –
455,599 Lealea Enterprise 95 0.0117,349 Ledlink Optics 20 –53,000 Ledtech Electronics 19 –72,000 Lee Chi Enterprises 19 –58,650 Lelon Electronics 58 0.0195,228 Leofoo Development 20 –67,203 Les Enphants 19 –
214,000 Lextar Electronics* 71 0.0121,080 Li Cheng Enterprise 57 0.01
412,362 Li Peng Enterprise 85 0.0122,490 Lian HWA Food 18 –
379,267 Lien Hwa Industrial 211 0.02329,000 Lingsen Precision Industries 98 0.01
8,000 Lion Travel Service 17 –119,134 Lite-On Semiconductor 71 0.01
1,131,060 Lite-On Technology 1,385 0.11223,000 Long Bon International 94 0.01302,206 Long Chen Paper 124 0.0141,373 Long Da Construction $
Development 11 –55,000 Longwell 40 –34,000 Lotes 82 0.01
211,000 Lucky Cement 49 –28,900 Lumax International 38 –53,000 Lung Yen Life Service 75 0.0138,199 Luxnet 34 –18,000 Macauto Industrials 87 0.01
4,000 Macroblock 7 –2,026,593 Macronix International 237 0.02
33,000 Mag Layers Scientific-Technics 43 –82,362 Makalot Industrial 258 0.0288,000 Marketech International 63 0.01
539,377 Masterlink Securities 122 0.01
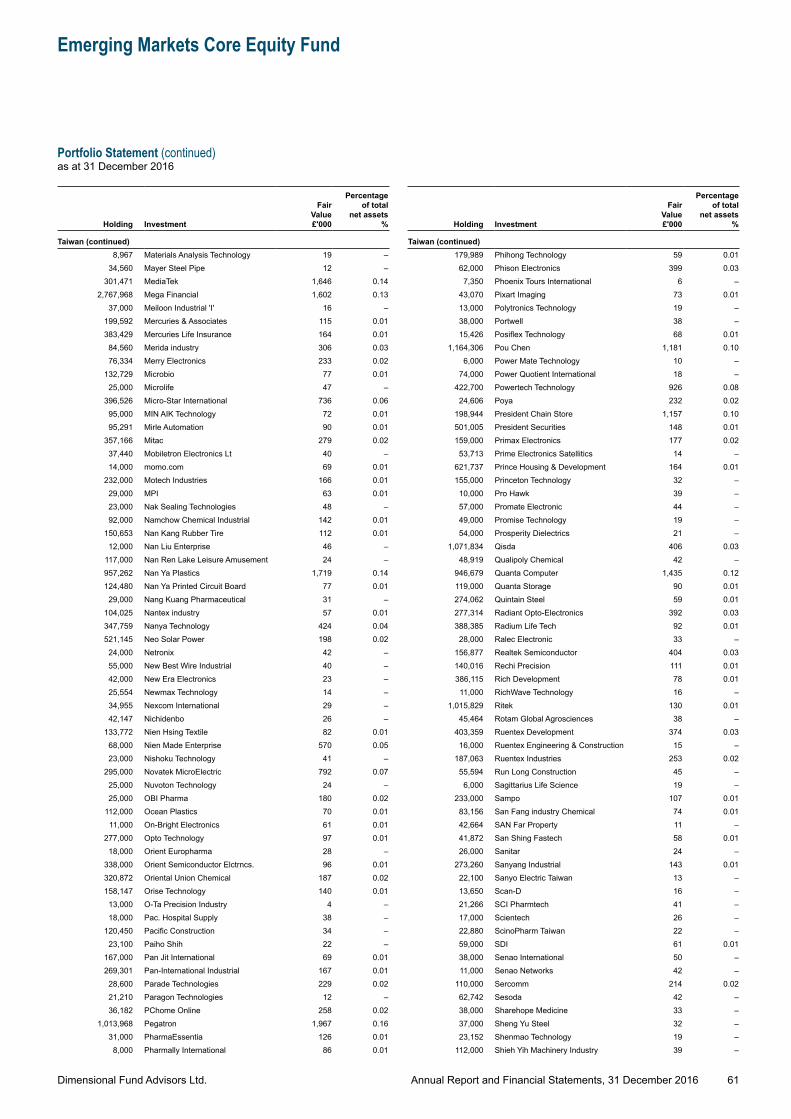
Dimensional Fund Advisors Ltd.
Emerging Markets Core Equity Fund
Portfolio Statement (continued)as at 31 December 2016
61Annual Report and Financial Statements, 31 December 2016
Holding Investment
Fair Value £'000
Percentage of total
net assets %
Taiwan (continued)8,967 Materials Analysis Technology 19 –
34,560 Mayer Steel Pipe 12 –301,471 MediaTek 1,646 0.14
2,767,968 Mega Financial 1,602 0.1337,000 Meiloon Industrial 'I' 16 –
199,592 Mercuries & Associates 115 0.01383,429 Mercuries Life Insurance 164 0.01
84,560 Merida industry 306 0.0376,334 Merry Electronics 233 0.02
132,729 Microbio 77 0.0125,000 Microlife 47 –
396,526 Micro-Star International 736 0.0695,000 MIN AIK Technology 72 0.0195,291 Mirle Automation 90 0.01
357,166 Mitac 279 0.0237,440 Mobiletron Electronics Lt 40 –14,000 momo.com 69 0.01
232,000 Motech Industries 166 0.0129,000 MPI 63 0.0123,000 Nak Sealing Technologies 48 –92,000 Namchow Chemical Industrial 142 0.01
150,653 Nan Kang Rubber Tire 112 0.0112,000 Nan Liu Enterprise 46 –
117,000 Nan Ren Lake Leisure Amusement 24 –957,262 Nan Ya Plastics 1,719 0.14124,480 Nan Ya Printed Circuit Board 77 0.01
29,000 Nang Kuang Pharmaceutical 31 –104,025 Nantex industry 57 0.01347,759 Nanya Technology 424 0.04521,145 Neo Solar Power 198 0.02
24,000 Netronix 42 –55,000 New Best Wire Industrial 40 –42,000 New Era Electronics 23 –25,554 Newmax Technology 14 –34,955 Nexcom International 29 –42,147 Nichidenbo 26 –
133,772 Nien Hsing Textile 82 0.0168,000 Nien Made Enterprise 570 0.0523,000 Nishoku Technology 41 –
295,000 Novatek MicroElectric 792 0.0725,000 Nuvoton Technology 24 –25,000 OBI Pharma 180 0.02
112,000 Ocean Plastics 70 0.0111,000 On-Bright Electronics 61 0.01
277,000 Opto Technology 97 0.0118,000 Orient Europharma 28 –
338,000 Orient Semiconductor Elctrncs. 96 0.01320,872 Oriental Union Chemical 187 0.02158,147 Orise Technology 140 0.01
13,000 O-Ta Precision Industry 4 –18,000 Pac. Hospital Supply 38 –
120,450 Pacific Construction 34 –23,100 Paiho Shih 22 –
167,000 Pan Jit International 69 0.01269,301 Pan-International Industrial 167 0.01
28,600 Parade Technologies 229 0.0221,210 Paragon Technologies 12 –36,182 PChome Online 258 0.02
1,013,968 Pegatron 1,967 0.1631,000 PharmaEssentia 126 0.01
8,000 Pharmally International 86 0.01
Holding Investment
Fair Value £'000
Percentage of total
net assets %
Taiwan (continued)179,989 Phihong Technology 59 0.01
62,000 Phison Electronics 399 0.037,350 Phoenix Tours International 6 –
43,070 Pixart Imaging 73 0.0113,000 Polytronics Technology 19 –38,000 Portwell 38 –15,426 Posiflex Technology 68 0.01
1,164,306 Pou Chen 1,181 0.106,000 Power Mate Technology 10 –
74,000 Power Quotient International 18 –422,700 Powertech Technology 926 0.0824,606 Poya 232 0.02
198,944 President Chain Store 1,157 0.10501,005 President Securities 148 0.01159,000 Primax Electronics 177 0.0253,713 Prime Electronics Satellitics 14 –
621,737 Prince Housing & Development 164 0.01155,000 Princeton Technology 32 –10,000 Pro Hawk 39 –57,000 Promate Electronic 44 –49,000 Promise Technology 19 –54,000 Prosperity Dielectrics 21 –
1,071,834 Qisda 406 0.0348,919 Qualipoly Chemical 42 –
946,679 Quanta Computer 1,435 0.12119,000 Quanta Storage 90 0.01274,062 Quintain Steel 59 0.01277,314 Radiant Opto-Electronics 392 0.03388,385 Radium Life Tech 92 0.0128,000 Ralec Electronic 33 –
156,877 Realtek Semiconductor 404 0.03140,016 Rechi Precision 111 0.01386,115 Rich Development 78 0.01
11,000 RichWave Technology 16 –1,015,829 Ritek 130 0.01
45,464 Rotam Global Agrosciences 38 –403,359 Ruentex Development 374 0.0316,000 Ruentex Engineering & Construction 15 –
187,063 Ruentex Industries 253 0.0255,594 Run Long Construction 45 –6,000 Sagittarius Life Science 19 –
233,000 Sampo 107 0.0183,156 San Fang industry Chemical 74 0.0142,664 SAN Far Property 11 –41,872 San Shing Fastech 58 0.0126,000 Sanitar 24 –
273,260 Sanyang Industrial 143 0.0122,100 Sanyo Electric Taiwan 13 –13,650 Scan-D 16 –21,266 SCI Pharmtech 41 –17,000 Scientech 26 –22,880 ScinoPharm Taiwan 22 –59,000 SDI 61 0.0138,000 Senao International 50 –11,000 Senao Networks 42 –
110,000 Sercomm 214 0.0262,742 Sesoda 42 –38,000 Sharehope Medicine 33 –37,000 Sheng Yu Steel 32 –23,152 Shenmao Technology 19 –
112,000 Shieh Yih Machinery Industry 39 –
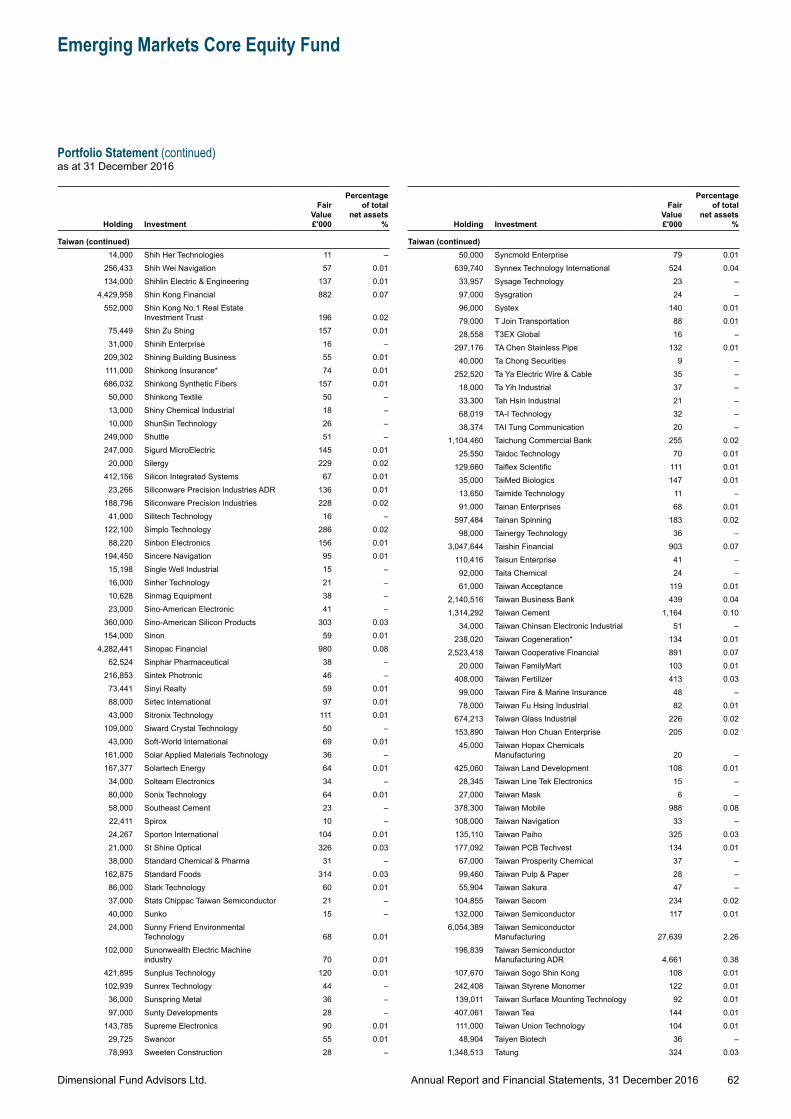
Dimensional Fund Advisors Ltd.
Emerging Markets Core Equity Fund
Portfolio Statement (continued)as at 31 December 2016
62Annual Report and Financial Statements, 31 December 2016
Holding Investment
Fair Value £'000
Percentage of total
net assets %
Taiwan (continued)14,000 Shih Her Technologies 11 –
256,433 Shih Wei Navigation 57 0.01134,000 Shihlin Electric & Engineering 137 0.01
4,429,958 Shin Kong Financial 882 0.07552,000 Shin Kong No.1 Real Estate
Investment Trust 196 0.0275,449 Shin Zu Shing 157 0.0131,000 Shinih Enterprise 16 –
209,302 Shining Building Business 55 0.01111,000 Shinkong Insurance* 74 0.01686,032 Shinkong Synthetic Fibers 157 0.01
50,000 Shinkong Textile 50 –13,000 Shiny Chemical Industrial 18 –10,000 ShunSin Technology 26 –
249,000 Shuttle 51 –247,000 Sigurd MicroElectric 145 0.01
20,000 Silergy 229 0.02412,156 Silicon Integrated Systems 67 0.01
23,266 Siliconware Precision Industries ADR 136 0.01188,796 Siliconware Precision Industries 228 0.02
41,000 Silitech Technology 16 –122,100 Simplo Technology 286 0.02
88,220 Sinbon Electronics 156 0.01194,450 Sincere Navigation 95 0.01
15,198 Single Well Industrial 15 –16,000 Sinher Technology 21 –10,628 Sinmag Equipment 38 –23,000 Sino-American Electronic 41 –
360,000 Sino-American Silicon Products 303 0.03154,000 Sinon 59 0.01
4,282,441 Sinopac Financial 980 0.0862,524 Sinphar Pharmaceutical 38 –
216,853 Sintek Photronic 46 –73,441 Sinyi Realty 59 0.0188,000 Sirtec International 97 0.0143,000 Sitronix Technology 111 0.01
109,000 Siward Crystal Technology 50 –43,000 Soft-World International 69 0.01
161,000 Solar Applied Materials Technology 36 –167,377 Solartech Energy 64 0.01
34,000 Solteam Electronics 34 –80,000 Sonix Technology 64 0.0158,000 Southeast Cement 23 –22,411 Spirox 10 –24,267 Sporton International 104 0.0121,000 St Shine Optical 326 0.0338,000 Standard Chemical & Pharma 31 –
162,875 Standard Foods 314 0.0386,000 Stark Technology 60 0.0137,000 Stats Chippac Taiwan Semiconductor 21 –40,000 Sunko 15 –24,000 Sunny Friend Environmental
Technology 68 0.01102,000 Sunonwealth Electric Machine
industry 70 0.01421,895 Sunplus Technology 120 0.01102,939 Sunrex Technology 44 –36,000 Sunspring Metal 36 –97,000 Sunty Developments 28 –
143,785 Supreme Electronics 90 0.0129,725 Swancor 55 0.0178,993 Sweeten Construction 28 –
Holding Investment
Fair Value £'000
Percentage of total
net assets %
Taiwan (continued)50,000 Syncmold Enterprise 79 0.01
639,740 Synnex Technology International 524 0.0433,957 Sysage Technology 23 –97,000 Sysgration 24 –96,000 Systex 140 0.0179,000 T Join Transportation 88 0.0128,558 T3EX Global 16 –
297,176 TA Chen Stainless Pipe 132 0.0140,000 Ta Chong Securities 9 –
252,520 Ta Ya Electric Wire & Cable 35 –18,000 Ta Yih Industrial 37 –33,300 Tah Hsin Industrial 21 –68,019 TA-I Technology 32 –38,374 TAI Tung Communication 20 –
1,104,460 Taichung Commercial Bank 255 0.0225,550 Taidoc Technology 70 0.01
129,660 Taiflex Scientific 111 0.0135,000 TaiMed Biologics 147 0.0113,650 Taimide Technology 11 –91,000 Tainan Enterprises 68 0.01
597,484 Tainan Spinning 183 0.0298,000 Tainergy Technology 36 –
3,047,644 Taishin Financial 903 0.07110,416 Taisun Enterprise 41 –92,000 Taita Chemical 24 –61,000 Taiwan Acceptance 119 0.01
2,140,516 Taiwan Business Bank 439 0.041,314,292 Taiwan Cement 1,164 0.10
34,000 Taiwan Chinsan Electronic Industrial 51 –238,020 Taiwan Cogeneration* 134 0.01
2,523,418 Taiwan Cooperative Financial 891 0.0720,000 Taiwan FamilyMart 103 0.01
408,000 Taiwan Fertilizer 413 0.0399,000 Taiwan Fire & Marine Insurance 48 –78,000 Taiwan Fu Hsing Industrial 82 0.01
674,213 Taiwan Glass Industrial 226 0.02153,890 Taiwan Hon Chuan Enterprise 205 0.0245,000 Taiwan Hopax Chemicals
Manufacturing 20 –425,060 Taiwan Land Development 108 0.0128,345 Taiwan Line Tek Electronics 15 –27,000 Taiwan Mask 6 –
378,300 Taiwan Mobile 988 0.08108,000 Taiwan Navigation 33 –135,110 Taiwan Paiho 325 0.03177,092 Taiwan PCB Techvest 134 0.0167,000 Taiwan Prosperity Chemical 37 –99,460 Taiwan Pulp & Paper 28 –55,904 Taiwan Sakura 47 –
104,855 Taiwan Secom 234 0.02132,000 Taiwan Semiconductor 117 0.01
6,054,389 Taiwan Semiconductor Manufacturing 27,639 2.26
196,839 Taiwan Semiconductor Manufacturing ADR 4,661 0.38
107,670 Taiwan Sogo Shin Kong 108 0.01242,408 Taiwan Styrene Monomer 122 0.01139,011 Taiwan Surface Mounting Technology 92 0.01407,061 Taiwan Tea 144 0.01111,000 Taiwan Union Technology 104 0.0148,904 Taiyen Biotech 36 –
1,348,513 Tatung 324 0.03
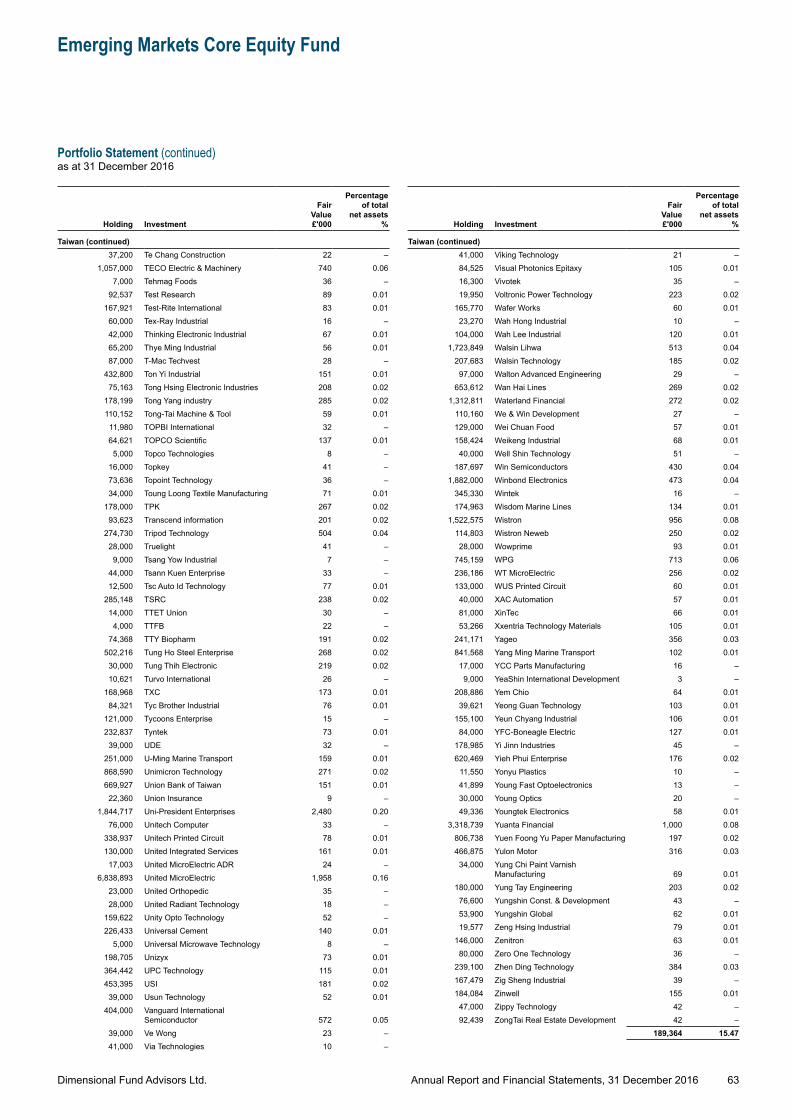
Dimensional Fund Advisors Ltd.
Emerging Markets Core Equity Fund
Portfolio Statement (continued)as at 31 December 2016
63Annual Report and Financial Statements, 31 December 2016
Holding Investment
Fair Value £'000
Percentage of total
net assets %
Taiwan (continued)37,200 Te Chang Construction 22 –
1,057,000 TECO Electric & Machinery 740 0.067,000 Tehmag Foods 36 –
92,537 Test Research 89 0.01167,921 Test-Rite International 83 0.01
60,000 Tex-Ray Industrial 16 –42,000 Thinking Electronic Industrial 67 0.0165,200 Thye Ming Industrial 56 0.0187,000 T-Mac Techvest 28 –
432,800 Ton Yi Industrial 151 0.0175,163 Tong Hsing Electronic Industries 208 0.02
178,199 Tong Yang industry 285 0.02110,152 Tong-Tai Machine & Tool 59 0.01
11,980 TOPBI International 32 –64,621 TOPCO Scientific 137 0.01
5,000 Topco Technologies 8 –16,000 Topkey 41 –73,636 Topoint Technology 36 –34,000 Toung Loong Textile Manufacturing 71 0.01
178,000 TPK 267 0.0293,623 Transcend information 201 0.02
274,730 Tripod Technology 504 0.0428,000 Truelight 41 –9,000 Tsang Yow Industrial 7 –
44,000 Tsann Kuen Enterprise 33 –12,500 Tsc Auto Id Technology 77 0.01
285,148 TSRC 238 0.0214,000 TTET Union 30 –4,000 TTFB 22 –
74,368 TTY Biopharm 191 0.02502,216 Tung Ho Steel Enterprise 268 0.02
30,000 Tung Thih Electronic 219 0.0210,621 Turvo International 26 –
168,968 TXC 173 0.0184,321 Tyc Brother Industrial 76 0.01
121,000 Tycoons Enterprise 15 –232,837 Tyntek 73 0.01
39,000 UDE 32 –251,000 U-Ming Marine Transport 159 0.01868,590 Unimicron Technology 271 0.02669,927 Union Bank of Taiwan 151 0.01
22,360 Union Insurance 9 –1,844,717 Uni-President Enterprises 2,480 0.20
76,000 Unitech Computer 33 –338,937 Unitech Printed Circuit 78 0.01130,000 United Integrated Services 161 0.01
17,003 United MicroElectric ADR 24 –6,838,893 United MicroElectric 1,958 0.16
23,000 United Orthopedic 35 –28,000 United Radiant Technology 18 –
159,622 Unity Opto Technology 52 –226,433 Universal Cement 140 0.01
5,000 Universal Microwave Technology 8 –198,705 Unizyx 73 0.01364,442 UPC Technology 115 0.01453,395 USI 181 0.02
39,000 Usun Technology 52 0.01404,000 Vanguard International
Semiconductor 572 0.0539,000 Ve Wong 23 –41,000 Via Technologies 10 –
Holding Investment
Fair Value £'000
Percentage of total
net assets %
Taiwan (continued)41,000 Viking Technology 21 –84,525 Visual Photonics Epitaxy 105 0.0116,300 Vivotek 35 –19,950 Voltronic Power Technology 223 0.02
165,770 Wafer Works 60 0.0123,270 Wah Hong Industrial 10 –
104,000 Wah Lee Industrial 120 0.011,723,849 Walsin Lihwa 513 0.04
207,683 Walsin Technology 185 0.0297,000 Walton Advanced Engineering 29 –
653,612 Wan Hai Lines 269 0.021,312,811 Waterland Financial 272 0.02
110,160 We & Win Development 27 –129,000 Wei Chuan Food 57 0.01158,424 Weikeng Industrial 68 0.0140,000 Well Shin Technology 51 –
187,697 Win Semiconductors 430 0.041,882,000 Winbond Electronics 473 0.04
345,330 Wintek 16 –174,963 Wisdom Marine Lines 134 0.01
1,522,575 Wistron 956 0.08114,803 Wistron Neweb 250 0.0228,000 Wowprime 93 0.01
745,159 WPG 713 0.06236,186 WT MicroElectric 256 0.02133,000 WUS Printed Circuit 60 0.0140,000 XAC Automation 57 0.0181,000 XinTec 66 0.0153,266 Xxentria Technology Materials 105 0.01
241,171 Yageo 356 0.03841,568 Yang Ming Marine Transport 102 0.0117,000 YCC Parts Manufacturing 16 –9,000 YeaShin International Development 3 –
208,886 Yem Chio 64 0.0139,621 Yeong Guan Technology 103 0.01
155,100 Yeun Chyang Industrial 106 0.0184,000 YFC-Boneagle Electric 127 0.01
178,985 Yi Jinn Industries 45 –620,469 Yieh Phui Enterprise 176 0.02
11,550 Yonyu Plastics 10 –41,899 Young Fast Optoelectronics 13 –30,000 Young Optics 20 –49,336 Youngtek Electronics 58 0.01
3,318,739 Yuanta Financial 1,000 0.08806,738 Yuen Foong Yu Paper Manufacturing 197 0.02466,875 Yulon Motor 316 0.0334,000 Yung Chi Paint Varnish
Manufacturing 69 0.01180,000 Yung Tay Engineering 203 0.0276,600 Yungshin Const. & Development 43 –53,900 Yungshin Global 62 0.0119,577 Zeng Hsing Industrial 79 0.01
146,000 Zenitron 63 0.0180,000 Zero One Technology 36 –
239,100 Zhen Ding Technology 384 0.03167,479 Zig Sheng Industrial 39 –184,084 Zinwell 155 0.0147,000 Zippy Technology 42 –92,439 ZongTai Real Estate Development 42 –
189,364 15.47
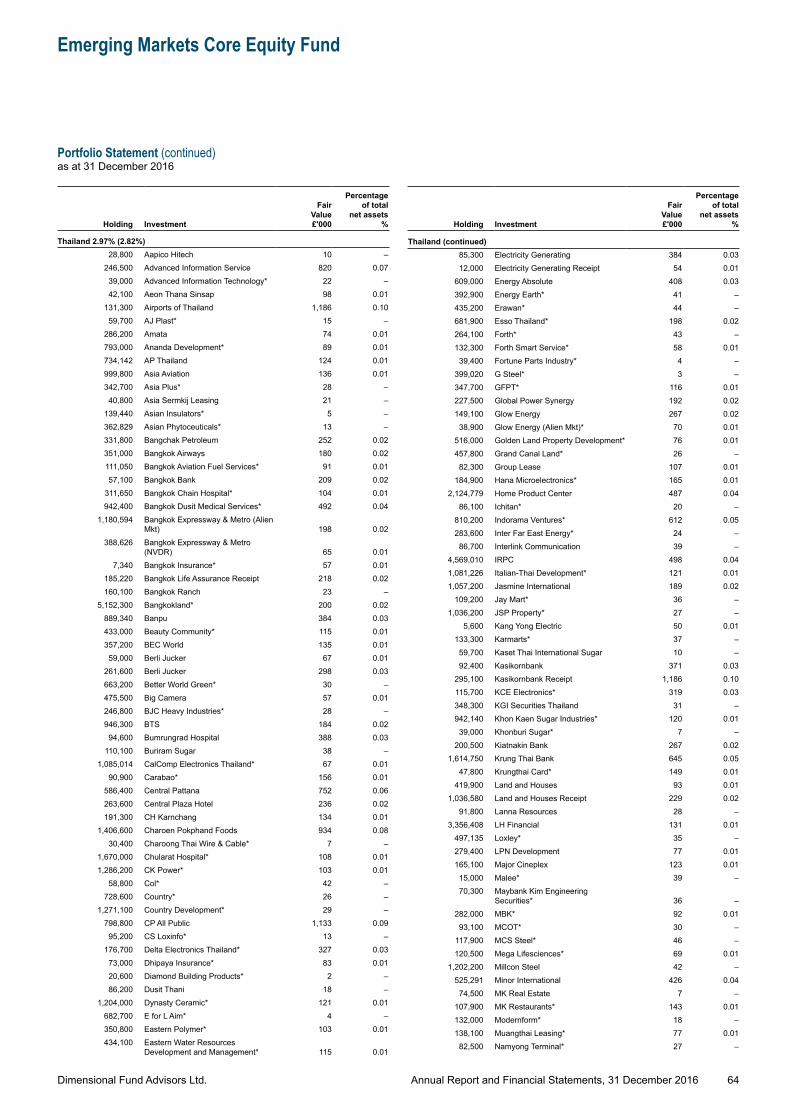
Dimensional Fund Advisors Ltd.
Emerging Markets Core Equity Fund
Portfolio Statement (continued)as at 31 December 2016
64Annual Report and Financial Statements, 31 December 2016
Holding Investment
Fair Value £'000
Percentage of total
net assets %
Thailand 2.97% (2.82%)28,800 Aapico Hitech 10 –
246,500 Advanced Information Service 820 0.0739,000 Advanced Information Technology* 22 –42,100 Aeon Thana Sinsap 98 0.01
131,300 Airports of Thailand 1,186 0.1059,700 AJ Plast* 15 –
286,200 Amata 74 0.01793,000 Ananda Development* 89 0.01734,142 AP Thailand 124 0.01999,800 Asia Aviation 136 0.01342,700 Asia Plus* 28 –40,800 Asia Sermkij Leasing 21 –
139,440 Asian Insulators* 5 –362,829 Asian Phytoceuticals* 13 –331,800 Bangchak Petroleum 252 0.02351,000 Bangkok Airways 180 0.02111,050 Bangkok Aviation Fuel Services* 91 0.0157,100 Bangkok Bank 209 0.02
311,650 Bangkok Chain Hospital* 104 0.01942,400 Bangkok Dusit Medical Services* 492 0.04
1,180,594 Bangkok Expressway & Metro (Alien Mkt) 198 0.02
388,626 Bangkok Expressway & Metro (NVDR) 65 0.01
7,340 Bangkok Insurance* 57 0.01185,220 Bangkok Life Assurance Receipt 218 0.02160,100 Bangkok Ranch 23 –
5,152,300 Bangkokland* 200 0.02889,340 Banpu 384 0.03433,000 Beauty Community* 115 0.01357,200 BEC World 135 0.01
59,000 Berli Jucker 67 0.01261,600 Berli Jucker 298 0.03663,200 Better World Green* 30 –475,500 Big Camera 57 0.01246,800 BJC Heavy Industries* 28 –946,300 BTS 184 0.02
94,600 Bumrungrad Hospital 388 0.03110,100 Buriram Sugar 38 –
1,085,014 CalComp Electronics Thailand* 67 0.0190,900 Carabao* 156 0.01
586,400 Central Pattana 752 0.06263,600 Central Plaza Hotel 236 0.02191,300 CH Karnchang 134 0.01
1,406,600 Charoen Pokphand Foods 934 0.0830,400 Charoong Thai Wire & Cable* 7 –
1,670,000 Chularat Hospital* 108 0.011,286,200 CK Power* 103 0.01
58,800 Col* 42 –728,600 Country* 26 –
1,271,100 Country Development* 29 –798,800 CP All Public 1,133 0.0995,200 CS Loxinfo* 13 –
176,700 Delta Electronics Thailand* 327 0.0373,000 Dhipaya Insurance* 83 0.0120,600 Diamond Building Products* 2 –86,200 Dusit Thani 18 –
1,204,000 Dynasty Ceramic* 121 0.01682,700 E for L Aim* 4 –350,800 Eastern Polymer* 103 0.01434,100 Eastern Water Resources
Development and Management* 115 0.01
Holding Investment
Fair Value £'000
Percentage of total
net assets %
Thailand (continued)85,300 Electricity Generating 384 0.0312,000 Electricity Generating Receipt 54 0.01
609,000 Energy Absolute 408 0.03392,900 Energy Earth* 41 –435,200 Erawan* 44 –681,900 Esso Thailand* 198 0.02264,100 Forth* 43 –132,300 Forth Smart Service* 58 0.0139,400 Fortune Parts Industry* 4 –
399,020 G Steel* 3 –347,700 GFPT* 116 0.01227,500 Global Power Synergy 192 0.02149,100 Glow Energy 267 0.0238,900 Glow Energy (Alien Mkt)* 70 0.01
516,000 Golden Land Property Development* 76 0.01457,800 Grand Canal Land* 26 –82,300 Group Lease 107 0.01
184,900 Hana Microelectronics* 165 0.012,124,779 Home Product Center 487 0.04
86,100 Ichitan* 20 –810,200 Indorama Ventures* 612 0.05283,600 Inter Far East Energy* 24 –86,700 Interlink Communication 39 –
4,569,010 IRPC 498 0.041,081,226 Italian-Thai Development* 121 0.011,057,200 Jasmine International 189 0.02
109,200 Jay Mart* 36 –1,036,200 JSP Property* 27 –
5,600 Kang Yong Electric 50 0.01133,300 Karmarts* 37 –59,700 Kaset Thai International Sugar 10 –92,400 Kasikornbank 371 0.03
295,100 Kasikornbank Receipt 1,186 0.10115,700 KCE Electronics* 319 0.03348,300 KGI Securities Thailand 31 –942,140 Khon Kaen Sugar Industries* 120 0.0139,000 Khonburi Sugar* 7 –
200,500 Kiatnakin Bank 267 0.021,614,750 Krung Thai Bank 645 0.05
47,800 Krungthai Card* 149 0.01419,900 Land and Houses 93 0.01
1,036,580 Land and Houses Receipt 229 0.0291,800 Lanna Resources 28 –
3,356,408 LH Financial 131 0.01497,135 Loxley* 35 –279,400 LPN Development 77 0.01165,100 Major Cineplex 123 0.0115,000 Malee* 39 –70,300 Maybank Kim Engineering
Securities* 36 –282,000 MBK* 92 0.0193,100 MCOT* 30 –
117,900 MCS Steel* 46 –120,500 Mega Lifesciences* 69 0.01
1,202,200 Millcon Steel 42 –525,291 Minor International 426 0.04
74,500 MK Real Estate 7 –107,900 MK Restaurants* 143 0.01132,000 Modernform* 18 –138,100 Muangthai Leasing* 77 0.0182,500 Namyong Terminal* 27 –
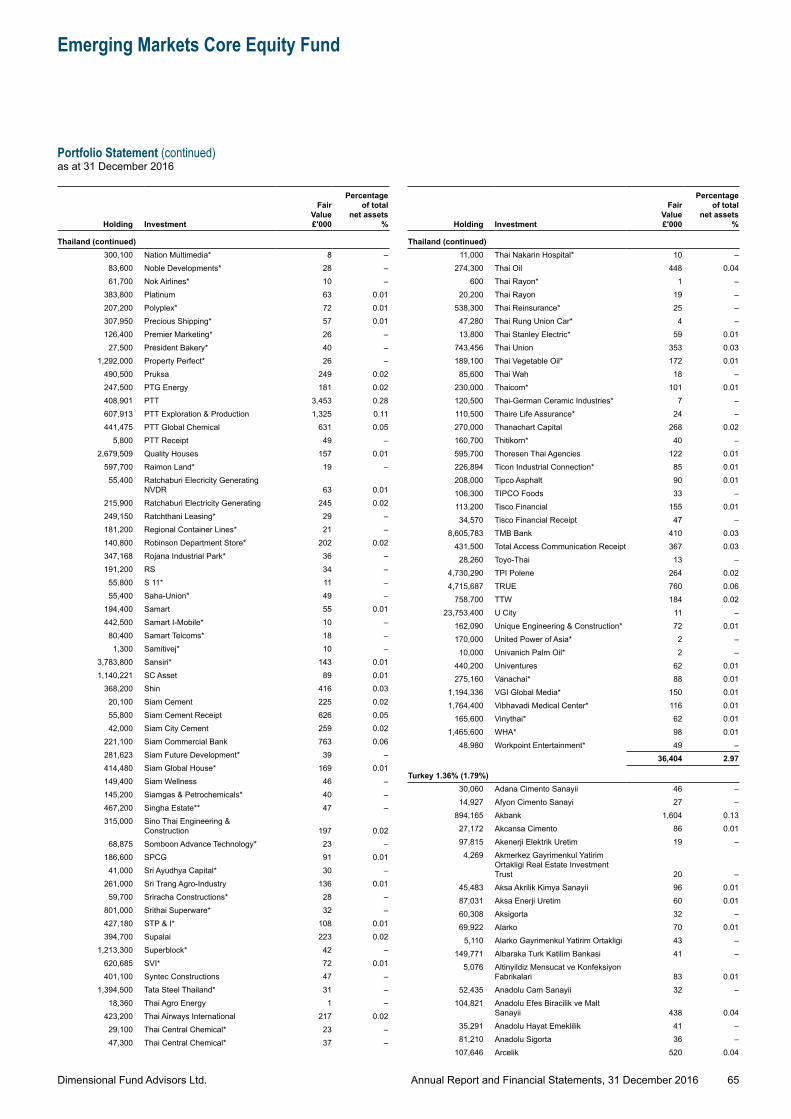
Dimensional Fund Advisors Ltd.
Emerging Markets Core Equity Fund
Portfolio Statement (continued)as at 31 December 2016
65Annual Report and Financial Statements, 31 December 2016
Holding Investment
Fair Value £'000
Percentage of total
net assets %
Thailand (continued)300,100 Nation Multimedia* 8 –
83,600 Noble Developments* 28 –61,700 Nok Airlines* 10 –
383,800 Platinum 63 0.01207,200 Polyplex* 72 0.01307,950 Precious Shipping* 57 0.01126,400 Premier Marketing* 26 –27,500 President Bakery* 40 –
1,292,000 Property Perfect* 26 –490,500 Pruksa 249 0.02247,500 PTG Energy 181 0.02408,901 PTT 3,453 0.28607,913 PTT Exploration & Production 1,325 0.11441,475 PTT Global Chemical 631 0.05
5,800 PTT Receipt 49 –2,679,509 Quality Houses 157 0.01
597,700 Raimon Land* 19 –55,400 Ratchaburi Elecricity Generating
NVDR 63 0.01215,900 Ratchaburi Electricity Generating 245 0.02249,150 Ratchthani Leasing* 29 –181,200 Regional Container Lines* 21 –140,800 Robinson Department Store* 202 0.02347,168 Rojana Industrial Park* 36 –191,200 RS 34 –55,800 S 11* 11 –55,400 Saha-Union* 49 –
194,400 Samart 55 0.01442,500 Samart I-Mobile* 10 –80,400 Samart Telcoms* 18 –1,300 Samitivej* 10 –
3,783,800 Sansiri* 143 0.011,140,221 SC Asset 89 0.01
368,200 Shin 416 0.0320,100 Siam Cement 225 0.0255,800 Siam Cement Receipt 626 0.0542,000 Siam City Cement 259 0.02
221,100 Siam Commercial Bank 763 0.06281,623 Siam Future Development* 39 –414,480 Siam Global House* 169 0.01149,400 Siam Wellness 46 –145,200 Siamgas & Petrochemicals* 40 –467,200 Singha Estate** 47 –315,000 Sino Thai Engineering &
Construction 197 0.0268,875 Somboon Advance Technology* 23 –
186,600 SPCG 91 0.0141,000 Sri Ayudhya Capital* 30 –
261,000 Sri Trang Agro-Industry 136 0.0159,700 Sriracha Constructions* 28 –
801,000 Srithai Superware* 32 –427,180 STP & I* 108 0.01394,700 Supalai 223 0.02
1,213,300 Superblock* 42 –620,685 SVI* 72 0.01401,100 Syntec Constructions 47 –
1,394,500 Tata Steel Thailand* 31 –18,360 Thai Agro Energy 1 –
423,200 Thai Airways International 217 0.0229,100 Thai Central Chemical* 23 –47,300 Thai Central Chemical* 37 –
Holding Investment
Fair Value £'000
Percentage of total
net assets %
Thailand (continued)11,000 Thai Nakarin Hospital* 10 –
274,300 Thai Oil 448 0.04600 Thai Rayon* 1 –
20,200 Thai Rayon 19 –538,300 Thai Reinsurance* 25 –47,280 Thai Rung Union Car* 4 –13,800 Thai Stanley Electric* 59 0.01
743,456 Thai Union 353 0.03189,100 Thai Vegetable Oil* 172 0.0185,600 Thai Wah 18 –
230,000 Thaicom* 101 0.01120,500 Thai-German Ceramic Industries* 7 –110,500 Thaire Life Assurance* 24 –270,000 Thanachart Capital 268 0.02160,700 Thitikorn* 40 –595,700 Thoresen Thai Agencies 122 0.01226,894 Ticon Industrial Connection* 85 0.01208,000 Tipco Asphalt 90 0.01106,300 TIPCO Foods 33 –113,200 Tisco Financial 155 0.0134,570 Tisco Financial Receipt 47 –
8,605,783 TMB Bank 410 0.03431,500 Total Access Communication Receipt 367 0.0328,260 Toyo-Thai 13 –
4,730,290 TPI Polene 264 0.024,715,687 TRUE 760 0.06
758,700 TTW 184 0.0223,753,400 U City 11 –
162,090 Unique Engineering & Construction* 72 0.01170,000 United Power of Asia* 2 –10,000 Univanich Palm Oil* 2 –
440,200 Univentures 62 0.01275,160 Vanachai* 88 0.01
1,194,336 VGI Global Media* 150 0.011,764,400 Vibhavadi Medical Center* 116 0.01
165,600 Vinythai* 62 0.011,465,600 WHA* 98 0.01
48,980 Workpoint Entertainment* 49 –36,404 2.97
Turkey 1.36% (1.79%)30,060 Adana Cimento Sanayii 46 –14,927 Afyon Cimento Sanayi 27 –
894,165 Akbank 1,604 0.1327,172 Akcansa Cimento 86 0.0197,815 Akenerji Elektrik Uretim 19 –4,269 Akmerkez Gayrimenkul Yatirim
Ortakligi Real Estate Investment Trust 20 –
45,483 Aksa Akrilik Kimya Sanayii 96 0.0187,031 Aksa Enerji Uretim 60 0.0160,308 Aksigorta 32 –69,922 Alarko 70 0.01
5,110 Alarko Gayrimenkul Yatirim Ortakligi 43 –149,771 Albaraka Turk Katilim Bankasi 41 –
5,076 Altinyildiz Mensucat ve Konfeksiyon Fabrikalari 83 0.01
52,435 Anadolu Cam Sanayii 32 –104,821 Anadolu Efes Biracilik ve Malt
Sanayii 438 0.0435,291 Anadolu Hayat Emeklilik 41 –81,210 Anadolu Sigorta 36 –
107,646 Arcelik 520 0.04
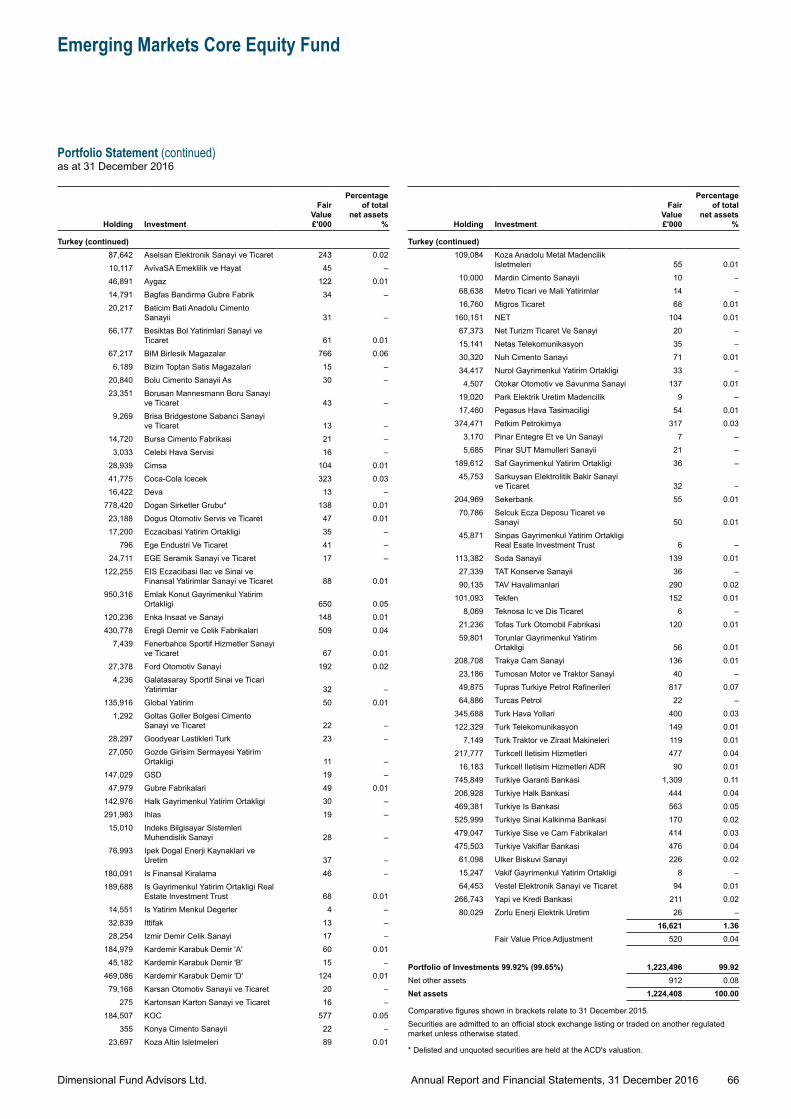
Dimensional Fund Advisors Ltd.
Emerging Markets Core Equity Fund
Portfolio Statement (continued)as at 31 December 2016
66Annual Report and Financial Statements, 31 December 2016
Holding Investment
Fair Value £'000
Percentage of total
net assets %
Turkey (continued)87,642 Aselsan Elektronik Sanayi ve Ticaret 243 0.0210,117 AvivaSA Emeklilik ve Hayat 45 –46,891 Aygaz 122 0.0114,791 Bagfas Bandirma Gubre Fabrik 34 –20,217 Baticim Bati Anadolu Cimento
Sanayii 31 –66,177 Besiktas Bol Yatirimlari Sanayi ve
Ticaret 61 0.0167,217 BIM Birlesik Magazalar 766 0.06
6,189 Bizim Toptan Satis Magazalari 15 –20,840 Bolu Cimento Sanayii As 30 –23,351 Borusan Mannesmann Boru Sanayi
ve Ticaret 43 –9,269 Brisa Bridgestone Sabanci Sanayi
ve Ticaret 13 –14,720 Bursa Cimento Fabrikasi 21 –3,033 Celebi Hava Servisi 16 –
28,939 Cimsa 104 0.0141,775 Coca-Cola Icecek 323 0.0316,422 Deva 13 –
778,420 Dogan Sirketler Grubu* 138 0.0123,188 Dogus Otomotiv Servis ve Ticaret 47 0.0117,200 Eczacibasi Yatirim Ortakligi 35 –
796 Ege Endustri Ve Ticaret 41 –24,711 EGE Seramik Sanayi ve Ticaret 17 –
122,255 EIS Eczacibasi Ilac ve Sinai ve Finansal Yatirimlar Sanayi ve Ticaret 88 0.01
950,316 Emlak Konut Gayrimenkul Yatirim Ortakligi 650 0.05
120,236 Enka Insaat ve Sanayi 148 0.01430,778 Eregli Demir ve Celik Fabrikalari 509 0.04
7,439 Fenerbahce Sportif Hizmetler Sanayi ve Ticaret 67 0.01
27,378 Ford Otomotiv Sanayi 192 0.024,236 Galatasaray Sportif Sinai ve Ticari
Yatirimlar 32 –135,916 Global Yatirim 50 0.01
1,292 Goltas Goller Bolgesi Cimento Sanayi ve Ticaret 22 –
28,297 Goodyear Lastikleri Turk 23 –27,050 Gozde Girisim Sermayesi Yatirim
Ortakligi 11 –147,029 GSD 19 –47,979 Gubre Fabrikalari 49 0.01
142,976 Halk Gayrimenkul Yatirim Ortakligi 30 –291,983 Ihlas 19 –15,010 Indeks Bilgisayar Sistemleri
Muhendislik Sanayi 28 –76,993 Ipek Dogal Enerji Kaynaklari ve
Uretim 37 –180,091 Is Finansal Kiralama 46 –189,688 Is Gayrimenkul Yatirim Ortakligi Real
Estate Investment Trust 68 0.0114,551 Is Yatirim Menkul Degerler 4 –32,839 Ittifak 13 –28,254 Izmir Demir Celik Sanayi 17 –
184,979 Kardemir Karabuk Demir 'A' 60 0.0145,182 Kardemir Karabuk Demir 'B' 15 –
469,086 Kardemir Karabuk Demir 'D' 124 0.0179,168 Karsan Otomotiv Sanayii ve Ticaret 20 –
275 Kartonsan Karton Sanayi ve Ticaret 16 –184,507 KOC 577 0.05
355 Konya Cimento Sanayii 22 –23,697 Koza Altin Isletmeleri 89 0.01
Holding Investment
Fair Value £'000
Percentage of total
net assets %
Turkey (continued)109,084 Koza Anadolu Metal Madencilik
Isletmeleri 55 0.0110,000 Mardin Cimento Sanayii 10 –68,638 Metro Ticari ve Mali Yatirimlar 14 –16,760 Migros Ticaret 68 0.01
160,151 NET 104 0.0167,373 Net Turizm Ticaret Ve Sanayi 20 –15,141 Netas Telekomunikasyon 35 –30,320 Nuh Cimento Sanayi 71 0.0134,417 Nurol Gayrimenkul Yatirim Ortakligi 33 –4,507 Otokar Otomotiv ve Savunma Sanayi 137 0.01
19,020 Park Elektrik Uretim Madencilik 9 –17,460 Pegasus Hava Tasimaciligi 54 0.01
374,471 Petkim Petrokimya 317 0.033,170 Pinar Entegre Et ve Un Sanayi 7 –5,685 Pinar SUT Mamulleri Sanayii 21 –
189,612 Saf Gayrimenkul Yatirim Ortakligi 36 –45,753 Sarkuysan Elektrolitik Bakir Sanayi
ve Ticaret 32 –204,969 Sekerbank 55 0.0170,786 Selcuk Ecza Deposu Ticaret ve
Sanayi 50 0.0145,871 Sinpas Gayrimenkul Yatirim Ortakligi
Real Esate Investment Trust 6 –113,382 Soda Sanayii 139 0.0127,339 TAT Konserve Sanayii 36 –90,135 TAV Havalimanlari 290 0.02
101,093 Tekfen 152 0.018,069 Teknosa Ic ve Dis Ticaret 6 –
21,236 Tofas Turk Otomobil Fabrikasi 120 0.0159,801 Torunlar Gayrimenkul Yatirim
Ortakligi 56 0.01208,708 Trakya Cam Sanayi 136 0.0123,186 Tumosan Motor ve Traktor Sanayi 40 –49,875 Tupras Turkiye Petrol Rafinerileri 817 0.0764,886 Turcas Petrol 22 –
345,688 Turk Hava Yollari 400 0.03122,329 Turk Telekomunikasyon 149 0.01
7,149 Turk Traktor ve Ziraat Makineleri 119 0.01217,777 Turkcell Iletisim Hizmetleri 477 0.0416,183 Turkcell Iletisim Hizmetleri ADR 90 0.01
745,849 Turkiye Garanti Bankasi 1,309 0.11206,928 Turkiye Halk Bankasi 444 0.04469,381 Turkiye Is Bankasi 563 0.05525,999 Turkiye Sinai Kalkinma Bankasi 170 0.02479,047 Turkiye Sise ve Cam Fabrikalari 414 0.03475,503 Turkiye Vakiflar Bankasi 476 0.0461,098 Ulker Biskuvi Sanayi 226 0.0215,247 Vakif Gayrimenkul Yatirim Ortakligi 8 –64,453 Vestel Elektronik Sanayi ve Ticaret 94 0.01
266,743 Yapi ve Kredi Bankasi 211 0.0280,029 Zorlu Enerji Elektrik Uretim 26 –
16,621 1.36Fair Value Price Adjustment 520 0.04
Portfolio of Investments 99.92% (99.65%) 1,223,496 99.92Net other assets 912 0.08Net assets 1,224,408 100.00
Comparative figures shown in brackets relate to 31 December 2015.Securities are admitted to an official stock exchange listing or traded on another regulated market unless otherwise stated.
* Delisted and unquoted securities are held at the ACD's valuation.
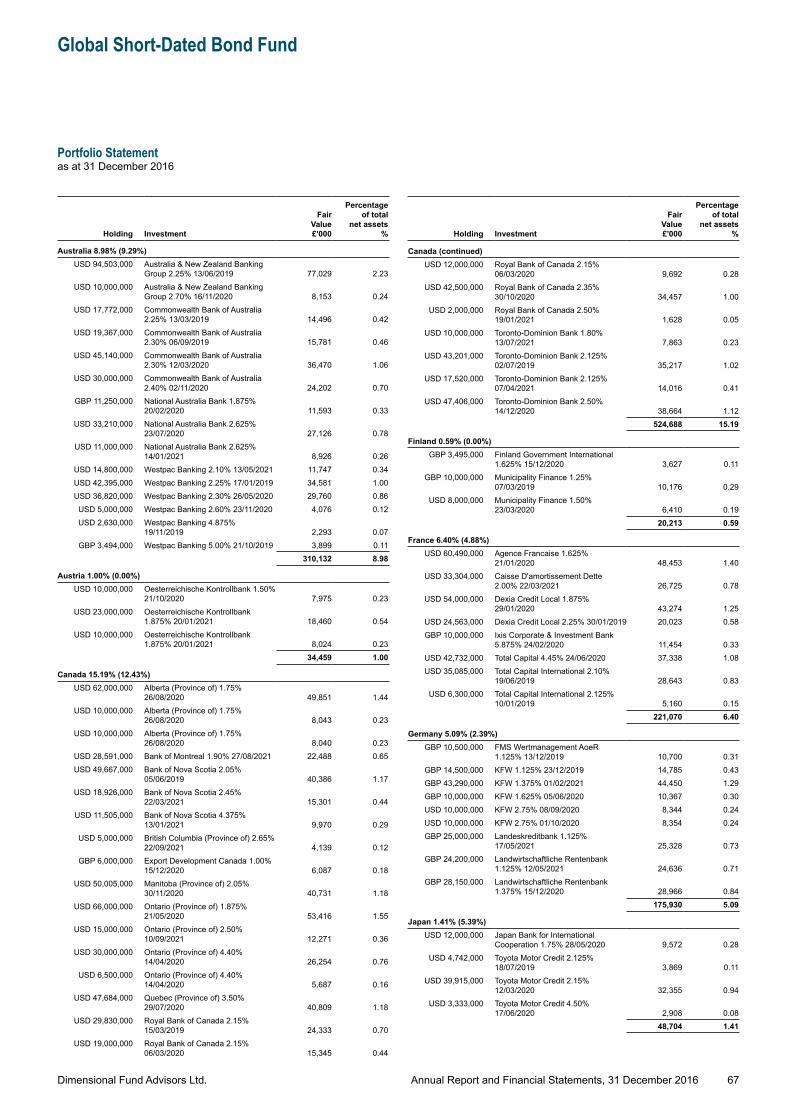
Dimensional Fund Advisors Ltd.
Global Short-Dated Bond Fund
Portfolio Statementas at 31 December 2016
67Annual Report and Financial Statements, 31 December 2016
Holding Investment
Fair Value £'000
Percentage of total
net assets %
Australia 8.98% (9.29%)USD 94,503,000 Australia & New Zealand Banking
Group 2.25% 13/06/2019 77,029 2.23USD 10,000,000 Australia & New Zealand Banking
Group 2.70% 16/11/2020 8,153 0.24USD 17,772,000 Commonwealth Bank of Australia
2.25% 13/03/2019 14,496 0.42USD 19,367,000 Commonwealth Bank of Australia
2.30% 06/09/2019 15,781 0.46USD 45,140,000 Commonwealth Bank of Australia
2.30% 12/03/2020 36,470 1.06USD 30,000,000 Commonwealth Bank of Australia
2.40% 02/11/2020 24,202 0.70GBP 11,250,000 National Australia Bank 1.875%
20/02/2020 11,593 0.33USD 33,210,000 National Australia Bank 2.625%
23/07/2020 27,126 0.78USD 11,000,000 National Australia Bank 2.625%
14/01/2021 8,926 0.26USD 14,800,000 Westpac Banking 2.10% 13/05/2021 11,747 0.34USD 42,395,000 Westpac Banking 2.25% 17/01/2019 34,581 1.00USD 36,820,000 Westpac Banking 2.30% 26/05/2020 29,760 0.86USD 5,000,000 Westpac Banking 2.60% 23/11/2020 4,076 0.12USD 2,630,000 Westpac Banking 4.875%
19/11/2019 2,293 0.07GBP 3,494,000 Westpac Banking 5.00% 21/10/2019 3,899 0.11
310,132 8.98
Austria 1.00% (0.00%)USD 10,000,000 Oesterreichische Kontrollbank 1.50%
21/10/2020 7,975 0.23USD 23,000,000 Oesterreichische Kontrollbank
1.875% 20/01/2021 18,460 0.54USD 10,000,000 Oesterreichische Kontrollbank
1.875% 20/01/2021 8,024 0.2334,459 1.00
Canada 15.19% (12.43%)USD 62,000,000 Alberta (Province of) 1.75%
26/08/2020 49,851 1.44USD 10,000,000 Alberta (Province of) 1.75%
26/08/2020 8,043 0.23USD 10,000,000 Alberta (Province of) 1.75%
26/08/2020 8,040 0.23USD 28,591,000 Bank of Montreal 1.90% 27/08/2021 22,488 0.65USD 49,667,000 Bank of Nova Scotia 2.05%
05/06/2019 40,386 1.17USD 18,926,000 Bank of Nova Scotia 2.45%
22/03/2021 15,301 0.44USD 11,505,000 Bank of Nova Scotia 4.375%
13/01/2021 9,970 0.29USD 5,000,000 British Columbia (Province of) 2.65%
22/09/2021 4,139 0.12GBP 6,000,000 Export Development Canada 1.00%
15/12/2020 6,087 0.18USD 50,005,000 Manitoba (Province of) 2.05%
30/11/2020 40,731 1.18USD 66,000,000 Ontario (Province of) 1.875%
21/05/2020 53,416 1.55USD 15,000,000 Ontario (Province of) 2.50%
10/09/2021 12,271 0.36USD 30,000,000 Ontario (Province of) 4.40%
14/04/2020 26,254 0.76USD 6,500,000 Ontario (Province of) 4.40%
14/04/2020 5,687 0.16USD 47,684,000 Quebec (Province of) 3.50%
29/07/2020 40,809 1.18USD 29,830,000 Royal Bank of Canada 2.15%
15/03/2019 24,333 0.70USD 19,000,000 Royal Bank of Canada 2.15%
06/03/2020 15,345 0.44
Holding Investment
Fair Value £'000
Percentage of total
net assets %
Canada (continued)USD 12,000,000 Royal Bank of Canada 2.15%
06/03/2020 9,692 0.28USD 42,500,000 Royal Bank of Canada 2.35%
30/10/2020 34,457 1.00USD 2,000,000 Royal Bank of Canada 2.50%
19/01/2021 1,628 0.05USD 10,000,000 Toronto-Dominion Bank 1.80%
13/07/2021 7,863 0.23USD 43,201,000 Toronto-Dominion Bank 2.125%
02/07/2019 35,217 1.02USD 17,520,000 Toronto-Dominion Bank 2.125%
07/04/2021 14,016 0.41USD 47,406,000 Toronto-Dominion Bank 2.50%
14/12/2020 38,664 1.12524,688 15.19
Finland 0.59% (0.00%)GBP 3,495,000 Finland Government International
1.625% 15/12/2020 3,627 0.11GBP 10,000,000 Municipality Finance 1.25%
07/03/2019 10,176 0.29USD 8,000,000 Municipality Finance 1.50%
23/03/2020 6,410 0.1920,213 0.59
France 6.40% (4.88%)USD 60,490,000 Agence Francaise 1.625%
21/01/2020 48,453 1.40USD 33,304,000 Caisse D'amortissement Dette
2.00% 22/03/2021 26,725 0.78USD 54,000,000 Dexia Credit Local 1.875%
29/01/2020 43,274 1.25USD 24,563,000 Dexia Credit Local 2.25% 30/01/2019 20,023 0.58GBP 10,000,000 Ixis Corporate & Investment Bank
5.875% 24/02/2020 11,454 0.33USD 42,732,000 Total Capital 4.45% 24/06/2020 37,338 1.08USD 35,085,000 Total Capital International 2.10%
19/06/2019 28,643 0.83USD 6,300,000 Total Capital International 2.125%
10/01/2019 5,160 0.15221,070 6.40
Germany 5.09% (2.39%)GBP 10,500,000 FMS Wertmanagement AoeR
1.125% 13/12/2019 10,700 0.31GBP 14,500,000 KFW 1.125% 23/12/2019 14,785 0.43GBP 43,290,000 KFW 1.375% 01/02/2021 44,450 1.29GBP 10,000,000 KFW 1.625% 05/06/2020 10,367 0.30USD 10,000,000 KFW 2.75% 08/09/2020 8,344 0.24USD 10,000,000 KFW 2.75% 01/10/2020 8,354 0.24GBP 25,000,000 Landeskreditbank 1.125%
17/05/2021 25,328 0.73GBP 24,200,000 Landwirtschaftliche Rentenbank
1.125% 12/05/2021 24,636 0.71GBP 28,150,000 Landwirtschaftliche Rentenbank
1.375% 15/12/2020 28,966 0.84175,930 5.09
Japan 1.41% (5.39%)USD 12,000,000 Japan Bank for International
Cooperation 1.75% 28/05/2020 9,572 0.28USD 4,742,000 Toyota Motor Credit 2.125%
18/07/2019 3,869 0.11USD 39,915,000 Toyota Motor Credit 2.15%
12/03/2020 32,355 0.94USD 3,333,000 Toyota Motor Credit 4.50%
17/06/2020 2,908 0.0848,704 1.41
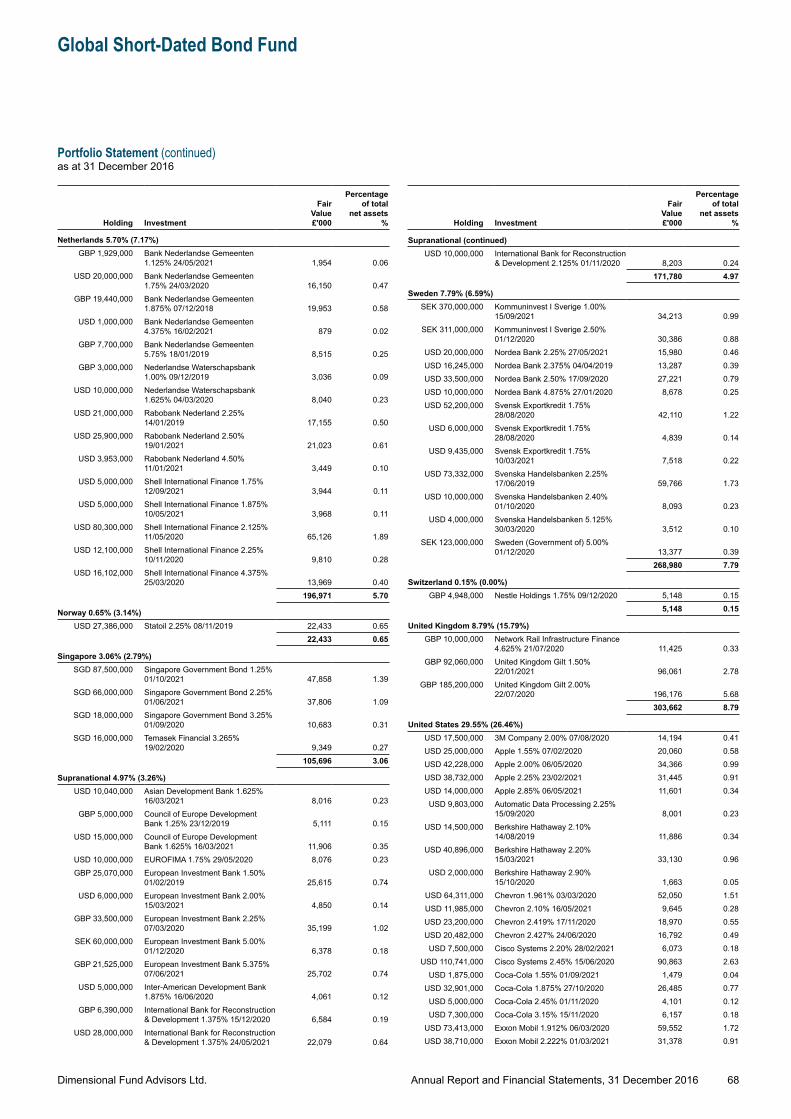
Dimensional Fund Advisors Ltd.
Global Short-Dated Bond Fund
Portfolio Statement (continued)as at 31 December 2016
68Annual Report and Financial Statements, 31 December 2016
Holding Investment
Fair Value £'000
Percentage of total
net assets %
Netherlands 5.70% (7.17%)GBP 1,929,000 Bank Nederlandse Gemeenten
1.125% 24/05/2021 1,954 0.06USD 20,000,000 Bank Nederlandse Gemeenten
1.75% 24/03/2020 16,150 0.47GBP 19,440,000 Bank Nederlandse Gemeenten
1.875% 07/12/2018 19,953 0.58USD 1,000,000 Bank Nederlandse Gemeenten
4.375% 16/02/2021 879 0.02GBP 7,700,000 Bank Nederlandse Gemeenten
5.75% 18/01/2019 8,515 0.25GBP 3,000,000 Nederlandse Waterschapsbank
1.00% 09/12/2019 3,036 0.09USD 10,000,000 Nederlandse Waterschapsbank
1.625% 04/03/2020 8,040 0.23USD 21,000,000 Rabobank Nederland 2.25%
14/01/2019 17,155 0.50USD 25,900,000 Rabobank Nederland 2.50%
19/01/2021 21,023 0.61USD 3,953,000 Rabobank Nederland 4.50%
11/01/2021 3,449 0.10USD 5,000,000 Shell International Finance 1.75%
12/09/2021 3,944 0.11USD 5,000,000 Shell International Finance 1.875%
10/05/2021 3,968 0.11USD 80,300,000 Shell International Finance 2.125%
11/05/2020 65,126 1.89USD 12,100,000 Shell International Finance 2.25%
10/11/2020 9,810 0.28USD 16,102,000 Shell International Finance 4.375%
25/03/2020 13,969 0.40196,971 5.70
Norway 0.65% (3.14%)USD 27,386,000 Statoil 2.25% 08/11/2019 22,433 0.65
22,433 0.65
Singapore 3.06% (2.79%)SGD 87,500,000 Singapore Government Bond 1.25%
01/10/2021 47,858 1.39SGD 66,000,000 Singapore Government Bond 2.25%
01/06/2021 37,806 1.09SGD 18,000,000 Singapore Government Bond 3.25%
01/09/2020 10,683 0.31SGD 16,000,000 Temasek Financial 3.265%
19/02/2020 9,349 0.27105,696 3.06
Supranational 4.97% (3.26%)USD 10,040,000 Asian Development Bank 1.625%
16/03/2021 8,016 0.23GBP 5,000,000 Council of Europe Development
Bank 1.25% 23/12/2019 5,111 0.15USD 15,000,000 Council of Europe Development
Bank 1.625% 16/03/2021 11,906 0.35USD 10,000,000 EUROFIMA 1.75% 29/05/2020 8,076 0.23GBP 25,070,000 European Investment Bank 1.50%
01/02/2019 25,615 0.74USD 6,000,000 European Investment Bank 2.00%
15/03/2021 4,850 0.14GBP 33,500,000 European Investment Bank 2.25%
07/03/2020 35,199 1.02SEK 60,000,000 European Investment Bank 5.00%
01/12/2020 6,378 0.18GBP 21,525,000 European Investment Bank 5.375%
07/06/2021 25,702 0.74USD 5,000,000 Inter-American Development Bank
1.875% 16/06/2020 4,061 0.12GBP 6,390,000 International Bank for Reconstruction
& Development 1.375% 15/12/2020 6,584 0.19USD 28,000,000 International Bank for Reconstruction
& Development 1.375% 24/05/2021 22,079 0.64
Holding Investment
Fair Value £'000
Percentage of total
net assets %
Supranational (continued)USD 10,000,000 International Bank for Reconstruction
& Development 2.125% 01/11/2020 8,203 0.24171,780 4.97
Sweden 7.79% (6.59%)SEK 370,000,000 Kommuninvest I Sverige 1.00%
15/09/2021 34,213 0.99SEK 311,000,000 Kommuninvest I Sverige 2.50%
01/12/2020 30,386 0.88USD 20,000,000 Nordea Bank 2.25% 27/05/2021 15,980 0.46USD 16,245,000 Nordea Bank 2.375% 04/04/2019 13,287 0.39USD 33,500,000 Nordea Bank 2.50% 17/09/2020 27,221 0.79USD 10,000,000 Nordea Bank 4.875% 27/01/2020 8,678 0.25USD 52,200,000 Svensk Exportkredit 1.75%
28/08/2020 42,110 1.22USD 6,000,000 Svensk Exportkredit 1.75%
28/08/2020 4,839 0.14USD 9,435,000 Svensk Exportkredit 1.75%
10/03/2021 7,518 0.22USD 73,332,000 Svenska Handelsbanken 2.25%
17/06/2019 59,766 1.73USD 10,000,000 Svenska Handelsbanken 2.40%
01/10/2020 8,093 0.23USD 4,000,000 Svenska Handelsbanken 5.125%
30/03/2020 3,512 0.10SEK 123,000,000 Sweden (Government of) 5.00%
01/12/2020 13,377 0.39268,980 7.79
Switzerland 0.15% (0.00%)GBP 4,948,000 Nestle Holdings 1.75% 09/12/2020 5,148 0.15
5,148 0.15
United Kingdom 8.79% (15.79%)GBP 10,000,000 Network Rail Infrastructure Finance
4.625% 21/07/2020 11,425 0.33GBP 92,060,000 United Kingdom Gilt 1.50%
22/01/2021 96,061 2.78GBP 185,200,000 United Kingdom Gilt 2.00%
22/07/2020 196,176 5.68303,662 8.79
United States 29.55% (26.46%)USD 17,500,000 3M Company 2.00% 07/08/2020 14,194 0.41USD 25,000,000 Apple 1.55% 07/02/2020 20,060 0.58USD 42,228,000 Apple 2.00% 06/05/2020 34,366 0.99USD 38,732,000 Apple 2.25% 23/02/2021 31,445 0.91USD 14,000,000 Apple 2.85% 06/05/2021 11,601 0.34
USD 9,803,000 Automatic Data Processing 2.25% 15/09/2020 8,001 0.23
USD 14,500,000 Berkshire Hathaway 2.10% 14/08/2019 11,886 0.34
USD 40,896,000 Berkshire Hathaway 2.20% 15/03/2021 33,130 0.96
USD 2,000,000 Berkshire Hathaway 2.90% 15/10/2020 1,663 0.05
USD 64,311,000 Chevron 1.961% 03/03/2020 52,050 1.51USD 11,985,000 Chevron 2.10% 16/05/2021 9,645 0.28USD 23,200,000 Chevron 2.419% 17/11/2020 18,970 0.55USD 20,482,000 Chevron 2.427% 24/06/2020 16,792 0.49
USD 7,500,000 Cisco Systems 2.20% 28/02/2021 6,073 0.18USD 110,741,000 Cisco Systems 2.45% 15/06/2020 90,863 2.63
USD 1,875,000 Coca-Cola 1.55% 01/09/2021 1,479 0.04USD 32,901,000 Coca-Cola 1.875% 27/10/2020 26,485 0.77
USD 5,000,000 Coca-Cola 2.45% 01/11/2020 4,101 0.12USD 7,300,000 Coca-Cola 3.15% 15/11/2020 6,157 0.18
USD 73,413,000 Exxon Mobil 1.912% 06/03/2020 59,552 1.72USD 38,710,000 Exxon Mobil 2.222% 01/03/2021 31,378 0.91
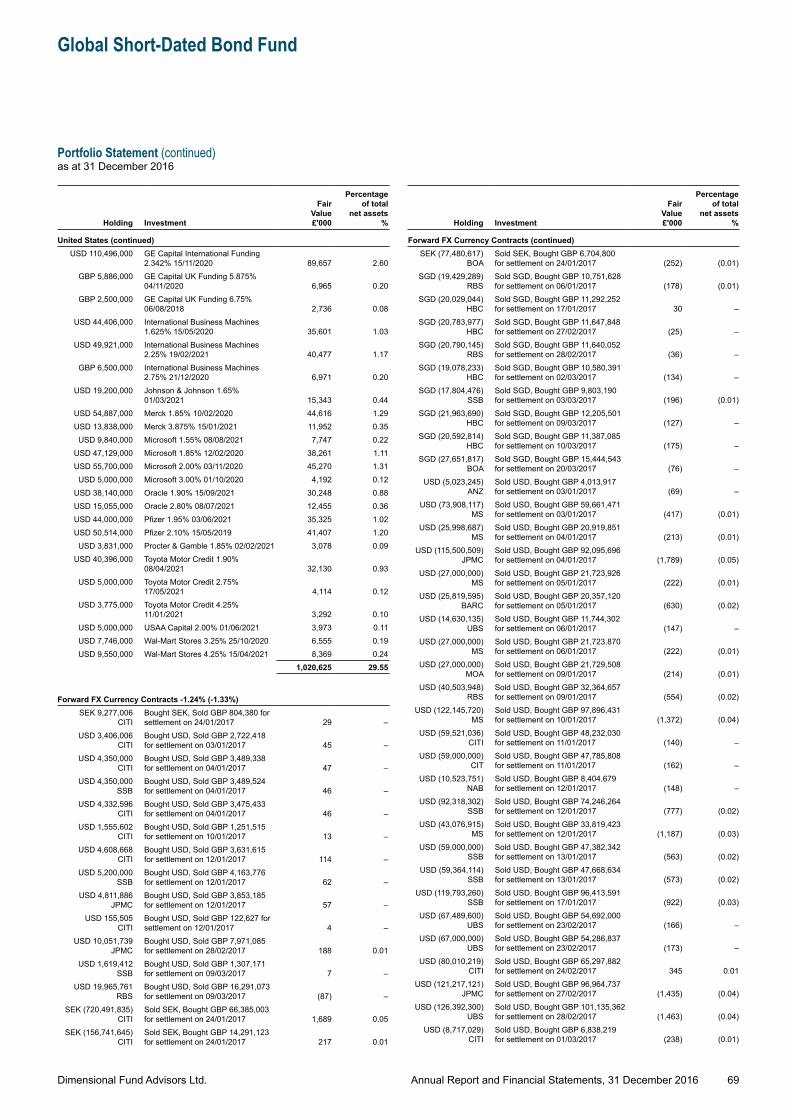
Dimensional Fund Advisors Ltd.
Global Short-Dated Bond Fund
Portfolio Statement (continued)as at 31 December 2016
69Annual Report and Financial Statements, 31 December 2016
Holding Investment
Fair Value £'000
Percentage of total
net assets %
United States (continued)USD 110,496,000 GE Capital International Funding
2.342% 15/11/2020 89,657 2.60GBP 5,886,000 GE Capital UK Funding 5.875%
04/11/2020 6,965 0.20GBP 2,500,000 GE Capital UK Funding 6.75%
06/08/2018 2,736 0.08USD 44,406,000 International Business Machines
1.625% 15/05/2020 35,601 1.03USD 49,921,000 International Business Machines
2.25% 19/02/2021 40,477 1.17GBP 6,500,000 International Business Machines
2.75% 21/12/2020 6,971 0.20USD 19,200,000 Johnson & Johnson 1.65%
01/03/2021 15,343 0.44USD 54,887,000 Merck 1.85% 10/02/2020 44,616 1.29USD 13,838,000 Merck 3.875% 15/01/2021 11,952 0.35
USD 9,840,000 Microsoft 1.55% 08/08/2021 7,747 0.22USD 47,129,000 Microsoft 1.85% 12/02/2020 38,261 1.11USD 55,700,000 Microsoft 2.00% 03/11/2020 45,270 1.31USD 5,000,000 Microsoft 3.00% 01/10/2020 4,192 0.12
USD 38,140,000 Oracle 1.90% 15/09/2021 30,248 0.88USD 15,055,000 Oracle 2.80% 08/07/2021 12,455 0.36USD 44,000,000 Pfizer 1.95% 03/06/2021 35,325 1.02USD 50,514,000 Pfizer 2.10% 15/05/2019 41,407 1.20USD 3,831,000 Procter & Gamble 1.85% 02/02/2021 3,078 0.09
USD 40,396,000 Toyota Motor Credit 1.90% 08/04/2021 32,130 0.93
USD 5,000,000 Toyota Motor Credit 2.75% 17/05/2021 4,114 0.12
USD 3,775,000 Toyota Motor Credit 4.25% 11/01/2021 3,292 0.10
USD 5,000,000 USAA Capital 2.00% 01/06/2021 3,973 0.11USD 7,746,000 Wal-Mart Stores 3.25% 25/10/2020 6,555 0.19USD 9,550,000 Wal-Mart Stores 4.25% 15/04/2021 8,369 0.24
1,020,625 29.55
Forward FX Currency Contracts -1.24% (-1.33%)SEK 9,277,006
CITIBought SEK, Sold GBP 804,380 for settlement on 24/01/2017 29 –
USD 3,406,006 CITI
Bought USD, Sold GBP 2,722,418 for settlement on 03/01/2017 45 –
USD 4,350,000 CITI
Bought USD, Sold GBP 3,489,338 for settlement on 04/01/2017 47 –
USD 4,350,000 SSB
Bought USD, Sold GBP 3,489,524 for settlement on 04/01/2017 46 –
USD 4,332,596 CITI
Bought USD, Sold GBP 3,475,433 for settlement on 04/01/2017 46 –
USD 1,555,602 CITI
Bought USD, Sold GBP 1,251,515 for settlement on 10/01/2017 13 –
USD 4,608,668 CITI
Bought USD, Sold GBP 3,631,615 for settlement on 12/01/2017 114 –
USD 5,200,000 SSB
Bought USD, Sold GBP 4,163,776 for settlement on 12/01/2017 62 –
USD 4,811,886 JPMC
Bought USD, Sold GBP 3,853,185 for settlement on 12/01/2017 57 –
USD 155,505 CITI
Bought USD, Sold GBP 122,627 for settlement on 12/01/2017 4 –
USD 10,051,739 JPMC
Bought USD, Sold GBP 7,971,085 for settlement on 28/02/2017 188 0.01
USD 1,619,412 SSB
Bought USD, Sold GBP 1,307,171 for settlement on 09/03/2017 7 –
USD 19,965,761 RBS
Bought USD, Sold GBP 16,291,073 for settlement on 09/03/2017 (87) –
SEK (720,491,835) CITI
Sold SEK, Bought GBP 66,385,003 for settlement on 24/01/2017 1,689 0.05
SEK (156,741,645) CITI
Sold SEK, Bought GBP 14,291,123 for settlement on 24/01/2017 217 0.01
Holding Investment
Fair Value £'000
Percentage of total
net assets %
Forward FX Currency Contracts (continued)SEK (77,480,617)
BOASold SEK, Bought GBP 6,704,800 for settlement on 24/01/2017 (252) (0.01)
SGD (19,429,289) RBS
Sold SGD, Bought GBP 10,751,628 for settlement on 06/01/2017 (178) (0.01)
SGD (20,029,044) HBC
Sold SGD, Bought GBP 11,292,252 for settlement on 17/01/2017 30 –
SGD (20,783,977) HBC
Sold SGD, Bought GBP 11,647,848 for settlement on 27/02/2017 (25) –
SGD (20,790,145) RBS
Sold SGD, Bought GBP 11,640,052 for settlement on 28/02/2017 (36) –
SGD (19,078,233) HBC
Sold SGD, Bought GBP 10,580,391 for settlement on 02/03/2017 (134) –
SGD (17,804,476) SSB
Sold SGD, Bought GBP 9,803,190 for settlement on 03/03/2017 (196) (0.01)
SGD (21,963,690) HBC
Sold SGD, Bought GBP 12,205,501 for settlement on 09/03/2017 (127) –
SGD (20,592,814) HBC
Sold SGD, Bought GBP 11,387,085 for settlement on 10/03/2017 (175) –
SGD (27,651,817) BOA
Sold SGD, Bought GBP 15,444,543 for settlement on 20/03/2017 (76) –
USD (5,023,245) ANZ
Sold USD, Bought GBP 4,013,917 for settlement on 03/01/2017 (69) –
USD (73,908,117) MS
Sold USD, Bought GBP 59,661,471 for settlement on 03/01/2017 (417) (0.01)
USD (25,998,687) MS
Sold USD, Bought GBP 20,919,851 for settlement on 04/01/2017 (213) (0.01)
USD (115,500,509) JPMC
Sold USD, Bought GBP 92,095,696 for settlement on 04/01/2017 (1,789) (0.05)
USD (27,000,000) MS
Sold USD, Bought GBP 21,723,926 for settlement on 05/01/2017 (222) (0.01)
USD (25,819,595) BARC
Sold USD, Bought GBP 20,357,120 for settlement on 05/01/2017 (630) (0.02)
USD (14,630,135) UBS
Sold USD, Bought GBP 11,744,302 for settlement on 06/01/2017 (147) –
USD (27,000,000) MS
Sold USD, Bought GBP 21,723,870 for settlement on 06/01/2017 (222) (0.01)
USD (27,000,000) MOA
Sold USD, Bought GBP 21,729,508 for settlement on 09/01/2017 (214) (0.01)
USD (40,503,948) RBS
Sold USD, Bought GBP 32,364,657 for settlement on 09/01/2017 (554) (0.02)
USD (122,145,720) MS
Sold USD, Bought GBP 97,896,431 for settlement on 10/01/2017 (1,372) (0.04)
USD (59,521,036) CITI
Sold USD, Bought GBP 48,232,030 for settlement on 11/01/2017 (140) –
USD (59,000,000) CIT
Sold USD, Bought GBP 47,785,808 for settlement on 11/01/2017 (162) –
USD (10,523,751) NAB
Sold USD, Bought GBP 8,404,679 for settlement on 12/01/2017 (148) –
USD (92,318,302) SSB
Sold USD, Bought GBP 74,246,264 for settlement on 12/01/2017 (777) (0.02)
USD (43,076,915) MS
Sold USD, Bought GBP 33,819,423 for settlement on 12/01/2017 (1,187) (0.03)
USD (59,000,000) SSB
Sold USD, Bought GBP 47,382,342 for settlement on 13/01/2017 (563) (0.02)
USD (59,364,114) SSB
Sold USD, Bought GBP 47,668,634 for settlement on 13/01/2017 (573) (0.02)
USD (119,793,260) SSB
Sold USD, Bought GBP 96,413,591 for settlement on 17/01/2017 (922) (0.03)
USD (67,489,600) UBS
Sold USD, Bought GBP 54,692,000 for settlement on 23/02/2017 (166) –
USD (67,000,000) UBS
Sold USD, Bought GBP 54,286,837 for settlement on 23/02/2017 (173) –
USD (80,010,219) CITI
Sold USD, Bought GBP 65,297,882 for settlement on 24/02/2017 345 0.01
USD (121,217,121) JPMC
Sold USD, Bought GBP 96,964,737 for settlement on 27/02/2017 (1,435) (0.04)
USD (126,392,300) UBS
Sold USD, Bought GBP 101,135,362 for settlement on 28/02/2017 (1,463) (0.04)
USD (8,717,029) CITI
Sold USD, Bought GBP 6,838,219 for settlement on 01/03/2017 (238) (0.01)
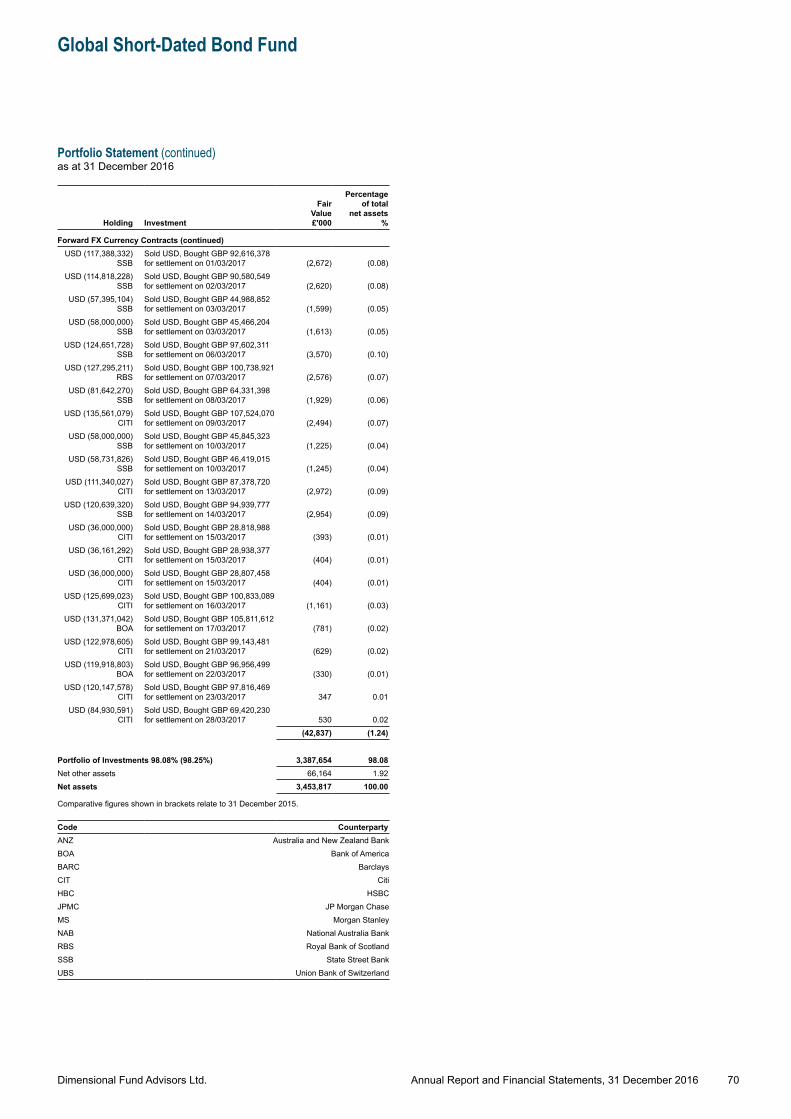
Dimensional Fund Advisors Ltd.
Global Short-Dated Bond Fund
Portfolio Statement (continued)as at 31 December 2016
70Annual Report and Financial Statements, 31 December 2016
Holding Investment
Fair Value £'000
Percentage of total
net assets %
Forward FX Currency Contracts (continued)USD (117,388,332)
SSBSold USD, Bought GBP 92,616,378 for settlement on 01/03/2017 (2,672) (0.08)
USD (114,818,228) SSB
Sold USD, Bought GBP 90,580,549 for settlement on 02/03/2017 (2,620) (0.08)
USD (57,395,104) SSB
Sold USD, Bought GBP 44,988,852 for settlement on 03/03/2017 (1,599) (0.05)
USD (58,000,000) SSB
Sold USD, Bought GBP 45,466,204 for settlement on 03/03/2017 (1,613) (0.05)
USD (124,651,728) SSB
Sold USD, Bought GBP 97,602,311 for settlement on 06/03/2017 (3,570) (0.10)
USD (127,295,211) RBS
Sold USD, Bought GBP 100,738,921 for settlement on 07/03/2017 (2,576) (0.07)
USD (81,642,270) SSB
Sold USD, Bought GBP 64,331,398 for settlement on 08/03/2017 (1,929) (0.06)
USD (135,561,079) CITI
Sold USD, Bought GBP 107,524,070 for settlement on 09/03/2017 (2,494) (0.07)
USD (58,000,000) SSB
Sold USD, Bought GBP 45,845,323 for settlement on 10/03/2017 (1,225) (0.04)
USD (58,731,826) SSB
Sold USD, Bought GBP 46,419,015 for settlement on 10/03/2017 (1,245) (0.04)
USD (111,340,027) CITI
Sold USD, Bought GBP 87,378,720 for settlement on 13/03/2017 (2,972) (0.09)
USD (120,639,320) SSB
Sold USD, Bought GBP 94,939,777 for settlement on 14/03/2017 (2,954) (0.09)
USD (36,000,000) CITI
Sold USD, Bought GBP 28,818,988 for settlement on 15/03/2017 (393) (0.01)
USD (36,161,292) CITI
Sold USD, Bought GBP 28,938,377 for settlement on 15/03/2017 (404) (0.01)
USD (36,000,000) CITI
Sold USD, Bought GBP 28,807,458 for settlement on 15/03/2017 (404) (0.01)
USD (125,699,023) CITI
Sold USD, Bought GBP 100,833,089 for settlement on 16/03/2017 (1,161) (0.03)
USD (131,371,042) BOA
Sold USD, Bought GBP 105,811,612 for settlement on 17/03/2017 (781) (0.02)
USD (122,978,605) CITI
Sold USD, Bought GBP 99,143,481 for settlement on 21/03/2017 (629) (0.02)
USD (119,918,803) BOA
Sold USD, Bought GBP 96,956,499 for settlement on 22/03/2017 (330) (0.01)
USD (120,147,578) CITI
Sold USD, Bought GBP 97,816,469 for settlement on 23/03/2017 347 0.01
USD (84,930,591) CITI
Sold USD, Bought GBP 69,420,230 for settlement on 28/03/2017 530 0.02
(42,837) (1.24)
Portfolio of Investments 98.08% (98.25%) 3,387,654 98.08Net other assets 66,164 1.92Net assets 3,453,817 100.00
Comparative figures shown in brackets relate to 31 December 2015.
Code CounterpartyANZ Australia and New Zealand BankBOA Bank of AmericaBARC BarclaysCIT CitiHBC HSBCJPMC JP Morgan ChaseMS Morgan StanleyNAB National Australia BankRBS Royal Bank of ScotlandSSB State Street BankUBS Union Bank of Switzerland
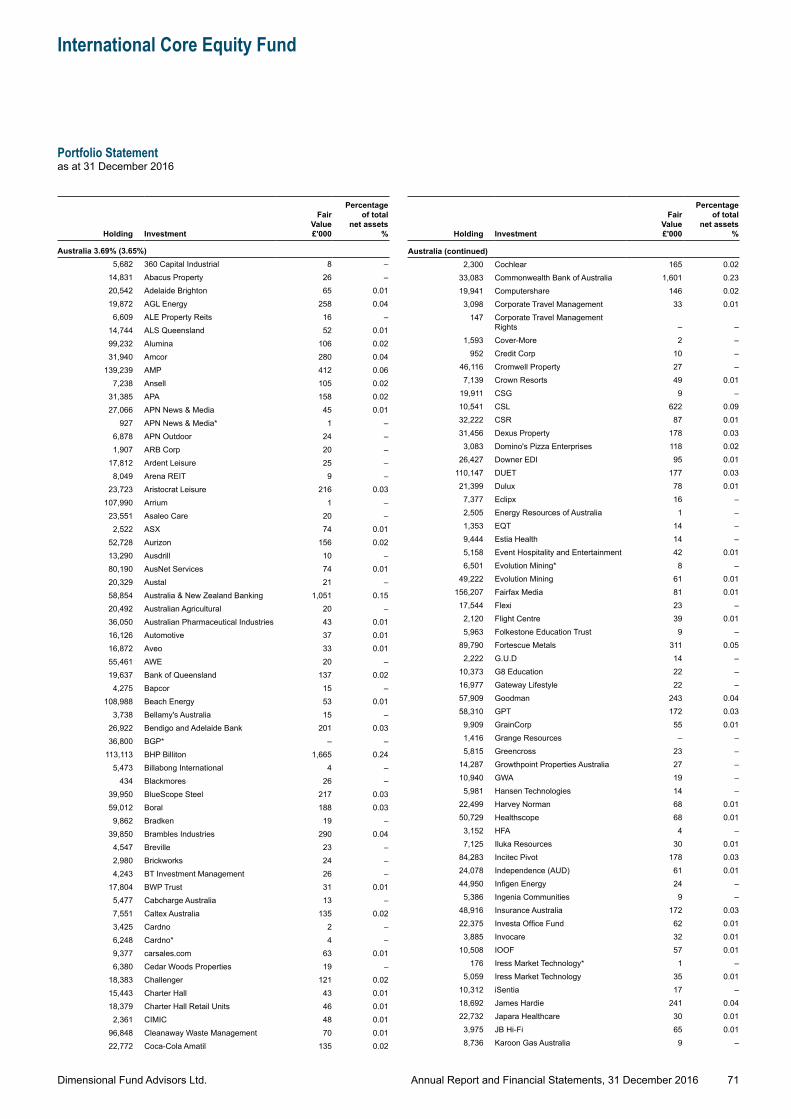
Dimensional Fund Advisors Ltd.
International Core Equity Fund
Portfolio Statementas at 31 December 2016
71Annual Report and Financial Statements, 31 December 2016
Holding Investment
Fair Value £'000
Percentage of total
net assets %
Australia 3.69% (3.65%)5,682 360 Capital Industrial 8 –
14,831 Abacus Property 26 –20,542 Adelaide Brighton 65 0.0119,872 AGL Energy 258 0.04
6,609 ALE Property Reits 16 –14,744 ALS Queensland 52 0.0199,232 Alumina 106 0.0231,940 Amcor 280 0.04
139,239 AMP 412 0.067,238 Ansell 105 0.02
31,385 APA 158 0.0227,066 APN News & Media 45 0.01
927 APN News & Media* 1 –6,878 APN Outdoor 24 –1,907 ARB Corp 20 –
17,812 Ardent Leisure 25 –8,049 Arena REIT 9 –
23,723 Aristocrat Leisure 216 0.03107,990 Arrium 1 –23,551 Asaleo Care 20 –2,522 ASX 74 0.01
52,728 Aurizon 156 0.0213,290 Ausdrill 10 –80,190 AusNet Services 74 0.0120,329 Austal 21 –58,854 Australia & New Zealand Banking 1,051 0.1520,492 Australian Agricultural 20 –36,050 Australian Pharmaceutical Industries 43 0.0116,126 Automotive 37 0.0116,872 Aveo 33 0.0155,461 AWE 20 –19,637 Bank of Queensland 137 0.02
4,275 Bapcor 15 –108,988 Beach Energy 53 0.01
3,738 Bellamy's Australia 15 –26,922 Bendigo and Adelaide Bank 201 0.0336,800 BGP* – –
113,113 BHP Billiton 1,665 0.245,473 Billabong International 4 –
434 Blackmores 26 –39,950 BlueScope Steel 217 0.0359,012 Boral 188 0.03
9,862 Bradken 19 –39,850 Brambles Industries 290 0.04
4,547 Breville 23 –2,980 Brickworks 24 –4,243 BT Investment Management 26 –
17,804 BWP Trust 31 0.015,477 Cabcharge Australia 13 –7,551 Caltex Australia 135 0.023,425 Cardno 2 –6,248 Cardno* 4 –9,377 carsales.com 63 0.016,380 Cedar Woods Properties 19 –
18,383 Challenger 121 0.0215,443 Charter Hall 43 0.0118,379 Charter Hall Retail Units 46 0.01
2,361 CIMIC 48 0.0196,848 Cleanaway Waste Management 70 0.0122,772 Coca-Cola Amatil 135 0.02
Holding Investment
Fair Value £'000
Percentage of total
net assets %
Australia (continued)2,300 Cochlear 165 0.02
33,083 Commonwealth Bank of Australia 1,601 0.2319,941 Computershare 146 0.02
3,098 Corporate Travel Management 33 0.01147 Corporate Travel Management
Rights – –1,593 Cover-More 2 –
952 Credit Corp 10 –46,116 Cromwell Property 27 –7,139 Crown Resorts 49 0.01
19,911 CSG 9 –10,541 CSL 622 0.0932,222 CSR 87 0.0131,456 Dexus Property 178 0.03
3,083 Domino's Pizza Enterprises 118 0.0226,427 Downer EDI 95 0.01
110,147 DUET 177 0.0321,399 Dulux 78 0.01
7,377 Eclipx 16 –2,505 Energy Resources of Australia 1 –1,353 EQT 14 –9,444 Estia Health 14 –5,158 Event Hospitality and Entertainment 42 0.016,501 Evolution Mining* 8 –
49,222 Evolution Mining 61 0.01156,207 Fairfax Media 81 0.0117,544 Flexi 23 –2,120 Flight Centre 39 0.015,963 Folkestone Education Trust 9 –
89,790 Fortescue Metals 311 0.052,222 G.U.D 14 –
10,373 G8 Education 22 –16,977 Gateway Lifestyle 22 –57,909 Goodman 243 0.0458,310 GPT 172 0.03
9,909 GrainCorp 55 0.011,416 Grange Resources – –5,815 Greencross 23 –
14,287 Growthpoint Properties Australia 27 –10,940 GWA 19 –5,981 Hansen Technologies 14 –
22,499 Harvey Norman 68 0.0150,729 Healthscope 68 0.01
3,152 HFA 4 –7,125 Iluka Resources 30 0.01
84,283 Incitec Pivot 178 0.0324,078 Independence (AUD) 61 0.0144,950 Infigen Energy 24 –5,386 Ingenia Communities 9 –
48,916 Insurance Australia 172 0.0322,375 Investa Office Fund 62 0.01
3,885 Invocare 32 0.0110,508 IOOF 57 0.01
176 Iress Market Technology* 1 –5,059 Iress Market Technology 35 0.01
10,312 iSentia 17 –18,692 James Hardie 241 0.0422,732 Japara Healthcare 30 0.01
3,975 JB Hi-Fi 65 0.018,736 Karoon Gas Australia 9 –
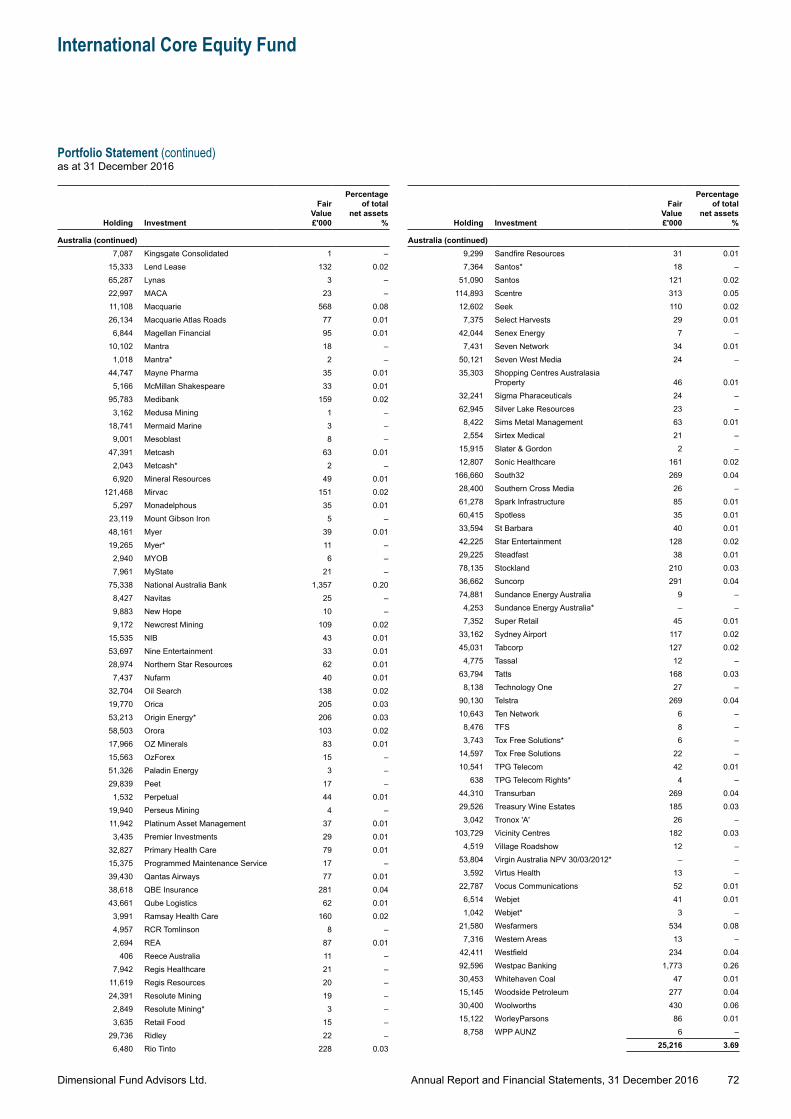
Dimensional Fund Advisors Ltd.
International Core Equity Fund
Portfolio Statement (continued)as at 31 December 2016
72Annual Report and Financial Statements, 31 December 2016
Holding Investment
Fair Value £'000
Percentage of total
net assets %
Australia (continued)7,087 Kingsgate Consolidated 1 –
15,333 Lend Lease 132 0.0265,287 Lynas 3 –22,997 MACA 23 –11,108 Macquarie 568 0.0826,134 Macquarie Atlas Roads 77 0.01
6,844 Magellan Financial 95 0.0110,102 Mantra 18 –1,018 Mantra* 2 –
44,747 Mayne Pharma 35 0.015,166 McMillan Shakespeare 33 0.01
95,783 Medibank 159 0.023,162 Medusa Mining 1 –
18,741 Mermaid Marine 3 –9,001 Mesoblast 8 –
47,391 Metcash 63 0.012,043 Metcash* 2 –6,920 Mineral Resources 49 0.01
121,468 Mirvac 151 0.025,297 Monadelphous 35 0.01
23,119 Mount Gibson Iron 5 –48,161 Myer 39 0.0119,265 Myer* 11 –2,940 MYOB 6 –7,961 MyState 21 –
75,338 National Australia Bank 1,357 0.208,427 Navitas 25 –9,883 New Hope 10 –9,172 Newcrest Mining 109 0.02
15,535 NIB 43 0.0153,697 Nine Entertainment 33 0.0128,974 Northern Star Resources 62 0.01
7,437 Nufarm 40 0.0132,704 Oil Search 138 0.0219,770 Orica 205 0.0353,213 Origin Energy* 206 0.0358,503 Orora 103 0.0217,966 OZ Minerals 83 0.0115,563 OzForex 15 –51,326 Paladin Energy 3 –29,839 Peet 17 –1,532 Perpetual 44 0.01
19,940 Perseus Mining 4 –11,942 Platinum Asset Management 37 0.013,435 Premier Investments 29 0.01
32,827 Primary Health Care 79 0.0115,375 Programmed Maintenance Service 17 –39,430 Qantas Airways 77 0.0138,618 QBE Insurance 281 0.0443,661 Qube Logistics 62 0.01
3,991 Ramsay Health Care 160 0.024,957 RCR Tomlinson 8 –2,694 REA 87 0.01
406 Reece Australia 11 –7,942 Regis Healthcare 21 –
11,619 Regis Resources 20 –24,391 Resolute Mining 19 –2,849 Resolute Mining* 3 –3,635 Retail Food 15 –
29,736 Ridley 22 –6,480 Rio Tinto 228 0.03
Holding Investment
Fair Value £'000
Percentage of total
net assets %
Australia (continued)9,299 Sandfire Resources 31 0.017,364 Santos* 18 –
51,090 Santos 121 0.02114,893 Scentre 313 0.0512,602 Seek 110 0.02
7,375 Select Harvests 29 0.0142,044 Senex Energy 7 –7,431 Seven Network 34 0.01
50,121 Seven West Media 24 –35,303 Shopping Centres Australasia
Property 46 0.0132,241 Sigma Pharaceuticals 24 –62,945 Silver Lake Resources 23 –8,422 Sims Metal Management 63 0.012,554 Sirtex Medical 21 –
15,915 Slater & Gordon 2 –12,807 Sonic Healthcare 161 0.02
166,660 South32 269 0.0428,400 Southern Cross Media 26 –61,278 Spark Infrastructure 85 0.0160,415 Spotless 35 0.0133,594 St Barbara 40 0.0142,225 Star Entertainment 128 0.0229,225 Steadfast 38 0.0178,135 Stockland 210 0.0336,662 Suncorp 291 0.0474,881 Sundance Energy Australia 9 –4,253 Sundance Energy Australia* – –7,352 Super Retail 45 0.01
33,162 Sydney Airport 117 0.0245,031 Tabcorp 127 0.02
4,775 Tassal 12 –63,794 Tatts 168 0.03
8,138 Technology One 27 –90,130 Telstra 269 0.0410,643 Ten Network 6 –8,476 TFS 8 –3,743 Tox Free Solutions* 6 –
14,597 Tox Free Solutions 22 –10,541 TPG Telecom 42 0.01
638 TPG Telecom Rights* 4 –44,310 Transurban 269 0.0429,526 Treasury Wine Estates 185 0.03
3,042 Tronox 'A' 26 –103,729 Vicinity Centres 182 0.03
4,519 Village Roadshow 12 –53,804 Virgin Australia NPV 30/03/2012* – –3,592 Virtus Health 13 –
22,787 Vocus Communications 52 0.016,514 Webjet 41 0.011,042 Webjet* 3 –
21,580 Wesfarmers 534 0.087,316 Western Areas 13 –
42,411 Westfield 234 0.0492,596 Westpac Banking 1,773 0.2630,453 Whitehaven Coal 47 0.0115,145 Woodside Petroleum 277 0.0430,400 Woolworths 430 0.0615,122 WorleyParsons 86 0.01
8,758 WPP AUNZ 6 –25,216 3.69
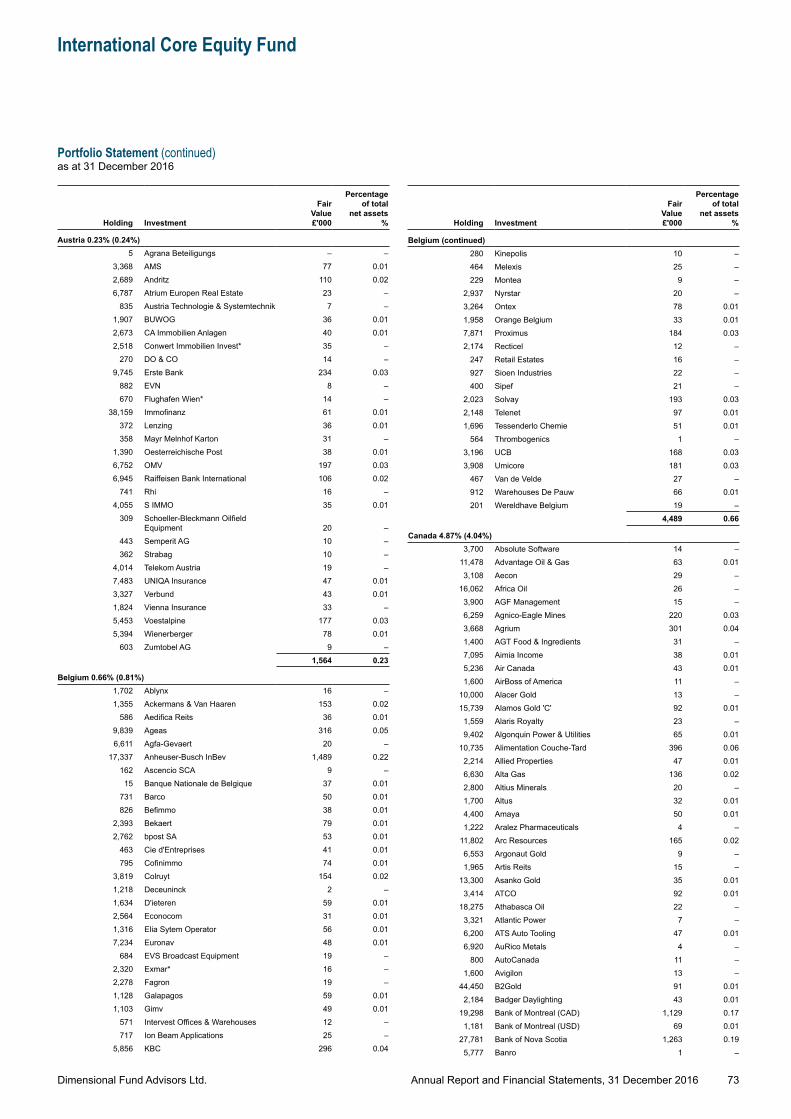
Dimensional Fund Advisors Ltd.
International Core Equity Fund
Portfolio Statement (continued)as at 31 December 2016
73Annual Report and Financial Statements, 31 December 2016
Holding Investment
Fair Value £'000
Percentage of total
net assets %
Austria 0.23% (0.24%)5 Agrana Beteiligungs – –
3,368 AMS 77 0.012,689 Andritz 110 0.026,787 Atrium Europen Real Estate 23 –
835 Austria Technologie & Systemtechnik 7 –1,907 BUWOG 36 0.012,673 CA Immobilien Anlagen 40 0.012,518 Conwert Immobilien Invest* 35 –
270 DO & CO 14 –9,745 Erste Bank 234 0.03
882 EVN 8 –670 Flughafen Wien* 14 –
38,159 Immofinanz 61 0.01372 Lenzing 36 0.01358 Mayr Melnhof Karton 31 –
1,390 Oesterreichische Post 38 0.016,752 OMV 197 0.036,945 Raiffeisen Bank International 106 0.02
741 Rhi 16 –4,055 S IMMO 35 0.01
309 Schoeller-Bleckmann Oilfield Equipment 20 –
443 Semperit AG 10 –362 Strabag 10 –
4,014 Telekom Austria 19 –7,483 UNIQA Insurance 47 0.013,327 Verbund 43 0.011,824 Vienna Insurance 33 –5,453 Voestalpine 177 0.035,394 Wienerberger 78 0.01
603 Zumtobel AG 9 –1,564 0.23
Belgium 0.66% (0.81%)1,702 Ablynx 16 –1,355 Ackermans & Van Haaren 153 0.02
586 Aedifica Reits 36 0.019,839 Ageas 316 0.056,611 Agfa-Gevaert 20 –
17,337 Anheuser-Busch InBev 1,489 0.22162 Ascencio SCA 9 –
15 Banque Nationale de Belgique 37 0.01731 Barco 50 0.01826 Befimmo 38 0.01
2,393 Bekaert 79 0.012,762 bpost SA 53 0.01
463 Cie d'Entreprises 41 0.01795 Cofinimmo 74 0.01
3,819 Colruyt 154 0.021,218 Deceuninck 2 –1,634 D'ieteren 59 0.012,564 Econocom 31 0.011,316 Elia Sytem Operator 56 0.017,234 Euronav 48 0.01
684 EVS Broadcast Equipment 19 –2,320 Exmar* 16 –2,278 Fagron 19 –1,128 Galapagos 59 0.011,103 Gimv 49 0.01
571 Intervest Offices & Warehouses 12 –717 Ion Beam Applications 25 –
5,856 KBC 296 0.04
Holding Investment
Fair Value £'000
Percentage of total
net assets %
Belgium (continued)280 Kinepolis 10 –464 Melexis 25 –229 Montea 9 –
2,937 Nyrstar 20 –3,264 Ontex 78 0.011,958 Orange Belgium 33 0.017,871 Proximus 184 0.032,174 Recticel 12 –
247 Retail Estates 16 –927 Sioen Industries 22 –400 Sipef 21 –
2,023 Solvay 193 0.032,148 Telenet 97 0.011,696 Tessenderlo Chemie 51 0.01
564 Thrombogenics 1 –3,196 UCB 168 0.033,908 Umicore 181 0.03
467 Van de Velde 27 –912 Warehouses De Pauw 66 0.01201 Wereldhave Belgium 19 –
4,489 0.66
Canada 4.87% (4.04%)3,700 Absolute Software 14 –
11,478 Advantage Oil & Gas 63 0.013,108 Aecon 29 –
16,062 Africa Oil 26 –3,900 AGF Management 15 –6,259 Agnico-Eagle Mines 220 0.033,668 Agrium 301 0.041,400 AGT Food & Ingredients 31 –7,095 Aimia Income 38 0.015,236 Air Canada 43 0.011,600 AirBoss of America 11 –
10,000 Alacer Gold 13 –15,739 Alamos Gold 'C' 92 0.01
1,559 Alaris Royalty 23 –9,402 Algonquin Power & Utilities 65 0.01
10,735 Alimentation Couche-Tard 396 0.062,214 Allied Properties 47 0.016,630 Alta Gas 136 0.022,800 Altius Minerals 20 –1,700 Altus 32 0.014,400 Amaya 50 0.011,222 Aralez Pharmaceuticals 4 –
11,802 Arc Resources 165 0.026,553 Argonaut Gold 9 –1,965 Artis Reits 15 –
13,300 Asanko Gold 35 0.013,414 ATCO 92 0.01
18,275 Athabasca Oil 22 –3,321 Atlantic Power 7 –6,200 ATS Auto Tooling 47 0.016,920 AuRico Metals 4 –
800 AutoCanada 11 –1,600 Avigilon 13 –
44,450 B2Gold 91 0.012,184 Badger Daylighting 43 0.01
19,298 Bank of Montreal (CAD) 1,129 0.171,181 Bank of Montreal (USD) 69 0.01
27,781 Bank of Nova Scotia 1,263 0.195,777 Banro 1 –
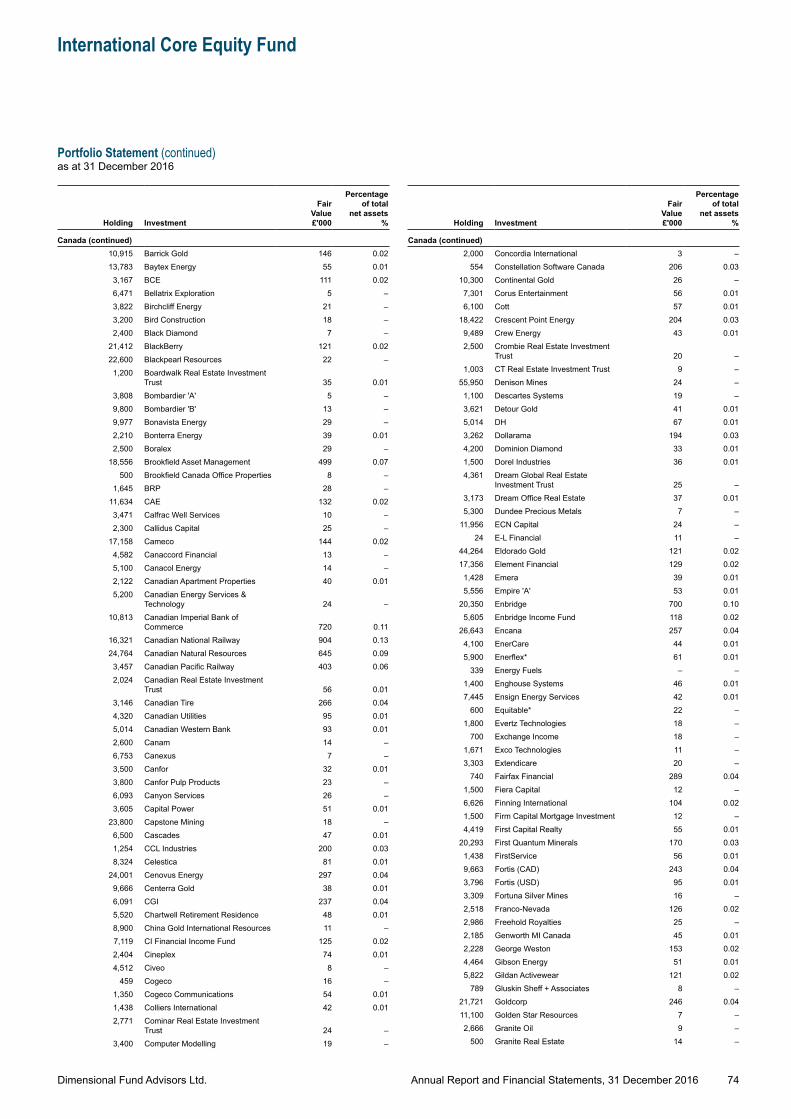
Dimensional Fund Advisors Ltd.
International Core Equity Fund
Portfolio Statement (continued)as at 31 December 2016
74Annual Report and Financial Statements, 31 December 2016
Holding Investment
Fair Value £'000
Percentage of total
net assets %
Canada (continued)10,915 Barrick Gold 146 0.0213,783 Baytex Energy 55 0.01
3,167 BCE 111 0.026,471 Bellatrix Exploration 5 –3,822 Birchcliff Energy 21 –3,200 Bird Construction 18 –2,400 Black Diamond 7 –
21,412 BlackBerry 121 0.0222,600 Blackpearl Resources 22 –1,200 Boardwalk Real Estate Investment
Trust 35 0.013,808 Bombardier 'A' 5 –9,800 Bombardier 'B' 13 –9,977 Bonavista Energy 29 –2,210 Bonterra Energy 39 0.012,500 Boralex 29 –
18,556 Brookfield Asset Management 499 0.07500 Brookfield Canada Office Properties 8 –
1,645 BRP 28 –11,634 CAE 132 0.023,471 Calfrac Well Services 10 –2,300 Callidus Capital 25 –
17,158 Cameco 144 0.024,582 Canaccord Financial 13 –5,100 Canacol Energy 14 –2,122 Canadian Apartment Properties 40 0.015,200 Canadian Energy Services &
Technology 24 –10,813 Canadian Imperial Bank of
Commerce 720 0.1116,321 Canadian National Railway 904 0.1324,764 Canadian Natural Resources 645 0.09
3,457 Canadian Pacific Railway 403 0.062,024 Canadian Real Estate Investment
Trust 56 0.013,146 Canadian Tire 266 0.044,320 Canadian Utilities 95 0.015,014 Canadian Western Bank 93 0.012,600 Canam 14 –6,753 Canexus 7 –3,500 Canfor 32 0.013,800 Canfor Pulp Products 23 –6,093 Canyon Services 26 –3,605 Capital Power 51 0.01
23,800 Capstone Mining 18 –6,500 Cascades 47 0.011,254 CCL Industries 200 0.038,324 Celestica 81 0.01
24,001 Cenovus Energy 297 0.049,666 Centerra Gold 38 0.016,091 CGI 237 0.045,520 Chartwell Retirement Residence 48 0.018,900 China Gold International Resources 11 –7,119 CI Financial Income Fund 125 0.022,404 Cineplex 74 0.014,512 Civeo 8 –
459 Cogeco 16 –1,350 Cogeco Communications 54 0.011,438 Colliers International 42 0.012,771 Cominar Real Estate Investment
Trust 24 –3,400 Computer Modelling 19 –
Holding Investment
Fair Value £'000
Percentage of total
net assets %
Canada (continued)2,000 Concordia International 3 –
554 Constellation Software Canada 206 0.0310,300 Continental Gold 26 –7,301 Corus Entertainment 56 0.016,100 Cott 57 0.01
18,422 Crescent Point Energy 204 0.039,489 Crew Energy 43 0.012,500 Crombie Real Estate Investment
Trust 20 –1,003 CT Real Estate Investment Trust 9 –
55,950 Denison Mines 24 –1,100 Descartes Systems 19 –3,621 Detour Gold 41 0.015,014 DH 67 0.013,262 Dollarama 194 0.034,200 Dominion Diamond 33 0.011,500 Dorel Industries 36 0.014,361 Dream Global Real Estate
Investment Trust 25 –3,173 Dream Office Real Estate 37 0.015,300 Dundee Precious Metals 7 –
11,956 ECN Capital 24 –24 E-L Financial 11 –
44,264 Eldorado Gold 121 0.0217,356 Element Financial 129 0.02
1,428 Emera 39 0.015,556 Empire 'A' 53 0.01
20,350 Enbridge 700 0.105,605 Enbridge Income Fund 118 0.02
26,643 Encana 257 0.044,100 EnerCare 44 0.015,900 Enerflex* 61 0.01
339 Energy Fuels – –1,400 Enghouse Systems 46 0.017,445 Ensign Energy Services 42 0.01
600 Equitable* 22 –1,800 Evertz Technologies 18 –
700 Exchange Income 18 –1,671 Exco Technologies 11 –3,303 Extendicare 20 –
740 Fairfax Financial 289 0.041,500 Fiera Capital 12 –6,626 Finning International 104 0.021,500 Firm Capital Mortgage Investment 12 –4,419 First Capital Realty 55 0.01
20,293 First Quantum Minerals 170 0.031,438 FirstService 56 0.019,663 Fortis (CAD) 243 0.043,796 Fortis (USD) 95 0.013,309 Fortuna Silver Mines 16 –2,518 Franco-Nevada 126 0.022,986 Freehold Royalties 25 –2,185 Genworth MI Canada 45 0.012,228 George Weston 153 0.024,464 Gibson Energy 51 0.015,822 Gildan Activewear 121 0.02
789 Gluskin Sheff + Associates 8 –21,721 Goldcorp 246 0.0411,100 Golden Star Resources 7 –2,666 Granite Oil 9 –
500 Granite Real Estate 14 –
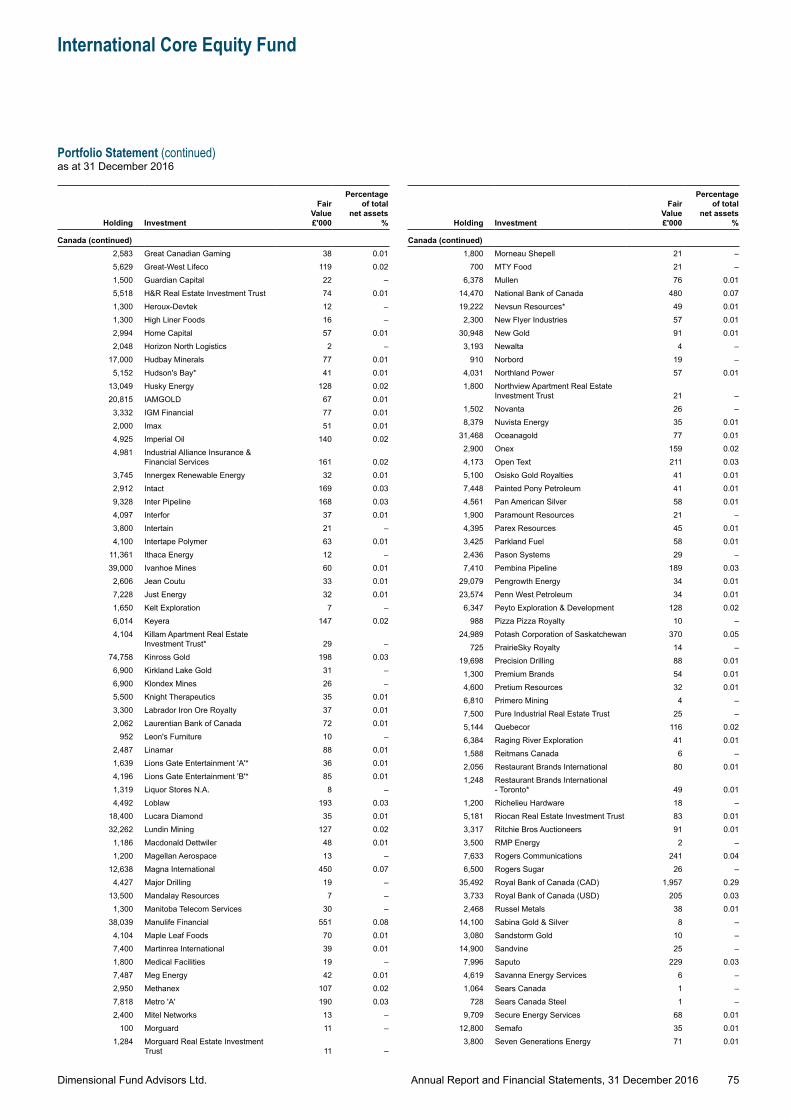
Dimensional Fund Advisors Ltd.
International Core Equity Fund
Portfolio Statement (continued)as at 31 December 2016
75Annual Report and Financial Statements, 31 December 2016
Holding Investment
Fair Value £'000
Percentage of total
net assets %
Canada (continued)2,583 Great Canadian Gaming 38 0.015,629 Great-West Lifeco 119 0.021,500 Guardian Capital 22 –5,518 H&R Real Estate Investment Trust 74 0.011,300 Heroux-Devtek 12 –1,300 High Liner Foods 16 –2,994 Home Capital 57 0.012,048 Horizon North Logistics 2 –
17,000 Hudbay Minerals 77 0.015,152 Hudson's Bay* 41 0.01
13,049 Husky Energy 128 0.0220,815 IAMGOLD 67 0.01
3,332 IGM Financial 77 0.012,000 Imax 51 0.014,925 Imperial Oil 140 0.024,981 Industrial Alliance Insurance &
Financial Services 161 0.023,745 Innergex Renewable Energy 32 0.012,912 Intact 169 0.039,328 Inter Pipeline 168 0.034,097 Interfor 37 0.013,800 Intertain 21 –4,100 Intertape Polymer 63 0.01
11,361 Ithaca Energy 12 –39,000 Ivanhoe Mines 60 0.01
2,606 Jean Coutu 33 0.017,228 Just Energy 32 0.011,650 Kelt Exploration 7 –6,014 Keyera 147 0.024,104 Killam Apartment Real Estate
Investment Trust* 29 –74,758 Kinross Gold 198 0.03
6,900 Kirkland Lake Gold 31 –6,900 Klondex Mines 26 –5,500 Knight Therapeutics 35 0.013,300 Labrador Iron Ore Royalty 37 0.012,062 Laurentian Bank of Canada 72 0.01
952 Leon's Furniture 10 –2,487 Linamar 88 0.011,639 Lions Gate Entertainment 'A'* 36 0.014,196 Lions Gate Entertainment 'B'* 85 0.011,319 Liquor Stores N.A. 8 –4,492 Loblaw 193 0.03
18,400 Lucara Diamond 35 0.0132,262 Lundin Mining 127 0.02
1,186 Macdonald Dettwiler 48 0.011,200 Magellan Aerospace 13 –
12,638 Magna International 450 0.074,427 Major Drilling 19 –
13,500 Mandalay Resources 7 –1,300 Manitoba Telecom Services 30 –
38,039 Manulife Financial 551 0.084,104 Maple Leaf Foods 70 0.017,400 Martinrea International 39 0.011,800 Medical Facilities 19 –7,487 Meg Energy 42 0.012,950 Methanex 107 0.027,818 Metro 'A' 190 0.032,400 Mitel Networks 13 –
100 Morguard 11 –1,284 Morguard Real Estate Investment
Trust 11 –
Holding Investment
Fair Value £'000
Percentage of total
net assets %
Canada (continued)1,800 Morneau Shepell 21 –
700 MTY Food 21 –6,378 Mullen 76 0.01
14,470 National Bank of Canada 480 0.0719,222 Nevsun Resources* 49 0.01
2,300 New Flyer Industries 57 0.0130,948 New Gold 91 0.01
3,193 Newalta 4 –910 Norbord 19 –
4,031 Northland Power 57 0.011,800 Northview Apartment Real Estate
Investment Trust 21 –1,502 Novanta 26 –8,379 Nuvista Energy 35 0.01
31,468 Oceanagold 77 0.012,900 Onex 159 0.024,173 Open Text 211 0.035,100 Osisko Gold Royalties 41 0.017,448 Painted Pony Petroleum 41 0.014,561 Pan American Silver 58 0.011,900 Paramount Resources 21 –4,395 Parex Resources 45 0.013,425 Parkland Fuel 58 0.012,436 Pason Systems 29 –7,410 Pembina Pipeline 189 0.03
29,079 Pengrowth Energy 34 0.0123,574 Penn West Petroleum 34 0.01
6,347 Peyto Exploration & Development 128 0.02988 Pizza Pizza Royalty 10 –
24,989 Potash Corporation of Saskatchewan 370 0.05725 PrairieSky Royalty 14 –
19,698 Precision Drilling 88 0.011,300 Premium Brands 54 0.014,600 Pretium Resources 32 0.016,810 Primero Mining 4 –7,500 Pure Industrial Real Estate Trust 25 –5,144 Quebecor 116 0.026,384 Raging River Exploration 41 0.011,588 Reitmans Canada 6 –2,056 Restaurant Brands International 80 0.011,248 Restaurant Brands International
- Toronto* 49 0.011,200 Richelieu Hardware 18 –5,181 Riocan Real Estate Investment Trust 83 0.013,317 Ritchie Bros Auctioneers 91 0.013,500 RMP Energy 2 –7,633 Rogers Communications 241 0.046,500 Rogers Sugar 26 –
35,492 Royal Bank of Canada (CAD) 1,957 0.293,733 Royal Bank of Canada (USD) 205 0.032,468 Russel Metals 38 0.01
14,100 Sabina Gold & Silver 8 –3,080 Sandstorm Gold 10 –
14,900 Sandvine 25 –7,996 Saputo 229 0.034,619 Savanna Energy Services 6 –1,064 Sears Canada 1 –
728 Sears Canada Steel 1 –9,709 Secure Energy Services 68 0.01
12,800 Semafo 35 0.013,800 Seven Generations Energy 71 0.01
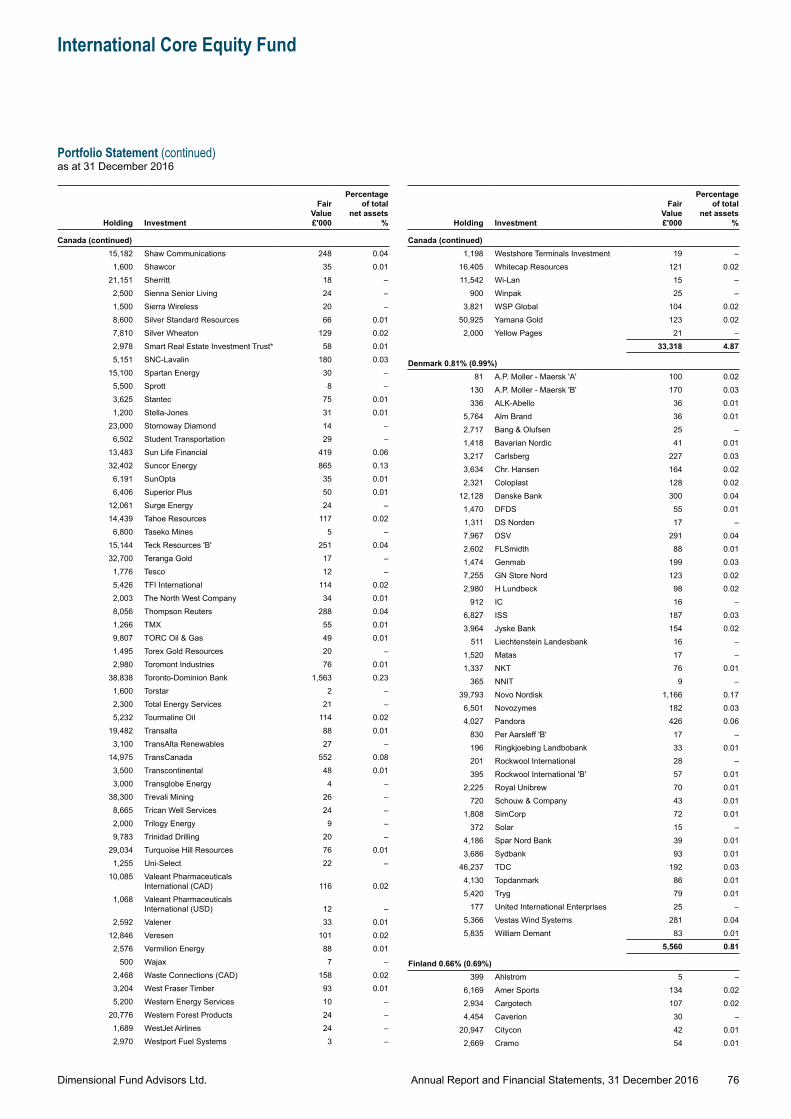
Dimensional Fund Advisors Ltd.
International Core Equity Fund
Portfolio Statement (continued)as at 31 December 2016
76Annual Report and Financial Statements, 31 December 2016
Holding Investment
Fair Value £'000
Percentage of total
net assets %
Canada (continued)15,182 Shaw Communications 248 0.04
1,600 Shawcor 35 0.0121,151 Sherritt 18 –2,500 Sienna Senior Living 24 –1,500 Sierra Wireless 20 –8,600 Silver Standard Resources 66 0.017,810 Silver Wheaton 129 0.022,978 Smart Real Estate Investment Trust* 58 0.015,151 SNC-Lavalin 180 0.03
15,100 Spartan Energy 30 –5,500 Sprott 8 –3,625 Stantec 75 0.011,200 Stella-Jones 31 0.01
23,000 Stornoway Diamond 14 –6,502 Student Transportation 29 –
13,483 Sun Life Financial 419 0.0632,402 Suncor Energy 865 0.13
6,191 SunOpta 35 0.016,406 Superior Plus 50 0.01
12,061 Surge Energy 24 –14,439 Tahoe Resources 117 0.02
6,800 Taseko Mines 5 –15,144 Teck Resources 'B' 251 0.0432,700 Teranga Gold 17 –1,776 Tesco 12 –5,426 TFI International 114 0.022,003 The North West Company 34 0.018,056 Thompson Reuters 288 0.041,266 TMX 55 0.019,807 TORC Oil & Gas 49 0.011,495 Torex Gold Resources 20 –2,980 Toromont Industries 76 0.01
38,838 Toronto-Dominion Bank 1,563 0.231,600 Torstar 2 –2,300 Total Energy Services 21 –5,232 Tourmaline Oil 114 0.02
19,482 Transalta 88 0.013,100 TransAlta Renewables 27 –
14,975 TransCanada 552 0.083,500 Transcontinental 48 0.013,000 Transglobe Energy 4 –
38,300 Trevali Mining 26 –8,665 Trican Well Services 24 –2,000 Trilogy Energy 9 –9,783 Trinidad Drilling 20 –
29,034 Turquoise Hill Resources 76 0.011,255 Uni-Select 22 –
10,085 Valeant Pharmaceuticals International (CAD) 116 0.02
1,068 Valeant Pharmaceuticals International (USD) 12 –
2,592 Valener 33 0.0112,846 Veresen 101 0.02
2,576 Vermilion Energy 88 0.01500 Wajax 7 –
2,468 Waste Connections (CAD) 158 0.023,204 West Fraser Timber 93 0.015,200 Western Energy Services 10 –
20,776 Western Forest Products 24 –1,689 WestJet Airlines 24 –2,970 Westport Fuel Systems 3 –
Holding Investment
Fair Value £'000
Percentage of total
net assets %
Canada (continued)1,198 Westshore Terminals Investment 19 –
16,405 Whitecap Resources 121 0.0211,542 Wi-Lan 15 –
900 Winpak 25 –3,821 WSP Global 104 0.02
50,925 Yamana Gold 123 0.022,000 Yellow Pages 21 –
33,318 4.87
Denmark 0.81% (0.99%)81 A.P. Moller - Maersk 'A' 100 0.02
130 A.P. Moller - Maersk 'B' 170 0.03336 ALK-Abello 36 0.01
5,764 Alm Brand 36 0.012,717 Bang & Olufsen 25 –1,418 Bavarian Nordic 41 0.013,217 Carlsberg 227 0.033,634 Chr. Hansen 164 0.022,321 Coloplast 128 0.02
12,128 Danske Bank 300 0.041,470 DFDS 55 0.011,311 DS Norden 17 –7,967 DSV 291 0.042,602 FLSmidth 88 0.011,474 Genmab 199 0.037,255 GN Store Nord 123 0.022,980 H Lundbeck 98 0.02
912 IC 16 –6,827 ISS 187 0.033,964 Jyske Bank 154 0.02
511 Liechtenstein Landesbank 16 –1,520 Matas 17 –1,337 NKT 76 0.01
365 NNIT 9 –39,793 Novo Nordisk 1,166 0.17
6,501 Novozymes 182 0.034,027 Pandora 426 0.06
830 Per Aarsleff 'B' 17 –196 Ringkjoebing Landbobank 33 0.01201 Rockwool International 28 –395 Rockwool International 'B' 57 0.01
2,225 Royal Unibrew 70 0.01720 Schouw & Company 43 0.01
1,808 SimCorp 72 0.01372 Solar 15 –
4,186 Spar Nord Bank 39 0.013,686 Sydbank 93 0.01
46,237 TDC 192 0.034,130 Topdanmark 86 0.015,420 Tryg 79 0.01
177 United International Enterprises 25 –5,366 Vestas Wind Systems 281 0.045,835 William Demant 83 0.01
5,560 0.81
Finland 0.66% (0.69%)399 Ahlstrom 5 –
6,169 Amer Sports 134 0.022,934 Cargotech 107 0.024,454 Caverion 30 –
20,947 Citycon 42 0.012,669 Cramo 54 0.01
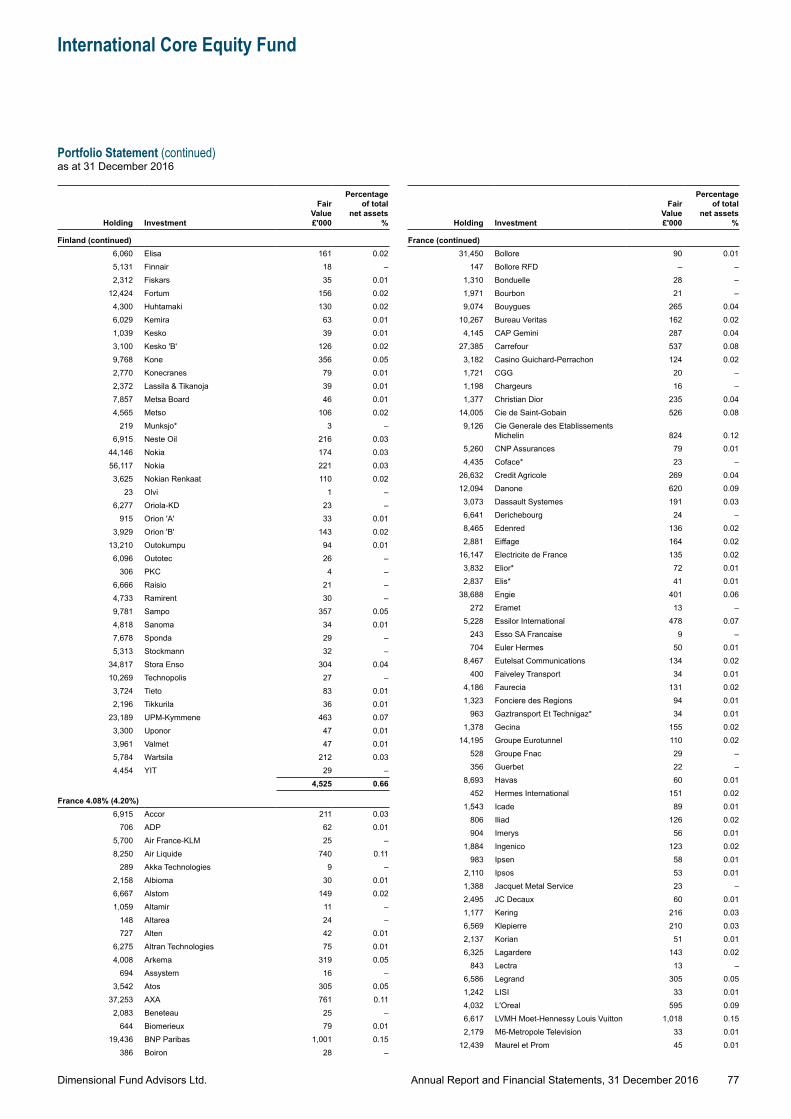
Dimensional Fund Advisors Ltd.
International Core Equity Fund
Portfolio Statement (continued)as at 31 December 2016
77Annual Report and Financial Statements, 31 December 2016
Holding Investment
Fair Value £'000
Percentage of total
net assets %
Finland (continued)6,060 Elisa 161 0.025,131 Finnair 18 –2,312 Fiskars 35 0.01
12,424 Fortum 156 0.024,300 Huhtamaki 130 0.026,029 Kemira 63 0.011,039 Kesko 39 0.013,100 Kesko 'B' 126 0.029,768 Kone 356 0.052,770 Konecranes 79 0.012,372 Lassila & Tikanoja 39 0.017,857 Metsa Board 46 0.014,565 Metso 106 0.02
219 Munksjo* 3 –6,915 Neste Oil 216 0.03
44,146 Nokia 174 0.0356,117 Nokia 221 0.033,625 Nokian Renkaat 110 0.02
23 Olvi 1 –6,277 Oriola-KD 23 –
915 Orion 'A' 33 0.013,929 Orion 'B' 143 0.02
13,210 Outokumpu 94 0.016,096 Outotec 26 –
306 PKC 4 –6,666 Raisio 21 –4,733 Ramirent 30 –9,781 Sampo 357 0.054,818 Sanoma 34 0.017,678 Sponda 29 –5,313 Stockmann 32 –
34,817 Stora Enso 304 0.0410,269 Technopolis 27 –3,724 Tieto 83 0.012,196 Tikkurila 36 0.01
23,189 UPM-Kymmene 463 0.073,300 Uponor 47 0.013,961 Valmet 47 0.015,784 Wartsila 212 0.034,454 YIT 29 –
4,525 0.66
France 4.08% (4.20%)6,915 Accor 211 0.03
706 ADP 62 0.015,700 Air France-KLM 25 –8,250 Air Liquide 740 0.11
289 Akka Technologies 9 –2,158 Albioma 30 0.016,667 Alstom 149 0.021,059 Altamir 11 –
148 Altarea 24 –727 Alten 42 0.01
6,275 Altran Technologies 75 0.014,008 Arkema 319 0.05
694 Assystem 16 –3,542 Atos 305 0.05
37,253 AXA 761 0.112,083 Beneteau 25 –
644 Biomerieux 79 0.0119,436 BNP Paribas 1,001 0.15
386 Boiron 28 –
Holding Investment
Fair Value £'000
Percentage of total
net assets %
France (continued)31,450 Bollore 90 0.01
147 Bollore RFD – –1,310 Bonduelle 28 –1,971 Bourbon 21 –9,074 Bouygues 265 0.04
10,267 Bureau Veritas 162 0.024,145 CAP Gemini 287 0.04
27,385 Carrefour 537 0.083,182 Casino Guichard-Perrachon 124 0.021,721 CGG 20 –1,198 Chargeurs 16 –1,377 Christian Dior 235 0.04
14,005 Cie de Saint-Gobain 526 0.089,126 Cie Generale des Etablissements
Michelin 824 0.125,260 CNP Assurances 79 0.014,435 Coface* 23 –
26,632 Credit Agricole 269 0.0412,094 Danone 620 0.09
3,073 Dassault Systemes 191 0.036,641 Derichebourg 24 –8,465 Edenred 136 0.022,881 Eiffage 164 0.02
16,147 Electricite de France 135 0.023,832 Elior* 72 0.012,837 Elis* 41 0.01
38,688 Engie 401 0.06272 Eramet 13 –
5,228 Essilor International 478 0.07243 Esso SA Francaise 9 –704 Euler Hermes 50 0.01
8,467 Eutelsat Communications 134 0.02400 Faiveley Transport 34 0.01
4,186 Faurecia 131 0.021,323 Fonciere des Regions 94 0.01
963 Gaztransport Et Technigaz* 34 0.011,378 Gecina 155 0.02
14,195 Groupe Eurotunnel 110 0.02528 Groupe Fnac 29 –356 Guerbet 22 –
8,693 Havas 60 0.01452 Hermes International 151 0.02
1,543 Icade 89 0.01806 Iliad 126 0.02904 Imerys 56 0.01
1,884 Ingenico 123 0.02983 Ipsen 58 0.01
2,110 Ipsos 53 0.011,388 Jacquet Metal Service 23 –2,495 JC Decaux 60 0.011,177 Kering 216 0.036,569 Klepierre 210 0.032,137 Korian 51 0.016,325 Lagardere 143 0.02
843 Lectra 13 –6,586 Legrand 305 0.051,242 LISI 33 0.014,032 L'Oreal 595 0.096,617 LVMH Moet-Hennessy Louis Vuitton 1,018 0.152,179 M6-Metropole Television 33 0.01
12,439 Maurel et Prom 45 0.01
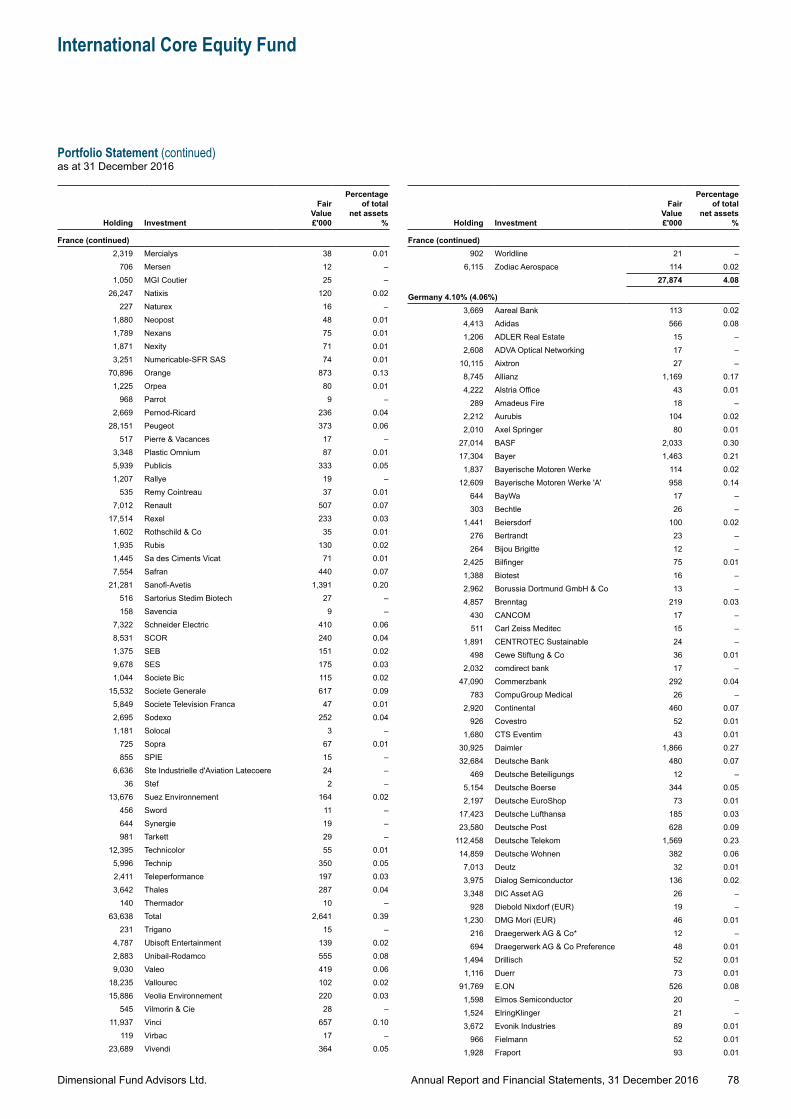
Dimensional Fund Advisors Ltd.
International Core Equity Fund
Portfolio Statement (continued)as at 31 December 2016
78Annual Report and Financial Statements, 31 December 2016
Holding Investment
Fair Value £'000
Percentage of total
net assets %
France (continued)2,319 Mercialys 38 0.01
706 Mersen 12 –1,050 MGI Coutier 25 –
26,247 Natixis 120 0.02227 Naturex 16 –
1,880 Neopost 48 0.011,789 Nexans 75 0.011,871 Nexity 71 0.013,251 Numericable-SFR SAS 74 0.01
70,896 Orange 873 0.131,225 Orpea 80 0.01
968 Parrot 9 –2,669 Pernod-Ricard 236 0.04
28,151 Peugeot 373 0.06517 Pierre & Vacances 17 –
3,348 Plastic Omnium 87 0.015,939 Publicis 333 0.051,207 Rallye 19 –
535 Remy Cointreau 37 0.017,012 Renault 507 0.07
17,514 Rexel 233 0.031,602 Rothschild & Co 35 0.011,935 Rubis 130 0.021,445 Sa des Ciments Vicat 71 0.017,554 Safran 440 0.07
21,281 Sanofi-Avetis 1,391 0.20516 Sartorius Stedim Biotech 27 –158 Savencia 9 –
7,322 Schneider Electric 410 0.068,531 SCOR 240 0.041,375 SEB 151 0.029,678 SES 175 0.031,044 Societe Bic 115 0.02
15,532 Societe Generale 617 0.095,849 Societe Television Franca 47 0.012,695 Sodexo 252 0.041,181 Solocal 3 –
725 Sopra 67 0.01855 SPIE 15 –
6,636 Ste Industrielle d'Aviation Latecoere 24 –36 Stef 2 –
13,676 Suez Environnement 164 0.02456 Sword 11 –644 Synergie 19 –981 Tarkett 29 –
12,395 Technicolor 55 0.015,996 Technip 350 0.052,411 Teleperformance 197 0.033,642 Thales 287 0.04
140 Thermador 10 –63,638 Total 2,641 0.39
231 Trigano 15 –4,787 Ubisoft Entertainment 139 0.022,883 Unibail-Rodamco 555 0.089,030 Valeo 419 0.06
18,235 Vallourec 102 0.0215,886 Veolia Environnement 220 0.03
545 Vilmorin & Cie 28 –11,937 Vinci 657 0.10
119 Virbac 17 –23,689 Vivendi 364 0.05
Holding Investment
Fair Value £'000
Percentage of total
net assets %
France (continued)902 Worldline 21 –
6,115 Zodiac Aerospace 114 0.0227,874 4.08
Germany 4.10% (4.06%)3,669 Aareal Bank 113 0.024,413 Adidas 566 0.081,206 ADLER Real Estate 15 –2,608 ADVA Optical Networking 17 –
10,115 Aixtron 27 –8,745 Allianz 1,169 0.174,222 Alstria Office 43 0.01
289 Amadeus Fire 18 –2,212 Aurubis 104 0.022,010 Axel Springer 80 0.01
27,014 BASF 2,033 0.3017,304 Bayer 1,463 0.21
1,837 Bayerische Motoren Werke 114 0.0212,609 Bayerische Motoren Werke 'A' 958 0.14
644 BayWa 17 –303 Bechtle 26 –
1,441 Beiersdorf 100 0.02276 Bertrandt 23 –264 Bijou Brigitte 12 –
2,425 Bilfinger 75 0.011,388 Biotest 16 –2,962 Borussia Dortmund GmbH & Co 13 –4,857 Brenntag 219 0.03
430 CANCOM 17 –511 Carl Zeiss Meditec 15 –
1,891 CENTROTEC Sustainable 24 –498 Cewe Stiftung & Co 36 0.01
2,032 comdirect bank 17 –47,090 Commerzbank 292 0.04
783 CompuGroup Medical 26 –2,920 Continental 460 0.07
926 Covestro 52 0.011,680 CTS Eventim 43 0.01
30,925 Daimler 1,866 0.2732,684 Deutsche Bank 480 0.07
469 Deutsche Beteiligungs 12 –5,154 Deutsche Boerse 344 0.052,197 Deutsche EuroShop 73 0.01
17,423 Deutsche Lufthansa 185 0.0323,580 Deutsche Post 628 0.09
112,458 Deutsche Telekom 1,569 0.2314,859 Deutsche Wohnen 382 0.06
7,013 Deutz 32 0.013,975 Dialog Semiconductor 136 0.023,348 DIC Asset AG 26 –
928 Diebold Nixdorf (EUR) 19 –1,230 DMG Mori (EUR) 46 0.01
216 Draegerwerk AG & Co* 12 –694 Draegerwerk AG & Co Preference 48 0.01
1,494 Drillisch 52 0.011,116 Duerr 73 0.01
91,769 E.ON 526 0.081,598 Elmos Semiconductor 20 –1,524 ElringKlinger 21 –3,672 Evonik Industries 89 0.01
966 Fielmann 52 0.011,928 Fraport 93 0.01
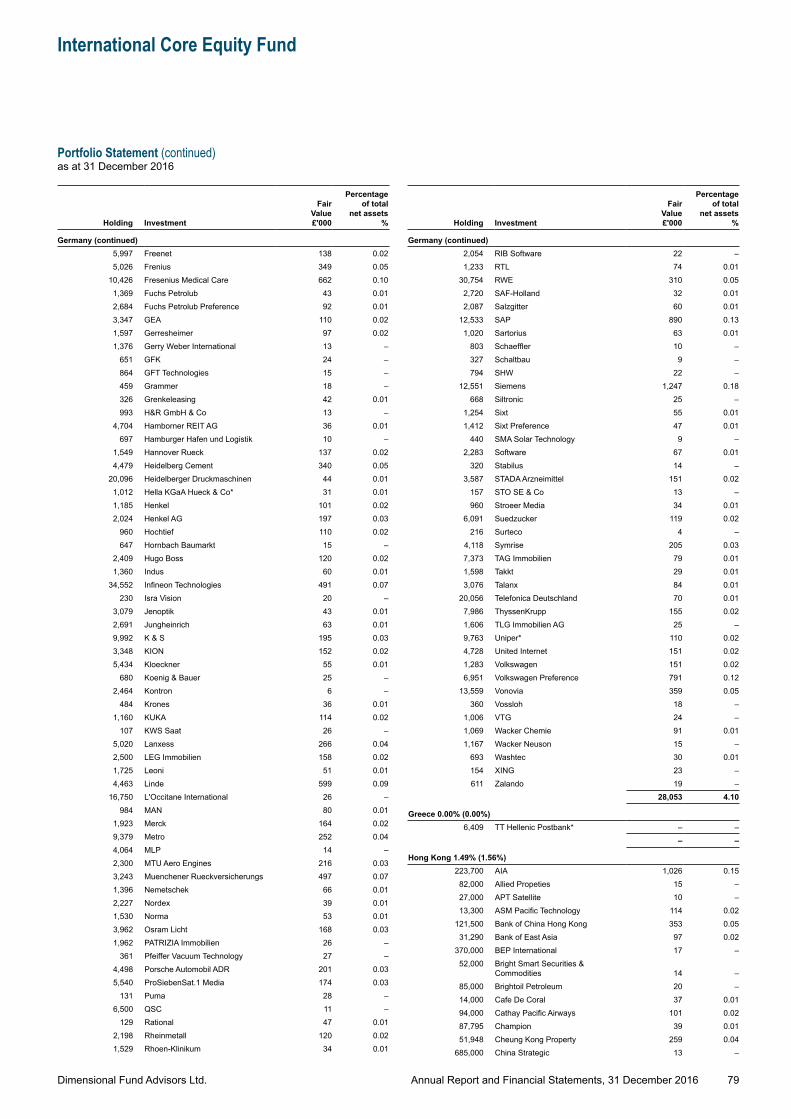
Dimensional Fund Advisors Ltd.
International Core Equity Fund
Portfolio Statement (continued)as at 31 December 2016
79Annual Report and Financial Statements, 31 December 2016
Holding Investment
Fair Value £'000
Percentage of total
net assets %
Germany (continued)5,997 Freenet 138 0.025,026 Frenius 349 0.05
10,426 Fresenius Medical Care 662 0.101,369 Fuchs Petrolub 43 0.012,684 Fuchs Petrolub Preference 92 0.013,347 GEA 110 0.021,597 Gerresheimer 97 0.021,376 Gerry Weber International 13 –
651 GFK 24 –864 GFT Technologies 15 –459 Grammer 18 –326 Grenkeleasing 42 0.01993 H&R GmbH & Co 13 –
4,704 Hamborner REIT AG 36 0.01697 Hamburger Hafen und Logistik 10 –
1,549 Hannover Rueck 137 0.024,479 Heidelberg Cement 340 0.05
20,096 Heidelberger Druckmaschinen 44 0.011,012 Hella KGaA Hueck & Co* 31 0.011,185 Henkel 101 0.022,024 Henkel AG 197 0.03
960 Hochtief 110 0.02647 Hornbach Baumarkt 15 –
2,409 Hugo Boss 120 0.021,360 Indus 60 0.01
34,552 Infineon Technologies 491 0.07230 Isra Vision 20 –
3,079 Jenoptik 43 0.012,691 Jungheinrich 63 0.019,992 K & S 195 0.033,348 KION 152 0.025,434 Kloeckner 55 0.01
680 Koenig & Bauer 25 –2,464 Kontron 6 –
484 Krones 36 0.011,160 KUKA 114 0.02
107 KWS Saat 26 –5,020 Lanxess 266 0.042,500 LEG Immobilien 158 0.021,725 Leoni 51 0.014,463 Linde 599 0.09
16,750 L'Occitane International 26 –984 MAN 80 0.01
1,923 Merck 164 0.029,379 Metro 252 0.044,064 MLP 14 –2,300 MTU Aero Engines 216 0.033,243 Muenchener Rueckversicherungs 497 0.071,396 Nemetschek 66 0.012,227 Nordex 39 0.011,530 Norma 53 0.013,962 Osram Licht 168 0.031,962 PATRIZIA Immobilien 26 –
361 Pfeiffer Vacuum Technology 27 –4,498 Porsche Automobil ADR 201 0.035,540 ProSiebenSat.1 Media 174 0.03
131 Puma 28 –6,500 QSC 11 –
129 Rational 47 0.012,198 Rheinmetall 120 0.021,529 Rhoen-Klinikum 34 0.01
Holding Investment
Fair Value £'000
Percentage of total
net assets %
Germany (continued)2,054 RIB Software 22 –1,233 RTL 74 0.01
30,754 RWE 310 0.052,720 SAF-Holland 32 0.012,087 Salzgitter 60 0.01
12,533 SAP 890 0.131,020 Sartorius 63 0.01
803 Schaeffler 10 –327 Schaltbau 9 –794 SHW 22 –
12,551 Siemens 1,247 0.18668 Siltronic 25 –
1,254 Sixt 55 0.011,412 Sixt Preference 47 0.01
440 SMA Solar Technology 9 –2,283 Software 67 0.01
320 Stabilus 14 –3,587 STADA Arzneimittel 151 0.02
157 STO SE & Co 13 –960 Stroeer Media 34 0.01
6,091 Suedzucker 119 0.02216 Surteco 4 –
4,118 Symrise 205 0.037,373 TAG Immobilien 79 0.011,598 Takkt 29 0.013,076 Talanx 84 0.01
20,056 Telefonica Deutschland 70 0.017,986 ThyssenKrupp 155 0.021,606 TLG Immobilien AG 25 –9,763 Uniper* 110 0.024,728 United Internet 151 0.021,283 Volkswagen 151 0.026,951 Volkswagen Preference 791 0.12
13,559 Vonovia 359 0.05360 Vossloh 18 –
1,006 VTG 24 –1,069 Wacker Chemie 91 0.011,167 Wacker Neuson 15 –
693 Washtec 30 0.01154 XING 23 –611 Zalando 19 –
28,053 4.10
Greece 0.00% (0.00%)6,409 TT Hellenic Postbank* – –
– –
Hong Kong 1.49% (1.56%)223,700 AIA 1,026 0.1582,000 Allied Propeties 15 –27,000 APT Satellite 10 –13,300 ASM Pacific Technology 114 0.02
121,500 Bank of China Hong Kong 353 0.0531,290 Bank of East Asia 97 0.02
370,000 BEP International 17 –52,000 Bright Smart Securities &
Commodities 14 –85,000 Brightoil Petroleum 20 –14,000 Cafe De Coral 37 0.0194,000 Cathay Pacific Airways 101 0.0287,795 Champion 39 0.0151,948 Cheung Kong Property 259 0.04
685,000 China Strategic 13 –
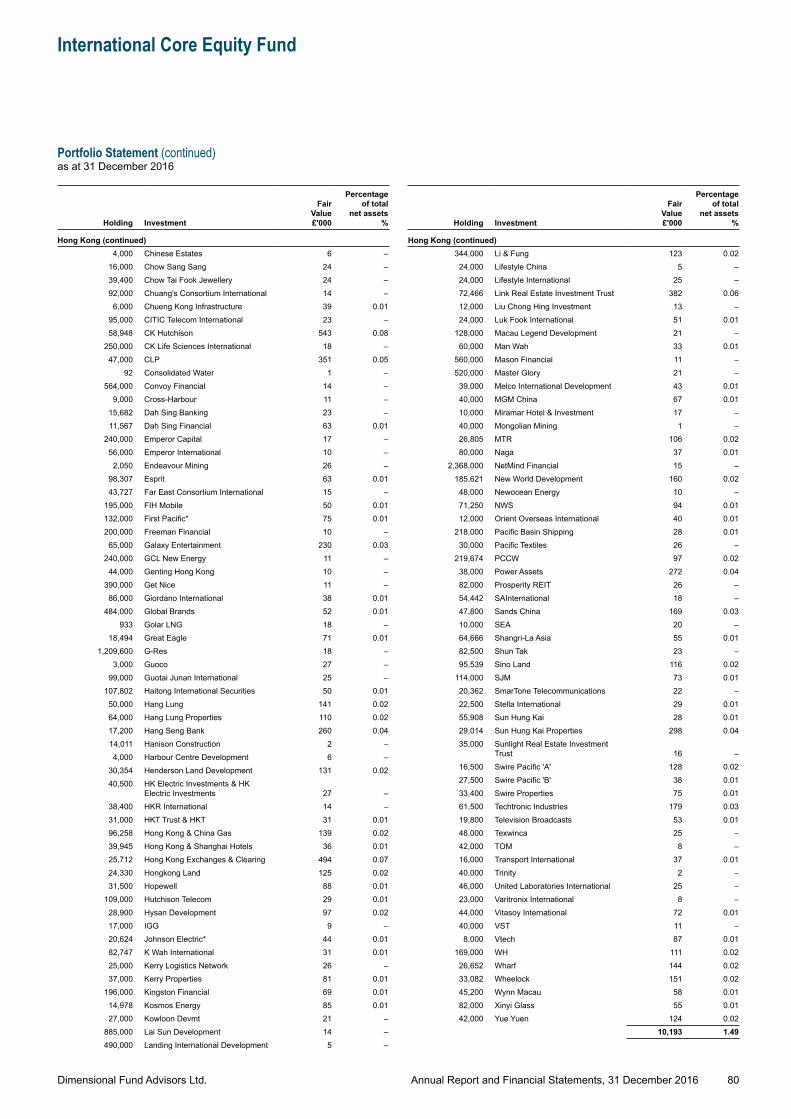
Dimensional Fund Advisors Ltd.
International Core Equity Fund
Portfolio Statement (continued)as at 31 December 2016
80Annual Report and Financial Statements, 31 December 2016
Holding Investment
Fair Value £'000
Percentage of total
net assets %
Hong Kong (continued)4,000 Chinese Estates 6 –
16,000 Chow Sang Sang 24 –39,400 Chow Tai Fook Jewellery 24 –92,000 Chuang's Consortium International 14 –6,000 Chueng Kong Infrastructure 39 0.01
95,000 CITIC Telecom International 23 –58,948 CK Hutchison 543 0.08
250,000 CK Life Sciences International 18 –47,000 CLP 351 0.05
92 Consolidated Water 1 –564,000 Convoy Financial 14 –
9,000 Cross-Harbour 11 –15,682 Dah Sing Banking 23 –11,567 Dah Sing Financial 63 0.01
240,000 Emperor Capital 17 –56,000 Emperor International 10 –2,050 Endeavour Mining 26 –
98,307 Esprit 63 0.0143,727 Far East Consortium International 15 –
195,000 FIH Mobile 50 0.01132,000 First Pacific* 75 0.01200,000 Freeman Financial 10 –65,000 Galaxy Entertainment 230 0.03
240,000 GCL New Energy 11 –44,000 Genting Hong Kong 10 –
390,000 Get Nice 11 –86,000 Giordano International 38 0.01
484,000 Global Brands 52 0.01933 Golar LNG 18 –
18,494 Great Eagle 71 0.011,209,600 G-Res 18 –
3,000 Guoco 27 –99,000 Guotai Junan International 25 –
107,802 Haitong International Securities 50 0.0150,000 Hang Lung 141 0.0264,000 Hang Lung Properties 110 0.0217,200 Hang Seng Bank 260 0.0414,011 Hanison Construction 2 –4,000 Harbour Centre Development 6 –
30,354 Henderson Land Development 131 0.0240,500 HK Electric Investments & HK
Electric Investments 27 –38,400 HKR International 14 –31,000 HKT Trust & HKT 31 0.0196,258 Hong Kong & China Gas 139 0.0239,945 Hong Kong & Shanghai Hotels 36 0.0125,712 Hong Kong Exchanges & Clearing 494 0.0724,330 Hongkong Land 125 0.0231,500 Hopewell 88 0.01
109,000 Hutchison Telecom 29 0.0128,900 Hysan Development 97 0.0217,000 IGG 9 –20,624 Johnson Electric* 44 0.0182,747 K Wah International 31 0.0125,000 Kerry Logistics Network 26 –37,000 Kerry Properties 81 0.01
196,000 Kingston Financial 69 0.0114,978 Kosmos Energy 85 0.0127,000 Kowloon Devmt 21 –
885,000 Lai Sun Development 14 –490,000 Landing International Development 5 –
Holding Investment
Fair Value £'000
Percentage of total
net assets %
Hong Kong (continued)344,000 Li & Fung 123 0.02
24,000 Lifestyle China 5 –24,000 Lifestyle International 25 –72,466 Link Real Estate Investment Trust 382 0.0612,000 Liu Chong Hing Investment 13 –24,000 Luk Fook International 51 0.01
128,000 Macau Legend Development 21 –60,000 Man Wah 33 0.01
560,000 Mason Financial 11 –520,000 Master Glory 21 –39,000 Melco International Development 43 0.0140,000 MGM China 67 0.0110,000 Miramar Hotel & Investment 17 –40,000 Mongolian Mining 1 –26,805 MTR 106 0.0280,000 Naga 37 0.01
2,368,000 NetMind Financial 15 –185,621 New World Development 160 0.02
48,000 Newocean Energy 10 –71,250 NWS 94 0.0112,000 Orient Overseas International 40 0.01
218,000 Pacific Basin Shipping 28 0.0130,000 Pacific Textiles 26 –
219,674 PCCW 97 0.0238,000 Power Assets 272 0.0482,000 Prosperity REIT 26 –54,442 SAInternational 18 –47,800 Sands China 169 0.0310,000 SEA 20 –64,666 Shangri-La Asia 55 0.0182,500 Shun Tak 23 –95,539 Sino Land 116 0.02
114,000 SJM 73 0.0120,362 SmarTone Telecommunications 22 –22,500 Stella International 29 0.0155,908 Sun Hung Kai 28 0.0129,014 Sun Hung Kai Properties 298 0.0435,000 Sunlight Real Estate Investment
Trust 16 –16,500 Swire Pacific 'A' 128 0.0227,500 Swire Pacific 'B' 38 0.0133,400 Swire Properties 75 0.0161,500 Techtronic Industries 179 0.0319,800 Television Broadcasts 53 0.0148,000 Texwinca 25 –42,000 TOM 8 –16,000 Transport International 37 0.0140,000 Trinity 2 –46,000 United Laboratories International 25 –23,000 Varitronix International 8 –44,000 Vitasoy International 72 0.0140,000 VST 11 –8,000 Vtech 87 0.01
169,000 WH 111 0.0226,652 Wharf 144 0.0233,082 Wheelock 151 0.0245,200 Wynn Macau 58 0.0182,000 Xinyi Glass 55 0.0142,000 Yue Yuen 124 0.02
10,193 1.49
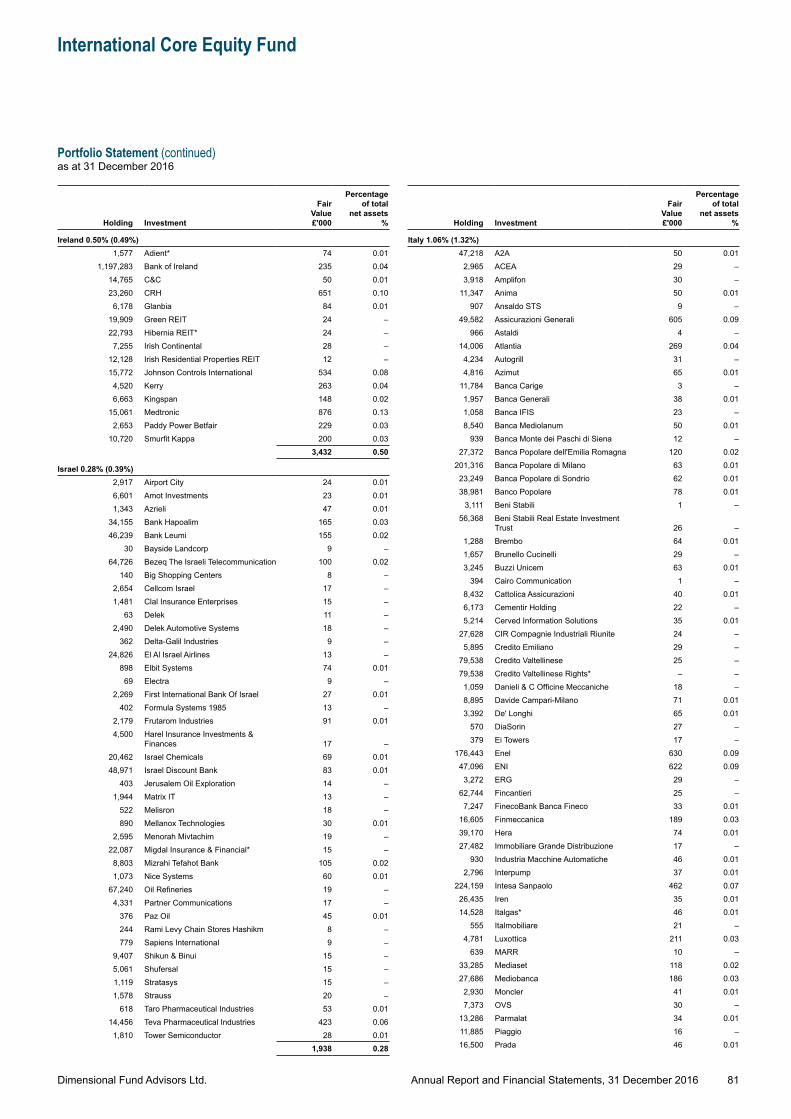
Dimensional Fund Advisors Ltd.
International Core Equity Fund
Portfolio Statement (continued)as at 31 December 2016
81Annual Report and Financial Statements, 31 December 2016
Holding Investment
Fair Value £'000
Percentage of total
net assets %
Ireland 0.50% (0.49%)1,577 Adient* 74 0.01
1,197,283 Bank of Ireland 235 0.0414,765 C&C 50 0.0123,260 CRH 651 0.10
6,178 Glanbia 84 0.0119,909 Green REIT 24 –22,793 Hibernia REIT* 24 –7,255 Irish Continental 28 –
12,128 Irish Residential Properties REIT 12 –15,772 Johnson Controls International 534 0.08
4,520 Kerry 263 0.046,663 Kingspan 148 0.02
15,061 Medtronic 876 0.132,653 Paddy Power Betfair 229 0.03
10,720 Smurfit Kappa 200 0.033,432 0.50
Israel 0.28% (0.39%)2,917 Airport City 24 0.016,601 Amot Investments 23 0.011,343 Azrieli 47 0.01
34,155 Bank Hapoalim 165 0.0346,239 Bank Leumi 155 0.02
30 Bayside Landcorp 9 –64,726 Bezeq The Israeli Telecommunication 100 0.02
140 Big Shopping Centers 8 –2,654 Cellcom Israel 17 –1,481 Clal Insurance Enterprises 15 –
63 Delek 11 –2,490 Delek Automotive Systems 18 –
362 Delta-Galil Industries 9 –24,826 El Al Israel Airlines 13 –
898 Elbit Systems 74 0.0169 Electra 9 –
2,269 First International Bank Of Israel 27 0.01402 Formula Systems 1985 13 –
2,179 Frutarom Industries 91 0.014,500 Harel Insurance Investments &
Finances 17 –20,462 Israel Chemicals 69 0.0148,971 Israel Discount Bank 83 0.01
403 Jerusalem Oil Exploration 14 –1,944 Matrix IT 13 –
522 Melisron 18 –890 Mellanox Technologies 30 0.01
2,595 Menorah Mivtachim 19 –22,087 Migdal Insurance & Financial* 15 –8,803 Mizrahi Tefahot Bank 105 0.021,073 Nice Systems 60 0.01
67,240 Oil Refineries 19 –4,331 Partner Communications 17 –
376 Paz Oil 45 0.01244 Rami Levy Chain Stores Hashikm 8 –779 Sapiens International 9 –
9,407 Shikun & Binui 15 –5,061 Shufersal 15 –1,119 Stratasys 15 –1,578 Strauss 20 –
618 Taro Pharmaceutical Industries 53 0.0114,456 Teva Pharmaceutical Industries 423 0.06
1,810 Tower Semiconductor 28 0.011,938 0.28
Holding Investment
Fair Value £'000
Percentage of total
net assets %
Italy 1.06% (1.32%)47,218 A2A 50 0.01
2,965 ACEA 29 –3,918 Amplifon 30 –
11,347 Anima 50 0.01907 Ansaldo STS 9 –
49,582 Assicurazioni Generali 605 0.09966 Astaldi 4 –
14,006 Atlantia 269 0.044,234 Autogrill 31 –4,816 Azimut 65 0.01
11,784 Banca Carige 3 –1,957 Banca Generali 38 0.011,058 Banca IFIS 23 –8,540 Banca Mediolanum 50 0.01
939 Banca Monte dei Paschi di Siena 12 –27,372 Banca Popolare dell'Emilia Romagna 120 0.02
201,316 Banca Popolare di Milano 63 0.0123,249 Banca Popolare di Sondrio 62 0.0138,981 Banco Popolare 78 0.01
3,111 Beni Stabili 1 –56,368 Beni Stabili Real Estate Investment
Trust 26 –1,288 Brembo 64 0.011,657 Brunello Cucinelli 29 –3,245 Buzzi Unicem 63 0.01
394 Cairo Communication 1 –8,432 Cattolica Assicurazioni 40 0.016,173 Cementir Holding 22 –5,214 Cerved Information Solutions 35 0.01
27,628 CIR Compagnie Industriali Riunite 24 –5,895 Credito Emiliano 29 –
79,538 Credito Valtellinese 25 –79,538 Credito Valtellinese Rights* – –1,059 Danieli & C Officine Meccaniche 18 –8,895 Davide Campari-Milano 71 0.013,392 De' Longhi 65 0.01
570 DiaSorin 27 –379 Ei Towers 17 –
176,443 Enel 630 0.0947,096 ENI 622 0.09
3,272 ERG 29 –62,744 Fincantieri 25 –7,247 FinecoBank Banca Fineco 33 0.01
16,605 Finmeccanica 189 0.0339,170 Hera 74 0.0127,482 Immobiliare Grande Distribuzione 17 –
930 Industria Macchine Automatiche 46 0.012,796 Interpump 37 0.01
224,159 Intesa Sanpaolo 462 0.0726,435 Iren 35 0.0114,528 Italgas* 46 0.01
555 Italmobiliare 21 –4,781 Luxottica 211 0.03
639 MARR 10 –33,285 Mediaset 118 0.0227,686 Mediobanca 186 0.03
2,930 Moncler 41 0.017,373 OVS 30 –
13,286 Parmalat 34 0.0111,885 Piaggio 16 –16,500 Prada 46 0.01
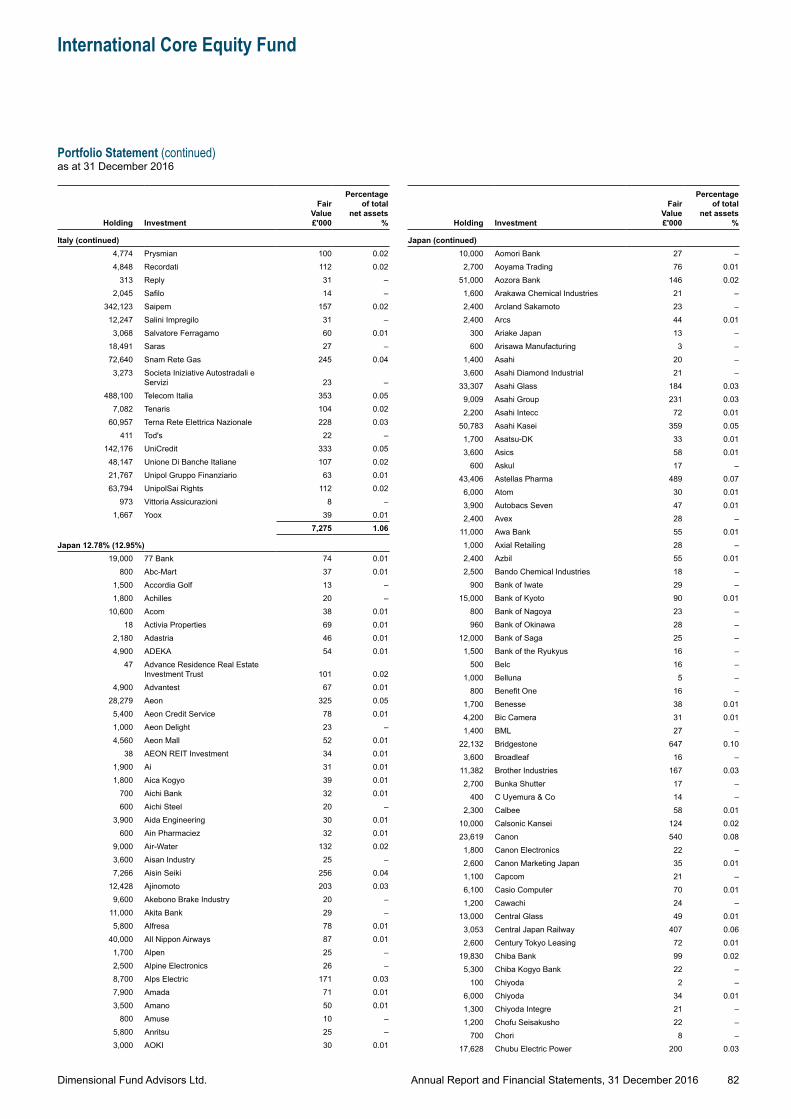
Dimensional Fund Advisors Ltd.
International Core Equity Fund
Portfolio Statement (continued)as at 31 December 2016
82Annual Report and Financial Statements, 31 December 2016
Holding Investment
Fair Value £'000
Percentage of total
net assets %
Italy (continued)4,774 Prysmian 100 0.024,848 Recordati 112 0.02
313 Reply 31 –2,045 Safilo 14 –
342,123 Saipem 157 0.0212,247 Salini Impregilo 31 –3,068 Salvatore Ferragamo 60 0.01
18,491 Saras 27 –72,640 Snam Rete Gas 245 0.04
3,273 Societa Iniziative Autostradali e Servizi 23 –
488,100 Telecom Italia 353 0.057,082 Tenaris 104 0.02
60,957 Terna Rete Elettrica Nazionale 228 0.03411 Tod's 22 –
142,176 UniCredit 333 0.0548,147 Unione Di Banche Italiane 107 0.0221,767 Unipol Gruppo Finanziario 63 0.0163,794 UnipolSai Rights 112 0.02
973 Vittoria Assicurazioni 8 –1,667 Yoox 39 0.01
7,275 1.06
Japan 12.78% (12.95%)19,000 77 Bank 74 0.01
800 Abc-Mart 37 0.011,500 Accordia Golf 13 –1,800 Achilles 20 –
10,600 Acom 38 0.0118 Activia Properties 69 0.01
2,180 Adastria 46 0.014,900 ADEKA 54 0.01
47 Advance Residence Real Estate Investment Trust 101 0.02
4,900 Advantest 67 0.0128,279 Aeon 325 0.05
5,400 Aeon Credit Service 78 0.011,000 Aeon Delight 23 –4,560 Aeon Mall 52 0.01
38 AEON REIT Investment 34 0.011,900 Ai 31 0.011,800 Aica Kogyo 39 0.01
700 Aichi Bank 32 0.01600 Aichi Steel 20 –
3,900 Aida Engineering 30 0.01600 Ain Pharmaciez 32 0.01
9,000 Air-Water 132 0.023,600 Aisan Industry 25 –7,266 Aisin Seiki 256 0.04
12,428 Ajinomoto 203 0.039,600 Akebono Brake Industry 20 –
11,000 Akita Bank 29 –5,800 Alfresa 78 0.01
40,000 All Nippon Airways 87 0.011,700 Alpen 25 –2,500 Alpine Electronics 26 –8,700 Alps Electric 171 0.037,900 Amada 71 0.013,500 Amano 50 0.01
800 Amuse 10 –5,800 Anritsu 25 –3,000 AOKI 30 0.01
Holding Investment
Fair Value £'000
Percentage of total
net assets %
Japan (continued)10,000 Aomori Bank 27 –2,700 Aoyama Trading 76 0.01
51,000 Aozora Bank 146 0.021,600 Arakawa Chemical Industries 21 –2,400 Arcland Sakamoto 23 –2,400 Arcs 44 0.01
300 Ariake Japan 13 –600 Arisawa Manufacturing 3 –
1,400 Asahi 20 –3,600 Asahi Diamond Industrial 21 –
33,307 Asahi Glass 184 0.039,009 Asahi Group 231 0.032,200 Asahi Intecc 72 0.01
50,783 Asahi Kasei 359 0.051,700 Asatsu-DK 33 0.013,600 Asics 58 0.01
600 Askul 17 –43,406 Astellas Pharma 489 0.07
6,000 Atom 30 0.013,900 Autobacs Seven 47 0.012,400 Avex 28 –
11,000 Awa Bank 55 0.011,000 Axial Retailing 28 –2,400 Azbil 55 0.012,500 Bando Chemical Industries 18 –
900 Bank of Iwate 29 –15,000 Bank of Kyoto 90 0.01
800 Bank of Nagoya 23 –960 Bank of Okinawa 28 –
12,000 Bank of Saga 25 –1,500 Bank of the Ryukyus 16 –
500 Belc 16 –1,000 Belluna 5 –
800 Benefit One 16 –1,700 Benesse 38 0.014,200 Bic Camera 31 0.011,400 BML 27 –
22,132 Bridgestone 647 0.103,600 Broadleaf 16 –
11,382 Brother Industries 167 0.032,700 Bunka Shutter 17 –
400 C Uyemura & Co 14 –2,300 Calbee 58 0.01
10,000 Calsonic Kansei 124 0.0223,619 Canon 540 0.08
1,800 Canon Electronics 22 –2,600 Canon Marketing Japan 35 0.011,100 Capcom 21 –6,100 Casio Computer 70 0.011,200 Cawachi 24 –
13,000 Central Glass 49 0.013,053 Central Japan Railway 407 0.062,600 Century Tokyo Leasing 72 0.01
19,830 Chiba Bank 99 0.025,300 Chiba Kogyo Bank 22 –
100 Chiyoda 2 –6,000 Chiyoda 34 0.011,300 Chiyoda Integre 21 –1,200 Chofu Seisakusho 22 –
700 Chori 8 –17,628 Chubu Electric Power 200 0.03
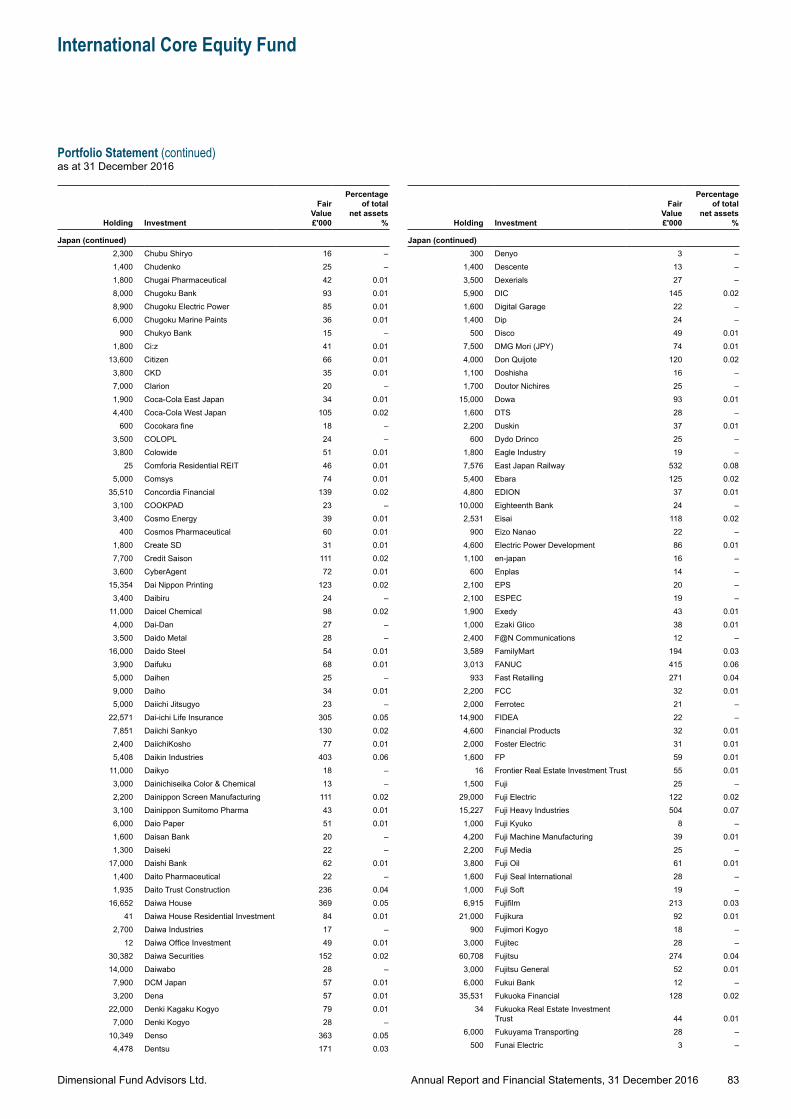
Dimensional Fund Advisors Ltd.
International Core Equity Fund
Portfolio Statement (continued)as at 31 December 2016
83Annual Report and Financial Statements, 31 December 2016
Holding Investment
Fair Value £'000
Percentage of total
net assets %
Japan (continued)2,300 Chubu Shiryo 16 –1,400 Chudenko 25 –1,800 Chugai Pharmaceutical 42 0.018,000 Chugoku Bank 93 0.018,900 Chugoku Electric Power 85 0.016,000 Chugoku Marine Paints 36 0.01
900 Chukyo Bank 15 –1,800 Ci:z 41 0.01
13,600 Citizen 66 0.013,800 CKD 35 0.017,000 Clarion 20 –1,900 Coca-Cola East Japan 34 0.014,400 Coca-Cola West Japan 105 0.02
600 Cocokara fine 18 –3,500 COLOPL 24 –3,800 Colowide 51 0.01
25 Comforia Residential REIT 46 0.015,000 Comsys 74 0.01
35,510 Concordia Financial 139 0.023,100 COOKPAD 23 –3,400 Cosmo Energy 39 0.01
400 Cosmos Pharmaceutical 60 0.011,800 Create SD 31 0.017,700 Credit Saison 111 0.023,600 CyberAgent 72 0.01
15,354 Dai Nippon Printing 123 0.023,400 Daibiru 24 –
11,000 Daicel Chemical 98 0.024,000 Dai-Dan 27 –3,500 Daido Metal 28 –
16,000 Daido Steel 54 0.013,900 Daifuku 68 0.015,000 Daihen 25 –9,000 Daiho 34 0.015,000 Daiichi Jitsugyo 23 –
22,571 Dai-ichi Life Insurance 305 0.057,851 Daiichi Sankyo 130 0.022,400 DaiichiKosho 77 0.015,408 Daikin Industries 403 0.06
11,000 Daikyo 18 –3,000 Dainichiseika Color & Chemical 13 –2,200 Dainippon Screen Manufacturing 111 0.023,100 Dainippon Sumitomo Pharma 43 0.016,000 Daio Paper 51 0.011,600 Daisan Bank 20 –1,300 Daiseki 22 –
17,000 Daishi Bank 62 0.011,400 Daito Pharmaceutical 22 –1,935 Daito Trust Construction 236 0.04
16,652 Daiwa House 369 0.0541 Daiwa House Residential Investment 84 0.01
2,700 Daiwa Industries 17 –12 Daiwa Office Investment 49 0.01
30,382 Daiwa Securities 152 0.0214,000 Daiwabo 28 –7,900 DCM Japan 57 0.013,200 Dena 57 0.01
22,000 Denki Kagaku Kogyo 79 0.017,000 Denki Kogyo 28 –
10,349 Denso 363 0.054,478 Dentsu 171 0.03
Holding Investment
Fair Value £'000
Percentage of total
net assets %
Japan (continued)300 Denyo 3 –
1,400 Descente 13 –3,500 Dexerials 27 –5,900 DIC 145 0.021,600 Digital Garage 22 –1,400 Dip 24 –
500 Disco 49 0.017,500 DMG Mori (JPY) 74 0.014,000 Don Quijote 120 0.021,100 Doshisha 16 –1,700 Doutor Nichires 25 –
15,000 Dowa 93 0.011,600 DTS 28 –2,200 Duskin 37 0.01
600 Dydo Drinco 25 –1,800 Eagle Industry 19 –7,576 East Japan Railway 532 0.085,400 Ebara 125 0.024,800 EDION 37 0.01
10,000 Eighteenth Bank 24 –2,531 Eisai 118 0.02
900 Eizo Nanao 22 –4,600 Electric Power Development 86 0.011,100 en-japan 16 –
600 Enplas 14 –2,100 EPS 20 –2,100 ESPEC 19 –1,900 Exedy 43 0.011,000 Ezaki Glico 38 0.012,400 F@N Communications 12 –3,589 FamilyMart 194 0.033,013 FANUC 415 0.06
933 Fast Retailing 271 0.042,200 FCC 32 0.012,000 Ferrotec 21 –
14,900 FIDEA 22 –4,600 Financial Products 32 0.012,000 Foster Electric 31 0.011,600 FP 59 0.01
16 Frontier Real Estate Investment Trust 55 0.011,500 Fuji 25 –
29,000 Fuji Electric 122 0.0215,227 Fuji Heavy Industries 504 0.07
1,000 Fuji Kyuko 8 –4,200 Fuji Machine Manufacturing 39 0.012,200 Fuji Media 25 –3,800 Fuji Oil 61 0.011,600 Fuji Seal International 28 –1,000 Fuji Soft 19 –6,915 Fujifilm 213 0.03
21,000 Fujikura 92 0.01900 Fujimori Kogyo 18 –
3,000 Fujitec 28 –60,708 Fujitsu 274 0.04
3,000 Fujitsu General 52 0.016,000 Fukui Bank 12 –
35,531 Fukuoka Financial 128 0.0234 Fukuoka Real Estate Investment
Trust 44 0.016,000 Fukuyama Transporting 28 –
500 Funai Electric 3 –
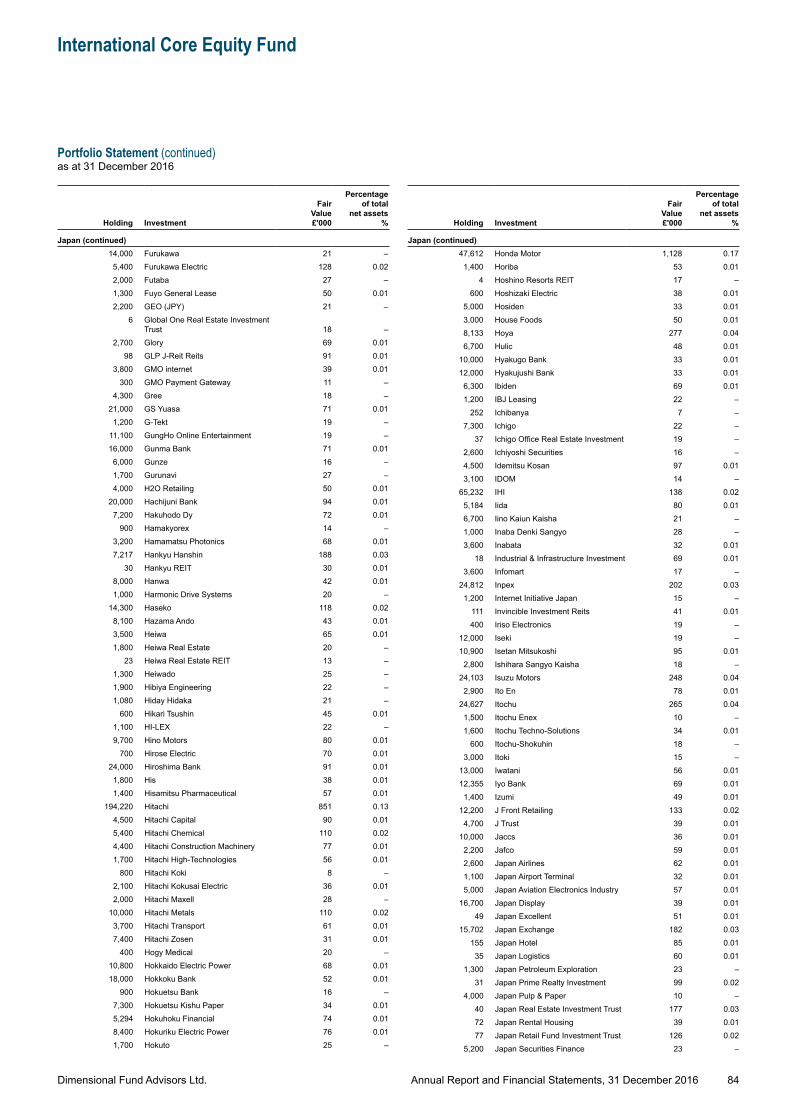
Dimensional Fund Advisors Ltd.
International Core Equity Fund
Portfolio Statement (continued)as at 31 December 2016
84Annual Report and Financial Statements, 31 December 2016
Holding Investment
Fair Value £'000
Percentage of total
net assets %
Japan (continued)14,000 Furukawa 21 –
5,400 Furukawa Electric 128 0.022,000 Futaba 27 –1,300 Fuyo General Lease 50 0.012,200 GEO (JPY) 21 –
6 Global One Real Estate Investment Trust 18 –
2,700 Glory 69 0.0198 GLP J-Reit Reits 91 0.01
3,800 GMO internet 39 0.01300 GMO Payment Gateway 11 –
4,300 Gree 18 –21,000 GS Yuasa 71 0.01
1,200 G-Tekt 19 –11,100 GungHo Online Entertainment 19 –16,000 Gunma Bank 71 0.01
6,000 Gunze 16 –1,700 Gurunavi 27 –4,000 H2O Retailing 50 0.01
20,000 Hachijuni Bank 94 0.017,200 Hakuhodo Dy 72 0.01
900 Hamakyorex 14 –3,200 Hamamatsu Photonics 68 0.017,217 Hankyu Hanshin 188 0.03
30 Hankyu REIT 30 0.018,000 Hanwa 42 0.011,000 Harmonic Drive Systems 20 –
14,300 Haseko 118 0.028,100 Hazama Ando 43 0.013,500 Heiwa 65 0.011,800 Heiwa Real Estate 20 –
23 Heiwa Real Estate REIT 13 –1,300 Heiwado 25 –1,900 Hibiya Engineering 22 –1,080 Hiday Hidaka 21 –
600 Hikari Tsushin 45 0.011,100 HI-LEX 22 –9,700 Hino Motors 80 0.01
700 Hirose Electric 70 0.0124,000 Hiroshima Bank 91 0.01
1,800 His 38 0.011,400 Hisamitsu Pharmaceutical 57 0.01
194,220 Hitachi 851 0.134,500 Hitachi Capital 90 0.015,400 Hitachi Chemical 110 0.024,400 Hitachi Construction Machinery 77 0.011,700 Hitachi High-Technologies 56 0.01
800 Hitachi Koki 8 –2,100 Hitachi Kokusai Electric 36 0.012,000 Hitachi Maxell 28 –
10,000 Hitachi Metals 110 0.023,700 Hitachi Transport 61 0.017,400 Hitachi Zosen 31 0.01
400 Hogy Medical 20 –10,800 Hokkaido Electric Power 68 0.0118,000 Hokkoku Bank 52 0.01
900 Hokuetsu Bank 16 –7,300 Hokuetsu Kishu Paper 34 0.015,294 Hokuhoku Financial 74 0.018,400 Hokuriku Electric Power 76 0.011,700 Hokuto 25 –
Holding Investment
Fair Value £'000
Percentage of total
net assets %
Japan (continued)47,612 Honda Motor 1,128 0.17
1,400 Horiba 53 0.014 Hoshino Resorts REIT 17 –
600 Hoshizaki Electric 38 0.015,000 Hosiden 33 0.013,000 House Foods 50 0.018,133 Hoya 277 0.046,700 Hulic 48 0.01
10,000 Hyakugo Bank 33 0.0112,000 Hyakujushi Bank 33 0.01
6,300 Ibiden 69 0.011,200 IBJ Leasing 22 –
252 Ichibanya 7 –7,300 Ichigo 22 –
37 Ichigo Office Real Estate Investment 19 –2,600 Ichiyoshi Securities 16 –4,500 Idemitsu Kosan 97 0.013,100 IDOM 14 –
65,232 IHI 138 0.025,184 Iida 80 0.016,700 Iino Kaiun Kaisha 21 –1,000 Inaba Denki Sangyo 28 –3,600 Inabata 32 0.01
18 Industrial & Infrastructure Investment 69 0.013,600 Infomart 17 –
24,812 Inpex 202 0.031,200 Internet Initiative Japan 15 –
111 Invincible Investment Reits 41 0.01400 Iriso Electronics 19 –
12,000 Iseki 19 –10,900 Isetan Mitsukoshi 95 0.01
2,800 Ishihara Sangyo Kaisha 18 –24,103 Isuzu Motors 248 0.04
2,900 Ito En 78 0.0124,627 Itochu 265 0.04
1,500 Itochu Enex 10 –1,600 Itochu Techno-Solutions 34 0.01
600 Itochu-Shokuhin 18 –3,000 Itoki 15 –
13,000 Iwatani 56 0.0112,355 Iyo Bank 69 0.01
1,400 Izumi 49 0.0112,200 J Front Retailing 133 0.02
4,700 J Trust 39 0.0110,000 Jaccs 36 0.01
2,200 Jafco 59 0.012,600 Japan Airlines 62 0.011,100 Japan Airport Terminal 32 0.015,000 Japan Aviation Electronics Industry 57 0.01
16,700 Japan Display 39 0.0149 Japan Excellent 51 0.01
15,702 Japan Exchange 182 0.03155 Japan Hotel 85 0.01
35 Japan Logistics 60 0.011,300 Japan Petroleum Exploration 23 –
31 Japan Prime Realty Investment 99 0.024,000 Japan Pulp & Paper 10 –
40 Japan Real Estate Investment Trust 177 0.0372 Japan Rental Housing 39 0.0177 Japan Retail Fund Investment Trust 126 0.02
5,200 Japan Securities Finance 23 –
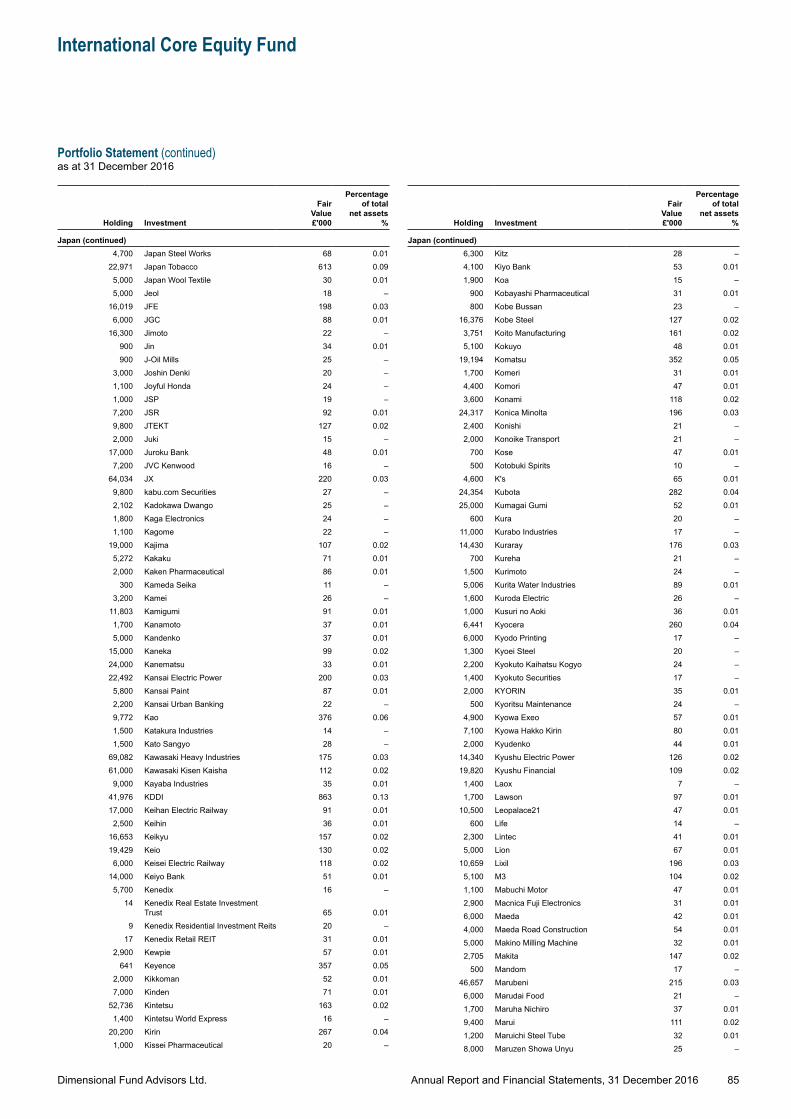
Dimensional Fund Advisors Ltd.
International Core Equity Fund
Portfolio Statement (continued)as at 31 December 2016
85Annual Report and Financial Statements, 31 December 2016
Holding Investment
Fair Value £'000
Percentage of total
net assets %
Japan (continued)4,700 Japan Steel Works 68 0.01
22,971 Japan Tobacco 613 0.095,000 Japan Wool Textile 30 0.015,000 Jeol 18 –
16,019 JFE 198 0.036,000 JGC 88 0.01
16,300 Jimoto 22 –900 Jin 34 0.01900 J-Oil Mills 25 –
3,000 Joshin Denki 20 –1,100 Joyful Honda 24 –1,000 JSP 19 –7,200 JSR 92 0.019,800 JTEKT 127 0.022,000 Juki 15 –
17,000 Juroku Bank 48 0.017,200 JVC Kenwood 16 –
64,034 JX 220 0.039,800 kabu.com Securities 27 –2,102 Kadokawa Dwango 25 –1,800 Kaga Electronics 24 –1,100 Kagome 22 –
19,000 Kajima 107 0.025,272 Kakaku 71 0.012,000 Kaken Pharmaceutical 86 0.01
300 Kameda Seika 11 –3,200 Kamei 26 –
11,803 Kamigumi 91 0.011,700 Kanamoto 37 0.015,000 Kandenko 37 0.01
15,000 Kaneka 99 0.0224,000 Kanematsu 33 0.0122,492 Kansai Electric Power 200 0.03
5,800 Kansai Paint 87 0.012,200 Kansai Urban Banking 22 –9,772 Kao 376 0.061,500 Katakura Industries 14 –1,500 Kato Sangyo 28 –
69,082 Kawasaki Heavy Industries 175 0.0361,000 Kawasaki Kisen Kaisha 112 0.02
9,000 Kayaba Industries 35 0.0141,976 KDDI 863 0.1317,000 Keihan Electric Railway 91 0.01
2,500 Keihin 36 0.0116,653 Keikyu 157 0.0219,429 Keio 130 0.02
6,000 Keisei Electric Railway 118 0.0214,000 Keiyo Bank 51 0.01
5,700 Kenedix 16 –14 Kenedix Real Estate Investment
Trust 65 0.019 Kenedix Residential Investment Reits 20 –
17 Kenedix Retail REIT 31 0.012,900 Kewpie 57 0.01
641 Keyence 357 0.052,000 Kikkoman 52 0.017,000 Kinden 71 0.01
52,736 Kintetsu 163 0.021,400 Kintetsu World Express 16 –
20,200 Kirin 267 0.041,000 Kissei Pharmaceutical 20 –
Holding Investment
Fair Value £'000
Percentage of total
net assets %
Japan (continued)6,300 Kitz 28 –4,100 Kiyo Bank 53 0.011,900 Koa 15 –
900 Kobayashi Pharmaceutical 31 0.01800 Kobe Bussan 23 –
16,376 Kobe Steel 127 0.023,751 Koito Manufacturing 161 0.025,100 Kokuyo 48 0.01
19,194 Komatsu 352 0.051,700 Komeri 31 0.014,400 Komori 47 0.013,600 Konami 118 0.02
24,317 Konica Minolta 196 0.032,400 Konishi 21 –2,000 Konoike Transport 21 –
700 Kose 47 0.01500 Kotobuki Spirits 10 –
4,600 K's 65 0.0124,354 Kubota 282 0.0425,000 Kumagai Gumi 52 0.01
600 Kura 20 –11,000 Kurabo Industries 17 –14,430 Kuraray 176 0.03
700 Kureha 21 –1,500 Kurimoto 24 –5,006 Kurita Water Industries 89 0.011,600 Kuroda Electric 26 –1,000 Kusuri no Aoki 36 0.016,441 Kyocera 260 0.046,000 Kyodo Printing 17 –1,300 Kyoei Steel 20 –2,200 Kyokuto Kaihatsu Kogyo 24 –1,400 Kyokuto Securities 17 –2,000 KYORIN 35 0.01
500 Kyoritsu Maintenance 24 –4,900 Kyowa Exeo 57 0.017,100 Kyowa Hakko Kirin 80 0.012,000 Kyudenko 44 0.01
14,340 Kyushu Electric Power 126 0.0219,820 Kyushu Financial 109 0.02
1,400 Laox 7 –1,700 Lawson 97 0.01
10,500 Leopalace21 47 0.01600 Life 14 –
2,300 Lintec 41 0.015,000 Lion 67 0.01
10,659 Lixil 196 0.035,100 M3 104 0.021,100 Mabuchi Motor 47 0.012,900 Macnica Fuji Electronics 31 0.016,000 Maeda 42 0.014,000 Maeda Road Construction 54 0.015,000 Makino Milling Machine 32 0.012,705 Makita 147 0.02
500 Mandom 17 –46,657 Marubeni 215 0.03
6,000 Marudai Food 21 –1,700 Maruha Nichiro 37 0.019,400 Marui 111 0.021,200 Maruichi Steel Tube 32 0.018,000 Maruzen Showa Unyu 25 –
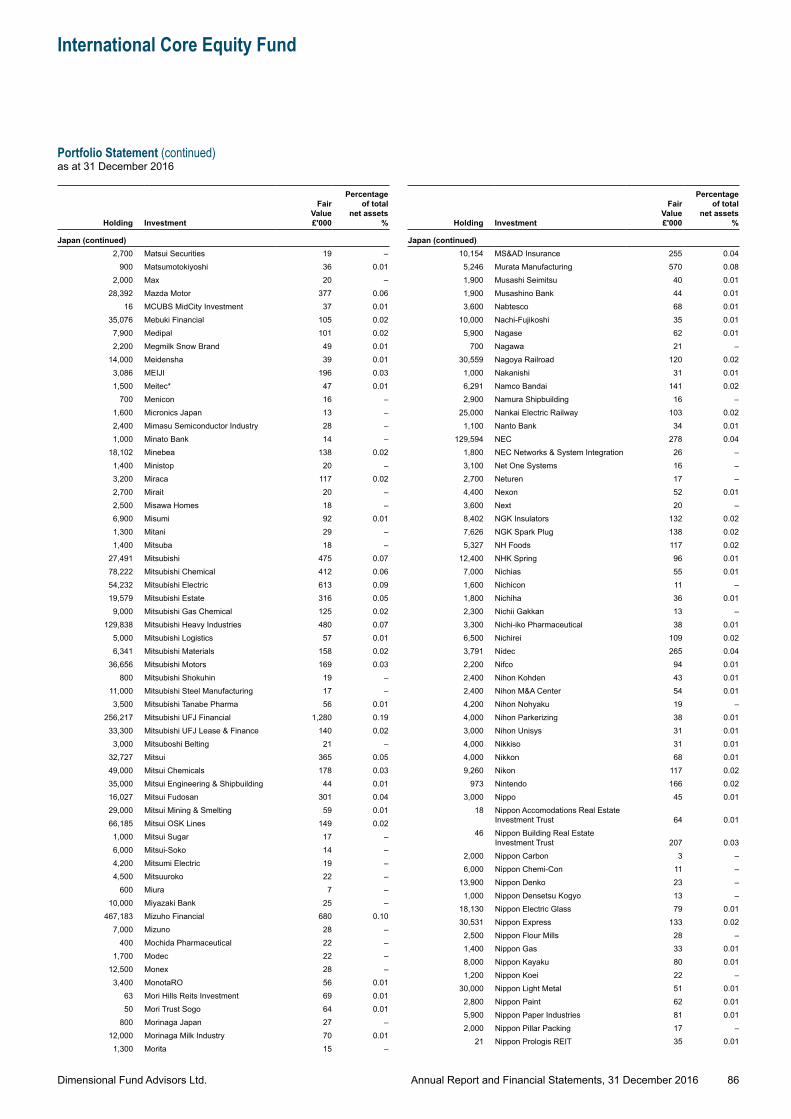
Dimensional Fund Advisors Ltd.
International Core Equity Fund
Portfolio Statement (continued)as at 31 December 2016
86Annual Report and Financial Statements, 31 December 2016
Holding Investment
Fair Value £'000
Percentage of total
net assets %
Japan (continued)2,700 Matsui Securities 19 –
900 Matsumotokiyoshi 36 0.012,000 Max 20 –
28,392 Mazda Motor 377 0.0616 MCUBS MidCity Investment 37 0.01
35,076 Mebuki Financial 105 0.027,900 Medipal 101 0.022,200 Megmilk Snow Brand 49 0.01
14,000 Meidensha 39 0.013,086 MEIJI 196 0.031,500 Meitec* 47 0.01
700 Menicon 16 –1,600 Micronics Japan 13 –2,400 Mimasu Semiconductor Industry 28 –1,000 Minato Bank 14 –
18,102 Minebea 138 0.021,400 Ministop 20 –3,200 Miraca 117 0.022,700 Mirait 20 –2,500 Misawa Homes 18 –6,900 Misumi 92 0.011,300 Mitani 29 –1,400 Mitsuba 18 –
27,491 Mitsubishi 475 0.0778,222 Mitsubishi Chemical 412 0.0654,232 Mitsubishi Electric 613 0.0919,579 Mitsubishi Estate 316 0.05
9,000 Mitsubishi Gas Chemical 125 0.02129,838 Mitsubishi Heavy Industries 480 0.07
5,000 Mitsubishi Logistics 57 0.016,341 Mitsubishi Materials 158 0.02
36,656 Mitsubishi Motors 169 0.03800 Mitsubishi Shokuhin 19 –
11,000 Mitsubishi Steel Manufacturing 17 –3,500 Mitsubishi Tanabe Pharma 56 0.01
256,217 Mitsubishi UFJ Financial 1,280 0.1933,300 Mitsubishi UFJ Lease & Finance 140 0.02
3,000 Mitsuboshi Belting 21 –32,727 Mitsui 365 0.0549,000 Mitsui Chemicals 178 0.0335,000 Mitsui Engineering & Shipbuilding 44 0.0116,027 Mitsui Fudosan 301 0.0429,000 Mitsui Mining & Smelting 59 0.0166,185 Mitsui OSK Lines 149 0.02
1,000 Mitsui Sugar 17 –6,000 Mitsui-Soko 14 –4,200 Mitsumi Electric 19 –4,500 Mitsuuroko 22 –
600 Miura 7 –10,000 Miyazaki Bank 25 –
467,183 Mizuho Financial 680 0.107,000 Mizuno 28 –
400 Mochida Pharmaceutical 22 –1,700 Modec 22 –
12,500 Monex 28 –3,400 MonotaRO 56 0.01
63 Mori Hills Reits Investment 69 0.0150 Mori Trust Sogo 64 0.01
800 Morinaga Japan 27 –12,000 Morinaga Milk Industry 70 0.01
1,300 Morita 15 –
Holding Investment
Fair Value £'000
Percentage of total
net assets %
Japan (continued)10,154 MS&AD Insurance 255 0.04
5,246 Murata Manufacturing 570 0.081,900 Musashi Seimitsu 40 0.011,900 Musashino Bank 44 0.013,600 Nabtesco 68 0.01
10,000 Nachi-Fujikoshi 35 0.015,900 Nagase 62 0.01
700 Nagawa 21 –30,559 Nagoya Railroad 120 0.02
1,000 Nakanishi 31 0.016,291 Namco Bandai 141 0.022,900 Namura Shipbuilding 16 –
25,000 Nankai Electric Railway 103 0.021,100 Nanto Bank 34 0.01
129,594 NEC 278 0.041,800 NEC Networks & System Integration 26 –3,100 Net One Systems 16 –2,700 Neturen 17 –4,400 Nexon 52 0.013,600 Next 20 –8,402 NGK Insulators 132 0.027,626 NGK Spark Plug 138 0.025,327 NH Foods 117 0.02
12,400 NHK Spring 96 0.017,000 Nichias 55 0.011,600 Nichicon 11 –1,800 Nichiha 36 0.012,300 Nichii Gakkan 13 –3,300 Nichi-iko Pharmaceutical 38 0.016,500 Nichirei 109 0.023,791 Nidec 265 0.042,200 Nifco 94 0.012,400 Nihon Kohden 43 0.012,400 Nihon M&A Center 54 0.014,200 Nihon Nohyaku 19 –4,000 Nihon Parkerizing 38 0.013,000 Nihon Unisys 31 0.014,000 Nikkiso 31 0.014,000 Nikkon 68 0.019,260 Nikon 117 0.02
973 Nintendo 166 0.023,000 Nippo 45 0.01
18 Nippon Accomodations Real Estate Investment Trust 64 0.01
46 Nippon Building Real Estate Investment Trust 207 0.03
2,000 Nippon Carbon 3 –6,000 Nippon Chemi-Con 11 –
13,900 Nippon Denko 23 –1,000 Nippon Densetsu Kogyo 13 –
18,130 Nippon Electric Glass 79 0.0130,531 Nippon Express 133 0.02
2,500 Nippon Flour Mills 28 –1,400 Nippon Gas 33 0.018,000 Nippon Kayaku 80 0.011,200 Nippon Koei 22 –
30,000 Nippon Light Metal 51 0.012,800 Nippon Paint 62 0.015,900 Nippon Paper Industries 81 0.012,000 Nippon Pillar Packing 17 –
21 Nippon Prologis REIT 35 0.01
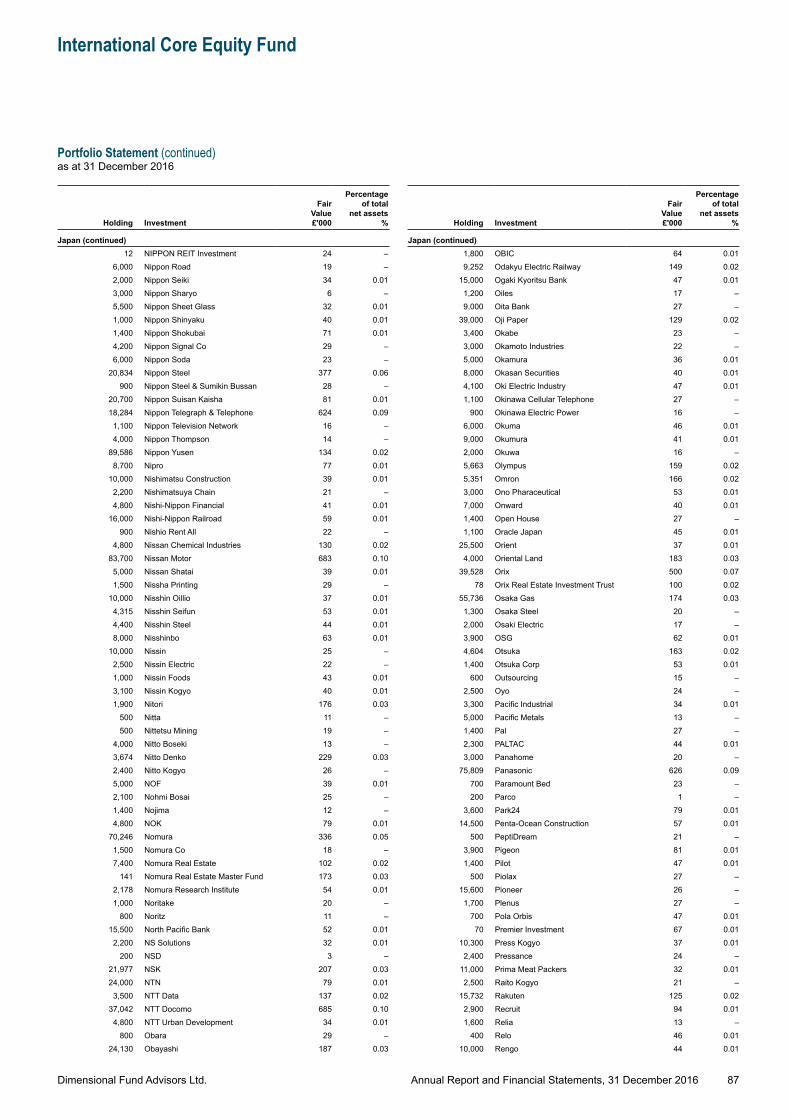
Dimensional Fund Advisors Ltd.
International Core Equity Fund
Portfolio Statement (continued)as at 31 December 2016
87Annual Report and Financial Statements, 31 December 2016
Holding Investment
Fair Value £'000
Percentage of total
net assets %
Japan (continued)12 NIPPON REIT Investment 24 –
6,000 Nippon Road 19 –2,000 Nippon Seiki 34 0.013,000 Nippon Sharyo 6 –5,500 Nippon Sheet Glass 32 0.011,000 Nippon Shinyaku 40 0.011,400 Nippon Shokubai 71 0.014,200 Nippon Signal Co 29 –6,000 Nippon Soda 23 –
20,834 Nippon Steel 377 0.06900 Nippon Steel & Sumikin Bussan 28 –
20,700 Nippon Suisan Kaisha 81 0.0118,284 Nippon Telegraph & Telephone 624 0.09
1,100 Nippon Television Network 16 –4,000 Nippon Thompson 14 –
89,586 Nippon Yusen 134 0.028,700 Nipro 77 0.01
10,000 Nishimatsu Construction 39 0.012,200 Nishimatsuya Chain 21 –4,800 Nishi-Nippon Financial 41 0.01
16,000 Nishi-Nippon Railroad 59 0.01900 Nishio Rent All 22 –
4,800 Nissan Chemical Industries 130 0.0283,700 Nissan Motor 683 0.10
5,000 Nissan Shatai 39 0.011,500 Nissha Printing 29 –
10,000 Nisshin Oillio 37 0.014,315 Nisshin Seifun 53 0.014,400 Nisshin Steel 44 0.018,000 Nisshinbo 63 0.01
10,000 Nissin 25 –2,500 Nissin Electric 22 –1,000 Nissin Foods 43 0.013,100 Nissin Kogyo 40 0.011,900 Nitori 176 0.03
500 Nitta 11 –500 Nittetsu Mining 19 –
4,000 Nitto Boseki 13 –3,674 Nitto Denko 229 0.032,400 Nitto Kogyo 26 –5,000 NOF 39 0.012,100 Nohmi Bosai 25 –1,400 Nojima 12 –4,800 NOK 79 0.01
70,246 Nomura 336 0.051,500 Nomura Co 18 –7,400 Nomura Real Estate 102 0.02
141 Nomura Real Estate Master Fund 173 0.032,178 Nomura Research Institute 54 0.011,000 Noritake 20 –
800 Noritz 11 –15,500 North Pacific Bank 52 0.01
2,200 NS Solutions 32 0.01200 NSD 3 –
21,977 NSK 207 0.0324,000 NTN 79 0.01
3,500 NTT Data 137 0.0237,042 NTT Docomo 685 0.10
4,800 NTT Urban Development 34 0.01800 Obara 29 –
24,130 Obayashi 187 0.03
Holding Investment
Fair Value £'000
Percentage of total
net assets %
Japan (continued)1,800 OBIC 64 0.019,252 Odakyu Electric Railway 149 0.02
15,000 Ogaki Kyoritsu Bank 47 0.011,200 Oiles 17 –9,000 Oita Bank 27 –
39,000 Oji Paper 129 0.023,400 Okabe 23 –3,000 Okamoto Industries 22 –5,000 Okamura 36 0.018,000 Okasan Securities 40 0.014,100 Oki Electric Industry 47 0.011,100 Okinawa Cellular Telephone 27 –
900 Okinawa Electric Power 16 –6,000 Okuma 46 0.019,000 Okumura 41 0.012,000 Okuwa 16 –5,663 Olympus 159 0.025,351 Omron 166 0.023,000 Ono Pharaceutical 53 0.017,000 Onward 40 0.011,400 Open House 27 –1,100 Oracle Japan 45 0.01
25,500 Orient 37 0.014,000 Oriental Land 183 0.03
39,528 Orix 500 0.0778 Orix Real Estate Investment Trust 100 0.02
55,736 Osaka Gas 174 0.031,300 Osaka Steel 20 –2,000 Osaki Electric 17 –3,900 OSG 62 0.014,604 Otsuka 163 0.021,400 Otsuka Corp 53 0.01
600 Outsourcing 15 –2,500 Oyo 24 –3,300 Pacific Industrial 34 0.015,000 Pacific Metals 13 –1,400 Pal 27 –2,300 PALTAC 44 0.013,000 Panahome 20 –
75,809 Panasonic 626 0.09700 Paramount Bed 23 –200 Parco 1 –
3,600 Park24 79 0.0114,500 Penta-Ocean Construction 57 0.01
500 PeptiDream 21 –3,900 Pigeon 81 0.011,400 Pilot 47 0.01
500 Piolax 27 –15,600 Pioneer 26 –1,700 Plenus 27 –
700 Pola Orbis 47 0.0170 Premier Investment 67 0.01
10,300 Press Kogyo 37 0.012,400 Pressance 24 –
11,000 Prima Meat Packers 32 0.012,500 Raito Kogyo 21 –
15,732 Rakuten 125 0.022,900 Recruit 94 0.011,600 Relia 13 –
400 Relo 46 0.0110,000 Rengo 44 0.01
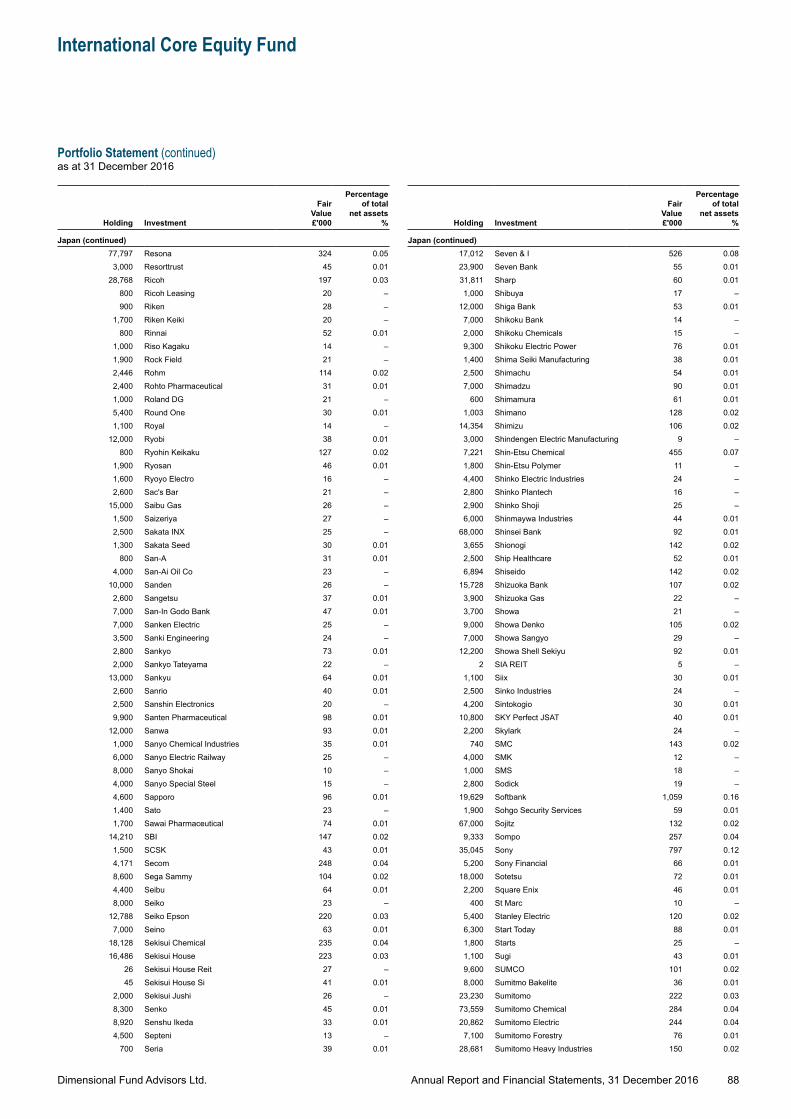
Dimensional Fund Advisors Ltd.
International Core Equity Fund
Portfolio Statement (continued)as at 31 December 2016
88Annual Report and Financial Statements, 31 December 2016
Holding Investment
Fair Value £'000
Percentage of total
net assets %
Japan (continued)77,797 Resona 324 0.05
3,000 Resorttrust 45 0.0128,768 Ricoh 197 0.03
800 Ricoh Leasing 20 –900 Riken 28 –
1,700 Riken Keiki 20 –800 Rinnai 52 0.01
1,000 Riso Kagaku 14 –1,900 Rock Field 21 –2,446 Rohm 114 0.022,400 Rohto Pharmaceutical 31 0.011,000 Roland DG 21 –5,400 Round One 30 0.011,100 Royal 14 –
12,000 Ryobi 38 0.01800 Ryohin Keikaku 127 0.02
1,900 Ryosan 46 0.011,600 Ryoyo Electro 16 –2,600 Sac's Bar 21 –
15,000 Saibu Gas 26 –1,500 Saizeriya 27 –2,500 Sakata INX 25 –1,300 Sakata Seed 30 0.01
800 San-A 31 0.014,000 San-Ai Oil Co 23 –
10,000 Sanden 26 –2,600 Sangetsu 37 0.017,000 San-In Godo Bank 47 0.017,000 Sanken Electric 25 –3,500 Sanki Engineering 24 –2,800 Sankyo 73 0.012,000 Sankyo Tateyama 22 –
13,000 Sankyu 64 0.012,600 Sanrio 40 0.012,500 Sanshin Electronics 20 –9,900 Santen Pharmaceutical 98 0.01
12,000 Sanwa 93 0.011,000 Sanyo Chemical Industries 35 0.016,000 Sanyo Electric Railway 25 –8,000 Sanyo Shokai 10 –4,000 Sanyo Special Steel 15 –4,600 Sapporo 96 0.011,400 Sato 23 –1,700 Sawai Pharmaceutical 74 0.01
14,210 SBI 147 0.021,500 SCSK 43 0.014,171 Secom 248 0.048,600 Sega Sammy 104 0.024,400 Seibu 64 0.018,000 Seiko 23 –
12,788 Seiko Epson 220 0.037,000 Seino 63 0.01
18,128 Sekisui Chemical 235 0.0416,486 Sekisui House 223 0.03
26 Sekisui House Reit 27 –45 Sekisui House Si 41 0.01
2,000 Sekisui Jushi 26 –8,300 Senko 45 0.018,920 Senshu Ikeda 33 0.014,500 Septeni 13 –
700 Seria 39 0.01
Holding Investment
Fair Value £'000
Percentage of total
net assets %
Japan (continued)17,012 Seven & I 526 0.0823,900 Seven Bank 55 0.0131,811 Sharp 60 0.011,000 Shibuya 17 –
12,000 Shiga Bank 53 0.017,000 Shikoku Bank 14 –2,000 Shikoku Chemicals 15 –9,300 Shikoku Electric Power 76 0.011,400 Shima Seiki Manufacturing 38 0.012,500 Shimachu 54 0.017,000 Shimadzu 90 0.01
600 Shimamura 61 0.011,003 Shimano 128 0.02
14,354 Shimizu 106 0.023,000 Shindengen Electric Manufacturing 9 –7,221 Shin-Etsu Chemical 455 0.071,800 Shin-Etsu Polymer 11 –4,400 Shinko Electric Industries 24 –2,800 Shinko Plantech 16 –2,900 Shinko Shoji 25 –6,000 Shinmaywa Industries 44 0.01
68,000 Shinsei Bank 92 0.013,655 Shionogi 142 0.022,500 Ship Healthcare 52 0.016,894 Shiseido 142 0.02
15,728 Shizuoka Bank 107 0.023,900 Shizuoka Gas 22 –3,700 Showa 21 –9,000 Showa Denko 105 0.027,000 Showa Sangyo 29 –
12,200 Showa Shell Sekiyu 92 0.012 SIA REIT 5 –
1,100 Siix 30 0.012,500 Sinko Industries 24 –4,200 Sintokogio 30 0.01
10,800 SKY Perfect JSAT 40 0.012,200 Skylark 24 –
740 SMC 143 0.024,000 SMK 12 –1,000 SMS 18 –2,800 Sodick 19 –
19,629 Softbank 1,059 0.161,900 Sohgo Security Services 59 0.01
67,000 Sojitz 132 0.029,333 Sompo 257 0.04
35,045 Sony 797 0.125,200 Sony Financial 66 0.01
18,000 Sotetsu 72 0.012,200 Square Enix 46 0.01
400 St Marc 10 –5,400 Stanley Electric 120 0.026,300 Start Today 88 0.011,800 Starts 25 –1,100 Sugi 43 0.019,600 SUMCO 101 0.028,000 Sumitmo Bakelite 36 0.01
23,230 Sumitomo 222 0.0373,559 Sumitomo Chemical 284 0.0420,862 Sumitomo Electric 244 0.04
7,100 Sumitomo Forestry 76 0.0128,681 Sumitomo Heavy Industries 150 0.02
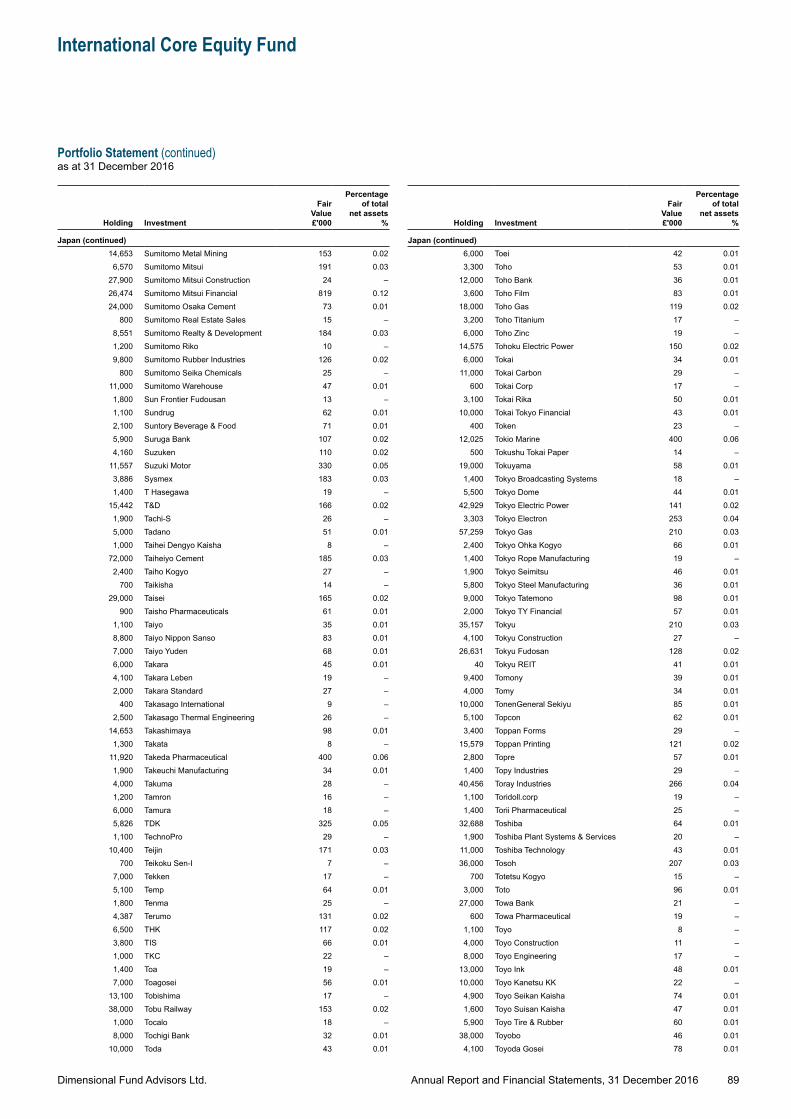
Dimensional Fund Advisors Ltd.
International Core Equity Fund
Portfolio Statement (continued)as at 31 December 2016
89Annual Report and Financial Statements, 31 December 2016
Holding Investment
Fair Value £'000
Percentage of total
net assets %
Japan (continued)14,653 Sumitomo Metal Mining 153 0.02
6,570 Sumitomo Mitsui 191 0.0327,900 Sumitomo Mitsui Construction 24 –26,474 Sumitomo Mitsui Financial 819 0.1224,000 Sumitomo Osaka Cement 73 0.01
800 Sumitomo Real Estate Sales 15 –8,551 Sumitomo Realty & Development 184 0.031,200 Sumitomo Riko 10 –9,800 Sumitomo Rubber Industries 126 0.02
800 Sumitomo Seika Chemicals 25 –11,000 Sumitomo Warehouse 47 0.011,800 Sun Frontier Fudousan 13 –1,100 Sundrug 62 0.012,100 Suntory Beverage & Food 71 0.015,900 Suruga Bank 107 0.024,160 Suzuken 110 0.02
11,557 Suzuki Motor 330 0.053,886 Sysmex 183 0.031,400 T Hasegawa 19 –
15,442 T&D 166 0.021,900 Tachi-S 26 –5,000 Tadano 51 0.011,000 Taihei Dengyo Kaisha 8 –
72,000 Taiheiyo Cement 185 0.032,400 Taiho Kogyo 27 –
700 Taikisha 14 –29,000 Taisei 165 0.02
900 Taisho Pharmaceuticals 61 0.011,100 Taiyo 35 0.018,800 Taiyo Nippon Sanso 83 0.017,000 Taiyo Yuden 68 0.016,000 Takara 45 0.014,100 Takara Leben 19 –2,000 Takara Standard 27 –
400 Takasago International 9 –2,500 Takasago Thermal Engineering 26 –
14,653 Takashimaya 98 0.011,300 Takata 8 –
11,920 Takeda Pharmaceutical 400 0.061,900 Takeuchi Manufacturing 34 0.014,000 Takuma 28 –1,200 Tamron 16 –6,000 Tamura 18 –5,826 TDK 325 0.051,100 TechnoPro 29 –
10,400 Teijin 171 0.03700 Teikoku Sen-I 7 –
7,000 Tekken 17 –5,100 Temp 64 0.011,800 Tenma 25 –4,387 Terumo 131 0.026,500 THK 117 0.023,800 TIS 66 0.011,000 TKC 22 –1,400 Toa 19 –7,000 Toagosei 56 0.01
13,100 Tobishima 17 –38,000 Tobu Railway 153 0.02
1,000 Tocalo 18 –8,000 Tochigi Bank 32 0.01
10,000 Toda 43 0.01
Holding Investment
Fair Value £'000
Percentage of total
net assets %
Japan (continued)6,000 Toei 42 0.013,300 Toho 53 0.01
12,000 Toho Bank 36 0.013,600 Toho Film 83 0.01
18,000 Toho Gas 119 0.023,200 Toho Titanium 17 –6,000 Toho Zinc 19 –
14,575 Tohoku Electric Power 150 0.026,000 Tokai 34 0.01
11,000 Tokai Carbon 29 –600 Tokai Corp 17 –
3,100 Tokai Rika 50 0.0110,000 Tokai Tokyo Financial 43 0.01
400 Token 23 –12,025 Tokio Marine 400 0.06
500 Tokushu Tokai Paper 14 –19,000 Tokuyama 58 0.01
1,400 Tokyo Broadcasting Systems 18 –5,500 Tokyo Dome 44 0.01
42,929 Tokyo Electric Power 141 0.023,303 Tokyo Electron 253 0.04
57,259 Tokyo Gas 210 0.032,400 Tokyo Ohka Kogyo 66 0.011,400 Tokyo Rope Manufacturing 19 –1,900 Tokyo Seimitsu 46 0.015,800 Tokyo Steel Manufacturing 36 0.019,000 Tokyo Tatemono 98 0.012,000 Tokyo TY Financial 57 0.01
35,157 Tokyu 210 0.034,100 Tokyu Construction 27 –
26,631 Tokyu Fudosan 128 0.0240 Tokyu REIT 41 0.01
9,400 Tomony 39 0.014,000 Tomy 34 0.01
10,000 TonenGeneral Sekiyu 85 0.015,100 Topcon 62 0.013,400 Toppan Forms 29 –
15,579 Toppan Printing 121 0.022,800 Topre 57 0.011,400 Topy Industries 29 –
40,456 Toray Industries 266 0.041,100 Toridoll.corp 19 –1,400 Torii Pharmaceutical 25 –
32,688 Toshiba 64 0.011,900 Toshiba Plant Systems & Services 20 –
11,000 Toshiba Technology 43 0.0136,000 Tosoh 207 0.03
700 Totetsu Kogyo 15 –3,000 Toto 96 0.01
27,000 Towa Bank 21 –600 Towa Pharmaceutical 19 –
1,100 Toyo 8 –4,000 Toyo Construction 11 –8,000 Toyo Engineering 17 –
13,000 Toyo Ink 48 0.0110,000 Toyo Kanetsu KK 22 –4,900 Toyo Seikan Kaisha 74 0.011,600 Toyo Suisan Kaisha 47 0.015,900 Toyo Tire & Rubber 60 0.01
38,000 Toyobo 46 0.014,100 Toyoda Gosei 78 0.01
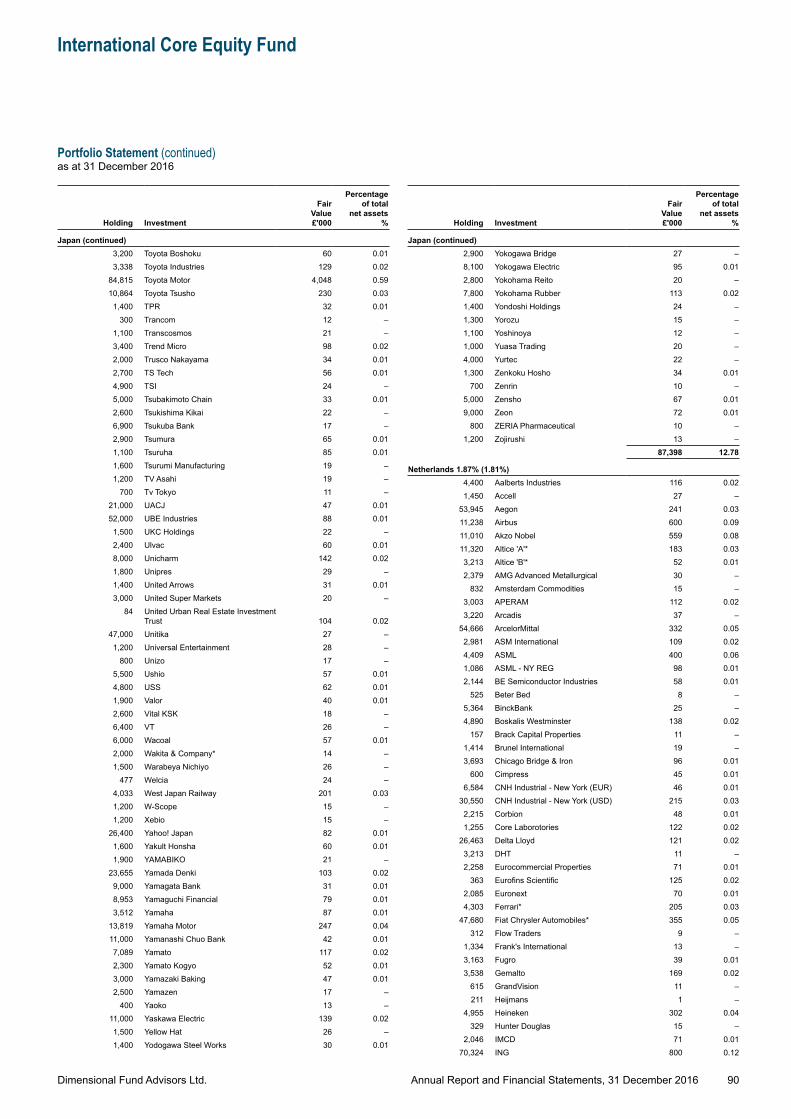
Dimensional Fund Advisors Ltd.
International Core Equity Fund
Portfolio Statement (continued)as at 31 December 2016
90Annual Report and Financial Statements, 31 December 2016
Holding Investment
Fair Value £'000
Percentage of total
net assets %
Japan (continued)3,200 Toyota Boshoku 60 0.013,338 Toyota Industries 129 0.02
84,815 Toyota Motor 4,048 0.5910,864 Toyota Tsusho 230 0.03
1,400 TPR 32 0.01300 Trancom 12 –
1,100 Transcosmos 21 –3,400 Trend Micro 98 0.022,000 Trusco Nakayama 34 0.012,700 TS Tech 56 0.014,900 TSI 24 –5,000 Tsubakimoto Chain 33 0.012,600 Tsukishima Kikai 22 –6,900 Tsukuba Bank 17 –2,900 Tsumura 65 0.011,100 Tsuruha 85 0.011,600 Tsurumi Manufacturing 19 –1,200 TV Asahi 19 –
700 Tv Tokyo 11 –21,000 UACJ 47 0.0152,000 UBE Industries 88 0.01
1,500 UKC Holdings 22 –2,400 Ulvac 60 0.018,000 Unicharm 142 0.021,800 Unipres 29 –1,400 United Arrows 31 0.013,000 United Super Markets 20 –
84 United Urban Real Estate Investment Trust 104 0.02
47,000 Unitika 27 –1,200 Universal Entertainment 28 –
800 Unizo 17 –5,500 Ushio 57 0.014,800 USS 62 0.011,900 Valor 40 0.012,600 Vital KSK 18 –6,400 VT 26 –6,000 Wacoal 57 0.012,000 Wakita & Company* 14 –1,500 Warabeya Nichiyo 26 –
477 Welcia 24 –4,033 West Japan Railway 201 0.031,200 W-Scope 15 –1,200 Xebio 15 –
26,400 Yahoo! Japan 82 0.011,600 Yakult Honsha 60 0.011,900 YAMABIKO 21 –
23,655 Yamada Denki 103 0.029,000 Yamagata Bank 31 0.018,953 Yamaguchi Financial 79 0.013,512 Yamaha 87 0.01
13,819 Yamaha Motor 247 0.0411,000 Yamanashi Chuo Bank 42 0.017,089 Yamato 117 0.022,300 Yamato Kogyo 52 0.013,000 Yamazaki Baking 47 0.012,500 Yamazen 17 –
400 Yaoko 13 –11,000 Yaskawa Electric 139 0.021,500 Yellow Hat 26 –1,400 Yodogawa Steel Works 30 0.01
Holding Investment
Fair Value £'000
Percentage of total
net assets %
Japan (continued)2,900 Yokogawa Bridge 27 –8,100 Yokogawa Electric 95 0.012,800 Yokohama Reito 20 –7,800 Yokohama Rubber 113 0.021,400 Yondoshi Holdings 24 –1,300 Yorozu 15 –1,100 Yoshinoya 12 –1,000 Yuasa Trading 20 –4,000 Yurtec 22 –1,300 Zenkoku Hosho 34 0.01
700 Zenrin 10 –5,000 Zensho 67 0.019,000 Zeon 72 0.01
800 ZERIA Pharmaceutical 10 –1,200 Zojirushi 13 –
87,398 12.78
Netherlands 1.87% (1.81%)4,400 Aalberts Industries 116 0.021,450 Accell 27 –
53,945 Aegon 241 0.0311,238 Airbus 600 0.0911,010 Akzo Nobel 559 0.0811,320 Altice 'A'* 183 0.033,213 Altice 'B'* 52 0.012,379 AMG Advanced Metallurgical 30 –
832 Amsterdam Commodities 15 –3,003 APERAM 112 0.023,220 Arcadis 37 –
54,666 ArcelorMittal 332 0.052,981 ASM International 109 0.024,409 ASML 400 0.061,086 ASML - NY REG 98 0.012,144 BE Semiconductor Industries 58 0.01
525 Beter Bed 8 –5,364 BinckBank 25 –4,890 Boskalis Westminster 138 0.02
157 Brack Capital Properties 11 –1,414 Brunel International 19 –3,693 Chicago Bridge & Iron 96 0.01
600 Cimpress 45 0.016,584 CNH Industrial - New York (EUR) 46 0.01
30,550 CNH Industrial - New York (USD) 215 0.032,215 Corbion 48 0.011,255 Core Laborotories 122 0.02
26,463 Delta Lloyd 121 0.023,213 DHT 11 –2,258 Eurocommercial Properties 71 0.01
363 Eurofins Scientific 125 0.022,085 Euronext 70 0.014,303 Ferrari* 205 0.03
47,680 Fiat Chrysler Automobiles* 355 0.05312 Flow Traders 9 –
1,334 Frank's International 13 –3,163 Fugro 39 0.013,538 Gemalto 169 0.02
615 GrandVision 11 –211 Heijmans 1 –
4,955 Heineken 302 0.04329 Hunter Douglas 15 –
2,046 IMCD 71 0.0170,324 ING 800 0.12
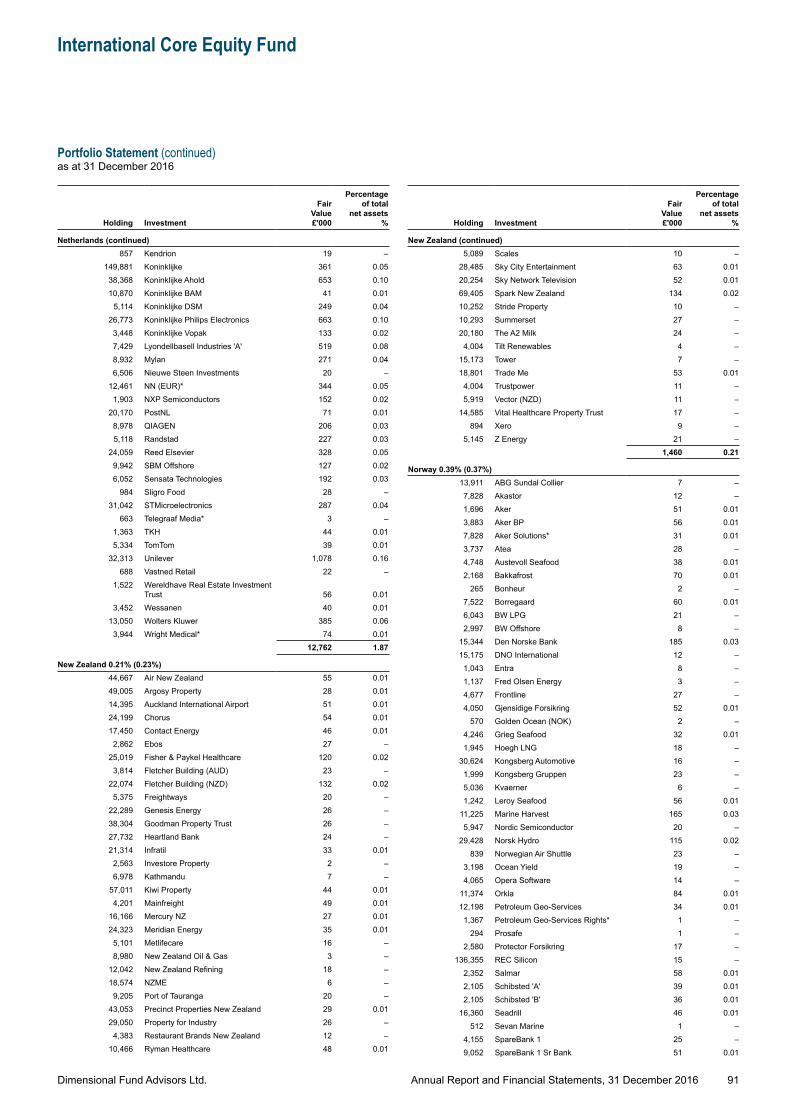
Dimensional Fund Advisors Ltd.
International Core Equity Fund
Portfolio Statement (continued)as at 31 December 2016
91Annual Report and Financial Statements, 31 December 2016
Holding Investment
Fair Value £'000
Percentage of total
net assets %
Netherlands (continued)857 Kendrion 19 –
149,881 Koninklijke 361 0.0538,368 Koninklijke Ahold 653 0.1010,870 Koninklijke BAM 41 0.01
5,114 Koninklijke DSM 249 0.0426,773 Koninklijke Philips Electronics 663 0.10
3,448 Koninklijke Vopak 133 0.027,429 Lyondellbasell Industries 'A' 519 0.088,932 Mylan 271 0.046,506 Nieuwe Steen Investments 20 –
12,461 NN (EUR)* 344 0.051,903 NXP Semiconductors 152 0.02
20,170 PostNL 71 0.018,978 QIAGEN 206 0.035,118 Randstad 227 0.03
24,059 Reed Elsevier 328 0.059,942 SBM Offshore 127 0.026,052 Sensata Technologies 192 0.03
984 Sligro Food 28 –31,042 STMicroelectronics 287 0.04
663 Telegraaf Media* 3 –1,363 TKH 44 0.015,334 TomTom 39 0.01
32,313 Unilever 1,078 0.16688 Vastned Retail 22 –
1,522 Wereldhave Real Estate Investment Trust 56 0.01
3,452 Wessanen 40 0.0113,050 Wolters Kluwer 385 0.06
3,944 Wright Medical* 74 0.0112,762 1.87
New Zealand 0.21% (0.23%)44,667 Air New Zealand 55 0.0149,005 Argosy Property 28 0.0114,395 Auckland International Airport 51 0.0124,199 Chorus 54 0.0117,450 Contact Energy 46 0.01
2,862 Ebos 27 –25,019 Fisher & Paykel Healthcare 120 0.02
3,814 Fletcher Building (AUD) 23 –22,074 Fletcher Building (NZD) 132 0.02
5,375 Freightways 20 –22,289 Genesis Energy 26 –38,304 Goodman Property Trust 26 –27,732 Heartland Bank 24 –21,314 Infratil 33 0.01
2,563 Investore Property 2 –6,978 Kathmandu 7 –
57,011 Kiwi Property 44 0.014,201 Mainfreight 49 0.01
16,166 Mercury NZ 27 0.0124,323 Meridian Energy 35 0.01
5,101 Metlifecare 16 –8,980 New Zealand Oil & Gas 3 –
12,042 New Zealand Refining 18 –18,574 NZME 6 –9,205 Port of Tauranga 20 –
43,053 Precinct Properties New Zealand 29 0.0129,050 Property for Industry 26 –4,383 Restaurant Brands New Zealand 12 –
10,466 Ryman Healthcare 48 0.01
Holding Investment
Fair Value £'000
Percentage of total
net assets %
New Zealand (continued)5,089 Scales 10 –
28,485 Sky City Entertainment 63 0.0120,254 Sky Network Television 52 0.0169,405 Spark New Zealand 134 0.0210,252 Stride Property 10 –10,293 Summerset 27 –20,180 The A2 Milk 24 –4,004 Tilt Renewables 4 –
15,173 Tower 7 –18,801 Trade Me 53 0.01
4,004 Trustpower 11 –5,919 Vector (NZD) 11 –
14,585 Vital Healthcare Property Trust 17 –894 Xero 9 –
5,145 Z Energy 21 –1,460 0.21
Norway 0.39% (0.37%)13,911 ABG Sundal Collier 7 –7,828 Akastor 12 –1,696 Aker 51 0.013,883 Aker BP 56 0.017,828 Aker Solutions* 31 0.013,737 Atea 28 –4,748 Austevoll Seafood 38 0.012,168 Bakkafrost 70 0.01
265 Bonheur 2 –7,522 Borregaard 60 0.016,043 BW LPG 21 –2,997 BW Offshore 8 –
15,344 Den Norske Bank 185 0.0315,175 DNO International 12 –1,043 Entra 8 –1,137 Fred Olsen Energy 3 –4,677 Frontline 27 –4,050 Gjensidige Forsikring 52 0.01
570 Golden Ocean (NOK) 2 –4,246 Grieg Seafood 32 0.011,945 Hoegh LNG 18 –
30,624 Kongsberg Automotive 16 –1,999 Kongsberg Gruppen 23 –5,036 Kvaerner 6 –1,242 Leroy Seafood 56 0.01
11,225 Marine Harvest 165 0.035,947 Nordic Semiconductor 20 –
29,428 Norsk Hydro 115 0.02839 Norwegian Air Shuttle 23 –
3,198 Ocean Yield 19 –4,065 Opera Software 14 –
11,374 Orkla 84 0.0112,198 Petroleum Geo-Services 34 0.01
1,367 Petroleum Geo-Services Rights* 1 –294 Prosafe 1 –
2,580 Protector Forsikring 17 –136,355 REC Silicon 15 –
2,352 Salmar 58 0.012,105 Schibsted 'A' 39 0.012,105 Schibsted 'B' 36 0.01
16,360 Seadrill 46 0.01512 Sevan Marine 1 –
4,155 SpareBank 1 25 –9,052 SpareBank 1 Sr Bank 51 0.01
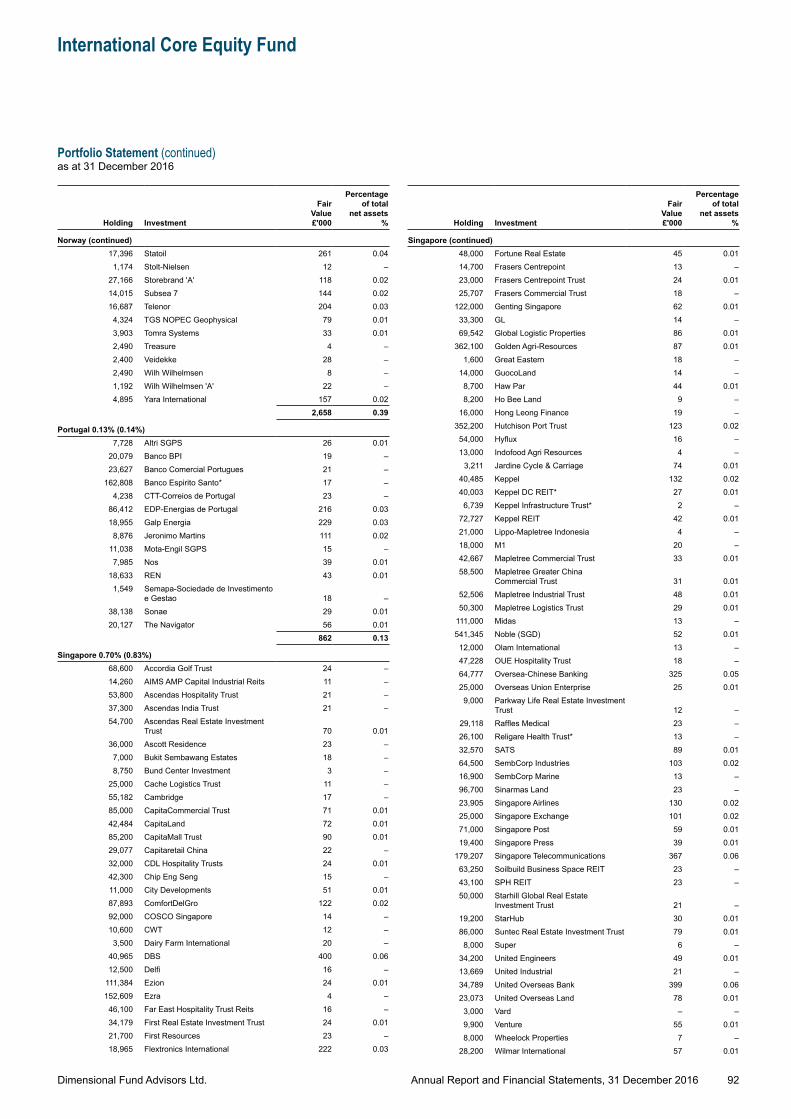
Dimensional Fund Advisors Ltd.
International Core Equity Fund
Portfolio Statement (continued)as at 31 December 2016
92Annual Report and Financial Statements, 31 December 2016
Holding Investment
Fair Value £'000
Percentage of total
net assets %
Norway (continued)17,396 Statoil 261 0.04
1,174 Stolt-Nielsen 12 –27,166 Storebrand 'A' 118 0.0214,015 Subsea 7 144 0.0216,687 Telenor 204 0.03
4,324 TGS NOPEC Geophysical 79 0.013,903 Tomra Systems 33 0.012,490 Treasure 4 –2,400 Veidekke 28 –2,490 Wilh Wilhelmsen 8 –1,192 Wilh Wilhelmsen 'A' 22 –4,895 Yara International 157 0.02
2,658 0.39
Portugal 0.13% (0.14%)7,728 Altri SGPS 26 0.01
20,079 Banco BPI 19 –23,627 Banco Comercial Portugues 21 –
162,808 Banco Espirito Santo* 17 –4,238 CTT-Correios de Portugal 23 –
86,412 EDP-Energias de Portugal 216 0.0318,955 Galp Energia 229 0.03
8,876 Jeronimo Martins 111 0.0211,038 Mota-Engil SGPS 15 –7,985 Nos 39 0.01
18,633 REN 43 0.011,549 Semapa-Sociedade de Investimento
e Gestao 18 –38,138 Sonae 29 0.0120,127 The Navigator 56 0.01
862 0.13
Singapore 0.70% (0.83%)68,600 Accordia Golf Trust 24 –14,260 AIMS AMP Capital Industrial Reits 11 –53,800 Ascendas Hospitality Trust 21 –37,300 Ascendas India Trust 21 –54,700 Ascendas Real Estate Investment
Trust 70 0.0136,000 Ascott Residence 23 –7,000 Bukit Sembawang Estates 18 –8,750 Bund Center Investment 3 –
25,000 Cache Logistics Trust 11 –55,182 Cambridge 17 –85,000 CapitaCommercial Trust 71 0.0142,484 CapitaLand 72 0.0185,200 CapitaMall Trust 90 0.0129,077 Capitaretail China 22 –32,000 CDL Hospitality Trusts 24 0.0142,300 Chip Eng Seng 15 –11,000 City Developments 51 0.0187,893 ComfortDelGro 122 0.0292,000 COSCO Singapore 14 –10,600 CWT 12 –3,500 Dairy Farm International 20 –
40,965 DBS 400 0.0612,500 Delfi 16 –
111,384 Ezion 24 0.01152,609 Ezra 4 –46,100 Far East Hospitality Trust Reits 16 –34,179 First Real Estate Investment Trust 24 0.0121,700 First Resources 23 –18,965 Flextronics International 222 0.03
Holding Investment
Fair Value £'000
Percentage of total
net assets %
Singapore (continued)48,000 Fortune Real Estate 45 0.0114,700 Frasers Centrepoint 13 –23,000 Frasers Centrepoint Trust 24 0.0125,707 Frasers Commercial Trust 18 –
122,000 Genting Singapore 62 0.0133,300 GL 14 –69,542 Global Logistic Properties 86 0.01
362,100 Golden Agri-Resources 87 0.011,600 Great Eastern 18 –
14,000 GuocoLand 14 –8,700 Haw Par 44 0.018,200 Ho Bee Land 9 –
16,000 Hong Leong Finance 19 –352,200 Hutchison Port Trust 123 0.0254,000 Hyflux 16 –13,000 Indofood Agri Resources 4 –
3,211 Jardine Cycle & Carriage 74 0.0140,485 Keppel 132 0.0240,003 Keppel DC REIT* 27 0.01
6,739 Keppel Infrastructure Trust* 2 –72,727 Keppel REIT 42 0.0121,000 Lippo-Mapletree Indonesia 4 –18,000 M1 20 –42,667 Mapletree Commercial Trust 33 0.0158,500 Mapletree Greater China
Commercial Trust 31 0.0152,506 Mapletree Industrial Trust 48 0.0150,300 Mapletree Logistics Trust 29 0.01
111,000 Midas 13 –541,345 Noble (SGD) 52 0.0112,000 Olam International 13 –47,228 OUE Hospitality Trust 18 –64,777 Oversea-Chinese Banking 325 0.0525,000 Overseas Union Enterprise 25 0.01
9,000 Parkway Life Real Estate Investment Trust 12 –
29,118 Raffles Medical 23 –26,100 Religare Health Trust* 13 –32,570 SATS 89 0.0164,500 SembCorp Industries 103 0.0216,900 SembCorp Marine 13 –96,700 Sinarmas Land 23 –23,905 Singapore Airlines 130 0.0225,000 Singapore Exchange 101 0.0271,000 Singapore Post 59 0.0119,400 Singapore Press 39 0.01
179,207 Singapore Telecommunications 367 0.0663,250 Soilbuild Business Space REIT 23 –43,100 SPH REIT 23 –50,000 Starhill Global Real Estate
Investment Trust 21 –19,200 StarHub 30 0.0186,000 Suntec Real Estate Investment Trust 79 0.01
8,000 Super 6 –34,200 United Engineers 49 0.0113,669 United Industrial 21 –34,789 United Overseas Bank 399 0.0623,073 United Overseas Land 78 0.01
3,000 Vard – –9,900 Venture 55 0.018,000 Wheelock Properties 7 –
28,200 Wilmar International 57 0.01
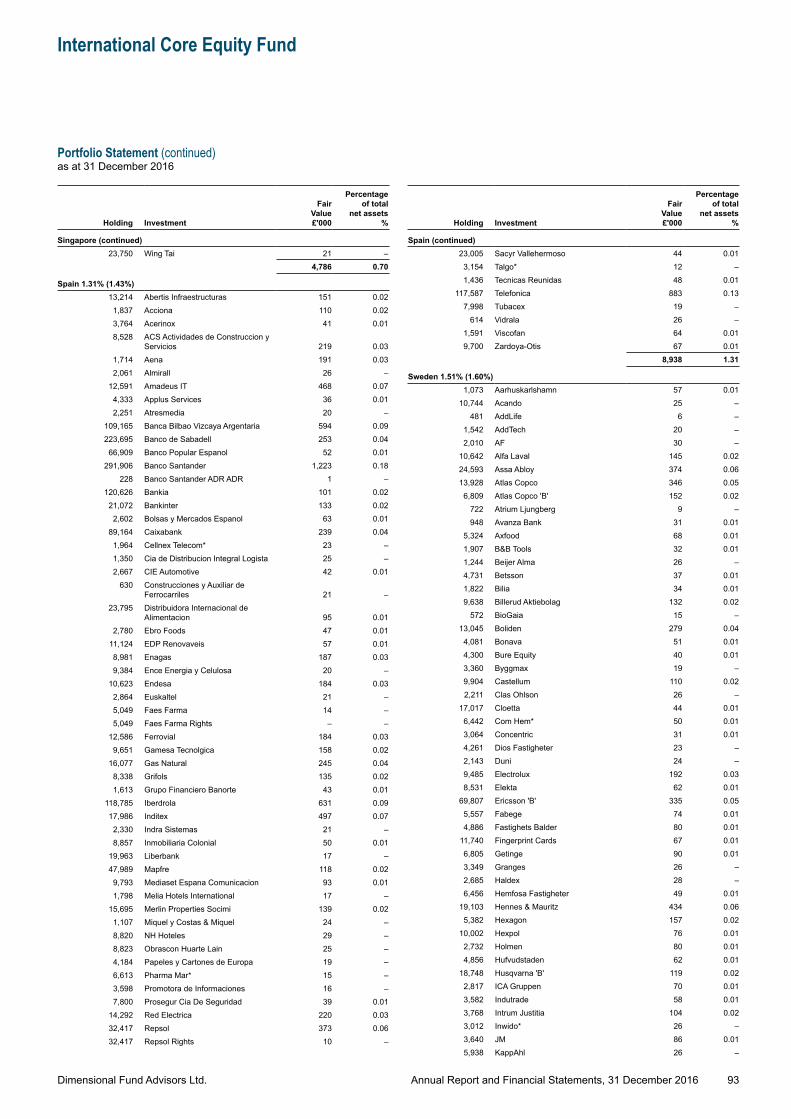
Dimensional Fund Advisors Ltd.
International Core Equity Fund
Portfolio Statement (continued)as at 31 December 2016
93Annual Report and Financial Statements, 31 December 2016
Holding Investment
Fair Value £'000
Percentage of total
net assets %
Singapore (continued)23,750 Wing Tai 21 –
4,786 0.70
Spain 1.31% (1.43%)13,214 Abertis Infraestructuras 151 0.02
1,837 Acciona 110 0.023,764 Acerinox 41 0.018,528 ACS Actividades de Construccion y
Servicios 219 0.031,714 Aena 191 0.032,061 Almirall 26 –
12,591 Amadeus IT 468 0.074,333 Applus Services 36 0.012,251 Atresmedia 20 –
109,165 Banca Bilbao Vizcaya Argentaria 594 0.09223,695 Banco de Sabadell 253 0.04
66,909 Banco Popular Espanol 52 0.01291,906 Banco Santander 1,223 0.18
228 Banco Santander ADR ADR 1 –120,626 Bankia 101 0.02
21,072 Bankinter 133 0.022,602 Bolsas y Mercados Espanol 63 0.01
89,164 Caixabank 239 0.041,964 Cellnex Telecom* 23 –1,350 Cia de Distribucion Integral Logista 25 –2,667 CIE Automotive 42 0.01
630 Construcciones y Auxiliar de Ferrocarriles 21 –
23,795 Distribuidora Internacional de Alimentacion 95 0.01
2,780 Ebro Foods 47 0.0111,124 EDP Renovaveis 57 0.018,981 Enagas 187 0.039,384 Ence Energia y Celulosa 20 –
10,623 Endesa 184 0.032,864 Euskaltel 21 –5,049 Faes Farma 14 –5,049 Faes Farma Rights – –
12,586 Ferrovial 184 0.039,651 Gamesa Tecnolgica 158 0.02
16,077 Gas Natural 245 0.048,338 Grifols 135 0.021,613 Grupo Financiero Banorte 43 0.01
118,785 Iberdrola 631 0.0917,986 Inditex 497 0.07
2,330 Indra Sistemas 21 –8,857 Inmobiliaria Colonial 50 0.01
19,963 Liberbank 17 –47,989 Mapfre 118 0.02
9,793 Mediaset Espana Comunicacion 93 0.011,798 Melia Hotels International 17 –
15,695 Merlin Properties Socimi 139 0.021,107 Miquel y Costas & Miquel 24 –8,820 NH Hoteles 29 –8,823 Obrascon Huarte Lain 25 –4,184 Papeles y Cartones de Europa 19 –6,613 Pharma Mar* 15 –3,598 Promotora de Informaciones 16 –7,800 Prosegur Cia De Seguridad 39 0.01
14,292 Red Electrica 220 0.0332,417 Repsol 373 0.0632,417 Repsol Rights 10 –
Holding Investment
Fair Value £'000
Percentage of total
net assets %
Spain (continued)23,005 Sacyr Vallehermoso 44 0.01
3,154 Talgo* 12 –1,436 Tecnicas Reunidas 48 0.01
117,587 Telefonica 883 0.137,998 Tubacex 19 –
614 Vidrala 26 –1,591 Viscofan 64 0.019,700 Zardoya-Otis 67 0.01
8,938 1.31
Sweden 1.51% (1.60%)1,073 Aarhuskarlshamn 57 0.01
10,744 Acando 25 –481 AddLife 6 –
1,542 AddTech 20 –2,010 AF 30 –
10,642 Alfa Laval 145 0.0224,593 Assa Abloy 374 0.0613,928 Atlas Copco 346 0.05
6,809 Atlas Copco 'B' 152 0.02722 Atrium Ljungberg 9 –948 Avanza Bank 31 0.01
5,324 Axfood 68 0.011,907 B&B Tools 32 0.011,244 Beijer Alma 26 –4,731 Betsson 37 0.011,822 Bilia 34 0.019,638 Billerud Aktiebolag 132 0.02
572 BioGaia 15 –13,045 Boliden 279 0.04
4,081 Bonava 51 0.014,300 Bure Equity 40 0.013,360 Byggmax 19 –9,904 Castellum 110 0.022,211 Clas Ohlson 26 –
17,017 Cloetta 44 0.016,442 Com Hem* 50 0.013,064 Concentric 31 0.014,261 Dios Fastigheter 23 –2,143 Duni 24 –9,485 Electrolux 192 0.038,531 Elekta 62 0.01
69,807 Ericsson 'B' 335 0.055,557 Fabege 74 0.014,886 Fastighets Balder 80 0.01
11,740 Fingerprint Cards 67 0.016,805 Getinge 90 0.013,349 Granges 26 –2,685 Haldex 28 –6,456 Hemfosa Fastigheter 49 0.01
19,103 Hennes & Mauritz 434 0.065,382 Hexagon 157 0.02
10,002 Hexpol 76 0.012,732 Holmen 80 0.014,856 Hufvudstaden 62 0.01
18,748 Husqvarna 'B' 119 0.022,817 ICA Gruppen 70 0.013,582 Indutrade 58 0.013,768 Intrum Justitia 104 0.023,012 Inwido* 26 –3,640 JM 86 0.015,938 KappAhl 26 –
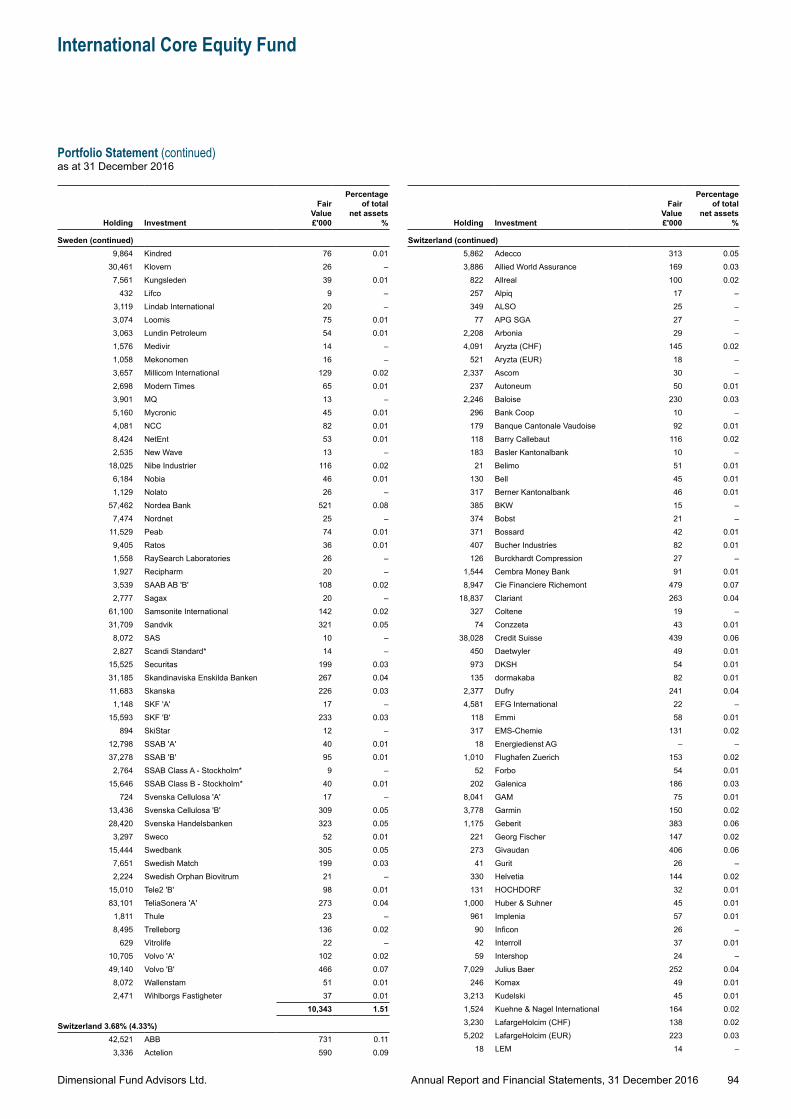
Dimensional Fund Advisors Ltd.
International Core Equity Fund
Portfolio Statement (continued)as at 31 December 2016
94Annual Report and Financial Statements, 31 December 2016
Holding Investment
Fair Value £'000
Percentage of total
net assets %
Sweden (continued)9,864 Kindred 76 0.01
30,461 Klovern 26 –7,561 Kungsleden 39 0.01
432 Lifco 9 –3,119 Lindab International 20 –3,074 Loomis 75 0.013,063 Lundin Petroleum 54 0.011,576 Medivir 14 –1,058 Mekonomen 16 –3,657 Millicom International 129 0.022,698 Modern Times 65 0.013,901 MQ 13 –5,160 Mycronic 45 0.014,081 NCC 82 0.018,424 NetEnt 53 0.012,535 New Wave 13 –
18,025 Nibe Industrier 116 0.026,184 Nobia 46 0.011,129 Nolato 26 –
57,462 Nordea Bank 521 0.087,474 Nordnet 25 –
11,529 Peab 74 0.019,405 Ratos 36 0.011,558 RaySearch Laboratories 26 –1,927 Recipharm 20 –3,539 SAAB AB 'B' 108 0.022,777 Sagax 20 –
61,100 Samsonite International 142 0.0231,709 Sandvik 321 0.05
8,072 SAS 10 –2,827 Scandi Standard* 14 –
15,525 Securitas 199 0.0331,185 Skandinaviska Enskilda Banken 267 0.0411,683 Skanska 226 0.031,148 SKF 'A' 17 –
15,593 SKF 'B' 233 0.03894 SkiStar 12 –
12,798 SSAB 'A' 40 0.0137,278 SSAB 'B' 95 0.01
2,764 SSAB Class A - Stockholm* 9 –15,646 SSAB Class B - Stockholm* 40 0.01
724 Svenska Cellulosa 'A' 17 –13,436 Svenska Cellulosa 'B' 309 0.0528,420 Svenska Handelsbanken 323 0.05
3,297 Sweco 52 0.0115,444 Swedbank 305 0.05
7,651 Swedish Match 199 0.032,224 Swedish Orphan Biovitrum 21 –
15,010 Tele2 'B' 98 0.0183,101 TeliaSonera 'A' 273 0.04
1,811 Thule 23 –8,495 Trelleborg 136 0.02
629 Vitrolife 22 –10,705 Volvo 'A' 102 0.0249,140 Volvo 'B' 466 0.07
8,072 Wallenstam 51 0.012,471 Wihlborgs Fastigheter 37 0.01
10,343 1.51
Switzerland 3.68% (4.33%)42,521 ABB 731 0.11
3,336 Actelion 590 0.09
Holding Investment
Fair Value £'000
Percentage of total
net assets %
Switzerland (continued)5,862 Adecco 313 0.053,886 Allied World Assurance 169 0.03
822 Allreal 100 0.02257 Alpiq 17 –349 ALSO 25 –
77 APG SGA 27 –2,208 Arbonia 29 –4,091 Aryzta (CHF) 145 0.02
521 Aryzta (EUR) 18 –2,337 Ascom 30 –
237 Autoneum 50 0.012,246 Baloise 230 0.03
296 Bank Coop 10 –179 Banque Cantonale Vaudoise 92 0.01118 Barry Callebaut 116 0.02183 Basler Kantonalbank 10 –
21 Belimo 51 0.01130 Bell 45 0.01317 Berner Kantonalbank 46 0.01385 BKW 15 –374 Bobst 21 –371 Bossard 42 0.01407 Bucher Industries 82 0.01126 Burckhardt Compression 27 –
1,544 Cembra Money Bank 91 0.018,947 Cie Financiere Richemont 479 0.07
18,837 Clariant 263 0.04327 Coltene 19 –
74 Conzzeta 43 0.0138,028 Credit Suisse 439 0.06
450 Daetwyler 49 0.01973 DKSH 54 0.01135 dormakaba 82 0.01
2,377 Dufry 241 0.044,581 EFG International 22 –
118 Emmi 58 0.01317 EMS-Chemie 131 0.02
18 Energiedienst AG – –1,010 Flughafen Zuerich 153 0.02
52 Forbo 54 0.01202 Galenica 186 0.03
8,041 GAM 75 0.013,778 Garmin 150 0.021,175 Geberit 383 0.06
221 Georg Fischer 147 0.02273 Givaudan 406 0.06
41 Gurit 26 –330 Helvetia 144 0.02131 HOCHDORF 32 0.01
1,000 Huber & Suhner 45 0.01961 Implenia 57 0.01
90 Inficon 26 –42 Interroll 37 0.0159 Intershop 24 –
7,029 Julius Baer 252 0.04246 Komax 49 0.01
3,213 Kudelski 45 0.011,524 Kuehne & Nagel International 164 0.023,230 LafargeHolcim (CHF) 138 0.025,202 LafargeHolcim (EUR) 223 0.03
18 LEM 14 –
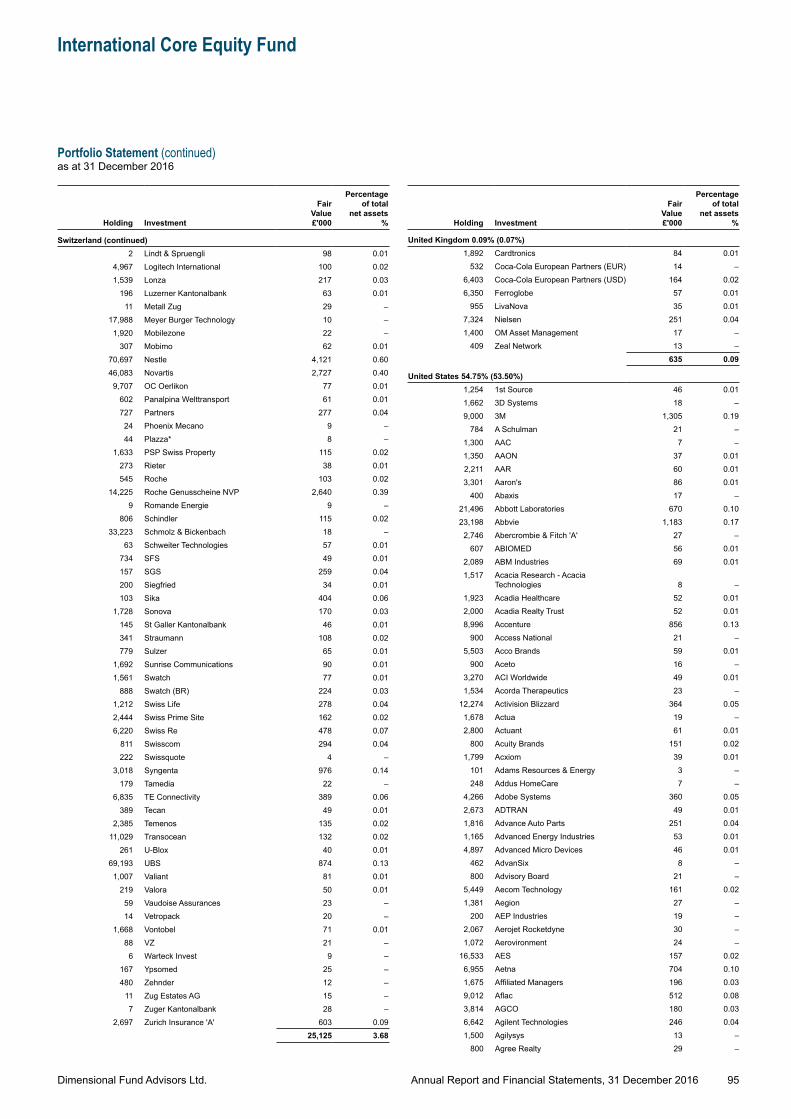
Dimensional Fund Advisors Ltd.
International Core Equity Fund
Portfolio Statement (continued)as at 31 December 2016
95Annual Report and Financial Statements, 31 December 2016
Holding Investment
Fair Value £'000
Percentage of total
net assets %
Switzerland (continued)2 Lindt & Spruengli 98 0.01
4,967 Logitech International 100 0.021,539 Lonza 217 0.03
196 Luzerner Kantonalbank 63 0.0111 Metall Zug 29 –
17,988 Meyer Burger Technology 10 –1,920 Mobilezone 22 –
307 Mobimo 62 0.0170,697 Nestle 4,121 0.6046,083 Novartis 2,727 0.40
9,707 OC Oerlikon 77 0.01602 Panalpina Welttransport 61 0.01727 Partners 277 0.04
24 Phoenix Mecano 9 –44 Plazza* 8 –
1,633 PSP Swiss Property 115 0.02273 Rieter 38 0.01545 Roche 103 0.02
14,225 Roche Genusscheine NVP 2,640 0.399 Romande Energie 9 –
806 Schindler 115 0.0233,223 Schmolz & Bickenbach 18 –
63 Schweiter Technologies 57 0.01734 SFS 49 0.01157 SGS 259 0.04200 Siegfried 34 0.01103 Sika 404 0.06
1,728 Sonova 170 0.03145 St Galler Kantonalbank 46 0.01341 Straumann 108 0.02779 Sulzer 65 0.01
1,692 Sunrise Communications 90 0.011,561 Swatch 77 0.01
888 Swatch (BR) 224 0.031,212 Swiss Life 278 0.042,444 Swiss Prime Site 162 0.026,220 Swiss Re 478 0.07
811 Swisscom 294 0.04222 Swissquote 4 –
3,018 Syngenta 976 0.14179 Tamedia 22 –
6,835 TE Connectivity 389 0.06389 Tecan 49 0.01
2,385 Temenos 135 0.0211,029 Transocean 132 0.02
261 U-Blox 40 0.0169,193 UBS 874 0.13
1,007 Valiant 81 0.01219 Valora 50 0.01
59 Vaudoise Assurances 23 –14 Vetropack 20 –
1,668 Vontobel 71 0.0188 VZ 21 –
6 Warteck Invest 9 –167 Ypsomed 25 –480 Zehnder 12 –
11 Zug Estates AG 15 –7 Zuger Kantonalbank 28 –
2,697 Zurich Insurance 'A' 603 0.0925,125 3.68
Holding Investment
Fair Value £'000
Percentage of total
net assets %
United Kingdom 0.09% (0.07%)1,892 Cardtronics 84 0.01
532 Coca-Cola European Partners (EUR) 14 –6,403 Coca-Cola European Partners (USD) 164 0.026,350 Ferroglobe 57 0.01
955 LivaNova 35 0.017,324 Nielsen 251 0.041,400 OM Asset Management 17 –
409 Zeal Network 13 –635 0.09
United States 54.75% (53.50%)1,254 1st Source 46 0.011,662 3D Systems 18 –9,000 3M 1,305 0.19
784 A Schulman 21 –1,300 AAC 7 –1,350 AAON 37 0.012,211 AAR 60 0.013,301 Aaron's 86 0.01
400 Abaxis 17 –21,496 Abbott Laboratories 670 0.1023,198 Abbvie 1,183 0.17
2,746 Abercrombie & Fitch 'A' 27 –607 ABIOMED 56 0.01
2,089 ABM Industries 69 0.011,517 Acacia Research - Acacia
Technologies 8 –1,923 Acadia Healthcare 52 0.012,000 Acadia Realty Trust 52 0.018,996 Accenture 856 0.13
900 Access National 21 –5,503 Acco Brands 59 0.01
900 Aceto 16 –3,270 ACI Worldwide 49 0.011,534 Acorda Therapeutics 23 –
12,274 Activision Blizzard 364 0.051,678 Actua 19 –2,800 Actuant 61 0.01
800 Acuity Brands 151 0.021,799 Acxiom 39 0.01
101 Adams Resources & Energy 3 –248 Addus HomeCare 7 –
4,266 Adobe Systems 360 0.052,673 ADTRAN 49 0.011,816 Advance Auto Parts 251 0.041,165 Advanced Energy Industries 53 0.014,897 Advanced Micro Devices 46 0.01
462 AdvanSix 8 –800 Advisory Board 21 –
5,449 Aecom Technology 161 0.021,381 Aegion 27 –
200 AEP Industries 19 –2,067 Aerojet Rocketdyne 30 –1,072 Aerovironment 24 –
16,533 AES 157 0.026,955 Aetna 704 0.101,675 Affiliated Managers 196 0.039,012 Aflac 512 0.083,814 AGCO 180 0.036,642 Agilent Technologies 246 0.041,500 Agilysys 13 –
800 Agree Realty 29 –
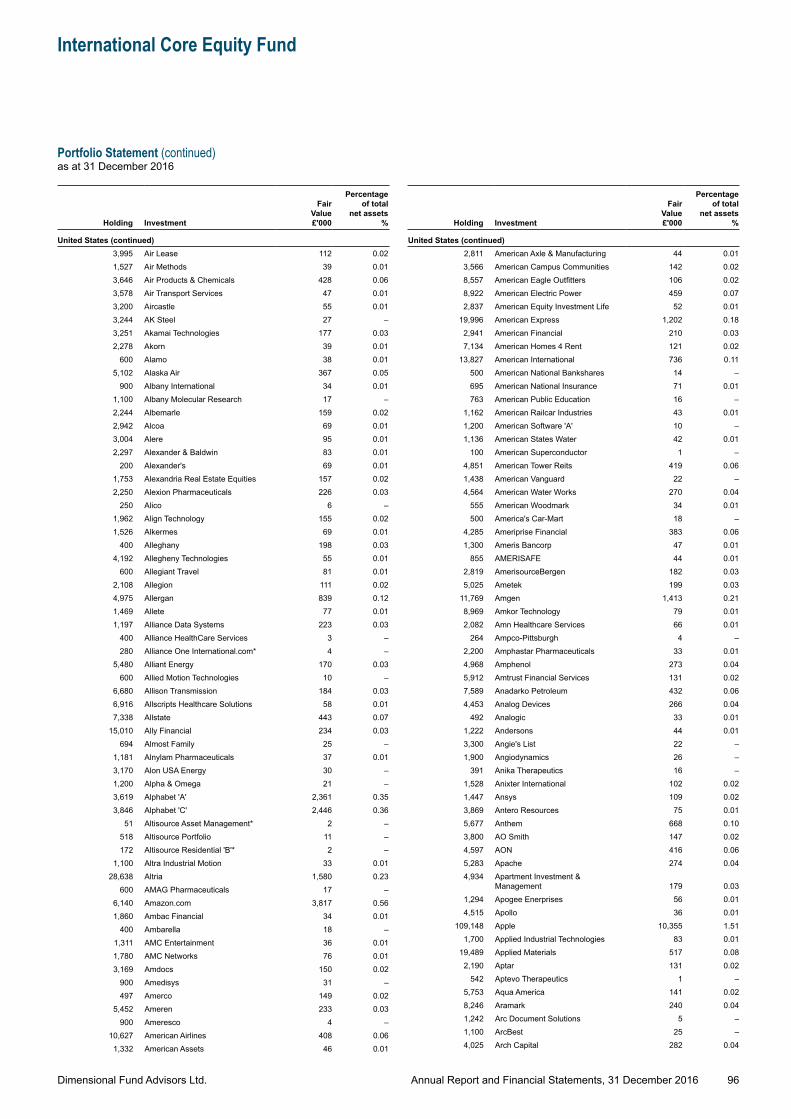
Dimensional Fund Advisors Ltd.
International Core Equity Fund
Portfolio Statement (continued)as at 31 December 2016
96Annual Report and Financial Statements, 31 December 2016
Holding Investment
Fair Value £'000
Percentage of total
net assets %
United States (continued)3,995 Air Lease 112 0.021,527 Air Methods 39 0.013,646 Air Products & Chemicals 428 0.063,578 Air Transport Services 47 0.013,200 Aircastle 55 0.013,244 AK Steel 27 –3,251 Akamai Technologies 177 0.032,278 Akorn 39 0.01
600 Alamo 38 0.015,102 Alaska Air 367 0.05
900 Albany International 34 0.011,100 Albany Molecular Research 17 –2,244 Albemarle 159 0.022,942 Alcoa 69 0.013,004 Alere 95 0.012,297 Alexander & Baldwin 83 0.01
200 Alexander's 69 0.011,753 Alexandria Real Estate Equities 157 0.022,250 Alexion Pharmaceuticals 226 0.03
250 Alico 6 –1,962 Align Technology 155 0.021,526 Alkermes 69 0.01
400 Alleghany 198 0.034,192 Allegheny Technologies 55 0.01
600 Allegiant Travel 81 0.012,108 Allegion 111 0.024,975 Allergan 839 0.121,469 Allete 77 0.011,197 Alliance Data Systems 223 0.03
400 Alliance HealthCare Services 3 –280 Alliance One International.com* 4 –
5,480 Alliant Energy 170 0.03600 Allied Motion Technologies 10 –
6,680 Allison Transmission 184 0.036,916 Allscripts Healthcare Solutions 58 0.017,338 Allstate 443 0.07
15,010 Ally Financial 234 0.03694 Almost Family 25 –
1,181 Alnylam Pharmaceuticals 37 0.013,170 Alon USA Energy 30 –1,200 Alpha & Omega 21 –3,619 Alphabet 'A' 2,361 0.353,846 Alphabet 'C' 2,446 0.36
51 Altisource Asset Management* 2 –518 Altisource Portfolio 11 –172 Altisource Residential 'B'* 2 –
1,100 Altra Industrial Motion 33 0.0128,638 Altria 1,580 0.23
600 AMAG Pharmaceuticals 17 –6,140 Amazon.com 3,817 0.561,860 Ambac Financial 34 0.01
400 Ambarella 18 –1,311 AMC Entertainment 36 0.011,780 AMC Networks 76 0.013,169 Amdocs 150 0.02
900 Amedisys 31 –497 Amerco 149 0.02
5,452 Ameren 233 0.03900 Ameresco 4 –
10,627 American Airlines 408 0.061,332 American Assets 46 0.01
Holding Investment
Fair Value £'000
Percentage of total
net assets %
United States (continued)2,811 American Axle & Manufacturing 44 0.013,566 American Campus Communities 142 0.028,557 American Eagle Outfitters 106 0.028,922 American Electric Power 459 0.072,837 American Equity Investment Life 52 0.01
19,996 American Express 1,202 0.182,941 American Financial 210 0.037,134 American Homes 4 Rent 121 0.02
13,827 American International 736 0.11500 American National Bankshares 14 –695 American National Insurance 71 0.01763 American Public Education 16 –
1,162 American Railcar Industries 43 0.011,200 American Software 'A' 10 –1,136 American States Water 42 0.01
100 American Superconductor 1 –4,851 American Tower Reits 419 0.061,438 American Vanguard 22 –4,564 American Water Works 270 0.04
555 American Woodmark 34 0.01500 America's Car-Mart 18 –
4,285 Ameriprise Financial 383 0.061,300 Ameris Bancorp 47 0.01
855 AMERISAFE 44 0.012,819 AmerisourceBergen 182 0.035,025 Ametek 199 0.03
11,769 Amgen 1,413 0.218,969 Amkor Technology 79 0.012,082 Amn Healthcare Services 66 0.01
264 Ampco-Pittsburgh 4 –2,200 Amphastar Pharmaceuticals 33 0.014,968 Amphenol 273 0.045,912 Amtrust Financial Services 131 0.027,589 Anadarko Petroleum 432 0.064,453 Analog Devices 266 0.04
492 Analogic 33 0.011,222 Andersons 44 0.013,300 Angie's List 22 –1,900 Angiodynamics 26 –
391 Anika Therapeutics 16 –1,528 Anixter International 102 0.021,447 Ansys 109 0.023,869 Antero Resources 75 0.015,677 Anthem 668 0.103,800 AO Smith 147 0.024,597 AON 416 0.065,283 Apache 274 0.044,934 Apartment Investment &
Management 179 0.031,294 Apogee Enerprises 56 0.014,515 Apollo 36 0.01
109,148 Apple 10,355 1.511,700 Applied Industrial Technologies 83 0.01
19,489 Applied Materials 517 0.082,190 Aptar 131 0.02
542 Aptevo Therapeutics 1 –5,753 Aqua America 141 0.028,246 Aramark 240 0.041,242 Arc Document Solutions 5 –1,100 ArcBest 25 –4,025 Arch Capital 282 0.04
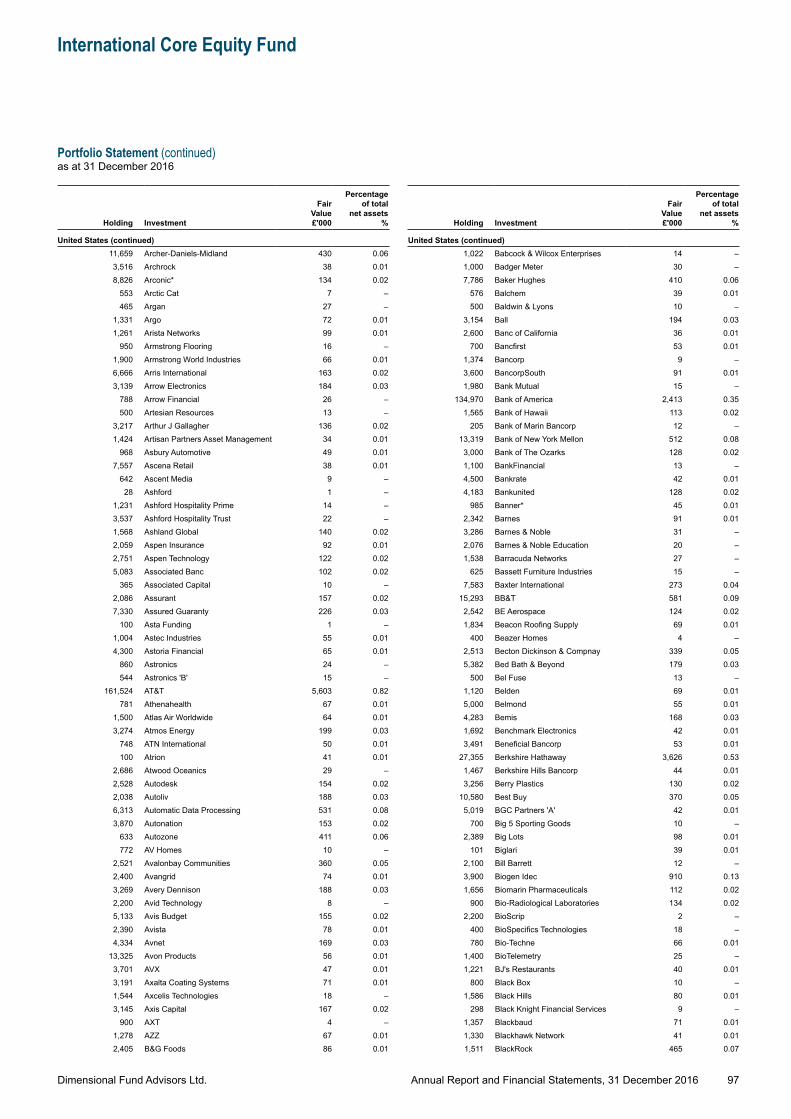
Dimensional Fund Advisors Ltd.
International Core Equity Fund
Portfolio Statement (continued)as at 31 December 2016
97Annual Report and Financial Statements, 31 December 2016
Holding Investment
Fair Value £'000
Percentage of total
net assets %
United States (continued)11,659 Archer-Daniels-Midland 430 0.063,516 Archrock 38 0.018,826 Arconic* 134 0.02
553 Arctic Cat 7 –465 Argan 27 –
1,331 Argo 72 0.011,261 Arista Networks 99 0.01
950 Armstrong Flooring 16 –1,900 Armstrong World Industries 66 0.016,666 Arris International 163 0.023,139 Arrow Electronics 184 0.03
788 Arrow Financial 26 –500 Artesian Resources 13 –
3,217 Arthur J Gallagher 136 0.021,424 Artisan Partners Asset Management 34 0.01
968 Asbury Automotive 49 0.017,557 Ascena Retail 38 0.01
642 Ascent Media 9 –28 Ashford 1 –
1,231 Ashford Hospitality Prime 14 –3,537 Ashford Hospitality Trust 22 –1,568 Ashland Global 140 0.022,059 Aspen Insurance 92 0.012,751 Aspen Technology 122 0.025,083 Associated Banc 102 0.02
365 Associated Capital 10 –2,086 Assurant 157 0.027,330 Assured Guaranty 226 0.03
100 Asta Funding 1 –1,004 Astec Industries 55 0.014,300 Astoria Financial 65 0.01
860 Astronics 24 –544 Astronics 'B' 15 –
161,524 AT&T 5,603 0.82781 Athenahealth 67 0.01
1,500 Atlas Air Worldwide 64 0.013,274 Atmos Energy 199 0.03
748 ATN International 50 0.01100 Atrion 41 0.01
2,686 Atwood Oceanics 29 –2,528 Autodesk 154 0.022,038 Autoliv 188 0.036,313 Automatic Data Processing 531 0.083,870 Autonation 153 0.02
633 Autozone 411 0.06772 AV Homes 10 –
2,521 Avalonbay Communities 360 0.052,400 Avangrid 74 0.013,269 Avery Dennison 188 0.032,200 Avid Technology 8 –5,133 Avis Budget 155 0.022,390 Avista 78 0.014,334 Avnet 169 0.03
13,325 Avon Products 56 0.013,701 AVX 47 0.013,191 Axalta Coating Systems 71 0.011,544 Axcelis Technologies 18 –3,145 Axis Capital 167 0.02
900 AXT 4 –1,278 AZZ 67 0.012,405 B&G Foods 86 0.01
Holding Investment
Fair Value £'000
Percentage of total
net assets %
United States (continued)1,022 Babcock & Wilcox Enterprises 14 –1,000 Badger Meter 30 –7,786 Baker Hughes 410 0.06
576 Balchem 39 0.01500 Baldwin & Lyons 10 –
3,154 Ball 194 0.032,600 Banc of California 36 0.01
700 Bancfirst 53 0.011,374 Bancorp 9 –3,600 BancorpSouth 91 0.011,980 Bank Mutual 15 –
134,970 Bank of America 2,413 0.351,565 Bank of Hawaii 113 0.02
205 Bank of Marin Bancorp 12 –13,319 Bank of New York Mellon 512 0.08
3,000 Bank of The Ozarks 128 0.021,100 BankFinancial 13 –4,500 Bankrate 42 0.014,183 Bankunited 128 0.02
985 Banner* 45 0.012,342 Barnes 91 0.013,286 Barnes & Noble 31 –2,076 Barnes & Noble Education 20 –1,538 Barracuda Networks 27 –
625 Bassett Furniture Industries 15 –7,583 Baxter International 273 0.04
15,293 BB&T 581 0.092,542 BE Aerospace 124 0.021,834 Beacon Roofing Supply 69 0.01
400 Beazer Homes 4 –2,513 Becton Dickinson & Compnay 339 0.055,382 Bed Bath & Beyond 179 0.03
500 Bel Fuse 13 –1,120 Belden 69 0.015,000 Belmond 55 0.014,283 Bemis 168 0.031,692 Benchmark Electronics 42 0.013,491 Beneficial Bancorp 53 0.01
27,355 Berkshire Hathaway 3,626 0.531,467 Berkshire Hills Bancorp 44 0.013,256 Berry Plastics 130 0.02
10,580 Best Buy 370 0.055,019 BGC Partners 'A' 42 0.01
700 Big 5 Sporting Goods 10 –2,389 Big Lots 98 0.01
101 Biglari 39 0.012,100 Bill Barrett 12 –3,900 Biogen Idec 910 0.131,656 Biomarin Pharmaceuticals 112 0.02
900 Bio-Radiological Laboratories 134 0.022,200 BioScrip 2 –
400 BioSpecifics Technologies 18 –780 Bio-Techne 66 0.01
1,400 BioTelemetry 25 –1,221 BJ's Restaurants 40 0.01
800 Black Box 10 –1,586 Black Hills 80 0.01
298 Black Knight Financial Services 9 –1,357 Blackbaud 71 0.011,330 Blackhawk Network 41 0.011,511 BlackRock 465 0.07
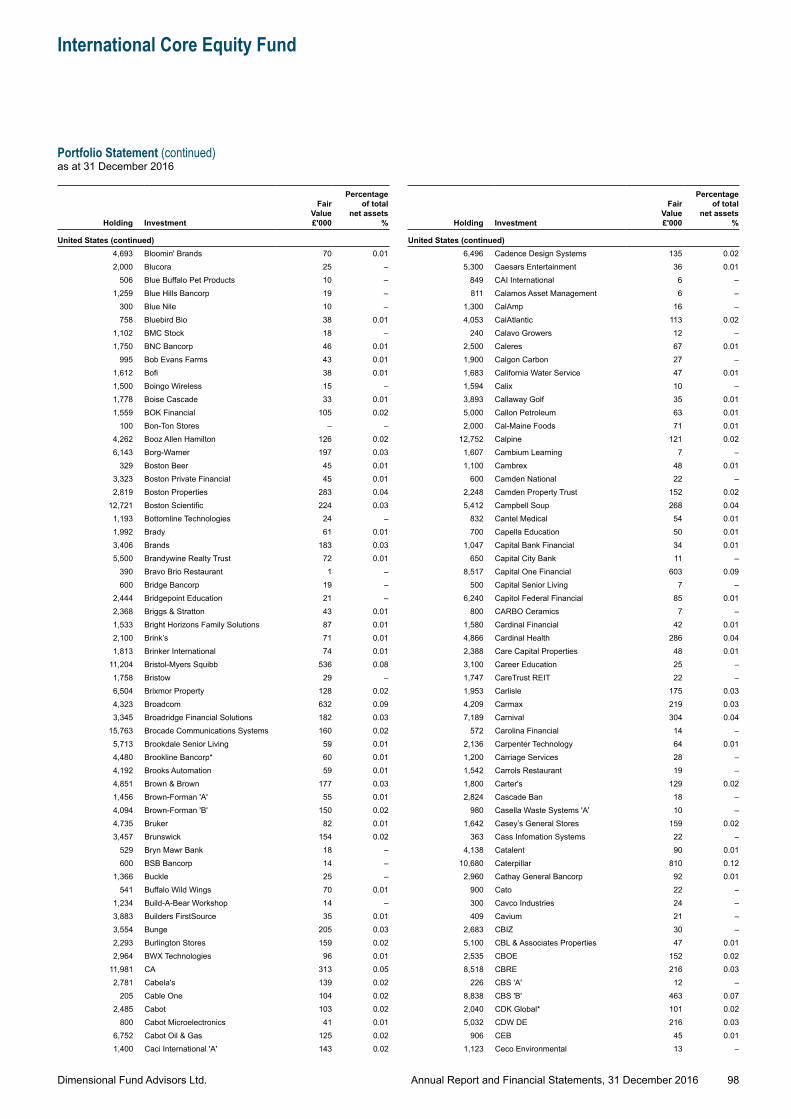
Dimensional Fund Advisors Ltd.
International Core Equity Fund
Portfolio Statement (continued)as at 31 December 2016
98Annual Report and Financial Statements, 31 December 2016
Holding Investment
Fair Value £'000
Percentage of total
net assets %
United States (continued)4,693 Bloomin' Brands 70 0.012,000 Blucora 25 –
506 Blue Buffalo Pet Products 10 –1,259 Blue Hills Bancorp 19 –
300 Blue Nile 10 –758 Bluebird Bio 38 0.01
1,102 BMC Stock 18 –1,750 BNC Bancorp 46 0.01
995 Bob Evans Farms 43 0.011,612 Bofi 38 0.011,500 Boingo Wireless 15 –1,778 Boise Cascade 33 0.011,559 BOK Financial 105 0.02
100 Bon-Ton Stores – –4,262 Booz Allen Hamilton 126 0.026,143 Borg-Warner 197 0.03
329 Boston Beer 45 0.013,323 Boston Private Financial 45 0.012,819 Boston Properties 283 0.04
12,721 Boston Scientific 224 0.031,193 Bottomline Technologies 24 –1,992 Brady 61 0.013,406 Brands 183 0.035,500 Brandywine Realty Trust 72 0.01
390 Bravo Brio Restaurant 1 –600 Bridge Bancorp 19 –
2,444 Bridgepoint Education 21 –2,368 Briggs & Stratton 43 0.011,533 Bright Horizons Family Solutions 87 0.012,100 Brink’s 71 0.011,813 Brinker International 74 0.01
11,204 Bristol-Myers Squibb 536 0.081,758 Bristow 29 –6,504 Brixmor Property 128 0.024,323 Broadcom 632 0.093,345 Broadridge Financial Solutions 182 0.03
15,763 Brocade Communications Systems 160 0.025,713 Brookdale Senior Living 59 0.014,480 Brookline Bancorp* 60 0.014,192 Brooks Automation 59 0.014,851 Brown & Brown 177 0.031,456 Brown-Forman 'A' 55 0.014,094 Brown-Forman 'B' 150 0.024,735 Bruker 82 0.013,457 Brunswick 154 0.02
529 Bryn Mawr Bank 18 –600 BSB Bancorp 14 –
1,366 Buckle 25 –541 Buffalo Wild Wings 70 0.01
1,234 Build-A-Bear Workshop 14 –3,883 Builders FirstSource 35 0.013,554 Bunge 205 0.032,293 Burlington Stores 159 0.022,964 BWX Technologies 96 0.01
11,981 CA 313 0.052,781 Cabela's 139 0.02
205 Cable One 104 0.022,485 Cabot 103 0.02
800 Cabot Microelectronics 41 0.016,752 Cabot Oil & Gas 125 0.021,400 Caci International 'A' 143 0.02
Holding Investment
Fair Value £'000
Percentage of total
net assets %
United States (continued)6,496 Cadence Design Systems 135 0.025,300 Caesars Entertainment 36 0.01
849 CAI International 6 –811 Calamos Asset Management 6 –
1,300 CalAmp 16 –4,053 CalAtlantic 113 0.02
240 Calavo Growers 12 –2,500 Caleres 67 0.011,900 Calgon Carbon 27 –1,683 California Water Service 47 0.011,594 Calix 10 –3,893 Callaway Golf 35 0.015,000 Callon Petroleum 63 0.012,000 Cal-Maine Foods 71 0.01
12,752 Calpine 121 0.021,607 Cambium Learning 7 –1,100 Cambrex 48 0.01
600 Camden National 22 –2,248 Camden Property Trust 152 0.025,412 Campbell Soup 268 0.04
832 Cantel Medical 54 0.01700 Capella Education 50 0.01
1,047 Capital Bank Financial 34 0.01650 Capital City Bank 11 –
8,517 Capital One Financial 603 0.09500 Capital Senior Living 7 –
6,240 Capitol Federal Financial 85 0.01800 CARBO Ceramics 7 –
1,580 Cardinal Financial 42 0.014,866 Cardinal Health 286 0.042,388 Care Capital Properties 48 0.013,100 Career Education 25 –1,747 CareTrust REIT 22 –1,953 Carlisle 175 0.034,209 Carmax 219 0.037,189 Carnival 304 0.04
572 Carolina Financial 14 –2,136 Carpenter Technology 64 0.011,200 Carriage Services 28 –1,542 Carrols Restaurant 19 –1,800 Carter's 129 0.022,824 Cascade Ban 18 –
980 Casella Waste Systems 'A' 10 –1,642 Casey’s General Stores 159 0.02
363 Cass Infomation Systems 22 –4,138 Catalent 90 0.01
10,680 Caterpillar 810 0.122,960 Cathay General Bancorp 92 0.01
900 Cato 22 –300 Cavco Industries 24 –409 Cavium 21 –
2,683 CBIZ 30 –5,100 CBL & Associates Properties 47 0.012,535 CBOE 152 0.028,518 CBRE 216 0.03
226 CBS 'A' 12 –8,838 CBS 'B' 463 0.072,040 CDK Global* 101 0.025,032 CDW DE 216 0.03
906 CEB 45 0.011,123 Ceco Environmental 13 –
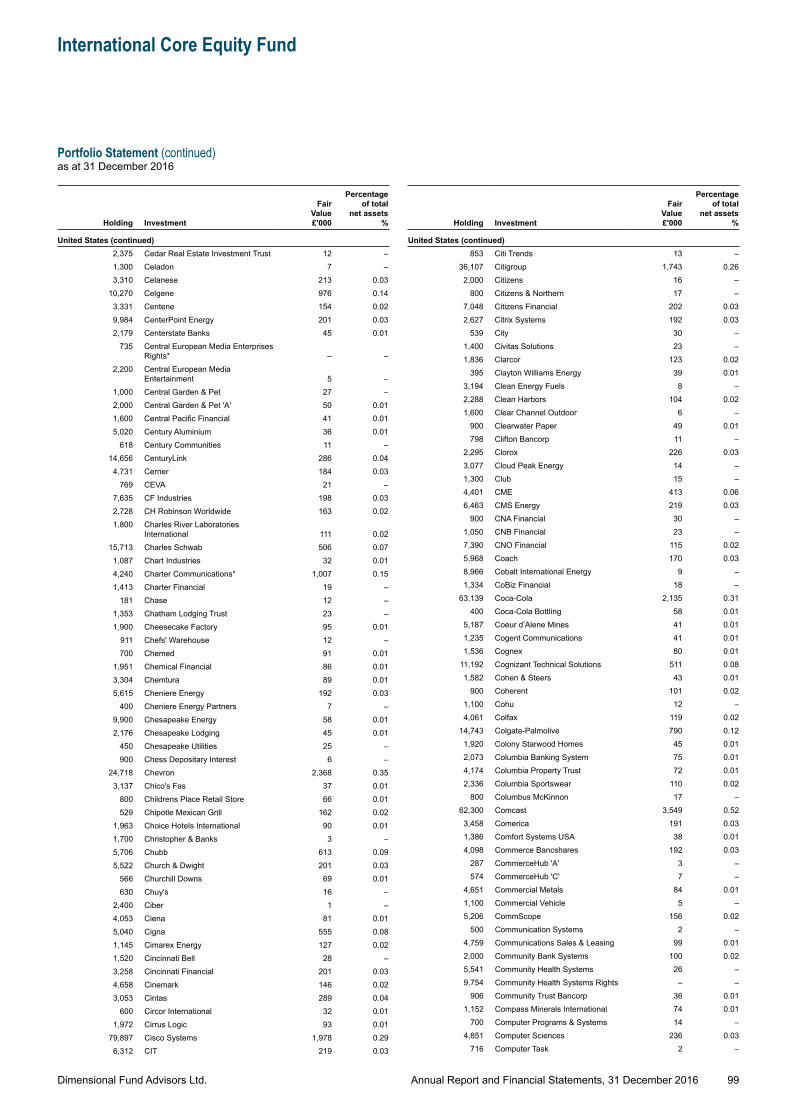
Dimensional Fund Advisors Ltd.
International Core Equity Fund
Portfolio Statement (continued)as at 31 December 2016
99Annual Report and Financial Statements, 31 December 2016
Holding Investment
Fair Value £'000
Percentage of total
net assets %
United States (continued)2,375 Cedar Real Estate Investment Trust 12 –1,300 Celadon 7 –3,310 Celanese 213 0.03
10,270 Celgene 976 0.143,331 Centene 154 0.029,984 CenterPoint Energy 201 0.032,179 Centerstate Banks 45 0.01
735 Central European Media Enterprises Rights* – –
2,200 Central European Media Entertainment 5 –
1,000 Central Garden & Pet 27 –2,000 Central Garden & Pet 'A' 50 0.011,600 Central Pacific Financial 41 0.015,020 Century Aluminium 36 0.01
618 Century Communities 11 –14,656 CenturyLink 286 0.04
4,731 Cerner 184 0.03769 CEVA 21 –
7,635 CF Industries 198 0.032,728 CH Robinson Worldwide 163 0.021,800 Charles River Laboratories
International 111 0.0215,713 Charles Schwab 506 0.07
1,087 Chart Industries 32 0.014,240 Charter Communications* 1,007 0.151,413 Charter Financial 19 –
181 Chase 12 –1,353 Chatham Lodging Trust 23 –1,900 Cheesecake Factory 95 0.01
911 Chefs' Warehouse 12 –700 Chemed 91 0.01
1,951 Chemical Financial 86 0.013,304 Chemtura 89 0.015,615 Cheniere Energy 192 0.03
400 Cheniere Energy Partners 7 –9,900 Chesapeake Energy 58 0.012,176 Chesapeake Lodging 45 0.01
450 Chesapeake Utilities 25 –900 Chess Depositary Interest 6 –
24,718 Chevron 2,368 0.353,137 Chico's Fas 37 0.01
800 Childrens Place Retail Store 66 0.01529 Chipotle Mexican Grill 162 0.02
1,963 Choice Hotels International 90 0.011,700 Christopher & Banks 3 –5,706 Chubb 613 0.095,522 Church & Dwight 201 0.03
566 Churchill Downs 69 0.01630 Chuy's 16 –
2,400 Ciber 1 –4,053 Ciena 81 0.015,040 Cigna 555 0.081,145 Cimarex Energy 127 0.021,520 Cincinnati Bell 28 –3,258 Cincinnati Financial 201 0.034,658 Cinemark 146 0.023,053 Cintas 289 0.04
600 Circor International 32 0.011,972 Cirrus Logic 93 0.01
79,897 Cisco Systems 1,978 0.296,312 CIT 219 0.03
Holding Investment
Fair Value £'000
Percentage of total
net assets %
United States (continued)853 Citi Trends 13 –
36,107 Citigroup 1,743 0.262,000 Citizens 16 –
800 Citizens & Northern 17 –7,048 Citizens Financial 202 0.032,627 Citrix Systems 192 0.03
539 City 30 –1,400 Civitas Solutions 23 –1,836 Clarcor 123 0.02
395 Clayton Williams Energy 39 0.013,194 Clean Energy Fuels 8 –2,288 Clean Harbors 104 0.021,600 Clear Channel Outdoor 6 –
900 Clearwater Paper 49 0.01798 Clifton Bancorp 11 –
2,295 Clorox 226 0.033,077 Cloud Peak Energy 14 –1,300 Club 15 –4,401 CME 413 0.066,463 CMS Energy 219 0.03
900 CNA Financial 30 –1,050 CNB Financial 23 –7,390 CNO Financial 115 0.025,968 Coach 170 0.038,966 Cobalt International Energy 9 –1,334 CoBiz Financial 18 –
63,139 Coca-Cola 2,135 0.31400 Coca-Cola Bottling 58 0.01
5,187 Coeur d’Alene Mines 41 0.011,235 Cogent Communications 41 0.011,536 Cognex 80 0.01
11,192 Cognizant Technical Solutions 511 0.081,582 Cohen & Steers 43 0.01
900 Coherent 101 0.021,100 Cohu 12 –4,061 Colfax 119 0.02
14,743 Colgate-Palmolive 790 0.121,920 Colony Starwood Homes 45 0.012,073 Columbia Banking System 75 0.014,174 Columbia Property Trust 72 0.012,336 Columbia Sportswear 110 0.02
800 Columbus McKinnon 17 –62,300 Comcast 3,549 0.52
3,458 Comerica 191 0.031,386 Comfort Systems USA 38 0.014,098 Commerce Bancshares 192 0.03
287 CommerceHub 'A' 3 –574 CommerceHub 'C' 7 –
4,651 Commercial Metals 84 0.011,100 Commercial Vehicle 5 –5,206 CommScope 156 0.02
500 Communication Systems 2 –4,759 Communications Sales & Leasing 99 0.012,000 Community Bank Systems 100 0.025,541 Community Health Systems 26 –9,754 Community Health Systems Rights – –
906 Community Trust Bancorp 36 0.011,152 Compass Minerals International 74 0.01
700 Computer Programs & Systems 14 –4,851 Computer Sciences 236 0.03
716 Computer Task 2 –
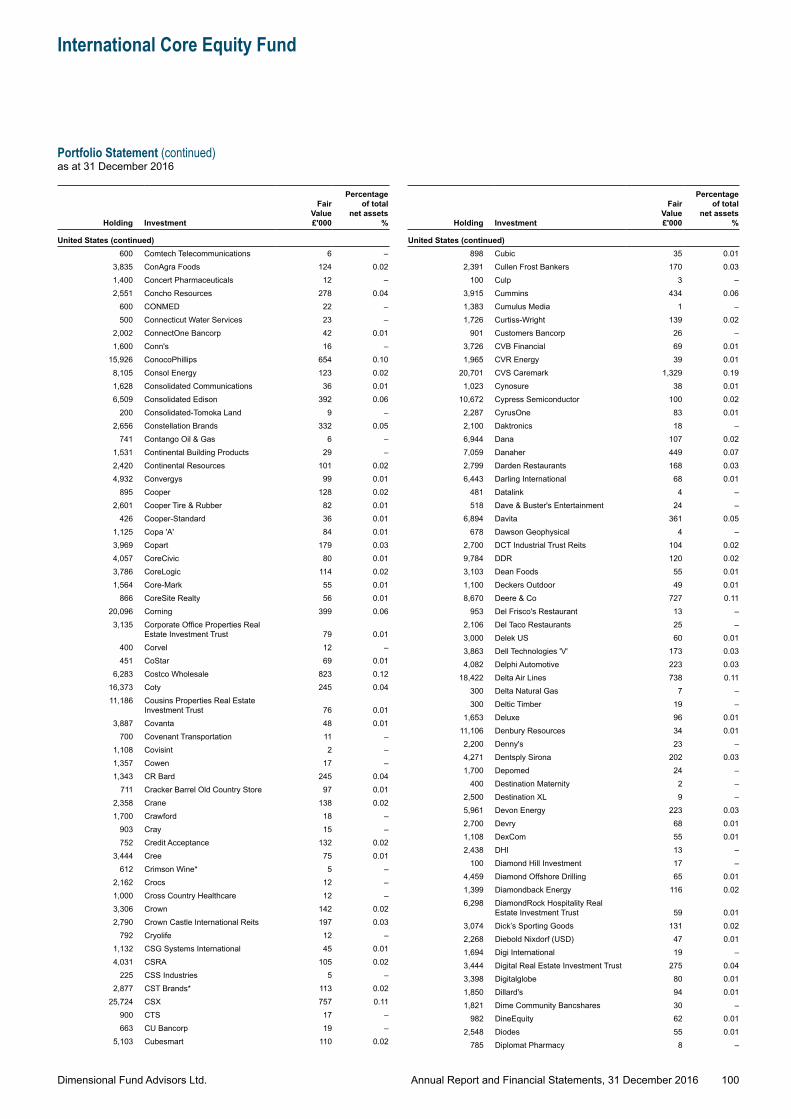
Dimensional Fund Advisors Ltd.
International Core Equity Fund
Portfolio Statement (continued)as at 31 December 2016
100Annual Report and Financial Statements, 31 December 2016
Holding Investment
Fair Value £'000
Percentage of total
net assets %
United States (continued)600 Comtech Telecommunications 6 –
3,835 ConAgra Foods 124 0.021,400 Concert Pharmaceuticals 12 –2,551 Concho Resources 278 0.04
600 CONMED 22 –500 Connecticut Water Services 23 –
2,002 ConnectOne Bancorp 42 0.011,600 Conn's 16 –
15,926 ConocoPhillips 654 0.108,105 Consol Energy 123 0.021,628 Consolidated Communications 36 0.016,509 Consolidated Edison 392 0.06
200 Consolidated-Tomoka Land 9 –2,656 Constellation Brands 332 0.05
741 Contango Oil & Gas 6 –1,531 Continental Building Products 29 –2,420 Continental Resources 101 0.024,932 Convergys 99 0.01
895 Cooper 128 0.022,601 Cooper Tire & Rubber 82 0.01
426 Cooper-Standard 36 0.011,125 Copa 'A' 84 0.013,969 Copart 179 0.034,057 CoreCivic 80 0.013,786 CoreLogic 114 0.021,564 Core-Mark 55 0.01
866 CoreSite Realty 56 0.0120,096 Corning 399 0.06
3,135 Corporate Office Properties Real Estate Investment Trust 79 0.01
400 Corvel 12 –451 CoStar 69 0.01
6,283 Costco Wholesale 823 0.1216,373 Coty 245 0.0411,186 Cousins Properties Real Estate
Investment Trust 76 0.013,887 Covanta 48 0.01
700 Covenant Transportation 11 –1,108 Covisint 2 –1,357 Cowen 17 –1,343 CR Bard 245 0.04
711 Cracker Barrel Old Country Store 97 0.012,358 Crane 138 0.021,700 Crawford 18 –
903 Cray 15 –752 Credit Acceptance 132 0.02
3,444 Cree 75 0.01612 Crimson Wine* 5 –
2,162 Crocs 12 –1,000 Cross Country Healthcare 12 –3,306 Crown 142 0.022,790 Crown Castle International Reits 197 0.03
792 Cryolife 12 –1,132 CSG Systems International 45 0.014,031 CSRA 105 0.02
225 CSS Industries 5 –2,877 CST Brands* 113 0.02
25,724 CSX 757 0.11900 CTS 17 –663 CU Bancorp 19 –
5,103 Cubesmart 110 0.02
Holding Investment
Fair Value £'000
Percentage of total
net assets %
United States (continued)898 Cubic 35 0.01
2,391 Cullen Frost Bankers 170 0.03100 Culp 3 –
3,915 Cummins 434 0.061,383 Cumulus Media 1 –1,726 Curtiss-Wright 139 0.02
901 Customers Bancorp 26 –3,726 CVB Financial 69 0.011,965 CVR Energy 39 0.01
20,701 CVS Caremark 1,329 0.191,023 Cynosure 38 0.01
10,672 Cypress Semiconductor 100 0.022,287 CyrusOne 83 0.012,100 Daktronics 18 –6,944 Dana 107 0.027,059 Danaher 449 0.072,799 Darden Restaurants 168 0.036,443 Darling International 68 0.01
481 Datalink 4 –518 Dave & Buster's Entertainment 24 –
6,894 Davita 361 0.05678 Dawson Geophysical 4 –
2,700 DCT Industrial Trust Reits 104 0.029,784 DDR 120 0.023,103 Dean Foods 55 0.011,100 Deckers Outdoor 49 0.018,670 Deere & Co 727 0.11
953 Del Frisco's Restaurant 13 –2,106 Del Taco Restaurants 25 –3,000 Delek US 60 0.013,863 Dell Technologies 'V' 173 0.034,082 Delphi Automotive 223 0.03
18,422 Delta Air Lines 738 0.11300 Delta Natural Gas 7 –300 Deltic Timber 19 –
1,653 Deluxe 96 0.0111,106 Denbury Resources 34 0.012,200 Denny's 23 –4,271 Dentsply Sirona 202 0.031,700 Depomed 24 –
400 Destination Maternity 2 –2,500 Destination XL 9 –5,961 Devon Energy 223 0.032,700 Devry 68 0.011,108 DexCom 55 0.012,438 DHI 13 –
100 Diamond Hill Investment 17 –4,459 Diamond Offshore Drilling 65 0.011,399 Diamondback Energy 116 0.026,298 DiamondRock Hospitality Real
Estate Investment Trust 59 0.013,074 Dick’s Sporting Goods 131 0.022,268 Diebold Nixdorf (USD) 47 0.011,694 Digi International 19 –3,444 Digital Real Estate Investment Trust 275 0.043,398 Digitalglobe 80 0.011,850 Dillard's 94 0.011,821 Dime Community Bancshares 30 –
982 DineEquity 62 0.012,548 Diodes 55 0.01
785 Diplomat Pharmacy 8 –
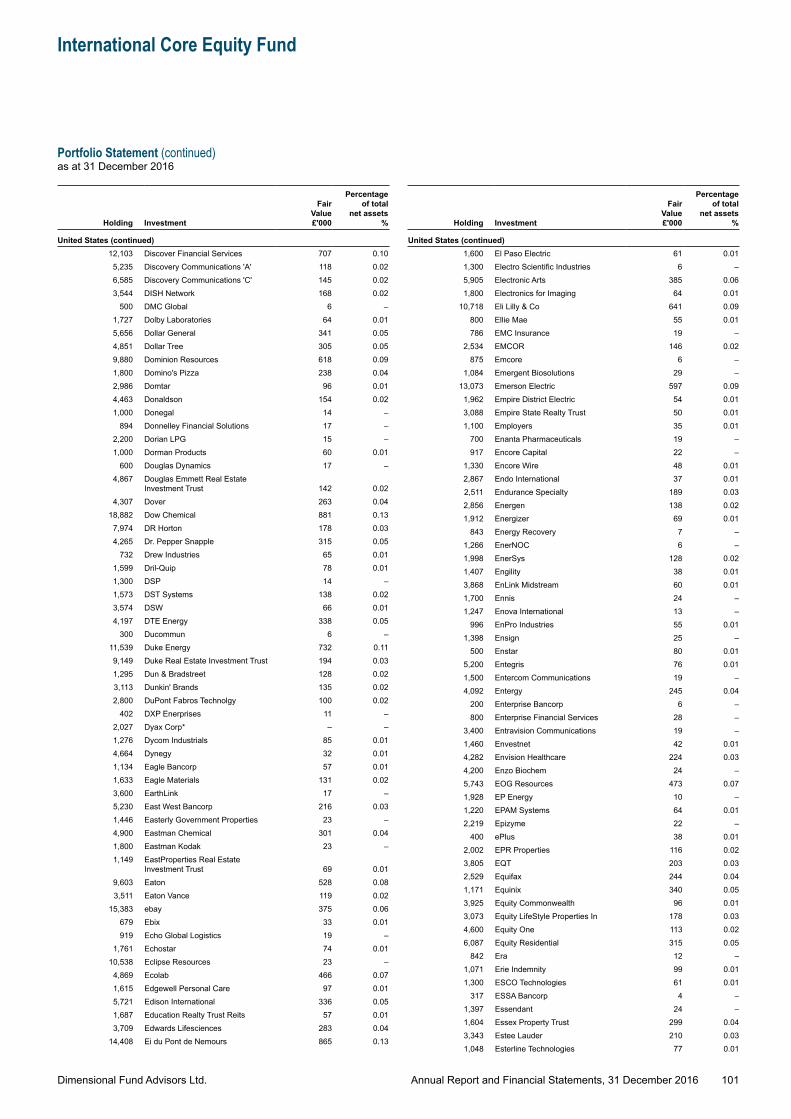
Dimensional Fund Advisors Ltd.
International Core Equity Fund
Portfolio Statement (continued)as at 31 December 2016
101Annual Report and Financial Statements, 31 December 2016
Holding Investment
Fair Value £'000
Percentage of total
net assets %
United States (continued)12,103 Discover Financial Services 707 0.10
5,235 Discovery Communications 'A' 118 0.026,585 Discovery Communications 'C' 145 0.023,544 DISH Network 168 0.02
500 DMC Global 6 –1,727 Dolby Laboratories 64 0.015,656 Dollar General 341 0.054,851 Dollar Tree 305 0.059,880 Dominion Resources 618 0.091,800 Domino's Pizza 238 0.042,986 Domtar 96 0.014,463 Donaldson 154 0.021,000 Donegal 14 –
894 Donnelley Financial Solutions 17 –2,200 Dorian LPG 15 –1,000 Dorman Products 60 0.01
600 Douglas Dynamics 17 –4,867 Douglas Emmett Real Estate
Investment Trust 142 0.024,307 Dover 263 0.04
18,882 Dow Chemical 881 0.137,974 DR Horton 178 0.034,265 Dr. Pepper Snapple 315 0.05
732 Drew Industries 65 0.011,599 Dril-Quip 78 0.011,300 DSP 14 –1,573 DST Systems 138 0.023,574 DSW 66 0.014,197 DTE Energy 338 0.05
300 Ducommun 6 –11,539 Duke Energy 732 0.119,149 Duke Real Estate Investment Trust 194 0.031,295 Dun & Bradstreet 128 0.023,113 Dunkin' Brands 135 0.022,800 DuPont Fabros Technolgy 100 0.02
402 DXP Enerprises 11 –2,027 Dyax Corp* – –1,276 Dycom Industrials 85 0.014,664 Dynegy 32 0.011,134 Eagle Bancorp 57 0.011,633 Eagle Materials 131 0.023,600 EarthLink 17 –5,230 East West Bancorp 216 0.031,446 Easterly Government Properties 23 –4,900 Eastman Chemical 301 0.041,800 Eastman Kodak 23 –1,149 EastProperties Real Estate
Investment Trust 69 0.019,603 Eaton 528 0.083,511 Eaton Vance 119 0.02
15,383 ebay 375 0.06679 Ebix 33 0.01919 Echo Global Logistics 19 –
1,761 Echostar 74 0.0110,538 Eclipse Resources 23 –4,869 Ecolab 466 0.071,615 Edgewell Personal Care 97 0.015,721 Edison International 336 0.051,687 Education Realty Trust Reits 57 0.013,709 Edwards Lifesciences 283 0.04
14,408 Ei du Pont de Nemours 865 0.13
Holding Investment
Fair Value £'000
Percentage of total
net assets %
United States (continued)1,600 El Paso Electric 61 0.011,300 Electro Scientific Industries 6 –5,905 Electronic Arts 385 0.061,800 Electronics for Imaging 64 0.01
10,718 Eli Lilly & Co 641 0.09800 Ellie Mae 55 0.01786 EMC Insurance 19 –
2,534 EMCOR 146 0.02875 Emcore 6 –
1,084 Emergent Biosolutions 29 –13,073 Emerson Electric 597 0.09
1,962 Empire District Electric 54 0.013,088 Empire State Realty Trust 50 0.011,100 Employers 35 0.01
700 Enanta Pharmaceuticals 19 –917 Encore Capital 22 –
1,330 Encore Wire 48 0.012,867 Endo International 37 0.012,511 Endurance Specialty 189 0.032,856 Energen 138 0.021,912 Energizer 69 0.01
843 Energy Recovery 7 –1,266 EnerNOC 6 –1,998 EnerSys 128 0.021,407 Engility 38 0.013,868 EnLink Midstream 60 0.011,700 Ennis 24 –1,247 Enova International 13 –
996 EnPro Industries 55 0.011,398 Ensign 25 –
500 Enstar 80 0.015,200 Entegris 76 0.011,500 Entercom Communications 19 –4,092 Entergy 245 0.04
200 Enterprise Bancorp 6 –800 Enterprise Financial Services 28 –
3,400 Entravision Communications 19 –1,460 Envestnet 42 0.014,282 Envision Healthcare 224 0.034,200 Enzo Biochem 24 –5,743 EOG Resources 473 0.071,928 EP Energy 10 –1,220 EPAM Systems 64 0.012,219 Epizyme 22 –
400 ePlus 38 0.012,002 EPR Properties 116 0.023,805 EQT 203 0.032,529 Equifax 244 0.041,171 Equinix 340 0.053,925 Equity Commonwealth 96 0.013,073 Equity LifeStyle Properties In 178 0.034,600 Equity One 113 0.026,087 Equity Residential 315 0.05
842 Era 12 –1,071 Erie Indemnity 99 0.011,300 ESCO Technologies 61 0.01
317 ESSA Bancorp 4 –1,397 Essendant 24 –1,604 Essex Property Trust 299 0.043,343 Estee Lauder 210 0.031,048 Esterline Technologies 77 0.01
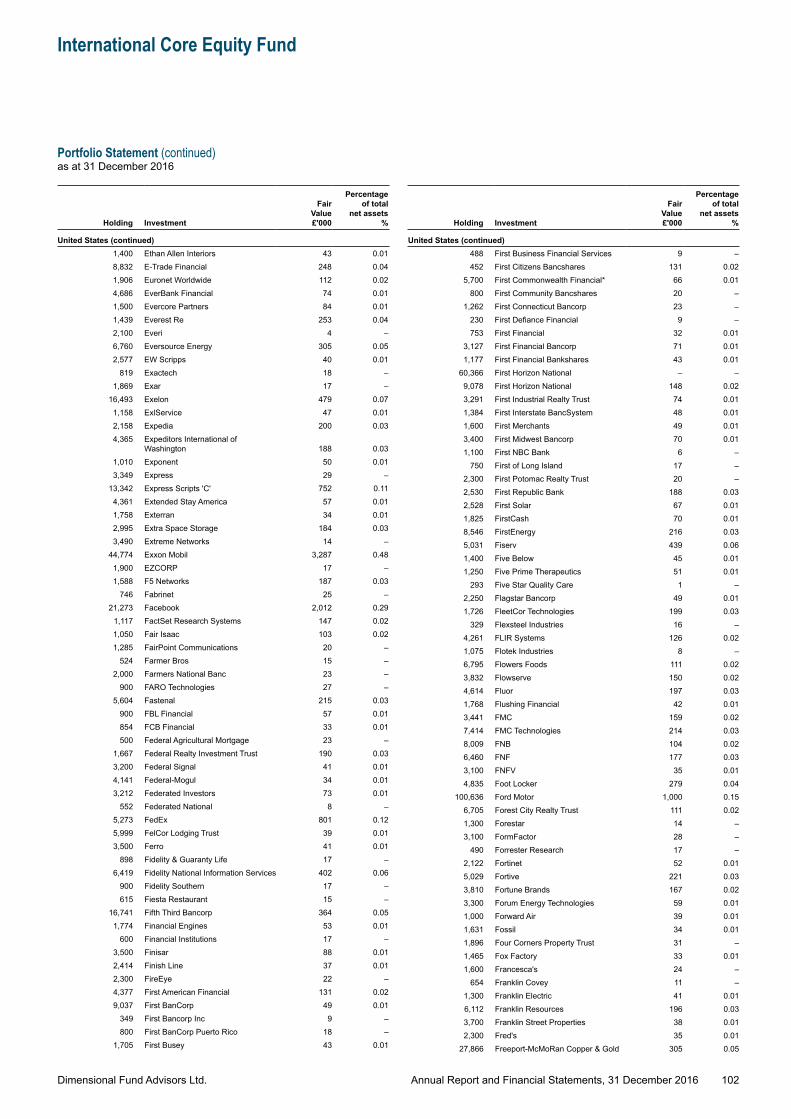
Dimensional Fund Advisors Ltd.
International Core Equity Fund
Portfolio Statement (continued)as at 31 December 2016
102Annual Report and Financial Statements, 31 December 2016
Holding Investment
Fair Value £'000
Percentage of total
net assets %
United States (continued)1,400 Ethan Allen Interiors 43 0.018,832 E-Trade Financial 248 0.041,906 Euronet Worldwide 112 0.024,686 EverBank Financial 74 0.011,500 Evercore Partners 84 0.011,439 Everest Re 253 0.042,100 Everi 4 –6,760 Eversource Energy 305 0.052,577 EW Scripps 40 0.01
819 Exactech 18 –1,869 Exar 17 –
16,493 Exelon 479 0.071,158 ExlService 47 0.012,158 Expedia 200 0.034,365 Expeditors International of
Washington 188 0.031,010 Exponent 50 0.013,349 Express 29 –
13,342 Express Scripts 'C' 752 0.114,361 Extended Stay America 57 0.011,758 Exterran 34 0.012,995 Extra Space Storage 184 0.033,490 Extreme Networks 14 –
44,774 Exxon Mobil 3,287 0.481,900 EZCORP 17 –1,588 F5 Networks 187 0.03
746 Fabrinet 25 –21,273 Facebook 2,012 0.29
1,117 FactSet Research Systems 147 0.021,050 Fair Isaac 103 0.021,285 FairPoint Communications 20 –
524 Farmer Bros 15 –2,000 Farmers National Banc 23 –
900 FARO Technologies 27 –5,604 Fastenal 215 0.03
900 FBL Financial 57 0.01854 FCB Financial 33 0.01500 Federal Agricultural Mortgage 23 –
1,667 Federal Realty Investment Trust 190 0.033,200 Federal Signal 41 0.014,141 Federal-Mogul 34 0.013,212 Federated Investors 73 0.01
552 Federated National 8 –5,273 FedEx 801 0.125,999 FelCor Lodging Trust 39 0.013,500 Ferro 41 0.01
898 Fidelity & Guaranty Life 17 –6,419 Fidelity National Information Services 402 0.06
900 Fidelity Southern 17 –615 Fiesta Restaurant 15 –
16,741 Fifth Third Bancorp 364 0.051,774 Financial Engines 53 0.01
600 Financial Institutions 17 –3,500 Finisar 88 0.012,414 Finish Line 37 0.012,300 FireEye 22 –4,377 First American Financial 131 0.029,037 First BanCorp 49 0.01
349 First Bancorp Inc 9 –800 First BanCorp Puerto Rico 18 –
1,705 First Busey 43 0.01
Holding Investment
Fair Value £'000
Percentage of total
net assets %
United States (continued)488 First Business Financial Services 9 –452 First Citizens Bancshares 131 0.02
5,700 First Commonwealth Financial* 66 0.01800 First Community Bancshares 20 –
1,262 First Connecticut Bancorp 23 –230 First Defiance Financial 9 –753 First Financial 32 0.01
3,127 First Financial Bancorp 71 0.011,177 First Financial Bankshares 43 0.01
60,366 First Horizon National – –9,078 First Horizon National 148 0.023,291 First Industrial Realty Trust 74 0.011,384 First Interstate BancSystem 48 0.011,600 First Merchants 49 0.013,400 First Midwest Bancorp 70 0.011,100 First NBC Bank 6 –
750 First of Long Island 17 –2,300 First Potomac Realty Trust 20 –2,530 First Republic Bank 188 0.032,528 First Solar 67 0.011,825 FirstCash 70 0.018,546 FirstEnergy 216 0.035,031 Fiserv 439 0.061,400 Five Below 45 0.011,250 Five Prime Therapeutics 51 0.01
293 Five Star Quality Care 1 –2,250 Flagstar Bancorp 49 0.011,726 FleetCor Technologies 199 0.03
329 Flexsteel Industries 16 –4,261 FLIR Systems 126 0.021,075 Flotek Industries 8 –6,795 Flowers Foods 111 0.023,832 Flowserve 150 0.024,614 Fluor 197 0.031,768 Flushing Financial 42 0.013,441 FMC 159 0.027,414 FMC Technologies 214 0.038,009 FNB 104 0.026,460 FNF 177 0.033,100 FNFV 35 0.014,835 Foot Locker 279 0.04
100,636 Ford Motor 1,000 0.156,705 Forest City Realty Trust 111 0.021,300 Forestar 14 –3,100 FormFactor 28 –
490 Forrester Research 17 –2,122 Fortinet 52 0.015,029 Fortive 221 0.033,810 Fortune Brands 167 0.023,300 Forum Energy Technologies 59 0.011,000 Forward Air 39 0.011,631 Fossil 34 0.011,896 Four Corners Property Trust 31 –1,465 Fox Factory 33 0.011,600 Francesca's 24 –
654 Franklin Covey 11 –1,300 Franklin Electric 41 0.016,112 Franklin Resources 196 0.033,700 Franklin Street Properties 38 0.012,300 Fred's 35 0.01
27,866 Freeport-McMoRan Copper & Gold 305 0.05
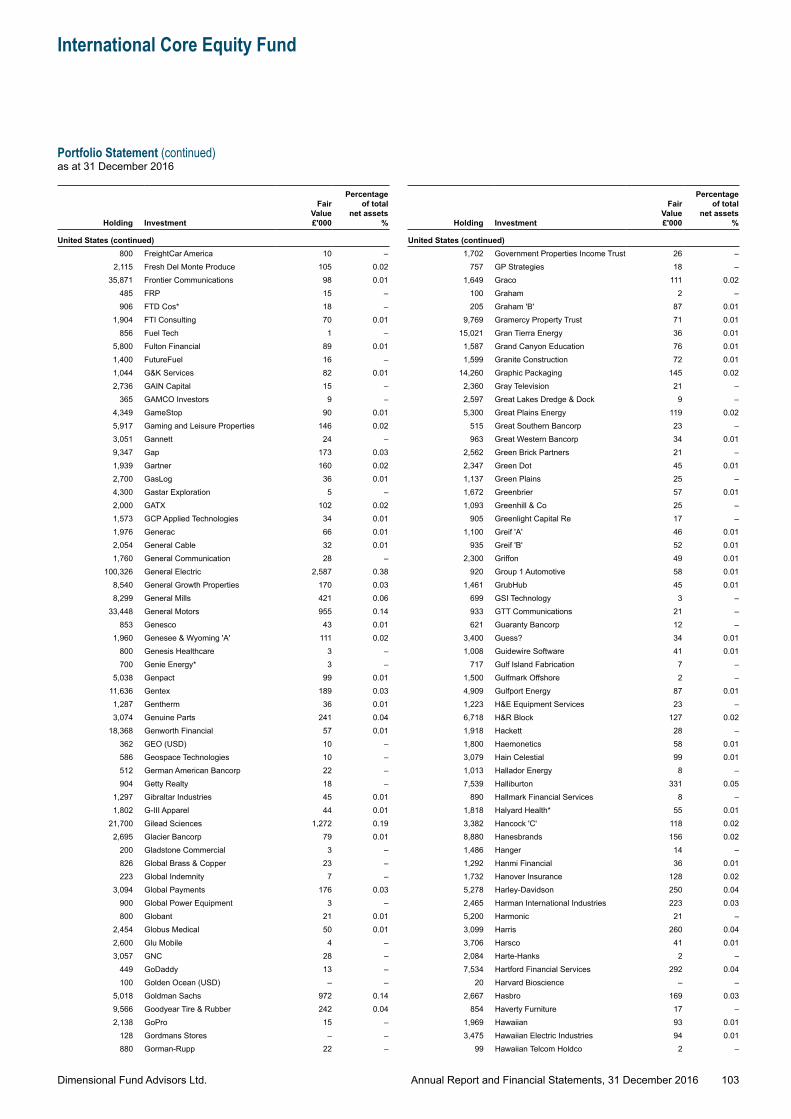
Dimensional Fund Advisors Ltd.
International Core Equity Fund
Portfolio Statement (continued)as at 31 December 2016
103Annual Report and Financial Statements, 31 December 2016
Holding Investment
Fair Value £'000
Percentage of total
net assets %
United States (continued)800 FreightCar America 10 –
2,115 Fresh Del Monte Produce 105 0.0235,871 Frontier Communications 98 0.01
485 FRP 15 –906 FTD Cos* 18 –
1,904 FTI Consulting 70 0.01856 Fuel Tech 1 –
5,800 Fulton Financial 89 0.011,400 FutureFuel 16 –1,044 G&K Services 82 0.012,736 GAIN Capital 15 –
365 GAMCO Investors 9 –4,349 GameStop 90 0.015,917 Gaming and Leisure Properties 146 0.023,051 Gannett 24 –9,347 Gap 173 0.031,939 Gartner 160 0.022,700 GasLog 36 0.014,300 Gastar Exploration 5 –2,000 GATX 102 0.021,573 GCP Applied Technologies 34 0.011,976 Generac 66 0.012,054 General Cable 32 0.011,760 General Communication 28 –
100,326 General Electric 2,587 0.388,540 General Growth Properties 170 0.038,299 General Mills 421 0.06
33,448 General Motors 955 0.14853 Genesco 43 0.01
1,960 Genesee & Wyoming 'A' 111 0.02800 Genesis Healthcare 3 –700 Genie Energy* 3 –
5,038 Genpact 99 0.0111,636 Gentex 189 0.031,287 Gentherm 36 0.013,074 Genuine Parts 241 0.04
18,368 Genworth Financial 57 0.01362 GEO (USD) 10 –586 Geospace Technologies 10 –512 German American Bancorp 22 –904 Getty Realty 18 –
1,297 Gibraltar Industries 45 0.011,802 G-III Apparel 44 0.01
21,700 Gilead Sciences 1,272 0.192,695 Glacier Bancorp 79 0.01
200 Gladstone Commercial 3 –826 Global Brass & Copper 23 –223 Global Indemnity 7 –
3,094 Global Payments 176 0.03900 Global Power Equipment 3 –800 Globant 21 0.01
2,454 Globus Medical 50 0.012,600 Glu Mobile 4 –3,057 GNC 28 –
449 GoDaddy 13 –100 Golden Ocean (USD) – –
5,018 Goldman Sachs 972 0.149,566 Goodyear Tire & Rubber 242 0.042,138 GoPro 15 –
128 Gordmans Stores – –880 Gorman-Rupp 22 –
Holding Investment
Fair Value £'000
Percentage of total
net assets %
United States (continued)1,702 Government Properties Income Trust 26 –
757 GP Strategies 18 –1,649 Graco 111 0.02
100 Graham 2 –205 Graham 'B' 87 0.01
9,769 Gramercy Property Trust 71 0.0115,021 Gran Tierra Energy 36 0.01
1,587 Grand Canyon Education 76 0.011,599 Granite Construction 72 0.01
14,260 Graphic Packaging 145 0.022,360 Gray Television 21 –2,597 Great Lakes Dredge & Dock 9 –5,300 Great Plains Energy 119 0.02
515 Great Southern Bancorp 23 –963 Great Western Bancorp 34 0.01
2,562 Green Brick Partners 21 –2,347 Green Dot 45 0.011,137 Green Plains 25 –1,672 Greenbrier 57 0.011,093 Greenhill & Co 25 –
905 Greenlight Capital Re 17 –1,100 Greif 'A' 46 0.01
935 Greif 'B' 52 0.012,300 Griffon 49 0.01
920 Group 1 Automotive 58 0.011,461 GrubHub 45 0.01
699 GSI Technology 3 –933 GTT Communications 21 –621 Guaranty Bancorp 12 –
3,400 Guess? 34 0.011,008 Guidewire Software 41 0.01
717 Gulf Island Fabrication 7 –1,500 Gulfmark Offshore 2 –4,909 Gulfport Energy 87 0.011,223 H&E Equipment Services 23 –6,718 H&R Block 127 0.021,918 Hackett 28 –1,800 Haemonetics 58 0.013,079 Hain Celestial 99 0.011,013 Hallador Energy 8 –7,539 Halliburton 331 0.05
890 Hallmark Financial Services 8 –1,818 Halyard Health* 55 0.013,382 Hancock 'C' 118 0.028,880 Hanesbrands 156 0.021,486 Hanger 14 –1,292 Hanmi Financial 36 0.011,732 Hanover Insurance 128 0.025,278 Harley-Davidson 250 0.042,465 Harman International Industries 223 0.035,200 Harmonic 21 –3,099 Harris 260 0.043,706 Harsco 41 0.012,084 Harte-Hanks 2 –7,534 Hartford Financial Services 292 0.04
20 Harvard Bioscience – –2,667 Hasbro 169 0.03
854 Haverty Furniture 17 –1,969 Hawaiian 93 0.013,475 Hawaiian Electric Industries 94 0.01
99 Hawaiian Telcom Holdco 2 –
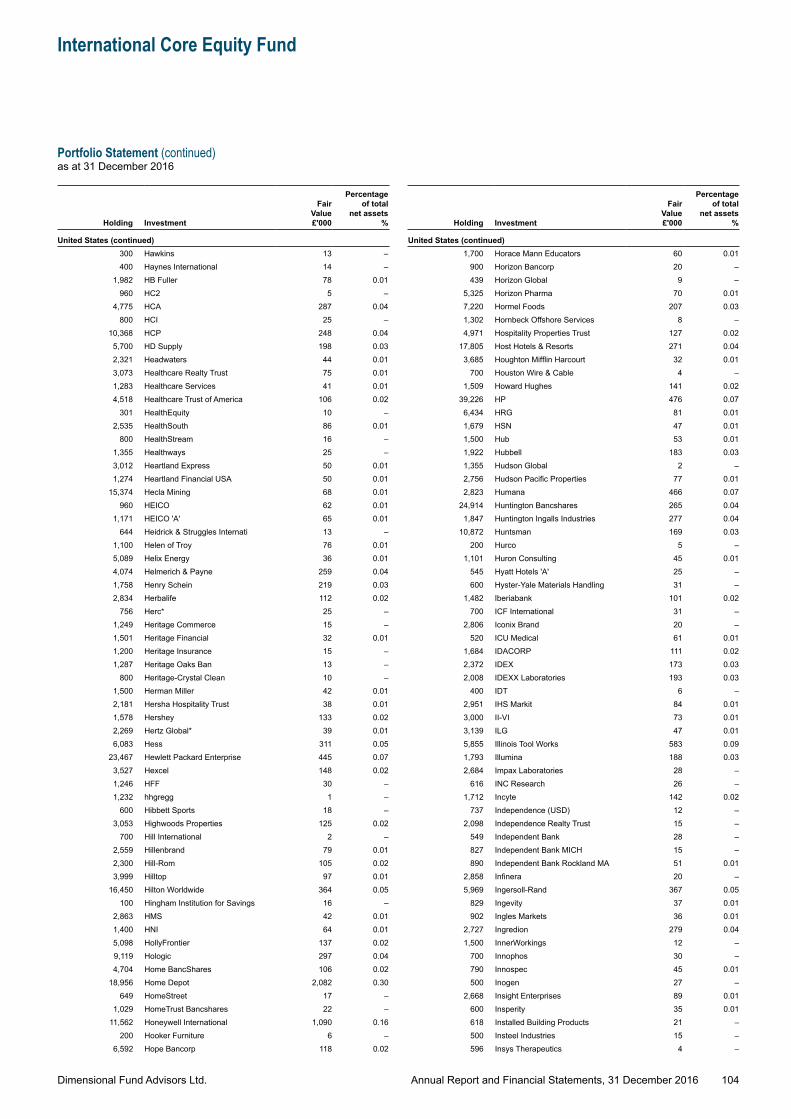
Dimensional Fund Advisors Ltd.
International Core Equity Fund
Portfolio Statement (continued)as at 31 December 2016
104Annual Report and Financial Statements, 31 December 2016
Holding Investment
Fair Value £'000
Percentage of total
net assets %
United States (continued)300 Hawkins 13 –400 Haynes International 14 –
1,982 HB Fuller 78 0.01960 HC2 5 –
4,775 HCA 287 0.04800 HCI 25 –
10,368 HCP 248 0.045,700 HD Supply 198 0.032,321 Headwaters 44 0.013,073 Healthcare Realty Trust 75 0.011,283 Healthcare Services 41 0.014,518 Healthcare Trust of America 106 0.02
301 HealthEquity 10 –2,535 HealthSouth 86 0.01
800 HealthStream 16 –1,355 Healthways 25 –3,012 Heartland Express 50 0.011,274 Heartland Financial USA 50 0.01
15,374 Hecla Mining 68 0.01960 HEICO 62 0.01
1,171 HEICO 'A' 65 0.01644 Heidrick & Struggles Internati 13 –
1,100 Helen of Troy 76 0.015,089 Helix Energy 36 0.014,074 Helmerich & Payne 259 0.041,758 Henry Schein 219 0.032,834 Herbalife 112 0.02
756 Herc* 25 –1,249 Heritage Commerce 15 –1,501 Heritage Financial 32 0.011,200 Heritage Insurance 15 –1,287 Heritage Oaks Ban 13 –
800 Heritage-Crystal Clean 10 –1,500 Herman Miller 42 0.012,181 Hersha Hospitality Trust 38 0.011,578 Hershey 133 0.022,269 Hertz Global* 39 0.016,083 Hess 311 0.05
23,467 Hewlett Packard Enterprise 445 0.073,527 Hexcel 148 0.021,246 HFF 30 –1,232 hhgregg 1 –
600 Hibbett Sports 18 –3,053 Highwoods Properties 125 0.02
700 Hill International 2 –2,559 Hillenbrand 79 0.012,300 Hill-Rom 105 0.023,999 Hilltop 97 0.01
16,450 Hilton Worldwide 364 0.05100 Hingham Institution for Savings 16 –
2,863 HMS 42 0.011,400 HNI 64 0.015,098 HollyFrontier 137 0.029,119 Hologic 297 0.044,704 Home BancShares 106 0.02
18,956 Home Depot 2,082 0.30649 HomeStreet 17 –
1,029 HomeTrust Bancshares 22 –11,562 Honeywell International 1,090 0.16
200 Hooker Furniture 6 –6,592 Hope Bancorp 118 0.02
Holding Investment
Fair Value £'000
Percentage of total
net assets %
United States (continued)1,700 Horace Mann Educators 60 0.01
900 Horizon Bancorp 20 –439 Horizon Global 9 –
5,325 Horizon Pharma 70 0.017,220 Hormel Foods 207 0.031,302 Hornbeck Offshore Services 8 –4,971 Hospitality Properties Trust 127 0.02
17,805 Host Hotels & Resorts 271 0.043,685 Houghton Mifflin Harcourt 32 0.01
700 Houston Wire & Cable 4 –1,509 Howard Hughes 141 0.02
39,226 HP 476 0.076,434 HRG 81 0.011,679 HSN 47 0.011,500 Hub 53 0.011,922 Hubbell 183 0.031,355 Hudson Global 2 –2,756 Hudson Pacific Properties 77 0.012,823 Humana 466 0.07
24,914 Huntington Bancshares 265 0.041,847 Huntington Ingalls Industries 277 0.04
10,872 Huntsman 169 0.03200 Hurco 5 –
1,101 Huron Consulting 45 0.01545 Hyatt Hotels 'A' 25 –600 Hyster-Yale Materials Handling 31 –
1,482 Iberiabank 101 0.02700 ICF International 31 –
2,806 Iconix Brand 20 –520 ICU Medical 61 0.01
1,684 IDACORP 111 0.022,372 IDEX 173 0.032,008 IDEXX Laboratories 193 0.03
400 IDT 6 –2,951 IHS Markit 84 0.013,000 II-VI 73 0.013,139 ILG 47 0.015,855 Illinois Tool Works 583 0.091,793 Illumina 188 0.032,684 Impax Laboratories 28 –
616 INC Research 26 –1,712 Incyte 142 0.02
737 Independence (USD) 12 –2,098 Independence Realty Trust 15 –
549 Independent Bank 28 –827 Independent Bank MICH 15 –890 Independent Bank Rockland MA 51 0.01
2,858 Infinera 20 –5,969 Ingersoll-Rand 367 0.05
829 Ingevity 37 0.01902 Ingles Markets 36 0.01
2,727 Ingredion 279 0.041,500 InnerWorkings 12 –
700 Innophos 30 –790 Innospec 45 0.01500 Inogen 27 –
2,668 Insight Enterprises 89 0.01600 Insperity 35 0.01618 Installed Building Products 21 –500 Insteel Industries 15 –596 Insys Therapeutics 4 –
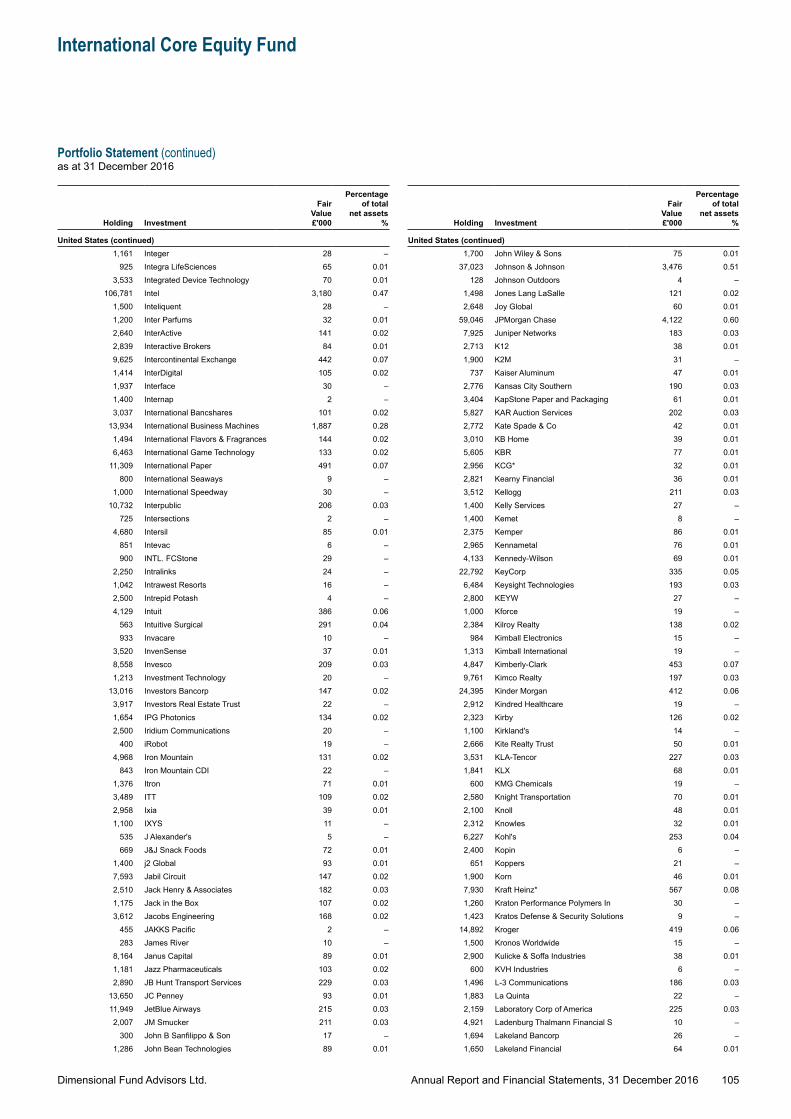
Dimensional Fund Advisors Ltd.
International Core Equity Fund
Portfolio Statement (continued)as at 31 December 2016
105Annual Report and Financial Statements, 31 December 2016
Holding Investment
Fair Value £'000
Percentage of total
net assets %
United States (continued)1,161 Integer 28 –
925 Integra LifeSciences 65 0.013,533 Integrated Device Technology 70 0.01
106,781 Intel 3,180 0.471,500 Inteliquent 28 –1,200 Inter Parfums 32 0.012,640 InterActive 141 0.022,839 Interactive Brokers 84 0.019,625 Intercontinental Exchange 442 0.071,414 InterDigital 105 0.021,937 Interface 30 –1,400 Internap 2 –3,037 International Bancshares 101 0.02
13,934 International Business Machines 1,887 0.281,494 International Flavors & Fragrances 144 0.026,463 International Game Technology 133 0.02
11,309 International Paper 491 0.07800 International Seaways 9 –
1,000 International Speedway 30 –10,732 Interpublic 206 0.03
725 Intersections 2 –4,680 Intersil 85 0.01
851 Intevac 6 –900 INTL. FCStone 29 –
2,250 Intralinks 24 –1,042 Intrawest Resorts 16 –2,500 Intrepid Potash 4 –4,129 Intuit 386 0.06
563 Intuitive Surgical 291 0.04933 Invacare 10 –
3,520 InvenSense 37 0.018,558 Invesco 209 0.031,213 Investment Technology 20 –
13,016 Investors Bancorp 147 0.023,917 Investors Real Estate Trust 22 –1,654 IPG Photonics 134 0.022,500 Iridium Communications 20 –
400 iRobot 19 –4,968 Iron Mountain 131 0.02
843 Iron Mountain CDI 22 –1,376 Itron 71 0.013,489 ITT 109 0.022,958 Ixia 39 0.011,100 IXYS 11 –
535 J Alexander's 5 –669 J&J Snack Foods 72 0.01
1,400 j2 Global 93 0.017,593 Jabil Circuit 147 0.022,510 Jack Henry & Associates 182 0.031,175 Jack in the Box 107 0.023,612 Jacobs Engineering 168 0.02
455 JAKKS Pacific 2 –283 James River 10 –
8,164 Janus Capital 89 0.011,181 Jazz Pharmaceuticals 103 0.022,890 JB Hunt Transport Services 229 0.03
13,650 JC Penney 93 0.0111,949 JetBlue Airways 215 0.032,007 JM Smucker 211 0.03
300 John B Sanfilippo & Son 17 –1,286 John Bean Technologies 89 0.01
Holding Investment
Fair Value £'000
Percentage of total
net assets %
United States (continued)1,700 John Wiley & Sons 75 0.01
37,023 Johnson & Johnson 3,476 0.51128 Johnson Outdoors 4 –
1,498 Jones Lang LaSalle 121 0.022,648 Joy Global 60 0.01
59,046 JPMorgan Chase 4,122 0.607,925 Juniper Networks 183 0.032,713 K12 38 0.011,900 K2M 31 –
737 Kaiser Aluminum 47 0.012,776 Kansas City Southern 190 0.033,404 KapStone Paper and Packaging 61 0.015,827 KAR Auction Services 202 0.032,772 Kate Spade & Co 42 0.013,010 KB Home 39 0.015,605 KBR 77 0.012,956 KCG* 32 0.012,821 Kearny Financial 36 0.013,512 Kellogg 211 0.031,400 Kelly Services 27 –1,400 Kemet 8 –2,375 Kemper 86 0.012,965 Kennametal 76 0.014,133 Kennedy-Wilson 69 0.01
22,792 KeyCorp 335 0.056,484 Keysight Technologies 193 0.032,800 KEYW 27 –1,000 Kforce 19 –2,384 Kilroy Realty 138 0.02
984 Kimball Electronics 15 –1,313 Kimball International 19 –4,847 Kimberly-Clark 453 0.079,761 Kimco Realty 197 0.03
24,395 Kinder Morgan 412 0.062,912 Kindred Healthcare 19 –2,323 Kirby 126 0.021,100 Kirkland's 14 –2,666 Kite Realty Trust 50 0.013,531 KLA-Tencor 227 0.031,841 KLX 68 0.01
600 KMG Chemicals 19 –2,580 Knight Transportation 70 0.012,100 Knoll 48 0.012,312 Knowles 32 0.016,227 Kohl's 253 0.042,400 Kopin 6 –
651 Koppers 21 –1,900 Korn 46 0.017,930 Kraft Heinz* 567 0.081,260 Kraton Performance Polymers In 30 –1,423 Kratos Defense & Security Solutions 9 –
14,892 Kroger 419 0.061,500 Kronos Worldwide 15 –2,900 Kulicke & Soffa Industries 38 0.01
600 KVH Industries 6 –1,496 L-3 Communications 186 0.031,883 La Quinta 22 –2,159 Laboratory Corp of America 225 0.034,921 Ladenburg Thalmann Financial S 10 –1,694 Lakeland Bancorp 26 –1,650 Lakeland Financial 64 0.01
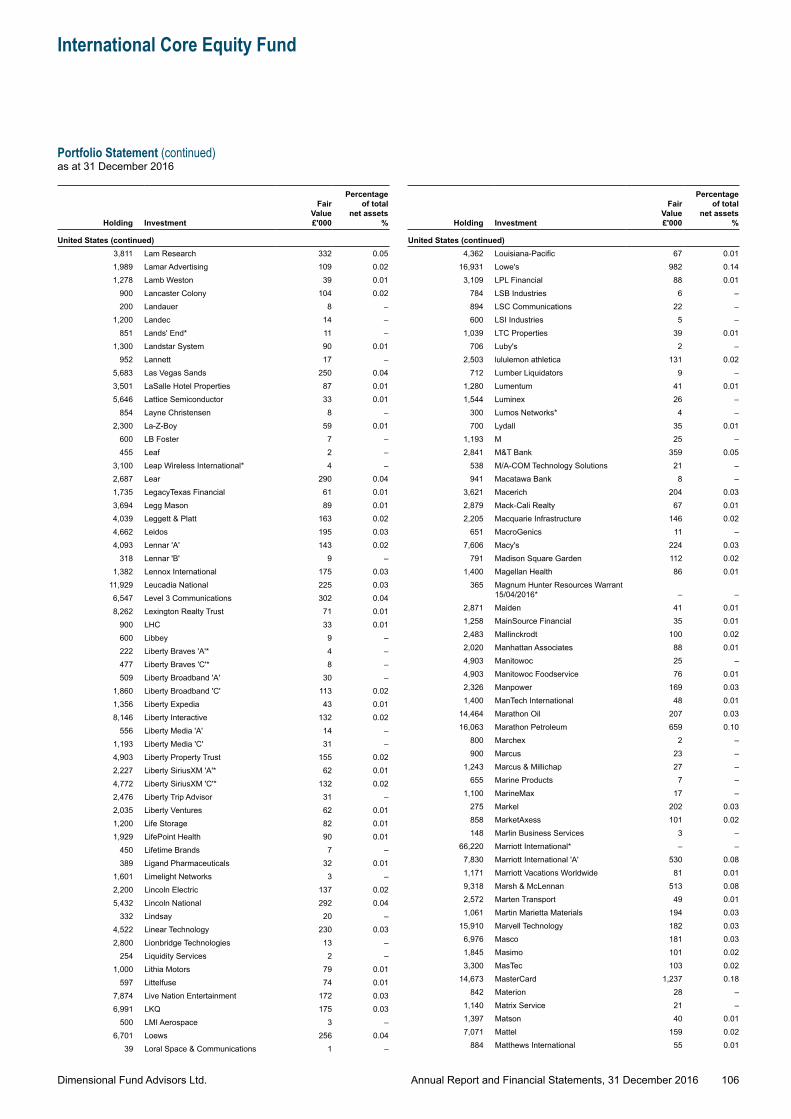
Dimensional Fund Advisors Ltd.
International Core Equity Fund
Portfolio Statement (continued)as at 31 December 2016
106Annual Report and Financial Statements, 31 December 2016
Holding Investment
Fair Value £'000
Percentage of total
net assets %
United States (continued)3,811 Lam Research 332 0.051,989 Lamar Advertising 109 0.021,278 Lamb Weston 39 0.01
900 Lancaster Colony 104 0.02200 Landauer 8 –
1,200 Landec 14 –851 Lands' End* 11 –
1,300 Landstar System 90 0.01952 Lannett 17 –
5,683 Las Vegas Sands 250 0.043,501 LaSalle Hotel Properties 87 0.015,646 Lattice Semiconductor 33 0.01
854 Layne Christensen 8 –2,300 La-Z-Boy 59 0.01
600 LB Foster 7 –455 Leaf 2 –
3,100 Leap Wireless International* 4 –2,687 Lear 290 0.041,735 LegacyTexas Financial 61 0.013,694 Legg Mason 89 0.014,039 Leggett & Platt 163 0.024,662 Leidos 195 0.034,093 Lennar 'A' 143 0.02
318 Lennar 'B' 9 –1,382 Lennox International 175 0.03
11,929 Leucadia National 225 0.036,547 Level 3 Communications 302 0.048,262 Lexington Realty Trust 71 0.01
900 LHC 33 0.01600 Libbey 9 –222 Liberty Braves 'A'* 4 –477 Liberty Braves 'C'* 8 –509 Liberty Broadband 'A' 30 –
1,860 Liberty Broadband 'C' 113 0.021,356 Liberty Expedia 43 0.018,146 Liberty Interactive 132 0.02
556 Liberty Media 'A' 14 –1,193 Liberty Media 'C' 31 –4,903 Liberty Property Trust 155 0.022,227 Liberty SiriusXM 'A'* 62 0.014,772 Liberty SiriusXM 'C'* 132 0.022,476 Liberty Trip Advisor 31 –2,035 Liberty Ventures 62 0.011,200 Life Storage 82 0.011,929 LifePoint Health 90 0.01
450 Lifetime Brands 7 –389 Ligand Pharmaceuticals 32 0.01
1,601 Limelight Networks 3 –2,200 Lincoln Electric 137 0.025,432 Lincoln National 292 0.04
332 Lindsay 20 –4,522 Linear Technology 230 0.032,800 Lionbridge Technologies 13 –
254 Liquidity Services 2 –1,000 Lithia Motors 79 0.01
597 Littelfuse 74 0.017,874 Live Nation Entertainment 172 0.036,991 LKQ 175 0.03
500 LMI Aerospace 3 –6,701 Loews 256 0.04
39 Loral Space & Communications 1 –
Holding Investment
Fair Value £'000
Percentage of total
net assets %
United States (continued)4,362 Louisiana-Pacific 67 0.01
16,931 Lowe's 982 0.143,109 LPL Financial 88 0.01
784 LSB Industries 6 –894 LSC Communications 22 –600 LSI Industries 5 –
1,039 LTC Properties 39 0.01706 Luby's 2 –
2,503 lululemon athletica 131 0.02712 Lumber Liquidators 9 –
1,280 Lumentum 41 0.011,544 Luminex 26 –
300 Lumos Networks* 4 –700 Lydall 35 0.01
1,193 M 25 –2,841 M&T Bank 359 0.05
538 M/A-COM Technology Solutions 21 –941 Macatawa Bank 8 –
3,621 Macerich 204 0.032,879 Mack-Cali Realty 67 0.012,205 Macquarie Infrastructure 146 0.02
651 MacroGenics 11 –7,606 Macy's 224 0.03
791 Madison Square Garden 112 0.021,400 Magellan Health 86 0.01
365 Magnum Hunter Resources Warrant 15/04/2016* – –
2,871 Maiden 41 0.011,258 MainSource Financial 35 0.012,483 Mallinckrodt 100 0.022,020 Manhattan Associates 88 0.014,903 Manitowoc 25 –4,903 Manitowoc Foodservice 76 0.012,326 Manpower 169 0.031,400 ManTech International 48 0.01
14,464 Marathon Oil 207 0.0316,063 Marathon Petroleum 659 0.10
800 Marchex 2 –900 Marcus 23 –
1,243 Marcus & Millichap 27 –655 Marine Products 7 –
1,100 MarineMax 17 –275 Markel 202 0.03858 MarketAxess 101 0.02148 Marlin Business Services 3 –
66,220 Marriott International* – –7,830 Marriott International 'A' 530 0.081,171 Marriott Vacations Worldwide 81 0.019,318 Marsh & McLennan 513 0.082,572 Marten Transport 49 0.011,061 Martin Marietta Materials 194 0.03
15,910 Marvell Technology 182 0.036,976 Masco 181 0.031,845 Masimo 101 0.023,300 MasTec 103 0.02
14,673 MasterCard 1,237 0.18842 Materion 28 –
1,140 Matrix Service 21 –1,397 Matson 40 0.017,071 Mattel 159 0.02
884 Matthews International 55 0.01
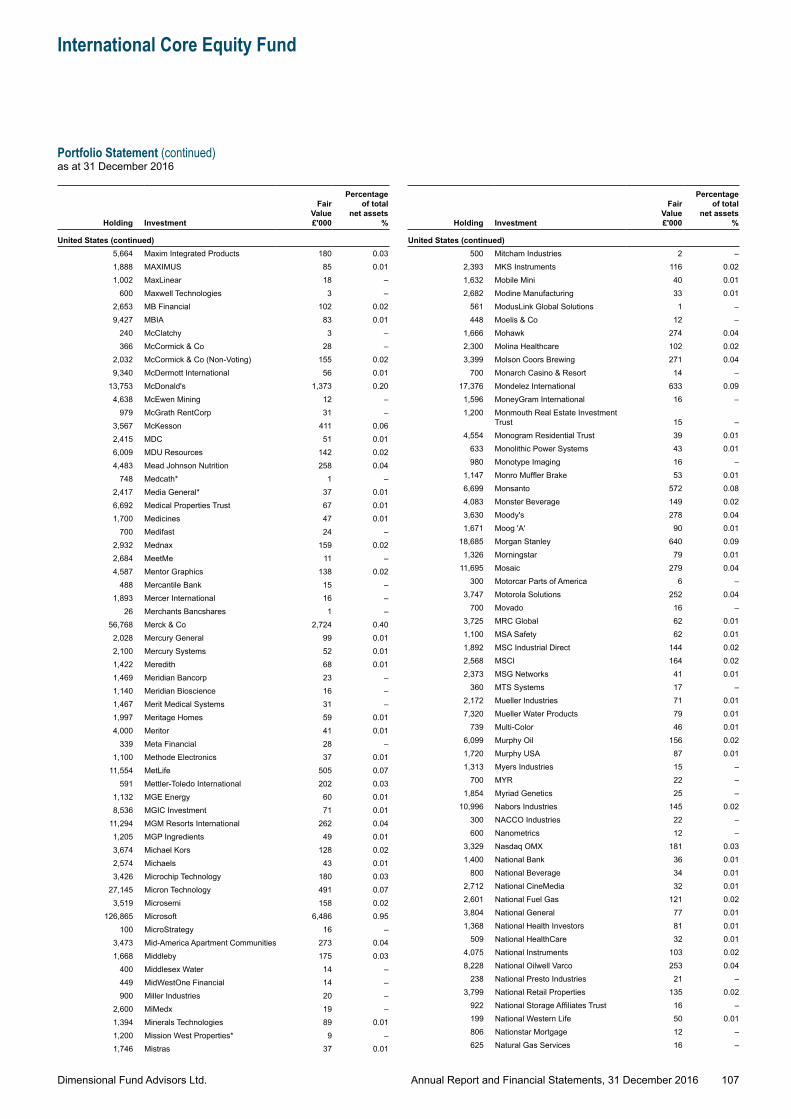
Dimensional Fund Advisors Ltd.
International Core Equity Fund
Portfolio Statement (continued)as at 31 December 2016
107Annual Report and Financial Statements, 31 December 2016
Holding Investment
Fair Value £'000
Percentage of total
net assets %
United States (continued)5,664 Maxim Integrated Products 180 0.031,888 MAXIMUS 85 0.011,002 MaxLinear 18 –
600 Maxwell Technologies 3 –2,653 MB Financial 102 0.029,427 MBIA 83 0.01
240 McClatchy 3 –366 McCormick & Co 28 –
2,032 McCormick & Co (Non-Voting) 155 0.029,340 McDermott International 56 0.01
13,753 McDonald's 1,373 0.204,638 McEwen Mining 12 –
979 McGrath RentCorp 31 –3,567 McKesson 411 0.062,415 MDC 51 0.016,009 MDU Resources 142 0.024,483 Mead Johnson Nutrition 258 0.04
748 Medcath* 1 –2,417 Media General* 37 0.016,692 Medical Properties Trust 67 0.011,700 Medicines 47 0.01
700 Medifast 24 –2,932 Mednax 159 0.022,684 MeetMe 11 –4,587 Mentor Graphics 138 0.02
488 Mercantile Bank 15 –1,893 Mercer International 16 –
26 Merchants Bancshares 1 –56,768 Merck & Co 2,724 0.40
2,028 Mercury General 99 0.012,100 Mercury Systems 52 0.011,422 Meredith 68 0.011,469 Meridian Bancorp 23 –1,140 Meridian Bioscience 16 –1,467 Merit Medical Systems 31 –1,997 Meritage Homes 59 0.014,000 Meritor 41 0.01
339 Meta Financial 28 –1,100 Methode Electronics 37 0.01
11,554 MetLife 505 0.07591 Mettler-Toledo International 202 0.03
1,132 MGE Energy 60 0.018,536 MGIC Investment 71 0.01
11,294 MGM Resorts International 262 0.041,205 MGP Ingredients 49 0.013,674 Michael Kors 128 0.022,574 Michaels 43 0.013,426 Microchip Technology 180 0.03
27,145 Micron Technology 491 0.073,519 Microsemi 158 0.02
126,865 Microsoft 6,486 0.95100 MicroStrategy 16 –
3,473 Mid-America Apartment Communities 273 0.041,668 Middleby 175 0.03
400 Middlesex Water 14 –449 MidWestOne Financial 14 –900 Miller Industries 20 –
2,600 MiMedx 19 –1,394 Minerals Technologies 89 0.011,200 Mission West Properties* 9 –1,746 Mistras 37 0.01
Holding Investment
Fair Value £'000
Percentage of total
net assets %
United States (continued)500 Mitcham Industries 2 –
2,393 MKS Instruments 116 0.021,632 Mobile Mini 40 0.012,682 Modine Manufacturing 33 0.01
561 ModusLink Global Solutions 1 –448 Moelis & Co 12 –
1,666 Mohawk 274 0.042,300 Molina Healthcare 102 0.023,399 Molson Coors Brewing 271 0.04
700 Monarch Casino & Resort 14 –17,376 Mondelez International 633 0.09
1,596 MoneyGram International 16 –1,200 Monmouth Real Estate Investment
Trust 15 –4,554 Monogram Residential Trust 39 0.01
633 Monolithic Power Systems 43 0.01980 Monotype Imaging 16 –
1,147 Monro Muffler Brake 53 0.016,699 Monsanto 572 0.084,083 Monster Beverage 149 0.023,630 Moody's 278 0.041,671 Moog 'A' 90 0.01
18,685 Morgan Stanley 640 0.091,326 Morningstar 79 0.01
11,695 Mosaic 279 0.04300 Motorcar Parts of America 6 –
3,747 Motorola Solutions 252 0.04700 Movado 16 –
3,725 MRC Global 62 0.011,100 MSA Safety 62 0.011,892 MSC Industrial Direct 144 0.022,568 MSCI 164 0.022,373 MSG Networks 41 0.01
360 MTS Systems 17 –2,172 Mueller Industries 71 0.017,320 Mueller Water Products 79 0.01
739 Multi-Color 46 0.016,099 Murphy Oil 156 0.021,720 Murphy USA 87 0.011,313 Myers Industries 15 –
700 MYR 22 –1,854 Myriad Genetics 25 –
10,996 Nabors Industries 145 0.02300 NACCO Industries 22 –600 Nanometrics 12 –
3,329 Nasdaq OMX 181 0.031,400 National Bank 36 0.01
800 National Beverage 34 0.012,712 National CineMedia 32 0.012,601 National Fuel Gas 121 0.023,804 National General 77 0.011,368 National Health Investors 81 0.01
509 National HealthCare 32 0.014,075 National Instruments 103 0.028,228 National Oilwell Varco 253 0.04
238 National Presto Industries 21 –3,799 National Retail Properties 135 0.02
922 National Storage Affiliates Trust 16 –199 National Western Life 50 0.01806 Nationstar Mortgage 12 –625 Natural Gas Services 16 –
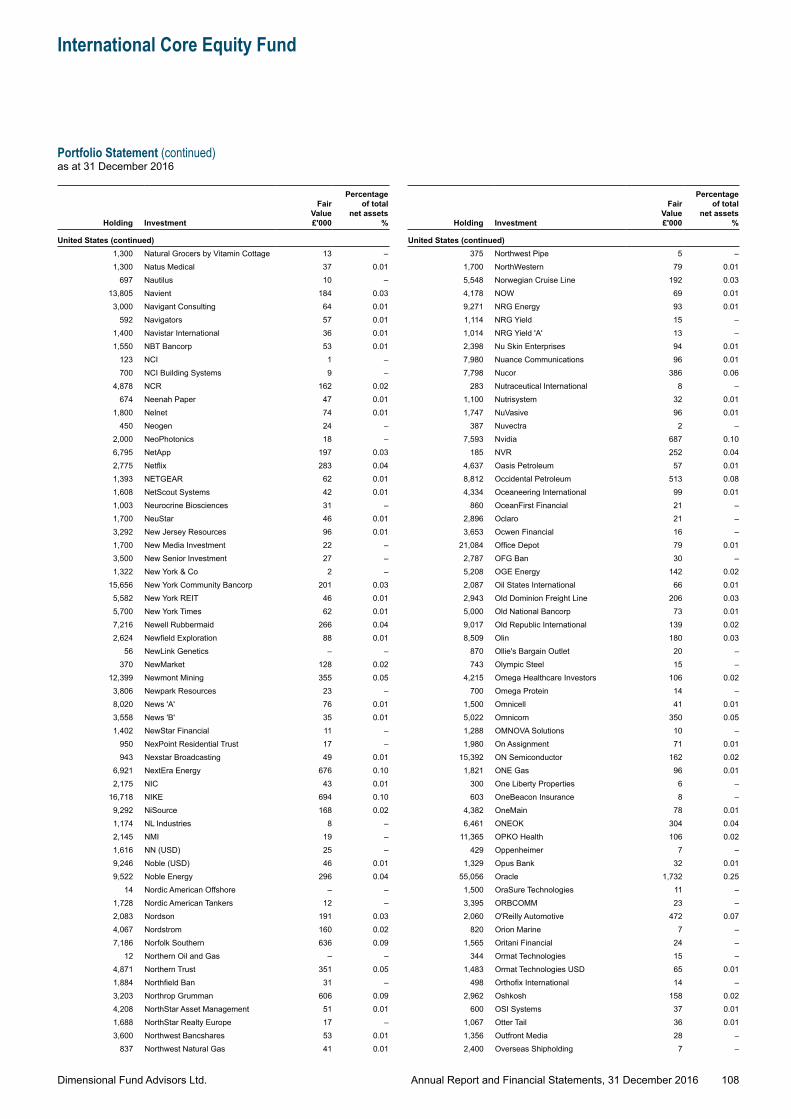
Dimensional Fund Advisors Ltd.
International Core Equity Fund
Portfolio Statement (continued)as at 31 December 2016
108Annual Report and Financial Statements, 31 December 2016
Holding Investment
Fair Value £'000
Percentage of total
net assets %
United States (continued)1,300 Natural Grocers by Vitamin Cottage 13 –1,300 Natus Medical 37 0.01
697 Nautilus 10 –13,805 Navient 184 0.03
3,000 Navigant Consulting 64 0.01592 Navigators 57 0.01
1,400 Navistar International 36 0.011,550 NBT Bancorp 53 0.01
123 NCI 1 –700 NCI Building Systems 9 –
4,878 NCR 162 0.02674 Neenah Paper 47 0.01
1,800 Nelnet 74 0.01450 Neogen 24 –
2,000 NeoPhotonics 18 –6,795 NetApp 197 0.032,775 Netflix 283 0.041,393 NETGEAR 62 0.011,608 NetScout Systems 42 0.011,003 Neurocrine Biosciences 31 –1,700 NeuStar 46 0.013,292 New Jersey Resources 96 0.011,700 New Media Investment 22 –3,500 New Senior Investment 27 –1,322 New York & Co 2 –
15,656 New York Community Bancorp 201 0.035,582 New York REIT 46 0.015,700 New York Times 62 0.017,216 Newell Rubbermaid 266 0.042,624 Newfield Exploration 88 0.01
56 NewLink Genetics – –370 NewMarket 128 0.02
12,399 Newmont Mining 355 0.053,806 Newpark Resources 23 –8,020 News 'A' 76 0.013,558 News 'B' 35 0.011,402 NewStar Financial 11 –
950 NexPoint Residential Trust 17 –943 Nexstar Broadcasting 49 0.01
6,921 NextEra Energy 676 0.102,175 NIC 43 0.01
16,718 NIKE 694 0.109,292 NiSource 168 0.021,174 NL Industries 8 –2,145 NMI 19 –1,616 NN (USD) 25 –9,246 Noble (USD) 46 0.019,522 Noble Energy 296 0.04
14 Nordic American Offshore – –1,728 Nordic American Tankers 12 –2,083 Nordson 191 0.034,067 Nordstrom 160 0.027,186 Norfolk Southern 636 0.09
12 Northern Oil and Gas – –4,871 Northern Trust 351 0.051,884 Northfield Ban 31 –3,203 Northrop Grumman 606 0.094,208 NorthStar Asset Management 51 0.011,688 NorthStar Realty Europe 17 –3,600 Northwest Bancshares 53 0.01
837 Northwest Natural Gas 41 0.01
Holding Investment
Fair Value £'000
Percentage of total
net assets %
United States (continued)375 Northwest Pipe 5 –
1,700 NorthWestern 79 0.015,548 Norwegian Cruise Line 192 0.034,178 NOW 69 0.019,271 NRG Energy 93 0.011,114 NRG Yield 15 –1,014 NRG Yield 'A' 13 –2,398 Nu Skin Enterprises 94 0.017,980 Nuance Communications 96 0.017,798 Nucor 386 0.06
283 Nutraceutical International 8 –1,100 Nutrisystem 32 0.011,747 NuVasive 96 0.01
387 Nuvectra 2 –7,593 Nvidia 687 0.10
185 NVR 252 0.044,637 Oasis Petroleum 57 0.018,812 Occidental Petroleum 513 0.084,334 Oceaneering International 99 0.01
860 OceanFirst Financial 21 –2,896 Oclaro 21 –3,653 Ocwen Financial 16 –
21,084 Office Depot 79 0.012,787 OFG Ban 30 –5,208 OGE Energy 142 0.022,087 Oil States International 66 0.012,943 Old Dominion Freight Line 206 0.035,000 Old National Bancorp 73 0.019,017 Old Republic International 139 0.028,509 Olin 180 0.03
870 Ollie's Bargain Outlet 20 –743 Olympic Steel 15 –
4,215 Omega Healthcare Investors 106 0.02700 Omega Protein 14 –
1,500 Omnicell 41 0.015,022 Omnicom 350 0.051,288 OMNOVA Solutions 10 –1,980 On Assignment 71 0.01
15,392 ON Semiconductor 162 0.021,821 ONE Gas 96 0.01
300 One Liberty Properties 6 –603 OneBeacon Insurance 8 –
4,382 OneMain 78 0.016,461 ONEOK 304 0.04
11,365 OPKO Health 106 0.02429 Oppenheimer 7 –
1,329 Opus Bank 32 0.0155,056 Oracle 1,732 0.25
1,500 OraSure Technologies 11 –3,395 ORBCOMM 23 –2,060 O'Reilly Automotive 472 0.07
820 Orion Marine 7 –1,565 Oritani Financial 24 –
344 Ormat Technologies 15 –1,483 Ormat Technologies USD 65 0.01
498 Orthofix International 14 –2,962 Oshkosh 158 0.02
600 OSI Systems 37 0.011,067 Otter Tail 36 0.011,356 Outfront Media 28 –2,400 Overseas Shipholding 7 –
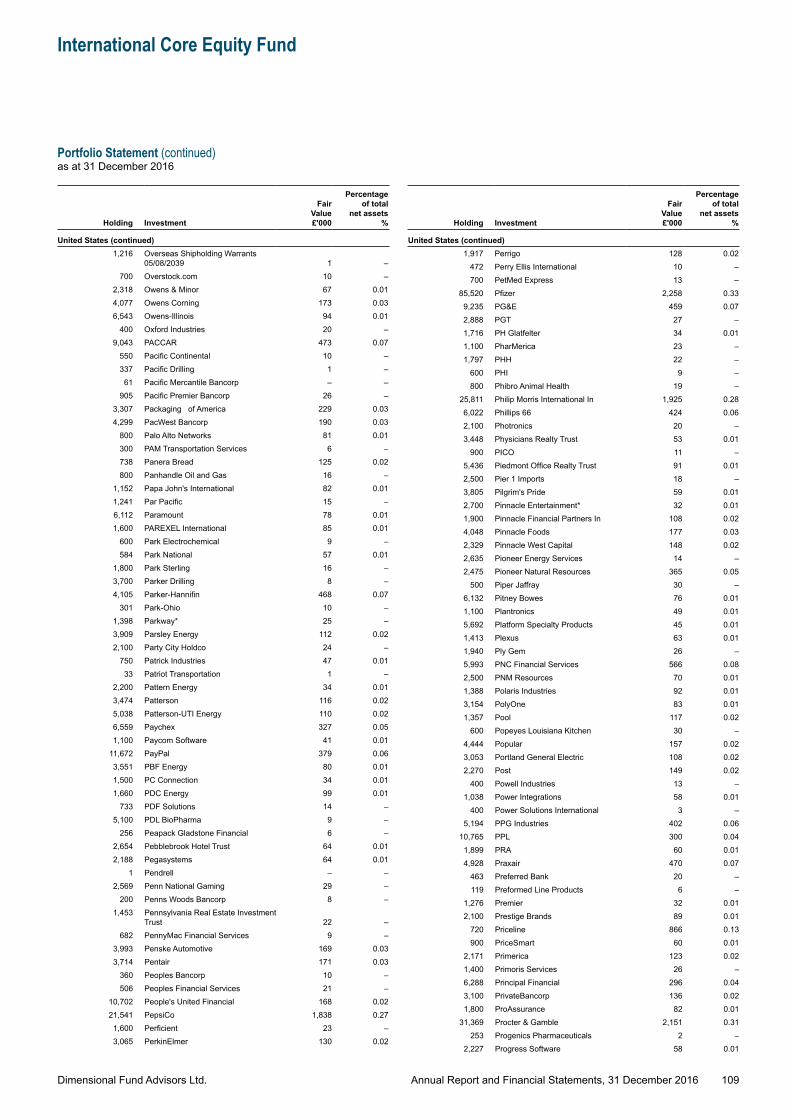
Dimensional Fund Advisors Ltd.
International Core Equity Fund
Portfolio Statement (continued)as at 31 December 2016
109Annual Report and Financial Statements, 31 December 2016
Holding Investment
Fair Value £'000
Percentage of total
net assets %
United States (continued)1,216 Overseas Shipholding Warrants
05/08/2039 1 –700 Overstock.com 10 –
2,318 Owens & Minor 67 0.014,077 Owens Corning 173 0.036,543 Owens-Illinois 94 0.01
400 Oxford Industries 20 –9,043 PACCAR 473 0.07
550 Pacific Continental 10 –337 Pacific Drilling 1 –
61 Pacific Mercantile Bancorp – –905 Pacific Premier Bancorp 26 –
3,307 Packaging of America 229 0.034,299 PacWest Bancorp 190 0.03
800 Palo Alto Networks 81 0.01300 PAM Transportation Services 6 –738 Panera Bread 125 0.02800 Panhandle Oil and Gas 16 –
1,152 Papa John's International 82 0.011,241 Par Pacific 15 –6,112 Paramount 78 0.011,600 PAREXEL International 85 0.01
600 Park Electrochemical 9 –584 Park National 57 0.01
1,800 Park Sterling 16 –3,700 Parker Drilling 8 –4,105 Parker-Hannifin 468 0.07
301 Park-Ohio 10 –1,398 Parkway* 25 –3,909 Parsley Energy 112 0.022,100 Party City Holdco 24 –
750 Patrick Industries 47 0.0133 Patriot Transportation 1 –
2,200 Pattern Energy 34 0.013,474 Patterson 116 0.025,038 Patterson-UTI Energy 110 0.026,559 Paychex 327 0.051,100 Paycom Software 41 0.01
11,672 PayPal 379 0.063,551 PBF Energy 80 0.011,500 PC Connection 34 0.011,660 PDC Energy 99 0.01
733 PDF Solutions 14 –5,100 PDL BioPharma 9 –
256 Peapack Gladstone Financial 6 –2,654 Pebblebrook Hotel Trust 64 0.012,188 Pegasystems 64 0.01
1 Pendrell – –2,569 Penn National Gaming 29 –
200 Penns Woods Bancorp 8 –1,453 Pennsylvania Real Estate Investment
Trust 22 –682 PennyMac Financial Services 9 –
3,993 Penske Automotive 169 0.033,714 Pentair 171 0.03
360 Peoples Bancorp 10 –506 Peoples Financial Services 21 –
10,702 People's United Financial 168 0.0221,541 PepsiCo 1,838 0.27
1,600 Perficient 23 –3,065 PerkinElmer 130 0.02
Holding Investment
Fair Value £'000
Percentage of total
net assets %
United States (continued)1,917 Perrigo 128 0.02
472 Perry Ellis International 10 –700 PetMed Express 13 –
85,520 Pfizer 2,258 0.339,235 PG&E 459 0.072,888 PGT 27 –1,716 PH Glatfelter 34 0.011,100 PharMerica 23 –1,797 PHH 22 –
600 PHI 9 –800 Phibro Animal Health 19 –
25,811 Philip Morris International In 1,925 0.286,022 Phillips 66 424 0.062,100 Photronics 20 –3,448 Physicians Realty Trust 53 0.01
900 PICO 11 –5,436 Piedmont Office Realty Trust 91 0.012,500 Pier 1 Imports 18 –3,805 Pilgrim's Pride 59 0.012,700 Pinnacle Entertainment* 32 0.011,900 Pinnacle Financial Partners In 108 0.024,048 Pinnacle Foods 177 0.032,329 Pinnacle West Capital 148 0.022,635 Pioneer Energy Services 14 –2,475 Pioneer Natural Resources 365 0.05
500 Piper Jaffray 30 –6,132 Pitney Bowes 76 0.011,100 Plantronics 49 0.015,692 Platform Specialty Products 45 0.011,413 Plexus 63 0.011,940 Ply Gem 26 –5,993 PNC Financial Services 566 0.082,500 PNM Resources 70 0.011,388 Polaris Industries 92 0.013,154 PolyOne 83 0.011,357 Pool 117 0.02
600 Popeyes Louisiana Kitchen 30 –4,444 Popular 157 0.023,053 Portland General Electric 108 0.022,270 Post 149 0.02
400 Powell Industries 13 –1,038 Power Integrations 58 0.01
400 Power Solutions International 3 –5,194 PPG Industries 402 0.06
10,765 PPL 300 0.041,899 PRA 60 0.014,928 Praxair 470 0.07
463 Preferred Bank 20 –119 Preformed Line Products 6 –
1,276 Premier 32 0.012,100 Prestige Brands 89 0.01
720 Priceline 866 0.13900 PriceSmart 60 0.01
2,171 Primerica 123 0.021,400 Primoris Services 26 –6,288 Principal Financial 296 0.043,100 PrivateBancorp 136 0.021,800 ProAssurance 82 0.01
31,369 Procter & Gamble 2,151 0.31253 Progenics Pharmaceuticals 2 –
2,227 Progress Software 58 0.01
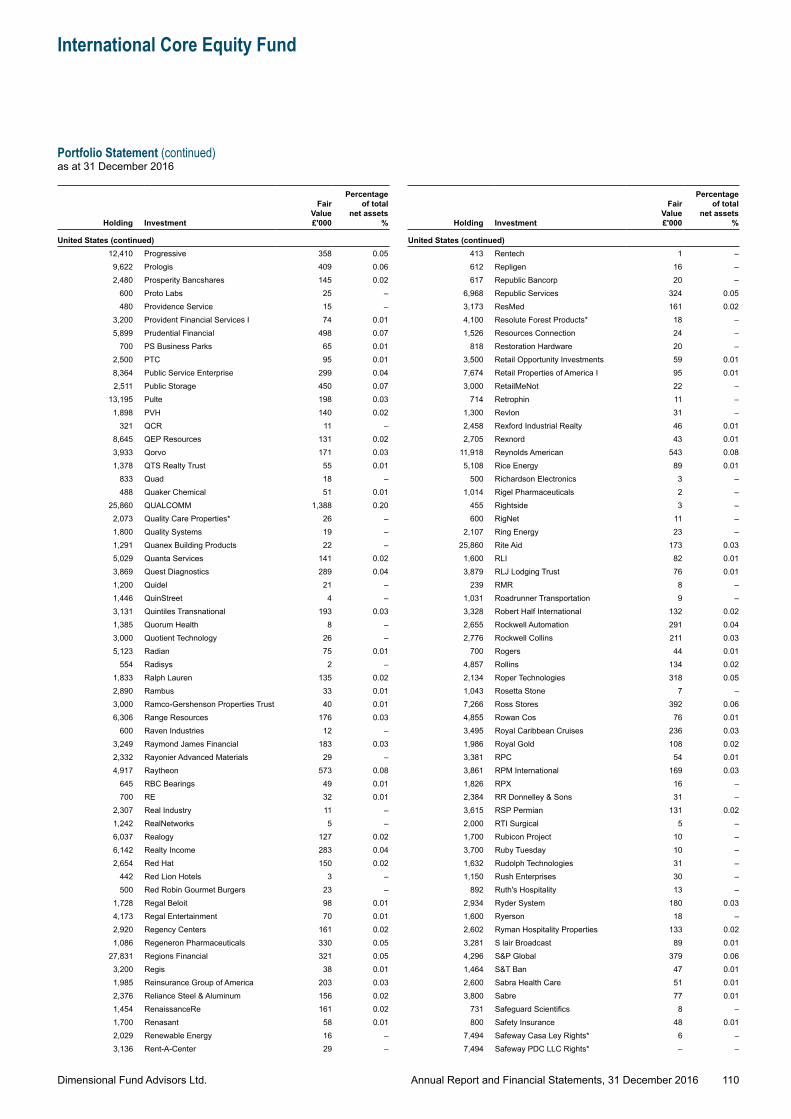
Dimensional Fund Advisors Ltd.
International Core Equity Fund
Portfolio Statement (continued)as at 31 December 2016
110Annual Report and Financial Statements, 31 December 2016
Holding Investment
Fair Value £'000
Percentage of total
net assets %
United States (continued)12,410 Progressive 358 0.05
9,622 Prologis 409 0.062,480 Prosperity Bancshares 145 0.02
600 Proto Labs 25 –480 Providence Service 15 –
3,200 Provident Financial Services I 74 0.015,899 Prudential Financial 498 0.07
700 PS Business Parks 65 0.012,500 PTC 95 0.018,364 Public Service Enterprise 299 0.042,511 Public Storage 450 0.07
13,195 Pulte 198 0.031,898 PVH 140 0.02
321 QCR 11 –8,645 QEP Resources 131 0.023,933 Qorvo 171 0.031,378 QTS Realty Trust 55 0.01
833 Quad 18 –488 Quaker Chemical 51 0.01
25,860 QUALCOMM 1,388 0.202,073 Quality Care Properties* 26 –1,800 Quality Systems 19 –1,291 Quanex Building Products 22 –5,029 Quanta Services 141 0.023,869 Quest Diagnostics 289 0.041,200 Quidel 21 –1,446 QuinStreet 4 –3,131 Quintiles Transnational 193 0.031,385 Quorum Health 8 –3,000 Quotient Technology 26 –5,123 Radian 75 0.01
554 Radisys 2 –1,833 Ralph Lauren 135 0.022,890 Rambus 33 0.013,000 Ramco-Gershenson Properties Trust 40 0.016,306 Range Resources 176 0.03
600 Raven Industries 12 –3,249 Raymond James Financial 183 0.032,332 Rayonier Advanced Materials 29 –4,917 Raytheon 573 0.08
645 RBC Bearings 49 0.01700 RE 32 0.01
2,307 Real Industry 11 –1,242 RealNetworks 5 –6,037 Realogy 127 0.026,142 Realty Income 283 0.042,654 Red Hat 150 0.02
442 Red Lion Hotels 3 –500 Red Robin Gourmet Burgers 23 –
1,728 Regal Beloit 98 0.014,173 Regal Entertainment 70 0.012,920 Regency Centers 161 0.021,086 Regeneron Pharmaceuticals 330 0.05
27,831 Regions Financial 321 0.053,200 Regis 38 0.011,985 Reinsurance Group of America 203 0.032,376 Reliance Steel & Aluminum 156 0.021,454 RenaissanceRe 161 0.021,700 Renasant 58 0.012,029 Renewable Energy 16 –3,136 Rent-A-Center 29 –
Holding Investment
Fair Value £'000
Percentage of total
net assets %
United States (continued)413 Rentech 1 –612 Repligen 16 –617 Republic Bancorp 20 –
6,968 Republic Services 324 0.053,173 ResMed 161 0.024,100 Resolute Forest Products* 18 –1,526 Resources Connection 24 –
818 Restoration Hardware 20 –3,500 Retail Opportunity Investments 59 0.017,674 Retail Properties of America I 95 0.013,000 RetailMeNot 22 –
714 Retrophin 11 –1,300 Revlon 31 –2,458 Rexford Industrial Realty 46 0.012,705 Rexnord 43 0.01
11,918 Reynolds American 543 0.085,108 Rice Energy 89 0.01
500 Richardson Electronics 3 –1,014 Rigel Pharmaceuticals 2 –
455 Rightside 3 –600 RigNet 11 –
2,107 Ring Energy 23 –25,860 Rite Aid 173 0.03
1,600 RLI 82 0.013,879 RLJ Lodging Trust 76 0.01
239 RMR 8 –1,031 Roadrunner Transportation 9 –3,328 Robert Half International 132 0.022,655 Rockwell Automation 291 0.042,776 Rockwell Collins 211 0.03
700 Rogers 44 0.014,857 Rollins 134 0.022,134 Roper Technologies 318 0.051,043 Rosetta Stone 7 –7,266 Ross Stores 392 0.064,855 Rowan Cos 76 0.013,495 Royal Caribbean Cruises 236 0.031,986 Royal Gold 108 0.023,381 RPC 54 0.013,861 RPM International 169 0.031,826 RPX 16 –2,384 RR Donnelley & Sons 31 –3,615 RSP Permian 131 0.022,000 RTI Surgical 5 –1,700 Rubicon Project 10 –3,700 Ruby Tuesday 10 –1,632 Rudolph Technologies 31 –1,150 Rush Enterprises 30 –
892 Ruth's Hospitality 13 –2,934 Ryder System 180 0.031,600 Ryerson 18 –2,602 Ryman Hospitality Properties 133 0.023,281 S lair Broadcast 89 0.014,296 S&P Global 379 0.061,464 S&T Ban 47 0.012,600 Sabra Health Care 51 0.013,800 Sabre 77 0.01
731 Safeguard Scientifics 8 –800 Safety Insurance 48 0.01
7,494 Safeway Casa Ley Rights* 6 –7,494 Safeway PDC LLC Rights* – –
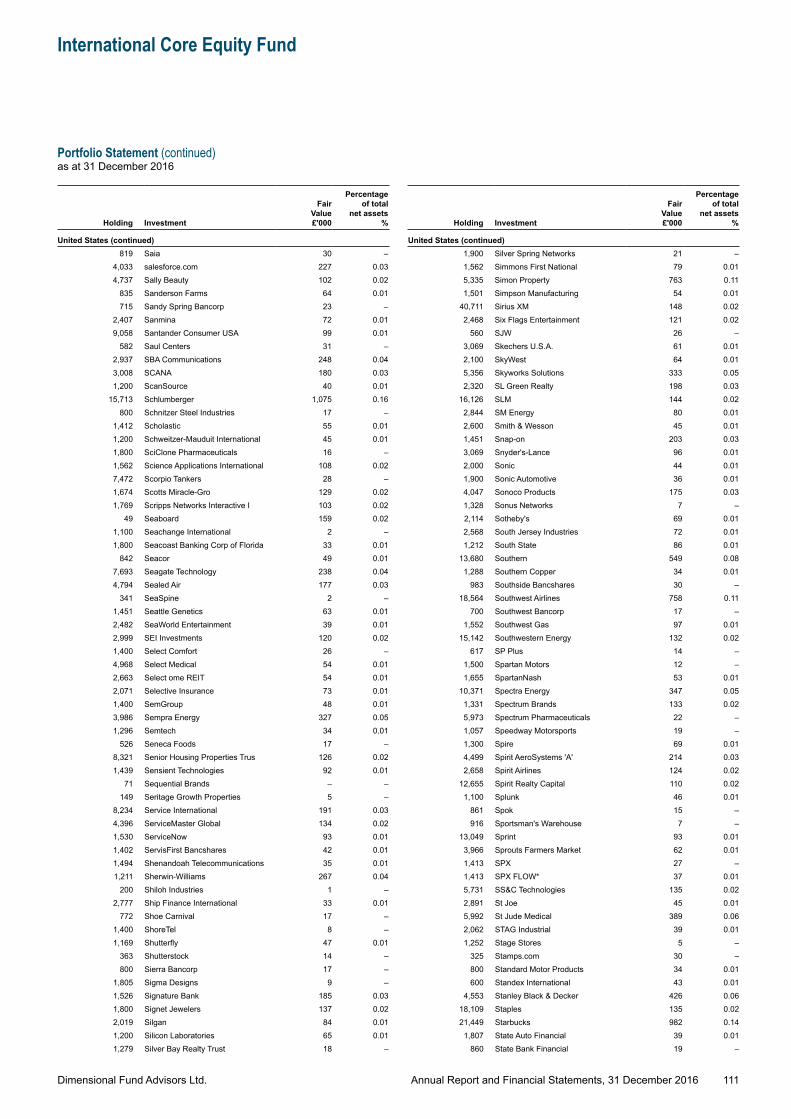
Dimensional Fund Advisors Ltd.
International Core Equity Fund
Portfolio Statement (continued)as at 31 December 2016
111Annual Report and Financial Statements, 31 December 2016
Holding Investment
Fair Value £'000
Percentage of total
net assets %
United States (continued)819 Saia 30 –
4,033 salesforce.com 227 0.034,737 Sally Beauty 102 0.02
835 Sanderson Farms 64 0.01715 Sandy Spring Bancorp 23 –
2,407 Sanmina 72 0.019,058 Santander Consumer USA 99 0.01
582 Saul Centers 31 –2,937 SBA Communications 248 0.043,008 SCANA 180 0.031,200 ScanSource 40 0.01
15,713 Schlumberger 1,075 0.16800 Schnitzer Steel Industries 17 –
1,412 Scholastic 55 0.011,200 Schweitzer-Mauduit International 45 0.011,800 SciClone Pharmaceuticals 16 –1,562 Science Applications International 108 0.027,472 Scorpio Tankers 28 –1,674 Scotts Miracle-Gro 129 0.021,769 Scripps Networks Interactive I 103 0.02
49 Seaboard 159 0.021,100 Seachange International 2 –1,800 Seacoast Banking Corp of Florida 33 0.01
842 Seacor 49 0.017,693 Seagate Technology 238 0.044,794 Sealed Air 177 0.03
341 SeaSpine 2 –1,451 Seattle Genetics 63 0.012,482 SeaWorld Entertainment 39 0.012,999 SEI Investments 120 0.021,400 Select Comfort 26 –4,968 Select Medical 54 0.012,663 Select ome REIT 54 0.012,071 Selective Insurance 73 0.011,400 SemGroup 48 0.013,986 Sempra Energy 327 0.051,296 Semtech 34 0.01
526 Seneca Foods 17 –8,321 Senior Housing Properties Trus 126 0.021,439 Sensient Technologies 92 0.01
71 Sequential Brands – –149 Seritage Growth Properties 5 –
8,234 Service International 191 0.034,396 ServiceMaster Global 134 0.021,530 ServiceNow 93 0.011,402 ServisFirst Bancshares 42 0.011,494 Shenandoah Telecommunications 35 0.011,211 Sherwin-Williams 267 0.04
200 Shiloh Industries 1 –2,777 Ship Finance International 33 0.01
772 Shoe Carnival 17 –1,400 ShoreTel 8 –1,169 Shutterfly 47 0.01
363 Shutterstock 14 –800 Sierra Bancorp 17 –
1,805 Sigma Designs 9 –1,526 Signature Bank 185 0.031,800 Signet Jewelers 137 0.022,019 Silgan 84 0.011,200 Silicon Laboratories 65 0.011,279 Silver Bay Realty Trust 18 –
Holding Investment
Fair Value £'000
Percentage of total
net assets %
United States (continued)1,900 Silver Spring Networks 21 –1,562 Simmons First National 79 0.015,335 Simon Property 763 0.111,501 Simpson Manufacturing 54 0.01
40,711 Sirius XM 148 0.022,468 Six Flags Entertainment 121 0.02
560 SJW 26 –3,069 Skechers U.S.A. 61 0.012,100 SkyWest 64 0.015,356 Skyworks Solutions 333 0.052,320 SL Green Realty 198 0.03
16,126 SLM 144 0.022,844 SM Energy 80 0.012,600 Smith & Wesson 45 0.011,451 Snap-on 203 0.033,069 Snyder's-Lance 96 0.012,000 Sonic 44 0.011,900 Sonic Automotive 36 0.014,047 Sonoco Products 175 0.031,328 Sonus Networks 7 –2,114 Sotheby's 69 0.012,568 South Jersey Industries 72 0.011,212 South State 86 0.01
13,680 Southern 549 0.081,288 Southern Copper 34 0.01
983 Southside Bancshares 30 –18,564 Southwest Airlines 758 0.11
700 Southwest Bancorp 17 –1,552 Southwest Gas 97 0.01
15,142 Southwestern Energy 132 0.02617 SP Plus 14 –
1,500 Spartan Motors 12 –1,655 SpartanNash 53 0.01
10,371 Spectra Energy 347 0.051,331 Spectrum Brands 133 0.025,973 Spectrum Pharmaceuticals 22 –1,057 Speedway Motorsports 19 –1,300 Spire 69 0.014,499 Spirit AeroSystems 'A' 214 0.032,658 Spirit Airlines 124 0.02
12,655 Spirit Realty Capital 110 0.021,100 Splunk 46 0.01
861 Spok 15 –916 Sportsman's Warehouse 7 –
13,049 Sprint 93 0.013,966 Sprouts Farmers Market 62 0.011,413 SPX 27 –1,413 SPX FLOW* 37 0.015,731 SS&C Technologies 135 0.022,891 St Joe 45 0.015,992 St Jude Medical 389 0.062,062 STAG Industrial 39 0.011,252 Stage Stores 5 –
325 Stamps.com 30 –800 Standard Motor Products 34 0.01600 Standex International 43 0.01
4,553 Stanley Black & Decker 426 0.0618,109 Staples 135 0.0221,449 Starbucks 982 0.14
1,807 State Auto Financial 39 0.01860 State Bank Financial 19 –
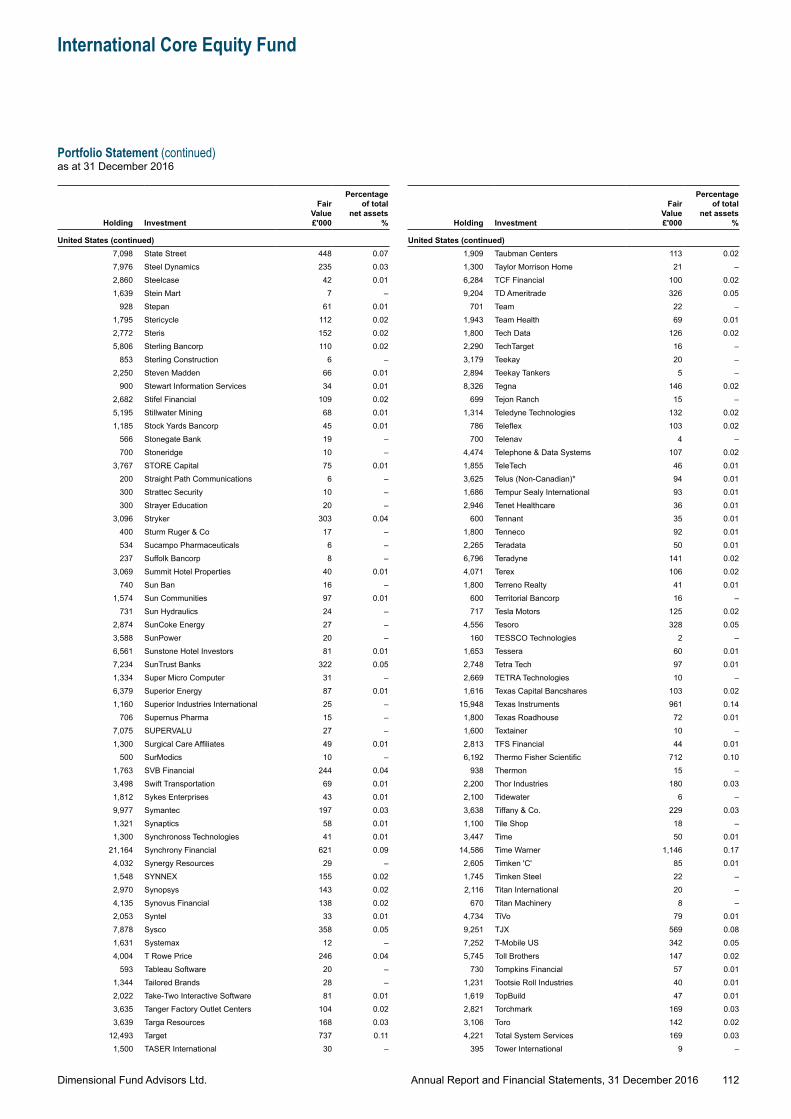
Dimensional Fund Advisors Ltd.
International Core Equity Fund
Portfolio Statement (continued)as at 31 December 2016
112Annual Report and Financial Statements, 31 December 2016
Holding Investment
Fair Value £'000
Percentage of total
net assets %
United States (continued)7,098 State Street 448 0.077,976 Steel Dynamics 235 0.032,860 Steelcase 42 0.011,639 Stein Mart 7 –
928 Stepan 61 0.011,795 Stericycle 112 0.022,772 Steris 152 0.025,806 Sterling Bancorp 110 0.02
853 Sterling Construction 6 –2,250 Steven Madden 66 0.01
900 Stewart Information Services 34 0.012,682 Stifel Financial 109 0.025,195 Stillwater Mining 68 0.011,185 Stock Yards Bancorp 45 0.01
566 Stonegate Bank 19 –700 Stoneridge 10 –
3,767 STORE Capital 75 0.01200 Straight Path Communications 6 –300 Strattec Security 10 –300 Strayer Education 20 –
3,096 Stryker 303 0.04400 Sturm Ruger & Co 17 –534 Sucampo Pharmaceuticals 6 –237 Suffolk Bancorp 8 –
3,069 Summit Hotel Properties 40 0.01740 Sun Ban 16 –
1,574 Sun Communities 97 0.01731 Sun Hydraulics 24 –
2,874 SunCoke Energy 27 –3,588 SunPower 20 –6,561 Sunstone Hotel Investors 81 0.017,234 SunTrust Banks 322 0.051,334 Super Micro Computer 31 –6,379 Superior Energy 87 0.011,160 Superior Industries International 25 –
706 Supernus Pharma 15 –7,075 SUPERVALU 27 –1,300 Surgical Care Affiliates 49 0.01
500 SurModics 10 –1,763 SVB Financial 244 0.043,498 Swift Transportation 69 0.011,812 Sykes Enterprises 43 0.019,977 Symantec 197 0.031,321 Synaptics 58 0.011,300 Synchronoss Technologies 41 0.01
21,164 Synchrony Financial 621 0.094,032 Synergy Resources 29 –1,548 SYNNEX 155 0.022,970 Synopsys 143 0.024,135 Synovus Financial 138 0.022,053 Syntel 33 0.017,878 Sysco 358 0.051,631 Systemax 12 –4,004 T Rowe Price 246 0.04
593 Tableau Software 20 –1,344 Tailored Brands 28 –2,022 Take-Two Interactive Software 81 0.013,635 Tanger Factory Outlet Centers 104 0.023,639 Targa Resources 168 0.03
12,493 Target 737 0.111,500 TASER International 30 –
Holding Investment
Fair Value £'000
Percentage of total
net assets %
United States (continued)1,909 Taubman Centers 113 0.021,300 Taylor Morrison Home 21 –6,284 TCF Financial 100 0.029,204 TD Ameritrade 326 0.05
701 Team 22 –1,943 Team Health 69 0.011,800 Tech Data 126 0.022,290 TechTarget 16 –3,179 Teekay 20 –2,894 Teekay Tankers 5 –8,326 Tegna 146 0.02
699 Tejon Ranch 15 –1,314 Teledyne Technologies 132 0.02
786 Teleflex 103 0.02700 Telenav 4 –
4,474 Telephone & Data Systems 107 0.021,855 TeleTech 46 0.013,625 Telus (Non-Canadian)* 94 0.011,686 Tempur Sealy International 93 0.012,946 Tenet Healthcare 36 0.01
600 Tennant 35 0.011,800 Tenneco 92 0.012,265 Teradata 50 0.016,796 Teradyne 141 0.024,071 Terex 106 0.021,800 Terreno Realty 41 0.01
600 Territorial Bancorp 16 –717 Tesla Motors 125 0.02
4,556 Tesoro 328 0.05160 TESSCO Technologies 2 –
1,653 Tessera 60 0.012,748 Tetra Tech 97 0.012,669 TETRA Technologies 10 –1,616 Texas Capital Bancshares 103 0.02
15,948 Texas Instruments 961 0.141,800 Texas Roadhouse 72 0.011,600 Textainer 10 –2,813 TFS Financial 44 0.016,192 Thermo Fisher Scientific 712 0.10
938 Thermon 15 –2,200 Thor Industries 180 0.032,100 Tidewater 6 –3,638 Tiffany & Co. 229 0.031,100 Tile Shop 18 –3,447 Time 50 0.01
14,586 Time Warner 1,146 0.172,605 Timken 'C' 85 0.011,745 Timken Steel 22 –2,116 Titan International 20 –
670 Titan Machinery 8 –4,734 TiVo 79 0.019,251 TJX 569 0.087,252 T-Mobile US 342 0.055,745 Toll Brothers 147 0.02
730 Tompkins Financial 57 0.011,231 Tootsie Roll Industries 40 0.011,619 TopBuild 47 0.012,821 Torchmark 169 0.033,106 Toro 142 0.024,221 Total System Services 169 0.03
395 Tower International 9 –
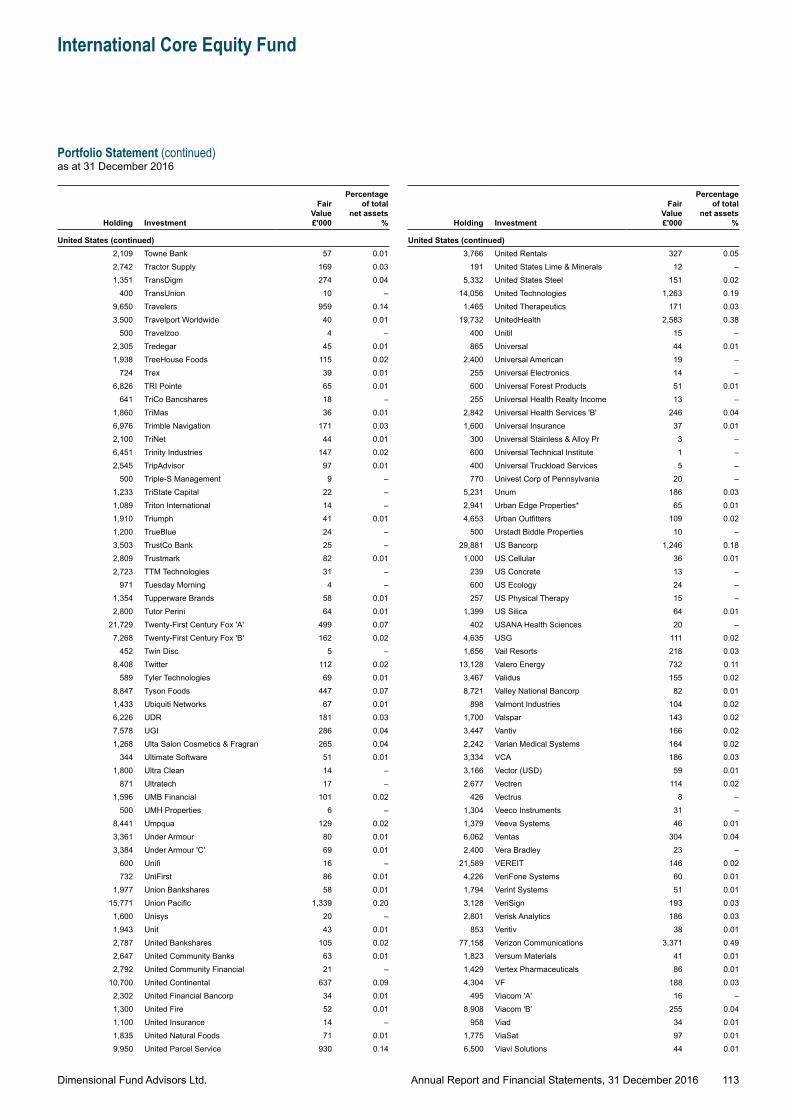
Dimensional Fund Advisors Ltd.
International Core Equity Fund
Portfolio Statement (continued)as at 31 December 2016
113Annual Report and Financial Statements, 31 December 2016
Holding Investment
Fair Value £'000
Percentage of total
net assets %
United States (continued)2,109 Towne Bank 57 0.012,742 Tractor Supply 169 0.031,351 TransDigm 274 0.04
400 TransUnion 10 –9,650 Travelers 959 0.143,500 Travelport Worldwide 40 0.01
500 Travelzoo 4 –2,305 Tredegar 45 0.011,938 TreeHouse Foods 115 0.02
724 Trex 39 0.016,826 TRI Pointe 65 0.01
641 TriCo Bancshares 18 –1,860 TriMas 36 0.016,976 Trimble Navigation 171 0.032,100 TriNet 44 0.016,451 Trinity Industries 147 0.022,545 TripAdvisor 97 0.01
500 Triple-S Management 9 –1,233 TriState Capital 22 –1,089 Triton International 14 –1,910 Triumph 41 0.011,200 TrueBlue 24 –3,503 TrustCo Bank 25 –2,809 Trustmark 82 0.012,723 TTM Technologies 31 –
971 Tuesday Morning 4 –1,354 Tupperware Brands 58 0.012,800 Tutor Perini 64 0.01
21,729 Twenty-First Century Fox 'A' 499 0.077,268 Twenty-First Century Fox 'B' 162 0.02
452 Twin Disc 5 –8,408 Twitter 112 0.02
589 Tyler Technologies 69 0.018,847 Tyson Foods 447 0.071,433 Ubiquiti Networks 67 0.016,226 UDR 181 0.037,578 UGI 286 0.041,268 Ulta Salon Cosmetics & Fragran 265 0.04
344 Ultimate Software 51 0.011,800 Ultra Clean 14 –
871 Ultratech 17 –1,596 UMB Financial 101 0.02
500 UMH Properties 6 –8,441 Umpqua 129 0.023,361 Under Armour 80 0.013,384 Under Armour 'C' 69 0.01
600 Unifi 16 –732 UniFirst 86 0.01
1,977 Union Bankshares 58 0.0115,771 Union Pacific 1,339 0.20
1,600 Unisys 20 –1,943 Unit 43 0.012,787 United Bankshares 105 0.022,647 United Community Banks 63 0.012,792 United Community Financial 21 –
10,700 United Continental 637 0.092,302 United Financial Bancorp 34 0.011,300 United Fire 52 0.011,100 United Insurance 14 –1,835 United Natural Foods 71 0.019,950 United Parcel Service 930 0.14
Holding Investment
Fair Value £'000
Percentage of total
net assets %
United States (continued)3,766 United Rentals 327 0.05
191 United States Lime & Minerals 12 –5,332 United States Steel 151 0.02
14,056 United Technologies 1,263 0.191,465 United Therapeutics 171 0.03
19,732 UnitedHealth 2,583 0.38400 Unitil 15 –865 Universal 44 0.01
2,400 Universal American 19 –255 Universal Electronics 14 –600 Universal Forest Products 51 0.01255 Universal Health Realty Income 13 –
2,842 Universal Health Services 'B' 246 0.041,600 Universal Insurance 37 0.01
300 Universal Stainless & Alloy Pr 3 –600 Universal Technical Institute 1 –400 Universal Truckload Services 5 –770 Univest Corp of Pennsylvania 20 –
5,231 Unum 186 0.032,941 Urban Edge Properties* 65 0.014,653 Urban Outfitters 109 0.02
500 Urstadt Biddle Properties 10 –29,881 US Bancorp 1,246 0.18
1,000 US Cellular 36 0.01239 US Concrete 13 –600 US Ecology 24 –257 US Physical Therapy 15 –
1,399 US Silica 64 0.01402 USANA Health Sciences 20 –
4,635 USG 111 0.021,656 Vail Resorts 218 0.03
13,128 Valero Energy 732 0.113,467 Validus 155 0.028,721 Valley National Bancorp 82 0.01
898 Valmont Industries 104 0.021,700 Valspar 143 0.023,447 Vantiv 166 0.022,242 Varian Medical Systems 164 0.023,334 VCA 186 0.033,166 Vector (USD) 59 0.012,677 Vectren 114 0.02
426 Vectrus 8 –1,304 Veeco Instruments 31 –1,379 Veeva Systems 46 0.016,062 Ventas 304 0.042,400 Vera Bradley 23 –
21,589 VEREIT 146 0.024,226 VeriFone Systems 60 0.011,794 Verint Systems 51 0.013,128 VeriSign 193 0.032,801 Verisk Analytics 186 0.03
853 Veritiv 38 0.0177,158 Verizon Communications 3,371 0.49
1,823 Versum Materials 41 0.011,429 Vertex Pharmaceuticals 86 0.014,304 VF 188 0.03
495 Viacom 'A' 16 –8,908 Viacom 'B' 255 0.04
958 Viad 34 0.011,775 ViaSat 97 0.016,500 Viavi Solutions 44 0.01
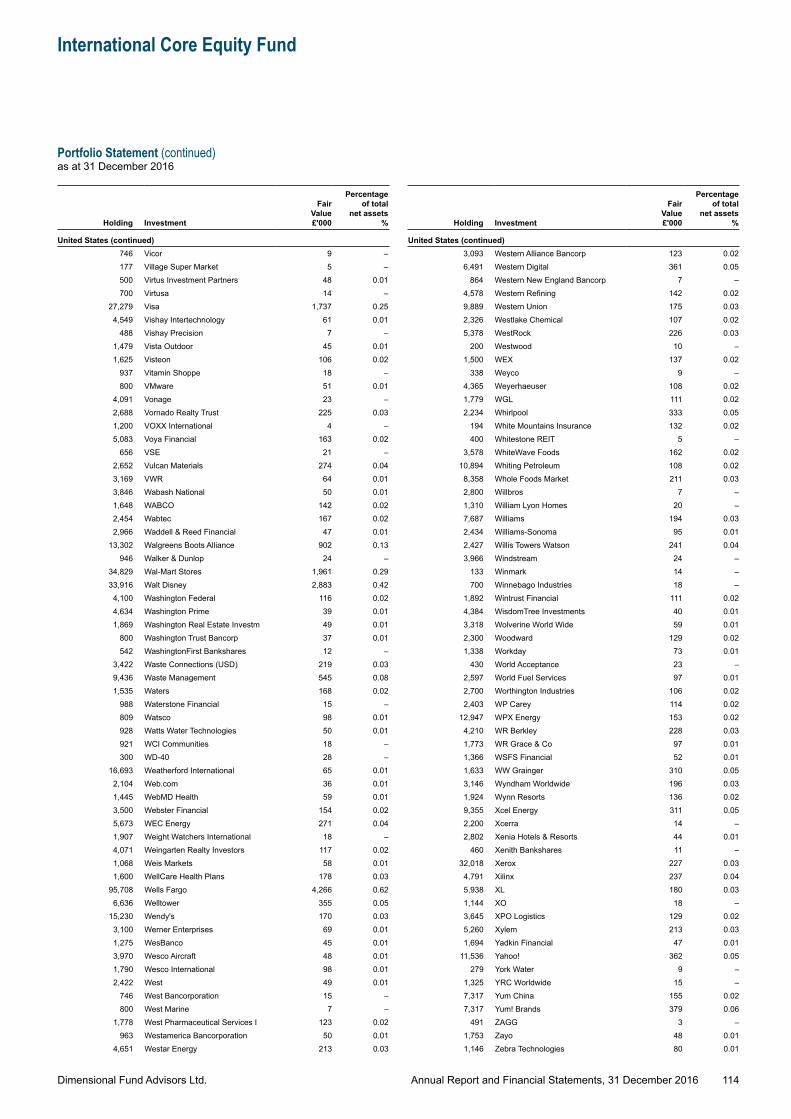
Dimensional Fund Advisors Ltd.
International Core Equity Fund
Portfolio Statement (continued)as at 31 December 2016
114Annual Report and Financial Statements, 31 December 2016
Holding Investment
Fair Value £'000
Percentage of total
net assets %
United States (continued)746 Vicor 9 –177 Village Super Market 5 –500 Virtus Investment Partners 48 0.01700 Virtusa 14 –
27,279 Visa 1,737 0.254,549 Vishay Intertechnology 61 0.01
488 Vishay Precision 7 –1,479 Vista Outdoor 45 0.011,625 Visteon 106 0.02
937 Vitamin Shoppe 18 –800 VMware 51 0.01
4,091 Vonage 23 –2,688 Vornado Realty Trust 225 0.031,200 VOXX International 4 –5,083 Voya Financial 163 0.02
656 VSE 21 –2,652 Vulcan Materials 274 0.043,169 VWR 64 0.013,846 Wabash National 50 0.011,648 WABCO 142 0.022,454 Wabtec 167 0.022,966 Waddell & Reed Financial 47 0.01
13,302 Walgreens Boots Alliance 902 0.13946 Walker & Dunlop 24 –
34,829 Wal-Mart Stores 1,961 0.2933,916 Walt Disney 2,883 0.42
4,100 Washington Federal 116 0.024,634 Washington Prime 39 0.011,869 Washington Real Estate Investm 49 0.01
800 Washington Trust Bancorp 37 0.01542 WashingtonFirst Bankshares 12 –
3,422 Waste Connections (USD) 219 0.039,436 Waste Management 545 0.081,535 Waters 168 0.02
988 Waterstone Financial 15 –809 Watsco 98 0.01928 Watts Water Technologies 50 0.01921 WCI Communities 18 –300 WD-40 28 –
16,693 Weatherford International 65 0.012,104 Web.com 36 0.011,445 WebMD Health 59 0.013,500 Webster Financial 154 0.025,673 WEC Energy 271 0.041,907 Weight Watchers International 18 –4,071 Weingarten Realty Investors 117 0.021,068 Weis Markets 58 0.011,600 WellCare Health Plans 178 0.03
95,708 Wells Fargo 4,266 0.626,636 Welltower 355 0.05
15,230 Wendy's 170 0.033,100 Werner Enterprises 69 0.011,275 WesBanco 45 0.013,970 Wesco Aircraft 48 0.011,790 Wesco International 98 0.012,422 West 49 0.01
746 West Bancorporation 15 –800 West Marine 7 –
1,778 West Pharmaceutical Services I 123 0.02963 Westamerica Bancorporation 50 0.01
4,651 Westar Energy 213 0.03
Holding Investment
Fair Value £'000
Percentage of total
net assets %
United States (continued)3,093 Western Alliance Bancorp 123 0.026,491 Western Digital 361 0.05
864 Western New England Bancorp 7 –4,578 Western Refining 142 0.029,889 Western Union 175 0.032,326 Westlake Chemical 107 0.025,378 WestRock 226 0.03
200 Westwood 10 –1,500 WEX 137 0.02
338 Weyco 9 –4,365 Weyerhaeuser 108 0.021,779 WGL 111 0.022,234 Whirlpool 333 0.05
194 White Mountains Insurance 132 0.02400 Whitestone REIT 5 –
3,578 WhiteWave Foods 162 0.0210,894 Whiting Petroleum 108 0.02
8,358 Whole Foods Market 211 0.032,800 Willbros 7 –1,310 William Lyon Homes 20 –7,687 Williams 194 0.032,434 Williams-Sonoma 95 0.012,427 Willis Towers Watson 241 0.043,966 Windstream 24 –
133 Winmark 14 –700 Winnebago Industries 18 –
1,892 Wintrust Financial 111 0.024,384 WisdomTree Investments 40 0.013,318 Wolverine World Wide 59 0.012,300 Woodward 129 0.021,338 Workday 73 0.01
430 World Acceptance 23 –2,597 World Fuel Services 97 0.012,700 Worthington Industries 106 0.022,403 WP Carey 114 0.02
12,947 WPX Energy 153 0.024,210 WR Berkley 228 0.031,773 WR Grace & Co 97 0.011,366 WSFS Financial 52 0.011,633 WW Grainger 310 0.053,146 Wyndham Worldwide 196 0.031,924 Wynn Resorts 136 0.029,355 Xcel Energy 311 0.052,200 Xcerra 14 –2,802 Xenia Hotels & Resorts 44 0.01
460 Xenith Bankshares 11 –32,018 Xerox 227 0.03
4,791 Xilinx 237 0.045,938 XL 180 0.031,144 XO 18 –3,645 XPO Logistics 129 0.025,260 Xylem 213 0.031,694 Yadkin Financial 47 0.01
11,536 Yahoo! 362 0.05279 York Water 9 –
1,325 YRC Worldwide 15 –7,317 Yum China 155 0.027,317 Yum! Brands 379 0.06
491 ZAGG 3 –1,753 Zayo 48 0.011,146 Zebra Technologies 80 0.01
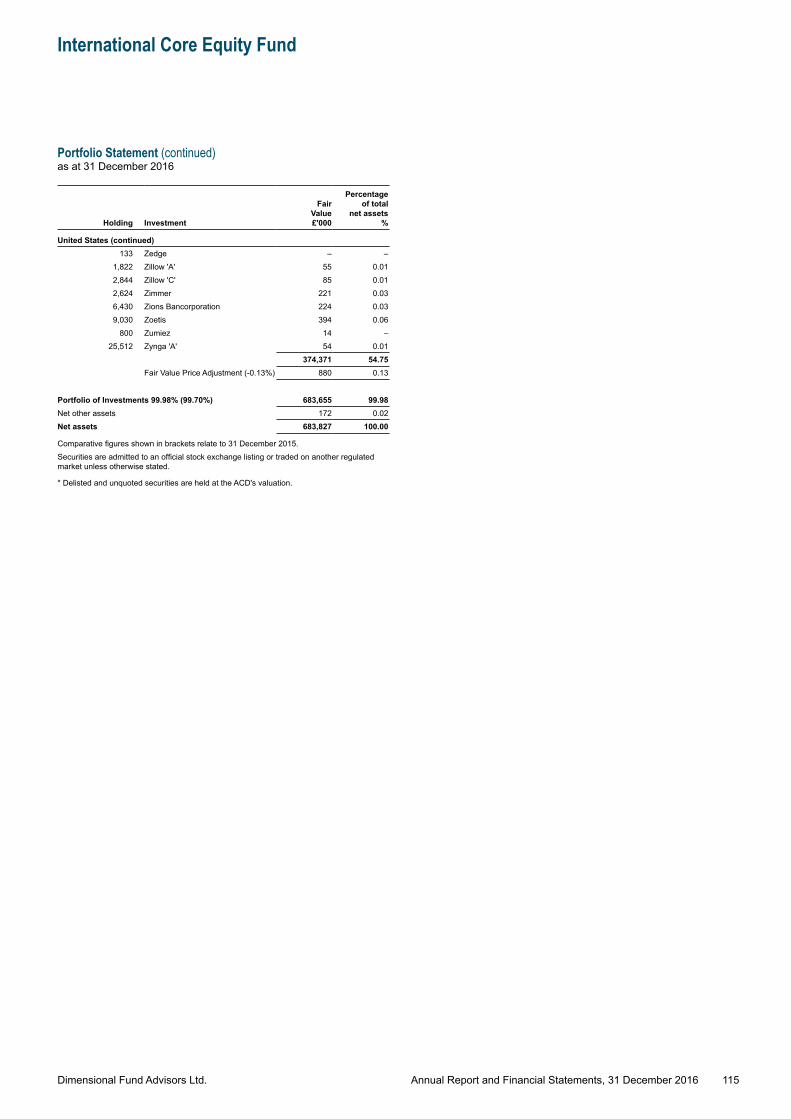
Dimensional Fund Advisors Ltd.
International Core Equity Fund
Portfolio Statement (continued)as at 31 December 2016
115Annual Report and Financial Statements, 31 December 2016
Holding Investment
Fair Value £'000
Percentage of total
net assets %
United States (continued)133 Zedge – –
1,822 Zillow 'A' 55 0.012,844 Zillow 'C' 85 0.012,624 Zimmer 221 0.036,430 Zions Bancorporation 224 0.039,030 Zoetis 394 0.06
800 Zumiez 14 –25,512 Zynga 'A' 54 0.01
374,371 54.75Fair Value Price Adjustment (-0.13%) 880 0.13
Portfolio of Investments 99.98% (99.70%) 683,655 99.98Net other assets 172 0.02Net assets 683,827 100.00
Comparative figures shown in brackets relate to 31 December 2015.Securities are admitted to an official stock exchange listing or traded on another regulated market unless otherwise stated.
* Delisted and unquoted securities are held at the ACD's valuation.
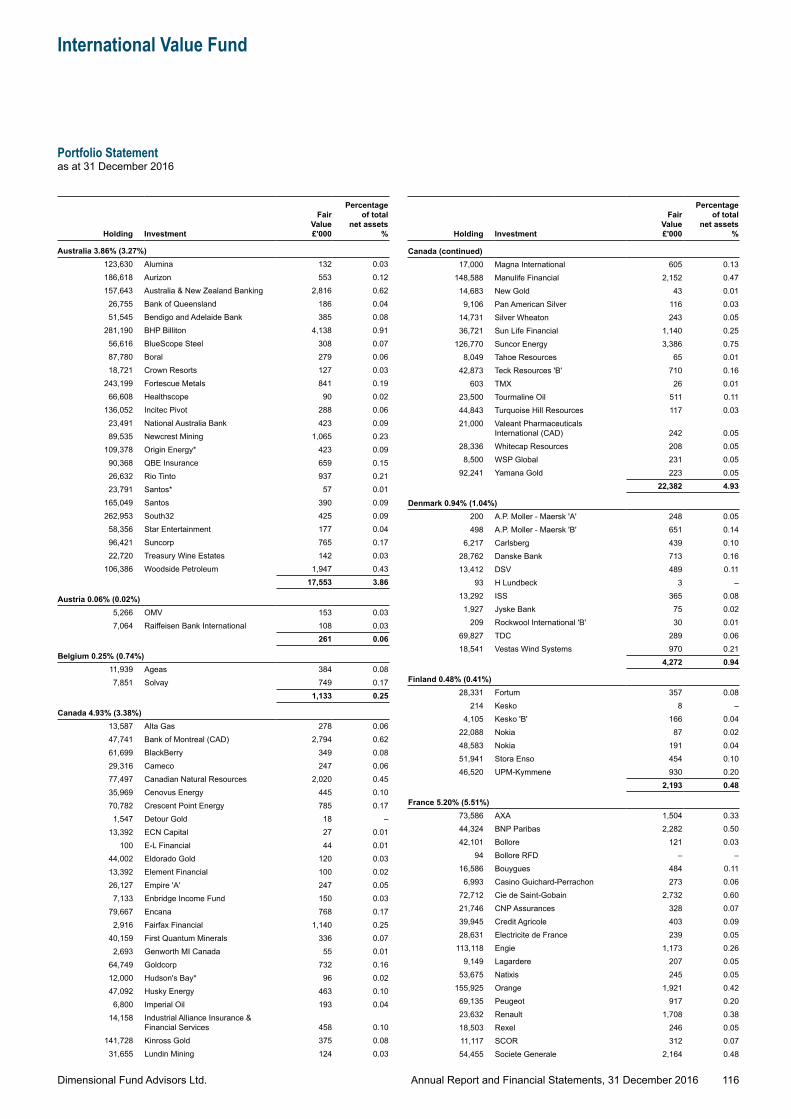
Dimensional Fund Advisors Ltd.
International Value Fund
Portfolio Statementas at 31 December 2016
116Annual Report and Financial Statements, 31 December 2016
Holding Investment
Fair Value £'000
Percentage of total
net assets %
Australia 3.86% (3.27%)123,630 Alumina 132 0.03186,618 Aurizon 553 0.12157,643 Australia & New Zealand Banking 2,816 0.6226,755 Bank of Queensland 186 0.0451,545 Bendigo and Adelaide Bank 385 0.08
281,190 BHP Billiton 4,138 0.9156,616 BlueScope Steel 308 0.0787,780 Boral 279 0.0618,721 Crown Resorts 127 0.03
243,199 Fortescue Metals 841 0.1966,608 Healthscope 90 0.02
136,052 Incitec Pivot 288 0.0623,491 National Australia Bank 423 0.0989,535 Newcrest Mining 1,065 0.23
109,378 Origin Energy* 423 0.0990,368 QBE Insurance 659 0.1526,632 Rio Tinto 937 0.2123,791 Santos* 57 0.01
165,049 Santos 390 0.09262,953 South32 425 0.09
58,356 Star Entertainment 177 0.0496,421 Suncorp 765 0.1722,720 Treasury Wine Estates 142 0.03
106,386 Woodside Petroleum 1,947 0.4317,553 3.86
Austria 0.06% (0.02%)5,266 OMV 153 0.037,064 Raiffeisen Bank International 108 0.03
261 0.06
Belgium 0.25% (0.74%)11,939 Ageas 384 0.087,851 Solvay 749 0.17
1,133 0.25
Canada 4.93% (3.38%)13,587 Alta Gas 278 0.0647,741 Bank of Montreal (CAD) 2,794 0.6261,699 BlackBerry 349 0.0829,316 Cameco 247 0.0677,497 Canadian Natural Resources 2,020 0.4535,969 Cenovus Energy 445 0.1070,782 Crescent Point Energy 785 0.17
1,547 Detour Gold 18 –13,392 ECN Capital 27 0.01
100 E-L Financial 44 0.0144,002 Eldorado Gold 120 0.0313,392 Element Financial 100 0.0226,127 Empire 'A' 247 0.05
7,133 Enbridge Income Fund 150 0.0379,667 Encana 768 0.17
2,916 Fairfax Financial 1,140 0.2540,159 First Quantum Minerals 336 0.07
2,693 Genworth MI Canada 55 0.0164,749 Goldcorp 732 0.1612,000 Hudson's Bay* 96 0.0247,092 Husky Energy 463 0.10
6,800 Imperial Oil 193 0.0414,158 Industrial Alliance Insurance &
Financial Services 458 0.10141,728 Kinross Gold 375 0.08
31,655 Lundin Mining 124 0.03
Holding Investment
Fair Value £'000
Percentage of total
net assets %
Canada (continued)17,000 Magna International 605 0.13
148,588 Manulife Financial 2,152 0.4714,683 New Gold 43 0.019,106 Pan American Silver 116 0.03
14,731 Silver Wheaton 243 0.0536,721 Sun Life Financial 1,140 0.25
126,770 Suncor Energy 3,386 0.758,049 Tahoe Resources 65 0.01
42,873 Teck Resources 'B' 710 0.16603 TMX 26 0.01
23,500 Tourmaline Oil 511 0.1144,843 Turquoise Hill Resources 117 0.0321,000 Valeant Pharmaceuticals
International (CAD) 242 0.0528,336 Whitecap Resources 208 0.05
8,500 WSP Global 231 0.0592,241 Yamana Gold 223 0.05
22,382 4.93
Denmark 0.94% (1.04%)200 A.P. Moller - Maersk 'A' 248 0.05498 A.P. Moller - Maersk 'B' 651 0.14
6,217 Carlsberg 439 0.1028,762 Danske Bank 713 0.1613,412 DSV 489 0.11
93 H Lundbeck 3 –13,292 ISS 365 0.08
1,927 Jyske Bank 75 0.02209 Rockwool International 'B' 30 0.01
69,827 TDC 289 0.0618,541 Vestas Wind Systems 970 0.21
4,272 0.94
Finland 0.48% (0.41%)28,331 Fortum 357 0.08
214 Kesko 8 –4,105 Kesko 'B' 166 0.04
22,088 Nokia 87 0.0248,583 Nokia 191 0.0451,941 Stora Enso 454 0.1046,520 UPM-Kymmene 930 0.20
2,193 0.48
France 5.20% (5.51%)73,586 AXA 1,504 0.3344,324 BNP Paribas 2,282 0.5042,101 Bollore 121 0.03
94 Bollore RFD – –16,586 Bouygues 484 0.11
6,993 Casino Guichard-Perrachon 273 0.0672,712 Cie de Saint-Gobain 2,732 0.6021,746 CNP Assurances 328 0.0739,945 Credit Agricole 403 0.0928,631 Electricite de France 239 0.05
113,118 Engie 1,173 0.269,149 Lagardere 207 0.05
53,675 Natixis 245 0.05155,925 Orange 1,921 0.4269,135 Peugeot 917 0.2023,632 Renault 1,708 0.3818,503 Rexel 246 0.0511,117 SCOR 312 0.0754,455 Societe Generale 2,164 0.48
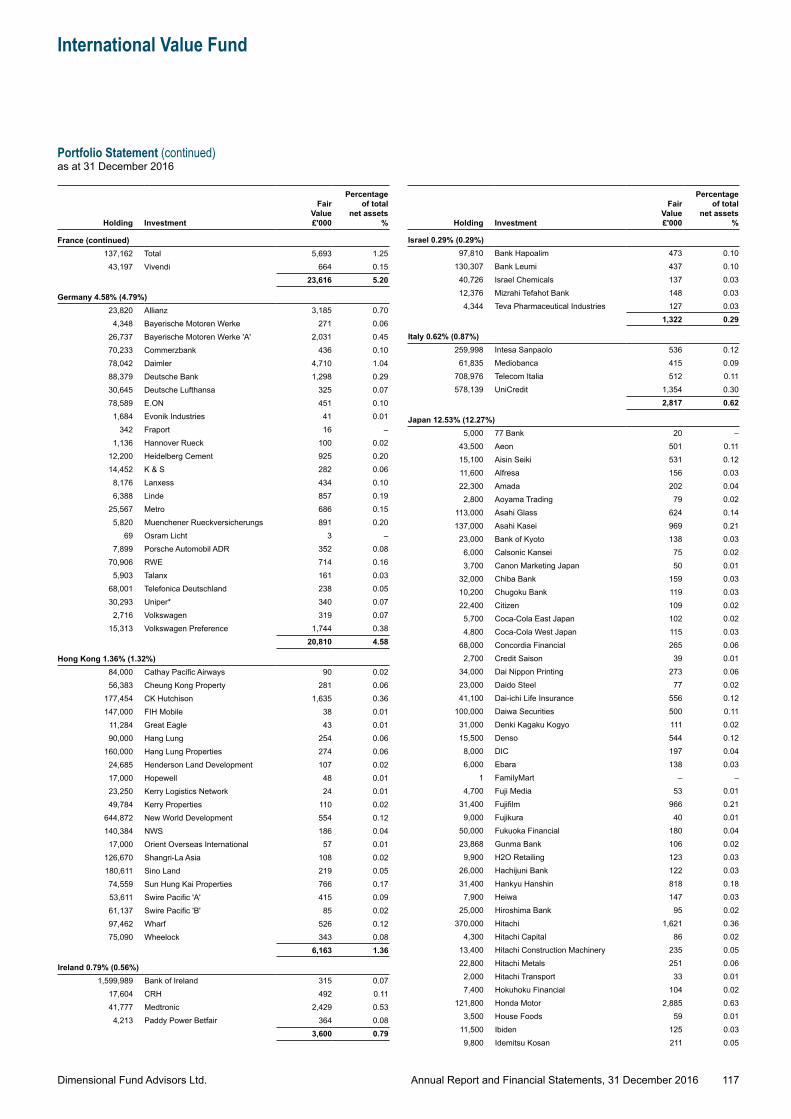
Dimensional Fund Advisors Ltd.
International Value Fund
Portfolio Statement (continued)as at 31 December 2016
117Annual Report and Financial Statements, 31 December 2016
Holding Investment
Fair Value £'000
Percentage of total
net assets %
France (continued)137,162 Total 5,693 1.2543,197 Vivendi 664 0.15
23,616 5.20
Germany 4.58% (4.79%)23,820 Allianz 3,185 0.70
4,348 Bayerische Motoren Werke 271 0.0626,737 Bayerische Motoren Werke 'A' 2,031 0.4570,233 Commerzbank 436 0.1078,042 Daimler 4,710 1.0488,379 Deutsche Bank 1,298 0.2930,645 Deutsche Lufthansa 325 0.0778,589 E.ON 451 0.10
1,684 Evonik Industries 41 0.01342 Fraport 16 –
1,136 Hannover Rueck 100 0.0212,200 Heidelberg Cement 925 0.2014,452 K & S 282 0.06
8,176 Lanxess 434 0.106,388 Linde 857 0.19
25,567 Metro 686 0.155,820 Muenchener Rueckversicherungs 891 0.20
69 Osram Licht 3 –7,899 Porsche Automobil ADR 352 0.08
70,906 RWE 714 0.165,903 Talanx 161 0.03
68,001 Telefonica Deutschland 238 0.0530,293 Uniper* 340 0.07
2,716 Volkswagen 319 0.0715,313 Volkswagen Preference 1,744 0.38
20,810 4.58
Hong Kong 1.36% (1.32%)84,000 Cathay Pacific Airways 90 0.0256,383 Cheung Kong Property 281 0.06
177,454 CK Hutchison 1,635 0.36147,000 FIH Mobile 38 0.01
11,284 Great Eagle 43 0.0190,000 Hang Lung 254 0.06
160,000 Hang Lung Properties 274 0.0624,685 Henderson Land Development 107 0.0217,000 Hopewell 48 0.0123,250 Kerry Logistics Network 24 0.0149,784 Kerry Properties 110 0.02
644,872 New World Development 554 0.12140,384 NWS 186 0.04
17,000 Orient Overseas International 57 0.01126,670 Shangri-La Asia 108 0.02180,611 Sino Land 219 0.0574,559 Sun Hung Kai Properties 766 0.1753,611 Swire Pacific 'A' 415 0.0961,137 Swire Pacific 'B' 85 0.0297,462 Wharf 526 0.1275,090 Wheelock 343 0.08
6,163 1.36
Ireland 0.79% (0.56%)1,599,989 Bank of Ireland 315 0.07
17,604 CRH 492 0.1141,777 Medtronic 2,429 0.534,213 Paddy Power Betfair 364 0.08
3,600 0.79
Holding Investment
Fair Value £'000
Percentage of total
net assets %
Israel 0.29% (0.29%)97,810 Bank Hapoalim 473 0.10
130,307 Bank Leumi 437 0.1040,726 Israel Chemicals 137 0.0312,376 Mizrahi Tefahot Bank 148 0.034,344 Teva Pharmaceutical Industries 127 0.03
1,322 0.29
Italy 0.62% (0.87%)259,998 Intesa Sanpaolo 536 0.12
61,835 Mediobanca 415 0.09708,976 Telecom Italia 512 0.11578,139 UniCredit 1,354 0.30
2,817 0.62
Japan 12.53% (12.27%)5,000 77 Bank 20 –
43,500 Aeon 501 0.1115,100 Aisin Seiki 531 0.1211,600 Alfresa 156 0.0322,300 Amada 202 0.04
2,800 Aoyama Trading 79 0.02113,000 Asahi Glass 624 0.14137,000 Asahi Kasei 969 0.21
23,000 Bank of Kyoto 138 0.036,000 Calsonic Kansei 75 0.023,700 Canon Marketing Japan 50 0.01
32,000 Chiba Bank 159 0.0310,200 Chugoku Bank 119 0.0322,400 Citizen 109 0.02
5,700 Coca-Cola East Japan 102 0.024,800 Coca-Cola West Japan 115 0.03
68,000 Concordia Financial 265 0.062,700 Credit Saison 39 0.01
34,000 Dai Nippon Printing 273 0.0623,000 Daido Steel 77 0.0241,100 Dai-ichi Life Insurance 556 0.12
100,000 Daiwa Securities 500 0.1131,000 Denki Kagaku Kogyo 111 0.0215,500 Denso 544 0.12
8,000 DIC 197 0.046,000 Ebara 138 0.03
1 FamilyMart – –4,700 Fuji Media 53 0.01
31,400 Fujifilm 966 0.219,000 Fujikura 40 0.01
50,000 Fukuoka Financial 180 0.0423,868 Gunma Bank 106 0.02
9,900 H2O Retailing 123 0.0326,000 Hachijuni Bank 122 0.0331,400 Hankyu Hanshin 818 0.18
7,900 Heiwa 147 0.0325,000 Hiroshima Bank 95 0.02
370,000 Hitachi 1,621 0.364,300 Hitachi Capital 86 0.02
13,400 Hitachi Construction Machinery 235 0.0522,800 Hitachi Metals 251 0.06
2,000 Hitachi Transport 33 0.017,400 Hokuhoku Financial 104 0.02
121,800 Honda Motor 2,885 0.633,500 House Foods 59 0.01
11,500 Ibiden 125 0.039,800 Idemitsu Kosan 211 0.05
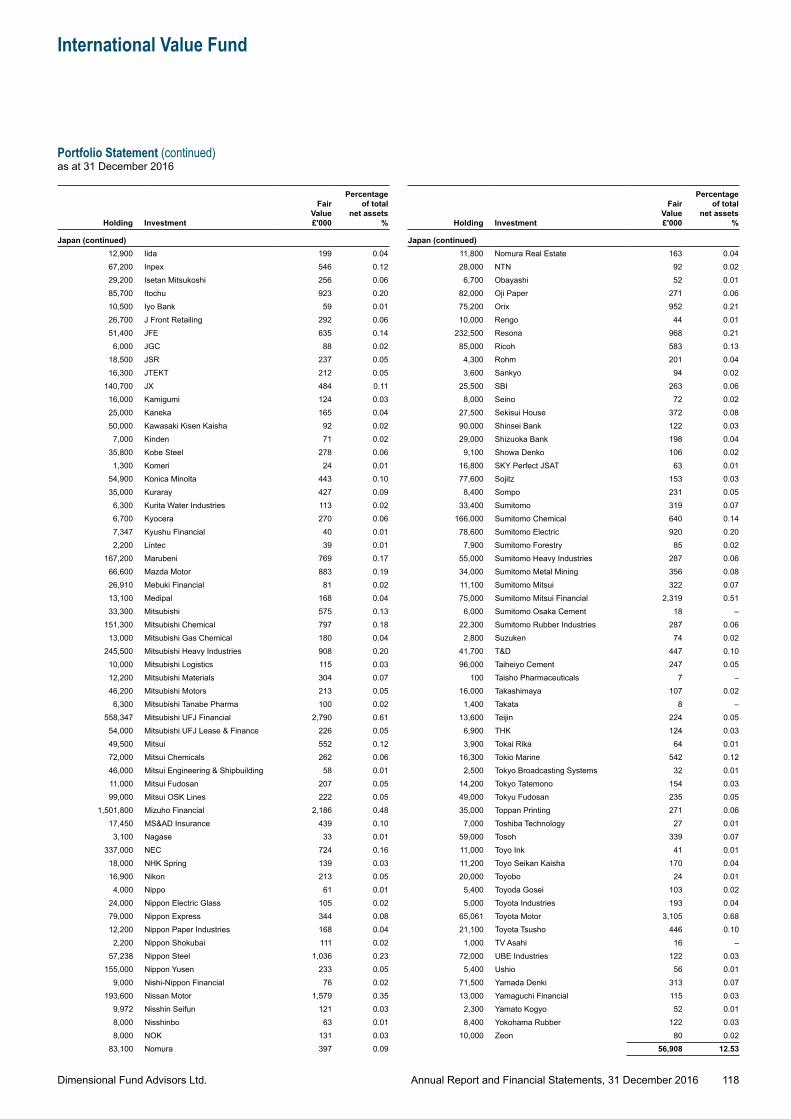
Dimensional Fund Advisors Ltd.
International Value Fund
Portfolio Statement (continued)as at 31 December 2016
118Annual Report and Financial Statements, 31 December 2016
Holding Investment
Fair Value £'000
Percentage of total
net assets %
Japan (continued)12,900 Iida 199 0.0467,200 Inpex 546 0.1229,200 Isetan Mitsukoshi 256 0.0685,700 Itochu 923 0.2010,500 Iyo Bank 59 0.0126,700 J Front Retailing 292 0.0651,400 JFE 635 0.14
6,000 JGC 88 0.0218,500 JSR 237 0.0516,300 JTEKT 212 0.05
140,700 JX 484 0.1116,000 Kamigumi 124 0.0325,000 Kaneka 165 0.0450,000 Kawasaki Kisen Kaisha 92 0.027,000 Kinden 71 0.02
35,800 Kobe Steel 278 0.061,300 Komeri 24 0.01
54,900 Konica Minolta 443 0.1035,000 Kuraray 427 0.09
6,300 Kurita Water Industries 113 0.026,700 Kyocera 270 0.067,347 Kyushu Financial 40 0.012,200 Lintec 39 0.01
167,200 Marubeni 769 0.1766,600 Mazda Motor 883 0.1926,910 Mebuki Financial 81 0.0213,100 Medipal 168 0.0433,300 Mitsubishi 575 0.13
151,300 Mitsubishi Chemical 797 0.1813,000 Mitsubishi Gas Chemical 180 0.04
245,500 Mitsubishi Heavy Industries 908 0.2010,000 Mitsubishi Logistics 115 0.0312,200 Mitsubishi Materials 304 0.0746,200 Mitsubishi Motors 213 0.05
6,300 Mitsubishi Tanabe Pharma 100 0.02558,347 Mitsubishi UFJ Financial 2,790 0.6154,000 Mitsubishi UFJ Lease & Finance 226 0.0549,500 Mitsui 552 0.1272,000 Mitsui Chemicals 262 0.0646,000 Mitsui Engineering & Shipbuilding 58 0.0111,000 Mitsui Fudosan 207 0.0599,000 Mitsui OSK Lines 222 0.05
1,501,800 Mizuho Financial 2,186 0.4817,450 MS&AD Insurance 439 0.10
3,100 Nagase 33 0.01337,000 NEC 724 0.16
18,000 NHK Spring 139 0.0316,900 Nikon 213 0.05
4,000 Nippo 61 0.0124,000 Nippon Electric Glass 105 0.0279,000 Nippon Express 344 0.0812,200 Nippon Paper Industries 168 0.04
2,200 Nippon Shokubai 111 0.0257,238 Nippon Steel 1,036 0.23
155,000 Nippon Yusen 233 0.059,000 Nishi-Nippon Financial 76 0.02
193,600 Nissan Motor 1,579 0.359,972 Nisshin Seifun 121 0.038,000 Nisshinbo 63 0.018,000 NOK 131 0.03
83,100 Nomura 397 0.09
Holding Investment
Fair Value £'000
Percentage of total
net assets %
Japan (continued)11,800 Nomura Real Estate 163 0.0428,000 NTN 92 0.026,700 Obayashi 52 0.01
82,000 Oji Paper 271 0.0675,200 Orix 952 0.2110,000 Rengo 44 0.01
232,500 Resona 968 0.2185,000 Ricoh 583 0.13
4,300 Rohm 201 0.043,600 Sankyo 94 0.02
25,500 SBI 263 0.068,000 Seino 72 0.02
27,500 Sekisui House 372 0.0890,000 Shinsei Bank 122 0.0329,000 Shizuoka Bank 198 0.04
9,100 Showa Denko 106 0.0216,800 SKY Perfect JSAT 63 0.0177,600 Sojitz 153 0.03
8,400 Sompo 231 0.0533,400 Sumitomo 319 0.07
166,000 Sumitomo Chemical 640 0.1478,600 Sumitomo Electric 920 0.20
7,900 Sumitomo Forestry 85 0.0255,000 Sumitomo Heavy Industries 287 0.0634,000 Sumitomo Metal Mining 356 0.0811,100 Sumitomo Mitsui 322 0.0775,000 Sumitomo Mitsui Financial 2,319 0.516,000 Sumitomo Osaka Cement 18 –
22,300 Sumitomo Rubber Industries 287 0.062,800 Suzuken 74 0.02
41,700 T&D 447 0.1096,000 Taiheiyo Cement 247 0.05
100 Taisho Pharmaceuticals 7 –16,000 Takashimaya 107 0.02
1,400 Takata 8 –13,600 Teijin 224 0.05
6,900 THK 124 0.033,900 Tokai Rika 64 0.01
16,300 Tokio Marine 542 0.122,500 Tokyo Broadcasting Systems 32 0.01
14,200 Tokyo Tatemono 154 0.0349,000 Tokyu Fudosan 235 0.0535,000 Toppan Printing 271 0.06
7,000 Toshiba Technology 27 0.0159,000 Tosoh 339 0.0711,000 Toyo Ink 41 0.0111,200 Toyo Seikan Kaisha 170 0.0420,000 Toyobo 24 0.015,400 Toyoda Gosei 103 0.025,000 Toyota Industries 193 0.04
65,061 Toyota Motor 3,105 0.6821,100 Toyota Tsusho 446 0.10
1,000 TV Asahi 16 –72,000 UBE Industries 122 0.03
5,400 Ushio 56 0.0171,500 Yamada Denki 313 0.0713,000 Yamaguchi Financial 115 0.032,300 Yamato Kogyo 52 0.018,400 Yokohama Rubber 122 0.03
10,000 Zeon 80 0.0256,908 12.53
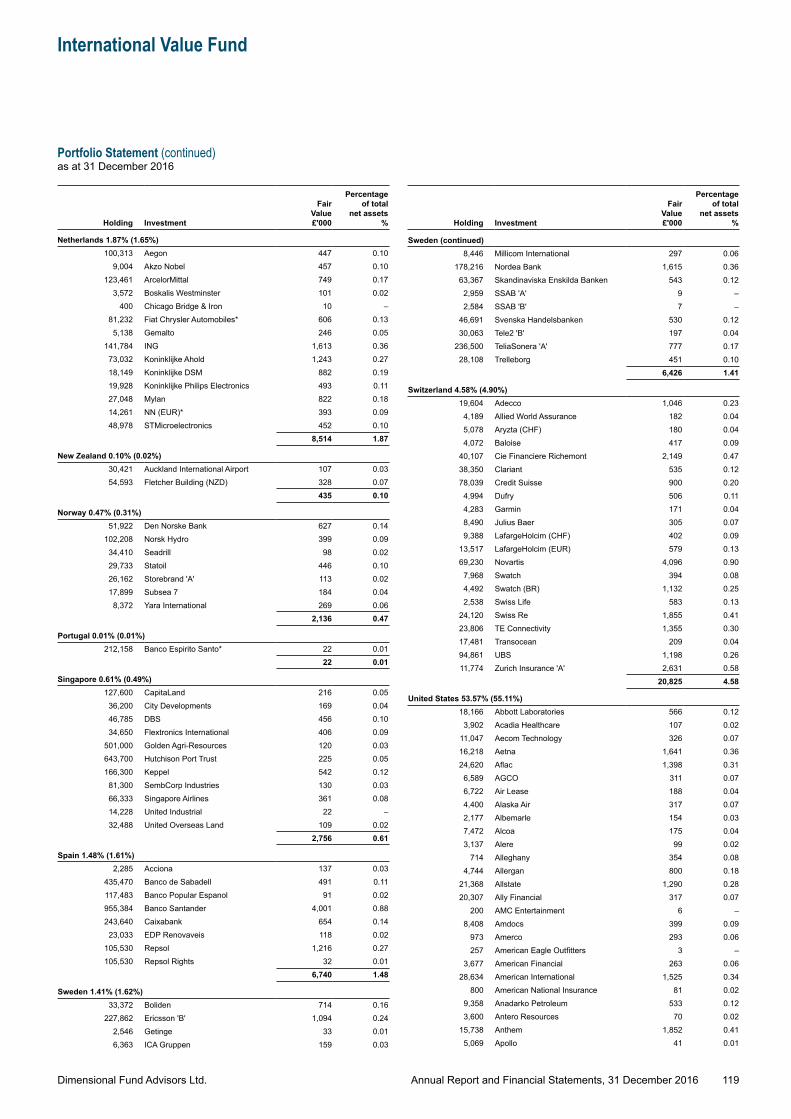
Dimensional Fund Advisors Ltd.
International Value Fund
Portfolio Statement (continued)as at 31 December 2016
119Annual Report and Financial Statements, 31 December 2016
Holding Investment
Fair Value £'000
Percentage of total
net assets %
Netherlands 1.87% (1.65%)100,313 Aegon 447 0.10
9,004 Akzo Nobel 457 0.10123,461 ArcelorMittal 749 0.17
3,572 Boskalis Westminster 101 0.02400 Chicago Bridge & Iron 10 –
81,232 Fiat Chrysler Automobiles* 606 0.135,138 Gemalto 246 0.05
141,784 ING 1,613 0.3673,032 Koninklijke Ahold 1,243 0.2718,149 Koninklijke DSM 882 0.1919,928 Koninklijke Philips Electronics 493 0.1127,048 Mylan 822 0.1814,261 NN (EUR)* 393 0.0948,978 STMicroelectronics 452 0.10
8,514 1.87
New Zealand 0.10% (0.02%)30,421 Auckland International Airport 107 0.0354,593 Fletcher Building (NZD) 328 0.07
435 0.10
Norway 0.47% (0.31%)51,922 Den Norske Bank 627 0.14
102,208 Norsk Hydro 399 0.0934,410 Seadrill 98 0.0229,733 Statoil 446 0.1026,162 Storebrand 'A' 113 0.0217,899 Subsea 7 184 0.04
8,372 Yara International 269 0.062,136 0.47
Portugal 0.01% (0.01%)212,158 Banco Espirito Santo* 22 0.01
22 0.01
Singapore 0.61% (0.49%)127,600 CapitaLand 216 0.05
36,200 City Developments 169 0.0446,785 DBS 456 0.1034,650 Flextronics International 406 0.09
501,000 Golden Agri-Resources 120 0.03643,700 Hutchison Port Trust 225 0.05166,300 Keppel 542 0.12
81,300 SembCorp Industries 130 0.0366,333 Singapore Airlines 361 0.0814,228 United Industrial 22 –32,488 United Overseas Land 109 0.02
2,756 0.61
Spain 1.48% (1.61%)2,285 Acciona 137 0.03
435,470 Banco de Sabadell 491 0.11117,483 Banco Popular Espanol 91 0.02955,384 Banco Santander 4,001 0.88243,640 Caixabank 654 0.14
23,033 EDP Renovaveis 118 0.02105,530 Repsol 1,216 0.27105,530 Repsol Rights 32 0.01
6,740 1.48
Sweden 1.41% (1.62%)33,372 Boliden 714 0.16
227,862 Ericsson 'B' 1,094 0.242,546 Getinge 33 0.016,363 ICA Gruppen 159 0.03
Holding Investment
Fair Value £'000
Percentage of total
net assets %
Sweden (continued)8,446 Millicom International 297 0.06
178,216 Nordea Bank 1,615 0.3663,367 Skandinaviska Enskilda Banken 543 0.12
2,959 SSAB 'A' 9 –2,584 SSAB 'B' 7 –
46,691 Svenska Handelsbanken 530 0.1230,063 Tele2 'B' 197 0.04
236,500 TeliaSonera 'A' 777 0.1728,108 Trelleborg 451 0.10
6,426 1.41
Switzerland 4.58% (4.90%)19,604 Adecco 1,046 0.234,189 Allied World Assurance 182 0.045,078 Aryzta (CHF) 180 0.044,072 Baloise 417 0.09
40,107 Cie Financiere Richemont 2,149 0.4738,350 Clariant 535 0.1278,039 Credit Suisse 900 0.20
4,994 Dufry 506 0.114,283 Garmin 171 0.048,490 Julius Baer 305 0.079,388 LafargeHolcim (CHF) 402 0.09
13,517 LafargeHolcim (EUR) 579 0.1369,230 Novartis 4,096 0.907,968 Swatch 394 0.084,492 Swatch (BR) 1,132 0.252,538 Swiss Life 583 0.13
24,120 Swiss Re 1,855 0.4123,806 TE Connectivity 1,355 0.3017,481 Transocean 209 0.0494,861 UBS 1,198 0.2611,774 Zurich Insurance 'A' 2,631 0.58
20,825 4.58
United States 53.57% (55.11%)18,166 Abbott Laboratories 566 0.12
3,902 Acadia Healthcare 107 0.0211,047 Aecom Technology 326 0.0716,218 Aetna 1,641 0.3624,620 Aflac 1,398 0.316,589 AGCO 311 0.076,722 Air Lease 188 0.044,400 Alaska Air 317 0.072,177 Albemarle 154 0.037,472 Alcoa 175 0.043,137 Alere 99 0.02
714 Alleghany 354 0.084,744 Allergan 800 0.18
21,368 Allstate 1,290 0.2820,307 Ally Financial 317 0.07
200 AMC Entertainment 6 –8,408 Amdocs 399 0.09
973 Amerco 293 0.06257 American Eagle Outfitters 3 –
3,677 American Financial 263 0.0628,634 American International 1,525 0.34
800 American National Insurance 81 0.029,358 Anadarko Petroleum 533 0.123,600 Antero Resources 70 0.02
15,738 Anthem 1,852 0.415,069 Apollo 41 0.01
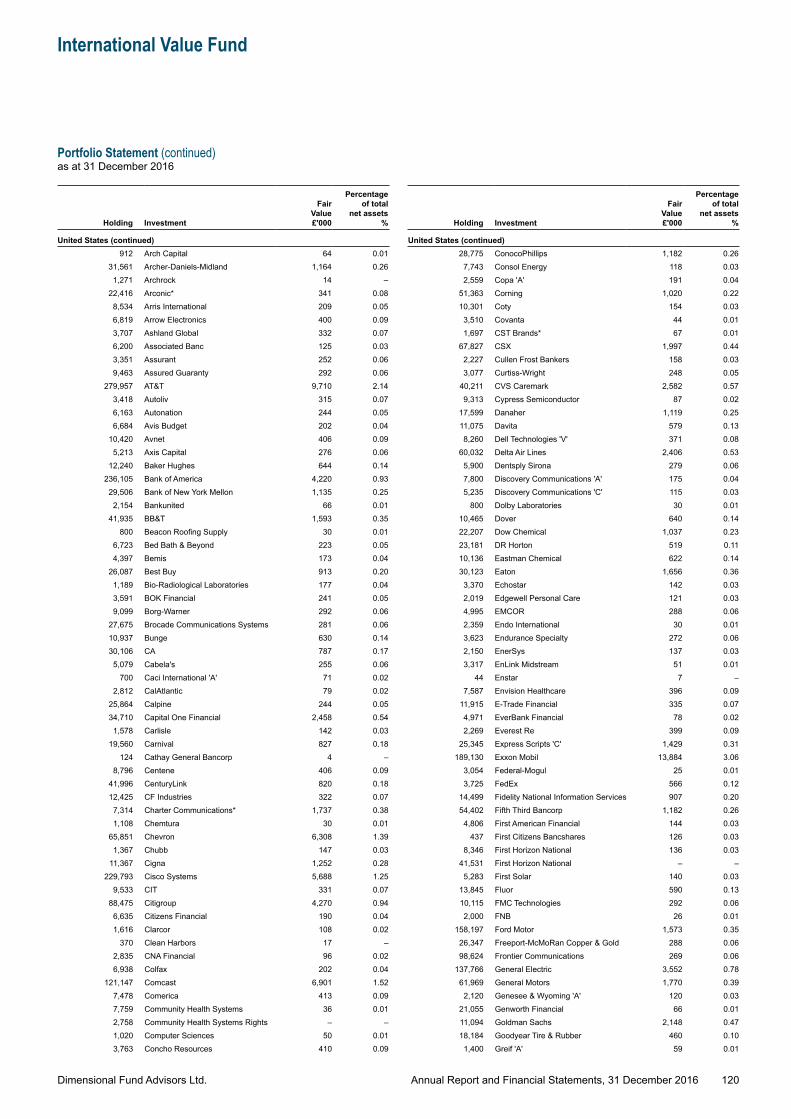
Dimensional Fund Advisors Ltd.
International Value Fund
Portfolio Statement (continued)as at 31 December 2016
120Annual Report and Financial Statements, 31 December 2016
Holding Investment
Fair Value £'000
Percentage of total
net assets %
United States (continued)912 Arch Capital 64 0.01
31,561 Archer-Daniels-Midland 1,164 0.261,271 Archrock 14 –
22,416 Arconic* 341 0.088,534 Arris International 209 0.056,819 Arrow Electronics 400 0.093,707 Ashland Global 332 0.076,200 Associated Banc 125 0.033,351 Assurant 252 0.069,463 Assured Guaranty 292 0.06
279,957 AT&T 9,710 2.143,418 Autoliv 315 0.076,163 Autonation 244 0.056,684 Avis Budget 202 0.04
10,420 Avnet 406 0.095,213 Axis Capital 276 0.06
12,240 Baker Hughes 644 0.14236,105 Bank of America 4,220 0.9329,506 Bank of New York Mellon 1,135 0.252,154 Bankunited 66 0.01
41,935 BB&T 1,593 0.35800 Beacon Roofing Supply 30 0.01
6,723 Bed Bath & Beyond 223 0.054,397 Bemis 173 0.04
26,087 Best Buy 913 0.201,189 Bio-Radiological Laboratories 177 0.043,591 BOK Financial 241 0.059,099 Borg-Warner 292 0.06
27,675 Brocade Communications Systems 281 0.0610,937 Bunge 630 0.1430,106 CA 787 0.17
5,079 Cabela's 255 0.06700 Caci International 'A' 71 0.02
2,812 CalAtlantic 79 0.0225,864 Calpine 244 0.0534,710 Capital One Financial 2,458 0.541,578 Carlisle 142 0.03
19,560 Carnival 827 0.18124 Cathay General Bancorp 4 –
8,796 Centene 406 0.0941,996 CenturyLink 820 0.1812,425 CF Industries 322 0.07
7,314 Charter Communications* 1,737 0.381,108 Chemtura 30 0.01
65,851 Chevron 6,308 1.391,367 Chubb 147 0.03
11,367 Cigna 1,252 0.28229,793 Cisco Systems 5,688 1.25
9,533 CIT 331 0.0788,475 Citigroup 4,270 0.946,635 Citizens Financial 190 0.041,616 Clarcor 108 0.02
370 Clean Harbors 17 –2,835 CNA Financial 96 0.026,938 Colfax 202 0.04
121,147 Comcast 6,901 1.527,478 Comerica 413 0.097,759 Community Health Systems 36 0.012,758 Community Health Systems Rights – –1,020 Computer Sciences 50 0.013,763 Concho Resources 410 0.09
Holding Investment
Fair Value £'000
Percentage of total
net assets %
United States (continued)28,775 ConocoPhillips 1,182 0.267,743 Consol Energy 118 0.032,559 Copa 'A' 191 0.04
51,363 Corning 1,020 0.2210,301 Coty 154 0.03
3,510 Covanta 44 0.011,697 CST Brands* 67 0.01
67,827 CSX 1,997 0.442,227 Cullen Frost Bankers 158 0.033,077 Curtiss-Wright 248 0.05
40,211 CVS Caremark 2,582 0.579,313 Cypress Semiconductor 87 0.02
17,599 Danaher 1,119 0.2511,075 Davita 579 0.138,260 Dell Technologies 'V' 371 0.08
60,032 Delta Air Lines 2,406 0.535,900 Dentsply Sirona 279 0.067,800 Discovery Communications 'A' 175 0.045,235 Discovery Communications 'C' 115 0.03
800 Dolby Laboratories 30 0.0110,465 Dover 640 0.1422,207 Dow Chemical 1,037 0.2323,181 DR Horton 519 0.1110,136 Eastman Chemical 622 0.1430,123 Eaton 1,656 0.363,370 Echostar 142 0.032,019 Edgewell Personal Care 121 0.034,995 EMCOR 288 0.062,359 Endo International 30 0.013,623 Endurance Specialty 272 0.062,150 EnerSys 137 0.033,317 EnLink Midstream 51 0.01
44 Enstar 7 –7,587 Envision Healthcare 396 0.09
11,915 E-Trade Financial 335 0.074,971 EverBank Financial 78 0.022,269 Everest Re 399 0.09
25,345 Express Scripts 'C' 1,429 0.31189,130 Exxon Mobil 13,884 3.06
3,054 Federal-Mogul 25 0.013,725 FedEx 566 0.12
14,499 Fidelity National Information Services 907 0.2054,402 Fifth Third Bancorp 1,182 0.264,806 First American Financial 144 0.03
437 First Citizens Bancshares 126 0.038,346 First Horizon National 136 0.03
41,531 First Horizon National – –5,283 First Solar 140 0.03
13,845 Fluor 590 0.1310,115 FMC Technologies 292 0.062,000 FNB 26 0.01
158,197 Ford Motor 1,573 0.3526,347 Freeport-McMoRan Copper & Gold 288 0.0698,624 Frontier Communications 269 0.06
137,766 General Electric 3,552 0.7861,969 General Motors 1,770 0.392,120 Genesee & Wyoming 'A' 120 0.03
21,055 Genworth Financial 66 0.0111,094 Goldman Sachs 2,148 0.4718,184 Goodyear Tire & Rubber 460 0.10
1,400 Greif 'A' 59 0.01

Dimensional Fund Advisors Ltd.
International Value Fund
Portfolio Statement (continued)as at 31 December 2016
121Annual Report and Financial Statements, 31 December 2016
Holding Investment
Fair Value £'000
Percentage of total
net assets %
United States (continued)194 Greif 'B' 11 –
4,960 Gulfport Energy 88 0.023,837 Hain Celestial 123 0.031,787 Hancock 'C' 63 0.012,517 Hanover Insurance 186 0.045,016 Harman International Industries 453 0.10
28,049 Hartford Financial Services 1,088 0.246,035 Helmerich & Payne 383 0.088,135 Hess 416 0.09
50,291 Hewlett Packard Enterprise 955 0.211,956 Hill-Rom 90 0.02
11,881 HollyFrontier 320 0.072,693 Horizon Pharma 35 0.016,432 Humana 1,061 0.23
68,521 Huntington Bancshares 728 0.1615,008 Huntsman 234 0.05
2,062 Hyatt Hotels 'A' 94 0.021,489 Iberiabank 102 0.02
17,255 Ingersoll-Rand 1,060 0.232,108 Ingevity 94 0.02
229,989 Intel 6,850 1.514,336 InterActive 231 0.058,189 International Game Technology 169 0.043,500 Intersil 63 0.018,666 Investors Bancorp 98 0.02
126 ITT 4 –12,842 Jabil Circuit 248 0.05
6,250 Jacobs Engineering 291 0.066,385 Janus Capital 70 0.02
26,214 JetBlue Airways 472 0.108,123 JM Smucker 853 0.19
438 John Wiley & Sons 19 –4,636 Joy Global 106 0.02
173,131 JPMorgan Chase 12,086 2.6622,372 Juniper Networks 516 0.11
6,395 Kansas City Southern 439 0.10400 Kennametal 10 –
43,635 KeyCorp 642 0.1416,412 Kinder Morgan 277 0.06
3,986 Kirby 217 0.0515,287 Kohl's 622 0.14
7,996 Kraft Heinz* 572 0.133,824 L-3 Communications 476 0.106,640 Laboratory Corp of America 692 0.158,474 Lam Research 738 0.164,269 Lear 461 0.10
813 Legg Mason 20 –7,199 Leidos 301 0.07
13,820 Lennar 'A' 482 0.111,400 Lennar 'B' 39 0.01
15,880 Leucadia National 299 0.0716,919 Level 3 Communications 782 0.17
396 Liberty Braves 'A'* 7 –792 Liberty Braves 'C'* 13 –
1,000 Liberty Broadband 'A' 60 0.014,176 Liberty Broadband 'C' 254 0.06
28,683 Liberty Interactive 466 0.10990 Liberty Media 'A' 26 0.01
1,981 Liberty Media 'C' 51 0.013,963 Liberty SiriusXM 'A'* 111 0.027,926 Liberty SiriusXM 'C'* 219 0.05
Holding Investment
Fair Value £'000
Percentage of total
net assets %
United States (continued)10,902 Lincoln National 586 0.1314,800 Loews 565 0.12
5,392 M&T Bank 682 0.151,775 Macquarie Infrastructure 118 0.03
18,292 Macy's 540 0.12806 Madison Square Garden 114 0.03
7,026 Mallinckrodt 283 0.065,530 Manpower 401 0.09
36,097 Marathon Oil 516 0.1134,650 Marathon Petroleum 1,421 0.31
369 Markel 271 0.062,937 Martin Marietta Materials 537 0.12
22,220 Marvell Technology 255 0.06400 MB Financial 15 –
4,794 Mednax 261 0.06500 Mentor Graphics 15 –
21,793 MetLife 953 0.212,417 MGIC Investment 20 –
45,539 MGM Resorts International 1,055 0.2366,309 Micron Technology 1,200 0.264,175 Mohawk 686 0.15
140 Molina Healthcare 6 –4,799 Molson Coors Brewing 382 0.08
25,846 Mondelez International 942 0.2133,534 Morgan Stanley 1,149 0.2523,465 Mosaic 559 0.12
7,920 Murphy Oil 203 0.0413,422 Nabors Industries 177 0.0419,376 National Oilwell Varco 596 0.13
2,781 Navient 37 0.0110,345 NetApp 300 0.0710,759 New York Community Bancorp 138 0.0311,402 Newell Rubbermaid 420 0.0940,542 Newmont Mining 1,162 0.2616,242 News 'A' 154 0.03
2,800 News 'B' 27 0.0121,808 Noble Energy 678 0.1521,916 Norfolk Southern 1,939 0.432,400 Norwegian Cruise Line 83 0.02
20,007 NRG Energy 201 0.045,898 Nuance Communications 71 0.02
24,388 Nucor 1,208 0.2711,605 Nvidia 1,050 0.2310,112 Occidental Petroleum 589 0.1315,425 Old Republic International 238 0.05
9,945 Olin 210 0.0524,504 ON Semiconductor 258 0.06
5,223 Oshkosh 279 0.069,027 Owens Corning 382 0.081,874 PACCAR 98 0.025,025 PacWest Bancorp 222 0.055,678 Patterson-UTI Energy 125 0.033,500 PDC Energy 210 0.055,717 Penske Automotive 242 0.059,050 Pentair 416 0.09
10,425 People's United Financial 164 0.043,736 PerkinElmer 158 0.033,648 Perrigo 244 0.05
163,381 Pfizer 4,314 0.9518,057 Phillips 66 1,272 0.288,429 Pinnacle Foods 368 0.08
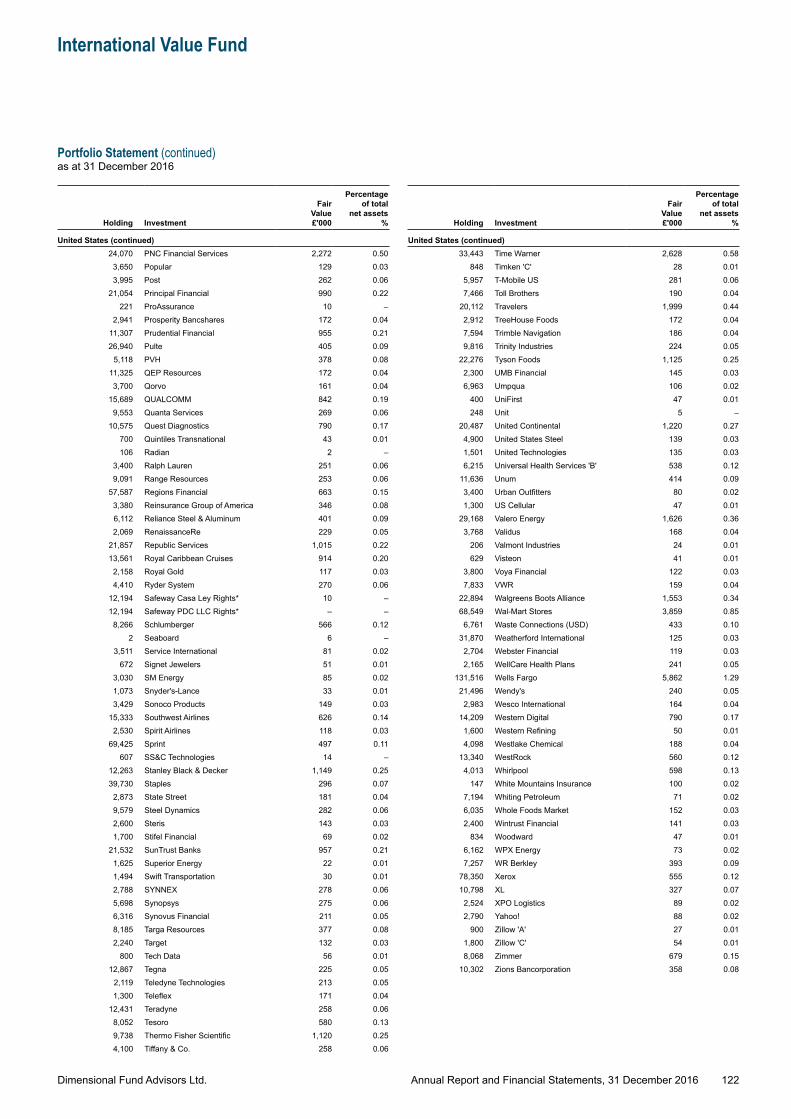
Dimensional Fund Advisors Ltd.
International Value Fund
Portfolio Statement (continued)as at 31 December 2016
122Annual Report and Financial Statements, 31 December 2016
Holding Investment
Fair Value £'000
Percentage of total
net assets %
United States (continued)24,070 PNC Financial Services 2,272 0.50
3,650 Popular 129 0.033,995 Post 262 0.06
21,054 Principal Financial 990 0.22221 ProAssurance 10 –
2,941 Prosperity Bancshares 172 0.0411,307 Prudential Financial 955 0.2126,940 Pulte 405 0.09
5,118 PVH 378 0.0811,325 QEP Resources 172 0.043,700 Qorvo 161 0.04
15,689 QUALCOMM 842 0.199,553 Quanta Services 269 0.06
10,575 Quest Diagnostics 790 0.17700 Quintiles Transnational 43 0.01106 Radian 2 –
3,400 Ralph Lauren 251 0.069,091 Range Resources 253 0.06
57,587 Regions Financial 663 0.153,380 Reinsurance Group of America 346 0.086,112 Reliance Steel & Aluminum 401 0.092,069 RenaissanceRe 229 0.05
21,857 Republic Services 1,015 0.2213,561 Royal Caribbean Cruises 914 0.20
2,158 Royal Gold 117 0.034,410 Ryder System 270 0.06
12,194 Safeway Casa Ley Rights* 10 –12,194 Safeway PDC LLC Rights* – –8,266 Schlumberger 566 0.12
2 Seaboard 6 –3,511 Service International 81 0.02
672 Signet Jewelers 51 0.013,030 SM Energy 85 0.021,073 Snyder's-Lance 33 0.013,429 Sonoco Products 149 0.03
15,333 Southwest Airlines 626 0.142,530 Spirit Airlines 118 0.03
69,425 Sprint 497 0.11607 SS&C Technologies 14 –
12,263 Stanley Black & Decker 1,149 0.2539,730 Staples 296 0.07
2,873 State Street 181 0.049,579 Steel Dynamics 282 0.062,600 Steris 143 0.031,700 Stifel Financial 69 0.02
21,532 SunTrust Banks 957 0.211,625 Superior Energy 22 0.011,494 Swift Transportation 30 0.012,788 SYNNEX 278 0.065,698 Synopsys 275 0.066,316 Synovus Financial 211 0.058,185 Targa Resources 377 0.082,240 Target 132 0.03
800 Tech Data 56 0.0112,867 Tegna 225 0.05
2,119 Teledyne Technologies 213 0.051,300 Teleflex 171 0.04
12,431 Teradyne 258 0.068,052 Tesoro 580 0.139,738 Thermo Fisher Scientific 1,120 0.254,100 Tiffany & Co. 258 0.06
Holding Investment
Fair Value £'000
Percentage of total
net assets %
United States (continued)33,443 Time Warner 2,628 0.58
848 Timken 'C' 28 0.015,957 T-Mobile US 281 0.067,466 Toll Brothers 190 0.04
20,112 Travelers 1,999 0.442,912 TreeHouse Foods 172 0.047,594 Trimble Navigation 186 0.049,816 Trinity Industries 224 0.05
22,276 Tyson Foods 1,125 0.252,300 UMB Financial 145 0.036,963 Umpqua 106 0.02
400 UniFirst 47 0.01248 Unit 5 –
20,487 United Continental 1,220 0.274,900 United States Steel 139 0.031,501 United Technologies 135 0.036,215 Universal Health Services 'B' 538 0.12
11,636 Unum 414 0.093,400 Urban Outfitters 80 0.021,300 US Cellular 47 0.01
29,168 Valero Energy 1,626 0.363,768 Validus 168 0.04
206 Valmont Industries 24 0.01629 Visteon 41 0.01
3,800 Voya Financial 122 0.037,833 VWR 159 0.04
22,894 Walgreens Boots Alliance 1,553 0.3468,549 Wal-Mart Stores 3,859 0.856,761 Waste Connections (USD) 433 0.10
31,870 Weatherford International 125 0.032,704 Webster Financial 119 0.032,165 WellCare Health Plans 241 0.05
131,516 Wells Fargo 5,862 1.2921,496 Wendy's 240 0.05
2,983 Wesco International 164 0.0414,209 Western Digital 790 0.17
1,600 Western Refining 50 0.014,098 Westlake Chemical 188 0.04
13,340 WestRock 560 0.124,013 Whirlpool 598 0.13
147 White Mountains Insurance 100 0.027,194 Whiting Petroleum 71 0.026,035 Whole Foods Market 152 0.032,400 Wintrust Financial 141 0.03
834 Woodward 47 0.016,162 WPX Energy 73 0.027,257 WR Berkley 393 0.09
78,350 Xerox 555 0.1210,798 XL 327 0.07
2,524 XPO Logistics 89 0.022,790 Yahoo! 88 0.02
900 Zillow 'A' 27 0.011,800 Zillow 'C' 54 0.018,068 Zimmer 679 0.15
10,302 Zions Bancorporation 358 0.08
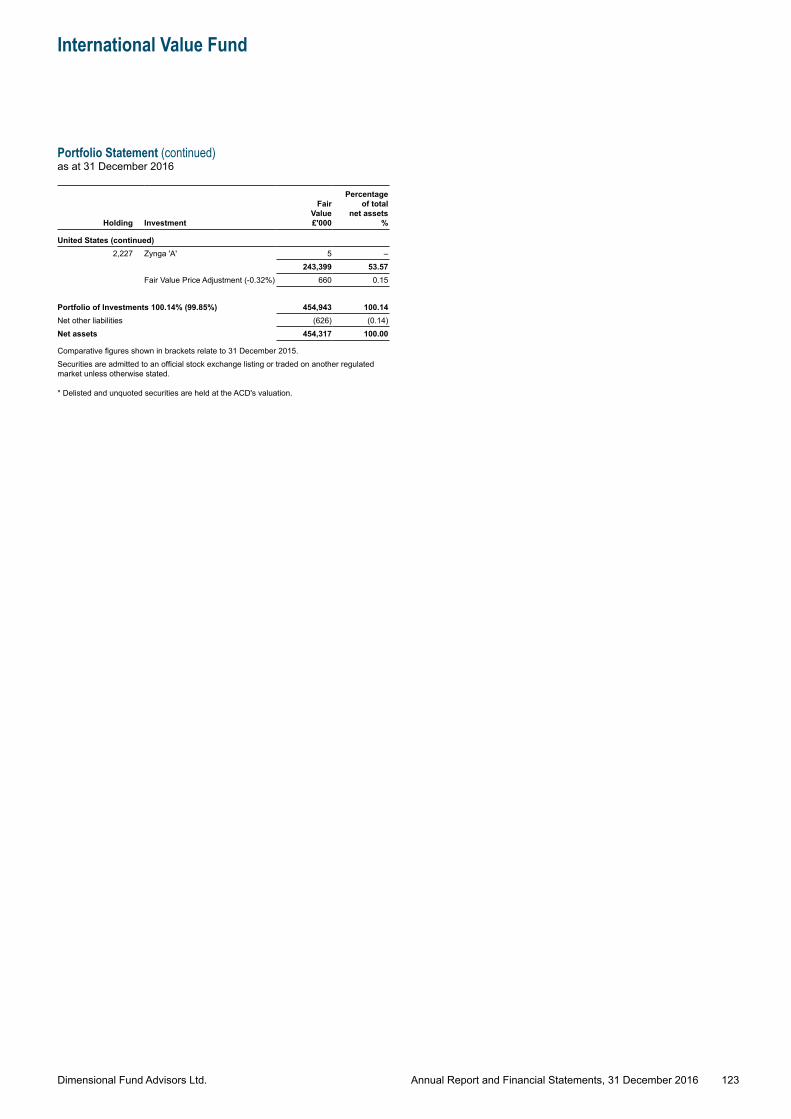
Dimensional Fund Advisors Ltd.
International Value Fund
Portfolio Statement (continued)as at 31 December 2016
123Annual Report and Financial Statements, 31 December 2016
Holding Investment
Fair Value £'000
Percentage of total
net assets %
United States (continued)2,227 Zynga 'A' 5 –
243,399 53.57Fair Value Price Adjustment (-0.32%) 660 0.15
Portfolio of Investments 100.14% (99.85%) 454,943 100.14Net other liabilities (626) (0.14)Net assets 454,317 100.00
Comparative figures shown in brackets relate to 31 December 2015.Securities are admitted to an official stock exchange listing or traded on another regulated market unless otherwise stated.
* Delisted and unquoted securities are held at the ACD's valuation.
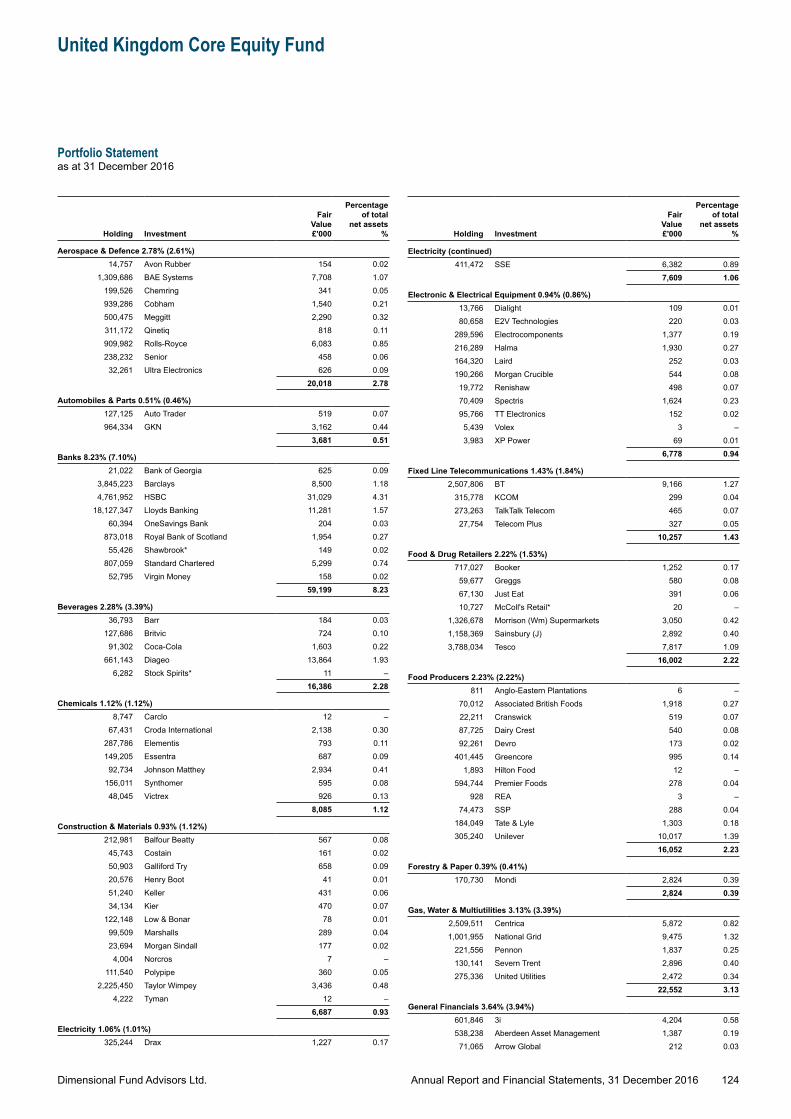
Dimensional Fund Advisors Ltd.
United Kingdom Core Equity Fund
Portfolio Statementas at 31 December 2016
124Annual Report and Financial Statements, 31 December 2016
Holding Investment
Fair Value £'000
Percentage of total
net assets %
Aerospace & Defence 2.78% (2.61%)14,757 Avon Rubber 154 0.02
1,309,686 BAE Systems 7,708 1.07199,526 Chemring 341 0.05939,286 Cobham 1,540 0.21500,475 Meggitt 2,290 0.32311,172 Qinetiq 818 0.11909,982 Rolls-Royce 6,083 0.85238,232 Senior 458 0.06
32,261 Ultra Electronics 626 0.0920,018 2.78
Automobiles & Parts 0.51% (0.46%)127,125 Auto Trader 519 0.07964,334 GKN 3,162 0.44
3,681 0.51
Banks 8.23% (7.10%)21,022 Bank of Georgia 625 0.09
3,845,223 Barclays 8,500 1.184,761,952 HSBC 31,029 4.31
18,127,347 Lloyds Banking 11,281 1.5760,394 OneSavings Bank 204 0.03
873,018 Royal Bank of Scotland 1,954 0.2755,426 Shawbrook* 149 0.02
807,059 Standard Chartered 5,299 0.7452,795 Virgin Money 158 0.02
59,199 8.23
Beverages 2.28% (3.39%)36,793 Barr 184 0.03
127,686 Britvic 724 0.1091,302 Coca-Cola 1,603 0.22
661,143 Diageo 13,864 1.936,282 Stock Spirits* 11 –
16,386 2.28
Chemicals 1.12% (1.12%)8,747 Carclo 12 –
67,431 Croda International 2,138 0.30287,786 Elementis 793 0.11149,205 Essentra 687 0.09
92,734 Johnson Matthey 2,934 0.41156,011 Synthomer 595 0.0848,045 Victrex 926 0.13
8,085 1.12
Construction & Materials 0.93% (1.12%)212,981 Balfour Beatty 567 0.08
45,743 Costain 161 0.0250,903 Galliford Try 658 0.0920,576 Henry Boot 41 0.0151,240 Keller 431 0.0634,134 Kier 470 0.07
122,148 Low & Bonar 78 0.0199,509 Marshalls 289 0.0423,694 Morgan Sindall 177 0.02
4,004 Norcros 7 –111,540 Polypipe 360 0.05
2,225,450 Taylor Wimpey 3,436 0.484,222 Tyman 12 –
6,687 0.93
Electricity 1.06% (1.01%)325,244 Drax 1,227 0.17
Holding Investment
Fair Value £'000
Percentage of total
net assets %
Electricity (continued)411,472 SSE 6,382 0.89
7,609 1.06
Electronic & Electrical Equipment 0.94% (0.86%)13,766 Dialight 109 0.0180,658 E2V Technologies 220 0.03
289,596 Electrocomponents 1,377 0.19216,289 Halma 1,930 0.27164,320 Laird 252 0.03190,266 Morgan Crucible 544 0.08
19,772 Renishaw 498 0.0770,409 Spectris 1,624 0.2395,766 TT Electronics 152 0.02
5,439 Volex 3 –3,983 XP Power 69 0.01
6,778 0.94
Fixed Line Telecommunications 1.43% (1.84%)2,507,806 BT 9,166 1.27
315,778 KCOM 299 0.04273,263 TalkTalk Telecom 465 0.07
27,754 Telecom Plus 327 0.0510,257 1.43
Food & Drug Retailers 2.22% (1.53%)717,027 Booker 1,252 0.1759,677 Greggs 580 0.0867,130 Just Eat 391 0.0610,727 McColl's Retail* 20 –
1,326,678 Morrison (Wm) Supermarkets 3,050 0.421,158,369 Sainsbury (J) 2,892 0.403,788,034 Tesco 7,817 1.09
16,002 2.22
Food Producers 2.23% (2.22%)811 Anglo-Eastern Plantations 6 –
70,012 Associated British Foods 1,918 0.2722,211 Cranswick 519 0.0787,725 Dairy Crest 540 0.0892,261 Devro 173 0.02
401,445 Greencore 995 0.141,893 Hilton Food 12 –
594,744 Premier Foods 278 0.04928 REA 3 –
74,473 SSP 288 0.04184,049 Tate & Lyle 1,303 0.18305,240 Unilever 10,017 1.39
16,052 2.23
Forestry & Paper 0.39% (0.41%)170,730 Mondi 2,824 0.39
2,824 0.39
Gas, Water & Multiutilities 3.13% (3.39%)2,509,511 Centrica 5,872 0.821,001,955 National Grid 9,475 1.32
221,556 Pennon 1,837 0.25130,141 Severn Trent 2,896 0.40275,336 United Utilities 2,472 0.34
22,552 3.13
General Financials 3.64% (3.94%)601,846 3i 4,204 0.58538,238 Aberdeen Asset Management 1,387 0.1971,065 Arrow Global 212 0.03
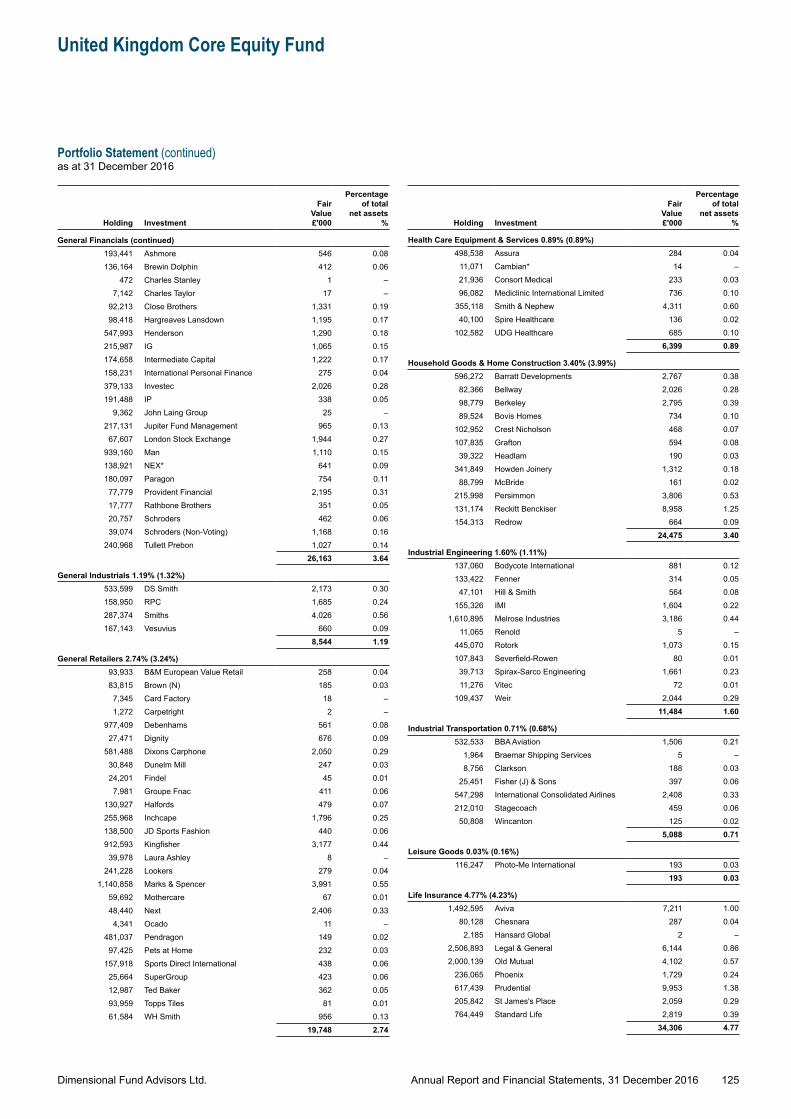
Dimensional Fund Advisors Ltd.
United Kingdom Core Equity Fund
Portfolio Statement (continued)as at 31 December 2016
125Annual Report and Financial Statements, 31 December 2016
Holding Investment
Fair Value £'000
Percentage of total
net assets %
General Financials (continued)193,441 Ashmore 546 0.08136,164 Brewin Dolphin 412 0.06
472 Charles Stanley 1 –7,142 Charles Taylor 17 –
92,213 Close Brothers 1,331 0.1998,418 Hargreaves Lansdown 1,195 0.17
547,993 Henderson 1,290 0.18215,987 IG 1,065 0.15174,658 Intermediate Capital 1,222 0.17158,231 International Personal Finance 275 0.04379,133 Investec 2,026 0.28191,488 IP 338 0.05
9,362 John Laing Group 25 –217,131 Jupiter Fund Management 965 0.13
67,607 London Stock Exchange 1,944 0.27939,160 Man 1,110 0.15138,921 NEX* 641 0.09180,097 Paragon 754 0.1177,779 Provident Financial 2,195 0.3117,777 Rathbone Brothers 351 0.0520,757 Schroders 462 0.0639,074 Schroders (Non-Voting) 1,168 0.16
240,968 Tullett Prebon 1,027 0.1426,163 3.64
General Industrials 1.19% (1.32%)533,599 DS Smith 2,173 0.30158,950 RPC 1,685 0.24287,374 Smiths 4,026 0.56167,143 Vesuvius 660 0.09
8,544 1.19
General Retailers 2.74% (3.24%)93,933 B&M European Value Retail 258 0.0483,815 Brown (N) 185 0.03
7,345 Card Factory 18 –1,272 Carpetright 2 –
977,409 Debenhams 561 0.0827,471 Dignity 676 0.09
581,488 Dixons Carphone 2,050 0.2930,848 Dunelm Mill 247 0.0324,201 Findel 45 0.017,981 Groupe Fnac 411 0.06
130,927 Halfords 479 0.07255,968 Inchcape 1,796 0.25138,500 JD Sports Fashion 440 0.06912,593 Kingfisher 3,177 0.4439,978 Laura Ashley 8 –
241,228 Lookers 279 0.041,140,858 Marks & Spencer 3,991 0.55
59,692 Mothercare 67 0.0148,440 Next 2,406 0.334,341 Ocado 11 –
481,037 Pendragon 149 0.0297,425 Pets at Home 232 0.03
157,918 Sports Direct International 438 0.0625,664 SuperGroup 423 0.0612,987 Ted Baker 362 0.0593,959 Topps Tiles 81 0.0161,584 WH Smith 956 0.13
19,748 2.74
Holding Investment
Fair Value £'000
Percentage of total
net assets %
Health Care Equipment & Services 0.89% (0.89%)498,538 Assura 284 0.04
11,071 Cambian* 14 –21,936 Consort Medical 233 0.0396,082 Mediclinic International Limited 736 0.10
355,118 Smith & Nephew 4,311 0.6040,100 Spire Healthcare 136 0.02
102,582 UDG Healthcare 685 0.106,399 0.89
Household Goods & Home Construction 3.40% (3.99%)596,272 Barratt Developments 2,767 0.3882,366 Bellway 2,026 0.2898,779 Berkeley 2,795 0.3989,524 Bovis Homes 734 0.10
102,952 Crest Nicholson 468 0.07107,835 Grafton 594 0.08
39,322 Headlam 190 0.03341,849 Howden Joinery 1,312 0.1888,799 McBride 161 0.02
215,998 Persimmon 3,806 0.53131,174 Reckitt Benckiser 8,958 1.25154,313 Redrow 664 0.09
24,475 3.40
Industrial Engineering 1.60% (1.11%)137,060 Bodycote International 881 0.12133,422 Fenner 314 0.05
47,101 Hill & Smith 564 0.08155,326 IMI 1,604 0.22
1,610,895 Melrose Industries 3,186 0.4411,065 Renold 5 –
445,070 Rotork 1,073 0.15107,843 Severfield-Rowen 80 0.0139,713 Spirax-Sarco Engineering 1,661 0.2311,276 Vitec 72 0.01
109,437 Weir 2,044 0.2911,484 1.60
Industrial Transportation 0.71% (0.68%)532,533 BBA Aviation 1,506 0.21
1,964 Braemar Shipping Services 5 –8,756 Clarkson 188 0.03
25,451 Fisher (J) & Sons 397 0.06547,298 International Consolidated Airlines 2,408 0.33212,010 Stagecoach 459 0.06
50,808 Wincanton 125 0.025,088 0.71
Leisure Goods 0.03% (0.16%)116,247 Photo-Me International 193 0.03
193 0.03
Life Insurance 4.77% (4.23%)1,492,595 Aviva 7,211 1.00
80,128 Chesnara 287 0.042,185 Hansard Global 2 –
2,506,893 Legal & General 6,144 0.862,000,139 Old Mutual 4,102 0.57
236,065 Phoenix 1,729 0.24617,439 Prudential 9,953 1.38205,842 St James's Place 2,059 0.29764,449 Standard Life 2,819 0.39
34,306 4.77
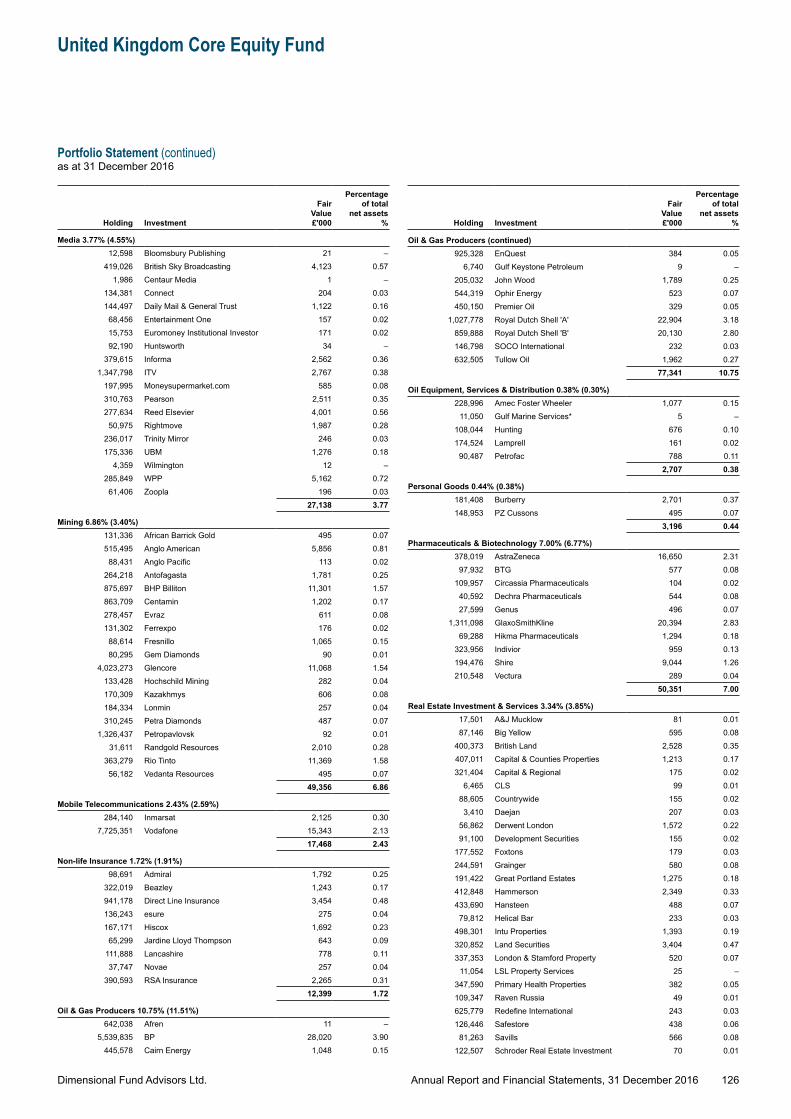
Dimensional Fund Advisors Ltd.
United Kingdom Core Equity Fund
Portfolio Statement (continued)as at 31 December 2016
126Annual Report and Financial Statements, 31 December 2016
Holding Investment
Fair Value £'000
Percentage of total
net assets %
Media 3.77% (4.55%)12,598 Bloomsbury Publishing 21 –
419,026 British Sky Broadcasting 4,123 0.571,986 Centaur Media 1 –
134,381 Connect 204 0.03144,497 Daily Mail & General Trust 1,122 0.1668,456 Entertainment One 157 0.0215,753 Euromoney Institutional Investor 171 0.0292,190 Huntsworth 34 –
379,615 Informa 2,562 0.361,347,798 ITV 2,767 0.38
197,995 Moneysupermarket.com 585 0.08310,763 Pearson 2,511 0.35277,634 Reed Elsevier 4,001 0.5650,975 Rightmove 1,987 0.28
236,017 Trinity Mirror 246 0.03175,336 UBM 1,276 0.18
4,359 Wilmington 12 –285,849 WPP 5,162 0.7261,406 Zoopla 196 0.03
27,138 3.77
Mining 6.86% (3.40%)131,336 African Barrick Gold 495 0.07515,495 Anglo American 5,856 0.8188,431 Anglo Pacific 113 0.02
264,218 Antofagasta 1,781 0.25875,697 BHP Billiton 11,301 1.57863,709 Centamin 1,202 0.17278,457 Evraz 611 0.08131,302 Ferrexpo 176 0.02
88,614 Fresnillo 1,065 0.1580,295 Gem Diamonds 90 0.01
4,023,273 Glencore 11,068 1.54133,428 Hochschild Mining 282 0.04170,309 Kazakhmys 606 0.08184,334 Lonmin 257 0.04310,245 Petra Diamonds 487 0.07
1,326,437 Petropavlovsk 92 0.0131,611 Randgold Resources 2,010 0.28
363,279 Rio Tinto 11,369 1.5856,182 Vedanta Resources 495 0.07
49,356 6.86
Mobile Telecommunications 2.43% (2.59%)284,140 Inmarsat 2,125 0.30
7,725,351 Vodafone 15,343 2.1317,468 2.43
Non-life Insurance 1.72% (1.91%)98,691 Admiral 1,792 0.25
322,019 Beazley 1,243 0.17941,178 Direct Line Insurance 3,454 0.48136,243 esure 275 0.04167,171 Hiscox 1,692 0.2365,299 Jardine Lloyd Thompson 643 0.09
111,888 Lancashire 778 0.1137,747 Novae 257 0.04
390,593 RSA Insurance 2,265 0.3112,399 1.72
Oil & Gas Producers 10.75% (11.51%)642,038 Afren 11 –
5,539,835 BP 28,020 3.90445,578 Cairn Energy 1,048 0.15
Holding Investment
Fair Value £'000
Percentage of total
net assets %
Oil & Gas Producers (continued)925,328 EnQuest 384 0.05
6,740 Gulf Keystone Petroleum 9 –205,032 John Wood 1,789 0.25544,319 Ophir Energy 523 0.07450,150 Premier Oil 329 0.05
1,027,778 Royal Dutch Shell 'A' 22,904 3.18859,888 Royal Dutch Shell 'B' 20,130 2.80146,798 SOCO International 232 0.03632,505 Tullow Oil 1,962 0.27
77,341 10.75
Oil Equipment, Services & Distribution 0.38% (0.30%)228,996 Amec Foster Wheeler 1,077 0.15
11,050 Gulf Marine Services* 5 –108,044 Hunting 676 0.10174,524 Lamprell 161 0.02
90,487 Petrofac 788 0.112,707 0.38
Personal Goods 0.44% (0.38%)181,408 Burberry 2,701 0.37148,953 PZ Cussons 495 0.07
3,196 0.44
Pharmaceuticals & Biotechnology 7.00% (6.77%)378,019 AstraZeneca 16,650 2.31
97,932 BTG 577 0.08109,957 Circassia Pharmaceuticals 104 0.02
40,592 Dechra Pharmaceuticals 544 0.0827,599 Genus 496 0.07
1,311,098 GlaxoSmithKline 20,394 2.8369,288 Hikma Pharmaceuticals 1,294 0.18
323,956 Indivior 959 0.13194,476 Shire 9,044 1.26210,548 Vectura 289 0.04
50,351 7.00
Real Estate Investment & Services 3.34% (3.85%)17,501 A&J Mucklow 81 0.0187,146 Big Yellow 595 0.08
400,373 British Land 2,528 0.35407,011 Capital & Counties Properties 1,213 0.17321,404 Capital & Regional 175 0.02
6,465 CLS 99 0.0188,605 Countrywide 155 0.02
3,410 Daejan 207 0.0356,862 Derwent London 1,572 0.2291,100 Development Securities 155 0.02
177,552 Foxtons 179 0.03244,591 Grainger 580 0.08191,422 Great Portland Estates 1,275 0.18412,848 Hammerson 2,349 0.33433,690 Hansteen 488 0.07
79,812 Helical Bar 233 0.03498,301 Intu Properties 1,393 0.19320,852 Land Securities 3,404 0.47337,353 London & Stamford Property 520 0.07
11,054 LSL Property Services 25 –347,590 Primary Health Properties 382 0.05109,347 Raven Russia 49 0.01625,779 Redefine International 243 0.03126,446 Safestore 438 0.06
81,263 Savills 566 0.08122,507 Schroder Real Estate Investment 70 0.01
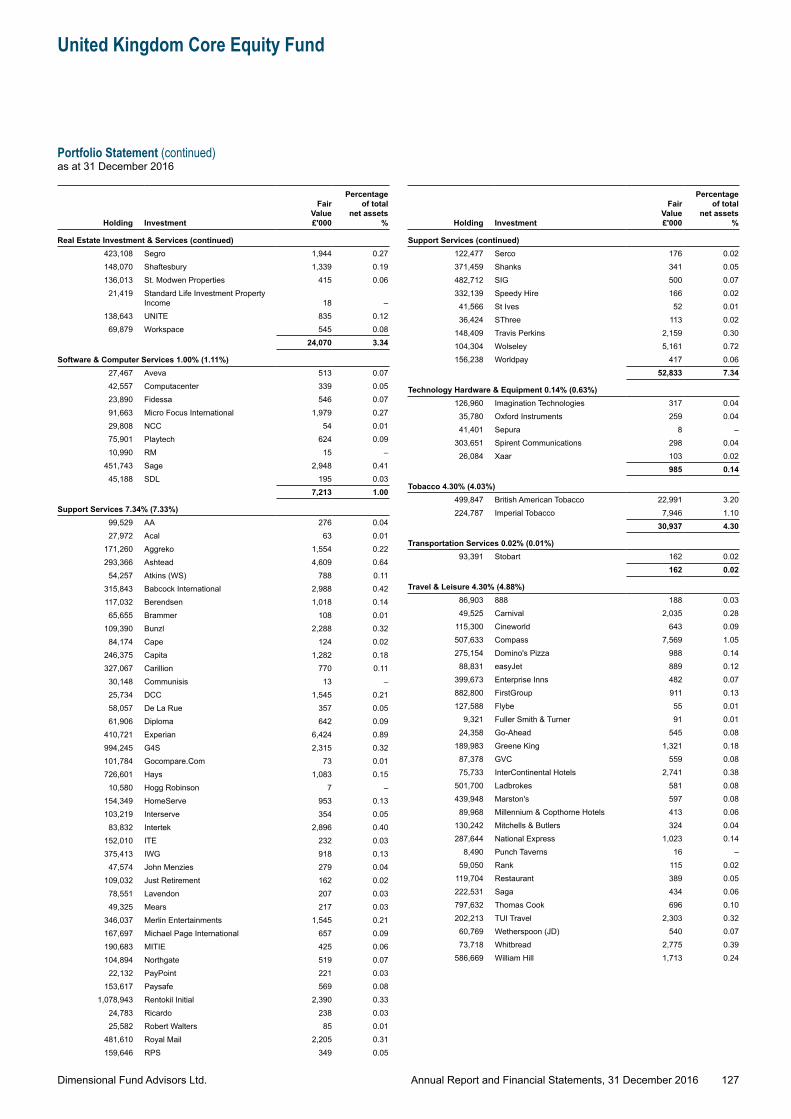
Dimensional Fund Advisors Ltd.
United Kingdom Core Equity Fund
Portfolio Statement (continued)as at 31 December 2016
127Annual Report and Financial Statements, 31 December 2016
Holding Investment
Fair Value £'000
Percentage of total
net assets %
Real Estate Investment & Services (continued)423,108 Segro 1,944 0.27148,070 Shaftesbury 1,339 0.19136,013 St. Modwen Properties 415 0.0621,419 Standard Life Investment Property
Income 18 –138,643 UNITE 835 0.12
69,879 Workspace 545 0.0824,070 3.34
Software & Computer Services 1.00% (1.11%)27,467 Aveva 513 0.0742,557 Computacenter 339 0.0523,890 Fidessa 546 0.0791,663 Micro Focus International 1,979 0.2729,808 NCC 54 0.0175,901 Playtech 624 0.0910,990 RM 15 –
451,743 Sage 2,948 0.4145,188 SDL 195 0.03
7,213 1.00
Support Services 7.34% (7.33%)99,529 AA 276 0.0427,972 Acal 63 0.01
171,260 Aggreko 1,554 0.22293,366 Ashtead 4,609 0.6454,257 Atkins (WS) 788 0.11
315,843 Babcock International 2,988 0.42117,032 Berendsen 1,018 0.1465,655 Brammer 108 0.01
109,390 Bunzl 2,288 0.3284,174 Cape 124 0.02
246,375 Capita 1,282 0.18327,067 Carillion 770 0.1130,148 Communisis 13 –25,734 DCC 1,545 0.2158,057 De La Rue 357 0.0561,906 Diploma 642 0.09
410,721 Experian 6,424 0.89994,245 G4S 2,315 0.32101,784 Gocompare.Com 73 0.01726,601 Hays 1,083 0.1510,580 Hogg Robinson 7 –
154,349 HomeServe 953 0.13103,219 Interserve 354 0.05
83,832 Intertek 2,896 0.40152,010 ITE 232 0.03375,413 IWG 918 0.13
47,574 John Menzies 279 0.04109,032 Just Retirement 162 0.02
78,551 Lavendon 207 0.0349,325 Mears 217 0.03
346,037 Merlin Entertainments 1,545 0.21167,697 Michael Page International 657 0.09190,683 MITIE 425 0.06104,894 Northgate 519 0.07
22,132 PayPoint 221 0.03153,617 Paysafe 569 0.08
1,078,943 Rentokil Initial 2,390 0.3324,783 Ricardo 238 0.0325,582 Robert Walters 85 0.01
481,610 Royal Mail 2,205 0.31159,646 RPS 349 0.05
Holding Investment
Fair Value £'000
Percentage of total
net assets %
Support Services (continued)122,477 Serco 176 0.02371,459 Shanks 341 0.05482,712 SIG 500 0.07332,139 Speedy Hire 166 0.02
41,566 St Ives 52 0.0136,424 SThree 113 0.02
148,409 Travis Perkins 2,159 0.30104,304 Wolseley 5,161 0.72156,238 Worldpay 417 0.06
52,833 7.34
Technology Hardware & Equipment 0.14% (0.63%)126,960 Imagination Technologies 317 0.04
35,780 Oxford Instruments 259 0.0441,401 Sepura 8 –
303,651 Spirent Communications 298 0.0426,084 Xaar 103 0.02
985 0.14
Tobacco 4.30% (4.03%)499,847 British American Tobacco 22,991 3.20224,787 Imperial Tobacco 7,946 1.10
30,937 4.30
Transportation Services 0.02% (0.01%)93,391 Stobart 162 0.02
162 0.02
Travel & Leisure 4.30% (4.88%)86,903 888 188 0.0349,525 Carnival 2,035 0.28
115,300 Cineworld 643 0.09507,633 Compass 7,569 1.05275,154 Domino's Pizza 988 0.14
88,831 easyJet 889 0.12399,673 Enterprise Inns 482 0.07882,800 FirstGroup 911 0.13127,588 Flybe 55 0.01
9,321 Fuller Smith & Turner 91 0.0124,358 Go-Ahead 545 0.08
189,983 Greene King 1,321 0.1887,378 GVC 559 0.0875,733 InterContinental Hotels 2,741 0.38
501,700 Ladbrokes 581 0.08439,948 Marston's 597 0.08
89,968 Millennium & Copthorne Hotels 413 0.06130,242 Mitchells & Butlers 324 0.04287,644 National Express 1,023 0.14
8,490 Punch Taverns 16 –59,050 Rank 115 0.02
119,704 Restaurant 389 0.05222,531 Saga 434 0.06797,632 Thomas Cook 696 0.10202,213 TUI Travel 2,303 0.3260,769 Wetherspoon (JD) 540 0.0773,718 Whitbread 2,775 0.39
586,669 William Hill 1,713 0.24
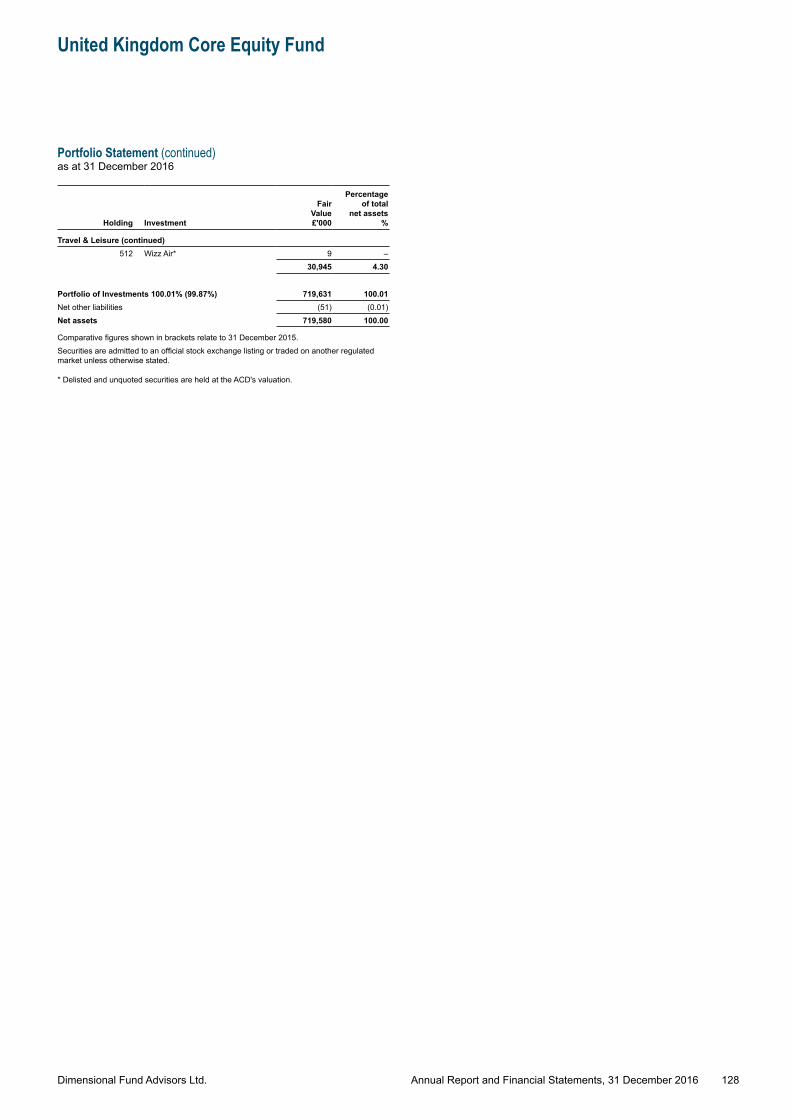
Dimensional Fund Advisors Ltd.
United Kingdom Core Equity Fund
Portfolio Statement (continued)as at 31 December 2016
128Annual Report and Financial Statements, 31 December 2016
Holding Investment
Fair Value £'000
Percentage of total
net assets %
Travel & Leisure (continued)512 Wizz Air* 9 –
30,945 4.30
Portfolio of Investments 100.01% (99.87%) 719,631 100.01Net other liabilities (51) (0.01)Net assets 719,580 100.00
Comparative figures shown in brackets relate to 31 December 2015.Securities are admitted to an official stock exchange listing or traded on another regulated market unless otherwise stated.
* Delisted and unquoted securities are held at the ACD's valuation.
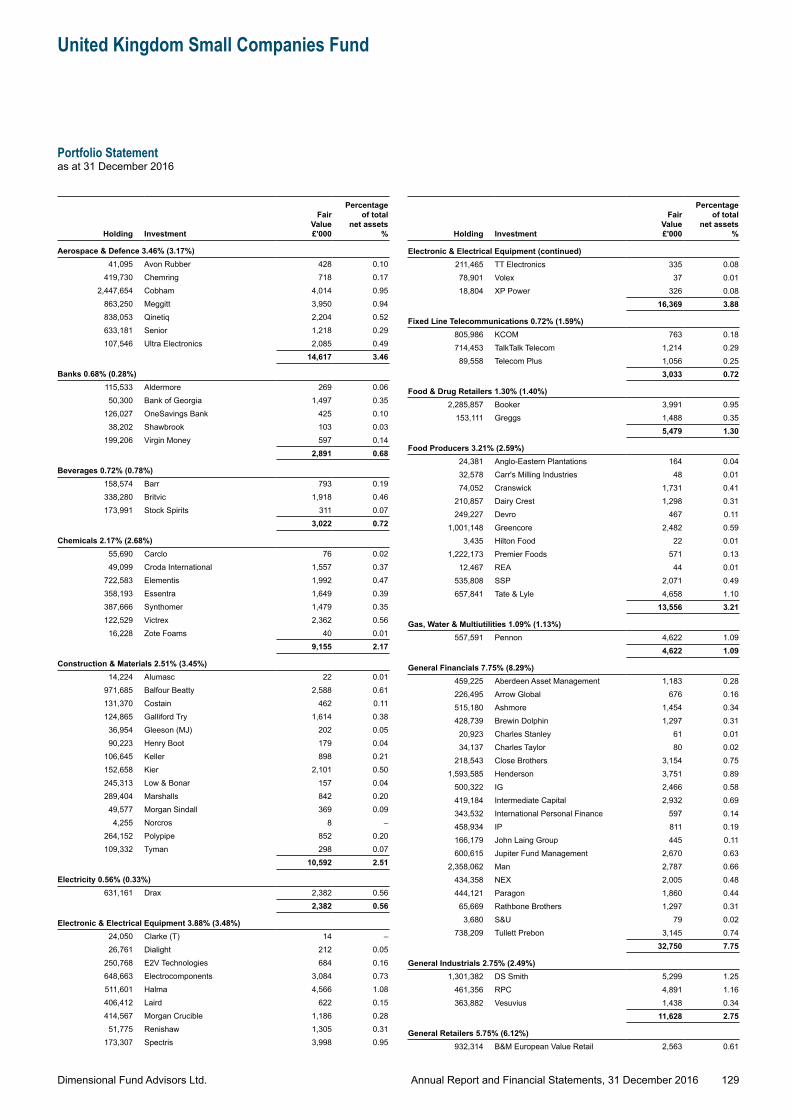
Dimensional Fund Advisors Ltd.
United Kingdom Small Companies Fund
Portfolio Statementas at 31 December 2016
129Annual Report and Financial Statements, 31 December 2016
Holding Investment
Fair Value £'000
Percentage of total
net assets %
Aerospace & Defence 3.46% (3.17%)41,095 Avon Rubber 428 0.10
419,730 Chemring 718 0.172,447,654 Cobham 4,014 0.95
863,250 Meggitt 3,950 0.94838,053 Qinetiq 2,204 0.52633,181 Senior 1,218 0.29107,546 Ultra Electronics 2,085 0.49
14,617 3.46
Banks 0.68% (0.28%)115,533 Aldermore 269 0.0650,300 Bank of Georgia 1,497 0.35
126,027 OneSavings Bank 425 0.1038,202 Shawbrook 103 0.03
199,206 Virgin Money 597 0.142,891 0.68
Beverages 0.72% (0.78%)158,574 Barr 793 0.19338,280 Britvic 1,918 0.46173,991 Stock Spirits 311 0.07
3,022 0.72
Chemicals 2.17% (2.68%)55,690 Carclo 76 0.0249,099 Croda International 1,557 0.37
722,583 Elementis 1,992 0.47358,193 Essentra 1,649 0.39387,666 Synthomer 1,479 0.35122,529 Victrex 2,362 0.5616,228 Zote Foams 40 0.01
9,155 2.17
Construction & Materials 2.51% (3.45%)14,224 Alumasc 22 0.01
971,685 Balfour Beatty 2,588 0.61131,370 Costain 462 0.11124,865 Galliford Try 1,614 0.3836,954 Gleeson (MJ) 202 0.0590,223 Henry Boot 179 0.04
106,645 Keller 898 0.21152,658 Kier 2,101 0.50245,313 Low & Bonar 157 0.04289,404 Marshalls 842 0.20
49,577 Morgan Sindall 369 0.094,255 Norcros 8 –
264,152 Polypipe 852 0.20109,332 Tyman 298 0.07
10,592 2.51
Electricity 0.56% (0.33%)631,161 Drax 2,382 0.56
2,382 0.56
Electronic & Electrical Equipment 3.88% (3.48%)24,050 Clarke (T) 14 –26,761 Dialight 212 0.05
250,768 E2V Technologies 684 0.16648,663 Electrocomponents 3,084 0.73511,601 Halma 4,566 1.08406,412 Laird 622 0.15414,567 Morgan Crucible 1,186 0.2851,775 Renishaw 1,305 0.31
173,307 Spectris 3,998 0.95
Holding Investment
Fair Value £'000
Percentage of total
net assets %
Electronic & Electrical Equipment (continued)211,465 TT Electronics 335 0.0878,901 Volex 37 0.0118,804 XP Power 326 0.08
16,369 3.88
Fixed Line Telecommunications 0.72% (1.59%)805,986 KCOM 763 0.18714,453 TalkTalk Telecom 1,214 0.2989,558 Telecom Plus 1,056 0.25
3,033 0.72
Food & Drug Retailers 1.30% (1.40%)2,285,857 Booker 3,991 0.95
153,111 Greggs 1,488 0.355,479 1.30
Food Producers 3.21% (2.59%)24,381 Anglo-Eastern Plantations 164 0.0432,578 Carr's Milling Industries 48 0.0174,052 Cranswick 1,731 0.41
210,857 Dairy Crest 1,298 0.31249,227 Devro 467 0.11
1,001,148 Greencore 2,482 0.593,435 Hilton Food 22 0.01
1,222,173 Premier Foods 571 0.1312,467 REA 44 0.01
535,808 SSP 2,071 0.49657,841 Tate & Lyle 4,658 1.10
13,556 3.21
Gas, Water & Multiutilities 1.09% (1.13%)557,591 Pennon 4,622 1.09
4,622 1.09
General Financials 7.75% (8.29%)459,225 Aberdeen Asset Management 1,183 0.28226,495 Arrow Global 676 0.16515,180 Ashmore 1,454 0.34428,739 Brewin Dolphin 1,297 0.3120,923 Charles Stanley 61 0.0134,137 Charles Taylor 80 0.02
218,543 Close Brothers 3,154 0.751,593,585 Henderson 3,751 0.89
500,322 IG 2,466 0.58419,184 Intermediate Capital 2,932 0.69343,532 International Personal Finance 597 0.14458,934 IP 811 0.19166,179 John Laing Group 445 0.11600,615 Jupiter Fund Management 2,670 0.63
2,358,062 Man 2,787 0.66434,358 NEX 2,005 0.48444,121 Paragon 1,860 0.4465,669 Rathbone Brothers 1,297 0.313,680 S&U 79 0.02
738,209 Tullett Prebon 3,145 0.7432,750 7.75
General Industrials 2.75% (2.49%)1,301,382 DS Smith 5,299 1.25
461,356 RPC 4,891 1.16363,882 Vesuvius 1,438 0.34
11,628 2.75
General Retailers 5.75% (6.12%)932,314 B&M European Value Retail 2,563 0.61
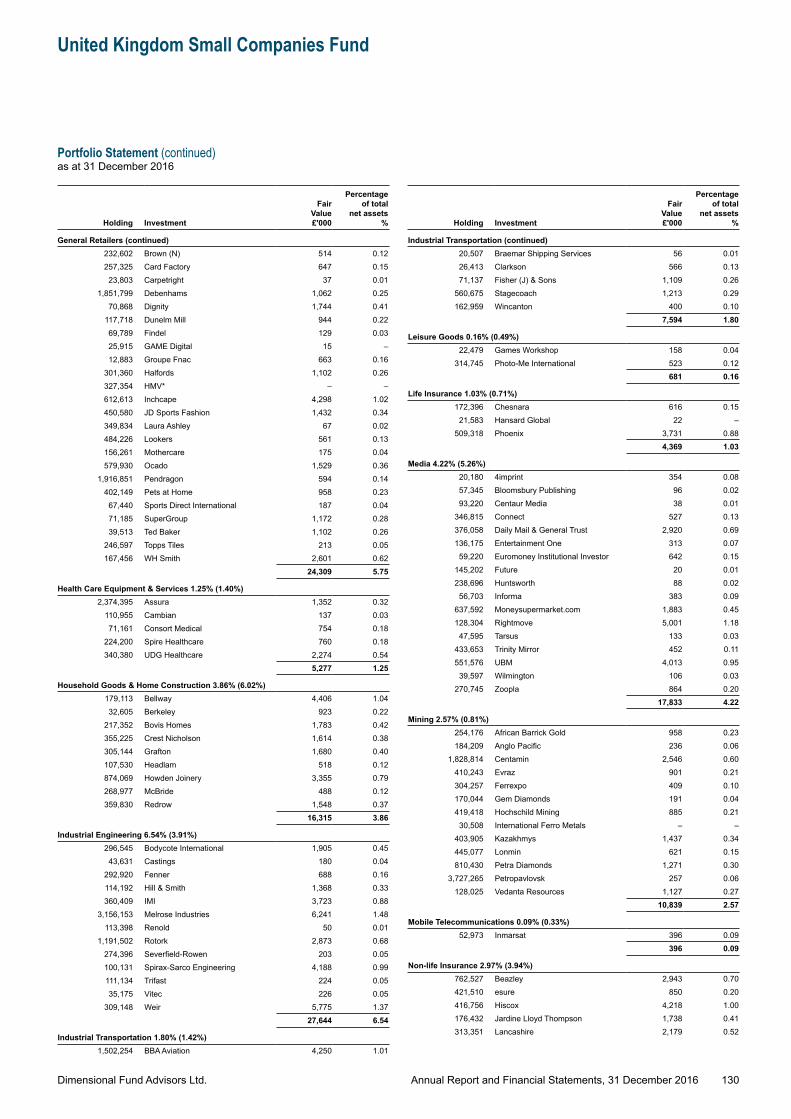
Dimensional Fund Advisors Ltd.
United Kingdom Small Companies Fund
Portfolio Statement (continued)as at 31 December 2016
130Annual Report and Financial Statements, 31 December 2016
Holding Investment
Fair Value £'000
Percentage of total
net assets %
General Retailers (continued)232,602 Brown (N) 514 0.12257,325 Card Factory 647 0.15
23,803 Carpetright 37 0.011,851,799 Debenhams 1,062 0.25
70,868 Dignity 1,744 0.41117,718 Dunelm Mill 944 0.2269,789 Findel 129 0.0325,915 GAME Digital 15 –12,883 Groupe Fnac 663 0.16
301,360 Halfords 1,102 0.26327,354 HMV* – –612,613 Inchcape 4,298 1.02450,580 JD Sports Fashion 1,432 0.34349,834 Laura Ashley 67 0.02484,226 Lookers 561 0.13156,261 Mothercare 175 0.04579,930 Ocado 1,529 0.36
1,916,851 Pendragon 594 0.14402,149 Pets at Home 958 0.23
67,440 Sports Direct International 187 0.0471,185 SuperGroup 1,172 0.2839,513 Ted Baker 1,102 0.26
246,597 Topps Tiles 213 0.05167,456 WH Smith 2,601 0.62
24,309 5.75
Health Care Equipment & Services 1.25% (1.40%)2,374,395 Assura 1,352 0.32
110,955 Cambian 137 0.0371,161 Consort Medical 754 0.18
224,200 Spire Healthcare 760 0.18340,380 UDG Healthcare 2,274 0.54
5,277 1.25
Household Goods & Home Construction 3.86% (6.02%)179,113 Bellway 4,406 1.0432,605 Berkeley 923 0.22
217,352 Bovis Homes 1,783 0.42355,225 Crest Nicholson 1,614 0.38305,144 Grafton 1,680 0.40107,530 Headlam 518 0.12874,069 Howden Joinery 3,355 0.79268,977 McBride 488 0.12359,830 Redrow 1,548 0.37
16,315 3.86
Industrial Engineering 6.54% (3.91%)296,545 Bodycote International 1,905 0.45
43,631 Castings 180 0.04292,920 Fenner 688 0.16114,192 Hill & Smith 1,368 0.33360,409 IMI 3,723 0.88
3,156,153 Melrose Industries 6,241 1.48113,398 Renold 50 0.01
1,191,502 Rotork 2,873 0.68274,396 Severfield-Rowen 203 0.05100,131 Spirax-Sarco Engineering 4,188 0.99111,134 Trifast 224 0.0535,175 Vitec 226 0.05
309,148 Weir 5,775 1.3727,644 6.54
Industrial Transportation 1.80% (1.42%)1,502,254 BBA Aviation 4,250 1.01
Holding Investment
Fair Value £'000
Percentage of total
net assets %
Industrial Transportation (continued)20,507 Braemar Shipping Services 56 0.0126,413 Clarkson 566 0.1371,137 Fisher (J) & Sons 1,109 0.26
560,675 Stagecoach 1,213 0.29162,959 Wincanton 400 0.10
7,594 1.80
Leisure Goods 0.16% (0.49%)22,479 Games Workshop 158 0.04
314,745 Photo-Me International 523 0.12681 0.16
Life Insurance 1.03% (0.71%)172,396 Chesnara 616 0.15
21,583 Hansard Global 22 –509,318 Phoenix 3,731 0.88
4,369 1.03
Media 4.22% (5.26%)20,180 4imprint 354 0.0857,345 Bloomsbury Publishing 96 0.0293,220 Centaur Media 38 0.01
346,815 Connect 527 0.13376,058 Daily Mail & General Trust 2,920 0.69136,175 Entertainment One 313 0.07
59,220 Euromoney Institutional Investor 642 0.15145,202 Future 20 0.01238,696 Huntsworth 88 0.0256,703 Informa 383 0.09
637,592 Moneysupermarket.com 1,883 0.45128,304 Rightmove 5,001 1.1847,595 Tarsus 133 0.03
433,653 Trinity Mirror 452 0.11551,576 UBM 4,013 0.9539,597 Wilmington 106 0.03
270,745 Zoopla 864 0.2017,833 4.22
Mining 2.57% (0.81%)254,176 African Barrick Gold 958 0.23184,209 Anglo Pacific 236 0.06
1,828,814 Centamin 2,546 0.60410,243 Evraz 901 0.21304,257 Ferrexpo 409 0.10170,044 Gem Diamonds 191 0.04419,418 Hochschild Mining 885 0.21
30,508 International Ferro Metals – –403,905 Kazakhmys 1,437 0.34445,077 Lonmin 621 0.15810,430 Petra Diamonds 1,271 0.30
3,727,265 Petropavlovsk 257 0.06128,025 Vedanta Resources 1,127 0.27
10,839 2.57
Mobile Telecommunications 0.09% (0.33%)52,973 Inmarsat 396 0.09
396 0.09
Non-life Insurance 2.97% (3.94%)762,527 Beazley 2,943 0.70421,510 esure 850 0.20416,756 Hiscox 4,218 1.00176,432 Jardine Lloyd Thompson 1,738 0.41313,351 Lancashire 2,179 0.52
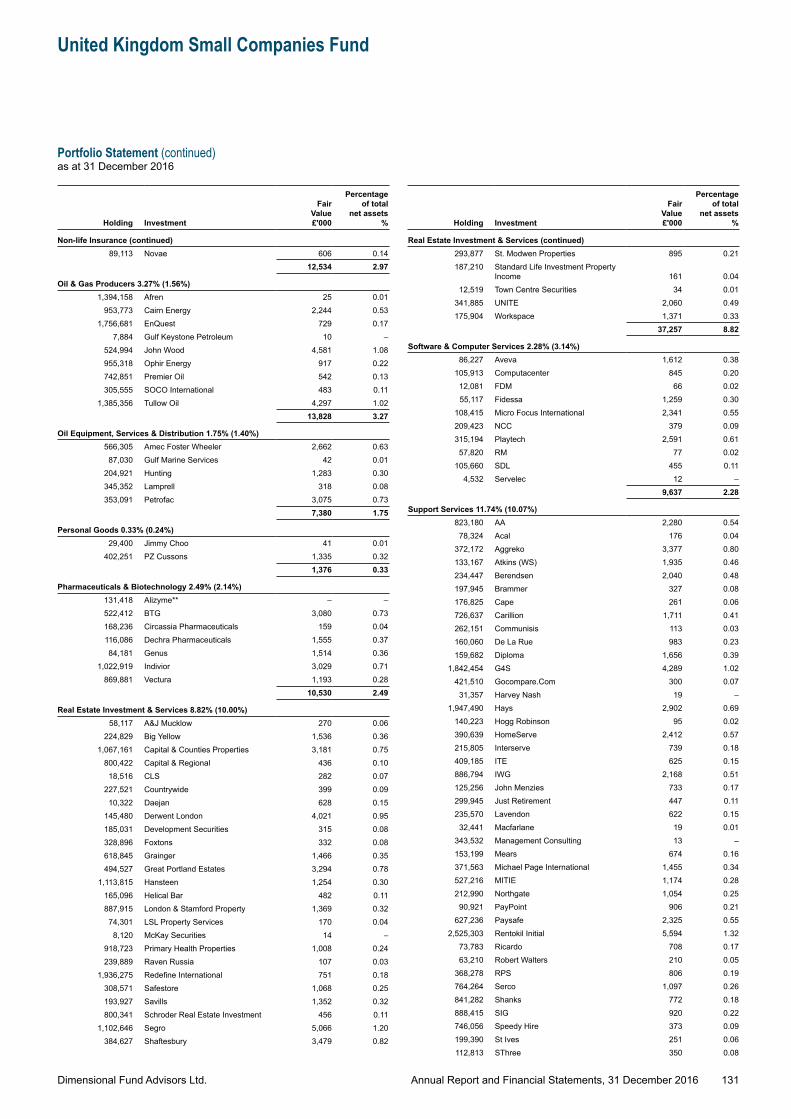
Dimensional Fund Advisors Ltd.
United Kingdom Small Companies Fund
Portfolio Statement (continued)as at 31 December 2016
131Annual Report and Financial Statements, 31 December 2016
Holding Investment
Fair Value £'000
Percentage of total
net assets %
Non-life Insurance (continued)89,113 Novae 606 0.14
12,534 2.97
Oil & Gas Producers 3.27% (1.56%)1,394,158 Afren 25 0.01
953,773 Cairn Energy 2,244 0.531,756,681 EnQuest 729 0.17
7,884 Gulf Keystone Petroleum 10 –524,994 John Wood 4,581 1.08955,318 Ophir Energy 917 0.22742,851 Premier Oil 542 0.13305,555 SOCO International 483 0.11
1,385,356 Tullow Oil 4,297 1.0213,828 3.27
Oil Equipment, Services & Distribution 1.75% (1.40%)566,305 Amec Foster Wheeler 2,662 0.6387,030 Gulf Marine Services 42 0.01
204,921 Hunting 1,283 0.30345,352 Lamprell 318 0.08353,091 Petrofac 3,075 0.73
7,380 1.75
Personal Goods 0.33% (0.24%)29,400 Jimmy Choo 41 0.01
402,251 PZ Cussons 1,335 0.321,376 0.33
Pharmaceuticals & Biotechnology 2.49% (2.14%)131,418 Alizyme** – –522,412 BTG 3,080 0.73168,236 Circassia Pharmaceuticals 159 0.04116,086 Dechra Pharmaceuticals 1,555 0.3784,181 Genus 1,514 0.36
1,022,919 Indivior 3,029 0.71869,881 Vectura 1,193 0.28
10,530 2.49
Real Estate Investment & Services 8.82% (10.00%)58,117 A&J Mucklow 270 0.06
224,829 Big Yellow 1,536 0.361,067,161 Capital & Counties Properties 3,181 0.75
800,422 Capital & Regional 436 0.1018,516 CLS 282 0.07
227,521 Countrywide 399 0.0910,322 Daejan 628 0.15
145,480 Derwent London 4,021 0.95185,031 Development Securities 315 0.08328,896 Foxtons 332 0.08618,845 Grainger 1,466 0.35494,527 Great Portland Estates 3,294 0.78
1,113,815 Hansteen 1,254 0.30165,096 Helical Bar 482 0.11887,915 London & Stamford Property 1,369 0.3274,301 LSL Property Services 170 0.04
8,120 McKay Securities 14 –918,723 Primary Health Properties 1,008 0.24239,889 Raven Russia 107 0.03
1,936,275 Redefine International 751 0.18308,571 Safestore 1,068 0.25193,927 Savills 1,352 0.32800,341 Schroder Real Estate Investment 456 0.11
1,102,646 Segro 5,066 1.20384,627 Shaftesbury 3,479 0.82
Holding Investment
Fair Value £'000
Percentage of total
net assets %
Real Estate Investment & Services (continued)293,877 St. Modwen Properties 895 0.21187,210 Standard Life Investment Property
Income 161 0.0412,519 Town Centre Securities 34 0.01
341,885 UNITE 2,060 0.49175,904 Workspace 1,371 0.33
37,257 8.82
Software & Computer Services 2.28% (3.14%)86,227 Aveva 1,612 0.38
105,913 Computacenter 845 0.2012,081 FDM 66 0.0255,117 Fidessa 1,259 0.30
108,415 Micro Focus International 2,341 0.55209,423 NCC 379 0.09315,194 Playtech 2,591 0.6157,820 RM 77 0.02
105,660 SDL 455 0.114,532 Servelec 12 –
9,637 2.28
Support Services 11.74% (10.07%)823,180 AA 2,280 0.5478,324 Acal 176 0.04
372,172 Aggreko 3,377 0.80133,167 Atkins (WS) 1,935 0.46234,447 Berendsen 2,040 0.48197,945 Brammer 327 0.08176,825 Cape 261 0.06726,637 Carillion 1,711 0.41262,151 Communisis 113 0.03160,060 De La Rue 983 0.23159,682 Diploma 1,656 0.39
1,842,454 G4S 4,289 1.02421,510 Gocompare.Com 300 0.07
31,357 Harvey Nash 19 –1,947,490 Hays 2,902 0.69
140,223 Hogg Robinson 95 0.02390,639 HomeServe 2,412 0.57215,805 Interserve 739 0.18409,185 ITE 625 0.15886,794 IWG 2,168 0.51125,256 John Menzies 733 0.17299,945 Just Retirement 447 0.11235,570 Lavendon 622 0.15
32,441 Macfarlane 19 0.01343,532 Management Consulting 13 –153,199 Mears 674 0.16371,563 Michael Page International 1,455 0.34527,216 MITIE 1,174 0.28212,990 Northgate 1,054 0.2590,921 PayPoint 906 0.21
627,236 Paysafe 2,325 0.552,525,303 Rentokil Initial 5,594 1.32
73,783 Ricardo 708 0.1763,210 Robert Walters 210 0.05
368,278 RPS 806 0.19764,264 Serco 1,097 0.26841,282 Shanks 772 0.18888,415 SIG 920 0.22746,056 Speedy Hire 373 0.09199,390 St Ives 251 0.06112,813 SThree 350 0.08
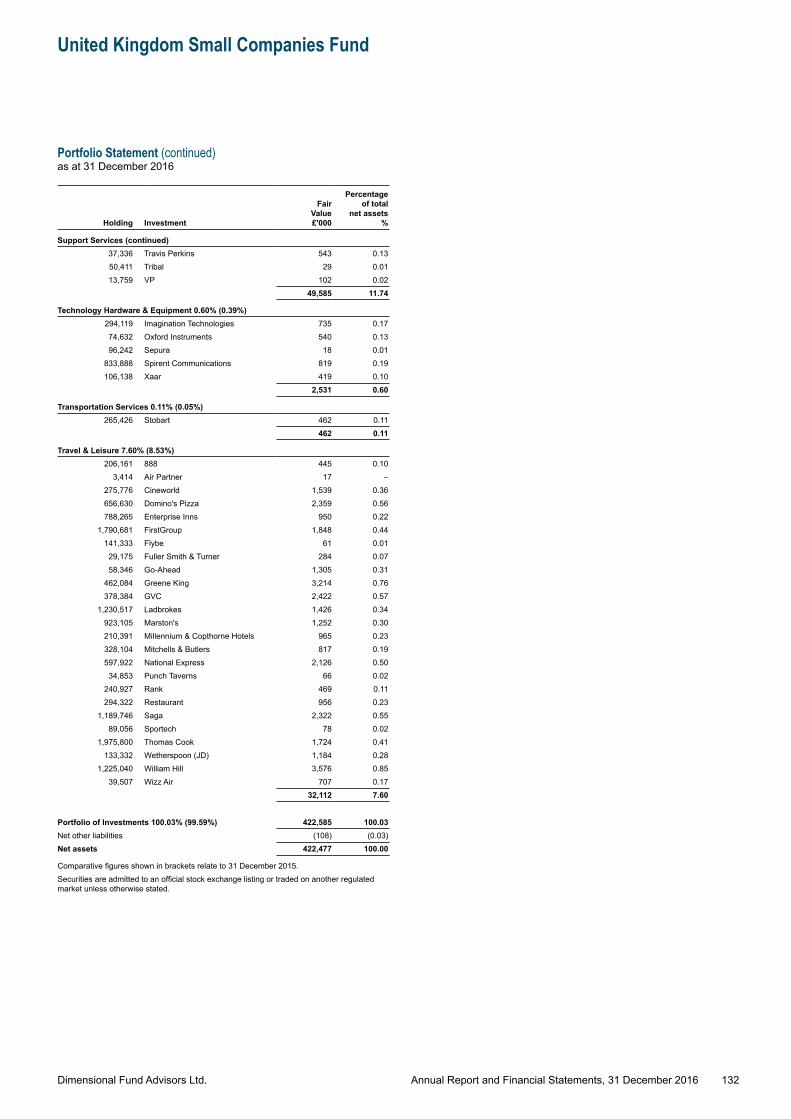
Dimensional Fund Advisors Ltd.
United Kingdom Small Companies Fund
Portfolio Statement (continued)as at 31 December 2016
132Annual Report and Financial Statements, 31 December 2016
Holding Investment
Fair Value £'000
Percentage of total
net assets %
Support Services (continued)37,336 Travis Perkins 543 0.1350,411 Tribal 29 0.0113,759 VP 102 0.02
49,585 11.74
Technology Hardware & Equipment 0.60% (0.39%)294,119 Imagination Technologies 735 0.1774,632 Oxford Instruments 540 0.1396,242 Sepura 18 0.01
833,888 Spirent Communications 819 0.19106,138 Xaar 419 0.10
2,531 0.60
Transportation Services 0.11% (0.05%)265,426 Stobart 462 0.11
462 0.11
Travel & Leisure 7.60% (8.53%)206,161 888 445 0.10
3,414 Air Partner 17 –275,776 Cineworld 1,539 0.36656,630 Domino's Pizza 2,359 0.56788,265 Enterprise Inns 950 0.22
1,790,681 FirstGroup 1,848 0.44141,333 Flybe 61 0.0129,175 Fuller Smith & Turner 284 0.0758,346 Go-Ahead 1,305 0.31
462,084 Greene King 3,214 0.76378,384 GVC 2,422 0.57
1,230,517 Ladbrokes 1,426 0.34923,105 Marston's 1,252 0.30210,391 Millennium & Copthorne Hotels 965 0.23328,104 Mitchells & Butlers 817 0.19597,922 National Express 2,126 0.5034,853 Punch Taverns 66 0.02
240,927 Rank 469 0.11294,322 Restaurant 956 0.23
1,189,746 Saga 2,322 0.5589,056 Sportech 78 0.02
1,975,800 Thomas Cook 1,724 0.41133,332 Wetherspoon (JD) 1,184 0.28
1,225,040 William Hill 3,576 0.8539,507 Wizz Air 707 0.17
32,112 7.60
Portfolio of Investments 100.03% (99.59%) 422,585 100.03Net other liabilities (108) (0.03)Net assets 422,477 100.00
Comparative figures shown in brackets relate to 31 December 2015.Securities are admitted to an official stock exchange listing or traded on another regulated market unless otherwise stated.
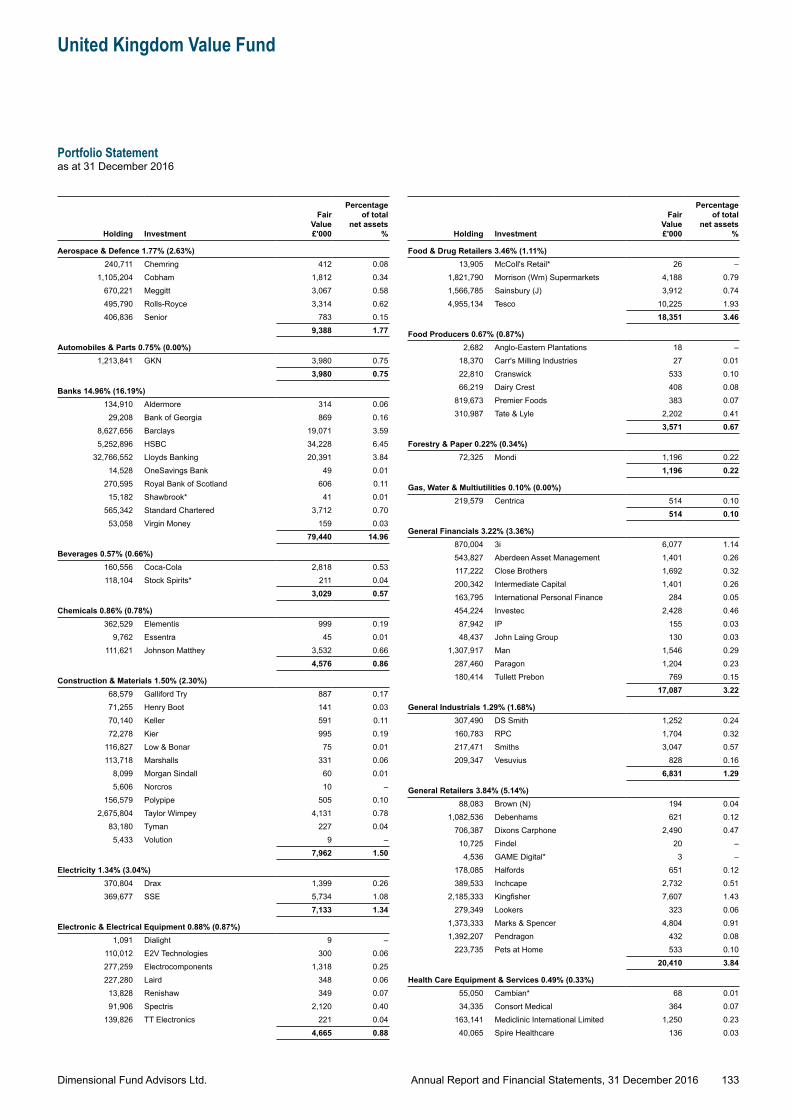
Dimensional Fund Advisors Ltd.
United Kingdom Value Fund
Portfolio Statementas at 31 December 2016
133Annual Report and Financial Statements, 31 December 2016
Holding Investment
Fair Value £'000
Percentage of total
net assets %
Aerospace & Defence 1.77% (2.63%)240,711 Chemring 412 0.08
1,105,204 Cobham 1,812 0.34670,221 Meggitt 3,067 0.58495,790 Rolls-Royce 3,314 0.62406,836 Senior 783 0.15
9,388 1.77
Automobiles & Parts 0.75% (0.00%)1,213,841 GKN 3,980 0.75
3,980 0.75
Banks 14.96% (16.19%)134,910 Aldermore 314 0.06
29,208 Bank of Georgia 869 0.168,627,656 Barclays 19,071 3.595,252,896 HSBC 34,228 6.45
32,766,552 Lloyds Banking 20,391 3.8414,528 OneSavings Bank 49 0.01
270,595 Royal Bank of Scotland 606 0.1115,182 Shawbrook* 41 0.01
565,342 Standard Chartered 3,712 0.7053,058 Virgin Money 159 0.03
79,440 14.96
Beverages 0.57% (0.66%)160,556 Coca-Cola 2,818 0.53118,104 Stock Spirits* 211 0.04
3,029 0.57
Chemicals 0.86% (0.78%)362,529 Elementis 999 0.19
9,762 Essentra 45 0.01111,621 Johnson Matthey 3,532 0.66
4,576 0.86
Construction & Materials 1.50% (2.30%)68,579 Galliford Try 887 0.1771,255 Henry Boot 141 0.0370,140 Keller 591 0.1172,278 Kier 995 0.19
116,827 Low & Bonar 75 0.01113,718 Marshalls 331 0.06
8,099 Morgan Sindall 60 0.015,606 Norcros 10 –
156,579 Polypipe 505 0.102,675,804 Taylor Wimpey 4,131 0.78
83,180 Tyman 227 0.045,433 Volution 9 –
7,962 1.50
Electricity 1.34% (3.04%)370,804 Drax 1,399 0.26369,677 SSE 5,734 1.08
7,133 1.34
Electronic & Electrical Equipment 0.88% (0.87%)1,091 Dialight 9 –
110,012 E2V Technologies 300 0.06277,259 Electrocomponents 1,318 0.25227,280 Laird 348 0.06
13,828 Renishaw 349 0.0791,906 Spectris 2,120 0.40
139,826 TT Electronics 221 0.044,665 0.88
Holding Investment
Fair Value £'000
Percentage of total
net assets %
Food & Drug Retailers 3.46% (1.11%)13,905 McColl's Retail* 26 –
1,821,790 Morrison (Wm) Supermarkets 4,188 0.791,566,785 Sainsbury (J) 3,912 0.744,955,134 Tesco 10,225 1.93
18,351 3.46
Food Producers 0.67% (0.87%)2,682 Anglo-Eastern Plantations 18 –
18,370 Carr's Milling Industries 27 0.0122,810 Cranswick 533 0.1066,219 Dairy Crest 408 0.08
819,673 Premier Foods 383 0.07310,987 Tate & Lyle 2,202 0.41
3,571 0.67
Forestry & Paper 0.22% (0.34%)72,325 Mondi 1,196 0.22
1,196 0.22
Gas, Water & Multiutilities 0.10% (0.00%)219,579 Centrica 514 0.10
514 0.10
General Financials 3.22% (3.36%)870,004 3i 6,077 1.14543,827 Aberdeen Asset Management 1,401 0.26117,222 Close Brothers 1,692 0.32200,342 Intermediate Capital 1,401 0.26163,795 International Personal Finance 284 0.05454,224 Investec 2,428 0.4687,942 IP 155 0.0348,437 John Laing Group 130 0.03
1,307,917 Man 1,546 0.29287,460 Paragon 1,204 0.23180,414 Tullett Prebon 769 0.15
17,087 3.22
General Industrials 1.29% (1.68%)307,490 DS Smith 1,252 0.24160,783 RPC 1,704 0.32217,471 Smiths 3,047 0.57209,347 Vesuvius 828 0.16
6,831 1.29
General Retailers 3.84% (5.14%)88,083 Brown (N) 194 0.04
1,082,536 Debenhams 621 0.12706,387 Dixons Carphone 2,490 0.4710,725 Findel 20 –
4,536 GAME Digital* 3 –178,085 Halfords 651 0.12389,533 Inchcape 2,732 0.51
2,185,333 Kingfisher 7,607 1.43279,349 Lookers 323 0.06
1,373,333 Marks & Spencer 4,804 0.911,392,207 Pendragon 432 0.08
223,735 Pets at Home 533 0.1020,410 3.84
Health Care Equipment & Services 0.49% (0.33%)55,050 Cambian* 68 0.0134,335 Consort Medical 364 0.07
163,141 Mediclinic International Limited 1,250 0.2340,065 Spire Healthcare 136 0.03
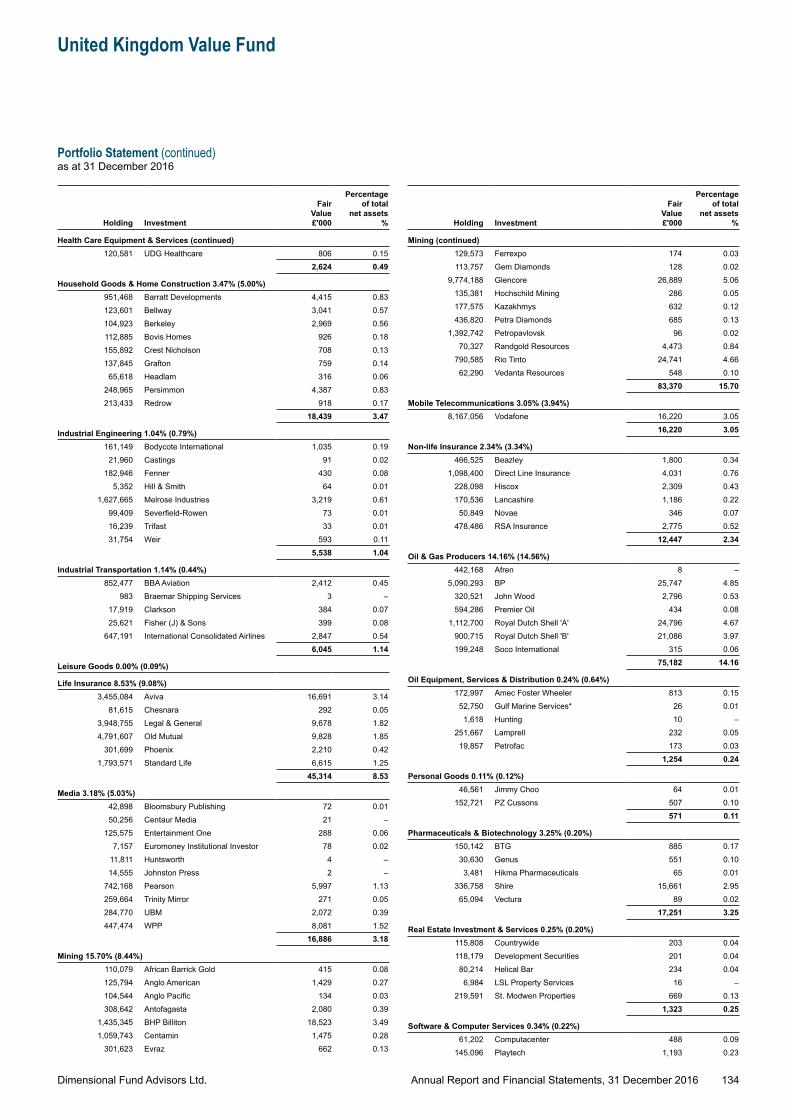
Dimensional Fund Advisors Ltd.
United Kingdom Value Fund
Portfolio Statement (continued)as at 31 December 2016
134Annual Report and Financial Statements, 31 December 2016
Holding Investment
Fair Value £'000
Percentage of total
net assets %
Health Care Equipment & Services (continued)120,581 UDG Healthcare 806 0.15
2,624 0.49
Household Goods & Home Construction 3.47% (5.00%)951,468 Barratt Developments 4,415 0.83123,601 Bellway 3,041 0.57104,923 Berkeley 2,969 0.56112,885 Bovis Homes 926 0.18155,892 Crest Nicholson 708 0.13137,845 Grafton 759 0.14
65,618 Headlam 316 0.06248,965 Persimmon 4,387 0.83213,433 Redrow 918 0.17
18,439 3.47
Industrial Engineering 1.04% (0.79%)161,149 Bodycote International 1,035 0.19
21,960 Castings 91 0.02182,946 Fenner 430 0.08
5,352 Hill & Smith 64 0.011,627,665 Melrose Industries 3,219 0.61
99,409 Severfield-Rowen 73 0.0116,239 Trifast 33 0.0131,754 Weir 593 0.11
5,538 1.04
Industrial Transportation 1.14% (0.44%)852,477 BBA Aviation 2,412 0.45
983 Braemar Shipping Services 3 –17,919 Clarkson 384 0.0725,621 Fisher (J) & Sons 399 0.08
647,191 International Consolidated Airlines 2,847 0.546,045 1.14
Leisure Goods 0.00% (0.09%)
Life Insurance 8.53% (9.08%)3,455,084 Aviva 16,691 3.14
81,615 Chesnara 292 0.053,948,755 Legal & General 9,678 1.824,791,607 Old Mutual 9,828 1.85
301,699 Phoenix 2,210 0.421,793,571 Standard Life 6,615 1.25
45,314 8.53
Media 3.18% (5.03%)42,898 Bloomsbury Publishing 72 0.0150,256 Centaur Media 21 –
125,575 Entertainment One 288 0.067,157 Euromoney Institutional Investor 78 0.02
11,811 Huntsworth 4 –14,555 Johnston Press 2 –
742,168 Pearson 5,997 1.13259,664 Trinity Mirror 271 0.05284,770 UBM 2,072 0.39447,474 WPP 8,081 1.52
16,886 3.18
Mining 15.70% (8.44%)110,079 African Barrick Gold 415 0.08125,794 Anglo American 1,429 0.27104,544 Anglo Pacific 134 0.03308,642 Antofagasta 2,080 0.39
1,435,345 BHP Billiton 18,523 3.491,059,743 Centamin 1,475 0.28
301,623 Evraz 662 0.13
Holding Investment
Fair Value £'000
Percentage of total
net assets %
Mining (continued)129,573 Ferrexpo 174 0.03113,757 Gem Diamonds 128 0.02
9,774,188 Glencore 26,889 5.06135,381 Hochschild Mining 286 0.05177,575 Kazakhmys 632 0.12436,820 Petra Diamonds 685 0.13
1,392,742 Petropavlovsk 96 0.0270,327 Randgold Resources 4,473 0.84
790,585 Rio Tinto 24,741 4.6662,290 Vedanta Resources 548 0.10
83,370 15.70
Mobile Telecommunications 3.05% (3.94%)8,167,056 Vodafone 16,220 3.05
16,220 3.05
Non-life Insurance 2.34% (3.34%)466,525 Beazley 1,800 0.34
1,098,400 Direct Line Insurance 4,031 0.76228,098 Hiscox 2,309 0.43170,536 Lancashire 1,186 0.2250,849 Novae 346 0.07
478,486 RSA Insurance 2,775 0.5212,447 2.34
Oil & Gas Producers 14.16% (14.56%)442,168 Afren 8 –
5,090,293 BP 25,747 4.85320,521 John Wood 2,796 0.53594,286 Premier Oil 434 0.08
1,112,700 Royal Dutch Shell 'A' 24,796 4.67900,715 Royal Dutch Shell 'B' 21,086 3.97199,248 Soco International 315 0.06
75,182 14.16
Oil Equipment, Services & Distribution 0.24% (0.64%)172,997 Amec Foster Wheeler 813 0.15
52,750 Gulf Marine Services* 26 0.011,618 Hunting 10 –
251,667 Lamprell 232 0.0519,857 Petrofac 173 0.03
1,254 0.24
Personal Goods 0.11% (0.12%)46,561 Jimmy Choo 64 0.01
152,721 PZ Cussons 507 0.10571 0.11
Pharmaceuticals & Biotechnology 3.25% (0.20%)150,142 BTG 885 0.17
30,630 Genus 551 0.103,481 Hikma Pharmaceuticals 65 0.01
336,758 Shire 15,661 2.9565,094 Vectura 89 0.02
17,251 3.25
Real Estate Investment & Services 0.25% (0.20%)115,808 Countrywide 203 0.04118,179 Development Securities 201 0.0480,214 Helical Bar 234 0.04
6,984 LSL Property Services 16 –219,591 St. Modwen Properties 669 0.13
1,323 0.25
Software & Computer Services 0.34% (0.22%)61,202 Computacenter 488 0.09
145,096 Playtech 1,193 0.23
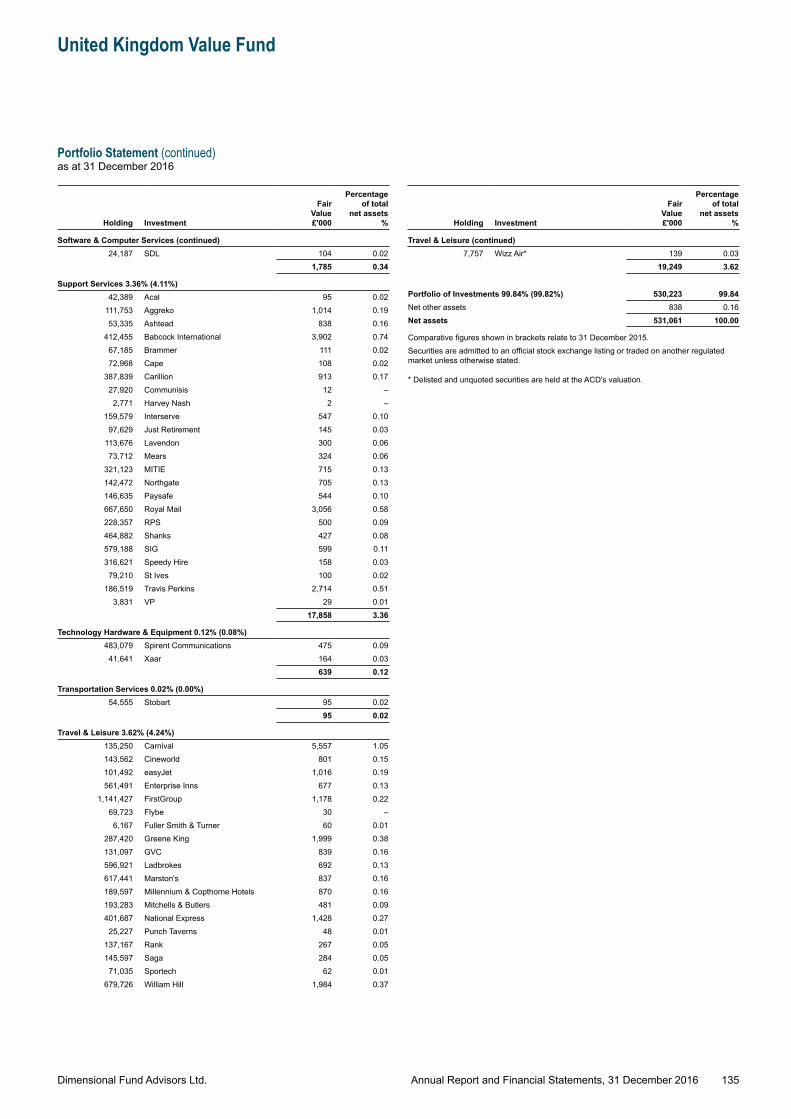
Dimensional Fund Advisors Ltd.
United Kingdom Value Fund
Portfolio Statement (continued)as at 31 December 2016
135Annual Report and Financial Statements, 31 December 2016
Holding Investment
Fair Value £'000
Percentage of total
net assets %
Software & Computer Services (continued)24,187 SDL 104 0.02
1,785 0.34
Support Services 3.36% (4.11%)42,389 Acal 95 0.02
111,753 Aggreko 1,014 0.1953,335 Ashtead 838 0.16
412,455 Babcock International 3,902 0.7467,185 Brammer 111 0.0272,968 Cape 108 0.02
387,839 Carillion 913 0.1727,920 Communisis 12 –
2,771 Harvey Nash 2 –159,579 Interserve 547 0.10
97,629 Just Retirement 145 0.03113,676 Lavendon 300 0.0673,712 Mears 324 0.06
321,123 MITIE 715 0.13142,472 Northgate 705 0.13146,635 Paysafe 544 0.10667,650 Royal Mail 3,056 0.58228,357 RPS 500 0.09464,882 Shanks 427 0.08579,188 SIG 599 0.11316,621 Speedy Hire 158 0.03
79,210 St Ives 100 0.02186,519 Travis Perkins 2,714 0.51
3,831 VP 29 0.0117,858 3.36
Technology Hardware & Equipment 0.12% (0.08%)483,079 Spirent Communications 475 0.09
41,641 Xaar 164 0.03639 0.12
Transportation Services 0.02% (0.00%)54,555 Stobart 95 0.02
95 0.02
Travel & Leisure 3.62% (4.24%)135,250 Carnival 5,557 1.05143,562 Cineworld 801 0.15101,492 easyJet 1,016 0.19561,491 Enterprise Inns 677 0.13
1,141,427 FirstGroup 1,178 0.2269,723 Flybe 30 –
6,167 Fuller Smith & Turner 60 0.01287,420 Greene King 1,999 0.38131,097 GVC 839 0.16596,921 Ladbrokes 692 0.13617,441 Marston's 837 0.16189,597 Millennium & Copthorne Hotels 870 0.16193,283 Mitchells & Butlers 481 0.09401,687 National Express 1,428 0.2725,227 Punch Taverns 48 0.01
137,167 Rank 267 0.05145,597 Saga 284 0.05
71,035 Sportech 62 0.01679,726 William Hill 1,984 0.37
Holding Investment
Fair Value £'000
Percentage of total
net assets %
Travel & Leisure (continued)7,757 Wizz Air* 139 0.03
19,249 3.62
Portfolio of Investments 99.84% (99.82%) 530,223 99.84Net other assets 838 0.16Net assets 531,061 100.00
Comparative figures shown in brackets relate to 31 December 2015.Securities are admitted to an official stock exchange listing or traded on another regulated market unless otherwise stated.
* Delisted and unquoted securities are held at the ACD's valuation.
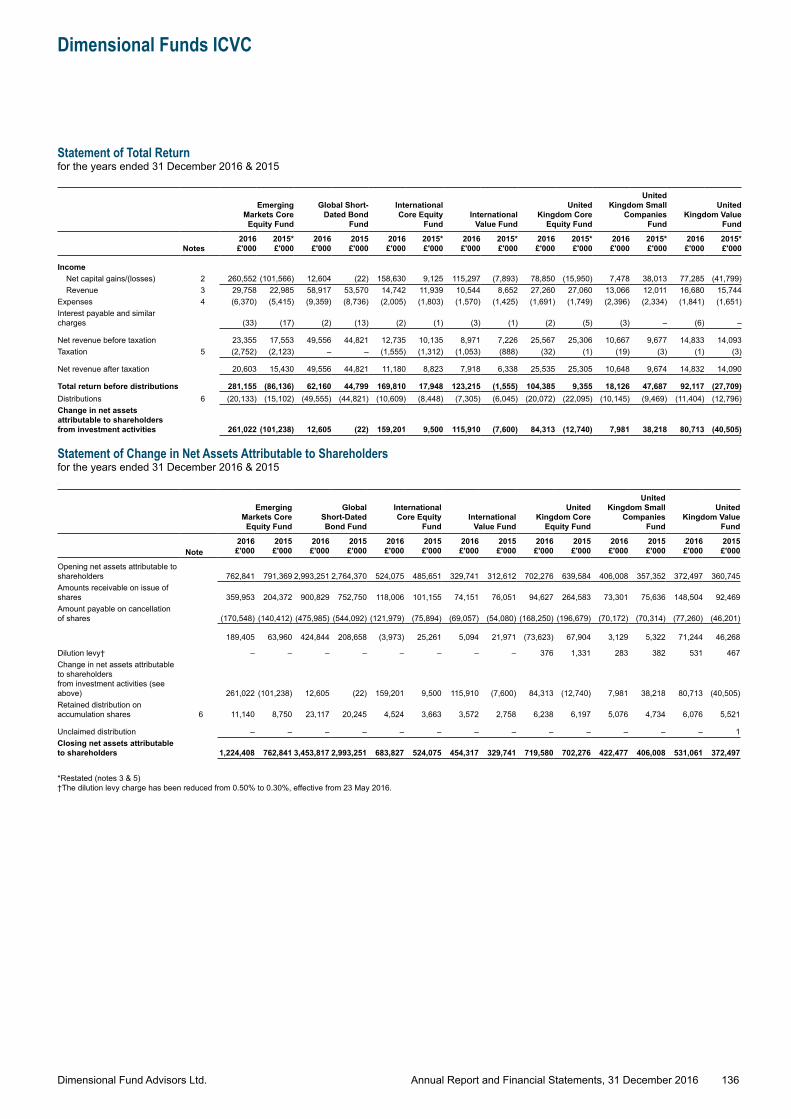
Dimensional Fund Advisors Ltd.
Dimensional Funds ICVC
136Annual Report and Financial Statements, 31 December 2016
Statement of Total Returnfor the years ended 31 December 2016 & 2015
Emerging Markets Core
Equity Fund
Global Short-Dated Bond
Fund
International Core Equity
FundInternational
Value Fund
United Kingdom Core
Equity Fund
United Kingdom Small
Companies Fund
United Kingdom Value
Fund
Notes2016 £'000
2015* £'000
2016 £'000
2015 £'000
2016 £'000
2015* £'000
2016 £'000
2015* £'000
2016 £'000
2015* £'000
2016 £'000
2015* £'000
2016 £'000
2015* £'000
IncomeNet capital gains/(losses) 2 260,552 (101,566) 12,604 (22) 158,630 9,125 115,297 (7,893) 78,850 (15,950) 7,478 38,013 77,285 (41,799)Revenue 3 29,758 22,985 58,917 53,570 14,742 11,939 10,544 8,652 27,260 27,060 13,066 12,011 16,680 15,744
Expenses 4 (6,370) (5,415) (9,359) (8,736) (2,005) (1,803) (1,570) (1,425) (1,691) (1,749) (2,396) (2,334) (1,841) (1,651)Interest payable and similar charges (33) (17) (2) (13) (2) (1) (3) (1) (2) (5) (3) – (6) –
Net revenue before taxation 23,355 17,553 49,556 44,821 12,735 10,135 8,971 7,226 25,567 25,306 10,667 9,677 14,833 14,093Taxation 5 (2,752) (2,123) – – (1,555) (1,312) (1,053) (888) (32) (1) (19) (3) (1) (3)
Net revenue after taxation 20,603 15,430 49,556 44,821 11,180 8,823 7,918 6,338 25,535 25,305 10,648 9,674 14,832 14,090
Total return before distributions 281,155 (86,136) 62,160 44,799 169,810 17,948 123,215 (1,555) 104,385 9,355 18,126 47,687 92,117 (27,709)Distributions 6 (20,133) (15,102) (49,555) (44,821) (10,609) (8,448) (7,305) (6,045) (20,072) (22,095) (10,145) (9,469) (11,404) (12,796)Change in net assets attributable to shareholders from investment activities 261,022 (101,238) 12,605 (22) 159,201 9,500 115,910 (7,600) 84,313 (12,740) 7,981 38,218 80,713 (40,505)
Statement of Change in Net Assets Attributable to Shareholdersfor the years ended 31 December 2016 & 2015s.
Emerging Markets Core
Equity Fund
GlobalShort-Dated Bond Fund
International Core Equity
FundInternational
Value Fund
United Kingdom Core
Equity Fund
United Kingdom Small
Companies Fund
United Kingdom Value
Fund
Note2016 £'000
2015 £'000
2016 £'000
2015 £'000
2016 £'000
2015 £'000
2016 £'000
2015 £'000
2016 £'000
2015 £'000
2016 £'000
2015 £'000
2016 £'000
2015 £'000
Opening net assets attributable to shareholders 762,841 791,369 2,993,251 2,764,370 524,075 485,651 329,741 312,612 702,276 639,584 406,008 357,352 372,497 360,745Amounts receivable on issue of shares 359,953 204,372 900,829 752,750 118,006 101,155 74,151 76,051 94,627 264,583 73,301 75,636 148,504 92,469Amount payable on cancellation of shares (170,548) (140,412) (475,985) (544,092) (121,979) (75,894) (69,057) (54,080) (168,250) (196,679) (70,172) (70,314) (77,260) (46,201)
189,405 63,960 424,844 208,658 (3,973) 25,261 5,094 21,971 (73,623) 67,904 3,129 5,322 71,244 46,268
Dilution levy† – – – – – – – – 376 1,331 283 382 531 467Change in net assets attributable to shareholders from investment activities (see above) 261,022 (101,238) 12,605 (22) 159,201 9,500 115,910 (7,600) 84,313 (12,740) 7,981 38,218 80,713 (40,505)Retained distribution on accumulation shares 6 11,140 8,750 23,117 20,245 4,524 3,663 3,572 2,758 6,238 6,197 5,076 4,734 6,076 5,521
Unclaimed distribution – – – – – – – – – – – – – 1Closing net assets attributable to shareholders 1,224,408 762,841 3,453,817 2,993,251 683,827 524,075 454,317 329,741 719,580 702,276 422,477 406,008 531,061 372,497
*Restated (notes 3 & 5)†The dilution levy charge has been reduced from 0.50% to 0.30%, effective from 23 May 2016.
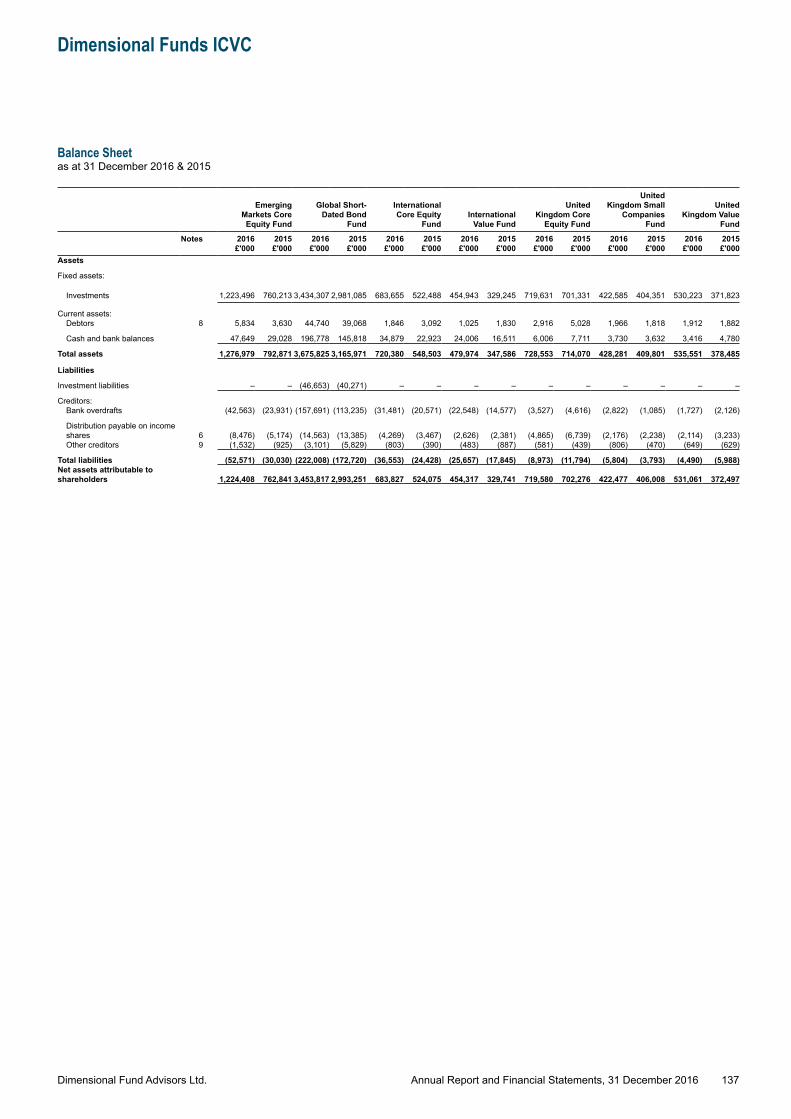
Dimensional Fund Advisors Ltd.
Dimensional Funds ICVC
137Annual Report and Financial Statements, 31 December 2016
Balance Sheetas at 31 December 2016 & 2015
Emerging Markets Core
Equity Fund
Global Short-Dated Bond
Fund
International Core Equity
FundInternational
Value Fund
United Kingdom Core
Equity Fund
United Kingdom Small
Companies Fund
United Kingdom Value
Fund
Notes 2016 £'000
2015 £'000
2016 £'000
2015 £'000
2016 £'000
2015 £'000
2016 £'000
2015 £'000
2016 £'000
2015 £'000
2016 £'000
2015 £'000
2016 £'000
2015 £'000
Assets
Fixed assets:
Investments 1,223,496 760,213 3,434,307 2,981,085 683,655 522,488 454,943 329,245 719,631 701,331 422,585 404,351 530,223 371,823
Current assets:Debtors 8 5,834 3,630 44,740 39,068 1,846 3,092 1,025 1,830 2,916 5,028 1,966 1,818 1,912 1,882
Cash and bank balances 47,649 29,028 196,778 145,818 34,879 22,923 24,006 16,511 6,006 7,711 3,730 3,632 3,416 4,780
Total assets 1,276,979 792,871 3,675,825 3,165,971 720,380 548,503 479,974 347,586 728,553 714,070 428,281 409,801 535,551 378,485
Liabilities
Investment liabilities – – (46,653) (40,271) – – – – – – – – – –
Creditors:Bank overdrafts (42,563) (23,931) (157,691) (113,235) (31,481) (20,571) (22,548) (14,577) (3,527) (4,616) (2,822) (1,085) (1,727) (2,126)
Distribution payable on income shares 6 (8,476) (5,174) (14,563) (13,385) (4,269) (3,467) (2,626) (2,381) (4,865) (6,739) (2,176) (2,238) (2,114) (3,233)Other creditors 9 (1,532) (925) (3,101) (5,829) (803) (390) (483) (887) (581) (439) (806) (470) (649) (629)
Total liabilities (52,571) (30,030) (222,008) (172,720) (36,553) (24,428) (25,657) (17,845) (8,973) (11,794) (5,804) (3,793) (4,490) (5,988)Net assets attributable to shareholders 1,224,408 762,841 3,453,817 2,993,251 683,827 524,075 454,317 329,741 719,580 702,276 422,477 406,008 531,061 372,497
Dimensional Fund Advisors Ltd.
Dimensional Funds ICVC
Notes to the Financial Statementsfor the years ended 31 December 2016 & 2015
138Annual Report and Financial Statements, 31 December 2016
1. Accounting Policies
Basis of AccountingThe financial statements have been prepared on a going concern basis under the historical cost convention, as modified by the revaluation of investments, and in accordance with United Kingdom Generally Accepted Accounting Practice and the Statement of Recommended Practice for UK Authorised Funds issued by the Investment Management Association in May 2014 (the “IMA SORP 2014"). The principal accounting policies which have been applied consistently are set out below.
RevenueDividends from quoted equity and non-equity shares are recognised net of attributable tax credits when the security is quoted ex-dividend. Bank interest, deposit interest and other revenue are recognised on an accrual basis.
Interest on debt securities is recognised on an accruals basis, taking into account the effective yield on the investment and is treated as revenue. The effective yield basis amortises any discount or premium on the debt element of the purchase of an investment over its remaining life based on estimated future cash flows.
Special DividendsThese are recognised as either revenue or capital depending upon the nature and circumstances of the dividend receivable.
Stock DividendsOrdinary stock dividends are recognised as revenue, based on the market value of the shares on the date they are quoted ex-dividend. Any enhancement above the cash dividend is treated as capital.
Stock Lending RevenueRevenue from stock lending is accounted for net of agent’s fees and commissions and is recognised as revenue on an accruals basis.
Distribution PolicyNet revenue receivable in respect of income shares is distributed to shareholders, while that in respect of accumulation shares is retained for investment in the relevant sub-fund. The Global Short-Dated Bond Fund distributes on an effective yield basis.
Distributions which have remained unclaimed by shareholders for more than six years are credited to the capital property of the sub-fund.
Stock dividends do not form part of the distribution.
InvestmentsAll investments are valued at their fair value as at 12 noon on 30 December 2016, being the last business day of the financial year. The fair value of the non-derivative securities and derivative securities is bid price. For markets that are closed at 12 noon, the ACDs uses a daily automated fair value pricing mechanism. This is applied to Dimensional International Value, Emerging Markets and International Core Equity Funds as the ACD does not believe the most recent bid price would reflect a fair and reasonable price. Unquoted investments are shown at the ACD’s valuation. The methodology used to produce the fair value hierarchy disclosures on page 151 complies with recent amendments by the Financial Reporting Council to disclose a three tier hierarchy for financial instruments and is aligned with International Financial Reporting Standards.
Investment Gains and LossesGains and losses, including exchange differences, on the realisation of investments and increases and decreases in the valuation of investments held at the balance sheet date, including unrealised exchange differences, are treated as capital.
Exchange RatesTransactions in foreign currencies are translated at the rate of exchange ruling on the date of the transaction. Where applicable, assets and liabilities denominated in foreign currencies are translated into sterling at the rate of exchange ruling as at 12 noon on 30 December 2016, being the last business day of the financial year.
TaxationCorporation tax is provided for on an accounting basis, hence deferred tax on short-term timing difference does not arise.
Deferred tax is provided for in respect of timing differences that have originated but not reversed by the balance sheet date, with the exception of those regarded as permanent differences. Any liability to deferred tax is provided at the average rate of tax expected to apply.
A deferred tax asset is recognised to the extent that it is expected to be utilised, based on the likelihood of taxable profits arising in the next twelve month period from which the future reversal of timing differences can be deducted. Deferred tax assets and liabilities are not discounted to reflect the time value of money.
Dilution LevyThe current policy of the ACD is to charge a dilution levy on all subscriptions in the United Kingdom Core Equity Fund, United Kingdom Small Companies Fund and United Kingdom Value Fund to the extent permitted by the FCA Rules. No dilution levy will be charged on redemptions from these Funds. Furthermore, no dilution levy is charged on either subscriptions or redemptions in the Global Short-Dated Bond Fund, Emerging Markets Core Equity Fund, International Core Equity Fund or the International Value Fund. On the basis of past experience, the ACD estimates that a dilution levy will be charged on subscriptions at a rate of 0.30% (0.50% up to 23 May 2016) of the value of the transaction before the imposition of the levy, in order to account for any stamp duty that may be charged when purchasing assets for the affected Funds. In the event of an adjustment to the rate of stamp duty, the rate of dilution levy may be adjusted accordingly.
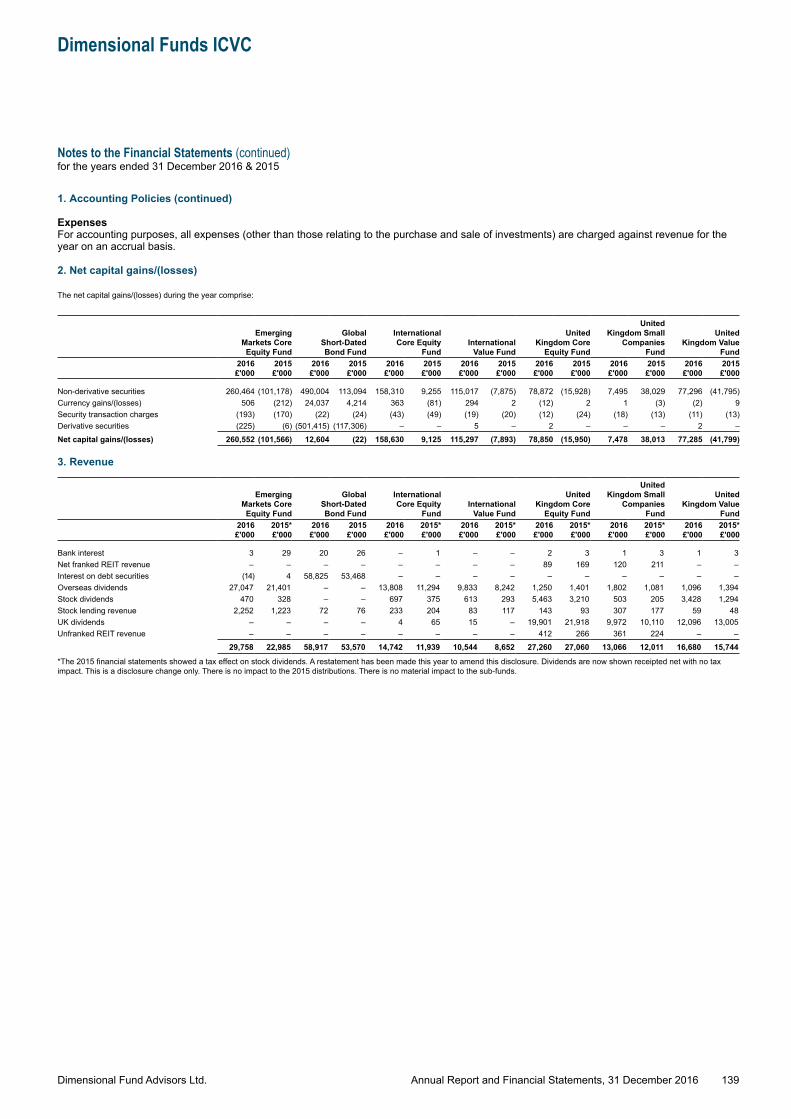
Dimensional Fund Advisors Ltd.
Dimensional Funds ICVC
Notes to the Financial Statements (continued)for the years ended 31 December 2016 & 2015
139Annual Report and Financial Statements, 31 December 2016
1. Accounting Policies (continued)
ExpensesFor accounting purposes, all expenses (other than those relating to the purchase and sale of investments) are charged against revenue for the year on an accrual basis.
2. Net capital gains/(losses)
The net capital gains/(losses) during the year comprise:
Emerging Markets Core
Equity Fund
Global Short-Dated Bond Fund
International Core Equity
FundInternational
Value Fund
United Kingdom Core
Equity Fund
United Kingdom Small
Companies Fund
United Kingdom Value
Fund2016 £'000
2015 £'000
2016 £'000
2015 £'000
2016 £'000
2015 £'000
2016 £'000
2015 £'000
2016 £'000
2015 £'000
2016 £'000
2015 £'000
2016 £'000
2015 £'000
Non-derivative securities 260,464 (101,178) 490,004 113,094 158,310 9,255 115,017 (7,875) 78,872 (15,928) 7,495 38,029 77,296 (41,795)Currency gains/(losses) 506 (212) 24,037 4,214 363 (81) 294 2 (12) 2 1 (3) (2) 9Security transaction charges (193) (170) (22) (24) (43) (49) (19) (20) (12) (24) (18) (13) (11) (13)Derivative securities (225) (6) (501,415) (117,306) – – 5 – 2 – – – 2 –Net capital gains/(losses) 260,552 (101,566) 12,604 (22) 158,630 9,125 115,297 (7,893) 78,850 (15,950) 7,478 38,013 77,285 (41,799)
3. Revenue
Emerging Markets Core
Equity Fund
GlobalShort-Dated Bond Fund
International Core Equity
FundInternational
Value Fund
United Kingdom Core
Equity Fund
United Kingdom Small
Companies Fund
United Kingdom Value
Fund2016 £'000
2015* £'000
2016 £'000
2015 £'000
2016 £'000
2015* £'000
2016 £'000
2015* £'000
2016 £'000
2015* £'000
2016 £'000
2015* £'000
2016 £'000
2015* £'000
Bank interest 3 29 20 26 – 1 – – 2 3 1 3 1 3Net franked REIT revenue – – – – – – – – 89 169 120 211 – –Interest on debt securities (14) 4 58,825 53,468 – – – – – – – – – –Overseas dividends 27,047 21,401 – – 13,808 11,294 9,833 8,242 1,250 1,401 1,802 1,081 1,096 1,394Stock dividends 470 328 – – 697 375 613 293 5,463 3,210 503 205 3,428 1,294Stock lending revenue 2,252 1,223 72 76 233 204 83 117 143 93 307 177 59 48UK dividends – – – – 4 65 15 – 19,901 21,918 9,972 10,110 12,096 13,005Unfranked REIT revenue – – – – – – – – 412 266 361 224 – –
29,758 22,985 58,917 53,570 14,742 11,939 10,544 8,652 27,260 27,060 13,066 12,011 16,680 15,744
*The 2015 financial statements showed a tax effect on stock dividends. A restatement has been made this year to amend this disclosure. Dividends are now shown receipted net with no tax impact. This is a disclosure change only. There is no impact to the 2015 distributions. There is no material impact to the sub-funds.
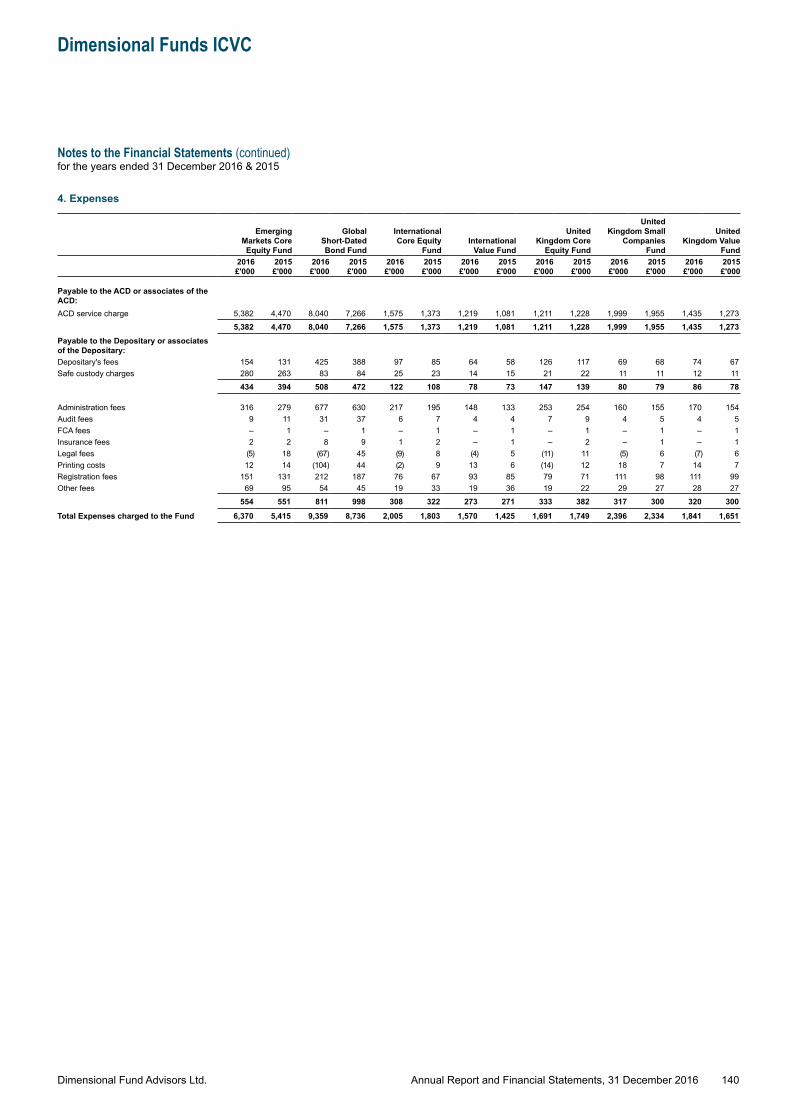
Dimensional Fund Advisors Ltd.
Dimensional Funds ICVC
Notes to the Financial Statements (continued)for the years ended 31 December 2016 & 2015
140Annual Report and Financial Statements, 31 December 2016
4. Expenses
Emerging Markets Core
Equity Fund
GlobalShort-Dated Bond Fund
International Core Equity
FundInternational
Value Fund
United Kingdom Core
Equity Fund
United Kingdom Small
Companies Fund
United Kingdom Value
Fund2016 £'000
2015 £'000
2016 £'000
2015 £'000
2016 £'000
2015 £'000
2016 £'000
2015 £'000
2016 £'000
2015 £'000
2016 £'000
2015 £'000
2016 £'000
2015 £'000
Payable to the ACD or associates of the ACD:ACD service charge 5,382 4,470 8,040 7,266 1,575 1,373 1,219 1,081 1,211 1,228 1,999 1,955 1,435 1,273
5,382 4,470 8,040 7,266 1,575 1,373 1,219 1,081 1,211 1,228 1,999 1,955 1,435 1,273Payable to the Depositary or associates of the Depositary:Depositary's fees 154 131 425 388 97 85 64 58 126 117 69 68 74 67Safe custody charges 280 263 83 84 25 23 14 15 21 22 11 11 12 11
434 394 508 472 122 108 78 73 147 139 80 79 86 78
Administration fees 316 279 677 630 217 195 148 133 253 254 160 155 170 154Audit fees 9 11 31 37 6 7 4 4 7 9 4 5 4 5FCA fees – 1 – 1 – 1 – 1 – 1 – 1 – 1Insurance fees 2 2 8 9 1 2 – 1 – 2 – 1 – 1Legal fees (5) 18 (67) 45 (9) 8 (4) 5 (11) 11 (5) 6 (7) 6Printing costs 12 14 (104) 44 (2) 9 13 6 (14) 12 18 7 14 7Registration fees 151 131 212 187 76 67 93 85 79 71 111 98 111 99Other fees 69 95 54 45 19 33 19 36 19 22 29 27 28 27
554 551 811 998 308 322 273 271 333 382 317 300 320 300
Total Expenses charged to the Fund 6,370 5,415 9,359 8,736 2,005 1,803 1,570 1,425 1,691 1,749 2,396 2,334 1,841 1,651
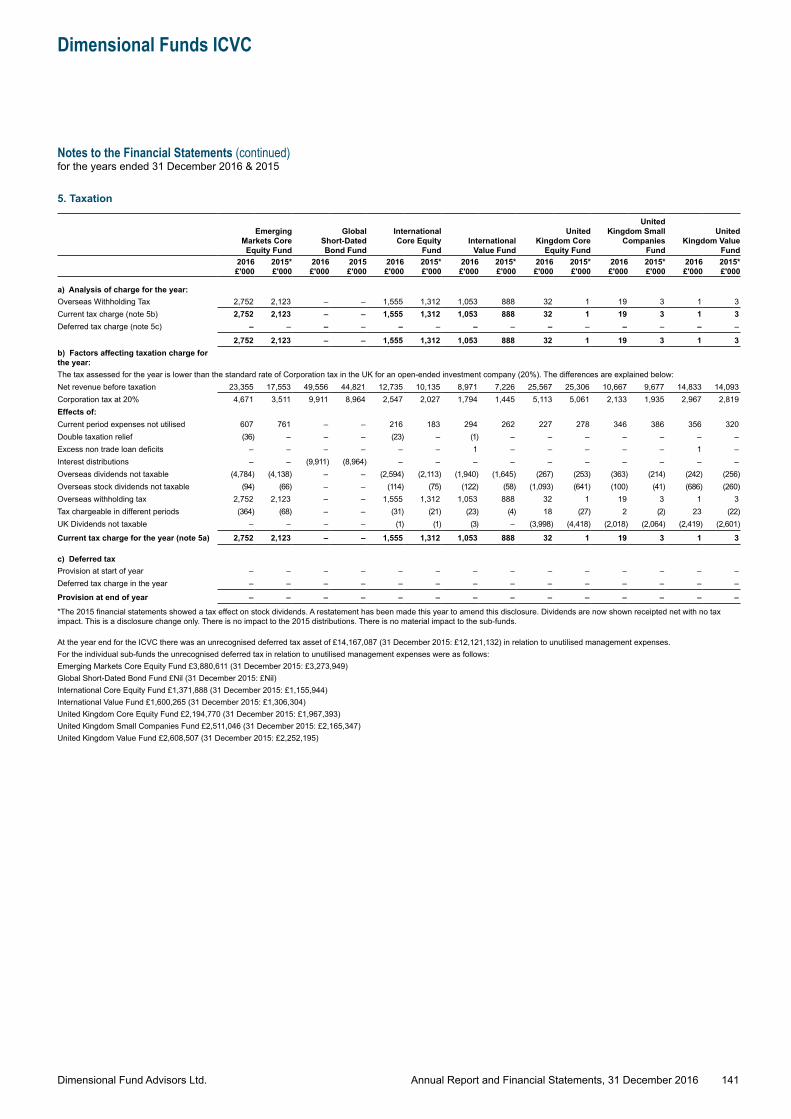
Dimensional Fund Advisors Ltd.
Dimensional Funds ICVC
Notes to the Financial Statements (continued)for the years ended 31 December 2016 & 2015
141Annual Report and Financial Statements, 31 December 2016
5. Taxation
Emerging Markets Core
Equity Fund
GlobalShort-Dated Bond Fund
International Core Equity
FundInternational
Value Fund
United Kingdom Core
Equity Fund
United Kingdom Small
Companies Fund
United Kingdom Value
Fund2016 £'000
2015* £'000
2016 £'000
2015 £'000
2016 £'000
2015* £'000
2016 £'000
2015* £'000
2016 £'000
2015* £'000
2016 £'000
2015* £'000
2016 £'000
2015* £'000
a) Analysis of charge for the year:Overseas Withholding Tax 2,752 2,123 – – 1,555 1,312 1,053 888 32 1 19 3 1 3Current tax charge (note 5b) 2,752 2,123 – – 1,555 1,312 1,053 888 32 1 19 3 1 3Deferred tax charge (note 5c) – – – – – – – – – – – – – –
2,752 2,123 – – 1,555 1,312 1,053 888 32 1 19 3 1 3b) Factors affecting taxation charge for the year:The tax assessed for the year is lower than the standard rate of Corporation tax in the UK for an open-ended investment company (20%). The differences are explained below: Net revenue before taxation 23,355 17,553 49,556 44,821 12,735 10,135 8,971 7,226 25,567 25,306 10,667 9,677 14,833 14,093Corporation tax at 20% 4,671 3,511 9,911 8,964 2,547 2,027 1,794 1,445 5,113 5,061 2,133 1,935 2,967 2,819Effects of:Current period expenses not utilised 607 761 – – 216 183 294 262 227 278 346 386 356 320Double taxation relief (36) – – – (23) – (1) – – – – – – –Excess non trade loan deficits – – – – – – 1 – – – – – 1 –Interest distributions – – (9,911) (8,964) – – – – – – – – – –Overseas dividends not taxable (4,784) (4,138) – – (2,594) (2,113) (1,940) (1,645) (267) (253) (363) (214) (242) (256)Overseas stock dividends not taxable (94) (66) – – (114) (75) (122) (58) (1,093) (641) (100) (41) (686) (260)Overseas withholding tax 2,752 2,123 – – 1,555 1,312 1,053 888 32 1 19 3 1 3Tax chargeable in different periods (364) (68) – – (31) (21) (23) (4) 18 (27) 2 (2) 23 (22)UK Dividends not taxable – – – – (1) (1) (3) – (3,998) (4,418) (2,018) (2,064) (2,419) (2,601)
Current tax charge for the year (note 5a) 2,752 2,123 – – 1,555 1,312 1,053 888 32 1 19 3 1 3
c) Deferred taxProvision at start of year – – – – – – – – – – – – – –Deferred tax charge in the year – – – – – – – – – – – – – –
Provision at end of year – – – – – – – – – – – – – –
*The 2015 financial statements showed a tax effect on stock dividends. A restatement has been made this year to amend this disclosure. Dividends are now shown receipted net with no tax impact. This is a disclosure change only. There is no impact to the 2015 distributions. There is no material impact to the sub-funds.
At the year end for the ICVC there was an unrecognised deferred tax asset of £14,167,087 (31 December 2015: £12,121,132) in relation to unutilised management expenses. For the individual sub-funds the unrecognised deferred tax in relation to unutilised management expenses were as follows:Emerging Markets Core Equity Fund £3,880,611 (31 December 2015: £3,273,949) Global Short-Dated Bond Fund £Nil (31 December 2015: £Nil) International Core Equity Fund £1,371,888 (31 December 2015: £1,155,944) International Value Fund £1,600,265 (31 December 2015: £1,306,304) United Kingdom Core Equity Fund £2,194,770 (31 December 2015: £1,967,393) United Kingdom Small Companies Fund £2,511,046 (31 December 2015: £2,165,347) United Kingdom Value Fund £2,608,507 (31 December 2015: £2,252,195)
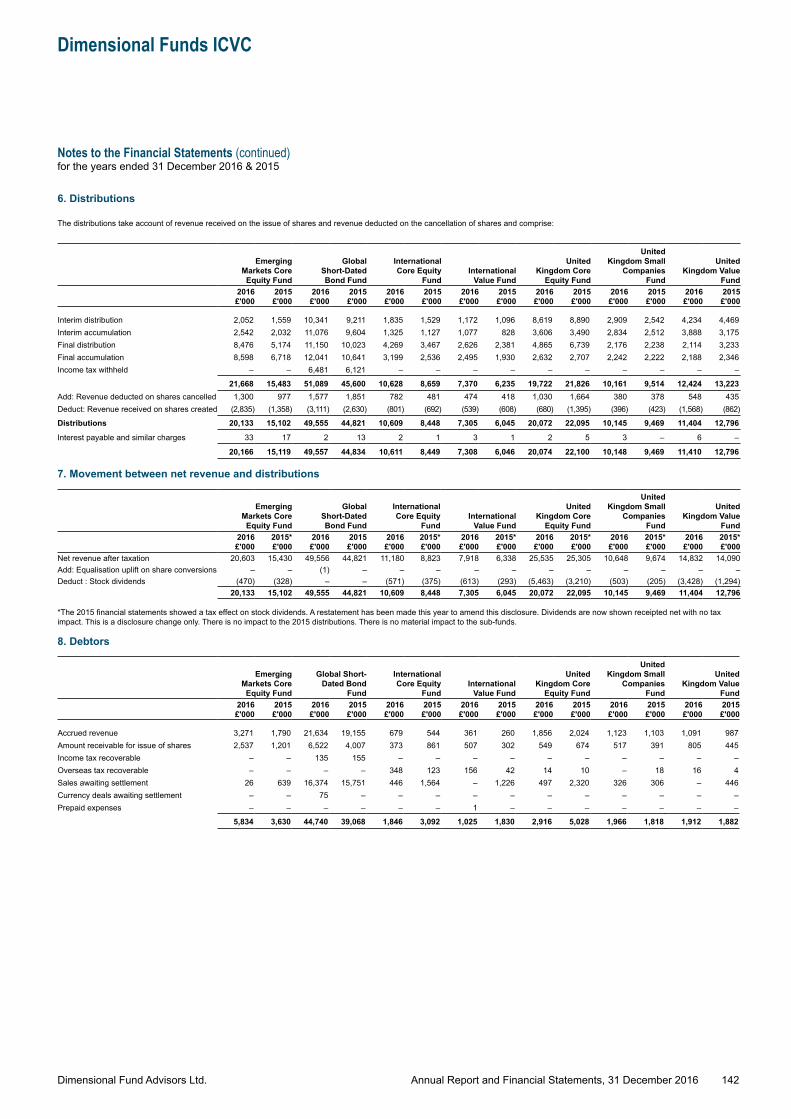
Dimensional Fund Advisors Ltd.
Dimensional Funds ICVC
Notes to the Financial Statements (continued)for the years ended 31 December 2016 & 2015
142Annual Report and Financial Statements, 31 December 2016
6. Distributions
The distributions take account of revenue received on the issue of shares and revenue deducted on the cancellation of shares and comprise:
Emerging Markets Core
Equity Fund
GlobalShort-Dated Bond Fund
International Core Equity
FundInternational
Value Fund
United Kingdom Core
Equity Fund
United Kingdom Small
Companies Fund
United Kingdom Value
Fund2016 £'000
2015 £'000
2016 £'000
2015 £'000
2016 £'000
2015 £'000
2016 £'000
2015 £'000
2016 £'000
2015 £'000
2016 £'000
2015 £'000
2016 £'000
2015 £'000
Interim distribution 2,052 1,559 10,341 9,211 1,835 1,529 1,172 1,096 8,619 8,890 2,909 2,542 4,234 4,469Interim accumulation 2,542 2,032 11,076 9,604 1,325 1,127 1,077 828 3,606 3,490 2,834 2,512 3,888 3,175Final distribution 8,476 5,174 11,150 10,023 4,269 3,467 2,626 2,381 4,865 6,739 2,176 2,238 2,114 3,233Final accumulation 8,598 6,718 12,041 10,641 3,199 2,536 2,495 1,930 2,632 2,707 2,242 2,222 2,188 2,346Income tax withheld – – 6,481 6,121 – – – – – – – – – –
21,668 15,483 51,089 45,600 10,628 8,659 7,370 6,235 19,722 21,826 10,161 9,514 12,424 13,223Add: Revenue deducted on shares cancelled 1,300 977 1,577 1,851 782 481 474 418 1,030 1,664 380 378 548 435Deduct: Revenue received on shares created (2,835) (1,358) (3,111) (2,630) (801) (692) (539) (608) (680) (1,395) (396) (423) (1,568) (862)
Distributions 20,133 15,102 49,555 44,821 10,609 8,448 7,305 6,045 20,072 22,095 10,145 9,469 11,404 12,796
Interest payable and similar charges 33 17 2 13 2 1 3 1 2 5 3 – 6 –
20,166 15,119 49,557 44,834 10,611 8,449 7,308 6,046 20,074 22,100 10,148 9,469 11,410 12,796
7. Movement between net revenue and distributions
Emerging Markets Core
Equity Fund
GlobalShort-Dated Bond Fund
International Core Equity
FundInternational
Value Fund
United Kingdom Core
Equity Fund
United Kingdom Small
Companies Fund
United Kingdom Value
Fund2016 £'000
2015* £'000
2016 £'000
2015 £'000
2016 £'000
2015* £'000
2016 £'000
2015* £'000
2016 £'000
2015* £'000
2016 £'000
2015* £'000
2016 £'000
2015* £'000
Net revenue after taxation 20,603 15,430 49,556 44,821 11,180 8,823 7,918 6,338 25,535 25,305 10,648 9,674 14,832 14,090Add: Equalisation uplift on share conversions – – (1) – – – – – – – – – – –Deduct : Stock dividends (470) (328) – – (571) (375) (613) (293) (5,463) (3,210) (503) (205) (3,428) (1,294)
20,133 15,102 49,555 44,821 10,609 8,448 7,305 6,045 20,072 22,095 10,145 9,469 11,404 12,796
*The 2015 financial statements showed a tax effect on stock dividends. A restatement has been made this year to amend this disclosure. Dividends are now shown receipted net with no tax impact. This is a disclosure change only. There is no impact to the 2015 distributions. There is no material impact to the sub-funds.
8. Debtors
Emerging Markets Core
Equity Fund
Global Short-Dated Bond
Fund
International Core Equity
FundInternational
Value Fund
United Kingdom Core
Equity Fund
United Kingdom Small
Companies Fund
United Kingdom Value
Fund2016 £'000
2015 £'000
2016 £'000
2015 £'000
2016 £'000
2015 £'000
2016 £'000
2015 £'000
2016 £'000
2015 £'000
2016 £'000
2015 £'000
2016 £'000
2015 £'000
Accrued revenue 3,271 1,790 21,634 19,155 679 544 361 260 1,856 2,024 1,123 1,103 1,091 987Amount receivable for issue of shares 2,537 1,201 6,522 4,007 373 861 507 302 549 674 517 391 805 445Income tax recoverable – – 135 155 – – – – – – – – – –Overseas tax recoverable – – – – 348 123 156 42 14 10 – 18 16 4Sales awaiting settlement 26 639 16,374 15,751 446 1,564 – 1,226 497 2,320 326 306 – 446Currency deals awaiting settlement – – 75 – – – – – – – – – – –Prepaid expenses – – – – – – 1 – – – – – – –
5,834 3,630 44,740 39,068 1,846 3,092 1,025 1,830 2,916 5,028 1,966 1,818 1,912 1,882
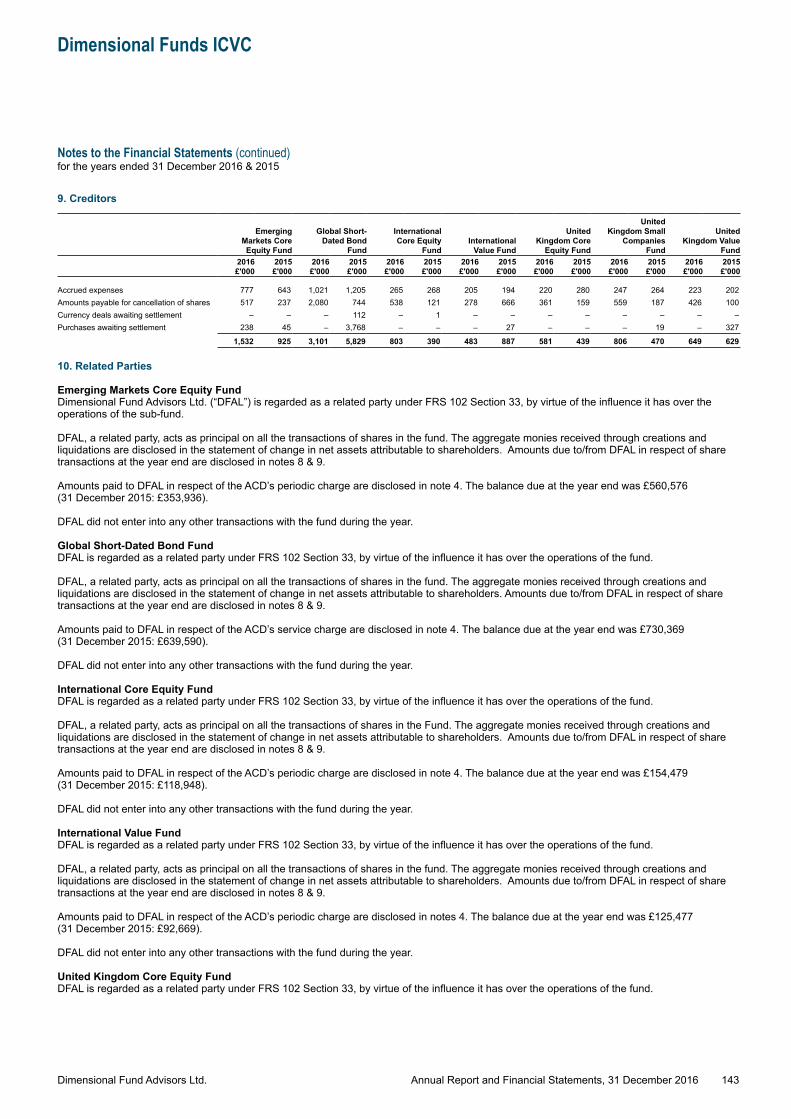
Dimensional Fund Advisors Ltd.
Dimensional Funds ICVC
Notes to the Financial Statements (continued)for the years ended 31 December 2016 & 2015
143Annual Report and Financial Statements, 31 December 2016
9. Creditors
Emerging Markets Core
Equity Fund
Global Short-Dated Bond
Fund
International Core Equity
FundInternational
Value Fund
United Kingdom Core
Equity Fund
United Kingdom Small
Companies Fund
United Kingdom Value
Fund2016 £'000
2015 £'000
2016 £'000
2015 £'000
2016 £'000
2015 £'000
2016 £'000
2015 £'000
2016 £'000
2015 £'000
2016 £'000
2015 £'000
2016 £'000
2015 £'000
Accrued expenses 777 643 1,021 1,205 265 268 205 194 220 280 247 264 223 202Amounts payable for cancellation of shares 517 237 2,080 744 538 121 278 666 361 159 559 187 426 100Currency deals awaiting settlement – – – 112 – 1 – – – – – – – –Purchases awaiting settlement 238 45 – 3,768 – – – 27 – – – 19 – 327
1,532 925 3,101 5,829 803 390 483 887 581 439 806 470 649 629
10. Related Parties
Emerging Markets Core Equity FundDimensional Fund Advisors Ltd. (“DFAL”) is regarded as a related party under FRS 102 Section 33, by virtue of the influence it has over the operations of the sub-fund.
DFAL, a related party, acts as principal on all the transactions of shares in the fund. The aggregate monies received through creations and liquidations are disclosed in the statement of change in net assets attributable to shareholders. Amounts due to/from DFAL in respect of share transactions at the year end are disclosed in notes 8 & 9.
Amounts paid to DFAL in respect of the ACD’s periodic charge are disclosed in note 4. The balance due at the year end was £560,576 (31 December 2015: £353,936).
DFAL did not enter into any other transactions with the fund during the year.
Global Short-Dated Bond FundDFAL is regarded as a related party under FRS 102 Section 33, by virtue of the influence it has over the operations of the fund.
DFAL, a related party, acts as principal on all the transactions of shares in the fund. The aggregate monies received through creations and liquidations are disclosed in the statement of change in net assets attributable to shareholders. Amounts due to/from DFAL in respect of share transactions at the year end are disclosed in notes 8 & 9.
Amounts paid to DFAL in respect of the ACD’s service charge are disclosed in note 4. The balance due at the year end was £730,369 (31 December 2015: £639,590).
DFAL did not enter into any other transactions with the fund during the year.
International Core Equity FundDFAL is regarded as a related party under FRS 102 Section 33, by virtue of the influence it has over the operations of the fund.
DFAL, a related party, acts as principal on all the transactions of shares in the Fund. The aggregate monies received through creations and liquidations are disclosed in the statement of change in net assets attributable to shareholders. Amounts due to/from DFAL in respect of share transactions at the year end are disclosed in notes 8 & 9.
Amounts paid to DFAL in respect of the ACD’s periodic charge are disclosed in note 4. The balance due at the year end was £154,479 (31 December 2015: £118,948).
DFAL did not enter into any other transactions with the fund during the year.
International Value FundDFAL is regarded as a related party under FRS 102 Section 33, by virtue of the influence it has over the operations of the fund.
DFAL, a related party, acts as principal on all the transactions of shares in the fund. The aggregate monies received through creations and liquidations are disclosed in the statement of change in net assets attributable to shareholders. Amounts due to/from DFAL in respect of share transactions at the year end are disclosed in notes 8 & 9.
Amounts paid to DFAL in respect of the ACD’s periodic charge are disclosed in notes 4. The balance due at the year end was £125,477 (31 December 2015: £92,669).
DFAL did not enter into any other transactions with the fund during the year.
United Kingdom Core Equity FundDFAL is regarded as a related party under FRS 102 Section 33, by virtue of the influence it has over the operations of the fund.
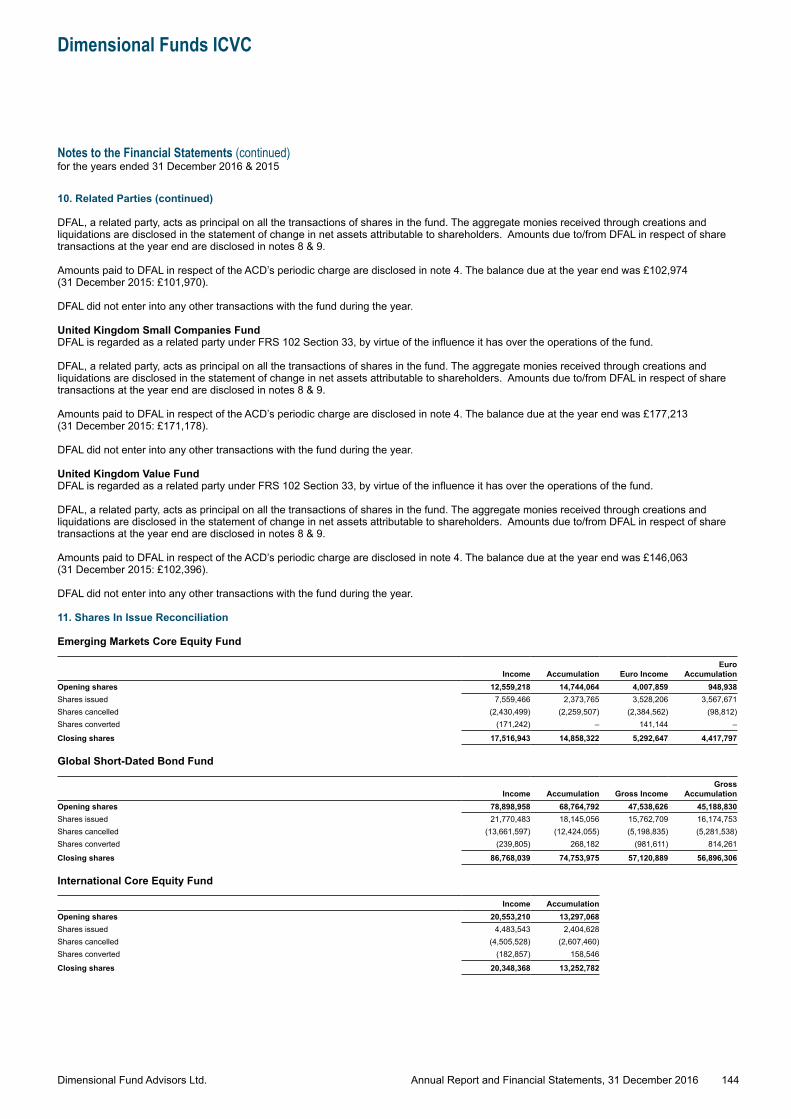
Dimensional Fund Advisors Ltd.
Dimensional Funds ICVC
Notes to the Financial Statements (continued)for the years ended 31 December 2016 & 2015
144Annual Report and Financial Statements, 31 December 2016
10. Related Parties (continued)
DFAL, a related party, acts as principal on all the transactions of shares in the fund. The aggregate monies received through creations and liquidations are disclosed in the statement of change in net assets attributable to shareholders. Amounts due to/from DFAL in respect of share transactions at the year end are disclosed in notes 8 & 9.
Amounts paid to DFAL in respect of the ACD’s periodic charge are disclosed in note 4. The balance due at the year end was £102,974 (31 December 2015: £101,970).
DFAL did not enter into any other transactions with the fund during the year.
United Kingdom Small Companies FundDFAL is regarded as a related party under FRS 102 Section 33, by virtue of the influence it has over the operations of the fund.
DFAL, a related party, acts as principal on all the transactions of shares in the fund. The aggregate monies received through creations and liquidations are disclosed in the statement of change in net assets attributable to shareholders. Amounts due to/from DFAL in respect of share transactions at the year end are disclosed in notes 8 & 9.
Amounts paid to DFAL in respect of the ACD’s periodic charge are disclosed in note 4. The balance due at the year end was £177,213 (31 December 2015: £171,178).
DFAL did not enter into any other transactions with the fund during the year.
United Kingdom Value FundDFAL is regarded as a related party under FRS 102 Section 33, by virtue of the influence it has over the operations of the fund.
DFAL, a related party, acts as principal on all the transactions of shares in the fund. The aggregate monies received through creations and liquidations are disclosed in the statement of change in net assets attributable to shareholders. Amounts due to/from DFAL in respect of share transactions at the year end are disclosed in notes 8 & 9.
Amounts paid to DFAL in respect of the ACD’s periodic charge are disclosed in note 4. The balance due at the year end was £146,063 (31 December 2015: £102,396).
DFAL did not enter into any other transactions with the fund during the year.
11. Shares In Issue Reconciliation
Emerging Markets Core Equity Fund
Income Accumulation Euro IncomeEuro
AccumulationOpening shares 12,559,218 14,744,064 4,007,859 948,938Shares issued 7,559,466 2,373,765 3,528,206 3,567,671Shares cancelled (2,430,499) (2,259,507) (2,384,562) (98,812)Shares converted (171,242) – 141,144 –
Closing shares 17,516,943 14,858,322 5,292,647 4,417,797
Global Short-Dated Bond Fund
Income Accumulation Gross IncomeGross
AccumulationOpening shares 78,898,958 68,764,792 47,538,626 45,188,830Shares issued 21,770,483 18,145,056 15,762,709 16,174,753Shares cancelled (13,661,597) (12,424,055) (5,198,835) (5,281,538)Shares converted (239,805) 268,182 (981,611) 814,261
Closing shares 86,768,039 74,753,975 57,120,889 56,896,306
International Core Equity Fund
Income AccumulationOpening shares 20,553,210 13,297,068Shares issued 4,483,543 2,404,628Shares cancelled (4,505,528) (2,607,460)Shares converted (182,857) 158,546
Closing shares 20,348,368 13,252,782
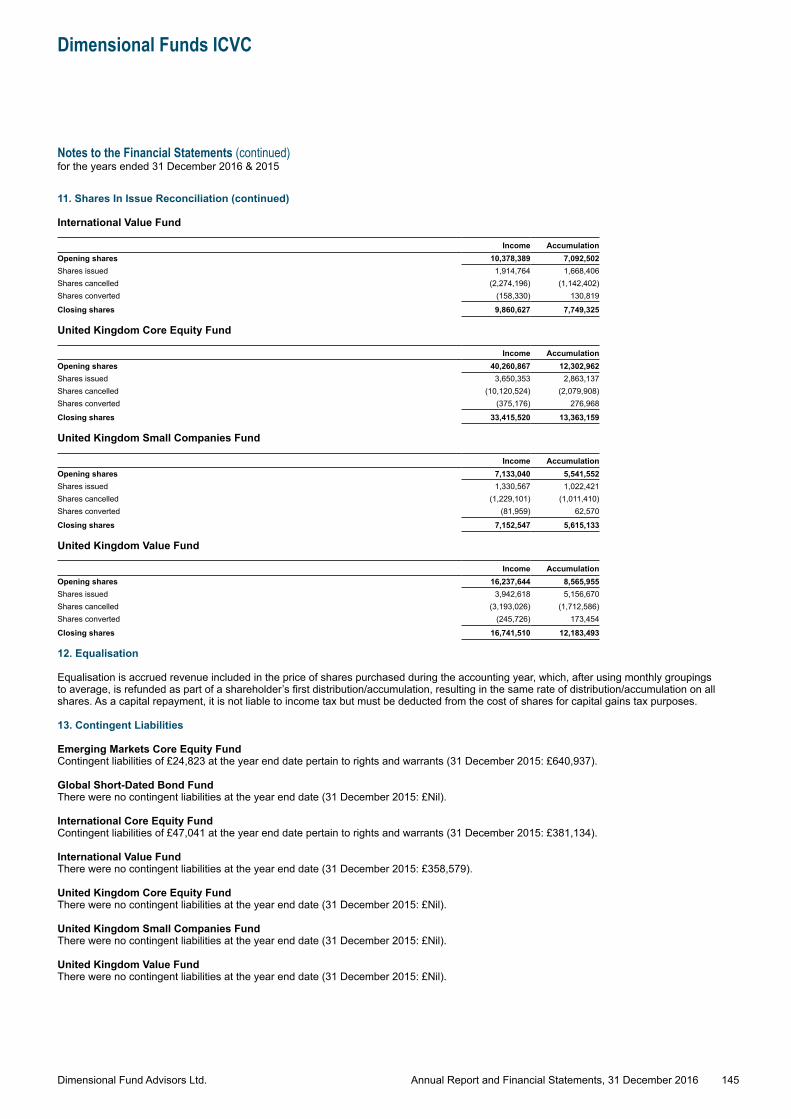
Dimensional Fund Advisors Ltd.
Dimensional Funds ICVC
Notes to the Financial Statements (continued)for the years ended 31 December 2016 & 2015
145Annual Report and Financial Statements, 31 December 2016
11. Shares In Issue Reconciliation (continued)
International Value Fund
Income AccumulationOpening shares 10,378,389 7,092,502Shares issued 1,914,764 1,668,406Shares cancelled (2,274,196) (1,142,402)Shares converted (158,330) 130,819
Closing shares 9,860,627 7,749,325
United Kingdom Core Equity Fund
Income AccumulationOpening shares 40,260,867 12,302,962Shares issued 3,650,353 2,863,137Shares cancelled (10,120,524) (2,079,908)Shares converted (375,176) 276,968
Closing shares 33,415,520 13,363,159
United Kingdom Small Companies Fund
Income AccumulationOpening shares 7,133,040 5,541,552Shares issued 1,330,567 1,022,421Shares cancelled (1,229,101) (1,011,410)Shares converted (81,959) 62,570
Closing shares 7,152,547 5,615,133
United Kingdom Value Fund
Income AccumulationOpening shares 16,237,644 8,565,955Shares issued 3,942,618 5,156,670Shares cancelled (3,193,026) (1,712,586)Shares converted (245,726) 173,454
Closing shares 16,741,510 12,183,493
12. Equalisation
Equalisation is accrued revenue included in the price of shares purchased during the accounting year, which, after using monthly groupings to average, is refunded as part of a shareholder’s first distribution/accumulation, resulting in the same rate of distribution/accumulation on all shares. As a capital repayment, it is not liable to income tax but must be deducted from the cost of shares for capital gains tax purposes.
13. Contingent Liabilities
Emerging Markets Core Equity FundContingent liabilities of £24,823 at the year end date pertain to rights and warrants (31 December 2015: £640,937).
Global Short-Dated Bond FundThere were no contingent liabilities at the year end date (31 December 2015: £Nil).
International Core Equity FundContingent liabilities of £47,041 at the year end date pertain to rights and warrants (31 December 2015: £381,134).
International Value FundThere were no contingent liabilities at the year end date (31 December 2015: £358,579).
United Kingdom Core Equity FundThere were no contingent liabilities at the year end date (31 December 2015: £Nil).
United Kingdom Small Companies FundThere were no contingent liabilities at the year end date (31 December 2015: £Nil).
United Kingdom Value FundThere were no contingent liabilities at the year end date (31 December 2015: £Nil).
Dimensional Fund Advisors Ltd.
Dimensional Funds ICVC
Notes to the Financial Statements (continued)for the years ended 31 December 2016 & 2015
146Annual Report and Financial Statements, 31 December 2016
14. Financial Instruments
In pursuing its investment objectives set out on pages 3 to 5, the funds may hold a number of financial instruments. These comprise:
● equity and non-equity shares. These are held in accordance with the funds investment objectives and policies;
● fixed income securities and floating rate securities. These are held in accordance with the funds investment objectives and policies;
● cash, liquid resources and short-term debtors and creditors that arise directly from its operations;
● shareholders’ funds which represent investors’ monies which are invested on their behalf;
● forward foreign currency contracts, the purpose of which is to manage the currency risk arising from the funds investment activities (and related financing). Open positions at the balance sheet date, which are all covered, are included in the portfolio statements. Gains/(losses) on forward foreign exchange transactions are taken to capital;
● futures and options.
15. Risks of Financial Instruments
The main risks arising from the funds financial instruments are market price, foreign currency, interest rate, liquidity and credit risks. The ACD reviews (and agrees with the Depositary) policies for managing each of these risks and they are summarised below. These policies have remained unchanged since the beginning of the year to which these financial statements relate (31 December 2015: same).
● Market Risk The investments of a Fund are subject to normal capital market fluctuations and to the risks inherent in investment in international securities markets, there can be no assurances that capital appreciation or preservation will occur. Market risk includes market price risk, currency risk, interest risk and other price risk. Investment decisions for all funds are made by the Investment Committee of the Investment Manager. The Investment Committee meets on a regular basis and also as needed to consider investment issues. The Investment Committee is composed of certain officers and directors of the Investment Manager and its parent. The Investment Committee maintains and monitors a list of eligible brokers and dealers to effect securities transactions. The Investment Manager is responsible for determining those securities which are eligible for purchase and sale by those Funds and may delegate this task to the Investment Sub-Advisors. The overall market positions are monitored on a quarterly basis by the board of directors.
Emerging Markets Core Equity FundAt 31 December 2016, if the price of the investments held by the Fund increased or decreased by 5%, with all other variables remaining constant, then the net assets attributable to shareholders would increase or decrease by approximately £61,174,807 (31 December 2015: £38,010,639).
Global Short-Dated Bond FundAt 31 December 2016, if the price of the investments held by the Fund increased or decreased by 5%, with all other variables remaining constant, then the net assets attributable to shareholders would increase or decrease by approximately £169,382,688 (31 December 2015: £147,040,695).
International Core Equity FundAt 31 December 2016, if the price of the investments held by the Fund increased or decreased by 5%, with all other variables remaining constant, then the net assets attributable to shareholders would increase or decrease by approximately £34,182,732 (31 December 2015: £26,124,402).
International Value FundAt 31 December 2016, if the price of the investments held by the Fund increased or decreased by 5%, with all other variables remaining constant, then the net assets attributable to shareholders would increase or decrease by approximately £22,747,133 (31 December 2015: £16,462,263).
United Kingdom Core Equity FundAt 31 December 2016, if the price of the investments held by the Fund increased or decreased by 5%, with all other variables remaining constant, then the net assets attributable to shareholders would increase or decrease by approximately £35,981,559 (31 December 2015: £35,066,536).
United Kingdom Small Companies FundAt 31 December 2016, if the price of the investments held by the Fund increased or decreased by 5%, with all other variables remaining constant, then the net assets attributable to shareholders would increase or decrease by approximately £21,129,238 (31 December 2015: £20,217,548).
United Kingdom Value FundAt 31 December 2016, if the price of the investments held by the Fund increased or decreased by 5%, with all other variables remaining constant, then the net assets attributable to shareholders would increase or decrease by approximately £26,511,160 (31 December 2015: £18,591,148).
Dimensional Fund Advisors Ltd.
Dimensional Funds ICVC
Notes to the Financial Statements (continued)for the years ended 31 December 2016 & 2015
147Annual Report and Financial Statements, 31 December 2016
15. Risks of Financial Instruments (continued)
● Foreign currency riskThe revenue and capital value of the funds investments can be significantly affected by foreign currency translation movements as a proportion of the funds assets and revenue that are denominated in currencies other than sterling, which is the funds functional currency.
The ACD has identified three principal areas where foreign currency risk could impact the funds. These are, movement in exchange rates affecting the value of investments, short-term timing differences such as exposure to exchange rate movements during the year between when an investment purchase or sale is entered into and the date when settlement of the investment occurs, and finally movements in exchange rates affecting revenues received by the funds.
Emerging Markets Core Equity FundAt 31 December 2016, if the value of Sterling increased or decreased by 1% against all currencies, with all other variables remaining constant, then the net assets attributable to shareholders would increase or decrease by approximately £12,293,274 (31 December 2015: £7,627,269).
Global Short-Dated Bond FundAt 31 December 2016, if the value of Sterling increased or decreased by 1% against all currencies, with all other variables remaining constant, then the net assets attributable to shareholders would decrease or increase by approximately £129,050 (31 December 2015: £1,612,582).
International Core Equity FundAt 31 December 2016, if the value of Sterling increased or decreased by 1% against all currencies, with all other variables remaining constant, then the net assets attributable to shareholders would increase or decrease by approximately £6,860,090 (31 December 2015: £5,257,919).
International Value FundAt 31 December 2016, if the value of Sterling increased or decreased by 1% against all currencies, with all other variables remaining constant, then the net assets attributable to shareholders would increase or decrease by approximately £4,565,824 (31 December 2015: £3,322,111).
United Kingdom Core Equity FundAt 31 December 2016, if the value of Sterling increased or decreased by 1% against all currencies, with all other variables remaining constant, then the net assets attributable to shareholders would increase or decrease by approximately £5,790 (31 December 2015: £6,489).
United Kingdom Small Companies FundAt 31 December 2016, if the value of Sterling increased or decreased by 1% against all currencies, with all other variables remaining constant, then the net assets attributable to shareholders would increase or decrease by approximately £8,563 (31 December 2015: £16,798).
United Kingdom Value FundAt 31 December 2016, if the value of Sterling increased or decreased by 1% against all currencies, with all other variables remaining constant, then the net assets attributable to shareholders would increase or decrease by approximately £32 (31 December 2015: £2,833).
Dimensional Fund Advisors Ltd.
Dimensional Funds ICVC
Notes to the Financial Statements (continued)for the years ended 31 December 2016 & 2015
148Annual Report and Financial Statements, 31 December 2016
15. Risks of Financial Instruments (continued)
● Foreign currency risk (continued)At the year end date a portion of the net assets of some of the funds were denominated in currencies other than sterling with the effect that the balance sheet and total return can be affected by exchange rate movements. These net assets consist of the following, unless otherwise stated:
Emerging Markets Core Equity Fund
Global Short-Dated Bond Fund†
International Core Equity Fund
International Value Fund
United Kingdom Core Equity Fund*
United Kingdom Small Companies
Fund*United Kingdom
Value Fund*2016 £'000
2015 £'000
2016 £'000
2015 £'000
2016 £'000
2015 £'000
2016 £'000
2015 £'000
2016 £'000
2015 £'000
2016 £'000
2015 £'000
2016 £'000
2015 £'000
Total net asset valueAustralian dollar – – – – 25,498 19,174 17,557 11,077 – – – – – –Brazilian real 85,644 35,617 – – – – – – – – – – – –Canadian dollar – – – – 33,000 20,863 22,472 11,386 – – – – – –Chilean peso 12,591 7,473 – – – – – – – – – – – –Colombian peso 6,005 3,396 – – – – – – – – – – – –Czech koruna 1,473 1,296 – – – – – – – – – – – –Danish krone – – – – 5,570 5,094 4,278 3,434 – – – – – –Euro 3,455 2,628 – – 96,993 77,283 67,224 53,270 552 30 819 17 2 –Hong Kong dollar 161,859 105,320 – – 10,261 8,358 6,164 4,395 – – – – – –Hungarian forint 5,128 2,356 – – – – – – – – – – – –Indian rupee 137,694 97,218 – – – – – – – – – – – –Indonesian rupiah 38,706 22,838 – – – – – – – – – – – –Israeli shekel – – – – 1,897 1,962 1,398 1,124 – – – – – –Japanese yen – – – – 87,600 67,740 56,999 40,213 – – – – – –Malaysian ringgit 41,305 33,619 – – – – – – – – – – – –Mexican peso 43,675 33,671 – – – – – – – – – – – –New Zealand dollar – – – – 1,465 1,199 444 80 – – – – – –Norwegian krone – – – – 3,058 2,028 2,138 1,020 – – – – – –Philippine peso 20,407 14,071 – – – – – – – – – – – –Polish zloty 18,033 13,393 – – – – – – – – – – – –Singapore dollar – – 470 (239) 4,442 3,808 2,330 1,459 – – – – – –South African rand 96,091 54,639 – – – – – – – – – – – –South Korean won 180,312 111,090 – – – – – – – – – – – –Sterling (5,441) 113 3,466,723 3,154,509 (2,182) (1,020) (2,266) (2,471) 719,001 701,627 421,621 404,329 531,057 372,214Swedish krona – – (314) (113) 10,162 8,269 6,427 5,336 – – – – – –Swiss franc – – – – 24,461 21,766 18,376 16,085 – – – – – –Taiwanese dollar 182,289 111,101 – – – – – – – – – – – –Thai baht 36,421 21,524 – – – – – – – – – – – –Turkish lira 16,532 13,565 – – – – – – – – – – – –US dollar 142,229 77,913 (13,062) (160,906) 381,602 287,551 250,776 183,333 27 619 37 1,662 2 283
1,224,408 762,841 3,453,817 2,993,251 683,827 524,075 454,317 329,741 719,580 702,276 422,477 406,008 531,061 372,497
* As the majority of these assets and revenue are denominated in Sterling the fund has no significant currency exposure.
† It is the policy of the ACD to hedge substantially all the foreign currency exposure of the portfolio into Sterling, substantially reducing the risk.
● Interest rate riskThe majority of the Funds’ financial assets are equity shares and other investments which neither pay interest nor have a maturity date. The funds’ financial liabilities are non-interest bearing which mature within one year. With the exception of the Global Short-Dated Bond Fund, interest rate risk is not considered significant.
The floating rate assets and liabilities comprise bank balances and overdrafts, whose rates are determined by reference to LIBOR or international equivalent borrowing rate.
● Global Short-Dated Bond Fund Interest rate riskThe Fund invests in both fixed rate and floating rate securities, any change to the interest rates relevant for particular securities may result in either revenue increasing or decreasing, or the ACD being unable to secure similar returns on the expiry of contracts or the sale of securities. In addition, changes to prevailing rates or changes in expectations of future rates could result in an increase or decrease in the value of the securities held.
In general, if interest rates rise the revenue potential of the Fund also rises but the value of fixed rate securities will decline (along with certain expenses calculated by reference to the assets of the sub-fund). A decline in interest rates will in general have the opposite effect. At 31 December 2016, if interest rates increased or decreased by 0.1% against all debt securities, with all other variables remaining constant, then the net assets attributable to shareholders would increase or decrease by approximately £6,132,515 (31 December 2015: £5,635,698).
Dimensional Fund Advisors Ltd.
Dimensional Funds ICVC
Notes to the Financial Statements (continued)for the years ended 31 December 2016 & 2015
149Annual Report and Financial Statements, 31 December 2016
15. Risks of Financial Instruments (continued)
● Global Short-Dated Bond Fund Interest rate risk (continued)The interest rate risk profile of financial assets and liabilities consists of the following:
Floating Rate Fixed RateNon-Interest
Bearing Total2016 £'000
2015 £'000
2016 £'000
2015 £'000
2016 £'000
2015 £'000
2016 £'000
2015 £'000
Portfolio – – 3,430,492 2,980,396 (42,838) (39,582) 3,387,654 2,940,814Cash at bank 39,087 32,583 – – – – 39,087 32,583Other assets – – – – 44,740 39,068 44,740 39,068Liabilities – – – – (17,664) (19,214) (17,664) (19,214)
39,087 32,583 3,430,492 2,980,396 (15,762) (19,728) 3,453,817 2,993,251
The floating rate assets and liabilities comprise bank balances and overdrafts, whose rates are determined by reference to LIBOR or international equivalent borrowing rate.
Fixed Rate Financial Assets:
Weighted Average
Interest Rate
Weighted Average
Period for which
Interest Rate is fixed
2016 %
2015 %
2016 Years
2015 Years
Singapore dollar 1.81 1.70 4.38 3.82Sterling 0.52 1.33 3.58 4.16Swedish krona 0.11 0.47 4.24 4.92US dollar 2.17 2.07 3.47 3.70
● Liquidity riskThe Company is exposed to daily cash redemptions of redeemable shares. It therefore invests the majority of its assets in investments that are traded in an active market and can be readily disposed of; it invests only a limited proportion of its assets in investments not actively traded on a stock exchange. Listed securities are considered readily realisable as they are listed on recognised and established stock exchanges. The Administrator monitors subscription and redemption volumes and notifies the Investment Manager of significant movements and unusual trends as appropriate. If outstanding redemption requests from shareholders of any fund for any dealing day exceed in the aggregate more than 10% of all the outstanding shares of that fund, the directors shall be entitled at their discretion to refuse to redeem such excess shares. If the directors refuse to redeem shares for these reasons, the requests for redemption on such date shall be reduced rateably and the Company shall not be obliged to redeem the remainder of the shares to which each request relates until the dealing day next following the date of such refusal to redeem. At the expiry of any such period, the Company shall complete the redemption of the remaining shares in respect of which redemption requests were received prior to the relevant dealing day and in priority to any subsequent requests.
● Counterparty riskTransactions in securities entered into by the Company give rise to exposure to the risk that counterparties may not be able to fulfil their responsibility by completing their side of the transaction. The Investment Adviser minimises this risk by conducting trades through only the most reputable counterparties.
● Credit riskCredit risk is the risk that a counterparty to or issuer of a financial instrument will fail to discharge an obligation or commitment that it has entered into with the funds. The funds are exposed to credit risk on parties with whom it trades and will also bear the risk of settlement default. All transactions in exchange traded securities are settled/paid for upon delivery using approved brokers. The risk of default is considered minimal, as delivery of securities sold is only made once the broker has received payment. Payment is made on a purchase once the securities have been received by the broker in all developed countries. The trade will fail if either party fails to meet their obligation. In certain emerging markets countries, the fund settles with the settlement house one day prior to the counterparty settlement. However the transaction will still fail if the counterparty does not settle the transaction. With the exception of the Global Short-Dated Bond Fund, credit and counterparty risk is not considered significant.
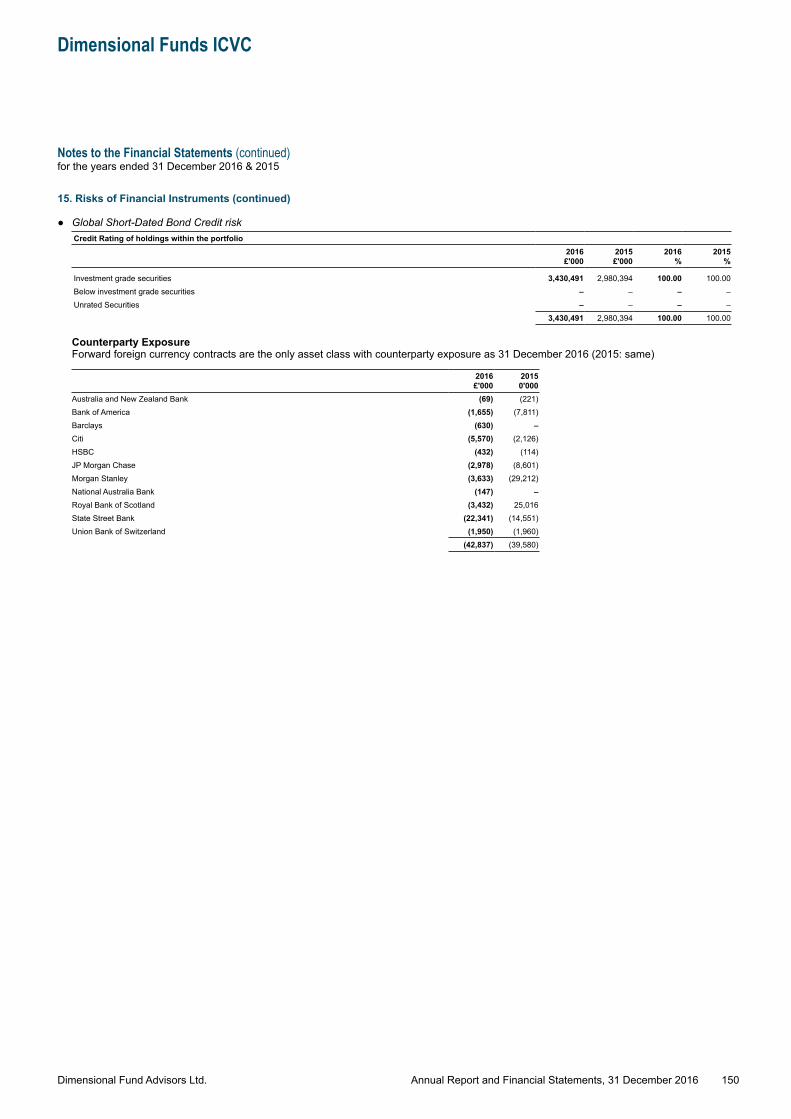
Dimensional Fund Advisors Ltd.
Dimensional Funds ICVC
Notes to the Financial Statements (continued)for the years ended 31 December 2016 & 2015
150Annual Report and Financial Statements, 31 December 2016
15. Risks of Financial Instruments (continued)
● Global Short-Dated Bond Credit riskCredit Rating of holdings within the portfolio
2016 £'000
2015 £'000
2016 %
2015 %
Investment grade securities 3,430,491 2,980,394 100.00 100.00Below investment grade securities – – – –Unrated Securities – – – –
3,430,491 2,980,394 100.00 100.00
Counterparty ExposureForward foreign currency contracts are the only asset class with counterparty exposure as 31 December 2016 (2015: same)
2016 £'000
2015 0'000
Australia and New Zealand Bank (69) (221)Bank of America (1,655) (7,811)Barclays (630) –Citi (5,570) (2,126)HSBC (432) (114)JP Morgan Chase (2,978) (8,601)Morgan Stanley (3,633) (29,212)National Australia Bank (147) –Royal Bank of Scotland (3,432) 25,016State Street Bank (22,341) (14,551)Union Bank of Switzerland (1,950) (1,960)
(42,837) (39,580)
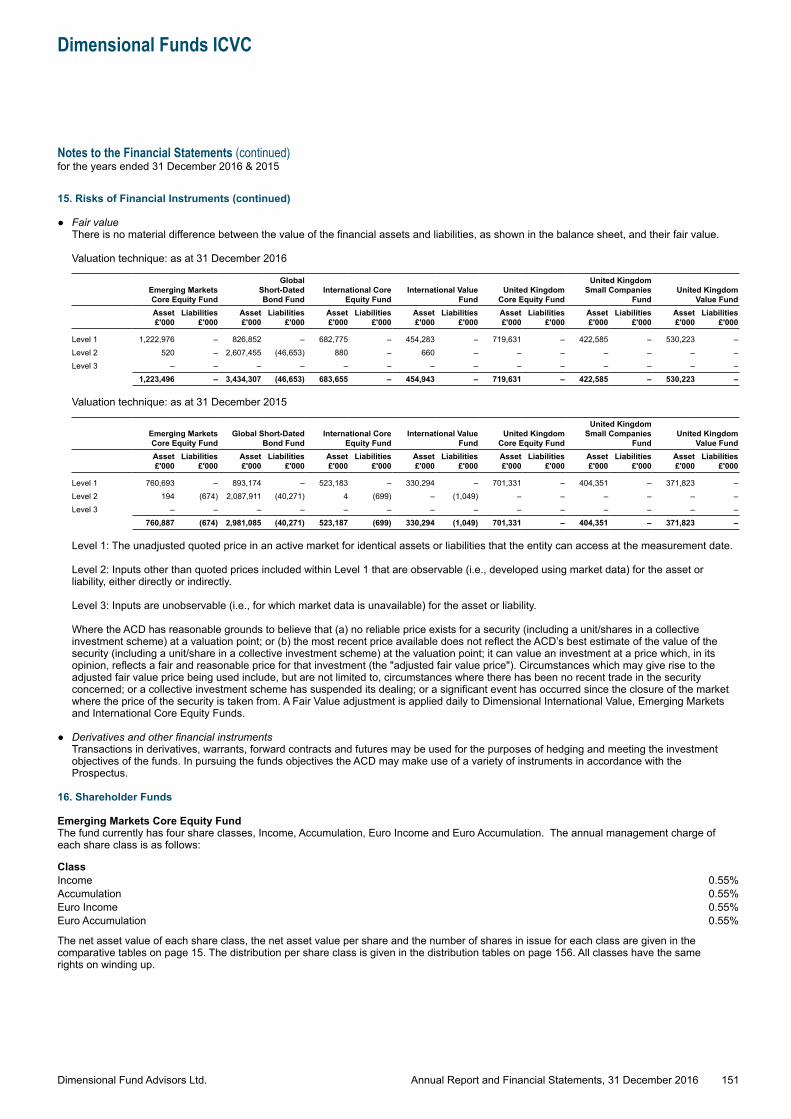
Dimensional Fund Advisors Ltd.
Dimensional Funds ICVC
Notes to the Financial Statements (continued)for the years ended 31 December 2016 & 2015
151Annual Report and Financial Statements, 31 December 2016
15. Risks of Financial Instruments (continued)
● Fair valueThere is no material difference between the value of the financial assets and liabilities, as shown in the balance sheet, and their fair value.
Valuation technique: as at 31 December 2016
Emerging Markets Core Equity Fund
Global Short-DatedBond Fund
International Core Equity Fund
International Value Fund
United Kingdom Core Equity Fund
United Kingdom Small Companies
FundUnited Kingdom
Value FundAsset £'000
Liabilities £'000
Asset £'000
Liabilities £'000
Asset £'000
Liabilities £'000
Asset £'000
Liabilities £'000
Asset £'000
Liabilities £'000
Asset £'000
Liabilities £'000
Asset £'000
Liabilities £'000
Level 1 1,222,976 – 826,852 – 682,775 – 454,283 – 719,631 – 422,585 – 530,223 –Level 2 520 – 2,607,455 (46,653) 880 – 660 – – – – – – –Level 3 – – – – – – – – – – – – – –
1,223,496 – 3,434,307 (46,653) 683,655 – 454,943 – 719,631 – 422,585 – 530,223 –
Valuation technique: as at 31 December 2015
Emerging Markets Core Equity Fund
Global Short-Dated Bond Fund
International Core Equity Fund
International Value Fund
United Kingdom Core Equity Fund
United Kingdom Small Companies
FundUnited Kingdom
Value FundAsset £'000
Liabilities £'000
Asset £'000
Liabilities £'000
Asset £'000
Liabilities £'000
Asset £'000
Liabilities £'000
Asset £'000
Liabilities £'000
Asset £'000
Liabilities £'000
Asset £'000
Liabilities £'000
Level 1 760,693 – 893,174 – 523,183 – 330,294 – 701,331 – 404,351 – 371,823 –Level 2 194 (674) 2,087,911 (40,271) 4 (699) – (1,049) – – – – – –Level 3 – – – – – – – – – – – – – –
760,887 (674) 2,981,085 (40,271) 523,187 (699) 330,294 (1,049) 701,331 – 404,351 – 371,823 –
Level 1: The unadjusted quoted price in an active market for identical assets or liabilities that the entity can access at the measurement date.
Level 2: Inputs other than quoted prices included within Level 1 that are observable (i.e., developed using market data) for the asset or liability, either directly or indirectly.
Level 3: Inputs are unobservable (i.e., for which market data is unavailable) for the asset or liability.
Where the ACD has reasonable grounds to believe that (a) no reliable price exists for a security (including a unit/shares in a collective investment scheme) at a valuation point; or (b) the most recent price available does not reflect the ACD’s best estimate of the value of the security (including a unit/share in a collective investment scheme) at the valuation point; it can value an investment at a price which, in its opinion, reflects a fair and reasonable price for that investment (the "adjusted fair value price"). Circumstances which may give rise to the adjusted fair value price being used include, but are not limited to, circumstances where there has been no recent trade in the security concerned; or a collective investment scheme has suspended its dealing; or a significant event has occurred since the closure of the market where the price of the security is taken from. A Fair Value adjustment is applied daily to Dimensional International Value, Emerging Markets and International Core Equity Funds.
● Derivatives and other financial instrumentsTransactions in derivatives, warrants, forward contracts and futures may be used for the purposes of hedging and meeting the investment objectives of the funds. In pursuing the funds objectives the ACD may make use of a variety of instruments in accordance with the Prospectus.
16. Shareholder Funds
Emerging Markets Core Equity FundThe fund currently has four share classes, Income, Accumulation, Euro Income and Euro Accumulation. The annual management charge of each share class is as follows:
ClassIncome 0.55%Accumulation 0.55%Euro Income 0.55%Euro Accumulation 0.55%
The net asset value of each share class, the net asset value per share and the number of shares in issue for each class are given in the comparative tables on page 15. The distribution per share class is given in the distribution tables on page 156. All classes have the same rights on winding up.
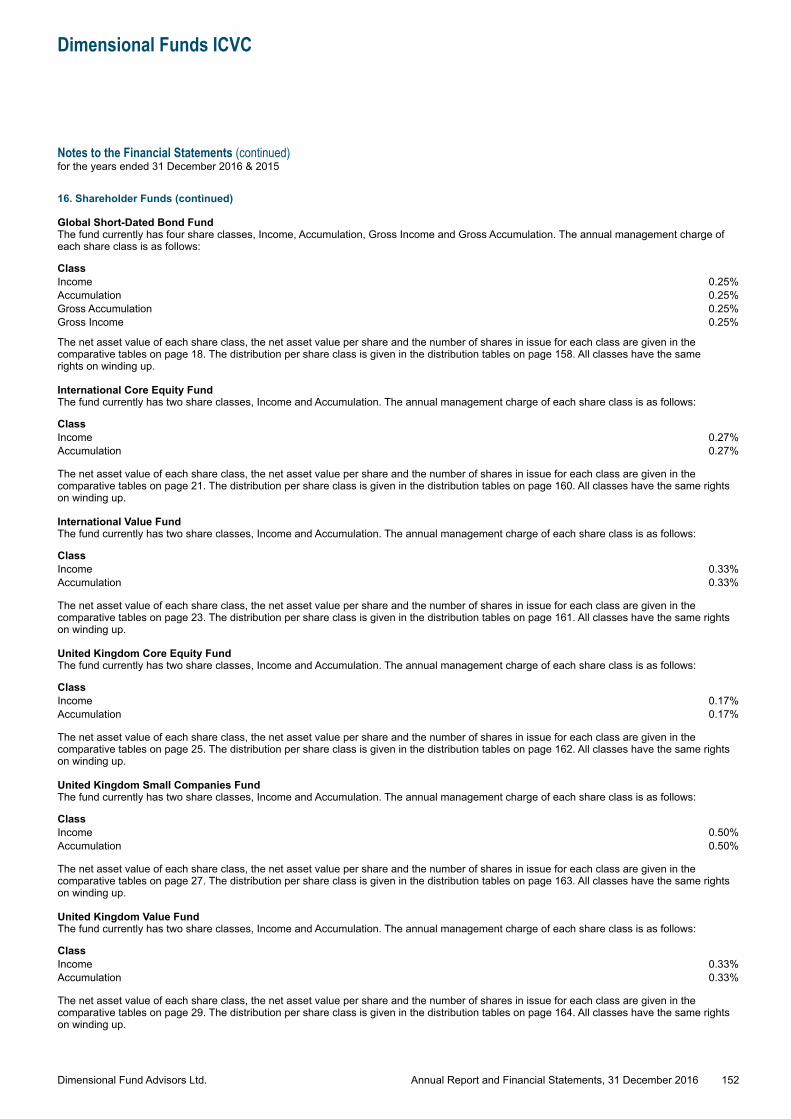
Dimensional Fund Advisors Ltd.
Dimensional Funds ICVC
Notes to the Financial Statements (continued)for the years ended 31 December 2016 & 2015
152Annual Report and Financial Statements, 31 December 2016
16. Shareholder Funds (continued)
Global Short-Dated Bond FundThe fund currently has four share classes, Income, Accumulation, Gross Income and Gross Accumulation. The annual management charge of each share class is as follows:
ClassIncome 0.25%Accumulation 0.25%Gross Accumulation 0.25%Gross Income 0.25%
The net asset value of each share class, the net asset value per share and the number of shares in issue for each class are given in the comparative tables on page 18. The distribution per share class is given in the distribution tables on page 158. All classes have the same rights on winding up.
International Core Equity FundThe fund currently has two share classes, Income and Accumulation. The annual management charge of each share class is as follows:
ClassIncome 0.27%Accumulation 0.27%
The net asset value of each share class, the net asset value per share and the number of shares in issue for each class are given in the comparative tables on page 21. The distribution per share class is given in the distribution tables on page 160. All classes have the same rights on winding up.
International Value FundThe fund currently has two share classes, Income and Accumulation. The annual management charge of each share class is as follows:
ClassIncome 0.33%Accumulation 0.33%
The net asset value of each share class, the net asset value per share and the number of shares in issue for each class are given in the comparative tables on page 23. The distribution per share class is given in the distribution tables on page 161. All classes have the same rights on winding up.
United Kingdom Core Equity FundThe fund currently has two share classes, Income and Accumulation. The annual management charge of each share class is as follows:
ClassIncome 0.17%Accumulation 0.17%
The net asset value of each share class, the net asset value per share and the number of shares in issue for each class are given in the comparative tables on page 25. The distribution per share class is given in the distribution tables on page 162. All classes have the same rights on winding up.
United Kingdom Small Companies FundThe fund currently has two share classes, Income and Accumulation. The annual management charge of each share class is as follows:
ClassIncome 0.50%Accumulation 0.50%
The net asset value of each share class, the net asset value per share and the number of shares in issue for each class are given in the comparative tables on page 27. The distribution per share class is given in the distribution tables on page 163. All classes have the same rights on winding up.
United Kingdom Value FundThe fund currently has two share classes, Income and Accumulation. The annual management charge of each share class is as follows:
ClassIncome 0.33%Accumulation 0.33%
The net asset value of each share class, the net asset value per share and the number of shares in issue for each class are given in the comparative tables on page 29. The distribution per share class is given in the distribution tables on page 164. All classes have the same rights on winding up.
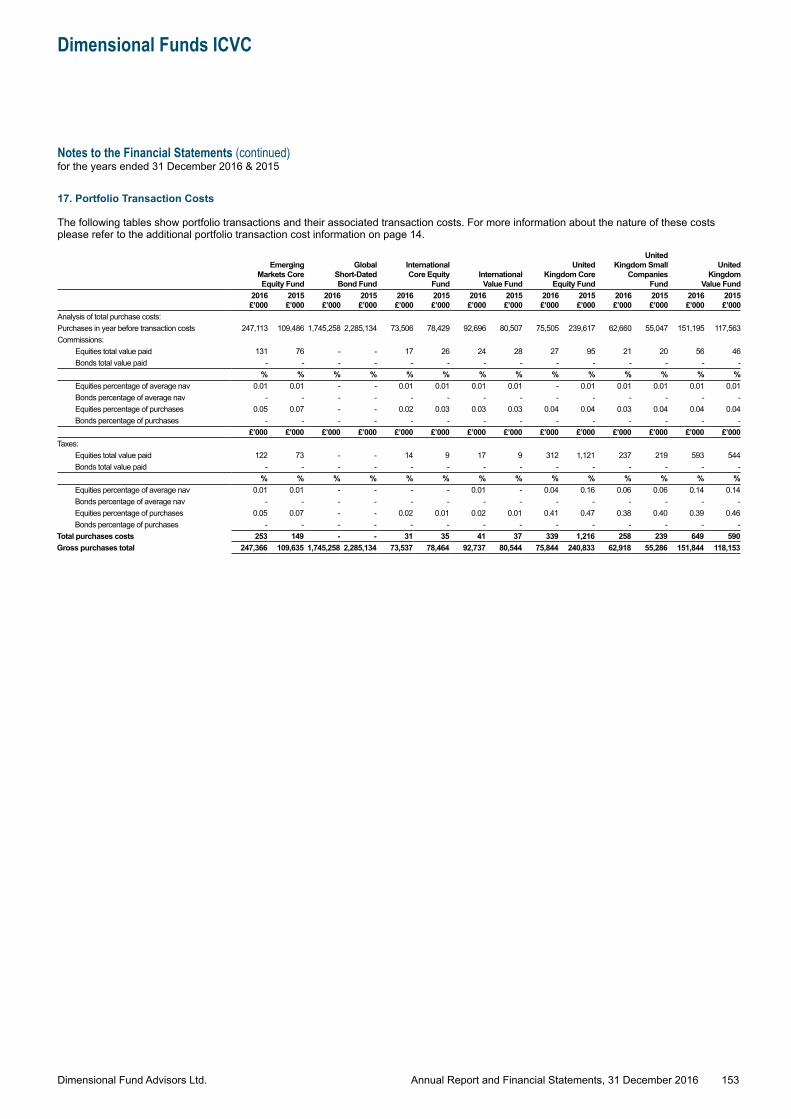
Dimensional Fund Advisors Ltd.
Dimensional Funds ICVC
Notes to the Financial Statements (continued)for the years ended 31 December 2016 & 2015
153Annual Report and Financial Statements, 31 December 2016
16. Shareholder Funds (continued)
Global Short-Dated Bond FundThe fund currently has four share classes, Income, Accumulation, Gross Income and Gross Accumulation. The annual management charge of each share class is as follows:
ClassIncome 0.25%Accumulation 0.25%Gross Accumulation 0.25%Gross Income 0.25%
The net asset value of each share class, the net asset value per share and the number of shares in issue for each class are given in the comparative tables on page 18. The distribution per share class is given in the distribution tables on page 159. All classes have the same rights on winding up.
International Core Equity FundThe fund currently has two share classes, Income and Accumulation. The annual management charge of each share class is as follows:
ClassIncome 0.27%Accumulation 0.27%
The net asset value of each share class, the net asset value per share and the number of shares in issue for each class are given in the comparative tables on page 21. The distribution per share class is given in the distribution tables on page 160. All classes have the same rights on winding up.
International Value FundThe fund currently has two share classes, Income and Accumulation. The annual management charge of each share class is as follows:
ClassIncome 0.33%Accumulation 0.33%
The net asset value of each share class, the net asset value per share and the number of shares in issue for each class are given in the comparative tables on page 23. The distribution per share class is given in the distribution tables on page 161. All classes have the same rights on winding up.
United Kingdom Core Equity FundThe fund currently has two share classes, Income and Accumulation. The annual management charge of each share class is as follows:
ClassIncome 0.17%Accumulation 0.17%
The net asset value of each share class, the net asset value per share and the number of shares in issue for each class are given in the comparative tables on page 25. The distribution per share class is given in the distribution tables on page 162. All classes have the same rights on winding up.
United Kingdom Small Companies FundThe fund currently has two share classes, Income and Accumulation. The annual management charge of each share class is as follows:
ClassIncome 0.50%Accumulation 0.50%
The net asset value of each share class, the net asset value per share and the number of shares in issue for each class are given in the comparative tables on page 27. The distribution per share class is given in the distribution tables on page 163. All classes have the same rights on winding up.
United Kingdom Value FundThe fund currently has two share classes, Income and Accumulation. The annual management charge of each share class is as follows:
ClassIncome 0.33%Accumulation 0.33%
The net asset value of each share class, the net asset value per share and the number of shares in issue for each class are given in the comparative tables on page 29. The distribution per share class is given in the distribution tables on page 164. All classes have the same rights on winding up.
17. Portfolio Transaction Costs
The following tables show portfolio transactions and their associated transaction costs. For more information about the nature of these costs please refer to the additional portfolio transaction cost information on page 14.
EmergingMarkets CoreEquity Fund
GlobalShort-DatedBond Fund
InternationalCore Equity
FundInternationalValue Fund
UnitedKingdom Core
Equity Fund
UnitedKingdom Small
CompaniesFund
UnitedKingdom
Value Fund2016£’000
2015£’000
2016£’000
2015£’000
2016£’000
2015£’000
2016£’000
2015£’000
2016£’000
2015£’000
2016£’000
2015£’000
2016£’000
2015£’000
Analysis of total purchase costs:Purchases in year before transaction costs 247,113 109,486 1,745,258 2,285,134 73,506 78,429 92,696 80,507 75,505 239,617 62,660 55,047 151,195 117,563Commissions:
Equities total value paid 131 76 - - 17 26 24 28 27 95 21 20 56 46Bonds total value paid - - - - - - - - - - - - - -
% % % % % % % % % % % % % %Equities percentage of average nav 0.01 0.01 - - 0.01 0.01 0.01 0.01 - 0.01 0.01 0.01 0.01 0.01Bonds percentage of average nav - - - - - - - - - - - - - -Equities percentage of purchases 0.05 0.07 - - 0.02 0.03 0.03 0.03 0.04 0.04 0.03 0.04 0.04 0.04Bonds percentage of purchases - - - - - - - - - - - - - -
£’000 £’000 £’000 £’000 £’000 £’000 £’000 £’000 £’000 £’000 £’000 £’000 £’000 £’000Taxes:
Equities total value paid 122 73 - - 14 9 17 9 312 1,121 237 219 593 544Bonds total value paid - - - - - - - - - - - - - -
% % % % % % % % % % % % % %Equities percentage of average nav 0.01 0.01 - - - - 0.01 - 0.04 0.16 0.06 0.06 0.14 0.14Bonds percentage of average nav - - - - - - - - - - - - - -Equities percentage of purchases 0.05 0.07 - - 0.02 0.01 0.02 0.01 0.41 0.47 0.38 0.40 0.39 0.46Bonds percentage of purchases - - - - - - - - - - - - - -
Total purchases costs 253 149 - - 31 35 41 37 339 1,216 258 239 649 590Gross purchases total 247,366 109,635 1,745,258 2,285,134 73,537 78,464 92,737 80,544 75,844 240,833 62,918 55,286 151,844 118,153
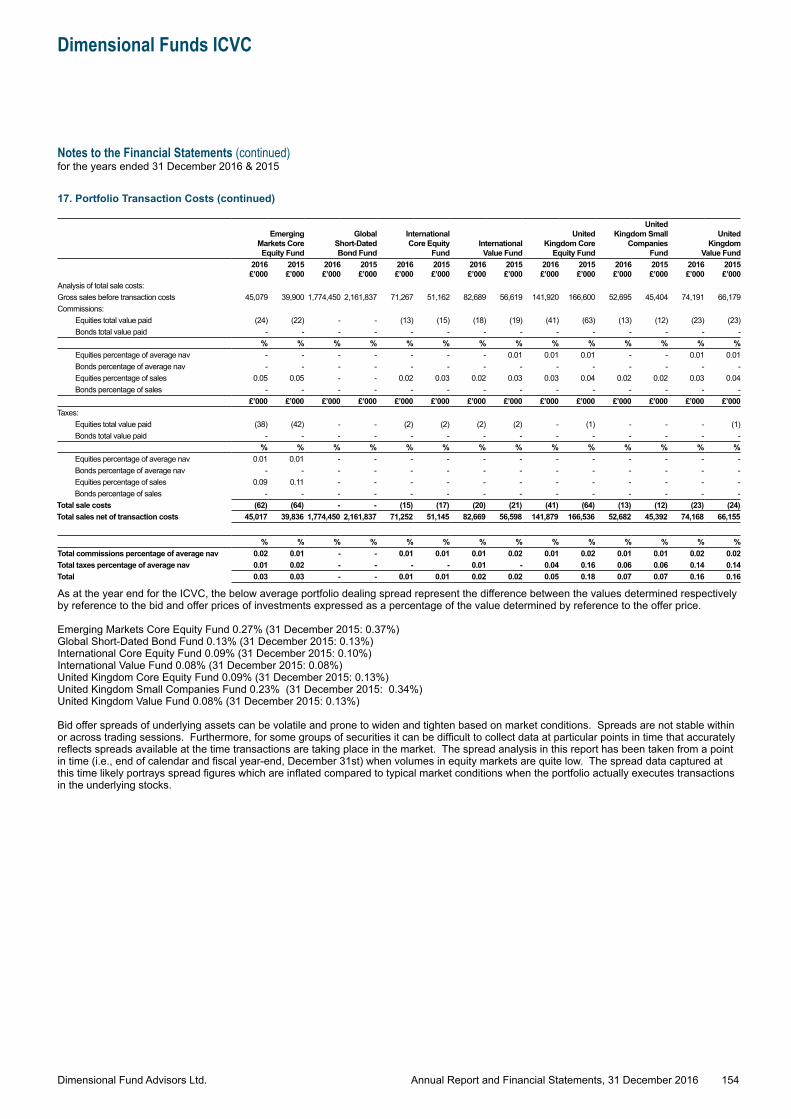
Dimensional Fund Advisors Ltd.
Dimensional Funds ICVC
Notes to the Financial Statements (continued)for the years ended 31 December 2016 & 2015
154Annual Report and Financial Statements, 31 December 2016
17. Portfolio Transaction Costs (continued)
EmergingMarkets CoreEquity Fund
GlobalShort-DatedBond Fund
InternationalCore Equity
FundInternationalValue Fund
UnitedKingdom Core
Equity Fund
UnitedKingdom Small
CompaniesFund
UnitedKingdom
Value Fund2016£’000
2015£’000
2016£’000
2015£’000
2016£’000
2015£’000
2016£’000
2015£’000
2016£’000
2015£’000
2016£’000
2015£’000
2016£’000
2015£’000
Analysis of total sale costs:Gross sales before transaction costs 45,079 39,900 1,774,450 2,161,837 71,267 51,162 82,689 56,619 141,920 166,600 52,695 45,404 74,191 66,179Commissions:
Equities total value paid (24) (22) - - (13) (15) (18) (19) (41) (63) (13) (12) (23) (23)Bonds total value paid - - - - - - - - - - - - - -
% % % % % % % % % % % % % %Equities percentage of average nav - - - - - - - 0.01 0.01 0.01 - - 0.01 0.01Bonds percentage of average nav - - - - - - - - - - - - - -Equities percentage of sales 0.05 0.05 - - 0.02 0.03 0.02 0.03 0.03 0.04 0.02 0.02 0.03 0.04Bonds percentage of sales - - - - - - - - - - - - - -
£’000 £’000 £’000 £’000 £’000 £’000 £’000 £’000 £’000 £’000 £’000 £’000 £’000 £’000Taxes:
Equities total value paid (38) (42) - - (2) (2) (2) (2) - (1) - - - (1)Bonds total value paid - - - - - - - - - - - - - -
% % % % % % % % % % % % % %Equities percentage of average nav 0.01 0.01 - - - - - - - - - - - -Bonds percentage of average nav - - - - - - - - - - - - - -Equities percentage of sales 0.09 0.11 - - - - - - - - - - - -Bonds percentage of sales - - - - - - - - - - - - - -
Total sale costs (62) (64) - - (15) (17) (20) (21) (41) (64) (13) (12) (23) (24)Total sales net of transaction costs 45,017 39,836 1,774,450 2,161,837 71,252 51,145 82,669 56,598 141,879 166,536 52,682 45,392 74,168 66,155
% % % % % % % % % % % % % %Total commissions percentage of average nav 0.02 0.01 - - 0.01 0.01 0.01 0.02 0.01 0.02 0.01 0.01 0.02 0.02Total taxes percentage of average nav 0.01 0.02 - - - - 0.01 - 0.04 0.16 0.06 0.06 0.14 0.14Total 0.03 0.03 - - 0.01 0.01 0.02 0.02 0.05 0.18 0.07 0.07 0.16 0.16
As at the year end for the ICVC, the below average portfolio dealing spread represent the difference between the values determined respectively by reference to the bid and offer prices of investments expressed as a percentage of the value determined by reference to the offer price.
Emerging Markets Core Equity Fund 0.27% (31 December 2015: 0.37%) Global Short-Dated Bond Fund 0.13% (31 December 2015: 0.13%) International Core Equity Fund 0.09% (31 December 2015: 0.10%) International Value Fund 0.08% (31 December 2015: 0.08%) United Kingdom Core Equity Fund 0.09% (31 December 2015: 0.13%) United Kingdom Small Companies Fund 0.23% (31 December 2015: 0.34%) United Kingdom Value Fund 0.08% (31 December 2015: 0.13%)
Bid offer spreads of underlying assets can be volatile and prone to widen and tighten based on market conditions. Spreads are not stable within or across trading sessions. Furthermore, for some groups of securities it can be difficult to collect data at particular points in time that accurately reflects spreads available at the time transactions are taking place in the market. The spread analysis in this report has been taken from a point in time (i.e., end of calendar and fiscal year-end, December 31st) when volumes in equity markets are quite low. The spread data captured at this time likely portrays spread figures which are inflated compared to typical market conditions when the portfolio actually executes transactions in the underlying stocks.
Dimensional Fund Advisors Ltd.
Dimensional Funds ICVC
Notes to the Financial Statements (continued)for the years ended 31 December 2016 & 2015
155Annual Report and Financial Statements, 31 December 2016
18. Post Balance Sheet Events
Emerging Markets Core Equity FundAfter the year end, public market fluctuations have resulted in the net asset value per accumulation share increasing 10.46% from 3,909p as at 31 December 2016 to 4,318p at 13 March 2017 and per Euro accumulation share increasing 8.58% from 1,095¢ as at 31 December 2016 to 1,189¢ at 13 March 2017.
Global Short-Dated Bond FundAfter the year end, public market fluctuations have resulted in the net asset value per accumulation share increasing 0.06 % from 1,556p as at 31 December 2016 to 1,557p at 13 March 2017 and per gross accumulation share retaining the price of 1,124p both as at 31 December 2016 and 13 March 2017.
International Core Equity FundAfter the year end, public market fluctuations have resulted in the net asset value per accumulation share increasing 5.43% from 2,228p as at 31 December 2016 to 2,349p at 13 March 2017.
International Value FundAfter the year end, public market fluctuations have resulted in the net asset value per accumulation share increasing 5.07% from 2,878p as at 31 December 2016 to 3,024p at 13 March 2017.
United Kingdom Core Equity FundAfter the year end, public market fluctuations have resulted in the net asset value per accumulation share increasing 4.93% from 1,907p as at 31 December 2016 to 2,001p at 13 March 2017.
United Kingdom Small Companies FundAfter the year end, public market fluctuations have resulted in the net asset value per accumulation share increasing 5.49% from 3,843p as at 31 December 2016 to 4,054p at 13 March 2017.
United Kingdom Value FundAfter the year end, public market fluctuations have resulted in the net asset value per accumulation share increasing 4.35% from 2,228p as at 31 December 2016 to 2,325p at 13 March 2017.
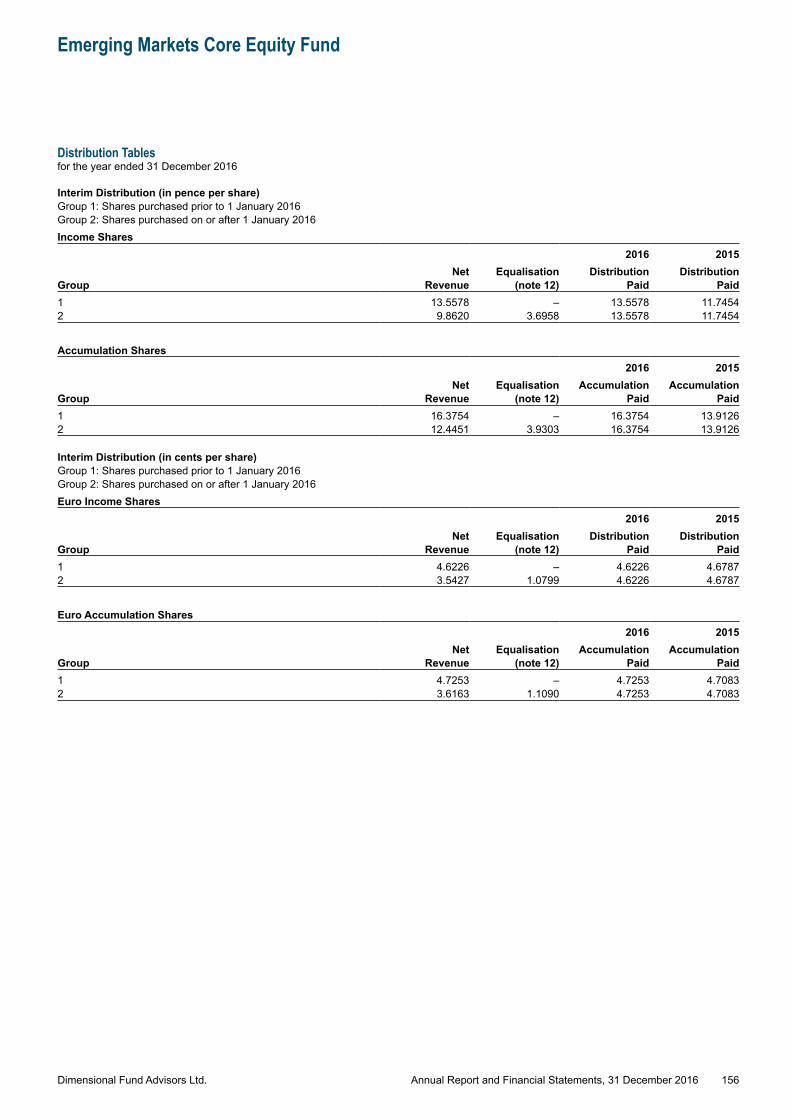
Dimensional Fund Advisors Ltd.
Emerging Markets Core Equity Fund
Distribution Tablesfor the year ended 31 December 2016
156Annual Report and Financial Statements, 31 December 2016
Interim Distribution (in pence per share)Group 1: Shares purchased prior to 1 January 2016Group 2: Shares purchased on or after 1 January 2016Income Shares
2016 2015Net Equalisation Distribution Distribution
Group Revenue (note 12) Paid Paid1 13.5578 – 13.5578 11.74542 9.8620 3.6958 13.5578 11.7454
Accumulation Shares2016 2015
Net Equalisation Accumulation AccumulationGroup Revenue (note 12) Paid Paid1 16.3754 – 16.3754 13.91262 12.4451 3.9303 16.3754 13.9126
Interim Distribution (in cents per share)Group 1: Shares purchased prior to 1 January 2016Group 2: Shares purchased on or after 1 January 2016Euro Income Shares
2016 2015Net Equalisation Distribution Distribution
Group Revenue (note 12) Paid Paid1 4.6226 – 4.6226 4.67872 3.5427 1.0799 4.6226 4.6787
Euro Accumulation Shares2016 2015
Net Equalisation Accumulation AccumulationGroup Revenue (note 12) Paid Paid1 4.7253 – 4.7253 4.70832 3.6163 1.1090 4.7253 4.7083
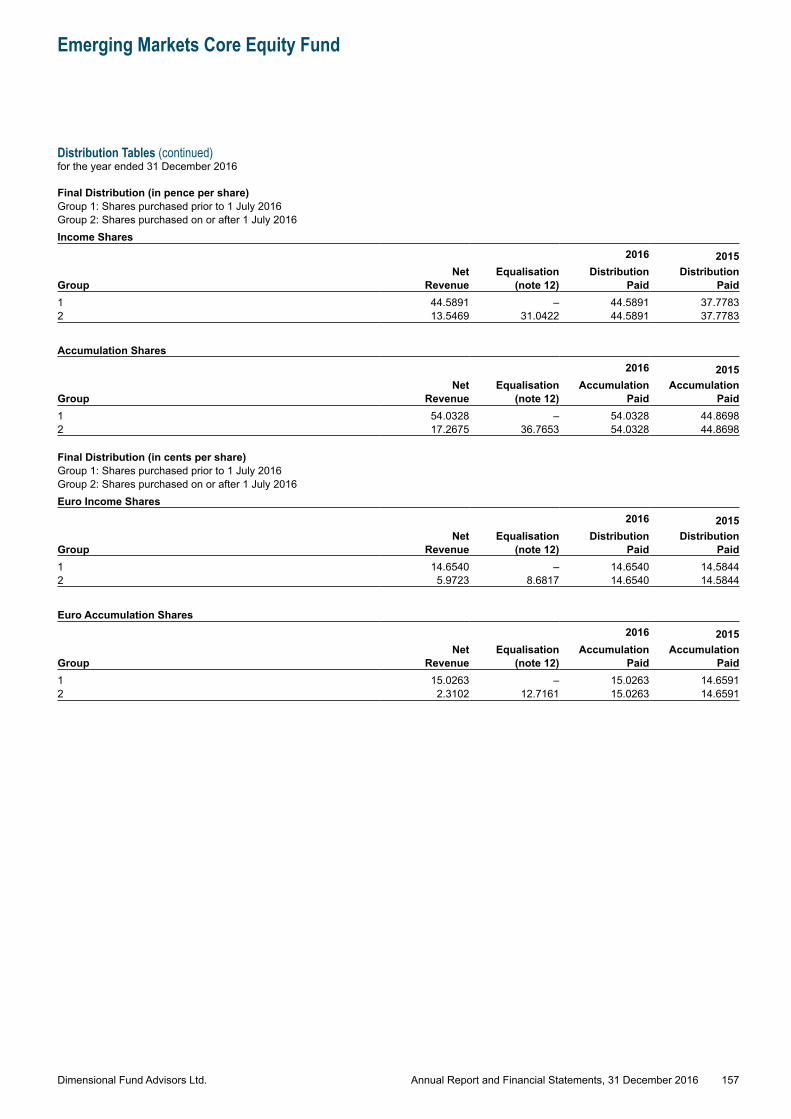
Dimensional Fund Advisors Ltd.
Emerging Markets Core Equity Fund
Distribution Tables (continued)for the year ended 31 December 2016
157Annual Report and Financial Statements, 31 December 2016
Final Distribution (in pence per share)Group 1: Shares purchased prior to 1 July 2016Group 2: Shares purchased on or after 1 July 2016Income Shares
2016 2015Net Equalisation Distribution Distribution
Group Revenue (note 12) Paid Paid1 44.5891 – 44.5891 37.77832 13.5469 31.0422 44.5891 37.7783
Accumulation Shares2016 2015
Net Equalisation Accumulation AccumulationGroup Revenue (note 12) Paid Paid1 54.0328 – 54.0328 44.86982 17.2675 36.7653 54.0328 44.8698
Final Distribution (in cents per share)Group 1: Shares purchased prior to 1 July 2016Group 2: Shares purchased on or after 1 July 2016Euro Income Shares
2016 2015Net Equalisation Distribution Distribution
Group Revenue (note 12) Paid Paid1 14.6540 – 14.6540 14.58442 5.9723 8.6817 14.6540 14.5844
Euro Accumulation Shares2016 2015
Net Equalisation Accumulation AccumulationGroup Revenue (note 12) Paid Paid1 15.0263 – 15.0263 14.65912 2.3102 12.7161 15.0263 14.6591
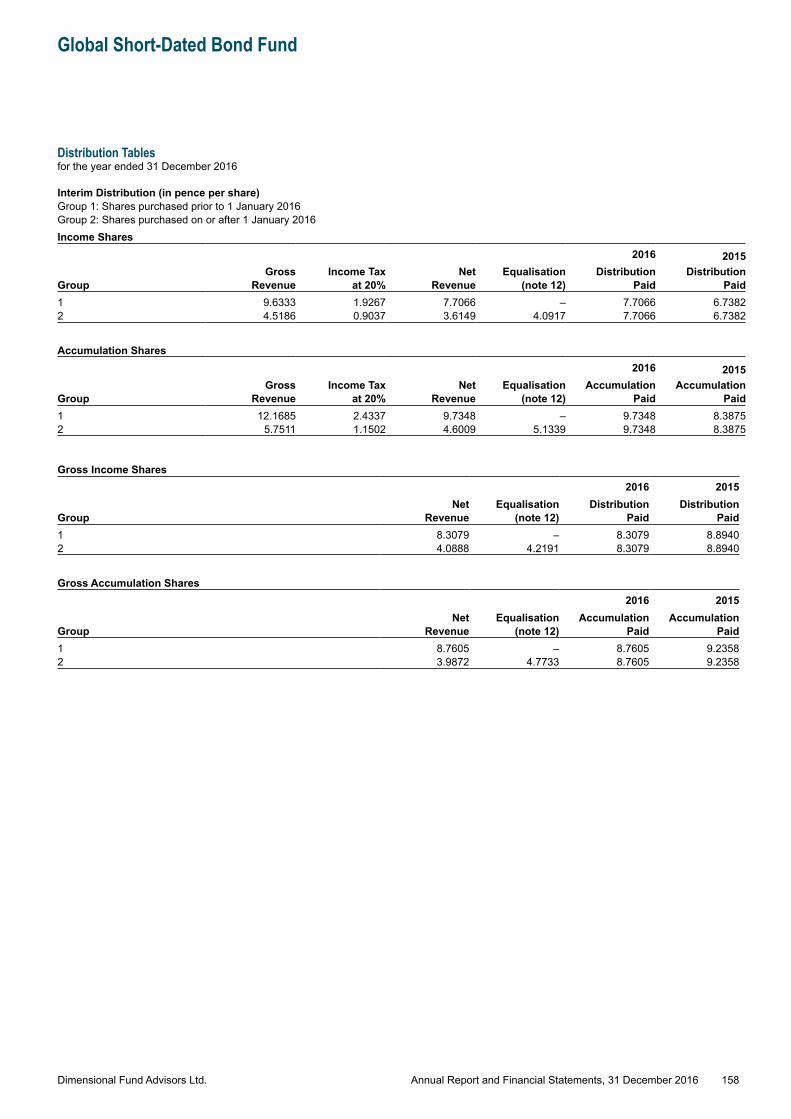
Dimensional Fund Advisors Ltd.
Global Short-Dated Bond Fund
Distribution Tablesfor the year ended 31 December 2016
158Annual Report and Financial Statements, 31 December 2016
Interim Distribution (in pence per share)Group 1: Shares purchased prior to 1 January 2016Group 2: Shares purchased on or after 1 January 2016Income Shares
2016 2015Gross Income Tax Net Equalisation Distribution Distribution
Group Revenue at 20% Revenue (note 12) Paid Paid1 9.6333 1.9267 7.7066 – 7.7066 6.73822 4.5186 0.9037 3.6149 4.0917 7.7066 6.7382
Accumulation Shares2016 2015
Gross Income Tax Net Equalisation Accumulation AccumulationGroup Revenue at 20% Revenue (note 12) Paid Paid1 12.1685 2.4337 9.7348 – 9.7348 8.38752 5.7511 1.1502 4.6009 5.1339 9.7348 8.3875
Gross Income Shares2016 2015
Net Equalisation Distribution DistributionGroup Revenue (note 12) Paid Paid1 8.3079 – 8.3079 8.89402 4.0888 4.2191 8.3079 8.8940
Gross Accumulation Shares2016 2015
Net Equalisation Accumulation AccumulationGroup Revenue (note 12) Paid Paid1 8.7605 – 8.7605 9.23582 3.9872 4.7733 8.7605 9.2358
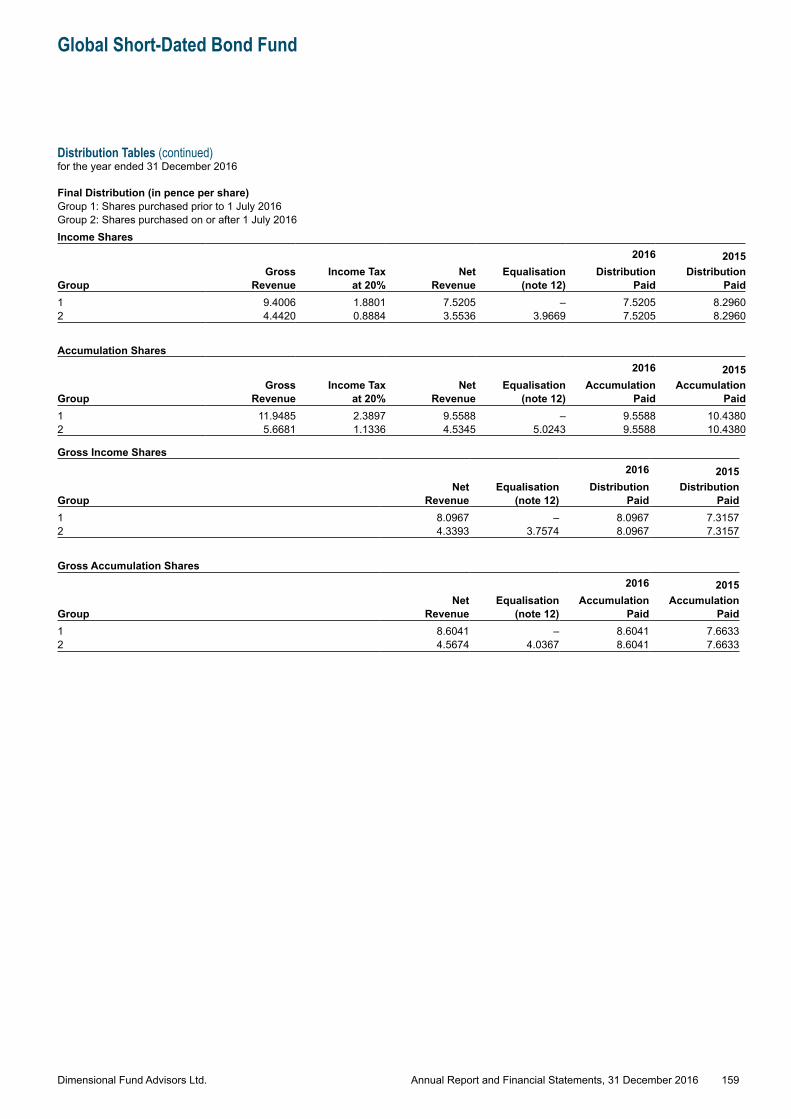
Dimensional Fund Advisors Ltd.
Global Short-Dated Bond Fund
Distribution Tables (continued)for the year ended 31 December 2016
159Annual Report and Financial Statements, 31 December 2016
Final Distribution (in pence per share)Group 1: Shares purchased prior to 1 July 2016Group 2: Shares purchased on or after 1 July 2016Income Shares
2016 2015Gross Income Tax Net Equalisation Distribution Distribution
Group Revenue at 20% Revenue (note 12) Paid Paid1 9.4006 1.8801 7.5205 – 7.5205 8.29602 4.4420 0.8884 3.5536 3.9669 7.5205 8.2960
Accumulation Shares2016 2015
Gross Income Tax Net Equalisation Accumulation AccumulationGroup Revenue at 20% Revenue (note 12) Paid Paid1 11.9485 2.3897 9.5588 – 9.5588 10.43802 5.6681 1.1336 4.5345 5.0243 9.5588 10.4380
Gross Income Shares2016 2015
Net Equalisation Distribution DistributionGroup Revenue (note 12) Paid Paid1 8.0967 – 8.0967 7.31572 4.3393 3.7574 8.0967 7.3157
Gross Accumulation Shares2016 2015
Net Equalisation Accumulation AccumulationGroup Revenue (note 12) Paid Paid1 8.6041 – 8.6041 7.66332 4.5674 4.0367 8.6041 7.6633
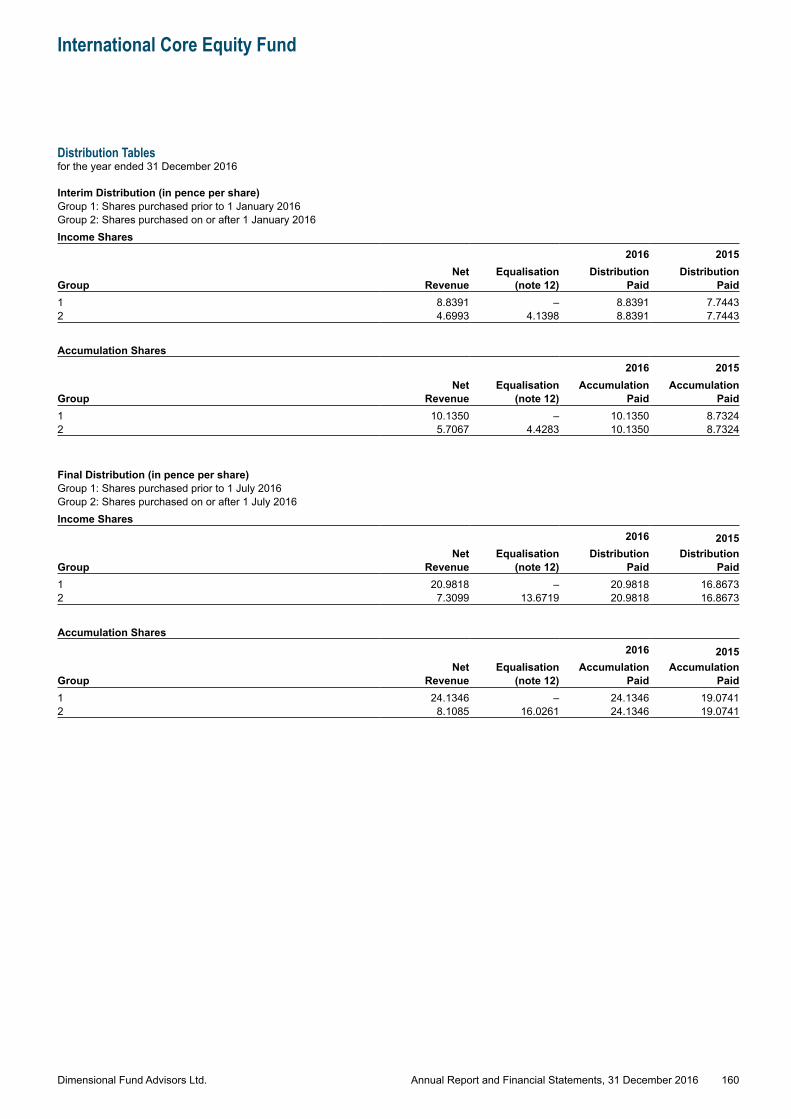
Dimensional Fund Advisors Ltd.
International Core Equity Fund
Distribution Tablesfor the year ended 31 December 2016
160Annual Report and Financial Statements, 31 December 2016
Interim Distribution (in pence per share)Group 1: Shares purchased prior to 1 January 2016Group 2: Shares purchased on or after 1 January 2016Income Shares
2016 2015Net Equalisation Distribution Distribution
Group Revenue (note 12) Paid Paid1 8.8391 – 8.8391 7.74432 4.6993 4.1398 8.8391 7.7443
Accumulation Shares2016 2015
Net Equalisation Accumulation AccumulationGroup Revenue (note 12) Paid Paid1 10.1350 – 10.1350 8.73242 5.7067 4.4283 10.1350 8.7324
Final Distribution (in pence per share)Group 1: Shares purchased prior to 1 July 2016Group 2: Shares purchased on or after 1 July 2016Income Shares
2016 2015Net Equalisation Distribution Distribution
Group Revenue (note 12) Paid Paid1 20.9818 – 20.9818 16.86732 7.3099 13.6719 20.9818 16.8673
Accumulation Shares2016 2015
Net Equalisation Accumulation AccumulationGroup Revenue (note 12) Paid Paid1 24.1346 – 24.1346 19.07412 8.1085 16.0261 24.1346 19.0741
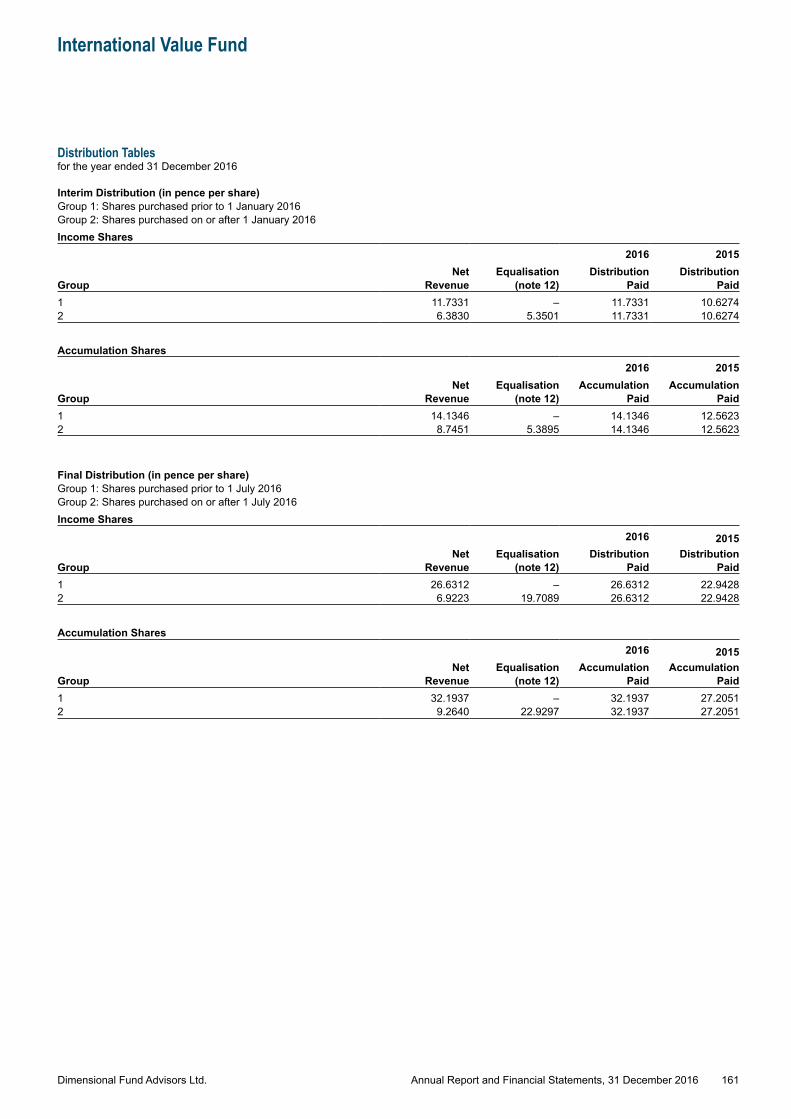
Dimensional Fund Advisors Ltd.
International Value Fund
Distribution Tablesfor the year ended 31 December 2016
161Annual Report and Financial Statements, 31 December 2016
Interim Distribution (in pence per share)Group 1: Shares purchased prior to 1 January 2016Group 2: Shares purchased on or after 1 January 2016Income Shares
2016 2015Net Equalisation Distribution Distribution
Group Revenue (note 12) Paid Paid1 11.7331 – 11.7331 10.62742 6.3830 5.3501 11.7331 10.6274
Accumulation Shares2016 2015
Net Equalisation Accumulation AccumulationGroup Revenue (note 12) Paid Paid1 14.1346 – 14.1346 12.56232 8.7451 5.3895 14.1346 12.5623
Final Distribution (in pence per share)Group 1: Shares purchased prior to 1 July 2016Group 2: Shares purchased on or after 1 July 2016Income Shares
2016 2015Net Equalisation Distribution Distribution
Group Revenue (note 12) Paid Paid1 26.6312 – 26.6312 22.94282 6.9223 19.7089 26.6312 22.9428
Accumulation Shares2016 2015
Net Equalisation Accumulation AccumulationGroup Revenue (note 12) Paid Paid1 32.1937 – 32.1937 27.20512 9.2640 22.9297 32.1937 27.2051

Dimensional Fund Advisors Ltd.
United Kingdom Core Equity Fund
Distribution Tablesfor the year ended 31 December 2016
162Annual Report and Financial Statements, 31 December 2016
Interim Distribution (in pence per share)Group 1: Shares purchased prior to 1 January 2016Group 2: Shares purchased on or after 1 January 2016Income Shares
2016 2015Net Equalisation Distribution Distribution
Group Revenue (note 12) Paid Paid1 21.3723 – 21.3723 22.67382 11.5195 9.8528 21.3723 22.6738
Accumulation Shares2016 2015
Net Equalisation Accumulation AccumulationGroup Revenue (note 12) Paid Paid1 28.4832 – 28.4832 29.29842 15.0416 13.4416 28.4832 29.2984
Final Distribution (in pence per share)Group 1: Shares purchased prior to 1 July 2016Group 2: Shares purchased on or after 1 July 2016Income Shares
2016 2015Net Equalisation Distribution Distribution
Group Revenue (note 12) Paid Paid1 14.5581 – 14.5581 16.73712 6.6312 7.9269 14.5581 16.7371
Accumulation Shares2016 2015
Net Equalisation Accumulation AccumulationGroup Revenue (note 12) Paid Paid1 19.6937 – 19.6937 22.00812 9.1549 10.5388 19.6937 22.0081
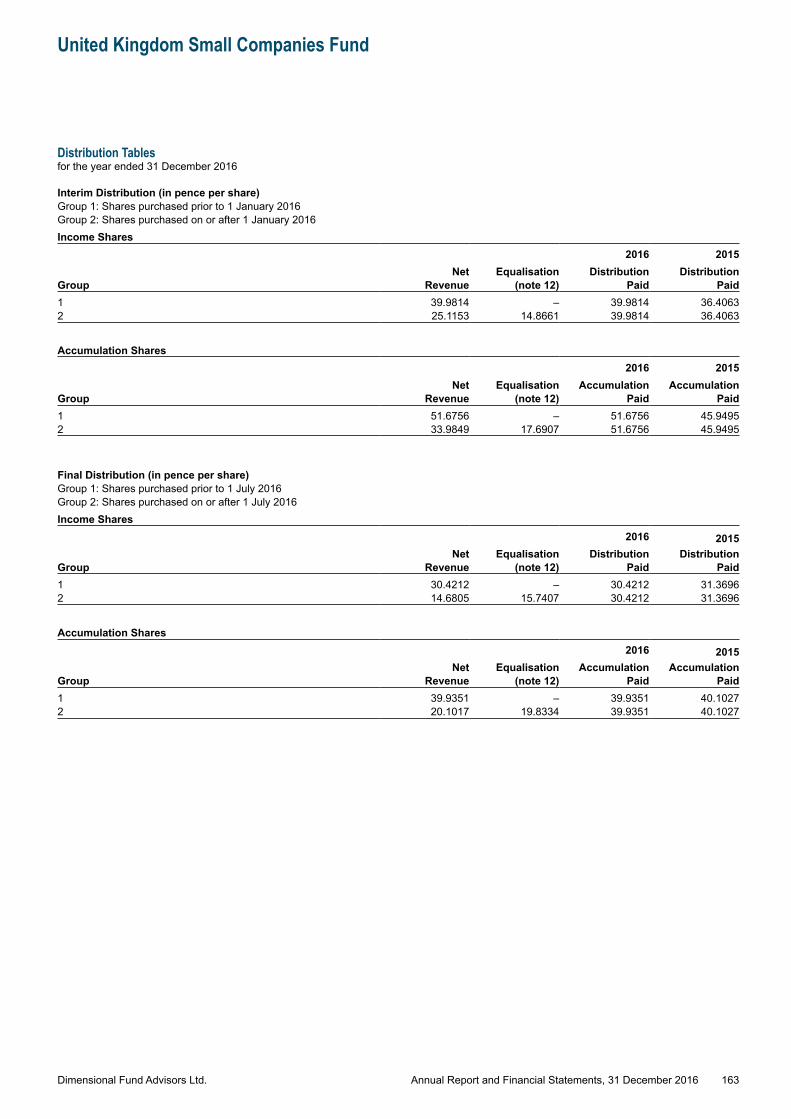
Dimensional Fund Advisors Ltd.
United Kingdom Small Companies Fund
Distribution Tablesfor the year ended 31 December 2016
163Annual Report and Financial Statements, 31 December 2016
Interim Distribution (in pence per share)Group 1: Shares purchased prior to 1 January 2016Group 2: Shares purchased on or after 1 January 2016Income Shares
2016 2015Net Equalisation Distribution Distribution
Group Revenue (note 12) Paid Paid1 39.9814 – 39.9814 36.40632 25.1153 14.8661 39.9814 36.4063
Accumulation Shares2016 2015
Net Equalisation Accumulation AccumulationGroup Revenue (note 12) Paid Paid1 51.6756 – 51.6756 45.94952 33.9849 17.6907 51.6756 45.9495
Final Distribution (in pence per share)Group 1: Shares purchased prior to 1 July 2016Group 2: Shares purchased on or after 1 July 2016Income Shares
2016 2015Net Equalisation Distribution Distribution
Group Revenue (note 12) Paid Paid1 30.4212 – 30.4212 31.36962 14.6805 15.7407 30.4212 31.3696
Accumulation Shares2016 2015
Net Equalisation Accumulation AccumulationGroup Revenue (note 12) Paid Paid1 39.9351 – 39.9351 40.10272 20.1017 19.8334 39.9351 40.1027
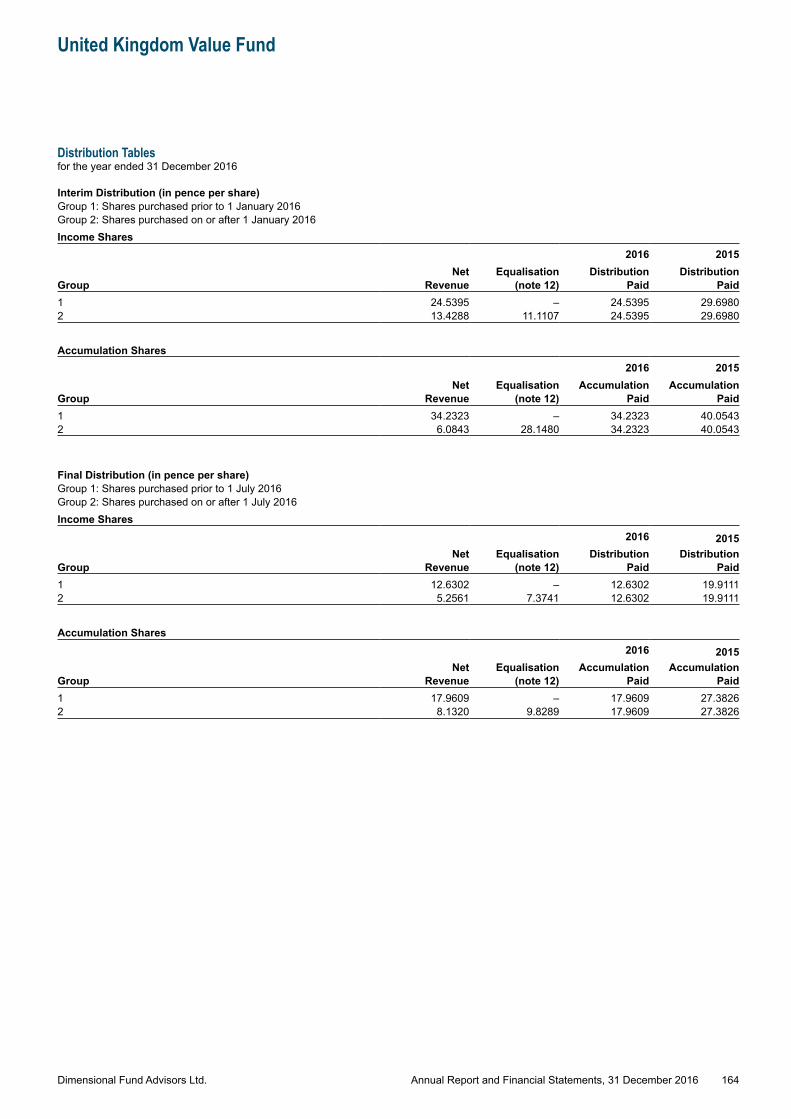
Dimensional Fund Advisors Ltd.
United Kingdom Value Fund
Distribution Tablesfor the year ended 31 December 2016
164Annual Report and Financial Statements, 31 December 2016
Interim Distribution (in pence per share)Group 1: Shares purchased prior to 1 January 2016Group 2: Shares purchased on or after 1 January 2016Income Shares
2016 2015Net Equalisation Distribution Distribution
Group Revenue (note 12) Paid Paid1 24.5395 – 24.5395 29.69802 13.4288 11.1107 24.5395 29.6980
Accumulation Shares2016 2015
Net Equalisation Accumulation AccumulationGroup Revenue (note 12) Paid Paid1 34.2323 – 34.2323 40.05432 6.0843 28.1480 34.2323 40.0543
Final Distribution (in pence per share)Group 1: Shares purchased prior to 1 July 2016Group 2: Shares purchased on or after 1 July 2016Income Shares
2016 2015Net Equalisation Distribution Distribution
Group Revenue (note 12) Paid Paid1 12.6302 – 12.6302 19.91112 5.2561 7.3741 12.6302 19.9111
Accumulation Shares2016 2015
Net Equalisation Accumulation AccumulationGroup Revenue (note 12) Paid Paid1 17.9609 – 17.9609 27.38262 8.1320 9.8289 17.9609 27.3826
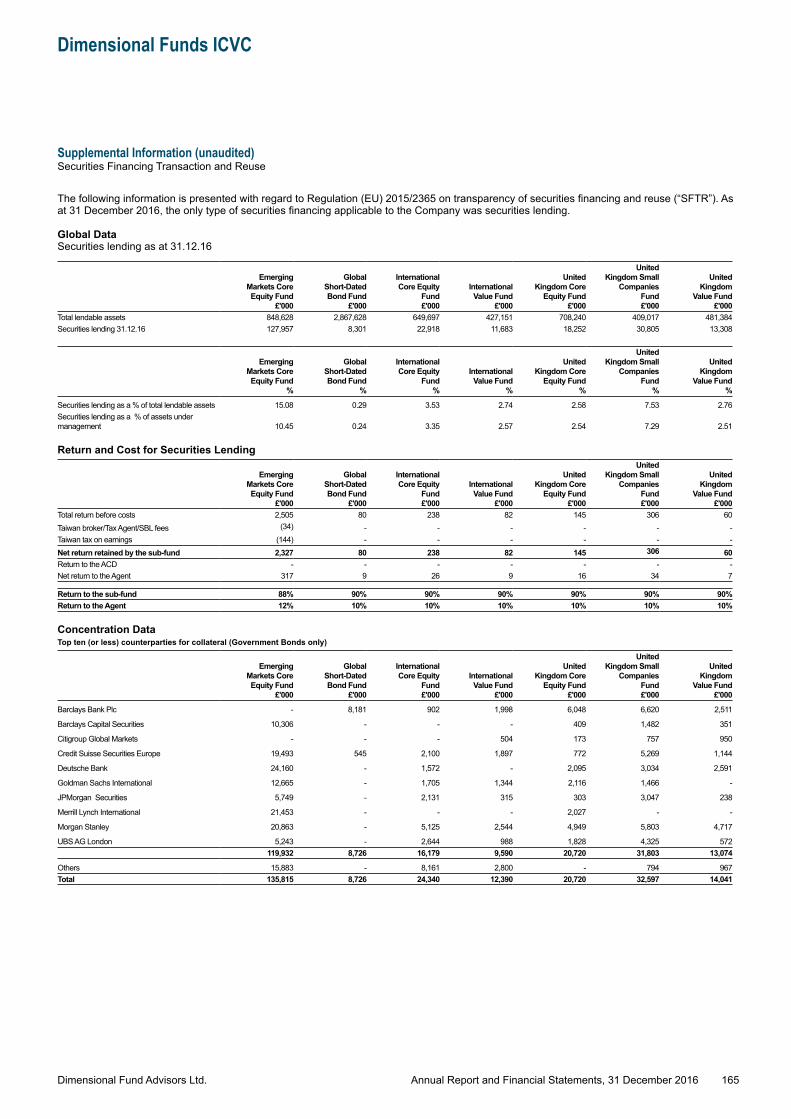
Dimensional Fund Advisors Ltd.
Dimensional Funds ICVC
Supplemental Information (unaudited)Securities Financing Transaction and Reuse
165Annual Report and Financial Statements, 31 December 2016
The following information is presented with regard to Regulation (EU) 2015/2365 on transparency of securities financing and reuse (“SFTR”). As at 31 December 2016, the only type of securities financing applicable to the Company was securities lending.
Global DataSecurities lending as at 31.12.16
Emerging Markets Core Equity Fund
£'000
Global Short-Dated Bond Fund
£'000
International Core Equity
Fund£'000
International Value Fund
£'000
United Kingdom Core
Equity Fund£'000
United Kingdom Small
Companies Fund£'000
United Kingdom
Value Fund£'000
Total lendable assets 848,628 2,867,628 649,697 427,151 708,240 409,017 481,384Securities lending 31.12.16 127,957 8,301 22,918 11,683 18,252 30,805 13,308
Emerging Markets Core Equity Fund
%
Global Short-Dated Bond Fund
%
International Core Equity
Fund%
International Value Fund
%
United Kingdom Core
Equity Fund%
United Kingdom Small
Companies Fund
%
United Kingdom
Value Fund%
Securities lending as a % of total lendable assets 15.08 0.29 3.53 2.74 2.58 7.53 2.76Securities lending as a % of assets under management 10.45 0.24 3.35 2.57 2.54 7.29 2.51
Return and Cost for Securities Lending
Emerging Markets Core Equity Fund
£'000
Global Short-Dated Bond Fund
£'000
International Core Equity
Fund£'000
International Value Fund
£'000
United Kingdom Core
Equity Fund£'000
United Kingdom Small
Companies Fund£'000
United Kingdom
Value Fund£'000
Total return before costs 2,505 80 238 82 145 306 60Taiwan broker/Tax Agent/SBL fees (34) - - - - - -Taiwan tax on earnings (144) - - - - - -Net return retained by the sub-fund 2,327 80 238 82 145 306 60Return to the ACD - - - - - - -Net return to the Agent 317 9 26 9 16 34 7
Return to the sub-fund 88% 90% 90% 90% 90% 90% 90%Return to the Agent 12% 10% 10% 10% 10% 10% 10%
Concentration DataTop ten (or less) counterparties for collateral (Government Bonds only)
Emerging Markets Core Equity Fund
£'000
Global Short-Dated Bond Fund
£'000
International Core Equity
Fund£'000
International Value Fund
£'000
United Kingdom Core
Equity Fund£'000
United Kingdom Small
Companies Fund£'000
United Kingdom
Value Fund£'000
Barclays Bank Plc - 8,181 902 1,998 6,048 6,620 2,511
Barclays Capital Securities 10,306 - - - 409 1,482 351
Citigroup Global Markets - - - 504 173 757 950
Credit Suisse Securities Europe 19,493 545 2,100 1,897 772 5,269 1,144
Deutsche Bank 24,160 - 1,572 - 2,095 3,034 2,591
Goldman Sachs International 12,665 - 1,705 1,344 2,116 1,466 -
JPMorgan Securities 5,749 - 2,131 315 303 3,047 238
Merrill Lynch International 21,453 - - - 2,027 - -
Morgan Stanley 20,863 - 5,125 2,544 4,949 5,803 4,717
UBS AG London 5,243 - 2,644 988 1,828 4,325 572 119,932 8,726 16,179 9,590 20,720 31,803 13,074
Others 15,883 - 8,161 2,800 - 794 967Total 135,815 8,726 24,340 12,390 20,720 32,597 14,041
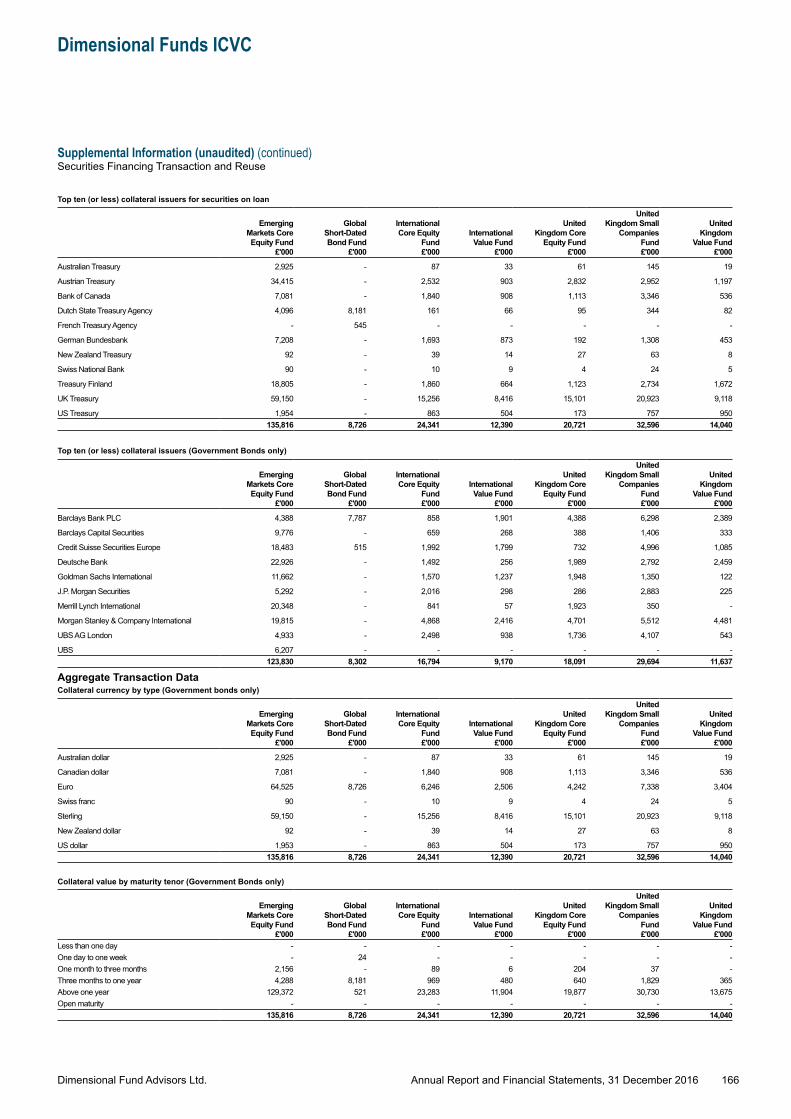
Dimensional Fund Advisors Ltd.
Dimensional Funds ICVC
Supplemental Information (unaudited) (continued)Securities Financing Transaction and Reuse
166Annual Report and Financial Statements, 31 December 2016
Top ten (or less) collateral issuers for securities on loan
Emerging Markets Core Equity Fund
£'000
Global Short-Dated Bond Fund
£'000
International Core Equity
Fund£'000
International Value Fund
£'000
United Kingdom Core
Equity Fund£'000
United Kingdom Small
Companies Fund£'000
United Kingdom
Value Fund£'000
Australian Treasury 2,925 - 87 33 61 145 19
Austrian Treasury 34,415 - 2,532 903 2,832 2,952 1,197
Bank of Canada 7,081 - 1,840 908 1,113 3,346 536
Dutch State Treasury Agency 4,096 8,181 161 66 95 344 82
French Treasury Agency - 545 - - - - -
German Bundesbank 7,208 - 1,693 873 192 1,308 453
New Zealand Treasury 92 - 39 14 27 63 8
Swiss National Bank 90 - 10 9 4 24 5
Treasury Finland 18,805 - 1,860 664 1,123 2,734 1,672
UK Treasury 59,150 - 15,256 8,416 15,101 20,923 9,118
US Treasury 1,954 - 863 504 173 757 950135,816 8,726 24,341 12,390 20,721 32,596 14,040
Top ten (or less) collateral issuers (Government Bonds only)
Emerging Markets Core Equity Fund
£'000
Global Short-Dated Bond Fund
£'000
International Core Equity
Fund£'000
International Value Fund
£'000
United Kingdom Core
Equity Fund£'000
United Kingdom Small
Companies Fund£'000
United Kingdom
Value Fund£'000
Barclays Bank PLC 4,388 7,787 858 1,901 4,388 6,298 2,389
Barclays Capital Securities 9,776 - 659 268 388 1,406 333
Credit Suisse Securities Europe 18,483 515 1,992 1,799 732 4,996 1,085
Deutsche Bank 22,926 - 1,492 256 1,989 2,792 2,459
Goldman Sachs International 11,662 - 1,570 1,237 1,948 1,350 122
J.P. Morgan Securities 5,292 - 2,016 298 286 2,883 225
Merrill Lynch International 20,348 - 841 57 1,923 350 -
Morgan Stanley & Company International 19,815 - 4,868 2,416 4,701 5,512 4,481
UBS AG London 4,933 - 2,498 938 1,736 4,107 543
UBS 6,207 - - - - - -123,830 8,302 16,794 9,170 18,091 29,694 11,637
Aggregate Transaction DataCollateral currency by type (Government bonds only)
Emerging Markets Core Equity Fund
£'000
Global Short-Dated Bond Fund
£'000
International Core Equity
Fund£'000
International Value Fund
£'000
United Kingdom Core
Equity Fund£'000
United Kingdom Small
Companies Fund£'000
United Kingdom
Value Fund£'000
Australian dollar 2,925 - 87 33 61 145 19
Canadian dollar 7,081 - 1,840 908 1,113 3,346 536
Euro 64,525 8,726 6,246 2,506 4,242 7,338 3,404
Swiss franc 90 - 10 9 4 24 5
Sterling 59,150 - 15,256 8,416 15,101 20,923 9,118
New Zealand dollar 92 - 39 14 27 63 8
US dollar 1,953 - 863 504 173 757 950135,816 8,726 24,341 12,390 20,721 32,596 14,040
Collateral value by maturity tenor (Government Bonds only)
Emerging Markets Core Equity Fund
£'000
Global Short-Dated Bond Fund
£'000
International Core Equity
Fund£'000
International Value Fund
£'000
United Kingdom Core
Equity Fund£'000
United Kingdom Small
Companies Fund£'000
United Kingdom
Value Fund£'000
Less than one day - - - - - - -One day to one week - 24 - - - - -One month to three months 2,156 - 89 6 204 37 -Three months to one year 4,288 8,181 969 480 640 1,829 365Above one year 129,372 521 23,283 11,904 19,877 30,730 13,675Open maturity - - - - - - -
135,816 8,726 24,341 12,390 20,721 32,596 14,040
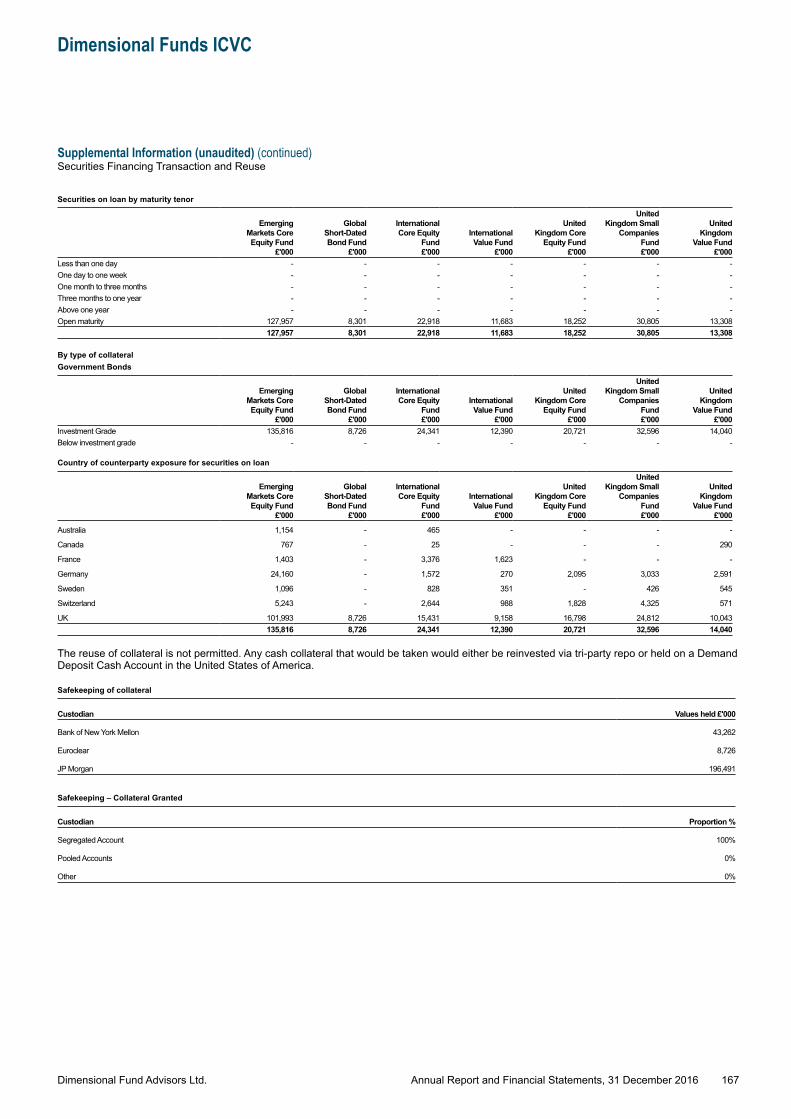
Dimensional Fund Advisors Ltd.
Dimensional Funds ICVC
Supplemental Information (unaudited) (continued)Securities Financing Transaction and Reuse
167Annual Report and Financial Statements, 31 December 2016
Securities on loan by maturity tenor
Emerging Markets Core Equity Fund
£'000
Global Short-Dated Bond Fund
£'000
International Core Equity
Fund£'000
International Value Fund
£'000
United Kingdom Core
Equity Fund£'000
United Kingdom Small
Companies Fund£'000
United Kingdom
Value Fund£'000
Less than one day - - - - - - -One day to one week - - - - - - -One month to three months - - - - - - -Three months to one year - - - - - - -Above one year - - - - - - -Open maturity 127,957 8,301 22,918 11,683 18,252 30,805 13,308
127,957 8,301 22,918 11,683 18,252 30,805 13,308
By type of collateralGovernment Bonds
Emerging Markets Core Equity Fund
£'000
Global Short-Dated Bond Fund
£'000
International Core Equity
Fund£'000
International Value Fund
£'000
United Kingdom Core
Equity Fund£'000
United Kingdom Small
Companies Fund£'000
United Kingdom
Value Fund£'000
Investment Grade 135,816 8,726 24,341 12,390 20,721 32,596 14,040Below investment grade - - - - - - -
Country of counterparty exposure for securities on loan
Emerging Markets Core Equity Fund
£'000
Global Short-Dated Bond Fund
£'000
International Core Equity
Fund£'000
International Value Fund
£'000
United Kingdom Core
Equity Fund£'000
United Kingdom Small
Companies Fund£'000
United Kingdom
Value Fund£'000
Australia 1,154 - 465 - - - -
Canada 767 - 25 - - - 290
France 1,403 - 3,376 1,623 - - -
Germany 24,160 - 1,572 270 2,095 3,033 2,591
Sweden 1,096 - 828 351 - 426 545
Switzerland 5,243 - 2,644 988 1,828 4,325 571
UK 101,993 8,726 15,431 9,158 16,798 24,812 10,043135,816 8,726 24,341 12,390 20,721 32,596 14,040
The reuse of collateral is not permitted. Any cash collateral that would be taken would either be reinvested via tri-party repo or held on a Demand Deposit Cash Account in the United States of America.
Safekeeping of collateral
Custodian
Values held £'000
Bank of New York Mellon 43,262
Euroclear 8,726
JP Morgan 196,491
Safekeeping – Collateral Granted
Custodian
Proportion %
Segregated Account 100%
Pooled Accounts 0%
Other 0%
dimensional.com
Authorised and Regulated by the Financial Conduct AuthorityFirm Reference Number: 150100
Dimensional Fund Advisors Ltd.20 Triton StreetRegent’s PlaceLondon NW1 3BF
The value of investments and any income from them may fall as well as rise and past performance is not a guarantee of future results.
This is not a prospectus. Dimensional Funds ICVC are offered solely under the terms and conditions of the current prospectus and applicable Key Investor Information Document (“KIID”). Consider the investment objectives, risks, charges and expenses of Dimensional Funds ICVC carefully before investing. For this and other information about the Dimensional Funds ICVC, please read the prospectus and KIIDs carefully before investing. The latest version of the prospectus (available in English) and applicable KIIDs (all in English and the appropriate local language) may be obtained at dimensional.com or by contacting the Dimensional Funds ICVC administrator, or the investment manager at +44 (0)203 033 3300.
Prospectuses are available to download from http://www.dimensional.com