Embed Size (px)
Citation preview
Annual Report and Financial Statements EUROPA OIL & GAS (HOLDINGS) plc
For the year ended 31 July 2014 Company registration number 5217946
Europa Oil & Gas (Holdings) plc
Europa Oil & Gas (Holdings) plc is an AIM listed exploration and production company focused on Europe. It offers an attractive mix of very high impact exploration offshore Ireland and onshore France, supported by exploration and production onshore UK.
Contents Highlights ....................................................................................................................................................................... 1 Chairman's statement ................................................................................................................................................... 2 Strategic report – Operations and development ...................................................................................................... 4 Strategic report – Operations ...................................................................................................................................... 6 Strategic report – Risks and uncertainties ............................................................................................................... 10 Directors’ report .......................................................................................................................................................... 11 Statement of directors’ responsibilities .................................................................................................................... 13 Report of the independent auditor........................................................................................................................... 14 Consolidated statement of comprehensive income .............................................................................................. 16 Consolidated statement of financial position ......................................................................................................... 17 Consolidated statement of changes in equity ......................................................................................................... 18 Company statement of financial position ............................................................................................................... 19 Company statement of changes in equity ............................................................................................................... 20 Consolidated statement of cash flows ..................................................................................................................... 21 Company statement of cash flows ........................................................................................................................... 22 Notes to the financial statements ............................................................................................................................. 23 Directors and advisers ................................................................................................................................................ 46
Europa Oil & Gas (Holdings) plc
1
Highlights
Operational highlights
Produced 165 boepd from three UK onshore fields
Completed 3D seismic acquisition programme offshore Ireland, completed seismic processing and commenced prospect mapping
Received a favourable judgment at the Court of Appeal for Holmwood planning
Spudded the Wressle well on 19 July 2014
Extended PEDL181 licence to 30 June 2015, obtained drill site and submitted planning application for Kiln Lane well
Renewed Béarn des Gaves permit to 22 March 2017
Renewed Tarbes val d’Adour permit to 18 January 2015
Raised £3.7 million net proceeds via a placing and oversubscribed open offer
Disposed of Romanian subsidiary for a nominal sum
Financial performance
Group revenue of £3.9 million (2013: £4.5 million)
Pre-tax profit from continuing operations excluding exploration write-off and impairment of £0.5 million (2013: £0.7 million)
Pre-tax loss from continuing operations of £0.7 million (2013: profit £0.5 million), after a £1.2 million impairment against the West Firsby field
Post-tax profit for the year £0.6 million (2013: loss £0.1 million)
Cash generated from continuing operations £1.4 million (2013: £1.7 million)
Net cash balance as at 31 July 2014 £4.5 million (31 July 2013: £0.7 million)
Post reporting date events
Kiln Lane well submitted for EA permitting, main well contracts being awarded
Announced that the Wressle well found 30 metres of potential hydrocarbon pay, production testing to commence later in 2014
Application submitted to extend the Tarbes val d’Adour permit to at least 2018
Europa Oil & Gas (Holdings) plc
2
Chairman's statement Europa is an exploration and production company with a portfolio of multi-stage projects in three core areas: onshore UK; offshore Ireland; and onshore France. The year under review saw Europa commence a multi-well programme focused on proving up our prospect inventory via the drill bit. We have embarked on an exciting phase in the development of our Company, one which, subject to the results, could see us deliver on our objective to build a top quartile AIM company in terms of market capitalisation.
Our drilling campaign got off to a good start in July with the Wressle-1 exploration well in East Lincolnshire, which was targeting a 2.1 mmbo conventional oil prospect, finding hydrocarbons. The stratigraphy encountered during drilling were in line with our pre-drill geological forecast and formation evaluation from log data indicated the presence of reservoirs that may contain hydrocarbons with sufficient porosity and permeability to flow at commercial rates. In all, over 30 metres of potential hydrocarbon pay have been identified in three main intervals. Testing is now required to determine if we have made a commercial discovery and this is scheduled to commence later this year.
Wressle will be followed by the drilling of the 2.9 mmbo Kiln Lane prospect on the neighbouring PEDL181 licence. Kiln Lane is a larger prospect than Wressle and a discovery on this previously undrilled licence would open up a new conventional oil and gas play and significantly de-risk additional leads identified on the licence. These additional leads would then become strong candidates for follow-up drilling. Furthermore, despite being a conventional oil exploration well, Kiln Lane may also provide information with which to assess any unconventional hydrocarbon prospectivity elsewhere in this large 540 km2 licence.
Needless to say, we are keen to drill more wells onshore UK and, subject to the results of Wressle and Kiln Lane, 2015 could see us undertake further drilling on already identified prospects on these licences. In addition, we will be participating in the upcoming 14th Onshore (Landward) Oil and Gas Licensing Round. Still in the UK, following favourable rulings by both the Court of Appeal and the High Court in relation to drilling a temporary exploratory well at the Holmwood prospect on the PEDL143 licence, we remain hopeful that we may be in a position to drill within the next 12 months, subject to a favourable determination by the Planning Inspectorate at a planning inquiry and available funding. PEDL143 is located in the Weald Basin, Surrey and with mean gross un-risked prospective resources of 5.6 mmbo, as estimated in a CPR published in June 2012, and with a one in three chance of success we rate Holmwood as being one of the best undrilled conventional prospects onshore in the UK.
While a discovery in the UK would result in a significant increase in our production generated revenues, our offshore Ireland and onshore France licences are the potential company-makers in our portfolio due to the size of the prospectivity identified. Here too considerable progress has been and continues to be made with regards to drilling these large prospects. In the South Porcupine Basin Offshore Ireland, where we previously mapped billion barrel prospects using historic 2D data, a 1,500 km2 3D seismic acquisition programme over our two licences was completed by the operator, Kosmos Energy, in October 2013. Kosmos are due to deliver a new prospect inventory based on this new data in Q4 2014. Upon receipt, Europa will commission an independent Competent Person’s Report covering our Irish licences. Whilst Kosmos have made no commitment to drill yet they have begun preparatory work to enable them to use the Atwood Achiever drillship in Ireland and subject to the quality of the prospect inventory could elect to drill a first well offshore Ireland in 2016. Under the terms of our farm-out agreement, Europa’s share of drilling costs for a first exploration well on each licence would be funded by Kosmos subject to a cap of either US$90 million in FEL 2/13 and or US$110 million in FEL 3/13. In our view an election to drill on our licences offshore Ireland is a value-trigger event. We estimate the minimum economic prospect size to be 100±20 mmbbls so if Kosmos do elect to drill, Europa will have a carried 15% interest targeting company-making volumetrics.
Europa Oil & Gas (Holdings) plc
3
Chairman’s statement (continued) In France, both our onshore licences were successfully renewed during the year under review. Europa holds 100% interests in the Béarn des Gaves (‘Béarn’) and Tarbes val d’Adour (‘Tarbes’) permits, located in the proven Aquitaine Basin. Of the two, Béarn is the potential company-maker thanks to the 107 bcf Berenx Shallow gas prospect and the 500+ bcf Berenx Deep gas appraisal project. Since the permit was renewed in October 2013 we have continued to obtain and reprocess seismic and enhance our geological model which has further refined the shallow and deep prospectivity. Whilst the mean unrisked resources of the shallow prospect are now 107 bcf, the resultant prospect is more robust and has enhanced technical credibility. Having augmented our model and upgraded the prospectivity, we have re-engaged with interested parties. In tandem with this process, we continue to advance well planning and permitting to drill the shallow prospect so that drilling operations can commence at the earliest opportunity. We have submitted an application to extend the Tarbes permit and discussions with a potential partner are on-going.
During the period we exited the UK PEDL150 licence, and disposed of our Romanian subsidiary for a nominal sum.
Financials
For the third consecutive year, our three UK onshore fields hit their twelve month production target, this year producing an average of 165 boepd and generating £3.9 million in revenues (2013: 182 boepd and £4.5 million). As these are mature fields, production is in long-term decline but thanks to our active field management programme we have improved operational performance, resulting in lower costs. Cash generated from continuing operations for the year was £1.4 million (2013: £1.7 million).
In January, we completed a placing of shares and an oversubscribed open offer to existing shareholders which together raised £3.7 million after expenses. We also collected a £0.3 million cash payment from Kosmos in connection with their farm-in to our Ireland licences. In total our cash balances at the period end stood at £4.5 million (2013: £0.7 million).
We have recorded a £1.2 million (2013: nil) impairment of the West Firsby field which arises from the lower assumed production rates used in the cash flow model.
The sale of our Romanian subsidiary allowed the write-back of a £0.6 million VAT creditor.
Outlook
We have one well in the UK about to undergo production testing, another well on course to commence in Q4 2014, and anticipate a new prospect inventory and CPR for offshore Ireland, which we expect will confirm the company-making potential of our licences. In addition, we are working to secure a farm-out for our 100% owned French permits. We will be participating in the upcoming UK and Irish licensing rounds, and we will continue to evaluate new projects and ventures that match our investment criteria. With all this activity in mind, shareholders can look forward to an exciting year ahead; one which we are confident will result in significant value creation, as we focus on monetising and growing our high quality asset base.
I was delighted to announce the appointment of Colin Bousfield to the Board in February. His extensive track record in securing debt and equity finance for oil and gas operating companies of all sizes, as well as his successful tenure as CFO for Composite Energy, makes Colin a valuable addition to our team.
Finally, I would like to thank the management, operational teams, the Board and advisers for their hard work and also our shareholders for their continued support over the year.
WH Adamson, Chairman
3 October 2014
Europa Oil & Gas (Holdings) plc
4
Strategic report - Our strategy
1. Generate substantial shareholder value by finding and producing oil and gas
2. Actively manage the exploration portfolio and make informed technical and commercial decisions on project progression.
3. Manage risk to maximize shareholder value
4. Exit projects at the point of maximum value for investors
5. Onshore Europe, North Atlantic and the Mediterranean are our principle areas of interest.
Strategic report - Our key performance indicators Financial KPIs
1. Revenue 2. Profit 3. Cash from operations 4. Net cash balances
Financial analysis is provided in the Chairman’s Statement (page 3) Non-financial KPIs
1. Health, safety and environmental measures 2. Production (boepd and non-productive time) 3. Progress with all the licences in which the Group has interests 4. Participation in ongoing and future licensing rounds
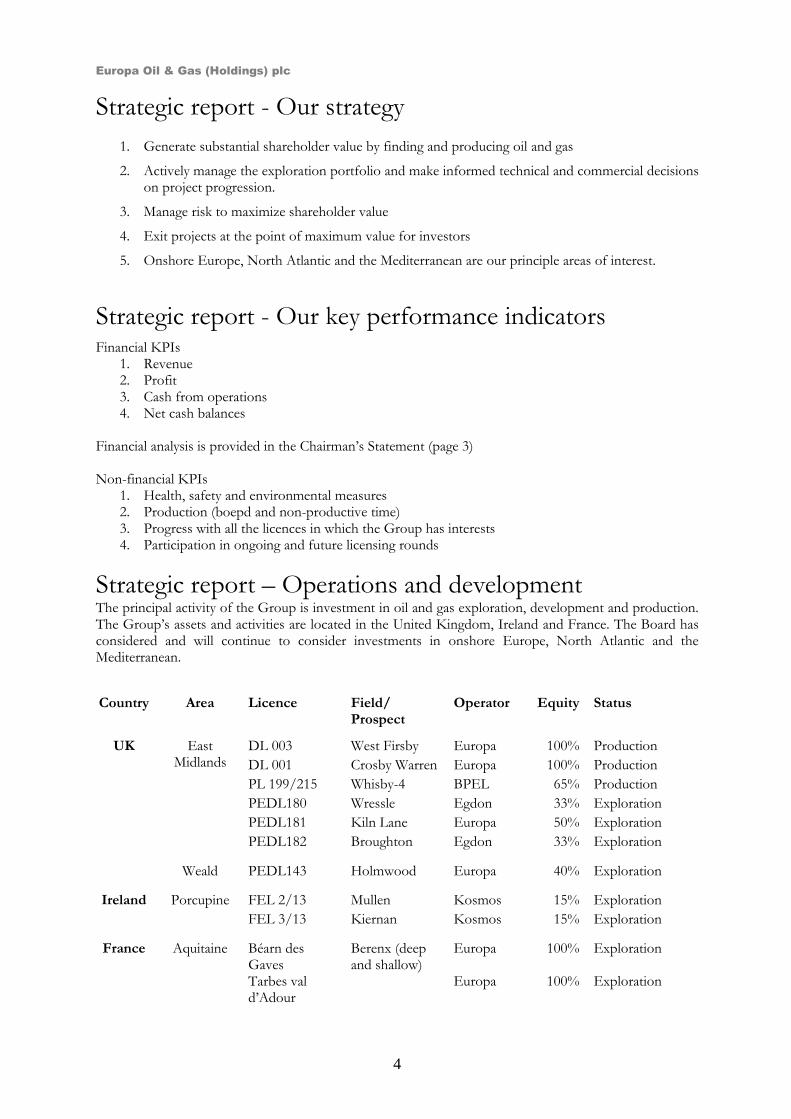
Strategic report – Operations and development The principal activity of the Group is investment in oil and gas exploration, development and production. The Group’s assets and activities are located in the United Kingdom, Ireland and France. The Board has considered and will continue to consider investments in onshore Europe, North Atlantic and the Mediterranean.
Country Area Licence Field/ Prospect
Operator Equity Status
UK East
Midlands DL 003 West Firsby Europa 100% Production
DL 001 Crosby Warren Europa 100% Production
PL 199/215 Whisby-4 BPEL 65% Production
PEDL180 Wressle Egdon 33% Exploration
PEDL181 Kiln Lane Europa 50% Exploration
PEDL182 Broughton Egdon 33% Exploration
Weald PEDL143 Holmwood Europa 40% Exploration
Ireland Porcupine FEL 2/13 Mullen Kosmos 15% Exploration
FEL 3/13 Kiernan Kosmos 15% Exploration
France Aquitaine Béarn des
Gaves Berenx (deep and shallow)
Europa 100% Exploration
Tarbes val d’Adour
Europa 100% Exploration
Europa Oil & Gas (Holdings) plc
5
Making progress across our business
Wressle Spud date 19 Jul 2014 The Wressle-1 exploration well, targeting a conventional prospect estimated by the operator to hold mean gross un-risked recoverable resources of 2.1 mmbo, was spudded on 19 July 2014. The well reached a total depth of 2,240 metres (1,814 metres TVDSS) on 23 August 2014 and discovered hydrocarbons. The well will be production tested later in 2014.
Kiln Lane Planning is proceeding on plan for the Kiln Lane exploration well. A drillsite has been leased, the planning application has been submitted with a decision due in Q4 2014, the EA mining waste permit has been submitted with a decision due in Q4 2014, all drilling services have been tendered and contracts awards will be made in Q4 2014. Subject to planning approval siteworks will commence in Q4 2014.
Europa Oil & Gas (Holdings) plc
6
Strategic report – Operations Ireland
Exploration - Porcupine Basin Frontier Exploration Licences (‘FELs’) 2/13 and 3/13 - Europa (15%); Kosmos (85% and operator)
The exploration model for these licences is the Cretaceous stratigraphic play: comprising Early Cretaceous turbidite sandstone reservoirs; charged by mature Late Jurassic and Early Cretaceous source rocks and contained in stratigraphic traps with elements of structural closure. The Cretaceous play in Ireland is essentially undrilled and is considered to be analogous to the same play in the equatorial Atlantic Margin province that has delivered the Jubilee and Mahogany oil fields.
Europa’s interpretation of pre-existing 2D seismic identified two previously unknown prospects in the Lower Cretaceous stratigraphic play: Mullen in FEL 2/13 and Kiernan in FEL 3/13. The Company estimates these to have gross mean un-risked indicative resources of 482 million barrels of oil and 1.6 billion barrels of oil equivalent respectively (see press releases dated 6 November 2012 and 16 January 2013 for further information).
Under the terms of the farm-in, Kosmos fully funded the costs of a 3D seismic programme over both FELs and for which acquisition was completed in October 2013 and final processed data delivered in April 2014. Kosmos has advised that a new prospect inventory based on the interpretation and mapping of the 3D data will be completed and delivered to Europa in Q4 2014. Upon receipt of this, Europa will commission a CPR to provide a third party assessment of the prospectivity of the two licence blocks. The 3D seismic is a highly significant first step towards realising the hydrocarbon potential of the basin and has the potential to substantially de-risk the prospects, particularly if features like conformance, flat events and AVO anomalies are observed on the data.
It is anticipated that the indicative resources previously provided to the market will change according to the vastly improved prospect mapping arising from the state of the art 3D data now available over the licences. We nevertheless expect that the prospect sizes will remain large to very large and the quantum of resources is likely to be hundreds of millions of barrels. We also anticipate that the geological risk will be significantly reduced from the 1 in 10 previously assigned based on the historic 2D seismic as we mature prospects to drillable status with the new 3D data.
Subject to the results of the prospect inventory, Kosmos may elect to drill a well as early as 2016 and in which Europa will have a 15% carried interest. Under the terms of the farm-out, Kosmos will incur 100% of the costs of the first exploration well on each licence. The first exploration wells on FEL 2/13 and FEL 3/13 have investment caps of US$90 million and US$110 million respectively. Costs in excess of the investment cap would be shared between Kosmos (85%) and Europa (15%).
The technical insights that Europa continues to gain from its work in the South Porcupine Basin provides a competitive edge that the directors will seek to exploit through participation in the 2015 Atlantic Margin Licensing Round that opened in June 2014.
France
Béarn des Gaves 100% Europa holds a 100% interest in the onshore Béarn des Gaves permit in the Aquitaine basin, the heartland of the French oil industry. The permit contains two prospects: Berenx Deep and Berenx Shallow. Berenx Deep is an appraisal project having previously been explored and drilled by EssoRep with two wells, Berenx-1 (1969) and Berenx-2 (1972), both encountering strong gas shows over a 500 metre thick gas bearing zone. In 1975 Berenx-2 was re-entered, drill stem tested and flowed gas to surface from the same carbonate reservoir that delivered 9 tcf and 2 tcf from nearby fields at Lacq and Meillon.
Europa’s in-house technical work indicates that the Berenx deep appraisal prospect could hold in excess of 500 bcf of recoverable gas resources. In a CPR dated 31 May 2012, ERC Equipoise estimated gross mean un-risked resources of 277 bcf for the Berenx deep gas play. The difference between Europa’s and ERC's assessment of resources reflects the confidence of each party in mapping in a geologically complex terrain. Europa was able to map a larger area of closure and as a consequence larger resources.
Europa Oil & Gas (Holdings) plc
7
Strategic Report – Operations (continued)
France (continued)
Béarn des Gaves 100% (continued) Thorough re-evaluation and interpretation of existing seismic and well data on the permit has resulted in the definition of a new shallow gas prospect, Berenx Shallow. Previous exploration on the concession had focused only on the deep gas prospectivity. A comprehensive review of historic well results, the recent discovery of previously missing seismic data by the French authorities, together with a substantial seismic reprocessing project has delivered a re-interpretation of structure and better understanding of proven hydrocarbon bearing reservoir distribution in the shallow Cretaceous and Late Jurassic carbonate sediments. This has resulted in a stronger technical interpretation and the resultant prospect is more robust and has enhanced technical credibility Europa has confirmed the Berenx Shallow gas prospectivity and suggests potential gross mean un-risked resources of 107 bcf.
The Company’s strategy for Béarn des Gaves is to first target the shallow gas play, drill a well with the aim of delivering a commercial flow rate and, on the back of commercial success, to further appraise the shallow prospectivity and undertake work to de-risk the Berenx Deep appraisal prospect. The shallow prospect can be tested with a comparatively simple exploration well with an anticipated total depth of 2,500 metres.
On 3 October 2013, the permit was successfully renewed for a period of five years from 22 March 2012 and carries an expenditure commitment of approximately €2.5 million. A farm-out process for the permit is currently underway in tandem with well planning and permitting for a well location on Berenx Shallow ahead of drilling in the next 18 months. A wellsite has been identified and a lease has been prepared. Scoping economics suggests a value of US$11.5 boe and NPV10 of US$170 million therefore the Directors believe that exploration success at Berenx Shallow would be a company maker for Europa.
Tarbes val d’Adour 100% Europa holds a 100% interest in the Tarbes val d’Adour permit (‘Tarbes’), in the proven Aquitaine Basin, onshore France. We received notification during the reporting period that the permit was extended for three years from 18 January 2012 until 18 January 2015. Tarbes contains several oil accumulations that were previously licensed by Elf but were abandoned in 1985 due to a combination of technical issues and low oil prices. Two fields, Jacque and Osmets, were drilled using vertical wells which generated modest production levels and as a result Tarbes is classified as an appraisal project. A farm-out process has been launched, discussions with a potential partner are ongoing and an application to extend the permit to at least 2018 has been submitted to the French authorities.
United Kingdom
NE Lincolnshire - PEDL180 33.3% (Wressle) PEDL180 covers an area of 100 km2 of the East Midlands Petroleum Province 5 km southeast of the Europa operated Crosby Warren field which has been producing oil for 28 years. Europa has a 33.3% working interest in the block with its partners Egdon Resources (operator, 25%), Celtique Energie Petroleum Ltd (33.3%) and Union Jack Oil (8.3%).
The Wressle-1 conventional exploration well spudded on 19 July 2014 targeting a conventional prospect estimated by the operator to hold mean gross un-risked recoverable resources of 2.1 mmbo. The well reached a total depth of 2,240 metres (1,814 metres TVDSS) on 23 August 2014.
Both the stratigraphy and reservoir horizons encountered by the well were in accordance with the pre-drill geological forecast which was based on 49 km2 of 3D seismic acquisition acquired in 2012. Preliminary petro-physical evaluation of MWD (measurement whilst drilling) log data has indicated that hydrocarbons with sufficient porosity and permeability to flow at commercial rates are present. In all, over 30 metres measured thickness of potential hydrocarbon pay has been identified in three main intervals: Penistone Flags with up to 19.8 metres measured thickness (15.9 metres vertical thickness) of potential hydrocarbon pay; Wingfield Flags with up to 5.6 metres measured thickness (5.1 metres vertical thickness) of potential hydrocarbon pay; and Ashover Grit with up to 6.1 metres measured thickness (5.8 metres vertical thickness) of potential hydrocarbon pay. Elevated mud gas readings were observed over large parts of the interval from the top of the Penistone Flags reservoir target (1,831 metres MD) to TD.

Europa Oil & Gas (Holdings) plc
8
Strategic Report – Operations (continued)
United Kingdom (continued)
NE Lincolnshire - PEDL180 33.3% (Wressle, continued) The three reservoirs will be further evaluated by well testing to define fluid type(s), reservoir properties, production rates and commerciality. The well has been completed with a 4 ½” liner to enable selective and sequential testing of the intervals as part of an extended well test, for which planning consent is already in place. Test operations using a work-over rig are expected to commence later this year.
NE Lincolnshire - PEDL182 33.3% (Broughton) PEDL182 covers an area of 40 km2. The Broughton prospect was previously drilled by BP and flowed oil. The May 2012 Competent Person’s Report (‘CPR’) estimated the Broughton prospect to hold mean gross un-risked recoverable resources of 1.85 mmbo. Broughton is located on trend with the producing Crosby Warren oil field and the Wressle prospect on PEDL180. Subject to the results of the planned production test of the Wressle–1 exploration well, the partners may elect to drill the Broughton prospect.
NE Lincolnshire - PEDL181 50% (Kiln Lane) Europa has a 50% interest in and is the operator of the PEDL181 licence, with Egdon Resources UK Limited and Celtique Energie Petroleum Ltd, each holding a 25% interest. PEDL181 is located in the Carboniferous petroleum play and covers an area of over 540 km2 in the Humber Basin.
The licence has good potential for conventional oil and gas and unusually for the East Midlands Petroleum Province has never been previously drilled. The licence is located in a working hydrocarbon system where a number of discoveries have been made along the Brigg-Broughton anticline, including Europa’s existing oil production at the Crosby Warren field at the westernmost end of the anticline.
Technical evaluation has confirmed several conventional prospects and leads in PEDL181. Four of these in the southern part of the licence were the focus of a 78 km 2D seismic acquisition programme that was completed in April 2013. Reprocessing of 150 km2 of existing 3D seismic data together with processing of the new data resulted in the maturing of a drill ready prospect, Kiln Lane, with gross un-risked prospective resources of 2.9 mmboe. In January 2014 a one year extension to the licence to June 2015 was secured and that will enable an exploration well to be drilled at Kiln Lane later this year. A drillsite has been leased and both the planning and EA Mining Waste Permit applications have been submitted and are being processed by the relevant authorities.
In addition to the conventional prospectivity the Humber basin may also have unconventional hydrocarbon potential. Interpretation of the new seismic data suggests that this basin may contain a much thicker sequence of Namurian age sediments than was previously thought. The content of this sedimentary package in the Humber basin is not known. The Namurian section in the Gainsborough Trough, located some 25 km to the west of PEDL181 has been drilled and is known to host the Bowland Shale which has well-documented potential for shale gas. It is possible that the Namurian section in the Humber basin may contain a Bowland Shale equivalent with similar potential to be both the source rock for the conventional hydrocarbons in the licence area, and perhaps also have some potential for unconventional hydrocarbons.
Dorking area - PEDL143 40% (Holmwood) The PEDL143 licence covers an area of 92 km2 of the Weald Basin, Surrey. Europa is the operator and has a 40% working interest in the licence with partners Egdon Resources (38.4%), Altwood Petroleum (1.6%), and Warwick Energy (20%). The Holmwood prospect is a conventional Jurassic sandstone reservoir with a low geological risk. The May 2012 CPR estimated Holmwood to hold gross mean recoverable resources of 5.64 mmbo. Europa considers Holmwood to be one of the best undrilled conventional exploration prospects in the UK.
Europa Oil & Gas (Holdings) plc
9
Strategic Report – Operations (continued)
United Kingdom (continued)
Dorking area - PEDL143 40% (Holmwood, continued) The prospect lies south of Dorking within the Surrey Hills Area of Outstanding Natural Beauty. An application to construct a temporary exploration well on the site was originally made in 2008. This application was refused in 2011 by Surrey County Council contrary to their planning officer’s recommendation to approve. An appeal to overturn the decision was heard at a public inquiry in July 2012. The appeal was dismissed on 26 September 2012.
Europa, along with its partners, applied for an order to quash the decision of the Secretary of State for Communities and Local Government’s appointed Inspector to dismiss the appeal. On 25 July 2013, the Royal Courts of Justice gave judgment in favour of Europa and quashed the Inspector’s decision. An appeal was submitted to the Court of Appeal which was subsequently dismissed by the Court on 19 June 2014. As a result, Europa’s appeal against Surrey County Council’s refusal to grant planning permission to drill one exploratory borehole and undertake a short-term test for conventional hydrocarbons at the Holmwood prospect has been remitted to the Planning Inspectorate for redetermination. This will involve a further planning inquiry in the first half of 2015.
Lincolnshire area - PEDL150 100% (Hykeham) During the year the Group completed the abandonment of the Hykeham well and relinquished the licence.
Production (West Firsby 100%; Crosby Warren 100%; Whisby W4 well 65%) The three UK fields produced an average of 165 boepd (2013: 182 boepd) during the year under review, the third consecutive year the full year production target was met. We recorded a £1.2 million impairment of the West Firsby field arising from lower production rates used in the cash flow projections and in accordance with the predicted decline forecast for the field. Unconventional resources - Shale Gas As previously noted PEDL181 may have some potential for shale gas.
Romania
In July 2014, the Company announced the completion of the sale of its entire holding in the issued share capital of the Romanian subsidiary Europa Oil & Gas SRL for a nominal sum. The subsidiary held interests in onshore concessions in Romania which had been relinquished, or were in the process of receiving government approval for such relinquishment. The assets were written down to nil value in the Group's financial statements for the year to 31 July 2012. The sale marks the termination of the Company's involvement in Romania.
Results for the year
The Group loss for the year after taxation from continuing activities was £368,000 (2013 loss: £54,000). The profit on discontinued activities was £933,000 (2013: loss £47,000).
Conclusion
Having commenced our drilling programme in July with the Wressle well, we are working hard to build and maintain a pipeline of drilling activity across our asset base. We are already funded to drill the Kiln Lane prospect in Q4 2014 and, subject to an election to drill by Kosmos, we have a free carry for two high impact wells, one on each of our licences offshore Ireland, the first of which could be drilled as early as 2016. On-going farm-out discussions for our two 100% owned French licences could lead to further drilling and in anticipation of this we are already progressing with well permitting and planning for the 107 bcf Shallow gas prospect on Béarn des Gaves and are extending the Tarbes val d’Adour permit. A number of potential follow-up prospects have been identified across our licences and success with the drill bit could lead to several of these being fast tracked for drilling. In the meantime we continue to look to acquire new licences and projects either through ground floor licensing rounds or corporate activity. I look forward to providing updates on our progress.
Hugh Mackay, CEO
3 October 2014
Europa Oil & Gas (Holdings) plc
10
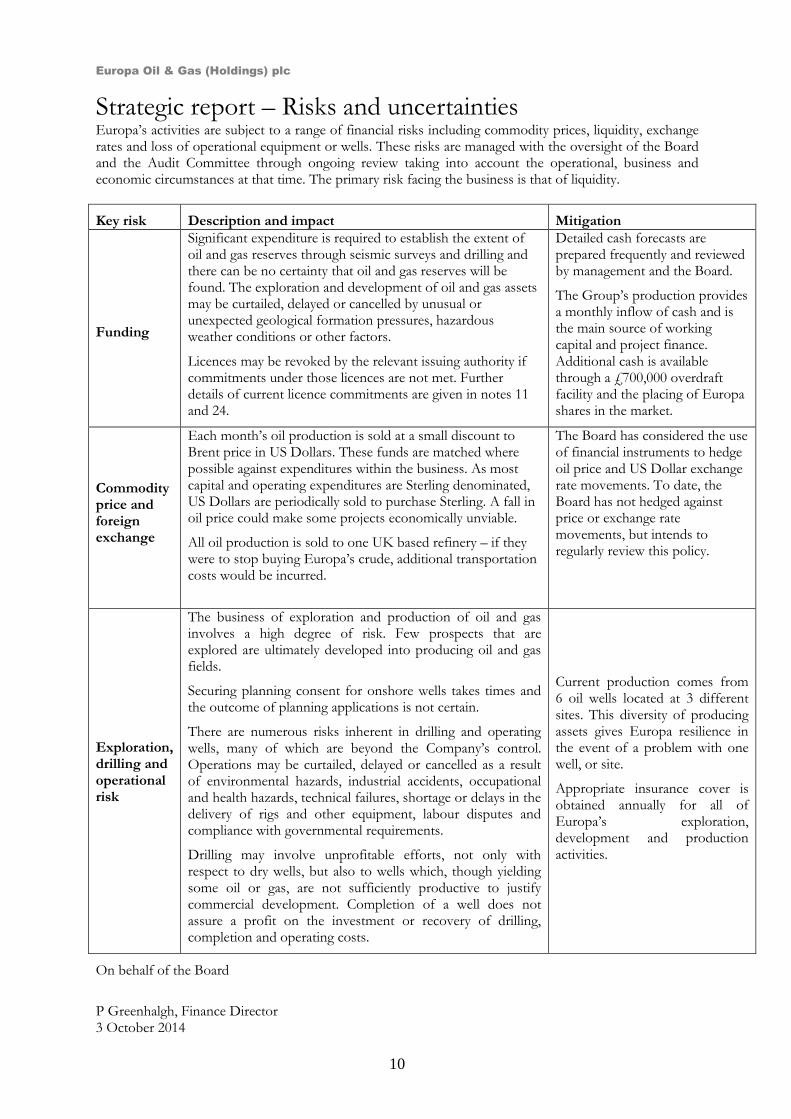
Strategic report – Risks and uncertainties Europa’s activities are subject to a range of financial risks including commodity prices, liquidity, exchange rates and loss of operational equipment or wells. These risks are managed with the oversight of the Board and the Audit Committee through ongoing review taking into account the operational, business and economic circumstances at that time. The primary risk facing the business is that of liquidity.
Key risk Description and impact Mitigation
Funding
Significant expenditure is required to establish the extent of oil and gas reserves through seismic surveys and drilling and there can be no certainty that oil and gas reserves will be found. The exploration and development of oil and gas assets may be curtailed, delayed or cancelled by unusual or unexpected geological formation pressures, hazardous weather conditions or other factors.
Licences may be revoked by the relevant issuing authority if commitments under those licences are not met. Further details of current licence commitments are given in notes 11 and 24.
Detailed cash forecasts are prepared frequently and reviewed by management and the Board.
The Group’s production provides a monthly inflow of cash and is the main source of working capital and project finance. Additional cash is available through a £700,000 overdraft facility and the placing of Europa shares in the market.
Commodity price and foreign exchange
Each month’s oil production is sold at a small discount to Brent price in US Dollars. These funds are matched where possible against expenditures within the business. As most capital and operating expenditures are Sterling denominated, US Dollars are periodically sold to purchase Sterling. A fall in oil price could make some projects economically unviable.
All oil production is sold to one UK based refinery – if they were to stop buying Europa’s crude, additional transportation costs would be incurred.
The Board has considered the use of financial instruments to hedge oil price and US Dollar exchange rate movements. To date, the Board has not hedged against price or exchange rate movements, but intends to regularly review this policy.
Exploration, drilling and operational risk
The business of exploration and production of oil and gas involves a high degree of risk. Few prospects that are explored are ultimately developed into producing oil and gas fields.
Securing planning consent for onshore wells takes times and the outcome of planning applications is not certain.
There are numerous risks inherent in drilling and operating wells, many of which are beyond the Company’s control. Operations may be curtailed, delayed or cancelled as a result of environmental hazards, industrial accidents, occupational and health hazards, technical failures, shortage or delays in the delivery of rigs and other equipment, labour disputes and compliance with governmental requirements.
Drilling may involve unprofitable efforts, not only with respect to dry wells, but also to wells which, though yielding some oil or gas, are not sufficiently productive to justify commercial development. Completion of a well does not assure a profit on the investment or recovery of drilling, completion and operating costs.
Current production comes from 6 oil wells located at 3 different sites. This diversity of producing assets gives Europa resilience in the event of a problem with one well, or site.
Appropriate insurance cover is obtained annually for all of Europa’s exploration, development and production activities.
On behalf of the Board
P Greenhalgh, Finance Director 3 October 2014
Europa Oil & Gas (Holdings) plc
11
Directors’ report
Business review
A detailed review of the Group’s business is set out in the Chairman’s statement (page 2) and Strategic report (page 4).
Future developments
Details of expected future developments for the Group are set out in the Chairman’s statement (page 2) and Strategic report (page 4).
Dividends
The directors do not recommend the payment of a dividend (2013: £nil).
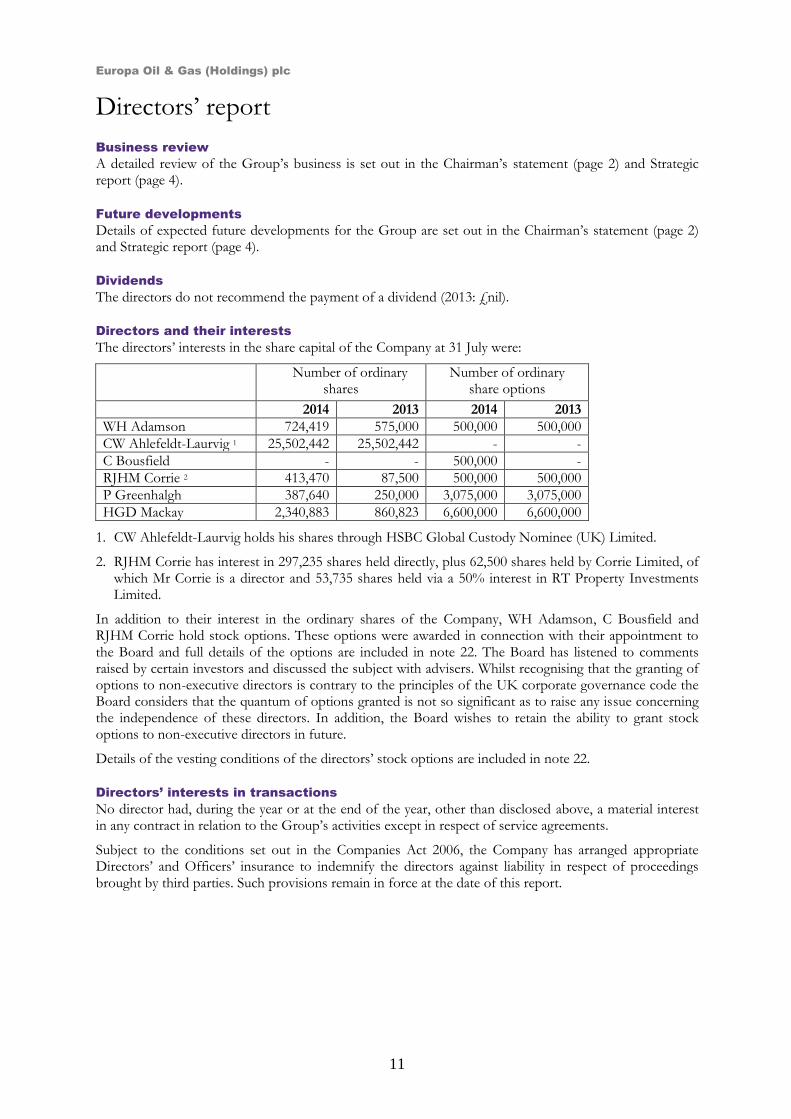
Directors and their interests The directors’ interests in the share capital of the Company at 31 July were:
Number of ordinary shares
Number of ordinary share options
2014 2013 2014 2013
WH Adamson 724,419 575,000 500,000 500,000
CW Ahlefeldt-Laurvig 1 25,502,442 25,502,442 - -
C Bousfield - - 500,000 -
RJHM Corrie 2 413,470 87,500 500,000 500,000
P Greenhalgh 387,640 250,000 3,075,000 3,075,000
HGD Mackay 2,340,883 860,823 6,600,000 6,600,000
1. CW Ahlefeldt-Laurvig holds his shares through HSBC Global Custody Nominee (UK) Limited.
2. RJHM Corrie has interest in 297,235 shares held directly, plus 62,500 shares held by Corrie Limited, of which Mr Corrie is a director and 53,735 shares held via a 50% interest in RT Property Investments Limited.
In addition to their interest in the ordinary shares of the Company, WH Adamson, C Bousfield and RJHM Corrie hold stock options. These options were awarded in connection with their appointment to the Board and full details of the options are included in note 22. The Board has listened to comments raised by certain investors and discussed the subject with advisers. Whilst recognising that the granting of options to non-executive directors is contrary to the principles of the UK corporate governance code the Board considers that the quantum of options granted is not so significant as to raise any issue concerning the independence of these directors. In addition, the Board wishes to retain the ability to grant stock options to non-executive directors in future.
Details of the vesting conditions of the directors’ stock options are included in note 22.
Directors’ interests in transactions
No director had, during the year or at the end of the year, other than disclosed above, a material interest in any contract in relation to the Group’s activities except in respect of service agreements.
Subject to the conditions set out in the Companies Act 2006, the Company has arranged appropriate Directors’ and Officers’ insurance to indemnify the directors against liability in respect of proceedings brought by third parties. Such provisions remain in force at the date of this report.
Europa Oil & Gas (Holdings) plc
12
Directors' report (continued)
Financial instruments
See note 1 and note 23 to the financial statements.
Related party transactions
See note 26 to the financial statements.
Post reporting date events
See note 27 to the financial statements.
Capital structure and going concern
Further details on the Group’s capital structure are included in note 21. Comments on going concern are included in note 1.
Accounting policies
A full list of accounting policies is set out in note 1 to the financial statements. The Group has not made any material changes to its accounting policies in the year to 31 July 2014.
Disclosure of information to the auditor
In the case of each person who was a director at the time this report was approved:
So far as that director was aware there was no relevant available information of which the Company’s auditor was unaware.
That director had taken all necessary steps to make themselves aware of any relevant audit information, and to establish that the Company’s auditors was aware of that information.
Auditor A resolution to re-appoint the auditor, BDO LLP will be proposed at the next Annual General Meeting.
On behalf of the Board
P Greenhalgh, Finance Director 3 October 2014
Europa Oil & Gas (Holdings) plc
13
Statement of directors’ responsibilities
Directors’ responsibilities
The directors are responsible for preparing the annual report and the financial statements in accordance with applicable law and regulations.
Company law requires the directors to prepare financial statements for each financial year. Under that law the directors have elected to prepare the Group and Company financial statements in accordance with International Financial Reporting Standards (IFRSs) as adopted by the European Union. Under Company law the directors must not approve the financial statements unless they are satisfied that they give a true and fair view of the state of affairs of the Group and Company and of the profit or loss of the Group for that year. The directors are also required to prepare financial statements in accordance with the rules of the London Stock Exchange for companies trading securities on the Alternative Investment Market.
In preparing these financial statements, the directors are required to:
select suitable accounting policies and then apply them consistently;
make judgements and accounting estimates that are reasonable and prudent;
state whether they have been prepared in accordance with IFRSs as adopted by the European Union, subject to any material departures disclosed and explained in the financial statements;
prepare the financial statements on the going concern basis unless it is inappropriate to presume that the Company will continue in business.
The directors are responsible for keeping adequate accounting records that are sufficient to show and explain the Company’s transactions and disclose with reasonable accuracy at any time the financial position of the Company and enable them to ensure that the financial statements comply with the requirements of the Companies Act 2006. They are also responsible for safeguarding the assets of the Company and hence for taking reasonable steps for the prevention and detection of fraud and other irregularities.
Website publication
The directors are responsible for ensuring the annual report and the financial statements are made available on a website. Financial statements are published on the Company's website in accordance with legislation in the United Kingdom governing the preparation and dissemination of financial statements, which may vary from legislation in other jurisdictions. The maintenance and integrity of the Company's website is the responsibility of the directors. The directors' responsibility also extends to the ongoing integrity of the financial statements contained therein.
Europa Oil & Gas (Holdings) plc
14
Report of the independent auditor
Independent auditor’s report to the members of Europa Oil & Gas (Holdings) plc
We have audited the financial statements of Europa Oil and Gas (Holdings) plc for the year ended 31 July 2014 which comprise the consolidated statement of comprehensive income, the consolidated and Company statement of financial position, the consolidated and Company statement of changes in equity, the consolidated and Company statement of cashflows and the related notes. The financial reporting framework that has been applied in their preparation is applicable law and International Financial Reporting Standards (IFRSs) as adopted by the European Union and, as regards the parent Company financial statements, as applied in accordance with the provisions of the Companies Act 2006.
This report is made solely to the Company’s members, as a body, in accordance with Chapter 3 of Part 16 of the Companies Act 2006. Our audit work has been undertaken so that we might state to the Company’s members those matters we are required to state to them in an auditor’s report and for no other purpose. To the fullest extent permitted by law, we do not accept or assume responsibility to anyone other than the Company and the Company’s members as a body, for our audit work, for this report, or for the opinions we have formed.
Respective responsibilities of directors and auditors
As explained more fully in the statement of directors’ responsibilities, the directors are responsible for the preparation of the financial statements and for being satisfied that they give a true and fair view. Our responsibility is to audit and express an opinion on the financial statements in accordance with applicable law and International Standards on Auditing (UK and Ireland). Those standards require us to comply with the Financial Reporting Council’s (FRC’s) Ethical Standards for Auditors.
Scope of the audit of the financial statements
A description of the scope of an audit of financial statements is provided on the FRC’s website at www.frc.org.uk/auditscopeukprivate
Opinion on financial statements
In our opinion:
the financial statements give a true and fair view of the state of the Group’s and the parent Company’s affairs as at 31 July 2014 and of the Group’s profit for the year then ended;
the group financial statements have been properly prepared in accordance with IFRSs as adopted by the European Union;
the parent Company financial statements have been properly prepared in accordance with IFRSs as adopted by the European Union and as applied in accordance with the provisions of the Companies Act 2006; and
the financial statements have been prepared in accordance with the requirements of the Companies Act 2006.
Opinion on other matters prescribed by the Companies Act 2006
In our opinion the information given in the strategic report and directors’ report for the financial year for which the financial statements are prepared is consistent with the financial statements.
Europa Oil & Gas (Holdings) plc
15
Report of the independent auditor (continued)
Matters on which we are required to report by exception
We have nothing to report in respect of the following matters where the Companies Act 2006 requires us to report to you if, in our opinion:
adequate accounting records have not been kept by the parent company, or returns adequate for our audit have not been received from branches not visited by us; or
the parent Company financial statements are not in agreement with the accounting records and returns; or
certain disclosures of directors’ remuneration specified by law are not made; or
we have not received all the information and explanations we require for our audit.
Scott Knight, Senior Statutory Auditor For and on behalf of BDO LLP, statutory auditor London, United Kingdom 3 October 2014
BDO LLP is a limited liability partnership registered in England and Wales (with registered number OC305127).
Europa Oil & Gas (Holdings) plc
16
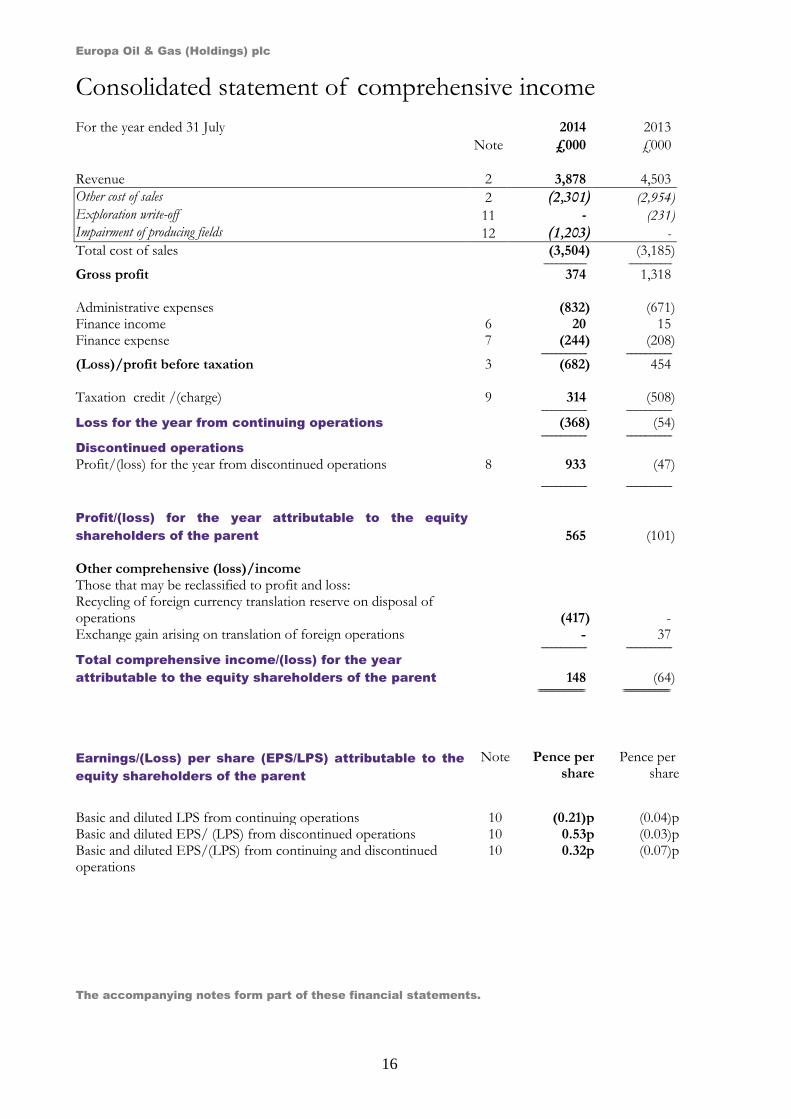
Consolidated statement of comprehensive income
Earnings/(Loss) per share (EPS/LPS) attributable to the
equity shareholders of the parent
Note Pence per share
Pence per share
Basic and diluted LPS from continuing operations 10 (0.21)p (0.04)p Basic and diluted EPS/ (LPS) from discontinued operations 10 0.53p (0.03)p Basic and diluted EPS/(LPS) from continuing and discontinued operations
10 0.32p (0.07)p
The accompanying notes form part of these financial statements.
For the year ended 31 July 2014 2013
Note £000 £000
Revenue 2 3,878 4,503
Other cost of sales 2 (2,301) (2,954) Exploration write-off 11 - (231) Impairment of producing fields 12 (1,203) -
Total cost of sales (3,504) (3,185) ---------------------------------- ---------------------------------- Gross profit 374 1,318 Administrative expenses (832) (671) Finance income 6 20 15 Finance expense 7 (244) (208) ------------------------------------ ------------------------------------ (Loss)/profit before taxation 3 (682) 454 Taxation credit /(charge) 9 314 (508) ------------------------------------ ------------------------------------ Loss for the year from continuing operations (368) (54)
------------------------------------ ------------------------------------ Discontinued operations Profit/(loss) for the year from discontinued operations 8 933 (47)
------------------------------------ ------------------------------------
Profit/(loss) for the year attributable to the equity
shareholders of the parent 565 (101) Other comprehensive (loss)/income Those that may be reclassified to profit and loss: Recycling of foreign currency translation reserve on disposal of operations (417) - Exchange gain arising on translation of foreign operations - 37 ------------------------------------ ------------------------------------ Total comprehensive income/(loss) for the year
attributable to the equity shareholders of the parent 148 (64) ===================================== =====================================
Europa Oil & Gas (Holdings) plc
17
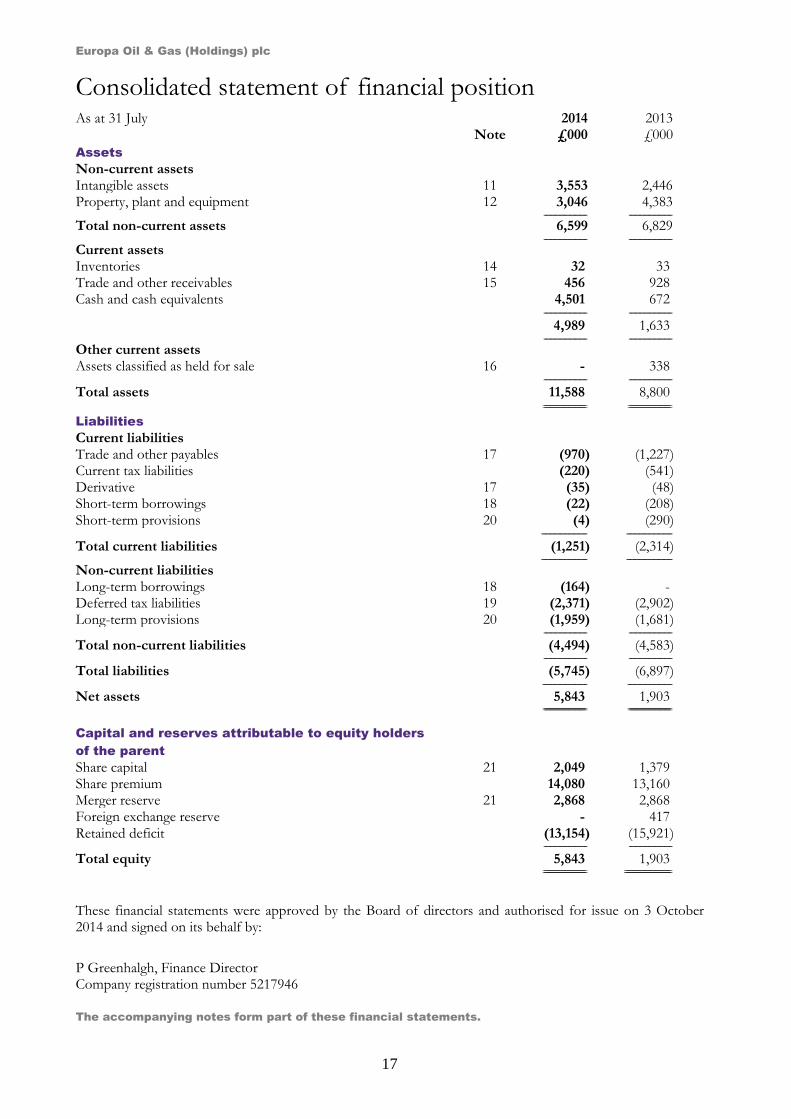
Consolidated statement of financial position As at 31 July 2014 2013 Note £000 £000
Assets
Non-current assets
Intangible assets 11 3,553 2,446 Property, plant and equipment 12 3,046 4,383 ---------------------------------- ----------------------------------
Total non-current assets 6,599 6,829 ---------------------------------- ----------------------------------
Current assets
Inventories 14 32 33 Trade and other receivables 15 456 928 Cash and cash equivalents 4,501 672 ---------------------------------- ----------------------------------
4,989 1,633 ---------------------------------- ----------------------------------
Other current assets Assets classified as held for sale
16 - 338
---------------------------------- ----------------------------------
Total assets 11,588 8,800 ================================== ==================================
Liabilities Current liabilities Trade and other payables 17 (970) (1,227) Current tax liabilities (220) (541) Derivative 17 (35) (48) Short-term borrowings 18 (22) (208) Short-term provisions 20 (4) (290) ------------------------------------ ------------------------------------
Total current liabilities (1,251) (2,314) ------------------------------------ ------------------------------------
Non-current liabilities
Long-term borrowings 18 (164) - Deferred tax liabilities 19 (2,371) (2,902) Long-term provisions 20 (1,959) (1,681) ---------------------------------- ----------------------------------
Total non-current liabilities (4,494) (4,583) ---------------------------------- ----------------------------------
Total liabilities (5,745) (6,897) ----------------------------------- -----------------------------------
Net assets 5,843 1,903 ================================== ==================================
Capital and reserves attributable to equity holders
of the parent
Share capital 21 2,049 1,379 Share premium 14,080 13,160 Merger reserve 21 2,868 2,868 Foreign exchange reserve - 417 Retained deficit (13,154) (15,921) ---------------------------------- ----------------------------------
Total equity 5,843 1,903 ================================== =====================================
These financial statements were approved by the Board of directors and authorised for issue on 3 October 2014 and signed on its behalf by:
P Greenhalgh, Finance Director Company registration number 5217946
The accompanying notes form part of these financial statements.
Europa Oil & Gas (Holdings) plc
18
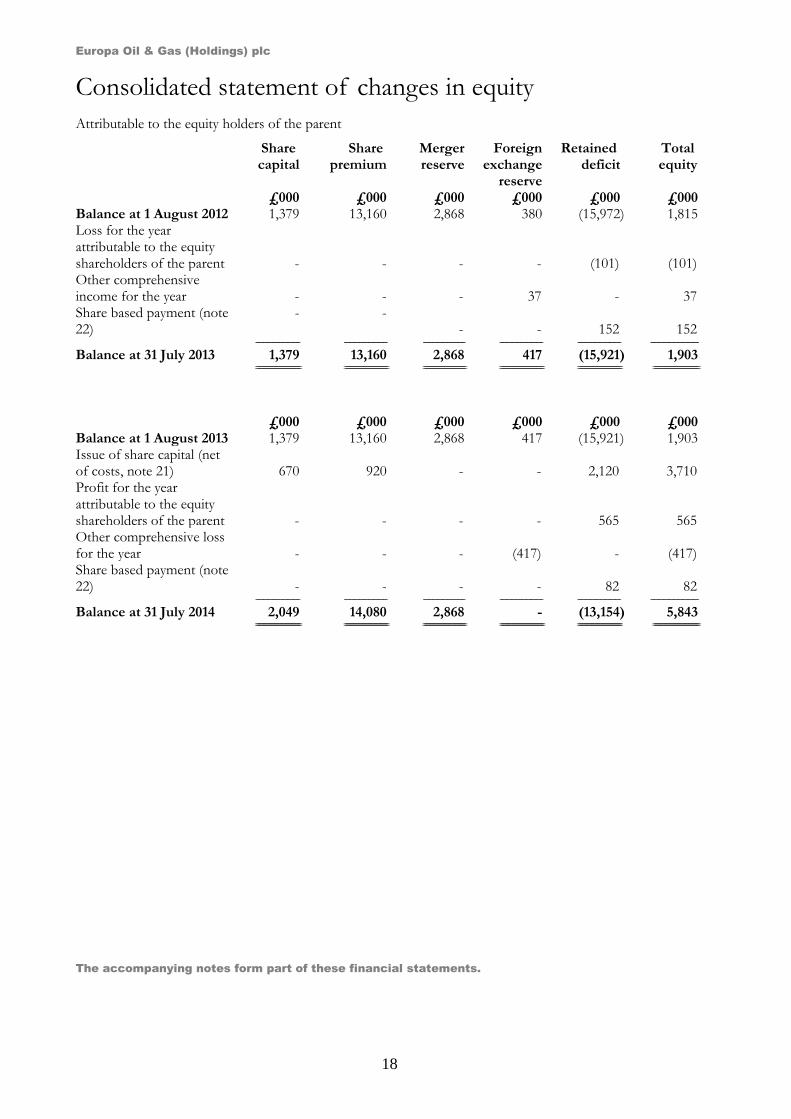
Consolidated statement of changes in equity
Attributable to the equity holders of the parent
Share capital
Share premium
Merger reserve
Foreign exchange
reserve
Retained deficit
Total equity
£000 £000 £000 £000 £000 £000 Balance at 1 August 2012 1,379 13,160 2,868 380 (15,972) 1,815 Loss for the year attributable to the equity shareholders of the parent - - - - (101) (101) Other comprehensive income for the year
-
- -
37
- 37
Share based payment (note 22)
- - - - 152 152
----------------------------------- ---------------------------------- --------------------------------- ---------------------------------- ---------------------------------- --------------------------------------
Balance at 31 July 2013 1,379 13,160 2,868 417 (15,921) 1,903 ==================================== =================================== ================================== =================================== =================================== =====================================
£000 £000 £000 £000 £000 £000 Balance at 1 August 2013 1,379 13,160 2,868 417 (15,921) 1,903 Issue of share capital (net of costs, note 21) 670 920 - - 2,120 3,710 Profit for the year attributable to the equity shareholders of the parent - - - - 565 565 Other comprehensive loss for the year
-
- -
(417)
-
(417)
Share based payment (note 22) - - - - 82 82 ----------------------------------- ---------------------------------- --------------------------------- ---------------------------------- ---------------------------------- --------------------------------------
Balance at 31 July 2014 2,049 14,080 2,868 - (13,154) 5,843 ==================================== =================================== ================================== =================================== =================================== =====================================
The accompanying notes form part of these financial statements.
Europa Oil & Gas (Holdings) plc
19
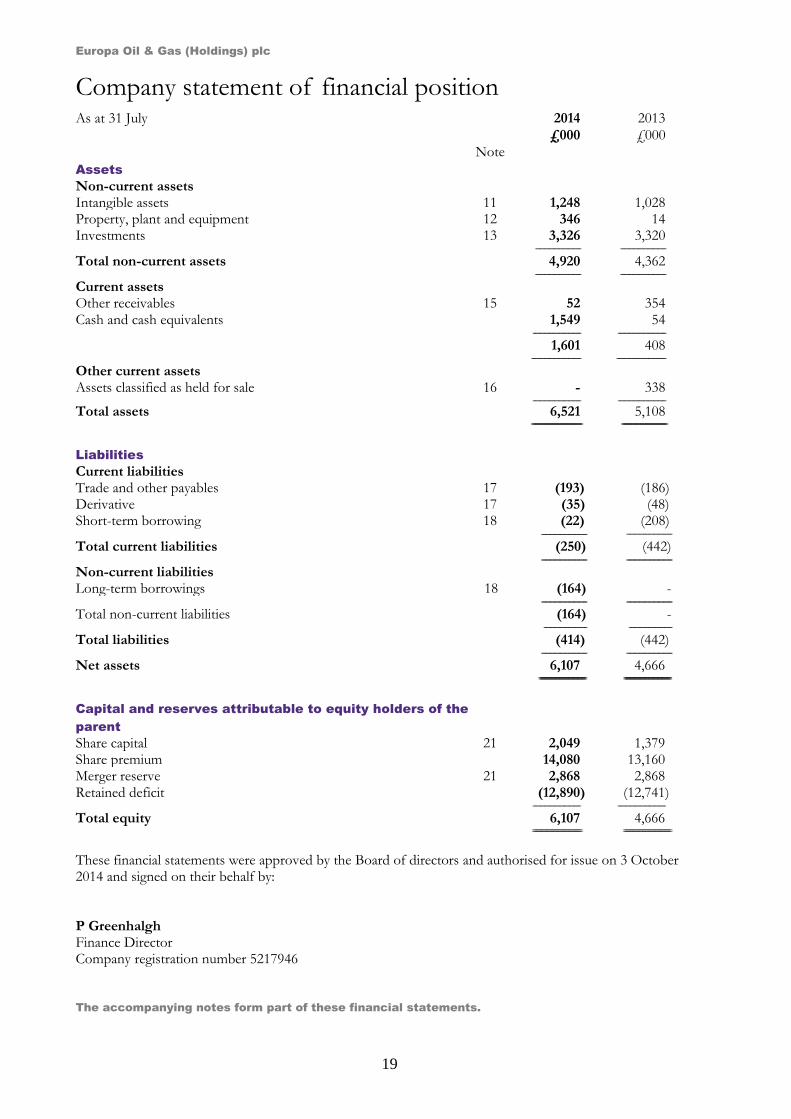
Company statement of financial position As at 31 July 2014 2013
£000 £000
Note
Assets Non-current assets Intangible assets 11 1,248 1,028 Property, plant and equipment 12 346 14 Investments 13 3,326 3,320 ------------------------------------ ------------------------------------
Total non-current assets 4,920 4,362 ------------------------------------ ------------------------------------
Current assets Other receivables 15 52 354 Cash and cash equivalents 1,549 54 -------------------------------------- --------------------------------------
1,601 408 --------------------------------------- ---------------------------------------
Other current assets
Assets classified as held for sale 16 - 338
-------------------------------------- --------------------------------------
Total assets 6,521 5,108 ======================================== ====================================
Liabilities Current liabilities Trade and other payables 17 (193) (186) Derivative 17 (35) (48) Short-term borrowing 18 (22) (208) ------------------------------------ ------------------------------------
Total current liabilities (250) (442) ------------------------------------ ------------------------------------
Non-current liabilities Long-term borrowings 18 (164) - ------------------------------------ ------------------------------------
Total non-current liabilities (164) - ---------------------------------- ----------------------------------
Total liabilities (414) (442) ------------------------------------ ------------------------------------
Net assets 6,107 4,666 ==================================== ====================================
Capital and reserves attributable to equity holders of the
parent
Share capital 21 2,049 1,379 Share premium 14,080 13,160 Merger reserve 21 2,868 2,868 Retained deficit (12,890) (12,741) -------------------------------------- --------------------------------------
Total equity 6,107 4,666 ======================================= ======================================
These financial statements were approved by the Board of directors and authorised for issue on 3 October 2014 and signed on their behalf by: P Greenhalgh Finance Director Company registration number 5217946
The accompanying notes form part of these financial statements.
Europa Oil & Gas (Holdings) plc
20
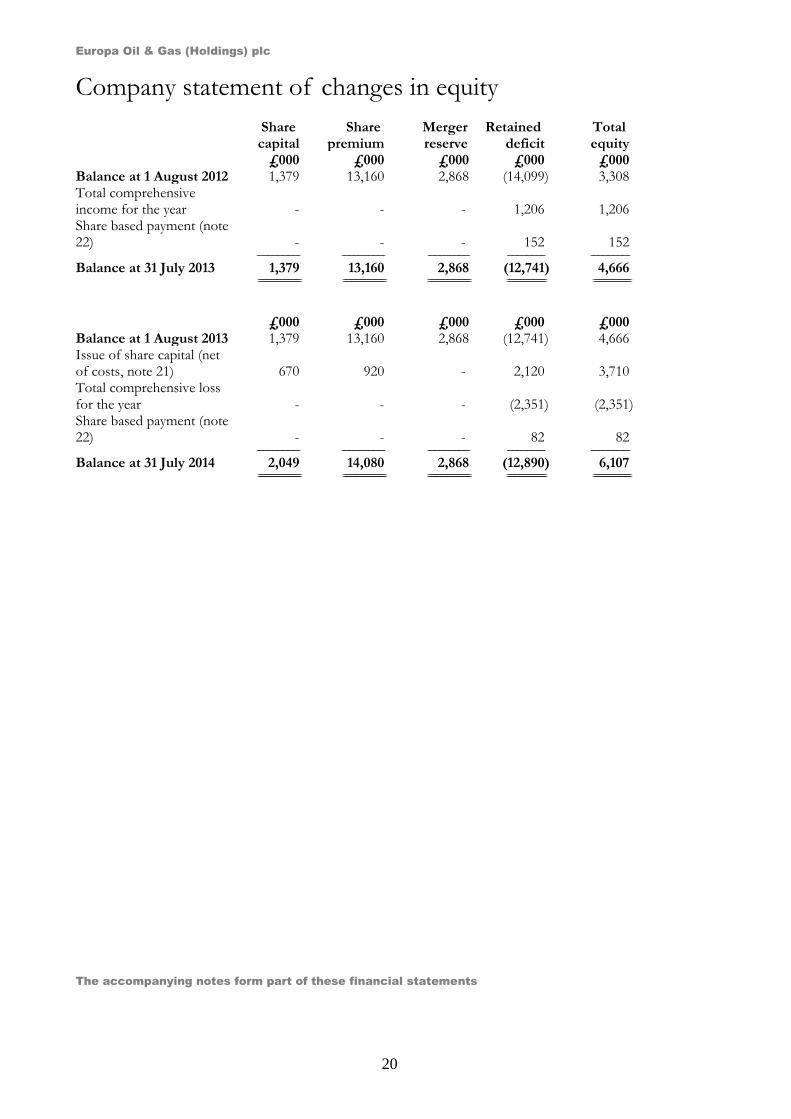
Company statement of changes in equity Share
capital Share
premium Merger reserve
Retained deficit
Total equity
£000 £000 £000 £000 £000 Balance at 1 August 2012 1,379 13,160 2,868 (14,099) 3,308 Total comprehensive income for the year
-
- -
1,206
1,206
Share based payment (note 22)
-
- - 152 152
---------------------------------- ---------------------------------- --------------------------------- ------------------------------ -------------------------------
Balance at 31 July 2013 1,379 13,160 2,868 (12,741) 4,666 ================================== ================================== ================================== =============================== ==============================
The accompanying notes form part of these financial statements
£000 £000 £000 £000 £000 Balance at 1 August 2013 1,379 13,160 2,868 (12,741) 4,666 Issue of share capital (net of costs, note 21) 670 920 - 2,120 3,710 Total comprehensive loss for the year
-
- -
(2,351)
(2,351)
Share based payment (note 22) - - - 82 82 ---------------------------------- ---------------------------------- --------------------------------- ------------------------------ -------------------------------
Balance at 31 July 2014 2,049 14,080 2,868 (12,890) 6,107 ================================== ================================== ================================== =============================== ==============================
Europa Oil & Gas (Holdings) plc
21
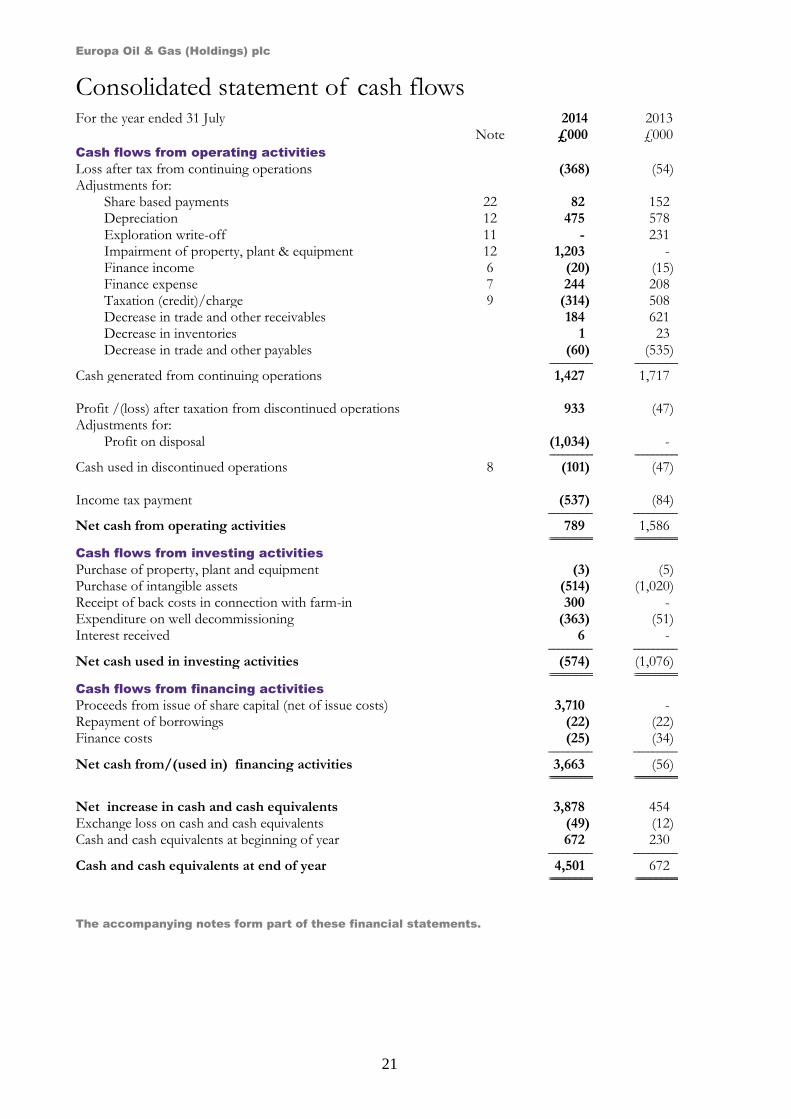
Consolidated statement of cash flows For the year ended 31 July 2014 2013 Note £000 £000
Cash flows from operating activities
Loss after tax from continuing operations (368) (54) Adjustments for:
Share based payments 22 82 152 Depreciation 12 475 578 Exploration write-off 11 - 231 Impairment of property, plant & equipment 12 1,203 - Finance income 6 (20) (15) Finance expense 7 244 208 Taxation (credit)/charge 9 (314) 508 Decrease in trade and other receivables 184 621 Decrease in inventories 1 23 Decrease in trade and other payables (60) (535)
------------------------------------ ------------------------------------
Cash generated from continuing operations 1,427 1,717 Profit /(loss) after taxation from discontinued operations 933 (47) Adjustments for:
Profit on disposal (1,034) - ------------------------------------ ------------------------------------
Cash used in discontinued operations 8 (101) (47) Income tax payment (537) (84) ----------------------------------- -----------------------------------
Net cash from operating activities 789 1,586 ===================================== =====================================
Cash flows from investing activities Purchase of property, plant and equipment (3) (5) Purchase of intangible assets (514) (1,020) Receipt of back costs in connection with farm-in 300 - Expenditure on well decommissioning (363) (51) Interest received 6 - ----------------------------------- -----------------------------------
Net cash used in investing activities (574) (1,076) ===================================== =====================================
Cash flows from financing activities Proceeds from issue of share capital (net of issue costs) 3,710 - Repayment of borrowings (22) (22) Finance costs (25) (34) ----------------------------------- -----------------------------------
Net cash from/(used in) financing activities 3,663 (56) ===================================== =====================================
Net increase in cash and cash equivalents 3,878 454 Exchange loss on cash and cash equivalents (49) (12) Cash and cash equivalents at beginning of year 672 230 ----------------------------------- -----------------------------------
Cash and cash equivalents at end of year 4,501 672 ===================================== ====================================
The accompanying notes form part of these financial statements.
Europa Oil & Gas (Holdings) plc
22
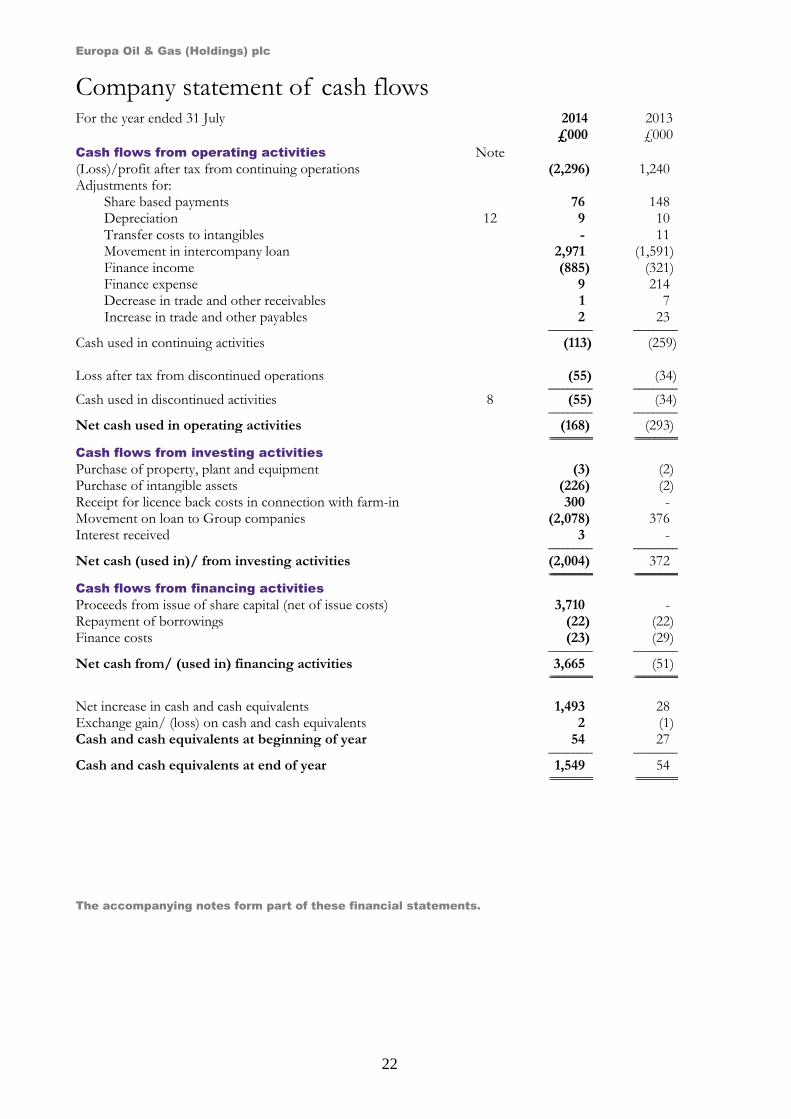
Company statement of cash flows For the year ended 31 July 2014 2013 £000 £000
Cash flows from operating activities Note
(Loss)/profit after tax from continuing operations (2,296) 1,240 Adjustments for:
Share based payments 76 148 Depreciation 12 9 10 Transfer costs to intangibles - 11 Movement in intercompany loan 2,971 (1,591) Finance income (885) (321) Finance expense 9 214 Decrease in trade and other receivables 1 7 Increase in trade and other payables 2 23
----------------------------------- -----------------------------------
Cash used in continuing activities (113) (259) Loss after tax from discontinued operations (55) (34) ----------------------------------- ----------------------------------- Cash used in discontinued activities 8 (55) (34) ----------------------------------- -----------------------------------
Net cash used in operating activities (168) (293) ===================================== =====================================
Cash flows from investing activities Purchase of property, plant and equipment (3) (2) Purchase of intangible assets (226) (2) Receipt for licence back costs in connection with farm-in 300 - Movement on loan to Group companies (2,078) 376 Interest received 3 - ----------------------------------- -----------------------------------
Net cash (used in)/ from investing activities (2,004) 372 ===================================== =====================================
Cash flows from financing activities Proceeds from issue of share capital (net of issue costs) 3,710 - Repayment of borrowings (22) (22) Finance costs (23) (29) ----------------------------------- -----------------------------------
Net cash from/ (used in) financing activities 3,665 (51) ===================================== =====================================
Net increase in cash and cash equivalents 1,493 28 Exchange gain/ (loss) on cash and cash equivalents 2 (1) Cash and cash equivalents at beginning of year 54 27 ----------------------------------- -----------------------------------
Cash and cash equivalents at end of year 1,549 54 ===================================== ====================================
The accompanying notes form part of these financial statements.
Europa Oil & Gas (Holdings) plc
23
Notes to the financial statements 1 Accounting Policies
General information
Europa Oil & Gas (Holdings) plc is a Company incorporated and domiciled in England and Wales with registered number 5217946. The address of the registered office is 6 Porter Street, London, W1U 6DD. The Company’s administrative office is at the same address.
The functional and presentational currency of the Company is Sterling (UK£).
Basis of accounting
The consolidated financial statements have been prepared in accordance with applicable International Financial Reporting Standards (IFRS) as adopted by the EU. The policies have not changed from the previous year.
The accounting policies that have been applied in the opening statement of financial position have also been applied throughout all periods presented in these financial statements. These accounting policies comply with each IFRS that is mandatory for accounting periods ending on 31 July 2014.
Going concern
In their assessment of going concern the directors note that the Group is dependent on the existing bank facility in place. The current facility is due to expire in January 2015. Based on correspondence with the Group’s bankers the directors have no reason to believe that the facility will not be renewed on the same or similar acceptable terms in an appropriate timescale. Therefore given this expectation and the continuing cash inflow from the Group’s producing assets the directors have concluded, at the time of approving the financial statements, that there is a reasonable expectation, based on the Group’s cash flow forecasts, that the Group can continue in operational existence for the foreseeable future, which is deemed to be at least 12 months from the date of signing these financial statements. Accordingly they continue to adopt the going concern basis in preparing the financial statements.
Future changes in accounting standards
The IFRS financial statements have been drawn up on the basis of accounting standards, interpretations and amendments effective at the beginning of the accounting period. The IASB and IFRIC have issued the following standards and interpretations:
Effective date IFRS 13 Fair Value Measurement 1 Jan 2013 IAS 19 Employee Benefits 1 Jan 2013
The following are amendments to existing standards and new standards which may apply to the Group in future accounting periods. Except for the disclosure requirements of IFRS 9 and IFRS 10, which the directors are continuing to assess, none of the following are considered to affect the Company.
Effective date (periods
beginning on or after)
IFRS 9 Financial instruments 1 Jan 2018 IFRS 10 Consolidated Financial Statements 1 Jan 2014 IFRS 11 Joint Arrangements 1 Jan 2014 IFRS 12 Disclosure of Interests with Other Entities 1 Jan 2014 IAS 27 Separate Financial Statements 1 Jan 2014 IAS 28 Investments in Associates and Joint Ventures 1 Jan 2014 IAS 36 Recoverable Amount Disclosures for non-Financial Assets 1 Jan 2014 IFRS 15 Revenue from Contracts with Customers 1 Jan 2017
Europa Oil & Gas (Holdings) plc
24
Notes to the financial statements (continued) 1 Accounting Policies (continued)
Basis of consolidation
The Group financial statements consolidate those of the Company and all of its material subsidiary undertakings drawn up to 31 July 2014. Subsidiaries are entities over which the Group has the power to control the financial and operating policies so as to obtain benefits from its activities. The Group obtains and exercises control through voting rights.
Intra Group balances are eliminated on consolidation. Unrealised gains on transactions between the Group and its subsidiaries are eliminated. Unrealised losses are also eliminated unless the transaction provides evidence of an impairment of the asset transferred. Amounts reported in the financial statements of subsidiaries have been adjusted where necessary to ensure consistency with the accounting policies adopted by the Group.
The Group is engaged in oil and gas exploration, development and production through unincorporated joint ventures. The accounting for the Group’s share of the results and net assets of these joint arrangements is described below.
Revenue Recognition
Revenue, excluding value added tax and similar taxes, represents net invoiced sales of the Group’s share of oil and gas revenues in the year. Revenue is recognised at the end of each month based upon the quantity and price of oil and gas delivered to the customer.
Non-current assets
Oil and gas interests The financial statements with regard to oil and gas exploration and appraisal expenditure have been prepared under the full cost basis. This accords with IFRS 6 which permits the continued application of a previously adopted accounting policy.
Pre-production assets Pre-production assets are categorized as intangible assets on the statement of financial position. Pre-licence expenditure is expensed as directed by IFRS 6. Expenditure on licence acquisition costs, geological and geophysical costs, costs of drilling exploration, appraisal and development wells, and an appropriate share of overheads (including directors’ costs) are capitalised and accumulated in cost pools on a geographical basis. These costs which relate to the exploration, appraisal and development of oil and gas interests are initially held as intangible non-current assets pending determination of commercial viability. On commencement of production these costs are tested for impairment prior to transfer to production assets.
Production assets Production assets are categorized within property, plant and equipment on the statement of financial position. With the determination of commercial viability and approval of an oil and gas project the related pre-production assets are transferred from intangible non-current assets to tangible non-current assets and depreciated upon commencement of production within the appropriate cash generating unit.
Impairment tests For the purposes of assessing impairment, assets are grouped at the lowest levels for which there are separately identifiable cash flows (cash generating units) as disclosed in Notes 11 and 12. As a result, some assets are tested individually for impairment and some are tested at cash generating unit level.
An impairment loss is recognised for the amount by which the asset's or cash generating unit's carrying amount exceeds its recoverable amount. The recoverable amount is the higher of fair value, reflecting market conditions less costs to sell, and value in use based on an internal discounted cash flow evaluation. Impairment losses recognised for cash-generating units, to which goodwill has been allocated, are credited initially to the carrying amount of goodwill. Any remaining impairment loss is charged pro rata to the other assets in the cash generating unit. With the exception of goodwill, all assets are subsequently reassessed for indications that an impairment loss previously recognised may no longer exist.
Europa Oil & Gas (Holdings) plc
25
Notes to the financial statements (continued) 1 Accounting Policies (continued)
Non-current assets (continued)
Property, plant and equipment Items of property, plant and equipment are initially recognised at cost. As well as the purchase price, cost includes directly attributable costs and the estimated present value of any future unavoidable costs of dismantling and removing items. The corresponding liability is recognised within provisions.
Depreciation All expenditure within each cost pool is depreciated from the commencement of production, on a unit of production basis, which is the ratio of oil and gas production in the period to the estimated quantities of proven plus probable commercial reserves at the end of the period, plus the production in the period. Costs used in the unit of production calculation comprise the net book value of capitalised costs plus the estimated future field development costs within each cost pool. Changes in the estimates of commercial reserves or future field development costs are dealt with prospectively.
Furniture and computers are depreciated on a 25% per annum straight line basis.
Leasehold buildings are depreciated on a 2% per annum straight line basis.
Reserves Proven and probable oil and gas reserves are estimated quantities of commercially producible hydrocarbons which the existing geological, geophysical and engineering data shows to be recoverable in future years. The proven reserves included herein conform to the definition approved by the Society of Petroleum Engineers (SPE) and the World Petroleum Congress (WPC). The probable and possible reserves conform to definitions of probable and possible approved by the SPE/WPC using the deterministic methodology. Reserves used in accounting estimates for depreciation are updated periodically to reflect management’s view of reserves in conjunction with third party formal reports. Reserves are reviewed at the time of formal updates or as a consequence of operational performance, plans and the business environment at that time.
Reserves are adjusted in the year that formal updates are undertaken or as a consequence of operational performance and plans, and the business environment at that time, with any resulting changes not applied retrospectively.
Future decommissioning costs A provision for decommissioning is recognised in full at the point that the Group has an obligation to decommission an appraisal, development or producing well. A corresponding non-current asset (included within producing fields in Note 12) of an amount equivalent to the provision is also created. The amount recognised is the estimated cost of decommissioning, discounted to its net present value and is reassessed each year in accordance with local conditions and requirements. For producing wells, the asset is subsequently depreciated as part of the capital costs of production facilities within tangible non current assets, on a unit of production basis. Any decommissioning obligation in respect of a pre-production asset is carried forward as part of its cost and tested annually for impairment in accordance with the above policy.
Changes in the estimates of commercial reserves or decommissioning cost estimates are dealt with prospectively by recording an adjustment to the provision, and a corresponding adjustment to the decommissioning asset. The unwinding of the discount on the decommissioning provision is included within finance expense.
Europa Oil & Gas (Holdings) plc
26
Notes to the financial statements (continued) 1 Accounting Policies (continued)
Taxation
Current tax is the tax payable based on taxable profit / (loss) for the year.
Deferred income taxes are calculated using the balance sheet liability method on temporary differences. Deferred tax is generally provided on the difference between the carrying amounts of assets and liabilities and their tax bases. However, deferred tax is not provided on the initial recognition of goodwill, nor on the initial recognition of an asset or liability unless the related transaction is a business combination or affects tax or accounting profit. Deferred tax on temporary differences associated with shares in subsidiaries and joint ventures is not provided if reversal of these temporary differences can be controlled by the Group and it is probable that reversal will not occur in the foreseeable future. Tax losses available to be carried forward as well as other income tax credits to the Group are assessed for recognition as deferred tax assets.
Deferred tax liabilities are provided in full, with no discounting. Deferred tax assets are recognised to the extent that it is probable that the underlying deductible temporary difference will be able to be offset against future taxable income. Current and deferred tax assets and liabilities are calculated at tax rates that are expected to apply to their respective period of realisation, provided they are enacted or substantively enacted at the reporting date.
Changes in deferred tax assets or liabilities are recognised as a component of tax expense in the statement of comprehensive income, except where they relate to items that are charged or credited directly to equity in which case the related deferred tax is also charged or credited directly to equity.
Foreign currency
The Group and Company prepare their financial statements in Sterling.
Transactions denominated in foreign currencies are translated at the rates of exchange ruling at the date of the transaction. Monetary assets and liabilities in foreign currencies are translated at the rates of exchange ruling at the reporting date. Non-monetary items that are measured at historical cost in a foreign currency are translated at the exchange rate at the date of transaction. Non-monetary items that are measured at fair value in a foreign currency are translated using the exchange rates at the date the fair value was determined.
Any exchange differences arising on the settlement of items or on translating items at rates different from those at which they were initially recorded are recognised in the Statement of comprehensive income in the period in which they arise. Exchange differences on non-monetary items are recognised in the Statement of Changes in Equity to the extent that they relate to a gain or loss on that non-monetary item taken to the Statement of Changes in Equity, otherwise such gains and losses are recognised in the Statement of comprehensive income.
The monetary assets and liabilities in the financial statements of foreign subsidiaries are translated at the rate of exchange ruling at the reporting date. Income and expenses are translated at monthly average rates providing there is no significant change in the month. The exchange differences arising from the retranslation of the opening net investment in subsidiaries are taken directly to the foreign exchange reserve in equity. On disposal of a foreign operation the cumulative translation differences are transferred to the statement of comprehensive income as part of the gain or loss on disposal.
Europa Oil and Gas (Holdings) plc is domiciled in the UK, which is its primary economic environment and the Company’s functional currency is Sterling. The Group’s current operations are based in the UK, Ireland and France, and the functional currencies of the Group's entities are the prevailing local currencies in each jurisdiction. Given that the functional currency of the Company is Sterling, management has elected to continue to present the consolidated financial statements of the Group and Company in Sterling.
Investments
Investments, which are only investments in subsidiaries, are carried at cost less any impairment. Additions include the net value of share options issued to employees of subsidiary companies less any lapsed, unvested options.
Europa Oil & Gas (Holdings) plc
27
Notes to the financial statements (continued)
1 Accounting Policies (continued)
Financial instruments
Financial assets and liabilities are recognised on the statement of financial position when the Group becomes a party to the contractual provisions of the instrument. The Group and Company classifies its financial assets into loans and receivables, which comprise trade and other receivables and cash and cash equivalents. The Group has not classified any of its financial assets as held to maturity or available for sale or fair value through profit or loss.
Trade and other receivables are measured initially at fair value plus directly attributable transaction costs, and subsequently at amortised cost using the effective interest rate method, less provision for impairment. A provision is established when there is objective evidence that the Group will not be able to collect all amounts due. The amount of any provision is recognised in the Statement of comprehensive income.
Cash and cash equivalents comprise cash held by the Group, short-term bank deposits with an original maturity of three months or less and bank overdrafts.
The Group and Company classify financial liabilities into one of two categories, depending on the purpose for which the asset was acquired. The accounting policy for each category is as follows:
Fair value through profit or loss. This category comprises only out-of-the-money derivatives. They are carried in the statement of financial position at fair value with changes in fair value recognised in the consolidated Statement of comprehensive income. Other than these derivative financial instruments, the Group does not have any liabilities held for trading nor has it designated any financial liabilities as being at fair value through profit or loss.
Other financial liabilities. Include the following items:
Bank and other borrowings are initially recognised at fair value net of any transaction costs directly attributable to the issue of the instrument. Such interest bearing liabilities are subsequently measured at amortised cost using the effective interest rate method, which ensures that any interest expense over the period to repayment is at a constant rate on the balance of the liability carried in the statement of financial position. Interest expense in this context includes initial transaction costs and any interest or coupon payable while the liability is outstanding.
Trade payables and other short-term monetary liabilities, which are initially recognised at fair value and subsequently carried at amortised cost using the effective interest method.
Financial liabilities and equity instruments issued by the Group are classified in accordance with the substance of the contractual arrangements entered into and the definitions of a financial liability and an equity instrument. An equity instrument is any contract that evidences a residual interest in the assets of the Group after deducting all of its liabilities. Equity instruments issued by the Company are recorded at the proceeds received, net of direct issue costs.
Leased assets
During the current and prior year the Group and Company did not have any finance leases. All leases are regarded as operating leases and the payments made under them are charged to the statement of comprehensive income on a straight line basis over the lease term. Lease incentives are spread over the term of the lease.
Assets held for sale
Assets classified as held for sale are those assets which are being actively marketed for sale and the Board has an expectation that the sale will be completed in the following year.
Treatment of finance costs
All finance costs are expensed through the income statement. The Group does not incur any finance costs that qualify for capitalisation.
Europa Oil & Gas (Holdings) plc
28
Notes to the financial statements (continued)
1 Accounting Policies (continued)
Defined contribution pension schemes
The pension costs charged against profits are the contributions payable to the scheme in respect of the accounting period.
Inventories Inventories comprise oil in tanks stated at the lower of cost and net realisable value. Cost is determined by reference to the actual cost of production in the period.
Joint ventures
Joint ventures are those ventures in which the Group holds an interest on a long-term basis which are jointly controlled by the Group and one or more venturers under a contractual arrangement. When these arrangements do not constitute entities in their own right, the consolidated financial statements reflect the relevant proportion of costs, revenues, assets and liabilities applicable to the Group’s interests in accordance with IAS 31. The Group’s exploration, development and production activities are presently conducted jointly with other companies in this way.
Share-based payments
All goods and services received in exchange for the grant of any share-based payment are measured at their fair values. Where employees are rewarded using share-based payments, the fair values of employees' services are determined indirectly by reference to the fair value of the instrument granted to the employee. This fair value is appraised at the grant date and excludes the impact of non-market vesting conditions (for example, profitability and sales growth targets).
All equity-settled share-based payments are ultimately recognised as an expense in the statement of comprehensive income with a corresponding credit to reserves. Where options over the parent Company’s shares are granted to employees of subsidiaries of the parent, the charge is recognised in the statement of comprehensive income of the subsidiary. In the parent Company accounts there is an increase in the cost of the investment in the subsidiary receiving the benefit.
If vesting periods or other non-market vesting conditions apply, the expense is allocated over the vesting period, based on the best available estimate of the number of share options expected to vest. Estimates are subsequently revised if there is any indication that the number of share options expected to vest differs from previous estimates. Any cumulative adjustment prior to vesting is recognised in the current period. No adjustment is made to any expense recognised in prior periods if the number of share options ultimately exercised is different to that initially estimated.
Upon exercise of share options the proceeds received, net of attributable transaction costs, are credited to share capital, and where appropriate share premium.
Critical accounting judgements and key sources of estimation uncertainty
Details of the Group’s significant accounting judgements and critical accounting estimates are set out in these financial statements and include:
Accounting judgements and estimates:
Carrying value of intangible assets (note 11) – carrying values are justified by reference to future estimates of reserves and costs to extract, discounted at appropriate rates.
Carrying value of property, plant and equipment (note 12) – carrying values are justified by reference to future estimates of cash flows, discounted at appropriate rates.
Deferred taxation (note 19) – assumptions regarding future rates of taxation and the future profitability of the Group.
Decommissioning provision (note 20) – inflation and discount rate estimates are used in calculating the provision, along with third party estimates of remediation costs.
Share-based payments (note 22) – various estimates, referenced to external sources where possible, are used in determining the fair value of options.
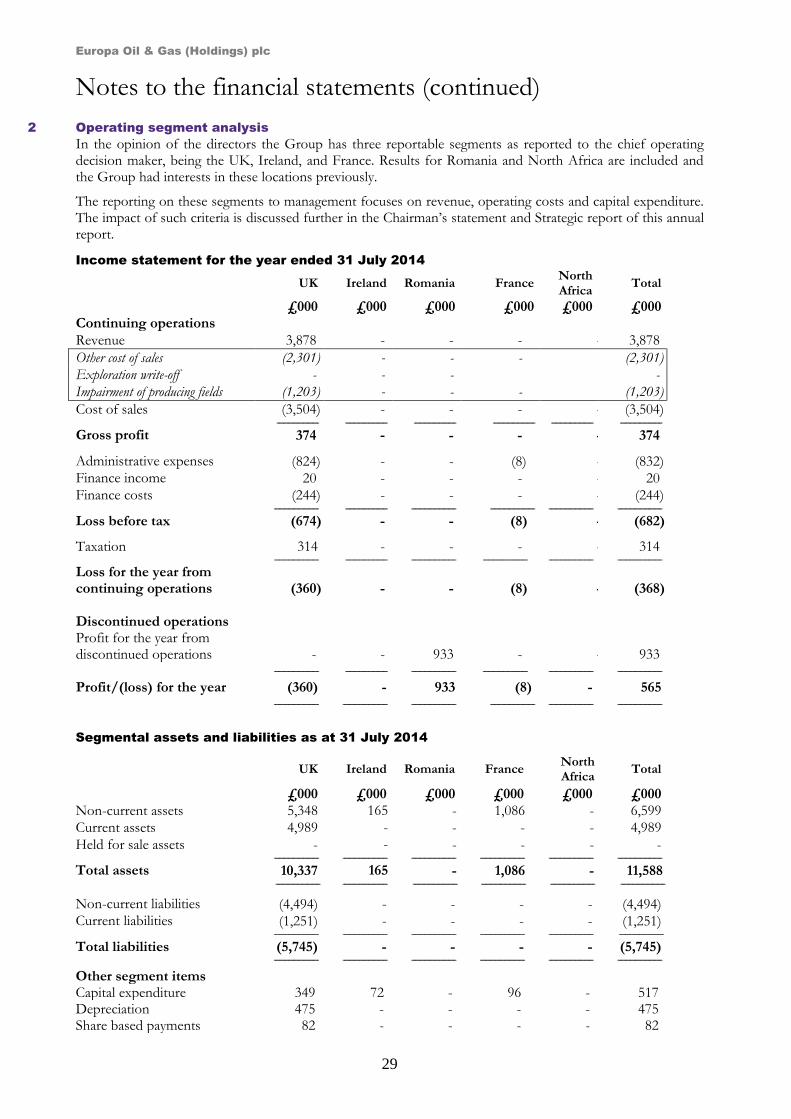
Europa Oil & Gas (Holdings) plc
29
Notes to the financial statements (continued)
2 Operating segment analysis
In the opinion of the directors the Group has three reportable segments as reported to the chief operating decision maker, being the UK, Ireland, and France. Results for Romania and North Africa are included and the Group had interests in these locations previously.
The reporting on these segments to management focuses on revenue, operating costs and capital expenditure. The impact of such criteria is discussed further in the Chairman’s statement and Strategic report of this annual report.
Income statement for the year ended 31 July 2014
UK Ireland Romania France North Africa
Total
£000 £000 £000 £000 £000 £000 Continuing operations
Revenue 3,878 - - - - 3,878
Other cost of sales (2,301) - - - - (2,301)
Exploration write-off - - - - -
Impairment of producing fields (1,203) - - - - (1,203)
Cost of sales (3,504) - - - - (3,504) --------------------------------- --------------------------------- --------------------------------- --------------------------------- --------------------------------- --------------------------------- Gross profit 374 - - - - 374 Administrative expenses (824) - - (8) - (832) Finance income 20 - - - - 20 Finance costs (244) - - - - (244) ----------------------------------- --------------------------------- ----------------------------------- ----------------------------------- ----------------------------------- -----------------------------------
Loss before tax (674) - - (8) - (682) Taxation 314 - - - - 314 ----------------------------------- --------------------------------- ----------------------------------- ----------------------------------- ----------------------------------- -----------------------------------
Loss for the year from continuing operations
(360) - - (8) - (368)
Discontinued operations Profit for the year from discontinued operations
-
-
933
-
-
933 ----------------------------------- --------------------------------- ----------------------------------- ----------------------------------- ----------------------------------- -----------------------------------
Profit/(loss) for the year (360) - 933 (8) - 565 ----------------------------------- ----------------------------------- ----------------------------------- ----------------------------------- ----------------------------------- -----------------------------------
Segmental assets and liabilities as at 31 July 2014
UK Ireland Romania France North Africa
Total
£000 £000 £000 £000 £000 £000 Non-current assets 5,348 165 - 1,086 - 6,599
Current assets 4,989 - - - - 4,989
Held for sale assets - - - - - - ----------------------------------- ----------------------------------- ----------------------------------- ----------------------------------- ----------------------------------- -----------------------------------
Total assets 10,337 165 - 1,086 - 11,588 ----------------------------------- ----------------------------------- ----------------------------------- ----------------------------------- ----------------------------------- -----------------------------------
Non-current liabilities (4,494) - - - - (4,494) Current liabilities (1,251) - - - - (1,251) ----------------------------------- ----------------------------------- ----------------------------------- ----------------------------------- ----------------------------------- -----------------------------------
Total liabilities (5,745) - - - - (5,745) ----------------------------------- ----------------------------------- ----------------------------------- ----------------------------------- ----------------------------------- -----------------------------------
Other segment items Capital expenditure 349 72 - 96 - 517 Depreciation 475 - - - - 475 Share based payments 82 - - - - 82
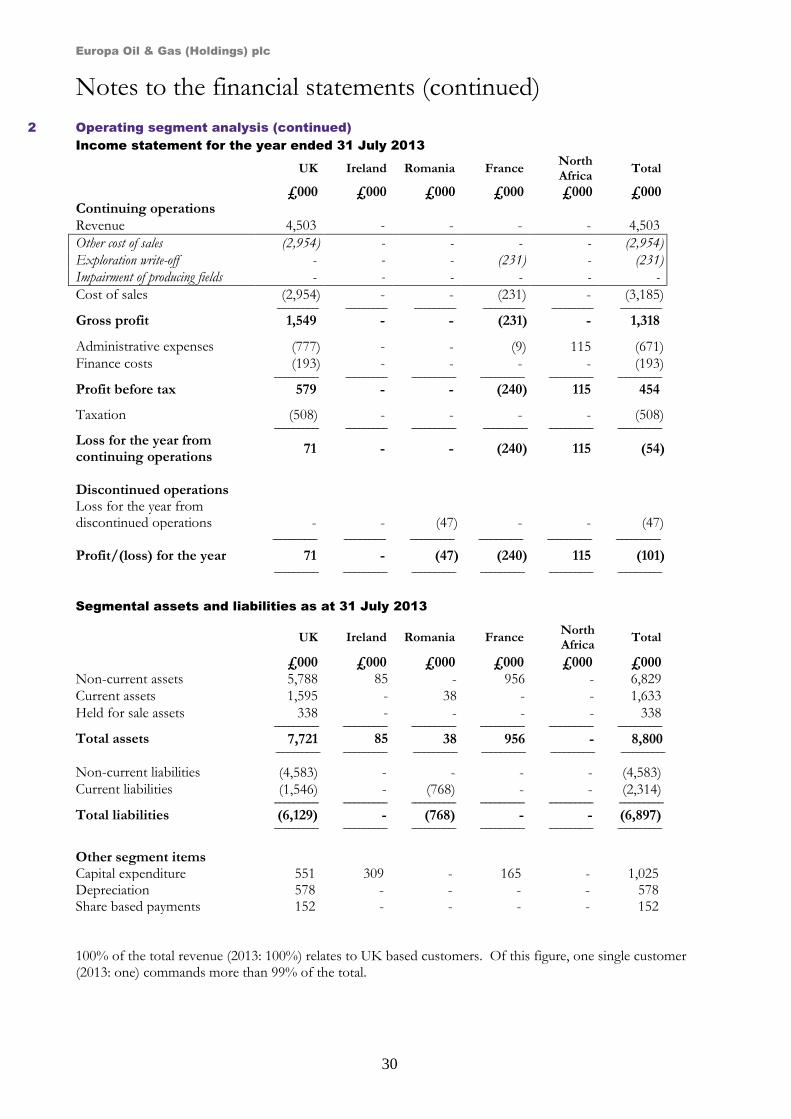
Europa Oil & Gas (Holdings) plc
30
Notes to the financial statements (continued)
2 Operating segment analysis (continued)
Income statement for the year ended 31 July 2013
UK Ireland Romania France North Africa
Total
£000 £000 £000 £000 £000 £000 Continuing operations
Revenue 4,503 - - - - 4,503
Other cost of sales (2,954) - - - - (2,954)
Exploration write-off - - - (231) - (231)
Impairment of producing fields - - - - - -
Cost of sales (2,954) - - (231) - (3,185) --------------------------------- --------------------------------- --------------------------------- --------------------------------- --------------------------------- --------------------------------- Gross profit 1,549 - - (231) - 1,318 Administrative expenses (777) - - (9) 115 (671) Finance costs (193) - - - - (193) ----------------------------------- --------------------------------- ----------------------------------- ----------------------------------- ----------------------------------- -----------------------------------
Profit before tax 579 - - (240) 115 454 Taxation (508) - - - - (508) ----------------------------------- --------------------------------- ----------------------------------- ----------------------------------- ----------------------------------- -----------------------------------
Loss for the year from continuing operations
71 - - (240) 115 (54)
Discontinued operations Loss for the year from discontinued operations
-
-
(47)
-
-
(47) ----------------------------------- --------------------------------- ----------------------------------- ----------------------------------- ----------------------------------- -----------------------------------
Profit/(loss) for the year 71 - (47) (240) 115 (101) ----------------------------------- ----------------------------------- ----------------------------------- ----------------------------------- ----------------------------------- -----------------------------------
Segmental assets and liabilities as at 31 July 2013
100% of the total revenue (2013: 100%) relates to UK based customers. Of this figure, one single customer (2013: one) commands more than 99% of the total.
UK Ireland Romania France North Africa
Total
£000 £000 £000 £000 £000 £000 Non-current assets 5,788 85 - 956 - 6,829
Current assets 1,595 - 38 - - 1,633
Held for sale assets 338 - - - - 338 ----------------------------------- ----------------------------------- ----------------------------------- ----------------------------------- ----------------------------------- -----------------------------------
Total assets 7,721 85 38 956 - 8,800 ----------------------------------- ----------------------------------- ----------------------------------- ----------------------------------- ----------------------------------- -----------------------------------
Non-current liabilities (4,583) - - - - (4,583) Current liabilities (1,546) - (768) - - (2,314) ----------------------------------- ----------------------------------- ----------------------------------- ----------------------------------- ----------------------------------- -----------------------------------
Total liabilities (6,129) - (768) - - (6,897) ----------------------------------- ----------------------------------- ----------------------------------- ----------------------------------- ----------------------------------- -----------------------------------
Other segment items Capital expenditure 551 309 - 165 - 1,025 Depreciation 578 - - - - 578 Share based payments 152 - - - - 152
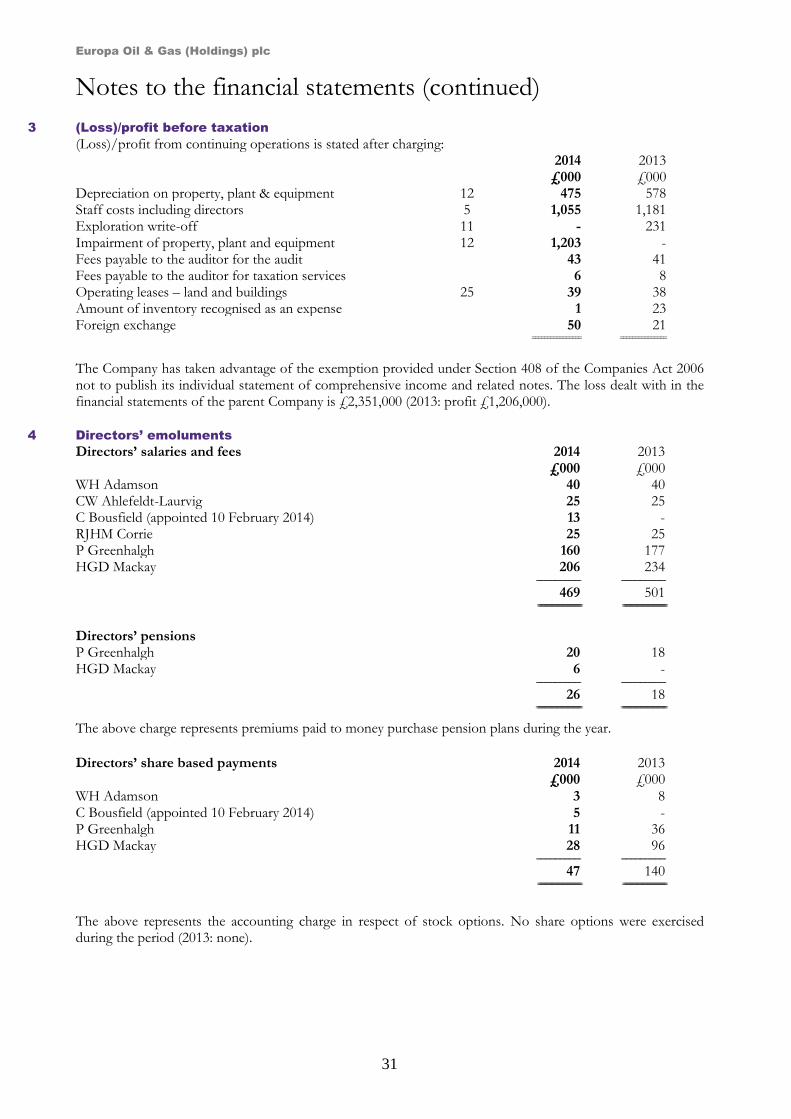
Europa Oil & Gas (Holdings) plc
31
Notes to the financial statements (continued)
3 (Loss)/profit before taxation
(Loss)/profit from continuing operations is stated after charging: 2014 2013 £000 £000 Depreciation on property, plant & equipment 12 475 578 Staff costs including directors 5 1,055 1,181 Exploration write-off 11 - 231 Impairment of property, plant and equipment 12 1,203 - Fees payable to the auditor for the audit 43 41 Fees payable to the auditor for taxation services 6 8 Operating leases – land and buildings 25 39 38 Amount of inventory recognised as an expense 1 23 Foreign exchange 50 21 ================ ===============
The Company has taken advantage of the exemption provided under Section 408 of the Companies Act 2006 not to publish its individual statement of comprehensive income and related notes. The loss dealt with in the financial statements of the parent Company is £2,351,000 (2013: profit £1,206,000).
4 Directors’ emoluments
Directors’ salaries and fees 2014 2013 £000 £000 WH Adamson 40 40 CW Ahlefeldt-Laurvig 25 25 C Bousfield (appointed 10 February 2014) 13 - RJHM Corrie 25 25 P Greenhalgh 160 177 HGD Mackay 206 234 ----------------------------------- -----------------------------------
469 501 =================================== ===================================
Directors’ pensions P Greenhalgh 20 18 HGD Mackay 6 - ----------------------------------- -----------------------------------
26 18 ==================================== ====================================
The above charge represents premiums paid to money purchase pension plans during the year.
The above represents the accounting charge in respect of stock options. No share options were exercised during the period (2013: none).
Directors’ share based payments 2014 2013
£000 £000 WH Adamson 3 8 C Bousfield (appointed 10 February 2014) 5 - P Greenhalgh 11 36 HGD Mackay 28 96 ----------------------------------- -----------------------------------
47 140 =================================== ===================================
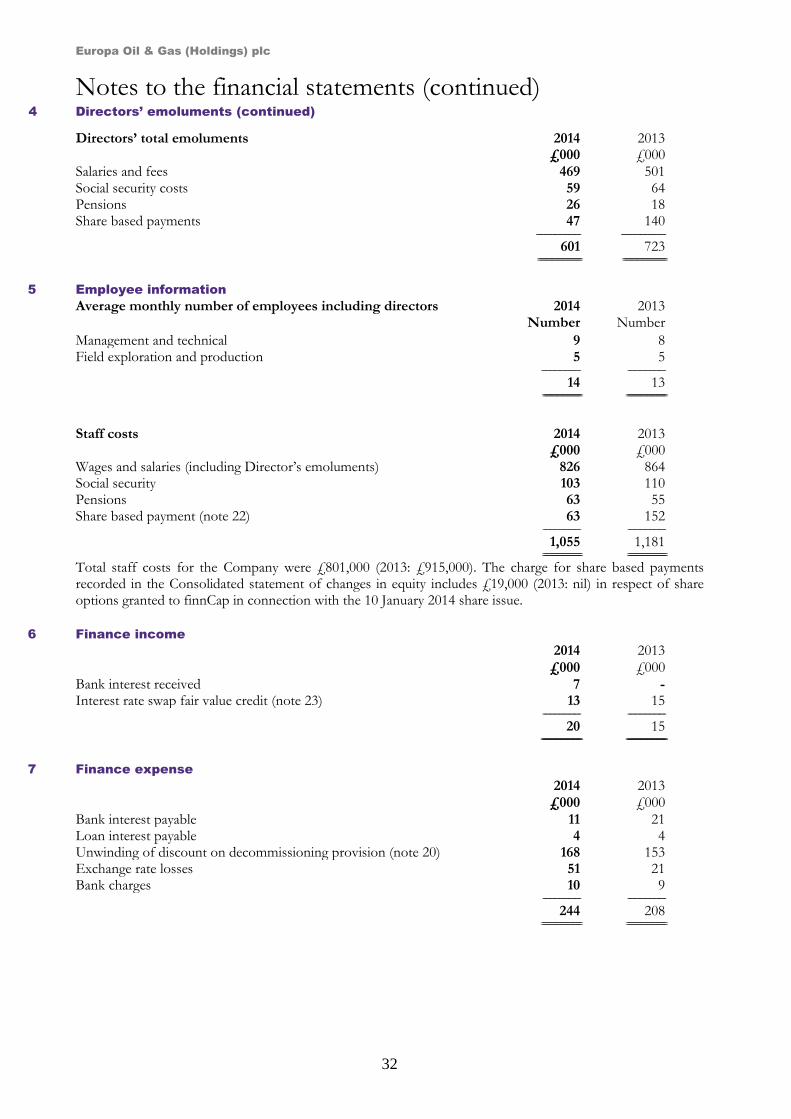
Europa Oil & Gas (Holdings) plc
32
Notes to the financial statements (continued) 4 Directors’ emoluments (continued)
5 Employee information
Average monthly number of employees including directors 2014 2013
Number Number
Management and technical 9 8 Field exploration and production 5 5 ------------------------------- ------------------------------
14 13 =============================== ================================
Staff costs 2014 2013 £000 £000 Wages and salaries (including Director’s emoluments) 826 864 Social security 103 110 Pensions 63 55 Share based payment (note 22) 63 152 ------------------------------ ------------------------------
1,055 1,181 =============================== ===============================
Total staff costs for the Company were £801,000 (2013: £915,000). The charge for share based payments recorded in the Consolidated statement of changes in equity includes £19,000 (2013: nil) in respect of share options granted to finnCap in connection with the 10 January 2014 share issue.
6 Finance income
2014 2013
£000 £000 Bank interest received 7 - Interest rate swap fair value credit (note 23) 13 15 ------------------------------ ------------------------------
20 15 ================================ ================================
7 Finance expense
2014 2013
£000 £000
Bank interest payable 11 21 Loan interest payable 4 4 Unwinding of discount on decommissioning provision (note 20) 168 153 Exchange rate losses 51 21 Bank charges 10 9 ------------------------------ ------------------------------
244 208 ================================ ================================
Directors’ total emoluments 2014 2013
£000 £000 Salaries and fees 469 501 Social security costs 59 64 Pensions 26 18 Share based payments 47 140 ----------------------------------- -----------------------------------
601 723 =================================== ===================================
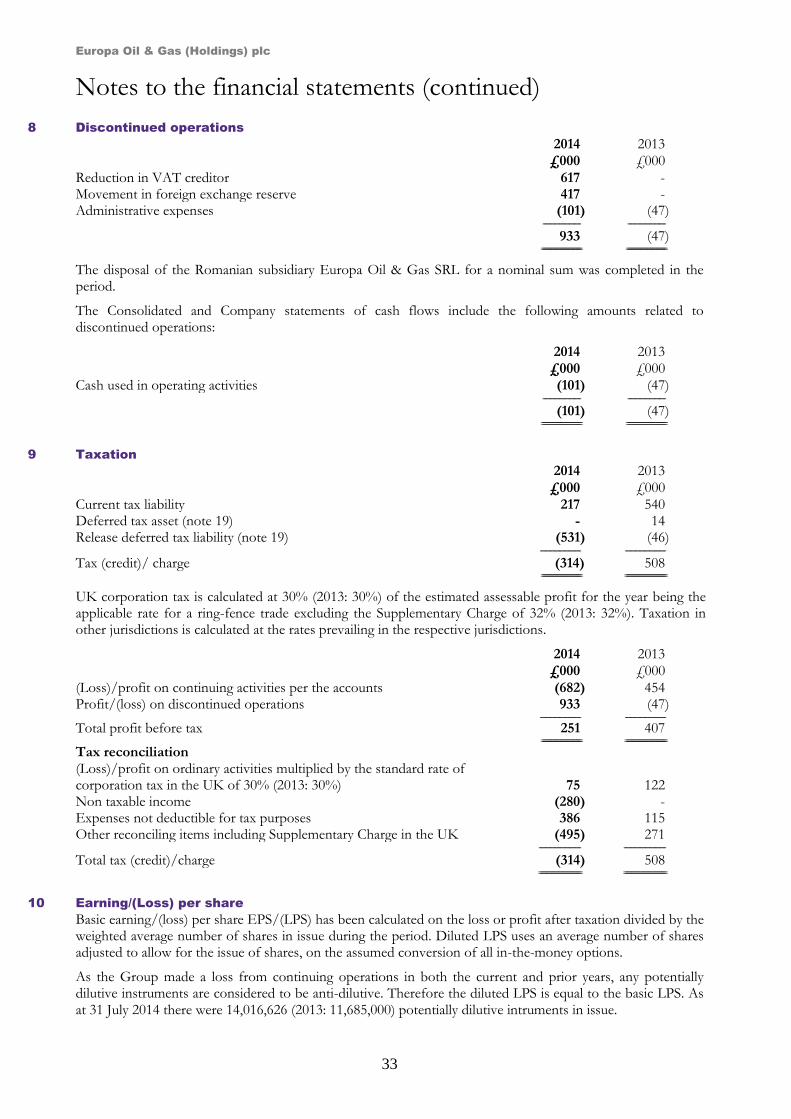
Europa Oil & Gas (Holdings) plc
33
Notes to the financial statements (continued)
8 Discontinued operations
2014 2013
£000 £000
Reduction in VAT creditor 617 - Movement in foreign exchange reserve 417 - Administrative expenses (101) (47) ------------------------------ ------------------------------
933 (47) ================================ ================================
The disposal of the Romanian subsidiary Europa Oil & Gas SRL for a nominal sum was completed in the period.
The Consolidated and Company statements of cash flows include the following amounts related to discontinued operations:
2014 2013
£000 £000 Cash used in operating activities (101) (47) ------------------------------ ------------------------------
(101) (47) ================================ ================================
9 Taxation
2014 2013
£000 £000 Current tax liability 217 540 Deferred tax asset (note 19) - 14 Release deferred tax liability (note 19) (531) (46) -------------------------------- --------------------------------
Tax (credit)/ charge (314) 508 ================================ =================================
UK corporation tax is calculated at 30% (2013: 30%) of the estimated assessable profit for the year being the applicable rate for a ring-fence trade excluding the Supplementary Charge of 32% (2013: 32%). Taxation in other jurisdictions is calculated at the rates prevailing in the respective jurisdictions.
2014 2013
£000 £000
(Loss)/profit on continuing activities per the accounts (682) 454 Profit/(loss) on discontinued operations 933 (47) -------------------------------- -------------------------------- Total profit before tax 251 407 ================================ ================================= Tax reconciliation (Loss)/profit on ordinary activities multiplied by the standard rate of corporation tax in the UK of 30% (2013: 30%) 75 122 Non taxable income (280) - Expenses not deductible for tax purposes 386 115 Other reconciling items including Supplementary Charge in the UK (495) 271
--------------------------------- ---------------------------------
Total tax (credit)/charge (314) 508 ================================== ==================================
10 Earning/(Loss) per share Basic earning/(loss) per share EPS/(LPS) has been calculated on the loss or profit after taxation divided by the weighted average number of shares in issue during the period. Diluted LPS uses an average number of shares adjusted to allow for the issue of shares, on the assumed conversion of all in-the-money options.
As the Group made a loss from continuing operations in both the current and prior years, any potentially dilutive instruments are considered to be anti-dilutive. Therefore the diluted LPS is equal to the basic LPS. As at 31 July 2014 there were 14,016,626 (2013: 11,685,000) potentially dilutive intruments in issue.
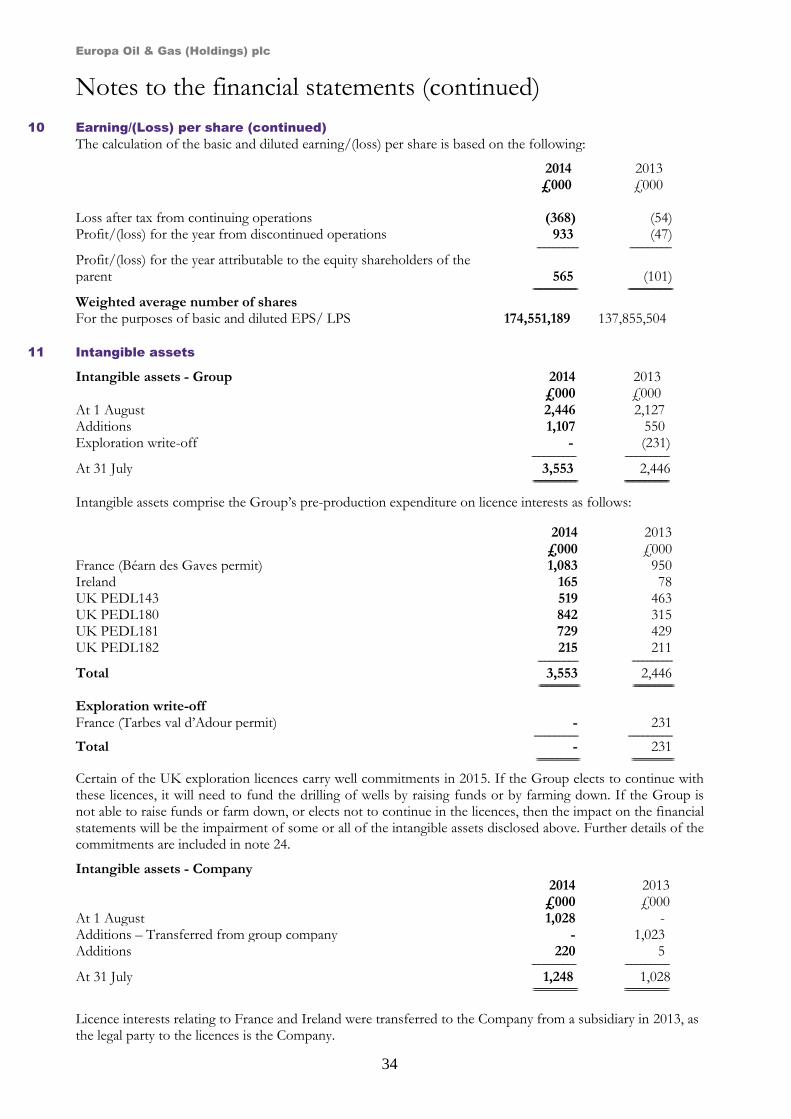
Europa Oil & Gas (Holdings) plc
34
Notes to the financial statements (continued)
10 Earning/(Loss) per share (continued) The calculation of the basic and diluted earning/(loss) per share is based on the following:
2014 2013 £000 £000 Loss after tax from continuing operations (368) (54) Profit/(loss) for the year from discontinued operations 933 (47) --------------------------------- ---------------------------------
Profit/(loss) for the year attributable to the equity shareholders of the parent 565 (101) =================================== ===================================
Weighted average number of shares For the purposes of basic and diluted EPS/ LPS 174,551,189 137,855,504
11 Intangible assets
Intangible assets - Group 2014 2013
£000 £000 At 1 August 2,446 2,127 Additions 1,107 550 Exploration write-off - (231) ----------------------------------- -----------------------------------
At 31 July 3,553 2,446 =================================== ===================================
Intangible assets comprise the Group’s pre-production expenditure on licence interests as follows:
Certain of the UK exploration licences carry well commitments in 2015. If the Group elects to continue with these licences, it will need to fund the drilling of wells by raising funds or by farming down. If the Group is not able to raise funds or farm down, or elects not to continue in the licences, then the impact on the financial statements will be the impairment of some or all of the intangible assets disclosed above. Further details of the commitments are included in note 24.
Intangible assets - Company 2014
£000 2013 £000
At 1 August 1,028 - Additions – Transferred from group company - 1,023 Additions 220 5 ----------------------------------- -----------------------------------
At 31 July 1,248 1,028 =================================== ===================================
Licence interests relating to France and Ireland were transferred to the Company from a subsidiary in 2013, as
the legal party to the licences is the Company.
2014 £000
2013 £000
France (Béarn des Gaves permit) 1,083 950 Ireland 165 78 UK PEDL143 519 463 UK PEDL180 842 315 UK PEDL181 729 429 UK PEDL182 215 211 -------------------------------- -------------------------------- Total 3,553 2,446 ================================ ================================
Exploration write-off
France (Tarbes val d’Adour permit) - 231
----------------------------------- -----------------------------------
Total - 231
================================== =================================
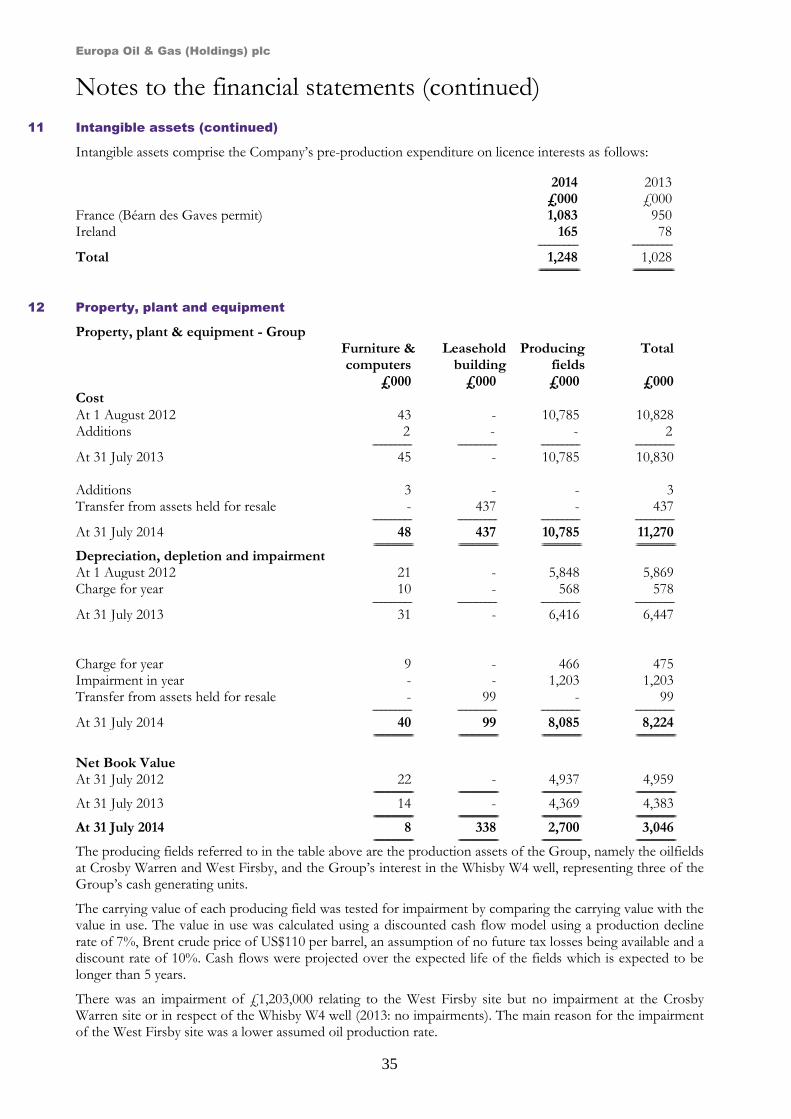
Europa Oil & Gas (Holdings) plc
35
Notes to the financial statements (continued)
11 Intangible assets (continued)
Intangible assets comprise the Company’s pre-production expenditure on licence interests as follows:
12 Property, plant and equipment
Property, plant & equipment - Group
Furniture & computers
Leasehold building
Producing fields
Total
£000 £000 £000 £000 Cost At 1 August 2012 43 - 10,785 10,828 Additions 2 - - 2 ------------------------------- ------------------------------- ------------------------------- -------------------------------
At 31 July 2013 45 - 10,785 10,830 Additions 3 - - 3 Transfer from assets held for resale - 437 - 437 ------------------------------- ------------------------------- ------------------------------- -------------------------------
At 31 July 2014 48 437 10,785 11,270 =============================== =============================== =============================== =============================== Depreciation, depletion and impairment At 1 August 2012 21 - 5,848 5,869 Charge for year 10 - 568 578 ------------------------------- ------------------------------- ------------------------------- -------------------------------
At 31 July 2013 31 - 6,416 6,447 Charge for year 9 - 466 475 Impairment in year - - 1,203 1,203 Transfer from assets held for resale - 99 - 99 ------------------------------- ------------------------------- ------------------------------- -------------------------------
At 31 July 2014 40 99 8,085 8,224 =============================== =============================== =============================== =============================== Net Book Value At 31 July 2012 22 - 4,937 4,959 =============================== =============================== =============================== =============================== At 31 July 2013 14 - 4,369 4,383 =============================== =============================== =============================== =============================== At 31 July 2014 8 338 2,700 3,046 =============================== =============================== =============================== =============================== The producing fields referred to in the table above are the production assets of the Group, namely the oilfields at Crosby Warren and West Firsby, and the Group’s interest in the Whisby W4 well, representing three of the Group’s cash generating units.
The carrying value of each producing field was tested for impairment by comparing the carrying value with the value in use. The value in use was calculated using a discounted cash flow model using a production decline rate of 7%, Brent crude price of US$110 per barrel, an assumption of no future tax losses being available and a discount rate of 10%. Cash flows were projected over the expected life of the fields which is expected to be longer than 5 years.
There was an impairment of £1,203,000 relating to the West Firsby site but no impairment at the Crosby Warren site or in respect of the Whisby W4 well (2013: no impairments). The main reason for the impairment of the West Firsby site was a lower assumed oil production rate.
2014 £000
2013 £000
France (Béarn des Gaves permit) 1,083 950 Ireland 165 78 -------------------------------- -------------------------------- Total 1,248 1,028 ================================ ================================
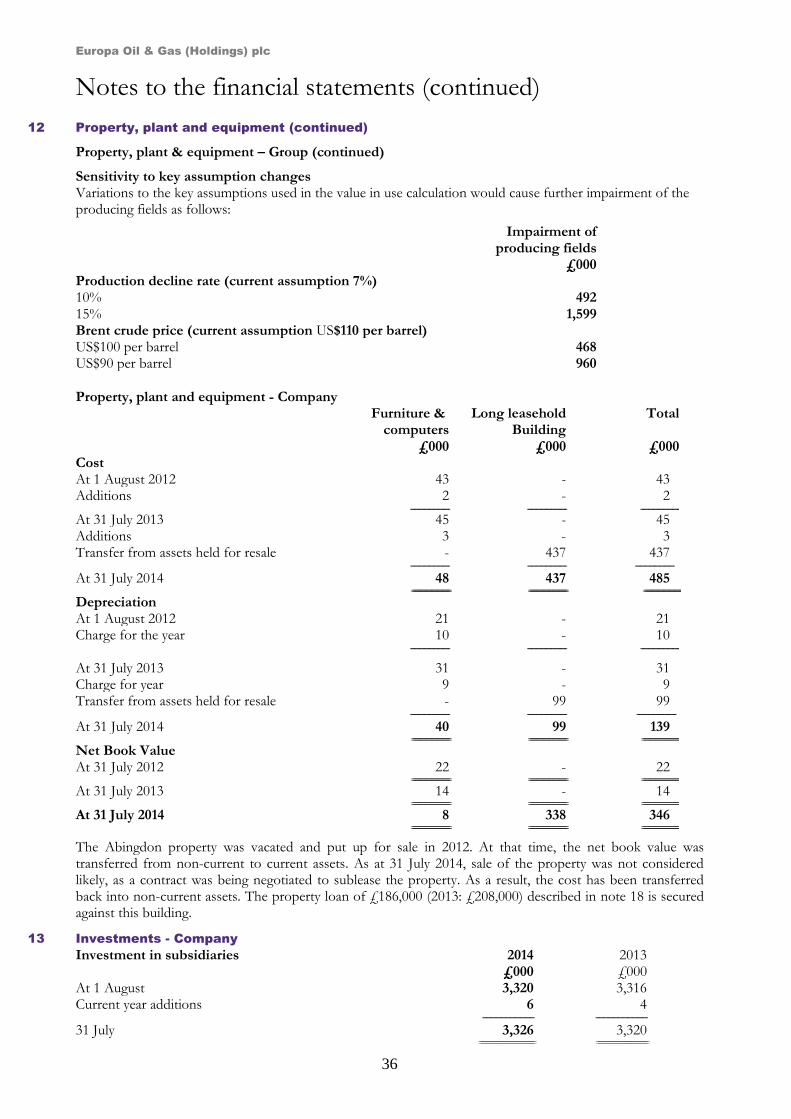
Europa Oil & Gas (Holdings) plc
36
Notes to the financial statements (continued)
12 Property, plant and equipment (continued)
Property, plant & equipment – Group (continued)
Sensitivity to key assumption changes Variations to the key assumptions used in the value in use calculation would cause further impairment of the producing fields as follows:
Property, plant and equipment - Company
Furniture & computers
Long leasehold Building
Total
£000 £000 £000 Cost At 1 August 2012 43 - 43 Additions 2 - 2 ------------------------------- ------------------------------- ------------------------------- At 31 July 2013 45 - 45 Additions 3 - 3 Transfer from assets held for resale - 437 437 ------------------------------- ------------------------------- -------------------------------
At 31 July 2014 48 437 485 =============================== =============================== =============================== Depreciation At 1 August 2012 21 - 21 Charge for the year 10 - 10 ------------------------------- ------------------------------- -------------------------------
At 31 July 2013 31 - 31 Charge for year 9 - 9 Transfer from assets held for resale - 99 99 ------------------------------- ------------------------------- -------------------------------
At 31 July 2014 40 99 139 =============================== =============================== =============================== Net Book Value At 31 July 2012 22 - 22 =============================== =============================== =============================== At 31 July 2013 14 - 14 =============================== =============================== =============================== At 31 July 2014 8 338 346 =============================== =============================== ===============================
The Abingdon property was vacated and put up for sale in 2012. At that time, the net book value was transferred from non-current to current assets. As at 31 July 2014, sale of the property was not considered likely, as a contract was being negotiated to sublease the property. As a result, the cost has been transferred back into non-current assets. The property loan of £186,000 (2013: £208,000) described in note 18 is secured against this building.
13 Investments - Company
Investment in subsidiaries 2014 2013 £000 £000 At 1 August 3,320 3,316 Current year additions 6 4 ----------------------------------------- -----------------------------------------
31 July 3,326 3,320 =========================== =========================
Impairment of producing fields
£000 Production decline rate (current assumption 7%) 10% 492 15% 1,599 Brent crude price (current assumption US$110 per barrel) US$100 per barrel 468 US$90 per barrel 960
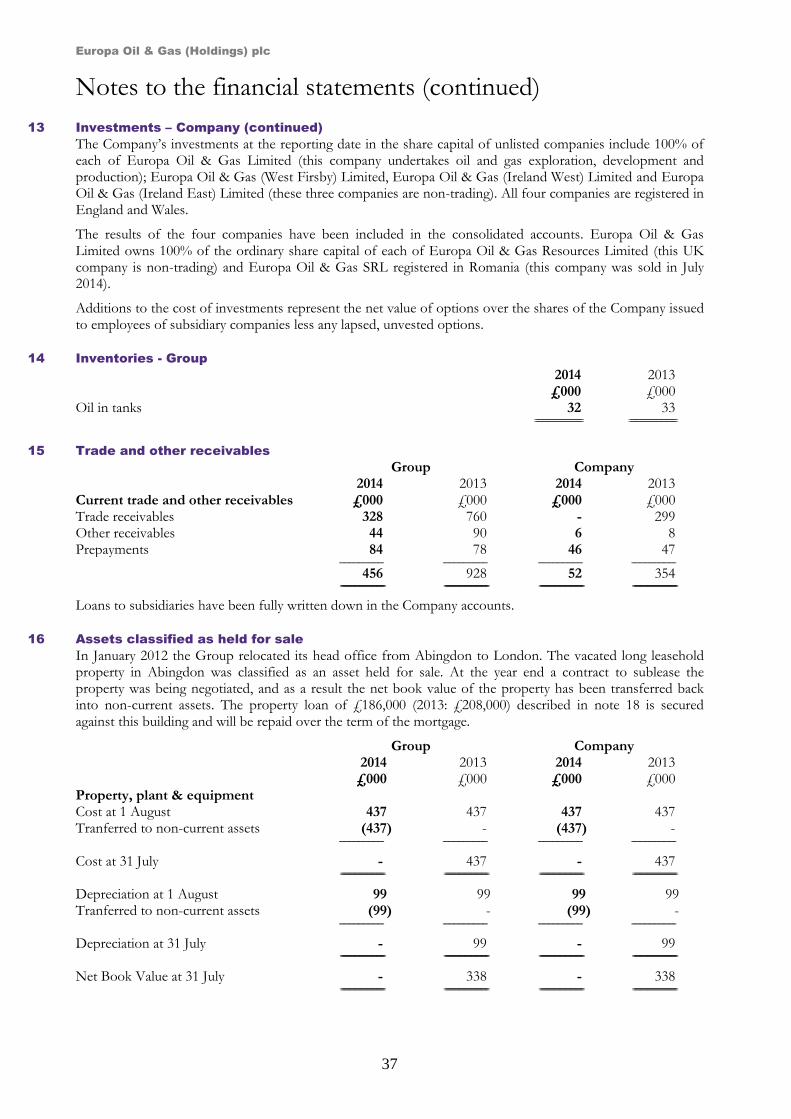
Europa Oil & Gas (Holdings) plc
37
Notes to the financial statements (continued)
13 Investments – Company (continued)
The Company’s investments at the reporting date in the share capital of unlisted companies include 100% of each of Europa Oil & Gas Limited (this company undertakes oil and gas exploration, development and production); Europa Oil & Gas (West Firsby) Limited, Europa Oil & Gas (Ireland West) Limited and Europa Oil & Gas (Ireland East) Limited (these three companies are non-trading). All four companies are registered in England and Wales. The results of the four companies have been included in the consolidated accounts. Europa Oil & Gas Limited owns 100% of the ordinary share capital of each of Europa Oil & Gas Resources Limited (this UK company is non-trading) and Europa Oil & Gas SRL registered in Romania (this company was sold in July 2014).
Additions to the cost of investments represent the net value of options over the shares of the Company issued to employees of subsidiary companies less any lapsed, unvested options.
14 Inventories - Group
2014 2013 £000 £000 Oil in tanks 32 33 ====================================== ======================================
15 Trade and other receivables Group Company 2014 2013 2014 2013 Current trade and other receivables £000 £000 £000 £000 Trade receivables 328 760 - 299 Other receivables 44 90 6 8 Prepayments 84 78 46 47 ----------------------------------- ----------------------------------- ----------------------------------- ----------------------------------- 456 928 52 354 =================================== =================================== =================================== ===================================
Loans to subsidiaries have been fully written down in the Company accounts.
16 Assets classified as held for sale
In January 2012 the Group relocated its head office from Abingdon to London. The vacated long leasehold property in Abingdon was classified as an asset held for sale. At the year end a contract to sublease the property was being negotiated, and as a result the net book value of the property has been transferred back into non-current assets. The property loan of £186,000 (2013: £208,000) described in note 18 is secured against this building and will be repaid over the term of the mortgage.
Group Company 2014 2013 2014 2013 £000 £000 £000 £000 Property, plant & equipment Cost at 1 August 437 437 437 437 Tranferred to non-current assets (437) - (437) -
----------------------------------- ----------------------------------- ----------------------------------- -----------------------------------
Cost at 31 July - 437 - 437 =================================== =================================== =================================== ===================================
Depreciation at 1 August 99 99 99 99 Tranferred to non-current assets (99) - (99) -
----------------------------------- ----------------------------------- ----------------------------------- -----------------------------------
Depreciation at 31 July - 99 - 99 =================================== =================================== =================================== ===================================
Net Book Value at 31 July - 338 - 338 =================================== =================================== =================================== ===================================
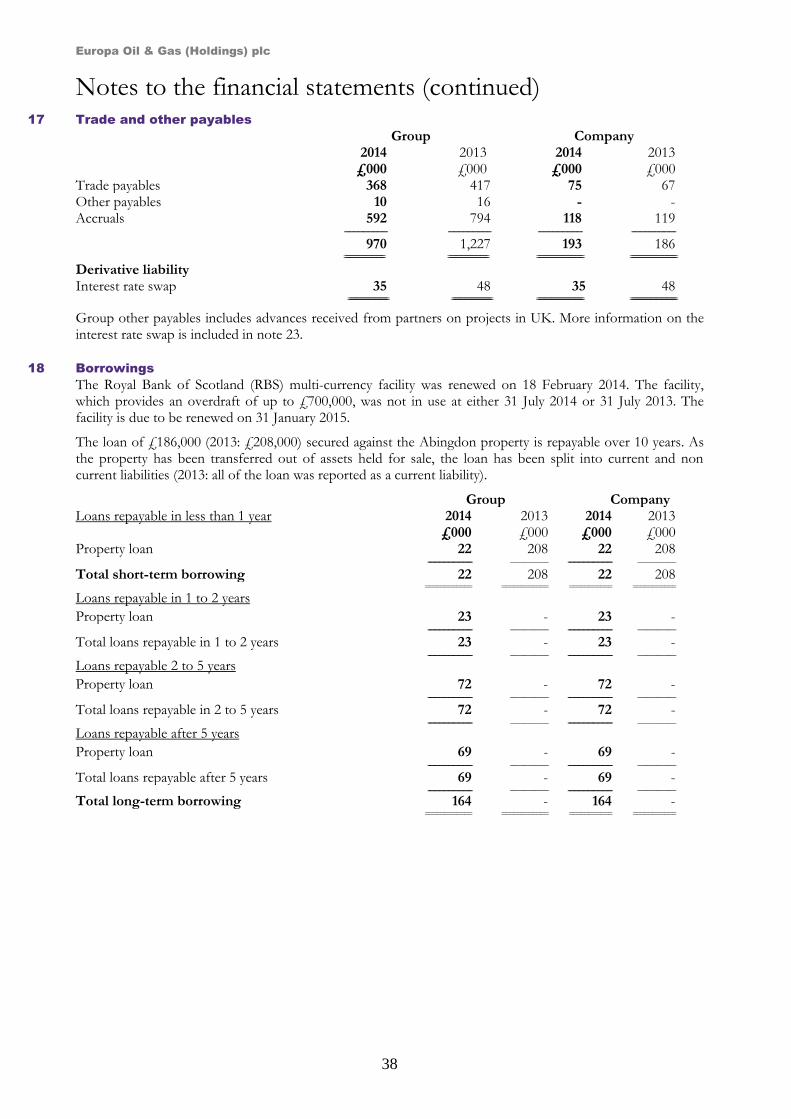
Europa Oil & Gas (Holdings) plc
38
Notes to the financial statements (continued) 17 Trade and other payables
Group Company 2014 2013 2014 2013 £000 £000 £000 £000 Trade payables 368 417 75 67 Other payables 10 16 - - Accruals 592 794 118 119 ---------------------------------- ---------------------------------- ----------------------------------- -----------------------------------
970 1,227 193 186 ================================ ================================ ===================================== =====================================
Derivative liability Interest rate swap 35 48 35 48
================================ ================================ ===================================== =====================================
Group other payables includes advances received from partners on projects in UK. More information on the interest rate swap is included in note 23.
18 Borrowings
The Royal Bank of Scotland (RBS) multi-currency facility was renewed on 18 February 2014. The facility, which provides an overdraft of up to £700,000, was not in use at either 31 July 2014 or 31 July 2013. The facility is due to be renewed on 31 January 2015.
The loan of £186,000 (2013: £208,000) secured against the Abingdon property is repayable over 10 years. As the property has been transferred out of assets held for sale, the loan has been split into current and non current liabilities (2013: all of the loan was reported as a current liability).
Group Company Loans repayable in less than 1 year 2014
£000 2013 £000
2014 £000
2013 £000
Property loan 22 208 22 208 ----------------------------------- ----------------------------------- ----------------------------------- -----------------------------------
Total short-term borrowing 22 208 22 208 ============ ============ =========== ===========
Loans repayable in 1 to 2 years
Property loan 23 - 23 - ----------------------------------- ----------------------------------- ----------------------------------- -----------------------------------
Total loans repayable in 1 to 2 years 23 - 23 - ----------------------------------- ----------------------------------- ----------------------------------- -----------------------------------
Loans repayable 2 to 5 years
Property loan 72 - 72 - ----------------------------------- ----------------------------------- ----------------------------------- -----------------------------------
Total loans repayable in 2 to 5 years 72 - 72 - ----------------------------------- ----------------------------------- ----------------------------------- -----------------------------------
Loans repayable after 5 years
Property loan 69 - 69 - ----------------------------------- ----------------------------------- ----------------------------------- -----------------------------------
Total loans repayable after 5 years 69 - 69 - ----------------------------------- ----------------------------------- ----------------------------------- -----------------------------------
Total long-term borrowing 164 - 164 - ============ ============ =========== ===========
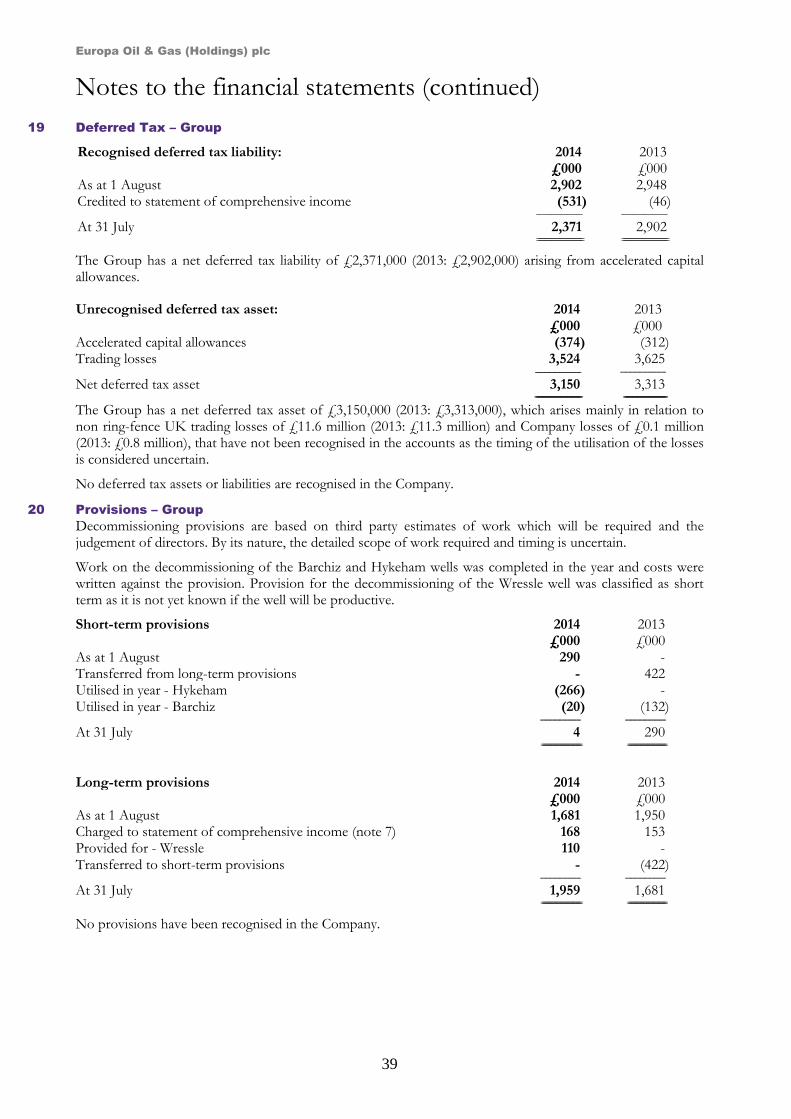
Europa Oil & Gas (Holdings) plc
39
Notes to the financial statements (continued)
19 Deferred Tax – Group
Recognised deferred tax liability: 2014 2013 £000 £000 As at 1 August 2,902 2,948 Credited to statement of comprehensive income (531) (46) ------------------------------------------ ------------------------------------------
At 31 July 2,371 2,902 ===================================== =====================================
The Group has a net deferred tax liability of £2,371,000 (2013: £2,902,000) arising from accelerated capital allowances.
Unrecognised deferred tax asset: 2014 2013 £000 £000 Accelerated capital allowances (374) (312) Trading losses 3,524 3,625 ------------------------------------ ------------------------------------
Net deferred tax asset 3,150 3,313 ===================================== ==================================
The Group has a net deferred tax asset of £3,150,000 (2013: £3,313,000), which arises mainly in relation to non ring-fence UK trading losses of £11.6 million (2013: £11.3 million) and Company losses of £0.1 million (2013: £0.8 million), that have not been recognised in the accounts as the timing of the utilisation of the losses is considered uncertain.
No deferred tax assets or liabilities are recognised in the Company.
20 Provisions – Group
Decommissioning provisions are based on third party estimates of work which will be required and the judgement of directors. By its nature, the detailed scope of work required and timing is uncertain.
Work on the decommissioning of the Barchiz and Hykeham wells was completed in the year and costs were written against the provision. Provision for the decommissioning of the Wressle well was classified as short term as it is not yet known if the well will be productive.
Short-term provisions 2014 2013 £000 £000 As at 1 August 290 - Transferred from long-term provisions - 422 Utilised in year - Hykeham (266) - Utilised in year - Barchiz (20) (132) -------------------------------- --------------------------------
At 31 July 4 290 ================================ ===============================
Long-term provisions 2014 2013 £000 £000 As at 1 August 1,681 1,950 Charged to statement of comprehensive income (note 7) 168 153 Provided for - Wressle 110 - Transferred to short-term provisions - (422) -------------------------------- --------------------------------
At 31 July 1,959 1,681 ================================ ===============================
No provisions have been recognised in the Company.
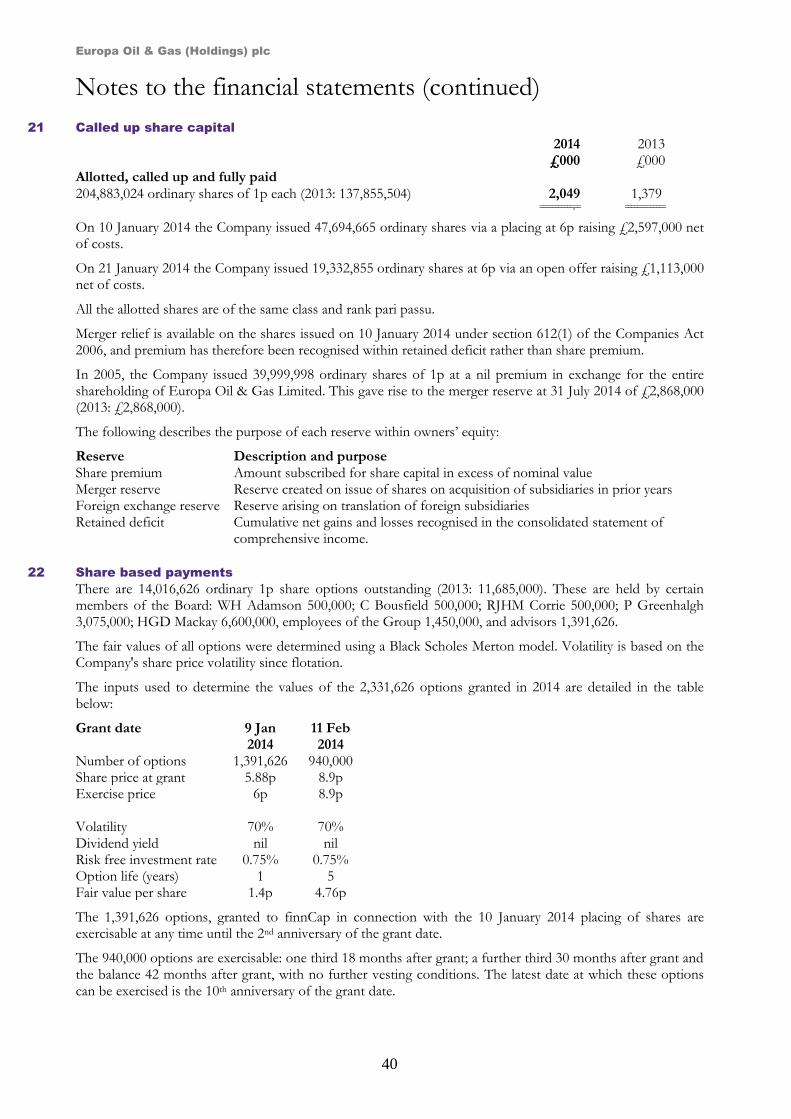
Europa Oil & Gas (Holdings) plc
40
Notes to the financial statements (continued)
21 Called up share capital
2014 2013 £000 £000 Allotted, called up and fully paid 204,883,024 ordinary shares of 1p each (2013: 137,855,504) 2,049 1,379 ===========,== =============
On 10 January 2014 the Company issued 47,694,665 ordinary shares via a placing at 6p raising £2,597,000 net of costs.
On 21 January 2014 the Company issued 19,332,855 ordinary shares at 6p via an open offer raising £1,113,000 net of costs.
All the allotted shares are of the same class and rank pari passu.
Merger relief is available on the shares issued on 10 January 2014 under section 612(1) of the Companies Act 2006, and premium has therefore been recognised within retained deficit rather than share premium.
In 2005, the Company issued 39,999,998 ordinary shares of 1p at a nil premium in exchange for the entire shareholding of Europa Oil & Gas Limited. This gave rise to the merger reserve at 31 July 2014 of £2,868,000 (2013: £2,868,000).
The following describes the purpose of each reserve within owners’ equity:
Reserve Description and purpose Share premium Amount subscribed for share capital in excess of nominal value Merger reserve Reserve created on issue of shares on acquisition of subsidiaries in prior years Foreign exchange reserve Reserve arising on translation of foreign subsidiaries Retained deficit Cumulative net gains and losses recognised in the consolidated statement of
comprehensive income.
22 Share based payments
There are 14,016,626 ordinary 1p share options outstanding (2013: 11,685,000). These are held by certain members of the Board: WH Adamson 500,000; C Bousfield 500,000; RJHM Corrie 500,000; P Greenhalgh 3,075,000; HGD Mackay 6,600,000, employees of the Group 1,450,000, and advisors 1,391,626.
The fair values of all options were determined using a Black Scholes Merton model. Volatility is based on the Company's share price volatility since flotation.
The inputs used to determine the values of the 2,331,626 options granted in 2014 are detailed in the table below:
Grant date 9 Jan 2014
11 Feb 2014
Number of options 1,391,626 940,000 Share price at grant 5.88p 8.9p Exercise price 6p 8.9p Volatility 70% 70% Dividend yield nil nil Risk free investment rate 0.75% 0.75% Option life (years) 1 5 Fair value per share 1.4p 4.76p
The 1,391,626 options, granted to finnCap in connection with the 10 January 2014 placing of shares are exercisable at any time until the 2nd anniversary of the grant date.
The 940,000 options are exercisable: one third 18 months after grant; a further third 30 months after grant and the balance 42 months after grant, with no further vesting conditions. The latest date at which these options can be exercised is the 10th anniversary of the grant date.
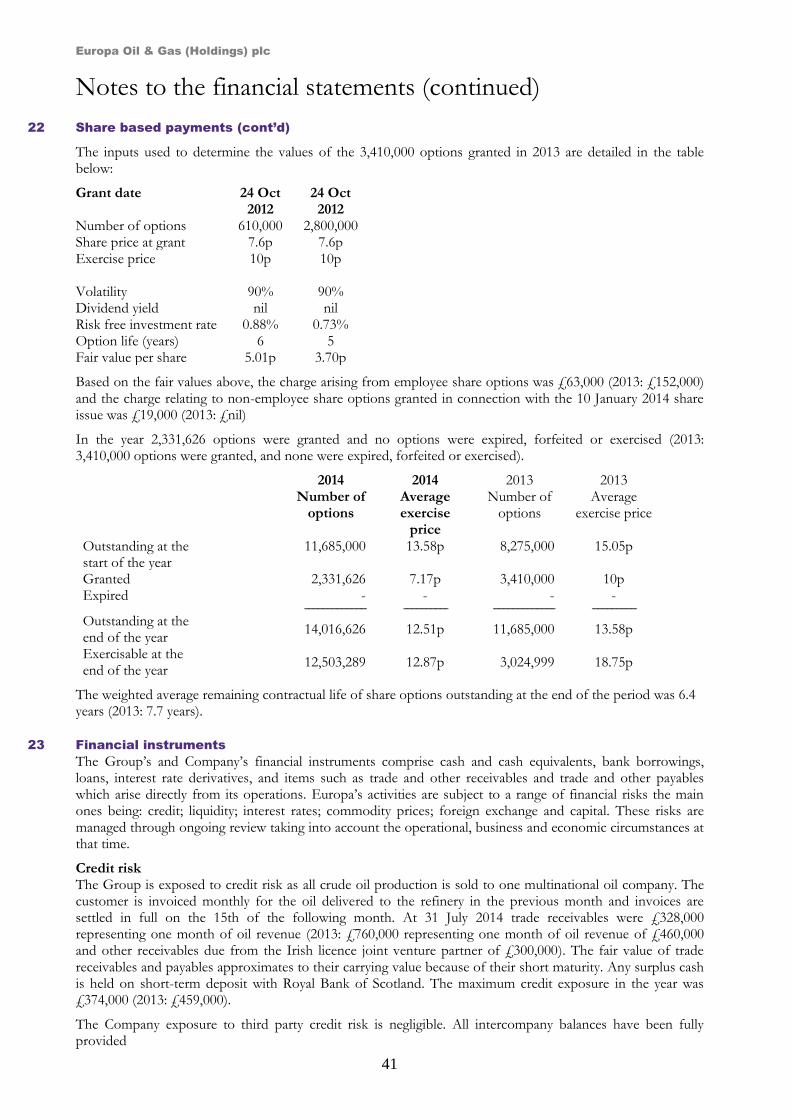
Europa Oil & Gas (Holdings) plc
41
Notes to the financial statements (continued)
22 Share based payments (cont’d)
The inputs used to determine the values of the 3,410,000 options granted in 2013 are detailed in the table below:
Grant date 24 Oct 2012
24 Oct 2012
Number of options 610,000 2,800,000 Share price at grant 7.6p 7.6p Exercise price 10p 10p Volatility 90% 90% Dividend yield nil nil Risk free investment rate 0.88% 0.73% Option life (years) 6 5 Fair value per share 5.01p 3.70p
Based on the fair values above, the charge arising from employee share options was £63,000 (2013: £152,000) and the charge relating to non-employee share options granted in connection with the 10 January 2014 share issue was £19,000 (2013: £nil)
In the year 2,331,626 options were granted and no options were expired, forfeited or exercised (2013: 3,410,000 options were granted, and none were expired, forfeited or exercised).
2014 Number of
options
2014 Average exercise
price
2013 Number of
options
2013 Average
exercise price
Outstanding at the start of the year
11,685,000 13.58p 8,275,000 15.05p
Granted 2,331,626 7.17p 3,410,000 10p Expired - - - - ------------------------------------------------- ----------------------------------- ------------------------------------------------- ----------------------------------- Outstanding at the end of the year
14,016,626 12.51p 11,685,000 13.58p
Exercisable at the end of the year
12,503,289 12.87p 3,024,999 18.75p
The weighted average remaining contractual life of share options outstanding at the end of the period was 6.4 years (2013: 7.7 years).
23 Financial instruments
The Group’s and Company’s financial instruments comprise cash and cash equivalents, bank borrowings, loans, interest rate derivatives, and items such as trade and other receivables and trade and other payables which arise directly from its operations. Europa’s activities are subject to a range of financial risks the main ones being: credit; liquidity; interest rates; commodity prices; foreign exchange and capital. These risks are managed through ongoing review taking into account the operational, business and economic circumstances at that time.
Credit risk The Group is exposed to credit risk as all crude oil production is sold to one multinational oil company. The customer is invoiced monthly for the oil delivered to the refinery in the previous month and invoices are settled in full on the 15th of the following month. At 31 July 2014 trade receivables were £328,000 representing one month of oil revenue (2013: £760,000 representing one month of oil revenue of £460,000 and other receivables due from the Irish licence joint venture partner of £300,000). The fair value of trade receivables and payables approximates to their carrying value because of their short maturity. Any surplus cash is held on short-term deposit with Royal Bank of Scotland. The maximum credit exposure in the year was £374,000 (2013: £459,000).
The Company exposure to third party credit risk is negligible. All intercompany balances have been fully provided
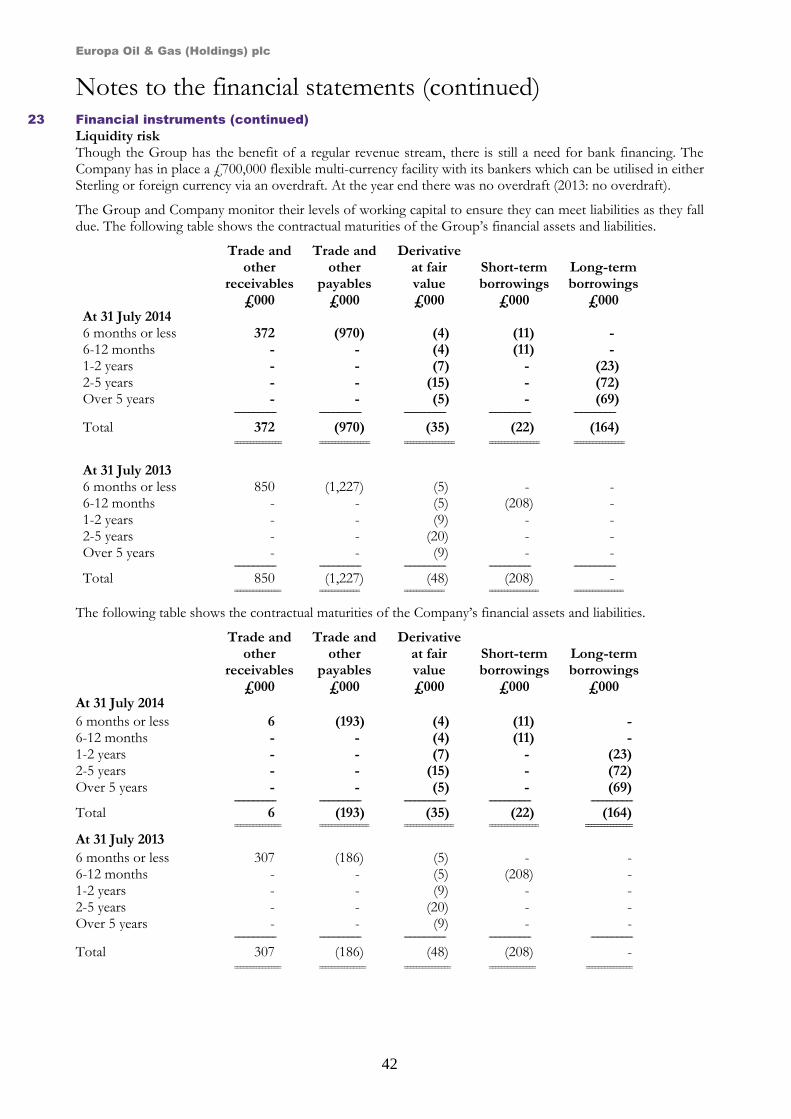
Europa Oil & Gas (Holdings) plc
42
Notes to the financial statements (continued) 23 Financial instruments (continued)
Liquidity risk Though the Group has the benefit of a regular revenue stream, there is still a need for bank financing. The Company has in place a £700,000 flexible multi-currency facility with its bankers which can be utilised in either Sterling or foreign currency via an overdraft. At the year end there was no overdraft (2013: no overdraft).
The Group and Company monitor their levels of working capital to ensure they can meet liabilities as they fall due. The following table shows the contractual maturities of the Group’s financial assets and liabilities.
Trade and other
receivables £000
Trade and other
payables £000
Derivative at fair value £000
Short-term borrowings
£000
Long-term borrowings
£000 At 31 July 2014 6 months or less 372 (970) (4) (11) - 6-12 months - - (4) (11) - 1-2 years - - (7) - (23) 2-5 years - - (15) - (72) Over 5 years - - (5) - (69) --------------------------------- --------------------------------- --------------------------------- --------------------------------- ---------------------------------
Total 372 (970) (35) (22) (164)
=============== ================ ================ ================ ================
At 31 July 2013 6 months or less 850 (1,227) (5) - - 6-12 months - - (5) (208) - 1-2 years - - (9) - - 2-5 years - - (20) - - Over 5 years - - (9) - - --------------------------------- --------------------------------- --------------------------------- --------------------------------- ---------------------------------
Total 850 (1,227) (48) (208) - =============== ============= ============= ================ ================
The following table shows the contractual maturities of the Company’s financial assets and liabilities.
Trade and other
receivables £000
Trade and other
payables £000
Derivative at fair value £000
Short-term borrowings
£000
Long-term borrowings
£000 At 31 July 2014 6 months or less 6 (193) (4) (11) - 6-12 months - - (4) (11) - 1-2 years - - (7) - (23) 2-5 years - - (15) - (72) Over 5 years - - (5) - (69) --------------------------------- --------------------------------- --------------------------------- --------------------------------- --------------------------------- Total 6 (193) (35) (22) (164) =============== ================ ================ ================ =============== At 31 July 2013 6 months or less 307 (186) (5) - - 6-12 months - - (5) (208) - 1-2 years - - (9) - - 2-5 years - - (20) - - Over 5 years - - (9) - - --------------------------------- --------------------------------- --------------------------------- --------------------------------- --------------------------------- Total 307 (186) (48) (208) -
=============== =============== =============== =============== ===============
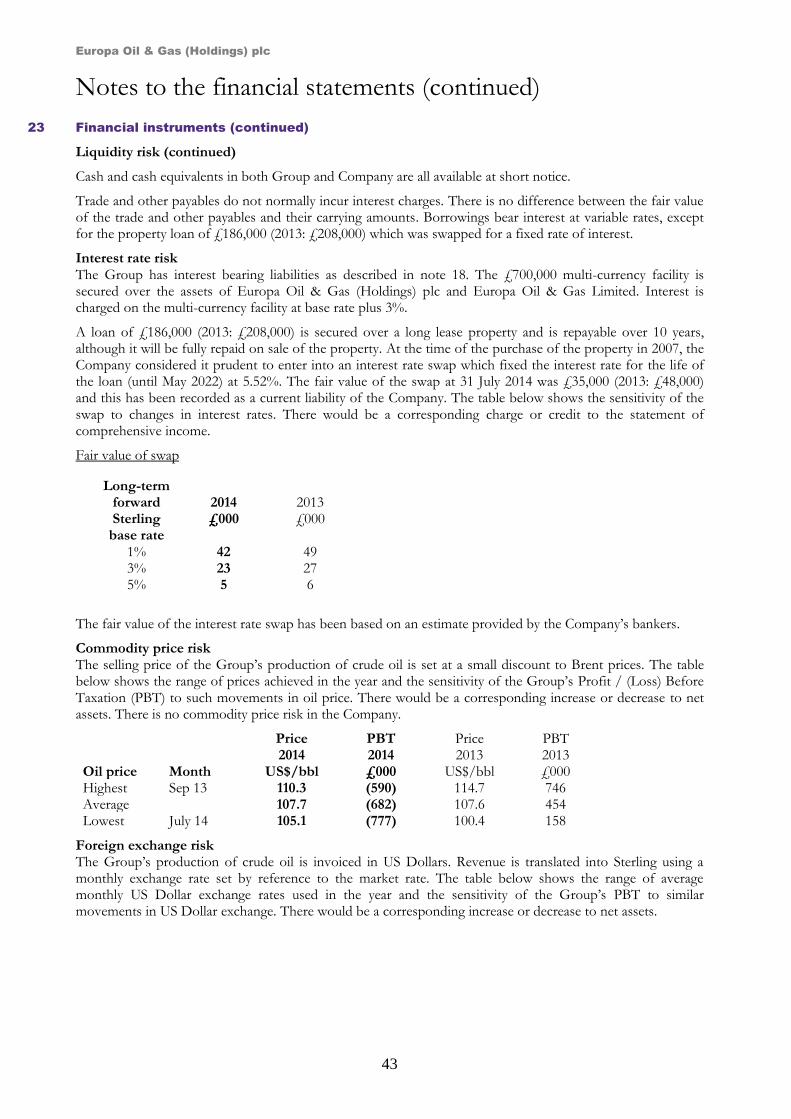
Europa Oil & Gas (Holdings) plc
43
Notes to the financial statements (continued)
23 Financial instruments (continued)
Liquidity risk (continued)
Cash and cash equivalents in both Group and Company are all available at short notice.
Trade and other payables do not normally incur interest charges. There is no difference between the fair value of the trade and other payables and their carrying amounts. Borrowings bear interest at variable rates, except for the property loan of £186,000 (2013: £208,000) which was swapped for a fixed rate of interest.
Interest rate risk
The Group has interest bearing liabilities as described in note 18. The £700,000 multi-currency facility is secured over the assets of Europa Oil & Gas (Holdings) plc and Europa Oil & Gas Limited. Interest is charged on the multi-currency facility at base rate plus 3%.
A loan of £186,000 (2013: £208,000) is secured over a long lease property and is repayable over 10 years, although it will be fully repaid on sale of the property. At the time of the purchase of the property in 2007, the Company considered it prudent to enter into an interest rate swap which fixed the interest rate for the life of the loan (until May 2022) at 5.52%. The fair value of the swap at 31 July 2014 was £35,000 (2013: £48,000) and this has been recorded as a current liability of the Company. The table below shows the sensitivity of the swap to changes in interest rates. There would be a corresponding charge or credit to the statement of comprehensive income.
Fair value of swap
The fair value of the interest rate swap has been based on an estimate provided by the Company’s bankers.
Commodity price risk The selling price of the Group’s production of crude oil is set at a small discount to Brent prices. The table below shows the range of prices achieved in the year and the sensitivity of the Group’s Profit / (Loss) Before Taxation (PBT) to such movements in oil price. There would be a corresponding increase or decrease to net assets. There is no commodity price risk in the Company.
Oil price
Month
Price 2014
US$/bbl
PBT 2014 £000
Price 2013
US$/bbl
PBT 2013 £000
Highest Sep 13 110.3 (590) 114.7 746 Average 107.7 (682) 107.6 454 Lowest July 14 105.1 (777) 100.4 158
Foreign exchange risk The Group’s production of crude oil is invoiced in US Dollars. Revenue is translated into Sterling using a monthly exchange rate set by reference to the market rate. The table below shows the range of average monthly US Dollar exchange rates used in the year and the sensitivity of the Group’s PBT to similar movements in US Dollar exchange. There would be a corresponding increase or decrease to net assets.
Long-term forward Sterling
base rate
2014 £000
2013 £000
1% 42 49 3% 23 27 5% 5 6
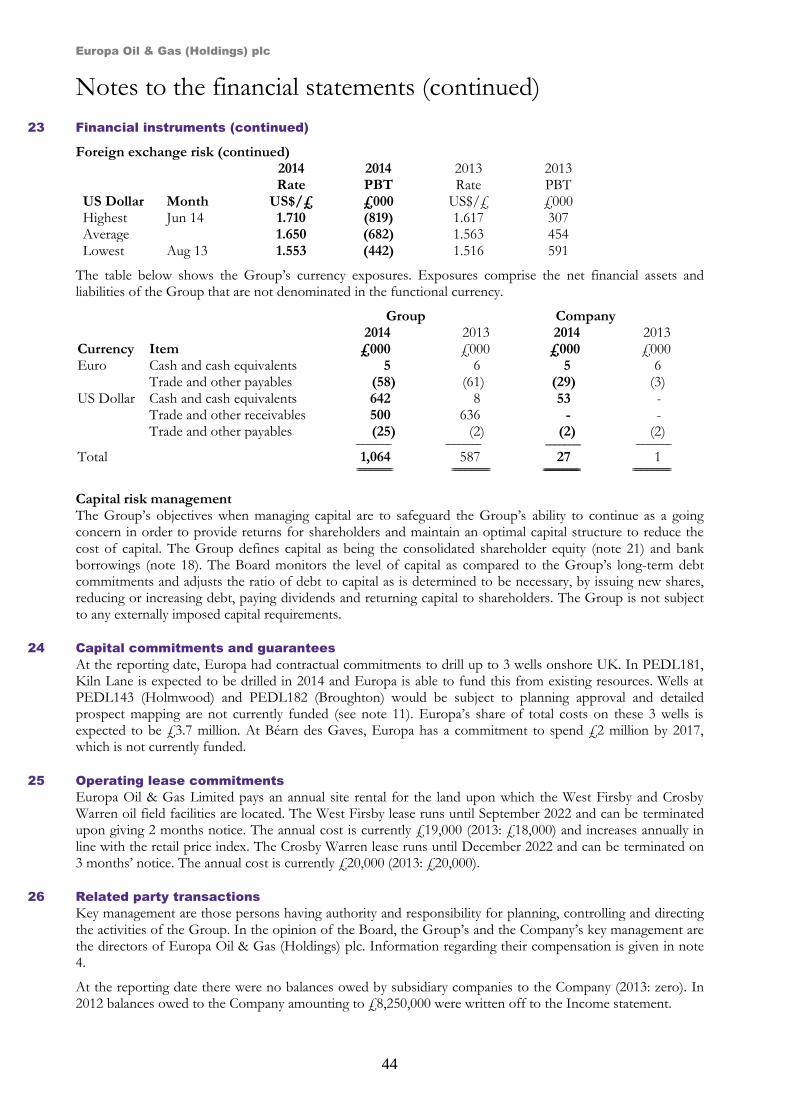
Europa Oil & Gas (Holdings) plc
44
Notes to the financial statements (continued)
23 Financial instruments (continued)
Foreign exchange risk (continued) 2014 2014 2013 2013 US Dollar
Month
Rate US$/£
PBT £000
Rate US$/£
PBT £000
Highest Jun 14 1.710 (819) 1.617 307 Average 1.650 (682) 1.563 454 Lowest Aug 13 1.553 (442) 1.516 591
The table below shows the Group’s currency exposures. Exposures comprise the net financial assets and liabilities of the Group that are not denominated in the functional currency.
Group Company 2014 2013 2014 2013 Currency Item £000 £000 £000 £000 Euro Cash and cash equivalents 5 6 5 6 Trade and other payables (58) (61) (29) (3) US Dollar Cash and cash equivalents 642 8 53 - Trade and other receivables 500 636 - - Trade and other payables (25) (2) (2) (2) ---------------------------- ---------------------------- ---------------------------- ----------------------------
Total 1,064 587 27 1 ============================ ============================== ============================ ==============================
Capital risk management The Group’s objectives when managing capital are to safeguard the Group’s ability to continue as a going concern in order to provide returns for shareholders and maintain an optimal capital structure to reduce the cost of capital. The Group defines capital as being the consolidated shareholder equity (note 21) and bank borrowings (note 18). The Board monitors the level of capital as compared to the Group’s long-term debt commitments and adjusts the ratio of debt to capital as is determined to be necessary, by issuing new shares, reducing or increasing debt, paying dividends and returning capital to shareholders. The Group is not subject to any externally imposed capital requirements.
24 Capital commitments and guarantees
At the reporting date, Europa had contractual commitments to drill up to 3 wells onshore UK. In PEDL181, Kiln Lane is expected to be drilled in 2014 and Europa is able to fund this from existing resources. Wells at PEDL143 (Holmwood) and PEDL182 (Broughton) would be subject to planning approval and detailed prospect mapping are not currently funded (see note 11). Europa’s share of total costs on these 3 wells is expected to be £3.7 million. At Béarn des Gaves, Europa has a commitment to spend £2 million by 2017, which is not currently funded.
25 Operating lease commitments
Europa Oil & Gas Limited pays an annual site rental for the land upon which the West Firsby and Crosby Warren oil field facilities are located. The West Firsby lease runs until September 2022 and can be terminated upon giving 2 months notice. The annual cost is currently £19,000 (2013: £18,000) and increases annually in line with the retail price index. The Crosby Warren lease runs until December 2022 and can be terminated on 3 months’ notice. The annual cost is currently £20,000 (2013: £20,000).
26 Related party transactions
Key management are those persons having authority and responsibility for planning, controlling and directing the activities of the Group. In the opinion of the Board, the Group’s and the Company’s key management are the directors of Europa Oil & Gas (Holdings) plc. Information regarding their compensation is given in note 4.
At the reporting date there were no balances owed by subsidiary companies to the Company (2013: zero). In 2012 balances owed to the Company amounting to £8,250,000 were written off to the Income statement.
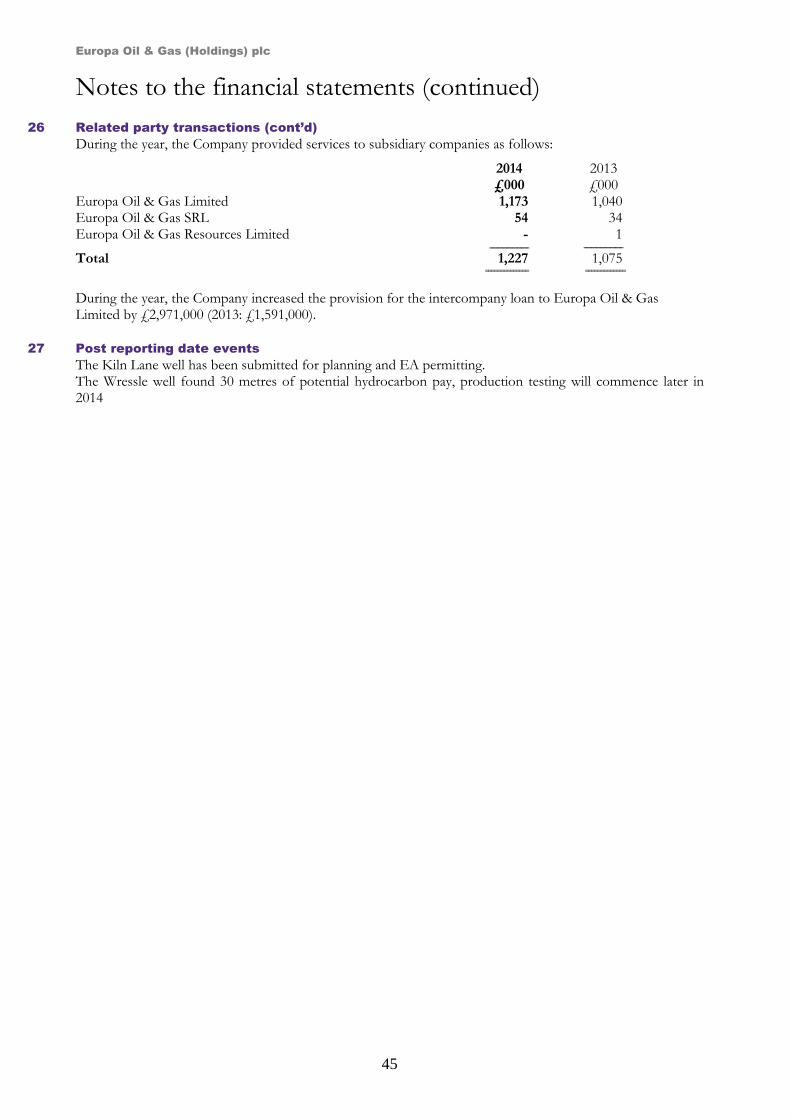
Europa Oil & Gas (Holdings) plc
45
Notes to the financial statements (continued)
26 Related party transactions (cont’d)
During the year, the Company provided services to subsidiary companies as follows:
2014 £000
2013 £000
Europa Oil & Gas Limited 1,173 1,040 Europa Oil & Gas SRL 54 34 Europa Oil & Gas Resources Limited - 1 ------------------------------- ------------------------------- Total 1,227 1,075 ============== =============
During the year, the Company increased the provision for the intercompany loan to Europa Oil & Gas Limited by £2,971,000 (2013: £1,591,000).
27 Post reporting date events
The Kiln Lane well has been submitted for planning and EA permitting. The Wressle well found 30 metres of potential hydrocarbon pay, production testing will commence later in 2014
Europa Oil & Gas (Holdings) plc
46
Directors and advisers
Company registration number 5217946
Registered office 6 Porter Street London W1U 6DD
Directors WH Adamson - Non Executive Chairman CW Ahlefeldt-Laurvig – Non Executive C Bousfield – Non Executive RJHM Corrie – Non Executive P Greenhalgh – Finance Director HGD Mackay – Chief Executive Officer
Secretary P Greenhalgh
Banker Royal Bank of Scotland plc 1 Albyn Place Aberdeen AB10 1BR
Solicitor Charles Russell LLP 5 Fleet Place London EC4M 7RD
Auditor BDO LLP 55 Baker Street London W1U 7EU
Nominated advisor and broker finnCap Limited 60 New Broad Street London EC2M 1JJ
Registrar Computershare Investor Services plc PO Box 82 The Pavilions Bridgwater Road Bristol BS99 7NH